executive cotton update - cottonworks
TRANSCRIPT
Executive Cotton Update U.S. Macroeconomic Indicators & the Cotton Supply Chain
November 2020 www.cottoninc.comMacroeconomic Overview: The U.S. presidential election is over, and one source of uncertainty for U.S. and global markets has been resolved. While a new president has been chosen, the elections did not generate a clear result for the U.S. Senate. Runoff elections in Georgia will determine whether Republicans hold onto their slight majority. Regardless of the outcome, the majority for either party will be slim and could make the passage of major legislation a challenge for the next couple years. In the next couple months, a legislative action (or inaction) to follow is whether another stimulus measure may be passed.
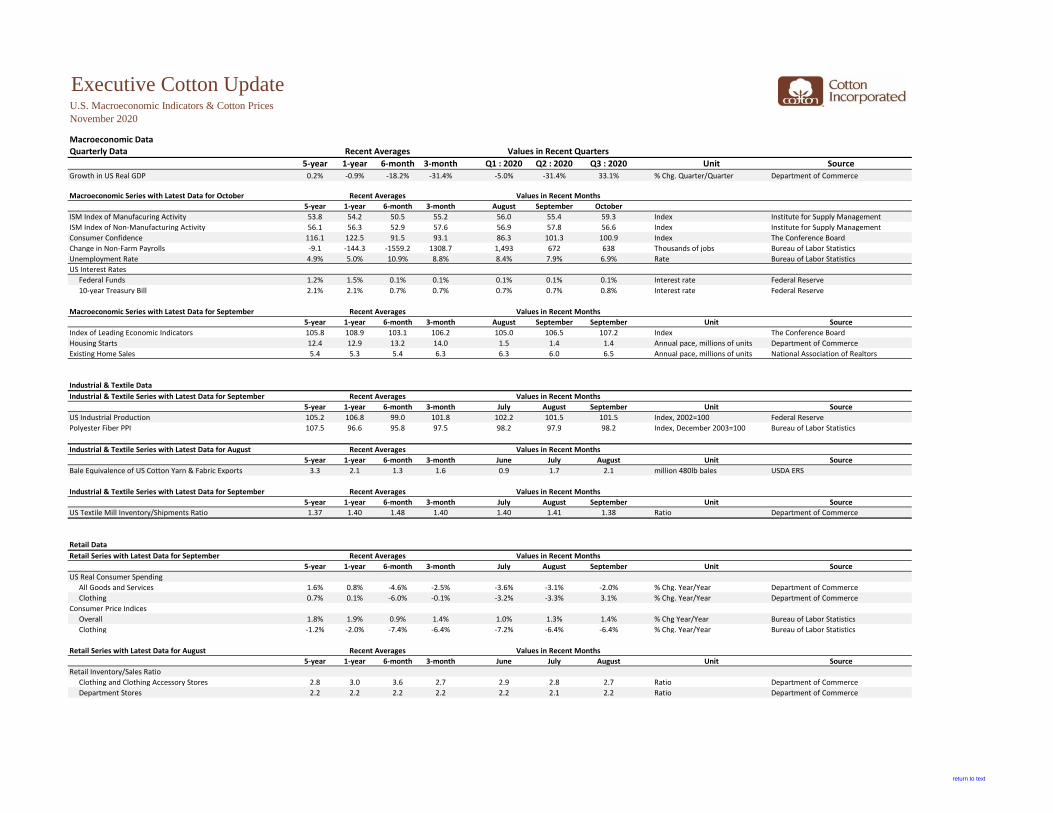
A combined effect of the shutdown this spring and the reopening that followed was a wide swing in data for the U.S. GDP. After a record contraction in the second quarter, there was a record expansion in the third. In the seasonally-adjusted annual rates that the Bureau of Economic Analysis uses for their headline number, the change was from -31.4% to +33.1%. Seasonally-adjusted annual rates for quarterly change can facilitate more direct comparison with annual rates but may be misleading in times of extreme volatility. An alternate way of examining GDP is in simple year-over-year terms. In the second quarter, the U.S. economy was -9.0% smaller year-over-year. In the third quarter, U.S. economic activity was -2.9% lower than one year ago.
The International Monetary Fund (IMF) released updates to their projections for global GDP last month. The IMF figure for 2020 improved from -4.9% (June estimate) to -4.4%. The increase was a result of stronger than expected growth in China (+0.9 percentage points, or ppt, relative to June, to +1.9%), the U.S. (+3.7 ppt versus June, to -4.3%), and the Euro Zone (+1.9 ppt to +5.2%). For 2021, the IMF is predicting a 5.2% global expansion. This is lower than the 5.4% growth forecast in June. The U.S. is projected to grow 3.1% in 2021. The Euro Zone is expected to grow +5.2%. The Chinese economy is forecast to expand +8.2%.
Meanwhile, global COVID cases continue to climb. Both the U.S. and Europe have been setting new records for daily diagnoses. Several European countries have already announced restrictions on consumer activity. The threat of further surges in caseloads around the world is a downside risk to all economic forecasts. With the uncertainty surrounding COVID and economic conditions, the National Retail Federation (NRF) did not issue their annual projection for holiday sales growth.
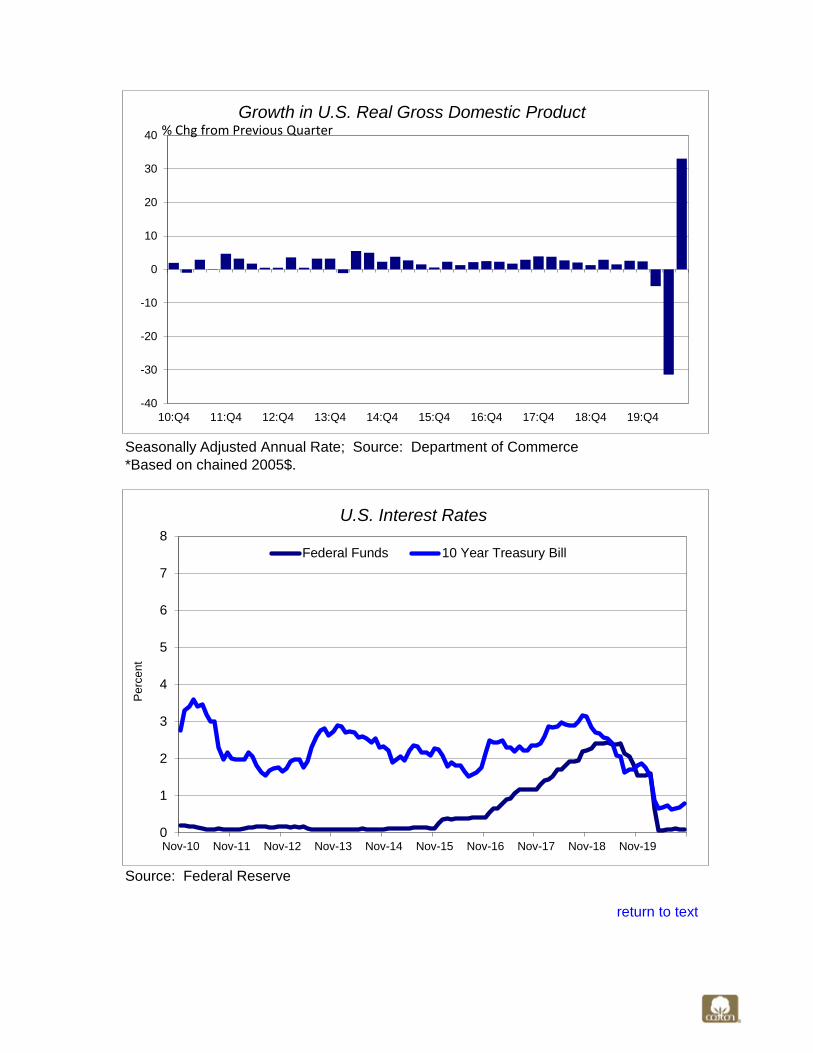
Nonetheless, there are reasons to be optimistic about holiday sales. Consumer confidence is above the long-term average, consumer spending has been consistently positive, and savings rates have been elevated for the past several months, suggesting that consumers have resources they could devote to purchases.
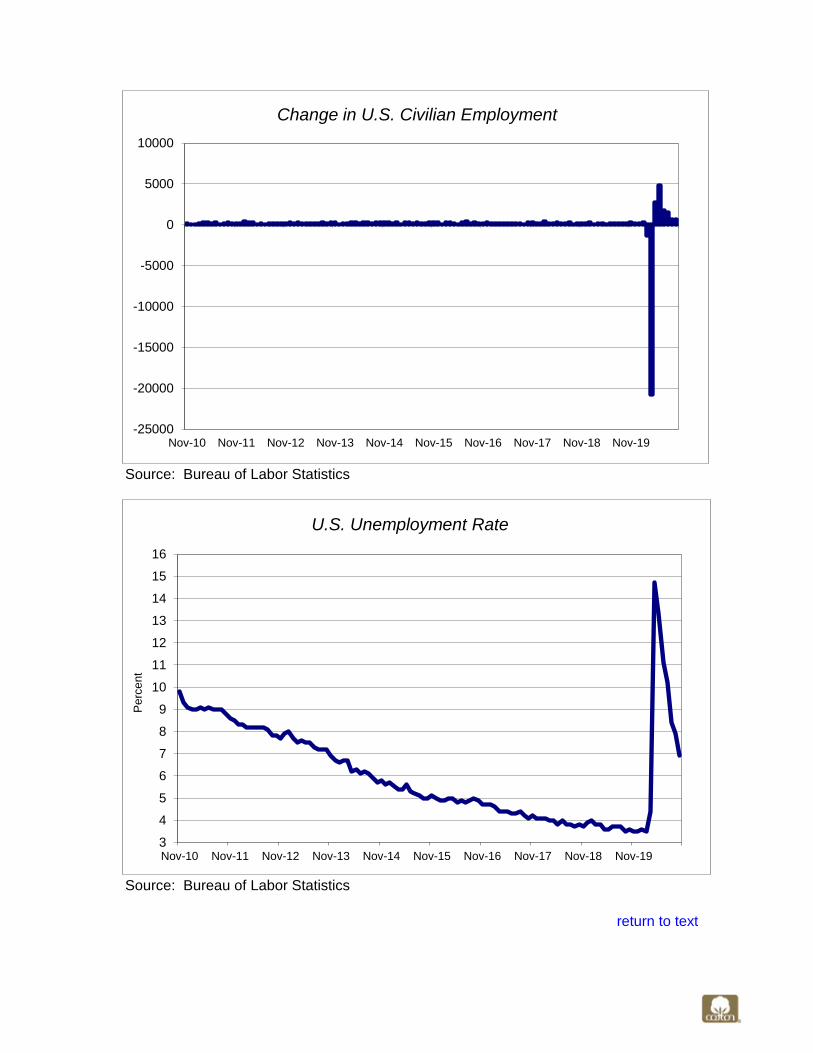
Employment: The U.S. economy was estimated to have added 638,000 jobs in October. This is the lowest monthly increase since May (was +2.7 million in May, +4.8 million in June, +1.8 million in August, +672,000 in September). The sum of these gains is 12.1 million. In March and April, losses totaled 22.2 million. The net result is that the U.S. economy is down a little more than ten million jobs since COVID-19.
The unemployment rate fell from 7.9% to 6.9% last month. Initial claims for unemployment insurance, a proxy for layoffs, remain stubbornly high at levels above 750,000. This is about 100,000 losses above the worst weeks during the financial crisis. With layoffs elevated, a factor helping the unemployment rate has been reductions in the labor force. Compared to one year ago, the number of people wanting to work declined by 3.5 million people.
Consumer Confidence & Spending: The Index of Consumer Confidence was nearly unchanged last month (-0.4 points, from 101.3 to 100.9). At its current level, the index is 20% lower than one year ago (126.1) but is above the long-term average (93.3 since 1970).
Overall consumer spending increased 1.2% month-over-month in September but was 2.0% lower year-over-year. Spending on apparel surged 6.4% month-over-month and turned positive year-over-year. The 3.1% year-over-year increase in clothing spending in September is higher than rates commonly posted over much of the past decade.
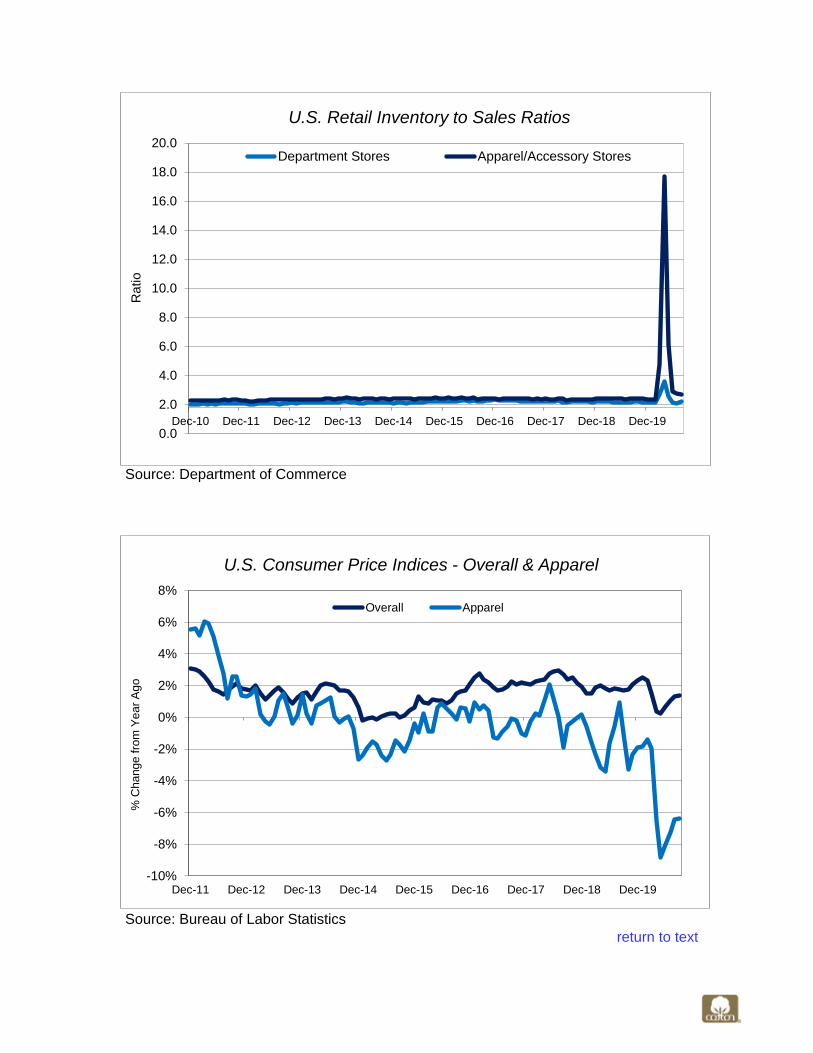
Consumer Prices & Import Data: Retail apparel prices, as measured by the CPI for garments, decreased 0.3% month-over-month in September. Year-over-year, average apparel prices were 6.4% lower. In terms of USD per square meter-equivalent (SME), average prices for cotton-dominant apparel imports increased 0.8% month-over-month (seasonally-adjusted). Year-over-year, average import prices were 8.8% lower.
In terms of import weight volume, year-over-year levels remain below those from one year ago, but the size of the gap has gotten smaller. The raw fiber equivalence of cotton contained in U.S. apparel imports was down 3.8% in September (latest available). Between April and August, the decreases were -46%, -66%, -45%, -24%, and -11%. Ahead of the pandemic, but after the imposition of tariffs on Chinese-made goods (Sept 2019-Feb 2020), imported cotton weight was down 8% year-over-year.
U.S. Macroeconomic & Cotton Supply Chain Charts
Macroeconomic Indicators Industry & Textiles Retail Currencies Cotton GDP Growth Leading Indicators Industrial Production Consumer Spending Weighted Index U.S. Balance Sheet Interest Rates Consumer Conf. Inventory/Shipments Inventory/Sales Asia Fiber Prices ISM Indices Employment U.S. Yarn Exports Consumer Prices The Americas
Housing Polyester PPI Europe
Executive Cotton UpdateU.S. Macroeconomic Indicators & Cotton Prices
November 2020
Macroeconomic Data
Quarterly Data
5-year 1-year 6-month 3-month Q1 : 2020 Q2 : 2020 Q3 : 2020 Unit Source
Growth in US Real GDP 0.2% -0.9% -18.2% -31.4% -5.0% -31.4% 33.1% % Chg. Quarter/Quarter Department of Commerce
Macroeconomic Series with Latest Data for October
5-year 1-year 6-month 3-month August September October
ISM Index of Manufacuring Activity 53.8 54.2 50.5 55.2 56.0 55.4 59.3 Index Institute for Supply Management
ISM Index of Non-Manufacturing Activity 56.1 56.3 52.9 57.6 56.9 57.8 56.6 Index Institute for Supply Management
Consumer Confidence 116.1 122.5 91.5 93.1 86.3 101.3 100.9 Index The Conference Board
Change in Non-Farm Payrolls -9.1 -144.3 -1559.2 1308.7 1,493 672 638 Thousands of jobs Bureau of Labor Statistics
Unemployment Rate 4.9% 5.0% 10.9% 8.8% 8.4% 7.9% 6.9% Rate Bureau of Labor Statistics
US Interest Rates
Federal Funds 1.2% 1.5% 0.1% 0.1% 0.1% 0.1% 0.1% Interest rate Federal Reserve
10-year Treasury Bill 2.1% 2.1% 0.7% 0.7% 0.7% 0.7% 0.8% Interest rate Federal Reserve
Macroeconomic Series with Latest Data for September
5-year 1-year 6-month 3-month August September September Unit Source
Index of Leading Economic Indicators 105.8 108.9 103.1 106.2 105.0 106.5 107.2 Index The Conference Board
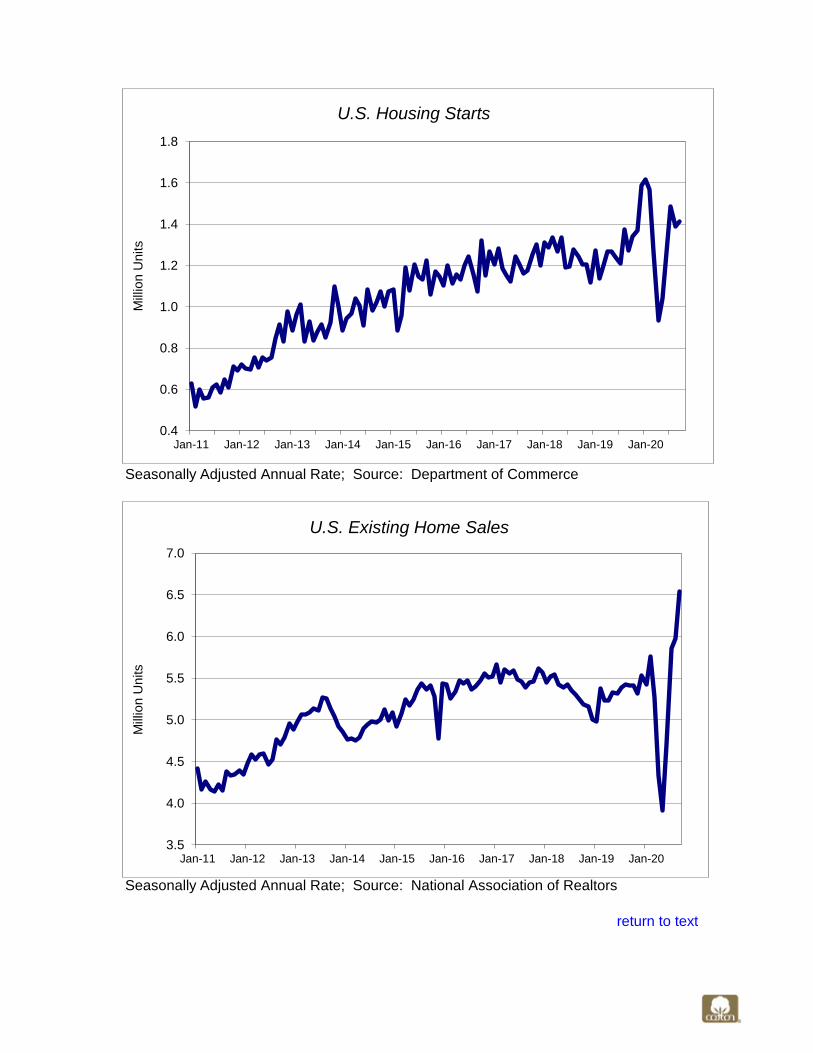
Housing Starts 12.4 12.9 13.2 14.0 1.5 1.4 1.4 Annual pace, millions of units Department of Commerce
Existing Home Sales 5.4 5.3 5.4 6.3 6.3 6.0 6.5 Annual pace, millions of units National Association of Realtors
Industrial & Textile Data
Industrial & Textile Series with Latest Data for September
5-year 1-year 6-month 3-month July August September Unit Source
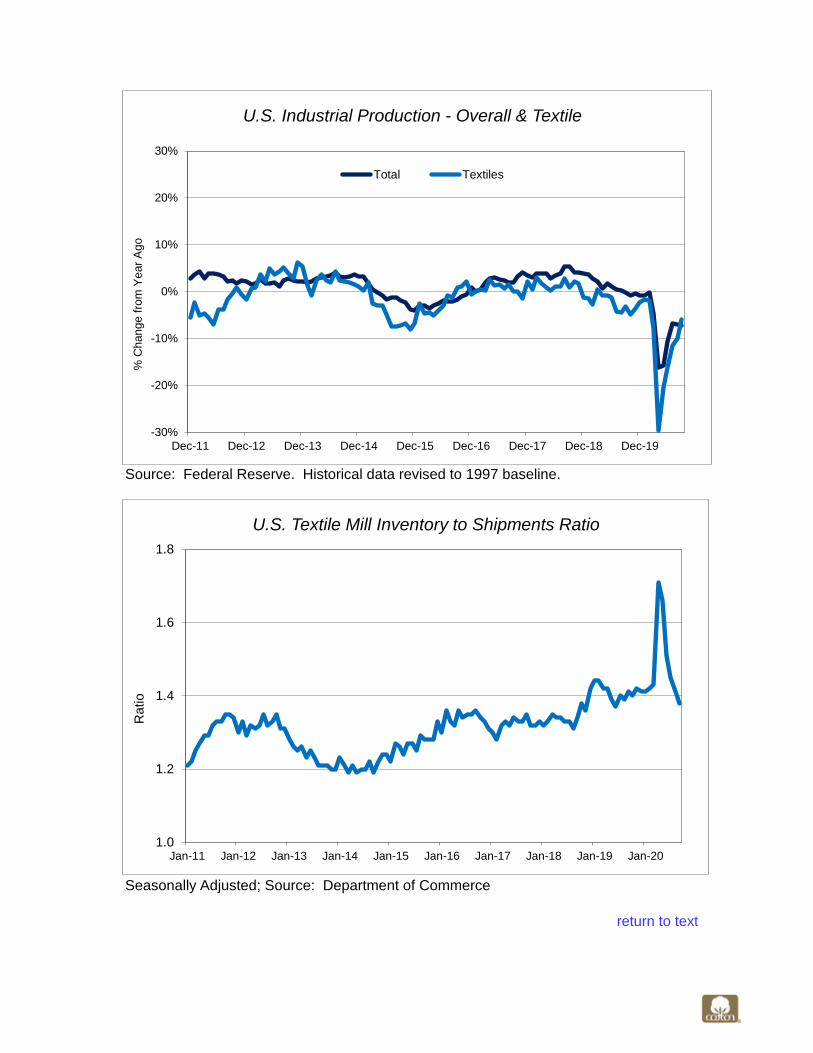
US Industrial Production 105.2 106.8 99.0 101.8 102.2 101.5 101.5 Index, 2002=100 Federal Reserve
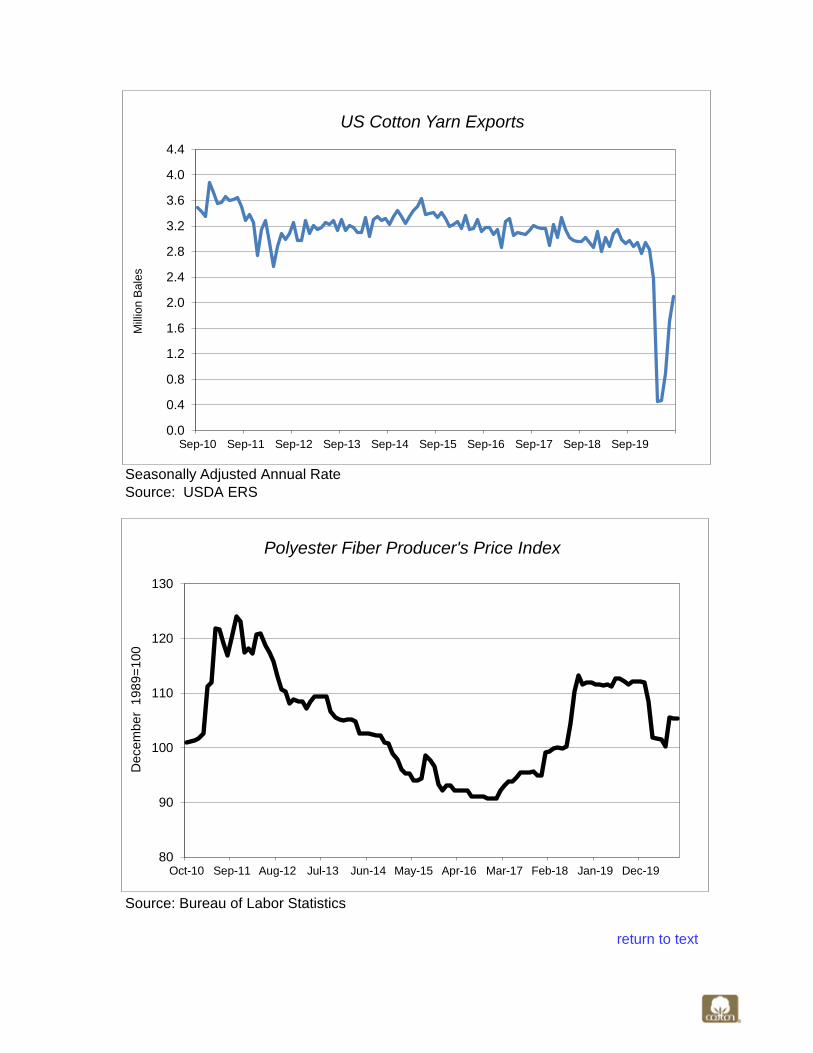
Polyester Fiber PPI 107.5 96.6 95.8 97.5 98.2 97.9 98.2 Index, December 2003=100 Bureau of Labor Statistics
Industrial & Textile Series with Latest Data for August
5-year 1-year 6-month 3-month June July August Unit Source
Bale Equivalence of US Cotton Yarn & Fabric Exports 3.3 2.1 1.3 1.6 0.9 1.7 2.1 million 480lb bales USDA ERS
Industrial & Textile Series with Latest Data for September
5-year 1-year 6-month 3-month July August September Unit Source
US Textile Mill Inventory/Shipments Ratio 1.37 1.40 1.48 1.40 1.40 1.41 1.38 Ratio Department of Commerce
Retail Data
Retail Series with Latest Data for September
5-year 1-year 6-month 3-month July August September Unit Source
US Real Consumer Spending
All Goods and Services 1.6% 0.8% -4.6% -2.5% -3.6% -3.1% -2.0% % Chg. Year/Year Department of Commerce
Clothing 0.7% 0.1% -6.0% -0.1% -3.2% -3.3% 3.1% % Chg. Year/Year Department of Commerce
Consumer Price Indices
Overall 1.8% 1.9% 0.9% 1.4% 1.0% 1.3% 1.4% % Chg Year/Year Bureau of Labor Statistics
Clothing -1.2% -2.0% -7.4% -6.4% -7.2% -6.4% -6.4% % Chg. Year/Year Bureau of Labor Statistics
Retail Series with Latest Data for August
5-year 1-year 6-month 3-month June July August Unit Source
Retail Inventory/Sales Ratio
Clothing and Clothing Accessory Stores 2.8 3.0 3.6 2.7 2.9 2.8 2.7 Ratio Department of Commerce
Department Stores 2.2 2.2 2.2 2.2 2.2 2.1 2.2 Ratio Department of Commerce
Recent Averages Values in Recent Quarters
Recent Averages Values in Recent Months
Recent Averages Values in Recent Months
Recent Averages Values in Recent Months
Recent Averages Values in Recent Months
Recent Averages Values in Recent Months
Recent Averages Values in Recent Months
Recent Averages Values in Recent Months
return to text

Executive Cotton UpdateDaily Cotton Price and Currency Data
November 2020
Daily Cotton Price Data
5-year 1-year 6-month 3-month August September October Unit Source
NY Nearby 69.1 70.5 68.6 66.8 63.6 64.6 69.2 cents/pound ICE
A Index 78.1 79.8 77.8 76.0 70.0 70.8 74.8 cents/pound Cotlook
Daily Currency Data
5-year 1-year 6-month 3-month August September October Unit Source
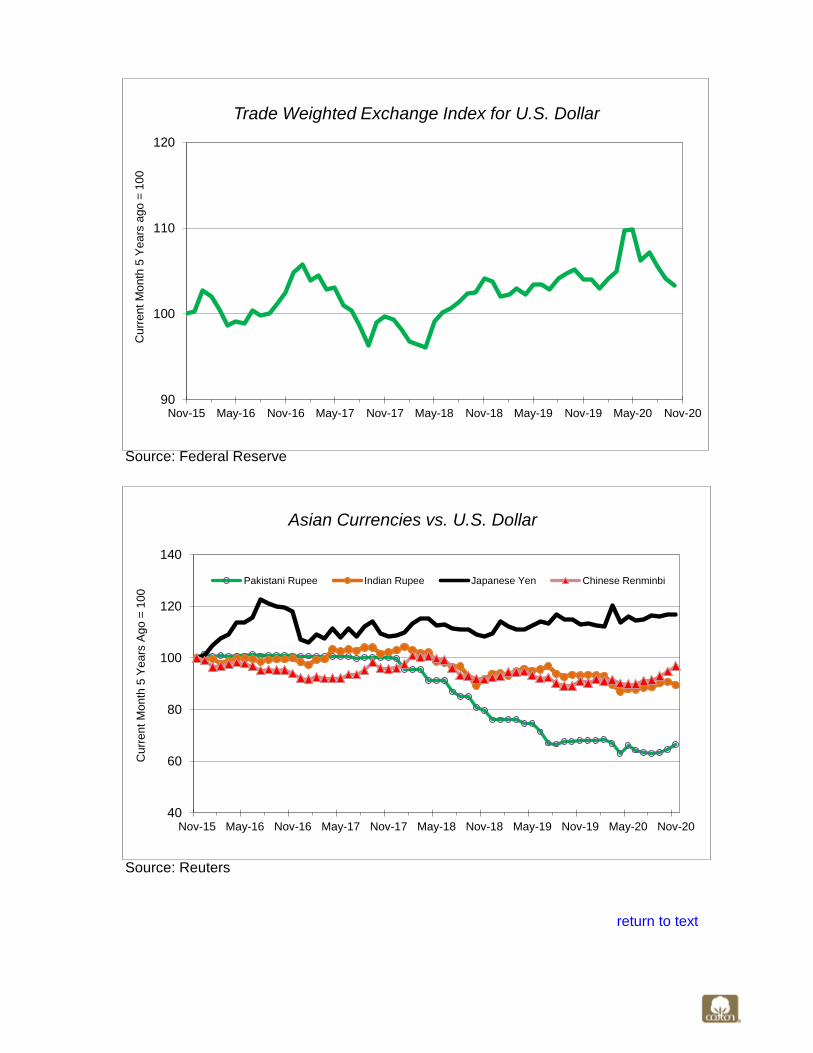
Dollar Trade Weighted Exchange Index 114.3 115.0 118.6 116.7 118.0 116.5 115.6 Index, January 1997=100 Federal Reserve
Asian Currencies
Chinese Renminbi 6.76 6.81 6.95 6.84 6.96 6.85 6.71 Chinese Renminbi/US dollar Reuters
Indian Rupee 68.74 70.42 74.63 73.87 74.93 73.55 73.15 Indian Rupee/US dollar Reuters
Japanese Yen 109.90 109.10 106.53 105.93 105.89 106.24 105.66 Japanese Yen/US dollar Reuters
Pakistani Rupee 126.41 140.79 164.75 166.04 167.85 166.45 163.83 Pakistani Rupee/US dollar Reuters
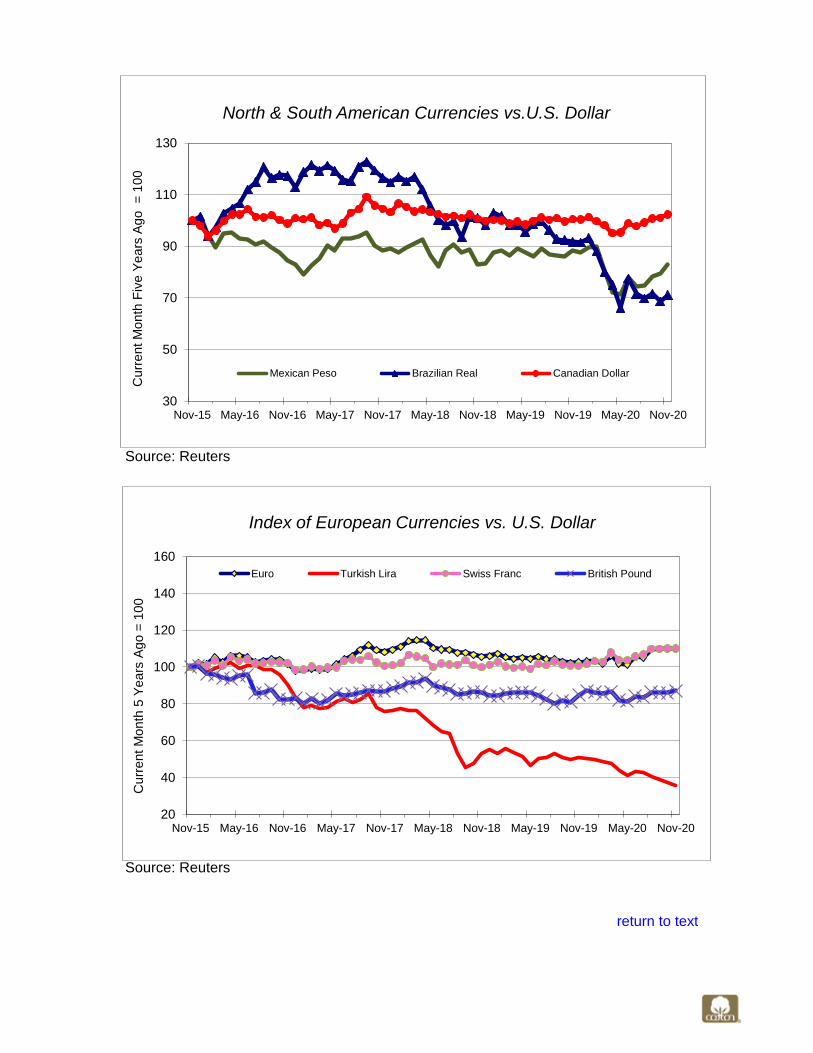
North & South American Currencies
Brazilian Real 3.81 4.10 5.37 5.42 5.44 5.30 5.53 Brazilian Real/US dollar Reuters
Canadian Dollar 1.32 1.32 1.34 1.32 1.34 1.32 1.31 Canadian dollar/US dollar Reuters
Mexican Peso 19.40 19.90 22.21 21.74 22.51 21.51 21.19 Mexican Peso/US dollar Reuters
European Currencies
British Pound 0.76 0.77 0.78 0.77 0.77 0.77 0.77 British Pound/US dollar Reuters
Euro 0.88 0.87 0.87 0.85 0.85 0.85 0.85 Euro/US dollar Reuters
Swiss Franc 0.98 0.98 0.93 0.91 0.91 0.91 0.91 Swiss Franc/US dollar Reuters
Turkish Lira 4.67 5.60 7.23 7.53 7.24 7.49 7.86 Turkish Lira/US dollar Reuters
Recent Averages Averages over Recent Months
Recent Averages Averages over Recent Months
return to text
March 4, 2009
Seasonally Adjusted Annual Rate; Source: Department of Commerce
*Based on chained 2005$.
Source: Federal Reserve
return to text
-40
-30
-20
-10
0
10
20
30
40
10:Q4 11:Q4 12:Q4 13:Q4 14:Q4 15:Q4 16:Q4 17:Q4 18:Q4 19:Q4
Growth in U.S. Real Gross Domestic Product
0
1
2
3
4
5
6
7
8
Nov-10 Nov-11 Nov-12 Nov-13 Nov-14 Nov-15 Nov-16 Nov-17 Nov-18 Nov-19
Perc
ent
U.S. Interest Rates
Federal Funds 10 Year Treasury Bill
% Chg from Previous Quarter

Source: Institute for Supply Chain Management
Source: Institute for Supply Chain Management
return to text
20
25
30
35
40
45
50
55
60
65
70
Nov-10 Nov-11 Nov-12 Nov-13 Nov-14 Nov-15 Nov-16 Nov-17 Nov-18 Nov-19
Index V
alu
es o
ver
50 I
ndic
ate
Expansio
n
ISM Index of Non-Manufacturing Activity
Service Sector Activity Service Sector Employment
20
25
30
35
40
45
50
55
60
65
70
Nov-10 Nov-11 Nov-12 Nov-13 Nov-14 Nov-15 Nov-16 Nov-17 Nov-18 Nov-19
Index V
alu
es o
ver
50 I
ndic
ate
Expansio
n
ISM Index of Manufacturing Activity
Manufacturing Activity Manufacturing Employment
Source: The Conference Board
Source: The Conference Board
return to text
20
40
60
80
100
120
140
Nov-10 Nov-11 Nov-12 Nov-13 Nov-14 Nov-15 Nov-16 Nov-17 Nov-18 Nov-19
Index (
1985 =
100)
U.S. Consumer Confidence
60
70
80
90
100
110
120
Nov-10 Nov-11 Nov-12 Nov-13 Nov-14 Nov-15 Nov-16 Nov-17 Nov-18 Nov-19
Index (
2004 =
100)
U.S. Leading Economic Indicators
Source: Bureau of Labor Statistics
Source: Bureau of Labor Statistics
return to text
3
4
5
6
7
8
9
10
11
12
13
14
15
16
Nov-10 Nov-11 Nov-12 Nov-13 Nov-14 Nov-15 Nov-16 Nov-17 Nov-18 Nov-19
Perc
ent
U.S. Unemployment Rate
-25000
-20000
-15000
-10000
-5000
0
5000
10000
Nov-10 Nov-11 Nov-12 Nov-13 Nov-14 Nov-15 Nov-16 Nov-17 Nov-18 Nov-19
Change in U.S. Civilian Employment
Seasonally Adjusted Annual Rate; Source: Department of Commerce
Seasonally Adjusted Annual Rate; Source: National Association of Realtors
return to text
3.5
4.0
4.5
5.0
5.5
6.0
6.5
7.0
Jan-11 Jan-12 Jan-13 Jan-14 Jan-15 Jan-16 Jan-17 Jan-18 Jan-19 Jan-20
Mill
ion
Un
its
U.S. Existing Home Sales
0.4
0.6
0.8
1.0
1.2
1.4
1.6
1.8
Jan-11 Jan-12 Jan-13 Jan-14 Jan-15 Jan-16 Jan-17 Jan-18 Jan-19 Jan-20
Mill
ion
Un
its
U.S. Housing Starts
Source: Federal Reserve. Historical data revised to 1997 baseline.
Seasonally Adjusted; Source: Department of Commerce
return to text
-30%
-20%
-10%
0%
10%
20%
30%
Dec-11 Dec-12 Dec-13 Dec-14 Dec-15 Dec-16 Dec-17 Dec-18 Dec-19
% C
hange f
rom
Year
Ago
U.S. Industrial Production - Overall & Textile
Total Textiles
1.0
1.2
1.4
1.6
1.8
Jan-11 Jan-12 Jan-13 Jan-14 Jan-15 Jan-16 Jan-17 Jan-18 Jan-19 Jan-20
Ra
tio
U.S. Textile Mill Inventory to Shipments Ratio
Seasonally Adjusted Annual Rate
Source: USDA ERS
Source: Bureau of Labor Statistics
return to text
0.0
0.4
0.8
1.2
1.6
2.0
2.4
2.8
3.2
3.6
4.0
4.4
Sep-10 Sep-11 Sep-12 Sep-13 Sep-14 Sep-15 Sep-16 Sep-17 Sep-18 Sep-19
Mill
ion B
ale
s
US Cotton Yarn Exports
80
90
100
110
120
130
Oct-10 Sep-11 Aug-12 Jul-13 Jun-14 May-15 Apr-16 Mar-17 Feb-18 Jan-19 Dec-19
De
ce
mb
er
19
89
=1
00
Polyester Fiber Producer's Price Index

Seasonally Adjusted Annual Rate; Source: Department of Commerce
*Based on chained 2005$.
Seasonally Adjusted Annual Rate; Source: Department of Commerce
*Based on chained 2005$.
return to text
-20%
-15%
-10%
-5%
0%
5%
10%
Dec-10 Dec-11 Dec-12 Dec-13 Dec-14 Dec-15 Dec-16 Dec-17 Dec-18 Dec-19
% C
hange f
rom
Year
Ago
U.S. Real Consumer Spending - All Goods & Services
-50%
-40%
-30%
-20%
-10%
0%
10%
Dec-10 Dec-11 Dec-12 Dec-13 Dec-14 Dec-15 Dec-16 Dec-17 Dec-18 Dec-19
% C
hange f
rom
Year
Ago
U.S. Real Consumer Spending on Clothing
Seasonally Adjusted; Source: Department of Commerce
Source: Department of Commerce
Source: Bureau of Labor Statistics
return to text
-10%
-8%
-6%
-4%
-2%
0%
2%
4%
6%
8%
Dec-11 Dec-12 Dec-13 Dec-14 Dec-15 Dec-16 Dec-17 Dec-18 Dec-19
% C
hange f
rom
Year
Ago
U.S. Consumer Price Indices - Overall & Apparel
Overall Apparel
0.0
2.0
4.0
6.0
8.0
10.0
12.0
14.0
16.0
18.0
20.0
Dec-10 Dec-11 Dec-12 Dec-13 Dec-14 Dec-15 Dec-16 Dec-17 Dec-18 Dec-19
Ra
tio
U.S. Retail Inventory to Sales Ratios
Department Stores Apparel/Accessory Stores
Source: Federal Reserve
Source: Reuters
return to text
40
60
80
100
120
140
Nov-15 May-16 Nov-16 May-17 Nov-17 May-18 Nov-18 May-19 Nov-19 May-20 Nov-20
Curr
ent
Month
5 Y
ears
Ago =
100
Asian Currencies vs. U.S. Dollar
Pakistani Rupee Indian Rupee Japanese Yen Chinese Renminbi
90
100
110
120
Nov-15 May-16 Nov-16 May-17 Nov-17 May-18 Nov-18 May-19 Nov-19 May-20 Nov-20
Trade Weighted Exchange Index for U.S. Dollar
Curr
ent
Month
5 Y
ears
ago =
100
Source: Reuters
Source: Reuters
return to text
20
40
60
80
100
120
140
160
Nov-15 May-16 Nov-16 May-17 Nov-17 May-18 Nov-18 May-19 Nov-19 May-20 Nov-20
Cu
rre
nt M
on
th 5
Ye
ars
Ag
o =
10
0
Index of European Currencies vs. U.S. Dollar
Euro Turkish Lira Swiss Franc British Pound
30
50
70
90
110
130
Nov-15 May-16 Nov-16 May-17 Nov-17 May-18 Nov-18 May-19 Nov-19 May-20 Nov-20
Cu
rre
nt M
on
th F
ive
Ye
ars
Ag
o
= 1
00
North & South American Currencies vs.U.S. Dollar
Mexican Peso Brazilian Real Canadian Dollar
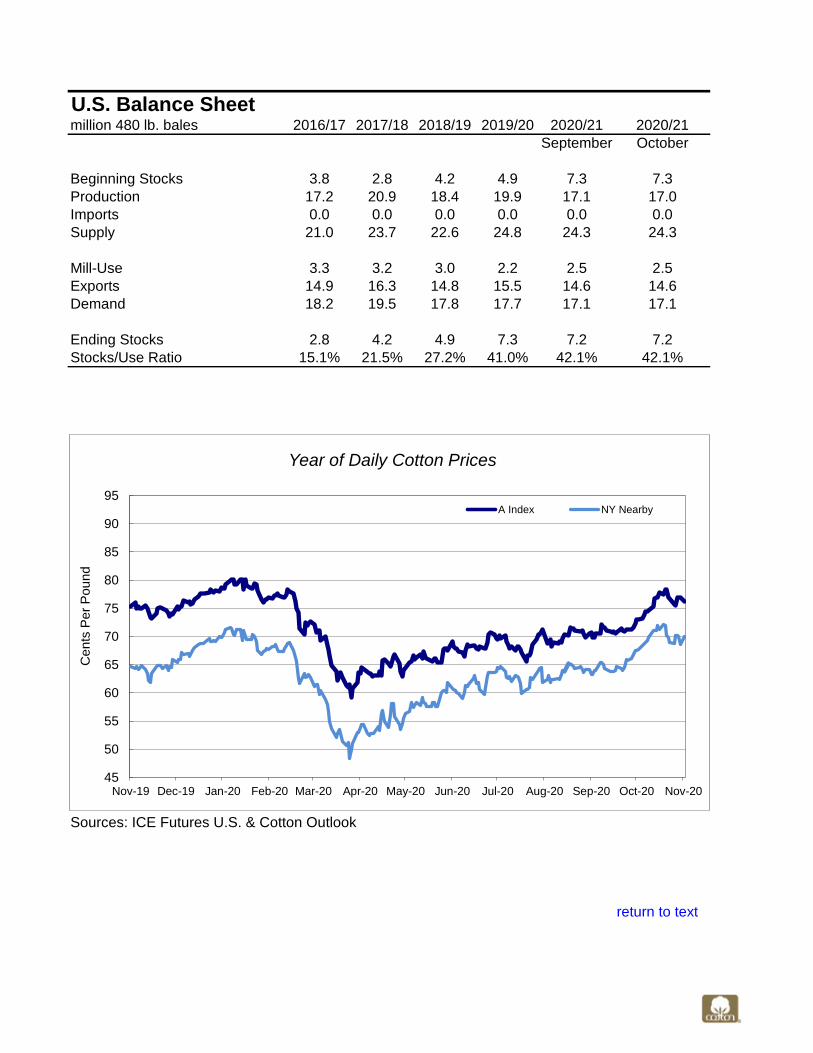
U.S. Balance Sheetmillion 480 lb. bales 2016/17 2017/18 2018/19 2019/20 2020/21 2020/21
September October
Beginning Stocks 3.8 2.8 4.2 4.9 7.3 7.3
Production 17.2 20.9 18.4 19.9 17.1 17.0
Imports 0.0 0.0 0.0 0.0 0.0 0.0
Supply 21.0 23.7 22.6 24.8 24.3 24.3
Mill-Use 3.3 3.2 3.0 2.2 2.5 2.5
Exports 14.9 16.3 14.8 15.5 14.6 14.6
Demand 18.2 19.5 17.8 17.7 17.1 17.1
Ending Stocks 2.8 4.2 4.9 7.3 7.2 7.2
Stocks/Use Ratio 15.1% 21.5% 27.2% 41.0% 42.1% 42.1%
Sources: ICE Futures U.S. & Cotton Outlook
return to text
45
50
55
60
65
70
75
80
85
90
95
Nov-19 Dec-19 Jan-20 Feb-20 Mar-20 Apr-20 May-20 Jun-20 Jul-20 Aug-20 Sep-20 Oct-20 Nov-20
Ce
nts
Per
Pou
nd
Year of Daily Cotton Prices
A Index NY Nearby