executive summarygf
TRANSCRIPT
“Risk And Return Analysis of SAHARA MUTUALFUNDS”
EXECUTIVE SUMMARY
Mutual Funds (MF) have in recent times become one of the mostattractive ways for an average person to invest their money. Itis said that Bank investment is the first priority of people toinvest their savings and the second place is for investment inMutual Funds and other avenues. A Mutual Fund pools resourcesfrom thousands of investors and then diversifies its investmentinto many different holdings such as stocks, bonds, or Governmentsecurities in order to provide high relative safety and returns.
The Project is a “FINANCE PROJECT” which tries to explain inlayman’s language about the history, growth, & pros and cons ofinvesting in Mutual Funds and the second part of it deals withthe analysis of risk and returns of equity and debt schemes ofSahara Mutual Fund in comparison with their respective benchmarkindices.
The main objective of the project was to get an Overview ofMutual Fund Industry, its set up, its working and to find out therisks and returns of both equity and debt schemes of SaharaMutual fund. Also generate leads of the prospective investors inMutual Funds for the Asset Management Company (AMC) to sellMutual Fund products and to make people aware of the SaharaMutual Fund and its products.
The project includes a brief idea about the growth of MF industry(History), the broad idea about the organization and concept ofMF and SEBI Guidelines on Mutual Funds. There are many improvements pending in the field and it has tohappen as soon as possible so as to call the MF industry as anOrganized and well-developed sector.
1 SRN ADARSH COLLEGE
“Risk And Return Analysis of SAHARA MUTUALFUNDS”
The past performance of MF is not necessarily indicative of future performance of the scheme and no AMC guarantees Returns and or safety of Principal.
INTRODUCTION TO MUTUAL FUNDS
Mutual Funds - The Concept
A Mutual Fund is a trust that pools the savings of a number ofinvestors who share a common financial goal. The money thuscollected is then invested in capital market instruments such asshares, debentures and other securities. The income earnedthrough these investments and the capital appreciations realizedare shared by its unit holders in proportion to the number ofunits owned by them.
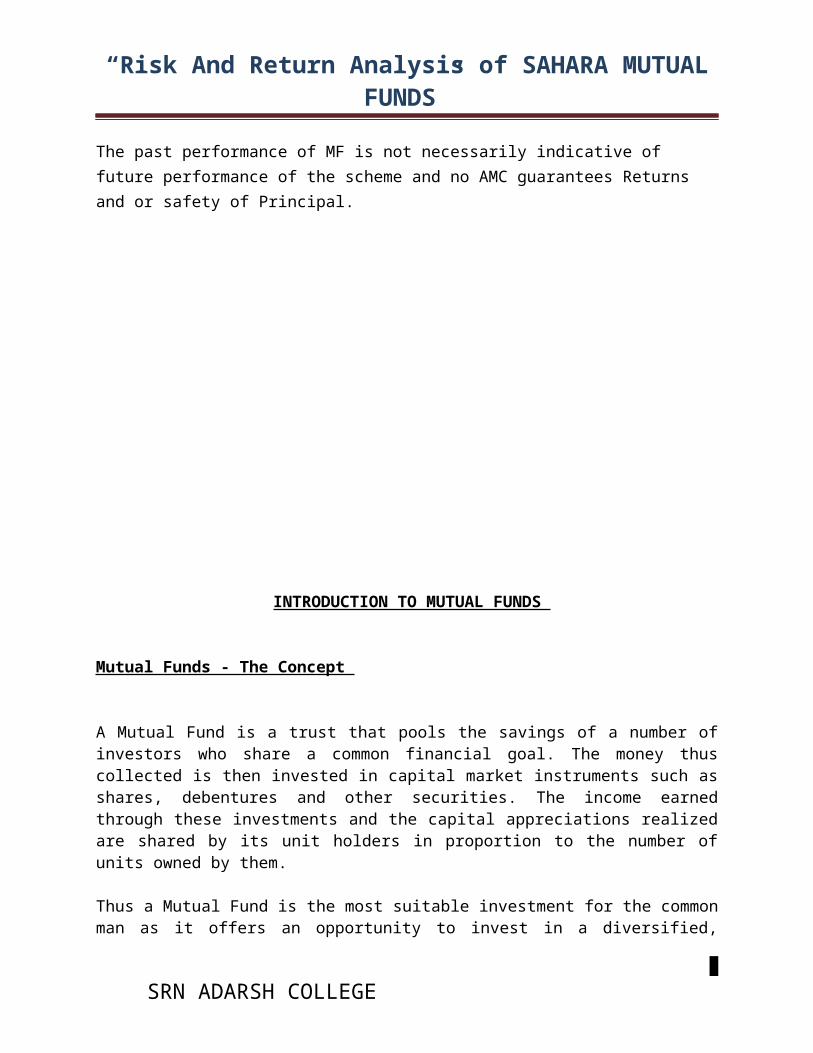
Thus a Mutual Fund is the most suitable investment for the commonman as it offers an opportunity to invest in a diversified,
2 SRN ADARSH COLLEGE
“Risk And Return Analysis of SAHARA MUTUALFUNDS”
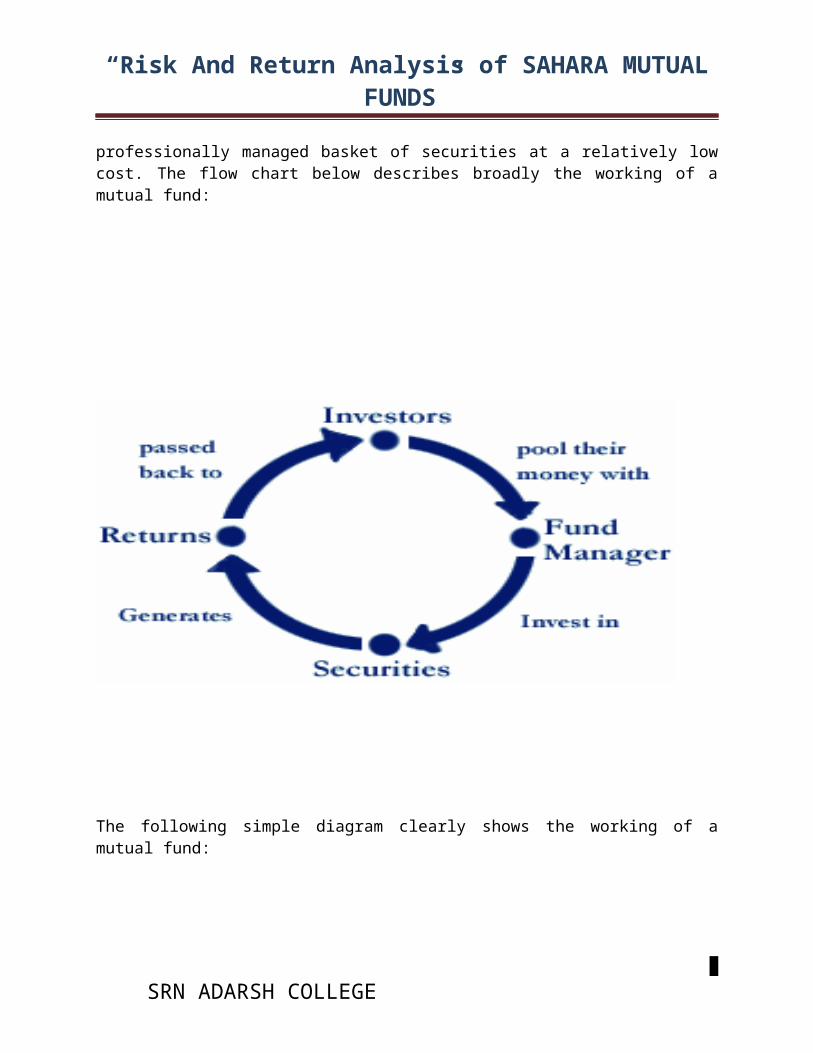
professionally managed basket of securities at a relatively lowcost. The flow chart below describes broadly the working of amutual fund:
The following simple diagram clearly shows the working of amutual fund:
3 SRN ADARSH COLLEGE
“Risk And Return Analysis of SAHARA MUTUALFUNDS”
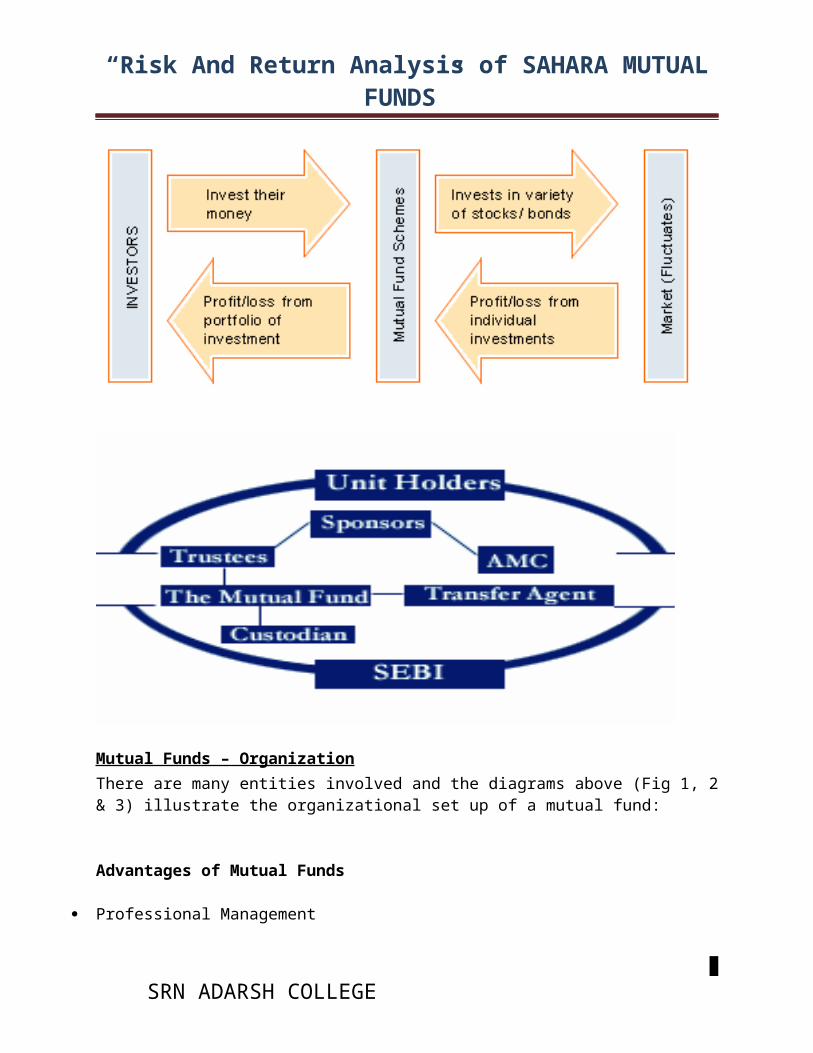
Mutual Funds – OrganizationThere are many entities involved and the diagrams above (Fig 1, 2& 3) illustrate the organizational set up of a mutual fund:
Advantages of Mutual Funds
Professional Management
4 SRN ADARSH COLLEGE
“Risk And Return Analysis of SAHARA MUTUALFUNDS”
Diversification
Convenient Administration
Return Potential
Low Costs
Liquidity
Transparency
Flexibility
Choice of scheme
Tax benefits
Well regulated
Disadvantages of Mutual Funds
No control over the costs
No tailor made portfolios
HISTORY OF MUTUAL FUNDS (WORLDWIDE):
When three Boston securities executives pooled their moneytogether in 1924 to create the first mutual fund, they had noidea how popular mutual funds would become. The idea of pooling money together for investing purposes startedin Europe in the mid-1800s. The first pooled fund in the U.S. wascreated in 1893 for the faculty and staff of Harvard University.
5 SRN ADARSH COLLEGE
“Risk And Return Analysis of SAHARA MUTUALFUNDS”
On March 21st, 1924 the first official mutual fund was born. Itwas called the Massachusetts Investors Trust.
After one year, the Massachusetts Investors Trust grew from$50,000 in assets in 1924 to $392,000 in assets (with around 200shareholders). In contrast, there are over 10,000 mutual funds inthe U.S. today totaling around $7 trillion (with approximately 83million individual investors) according to the Investment CompanyInstitute.
The stock market crash of 1929 slowed the growth of mutual funds.In response to the stock market crash, Congress passed theSecurities Act of 1933 and the Securities Exchange Act of 1934.These laws require that a fund be registered with the SEC andprovide prospective investors with a prospectus. The SEC (U.S.Securities and Exchange Commission) helped create the InvestmentCompany Act of 1940, which provides the guidelines that all fundsmust comply with today.
With renewed confidence in the stock market, mutual funds beganto blossom. By the end of the 1960s there were around 270 fundswith $48 billion in assets.
In 1976, John C. Bogle opened the first retail index fund called the First Index Investment Trust. It is now called the Vanguard 500 Index fund. In November of 2000 it became the largest mutual fund ever with $100 billion in assets.
History of Indian Mutual Fund Industry The history of Mutual Funds in India can be broadly divided into4 Phases:
1. First phase (1964-1987)
The Unit Trust of India (UTI) was established in the year 1963 bypassing an Act in the Parliament.
6 SRN ADARSH COLLEGE
“Risk And Return Analysis of SAHARA MUTUALFUNDS”
The UTI was setup by the Reserve Bank of India (RBI) andfunctioned under the Regulatory and Administrative control of theRBI.
The First scheme in the history of mutual funds was UNIT SCHEME-64, which is popularly known as US-64.
In 1978, UTI was de-linked from RBI. The Industrial DevelopmentBank of India (IDBI) took over the Regulatory and Administrativecontrol.
At the end of the year 1988, UTI had Rs.6,700/- Crores of AssetsUnder Management.
2. Second phase (1987-1993)
Entry of Public Sector Funds.
In the year 1987, public sector Mutual Funds setup by publicsector banks, Life Insurance Corporation of India (LIC) andGeneral Insurance Corporation of India (GIC) are came in toexistence.
State Bank of India Mutual Fund was the first non-UTI MutualFund.
The following are the non-UTI Mutual Funds at initial stages.
SBI Mutual Fund in June 1987.
Can Bank Mutual Fund in December 1987.
LIC Mutual Fund in June 1989.
Punjab National Bank Mutual Fund in August 1989.
7 SRN ADARSH COLLEGE
“Risk And Return Analysis of SAHARA MUTUALFUNDS”
Indian Bank Mutual Fund in November 1989.
Bank of India Mutual Fund in June 1990.
GIC Mutual Fund in December 1990.
Bank of Baroda Mutual Fund in October 1992. At the end of 1993, the entire Mutual Fund Industry had Assets under Management of Rs.47, 004/- Crores.
3. Third phase (1993-2003)
Entry of Private Sector Funds - a wide choice to Indian MutualFund investors.
In 1993, the first Mutual Fund Regulations came into existence,under which all mutual funds except UTI were to be registered andgoverned.
The Erstwhile Kothari Pioneer (now merged with FranklinTempleton) was the first private sector Mutual Fund Registered inJuly 1993.
In 1996, the 1993 Securities Exchange Board of India (SEBI)Mutual Funds Regulations were substituted by a more comprehensiveand revised Mutual Fund Regulations.
The number of Mutual Fund houses went on increasing, with manyforeign mutual funds setting up funds in India.
In this time, the Mutual Fund industry has witnessed severalMergers &Acquisitions.
The UTI with Rs.44, 541/- Crores. Of Assets Under management wasway ahead of all other Mutual Funds.
8 SRN ADARSH COLLEGE
“Risk And Return Analysis of SAHARA MUTUALFUNDS”
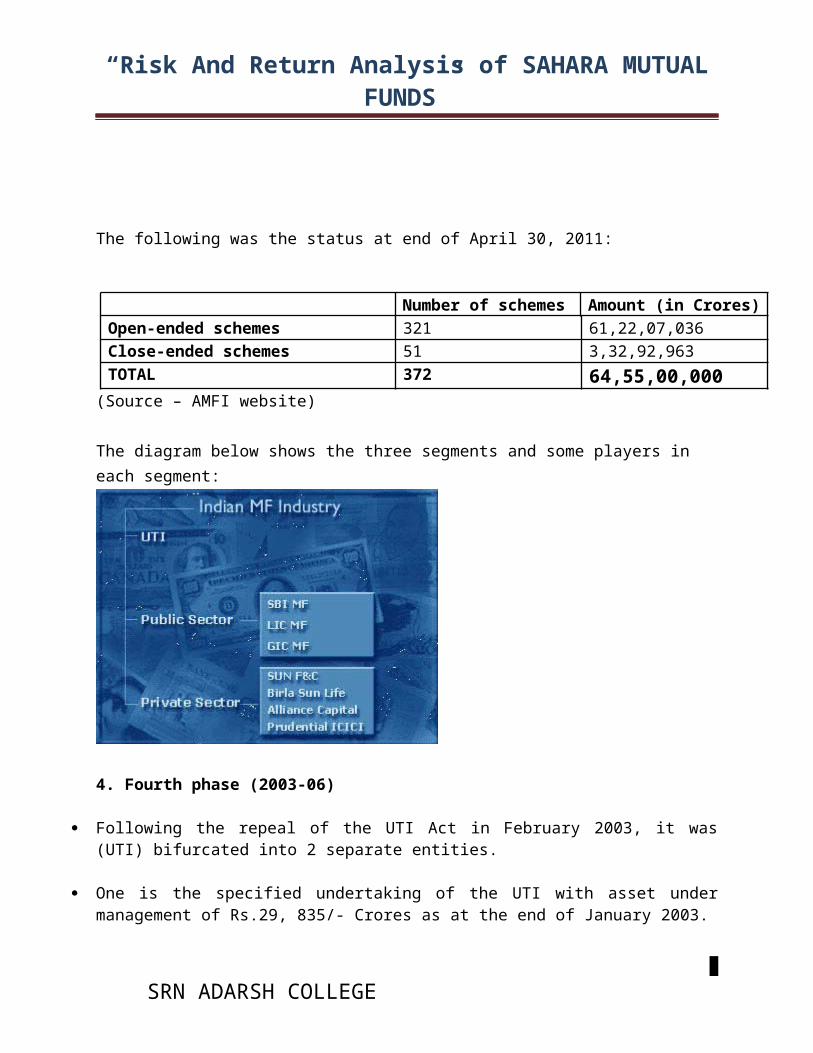
The following was the status at end of April 30, 2011:
Number of schemes Amount (in Crores)Open-ended schemes 321 61,22,07,036Close-ended schemes 51 3,32,92,963TOTAL 372 64,55,00,000
(Source – AMFI website)
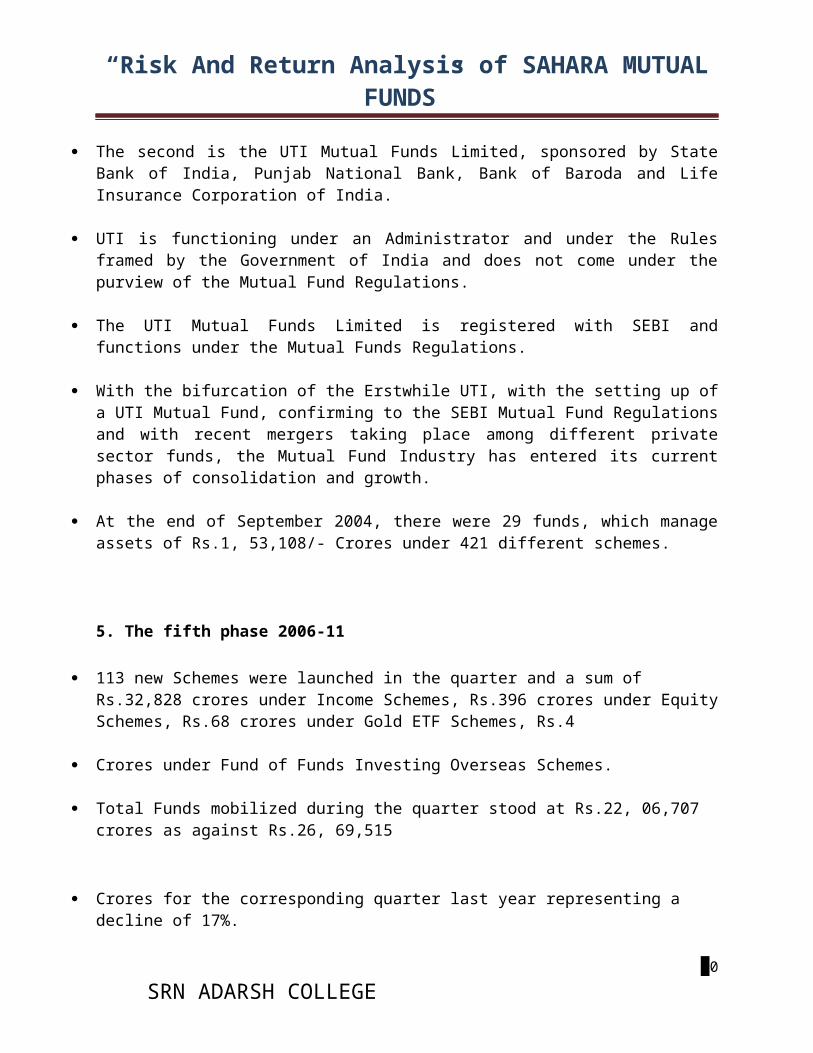
The diagram below shows the three segments and some players in each segment:
4. Fourth phase (2003-06)
Following the repeal of the UTI Act in February 2003, it was(UTI) bifurcated into 2 separate entities.
One is the specified undertaking of the UTI with asset undermanagement of Rs.29, 835/- Crores as at the end of January 2003.
9 SRN ADARSH COLLEGE
“Risk And Return Analysis of SAHARA MUTUALFUNDS”
The second is the UTI Mutual Funds Limited, sponsored by StateBank of India, Punjab National Bank, Bank of Baroda and LifeInsurance Corporation of India.
UTI is functioning under an Administrator and under the Rulesframed by the Government of India and does not come under thepurview of the Mutual Fund Regulations.
The UTI Mutual Funds Limited is registered with SEBI andfunctions under the Mutual Funds Regulations.
With the bifurcation of the Erstwhile UTI, with the setting up ofa UTI Mutual Fund, confirming to the SEBI Mutual Fund Regulationsand with recent mergers taking place among different privatesector funds, the Mutual Fund Industry has entered its currentphases of consolidation and growth.
At the end of September 2004, there were 29 funds, which manageassets of Rs.1, 53,108/- Crores under 421 different schemes.
5. The fifth phase 2006-11
113 new Schemes were launched in the quarter and a sum of Rs.32,828 crores under Income Schemes, Rs.396 crores under EquitySchemes, Rs.68 crores under Gold ETF Schemes, Rs.4
Crores under Fund of Funds Investing Overseas Schemes.
Total Funds mobilized during the quarter stood at Rs.22, 06,707 crores as against Rs.26, 69,515
Crores for the corresponding quarter last year representing a decline of 17%.
10 SRN ADARSH COLLEGE
“Risk And Return Analysis of SAHARA MUTUALFUNDS”
l Redemptions at Rs.22,38,419 crores were 15% lower than the redemptions of Rs.26,40,304 crores in the corresponding quarter last year. l On a net basis, there was an outflow of Rs.31,712 crores during the quarter as against an inflow of Rs.29,211 crores in the corresponding quarter last year.
Data on Fund of Funds is given The Assets under Management as on December 31, 2010 stood at Rs. 6, 26,314 crores as against Rs. 6,65,146 crores as at the end of the previous year representing a decline of 6%.
Association of Mutual Funds in India (AMFI)
With the increase in Mutual Fund players in India, a need forMutual Fund Association in India was generated to function as anon-profit organization. Association of Mutual Funds in India(AMFI) was incorporated on 22nd August, 1995.
AMFI is an apex body of all Asset Management Companies (AMC)which has been registered with Securities Exchange Board of India(SEBI). Till date all the AMCs are that have launched mutual fundschemes are its members. It functions under the supervision andguidelines of its Board of Directors.
Association of Mutual Funds India has brought down the IndianMutual Fund Industry to a professional and healthy market withethical lines enhancing and maintaining standards. It follows theprinciple of both protecting and promoting the interests ofmutual funds as well as their unit holders.
The objectives of Association of Mutual Funds in India
The Association of Mutual Funds of India works with 30 registeredAMCs of the country. It has certain defined objectives which
11 SRN ADARSH COLLEGE
“Risk And Return Analysis of SAHARA MUTUALFUNDS”
juxtaposes the guidelines of its Board of Directors. Theobjectives are as follows:
This Mutual Fund Association of India maintains high professionaland ethical standards in all areas of operation of the industry.
It also recommends and promotes the top class business practicesand code of conduct which is followed by members and relatedpeople engaged in the activities of Mutual Fund and AssetManagement. The agencies who are by any means connected orinvolved in the field of capital markets and financial servicesalso involved in this code of conduct of the association.
AMFI interacts with SEBI and works according to SEBIs guidelines inthe Mutual Fund industry.
Associations of Mutual Fund of India do represent the Governmentof India, the Reserve Bank of India and other related bodies onmatters relating to the Mutual Fund Industry.
It develops a team of well qualified and trained Agentdistributors. It implements a programme of training andcertification for all intermediaries and other engaged in themutual fund industry.
AMFI undertakes all India awareness programme for investors inorder to promote proper understanding of the concept and workingof Mutual Funds.
At last but not the least Association of Mutual Fund of Indiaalso disseminate information on Mutual Fund Industry andundertakes studies and research either directly or in associationwith other bodies.
The sponsors of Association of Mutual Funds in India
Bank Sponsored 12
SRN ADARSH COLLEGE
“Risk And Return Analysis of SAHARA MUTUALFUNDS”
SBI Fund Management Ltd.
BOB Asset Management Co. Ltd.
Canbank Investment Management Services Ltd.
UTI Asset Management Company Pvt. Ltd.
Institutions
GIC Asset Management Co. Ltd.
Jeevan Bima Sahayog Asset Management Co. Ltd.
Private Sector
Indian:
Benchmark Asset Management Co. Pvt. Ltd.
Cholamandalam Asset Management Co. Ltd.
Credit Capital Asset Management Co. Ltd.
Escorts Asset Management Ltd.
JM Financial Mutual Fund
Kotak Mahindra Asset Management Co. Ltd.
Reliance Capital Asset Management Ltd.
Sahara Asset Management Co. Pvt. Ltd
Sundaram Asset Management Company Ltd. 13
SRN ADARSH COLLEGE
“Risk And Return Analysis of SAHARA MUTUALFUNDS”
Tata Asset Management Private Ltd.
Predominantly India Joint Ventures:
Birla Sun Life Asset Management Co. Ltd.
DSP Merrill Lynch Fund Managers Limited
HDFC Asset Management Company Ltd.
Predominantly Foreign Joint Ventures:
ABN AMRO Asset Management (I) Ltd.
Alliance Capital Asset Management (India) Pvt. Ltd.
Deutsche Asset Management (India) Pvt. Ltd.
Fidelity Fund Management Private Limited
Franklin Templeton Asset Mgmt. (India) Pvt. Ltd.
HSBC Asset Management (India) Private Ltd.
ING Investment Management (India) Pvt. Ltd.
Morgan Stanley Investment Management Pvt. Ltd.
Principal Asset Management Co. Pvt. Ltd.
Prudential ICICI Asset Management Co. Ltd. 14
SRN ADARSH COLLEGE
“Risk And Return Analysis of SAHARA MUTUALFUNDS”
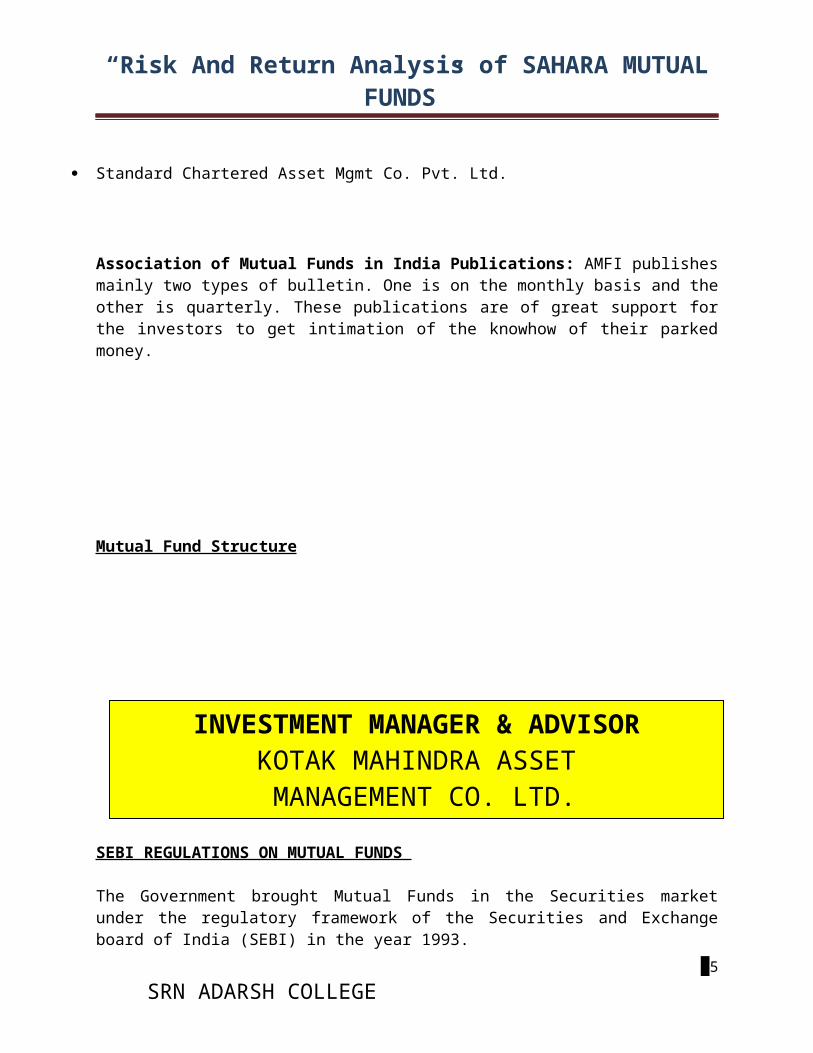
Standard Chartered Asset Mgmt Co. Pvt. Ltd.
Association of Mutual Funds in India Publications: AMFI publishesmainly two types of bulletin. One is on the monthly basis and theother is quarterly. These publications are of great support forthe investors to get intimation of the knowhow of their parkedmoney.
Mutual Fund Structure
SEBI REGULATIONS ON MUTUAL FUNDS
The Government brought Mutual Funds in the Securities marketunder the regulatory framework of the Securities and Exchangeboard of India (SEBI) in the year 1993.
15 SRN ADARSH COLLEGE
Contd…
INVESTMENT MANAGER & ADVISORKOTAK MAHINDRA ASSET MANAGEMENT CO. LTD.
“Risk And Return Analysis of SAHARA MUTUALFUNDS”
SEBI issued guidelines in the year 1991 and comprehensive set ofregulations relating to the organization and management of MutualFunds in 1993. SEBI REGULATIONS 1993
The regulations bar Mutual Funds from options trading, shortselling and carrying forward transactions in securities. TheMutual Funds have been permitted to invest only in transferablesecurities in the money and capital markets or any privatelyplaced debentures or securities debt. Restrictions have also beenplaced on them to ensure that investments under an individualscheme, do not exceed five per cent and investment in all theschemes put together does not exceed 10 per cent of the corpus.Investments under all the schemes cannot exceed 15 per cent ofthe funds in the shares and debentures of a single company. SEBI grants registration to only those mutual funds that canprove an efficient and orderly conduct of business. The trackrecord of sponsors, a minimum experience of five years in therelevant field of Investment, financial services, integrity inbusiness transactions and financial soundness are taken intoaccount. The regulations also prescribe the advertisement codefor the marketing schemes of Mutual Funds, the contents of thetrust deed, the investment management agreement and the scheme-wise balance sheet. Mutual Funds are required to be formed astrusts and managed by separately formed as trusts and managed byseparately formed Asset Management Companies (AMC). The minimumnet worth of such AMC is stipulated at Rs.5 crores of which, theMutual Fund should have a custodian who is not associated in anyway with the AMC and registered with the SEBI.
The minimum amount raised in closed-ended scheme should be Rs.20Crores and for the open-ended scheme, Rs.50 Crores. In case, theamount collected falls short of the minimum prescribed, theentire amount should be refunded not later than six weeks fromthe date of closure of the scheme. If this is not done, the fundis required to pay an interest at the rate of 15 per cent per
16 SRN ADARSH COLLEGE
“Risk And Return Analysis of SAHARA MUTUALFUNDS”
annum from the date of expiry of six weeks. In addition to these,the Mutual Funds are obliged to maintain books of accounts andprovision for depreciation and bad debts.
Further, the Mutual Funds are now under the obligation to publishscheme-wise annual reports, furnish six month un-auditedaccounts, quarterly statements of the movements of the net assetvalue and quarterly portfolio statements to the SEBI. There isalso a stipulation that the Mutual Funds should ensure adequatedisclosures to the investors. SEBI has agreed to let the MutualFunds buy back the units of their schemes. However, the fundscannot advertise this facility in their prospectus. SEBI is alsoempowered to appoint an auditor to investigate into the books ofaccounts or the affairs of the Mutual Funds.
SEBI can suspend the registration of Mutual Funds in the case ofdeliberate manipulation, price rigging or deterioration of thefinancial position of Mutual Funds.
SEBI REGULATIONS, 1996
SEBI announced the amended Mutual Fund Regulations on December 9,1996 covering Registration of Mutual Funds, Constitution andManagement of Mutual funds and Operation of Trustees,Constitution and Management of Asset Management Companies (AMCs)and custodian schemes of MFs, investment objectives and valuationpolicies, general obligations, inspection and audit. The revisionhas been carried out with the objective of improving investorprotection, imparting a greater degree of flexibility andpromoting innovation.
The increase in the number of MFs and the types of schemesoffered by them necessitated uniform norms for valuation ofinvestments and accounting practices in order to enable theinvestors to judge their performance on a comparable basis. TheMutual Fund Regulations is sued in December 1996 provide for ascheme-wise report and justification of performance, disclosure
17 SRN ADARSH COLLEGE
“Risk And Return Analysis of SAHARA MUTUALFUNDS”
of large investments which constitute a significant portion ofthe portfolio and disclosure of the movements in the unitcapital.
The existing Asset Management Companies are required to increasetheir net worth from Rs.10 crores within one year from the dateof notification of the amended guidelines. AMCs are also allowedto do other fund-based businesses such as providing investmentmanagement services to offshore funds, other Mutual Funds,Venture Capital Funds and Insurance Companies. The amendedguidelines retained the former fee structure of the AMCs of 1.25%of weekly average Net Asset Value (NAV) up to Rs.100 crores and1% of NAV for net assets in excess of Rs.100 crores.
The consent of the investors has to be obtained for bringingabout any change in the fundamental attributes of the scheme onthe basis of which the unit holders had made initial investments.The regulation empowers the investor. The amended guidelinesrequire portfolio disclosure, standardization of accountingpolicies, valuation norms for NAV and pricing. The regulationsalso sought to address the areas of misuse of funds byintroducing prohibitions and restrictions on affiliatetransactions and investment exposures to companies belonging tothe group of sponsors of mutual funds. The payment of early birdincentive for various schemes has been allowed provided they areviewed as interest payment of early bird incentive for earlyinvestment with full disclosure.
The various Mutual Funds are allowed to mention an indicativereturn for schemes for fixed income securities. In 1998-99 theMutual Funds Regulation were amended to permit Mutual Funds totrade in derivatives for the purpose of hedging and portfoliobalancing. SEBI registered Mutual Funds and Fund managers arepermitted to invest in overseas markets, initially within anoverall limit of US $500 million and a ceiling for an individualfund at US$ 50 million.
18 SRN ADARSH COLLEGE
“Risk And Return Analysis of SAHARA MUTUALFUNDS”
SEBI made (October 8, 1999) investment guidelines for MFs morestringent. The new guidelines restrict MFs to invest no more than10% of NAV of a scheme in share or share related instruments of asingle company. MF’s in rated debt instruments of a single issueis restricted to 15% of NAV of the scheme (up to 20% with priorapproval of Board of Trustees or AMC). Restrictions in un- rateddebt instruments and in shares of unlisted companies. The newnorms also specify a maximum limit of 25% of NAV for any schemefor investment in listed group companies as against an umbrellalimit of 25% of NAV of all schemes taken together earlier. SEBIincreased (June 7, 2000) the maximum investment limit for MFs inlisted companies from 5% to 10% of NAV in respect of open-endedfunds. Changes in fundamental attributes of a scheme was alsoallowed without the consent of three fourths of unit holdersprovided the unit holders are given the exit option at NAVwithout any exit load. MFs are also not to make assurance orclaim that is likely to mislead investors. They are also bannedfrom making claims in advertisement based on past performance.
Types of Mutual Fund Schemes
Wide variety of Mutual Fund Schemes exists to cater to the needssuch as financial position, risk tolerance and returnexpectations etc. The table below gives an overview into theexisting types of schemes in the Industry.
By Structure
Open - Ended Schemes
Close - Ended Schemes
Interval Schemes
By Investment Objective Growth/Equity Schemes
19 SRN ADARSH COLLEGE
“Risk And Return Analysis of SAHARA MUTUALFUNDS”
General Purpose
Income/Debt Funds
Money Market
Guilt Funds
Balanced Schemes
Other Schemes
Tax Saving Schemes
Special Schemes: Sector Specific Schemes Index Schemes
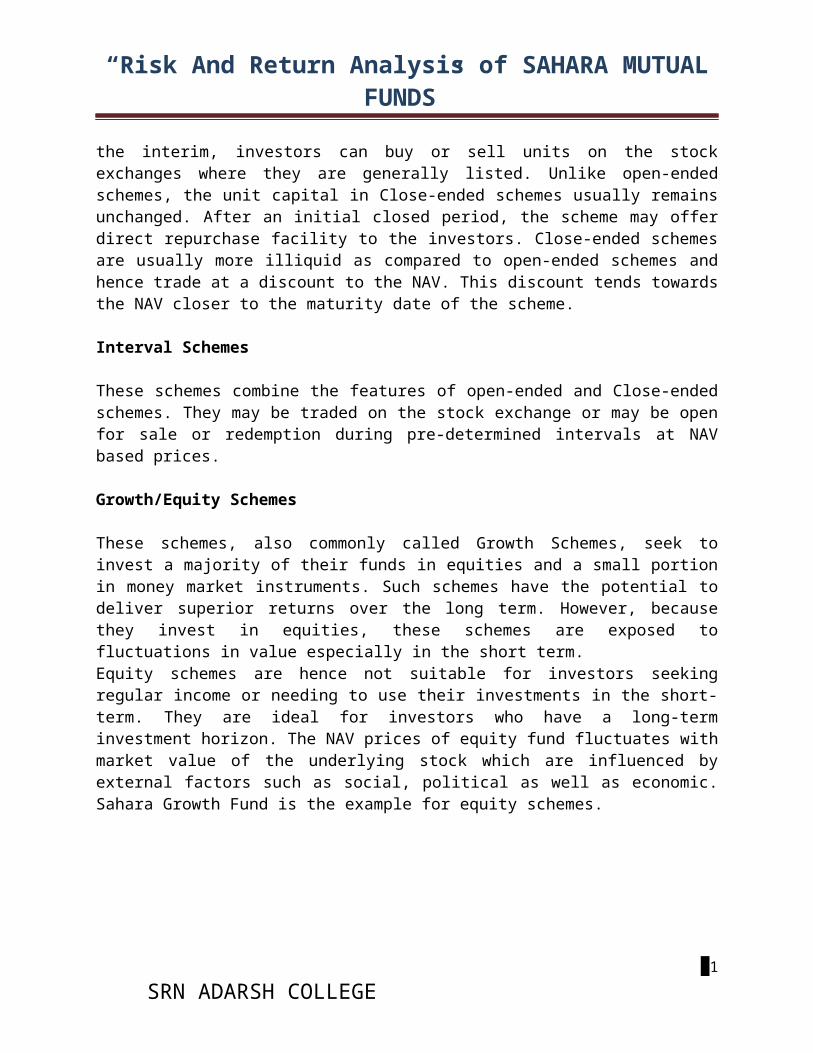
Open Ended Schemes
The units offered by these schemes are available for sale andrepurchase on any business day at NAV based prices. Hence, theunit capital of the schemes keeps changing each day. Such schemesthus offer very high liquidity to investors and are becomingincreasingly popular in India. Please note that an open-endedfund is NOT obliged to keep selling/issuing new units at alltimes, and may stop issuing further subscription to newinvestors. On the other hand, an open-ended fund rarely denies toits investor the facility to redeem existing units.
Close Ended Schemes
The unit capital of a close-ended product is fixed as it makes aone-time sale of fixed number of units. These schemes arelaunched with New Fund Offer (NFO) with a stated maturity periodafter which the units are fully redeemed at NAV linked prices. In
20 SRN ADARSH COLLEGE
“Risk And Return Analysis of SAHARA MUTUALFUNDS”
the interim, investors can buy or sell units on the stockexchanges where they are generally listed. Unlike open-endedschemes, the unit capital in Close-ended schemes usually remainsunchanged. After an initial closed period, the scheme may offerdirect repurchase facility to the investors. Close-ended schemesare usually more illiquid as compared to open-ended schemes andhence trade at a discount to the NAV. This discount tends towardsthe NAV closer to the maturity date of the scheme.
Interval Schemes
These schemes combine the features of open-ended and Close-endedschemes. They may be traded on the stock exchange or may be openfor sale or redemption during pre-determined intervals at NAVbased prices.
Growth/Equity Schemes
These schemes, also commonly called Growth Schemes, seek toinvest a majority of their funds in equities and a small portionin money market instruments. Such schemes have the potential todeliver superior returns over the long term. However, becausethey invest in equities, these schemes are exposed tofluctuations in value especially in the short term. Equity schemes are hence not suitable for investors seekingregular income or needing to use their investments in the short-term. They are ideal for investors who have a long-terminvestment horizon. The NAV prices of equity fund fluctuates withmarket value of the underlying stock which are influenced byexternal factors such as social, political as well as economic.Sahara Growth Fund is the example for equity schemes.
21 SRN ADARSH COLLEGE
“Risk And Return Analysis of SAHARA MUTUALFUNDS”
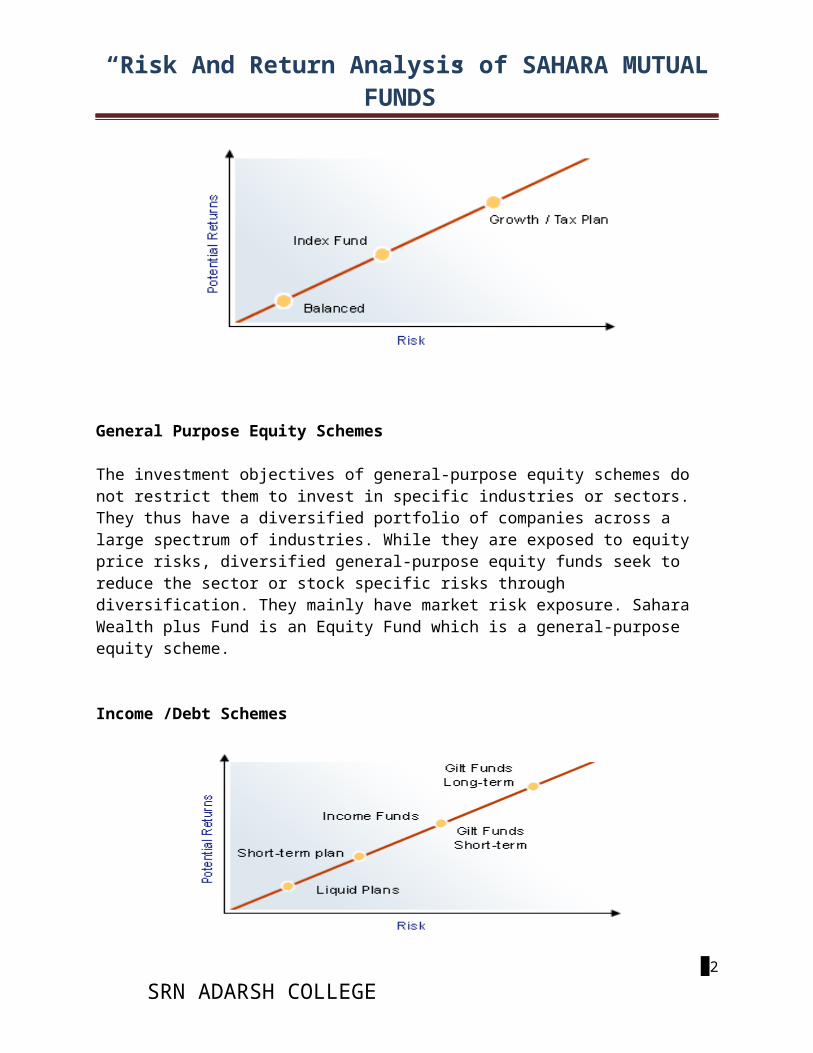
General Purpose Equity Schemes
The investment objectives of general-purpose equity schemes do not restrict them to invest in specific industries or sectors. They thus have a diversified portfolio of companies across a large spectrum of industries. While they are exposed to equity price risks, diversified general-purpose equity funds seek to reduce the sector or stock specific risks through diversification. They mainly have market risk exposure. Sahara Wealth plus Fund is an Equity Fund which is a general-purpose equity scheme.
Income /Debt Schemes
22 SRN ADARSH COLLEGE

“Risk And Return Analysis of SAHARA MUTUALFUNDS”
These schemes, also commonly known as Income Schemes, invest indebt securities such as corporate bonds, debentures andgovernment securities. The prices of these schemes tend to bemore stable compared with equity schemes and most of the returnsto the investors are generated through dividends or steadycapital appreciation. These schemes are ideal for conservativeinvestors or those who are not in a position to take higherequity risks. However, as compared to the money market schemesthey do have a higher price fluctuation risk and compared to aGilt fund they have a higher credit risk. These schemes invest in money markets, bonds and debentures ofcorporate companies with medium and long-term maturities. Theseschemes primarily target current income instead of capitalappreciation. Hence, a substantial part of the distributablesurplus is given back to the investor by way of dividenddistribution. These schemes usually declare quarterly dividendsand are suitable for conservative investors who have medium tolong-term investment horizon and are looking for regular incomethrough dividend or steady capital appreciation. Sahara IncomeFund is an example of Income/Debt/Bond scheme. Money Market Schemes
These schemes invest in short term instruments such as commercialpaper ("CP"), certificates of deposit ("CD"), treasury bills ("T-Bill") and overnight money ("Call"). The schemes are the leastvolatile of all the types of schemes because of their investmentsin money market instrument with short-term maturities. Theseschemes have become popular with institutional investors and highnet-worth individuals having short-term surplus funds. SaharaShort Term Plan is an example of Money Market Scheme.
Gilt Funds
These primarily invest in Government Debt. Hence, the investorusually does not have to worry about credit risk since Government
23 SRN ADARSH COLLEGE
“Risk And Return Analysis of SAHARA MUTUALFUNDS”
Debt is generally credit risk free. The investor is open toInterest risk, where the value of the securities changes inrelation to the market scenario. Sahara Gilt Fund is an exampleof one such scheme.
Balanced Schemes
These schemes are also commonly called balanced schemes. Theseinvest in both equities as well as debt. By investing in a mix ofthis nature, balanced schemes seek to attain the objective ofincome and moderate capital appreciation. Such schemes are idealfor investors with a conservative, long-term orientation. TataBalanced Fund and Tata Young Citizen's Fund are perfect examplesof such hybrid schemes. Tax Saving Schemes
Investors (individuals and Hindu Undivided Families (‘HUFs’)) arebeing encouraged to invest in equity markets through EquityLinked Savings Scheme ("ELSS") by offering them a tax rebate.Units purchased cannot be assigned / transferred/ pledged /redeemed / switched - out until completion of 3 years from thedate of allotment of the respective Units. The Scheme is subjectto Securities & Exchange Board of India (Mutual Funds)Regulations, 1996 and the notifications issued by the Ministry ofFinance (Department of Economic Affairs), Government of Indiaregarding ELSS. Subject to such conditions and limitations, asprescribed under Section 80 C of the Income-tax Act, 1961,subscriptions to the Units not exceeding Rs.1, 00, 000 would befully tax exempt from income tax. The exemption under section 80C of IT act is also applicable to other eligible schemes. SaharaTax Gain Fund is an example of ELSS.
Special Schemes
Sector Specific Equity Schemes:
24 SRN ADARSH COLLEGE

“Risk And Return Analysis of SAHARA MUTUALFUNDS”
These schemes restrict their investing to one or more pre-definedsectors, e.g. technology sector. They depend upon the performanceof these select sectors only and are hence inherently more riskythan general-purpose equity schemes. Ideally suited for informedinvestors who wish to take a view and risk on the concernedsector. The Tata Life Sciences and Technology Fund is an exampleof sector specific equity scheme.
Index schemes:
An Index is used as a measure of performance of the market as awhole, or a specific sector of the market. It also serves as arelevant benchmark to evaluate the performance of mutual funds.Some investors are interested in investing in the market ingeneral rather than investing in any specific fund. Suchinvestors are happy to receive the returns posted by the markets.As it is not practical to invest in each and every stock in themarket in proportion to its size, these investors are comfortableinvesting in a fund that they believe is a good representative ofthe entire market. Index Funds are launched and managed for suchinvestors. An example to such a fund is the Tata Index Fund.
Comparison of Mutual Funds with other Products/ Investmentopportunities
The mutual fund sector operates under stricter regulations ascompared to most other investment avenues. Apart from the taxefficiency and legal comfort how do mutual funds compare withother products? Here the investment in Mutual Funds is comparedwith:
1. Company Fixed Deposits.
2. Bank Fixed Deposits.
3. Bonds and Debentures. 25
SRN ADARSH COLLEGE

“Risk And Return Analysis of SAHARA MUTUALFUNDS”
4. Equity.
5. Life Insurance
1. Company Fixed Deposits versus Mutual Funds
Fixed deposits are unsecured borrowings by the company acceptingthe deposits. Credit rating of the fixed deposit program is anindication of the inherent default risk in the investment. The moneys of investors in a mutual fund scheme are invested bythe AMC in specific investments under that scheme. Theseinvestments are held and managed in-trust for the benefit ofscheme’s investors. On the other hand, there is no such directcorrelation between a company’s fixed deposit mobilization, andthe avenues where these resources are deployed.
A corollary of such linkage between mobilization and investmentis that the gains and losses from the mutual fund scheme entirelyflow through to the investors. Therefore, there can be nocertainty of yield, unless a named guarantor assures a return or,to a lesser extent, if the investment is in a serial gilt scheme.On the other hand, the return under a fixed deposit is certain,subject only to the default risk of the borrower.
Both fixed deposits and mutual funds offer liquidity, but subjectto some differences:
• The provider of liquidity in the case of fixed deposits is theborrowing company. In mutual funds, the liquidity provider is thescheme itself (for open-end schemes) or the market (in the caseof closed-end schemes).
• The basic value at which fixed deposits are en-cashed is notsubject to market risk. However, the value at which units of ascheme are redeemed entirely depends on the market. If securities
26 SRN ADARSH COLLEGE
“Risk And Return Analysis of SAHARA MUTUALFUNDS”
have gained in value during the period, then the investor caneven earn a return that is higher than what she anticipated whenshe invested. Conversely, she could also end up with a loss.
• Early encashment of fixed deposits is always subject to apenalty charged by the company that accepted the fixed deposit.Mutual fund schemes also have the option of charging a penalty on“early” redemption of units (by way of an ‘exit load’). If theNAV has appreciated adequately, then despite the exit load, theinvestor could earn a capital gain on her investment.
2. Bank Fixed Deposits versus Mutual Funds
Bank fixed deposits are similar to company fixed deposits. Themajor difference is that banks are more stringently regulatedthan are companies. They even operate under stricter requirementsregarding Statutory Liquidity Ratio (SLR) and Cash Reserve Ratio(CRR).
While the above are causes for comfort, bank deposits too aresubject to default risk. However, given the political andeconomic impact of bank defaults, the Government as well asReserve Bank of India (RBI) tries to ensure that banks do notfail.
Further, bank deposits up to Rs 1, 00, 000 are protected by theDeposit Insurance and Credit Guarantee Corporation (DICGC), solong as the bank has paid the required insurance premium of 5paisa per annum for every Rs 100 of deposits. The monetaryceiling of Rs 100,000 is for all the deposits in all the branchesof a bank, held by the depositor in the same capacity and right.
3. Bonds and Debentures versus Mutual Funds
27 SRN ADARSH COLLEGE
“Risk And Return Analysis of SAHARA MUTUALFUNDS”
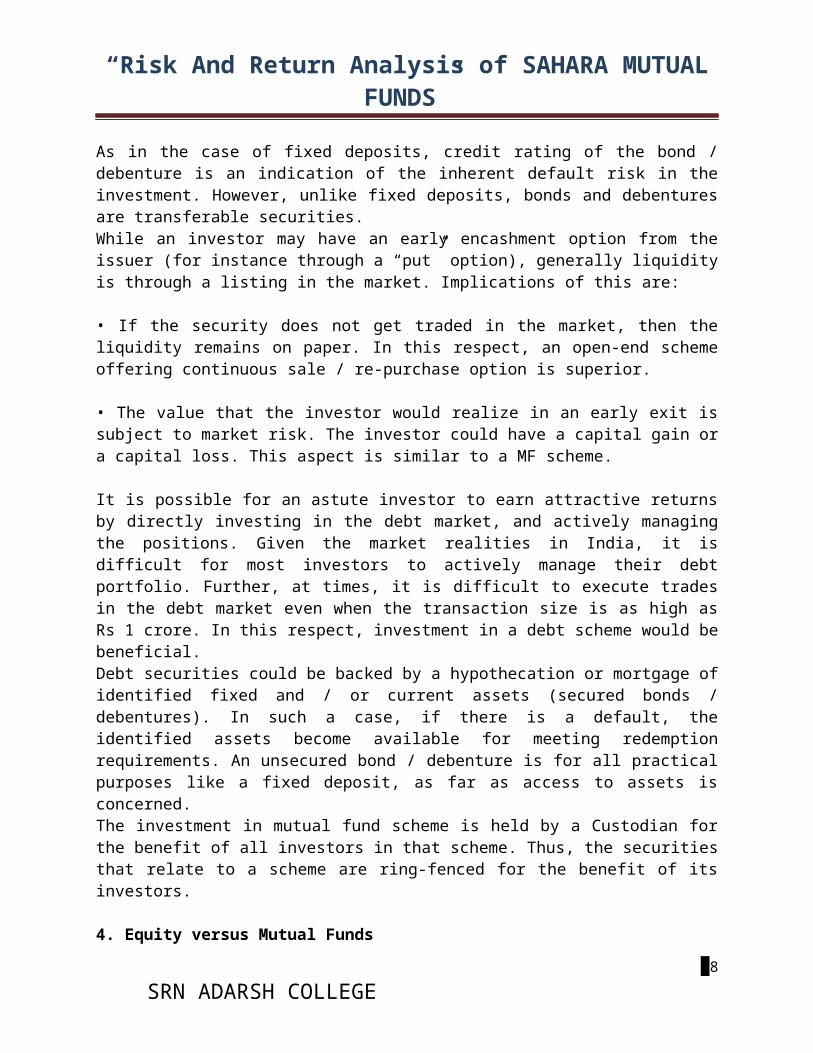
As in the case of fixed deposits, credit rating of the bond /debenture is an indication of the inherent default risk in theinvestment. However, unlike fixed deposits, bonds and debenturesare transferable securities. While an investor may have an early encashment option from theissuer (for instance through a “put” option), generally liquidityis through a listing in the market. Implications of this are:
• If the security does not get traded in the market, then theliquidity remains on paper. In this respect, an open-end schemeoffering continuous sale / re-purchase option is superior.
• The value that the investor would realize in an early exit issubject to market risk. The investor could have a capital gain ora capital loss. This aspect is similar to a MF scheme.
It is possible for an astute investor to earn attractive returnsby directly investing in the debt market, and actively managingthe positions. Given the market realities in India, it isdifficult for most investors to actively manage their debtportfolio. Further, at times, it is difficult to execute tradesin the debt market even when the transaction size is as high asRs 1 crore. In this respect, investment in a debt scheme would bebeneficial. Debt securities could be backed by a hypothecation or mortgage ofidentified fixed and / or current assets (secured bonds /debentures). In such a case, if there is a default, theidentified assets become available for meeting redemptionrequirements. An unsecured bond / debenture is for all practicalpurposes like a fixed deposit, as far as access to assets isconcerned. The investment in mutual fund scheme is held by a Custodian forthe benefit of all investors in that scheme. Thus, the securitiesthat relate to a scheme are ring-fenced for the benefit of itsinvestors.
4. Equity versus Mutual Funds 28
SRN ADARSH COLLEGE
“Risk And Return Analysis of SAHARA MUTUALFUNDS”
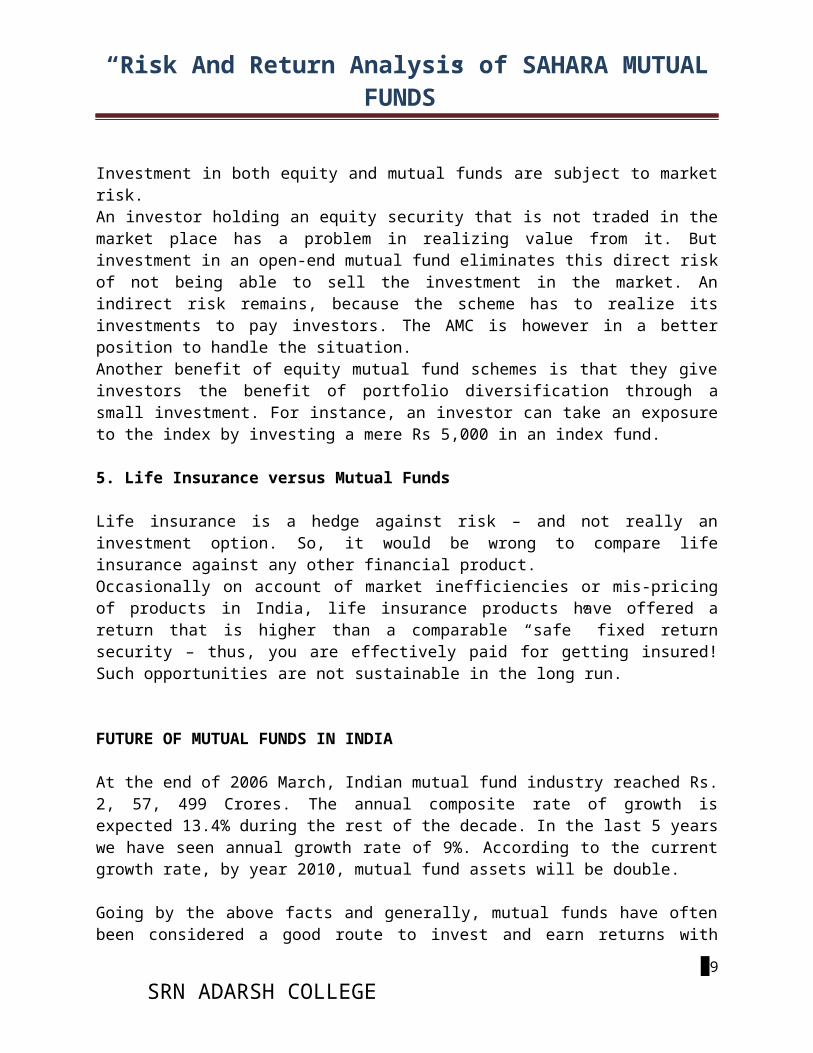
Investment in both equity and mutual funds are subject to marketrisk. An investor holding an equity security that is not traded in themarket place has a problem in realizing value from it. Butinvestment in an open-end mutual fund eliminates this direct riskof not being able to sell the investment in the market. Anindirect risk remains, because the scheme has to realize itsinvestments to pay investors. The AMC is however in a betterposition to handle the situation. Another benefit of equity mutual fund schemes is that they giveinvestors the benefit of portfolio diversification through asmall investment. For instance, an investor can take an exposureto the index by investing a mere Rs 5,000 in an index fund.
5. Life Insurance versus Mutual Funds
Life insurance is a hedge against risk – and not really aninvestment option. So, it would be wrong to compare lifeinsurance against any other financial product. Occasionally on account of market inefficiencies or mis-pricingof products in India, life insurance products have offered areturn that is higher than a comparable “safe” fixed returnsecurity – thus, you are effectively paid for getting insured!Such opportunities are not sustainable in the long run.
FUTURE OF MUTUAL FUNDS IN INDIA
At the end of 2006 March, Indian mutual fund industry reached Rs.2, 57, 499 Crores. The annual composite rate of growth isexpected 13.4% during the rest of the decade. In the last 5 yearswe have seen annual growth rate of 9%. According to the currentgrowth rate, by year 2010, mutual fund assets will be double.
Going by the above facts and generally, mutual funds have oftenbeen considered a good route to invest and earn returns with
29 SRN ADARSH COLLEGE
“Risk And Return Analysis of SAHARA MUTUALFUNDS”
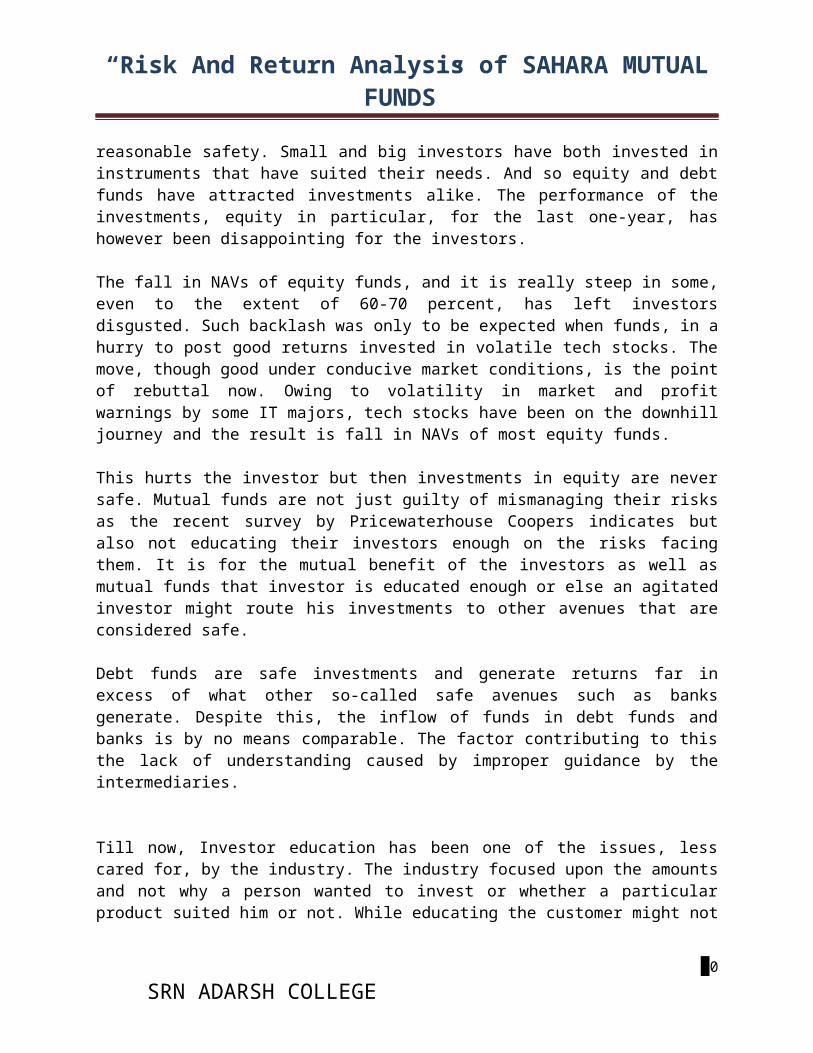
reasonable safety. Small and big investors have both invested ininstruments that have suited their needs. And so equity and debtfunds have attracted investments alike. The performance of theinvestments, equity in particular, for the last one-year, hashowever been disappointing for the investors.
The fall in NAVs of equity funds, and it is really steep in some,even to the extent of 60-70 percent, has left investorsdisgusted. Such backlash was only to be expected when funds, in ahurry to post good returns invested in volatile tech stocks. Themove, though good under conducive market conditions, is the pointof rebuttal now. Owing to volatility in market and profitwarnings by some IT majors, tech stocks have been on the downhilljourney and the result is fall in NAVs of most equity funds.
This hurts the investor but then investments in equity are neversafe. Mutual funds are not just guilty of mismanaging their risksas the recent survey by Pricewaterhouse Coopers indicates butalso not educating their investors enough on the risks facingthem. It is for the mutual benefit of the investors as well asmutual funds that investor is educated enough or else an agitatedinvestor might route his investments to other avenues that areconsidered safe.
Debt funds are safe investments and generate returns far inexcess of what other so-called safe avenues such as banksgenerate. Despite this, the inflow of funds in debt funds andbanks is by no means comparable. The factor contributing to thisthe lack of understanding caused by improper guidance by theintermediaries.
Till now, Investor education has been one of the issues, lesscared for, by the industry. The industry focused upon the amountsand not why a person wanted to invest or whether a particularproduct suited him or not. While educating the customer might not
30 SRN ADARSH COLLEGE

“Risk And Return Analysis of SAHARA MUTUALFUNDS”
have been on the cards earlier, the things are beginning tochange now.
With SEBI passing on the guidelines, the funds will engage ininvestor education. The guidelines state that funds will utilizethe income earned on unclaimed money lying with them for a periodexceeding three years to educate the investors. AMFI has starteda certification program for intermediaries. This will be mademandatory for the intermediaries and is aimed at educating theinvestors about the risks attached to the schemes and toinculcate adequate skills into the intermediaries to help theinvestors choose the right kind of fund. Steps such as these areaimed at obliterating various flaws in the system bystandardizing the knowledge base of intermediaries, as they arethe interface between the investor and the funds.
Although the investors themselves are also guilty of pickingfunds that were not suited for them, the blame can’t lie squareon their shoulders alone. The industry has also got to bear someof it. With such programs becoming mandatory, it can be ensuredto some extent that ignorance ceases to be an aspect associatedwith the industry.
Till now, investors have been ignorant about the kind of fund tobe picked or how to select a fund. Teaching an investor how toselect a fund is thus an important aspect. Educated investorscan, on their part, ask pertinent questions to find funds thatqualify to be in their portfolio as per their risk bearingcapacity.
It would not be improper to say that investor education is stillthe key to managing the funds handed over by investors. Theinvestors are important to the industry and likewise, mutualfunds form an important avenue for an investor. It would thus beof critical importance to educate people for an informed investoris in the best position to pick up Schemes as per his need. Thiswould also infuse some confidence in the minds of the investors
31 SRN ADARSH COLLEGE
“Risk And Return Analysis of SAHARA MUTUALFUNDS”
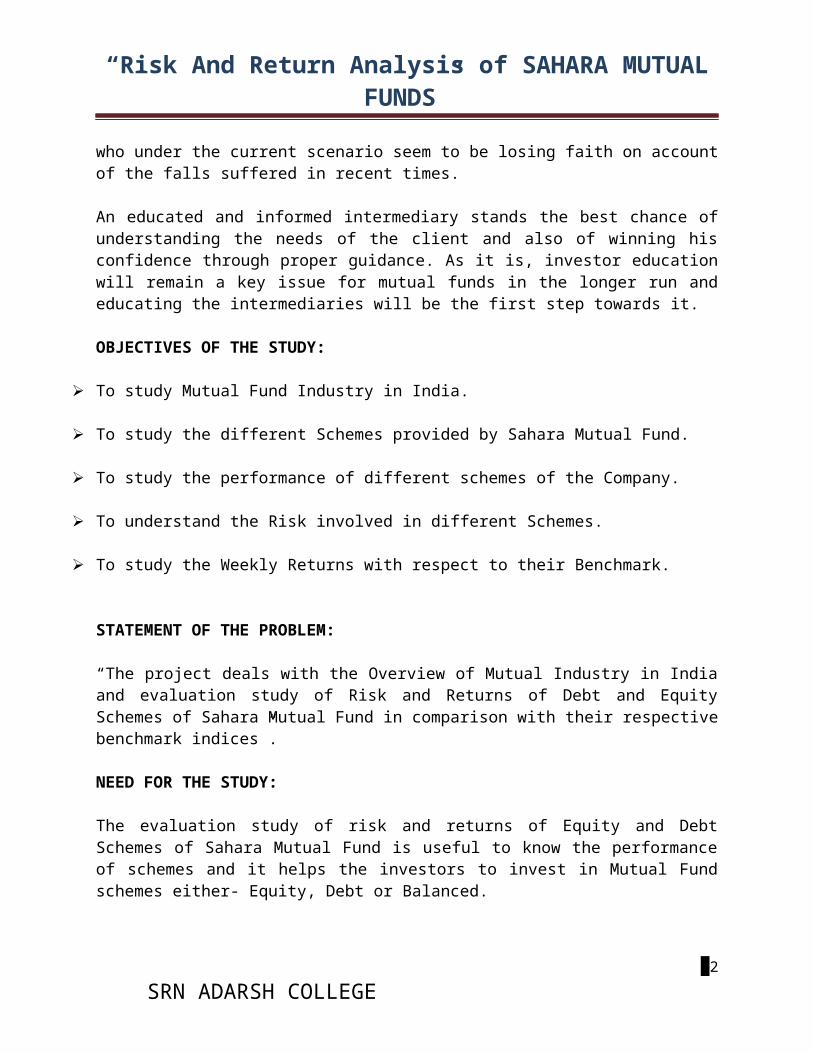
who under the current scenario seem to be losing faith on accountof the falls suffered in recent times.
An educated and informed intermediary stands the best chance ofunderstanding the needs of the client and also of winning hisconfidence through proper guidance. As it is, investor educationwill remain a key issue for mutual funds in the longer run andeducating the intermediaries will be the first step towards it.
OBJECTIVES OF THE STUDY:
To study Mutual Fund Industry in India.
To study the different Schemes provided by Sahara Mutual Fund.
To study the performance of different schemes of the Company.
To understand the Risk involved in different Schemes.
To study the Weekly Returns with respect to their Benchmark.
STATEMENT OF THE PROBLEM:
“The project deals with the Overview of Mutual Industry in Indiaand evaluation study of Risk and Returns of Debt and EquitySchemes of Sahara Mutual Fund in comparison with their respectivebenchmark indices”.
NEED FOR THE STUDY:
The evaluation study of risk and returns of Equity and DebtSchemes of Sahara Mutual Fund is useful to know the performanceof schemes and it helps the investors to invest in Mutual Fundschemes either- Equity, Debt or Balanced.
32 SRN ADARSH COLLEGE

“Risk And Return Analysis of SAHARA MUTUALFUNDS”
The performance of different schemes however helps theprospective investors to choose the best schemes that suit hisobjective.
SCOPE OF THE STUDY:
The study was limited to just finding the risk and returnsassociated with the schemes.
The study covers the six different schemes provided by SaharaMutual Fund.
The study covers the period of past three and half months fromFebruary 10, 2006 to May 26, 2006.
The study covers only the open-ended funds.
The study does not cover the scheme Sahara Tax Gain Fund, an openended fund, due to non availability of historical benchmark indexof this scheme.
LIMITATIONS OF THE STUDY:
The study was limited only to Sahara Mutual Fund schemes.
Time duration for the study was very short as it was restrictedto just 10 weeks.
Out of eight schemes only six have been taken for analysis.
The study was limited to the extent of just finding the risks andreturns of each schemes of the fund.
33 SRN ADARSH COLLEGE
“Risk And Return Analysis of SAHARA MUTUALFUNDS”
COMPANY PROFILE
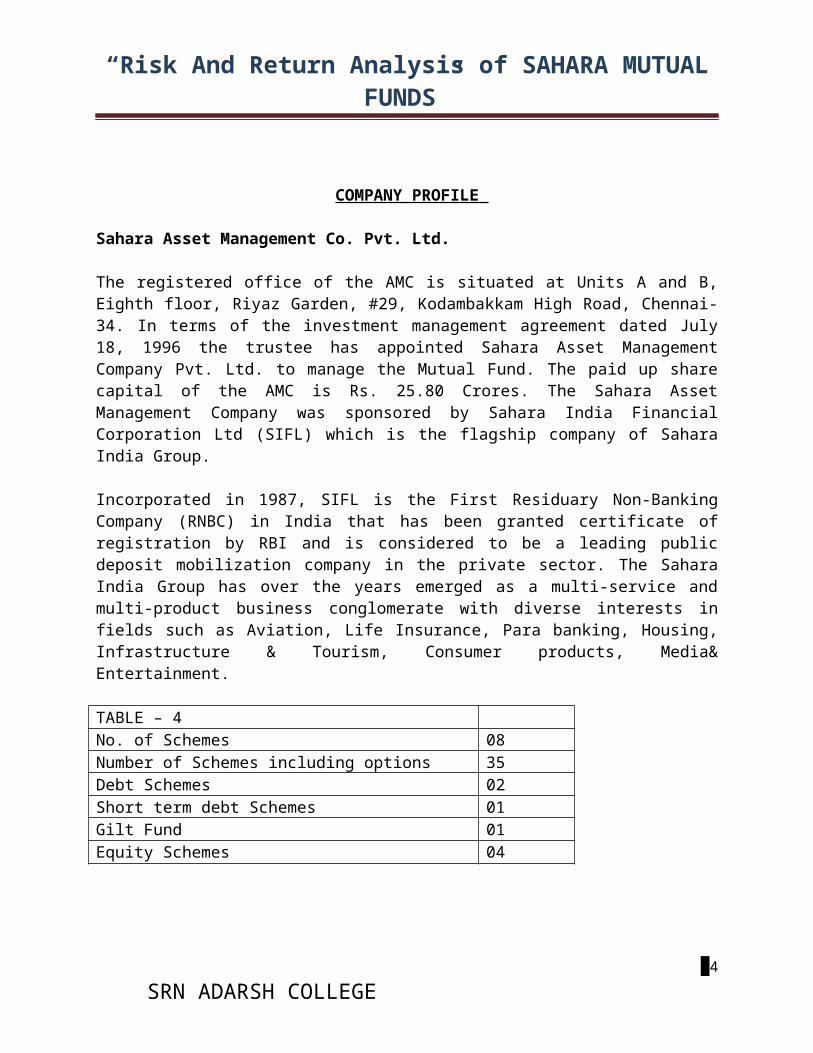
Sahara Asset Management Co. Pvt. Ltd. The registered office of the AMC is situated at Units A and B,Eighth floor, Riyaz Garden, #29, Kodambakkam High Road, Chennai-34. In terms of the investment management agreement dated July18, 1996 the trustee has appointed Sahara Asset ManagementCompany Pvt. Ltd. to manage the Mutual Fund. The paid up sharecapital of the AMC is Rs. 25.80 Crores. The Sahara AssetManagement Company was sponsored by Sahara India FinancialCorporation Ltd (SIFL) which is the flagship company of SaharaIndia Group.
Incorporated in 1987, SIFL is the First Residuary Non-BankingCompany (RNBC) in India that has been granted certificate ofregistration by RBI and is considered to be a leading publicdeposit mobilization company in the private sector. The SaharaIndia Group has over the years emerged as a multi-service andmulti-product business conglomerate with diverse interests infields such as Aviation, Life Insurance, Para banking, Housing,Infrastructure & Tourism, Consumer products, Media&Entertainment.
TABLE – 4No. of Schemes 08Number of Schemes including options 35Debt Schemes 02Short term debt Schemes 01Gilt Fund 01Equity Schemes 04
34 SRN ADARSH COLLEGE
“Risk And Return Analysis of SAHARA MUTUALFUNDS”
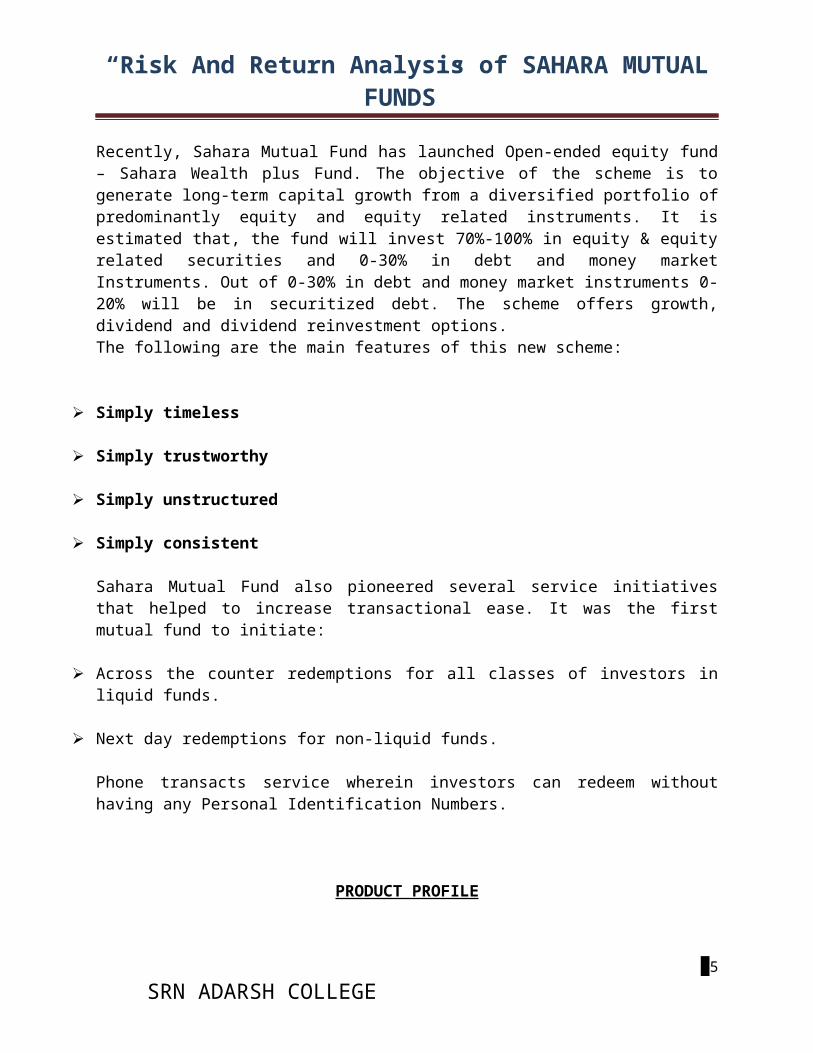
Recently, Sahara Mutual Fund has launched Open-ended equity fund– Sahara Wealth plus Fund. The objective of the scheme is togenerate long-term capital growth from a diversified portfolio ofpredominantly equity and equity related instruments. It isestimated that, the fund will invest 70%-100% in equity & equityrelated securities and 0-30% in debt and money marketInstruments. Out of 0-30% in debt and money market instruments 0-20% will be in securitized debt. The scheme offers growth,dividend and dividend reinvestment options. The following are the main features of this new scheme:
Simply timeless
Simply trustworthy
Simply unstructured
Simply consistent
Sahara Mutual Fund also pioneered several service initiativesthat helped to increase transactional ease. It was the firstmutual fund to initiate:
Across the counter redemptions for all classes of investors inliquid funds.
Next day redemptions for non-liquid funds.
Phone transacts service wherein investors can redeem withouthaving any Personal Identification Numbers.
PRODUCT PROFILE
35
SRN ADARSH COLLEGE
“Risk And Return Analysis of SAHARA MUTUALFUNDS”
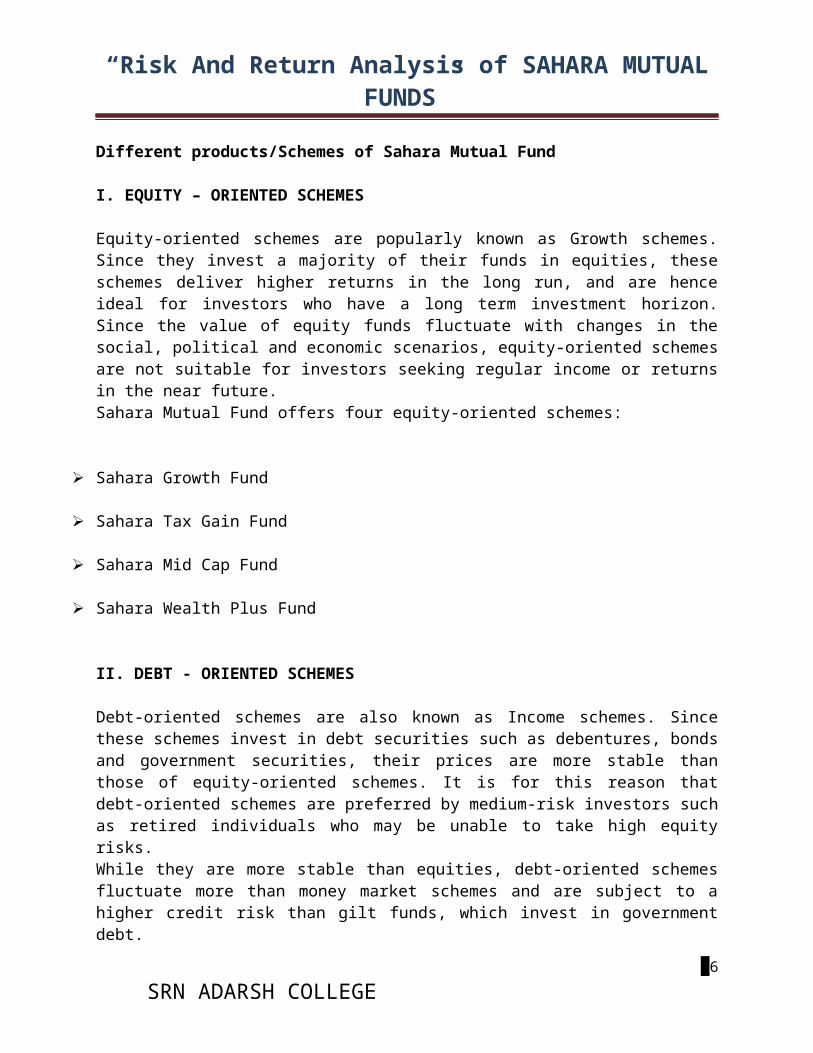
Different products/Schemes of Sahara Mutual Fund
I. EQUITY – ORIENTED SCHEMES
Equity-oriented schemes are popularly known as Growth schemes.Since they invest a majority of their funds in equities, theseschemes deliver higher returns in the long run, and are henceideal for investors who have a long term investment horizon.Since the value of equity funds fluctuate with changes in thesocial, political and economic scenarios, equity-oriented schemesare not suitable for investors seeking regular income or returnsin the near future. Sahara Mutual Fund offers four equity-oriented schemes:
Sahara Growth Fund
Sahara Tax Gain Fund
Sahara Mid Cap Fund
Sahara Wealth Plus Fund
II. DEBT - ORIENTED SCHEMES
Debt-oriented schemes are also known as Income schemes. Sincethese schemes invest in debt securities such as debentures, bondsand government securities, their prices are more stable thanthose of equity-oriented schemes. It is for this reason thatdebt-oriented schemes are preferred by medium-risk investors suchas retired individuals who may be unable to take high equityrisks. While they are more stable than equities, debt-oriented schemesfluctuate more than money market schemes and are subject to ahigher credit risk than gilt funds, which invest in governmentdebt.
36 SRN ADARSH COLLEGE
“Risk And Return Analysis of SAHARA MUTUALFUNDS”
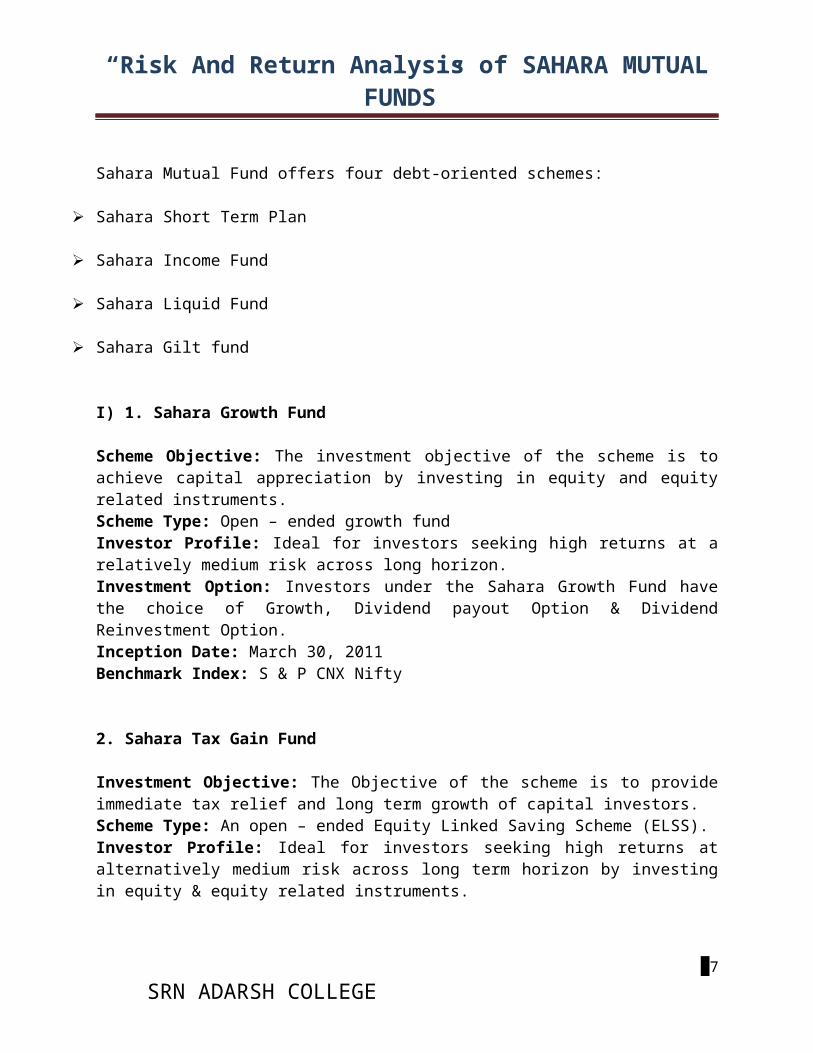
Sahara Mutual Fund offers four debt-oriented schemes:
Sahara Short Term Plan
Sahara Income Fund
Sahara Liquid Fund
Sahara Gilt fund
I) 1. Sahara Growth Fund
Scheme Objective: The investment objective of the scheme is toachieve capital appreciation by investing in equity and equityrelated instruments. Scheme Type: Open – ended growth fund Investor Profile: Ideal for investors seeking high returns at arelatively medium risk across long horizon. Investment Option: Investors under the Sahara Growth Fund havethe choice of Growth, Dividend payout Option & DividendReinvestment Option. Inception Date: March 30, 2011 Benchmark Index: S & P CNX Nifty
2. Sahara Tax Gain Fund
Investment Objective: The Objective of the scheme is to provideimmediate tax relief and long term growth of capital investors. Scheme Type: An open – ended Equity Linked Saving Scheme (ELSS). Investor Profile: Ideal for investors seeking high returns atalternatively medium risk across long term horizon by investingin equity & equity related instruments.
37 SRN ADARSH COLLEGE
“Risk And Return Analysis of SAHARA MUTUALFUNDS”
Investment Option: Investors under the Sahara Tax Gain Fund havethe choice of Growth, Dividend payout, Dividend ReinvestmentOption. Inception Date: March 30, 2011 Benchmark Index: BSE 200 Index
3. Sahara Midcap Fund
Investment Objective: The investment objective of the scheme isto achieve long term capital growth at medium level of risks byinvesting primarily in mid-cap stocks. The investment managerwill have the discretion to invest up to 100% of the assets inthe portfolio in equity/equity related instruments at a givenpoint of time. Scheme Type: An open – ended growth fund Investor profile: Ideal for investors seeking high returns atrelatively medium risk across long term horizon. Investment Option: Investors under the Sahara Mid Cap Fund havethe choice of Growth plan, Dividend plan, Growth Auto-payout planand Bonus plan. Inception Date: March 31, 2011 Benchmark index: CNX Midcap Index
4. Sahara Wealth plus Fund
Investment Objective: The primary objective of the scheme wouldbe to invest in equity & equity related instruments of companiesthat would be wealth builders in the long term. Scheme Type: open- ended growth fundInvestor profile: Ideal for investors seeking high returns atrelatively medium risk across long term horizon. Investment Option: Investors under the Sahara Wealth plus Fundhave the choice of Variable pricing option and Fixed pricingoption. Sub options: Under variable pricing option – Growth, Dividend,Dividend Reinvestment option.
38 SRN ADARSH COLLEGE
“Risk And Return Analysis of SAHARA MUTUALFUNDS”
Inception Date: April 30, 2011Benchmark Index: S & P CNX 500
II) 1. Sahara Short Term Plan
Investment Objective: The primary objective of the scheme wouldbe to generate regular income and secondary objective is growthof capital through investment in debt instruments, money marketand related instruments, whilst at all times emphasizing theimportance of capital preservation. The overall objective of Sahara Short term plan would be inconsonance with the investment objective of Sahara Income Fund,however the specific objective is to generate returns that wouldEndeavour to generate returns in line with Mibor linked shortterm papers with daily call/put option. Scheme Type: open- ended short term plan. Investor profile: Ideal for investors who have a short terminvestment horizon and wish to avoid high volatility but expectsuperior returns than liquid Funds. Investment Option: Investors under the Sahara Short term planhave the choice of growth, Dividend payout and DividendReinvestment option.
Inception date: March 30, 2011 Benchmark Index: CRISIL Liquid Fund Index
2. Sahara Income Fund
Investment Objective: The primary objective of the scheme wouldbe to generate regular income and secondary objective is growthof capital through investment in debt instruments, money marketand related instruments, whilst at all times emphasizing theimportance of capital preservation. Scheme Type: open- ended Income Fund. Investor profile: Ideal for investors seeking reasonable returnsat relatively low risk across a medium to long term investmenthorizon.
39 SRN ADARSH COLLEGE

“Risk And Return Analysis of SAHARA MUTUALFUNDS”
Investment Option: Investors under the Sahara Income Fund havethe choice of Growth, Dividend payout and Dividend Reinvestmentoption. Inception date: February 21, 2011 Benchmark Index: CRISIL Composite Bond Fund Index
3. Sahara Liquid Fund
Investment Objective: To create a highly liquid portfolio of goodquality debt as well as money market instruments with a view toprovide high liquidity and reasonable returns to the Unitholders. Scheme Type: open- ended Liquid Fund. Investor profile: Ideal for investors who wish to park theirshort term surpluses at relatively low risk. Corporate and HighNet Worth investors who have temporary surpluses can benefit fromthis scheme.
Investment Option: Investors under the Sahara Liquid Fund havethe choice of Growth and Dividend Reinvestment options. Inception date: February 19, 2011 Benchmark Index: CRISIL Liquid Fund index
4. Sahara Gilt Fund
Investment Objective: To generate risk free return and thusprovide medium to long term capital gains with incomedistribution along with capital gains tax relief to its Unitholders, at all times emphasizing the importance of capitalpreservation. Scheme Type: open- ended Gilt Fund. Investor profile: Ideal for investors with low-moderate riskappetite, PF trusts, financial institutions/Banks & Corporate.
40 SRN ADARSH COLLEGE
“Risk And Return Analysis of SAHARA MUTUALFUNDS”
Investment Option: Investors under the Sahara Gilt Fund have thechoice of Growth, Dividend payout and Dividend Reinvestmentoption. Inception date: February 21, 2011Benchmark Index: I Sec Composite Index
DESIGN OF THE STUDY
INTRODUCTION:
A detail study is done on various Investment Schemes provided bySahara Mutual Fund. Analysis is done on the Risk and Returns ofDebt and Equity Scheme provided by the organization. Where it isuseful to the investors to mobilize the savings in the respectiveschemes provided by the Company.
RESEARCH DESIGN:
A Research design is a method and procedure for acquiringinformation needed to solve the problem. A research design is thebasic plan that helps in the data collection or analysis. Itspecifies the type of information to be collected the sources anddata collection procedure.
METHOD OF RESEARCH DESIGN USED UNDER STUDY IS: DESCRIPTIVE RESEARCH:
Descriptive research is study of existing facts to come to aconclusion. In this research an attempt has been made to analyzethe past performance of the Sahara Mutual schemes and to know thebenefits to the investors. The study is done on different schemesprovided by the company to know the company’s performance for thepast few months and to know the risk and returns of the funds.
41 SRN ADARSH COLLEGE
“Risk And Return Analysis of SAHARA MUTUALFUNDS”
OPERATIONAL DEFINITIONS OF THE CONCEPT RISK:
The dictionary meaning of risk is the possibility of loss orinjury. Any rational investor, before investing his/herinvestible wealth in the security, analyzes the risk associatedwith a particular security. The actual return he receives from asecurity may vary from his expected return and the risk isexpressed in term of variability of return. The down side of riskmay be caused by several factors, either common to all securitiesor specific to a particular security. Investor in general wouldlike to analyze the risk factors and a thorough knowledge of arisk helps him to plan his portfolio in such a manner so as tominimize risk associated with the investment. Risk consists of two components:
The systematic risk.
The unsystematic risk.
The systematic risk is caused by the factors external to aparticular company and uncontrollable by the company. Thesystematic risk affects the market as a whole. In case of unsystematic risk the factors are specific, unique andrelated to a particular industry or company.
Systematic Risk: The systematic risk affects the entire market.The economic conditions, political situations and thesociological changes affect the security market. These factorsare beyond the control of the corporate and the investor. Theinvestor cannot avoid them. This is subdivided into:
i. Market Risk
ii. Interest Rate Risk
iii. Purchasing Power Risk.
42 SRN ADARSH COLLEGE
“Risk And Return Analysis of SAHARA MUTUALFUNDS”
Unsystematic Risk: The unsystematic risk is unique and peculiarto a firm or an industry. Unsystematic Risk stems from managerialinefficiency, technological change in the production process,availability of raw material, changes in the customer preference,and labour problems. The nature and magnitude of the above-mentioned factors differ from industry to industry, and companyto company. They have to be analyzed separately for each industryand firm. Broadly, unsystematic risk can be classified into:
i. Business Risk
ii. Financial Risk
Risk Measurement: Understanding the nature of risk is notadequate unless the investor or analyst is capable of expressingit in some quantitative terms. Measurements cannot be assured ofcent percent accuracy because risk is caused by numerous factorssuch as social, political, economic and managerial efficiency.The statistical tools used to quantify risk are:
i. Standard Deviation:
a. A measure of the dispersion of a set of data from its mean. Themore spread apart the data is, the higher the deviation.
b. In finance, standard deviation is applied to the annual rate ofreturn of an investment to measure the investment's volatility(risk).
A volatile stock would have a high standard deviation. In mutualfunds, the standard deviation tells us how much the return on thefund is deviating from the expected normal returns. Standarddeviation can also be calculated as the square root of thevariance.
ii. Beta: Beta describes the relationship between the securitiesreturn and the index returns.
43 SRN ADARSH COLLEGE
“Risk And Return Analysis of SAHARA MUTUALFUNDS”
Beta = + 1.0 One percent change in market index returns causes exactly one
percent change in the security return. It indicates that thesecurity moves in tandem with the market.
Beta = + 0.5
One percent changes in the market index return causes 0.5 percentchange in the security return. The security is less volatilecompared to the market.
Beta = + 2.0
One percent change in the market index return causes 2 percentchange in the security return. The security return is morevolatile. When there is a decline of 10% in the market return,the security with beta of 2 would give a negative return of 20%.The security with more than 1 beta value is considered to berisky.
Negative Beta Negative beta value indicates that the security returnmoves in the opposite direction to the market return. A securitywith a negative beta of -1 would provide a return of 10%, if themarket return declines by 10% and vice-versa.
RATE OF RETURN:
The compounded annual return on a mutual fund scheme representsthe return to investors from a scheme since the date of issue. Itis calculated on NAV basis or price basis. On NAV basis itreflects the return generated by the fund manager on NAV. Onprice basis it reflects the return to investors by way of marketor repurchase price
44 SRN ADARSH COLLEGE
“Risk And Return Analysis of SAHARA MUTUALFUNDS”
Net Asset Value (NAV):
The net asset value of the fund is the cumulative market value ofthe assets fund of its liabilities. In other words, if the fundis dissolved or liquidated, by selling off all the assets in thefund, this is the amount that the shareholders would collectivelyown. This gives rise to the concept of net asset value per unit,which is the value, represented by the ownership of one unit inthe fund. It is calculated simply by dividing the net asset valueof tumbler of units. However, most people refer loosely to theNAV per unit as NAV, ignoring the “per unit”. We also abide bythe same convention.
Computation of Net Asset Value
The Net Asset Value (NAV) of the units will be determined as ofevery working day and for such other days as may be required forthe purpose of transaction of units. The NAV shall be calculated in accordance with the followingformula, or such other formula as may be prescribed by SEBI fromtime to time.
Market /Fair value of scheme’s investments +
Receivables + Accrued Income + Other Assets – Accrued Expenses –
Payables – OtherLiabilities
NAV =--------------------------------------------------------------------------------------
Number of Units Outstanding
METHODOLOGY OF DATA COLLECTION:
45 SRN ADARSH COLLEGE
“Risk And Return Analysis of SAHARA MUTUALFUNDS”
SOURCES OF DATA: SECONDARY DATA used for the study:
Internet sources.
Newspapers.
Announcements and publishing’s by the company.
CONCEPTUAL DESIGN: Sample unit: Schemes of Sahara Mutual Fund. Sample size: 16 weeks NAV of the Schemes. Sampling Procedure: Direct.
SCHEMES CONSIDERED FOR THE EVALUATION STUDY
In this project I have considered total of six schemes. Theirrelative Benchmark Indices are:
SAHARA INCOME FUND – CRISIL COMPOSITE BOND INDEX
SAHARA SHORT TERM FUND – CRISIL LIQUID FUND INDEX
SAHARA LIQUID FUND – CRISIL LIQUID FUND INDEX
SAHARA GILT FUND – I SEC COMPOSITE INDEX
SAHARA GROWTH FUND – S&P CNX NIFTY
SAHARA MIDCAP FUND – S&P CNX MIDCAP INDEX
TOOLS & TECHNIQUES USED FOR THE STUDY
46 SRN ADARSH COLLEGE
“Risk And Return Analysis of SAHARA MUTUALFUNDS”
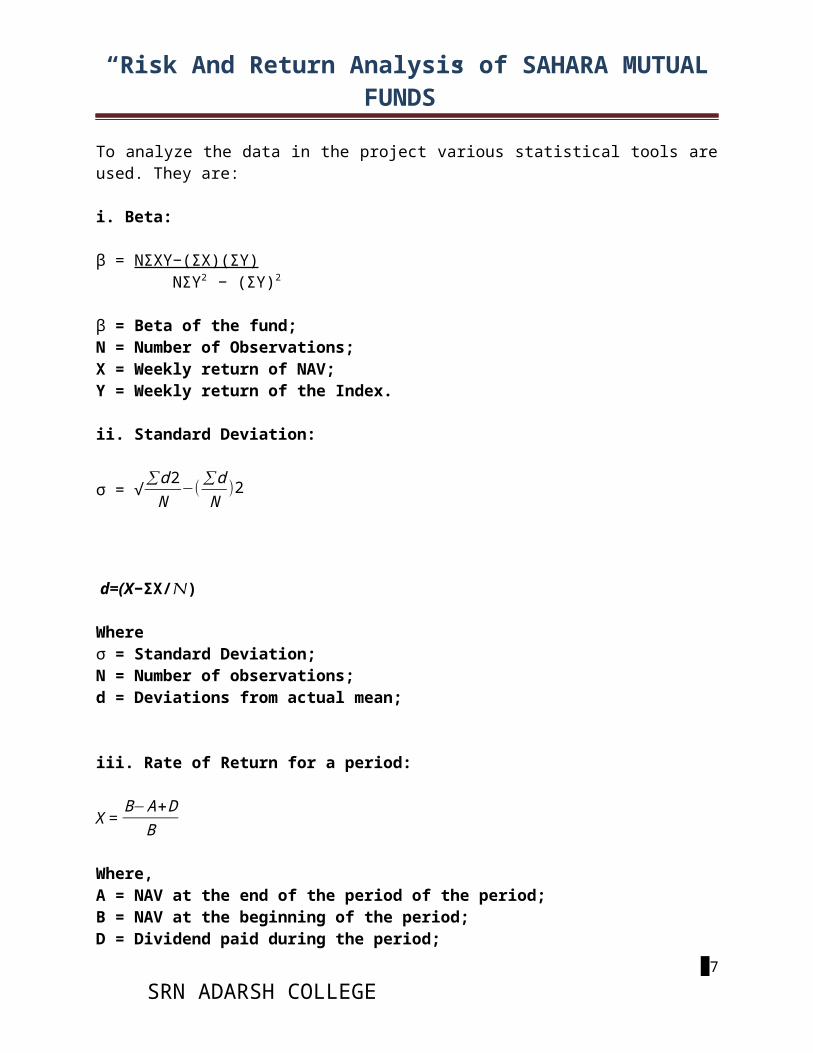
To analyze the data in the project various statistical tools areused. They are:
i. Beta:
β = NΣXY−(ΣX)(ΣY) NΣY2 − (ΣY)2
β = Beta of the fund; N = Number of Observations; X = Weekly return of NAV; Y = Weekly return of the Index.
ii. Standard Deviation:
σ = √∑d2N
−(∑dN
)2
d=(X−ΣX/𝛮)
Where σ = Standard Deviation; N = Number of observations; d = Deviations from actual mean;
iii. Rate of Return for a period:
X = B−A+D
B
Where, A = NAV at the end of the period of the period; B = NAV at the beginning of the period; D = Dividend paid during the period;
47 SRN ADARSH COLLEGE
“Risk And Return Analysis of SAHARA MUTUALFUNDS”
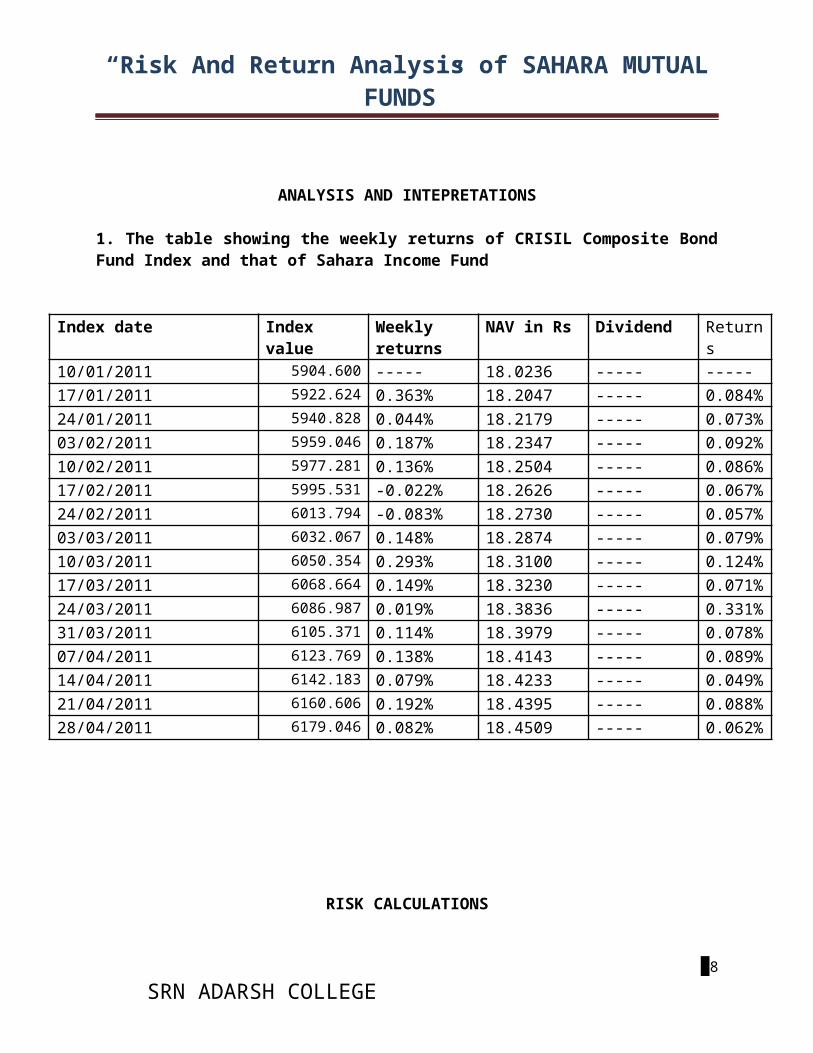
ANALYSIS AND INTEPRETATIONS
1. The table showing the weekly returns of CRISIL Composite BondFund Index and that of Sahara Income Fund
Index date Indexvalue
Weeklyreturns
NAV in Rs Dividend Returns
10/01/2011 5904.600 ----- 18.0236 ----- ----- 17/01/2011 5922.624 0.363% 18.2047 ----- 0.084%24/01/2011 5940.828 0.044% 18.2179 ----- 0.073%03/02/2011 5959.046 0.187% 18.2347 ----- 0.092%10/02/2011 5977.281 0.136% 18.2504 ----- 0.086%17/02/2011 5995.531 -0.022% 18.2626 ----- 0.067%24/02/2011 6013.794 -0.083% 18.2730 ----- 0.057%03/03/2011 6032.067 0.148% 18.2874 ----- 0.079%10/03/2011 6050.354 0.293% 18.3100 ----- 0.124%17/03/2011 6068.664 0.149% 18.3230 ----- 0.071%24/03/2011 6086.987 0.019% 18.3836 ----- 0.331%31/03/2011 6105.371 0.114% 18.3979 ----- 0.078%07/04/2011 6123.769 0.138% 18.4143 ----- 0.089%14/04/2011 6142.183 0.079% 18.4233 ----- 0.049%21/04/2011 6160.606 0.192% 18.4395 ----- 0.088%28/04/2011 6179.046 0.082% 18.4509 ----- 0.062%
RISK CALCULATIONS
48 SRN ADARSH COLLEGE
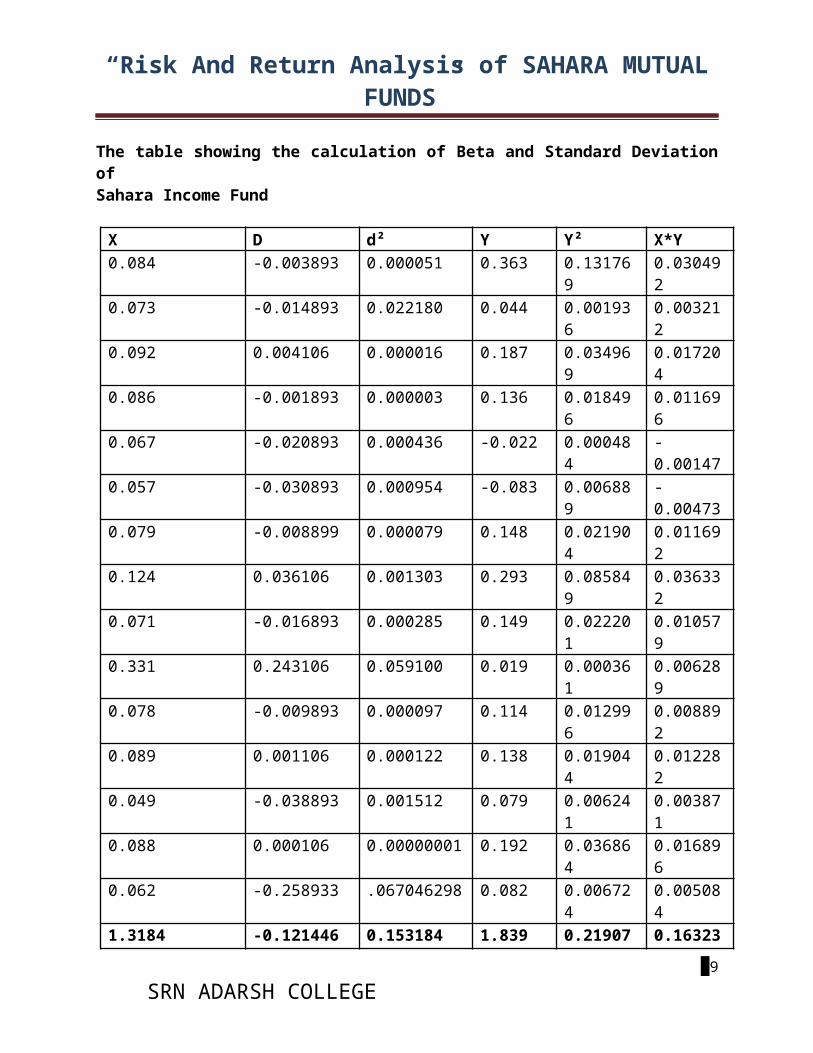
“Risk And Return Analysis of SAHARA MUTUALFUNDS”
The table showing the calculation of Beta and Standard Deviationof Sahara Income Fund
X D d² Y Y² X*Y 0.084 -0.003893 0.000051 0.363 0.13176
9 0.030492
0.073 -0.014893 0.022180 0.044 0.001936
0.003212
0.092 0.004106 0.000016 0.187 0.034969
0.017204
0.086 -0.001893 0.000003 0.136 0.018496
0.011696
0.067 -0.020893 0.000436 -0.022 0.000484
-0.00147
0.057 -0.030893 0.000954 -0.083 0.006889
-0.00473
0.079 -0.008899 0.000079 0.148 0.021904
0.011692
0.124 0.036106 0.001303 0.293 0.085849
0.036332
0.071 -0.016893 0.000285 0.149 0.022201
0.010579
0.331 0.243106 0.059100 0.019 0.000361
0.006289
0.078 -0.009893 0.000097 0.114 0.012996
0.008892
0.089 0.001106 0.000122 0.138 0.019044
0.012282
0.049 -0.038893 0.001512 0.079 0.006241
0.003871
0.088 0.000106 0.00000001 0.192 0.036864
0.016896
0.062 -0.258933 .067046298 0.082 0.006724
0.005084
1.3184 -0.121446 0.153184 1.839 0.21907 0.1632349
SRN ADARSH COLLEGE
“Risk And Return Analysis of SAHARA MUTUALFUNDS”
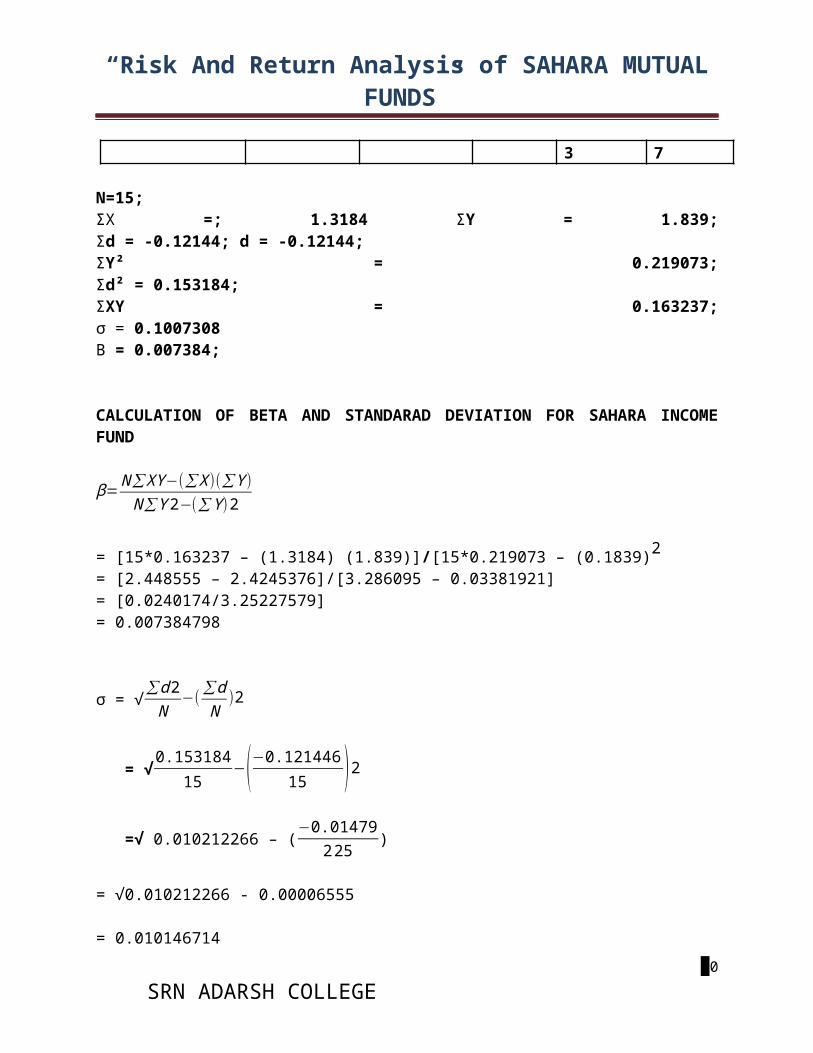
3 7
N=15; ΣΧ =; 1.3184 ΣY = 1.839;Σd = -0.12144; d = -0.12144; ΣY² = 0.219073;Σd² = 0.153184; ΣXY = 0.163237;σ = 0.1007308 Β = 0.007384;
CALCULATION OF BETA AND STANDARAD DEVIATION FOR SAHARA INCOMEFUND
β=N∑XY−(∑X)(∑Y)N∑Y2−(∑Y)2
= [15*0.163237 – (1.3184) (1.839)]/[15*0.219073 – (0.1839)2 = [2.448555 – 2.4245376]/[3.286095 – 0.03381921] = [0.0240174/3.25227579] = 0.007384798
σ = √∑d2N
−(∑dN
)2
= √0.15318415−(−0.12144615 )2
=√ 0.010212266 – (−0.01479225 )
= √0.010212266 - 0.00006555
= 0.01014671450
SRN ADARSH COLLEGE
“Risk And Return Analysis of SAHARA MUTUALFUNDS”
= √0.1007308
Inference: As the β is less than 1 it can be said that the scheme is lessrisky. For One percent change in the market index causes 0.007384percent change in the scheme return. The scheme is less volatilecompared to the market. The Standard Deviation of the scheme is0.1007308.which means the scheme’s returns vary with the index tothe extent of 0.1007308.
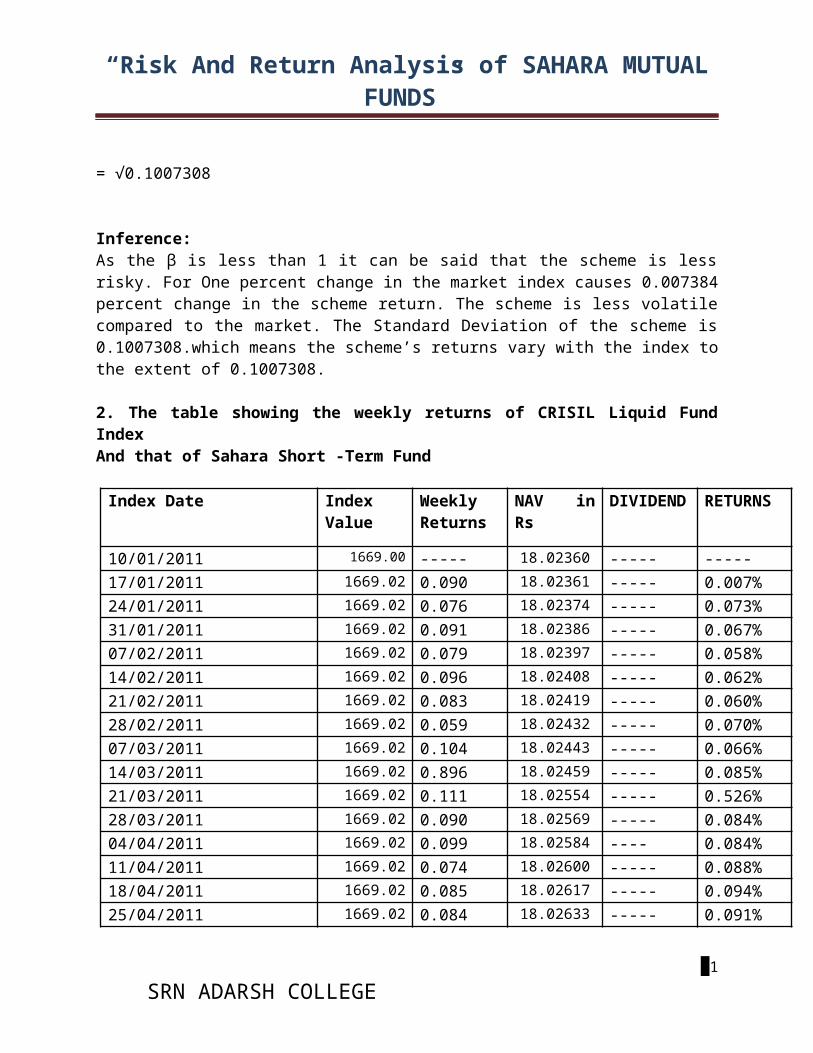
2. The table showing the weekly returns of CRISIL Liquid FundIndex And that of Sahara Short -Term Fund
Index Date IndexValue
WeeklyReturns
NAV inRs
DIVIDEND RETURNS
10/01/2011 1669.00 ----- 18.02360 ----- ----- 17/01/2011 1669.02 0.090 18.02361 ----- 0.007% 24/01/2011 1669.02 0.076 18.02374 ----- 0.073% 31/01/2011 1669.02 0.091 18.02386 ----- 0.067% 07/02/2011 1669.02 0.079 18.02397 ----- 0.058% 14/02/2011 1669.02 0.096 18.02408 ----- 0.062% 21/02/2011 1669.02 0.083 18.02419 ----- 0.060% 28/02/2011 1669.02 0.059 18.02432 ----- 0.070% 07/03/2011 1669.02 0.104 18.02443 ----- 0.066% 14/03/2011 1669.02 0.896 18.02459 ----- 0.085% 21/03/2011 1669.02 0.111 18.02554 ----- 0.526% 28/03/2011 1669.02 0.090 18.02569 ----- 0.084% 04/04/2011 1669.02 0.099 18.02584 ---- 0.084% 11/04/2011 1669.02 0.074 18.02600 ----- 0.088% 18/04/2011 1669.02 0.085 18.02617 ----- 0.094% 25/04/2011 1669.02 0.084 18.02633 ----- 0.091%
51 SRN ADARSH COLLEGE
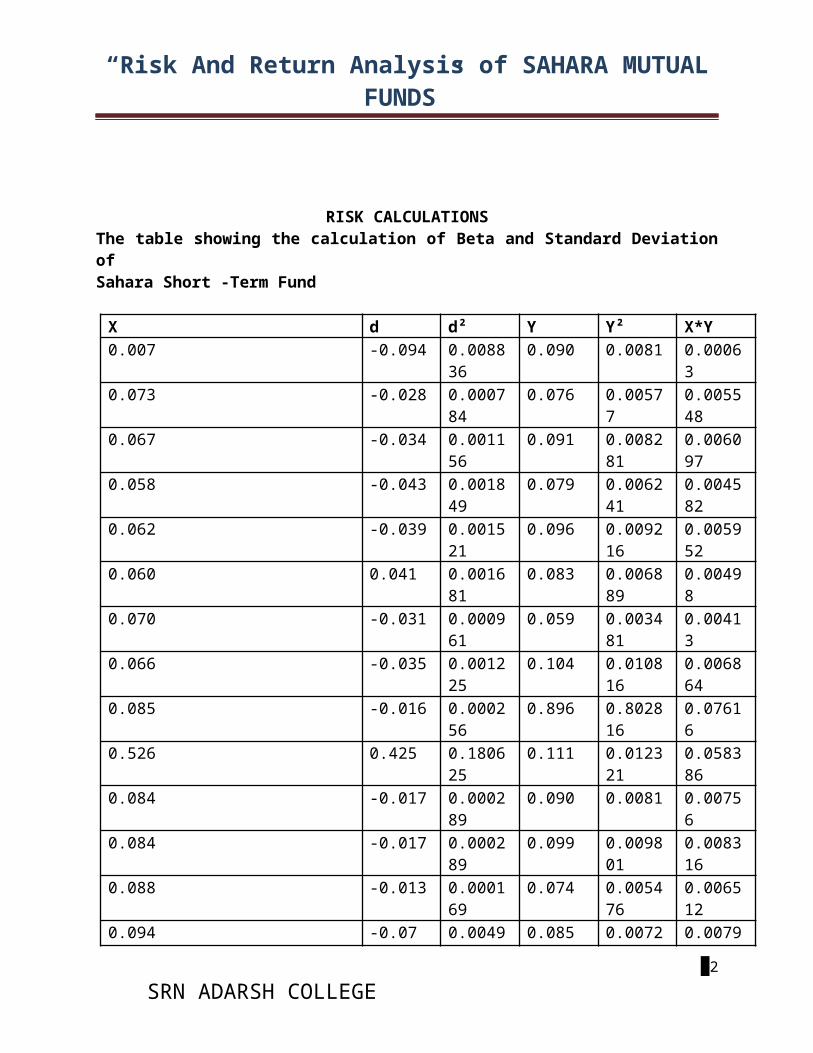
“Risk And Return Analysis of SAHARA MUTUALFUNDS”
RISK CALCULATIONS The table showing the calculation of Beta and Standard Deviationof Sahara Short -Term Fund
X d d² Y Y² X*Y 0.007 -0.094 0.0088
36 0.090 0.0081 0.0006
3 0.073 -0.028 0.0007
84 0.076 0.0057
7 0.005548
0.067 -0.034 0.001156
0.091 0.008281
0.006097
0.058 -0.043 0.001849
0.079 0.006241
0.004582
0.062 -0.039 0.001521
0.096 0.009216
0.005952
0.060 0.041 0.001681
0.083 0.006889
0.00498
0.070 -0.031 0.000961
0.059 0.003481
0.00413
0.066 -0.035 0.001225
0.104 0.010816
0.006864
0.085 -0.016 0.000256
0.896 0.802816
0.07616
0.526 0.425 0.180625
0.111 0.012321
0.058386
0.084 -0.017 0.000289
0.090 0.0081 0.00756
0.084 -0.017 0.000289
0.099 0.009801
0.008316
0.088 -0.013 0.000169
0.074 0.005476
0.006512
0.094 -0.07 0.0049 0.085 0.0072 0.0079
52 SRN ADARSH COLLEGE
“Risk And Return Analysis of SAHARA MUTUALFUNDS”
25 9 0.091 -0.10 0.01 0.084 0.0070
56 0.007644
1.515 -0.071 0.214252
2.117000
0.911589
0.211351
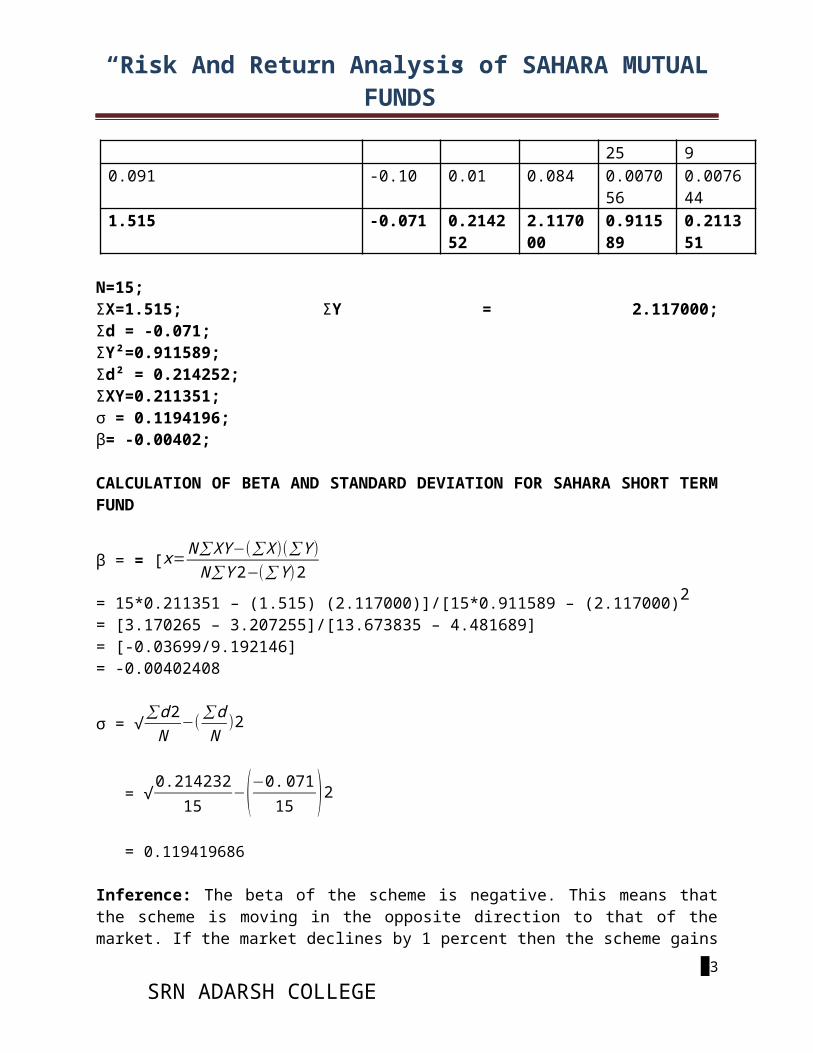
N=15; ΣX=1.515; ΣY = 2.117000;Σd = -0.071; ΣY²=0.911589;Σd² = 0.214252; ΣXY=0.211351;σ = 0.1194196; β= -0.00402;
CALCULATION OF BETA AND STANDARD DEVIATION FOR SAHARA SHORT TERMFUND
β = = [x=N∑XY−(∑X)(∑Y)N∑Y2−(∑Y)2
= 15*0.211351 – (1.515) (2.117000)]/[15*0.911589 – (2.117000)2 = [3.170265 – 3.207255]/[13.673835 – 4.481689] = [-0.03699/9.192146] = -0.00402408
σ = √∑d2N
−(∑dN
)2
= √0.21423215−(−0.07115 )2
= 0.119419686
Inference: The beta of the scheme is negative. This means thatthe scheme is moving in the opposite direction to that of themarket. If the market declines by 1 percent then the scheme gains
53 SRN ADARSH COLLEGE
“Risk And Return Analysis of SAHARA MUTUALFUNDS”
by 0.00402408 percent. The standard deviation of the scheme is0.119419686, which means the fund does not have much variation inthe returns.
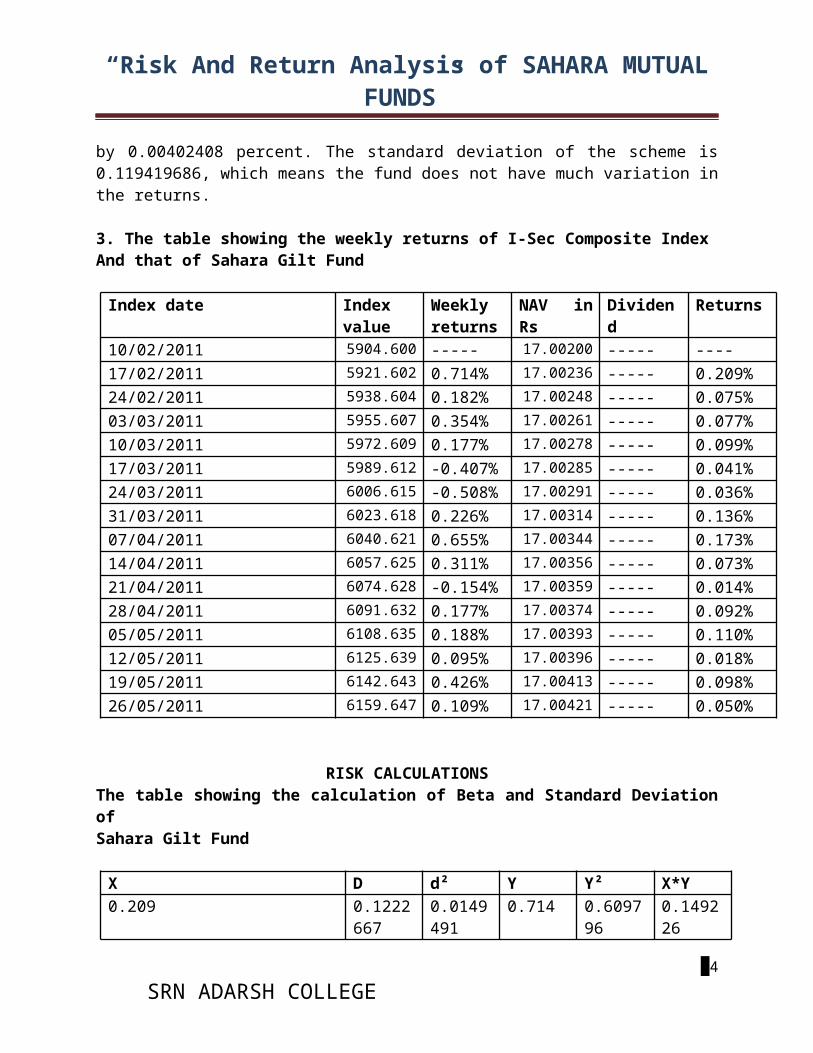
3. The table showing the weekly returns of I-Sec Composite Index And that of Sahara Gilt Fund Index date Index
valueWeeklyreturns
NAV inRs
Dividend
Returns
10/02/2011 5904.600 ----- 17.00200 ----- ---- 17/02/2011 5921.602 0.714% 17.00236 ----- 0.209% 24/02/2011 5938.604 0.182% 17.00248 ----- 0.075% 03/03/2011 5955.607 0.354% 17.00261 ----- 0.077% 10/03/2011 5972.609 0.177% 17.00278 ----- 0.099% 17/03/2011 5989.612 -0.407% 17.00285 ----- 0.041% 24/03/2011 6006.615 -0.508% 17.00291 ----- 0.036% 31/03/2011 6023.618 0.226% 17.00314 ----- 0.136% 07/04/2011 6040.621 0.655% 17.00344 ----- 0.173% 14/04/2011 6057.625 0.311% 17.00356 ----- 0.073% 21/04/2011 6074.628 -0.154% 17.00359 ----- 0.014% 28/04/2011 6091.632 0.177% 17.00374 ----- 0.092% 05/05/2011 6108.635 0.188% 17.00393 ----- 0.110% 12/05/2011 6125.639 0.095% 17.00396 ----- 0.018% 19/05/2011 6142.643 0.426% 17.00413 ----- 0.098% 26/05/2011 6159.647 0.109% 17.00421 ----- 0.050%
RISK CALCULATIONS The table showing the calculation of Beta and Standard Deviationof Sahara Gilt Fund
X D d² Y Y² X*Y 0.209 0.1222
667 0.0149491
0.714 0.609796
0.149226
54 SRN ADARSH COLLEGE

“Risk And Return Analysis of SAHARA MUTUALFUNDS”
0.075 -0.011733
0.00013766
0.182 0.033124
0.01365
0.077 -0.009733
0.000094731
0.354 0.125316
0.027258
0.099 0.012267
0.000150479
0.177 0.031329
0.017523
0.041 -0.045733
0.002091507
-0.407 0.165649
-0.01668
0.036 -0.050733
0.002573837
-0.508 0.258064
-0.01828
0.136 0.049267
0.002427237
0.226 0.051076
0.030736
0.173 0.086267
0.007441995
0.655 0.429025
0.113315
0.073 -0.013733
0.000188595
0.311 0.096721
0.022703
0.014 -0.072733
0.005290089
-0.154 0.023716
-0.00215
0.092 0.005267
0.000027741
0.177 0.031329
0.016284
0.110 0.023267
0.000541353
0.188 0.035344
0.02068
0.018 -0.068733
0.004724225
0.095 0.009025
0.00171
0.098 0.011267
0.000126945
0.426 0.181476
0.041748
0.050 -0.036733
0.001349313
0.109 0.011881
0.00545
55 SRN ADARSH COLLEGE
“Risk And Return Analysis of SAHARA MUTUALFUNDS”
1.301 0.0000047
0.019690256
2.545 2.092871
0.423173
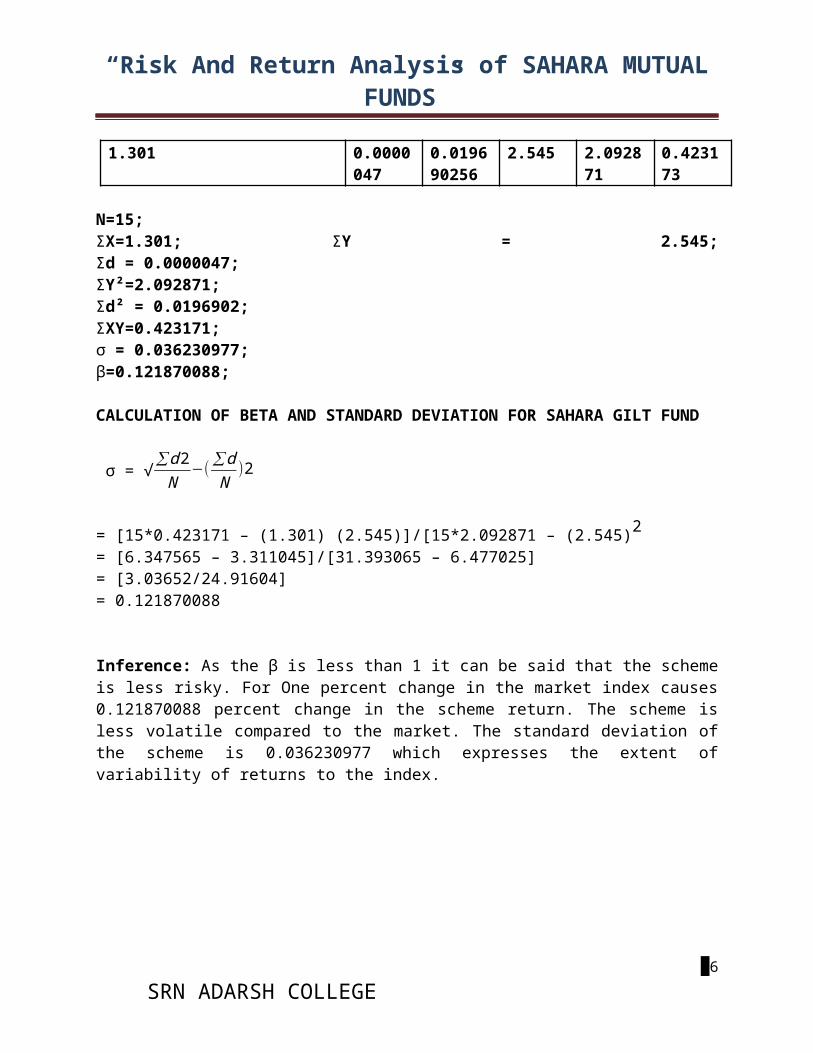
N=15; ΣX=1.301; ΣY = 2.545;Σd = 0.0000047; ΣY²=2.092871;Σd² = 0.0196902; ΣXY=0.423171;σ = 0.036230977; β=0.121870088;
CALCULATION OF BETA AND STANDARD DEVIATION FOR SAHARA GILT FUND
σ = √∑d2N
−(∑dN
)2
= [15*0.423171 – (1.301) (2.545)]/[15*2.092871 – (2.545)2 = [6.347565 – 3.311045]/[31.393065 – 6.477025] = [3.03652/24.91604] = 0.121870088
Inference: As the β is less than 1 it can be said that the schemeis less risky. For One percent change in the market index causes0.121870088 percent change in the scheme return. The scheme isless volatile compared to the market. The standard deviation ofthe scheme is 0.036230977 which expresses the extent ofvariability of returns to the index.
56 SRN ADARSH COLLEGE
“Risk And Return Analysis of SAHARA MUTUALFUNDS”
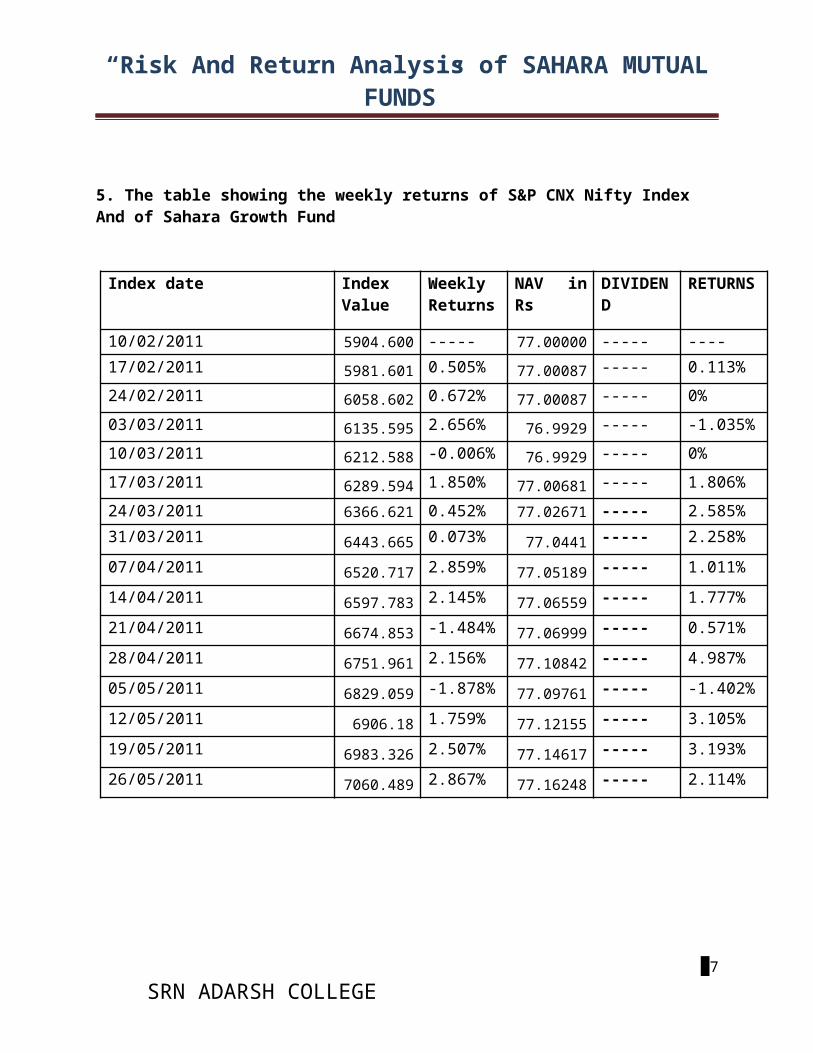
5. The table showing the weekly returns of S&P CNX Nifty Index And of Sahara Growth Fund
Index date IndexValue
WeeklyReturns
NAV inRs
DIVIDEND
RETURNS
10/02/2011 5904.600 ----- 77.00000 ----- ---- 17/02/2011 5981.601 0.505% 77.00087 ----- 0.113% 24/02/2011 6058.602 0.672% 77.00087 ----- 0% 03/03/2011 6135.595 2.656% 76.9929 ----- -1.035%10/03/2011 6212.588 -0.006% 76.9929 ----- 0% 17/03/2011 6289.594 1.850% 77.00681 ----- 1.806% 24/03/2011 6366.621 0.452% 77.02671 ----- 2.585% 31/03/2011 6443.665 0.073% 77.0441 ----- 2.258% 07/04/2011 6520.717 2.859% 77.05189 ----- 1.011% 14/04/2011 6597.783 2.145% 77.06559 ----- 1.777% 21/04/2011 6674.853 -1.484% 77.06999 ----- 0.571% 28/04/2011 6751.961 2.156% 77.10842 ----- 4.987% 05/05/2011 6829.059 -1.878% 77.09761 ----- -1.402%12/05/2011 6906.18 1.759% 77.12155 ----- 3.105% 19/05/2011 6983.326 2.507% 77.14617 ----- 3.193% 26/05/2011 7060.489 2.867% 77.16248 ----- 2.114%
57 SRN ADARSH COLLEGE

“Risk And Return Analysis of SAHARA MUTUALFUNDS”
RISK CALCULATIONS The table showing the calculation of Beta and Standard Deviationof Sahara Growth Fund X D d² Y Y² X*Y 0.113 -1.3382 1.70779 0.505 0.25502 0.05706
5 0 -1.4512 2.10598 0.672 0.45158 0 -.035 -1.812 3.28334 2.656 7.05433 -
0.092960 -1.4512 2.10598 -0.006 0.00003
6 0
1.806 0.3548 0.12588 1.850 3.4225 3.3411 2.585 1.1338 1.28550 0.452 0.20430
4 1.16842
2.258 0.8068 0.65092 0.073 0.005329
0.166805
1.011 -0.4402 0.19377 2.859 8.173881
2.890449
1.777 0.3258 0.10614 2.145 4.601025
3.811665
0.571 -0.8802 0.77475 -1.484 2.202256
-0.84736
4.987 3.5358 12.5018 2.156 4.648336
10.751972
-1.402 -2.8532 8.14075 -1.878 3.526884
2.632956
3.105 1.6538 2.73505 1.759 3.094081
5.461695
3.193 1.7418 3.03386 2.507 6.285049
8.004851
2.114 0.6628 0.43930 2.867 8.219689
6.060838
58 SRN ADARSH COLLEGE
“Risk And Return Analysis of SAHARA MUTUALFUNDS”
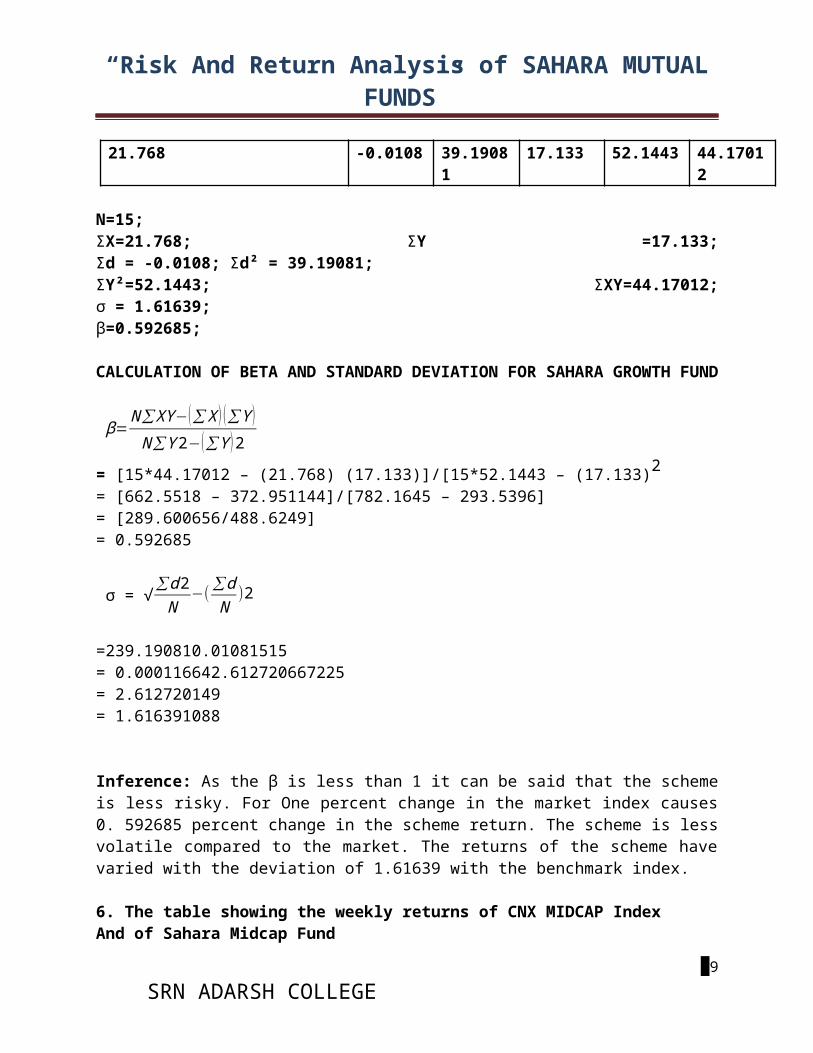
21.768 -0.0108 39.19081
17.133 52.1443 44.17012
N=15; ΣX=21.768; ΣY =17.133;Σd = -0.0108; Σd² = 39.19081; ΣY²=52.1443; ΣXY=44.17012;σ = 1.61639; β=0.592685;
CALCULATION OF BETA AND STANDARD DEVIATION FOR SAHARA GROWTH FUND
β=N∑XY−(∑X ) (∑Y )N∑Y2−(∑Y )2
= [15*44.17012 – (21.768) (17.133)]/[15*52.1443 – (17.133)2 = [662.5518 – 372.951144]/[782.1645 – 293.5396] = [289.600656/488.6249] = 0.592685
σ = √∑d2N
−(∑dN
)2
=239.190810.01081515 = 0.000116642.612720667225 = 2.612720149 = 1.616391088
Inference: As the β is less than 1 it can be said that the schemeis less risky. For One percent change in the market index causes0. 592685 percent change in the scheme return. The scheme is lessvolatile compared to the market. The returns of the scheme havevaried with the deviation of 1.61639 with the benchmark index.
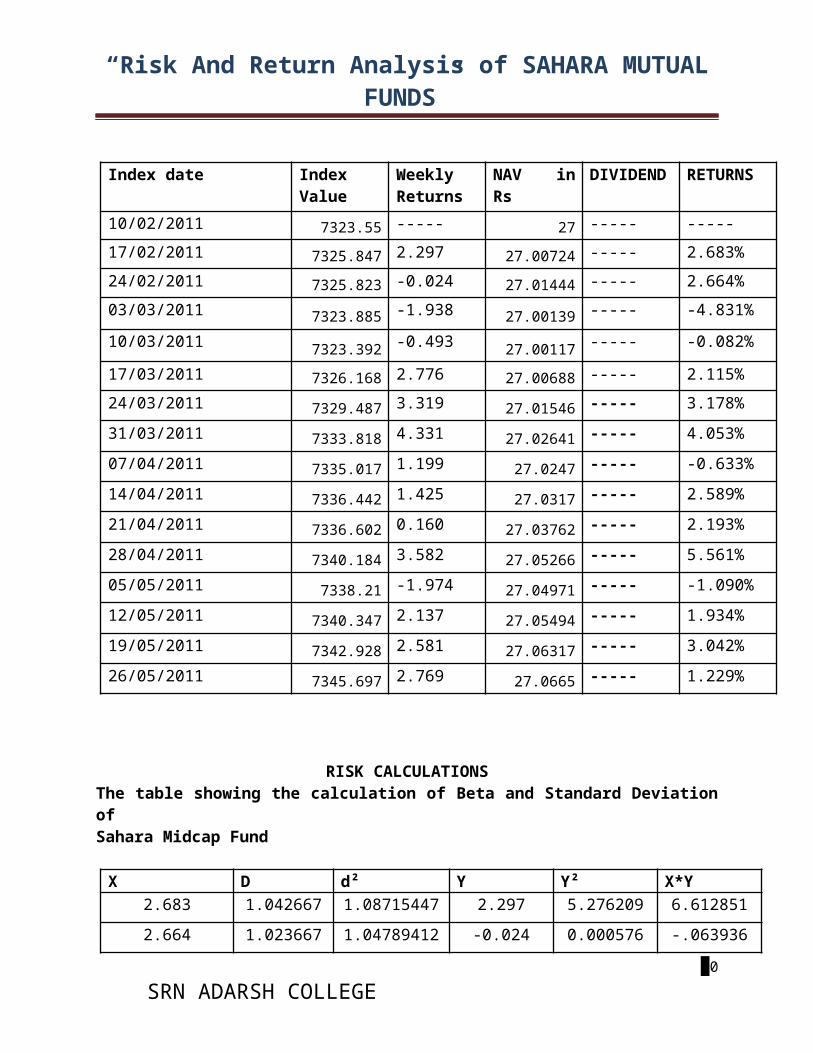
6. The table showing the weekly returns of CNX MIDCAP Index And of Sahara Midcap Fund
59 SRN ADARSH COLLEGE
“Risk And Return Analysis of SAHARA MUTUALFUNDS”
Index date IndexValue
WeeklyReturns
NAV inRs
DIVIDEND RETURNS
10/02/2011 7323.55 ----- 27 ----- ----- 17/02/2011 7325.847 2.297 27.00724 ----- 2.683% 24/02/2011 7325.823 -0.024 27.01444 ----- 2.664% 03/03/2011 7323.885 -1.938 27.00139 ----- -4.831% 10/03/2011 7323.392 -0.493 27.00117 ----- -0.082%
17/03/2011 7326.168 2.776 27.00688 ----- 2.115% 24/03/2011 7329.487 3.319 27.01546 ----- 3.178% 31/03/2011 7333.818 4.331 27.02641 ----- 4.053% 07/04/2011 7335.017 1.199 27.0247 ----- -0.633% 14/04/2011 7336.442 1.425 27.0317 ----- 2.589% 21/04/2011 7336.602 0.160 27.03762 ----- 2.193% 28/04/2011 7340.184 3.582 27.05266 ----- 5.561% 05/05/2011 7338.21 -1.974 27.04971 ----- -1.090% 12/05/2011 7340.347 2.137 27.05494 ----- 1.934% 19/05/2011 7342.928 2.581 27.06317 ----- 3.042% 26/05/2011 7345.697 2.769 27.0665 ----- 1.229%
RISK CALCULATIONS The table showing the calculation of Beta and Standard Deviationof Sahara Midcap Fund
X D d² Y Y² X*Y 2.683 1.042667 1.08715447 2.297 5.276209 6.612851 2.664 1.023667 1.04789412 -0.024 0.000576 -.063936
60 SRN ADARSH COLLEGE
“Risk And Return Analysis of SAHARA MUTUALFUNDS”
-.831 -6.471333
41.8781508 -1.938 3.755844 9.362478
-.082 -1.72233 2.966240629
-0.493 0.243049 0.040426
2.115 0.474667 0.22530876 2.776 7.706176 5.87124 3.178 1.537667 2.36441980
33.319 11.015761 10.547782
4.053 2.412667 5.820962053
4.331 18.757561 17.5535
-0.633 -2.27333 5.168029289
1.199 1.437601 0.758967
2.589 0.948667 0.899969076
1.425 2.030625 5.257288125
2.193 0.552667 0.305440812
0.160 0.0256 0.35088
5.561 3.92067 15.37165325
3.582 12.830724 19.919502
-1.090 -2.273033
5.166679019
-1.974 3.896676 2.15166
1.934 0.29367 0.086242068
2.137 4.566769 4.132958
3.042 1.401667 1.964670379
2.581 6.661561 7.851402
1.229 -0.41133 0.169192368
2.769 7.667361 3.403101
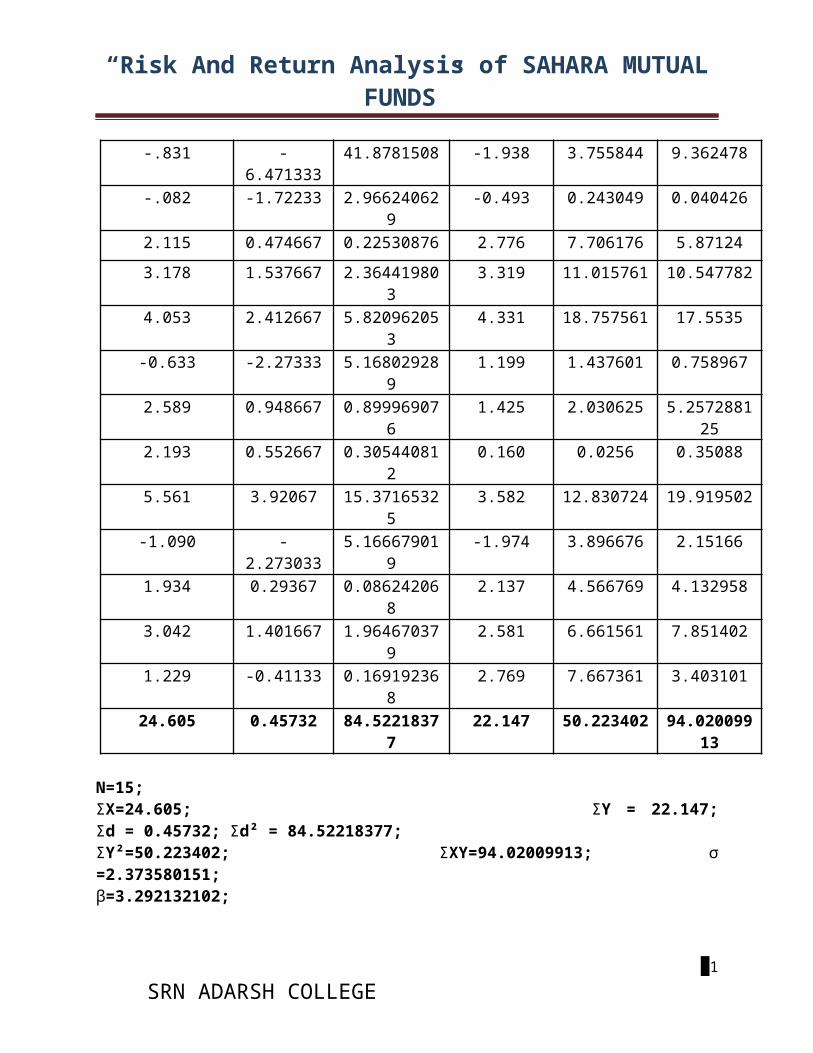
24.605 0.45732 84.52218377
22.147 50.223402 94.02009913
N=15; ΣX=24.605; ΣY = 22.147;Σd = 0.45732; Σd² = 84.52218377; ΣY²=50.223402; ΣXY=94.02009913; σ=2.373580151; β=3.292132102;
61 SRN ADARSH COLLEGE
“Risk And Return Analysis of SAHARA MUTUALFUNDS”
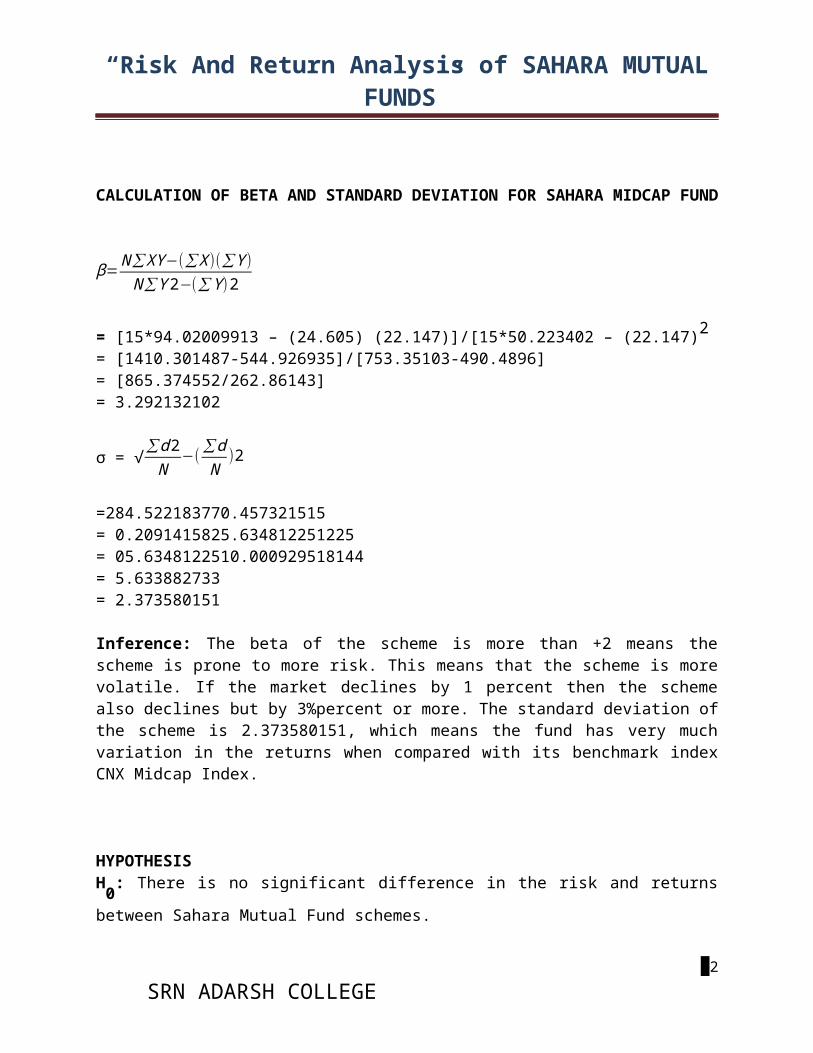
CALCULATION OF BETA AND STANDARD DEVIATION FOR SAHARA MIDCAP FUND
β=
N∑XY−(∑X)(∑Y)N∑Y2−(∑Y)2
= [15*94.02009913 – (24.605) (22.147)]/[15*50.223402 – (22.147)2 = [1410.301487-544.926935]/[753.35103-490.4896] = [865.374552/262.86143] = 3.292132102
σ = √∑d2N
−(∑dN
)2
=284.522183770.457321515= 0.2091415825.634812251225= 05.6348122510.000929518144 = 5.633882733 = 2.373580151
Inference: The beta of the scheme is more than +2 means thescheme is prone to more risk. This means that the scheme is morevolatile. If the market declines by 1 percent then the schemealso declines but by 3%percent or more. The standard deviation ofthe scheme is 2.373580151, which means the fund has very muchvariation in the returns when compared with its benchmark indexCNX Midcap Index.
HYPOTHESIS H0: There is no significant difference in the risk and returns
between Sahara Mutual Fund schemes.
62 SRN ADARSH COLLEGE
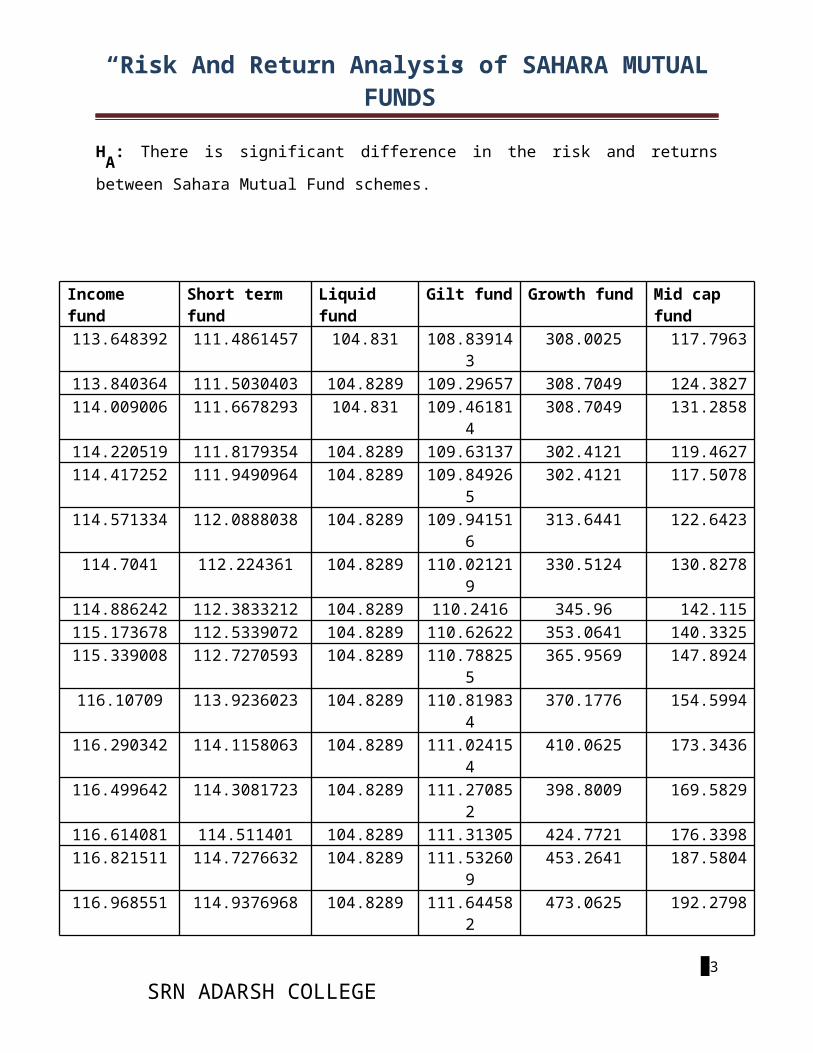
“Risk And Return Analysis of SAHARA MUTUALFUNDS”
HA: There is significant difference in the risk and returns
between Sahara Mutual Fund schemes.
Income fund
Short term fund
Liquid fund
Gilt fund Growth fund Mid cap fund
113.648392 111.4861457 104.831 108.839143
308.0025 117.7963
113.840364 111.5030403 104.8289 109.29657 308.7049 124.3827114.009006 111.6678293 104.831 109.46181
4 308.7049 131.2858
114.220519 111.8179354 104.8289 109.63137 302.4121 119.4627114.417252 111.9490964 104.8289 109.84926
5 302.4121 117.5078
114.571334 112.0888038 104.8289 109.941516
313.6441 122.6423
114.7041 112.224361 104.8289 110.021219
330.5124 130.8278
114.886242 112.3833212 104.8289 110.2416 345.96 142.115115.173678 112.5339072 104.8289 110.62622 353.0641 140.3325115.339008 112.7270593 104.8289 110.78825
5 365.9569 147.8924
116.10709 113.9236023 104.8289 110.819834
370.1776 154.5994
116.290342 114.1158063 104.8289 111.024154
410.0625 173.3436
116.499642 114.3081723 104.8289 111.270852
398.8009 169.5829
116.614081 114.511401 104.8289 111.31305 424.7721 176.3398116.821511 114.7276632 104.8289 111.53260
9 453.2641 187.5804
116.968551 114.9376968 104.8289 111.644582
473.0625 192.2798
63 SRN ADARSH COLLEGE

“Risk And Return Analysis of SAHARA MUTUALFUNDS”
1. ΣX2 = 15212.0708
2. ΣX2 = 15212.0708 N 96 = 158.4590711
3. Sum of squares of funds = 115.2569446 + 112.9316151 + 104.82919 + 110.3938784 +360.594606 + 146.7482 = 950.7544264
4. Total sum of squares = 15212.0708 - 158.4590711 = 15053.61175
5. Sum of squares due to different fund = 950.7544264 - 158.4590711 = 792.2953554
ANOVA TABLE
Sources of variance Sum of Degrees Mean F cal F tab 64
SRN ADARSH COLLEGE
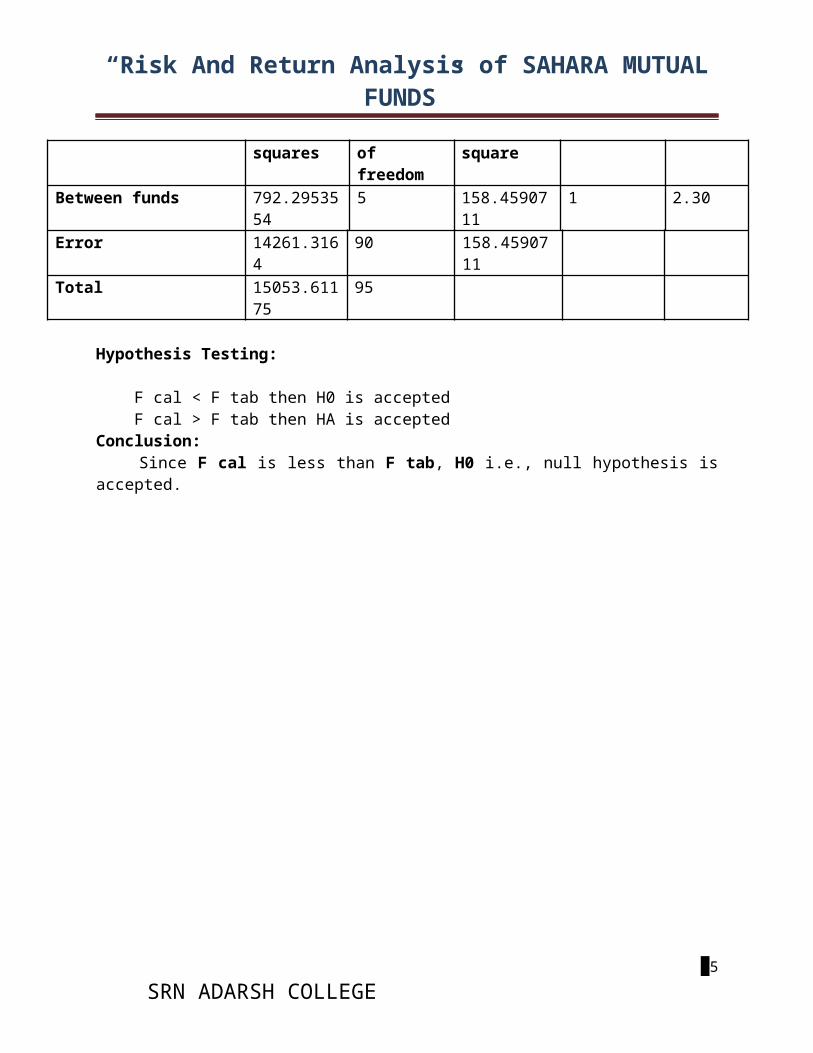
“Risk And Return Analysis of SAHARA MUTUALFUNDS”
squares offreedom
square
Between funds 792.2953554
5 158.4590711
1 2.30
Error 14261.3164
90 158.4590711
Total 15053.61175
95
Hypothesis Testing:
F cal < F tab then H0 is accepted F cal > F tab then HA is accepted Conclusion: Since F cal is less than F tab, H0 i.e., null hypothesis isaccepted.
65 SRN ADARSH COLLEGE
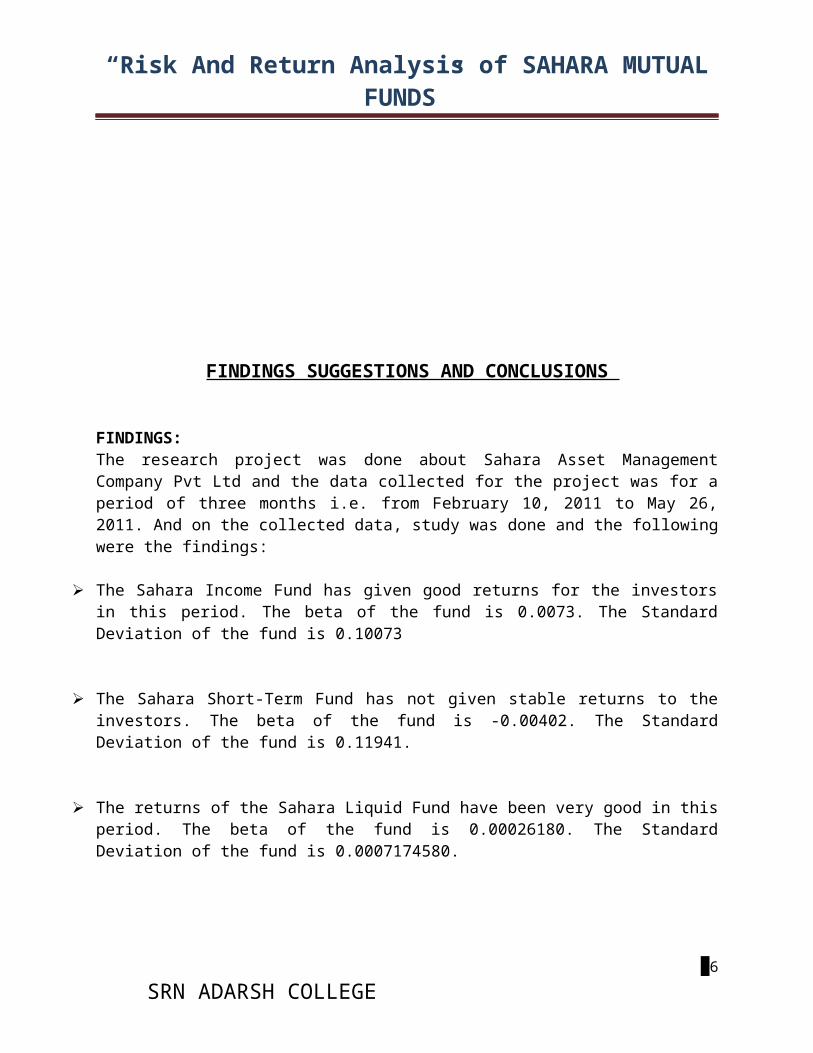
“Risk And Return Analysis of SAHARA MUTUALFUNDS”
FINDINGS SUGGESTIONS AND CONCLUSIONS
FINDINGS: The research project was done about Sahara Asset ManagementCompany Pvt Ltd and the data collected for the project was for aperiod of three months i.e. from February 10, 2011 to May 26,2011. And on the collected data, study was done and the followingwere the findings:
The Sahara Income Fund has given good returns for the investorsin this period. The beta of the fund is 0.0073. The StandardDeviation of the fund is 0.10073
The Sahara Short-Term Fund has not given stable returns to theinvestors. The beta of the fund is -0.00402. The StandardDeviation of the fund is 0.11941.
The returns of the Sahara Liquid Fund have been very good in thisperiod. The beta of the fund is 0.00026180. The StandardDeviation of the fund is 0.0007174580.
66 SRN ADARSH COLLEGE
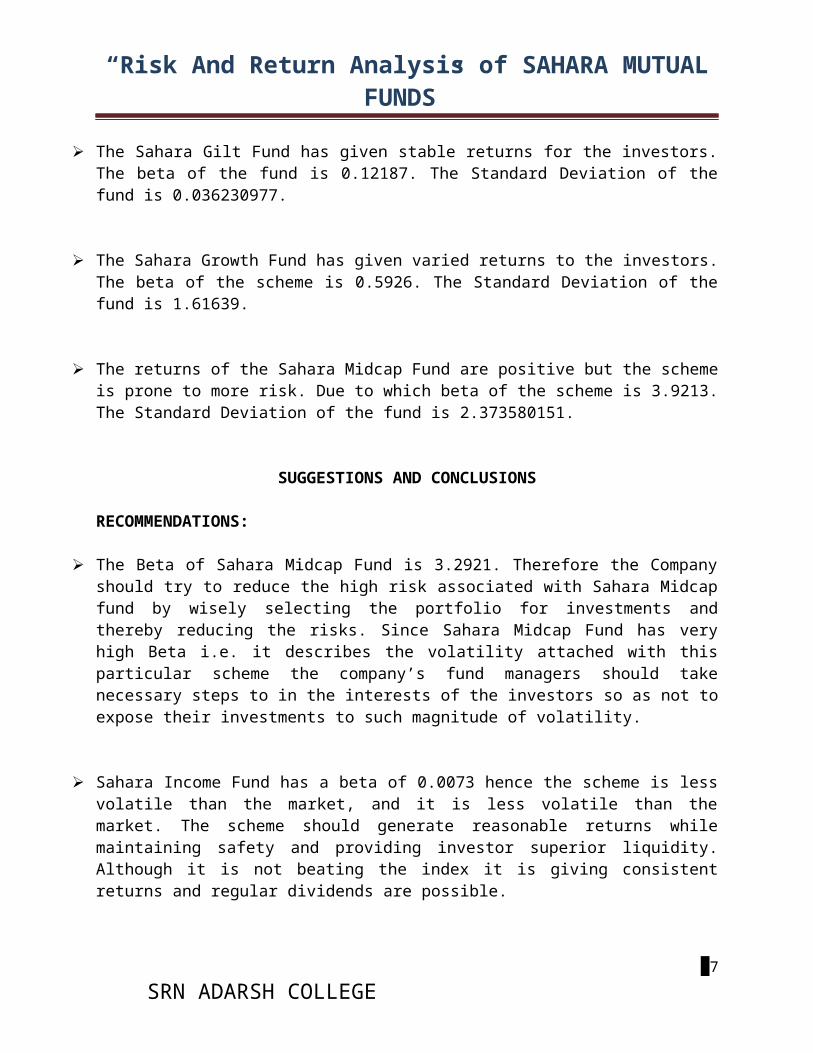
“Risk And Return Analysis of SAHARA MUTUALFUNDS”
The Sahara Gilt Fund has given stable returns for the investors.The beta of the fund is 0.12187. The Standard Deviation of thefund is 0.036230977.
The Sahara Growth Fund has given varied returns to the investors.The beta of the scheme is 0.5926. The Standard Deviation of thefund is 1.61639.
The returns of the Sahara Midcap Fund are positive but the schemeis prone to more risk. Due to which beta of the scheme is 3.9213.The Standard Deviation of the fund is 2.373580151.
SUGGESTIONS AND CONCLUSIONS
RECOMMENDATIONS:
The Beta of Sahara Midcap Fund is 3.2921. Therefore the Companyshould try to reduce the high risk associated with Sahara Midcapfund by wisely selecting the portfolio for investments andthereby reducing the risks. Since Sahara Midcap Fund has veryhigh Beta i.e. it describes the volatility attached with thisparticular scheme the company’s fund managers should takenecessary steps to in the interests of the investors so as not toexpose their investments to such magnitude of volatility.
Sahara Income Fund has a beta of 0.0073 hence the scheme is lessvolatile than the market, and it is less volatile than themarket. The scheme should generate reasonable returns whilemaintaining safety and providing investor superior liquidity.Although it is not beating the index it is giving consistentreturns and regular dividends are possible.
67 SRN ADARSH COLLEGE
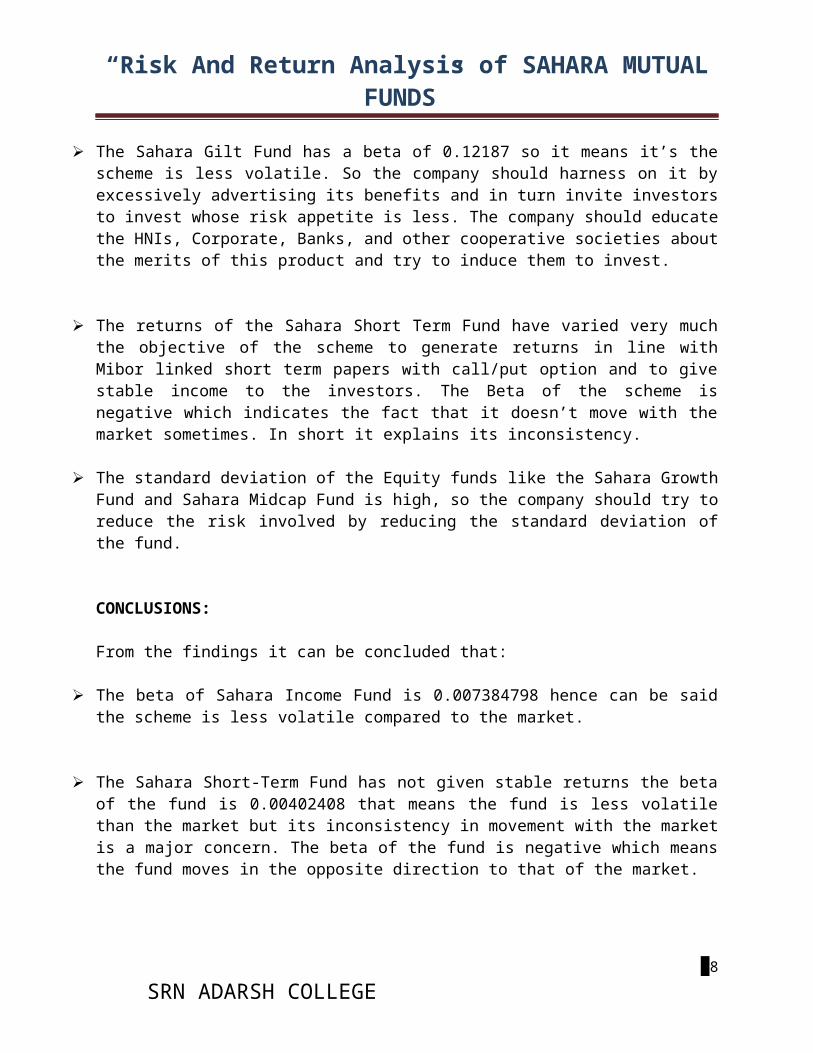
“Risk And Return Analysis of SAHARA MUTUALFUNDS”
The Sahara Gilt Fund has a beta of 0.12187 so it means it’s thescheme is less volatile. So the company should harness on it byexcessively advertising its benefits and in turn invite investorsto invest whose risk appetite is less. The company should educatethe HNIs, Corporate, Banks, and other cooperative societies aboutthe merits of this product and try to induce them to invest.
The returns of the Sahara Short Term Fund have varied very muchthe objective of the scheme to generate returns in line withMibor linked short term papers with call/put option and to givestable income to the investors. The Beta of the scheme isnegative which indicates the fact that it doesn’t move with themarket sometimes. In short it explains its inconsistency.
The standard deviation of the Equity funds like the Sahara GrowthFund and Sahara Midcap Fund is high, so the company should try toreduce the risk involved by reducing the standard deviation ofthe fund.
CONCLUSIONS:
From the findings it can be concluded that:
The beta of Sahara Income Fund is 0.007384798 hence can be saidthe scheme is less volatile compared to the market.
The Sahara Short-Term Fund has not given stable returns the betaof the fund is 0.00402408 that means the fund is less volatilethan the market but its inconsistency in movement with the marketis a major concern. The beta of the fund is negative which meansthe fund moves in the opposite direction to that of the market.
68 SRN ADARSH COLLEGE

“Risk And Return Analysis of SAHARA MUTUALFUNDS”
Sahara Liquid Fund has the beta of 0.00026180 this means forevery 1% change in the market index causes 0.00026180 change inthe scheme return. The scheme is almost volatile free whencompared to the market.
Sahara Gilt Fund has given a stable return with the standarddeviation of 0.03623. Under its own category it is doingexceptionally well.
The standard deviation of the Equity schemes of Sahara MutualFund viz. Sahara Growth Fund and Sahara Midcap Fund are highwhich means the returns of these funds have varied from theaverage return of the respective funds.
69 SRN ADARSH COLLEGE
“Risk And Return Analysis of SAHARA MUTUALFUNDS”
BIBLIOGRAPHY
BOOKS REFERRED
Investment and Portfolio Management by Prasanna Chandra.
Security Analysis and Portfolio Management by Punithavathy Pandian.
Security Analysis and Portfolio Management by V.K.Bhalla.
Investment Management by Preeti Singh.
Indian Financial System by M.Y.Khan.
Invest India Economic Foundation’s Mutual Fund Industry guide.
70 SRN ADARSH COLLEGE
“Risk And Return Analysis of SAHARA MUTUALFUNDS”
MAGAZINES
ICFAI university press’s monthly periodical journal CHARTERED FINANCIAL ANALYST.
Outlook Money by fortnightly magazines.
Business Today.
Business World.
NEWS PAPERS
Business Standard.
Economic Times.
Business Line.
WEB SITES
www.saharamutual.com
www.amfi.com
www.sebi.gov.in
www.mutualfundsindia.com
www.nseindia.com
71 SRN ADARSH COLLEGE