exchange rate pass through inflation in thailand
TRANSCRIPT

Introduction Inflation in Thailand from 2000 to 2010 Literature Review and Methodology Research Result Conclusion
Exchange Rate Pass Through Inflation inThailand
Panit Wattanakoon1
1Faculty of EconomicsThammasat University
Setthathat 2011
Introduction Inflation in Thailand from 2000 to 2010 Literature Review and Methodology Research Result Conclusion
Outline
1 Introduction
2 Inflation in Thailand from 2000 to 2010
3 Literature Review and Methodology
4 Research Result
5 Conclusion
Introduction Inflation in Thailand from 2000 to 2010 Literature Review and Methodology Research Result Conclusion
The Importance of the Study
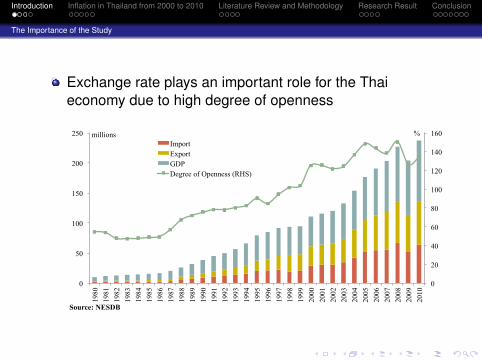
Exchange rate plays an important role for the Thaieconomy due to high degree of openness
0
20
40
60
80
100
120
140
160
0
50
100
150
200
250
1980
19
81
1982
19
83
1984
19
85
1986
19
87
1988
19
89
1990
19
91
1992
19
93
1994
19
95
1996
19
97
1998
19
99
2000
20
01
2002
20
03
2004
20
05
2006
20
07
2008
20
09
2010
% millions
Source: NESDB
Import Export GDP Degree of Openness (RHS)

Introduction Inflation in Thailand from 2000 to 2010 Literature Review and Methodology Research Result Conclusion
The Importance of the Study
The process that the change in exchange rate contributesto the change in inflation is called passthrough.Complete passthrough happens when the total adjustmentin exchange rate causes the same magnitude of change toconsumer price index.Incomplete passthrough should be observed these days asmany restrictions come out in both exchange rate andproduct market of one economy.Nevertheless, if the exchange rate does not cause anychanges to the inflation, no pass through is for suchcircumstance.

Introduction Inflation in Thailand from 2000 to 2010 Literature Review and Methodology Research Result Conclusion
The Importance of the Study
Change in Exchange Rate
Imported price for intermediate inputs
Imported price to consumers
Cost of Production
Price Level in the economy
Price of Factor of Production

Introduction Inflation in Thailand from 2000 to 2010 Literature Review and Methodology Research Result Conclusion
Objective and Scobe of the Study
ObjectiveTo describe the behavior of consumer price index andexchange rate in the interested periodTo explain the relationship between inflation and exchangerate after the 1997 crisisTo investigate the degree of exchange rate pass-throughinflation in Thailand
Scobe of the StudyThailand as a case studyAvoid structural change in 1997, start around 2000 to Aug2011

Introduction Inflation in Thailand from 2000 to 2010 Literature Review and Methodology Research Result Conclusion
Inflation and Exchange Rate
Consumer Price Index expresses less volatile pattern asthe Bank of Thailand employs inflation targeting policyBank of Thailand also adopted managed-float exchangerate system, trying to smooth out the fluctuation of theexchange rate.
-15
-10
-5
0
5
10
15
20
25
Jan-
00
Jun-
00
Nov
-00
Apr
-01
Sep-
01
Feb-
02
Jul-0
2 D
ec-0
2 M
ay-0
3 O
ct-0
3 M
ar-0
4 A
ug-0
4 Ja
n-05
Ju
n-05
N
ov-0
5 A
pr-0
6 Se
p-06
Fe
b-07
Ju
l-07
Dec
-07
May
-08
Oct
-08
Mar
-09
Aug
-09
Jan-
10
Jun-
10
Nov
-10
Apr
-11
% yoy
Source: Bank of Thailand and Bureau of Trade and Economic Indices
B/$ CPI

Introduction Inflation in Thailand from 2000 to 2010 Literature Review and Methodology Research Result Conclusion
Inflation and Import
Consumer Price Index moves in the same direction as theimport price index
60
80
100
120
Jan-
00
May
-00
Sep-
00
Jan-
01
May
-01
Sep-
01
Jan-
02
May
-02
Sep-
02
Jan-
03
May
-03
Sep-
03
Jan-
04
May
-04
Sep-
04
Jan-
05
May
-05
Sep-
05
Jan-
06
May
-06
Sep-
06
Jan-
07
May
-07
Sep-
07
Jan-
08
May
-08
Sep-
08
Jan-
09
May
-09
Sep-
09
Jan-
10
May
-10
Sep-
10
Jan-
11
May
-11
Source: Bureau of Trade and Economic Indices
Import Price Index Headline CPI
Introduction Inflation in Thailand from 2000 to 2010 Literature Review and Methodology Research Result Conclusion
Inflation and Oil Price
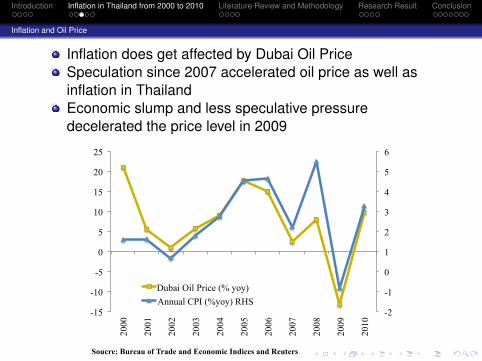
Inflation does get affected by Dubai Oil PriceSpeculation since 2007 accelerated oil price as well asinflation in ThailandEconomic slump and less speculative pressuredecelerated the price level in 2009
-2
-1
0
1
2
3
4
5
6
-15
-10
-5
0
5
10
15
20
25
2000
2001
2002
2003
2004
2005
2006
2007
2008
2009
2010
Soucre: Bureau of Trade and Economic Indices and Reuters
Dubai Oil Price (% yoy) Annual CPI (%yoy) RHS
Introduction Inflation in Thailand from 2000 to 2010 Literature Review and Methodology Research Result Conclusion
Inflation and Economic Growth
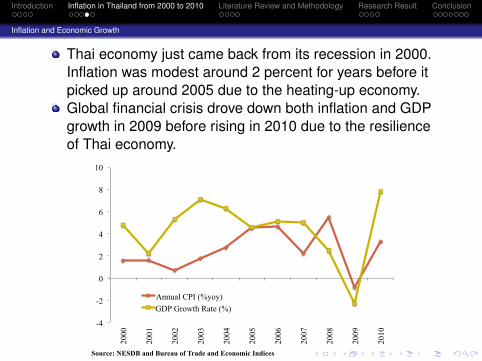
Thai economy just came back from its recession in 2000.Inflation was modest around 2 percent for years before itpicked up around 2005 due to the heating-up economy.Global financial crisis drove down both inflation and GDPgrowth in 2009 before rising in 2010 due to the resilienceof Thai economy.
-4
-2
0
2
4
6
8
10
2000
2001
2002
2003
2004
2005
2006
2007
2008
2009
2010
Source: NESDB and Bureau of Trade and Economic Indices
Annual CPI (%yoy) GDP Growth Rate (%)
Introduction Inflation in Thailand from 2000 to 2010 Literature Review and Methodology Research Result Conclusion
Policy Package
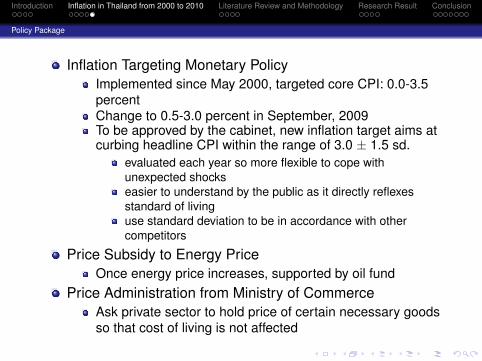
Inflation Targeting Monetary PolicyImplemented since May 2000, targeted core CPI: 0.0-3.5percentChange to 0.5-3.0 percent in September, 2009To be approved by the cabinet, new inflation target aims atcurbing headline CPI within the range of 3.0 ± 1.5 sd.
evaluated each year so more flexible to cope withunexpected shockseasier to understand by the public as it directly reflexesstandard of livinguse standard deviation to be in accordance with othercompetitors
Price Subsidy to Energy PriceOnce energy price increases, supported by oil fund
Price Administration from Ministry of CommerceAsk private sector to hold price of certain necessary goodsso that cost of living is not affected

Introduction Inflation in Thailand from 2000 to 2010 Literature Review and Methodology Research Result Conclusion
Literature Review
Various studies employed various models to investigate thedegree of pass through in several countries, incompletefound and decreasing in magnitude over the past years,
Dornbusch (1987),Hopper and Mann (1989),Dwyer, Kent and Pease (1993),Campa and Goldberg (2002) ,Wickremasinghe and Silvapulle (2004),Korthonen and Wachtel (2005),Kiptui, Ndolo and Kaminchia (2005),Mishkin (2008),Barhoumi and Jouini (2008).
This paper will use the model applied in Chai-anant, et al(2008)
Introduction Inflation in Thailand from 2000 to 2010 Literature Review and Methodology Research Result Conclusion
Methodology
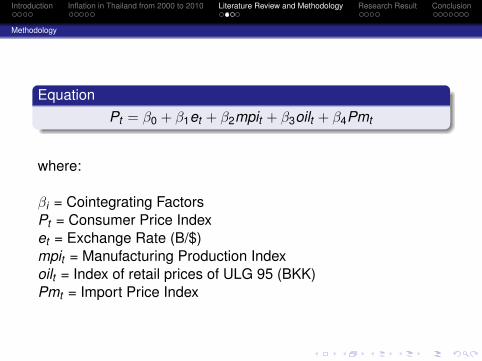
EquationPt = β0 + β1et + β2mpit + β3oilt + β4Pmt
where:
βi = Cointegrating FactorsPt = Consumer Price Indexet = Exchange Rate (B/$)mpit = Manufacturing Production Indexoilt = Index of retail prices of ULG 95 (BKK)Pmt = Import Price Index

Introduction Inflation in Thailand from 2000 to 2010 Literature Review and Methodology Research Result Conclusion
Methodology
To find the short run relationship, the Error Correction Model(ECM) will show the behavior of exchange rate how it correctsitself to the long-run equilibrium
ECM
∆Pt = α0 + α1ECMt−1 +∑p
i=1 γ1i∆oilt−i +∑p
i=1 γ2i∆Pmt−i +∑pi=1 γ3i∆mpit−i +
∑pi=1 γ4i∆et−i
where ECM = Pt − β0 + β1et + β2mpit + β3oilt + β4Pmt

Introduction Inflation in Thailand from 2000 to 2010 Literature Review and Methodology Research Result Conclusion
Econometric Test
Unit-root test to find whether the data is stationary whichcan be manipulated in the modelCointegration test with Augmented Dickey-Fuller Test, willbe adopted to find whether the interested variables willreach their long-run equilibrium.

Introduction Inflation in Thailand from 2000 to 2010 Literature Review and Methodology Research Result Conclusion
Unit Root Test
Unit Root Test at Level
Variable t-statistics 5% critical value ResultCPI 0.24 -2.88 Non StationaryOil -0.40 -2.88 Non Stationary
Import Price 0.57 -2.88 Non StationaryMPI -0.19 -2.88 Non Stationary
Exchange Rate -0.18 -2.88 Non Stationary

Introduction Inflation in Thailand from 2000 to 2010 Literature Review and Methodology Research Result Conclusion
Unit Root Test
Unit Root Test at Difference
Variable t-statistics 5% critical value ResultCPI -11.30 -2.88 StationaryOil -8.90 -2.88 Stationary
Import Price -6.68 -2.88 StationaryMPI -6.02 -2.88 Stationary
Exchange Rate -7.77 -2.88 Stationary
Introduction Inflation in Thailand from 2000 to 2010 Literature Review and Methodology Research Result Conclusion
Cointegration Test
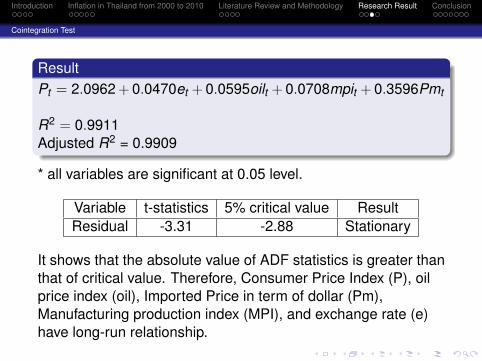
ResultPt = 2.0962 + 0.0470et + 0.0595oilt + 0.0708mpit + 0.3596Pmt
R2 = 0.9911Adjusted R2 = 0.9909
* all variables are significant at 0.05 level.
Variable t-statistics 5% critical value ResultResidual -3.31 -2.88 Stationary
It shows that the absolute value of ADF statistics is greater thanthat of critical value. Therefore, Consumer Price Index (P), oilprice index (oil), Imported Price in term of dollar (Pm),Manufacturing production index (MPI), and exchange rate (e)have long-run relationship.
Introduction Inflation in Thailand from 2000 to 2010 Literature Review and Methodology Research Result Conclusion
Error Correction Model
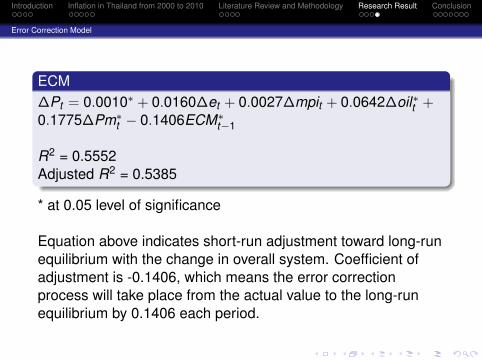
ECM∆Pt = 0.0010∗ + 0.0160∆et + 0.0027∆mpit + 0.0642∆oil∗t +0.1775∆Pm∗
t − 0.1406ECM∗t−1
R2 = 0.5552Adjusted R2 = 0.5385
* at 0.05 level of significance
Equation above indicates short-run adjustment toward long-runequilibrium with the change in overall system. Coefficient ofadjustment is -0.1406, which means the error correctionprocess will take place from the actual value to the long-runequilibrium by 0.1406 each period.

Introduction Inflation in Thailand from 2000 to 2010 Literature Review and Methodology Research Result Conclusion
Policy Implication
The depreciation and appreciation of Thai baht will havecertain impact to inflation in ThailandThis study reveals that there is 4.70 percent ofpassthrough from exchange rate to inflation, and the valuewill be corrected by -14.06 percent in each period
Jitpokkasame (2007) applied quarterly data from 1995 to2005 and found that the degree of passthrough is 18.35percent, and correcting itself by -17.25 percent per quarter.Chai-anant et al. (2008) found that there is 20.6 ofpassthrough for the Thai economy with correction processby -13.0 percent in each month.
This paper can also conclude that overtime, lower degreeof passthrough is identified.

Introduction Inflation in Thailand from 2000 to 2010 Literature Review and Methodology Research Result Conclusion
Policy Implication
A decline in degree of passthrough overtimes
0.0804
0.0467
0.0000
0.0200
0.0400
0.0600
0.0800
0.1000
0.1200 Ja
n-05
M
ar-0
5 M
ay-0
5 Ju
l-05
Sep-
05
Nov
-05
Jan-
06
Mar
-06
May
-06
Jul-0
6 Se
p-06
N
ov-0
6 Ja
n-07
M
ar-0
7 M
ay-0
7 Ju
l-07
Sep-
07
Nov
-07
Jan-
08
Mar
-08
May
-08
Jul-0
8 Se
p-08
N
ov-0
8 Ja
n-09
M
ar-0
9 M
ay-0
9 Ju
l-09
Sep-
09
Nov
-09
Jan-
10
Mar
-10
May
-10
Jul-1
0 Se
p-10
N
ov-1
0 Ja
n-11
M
ar-1
1 M
ay-1
1 Ju
l-11
Coefficient of Passthrough
Note: X-axis indicates the range of data used from January 2000 to that point in time. Each point represents the
degree of passthrough from each cointegration equation
Introduction Inflation in Thailand from 2000 to 2010 Literature Review and Methodology Research Result Conclusion
Policy Implication
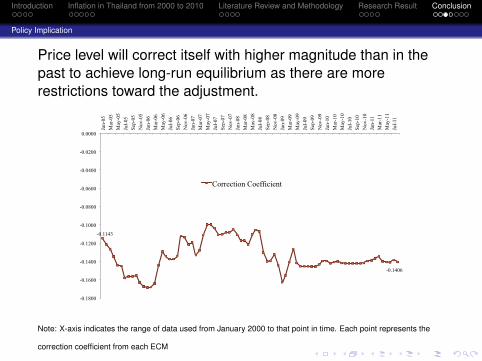
Price level will correct itself with higher magnitude than in thepast to achieve long-run equilibrium as there are morerestrictions toward the adjustment.
-0.1143
-0.1406
-0.1800
-0.1600
-0.1400
-0.1200
-0.1000
-0.0800
-0.0600
-0.0400
-0.0200
0.0000
Jan-
05
Mar
-05
May
-05
Jul-0
5 Se
p-05
N
ov-0
5 Ja
n-06
M
ar-0
6 M
ay-0
6 Ju
l-06
Sep-
06
Nov
-06
Jan-
07
Mar
-07
May
-07
Jul-0
7 Se
p-07
N
ov-0
7 Ja
n-08
M
ar-0
8 M
ay-0
8 Ju
l-08
Sep-
08
Nov
-08
Jan-
09
Mar
-09
May
-09
Jul-0
9 Se
p-09
N
ov-0
9 Ja
n-10
M
ar-1
0 M
ay-1
0 Ju
l-10
Sep-
10
Nov
-10
Jan-
11
Mar
-11
May
-11
Jul-1
1
Correction Coefficient
Note: X-axis indicates the range of data used from January 2000 to that point in time. Each point represents the
correction coefficient from each ECM

Introduction Inflation in Thailand from 2000 to 2010 Literature Review and Methodology Research Result Conclusion
Policy Implication
With less transmission between exchange rate andinflation, currency flexibility will be realized since thechange in exchange rate will not be passing throughdomestic price level that much. So more rooms are forcentral bank to curb with external balances without hurtingthe price stabilityNevertheless, Bank of Thailand still needs to keep theireyes on both currency and inflation management
Introduction Inflation in Thailand from 2000 to 2010 Literature Review and Methodology Research Result Conclusion
Limitation and Future Research
This research can also be extended to investigate in detailon each category of goods and services.Other currencies can be added in the model to find theirimpacts to the price level in one economy.
Introduction Inflation in Thailand from 2000 to 2010 Literature Review and Methodology Research Result Conclusion
Conclusion
Baht has been appreciating since 2000.Various factors adversly affect inflation in ThailandInflation targeting monetary policy, price administration andspecial programs from government authorities havealleviated inflationary pressure to the Thai economyThe study finds that there is 4.70 percent of pass throughfrom exchange rate to inflation in the long run.In each month, consumer price index will correct its errorby 14.06 percent and achieve its long-run equilibrium

Introduction Inflation in Thailand from 2000 to 2010 Literature Review and Methodology Research Result Conclusion
Conclusion
Thank you for your attention