exchange rate pass-through to inflation in sierra leone: a structural vector autoregressive approach
TRANSCRIPT
EXCHANGE RATE PASS-THROUGH TO INFLATION IN SIERRA LEONE: A STRUCTURAL VECTOR AUTOREGRESSIVE APPROACH
Morlai Bangura, Eugene Caulker and Sandy Pessima30
Abstract
The paper employs the Structural Vector Autoregression(SVAR) model for the Sierra Leone economy to estimate the pass-through effects of exchange rate changes to consumer prices. The model incorporates the key characteristics of the economy, especially its high dependence on foreign inflows in the contest of Monetary targeting Framework. The findings show that the pass-through to consumer prices, although incomplete, is significant. This suggest that exchange depreciation is a potential yet significant source of inflation in Sierra Leone. Using variance decomposition analyses and dynamic elasticity concept, it is found that nominal exchange rate depreciation has been more important in explaining Sierra Leone's actual Inflationary process in Sierra Leone. One policy implication of these findings is that policies aimed at lowering inflation must focus on both exchange rate and monetary stability.
JEL Classification Codes: E31,F31,F35,F41 Keywords: Exchange Rate Pass-Through, CPI Inflation, Structural Vector-Autoregression, Impulse Responses, Variance Decompositions, Sierra Leone.
INTRODUCTION High Inflation has been a major macroeconomic challenge in Sierra Leone since the 1970s and therefore, research on the sources of inflation remains a crucial issue among academics and policy makers. The economy of Sierra Leone largely depends on imported goods for local consumption, and on primary commodity exports and foreign aid for building its reserves. This means that domestic inflation and the external sector performance of the country are highly vulnerable to foreign monetary developments, especially the exchange rate volatility of the local currency against the currencies of its major trading partners. In addition, there has been continuous depreciation of the Leone since the second half of the 1970s and
30 Bangura, Caulker and Pessima are staff of the Research Department Bank of Sierra Leone.
The views expressed in this paper are those of the authors and do not in any way represent the
official position of the Bank of Sierra Leone.

Vol. 12, No.1 Journal of Monetary and Economic Integration
94
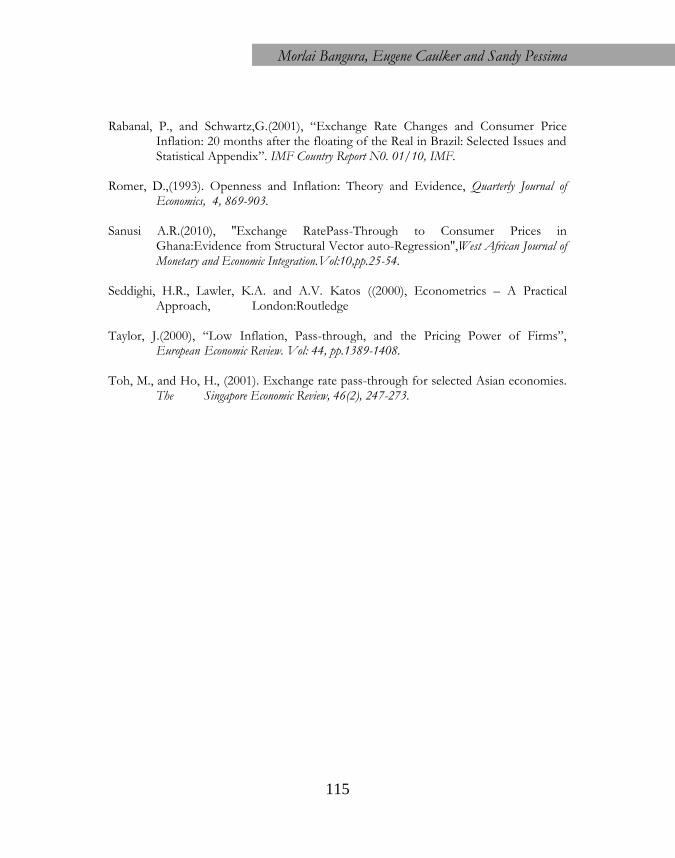
this is translated into higher cost of imported goods and services, thereby, culmination into domestic inflation. The nominal exchange rate depreciated from an average of 1.70% over the period 1971-1975 to an average of 3.54% over the period 1976 –1980. During these same periods, inflation increased from an average of 8.84% during 1971-1975 to an average of 14.10% during 1976-1980. The Leone depreciated further in the 1980s, averaging 41.11% and 112.02% over the periods 1981-1985 and 1986-1990 respectively with inflation also accelerating, averaging 52.40% and 93.14% over the same periods. The rate of depreciation of the nominal exchange rate however declined in the 1990s, ranging from an average of 23.83% during 1991-1995 to 41.97% during the periods 1996-2000, which were lower than the values recorded in the preceding decade. Although inflation remained in double digit during the 1990s, it also declined significantly from an average of 48.12% in the first half of the 1990s to 21.38% in the second half, which were also lower than the values in the previous decade. The rate of depreciation of the nominal exchange rate further decelerated in the first half of the 2000s from an average of 41.97% over the period 1996-2000 to 6.90% over the period 2001-2005.This was accompanied by a significant fall in inflation rate from an average of 21.38% over the period 1996-2000 to single digit, averaging 6.54% during the period 2001-2005. With the onset of the global crises in 2008 through to 2009, the exchange rate deprecation increased slightly in the second half of the 2000s to an average of 7.26% over the period 2006-2011, accompanied by a reversal of inflation to double digit averaging 13.42% over the period 2006-2011. The above analyses shows that high rate of inflation was a common phenomenon in Sierra Leone since the second half of the 1970s to 2000s. Moreover, the trend of inflation seems to have mimicked the trend of exchange rate deprecation suggesting that in addition to monetary instability, exchange rate depreciation is potentially an important driver of inflation in Sierra Leone. Appendix 1 shows the trends of inflation and exchange rate depreciation in Sierra Leone. Important empirical questions from the trends of inflation and exchange rate depreciation are: What could be the likely quantitative impact of exchange rate depreciation on domestic inflation? In spite of the growing literature on exchange rate pass–through, this issue has not, so far, attracted the attention of researchers in the empirical literature in Sierra Leone as we are not aware of any published study on this issue in the Sierra Leone context. The objective of this paper is therefore to investigate the magnitude and speed of exchange rate pass-through to inflation in Sierra Leone. The importance of the study is predicated on the fact that an understanding of the dynamics of exchange rate pass-through provides valuable insight into appropriate policy response required to dampen exchange rate volatility and thereby reduce inflation and facilitate macroeconomic stability.

Morlai Bangura, Eugene Caulker and Sandy Pessima
95
Furthermore, evidence of exchange rate pass-through will throw light on the implications of exchange rate depreciation for the transmission mechanism of monetary policy. In particular, an investigation into exchange rate pass-through can aid monetary authorities in forecasting inflation which is crucial in an effort to achieve price stability. The rest of the paper is organised as follows: Section two reviews the theoretical and empirical literature on exchange rate pass-through. Section three presents the methodology and empirical result. Section four concludes the study.
LITERATURE REVIEW
Theoretical Literature Goldberg and Knetter (1997) defines exchange rate pass-through (ERPT) as “the percentage change in local currency import prices resulting from a one percent change in the exchange rate between the exporting and importing countries.” (p. 1248). However, changes in import prices somehow find their way into producer and consumer prices. In this paper, changes in consumer prices are attributed to a prior change in the nominal exchange rate. Another important determinant of exchange rate pass-through(ERPT), from a theoretical standpoint is the degree of trade openness of a country. The most immediate connection between the two variables is positive: the more open a country is, the more movements in exchange rate are transmitted via import prices into consumer price index (CPI) changes. However, this picture becomes more complex once we take into consideration that inflation could be negatively correlated with openness, as empirically found by Romer (1993). This gives rise to an indirect channel, whereby openness is negatively correlated with inflation and, taking in to account Taylor’s hypothesis31, the degree of pass-through, the direct and indirect channels go in opposite directions and the overall sign of the correlation between pass-through and openness can be either positive or negative. Specifically, exchange rate movements can influence domestic prices through direct and indirect channels. In case of direct channel, exchange rate movements can affect domestic prices through changes in the price of imported finished goods and imported inputs. Thus the potentially higher costs of imported raw material and capital goods associated with exchange rate depreciation increase marginal costs and lead to higher
31
Taylor (2000) tries to address the question of what determines ERPT by putting forward the
hypothesis that the responsiveness of prices to exchange rate fluctuations depends positively on
inflation.

Vol. 12, No.1 Journal of Monetary and Economic Integration
96
prices of domestically produced goods. In general, when a currency depreciates, it will result in higher import prices while lower import prices result from appreciation in price taker countries like Sierra Leone. In the case of the indirect effect, exchange rate depreciation affects domestic prices either through the substitution or income effects. With the substitution effect, it is assumed that when the exchange depreciates, the price of imported goods increase which result to decrease in their demand. Consumers will therefore shift their demand from imported goods to locally produced goods. The resulting increase in aggregate demand for substitutes triggers domestic price to rise. This mechanism is called the substitution effects. Regarding the income effect, it is assumed that depreciation of the exchange rate stimulates exports, as exports goods become more competitive. The increase in export earnings necessitates increase demand for labour that translates to increase in wages. The resulting wages increment means higher purchasing power and increased aggregate demand. Under the assumption of a small country like Sierra Leone, the prices of tradable remains unchanged but those of nontradable/substitutes increase thereby resulting to inflation. This is called the income effect. However, the extent and the speed of exchange rate pass-through depends on several factors such as market structure, pricing policies, general inflationary environment, involvement of non-tradables in the distribution of tradable, relative share of imports in the CPI basket, etc. A good number of monetary models of the exchange rate and balance of payments assume a one-to-one relationship between the exchange rate and domestic prices, based on the law of one price (or purchasing power parity, PPP.). Whether this assumption holds or not is an empirical issue.
Empirical Literature
Several studies exist on exchange rate pass-through. moreover several estimation techniques have been adopted to conduct empirical studies on exchange rate pass through to domestic prices which include single equation models (Campa and Goldberg, 2005, Mihailov,2005 and Barhoumi 2006) and Vector Autoregressions(VAR) models (for example Mihailov 2005, Ashok 2002, Leigh and Rossi 2002, Rabanal and Schwartz 2001, Toh and Ho,2001 and McCarthy 2000) Ashok (2002) finds that the average pass-through is low and inflationary impact of exchange rate depreciation is absorbed at the intermediate stage of production in South Africa. However, shocks to producer prices tend to have a considerable impact on consumer prices. He also found that pass-through is much higher for nominal rather than for real shocks.
Morlai Bangura, Eugene Caulker and Sandy Pessima
97
The findings of Leigh and Rossi (2002) are (i) the pass-through from the exchange rate to domestic prices continues for a year but is more intense in the first four months (ii) the pass through to WPI is more pronounced than CPI (iii) forecast of inflation based on estimates of the pass-through coefficient provides only partial information about the underlying price pressures. Rabanal and Schwartz (2001) show that after 18 months, about two-thirds of the initial exchange rate shock is passed through to WPI and two-ninths to CPI in the case of Brazil, indicating that the pass-through to WPI is more pronounced as compared to the pass through to CPI. Michael Devereux (2000) showed that nominal movements in exchange rates typically feed quickly into price levels in emerging-market economies, or at least do so a lot more quickly than in OECD economies. The reason behind this is the presence of credible monetary policy in the OECD countries. For example, since 1991, Canada has been following a strict inflation targeting policy. As regards to the developing countries, the literature is limited for SSA. However, the few existing works tend to show similar results to those of developed countries (see Mwase, 2006 for Tanzania; Kiptui, et al., 2005 for Kenya and Bhundia, 2002 for South Africa). Chaoudhri and Hakura (2001) found zero elasticity of pass-through to inflation in Bahrain, Canada, Finland, Singapore, Ethiopia and Tunisia, 0.09 for Kenya, 0.02 for South Africa, 0.06 for Zimbabwe, 0.22 for Cameroon, 0.14 for Ghana, and 0.16 for Burkina Faso. A recent study, Frimpong and Adam (2010), uses Vector Error-Correction (VEC) approach to estimate the exchange rate pass-through to inflation for Ghana. They use monthly data for the period 1990-2009 and found that the exchange rate pass-through is incomplete and low. Drawing from the literature, the magnitude and speed of exchange rate pass through is mixed across countries. In spite of the growing literature on exchange rate pass through, the authors are not aware of any published work on this issue in the Sierra Leone context. Thus this paper extends the literature by investigation exchange rate pass–through to inflation in Sierra Leone using a SVAR approach.

Vol. 12, No.1 Journal of Monetary and Economic Integration
98
METHODOLOGY AND EMPIRICAL RESULTS
Methodology To assess the effect of exchange rate pass-through on domestic prices, we employ a VAR technique Following Aliyu R. Sanusi (2010), we set up a 4-variable VAR model as follows:
A(L)yt = ut (1) where yt is a column vector of the endogenous variables consisting of the foreign reserves stock (Reser), money supply (M2), nominal exchange rate (Exc), and domestic prices (CPI).32 A(L) is a 4×4 matrix polynomial in the lag operator L and ut is a column vector of serially independent errors. M2 is included to capture monetary policy effects on the price level. Reser is included to capture the impact of foreign inflows on inflation and Exc is included to test the exchange rate –pass-through phenomenon. To generate the structural shocks of exchange rate on domestic prices, we use a Cholesky decomposition of Matrix Ω, a variance –covariance of the reduced –form VAR residuals. The relationship between the reduced-form VAR residuals ( µt ) and the structural disturbances ( εt ) can be written as follows:
32 Consistent with the work of Aliyu.R. Sansui (2010), the study focus on the demand side
monetary shocks to inflation and therefore our model does not capture supply side factors such
as GDP. Moreover, lack of quarterly data on supply side variables like GDP precludes their
use in our model. In addition to monetary aggregates, we also attempted including interest rate
as traditionally used in the inflation model but the sign of interest rate is theoretically
inconsistent and does not reflect overall monetary conditions possibly due to the under
developed financial market in Sierra Leone. Inline with the studies of Mansaray (2011), Aliyu
R. Sansui, (2010),Montiel( 1991 and et al), this paper therefore use monetary aggregates as
proxy for monetary instrument.

Morlai Bangura, Eugene Caulker and Sandy Pessima
99
cpit
exct
tm
resert
cpit
exct
tm
resert
22
1
01
001
0001
(2) where εReser, denotes foreign inflow shocks; εm2, the monetary shock; εexc,the norminal exchange shock; and εcpi,the price shock. The structural VAR model is identified because the K (K-1)/2 restrictions are imposed on the matrix S as zero restrictions where k denotes the number of endogenous variables. The use of SVAR is justified on the grounds that it takes into account the contemporaneous correlation among the variables ignored by the unrestricted VAR. The resulting lower-triangular matrix S implies that some structural shocks have no contemporaneous effects on some endogenous variables given the ordering of the endogenous variables. Reser is ordered first on the assumption that it is exogenous, suggesting three restrictions on the S matrix –that is zeros on the 2nd, 3rd and 4th elements of its first row.M2 is placed second in the ordering on the assumption that monetary aggregates is influenced by shocks to foreign reserves and is independent of shocks to all other variables which implies two additional restrictions on the S matrix -i.e. Zeros on the 3rd and 4th elements of its second row. Exc is ordered third on the assumption that Shocks to the exchange rate are influenced by shocks to gross foreign reserves and shocks to money supply suggesting the sixth restriction on the matrix S - i.e. zero on the 4th element of it third row. CPI is ordered fourth on the assumption that price shock is contemporaneously affected by all other shocks while the price shock has no contemporaneous impact on the other variables.
Estimation procedure The investigation procedure consists of five main steps. First, the time series properties of the series were probed using ADF and PP approach to determine the appropriate form in which the variables should be included in the VAR. Secondly, the optimal lag length for our empirical VAR was identified based on the traditional lag length criteria test, the longlikelihhod test, the Schwarz, the Akaike, Final Prediction Error and Hannan-Quinn information criteria. .Third, we utilised the estimated residuals from the unrestricted VAR to estimate SVAR using Eviews Version 5. Fourth, based on the SVAR, we estimated the IRF to trace out the effect over time, on prices of a structural one standard deviation shock to the exchange rate equation and other macroeconomic variables. This was complemented by the dynamic pass-through elasticity which measurers the proportionate change in CPI to proportionate change in Exc calculated as:
(3)
Vol. 12, No.1 Journal of Monetary and Economic Integration
100
where %ΔPt, is the percentage change in the price level between period 0, and time t; and %ΔExct, is the percentage change in the exchange rate between period 0 and time t represented by a structural one standard deviation shock(that is εt ) derived from the SVAR estimates. Finally variance decompositions were estimated to determine the explanatory power of each of the endogenous variable on the variance of inflation.
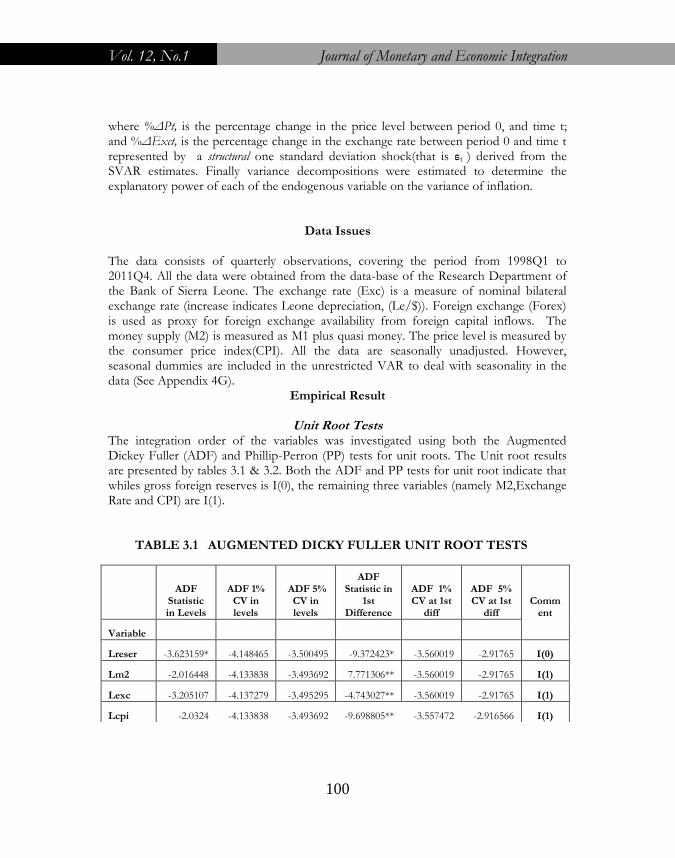
Data Issues The data consists of quarterly observations, covering the period from 1998Q1 to 2011Q4. All the data were obtained from the data-base of the Research Department of the Bank of Sierra Leone. The exchange rate (Exc) is a measure of nominal bilateral exchange rate (increase indicates Leone depreciation, (Le/$)). Foreign exchange (Forex) is used as proxy for foreign exchange availability from foreign capital inflows. The money supply (M2) is measured as M1 plus quasi money. The price level is measured by the consumer price index(CPI). All the data are seasonally unadjusted. However, seasonal dummies are included in the unrestricted VAR to deal with seasonality in the data (See Appendix 4G).
Empirical Result
Unit Root Tests The integration order of the variables was investigated using both the Augmented Dickey Fuller (ADF) and Phillip-Perron (PP) tests for unit roots. The Unit root results are presented by tables 3.1 & 3.2. Both the ADF and PP tests for unit root indicate that whiles gross foreign reserves is I(0), the remaining three variables (namely M2,Exchange Rate and CPI) are I(1). TABLE 3.1 AUGMENTED DICKY FULLER UNIT ROOT TESTS
ADF Statistic in Levels
ADF 1% CV in levels
ADF 5% CV in levels
ADF Statistic in
1st Difference
ADF 1% CV at 1st
diff
ADF 5% CV at 1st
diff Comm
ent
Variable
Lreser -3.623159* -4.148465 -3.500495 -9.372423* -3.560019 -2.91765 I(0)
Lm2 -2.016448 -4.133838 -3.493692 7.771306** -3.560019 -2.91765 I(1)
Lexc -3.205107 -4.137279 -3.495295 -4.743027** -3.560019 -2.91765 I(1)
Lcpi -2.0324 -4.133838 -3.493692 -9.698805** -3.557472 -2.916566 I(1)
Morlai Bangura, Eugene Caulker and Sandy Pessima
101
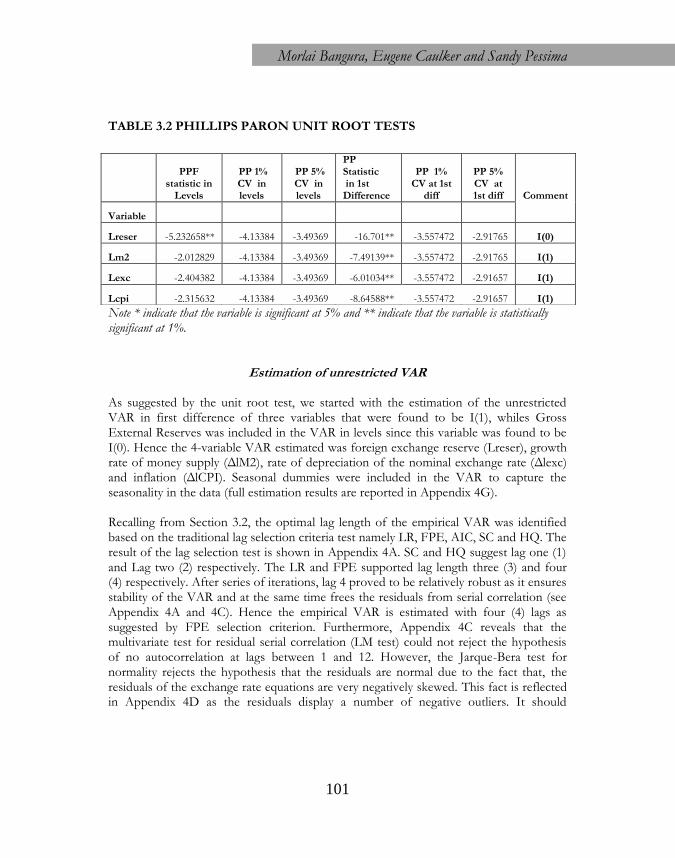
TABLE 3.2 PHILLIPS PARON UNIT ROOT TESTS
Note * indicate that the variable is significant at 5% and ** indicate that the variable is statistically significant at 1%.
Estimation of unrestricted VAR As suggested by the unit root test, we started with the estimation of the unrestricted VAR in first difference of three variables that were found to be I(1), whiles Gross External Reserves was included in the VAR in levels since this variable was found to be I(0). Hence the 4-variable VAR estimated was foreign exchange reserve (Lreser), growth rate of money supply (ΔlM2), rate of depreciation of the nominal exchange rate (Δlexc) and inflation (ΔlCPI). Seasonal dummies were included in the VAR to capture the seasonality in the data (full estimation results are reported in Appendix 4G). Recalling from Section 3.2, the optimal lag length of the empirical VAR was identified based on the traditional lag selection criteria test namely LR, FPE, AIC, SC and HQ. The result of the lag selection test is shown in Appendix 4A. SC and HQ suggest lag one (1) and Lag two (2) respectively. The LR and FPE supported lag length three (3) and four (4) respectively. After series of iterations, lag 4 proved to be relatively robust as it ensures stability of the VAR and at the same time frees the residuals from serial correlation (see Appendix 4A and 4C). Hence the empirical VAR is estimated with four (4) lags as suggested by FPE selection criterion. Furthermore, Appendix 4C reveals that the multivariate test for residual serial correlation (LM test) could not reject the hypothesis of no autocorrelation at lags between 1 and 12. However, the Jarque-Bera test for normality rejects the hypothesis that the residuals are normal due to the fact that, the residuals of the exchange rate equations are very negatively skewed. This fact is reflected in Appendix 4D as the residuals display a number of negative outliers. It should
PPF statistic in
Levels
PP 1% CV in levels
PP 5% CV in levels
PP Statistic in 1st Difference
PP 1% CV at 1st
diff
PP 5% CV at 1st diff Comment
Variable
Lreser -5.232658** -4.13384 -3.49369 -16.701** -3.557472 -2.91765 I(0)
Lm2 -2.012829 -4.13384 -3.49369 -7.49139** -3.557472 -2.91765 I(1)
Lexc -2.404382 -4.13384 -3.49369 -6.01034** -3.557472 -2.91657 I(1)
Lcpi -2.315632 -4.13384 -3.49369 -8.64588** -3.557472 -2.91657 I(1)
Vol. 12, No.1 Journal of Monetary and Economic Integration
102
however be noted that even when residuals are non-normal, the Monte Carlo test for serial correlation is still very accurate, though not exact (Lutkepohl, 1991).33 The calculated variance and correlation matrices of the residuals are shown in Appendix 4E and 4F. Based on full estimation results of the unrestricted VAR as shown in appendix 4G, we conducted the LR test for the joint significance of off-diagonal elements of the covariance matrix of the residuals (see Appendix 4H). The null hypothesis that the covariance is jointly zero is rejected at 5 percent level. This implies that, there are contemporaneous correlations among the variables ignored by the unrestricted VAR.34 This further justifies the need for SVAR, which takes into account these contemporaneous effects among those variables.
Estimation of SVAR
The estimated system of shocks from the SVAR is given by equations 4 through to 7 below. They are derived from the estimated residuals of the unrestricted VAR using structural factorisation. Figures in parenthesis are the p-values. The coefficients of the structural shocks, εi, are their respective standard deviations. µReser = 0.172εReser (4) (0.00) µm2= -0.02µReser + 0.04εm2 - (5) (0.75) (0.00) µexc = -0.024µReser + 0.44µm2 + 0.03εexc (6) (0.45) (0.00) (0.00) µcpi = 0.02 µReser + 0.02 µm2 + 0.24 µexc + 0.023εcpi (7) (0.08) (0.70) (0.00) (0.00) Where
@e1 = C(1)*@u1
@e2 = C(2)*@e1 + C(3)*@u2
@e3 = C(4)*@e1 + C(5)*@e2 + C(6)*@u3
@e4 = C(7)*@e1 + C(8)*@e2 + C(9)*@e3 +C(10)*@u4
33 For sample sizes that are sufficiently large, violation of the normality assumption is virtually
inconsequential. Appealing to a central limit theorem, the test statistics will asymptotically
follow the appropriate distributions even in the absence of error normality (Chrix Brooks
introductory econometrics for finance page 164)
34
Note also that the off-diagonal elements of the correlation matrix of the residuals (See
Apendix 4E) are clearly non-zero.
Morlai Bangura, Eugene Caulker and Sandy Pessima
103
and
@e1 represents LRESER residuals
@e2 represents DLM2 residuals
@e3 represents DLEXC residuals @e4 represents DLCPI residuals SVAR IS JUST IDENTIFED
SVAR result indicates that the system is just identified meaning the identification scheme is satisfied by the empirical data. Furthermore, the contemporaneous relationship among the variables in the system seems to be captured fairly well as all the coefficients are correctly signed. Of special interest is the coefficient of the exchange rate shock in equation seven (7), which is 0.24 and significant at 1%.This implies that shocks to exchange rate depreciation exert a statistically significant positive effect on inflation. In other words, a depreciation of Leone is associated with an immediate increase in inflation suggesting the presence of exchange rate pass-through phenomenon in Sierra Leone. The full impact of exchange rate changes on the price level, given by the accumulated IRFs and Dynamic elasticity is discussed in the next section.
Estimation of Impulse Response and Dynamic Pass-Through Elasticity of Variables to Inflation
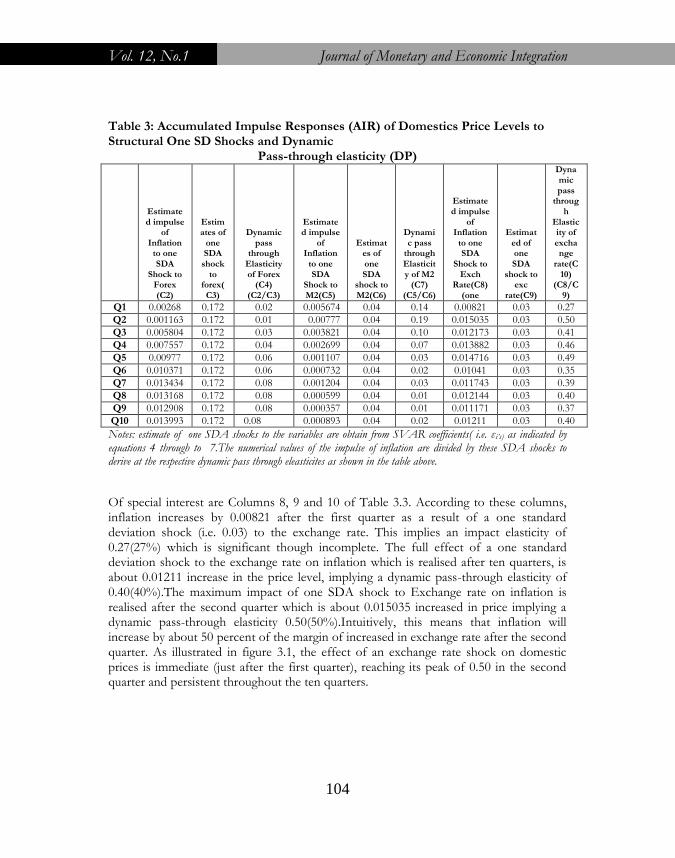
Table 3.3 shows the accumulated response of price to a structural one standard deviation shock to each of the variables and their respective dynamic pass through elasticities.Drawing from equation (3) in Section 4.2, the dynamic elasticities are obtain by dividing the numerical values of the impulse response function of inflation by the coefficients of the structural shocks (i.e. εi’s) derived from the SVAR estimates as indicated by equations 4 through to 7).
Vol. 12, No.1 Journal of Monetary and Economic Integration
104
Table 3: Accumulated Impulse Responses (AIR) of Domestics Price Levels to Structural One SD Shocks and Dynamic
Pass-through elasticity (DP)
Estimated impulse
of Inflation
to one SDA
Shock to Forex (C2)
Estimates of
one SDA
shock to
forex(C3)
Dynamic pass
through Elasticity of Forex
(C4) (C2/C3)
Estimated impulse
of Inflation
to one SDA
Shock to M2(C5)
Estimates of one SDA
shock to M2(C6)
Dynamic pass
through Elasticity of M2
(C7) (C5/C6)
Estimated impulse
of Inflation
to one SDA
Shock to Exch
Rate(C8) (one
Estimated of one SDA
shock to exc
rate(C9)
Dynamic pass
through
Elasticity of exchange
rate(C10)
(C8/C9)
Q1 0.00268 0.172 0.02 0.005674 0.04 0.14 0.00821 0.03 0.27
Q2 0.001163 0.172 0.01 0.00777 0.04 0.19 0.015035 0.03 0.50
Q3 0.005804 0.172 0.03 0.003821 0.04 0.10 0.012173 0.03 0.41
Q4 0.007557 0.172 0.04 0.002699 0.04 0.07 0.013882 0.03 0.46
Q5 0.00977 0.172 0.06 0.001107 0.04 0.03 0.014716 0.03 0.49
Q6 0.010371 0.172 0.06 0.000732 0.04 0.02 0.01041 0.03 0.35
Q7 0.013434 0.172 0.08 0.001204 0.04 0.03 0.011743 0.03 0.39
Q8 0.013168 0.172 0.08 0.000599 0.04 0.01 0.012144 0.03 0.40
Q9 0.012908 0.172 0.08 0.000357 0.04 0.01 0.011171 0.03 0.37
Q10 0.013993 0.172 0.08 0.000893 0.04 0.02 0.01211 0.03 0.40
Notes: estimate of one SDA shocks to the variables are obtain from SVAR coefficients( i.e. εi’s) as indicated by equations 4 through to 7.The numerical values of the impulse of inflation are divided by these SDA shocks to derive at the respective dynamic pass through eleasticites as shown in the table above.
Of special interest are Columns 8, 9 and 10 of Table 3.3. According to these columns, inflation increases by 0.00821 after the first quarter as a result of a one standard deviation shock (i.e. 0.03) to the exchange rate. This implies an impact elasticity of 0.27(27%) which is significant though incomplete. The full effect of a one standard deviation shock to the exchange rate on inflation which is realised after ten quarters, is about 0.01211 increase in the price level, implying a dynamic pass-through elasticity of 0.40(40%).The maximum impact of one SDA shock to Exchange rate on inflation is realised after the second quarter which is about 0.015035 increased in price implying a dynamic pass-through elasticity 0.50(50%).Intuitively, this means that inflation will increase by about 50 percent of the margin of increased in exchange rate after the second quarter. As illustrated in figure 3.1, the effect of an exchange rate shock on domestic prices is immediate (just after the first quarter), reaching its peak of 0.50 in the second quarter and persistent throughout the ten quarters.

Morlai Bangura, Eugene Caulker and Sandy Pessima
105
Figure 1. Dynamic Elasticity of exchange Rate Pass Through to inflation
These results are evidence of the presence of exchange rate pass-through in Sierra Leone and are broadly in line with that of other empirical studies35.However, the magnitude of exchange rate pass through in Sierra Leone seems to be relatively lower compared those found in most emerging economies36 The presence of exchange rate pass-through in Sierra Leone could be attributed to the continuous depreciation of the Leone over the whole sample period. Consistent with the literature, continuous depreciation of a country’s exchange rate increases agents’ expectations of further deprecation and inflation.
35 For instance,Chaoudhri and Hakura(2001) found the pass-through elasticity of 0.39 for
Kenya and Cameroon, and 0.46 for Zambia, , while Mwase(2006) found the pass-through for
Tanzania to be 0.028.
36 For instance, McFarlane (2002) found a pass-through of about 80 percent for Jamaica; Ito
et al. (2005) found the pass-through to CPI be completed in four months for Indonesia and an
elasticity of 1.4 after one year; Zorzi et al. (2007) also found substantially large pass-through
elasticities for several countries. They found the pass-through elasticity of 0.77 for China and
Czech Republic, 0.91 for Hungary, 0.56 for Poland and 1.39 for Mexico.

Vol. 12, No.1 Journal of Monetary and Economic Integration
106
Firms and importers are therefore likely to perceive any increase in costs due to exchange rate depreciation as persisting and, therefore, pass on to consumers some of the resultant increases in costs. This assertion seems to be plausible for a country like Sierra Leone that is vulnerable to imported inflation due to its high dependence on imported goods for local consumption and investment activities. Money supply shocks also have a significant effect on domestic prices. As illustrated by columns 5, 6 and 7 of table 3.3, a structural shock of 0.04 to money supply leads to a 0.005674 increase in price after the first quarter. This implies a dynamic pass through elasticity of 0.14(14%) after the first quarter. The maximum impact of monetary shocks on inflation which is realised after the second quarter is a 0.00777 increase in price level and a dynamic elasticity of 0.19(19%).Intuitively, this implies that inflation will increase by 19 percent of the margin of change/increase in M2 after the second quarter.The dynamic pass through elasticity of monetary aggregates subsequently declines consistently till the tenth quarter to the tune of only 0.02(2%). Thus monetary shocks on inflation seem to be short-lived, suggesting that the Monetary Authorities are reactive in containing monetary shocks in an effort to reduce inflation. It is evidenced from figure 3.2 that the effect of monetary shocks on inflation is immediate (just after first quarter), fairly significant after the second quarter (i.e. 0.19) but short lived as it dies out consistently throughout to the tenth quarter. Figure 2. Dynamic Pass through Elasticity of M2
Morlai Bangura, Eugene Caulker and Sandy Pessima
107
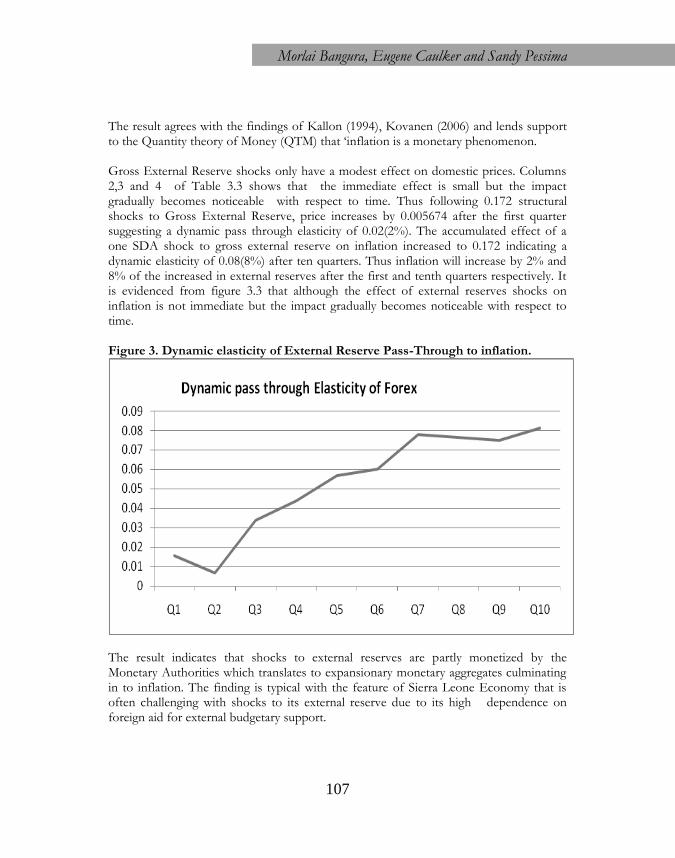
The result agrees with the findings of Kallon (1994), Kovanen (2006) and lends support to the Quantity theory of Money (QTM) that ‘inflation is a monetary phenomenon. Gross External Reserve shocks only have a modest effect on domestic prices. Columns 2,3 and 4 of Table 3.3 shows that the immediate effect is small but the impact gradually becomes noticeable with respect to time. Thus following 0.172 structural shocks to Gross External Reserve, price increases by 0.005674 after the first quarter suggesting a dynamic pass through elasticity of 0.02(2%). The accumulated effect of a one SDA shock to gross external reserve on inflation increased to 0.172 indicating a dynamic elasticity of 0.08(8%) after ten quarters. Thus inflation will increase by 2% and 8% of the increased in external reserves after the first and tenth quarters respectively. It is evidenced from figure 3.3 that although the effect of external reserves shocks on inflation is not immediate but the impact gradually becomes noticeable with respect to time. Figure 3. Dynamic elasticity of External Reserve Pass-Through to inflation.
The result indicates that shocks to external reserves are partly monetized by the Monetary Authorities which translates to expansionary monetary aggregates culminating in to inflation. The finding is typical with the feature of Sierra Leone Economy that is often challenging with shocks to its external reserve due to its high dependence on foreign aid for external budgetary support.

Vol. 12, No.1 Journal of Monetary and Economic Integration
108
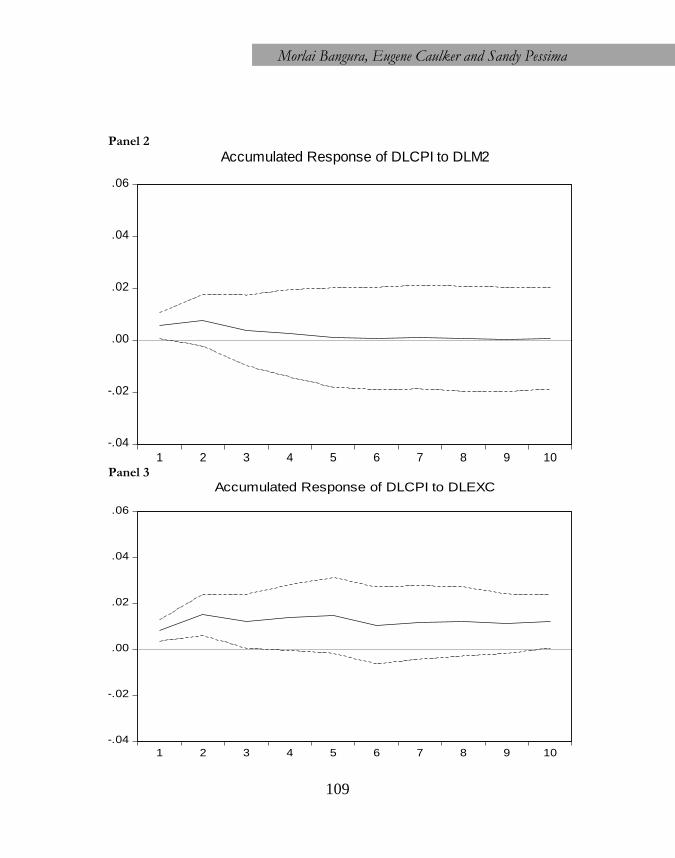
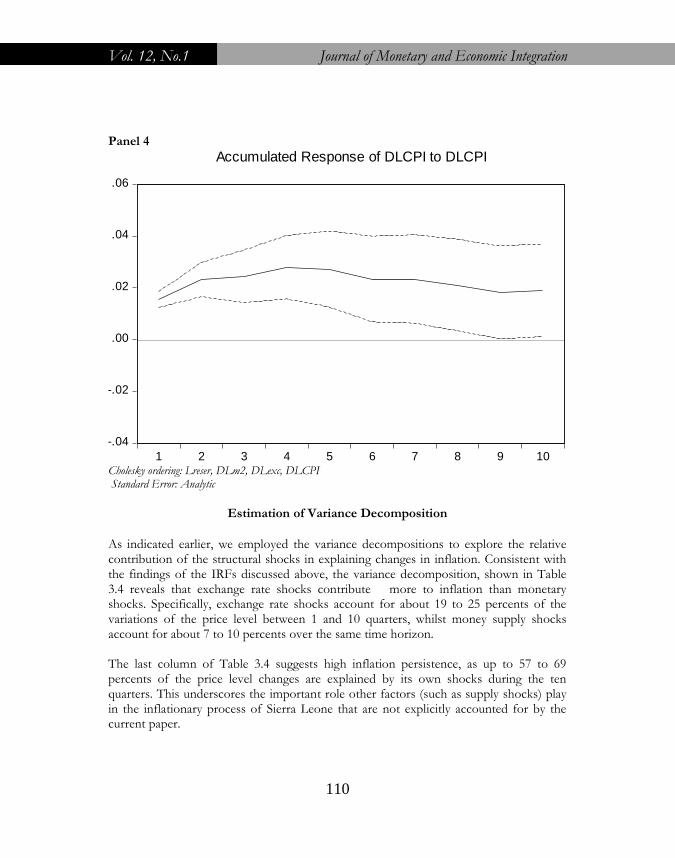
Figure 3.3 depicts a summary of the IRF plots of the entire system to one standard deviation shock. The results of the IRFs plots are consistent with the findings of dynamic elasticity. Thus panel 1 of Figure 3.4 reflects the fact that the effect of external reserves shocks on inflation is not immediate but the impact becomes gradually noticeable with respect to time. Panel 2 depicts that the effect of monetary shocks on inflation is immediate, fairly significant but short lived. Panel 3 shows that the effect of an exchange rate shock on domestic prices is immediate, fairly significant, and persistent. Panel 4 suggests high inflation persistence. Figure 4 Impulse Responses to Forex, Money Supply, Exchange Rate and inflation to one SD structural shock 1998Q1 to 2011 Panel 1
-.04
-.02
.00
.02
.04
.06
1 2 3 4 5 6 7 8 9 10
Accumulated Response of DLCPI to LRESER
Morlai Bangura, Eugene Caulker and Sandy Pessima
109
Panel 2
-.04
-.02
.00
.02
.04
.06
1 2 3 4 5 6 7 8 9 10
Accumulated Response of DLCPI to DLM2
Panel 3
-.04
-.02
.00
.02
.04
.06
1 2 3 4 5 6 7 8 9 10
Accumulated Response of DLCPI to DLEXC
Vol. 12, No.1 Journal of Monetary and Economic Integration
110
Panel 4
-.04
-.02
.00
.02
.04
.06
1 2 3 4 5 6 7 8 9 10
Accumulated Response of DLCPI to DLCPI
Cholesky ordering: Lreser, DLm2, DLexc, DLCPI Standard Error: Analytic
Estimation of Variance Decomposition
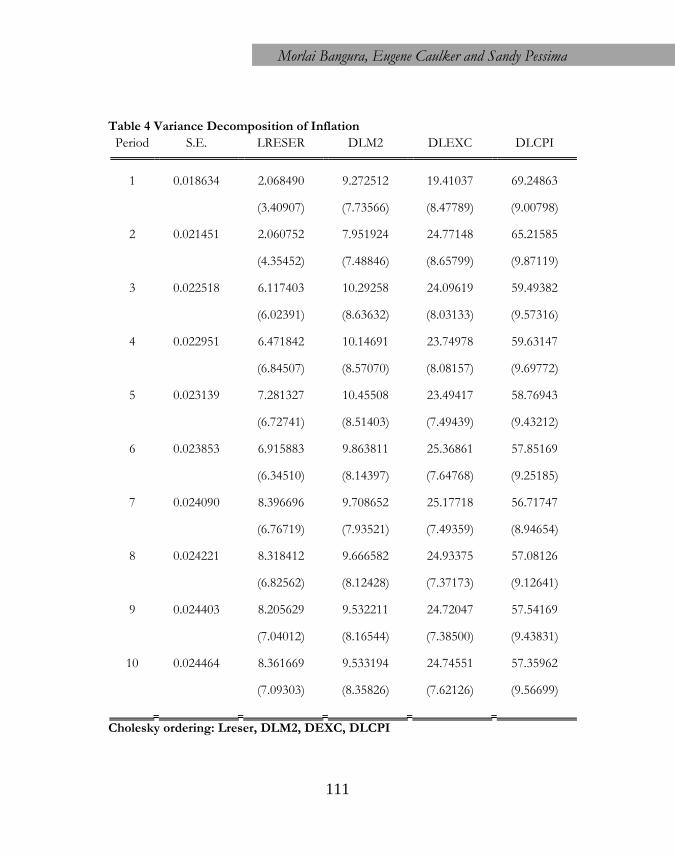
As indicated earlier, we employed the variance decompositions to explore the relative contribution of the structural shocks in explaining changes in inflation. Consistent with the findings of the IRFs discussed above, the variance decomposition, shown in Table 3.4 reveals that exchange rate shocks contribute more to inflation than monetary shocks. Specifically, exchange rate shocks account for about 19 to 25 percents of the variations of the price level between 1 and 10 quarters, whilst money supply shocks account for about 7 to 10 percents over the same time horizon. The last column of Table 3.4 suggests high inflation persistence, as up to 57 to 69 percents of the price level changes are explained by its own shocks during the ten quarters. This underscores the important role other factors (such as supply shocks) play in the inflationary process of Sierra Leone that are not explicitly accounted for by the current paper.
Morlai Bangura, Eugene Caulker and Sandy Pessima
111
Table 4 Variance Decomposition of Inflation
Period S.E. LRESER DLM2 DLEXC DLCPI
1 0.018634 2.068490 9.272512 19.41037 69.24863
(3.40907) (7.73566) (8.47789) (9.00798)
2 0.021451 2.060752 7.951924 24.77148 65.21585
(4.35452) (7.48846) (8.65799) (9.87119)
3 0.022518 6.117403 10.29258 24.09619 59.49382
(6.02391) (8.63632) (8.03133) (9.57316)
4 0.022951 6.471842 10.14691 23.74978 59.63147
(6.84507) (8.57070) (8.08157) (9.69772)
5 0.023139 7.281327 10.45508 23.49417 58.76943
(6.72741) (8.51403) (7.49439) (9.43212)
6 0.023853 6.915883 9.863811 25.36861 57.85169
(6.34510) (8.14397) (7.64768) (9.25185)
7 0.024090 8.396696 9.708652 25.17718 56.71747
(6.76719) (7.93521) (7.49359) (8.94654)
8 0.024221 8.318412 9.666582 24.93375 57.08126
(6.82562) (8.12428) (7.37173) (9.12641)
9 0.024403 8.205629 9.532211 24.72047 57.54169
(7.04012) (8.16544) (7.38500) (9.43831)
10 0.024464 8.361669 9.533194 24.74551 57.35962
(7.09303) (8.35826) (7.62126) (9.56699)
Cholesky ordering: Lreser, DLM2, DEXC, DLCPI

Vol. 12, No.1 Journal of Monetary and Economic Integration
112
CONCLUSION In this paper, we estimated the exchange rate pass-through to consumer prices for Sierra Leone using the SVAR approach. The SVAR specification incorporated specific features of the Sierra Leone economy, especially the central role of foreign exchange inflows in the conduct of monetary policy. The degree of exchange rate pass-through was estimated by means of IRFs and dynamic eclaticites. Evidence from the analysis, covering the period 1998Q1 through to 2011Q4, reveals that exchange rate pass-through to consumer prices in Sierra Leone is significant partly reflecting the continuous depreciation of the Leone over the whole sample period. Variance decomposition analysis indicates that shocks to monetary variables significantly account for variation in inflation partly lending support to the literature that inflation is monetary phenomenon. An important policy implication of this finding is that, although the flexible exchange rate regime would help Sierra Leone achieve the required external adjustment, it may endanger the goal of achieving price stability, if the necessary exchange rate movements are large. In addition, the attainment of the low inflation targets in Sierra Leone would require policy makers to aim at stable exchange rates in addition to monetary stability. The Occasional foreign exchange interventions by BSL that is aimed at smoothing out short-term fluctuations in the exchange rate are therefore justified since they would as well enhance price stability .The Central Bank should continue to use the foreign exchange auction as an complementary instrument for effective monetary policy management. The noticeable dynamic elasticity of foreign reserve suggests that the authorities must remain vigilant in managing aid and other private inflows in order to mitigate its potential inflationary outcome. Concluding to the fact that exchange rate pass through is high implies that policies that aim at lowering inflation must focus on monetary and exchange rate stability
Morlai Bangura, Eugene Caulker and Sandy Pessima
113
REFERENCES
An, L., (2006). Exchange rate pass-through: Evidence based on Vector Autoregression with Sign Restrictions, MPRA Paper 527, University Library of Munich.
Bache, I., (2006). Assessing the Structural VAR Approach to Exchange rate pass-
through, Computing in Economics and Finance 2006, 309, Society for computational economics.
Barhoumi, K., (2006). Differencing in long run exchange rate pass-through into import
prices in developing countries: An empirical investigation. Economic modeling, 23, 926-951.
Bhundia, Ashok J. (2002). “An Empirical Investigation of Exchange Rate Pass-Through
in South Africa”. Working Paper No. 02/165, IMF. Brooks, C.(2008). Introductory Econometrics for Finance. Cambridge University Press. Campa, J. M. and L. S. Goldberg.L.S.(2002). “Exchange Rate Pass-Through into Import
Prices: A Macro or Micro Phenomenon?”. Working Paper No. 8934, National Bureau of Economic Research, USA.
Choudhri, E. U., Faruqee, H., Hakura, D. S (2002). “Explaining the Exchange Rate Pass-
Through in Different Prices”. Working Paper No. 02/224, IMF. Devereux Michael B. (2000) “Monetary Policy, Exchange Rate Flexibility, and Exchange
Rate Pass-Through”, Proceedings of a Conference held by the Bank of Canada. http://www.bankofcanada.ca/en/res/wp/2000/devereux.pdf Feinberg, R. M. (1989). “The Effects of Foreign Exchange Movements on U.S.
Domestic Prices”. Review of Economics and Statistics, Vol. 71, No. 3, pp. 505-11. Frimpong ,S. and Adam, A. M (2010) 'Exchange rate pass-through in Ghana',
International Business Research, Vol.79, No.2, September, pp.186-192 Goldberg, P.K. (1995). “Product Differentiation and Oligopoly in International Markets:
The Case of the U.S. Automobile Industry”. Econometrica, Vol. 63(4), pp. 891-951 Goldberg, P. K. and Knetter M. M. (1997): “Goods Prices and Exchange Rates: What
Have We Learned?”. Journal of Economic Literature, Vol. 35, No. 3, pp. 1243-72. Gueorguiev, N, (2003). “Exchange Rate Pass-Through in Romania” IMF Working Paper
No 03/130

Vol. 12, No.1 Journal of Monetary and Economic Integration
114
Hamilton, J. D. (1994). “Time Series Analysis”, Princeton University Press. Hooper, P. and Catherine L. M. (1989). “Exchange Rate Pass-Through in the 1980s: the
Case of U.S. Imports of Manufactures”. Brookings Papers on Economic Activity,. Hyder, Z and Shah, S. (2004), “Exchange Rate Pass-Through to Domestic Prices in
Pakistan”, State Bank of Pakistan Working Paper No. 5. Johansen, S., (1988). Statistical analysis of cointegration vectors. Journal of Economic
Dynamics and Control 12, No.2/3, 231-54. Johansen, S., and Juselius, K., (1990). Maximum likelihood estimation and inference on
cointegration with applications to the demand for money. Oxford Bulletin of Economics and Statistics, 52, pp 169-210.
Kiptui,M., Ndolo,D. and Kaminchia,S.(2005) 'Exchange rate pass-through: to what extent do exchange rate fluctuations affect import prices and inflation in Kenya?', Central Bank of Kenya Working Paper, No.1.
Kim, Ki-Ho (1998): “US Inflation and the Dollar Exchange Rate: A Vector Error
Correction Model”, Applied Economics, Vol. 30, pp. 613-19. Leigh, D. and Rossi, M. (2002). “Exchange Rate Pass-Through in Turkey”. Working Paper
No. 02/204, IMF. Mansaray.K.(2011), ''Estimating the Monetary Policy Reaction function for Sierra Leone:
An Econometric Approach'',West African Journal of Monetary and Economic Integration.Vol:11,pp.107128.
McCharthy, J.(1999). “Pass-Through of Exchange Rates and Import Prices to Domestic
Inflation in some Industrialized Economies.” BIS working Paper No. 79 McCarthy, J. (2000). “Pass-Through of Exchange Rates and Import Prices to Domestic
Inflation in Some Industrialized Economies”. Staff reports No.11, Federal Reserve Bank of New York.
Mihailov, A., (2005). Exchange rate pass-through on prices in Macrodata: A comparative
sensitivity analysis. University of Essex economic discussion papers, 568. Mwase, N.(2006) 'An empirical investigation of the exchange rate pass-through to
inflation in Tanzania',IMF working Paper, No.150.
Morlai Bangura, Eugene Caulker and Sandy Pessima
115
Rabanal, P., and Schwartz,G.(2001), “Exchange Rate Changes and Consumer Price Inflation: 20 months after the floating of the Real in Brazil: Selected Issues and Statistical Appendix”. IMF Country Report N0. 01/10, IMF.
Romer, D.,(1993). Openness and Inflation: Theory and Evidence, Quarterly Journal of
Economics, 4, 869-903. Sanusi A.R.(2010), ''Exchange RatePass-Through to Consumer Prices in
Ghana:Evidence from Structural Vector auto-Regression'',West African Journal of Monetary and Economic Integration.Vol:10,pp.25-54.
Seddighi, H.R., Lawler, K.A. and A.V. Katos ((2000), Econometrics – A Practical
Approach, London:Routledge Taylor, J.(2000), “Low Inflation, Pass-through, and the Pricing Power of Firms”,
European Economic Review. Vol: 44, pp.1389-1408. Toh, M., and Ho, H., (2001). Exchange rate pass-through for selected Asian economies.
The Singapore Economic Review, 46(2), 247-273.
Vol. 12, No.1 Journal of Monetary and Economic Integration
116
APPENDIX
1: Inflation and Exchange Rate Dynamic in Sierra Leone
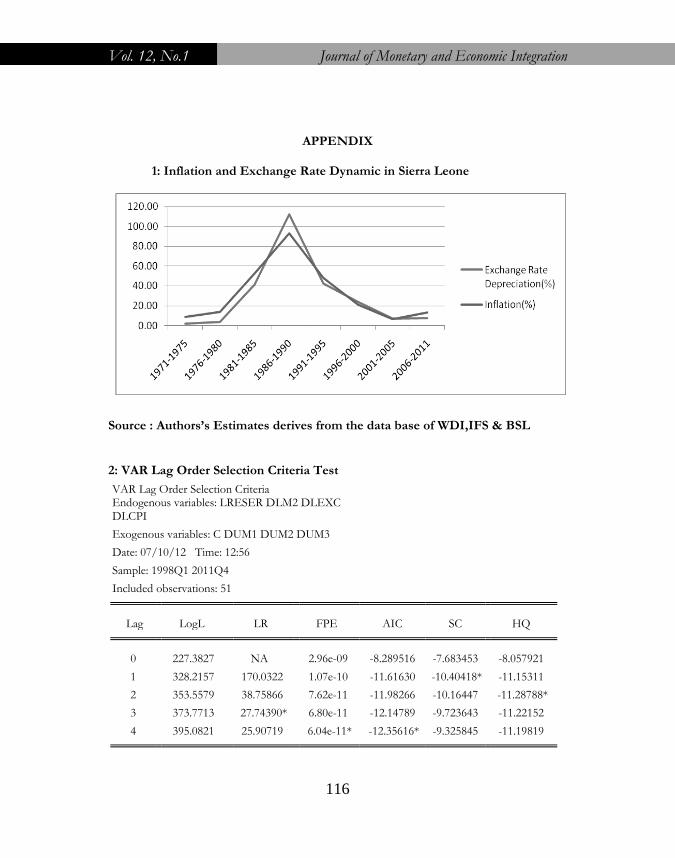
Source : Authors’s Estimates derives from the data base of WDI,IFS & BSL 2: VAR Lag Order Selection Criteria Test
VAR Lag Order Selection Criteria Endogenous variables: LRESER DLM2 DLEXC DLCPI
Exogenous variables: C DUM1 DUM2 DUM3
Date: 07/10/12 Time: 12:56
Sample: 1998Q1 2011Q4
Included observations: 51
Lag LogL LR FPE AIC SC HQ 0 227.3827 NA 2.96e-09 -8.289516 -7.683453 -8.057921
1 328.2157 170.0322 1.07e-10 -11.61630 -10.40418* -11.15311
2 353.5579 38.75866 7.62e-11 -11.98266 -10.16447 -11.28788*
3 373.7713 27.74390* 6.80e-11 -12.14789 -9.723643 -11.22152
4 395.0821 25.90719 6.04e-11* -12.35616* -9.325845 -11.19819
Morlai Bangura, Eugene Caulker and Sandy Pessima
117
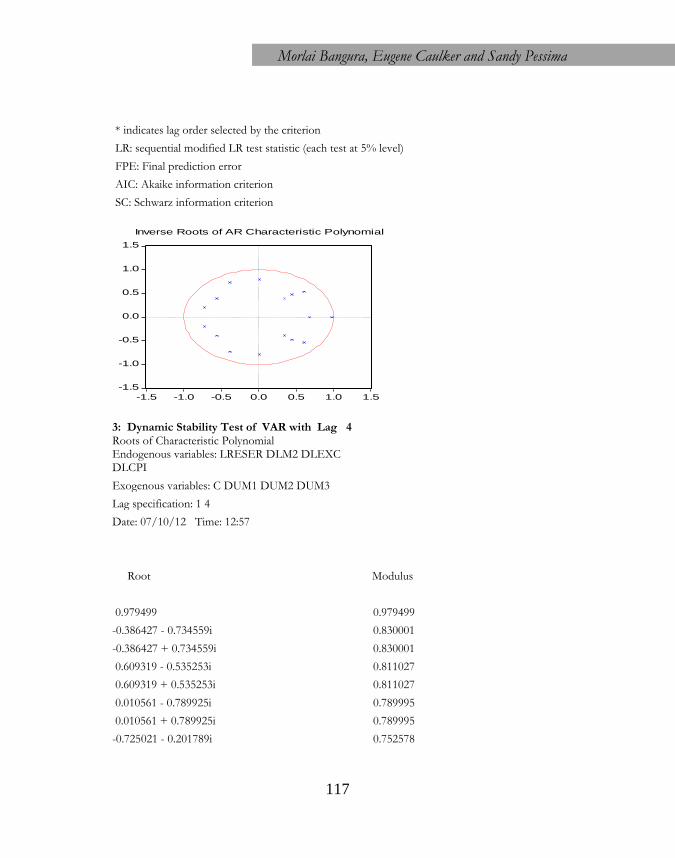
* indicates lag order selected by the criterion
LR: sequential modified LR test statistic (each test at 5% level)
FPE: Final prediction error
AIC: Akaike information criterion
SC: Schwarz information criterion
-1.5
-1.0
-0.5
0.0
0.5
1.0
1.5
-1.5 -1.0 -0.5 0.0 0.5 1.0 1.5
Inverse Roots of AR Characteristic Polynomial
3: Dynamic Stability Test of VAR with Lag 4 Roots of Characteristic Polynomial
Endogenous variables: LRESER DLM2 DLEXC DLCPI
Exogenous variables: C DUM1 DUM2 DUM3
Lag specification: 1 4
Date: 07/10/12 Time: 12:57
Root Modulus
0.979499 0.979499
-0.386427 - 0.734559i 0.830001
-0.386427 + 0.734559i 0.830001
0.609319 - 0.535253i 0.811027
0.609319 + 0.535253i 0.811027
0.010561 - 0.789925i 0.789995
0.010561 + 0.789925i 0.789995
-0.725021 - 0.201789i 0.752578
Vol. 12, No.1 Journal of Monetary and Economic Integration
118
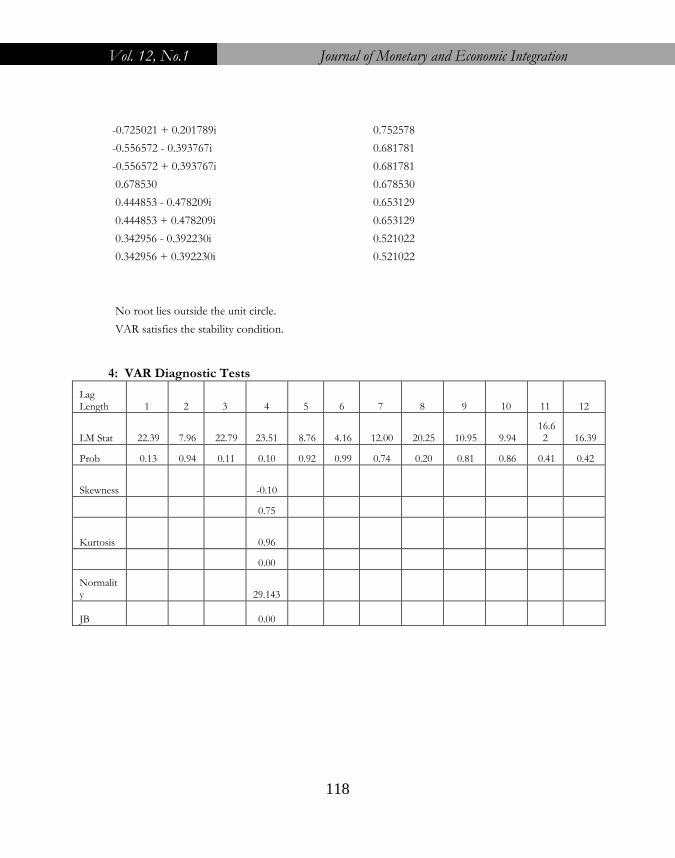
-0.725021 + 0.201789i 0.752578
-0.556572 - 0.393767i 0.681781
-0.556572 + 0.393767i 0.681781
0.678530 0.678530
0.444853 - 0.478209i 0.653129
0.444853 + 0.478209i 0.653129
0.342956 - 0.392230i 0.521022
0.342956 + 0.392230i 0.521022
No root lies outside the unit circle.
VAR satisfies the stability condition.
4: VAR Diagnostic Tests
Lag Length 1 2 3 4 5 6 7 8 9 10 11 12
LM Stat 22.39 7.96 22.79 23.51 8.76 4.16 12.00 20.25 10.95 9.94 16.6
2 16.39
Prob 0.13 0.94 0.11 0.10 0.92 0.99 0.74 0.20 0.81 0.86 0.41 0.42
Skewness -0.10
0.75
Kurtosis 0.96
0.00
Normality 29.143
JB 0.00

Morlai Bangura, Eugene Caulker and Sandy Pessima
119
5: Residuals of the VAR Equations (Full Sample)
-.4
-.3
-.2
-.1
.0
.1
.2
.3
.4
.5
99 00 01 02 03 04 05 06 07 08 09 10 11
LRESER Residuals
-.12
-.08
-.04
.00
.04
.08
.12
99 00 01 02 03 04 05 06 07 08 09 10 11
DLM2 Residuals
-.12
-.08
-.04
.00
.04
.08
99 00 01 02 03 04 05 06 07 08 09 10 11
DLEXC Residuals
-.04
-.03
-.02
-.01
.00
.01
.02
.03
.04
99 00 01 02 03 04 05 06 07 08 09 10 11
DLCPI Residuals
6: Variance-Covariance Matrixes of the Residuals (Full Sample)
LRESER DLM2 DLEXC DLCPI
LRESER 0.029845 -0.000349 -0.000765 0.000463
DLM2 -0.000349 0.001978 0.000872 0.000247
DLEXC -0.000765 0.000872 0.001532 0.000375
DLCPI 0.000463 0.000247 0.000375 0.000347

Vol. 12, No.1 Journal of Monetary and Economic Integration
120
7: Correlation Matrix of the Residuals (Full Sample)
LRESER DLM2 DLEXC DLCPI
LRESER 1.000000 -0.045471 -0.113177 0.143822
DLM2 -0.045471 1.000000 0.500810 0.297654
DLEXC -0.113177 0.500810 1.000000 0.514064
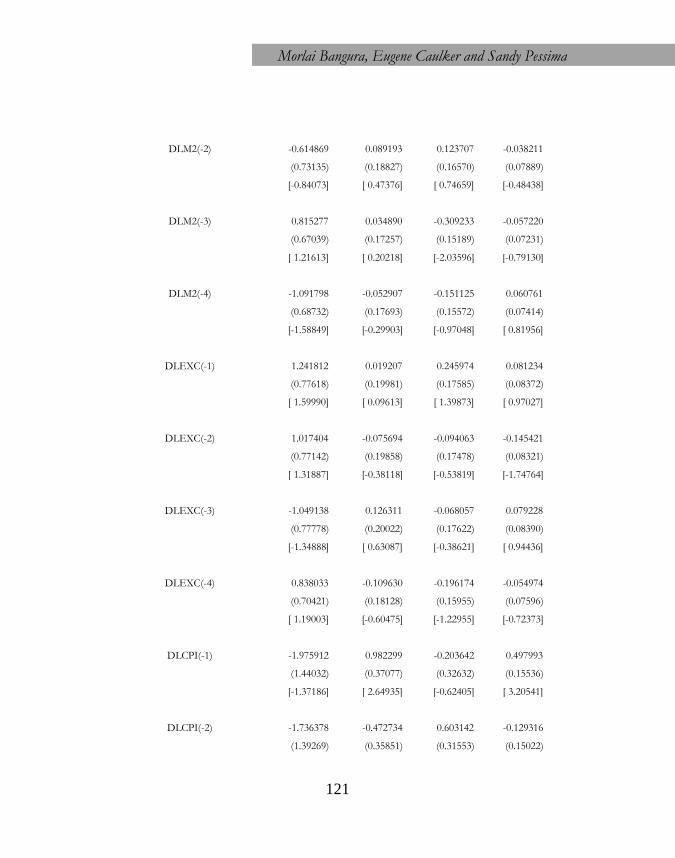
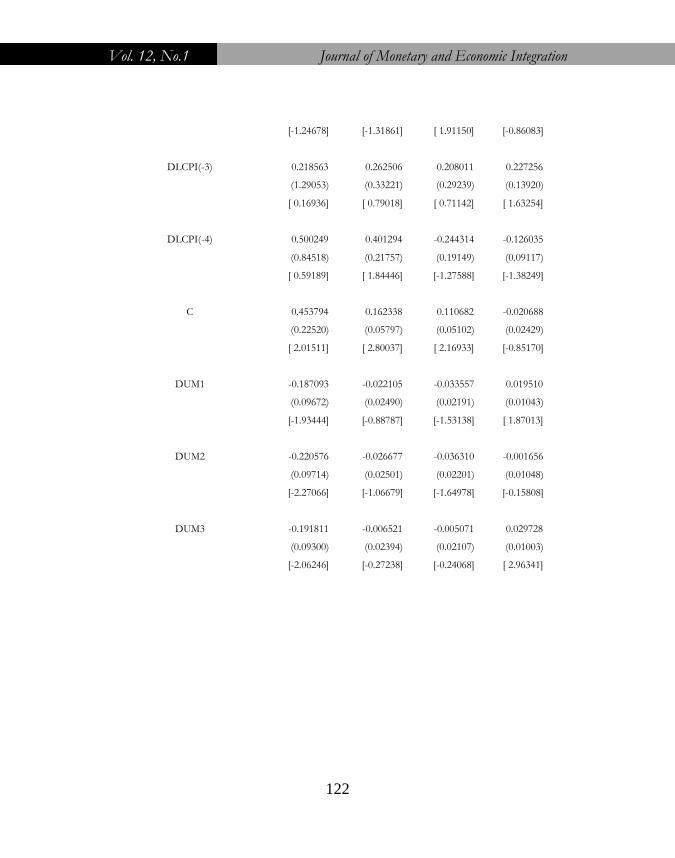
DLCPI 0.143822 0.297654 0.514064 1.000000 8: Full Sample Estimates of the Unrestricted VAR
Vector Autoregression Estimates
Date: 07/10/12 Time: 13:02
Sample (adjusted): 1999Q2 2011Q4
Included observations: 51 after adjustments
Standard errors in ( ) & t-statistics in [ ]
LRESER DLM2 DLEXC DLCPI
LRESER(-1) 0.647382 0.096398 0.023518 -0.015029
(0.17302) (0.04454) (0.03920) (0.01866)
[ 3.74157] [ 2.16429] [ 0.59993] [-0.80528]
LRESER(-2) 0.215998 -0.118096 -0.055200 0.042610
(0.21526) (0.05541) (0.04877) (0.02322)
[ 1.00343] [-2.13121] [-1.13184] [ 1.83512]
LRESER(-3) -0.161394 -0.080274 0.046959 -0.019345
(0.22049) (0.05676) (0.04995) (0.02378)
[-0.73200] [-1.41433] [ 0.94005] [-0.81339]
LRESER(-4) 0.287857 0.079711 -0.024959 -0.002401
(0.16912) (0.04354) (0.03832) (0.01824)
[ 1.70210] [ 1.83096] [-0.65141] [-0.13164]
DLM2(-1) -1.154421 -0.253981 -0.245464 -0.051939
(0.66066) (0.17007) (0.14968) (0.07126)
[-1.74736] [-1.49339] [-1.63989] [-0.72884]
Morlai Bangura, Eugene Caulker and Sandy Pessima
121
DLM2(-2) -0.614869 0.089193 0.123707 -0.038211
(0.73135) (0.18827) (0.16570) (0.07889)
[-0.84073] [ 0.47376] [ 0.74659] [-0.48438]
DLM2(-3) 0.815277 0.034890 -0.309233 -0.057220
(0.67039) (0.17257) (0.15189) (0.07231)
[ 1.21613] [ 0.20218] [-2.03596] [-0.79130]
DLM2(-4) -1.091798 -0.052907 -0.151125 0.060761
(0.68732) (0.17693) (0.15572) (0.07414)
[-1.58849] [-0.29903] [-0.97048] [ 0.81956]
DLEXC(-1) 1.241812 0.019207 0.245974 0.081234
(0.77618) (0.19981) (0.17585) (0.08372)
[ 1.59990] [ 0.09613] [ 1.39873] [ 0.97027]
DLEXC(-2) 1.017404 -0.075694 -0.094063 -0.145421
(0.77142) (0.19858) (0.17478) (0.08321)
[ 1.31887] [-0.38118] [-0.53819] [-1.74764]
DLEXC(-3) -1.049138 0.126311 -0.068057 0.079228
(0.77778) (0.20022) (0.17622) (0.08390)
[-1.34888] [ 0.63087] [-0.38621] [ 0.94436]
DLEXC(-4) 0.838033 -0.109630 -0.196174 -0.054974
(0.70421) (0.18128) (0.15955) (0.07596)
[ 1.19003] [-0.60475] [-1.22955] [-0.72373]
DLCPI(-1) -1.975912 0.982299 -0.203642 0.497993
(1.44032) (0.37077) (0.32632) (0.15536)
[-1.37186] [ 2.64935] [-0.62405] [ 3.20541]
DLCPI(-2) -1.736378 -0.472734 0.603142 -0.129316
(1.39269) (0.35851) (0.31553) (0.15022)
Vol. 12, No.1 Journal of Monetary and Economic Integration
122
[-1.24678] [-1.31861] [ 1.91150] [-0.86083]
DLCPI(-3) 0.218563 0.262506 0.208011 0.227256
(1.29053) (0.33221) (0.29239) (0.13920)
[ 0.16936] [ 0.79018] [ 0.71142] [ 1.63254]
DLCPI(-4) 0.500249 0.401294 -0.244314 -0.126035
(0.84518) (0.21757) (0.19149) (0.09117)
[ 0.59189] [ 1.84446] [-1.27588] [-1.38249]
C 0.453794 0.162338 0.110682 -0.020688
(0.22520) (0.05797) (0.05102) (0.02429)
[ 2.01511] [ 2.80037] [ 2.16933] [-0.85170]
DUM1 -0.187093 -0.022105 -0.033557 0.019510
(0.09672) (0.02490) (0.02191) (0.01043)
[-1.93444] [-0.88787] [-1.53138] [ 1.87013]
DUM2 -0.220576 -0.026677 -0.036310 -0.001656
(0.09714) (0.02501) (0.02201) (0.01048)
[-2.27066] [-1.06679] [-1.64978] [-0.15808]
DUM3 -0.191811 -0.006521 -0.005071 0.029728
(0.09300) (0.02394) (0.02107) (0.01003)
[-2.06246] [-0.27238] [-0.24068] [ 2.96341]
Morlai Bangura, Eugene Caulker and Sandy Pessima
123
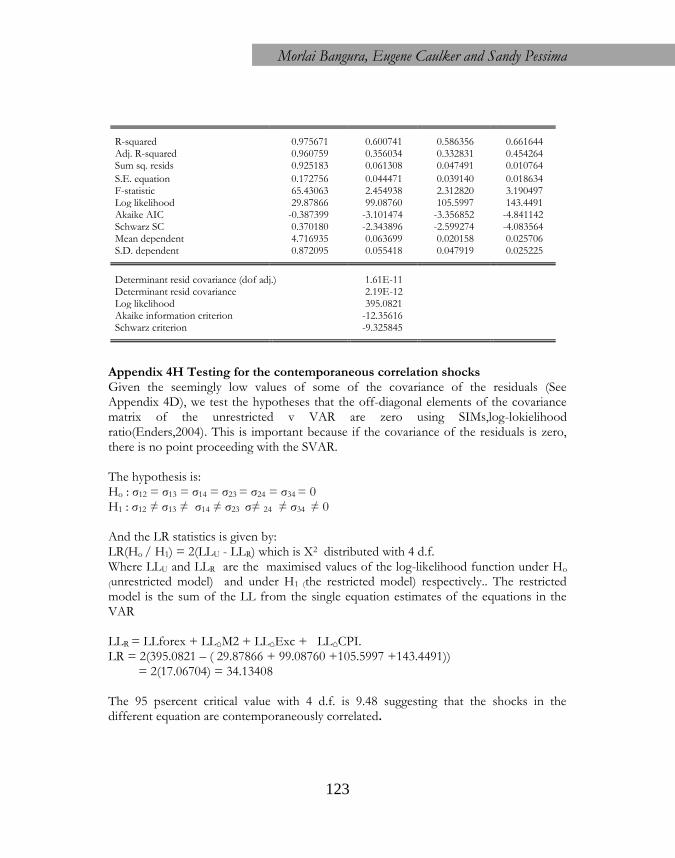
R-squared 0.975671 0.600741 0.586356 0.661644 Adj. R-squared 0.960759 0.356034 0.332831 0.454264 Sum sq. resids 0.925183 0.061308 0.047491 0.010764
S.E. equation 0.172756 0.044471 0.039140 0.018634 F-statistic 65.43063 2.454938 2.312820 3.190497 Log likelihood 29.87866 99.08760 105.5997 143.4491 Akaike AIC -0.387399 -3.101474 -3.356852 -4.841142 Schwarz SC 0.370180 -2.343896 -2.599274 -4.083564 Mean dependent 4.716935 0.063699 0.020158 0.025706 S.D. dependent 0.872095 0.055418 0.047919 0.025225
Determinant resid covariance (dof adj.) 1.61E-11 Determinant resid covariance 2.19E-12 Log likelihood 395.0821 Akaike information criterion -12.35616 Schwarz criterion -9.325845
Appendix 4H Testing for the contemporaneous correlation shocks Given the seemingly low values of some of the covariance of the residuals (See Appendix 4D), we test the hypotheses that the off-diagonal elements of the covariance matrix of the unrestricted v VAR are zero using SIMs,log-lokielihood ratio(Enders,2004). This is important because if the covariance of the residuals is zero, there is no point proceeding with the SVAR. The hypothesis is: Ho : σ12 = σ13 = σ14 = σ23 = σ24 = σ34 = 0 H1 : σ12 ≠ σ13 ≠ σ14 ≠ σ23 σ≠ 24 ≠ σ34 ≠ 0 And the LR statistics is given by: LR(Ho / H1) = 2(LLU - LLR) which is X2 distributed with 4 d.f. Where LLU and LLR are the maximised values of the log-likelihood function under Ho
(unrestricted model) and under H1 (the restricted model) respectively.. The restricted model is the sum of the LL from the single equation estimates of the equations in the VAR LLR = LLforex + LL⌂M2 + LL⌂Exc + LL⌂CPI. LR = 2(395.0821 – ( 29.87866 + 99.08760 +105.5997 +143.4491)) = 2(17.06704) = 34.13408 The 95 psercent critical value with 4 d.f. is 9.48 suggesting that the shocks in the different equation are contemporaneously correlated.