evolution of source eeg synchronization in early alzheimer's disease
TRANSCRIPT
Neurobiology of Aging xx (2012) xxx
0h
Evolution of source EEG synchronization in early Alzheimer’s disease
Maria G. Knyazevaa,b,*, Cristian Carmelia, Alireza Khadivic, Joseph Ghikaa, Reto Meulib,d,Richard S. Frackowiaka
a LREN, Department of Clinical Neuroscience, Centre Hospitalier Universitaire Vaudois (CHUV), and University of Lausanne, Lausanne, Switzerlandb Department of Radiology, Centre Hospitalier Universitaire Vaudois (CHUV), and University of Lausanne, Lausanne, Switzerland
c LANOS, EPFL Lausanne, Switzerlandd CIBM, CHUV Unit, Lausanne, Switzerland
Received 21 February 2012; received in revised form 29 June 2012; accepted 11 July 2012
Abstract
Alzheimer’s disease (AD) disrupts functional connectivity in distributed cortical networks. We analyzed changes in the S-estimator, ameasure of multivariate intraregional synchronization, in electroencephalogram (EEG) source space in 15 mild AD patients versus 15age-matched controls to evaluate its potential as a marker of AD progression. All participants underwent 2 clinical evaluations and 2 EEGrecording sessions on diagnosis and after a year. The main effect of AD was hyposynchronization in the medial temporal and frontal regionsand relative hypersynchronization in posterior cingulate, precuneus, cuneus, and parietotemporal cortices. However, the S-estimator did notchange over time in either group. This result motivated an analysis of rapidly progressing AD versus slow-progressing patients. Rapidlyprogressing AD patients showed a significant reduction in synchronization with time, manifest in left frontotemporal cortex. Thus, theevolution of source EEG synchronization over time is correlated with the rate of disease progression and should be considered as acost-effective AD biomarker.© 2012 Elsevier Inc. All rights reserved.
Keywords: Alzheimer’s disease; Functional connectivity; Hypersynchronization; Hyposynchronization; Prognosis; S-estimator; EEG; Clinical biomarker
www.elsevier.com/locate/neuaging
wclc
ii
1. Introduction
What happens to neuronal synchronization in Alzhei-mer’s disease (AD)? The question is of primary importancebecause synchronization between spatially remote neuro-physiological events is thought to be a principal mechanismof effective and functional connectivity (EC and FC) that isof direct and indirect interactions between spatially distrib-uted brain areas (Friston et al., 1993; Singer, 1999). Elec-troencephalogram (EEG) reports describing moderate tosevere AD suggest a progressive degradation similar to thatin structural connectivity (Babiloni et al., 2006a; Koenig etal., 2005; Kramer et al., 2007; Lizio et al., 2011; Stam et al.,2005). However, findings in preclinical and early AD show
* Corresponding author at: LREN, NLG, BH07, CHUV, 1011 Lausanne,Switzerland. Tel.: �41 21 314 32 31; fax: �41 21 314 12 90.
E-mail address: [email protected] (M. Knyazeva).
197-4580/$ – see front matter © 2012 Elsevier Inc. All rights reserved.ttp://dx.doi.org/10.1016/j.neurobiolaging.2012.07.012
a more complicated picture that includes both strengtheningand weakening of FC estimated with functional magneticresonance imaging (fMRI) (Damoiseaux et al., 2012; Sper-ling et al., 2010; Wang et al., 2007; Zhang et al., 2010) orEEG synchronization (Knyazeva et al., 2010; Rossini et al.,2006) at rest and with activation. New evidence based on amouse model of AD suggests these phenomena correlatewith the accumulation of �-amyloid, which is associated
ith dysfunction of inhibitory interneurons that, in turn,ould augment synchronicity between pyramidal cells (Pa-op and Mucke, 2010). There are findings in human ADompatible with such a hypothesis.
A disproportionate weakening of EC, ascribed to lostnhibitory modulatory connections, has been demonstratedn mild AD (Rytsar et al., 2011). In this study, EC in AD
patients and matched controls was analyzed by means ofdynamic causal modeling of fMRI time series in a visual
integration task. The inhibitory effects exerted by extrastri-
thc(A
ndsfw2gtepiwccpudssm
2
2
mtsaaepedwwDcps
ina18(npiwa(s
2 M. G. Knyazeva et al. / Neurobiology of Aging xx (2012) xxx
ate on primary visual areas associated with interhemisphericintegration of a visual stimulus were significantly weakenedin AD patients. The same AD patients were also character-ized by an abnormal landscape of intraregional EEG syn-chronization that was impaired in frontotemporal regions ofthe left hemisphere and augmented in the posterior tempo-ral, parietal, and occipital cortices of both hemispheres(Knyazeva et al., 2010). These features discriminated pa-ients from controls with an accuracy of up to 94%. Anterioryposynchronization and posterior hypersynchronizationorrelated with individual Mini Mental State ExaminationMMSE) scores, thus linking both types of FC change toD-associated cognitive decline.Posterior hypersynchronization was much more pro-
ounced in early-onset AD patients and in those with shortisease duration (Knyazeva et al., 2010). The literatureuggests further changes in moderate to severe AD mani-esting predominantly as hyposynchronization comparedith matched controls (Koenig et al., 2005; Lizio et al.,011). Therefore, the evolution of AD-associated neurode-eneration causes qualitative changes in EEG synchroniza-ion, and hypersynchronization is a hallmark of early orven preclinical AD. However, this sequence of events isresently based on extrapolation from cross-sectional stud-es. Proof from formal longitudinal studies is required. Heree present a longitudinal study over a year starting from the
linical diagnosis of AD. To assay the dynamics of syn-hronization within this period, we apply whole-brain map-ing of multivariate intraregional FC in EEG source spacesing the S-estimator, a multivariate measure exploitingimensionality shrinking—a theoretical consequence ofynchronization phenomena (see Section 2.4.)—for the as-essment of synchronization within a set of multivariateeasurements (Carmeli et al., 2005).
. Methods
.1. Patients and control subjects
Fifteen newly diagnosed AD patients (3 women and 12en; Table 1a) were recruited from the Memory Clinic of
he Neurology Service (CHUV, Lausanne). Fifteen controlubjects (9 women and 6 men) were volunteers enrolledmong partners, caregivers, or family members. The patientnd control groups differed neither in age nor in level ofducation. At baseline, this population overlapped with theopulation reported in our cross-sectional study (Knyazevat al., 2010), where we analyzed surface EEG in newlyiagnosed AD patients. Eleven patients and 11 controlsere common across these 2 studies. All participants gaveritten informed consent. All procedures conformed to theeclaration of Helsinki (1964) of the World Medical Asso-
iation concerning human experimentation and were ap-roved by the local Ethics Committee of Lausanne Univer-
ity. FThe clinical diagnosis of probable AD was made accord-ng to the National Institute of Neurological and Commu-icative Disorders and Stroke and the Alzheimer’s Diseasend Related Disorders Association criteria (McKhann et al.,984), allowing a certainty in the diagnosis of about 80%–5%. Cognitive functions were assessed with the MMSEFolstein et al., 1975) and with a detailed standardizedeuropsychological assessment scale validated for a franco-hone population (Puel and Hugonot-Diener, 1996). Thempact of cognitive impairment on daily life was evaluatedith the Basic Activity of Daily Living Scale (Katz, 1983),
nd with the Instrumental Activity of Daily Living ScaleLawton and Brody, 1969). To improve compatibility acrosstudies the stage of dementia was determined both by the
Table 1Demographic and clinical characteristics of the AD and control subjectsand of the relatively stable and fast-progressing AD patients
a. Demographic and clinical characteristics of the AD and controlgroups
Group AD patients Control subjects p
Subjects, n 15 15 —Gender, M/F 12/3 6/9 —Age (y) 68.7 � 5.1 67.6 � 5.0 NSCO (y) 1.9 � 0.2 1.6 � 0.2 NSEEG observation interval
(months)12.4 � 0.7 12.2 � 0.6 NS
MMSE at baseline 22.6 � 1.1 28.5 � 1.2 0.001MMSE in the end of CO 18.1 � 2.1 28.5 � 1.2 0.001Disease duration (y) 3.8 � 0.5 — —Educationa 2.2 � 0.2 2.4 � 0.1 NS
b. Demographic and clinical characteristics of the relatively stable andprogressing AD subgroups
Fast-progressingAD patients
Slow-progressingAD patients
Number of subjects 8 7 —Gender M/F 5/3 7/0 —Age (y) 71.9 � 4.0 65.6 � 3.1 NSCO (y) 1.8 � 0.3 2.1 � 0.3 NSEEG observation interval
(months)12.1 � 0.9 12.6 � 1.0 NS
MMSE at baseline 20.5 � 1.5 24.6 � 1.4 NSMMSE in the end of CO 11.9 � 2.1 24.3 � 1.8 0.001Disease duration 4.1 � 0.7 3.6 � 0.8 NSEducationa 2.3 � 0.3 2.1 � 0.3 NS
Second and third columns present group characteristics (mean � standarderror). Fourth column presents p-values for the statistical significance ofthe between-group differences. The duration of the disease was determinedas the time in years between the onset of recent episodic memory symp-toms reported by the patient or relatives and the date of neuropsychologicalexamination, as recommended in the American Academy of NeurologyPractice Handbook (Practice parameter for diagnosis and evaluation ofdementia (summary statement)).Key: AD, Alzheimer’s disease; CO, clinical observation; EEG, electroen-cephalogram; F, female; M, male; MMSE, Mini Mental State Examination;NS, not significant.
a Educational status was determined by 3 categories: 1, primary/second-ary school without, or with short (� 3 years) professional training; 2,primary/secondary school with professional training (� 3 years); and 3,high school and tertiary education.
unctional Assessment Staging (Scaln and Reisberg, 1992)
aiuacl
s1t1spwbaci
rfiudaoTi
e
1ueao
3M. G. Knyazeva et al. / Neurobiology of Aging xx (2012) xxx
and Clinical Dementia Rating (Morris, 1993) scales. Forthis study we selected patients with mild dementia at base-line (Functional Assessment Staging score, 3–4; and Clin-ical Dementia Rating score, 0.5–1).
Clinical laboratory investigations and diagnostic neuro-imaging (computed tomography or magnetic resonance im-aging [MRI] and metrizamide single-photon emission com-puted tomography) were performed to exclude other causesof dementia. Exclusion criteria were severe physical illness,psychiatric or other neurological disorders associated withpotential cognitive dysfunction, other dementing conditions(frontotemporal dementia, dementia associated with Parkin-sonism, Lewy body disease, pure vascular or prion-associ-ated dementia, etc.), alcohol/drug abuse, and regular use ofneuroleptics, antidepressants with anticholinergic action,benzodiazepines, stimulants, or �-blockers. To confirm thebsence of psychoactive drug use, or other diseases thatnterfere with cognitive functions, potential control subjectsnderwent a brief clinical interview, including the MMSE,nd a brain MRI scan. Only individuals with no cognitiveomplaints and a score � 28 for a high and � 26 for a lowevel of education were accepted as controls.
All the subjects are participants of a 3-year longitudinaltudy (Swiss National Foundation, Grant number 320030-27538/1), which includes clinical, EEG, and MRI evalua-ions on an annual basis. Here we report the EEG results at
year from AD diagnosis. The mean time between EEGessions was 12.4 � 0.7 (mean � standard error) months foratients and 12.2 � 0.6 months for controls. All patientsere treated with a cholinesterase inhibitor in this period, allut 1 slow and 1 rapidly regressing patient received anntidepressant and none of the control subjects was medi-ated. Considering that (1) the effects of cholinesterasenhibitors on AD progression are very limited (Birks, 2006),
(2) antidepressants have never affected AD progression orMMSE scores, and (3) that medication is given to reduce thedifferences between controls and patients, medication-re-lated false positives are very unlikely.
2.2. EEG recording and preprocessing
The EEG data were collected with subjects sitting re-laxed with eyes closed. The EEGs were recorded with a128-channel Geodesic Sensor Net (Electrical Geodesic,Inc., Eugene, OR, USA) for 3–4 minutes. All electrodeimpedances were kept under 30 k�—much lower thanecommended (50 k�) for the high-input impedance ampli-ers. The recordings were made with vertex referencessing a low-pass filter set to 100 Hz. The signals wereigitized at a rate of 500 samples per second with a 12-bitnalogue-to-digital converter. They were filtered (band-passf 1–50 Hz) and rereferenced against the common average.he latter operation has the benefit of providing reference-
ndependent inverse solutions (Pascual-Marqui, 2009).To achieve greater confidence in the synchronization
stimates, the signals were segmented into nonoverlapping
-second epochs. Using short segments for analysis alloweds to record 155 � 17 (mean � standard error) artifact-freepochs for patients and 142 � 18 for controls. Artifacts inll channels were edited off-line: first automatically, basedn an absolute voltage threshold (100 �V) and on a transi-
tion threshold (50 �V), and then on the basis of a thoroughvisual inspection. The sensors producing artifacts more than20% of the recording time were corrected using a badchannel replacement tool (Net Station 4.2, Electrical Geo-desic, Inc.).
2.3. LAURA—bioelectromagnetic inverse imaging
Local auto-regressive average (LAURA) is a methodused to image generators of scalp-recorded electromagneticactivity (Grave de Peralta Menendez et al., 2001). It pro-vides a distributed linear inverse solution based on a localauto-regressive average model of unknown current densityin the brain. Its interpolation coefficients depend upon apower of the Euclidean distance between current densitylocations of interest and their neighbors. We computed theLAURA-based EEG solution for a head model with 4024solution points isotropically distributed at 6 mm intervalswithin the gray matter compartment of the Montreal Neu-rological Institute’s (MNI) average brain (Mazziotta et al.,1995). These solution points span superficial and deep graymatter, except the cerebellum. The head model was coreg-istered with EEG electrode coordinates from MNI space,and the lead-field matrix was computed via the 3 shellSYmmetric Spherical Head Model with Anatomical Con-strains (Grave de Peralta Menendez et al., 2006). Thismethod has been successfully used in clinical and experi-mental studies and results in localization precision that iscomparable with realistic boundary element models (Gug-gisberg et al., 2011). At each solution point, 3-D currentdensity time series were produced. To avoid excessive com-putational demands and uncertainties in the interpretation ofsynchronization maps along the 3 components of currentdensity vectors, for subsequent data analysis we consideredthe modulus or intensity of the vectors, thus discarding theirdirectionality.
2.4. Measuring multivariate source EEG synchronization
Synchronization occurs when there is a correlation ofactivity between a number of systems due to either a cou-pling configuration or driven by an external source (Brownand Koçarev, 2000). In order to estimate the amount ofsynchrony defined by distances (volumes) of interest (seebelow), that is between multiple neighboring sources, weexploited the S-estimator (for a discussion of this multivar-iate approach and numerical validation of the method, seeCarmeli, 2006; Carmeli et al., 2005). The S-estimator ex-ploits the theoretical consequences of synchronization phe-nomena to quantify the synchronization of a set of signals.The observable dimensionality of a network of dynamic
systems decreases as a result of interactions among its
eon
a
w
Ic
4 M. G. Knyazeva et al. / Neurobiology of Aging xx (2012) xxx
elements (Brown and Koçarev, 2000). The S-estimator in-directly measures this synchronization-induced contractionof observed dimensionality by measuring the eigenvaluedispersion (entropy) in the 0-lag correlation matrix of amultivariate set of signals. The S-estimator can be applied tomultivariate time series or to phase-space embedded multi-variate data. The latter involves the estimation of 2 param-eters for each solution point, namely time lag and embed-ding dimension (Carmeli et al., 2005). Because suchstimations are time-consuming in a large-scale setting, wepted for the most simple approach, that of considering theonphase-space embedded time series.
Given a K-variate time series, the S-estimator is defineds:
S � 1 �E(�)
log(K)
here � designates the normalized eigenvalues of the 0-lagcorrelation matrix of the K-variate time series, and E(�) istheir Shannon entropy. When all normalized eigenvaluesare roughly of the same value (maximum dispersion ofeigenvalues), all the state-space dimensions are almostequally visited; in this case E(�) is maximum [close tolog(K)], consequently S is close to 0, meaning no contrac-tion of the observed dimensionality, i.e., no synchroniza-tion. Alternatively, when nearly all normalized eigenvaluesare roughly 0 and only a few are not (minimal dispersion),only a few state-space dimensions are visited; in this caseE(�) is minimal (close to 0), consequently S is close to 1,meaning maximal contraction of the observed dimensional-ity and complete synchronization. Thus, the S-estimator is amultivariate measure that fits the structure of source EEG byallowing a reconstruction of the whole-brain topography ofsynchronization.
2.5. Whole-brain topography
Whole-brain maps were obtained by applying the S-es-timator to 4024 volumes of interest. Each volume of interestcorresponded to a sphere of 3 cm in radius centered on asolution point. On average, a volume of interest includedabout K � 200 sources, and embraced the range of distancesspanned by short corticocortical association fibers (Schuzand Braitenberg, 2002), which are demyelinated in earlyAD patients (Fornari et al., 2012). To reduce the computa-tional burden and to avoid the issue of multiple comparisonswhen assessing synchronization maps for several EEG fre-quency bands, we applied the S-estimator to broadbandsource EEG signals. This approach seemed to be optimal forachieving the aims of our study given the further fact that inprevious work similar synchronization landscapes werefound across conventional EEG frequency bands (Knyazevaet al., 2010).
Following a summary statistics approach, whole-brainsynchronization maps were computed for each subject by
averaging over all available epochs. To control for interin-dividual variability and to decouple regional synchroniza-tion from global synchronization level in individual sub-jects, each map was normalized by its global mean, i.e., thespatial average of synchronization was subtracted from eachlocal S-estimator in each 1-second epoch. Such normaliza-tion assumes an equality of global mean values acrosssamples, which was the case for the baseline versus 1-yearsessions in both groups, but not for patients versus controls(2-way analysis of variance [ANOVA] with disease [ADpatients vs. controls] and observation period [baseline and1-year session] factors). Because our study was primarilyfocused on the evolution of EEG synchronization, we usedthe normalization to unmask regions with the greatest rateof AD-related progression. However, to avoid misinterpre-tations due to significantly lower mean synchronization lev-els in patients (p � 0.01), we also analyzed nonnormalizeddata. The so obtained absolute and relative synchronizationmaps entered a population analysis.
We acknowledge the fact that localization of distributedsources based on the LAURA algorithm has limited spatialresolution, because field spread is not completely abolishedin source space (Schoffelen and Gross, 2009). This is aconsequence of the high indeterminacy of the inverse prob-lem and of the approximations in modeling head geometryand spatial conductivity in the forward model. As a result,source signals are not perfectly reconstructed and spatiallylocalized and may result in spurious values of the S-estima-tor. Given our high-density EEG setup (� 100 channels),the localization accuracy with LAURA is in the order of thegrid size, i.e., about 1 cm (Michel et al., 2004). Furthermore,the whole-brain maps of source power minimize the possi-bility that our synchronization maps depend significantly onsignal-to-noise ratio changes (see Supplementary data). Fi-nally, as described in the following paragraph, we applied aconservative statistical approach in order to interpret onlythe most pronounced effects.
2.6. Group statistics
Two-way between-within ANOVAs included disease(AD patients vs. controls) as a first factor and observationperiod (2 levels: t0 and t1 at baseline and 1-year session,respectively) as a second. Two-way between-within ANOVAswere also performed on the AD patients separately. Withthis design we analyzed the effects of AD subtype (fast-progressing patients vs. slow-progressing patients), obser-vation period (2 levels: t0 and t1), and their interaction.nteractions were sought with planned comparisons thatontrasted t0 and t1 data separately in patients and controls
(the first ANOVA) and in the 2 subgroups of patients (thesecond ANOVA).
To reduce the computational burden of permutation-based nonparametric testing, we applied a parametricANOVA based on the Gaussian distribution. According tothe central limit theorem, because our summary statistics at
the between-subject level are linear mixtures of within-
wwa
tpnd
oe(Sc
ofsb
3
ottu(i
iSnladraidsg
lhsTcgtmrhtss
s
wwa1a
5M. G. Knyazeva et al. / Neurobiology of Aging xx (2012) xxx
subject level data, the random errors in such ANOVAs arewell approximated by a Gaussian distribution.
The univariate p-values were controlled for whole-brainmultiple testing through the local false discovery rate (lfdr)approach (Efron, 2004). The lfdr controls the expected pro-portion of significant findings that are indeed false positives(type I errors). It is an empirical Bayesian method and isdefined from a 2-component mixture model of the observedp-value distribution, namely:
f(P) � �0f0(P) � (1 � �0)fA(P)
here the null density f0 is the uniform distribution U(0,1),hich corresponds to the p-values of no interest, fA is an
lternative density for the p-values of interest, �0 is a truenull proportion, which is estimated from the computed p-value distribution together with the alternative density fA.The lfdr is defined as:
lfdr(P) ��0f0(P)
fA(P)
This formula provides the probability that a null hypothesisis true given the corresponding p-value. Contrary to tradi-ional false discovery methods (Strimmer, 2008), this ap-roach takes into account dependencies between multipleull hypotheses. In our case, it also accommodates spatialependences across a whole-brain synchronization map.
We computed the lfdr from the distribution of p-valuesbtained for the 4024 null hypotheses under test via anstimator implemented in the software package fdrtoolhttp://cran.r-project.org/web/packages/fdrtool/index.html).olution points with a conservative lfdr 0.1 (c.f., with aonventional lfdr 0.2) were considered significant.
The results of ANOVAs are described as the percentagef solution points with significant changes of S-estimatoror broadband source EEG relative to the total number ofolution points spanning relevant anatomical structures,
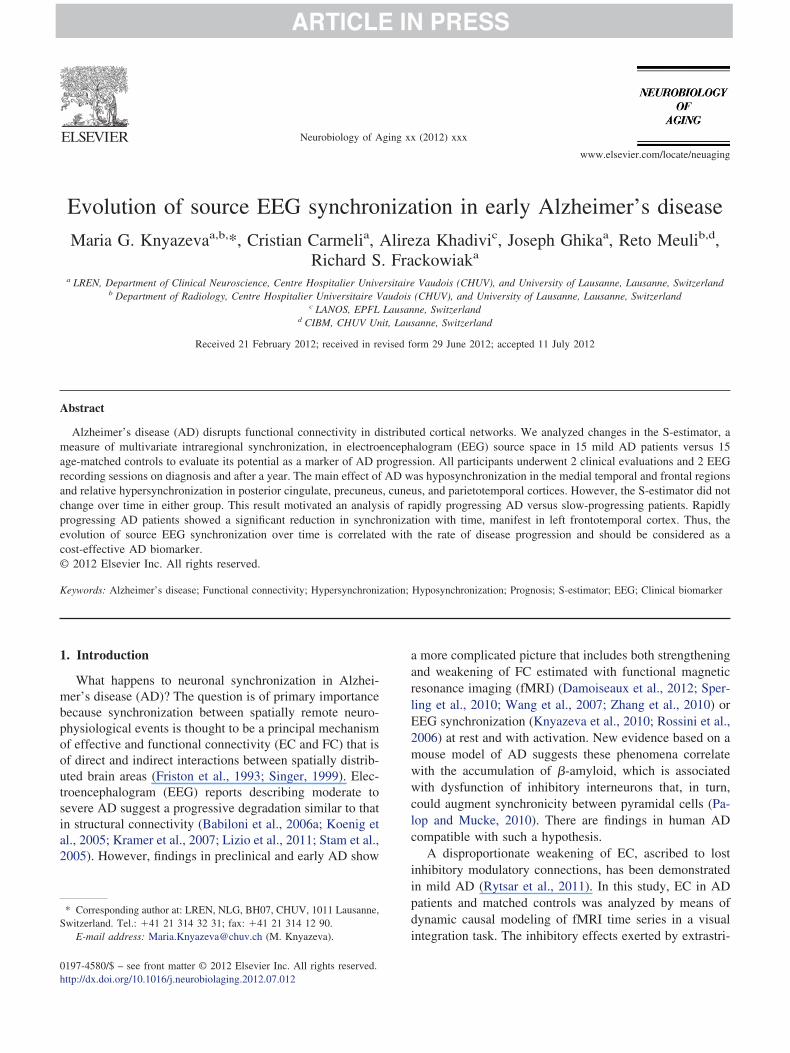
Fig. 1. Main effect of Alzheimer’s disease on regional multivariate synchources hypersynchronized (in red) and hyposynchronized (in blue) in pat
(EEG) recording session. The effects were considered significant at localere no significant effects. For details see the Results section. All the maphich displays the solution points as a series of transparent iso-surfaces.
nd surface projection was used. Specifically, deep sources were displaye2% of the maximum depth, i.e., the depth of 1 hemisphere of the Montreamedium shift (25% of the maximum depth).
ased on the source grid (see Section 2.3.). (
. Results
An ANOVA on nonnormalized data with disease andbservation period as factors (see Methods section for de-ails) showed a significant effect of disease but no effect ofime, nor any interaction. The main effect of disease showedp as a synchronization reduction across all solution pointslfdr 0.1). Therefore, nonnormalized data failed to local-ze AD-affected brain regions or to follow AD progression.
The main effect of disease on normalized S-maps man-fested itself in both hemispheres (blue clusters in Fig. 1,upplementary Table 1) as both hyper- and hyposynchro-ized clusters. Hyposynchronized clusters in patients wereocated in the temporal and prefrontal cortices. The mostffected territories included the superior, middle, and me-ial frontal gyri bilaterally (20%–40%, the percentage iselative to the total number of sources spanning respectivenatomical structure based on the source grid) and the leftnferior and middle temporal gyri (13%–47%). In the me-ial temporal lobe, the uncus (bilaterally, 20%–54% ofources), and the left parahippocampal gyrus (18%) to-ether with the left fusiform gyrus (27%) were affected.
Hypersynchronization was found in posterior clustersocated on the medial, basal, and lateral surfaces of bothemispheres (red clusters in Fig. 1) with the largest hyper-ynchronized network on the right hemispheric convexity.his cluster spread from the right inferior and middle oc-ipital gyri posteriorly to the precentral and middle frontalyri anteriorly, thus covering a significant part of the lateralemporal territories including the superior (57% of sources),iddle (33%), and transverse (86%) temporal gyri and the
ight insula (70%) (Supplementary Table 1). In the leftemisphere, the hypersynchronized cluster was limited tohe parietal and temporal cortices including parts of theuperior and middle temporal gyri (31% and 20% ofources, respectively), and of the supramarginal gyrus
on. The whole-brain 3-D rendering for the S-estimator shows clusters ofmpared with control subjects independently of the electroencephalogram
scovery rate (lfdr) 0.1 for clusters � 5 sources. In the gray areas theremade with Cartool software (https://sites.google.com/site/fbmlab/cartool),er the significant effect at a deep source, a shift between its real positionp of superficial sources. For medial views, we applied a light shift (up tological Institute’s [MNI] average brain), while for other views we applied
ronizatiients cofalse dis were
To rendd on tol Neuro
21%).

iuAtEi
wtc(wp
ftrlrppbd
e
t
6 M. G. Knyazeva et al. / Neurobiology of Aging xx (2012) xxx
The medial hemispheric surfaces were affected symmet-rically. Hypersynchronized networks covered the posteriorcingulate gyrus (51%–69% of sources), precuneus (37%–42%), and cuneus (53%–57%). On the basal hemisphericsurface they were found in the lingual (31%–36% ofsources), right fusiform (11%), and right parahippocampal(30%) gyri. Neither the main effect of time nor the interac-tion was significant.
Because heterogeneity of AD progression was a probablecause for the failure to show AD-specific changes in EEGsynchronization with time, we repeated this analysis afterdividing our patients into 2 sets characterized by fast- (RADgroup, 8 patients) or slow progression (SAD group, 7 pa-tients) of AD symptoms in the period of observation (Table1b). As seen in the table, at baseline the 2 AD subgroups didnot differ significantly in age, MMSE score, or the durationof AD symptoms. Over the period of clinical observation (2years on average) the MMSE score dropped in the RADgroup (p � 0.001), but did not change significantly in theSAD group. The between-subgroup difference in MMSEwas significant both at first-year (t1) (p � 0.005; not givenn the table) and second-year examination (p � 0.001). Wesed this categorization for a 2-way between-withinNOVA to explore the main effects and interaction be-
ween AD subtypes (RAD vs. SAD) and period betweenEGs (t1 vs. t0). We found no significant main effects or
nteraction, when analyzing nonnormalized data.For normalized data, despite the absence of main effects,
e found a significant interaction between AD subtype andime, revealing cortical territories in which synchronizationhanged differentially in RAD compared with SAD patientsFig. 2, top row; Supplementary Table 2). The differencesere much more widespread in the left hemisphere occu-ying frontal and temporal cortices, including the inferior
Fig. 2. Interaction between progression of Alzheimer’s disease and time. Thareas correspond to the significant interaction effects at local false discove
in Alzheimer’s disease (AD) patients with rapidly progressing disease. B
0see the Results section.
rontal gyrus (31% of sources) together with adjacent terri-ories in the precentral (20%), middle frontal (15%), supe-ior temporal (13%), and middle temporal (4%) gyri. Theeft medial temporal lobe was among the most affectedegions. Clusters of deviant synchronization were locatedrominently in the uncus (79% of sources) and the parahip-ocampal gyrus (30%). The posterior cingulate was affectedilaterally (10%–41%). Another cluster was located in theistal part of the left precentral gyrus.
To interpret the interaction, we examined simple mainffects with planned comparisons between the 2 sessions (t1
vs. t0) separately in RAD and SAD patients. The results ofthese comparisons show frontotemporal hypo-synchroniza-tion in the RAD subgroup over a year (Fig. 2, bottom row).These effects were seen predominantly in the left hemi-sphere. Seventy-one percent of sources were affected in theuncus, 25% in the parahippocampal gyrus, 28% in theinferior frontal gyrus and 14%, in the middle frontal gyrus.There were also small clusters of increased synchronizationlocated in the precentral and posterior cingulate gyri bilat-erally and in the left subcallosal gyrus and left precuneus.SAD patients showed no significant changes in source EEGsynchronization over a year.
To better understand regional dynamics exposed by hy-persynchronized clusters in normalized maps, we visualizeda synchronization landscape in absolute values of S-estima-tor (Fig. 3A). As this figure demonstrates, the landscape ischaracterized by peak values of S-estimator in the parietal/cingulate regions in both groups and by dip values in themedial temporal regions. We also performed a 3-wayANOVA with disease (AD vs. controls), observation period(t0 vs. t1) and cluster type (hyper- vs. hyposynchronized)factors on absolute values of the S-estimator averaged overthe clusters outlined in Fig. 3A. They showed up both in the
w shows the 3-D rendering of interaction effects on the S-estimator. Black(lfdr) 0.1. The bottom row shows the planned simple contrast t1 versusr corresponds to t � t , while red color corresponds to t � t . For details
e top rory ratelue colo
1 0 1 0
nscbl0
sSscpEeevi
4
ipairb
aAccT
tpwctstf
isTisakppm2
tpcfigo(tpAc
(om(
7M. G. Knyazeva et al. / Neurobiology of Aging xx (2012) xxx
main effect of AD (Fig. 1) and as an interaction (Fig. 2). Foronnormalized data, we found a significant cluster by ob-ervation period interaction (hypersynchronized clustershanged more slowly with time at p � 0.023) and a clustery disease interaction (the difference in synchronizationevels between cluster types was greater in patients at p �.026 [Fig. 3B]).
We additionally performed a whole-brain analysis ofource EEG power (see Supplementary information andupplementary Fig. 1) with the 2 ANOVAs applied to theynchronization maps. In contrast to regionally specifichanges of the S-estimator, we found either a highly dis-ersed decrease in absolute (i.e., nonnormalized) sourceEG power in AD patients versus controls or no significantffects (RAD vs. SAD patients). This makes a significantffect of signal-to-noise ratio changes on the S-estimatorery unlikely, so supporting the interpretation of our find-ngs in terms of true regional FC.
. Discussion
The year following clinical diagnosis is of particularmportance as it is a period when a treatment is oftenrescribed and its effects must be tracked and estimatedccurately. Here we report changes in local intraregional FCnduced by mild AD and their evolution over a year. Ouresults suggest that such an EEG measure has potential as aiomarker of disease progression.
Some of our AD patients belonged to a larger groupnalyzed in a cross-sectional study (Knyazeva et al., 2010).t the point of clinical diagnosis, the whole group was
haracterized by a specific landscape of synchronizationhanges derived from high-density EEG in sensor space.
Fig. 3. (A) Topography of absolute synchronization. The whole-brain landsA cool-warm color scale represents low-high values of synchronization(https://sites.google.com/site/fbmlab/cartool) as described in Fig. 1. The b12 and 21 sources, respectively) that are common to the main effect of Alzn absolute values of S-estimator averaged for clusters outlined in (A). A siore slowly with time (p � 0.023) and a cluster by disease interaction: the
p � 0.026).
his included hyposynchronized clusters in the left fronto- p
emporal region and hypersynchronized ones in temporo-arieto-occipital regions bilaterally. This pattern of changesas reproducible across different measures of EEG syn-
hronization and across frequency bands. However, surfaceopography provides limited information about source braintructures causing the changes in EEG synchronization andherefore, limits compatibility of EEG data with resultsrom other neuroimaging domains.
To ensure the integration of EEG-based local FC find-ngs with other neuroimaging modalities, we applied aource EEG reconstruction with the LAURA algorithm.his allowed us to reproduce our earlier main findings,
ncluding bidirectional changes of intraregional FC inource space. In general, the distribution of regions withberrant synchronization corresponds to brain regionsnown to be implicated in AD, including the medial tem-oral lobe and the posterior cingulate—key regions sup-orting memory function—as well as the lateral parietal andedial frontal areas (Braak and Braak, 1991; Buckner et al.,
005; Thompson et al., 2003, 2007).However, our finding that in mild AD the frontal and
emporal networks show reduced synchronization, whileosterior networks are hypersynchronized requires specialonsideration. To the best of our knowledge, we were therst to show such a landscape of changes in local intrare-ional synchronization; a finding that is discrepant withther EEG reports and discussed in detail by Knyazeva et al.2010) previously and so not reprised here. We suggestedhat local hypersynchronization is a transient event androposed a 2-phase scenario for the evolution of FC withD progression. Our idea was that an increase in temporal
oordination of EEG activity is characteristic of early and
absolute S-estimator values is shown for recordings at the baseline session.3-D maps of the left hemisphere were rendered with Cartool softwarered ellipses highlight regions of relative hypo- and hypersynchronization’s disease (AD) (Fig. 1) and the interaction (Fig. 2). (B) Interaction effectst cluster by time interaction: hypersynchronized clusters (red bars) change
nce in synchronization level between the cluster types is greater in patients
cape of. Thelue andheimergnificandiffere
ossibly preclinical AD. With progression, ongoing degra-

8 M. G. Knyazeva et al. / Neurobiology of Aging xx (2012) xxx
dation of anatomical connectivity ultimately results in hy-posynchronization. Our new results support such a scenario.
4.1. AD networks with decreased synchronization: linksto other neuroimaging data
The networks with decreased intraregional synchroniza-tion are in the lateral and medial temporal regions includingparahippocampal and fusiform gyri of the left hemisphereand the uncus, which is affected early in AD, and is bilat-erally desynchronized. Such networks were also localizedalong the interhemispheric fissure, on the convexity andmedial surfaces of both hemispheres from superior andmedial frontal gyri to the postcentral gyrus and paracentrallobule, respectively.
The finding of hyposynchronized networks is an ex-pected result within mainstream thinking about FC in AD.The novel aspect we add is that based on source EEG welocalize these clusters to brain regions involved early in AD,thus confirming their disease-specific topography. The ac-cumulation of neurofibrillary tangles starts in the medialtemporal regions (Braak and Braak, 1991). In vivo neuro-imaging and postmortem anatomical studies consistentlyshow that brain atrophy first develops in the medial tempo-ral lobe and then spreads across the association neocortices.These neuropathological changes manifest with gray matter(Li et al., 2011; Schuff et al., 2009; Thompson et al., 2003,2007) and white matter (Fornari et al., 2012) loss. The lattercan thus be linked to impaired FC as indeed shown inBabiloni et al. (2006b) and Knyazeva et al. (2009).
The asymmetry of hyposynchronization with greater ef-fects in the left hemisphere is mirrored by a comparablespatial pattern of demyelination of juxtacortical white mat-ter (Fornari et al., 2012). The juxtacortical white matterconsists mostly of association U-fibers that implement localcorticocortical connectivity. The deterioration of synchro-nization over a year (see section 4.3.) occurred in the sameand neighboring areas of the left hemisphere. Thompson etal. (2003) found similar asymmetric gray matter atrophy inAD patients. Moreover, the rate of loss at follow-up wasgreater in the left hemisphere. These structural findings arecompatible with our functional ones. Although mountingdata show that the left hemisphere is more affected in earlyAD (Fornari et al., 2012; Thompson et al., 1998; Loewen-stein et al., 1989; Thompson et al., 2003; Zhang et al.,2010), there is no explanation for this finding so far. Otherneurodegenerative diseases, e.g., Parkinson’s disease alsoshow asymmetrical changes at onset.
4.2. What is so special about relativelyhypersynchronized EEG networks?
The relatively hypersynchronized clusters in the normal-ized maps emphasize some regional features hidden in thenonnormalized data. Firstly, these networks have the high-est absolute FC as demonstrated by the landscapes with the
peak parietal/cingulate and the dip mediotemporal S-esti-mator values in our control and patient groups. An fMRI-based analysis of FC similarly showed that the posteriorcingulate and lateral parietal cortices are among regionswith the highest connectivity (Buckner et al., 2009). Sec-ondly, they are characterized by a less rapid decline of FCthan the medial temporal networks. Therefore, while globalsynchronization was lower in our AD group than in con-trols, there existed a differential spatial pattern with parietaland cingulate regions showing somewhat greater synchro-nization and a slower decline than the frontotemporal ones.
On the other hand, our results confirm that clinical man-ifestations of AD are associated with already impaired FCand leave open an issue of AD-related absolute increases.Because the latter were observed in a cross-sectional studyof newly diagnosed AD patients (Knyazeva et al., 2010),this effect may characterize the earlier stages of disease.Indeed, recent fMRI-based studies of FC report bidirec-tional changes in mild AD (Damoiseaux et al., 2012; He etal., 2007; Wang et al., 2007; Zhang et al., 2010). However,given that normalization procedures were used at least insome of these studies (Damoiseaux et al., 2012; Zhang etal., 2010), the phenomenon requires further experimentalexamination in preclinical and early AD.
The posterior neocortical relatively hypersynchronizednetworks overlap with regions of decreased oxygen andglucose metabolism measured with 15O-positron-emissiontomography and fluorodeoxyglucose (FDG)-positron-emis-sion tomography. The latter include the lateral and medialparietal and posterior cingulate cortices, extending into lat-eral occipital and medial temporal regions (Buckner et al.,2005; Edison et al., 2007; Ewers et al., 2011; Frackowiak etal., 1981). Hypometabolism in parietal/posterior cingulateregions is a very early event observed at a preclinical stage,when neither cognitive deficits, nor cerebral atrophy aredetected (Mosconi et al., 2008). The metabolic findingsindicate declining synaptic activity that correlates with cog-nitive deterioration (Jack et al., 2010) and with postmortemchanges of AD (Hoffman et al., 2000).
Because EEG and glucose metabolism reflect aspects ofsynaptic activity, the methods would be expected to produceclinically relevant spatially overlapping results, which isindeed the case. Correlations between EEG localizationbased on a single dipole model and spatial extent of energyhypometabolism have been demonstrated in a mixed mildcognitive impairment-AD population (Dierks et al., 2000).In a recent mouse model with a prodromal AD/mild cogni-tive impairment phenotype, hypometabolic regions overlapwith loci of EEG change (Platt et al., 2011). Finally, a likelyassociation between hypometabolism and intraregionalEEG synchronization is supported by accumulating evi-dence from epilepsy studies. Sites of seizure generation andpropagation demonstrate interictal glucose hypometabolism(Henry and Votaw, 2004) and an increase of interictal re-gional synchronization of intracranial activity, magnetoen-
cephalographic (MEG), and EEG across a wide range of
i
9M. G. Knyazeva et al. / Neurobiology of Aging xx (2012) xxx
epilepsies in both animal models and humans (Bettus et al.,2008; Douw et al., 2010; Garcia Dominguez et al., 2005;Ortega et al., 2008; Schevon et al., 2007).
Collectively these results suggest that increased EEGsynchronization is a manifestation of the hypoactive state ofa region in early AD. The clinical significance of this pos-sibility is that the earliest EEG signs of preclinical AD maybe hypersynchronization in the posterior cortex.
4.3. Follow-up: rapidly progressing versus slowlyprogressing AD
Several longitudinal studies have considered EEG/MEGas a potential objective marker of AD progression. Only aproportion of them is based on serial recordings (al Soininenet al., 1991; Coben et al., 1985; Dunkin et al., 1994; Jelic etal., 2000; Rossini et al., 2006), while in others the baselineEEG/MEG has been retrospectively used as a predictor ofoutcome in clinical follow-up (Luckhaus et al., 2008;Prichep, 2007; van der Hiele et al., 2008; Verdoorn et al.,2011). Reports based on power spectral analysis have con-sistently shown EEG slowing in AD patients, associatedwith a relative power decrease in the fast and � and anncrease in the � and � frequencies. Although well estab-
lished, these EEG features lack sufficient specificity, be-cause they are also present in other frequent pathologiesencountered in elderly populations, among them multi-in-farct dementia, Parkinson’s disease, stroke, as well as innormal aging (Stomrud et al., 2010).
EEG source analysis was expected to improve its diag-nostic specificity via the localization of power changes toregions preferentially affected by AD. Indeed, increased �source power has been found in the temporal and parietalcortices in AD-converters (Prichep, 2007). Yet, of the 2longitudinal studies using source EEG analysis that reportmedication effects, only 1 found a shift of the power spec-trum after a 3-month treatment with rivastigmine in fronto-parietal, posterior cingulate, and medial temporal regions(Gianotti et al., 2008), while the other failed to find anychanges after a year of donepezil dosing (Babiloni et al.,2006).
Mapping synchronization of source EEG (or MEG) is analternative approach to improving the potential of highdensity EEG as an AD biomarker. Although previous stud-ies have not fully exploited the spatial dimension of EEG,because region-of-interest approaches and/or bivariate mea-sures of synchronization suboptimal for whole-brain map-ping, they have reported a number of promising findings,including the AD-specific topography of longitudinalchanges and their correlation with AD progression (Prichep,2007; Rossini et al., 2006; Verdoorn et al., 2011). In con-trast to the greater accuracy of narrow-band power indica-tors of AD, an efficient marker of changes in functionalconnectivity turns out to be broadband synchronization (Kn-yazeva et al., 2010; Prichep, 2007; Verdoorn et al., 2011).
Here we have further optimized the analysis of FC in AD bywhole-brain mapping of broadband multivariate source syn-chronization.
The temporal dynamics of normalized synchronizationappear to be sensitive to AD progression rate within thelimited observation period of a year. We have demonstrateda clear interaction between synchronization changes overtime and the rate of AD progression in territories affected byAD pathology. In contrast to the relatively stable AD groupthat showed no detectable synchronization changes, theprogressing group showed both increases and decreases inregional synchronization. The major change, however, isleft-lateralized hyposynchronization in the medial temporallobe and adjacent frontal cortex that includes the uncus,parahippocampal gyrus, and inferior and middle frontalgyri, further supporting the AD specific topography of EEGsynchronization changes.
In contrast, the relative increase in synchronization islocalized to small bilateral areas in the posterior cingulateand precentral gyri. Three of 4 areas overlap with the hy-persynchronized areas implicated by the main effect of AD.The comparisons between baseline and after a year showthat although hypersynchronization is still observable inrapidly progressive AD, it is much less widespread thanhyposynchronization, which may indicate flattening of re-gional rates of decline. A similar trend was observed byDamoiseaux et al. (2012), who showed bidirectionalchanges of fMRI-based connectivity in AD patients at base-line, but only reductions at follow-up.
These findings imply that normalized intraregional syn-chronization is a sensitive measure of AD progression andof interregional heterochronicity associated with patholog-ical processes. As our results relate to group studies, itremains to be determined whether the sensitivity of ournoninvasive and readily available technique is sufficient forindividual patient monitoring.
4.4. Conclusion
The significance of EEG for AD has been relatively lowbecause of nonspecific findings such as spectral slowing(Jeong, 2004). Our approach, based on multivariate sourceEEG synchronization has revealed a whole-brain, AD-spe-cific phenotype of temporal coordination in distributed cor-tical networks, which shows clinically relevant changesover time. This suggests a new role for EEG as part of amultimodal imaging approach to early diagnostics and fortracking AD evolution. As a cost-effective noninvasivetechnique, EEG can be widely used for primary preclinicalAD screening, followed by other neuroimaging techniques,if indicated. However, the limitations of this study, whichinclude gender composition of control and patient groupsand small sample size for the post hoc descriptive analysisof RAD vs. SAD subgroups, require confirmation of theresults obtained and further studies designed to specify indetail the association between regional EEG synchroniza-
tion and other neuroimaging modalities.
10 M. G. Knyazeva et al. / Neurobiology of Aging xx (2012) xxx
Disclosure statement
The authors disclose no conflicts of interest.All the procedures applied in this study and described in
this report conform to the Declaration of Helsinki (1964) bythe World Medical Association concerning human experi-mentation and were approved by the local Ethics Committeeof Lausanne University. All the patients, caregivers, andcontrol subjects gave written informed consent.
Acknowledgements
This work was supported by Swiss National Foundation,Grant Number 320030-127538/1. We thank Drs. S. Gonza-lez and R. Grave Peralta de Menendez for the discussionsand advice on the inverse EEG solution. We are also in-debted to Mme. Brioschi, Mme. Bourquin, and Mme. Mosetfor the neuropsychological testing of patients and controls.Finally, we greatly acknowledge all the patients and con-trols, who kindly agreed to participate in the study.
Appendix A. Supplementary data
Supplementary data associated with this article can befound, in the online version, at http://dx.doi.org/10.1016/j.neurobiolaging.2012.07.012.
References
Practice parameter for diagnosis and evaluation of dementia (summarystatement). Report of the Quality Standards Subcommittee of theAmerican Academy of Neurology. Neurology, 1994 44, 2203–2206.
Babiloni, C., Cassetta, E., Dal Forno, G., Del Percio, C., Ferreri, F., Ferri,R., Lanuzza, B., Miniussi, C., Moretti, D.V., Nobili, F., Pascual-Marqui, R.D., Rodriguez, G., Luca Romani, G., Salinari, S., Zanetti,O., Rossini, P.M., 2006. Donepezil effects on sources of corticalrhythms in mild Alzheimer’s disease: responders vs. non-responders.Neuroimage 31, 1650–1665.
Babiloni, C., Ferri, R., Binetti, G., Cassarino, A., Dal Forno, G., Ercolani,M., Ferreri, F., Frisoni, G.B., Lanuzza, B., Miniussi, C., Nobili, F.,Rodriguez, G., Rundo, F., Stam, C.J., Musha, T., Vecchio, F., Rossini,P.M., 2006a. Fronto-parietal coupling of brain rhythms in mild cogni-tive impairment: a multicentric EEG study. Brain Res. Bull. 69, 63–73.
Babiloni, C., Frisoni, G., Steriade, M., Bresciani, L., Binetti, G., DelPercio, C., Geroldi, C., Miniussi, C., Nobili, F., Rodriguez, G., Zap-pasodi, F., Carfagna, T., Rossini, P.M., 2006b. Frontal white mattervolume and delta EEG sources negatively correlate in awake subjectswith mild cognitive impairment and Alzheimer’s disease. Clin. Neu-rophysiol. 117, 1113–1129.
Bettus, G., Wendling, F., Guye, M., Valton, L., Régis, J., Chauvel, P.,Bartolomei, F., 2008. Enhanced EEG functional connectivity in mesialtemporal lobe epilepsy. Epilepsy Res. 81, 58–68.
Birks, J., 2006. Cholinesterase inhibitors for Alzheimer’s disease. Co-chrane Database Syst. Rev. 25:CD005593.
Braak, H., Braak, E., 1991. Neuropathological stageing of Alzheimer-related changes. Acta Neuropathol. 82, 239–259.
Brown, R., Kocarev, L., 2000. A unifying definition of synchronization fordynamical systems. Chaos 10, 344–349.
Buckner, R.L., Snyder, A.Z., Shannon, B.J., LaRossa, G., Sachs, R.,Fotenos, A.F., Sheline, Y.I., Klunk, W.E., Mathis, C.A., Morris, J.C.,
Mintun, M.A., 2005. Molecular, structural, and functional character-ization of Alzheimer’s disease: evidence for a relationship betweendefault activity, amyloid, and memory. J. Neurosci. 25, 7709–7717.
Carmeli, C., 2006. Assessing Cooperative Behavior in Dynamical Net-works With Applications to Brain Data. Available at: http://library.epfl.ch/theses/?nr�3651.
Carmeli, C., Knyazeva, M.G., Innocenti, G.M., De Feo, O., 2005. Assess-ment of EEG synchronization based on state-space analysis. Neuroim-age 25, 339–354.
Coben, L.A., Danziger, W., Storandt, M., 1985. A longitudinal EEG studyof mild senile dementia of Alzheimer type: changes at 1 year and at 2.5years. Electroencephalogr. Clin. Neurophysiol. 61, 101–112.
Damoiseaux, J.S., Prater, K.E., Miller, B.L., Greicius, M.D., 2012. Func-tional connectivity tracks clinical deterioration in Alzheimer’s disease.Neurobiol. Aging 33, 828.e19–30.
Dierks, T., Jelic, V., Pascual-Marqui, R.D., Wahlund, L., Julin, P., Linden,D.E., Maurer, K., Winblad, B., Nordberg, A., 2000. Spatial pattern ofcerebral glucose metabolism (PET) correlates with localization of in-tracerebral EEG-generators in Alzheimer’s disease. Clin. Neuro-physiol. 111, 1817–1824.
Douw, L., de Groot, M., van Dellen, E., Heimans, J.J., Ronner, H.E., Stam,C.J., Reijneveld, J.C., 2010. “Functional connectivity” is a sensitivepredictor of epilepsy diagnosis after the first seizure. PLoS One 5,e.10839.
Dunkin, J.J., Leuchter, A.F., Newton, T.F., Cook, I.A., 1994. ReducedEEG coherence in dementia: state or trait marker? Biol. Psychiatry 35,870–879.
Edison, P., Archer, H.A., Hinz, R., Hammers, A., Pavese, N., Tai, Y.F.,Hotton, G., Cutler, D., Fox, N., Kennedy, A., Rossor, M., Brooks, D.J.,2007. Amyloid, hypometabolism, and cognition in Alzheimer disease:an [11C]PIB and [18F]FDG PET study. Neurology 68, 501–508.
Efron, B., 2004. Large-scale simultaneous hypothesis testing: the choice ofa null hypothesis. J. Am. Stat. Assoc. 99, 96–104.
Ewers, M., Frisoni, G.B., Teipel, S.J., Grinberg, L.T., Amaro, E.Jr.,Heinsen, H., Thompson, P.M., Hampel, H., 2011. Staging Alzheimer’sdisease progression with multimodality neuroimaging. Prog. Neuro-biol. 95, 535–546.
Folstein, M.F., Folstein, S.E., McHugh, P.R., 1975. “Mini-mental state”. Apractical method for grading the cognitive state of patients for theclinician. J. Psychiatr. Res. 12, 189–198.
Fornari, E., Maeder, P., Meuli, R., Ghika, J., Knyazeva, M.G., 2012.Demyelination of superficial white matter in early Alzheimer’sdisease: a magnetization transfer imaging study. Neurobiol. Aging33, 428e7.–19.
Frackowiak, R.S., Pozzilli, C., Legg, N.J., Du Boulay, G.H., Marshall, J.,Lenzi, G.L., Jones, T., 1981. Regional cerebral oxygen supply andutilization in dementia. A clinical and physiological study with oxy-gen-15 and positron tomography. Brain 104, 753–778.
Friston, K.J., Frith, C.D., Frackowiak, R.S.J., 1993. Time dependentchanges in effective connectivity measured with PET. Hum. BrainMapp. 1, 69–80.
Garcia Dominguez, L., Wennberg, R.A., Gaetz, W., Cheyne, D., Snead,O.C., III, Perez Velazquez, J.L., 2005. Enhanced synchrony in epilep-tiform activity? Local versus distant phase synchronization in general-ized seizures. J. Neurosci. 25, 8077–8084.
Gianotti, L.R., Künig, G., Faber, P.L., Lehmann, D., Pascual-Marqui, R.D.,Kochi, K., Schreiter-Gasser, U., 2008. Rivastigmine effects on EEGspectra and three-dimensional LORETA functional imaging in Alzhei-mer’s disease. Psychopharmacology (Berl.) 198, 323–332.
Grave de Peralta Menendez, R., Gonzalez Andino, S., Lantz, G., Michel,C.M., Landis, T., 2001. Noninvasive localization of electromagneticepileptic activity. I. Method descriptions and simulations. BrainTopogr. 14, 131–137.
Grave de Peralta Menendez, R., Morier, P., Picard, F., Landis, T., GonzalezAndino, S.L., 2006. Simple techniques for EEG source imaging. Int.
J. Bioelectromagnet. 8, 1–8.
11M. G. Knyazeva et al. / Neurobiology of Aging xx (2012) xxx
Guggisberg, A.G., Dalal, S.S., Zumer, J.M., Wong, D.D., Dubovik, S.,Michel, C.M., Schnider, A., 2011. Localization of cortico-peripheralcoherence with electroencephalography. Neuroimage 57, 1348–1357.
He, Y., Wang, L., Zang, Y., Tian, L., Zhang, X., Li, K., Jiang, T., 2007.Regional coherence changes in the early stages of Alzheimer’s disease:a combined structural and resting-state functional MRI study. Neuro-image 35, 488–500.
Henry, T.R., Votaw, J.R., 2004. The role of positron emission tomographywith [18F]fluorodeoxyglucose in the evaluation of the epilepsies. Neu-roimaging Clin. N. Am. 14, 517–535.
Hoffman, J.M., Welsh-Bohmer, K.A., Hanson, M., Crain, B., Hulette, C.,Earl, N., Coleman, R.E., 2000. FDG PET imaging in patients withpathologically verified dementia. J. Nucl. Med. 41, 1920–1928.
Jack, C.R., Jr., Knopman, D.S., Jagust, W.J., Shaw, L.M., Aisen, P.S.,Weiner, M.W., Petersen, R.C., Trojanowski, J.Q., 2010. Hypotheticalmodel of dynamic biomarkers of the Alzheimer’s pathological cascade.Lancet Neurol. 9, 119–128.
Jelic, V., Johansson, S.E., Almkvist, O., Shigeta, M., Julin, P., Nordberg,A., Winblad, B., Wahlund, L.O., 2000. Quantitative electroencepha-lography in mild cognitive impairment: longitudinal changes and pos-sible prediction of Alzheimer’s disease. Neurobiol. Aging 21, 533–540.
Jeong, J., 2004. EEG dynamics in patients with Alzheimer’s disease. Clin.Neurophysiol. 115, 1490–1505.
Katz, S., 1983. Assessing self-maintenance: activities of daily living, mo-bility, and instrumental activities of daily living. J. Am. Geriatr. Soc.31, 721–727.
Knyazeva, M.G., Fornari, E., Jalili, M., Meuli, R., Maeder, P., 2009.Abnormal EEG synchronization correlates with demyelination in Alz-heimer’s disease. NeuroImage 47(Suppl 1), S112.
Knyazeva, M.G., Jalili, M., Brioschi, A., Bourquin, I., Fornari, E., Hasler,M., Meuli, R., Maeder, P., Ghika, J., 2010. Topography of EEGmultivariate phase synchronization in early Alzheimer’s disease. Neu-robiol. Aging 31, 1132–1144.
Koenig, T., Prichep, L., Dierks, T., Hubl, D., Wahlund, L.O., John, E.R.,Jelic, V., 2005. Decreased EEG synchronization in Alzheimer’s diseaseand mild cognitive impairment. Neurobiol. Aging 26, 165–171.
Kramer, M.A., Chang, F.L., Cohen, M.E., Hudson, D., Szeri, A.J., 2007.Synchronization measures of the scalp electroencephalogram can dis-criminate healthy from Alzheimer’s subjects. Int. J. Neural Syst. 17,61–69.
Lawton, M.P., Brody, E.M., 1969. Assessment of older people: self-maintaining and instrumental activities of daily living. Gerontologist 9,179–186.
Li, X., Coyle, D., Maguire, L., Watson, D.R., McGinnity, T.M., 2011. Graymatter concentration and effective connectivity changes in Alzheimer’sdisease: a longitudinal structural MRI study. Neuroradiology 53, 733–748.
Lizio, R., Vecchio, F., Frisoni, G.B., Ferri, R., Rodriguez, G., Babiloni, C.,2011. Electroencephalographic rhythms in Alzheimer’s disease. Int. J.Alzheimers Dis. 2011, 927573.
Loewenstein, D.A., Barker, W.W., Chang, J.Y., Apicella, A., Yoshii, F.,Kothari, P., Levin, B., Duara, R., 1989. Predominant left hemispheremetabolic dysfunction in dementia. Arch. Neurol. 46, 146–152.
Luckhaus, C., Grass-Kapanke, B., Blaeser, I., Ihl, R., Supprian, T., Win-terer, G., Zielasek, J., Brinkmeyer, J., 2008. Quantitative EEG inprogressing vs stable mild cognitive impairment (MCI): results of a1-year follow-up study. Int. J. Geriatr. Psychiatry 23, 1148–1155.
Mazziotta, J.C., Toga, A.W., Evans, A., Fox, P., Lancaster, J., 1995. Aprobabilistic atlas of the human brain: theory and rationale for itsdevelopment. The International Consortium for Brain Mapping(ICBM). NeuroImage 2, 89–101.
McKhann, G., Drachman, D., Folstein, M., Katzman, R., Price, D., Stadlan,E.M., 1984. Clinical diagnosis of Alzheimer’s disease: report of theNINCDS-ADRDA Work Group under the auspices of Department ofHealth and Human Services Task Force on Alzheimer’s Disease. Neu-
rology 34, 939–944.Michel, C.M., Murray, M.M., Lantz, G., Gonzalez, S., Spinelli, L., Gravede Peralta, R., 2004. EEG source imaging. Clin. Neurophysiol. 115,2195–2222.
Morris, J.C., 1993. The clinical dementia rating (CDR): current version andscoring rules. Neurology 43, 2412–2414.
Mosconi, L., Pupi, A., De Leon, M.J., 2008. Brain glucose hypometabo-lism and oxidative stress in preclinical Alzheimer’s disease. Ann. N. Y.Acad. Sci. 1147, 180–195.
Ortega, G.J., Menendez de la Prida, L., Sola, R.G., Pastor, J., 2008.Synchronization clusters of interictal activity in the lateral temporalcortex of epileptic patients: intraoperative electrocorticographic analy-sis. Epilepsia 49, 269–280.
Palop, J.J., Mucke, L., 2010. Amyloid-beta-induced neuronal dysfunctionin Alzheimer’s disease: from synapses toward neural networks. Nat.Neurosci. 13, 812–818.
Pascual-Marqui, R.D., 2009. Theory of the EEG inverse problem, in: Tong,S., Thakor, N. (Eds.), Quantitative EEG Analysis: Methods and Clin-ical Applications. Artech House, Boston, pp. 121–140.
Platt, B., Drever, B., Koss, D., Stoppelkamp, S., Jyoti, A., Plano, A., Utan,A., Merrick, G., Ryan, D., Melis, V., Wan, H., Mingarelli, M., Porcu,E., Scrocchi, L., Welch, A., Riedel, G., 2011. Abnormal cognition,sleep, EEG and brain metabolism in a novel knock-in Alzheimermouse, PLB1. PLoS One 6(11):e27068.
Prichep, L.S., 2007. Quantitative EEG and electromagnetic brain imagingin aging and in the evolution of dementia. Ann. N. Y. Acad. Sci. 1097,156–167.
Puel, M., Hugonot-Diener, L., 1996. Presenting by the GRECO group ofthe French adaptation of a cognitive assessment scale used in Alzhei-mer type dementia. Presse Med. 22, 1028–1132.
Rossini, P.M., Del Percio, C., Pasqualetti, P., Cassetta, E., Binetti, G., DalForno, G., Ferreri, F., Frisoni, G., Chiovenda, P., Miniussi, C., Parisi,L., Tombini, M., Vecchio, F., Babiloni, C., 2006. Conversion frommild cognitive impairment to Alzheimer’s disease is predicted bysources and coherence of brain electroencephalography rhythms. Neu-roscience 143, 793–803.
Rytsar, R., Fornari, E., Frackowiak, R.S., Ghika, J.A., Knyazeva, M.G.,2011. Inhibition in early Alzheimer’s disease: an fMRI-based study ofeffective connectivity. Neuroimage 57, 1131–1139.
Scaln, S.G., Reisberg, B., 1992. Functional Assessment Staging (FAST) inAlzhiemer’s disease: reliability, validity and ordinality. Int. Psychoge-riatr. 4, 55–69.
Schevon, C.A., Cappell, J., Emerson, R., Isler, J., Grieve, P., Goodman, R.,McKhann, G., Jr., Weiner, H., Doyle, W., Kuzniecky, R., Devinsky, O.,Gilliam, F., 2007. Cortical abnormalities in epilepsy revealed by localEEG synchrony. Neuroimage 35, 140–148.
Schoffelen, J.M., Gross, J., 2009. Source connectivity analysis with MEGand EEG. Hum. Brain Mapp. 30, 1857–1865.
Schuff, N., Woerner, N., Boreta, L., Kornfield, T., Shaw, L.M., Tro-janowski, J.Q., Thompson, P.M., Jack, C.R., Jr., Weiner, M.W., Alz-heimer’s Disease Neuroimaging Initiative, 2009. MRI of hippocampalvolume loss in early Alzheimer’s disease in relation to ApoE genotypeand biomarkers. Brain 132, 1067–1077.
Schuz, A., Braitenberg, V., 2002. The human cortical white matter: Quan-titative aspects of cortico-cortical long-range connectivity, in: Schultz,R., Miller, R. (Eds.), Cortical Areas: Unity and Diversity (ConceptualAdvances in Brain Research). Taylor & Francis, London, pp. 377–386.
Singer, W., 1999. Neuronal synchrony: a versatile code for the definition ofrelations? Neuron 24, 49–65, 111–125.
Soininen, H., Partanen, J., Laulumaa, V., Pääkkönen, A., Helkala, E.L.,Riekkinen, P.J., 1991. Serial EEG in Alzheimer’s disease: 3 yearfollow-up and clinical outcome. Electroencephalogr. Clin. Neuro-physiol. 79, 342–348.
Sperling, R.A., Dickerson, B.C., Pihlajamaki, M., Vannini, P., LaVio-lette, P.S., Vitolo, O.V., Hedden, T., Becker, J.A., Rentz, D.M.,
Selkoe, D.J., Johnson, K.A., 2010. Functional alterations in memory
12 M. G. Knyazeva et al. / Neurobiology of Aging xx (2012) xxx
networks in early Alzheimer’s disease. Neuromolecular Med. 12,27– 43.
Stam, C.J., Montez, T., Jones, B.F., Rombouts, S.A., van der Made, Y., Pijnen-burg, Y.A., Scheltens, P., 2005. Disturbed fluctuations of resting state EEGsynchronization in Alzheimer’s disease. Clin. Neurophysiol. 116, 708–715.
Stomrud, E., Hansson, O., Minthon, L., Blennow, K., Rosén, I., Londos, E.,2010. Slowing of EEG correlates with CSF biomarkers and reducedcognitive speed in elderly with normal cognition over 4 years. Neuro-biol. Aging 31, 215–223.
Strimmer, K., 2008. A unified approach to false discovery rate estimation.BMC Bioinformatics 9, 303.
Thompson, P.M., Moussai, J., Zohoori, S., Goldkorn, A., Khan, A.A.,Mega, M.S., Small, G.W., Cummings, J.L., Toga, A.W., 1998. Corticalvariability and asymmetry in normal aging and Alzheimer’s disease.Cereb. Cortex 8, 492–509.
Thompson, P.M., Hayashi, K.M., de Zubicaray, G., Janke, A.L., Rose,S.E., Semple, J., Herman, D., Hong, M.S., Dittmer, S.S., Doddrell,D.M., Toga, A.W., 2003. Dynamics of gray matter loss in Alzheimer’s
disease. J. Neurosci. 23, 994–1005.Thompson, P.M., Hayashi, K.M., Dutton, R.A., Chiang, M.C., Leow, A.D.,Sowell, E.R., De Zubicaray, G., Becker, J.T., Lopez, O.L., Aizenstein,H.J., Toga, A.W., 2007. Tracking Alzheimer’s disease. Ann. N. Y.Acad. Sci. 1097, 183–214.
van der Hiele, K., Bollen, E.L., Vein, A.A., Reijntjes, R.H., Westendorp,R.G., van Buchem, M.A., Middelkoop, H.A., van Dijk, J.G., 2008.EEG markers of future cognitive performance in the elderly. J. Clin.Neurophysiol. 25, 83–89.
Verdoorn, T.A., McCarten, J.R., Arciniegas, D.B., Golden, R., Moldauer,L., Georgopoulos, A., Lewis, S., Cassano, M., Hemmy, L., Orr, W.,Rojas, D.C., 2011. Evaluation and tracking of Alzheimer’s diseaseseverity using resting-state magnetoencephalography. J. AlzheimersDis. 26(Suppl 3), 239–255.
Wang, K., Liang, M., Wang, L., Tian, L., Zhang, X., Li, K., Jiang, T., 2007.Altered functional connectivity in early Alzheimer’s disease: a resting-state fMRI study. Hum. Brain Mapp. 28, 967–978.
Zhang, H.Y., Wang, S.J., Liu, B., Ma, Z.L., Yang, M., Zhang, Z.J., Teng,G.J., 2010. Resting brain connectivity: changes during the progress of
Alzheimer disease. Radiology 256, 598–606.