evolution of reduced pre-adult viability and larval growth rate in laboratory populations of...
TRANSCRIPT
Genet. Res., Camb. (2000), 76, pp. 249–259. With 5 figures. Printed in the United Kingdom # 2000 Cambridge University Press 249
Evolution of reduced pre-adult viability and larval growth
rate in laboratory populations of Drosophila melanogaster
selected for shorter development time
N. G. PRASAD, MALLIKARJUN SHAKARAD, VISHAL M. GOHIL†, V. SHEEBA,
M. RAJAMANI AMITABH JOSHI*E�olutionary Biology Laboratory, E�olutionary & Organismal Biology Unit, Jawaharlal Nehru Centre for Ad�anced Scientific Research,PO Box No. 6436, Jakkur, Bangalore 560 064, India
(Recei�ed 28 July 1999 and in re�ised form 29 February and 12 June 2000)
Summary
Four large (n"1000) populations of Drosophila melanogaster, derived from control populations
maintained on a 3 week discrete generation cycle, were subjected to selection for fast development
and early reproduction. Egg to eclosion survivorship and development time and dry weight at
eclosion were monitored every 10 generations. Over 70 generations of selection, development time
in the selected populations decreased by approximately 36 h relative to controls, a 20% decline.
The difference in male and female development time was also reduced in the selected populations.
Flies from the selected populations were increasingly lighter at eclosion than controls, with the
reduction in dry weight at eclosion over 70 generations of selection being approximately 45% in
males and 39% in females. Larval growth rate (dry weight at eclosion}development time) was also
reduced in the selected lines over 70 generations, relative to controls, by approximately 32% in
males and 24% in females. However, part of this relative reduction was due to an increase in
growth rate of the controls populations, presumably an expression of adaptation to conditions in
our laboratory. After 50 generations of selection had elapsed, a considerable and increasing pre-
adult viability cost to faster development became apparent, with viability in the selected
populations being about 22% less than that of controls at generation 70 of selection.
1. Introduction
In recent years, much empirical work on life-history
evolution has focused upon the elucidation of trade-
offs between components of fitness, especially those
generated by antagonistic pleiotropy, and the bulk of
this work has been done on Drosophila species (Rose
et al., 1987, 1996; Joshi, 1997). There is now clear
evidence for multiple trade-offs between components
of adult fitness in Drosophila, for example negative
effects of early reproduction upon later reproduction
and adult survival}longevity (Rose, 1984; Service et
al., 1985, 1988; Roper et al., 1993; Zwaan, 1993;
Leroi et al., 1994; Joshi et al., 1996), as well as
between larval components of fitness, such as rate of
food acquisition and the efficiency of its utilization
* Corresponding author. Tel : 80 8462750. Fax: 80 8462766.e-mail : ajoshi!jncasr.ac.in
† Present address : Department of Biological Sciences, Wayne StateUniversity, Detroit MI 48202, USA.
(Mueller, 1990; Joshi & Mueller, 1996; Santos et al.,
1997), or the rate of food acquisition and survival to
eclosion, especially in the presence of nitrogenous
metabolic wastes (Borash et al., 1998). Trade-offs
between larval and adult fitness components, however,
have not received as much attention, even though
selection on juvenile stages in organisms with a
complex life-cycle, such as holometabolous insects,
can have profound effects on traits directly relevant to
adult fitness (Chippindale et al., 1997; Santos et al.,
1997).
Most work on trade-offs linking larval and adult
fitness components in Drosophila has centred around
the relationship between development time, adult size
and adult lifespan, and, unfortunately, studies in
different laboratories have tended to yield somewhat
discordant results (e.g. see discussion in Chippindale
et al., 1994). In this paper, we focus on the relationship
between development time and adult size at eclosion.
Adult size at eclosion is an important fitness trait in
N. G. Prasad et al. 250
holometabolous insects such as Drosophila, being at
the junction of the pre-adult and adult life-stages.
Adult size at eclosion is, thus, a good example of a
trait that is determined largely by resource acquisition
and utilization during the larval stage but exerts its
effects on fitness through adult life-history components
such as fecundity and lifespan. Large body size in
Drosophila tends to be positively correlated with both
male mating success (Partridge et al., 1987) and
female fecundity (Mueller, 1985). Consequently, it has
been thought that there is a trade-off between faster
development and adult size, and that this trade-off, in
part, has shaped the evolution of larval growth rates
in nature (Santos et al., 1988; Partridge & Fowler,
1993). In different studies on Drosophila, direct
selection for fast development has been seen to yield
correlated decreases in adult weight (Zwaan et al.,
1995; Nunney, 1996; Chippindale et al., 1997).
Selection for larger flies has also been seen to result in
correlated increases in development time, but selection
for smaller flies did not result in the evolution of
decreased development time (Partridge & Fowler,
1993). The notion of a trade-off between fast
development and adult size is also supported by
quantitative genetic studies of fitness effects of
chromosome inversions in D. buzzatii (Betran et al.,
1998). However, subjecting Drosophila populations to
extreme larval crowding, a scenario in which faster
development is also under indirect selection because
food runs out well before most larvae have finished
development, does not result in the evolution of
smaller body size (Santos et al., 1997). It is likely,
therefore, that even this fairly consistently seen
trade-off between fast development and adult size
may be susceptible to environmental effects, especially
density.
There is also some evidence of a trade-off between
faster development and pre-adult survivorship. In a
survey of laboratory populations subjected to varying
demographic maintenance regimes, Chippindale et al.
(1994) observed a negative correlation between de-
velopment time and pre-adult survivorship. Similarly,
selection for faster development was seen to result in
decreased pre-adult survivorship (Chippindale et al.,
1997). However, in a study using flies from a different
ancestry than those used by Chippindale et al.
(1994, 1997), no significant differences were obser-
ved in pre-adult survivorship between control lines
and those selected for faster development (Zwaan
et al., 1995).
Given the importance of large body size due to the
correlation of size and fecundity, and the trade-off
between faster development and adult body size, it is
reasonable to expect that, all else being equal, selection
for faster pre-adult development will result in the
evolution of a greater larval growth rate (i.e. the rate
at which weight is put on during development). If such
selection does not result in the evolution of a higher
larval growth rate, it would indicate the existence of
some hitherto unexplored constraints on the optimiz-
ation of growth rate and body size. Due to the impact
of body size on adult components of fitness, such
constraints, if they exist, would be of considerable
significance in shaping the evolution of life-histories
under scenarios where faster development is selectively
favoured.
In this paper, we report results from the first 70
generations of a continuing experiment in which we
subjected four large, outbred populations of Droso-
phila melanogaster to selection for fast development
and early reproduction, relative to their ancestral
populations that served as controls, and compared the
selected populations and their controls for egg to
eclosion development time and survivorship, dry
weight at eclosion, and larval growth rate. Our
populations share common ancestors (the B popu-
lations of Rose, 1984) with all populations used in
studies in the Rose laboratory (Service et al., 1985,
1988; Leroi et al., 1994; Chippindale et al., 1994,
1997). Our study, therefore, also acts as a useful
repetition, with some differences in protocol, of a
similar study carried out by Chippindale et al. (1997);
such repetition is helpful in assessing how robust
results from laboratory studies in life-history evolution
are (Joshi & Mueller, 1996; Reznick & Ghalambor,
1999; Harshman & Hoffmann, 2000).
2. Materials and methods
(i) Experimental populations
This study was conducted on eight laboratory popu-
lations of D. melanogaster : four populations selected
for fast development from egg to eclosion and early
reproduction (FEJ-1…4; Fast development, Early
reproduction, derived from JB populations), and the
four control populations from which the selected lines
were derived (JB-1…4; first described by Sheeba et
al., 1998). The JB populations are maintained at 25 °Con a 21 day discrete-generation cycle, under constant
light, at moderate densities of approximately 60–80
larvae per 8 dram vial (9±0 cm high¬2±4 cm diameter)
containing approximately 6 ml of banana-jaggery
food medium. Every generation, adults of each
population are allowed to oviposit for about 18 h on
Petri plates of fresh banana-jaggery food placed in a
Plexiglas cage (25¬20¬15 cm$). From these Petri
plates, approximately 60–80 eggs are collected into
each of 40 vials in which larvae then develop into
adults. Adults eclosing from these vials are transferred
to fresh food vials on day 12, 14 and 16 after egg-lay.
On the 18th day after egg-lay, adult flies are transferred
into Plexiglas cages and supplied with banana-jaggery
food supplemented with live yeast and acetic acid
paste for 2 days, after which eggs are collected to
Selection for rapid de�elopment in Drosophila 251
initiate the next generation and the adults discarded.
The population typically consists of about 1600–1800
flies at this stage.
The FEJ populations are maintained on a similar
regime except that 80 vials of approximately 60–80
eggs are collected per population, and once the pupae
darken, the vials are closely monitored and only the
first 25% or so of eclosing flies per vial, regardless of
sex, are transferred into cages to constitute the pool of
breeding adults. The flies in the cages are supplied
with yeasted food medium for 2 days and then
allowed to oviposit for about 1 h on a fresh food
plate. The number of breeding adults in the FEJ
populations is typically 1000–1200. Thus, the differ-
ences between the two types of population are : (a)
FEJ eggs are collected around day 11 (day 10 in later
generations of selection) while those of JB are collected
on day 21 after egg-lay, (b) the egg-laying window is
approximately 1 h for FEJ and 18 h for JB, (c) only
the first 25% or so of eclosing flies contribute to the
next generation in FEJ, whereas in JB populations
all flies eclosing on or before day 12 contribute to
the next generation (this is sufficient time for prac-
tically all the surviving individuals to eclose at the
moderate densities used to maintain these popu-
lations), and (d) the number of breeding adults in the
JB populations is somewhat greater than in the FEJ
populations.
Each FEJ population was derived from one JB
population. Therefore, FEJ and JB populations
bearing the same numerical subscript are more closely
related than different FEJ or JB populations are
amongst themselves (FEJ-i, JB-i are more closely
related than FEJ-i and FEJ-j or JB-i and JB-j ; i, j¯1,…,4). Populations bearing the same numerical sub-
script were, consequently, treated as blocks in the
statistical analyses. The four JB populations were
derived from four of the fiveUUpopulations described
in Joshi & Mueller (1996), and had been independent
evolutionary entities in the laboratory for over 450
generations since their derivation from a common
ancestral population established from wild-caught
flies in South Amherst, Massachussetts (Ives, 1970).
For about 110 generations preceding the derivation of
the JB populations, the UU populations had been
maintained on a 21 day discrete-generation cycle in
the laboratory, prior to which the ancestors of the UU
populations, the B populations of Rose (1984), had
been maintained on a 14 day discrete-generation cycle
for approximately 350 generations. Both the B
populations and the UU populations were maintained
on banana-molasses food at 25 °C under constant
light. The maintenance regime of the JB populations
is essentially the same as that of their UU ancestors,
except for the fact that the banana-jaggery food,
though very similar, is not exactly identical to banana-
molasses food.
(ii) Collection of adults for assays
Prior to assaying, all populations were passed through
a full generation of common rearing to obviate any
parental effects due to differences in maintenance
regime. From the running cultures of each of the FEJ
and JB populations, 20 vials of approximately 60–80
eggs were collected. Adults eclosing in these vials were
collected into cages 12 days after egg-lay, by which
time all flies would have eclosed. The progeny of
these adults (henceforth referred to as standardized
flies) were used for the various assays.
(iii) De�elopment time and sur�i�orship assays
Development time and survivorship assays were
conducted every 10 generations during the course of
selection. Standardized flies of each JB and FEJ
population were supplied with yeasted agar plates in
the cages for 1 h. Eggs were collected off these plates
with the help of a moistened brush and placed in vials
containing 5 ml banana food at a density of 30 eggs
per vial. Sixteen such vials were set up per population
(8 for the generation 10 and 20 assays). Once the
pupae darkened, the vials were checked every 4 h and
any eclosed adults were removed, sexed and the time
of their eclosion recorded. These 4 hourly checks were
continued until 3 consecutive days passed with no
eclosion recorded from any vial.
(iv) Dry weight assays
Dry weight assays were conducted every 10 gener-
ations, from generation 20 onward. Freshly eclosed
adults (! 2 h post-eclosion) originating from eggs laid
by standardized flies were collected, killed by freezing,
dried for 18 h at approximately 70 °C and weighed in
batches of 5 males or 5 females. The flies collected for
the assays were reared at a larval density of 30 eggs
per vial, and all flies eclosing during the 10–14 h
period of bulk eclosion in each vial were collected at
2 h intervals and frozen. From these frozen flies, six
batches each of males and females were chosen
haphazardly and weighed for each FEJ and JB
population. Data on dry weight at eclosion and egg to
eclosion development time were also used to estimate
larval growth rates for each FEJ and JB population by
dividing population mean dry weight at eclosion by
the mean development time.
(v) Statistical analyses
In selection experiments, the unit of replication is the
population, implying that the error variation for
N. G. Prasad et al. 252
220
210
200
190
180
170
160
150
140
13010 20 30 40 50 60 70
FEJ
JB
40 50 60 70302010
Generations of FEJ selection
Mea
n de
velo
pmen
t tim
e (h
rs)
Males Females
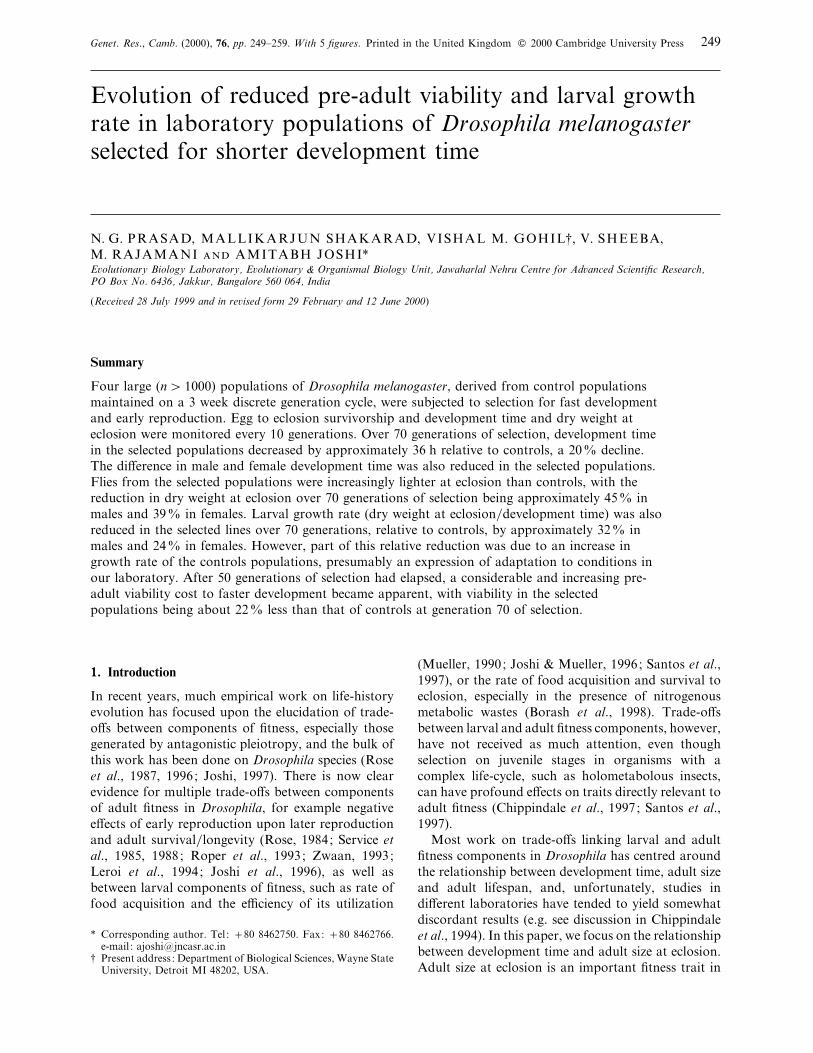
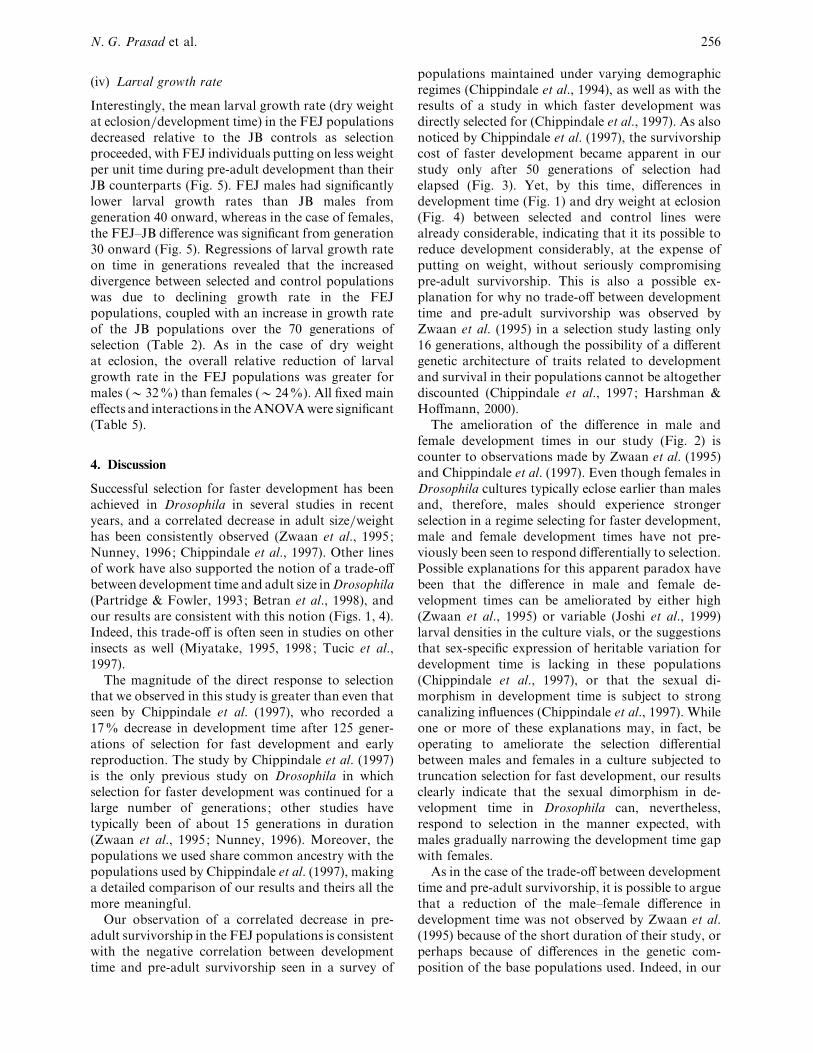
Fig. 1. Mean egg to eclosion development time of males and females from the selected (FEJ) and control (JB)populations over the course of selection for faster development and early reproduction. The error bars represent 95%confidence intervals about the mean of the four replicate populations in each selection regime, calculated using leastsquares estimates of the standard errors of the appropriate cell means in the randomized block ANOVA, and can,therefore, be used for visual hypothesis testing.
testing hypotheses regarding selection regime is the
variation among population means (Chippindale et
al., 1994; Rose et al., 1996). Consequently, for each of
the four traits considered (development time, pre-
adult survivorship, dry weight at eclosion, and larval
growth rate), the primary units of analyses were the
population mean trait values for a given combination
of block¬generation of assay¬sex (except for sur-
vivorship)¬selection regime. For each trait, two
analyses were done. Analyses of variance (ANOVAs)
were conducted according to a mixed model, com-
pletely randomized block design wherein time (gen-
eration of assay), sex (except in the case of sur-
vivorship) and selection regime were treated as fixed
factors, crossed amongst themselves, and with random
blocks based on ancestry (see last paragraph of
Section 2.i, above). In such a design, it is not possible
to test for significance of block or any interactions
involving block; these effects are anyway not of great
interest in laboratory selection studies. All ANOVAs
were done on untransformed data, since the units of
analysis were mean values, which can be assumed to
follow a normal distribution to a reasonable degree.
In addition to the ANOVAs, the mean trait values for
each combination of block¬generation¬sex (except
for survivorship)¬selection regime were linearly
regressed upon time in generations, to detect any
long-term directional changes in mean trait values in
either the control or selected populations in the course
of the 70 generations of selection. In the case of
development time, the difference between males and
females in each population was also regressed over
time in generations to determine whether selection for
faster development ameliorated the development time
advantage of females typically seen in Drosophila
cultures. All statistical analyses were implemented
using STATISTICA for Windows, release 5.0 B
(StatSoft, 1995).
3. Results
(i) Egg to eclosion de�elopment time
We observed a strong and consistent direct response
to selection on egg to eclosion development time, with
the mean difference between FEJ and JB populations
increasing from approximately 6 h at generation 10 to
approximately 36 h (a 20% reduction, relative to
controls) at generation 70 of selection (Fig. 1).
Although the absolute values of development time
changed considerably from assay to assay, the
difference in development time between the selected
and control lines underwent an almost linear increase
over time. The ANOVA revealed significant main
effects of time, sex (males took longer to develop than
females) and selection regime, as well as significant
time¬sex and time¬selection regime interactions
(Table 1). The regression of development time on time
in generations had a significantly negative slope in the
FEJ populations, whereas the slope of the JB
populations did not differ significantly from zero
(Table 2), and this difference in long-term trends in
the selected and control populations is reflected in the
strong time¬selection regime interaction in the
ANOVA.
As selection proceeded, the difference between male
and female mean development time was consistently
reduced in the FEJ populations, declining from 4±5 h
Selection for rapid de�elopment in Drosophila 253
Table 1. Results of analysis of �ariance (ANOVA) on mean egg to
eclosion de�elopment time in the FEJ and JB populations
Source df MS F P
Time 6 3200±36 23±34 ! 0±001
Sex 1 385±97 1331±72 ! 0±001
Selection regime (Sel) 1 14314±01 1487±28 ! 0±001
Time¬Sex 6 2±92 5±82 0±002Time¬Sel 6 434±66 44±75 ! 0±001
Sex¬Sel 1 6±72 6±86 0±079Time¬Sex¬Sel 6 0±61 0±59 0±733
The effects of block and interactions involving block cannot be tested forsignificance in the randomized block design and have, therefore, been omittedfrom the table.
Table 2. Summary of the results of linear regressions of mean trait �alue o�er time in generations for
de�elopment time (in h), dry weight at eclosion (in mg) and lar�al growth rate (in µg}h)
Trait
Selection regime
FEJ JB
Males Females Males Females
Development time ®0±6654 ®0±6216 ®0±1920 ®0±1680(1±6¬10−' ; 0±59) (4±0¬10−' ; 0±57) (0±0784; 0±11) (0±1179; 0±09)
Dry weight at eclosion ®0±0017 ®0±0019 ®0±0003 ®0±0003(4±4¬10−"" ; 0±87) (6±6¬10−* ; 0±79) (0±1357; 0±10) (0±2388; 0±06)
Larval growth rate ®0±0039 ®0±0034 0±0019 0±0027(8±7¬10−& ; 0±51) (0±0126; 0±25) (0±0418; 0±18) (0±0216; 0±22)
Entries are the slopes of the regressions, followed by P values and coefficients of determination (R#), respectively, inparentheses.
8
7
6
5
4
3
2
1
0
FEJJB
10 20 30 40 50 60 70Generations of FEJ selection
Mea
n di
ffer
ence
in d
evel
opm
ent t
ime
betw
een
mal
es a
nd f
emal
es
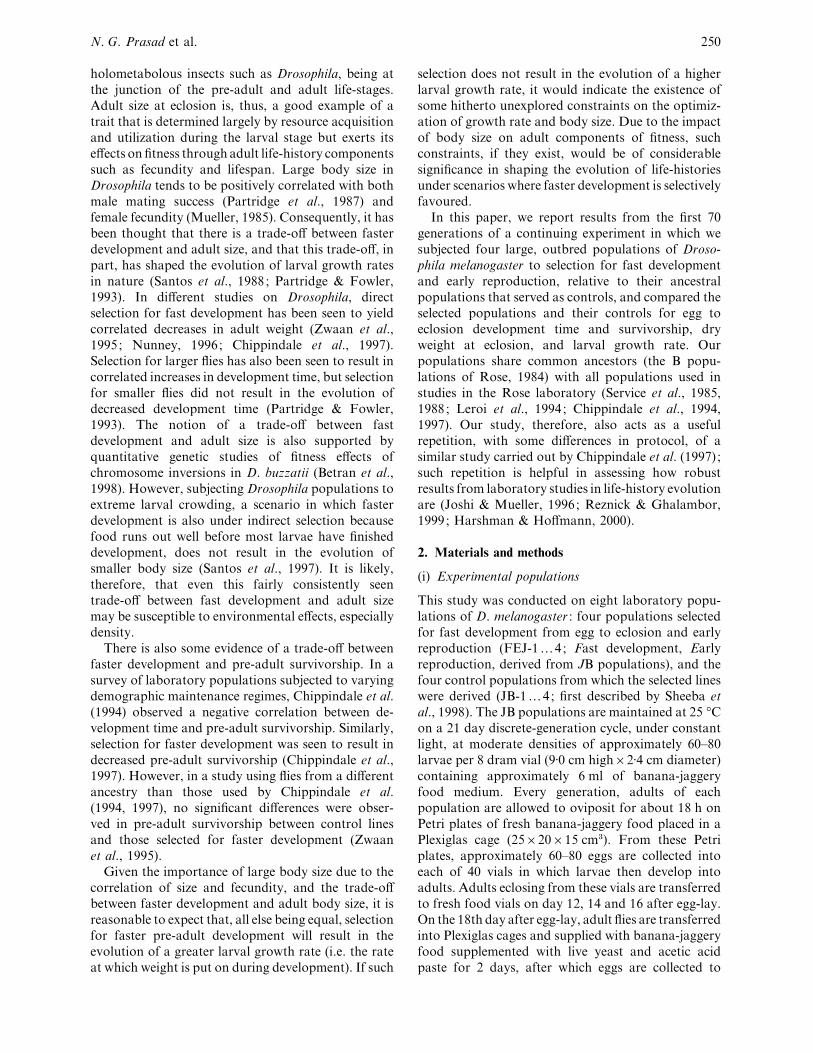
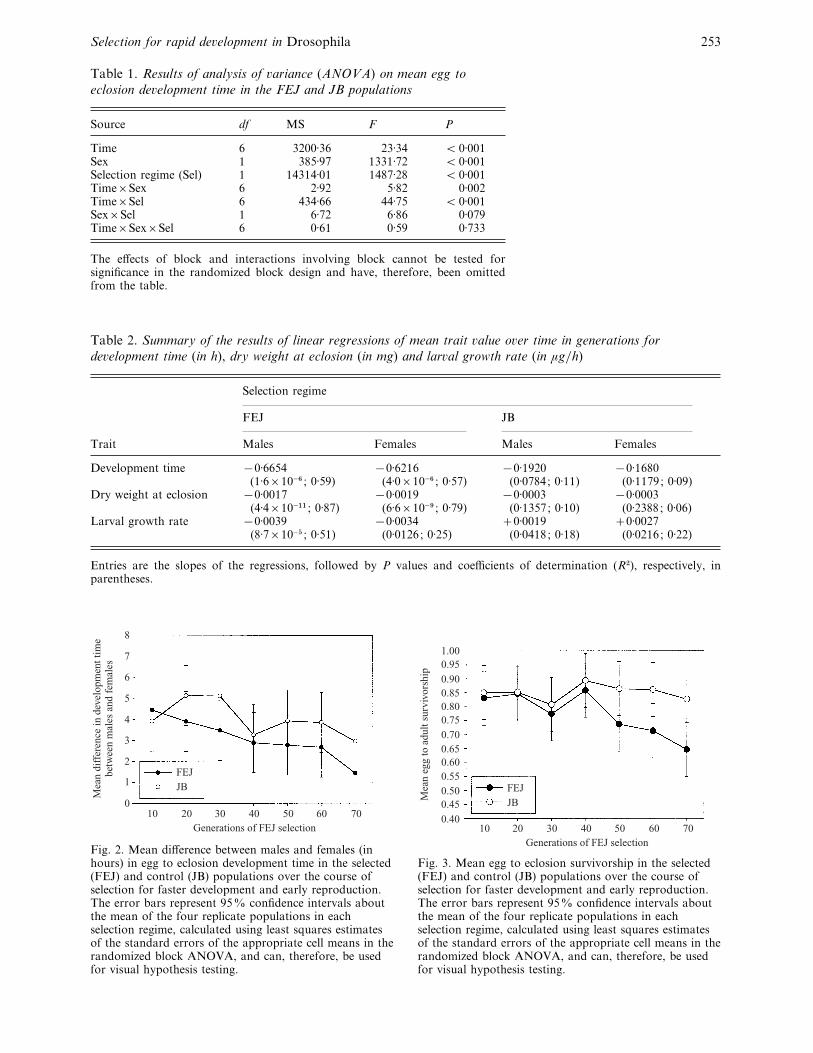
Fig. 2. Mean difference between males and females (inhours) in egg to eclosion development time in the selected(FEJ) and control (JB) populations over the course ofselection for faster development and early reproduction.The error bars represent 95% confidence intervals aboutthe mean of the four replicate populations in eachselection regime, calculated using least squares estimatesof the standard errors of the appropriate cell means in therandomized block ANOVA, and can, therefore, be usedfor visual hypothesis testing.
1.00
0.900.850.80
0.700.65
0.500.45
0.40
FEJJB
10 20 30 40 50 60 70Generations of FEJ selection
Mea
n eg
g to
adu
lt s
urvi
vors
hip
0.550.60
0.75
0.95
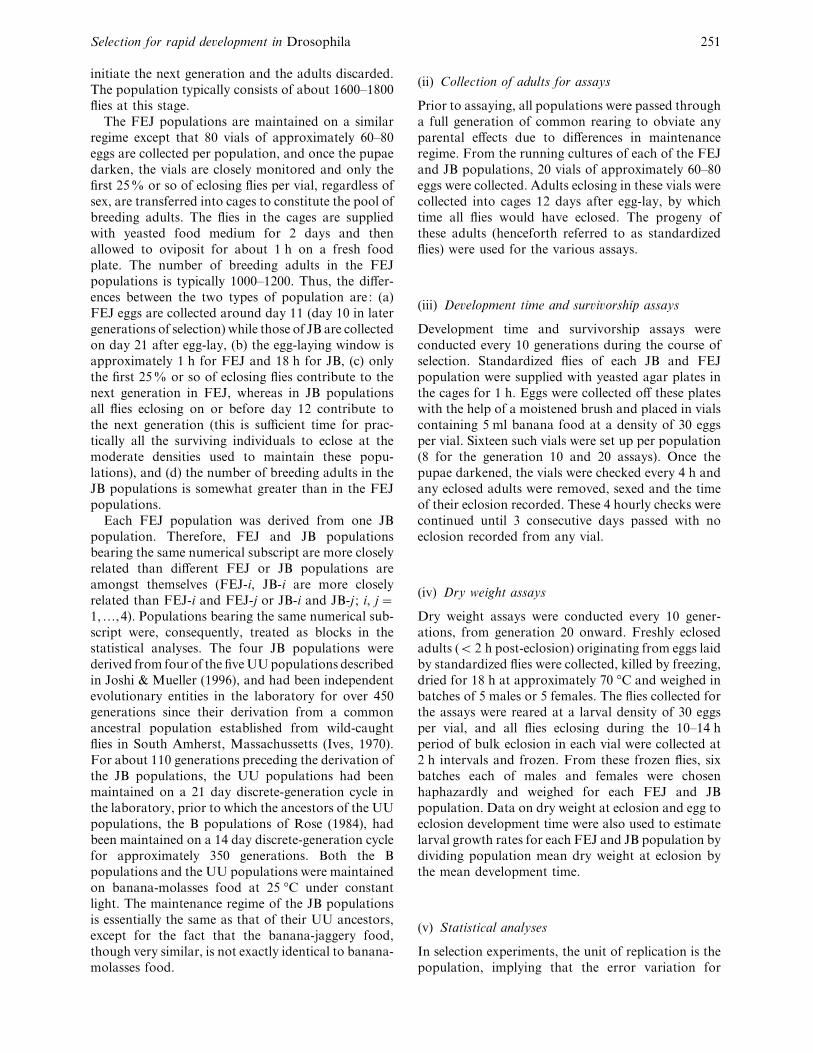
Fig. 3. Mean egg to eclosion survivorship in the selected(FEJ) and control (JB) populations over the course ofselection for faster development and early reproduction.The error bars represent 95% confidence intervals aboutthe mean of the four replicate populations in eachselection regime, calculated using least squares estimatesof the standard errors of the appropriate cell means in therandomized block ANOVA, and can, therefore, be usedfor visual hypothesis testing.
N. G. Prasad et al. 254
Table 3. Results of analysis of �ariance (ANOVA) on
mean egg to eclosion sur�i�orship in the FEJ and JB
populations
Source df MS F P
Time 6 0±0176 5±211 0±0029Selection regime (Sel) 1 0±0859 24±108 0±0162Time¬Sel 6 0±0100 2±354 0±0744
The effects of block and interactions involving block cannotbe tested for significance in the randomized block designand have, therefore, been omitted from the table.
at generation 10 to 1±4 h at generation 70 (Fig. 2).
Regressing the difference between males and females
over time in generations revealed a significantly
negative slope in the FEJ populations (slope ¯®0±0438; P!10−& ; R#¯ 0±60), whereas the slope
in the JB populations did not differ significantly from
zero (slope¯®0±0240; P¯ 0±0921 ; R#¯ 0±11). The
mean difference between males and females, averaged
across selection regimes, also declined with time as a
consequence of the decline in the FEJ difference,
giving rise to the significant time¬sex interaction in
the ANOVA (Table 1), although the time¬sex¬selection regime interaction was not significant.
Overall, the difference between male and female
development times was less in the FEJ populations,
compared with the JB controls at every generation
except the tenth, although only the differences
observed at generations 30 and 70 were statistically
significant (Fig. 2).
(ii) Pre-adult sur�i�orship
Egg to adult survivorship did not differ significantly
between the FEJ and JB populations for the first 40
0·40
0·35
0·30
0·25
0·20
0·15
0·1020 30 40 50 60 70
FEJ
JB
40 50 60 703020
Generations of FEJ selection
Mea
n dr
y w
eigh
t at e
clos
ion
(mg/
fly)
Males Females
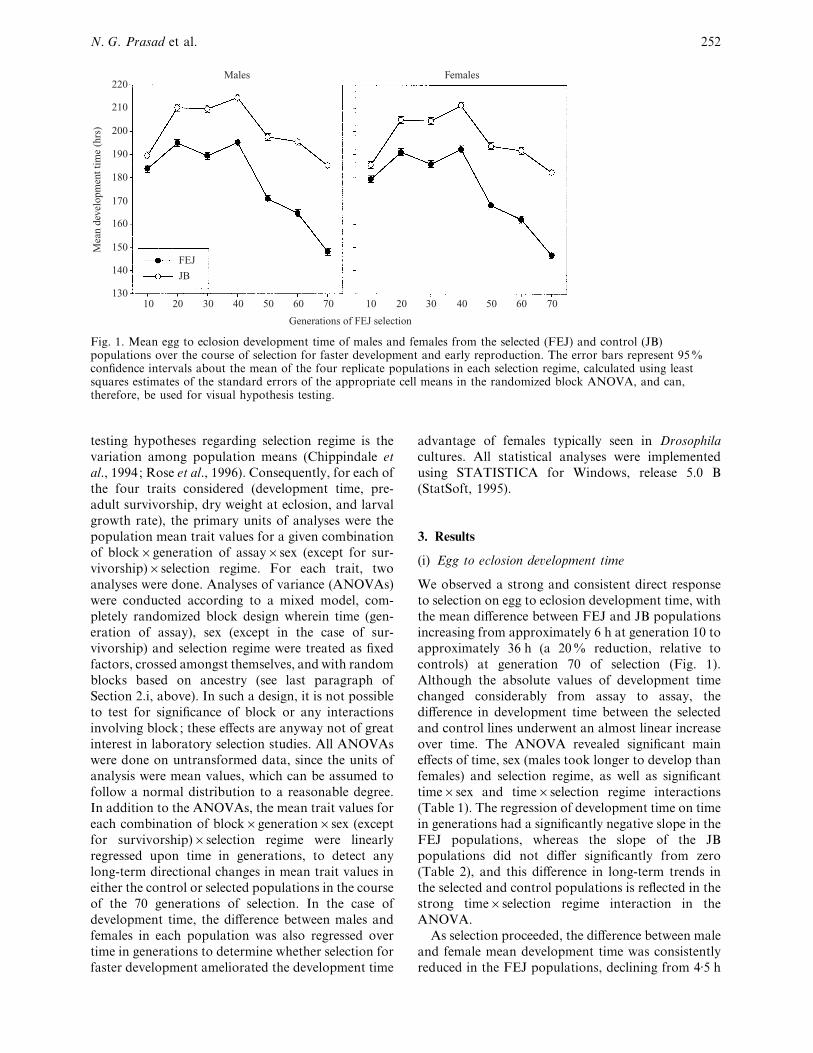
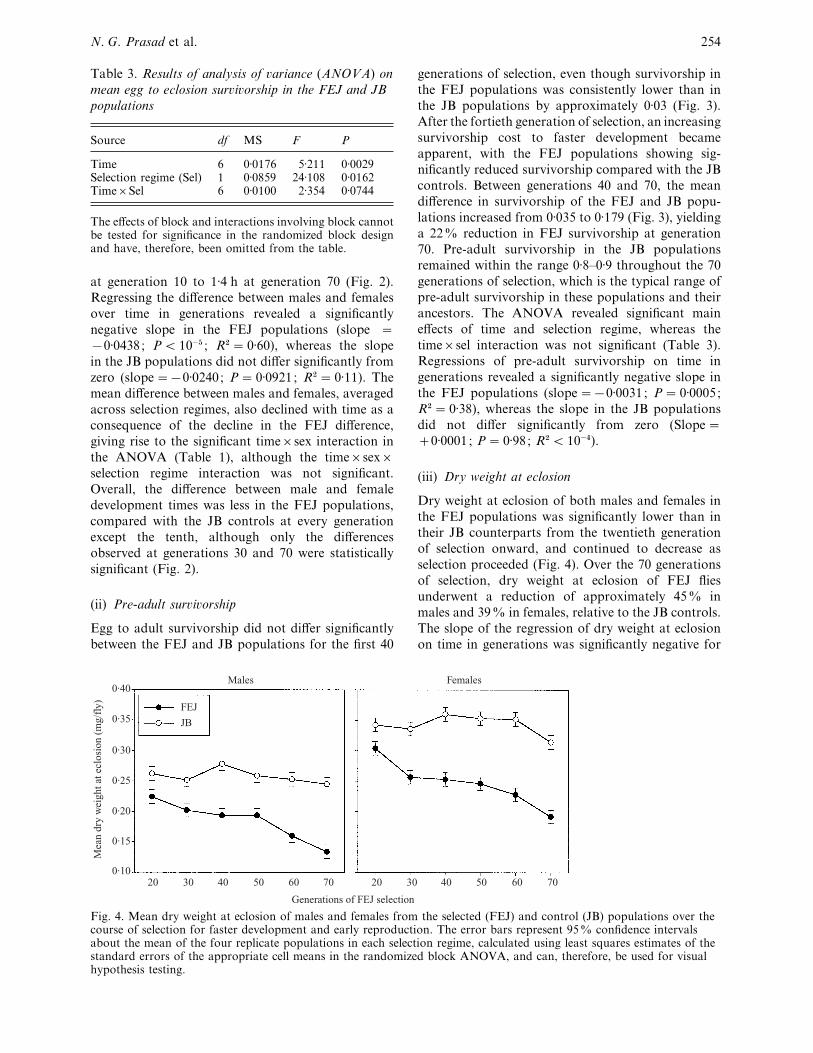
Fig. 4. Mean dry weight at eclosion of males and females from the selected (FEJ) and control (JB) populations over thecourse of selection for faster development and early reproduction. The error bars represent 95% confidence intervalsabout the mean of the four replicate populations in each selection regime, calculated using least squares estimates of thestandard errors of the appropriate cell means in the randomized block ANOVA, and can, therefore, be used for visualhypothesis testing.
generations of selection, even though survivorship in
the FEJ populations was consistently lower than in
the JB populations by approximately 0±03 (Fig. 3).
After the fortieth generation of selection, an increasing
survivorship cost to faster development became
apparent, with the FEJ populations showing sig-
nificantly reduced survivorship compared with the JB
controls. Between generations 40 and 70, the mean
difference in survivorship of the FEJ and JB popu-
lations increased from 0±035 to 0±179 (Fig. 3), yielding
a 22% reduction in FEJ survivorship at generation
70. Pre-adult survivorship in the JB populations
remained within the range 0±8–0±9 throughout the 70
generations of selection, which is the typical range of
pre-adult survivorship in these populations and their
ancestors. The ANOVA revealed significant main
effects of time and selection regime, whereas the
time¬sel interaction was not significant (Table 3).
Regressions of pre-adult survivorship on time in
generations revealed a significantly negative slope in
the FEJ populations (slope¯®0±0031 ; P¯ 0±0005;
R#¯ 0±38), whereas the slope in the JB populations
did not differ significantly from zero (Slope¯0±0001 ; P¯ 0±98; R#!10−%).
(iii) Dry weight at eclosion
Dry weight at eclosion of both males and females in
the FEJ populations was significantly lower than in
their JB counterparts from the twentieth generation
of selection onward, and continued to decrease as
selection proceeded (Fig. 4). Over the 70 generations
of selection, dry weight at eclosion of FEJ flies
underwent a reduction of approximately 45% in
males and 39% in females, relative to the JB controls.
The slope of the regression of dry weight at eclosion
on time in generations was significantly negative for
Selection for rapid de�elopment in Drosophila 255
Table 4. Results of analysis of �ariance (ANOVA) on mean dry weight
at eclosion in the FEJ and JB populations
Source df MS F P
Time 5 0±007331 18±52 ! 0±001
Sex 1 0±129607 1925±96 ! 0±001
Selection regime (Sel) 1 0±172808 626±96 ! 0±001
Time¬Sex 5 0±000213 2±42 0±085Time¬Sel 5 0±003432 26±57 ! 0±001
Sex¬Sel 1 0±003115 35±11 0±010Time¬Sex¬Sel 5 0±000223 4±01 0±017
The effects of block and interactions involving block cannot be tested forsignificance in the randomized block design and have, therefore, been omittedfrom the table.
2·0
1·8
1·6
1·2
1·0
0·8
0·620 30 40 50 60 70
FEJ
JB
40 50 60 703020
Generations of FEJ selection
Mea
n la
rval
gro
wth
rat
e (l
g/hr
/fly
)
Males Females
1·4
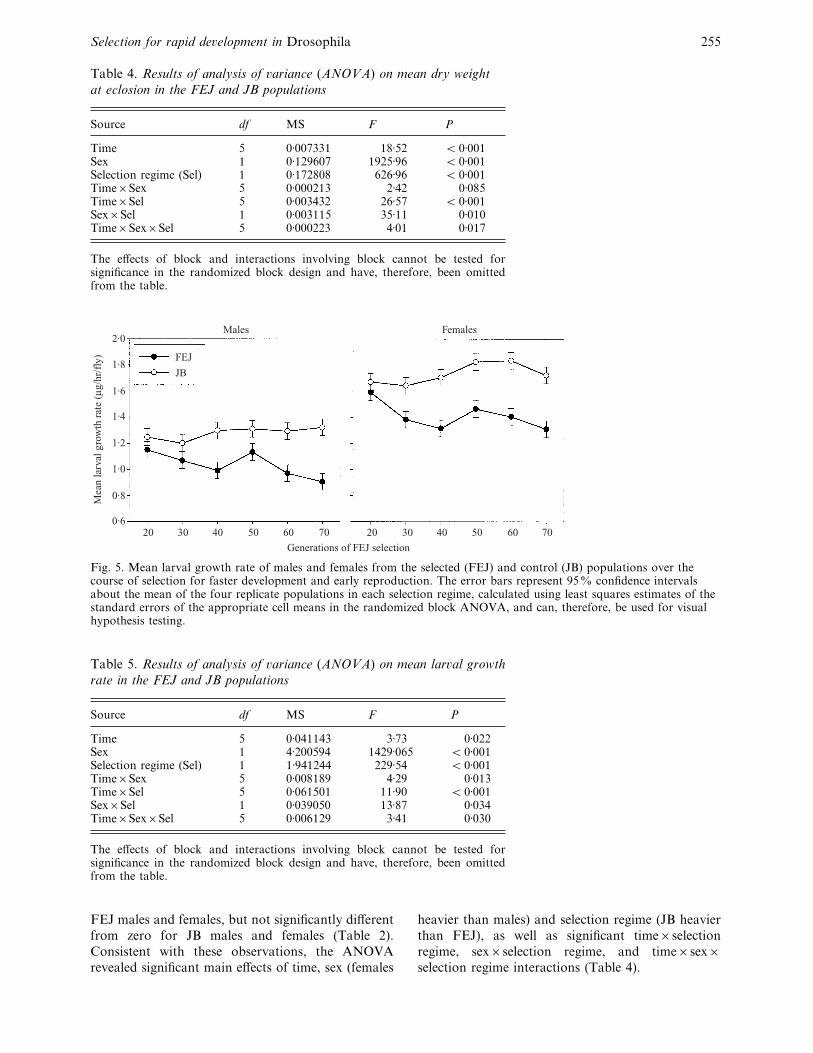
Fig. 5. Mean larval growth rate of males and females from the selected (FEJ) and control (JB) populations over thecourse of selection for faster development and early reproduction. The error bars represent 95% confidence intervalsabout the mean of the four replicate populations in each selection regime, calculated using least squares estimates of thestandard errors of the appropriate cell means in the randomized block ANOVA, and can, therefore, be used for visualhypothesis testing.
Table 5. Results of analysis of �ariance (ANOVA) on mean lar�al growth
rate in the FEJ and JB populations
Source df MS F P
Time 5 0±041143 3±73 0±022Sex 1 4±200594 1429±065 ! 0±001
Selection regime (Sel) 1 1±941244 229±54 ! 0±001
Time¬Sex 5 0±008189 4±29 0±013Time¬Sel 5 0±061501 11±90 ! 0±001
Sex¬Sel 1 0±039050 13±87 0±034Time¬Sex¬Sel 5 0±006129 3±41 0±030
The effects of block and interactions involving block cannot be tested forsignificance in the randomized block design and have, therefore, been omittedfrom the table.
FEJ males and females, but not significantly different
from zero for JB males and females (Table 2).
Consistent with these observations, the ANOVA
revealed significant main effects of time, sex (females
heavier than males) and selection regime (JB heavier
than FEJ), as well as significant time¬selection
regime, sex¬selection regime, and time¬sex¬selection regime interactions (Table 4).
N. G. Prasad et al. 256
(iv) Lar�al growth rate
Interestingly, the mean larval growth rate (dry weight
at eclosion}development time) in the FEJ populations
decreased relative to the JB controls as selection
proceeded, with FEJ individuals putting on less weight
per unit time during pre-adult development than their
JB counterparts (Fig. 5). FEJ males had significantly
lower larval growth rates than JB males from
generation 40 onward, whereas in the case of females,
the FEJ–JB difference was significant from generation
30 onward (Fig. 5). Regressions of larval growth rate
on time in generations revealed that the increased
divergence between selected and control populations
was due to declining growth rate in the FEJ
populations, coupled with an increase in growth rate
of the JB populations over the 70 generations of
selection (Table 2). As in the case of dry weight
at eclosion, the overall relative reduction of larval
growth rate in the FEJ populations was greater for
males (C 32%) than females (C 24%). All fixed main
effects and interactions in the ANOVA were significant
(Table 5).
4. Discussion
Successful selection for faster development has been
achieved in Drosophila in several studies in recent
years, and a correlated decrease in adult size}weight
has been consistently observed (Zwaan et al., 1995;
Nunney, 1996; Chippindale et al., 1997). Other lines
of work have also supported the notion of a trade-off
between development time and adult size in Drosophila
(Partridge & Fowler, 1993; Betran et al., 1998), and
our results are consistent with this notion (Figs. 1, 4).
Indeed, this trade-off is often seen in studies on other
insects as well (Miyatake, 1995, 1998; Tucic et al.,
1997).
The magnitude of the direct response to selection
that we observed in this study is greater than even that
seen by Chippindale et al. (1997), who recorded a
17% decrease in development time after 125 gener-
ations of selection for fast development and early
reproduction. The study by Chippindale et al. (1997)
is the only previous study on Drosophila in which
selection for faster development was continued for a
large number of generations; other studies have
typically been of about 15 generations in duration
(Zwaan et al., 1995; Nunney, 1996). Moreover, the
populations we used share common ancestry with the
populations used by Chippindale et al. (1997), making
a detailed comparison of our results and theirs all the
more meaningful.
Our observation of a correlated decrease in pre-
adult survivorship in the FEJ populations is consistent
with the negative correlation between development
time and pre-adult survivorship seen in a survey of
populations maintained under varying demographic
regimes (Chippindale et al., 1994), as well as with the
results of a study in which faster development was
directly selected for (Chippindale et al., 1997). As also
noticed by Chippindale et al. (1997), the survivorship
cost of faster development became apparent in our
study only after 50 generations of selection had
elapsed (Fig. 3). Yet, by this time, differences in
development time (Fig. 1) and dry weight at eclosion
(Fig. 4) between selected and control lines were
already considerable, indicating that it its possible to
reduce development considerably, at the expense of
putting on weight, without seriously compromising
pre-adult survivorship. This is also a possible ex-
planation for why no trade-off between development
time and pre-adult survivorship was observed by
Zwaan et al. (1995) in a selection study lasting only
16 generations, although the possibility of a different
genetic architecture of traits related to development
and survival in their populations cannot be altogether
discounted (Chippindale et al., 1997; Harshman &
Hoffmann, 2000).
The amelioration of the difference in male and
female development times in our study (Fig. 2) is
counter to observations made by Zwaan et al. (1995)
and Chippindale et al. (1997). Even though females in
Drosophila cultures typically eclose earlier than males
and, therefore, males should experience stronger
selection in a regime selecting for faster development,
male and female development times have not pre-
viously been seen to respond differentially to selection.
Possible explanations for this apparent paradox have
been that the difference in male and female de-
velopment times can be ameliorated by either high
(Zwaan et al., 1995) or variable (Joshi et al., 1999)
larval densities in the culture vials, or the suggestions
that sex-specific expression of heritable variation for
development time is lacking in these populations
(Chippindale et al., 1997), or that the sexual di-
morphism in development time is subject to strong
canalizing influences (Chippindale et al., 1997). While
one or more of these explanations may, in fact, be
operating to ameliorate the selection differential
between males and females in a culture subjected to
truncation selection for fast development, our results
clearly indicate that the sexual dimorphism in de-
velopment time in Drosophila can, nevertheless,
respond to selection in the manner expected, with
males gradually narrowing the development time gap
with females.
As in the case of the trade-off between development
time and pre-adult survivorship, it is possible to argue
that a reduction of the male–female difference in
development time was not observed by Zwaan et al.
(1995) because of the short duration of their study, or
perhaps because of differences in the genetic com-
position of the base populations used. Indeed, in our
Selection for rapid de�elopment in Drosophila 257
study too, the reduction of the male–female difference
in development time as selection proceeds is observed
only when data from 70 generations are considered. It
is not clear, however, why such a reduction was not
seen in the study by Chippindale et al. (1997), given
the similarities between our study and theirs : they
continued selection for 125 generations, and their flies
and ours share common ancestry. There are, however,
two major differences between our selection protocol
and that used by Chippindale et al. (1997). In the FEJ
populations, flies had 48 h after eclosion before eggs
were collected for initiating the next generation,
whereas in the selected lines of Chippindale et al.
(1997) eggs were collected as soon as enough were
available, typically within 24 h of eclosion. It is
possible that FEJ males, not being under as strong
selection for early sexual maturity as males in the
populations of Chippindale et al. (1997), were able to
undergo a reduction in the duration of some phase of
development that could be compensated for after
eclosion. Our selection intensity was also somewhat
greater than that of Chippindale et al. (1997), as
evidenced by the more rapid response to selection we
observed, and population numbers in the FEJ popu-
lations were also greater (80 vials of 60–80 eggs versus
50 vials). It is, therefore, also possible that such a
reduction in the male–female difference in devel-
opment time may have been seen by Chippindale et al.
had they continued selection for longer.
Perhaps the most interesting result in the present
study is that larval growth rate actually decreased in
the FEJ populations that were selected for shorter
development time. All else being equal, it is not
unreasonable to expect that the FEJ populations
would have evolved a higher larval growth rate, being
under selection for both a shorter development time,
and fecundity at 2 days of adult age. Yet, larval
growth rate, the average rate of dry weight gain over
the course of development from egg to eclosion,
clearly decreased in the FEJ populations as selection
proceeded (Fig. 5). In the case of both dry weight at
eclosion and larval growth rate, the fractional re-
duction, relative to controls, in FEJ males was greater
than that seen in FEJ females. This is not altogether
surprising, given that weight at eclosion is clearly
important to females due to its relationship to early
life fecundity (Mueller, 1985), whereas male size is not
strongly related to reproductive success in laboratory
cultures maintained at low larval densities (Joshi et
al., 1999). Part of the decrease in growth rate of the
FEJ populations relative to the JB controls was
actually due to an increase in JB growth rates as
selection proceeded (Fig. 5, Table 2). We suspect that
this may be an expression of the JB populations
adapting to some novel aspect of rearing in our
laboratory, pehaps the banana-jaggery food.
Although previous studies in which faster devel-
opment was selected for (Zwaan et al., 1995; Nunney,
1996; Chippindale et al., 1997) did not explicitly
address the issue of larval growth rate, as opposed to
development time, some data from other studies are
consistent with our result that shorter development
time is accompanied by a slower larval growth rate.
Nunney (1996) selected for shorter egg hatch to
pupation time, and if we divide the mean dry weight
of eclosing adults in his control and selected popu-
lations by the larval development time, the average
larval growth rates obtained are 2±44 and 3±13 µg}h
for control males and females, respectively, and 2±28
and 2±81 µg}h for males and females from the selected
lines. In another study, larval growth rates of female
D. melanogaster from two geographically distinct
populations were found to vary with development
time (Azevedo et al., 1997). A population from
Ecuador had a mean development time of 208±5 h and
mean larval growth rate of 1±394 µg}h, whereas a
North Carolina population had a mean development
time and larval growth rate of 215±6 h and 1±449 µg}h,
respectively. Similarly, the average larval growth rates
obtained by Tucic et al. (1997) in a study of density-
dependent selection on the beanweevil Acanthoscelides
obtectus were 0±156 and 0±186 mg}day for males and
females from slow-developing lines, and 0±155 and
0±183 mg}day for males and females from faster-
developing lines, respectively. Although none of these
data from the literature permit testing for statistical
significance, the trend observed is consistent with our
findings of a slower larval growth rate in the FEJ
populations.
Overall, our results clearly suggest that there is
more to the evolution of faster development than
merely a reduction in development time. Perhaps pre-
adult development in Drosophila consists of distinct
phases during which either weight gain or devel-
opmental processes take precedence, respectively. If
so, it may be that the fitness cost of reduction in
periods of weight gain is less than that of reduction in
periods when developmental processes are occurring,
and the duration of periods of weight gain is the first
to be reduced in response to selection for faster
development. Both the slowing down of larval growth
rate in the FEJ populations, and the relatively late
observation of reduced pre-adult survivorship, are
consistent with this scenario. Possibly, if the selection
regime was such that both shorter development and
larger adult size (perhaps through longer adult
lifespan) were at a premium, larval growth rates
would actually increase during selection. There is
some evidence from the lepidopteran Epirrita aut-
umnata that short development time and larger adult
size can evolve simultaneously (Kause et al., 1999),
and studies on the melon fly Bactrocera cucurbitae
suggest that short development and higher early life
fecundity can also be successfully selected for
N. G. Prasad et al. 258
simultaneously (Miyatake, 1998). The possibility that
males, and perhaps females, in the FEJ populations
are achieving some part of their reduction in de-
velopment time by postponing some aspect(s) of
reproductive development until after eclosion is a
tantalizing one; it may also be a partial explanation of
why we obtained a stronger response to selection than
Chippindale et al. (1997). Further studies on the time
course of larval weight gain, and on the timing of the
attainment of sexual maturity in the FEJ and JB
populations, may help to clarify these issues.
We thank K. Shankar Murthy, Sneha Krishna, Diwakar N.Belavadi, Jyothi N. Belavadi and Rajanna for assistance inthe laboratory, Adam K. Chippindale and Vijay K. Sharmafor much insightful discussion, and Trudy F. C. Mackayand two anonymous reviewers for helpful comments on themanuscript. N. G. Prasad thanks the Council for Scientific& Industrial Research, Government of India, for financialsupport through a Junior Research Fellowship. This workwas supported in part by funds from the Department ofScience & Technology, Government of India.
References
Azevedo, R. B. R., French, V. & Partridge, L. (1997). Life-history consequences of egg size in Drosophila melano-gaster. American Naturalist 150, 250–282.
Betran, E., Santos, M. & Ruiz, A. (1998). Antagonisticpleiotropic effect of second-chromosome inversions onbody size and early life-history traits in Drosophilabuzzatii. E�olution 52, 144–154.
Borash, D. J., Gibbs, A. G., Joshi, A. & Mueller, L. D.(1998). A genetic polymorphism maintained by naturalselection in a temporally varying environment. AmericanNaturalist 151, 148–156.
Chippindale, A. K., Hoang, D. T., Service, P. M. & Rose,M. R. (1994). The evolution of development in Drosophilamelanogaster selected for postponed senescence. E�olution48, 1880–1899.
Chippindale, A. K., Alipaz, J. A., Chen, H.-W. & Rose,M. R. (1997). Experimental evolution of accelerated de-velopment in Drosophila. 1. Developmental speed andlarval survival. E�olution 51, 1536–1551.
Harshman, L. G. & Hoffmann, A. A. (2000). Laboratoryselection experiments using Drosophila : what do theyreally tell us? Trends in Ecology and E�olution 15, 32–36.
Ives, R. T. (1970). Further studies of the South Amherstpopulation of Drosophila melanogaster. E�olution 38,507–518.
Joshi, A. (1997). Laboratory studies of density-dependentselection: adaptations to crowding in Drosophila melano-gaster. Current Science 72, 555–562.
Joshi, A. & Mueller, L. D. (1996). Density-dependentnatural selection in Drosophila : trade-offs between larvalfood acquisition and utilization. E�olutionary Ecology 10,463–474.
Joshi, A., Shiotsugu, J. & Mueller, L. D. (1996). Phenotypicenhancement of longevity by environmental urea inDrosophila melanogaster. Experimental Gerontology 31,533–544.
Joshi, A., Do, M. H. & Mueller, L. D. (1999). Poissondistribution of male mating success in laboratory popu-
lations of Drosophila melanogaster. Genetical Research73, 239–249.
Kause, A., Saloniemi, I., Haukioja, E. & Hanhima$ ki, S.(1999). How to become large quickly: quantitativegenetics of growth and foraging in a flush feedinglepidopteran larva. Journal of E�olutionary Biology 12,471–482.
Leroi, A. M., Chippindale, A. K. & Rose, M. R. (1994).Long-term laboratory evolution of a genetic life-historytrade-off in Drosophila melanogaster. 1. The role ofgenotype by environment interaction. E�olution 48,1244–1257.
Miyatake, T. (1995). Two-way artificial selection fordevelopmental period in Bactrocera cucurbitae (Diptera:Tephritidae). Annals of the Entomological Society ofAmerica 88, 848–855.
Miyatake, T. (1998). Genetic changes of life history andbehavioural traits during mass-rearing in the melon fly,Bactrocera cucurbitae (Diptera: Tephritidae). Researchesin Population Ecology 40, 301–310.
Mueller, L. D. (1985). The evolutionary ecology of Droso-phila. E�olutionary Biology 19, 37–98.
Mueller, L. D. (1990). Density-dependent natural selectiondoes not increase efficiency. E�olutionary Ecology 4,290–297.
Nunney, L. (1996). The response to selection for fast larvaldevelopment in Drosophila melanogaster and its effect onadult weight : an example of a fitness trade-off. E�olution50, 1193–1204.
Partridge, L. & Fowler, K. (1993). Responses and correlatedresponses to artificial selection on thorax length inDrosophila melanogaster. E�olution 47, 213–226.
Partridge, L., Hoffmann, A. & Jones, J. S. (1987). Male sizeand mating success in Drosophila melanogaster andDrosophila pseudoobscura under field conditions. AnimalBeha�ior 35, 468–476.
Reznick, D. N. & Ghalambor, C. (1999). Sex and death.Science 286, 2458–2459.
Roper, C., Pignatelli, P. & Partridge, P. (1993). Evolutionaryeffects of selection on age at reproduction in larval andadult Drosophila melanogaster. E�olution 47, 445–455.
Rose, M. R. (1984). Laboratory evolution of postponedsenescence in Drosophila melanogaster. E�olution 38,1004–1010.
Rose, M. R., Service, P. M. & Hutchinson, E. W. (1987).Three approaches to trade-offs in life-history evolution.In Genetic Constraints on Adapti�e E�olution (ed. V.Loeschke), pp. 91–105. Berlin: Springer.
Rose, M. R., Nusbaum, T. J. & Chippindale, A. K. (1996).Laboratory evolution: the experimental wonderland andthe Cheshire Cat syndrome. In Adaptation (ed. M. R.Rose& G. V.Lauder), pp. 221–241.NewYork: AcademicPress.
Santos, M., Ruiz, A., Barbadilla, A., Quezada-Diaz, J. E.,Hasson, E. & Fontdevila, A. (1988). The evolutionaryhistory of Drosophila buzzatii. XIV. Larger flies matemore often in nature. Heredity 61, 255–262.
Santos, M., Borash, D. J., Joshi, A., Bounlutay, N. &Mueller, L. D. (1997). Density-dependent natural selec-tion in Drosophila : evolution of growth rate and bodysize. E�olution 51, 420–432.
Service, P. M., Hutchinson, E. W. MacInley, M. D. & Rose,M. R. (1985). Resistance to environmental stress inDrosophila melanogaster selected for postponed sen-escence. Physiological Zoology 58, 380–389.
Service, P. M., Hutchinson, E. W. & Rose, M. R. (1988).

Selection for rapid de�elopment in Drosophila 259
Multiple genetic mechanisms for the evolution ofsenescence in Drosophila melanogaster. E�olution 42,708–716.
Sheeba, V., Madhyastha, N. A. A. & Joshi, A. (1998).Oviposition preference for novel versus normal foodresources in laboratory populations of Drosophila melano-gaster. Journal of Biosciences 23, 93–100.
STATISTICA. (1995). Statistica Vol. I: General Con�entionsand Statistics I. Tulsa : StatSoft Inc.
Tucic, N., Stojkovic, O., Gliksman, I., Milanovic, D. &S) es) lija, D. (1997). Laboratory evolution of life-history
traits in the bean weevil (Acanthoscelides obtectus) : theeffects of density-dependent and age-specific selection.E�olution 51, 1896–1909.
Zwaan, B. (1993). Genetic and environmental aspects ofageing in Drosophila melanogaster : an evolutionaryperspective. PhD dissertation, University of Groeningen,The Netherlands.
Zwaan, B., Bijlsma, R. & Hoekstra, R. F. (1995). Artificialselection for development time in Drosophila melanogasterin relation to the evolution of aging: direct and correlatedresponses. E�olution 49, 635–648.