evaluation of mangrove structure and condition in two trans-boundary areas in the western indian...
TRANSCRIPT
AQUATIC CONSERVATION: MARINE AND FRESHWATER ECOSYSTEMS
Aquatic Conserv: Mar. Freshw. Ecosyst. 19: S46–S55 (2009)
Published online 18 May 2009 in Wiley InterScience(www.interscience.wiley.com). DOI: 10.1002/aqc.1044
Evaluation of mangrove structure and condition in twotrans-boundary areas in the Western Indian Ocean
S. O. BANDEIRAa,�, C. C. F. MACAMOa, J. G. KAIROb, F. AMADEa, N. JIDDAWIc and J. PAULAd
aDepartment of Biological Sciences, Eduardo Mondlane University, P.O. Box 257, Maputo, MozambiquebKenya Marine and Fisheries Research Institute, P.O. Box 81651-80100, Mombasa, Kenya
cInstitute of Marine Sciences, University of Dar es Salaam, P.O. Box 668, Zanzibar, TanzaniadIMAR - Laboratorio Marıtimo da Guia, Faculdade de Ciencias da Universidade de Lisboa, Av. Nossa Senhora do Cabo, 939,
2750-374 Cascais, Portugal
ABSTRACT
1. The structure, forest condition and regeneration status of nine mangrove forests in two trans-boundary areasof Mozambique bordering Tanzania and South Africa were studied. The main objective was to estimate thecutting intensity in the selected sites – Saco and Sangala in southern Mozambique; Mecufi, Pemba, Ibo, Luchete,Ulo in northern Mozambique, and Mngoji 1 and Mngoji 2 in Tanzania.2. A total of 135, 10m� 10m quadrats were set in the outer, middle and lower parts of the mangrove forests at
all sampling sites. Measurements included stem diameter at breast height (DBH) and height of adult trees (i.e. alltrees with stem diameter more than 2.5 cm). Young trees (with stem diameter of less than 2.5 cm) were classifiedas juveniles. To assess forest condition, trees within the quadrat were classified into intact, partially cut, coppiced,die back and stump. Pole quality was appraised through the classification of the lead stem into threecategories–straight, semi-straight and crooked poles.3. The results indicate different levels of exploitation with Mngoji 1 and Mngoji 2, the most degraded sites,
having stump densities of 959 stumps ha�1 and 592 stumps ha�1, respectively. Most sites had mostly polesof inferior quality (crooked poles), but high densities of straight and semi-straight poles were found in Mngoji 1(742 stems ha�1) and Saco (636 stems ha�1).4. Natural regeneration was observed in most sites but not for all species, with adequate regeneration in Saco
(14 766 saplings ha�1) and Mecufi (14 706 saplings ha�1), while low regeneration was recorded in Mngoji 1 and 2(2212 saplings ha�1 and 4799 saplings ha�1, respectively).5. These results indicate the need for improved mangrove management and replanting especially in mangrove
depleted conservation areas of southern Tanzania.Copyright r 2009 John Wiley & Sons, Ltd.
Received 16 December 2008; Revised 10 March 2009; Accepted 15 March 2009
KEY WORDS: mangrove forest structure; forest condition; pole morphology; Eastern Africa
INTRODUCTION
Mangrove forests occupy intertidal areas of tropical and
subtropical coasts, between high water and low water mark of
spring tides (Tomlinson, 1986). The forest provides timber and
non timber products such as fuelwood, poles, fodder and fisheries
resources to millions of people in the tropics (Saenger, 2002). They
buffer land from storms and provide safe havens for humans
(Spalding et al., 1997). Mangroves have the capacity to absorb
heavy metals and other pollutants, thus controlling the quality of
water reaching coral reef and seagrass ecosystems (Chu et al.,
1998). In addition, mangrove forests provide nursery grounds for
a number of commercially important fish species, prawn, crabs
and other animals, and enhance fishery productivity of the nearby
waters (Kathiresan and Bingham, 2001).
The widespread mangrove deforestation and subsequent loss
of habitat is of global concern (Hogarth, 1999; Valiela
et al., 2001; FAO, 2005). A number of case studies of mangrove
*Correspondence to: S. O. Bandeira, Department of Biological Sciences, Eduardo Mondlane University, P.O. Box 257, Maputo, Mozambique.E-mail: [email protected]
Copyright r 2009 John Wiley & Sons, Ltd.

degradation have been documented for Africa, Latin America and
Asia (FAO, 2005). According to a recent assessment of global
mangrove forests, the Western Indian Ocean (WIO) region has
lost approximately 8% of its mangrove cover in the last 25 years
(FAO, 2005), on average approximately 3000hayear�1. Direct
causes of mangrove degradation in the WIO include over-
exploitation of wood products, conversion of mangrove areas for
aquaculture, solar salt works and urban development (Semesi,
1998; Barbosa et al., 2001; Beentje and Bandeira, 2007).
In Zanzibar (Tanzania), for instance, the area of mangroves
dropped by 7% in 40 years prior to 1989 (Taylor et al., 2003),
and demand for firewood has increased 100-fold since 1950
(Shunula, 2002). Madagascar, with its 330 000 ha of mangrove
area, has experienced a reduction of mangrove area by at least
7500 ha in the period 1972 to 1995, mostly due to aquaculture
development (Ranaivoson, 1998; Taylor et al., 2003).
Degradation and transformations of mangroves in Kenya
have been linked to over-harvesting of wood products,
conversion of mangrove area for pond aquaculture and solar
salt pans as well as pollution (Abuodha and Kairo, 2001). In
Mozambique, an estimated 809 ha per year of mangrove were
lost mainly to firewood and salt pan production between 1972
and 1990 (Saket and Matusse, 1994; Barbosa et al., 2001).
This paper aimed to assess mangrove forest condition in two
trans-boundary areas at the Tanzania–Mozambique and
Mozambique–South Africa borders, through the estimation
of cutting intensity in different mangrove areas.
METHODS
Study sites
The sampling was designed to assess the variation between south
and north, and included a spatial approach, at each location.
Two locations were chosen to compare two trans-boundary
areas within the border region of Mozambique with South
Africa (in the south) and Tanzania (in the north) – Inhaca Island
sampling location is separated by around 2500km from the
other location, and is relatively close to the critical southern
disappearance of mangrove forests on the eastern African coast.
Sampling in South Africa was not carried out given the existence
of only scattered small stands of mangroves and fewer mangrove
tree species with an inconspicuous zonation pattern (Berjak
et al., 1977; Beentje and Bandeira, 2007). Nine sampling sites
(surveying mangrove stand) were chosen to assess mangrove
condition: Saco and Sangala mangroves at Inhaca Island
(southern Mozambique); Mecufi, Pemba, Ibo Island, Luchete,
and Ulo (in northern Mozambique). In Tanzania, mangroves
were sampled at Mngoji 1 and Mngoji 2 (Figure 1).
The climate at the nine sites is characterized by having a
rainy season between November and March and a cooler dryer
season over the rest of the year. Species composition and
zonation at all sites is similar. In both Tanzania and
Mozambique, the upper zone is characterized by the presence
of white mangrove (Avicennia marina); the middle zone is
characterized by extensive cover of the red mangrove
(Rhizophora mucronata); whereas the lower zone is dominated
by apple mangrove (Sonneratia alba) in Tanzania, and northern
Mozambique (Mecufi, Pemba, Ibo, Luchete, Ulo) and by
white mangrove (Avicennia marina) in southern Mozambique
(Saco and Sangala) (Kalk, 1995; Semesi, 1998). The main
economic activities in the area are agriculture and fisheries.
Tourism is a growing industry, particularly in northern
Mozambique. Some demographic data are: 5211 inhabitants
in Inhaca Island (Saco and Sangala); 65 365 in Pemba-Metuge
district (Mecufi); 141 316 in Pemba City; 9509 inhabitants in
Ibo; 94 197 in Mocimboa da Praia district (Ulo and Luchete)
(www.ine.gov.mz.censo2007); and 1600 inhabitants in Mngoji
(census of 2002, www.tanzania.go.tz/census/regions.htm).
Mangrove structure and condition analysis
A total of 135 quadrats 10� 10m2 were set, 30 of them in
southern and 75 in northern Mozambique and 30 in Tanzania.
Three zones were distinguished in each forest: the upper landward
zone; the middle zone; and the lower seaward zone, following the
species zonation pattern of the forest. In each zone, five random
quadrats separated by not less than 20m were sampled, giving a
total of 15 quadrats per forest. Within each quadrat all trees
greater than 2.5 cm diameter were identified and counted.
Vegetation measurements included tree height (m) and stem
diameter measured at 1.3m above ground (DBH); from which
were derived tree basal areas (m2), species density (stemsha�1)
and frequency (Muller-Dombois and Ellenberg, 1974; Cintron
and Schaeffer-Novelli, 1984). The ecological importance value
(IV) of each species was calculated by summing the relative
density, relative frequency and relative dominance (Cintron and
Schaeffer-Novelli, 1984). The complexity index of each study site
was obtained as the product of number of species, basal
area (m2ha�1), maximum tree height (m) and number of
stemsha�1� 10�5 in a ha plot (Holdridge et al., 1971).
To assess mangrove forest status, individuals were counted
and grouped into five categories. These were: intact; partially
cut; coppiced, die back, and stumps; following the approach
described in Cintron and Schaeffer-Novelli (1984), FAO (1994)
and Kairo et al. (2002). Intact stands correspond to pristine
stands with no signs of cutting, whereas, partially cut forests
include plots whose trees have lateral branch cut or there is
presence of past stumps. Coppicing of mangroves is known in
the following species: Avicennia marina, Sonneratia alba,
Lumnitzera racemosa and Bruguiera gymnorhiza (Tomlinson,
1986; Kairo and Kivyatu, 2000). Die back plants are those
whose death was not caused directly by cutting.
The morphology of the sampled trees reflected the usage
quality of available poles and was assessed based on the form of
the lead stem, which was categorized either as Form 1, 2 or 3.
Form 1 represents most straight poles suitable for building and
Form 2 represents poles that need some modification prior to use
in construction, while Form 3 represents crooked poles
unsuitable for construction (Kairo et al., 2001).
Regeneration status of the forests was assessed by the
identification and counting of young individuals (diameter at
breast height less than 2.5 cm) within the quadrat, and their
categorization into three groups, height less than 40.0 cm
(RC I); height between 40.1 and 150.0 cm (RC II), and
height greater than 150.0 cm but less than 3.0m (RC III)
(Kairo et al., 2002).
Data on mangrove condition (height, diameter at
breast height, deforestation category, tree wood quality and
regeneration) were subjected to normality and homogeneity of
variances tests. As they did not meet all the ANOVA
assumptions, the test performed was Kruskal–Wallis at 0.05
probability level to distinguish statistical differences. Comparisons
EVALUATION OF MANGROVE STRUCTURE AND CONDITION S47
Copyright r 2009 John Wiley & Sons, Ltd. Aquatic Conserv: Mar. Freshw. Ecosyst. 19: S46–S55 (2009)
DOI: 10.1002/aqc

of stem density were made between sites and between species, the
null hypothesis being that there is no difference in stem densities
between sites and among species in a site.
RESULTS
Mangrove structure
A total of 3271 adult individuals were sampled, the commonest
being A. marina and R. mucronata. The rarest species was
L. racemosa, found only at Ulo (very few individuals and
therefore not included in the statistical analysis). Overall stand
stem density, DBH and tree height varied significantly between
sites and between species at a site (Tables 1 and 2). For this
study, the stem density appeared not to follow a specific
pattern, but basal area and complexity index were markedly
lower in both Mngoji forests. Most trees in the study area were
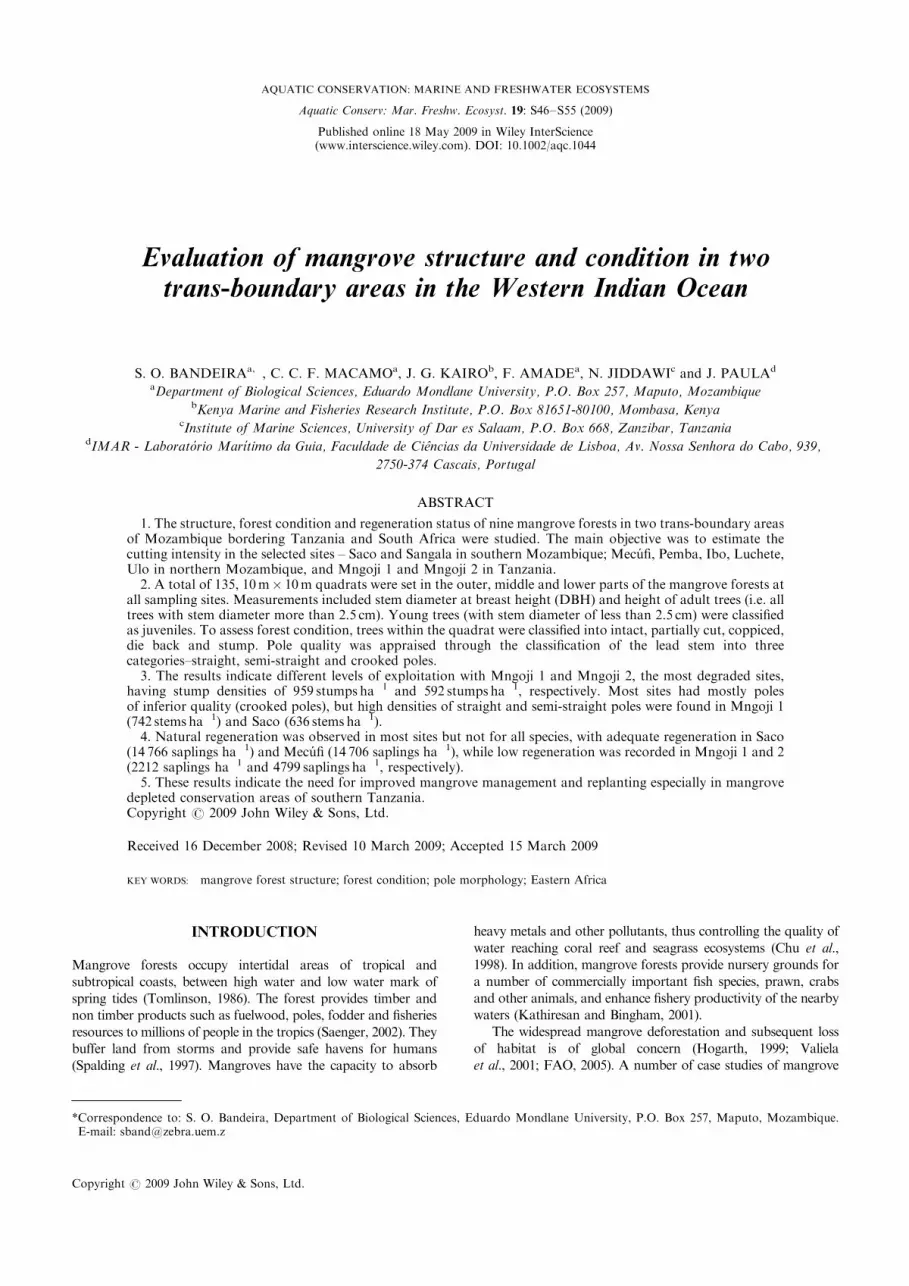
small (Figure 2). In the Mozambican forests the modal
diameter class was less than 5 cm, while in both Mngoji
forests the commonest class was 5.1–15 cm. Mean heights
Figure 1. Geographical position of the sampling areas across the two trans-boundary locations in eastern Africa.
S.O. BANDEIRA ET AL.S48
Copyright r 2009 John Wiley & Sons, Ltd. Aquatic Conserv: Mar. Freshw. Ecosyst. 19: S46–S55 (2009)
DOI: 10.1002/aqc

ranged between 2.19m (at Luchete) and 5.16m (at Mngoji 1)
and the tallest trees were found in Mngoji 1, Mngoji 2 and
Saco with canopy heights of 5.16, 3.77 and 3.88m,
respectively. The tallest trees observed were S. alba (mean
height 4.58m), followed by R. mucronata (3.91m). In terms of
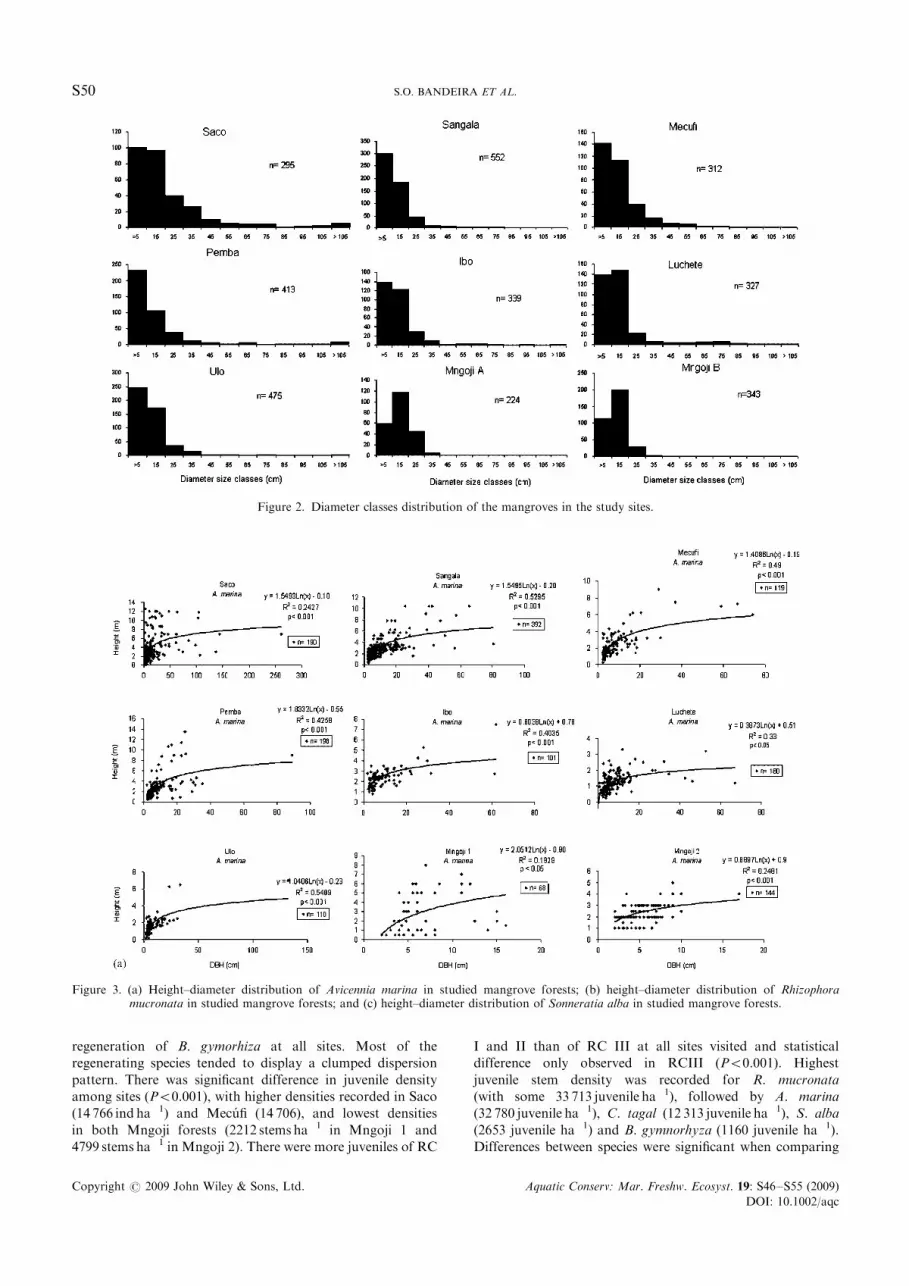
diameter distribution, there was a general trend of having
more individuals with narrow stems (Figure 3(a), (b) and (c)),
the correlation between diameter and height being statistically
significant in all scatter plots of all three species (A. marina,
R. mucronata and S. alba).
Mangrove condition and wood quality
The sites studied all indicated different levels of mangrove
degradation, as evidenced by the number of partially cut trees
and stumps (Table 3). There were significant differences between
sites in terms of stumps count (Po0.001), die back (Po0.05),
coppicing (Po0.05), partially cut (Po0.001) and intact stands
(Po0.05). Highest mean stump densities were found in both
Mngoji forests (959 stumps ha�1 in Mngoji 1 and 592 stumps
ha�1 in Mngoji 2). Mangroves at Mngoji have traditionally been
used for firewood, building and sold to neighbouring villages in
Tanzania. Partially cut trees were common all over Mozambican
mangroves, with higher stem densities in Ulo (866 stems ha�1),
Luchete (713 stems ha�1) and Saco (631 stems ha�1). More intact
individuals were found in Sangala (987 stems ha�1) and Ulo (844
stems ha�1). There were very few coppiced individuals at any
sites, but where this occurred A. marina and R. mucronata were
the preferred species for cutting. Overall, the highest stump
density per species was recorded for S. alba at 989 stumps ha�1.
Significant differences were found when comparing (per species)
stumps (Po0.05), coppicing (Po0.05), partially cut (Po0.001)
and intact (Po0.05) but mean densities of die back were not
significantly different (P40.05).
Most poles in the study area were crooked (Table 4). High
quality poles (straight and semi-straight poles) were found
only in Ulo (618 stems ha�1) and Mngoji 1 (742 stems ha�1).
Differences of poles quality among sites were statistically
significant (Po0.001) for all pole categories. Crooked poles
were more abundant in Mngoji 2, Luchete and Ibo (1287 stems
ha�1; 1212 stems ha�1 and 890 stems ha�1, respectively). At
species level, R. mucronata (504 stems ha�1) and S. alba (436
stems ha�1) had more poles suitable for construction (straight
poles), whereas A. marina had most of the crooked poles (1360
stems ha�1). There were statistical differences in wood quality
between species (Po0.001 for straight poles; Po0.05 for
semi-straight poles; Po0.001 for crooked poles).
Forest regeneration status
Natural regeneration was observed at all sites but with very
high intra-site variance (Figure 4). There was very little
Table 1. Importance value (IV) of the mangroves in the study sites. Alltrees larger than 2.5 cm diameter at breast height (DBH) inside 0.01 haplots were measured
Relative values (%)
Site Species Dominance Stemdensity
Frequency IV
Saco A. marina 85.43 64.41 57.14 206.98B. gymnorhiza 0.004 0.34 4.76 5.10C. tagal 0.53 4.07 14.29 18.89R. mucronata 14.05 31.19 23.81 69.05
Sangala A. marina 88.01 71.01 45.45 204.47B. gymnorhiza 1.17 5.80 13.64 20.61C. tagal 1.26 7.07 18.18 26.51R. mucronata 9.57 16.12 22.73 47.69
Mecufi A. marina 30.92 36.39 34.29 101.6B. gymnorhiza 0.2 2.75 8.57 11.52C. tagal 1.50 9.79 14.29 25.58R. mucronata 47.00 18.04 22.86 87.9S. alba 20.38 33.03 20.00 73.41
Pemba A. marina 9.72 47.94 40.00 97.66B. gymnorhiza 0.02 0.24 3.33 3.59C. tagal 2.35 19.37 16.67 38.39R. mucronata 8.48 25.67 23.33 57.48S. alba 79.43 6.78 16.67 102.88
Ibo A. marina 13.40 32.37 24.00 67.77C. tagal 1.10 11.86 20.00 32.96R. mucronata 7.81 31.40 20.00 59.22S. alba 77.69 24.36 36.00 138.05
Luchete A. marina 17.98 53.10 35.29 106.37C. tagal 0.02 0.59 5.88 6.49R. mucronata 53.11 38.64 29.41 121.16S. alba 28.88 7.67 29.41 65.96
Ulo A. marina 39.49 23.50 20.83 83.82B. gymnorhiza 0.01 0.21 4.17 4.39C. tagal 2.57 14.79 29.17 46.53R. mucronata 17.76 46.58 25.00 89.34S. alba 37.74 14.96 20.83 73.53
Mngoji 1 A. marina 10.86 30.63 26.32 67.81C. tagal 5.42 5.86 21.05 32.33R. mucronata 37.91 28.38 26.32 92.61S. alba 45.81 35.14 26.32 107.27
Mngoji 2 A. marina 14.01 41.98 33.33 89.32R. mucronata 34.07 26.82 33.33 94.22S. alba 51.92 31.20 33.33 116.45
Table 2. Structural attributes of the mangroves in the study sites
Site Mean diameter(cm) (1)
No. ofspecies (2)
Stem densityha�1 (3)
Mean height(m) (4)
Basal area(m2 ha�1) (5)
Complexityindex
Saco 16.8371.46 4 196670.03 3.8870.20 10.31 3.15Sangala 7.8470.38 4 36807451 2.4870.10 1.56 0.57Mecufi 10.7270.64 5 21807352 3.2370.10 2.57 0.91Pemba 11.7671.13 5 27537439 3.4170.11 23.03 10.81Ibo 10.6271.01 4 20807269 2.9870.10 5.72 1.42Luchete 11.4670.9 4 22607438 2.1970.11 8.73 1.73Ulo 7.7370.43 5 31207629 2.7170.6 3.21 1.36Mngoji 1 10.0070.39 4 14807136 5.1670.26 1.16 0.35Mngoji 2 8.1770.26 3 22867220 3.7770.12 0.82 0.21
�Complexity index C.I. equals the product of (2), (3), (4) and (5) divided by 105 (Holdridge et al., 1971).
EVALUATION OF MANGROVE STRUCTURE AND CONDITION S49
Copyright r 2009 John Wiley & Sons, Ltd. Aquatic Conserv: Mar. Freshw. Ecosyst. 19: S46–S55 (2009)
DOI: 10.1002/aqc
regeneration of B. gymorhiza at all sites. Most of the
regenerating species tended to display a clumped dispersion
pattern. There was significant difference in juvenile density
among sites (Po0.001), with higher densities recorded in Saco
(14 766 ind ha�1) and Mecufi (14 706), and lowest densities
in both Mngoji forests (2212 stems ha�1 in Mngoji 1 and
4799 stems ha�1 in Mngoji 2). There were more juveniles of RC
I and II than of RC III at all sites visited and statistical
difference only observed in RCIII (Po0.001). Highest
juvenile stem density was recorded for R. mucronata
(with some 33 713 juvenile ha�1), followed by A. marina
(32 780 juvenile ha�1), C. tagal (12 313 juvenile ha�1), S. alba
(2653 juvenile ha�1) and B. gymnorhyza (1160 juvenile ha�1).
Differences between species were significant when comparing
Figure 2. Diameter classes distribution of the mangroves in the study sites.
Figure 3. (a) Height–diameter distribution of Avicennia marina in studied mangrove forests; (b) height–diameter distribution of Rhizophoramucronata in studied mangrove forests; and (c) height–diameter distribution of Sonneratia alba in studied mangrove forests.
S.O. BANDEIRA ET AL.S50
Copyright r 2009 John Wiley & Sons, Ltd. Aquatic Conserv: Mar. Freshw. Ecosyst. 19: S46–S55 (2009)
DOI: 10.1002/aqc

stem density of individuals (Po0.001 for classes I and II; and
Po0.05 for class II).
DISCUSSION
Mangrove forests in the study area showed evidence for usage
at varying scales. Mangroves from Sangala, Ulo and Pemba in
Mozambique were least degraded compared with Mngoji
forests. The size-class structure (Figures 2, 3(a), (b) and (c)) in
most localities of the study area showed the predominance of
smaller trees, possibly indicating selective logging. Similar
studies in Kenya have shown that selective harvesting of
mangroves does not necessarily lead to loss in cover, but to
changes in forest structures such that the superior stand
containing preferred species is replaced by inferior unwanted
species (Kairo et al., 2002). According to Walters (2005)
and Kairo et al. (2002), stand stem density, basal area, and
Figure 3. Continued.
EVALUATION OF MANGROVE STRUCTURE AND CONDITION S51
Copyright r 2009 John Wiley & Sons, Ltd. Aquatic Conserv: Mar. Freshw. Ecosyst. 19: S46–S55 (2009)
DOI: 10.1002/aqc

complexity indices tend to be lower in disturbed forests. Low
complexity index observed in both Mngoji forests indicated
disturbed mangrove areas.
Small-scale logging may influence pattern and composition
of natural regeneration in a mangrove stand (Ellison and
Farnsworth, 1996; Krauss and Allen, 2003; Pinzon et al., 2003;
Walters, 2005; Bosire et al., 2008). Gap creation during
harvesting allows more light to reach the forest floor thus
stimulating natural regeneration of the forest (Clark and
Allaway, 1993; Sherman et al., 2000). However, as canopy
gaps in the forest become more abundant, species regeneration
may also be selective, favouring those species more capable of
surviving in gaps (Sherman et al., 2000; Michinton, 2001;
Walters, 2005). Results from this study indicate that all sites
are being naturally regenerated, though at different rates. The
Mngoji sites have the lowest juvenile stem density because of
over-exploitation of the forests that has affected adult stocking
densities. Among species, A. marina showed the highest
generation capacity in all stands visited, and this could be
due to its wide tolerance range to both salinity and shade
Table 3. Mangrove forests conditions in the study sites
Site Species Intact Partially cut Coppicing Die back Stump
Meandensity
S.E. Meandensity
S.E. Meandensity
S.E. Meandensity
S.E. Meandensity
S.E.
Saco Am 408.3 132.3 1125.0 249.6 — — — — 108.3 58.3Ct 333.3 145.3 66.7 33.3 — — — — — —Bg 100.0 � — — — — — — — —Rm 1160.0 312.4 700.0 104.9 — — — — — —Average 500.4 630.6 — 0.0 108.3 �
Sangala Am 1340.0 437.0 1226.7 233.9 — — 13.3 9.1 186.7 57.6Ct 640.0 254.2 140.0 87.2 — — — — 120.0 37.4Bg 666.7 348.0 366.7 185.6 — — — — 33.3 33.3Rm 1300.0 286.4 250.0 105.7 — — — — 150.0 76.4Average 986.7 495.8 — 13.3 � 122.5
Mecufi Am 361.5 98.4 523.1 149.4 23.1 12.2 — — 115.4 52.9Ct 440.0 156.8 200.0 154.9 — — — — 580.0 555.3Bg 200.0 200.0 100.0 � — — — — 33.3 33.3Rm 337.5 106.8 375.0 114.6 — — 12.5 12.5 450.0 181.3Sa 942.9 541.1 514.3 143.8 57.1 42.9 28.6 18.4 28.6 18.4Average 465.4 342.5 40.1 20.5 241.5
Pemba Am 1191.7 439.9 433.3 115.0 16.7 11.2 — — 66.7 18.8Ct 866.7 413.7 433.3 201.1 16.7 16.7 — — 333.3 125.6Bg 100.0 � — — — — — — — —Rm 1300.0 504.7 200.0 57.7 — — 28.6 28.6 342.9 179.8Sa 20.0 20.0 540.0 67.8 — — — — 20.0 20.0Average 695.7 401.7 16.7 28.6 � 190.7
Ibo Am 633.3 289.4 966.7 224.6 33.3 33.3 16.7 16.7 1016.7 350.6Ct 500.0 197.6 42.9 29.7 — — — — 757.1 369.6Rm 933.3 240.4 683.3 218.2 — — — — 166.7 84.3Sa 400.0 132.3 266.7 70.7 155.6 86.8 — — 22.2 14.7Average 616.7 489.9 94.4 16.7 490.7
Luchete Am 683.3 360.9 1633.3 530.2 716.7 464.3 — — 33.3 21.1Ct 100.0 � 100.0 � — — — — — —Rm 1600.0 418.3 980.0 315.3 — — 40.0 24.5 — —Sa 340.0 188.7 140.0 87.2 40.0 24.5 — — — —Average 680.8 713.3 378.3 40.0 33.3
Ulo Am 440.0 60.0 1460.0 404.5 220.0 102.0 120.0 97.0 300.0 137.8Ct 687.5 301.4 187.5 81.1 — — 75.0 49.1 350.0 169.0Rm 2250.0 833.4 1400.0 371.5 616.7 616.7 16.7 16.7 800.0 330.7Sa 440.0 169.1 980.0 272.8 — — — — 240.0 92.7Average 843.5 865.5 418.3 70.6 422.5
Mngoji 1 Am 300.0 126.5 40.0 40.0 — — — — 1380.0 265.3Ct 250.0 125.8 50.0 50.0 25.0 25.0 25.0 25.0 275.0 149.3Rm 480.0 153.0 20.0 20.0 — — — — 1120.0 213.1Sa 20.0 20.0 20.0 20.0 320.0 66.3 420.0 58.3 1060.0 273.1Average 262.5 32.5 172.5 222.5 958.8
Mngoji 2 Am — — — — — — 100.0 � 100.0 �
Rm 100.0 100.0 25.0 25.0 — — — — 950.0 330.4Sa 150.0 64.5 — — 25.0 25.0 — — 725.0 286.9Average 125.0 25 25 100 591.7
All 700.9 66.1 542.8 46.6 63.7 23.0 21.4 5.6 316.7 36.4
Am denotes Avicennia marina etc. S.E.5 standard error; �means only one sample (S.E. not calculated in this case); — means no individuals of thespecies were found in this condition.
S.O. BANDEIRA ET AL.S52
Copyright r 2009 John Wiley & Sons, Ltd. Aquatic Conserv: Mar. Freshw. Ecosyst. 19: S46–S55 (2009)
DOI: 10.1002/aqc

(Clark and Allaway, 1993). Many biotic and abiotic processes
such as change in salinity, light penetration, temperature,
sedimentation rates and sediment organic content, that are
altered by tree cutting may also influence forest regeneration,
predation of propagules by crabs and colonization of seedlings
by insects (Krauss and Allen, 2003; Bosire et al., 2008; Granek
and Ruttenberg, 2008).
The most utilized mangrove species at the study sites were
A. marina, R. mucronata and S. alba, and this is similar to what
has been reported in Kenya (Dahdouh-Guebas et al., 2000)
and Tanzania (Semesi, 1998). In most parts of Eastern Africa,
the wood from A. marina is used for many purposes, such as
charcoal and firewood production, boat construction,
handcraft handles, pounding poles, traditional drums and
other small wood products (Dahdouh-Guebas et al., 2000;
Taylor et al., 2003). R. mucronata on the other hand is mainly
used for building and charcoal production; while S. alba wood
is mostly used for boat construction and house ceilings (Taylor
et al., 2003). The preferred size classes for construction poles
are between 8.0 to 13 cm as documented by Kokwaro (1985)
and Dahdough-Guebas et al. (2000). More resistant wood (to
insect attack and rotting) is preferred for construction
Table 4. Quality of mangrove poles in the study sites
Site Species Straight poles Semi-straight poles Crooked poles
Meandensity
S.E. Meandensity
S.E. Meandensity
S.E.
Saco Am 8.3 8.3 575.0 171.5 950.0 232.7Ct — — 333.3 202.8 66.7 33.3Bg — — — — 100.0 �
Rm 160.0 92.7 1000.0 223.6 700.0 327.1Average 84.2 636.1 454.2
Sangala Am 113.3 99.5 246.7 70.3 2246.7 530.2Ct 50.0 50.0 250.0 165.8 650.0 193.6Bg 33.3 33.3 833.3 441.0 166.7 33.3Rm 33.3 33.3 700.0 298.9 800.0 273.3Average 62.8 533.2 863.5
Mecufi Am 15.4 10.4 400.0 94.7 476.9 152.0Ct 80.0 58.3 340.0 174.9 220.0 124.1Bg 66.7 66.7 233.3 133.3 — —Rm 50.0 37.8 575.0 192.5 87.5 47.9Sa 328.6 174.2 971.4 420.7 185.7 101.0Average 108.1 504.0 242.5
Pemba Am 175.0 56.6 625.0 228.3 833.3 319.4Ct 450.0 168.8 300.0 131.7 566.7 430.2Bg — — — — 100.0 �
Rm 1042.9 513.6 342.9 89.6 128.6 56.5Sa 220.0 66.3 320.0 37.4 20.0 20.0Average 472.0 397.0 378.1
Ibo Am 16.7 16.7 666.7 152.0 950.0 368.6Ct — — — — 760.0 250.2Rm 100.0 44.7 320.0 146.3 1560.0 186.0Sa 100.0 40.8 433.3 74.5 288.9 108.6Average 69.9 428.9 889.7
Luchete Am 33.3 21.1 66.7 49.4 2916.7 845.1Ct — — 100.0 � 100.0 �
Rm 920.0 208.3 1060.0 522.1 620.0 97.0Sa 460.0 140.0 20.0 20.0 — —Average 471.1 311.7 1212.2
Ulo Am 100.0 77.5 220.0 86.0 1860.0 481.2Ct 471.4 228.6 228.6 96.9 300.0 123.4Rm 800.0 235.2 2433.3 859.7 416.7 124.9Sa 1220.0 355.5 100.0 77.5 100.0 31.6Average 618.3 530.3 555.3
Mngoji 1 Am — — — — 1550.0 263.0Ct 166.7 166.7 — — 300.0 208.2Rm 1080.0 217.7 40.0 24.5 140.0 116.6Sa 980.0 66.3 480.0 205.9 440.0 196.5Average 742.2 260 607.5
Mngoji 2 Am — — — — — 380.1Rm 333.3 333.3 — — 1333.3 176.4Sa 120.0 120.0 120.0 � 1240.0 220.5Average 226.7 120.0 1286.7
Total 269.2 34.6 448.1 48.5 749.5 74.8
Am denotes Avicennia marina etc. S.E.5 standard error; �means only one sample (S.E. not calculated in this case); — means no individuals of thespecies were found in this condition.
EVALUATION OF MANGROVE STRUCTURE AND CONDITION S53
Copyright r 2009 John Wiley & Sons, Ltd. Aquatic Conserv: Mar. Freshw. Ecosyst. 19: S46–S55 (2009)
DOI: 10.1002/aqc

purposes such as R. mucronata, while for firewood production,
the preference is for slow burning and smokeless species such
as A. marina (Taylor et al., 2003).
Main drivers for mangrove destruction in Eastern Africa
include overharvesting for fuelwood and charcoal supply,
mangrove habitat conversion for salt works, as well as
sedimentation associated with heavy river sediment discharge
(Abuodha and Kairo, 2001; Kitheka et al., 2002). The loss of
mangrove forests has been greatly increased by the growth of
coastal towns such as Maputo and Beira in Mozambique
(Barbosa et al., 2001). Further disturbance such as solid waste
disposal, wastewater discharge and oil spills tend to occur in
mangroves near to population centres (Semesi, 1998; Abuodha
and Kairo, 2001). Infrastructure development associated with
human density and poverty are important factors while
analysing the root causes of mangrove degradation, all
leading to ecological impacts such as loss of mangrove cover
(Abuodha and Kairo, 2001; Beentje and Bandeira, 2007),
increased shoreline erosion (Kitheka et al., 2003) and
reduction in fisheries. The socio-economic consequences of
this are loss of livelihood and increased poverty among the
people who depend on mangroves. These activities have an
accumulated effect on the current structure and regeneration
of the forest (Dahdouh-Guebas et al., 2000).
CONCLUSION
Human activities have an accumulated effect on the current
structure and conditions of the forest in the study area. The
high CI values in Pemba, Saco, and Luchete compared to
other sites could be due to differences in cutting intensity. The
existence of significantly higher densities of stump at Mngoji
than other sites may indicate the need for management
intervention on the mangrove forests in this protected area
of Tanzania. Mangrove reforestation as practised in Kenya
and other parts of world has the potential of returning the lost
forests, and thereby sustaining the supply of mangrove goods
and services in the area. The replanted mangroves in Kenya
have been shown to provide ecosystem services (e.g. coastal
protection, biodiversity conservation, etc.) similar to natural
stands (Bosire et al., 2005, 2008; Crona and Ronnback, 2005),
and have also been shown to harbour higher quality poles than
the degraded forests (Kairo et al., 2008). There is clear need to
map degraded mangrove area in WIO region in order to
initiate programmes for conservation, rehabilitation and
sustainable utilization of mangrove resources. Such a
programme has already started in the northern Mozambique
in which UNEP is supporting mangrove reforestation in
Nacala-Mossuril biodiversity hotspot (www.wiolab.org).
ACKNOWLEDGEMENTS
This study was funded by the EU funded projects
TRANSMAP (INCO-CT2004-510862, 6th Framework) and
PUMPSEA (INCO-CT2004-510863, 6th Framework). The
authors extend their gratitude to Daudi Msangameno, Saleh
Yahya and Jude Shunula in Tanzania, and Pedro Muianga
and Adriano Macia in Mozambique, for their help during field
work and logistics.
REFERENCES
Abuodha P, Kairo JG. 2001. Human-induced stresses onmangrove swamps along Kenya coast. Hydrobiology 458:255–265.
Figure 4. Juvenile density (saplings ha�1) in the studied forests.
S.O. BANDEIRA ET AL.S54
Copyright r 2009 John Wiley & Sons, Ltd. Aquatic Conserv: Mar. Freshw. Ecosyst. 19: S46–S55 (2009)
DOI: 10.1002/aqc
Barbosa FMA, Cuambe CC, Bandeira SO. 2001. Status anddistribution of mangroves in Mozambique. South AfricanJournal of Botany 67: 393–398.
Beentje H, Bandeira S. 2007. Field Guide to the MangroveTrees of Africa and Madagascar. Kew Publishing: UK.
Berjak P, Campbell GK, Huckett I, Pammenter NW. 1977.In the Mangroves of Southern Africa. Wildlife Society ofSouthern Africa: Natal.
Bosire JO, Dahdouh-Guebas F, Kairo JG, Kazungu J,Dehairs F, Koedam N. 2005. Litter degradation and CNdynamics in reforested mangrove plantations at Gazi Bay,Kenya. Biological Conservation 126: 287–295.
Bosire JO, Dahdouh-Guebas F, Walton M, Crona BI,Lewis III R, Field C, Kairo JG, Koedam N. 2008.Functionality of restored mangroves. A review. AquaticBotany 89: 251–259.
Chu HY, Chen NC, Yeung MC, Tam NFY, Wong YS. 1998.Tide-tank system simulating mangrove wetland for removalof nutrients and heavy metals from wastewater. Water,Science and Technology 38: 361–368.
Cintron G, Schaeffer-Novelli Y. 1984. Methods for studyingmangrove structure. In The Mangrove Ecosystem: ResearchMethods, Snedaker SC, Snedaker JG (eds). UNESCO:Bungay, UK; 91–113.
Clark P, Allaway W. 1993.The regeneration niche of the greymangrove (Avicennia marina): effects of salinity, light andsediment factors on establishment, growth and survival inthe field. Oecologia 93: 548–566.
Crona B, Ronnback P. 2005. Use of replanted mangroves asnursery grounds by shrimp communities in Gazi Bay,Kenya. Estuarine, Coastal and Shelf Science 65: 535–544.
Dahdouh-Guebas F, Mathenge C, Kairo JG, Koedan N. 2000.Utilization of mangrove wood products around Mida Creek(Kenya) among subsistence and commercial users. EconomicBotany 54: 513–527.
Ellison A, Farnsworth E. 1996. Anthropogenic disturbance ofCaribbean mangrove ecosystems: past impacts, presenttrends and future predictions. Biotropica 28: 549–566.
FAO (Food and Agriculture Organization). 1994. MangroveForest Management Guidelines. FAO Forestry Paper 117.FAO, Rome.
FAO (Food and Agriculture Organization). 2005. Status andtrends in mangrove area extent worldwide. Working PaperNo. 64. Forest resource division. FAO, Rome.
Granek E, Ruttenberg BI. 2008. Changes in biotic and abioticprocesses following mangrove clearing. Estuarine, Coastaland Shelf Science 80(4): 555–562.
Hogarth PJ. 1999. The Biology of Mangroves. OxfordUniversity Press.
Holdridge L, Greeke W, Hatheway W, Liang T, Tosi J. 1971.Forest Environment in Tropical Life Zones. Pergamon Press:New York.
Kairo JG, Kivyatu B. 2000. Mangrove management surveywithin and adjacent to Kiunga Marine National Reserve.Final Technical Report. WWF-East Africa RegionalProgram Office, Contract No. 0089/01.
Kairo JG, Dahdouh-Guebas F, Bosire J, Koedam N. 2001.Restoration and management of mangrove systems — alesson for and from the East African region. South AfricanJournal of Botany 67: 383–389.
Kairo JG, Dahdouh-Guebas F, Gwada PO, Ochieng C,Koedam N. 2002 Regeneration status of mangrove forestsin Mida Creek, Kenya: a compromised or secured future?Ambio 31: 562–568.
Kairo JG, Langat JS, Dahdouh-Guebas F, Bosire J,Karachi M. 2008. Structural development and productivityof replanted mangrove plantations in Kenya. Forest Ecologyand Management 255(7): 2670–2677.
Kalk M. 1995. A Natural History of Inhaca Island,Mozambique, 3rd edn. Witwatersrand University Press.
Kathiresan K, Bingham BL. 2001. Biology of mangroves andmangrove ecosystems. Advances in Marine Biology 40:81–251.
Kitheka JU, Ongwenyi GS, Mavuti KM. 2002. Dynamics ofsuspended sediment exchange and transport in a degradedmangrove Creek in Kenya. Ambio 31: 580–587.
Kitheka JU, Ongwenyi GS, Mavuti KM. 2003. Fluxes andexchange of suspended sediments in tidal inlets draining adegraded mangrove forest in Kenya. Estuarine, Coastal andShelf Science 56: 655–667.
Kokwaro JO. 1985. The distribution and economicimportance of mangrove forests in Kenya. Journal of theEast African Natural History Society and National Museum75: 1–12.
Krauss K, Allen J. 2003. Factors influencing regeneration ofmangrove Bruguiera gymnorhiza (L.) Lamk. on a tropicalIsland. Forest Ecology and Management 176: 49–60.
Michinton T. 2001. Canopy and substratum heterogeneityinfluence recruitment of the mangrove Avicennia marina.Journal of Ecology 89: 888–902.
Muller-Dombois D, Ellenberg H. 1974. Aims and Methodsof Vegetation Ecology. John Wiley and Sons Inc:New York.
Pinzon Z, Ewel K, Putz F. 2003. Gap formation and forestregeneration in a Micronesian mangrove forest. Journal ofTropical Ecology 19: 143–153.
Ranaivoson E. 1998. Biodiversite Cotiere et marine. InMonographie Nationale sur la Biodiversite. UNEP, ONE,ANGAP, Ministere de l’Environnement, Ministere des Eauxet Forets 117–137.
Saenger P. 2002. Mangrove Ecology, Silviculture andConservation. Kluwer Academic Publishers: Dordrecht,The Netherlands.
Saket M, Matusse R. 1994. Study for the determination ofthe rate of deforestation of the mangrove vegetationin Mozambique. DNFFB. FAO/PNUD/MOZ/92/013.Technical report.
Semesi AK. 1998. Mangrove management and utilization inEastern Africa. Ambio 27: 620–626.
Sherman R, Fahey T, Battles J. 2000. Small-scale disturbanceand regeneration dynamics in a neotropical mangrove forest.Journal of Ecology 88: 165–178.
Shunula JP 2002. Public awareness, key to mangrovemanagement and conservation: the case of Zanzibar. Trees16: 209–212.
Spalding M, Blasco F, Field C. 1997. World Mangrove Atlas.International Society for Mangrove Ecosystems: Okinawa,Japan.
Taylor M, Ravilious C, Green EP. 2003. Mangroves of EastAfrica. UNEP-WCMC: Cambridge.
Tomlinson PB. 1986. The Botany of Mangroves. CambridgeUniversity Press: Cambridge.
Valiela I, Bowen JL, York JK. 2001. Mangrove forests: oneof the world’s threatened major tropical environments.Bioscience 51: 807–815.
Walters BB. 2005. Ecological effects of small-scale cuttingof Philippine mangrove forests. Forest Ecology andManagement 206: 331–348.
EVALUATION OF MANGROVE STRUCTURE AND CONDITION S55
Copyright r 2009 John Wiley & Sons, Ltd. Aquatic Conserv: Mar. Freshw. Ecosyst. 19: S46–S55 (2009)
DOI: 10.1002/aqc