evaluation of magma mixing and fractional crystallization using whole-rock chemical analyses:...
TRANSCRIPT

Evaluation of magma mixing and fractional crystallizationusing whole-rock chemical analyses: Polytopic vector analyses
Thomas A. Vogel, Paulo J. Hidalgo, Lina Patino, and Karen S. TefendDepartment of Geological Sciences, Michigan State University, East Lansing, Michigan 48824, USA ([email protected])
Robert Ehrlich1048 South Oak Hills Way, Salt Lake City, Utah 84108, USA
[1] Magma mixing and crystal fractionation are fundamental processes that lead to the diversity of magmacompositions, but rarely are all of the major and trace element data on whole rocks used simultaneously inevaluating proposed models. Polytopic vector analysis (PVA) is an oblique factor analysis proceduredesigned specifically to evaluate mixing or unmixing (fractional crystallization) in geologic systems usingall of the analytes (major and trace elements) simultaneously. It differs from other techniques in that it notonly determines the number of end-members and their compositions, but also partitions the relativeproportions of the end-members into each sample in the data array. These samples, expressed asproportions of end-members, can be used as input in other multivariate analyses. The purpose of this paperis to use PVA to evaluate some examples of magma mixing and fractional crystallization and use theseexamples as templates for more complicated systems in order to show both the strengths and theweaknesses of the approach. Five well-constrained examples illustrate how PVA can discriminate betweenthese two processes and provide additional petrogenetic information. Using PVA, mixing between magmatypes can be easily distinguished from crystal fractionation. With fractional crystallization the end-members, generated by PVA, are the initial and final liquids and the compositions where new phases jointhe crystallizing assemblage.
Components: 8894 words, 17 figures, 8 tables.
Keywords: magma mixing; fractional crystallization; chemical composition; factor analysis.
Index Terms: 3610 Mineralogy and Petrology: Geochemical modeling (1009, 8410); 3619 Mineralogy and Petrology:
Magma genesis and partial melting (1037); 3618 Mineralogy and Petrology: Magma chamber processes (1036).
Received 13 August 2007; Revised 29 January 2008; Accepted 8 February 2008; Published 12 April 2008.
Vogel, T. A., P. J. Hidalgo, L. Patino, K. S. Tefend, and R. Ehrlich (2008), Evaluation of magma mixing and fractional
crystallization using whole-rock chemical analyses: Polytopic vector analyses, Geochem. Geophys. Geosyst., 9, Q04020,
doi:10.1029/2007GC001790.
1. Introduction
[2] Major and trace element analyses of wholerocks have been widely used to test major petro-logic processes, but commonly using only a subsetof the major and trace elements. However, the
entire suite of analytes must be consistent with aproposed model. Polytopic vector analysis (PVA)[Johnson et al., 2002] was designed specifically toevaluate mixing or unmixing (crystal fractionation)in geologic systems using all the concentrations ofthe elements as variables. Five well-characterized
G3G3GeochemistryGeophysics
Geosystems
Published by AGU and the Geochemical Society
AN ELECTRONIC JOURNAL OF THE EARTH SCIENCES
GeochemistryGeophysics
Geosystems
Article
Volume 9, Number 4
12 April 2008
Q04020, doi:10.1029/2007GC001790
ISSN: 1525-2027
Copyright 2008 by the American Geophysical Union 1 of 27
sample suites (two of magma mixing, two offractional crystallization and one that contains bothmixing and fractionation) are used to illustratethe usefulness of PVA. In all cases, PVA outputcan unambiguously identify processes and end-members that are involved with the mixing orfractionation processes. In some examples(Unzen volcano and Tiribı Tuff) PVA outputallows us to refine our original interpretations.
[3] Historically, fractional crystallization modelshave been evaluated with whole-rock chemicalanalyses using a variety of techniques. Multiplelinear regression methods have been widely used toevaluate crystal fractionation as well as magmamixing (and/or assimilation models) [Bryan et al.,1969; Wright and Doherty, 1970]. Another widelyused approach to test fractional crystallizationmodels is by modeling trace elements amongpossible fractionating phases, often using the frac-tionating phases identified with multiple linearregression models. Bivariate plots of major andtrace elements are commonly used to evaluatefractionation; these plots are compared to modeleddata variation to determine if the data array isconsistent with fractional crystallization. In a sim-ple fractionating system, this is unambiguous, butin complex systems with both mixing and crystalfractionation the interpretation may be difficult.MELTS is also commonly used on basaltic systemsto determine if chemical variation within a suite isconsistent with thermodynamic modeling of frac-tional crystallization [Ghiorso and Sack, 1995]. Weshow below how PVA can identify systems thathave been dominated by separation of melt fromcrystals.
[4] Magma mixing models have been evaluatedwith whole-rock chemical analyses of many igne-ous suites. Textural and microchemical analyses ofphenocrysts and melt inclusions have been mostsuccessful for inferring magma mixing/mingling[e.g., see Browne et al., 2006a, 2006b; Davidsonet al., 2001; Izbekov et al., 2004; Nakada et al.,1994; Tepley et al., 2000]. Whole-rock chemicalvariations, using bivariate diagrams alone, have notbeen particularly successful in testing mixing mod-els. However, diagrams that use element ratiosinvolving 4 separate elements, have been success-ful [Browne et al., 2006b; Cox et al., 1979; Floodet al., 1989; Hannah et al., 2002; Langmuir et al.,1978]. To accomplish this, authors often presentratio-ratio plots that make the best case for mixing,while not presenting other plots that might be lessconvincing.
[5] The unique aspect of PVA is that it uses all ofthe chemical data to estimate the composition ofend-members and evaluates each sample with re-spect to its proportion of end-members. We em-phasize that PVA is not a stand-alone technique toevaluate magmatic systems, but should be usedalong with other techniques. PVA is a tool that canhelp decipher complex histories because all of theelements are included in a single analysis. Atroubling source of variability arises from instru-mental error or low analytical precision of someelements. In this case PVA can clearly identifysuch effects and, in the case of low precision, canmake some adjustments. We emphasize that in thisstudy we use PVA for simple systems only toillustrate how PVA can be used. In complexfractionating/mixing systems, PVA provides a ro-bust solution that can be used to identify end-members and specific samples involved in mixingwithin a sample suite. The researcher can use thesesamples for further analyses in order to betterdocument the magmatic processes involved.
2. Polytopic Vector Analyses
[6] A complete description of PVA is beyond thescope of this paper and is given by Johnson et al.[2002] and the following discussion was takenfrom this paper. A summary of PVA is given byTefend et al. [2007]. PVA was developed foranalysis of mixtures in the geological sciences,but it has evolved over a period of 40 years, withdifferent aspects of the algorithm presented in aseries of publications, by a number of differentauthors [Full et al., 1981, 1982; Imbrie, 1963;Imbrie and Kipp, 1971; Klovan and Imbrie,1971; Klovan and Miesch, 1976; Miesch, 1976a,1976b]. PVA extracts end-member compositionsand the proportion of end-members in each samplein the database. Although one of the originalresearchers that led to the development of PVAwas a petrologist/geochemist [Miesch, 1976b],there have been few investigations that have ap-plied this technique (or its earlier versions) tomixing problems in petrology [Horkowitz et al.,1989; Vogel et al., 1989]. However, recently Tefendet al. [2007] used PVA to evaluate the complexmixing/fractionation processes in the TopopahSprings–Pah Canyon ash-flow sheets in the South-west Nevada Volcanic Field.
[7] As in all mixing systems, PVA requires plottingthe data into a geometric figure termed a polytope.A polytope (sometimes called a simplex [Johnsonet al., 2002]) represents the generalization of a
GeochemistryGeophysicsGeosystems G3G3
vogel et al.: magma mixing and fractional crystallization 10.1029/2007GC001790
2 of 27
polyhedron to any dimension (triangle, tetrahedron,pentahedron, etc.). The vertices of the polytoperepresent the compositions of end-members gener-ated by PVA. A polytope has one vertex more thanthe number of dimensions in which it is embedded.For instance a five end-member system requires afour dimensional polytope. Thus PVA can be usedto explore relationships that require more than 3dimensions to be expressed without the bias thatcan accompany reducing the system by projectiononto a plane.
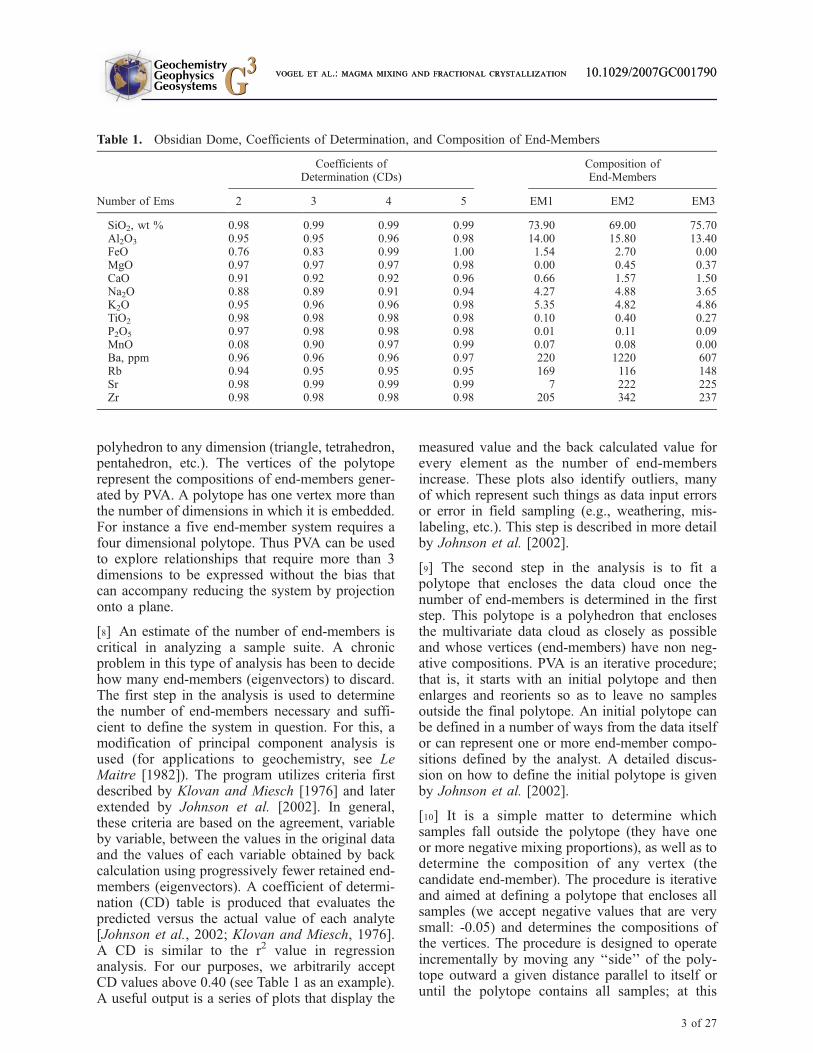
[8] An estimate of the number of end-members iscritical in analyzing a sample suite. A chronicproblem in this type of analysis has been to decidehow many end-members (eigenvectors) to discard.The first step in the analysis is used to determinethe number of end-members necessary and suffi-cient to define the system in question. For this, amodification of principal component analysis isused (for applications to geochemistry, see LeMaitre [1982]). The program utilizes criteria firstdescribed by Klovan and Miesch [1976] and laterextended by Johnson et al. [2002]. In general,these criteria are based on the agreement, variableby variable, between the values in the original dataand the values of each variable obtained by backcalculation using progressively fewer retained end-members (eigenvectors). A coefficient of determi-nation (CD) table is produced that evaluates thepredicted versus the actual value of each analyte[Johnson et al., 2002; Klovan and Miesch, 1976].A CD is similar to the r2 value in regressionanalysis. For our purposes, we arbitrarily acceptCD values above 0.40 (see Table 1 as an example).A useful output is a series of plots that display the
measured value and the back calculated value forevery element as the number of end-membersincrease. These plots also identify outliers, manyof which represent such things as data input errorsor error in field sampling (e.g., weathering, mis-labeling, etc.). This step is described in more detailby Johnson et al. [2002].
[9] The second step in the analysis is to fit apolytope that encloses the data cloud once thenumber of end-members is determined in the firststep. This polytope is a polyhedron that enclosesthe multivariate data cloud as closely as possibleand whose vertices (end-members) have non neg-ative compositions. PVA is an iterative procedure;that is, it starts with an initial polytope and thenenlarges and reorients so as to leave no samplesoutside the final polytope. An initial polytope canbe defined in a number of ways from the data itselfor can represent one or more end-member compo-sitions defined by the analyst. A detailed discus-sion on how to define the initial polytope is givenby Johnson et al. [2002].
[10] It is a simple matter to determine whichsamples fall outside the polytope (they have oneor more negative mixing proportions), as well as todetermine the composition of any vertex (thecandidate end-member). The procedure is iterativeand aimed at defining a polytope that encloses allsamples (we accept negative values that are verysmall: -0.05) and determines the compositions ofthe vertices. The procedure is designed to operateincrementally by moving any ‘‘side’’ of the poly-tope outward a given distance parallel to itself oruntil the polytope contains all samples; at this
Table 1. Obsidian Dome, Coefficients of Determination, and Composition of End-Members
Number of Ems
Coefficients ofDetermination (CDs)
Composition ofEnd-Members
2 3 4 5 EM1 EM2 EM3
SiO2, wt % 0.98 0.99 0.99 0.99 73.90 69.00 75.70Al2O3 0.95 0.95 0.96 0.98 14.00 15.80 13.40FeO 0.76 0.83 0.99 1.00 1.54 2.70 0.00MgO 0.97 0.97 0.97 0.98 0.00 0.45 0.37CaO 0.91 0.92 0.92 0.96 0.66 1.57 1.50Na2O 0.88 0.89 0.91 0.94 4.27 4.88 3.65K2O 0.95 0.96 0.96 0.98 5.35 4.82 4.86TiO2 0.98 0.98 0.98 0.98 0.10 0.40 0.27P2O5 0.97 0.98 0.98 0.98 0.01 0.11 0.09MnO 0.08 0.90 0.97 0.99 0.07 0.08 0.00Ba, ppm 0.96 0.96 0.96 0.97 220 1220 607Rb 0.94 0.95 0.95 0.95 169 116 148Sr 0.98 0.99 0.99 0.99 7 222 225Zr 0.98 0.98 0.98 0.98 205 342 237
GeochemistryGeophysicsGeosystems G3G3
vogel et al.: magma mixing and fractional crystallization 10.1029/2007GC001790vogel et al.: magma mixing and fractional crystallization 10.1029/2007GC001790
3 of 27
point, the procedure signals convergence. Thus,each iteration has two parts: (1) the movement ofthe polytope edges outward, thus defining newvertices, and (2) changing any negative elementsin the end-member compositions to zero (or withinthe allowable negative value -0.05), thus rotatingthe polytope. Samples within the polytope can bedefined on the basis of their end-member compo-sitions. The composition of the end-members (ver-tices) and their mixing proportions can be a strongaid in assessing the nature and complexity of thesample suite. PVA and the instruction manual areavailable as Related Links.1
3. Magma Mixing
3.1. Obsidian Dome
[11] Obsidian dome is part of the Inyo chain, whichis a 12 km long chain containing at least seven
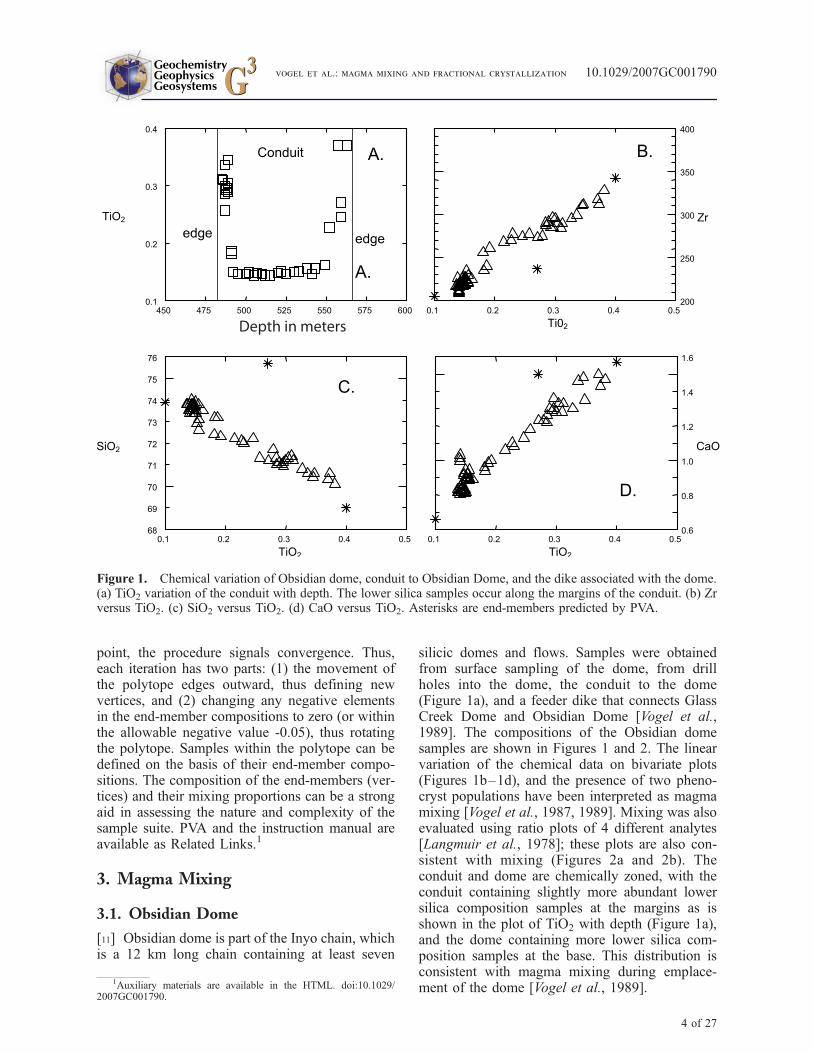
silicic domes and flows. Samples were obtainedfrom surface sampling of the dome, from drillholes into the dome, the conduit to the dome(Figure 1a), and a feeder dike that connects GlassCreek Dome and Obsidian Dome [Vogel et al.,1989]. The compositions of the Obsidian domesamples are shown in Figures 1 and 2. The linearvariation of the chemical data on bivariate plots(Figures 1b–1d), and the presence of two pheno-cryst populations have been interpreted as magmamixing [Vogel et al., 1987, 1989]. Mixing was alsoevaluated using ratio plots of 4 different analytes[Langmuir et al., 1978]; these plots are also con-sistent with mixing (Figures 2a and 2b). Theconduit and dome are chemically zoned, with theconduit containing slightly more abundant lowersilica composition samples at the margins as isshown in the plot of TiO2 with depth (Figure 1a),and the dome containing more lower silica com-position samples at the base. This distribution isconsistent with magma mixing during emplace-ment of the dome [Vogel et al., 1989].
Figure 1. Chemical variation of Obsidian dome, conduit to Obsidian Dome, and the dike associated with the dome.(a) TiO2 variation of the conduit with depth. The lower silica samples occur along the margins of the conduit. (b) Zrversus TiO2. (c) SiO2 versus TiO2. (d) CaO versus TiO2. Asterisks are end-members predicted by PVA.
1Auxiliary materials are available in the HTML. doi:10.1029/2007GC001790.
GeochemistryGeophysicsGeosystems G3G3
vogel et al.: magma mixing and fractional crystallization 10.1029/2007GC001790
4 of 27

[12] The first step in Polytopic Vector Analysis isto choose the number of end-members on the basisof the coefficient of determination (CD). In exam-ining the CDs (Table 1), it can be seen that onlyMnO has an unacceptable CD value for a two end-member solution (0.08), that is, the back-calculatedvalue approaches randomness and any inferencefrom the analysis, if based on MnO should beinvalid. All other CD values are greater than 0.76and most are greater than 0.90. A two end-membersolution is consistent with all of the variation,except MnO (Table 1), which has little variationin this data set. However we impose a 3 end-member solution in order to demonstrate howPVA deals with the very noisy MnO analysis. Notethat the absence of MnO concentration (Table 1)occurs only in the highest-silica end-member,which is clearly an artifact of the PVA analysis.
Thus the small proportions of this end-member inthe samples (Table 2) represent the degree of biasin each sample due to the noise.
[13] The second step is to calculate the compositionof the end-members and the mixing proportions. Inthe initial run of PVA assuming three end-members,two very similar silicic end-members were identi-fied (EM1 and EM3, 73.9 and 75.7 wt.% SiO2,respectively; Table 1). Only one of the silicic end-members contains MgO. The Obsidian Dome silicicsamples contain very low concentrations of MgO(many samples contain less than 0.10 wt.%MgO) and thus because we are near the XRFdelectability limits for MgO concentrations, thevalues show a high degree of scatter in the low-MgO samples. Thus the PVA procedure yieldedtwo silicic end-members, one with 0.00% MgO
Figure 2. (a) Ratio-ratio plot evaluating mixing [Langmuir et al., 1978] in samples from Obsidian dome. Theequation is the equation for the hyperbola. (b) Companion plot of ratio of the denominators versus one of the originalratios. (c) Triangular plot of end-member proportions. Filled squares, lower silica samples; open squares, silicicsamples; open triangles, mixed samples. Double-barbed dashed line shows mixing trend.
GeochemistryGeophysicsGeosystems G3G3
vogel et al.: magma mixing and fractional crystallization 10.1029/2007GC001790
5 of 27
and the other with 0.37% MgO. Any samplecontaining high proportions of the higher MgOend-member is biased by the spurious effect ofMgO.
[14] Thus our interpretation is that this is actually atwo end-member system and that two silicic end-members are not needed except to point out preci-sion problems for MgO (Table 1). The MgO-richsilicic end-member (EM 3) is of relatively lowabundance in most of the high-silica samples andcluster at about 15% abundance (Figure 2c) and sixhigh-silica samples cluster at about 30% abun-dance. Including both end-members has little effecton our conclusions. The lower-silica end-member(EM2) has significantly higher concentrations ofFeO, MgO, MnO, TiO2, Al2O3 P2O5, Ba and Zrthan either of the silicic end-members (EM1 andEM3).
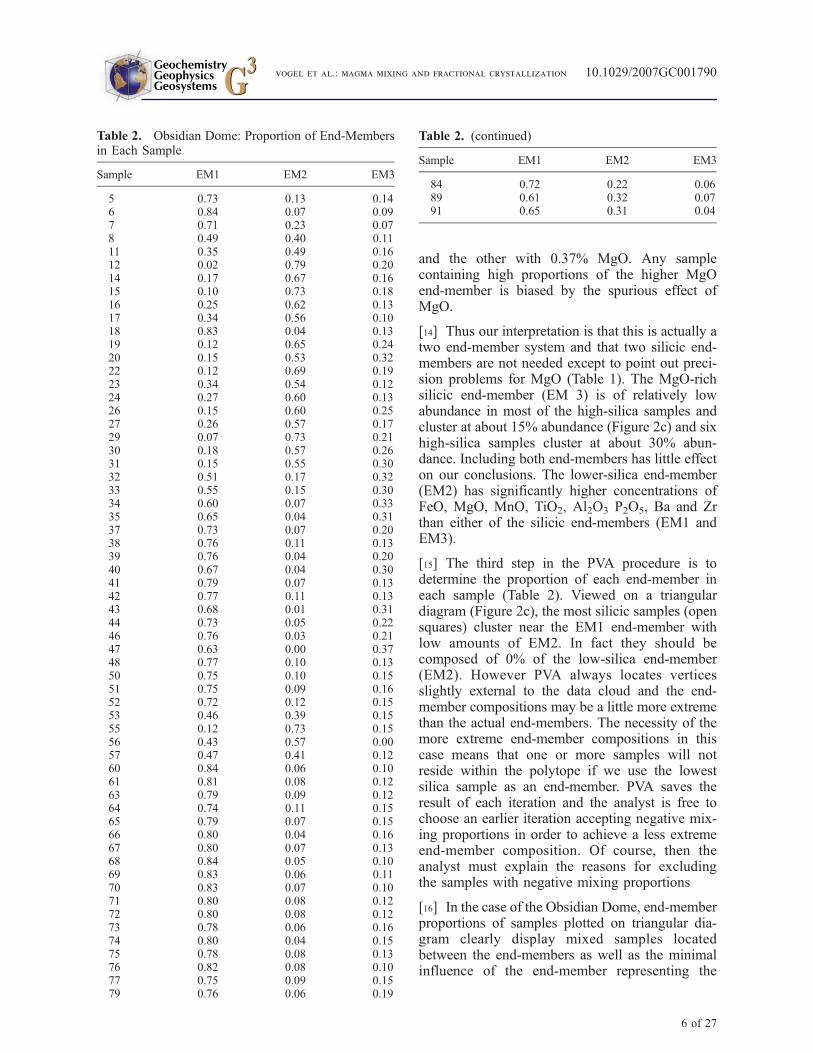
[15] The third step in the PVA procedure is todetermine the proportion of each end-member ineach sample (Table 2). Viewed on a triangulardiagram (Figure 2c), the most silicic samples (opensquares) cluster near the EM1 end-member withlow amounts of EM2. In fact they should becomposed of 0% of the low-silica end-member(EM2). However PVA always locates verticesslightly external to the data cloud and the end-member compositions may be a little more extremethan the actual end-members. The necessity of themore extreme end-member compositions in thiscase means that one or more samples will notreside within the polytope if we use the lowestsilica sample as an end-member. PVA saves theresult of each iteration and the analyst is free tochoose an earlier iteration accepting negative mix-ing proportions in order to achieve a less extremeend-member composition. Of course, then theanalyst must explain the reasons for excludingthe samples with negative mixing proportions
[16] In the case of the Obsidian Dome, end-memberproportions of samples plotted on triangular dia-gram clearly display mixed samples locatedbetween the end-members as well as the minimalinfluence of the end-member representing the
Table 2. Obsidian Dome: Proportion of End-Membersin Each Sample
Sample EM1 EM2 EM3
5 0.73 0.13 0.146 0.84 0.07 0.097 0.71 0.23 0.078 0.49 0.40 0.1111 0.35 0.49 0.1612 0.02 0.79 0.2014 0.17 0.67 0.1615 0.10 0.73 0.1816 0.25 0.62 0.1317 0.34 0.56 0.1018 0.83 0.04 0.1319 0.12 0.65 0.2420 0.15 0.53 0.3222 0.12 0.69 0.1923 0.34 0.54 0.1224 0.27 0.60 0.1326 0.15 0.60 0.2527 0.26 0.57 0.1729 0.07 0.73 0.2130 0.18 0.57 0.2631 0.15 0.55 0.3032 0.51 0.17 0.3233 0.55 0.15 0.3034 0.60 0.07 0.3335 0.65 0.04 0.3137 0.73 0.07 0.2038 0.76 0.11 0.1339 0.76 0.04 0.2040 0.67 0.04 0.3041 0.79 0.07 0.1342 0.77 0.11 0.1343 0.68 0.01 0.3144 0.73 0.05 0.2246 0.76 0.03 0.2147 0.63 0.00 0.3748 0.77 0.10 0.1350 0.75 0.10 0.1551 0.75 0.09 0.1652 0.72 0.12 0.1553 0.46 0.39 0.1555 0.12 0.73 0.1556 0.43 0.57 0.0057 0.47 0.41 0.1260 0.84 0.06 0.1061 0.81 0.08 0.1263 0.79 0.09 0.1264 0.74 0.11 0.1565 0.79 0.07 0.1566 0.80 0.04 0.1667 0.80 0.07 0.1368 0.84 0.05 0.1069 0.83 0.06 0.1170 0.83 0.07 0.1071 0.80 0.08 0.1272 0.80 0.08 0.1273 0.78 0.06 0.1674 0.80 0.04 0.1575 0.78 0.08 0.1376 0.82 0.08 0.1077 0.75 0.09 0.1579 0.76 0.06 0.19
Table 2. (continued)
Sample EM1 EM2 EM3
84 0.72 0.22 0.0689 0.61 0.32 0.0791 0.65 0.31 0.04
GeochemistryGeophysicsGeosystems G3G3
vogel et al.: magma mixing and fractional crystallization 10.1029/2007GC001790
6 of 27
effect of low analytical precision for MgO andMnObecause of the low concentrations. This systemillustrates the pattern that occurs in a simple mixingsituation and provides a template for evaluatingmixing in other, more complicated systems.
3.2. Unzen Volcano
[17] Unzen volcano has been subjected to hundredsof low-silica recharge events with many individualeruptions during the life of the volcano [Browne etal., 2006a] and is an excellent example of a magmasystem that evolved, in large part, by magmamixing. Browne et al. [2006a] identified two typesof low-silica enclaves that occur in the dacitic hostof the lava flows primarily on the basis of texturesand microanalyses of minerals as well as whole-rock chemical analyses. They demonstrated thatlow-silica enclaves and the dacitic host have acomplex mixing/mingling relationship with someof the material from the low-silica enclaves mixedinto the dacitic host and some of the host mixedinto the enclaves [Browne et al., 2006a]. Thisprevious work identified only one chemical typeof low-silica magma, however with PVA, we showthat two low-silica magmas are required to explainthe data array. The whole-rock samples used in thisstudy were obtained from USDP-1 drill hole[Hoshizumi et al., 2002] and surface samplescollected from the 1991–1995 eruption [Browneet al., 2006a].
[18] Browne et al. [2006b], on the basis of drillhole (ages = 18,750 years B.P. to 500,000 ka) andsurface sampling (1663 and 1991-95 lavas), docu-mented two types of low-silica enclaves in a dacitichost: a porphyritic enclave (P-enclave) and anequigranular enclave (E-enclave). Both have inter-acted with the dacitic host to various degrees.Porphyritic enclaves (P-enclaves) contain abundantlarge crystals of plagioclase in a groundmass ofmicrophenocrysts. In contrast, the equigranularenclaves (E-enclaves) are not porphyritic, and arecoarser grained than porphyritic enclaves. Browneet al. [2006a, 2006b] demonstrated complex mix-ing relationships between these types of enclavesand the host, the details of which are beyond thescope of the present paper.
[19] Browne et al. [2006a, 2006b] interpreted theseobservations as follows: (1) The P-enclavesresulted from injection of basaltic magma into thehost dacite. Phenocrysts from the injecting basaltwere mingled into the host and phenocrysts fromthe host were mingled into the basaltic enclave.The porphyritic enclaves are products of dispersal
and mixing/mingling of a hotter basaltic magmawith cooler dacitic magma. During intrusion of thebasaltic magma, it engulfed and mixed with por-tions of the host magma, and rapidly crystallized.(2) The E-enclaves are produced by slowly crys-tallizing low-silica magma that underplated andinteracted with the overlying dacitic host. Slowercooling permits thorough homogenization. Equi-granular clots (E-enclaves) are stripped from thecooling and crystallizing underplated magma byconvective stirring in the above host dacitic magmaor perhaps by subsequent replenishment of low-silica magma [Browne et al., 2006a, Figure 19].The 1663 lava represents an eruption of this hybridmagma without dispersing and quenching in theresident dacitic magma [Browne et al., 2006a].
[20] Microchemical analyses demonstrate unequiv-ocally that mixing is a dominant process at Unzen.Many of the compositional arrays on x-y plots arebroadly linear (see MgO and K2O versus SiO2 inFigure 3 as an example) over a relatively largerange of silicic compositions and this linear varia-tion is consistent with simple mixing. However,many other compositional arrays (e.g., Zr, Hf andREEs) are not consistent with simple two end-member mixing (Figure 3).
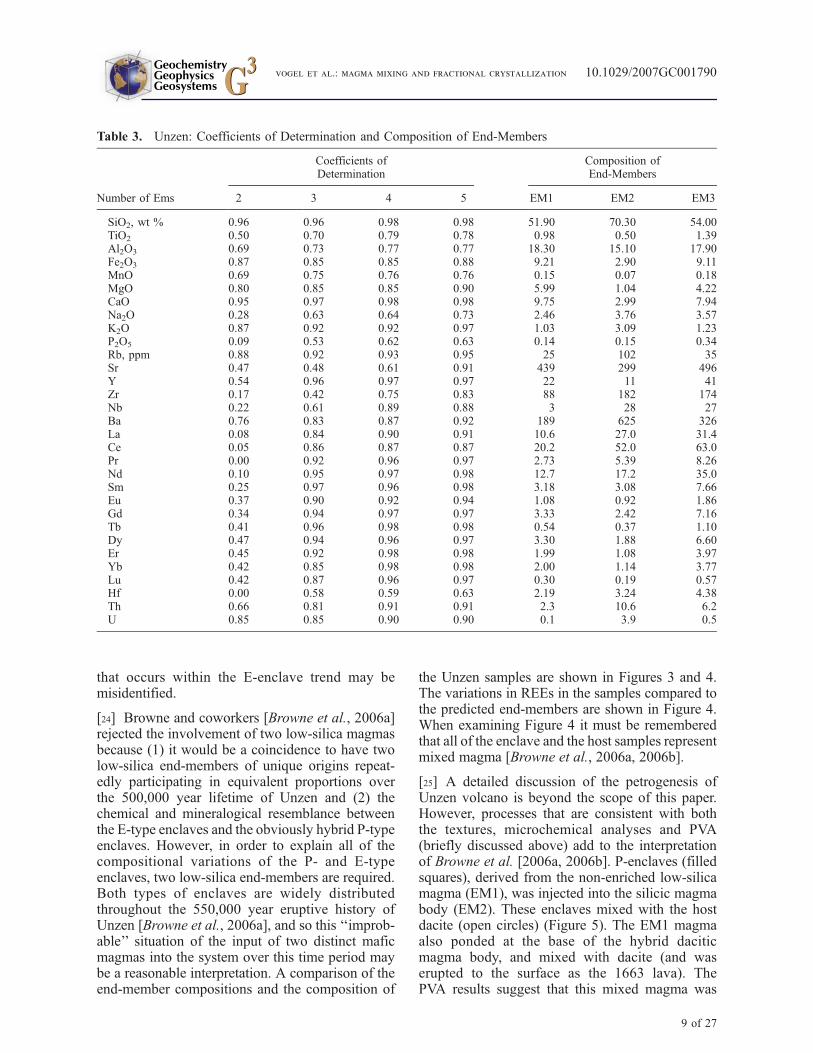
[21] All of the chemical data used in this studywere obtained at the XRF and ICP-MS laboratoriesat Michigan State University and most of thesewere published by Browne et al. [2006a] andwere combined with eleven new enclaves analy-ses for the present study. (These data are given inTable S1 in the auxiliary material2.) Thirty-fourwhole rock chemical analyses using 31 chemicalconstituents (analytes) were used for the PVAanalyses. Examination of Table 3 shows that atwo end-member solution is unacceptable. The CDsof Na2O, P2O5 and many of the rare earth elements,Zr, and Hf are unacceptably low. With three end-members all of these values become acceptable.With four end-members the CDs improve, but theadditional end-member is silicic and only slightlydifferent in composition to the silicic end-membercalculated with a 3 end-member solution (a similarsituation to forcing a 3 end-member solution toObsidian dome above). Therefore, we chose to usea three end-member solution.
[22] The composition of the end-members are givenin Table 3 and shown in Figures 3 and 4. There isone silicic end-member (EM2) and two low-silica
2Auxiliary materials are available in the HTML. doi:10.1029/2007GC001790.
GeochemistryGeophysicsGeosystems G3G3
vogel et al.: magma mixing and fractional crystallization 10.1029/2007GC001790
7 of 27

end-members (EM1 and EM3). From an inspectionof Figure 3, it can be seen that two low-silica end-members are required to explain some of the dataarrays. EM1 is less enriched in REEs and otherincompatible elements than EM3 (Figure 3), withsignificant differences in concentrations other ele-ment as well (Table 3 and Figures 3 and 4).
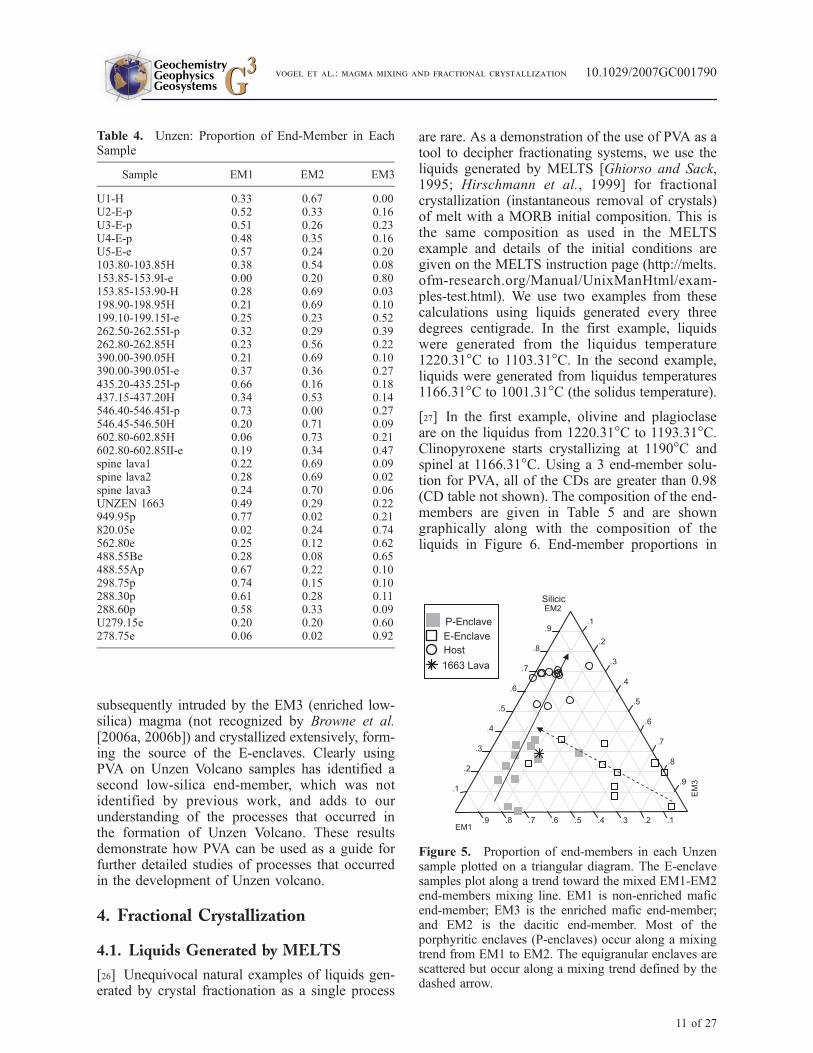
[23] The proportions of each end-member in thesamples are shown in Table 4 and displayedgraphically in Figure 5 on a plot of the proportionsof end-members on a triangular diagram. There is atrend parallel to the EM1-EM2 side of the triangle
(solid line) that represents mixing of a low-silica,(not enriched) EM1 magmas with silicic EM2magmas with minor (10%) amounts of the enrichedlow-silica EM 3 magma. Most of the enclavesidentified as P-enclaves occur along this trend(including the 1663 lava). Another, broadly definedtrend on this diagram is from the low-silica,enriched EM3 magma to a mixed magma, intersect-ing the EM1-EM2 mixed trend (at about 47% EM2,42% EM1, 11% EM3). Most of the E-enclaves fallon this trend. The one sample that is a P-enclave and
Figure 3. Chemical variations of selected major and trace elements for Unzen samples and predicted PVA end-members (stars). Note that three end-members are required for many of these trends.
GeochemistryGeophysicsGeosystems G3G3
vogel et al.: magma mixing and fractional crystallization 10.1029/2007GC001790
8 of 27
that occurs within the E-enclave trend may bemisidentified.
[24] Browne and coworkers [Browne et al., 2006a]rejected the involvement of two low-silica magmasbecause (1) it would be a coincidence to have twolow-silica end-members of unique origins repeat-edly participating in equivalent proportions overthe 500,000 year lifetime of Unzen and (2) thechemical and mineralogical resemblance betweenthe E-type enclaves and the obviously hybrid P-typeenclaves. However, in order to explain all of thecompositional variations of the P- and E-typeenclaves, two low-silica end-members are required.Both types of enclaves are widely distributedthroughout the 550,000 year eruptive history ofUnzen [Browne et al., 2006a], and so this ‘‘improb-able’’ situation of the input of two distinct maficmagmas into the system over this time period maybe a reasonable interpretation. A comparison of theend-member compositions and the composition of
the Unzen samples are shown in Figures 3 and 4.The variations in REEs in the samples compared tothe predicted end-members are shown in Figure 4.When examining Figure 4 it must be rememberedthat all of the enclave and the host samples representmixed magma [Browne et al., 2006a, 2006b].
[25] A detailed discussion of the petrogenesis ofUnzen volcano is beyond the scope of this paper.However, processes that are consistent with boththe textures, microchemical analyses and PVA(briefly discussed above) add to the interpretationof Browne et al. [2006a, 2006b]. P-enclaves (filledsquares), derived from the non-enriched low-silicamagma (EM1), was injected into the silicic magmabody (EM2). These enclaves mixed with the hostdacite (open circles) (Figure 5). The EM1 magmaalso ponded at the base of the hybrid daciticmagma body, and mixed with dacite (and waserupted to the surface as the 1663 lava). ThePVA results suggest that this mixed magma was
Table 3. Unzen: Coefficients of Determination and Composition of End-Members
Number of Ems
Coefficients ofDetermination
Composition ofEnd-Members
2 3 4 5 EM1 EM2 EM3
SiO2, wt % 0.96 0.96 0.98 0.98 51.90 70.30 54.00TiO2 0.50 0.70 0.79 0.78 0.98 0.50 1.39Al2O3 0.69 0.73 0.77 0.77 18.30 15.10 17.90Fe2O3 0.87 0.85 0.85 0.88 9.21 2.90 9.11MnO 0.69 0.75 0.76 0.76 0.15 0.07 0.18MgO 0.80 0.85 0.85 0.90 5.99 1.04 4.22CaO 0.95 0.97 0.98 0.98 9.75 2.99 7.94Na2O 0.28 0.63 0.64 0.73 2.46 3.76 3.57K2O 0.87 0.92 0.92 0.97 1.03 3.09 1.23P2O5 0.09 0.53 0.62 0.63 0.14 0.15 0.34Rb, ppm 0.88 0.92 0.93 0.95 25 102 35Sr 0.47 0.48 0.61 0.91 439 299 496Y 0.54 0.96 0.97 0.97 22 11 41Zr 0.17 0.42 0.75 0.83 88 182 174Nb 0.22 0.61 0.89 0.88 3 28 27Ba 0.76 0.83 0.87 0.92 189 625 326La 0.08 0.84 0.90 0.91 10.6 27.0 31.4Ce 0.05 0.86 0.87 0.87 20.2 52.0 63.0Pr 0.00 0.92 0.96 0.97 2.73 5.39 8.26Nd 0.10 0.95 0.97 0.98 12.7 17.2 35.0Sm 0.25 0.97 0.96 0.98 3.18 3.08 7.66Eu 0.37 0.90 0.92 0.94 1.08 0.92 1.86Gd 0.34 0.94 0.97 0.97 3.33 2.42 7.16Tb 0.41 0.96 0.98 0.98 0.54 0.37 1.10Dy 0.47 0.94 0.96 0.97 3.30 1.88 6.60Er 0.45 0.92 0.98 0.98 1.99 1.08 3.97Yb 0.42 0.85 0.98 0.98 2.00 1.14 3.77Lu 0.42 0.87 0.96 0.97 0.30 0.19 0.57Hf 0.00 0.58 0.59 0.63 2.19 3.24 4.38Th 0.66 0.81 0.91 0.91 2.3 10.6 6.2U 0.85 0.85 0.90 0.90 0.1 3.9 0.5
GeochemistryGeophysicsGeosystems G3G3
vogel et al.: magma mixing and fractional crystallization 10.1029/2007GC001790
9 of 27
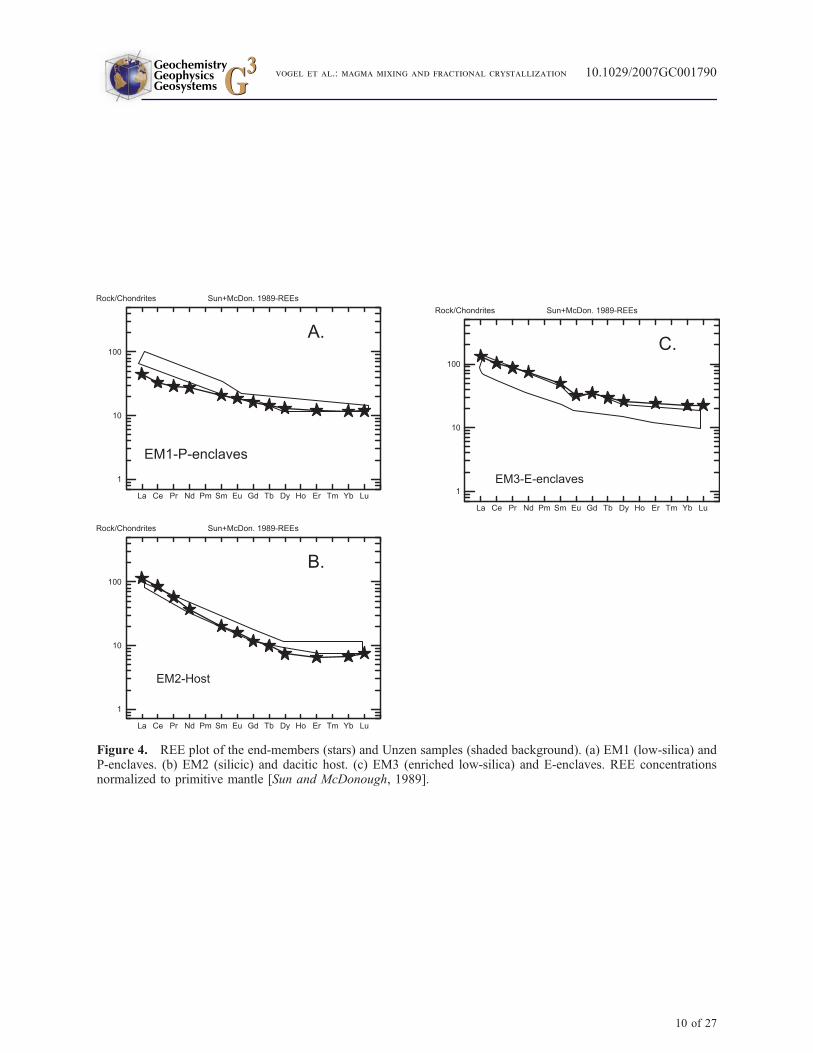
Figure 4. REE plot of the end-members (stars) and Unzen samples (shaded background). (a) EM1 (low-silica) andP-enclaves. (b) EM2 (silicic) and dacitic host. (c) EM3 (enriched low-silica) and E-enclaves. REE concentrationsnormalized to primitive mantle [Sun and McDonough, 1989].
GeochemistryGeophysicsGeosystems G3G3
vogel et al.: magma mixing and fractional crystallization 10.1029/2007GC001790
10 of 27
subsequently intruded by the EM3 (enriched low-silica) magma (not recognized by Browne et al.[2006a, 2006b]) and crystallized extensively, form-ing the source of the E-enclaves. Clearly usingPVA on Unzen Volcano samples has identified asecond low-silica end-member, which was notidentified by previous work, and adds to ourunderstanding of the processes that occurred inthe formation of Unzen Volcano. These resultsdemonstrate how PVA can be used as a guide forfurther detailed studies of processes that occurredin the development of Unzen volcano.
4. Fractional Crystallization
4.1. Liquids Generated by MELTS
[26] Unequivocal natural examples of liquids gen-erated by crystal fractionation as a single process
are rare. As a demonstration of the use of PVA as atool to decipher fractionating systems, we use theliquids generated by MELTS [Ghiorso and Sack,1995; Hirschmann et al., 1999] for fractionalcrystallization (instantaneous removal of crystals)of melt with a MORB initial composition. This isthe same composition as used in the MELTSexample and details of the initial conditions aregiven on the MELTS instruction page (http://melts.ofm-research.org/Manual/UnixManHtml/exam-ples-test.html). We use two examples from thesecalculations using liquids generated every threedegrees centigrade. In the first example, liquidswere generated from the liquidus temperature1220.31�C to 1103.31�C. In the second example,liquids were generated from liquidus temperatures1166.31�C to 1001.31�C (the solidus temperature).
[27] In the first example, olivine and plagioclaseare on the liquidus from 1220.31�C to 1193.31�C.Clinopyroxene starts crystallizing at 1190�C andspinel at 1166.31�C. Using a 3 end-member solu-tion for PVA, all of the CDs are greater than 0.98(CD table not shown). The composition of the end-members are given in Table 5 and are showngraphically along with the composition of theliquids in Figure 6. End-member proportions in
Table 4. Unzen: Proportion of End-Member in EachSample
Sample EM1 EM2 EM3
U1-H 0.33 0.67 0.00U2-E-p 0.52 0.33 0.16U3-E-p 0.51 0.26 0.23U4-E-p 0.48 0.35 0.16U5-E-e 0.57 0.24 0.20103.80-103.85H 0.38 0.54 0.08153.85-153.9I-e 0.00 0.20 0.80153.85-153.90-H 0.28 0.69 0.03198.90-198.95H 0.21 0.69 0.10199.10-199.15I-e 0.25 0.23 0.52262.50-262.55I-p 0.32 0.29 0.39262.80-262.85H 0.23 0.56 0.22390.00-390.05H 0.21 0.69 0.10390.00-390.05I-e 0.37 0.36 0.27435.20-435.25I-p 0.66 0.16 0.18437.15-437.20H 0.34 0.53 0.14546.40-546.45I-p 0.73 0.00 0.27546.45-546.50H 0.20 0.71 0.09602.80-602.85H 0.06 0.73 0.21602.80-602.85II-e 0.19 0.34 0.47spine lava1 0.22 0.69 0.09spine lava2 0.28 0.69 0.02spine lava3 0.24 0.70 0.06UNZEN 1663 0.49 0.29 0.22949.95p 0.77 0.02 0.21820.05e 0.02 0.24 0.74562.80e 0.25 0.12 0.62488.55Be 0.28 0.08 0.65488.55Ap 0.67 0.22 0.10298.75p 0.74 0.15 0.10288.30p 0.61 0.28 0.11288.60p 0.58 0.33 0.09U279.15e 0.20 0.20 0.60278.75e 0.06 0.02 0.92
Figure 5. Proportion of end-members in each Unzensample plotted on a triangular diagram. The E-enclavesamples plot along a trend toward the mixed EM1-EM2end-members mixing line. EM1 is non-enriched maficend-member; EM3 is the enriched mafic end-member;and EM2 is the dacitic end-member. Most of theporphyritic enclaves (P-enclaves) occur along a mixingtrend from EM1 to EM2. The equigranular enclaves arescattered but occur along a mixing trend defined by thedashed arrow.
GeochemistryGeophysicsGeosystems G3G3
vogel et al.: magma mixing and fractional crystallization 10.1029/2007GC001790
11 of 27
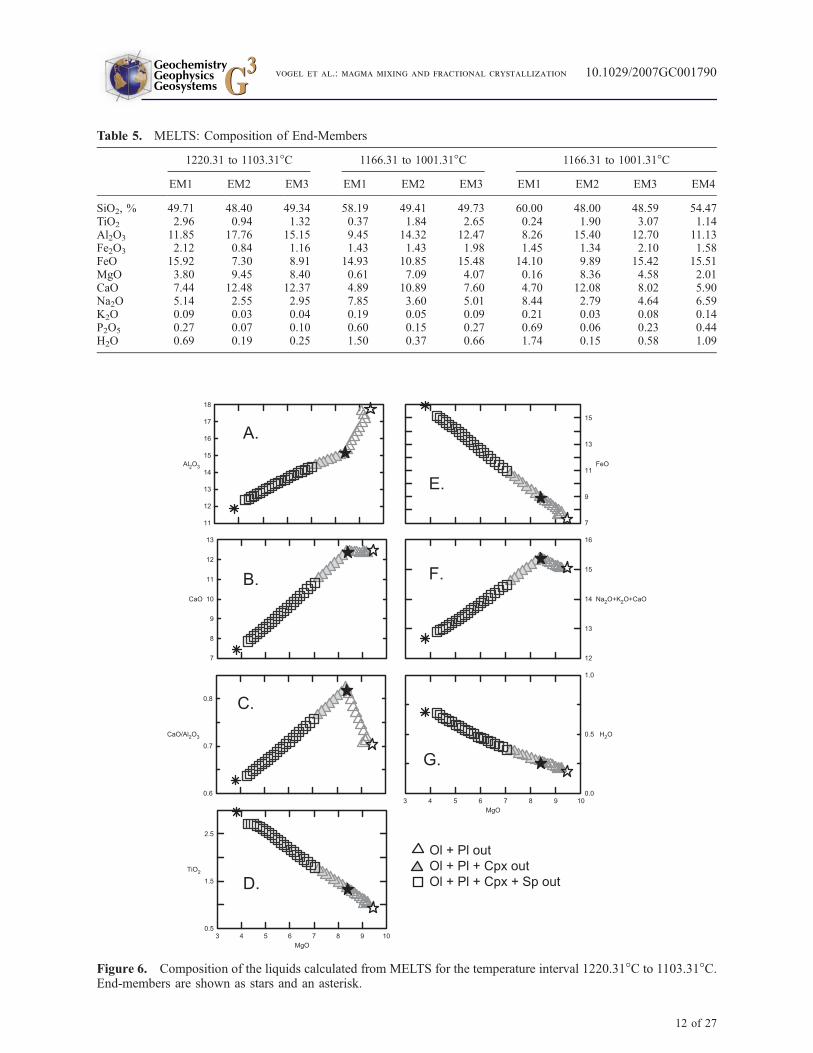
Table 5. MELTS: Composition of End-Members
1220.31 to 1103.31�C 1166.31 to 1001.31�C 1166.31 to 1001.31�C
EM1 EM2 EM3 EM1 EM2 EM3 EM1 EM2 EM3 EM4
SiO2, % 49.71 48.40 49.34 58.19 49.41 49.73 60.00 48.00 48.59 54.47TiO2 2.96 0.94 1.32 0.37 1.84 2.65 0.24 1.90 3.07 1.14Al2O3 11.85 17.76 15.15 9.45 14.32 12.47 8.26 15.40 12.70 11.13Fe2O3 2.12 0.84 1.16 1.43 1.43 1.98 1.45 1.34 2.10 1.58FeO 15.92 7.30 8.91 14.93 10.85 15.48 14.10 9.89 15.42 15.51MgO 3.80 9.45 8.40 0.61 7.09 4.07 0.16 8.36 4.58 2.01CaO 7.44 12.48 12.37 4.89 10.89 7.60 4.70 12.08 8.02 5.90Na2O 5.14 2.55 2.95 7.85 3.60 5.01 8.44 2.79 4.64 6.59K2O 0.09 0.03 0.04 0.19 0.05 0.09 0.21 0.03 0.08 0.14P2O5 0.27 0.07 0.10 0.60 0.15 0.27 0.69 0.06 0.23 0.44H2O 0.69 0.19 0.25 1.50 0.37 0.66 1.74 0.15 0.58 1.09
Figure 6. Composition of the liquids calculated from MELTS for the temperature interval 1220.31�C to 1103.31�C.End-members are shown as stars and an asterisk.
GeochemistryGeophysicsGeosystems G3G3
vogel et al.: magma mixing and fractional crystallization 10.1029/2007GC001790
12 of 27
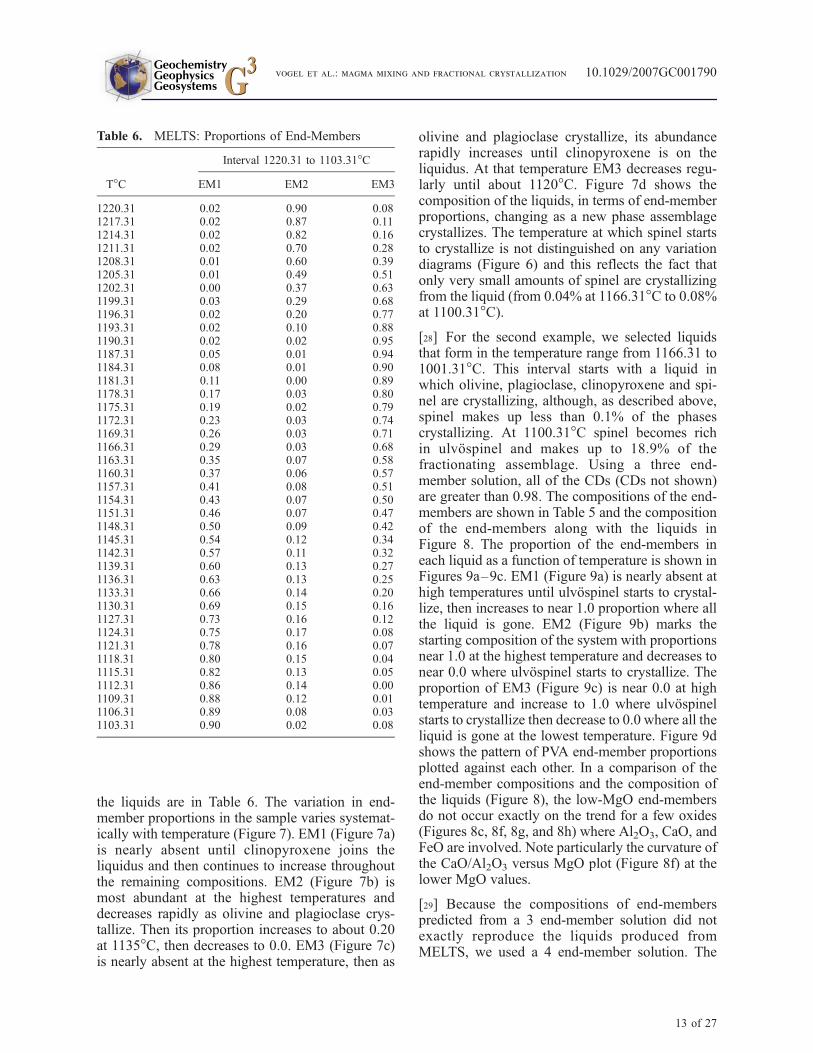
the liquids are in Table 6. The variation in end-member proportions in the sample varies systemat-ically with temperature (Figure 7). EM1 (Figure 7a)is nearly absent until clinopyroxene joins theliquidus and then continues to increase throughoutthe remaining compositions. EM2 (Figure 7b) ismost abundant at the highest temperatures anddecreases rapidly as olivine and plagioclase crys-tallize. Then its proportion increases to about 0.20at 1135�C, then decreases to 0.0. EM3 (Figure 7c)is nearly absent at the highest temperature, then as
olivine and plagioclase crystallize, its abundancerapidly increases until clinopyroxene is on theliquidus. At that temperature EM3 decreases regu-larly until about 1120�C. Figure 7d shows thecomposition of the liquids, in terms of end-memberproportions, changing as a new phase assemblagecrystallizes. The temperature at which spinel startsto crystallize is not distinguished on any variationdiagrams (Figure 6) and this reflects the fact thatonly very small amounts of spinel are crystallizingfrom the liquid (from 0.04% at 1166.31�C to 0.08%at 1100.31�C).
[28] For the second example, we selected liquidsthat form in the temperature range from 1166.31 to1001.31�C. This interval starts with a liquid inwhich olivine, plagioclase, clinopyroxene and spi-nel are crystallizing, although, as described above,spinel makes up less than 0.1% of the phasescrystallizing. At 1100.31�C spinel becomes richin ulvospinel and makes up to 18.9% of thefractionating assemblage. Using a three end-member solution, all of the CDs (CDs not shown)are greater than 0.98. The compositions of the end-members are shown in Table 5 and the compositionof the end-members along with the liquids inFigure 8. The proportion of the end-members ineach liquid as a function of temperature is shown inFigures 9a–9c. EM1 (Figure 9a) is nearly absent athigh temperatures until ulvospinel starts to crystal-lize, then increases to near 1.0 proportion where allthe liquid is gone. EM2 (Figure 9b) marks thestarting composition of the system with proportionsnear 1.0 at the highest temperature and decreases tonear 0.0 where ulvospinel starts to crystallize. Theproportion of EM3 (Figure 9c) is near 0.0 at hightemperature and increase to 1.0 where ulvospinelstarts to crystallize then decrease to 0.0 where all theliquid is gone at the lowest temperature. Figure 9dshows the pattern of PVA end-member proportionsplotted against each other. In a comparison of theend-member compositions and the composition ofthe liquids (Figure 8), the low-MgO end-membersdo not occur exactly on the trend for a few oxides(Figures 8c, 8f, 8g, and 8h) where Al2O3, CaO, andFeO are involved. Note particularly the curvature ofthe CaO/Al2O3 versus MgO plot (Figure 8f) at thelower MgO values.
[29] Because the compositions of end-memberspredicted from a 3 end-member solution did notexactly reproduce the liquids produced fromMELTS, we used a 4 end-member solution. The
Table 6. MELTS: Proportions of End-Members
T�C
Interval 1220.31 to 1103.31�C
EM1 EM2 EM3
1220.31 0.02 0.90 0.081217.31 0.02 0.87 0.111214.31 0.02 0.82 0.161211.31 0.02 0.70 0.281208.31 0.01 0.60 0.391205.31 0.01 0.49 0.511202.31 0.00 0.37 0.631199.31 0.03 0.29 0.681196.31 0.02 0.20 0.771193.31 0.02 0.10 0.881190.31 0.02 0.02 0.951187.31 0.05 0.01 0.941184.31 0.08 0.01 0.901181.31 0.11 0.00 0.891178.31 0.17 0.03 0.801175.31 0.19 0.02 0.791172.31 0.23 0.03 0.741169.31 0.26 0.03 0.711166.31 0.29 0.03 0.681163.31 0.35 0.07 0.581160.31 0.37 0.06 0.571157.31 0.41 0.08 0.511154.31 0.43 0.07 0.501151.31 0.46 0.07 0.471148.31 0.50 0.09 0.421145.31 0.54 0.12 0.341142.31 0.57 0.11 0.321139.31 0.60 0.13 0.271136.31 0.63 0.13 0.251133.31 0.66 0.14 0.201130.31 0.69 0.15 0.161127.31 0.73 0.16 0.121124.31 0.75 0.17 0.081121.31 0.78 0.16 0.071118.31 0.80 0.15 0.041115.31 0.82 0.13 0.051112.31 0.86 0.14 0.001109.31 0.88 0.12 0.011106.31 0.89 0.08 0.031103.31 0.90 0.02 0.08
GeochemistryGeophysicsGeosystems G3G3
vogel et al.: magma mixing and fractional crystallization 10.1029/2007GC001790
13 of 27
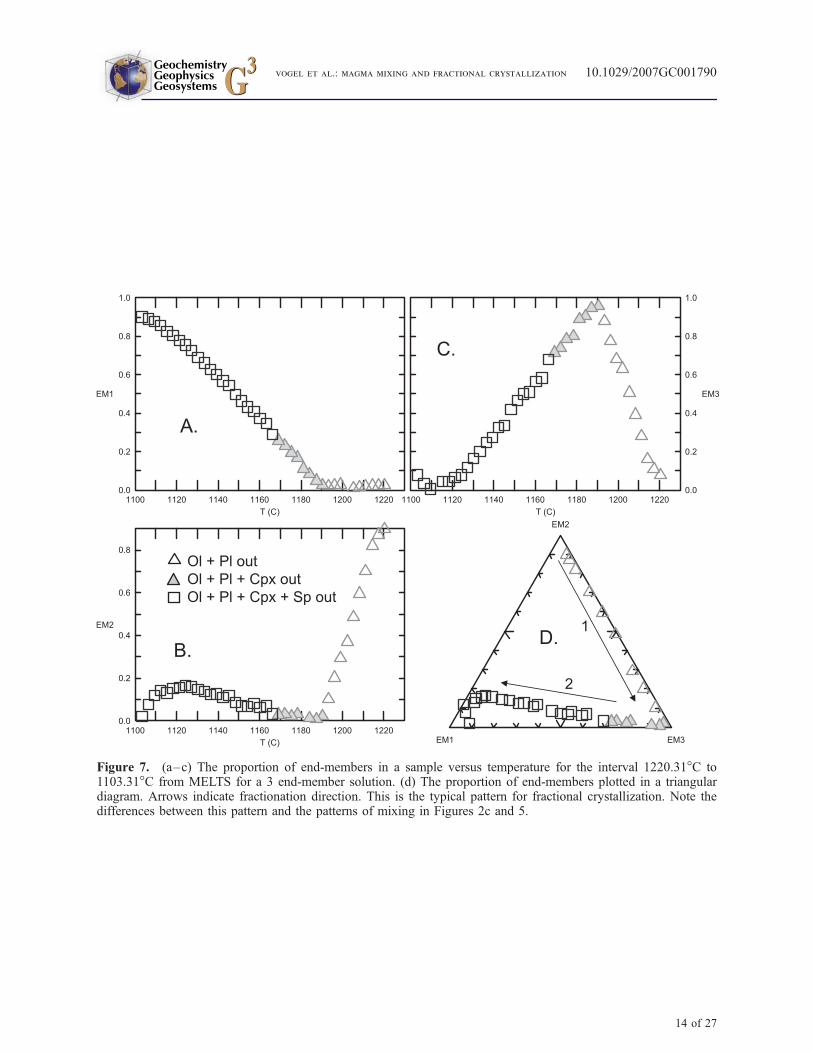
Figure 7. (a–c) The proportion of end-members in a sample versus temperature for the interval 1220.31�C to1103.31�C from MELTS for a 3 end-member solution. (d) The proportion of end-members plotted in a triangulardiagram. Arrows indicate fractionation direction. This is the typical pattern for fractional crystallization. Note thedifferences between this pattern and the patterns of mixing in Figures 2c and 5.
GeochemistryGeophysicsGeosystems G3G3
vogel et al.: magma mixing and fractional crystallization 10.1029/2007GC001790
14 of 27
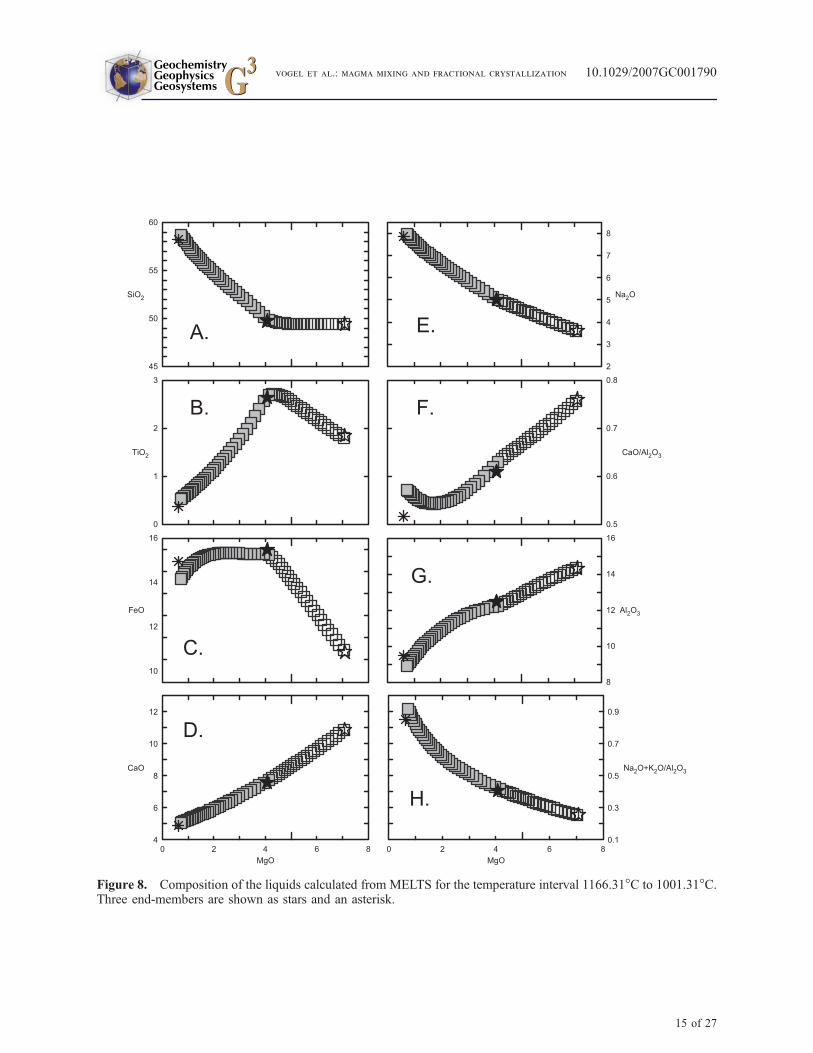
Figure 8. Composition of the liquids calculated from MELTS for the temperature interval 1166.31�C to 1001.31�C.Three end-members are shown as stars and an asterisk.
GeochemistryGeophysicsGeosystems G3G3
vogel et al.: magma mixing and fractional crystallization 10.1029/2007GC001790
15 of 27
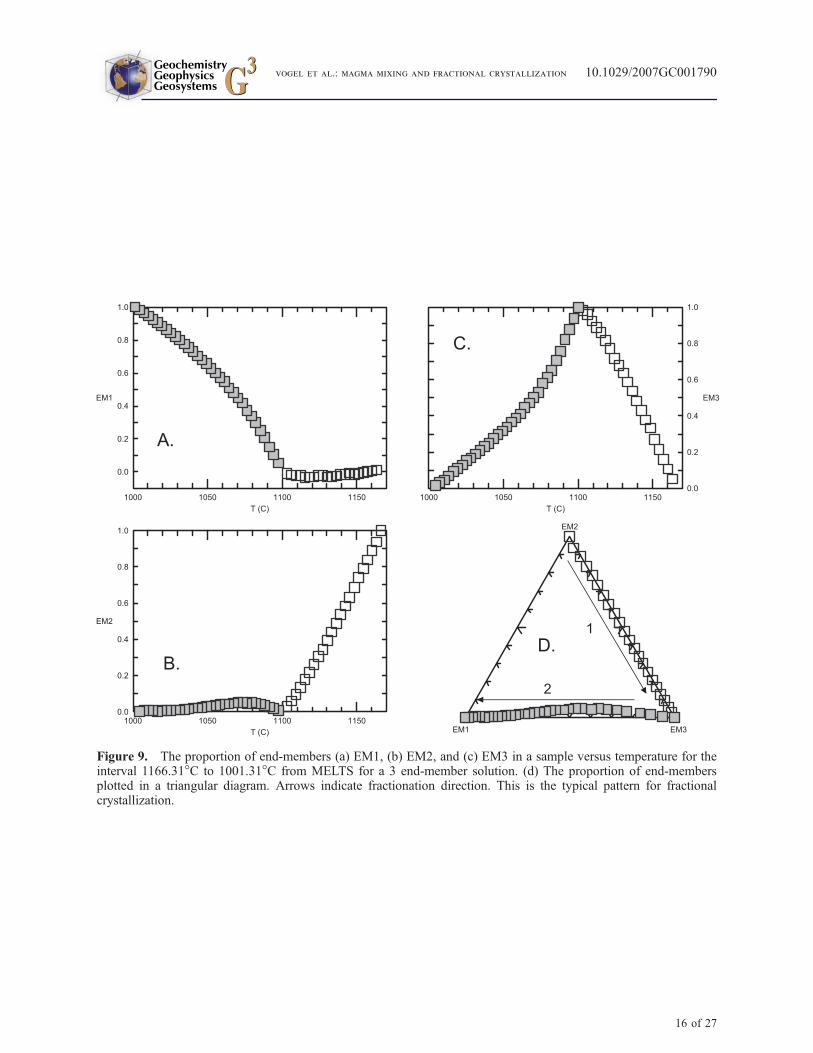
Figure 9. The proportion of end-members (a) EM1, (b) EM2, and (c) EM3 in a sample versus temperature for theinterval 1166.31�C to 1001.31�C from MELTS for a 3 end-member solution. (d) The proportion of end-membersplotted in a triangular diagram. Arrows indicate fractionation direction. This is the typical pattern for fractionalcrystallization.
GeochemistryGeophysicsGeosystems G3G3
vogel et al.: magma mixing and fractional crystallization 10.1029/2007GC001790
16 of 27
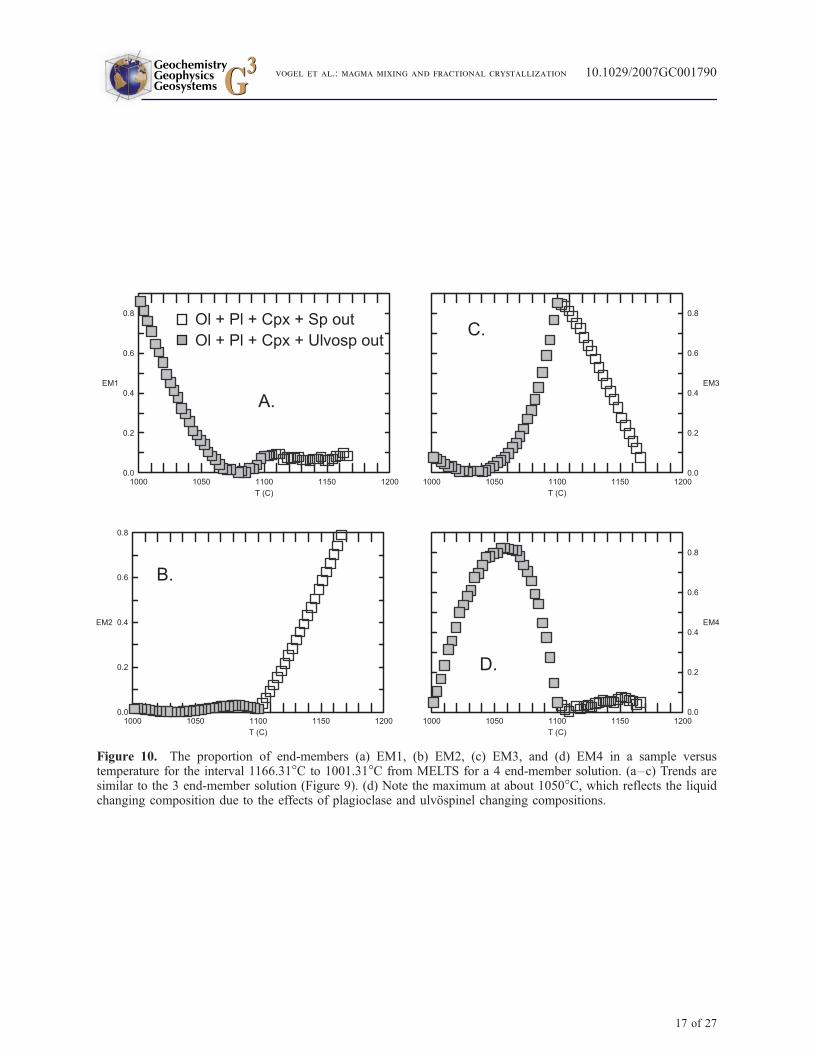
Figure 10. The proportion of end-members (a) EM1, (b) EM2, (c) EM3, and (d) EM4 in a sample versustemperature for the interval 1166.31�C to 1001.31�C from MELTS for a 4 end-member solution. (a–c) Trends aresimilar to the 3 end-member solution (Figure 9). (d) Note the maximum at about 1050�C, which reflects the liquidchanging composition due to the effects of plagioclase and ulvospinel changing compositions.
GeochemistryGeophysicsGeosystems G3G3
vogel et al.: magma mixing and fractional crystallization 10.1029/2007GC001790
17 of 27
compositions of the end-members are shown inTable 5. The proportions of the end-member pres-ent in each sample are plotted against temperaturein Figure 10. In comparing the 3 and 4 end-member solutions, end-member 1, 2 and 3 of thetwo solutions are similar, but slightly different(Table 5 and Figure 11). The 4 end-membersolution slightly over predicts the end-membercomposition, but has the added benefit of predict-ing a fourth end-member, which can better explainall of the compositional variation of the samples.For the 4 end-member solution EM2 has greateramounts of MgO, Al2O3 and CaO, and lesseramounts of SiO2, FeO, K2O, Na2O, P2O5 andH2O. For the 4 end-member solution EM1containsgreater amounts of SiO2, K2O, Na2O, P2O5 andH2O and lesser amounts of Al2O3 and FeO. ForEM3 both solutions are similar except for slightlygreater MgO in the 4 end-member solution. Thevariation of proportion of the new end-member,EM4, with temperature is very different from thatof other end-members (Figure 10). At the highest
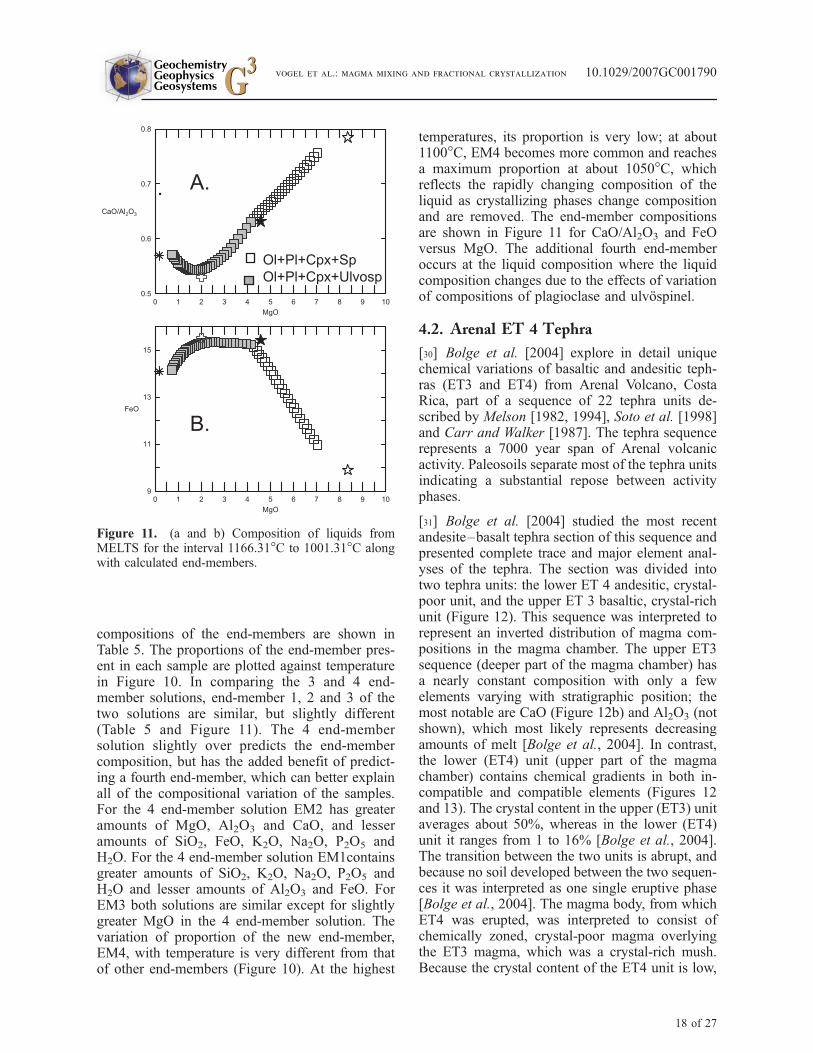
temperatures, its proportion is very low; at about1100�C, EM4 becomes more common and reachesa maximum proportion at about 1050�C, whichreflects the rapidly changing composition of theliquid as crystallizing phases change compositionand are removed. The end-member compositionsare shown in Figure 11 for CaO/Al2O3 and FeOversus MgO. The additional fourth end-memberoccurs at the liquid composition where the liquidcomposition changes due to the effects of variationof compositions of plagioclase and ulvospinel.
4.2. Arenal ET 4 Tephra
[30] Bolge et al. [2004] explore in detail uniquechemical variations of basaltic and andesitic teph-ras (ET3 and ET4) from Arenal Volcano, CostaRica, part of a sequence of 22 tephra units de-scribed by Melson [1982, 1994], Soto et al. [1998]and Carr and Walker [1987]. The tephra sequencerepresents a 7000 year span of Arenal volcanicactivity. Paleosoils separate most of the tephra unitsindicating a substantial repose between activityphases.
[31] Bolge et al. [2004] studied the most recentandesite–basalt tephra section of this sequence andpresented complete trace and major element anal-yses of the tephra. The section was divided intotwo tephra units: the lower ET 4 andesitic, crystal-poor unit, and the upper ET 3 basaltic, crystal-richunit (Figure 12). This sequence was interpreted torepresent an inverted distribution of magma com-positions in the magma chamber. The upper ET3sequence (deeper part of the magma chamber) hasa nearly constant composition with only a fewelements varying with stratigraphic position; themost notable are CaO (Figure 12b) and Al2O3 (notshown), which most likely represents decreasingamounts of melt [Bolge et al., 2004]. In contrast,the lower (ET4) unit (upper part of the magmachamber) contains chemical gradients in both in-compatible and compatible elements (Figures 12and 13). The crystal content in the upper (ET3) unitaverages about 50%, whereas in the lower (ET4)unit it ranges from 1 to 16% [Bolge et al., 2004].The transition between the two units is abrupt, andbecause no soil developed between the two sequen-ces it was interpreted as one single eruptive phase[Bolge et al., 2004]. The magma body, from whichET4 was erupted, was interpreted to consist ofchemically zoned, crystal-poor magma overlyingthe ET3 magma, which was a crystal-rich mush.Because the crystal content of the ET4 unit is low,
Figure 11. (a and b) Composition of liquids fromMELTS for the interval 1166.31�C to 1001.31�C alongwith calculated end-members.
GeochemistryGeophysicsGeosystems G3G3
vogel et al.: magma mixing and fractional crystallization 10.1029/2007GC001790
18 of 27
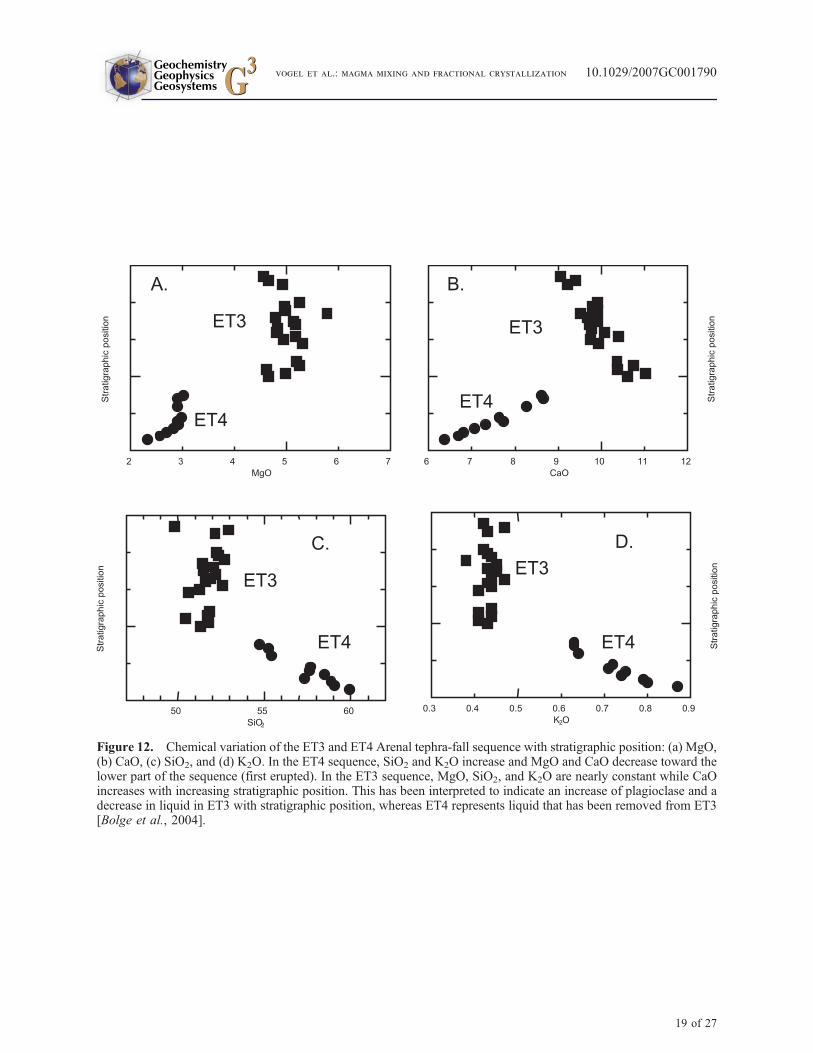
Figure 12. Chemical variation of the ET3 and ET4 Arenal tephra-fall sequence with stratigraphic position: (a) MgO,(b) CaO, (c) SiO2, and (d) K2O. In the ET4 sequence, SiO2 and K2O increase and MgO and CaO decrease toward thelower part of the sequence (first erupted). In the ET3 sequence, MgO, SiO2, and K2O are nearly constant while CaOincreases with increasing stratigraphic position. This has been interpreted to indicate an increase of plagioclase and adecrease in liquid in ET3 with stratigraphic position, whereas ET4 represents liquid that has been removed from ET3[Bolge et al., 2004].
GeochemistryGeophysicsGeosystems G3G3
vogel et al.: magma mixing and fractional crystallization 10.1029/2007GC001790
19 of 27
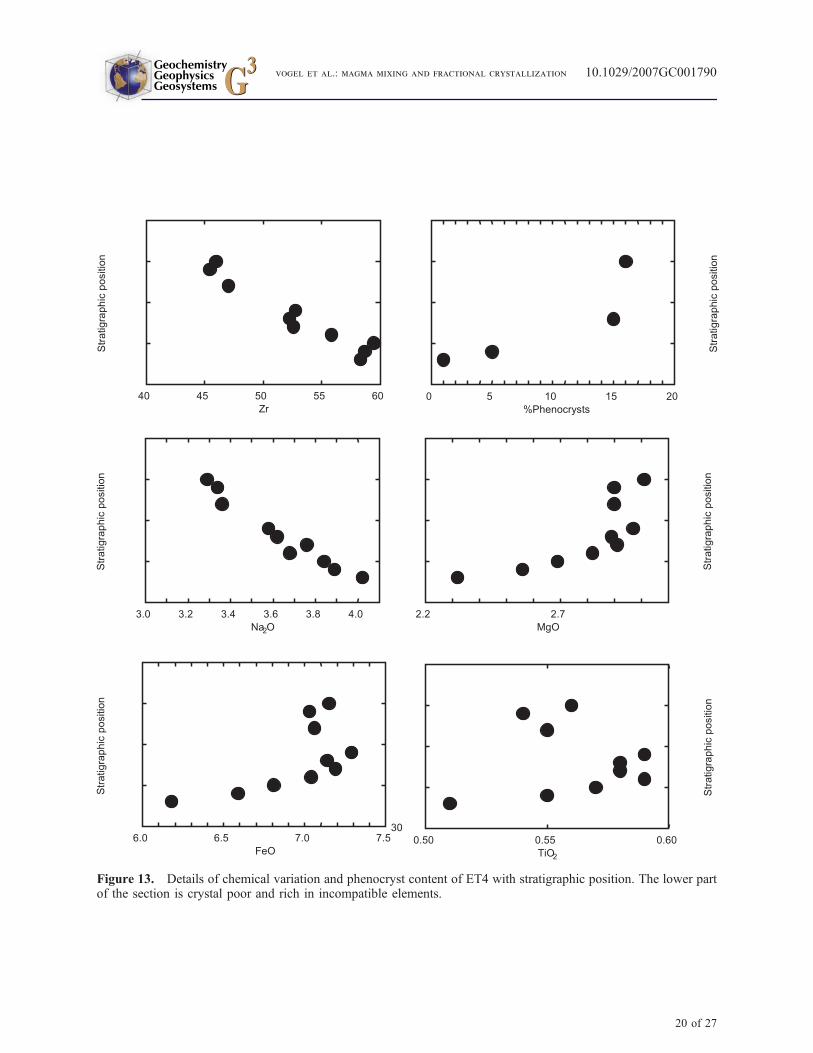
Figure 13. Details of chemical variation and phenocryst content of ET4 with stratigraphic position. The lower partof the section is crystal poor and rich in incompatible elements.
GeochemistryGeophysicsGeosystems G3G3
vogel et al.: magma mixing and fractional crystallization 10.1029/2007GC001790
20 of 27
compositional zoning in the ET4 magma bodymust have been established before crystallization.The ET4 magma was most likely derived fromliquids that progressively separated from the un-derlying crystallizing mushy zone. As each batchof liquid separated, it would rise to its own levelbased on its density, controlled in part by watercontent. The variation in crystal content may havebeen due to the variation in water content, with thewater-rich melt rising to the top of the chamber,thus lowering the liquidus temperature.
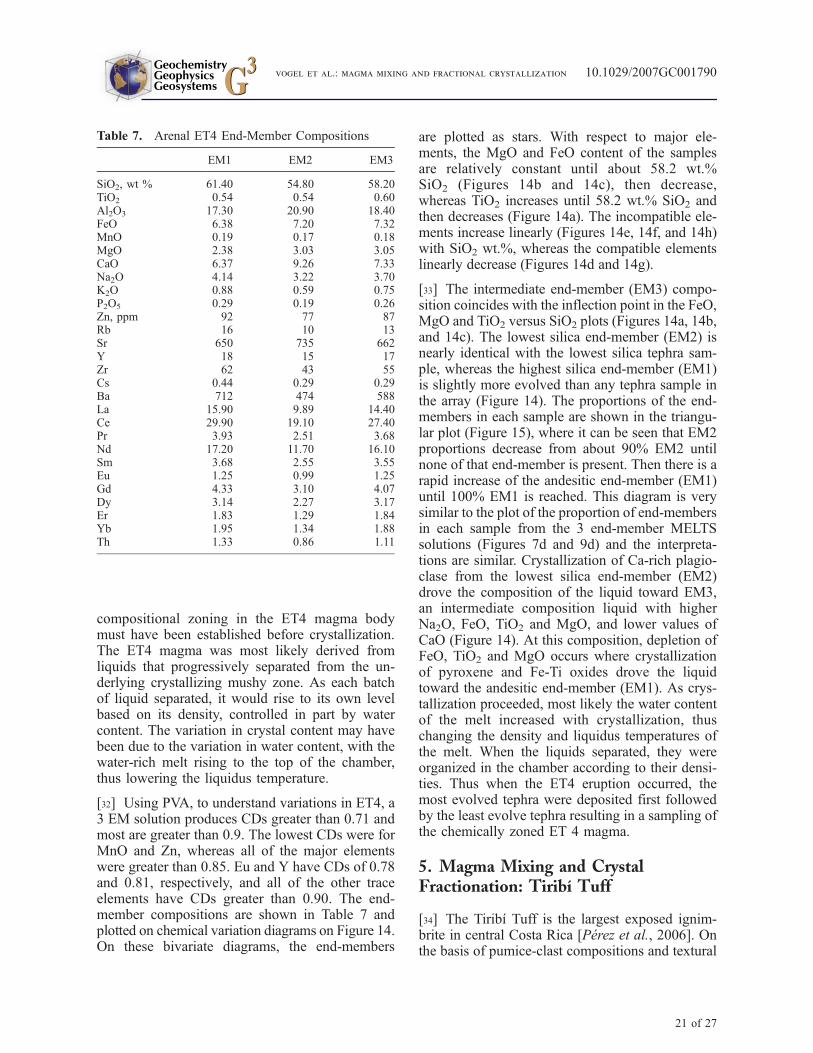
[32] Using PVA, to understand variations in ET4, a3 EM solution produces CDs greater than 0.71 andmost are greater than 0.9. The lowest CDs were forMnO and Zn, whereas all of the major elementswere greater than 0.85. Eu and Y have CDs of 0.78and 0.81, respectively, and all of the other traceelements have CDs greater than 0.90. The end-member compositions are shown in Table 7 andplotted on chemical variation diagrams on Figure 14.On these bivariate diagrams, the end-members
are plotted as stars. With respect to major ele-ments, the MgO and FeO content of the samplesare relatively constant until about 58.2 wt.%SiO2 (Figures 14b and 14c), then decrease,whereas TiO2 increases until 58.2 wt.% SiO2 andthen decreases (Figure 14a). The incompatible ele-ments increase linearly (Figures 14e, 14f, and 14h)with SiO2 wt.%, whereas the compatible elementslinearly decrease (Figures 14d and 14g).
[33] The intermediate end-member (EM3) compo-sition coincides with the inflection point in the FeO,MgO and TiO2 versus SiO2 plots (Figures 14a, 14b,and 14c). The lowest silica end-member (EM2) isnearly identical with the lowest silica tephra sam-ple, whereas the highest silica end-member (EM1)is slightly more evolved than any tephra sample inthe array (Figure 14). The proportions of the end-members in each sample are shown in the triangu-lar plot (Figure 15), where it can be seen that EM2proportions decrease from about 90% EM2 untilnone of that end-member is present. Then there is arapid increase of the andesitic end-member (EM1)until 100% EM1 is reached. This diagram is verysimilar to the plot of the proportion of end-membersin each sample from the 3 end-member MELTSsolutions (Figures 7d and 9d) and the interpreta-tions are similar. Crystallization of Ca-rich plagio-clase from the lowest silica end-member (EM2)drove the composition of the liquid toward EM3,an intermediate composition liquid with higherNa2O, FeO, TiO2 and MgO, and lower values ofCaO (Figure 14). At this composition, depletion ofFeO, TiO2 and MgO occurs where crystallizationof pyroxene and Fe-Ti oxides drove the liquidtoward the andesitic end-member (EM1). As crys-tallization proceeded, most likely the water contentof the melt increased with crystallization, thuschanging the density and liquidus temperatures ofthe melt. When the liquids separated, they wereorganized in the chamber according to their densi-ties. Thus when the ET4 eruption occurred, themost evolved tephra were deposited first followedby the least evolve tephra resulting in a sampling ofthe chemically zoned ET 4 magma.
5. Magma Mixing and CrystalFractionation: Tiribı Tuff
[34] The Tiribı Tuff is the largest exposed ignim-brite in central Costa Rica [Perez et al., 2006]. Onthe basis of pumice-clast compositions and textural
Table 7. Arenal ET4 End-Member Compositions
EM1 EM2 EM3
SiO2, wt % 61.40 54.80 58.20TiO2 0.54 0.54 0.60Al2O3 17.30 20.90 18.40FeO 6.38 7.20 7.32MnO 0.19 0.17 0.18MgO 2.38 3.03 3.05CaO 6.37 9.26 7.33Na2O 4.14 3.22 3.70K2O 0.88 0.59 0.75P2O5 0.29 0.19 0.26Zn, ppm 92 77 87Rb 16 10 13Sr 650 735 662Y 18 15 17Zr 62 43 55Cs 0.44 0.29 0.29Ba 712 474 588La 15.90 9.89 14.40Ce 29.90 19.10 27.40Pr 3.93 2.51 3.68Nd 17.20 11.70 16.10Sm 3.68 2.55 3.55Eu 1.25 0.99 1.25Gd 4.33 3.10 4.07Dy 3.14 2.27 3.17Er 1.83 1.29 1.84Yb 1.95 1.34 1.88Th 1.33 0.86 1.11
GeochemistryGeophysicsGeosystems G3G3
vogel et al.: magma mixing and fractional crystallization 10.1029/2007GC001790
21 of 27
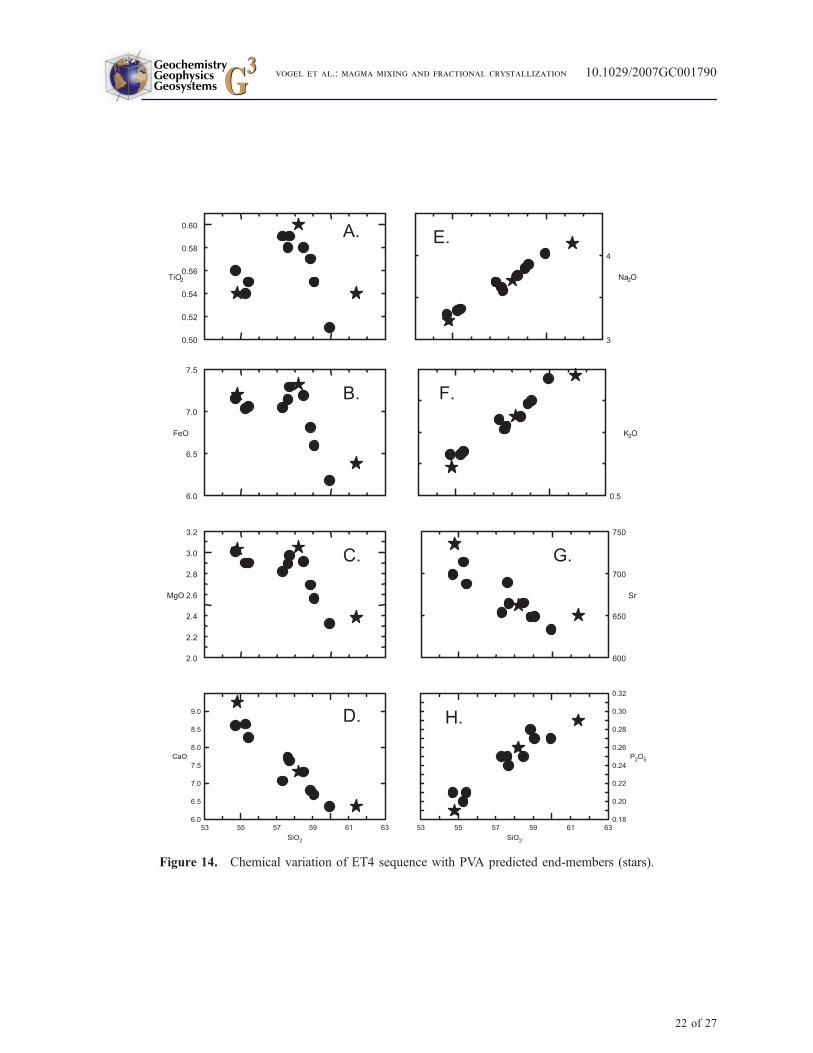
Figure 14. Chemical variation of ET4 sequence with PVA predicted end-members (stars).
GeochemistryGeophysicsGeosystems G3G3
vogel et al.: magma mixing and fractional crystallization 10.1029/2007GC001790
22 of 27

observations, three sample groups were defined byHannah et al. [2002]: a low-silica group (55.1 to65.6 wt% SiO2), a silicic group (66.2 to 69.2 wt%SiO2), and a mingled group (58.6 to 67.7 wt%SiO2) (all compositions calculated 100% anhy-drous) (Figure 16). The mingled samples wererecognized by streaks or bands of different coloredglass (which reflected compositional differences)in thin sections. Hannah et al. [2002] concludedthat the low-silica group and the silicic grouprepresent two distinct magmas that did not evolvein the same magma chamber and that some bivar-iate diagrams are consistent with mingling/mixing(Figures 16c and 16d). Their study focused on theidentification and origin of the low-silica andsilicic magmas and not the mixing processes[Hannah et al., 2002]; however, they did pointout that simple two end-member mixing was notconsistent with the data array (Figures 16a and16b).
[35] In examining the CDs (CDs not shown), Na2Ohas a relatively low CD for 3 end-members (0.37)and does not improve much with 4 end-members(0.44). All of the other CDs for 3 end-membersexcept Zn (CD = 0.56) were greater than 0.80. Weevaluated both the 3 and 4 end-member solutions
and in each case there is only one high-silica end-member present. The 3 end-member solution issufficient to explain the data array and it is con-sistent with microchemical data.
[36] The end-member compositions for the 3 end-member solution are shown (Table 8 and Figures16a–16c). The low-silica samples have end-members with silica concentrations of 53.9 and62.7 wt.%, whereas the silicic end-member has asilica content of 70.4 wt.%.
[37] The proportions of the end-members in thesamples for the 3 end-member solution are shownin Figure 17. The symbols for the samples on thisdiagram are: low-silica (basaltic andesite to andes-ite; filled squares), silicic (rhyolite) (open squares)and mixed (between the silicic and low-silica set ofsamples; triangles). The silicic samples (opensquares) cluster near the silicic end-member(EM1). A few silicic samples fall along the trendof mingled samples (with �60% EM1) and thesemay represent mixing.
[38] All of the mixed samples that occur betweenthe low-silica and silicic samples contain bands ofdark and light glass [Hannah et al., 2002] (trian-gles in Figure 17), and these samples trend fromthe silicic sample cluster to the andesitic end of thelow-silica sample trend (Figure 17). It is interestingto note that the mingling of the silicic magma tookplace only with the more evolved low-silica mag-ma (andesitic) (Figures 16 and 17) and not with thebasaltic andesite magma (those samples high inEM2). Hannah et al. [2002] clearly recognized thatthere were two magma types and that anotherprocess in addition to simple mixing between twoend-members was needed to explain the chemicaldata array. Our analysis using PVA demonstratesthat the low-silica magma evolved independentlyfrom the silicic magma and limited mingling oc-curred between the silicic magma and the low-silica magma.
[39] The two dominant end-member compositionsfor the low-silica samples represent a basalticmagma (EM2) and an andesitic magma (EM3).The occurrence of dark and gray glass bands inthe low-silica samples [Hannah et al., 2002](Figure 16), along with the PVA output withinthe low-silica samples (Figure 17), supports amodel that the differences among the low-silicasamples represents crystal fractionation of basaltic
Figure 15. Arenal ET4 triangular plot of end-memberproportions. Filled squares, lower silica compositions;open squares, more silicic compositions. Arrows showdirection of fractional crystallization. Note the similarityof these plots with the MELTS 3 end-member solution(Figures 7d and 9d).
GeochemistryGeophysicsGeosystems G3G3
vogel et al.: magma mixing and fractional crystallization 10.1029/2007GC001790
23 of 27
Figure 16. Chemical variation of the Tiribı samples. (a) TiO2 versus SiO2. (b) Sm versus SiO2. (c) K2O versusSiO2. (d) Ratio plot testing mixing. Symbols are as follows: open squares, low-silica; open pluses, silicic; opentriangles, identified petrographically as mingled and include mingle low-silica [Hannah et al., 2002]; asterisks, end-members predicted by PVA.
GeochemistryGeophysicsGeosystems G3G3
vogel et al.: magma mixing and fractional crystallization 10.1029/2007GC001790
24 of 27
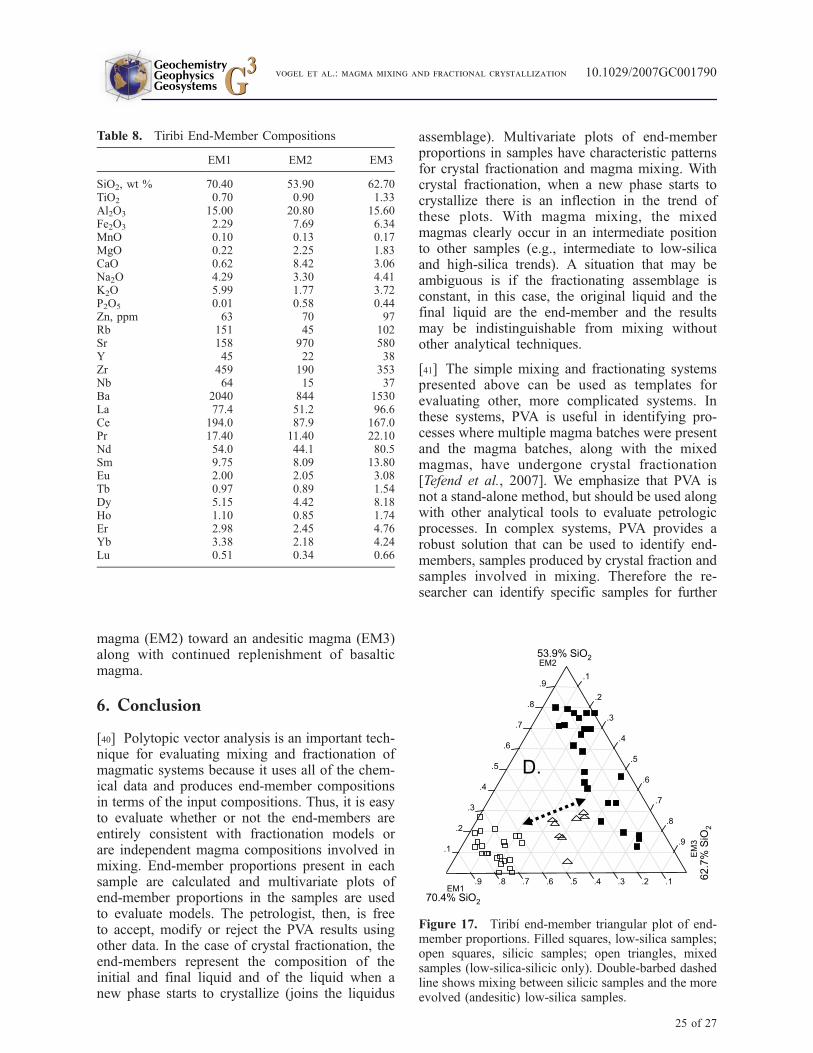
magma (EM2) toward an andesitic magma (EM3)along with continued replenishment of basalticmagma.
6. Conclusion
[40] Polytopic vector analysis is an important tech-nique for evaluating mixing and fractionation ofmagmatic systems because it uses all of the chem-ical data and produces end-member compositionsin terms of the input compositions. Thus, it is easyto evaluate whether or not the end-members areentirely consistent with fractionation models orare independent magma compositions involved inmixing. End-member proportions present in eachsample are calculated and multivariate plots ofend-member proportions in the samples are usedto evaluate models. The petrologist, then, is freeto accept, modify or reject the PVA results usingother data. In the case of crystal fractionation, theend-members represent the composition of theinitial and final liquid and of the liquid when anew phase starts to crystallize (joins the liquidus
assemblage). Multivariate plots of end-memberproportions in samples have characteristic patternsfor crystal fractionation and magma mixing. Withcrystal fractionation, when a new phase starts tocrystallize there is an inflection in the trend ofthese plots. With magma mixing, the mixedmagmas clearly occur in an intermediate positionto other samples (e.g., intermediate to low-silicaand high-silica trends). A situation that may beambiguous is if the fractionating assemblage isconstant, in this case, the original liquid and thefinal liquid are the end-member and the resultsmay be indistinguishable from mixing withoutother analytical techniques.
[41] The simple mixing and fractionating systemspresented above can be used as templates forevaluating other, more complicated systems. Inthese systems, PVA is useful in identifying pro-cesses where multiple magma batches were presentand the magma batches, along with the mixedmagmas, have undergone crystal fractionation[Tefend et al., 2007]. We emphasize that PVA isnot a stand-alone method, but should be used alongwith other analytical tools to evaluate petrologicprocesses. In complex systems, PVA provides arobust solution that can be used to identify end-members, samples produced by crystal fraction andsamples involved in mixing. Therefore the re-searcher can identify specific samples for further
Table 8. Tiribi End-Member Compositions
EM1 EM2 EM3
SiO2, wt % 70.40 53.90 62.70TiO2 0.70 0.90 1.33Al2O3 15.00 20.80 15.60Fe2O3 2.29 7.69 6.34MnO 0.10 0.13 0.17MgO 0.22 2.25 1.83CaO 0.62 8.42 3.06Na2O 4.29 3.30 4.41K2O 5.99 1.77 3.72P2O5 0.01 0.58 0.44Zn, ppm 63 70 97Rb 151 45 102Sr 158 970 580Y 45 22 38Zr 459 190 353Nb 64 15 37Ba 2040 844 1530La 77.4 51.2 96.6Ce 194.0 87.9 167.0Pr 17.40 11.40 22.10Nd 54.0 44.1 80.5Sm 9.75 8.09 13.80Eu 2.00 2.05 3.08Tb 0.97 0.89 1.54Dy 5.15 4.42 8.18Ho 1.10 0.85 1.74Er 2.98 2.45 4.76Yb 3.38 2.18 4.24Lu 0.51 0.34 0.66
Figure 17. Tiribı end-member triangular plot of end-member proportions. Filled squares, low-silica samples;open squares, silicic samples; open triangles, mixedsamples (low-silica-silicic only). Double-barbed dashedline shows mixing between silicic samples and the moreevolved (andesitic) low-silica samples.
GeochemistryGeophysicsGeosystems G3G3
vogel et al.: magma mixing and fractional crystallization 10.1029/2007GC001790
25 of 27
microanalytical analyses in order to better docu-ment the magmatic processes.
Acknowledgments
[42] We wish to thank David Szymanski and Chad Deering
for many hours of discussion of PVA and its application to
petrologic mixing problems. We appreciate Louise Bolge for
sharing her chemical data for the Arenal ET4 and ET3
sequences and for helping us understand the Arenal PVA
results. We thank the National Science Foundation for their
financial support of research on Unzen Volcano (grants EAR-
NSF EAR-0106596 and EAR-0309773 to T.A.V. and L.C.P.).
We gratefully acknowledge the very helpful constructive
criticism of Tom Sisson.
References
Bolge, L. L., et al. (2004), Geochemistry and magmatic evolu-tion of explosive tephras ET3 and ET4 from Arenal Volcano,Costa Rica, Rev. Geol. Am. Cent., 30, 127–135.
Browne, B. L., et al. (2006a), Generation of porphyritic andequigranular mafic enclaves during magma recharge eventsat Unzen Volcano, Japan, J. Petrol., 47(2), 301–328.
Browne, B. L., et al. (2006b), Magma mingling as indicated bytexture and Sr/Ba ratios of plagioclase phenocrysts fromUnzen volcano, SW Japan, J. Volcanol. Geotherm. Res.,154(1–2), 103–116.
Bryan, W. B., et al. (1969), Estimating proportion in petro-graphic mixing equations by least squares approximation,Science, 163, 926–927.
Carr, M. J., and J. A. Walker (1987), Intra-eruption changes inthe composition of some mafic to intermediate tephras inCentral America, J. Volcanol. Geotherm. Res., 33, 369–380.
Cox, K. G., et al. (1979). The Interpretation of Igneous Rocks,358 pp., Allen and Unwin, London.
Davidson, J. P., et al. (2001), Magma recharge, contaminationand residence times revealed by in situ laser ablation isotopicanalysis of feldspar in volcanic rocks, Earth Planet. Sci.Lett., 184, 427–442.
Flood, T. P., et al. (1989), Chemical evolution of a magmaticsystem: The Paintbrush Tuff, Southwest Nevada VolcanicField, J. Geophys. Res., 94(B5), 5943–5960.
Full, W. E., et al. (1981), Extended QModel—Objective defi-nition of external end members in the analysis of mixtures,J. Math. Geol., 13, 331–344.
Full, W. E., et al. (1982), Fuzzy QModel—A new approach forlinear unmixing, J. Math. Geol., 14, 259–270.
Ghiorso, M. S., and R. O. Sack (1995), Chemical mass transferin magmatic processes IV. A revised and internally consis-tent thermodynamic model for the interpolation and extra-polation of liquid-solid equilibria in magmatic systems atelevated temperatures and pressures, J. Petrol., 119, 197–212.
Hannah, R. S., et al. (2002), Origin of the silicic volcanic rocksin central Costa Rica: A study of a chemically variable ash-flow sheet in the Tiribı Tuff, Bull. Volcanol., 64, 117–133.
Hirschmann, M. M., et al. (1999), Calculation of peridotitepartial melting from thermodynamic models of mineralsand melts. II. Isobaric variations in melts near the solidusand owing to variable source composition, J. Petrol., 40(2),297–313.
Horkowitz, J., et al. (1989), Unmixing mid-ocean ridge basaltswith extended Qmodel, Tectonophysics, 165, 1–19.
Hoshizumi, H., et al. (2002). Geology of Unzen volcano andcore stratigraphy of the flank drilling (abstract), paper pre-sented at Unzen Workshop on the Unzen Scientific DrillingProject, Fairbanks, Alaska.
Imbrie, J. (1963). Factor and vector analysis programs foranalyzing geologic data, p. 83, Off. of Naval Res., Washing-ton, D. C.
Imbrie, J., and N. Kipp (1971). A new micropaleoontologicalmethod for quantitative paleoclimatology: Application to alate Pleistocene Caribbean core, in The Late Cenozoic Gla-cial Ages, edited by K. K. Turekian, pp. 71–181, Yale Univ.Press, New Haven, Conn.
Izbekov, P. E., et al. (2004), The 1996 eruption of Karymskyvolcano, Kamchatka: Historical record of basaltic replenish-ment of an andesite reservoir, J. Petrol., 45(11), 2325–2345.
Johnson, G. W., et al. (2002), Principal components analysisand receptor models in environmental forensics, in An Intro-duction to Environmental Forensics, edited by B. L. Murphyand R. D. Morrison, pp. 461–515, Academic, San Diego,Calif.
Klovan, J. E., and J. Imbrie (1971), An algorithm and FOR-TRAN-IV program for large-scale Q-mode factor analysisand calculation of factor scores, Math. Geol., 3, 61–77.
Klovan, J. E., and A. T. Miesch (1976), EXTENDED CAB-FAC and QMODEL, computer programs for Q-mode factoranalysis of compositional data, Comput. Geosci., 1, 161–178.
Langmuir, C. H., et al. (1978), A general mixing equation withapplications to Iceland basalts, Earth Planet. Sci. Lett., 37,380–392.
Le Maitre, R. W. (1982). Numerical Petrology: StatisticalInterpretation of Geochemical Data, 281 pp., Elsevier,Amsterdam.
Melson, W. G. (1982), Alternancia entre magmas acidos ybasicos en las erupciones explosivas mayeres del VolcanArenal, Costa, Bol. Vulcanol., 14, 65–74.
Melson, W. G. (1994). The eruption of 1968 and tephra strati-graphy of Arenal Volcano, in Archaeology, Volcanism, andRemote Sensing in the Arenal Region, Costa Rica, edited byP. D. Sheets and B. R. Mckee, pp. 24–47, Univ. of TexasPress, Austin.
Miesch, A. T. (1976a), Q-mode factor analysis of geochemicaland petrologic data matrices with constant row sums, U.S.Geol. Surv. Prof. Pap., 574-G, 1–47.
Miesch, A. T. (1976b), Interactive computer programs for pet-rologic modeling with Extended Q-mode factor analysis,Comput. Geosci., 2, 439–492.
Nakada, S., et al. (1994), Origin of pheocrysts and composi-tional diversity in pre-Mazama rhyodacite lavas, CraterLake, Oregon, J. Petrol., 35, 127–162.
Perez, W., et al. (2006), The 322 ka Tiribı Tuff: Stratigraphy,geochronology and mechanisms of deposition of the largestand most recent ignimbrite in the Valle Central, Costa Rica,J. Volcanol. Geotherm. Res., 69, 25–40.
Soto, G. J., et al. (1998), El registro euptivo del Arenal en ellapso 3000–7000 anos antes del presente y nuevas deduc-ciones sobre la eda del volcan, Bol. OSIVAM, 13–14, 19–49.
Sun, S., and W. F. McDonough (1989). Chemical and isotopicsystematics of oceanic basalts: Implications for mantle com-positions and processes, in Magmatism in the Ocean Basins,edited by A. D. Saunders and M. J. Norry, Geol. Soc. Spec.Publ., 42, 313–345.
GeochemistryGeophysicsGeosystems G3G3
vogel et al.: magma mixing and fractional crystallization 10.1029/2007GC001790
26 of 27
Tefend, K. S., et al. (2007), Identifying relationships amongsilicic magma batches by polytopic vector analysis: A studyof the Topopah Spring and Pah Canyon ash-flow sheets ofthe southwest Nevada volcanic field, J. Volcanol. Geotherm.Res., 167, 198–211.
Tepley, F. J., et al. (2000), Magma mixing, recharge and erup-tion histories recorded in plagioclase phenocrysts from ElChichon Volcano, Mexico, J. Petrol., 41, 1397–1411.
Vogel, T. A., et al. (1987), Constraints on magma ascent,emplacement and eruption: Chemical and mineralogical
data from drill core samples at Obsidian Dome Inyo Chain,California, Geology, 15, 405–408.
Vogel, T. A., et al. (1989), Petrology and emplacement dy-namics of the intrusive and extrusive rhyolites of ObsidianDome Inyo Craters Volcanic Chain, eastern California,J. Geophys. Res., 94, 17,937–17,56.
Wright, T. L., and P. C. Doherty (1970), A linear programmingand least squares computer method for solving petrologicmixing problems, Geol. Soc. Am. Bull., 81, 1995–2008.
GeochemistryGeophysicsGeosystems G3G3
vogel et al.: magma mixing and fractional crystallization 10.1029/2007GC001790
27 of 27