the role of percolation threshold and water-magma interaction
TRANSCRIPT
The role of percolation threshold
and water-magma interaction on
volcanic eruptive style
Mathieu Colombier
München, 2018

The role of percolation threshold
and water-magma interaction on
volcanic eruptive style
Mathieu Colombier
Dissertation zur Erlangung des Doktorgrades an der Fakultät für Geowissenschaften
der Ludwig-Maximilians-Universität München
vorgelegt von Mathieu Colombier
aus Grenoble, France
München, den 07.03.2018


Erstgutachter: Prof. Dr. Donald B. Dingwell Zweitgutachter: PD Dr. Bettina Scheu Tag der mundlichen Prufung: 25.06.2018


À l’amour de ma vie mon fils chéri Adrien. A mi gran amor mi Vane preciosa.
Et à toute ma famille en France et en Équateur et mes amis dans le monde entier…

I
Zusammenfassung
Vulkanausbrüche werden durch den Aufstieg von Magma aus dem Erdinneren an die Oberfläche
getrieben. Der Ausbruchsstil ist sehr variabel und reicht von heftigen, anhaltenden explosiven Erup-
tionen bis hin zur langsamen Extrusion von Lavaströmen oder Kuppeln. Folglich sind auch die damit
verbundenen vulkanischen Gefahren sehr vielfältig. Der Eruptionsstil wird stark von Entgasungspro-
zessen während des Magmenaufstiegs im Schlot oder in den flachen Schichten der Kruste gesteu-
ert, sowie der Umgebung (z.B. Luft, Wasser oder feuchte Sedimente), in die das Magma eruptiert
wird.
Die Art der Entgasung, die im Vulkanschlot (geschlossenes vs. offenes System) auftritt, hat
eine große Bedeutung für den eruptiven Stil. Während der Entgasung im geschlossenen System
führen Übersättigung und Ausfällung volatiler Phasen in Folge von Dekompression zu Blasenbildung
und - wachstum. Dies resultiert in einem signifikanten Blasenüberdruck oder einer Beschleunigung
des aufsteigenden Magmas, was zu einem explosiven Ausbruch führen kann. Bei der Entgasung
im offenen System wiederum können die volatilen Phasen über die Schlotwände oder über mitei-
nander verbundene poröse Wegsamkeiten aus dem Magma zur Atmosphäre entweichen. Diese
letztgenannte Art der Entgasung verhindert tendenziell die Ausbildung von signifikantem Blasen-
überdruck oder Magmenbeschleunigung und begünstigt damit die effusive Aktivität. Der Übergang
zwischen geschlossenem und offenem System erfolgt an dem Perkolationsschwellenwert, der die
kritische Porosität beschreibt, bei der das Magma von inpermeabel zu permeabel (oder umgekehrt)
übergeht. Dieser Schwellenwert kann z.B. durch Blasenkoaleszenz, Sprödbruch oder verdichten-
dem Verschweißen im Schlot erreicht werden, wodurch das Magma zwischen überdruckgünstigen
Bedingungen und Gasaustritt in der Leitung umschaltet. Der Perkolationsschwellenwert entspricht
dem Beginn der Porenkonnektivität und Permeabilität und kann daher mit Hilfe dieser Parameter
qualitativ und quantitativ eingeschränkt werden.
Im Rahmen dieser Dissertation wurden die Konnektivität-Porosität-Beziehungen einer Serie
von vulkanischen Gesteinen untersucht und in einer Datenbank aus Literaturwerten und eigenen
Messungen zusammengestellt. Weiterhin wurde die Rolle von Kristallen auf den Perkolations-
schwellenwert anhand von 4D-Synchrotron-Vesikulations- und Sinterexperimenten an kristallhalti-
gen Magma-Analoga in Kombination mit Röntgenmikrotomographie durchgeführt. Die Kombination
von Helium-Pyknometrie und Röntgen-Tomographie erlaubte es, die Methoden zur Quantifizierung
des Perkolationsschwellenwert zu verbessern und den Unterschied zwischen den beiden Techniken
gründlich zu untersuchen. Konnektivität-Porosität-Beziehungen wurden systematisch mit Permea-
bilität-Porosität-Beziehungen verglichen.
Die Porenkonnektivität ist eine nützliche und bislang unzureichend genutzte Metrik, um erup-
tive Prozesse bei Vulkanausbrüchen zu untersuchen. Diese erlaubt zum Beispiel die Unterschei-
dung zwischen vulkanischen Produkten, wie Gesteinen aus explosiver und effusiver Aktivität, Pro-
dukten der Vesikulation und Verdichtung und Scoria hawaiianischer oder strombolianischer Aktivität.
II
Es ermöglicht auch eine bessere quantitative Bewertung des Perkolationsschwellenwertes im Ver-
gleich zur Permeabilität, da dies bei Porositäten unterhalb und oberhalb dieser Schwelle ermittelt
werden kann, während dies bei der Permeabilität nicht möglich ist. Die Beziehungen zwischen Po-
renkonnektivität und Porosität, kombiniert mit einer texturellen Untersuchung der vulkanischen Pro-
dukte, erlauben Rückschlüsse darauf, welche Entgasungsprozesse im Magma vor der Eruption vor-
herrschend waren. Diese Beziehungen bedürfen jedoch einer sorgfältigen Prüfung, da sich das
Magma nach der Fragmentation und Ablagerung texturell weiterentwickeln kann. Außerdem können
unterschiedliche Entgasungsprozesse und Konnektivitäts-Porositätspfade zu sehr ähnlichen End-
produkten führen. Effusivgesteine lassen sich durch einen sehr niedrigen Perkolationsschwellenwert
erklären, der durch Blasenverformung, Sprödbruch, Verdichtung und Vesikulation in hochkristallinen
Schmelzen hervorgerufen wird und die Ausgasung und Reduzierung des Blasenüberdrucks begüns-
tigt. Produkte primär explosiver Tätigkeit wie Scoria und Bimsstein wiederum stammen meist aus
kristallarmen Magmen mit einer stark polydispersen Blasengrößenverteilung und häufig ohne De-
formation, was alles zu einem hohen Perkolationsschwellenwert führt. Diese Magmen-Fragmente
entstehen durch hohen Blasenüberdruck oder Magmenbeschleunigung, da der hohe Perkolations-
schwellenwertden Gasaustritt in den Schlot behindert oder verzögert. Zukünftige Studien sollten die
Zusammenhänge zwischen Perkolationsschwellenwert, Entgasung und Fragmentation weiter unter-
suchen und die komplexe Wirkung des Perkolationsschwellenwertes in numerische Modelle zur
Magmenentgasung in einem Vulkanschlot einbeziehen.
Sobald Magma an der Erdoberfläche explosionsartig oder effusiv ausbricht, können weitere
Veränderungen des eruptiven Stils durch die Eruptionsumgebung hervorgerufen werden. Beispiels-
weise wird das Vorhandensein von Meerwasser über dem eruptiven Schlot die eruptiven Prozesse
wie Kühlung, Fragmentierung, Vesikulation und Aggregation aufgrund der unterschiedlichen physi-
kalischen, thermischen und chemischen Eigenschaften von Meerwasser im Vergleich zu Luft dra-
matisch verändern. Surtseyanische Ausbrüche sind flache subaquatische Ausbrüche, die oft im
Laufe der Eruption die Wasseroberfläche durchbrechen, subaerisch werden und Tuffkegel bilden.
Die eruptiven Prozesse sind bei diesen Eruptionen sehr komplex, da sich die Wasser-Magma-Wech-
selwirkungen während der fortschreitenden Konstruktion des Tuffsteinkegels räumlich und zeitlich
entwickeln. Es ist von hoher Wichtigkeit, die eruptiven Prozesse während surtseyanischer Aktivität
zu verstehen, da diese Art von subaquatischen Ausbrüchen Gefahren für Bevölkerung und Störun-
gen des Flugverkehrs durch die hohe Bildung feiner Aschepartikel verursachen kann.
Diese Arbeit untersucht die Rolle der Wasser-Magma-Wechselwirkung auf die eruptiven Pro-
zesse während solcher surtseyanischer Ausbrüche und die Auswirkungen auf die damit verbunde-
nen Gefahren. Lapilli und Bomben von mehreren surtseyanischen Ausbrüchen an den Vulkanen
Hunga Tonga-Hunga Ha'apai und Capelinhos wurden mittels Messungen von Porenmetriken und
3D-Texturanalyse mit Hilfe von Röntgenmikrotomographie analysiert. Die strukturellen Merkmale
und Porenmetriken wurden mit numerischen thermischen Modellen kombiniert, um die Abkühlungs-
dynamik in den Lapilli und Bomben zu begrenzen. Die mit dem thermischen Modell ermittelten Ab-
kühlraten wurden mit Literaturdaten von Abkühlraten verglichen, die mit Hilfe der Geospeedometrie
an subaquatischen Produkten gemessen wurden.
III
Lapilli und Bomben, die während surtseyanischer Ausbrüche gebildet wurden, zeigen allmäh-
liche strukturelle Variationen mit einer Zunahme der Vesikelkonnektivität von Rand zu Kern, die
durch die Vesikulation nach der Fragmentation verursacht wird, die in verschiedenen Stadien durch
Abschrecken im Wasser unterbrochen wird. Die Abkühlung der Ränder der Lapilli erfolgt durch Wär-
meleitung bei direktem Kontakt mit Wasser und durch Strahlung und Konvektion bei Vorhandensein
eines stabilen Dampffilms (Leidenfrost-Effekt). In beiden Fällen führen die hohen Abkühlraten an
den Rändern zu einer raschen Abschreckung und Unterbrechung der Vesikulation, was die niedrigen
Vesikularitäten und Vesikelkonnektivität erklärt. Im Kern sind die Abkühlungsraten viel niedriger und
die Zeit, die für die Vesikulation zur Verfügung steht, ist dramatisch höher, was die höheren Vesiku-
laritäten und Vesikelkonnektivität erklärt. Die Abkühlraten in Pyroklasten aus subaquatischen Aus-
brüchen zeigen eine große Bandbreite, die hauptsächlich von der Partikelgröße, der Art der Abküh-
lung an der Oberfläche (direkter Kontakt Wasser oder Leidenfrost-Effekt), der Schmelztemperatur
und der radialen Position im Partikel abhängen. Die hohen Abkühlraten an den Rändern und die
niedrigen Abkühlraten in den Kernen der Lapilli verursachen eine hohe thermische Belastung an den
Rändern. Dies führt zu thermischer Rissbildung und thermischer Granulierung der Ränder und zur
Bildung von Aschepartikeln, die ascheumrandete Lapilli bilden, in denen die Aschepartikel puzzel-
mäßig ineinandergreifen. Lösungs-Experimente ergaben, dass die Bindung von Aschepartikeln in
den Rändern der mit Asche umhüllten Lapilli durch erhebliche Salzausfällungen (meist NaCl und
CaSO4) stabilisiert wird, die durch die Verdunstung von Meerwasser verursacht werden. Die Salz-
konzentration kann möglicherweise als Indikator für den Grad der Wasser-Magma-Wechselwirkung
bei surtseyanischen Ausbrüchen dienen. Die mit Asche umhüllten Lapilli galten früher als beschich-
tete oder gepanzerte Lapilli, die durch Aggregation in einer asche- und dampfreichen Umgebung
gebildet wurden. Das neue Modell besagt, dass die Ummantelung nicht notwendigerweise ein Be-
weis für die Aggregation von Partikeln ist, sondern vielmehr aus der Bildung neuer primärer Asche
resultieren kann, mit deutlichen Auswirkungen auf die damit verbundenen Gefahren. Die thermische
Granulierung gilt als ein wichtiger Mechanismus, der bei surtseyanischen Ausbrüchen zur Aschebil-
dung führt. In zukünftigen Studien wird das Verständnis des Gleichgewichts zwischen der Aggrega-
tion in der Aschewolke und der subaquatischen Produktion von Asche durch thermische Granulation
ein Schlüsselfaktor für eine bessere Abschätzung potenzieller Gefahren im Zusammenhang mit der
Aschedispersion in flachen subaquatischen Settings sein.
Diese Arbeit kombiniert 3D-Röntgen-Tomographie, porenmetrische Messungen, experimen-
telle Arbeiten an Magma-Analoga, numerische Modellierung und chemische Analysen, um unser
Wissen über den Einfluss von Entgasungsprozessen und Wasser-Magma-Interaktion auf den Stil
von Vulkanausbrüchen und die damit verbundenen Gefahren zu verfeinern. Dieser Ansatz führte zu
innovativen Ergebnissen mit neuartigen Schlussfolgerungen über die Mechanismen, die effusive-
explosive Übergänge während des Magmaaufstiegs auslösen, sowie für die Modifikationen von
eruptiven Prozessen und Gefahren, die durch die Abkühlung im Wasser an der Erdoberfläche her-
vorgerufen werden.
IV
Extended abstract
Volcanic eruptions are driven by the generation and ascent of magma from the earth interior to its
surface. The style of volcanic eruptions is highly variable and ranges from violent, sustained explo-
sive eruptions to slow extrusion of lava flows or domes. Consequently, the related volcanic hazards
are also highly diverse. Eruptive style is strongly controlled by degassing processes in the conduit
during magma ascent at shallow levels of the crust as well as by the nature of the eruptive, cooling
environment (e.g., air, water or wet sediments).
The type of degassing occurring in the conduit (closed- vs. open-system) has a major control
on the eruptive style. During closed-system degassing, volatile exsolution leads to bubble nucleation
and growth during decompression, causing significant bubble overpressure or acceleration of the
gas phase possibly resulting in explosive fragmentation of the magma. During open-system degas-
sing, in turn, the volatiles can freely escape from the magma to the conduit walls or the atmosphere
through interconnected porous pathways. This latter mode of degassing tends to impede significant
bubble overpressure or acceleration and hence promotes effusive activity. The transition between
closed- and open-system conditions occurs at the percolation threshold, which is the critical porosity
at which the magma transitions from impermeable to permeable (or vice versa). This threshold can
be achieved for instance via bubble coalescence, brittle fracturing or densification in the conduit,
causing the magma to switch between conditions favourable for overpressure and gas escape in the
conduit. The percolation threshold corresponds to the onset of pore connectivity and permeability
and can therefore be qualitatively to quantitatively constrained using these metrics.
I studied the connectivity-porosity relationships of a suite of volcanic rocks, compiled in a
database from literature and own measurements. I also examined the role of crystals on the perco-
lation threshold by performing 4D synchrotron vesiculation and sintering experiments on crystal-
bearing magma analogues combined to X-ray micro-tomography. Combination of Helium pyc-
nometry and X-ray tomography techniques allowed to improve the methods for quantification of the
percolation threshold and the difference between the two techniques was thoroughly examined.
Connectivity-porosity relationships were systematically compared to permeability-porosity relation-
ships.
Pore connectivity is a useful and underutilized metric to study the eruptive processes during
volcanic eruptions. First, it allows distinguishing between subsets of volcanic products, including
rocks derived from explosive and effusive activity, products of vesiculation and densification and
scoria of Hawaiian and Strombolian activity. It also allows a better quantitative assessment of the
percolation threshold compared to permeability because it can be constrained at porosities below
and above this threshold, whereas permeability cannot. Pore connectivity-porosity relationships,
combined with a textural study of the volcanic products, allow to infer which degassing processes
V
were dominant in the parent magma prior to the eruption. However, these relationships require care-
ful consideration because the magma can continue to evolve texturally after fragmentation or em-
placement. Besides, different degassing processes and connectivity-porosity paths can lead to very
similar final erupted products. Effusive rocks can be explained by very low percolation threshold due
to bubble deformation, brittle fracturing, densification and vesiculation in highly crystalline melts,
which all promote outgassing and reduction of bubble overpressure. In turn, products from explosive
activity such as scoria and pumices originate mostly from crystal-poor magmas with a highly poly-
disperse bubble size distribution which all tend to increase the percolation threshold. These magmas
fragment due to high bubble overpressure or acceleration of the gas phase due to a high percolation
threshold which impedes or delays gas escape in the conduit. Future studies should further examine
the relationships between percolation threshold, degassing and fragmentation and incorporate the
complex effect of the percolation threshold in numerical models of conduit degassing.
Once magma is erupted explosively or effusively at the earth surface, further modifications
of the eruptive style can be induced by the cooling environment. For instance, the presence of sea-
water above the eruptive vent in subaqueous settings will dramatically alter the eruptive processes
such as cooling, fragmentation, vesiculation and aggregation because of the different physical, ther-
mal and chemical properties of seawater compared to air. Surtseyan eruptions are shallow suba-
queous eruptions becoming progressively emergent and leading to the formation of tuff cones. The
eruptive processes are highly complex during these eruptions because the water-magma interac-
tions evolves spatially and temporally during progressive construction of the tuff cone. It is of para-
mount importance to understand the eruptive processes during Surtseyan activity because this type
of subaqueous eruptions can cause hazards to populations and disturbance of air traffic due to ex-
tensive generation of fine ash particles.
This thesis investigates the role of water-magma interaction on the eruptive processes during
Surtseyan eruptions and the implications for related hazards. Lapilli and bombs from several
Surtseyan eruptions at Hunga Tonga-Hunga Ha’apai and Capelinhos volcanoes were analysed via
measurements of pore metrics and 3D textural analysis via X-ray micro-tomography. The textural
features and pore metrics were combined with numerical thermal modelling in order to constrain the
cooling dynamics in the lapilli and bombs. Cooling rates obtained with the thermal model were com-
pared to literature data of cooling rates measured by geospeedometry on subaqueous products.
Leaching experiments were then performed in order to constrain the role of salts on particle binding
in Surtseyan deposits.
Lapilli and bombs formed during Surtseyan eruptions exhibit gradual textural variations with
increase of vesicle connectivity from margin to core caused by post-fragmentation vesiculation in-
terrupted at different stages by quenching in water. Cooling of the margins of the lapilli occurs by
conduction in the case of direct contact with water and by radiation and convection in the case of
the presence of a stable vapour film (Leidenfrost effect). In both cases, the high cooling rates at the
margins induce rapid quenching and interruption of vesiculation, explaining the low vesicularities
and vesicle connectivities. In the core, the cooling rates are much lower and the time available for
vesiculation is dramatically higher, explaining the higher vesicularities and vesicle connectivities.
Cooling rates in pyroclasts from subaqueous eruptions show a wide range of values, depending
VI
mostly on the particle size, type of cooling at the surface (direct contact of Leidenfrost effect), melt
temperature and radial position in the particle. The high cooling rates at the margins and low cooling
rates in the cores of the lapilli cause high levels of thermal stress at the margins. This leads to thermal
cracking and in situ thermal granulation of the margins and generation of ash particles that are kept
in place in a jigsaw fit pattern, forming ash-encased lapilli. Leaching experiments revealed that the
binding of ash particles in the ash rims of the ash-encased lapilli is stabilized by substantial salt
precipitation (mostly NaCl and CaSO4) caused by seawater evaporation. Salt concentrations can
potentially serve as an indicator of the degree of water-magma interaction during Surtseyan erup-
tions occurring in seawater settings. Ash-encased lapilli were previously considered coated or ar-
moured lapilli formed by aggregation in an ash and vapour-rich environment. The new model pre-
sented here implies that encasement is not necessarily evidence of particle aggregation, but can
instead result from new primary ash formation, with distinct implications for related hazards. Thermal
granulation is considered an important disruption mechanism causing the generation of ash during
Surtseyan eruptions. In future studies, understanding the balance between in-plume aggregation
and subaqueous production of ash by thermal granulation will be a key for better assessment of
potential hazards related to ash dispersal in Surtseyan settings.
This thesis combined 3D X-ray tomography, pore metric measurements, experimental work
on magma analogues, numerical modelling and chemical analysis to refine our knowledge of the
influence of degassing processes and water-magma interaction on the style of volcanic eruptions
and their related hazards. This approach yielded innovative results with novel implications for the
mechanisms triggering effusive-explosive transitions during magma ascent and the modifications of
eruptive processes and hazards induced by magma cooling in water at the earth surface.
VII
Preamble
Part of the data presented in this thesis has been published in peer-reviewed scientific journals, are
in the review process or have been submitted, namely,
1. Colombier, M., Wadsworth, F. B., Gurioli, L., Scheu, B., Kueppers, U., Di Muro, A., & Ding-
well, D. B. (2017). The evolution of pore connectivity in volcanic rocks. Earth and Planetary
Science Letters, 462, 99-109. DOI: 10.1016/j.epsl.2017.01.011
2. Colombier, M., Gurioli, L., Druitt, T. H., Shea, T., Boivin, P., Miallier, D., & Cluzel, N. (2017).
Textural evolution of magma during the 9.4-ka trachytic explosive eruption at Kilian Volcano,
Chaîne des Puys, France. Bulletin of Volcanology, 79(2), 17. DOI: 10.1007/s00445-017-
1099-7
3. Wadsworth, F.B., Vasseur, J., Llewellin, E.W., Dobson, K.J., Colombier, M., von Aulock, F.W.,
Fife, J.L., Wiesmaier, S., Hess, K.U., Scheu, B. and Lavallée, Y., 2017. Topological inversions
in coalescing granular media control fluid-flow regimes. Physical Review E, 96(3), p.033113.
DOI:10.1103/PhysRevE.96.033113
4. Colombier, M., Scheu, B., Wadsworth, F.B., Cronin, S., Vasseur, J., Dobson, K.J., Hess, K.-
U., Tost, M., Yilmaz, T., Cimarelli, C., Brenna, M., Ruthensteiner, B., Dingwell, D.B. Vesicula-
tion and quenching during Surtseyan eruptions at Hunga Tonga-Hunga Ha’apai volcano,
Tonga. In Review, Journal of Geophysical Research.
5. Colombier, M., Scheu, B., Kueppers, U., Cronin, S., Mueller, S.B., Wadsworth, F.B., Tost,
M., Hess, K-U., Dobson, K.J., Ruthensteiner, B., Dingwell, D.B. In situ granulation of particle
surfaces by thermal stress during subaqueous volcanic eruptions. Submitted to Nature Geo-
sciences.
VIII
Table of Contents
Zussamenfassung .............................................................................................................. I
Extended abstract ............................................................................................................ IV
Glossary ......................................................................................................................... XIII
Introduction ........................................................................................................................ 1
A. Percolation threshold, pore connectivity and permeability in volcanic
rocks and magma ........................................................................................................ 4
A.1. State of the art on the degassing processes and the percolation threshold
during volcanic eruptions ................................................................................................. 5
A.1.1. Vesiculation and closed-system degassing .................................................... 6
A.1.2. Open system degassing or outgassing .......................................................... 8
A.1.3. Fragmentation ................................................................................................ 9
A.1.4. Percolation threshold and permeability development ................................... 11
A.2 The evolution of pore connectivity in volcanic rocks ............................................ 15
A.2.1. Methodology .............................................................................................. 17
A.2.2. Results ....................................................................................................... 19
A.2.3. Extended discussion .................................................................................... 28
A.2.4. Conclusion ................................................................................................... 34
A.3 The percolation threshold and outgassing in crystal-rich magmas ...................... 35
A.3.1. Methodology ................................................................................................ 36
A.3.2. Results......................................................................................................... 39
A.3.3. Discussion ................................................................................................... 43
A.3.4. Conclusion ................................................................................................... 49
B. The eruptive processes during Surtseyan eruptions ............................................ 50
B.1. State of the art on subaqueous volcanism ............................................................ 51
B.1.1.Surtseyan eruptions ...................................................................................... 52
B.1.2. Physical properties of water ......................................................................... 54
B.1.3. Cooling processes during water-magma interactions ................................... 56
B.1.4. Fragmentation mechanisms in subaqueous settings .................................... 57
B.1.5. Vesiculation ................................................................................................ 60
B.1.6. Aggregation ................................................................................................. 61
IX
B.1.7. Influence of the presence of a slurry and magma-wet sediment
interactions ............................................................................................................ 62
B.2. Vesiculation and quenching during Surtseyan eruptions at
Hunga Tonga- Hunga Ha’apai volcano, Tonga .............................................................. 63
B.2.1. Geological context ....................................................................................... 64
B.2.2. Methodology ................................................................................................ 66
B.2.3. Results ......................................................................................................... 73
B.2.4. Discussion ................................................................................................... 77
B.2.5. Cooling processes during the 2014-2015 eruption ....................................... 80
B.2.6. Conclusion ................................................................................................... 88
B.3. In situ granulation of particle surfaces by thermal stress during Surtseyan
eruptions .......................................................................................................................... 89
B.3.1. Geological context ....................................................................................... 90
B.3.2. Methodology ................................................................................................ 90
B.3.3. Results ......................................................................................................... 92
B.3.4. Discussion ................................................................................................... 96
B.3.5.Conclusion .................................................................................................... 99
B.4. Water-magma interaction and its role for particle binding during the
emergent phases of Surtseyan eruptions .................................................................. 101
B.4.1. Methodology .............................................................................................. 101
B.4.2. Results ....................................................................................................... 102
B.4.2. Discussion ................................................................................................. 104
B.4.2. Conclusion ................................................................................................. 105
Summary and Implications .................................................................................................. 106
Outlook ..................................................................................................................................... 108
Supplementary material ........................................................................................................ 110
References .............................................................................................................................. 115
X
List of figures
Fig 1. Degassing conditions during volcanic eruptions ................................................................... 8
Fig 2. Percolation during monodisperse vesiculation and granular densification. .......................... 12
Fig 3. The covariance of connectivity with porosity for vesiculating and densifying systems ........ 21
Fig 4. The covariance of connectivity with porosity for all natural rocks classified by bulk rock
composition. ................................................................................................................................. 24
Fig 5. Comparison between the evolution of connectivity and permeability with porosity for rocks
from effusive and explosive eruptions. .......................................................................................... 25
Fig 6. The variation of connectivity 𝐶 with permeability 𝑘 for rhyolites, dacites, and andesites ...... 27
Fig 7. Effect of shear-deformation on the connectivity and permeability with porosity for natural
volcanic rocks ............................................................................................................................... 29
Fig 8. Different paths of connectivity with porosity for different processes in rhyolitic magma. ...... 33
Fig 9. SEM images of the pre- and post-experimental magma analogues .................................... 37
Fig 10. Textural stages and evolution of porosity and connectivity with temperature during the
vesiculation experiments ............................................................................................................... 41
Fig 11. Connectivity-Porosity relationships for the different types of experiments ......................... 42
Fig 12. 3D volume renderings showing the 3D textural evolution during the different types of
experiments .................................................................................................................................. 43
Fig 13. Comparison of connectivity and permeability relationships to porosity with natural data ... 45
Fig 14. Conceptual model showing the different textural regimes as a function of viscosity and
heating rate during the vesiculation experiments .......................................................................... 46
Fig 15. Conceptual model showing the role of percolation threshold and crystallinity on outgassing
and eruptive style .......................................................................................................................... 48
Fig 16. Simultaneous Surtseyan and purely magmatic eruptive style during the 1963-1967 Surtsey
eruption ........................................................................................................................................ 53
Fig 17. Regimes of steam formation during interaction between water and a hot magma surface. 55
Fig 18. Geological setting of the 2009 and 2014-2015 Surtseyan eruptions of Hunga Tonga- Hunga
Ha’apai volcano ............................................................................................................................ 65
Fig 19. Sketch showing the differences between the connectivity definitions ................................ 70
Fig 20. Heat flow signal and relative mass loss versus temperature during heating treatment of
coarse ash particles ..................................................................................................................... 71
Fig 21. Textural variations in lapilli and bombs ............................................................................. 74
Fig 22. 2D and 3D vesicle size distributions ................................................................................. 75
Fig 23. Connectivity-vesicularity relationships in the lapilli and bombs .......................................... 76
XI
Fig 24. 3D volume renderings obtained by XCT showing the textural properties of the lapilli and
bombs ........................................................................................................................................... 76
Fig 25. Conditions of direct contact and formation of stable vapour film during interaction of water
with a hot magma surface ............................................................................................................. 81
Fig 26. Time available for vesiculation as a function of particle radius .......................................... 82
Fig 27. Time available for vesiculation and evolution of vesicularity as a function of radial position in
the particle .................................................................................................................................... 83
Fig 28. Influence of melt temperature on the time available for vesiculation ................................. 84
Fig 29. Conceptual model linking cooling and vesiculation in the lapilli and bombs ...................... 85
Fig 30. Cooling rates in subaqueous lava bodies as a function of size of the body ....................... 87
Fig 31. 2D and 3D XCT images of the cracks at the margins of the cores of the ash-encased
lapilli ............................................................................................................................................. 93
Fig 32. 2D and 3D XCT images of the jigsaw fit textures .............................................................. 94
Fig 33. 2D and 3D XCT images showing the influence of heterogeneities on crack propagation .. 95
Fig 34. Conceptual model showing the optimum conditions of thermal granulation at the margins of
a lava body ................................................................................................................................... 97
Fig 35. Conceptual model showing the formation of the ash-encased lapilli ................................. 98
Fig 36. Salt concentrations in the rims of the ash-encased lapilli ............................................... 103
Fig 37. Evolution of salt concentrations with the stratigraphic sequence ..................................... 103
Fig 38. Molar concentrations of Na-Cl and Ca-SO4 .................................................................... 104
Fig S1. Comparison of connectivity definitions obtained by XCT ................................................ 110
Fig S2. Analysis workflow for image processing showing all the key steps for assessing the impact
of processing on the final outputs ............................................................................................... 111
Fig S3. Plots showing the effect of the size of the VOI on the measurement of vesicularity and
connectivity ................................................................................................................................. 112
XII
List of tables
Table 1. Experimental conditions and porosity, connectivity and permeability data of samples ana-
lysed in this study ........................................................................................................................ 40
Table 2. Textural analysis using SEM (2D), XCT (3D) and other standard methods ..................... 67
Table 3. Density, bulk and connected vesicularity and C1 connectivity for the lapilli and bombs, as
measured by the Archimedes method and by Helium pycnometry ................................................ 68
Table 4. Vesicularity (Φ), and C1 and C2 vesicle connectivity for the lapilli and bombs as determined
from XCT data ............................................................................................................................. 69
Table 5. Sample name, deposit type and scan conditions for the ash-encased lapilli analysed by
XCT .................................................................................................................................... 91
Table 6. Element concentrations after the leaching experiments ............................................. 102
Table S1. Porosity, connectivity and permeability range for natural and experimental products with
associated publication, author, chemistry, number of samples analysed and techniques used ... 113
Table S2. Chemical analysis of glass and crystal phases in the magma analogues after vesiculation
experiments ................................................................................................................................ 114
XIII
Glossary
This glossary presents a non exhaustive list of terms and their usage in this dissertation.
Ash: pyroclast with diameter lower than 2 mm. Fine ash refers to ash particles with diameter lower
than 63 µm.
Ash aggregation: clustering of ash particles in a volcanic plume around pre-existing pyroclasts
(coated or armoured particles) or as newly formed pyroclasts, typically lapilli-sized (accretionary la-
pilli). The ash particles are bound via hydro-bonds, salt precipitation or electrostatic forces.
Bomb: pyroclast with diameter higher than 64 mm.
Bubble: globule of volcanic gas in the magma formed by nucleation after volatile exsolution.
Degassing: loss of volatiles from the melt phase. We can distinguish open-system degassing in
which the loss occurs by diffusion and closed-system degassing in which the volatiles escape
through interconnected pores.
Densification: increase of density and reduction of porosity/vesicularity of a magma or granular
magma droplets/pyroclasts caused by outgassing, welding or compaction.
Disruption/break-up: process in which the magma/lava or pyroclasts break in smaller pieces. This
includes explosive fragmentation driving an explosive eruption or secondary, non explosive mechan-
ical or thermal granulation during the eruption.
Exsolution: process by which the reduction of volatile solubility in the magma induced by decom-
pression or heating causes saturation and formation of a gas phase by bubble nucleation and growth.
Fragmentation: process in which an ascending or stagnant magma (or even lava) transforms from
a continuous melt phase containing gas bubbles to a continuous gas phase containing discrete par-
ticles of magma/lava or pyroclasts ejected in the atmosphere or hydrosphere.
Glass: quenched silicate melt.
Jigsaw texture: texture in which volcanic particles resulting from mechanical or thermal granulation
of a magma body/pyroclast are kept in place after generation and can still fit together and with the
parent magma/pyroclast.
Lapillus (plural. lapilli): pyroclast with diameter ranging from 2 to 64 mm.
Lava: magma extruded or erupted at the earth surface before it quenches and solidifies to a volcanic
rock. This term can also be used to define magmas emplaced effusively at the earth surface such
as a lava flow or lava dome.
Leidenfrost effect: physical phenomenon leading to the formation of a stable, insulating vapour film
upon contact between a hot magma surface and water.

XIV
Magma: silicate melt with varying composition, volatile contents, amounts of crystals and bubbles.
Margin/Rim: Margin here refers to the outer surface of a pyroclast or a magma body. Rim is in turn
used to describe the ash particles surrounding the ash-encased lapilli formed by situ in situ thermal
granulation and possibly by aggregation.
Outgassing: synonymous of open-system degassing. Defines the gas escape from the magma to
the surroundings by permeable flow through a percolating, connected porous network (bubbles,
cracks, voids).
Overpressure: pressure in excess of lithostatic/magmastatic pressure in the magma.
Permeability: measure of the ability of a connected network of vesicles, fractures or interganular
void space in a magma or volcanic rock to transport gas in response to a pressure gradient.
Pore: void space in a volcanic rock/deposit including vesicles, cracks and intergranular pores.
Porosity: volume fraction of the pores contained in a magma or volcanic rock. These pores can be
bubbles/vesicles, cracks or intergranular void space.
Pyroclast/Tephra: individual volcanic particle that was formed by quenching of a magma droplet
during explosive activity and was ejected in the atmosphere or hydrosphere.
Quenching: cooling of a magma body below the glass transition temperature causing solidification
of the body.
Vesicle: remnant of a quenched bubble in a volcanic rock.
Vesicularity: volume fraction of vesicles. This term will be used instead of porosity to describe the
bubble/vesicle content of magmas/volcanic rocks in which cracks or intergranular pores are rare or
absent.
Vesiculation: process of bubble nucleation, growth and coalescence causing an increase in poros-
ity/vesicularity.
Volatiles: gas species present in the magma.
Volcanic eruption: transport of magma and magmatic gases from the earth interior to the surface.
Volcanic explosion: discrete explosive pulse occurring during an explosive volcanic eruption.
Volcanic hazard: refers to any potentially dangerous process related to volcanic activity
Volcanic rock: quenched product of lava or magmatic particles formed during volcanic eruptions.
Volcanic plume: mixture of magma droplets, pyroclasts, magmatic gases and entrained surrounding
medium (air/water) formed during an explosive eruption that rises buoyantly and possibly spreads
over large distances in the atmosphere (or hydrosphere), causing tephra sedimentation.
Welding/Sintering: viscous agglutination of pyroclasts occurring typically in tuffisite veins or welded
deposits and causing a densification of the granular medium.

1
Introduction
2
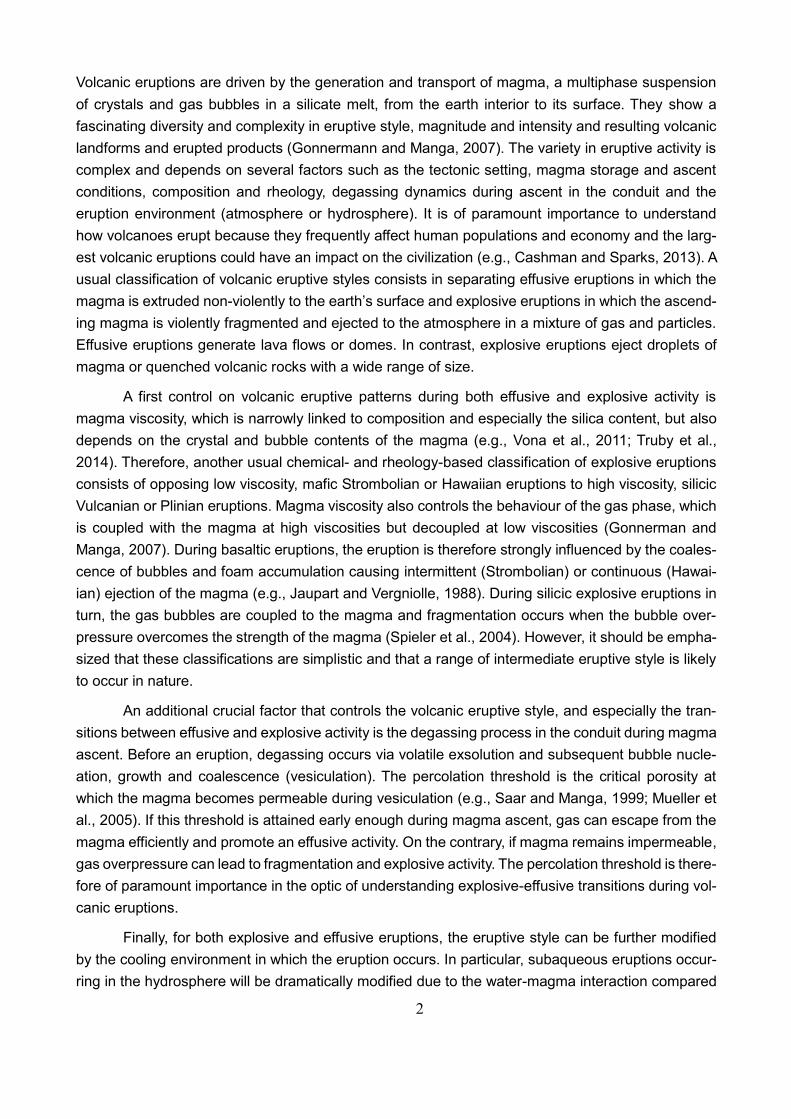
Volcanic eruptions are driven by the generation and transport of magma, a multiphase suspension
of crystals and gas bubbles in a silicate melt, from the earth interior to its surface. They show a
fascinating diversity and complexity in eruptive style, magnitude and intensity and resulting volcanic
landforms and erupted products (Gonnermann and Manga, 2007). The variety in eruptive activity is
complex and depends on several factors such as the tectonic setting, magma storage and ascent
conditions, composition and rheology, degassing dynamics during ascent in the conduit and the
eruption environment (atmosphere or hydrosphere). It is of paramount importance to understand
how volcanoes erupt because they frequently affect human populations and economy and the larg-
est volcanic eruptions could have an impact on the civilization (e.g., Cashman and Sparks, 2013). A
usual classification of volcanic eruptive styles consists in separating effusive eruptions in which the
magma is extruded non-violently to the earth’s surface and explosive eruptions in which the ascend-
ing magma is violently fragmented and ejected to the atmosphere in a mixture of gas and particles.
Effusive eruptions generate lava flows or domes. In contrast, explosive eruptions eject droplets of
magma or quenched volcanic rocks with a wide range of size.
A first control on volcanic eruptive patterns during both effusive and explosive activity is
magma viscosity, which is narrowly linked to composition and especially the silica content, but also
depends on the crystal and bubble contents of the magma (e.g., Vona et al., 2011; Truby et al.,
2014). Therefore, another usual chemical- and rheology-based classification of explosive eruptions
consists of opposing low viscosity, mafic Strombolian or Hawaiian eruptions to high viscosity, silicic
Vulcanian or Plinian eruptions. Magma viscosity also controls the behaviour of the gas phase, which
is coupled with the magma at high viscosities but decoupled at low viscosities (Gonnerman and
Manga, 2007). During basaltic eruptions, the eruption is therefore strongly influenced by the coales-
cence of bubbles and foam accumulation causing intermittent (Strombolian) or continuous (Hawai-
ian) ejection of the magma (e.g., Jaupart and Vergniolle, 1988). During silicic explosive eruptions in
turn, the gas bubbles are coupled to the magma and fragmentation occurs when the bubble over-
pressure overcomes the strength of the magma (Spieler et al., 2004). However, it should be empha-
sized that these classifications are simplistic and that a range of intermediate eruptive style is likely
to occur in nature.
An additional crucial factor that controls the volcanic eruptive style, and especially the tran-
sitions between effusive and explosive activity is the degassing process in the conduit during magma
ascent. Before an eruption, degassing occurs via volatile exsolution and subsequent bubble nucle-
ation, growth and coalescence (vesiculation). The percolation threshold is the critical porosity at
which the magma becomes permeable during vesiculation (e.g., Saar and Manga, 1999; Mueller et
al., 2005). If this threshold is attained early enough during magma ascent, gas can escape from the
magma efficiently and promote an effusive activity. On the contrary, if magma remains impermeable,
gas overpressure can lead to fragmentation and explosive activity. The percolation threshold is there-
fore of paramount importance in the optic of understanding explosive-effusive transitions during vol-
canic eruptions.
Finally, for both explosive and effusive eruptions, the eruptive style can be further modified
by the cooling environment in which the eruption occurs. In particular, subaqueous eruptions occur-
ring in the hydrosphere will be dramatically modified due to the water-magma interaction compared
3
to their subaerial counterparts (e.g., Wohletz, 1986). This is because of the different physical and
thermal properties of water compared to air.
Previous studies dealing with degassing processes and permeability in magma frequently
omitted the complexity of the percolation threshold and its relevance for the degassing processes in
volcanic conduits. Furthermore, subaqueous eruptions and associated eruptive processes related
to water-magma interactions remain poorly studied compared to their subaerial counterparts. This
thesis aims to fill these gaps by focusing on the role of the percolation threshold and water-magma
interaction on volcanic eruptive style.
Chapter A aims to understand the conduit processes that trigger effusive-explosive transitions
during volcanic eruptions. Section A.1 reviews the state of the art on the degassing dynamics, per-
colation threshold and evolution of permeability in magma. In section A.2, a compilation of pore
connectivity and permeability data allows to shed light on the vesiculation, brittle fracturing and den-
sification processes in volcanic conduits and deposits. Section A.3 shows experimentally the effect
of crystallinity and magma viscosity on the percolation threshold, pore connectivity, permeability and
treats the consequences for effusive-explosive transitions during volcanic eruptions.
Chapter B deals with the modifications of eruptive style induced by shallow water-magma
interaction during emergent subaqueous, Surtseyan eruptions. Section B.1 presents a review of the
state of the art on the shallow subaqueous volcanism and physics of water-magma interactions.
Sections B.2, B.3 and B.4 discuss the influence of magma-water interactions on the eruptive pro-
cesses such as cooling, vesiculation, fragmentation and aggregation during Surtseyan eruptions.
4
A. The percolation threshold, pore
connectivity and permeability in
volcanic rocks and magma
5
A.1. State of the art on degassing processes and
the percolation threshold during volcanic
eruptions
Volcanic eruptions are triggered by the ascent of magma from shallow storage systems (magma
chambers, sills, dykes) in the crust causing either (i) magma explosive fragmentation into a mix-
ture of magma droplets/pyroclasts and gas or (ii) effusive activity leading to the emplacement of
lava flows and domes. Effusive-explosive transitions, and hybrid activity between explosive and
effusive activity have been frequently witnessed during volcanic eruptions (Jaupart and Allègre,
1991; Fink et al., 1992; Platz et al., 2007; Resing et al., 2011; Castro et al., 2012; Graettinger et al.,
2013; Schipper et al., 2013; Colombier et al., 2017). It is crucial to understand how eruptions evolve
from highly hazardous explosive style to less hazardous effusive activity. These transitions are pri-
marily controlled by (i) rheological changes in the magma or (ii) the conditions of degassing during
magma ascent in the conduit. Of primary importance is the transition between an isolated, imperme-
able network of pores (consisting mostly of gas bubbles) promoting gas overpressure and explosive
fragmentation to a connected, permeable porous network allowing gas escape and promoting effu-
sive activity. This transition occurs at a critical porosity called the percolation threshold that can be
tracked by measuring the pore connectivity, permeability and porosity of volcanic rocks or mag-
mas. Degassing in the former, isolated pore network scenario is referred to as closed-system de-
gassing whereas the latter, connected pore network case is referred to as open-system degassing
or outgassing (Eichelberger, 1986; Gonnerman and Manga, 2007). These two types of degassing
systems represent endmembers for the ease of discussion and conceptualization. Degassing in
magmatic systems is in reality more complex than this binary representation because (i) shifts be-
tween these endmembers are frequent and (ii) the ease of gas escape during open-system degas-
sing is largely controlled by the efficiency and longevity of magma permeability.
I hereafter first review the degassing conditions in a volcanic conduit from volatile exsolution
up to coalescence during closed-system degassing. I then consider all the possible mechanisms of
open-system degassing (outgassing) leading to permeable gas escape including bubble coales-
cence, brittle fracturing and granular densification. I also briefly discuss the fragmentation mecha-
nism and the importance of the gas phase during this process. Finally, I review the state of the art of
the work done on the percolation threshold, its controlling factors and its implications for eruptive
style, and especially effusive-explosive transitions during volcanic eruptions.
6
A.1.1. Vesiculation and closed-system degassing
It has been recognized since the first half of the twentieth century that gas plays an important role in
forcing magma to the earth’s surface and generating volcanic eruptions (e.g., Wallace et al., 2015).
Vesiculation corresponds to the process of gas phase formation in a magma through volatile exso-
lution and subsequent bubble nucleation, growth and coalescence (e.g., Toramaru 1989). Vesicu-
lation of magma occurs in all types of eruptions from the most violent and hazardous Plinian erup-
tions to the slow emplacement of lava flows or domes and is often assumed to be a key factor
controlling the eruption dynamics (Toramaru, 1989).
Erupting magma shows a highly variable range of volatile content. Water and carbon dioxide
are the major volatile components in magmas with a plethora of additional components present in
minor amounts such as for instance sulfur, chlorine and fluorine (e.g., Wallace et al., 2015). The
initial volatile contents in ascending magmas prior to vesiculation can be estimated from analysis of
glass that experienced no significant bubble formation and expansion (e.g., quenched glass from
submarine eruptions with limited exsolution) or from melt inclusions trapped in crystal phases during
ascent (Wallace et al., 2015). The volatile concentrations in ascending magmas vary mostly depend-
ing on the geological setting and the magma composition. For similar initial concentrations, the vol-
atile content can evolve distinctly with time depending on the eruptive style. Several studies reported
a decrease in volatile content, especially H20 content during explosive-effusive transitions (e.g., Bou-
don et al., 2015). It will be shown in Section A.1.2 that this depletion in volatiles is strongly linked to
the process of outgassing.
The volatiles dissolved in the magma at depth can exsolve as a gas phase causing vesicu-
lation if their solubility is reduced. This can occur by decompression (e.g., Sparks, 1978), heating
(e.g., by friction; Lavallée et al., 2015), magma mixing (e.g., Sparks 1977; Eichelberger, 1980;) or
cooling-induced crystallization (Eichelberger, 1980; Toramaru, 1989). The most common scenario
during volcanic eruptions is volatile exsolution driven by decompression during magma ascent.
During decompression, the rates of volatile exsolution and vesiculation are strongly depend-
ent on the kinetics of bubble nucleation (e.g., Cluzel et al., 2008; Fig.1a, c). Bubble nucleation
can be homogeneous, that is occurring directly in the melt phase (e.g. Mourtada Bonnefoi and
Laporte, 2004) or heterogeneous in the case of nucleation on pre-existing crystal phases (e.g.,
Cluzel et al., 2008). Several studies have shown that heterogeneous bubble nucleation might be an
important process during volcanic eruptions, either on oxides or silicate phases (Giachetti et al.,
2010; Colombier et al., 2017 ; Shea et al., 2017; Plese et al., 2017). Bubble nucleation occurs at the
pressure of supersaturation (Hurwitz and Navon, 1994) which depends on the type of nucleation and
is higher in the case of homogeneous nucleation leading to delayed vesiculation (e.g. Cluzel et al.,
2008). The kinetics of bubble nucleation also depend on the decompression rate which exerts a
primary control on the bubble number density (e.g., Toramaru, 2006).
Once bubbles nucleate, they start to grow by (i) volatile diffusion from the melt to the melt-
bubble interface and (ii) expansion, due to the decrease in pressure or increase in temperature (e.g.
7
Gonnerman and Manga, 2007; Fig.1a, c). During bubble growth, bubbles get closer and closer and
start to interconnect causing bubble coalescence (Fig. 1a, c). Nguyen et al (2013) examined the
relative importance of capillary (surface tension driven) and gravitational forces on film thinning and
drainage and subsequent bubble coalescence using an experimental approach. They state that driv-
ing forces for film drainage are surface tension and gravitational forces whereas the resisting force
is mostly viscosity. In agreement, Gonnerman and Manga (2007) propose that coalescence is prob-
ably more important in low viscosity magmas. Coalescence and film drainage are also enhanced in
the presence of shear deformation (Klug and Cashman., 1996; Okumura et al., 2008 ; Castro et al.,
2012). Castro et al. (2012) performed vesiculation experiments of rhyolitic melts and showed that
deformation can cause bubble walls to wrinkle, leading to coalescence. This experimental result is
in agreement with abundant deformation textures and coalescence features such as wrinkling of thin
films commonly observed in natural rhyolitic pumices (e.g., Klug and Cashman, 1996).
I here discussed that vesiculation can occur during magma ascent in the conduit up to frag-
mentation. It should be emphasized that bubble nucleation, growth and coalescence can also take
place after fragmentation during ejection of magmatic droplets in the atmosphere up to deposition
as long as (i) the bubbles retain their gas and (ii) the magma remains in a liquid state and its viscosity
is low enough to allow coalescence (Fig. 1c; e.g., Gardner et al., 1996). Gardner et al. (1996) pro-
pose that bubble expansion can occur after fragmentation for magmas with a viscosity lower than
109 Pa.s and that the rate of vesiculation is inversely proportional to the viscosity. Post-fragmenta-
tion vesiculation textures are common in pyroclasts and particularly in lapilli and bombs from Ha-
waiian, Vulcanian, and subaqueous explosive eruptions in which the margins are quenched quickly
impeding vesiculation whereas the interiors remain hot longer allowing significant expansion (e.g.,
Stovall et al., 2011; Giachetti et al., 2011; Jutzeler et al., 2016).
If the degassing during magma ascent in the conduit occurs solely in closed-system condi-
tions with only local coalescence, no gas escape will be allowed and bubble nucleation and growth
will cause gas overpressure and likely result in an explosive eruption (Fig. 1c).
8
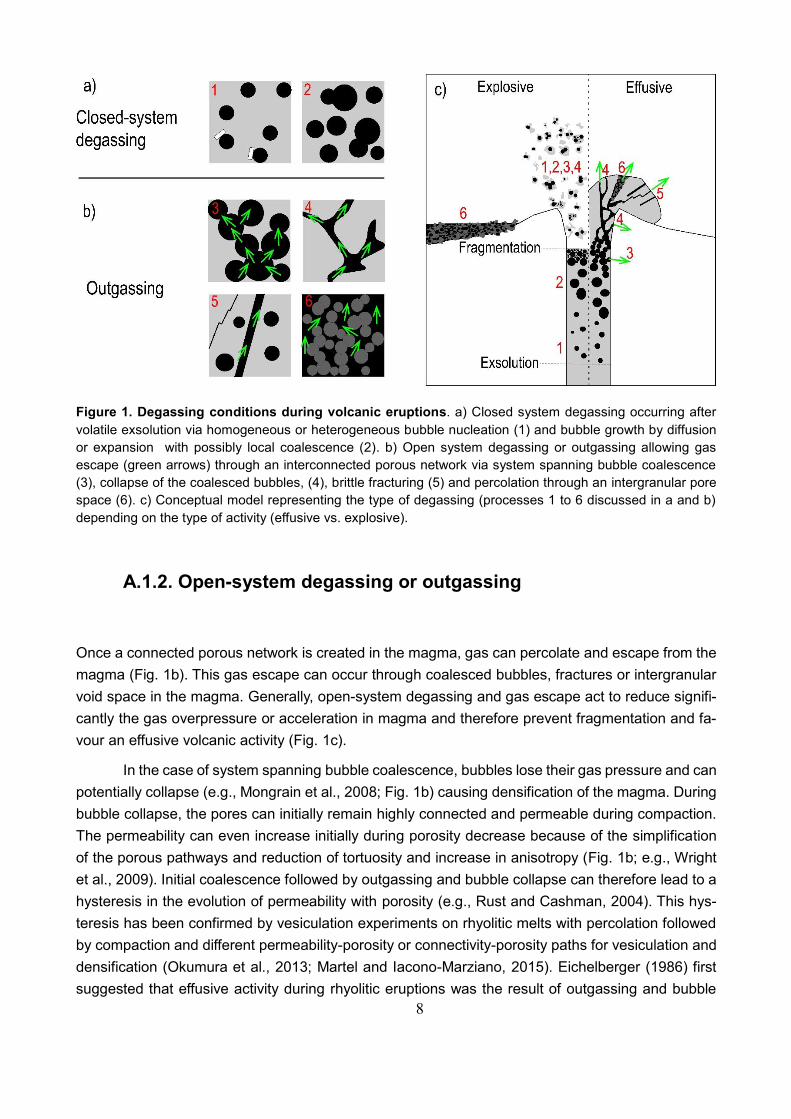
Figure 1. Degassing conditions during volcanic eruptions. a) Closed system degassing occurring after
volatile exsolution via homogeneous or heterogeneous bubble nucleation (1) and bubble growth by diffusion
or expansion with possibly local coalescence (2). b) Open system degassing or outgassing allowing gas
escape (green arrows) through an interconnected porous network via system spanning bubble coalescence
(3), collapse of the coalesced bubbles, (4), brittle fracturing (5) and percolation through an intergranular pore
space (6). c) Conceptual model representing the type of degassing (processes 1 to 6 discussed in a and b)
depending on the type of activity (effusive vs. explosive).
A.1.2. Open-system degassing or outgassing
Once a connected porous network is created in the magma, gas can percolate and escape from the
magma (Fig. 1b). This gas escape can occur through coalesced bubbles, fractures or intergranular
void space in the magma. Generally, open-system degassing and gas escape act to reduce signifi-
cantly the gas overpressure or acceleration in magma and therefore prevent fragmentation and fa-
vour an effusive volcanic activity (Fig. 1c).
In the case of system spanning bubble coalescence, bubbles lose their gas pressure and can
potentially collapse (e.g., Mongrain et al., 2008; Fig. 1b) causing densification of the magma. During
bubble collapse, the pores can initially remain highly connected and permeable during compaction.
The permeability can even increase initially during porosity decrease because of the simplification
of the porous pathways and reduction of tortuosity and increase in anisotropy (Fig. 1b; e.g., Wright
et al., 2009). Initial coalescence followed by outgassing and bubble collapse can therefore lead to a
hysteresis in the evolution of permeability with porosity (e.g., Rust and Cashman, 2004). This hys-
teresis has been confirmed by vesiculation experiments on rhyolitic melts with percolation followed
by compaction and different permeability-porosity or connectivity-porosity paths for vesiculation and
densification (Okumura et al., 2013; Martel and Iacono-Marziano, 2015). Eichelberger (1986) first
suggested that effusive activity during rhyolitic eruptions was the result of outgassing and bubble
9
collapse, explaining the reduction in volatile content in the effusive rocks. Kennedy et al., (2016) and
Von Aulock et al. (2017) performed densification experiments on natural and experimental rhyolites
with highly vesicular and connected bubble network and showed that shrinking and collapse of the
pore space was mostly a result of relaxation by surface tension.
In addition to bubble coalescence, gas escape in a volcanic conduit can occur through cracks
(e.g. Lamur et al., 2017; Fig.1b, c) or through intergranular porous network of crack-filling granular
magma such as tuffisite veins (e.g. Kendrick et al., 2016; Fig.1b, c). The permeability can be dra-
matically increased with little change in porosity causing significant outgassing in the presence of
fractures (e.g., Lamur et al., 2017).
A.1.3. Fragmentation
I here discuss the various primary fragmentation mechanisms causing purely magmatic explosive
eruptions. Additional fragmentation mechanisms resulting from water-magma interactions are dis-
cussed in Chapter B. The vesiculation process is narrowly linked to the fragmentation mechanisms
and resulting eruptive style during explosive volcanic eruptions. The role of bubbles on the fragmen-
tation is however drastically different for low viscosity basaltic magmas and for highly viscous, silicic
magmas. In the former case, fragmentation is mostly the result of fluid-dynamic breakup whereas
in the latter brittle fragmentation at the glass transition is dominant (e.g., Gonnermann, 2015;
Cashman and Scheu, 2015).
In the low viscosity case (i.e., mafic magmas), gas bubbles are decoupled from and as-
cend at faster rates than the magma, leading to significant bubble coalescence in a rather stagnant
magma column. Bubble growth is not impeded by melt viscosity in mafic melts and therefore little
overpressure builds up (e.g., Gonnermann, 2015; Cashman and Scheu, 2015). Furthermore, brittle
failure of low viscosity melts is often considered as unlikely (Gonnermann, 2015). The eruptive style
of basaltic magmas is therefore principally driven by the dynamics of separated flow between gas
and magma. Transitions in the flow regime have been discussed to explain the transitions from
Strombolian to Hawaiian (fire fountaining) activity (e.g., Vergniolle and Jaupart, 1986; Taddeucci
et al., 2015). Vergniolle and Jaupart (1986) distinguish a bubbly flow regime which consists in a
suspension of discrete bubbles in a continuous liquid which transitions deep in the conduit by foam
coalescence to (i) a slug or intermittent regime in which coalescence forms cyclically large bubbles
occupying the conduit diameter or to (ii) an annular flow regime in which coalescence forms a con-
tinuous gas jet in the centre of the conduit. The slug regime has been interpreted as the principal
mechanism explaining typical transient Strombolian activity whereas the annular flow regime nicely
explains continuous lava fountain-forming Hawaiian eruptions. The dominant type of regime (slug or
annular flow) is controlled by variations in gas flux and extent of coalescence (Vergniolle and Jaupart,
1986). In both cases, large bubbles bursting or jetting cause fragmentation and propulsion of clots
of the surrounding magma out of the vent. Fragmentation in this case is due to stretching as the gas
decompresses and expands as well as inertial forces and drag due to the high velocity of the gas
10
phase (Namiki and Manga, 2008; Gonnermann, 2015). Only small bubbles present in the magma at
the time of fragmentation are preserved and there are no remnants of the large bubbles driving the
eruption in the ejected pyroclasts. Basaltic Plinian eruptions can also occur but the mechanisms of
fragmentation during this type of activity remains poorly constrained. To summarize, in the majority
of eruptions of low viscosity (e.g., basaltic) magmas, fragmentation is driven by the motion and ac-
celeration of the separated gas phase rather than by bubble overpressure or brittle failure (e.g.,
Cashman and Scheu, 2015).
In silicic magmas in turn, the high melt viscosity impedes motion of the gas phase and
bubbles therefore remain coupled with the magma. Fragmentation in this scenario is driven by gas
overpressure and acceleration and can be limited by bubble coalescence and gas escape. A frag-
mentation criteria based on a vesicularity threshold with Φ>0.60 has been proposed for silicic explo-
sive eruptions based on the observations that silicic pumices are frequently highly vesicular (e.g.,
Sparks, 1978; Gardner et al., 1996). However, in the last 20 years, experimental studies demon-
strated that fragmentation of low porosity magma is also possible (e.g., Spieler et al., 2004). Two
principal fragmentation mechanism have been recognized. First, fragmentation can be the conse-
quence of bubble overpressure that exceeds the strength of the surrounding melt (e.g., Koyaguchi
et al., 2008). Spieler et al, (2004) demonstrated experimentally that fragmentation can achieved by
brittle failure across the glass transition by rapid decompression. The second fragmentation
mechanism can be a consequence of acceleration of the ascending magma exceeding a critical
strain rate (e.g., Papale, 1999).
Rapid decompression and bubble overpressure are however often narrowly linked in volcanic
eruptions. First, if the time scale for decompression is fast enough, the bubble growth is delayed
during decompression causing bubble overpressure (Gonnermann, 2015). Plinian eruptions are
characterized by sustained activity (hours to days) and are usually explained by both bubble over-
pressure and acceleration (Cashman and Scheu, 2015). Vulcanian eruptions are short-lived explo-
sions primarily caused by the disruption of stagnant magma (plug or dome) at shallow levels in the
conduit. The initial fragmentation is commonly the result of bubble overpressure leading to the dis-
ruption of the magma plug or dome and is subsequently driven by migration of the fragmentation
front downward in the conduit and rapid decompression (Druitt et al., 2002; Giachetti et al., 2010;
Cashman and Scheu, 2015; Colombier et al., 2017).
Shock tube experiments in the last two decades allowed to increase our understanding of
brittle fragmentation caused by bubble overpressure and rapid decompression (e.g., Alidibirov and
Dingwell, 1996; Martel, 2001; Spieler et al., 2004; Kueppers et al., 2006; Scheu et al., 2008; Mueller
et al., 2008). The major outcome of these studies is that brittle failure occurs when the bubble over-
pressure exceeds a critical fragmentation threshold, which depends principally on magma porosity
and permeability (Spieler et al., 2004; Scheu et al., 2008). Fragmentation during these experiments
occurs via layer by layer brittle failure caused by the downward propagation of the fragmentation
front, similarly to the fragmentation process during Vulcanian eruptions (Fowler et al., 2010).
11
A.1.4. Percolation threshold and permeability development
The percolation threshold Φc is defined in this study as the critical porosity at which the transition
from an impermeable to permeable (or vice versa) magma occurs. This threshold can be achieved
by both porosity increasing and porosity decreasing processes (e.g., Fig. 2). This threshold is also
equivalent to the onset of system spanning pore connectivity and permeability allowing outgas-
sing in the magma. Therefore, this threshold has often been considered through studies of the per-
meability relationship to porosity (e.g., Blower, 2001a; Rust and Cashman, 2004, 2011; Saar and
Manga., 1999; Scheu et al., 2008; Wright et al., 2009) and less frequently the pore connectivity
relationship to porosity (Fig. 2; e.g., Okumura et al., 2008, 2013; Vasseur and Wadsworth., 2017).
The percolation threshold Φc in magmas in explosive volcanic rocks has long been treated in
a very simplistic manner based on the percolation theory centred on models of overlapping spheres
(e.g., Saar and Manga 1999; Mueller et al., 2005). Percolation theory for overlapping spheres pre-
dicts that a monodisperse system of spheres in a volume becomes percolating at a threshold Φc
~0.28-0.30 (Fig. 2a; e.g., Sahimi, 1994; Vasseur and Wadsworth, 2017). These studies however
showed that dense volcanic rocks formed in effusive eruptions could not be predicted by a unique
percolation threshold. Mueller et al. (2005) for instance proposed that the permeability-porosity rela-
tionship for effusive rocks was explained by a low percolation threshold allowed by a network of
microcracks and was able to clearly distinguish data from effusive and explosive rocks with this
approach. However, some data for highly porous pumices still did not fit with this approach and could
not be explained by percolation theory. This possible ability to distinguish between volcanic products
from effusive and explosive rocks (and magmas), and consequently to understand the effusive-ex-
plosive transitions using the percolation threshold was the conundrum that motivated this research.
A review on permeability and percolation threshold (Rust and Cashman, 2011) confirmed that
Φc in magma is much more complex than previously thought and is controlled by a lot of parameters
and can have a very broad range of values (Rust and Cashman, 2011). Φc and evolution of perme-
ability with porosity depend principally on the porosity changing process (vesiculation, fracturing,
densification), bubble deformation (Garbozci, et al 1995; Okumura et al., 2008; Mongrain et al.,
2008; Rust and Cashman, 2011; Burgisser et al., 2017), melt viscosity (e.g., Blower, 2001; Lindoo
et al., 2016, Gonnermann et al., 2017), melt crystallinity (Blower, 2001; Okumura et al., 2012; Op-
penheimer et al., 2015; Lindoo et al., 2017), presence or not of fractures (Mueller et al., 2005;
Kushnir et al., 2017; Lamur et al., 2017), the bubble size distribution (Blower, 2001; Gaonac’h et
al., 2003; 2007; Pistone et al., 2015; Burgisser et al., 2017) and the decompression rate (e.g.,
Lindoo et al., 2017). I here review the principal controls on the percolation threshold.
12
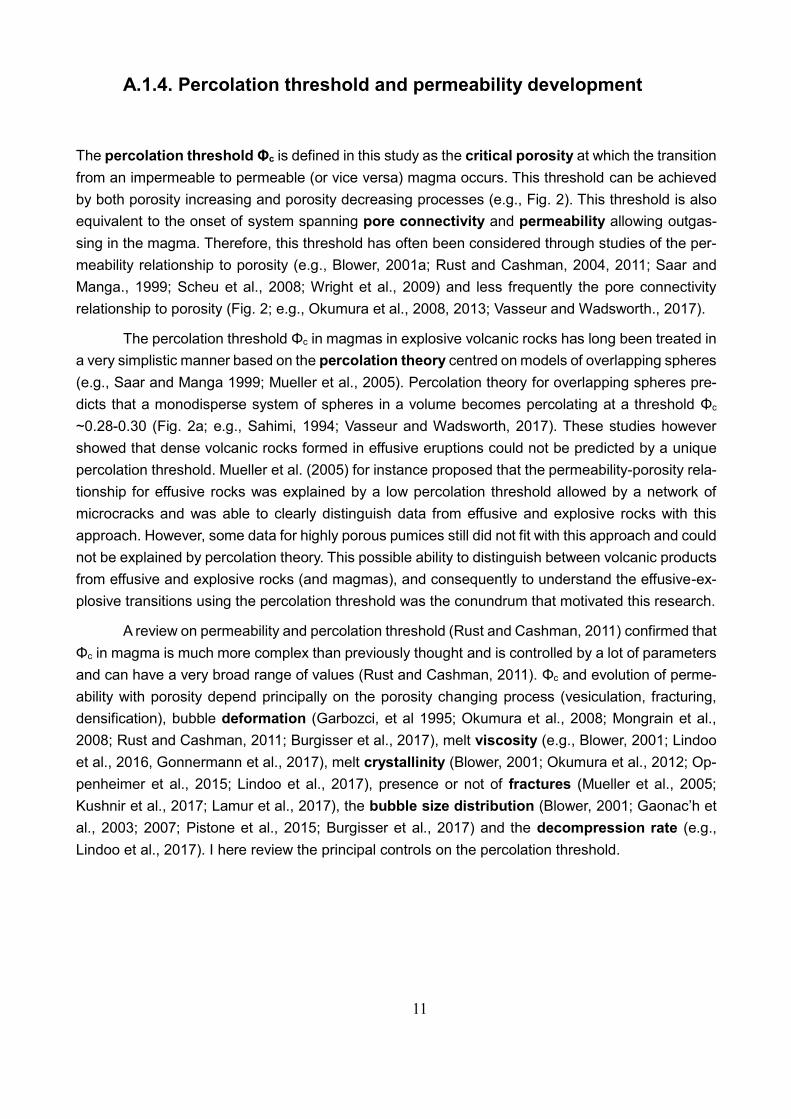
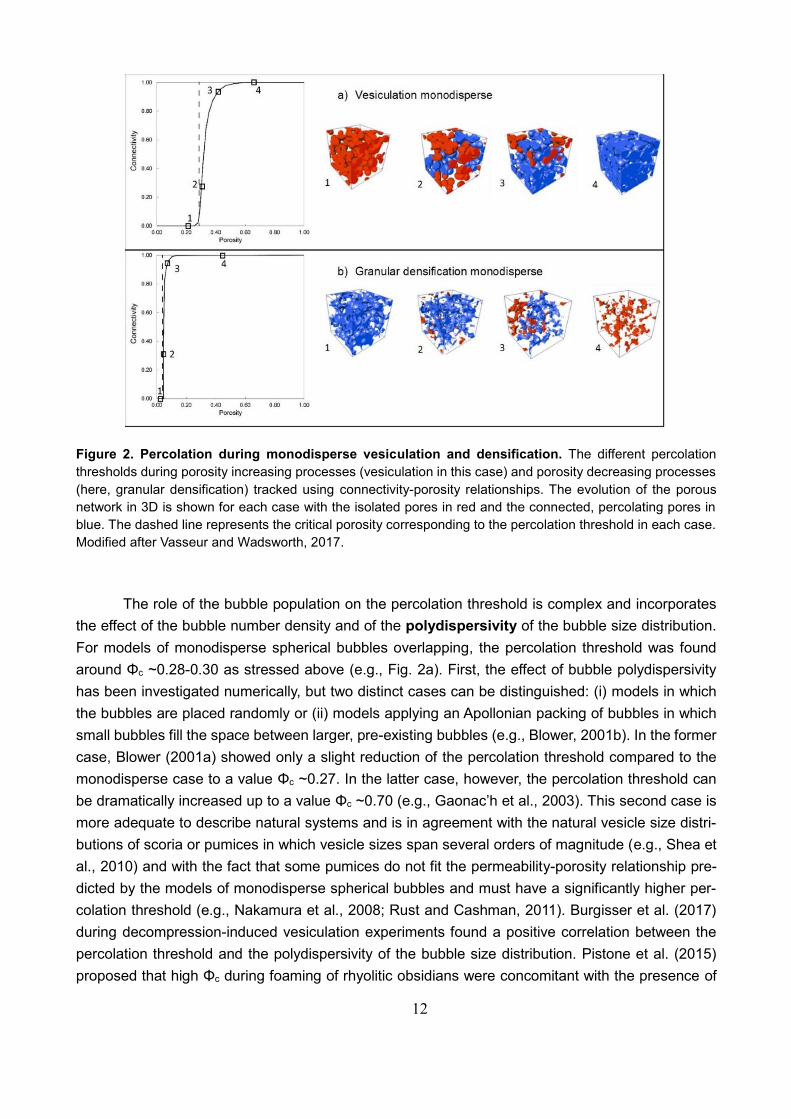
Figure 2. Percolation during monodisperse vesiculation and densification. The different percolation
thresholds during porosity increasing processes (vesiculation in this case) and porosity decreasing processes
(here, granular densification) tracked using connectivity-porosity relationships. The evolution of the porous
network in 3D is shown for each case with the isolated pores in red and the connected, percolating pores in
blue. The dashed line represents the critical porosity corresponding to the percolation threshold in each case.
Modified after Vasseur and Wadsworth, 2017.
The role of the bubble population on the percolation threshold is complex and incorporates
the effect of the bubble number density and of the polydispersivity of the bubble size distribution.
For models of monodisperse spherical bubbles overlapping, the percolation threshold was found
around Φc ~0.28-0.30 as stressed above (e.g., Fig. 2a). First, the effect of bubble polydispersivity
has been investigated numerically, but two distinct cases can be distinguished: (i) models in which
the bubbles are placed randomly or (ii) models applying an Apollonian packing of bubbles in which
small bubbles fill the space between larger, pre-existing bubbles (e.g., Blower, 2001b). In the former
case, Blower (2001a) showed only a slight reduction of the percolation threshold compared to the
monodisperse case to a value Φc ~0.27. In the latter case, however, the percolation threshold can
be dramatically increased up to a value Φc ~0.70 (e.g., Gaonac’h et al., 2003). This second case is
more adequate to describe natural systems and is in agreement with the natural vesicle size distri-
butions of scoria or pumices in which vesicle sizes span several orders of magnitude (e.g., Shea et
al., 2010) and with the fact that some pumices do not fit the permeability-porosity relationship pre-
dicted by the models of monodisperse spherical bubbles and must have a significantly higher per-
colation threshold (e.g., Nakamura et al., 2008; Rust and Cashman, 2011). Burgisser et al. (2017)
during decompression-induced vesiculation experiments found a positive correlation between the
percolation threshold and the polydispersivity of the bubble size distribution. Pistone et al. (2015)
proposed that high Φc during foaming of rhyolitic obsidians were concomitant with the presence of
13
pre-existing population of large bubbles whereas Φc was lower in the absence of these large bub-
bles. The effect of bubble size in the above-mentioned numerical simulations reflects the role of the
bubble number density on the percolation threshold. Bubble number density can be approximated
for natural volcanic rocks from the vesicle size distributions and have been shown to span several
orders of magnitude. However, variations in bubble number density have only a small effect on the
percolation threshold (Blower, 2001a; Vasseur and Wadsworth, 2017). To conclude, the polydisper-
sivity and degree of packing are a primary control on Φc.
Bubble deformation has also a strong effect on the percolation threshold. This was first
shown in numerical simulations of overlapping ellipsoids with aspect ratios of 3-4 which led to a
reduction of Φc to a value of Φc ~0.20 compared to Φc ~0.28-0.30 for overlapping spheres (Garbozci
et al., 1995). Shear-deformation also causes a reduction of the percolation threshold to similar values
as shown experimentally by Okumura et al., (2008) who performed vesiculation experiments in the
presence of torsion and found a percolation threshold around Φc ~0.20-0.25 in the presence of de-
formation and Φc >0.40 in the absence of deformation.
Brittle fracturing causing the formation of cracks in the magma or volcanic rocks can also
significantly reduce the percolation threshold compared to porous networks dominated by bubbles
only. Kushnir et al. (2017) performed torsion induced vesiculation experiments of rhyolitic melts and
found that the percolation threshold was reached only once the magma experienced brittle fracturing
and formation of microcracks that connected the isolated elongated pores. The threshold was
achieved at a porosity value Φc ~0.14. Lamur et al. (2017) showed the dramatic increase in perme-
ability in fractured volcanic rocks even at very low porosities, consistent with a low percolation thresh-
old although they did not quantify this threshold in their study.
The strong influences of viscosity and surface tension on bubble coalescence (see section
A.1.1) can consequently also influence the percolation threshold in magma. The effect of high vis-
cosity is often demonstrated by the persistence of melt films between two impinging bubbles (caus-
ing bubble deformation) because the drainage and retraction of melt film is slowest in these high
viscosity liquids (e.g., Blower, 2001a; Gonnerman et al., 2017). To take into account this effect,
numerical studies take into account an additional parameter referred to as the “barrier to coales-
cence” by Blower (2001b) and that describes the amount of bubble overlapping required to generate
coalescence (Blower, 2001b; Gonnerman et al., 2017). With increasing this required degree of over-
lapping, the percolation threshold dramatically increases up to values of Φc >0.70 (Blower, 2001b;
Gonnerman et al., 2017). This observation is in good agreement with experimental studies on highly
viscous rhyolitic melts and permeability-porosity relationships of crystal-free rhyolitic pumices which
all suggested a similar high value for the percolation threshold (e.g., Takeuchi et al., 2009; Nakamura
et al., 2008; Rust and Cashman, 2011; Lindoo et al., 2016). In contrast, Lindoo et al. (2016) per-
formed decompression-induced vesiculation experiments on crystal-free melts with a wide range of
viscosities (102-106 Pa.s) and found systematically higher percolation thresholds for viscosities
higher than 104.6 (Φc >0.70) than for the low viscosity basaltic-andesite melts (Φc >0.63), in agree-
ment with the fact that several factors also play a role on this threshold.
Additionally, the role of crystals on ΦC is also very important and has been discussed in
several studies (Blower, 2001; Rust and Cashman, 2004, 2011; Okumura et al., 2012; Oppenheimer
14
et al., 2015; Pistone et al., 2015; Spina et al., 2016; Parmigiani et al, 2016; Lindoo et al., 2016, 2017;
Colombier et al., 2017a, b). Several authors suggested a reduction of the ΦC and an increase of
bubble connectivity, gas permeability and outgassing efficiency in crystal bearing melts compared
to crystal free melts (Nakamura et al., 2008, Oppenheimer et al., 2015, Colombier et al 2017b; Lindoo
et al., 2017). Crystals affect bubble growth and coalescence in several ways. First, high crystallinity
simply leads to a reduction of the distance between two nucleating and growing bubbles, therefore
enhancing coalescence and causing a shift of ΦC to lower porosities and increase of permeability
(Blower, 2001). Additionally, at high crystallinities, the crystals lead to (i) deformation of the bubbles
leading to a reduction of ΦC and (ii) migration of bubbles through fingering pathways or pseudo-
fractures enhancing the outgassing efficiency (Oppenheimer et al., 2015; Parmigiani et al., 2016).
Lindoo et al. (2017) performed decompression-induced vesiculation experiments and were able to
quantify the effect of crystals on the percolation threshold, permeability and outgassing in low vis-
cosity basaltic andesitic melts. In this study they confirm an inverse relationship between ΦC and the
melt crystallinity. Finally, crystals also affect bubble nucleation after volatile exsolution in the conduit.
Heterogeneous bubble nucleation on crystal phases controls the initial spatial distribution of the ves-
icles and therefore also further bubble growth and coalescence (e.g., Hurwitz and Navon, 1994).
Several experimental and textural studies have shown that heterogeneous nucleation is a common
and important mechanism during volcanic eruptions (Bagdassarov and Dingwell, 1994; Hurwitz and
Navon, 1994; Giachetti et al., 2010; Shea et al., 2017; Colombier et al., 2017; Plese et al., 2017).
Spina et al. (2016) noted that heterogeneous bubble nucleation during analogous experiments led
to an enhancement of foam formation compared to crystal-free experiments. Plese et al (2017) per-
formed in situ vesiculation experiments and showed that both silicate and oxide crystals had an
influence on the bubble spatial distribution and coalescence kinetics.
Finally, the type of porosity changing process influences the pore network geometry and
therefore also the percolation threshold. Cracks formed during brittle fracturing for example can lead
to development of permeability at very low porosities (i.e., low ΦC). The range of percolation thresh-
olds is very wide for porosity increasing processes (vesiculation, cracking) whereas ΦC is systemat-
ically low for granular densification (Fig. 2b; e.g., Wadsworth et al., 2017)
15
A.2. The evolution of pore connectivity in volcanic
rocks
Mathieu Colombier1, Fabian B. Wadsworth1, Lucia Gurioli2, Bettina Scheu1,
Ulrich Kueppers1, Andrea Di Muro3, Donald B Dingwell1
1Department of Earth and Environmental Sciences, Ludwig-Maximilians-Uni-
versität München, Germany.
2Laboratoire Magmas et Volcans, Université Blaise Pascal-CNRS-IRD-
OPGC, Clermont-Ferrand, France.
3Institut de Physique du Globe de Paris, Observatoire Volcanologique du Pi-
ton de la Fournaise (OVPF), Sorbonne Paris Cité, UMR 7154 CNRS, Univer-
sité Paris Diderot.
Earth and Planetary Science Letters, Volume 462, 15 January 2017, Pages 99-109
16
Volcanic eruption style is controlled dominantly by the efficiency with which exsolved volatiles can
outgas from the system at shallow levels (Section A.1.; e.g., Rust & Cashman., 2004; Gonnermann
and Manga, 2012). This is governed by the development and longevity of permeability (e.g., Blower,
2001). The explosive potential, driven by a pressurizing gas phase, can be reduced if permeability
is quickly established and remains high (e.g., Eichelberger et al., 1986; Klug & Cashman, 1996).
Understanding the time-dependence of permeability evolution in shallow magmatic systems should
help to refine models of a wide range of magmatic processes, including heat transfer (e.g., Connor
et al., 1997), volcanic welding (e.g., Wadsworth et al., 2014; Heap et al., 2015), fragmentation likeli-
hood (e.g. Mueller et al., 2008) and volcanic gas flux (e.g., of SO2; Edmonds et al., 2007). In all these
cases, the evolution of gas permeability is strongly coupled to the evolution of the bulk porosity of
the system by constitutive laws that depend on the geometry of the pore space (e.g., Saar & Manga,
1999; Blower et al., 2001; Wadsworth et al., 2016). Metrics for the geometry of pore space, including
inter-pore aperture size, pore network anisotropy and tortuosity or, in the case of a welding scenario,
initial particle size and shape, have all been found to be useful in scaling models of permeability with
porosity (e.g., Blower, 2001; Le Pennec et al., 2001; Bernard et al., 2007; Yokoyama and Takeuchi.,
2009; Wright et al., 2009; Degruyter et al. 2010; Wright & Cashman, 2014; Wadsworth et al., 2016).
Pore connectivity, the fraction of total porosity that is connected, directly records the onset of perme-
ability (e.g., Rust & Cashman, 2011).
In the simplest view of magma ascent, volatiles exsolve from the melt, and lead to bubble
nucleation, growth and coalescence (e.g., Gonnermann & Manga, 2007). At a critical percolation
porosity (the percolation threshold 𝜙𝑐), bubble coalescence becomes system-spanning leading to
the development of connectivity (e.g. Blower, 2001). In volcanic rocks, porosity is often composed
dominantly or even completely of connected porosity (i.e., isolated porosity of zero) reflecting exten-
sive coalescence or microcracking (e.g., Robert et al., 2008; Kennedy et al., 2010). If continued
volatile exsolution into this coalescing pore network is sufficiently vigorous, or ascent is sufficiently
rapid, then the gas pressure rises and can result in fragmentation (e.g., Namiki & Manga, 2008).
The traditional view espoused above is ubiquitously cast as a system in which porosity in-
crease during ascent. However, a more nuanced view acknowledges that magma with a highly con-
nected pore phase is unstable if the gas pressure does not balance the magmastatic pressure. This
can be the case when connectivity extends over large length-scales where the pore pressure can
drop due to outgassing through the system. Magmas for which this is the case will densify either by
compaction (Michaut et al., 2009) or by surface tension at melt-gas interfaces (Wadsworth et al.,
2014; Wadsworth et al., 2016; Kennedy et al., 2016), decreasing porosity back toward a percolation
threshold 𝜙𝑐.
In addition to nucleating and growing bubbles, magma porosity can be formed by cracks (e.g.
Lavallée et al., 2008) or by crack-filling granular magma such as tuffisite (e.g. Kendrick et al., 2016)
that possibly represents intra-conduit fragmentation events in the absence of explosive eruption (e.g.
Gonnermann & Manga, 2003; Castro et al., 2012). In the case of cracks, connectivity can be in-
creased rapidly with little change in porosity. Crack development is ubiquitous in shallow dome-
forming lavas (e.g., Calder et al., 2015). In the case of the formation of granular materials, the inter-
particle connectivity is typically high (Wadsworth et al., 2016).
17
We have collated literature data in order to explore a connectivity metric for porosity that has
been used to elucidate the development of permeability (Farquharson et al., 2015). We show that
while vesiculation will increase porosity 𝜙 and increase connectivity at 𝜙 > 𝜙𝑐 (e.g., Blower, 2001),
crack-closure, viscous compaction of bubbly magma, gas-resorption, and volcanic welding all con-
spire to decrease porosity and connectivity toward a low 𝜙𝑐. We highlight that the 𝜙𝑐 intercepted
during porosity increase need not be the same value as that which is intersected during porosity-
decreasing processes. This is inherent in the concept of a permeability hysteresis (Rust & Cashman,
2004; Michaut et al., 2009). We propose that pore-connectivity is useful for distinguishing global
composition-dependent characteristics of magma porosity development and destruction and we ex-
plore the efficacy of this metric for understanding the evolution of eruption style.
A.2.1. Methodology
Definitions and measuring techniques
In most previous studies dealing with the evolution of pore connectivity with porosity, the results have
been presented by visualizing the connected porosity 𝜙′ as a function of the bulk porosity 𝜙 (Klug et
al., 2002; Formenti and Druitt, 2003; Bouvet de Maisonneuve et al., 2009; Shea et al., 2012). The
interpretation of such correlation plots is difficult because the trends are not easy to discriminate and
interpret when data plot close to the equiline. A more intuitive way to make use of these results is to
plot pore connectivity as a function of bulk porosity, an approach that has been adopted in only very
few studies to date (Shimano and Nakada., 2006; Nakamura et al., 2008; Okumura et al., 2013;
Farquharson et al., 2015; Colombier et al., 2017). We use the common definition of connectivity 𝐶
where
𝐶 =
𝜙′
𝜙 . Eq. 1
In this study, and in the case of ~99% of the values in the database here compiled, we meas-
ure 𝜙′ by a pycnometry method. With this technique, pore clusters connected to the exterior of a
rock sample are considered connected porosity. However, these pores do not necessarily contribute
to fluid transport and permeability. A subset of the data represent a 𝜙′ determined using water im-
pregnation (Kato, 1987; Nakamura et al., 2008) or by X-ray tomographic imaging techniques (Oku-
mura et al., 2008; Song et al. 2001). The pore connectivity can also be qualitatively estimated from
the Euler characteristic which is calculated by counting the numbers of connections and isolated
objects (Vogel, 2002). Finally, it can also be retrieved using skeleton analysis which relies on the
quantification of number and geometry of the disconnected pore medial axis (Lindquist et al., 1996).
18
While these different definitions of connectivity yield similar results and are used synonymously in
this study, some discrepancies are likely and should be considered.
In the following sections A.3 and B.2, an additional definition based on X-ray tomography will
be used. This definition consists of measuring the pores that are connected from one side of the
sample to the opposite and is therefore more relevant for comparison with permeability and for quan-
tification of the percolation threshold. As tomography also allows to measure a pycnometry derived
connectivity, section A.3 provides a comparison of the two definitions measured by tomography on
the same datasets allowing to convert the connectivity data obtained by one definition to the other
(See figure S1 in Supplementary material). Section B.2 shows a comparison between connectivity-
porosity relationships measured on the same sets of samples by He pycnometry and tomography
(Fig. 23).
Compilation of the connectivity database
We compiled a large database of porosity and connectivity comprising bulk-rock composition and
measurement techniques for natural and experimental data from studies published in the last 30
years as well as unpublished data for erupted volcanic materials measured herein. The compiled
database results in 2715 pairs of connectivity and porosity values for natural volcanic rocks across
35 volcanoes covering a broad range of eruptive styles and compositions and 116 pairs from 7 ex-
perimental studies. This database includes rhyolitic (Kato, 1987; Klug et al., 2002; Rust and Cash-
man, 2004; Mueller, 2007; Nakamura et al., 2008; Bouvet de Maisonneuve et al., 2009; Alfano et al.,
2012; Nguyen et al., 2014), dacitic (Rust et al., 1999; Mueller, 2007; Wright et al., 2007; Nguyen et
al., 2014; Heap et al., 2015), phonolitic and trachytic (Shea et al., 2012; Colombier et al., 2017),
andesitic (Formenti and Druitt, 2003; Mueller, 2007; Platz et al., 2007; Bernard et al., 2007; Giachetti
et al., 2010; Farquharson et al., 2015), and basaltic to basaltic andesitic (Rust et al., 1999; Song et
al., 2001; Mueller, 2007; Kawabata et al., 2015) volcanic rocks from a wide range of sites, as well as
naturally welded deposits (Klug et al., 2002; Michol et al., 2008; Wright and Cashman, 2014; Heap
et al., 2015). It should be noted that more than 90 % of the data for the trachytes arise from analysis
of rocks of a single eruption (Colombier et al., 2017). The database also comprises experimental
products from both vesiculation (Okumura et al., 2008; Takeuchi et al., 2009) and densification ex-
periments (Robert et al., 2008; Okumura et al., 2013; Vasseur et al., 2013; Kennedy et al., 2016 ;
Vasseur et al., 2016).
We complement the above database with unpublished measurements of basaltic scoria from
the Chisny AD 381 BP (Morandi et al., 2016) lava fountaining eruption (Piton de la Fournaise; Dyn-
Volc database), Stromboli 2011 and 2013 eruptions (DynVolc database), and of andesitic pumices
from Montagne Pelée volcano. Where measurements were made by the authors, helium-pycnome-
ters at LMU (Ludwig-Maximilians-Universität) and LMV (Laboratoire Magmas et Volcans) were used
(Quantachrome Ultrapyc 1200e and a Micromeritics Accupyc 1340, respectively). In the Supplemen-
tary File, we provide Supplementary Table S1 with a list of all the contributions to the database
specifying the publication title, the eruption date and style or the type of experimental study, the
19
number of samples analysed, the technique used to measure connectivity, the porosity and connec-
tivity ranges and, if available, the sample permeability range. The complete database with porosity,
connectivity and if available permeability data for each dataset is available in open access at
https://www.sciencedirect.com/science/article/pii/S0012821X17300171#se0160.
Potential weaknesses in the connectivity database
The database includes data with 𝐶 > 1. Since such connectivity values above unity are unphysical,
we have to consider the potential sources of errors on the measurements. Key to the accurate meas-
urement of total porosity is knowledge of the density of the solid, pore-free phase(s) in the volcanic
rock. A first weakness in the data compiled here arises from the value chosen for the solid density in
the calculation of the porosity. Indeed, in some studies only the solid-density of one representative
clast is measured and this density value is used to compute total porosity for a suite of samples. This
carries with it the implicit assumption that the solid density does not vary from clast-to-clast. How-
ever, heterogeneity in the phenocryst assemblage between clasts or variations in bulk composition
may be common. This can lead to unphysical connectivity values greater than 1. To address this
issue, Wright and Cashman. (2014) demonstrate that a range of solid density could be plausible for
welded deposits and discuss difference that may arise due to chemical variations. However, in most
studies the rock population studied are more homogeneous with little variations of the solid density.
This was the case for example for a breadcrust bomb population from Soufrière Hills volcano
(Giachetti et al., 2010) and welded block and ash flows deposits from Mount Meager volcano (Michol
et al., 2008) in which the solid density of a large number of rocks were measured and showed very
small standard deviation. In this case, the potential source of error on connectivity arises only from
determination of both bulk and connected porosities. In a few studies, these errors are quoted by
the authors and allow us to determine the error on connectivity (Formenti and Druitt, 2003; Michol et
al., 2008; Giachetti et al., 2010; Shea et al., 2012).
Another drawback to consider is that the connectivity that is measurable on typically-sized
rock sample (typically on the order of ~ 10-5 to 10-7 m³) may not scale to volcanic length-scales. That
is, connectivity of pore networks extends over finite lengths and porosity that is system spanning in
the laboratory may not be system spanning in nature. Nevertheless, these measurements remain
informative when interpreting laboratory-scale permeability measurements on which most permea-
bility scaling laws are based.
A.2.2. Results
Connectivity 𝐶 co-varies with 𝜙 in a trend that depend on the process involved in controlling changes
in 𝜙. In what follows, we present subsets of the compiled database to analyze these trends for (1)
20
experimental or natural data for which the mechanism by which connectivity was created or de-
stroyed is known, and then (2) data from natural rocks of a wide range of bulk chemistry. By adopting
this two-stage analysis we aim to discriminate trends that can inform us about the processes by
which connectivity is typically established or destroyed in magmas that come to be deposited as
volcanic rocks.
Contrasting vesiculation and densification trends
Here we constrain the trends in which 𝜙 was an increasing function of time in experiments in which
samples were vesiculated to different total 𝜙. In these experimental data, the onset of non-zero 𝐶
occurred at 𝜙𝑐, which is the point at which bubble coalescence spanned the measured sample or
connected to the outside. We term these trends “vesiculating” to refer to any trend in which bubble
nucleation, growth, coalescence and forced gas percolation, or all of these dominate the mechanism
by which 𝜙 increases. We distinguish vesiculating trends from those in which experimental work
showed that 𝜙 decreased with time, which we term “densifying”.
Figure 3a shows the relationship between 𝐶 and 𝜙 for vesiculating trends for a range of
materials. First, the post-experimental results are shown for samples formed in vesiculation experi-
ments (Okumura et al., 2008; Takeuchi et al., 2009) performed with and without syn-vesiculation
shear stress imposed on the samples. In the former case, a qualitative estimate of the minimum
threshold 𝜙𝑐 is ~0.21, whereas in the latter case, 0.42 < 𝜙𝑐 < 0.6. These experiments confirm that
for the vesiculating trend, the positive correlation of 𝐶 with 𝜙 can be used to estimate a wide range
of 𝜙𝑐 which will be discussed later (see Section A.2.3).
We compare the experimental results with those from samples for which 𝜙 is known to have
been a positive function of time. Breadcrust bomb samples from Soufrière Hills (Giachetti et al.,
2010), Unzen (Mueller, 2007) and Guagua Pichincha (Wright et al., 2007) volcanoes are shown.
These trends are characterized by post-fragmentation vesiculation of the bomb-cores while the
bomb-rinds remained less porous due to fast quenching and solidification. As a result, the rinds
record 0 ≤ 𝜙 ≤ 0.25 and the vesicles inside are completely isolated with 𝐶 = 0, whereas their asso-
ciated cores record higher porosity 0.2 ≤ 𝜙 ≤ 0.7 and corresponding 0.65 ≤ 𝐶 ≤ 0.95. Note that in
the case of Unzen and Guagua Pichincha volcanoes (Mueller, 2007; Wright et al., 2007) the rinds
were not measured. The 𝜙c at which connectivity onset can be estimated is likely to be in the range
of the porosity of the rinds, that is 0 ≤ 𝜙c ≤ 0.25. Finally, we compare these data with rhyolitic pumices
that contain vesicles with no diagnostic sign of shear-deformation or post-vesiculation collapse and
which are reported to record coalescence features (Klug et al., 2002; Mueller, 2007; Bouvet de Mai-
sonneuve et al., 2009; Nguyen et al., 2014). These pumices show a wide range of 𝐶 from 0.25 to
~1 over a small range of porosity 0.63 ≤ 𝜙 ≤ 0.85. Qualitative estimates of what the value of 𝜙 would
be at 𝐶 = 0, might suggest a high 𝜙𝑐 of >0.5.
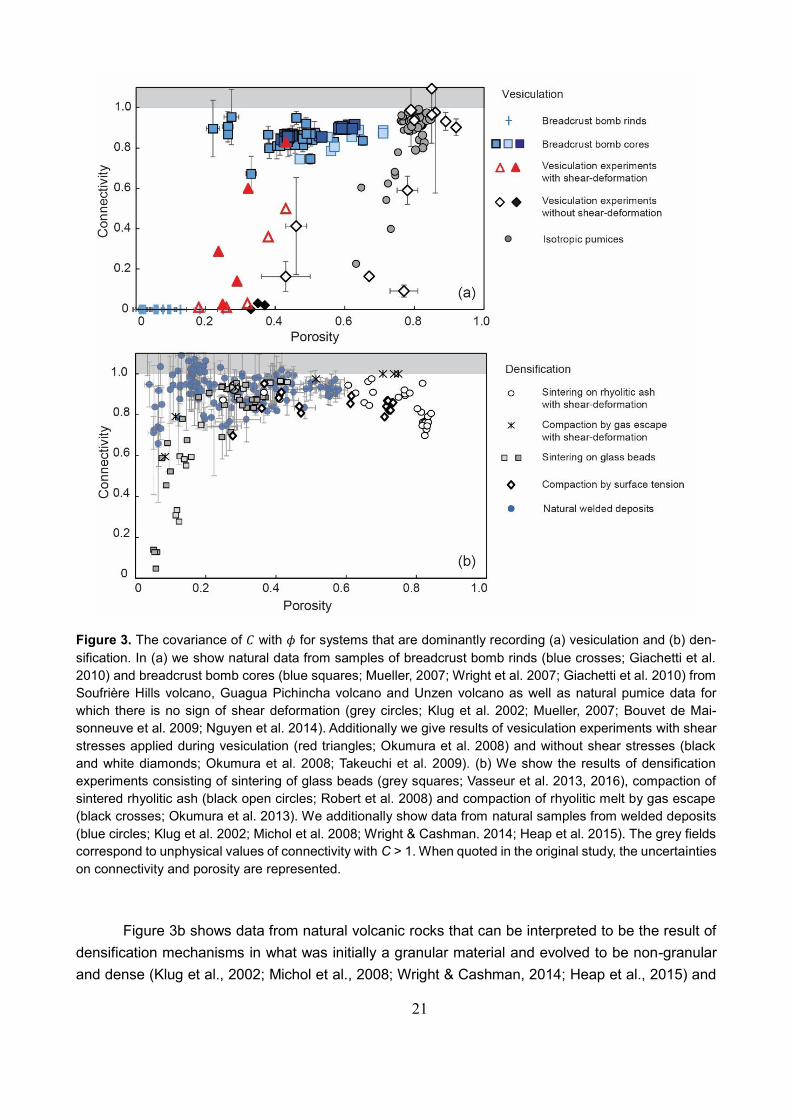
21
Figure 3. The covariance of 𝐶 with 𝜙 for systems that are dominantly recording (a) vesiculation and (b) den-
sification. In (a) we show natural data from samples of breadcrust bomb rinds (blue crosses; Giachetti et al.
2010) and breadcrust bomb cores (blue squares; Mueller, 2007; Wright et al. 2007; Giachetti et al. 2010) from
Soufrière Hills volcano, Guagua Pichincha volcano and Unzen volcano as well as natural pumice data for
which there is no sign of shear deformation (grey circles; Klug et al. 2002; Mueller, 2007; Bouvet de Mai-
sonneuve et al. 2009; Nguyen et al. 2014). Additionally we give results of vesiculation experiments with shear
stresses applied during vesiculation (red triangles; Okumura et al. 2008) and without shear stresses (black
and white diamonds; Okumura et al. 2008; Takeuchi et al. 2009). (b) We show the results of densification
experiments consisting of sintering of glass beads (grey squares; Vasseur et al. 2013, 2016), compaction of
sintered rhyolitic ash (black open circles; Robert et al. 2008) and compaction of rhyolitic melt by gas escape
(black crosses; Okumura et al. 2013). We additionally show data from natural samples from welded deposits
(blue circles; Klug et al. 2002; Michol et al. 2008; Wright & Cashman. 2014; Heap et al. 2015). The grey fields
correspond to unphysical values of connectivity with C > 1. When quoted in the original study, the uncertainties
on connectivity and porosity are represented.
Figure 3b shows data from natural volcanic rocks that can be interpreted to be the result of
densification mechanisms in what was initially a granular material and evolved to be non-granular
and dense (Klug et al., 2002; Michol et al., 2008; Wright & Cashman, 2014; Heap et al., 2015) and
22
experimental data from densifying systems (Robert et al., 2008; Okumura et al., 2013; Vasseur et
al., 2013, 2016; Kennedy et al., 2016). The compaction experiments from Robert et al. (2008) and
the sintering experiments from Vasseur et al. (2013, 2016) were performed using initially granular
materials. Robert et al. (2008) used a rhyolitic volcanic ash with a high initial porosity (𝜙𝑖 ≈ 0.8) as
starting material, whereas Vasseur et al. (2013, 2016) used angular glass fragments with an initial
porosity of 𝜙𝑖 ≈ 0.4. In these experiments 𝜙 decreased with time while the material maintained a
high connectivity around 𝐶~1. Only at the late stages of compaction or sintering, with continued
densification did 𝐶 decrease toward a low 𝜙𝑐 that can be qualitatively assessed to be on the order
of 𝜙𝑐 ≈ 0.05. The experimental results of Okumura et al. (2013) demonstrate a similar evolution of
𝜙 and 𝐶 down to a similar 𝜙𝑐. However, in this study (Okumura et al., 2013) the compaction was a
result of gas escape after an initial vesiculation and coalescence process. In Kennedy et al. (2016),
the densification was a consequence of surface tension processes and also led to a decrease of 𝐶
with 𝜙. The natural datasets selected to demonstrate the densification trend are those from the
Wineglass Tuff (Crater Lake; Klug and Cashman, 2002), welded block and ash flow deposits (Mount
Meager volcano; Michol et al., 2008; Heap et al., 2015), and the Shevlin Park Tuff (Wright and Cash-
man, 2014). We see that these natural datasets follow a similar relationship between 𝜙 and 𝐶 as the
experimental densification trend with a dramatic drop of porosity and a less pronounced and more
scattered decrease of connectivity.
Trends associated with bulk composition
In figure 4, we present compiled datasets for natural volcanic rocks grouped by bulk chemical com-
position. Further distinction is made between vesicular rocks erupted during explosive activity (pum-
ice or scoria and breadcrust bombs) and volcanic rocks derived from effusive eruptions such as
lavas, dome lavas sampled in situ or in block and ash flow deposits where these distinctions are
made in the studies originating the data and not here. Some problems with this simple separation
might be encountered with transitional or complex eruption styles. For the rocks from explosive ba-
saltic eruptions, we further differentiate between those from Strombolian eruptions and those from
Hawaiian fire fountain activity.
The first observation we make is that 𝐶 is high for most volcanic rocks independent of eruptive
style. A broad range of connectivity is nevertheless observed for rhyolitic pumices and basaltic scoria
(Fig. 4a, b). We emphasize that similar patterns can be discerned across all compositions; namely
that rocks formed in explosive eruptions tend to have a relationship between 𝐶 and 𝜙 that is distinct
from rocks formed in effusive activity. Due to the high 𝐶 in all rocks, it is difficult to discern what 𝜙𝑐
is for each rock type except for the rinds of the breadcrust bombs (Fig. 3). However, it is clear that
the minimum 𝜙 for rocks formed in explosive activity is greater than the minimum 𝜙 found for rocks
formed in effusive activity. The dacitic, andesitic and trachytic rocks formed by effusive activity record
low-𝜙 trends that show how 𝐶 is an increasing function of 𝜙.
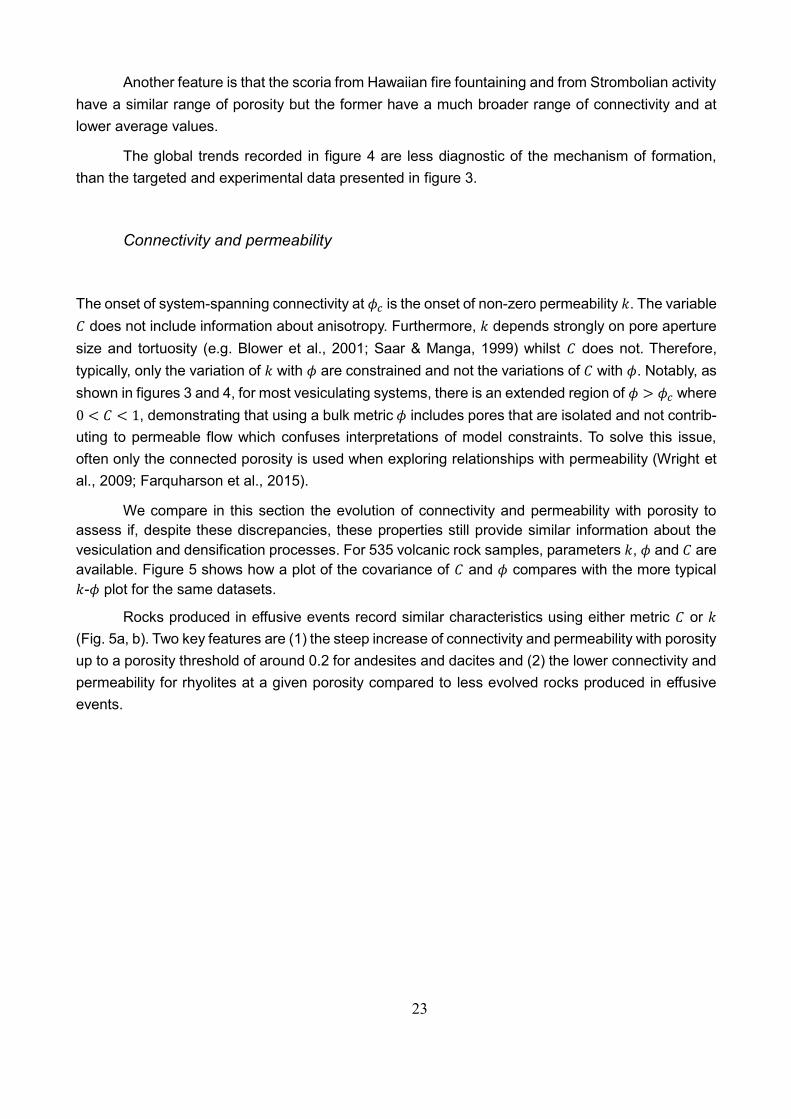
23
Another feature is that the scoria from Hawaiian fire fountaining and from Strombolian activity
have a similar range of porosity but the former have a much broader range of connectivity and at
lower average values.
The global trends recorded in figure 4 are less diagnostic of the mechanism of formation,
than the targeted and experimental data presented in figure 3.
Connectivity and permeability
The onset of system-spanning connectivity at 𝜙𝑐 is the onset of non-zero permeability 𝑘. The variable
𝐶 does not include information about anisotropy. Furthermore, 𝑘 depends strongly on pore aperture
size and tortuosity (e.g. Blower et al., 2001; Saar & Manga, 1999) whilst 𝐶 does not. Therefore,
typically, only the variation of 𝑘 with 𝜙 are constrained and not the variations of 𝐶 with 𝜙. Notably, as
shown in figures 3 and 4, for most vesiculating systems, there is an extended region of 𝜙 > 𝜙𝑐 where
0 < 𝐶 < 1, demonstrating that using a bulk metric 𝜙 includes pores that are isolated and not contrib-
uting to permeable flow which confuses interpretations of model constraints. To solve this issue,
often only the connected porosity is used when exploring relationships with permeability (Wright et
al., 2009; Farquharson et al., 2015).
We compare in this section the evolution of connectivity and permeability with porosity to
assess if, despite these discrepancies, these properties still provide similar information about the
vesiculation and densification processes. For 535 volcanic rock samples, parameters 𝑘, 𝜙 and 𝐶 are
available. Figure 5 shows how a plot of the covariance of 𝐶 and 𝜙 compares with the more typical
𝑘-𝜙 plot for the same datasets.
Rocks produced in effusive events record similar characteristics using either metric 𝐶 or 𝑘
(Fig. 5a, b). Two key features are (1) the steep increase of connectivity and permeability with porosity
up to a porosity threshold of around 0.2 for andesites and dacites and (2) the lower connectivity and
permeability for rhyolites at a given porosity compared to less evolved rocks produced in effusive
events.
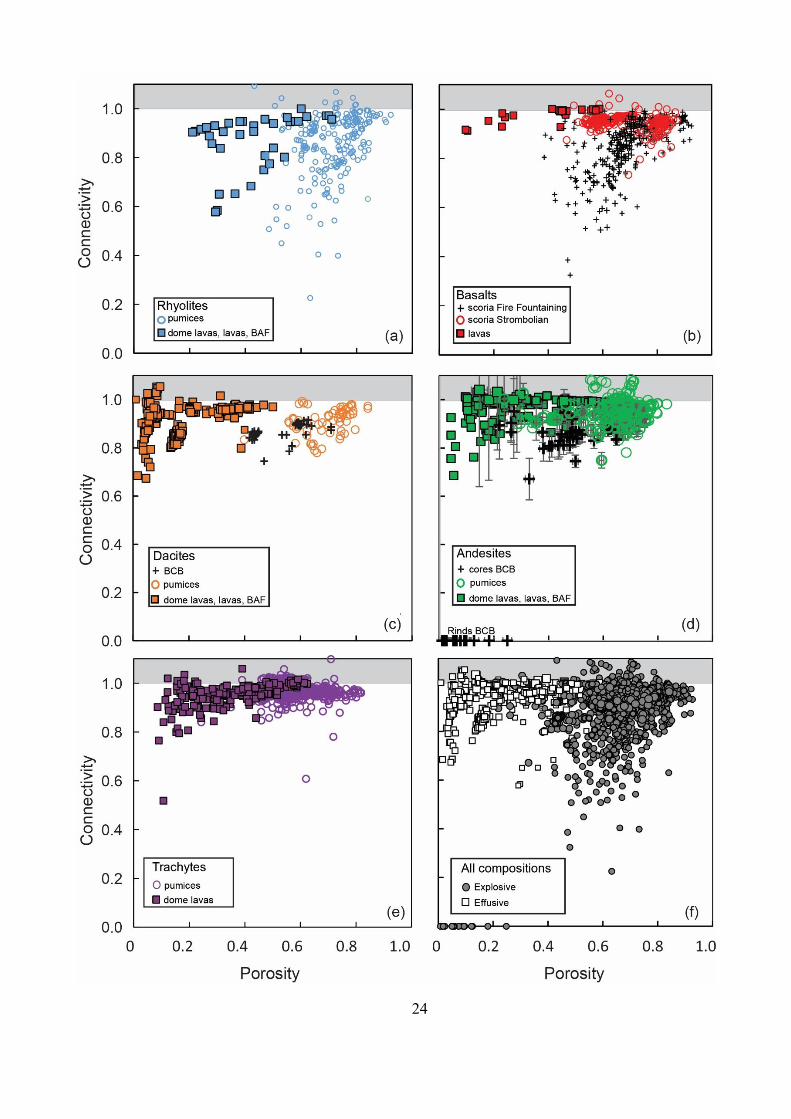
24
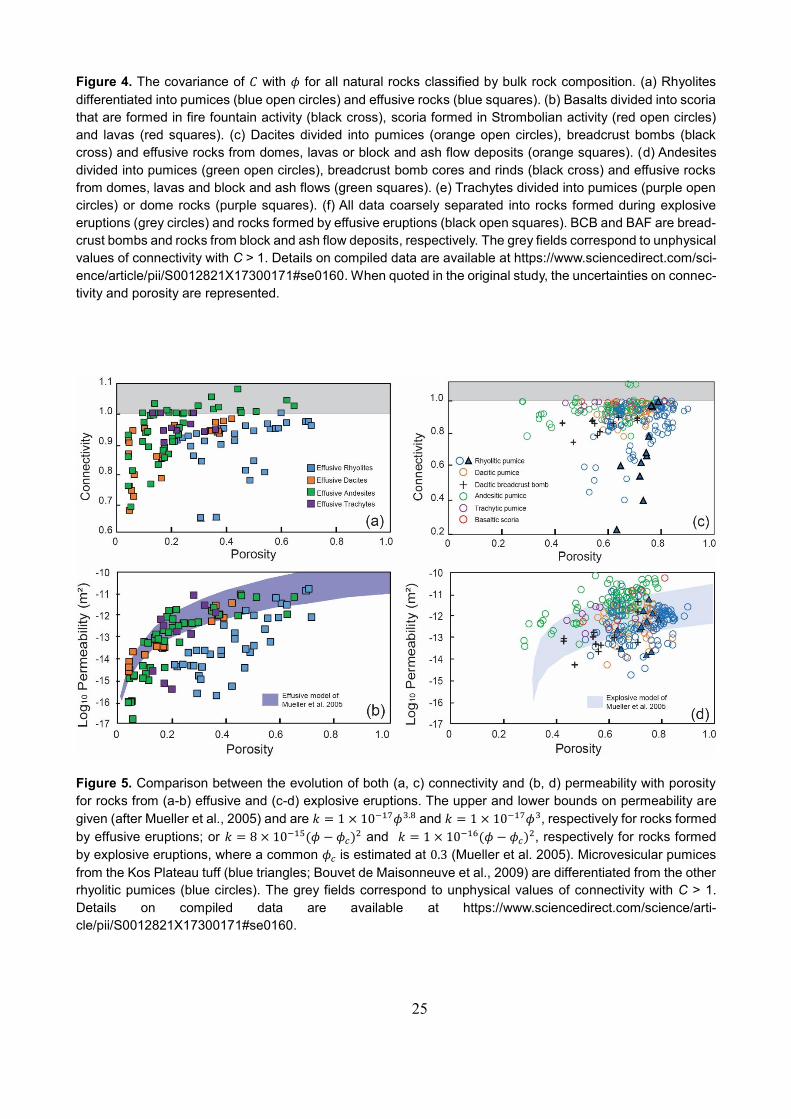
25
Figure 4. The covariance of 𝐶 with 𝜙 for all natural rocks classified by bulk rock composition. (a) Rhyolites
differentiated into pumices (blue open circles) and effusive rocks (blue squares). (b) Basalts divided into scoria
that are formed in fire fountain activity (black cross), scoria formed in Strombolian activity (red open circles)
and lavas (red squares). (c) Dacites divided into pumices (orange open circles), breadcrust bombs (black
cross) and effusive rocks from domes, lavas or block and ash flow deposits (orange squares). (d) Andesites
divided into pumices (green open circles), breadcrust bomb cores and rinds (black cross) and effusive rocks
from domes, lavas and block and ash flows (green squares). (e) Trachytes divided into pumices (purple open
circles) or dome rocks (purple squares). (f) All data coarsely separated into rocks formed during explosive
eruptions (grey circles) and rocks formed by effusive eruptions (black open squares). BCB and BAF are bread-
crust bombs and rocks from block and ash flow deposits, respectively. The grey fields correspond to unphysical
values of connectivity with C > 1. Details on compiled data are available at https://www.sciencedirect.com/sci-
ence/article/pii/S0012821X17300171#se0160. When quoted in the original study, the uncertainties on connec-
tivity and porosity are represented.
Figure 5. Comparison between the evolution of both (a, c) connectivity and (b, d) permeability with porosity
for rocks from (a-b) effusive and (c-d) explosive eruptions. The upper and lower bounds on permeability are
given (after Mueller et al., 2005) and are 𝑘 = 1 × 10⁻¹⁷𝜙3.8 and 𝑘 = 1 × 10⁻¹⁷𝜙3, respectively for rocks formed
by effusive eruptions; or 𝑘 = 8 × 10⁻¹⁵(𝜙 − 𝜙𝑐)2 and 𝑘 = 1 × 10⁻¹⁶(𝜙 − 𝜙𝑐)2, respectively for rocks formed
by explosive eruptions, where a common 𝜙𝑐 is estimated at 0.3 (Mueller et al. 2005). Microvesicular pumices
from the Kos Plateau tuff (blue triangles; Bouvet de Maisonneuve et al., 2009) are differentiated from the other
rhyolitic pumices (blue circles). The grey fields correspond to unphysical values of connectivity with C > 1.
Details on compiled data are available at https://www.sciencedirect.com/science/arti-
cle/pii/S0012821X17300171#se0160.
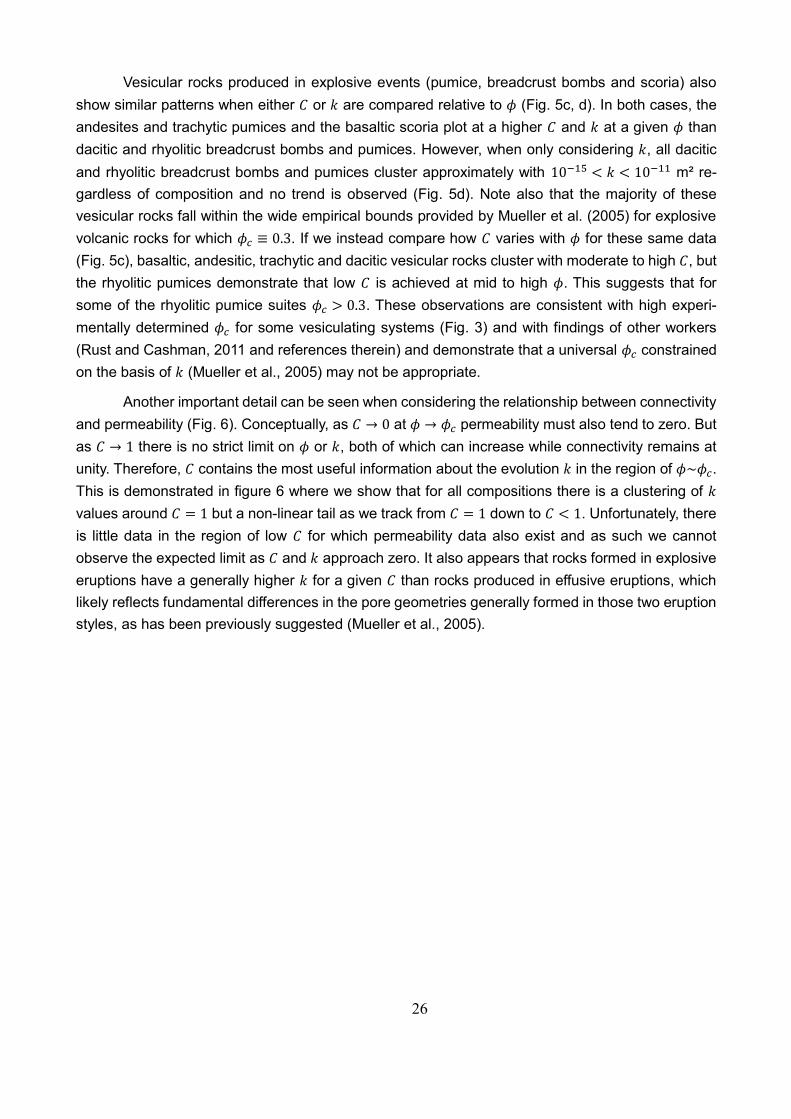
26
Vesicular rocks produced in explosive events (pumice, breadcrust bombs and scoria) also
show similar patterns when either 𝐶 or 𝑘 are compared relative to 𝜙 (Fig. 5c, d). In both cases, the
andesites and trachytic pumices and the basaltic scoria plot at a higher 𝐶 and 𝑘 at a given 𝜙 than
dacitic and rhyolitic breadcrust bombs and pumices. However, when only considering 𝑘, all dacitic
and rhyolitic breadcrust bombs and pumices cluster approximately with 10−15 < 𝑘 < 10−11 m² re-
gardless of composition and no trend is observed (Fig. 5d). Note also that the majority of these
vesicular rocks fall within the wide empirical bounds provided by Mueller et al. (2005) for explosive
volcanic rocks for which 𝜙𝑐 ≡ 0.3. If we instead compare how 𝐶 varies with 𝜙 for these same data
(Fig. 5c), basaltic, andesitic, trachytic and dacitic vesicular rocks cluster with moderate to high 𝐶, but
the rhyolitic pumices demonstrate that low 𝐶 is achieved at mid to high 𝜙. This suggests that for
some of the rhyolitic pumice suites 𝜙𝑐 > 0.3. These observations are consistent with high experi-
mentally determined 𝜙𝑐 for some vesiculating systems (Fig. 3) and with findings of other workers
(Rust and Cashman, 2011 and references therein) and demonstrate that a universal 𝜙𝑐 constrained
on the basis of 𝑘 (Mueller et al., 2005) may not be appropriate.
Another important detail can be seen when considering the relationship between connectivity
and permeability (Fig. 6). Conceptually, as 𝐶 → 0 at 𝜙 → 𝜙𝑐 permeability must also tend to zero. But
as 𝐶 → 1 there is no strict limit on 𝜙 or 𝑘, both of which can increase while connectivity remains at
unity. Therefore, 𝐶 contains the most useful information about the evolution 𝑘 in the region of 𝜙~𝜙𝑐.
This is demonstrated in figure 6 where we show that for all compositions there is a clustering of 𝑘
values around 𝐶 = 1 but a non-linear tail as we track from 𝐶 = 1 down to 𝐶 < 1. Unfortunately, there
is little data in the region of low 𝐶 for which permeability data also exist and as such we cannot
observe the expected limit as 𝐶 and 𝑘 approach zero. It also appears that rocks formed in explosive
eruptions have a generally higher 𝑘 for a given 𝐶 than rocks produced in effusive eruptions, which
likely reflects fundamental differences in the pore geometries generally formed in those two eruption
styles, as has been previously suggested (Mueller et al., 2005).
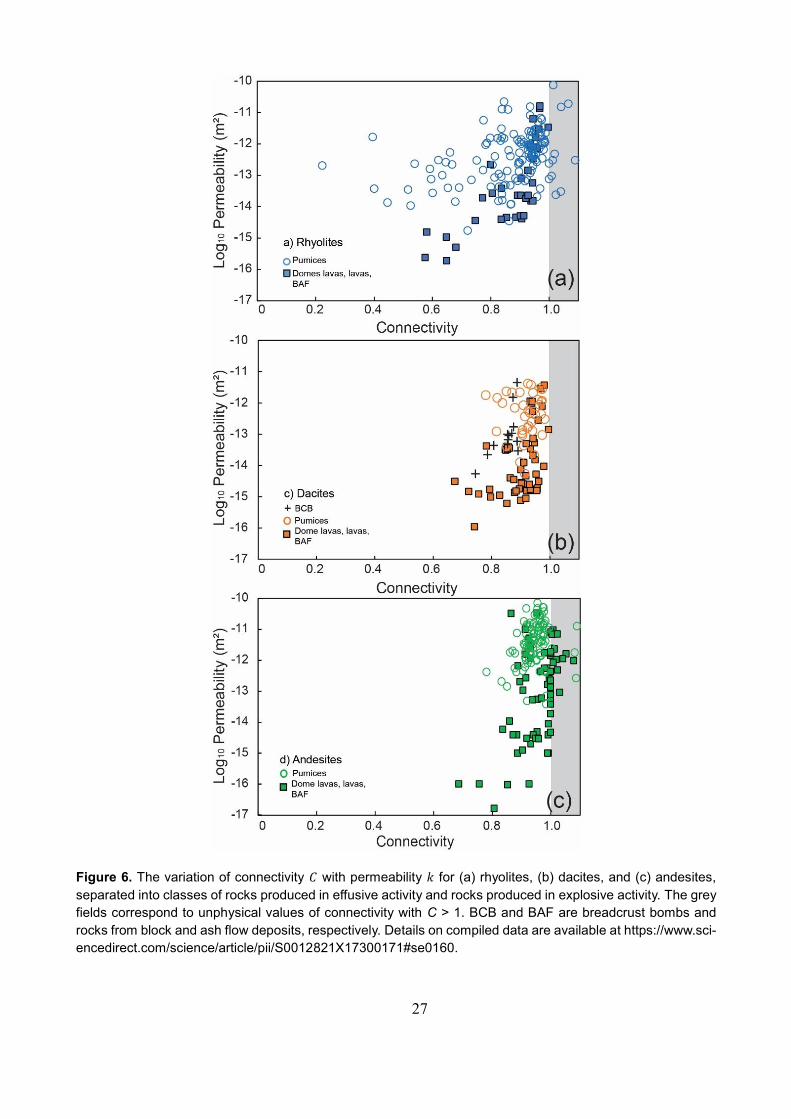
27
Figure 6. The variation of connectivity 𝐶 with permeability 𝑘 for (a) rhyolites, (b) dacites, and (c) andesites,
separated into classes of rocks produced in effusive activity and rocks produced in explosive activity. The grey
fields correspond to unphysical values of connectivity with C > 1. BCB and BAF are breadcrust bombs and
rocks from block and ash flow deposits, respectively. Details on compiled data are available at https://www.sci-
encedirect.com/science/article/pii/S0012821X17300171#se0160.
28
A.2.3. Extended discussion
Granular and non-granular materials: Insights from experimental work
We highlight that a subset of densification trends in figure 3 derive from initially granular materials,
while the vesiculation trends are for non-granular porous media. Here we discuss the differences
one might expect from this geometric distinction.
First, for the densification data presented in figure 3 (Robert et al., 2008; Vasseur et al., 2013;
Vasseur et al., 2016), the evolution of 𝐶 with 𝜙 appears to a first order to be independent of the
densification mechanism over a wide range of conditions. For the data from Robert et al. (2008),
granular volcanic ash was partially sintered before being drilled to a cylindrical core, then a uniaxial
load was applied resulting in a range of strain rates at high temperature in the viscous regime such
that densification proceeded before quenching. The data from Vasseur et al. (2013; 2016) were pro-
duced using granular crushed synthetic glass shards loaded in crucibles and densification pro-
ceeded under surface tension at the particle interfaces, no applied load was used. In Okumura et al.
(2013), the densification arises from shear-induced outgassing of a highly connected pore network.
In Kennedy et al. (2016), surface tension-driven retraction of bubble walls led to the densification of
crystal-bearing pumices. Despite these large differences in densification mechanism, 𝐶 and 𝜙 vary
consistently such that we conclude that in the viscous regime densification trends produce a similar
evolution of connectivity.
On the other hand, examination of the data for the vesiculation trend presented in figure 3
shows that the same mechanism-invariance of the trend of 𝐶 with 𝜙 cannot hold here. As an exam-
ple, the increase in 𝐶 from 𝜙𝑐 occurs at a much lower window of 𝜙 for experiments in which vesicu-
lation was coincident with applied shear stress than for vesiculation experiments in the absence of
shear stress (Okumura et al., 2008; Takeuchi et al., 2009). This indicates that bubble growth-driven
coalescence is strongly influenced by shear strain whereas the deformation of initially granular ma-
terials is less influenced by deformation (Fig. 7).
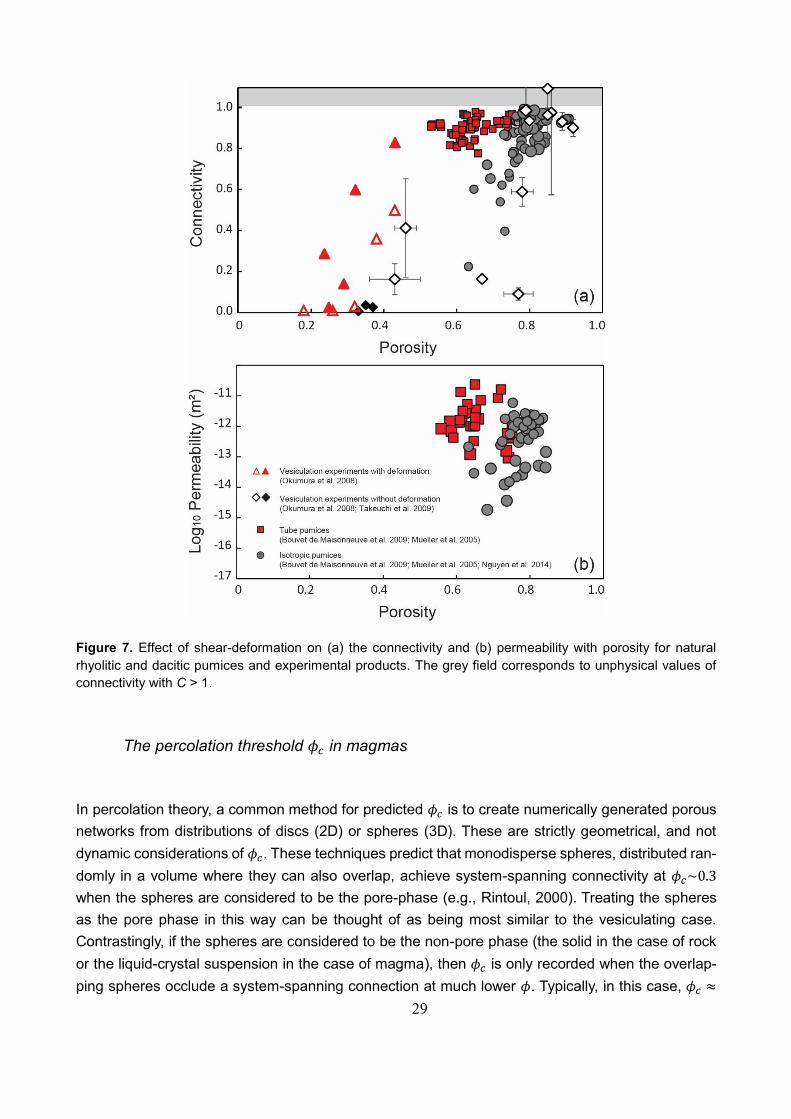
29
Figure 7. Effect of shear-deformation on (a) the connectivity and (b) permeability with porosity for natural
rhyolitic and dacitic pumices and experimental products. The grey field corresponds to unphysical values of
connectivity with C > 1.
The percolation threshold 𝜙𝑐 in magmas
In percolation theory, a common method for predicted 𝜙𝑐 is to create numerically generated porous
networks from distributions of discs (2D) or spheres (3D). These are strictly geometrical, and not
dynamic considerations of 𝜙𝑐. These techniques predict that monodisperse spheres, distributed ran-
domly in a volume where they can also overlap, achieve system-spanning connectivity at 𝜙𝑐~0.3
when the spheres are considered to be the pore-phase (e.g., Rintoul, 2000). Treating the spheres
as the pore phase in this way can be thought of as being most similar to the vesiculating case.
Contrastingly, if the spheres are considered to be the non-pore phase (the solid in the case of rock
or the liquid-crystal suspension in the case of magma), then 𝜙𝑐 is only recorded when the overlap-
ping spheres occlude a system-spanning connection at much lower 𝜙. Typically, in this case, 𝜙𝑐 ≈
30
0.03 (Rintoul. 2000; Wadsworth et al., 2016). This second case, where the spheres are the non-pore
matrix material is broadly analogous to the volcanic welding scenario. We find it informative to high-
light how these 𝜙𝑐 constraints for sphere populations are altered by simple variables in both cases;
(1) where the spheres are the pores and (2) where the spheres are particles. In case (1) 𝜙𝑐 is a
strong function of the polydispersivity of the spheres sizes used in the geometrical simulation (e.g.,
Blower, 2001), whereas in case (2) 𝜙𝑐 is a weak function of polydispersivity (Rintoul, 2000). This is
further demonstrated in figure 3, where 𝜙𝑐 covers a wide range of values for the vesiculating case
(case 1), whereas 𝜙𝑐 is ubiquitously consistent with the 𝜙𝑐 = 0.03 prediction for the granular case
(case 2). Microvesicular rhyolitic pumices from the Kos Plateau tuff (Bouvet de Maisonneuve et al.,
2009) contain two vesicle populations attributed to two distinct nucleation events. Consequently,
these pumices apparently record a more complex approach to the percolation threshold (Fig. 5).
In natural magmas, the intersection of the percolation threshold as 𝜙 increases or decreases
is often complicated by dynamic processes that may invalidate the numerical geometrical ap-
proaches outlined above. Some of these are discussed briefly here. Variable 𝜙𝑐 have been dis-
cussed in numerical, experimental or permeability studies (Rust and Cashman, 2011 and literature
therein) with reference to dynamic scenarios. First, crystallinity has been shown to halt densification
processes at a 𝜙 greater than 𝜙𝑐 that would have been predicted on geometrical grounds alone, due
to crystal-crystal interactions (Kennedy et al., 2016). These interactions produce a rigid framework
and thus an elevated yield stress in the system that needs to be overcome for densification to pro-
ceed to 𝜙𝑐. In some of these cases, however, the system is still percolating (i.e. permeable) even
when changes in 𝜙 have stopped.
Additional, first-order effects controlling 𝜙𝑐 and the onset of connectivity for vesicular magmas
are the presence or not of shear-deformation (Okumura et al., 2008; Takeuchi et al., 2009; Burgisser
and Gardner, 2004; Rust and Cashman, 2011), the melt crystallinity and the modality of the vesicle
size distribution in vesiculating systems (Blower, 2001). Shear-stress and the resulting deformation
will favor the onset of connectivity and permeability at a lower 𝜙𝑐 as shown by decompression and
vesiculation experiments (Figs. 3 and 7; Okumura et al., 2008, 2013; Takeuchi et al., 2009; Namiki
and Manga, 2008). Tube pumices, generally the product of large shear strain (Dingwell et al., 2016),
are consistent with experimental work for which vesiculation was coincident with shear deformation
(Fig. 7). Contrastingly, isotropic pumice materials are more consistent with experiments where ve-
siculation happens in the absence of shear deformation (Figs. 3 and 7). It is clear from both natural
and experimental datasets that 𝜙𝑐 is significantly reduced in the presence of shearing, consistent
with previous studies (Okumura et al., 2008; Burgisser and Gardner, 2004).
The differences in 𝜙𝑐 between vesicular rocks might be also related to differences in crystal-
linity. The role of crystals on the connectivity and percolation threshold is complex. First, because
bubbles cannot occupy the crystal-phase, for a given porosity, the addition of crystals reduces the
space between bubbles, therefore enhancing coalescence at lower porosities (Blower, 2001). Sec-
ond, the crystals are barriers to simple flow patterns and so they promote bubble deformation en-
hancing the likelihood of coalescence (Oppenheimer et al., 2015). In both cases, the addition of
crystals appears to induce a shift of 𝜙𝑐 to lower porosity. Inversely, 𝜙𝑐 in crystal poor pumices might
be quite high (Nakamura et al., 2008; Rust and Cashman, 2011). Even though our database lacks
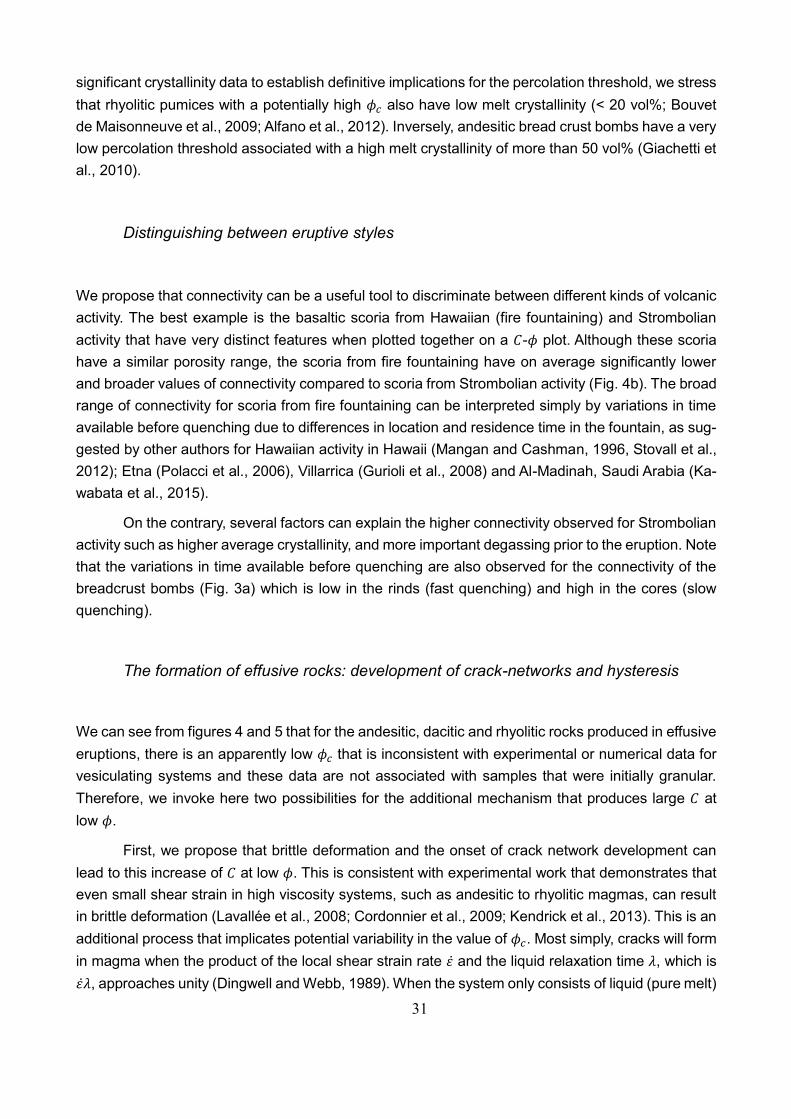
31
significant crystallinity data to establish definitive implications for the percolation threshold, we stress
that rhyolitic pumices with a potentially high 𝜙𝑐 also have low melt crystallinity (< 20 vol%; Bouvet
de Maisonneuve et al., 2009; Alfano et al., 2012). Inversely, andesitic bread crust bombs have a very
low percolation threshold associated with a high melt crystallinity of more than 50 vol% (Giachetti et
al., 2010).
Distinguishing between eruptive styles
We propose that connectivity can be a useful tool to discriminate between different kinds of volcanic
activity. The best example is the basaltic scoria from Hawaiian (fire fountaining) and Strombolian
activity that have very distinct features when plotted together on a 𝐶-𝜙 plot. Although these scoria
have a similar porosity range, the scoria from fire fountaining have on average significantly lower
and broader values of connectivity compared to scoria from Strombolian activity (Fig. 4b). The broad
range of connectivity for scoria from fire fountaining can be interpreted simply by variations in time
available before quenching due to differences in location and residence time in the fountain, as sug-
gested by other authors for Hawaiian activity in Hawaii (Mangan and Cashman, 1996, Stovall et al.,
2012); Etna (Polacci et al., 2006), Villarrica (Gurioli et al., 2008) and Al-Madinah, Saudi Arabia (Ka-
wabata et al., 2015).
On the contrary, several factors can explain the higher connectivity observed for Strombolian
activity such as higher average crystallinity, and more important degassing prior to the eruption. Note
that the variations in time available before quenching are also observed for the connectivity of the
breadcrust bombs (Fig. 3a) which is low in the rinds (fast quenching) and high in the cores (slow
quenching).
The formation of effusive rocks: development of crack-networks and hysteresis
We can see from figures 4 and 5 that for the andesitic, dacitic and rhyolitic rocks produced in effusive
eruptions, there is an apparently low 𝜙𝑐 that is inconsistent with experimental or numerical data for
vesiculating systems and these data are not associated with samples that were initially granular.
Therefore, we invoke here two possibilities for the additional mechanism that produces large 𝐶 at
low 𝜙.
First, we propose that brittle deformation and the onset of crack network development can
lead to this increase of 𝐶 at low 𝜙. This is consistent with experimental work that demonstrates that
even small shear strain in high viscosity systems, such as andesitic to rhyolitic magmas, can result
in brittle deformation (Lavallée et al., 2008; Cordonnier et al., 2009; Kendrick et al., 2013). This is an
additional process that implicates potential variability in the value of 𝜙𝑐. Most simply, cracks will form
in magma when the product of the local shear strain rate 𝜀̇ and the liquid relaxation time 𝜆, which is
𝜀̇𝜆, approaches unity (Dingwell and Webb, 1989). When the system only consists of liquid (pure melt)
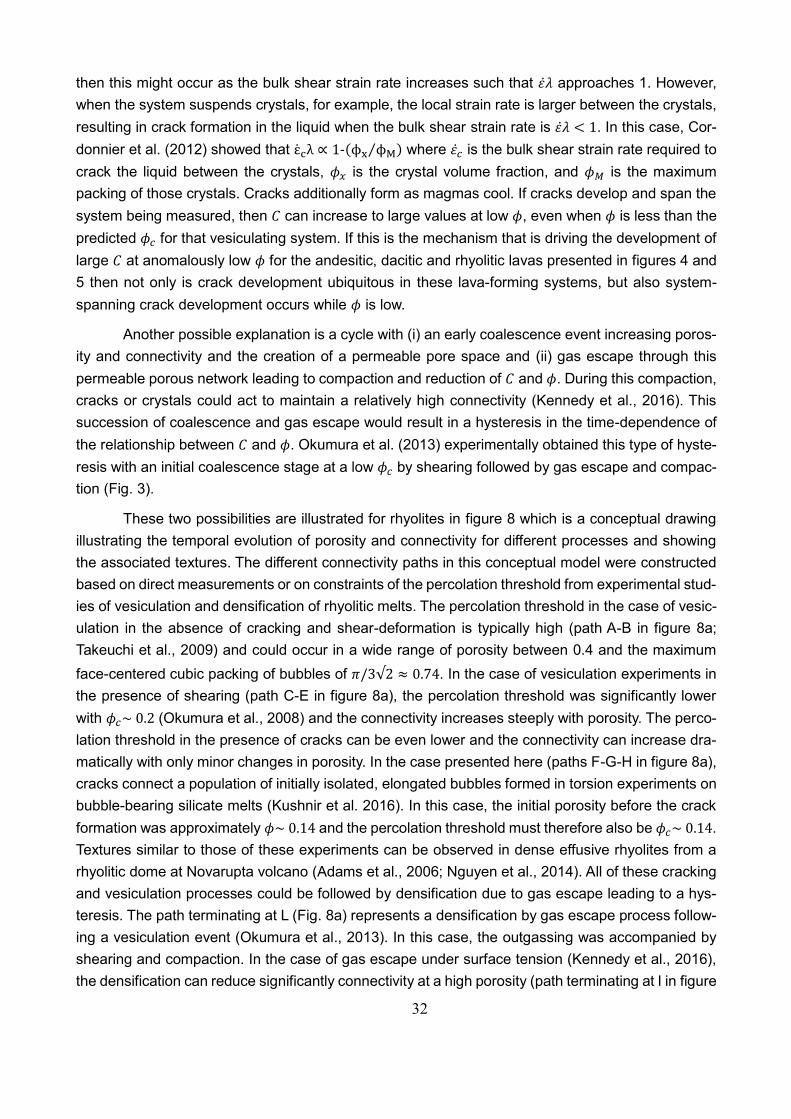
32
then this might occur as the bulk shear strain rate increases such that 𝜀̇𝜆 approaches 1. However,
when the system suspends crystals, for example, the local strain rate is larger between the crystals,
resulting in crack formation in the liquid when the bulk shear strain rate is 𝜀̇𝜆 < 1. In this case, Cor-
donnier et al. (2012) showed that ε̇cλ ∝ 1-(ϕx ϕM⁄ ) where 𝜀�̇� is the bulk shear strain rate required to
crack the liquid between the crystals, 𝜙𝑥 is the crystal volume fraction, and 𝜙𝑀 is the maximum
packing of those crystals. Cracks additionally form as magmas cool. If cracks develop and span the
system being measured, then 𝐶 can increase to large values at low 𝜙, even when 𝜙 is less than the
predicted 𝜙𝑐 for that vesiculating system. If this is the mechanism that is driving the development of
large 𝐶 at anomalously low 𝜙 for the andesitic, dacitic and rhyolitic lavas presented in figures 4 and
5 then not only is crack development ubiquitous in these lava-forming systems, but also system-
spanning crack development occurs while 𝜙 is low.
Another possible explanation is a cycle with (i) an early coalescence event increasing poros-
ity and connectivity and the creation of a permeable pore space and (ii) gas escape through this
permeable porous network leading to compaction and reduction of 𝐶 and 𝜙. During this compaction,
cracks or crystals could act to maintain a relatively high connectivity (Kennedy et al., 2016). This
succession of coalescence and gas escape would result in a hysteresis in the time-dependence of
the relationship between 𝐶 and 𝜙. Okumura et al. (2013) experimentally obtained this type of hyste-
resis with an initial coalescence stage at a low 𝜙𝑐 by shearing followed by gas escape and compac-
tion (Fig. 3).
These two possibilities are illustrated for rhyolites in figure 8 which is a conceptual drawing
illustrating the temporal evolution of porosity and connectivity for different processes and showing
the associated textures. The different connectivity paths in this conceptual model were constructed
based on direct measurements or on constraints of the percolation threshold from experimental stud-
ies of vesiculation and densification of rhyolitic melts. The percolation threshold in the case of vesic-
ulation in the absence of cracking and shear-deformation is typically high (path A-B in figure 8a;
Takeuchi et al., 2009) and could occur in a wide range of porosity between 0.4 and the maximum
face-centered cubic packing of bubbles of 𝜋/3√2 ≈ 0.74. In the case of vesiculation experiments in
the presence of shearing (path C-E in figure 8a), the percolation threshold was significantly lower
with 𝜙𝑐~ 0.2 (Okumura et al., 2008) and the connectivity increases steeply with porosity. The perco-
lation threshold in the presence of cracks can be even lower and the connectivity can increase dra-
matically with only minor changes in porosity. In the case presented here (paths F-G-H in figure 8a),
cracks connect a population of initially isolated, elongated bubbles formed in torsion experiments on
bubble-bearing silicate melts (Kushnir et al. 2016). In this case, the initial porosity before the crack
formation was approximately 𝜙~ 0.14 and the percolation threshold must therefore also be 𝜙𝑐~ 0.14.
Textures similar to those of these experiments can be observed in dense effusive rhyolites from a
rhyolitic dome at Novarupta volcano (Adams et al., 2006; Nguyen et al., 2014). All of these cracking
and vesiculation processes could be followed by densification due to gas escape leading to a hys-
teresis. The path terminating at L (Fig. 8a) represents a densification by gas escape process follow-
ing a vesiculation event (Okumura et al., 2013). In this case, the outgassing was accompanied by
shearing and compaction. In the case of gas escape under surface tension (Kennedy et al., 2016),
the densification can reduce significantly connectivity at a high porosity (path terminating at I in figure
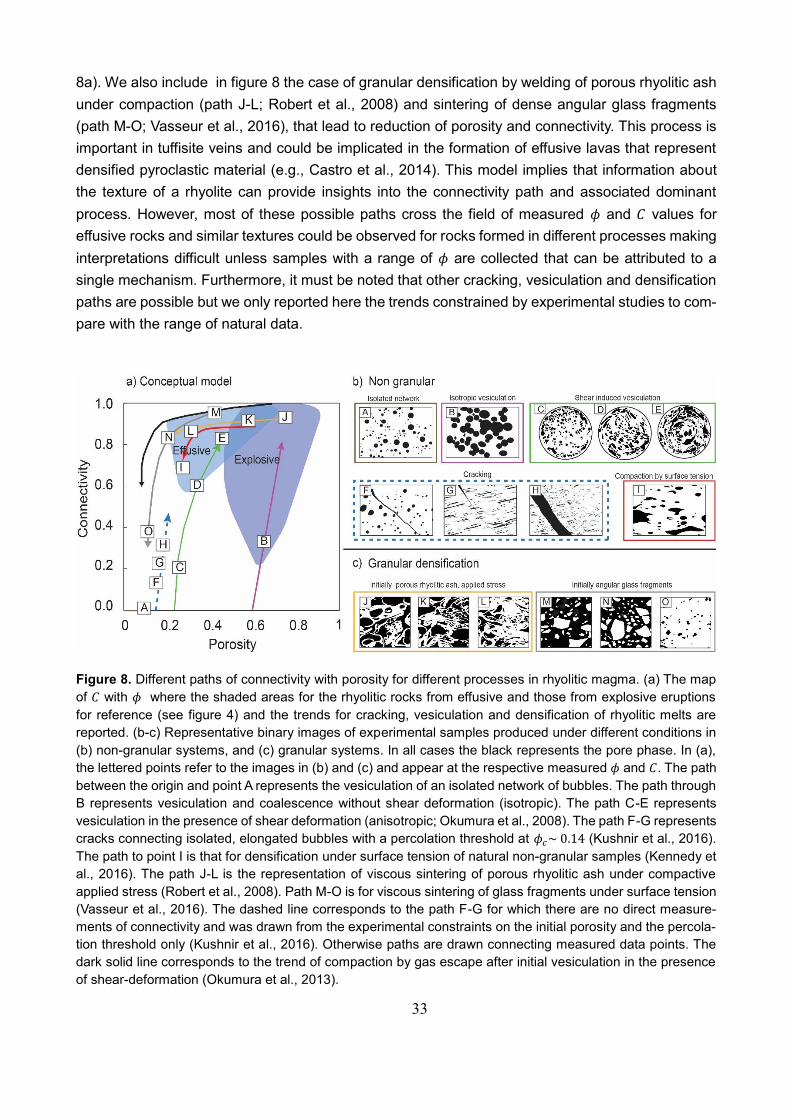
33
8a). We also include in figure 8 the case of granular densification by welding of porous rhyolitic ash
under compaction (path J-L; Robert et al., 2008) and sintering of dense angular glass fragments
(path M-O; Vasseur et al., 2016), that lead to reduction of porosity and connectivity. This process is
important in tuffisite veins and could be implicated in the formation of effusive lavas that represent
densified pyroclastic material (e.g., Castro et al., 2014). This model implies that information about
the texture of a rhyolite can provide insights into the connectivity path and associated dominant
process. However, most of these possible paths cross the field of measured 𝜙 and 𝐶 values for
effusive rocks and similar textures could be observed for rocks formed in different processes making
interpretations difficult unless samples with a range of 𝜙 are collected that can be attributed to a
single mechanism. Furthermore, it must be noted that other cracking, vesiculation and densification
paths are possible but we only reported here the trends constrained by experimental studies to com-
pare with the range of natural data.
Figure 8. Different paths of connectivity with porosity for different processes in rhyolitic magma. (a) The map
of 𝐶 with 𝜙 where the shaded areas for the rhyolitic rocks from effusive and those from explosive eruptions
for reference (see figure 4) and the trends for cracking, vesiculation and densification of rhyolitic melts are
reported. (b-c) Representative binary images of experimental samples produced under different conditions in
(b) non-granular systems, and (c) granular systems. In all cases the black represents the pore phase. In (a),
the lettered points refer to the images in (b) and (c) and appear at the respective measured 𝜙 and 𝐶. The path
between the origin and point A represents the vesiculation of an isolated network of bubbles. The path through
B represents vesiculation and coalescence without shear deformation (isotropic). The path C-E represents
vesiculation in the presence of shear deformation (anisotropic; Okumura et al., 2008). The path F-G represents
cracks connecting isolated, elongated bubbles with a percolation threshold at 𝜙𝑐~ 0.14 (Kushnir et al., 2016).
The path to point I is that for densification under surface tension of natural non-granular samples (Kennedy et
al., 2016). The path J-L is the representation of viscous sintering of porous rhyolitic ash under compactive
applied stress (Robert et al., 2008). Path M-O is for viscous sintering of glass fragments under surface tension
(Vasseur et al., 2016). The dashed line corresponds to the path F-G for which there are no direct measure-
ments of connectivity and was drawn from the experimental constraints on the initial porosity and the percola-
tion threshold only (Kushnir et al., 2016). Otherwise paths are drawn connecting measured data points. The
dark solid line corresponds to the trend of compaction by gas escape after initial vesiculation in the presence
of shear-deformation (Okumura et al., 2013).
34
A.2.4. Conclusions
We present here a database of pore connectivity 𝐶 and porosity 𝜙 data for natural volcanic rocks
(𝑛 = 2715) and experimental products (𝑛 = 116) from published sources and additional measure-
ments. When available, permeability data was also included for comparison (𝑛 = 535). Analysis of
these data lead to the following broad conclusions:
Connectivity can be used to distinguish between subsets of volcanic materials including ef-
fusive and explosive products, products of fire fountaining and Strombolian basaltic activity
and bulk chemical differences, when large datasets are measured or compiled.
Connectivity can be used to identify the percolation threshold porosity as it can be con-
strained in samples below and above this threshold, where permeability cannot.
Pore connectivity develops by vesiculation and bubble growth-driven coalescence or by
cracking or combinations of both processes. Pore connectivity decreases by densification
processes including compaction, sintering or welding. The trend of connectivity with porosity
is distinct for these porosity-increasing and porosity-decreasing processes.
Connectivity potentially contains important information about permeability at porosities close
to the percolation threshold where 0 < 𝐶 < 1.
Our work shows that a valuable frontier to pursue would be the systematic measure-
ment of suites of rocks or experimental samples in the range where connectivity is less than unity
but greater than zero. It is in this range that the co-variation of connectivity with porosity is directly
informative of the evolution of permeability. That is, near to the percolation threshold, connectivity is
an underutilized metric. Specifically this constraint for a range of processes could be achieved using
tomographic techniques and targeted experimental work spanning the evolution from non-percolat-
ing to percolating systems during both vesiculation and densification processes. Key first order im-
plications of such constraints would be associated with knowing how and when permeability is es-
tablished or shuts off in volcanic interiors or deposits. In turn, this would permit us to know under
what conditions a volcano may start to build fluid overpressure leading to an eruption and when the
volcano may effectively dissipate overpressure.
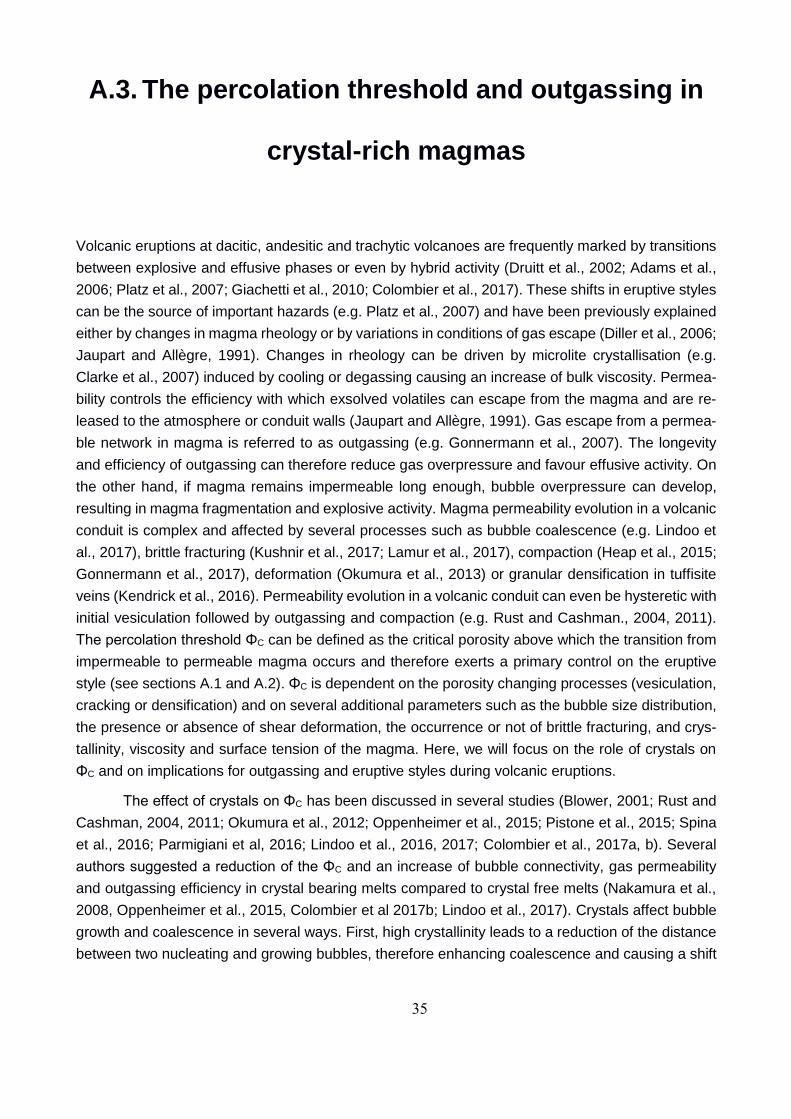
35
A.3. The percolation threshold and outgassing in
crystal-rich magmas
Volcanic eruptions at dacitic, andesitic and trachytic volcanoes are frequently marked by transitions
between explosive and effusive phases or even by hybrid activity (Druitt et al., 2002; Adams et al.,
2006; Platz et al., 2007; Giachetti et al., 2010; Colombier et al., 2017). These shifts in eruptive styles
can be the source of important hazards (e.g. Platz et al., 2007) and have been previously explained
either by changes in magma rheology or by variations in conditions of gas escape (Diller et al., 2006;
Jaupart and Allègre, 1991). Changes in rheology can be driven by microlite crystallisation (e.g.
Clarke et al., 2007) induced by cooling or degassing causing an increase of bulk viscosity. Permea-
bility controls the efficiency with which exsolved volatiles can escape from the magma and are re-
leased to the atmosphere or conduit walls (Jaupart and Allègre, 1991). Gas escape from a permea-
ble network in magma is referred to as outgassing (e.g. Gonnermann et al., 2007). The longevity
and efficiency of outgassing can therefore reduce gas overpressure and favour effusive activity. On
the other hand, if magma remains impermeable long enough, bubble overpressure can develop,
resulting in magma fragmentation and explosive activity. Magma permeability evolution in a volcanic
conduit is complex and affected by several processes such as bubble coalescence (e.g. Lindoo et
al., 2017), brittle fracturing (Kushnir et al., 2017; Lamur et al., 2017), compaction (Heap et al., 2015;
Gonnermann et al., 2017), deformation (Okumura et al., 2013) or granular densification in tuffisite
veins (Kendrick et al., 2016). Permeability evolution in a volcanic conduit can even be hysteretic with
initial vesiculation followed by outgassing and compaction (e.g. Rust and Cashman., 2004, 2011).
The percolation threshold ΦC can be defined as the critical porosity above which the transition from
impermeable to permeable magma occurs and therefore exerts a primary control on the eruptive
style (see sections A.1 and A.2). ΦC is dependent on the porosity changing processes (vesiculation,
cracking or densification) and on several additional parameters such as the bubble size distribution,
the presence or absence of shear deformation, the occurrence or not of brittle fracturing, and crys-
tallinity, viscosity and surface tension of the magma. Here, we will focus on the role of crystals on
ΦC and on implications for outgassing and eruptive styles during volcanic eruptions.
The effect of crystals on ΦC has been discussed in several studies (Blower, 2001; Rust and
Cashman, 2004, 2011; Okumura et al., 2012; Oppenheimer et al., 2015; Pistone et al., 2015; Spina
et al., 2016; Parmigiani et al, 2016; Lindoo et al., 2016, 2017; Colombier et al., 2017a, b). Several
authors suggested a reduction of the ΦC and an increase of bubble connectivity, gas permeability
and outgassing efficiency in crystal bearing melts compared to crystal free melts (Nakamura et al.,
2008, Oppenheimer et al., 2015, Colombier et al 2017b; Lindoo et al., 2017). Crystals affect bubble
growth and coalescence in several ways. First, high crystallinity leads to a reduction of the distance
between two nucleating and growing bubbles, therefore enhancing coalescence and causing a shift
36
of ΦC to lower porosities and increase of permeability (Blower, 2001). Additionally, at high crystallin-
ities, the crystals induce (i) deformation of the bubbles leading to a reduction of ΦC and (ii) migration
of bubbles through fingering pathways or pseudo-fractures (Oppenheimer et al., 2015; Parmigiani et
al., 2016). Lindoo et al. (2017) performed decompression-induced vesiculation experiments and
were able to quantify the effect of crystals on the percolation threshold, permeability and outgassing
in low viscosity basaltic andesitic melts. In this study they confirm an inverse relationship between
ΦC and the melt crystallinity.
To further explore the influence of crystals on ΦC, we performed in situ vesiculation and den-
sification experiments on a range of crystal-bearing samples at a synchrotron X-ray computed to-
mography beamline (TOMCAT) and tracked the evolution of bubble connectivity and gas permea-
bility during the experiments. We show for the first time that outgassing and dome formation at an-
desitic, trachytic and dacitic volcanoes can be explained by systematically low percolation thresholds
during cycles of vesiculation and densification in high viscosity, crystals-rich magmas and during
sintering in tuffisite veins. At lower melt viscosities, the percolation threshold is also dependent on
crystallinity but occurs at higher values at a given crystallinity, consistent with previous studies (Lin-
doo et al., 2017). We finally propose a conceptual model linking the melt crystallinity, percolation
threshold and melt viscosity to the eruptive style of crystal-bearing magmas.
A.3.1. Methodology
Vesiculation and sintering experiments
We synthesized bubble- and crystal-bearing magma analogues by sintering Soda lime glass beads
(63-90 µm in diameter) with variable amounts of quartz crystals (63-90 µm in diameter; 0, 19, 29 and
39 vol %; Table1). We first packed the granular mixtures of glass beads and crystals into cylindrical
samples of 3 by 3mm dimensions and placed them into a 28mm stainless steel sample holder. We
then sintered these granular packs in an externally heated autoclave at high temperature (850°C)
and high pressure (50 bars via Argon gas). We produced 2 sets of samples with sintering durations
of 4 hours (Dry1) and 18 hours (DRY2), respectively. The synthesis led to the formation of several
additional crystal phases, consisting principally of needle shaped devitrite microlites. Devitrite is a
typical mineral formed by devitrification of Soda Lime glass beads during sintering (Prado et al.,
2003; Knowles and Thompson, 2014). As a result, all our magma analogues were crystal-bearing
with crystallinities ranging between 15 and 48 vol% (Fig. 9; Table 1). The synthesized crystals com-
monly display high aspect ratios, are highly interconnected and are distributed quite heterogene-
ously, so that even the samples with lowest bulk crystal content show local high crystallinities higher
than 40 vol% (Fig. 9b, d). We did not observe any notable modifications of the crystal networks
before and after the vesiculation experiments (Fig. 9a-f). After complete sintering, we obtained
magma analogues with low vesicularities (~4 vol%) and with an isolated bubble network (Fig. 9a, b).
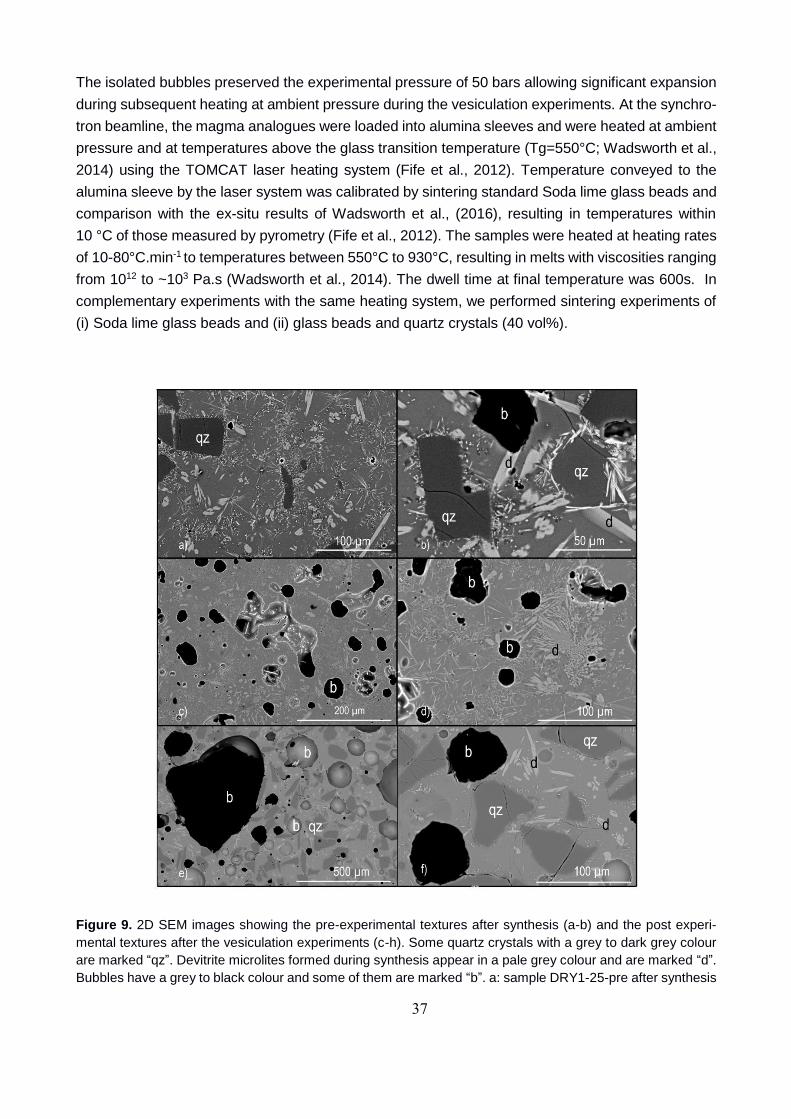
37
The isolated bubbles preserved the experimental pressure of 50 bars allowing significant expansion
during subsequent heating at ambient pressure during the vesiculation experiments. At the synchro-
tron beamline, the magma analogues were loaded into alumina sleeves and were heated at ambient
pressure and at temperatures above the glass transition temperature (Tg=550°C; Wadsworth et al.,
2014) using the TOMCAT laser heating system (Fife et al., 2012). Temperature conveyed to the
alumina sleeve by the laser system was calibrated by sintering standard Soda lime glass beads and
comparison with the ex-situ results of Wadsworth et al., (2016), resulting in temperatures within
10 °C of those measured by pyrometry (Fife et al., 2012). The samples were heated at heating rates
of 10-80°C.min-1 to temperatures between 550°C to 930°C, resulting in melts with viscosities ranging
from 1012 to ~103 Pa.s (Wadsworth et al., 2014). The dwell time at final temperature was 600s. In
complementary experiments with the same heating system, we performed sintering experiments of
(i) Soda lime glass beads and (ii) glass beads and quartz crystals (40 vol%).
Figure 9. 2D SEM images showing the pre-experimental textures after synthesis (a-b) and the post experi-
mental textures after the vesiculation experiments (c-h). Some quartz crystals with a grey to dark grey colour
are marked “qz”. Devitrite microlites formed during synthesis appear in a pale grey colour and are marked “d”.
Bubbles have a grey to black colour and some of them are marked “b”. a: sample DRY1-25-pre after synthesis
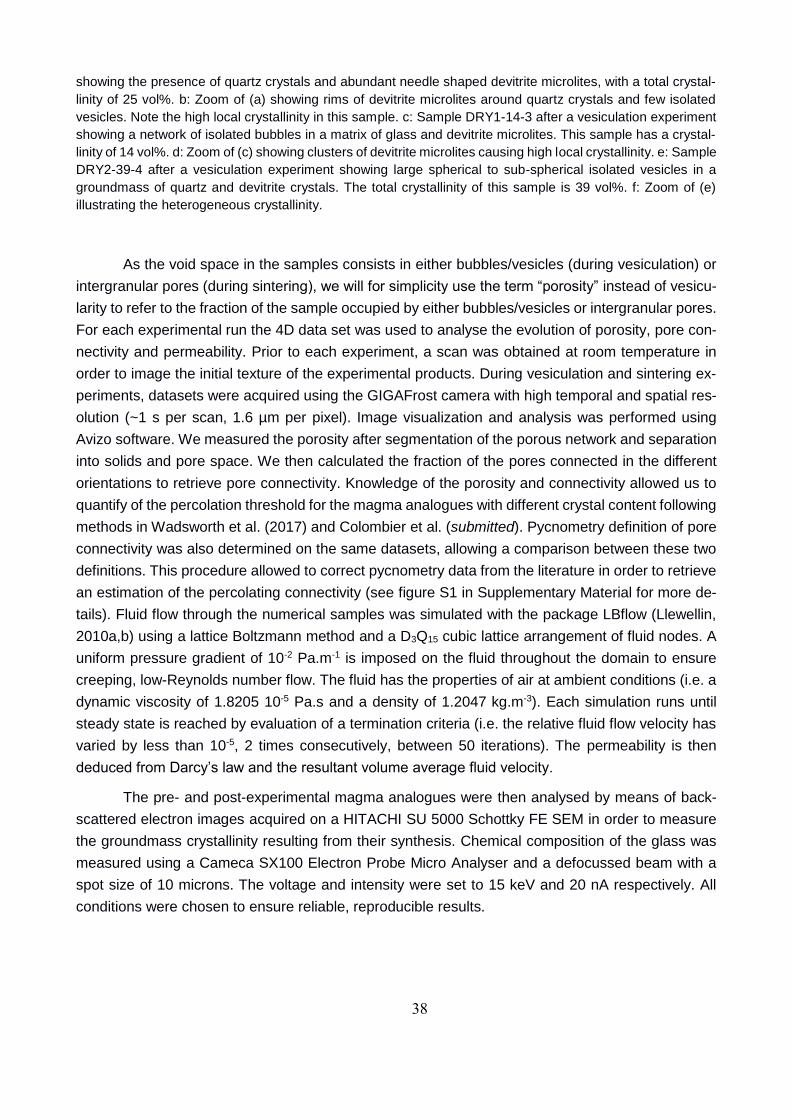
38
showing the presence of quartz crystals and abundant needle shaped devitrite microlites, with a total crystal-
linity of 25 vol%. b: Zoom of (a) showing rims of devitrite microlites around quartz crystals and few isolated
vesicles. Note the high local crystallinity in this sample. c: Sample DRY1-14-3 after a vesiculation experiment
showing a network of isolated bubbles in a matrix of glass and devitrite microlites. This sample has a crystal-
linity of 14 vol%. d: Zoom of (c) showing clusters of devitrite microlites causing high local crystallinity. e: Sample
DRY2-39-4 after a vesiculation experiment showing large spherical to sub-spherical isolated vesicles in a
groundmass of quartz and devitrite crystals. The total crystallinity of this sample is 39 vol%. f: Zoom of (e)
illustrating the heterogeneous crystallinity.
As the void space in the samples consists in either bubbles/vesicles (during vesiculation) or
intergranular pores (during sintering), we will for simplicity use the term “porosity” instead of vesicu-
larity to refer to the fraction of the sample occupied by either bubbles/vesicles or intergranular pores.
For each experimental run the 4D data set was used to analyse the evolution of porosity, pore con-
nectivity and permeability. Prior to each experiment, a scan was obtained at room temperature in
order to image the initial texture of the experimental products. During vesiculation and sintering ex-
periments, datasets were acquired using the GIGAFrost camera with high temporal and spatial res-
olution (~1 s per scan, 1.6 µm per pixel). Image visualization and analysis was performed using
Avizo software. We measured the porosity after segmentation of the porous network and separation
into solids and pore space. We then calculated the fraction of the pores connected in the different
orientations to retrieve pore connectivity. Knowledge of the porosity and connectivity allowed us to
quantify of the percolation threshold for the magma analogues with different crystal content following
methods in Wadsworth et al. (2017) and Colombier et al. (submitted). Pycnometry definition of pore
connectivity was also determined on the same datasets, allowing a comparison between these two
definitions. This procedure allowed to correct pycnometry data from the literature in order to retrieve
an estimation of the percolating connectivity (see figure S1 in Supplementary Material for more de-
tails). Fluid flow through the numerical samples was simulated with the package LBflow (Llewellin,
2010a,b) using a lattice Boltzmann method and a D3Q15 cubic lattice arrangement of fluid nodes. A
uniform pressure gradient of 10-2 Pa.m-1 is imposed on the fluid throughout the domain to ensure
creeping, low-Reynolds number flow. The fluid has the properties of air at ambient conditions (i.e. a
dynamic viscosity of 1.8205 10-5 Pa.s and a density of 1.2047 kg.m-3). Each simulation runs until
steady state is reached by evaluation of a termination criteria (i.e. the relative fluid flow velocity has
varied by less than 10-5, 2 times consecutively, between 50 iterations). The permeability is then
deduced from Darcy’s law and the resultant volume average fluid velocity.
The pre- and post-experimental magma analogues were then analysed by means of back-
scattered electron images acquired on a HITACHI SU 5000 Schottky FE SEM in order to measure
the groundmass crystallinity resulting from their synthesis. Chemical composition of the glass was
measured using a Cameca SX100 Electron Probe Micro Analyser and a defocussed beam with a
spot size of 10 microns. The voltage and intensity were set to 15 keV and 20 nA respectively. All
conditions were chosen to ensure reliable, reproducible results.
39
A.3.2. Results
During the vesiculation experiments, several textural stages could be identified (Fig. 10): (1) expan-
sion of the isolated and pressurized bubbles causing an increase of porosity and local coalescence
but without onset of bubble connectivity across the samples; (2) system-spanning coalescence and
percolation of connected chains of bubbles resembling the fingering pathways discussed in previous
studies (Oppenheimer et al., 2015; Parmigiani et al., 2016); once these fingering pathways connect
to the exterior of the sample, outgassing occurs leading to (3) subsequent densification and isolation
of the connected porous network; finally, (4) the isolated bubbles expand further leading to an in-
crease in porosity but no coalescence is observed during this stage and bubbles remain isolated.
This stage is accompanied by significant rounding of bubbles. The second stage of bubble percola-
tion will be hereafter referred to as the “fingering regime” whereas the fourth stage consisting of
bubble expansion with absence of percolation will be termed the “bubbly regime”. The bubbly regime
occurred at systematically higher temperatures and consequently lower melt viscosities (typically
η<106 Pa.s) than the fingering regime and subsequent densification and isolation (η~106-1012 Pa.s).
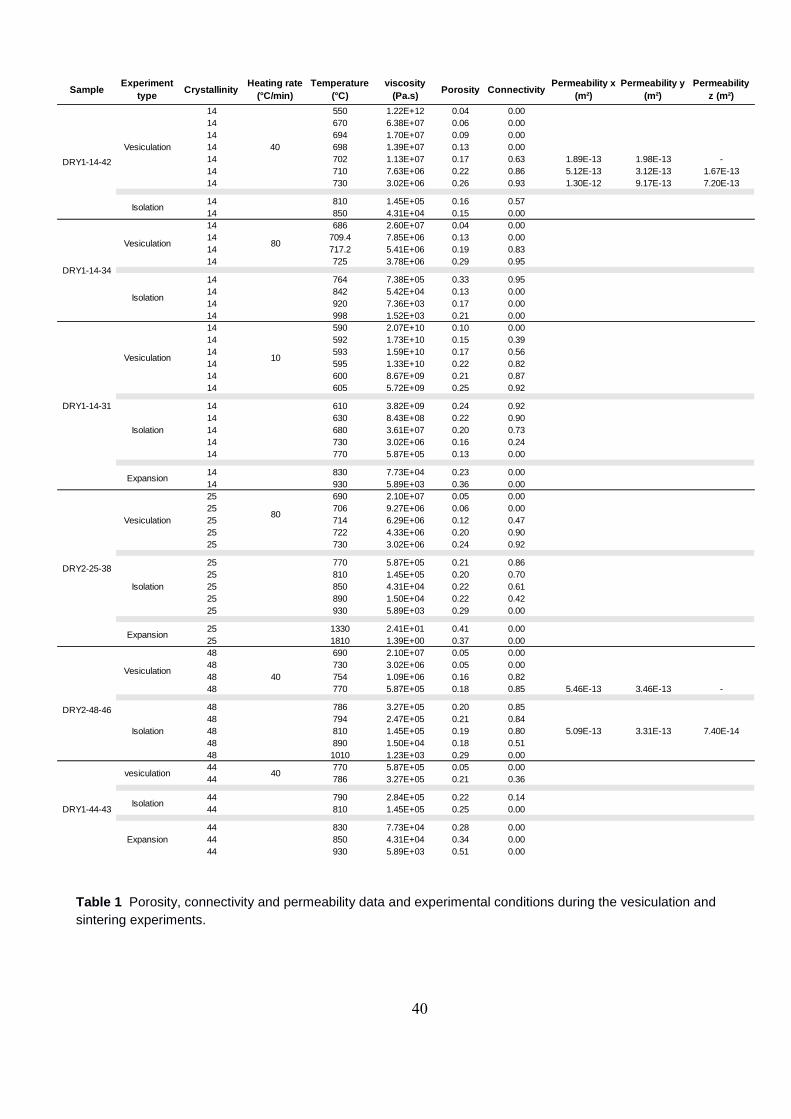
40
Table 1 Porosity, connectivity and permeability data and experimental conditions during the vesiculation and
sintering experiments.
SampleExperiment
typeCrystallinity
Heating rate
(°C/min)
Temperature
(°C)
viscosity
(Pa.s)Porosity Connectivity
Permeability x
(m²)
Permeability y
(m²)
Permeability
z (m²)
14 550 1.22E+12 0.04 0.00
14 670 6.38E+07 0.06 0.00
14 694 1.70E+07 0.09 0.00
14 698 1.39E+07 0.13 0.00
14 702 1.13E+07 0.17 0.63 1.89E-13 1.98E-13 -
14 710 7.63E+06 0.22 0.86 5.12E-13 3.12E-13 1.67E-13
14 730 3.02E+06 0.26 0.93 1.30E-12 9.17E-13 7.20E-13
14 810 1.45E+05 0.16 0.57
14 850 4.31E+04 0.15 0.00
14 686 2.60E+07 0.04 0.00
14 709.4 7.85E+06 0.13 0.00
14 717.2 5.41E+06 0.19 0.83
14 725 3.78E+06 0.29 0.95
14 764 7.38E+05 0.33 0.95
14 842 5.42E+04 0.13 0.00
14 920 7.36E+03 0.17 0.00
14 998 1.52E+03 0.21 0.00
14 590 2.07E+10 0.10 0.00
14 592 1.73E+10 0.15 0.39
14 593 1.59E+10 0.17 0.56
14 595 1.33E+10 0.22 0.82
14 600 8.67E+09 0.21 0.87
14 605 5.72E+09 0.25 0.92
14 610 3.82E+09 0.24 0.92
14 630 8.43E+08 0.22 0.90
14 680 3.61E+07 0.20 0.73
14 730 3.02E+06 0.16 0.24
14 770 5.87E+05 0.13 0.00
14 830 7.73E+04 0.23 0.00
14 930 5.89E+03 0.36 0.00
25 690 2.10E+07 0.05 0.00
25 706 9.27E+06 0.06 0.00
25 714 6.29E+06 0.12 0.47
25 722 4.33E+06 0.20 0.90
25 730 3.02E+06 0.24 0.92
25 770 5.87E+05 0.21 0.86
25 810 1.45E+05 0.20 0.70
25 850 4.31E+04 0.22 0.61
25 890 1.50E+04 0.22 0.42
25 930 5.89E+03 0.29 0.00
25 1330 2.41E+01 0.41 0.00
25 1810 1.39E+00 0.37 0.00
48 690 2.10E+07 0.05 0.00
48 730 3.02E+06 0.05 0.00
48 754 1.09E+06 0.16 0.82
48 770 5.87E+05 0.18 0.85 5.46E-13 3.46E-13 -
48 786 3.27E+05 0.20 0.85
48 794 2.47E+05 0.21 0.84
48 810 1.45E+05 0.19 0.80 5.09E-13 3.31E-13 7.40E-14
48 890 1.50E+04 0.18 0.51
48 1010 1.23E+03 0.29 0.00
44 770 5.87E+05 0.05 0.00
44 786 3.27E+05 0.21 0.36
44 790 2.84E+05 0.22 0.14
44 810 1.45E+05 0.25 0.00
44 830 7.73E+04 0.28 0.00
44 850 4.31E+04 0.34 0.00
44 930 5.89E+03 0.51 0.00
Vesiculation
DRY2-48-46
40
Isolation
DRY1-44-43
vesiculation 40
Isolation
Expansion
DRY1-14-31
Vesiculation 10
Isolation
Expansion
DRY2-25-38
Vesiculation80
Isolation
Expansion
DRY1-14-42
Vesiculation 40
Isolation
DRY1-14-34
Vesiculation 80
Isolation
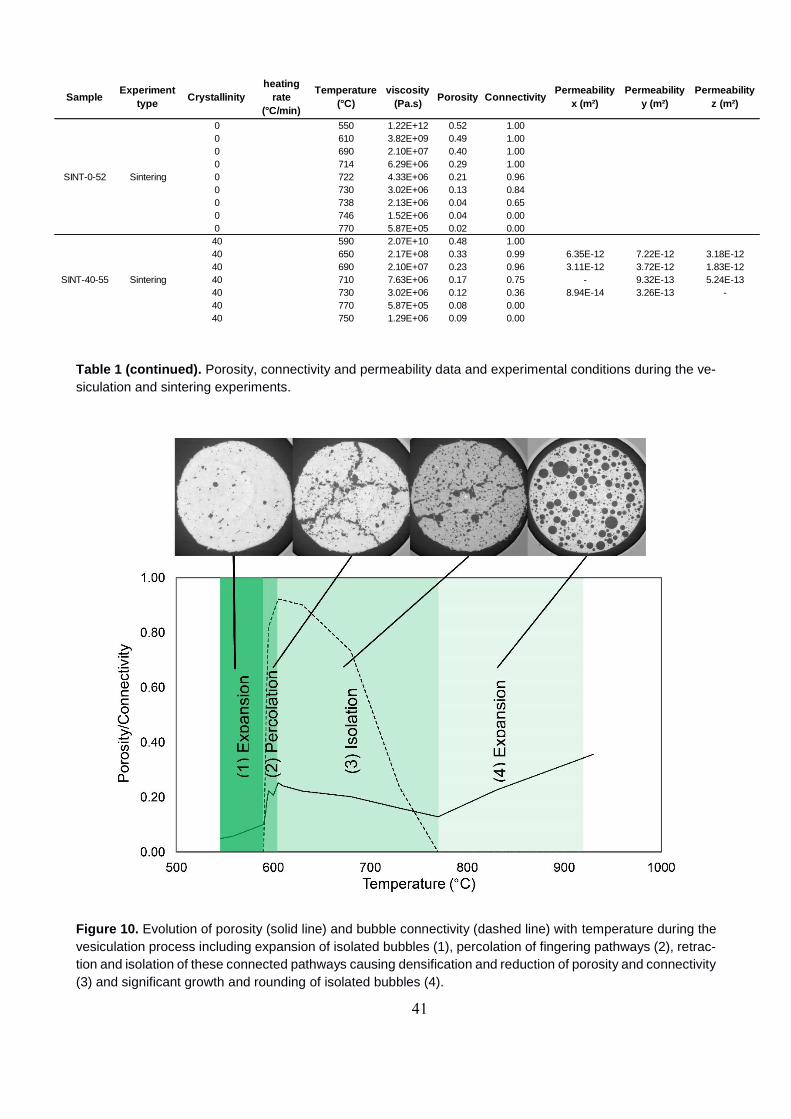
41
Table 1 (continued). Porosity, connectivity and permeability data and experimental conditions during the ve-
siculation and sintering experiments.
Figure 10. Evolution of porosity (solid line) and bubble connectivity (dashed line) with temperature during the
vesiculation process including expansion of isolated bubbles (1), percolation of fingering pathways (2), retrac-
tion and isolation of these connected pathways causing densification and reduction of porosity and connectivity
(3) and significant growth and rounding of isolated bubbles (4).
SampleExperiment
typeCrystallinity
heating
rate
(°C/min)
Temperature
(°C)
viscosity
(Pa.s)Porosity Connectivity
Permeability
x (m²)
Permeability
y (m²)
Permeability
z (m²)
0 550 1.22E+12 0.52 1.00
0 610 3.82E+09 0.49 1.00
0 690 2.10E+07 0.40 1.00
0 714 6.29E+06 0.29 1.00
0 722 4.33E+06 0.21 0.96
0 730 3.02E+06 0.13 0.84
0 738 2.13E+06 0.04 0.65
0 746 1.52E+06 0.04 0.00
0 770 5.87E+05 0.02 0.00
40 590 2.07E+10 0.48 1.00
40 650 2.17E+08 0.33 0.99 6.35E-12 7.22E-12 3.18E-12
40 690 2.10E+07 0.23 0.96 3.11E-12 3.72E-12 1.83E-12
40 710 7.63E+06 0.17 0.75 - 9.32E-13 5.24E-13
40 730 3.02E+06 0.12 0.36 8.94E-14 3.26E-13 -
40 770 5.87E+05 0.08 0.00
40 750 1.29E+06 0.09 0.00
Sintering
Sintering
SINT-0-52
SINT-40-55
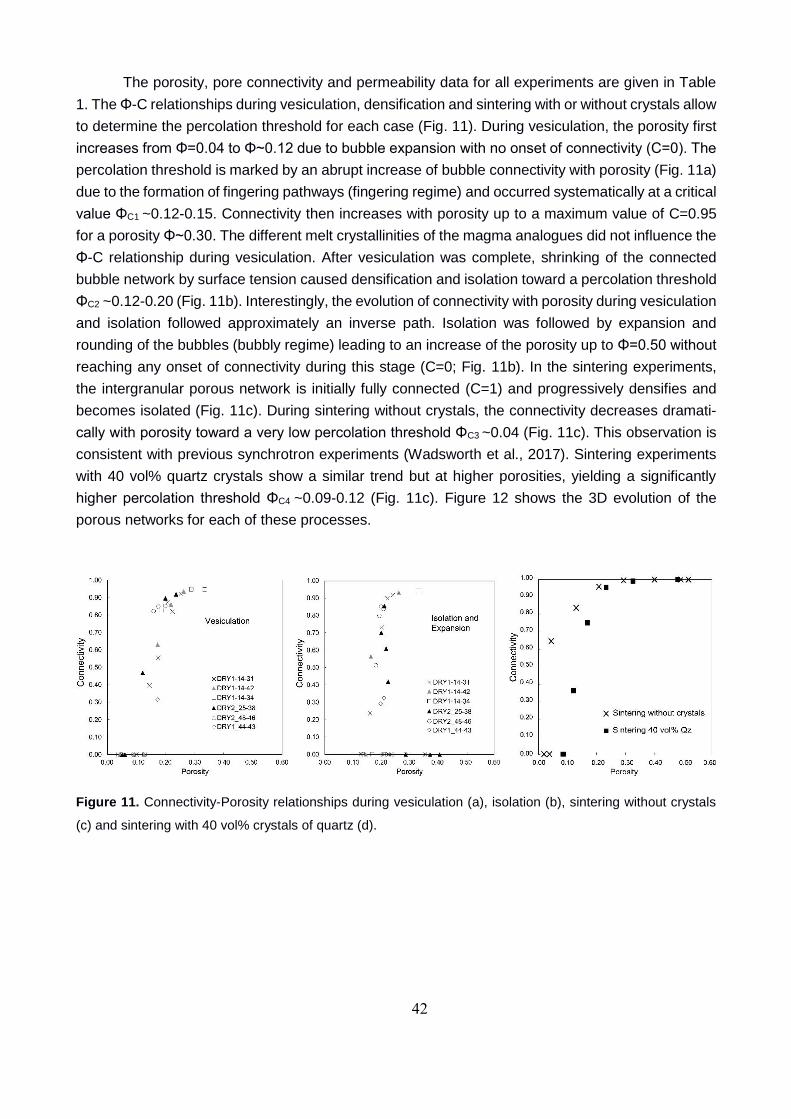
42
The porosity, pore connectivity and permeability data for all experiments are given in Table
1. The Φ-C relationships during vesiculation, densification and sintering with or without crystals allow
to determine the percolation threshold for each case (Fig. 11). During vesiculation, the porosity first
increases from Φ=0.04 to Φ~0.12 due to bubble expansion with no onset of connectivity (C=0). The
percolation threshold is marked by an abrupt increase of bubble connectivity with porosity (Fig. 11a)
due to the formation of fingering pathways (fingering regime) and occurred systematically at a critical
value ΦC1 ~0.12-0.15. Connectivity then increases with porosity up to a maximum value of C=0.95
for a porosity Φ~0.30. The different melt crystallinities of the magma analogues did not influence the
Φ-C relationship during vesiculation. After vesiculation was complete, shrinking of the connected
bubble network by surface tension caused densification and isolation toward a percolation threshold
ΦC2 ~0.12-0.20 (Fig. 11b). Interestingly, the evolution of connectivity with porosity during vesiculation
and isolation followed approximately an inverse path. Isolation was followed by expansion and
rounding of the bubbles (bubbly regime) leading to an increase of the porosity up to Φ=0.50 without
reaching any onset of connectivity during this stage (C=0; Fig. 11b). In the sintering experiments,
the intergranular porous network is initially fully connected (C=1) and progressively densifies and
becomes isolated (Fig. 11c). During sintering without crystals, the connectivity decreases dramati-
cally with porosity toward a very low percolation threshold ΦC3 ~0.04 (Fig. 11c). This observation is
consistent with previous synchrotron experiments (Wadsworth et al., 2017). Sintering experiments
with 40 vol% quartz crystals show a similar trend but at higher porosities, yielding a significantly
higher percolation threshold ΦC4 ~0.09-0.12 (Fig. 11c). Figure 12 shows the 3D evolution of the
porous networks for each of these processes.
Figure 11. Connectivity-Porosity relationships during vesiculation (a), isolation (b), sintering without crystals
(c) and sintering with 40 vol% crystals of quartz (d).
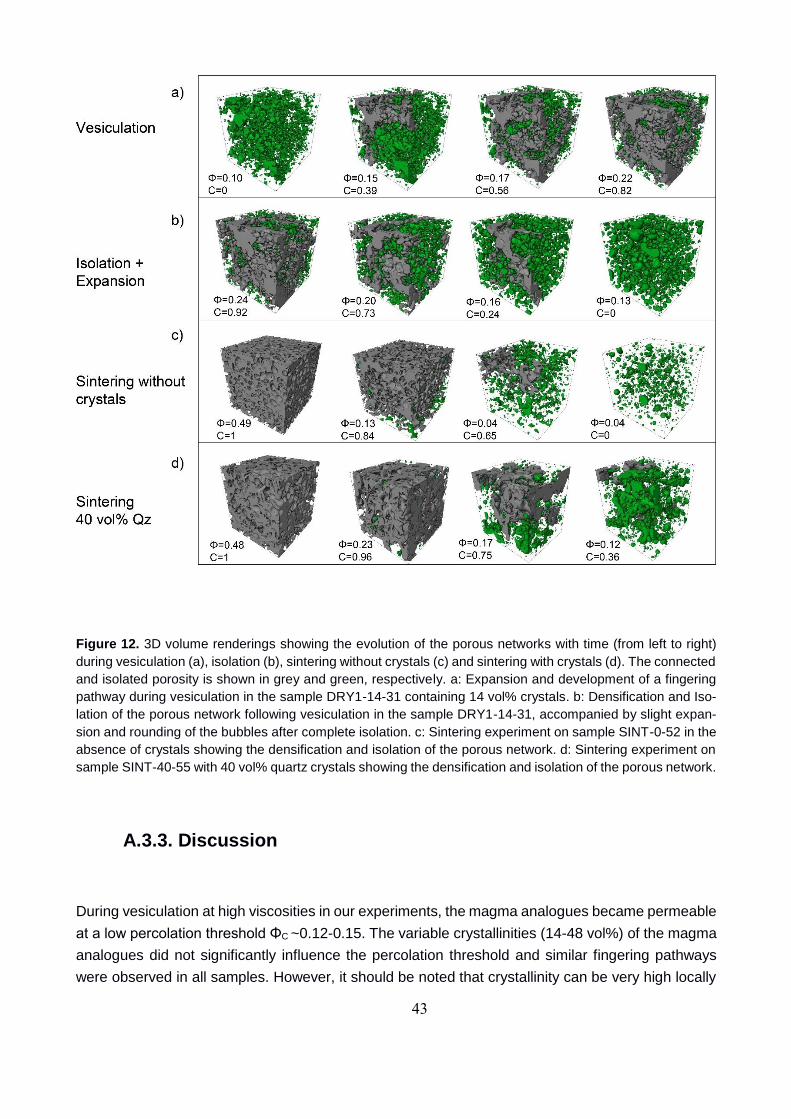
43
Figure 12. 3D volume renderings showing the evolution of the porous networks with time (from left to right)
during vesiculation (a), isolation (b), sintering without crystals (c) and sintering with crystals (d). The connected
and isolated porosity is shown in grey and green, respectively. a: Expansion and development of a fingering
pathway during vesiculation in the sample DRY1-14-31 containing 14 vol% crystals. b: Densification and Iso-
lation of the porous network following vesiculation in the sample DRY1-14-31, accompanied by slight expan-
sion and rounding of the bubbles after complete isolation. c: Sintering experiment on sample SINT-0-52 in the
absence of crystals showing the densification and isolation of the porous network. d: Sintering experiment on
sample SINT-40-55 with 40 vol% quartz crystals showing the densification and isolation of the porous network.
A.3.3. Discussion
During vesiculation at high viscosities in our experiments, the magma analogues became permeable
at a low percolation threshold ΦC ~0.12-0.15. The variable crystallinities (14-48 vol%) of the magma
analogues did not significantly influence the percolation threshold and similar fingering pathways
were observed in all samples. However, it should be noted that crystallinity can be very high locally
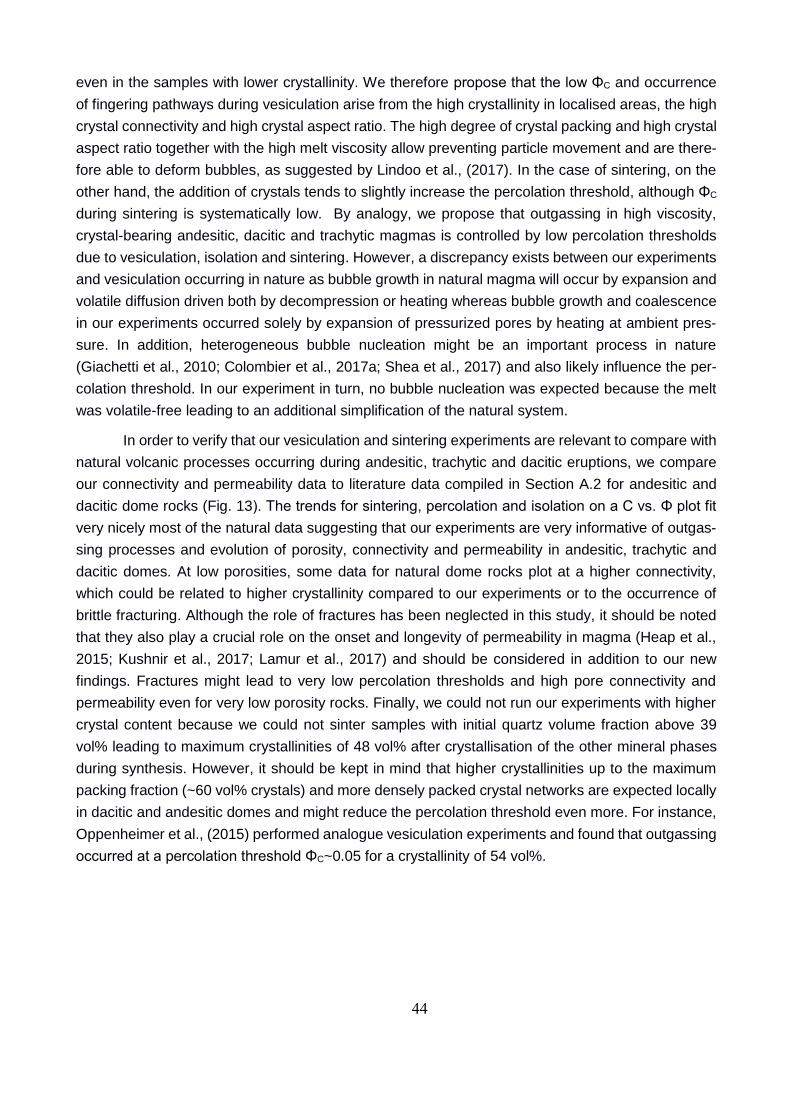
44
even in the samples with lower crystallinity. We therefore propose that the low ΦC and occurrence
of fingering pathways during vesiculation arise from the high crystallinity in localised areas, the high
crystal connectivity and high crystal aspect ratio. The high degree of crystal packing and high crystal
aspect ratio together with the high melt viscosity allow preventing particle movement and are there-
fore able to deform bubbles, as suggested by Lindoo et al., (2017). In the case of sintering, on the
other hand, the addition of crystals tends to slightly increase the percolation threshold, although ΦC
during sintering is systematically low. By analogy, we propose that outgassing in high viscosity,
crystal-bearing andesitic, dacitic and trachytic magmas is controlled by low percolation thresholds
due to vesiculation, isolation and sintering. However, a discrepancy exists between our experiments
and vesiculation occurring in nature as bubble growth in natural magma will occur by expansion and
volatile diffusion driven both by decompression or heating whereas bubble growth and coalescence
in our experiments occurred solely by expansion of pressurized pores by heating at ambient pres-
sure. In addition, heterogeneous bubble nucleation might be an important process in nature
(Giachetti et al., 2010; Colombier et al., 2017a; Shea et al., 2017) and also likely influence the per-
colation threshold. In our experiment in turn, no bubble nucleation was expected because the melt
was volatile-free leading to an additional simplification of the natural system.
In order to verify that our vesiculation and sintering experiments are relevant to compare with
natural volcanic processes occurring during andesitic, trachytic and dacitic eruptions, we compare
our connectivity and permeability data to literature data compiled in Section A.2 for andesitic and
dacitic dome rocks (Fig. 13). The trends for sintering, percolation and isolation on a C vs. Φ plot fit
very nicely most of the natural data suggesting that our experiments are very informative of outgas-
sing processes and evolution of porosity, connectivity and permeability in andesitic, trachytic and
dacitic domes. At low porosities, some data for natural dome rocks plot at a higher connectivity,
which could be related to higher crystallinity compared to our experiments or to the occurrence of
brittle fracturing. Although the role of fractures has been neglected in this study, it should be noted
that they also play a crucial role on the onset and longevity of permeability in magma (Heap et al.,
2015; Kushnir et al., 2017; Lamur et al., 2017) and should be considered in addition to our new
findings. Fractures might lead to very low percolation thresholds and high pore connectivity and
permeability even for very low porosity rocks. Finally, we could not run our experiments with higher
crystal content because we could not sinter samples with initial quartz volume fraction above 39
vol% leading to maximum crystallinities of 48 vol% after crystallisation of the other mineral phases
during synthesis. However, it should be kept in mind that higher crystallinities up to the maximum
packing fraction (~60 vol% crystals) and more densely packed crystal networks are expected locally
in dacitic and andesitic domes and might reduce the percolation threshold even more. For instance,
Oppenheimer et al., (2015) performed analogue vesiculation experiments and found that outgassing
occurred at a percolation threshold ΦC~0.05 for a crystallinity of 54 vol%.
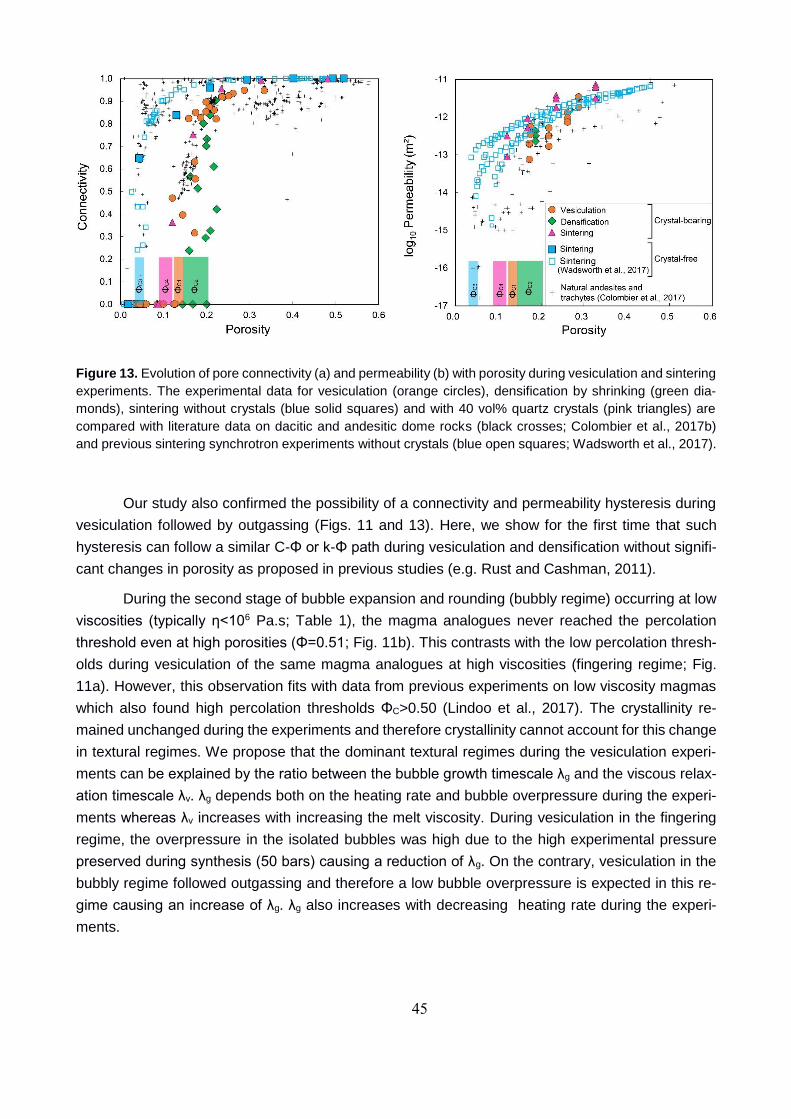
45
Figure 13. Evolution of pore connectivity (a) and permeability (b) with porosity during vesiculation and sintering
experiments. The experimental data for vesiculation (orange circles), densification by shrinking (green dia-
monds), sintering without crystals (blue solid squares) and with 40 vol% quartz crystals (pink triangles) are
compared with literature data on dacitic and andesitic dome rocks (black crosses; Colombier et al., 2017b)
and previous sintering synchrotron experiments without crystals (blue open squares; Wadsworth et al., 2017).
Our study also confirmed the possibility of a connectivity and permeability hysteresis during
vesiculation followed by outgassing (Figs. 11 and 13). Here, we show for the first time that such
hysteresis can follow a similar C-Φ or k-Φ path during vesiculation and densification without signifi-
cant changes in porosity as proposed in previous studies (e.g. Rust and Cashman, 2011).
During the second stage of bubble expansion and rounding (bubbly regime) occurring at low
viscosities (typically η<106 Pa.s; Table 1), the magma analogues never reached the percolation
threshold even at high porosities (Φ=0.51; Fig. 11b). This contrasts with the low percolation thresh-
olds during vesiculation of the same magma analogues at high viscosities (fingering regime; Fig.
11a). However, this observation fits with data from previous experiments on low viscosity magmas
which also found high percolation thresholds ΦC>0.50 (Lindoo et al., 2017). The crystallinity re-
mained unchanged during the experiments and therefore crystallinity cannot account for this change
in textural regimes. We propose that the dominant textural regimes during the vesiculation experi-
ments can be explained by the ratio between the bubble growth timescale λg and the viscous relax-
ation timescale λv. λg depends both on the heating rate and bubble overpressure during the experi-
ments whereas λv increases with increasing the melt viscosity. During vesiculation in the fingering
regime, the overpressure in the isolated bubbles was high due to the high experimental pressure
preserved during synthesis (50 bars) causing a reduction of λg. On the contrary, vesiculation in the
bubbly regime followed outgassing and therefore a low bubble overpressure is expected in this re-
gime causing an increase of λg. λg also increases with decreasing heating rate during the experi-
ments.
46
Figure 14. Effect of the viscosity and heating rate on the textural regimes during the vesiculation experiments.
The orange squares correspond to the critical viscosity at which the percolating, fingering pathways develop
and define the limits of the fingering textural regime. The blue circles in turn define the critical viscosity at which
the expansion in the bubbly regime occurs. Finally, the grey triangles correspond to the onset of isolation
during the experiments and mark the transition between the fingering and bubbly regimes. Note: during vesic-
ulation in the fingering regime, isolated bubbles were overpressurized exerting a pressure on the melt. This
pressure was released as soon as the fingering pathways connected to the exterior of the sample, causing
outgassing. Overpressure in the bubbly regime was consequently low.
The effects of these timescales are illustrated in figure 14 which represents the fields for the
distinct textural regimes as a function of the viscosity (and therefore λv), heating rate and bubble
overpressure (both controlling λg). At a given viscosity (constant λv), increasing the heating rate leads
to a decrease in λg, therefore the ratio λg/λv << 1 and the bubbles have less time for expansion and
their growth is inhibited by the high viscosity causing a shift from the bubbly to the fingering regime
and a decrease of ΦC (Fig. 14). Similarly, increasing the bubble overpressure reduces λg and leads
to λg/λv << 1, promoting a fingering regime. On the contrary, at a given heating rate and bubble
overpressure (constant λg), decreasing the viscosity (and consequently λv) leads to λg/λv >> 1 and
the expanding bubbles can more easily push the crystals away due to the lower bulk viscosity and
rigidity of the crystal network. This causes the transition from a fingering to a bubbly textural regime
and an increase of ΦC (Fig. 14).
Vesiculation and bubble growth in nature can occur by either decompression or heating (e.g.,
Lavallée et al., 2015), thus both decompression rate and heating rate control the timescale λg during
an eruption. During magma ascent, crystallisation occurs in response to magma cooling or degas-
sing (e.g., Clarke et al., 2007). Release of latent heat during crystallisation can in turn provide a
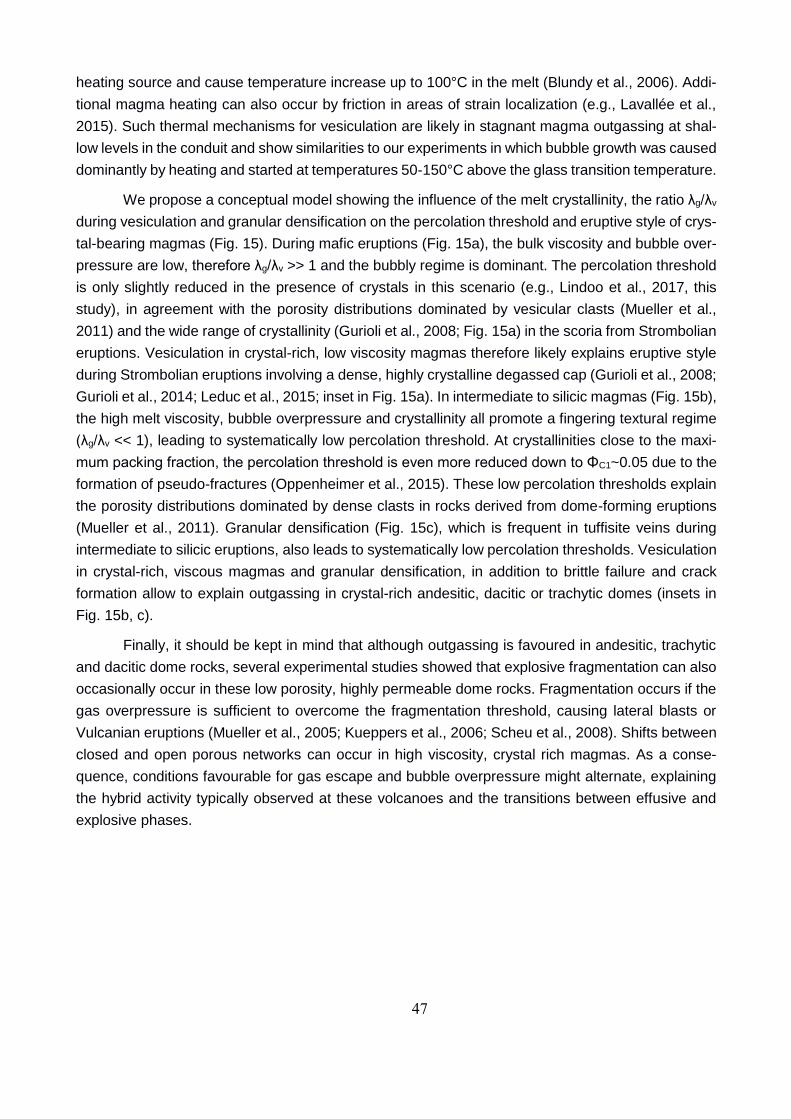
47
heating source and cause temperature increase up to 100°C in the melt (Blundy et al., 2006). Addi-
tional magma heating can also occur by friction in areas of strain localization (e.g., Lavallée et al.,
2015). Such thermal mechanisms for vesiculation are likely in stagnant magma outgassing at shal-
low levels in the conduit and show similarities to our experiments in which bubble growth was caused
dominantly by heating and started at temperatures 50-150°C above the glass transition temperature.
We propose a conceptual model showing the influence of the melt crystallinity, the ratio λg/λv
during vesiculation and granular densification on the percolation threshold and eruptive style of crys-
tal-bearing magmas (Fig. 15). During mafic eruptions (Fig. 15a), the bulk viscosity and bubble over-
pressure are low, therefore λg/λv >> 1 and the bubbly regime is dominant. The percolation threshold
is only slightly reduced in the presence of crystals in this scenario (e.g., Lindoo et al., 2017, this
study), in agreement with the porosity distributions dominated by vesicular clasts (Mueller et al.,
2011) and the wide range of crystallinity (Gurioli et al., 2008; Fig. 15a) in the scoria from Strombolian
eruptions. Vesiculation in crystal-rich, low viscosity magmas therefore likely explains eruptive style
during Strombolian eruptions involving a dense, highly crystalline degassed cap (Gurioli et al., 2008;
Gurioli et al., 2014; Leduc et al., 2015; inset in Fig. 15a). In intermediate to silicic magmas (Fig. 15b),
the high melt viscosity, bubble overpressure and crystallinity all promote a fingering textural regime
(λg/λv << 1), leading to systematically low percolation threshold. At crystallinities close to the maxi-
mum packing fraction, the percolation threshold is even more reduced down to ΦC1~0.05 due to the
formation of pseudo-fractures (Oppenheimer et al., 2015). These low percolation thresholds explain
the porosity distributions dominated by dense clasts in rocks derived from dome-forming eruptions
(Mueller et al., 2011). Granular densification (Fig. 15c), which is frequent in tuffisite veins during
intermediate to silicic eruptions, also leads to systematically low percolation thresholds. Vesiculation
in crystal-rich, viscous magmas and granular densification, in addition to brittle failure and crack
formation allow to explain outgassing in crystal-rich andesitic, dacitic or trachytic domes (insets in
Fig. 15b, c).
Finally, it should be kept in mind that although outgassing is favoured in andesitic, trachytic
and dacitic dome rocks, several experimental studies showed that explosive fragmentation can also
occasionally occur in these low porosity, highly permeable dome rocks. Fragmentation occurs if the
gas overpressure is sufficient to overcome the fragmentation threshold, causing lateral blasts or
Vulcanian eruptions (Mueller et al., 2005; Kueppers et al., 2006; Scheu et al., 2008). Shifts between
closed and open porous networks can occur in high viscosity, crystal rich magmas. As a conse-
quence, conditions favourable for gas escape and bubble overpressure might alternate, explaining
the hybrid activity typically observed at these volcanoes and the transitions between effusive and
explosive phases.
48
Figure 15. Conceptual model illustrating the dominant textural and outgassing regimes in crystal-rich magmas.
a) Influence of crystallinity on ΦC during vesiculation in low viscosity magmas and related porosity distribution
during Strombolian eruptions (Mueller et al., 2011). The dashed line shows the assumed location of the per-
colation threshold. Inset: Sketch illustrating outgassing in a low viscosity, crystal-rich magma during a Strom-
bolian eruption involving an outgassed cap. b) Influence of crystallinity on the ΦC in intermediate to silicic
magmas and related typical porosity distribution during dome-forming eruptions. The lines correspond to the
percolation threshold during vesiculation in this study (dashed line) and in a previous study (Oppenheimer et
al., 2015; solid line). T Inset: Sketch illustrating outgassing through fingering pathways during andesitic, tra-
chytic and dacitic eruptions. c) Influence of crystallinity on ΦC during granular densification. Inset: Sketch illus-
trating outgassing in tuffisite veins, typically in intermediate to silicic magmas. The dashed line separating the
impermeable and permeable samples represents the percolation threshold.
49
A.3.4. Conclusion
We showed that outgassing in viscous, crystal-rich andesitic, dacitic and trachytic magmas can be
explained by systematically low percolation thresholds during vesiculation through fingering path-
ways, densification due to gas escape causing isolation of the porous network and sintering of gran-
ular material in tuffisite veins. The percolation threshold in magma during vesiculation is primarily
controlled by the decompression rate, heating rate, magma viscosity and crystallinity. Low percola-
tion threshold in crystal rich magmas favour an effusive activity by allowing gas escape at low po-
rosities. However, explosive activity is not completely ruled out in these crystal rich magmas, for
instance during episodes of pore closing by shrinking due to surface tension following vesiculation
or by sintering, which both can promote bubble overpressure. Future textural studies linking the
crystal content, porosity, permeability and pore connectivity and the volatile content in crystal rich
dome rocks might provide additional information on the complex outgassing processes during these
eruptions.
50
B. The eruptive processes during
Surtseyan eruptions
51
B.1. State of the art on subaqueous volcanism
Subaqueous eruptions can be defined as volcanic eruptions occurring below a water column (sea,
ocean, lakes) often causing interaction between lava, magma droplets, hot pyroclasts and volcanic
gas with the surrounding water or wet sediments. These eruptions are termed submarine when they
occur and remain below the sea surface. Submarine eruptions occur at divergent plate boundaries
and in intraplate areas, commonly building seamounts (e.g. Head and Wilson, 2003). Subglacial
eruptions in which the eruption occurs underneath an ice body are very similar to subaqueous erup-
tions. Although most of the active volcanism on earth occurs in subaqueous settings, these erup-
tions remain poorly constrained compared to their subaerial counterparts. Direct video observations
of intermediate to deep (500 to 1200 mbsl) subaqueous eruptions are rare and limited to only weakly
explosive eruptions (Chadwick et al, 2008; Deardoff et al., 2011; Resing et al., 2011). Furthermore,
sampling of intermediate to deep deposits of subaqueous eruptions is still challenging. On the other
hand, shallow to emergent Surtseyan eruptions allow both sampling and direct observations and
provide a unique opportunity to increase our understanding of eruptive processes during subaque-
ous eruptions.
Such as for subaerial volcanism, subaqueous eruptions can be either explosive or effusive
or show effusive-explosive transitions or hybrid activity (e.g., Graettinger et al., 2013; Resing et al.,
2011). Most of the dominant eruptive styles observed at subaerial volcanoes (Plinian, Sub-plinian,
Vulcanian, Strombolian and Hawaiian) were also discussed for subaqueous eruptions (Head and
Wilson., 2003; Chadwick et al., 2008; Fiske et al., 1998; Barker et al., 2012) whereas new terminol-
ogy such as “Surtseyan” (e.g. Kokelaar, 1986) or “littoral explosions” (e.g. Mattox and Mangan, 2000)
has also been adopted to take into account the peculiarities of some subaqueous eruptions.
Several factors, which are strongly interdependent, control the eruptive style of subaqueous
eruptions such as magma composition and volatile content, eruptive flux, water depth as well as
nature and intensity of water-magma interactions. As for subaerial eruptions, fragmentation in sub-
aqueous setting can be driven by (i) magmatic gases or (ii) magma-water interaction. At important
water depths (typically >1km), hydrostatic pressure was previously expected to suppress volatile
exsolution and therefore limit explosive activity and pyroclastic deposits beyond a certain critical
depth (termed the volatile fragmentation depth in Head and Wilson, 2003) which depends primarily
on magma composition and volatile content (e.g. Batiza and White, 2000). Head and Wilson (2003)
in turn propose a range of alternative mechanisms to allow foam formation and magmatic explosivity
even for very deep settings. The question of deep explosive eruptions is still currently debated
(e.g.,Schipper et al., 2013).
In this thesis, I will focus on shallow to emergent subaqueous eruptions often called
Surtseyan eruptions for which the possible explosivity driven by the exsolution of volatiles is not
debated because of the negligible effect of hydrostatic pressure at the shallow depths considered.
These eruptions are probably amongst the most dangerous subaqueous eruptions because of their
52
shallow nature and the vicinity of potential Surtseyan volcanoes to highly populated areas (e.g.,
Agustin-Flores et al., 2015). Furthermore, these eruptions allow a unique opportunity for visual ob-
servations and sampling, allowing increasing our understanding of water-magma interactions
through examination of erupted tephra.
I hereafter focus on the eruptive processes during Surtseyan eruptions, and particularly those
occurring after primary fragmentation during ejection and interaction of lava/pyroclasts with the water
column. Most of the results are applicable to non-emergent, subaqueous volcanism to some extent.
First, a review of the main characteristics of Surtseyan eruptions is presented. I then briefly review
the influences of water-magma interactions on the eruptive processes such as fragmentation, cool-
ing, vesiculation and aggregation during subaqueous eruptions in general, and more in detail for
Surtseyan eruptions.
B.1.1. Surtseyan eruptions
Surtseyan eruptions are shallow to emergent subaqueous volcanic eruptions leading to the
growth and formation of monogenetic tuff cones (Kano, 1998; Cole et al., 2001; Gjerlow et al., 2015;
Kereszturi and Nemeth, 2013). The term Surtseyan was attributed to this type of volcanism after the
1963-1967 eruption of Surtsey (Thorarinsson, 1967) and was subsequently attributed to other similar
eruptions such as for example Capelinhos (1957-1958) and Hunga Tonga- Hunga Ha’apai (2009,
2014-2015).
Their difference to the subaerial counterparts arises from the physical properties of water
as cooling medium, namely density, viscosity, heat capacity and thermal conductivity. Accordingly,
eruptive processes such as fragmentation mechanism, magma cooling and vesiculation, aggre-
gation, recycling and dispersal are strongly affected. Surtseyan eruptions can generate high vol-
canic plumes posing hazards related to ash fall, surges, tsunamis or lahars (e.g., Németh et al.,
2006) and causing perturbation of the air traffic (e.g., Vaughan and Webley, 2010). It is therefore of
significant importance to understand the eruptive processes that control the amount and dispersal
of ash in Surtseyan plumes.
The key features of this eruptive style, that are to a first order dependent on the type and
intensity of water-magma interaction are: an alternation of fallout and surge deposits that lead to the
formation of tuff cones (e.g., Cole et al., 2001), partly incandescent eruptive columns at night (Cole
et al., 2001), the commonly well sorted and fine grained nature of the tephra layers (Walker and
Croasdale, 1971), a possible temporal or spatial shift in the activity between wet phases (steam rich
tephra finger jets, continuous uprush) and dry magmatic phases due to (i) progressive emergence
and exclusion of water from the top of the vent or (ii) migration of the activity through the eruption
fissure (Fig. 16.; Thorarinsson, 1964, 1967; Kokelaar, 1986; Cole et al., 2001; Mattsson and
Hoskuldsson 2011; Gjerlow et al., 2015), significant alteration (e.g., palagonitization) of the tephra
after deposition (e.g., Jakobsson, 1972), important recycling due to the interaction and mingling be-
tween magma and slurry in a flooded vent (Kokelaar, 1983; Schipper and White, 2016; Graettinger
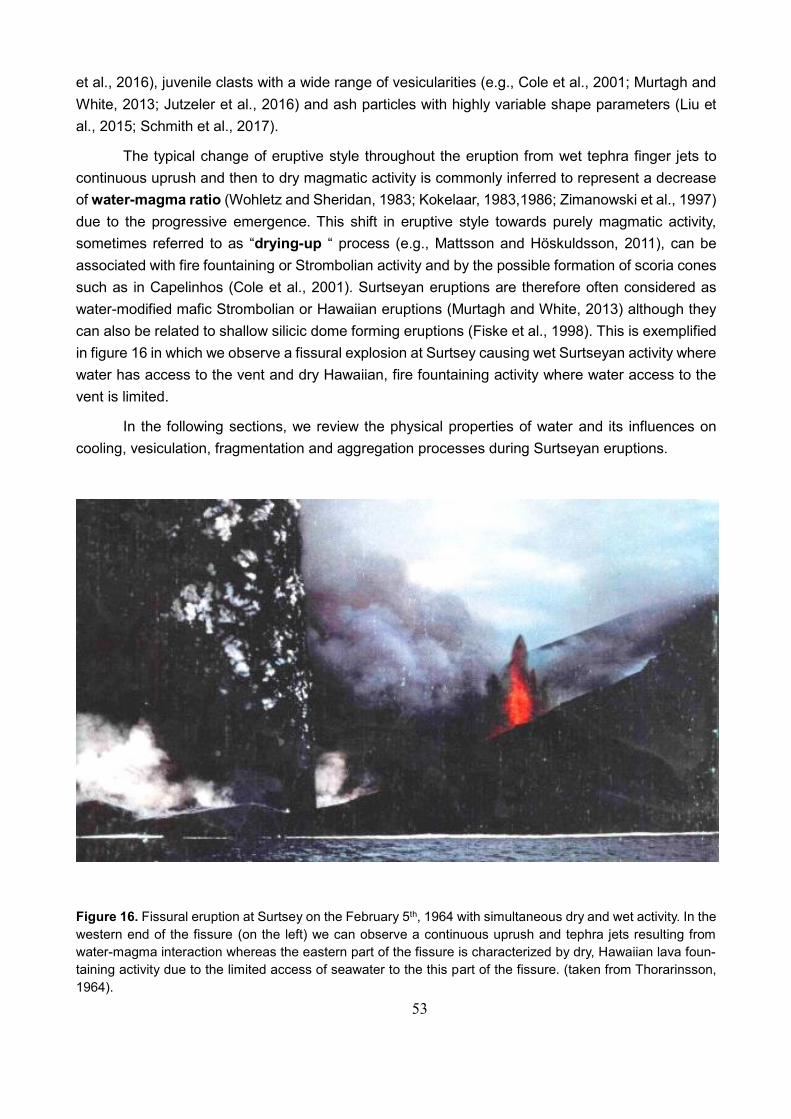
53
et al., 2016), juvenile clasts with a wide range of vesicularities (e.g., Cole et al., 2001; Murtagh and
White, 2013; Jutzeler et al., 2016) and ash particles with highly variable shape parameters (Liu et
al., 2015; Schmith et al., 2017).
The typical change of eruptive style throughout the eruption from wet tephra finger jets to
continuous uprush and then to dry magmatic activity is commonly inferred to represent a decrease
of water-magma ratio (Wohletz and Sheridan, 1983; Kokelaar, 1983,1986; Zimanowski et al., 1997)
due to the progressive emergence. This shift in eruptive style towards purely magmatic activity,
sometimes referred to as “drying-up “ process (e.g., Mattsson and Höskuldsson, 2011), can be
associated with fire fountaining or Strombolian activity and by the possible formation of scoria cones
such as in Capelinhos (Cole et al., 2001). Surtseyan eruptions are therefore often considered as
water-modified mafic Strombolian or Hawaiian eruptions (Murtagh and White, 2013) although they
can also be related to shallow silicic dome forming eruptions (Fiske et al., 1998). This is exemplified
in figure 16 in which we observe a fissural explosion at Surtsey causing wet Surtseyan activity where
water has access to the vent and dry Hawaiian, fire fountaining activity where water access to the
vent is limited.
In the following sections, we review the physical properties of water and its influences on
cooling, vesiculation, fragmentation and aggregation processes during Surtseyan eruptions.
Figure 16. Fissural eruption at Surtsey on the February 5th, 1964 with simultaneous dry and wet activity. In the
western end of the fissure (on the left) we can observe a continuous uprush and tephra jets resulting from
water-magma interaction whereas the eastern part of the fissure is characterized by dry, Hawaiian lava foun-
taining activity due to the limited access of seawater to the this part of the fissure. (taken from Thorarinsson,
1964).
54
B.1.2. Physical properties of water
The interaction between lava, magma droplets or hot pyroclasts and water strongly modifies the
eruptive style of subaqueous eruptions compared to their subaerial counterparts. This is due to the
different physical properties of water compared to air. The ´greater density and viscosity of water
influence the buoyancy of particles and therefore the tephra dispersal and sedimentation. The
greater heat capacity and thermal conductivity of water influence the particle cooling and conse-
quently also cause modifications of the vesiculation and fragmentation processes. Other processes
such as waterlogging (absorption of water in the porous pyroclasts) can further affect the eruptive
style (e.g. Rotella et al., 2014).
Besides these different physical properties of liquid water compared to air and magmatic
gases, another crucial parameter influencing water-magma interactions is the phase transition of
water to steam at high temperatures (Wohletz et al., 2013). The rate of heat transfer, which directly
controls magma cooling, and secondarily affects vesiculation and fragmentation processes occurring
in subaqueous volcanic jets, is strongly dependent on the physical state of water. Rates of heat
transfer are indeed estimated to be 2 orders of magnitude lower in the presence of a steam layer
insulating the magma compared to direct contact with liquid water (e.g., Wohletz et al., 2013 ; Schip-
per et al., 2013). The parameters controlling the physical state of the water in a subaqueous jet are
to a first order dependent on the ambient water temperature, the melt surface temperature and the
hydrostatic pressure. Steam formation is complex and can be divided in three main regimes which
depend on the temperature difference between the melt surface and the boiling temperature of water
ΔT (Fig. 17; Woodcock et al., 2012): (i) “nucleate boiling” regime with nucleation of bubbles at low
ΔT, (ii) “transition boiling” regime at higher ΔT and (iii) stable film boiling regime at even higher ΔT.
Interestingly, the heat flux from melt surface to water increases with ΔT in the nucleate boiling and
stable film boiling regimes but decreases with ΔT in the transition boiling.
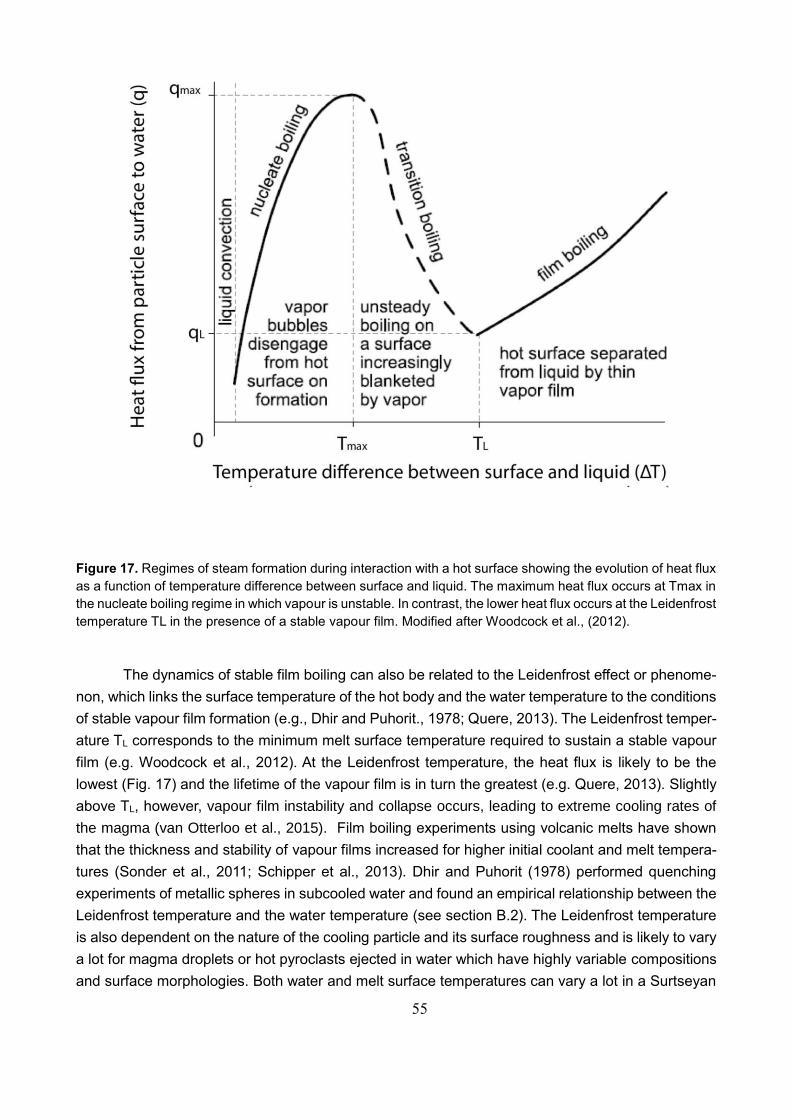
55
Figure 17. Regimes of steam formation during interaction with a hot surface showing the evolution of heat flux
as a function of temperature difference between surface and liquid. The maximum heat flux occurs at Tmax in
the nucleate boiling regime in which vapour is unstable. In contrast, the lower heat flux occurs at the Leidenfrost
temperature TL in the presence of a stable vapour film. Modified after Woodcock et al., (2012).
The dynamics of stable film boiling can also be related to the Leidenfrost effect or phenome-
non, which links the surface temperature of the hot body and the water temperature to the conditions
of stable vapour film formation (e.g., Dhir and Puhorit., 1978; Quere, 2013). The Leidenfrost temper-
ature TL corresponds to the minimum melt surface temperature required to sustain a stable vapour
film (e.g. Woodcock et al., 2012). At the Leidenfrost temperature, the heat flux is likely to be the
lowest (Fig. 17) and the lifetime of the vapour film is in turn the greatest (e.g. Quere, 2013). Slightly
above TL, however, vapour film instability and collapse occurs, leading to extreme cooling rates of
the magma (van Otterloo et al., 2015). Film boiling experiments using volcanic melts have shown
that the thickness and stability of vapour films increased for higher initial coolant and melt tempera-
tures (Sonder et al., 2011; Schipper et al., 2013). Dhir and Puhorit (1978) performed quenching
experiments of metallic spheres in subcooled water and found an empirical relationship between the
Leidenfrost temperature and the water temperature (see section B.2). The Leidenfrost temperature
is also dependent on the nature of the cooling particle and its surface roughness and is likely to vary
a lot for magma droplets or hot pyroclasts ejected in water which have highly variable compositions
and surface morphologies. Both water and melt surface temperatures can vary a lot in a Surtseyan
56
plume therefore causing variations of the dynamics of film boiling. Furthermore, the effect of hydro-
static pressure has been poorly addressed in the literature and might have an important role. Steam
formation is known impossible for water depths exceeding the critical point of seawater (~3 km depth;
e.g., Clague et al., 2009). However, we can neglect the effect of hydrostatic pressure for the emer-
gent phases of Surtseyan eruptions that occur at water depths of few tens of meters only (e.g.
Agustin-Flores et al., 2015).
The effect of water salinity on the physical properties of water has not been addressed alt-
hough most of Surtseyan eruptions occur in seawater settings. The dissolved salts in the water might
have a role on the magma-water interaction. Salts for instance reduce the heat capacity of seawater
by several percents (e.g., Wohletz et al., 2013). However, a detailed consideration of the effect of
salinity on water-magma interaction is beyond the scope of this study.
B.1.3. Cooling processes during water-magma interactions
As discussed in the previous section, the rates of heat transfer at the particle-water interface in a
subaqueous eruption are highly variable and depend principally on the physical state of water. At
the magma surface, magma-water heat transfer in the case of cooling in the stable film boiling regime
(Leidenfrost effect) occurs by radiation and convection (Wilding et al., 1996b; Woodcock et al., 2012;
Van Otterloo et al., 2015). On the other hand, surface cooling by direct contact occurs mostly by
conduction (e.g., Mastin, 2007). Therefore studies considering magma surface cooling and heat
transfer during subaqueous eruptions should treat both the slow cooling endmember (Leidenfrost
case with low rate of heat transfer via radiation and convection through a stable vapour film) and the
fast endmember (direct contact case with heat transfer by conduction) as plausible scenarios.
On the other hand, cooling in the interior of the magmatic droplets occurs systematically by
conductive heat transfer from the rapidly quenched and solidified surface (e.g., Xu and Zhang, 2002).
As the magma thermal conductivity is very low compared to that of water (e.g., Wohletz et al., 2013),
cooling in the cores of large particles is expected to be slow allowing post-fragmentation vesiculation
in these particles (see section B.1.5). Counter-intuitively, however, this vesiculation process can in-
duce quenching of the melt, therefore increasing again the cooling rate and adding some complexi-
ties to the process of cooling (e.g. Wilding et al., 1996a).
Cooling rates of volcanic particles quenched in water are much higher than in air (e.g., Xu
and Zhang, 2002). Cooling rates can be quantified using geospeedometry which consists of per-
forming a series of heating/cooling treatments at matching rates on volcanic glass through the glass
transition in order to retrieve the initial, natural cooling rate stored in the glass after quenching in
water (Wilding et al., 1995, 2000 ; Potuzak et al., 2008 ; Nichols et al., 2009 ; Kueppers et al., 2012 ;
Helo et al., 2013). To date, measurements in subaqueous settings have been carried on Limu o Pelé
(Potuzak et al., 2008), hyaloclastites (Nichols et al., 2009) and shells of lava balloons (Kueppers et
al., 2012). The main results from these studies is that the range of cooling rates during subaqueous
57
volcanic eruptions spans several orders of magnitude (10-1-105.6 K.s-1). The highest cooling rates
have been found by Potuzak et al (2008) who measured a cooling rate of 105.6 K.s-1 on Limu o Pelé
from Loihi seamount, Hawaii. Most of these measurements were applied on products from relatively
deep subaqueous volcanism and no data of cooling rates have been previously collected on particles
from Surtseyan eruptions. It should be emphasized that this approach is a simplification of the natural
cooling process since it provides only values of cooling rates across the glass transition region
whereas magma in nature cools from high initial temperature through the glass transition tempera-
ture Tg to final temperatures (e.g., Wilding et al., 1996a). Interpreting geospeedometry data is difficult
because several parameters are susceptible to influence the cooling rates of particles during
quenching in water such as the particle size, the distance to the interface with the coolant (radial
position in the particle), the physical state of water, the melt surface initial temperature and thermal
properties (e.g., Wilding et al., 1996a).
Additional insights on magma cooling can be obtained from numerical models (e.g. Wood-
cock et al., 2012) and cooling rates can also be qualitatively assessed using textural observations
such as variations in microlite content and vesicularity (e.g. Jutzeler et al., 2016). In this thesis, we
use both numerical modelling and textural approach to shed light on the cooling process during
Surtseyan eruptions.
B.1.4. Fragmentation mechanisms during subaqueous eruptions
Magma disruption is a major phenomenon during explosive volcanic eruptions because it controls
the amount, size and morphology of tephra released to the atmosphere and subsequent hazards
related to transport and deposition. Of particular importance is the production of fine ash, which
poses a considerable hazard for populations and causes disturbances of global air traffic.
Grain-size distribution of Surtseyan deposits contrast dramatically with those from dry mafic
eruptions and are characterized by a dominance of fine ash particles (Walker and Croasdale, 1971 ;
Gjerlow et al., 2015 ; Liu et al., 2017). This higher amount of fine ash has often been attributed to a
higher explosive energy related to intense magma-water explosions (e.g. Austin-Ericksson et al.,
2008) or to an extensive disintegration of pyroclasts caused by thermal stress (Liu et al., 2017).
However, other studies propose that the sole presence of fine ash is not systematically diagnostic of
the nature of the break-up process (e.g. White and Valentine, 2016). The typical disruption processes
discussed for Surtseyan eruptions and subaqueous eruptions in general are magmatic fragmenta-
tion, molten-fuel coolant interactions, granulation by thermal stress and turbulent shedding (Koke-
laar, 1986; Mastin, 2007; Mastin et al., 2009). Fragmentation intensity and mechanisms during water-
magma interaction depend on the melt-water interface area (premixing), the water to melt ratio, the
temperature of melt and water and the rate of heat transfer (Zimanowski et al., 1997; Sonder et al.,
2011; Wohletz et al., 2013; Gonnermann, 2015). In the following, we review these mechanisms and
consider additional possible disruption processes.
58
Magmatic explosivity primarily driven by volatile exsolution is the major fragmentation mech-
anism during subaerial magmatic volcanism (see Chapter A). It is likely to occur in subaqueous set-
tings as well, especially in shallow water depths characterizing Surtseyan eruptions. Even for deep
subaqueous eruptions, in which this mechanism has been largely debated because of the effect of
high hydrostatic pressure on the volatile exsolution (e.g., Cas, 1992), Head and Wilson (2003) pro-
posed a range of volcanic conduit scenarios to allow foam buildup and magmatic fragmentation.
Video observations of subaqueous eruptions at NW Rota-1 and West Mata volcanoes (Deardorff et
al., 2011; Resing et al., 2011) confirmed the initial magmatic origin of the magma ejection at inter-
mediate water depths.
Molten fuel coolant interactions (MFCI) (also termed contact surface explosivity by Kokelaar,
1986) have also been discussed as primary mechanism causing explosive activity during Surtseyan
eruptions. The essence of MFCI is that it requires extreme rates of heat transfer from magma to
water (White, 1996). This type of fragmentation is generally inferred to be the source of phreatomag-
matic eruptions (White, 1996). It can be divided in several stages that repeat as a positive feedback:
(1) the mixing of magma and water and formation of a vapour film at the contact, (2) vapour film
expansion, condensation, and collapse or oscillations, leading to instabilities that fragment melt at
the interface, (3) increased heat transfer as new surface area is created and further enhanced mixing
and fragmentation (Wohletz, 1986; White, 1996 ; Zimanowski 1997 ; Gonnerman, 2015). The as-
sumption that MFCI were the driving mechanism for Surtseyan eruptions was based on the obser-
vation that cyclic explosive pulses during Surtsey eruption were concomitant with cycles of water
flooding in the vent area (Thorarinsson et al. 1964). In contrast, White (1996) proposed that MFCI
also occur during Surtseyan eruptions but are not self-driven and that they require pre-existing mag-
matic fragmentation.
Thermal granulation (or cooling-contraction granulation) is generally considered as a major
non explosive clast forming process at any water depths during subaqueous eruptions (Kokelaar,
1986). In this mechanism, magma in direct contact with water cools mostly by conductive heat trans-
fer at its surface causing solidification of the rind and develops a high temperature gradient between
the center and the surface of the fragment. Some studies suggest that granulation occurs as the
result of the contraction of the centre, which cannot be accommodated by the solid outer layer (e.g.
Kokelaar, 1986; Head and Wilson, 2003). Other studies propose that thermal cracking and granula-
tion are a direct consequence of the thermal stress caused by the high temperature gradient (e.g.
van Otterloo et al., 2015; Wohletz et al., 2013). This mechanism has been demonstrated as a dom-
inant clast formation mechanism during the interaction of lava flows (especially pillow lavas) with
seawater producing hyaloclastites and during the intrusion of magmatic body into water-saturated
sediments forming peperites (Carlisle, 1963; Staudigel and Schminke, 1984; Hanson and Hargrove,
1999; Doyle, 2000; Skilling et al., 2002). The principal fingerprints of such a breakup process are
jigsaw fit textures of particles that were granulated and subsequently kept in place or only slightly
displaced or rotated (Hanson and Hargrove, 1999; Doyle, 2000). Some studies suggest that this
mechanism generates coarser particles and small amount of fine particles compared to high inten-
sity, explosive magma-water interactions such as MFCI (Wohletz et al., 2013; Sonder et al., 2011)
59
whereas other present thermal granulation as a possible major mechanism generating fine ash dur-
ing water-magma interactions (e.g., Liu et al., 2017). Sonder et al (2011) investigated experimentally
the effect of water and melt temperature on total grain size distribution during thermal granulation of
basaltic melts. At fixed melt temperature, they found a clear correlation between the distributions
with initial water temperature, with lower average grain sizes obtained for higher initial water tem-
perature. They explained this observation by the presence of thick vapour films, dramatically reduc-
ing the heat flux and resulting thermal gradient. Reducing the thermal gradient lowers the thermal
stress and the resulting crack number density (Sonder et al., 2011 ; Van Otterloo et al., 2015) and
therefore induces coarser granulated particles. Textural properties (vesicularity, vesicle size and
shape and crystal content) of the melt will also have an influence on the thermal cracking and result-
ing grain size distribution during thermal granulation (Heap et al., 2014; Liu et al., 2015, 2017). Im-
portantly, brittle failure during thermal granulation can occur either during or after solidification (Van
Otterloo et a., 2015; Liu et al., 2017).
Turbulent shedding has been introduced by Mastin (2007) and demonstrated experimentally
by Mastin et al., (2009) as an additional non-explosive magma break-up mechanism during magma-
water interaction. It is described as the result of growth and disintegration of glassy rinds favored by
high cooling and deformation rates during shallow subaqueous eruptions (Mastin, 2007).
Steam-driven eruptions can also trigger Surtseyan activity, even at subaerial volcanoes in
the presence of a crater lake such as at Mount Ruapehu (Kilgour et al., 2010). This mechanism can
be caused by the rupture of hydrothermal vents and involves only minor amount of magma (Kilgour
et al., 2010; Montanaro et al., 2016). This type of explosive activity should be distinguished from the
explosive interaction of magma and a collapsing steam layer typical of MFCI.
Finally, other secondary break-up mechanisms such as inter-particle collisions and abrasion
(e.g., Dufek et al., 2012) are also likely to occur during clast transport and landing and contribute to
the formation of fine ash. Besides, several studies showed that mechanical break-up is enhanced in
melts/glass that previously experienced thermal stress. For instance, Patel et al., 2013 showed ex-
perimentally the enhancement of cracking and granulation in collision and abrasion experiments
after initial thermal quenching.
All these break-up mechanism should be further separated between explosive fragmentation
mechanisms (magmatic explosivity, MFCI) and non-explosive disruption processes such as thermal
or mechanical granulation or shedding. Importantly, recent studies proposed that Surtseyan erup-
tions could not be explained by a single fragmentation mechanism but rather by a feedback between
magmatic fragmentation, MFCI, bulk interaction explosivity and thermal granulation (White, 1996;
Graettinger et al., 2013; Schipper and White, 2016).
The grain size distribution and morphology of volcanic particles formed during Surtseyan
eruptions are therefore not diagnostic of a single fragmentation/break-up mechanism but instead
possibly reflect a range break-up processes. Additional features must be taken into account in order
to determine the formation mechanism of tephra during Surtseyan eruptions.
60
B.1.5. Vesiculation
Pyroclasts formed during subaqueous eruptions typically display a broader range and lower average
values of vesicularity compared to subaerial magmatic eruptions (Cole et al., 2001; Murtagh and
White, 2013; Jutzeler et al., 2016). Two cases can be often distinguished depending on the eruptions
with (i) broad range with values typically between 0 and 65 vol % and dominance of dense pyroclasts
(Augustin Flores et al., 2015; Mattson et al., 2010; Murtagh and White, 2011) and (ii) very broad
range of vesicularities spanning the whole spectra from nearly 0 up to 90 % (Murtagh and White,
2013; Barker et al., 2012). Frequently, the range is narrower and at lower vesicularities for deep
mafic eruptions and very broad for shallow Surtseyan eruptions (Schipper et al., 2011; Deardorff et
al., 2011; Resing et al., 2011). This might be because pre-fragmentation vesiculation caused by vol-
atile exsolution during magma ascent may be hindered by water pressure for deep mafic eruptions
(e.g., Wright et al., 2003). However, this effect is likely to be negligible for the emergent phases of
Surtseyan eruptions considered in this study occurring at very shallow water depths explaining the
higher upper values of vesicularity.
Vesicularity and vesicles metrics in pyroclasts produced by Surtseyan eruptions therefore
reflect principally vesiculation processes occurring (i) during magma ascent and volatile exsolution
before fragmentation in the conduit and (ii) during continued vesiculation after fragmentation and
ejection in the eruptive plume and before complete quenching (e.g., Jutzeler et al., 2016). Post-
fragmentation vesiculation (see Chapter A) of ejected pyroclasts may then be interrupted at different
stages by quenching and vesicularity of these ejecta is hence likely directly affected by cooling rates
in the water column. Efficient magma cooling by direct contact in water likely impedes post-fragmen-
tation bubble growth (e.g., Liu et al., 2015), and coalescence, producing dense clasts (e.g., Schipper
et al., 2011). At shallow water depths ( <200 m and even less for the emergent phases) during
Surtseyan eruptions, magma can be insulated from direct contact with water by a steam cupola
(Kokelaar, 1986). Thus, quenching may not be as rapid as in the deep water case, and vesiculation
may be less affected. This could explain high vesicularities commonly found in tephra from Surtseyan
eruptions (e.g., Murtagh & White, 2013). In addition to the nature of the coolant (air, vapour film or
liquid water), the timing of vesiculation and quenching is dependent on several additional parameters
such as the radial distance between magma and the cooling media and magma droplet sizes (Wild-
ing et al., 2000; Kueppers et al., 2012).
Vesicularity spectra of erupted tephra has often been used to infer fragmentation mecha-
nisms and distinguish between eruptions caused by water-magma interaction from subaerial, purely
magmatic eruptions (e.g., Houghton and Wilson, 1989). High vesicularities have for instance fre-
quently been interpreted as evidence for magmatic explosivity driven by volatile exsolution and ve-
siculation (e.g., Murtagh and White, 2013) whereas low values or broad ranges of vesicularities are
commonly interpreted as the result of explosive magma-water interaction (e.g., Houghton and Wil-
61
son, 1989). As for other deposit characteristics discussed previously, the vesicularity of volcanic par-
ticles is not diagnostic of a single fragmentation mechanism and should be combined to other pa-
rameters.
B.1.6. Aggregation
Ash aggregation is a common process during volcanic eruptions. Aggregates commonly have larger
size, lower densities and higher settling velocities than individual pyroclasts, causing an increase of
the sedimentation in proximal to medial areas of volcanoes (e.g., Brown et al., 2012). Aggregation
is thus of paramount importance because it directly influences ash dispersal in volcanic plumes and
related hazards related to ash fall and it should be taken into account in models of plume dispersal
and tephra sedimentation.
Ash particles in aggregates are typically bound via hydro-bonds (liquid and ice water) and
electrostatic forces (Brown et al., 2012). The rate of particle aggregation increases dramatically with
ambient humidity of the eruption (Brown et al., 2012; Mueller et al., 2016). When the aggregates
pass through less humid regions, they can precipitate soluble salt crystals such as e.g., NaCl,
CaSO4 or MgSO4 (e.g., Mueller et al., 2017). The formation of salts enhance the cementation and
the stability of the ash aggregates (Brown et al., 2012; Mueller et al., 2016). From the above consid-
erations, it is likely that the combined effect of high humidity and abundant presence of salts in
Surtseyan eruptions occurring in seawater settings will therefore contribute to increase the amount
of aggregates in the deposits compared to subaerial eruptions or Surtseyan eruptions occurring be-
low lakes.
Ash Aggregates are indeed ubiquitous in the deposits of Surtseyan eruptions (Thorarinsson,
1967; Waters and Fisher, 1971; Lorenz, 1974; Moore, 1985; Sohn and Chough, 1992; Cole et al.,
2001; White et al., 2003; Solgevik et al., 2007; Brown et al., 2012) and consist mostly of accretionary
lapilli and coated/armoured lapilli with a central juvenile pyroclast coated with a rim of ash. Several
studies interpreted these aggregates as the result of wet surges (Lorenz, 1974 ; Sohn and Chough,
1992). However, this argument is not valid for coated lapilli because these aggregates are found in
both fall and surge deposits. Mueller (2003) in turn interpreted these coated lapilli as the result of
aggregation in a steam and ash-rich environment. Moore (1985) noted that coated lapilli are the
dominant constituent of the deposits from Surtsey (1963-1967). Understanding the formation mech-
anism of these coated particles is therefore critical because the stability of the coating might signifi-
cantly control the amount of ash in the plume and consequently affect the dispersal and deposition
of tephra.
62
B.1.7. Influence of the presence of a slurry and magma-wet sedi-
ment interactions
Instead of interacting with pure water, ejected magma during Surtseyan eruptions most likely inter-
mingles with a vent-filling slurry of clastic-material, water and steam (e.g., Kokelaar, 1986). This
interaction leads to important recycling of previously erupted tephra, that is commonly evidenced by
the composite textures of lapilli and bombs containing inclusions of entrained, recycled tephra (Mur-
tagh and White, 2013; Schipper and White., 2016; Jutzeler et al., 2016). The inclusions are frequently
surrounded by a void space, which has been interpreted as the venting of steam during the ejection
(McGuiness et al., 2016).
For simplification, in this thesis we do not consider the presence of wet-sediments in
Surtseyan settings and rather interpret the eruptive processes as the result of interaction of magma
with pure water or steam. However, it should be stressed that the presence of wet sediments influ-
ence the style and intensity of magma-coolant interactions. As an example, White (1996) shows that
the magma interaction with impure coolant is affected by higher coolant density, viscosity and ther-
mal conductivity and lower heat capacity compared to pure water.
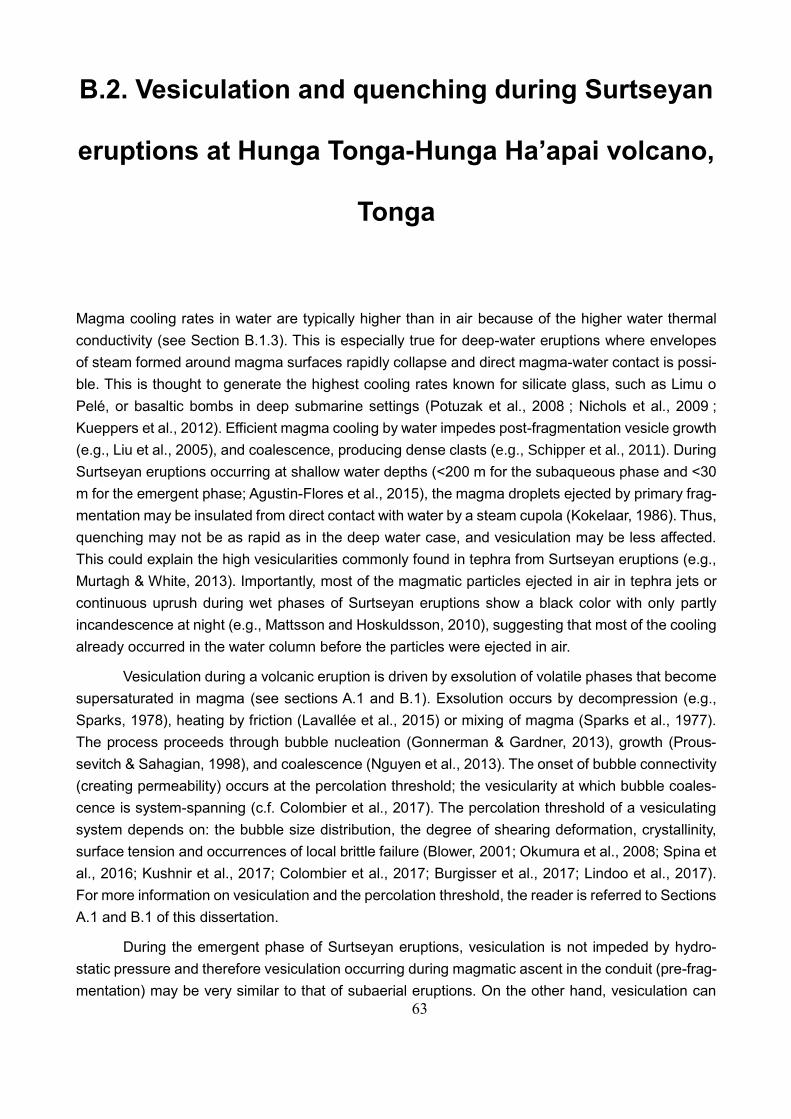
63
B.2. Vesiculation and quenching during Surtseyan
eruptions at Hunga Tonga-Hunga Ha’apai volcano,
Tonga
Magma cooling rates in water are typically higher than in air because of the higher water thermal
conductivity (see Section B.1.3). This is especially true for deep-water eruptions where envelopes
of steam formed around magma surfaces rapidly collapse and direct magma-water contact is possi-
ble. This is thought to generate the highest cooling rates known for silicate glass, such as Limu o
Pelé, or basaltic bombs in deep submarine settings (Potuzak et al., 2008 ; Nichols et al., 2009 ;
Kueppers et al., 2012). Efficient magma cooling by water impedes post-fragmentation vesicle growth
(e.g., Liu et al., 2005), and coalescence, producing dense clasts (e.g., Schipper et al., 2011). During
Surtseyan eruptions occurring at shallow water depths (<200 m for the subaqueous phase and <30
m for the emergent phase; Agustin-Flores et al., 2015), the magma droplets ejected by primary frag-
mentation may be insulated from direct contact with water by a steam cupola (Kokelaar, 1986). Thus,
quenching may not be as rapid as in the deep water case, and vesiculation may be less affected.
This could explain the high vesicularities commonly found in tephra from Surtseyan eruptions (e.g.,
Murtagh & White, 2013). Importantly, most of the magmatic particles ejected in air in tephra jets or
continuous uprush during wet phases of Surtseyan eruptions show a black color with only partly
incandescence at night (e.g., Mattsson and Hoskuldsson, 2010), suggesting that most of the cooling
already occurred in the water column before the particles were ejected in air.
Vesiculation during a volcanic eruption is driven by exsolution of volatile phases that become
supersaturated in magma (see sections A.1 and B.1). Exsolution occurs by decompression (e.g.,
Sparks, 1978), heating by friction (Lavallée et al., 2015) or mixing of magma (Sparks et al., 1977).
The process proceeds through bubble nucleation (Gonnerman & Gardner, 2013), growth (Prous-
sevitch & Sahagian, 1998), and coalescence (Nguyen et al., 2013). The onset of bubble connectivity
(creating permeability) occurs at the percolation threshold; the vesicularity at which bubble coales-
cence is system-spanning (c.f. Colombier et al., 2017). The percolation threshold of a vesiculating
system depends on: the bubble size distribution, the degree of shearing deformation, crystallinity,
surface tension and occurrences of local brittle failure (Blower, 2001; Okumura et al., 2008; Spina et
al., 2016; Kushnir et al., 2017; Colombier et al., 2017; Burgisser et al., 2017; Lindoo et al., 2017).
For more information on vesiculation and the percolation threshold, the reader is referred to Sections
A.1 and B.1 of this dissertation.
During the emergent phase of Surtseyan eruptions, vesiculation is not impeded by hydro-
static pressure and therefore vesiculation occurring during magmatic ascent in the conduit (pre-frag-
mentation) may be very similar to that of subaerial eruptions. On the other hand, vesiculation can
64
continue after ejection of tephra (post-fragmentation) if the melt remains volatile-rich and hot enough.
This post-fragmentation vesiculation of ejected magma droplets may be dramatically more affected
by cooling in the water column compared to cooling in air during subaerial eruptions. The timing of
post-fragmentation vesiculation and quenching is dependent on the nature of the coolant (air, vapour
film or liquid water), on the radial distance between magma and this cooling media and on the clast
sizes (Wilding et al., 2000; Kueppers et al., 2012).
In this study, we investigate the relationship between cooling and post-fragmentation vesicu-
lation during Surtseyan eruptions. By examining the internal structure of the pyroclasts, we shed
light on the vesiculation processes and estimate the percolation threshold in lapilli and bombs from
the 2009 and 2014-2015 Surtseyan eruptions of Hunga Tonga-Hunga Ha’apai volcano. We then
propose a conceptual generalizable framework for explaining the first-order relationships between
quenching and vesiculation for these types of eruption by comparison with a 1D solution to the heat
equation. Cooling rates obtained with the model are finally compared to cooling rates obtained by
geospeedometry on tephra from submarine eruptions.
B.2.1. Geological context
The islands of Hunga Tonga and Hunga Ha’apai are located ~67 km north-northwest of Nuku'alofa,
Kingdom of Tonga. They are part of the intra-oceanic Tonga-Kermadec arc (Fig. 18), formed as a
result of subduction of the Pacific Plate beneath the Australian plate (e.g., Ewart et al., 1977). The
two islands are remnants of the rim of a roughly 3-4 km large submarine caldera (Fig. 18b). In various
parts of the caldera, eruptions were noted in 1912, 1938 and 1988, with the best-recorded being
Surtseyan eruptions forming tuff cones in separate locations in 2009 and 2014-2015 (Bryan et al.,
1972; Global Volcanism Program 1988, 2009a, b; Vaughan & Webley, 2010; Bohnenstiel et al.,
2013 ; Global Volcanism Program, 2015).
The 2009 eruption lasted from 17th to 21st of March 2009 and formed two subaerial tuff cones
on the north-western and southern sides of Hunga Ha’apai (Vaughan and Webley, 2010). The erup-
tion was characterised by steam and ash plumes rising up to ≤7.6 km asl and posing hazards to
local air traffic, with base surges and debris jets observed from three individual vents, (Global Vol-
canism Program, 2009a, b; Vaughan and Webley, 2010; Bohnenstiel et al., 2013). The newly formed
tuff cones were quickly eroded by waves once activity had ceased. At the time of sampling in No-
vember 2015, only a small remnant of the cone located on the western site of Hunga Ha’apai was
still preserved above the water surface.
65
Figure 18. Geological setting of the 2009 and 2014-2015 Surtseyan eruptions at Hunga Tonga-Hunga Ha’apai
volcano. a) Map representing the intra-oceanic Tonga arc in its regional tectonic setting and the location of the
Hunga Tonga-Hunga Ha’apai volcano marked with a red star (modified after Bohnenstiehl et al., 2013 and
Bryan et al., 2004). b) Bathymetry of the area showing the Hunga Ha’apai and Hunga Tonga islands (in the
red box) at the rims of a pre-existing caldera. c) Google Earth image of the islands after the 2009 eruptions.
Two vents and associated tuff cones at the north-western and south sides of Hunga Ha’apai are visible. d)
Image showing the Hunga Ha’apai- Hunga Tonga volcano after the 2014-2015 eruption and the presence of
the newly formed tuff cone. The location of the samples used in this study is marked by a red solid circle. Most
of the samples come from the 2014-2015 eruption except samples HH71 and 74 that come from the 2009
north-western tuff cone. e) Typical example of a steam and ash plume during the 2014-2015 eruption (picture
courtesy of New Zealand High Commission in Nuku'alofa).
66
The 2014-2015 eruption occurred between 19th of September 2014 and 24th of January 2015
and formed a ~120 m high and 2km wide near-circular tephra cone which coalesced with the two
pre-existing islands of Hunga Tonga and Hunga Ha’apai. The eruption did not produce much distal
ash, but steam-plumes up to 10 km-high were observed, causing cancellation of international flights
on the 13th and 14th of January (Global Volcanism Program, 2015). The edifice was constructed
within ~10 days by vigorous tephra jets (≤750 m asl) and radiating base surges (≤150 m asl) (Global
Volcanism Program, 2015).
Most samples analyzed in this study were collected from proximal fall/jet deposits sampled
from the main cone formed during the 2014-2015 eruption, with one clast collected from surge de-
posits beyond the main cone (Fig. 18d). In addition, two bombs were sampled from the proximal
fall/debris jet deposits of the 2009 tuff cone formed at the north-western flank of Hunga Ha’apai (Fig.
18d). The 2009 and 2014-2015 magmas are almost identical in composition and are basaltic-ande-
sitic to andesitic.
B.2.2. Methodology
We analyzed 21 juvenile lapilli and 10 bombs from the 2009 and 2014-2015 eruptions. On a subset
of these clasts, we measured vesicle-size distributions and number densities using scanning elec-
tron microscopy (SEM) and x-ray computed micro-tomography (XCT). The vesicularity and vesicle
connectivity of the juvenile lapilli and bombs were estimated combining Helium pycnometry and XCT.
We also present in this section methods of thermal analysis and modelling, based on heat transfer
equations allowing us to link textural features to cooling processes.
2D image analysis
We studied the 2D textures of three lapilli clasts and two bomb clasts using back-scattered electron
images collected on a HITACHI SU 5000 Schottky FE-SEM. We used the image nesting strategy
presented by Shea et al. (2009), taking images at different magnifications (x25, x100 and x250) in
order to image the range of vesicle size in all samples. These 2D images were binarised using Adobe
Photoshop© and analyzed using FOAMS (MATLAB user interface developed by Shea et al. 2009) in
order to retrieve the 2D vesicularity, the vesicle-size distribution and vesicle number-density through
2D to 3D stereological conversion (results presented in Table 2). We only measured the vesicle size
distribution and number density in samples with low vesicle connectivity, because the 2D image
analysis process is not well-suited to complex and interconnected pore networks. In other samples
with high connectivity, we only measured the 2D vesicularity since this is a bulk metric not dependent
on the pore geometries.
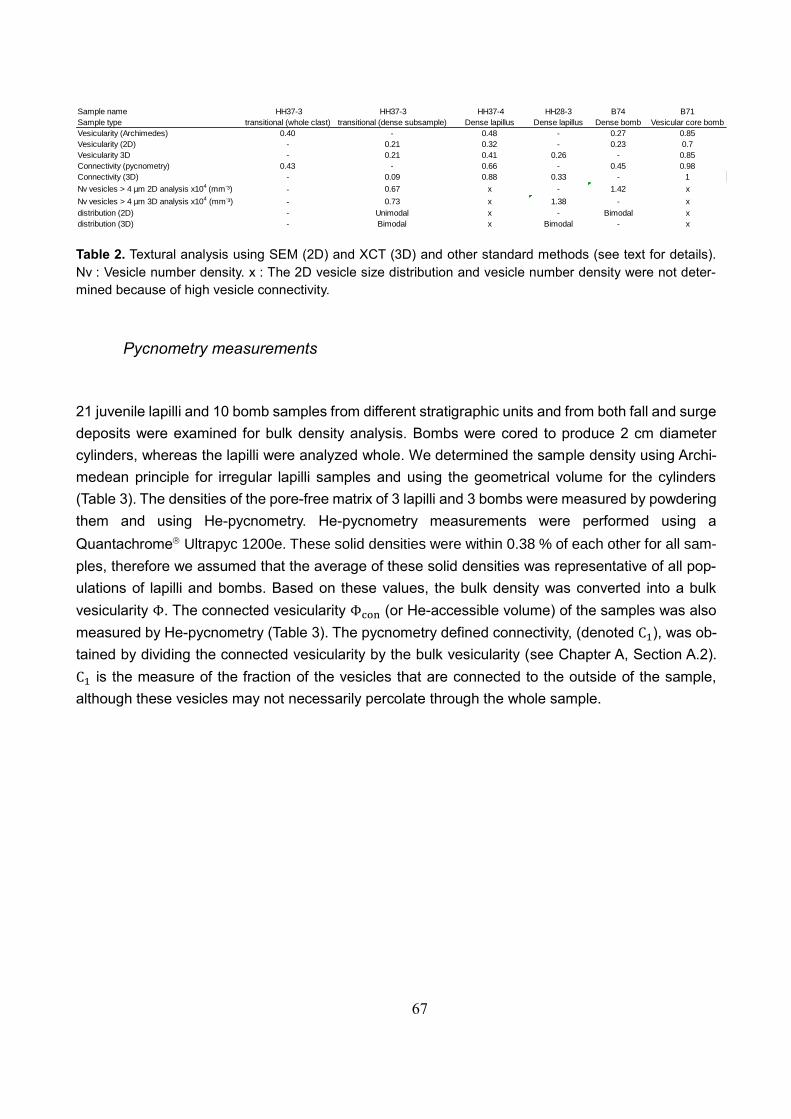
67
Table 2. Textural analysis using SEM (2D) and XCT (3D) and other standard methods (see text for details).
Nv : Vesicle number density. x : The 2D vesicle size distribution and vesicle number density were not deter-
mined because of high vesicle connectivity.
Pycnometry measurements
21 juvenile lapilli and 10 bomb samples from different stratigraphic units and from both fall and surge
deposits were examined for bulk density analysis. Bombs were cored to produce 2 cm diameter
cylinders, whereas the lapilli were analyzed whole. We determined the sample density using Archi-
medean principle for irregular lapilli samples and using the geometrical volume for the cylinders
(Table 3). The densities of the pore-free matrix of 3 lapilli and 3 bombs were measured by powdering
them and using He-pycnometry. He-pycnometry measurements were performed using a
Quantachrome Ultrapyc 1200e. These solid densities were within 0.38 % of each other for all sam-
ples, therefore we assumed that the average of these solid densities was representative of all pop-
ulations of lapilli and bombs. Based on these values, the bulk density was converted into a bulk
vesicularity Φ. The connected vesicularity Φcon (or He-accessible volume) of the samples was also
measured by He-pycnometry (Table 3). The pycnometry defined connectivity, (denoted C1), was ob-
tained by dividing the connected vesicularity by the bulk vesicularity (see Chapter A, Section A.2).
C1 is the measure of the fraction of the vesicles that are connected to the outside of the sample,
although these vesicles may not necessarily percolate through the whole sample.
Sample name HH37-3 HH37-3 HH37-4 HH28-3 B74 B71
Sample type transitional (whole clast) transitional (dense subsample) Dense lapillus Dense lapillus Dense bomb Vesicular core bomb
Vesicularity (Archimedes) 0.40 - 0.48 - 0.27 0.85
Vesicularity (2D) - 0.21 0.32 - 0.23 0.7
Vesicularity 3D - 0.21 0.41 0.26 - 0.85
Connectivity (pycnometry) 0.43 - 0.66 - 0.45 0.98
Connectivity (3D) - 0.09 0.88 0.33 - 1
Nv vesicles > 4 µm 2D analysis x104 (mm-³) - 0.67 x - 1.42 x
Nv vesicles > 4 µm 3D analysis x104 (mm-³) - 0.73 x 1.38 - x
distribution (2D) - Unimodal x - Bimodal x
distribution (3D) - Bimodal x Bimodal - x
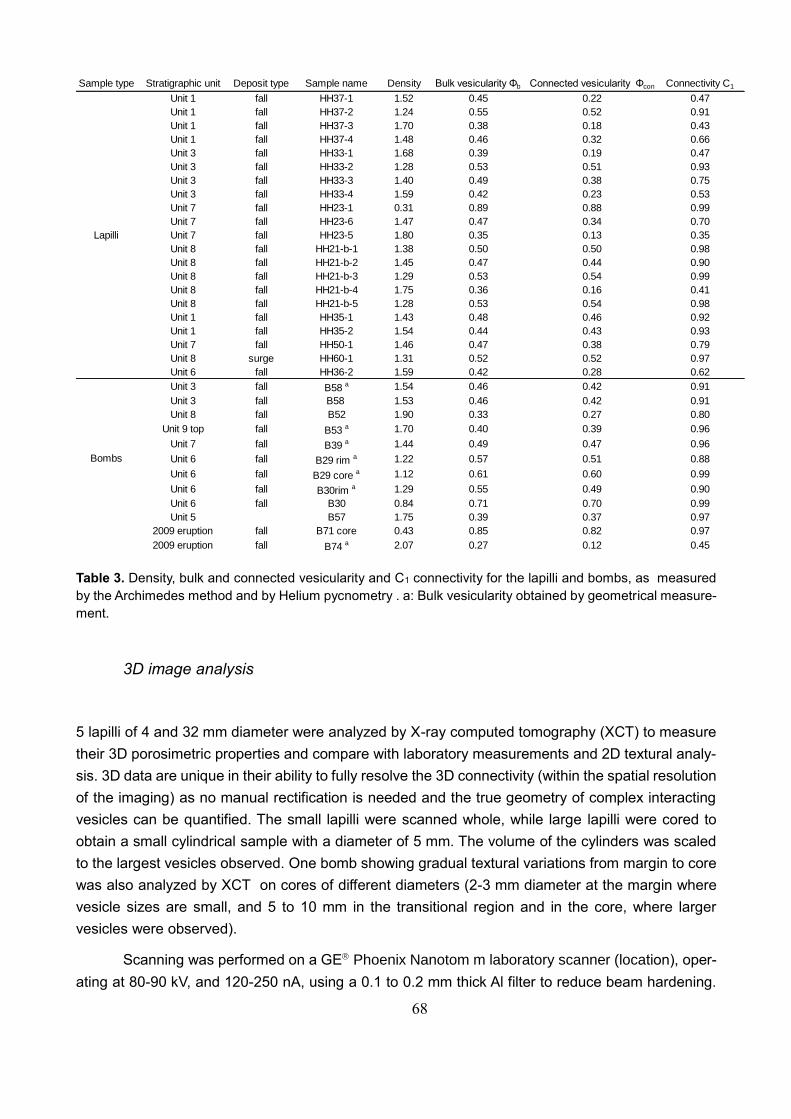
68
Table 3. Density, bulk and connected vesicularity and C1 connectivity for the lapilli and bombs, as measured
by the Archimedes method and by Helium pycnometry . a: Bulk vesicularity obtained by geometrical measure-
ment.
3D image analysis
5 lapilli of 4 and 32 mm diameter were analyzed by X-ray computed tomography (XCT) to measure
their 3D porosimetric properties and compare with laboratory measurements and 2D textural analy-
sis. 3D data are unique in their ability to fully resolve the 3D connectivity (within the spatial resolution
of the imaging) as no manual rectification is needed and the true geometry of complex interacting
vesicles can be quantified. The small lapilli were scanned whole, while large lapilli were cored to
obtain a small cylindrical sample with a diameter of 5 mm. The volume of the cylinders was scaled
to the largest vesicles observed. One bomb showing gradual textural variations from margin to core
was also analyzed by XCT on cores of different diameters (2-3 mm diameter at the margin where
vesicle sizes are small, and 5 to 10 mm in the transitional region and in the core, where larger
vesicles were observed).
Scanning was performed on a GE Phoenix Nanotom m laboratory scanner (location), oper-
ating at 80-90 kV, and 120-250 nA, using a 0.1 to 0.2 mm thick Al filter to reduce beam hardening.
Sample type Stratigraphic unit Deposit type Sample name Density Bulk vesicularity Φb Connected vesicularity Φcon Connectivity C1
Unit 1 fall HH37-1 1.52 0.45 0.22 0.47
Unit 1 fall HH37-2 1.24 0.55 0.52 0.91
Unit 1 fall HH37-3 1.70 0.38 0.18 0.43
Unit 1 fall HH37-4 1.48 0.46 0.32 0.66
Unit 3 fall HH33-1 1.68 0.39 0.19 0.47
Unit 3 fall HH33-2 1.28 0.53 0.51 0.93
Unit 3 fall HH33-3 1.40 0.49 0.38 0.75
Unit 3 fall HH33-4 1.59 0.42 0.23 0.53
Unit 7 fall HH23-1 0.31 0.89 0.88 0.99
Unit 7 fall HH23-6 1.47 0.47 0.34 0.70
Unit 7 fall HH23-5 1.80 0.35 0.13 0.35
Unit 8 fall HH21-b-1 1.38 0.50 0.50 0.98
Unit 8 fall HH21-b-2 1.45 0.47 0.44 0.90
Unit 8 fall HH21-b-3 1.29 0.53 0.54 0.99
Unit 8 fall HH21-b-4 1.75 0.36 0.16 0.41
Unit 8 fall HH21-b-5 1.28 0.53 0.54 0.98
Unit 1 fall HH35-1 1.43 0.48 0.46 0.92
Unit 1 fall HH35-2 1.54 0.44 0.43 0.93
Unit 7 fall HH50-1 1.46 0.47 0.38 0.79
Unit 8 surge HH60-1 1.31 0.52 0.52 0.97
Unit 6 fall HH36-2 1.59 0.42 0.28 0.62
Unit 3 fall B58 a 1.54 0.46 0.42 0.91
Unit 3 fall B58 1.53 0.46 0.42 0.91
Unit 8 fall B52 1.90 0.33 0.27 0.80
Unit 9 top fall B53 a 1.70 0.40 0.39 0.96
Unit 7 fall B39 a 1.44 0.49 0.47 0.96
Unit 6 fall B29 rim a 1.22 0.57 0.51 0.88
Unit 6 fall B29 core a 1.12 0.61 0.60 0.99
Unit 6 fall B30rim a 1.29 0.55 0.49 0.90
Unit 6 fall B30 0.84 0.71 0.70 0.99
Unit 5 B57 1.75 0.39 0.37 0.97
2009 eruption fall B71 core 0.43 0.85 0.82 0.97
2009 eruption fall B74 a 2.07 0.27 0.12 0.45
Lapilli
Bombs
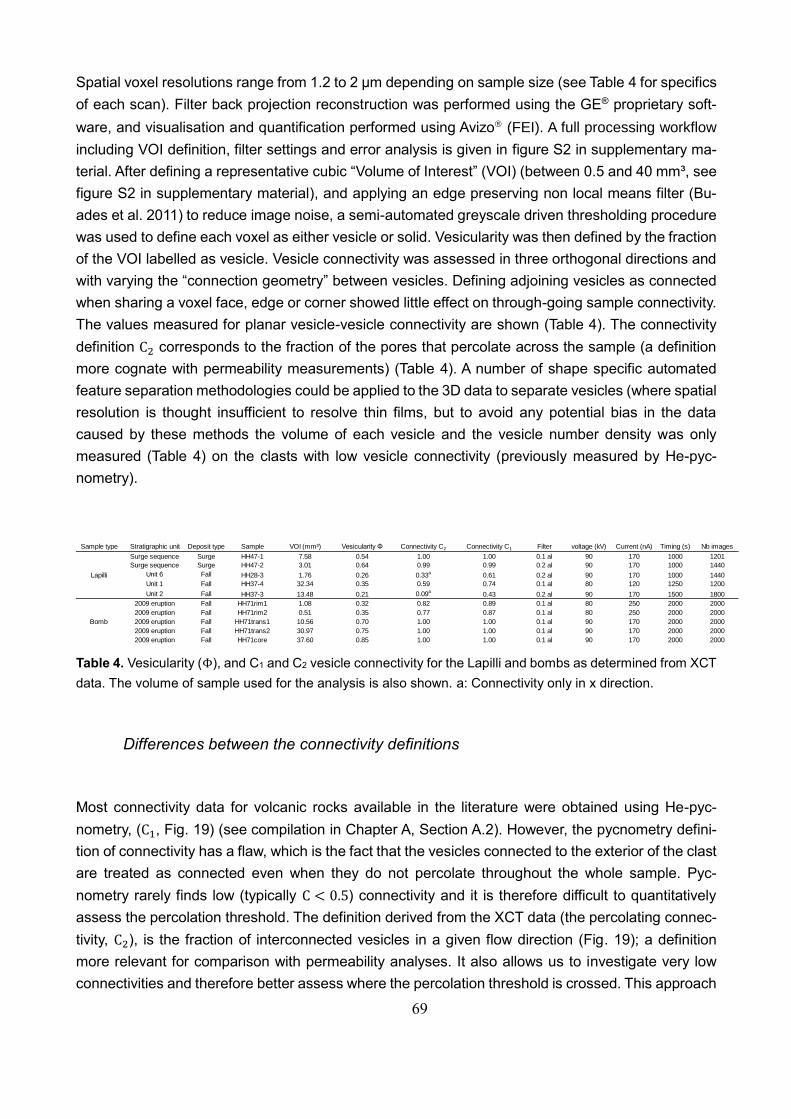
69
Spatial voxel resolutions range from 1.2 to 2 µm depending on sample size (see Table 4 for specifics
of each scan). Filter back projection reconstruction was performed using the GE® proprietary soft-
ware, and visualisation and quantification performed using Avizo (FEI). A full processing workflow
including VOI definition, filter settings and error analysis is given in figure S2 in supplementary ma-
terial. After defining a representative cubic “Volume of Interest” (VOI) (between 0.5 and 40 mm³, see
figure S2 in supplementary material), and applying an edge preserving non local means filter (Bu-
ades et al. 2011) to reduce image noise, a semi-automated greyscale driven thresholding procedure
was used to define each voxel as either vesicle or solid. Vesicularity was then defined by the fraction
of the VOI labelled as vesicle. Vesicle connectivity was assessed in three orthogonal directions and
with varying the “connection geometry” between vesicles. Defining adjoining vesicles as connected
when sharing a voxel face, edge or corner showed little effect on through-going sample connectivity.
The values measured for planar vesicle-vesicle connectivity are shown (Table 4). The connectivity
definition C2 corresponds to the fraction of the pores that percolate across the sample (a definition
more cognate with permeability measurements) (Table 4). A number of shape specific automated
feature separation methodologies could be applied to the 3D data to separate vesicles (where spatial
resolution is thought insufficient to resolve thin films, but to avoid any potential bias in the data
caused by these methods the volume of each vesicle and the vesicle number density was only
measured (Table 4) on the clasts with low vesicle connectivity (previously measured by He-pyc-
nometry).
Table 4. Vesicularity (Φ), and C1 and C2 vesicle connectivity for the Lapilli and bombs as determined from XCT
data. The volume of sample used for the analysis is also shown. a: Connectivity only in x direction.
Differences between the connectivity definitions
Most connectivity data for volcanic rocks available in the literature were obtained using He-pyc-
nometry, (C1, Fig. 19) (see compilation in Chapter A, Section A.2). However, the pycnometry defini-
tion of connectivity has a flaw, which is the fact that the vesicles connected to the exterior of the clast
are treated as connected even when they do not percolate throughout the whole sample. Pyc-
nometry rarely finds low (typically C < 0.5) connectivity and it is therefore difficult to quantitatively
assess the percolation threshold. The definition derived from the XCT data (the percolating connec-
tivity, C2), is the fraction of interconnected vesicles in a given flow direction (Fig. 19); a definition
more relevant for comparison with permeability analyses. It also allows us to investigate very low
connectivities and therefore better assess where the percolation threshold is crossed. This approach
Sample type Stratigraphic unit Deposit type Sample VOI (mm³) Vesicularity Φ Connectivity C2 Connectivity C1 Filter voltage (kV) Current (nA) Timing (s) Nb images
Surge sequence Surge HH47-1 7.58 0.54 1.00 1.00 0.1 al 90 170 1000 1201
Surge sequence Surge HH47-2 3.01 0.64 0.99 0.99 0.2 al 90 170 1000 1440
Unit 6 Fall HH28-3 1.76 0.26 0.33a 0.61 0.2 al 90 170 1000 1440
Unit 1 Fall HH37-4 32.34 0.35 0.59 0.74 0.1 al 80 120 1250 1200
Unit 2 Fall HH37-3 13.48 0.21 0.09a0.43 0.2 al 90 170 1500 1800
2009 eruption Fall HH71rim1 1.08 0.32 0.82 0.89 0.1 al 80 250 2000 2000
2009 eruption Fall HH71rim2 0.51 0.35 0.77 0.87 0.1 al 80 250 2000 2000
2009 eruption Fall HH71trans1 10.56 0.70 1.00 1.00 0.1 al 90 170 2000 2000
2009 eruption Fall HH71trans2 30.97 0.75 1.00 1.00 0.1 al 90 170 2000 2000
2009 eruption Fall HH71core 37.60 0.85 1.00 1.00 0.1 al 90 170 2000 2000
Lapilli
Bomb
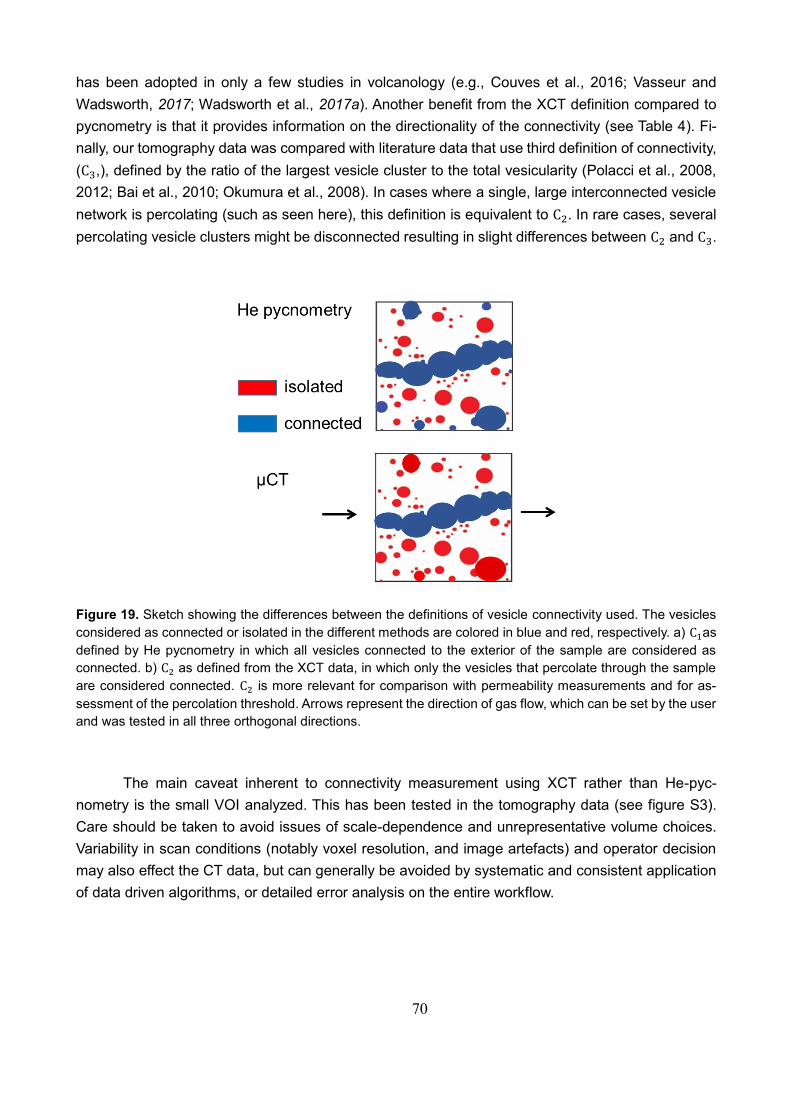
70
has been adopted in only a few studies in volcanology (e.g., Couves et al., 2016; Vasseur and
Wadsworth, 2017; Wadsworth et al., 2017a). Another benefit from the XCT definition compared to
pycnometry is that it provides information on the directionality of the connectivity (see Table 4). Fi-
nally, our tomography data was compared with literature data that use third definition of connectivity,
(C3,), defined by the ratio of the largest vesicle cluster to the total vesicularity (Polacci et al., 2008,
2012; Bai et al., 2010; Okumura et al., 2008). In cases where a single, large interconnected vesicle
network is percolating (such as seen here), this definition is equivalent to C2. In rare cases, several
percolating vesicle clusters might be disconnected resulting in slight differences between C2 and C3.
Figure 19. Sketch showing the differences between the definitions of vesicle connectivity used. The vesicles
considered as connected or isolated in the different methods are colored in blue and red, respectively. a) C1as
defined by He pycnometry in which all vesicles connected to the exterior of the sample are considered as
connected. b) C2 as defined from the XCT data, in which only the vesicles that percolate through the sample
are considered connected. C2 is more relevant for comparison with permeability measurements and for as-
sessment of the percolation threshold. Arrows represent the direction of gas flow, which can be set by the user
and was tested in all three orthogonal directions.
The main caveat inherent to connectivity measurement using XCT rather than He-pyc-
nometry is the small VOI analyzed. This has been tested in the tomography data (see figure S3).
Care should be taken to avoid issues of scale-dependence and unrepresentative volume choices.
Variability in scan conditions (notably voxel resolution, and image artefacts) and operator decision
may also effect the CT data, but can generally be avoided by systematic and consistent application
of data driven algorithms, or detailed error analysis on the entire workflow.
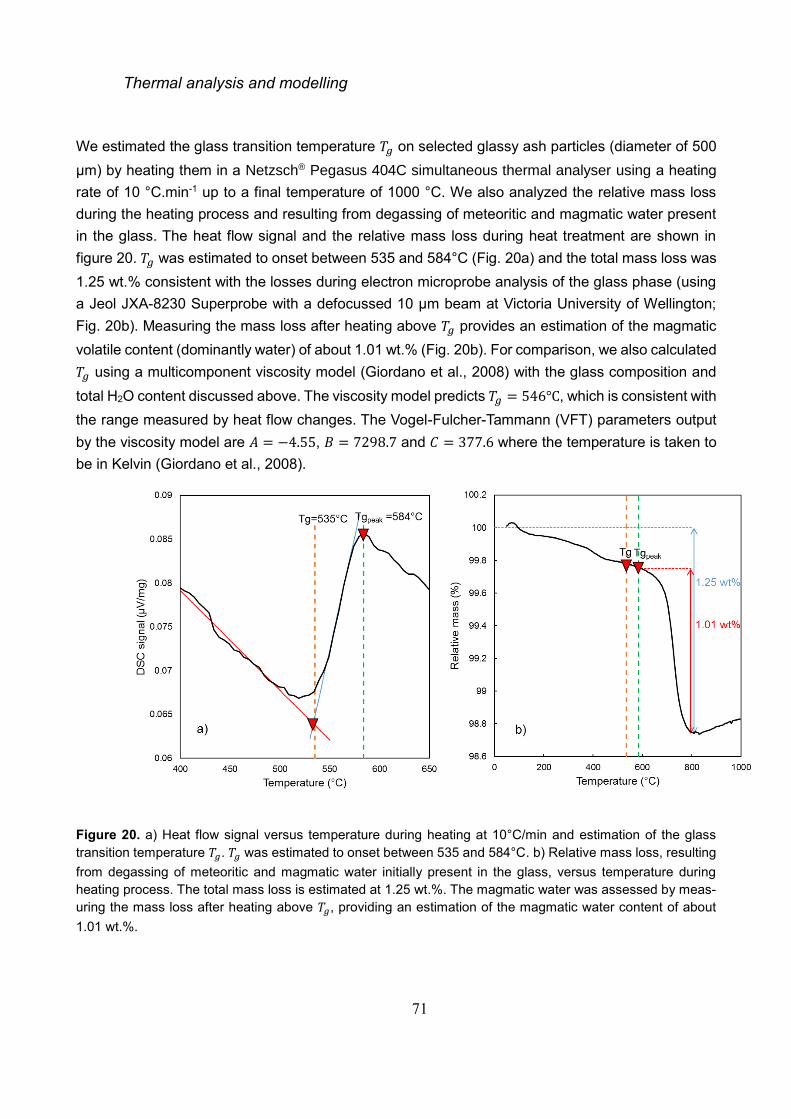
71
Thermal analysis and modelling
We estimated the glass transition temperature 𝑇𝑔 on selected glassy ash particles (diameter of 500
µm) by heating them in a Netzsch® Pegasus 404C simultaneous thermal analyser using a heating
rate of 10 °C.min-1 up to a final temperature of 1000 °C. We also analyzed the relative mass loss
during the heating process and resulting from degassing of meteoritic and magmatic water present
in the glass. The heat flow signal and the relative mass loss during heat treatment are shown in
figure 20. 𝑇𝑔 was estimated to onset between 535 and 584°C (Fig. 20a) and the total mass loss was
1.25 wt.% consistent with the losses during electron microprobe analysis of the glass phase (using
a Jeol JXA-8230 Superprobe with a defocussed 10 µm beam at Victoria University of Wellington;
Fig. 20b). Measuring the mass loss after heating above 𝑇𝑔 provides an estimation of the magmatic
volatile content (dominantly water) of about 1.01 wt.% (Fig. 20b). For comparison, we also calculated
𝑇𝑔 using a multicomponent viscosity model (Giordano et al., 2008) with the glass composition and
total H2O content discussed above. The viscosity model predicts 𝑇𝑔 = 546°C, which is consistent with
the range measured by heat flow changes. The Vogel-Fulcher-Tammann (VFT) parameters output
by the viscosity model are 𝐴 = −4.55, 𝐵 = 7298.7 and 𝐶 = 377.6 where the temperature is taken to
be in Kelvin (Giordano et al., 2008).
Figure 20. a) Heat flow signal versus temperature during heating at 10°C/min and estimation of the glass
transition temperature 𝑇𝑔. 𝑇𝑔 was estimated to onset between 535 and 584°C. b) Relative mass loss, resulting
from degassing of meteoritic and magmatic water initially present in the glass, versus temperature during
heating process. The total mass loss is estimated at 1.25 wt.%. The magmatic water was assessed by meas-
uring the mass loss after heating above 𝑇𝑔, providing an estimation of the magmatic water content of about
1.01 wt.%.
72
We assessed the evolution of the temperature distribution 𝑇 in a particle of radius 𝑅 using
Fourier’s law for diffusive heat transfer cast in 1D spherical coordinates (Crank, 1975)
𝑟2
𝜕𝑇
𝜕𝑡=
𝜕
𝜕𝑟(𝑟2𝐷
𝜕𝑇
𝜕𝑟) Eq. 2
where 𝑡 is the time, 𝑟 is the radial distance from the particle centre and 𝐷 is the thermal
diffusivity in the material. The value of 𝐷 is dependent on temperature and for silicate melts and
glasses can be predicted smoothly across the glass transition interval, by
𝐷 = 𝐷0 exp(𝛼𝑇) Eq. 3
where 𝐷0 is the extrapolated diffusivity at 𝑇 = 0 and a function of Φ, and 𝛼 is a constant. For
Φ = 0 and by comparison with measurements from Bagdassarov & Dingwell (1994), Wadsworth et
al. (2017b) calibrated these two parameters in the range 550-1100°C as 𝐷0 = 1.88 × 10⁻⁷ m2.s-1 and
𝛼 = 1.58 × 10⁻³ K-1. 𝐷0(Φ) is then given by (see Connor et al., 1997)
𝐷0(Φ) = 𝐷0
𝜌𝐶𝑝(1 − Φ)
(1 + Φ)(𝜌𝐶𝑝(1 − Φ) + Φ𝜌𝑤𝐶𝑝,𝑤) Eq. 4
for which 𝜌 and 𝜌𝑤 are the melt and water densities respectively, and 𝐶𝑝 and 𝐶𝑝,𝑤 are the
specific heat capacities. We used 𝜌 = 2200 kg.m-3 and 𝐶𝑝 = 1000 J.kg.K-1, and looked at 𝑅 in the
range 5-500 mm and Φ between 0.2 and 0.6. We solved the heat equation numerically by means of
a fully implicit finite-difference scheme (i.e. backward-time, centered-space) coupled with a relaxed
fixed-point method to ensure convergence at each time step (e.g. Wadsworth et al., 2017b). We
assumed that at 𝑡 = 0 the particle is in thermal equilibrium at the initial melt temperature
𝑇𝑚𝑖; 𝑇(𝑡 = 0, 𝑟) = 𝑇𝑚𝑖. At the particle center we employ a Neumann boundary condition of 0 (i.e.
boundary of insulation; 𝐷𝜕𝑇
𝜕𝑟|
𝑟=0= 0) and at the margin we looked at two specific cases: (1) the
temperature is instantaneously dropped to the surrounding water temperature 𝑇𝑤; 𝑇(𝑡, 𝑟 = 𝑅) = 𝑇𝑤
and (2) the temperature decreases according to convective and radiative heat exchange across the
margin;
𝐷
𝜕𝑇
𝜕𝑟|
𝑡,𝑟=𝑅=
𝜎𝜀
𝜌𝐶𝑝𝑇4 +
ℎ
𝜌𝐶𝑝𝑇 Eq. 5
73
where 𝜎 is the Stefan-Boltzmann constant (5.67x10⁻⁸ W.m-2.K-4), 𝜀 the radiative emissivity
and ℎ the convective heat transfer coefficient. In the case of (2) we used a convective heat transfer
coefficient of ℎ = 50 W.m-2.K-1 (Stroberg et al., 2010) and a radiative emissivity of 𝜀 = 0.9 (Mastin,
2007). In this case, radiation was negligible so that the choice of 𝜀 makes little difference. We choose
to track the time for 𝑇 to reach the measured range of 𝑇𝑔 in the particle. This is a coarse, first order
metric for when the particle is quenched and vesiculation can no longer occur.
B.2.3. Results
Macroscopic description of the pyroclasts
On the basis of vesicle texture and vesicularity, the lapilli can be separated into three main textural
types: (1) dense, (2) transitional and (3) vesicular. The dense and transitional textural types are also
recognized internally within the bombs (Fig. 21a-c). The transitional lapilli and bombs exhibit textures
with a gradual increase of vesicle size and degree of coalescence from margin to core (Fig. 21b-d).
Large vesicles are more common in the vesicular cores of these clasts, but can also be present in
the dense margins (Fig. 21b, c, d). We distinguish three textural layers in the transitional bombs
which are a dense margin (layer A), a transitional zone (layer B) and a vesicular interior (layer C)
(Fig. 21b, c). The transitional bombs can further be differentiated into two sub-classes, which are (i)
bombs with a thick, dense transitional zone that abruptly transitions into more vesicular interior (Type
1; Fig. 21b) and (ii) bombs with a very gradual increase of vesicularity from the transitional zone
toward the core (Type 2; Fig. 21c). The core vesicularity is also generally higher in the Type 2 tran-
sitional bombs. Type 2 transitional bombs resemble the transitional bombs from Lō`ihi Seamount,
Hawai`i for which three textural zones were also defined (Figure 3 in Schipper et al., 2010). BSE
images of the groundmass from a bomb and a lapillus highlight the commonly higher microlite con-
tent in the bombs (Fig. 21e, f).
Vesicle size distribution and number density
First, we note that the vesicularities and vesicle number densities obtained on the same samples in
2D (SEM) and 3D (XCT) are generally similar (Table 2). Figure 22 shows the 2D and 3D vesicle size
distribution as histograms of the equivalent vesicle diameter 𝐿 for selected samples. The vesicle
diameters measured here span four orders of magnitude from 0.004 to > 1 mm. HH37-3 displays a
unimodal distribution in 2D with 𝐿 ranging from 0.004 to 0.6 mm and a bimodal distribution in 3D with
a small population (mode A) ranging from 0.01 to 0.3 mm and a large population (mode B) ranging
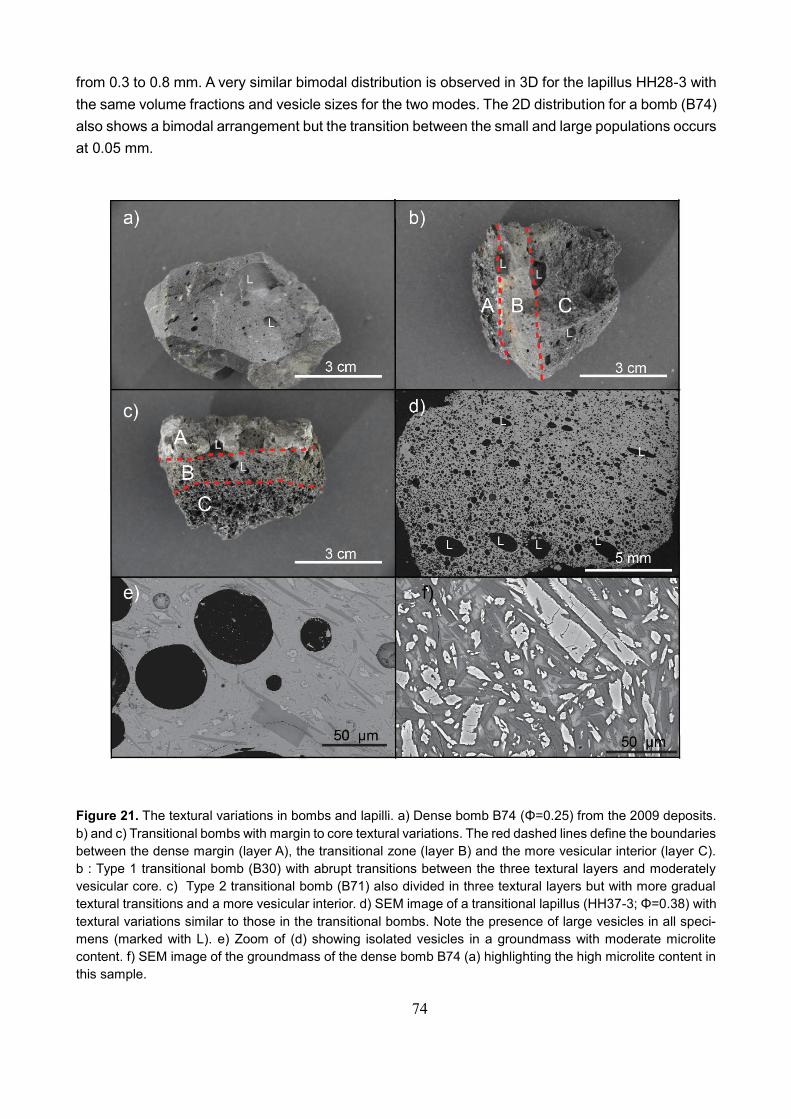
74
from 0.3 to 0.8 mm. A very similar bimodal distribution is observed in 3D for the lapillus HH28-3 with
the same volume fractions and vesicle sizes for the two modes. The 2D distribution for a bomb (B74)
also shows a bimodal arrangement but the transition between the small and large populations occurs
at 0.05 mm.
Figure 21. The textural variations in bombs and lapilli. a) Dense bomb B74 (Φ=0.25) from the 2009 deposits.
b) and c) Transitional bombs with margin to core textural variations. The red dashed lines define the boundaries
between the dense margin (layer A), the transitional zone (layer B) and the more vesicular interior (layer C).
b : Type 1 transitional bomb (B30) with abrupt transitions between the three textural layers and moderately
vesicular core. c) Type 2 transitional bomb (B71) also divided in three textural layers but with more gradual
textural transitions and a more vesicular interior. d) SEM image of a transitional lapillus (HH37-3; Φ=0.38) with
textural variations similar to those in the transitional bombs. Note the presence of large vesicles in all speci-
mens (marked with L). e) Zoom of (d) showing isolated vesicles in a groundmass with moderate microlite
content. f) SEM image of the groundmass of the dense bomb B74 (a) highlighting the high microlite content in
this sample.
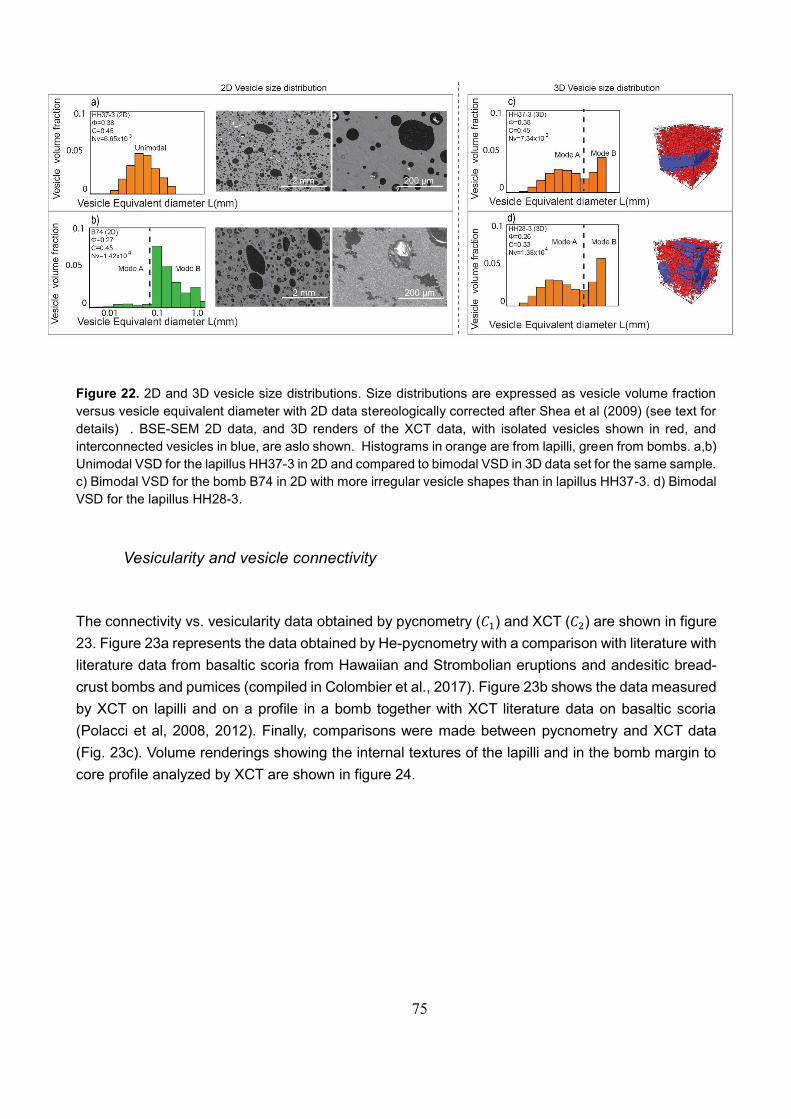
75
Figure 22. 2D and 3D vesicle size distributions. Size distributions are expressed as vesicle volume fraction
versus vesicle equivalent diameter with 2D data stereologically corrected after Shea et al (2009) (see text for
details) . BSE-SEM 2D data, and 3D renders of the XCT data, with isolated vesicles shown in red, and
interconnected vesicles in blue, are aslo shown. Histograms in orange are from lapilli, green from bombs. a,b)
Unimodal VSD for the lapillus HH37-3 in 2D and compared to bimodal VSD in 3D data set for the same sample.
c) Bimodal VSD for the bomb B74 in 2D with more irregular vesicle shapes than in lapillus HH37-3. d) Bimodal
VSD for the lapillus HH28-3.
Vesicularity and vesicle connectivity
The connectivity vs. vesicularity data obtained by pycnometry (𝐶1) and XCT (𝐶2) are shown in figure
23. Figure 23a represents the data obtained by He-pycnometry with a comparison with literature with
literature data from basaltic scoria from Hawaiian and Strombolian eruptions and andesitic bread-
crust bombs and pumices (compiled in Colombier et al., 2017). Figure 23b shows the data measured
by XCT on lapilli and on a profile in a bomb together with XCT literature data on basaltic scoria
(Polacci et al, 2008, 2012). Finally, comparisons were made between pycnometry and XCT data
(Fig. 23c). Volume renderings showing the internal textures of the lapilli and in the bomb margin to
core profile analyzed by XCT are shown in figure 24.
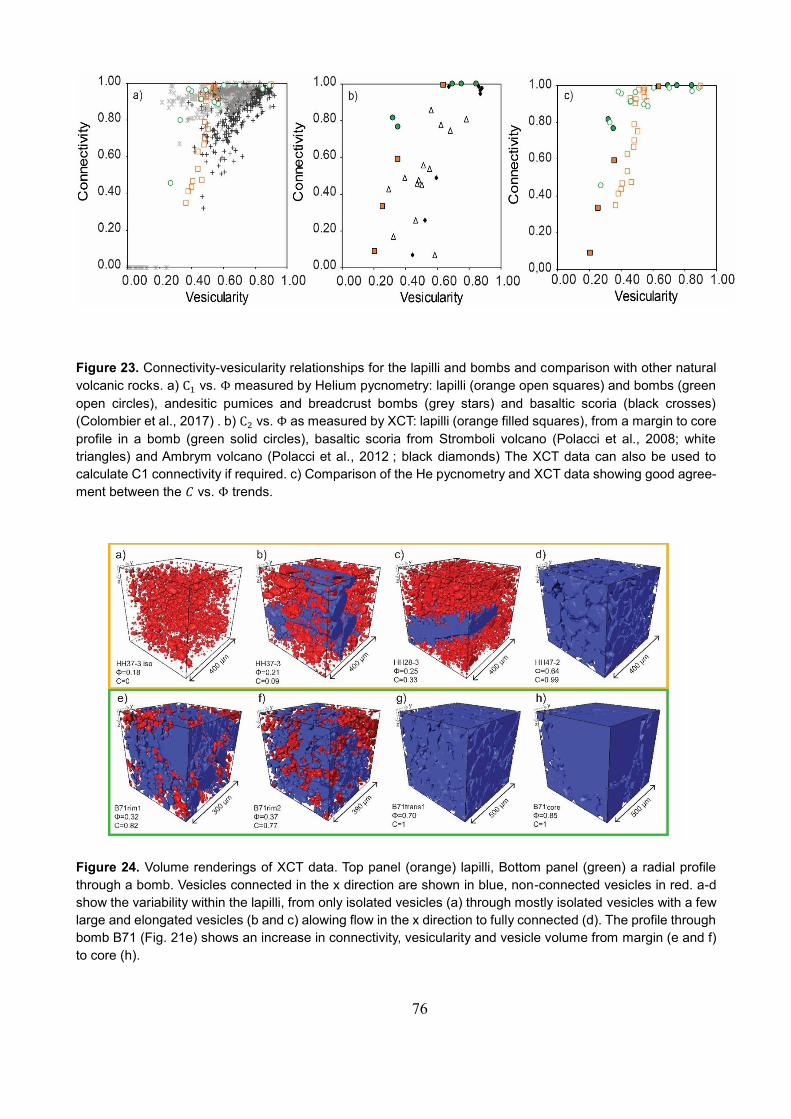
76
Figure 23. Connectivity-vesicularity relationships for the lapilli and bombs and comparison with other natural
volcanic rocks. a) C1 vs. Φ measured by Helium pycnometry: lapilli (orange open squares) and bombs (green
open circles), andesitic pumices and breadcrust bombs (grey stars) and basaltic scoria (black crosses)
(Colombier et al., 2017) . b) C2 vs. Φ as measured by XCT: lapilli (orange filled squares), from a margin to core
profile in a bomb (green solid circles), basaltic scoria from Stromboli volcano (Polacci et al., 2008; white
triangles) and Ambrym volcano (Polacci et al., 2012 ; black diamonds) The XCT data can also be used to
calculate C1 connectivity if required. c) Comparison of the He pycnometry and XCT data showing good agree-
ment between the 𝐶 vs. Φ trends.
Figure 24. Volume renderings of XCT data. Top panel (orange) lapilli, Bottom panel (green) a radial profile
through a bomb. Vesicles connected in the x direction are shown in blue, non-connected vesicles in red. a-d
show the variability within the lapilli, from only isolated vesicles (a) through mostly isolated vesicles with a few
large and elongated vesicles (b and c) alowing flow in the x direction to fully connected (d). The profile through
bomb B71 (Fig. 21e) shows an increase in connectivity, vesicularity and vesicle volume from margin (e and f)
to core (h).
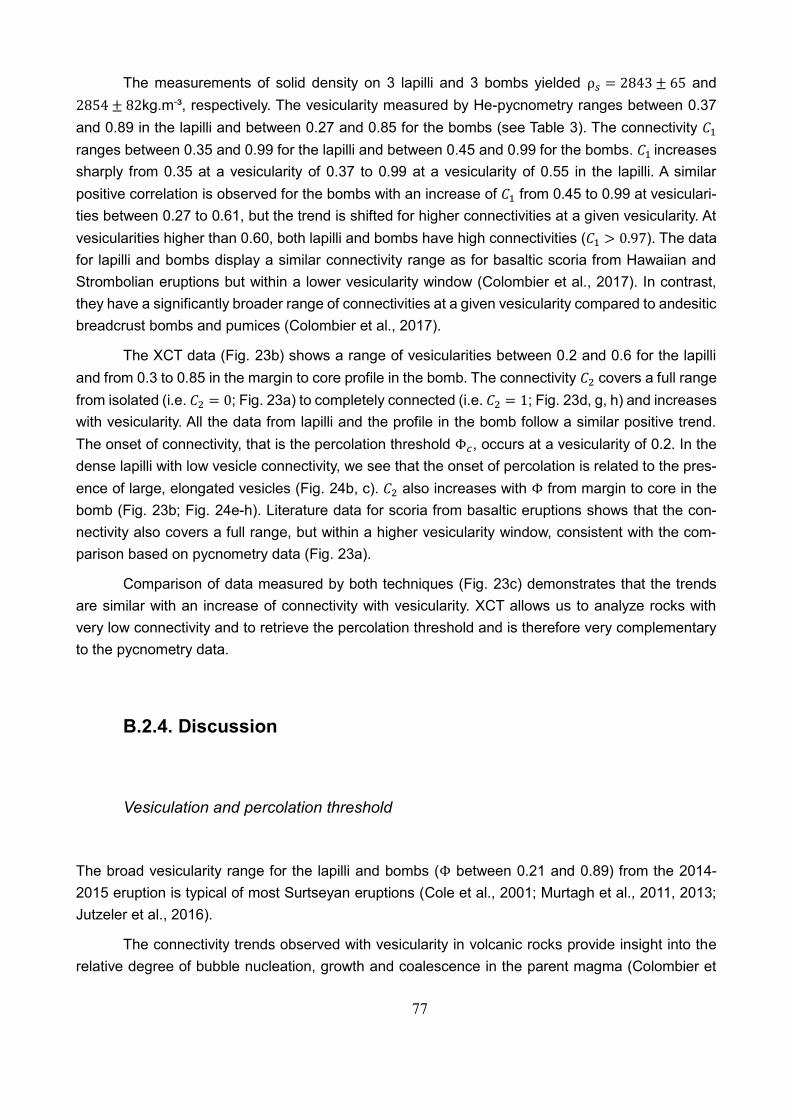
77
The measurements of solid density on 3 lapilli and 3 bombs yielded ρ𝑠 = 2843 ± 65 and
2854 ± 82kg.m-³, respectively. The vesicularity measured by He-pycnometry ranges between 0.37
and 0.89 in the lapilli and between 0.27 and 0.85 for the bombs (see Table 3). The connectivity 𝐶1
ranges between 0.35 and 0.99 for the lapilli and between 0.45 and 0.99 for the bombs. 𝐶1 increases
sharply from 0.35 at a vesicularity of 0.37 to 0.99 at a vesicularity of 0.55 in the lapilli. A similar
positive correlation is observed for the bombs with an increase of 𝐶1 from 0.45 to 0.99 at vesiculari-
ties between 0.27 to 0.61, but the trend is shifted for higher connectivities at a given vesicularity. At
vesicularities higher than 0.60, both lapilli and bombs have high connectivities (𝐶1 > 0.97). The data
for lapilli and bombs display a similar connectivity range as for basaltic scoria from Hawaiian and
Strombolian eruptions but within a lower vesicularity window (Colombier et al., 2017). In contrast,
they have a significantly broader range of connectivities at a given vesicularity compared to andesitic
breadcrust bombs and pumices (Colombier et al., 2017).
The XCT data (Fig. 23b) shows a range of vesicularities between 0.2 and 0.6 for the lapilli
and from 0.3 to 0.85 in the margin to core profile in the bomb. The connectivity 𝐶2 covers a full range
from isolated (i.e. 𝐶2 = 0; Fig. 23a) to completely connected (i.e. 𝐶2 = 1; Fig. 23d, g, h) and increases
with vesicularity. All the data from lapilli and the profile in the bomb follow a similar positive trend.
The onset of connectivity, that is the percolation threshold Φ𝑐, occurs at a vesicularity of 0.2. In the
dense lapilli with low vesicle connectivity, we see that the onset of percolation is related to the pres-
ence of large, elongated vesicles (Fig. 24b, c). 𝐶2 also increases with Φ from margin to core in the
bomb (Fig. 23b; Fig. 24e-h). Literature data for scoria from basaltic eruptions shows that the con-
nectivity also covers a full range, but within a higher vesicularity window, consistent with the com-
parison based on pycnometry data (Fig. 23a).
Comparison of data measured by both techniques (Fig. 23c) demonstrates that the trends
are similar with an increase of connectivity with vesicularity. XCT allows us to analyze rocks with
very low connectivity and to retrieve the percolation threshold and is therefore very complementary
to the pycnometry data.
B.2.4. Discussion
Vesiculation and percolation threshold
The broad vesicularity range for the lapilli and bombs (Φ between 0.21 and 0.89) from the 2014-
2015 eruption is typical of most Surtseyan eruptions (Cole et al., 2001; Murtagh et al., 2011, 2013;
Jutzeler et al., 2016).
The connectivity trends observed with vesicularity in volcanic rocks provide insight into the
relative degree of bubble nucleation, growth and coalescence in the parent magma (Colombier et
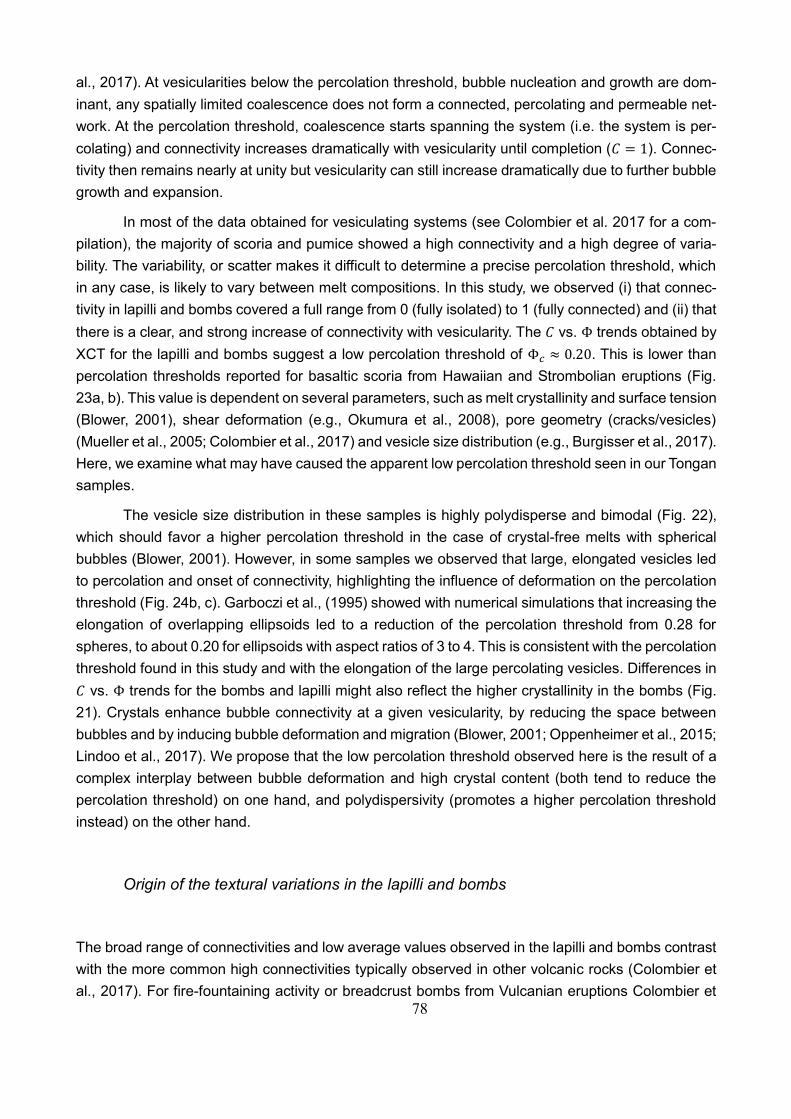
78
al., 2017). At vesicularities below the percolation threshold, bubble nucleation and growth are dom-
inant, any spatially limited coalescence does not form a connected, percolating and permeable net-
work. At the percolation threshold, coalescence starts spanning the system (i.e. the system is per-
colating) and connectivity increases dramatically with vesicularity until completion (𝐶 = 1). Connec-
tivity then remains nearly at unity but vesicularity can still increase dramatically due to further bubble
growth and expansion.
In most of the data obtained for vesiculating systems (see Colombier et al. 2017 for a com-
pilation), the majority of scoria and pumice showed a high connectivity and a high degree of varia-
bility. The variability, or scatter makes it difficult to determine a precise percolation threshold, which
in any case, is likely to vary between melt compositions. In this study, we observed (i) that connec-
tivity in lapilli and bombs covered a full range from 0 (fully isolated) to 1 (fully connected) and (ii) that
there is a clear, and strong increase of connectivity with vesicularity. The 𝐶 vs. Φ trends obtained by
XCT for the lapilli and bombs suggest a low percolation threshold of Φ𝑐 ≈ 0.20. This is lower than
percolation thresholds reported for basaltic scoria from Hawaiian and Strombolian eruptions (Fig.
23a, b). This value is dependent on several parameters, such as melt crystallinity and surface tension
(Blower, 2001), shear deformation (e.g., Okumura et al., 2008), pore geometry (cracks/vesicles)
(Mueller et al., 2005; Colombier et al., 2017) and vesicle size distribution (e.g., Burgisser et al., 2017).
Here, we examine what may have caused the apparent low percolation threshold seen in our Tongan
samples.
The vesicle size distribution in these samples is highly polydisperse and bimodal (Fig. 22),
which should favor a higher percolation threshold in the case of crystal-free melts with spherical
bubbles (Blower, 2001). However, in some samples we observed that large, elongated vesicles led
to percolation and onset of connectivity, highlighting the influence of deformation on the percolation
threshold (Fig. 24b, c). Garboczi et al., (1995) showed with numerical simulations that increasing the
elongation of overlapping ellipsoids led to a reduction of the percolation threshold from 0.28 for
spheres, to about 0.20 for ellipsoids with aspect ratios of 3 to 4. This is consistent with the percolation
threshold found in this study and with the elongation of the large percolating vesicles. Differences in
𝐶 vs. Φ trends for the bombs and lapilli might also reflect the higher crystallinity in the bombs (Fig.
21). Crystals enhance bubble connectivity at a given vesicularity, by reducing the space between
bubbles and by inducing bubble deformation and migration (Blower, 2001; Oppenheimer et al., 2015;
Lindoo et al., 2017). We propose that the low percolation threshold observed here is the result of a
complex interplay between bubble deformation and high crystal content (both tend to reduce the
percolation threshold) on one hand, and polydispersivity (promotes a higher percolation threshold
instead) on the other hand.
Origin of the textural variations in the lapilli and bombs
The broad range of connectivities and low average values observed in the lapilli and bombs contrast
with the more common high connectivities typically observed in other volcanic rocks (Colombier et
al., 2017). For fire-fountaining activity or breadcrust bombs from Vulcanian eruptions Colombier et
79
al., (2017) proposed that low connectivity and broad ranges in connectivity may reflect quenching,
which hindered post-fragmentation vesiculation. The gradual textural variations observed in the
Tongan transitional, margin to core samples are similar to those seen in scoria from fire fountaining
eruptions (e.g., Stovall et al., 2011), breadcrust bombs from Vulcanian eruptions (Giachetti et al.
2010; Wright et al., 2007), or pyroclasts from shallow or deep subaqueous eruptions (e.g., Jutzeler
et al., 2016; Schipper et al., 2010). The margins in such specimens preserve low vesicularity and
small, isolated vesicles, inferred to represent the state of the magma at the point of fragmentation.
By contrast, the cores show large, completely coalesced (connected) vesicles that are interpreted
as the result of extensive bubble growth and coalescence occurring after fragmentation (Stovall et
al. 2011). We therefore propose that the transitional lapilli and bombs from the 2009 and 2014-2015
eruption and the associated 𝐶 vs. Φ trends were the result of post-fragmentation vesiculation. As the
dense, transitional and vesicular lapilli and bombs follow a similar 𝐶 vs. Φ path, all the textures
appear to reflect different degrees of vesiculation that were interrupted by quenching by contact with
water. Hence, dense particles and dense margins of transitional particles had less time for vesicula-
tion, whereas vesicular clasts and cores of transitional particles were insulated enough for bubbles
to continue growing, leading to an increase of connectivity and vesicularity. Variations of the timing
of quenching by water and vesiculation could be due to particle size and initial melt temperature,
along with the radial distance of the melt to the coolant in the case of transitional clasts, or the
presence of an insulating vapour film that would allow longer vesiculation until film collapse and
quenching. In the following section, we explore these processes.
Vesicle size distribution
The vesicle number densities of the Tongan lapilli and bombs (Table 2) have values typical of shallow
subaqueous mafic eruptions (Jutzeler et al., 2016), and the values are similar using either 2D and
3D methods for sample HH37-3 (Table 2). However, there are discrepancies in the vesicle-size dis-
tribution (VSD) in 2D and 3D measurements. For the same lapillus HH37-3, the VSD is unimodal in
2D and bimodal in 3D (Fig. 22a, c). This reflects the presence of a significant population of elongated
vesicles in the dense particles, also observed visually in the most dense lapilli and bombs (Figs. 21
and 24). This population is missed in 2D analysis because the large vesicles were not intersected
along their long-axis during thin-section preparation. This highlights the importance of using 3D tech-
niques for anisotropic textures that are not easily converted from 2D images by stereological tech-
niques.
The population of large vesicles (mode B) is present in both dense and vesicular parts of the
transitional lapilli and bombs. Since the dense margins were formed by water quenching, the large
vesicles must have pre-dated contact with water and were likely present at the time of fragmentation.
Thus, mode B is the result bubble nucleation and growth during magma ascent in the conduit. In
turn, the small vesicles (mode A) increase significantly in size from margin to core, therefore reflect-
ing post-fragmentation vesiculation interrupted at different stages by quenching.
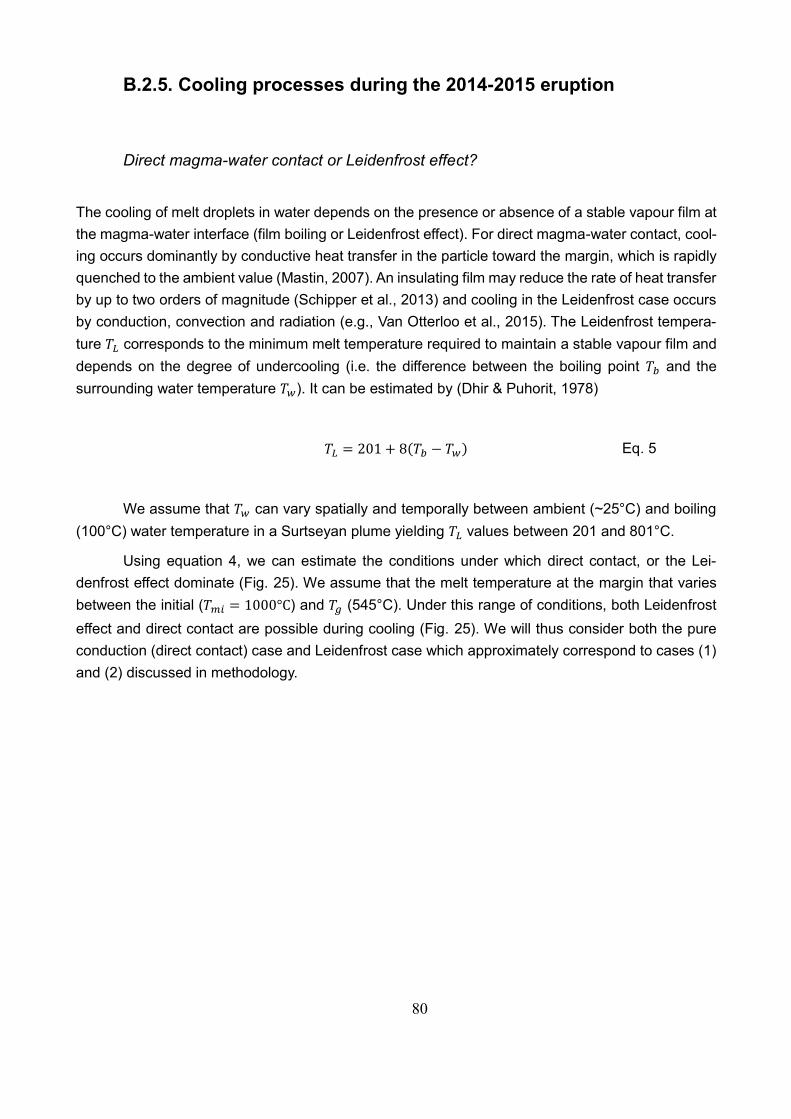
80
B.2.5. Cooling processes during the 2014-2015 eruption
Direct magma-water contact or Leidenfrost effect?
The cooling of melt droplets in water depends on the presence or absence of a stable vapour film at
the magma-water interface (film boiling or Leidenfrost effect). For direct magma-water contact, cool-
ing occurs dominantly by conductive heat transfer in the particle toward the margin, which is rapidly
quenched to the ambient value (Mastin, 2007). An insulating film may reduce the rate of heat transfer
by up to two orders of magnitude (Schipper et al., 2013) and cooling in the Leidenfrost case occurs
by conduction, convection and radiation (e.g., Van Otterloo et al., 2015). The Leidenfrost tempera-
ture 𝑇𝐿 corresponds to the minimum melt temperature required to maintain a stable vapour film and
depends on the degree of undercooling (i.e. the difference between the boiling point 𝑇𝑏 and the
surrounding water temperature 𝑇𝑤). It can be estimated by (Dhir & Puhorit, 1978)
𝑇𝐿 = 201 + 8(𝑇𝑏 − 𝑇𝑤) Eq. 5
We assume that 𝑇𝑤 can vary spatially and temporally between ambient (~25°C) and boiling
(100°C) water temperature in a Surtseyan plume yielding 𝑇𝐿 values between 201 and 801°C.
Using equation 4, we can estimate the conditions under which direct contact, or the Lei-
denfrost effect dominate (Fig. 25). We assume that the melt temperature at the margin that varies
between the initial (𝑇𝑚𝑖 = 1000°C) and 𝑇𝑔 (545°C). Under this range of conditions, both Leidenfrost
effect and direct contact are possible during cooling (Fig. 25). We will thus consider both the pure
conduction (direct contact) case and Leidenfrost case which approximately correspond to cases (1)
and (2) discussed in methodology.
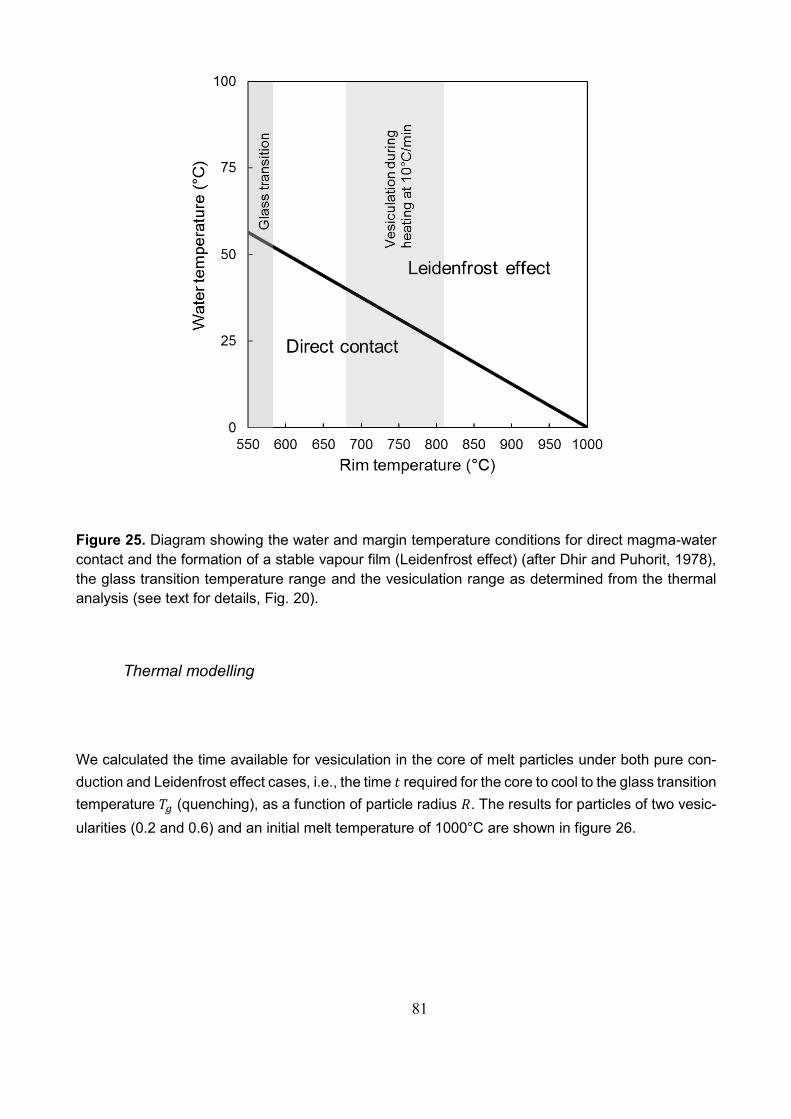
81
Figure 25. Diagram showing the water and margin temperature conditions for direct magma-water
contact and the formation of a stable vapour film (Leidenfrost effect) (after Dhir and Puhorit, 1978),
the glass transition temperature range and the vesiculation range as determined from the thermal
analysis (see text for details, Fig. 20).
Thermal modelling
We calculated the time available for vesiculation in the core of melt particles under both pure con-
duction and Leidenfrost effect cases, i.e., the time 𝑡 required for the core to cool to the glass transition
temperature 𝑇𝑔 (quenching), as a function of particle radius 𝑅. The results for particles of two vesic-
ularities (0.2 and 0.6) and an initial melt temperature of 1000°C are shown in figure 26.
82
Figure 26. Relationship between time available for vesiculation (before quenching below 𝑇𝑔) in the core and
particle radius for both direct contact (solid lines) and Leidenfrost effect (dashed lines) at a vesicularity of 0.2
(black) and 0.6 (red).
The vesiculation time in the core of a particle before quenching to 𝑇𝑔 is dominantly influenced
by the particle radius. For the smallest particles (𝑅 = 5 mm), the time required for the core to reach
𝑇𝑔 is between 6 and 28 s, whereas it takes more than 17.5 hours for the core of the largest particles
(𝑅 = 500 mm). At a given particle radius, we also observe the influence of vesicularity and of the
Leidenfrost effect. For large particle radius (typically 𝑅 > 100 mm), vesicularity has a greater influ-
ence than the Leidenfrost effect on the cooling of the core. Increasing vesicularity increases the time
required to quench a particle. By contrast, the Leidenfrost effect becomes more important as particle
size decreases and the time for vesiculation logically increases in the presence of a stable vapour
film. A power law describes the relationship in the pure conduction case.
We also computed the evolution of the spatial variation of temperature from margin to core
in particles of different sizes and vesicularities for the two contact cases (Fig. 27). In the case of pure
1
10
100
1000
10000
100000
5 50 500
Tim
e fo
r ve
sic
ula
tio
n in
th
e c
ore
t (
s)
Particle radius R (mm)
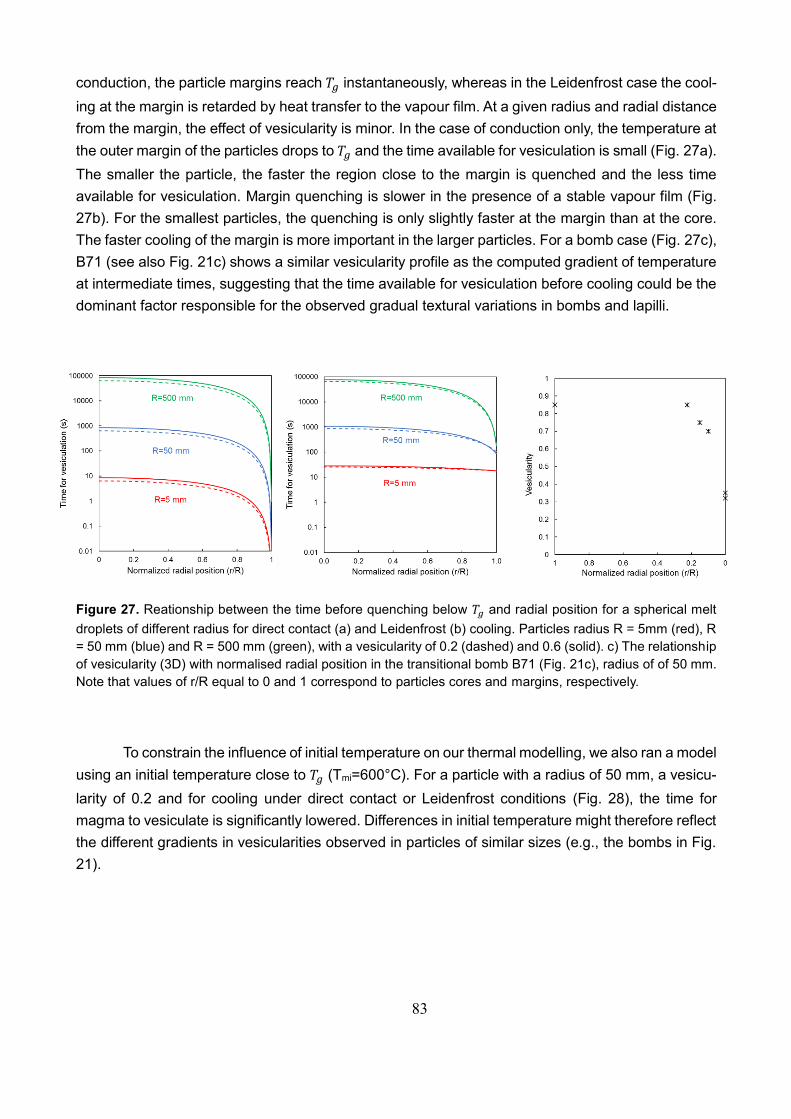
83
conduction, the particle margins reach 𝑇𝑔 instantaneously, whereas in the Leidenfrost case the cool-
ing at the margin is retarded by heat transfer to the vapour film. At a given radius and radial distance
from the margin, the effect of vesicularity is minor. In the case of conduction only, the temperature at
the outer margin of the particles drops to 𝑇𝑔 and the time available for vesiculation is small (Fig. 27a).
The smaller the particle, the faster the region close to the margin is quenched and the less time
available for vesiculation. Margin quenching is slower in the presence of a stable vapour film (Fig.
27b). For the smallest particles, the quenching is only slightly faster at the margin than at the core.
The faster cooling of the margin is more important in the larger particles. For a bomb case (Fig. 27c),
B71 (see also Fig. 21c) shows a similar vesicularity profile as the computed gradient of temperature
at intermediate times, suggesting that the time available for vesiculation before cooling could be the
dominant factor responsible for the observed gradual textural variations in bombs and lapilli.
Figure 27. Reationship between the time before quenching below 𝑇𝑔 and radial position for a spherical melt
droplets of different radius for direct contact (a) and Leidenfrost (b) cooling. Particles radius R = 5mm (red), R
= 50 mm (blue) and R = 500 mm (green), with a vesicularity of 0.2 (dashed) and 0.6 (solid). c) The relationship
of vesicularity (3D) with normalised radial position in the transitional bomb B71 (Fig. 21c), radius of of 50 mm.
Note that values of r/R equal to 0 and 1 correspond to particles cores and margins, respectively.
To constrain the influence of initial temperature on our thermal modelling, we also ran a model
using an initial temperature close to 𝑇𝑔 (Tmi=600°C). For a particle with a radius of 50 mm, a vesicu-
larity of 0.2 and for cooling under direct contact or Leidenfrost conditions (Fig. 28), the time for
magma to vesiculate is significantly lowered. Differences in initial temperature might therefore reflect
the different gradients in vesicularities observed in particles of similar sizes (e.g., the bombs in Fig.
21).
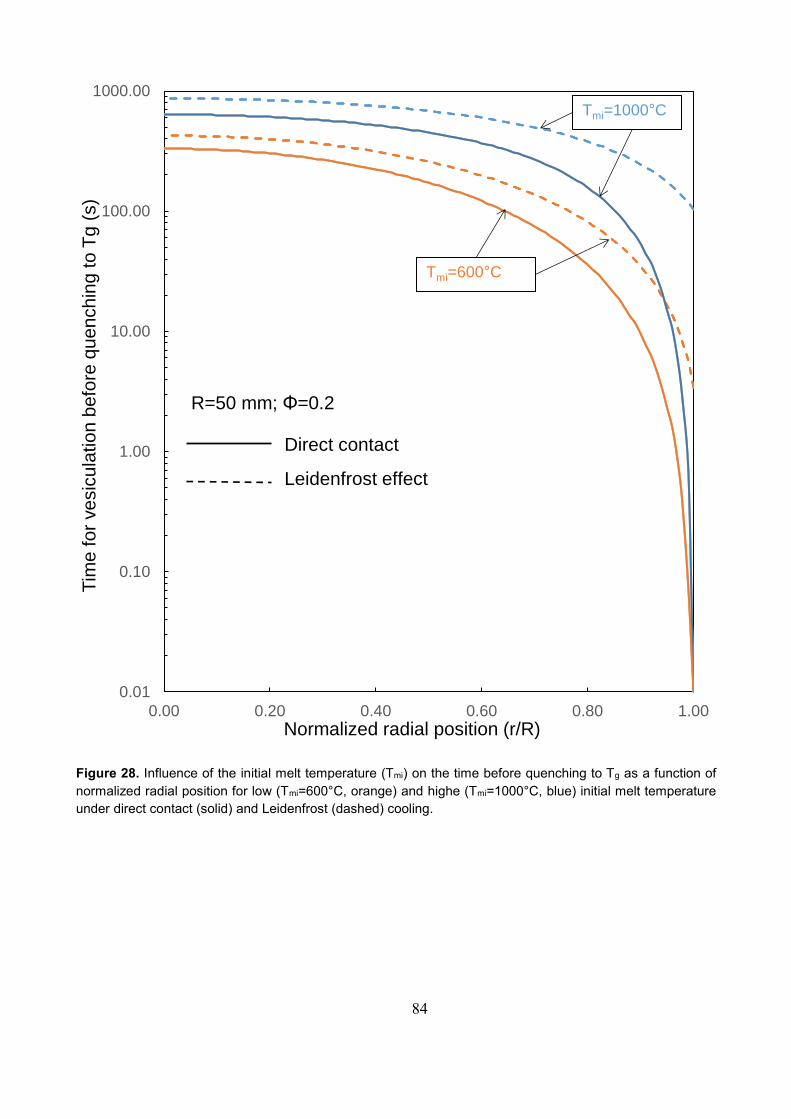
84
Figure 28. Influence of the initial melt temperature (Tmi) on the time before quenching to Tg as a function of
normalized radial position for low (Tmi=600°C, orange) and highe (Tmi=1000°C, blue) initial melt temperature
under direct contact (solid) and Leidenfrost (dashed) cooling.
0.01
0.10
1.00
10.00
100.00
1000.00
0.00 0.20 0.40 0.60 0.80 1.00
Tim
e fo
r ve
sic
ula
tio
n b
efo
re q
ue
nch
ing
to
Tg
(s)
Normalized radial position (r/R)
Tmi=600°CTmi=600°C
Tmi=1000°C
Tmi=600°C
Direct contact
Leidenfrost effect
R=50 mm; Φ=0.2
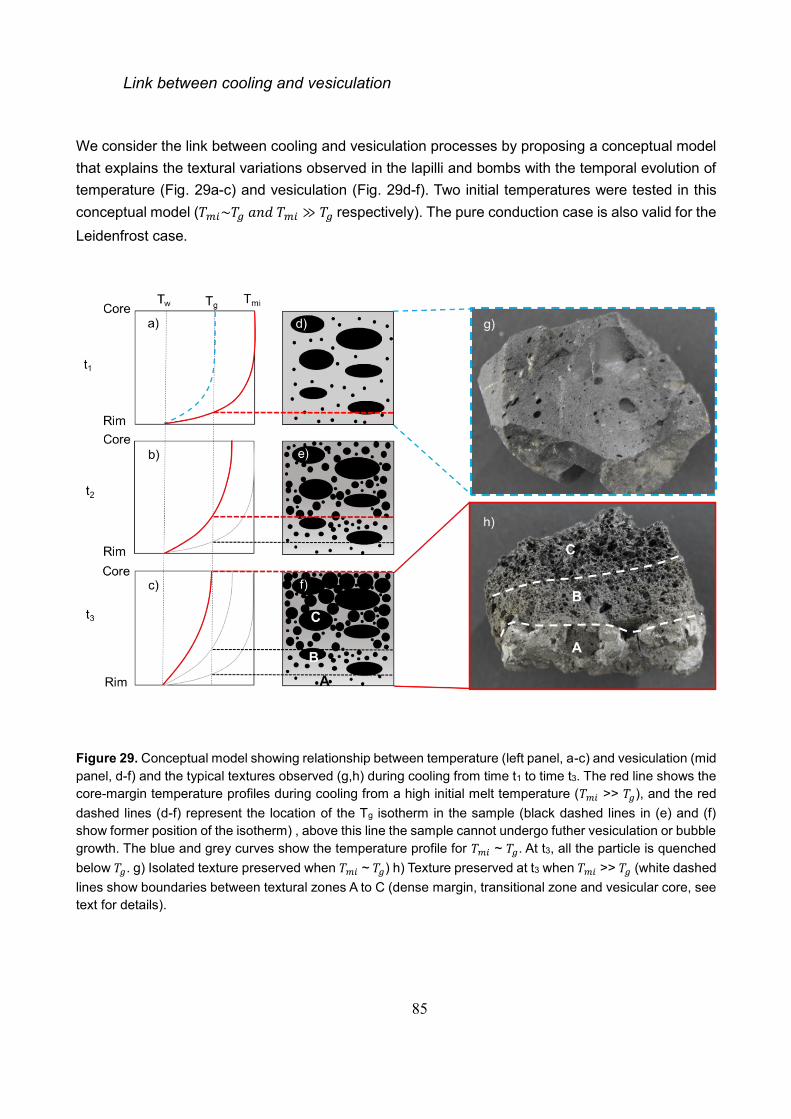
85
Link between cooling and vesiculation
We consider the link between cooling and vesiculation processes by proposing a conceptual model
that explains the textural variations observed in the lapilli and bombs with the temporal evolution of
temperature (Fig. 29a-c) and vesiculation (Fig. 29d-f). Two initial temperatures were tested in this
conceptual model (𝑇𝑚𝑖~𝑇𝑔 𝑎𝑛𝑑 𝑇𝑚𝑖 ≫ 𝑇𝑔 respectively). The pure conduction case is also valid for the
Leidenfrost case.
Figure 29. Conceptual model showing relationship between temperature (left panel, a-c) and vesiculation (mid
panel, d-f) and the typical textures observed (g,h) during cooling from time t1 to time t3. The red line shows the
core-margin temperature profiles during cooling from a high initial melt temperature (𝑇𝑚𝑖 >> 𝑇𝑔), and the red
dashed lines (d-f) represent the location of the Tg isotherm in the sample (black dashed lines in (e) and (f)
show former position of the isotherm) , above this line the sample cannot undergo futher vesiculation or bubble
growth. The blue and grey curves show the temperature profile for 𝑇𝑚𝑖 ~ 𝑇𝑔. At t3, all the particle is quenched
below 𝑇𝑔. g) Isolated texture preserved when 𝑇𝑚𝑖 ~ 𝑇𝑔) h) Texture preserved at t3 when 𝑇𝑚𝑖 >> 𝑇𝑔 (white dashed
lines show boundaries between textural zones A to C (dense margin, transitional zone and vesicular core, see
text for details).
86
In case (1) the Initial melt temperature is close to the glass transition (blue curve in fig. 29a).
At time 𝑡1, the particle contains pre-existing large bubbles and has a low vesicularity (Fig. 29d). At
this low temperature, vesiculation is slow and the whole particle is quickly quenched below 𝑇𝑔 and
preserves a dense texture similar to that at fragmentation (Fig. 29a, d).
In case (2) the Initial melt temperature is highly above 𝑇𝑔 (red curve in fig. 29a). At time 𝑡1,
the particle contains pre-existing large bubbles with low vesicularity and a second bubble nucleation
event starts. The particle margin drops rapidly below 𝑇𝑔 leading to solidification and arrest of the
textural evolution in the margin. Vesiculation continues in the interior. At time 𝑡2, a transitional zone
of the particle between the margin and the core is now also cooled below 𝑇𝑔 (Fig. 29b, e). Vesicula-
tion continues in the core of the particle. At time 𝑡3, the whole particle is cooled below 𝑇𝑔 and a final,
transitional texture is preserved (Fig. 29c, f).
The first case explains the observed dense particles (Fig. 29g) whose textures might be close
to that at the time of fragmentation. Case 2 with cooling and textural evolution from 𝑡1 to 𝑡3 could
readily explain the textures preserved in transitional bombs (Fig. 29h).
Cooling rates during subaqueous eruptions
We were able to estimate the cooling rates at the margins and cores of the particles for both the
direct contact and Leidenfrost cases and compare them to the cooling rates measured by geospeed-
ometry on hyloclastites (Nichols et al., 2009), fine particles and outer margins from lava balloons
(Kueppers et al., 2012) (Fig. 30). The cooling rates at the outer surface of the margin could not be
estimated with the numerical model because of the boundary condition in the case of direct contact
(surface directly cooled to the ambient temperature). We thus chose to measure the cooling rate at
a distance of 1.5 mm from the interface. The cooling rates measured with this protocol are therefore
likely underestimated compared to the real cooling rates at the margin. Furthermore, for simplicity,
only the results of the model for an initial temperature of 1000°C and a porosity of 0.2 are shown
here.
As the particles analysed by geospeedometry represent frequently broken fragments of a
larger cooling magma body, we must estimate the size of these initial cooling magma bodies. For
hyloclastites formed during quenching of pillow lava margins, we estimate a range of size for the
pillows between 2.5 and 50 cm (Walker, 1991; Garcia et al., 2007). For the margins of the lava
balloons which can have diameters of up to 1m but mostly related to the size of the interior gas cavity
that expanded during cooling, we chose the thickness of the lava shell as an approximation of the
initial particle size during cooling of the margin (5-10cm).
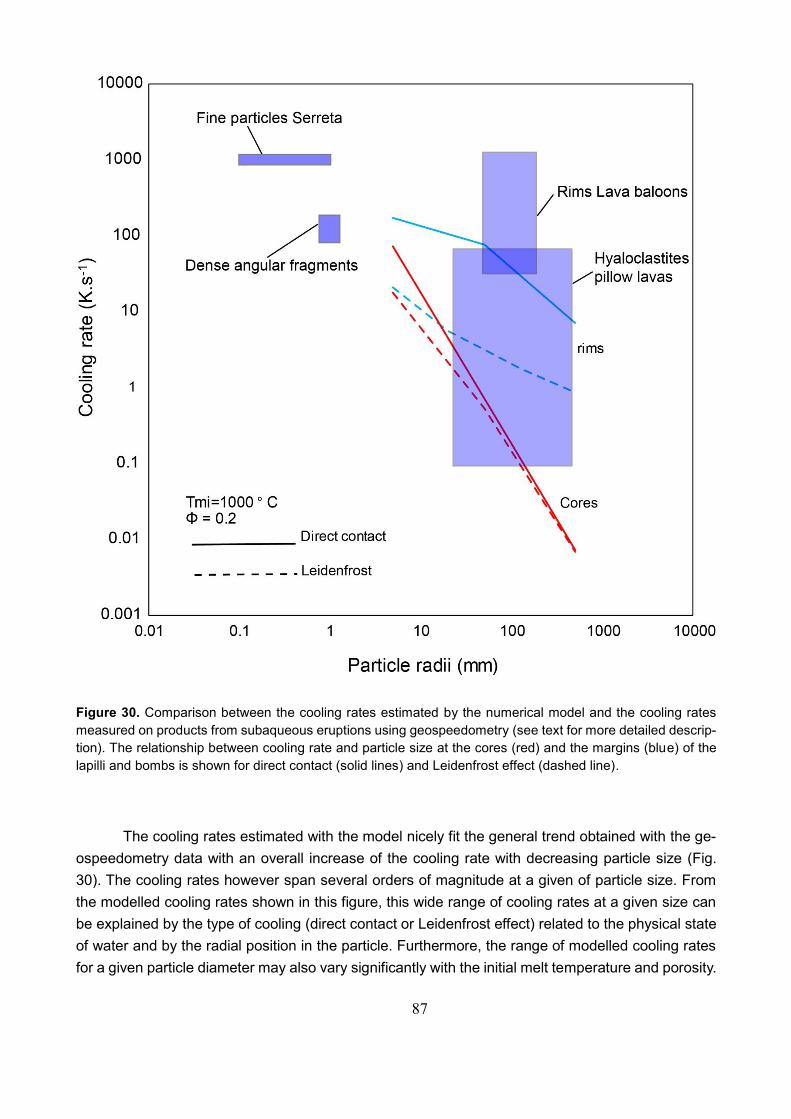
87
Figure 30. Comparison between the cooling rates estimated by the numerical model and the cooling rates
measured on products from subaqueous eruptions using geospeedometry (see text for more detailed descrip-
tion). The relationship between cooling rate and particle size at the cores (red) and the margins (blue) of the
lapilli and bombs is shown for direct contact (solid lines) and Leidenfrost effect (dashed line).
The cooling rates estimated with the model nicely fit the general trend obtained with the ge-
ospeedometry data with an overall increase of the cooling rate with decreasing particle size (Fig.
30). The cooling rates however span several orders of magnitude at a given of particle size. From
the modelled cooling rates shown in this figure, this wide range of cooling rates at a given size can
be explained by the type of cooling (direct contact or Leidenfrost effect) related to the physical state
of water and by the radial position in the particle. Furthermore, the range of modelled cooling rates
for a given particle diameter may also vary significantly with the initial melt temperature and porosity.
88
Studies analysing the cooling rates of subaqueous volcanic particles should therefore consider all
these parameters when discussing the range of values obtained in subaqueous tephra.
B.2.6. Conclusion
Pyroclasts from the Hunga Tonga-Hunga Ha’apai volcano – erupted in 2009 and 2014-2015 – con-
tain textural clues to the conditions of their formation. We have combined 2D and 3D vesicle-scale
analyses to constrain bulk vesicularity and vesicle metrics from margin-to-core in bombs and lapilli
of a range of sizes. We additionally ran a numerical thermal model that resulted in a conceptual and
a quantitative view of the cooling trajectory of these same particles. We conclude that the particle
size, Leidenfrost effect and initial temperature are the dominant factor in explaining how these par-
ticles continued to vesiculate post-fragmentation. A combination of textural and numerical constraints
is the key to understanding submarine and emergent eruptions that are difficult to characterize in
situ during the event. Conditions of cooling in a Surtseyan eruption are an interesting test bed, be-
cause they display a variety of cooling/quenching conditions that influence the intensity of thermal
stress experienced by glassy particles and the subsequent quench-induced fragmentation (see Sec-
tion B.3). This, in turn influences the amount of fine ash in Surtseyan plumes – which is a notable
aviation hazard. For this reason, further work should experimentally focus on the link between cool-
ing and secondary fragmentation processes in conditions relevant to Surtseyan settings. Geospeed-
ometry measurements on glassy particles of different size from Surtseyan eruptions could be addi-
tionally used to test the results of our thermal modelling and explore the role of particle size and
vesicularity on cooling, as well as track the evolution of cooling rates during progressive emergence
of tuff cones.
89
B.3. In situ granulation of particle surfaces by
thermal stress during Surtseyan eruptions
Surtseyan eruptions occur in subaqueous settings and are named after the 1963-1967 eruption of
Surtsey, Iceland (Thorarinsson, 1967), which followed a similar eruption at Capelinhos (1957-1958).
One of the most recent of these was at Hunga Tonga-Hunga Ha’apai in 2014-2015 which caused
cancellation of international flights due to widespread ash dispersal (Global Volcanism Program,
2015). In contrast with subaerial eruptions, water is a more efficient cooling medium, with a high
specific heat capacity and thermal conductivity compared with air. Accordingly, magma fragmenta-
tion mechanisms, cooling, vesiculation, aggregation, recycling and particle dispersal are strongly
affected. Surtseyan eruptions may generate high volcanic ash plumes posing hazards related to ash
fall, surges or tsunamis (Németh et al., 2006) as well as disrupting air traffic. It is therefore important
to understand the processes that control the amount and dispersal of ash from Surtseyan eruptions.
Magma disruption during Surtseyan eruptions can be both explosive and non-explosive with
processes that include: (i) magmatic fragmentation driven by volatile exsolution and controlled by
the degassing or outgassing conditions (e.g., Gonnermann, 2015); (ii) molten-fuel-coolant interac-
tions (MFCI; Zimanowski et al., 1997); (iii) steam-driven explosions (e.g., Kilgour et al., 2010); (iv)
thermal granulation (e.g., Kokelaar, 1986); and (v) turbulent shedding (Mastin, 2007; Mastin et al.,
2009). Fragmentation intensity and mechanisms depend on the melt-water interface (premixing), the
water-to-melt ratio, as well as the melt and water temperatures (Zimanowski et al., 1997; Sonder et
al., 2011; Wohletz et al., 2013; van Otterloo et al., 2015). Thermal granulation is in situ magma
fragmentation caused by rapid cooling by water. Thermal stresses develop when local volume equi-
librium in the melt or glass cannot be achieved in the cooling time available. This in turn can result
in tensile cooling cracks if the thermally-induced stresses rise above the melt or glass strength (van
Otterloo et al., 2015). Recent studies proposed that Surtseyan eruptions cannot be explained by any
single fragmentation mechanism, but rather by a feedback between magmatic fragmentation, MFCI
and thermal granulation (Graettinger et al., 2013; Schipper and White, 2016).
Aggregation of ash particles is a common process during eruptions involving water (e.g.,
Waters and Fisher, 1971; Moore, 1985; Cole et al., 2001; Brown et al., 2012). Moore (1985) noted
that ash “coated” lapilli were the dominant constituent of the deposits at Surtsey (1963-1967). Un-
derstanding the formation of these particles is important, because they imply the entrapment of ash
particles instead of individual dispersal in plumes. Hence, the stability of ash haloes around particles
is also an important control on the amount of ash in a plume and consequently the dispersal and
hazard.
90
We examined samples from the Capelinhos (1957-1958) and Hunga Tonga-Hunga Ha’apai
(2014-2015) eruptions using 3D X-ray micro-computed tomography (XCT). These ash-encased py-
roclastic particles were previously interpreted as the result of aggregation in a vapour and particle-
rich mixture (Mueller, 2003). Here we propose an alternative formation mechanism, and show how
the ash rim is actually jigsaw-fit and therefore formed in situ, analogous to hyaloclastite (water/ice-
magma interaction) and peperite (wet sediment-magma interaction) deposits. We further conclude
that thermal granulation is a major secondary fragmentation process generating ash in Surtseyan
plumes.
B.3.1. Geological context
Capelinhos: The eruption off the western tip of Faial island (Azores, Portugal) lasted from September
1957 through October 1958. Eruptions were sporadic and included at least two cycles of shift from
Surtseyan to magmatic as water became progressively excluded from the vent (Machado et al.,
1962). The newly formed island joined onto Faial with much of the tephra also dispersed onto the
existing island (Machado et al., 1962). The samples here were from primary fall deposits at the
western and northern beach. The units comprised loose, cm- to dm-thick beds of mainly massive or
weakly stratified, poorly sorted ash-lapilli tuffs (~2-4 mm modal particle size).
Hunga Tonga-Hunga Ha’apai: The eruption occurred in the intra-oceanic Tonga-Kermadec arc ~67
km north-northwest of Nuku’alofa (Kingdom of Tonga) between two existing islands of Hunga Tonga
and Hunga Ha’apai. The activity lasted between 19th of September 2014 and 24th of January 2015
and formed a new near-circular tephra cone, ~120 m high and 2 km wide that coalesced with the
pre-existing islands. The edifice was constructed by alternating tephra jets (up to 750 m high) and
base surges, accompanied by fall from steam and ash plumes that rose up to 10 km into the atmos-
phere. Cancellation of international flights on the 13th and 14th of January were caused by ash dis-
persed up to 870 km from the volcano (Global Volcanism Program, 2015). The samples analysed
here were collected from fall deposits from the margins of the new cone and base surge deposits
extending onto the pre-existing islands (~3-5 mm modal particle size).
B.3.2. Methodology
Image analysis
We selected 9 ash-encased lapilli (4 from Hunga Tonga-Hunga Ha’apai volcano and 5 from Cape-
linhos) and analysed them by X-ray computed tomography. Scanning was performed using a GE®
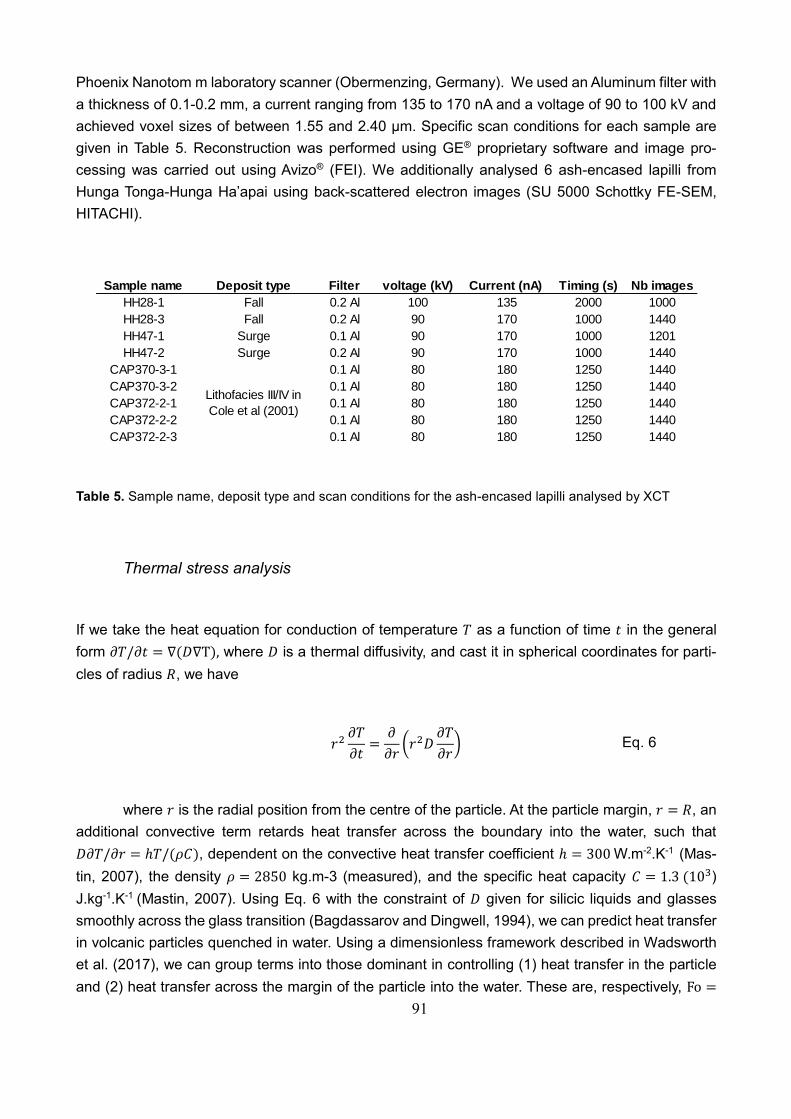
91
Phoenix Nanotom m laboratory scanner (Obermenzing, Germany). We used an Aluminum filter with
a thickness of 0.1-0.2 mm, a current ranging from 135 to 170 nA and a voltage of 90 to 100 kV and
achieved voxel sizes of between 1.55 and 2.40 μm. Specific scan conditions for each sample are
given in Table 5. Reconstruction was performed using GE® proprietary software and image pro-
cessing was carried out using Avizo® (FEI). We additionally analysed 6 ash-encased lapilli from
Hunga Tonga-Hunga Ha’apai using back-scattered electron images (SU 5000 Schottky FE-SEM,
HITACHI).
Table 5. Sample name, deposit type and scan conditions for the ash-encased lapilli analysed by XCT
Thermal stress analysis
If we take the heat equation for conduction of temperature 𝑇 as a function of time 𝑡 in the general
form 𝜕𝑇/𝜕𝑡 = ∇(𝐷∇T), where 𝐷 is a thermal diffusivity, and cast it in spherical coordinates for parti-
cles of radius 𝑅, we have
𝑟2
𝜕𝑇
𝜕𝑡=
𝜕
𝜕𝑟(𝑟2𝐷
𝜕𝑇
𝜕𝑟) Eq. 6
where 𝑟 is the radial position from the centre of the particle. At the particle margin, 𝑟 = 𝑅, an
additional convective term retards heat transfer across the boundary into the water, such that
𝐷𝜕𝑇/𝜕𝑟 = ℎ𝑇/(𝜌𝐶), dependent on the convective heat transfer coefficient ℎ = 300 W.m-2.K-1 (Mas-
tin, 2007), the density 𝜌 = 2850 kg.m-3 (measured), and the specific heat capacity 𝐶 = 1.3 (103)
J.kg-1.K-1 (Mastin, 2007). Using Eq. 6 with the constraint of 𝐷 given for silicic liquids and glasses
smoothly across the glass transition (Bagdassarov and Dingwell, 1994), we can predict heat transfer
in volcanic particles quenched in water. Using a dimensionless framework described in Wadsworth
et al. (2017), we can group terms into those dominant in controlling (1) heat transfer in the particle
and (2) heat transfer across the margin of the particle into the water. These are, respectively, Fo =
Sample name Deposit type Filter voltage (kV) Current (nA) Timing (s) Nb images
HH28-1 Fall 0.2 Al 100 135 2000 1000
HH28-3 Fall 0.2 Al 90 170 1000 1440
HH47-1 Surge 0.1 Al 90 170 1000 1201
HH47-2 Surge 0.2 Al 90 170 1000 1440
CAP370-3-1 0.1 Al 80 180 1250 1440
CAP370-3-2 0.1 Al 80 180 1250 1440
CAP372-2-1 0.1 Al 80 180 1250 1440
CAP372-2-2 0.1 Al 80 180 1250 1440
CAP372-2-3 0.1 Al 80 180 1250 1440
Lithofacies III/IV in
Cole et al (2001)
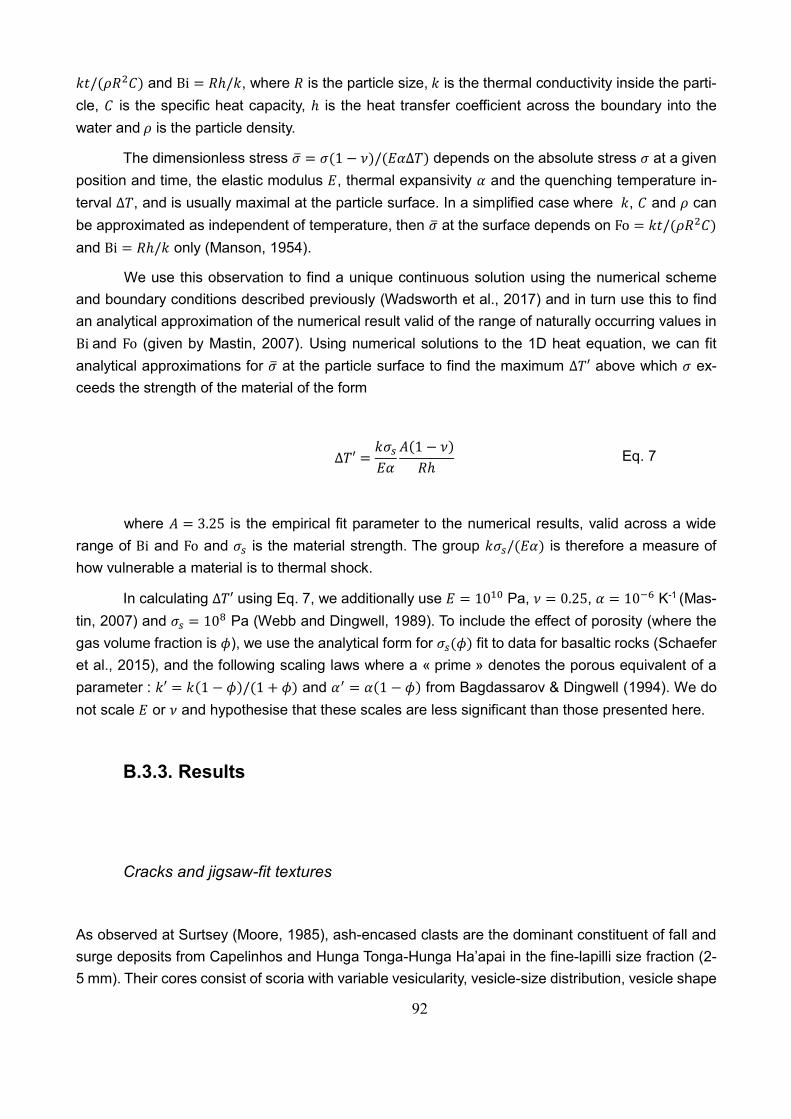
92
𝑘𝑡/(𝜌𝑅2𝐶) and Bi = 𝑅ℎ/𝑘, where 𝑅 is the particle size, 𝑘 is the thermal conductivity inside the parti-
cle, 𝐶 is the specific heat capacity, ℎ is the heat transfer coefficient across the boundary into the
water and 𝜌 is the particle density.
The dimensionless stress �̅� = 𝜎(1 − 𝜈)/(𝐸𝛼Δ𝑇) depends on the absolute stress 𝜎 at a given
position and time, the elastic modulus 𝐸, thermal expansivity 𝛼 and the quenching temperature in-
terval Δ𝑇, and is usually maximal at the particle surface. In a simplified case where 𝑘, 𝐶 and 𝜌 can
be approximated as independent of temperature, then �̅� at the surface depends on Fo = 𝑘𝑡/(𝜌𝑅2𝐶)
and Bi = 𝑅ℎ/𝑘 only (Manson, 1954).
We use this observation to find a unique continuous solution using the numerical scheme
and boundary conditions described previously (Wadsworth et al., 2017) and in turn use this to find
an analytical approximation of the numerical result valid of the range of naturally occurring values in
Bi and Fo (given by Mastin, 2007). Using numerical solutions to the 1D heat equation, we can fit
analytical approximations for �̅� at the particle surface to find the maximum Δ𝑇′ above which 𝜎 ex-
ceeds the strength of the material of the form
Δ𝑇′ =
𝑘𝜎𝑠
𝐸𝛼
𝐴(1 − 𝜈)
𝑅ℎ Eq. 7
where 𝐴 = 3.25 is the empirical fit parameter to the numerical results, valid across a wide
range of Bi and Fo and 𝜎𝑠 is the material strength. The group 𝑘𝜎𝑠/(𝐸𝛼) is therefore a measure of
how vulnerable a material is to thermal shock.
In calculating Δ𝑇′ using Eq. 7, we additionally use 𝐸 = 1010 Pa, 𝜈 = 0.25, 𝛼 = 10−6 K-1 (Mas-
tin, 2007) and 𝜎𝑠 = 108 Pa (Webb and Dingwell, 1989). To include the effect of porosity (where the
gas volume fraction is 𝜙), we use the analytical form for 𝜎𝑠(𝜙) fit to data for basaltic rocks (Schaefer
et al., 2015), and the following scaling laws where a « prime » denotes the porous equivalent of a
parameter : 𝑘′ = 𝑘(1 − 𝜙)/(1 + 𝜙) and 𝛼′ = 𝛼(1 − 𝜙) from Bagdassarov & Dingwell (1994). We do
not scale 𝐸 or 𝜈 and hypothesise that these scales are less significant than those presented here.
B.3.3. Results
Cracks and jigsaw-fit textures
As observed at Surtsey (Moore, 1985), ash-encased clasts are the dominant constituent of fall and
surge deposits from Capelinhos and Hunga Tonga-Hunga Ha’apai in the fine-lapilli size fraction (2-
5 mm). Their cores consist of scoria with variable vesicularity, vesicle-size distribution, vesicle shape
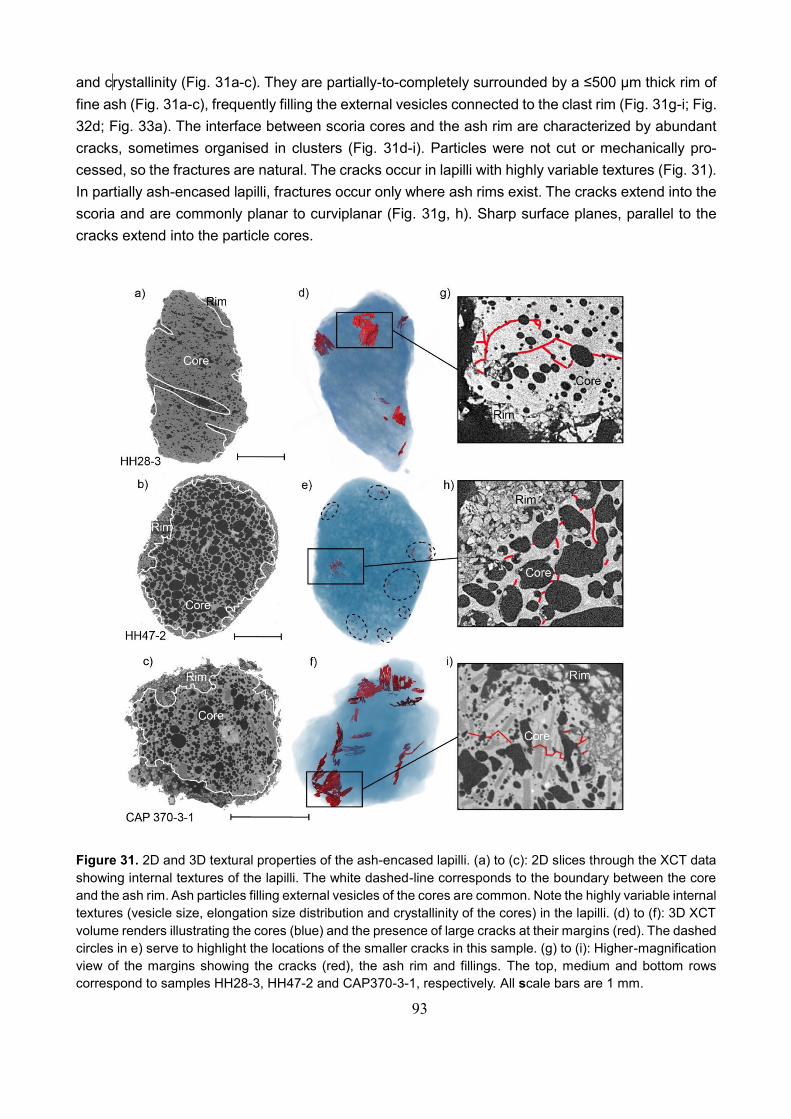
93
and c rystallinity (Fig. 31a-c). They are partially-to-completely surrounded by a ≤500 µm thick rim of
fine ash (Fig. 31a-c), frequently filling the external vesicles connected to the clast rim (Fig. 31g-i; Fig.
32d; Fig. 33a). The interface between scoria cores and the ash rim are characterized by abundant
cracks, sometimes organised in clusters (Fig. 31d-i). Particles were not cut or mechanically pro-
cessed, so the fractures are natural. The cracks occur in lapilli with highly variable textures (Fig. 31).
In partially ash-encased lapilli, fractures occur only where ash rims exist. The cracks extend into the
scoria and are commonly planar to curviplanar (Fig. 31g, h). Sharp surface planes, parallel to the
cracks extend into the particle cores.
Figure 31. 2D and 3D textural properties of the ash-encased lapilli. (a) to (c): 2D slices through the XCT data
showing internal textures of the lapilli. The white dashed-line corresponds to the boundary between the core
and the ash rim. Ash particles filling external vesicles of the cores are common. Note the highly variable internal
textures (vesicle size, elongation size distribution and crystallinity of the cores) in the lapilli. (d) to (f): 3D XCT
volume renders illustrating the cores (blue) and the presence of large cracks at their margins (red). The dashed
circles in e) serve to highlight the locations of the smaller cracks in this sample. (g) to (i): Higher-magnification
view of the margins showing the cracks (red), the ash rim and fillings. The top, medium and bottom rows
correspond to samples HH28-3, HH47-2 and CAP370-3-1, respectively. All scale bars are 1 mm.
94
In the ash rim, and at the contact to the core, we observed matching jigsaw-fit fracture planes
(Fig. 32a-c), vesicle concavities (Fig. 32a, e) and crystal fragments (Fig. 32b, c). Many of the jigsaw
textured domains show varying degrees of internal particle rotation and/or displacement down to the
scale of the smallest particles (~20 µm) clearly observable with the nano-XCT resolution. The crack
number density decreases from the ash rim towards the scoria core (Figs. 31, 32).
Figure 32. Jigsaw-fit textures. (a) 2D slice through the XCT data of sample HH47-2 showing the jigsaw-fit
texture in the ash rim at the margins of a vesicular core (highlighted in pink solid line). All the particles fit
together and with the core. The red dashed line corresponds to a vesicle concavity common to several ash
particles and to the core. Note the high number density and small size of the cracks in this area. (b) BSE- SEM
image of the sample HH37-3 showing the jigsaw-fit textures at the rim of a dense core, with (c) four jigsaw-fit
particles separated by cracks and sharing matching crystal fragments. (d) 2D slice through XCT data of sample
CAP372-2-3 showing the margins of a core (pink outline) and the associated ash rim jigsaw-fit particles (out-
lined in blue solid lines). Small particles could not identified as jigsaw-fit due to voxel resolution. Particles 1
and 2 represent two fitting particles with a vesicle concavity in common, and fit with a part of the core (3). (e)
XCT volume render of the two jigsaw-fit particles in (d) viewed from two different angles. The five matching
vesicle concavities are highlighted in red dashed circles.
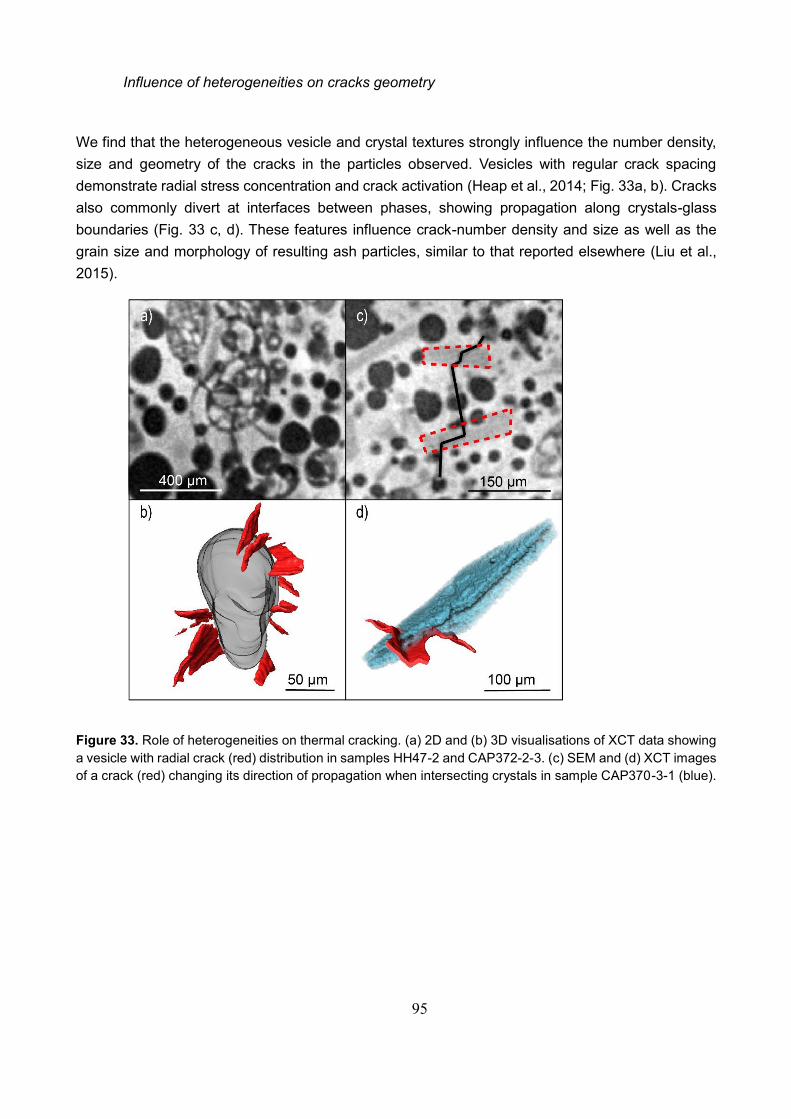
95
Influence of heterogeneities on cracks geometry
We find that the heterogeneous vesicle and crystal textures strongly influence the number density,
size and geometry of the cracks in the particles observed. Vesicles with regular crack spacing
demonstrate radial stress concentration and crack activation (Heap et al., 2014; Fig. 33a, b). Cracks
also commonly divert at interfaces between phases, showing propagation along crystals-glass
boundaries (Fig. 33 c, d). These features influence crack-number density and size as well as the
grain size and morphology of resulting ash particles, similar to that reported elsewhere (Liu et al.,
2015).
Figure 33. Role of heterogeneities on thermal cracking. (a) 2D and (b) 3D visualisations of XCT data showing
a vesicle with radial crack (red) distribution in samples HH47-2 and CAP372-2-3. (c) SEM and (d) XCT images
of a crack (red) changing its direction of propagation when intersecting crystals in sample CAP370-3-1 (blue).
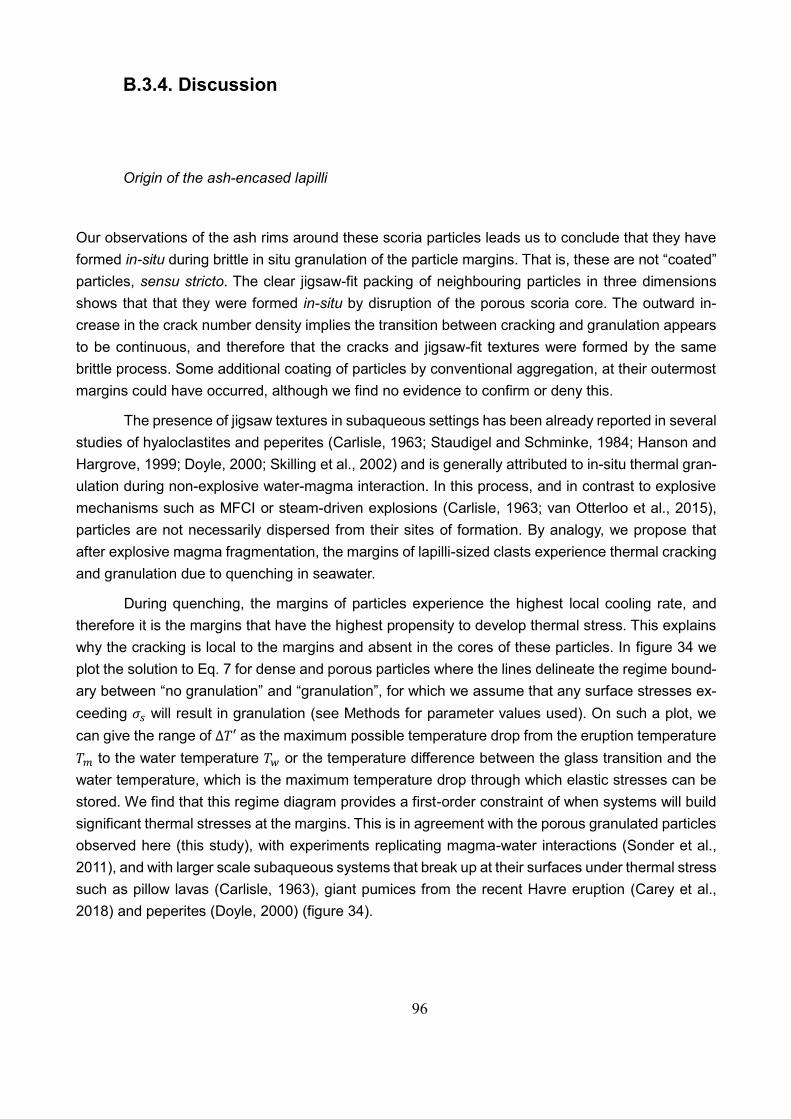
96
B.3.4. Discussion
Origin of the ash-encased lapilli
Our observations of the ash rims around these scoria particles leads us to conclude that they have
formed in-situ during brittle in situ granulation of the particle margins. That is, these are not “coated”
particles, sensu stricto. The clear jigsaw-fit packing of neighbouring particles in three dimensions
shows that that they were formed in-situ by disruption of the porous scoria core. The outward in-
crease in the crack number density implies the transition between cracking and granulation appears
to be continuous, and therefore that the cracks and jigsaw-fit textures were formed by the same
brittle process. Some additional coating of particles by conventional aggregation, at their outermost
margins could have occurred, although we find no evidence to confirm or deny this.
The presence of jigsaw textures in subaqueous settings has been already reported in several
studies of hyaloclastites and peperites (Carlisle, 1963; Staudigel and Schminke, 1984; Hanson and
Hargrove, 1999; Doyle, 2000; Skilling et al., 2002) and is generally attributed to in-situ thermal gran-
ulation during non-explosive water-magma interaction. In this process, and in contrast to explosive
mechanisms such as MFCI or steam-driven explosions (Carlisle, 1963; van Otterloo et al., 2015),
particles are not necessarily dispersed from their sites of formation. By analogy, we propose that
after explosive magma fragmentation, the margins of lapilli-sized clasts experience thermal cracking
and granulation due to quenching in seawater.
During quenching, the margins of particles experience the highest local cooling rate, and
therefore it is the margins that have the highest propensity to develop thermal stress. This explains
why the cracking is local to the margins and absent in the cores of these particles. In figure 34 we
plot the solution to Eq. 7 for dense and porous particles where the lines delineate the regime bound-
ary between “no granulation” and “granulation”, for which we assume that any surface stresses ex-
ceeding 𝜎𝑠 will result in granulation (see Methods for parameter values used). On such a plot, we
can give the range of Δ𝑇′ as the maximum possible temperature drop from the eruption temperature
𝑇𝑚 to the water temperature 𝑇𝑤 or the temperature difference between the glass transition and the
water temperature, which is the maximum temperature drop through which elastic stresses can be
stored. We find that this regime diagram provides a first-order constraint of when systems will build
significant thermal stresses at the margins. This is in agreement with the porous granulated particles
observed here (this study), with experiments replicating magma-water interactions (Sonder et al.,
2011), and with larger scale subaqueous systems that break up at their surfaces under thermal stress
such as pillow lavas (Carlisle, 1963), giant pumices from the recent Havre eruption (Carey et al.,
2018) and peperites (Doyle, 2000) (figure 34).
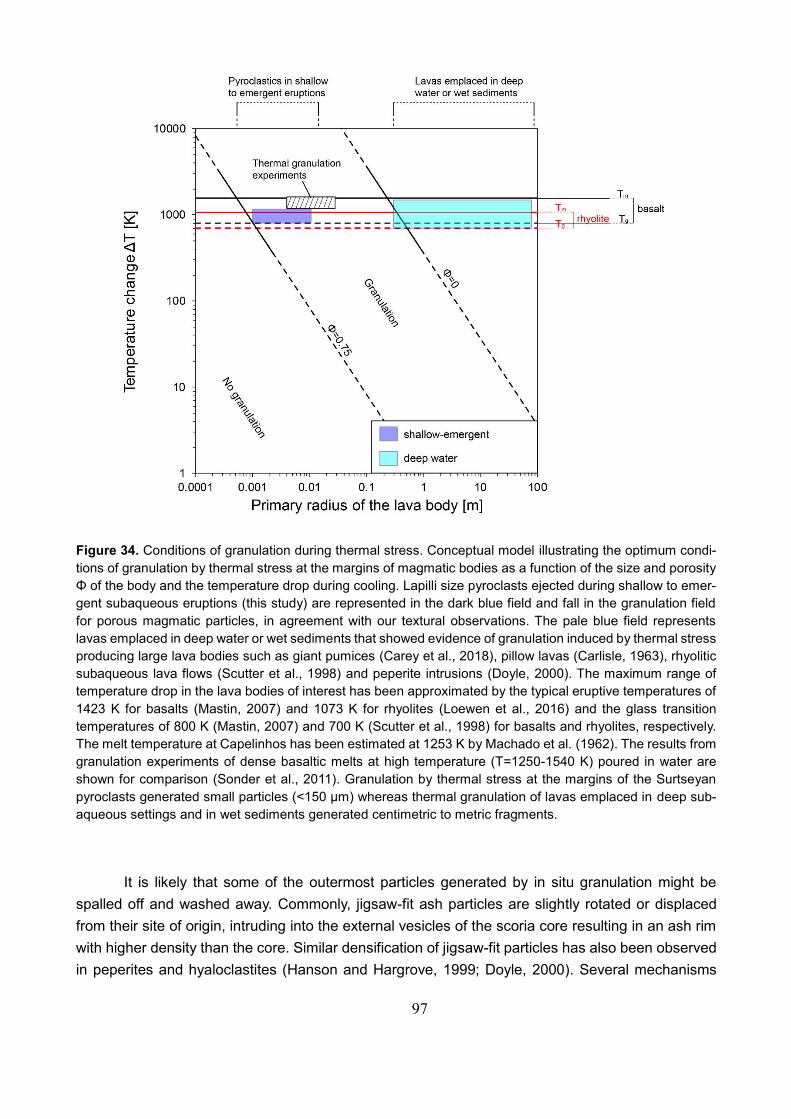
97
Figure 34. Conditions of granulation during thermal stress. Conceptual model illustrating the optimum condi-
tions of granulation by thermal stress at the margins of magmatic bodies as a function of the size and porosity
Φ of the body and the temperature drop during cooling. Lapilli size pyroclasts ejected during shallow to emer-
gent subaqueous eruptions (this study) are represented in the dark blue field and fall in the granulation field
for porous magmatic particles, in agreement with our textural observations. The pale blue field represents
lavas emplaced in deep water or wet sediments that showed evidence of granulation induced by thermal stress
producing large lava bodies such as giant pumices (Carey et al., 2018), pillow lavas (Carlisle, 1963), rhyolitic
subaqueous lava flows (Scutter et al., 1998) and peperite intrusions (Doyle, 2000). The maximum range of
temperature drop in the lava bodies of interest has been approximated by the typical eruptive temperatures of
1423 K for basalts (Mastin, 2007) and 1073 K for rhyolites (Loewen et al., 2016) and the glass transition
temperatures of 800 K (Mastin, 2007) and 700 K (Scutter et al., 1998) for basalts and rhyolites, respectively.
The melt temperature at Capelinhos has been estimated at 1253 K by Machado et al. (1962). The results from
granulation experiments of dense basaltic melts at high temperature (T=1250-1540 K) poured in water are
shown for comparison (Sonder et al., 2011). Granulation by thermal stress at the margins of the Surtseyan
pyroclasts generated small particles (<150 µm) whereas thermal granulation of lavas emplaced in deep sub-
aqueous settings and in wet sediments generated centimetric to metric fragments.
It is likely that some of the outermost particles generated by in situ granulation might be
spalled off and washed away. Commonly, jigsaw-fit ash particles are slightly rotated or displaced
from their site of origin, intruding into the external vesicles of the scoria core resulting in an ash rim
with higher density than the core. Similar densification of jigsaw-fit particles has also been observed
in peperites and hyaloclastites (Hanson and Hargrove, 1999; Doyle, 2000). Several mechanisms
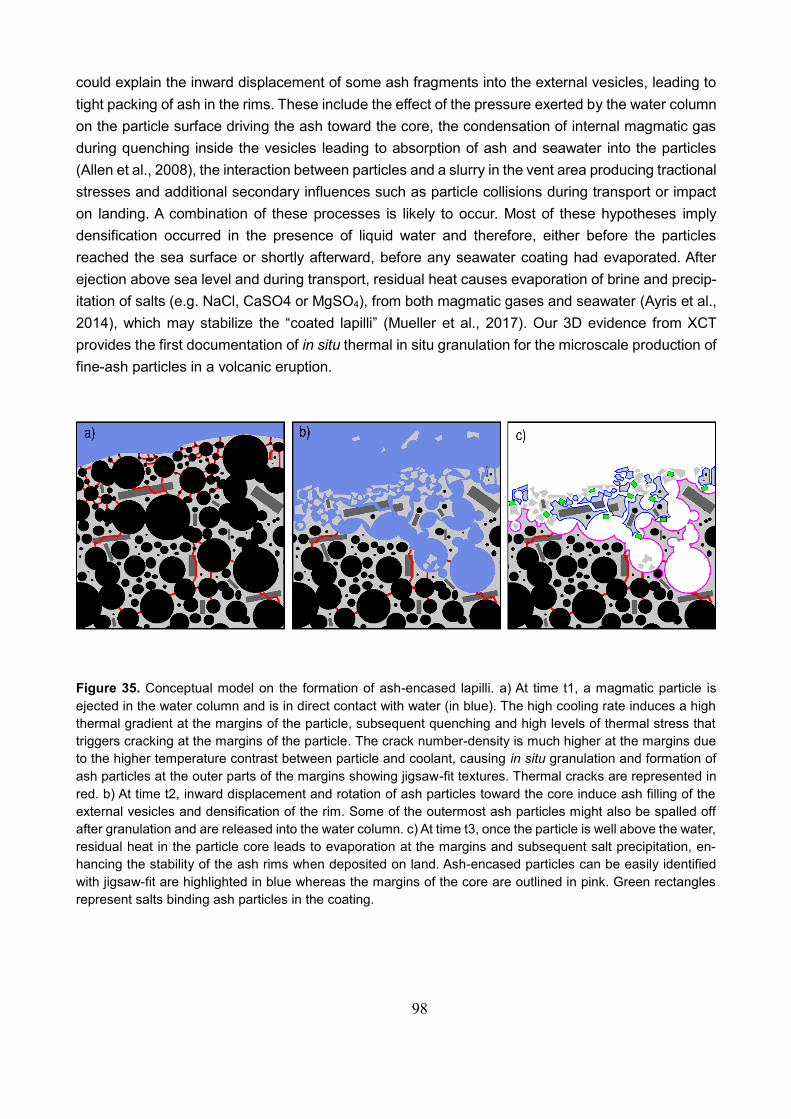
98
could explain the inward displacement of some ash fragments into the external vesicles, leading to
tight packing of ash in the rims. These include the effect of the pressure exerted by the water column
on the particle surface driving the ash toward the core, the condensation of internal magmatic gas
during quenching inside the vesicles leading to absorption of ash and seawater into the particles
(Allen et al., 2008), the interaction between particles and a slurry in the vent area producing tractional
stresses and additional secondary influences such as particle collisions during transport or impact
on landing. A combination of these processes is likely to occur. Most of these hypotheses imply
densification occurred in the presence of liquid water and therefore, either before the particles
reached the sea surface or shortly afterward, before any seawater coating had evaporated. After
ejection above sea level and during transport, residual heat causes evaporation of brine and precip-
itation of salts (e.g. NaCl, CaSO4 or MgSO4), from both magmatic gases and seawater (Ayris et al.,
2014), which may stabilize the “coated lapilli” (Mueller et al., 2017). Our 3D evidence from XCT
provides the first documentation of in situ thermal in situ granulation for the microscale production of
fine-ash particles in a volcanic eruption.
Figure 35. Conceptual model on the formation of ash-encased lapilli. a) At time t1, a magmatic particle is
ejected in the water column and is in direct contact with water (in blue). The high cooling rate induces a high
thermal gradient at the margins of the particle, subsequent quenching and high levels of thermal stress that
triggers cracking at the margins of the particle. The crack number-density is much higher at the margins due
to the higher temperature contrast between particle and coolant, causing in situ granulation and formation of
ash particles at the outer parts of the margins showing jigsaw-fit textures. Thermal cracks are represented in
red. b) At time t2, inward displacement and rotation of ash particles toward the core induce ash filling of the
external vesicles and densification of the rim. Some of the outermost ash particles might also be spalled off
after granulation and are released into the water column. c) At time t3, once the particle is well above the water,
residual heat in the particle core leads to evaporation at the margins and subsequent salt precipitation, en-
hancing the stability of the ash rims when deposited on land. Ash-encased particles can be easily identified
with jigsaw-fit are highlighted in blue whereas the margins of the core are outlined in pink. Green rectangles
represent salts binding ash particles in the coating.
99
We propose a conceptual model to explain the formation of the ash-encased lapilli in three
steps (Fig. 35): Following the initial explosive magma fragmentation, there is (i) direct contact be-
tween a primary pyroclast and seawater causing thermal-stress induced cracking and granulation;
this is followed by (ii) release of some outermost fragments generated by in situ granulation into the
water column and inward-directed drag of ash particles and seawater into the particle causing den-
sification of the ash rim; finally, (iii) the ejection of the ash-encased lapilli into the atmosphere, ac-
companied by precipitation of salts that stabilize the ash rims and preserve the jigsaw-fit textures.
Implications for Surtseyan eruptions and related hazards
Ash-encased lapilli are the dominant constituent of the lapilli fraction of deposit from Surtsey (1963-
1967) (Moore, 1985), Capelinhos (1957-1958) and Hunga Tonga-Hunga Ha’apai (2014-2015) erup-
tions. These have always been termed “ash-coated” particles, with the inherent assumption of an
active process where foreign ash particles are attracted to and adhering to the outside margins of a
lapilli particle – e.g., similar to the aggregation process of ash into accretionary lapilli in moist atmos-
pheric eruption plumes (Mueller, 2003). The thermal cracks and jigsaw textures observed in all the
lapilli examined in our study, indicate that ash rims on scoriaceous lapilli may, in fact, result domi-
nantly from in situ thermal in situ granulation. This implies a greater importance of this secondary
fragmentation process than previously considered. In contrast to conventional dry and wet aggrega-
tion in volcanic ash plumes (Mueller, 2003), the in situ granulation model binds at least some of the
ash directly after generation. In this scenario, the ash-encased particles are actually an indicator of
ash-production, rather than locking up of free-ash particles into coatings. Additional wet aggregation
of further ash particles, or alternatively loss of ash from the rims may occur during transport above
sea level. Wet particle aggregation initiates at relative atmospheric humidity levels of 15-20% or
higher (Mueller et al., 2016), which is highly likely in Surtseyan eruption plumes. In future, under-
standing the conditions that alter the relative balance between in-plume aggregation (decreasing
free ash) and the subaqueous production of ash by in situ granulation (possibly increasing free ash)
will be a key for better assessment of potential hazard of ash particles in the atmosphere impacting
on populations and air traffic.
B.3.5. Conclusion
The most compelling results from this section are:
Ash-encased particles are not coated, sensu stricto, bur are dominantly formed by in situ
granulation via thermal stress of particle surfaces during interaction with water.
The presence of ash rims in these cases is evidence of ash formation rather than ash reduc-
tion by conventional aggregation.
100
Thermal granulation is an important disruption mechanism during volcanic eruptions involv-
ing water-magma interaction and is influenced by the presence of heterogeneities such as
crystals and vesicles.
Future models of ash dispersal in volcanic plumes should take into consideration this new
mechanism in order to infer hazards related to ash fall in proximal and distal areas of volca-
noes.
101
B.4. Water-magma interaction and its role for par-
ticle binding during the emergent phases of
Surtseyan eruptions
Binding of volcanic ash particles to produce ash aggregates can typically occur via hydro-bonds
(liquid and ice water), electrostatic forces (Brown et al., 2012) or precipitation of soluble salt crystals
such as e.g., NaCl, CaSO4 or MgSO4 (e.g., Mueller et al., 2017). The rate of particle aggregation
increases dramatically with ambient humidity of the eruption (Brown et al., 2012; Mueller et al., 2016).
On the other hand, the formation of salts enhances the stability of the ash aggregates (Brown et al.,
2012; Mueller et al., 2016). The high humidity and high water salt content for Surtseyan eruptions
occurring in seawater settings therefore potentially provide ideal conditions for pervasive ash aggre-
gation.
The previous section showed that ash-encased particles are a common product of Surtseyan
eruptions and that the ash particles in the rims can largely be formed by in situ granulation due to
thermal stress. We then proposed a conceptual model for the formation of these ash-encased lapilli
in which the granulation was followed by precipitation of salts that helped to increase the stability of
the ash rims. In order to further constrain the stabilization proposed in this model, we performed
leaching experiments on the ash particles present in the rims of ash-encased lapilli from the 2014-
2015 Surtseyan eruption at Hunga Tonga- Hunga Ha’apai volcano (see previous sections for a de-
tailed description of the geological setting and eruption) to reveal the presence or absence of salts.
This enables us to confirm the primary role of salts on the stability of ash-encased particles in this
eruption and validate our former model. Additionally, it provides possible ways to study the degree
and variations of water-magma interaction during the emergent phases of Surtseyan eruptions.
B.4.1. Methodology
Aqueous leaching was used to characterize surface salt loading of specific ash-encased lapilli pre-
sent in the fall deposits of the Hunga Tonga-Hunga Ha’apai 2014-2015 tuff cone. We first separated
mechanically the ash particles forming the ash rims from the cores of ash-encased lapilli for three
stratigraphic units (HH35, HH33 and HH23) from the building phase (emergence) of the 2014-2015
Hunga Tonga- Hunga Ha’apai tuff cone. The separated ash rims were then immersed in deionised
water for one hour at solid:solution ratios of 1:100, 1:500 and 1:1000 (Table 6). Water extracts were
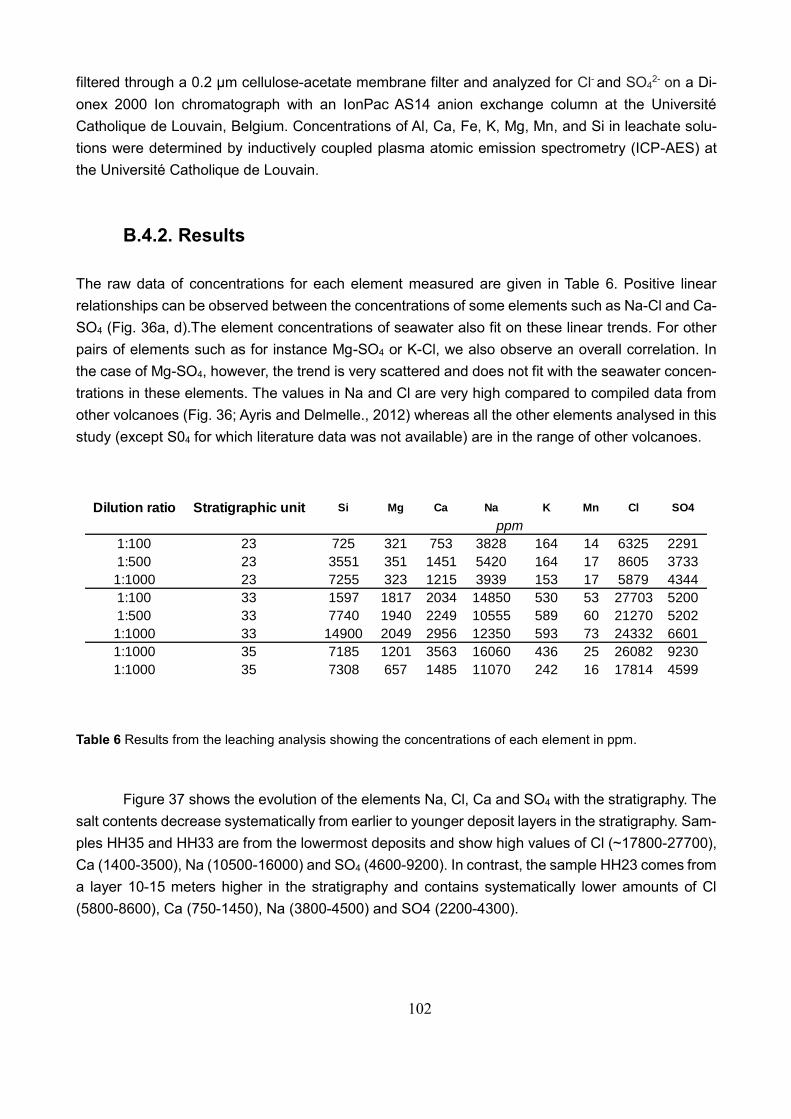
102
filtered through a 0.2 µm cellulose-acetate membrane filter and analyzed for Cl- and SO42- on a Di-
onex 2000 Ion chromatograph with an IonPac AS14 anion exchange column at the Université
Catholique de Louvain, Belgium. Concentrations of Al, Ca, Fe, K, Mg, Mn, and Si in leachate solu-
tions were determined by inductively coupled plasma atomic emission spectrometry (ICP-AES) at
the Université Catholique de Louvain.
B.4.2. Results
The raw data of concentrations for each element measured are given in Table 6. Positive linear
relationships can be observed between the concentrations of some elements such as Na-Cl and Ca-
SO4 (Fig. 36a, d).The element concentrations of seawater also fit on these linear trends. For other
pairs of elements such as for instance Mg-SO4 or K-Cl, we also observe an overall correlation. In
the case of Mg-SO4, however, the trend is very scattered and does not fit with the seawater concen-
trations in these elements. The values in Na and Cl are very high compared to compiled data from
other volcanoes (Fig. 36; Ayris and Delmelle., 2012) whereas all the other elements analysed in this
study (except S04 for which literature data was not available) are in the range of other volcanoes.
Table 6 Results from the leaching analysis showing the concentrations of each element in ppm.
Figure 37 shows the evolution of the elements Na, Cl, Ca and SO4 with the stratigraphy. The
salt contents decrease systematically from earlier to younger deposit layers in the stratigraphy. Sam-
ples HH35 and HH33 are from the lowermost deposits and show high values of Cl (~17800-27700),
Ca (1400-3500), Na (10500-16000) and SO4 (4600-9200). In contrast, the sample HH23 comes from
a layer 10-15 meters higher in the stratigraphy and contains systematically lower amounts of Cl
(5800-8600), Ca (750-1450), Na (3800-4500) and SO4 (2200-4300).
Dilution ratio Stratigraphic unit Si Mg Ca Na K Mn Cl SO4
1:100 23 725 321 753 3828 164 14 6325 2291
1:500 23 3551 351 1451 5420 164 17 8605 3733
1:1000 23 7255 323 1215 3939 153 17 5879 4344
1:100 33 1597 1817 2034 14850 530 53 27703 5200
1:500 33 7740 1940 2249 10555 589 60 21270 5202
1:1000 33 14900 2049 2956 12350 593 73 24332 6601
1:1000 35 7185 1201 3563 16060 436 25 26082 9230
1:1000 35 7308 657 1485 11070 242 16 17814 4599
ppm
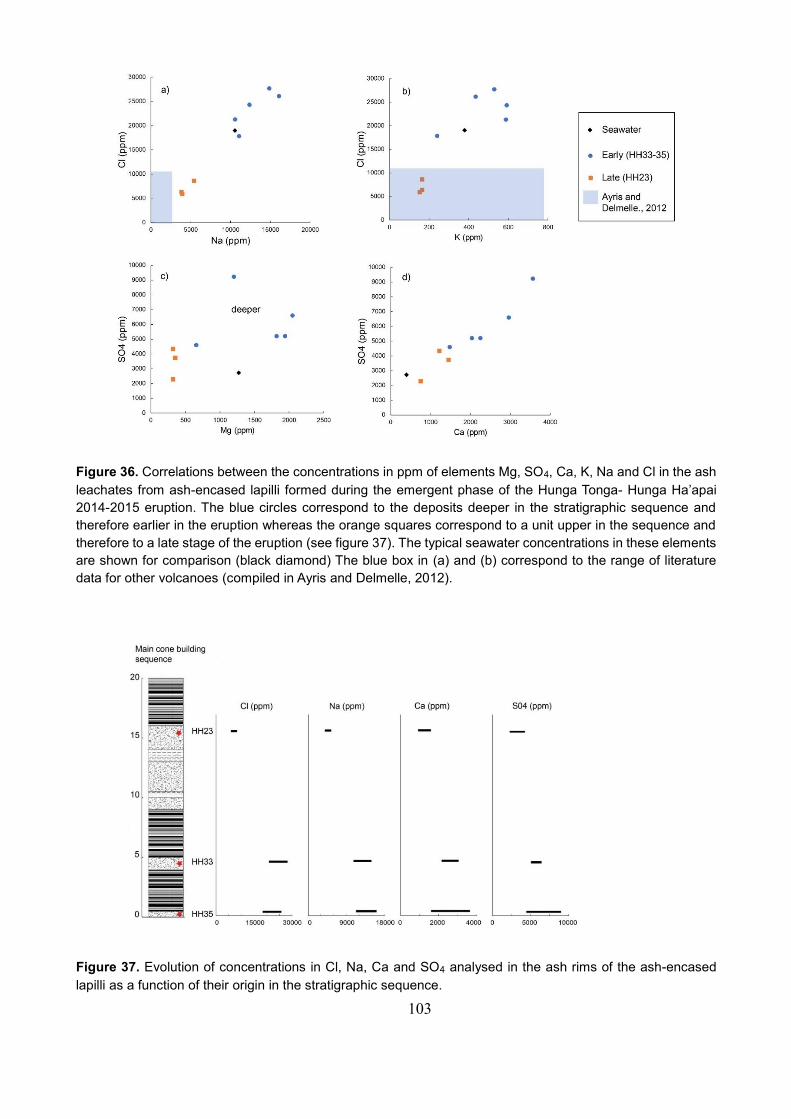
103
Figure 36. Correlations between the concentrations in ppm of elements Mg, SO4, Ca, K, Na and Cl in the ash
leachates from ash-encased lapilli formed during the emergent phase of the Hunga Tonga- Hunga Ha’apai
2014-2015 eruption. The blue circles correspond to the deposits deeper in the stratigraphic sequence and
therefore earlier in the eruption whereas the orange squares correspond to a unit upper in the sequence and
therefore to a late stage of the eruption (see figure 37). The typical seawater concentrations in these elements
are shown for comparison (black diamond) The blue box in (a) and (b) correspond to the range of literature
data for other volcanoes (compiled in Ayris and Delmelle, 2012).
Figure 37. Evolution of concentrations in Cl, Na, Ca and SO4 analysed in the ash rims of the ash-encased
lapilli as a function of their origin in the stratigraphic sequence.
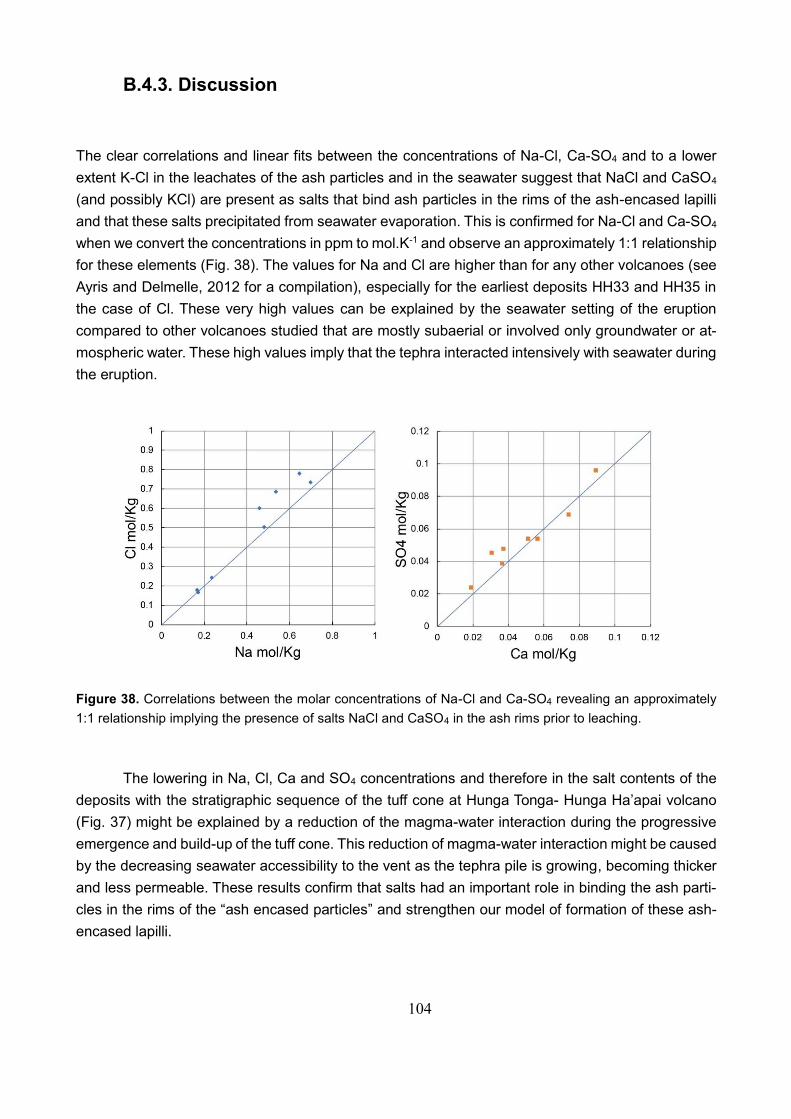
104
B.4.3. Discussion
The clear correlations and linear fits between the concentrations of Na-Cl, Ca-SO4 and to a lower
extent K-Cl in the leachates of the ash particles and in the seawater suggest that NaCl and CaSO4
(and possibly KCl) are present as salts that bind ash particles in the rims of the ash-encased lapilli
and that these salts precipitated from seawater evaporation. This is confirmed for Na-Cl and Ca-SO4
when we convert the concentrations in ppm to mol.K-1 and observe an approximately 1:1 relationship
for these elements (Fig. 38). The values for Na and Cl are higher than for any other volcanoes (see
Ayris and Delmelle, 2012 for a compilation), especially for the earliest deposits HH33 and HH35 in
the case of Cl. These very high values can be explained by the seawater setting of the eruption
compared to other volcanoes studied that are mostly subaerial or involved only groundwater or at-
mospheric water. These high values imply that the tephra interacted intensively with seawater during
the eruption.
Figure 38. Correlations between the molar concentrations of Na-Cl and Ca-SO4 revealing an approximately
1:1 relationship implying the presence of salts NaCl and CaSO4 in the ash rims prior to leaching.
The lowering in Na, Cl, Ca and SO4 concentrations and therefore in the salt contents of the
deposits with the stratigraphic sequence of the tuff cone at Hunga Tonga- Hunga Ha’apai volcano
(Fig. 37) might be explained by a reduction of the magma-water interaction during the progressive
emergence and build-up of the tuff cone. This reduction of magma-water interaction might be caused
by the decreasing seawater accessibility to the vent as the tephra pile is growing, becoming thicker
and less permeable. These results confirm that salts had an important role in binding the ash parti-
cles in the rims of the “ash encased particles” and strengthen our model of formation of these ash-
encased lapilli.
105
B.4.4. Conclusion
We performed leaching experiments of ash particles present in the ash rims of ash-encased lapilli in
order to explore the role of salts on binding ash particles and stabilizing the ash rims. The most
compelling results of this research are:
We found, to our knowledge, the highest values of Na and Cl in the leachates of volcanic ash
particles published in the literature.
These high values are most likely the result of pervasive precipitation of NaCl after seawater
evaporation during the eruption. This is confirmed by the linear positive relationships between
the molar concentration of Na and Cl leached during the experiments and typical concentra-
tions for seawater.
Similarly, we found linear positive relationships between the molar concentration of Ca and
SO4 in the leachates and in seawater. This suggests that CaSO4 is the second most important
salt that precipitated in the ash rims of the ash encased lapilli from Hunga Tonga-Hunga
Ha’apai volcano.
The concentrations of Na, Cl, Ca and SO4 decrease significantly towards high units in the
stratigraphy of the proximal deposits. This is most likely due to a reduction of the seawater-
magma interaction during the progressive emergence because of the thicker tephra pile as
the tuff cone is growing. Our results therefore allow to link the salt concentrations in the de-
posits to the eruptive conditions.
This reduction of seawater-magma interaction suggests a drying-up process typical of
Surtseyan eruptions. However, in this case water was not completely excluded from the vent.
106
Summary and implications
This thesis provided compelling insights on the importance of pore connectivity, percolation thresh-
old and water-magma interactions on the style of volcanic eruptions. This section summarizes the
principal outcomes of this thesis and their implications.
The percolation threshold Φc, which is the critical porosity at which the transition from an
impermeable to permeable magma occurs, is of paramount importance to understand the transitions
between effusive and explosive eruptions because it controls the shifts between the dominant types
of degassing (open- vs. closed-system) in the conduit before an eruption. Pore connectivity has been
proved an insightful metric in order to differentiate between effusive and explosive volcanic rocks
and to assess quantitatively the percolation threshold. Connectivity can provide additional infor-
mation on Φc compared to permeability because it can be constrained below and above Φc, whereas
permeability cannot. Interestingly, the connectivity database compiled in this dissertation allowed to
distinguish between most of eruptive products based on their eruptive nature (explosive vs. effusive)
and chemistry. This database revealed lower percolation thresholds for effusive rocks compared to
explosive rocks. The formation of effusive rocks is favoured by the onset of outgassing in magma at
low percolation thresholds due to several processes such as (i) brittle fracturing, (ii) vesiculation in
highly crystalline magmas, (iii) granular densification (sintering), (iv) hysteresis with vesiculation fol-
lowed by densification and (v) extensive shear-deformation. Crystallization plays an important role
on the percolation threshold in magma during vesiculation and consequently on explosive-effusive
transitions. In highly viscous crystal-bearing andesitic, trachytic and dacitic magmas, the percolation
threshold is strongly reduced during vesiculation leading to conditions favourable for outgassing and
effusive activity. The percolation threshold and outgassing efficiency in crystal bearing-magmas de-
pend on the melt viscosity and crystallinity as well as the heating and decompression rate. The
formation of explosive rocks is in turn promoted in the case of higher percolation thresholds which
impede or delay gas escape during magma ascent, allowing to form significant bubble overpressure
and acceleration triggering explosive fragmentation.
This thesis also provided important outcomes for the influence of magma-water interaction
on the eruptive processes during Surtseyan eruptions. Cooling of magma droplets ejected by frag-
mentation in the water column is complex because of the phase transition of water at high tempera-
tures. In the presence of a stable vapour film (Leidenfrost effect) the rate of heat transfer is dramat-
ically reduced compared to cooling in the case of direct contact with liquid water. However, the cool-
ing rates in both cases are higher than in air, causing high temperature gradients in the magma
droplets and rapid quenching of the particle margins compared to slower cooling of the cores. Such
temperature gradients commonly result in (i) gradual textural features with increase of vesicularity
and connectivity from margin to core and (ii) high thermal stress resulting in in situ granulation at the
margins. In situ thermal granulation is an important disruption mechanism during Surtseyan erup-
tions causing the formation of ash particles. Post-fragmentation vesiculation generates pyroclasts
107
with highly variable textures, which in turn influences the activation and propagation of cracks during
thermal cracking and granulation. Some of the ash particles formed by this process are kept in place
after granulation and form an ash rim at the lapilli surface. The ash rims in these ash-encased lapilli
resemble the coatings of armoured lapilli typically formed by aggregation and causing a reduction of
free ash in the volcanic plume. In this new model, the ash content in the plume can instead increase
if some ash particles are released to the plume and atmosphere after thermal granulation. Therefore,
the interpretations of ash-encased particles in Surtseyan deposits and their meaning for ash plume
dispersal and related hazards should be considered cautiously in future studies. Ash dispersal mod-
els should consider the relative balance between in-plume aggregation and production of ash by in
situ granulation, as these processes have an inverse impact on the amount of proximal/distal ash
deposition. Extreme salt precipitation promoted by the high salinity of the seawater enhances the
stability of the ash rims around the ash-encased lapilli. The salt content in the ash rims of the ash-
encased lapilli can potentially serve as an indicator of the reduction of water-magma interaction
(drying up process) during emergence of Surtseyan tuff cones possibly leading to shifts towards
purely magmatic activity.
108
Outlook
This thesis yielded new perspectives for the study of the percolation threshold and the subsequent
evolution of pore connectivity and permeability during degassing in volcanic conduits. Future textural
studies focused on connectivity (or permeability) relationships to porosity in suites of volcanic rocks
should systematically include measurements of the vesicle size distribution, vesicle elongation, glass
crystallinity, crack number density in order to determine which degassing process in the parent
magma caused the observed texture in the final, quenched volcanic rock. This will further improve
our current understanding of the percolation threshold and its controlling parameters in volcanic
rocks.
Additional experimental studies of vesiculation, deformation, brittle fracturing or densification
using magma analogues or natural obsidians could help to further unravel on the complex degassing
processes occurring in magma and complement the results from the in situ experiments presented
in Chapter A. For example, vesiculation during the synchrotron experiments discussed in Section
A.3 occurred solely by expansion of the pressurized bubbles, which is an significant simplification of
nature in which bubble growth by volatile diffusion is also crucial. The complexity of natural systems
was tested in preliminary synchrotron sintering experiments on volatile-rich magma analogues (not
discussed in this thesis) that indeed revealed that open-system (gas escape) and closed-system
(bubble nucleation and growth by diffusion) degassing can occur simultaneously in magma. The role
of brittle fracturing on the percolation threshold and evolution of pore connectivity could easily be
tested experimentally by applying a mechanical stress on magma analogues with varying vesicular-
ities and containing only isolated bubbles. It is expected that the formation of cracks will initiate
percolation and onset of pore connectivity and permeability at any initial isolated vesicularities. The
new insights on the percolation threshold gained from these diverse textural and experimental stud-
ies should then be incorporated in numerical models of conduit degassing which often consider this
threshold rather simplistically.
Information on eruptive processes during Surtseyan eruptions such as cooling, vesiculation,
fragmentation and aggregation was obtained from a combination of textural and numerical analysis
in this thesis. Additional thermal granulation experiments on magma analogues might help to better
constrain the role of cooling rates, vapour formation dynamics and textural properties of the melt on
thermal cracking and granulation process. Preliminary experiments were performed by immersing
hot cylindrical samples cored in the bombs from the 2014-2015 Hunga Tonga- Hunga Ha’apai erup-
tion in a tank of water at different temperature. Pre- and post-experimental X-ray micro-tomography
revealed the formation of cracks in the samples induced by the quenching in water. Future quenching
experiments could focus on magma analogues with variable textures having thermocouples inserted,
allowing to track the evolution of temperature during quenching and determining the cooling rates at
different radial position of the samples. High speed camera footage might allow to provide insights
on the dynamics of vapour formation and collapse during quenching and on its role on cracking and
109
granulation. Measurements of the particle grain size distribution resulting from thermal granulation
could allow to pin down the influence of the cooling rates, vapour dynamics, textural properties and
dimensions of the magma body on the efficiency of thermal granulation. Geospeedometry measure-
ments might allow to compare the cooling rates of experimental particles with cooling rates in natural
pyroclasts from Surtseyan eruptions as well as the modeled values discussed in this thesis. Shock
tube fragmentation experiments ejecting hot experimental magma fragments at high velocity in a wet
column (water/wet sediments) might allow a step further in our current understanding of turbulent
magma-water interaction in Surtseyan plumes.
The evolution of salt content with stratigraphic sequence suggested a reduction of water-
magma interaction during progressive emergence and construction of a tuff cone during a Surtseyan
eruption. Additional leaching experiments should be carried on intermediate stratigraphic units in
order to verify that the salt content diminishes continuously during emergence. Comparison with
tephra from Surtseyan eruptions that involved lake water instead of seawater should also be per-
formed in order to shed light on possible differences in the efficiency of particle binding. Constrains
on the timing required to bind hot ash particles allowing to prove the scenario proposed may be
obtained experimentally. Basaltic or andesitic particles could be crushed to ash size and heat at a
range of temperatures representative of the eruptive temperature. These fine particles could then be
let to interact with seawater for different amount of times. Finally, leaching of the experimental prod-
ucts could reveal which experimental conditions (time, temperature) could explain the range of nat-
ural values observed in this thesis.
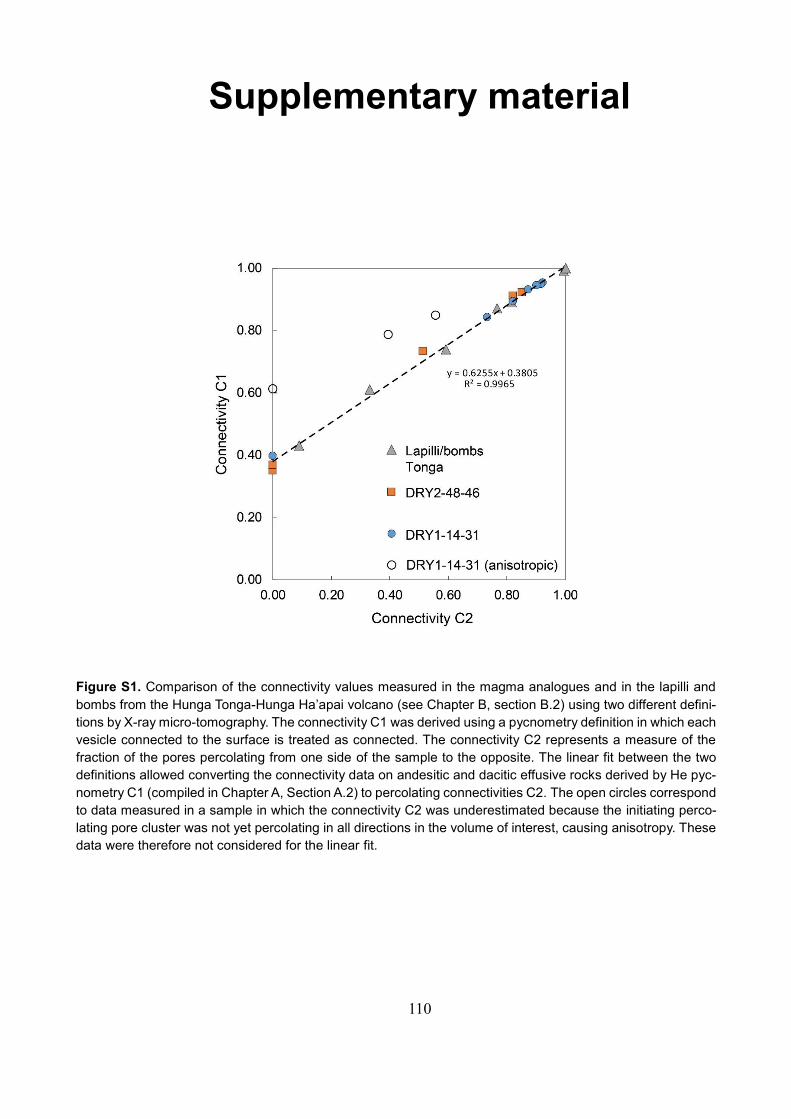
110
Supplementary material
Figure S1. Comparison of the connectivity values measured in the magma analogues and in the lapilli and
bombs from the Hunga Tonga-Hunga Ha’apai volcano (see Chapter B, section B.2) using two different defini-
tions by X-ray micro-tomography. The connectivity C1 was derived using a pycnometry definition in which each
vesicle connected to the surface is treated as connected. The connectivity C2 represents a measure of the
fraction of the pores percolating from one side of the sample to the opposite. The linear fit between the two
definitions allowed converting the connectivity data on andesitic and dacitic effusive rocks derived by He pyc-
nometry C1 (compiled in Chapter A, Section A.2) to percolating connectivities C2. The open circles correspond
to data measured in a sample in which the connectivity C2 was underestimated because the initiating perco-
lating pore cluster was not yet percolating in all directions in the volume of interest, causing anisotropy. These
data were therefore not considered for the linear fit.
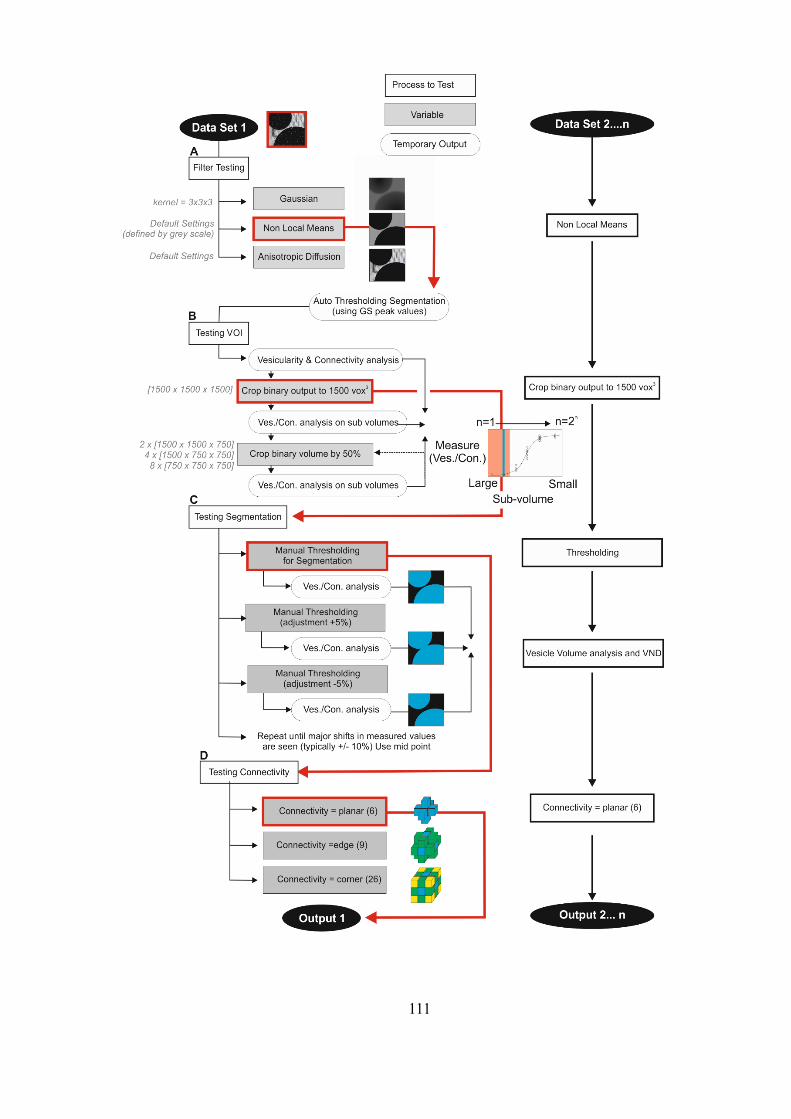
111
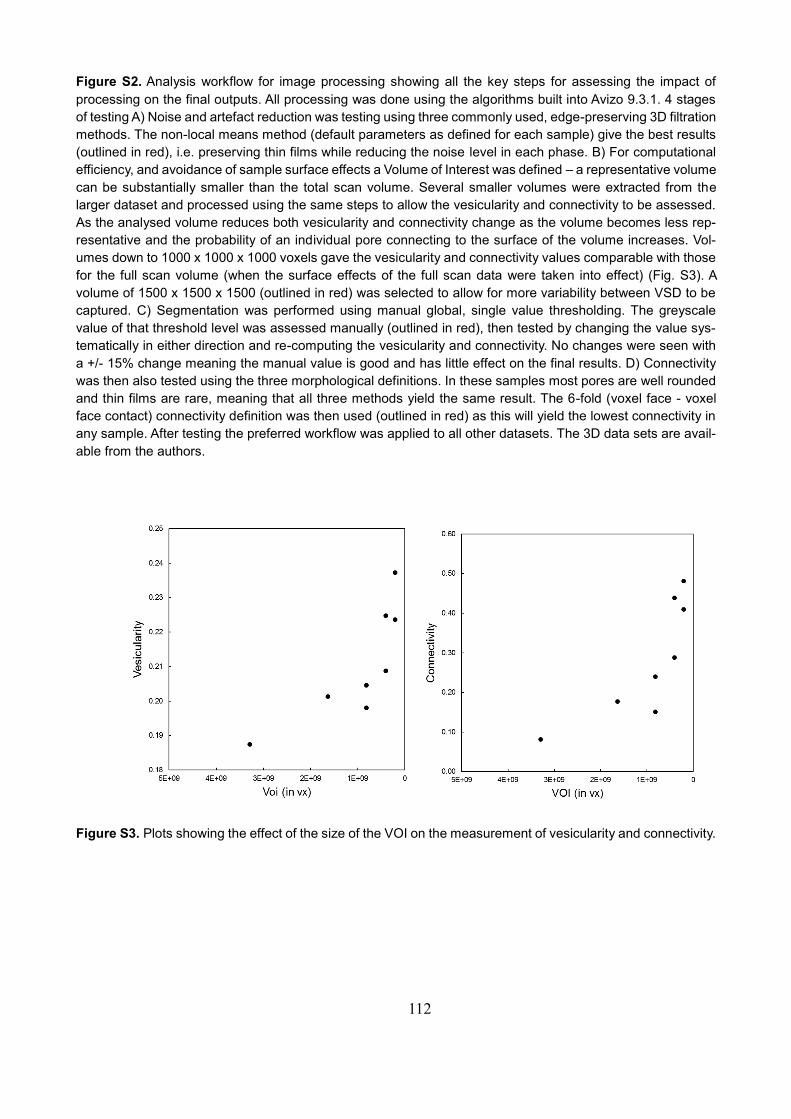
112
Figure S2. Analysis workflow for image processing showing all the key steps for assessing the impact of
processing on the final outputs. All processing was done using the algorithms built into Avizo 9.3.1. 4 stages
of testing A) Noise and artefact reduction was testing using three commonly used, edge-preserving 3D filtration
methods. The non-local means method (default parameters as defined for each sample) give the best results
(outlined in red), i.e. preserving thin films while reducing the noise level in each phase. B) For computational
efficiency, and avoidance of sample surface effects a Volume of Interest was defined – a representative volume
can be substantially smaller than the total scan volume. Several smaller volumes were extracted from the
larger dataset and processed using the same steps to allow the vesicularity and connectivity to be assessed.
As the analysed volume reduces both vesicularity and connectivity change as the volume becomes less rep-
resentative and the probability of an individual pore connecting to the surface of the volume increases. Vol-
umes down to 1000 x 1000 x 1000 voxels gave the vesicularity and connectivity values comparable with those
for the full scan volume (when the surface effects of the full scan data were taken into effect) (Fig. S3). A
volume of 1500 x 1500 x 1500 (outlined in red) was selected to allow for more variability between VSD to be
captured. C) Segmentation was performed using manual global, single value thresholding. The greyscale
value of that threshold level was assessed manually (outlined in red), then tested by changing the value sys-
tematically in either direction and re-computing the vesicularity and connectivity. No changes were seen with
a +/- 15% change meaning the manual value is good and has little effect on the final results. D) Connectivity
was then also tested using the three morphological definitions. In these samples most pores are well rounded
and thin films are rare, meaning that all three methods yield the same result. The 6-fold (voxel face - voxel
face contact) connectivity definition was then used (outlined in red) as this will yield the lowest connectivity in
any sample. After testing the preferred workflow was applied to all other datasets. The 3D data sets are avail-
able from the authors.
Figure S3. Plots showing the effect of the size of the VOI on the measurement of vesicularity and connectivity.
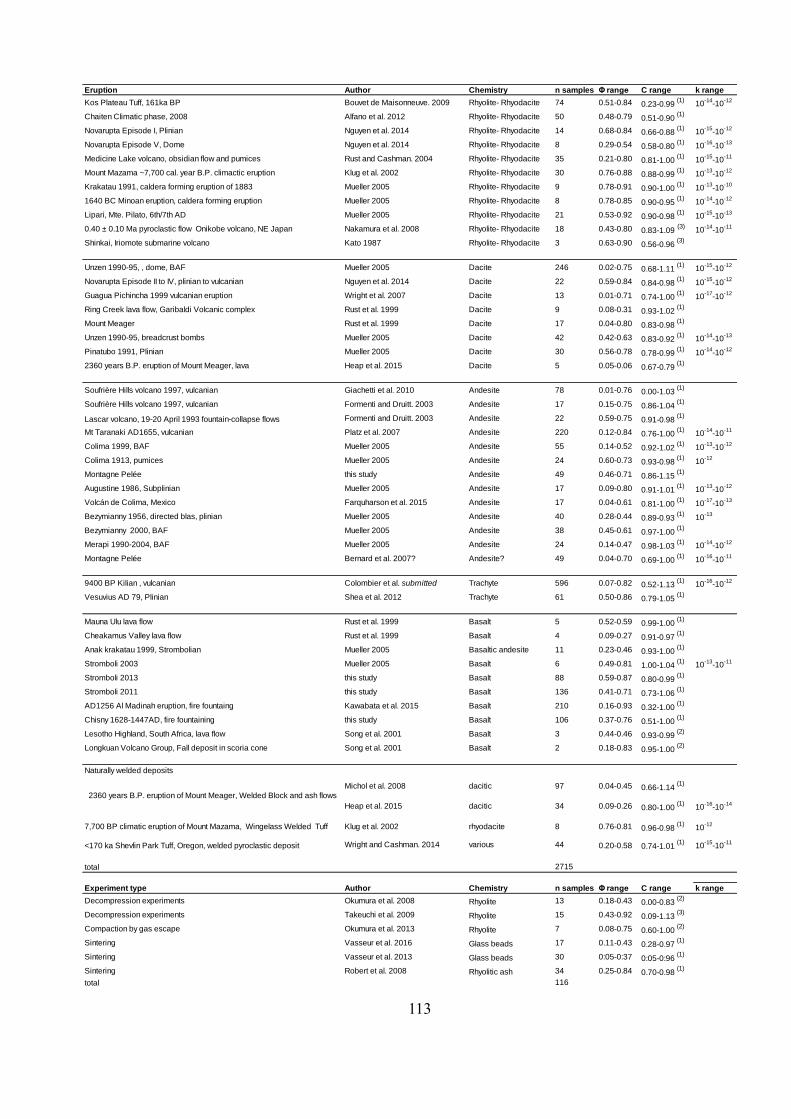
113
Eruption Author Chemistry n samples Φ range C range k range
Kos Plateau Tuff, 161ka BP Bouvet de Maisonneuve. 2009 Rhyolite- Rhyodacite 74 0.51-0.84 0.23-0.99 (1)
10-14
-10-12
Chaiten Climatic phase, 2008 Alfano et al. 2012 Rhyolite- Rhyodacite 50 0.48-0.79 0.51-0.90 (1)
Novarupta Episode I, Plinian Nguyen et al. 2014 Rhyolite- Rhyodacite 14 0.68-0.84 0.66-0.88 (1)
10-15
-10-12
Novarupta Episode V, Dome Nguyen et al. 2014 Rhyolite- Rhyodacite 8 0.29-0.54 0.58-0.80 (1)
10-16
-10-13
Medicine Lake volcano, obsidian flow and pumices Rust and Cashman. 2004 Rhyolite- Rhyodacite 35 0.21-0.80 0.81-1.00 (1)
10-15
-10-11
Mount Mazama ~7,700 cal. year B.P. climactic eruption Klug et al. 2002 Rhyolite- Rhyodacite 30 0.76-0.88 0.88-0.99 (1)
10-13
-10-12
Krakatau 1991, caldera forming eruption of 1883 Mueller 2005 Rhyolite- Rhyodacite 9 0.78-0.91 0.90-1.00 (1)
10-13
-10-10
1640 BC Minoan eruption, caldera forming eruption Mueller 2005 Rhyolite- Rhyodacite 8 0.78-0.85 0.90-0.95 (1)
10-14
-10-12
Lipari, Mte. Pilato, 6th/7th AD Mueller 2005 Rhyolite- Rhyodacite 21 0.53-0.92 0.90-0.98 (1)
10-15
-10-13
0.40 ± 0.10 Ma pyroclastic flow Onikobe volcano, NE Japan Nakamura et al. 2008 Rhyolite- Rhyodacite 18 0.43-0.80 0.83-1.09 (3)
10-14
-10-11
Shinkai, Iriomote submarine volcano Kato 1987 Rhyolite- Rhyodacite 3 0.63-0.90 0.56-0.96 (3)
Unzen 1990-95, , dome, BAF Mueller 2005 Dacite 246 0.02-0.75 0.68-1.11 (1)
10-15
-10-12
Novarupta Episode II to IV, plinian to vulcanian Nguyen et al. 2014 Dacite 22 0.59-0.84 0.84-0.98 (1)
10-15
-10-12
Guagua Pichincha 1999 vulcanian eruption Wright et al. 2007 Dacite 13 0.01-0.71 0.74-1.00 (1)
10-17
-10-12
Ring Creek lava flow, Garibaldi Volcanic complex Rust et al. 1999 Dacite 9 0.08-0.31 0.93-1.02 (1)
Mount Meager Rust et al. 1999 Dacite 17 0.04-0.80 0.83-0.98 (1)
Unzen 1990-95, breadcrust bombs Mueller 2005 Dacite 42 0.42-0.63 0.83-0.92 (1)
10-14
-10-13
Pinatubo 1991, Plinian Mueller 2005 Dacite 30 0.56-0.78 0.78-0.99 (1)
10-14
-10-12
2360 years B.P. eruption of Mount Meager, lava Heap et al. 2015 Dacite 5 0.05-0.06 0.67-0.79 (1)
Soufrière Hills volcano 1997, vulcanian Giachetti et al. 2010 Andesite 78 0.01-0.76 0.00-1.03 (1)
Soufrière Hills volcano 1997, vulcanian Formenti and Druitt. 2003 Andesite 17 0.15-0.75 0.86-1.04 (1)
Lascar volcano, 19-20 April 1993 fountain-collapse flows Formenti and Druitt. 2003 Andesite 22 0.59-0.75 0.91-0.98 (1)
Mt Taranaki AD1655, vulcanian Platz et al. 2007 Andesite 220 0.12-0.84 0.76-1.00 (1)
10-14
-10-11
Colima 1999, BAF Mueller 2005 Andesite 55 0.14-0.52 0.92-1.02 (1)
10-13
-10-12
Colima 1913, pumices Mueller 2005 Andesite 24 0.60-0.73 0.93-0.98 (1)
10-12
Montagne Pelée this study Andesite 49 0.46-0.71 0.86-1.15 (1)
Augustine 1986, Subplinian Mueller 2005 Andesite 17 0.09-0.80 0.91-1.01 (1)
10-13
-10-12
Volcán de Colima, Mexico Farquharson et al. 2015 Andesite 17 0.04-0.61 0.81-1.00 (1)
10-17
-10-13
Bezymianny 1956, directed blas, plinian Mueller 2005 Andesite 40 0.28-0.44 0.89-0.93 (1)
10-13
Bezymianny 2000, BAF Mueller 2005 Andesite 38 0.45-0.61 0.97-1.00 (1)
Merapi 1990-2004, BAF Mueller 2005 Andesite 24 0.14-0.47 0.98-1.03 (1)
10-14
-10-12
Montagne Pelée Bernard et al. 2007? Andesite? 49 0.04-0.70 0.69-1.00 (1)
10-16
-10-11
9400 BP Kilian , vulcanian Colombier et al. submitted Trachyte 596 0.07-0.82 0.52-1.13 (1)
10-16
-10-12
Vesuvius AD 79, Plinian Shea et al. 2012 Trachyte 61 0.50-0.86 0.79-1.05 (1)
Mauna Ulu lava flow Rust et al. 1999 Basalt 5 0.52-0.59 0.99-1.00 (1)
Cheakamus Valley lava flow Rust et al. 1999 Basalt 4 0.09-0.27 0.91-0.97 (1)
Anak krakatau 1999, Strombolian Mueller 2005 Basaltic andesite 11 0.23-0.46 0.93-1.00 (1)
Stromboli 2003 Mueller 2005 Basalt 6 0.49-0.81 1.00-1.04 (1)
10-13
-10-11
Stromboli 2013 this study Basalt 88 0.59-0.87 0.80-0.99 (1)
Stromboli 2011 this study Basalt 136 0.41-0.71 0.73-1.06 (1)
AD1256 Al Madinah eruption, fire fountaing Kawabata et al. 2015 Basalt 210 0.16-0.93 0.32-1.00 (1)
Chisny 1628-1447AD, fire fountaining this study Basalt 106 0.37-0.76 0.51-1.00 (1)
Lesotho Highland, South Africa, lava flow Song et al. 2001 Basalt 3 0.44-0.46 0.93-0.99 (2)
Longkuan Volcano Group, Fall deposit in scoria cone Song et al. 2001 Basalt 2 0.18-0.83 0.95-1.00 (2)
Naturally welded deposits
Michol et al. 2008 dacitic 97 0.04-0.45 0.66-1.14 (1)
Heap et al. 2015 dacitic 34 0.09-0.26 0.80-1.00 (1)
10-16
-10-14
7,700 BP climatic eruption of Mount Mazama, Wingelass Welded Tuff Klug et al. 2002 rhyodacite 8 0.76-0.81 0.96-0.98 (1)
10-12
<170 ka Shevlin Park Tuff, Oregon, welded pyroclastic deposit Wright and Cashman. 2014 various 44 0.20-0.58 0.74-1.01 (1)
10-15
-10-11
total 2715
Experiment type Author Chemistry n samples Φ range C range k range
Decompression experiments Okumura et al. 2008 Rhyolite 13 0.18-0.43 0.00-0.83 (2)
Decompression experiments Takeuchi et al. 2009 Rhyolite 15 0.43-0.92 0.09-1.13 (3)
Compaction by gas escape Okumura et al. 2013 Rhyolite 7 0.08-0.75 0.60-1.00 (2)
Sintering Vasseur et al. 2016 Glass beads 17 0.11-0.43 0.28-0.97 (1)
Sintering Vasseur et al. 2013 Glass beads 30 0:05-0:37 0:05-0:96 (1)
Sintering Robert et al. 2008 Rhyolitic ash 34 0.25-0.84 0.70-0.98 (1)
total 116
2360 years B.P. eruption of Mount Meager, Welded Block and ash flows
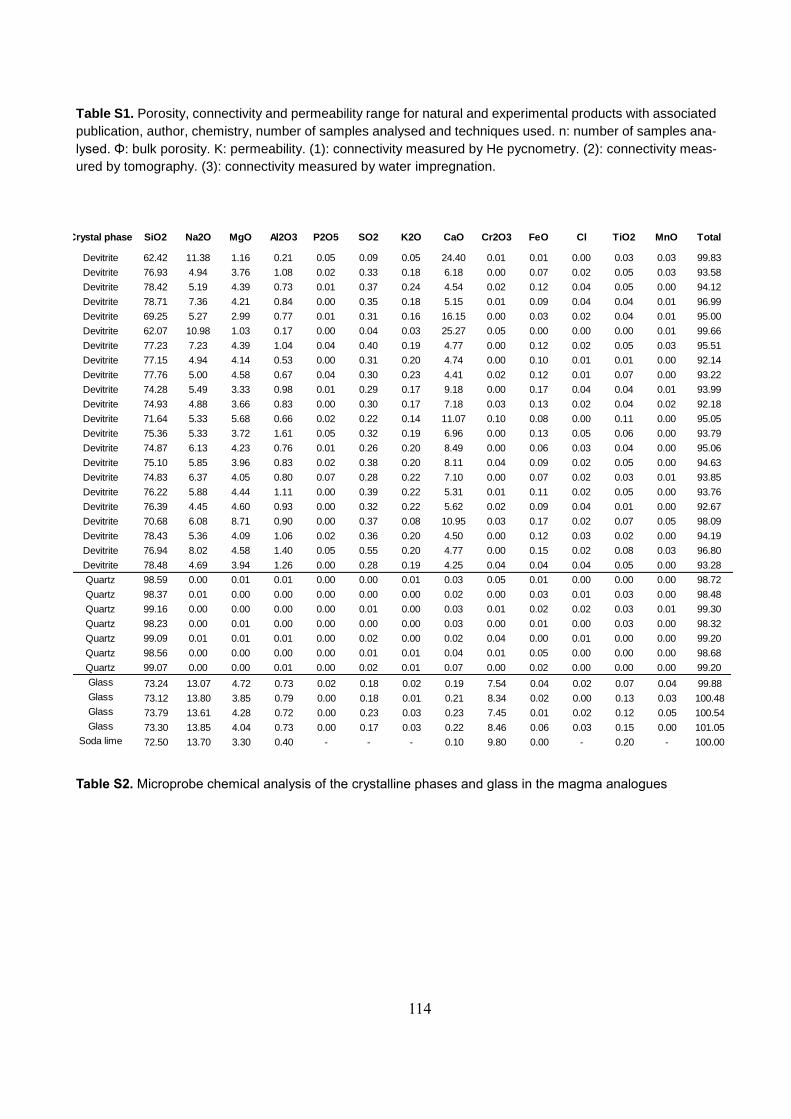
114
Table S1. Porosity, connectivity and permeability range for natural and experimental products with associated
publication, author, chemistry, number of samples analysed and techniques used. n: number of samples ana-
lysed. Φ: bulk porosity. K: permeability. (1): connectivity measured by He pycnometry. (2): connectivity meas-
ured by tomography. (3): connectivity measured by water impregnation.
Table S2. Microprobe chemical analysis of the crystalline phases and glass in the magma analogues
Crystal phase SiO2 Na2O MgO Al2O3 P2O5 SO2 K2O CaO Cr2O3 FeO Cl TiO2 MnO Total
Devitrite 62.42 11.38 1.16 0.21 0.05 0.09 0.05 24.40 0.01 0.01 0.00 0.03 0.03 99.83
Devitrite 76.93 4.94 3.76 1.08 0.02 0.33 0.18 6.18 0.00 0.07 0.02 0.05 0.03 93.58
Devitrite 78.42 5.19 4.39 0.73 0.01 0.37 0.24 4.54 0.02 0.12 0.04 0.05 0.00 94.12
Devitrite 78.71 7.36 4.21 0.84 0.00 0.35 0.18 5.15 0.01 0.09 0.04 0.04 0.01 96.99
Devitrite 69.25 5.27 2.99 0.77 0.01 0.31 0.16 16.15 0.00 0.03 0.02 0.04 0.01 95.00
Devitrite 62.07 10.98 1.03 0.17 0.00 0.04 0.03 25.27 0.05 0.00 0.00 0.00 0.01 99.66
Devitrite 77.23 7.23 4.39 1.04 0.04 0.40 0.19 4.77 0.00 0.12 0.02 0.05 0.03 95.51
Devitrite 77.15 4.94 4.14 0.53 0.00 0.31 0.20 4.74 0.00 0.10 0.01 0.01 0.00 92.14
Devitrite 77.76 5.00 4.58 0.67 0.04 0.30 0.23 4.41 0.02 0.12 0.01 0.07 0.00 93.22
Devitrite 74.28 5.49 3.33 0.98 0.01 0.29 0.17 9.18 0.00 0.17 0.04 0.04 0.01 93.99
Devitrite 74.93 4.88 3.66 0.83 0.00 0.30 0.17 7.18 0.03 0.13 0.02 0.04 0.02 92.18
Devitrite 71.64 5.33 5.68 0.66 0.02 0.22 0.14 11.07 0.10 0.08 0.00 0.11 0.00 95.05
Devitrite 75.36 5.33 3.72 1.61 0.05 0.32 0.19 6.96 0.00 0.13 0.05 0.06 0.00 93.79
Devitrite 74.87 6.13 4.23 0.76 0.01 0.26 0.20 8.49 0.00 0.06 0.03 0.04 0.00 95.06
Devitrite 75.10 5.85 3.96 0.83 0.02 0.38 0.20 8.11 0.04 0.09 0.02 0.05 0.00 94.63
Devitrite 74.83 6.37 4.05 0.80 0.07 0.28 0.22 7.10 0.00 0.07 0.02 0.03 0.01 93.85
Devitrite 76.22 5.88 4.44 1.11 0.00 0.39 0.22 5.31 0.01 0.11 0.02 0.05 0.00 93.76
Devitrite 76.39 4.45 4.60 0.93 0.00 0.32 0.22 5.62 0.02 0.09 0.04 0.01 0.00 92.67
Devitrite 70.68 6.08 8.71 0.90 0.00 0.37 0.08 10.95 0.03 0.17 0.02 0.07 0.05 98.09
Devitrite 78.43 5.36 4.09 1.06 0.02 0.36 0.20 4.50 0.00 0.12 0.03 0.02 0.00 94.19
Devitrite 76.94 8.02 4.58 1.40 0.05 0.55 0.20 4.77 0.00 0.15 0.02 0.08 0.03 96.80
Devitrite 78.48 4.69 3.94 1.26 0.00 0.28 0.19 4.25 0.04 0.04 0.04 0.05 0.00 93.28
Quartz 98.59 0.00 0.01 0.01 0.00 0.00 0.01 0.03 0.05 0.01 0.00 0.00 0.00 98.72
Quartz 98.37 0.01 0.00 0.00 0.00 0.00 0.00 0.02 0.00 0.03 0.01 0.03 0.00 98.48
Quartz 99.16 0.00 0.00 0.00 0.00 0.01 0.00 0.03 0.01 0.02 0.02 0.03 0.01 99.30
Quartz 98.23 0.00 0.01 0.00 0.00 0.00 0.00 0.03 0.00 0.01 0.00 0.03 0.00 98.32
Quartz 99.09 0.01 0.01 0.01 0.00 0.02 0.00 0.02 0.04 0.00 0.01 0.00 0.00 99.20
Quartz 98.56 0.00 0.00 0.00 0.00 0.01 0.01 0.04 0.01 0.05 0.00 0.00 0.00 98.68
Quartz 99.07 0.00 0.00 0.01 0.00 0.02 0.01 0.07 0.00 0.02 0.00 0.00 0.00 99.20
Glass 73.24 13.07 4.72 0.73 0.02 0.18 0.02 0.19 7.54 0.04 0.02 0.07 0.04 99.88
Glass 73.12 13.80 3.85 0.79 0.00 0.18 0.01 0.21 8.34 0.02 0.00 0.13 0.03 100.48
Glass 73.79 13.61 4.28 0.72 0.00 0.23 0.03 0.23 7.45 0.01 0.02 0.12 0.05 100.54
Glass 73.30 13.85 4.04 0.73 0.00 0.17 0.03 0.22 8.46 0.06 0.03 0.15 0.00 101.05
Soda lime 72.50 13.70 3.30 0.40 - - - 0.10 9.80 0.00 - 0.20 - 100.00
115
References
Adams, N.K., Houghton, B.F., Fagents, S.A., Hildreth, W., 2006. The transition from explosive to effusive eruptive regime: The example of the 1912 Novarupta eruption, Alaska. Bull. Geol. Soc. Am. 118, 620–634. doi:10.1130/B25768.1
Agustín-Flores, J., Németh, K., Cronin, S. J., Lindsay, J. M., & Kereszturi, G. (2015). Construction of the North Head (Maungauika) tuff cone: a product of Surtseyan volcanism, rare in the Auckland Volcanic Field, New Zealand. Bulletin of Volcanology, 77(2), 11. https://doi.org/10.1007/s00445-014-0892-9
Alfano, F., Bonadonna, C., Gurioli, L., 2012. Insights into eruption dynamics from textural analysis: The case of the May, 2008, Chaitén eruption. Bull. Volcanol. 74, 2095–2108. doi:10.1007/s00445-012-0648-3
Alidibirov, M., & Dingwell, D. B. (1996). Magma fragmentation by rapid decompression. Na-ture, 380(6570), 146.
Allen, S.R., Fiske, R.S., Cashman, K. V, 2008. Quenching of steam-charged pumice : Implications for submarine pyroclastic volcanism. Earth Planet. Sci. Lett. 274, 40–49. doi:10.1016/j.epsl.2008.06.050
von Aulock, F. W., Kennedy, B. M., Maksimenko, A., Wadsworth, F. B., & Lavallée, Y. (2017). Out-gassing from Open and Closed Magma Foams. Frontiers in Earth Science, 5, 46. https://doi.org/10.3389/feart.2017.00046
Ayris, P. M., & Delmelle, P. (2012). The immediate environmental effects of tephra emission. Bulletin of Volcanology, 74(9), 1905-1936. https://doi.org/10.1007/s00445-012-0654-5
Ayris, P.M., et al. (2014). HCl uptake by volcanic ash in the high temperature plume: Mechanistic insights. Geochim. Cosmochim. Acta 144, 188-201.
Bagdassarov, N., Dingwell, D., 1994. Thermal properties of vesicular rhyolite. J. Volcanol. Geotherm. Res. 60, 179–191.
Bai, L., Baker, D.R., Hill, R.J., 2010. Permeability of vesicular Stromboli basaltic glass: Lattice Boltz-mann simulations and laboratory measurements. J. Geophys. Res. 115, 1–16. doi:10.1029/2009JB007047
Barker, S. J., Rotella, M. D., Wilson, C. J., Wright, I. C., & Wysoczanski, R. J. (2012). Contrasting pyroclast density spectra from subaerial and submarine silicic eruptions in the Kermadec arc: implications for eruption processes and dredge sampling. Bulletin of volcanology, 74(6), 1425-1443. https://doi.org/10.1007/s00445-012-0604-2
Batiza, R. O. D. E. Y., White, J. D., & Sigurdsson, H. (2000). Submarine lavas and hyaloclastite. En-cyclopedia of volcanoes, 361-381.
116
Bernard, M.L., Zamora, M., Géraud, Y., Boudon, G., 2007. Transport properties of pyroclastic rocks from Montagne Pelée volcano (Martinique, Lesser Antilles). J. Geophys. Res. Solid Earth 112, 1–16. doi:10.1029/2006JB004385
Blower, J. D., Keating, J. P., Mader, H. M., & Phillips, J. C. (2001). Inferring volcanic degassing processes from vesicle size distributions. Geophysical research letters, 28(2), 347-350. DOI: 10.1029/2000GL012188
Blower, J., 2001. Factors controlling permeability-porosity relationships in magma. Bull. Volcanol. 63, 497–504. doi:10.1007/s004450100172
Blundy, J., Cashman, K., & Humphreys, M. (2006). Magma heating by decompression-driven crys-tallization beneath andesite volcanoes. Nature, 443(7107), 76. doi:10.1038/nature05100
Bohnenstiehl, D. R., Dziak, R. P., Matsumoto, H., & Lau, T. K. A. (2013). Underwater acoustic rec-ords from the March 2009 eruption of Hunga Ha'apai-Hunga Tonga volcano in the Kingdom of Tonga. Journal of Volcanology and Geothermal Research, 249, 12-24.
Boudon, G., Balcone-Boissard, H., Villemant, B., & Morgan, D. J. (2015). What factors control su-perficial lava dome explosivity?. Scientific reports, 5, 14551. doi:10.1038/srep14551
Bouvet de Maisonneuve, C., Bachmann, O., Burgisser, A., 2009. Characterization of juvenile pyro-clasts from the Kos Plateau Tuff (Aegean Arc): Insights into the eruptive dynamics of a large rhyolitic eruption. Bull. Volcanol. 71, 643–658. doi:10.1007/s00445-008-0250-x
Brown, R. J., Bonadonna, C., & Durant, A. J. (2012). A review of volcanic ash aggregation. Physics and Chemistry of the Earth, Parts A/B/C, 45, 65-78. https://doi.org/10.1016/j.pce.2011.11.001
Bryan, W.B., Stice, G.D., Ewart, A., 1972. Geology , and Geochemistry of the Volcanic Islands of Tonga. J. Geophys. Res. 77, 1566–1585.
Bryan, S. E., Cook, A., Evans, J. P., Colls, P. W., Wells, M. G., Lawrence, M. G., ... & Leslie, R. (2004). Pumice rafting and faunal dispersion during 2001–2002 in the Southwest Pacific: record of a dacitic submarine explosive eruption from Tonga. Earth and Planetary Science Let-ters, 227(1), 135-154. doi:10.1016/j.epsl.2004.08.009
Buades, A., Coll, B., Morel, J., 2011. Non-Local Means Denoising Pixelwise Implementation. Image Process. Line 1, 208–212. doi:10.5201/ipol.2011.bcm_nlm
Burgisser, A., Gardner, J.E., 2004. Experimental constraints on degassing and permeability in vol-canic conduit flow. Bull. Volcanol. 67, 42–56. doi:10.1007/s00445-004-0359-5
Burgisser, A., Chevalier, L., Gardner, J.E., Castro, J.M., 2017. The percolation threshold and per-meability evolution of ascending magmas. Earth Planet. Sci. Lett. 470, 37–47. doi:10.1016/j.epsl.2017.04.023
Calder, E. S., et al. "Lava dome eruptions." Encyclopedia of volcanoes, 2nd edn. Academic Press, San Diego (2015).
Carey, R. et al. The largest deep-ocean silicic volcanic eruption of the past century. Sci. Adv. 1–7 (2018). doi:10.1126/sciadv.1701121
117
Carlisle, D. Pillow Breccias and Their Aquagene Tuffs , Quadra Island , British Columbia. J. Geol. 71, 48–71 (1963).
Cashman, K. V., & Sparks, R. S. J. (2013). How volcanoes work: A 25 year perspective. Bulle-tin, 125(5-6), 664-690. https://doi.org/10.1130/B30720.1
Cashman, K. V., & Scheu, B. (2015). Magmatic fragmentation. In The Encyclopedia of Volcanoes (Second Edition) (pp. 459-471). https://doi.org/10.1016/B978-0-12-385938-9.00025-0
Castro, J.M., Cordonnier, B., Tuffen, H., Tobin, M.J., Puskar, L., Martin, M.C., Bechtel, H.A., 2012. The role of melt-fracture degassing in defusing explosive rhyolite eruptions at volcán Chaitén. Earth Planet. Sci. Lett. 333-334, 63–69. doi:10.1016/j.epsl.2012.04.024
Castro, J. M., Burgisser, A., Schipper, C. I., & Mancini, S. (2012). Mechanisms of bubble coales-cence in silicic magmas. Bulletin of Volcanology, 74(10), 2339-2352. https://doi.org/10.1007/s00445-012-0666-1
Castro, J.M., Bindeman, I.N., Tuffen, H., Ian Schipper, C., 2014. Explosive origin of silicic lava: Tex-tural and ??D-H2O evidence for pyroclastic degassing during rhyolite effusion. Earth Planet. Sci. Lett. 405, 52–61. doi:10.1016/j.epsl.2014.08.012
Chadwick, W. W., Cashman, K. V., Embley, R. W., Matsumoto, H., Dziak, R. P., De Ronde, C. E. J., ... & Merle, S. G. (2008). Direct video and hydrophone observations of submarine explosive eruptions at NW Rota-1 volcano, Mariana arc. Journal of Geophysical Research: Solid Earth, 113(B8). DOI: 10.1029/2007JB005215
Clague, D. A., Paduan, J. B., & Davis, A. S. (2009). Widespread strombolian eruptions of mid-ocean ridge basalt. Journal of Volcanology and Geothermal Research, 180(2), 171-188. https://doi.org/10.1016/j.jvolgeores.2008.08.007
Cluzel, N., Laporte, D., Provost, A., & Kannewischer, I. (2008). Kinetics of heterogeneous bubble nucleation in rhyolitic melts: implications for the number density of bubbles in volcanic conduits and for pumice textures. Contributions to Mineralogy and Petrology, 156(6), 745-763. https://doi.org/10.1007/s00410-008-0313-1
Cole, P.., Guest, J.., Duncan, A.., Pacheco, J.., 2001. Capelinhos 1957-1958 , Faial , Azores : de-posits formed by an emergent surtseyan eruption. Bull. Volcanol. 63, 204–220. doi:10.1007/s004450100136
Colombier, M., Gurioli, L., Druitt, T.H., Shea, T., Boivin, P., Miallier, D., Cluzel, N., 2017. Textural evolution of magma during the 9.4 ka trachytic explosive eruption at Kilian Volcano, Chaîne des Puys, France. https://doi.org/10.1007/s00445-017-1099-7
Colombier, M., Wadsworth, F.B., Gurioli, L., Scheu, B., Kueppers, U., Di, A., Dingwell, D.B., 2017. The evolution of pore connectivity in volcanic rocks. Earth Planet. Sci. Lett. 462, 99–109. doi:10.1016/j.epsl.2017.01.011
Connor, C.B., Lichtner, P.C., Conway, F.M., Hill, B.E., Ovsyannikov, A.A., Federchenko, I., Doubik, Y., Shapar, N., Taran, Y.A., Lichtner, P.C., 1997. Cooling of an igneous dike 20 yr after intru-sion. Geology 25, no. 8 (1997): 711-714. doi:10.1130/0091-7613(1997)025<0711
118
Cordonnier, B., Caricchi, L., Pistone, M., Castro, J., Hess, K., Gottschaller, S., Manga, M., Dingwell, D.B., 2012. The viscous-brittle transition of crystal-bearing silicic melt : Direct observation of magma rupture and healing. Geology 5–8. doi:10.1130/G3914.1
Cordonnier, B., Hess, K., Lavallee, Y., Dingwell, D.B., 2009. Rheological properties of dome lavas : Case study of Unzen volcano. Earth Planet. Sci. Lett. 279, 263–272. doi:10.1016/j.epsl.2009.01.014
Couves, C., Roberts, S., Racey, A., Troth, I., Best, A., 2016. Use of X-Ray Computed Tomography To Quantify the Petrophysical Properties of Volcanic Rocks : a Case Study From Tenerife , Canary Islands. J. Pet. Geol. 39, 79–94. doi:10.1111/jpg.12629
Crank, J. (1975). Diffusion in a plane sheet. The mathematics of diffusion, 2, 44-68.
Deardorff, N. D., Cashman, K. V., & Chadwick Jr, W. W. (2011). Observations of eruptive plume dynamics and pyroclastic deposits from submarine explosive eruptions at NW Rota-1, Mariana arc. Journal of Volcanology and Geothermal Research, 202(1-2), 47-59. https://doi.org/10.1016/j.jvolgeores.2011.01.003
Degruyter, W., Burgisser, A., Bachmann, O., Malaspinas, O., 2010. Synchrotron X-ray microtomog-raphy and lattice Boltzmann simulations of gas flow through volcanic pumices. Geosphere 6, 470–481. doi:10.1130/GES00555.1
Dhir, V. K., & Purohit, G. P. (1978). Subcooled film-boiling heat transfer from spheres. Nuclear En-gineering and Design, 47(1), 49-66. https://doi.org/10.1016/0029-5493(78)90004-3
Dingwell, D.B., Webb, S.L., 1989. Structural Relaxation in Silicate Melts and Non-Newtonian Melt Rheology in Geologic Processes ." Physics and Chemistry of Minerals 16, no. 5 (1989): 508–516.
Dingwell, D. B. (1996). Volcanic Dilemma--Flow or Blow?. Science, 273(5278), 1054-1055.
Dingwell, D.B., Lavallée, Y., Hess, K., Flaws, A., Marti, J., Nichols, A.R.L., Gilg, H.A., Schillinger, B., 2016. Eruptive shearing of tube pumice : pure and simple. Solid Earth 7, 1383–1393. doi:10.5194/se-7-1383-2016
Dhir, V.K., Puhorit, G.P., 1978. Subcooled Film-Boiling Heat Transfer From Spheres. Nucl. Eng. Des. 47, 49–66.
Doyle, M. G. Clast shape and textural associations in peperite as a guide to hydromagmatic interac-tions : Upper Permian basaltic and basaltic andesite examples from Kiama , Australia. Aust. J. earth Sci. 47, 167–177 (2000).
Dufek, J., Manga, M., & Patel, A. (2012). Granular disruption during explosive volcanic erup-tions. Nature Geoscience, 5(8), 561. doi:10.1038/ngeo1524
Edmonds, M., Herd, R.A., 2007. A volcanic degassing event at the explosive-effusive transition. Geophys. Res. Lett. 34, 1–6. doi:10.1029/2007GL031379
Eichelberger, J. C. (1980). Vesiculation of mafic magma during replenishment of silicic magma res-ervoirs. Nature, 288(5790), 446.
119
Eichelberger, J. C., Carrigan, C. R., Westrich, H. R., & Price, R. H. (1986). Non-explosive silicic volcanism. Nature, 323(6089), 598-602.
Ewart, A., Collerson, K.D., Regelous, M., Wendt, J.I., Niu, Y., 1998. Geochemical Evolution within the Tonga – Kermadec – Lau Arc – Back-arc Systems : the Role of Varying Mantle Wedge Composition in Space and Time. J. Petrol. 39, 331–368.
Farquharson, J., Heap, M.J., Varley, N.R., Baud, P., Reuschlé, T., 2015. Permeability and porosity relationships of edifice-forming andesites: A combined field and laboratory study. J. Volcanol. Geotherm. Res. 297, 52–68. doi:10.1016/j.jvolgeores.2015.03.016
Fife, J. L., Rappaz, M., Pistone, M., Celcer, T., Mikuljan, G., & Stampanoni, M. (2012). Development of a laser-based heating system for in situ synchrotron-based X-ray tomographic micros-copy. Journal of synchrotron radiation, 19(3), 352-358.
Fink, J. H., Anderson, S. W., & Manley, C. R. (1992). Textural constraints on effusive silicic volcan-ism: Beyond the permeable foam model. Journal of Geophysical Research: Solid Earth, 97(B6), 9073-9083.
Fiske, R. S., Cashman, K. V., Shibata, A., & Watanabe, K. (1998). Tephra dispersal from Myojinsho, Japan, during its shallow submarine eruption of 1952–1953. Bulletin of Volcanology, 59(4), 262-275. https://doi.org/10.1007/s004450050190
Formenti, Y., Druitt, T.H., 2003. Vesicle connectivity in pyroclasts and implications for the fluidisation of fountain-collapse pyroclastic flows, Montserrat (West Indies). Earth Planet. Sci. Lett. 214, 561–574. doi:10.1016/S0012-821X(03)00386-8
Fowler, A. C., Scheu, B., Lee, W. T., & McGuinness, M. J. (2010, March). A theoretical model of the explosive fragmentation of vesicular magma. In Proceedings of the Royal Society of London A: Mathematical, Physical and Engineering Sciences (Vol. 466, No. 2115, pp. 731-752). The Royal Society.
Gaonac'h, H., Lovejoy, S., & Schertzer, D. (2003). Percolating magmas and explosive volcan-ism. Geophysical research letters, 30(11). DOI: 10.1029/2002GL016022
Gaonac'h, H., Lovejoy, S., Carrier-Nunes, M., Schertzer, D., & Lepine, F. (2007). Percolating mag-mas in three dimensions. Nonlinear Processes in Geophysics, 14(6), 743-755.
Garboczi, E.J., Snyder, K.A., Douglas, J.F., Thorpe, M.F., 1995. Geometrical percolation threshold of overlapping ellipsoids. Phys. Rev. 52, 819–828.
Gardner, J. E., Thomas, R. M., Jaupart, C., & Tait, S. (1996). Fragmentation of magma during Plinian volcanic eruptions. Bulletin of Volcanology, 58(2-3), 144-162.
Giachetti, T., Druitt, T.H., Burgisser, A., Arbaret, L., Galven, C., 2010. Bubble nucleation, growth and coalescence during the 1997 Vulcanian explosions of Soufrière Hills Volcano, Montserrat. J. Volcanol. Geotherm. Res. 193, 215–231. doi:10.1016/j.jvolgeores.2010.04.001
Giordano, D., Russell, J.K., Dingwell, D.B., 2008. Viscosity of magmatic liquids : A model. Earth Planet. Sci. Lett. 271, 123–134. doi:10.1016/j.epsl.2008.03.038
120
Gjerløw, E., Höskuldsson, A., & Pedersen, R. B. (2015). The 1732 Surtseyan eruption of Eggøya, Jan Mayen, North Atlantic: deposits, distribution, chemistry and chronology. Bulletin of Volcan-ology, 77(2), 14. https://doi.org/10.1007/s00445-014-0895-6
Global Volcanism Program, 1988, 2009a, 2009b, 2015
Gonnermann, H.M., Manga, M., 2003. Explosive volcanism may not be an inevitable consequence of magma fragmentation. Nature 426, 8–11. doi:10.1038/nature02159.1.
Gonnermann, H.M., Manga, M., 2007. The Fluid Mechanics Inside a Volcano. doi:10.1146/an-nurev.fluid.39.050905.110207
Gonnermann, H. M., & Manga, M. (2012). Dynamics of magma ascent in the volcanic conduit. In C. U. Press (Ed.), Modeling Volcanic Processes: The physics and Mathematics of Volcanism (pp. 55-84).
Gonnermann, H.M., Gardner, J.E., 2013. Homogeneous bubble nucleation in rhyolitic melt : Experi-ments and nonclassical theory. Geochemistry, Geophysics. Geosystems 14, 4758–4773. doi:10.1002/ggge.20281
Gonnermann, H. M. Magma Fragmentation. Annu. Rev. Earth Planet. Sci. 43, 431–458 (2015).
Gonnermann, H., Giachetti, T., Fliedner, C., Nguyen, C. T., Houghton, B. F., Crozier, J. A., & Carey, R. J. (2017). Permeability during magma expansion and compaction. Journal of Geophysical Research: Solid Earth. DOI: 10.1002/2017JB014783
Graettinger, A. H., Skilling, I., Mcgarvie, D. & Höskuldsson, Á. Subaqueous basaltic magmatic ex-plosions trigger phreatomagmatism : A case study from Askja, Iceland. J. Volcanol. Geotherm. Res. 264, 17–35 (2013).
Graettinger, A. H., Valentine, G. A., & Sonder, I. (2016). Recycling in debris-filled volcanic vents. Ge-ology, 44(10), 811-814. https://doi.org/10.1130/G38081.1
Gurioli, L., Harris, A.J.L., Houghton, B.F., Polacci, M., Ripepe, M., 2008. Textural and geophysical characterization of explosive basaltic activity at Villarrica volcano. J. Geophys. Res. 113, 1–16. doi:10.1029/2007JB005328
Hanson, R. E. & Hargrove, U. . Processes of magma / wet sediment interaction in a large-scale Jurassic andesitic peperite complex , northern Sierra Nevada , California. Bull. Volcanol. 60, 610–626 (1999)Loewen, M. W., Bindeman, I. N. & Melnik, O. E. Eruption mechanisms and short duration of large rhyolitic lava flows of Yellowstone. Earth Planet. Sci. Lett. 1, 1–12 (2016).
Head III, J. W., & Wilson, L. (2003). Deep submarine pyroclastic eruptions: theory and predicted landforms and deposits. Journal of Volcanology and Geothermal Research, 121(3-4), 155-193. https://doi.org/10.1016/S0377-0273(02)00425-0
Heap, M. J., Xu, T. & Chen, C. The influence of porosity and vesicle size on the brittle strength of volcanic rocks and magma. Bull. Volcanol. (2014). doi:10.1007/s00445-014-0856-010.
Heap, M.J., Farquharson, J.I., Wadsworth, F.B., Kolzenburg, S., Russell, J.K., 2015. Timescales for permeability reduction and strength recovery in densifying magma. Earth Planet. Sci. Lett. 429, 223–233. doi:10.1016/j.epsl.2015.07.053
121
Helo, C., Clague, D. A., Dingwell, D. B., & Stix, J. (2013). High and highly variable cooling rates during pyroclastic eruptions on Axial Seamount, Juan de Fuca Ridge. Journal of Volcanology and Geothermal Research, 253, 54-64. https://doi.org/10.1016/j.jvolgeores.2012.12.004
Houghton, B. F., & Wilson, C. J. N. (1989). A vesicularity index for pyroclastic deposits. Bulletin of volcanology, 51(6), 451-462. https://doi.org/10.1007/BF01078811
Jakobsson, S. P. (1972). On the consolidation and palagonitization of the tephra of the Surtsey vol-canic island, Iceland. Surtsey Research Progress Report, 6, 1-8.
Jaupart, C., & Vergniolle, S. (1988). Laboratory models of Hawaiian and Strombolian eruptions. Na-ture, 331(6151), 58. doi:10.1038/331058a0
Jaupart, C., & Allègre, C. J. (1991). Gas content, eruption rate and instabilities of eruption regime in silicic volcanoes. Earth and Planetary Science Letters, 102(3-4), 413-429.
Jutzeler, M., White, J.D.L., Proussevitch, A.A., Gordee, S.M., 2016. Vesiculation and fragmentation history in a submarine scoria cone-forming eruption , an example from Nishiizu ( Izu Peninsula , Japan ). Bull. Volcanol. 78. doi:10.1007/s00445-016-0999-2
Kano, K. (1998). A shallow-marine alkali-basalt tuff cone in the Middle Miocene Jinzai Formation, Izumo, SW Japan. Journal of Volcanology and Geothermal Research, 87(1-4), 173-191. https://doi.org/10.1016/S0377-0273(98)00098-5
Kato Y (1987) Woody pumice generated with submarine eruption.Chishitsugaku Zasshi J Geol Soc Jpn 93:11–20
Kawabata, E., Cronin, S.J., Bebbington, M.S., Moufti, M.R.H., El-Masry, N., Wang, T., 2015. Identi-fying multiple eruption phases from a compound tephra blanket: an example of the AD1256 Al-Madinah eruption, Saudi Arabia. Bull. Volcanol. 77. doi:10.1007/s00445-014-0890-y
Kendrick, J.E., Lavallée, Y., Hess, K., Heap, M.J., Gaunt, H.E., Meredith, P.G., Dingwell, D.B., 2013. Tracking the permeable porous network during strain-dependent magmatic flow. J. Volcanol. Geotherm. Res. 260, 117–126. doi:10.1016/j.jvolgeores.2013.05.012
Kendrick, J.E., Lavallée, Y., Varley, N.R., Wadsworth, F.B., Lamb, O.D., Vasseur, J., 2016. Blowing Off Steam : Tuffisite Formation as a Regulator for Lava Dome Eruptions. Front. Earth Sci. 4, 1–15. doi:10.3389/feart.2016.00041
Kennedy, B.M., Jellinek, A.M., Russell, J.K., Nichols, A.R.L., Vigouroux, N., 2010. Time-and temper-ature-dependent conduit wall porosity : A key control on degassing and explosivity at Tarawera volcano, New Zealand. Earth Planet. Sci. Lett. 299, 126–137. doi:10.1016/j.epsl.2010.08.028
Kennedy, B.M., Wadsworth, F.B., Vasseur, J., Schipper, C.I., Jellinek, A.M., Aulock, F.W. Von, Hess, K., Russell, J.K., Lavallée, Y., Nichols, A.R.L., Dingwell, D.B., 2016. Surface tension driven processes densify and retain permeability in magma and lava. Earth Planet. Sci. Lett. 433, 116–124. doi:10.1016/j.epsl.2015.10.031
Kereszturi, G., & Németh, K. (2012). Monogenetic basaltic volcanoes: genetic classification, growth, geomorphology and degradation. In Updates in Volcanology-New Advances in Understanding Volcanic Systems. InTech. DOI: 10.5772/51387
122
Kilgour, G., et al. 2010. The 25 September 2007 eruption of Mount Ruapehu , New Zealand : Di-rected ballistics, surtseyan jets, and ice-slurry lahars. J. Volcanol. Geotherm. Res. 191, 1–14. doi:10.1016/j.jvolgeores.2009.10.015.
Klug, C., Cashman, K. V, 1996. Permeability development in vesiculating magmas : implications for fragmentation. Bull. Volcanol. 58, 87–100.
Klug, C., Cashman, K., Bacon, C., 2002. Structure and physical characteristics of pumice from the climactic eruption of Mount Mazama (Crater Lake), Oregon. Bull. Volcanol. 64, 486–501. doi:10.1007/s00445-002-0230-5
Knowles, K. M., & Thompson, R. P. (2014). Growth of devitrite, Na2Ca3Si6O16, in soda–lime–silica glass. Journal of the American Ceramic Society, 97(5), 1425-1433.
Kokelaar, B. P. (1983). The mechanism of Surtseyan volcanism. Journal of the Geological Soci-ety, 140(6), 939-944.
Kokelaar, P., 1986. Magma-water interactions in subaqueous and emergent basaltic volcanism. Bull. Volcanol. 1, 275–289.
Koyaguchi, T., Scheu, B., Mitani, N. K., & Melnik, O. (2008). A fragmentation criterion for highly viscous bubbly magmas estimated from shock tube experiments. Journal of Volcanology and Geothermal Research, 178(1), 58-71. https://doi.org/10.1016/j.jvolgeores.2008.02.008
Kueppers, U., Scheu, B., Spieler, O., & Dingwell, D. B. (2006). Fragmentation efficiency of explosive volcanic eruptions: a study of experimentally generated pyroclasts. Journal of Volcanology and Geothermal Research, 153(1-2), 125-135. https://doi.org/10.1016/j.jvolgeores.2005.08.006
Kueppers, U., Nichols, A.R.L., Zanon, V., Potuzak, M., Pacheco, J.M.R., 2012. Lava balloons — peculiar products of basaltic submarine eruptions. Bull. Volcanol. 74, 1379–1393. doi:10.1007/s00445-012-0597-x
Kushnir, A.R.L., Martel, C., Bourdier, J., Heap, M.J., Reuschlé, T., Erdmann, S., Komorowski, J., Cholik, N., 2016. Probing permeability and microstructure : Unravelling the role of a low-perme-ability dome on the explosivity of Merapi ( Indonesia ). J. Volcanol. Geotherm. Res. 316, 56–71. doi:10.1016/j.jvolgeores.2016.02.012
Kushnir, A.R.L., Martel, C., Champallier, R., Arbaret, L., 2017. In situ confirmation of permeability development in shearing bubble-bearing melts and implications for volcanic outgassing bubble-bearing melts and implications for volcanic outgassing. Earth Planet. Sci. Lett. 458, 315–326. doi:10.1016/j.epsl.2016.10.053
Lamur, A., Kendrick, J. E., Eggertsson, G. H., Wall, R. J., Ashworth, J. D., & Lavallée, Y. (2017). The permeability of fractured rocks in pressurised volcanic and geothermal systems. Scientific Re-ports, 7(1), 6173. doi:10.1038/s41598-017-05460-4
Lavallée, Y., Meredith, P.G., Dingwell, D.B., Hess, K., Wassermann, J., Cordonnier, B., Gerik, A., Kruhl, J.H., 2008. Seismogenic lavas and explosive eruption forecasting. Nature 453, 507–510. doi:10.1038/nature06980
Lavallée, Y., Dingwell, D.B., Johnson, J.B., Cimarelli, C., Hornby, A.J., Kendrick, J.E., Aulock, F.W. Von, Kennedy, B.M., Andrews, B.J., Wadsworth, F.B., Rhodes, E., Chigna, G., 2015. Thermal vesiculation during volcanic eruptions. Nature 528, 544–547. doi:10.1038/nature16153
123
Le Pennec JL, Hermitte D, Isya D, Pezard P, Coulon C, Cochemé J-J, MulyadiE,Ollagnier F,RevestC (2001) Electrical conductivity and pore-space topology of Merapi lavas: implication for the de-gassing of porphyritic andesite magmas. Geophys Res Lett 28(22):4283– 4286
Lindquist, W.B., Lee, S.-M., Coker, D. a., Jones, K.W., Spanne, P., 1996. Medial axis analysis of void structure in three-dimensional tomographic images of porous media. J. Geophys. Res. 101, 8297. doi:10.1029/95JB03039
Lindoo, A., Larsen, J. F., Cashman, K. V., Dunn, A. L., & Neill, O. K. (2016). An experimental study of permeability development as a function of crystal-free melt viscosity. Earth and Planetary Science Letters, 435, 45-54. https://doi.org/10.1016/j.epsl.2015.11.035
Lindoo, A., Larsen, J.F., Cashman, K. V, Oppenheimer, J., 2017. Crystal controls on permeability development and degassing in basaltic andesite magma. Geol. Soc. Am. 45, 2–5. doi:10.1130/G39157.1
Liu, Y., Zhang, Y., Behrens, H., 2005. Solubility of H 2 O in rhyolitic melts at low pressures and a new empirical model for mixed H 2 O – CO 2 solubility in rhyolitic melts. J. Volcanol. Geotherm. Res. 143, 219–235. doi:10.1016/j.jvolgeores.2004.09.019
Liu, E. J., Cashman, K. V., Rust, A. C. & Gislason, S. R. The role of bubbles in generating fine ash during hydromagmatic eruptions. Geology 43, 239–242 (2015).
Liu, E. J., Cashman, K. V., Rust, A. C., & Höskuldsson, A. (2017). Contrasting mechanisms of magma fragmentation during coeval magmatic and hydromagmatic activity: the Hverfjall Fires fissure eruption, Iceland. Bulletin of Volcanology, 79(10), 68. https://doi.org/10.1007/s00445-017-1150-8
Lorenz, V. (1974). Vesiculated tuffs and associated features. Sedimentology, 21(2), 273-291. DOI: 10.1111/j.1365-3091.1974.tb02059.x
Machado, F., Parsons, W. H., Richards, A. F. & Mulford, J. W. Capelinhos Eruption of Fayal Volcano , Azores , 1957-1958. 67, (1962).
Mangan, M.T., Cashman, K. V, 1996. The structure of basaltic scoria and reticulite and inferences for vesiculation , foam formation , and fragmentation in lava fountains. J. Volcanol. Geotherm. Res. 0273, 1–18.
Manson, S. S. Behavior of materials under conditoins of thermal stress. (1954).
Martel, C., Dingwell, D. B., Spieler, O., Pichavant, M., & Wilke, M. (2001). Experimental fragmenta-tion of crystal-and vesicle-bearing silicic melts. Bulletin of Volcanology, 63(6), 398-405.
Martel, C., & Iacono-Marziano, G. (2015). Timescales of bubble coalescence, outgassing, and foam collapse in decompressed rhyolitic melts. Earth and Planetary Science Letters, 412, 173-185. https://doi.org/10.1016/j.epsl.2014.12.010
Mastin, L.G., 2007. Generation of fine hydromagmatic ash by growth and disintegration of glassy rinds. J. Geophys. Res. 112, 1–17. doi:10.1029/2005JB003883
Mastin, L.G., Spieler, O., Downey, W.S., 2009. An experimental study of hydromagmatic fragmen-tation through energetic , non-explosive magma – water mixing. J. Volcanol. Geotherm. Res. 180, 161–170. doi:10.1016/j.jvolgeores.2008.09.01215.27.
124
Mattox, T. N., & Mangan, M. T. (1997). Littoral hydrovolcanic explosions: a case study of lava–sea-water interaction at Kilauea Volcano. Journal of Volcanology and Geothermal Research, 75(1-2), 1-17. https://doi.org/10.1016/S0377-0273(96)00048-0
Mattsson, H. B. (2010). Textural variation in juvenile pyroclasts from an emergent, Surtseyan-type, volcanic eruption: The Capelas tuff cone, São Miguel (Azores). Journal of volcanology and ge-othermal research, 189(1-2), 81-91. https://doi.org/10.1016/j.jvolgeores.2009.10.007
Mattsson, H. B., & Höskuldsson, Á. (2011). Contemporaneous phreatomagmatic and effusive activity along the Hverfjall eruptive fissure, north Iceland: Eruption chronology and resulting depos-its. Journal of volcanology and geothermal research, 201(1-4), 241-252. https://doi.org/10.1016/j.jvolgeores.2010.05.015
Michaut, C., Bercovici, D., Sparks, R.S.J., 2009. Ascent and compaction of gas rich magma and the effects of hysteretic permeability. Earth Planet. Sci. Lett. 282, 258–267. doi:10.1016/j.epsl.2009.03.026
Michol, K.A., Russell, J.K., Andrews, G.D.M., 2008. Welded block and ash flow deposits from Mount Meager, British Columbia, Canada. J. Volcanol. Geotherm. Res. 169, 121–144. doi:10.1016/j.jvolgeores.2007.08.010
Mongrain, J., Larsen, J. F., & King, P. L. (2008). Rapid water exsolution, degassing, and bubble collapse observed experimentally in K-phonolite melts. Journal of Volcanology and Geothermal Research, 173(3-4), 178-184.
Montanaro, C., Scheu, B., Gudmundsson, M. T., Vogfjörd, K., Reynolds, H. I., Dürig, T., ... & Dingwell, D. B. (2016). Multidisciplinary constraints of hydrothermal explosions based on the 2013 Gengissig lake events, Kverkfjöll volcano, Iceland. Earth and Planetary Science Letters, 434, 308-319. https://doi.org/10.1016/j.epsl.2015.11.043
Morandi, A., Muro, A. Di, Principe, C., Michon, L., Leroi, G., Norelli, F., Bachèlery, P., 2016. Pre-historic (<5 kiloyear) Explosive Activity at Piton de la Fournaise Volcano. In Active Volcanoes of the Southwest Indian Ocean (pp. 107-138). Springer Berlin Heidelberg.
Moore, J. G. Structure and eruptive mechanisms at Surtsey Volcano , Iceland. Geol. Mag. 122, 649–661 (1985).
Mourtada-Bonnefoi, C. C., & Laporte, D. (2004). Kinetics of bubble nucleation in a rhyolitic melt: an experimental study of the effect of ascent rate. Earth and Planetary Science Letters, 218(3-4), 521-537. https://doi.org/10.1016/S0012-821X(03)00684-8
Mueller, Sebastian, (2007). PhD thesis “Permeability and porosity as constraints on the explosive eruption of magma: Laboratory experiments and field investigations”
Mueller, S., Melnik, O., Spieler, O., Scheu, B., Dingwell, D.B., 2005. Permeability and degassing of dome lavas undergoing rapid decompression: An experimental determination. Bull. Volcanol. 67, 526–538. doi:10.1007/s00445-004-0392-4
Mueller, S., Scheu, B., Spieler, O., Dingwell, D.B., 2008. Permeability control on magma fragmenta-tion. Geology 36, 399–402. doi:10.1130/G24605A.1
Mueller, W. U. (2003). A Subaqueous Eruption Model for Shallow-Water, Small Volume Eruptions: Evidence from Two Precambrian Examples. In White, J. D., Smellie, J. L., & Clague, D. A.
125
(2003). Explosive subaqueous volcanism (Vol. 140, pp. 1-23). American Geophysical Union, Washington, DC.
Mueller, S.B., et al. (2017). Stability of volcanic ash aggregates and break-up processes. Sci. Rep. 7:7440.
Mueller, S. B., Kueppers, U., Ayris, P. M., Jacob, M. & Dingwell, D. B. Experimental volcanic ash aggregation: Internal structuring of accretionary lapilli and the role of liquid bonding. Earth Planet. Sci. Lett. 433, 232–240 (2016).
Murtagh, R.M., White, J.D.L., Kwan, Y., 2011. Pyroclast textures of the Ilchulbong “ wet ” tuff cone , Jeju Island , South Korea. J. Volcanol. Geotherm. Res. 201, 385–396. doi:10.1016/j.jvolge-ores.2010.09.009
Murtagh, R.M., White, J.D.L., 2013. Pyroclast characteristics of a subaqueous to emergent Surtseyan eruption , Black Point volcano , California. J. Volcanol. Geotherm. Res. 267, 75–91. doi:10.1016/j.jvolgeores.2013.08.015
Nakamura, M., Otaki, K., Takeuchi, S., 2008. Permeability and pore-connectivity variation of pumices from a single pyroclastic flow eruption: Implications for partial fragmentation. J. Volcanol. Geo-therm. Res. 176, 302–314. doi:10.1016/j.jvolgeores.2008.04.011
Namiki, A., Manga, M., 2008. Transition between fragmentation and permeable outgassing of low viscosity magmas. J. Volcanol. Geotherm. Res. 169, 48–60. doi:10.1016/j.jvolge-ores.2007.07.020
Németh, K., Cronin, S. J., Charley, D. T., Harrison, M. J., & Garae, E. (2006). Exploding lakes in Vanuatu-" Surtseyan-style" eruptions witnessed on Ambae Island. EPISODES 2006 vol. 29., No. 2., 87-93
Nguyen, C. T., Gonnermann, H. M., Chen, Y., Huber, C., Maiorano, A. A., Gouldstone, A., & Dufek, J. (2013). Film drainage and the lifetime of bubbles. Geochemistry, Geophysics, Geosys-tems, 14(9), 3616-3631.
Nguyen, C.T., Gonnermann, H.M., Houghton, B.F., 2014. Explosive to effusive transition during the largest volcanic eruption of the 20th century (Novarupta 1912, Alaska). Geology 42, 703–706. doi:10.1130/G35593.1
Nichols, A.R.L., Potuzak, M., Dingwell, D.B., 2009. Cooling rates of basaltic hyaloclastites and pillow lava glasses from the HSDP2 drill core. Geochim. Cosmochim. Acta 73, 1052–1066. doi:10.1016/j.gca.2008.11.023
Okumura, S., Nakamura, M., Tsuchiyama, A., Nakano, T., Uesugi, K., 2008. Evolution of bubble mi-crostructure in sheared rhyolite: Formation of a channel-like bubble network. J. Geophys. Res. Solid Earth 113, 1–18. doi:10.1029/2007JB005362
Okumura, S., Nakamura, M., Uesugi, K., Nakano, T., Fujioka, T., 2013. Coupled effect of magma degassing and rheology on silicic volcanism. Earth Planet. Sci. Lett. 362, 163–170. doi:10.1016/j.epsl.2012.11.056
Oppenheimer, J., Rust, A.C., Cashman, K. V, Sandnes, B., 2015. Gas migration regimes and out-gassing in particle-rich suspensions. Front. Phys. 3, 1–13. doi:10.3389/fphy.2015.00060
126
van Otterloo, J., Cas, R.A.F., Scutter, C.R., 2015. Earth-Science Reviews The fracture behaviour of volcanic glass and relevance to quench fragmentation during formation of hyaloclastite and phreatomagmatism. Earth-Science Rev. 151, 79–116. doi:10.1016/j.earscirev.2015.10.003
Parmigiani, A., Faroughi, S., Huber, C., Bachmann, O., & Su, Y. (2016). Bubble accumulation and its role in the evolution of magma reservoirs in the upper crust. Nature, 532(7600), 492. doi:10.1038/nature17401
Patel, A., Manga, M., Carey, R. J., & Degruyter, W. (2013). Effects of thermal quenching on mechan-ical properties of pyroclasts. Journal of Volcanology and Geothermal Research, 258, 24-30. https://doi.org/10.1016/j.jvolgeores.2013.04.001
Platz, T., Cronin, S.J., Cashman, K. V., Stewart, R.B., Smith, I.E.M., 2007. Transition from effusive to explosive phases in andesite eruptions - A case-study from the AD1655 eruption of Mt. Tara-naki, New Zealand. J. Volcanol. Geotherm. Res. 161, 15–34. doi:10.1016/j.jvolge-ores.2006.11.005
Pleše, P., Higgins, M. D., Mancini, L., Lanzafame, G., Brun, F., Fife, J. L., ... & Baker, D. R. (2018). Dynamic observations of vesiculation reveal the role of silicate crystals in bubble nucleation and growth in andesitic magmas. Lithos, 296, 532-546.
Pistone, M., Caricchi, L., Fife, J. L., Mader, K., & Ulmer, P. (2015). In situ X-ray tomographic micros-copy observations of vesiculation of bubble-free and bubble-bearing magmas. Bulletin of Vol-canology, 77(12), 108. https://doi.org/10.1007/s00445-015-0992-1
Polacci, M., Baker, D.R., Mancini, L., Tromba, G., Zanini, F., 2006. Three-dimensional investigation of volcanic textures by X-ray microtomography and implications for conduit processes. Ge-ophys. Res. Lett. 33, 3–7. doi:10.1029/2006GL026241
Polacci, M., Baker, D.R., Bai, L., Mancini, L., 2008. Large vesicles record pathways of degassing at basaltic volcanoes. Bull. Volcanol. 70, 1023–1029. doi:10.1007/s00445-007-0184-8
Polacci, M., Baker, D.R., La Rue, A., Mancini, L., Allard, P., 2012. Degassing behaviour of vesicu-lated basaltic magmas: An example from Ambrym volcano, Vanuatu Arc. J. Volcanol. Geo-therm. Res. 233–234, 55–64. doi:10.1016/j.jvolgeores.2012.04.019
Potuzak, M., Nichols, A.R.L., Dingwell, D.B., Clague, D.A., 2008. Hyperquenched volcanic glass from Loihi Seamount , Hawaii. Earth Planet. Sci. Lett. 270, 54–62. doi:10.1016/j.epsl.2008.03.018
Prado, M. O., Fredericci, C., & Zanotto, E. D. (2003). Isothermal sintering with concurrent crystallization of polydispersed soda–lime–silica glass beads. Journal of non-crystalline solids, 331(1-3), 145-156.
Proussevitch, A.A., Sahagian, D.L., 1998. Dynamics and energetics of bubble growth in magmas : Analytical formulation and numerical modeling Pg. J. Geophys. Res. 103, 18223–18251. doi:10.1029/98JB00906
Quéré, D. (2013). Leidenfrost dynamics. Annual Review of Fluid Mechanics, 45, 197-215. https://doi.org/10.1146/annurev-fluid-011212-140709
Resing, J. A., Rubin, K. H., Embley, R. W., Lupton, J. E., Baker, E. T., Dziak, R. P., ... & Butterfield, D. A. (2011). Active submarine eruption of boninite in the northeastern Lau Basin. Nature Ge-oscience, 4(11), 799. doi:10.1038/ngeo1275
127
Rintoul, M.D., 2000. Precise determination of the void percolation threshold for two distributions of overlapping spheres. Physical Review E, 62(1), p.68.
Robert, G., Russell, J.K., Giordano, D., 2008. Rheology of porous volcanic materials: High-temper-ature experimentation under controlled water pressure. Chem. Geol. 256, 215–229. doi:10.1016/j.chemgeo.2008.06.028
Rotella, M. D., Wilson, C. J., Barker, S. J., Cashman, K. V., Houghton, B. F., & Wright, I. C. (2014). Bubble development in explosive silicic eruptions: insights from pyroclast vesicularity textures from Raoul volcano (Kermadec arc). Bulletin of Volcanology, 76(8), 826. https://doi.org/10.1007/s00445-014-0826-6
Rust, A.C., Cashman, K. V., 2004. Permeability of vesicular silicic magma: Inertial and hysteresis effects. Earth Planet. Sci. Lett. 228, 93–107. doi:10.1016/j.epsl.2004.09.025
Rust, A.C., Cashman, K. V., 2011. Permeability controls on expansion and size distributions of pyro-clasts. J. Geophys. Res. Solid Earth 116, 1–17. doi:10.1029/2011JB008494
Rust, A.C., Russell, J.K., Knight, R.J., 1999. Dielectric constant as a predictor of porosity in dry volcanic rocks. J. Volcanol. Geotherm. Res. 91, 79–96. doi:10.1016/S0377-0273(99)00055-4
Saar, M. O., & Manga, M. (1999). Permeability-porosity relationship in vesicular basalts. Geophys. Res. Lett, 26(1), 111-114
Sahimi, M. (1994). Applications of percolation theory. CRC Press.
Schaefer, L. N. et al. Geomechanical rock properties of a basaltic volcano. Front. Earth Sci. 3, 1–15 (2015).
Scheu, B., Kueppers, U., Mueller, S., Spieler, O., & Dingwell, D. B. (2008). Experimental volcanology on eruptive products of Unzen volcano. Journal of Volcanology and Geothermal Re-search, 175(1-2), 110-119. https://doi.org/10.1016/j.jvolgeores.2008.03.023
Schipper, C.I., White, J.D.L., Houghton, B.F., 2010. Syn- and post-fragmentation textures in subma-rine pyroclasts from L ō ` ihi Seamount , Hawai ` i. J. Volcanol. Geotherm. Res. 191, 93–106. doi:10.1016/j.jvolgeores.2010.01.002
Schipper, C.I., White, J.D.L., Houghton, B.F., 2011. Textural , geochemical , and volatile evidence for a Strombolian-like eruption sequence at L ō ` ihi Seamount , Hawai ` i. J. Volcanol. Geo-therm. Res. 207, 16–32. doi:10.1016/j.jvolgeores.2011.08.001
Schipper, C.I., Sonder, I., Schmid, A., White, J.D.L., Dürig, T., Zimanowski, B., Büttner, R., 2013. Vapour dynamics during magma – water interaction experiments : hydromagmatic origins of submarine volcaniclastic particles ( limu o Pele ). Geophys. J. Int. 192, 1109–1115. doi:10.1093/gji/ggs099
Schipper, C. I., Castro, J. M., Tuffen, H., James, M. R., & How, P. (2013). Shallow vent architecture during hybrid explosive–effusive activity at Cordón Caulle (Chile, 2011–12): evidence from di-rect observations and pyroclast textures. Journal of Volcanology and Geothermal Re-search, 262, 25-37. https://doi.org/10.1016/j.jvolgeores.2013.06.005
Schipper, C. I. & White, J. D. L. Magma-slurry interaction in Surtseyan eruptions. Geology 44, 1–4 (2016).
128
Schmith, J., Höskuldsson, Á., & Holm, P. M. (2017). Grain shape of basaltic ash populations: impli-cations for fragmentation. Bulletin of Volcanology, 79(2), 14. https://doi.org/10.1007/s00445-016-1093-5
Scutter, C. R., Cas, R. A. F. & Moore, C. L. Circeo. J. Geophys. Res. 103, 551–566 (1998).
Shea, T., Houghton, B.F., Gurioli, L., Cashman, K. V., Hammer, J.E., Hobden, B.J., 2010. Textural studies of vesicles in volcanic rocks: An integrated methodology. J. Volcanol. Geotherm. Res. 190, 271–289. doi:10.1016/j.jvolgeores.2009.12.003
Shea, T., Gurioli, L., Houghton, B.F., 2012. Transitions between fall phases and pyroclastic density currents during the AD 79 eruption at Vesuvius: Building a transient conduit model from the textural and volatile record. Bull. Volcanol. 74, 2363–2381. doi:10.1007/s00445-012-0668-z
Shea, T. (2017). Bubble nucleation in magmas: A dominantly heterogeneous process?. Journal of Volcanology and Geothermal Research, 343, 155-170. https://doi.org/10.1016/j.jvolge-ores.2017.06.025
Shimano, T., Nakada, S., 2006. Vesiculation path of ascending magma in the 1983 and the 2000 eruptions of Miyakejima volcano, Japan. Bull. Volcanol. 68, 549–566. doi:10.1007/s00445-005-0029-2
Skilling, I. P., White, J. D. L. & Mcphie, J. Peperite : a review of magma ^ sediment mingling. J. Volcanol.
Sonder, I., Schmid, A., Seegelken, R., Zimanowski, B. & Büttner, R. Heat source or heat sink : What dominates behavior of non - explosive magma - water interaction ? J. Geophys. Res. 116, 1–8 (2011).
Sohn, Y. K., & Chough, S. K. (1992). The Ilchulbong tuff cone, Cheju Island, South Korea. Sedimen-tology, 39(4), 523-544. DOI: 10.1111/j.1365-3091.1992.tb02135.x
Solgevik, H., Mattsson, H. B., & Hermelin, O. (2007). Growth of an emergent tuff cone: fragmentation and depositional processes recorded in the Capelas tuff cone, São Miguel, Azores. Journal of Volcanology and Geothermal Research, 159(1-3), 246-266. https://doi.org/10.1016/j.jvolge-ores.2006.06.020
Song, S.R., Jones, K.W., Lindquist, W.B., Dowd, B.A., Sahagian, D.L., 2001. Synchrotron X-ray computed microtomography: Studies on vesiculated basaltic rocks. Bull. Volcanol. 63, 252–263. doi:10.1007/s004450100141
Sparks, S. R., Sigurdsson, H., & Wilson, L. (1977). Magma mixing: a mechanism for triggering acid explosive eruptions. Nature, 267(5609), 315.
Sparks, R.S.J., 1978. The Dynamics Of Bubble Formation And Growth In Magmas: A review And Analysis. J. Volcanol. Geotherm. Res. 3, 1–37.
Spieler, O., Kennedy, B., Kueppers, U., Dingwell, D. B., Scheu, B., & Taddeucci, J. (2004). The fragmentation threshold of pyroclastic rocks. Earth and Planetary Science Letters, 226(1-2), 139-148. https://doi.org/10.1016/j.epsl.2004.07.016
129
Spina, L., Cimarelli, C., Scheu, B., Genova, D. Di, Dingwell, D.B., 2016. On the slow decompressive response of volatile- and crystal-bearing magmas : An analogue experimental investigation. Earth Planet. Sci. Lett. 433, 44–53. doi:10.1016/j.epsl.2015.10.029
Staudigel, H. & Schmincke, H. The Pliocene Seamount Series of La Palma / Canary Islands. J. Geophys. Res. 89, 11,195-11,215 (1984).
Stovall, W.K., Houghton, B.F., Gonnermann, H., Fagents, S.A., Swanson, D.A., 2011. Eruption dy-namics of Hawaiian-style fountains : the case study of episode 1 of the K ī lauea Iki 1959 erup-tion. Bull. Volcanol. 1959, 511–529. doi:10.1007/s00445-010-0426-z
Stovall, W.K., Houghton, B.F., Hammer, J.E., Fagents, S.A., Swanson, D.A., 2012. Vesiculation of high fountaining Hawaiian eruptions : episodes 15 and 16 of 1959 K ī lauea Iki. Bull. Volcanol. 441–455. doi:10.1007/s00445-011-0531-7
Stroberg, T. W., Manga, M., & Dufek, J. (2010). Heat transfer coefficients of natural volcanic clasts. Journal of Volcanology and Geothermal Research, 194(4), 214-219. 10.1016/j.jvolge-ores.2010.05.007
Stroncik, N. A., & Schmincke, H. U. (2002). Palagonite–a review. International Journal of Earth Sci-ences, 91(4), 680-697. https://doi.org/10.1007/s00531-001-0238-7
Taddeucci, J., Edmonds, M., Houghton, B., James, M. R., & Vergniolle, S. (2015). Hawaiian and Strombolian eruptions. In The Encyclopedia of Volcanoes (Second Edition) (pp. 485-503).
Takeuchi, S., Tomiya, A., Shinohara, H., 2009. Degassing conditions for permeable silicic magmas: Implications from decompression experiments with constant rates. Earth Planet. Sci. Lett. 283, 101–110. doi:10.1016/j.epsl.2009.04.001
Thorarinsson, S., Einarsson, T., Sigvaldason, G., & Elisson, G. (1964). The submarine eruption off the Vestmann Islands 1963–64. Bulletin Volcanologique, 27(1), 435-445.
Thorarinsson, S. (1964). Eyan nýja í Atlantshafi. Surtsey. The new island in the north Atlantic.-64 p., Reykjavík, Iceland,(Almenna Bókafélagið).
Thorarinsson, S. (1967). The Surtsey eruption and related scientific work. Polar Record, 13(86), 571-578.
Toramaru, A. (1989). Vesiculation process and bubble size distributions in ascending magmas with constant velocities. Journal of Geophysical Research: Solid Earth, 94(B12), 17523-17542.
Toramaru, A. (2006). BND (bubble number density) decompression rate meter for explosive volcanic eruptions. Journal of Volcanology and Geothermal Research, 154(3-4), 303-316. https://doi.org/10.1016/j.jvolgeores.2006.03.027
Truby, J. M., Mueller, S. P., Llewellin, E. W., & Mader, H. M. (2015, January). The rheology of three-phase suspensions at low bubble capillary number. In Proc. R. Soc. A (Vol. 471, No. 2173, p. 20140557). The Royal Society. DOI: 10.1098/rspa.2014.0557
Vasseur, J., Wadsworth, F.B., Lavallée, Y., Hess, K.U., Dingwell, D.B., 2013. Volcanic sintering: Timescales of viscous densification and strength recovery. Geophys. Res. Lett. 40, 5658–5664. doi:10.1002/2013GL058105
130
Vasseur, J., Wadsworth, F.B., Lavallée, Y., Dingwell, D.B., 2016. Dynamic elastic moduli during isotropic densification of initially granular media. Geophysical Journal International , 204, 1721–1728. doi:10.1093/gji/ggv550
Vasseur, J., & Wadsworth, F. B. (2017). Sphere models for pore geometry and fluid permeability in heterogeneous magmas. Bulletin of Volcanology, 79(11), 77.
Vaughan, R.G., Webley, P.W., 2010. Satellite observations of a surtseyan eruption : Hunga Ha’apai , Tonga. J. Volcanol. Geotherm. Res. 198, 177–186. doi:10.1016/j.jvolgeores.2010.08.017
Vergniolle, S., & Jaupart, C. (1986). Separated two-phase flow and basaltic eruptions. Journal of Geophysical Research: Solid Earth, 91(B12), 12842-12860.
Verolino, A., White, J. D. L., & Zimanowski, B. (2017). Particle transport in subaqueous eruptions: An experimental investigation. Journal of Volcanology and Geothermal Research. https://doi.org/10.1016/j.jvolgeores.2017.11.013
Vogel, H.-J., 2002. Topological Characterization of Porous Media. Morphol. Condens. Matter SE - 3 600, 75–92. doi:10.1007/3-540-45782-8_3
Vona, A., Romano, C., Dingwell, D. B., & Giordano, D. (2011). The rheology of crystal-bearing ba-saltic magmas from Stromboli and Etna. Geochimica et Cosmochimica Acta, 75(11), 3214-3236.
Wadsworth, F.B., Vasseur, J., Aulock, F.W. Von, Hess, K.-U., Scheu, B., Lavallée, Y., Dingwell, D.B., 2014. Journal of Geophysical Research : Solid Earth Nonisothermal viscous sintering of volcanic ash. doi:10.1002/2014JB011453.Received
Wadsworth, F. B., Vasseur, J., Llewellin, E. W., Schauroth, J., Dobson, K. J., Scheu, B., & Dingwell, D. B. (2016). Sintering of viscous droplets under surface tension. Proc. R. Soc. A (Vol. 472, No. 2188, p. 20150780).
Wadsworth, F.B., Vasseur, J., Scheu, B., Kendrick, J.E., Lavallée, Y., Dingwell, D.B., 2016. Univer-sal scaling of fluid permeability during volcanic welding and sediment diagenesis. Geology 44, 219–222. doi:10.1130/G37559.1
Wadsworth, F. B., Vasseur, J., Llewellin, E. W., Dobson, K. J., Colombier, M., von Aulock, F. W., ... & Lavallée, Y. (2017). Topological inversions in coalescing granular media control fluid-flow regimes. Physical Review E, 96(3), 033113.
Wadsworth, F. B., Vasseur, J., Llewellin, E. W., Genareau, K., Cimarelli, C., & Dingwell, D. B. (2017). Size limits for rounding of volcanic ash particles heated by lightning. Journal of Geophysical Research: Solid Earth, 122(3), 1977-1989.
Walker, G.P.L, Croasdale, 1971. Characteristics of some basaltic pyroclastics, Bulletin Volcan-ologique 35: 303–317.
Waters, A. C. & Fisher, R. V. Surges and Their Deposits : Capelinhos and Taal Volcanoes. J. Ge-ophys. Res. 76, 5596–5614 (1971).
Wallace, P. J., Plank, T., Edmonds, M., & Hauri, E. H. (2015). Volatiles in magmas. In The Encyclo-pedia of Volcanoes (Second Edition) (pp. 163-183). https://doi.org/10.1016/B978-0-12-385938-9.00007-9
131
White, J. D. (1996). Impure coolants and interaction dynamics of phreatomagmatic eruptions. Jour-nal of Volcanology and Geothermal Research, 74(3-4), 155-170. https://doi.org/10.1016/S0377-0273(96)00061-3
White, J. D., & Valentine, G. A. (2016). Magmatic versus phreatomagmatic fragmentation: Absence of evidence is not evidence of absence. Geosphere, 12(5), 1478-1488. DOI: https://doi.org/10.1130/GES01337.1
Wilding, M. C., Webb, S. L., & Dingwell, D. B. (1995). Evaluation of a relaxation geospeedometer for volcanic glasses. Chemical Geology, 125(3-4), 137-148. https://doi.org/10.1016/0009-2541(95)00067-V
Wilding, M., Webb, S., Dingwell, D., Ablay, G., & Marti, J. (1996). Cooling rate variation in natural volcanic glasses from Tenerife, Canary Islands. Contributions to mineralogy and petrol-ogy, 125(2-3), 151-160. https://doi.org/10.1007/s004100050212
Wilding, M., Webb, S., & Dingwell, D. B. (1996). Tektite cooling rates: calorimetric relaxation geo-speedometry applied to a natural glass. Geochimica et cosmochimica acta, 60(6), 1099-1103. https://doi.org/10.1016/0016-7037(96)00010-5
Wilding, M., Dingwell, D., Batiza, R., Wilson, L., 2000. Cooling rates of hyaloclastites : applications of relaxation geospeedometry to undersea volcanic deposits. Bull. Volcanol. 61, 527–536.
Wohletz, K. H., & Sheridan, M. F. (1983). Hydrovolcanic explosions; II, Evolution of basaltic tuff rings and tuff cones. American journal of science, 283(5), 385-413.
Wohletz, K. H. (1986). Explosive magma-water interactions: Thermodynamics, explosion mecha-nisms, and field studies. Bulletin of Volcanology, 48(5), 245-264. https://doi.org/10.1007/BF01081754
Wohletz, K., Zimanowski, B. & Büttner, R. in Modeling Volcanic Processes: The Physics and Math-ematics of Volcanism 230–257 (2012).
Woodcock, D. C., Gilbert, J. S., & Lane, S. J. (2012). Particle-water heat transfer during explosive volcanic eruptions. Journal of Geophysical Research: Solid Earth, 117(B10). DOI: 10.1029/2012JB009240
Wright, I. C., Gamble, J. A., & Shane, P. A. (2003). Submarine silicic volcanism of the Healy caldera, southern Kermadec arc (SW Pacific): I-volcanology and eruption mechanisms. Bulletin of Vol-canology, 65(1), 15-29.
Wright, H.M.N., Cashman, K. V., Gottesfeld, E.H., Roberts, J.J., 2009. Pore structure of volcanic clasts: Measurements of permeability and electrical conductivity. Earth Planet. Sci. Lett. 280, 93–104. doi:10.1016/j.epsl.2009.01.023
Wright, H.M.N., Cashman, K. V., Rosi, M., Cioni, R., 2007. Breadcrust bombs as indicators of Vul-canian eruption dynamics at Guagua Pichincha volcano, Ecuador. Bull. Volcanol. 69, 281–300. doi:10.1007/s00445-006-0073-6
Wright, H.M., Cashman, K. V., 2014. Compaction and gas loss in welded pyroclastic deposits as revealed by porosity, permeability, and electrical conductivity measurements of the Shevlin Park Tuff. Geol. Soc. Am. Bull. 126, 234–247. doi:10.1130/b30668.1
132
Xu, Z., & Zhang, Y. (2002). Quench rates in air, water, and liquid nitrogen, and inference of temper-ature in volcanic eruption columns. Earth and Planetary Science Letters, 200(3-4), 315-330. https://doi.org/10.1016/S0012-821X(02)00656-8
Yokoyama, T., Takeuchi, S., 2009. Porosimetry of vesicular volcanic products by a water-expulsion method and the relationship of pore characteristics to permeability. J. Geophys. Res. Solid Earth 114. doi:10.1029/2008JB005758
Zimanowski, B., Büttner, R. & Lorenz, V. Premixing of magma and water in MFCI experiments. Bull. Volcanol. 58, 491–495 (1997).
133
Acknowledgements
Best acknowledgments! There are so many people that I want to thank for their daily support since
I started this thesis a first of April (best poisson d’avril).
First, I would like to thank Don, Betty and Ulli for giving me this opportunity to do this PhD
here in the best conditions in Munich, for trusting in me and for guiding me during these 3 years. I
really gave all what I could to pay all this back to you. Don, thank you so much for all the discussions
we had and the useful comments you gave on my work, for all the freedom I had to do my research
and for letting me go to so many cool conferences or field trips. Vielen Dank zum Betty und Ulli for
being such great supervisors, for taking so much time to discuss with me, for making me feel good
in this group when I arrived, for letting me explore and push further all the ideas I had and for forgiving
me when I did stupid things (e.g., not waking up at EGU for important meeting ^^). I am sorry that
we could not realise our initial plan with this crazy subaqueous set up but I hope we can make it in
future. You are not only great supervisors but also great persons and I hope we will continue seeing
and working together for a long time.
I take advantage to say again a special thanks to Lucia and Tim for introducing me to research
and volcanology during my Masters.
Merci de tout mon cœur à mon fils que j’aime Adrien et ma femme chérie Vane. C’est vous
deux qui m’avez donné la force de faire cette thèse et de ne jamais rien lâcher. Merci de m’avoir
suivi à Munich et pour m’avoir toujours soutenu. J’ai tellement de chance de vous avoir à mes côtés.
Un très grand merci à mes parents, mon frère et ma sœur qui m’ont beaucoup soutenu pendant
cette thèse, en Allemagne ou en France. Et une spéciale dédicace à mes neveux Germain et Yann.
Et à ma mamie avec qui j’aurai aimé discuter de tout ça! Et merci à toute ma famille en France et en
Équateur! Je vous aime très fort tous.
Thanks also to all my colleagues and co-workers, here in Munich or from abroad, with whom
I exchanged ideas and without whom this work wouldn’t have been possible. First, I would like to
say thanks to Fabian. Thanks mate for all the exciting discussions and ideas we shared together,
that is how research should always work. Dude you really contributed a lot to this work and I am very
grateful for this. I hope we will keep working together for long. A special thank also to Kai, Kate,
Jérémie and Pancho for all the help and discussions we had. Thanks also to the best beamtime
group in SLS for all the work day and night and the good energy you gave to this project. I am also
very grateful to Andre who took lots of time to help me with data copying. Thanks also to Shane
Cronin and Manuela Tost for letting me work on the best Tongan volcano and for sending me so
many samples. Thanks also to Lucia Gurioli, Sebastian Mueller, Anja Allabar, Tim Yilmaz, Pierre
Delmelle, Andrea Di Muro, Corrado Cimarelli, Marco Brenna, Bernard Ruthensteiner, Federica
Marone and Christian Schlepuetz.
134
Now is time to say many thanks to all my best boring, asocial and naked friends during the
PhD. Look guys, it will be a bit boring acknowledgements because I am very tired at the moment of
writing but I would like you to know how important and helpful your presence was for me during my
PhD. Thanks you all for the balcony and coffee breaks, the best parties, the best jokes we did… I
love all of you my friends. So here we go thanks to Basti (Stimmung garantiert), Leti (best boring),
Pancho (naked), Ana (excited), Joan (useless), Joali (me chamo Choa y me gusta el chogurt), Vale
(grazie di esistere), Damiano (best asocial), Nora (Plankton, grazie Kate), Christian (non me rompe
er ca), Kathrin (Kati Kati), Pablito (precocito), Ben (biche), Antho (biche), Marina (biche), Val (trop
bien de t’avoir retrouvé mon pote!), Guilhemito (c’est à moi que tu parles?), Rike (Raki), Micha (best
Harlekin party), Ale (Hai le mano pulite?), Lukas (loco Lukas), Sid (pero porque?), Jérémie (qui aime
les cheveux), Fab (aaaah the candle), Anush (aaaah…what?), Caron (I need to pee), Quentin a.k.a
Couenetine (Ziz iz ze pizzeria), Tim (massiveness), Stephane (best dancer), Justine (best EGU),
Anja (best synchrotron), Serena (best risotto), Julia (best bouldering), Shanje (best dog year), Mar-
got (Morgat), Adrian (dim sun contest!), Clara (la seule sicilienne martiniquaise mariée à un bavarois
que je connaisse), Pierrivo (asocial), Pier Paolo (Best Portland), Julie (best Chinatown at AGU),
Sonke (asocial), Danilo (tour de France), Gilles (Guy-Les) and also Klaus, Laura, Gerardo, Morgane,
Stephanie, Eduardo, Ines, Inga, Jim, Mehdi, Taylor, Diegito, Jenny, Dirk, David, Paul, Luke, Dini,
Mike, Jamie, Alejandra, Alexandra, Mar, Stefano, Leander, Mirta, Janina, Holly, Estelle, Erin, Kai,
Juan Jo, Mike, Johannes, Steffi, Diana, Michael, Oliver, Pia, Jacoppo, Tulio, Brett… and very sorry
if I forget somebody (sorry is friend of bullshit!). Group hug to all of you!
Thanks to the best group for being always asocial, boring and naked. Thanks to the boulder-
ing people and to bouldering itself. Thanks to Konis Hupen, Die Woody’s, Despacito (Luis Ponchi,
Vietnamese and Chicken version), Stach stach (Bratisla boys), Eros Ramazzoti, Celine Dion, Gua-
camole song, Vey super famous, Show me your ***, the lion and also to good music for accompa-
nying me during my thesis! Thanks to our old friend in Vincenzmur for always welcoming Basti,
Pancho and me and being so friendly even when we asked for 5 scheiben leberkässemel! Muchísi-
mas gracias a mi gente latina por ser tan chévere y haber ganado tantas veces a los europeos al
futbol! En parlant de foot, merci à tous mes amis d’enfance du FC2A, aux potos du FCT à Munich
et bien sûr à l’Olympique de Marseille (aller l’OM !). Merci à tous mes amis en France, tous les
bibiches mâles et femelles de la promo de M2 à Clermont, les potes de licence que j’ai recroisé,
Raph, Sercan (mercimek), Edwin, Donis et sa famille, tous mes amis d’enfance à Grenoble, tous les
gens de mon village au Chateau.
Thanks to the best volcanoes which I studied, climbed or just watched during my master,
thesis or holidays, namely Kilian volcano (and all Chaîne des puys), Hunga Tonga-Hunga Ha’apai (I
won’t say the name of the volcano), Cotopaxi and Pasochoa (y todos los otros en Ecuador), Strom-
boli (e anche grazie a Ingrid, magari ci vediamo altra volta), Mount St Helens, Solfatara. Finally,
thanks to the bubble-bubbles sukas!
Voilà ma foi c’est déjà pas mal, balcony break?
FORMBLATT 3
FAKULTÄT FÜR
GEOWISSENSCHAFTEN
Eidesstattliche Versicherung
Ich versichere hiermit an Eides statt, dass die Dissertation von mir selbstständig und ohne
Beihilfe angefertigt worden ist.
(Ort, Datum) (Unterschrift des Doktoranden / der Doktorandin)
Erklärung
Hiermit erkläre ich, dass die Dissertation, ganz oder in Teilen, noch keiner anderen
Promotionskommission vorgelegt worden ist.
(Ort, Datum) (Unterschrift des Doktoranden / der Doktorandin)
Erklärung
Hiermit erkläre ich, dass ich mich anderweitig einer Doktorprüfung ohne Erfolg nicht unterzogen habe.
(Ort, Datum) (Unterschrift des Doktoranden / der Doktorandin)