evaluation of locally established reference intervals for hematology and biochemistry parameters in...
TRANSCRIPT
RESEARCH ARTICLE
Evaluation of Locally Established ReferenceIntervals for Hematology and BiochemistryParameters in Western KenyaCollins Odhiambo1, Boaz Oyaro1, Richard Odipo1, Fredrick Otieno1, George Alemnji2,JohnWilliamson3, Clement Zeh3*
1 Kenya Medical Research Institute, Kisumu, Kenya, 2 U.S. Centers for Disease Control and Prevention(CDC), Bridgetown, Barbados, 3 U.S. Centers for Disease Control and Prevention (CDC), Kisumu, Kenya
AbstractBackground
Important differences have been demonstrated in laboratory parameters from healthy per-
sons in different geographical regions and populations, mostly driven by a combination of
genetic, demographic, nutritional, and environmental factors. Despite this, European and
North American derived laboratory reference intervals are used in African countries for pa-
tient management, clinical trial eligibility, and toxicity determination; which can result in mis-
classification of healthy persons as having laboratory abnormalities.
Methods
An observational prospective cohort study known as the Kisumu Incidence Cohort Study
(KICoS) was conducted to estimate the incidence of HIV seroconversion and identify deter-
minants of successful recruitment and retention in preparation for an HIV vaccine/prevention
trial among young adults and adolescents in western Kenya. Laboratory values generated
from the KICoS were compared to published region-specific reference intervals and the
2004 NIH DAIDS toxicity tables used for the trial.
Results
About 1106 participants were screened for the KICoS between January 2007 and June
2010. Nine hundred and fifty-three participants aged 16 to 34 years, HIV-seronegative, clini-
cally healthy, and non-pregnant were selected for this analysis. Median and 95% reference
intervals were calculated for hematological and biochemistry parameters. When compared
with both published region-specific reference values and the 2004 NIH DAIDS toxicity table,
it was shown that the use of locally established reference intervals would have resulted in
fewer participants classified as having abnormal hematological or biochemistry values com-
pared to US derived reference intervals from DAIDS (10% classified as abnormal by local
parameters vs.>40% by US DAIDS). Blood urea nitrogen was most often out of range if US
based intervals were used:<10% abnormal by local intervals compared to>83% by US
based reference intervals.
PLOS ONE | DOI:10.1371/journal.pone.0123140 April 13, 2015 1 / 12
OPEN ACCESS
Citation: Odhiambo C, Oyaro B, Odipo R, Otieno F,Alemnji G, Williamson J, et al. (2015) Evaluation ofLocally Established Reference Intervals forHematology and Biochemistry Parameters inWestern Kenya. PLoS ONE 10(4): e0123140.doi:10.1371/journal.pone.0123140
Academic Editor: Clive M. Gray, University of CapeTown, SOUTH AFRICA
Received: November 20, 2014
Accepted: February 17, 2015
Published: April 13, 2015
Copyright: This is an open access article, free of allcopyright, and may be freely reproduced, distributed,transmitted, modified, built upon, or otherwise usedby anyone for any lawful purpose. The work is madeavailable under the Creative Commons CC0 publicdomain dedication.
Data Availability Statement: All relevant data arewithin the paper.
Funding: This work was funded by the Division ofHIV/AIDS Prevention, Centers for Disease Controland Prevention. The funders had no role in studydesign, data collection and analysis, decision topublish, or preparation of the manuscript.
Competing Interests: The authors have declaredthat no competing interests exist.
Conclusion
Differences in reference intervals for hematological and biochemical parameters between
western and African populations highlight importance of developing local reference intervals
for clinical care and trials in Africa.
IntroductionThe burden of diseases such as HIV/AIDS, tuberculosis, and malaria is heaviest in sub-SaharanAfrica compared to the rest of the world [1, 2]. For example, sub-Saharan Africa has the highestprevalence and incidence of HIV infection globally. As such, a major of many recent HIV pre-vention, care and treatment initiatives are being conducted within the region [3, 4]. includingmost phase I ⁄ IIB HIV-1 vaccine trials [5].
With increasing clinical trials in sub-Saharan Africa to combat these diseases, there is aneed for accurate clinical laboratory reference intervals for appropriate participant screening,disease progression monitoring and evaluation of possible clinical trial-associated toxicity andadverse events [6]. Reference intervals are important for guiding patient treatment and man-agement as well as identifying abnormal hematologic values [7]. For example, the completeblood count and CD4 determination are important laboratory tests in HIV-endemic regions[8]. The level of hemoglobin concentration has utility as a prognostic indicator while CD4 isused to make decisions regarding initiation of antiretroviral drugs and to monitor disease pro-gression. These tests require accurate reference intervals for correct interpretation of laboratoryresults. However, currently used reference intervals in many countries in sub-Saharan Africaare derived from populations in Europe and North America [6, 9]. Since hematologic parame-ters are affected not only by individual factors such as age, sex and lifestyle, but also by popula-tion and ecological factors such as ethnic background, climate, exposure to pathogens andaltitude, they vary not only between individuals but also between populations [10]. Thus, thereis not a universal definition of ‘normal’ hence it is important to define reference intervals thatare suited to the particular population of interest [10]. A few studies conducted in Africa overthe last decade have highlighted differences in hematologic parameters between the local popu-lation and Caucasian populations in Europe and North America [11–15]. More recently, astudy highlighted differences in hematological and biochemistry values between adolescentand young adult males [15]. Despite these recorded inter-population differences in referencevalues for different geographical regions, few data exist in Africa to provide locally-derived val-ues [7, 12, 13, 16].
Despite these recorded differences, the Division of AIDS (DAIDS) National Institute ofHealth toxicity tables [17], are still used for grading the severity of adult and pediatric adverseevents, whether or not they are considered to be related to the study intervention. This leads tounnecessary exclusion of would be participants misclassified as having abnormal hematologicparameters thereby escalating operational costs especially in phase I safety trials where theremay not be a control group [18–20]. This may also lead to improper patient managementthrough misclassification of adverse events. Due to these differences, there is a need to developand test locally-derived age specific reference intervals within African populations.
While it is desirable to generate reference intervals for different populations, the procedureremains a challenge due to the prohibitive cost involved in performing these studies and thelimitation in identifying suitable healthy reference individual. Thus, the recommendation bythe Clinical and Laboratory Standards Institute (CLSI) that all diagnostic laboratories must
Evaluation of Local Reference Intervals for Use in Kenya
PLOS ONE | DOI:10.1371/journal.pone.0123140 April 13, 2015 2 / 12
determine and maintain their own reference interval for each laboratory parameter is impracti-cal. CLSI further recommends that if it is not possible to establish the detailed reference studies,then validation of published reference intervals can be performed using own methodology forthe population served by the laboratory. Zeh et al have recently established reference intervalsfor use in western Kenya [15]. These intervals were generated from a study conducted on 13–34year old, clinically healthy, HIV-seronegative, non-pregnant residents of western Kenya. Be-cause the established reference intervals were from a population in Siaya County in westernKenya, our aim was to validate these established reference intervals for use in Kisumu Countyof western Kenya. We also retrospectively determined the proportion of participants in an ob-servational prospective cohort study known as the Kisumu Incidence Cohort Study (KICoS),who would be misclassified as having abnormal hematological parameters using the establishedreference intervals and compared our findings to those obtained using the 2004 NIH DAIDStoxicity tables.
Materials and Methods
Study populationThis analysis utilized 953 samples obtained from 1106 participants screened in the KICoS con-ducted between January 2007 and June 2010 at the KEMRI/CDC Clinical Research Center(CRC) within New Nyanza Provincial General Hospital, Kisumu. The laboratory where thestudy was conducted is accredited by the South African National Accreditation System [21].
KiCoS was an observational prospective cohort study designed to estimate the incidence ofHIV seroconversion and to identify determinants of successful recruitment and retention inpreparation for an HIV vaccine or prevention trial among young adults and adolescents in Ki-sumu, western Kenya. Healthy adolescent (16–17 years) and young adult (18–34 years) resi-dents of Kisumu who reported having sexual intercourse at least once in the past three monthswere eligible for the study. The study was conducted in the catchment area of Kisumu, a city ofapproximate population of 578,865 as projected by central bureau of statistics by 2006 in west-ern Kenya [22]. All participants underwent screening for HIV-1 and HSV-2 among other sexu-ally transmitted infections. Signs and symptoms were collected both in a self administeredAudio Computer Assisted Self Interview (ACASI) (for STI symptoms) and a clinician adminis-tered Computer Assisted Personal Interview (CAPI) for all other symptoms. Blood sampleswere collected for complete blood count, HIV and HSV-2 testing with laboratory results.
Ethical approvalEthical approval for the study was obtained from KEMRI and CDC ethics review committee/institutional review board. Written informed consent was obtained from each participant priorto study initiation. Minors (<18 years of age) were classified as “mature” or “non-mature”using legal definitions [23]. Mature minors could consent to study participation as they wouldfor HIV counseling and testing in Kenya. Non-mature minors went through a two-step writtenconsent process involving consent from the parent or guardian followed by written individualassent from the minor.
Blood collection and HIV serologyWhole blood was collected in EDTA vacutainer tubes (Becton Dickinson, Franklin Lakes, NJ)and transported to the KEMRI/CDC HIV-research laboratory for processing and analysiswithin six hours of specimen collection. HIV status was determined from whole blood usingHIV rapid test kits as follows: Determine (Abbot Laboratories, Tokyo, Japan), and Unigold
Evaluation of Local Reference Intervals for Use in Kenya
PLOS ONE | DOI:10.1371/journal.pone.0123140 April 13, 2015 3 / 12
(Trinity Biotech Plc, Bray, Ireland), with Bioline (Standard Diagnostics Inc., Korea) as atie breaker.
Pregnancy testingA urine pregnancy test was administered to all females who were not visibly pregnant, usingFirst Sign HCG One Step (UNIMED International, Inc., South San Francisco, CA, USA).
Hematological analysisAbsolute white blood cell counts and percentages for leukocytes (WBC) with differentials(neutrophils, lymphocytes, monocytes, eosinophils, and basophils), erythrocytes (RBC) withparameters (hemoglobin (Hb), hematocrit (Hct), MCV, and MCH), and platelet counts weredetermined from whole blood using a Coulter ACT 5Diff CP analyzer (Beckman Coulter,France). This was performed within 24 hours of sample collection as recommended bythe manufacturer.
Biochemistry analysisClinical chemistries were analyzed from serum obtained from serum separation tubes (BectonDickinson, Franklin Lakes, NJ). Samples were analyzed for alanine aminotransferase (ALT),creatinine (Cr), and blood urea nitrogen (BUN) using the Cobas Integra 400 plus biochemistryanalyzer (Roche, Germany) per the manufacturer’s instructions.
Quality ControlQuality control protocols included running known standards each day before testing samples.In addition, the laboratory is enrolled in external quality assurance testing programs with theCollege of American Pathologists (lymphocyte immunophenotyping, hematology, and clinicalchemistry) and the United Kingdom National External Quality Assurance Service (lymphocyteimmunophenotyping). The laboratory has satisfactory performance in UK NEQAS (Lympho-cyte Immunophenotyping) and CAP Clinical Chemistry as well as CAP Hematology over thepast three years.
Statistical analysisData were collected on optical character recognition (OCR) enabled forms and entered withscanners. Cross-checking and data cleaning was performed regularly We followed the guide-lines of the Clinical Laboratory Standards Institute (CLSI, Wayne, PA, USA) for reference in-terval determination [10]. While these guidelines are meant for establishing new referenceintervals, the basic principles also apply to validation of reference intervals [8]. The medianand the 2.5 and 97.5 percentiles were calculated for each hematological parameter. Study par-ticipants were partitioned into two age groups: those 17 and younger (adolescents) and those18 and older (young adults) and analyzed using SAS v9.1 (Cary, NC, USA). The Wilcoxon testwas used to compare hematological parameters between the two age groups separately formales and females and to compare males and females separately by age group. A two-sided Pvalue of�0.05 was considered significant.
We compared our data against reference intervals from the established reference intervalsfor western Kenya (Table 1), the Massachusetts General Hospital (MGH), USA reference inter-vals and the U.S. NIH Division of AIDS (DAIDS) toxicity tables, to determine the number(and percentage) of study participants who had values outside the established reference inter-vals (2.5 to 97.5 percentiles) or who had any adverse events as graded by the DAIDS criteria.
Evaluation of Local Reference Intervals for Use in Kenya
PLOS ONE | DOI:10.1371/journal.pone.0123140 April 13, 2015 4 / 12

Results
Sample collection resultsOut of 1106 participants screened for eligibility, 534 (48.3%) were males while 572 (51.7%)were females. Following screening, a total of 153 (13.8%) participants was excluded of which125 (81.7%) were HIV-1 infected, 20 (13.1%) were pregnant and 8 (5.2%) both HIV-1 infectedand pregnant. Thus, 499 (93.4%) male and 454 (79.4%) clinically healthy female participantswere selected for this analysis. Of the male participants, 22.0% (110) were adolescents and78.0% (389) were young adults while adolescents and young adults constituted 29.1% (132)and 70.9% (322) of the female participants respectively. The number of participants tested foreach parameter was within the sample size (N = 120) recommended by the CLSI for the estab-lishment of reference intervals except the male adolescent group which had 110 participants.However all gender and age groups had sample size above the number required for referenceinterval transference (N = 60) [10].
Hematology and chemistry reference intervalsTables 2 and 3 summarizes the calculated median and 95th percentile reference interval for he-matological and biochemistry parameters for adolescents and young adults respectively ob-tained from this study. The reference intervals were generally comparable although our upperreference limit for some parameters was slightly higher than those of the established referenceintervals. There were significant differences in Hb, RBC, Hct, creatinine, ALT and BUN
Table 1. Hematological, immunologic and biochemistry reference intervals (median and 95th-percentile) stratified by age and gender from a 13–34years old cohort in rural western Kenya (2003–2005) [15].
Age 13–17 years Age 18–34 yearsParameter Male Female Male Female
RBC (106 Cells/μl) 4.9 (4.1–5.8) 4.7 (3.3–5.4) 5.3 (4.3–6.5) 4.5 (3.4–5.7)
Hb (g/dL) 13.1(10.6–15.6) 12.2 (8.1–14.2) 14.2 (11.4–16.9) 12.1 (8.0–14.2)
HCT (%) 38.8 (29.3–48.1) 35.6 (24.8–43.1) 41.7 (32.6–51.5) 35.8 (23.2–44.3)
MCV (fL) 79 (62–92) 78 (57–91) 80 (55–98) 79 (60–94)
PLT (103 cells/μl) 224 (103–386) 233 (134–439) 201 (102–307) 220 (88–439)
WBC(103 cells/μl) 5.6 (3.3–8.3) 5.2 (3.9–10.2) 5.3 (2.5–7.4) 5.6 (3.3–9.7)
Ne (103 cells/μl) 1.9 (0.8–5.0) 2.0 (1.1–3.1) 2.0 (0.8–3.9) 2.3 (1.3–3.8)
Ly (103 cells/μl) 2.2 (1.0–4.2) 2.2 (1.1–3.1) 2.2 (1.0–3.5) 2.2 (1.3–3.8)
Mo (103 cells/μl) 0.5 (0.2–0.7) 0.4 (0.2–0.7) 0.5 (0.2–0.9) 0.5 (0.3–0.8)
Eo (103 cells/μl) 0.4 (0.1–1.8) 0.4 (0.1–2.2) 0.5 (0.1–1.7) 0.4 (0.1–1.3)
Ba (103 cells/μl) 0.04 (0.02–0.30) 0.04 (0–0.10) 0.04 (0.01–0.19) 0.04 (0–0.20)
CD4 (103 cells/mm3) 874 (367–1571) 934 (465–1553) 811 (462–1306) 866 (440–1602)
CD8(103 cells/mm3) 468 (196–988) 505 (195–1068) 486 (201–1104) 472 (262–1167)
CD4% 42 (32–56) 44 (30–56) 41 (29–54) 44 (32–55)
CD8% 23.1(12.4–36.4) 23.5 (17.0–34.8) 24.6 (14.9–44.0) 24.3 (17.5–35.0)
CD4:CD8 ratio 1.8 (1.0–3.1) 1.8 (0.9–3.2) 1.6 (0.8–2.8) 1.8 (0.8–2.8)
ALT (μ/L) 20.5 (4.9–42.4) 17.4 (4.2–65.3) 22.4 (12.0–80.6) 18.9 (10.7–61.3)
AST (μ/L) 26.9 (17.0–59.2) 22.6 (12.0–43.1) 26.7 (12.5–69.3) 22.2 (13.5–48.5)
T-Bil (μmol/L) 13.9 (5.7–62.6) 9.7 (3.7–38.5) 13.8 (5.3–50.7) 11.5 (5.8–36.1)
Creatinine (μmol/L) 66.3 (49.6–103.7) 64.5 (48.0–87.6) 83.1 (54.2–137.8) 70.7 (52.4–96.8)
Glu (mmol/L) 3.8 (2.2–6.6) 3.8 (2.0–7.0) 3.7 (2.1–9.0) 3.8 (2.1–6.0)
BUN (mmol/L) 2.5 (1.7–4.1) 2.3 (1.2–4.8) 3.0 (1.8–5.3) 2.8 (1.4–4.5)
doi:10.1371/journal.pone.0123140.t001
Evaluation of Local Reference Intervals for Use in Kenya
PLOS ONE | DOI:10.1371/journal.pone.0123140 April 13, 2015 5 / 12
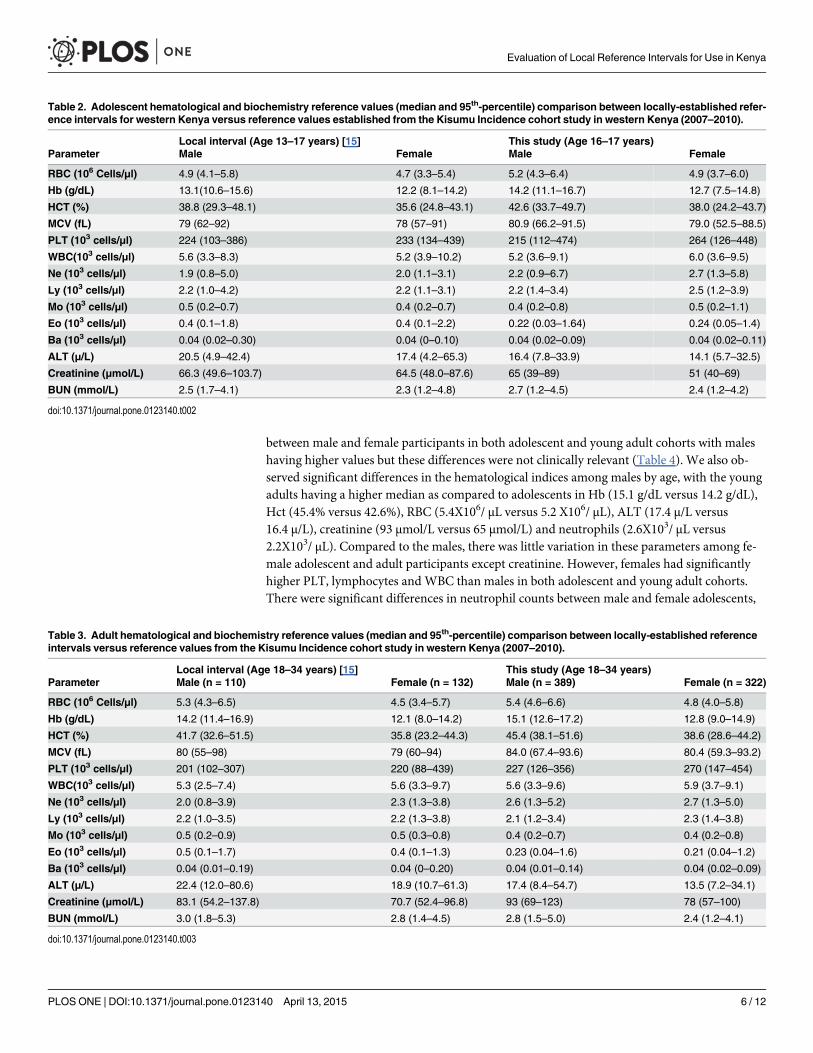
between male and female participants in both adolescent and young adult cohorts with maleshaving higher values but these differences were not clinically relevant (Table 4). We also ob-served significant differences in the hematological indices among males by age, with the youngadults having a higher median as compared to adolescents in Hb (15.1 g/dL versus 14.2 g/dL),Hct (45.4% versus 42.6%), RBC (5.4X10⁶/ μL versus 5.2 X10⁶/ μL), ALT (17.4 μ/L versus16.4 μ/L), creatinine (93 μmol/L versus 65 μmol/L) and neutrophils (2.6X10³/ μL versus2.2X103/ μL). Compared to the males, there was little variation in these parameters among fe-male adolescent and adult participants except creatinine. However, females had significantlyhigher PLT, lymphocytes and WBC than males in both adolescent and young adult cohorts.There were significant differences in neutrophil counts between male and female adolescents,
Table 2. Adolescent hematological and biochemistry reference values (median and 95th-percentile) comparison between locally-established refer-ence intervals for western Kenya versus reference values established from the Kisumu Incidence cohort study in western Kenya (2007–2010).
Local interval (Age 13–17 years) [15] This study (Age 16–17 years)Parameter Male Female Male Female
RBC (106 Cells/μl) 4.9 (4.1–5.8) 4.7 (3.3–5.4) 5.2 (4.3–6.4) 4.9 (3.7–6.0)
Hb (g/dL) 13.1(10.6–15.6) 12.2 (8.1–14.2) 14.2 (11.1–16.7) 12.7 (7.5–14.8)
HCT (%) 38.8 (29.3–48.1) 35.6 (24.8–43.1) 42.6 (33.7–49.7) 38.0 (24.2–43.7)
MCV (fL) 79 (62–92) 78 (57–91) 80.9 (66.2–91.5) 79.0 (52.5–88.5)
PLT (103 cells/μl) 224 (103–386) 233 (134–439) 215 (112–474) 264 (126–448)
WBC(103 cells/μl) 5.6 (3.3–8.3) 5.2 (3.9–10.2) 5.2 (3.6–9.1) 6.0 (3.6–9.5)
Ne (103 cells/μl) 1.9 (0.8–5.0) 2.0 (1.1–3.1) 2.2 (0.9–6.7) 2.7 (1.3–5.8)
Ly (103 cells/μl) 2.2 (1.0–4.2) 2.2 (1.1–3.1) 2.2 (1.4–3.4) 2.5 (1.2–3.9)
Mo (103 cells/μl) 0.5 (0.2–0.7) 0.4 (0.2–0.7) 0.4 (0.2–0.8) 0.5 (0.2–1.1)
Eo (103 cells/μl) 0.4 (0.1–1.8) 0.4 (0.1–2.2) 0.22 (0.03–1.64) 0.24 (0.05–1.4)
Ba (103 cells/μl) 0.04 (0.02–0.30) 0.04 (0–0.10) 0.04 (0.02–0.09) 0.04 (0.02–0.11)
ALT (μ/L) 20.5 (4.9–42.4) 17.4 (4.2–65.3) 16.4 (7.8–33.9) 14.1 (5.7–32.5)
Creatinine (μmol/L) 66.3 (49.6–103.7) 64.5 (48.0–87.6) 65 (39–89) 51 (40–69)
BUN (mmol/L) 2.5 (1.7–4.1) 2.3 (1.2–4.8) 2.7 (1.2–4.5) 2.4 (1.2–4.2)
doi:10.1371/journal.pone.0123140.t002
Table 3. Adult hematological and biochemistry reference values (median and 95th-percentile) comparison between locally-established referenceintervals versus reference values from the Kisumu Incidence cohort study in western Kenya (2007–2010).
Local interval (Age 18–34 years) [15] This study (Age 18–34 years)Parameter Male (n = 110) Female (n = 132) Male (n = 389) Female (n = 322)
RBC (106 Cells/μl) 5.3 (4.3–6.5) 4.5 (3.4–5.7) 5.4 (4.6–6.6) 4.8 (4.0–5.8)
Hb (g/dL) 14.2 (11.4–16.9) 12.1 (8.0–14.2) 15.1 (12.6–17.2) 12.8 (9.0–14.9)
HCT (%) 41.7 (32.6–51.5) 35.8 (23.2–44.3) 45.4 (38.1–51.6) 38.6 (28.6–44.2)
MCV (fL) 80 (55–98) 79 (60–94) 84.0 (67.4–93.6) 80.4 (59.3–93.2)
PLT (103 cells/μl) 201 (102–307) 220 (88–439) 227 (126–356) 270 (147–454)
WBC(103 cells/μl) 5.3 (2.5–7.4) 5.6 (3.3–9.7) 5.6 (3.3–9.6) 5.9 (3.7–9.1)
Ne (103 cells/μl) 2.0 (0.8–3.9) 2.3 (1.3–3.8) 2.6 (1.3–5.2) 2.7 (1.3–5.0)
Ly (103 cells/μl) 2.2 (1.0–3.5) 2.2 (1.3–3.8) 2.1 (1.2–3.4) 2.3 (1.4–3.8)
Mo (103 cells/μl) 0.5 (0.2–0.9) 0.5 (0.3–0.8) 0.4 (0.2–0.7) 0.4 (0.2–0.8)
Eo (103 cells/μl) 0.5 (0.1–1.7) 0.4 (0.1–1.3) 0.23 (0.04–1.6) 0.21 (0.04–1.2)
Ba (103 cells/μl) 0.04 (0.01–0.19) 0.04 (0–0.20) 0.04 (0.01–0.14) 0.04 (0.02–0.09)
ALT (μ/L) 22.4 (12.0–80.6) 18.9 (10.7–61.3) 17.4 (8.4–54.7) 13.5 (7.2–34.1)
Creatinine (μmol/L) 83.1 (54.2–137.8) 70.7 (52.4–96.8) 93 (69–123) 78 (57–100)
BUN (mmol/L) 3.0 (1.8–5.3) 2.8 (1.4–4.5) 2.8 (1.5–5.0) 2.4 (1.2–4.1)
doi:10.1371/journal.pone.0123140.t003
Evaluation of Local Reference Intervals for Use in Kenya
PLOS ONE | DOI:10.1371/journal.pone.0123140 April 13, 2015 6 / 12
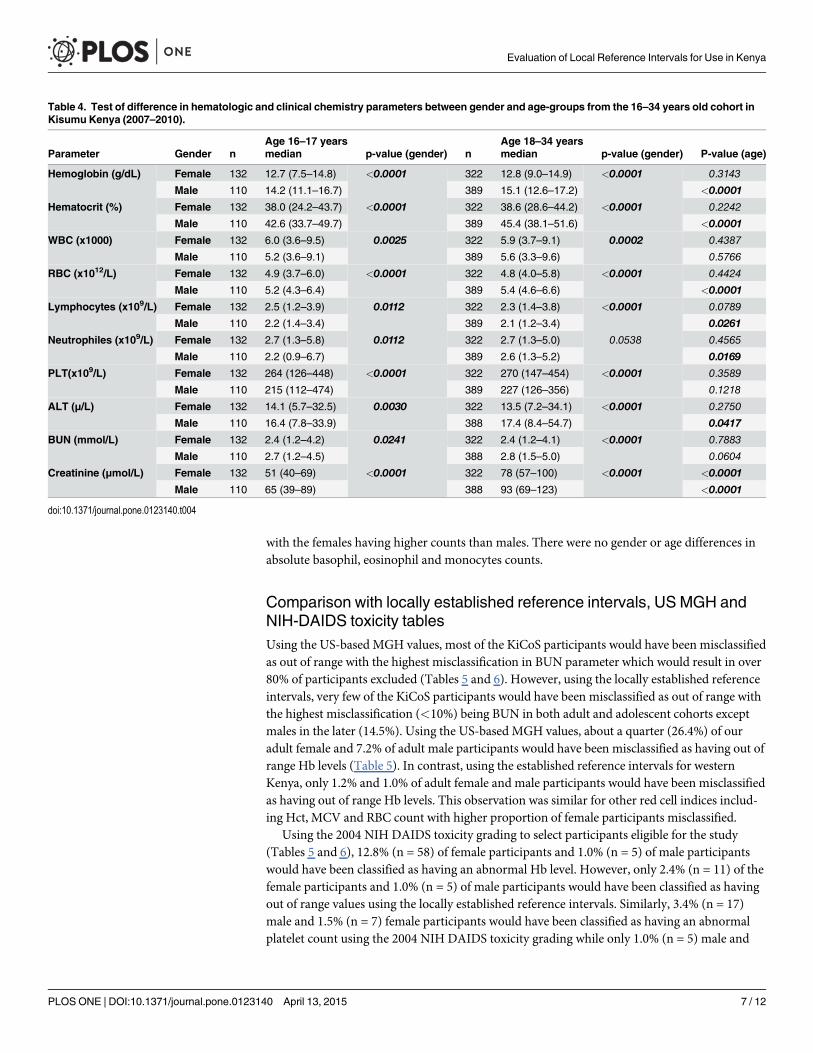
with the females having higher counts than males. There were no gender or age differences inabsolute basophil, eosinophil and monocytes counts.
Comparison with locally established reference intervals, US MGH andNIH-DAIDS toxicity tablesUsing the US-based MGH values, most of the KiCoS participants would have been misclassifiedas out of range with the highest misclassification in BUN parameter which would result in over80% of participants excluded (Tables 5 and 6). However, using the locally established referenceintervals, very few of the KiCoS participants would have been misclassified as out of range withthe highest misclassification (<10%) being BUN in both adult and adolescent cohorts exceptmales in the later (14.5%). Using the US-based MGH values, about a quarter (26.4%) of ouradult female and 7.2% of adult male participants would have been misclassified as having out ofrange Hb levels (Table 5). In contrast, using the established reference intervals for westernKenya, only 1.2% and 1.0% of adult female and male participants would have been misclassifiedas having out of range Hb levels. This observation was similar for other red cell indices includ-ing Hct, MCV and RBC count with higher proportion of female participants misclassified.
Using the 2004 NIH DAIDS toxicity grading to select participants eligible for the study(Tables 5 and 6), 12.8% (n = 58) of female participants and 1.0% (n = 5) of male participantswould have been classified as having an abnormal Hb level. However, only 2.4% (n = 11) of thefemale participants and 1.0% (n = 5) of male participants would have been classified as havingout of range values using the locally established reference intervals. Similarly, 3.4% (n = 17)male and 1.5% (n = 7) female participants would have been classified as having an abnormalplatelet count using the 2004 NIH DAIDS toxicity grading while only 1.0% (n = 5) male and
Table 4. Test of difference in hematologic and clinical chemistry parameters between gender and age-groups from the 16–34 years old cohort inKisumu Kenya (2007–2010).
Age 16–17 years Age 18–34 yearsParameter Gender n median p-value (gender) n median p-value (gender) P-value (age)
Hemoglobin (g/dL) Female 132 12.7 (7.5–14.8) <0.0001 322 12.8 (9.0–14.9) <0.0001 0.3143
Male 110 14.2 (11.1–16.7) 389 15.1 (12.6–17.2) <0.0001
Hematocrit (%) Female 132 38.0 (24.2–43.7) <0.0001 322 38.6 (28.6–44.2) <0.0001 0.2242
Male 110 42.6 (33.7–49.7) 389 45.4 (38.1–51.6) <0.0001
WBC (x1000) Female 132 6.0 (3.6–9.5) 0.0025 322 5.9 (3.7–9.1) 0.0002 0.4387
Male 110 5.2 (3.6–9.1) 389 5.6 (3.3–9.6) 0.5766
RBC (x1012/L) Female 132 4.9 (3.7–6.0) <0.0001 322 4.8 (4.0–5.8) <0.0001 0.4424
Male 110 5.2 (4.3–6.4) 389 5.4 (4.6–6.6) <0.0001
Lymphocytes (x109/L) Female 132 2.5 (1.2–3.9) 0.0112 322 2.3 (1.4–3.8) <0.0001 0.0789
Male 110 2.2 (1.4–3.4) 389 2.1 (1.2–3.4) 0.0261
Neutrophiles (x109/L) Female 132 2.7 (1.3–5.8) 0.0112 322 2.7 (1.3–5.0) 0.0538 0.4565
Male 110 2.2 (0.9–6.7) 389 2.6 (1.3–5.2) 0.0169
PLT(x109/L) Female 132 264 (126–448) <0.0001 322 270 (147–454) <0.0001 0.3589
Male 110 215 (112–474) 389 227 (126–356) 0.1218
ALT (μ/L) Female 132 14.1 (5.7–32.5) 0.0030 322 13.5 (7.2–34.1) <0.0001 0.2750
Male 110 16.4 (7.8–33.9) 388 17.4 (8.4–54.7) 0.0417
BUN (mmol/L) Female 132 2.4 (1.2–4.2) 0.0241 322 2.4 (1.2–4.1) <0.0001 0.7883
Male 110 2.7 (1.2–4.5) 388 2.8 (1.5–5.0) 0.0604
Creatinine (μmol/L) Female 132 51 (40–69) <0.0001 322 78 (57–100) <0.0001 <0.0001
Male 110 65 (39–89) 388 93 (69–123) <0.0001
doi:10.1371/journal.pone.0123140.t004
Evaluation of Local Reference Intervals for Use in Kenya
PLOS ONE | DOI:10.1371/journal.pone.0123140 April 13, 2015 7 / 12

0.7% (n = 3) female participants would have been classified as out of range using the estab-lished reference interval for western Kenya.
DiscussionWith increasing clinical trials in Africa in an effort to combat tropical diseases [24], a needarises to consider the health status of the likely participants in such studies [12]. In this regard,several African studies have generated reference intervals for use in the respective regions[13, 15, 24, 25]. While it is important to develop locally derived reference intervals that ensureproper assessment of volunteers in clinical trials, monitoring of laboratory-based adverseevents and prevention of unnecessary exclusion, it is important to evaluate their use within thelocal population. To our knowledge, this is one of the first evaluations of established referenceintervals reported in sub-Saharan Africa. In this study, we evaluate the use of hematologicaland biochemistry reference intervals established for western Kenya using specimen drawnfrom participants in a HIV incidence cohort study in Kisumu. Our values were comparable tothose of the established reference intervals for most parameters although our median valueswere slightly higher for most hematological parameters. This may be so given that the samples
Table 5. Out of range and frequency of adverse events in the Kisumu Adult cohort obtained from comparison with values from locally-establishedreference intervals, DAIDS and North American derived MGH values.
Out of rangecomparison
This Study Local reference[15]
MGH-USA [9] 2004 DAIDS[17]
Parameter Gender 95% referenceinterval
n 95% referenceinterval
n % 95% referenceinterval
n % Cut-off N %
Hemoglobin (g/dL) Female 9.0–14.9 322 8.0–14.2 4 1.2 12–16 85 26.4 >10.9 40 12.4
Male 12.6–17.2 389 11.4–16.9 4 1.0 13.5–17.5 28 7.2 >10.9 3 0.8
Hematocrit (%) Female 28.6–44.2 322 23.2–44.3 2 0.6 36–46 83 25.8
Male 38.1–51.6 389 32.6–51.5 3 0.8 41–53 37 9.5
MCV (%) Female 59.3–93.2 322 60–94 12 3.7 80–100 153 47.5
Male 67.4–93.6 389 55–98 3 0.8 80–100 103 26.5
WBC (x109/L) Female 3.7–9.1 322 3.3–9.7 8 2.5 4.5–11.0 37 11.5 >2.5 1 0.3
Male 3.3–9.6 389 2.5–7.4 0 0 4.5–11.0 82 21.1 >2.5 0 0
RBC (x1012/L) Female 4.0–5.8 322 3.4–5.7 1 0.3 4.0–5.2 7 2.2
Male 4.6–6.6 389 4.3–6.5 2 0.5 4.2–6.3 2 0.5
Lymphocytes (x109/L)
Female 1.4–3.8 322 1.3–3.8 7 2.2 1.0–4.8 0 0
Male 1.2–3.4 389 1.0–3.5 4 1.0 1.0–4.8 4 1.0
Neutrophils (x109/L) Female 1.3–5.0 322 1.3–3.8 10 3.1 1.8–7.7 0 0 >1.3 10 3.3
Male 1.3–5.2 389 0.8–3.9 0 0 1.8–7.7 4 1.0 >1.3 13 4.0
PLT (x109/L) Female 147–454 322 88–439 1 0.3 150–350 12 3.7 �125 4 1.2
Male 126–356 389 102–307 4 1.0 150–350 30 7.7 �125 8 2.1
Eosinophils (103
cells/μl)Female 0.04–1.2 322 0–1.3 7 2.2 0–0.5 52 16.1
Male 0.04–1.6 389 0–1.7 5 1.3 0–0.5 77 19.8
ALT (μ/L) Female 7.2–34.1 322 0–61.3 1 0.3 0–35 7 2.2 <76.6 0 0
Male 8.4–54.7 389 0–80.6 4 1.0 0–35 39 10.0 <100.8 2 0.5
BUN (mmol/L) Female 1.2–4.1 322 1.4–4.5 23 7.1 3.6–7.1 305 94.7
Male 1.5–5.0 389 1.8–5.3 32 8.2 3.6–7.1 324 83.3
Creatinine (μmol/L) Female 57–100 322 0–96.8 18 5.6 0–133 0 0 <106.5 4 1.2
Male 69–123 389 0–137.8 2 0.5 0–133 2 0.5 <151.6 1 0.3
doi:10.1371/journal.pone.0123140.t005
Evaluation of Local Reference Intervals for Use in Kenya
PLOS ONE | DOI:10.1371/journal.pone.0123140 April 13, 2015 8 / 12
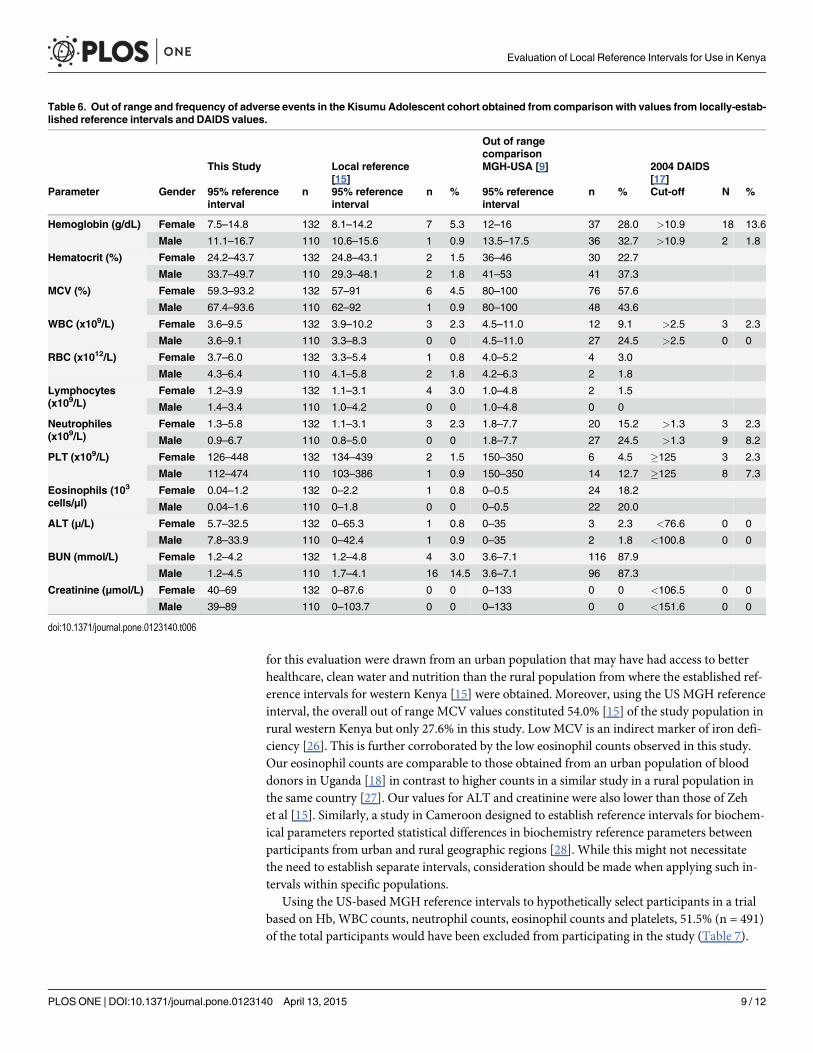
for this evaluation were drawn from an urban population that may have had access to betterhealthcare, clean water and nutrition than the rural population from where the established ref-erence intervals for western Kenya [15] were obtained. Moreover, using the US MGH referenceinterval, the overall out of range MCV values constituted 54.0% [15] of the study population inrural western Kenya but only 27.6% in this study. Low MCV is an indirect marker of iron defi-ciency [26]. This is further corroborated by the low eosinophil counts observed in this study.Our eosinophil counts are comparable to those obtained from an urban population of blooddonors in Uganda [18] in contrast to higher counts in a similar study in a rural population inthe same country [27]. Our values for ALT and creatinine were also lower than those of Zehet al [15]. Similarly, a study in Cameroon designed to establish reference intervals for biochem-ical parameters reported statistical differences in biochemistry reference parameters betweenparticipants from urban and rural geographic regions [28]. While this might not necessitatethe need to establish separate intervals, consideration should be made when applying such in-tervals within specific populations.
Using the US-based MGH reference intervals to hypothetically select participants in a trialbased on Hb, WBC counts, neutrophil counts, eosinophil counts and platelets, 51.5% (n = 491)of the total participants would have been excluded from participating in the study (Table 7).
Table 6. Out of range and frequency of adverse events in the Kisumu Adolescent cohort obtained from comparison with values from locally-estab-lished reference intervals and DAIDS values.
Out of rangecomparison
This Study Local reference[15]
MGH-USA [9] 2004 DAIDS[17]
Parameter Gender 95% referenceinterval
n 95% referenceinterval
n % 95% referenceinterval
n % Cut-off N %
Hemoglobin (g/dL) Female 7.5–14.8 132 8.1–14.2 7 5.3 12–16 37 28.0 >10.9 18 13.6
Male 11.1–16.7 110 10.6–15.6 1 0.9 13.5–17.5 36 32.7 >10.9 2 1.8
Hematocrit (%) Female 24.2–43.7 132 24.8–43.1 2 1.5 36–46 30 22.7
Male 33.7–49.7 110 29.3–48.1 2 1.8 41–53 41 37.3
MCV (%) Female 59.3–93.2 132 57–91 6 4.5 80–100 76 57.6
Male 67.4–93.6 110 62–92 1 0.9 80–100 48 43.6
WBC (x109/L) Female 3.6–9.5 132 3.9–10.2 3 2.3 4.5–11.0 12 9.1 >2.5 3 2.3
Male 3.6–9.1 110 3.3–8.3 0 0 4.5–11.0 27 24.5 >2.5 0 0
RBC (x1012/L) Female 3.7–6.0 132 3.3–5.4 1 0.8 4.0–5.2 4 3.0
Male 4.3–6.4 110 4.1–5.8 2 1.8 4.2–6.3 2 1.8
Lymphocytes(x109/L)
Female 1.2–3.9 132 1.1–3.1 4 3.0 1.0–4.8 2 1.5
Male 1.4–3.4 110 1.0–4.2 0 0 1.0–4.8 0 0
Neutrophiles(x109/L)
Female 1.3–5.8 132 1.1–3.1 3 2.3 1.8–7.7 20 15.2 >1.3 3 2.3
Male 0.9–6.7 110 0.8–5.0 0 0 1.8–7.7 27 24.5 >1.3 9 8.2
PLT (x109/L) Female 126–448 132 134–439 2 1.5 150–350 6 4.5 �125 3 2.3
Male 112–474 110 103–386 1 0.9 150–350 14 12.7 �125 8 7.3
Eosinophils (103
cells/μl)Female 0.04–1.2 132 0–2.2 1 0.8 0–0.5 24 18.2
Male 0.04–1.6 110 0–1.8 0 0 0–0.5 22 20.0
ALT (μ/L) Female 5.7–32.5 132 0–65.3 1 0.8 0–35 3 2.3 <76.6 0 0
Male 7.8–33.9 110 0–42.4 1 0.9 0–35 2 1.8 <100.8 0 0
BUN (mmol/L) Female 1.2–4.2 132 1.2–4.8 4 3.0 3.6–7.1 116 87.9
Male 1.2–4.5 110 1.7–4.1 16 14.5 3.6–7.1 96 87.3
Creatinine (μmol/L) Female 40–69 132 0–87.6 0 0 0–133 0 0 <106.5 0 0
Male 39–89 110 0–103.7 0 0 0–133 0 0 <151.6 0 0
doi:10.1371/journal.pone.0123140.t006
Evaluation of Local Reference Intervals for Use in Kenya
PLOS ONE | DOI:10.1371/journal.pone.0123140 April 13, 2015 9 / 12
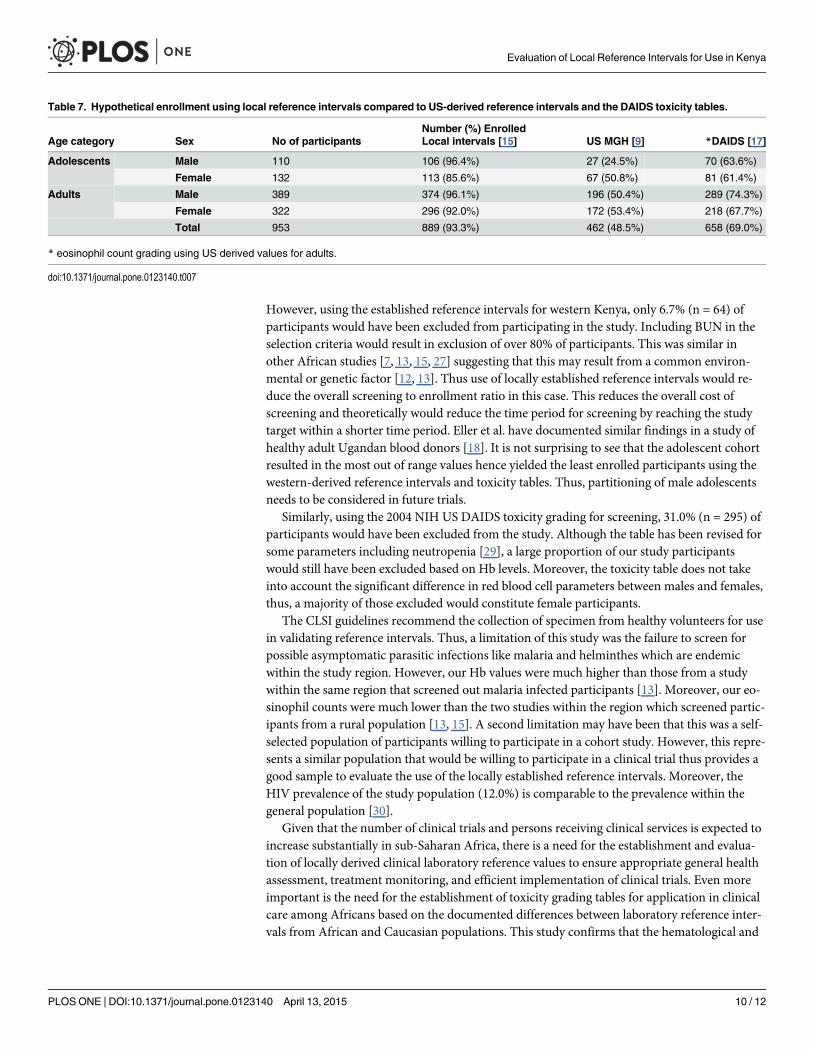
However, using the established reference intervals for western Kenya, only 6.7% (n = 64) ofparticipants would have been excluded from participating in the study. Including BUN in theselection criteria would result in exclusion of over 80% of participants. This was similar inother African studies [7, 13, 15, 27] suggesting that this may result from a common environ-mental or genetic factor [12, 13]. Thus use of locally established reference intervals would re-duce the overall screening to enrollment ratio in this case. This reduces the overall cost ofscreening and theoretically would reduce the time period for screening by reaching the studytarget within a shorter time period. Eller et al. have documented similar findings in a study ofhealthy adult Ugandan blood donors [18]. It is not surprising to see that the adolescent cohortresulted in the most out of range values hence yielded the least enrolled participants using thewestern-derived reference intervals and toxicity tables. Thus, partitioning of male adolescentsneeds to be considered in future trials.
Similarly, using the 2004 NIH US DAIDS toxicity grading for screening, 31.0% (n = 295) ofparticipants would have been excluded from the study. Although the table has been revised forsome parameters including neutropenia [29], a large proportion of our study participantswould still have been excluded based on Hb levels. Moreover, the toxicity table does not takeinto account the significant difference in red blood cell parameters between males and females,thus, a majority of those excluded would constitute female participants.
The CLSI guidelines recommend the collection of specimen from healthy volunteers for usein validating reference intervals. Thus, a limitation of this study was the failure to screen forpossible asymptomatic parasitic infections like malaria and helminthes which are endemicwithin the study region. However, our Hb values were much higher than those from a studywithin the same region that screened out malaria infected participants [13]. Moreover, our eo-sinophil counts were much lower than the two studies within the region which screened partic-ipants from a rural population [13, 15]. A second limitation may have been that this was a self-selected population of participants willing to participate in a cohort study. However, this repre-sents a similar population that would be willing to participate in a clinical trial thus provides agood sample to evaluate the use of the locally established reference intervals. Moreover, theHIV prevalence of the study population (12.0%) is comparable to the prevalence within thegeneral population [30].
Given that the number of clinical trials and persons receiving clinical services is expected toincrease substantially in sub-Saharan Africa, there is a need for the establishment and evalua-tion of locally derived clinical laboratory reference values to ensure appropriate general healthassessment, treatment monitoring, and efficient implementation of clinical trials. Even moreimportant is the need for the establishment of toxicity grading tables for application in clinicalcare among Africans based on the documented differences between laboratory reference inter-vals from African and Caucasian populations. This study confirms that the hematological and
Table 7. Hypothetical enrollment using local reference intervals compared to US-derived reference intervals and the DAIDS toxicity tables.
Number (%) EnrolledAge category Sex No of participants Local intervals [15] US MGH [9] *DAIDS [17]
Adolescents Male 110 106 (96.4%) 27 (24.5%) 70 (63.6%)
Female 132 113 (85.6%) 67 (50.8%) 81 (61.4%)
Adults Male 389 374 (96.1%) 196 (50.4%) 289 (74.3%)
Female 322 296 (92.0%) 172 (53.4%) 218 (67.7%)
Total 953 889 (93.3%) 462 (48.5%) 658 (69.0%)
* eosinophil count grading using US derived values for adults.
doi:10.1371/journal.pone.0123140.t007
Evaluation of Local Reference Intervals for Use in Kenya
PLOS ONE | DOI:10.1371/journal.pone.0123140 April 13, 2015 10 / 12
biochemistry reference intervals established by Zeh et al. are valid for use in participant recruit-ment in western Kenya.
AcknowledgmentsDisclaimer: The findings and conclusions in this article are those of the authors and do notnecessarily represent the views of the CDC. Use of trade names is for identification purposesonly and does not constitute endorsement by the CDC or the Department of Health andHuman Services.
We are grateful to the study participants, the Kisumu Incidence Cohort study team, theHIV research laboratory, Kenya Medical Research Institute (KEMRI) and Kenya Ministry ofHealth whose participation made this study possible. This paper is published with the permis-sion of the Director of KEMRI.
Author ContributionsConceived and designed the experiments: CO CZ. Performed the experiments: BO RO. Ana-lyzed the data: CO JW CZ. Contributed reagents/materials/analysis tools: GA FO CZ. Wrotethe paper: CO JW GA CZ. Reviewed final manuscript: CO BO RO FO GA JW CZ.
References1. The Global Fund to Fight AIDS, TB and Malaria;‘‘Global FundARVFactSheet. (01-June-2009). Avail-
able: http://www.theglobalfund.org/en/publications/annualreports/
2. UNAIDS Global Report: UNAIDS Report on the Global AIDS Epidemic 2013WHO press. Geneva,Switzerland. Available:. http://www.unaids.org/en/resources/documents/2013/20130923_UNAIDS_Global_Report_2013. Accessed 07 March 2015.
3. PEPFAR. The United States President's Emergency Plan for AIDS relief. Seventh Annual Report toCongress on PEPFAR; 2011. Available: http://www.pepfar.gov/press/seventhannualreport/. Accessed07 March 2015.
4. UNAIDS (2010) Report on the global AIDS epidemic. Geneva, Switzerland, WHO press. UNAIDS.
5. Esparza J, Osmanov S. HIV vaccines: a global perspective. Curr Mol Med. 2003; 3:183–193. PMID:12699356
6. JaokoW, Nakwagala FN, Anzala O, Manyonyi GO, Birungi J, Nanvubya A, et al. Safety and immunoge-nicity of recombinant low-dosage HIV-1 A vaccine candidates vectored by plasmid pTHr DNA or modi-fied vaccinia virus Ankara (MVA) in humans in East Africa. Vaccine 2008; 26: 2788–2795. doi: 10.1016/j.vaccine.2008.02.071 PMID: 18440674
7. Saathoff E, Schneider P, Kleinfeldt V, Geis S, Haule D, Maboko L, et al. Laboratory reference values forhealthy adults from southern Tanzania. Trop Med Int Health. 2008; 13: 612–625. doi: 10.1111/j.1365-3156.2008.02047.x PMID: 18331386
8. Lawrie D, Coetzee LM, Becker P, Mahlangu J, StevensW, Glencross DK. Local reference ranges forfull blood count and CD4 lymphocyte count testing. S Afr Med J. 2009; 99: 243–248. PMID: 19588777
9. Kratz A, Ferraro M, Sluss PM, Lewandrowski KB. Case records of the Massachusetts General Hospital.Weekly clinicopathological exercises. Laboratory reference values. N Engl J Med. 2004; 351:1548–1563. PMID: 15470219
10. National Committee for Clinical laboratory Standards. How to define and determine reference intervalsin the clinical laboratory; approved guideline-second-edition. Wayne, PA, USA: NCCLS C28-A2, vol 20(13); 2000.
11. Buchanan AM, Muro FJ, Gratz J, Crump JA, Musyoka AM, Sichangi MW, et al. Establishment of hae-matological and immunological reference values for healthy Tanzanian children in Kilimanjaro Region.Trop Med Int Health. 2010; 15: 1011–1021. doi: 10.1111/j.1365-3156.2010.02585.x PMID: 20636301
12. Karita E, Ketter N, Price MA, Kayitenkore K, Kaleebu P, Nanvubya A, et al. CLSI derived hematologyand biochemistry reference intervals for healthy adults in eastern and southern Africa. PLOS One.2009; 4: e4401. doi: 10.1371/journal.pone.0004401 PMID: 19197365
13. Kibaya RS, Bautista CT, Sawe FK, Shaffer DN, SaterenWB, Scott PT, et al. Reference ranges for theclinical laboratory derived from a rural population in Kericho, Kenya. PLOS One. 2008; 3:e3327. doi:10.1371/journal.pone.0003327 PMID: 18833329
Evaluation of Local Reference Intervals for Use in Kenya
PLOS ONE | DOI:10.1371/journal.pone.0123140 April 13, 2015 11 / 12
14. Menard D, Mandeng MJ, Tothy MB, Kelembho EK, Gresenguet G, Talarmin A. Immunohematologicalreference ranges for adults from the Central African Republic. Clin Diagn Lab Immunol. 2003; 10:443–445. PMID: 12738646
15. Zeh C, Amornkul PN, Inzaule S, Ondoa P, Oyaro B, Mwaengo DM, et al. Population-based biochemis-try, immunologic and hematological reference values for adolescents and young adults in a rural popu-lation in Western Kenya. PLOS One. 2011; 6:e21040. doi: 10.1371/journal.pone.0021040 PMID:21713038
16. Tsegaye A, Messele T, Tilahun T, Hailu E, Sahlu T, Doorly R, et al. Immunohematological referenceranges for adult Ethiopians. Clin Diagn Lab Immunol. 1999; 6: 410–414. PMID: 10225845
17. DAIDS. Division of AIDS Table for Grading the Severity of Adult and Pediatric Adverse Events. Beth-seda, MD, USA. DAIDS: 2004
18. Eller LA, Eller MA, Ouma B, Kataaha P, Kyabaggu D, Tumusiime R, et al. Reference intervals in healthyadult Ugandan blood donors and their impact on conducting international vaccine trials. PLOSOne.2008: 3: e3919. doi: 10.1371/journal.pone.0003919 PMID: 19079547
19. Lubega IR, Fowler MG, Musoke PM, Elbireer A, Bagenda D, Kafulafula G, et al. Considerations inusing US-based laboratory toxicity tables to evaluate laboratory toxicities among healthy malawian andUgandan infants. J Acquir Immune Defic Syndr. 2010; 55: 58–64. doi: 10.1097/QAI.0b013e3181db059d PMID: 20588184
20. Omosa-Manyonyi GS, JaokoW, Anzala O, Ogutu H, Wakasiaka S, Malogo R, et al. Reasons for ineligi-bility in in phase 1 and 2A HIV vaccine clinical trials at Kenya AIDS vaccine initiative (KAVI), Kenya.PLOS One. 2011; 6: e14580. doi: 10.1371/journal.pone.0014580 PMID: 21283743
21. SANAS South African National Accreditation System. Available: http://home.sanas.co.za/. Accessed07 March 2015.
22. Central Bureau of Statistics. Ministry of Planning and National Development. Population distribution byadministrative areas and urban centres, Kenya 1999 Population and Housing Census. Vol. 1. Nairobi,Kenya Central Bureau of Statistics; 1999.
23. National AIDS and STD Control Programme, Ministry of Public Health and Sanitation, Kenya. Guide-lines for HIV Testing and Counselling in Kenya. NASCOP; 2008. Available: http://www.google.com/url?sa = t&rct = j&q=&esrc = s&source = web&cd=1&ved=0CB0QFjAA&url = http%3A%2F%2Fwww.who.int%2Fhiv%2Ftopics%2Fvct%2Fpolicy%2FKenyaGuidelines_Final2009.pdf&ei=2h37VOyGMbLe7AaQroCICA&usg=AFQjCNEyh5-DfPUxq6eJZyvZPu6o-Og7zQ&bvm = bv.87611401,d.ZWU. Accessed07 March 2015.
24. Excler J. AIDS vaccine efficacy trials: expand capacity and prioritize. 'Throughout Africa, Asia and LatinAmerica state-of-the-art clinics and laboratories...exist where, 4 years ago, there were none'. ExpertRev Vaccines. 2006; 5: 167–170. PMID: 16608417
25. Kueviakoe IM, Segbena AY, Jouault H, Vovor A, Imbert M. Hematological reference values for healthyadults in Togo. ISRN Hematol. 2011: e3919.
26. Tefferi A. Anemia in adults: a contemporary approach to diagnosis. Mayo Clin Proc. 2003; 78:1274–1280. PMID: 14531486
27. Lugada ES, Mermin J, Kaharuza F, Ulvestad E, WereW, Langeland N, et al. Population-based hemato-logic and immunologic reference values for a healthy Ugandan population. Clin Diagn Lab Immunol.2004; 11: 29–34. PMID: 14715541
28. Alemnji GA, Mbuagbaw J, Folefac E, Teto G, Nkengafac S, Atems N, et al. Reference PhysiologicalRanges for Serum Biochemical Parameters among Healthy Cameroonians to Support HIV Vaccineand Related Clinical Trials. Afr J Health Sci. 2010; 17: 75–82.
29. Wells J, Shetty AK, Stranix L, Falkovitz-Halpern MS, Chipato T, Nyoni N, et al. Range of normal neutro-phil counts in healthy Zimbabwean infants: implications for monitoring antiretroviral drug toxicity. JAcquir Immune Defic Syndr. 2006; 42: 460–463. PMID: 16810112
30. National AIDS and STI Control Programme N. Kenya AIDS Indicator Survey 2007: Preliminary Report.Nairobi, Kenya: Ministry of Health Kenya; 2008. Available: www.nacc.or.ke/nacc%20downloads/official_kais_report_2009.pdf. Accessed 2015 Mar 7.
Evaluation of Local Reference Intervals for Use in Kenya
PLOS ONE | DOI:10.1371/journal.pone.0123140 April 13, 2015 12 / 12