evaluating garment sizing and fit for petite
TRANSCRIPT

EVALUATING GARMENT SIZING AND FIT FOR PETITE WOMEN USING 3D
BODY SCANNED ANTHROPOMETRIC DATA
by
Masejeng Marion Phasha
Submitted in accordance with the requirements
for the degree
MASTER OF CONSUMER SCIENCE
in the
COLLEGE OF AGRICULTURE AND ENVIRONMENTAL SCIENCES DEPARTMENT OF LIFE AND CONSUMER SCIENCE
at the
UNIVERSITY OF SOUTH AFRICA
FLORIDA CAMPUS
Supervisor:
Ms. K. Pandarum
Co-supervisor:
Prof. S. C. Harlock
November 2017

i
DEDICATION
To my late father, Dr Ramosedi Lucas Phasha, you always believed in me and
taught me the importance of education.
Dad, I made it!
Ke lebogile go menagane Hlabirwa a’ Dimo (Thank you).
You were the wind beneath my wings. Your legacy lives on!
ii
DECLARATION
Name: Masejeng Marion Phasha
Student number: 54178924
Degree: Master of Consumer Science
I declare that
“Evaluating garment sizing and fit for petite women using 3D body scanned
anthropometric data”
is my own work and that all the sources that I have used or quoted have been
indicated and acknowledged by means of complete references.
November 2017
SIGNATURE DATE

iii
ACKNOWLEDGMENTS
Firstly, I would like to thank God for giving me the strength, ability and determination
to complete this study. I would also like to express my sincere gratitude to the
following individuals who have been supportive throughout my studies.
Ms. Reena Pandarum my supervisor, for her expert advice, guidance and
motivation throughout this research. I am deeply grateful to you for accepting me
as a Master‟s student under your supervision for the past three years. The time
and effort that you have invested in me is greatly appreciated.
Professor Simon Harlock my co-supervisor, thank you for your insight, guidance
and academic encouragement. Your contribution, ideas and detailed constructive
comments were tremendously valuable.
Special thanks go to the following organisations, the National Research Fund
(NRF) and the University of South Africa (UNISA) for awarding me scholarships
for two years to support my tuition fees. I am deeply grateful for the assistance
and support towards the completion of this study.
All the participants who took part in the study, thank you for providing the data,
contributing your valuable time to come for the scan, complete the demographic
and psychographic questionnaire and assisting with the garment fit test
evaluations. This study would not have succeeded without your participation.
My statistician Mr Hennie Gerber and Busi Tabo, thank you for assisting with and
reviewing the statistical analysis.
My English language editor Tanya Seiderer, for editing the dissertation.
To Mrs Annemie Niemann and Ms Mirriam Makopo thank you for assisting with
the patterns and garment fit test evaluations.
To my mother Glorina Ramatsimela Phasha, thank you for being my pillar of
strength. My expression of gratitude will never be enough to acknowledge the
undying support, incomparable love that I continuously receive from you. I
sincerely thank you for your prayers and allowing me to follow my dreams.
My family and friends, thank you for everyone‟s continuous love and unfailing
support during my studies. I am truly blessed to have you all in my life.

iv
CERTIFICATE FOR ENGLISH LANGUAGE EDITING
Editing Certificate To whom it may concern:
Declaration of Language Editing: EVALUATING GARMENT SIZING AND FIT FOR
PETITE WOMEN USING 3D BODY SCANNED ANTHROPOMETRIC DATA.
This letter confirms that I have undertaken language editing of the document:
“Evaluating garment sizing and fit for petite women using 3D body scanned
anthropometric data” written by Masejeng Marion Phasha.
I have corrected the language and I am of opinion that this document is suitable for
submission.
Please feel free to contact me should you have any queries.
Name of Editor: Tanya Seiderer
Signature:
Contact Number: 083 288 5793
Email address: [email protected]
Date Issued: 11 November 2017

v
SUMMARY
Research suggests that there is a plethora of information on the size and shape of
the average and plus sized women in South Africa (Winks, 1990; Pandarum, 2009;
Muthambi, 2012; Afolayan & Mastamet-Mason, 2013 and Makhanya, 2015).
However, there is very little information on petite women‟s body shapes, their body
measurements and their shopping behaviour, especially in South Africa, for
manufacturing ready-to-wear garments.
The purpose of this petite women study was to investigate the shapes and sizes of a
sample of petite South African women and develop size charts for the upper and
lower body dimensions.
This study used a mixed-method; purposive, non-probability sampling method to
achieve the objectives of the study. A (TC)² NX16 3D full body scanner and an
Adam‟s® medical scale were used to collect the body measurement data of 200
petite South African women, aged between 20-54 years with an average height
range of 157cm, residing in Gauteng (Pretoria and Johannesburg). Other data
collection instruments included a demographic questionnaire to collect the subjects‟
demographic information such as, age, height, weight, etc.; and the psychographic
questionnaire to gather the petite subjects‟ demographics as well as their
perceptions and preferences on currently available ready-to-wear shirt and trouser
garments.
Of the 200 subjects that were initially recruited, based on the petite women‟s body
height that ranged from 5‟ 4” (163 cm) and below, the most prevalent body shape
profile that emerged from the dataset, was the pear body shape which was evident in
180 of the 3D full body scanned petite women subjects. Therefore, the
anthropometric data for these 180 subjects was used in the development of the
experimental upper and lower body dimensions size charts and as the basis for the
fit test garments developed in this study. The collected data was analysed and
interpreted in Microsoft Excel and the IBM SPSS Statistics 24 (2016) software
package, using principal component analysis (PCA) to produce the experimental size
vi
charts for the upper and lower body dimensions necessary for creating prototype
shirt and trouser garments. Regression analysis was used to establish the primary
and secondary body dimensions for the development of the size charts and for
determining the size ranges. The experimental upper and lower body dimensions
size charts were developed for sizes ranging from size 6/30 to size 26/50.
Subsequently, the accuracy of the size charts developed in this study was evaluated
by a panel of experts who analysed the fit of the prototype shirt and trouser
garments, manufactured using measurements for a size 10/34 size range from the
size chart, on a sample of the petite subjects. The fit of these garments was also
compared with the fit of garments manufactured using the 3D full body scanned
measurements of a size 10/34 petite tailoring mannequin, that is currently
commercially available for use in the production of garments for petite women in
South Africa.
The shirt and trouser prototype garments developed using the size 10/34 upper and
lower body dimensions size chart measurements had, overall, a better quality of fit
than the garments made to fit the current, commercially available, size 10/34
mannequin. These findings thereby confirmed that the data extracted from the (TC)²
NX16 3D full body scanner and the size charts subsequently developed using the
data, has the potential to provide better/improved fit in garments for petite South
African women than data hitherto published.
From the evidence of this study, it is recommended that the South African garment
manufacturing industry needs to revise the current sizing system for petite women to
accommodate the body dimensions and shape variations that currently prevail
amongst consumers. The South African garment manufacturers and retailers also
need to familiarise themselves with the needs, challenges and preferences of the
petite consumers‟ target market that purchase ready-to-wear shirt and trouser
garments in South Africa.
Keywords: Petite women, 3D body scanner, pear body shape, garment sizing and
fit, principal component analysis, body dimensions, size charts, shirt garments,
trouser garments, fit test evaluations.
vii
TABLE OF CONTENTS
DEDICATION .............................................................................................................. i
DECLARATION .......................................................................................................... ii
ACKNOWLEDGEMENTS .......................................................................................... iii
CERTIFICATE FOR LANGUAGE EDITING ............................................................... iv
SUMMARY ................................................................................................................. v
CHAPTER 1: OVERVIEW OF THE STUDY…………………………………………….1
1.1 INTRODUCTION AND BACKGROUND TO THE STUDY ................................... 1
1.2 PROBLEM STATEMENT ..................................................................................... 4
1.3 RESEARCH QUESTIONS AND OBJECTIVES.................................................... 4
1.4 SIGNIFICANCE OF THE STUDY......................................................................... 5
1.5 RESEARCH DESIGN AND METHODOLOGY ..................................................... 6
1.6 DEFINITIONS..................................................................................................... 11
1.7 ACRONYMS ...................................................................................................... 12
1.8 OUTLINE OF THE DISSERTATION .................................................................. 13
CHAPTER 2: LITERATURE REVIEW…………………………………………………. 15
2.1 INTRODUCTION ................................................................................................ 15
2.2 DEFENITION OF A PETITE WOMAN ............................................................... 16
2.3 WOMEN‟S BODY DIMENSIONS AND SHAPES ............................................... 17
2.3.1 Classification of women‟s body shapes and body dimensions, inclusive of the
petite women ............................................................................................................ 17
2.3.1.1 The ideal body shape ................................................................................... 21
2.3.1.2 The hourglass body shape ........................................................................... 22
2.3.1.3 The triangular or pear body shape .............................................................. 24
2.3.1.4 The inverted triangular body shape ............................................................. 25
viii
2.3.1.5 The rectangular or straight body shape ........................................................ 25
2.3.1.6 The oval or rounded body shape ................................................................ 26
2.3.1.7 The diamond body shape ............................................................................ 26
2.3.2 Petite women‟s body measurements ............................................................... 29
2.4 GARMENT FIT ................................................................................................... 31
2.4.1 Defining garment fit ......................................................................................... 31
2.4.1.1 Fabric grain .................................................................................................. 32
2.4.1.2 Garment ease ............................................................................................... 33
2.4.1.3 Garment line ................................................................................................. 34
2.4.1.4 Garment set.................................................................................................. 34
2.4.1.5 Garment balance .......................................................................................... 36
2.4.2 Garment Standards used in the evaluation of garment fit ............................... 36
2.5 THE RELATIONSHIP BETWEEN BODY DIMENSIONS, BODY SHAPE AND
GARMENT FIT ......................................................................................................... 37
2.6 CONSUMER'S PERCEPTIONS ON GARMENT FIT AND THEIR BODY
SHAPES………………………………………………………………………………...42
2.7 HOW THE INDUSTRY BASE-SIZE GARMENTS ARE TESTED FOR FIT ........ 43
2.7.1 Using fit models to test garment fit .................................................................. 44
2.7.1.1 The dress form ............................................................................................. 44
2.7.1.2 The human fit model .................................................................................... 45
2.7.1.3 The virtual fit model ..................................................................................... 46
2.8 GARMENT SIZING SYSTEMS .......................................................................... 49
2.8.1 Garment sizing Systems, body measurements and size charts ...................... 49
2.8.2 Developing sizing systems .............................................................................. 51
2.8.2.1 Developing sizing systems using collected data from 3D body scanners ..... 52
2.8.3 Classifying the anthropometric data into different body shapes based on key
body dimensions when developing sizing systems .................................................. 55
2.8.4 Establishing the size ranges for a sizing system ............................................. 56

ix
2.8.5 The relationship between body measurements in sizing systems ................... 57
2.8.6 Garment sizing systems as a contributing factor to fit ..................................... 57
2.8.7 Communication of garment sizing systems ..................................................... 58
2.9 READY-TO-WEAR GARMENTS........................................................................ 62
2.10 PETITE WOMEN‟S GARMENT CATEGORISATION ....................................... 63
2.11 PATTERN DRAFTING IN THE INDUSTRY ..................................................... 64
2.11.1 Pattern grading .............................................................................................. 68
2.12 CONCLUSION ................................................................................................. 71
CHAPTER 3: RESEARCH METHODOLOGY ......................................................... 73
3.1 INTRODUCTION ................................................................................................ 73
3.2 THE RESEARCH DESIGN ................................................................................ 73
3.2.1 Selection of subjects (Sampling) ..................................................................... 74
3.2.2 Data collection instruments used in the study ................................................. 77
3.2.2.1 A demographic and psychographic questionnaire ........................................ 77
3.2.2.2 The equipment used to collect the anthropometric data ............................... 78
3.3 UNIT OF ANALYSIS AND INTERPRETATION .................................................. 86
3.4 THE UPPER AND LOWER BODY GARMENT STYLES USED IN THIS PETITE
WOMEN‟S STUDY ................................................................................................... 88
3.4.1 Basic style - women‟s shirt .............................................................................. 88
3.4.2 Basic style - women‟s trouser .......................................................................... 88
3.5 QUALITY OF THE DATA ................................................................................... 89
3.6 ETHICAL CONSIDERATIONS ........................................................................... 90
CHAPTER 4: DATA ANALYSIS AND INTERPRETATION ..................................... 93
4.1 INTRODUCTION ................................................................................................ 93
4.2 SUBJECTS‟ DEMOGRAPHIC AND BODY SHAPE INFORMATION ................. 94

x
4.3 PRINCIPAL COMPONENT ANALYSIS (PCA) FOR THE UPPER AND LOWER
BODY DIMENSIONS ............................................................................................. 101
4.3.1 Results of the component matrix for the upper body dimensions to be used as
key body dimensions when developing the size chart in this study ........................ 126
4.3.2 Results of the component matrix for the lower body dimensions to be used as
key body dimensions when developing the size chart in this study ........................ 126
4.4 METHODS AND PROCEDURES FOR DEVELOPING THE EXPERIMENTAL
SIZE CHARTS FOR PETITE WOMEN IN SOUTH AFRICA .................................. 128
4.4.1 Regression analysis for predicting the size ranges for the size charts .......... 132
4.4.1.1 Calculations for determining the size intervals for the upper key body
dimensions ............................................................................................................. 134
4.4.1.2 Calculations for determining the size intervals for the lower key body
dimensions ............................................................................................................. 135
4.4.1.3 Calculations for determining the regression constants in the equations that
relate to the primary (upper key) body dimensions ................................................ 136
4.4.1.4 Calculations for determining the regression constants in the equations that
relate to the primary (lower key) body dimensions and the secondary body
dimensions ............................................................................................................. 137
4.4.1.5 Predictions and allocation of the size range measurements for the upper key
body dimensions .................................................................................................... 140
4.4.1.6 Predictions and allocation of the size range measurements for the lower key
body dimensions .................................................................................................... 142
4.4.2 The experimental size charts developed for the South African petite women 144
4.5 CALIBRATION OF SIZE CHARTS ................................................................... 146
4.6 COMPARISON BETWEEN THE PETITE SIZE CHARTS DEVELOPED IN THIS
STUDY AND OTHER PUBLISHED PETITE SIZE CHARTS .................................. 153
4.7 THE PETITE SUBJECTS‟ PERCEPTIONS OBTAINED FROM THE
PSYCHOGRAPHIC QUESTIONNAIRE ................................................................. 162
4.8 CONCLUSION ................................................................................................. 177

xi
CHAPTER 5: CONSTRUCTING THE BASIC SHIRT AND TROUSER PATTERN
BLOCKS; MANUFACTURING THE GARMENTS AND CONDUCTING GARMENT
FIT TEST EVALUATIONS .................................................................................... .179
5.1 INTRODUCTION .............................................................................................. 179
5.2 DEVELOPING THE PATTERN BLOCKS FOR CONSTRUCTING THE
PROTOTYPE SHIRT AND TROUSER GARMENTS ............................................. 179
5.2.1 Constructing the prototype shirt and trouser pattern blocks .......................... 180
5.3 MANUFACTURING THE PROTOTYPE SHIRT AND TROUSER GARMENTS
............................................................................................................................... 187
5.4 GARMENT FIT TEST EVALUATIONS ............................................................. 188
5.4.1 Conducting the garment fit test evaluations .................................................. 192
5.4.2 Analysis of the shirt and trouser garment fit test evaluating rating scales ..... 194
5.5 THE ASSESSMENTS OF THE SHIRT AND TROUSER GARMENT FIT TEST
EVALUATIONS FOR THE SIZE 10/34 PETITE SUBJECTS ................................. 204
5.5.1 The petite tailoring mannequin fit test evaluations ......................................... 205
5.5.2 Fit tes evaluations for Subject 1 .................................................................... 207
5.5.2.1 Subject 1 mannequin size 10/34 shirt fit test evaluations ........................... 207
5.5.2.2 Subject 1 size chart size 10/34 shirt fit test evaluations ............................. 208
5.5.2.3 Subject 1 mannequin size 10/34 trouser fit test evaluations ....................... 209
5.5.2.4 Subject 1 size chart size 10/34 trouser fit test evaluations ......................... 210
5.5.3 Fit test evaluations for Subject 2 ................................................................... 211
5.5.3.1 Subject 2 mannequin size 10/34 shirt fit test evaluations ........................... 211
5.5.3.2 Subject 2 size chart size 10/34 shirt fit test evaluations ............................. 212
5.5.3.3 Subject 2 mannequin size 10/34 trouser fit test evaluations ....................... 213
5.5.3.4 Subject 2 size chart size 10/34 trouser fit test evaluations ......................... 213
5.5.4 Fit test evaluations for Subject 3 ................................................................... 214
5.5.4.1 Subject 3 mannequin size 10/34 shirt fit test evaluations ........................... 214
5.5.4.2 Subject 3 size chart size 10/34 shirt fit test evaluations ............................. 215
xii
5.5.4.3 Subject 3 mannequin size 10/34 trouser fit test evaluations ....................... 215
5.5.4.4 Subject 3 size chart size 10/34 trouser fit test evaluations ......................... 216
5.5.5 Fit test evaluations for Subject 4 ................................................................... 217
5.5.5.1 Subject 4 mannequin size 10/34 shirt fit test evaluations ........................... 217
5.5.5.2 Subject 4 size chart size 10/34 shirt fit test evaluations ............................. 217
5.5.5.3 Subject 4 mannequin size 10/34 trouser fit test evaluations ....................... 218
5.5.5.4 Subject 4 size chart size 10/34 trouser fit test evaluations ......................... 219
5.5.6 Fit test evaluations for Subject 5 ................................................................... 220
5.5.6.1 Subject 5 mannequin size 10/34 shirt fit test evaluations ........................... 220
5.5.6.2 Subject 5 size chart size 10/34 shirt fit test evaluations ............................. 221
5.5.6.3 Subject 5 mannequin size 10/34 trouser fit test evaluations ....................... 222
5.5.6.4 Subject 5 size chart size 10/34 trouser fit test evaluations ......................... 223
5.5.7 Fit test evaluations for Subject 6 ................................................................... 224
5.5.7.1 Subject 6 mannequin size 10/34 shirt fit test evaluations ........................... 224
5.5.7.2 Subject 6 size chart size 10/34 shirt fit test evaluations ............................. 225
5.5.7.3 Subject 6 mannequin size 10/34 trouser fit test evaluations ....................... 226
5.5.7.4 Subject 6 size chart size 10/34 trouser fit test evaluations ......................... 226
5.5.8 Fit test evaluations for Subject 7 ................................................................... 227
5.5.8.1 Subject 7 mannequin size 10/34 shirt fit test evaluations ........................... 227
5.5.8.2 Subject 7 size chart size 10/34 shirt fit test evaluations ............................. 228
5.5.8.3 Subject 7 mannequin size 10/34 trouser fit test evaluations ....................... 229
5.5.8.4 Subject 7 size chart size 10/34 trouser fit test evaluations ......................... 230
5.5.9 Fit test evaluations for Subject 8 ................................................................... 231
5.5.9.1 Subject 8 mannequin size 10/34 shirt fit test evaluations ........................... 231
5.5.9.2 Subject 8 size chart size 10/34 shirt fit test revaluations ............................ 231
5.5.9.3 Subject 8 mannequin size 10/34 trouser fit test evaluations ....................... 232
5.5.9.4 Subject 8 size chart size 10/34 trouser fit test evaluations ......................... 232
xiii
5.5.10 Fit test evaluations for Subject 9 ................................................................. 233
5.5.10.1 Subject 9 mannequin size 10/34 shirt fit test evaluations ......................... 233
5.5.10.2 Subject 9 size chart size 10/34 shirt fit test evaluations ........................... 234
5.5.10.3 Subject 9 mannequin size 10/34 trouser fit test evaluations ..................... 234
5.5.10.4 Subject 9 size chart size 10/34 trouser fit test evaluations ....................... 235
5.6 CONCLUSION ................................................................................................. 235
CHAPTER 6: CONCLUSIONS, IMPLICATIONS, LIMITATIONS AND
RECOMMENDATIONS FOR FURTHER RESEARCH .......................................... 240
6.1 INTRODUCTION .............................................................................................. 240
6.2 SUMMARY OF THE RESEARCH METHODOLOGY ....................................... 240
6.3 KEY CONCLUSIONS FOR THE OBJECTIVES IN THIS STUDY .................... 241
6.3.1 The body measurements and body shapes of the 200, 3D full body scanned
petite subjects ........................................................................................................ 241
6.3.2 The developed experimental upper and lower body dimensions size charts
from the 3D full body scanned petite subject‟s measurements. ............................. 243
6.3.3 Comparing the collected 3D full body scanned petite women subject‟s upper
and lower body dimensions size chart measurements with previously published size
charts for petite women .......................................................................................... 244
6.3.4 Investigating the petite subject‟s perceptions of their body shapes and
proportions, together with their upper body and lower body garment evaluations and
purchasing behaviour. ............................................................................................ 246
6.3.5 Constructing basic pattern blocks for shirt and trousers patterns using the 3D
full body scanned petite women subject‟s data for the developed experimental size
charts and the 3D scanned petite tailoring mannequin measurements; to aid the
manufacturing of the prototype shirt and trouser garments for the fit test evaluations.
............................................................................................................................... 249
6.4 CONTRIBUTION OF THE STUDY TO GARMENT SIZING AND FIT RESEARCH
............................................................................................................................... 252
6.5 IMPLICATIONS AND LIMITATIONS OF THE STUDY ..................................... 252

xiv
6.6 RECOMMENDATIONS .................................................................................... 254
6.7 FURTHER STUDIES ........................................................................................ 256
LIST OF REFERENCES ........................................................................................ 259

xv
LIST OF FIGURES
Figure 1.1: Figures of different female body proportions from Alterations Needed
(2010). ........................................................................................................................ 2
Figure 1.2: An adapted conceptual framework showing the relationship between the
parameters used to determine sizing methods and to evaluate garment fit for this
study. .......................................................................................................................... 7
Figure 2.1: Female Figure Identification Technique (FFIT©) for Apparel (Simmons et
al., 2004b). ............................................................................................................... 19
Figure 2.2: Body Shape Assessment Scale (BSAS©) (Connell et al., 2006).. ......... 20
Figure 2.3: An illustration of an ideal body shape (Adapted from Liechty et al., 2010:
81). ........................................................................................................................... 22
Figure 2.4: An illustration of an hourglass body shape (adapted from Liechty et al.,
2010: 81). ................................................................................................................. 23
Figure 2.5: An illustration of a triangular/pear body shape (Adapted from Liechty et
al., 2010: 81). ........................................................................................................... 24
Figure 2.6: An illustration of an inverted triangular body shape (Adapted from Liechty
et al., 2010: 81). ....................................................................................................... 24
Figure 2.7: An illustration of a rectangular/straight body shape (Adapted from Liechty
et al., 2010: 81). ....................................................................................................... 25
Figure 2.8: An illustration of an oval/rounded body shape (Adapted from Liechty et
al., 2010: 81). ........................................................................................................... 26
Figure 2.9: An illustration of a diamond body shape (Adapted from Liechty et al.,
2010: 81). ................................................................................................................. 26

xvi
Figure 2.10: Body shapes classifications common to both small and average to plus-
size women‟s silhouettes in different body heights and BMI including petite women,
established by Pandarum (2015). ............................................................................ 27
Figure 2.11: Observations of different female lower-body sizes and shapes
established by Song et al. (2013:149). .................................................................... 40
Figure 2.12: Illustrations of different types of dress forms by Figure Forms (2015)
.............................................................................................................................. …45
Figure 2.13: An image of a human (live) fit model with garment fit evaluators
(Adapted from H&M, 2015). ..................................................................................... 46
Figure 2.14: An illustration of a virtual fit testing and pattern manipulation simulation
on a virtual fit model in OptiTex® (Sohn & Sun, 2013:69)…………………………….47
Figure 2.15: 3D body scan transformed into a virtual fit model for fit test evaluations
(Apeagyei, 2010:63)…………………………………………………………………….…48
Figure 2.16: A women‟s trouser size chart (Adapted from Pandarum and Yu,
2015:193) ................................................................................................................. 51
Figure 2.17: A pictogram size description illustration for a female‟s sizing labelling
(Adapted from SANS 1360-2, 2008)......................................................................... 61
Figure 2.18: Examples of a basic bodice front and back pattern blocks (Adapted from
Joseph-Armstrong, 2014:45). ................................................................................... 67
Figure 2.19: An illustration of a basic sleeve pattern block (Adapted from Joseph-
Armstrong, 2014:61). ................................................................................................ 67
Figure 2.20: Illustrations of back and front basic trouser pattern blocks (Adapted from
Joseph-Armstrong 2014:671). .................................................................................. 68
Figure 2.21: Examples of grading cardinal points on a basic master bodice (back and
front) pattern blocks (Adapted from Gupta 2014:59). ............................................... 69

xvii
Figure 2.22: Back and front bodice block patterns graded one size up (Adapted from
Aldrich 2015:208). .................................................................................................... 70
Figure 3.1: Images of the (TC)² NX16 3D full body scanner image and the cameras
and sensors inside the scanner, captured on the Unisa Science campus scanner
laboratory. ................................................................................................................ 79
Figure 3.2: An illustration of the 3D scanning posture (Adapted from Pandarum,
2009:58).. ................................................................................................................. 80
Figure 3.3:The (TC)² NX16 - 3D body model in point cloud with extracted body
measurements ......................................................................................................... 81
Figure 3.4: A 3D full body scanned front and side view image of the petite tailoring
mannequin used in this study.. ................................................................................. 82
Figure 3.5: Illustrations of different body landmark mep used in the extraction of the
3D data collected for this study.. .............................................................................. 83
Figure 3.6: An image of a basic shirt (Adapted from Patch 2009:76). ...................... 88
Figure 3.7: Four main trouser styles (Adapted from Joseph-Armstrong, 2014:661). 89
Figure 4.1: The age, weight and height measurements distributions of the 200, 3D
full body scanned South African petite women subjects collected for this study. ..... 94
Figure 4.2: An example of the small and plus-size women‟s pear body shape profiles
................................................................................................................................. 96
Figure 4.3: An example of a crossover body shape classified between hourglass and
pear body shape profiles. ......................................................................................... 97
Figure 4.4: An example of a crossover body shape classified between straight and
pear body shape profiles .......................................................................................... 97
Figure 4.5: A scree plot for the upper body dimensions required for developing the
prototype shirt pattern block.. ................................................................................. 121
xviii
Figure 4.6: A scree plot for the lower body dimensions required for developing the
prototype trouser pattern block ............................................................................... 121
Figure 4.7: The subjects‟ percentage satisfaction ratings of their body parts…..…164
Figure 4.8: Examples of the 3D full body scans showing the body shapes of the
petite subjects who answered that they altered their garments after purchasing them
in retail stores (n=151 of the 180 subjects) ............................................................ 168
Figure 4.9: Examples of the 3D full body scans showing the body shapes of petite
subjects who stated that they do not alter their garments after purchasing them in
retail stores (n=29 of the 180 subjects). ................................................................. 168
Figure 4.10: Plots of the purchased/perceived shirt size ranges and the size chart
shirt size ranges ..................................................................................................... 172
Figure 4.11: Plots of the purchased/perceived trouser size ranges and the size chart
trouser size ranges. ................................................................................................ 173
Figure 4.12: The perceived minimum shirt sizes vs the size chart shirt sizes ........ 174
Figure 4.13: The perceived maximum shirt sizes vs the size chart shirt sizes). .... 175
Figure 4.14: The perceived minimum trouser sizes vs the size chart trouser sizes.
............................................................................................................................... 175
Figure 4.15: The perceived maximum trouser sizes vs the size chart trouser sizes
............................................................................................................................... 176
Figure 5.1: Patterns blocks developed from the petite subjects‟ size chart, size 10/34
measurements collected in this study..................................................................... 183
Figure 5.2: Patterns blocks developed from the size 10/34 petite tailoring mannequin
measurements used in this study ........................................................................... 184
Figure 5.3: Images of the fit comparison between the shirt and trouser garments
created using the size 10/34 petite mannequin measurements and the shirt and
trouser garments created using the size 10/34 size chart measurements.............. 205

xix
Figure 5.4: The prototype shirt and trouser garments fitted on subject 1 and the
subject‟s 3D full body scan ..................................................................................... 207
Figure 5.5: The prototype shirt and trouser garments fitted on subject 2 and the
subject‟s 3D full body scan ..................................................................................... 211
Figure 5.6: The prototype shirt and trouser garments fitted on subject 3 and the
subject‟s 3D full body scan ..................................................................................... 214
Figure 5.7: The prototype shirt and trouser garments fitted on subject 4 and the
subject‟s 3D full body scan. .................................................................................... 217
Figure 5.8: The prototype shirt and trouser garments fitted on subject 5 and the
subject‟s 3D full body scan ..................................................................................... 220
Figure 5.9: The prototype shirt and trouser garments fitted on subject 6 and the
subject‟s 3D full body scan. .................................................................................... 224
Figure 5.10: The prototype shirt and trouser garments fitted on subject 7 and the
subject‟s 3D full body scan. .................................................................................... 227
Figure 5.11: The prototype shirt and trouser garments fitted on subject 8 and the
subject‟s 3D full body scan ..................................................................................... 231
Figure 5.12: The prototype shirt and trouser garments fitted on subject 9 and the
subject‟s 3D full body scan ..................................................................................... 233
xx
LIST OF TABLES
Table 2.1: Petite size chart from size 6/32, representing the minimum size
measurement to 20/46, representing the maximum size measurement adapted from
BurdaStyle (n.d). ...................................................................................................... 50
Table 3.1: Age and race distribution of the sample of 200 petite women collected for
this study based on Statistics S.A. (2011-2014) data. .............................................. 75
Table 4.1: The different body shapes that emerged from the 200, 3D scanned
subjects .................................................................................................................... 95
Table 4.2: The petite subjects‟ body shape profile perceptions based on each
individual‟s personal evaluations of their body shapes. ............................................ 99
Table 4.3: Number and percentage distributions of the pear body shape profile within
the petite ethnic groups. ......................................................................................... 100
Table 4.4: The correlation matrix of the upper body dimensions required to construct
the prototype shirt pattern block. ............................................................................ 103
Table 4.5: The significance values of the upper body dimensions required to
construct the prototype shirt pattern block. ............................................................. 104
Table 4.6: The correlation matrix of the lower body dimensions required to construct
the prototype trouser pattern block. ........................................................................ 106
Table 4.7: The significance values of the lower body dimensions required to
construct the prototype trouser pattern block. ........................................................ 107
Table 4.8: Correlation matrix of the age, weight and height against upper body
dimensions required to construct the shirt prototype pattern block. ....................... 111
Table 4.9: The significance values of the age, weight and height against upper body
dimensions required to construct the prototype shirt pattern block. ....................... 112
xxi
Table 4.10: Correlation matrix of the age, weight and height against lower body
dimensions required to construct the prototype trouser pattern block. ................... 113
Table 4.11: The significance values of the age, weight and height against lower body
dimensions required to construct prototype trouser pattern block. ......................... 114
Table 4.12: The Bartlett‟s Test of “Sphericity” and the Kaiser-Meyer-Olkin Test of
Sampling Adequacy (KMO) for the upper body dimensions. .................................. 116
Table 4.13: The Bartlett‟s Test of “Sphericity” and the Kaiser-Meyer-Olkin Test of
Sampling Adequacy (KMO) for the lower body dimensions. .................................. 116
Table 4.14: The total variance explained for the upper body dimensions required for
developing the prototype shirt pattern block. .......................................................... 118
Table 4.15: The total variance explained for the lower body dimensions required for
developing the prototype trouser pattern block. ..................................................... 119
Table 4.16: A rotated component matrix showing factor loadings for the upper body
dimensions required for developing the prototype shirt pattern block. ................... 123
Table 4.17: A rotated component matrix showing factor loadings for the lower body
dimensions required for developing the prototype trouser pattern block. ............... 124
Table 4.18: The minimum and maximum measurement values for the upper body
dimensions ............................................................................................................. 130
Table 4.19: The minimum and maximum measurement values for the lower body
dimensions ............................................................................................................. 131
Table 4.20: Regression coefficient constants calculations for the upper body girth
related body dimensions. ....................................................................................... 136
Table 4.21: Regression coefficient constants calculations for the upper body length
related body dimension. ......................................................................................... 137
Table 4.22: Regression coefficient constants calculations for the upper body arm
related body dimension .......................................................................................... 137

xxii
Table 4.23: Regression coefficient constants calculations for the lower body girth
related body dimensions ........................................................................................ 137
Table 4.24: Regression coefficient constants calculations for the lower body crotch
length related body dimension ............................................................................... 138
Table 4.25: Regression coefficient constants calculations for the lower body length
related body dimension .......................................................................................... 138
Table 4.26: Size range measurement predictions and allocation of the upper body
girth related key body dimensions. ......................................................................... 140
Table 4.27: Size range measurement predictions and allocation of the upper body
length related key body dimension. ........................................................................ 141
Table 4.28: Size range measurement predictions and allocation of the upper body
arm related key body dimension. ........................................................................... 141
Table 4.29: Size range measurement predictions and allocation of the lower body
girth related key body dimensions. ......................................................................... 142
Table 4.30: Size range measurement predictions and allocation of the lower body
crotch length related key body dimension .............................................................. 142
Table 4.31: Size range measurement predictions and allocation of the lower body
length related key body dimension. ........................................................................ 143
Table 4.32: The experimental size chart (with size intervals) for constructing the
pattern blocks for creating prototype shirt garments for South African petite women.
............................................................................................................................... 144
Table 4.33: The experimental size chart (with size intervals) for constructing the
pattern blocks for creating prototype trouser garments for South African petite
women. ................................................................................................................... 145
xxiii
Table 4.34: The differences between the size 10/34 3D full body scanned petite
women‟s upper body measurements and the size 10/34 3D full body scanned petite
tailoring mannequin‟s measurements ..................................................................... 146
Table 4.35: The differences between the size 10/34 3D full body scanned petite
women‟s lower body measurements and the size 10/34 3D full body scanned petite
tailoring mannequin‟s measurements. .................................................................... 147
Table 4.36: The minimum and maximum measurement coverage of the upper body
dimensions required to construct the shirt garment in this study. ........................... 151
Table 4.37: The minimum and maximum measurement coverage of the lower body
dimensions required to construct the trouser garment in this study. ...................... 152
Table 4.38: The petite women‟s size chart developed by Bailey (2010:23) ............ 154
Table 4.39: Comparison between the size 10/34 petite size upper body
measurements developed for this study with the 3D full body scanned petite tailoring
mannequin, Defty‟s (1988:17-18) and Winks‟ (1990:74-76) published South African
petite size charts that are in the public domain. ..................................................... 155
Table 4.40: Comparison between the size 10/34 petite size lower body
measurements developed for this study with the 3D full body scanned petite tailoring
mannequin, Defty‟s (1988:17-18) and Winks‟ (1990:74-76) published South African
petite size charts that are in the public domain. ..................................................... 156
Table 4.41: Size chart for short women used for comparing upper body dimensions
by Defty (1988:17). ................................................................................................. 158
Table 4.42: Size chart for short women used for comparing lower body dimensions
by Defty (1988:17). ................................................................................................. 159
Table 4.43:The different body shapes and size distribution chart established by
Winks (1990:76) ..................................................................................................... 160
xxiv
Table 4.44: Measurement differences of the 3D full body scanned petite
measurements when compared to commonly occurring 3D full body scanned petite
mannequin measurements, Defty (1988:17-18) and Winks (1990:74-76) petite
measurements using the average height, bust and hip. The limitations of the
comparison consider the lack of data for Defty (1988) and Winks (1990). ............. 161
Table 4.45: Satisfaction of the petite subjects with certain body parts ................... 164
Table 4.46: Body fit evaluation of shirt garments for the petite women subjects. ... 166
Table 4.47: Body fit evaluation of trouser garments for the petite women subjects.
............................................................................................................................... 166
Table 4.48: Ratings for the most considered criteria used when purchasing shirt and
trouser garments. ................................................................................................... 169
Table 4.49: Garment sizes that the petite subjects perceive themselves to be and are
more likely to select when purchasing their ready-to-wear shirt garments. ............ 170
Table 4.50: garment sizes that the petite subjects perceive themselves to be and are
more likely to select when purchasing their ready-to-wear trouser garments. ........ 171
Table 5.1: Bust and hip dimensions of the size chart measurements, petite
mannequin measurements and the selected subject‟s actual body measurements.
............................................................................................................................... 190
Table 5.2: The shirt garments rating scales assessed individually by each fit test
evaluator (Subjects 1-5). ........................................................................................ 195
Table 5.3: The shirt garments rating scales assessed individually by each fit test
evaluator (Subjects 6-9). ........................................................................................ 196
Table 5.4: The trouser garments rating scales assessed individually by each fit test
evaluator (Subjects 1-5). ........................................................................................ 197
Table 5.5: The trouser garments rating scales assessed individually by each fit test
evaluator (Subjects 6-9). ........................................................................................ 198

xxv
Table 5.6: Comparative mean ratings of the evaluated shirt garments per subject.
.............................................................................................................................. .201
Table 5.7: Comparative mean ratings of the evaluated trouser garments per subject
............................................................................................................................... 202
xxvi
LIST OF APPENDICES
APPENDIX A: INVITATION LETTER ..................................................................... 284
APPENDIX B: CONSENT FORM ........................................................................... 286
APPENDIX C: ETHICAL CLEARANCE LETTER ................................................... 287
APPENDIX D: DATA COLLECTING DEMOGRAPHIC AND PSYCHOGRAPHIC
QUESTIONNAIRE FOR PETITE WOMEN‟S SIZING AND FIT STUDY ................ 289
APPENDIX E: LETTER OF APPRECIATION ........................................................ 300
APPENDIX F: EXAMPLES OF THE BOX PLOTS, HISTOGRAMS AND DATA
DISTRIBUTIONS OF THE 3D FULL BODY SCANNED PETITE SUBJECTS‟ UPPER
PEAR BODY DIMENSIONS ................................................................................... 301
APPENDIX G: EXAMPLES OF THE BOX PLOTS, HISTOGRAMS AND DATA
DISTRIBUTIONS OF THE 3D FULL BODY SCANNED PETITE SUBJECTS‟
LOWER PEAR BODY DIMENSIONS ..................................................................... 315
APPENDIX H: AN EXAMPLE OF THE REGRESSION CALCULATIONS FOR
ALLOCATING THE SIZE RANGES IN THE SIZE CHARTS .................................. 328
Appendix H1: Calculations for allocating the average measurement for the chest
secondary body dimension ..................................................................................... 328
Appendix H2: Calculations for allocating the size interval for the chest secondary
body dimension ...................................................................................................... 329
APPENDIX I: TECHNICAL SPECIFICATIONS AND PARAMETERS ASSOCIATED
WITH MANUFACTURING THE PROTOTYPE SHIRT AND TROUSER GARMENTS
............................................................................................................................... 330
APPENDIX J: STANDARDS FOR THE GARMENT FIT TEST EVALUATIONS .... 335

xxvii
APPENDIX K: COMPARATIVE MEAN RATINGS FOR THE QUALITY OF THE
SHIRTS AND TROUSERS GARMENT FIT EVALUATATED ON EACH SUBJECT
............................................................................................................................... 337
Appendix K1: The comparative mean ratings for the shirts quality of fit attained from
subject 1 ................................................................................................................. 337
Appendix K2: The comparative mean ratings for the shirts quality of fit attained from
subject 2 ................................................................................................................. 338
Appendix K3: The comparative mean ratings for the shirts quality of fit attained from
subject 3 ................................................................................................................. 339
Appendix K4: The comparative mean ratings for the shirts quality of fit attained from
subject 4 ................................................................................................................. 340
Appendix K5: The comparative mean ratings for the shirts quality of fit attained from
subject 5 ................................................................................................................. 341
Appendix K6: The comparative mean ratings for the shirts quality of fit attained from
subject 6 ................................................................................................................. 342
Appendix K7: The comparative mean ratings for the shirts quality of fit attained from
subject 7 ................................................................................................................. 343
Appendix K8: The comparative mean ratings for the shirts quality of fit attained from
subject 8 ................................................................................................................. 344
Appendix K9: The comparative mean ratings for the shirts quality of fit attained from
subject 9 ................................................................................................................. 345
Appendix K10: The comparative mean ratings for the trousers quality of fit attained
from subject 1 ......................................................................................................... 346

xxviii
Appendix K11: The comparative mean ratings for the trousers quality of fit attained
from subject 2 ......................................................................................................... 347
Appendix K12: The comparative mean ratings for the trousers quality of fit attained
from subject 3 ......................................................................................................... 348
Appendix K13: The comparative mean ratings for the trousers quality of fit attained
from subject 4 ......................................................................................................... 349
Appendix K14: The comparative mean ratings for the trousers quality of fit attained
from subject 5 ......................................................................................................... 350
Appendix K15: The comparative mean ratings for the trousers quality of fit attained
from subject 6 ......................................................................................................... 351
Appendix K16: The comparative mean ratings for the trousers quality of fit attained
from subject 7 ......................................................................................................... 352
Appendix K17: The comparative mean ratings for the trousers quality of fit attained
from subject 8 ......................................................................................................... 353
Appendix K18: The comparative mean ratings for the trousers quality of fit attained
from subject 9 ......................................................................................................... 354
APPENDIX L: EACH SUBJECT‟S 3D FULL BODY SCANNED MEASUREMENTS
COMPARED WITH THE SIZE 10/34 CHART MEASUREMENTS AND THE SIZE
10/34 MEASUREMENTS FROM THE PETITE MANNEQUIN ............................... 355
Appendix L1: Measurement comparison for subject 1............................................ 355
Appendix L2: Measurement comparison for subject 2............................................ 357
Appendix L3: Measurement comparison for subject 3............................................ 359
Appendix L4: Measurement comparison for subject 4............................................ 361

xxix
Appendix L5: Measurement comparison for subject 5............................................ 363
Appendix L6: Measurement comparison for subject 6............................................ 365
Appendix L7: Measurement comparison for subject 7............................................ 367
Appendix L8: Measurement comparison for subject 8............................................ 369
Appendix L9: Measurement comparison for subject 9…………………………….....371

1
CHAPTER 1
OVERVIEW OF THE STUDY
1.1 INTRODUCTION AND BACKGROUND TO THE STUDY
The first known and recorded study on petite women‟s garment sizing, according to
Kim et al. (2016:48-49) was published in the United States in “Women’s
Measurements for Garment production and Pattern Construction”, a publication by
O‟Brien and Shelton in 1941. The authors divided the women‟s body measurements
into three categories, namely: short, regular and tall; however, the United States‟
“Women’s Measurements for Garment production and Pattern Construction” apparel
government publications used the word “short” to classify petite measurements, at
that time. In 1971, the National Bureau of Standards published the PS 42-70
standard that defined a petite woman as being shorter than the average woman, but
having similar girth and width measurements as that of average women. Thereafter,
in 1995, the American Society for Testing and Materials (ASTM) international issued
ASTM D5585 Standard Table of Body Measurements for “Adult Female Misses
Figure Type”, replacing the National Bureau of Standards. Subsequently, in 2013,
the ASTM International standard developed the currently used ASTM D7878 sizing
standard for Misses petite women.
A petite woman has been defined differently by various authors and researchers. In
South Africa, Defty (1988:16), Winks (1990:74), and Bailey (2010:3) defined a petite
woman as women who are short in body stature resulting in shorter body length
measurements. Crenna‟s (1990) study defines a petite woman by their body weight
coupled with a short height. Boston‟s (1992) study suggests that the division of body
dimensions from the bust to the waist and the waist to the hip can be used as a
guideline to differentiate petite women from the average woman, whom Chun
(2014:275) classifies as a regular sized woman with a body frame that is neither tall
or short, nor large or thin. Furthermore, Bello‟s (1994) study included narrow
shoulders and a reduced waistline to crotch length to define petite women.

2
An article in Alterations Needed (2010) states that petite body proportions may vary,
being either evenly proportioned to having a long torso and short legs or a short
torso and long legs (see the different female body proportions in Figure 1.1).
Long torso/ Short legs Short torso/ long legs Evenly proportioned
Figure 1.1: Figures of different female body proportions from Alterations Needed
(2010).
However, Defty (1988:16), Winks (1990:74), Boston (1992), Rayner (1997:1), Yoo et
al. (1999:220), Barona-McRoberts (2005:10), Townsel (2005:1), Petite Resource
(2007), Williams (2007), Bailey (2010:1), Kgarza (2013), Simplicity (2013), Lee
(2014), and Taylor (2014) suggest that petite women‟s garments are manufactured
principally with an emphasis on the body height measurements, which are from 5‟4”
(163 cm) and below. Knowles‟ (2005:35, 37, 40) study classified two types of petite
women, the junior petite woman, having a typical height measurement of 5‟1” (156
cm), and the misses‟ petite woman, having a maximum height measurement of 5‟2”
(158 cm). The junior petite women have a small body frame, a short torso and short
sleeves; whilst the misses‟ petite women are said to be shorter than the average
women who have a more matured body frame. Nonetheless, Kim‟s (1993) study
supports the studies mentioned above, and argue that petite woman requires their
own sizing categories for ready-to-wear garments, as petite women are differently
proportioned in comparison to the average woman.

3
This is endorsed by Rasband and Liechty‟s (2006:24) study who maintain that body
proportions must also be used, together with body height measurements to
distinguish petite women from the average women.
To date, Defty (1988) who published a size chart for short (petite) women for
patternmaking purposes; Winks (1990), and Bailey (2010) are the only known South
African studies to have reported on petite women. These studies collected body
measurements manually, by tape-measure, for women whose body heights ranged
from 156 cm to 161 cm (Defty, 1988: 16-18), 156 cm to 163 cm with a mean of 160
cm, (Winks, 1990:74-76) and 160 cm and below (Bailey, 2010:3), respectively.
Consequently, this study used body height as the principle recruitment criteria for the
petite women subjects for this study.
Bye et al. (2006:66) suggest that ready-to-wear garments are mostly manufactured
using the apparel industry‟s standard-sized body measurements and the most
common size category for the average consumer. Bye et al. (2006:66) further
mention that the industry standards vary per country and are defined according to an
ideal body shape that appears to be balanced in upper and lower body proportions.
However, Strydom and De Klerk (2006:81), Pisut and Connell (2007:370), and
Petrova and Ashdown (2008:320) state that a single garment of a specific size is
unlikely to have the same level of fit on two different individuals because of their
varied body shapes and proportions, as most women do not conform to an ideal
body shape (Rasband & Liechty, 2006:23; Keiser & Garner, 2008:352).
Ready-to-wear garments are defined as garments that are mass-produced in
predetermined body size measurements with the purpose of being sold in stores
(Zakaria & Gupta, 2014:3). Most customers today primarily purchase mass-produced
ready-to-wear garments and these garments are mainly sized according to the
retailer‟s or manufacturer‟s apparel sizing systems, based on their target markets
(Bye et al., 2006:66; Chun, 2007:220-221; Petrova, 2007:64). Therefore, to improve
the quality of ready-to-wear garment fit for different individuals, body measurements
together with body proportions/dimensions, i.e. body shapes should be considered
when developing garment-sizing systems (Strydom & De Klerk, 2006:81).

4
1.2 PROBLEM STATEMENT
The aforementioned dearth of relevant information for petite women‟s body sizes and
the confusion that currently exists in the apparel industry as to the definition of a
petite woman prompted this study.
Anecdotal experience by the author is that South African petite women experience
significant garment fit issues. This is endorsed, to some extent, by previous studies
conducted by South African researchers, such as Bailey (2010:6) who stated that
most petite women often purchase their ready-to-wear garments in the children‟s
department, whilst others find that they have to alter the ready-to-wear garments to
achieve a better fit. Barona-McRoberts (2005:21) and Apeagyei (2008:4) further
state that vanity sizing promoted by garment manufacturers who place a smaller size
label on a garment with larger measurements to satisfy, but ultimately confuse
customers, has also contributed immensely to garment fit problems that consumers
are faced with today. Hence, the purpose of this study was to gain some insight into
the garment fit issues experienced by South African petite women to determine to
what extent sizing and fit is a problem.
1.3 RESEARCH QUESTIONS AND OBJECTIVES
This study aimed to address the following:
1.3.1. To what extent are South African petite women satisfied with the sizing and fit
of ready-to-wear of shirt and trouser garments currently offered in retail stores
in South Africa?
1.3.2. How relevant are the size charts previously established by Defty (1988:17-
18), Winks (1990:74-76), and Bailey (2010:23) for the manufacturing of
garments for petite South African women?
1.3.3. How does the fit of garments generated from the size charts produced from
3D full body scanned data of South African petite women compare with the fit
from the scanned data for a petite tailoring mannequin currently used
commercially in the manufacturing of garments for petite South African
women?

5
To answer these questions, the following objectives were formulated:
Objective 1: To perform 3D full body scans of 200 petite women subjects
residing in Gauteng (Pretoria and Johannesburg), South Africa, and analyse their
body measurements and body shapes from the generated data.
Objective 2: To develop experimental upper and lower body dimension size
charts from the 3D full body scanned subjects‟ measurements for the most
prevalent body shape of the subjects arising in this study.
Objective 3: To compare the collected 3D full body scanned subjects‟ upper and
lower body dimensions size chart measurements derived from this study with
previously published size charts for petite women by Defty (1988:17-18), Winks
(1990:74-76), and Bailey (2010:23), and the 3D full body scanned petite tailoring
mannequin‟s measurements.
Objective 4: To investigate the petite women subjects‟ perceptions of their body
shapes and proportions, together with their shirt (upper body) and trouser (lower
body) garment fit evaluations and purchasing behaviour. This was done to
evaluate the satisfaction with, and challenges faced by the petite consumers
when purchasing currently available ready-to-wear shirt and trouser garments.
Objective 5: To assess the accuracy of the measurements in the experimental
upper and lower body size charts developed for this study compared with the
mannequin‟s measurements, and thereby determining which of the two sets of
measurements provided better fitting garments. This was done by evaluating the
fit of prototype shirt and trouser garments manufactured from basic pattern blocks
using the 3D full body scanned petite women subjects‟ data from the developed
experimental size charts and the 3D full body scanned mannequin
measurements.
1.4 SIGNIFICANCE OF THE STUDY
The information gathered from the study is intended to be published and made
available for the South African apparel industry to improve the fit of South African
petite women‟s ready-to-wear garments. Within the scope and size of the study, it is
also anticipated that the outcomes of the study will make the South African apparel
6
industry aware of the sizing and fit concerns that South African petite women are
experiencing to date.
1.5 RESEARCH DESIGN AND METHODOLOGY
This study used a mixed-method, purposive sampling, non-probability sampling
method to achieve the objectives of the study (Maree, 2007:76). The use of mixed-
method research in a study, according to Maree (2007:262) improves the
significance of a study and strengthens legitimacy in the objectives of the study. The
above-mentioned sampling methods are further explained in section 3.2.
Taking into consideration the literature background and the objectives of the study
discussed in the afore-mentioned sections, the following conceptual framework for
this study, adapted from Ashdown (2007: xix) is presented in Figure 1.2. This will
serve as a proposed structure that will guide the perceptual study on garment sizing
and fit for petite female consumers in South Africa. The conceptual framework
highlights the most important concepts of the study and it also displays how each
concept may ultimately be related to or has an influence on one another.
Furthermore, the conceptual framework permits that all aspects that the study
proposes to generate are considered and emphasised when concluding the findings
and suggesting recommendations at the end of the study.

7
Figure 1.2: An adapted conceptual framework showing the relationship between the
parameters used to determine sizing methods and to evaluate garment fit for this
study.
The conceptual framework devised for this study adapted the population measures
from Ashdown‟s study as the petite women‟s measurements and focused on fit
issues. The numbers as indicated in Figure 1.2 are used below to explain the flow of
the conceptual framework for this study.
The above conceptual framework suggests the collection of the petite women‟s body
measurements (1) as a starting point for accurate and up-to-date garment sizing and
fit. Since female body shapes and body proportions differ and may have an influence
on their body measurements this is a critical step. Hereby, challenging garment
manufacturers and designers when developing patterns and creating well-fitting
garments to fit various body shape profiles existing in a population. A (TC)² NX16 3D
full body scanner (2) and an Adam‟s® medical scale (3) was used to collect the
anthropometric data for the 200 petite women subjects sampled in this study.
8
The 3D full body scanner have the advantage of detecting different body shapes
from the scanned data (Apeagyei, 2010:58; Connell et al., 2006:81). Data collected
using 3D full body scanners is collected in a short period of time, reliable, more
accurate, repeatable and non-intrusive (Yu, 2004:164; Pandarum & Yu, 2015:187).
3D full body scanners can also measure body landmarks, such as the crotch area
(Pandarum, 2009:4; Kouchi, 2014:67). The data collection process included the
procedure as defined in ISO 20685 (2010) for reducing errors in 3D scanning to
ensure comparability of body measurements. The Adam‟s® medical scale was used
to collect the height and weight measurements since they could not be extracted by
the 3D full body scanner.
The 3D scanned subjects‟ body shapes were classified using the scanner
manufacturer‟s proprietary body shape identification software. Thereafter, every
subject‟s body shape was visually reviewed (using the 3D-point cloud surface
images generated from the subject‟s 3D full body scans) by a panel of
clothing/fashion experts to verify the body shape classification identified by the (TC)²
NX16 3D full body scanner software. The IBM SPSS Statistics 24, (2016) software
package and Microsoft Excel were used to analyse and interpret the data collected in
this study.
Experimental upper and lower body dimensions size charts were developed from the
3D full body scanned measurements of the 180 pear shaped petite subjects, as
identified by the scanner shape software and verified by the panel‟s visual
assessment. The measurements were thereafter compared to the manual tape-
measurement data derived from Defty‟s (1988:17-18), Winks‟ (1990:74-76), and
Bailey‟s (2010:23) size charts for South African petite women. This was further
compared with the data collected from a 3D full body scan of a size 10/34 petite
tailoring mannequin developed by a well-known mannequin company in South
Africa. The mannequin was produced for a large-scale retailer, from data supplied by
the retailer gathered from their target market in 2003, which is still in use today
(Millam, 2016).

9
The decision to use the petite tailoring mannequins‟ measurements was because
these are the only currently acceptable “true values” measurements since there are
no other petite 3D scanned anthropometric data measurements in South Africa with
which to compare the 3D full body scanned data of the subjects collected during this
study. Subsequently, prototype shirt and trouser garment pattern blocks were
developed from both the 3D full body scans of the 180 pear shaped petite subjects‟
measurements and the scanned mannequin data. These were used to manufacture
prototype shirt and trouser garments.
Most garment manufacturers in developing countries, including South Africa, do not
adhere to standardised sizing methods (4) when manufacturing their garments. This
promotes fit issues (5), due to varying sizes among the manufacturers or within the
same manufacturer (Loker et al., 2005:2; Pisut & Connell, 2007:368; Mgwali, 2014).
This results in consumers being dissatisfied. Irrespective of the above-mentioned
factors, this study explored two influences of fit to minimise garment sizing and fit
problems for petite women in South Africa, namely, the quantification of fit (6) and
the perception of fit (7). The quantification of fit were calculations of the subjects‟ 3D
full body scanned measurements and that of using the Adam‟s® medical scale
measurements, to develop the upper and lower body size charts. Thereafter
measurements were established for a garment size range to use for constructing the
prototype shirt and trouser garments as proposed in this study for fit test (8)
evaluations. The perception of fit (in this petite study) included the subject‟s opinions
(9) and expert opinions (10). The subjects‟ opinions consisted of the subjects‟
perceptions, experiences and challenges with their ready-to-wear shirt and trouser
garments currently available in retail stores.
A demographic and psychographic questionnaire in the form of open ended and
closed questions, Likert and semantic differential scales were used to collect the
data from the psychographic questionnaire. Included also was a photographic
question on the subjects‟ self-perceived body shapes adapted from Liddelow (2016).
As the study seeks to explore the petite female challenges and experiences with
ready-to-wear shirt and trouser garments currently offered in retail stores for South
African petite consumers.
10
The conceptual framework further suggests that another important evaluative
dimension relevant to this study is the expert opinion on garment sizing and fit. The
expert opinions included analysis and classifications of the subjects‟ body shapes,
along with the evaluations of the fit of the prototype garments produced from this
study, only for the 10/34 size range.
Human fit models or dress form tailoring mannequins are used by the fashion
industry to establish the fit and drape of a given garment style on the body, based on
an industry established base size as determined by their target markets (Alexander
et al., 2005:56; Bougourd, 2007:130-131; Kadolph, 2008:91; Song et al., 2010:264;
Joseph-Armstrong, 2014:35,38). This study used both the live human fit model (the
selected subjects) and a petite mannequin to test the quality of fit of the prototype
shirt and trouser garments manufactured in this study. The quality of the garment fit
of the prototype shirt and trouser garments on a sample of petite women subjects
was analysed and evaluated by a panel of clothing lecturers within the Department of
Life and Consumer Sciences at UNISA, to determine the accuracy and limitations of
the experimental size charts and the mannequins‟ measurements. The fitting
standards for evaluating the fit of the prototype garments, from this study, was
adapted from studies by Stamper et al. (2005), Liechty et al. (2010:54) and Marshall
et al. (2012).
Furthermore, the conceptual framework proposes that the petite female consumers
who experience fit problems in their shirt and trouser garments contributed by their
body measurements, shapes and proportions may influence garment sizing and can
be a factor in providing garment manufacturers and retailers with practical solutions
to improve garment fit for petite female consumers in South Africa. Consequently,
the development of the size charts for the upper and lower body dimensions when
applying the concepts (1-6) from the conceptual framework shows that the concepts
will ultimately promote and serve to understand petite women‟s measurements and
sizing systems. The concepts (7-10) will promote a better understanding of the
consumer‟s challenges and experiences with shirt and trouser garment sizing and fit.
This further provides information and contribution to female petite garment
manufacturers and retailers in South Africa.
11
The data collected in this study is intended for use by the apparel retail and
manufacturing sectors, in the hope of minimising dissatisfaction among the petite
consumers in South Africa who still have challenges in finding a satisfactory fit in
ready-to-wear shirt and trouser garments.
1.6 DEFINITIONS
Anthropometric measurements/data: A collection of varying human body
measurements, proportions, size and weight, grouping them in a range of sizes
(Bougourd, 2007:19; Gupta, 2014:38; Zakaria, 2014:95).
Basic garment: A simple designed garment with few pattern pieces usually used for
evaluating garment fit (Liechty et al., 2010:9-10).
Body dimension size chart: A table of upper and lower body dimension‟s data,
consisting of 3D scanned body measurements established for a range of garment
sizes.
Body proportions: The length of body sections based on how they relate to each
other e.g.: an individual can have a short torso and long legs or a long torso and
short legs or an evenly proportioned body (Palmer & Alto, 2005:58; Alterations
Needed, 2010).
Body shape: A distribution of muscle and fat formed around a human‟s body
structure (Rasband & Liechty, 2006:19).
Garment drape: The effect of how a fabric hangs or falls on a human body,
controlled by the fabric‟s weight and the body silhouette (Liechty et al., 2010:31).
Garment fit: The relationship between the size of a body silhouette and the size of a
garment (Chen, 2007:132).
Garment sizing: A range of categorised dimensions used to classify manufactured
garments (Petrova, 2007:61).
Ideal body shape: A description of a balanced, well-proportioned body (Bye et al.,
2006:66; Zwane & Magagula, 2007:283; Mastamet-Mason, 2008:58; Liechty et al.,
2010: 82).
Pattern: A template draft of garment pieces constructed on a paperboard or
cardboard that can be traced onto a fabric, cut out and assembled (Liechty et al.,
2010:11-12; Aldrich, 2015:13).

12
Petite: A small framed woman with a less than average height (Bello, 1994 and
Trulypetite, 2007). Petite is based on height, not the weight of a person (Williams-
Dahlman & Shelton, 2004:2).
Size labels: Labels placed on garments, providing information on body
measurements for body sizes that the particular garment is designed to fit (Kinley,
2010:401).
Sizing standards: Documents published and developed by authority within an
agreement of principles of an organisation (La Bat, 2007:88).
Sizing system: A principle used for establishing size ranges for clothing sizing
requirements in a population (Petrova, 2007:57).
Three-Dimensional (3D) body scanner: Scanning device, using different light
methods to scan a subject and different systems to extract the scanned data
(Connell et al., 2006:81; Petrova & Ashdown, 2008:227; Pandarum, 2009:8,11;
Apeagyei, 2010:60; Ka Wai YIP, 2013:13-14).
Vanity sizing: A marketing tool used by manufacturers to sell their garments by
placing a smaller size label on a garment with larger measurements to satisfy
consumers who want to feel slim (Alexander et al., 2005:56; Pisut & Connell,
2007:368; Apeagyei, 2008:4).
1.7 ACRONYMS
ASTM: American Society for Testing and Materials
BMI: Body mass index
CAESAR: The Civilian American and European Surface Anthropometry Research
ISO: International Organisation for Standardisation
SABS: South African Bureau of Standards
SANS: South African National Standards
NPD: National Purchase Diary
(TC)²: Textile/Clothing Technology Corporation
UNISA: University of South Africa
USA: United States of America
13
1.8 OUTLINE OF THE DISSERTATION
Chapter 1: Introduction
The introductory chapter presents a brief overview of the study by presenting the
background, the motivation, and reasoning behind petite women‟s garment sizing
and fit, the objectives of the study, the methodology, definition of terms and
acronyms used in this study.
Chapter 2: Literature review
Chapter 2 presents the relevant literature relating to the study‟s purpose by
reviewing literature relating to previous studies of petite women‟s body height,
shapes and dimensions, anthropometric measurements, garment fit, fitting models,
garment sizing systems, ready-to-wear garments and garment styles used in this
study. A review of contemporary literature on 3D full body scanners and garment
patterns is also presented in Chapter 2.
Chapter 3: Research Methodology
Chapter 3 describes the methodology used in the study. Detailed research methods,
sampling and data measurement instruments are provided, and broad explanations
are given on how the data was collected and analysed. Measures employed to
enhance the quality of the data, in terms of its validity, reliability and ethical
considerations are also discussed.
Chapter 4: Data analysis and interpretation
Chapter 4 initially describes the classification of the 3D body shapes of the petite
women in this study to determine the predominant body shape. It then presents the
data analysis, interpretation and the different steps used to create the experimental
upper and lower body dimensions size charts, using the analysed body
measurement data for 180 of the subjects with pear body shape profiles, from their
3D full body scans.
This chapter also compares the 3D full body scanned subject‟s upper and lower
body size chart measurements derived from this study with those previously
14
published in size charts for petite women by Defty (1988:17-18), Winks (1990:74-76),
and Bailey (2010:23), and the 3D scanned petite tailoring mannequin‟s
measurements. Furthermore, the subject‟s self-perceptions of their body shapes and
body proportions, together with their shopping and purchasing behaviour regarding
their shirt and trouser garments extracted from the psychographic questionnaire
were analysed and interpreted in this chapter.
Chapter 5: Developing the basic pattern blocks, constructing the garments and
the selected subject‟s fit test evaluations
Chapter 5 describes how the size 10/34 size range obtained from the developed
experimental upper and lower body dimensions size charts and the measurements
of the size 10/34 3D full body scanned mannequin was used to manually draft basic
shirt and trouser pattern blocks.
Furthermore, this chapter describes how the prototype garments were produced
from the drafted shirt and trouser pattern blocks. The quality of the fit attained from
the garments produced was evaluated and are presented in the latter part of this
chapter.
Chapter 6: Conclusion, implications, limitations and recommendations for
further research
Chapter 6 summarises the results obtained from the study and presents conclusions
in relation to the research questions posed and objectives set. In addition, the
implication of the findings, the limitations, and shortcomings of the study are
discussed and recommendations for further research are proposed.
The referencing techniques used in this study follow the Harvard method adopted by
the Department of Consumer Science at the University of South Africa (UNISA).
British English is used throughout this dissertation. For further references,
appendices are provided.

15
CHAPTER 2
LITERATURE REVIEW
2.1 INTRODUCTION
Barona-McRoberts (2005:28) state that petite women have different body
dimensions from the average women and that manufacturers rarely consider their
body dimensions when manufacturing petite garments. This results in petite women
having difficulties in finding garments that fit properly in relation to their diverse body
dimensions. The South African apparel industry has a well-established sector
consisting of highly competitive garment retailers and manufacturers, as well as
formal and informal traders that supply to diverse consumers in different ethnic
groups (Kahn, 2008:1). Despite this vibrancy, there is still a lack of knowledge on
realistic South African female body shapes and sizes (Kasambala 2013:42).
According to Bailey (2010:9) the South African apparel industry has paid little
attention to petite women‟s clothing. An article in a national newspaper by Kahn
(2008), Kasambala et al. (2015:98), and Pandarum and Yu (2015:192) highlight the
fact that there has never been an extensive body shape and sizing study conducted
on the South African population to date. The SABS has not published a ready-to-
wear apparel sizing standard for South African women (Muthambi, 2012:18). As a
result, the South African garment manufacturers and retailers rely on garment sizing
charts that are out-dated when designing and manufacturing ready-to-wear garments
for South African consumers (Strydom, 2006:217; Zwane & Magagula, 2007:283;
Kahn, 2008; Ola-Afolayan & Mastamet-Mason, 2013:202-203; Mbandazayo et al.,
2014; Pandarum & Yu, 2015:192).
In South Africa, the only known studies conducted for petite women are those of
Defty (1988:17-18), Winks (1990:74-76), and Bailey (2010:23), all of which used
manually, dress-makers tape measured, anthropometric data. Defty (1988:17-18)
used the measurements of women without shoes, based on their width and the body
height measurement of 153 cm to develop a size chart for “short”/petite women.
Winks‟ (1990:74-76) study identified body size distribution measurements of three
female ethnic groups, whites, blacks and coloureds and defined a mean body height
16
measurement of 160 cm for petite women. Bailey‟s (2010:22) study, which is the
most recent, collected data from 60 students from the Cape Peninsula University of
Technology and the University of Cape Town, to evaluate their clothing perceptions
and confidence in women‟s clothing. The findings from Bailey‟s study revealed that
all the subjects in the study were unhappy with the ready-to-wear petite women‟s
garments sold in retail stores and that they felt that they were not adequately
accommodated in terms of well-fitting garments.
The next sections begin by defining petite women and conceptualising garment,
body dimensions and body shapes, together with factors that influence garment
sizing and fit for petite women.
2.2 DEFENITION OF A PETITE WOMAN
Petite women have been classified by various international and national researchers,
(Winks, 1990:74-76; Boston, 1992; Rayner, 1997:1; Defty,1988:16-18; Yoo et al.,
1999:220; Knowles, 2005:35,37,40; Townsel, 2005:1; Barona-McRoberts, 2005:10;
Petite Resource, 2007; Williams, 2007; Bailey, 2010:1; Kgarza, 2013; Simplicity,
2013; Lee, 2014; Taylor, 2014) by their body height, measuring from 5‟ 4” (163 cm)
and below with proportionally smaller body dimensions (Crenna, 1990; Rayner,
1997:1).
Kim et al. (2016:49,52) compared the 2013, ASTM standard D7878 for the Misses
petite women, with the ASTM D5585, a sizing standard developed in 1995 for the
adult female Misses average, regular sized women. The average women‟s data
consisted of a height measurement taller than 5‟ 4” (163 cm) to 5‟ 8” (173 cm). This
comparison noted that petite women can be identified as having a body stature that
is 3 inches shorter, a back-waist length that is ¾ inches shorter, a 2 inches shorter
leg length and an arm length that is 17/8 inches shorter than regular sized women.
Kim et al. (2016:49) further defined petite women‟s circumferences by a waist girth
that was smaller by ½ an inch and a shoulder width that was ½ an inch smaller than
the average women‟s sizes, whilst the balance of the girth and length measurements
remained the same as those in the two standards.

17
2.3 WOMEN‟S BODY DIMENSIONS AND SHAPES
2.3.1 Classification of women‟s body shapes and body dimensions, inclusive
of the petite women
According to Schofield et al. (2006:148) an individual‟s body shape changes with age
and varies (Paquet, 2014:125) by country (Nkambule, 2010:22) which may also
affect the fit of garments. Nutritional diet, lifestyle and body weight are among the
factors that have an influence on an individual‟s body shape (Howarton & Lee,
2010:220). Garment manufacturers usually use an ideal body shape as a base-
pattern size for manufacturing ready-to-wear garments (Loker et al., 2005:1). The
ideal body is defined as having an evenly balanced upper and lower torso, a slightly
narrow waist, average bust and buttocks curves that balance each other, a flat
abdomen, together with lean arms and legs (Bye et al., 2006:66; Zwane & Magagula,
2007:283; Mastamet-Mason, 2008:58; Liechty et al., 2010: 82). Rasband and
Liechty (2006:23) stated that only a limited number of people can be classified as
having an ideal body shape.
According to Park et al. (2009:374), most female consumers that do not have a body
shape that is particular to an apparel retailer‟s target market, might experience
problems with the fit of garments sold in retail stores. The apparel industry is said to
have predetermined standard garment sizing systems to manufacture ready-to-wear
garments, using the most common size category, for their target markets.
Furthermore, Vuruskan and Bulgun‟s (2011:46) study found that two individuals with
the same body measurements would experience different levels of garment fit
because their individual body shapes and dimensions may vary. Therefore,
identifying and classifying the most commonly represented body shapes in a
population is beneficial for garment manufacturers, as this will provide guidelines on
how to manufacture better fitting garments for many consumers in the different
garment size categories (Vuruskan & Bulgun, 2011:46-47). Vuruskan and Bulgun
(2011:46-47) and Pandarum and Yu (2015:192) suggest that geometrical figures and
terminologies are often used to indicate an individual‟s body shape. For example, the
triangular, inverted triangular, rectangle, oval, hourglass, bottom hourglass, top
hourglass, spoon and diamond which may also be represented by the letters (A, V,

18
H, O, X) or fruits (such as pear and apple). These figure terminologies could affect
garment fit if the consumer does not understand what they mean since they are
usually used as information communicated to represent various body shapes.
Female body shapes vary greatly when compared to men and are expressed in
various types and proportions (Bougourd, 2007:120; Rasband & Liechty, 2006:19);
which, until the 1980s, were studied and categorised using traditional anthropometry
and then, subsequently, using 3D full body scanners. According to Apeagyei
(2010:58) and Connell et al. (2006:81), the advantage of collecting data using a 3D
full body scanner is that it can detect the different body shapes from the scanned
data. However, prior to 3D full body scanners, for body shape classification, female
body shapes were identified and categorised through visual observations of the front
and side view of photographic images of the body and by drop values. Drop values
are the relationship between fundamental body parts; such as the bust, waist and
hips, which were used to differentiate body shapes (Petrova & Ashdown, 2008:230;
Bougourd, 2007:120; Chen, 2007:8). Various researchers including Rasband and
Liechty (2006) and Liddelow (2011) have used rating scales in their studies from
photographs and images.
However, Simmons et al. (2004a,b), and Connell et al. (2006) used a 3D body
scanner to classify the commonly known body shapes and defined variations in
figure types from 3D scan data. The researchers found that most of the women‟s
physical features did not conform to the description of an ideal body shape.
Simmons et al.’s (2004a) Female Figure Identification Technique (FFIT©) for Apparel
study suggest that aside from the “ideal” body shape, there are nine different body
shapes viz. the hourglass, bottom hourglass, top hourglass, rectangle, oval,
diamond, triangular, spoon and inverted triangular (see Figure 2.1). Simmons et al.
(2004b) developed the Female Figure Identification Technique (FFIT©) for Apparel
software to analyse 3D body scanned data and identified the nine different shapes
from a convenience sample of 253 women based on their body measurements,
relative body proportions and the different shapes occurring within the scanned data.
The body measurements for shape identification in Simmons et al.’s (2004b)
research were the bust, waist, hips, high hips, abdomen and stomach
circumferences to analyse ratios and differences of the body measurements.

19
Limits in the above-mentioned body circumferences were defined to categorise
different body shapes.
Figure 2.1: Female Figure Identification Technique (FFIT©) for Apparel (Simmons et
al., 2004b)
The findings from Simmons et al.‟s (2004b) FFIT© software study revealed that the
overall percentage accuracy of the FFIT© software provided better results in
classifying seven of the nine shape groups as compared to a discriminant function
that was developed from using body shapes obtained from the visual analysis of the
training data. Devarajan et al.’s (2004:1,13) study to validate the FFIT© software

20
showed that the software was designed in a manner that it looks at one person‟s
body shape at a time before moving to the next person and the percentage of
accuracy from the validation was found to be approximately 90%.
Connell et al. (2006) developed the Body Shape Assessment Scale (BSAS©)
software to evaluate physical characteristics from the front and side views of 3D
scanned bodies. The body scans were derived from a sample of 42 women between
the ages of 20 and 55. The researchers also assessed and reviewed existing body
scales, and thereafter combined the existing body scales with their results to develop
nine modified scales to evaluate the body shapes. The BSAS© comprised four
categories of viz. Body Build, Body Shape, Hip Shape and Shoulder Slope from the
frontal view and five categories viz. Torso Contour, Bust Shape, Buttocks
Prominence, Back Curve and Posture from the side view. The Body Shape category
generated four prominent frontal body shapes which included the rectangular,
hourglass, pear and inverted triangular body shapes (see Figure 2.2).
Figure 2.2: Body Shape Assessment Scale (BSAS©) (Connell et al., 2006).
21
The four body shapes were founded on the following body landmarks: shoulder to
shoulder point, the frontal waistline and the widest point between the waist and front
crotch line. For validation purposes, a panel of five experts used the BSAS© to
evaluate 100 additional body scans. The evaluations permitted the development of
BSAS© software that can take measurements of body parts in 3D; the BSAS©
software has the capability of measuring body mass index (BMI), body
measurements, and weight.
Both Simmons et al.’s (2004b) FFIT© and Connell et al.’s (2006) BSAS© studies
represent the most significant uses of the point cloud data produced by 3D body
scanning systems and using algorithms based on 3D form to identify shapes and to
evaluate anthropometric body shapes related to the garment fit studies. Similarly, to
Connell et al.‟s (2006) Body Shape Assessment Scale (BSAS©), observational
evaluations by Rasband and Liechty (2006), and Liddelow (2011), identified four
common female body shapes viz. the hourglass, the triangular, the inverted
triangular and the rectangle. The observational methods of Rasband and Liechty‟s
(2006) and Liddelow‟s (2011) studies additionally identified the oval and the diamond
body shapes as part of the common female body shapes. Liddelow‟s (2011)
classification system identified all six common female body shapes whilst other
classification systems, by the above-mentioned researchers, had either less or more
female body shapes.
Discussed below are the different types of the commonly known female body shape
profiles with the representing illustration of every shape.
2.3.1.1 The ideal body shape profile
An ideal body shape is said to be equally proportioned in body weight and
dimensions (Zwane & Magagula, 2007:283; Mastamet-Mason, 2008:58; Liechty et
al., 2010: 82) as indicated in Figure 2.3. However, Rasband and Liechty (2006:24)
further state that a shape with proportionally balanced length and width
characteristics consisting of body parts with a fairly rounded bottom and lean
thighs is considered as the ideal body shape.
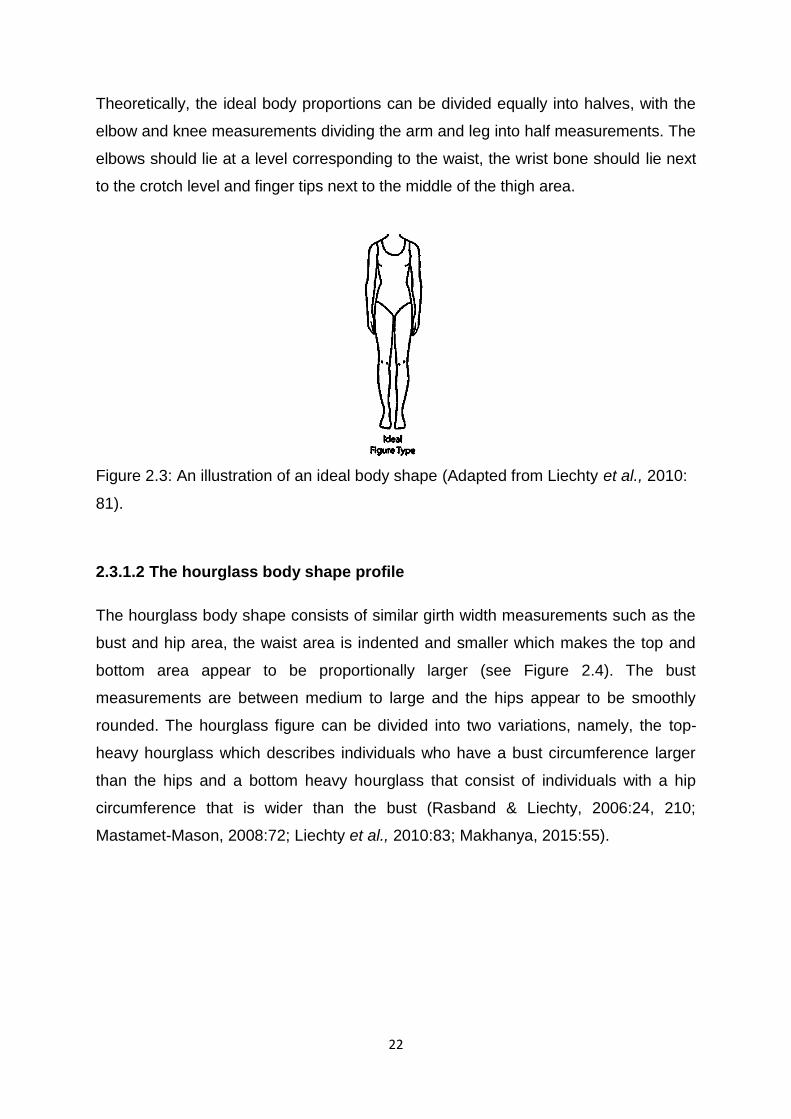
22
Theoretically, the ideal body proportions can be divided equally into halves, with the
elbow and knee measurements dividing the arm and leg into half measurements. The
elbows should lie at a level corresponding to the waist, the wrist bone should lie next
to the crotch level and finger tips next to the middle of the thigh area.
Figure 2.3: An illustration of an ideal body shape (Adapted from Liechty et al., 2010:
81).
2.3.1.2 The hourglass body shape profile
The hourglass body shape consists of similar girth width measurements such as the
bust and hip area, the waist area is indented and smaller which makes the top and
bottom area appear to be proportionally larger (see Figure 2.4). The bust
measurements are between medium to large and the hips appear to be smoothly
rounded. The hourglass figure can be divided into two variations, namely, the top-
heavy hourglass which describes individuals who have a bust circumference larger
than the hips and a bottom heavy hourglass that consist of individuals with a hip
circumference that is wider than the bust (Rasband & Liechty, 2006:24, 210;
Mastamet-Mason, 2008:72; Liechty et al., 2010:83; Makhanya, 2015:55).
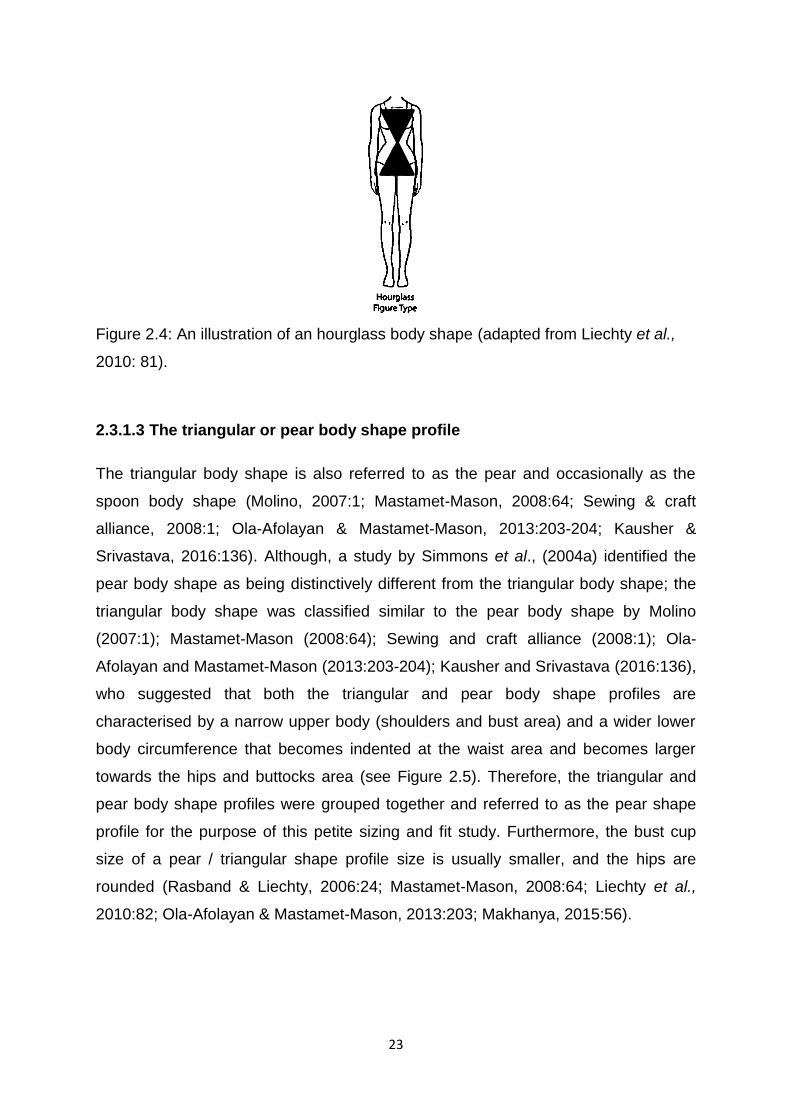
23
Figure 2.4: An illustration of an hourglass body shape (adapted from Liechty et al.,
2010: 81).
2.3.1.3 The triangular or pear body shape profile
The triangular body shape is also referred to as the pear and occasionally as the
spoon body shape (Molino, 2007:1; Mastamet-Mason, 2008:64; Sewing & craft
alliance, 2008:1; Ola-Afolayan & Mastamet-Mason, 2013:203-204; Kausher &
Srivastava, 2016:136). Although, a study by Simmons et al., (2004a) identified the
pear body shape as being distinctively different from the triangular body shape; the
triangular body shape was classified similar to the pear body shape by Molino
(2007:1); Mastamet-Mason (2008:64); Sewing and craft alliance (2008:1); Ola-
Afolayan and Mastamet-Mason (2013:203-204); Kausher and Srivastava (2016:136),
who suggested that both the triangular and pear body shape profiles are
characterised by a narrow upper body (shoulders and bust area) and a wider lower
body circumference that becomes indented at the waist area and becomes larger
towards the hips and buttocks area (see Figure 2.5). Therefore, the triangular and
pear body shape profiles were grouped together and referred to as the pear shape
profile for the purpose of this petite sizing and fit study. Furthermore, the bust cup
size of a pear / triangular shape profile size is usually smaller, and the hips are
rounded (Rasband & Liechty, 2006:24; Mastamet-Mason, 2008:64; Liechty et al.,
2010:82; Ola-Afolayan & Mastamet-Mason, 2013:203; Makhanya, 2015:56).
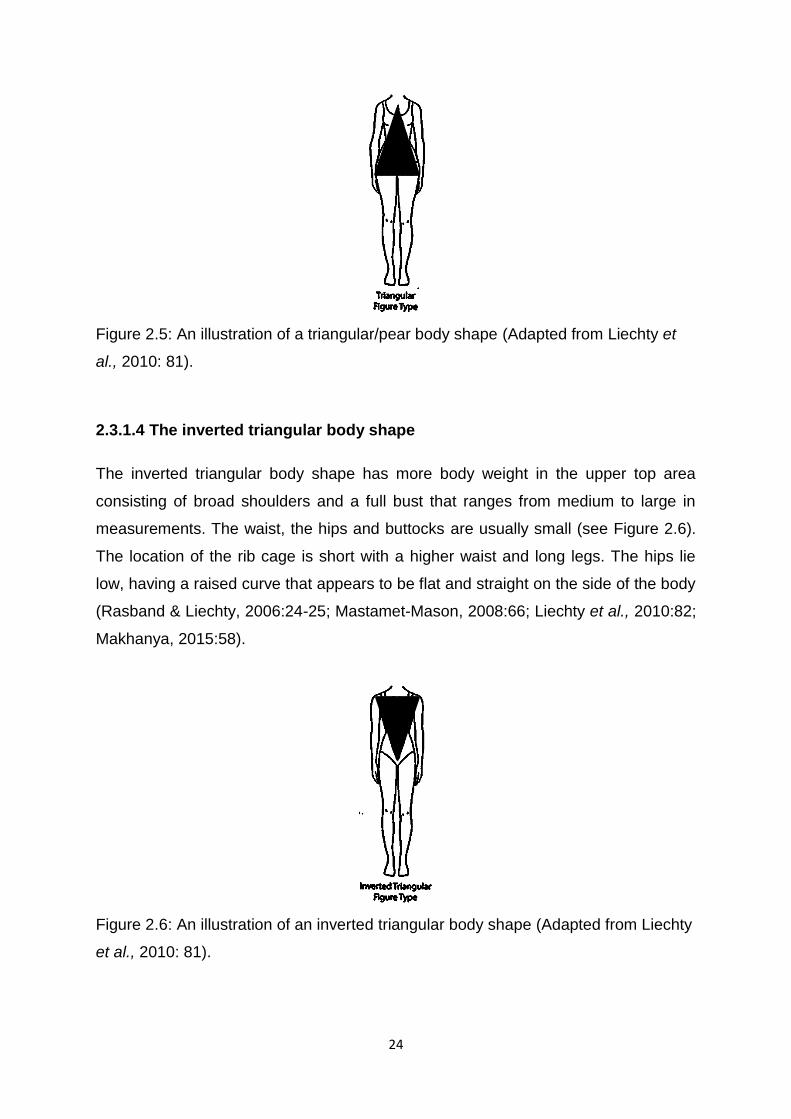
24
Figure 2.5: An illustration of a triangular/pear body shape (Adapted from Liechty et
al., 2010: 81).
2.3.1.4 The inverted triangular body shape
The inverted triangular body shape has more body weight in the upper top area
consisting of broad shoulders and a full bust that ranges from medium to large in
measurements. The waist, the hips and buttocks are usually small (see Figure 2.6).
The location of the rib cage is short with a higher waist and long legs. The hips lie
low, having a raised curve that appears to be flat and straight on the side of the body
(Rasband & Liechty, 2006:24-25; Mastamet-Mason, 2008:66; Liechty et al., 2010:82;
Makhanya, 2015:58).
Figure 2.6: An illustration of an inverted triangular body shape (Adapted from Liechty
et al., 2010: 81).

25
2.3.1.5 The rectangular or straight body shape
The rectangular body shape, also referred to as a straight body shape does not have
an indented waist but has similar width measurements at the shoulders, waist and
hips making the shape have a straight appearance (see Figure 2.7). This type of
body shape appears commonly in plus-size women with big body silhouettes and tall
women. Individuals with a slimmer rectangular body have a more visible bone
structure resulting in a tubular body shape appearance (Rasband & Liechty,
2006:25; Mastamet-Mason, 2008:70; Liechty et al., 2010:82-83; Makhanya,
2015:57).
Figure 2.7: An illustration of a rectangular/straight body shape (Adapted from Liechty
et al., 2010: 81).
2.3.1.6 The oval or rounded body shape
The oval or rounded body shape also referred to as the apple body shape consist of
a fully round body area in the bust, waist and abdomen area; hips that have a flat
buttocks and slender legs (see Figure 2.8). An individual with an oval or rounded
body shape usually has a full face, is with a shorter neck and the shoulders are not
as angular as in other body shapes (Rasband & Liechty, 2006:25-26; Liechty et al.,
2010:83-84; Makhanya, 2015:59).

26
Figure 2.8: An illustration of an oval/rounded body shape (Adapted from Liechty et
al., 2010: 81).
2.3.1.7 The diamond body shape
A diamond body shape consists of relatively narrow shoulders and hips and a wide
mid-section which is the stomach, waist and abdomen area. The hips are straight
and taper inward at the side of the thighs, the buttocks are usually flat (see Figure
2.9). An individual with a diamond shape has relatively thin legs and arms (Rasband
& Liechty, 2006:25; Liechty et al., 2010:83; Makhanya, 2015:59).
Figure 2.9: An illustration of a diamond body shape (Adapted from Liechty et al.,
2010: 81).
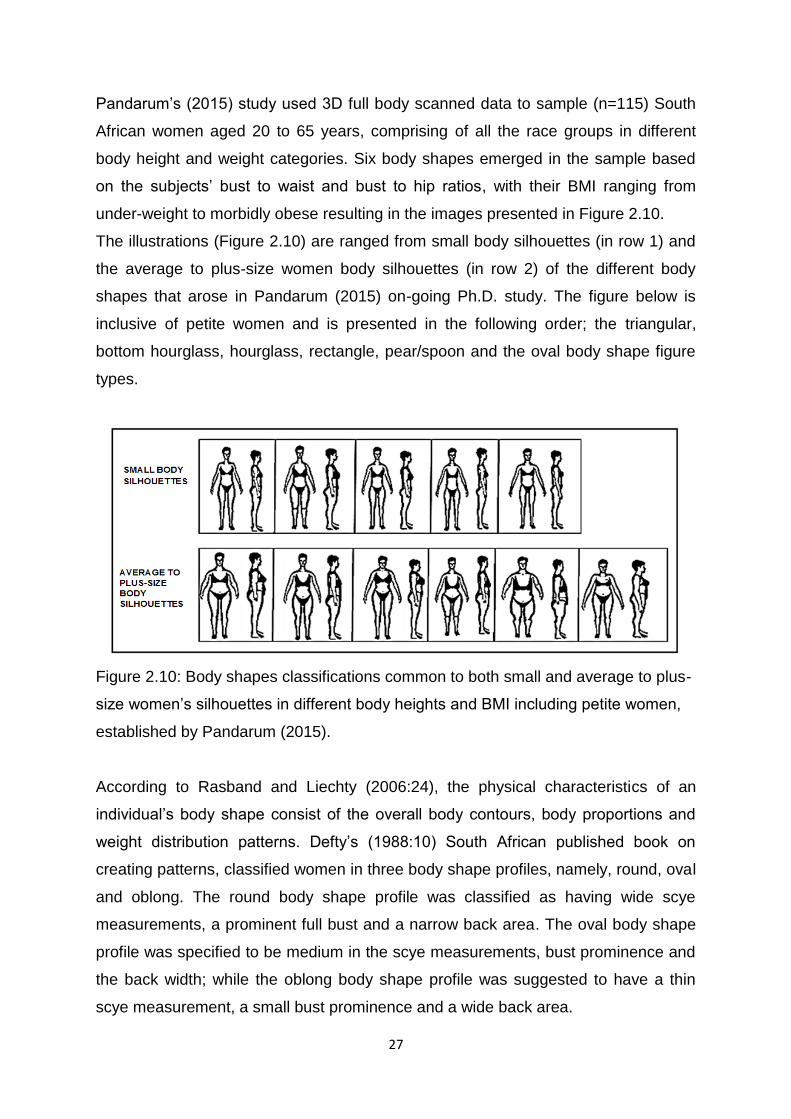
27
Pandarum‟s (2015) study used 3D full body scanned data to sample (n=115) South
African women aged 20 to 65 years, comprising of all the race groups in different
body height and weight categories. Six body shapes emerged in the sample based
on the subjects‟ bust to waist and bust to hip ratios, with their BMI ranging from
under-weight to morbidly obese resulting in the images presented in Figure 2.10.
The illustrations (Figure 2.10) are ranged from small body silhouettes (in row 1) and
the average to plus-size women body silhouettes (in row 2) of the different body
shapes that arose in Pandarum (2015) on-going Ph.D. study. The figure below is
inclusive of petite women and is presented in the following order; the triangular,
bottom hourglass, hourglass, rectangle, pear/spoon and the oval body shape figure
types.
Figure 2.10: Body shapes classifications common to both small and average to plus-
size women‟s silhouettes in different body heights and BMI including petite women,
established by Pandarum (2015).
According to Rasband and Liechty (2006:24), the physical characteristics of an
individual‟s body shape consist of the overall body contours, body proportions and
weight distribution patterns. Defty‟s (1988:10) South African published book on
creating patterns, classified women in three body shape profiles, namely, round, oval
and oblong. The round body shape profile was classified as having wide scye
measurements, a prominent full bust and a narrow back area. The oval body shape
profile was specified to be medium in the scye measurements, bust prominence and
the back width; while the oblong body shape profile was suggested to have a thin
scye measurement, a small bust prominence and a wide back area.
28
Winks‟ (1990:75) study classified three body shapes, namely, A, M and H body
shape profiles to use in his study. Winks (1990) further stated that the A body shape
profile consisted of a hip girth measurement that was at least 9cm bigger than the
bust girth measurement. The M body shape profile was suggested to have a hip girth
measurement that was 4 cm to 8 cm bigger than the bust girth measurement.
Additionally, the H body shape profile was described to have approximately equal hip
and bust girth measurements. Furthermore, Bailey‟s (2010) study did not classify
body shapes, as the study was more focused on studying the subject‟s perceptions
and reflections through garments created for petite women as a form of
communication between the garment manufacturers and the individual.
Makhanya‟s (2015) study on body shapes of 234 African and Caucasian women
focused on the body shapes found on a University campus of women aged 18 to 25
years. Makhanya‟s (2015) study identified the women as having triangular, hourglass
and rectangle body shapes. This South African study, conducted in 2015 highlighted
differences in the women‟s body shapes using drop values of the African and
Caucasian body dimension. This finding is similar to Lee et al.’s (2007:375) study on
the American and Korean body shape which indicated that ethnicity influences the
physical characteristics of an individual‟s body shape and is one of the many
contributing factors on how the garment fits the body. Makhanya‟s (2015) study is
also said to support Liechty et al.’s (2010:44) “Fitting and pattern alterations”
American publication that stated that populations with African descendants‟ body
shapes generally consist of a “raised curve on their buttocks”. However, Makhanya‟s
(2015) study only sampled 109 of the black South African women aged 18-25 and
hence, this finding cannot be generalised to all South African women of black African
descent and can only be verified with a larger sample size and in future, another
study of black South African women.
Most recently, other South African academic studies by Muthambi (2012), Ola-
Afolayan and Mastamet-Mason (2013), and Makhanya et al. (2014) have identified
the triangular /pear body shape as the most prominent South African body shape
arising from their dataset for 60, 50 and 234 women respectively. These authors
describe the triangular /pear body shape as having a wider hip area than the bust
and shoulder area with a scooped waist and full rounded breasts; nevertheless, this
29
body shape differs from the western triangular /pear body shape (Ola-Afolayan,
2012; Ola-Afolayan & Mastamet-Mason, 2013:204).
According to Ola-Afolayan and Mastamet-Mason (2013:203), the South African
women‟s triangular/pear body shape hip area is 30 cm larger than the bust area,
whereas the western triangular/pear body shape consists of a hip area that is 8
cm larger than the bust (Simmons et al., 2004b). Additionally, Makhanya‟s (2015)
study established that the South African triangular shaped women had wider hips,
with shorter overall body-to-waist and shorter overall body-to-hip height ratios than
the Caucasian triangular shaped women did. However, these studies were reported
on the average and plus-sized women body shapes and dimensions, and not on the
petite women.
2.3.2 Petite women‟s body measurements
In South Africa the earliest recorded and published study on petite sizing systems,
was by Defty (1988) who published a size chart for short (petite) women for the
purpose of making patterns; followed by Winks (1990:74-76) who conducted a study
on 25 female body dimensions from a sample size of 343 subjects in six South
African prisons. Winks‟ (1990:74-76) data was rearranged into three height groups.
The height groups were established as short, ranging from 156-163 cm with a 160
cm mean, regular, ranging from 164-171 cm with a 168 cm mean and long, ranging
from 172-179 cm with a 176 cm mean. The data grouping from Winks‟ study
considered the differences between the hip and bust girth measurements of three
race groups, namely, the Whites, Blacks and Coloureds. However, Winks‟ (1990)
study was not entirely focused on petite women. The size chart developed from the
study was classified as generic data according to the subject‟s body shape. Defty‟s
(1988:17-18) size chart, was classified in different sizes, some which differed from
the currently industry used size ranges, ranging from a size 9, 11, 13, 14, 16, 18, 20,
22, and 24; focusing on body dimensions such as the bust, waist, hips, hip depth,
across back, back length to waist, forearm length, upper arm length and the skirt
length mid-calf. Bailey (2010:23) developed a size chart from her study. Her size
chart was derived by grouping the data into three petite size ranges of 2, 4, and 6,

30
based on three body measurements; viz. the bust, waist and hip girth
measurements.
A personal conversation with Millam (2016) from the South African mannequin
manufacturing company disclosed that in 2003, a measurement specification sheet
for petite women was based on a total body height measurement of 160 cm.
However, the data was not made available for public use as it was used to
manufacture a mannequin for a private chain store company. To date this is the only
known mannequin developed for petite women in the country.
The lack of information on the collection of women‟s anthropometric data in general
is acknowledged, more especially for petite women in South Africa. However, there
have been numerous international studies conducted for developing petite women
sizing systems such as that in the USA by Kim et al. (2016), who compared body
measurements used in petite sizing systems and regular sizing systems of 14
apparel companies in the USA for women aged 18-35, together with sizing
measurements from the ASTM D7878 and ASTM D5585, with the purpose of
investigating how apparel companies define petite women‟s body dimensions and
the procedures used to scale down petite women‟s measurements using average
garment sizes. Kim et al.‟s (2016) study consisted of a sample size of 2,714 Size
USA female dataset from research conducted in 2004 by the Textile Clothing
Technology Incorporated to divide the size categories of petite and average women.
The study selected 1,618 petite women and 1,096 average women from the sample
and used those numbers as a basis for comparing the two female groups. Kim et
al.‟s (2016:58-59) study characterised four groups of petite women‟s body shapes,
namely, the top petite for women with the shortest torso and relatively average limbs,
the bottom petite for women with the shortest limbs and an average torso length, the
regular petite for women with a relatively longer torso and long limbs, and the plus-
size petite for women with a larger overall body size. The findings from Kim et al.‟s
(2016) study revealed significant differences in girth and width measurements
between the two groups and a degree of reduction in measurements for petite
women. However, the body shape definitions characterised in Kim et al.’s (2016)
study differ from the industries‟ body shape definitions.
31
2.4 GARMENT FIT
2.4.1 Defining garment fit
The definitions of garment fit vary. Generally fit is an essential component that
contributes to consumer satisfaction in garments (Song & Ashdown, 2012:315). A
better fitting garment is supposed to enhance the wearer‟s body and make it more
flattering (Rasband & Liechty, 2006:3).
The challenge for garment manufacturers in producing better fitting garments, is that
garment manufacturers, patternmakers and consumers themselves all have different
definitions, perceptions and evaluations with regard to the quality of the fit of a
garment on the body (Doshi, 2006:1; Ashdown & O‟Connell, 2006:137; Pisut &
Connell, 2007:367). Doshi (2006:1) further states that garment manufacturers are
mostly interested in creating aesthetic appealing designs that will provide the wearer
with a clean look. Physical and psychological factors also have an influence on how
garment manufacturers and consumers define fit. Pisut and Connell (2007:368)
identified comfort, appearance, fashion trends, body shape, age, lifestyle, cultural
standards, and personal choices as factors that have contributed to the fit of
garments.
Pisut and Connell (2007:370), and Liechty et al. (2010:48), mention that garments
should fit the body smoothly with comfort and without any restrictions in movement
and wearability, but it is difficult to achieve that effect on all individuals because body
structures differ, and this affects the positioning of the structural lines and how the
garment balances on the body. Stamper et al. (2005:297), Chen (2007:123), Keiser
and Garner (2008:368-370), and Petrova and Ashdown (2008:40) further suggest
that the fabric grain, garment ease, line, set and balance are the five principles that
individuals use as elements to evaluate the way their bodies fit into a garment, that
ultimately contribute to the quality of a well-fitting garment on a consumer‟s body
silhouette.
The above-mentioned five elements associated with garment fit is discussed below
to provide the background to the fitting test criteria used to evaluate the fit of the
32
prototype shirt and trouser prototype garments, developed in this study, as reported
in Chapter 6.
2.4.1.1 Fabric grain
All fabrics should be cut relative to the fabric grain to ensure that the fabric of the
garment drapes correctly and conforms to the wearer‟s body contour as required by
the garment design style. The fabric grain is listed by Stamper et al. (2005:297) as
the first and key component used to distinguish and understand garment fit and is
classified by three fabric grains; namely, the lengthwise, the crosswise and bias
grains (Rasband & Liechty, 2006:54; Liechty et al., 2010:17-18). Branson and Nam
(2007:265) suggest that lengthwise and crosswise grains lie at a 90° angle to
each other, which allows the garment to hang evenly on both sides of the body
with even seams. Rasband and Liechty (2006:54), Branson and Nam (2007:265),
Keiser and Garner (2008:368), and Liechty et al. (2010:17-18) further explain
lengthwise grains of the fabric as warp threads with little stretch in the fabric that
lie parallel to the finished edge of the fabric and they are perpendicular to the floor.
The crosswise grains of the fabric are weft threads that lie between, or at right
angles to the selvages of the fabric. Crosswise grain fabrics have some stretch in
them and lie parallel to the floor, across the chest and hip when worn. Bias grain
cut fabrics stretch easily, they lie diagonally across the lengthwise and crosswise
threads. Bias fabrics form a true bias grain at a 45° angle when folded, allowing
the lengthwise grains to lie exactly on top of the crosswise grains.
A garment that is cut on the correct grain will appear balanced, smart and
presentable when worn, opposing to a garment which is cut with a fabric grain that
is out of line which may result in ripples at the hemline, and pulling or gaping at
the seams, especially after it has been washed (Liechty et al., 2010:17,40).
33
2.4.1.2 Garment ease
Garment ease is usually decided by the garment designer. According to Stamper et
al. (2005:298), Chen (2007:132), Petrova (2007:61), Keiser and Garner (2008:369-
370), and Liechty et al. (2010:18), ease refers to the extra measurements that should
be incorporated into a pattern beyond those defined by the specific body
measurements. This means that there should be a slight difference in measurements
used to size a garment and the intended individual‟s body measurements that will fit
into the garment, to allow the individual to be able to move comfortably in the
garment. The amount of ease added depends on comfort, movement and the
appearance required of the garment which is defined in terms of the tightness and
looseness of the required fit. The ease is also highly dependent on fabric properties.
Shirts should be designed to fit and hang smoothly on the upper body from the
shoulders and trousers should be designed to fit and hang smoothly on the lower
body from the waist or the hip area (Liechty et al., 2010:52).
According to Keiser and Garner (2003:316), the ease allowance for shirts is
generally determined by the bust measurement, whilst the ease allowance of
trousers is usually determined by the hip measurement. Rasband and Liechty
(2006:36) further suggest critical aspects such as the style of the garment, the fabric
used, the body shape and proportions of the targeted individuals who will fit into the
garment, the occasion where the garment will be worn, and personal preferences
and needs. Furthermore, the wearing/functional ease and design ease are factors
that garment designers must consider when designing ease for garments. These are
discussed below.
a. Wearing/ functional ease
Wearing ease is described by Chen (2007:123), Keiser and Garner (2008:370), and
Liechty et al. (2010:18-19) as an amount of extra fabric added into a garment to
allow movement and comfort such as breathability and flexibility for walking and
sitting in the garment. A garment constructed without ease is likely to be
uncomfortable to wear, as the garment strains and wrinkles. This may possibly
highlight unattractive parts of the wearer‟s body silhouette (Branson & Nam,

34
2007:266). Therefore, appropriate body proportions should be considered when
garment designers determine the amount of ease to add to a garment.
b.Design ease
According to Stamper et al. (2005:298), Chen (2007:132), Branson and Nam
(2007:266), Keiser and Garner (2008:370), and Liechty et al. (2010:19) design ease
refers to the amount of fabric used to determine a desired look for a garment; for
example: whether the garment will be tight fitting, semi-fitting or loose fitting. Design
ease is also used to improve easy movement in a garment and is also greatly
influenced by fashion trends (Stamper et al., 2005:298; Keiser & Garner, 2008:370).
2.4.1.3 Garment line
According to Stamper et al. (2005:298-299), Keiser and Garner (2008:369), and
Liechty et al. (2010:17) garment line refers to structural lines that follow the body‟s
natural silhouette, providing a proper fit appearance. This is achieved by garment
features such as decorative seams, darts, hems and fabric folds made by pleats and
tucks. Stamper et al. (2005:299) and Liechty et al. (2010:17-18) suggest that seams
should be vertical to the floor at the centre back front, back and side and
furthermore, correspond with the outer curves of the body they are designed to
accommodate. These garment lines, including decorative lines and folds on the
garment should appear smooth and balanced against the wearer‟s body, creating an
appealing visual impression and at the same time accentuating the wearer‟s body
silhouette (Stamper et al., 2005:299; Keiser & Garner, 2008:369).
2.4.1.4 Garment set
Garment wrinkles are a good indication for analysing a good garment fit. A garment
that is set reflects a garment that does not form undesirable wrinkles on the wearer‟s
body; consumers should not confuse wrinkles caused by pulling and snagging with
wrinkles that are created as part of the design aesthetic of the garment (Stamper et
al., 2005:299). Keiser and Garner (2008:369) mention that a garment that forms
wrinkles, sagging or pulls from the body is an indication that the garment may be

35
either too small or too large. Horizontal wrinkles indicate that the garment is too tight
above or below the curve of the body. Vertical wrinkles indicate a garment is too
large; these wrinkles are commonly visible in jackets and dresses. Diagonal wrinkles
indicate that the garment is too small, short or narrow for the outer curves of the
wearer‟s body.
Tight wrinkles occur on garments with little wearing ease, which adds strain to the
fabric of the garment (Stamper et al., 2005:299). Rasband and Liechty (2006:63)
further suggest that generally, wrinkles are expected when walking, bending and
reaching but the garment should hang smoothly when the wearer is standing still.
2.4.1.5 Garment balance
Stamper et al. (2005:300), Keiser and Garner (2008:369), and Liechty et al.
(2010:36) suggest that the balance of most garments, including shirts and trousers is
achieved through having a garment that evenly hangs on the wearer‟s body in every
direction; this usually affects the fit of the garment. The authors further define a well-
balanced garment as a garment that consists of even design details and a hemline
that provides a balanced garment drape on both sides of the body and at the bottom
of the garment. A poorly balanced garment will affect the fit of the garment, as the
garment will shift or sag (Rasband & Liechty, 2006:13), which occurs mostly in
garments that are uneven on the hemline. According to Stamper et al. (2005:300),
poor body posture and body imperfections on the outer body curves may affect the
balance of garments on the wearer‟s body that may contribute to mass-produced
garment fit problems.
Challenges in constructing patterns may also affect the balance of garments on the
wearer‟s body if the drafted pattern proportions do not correspond with the body
measurements of the consumer the pattern is intended to fit (Keiser & Garner,
2008:369).
36
2.4.2 Garment Standards used in the evaluation of garment fit
In addition to the five elements of garment fit, mentioned above, there are standard
guidelines which are basic rules introduced to describe and evaluate how a garment
should fit the body. Socio-cultural factors such as ethnicity, age, gender, religion,
occupation, fashion trends and economic influences affect how consumers evaluate
fit (Liechty et al., 2010:44-47).
Therefore, it is important that every country has its own population‟s sizing data to
provide accurate body measurements for garment manufacturing to ensure better
fitting garments and to increase consumers purchasing performances (Strydom & De
Klerk, 2006:80; Vithanage et al., 2012:30,59; Ka Wai YIP, 2013:10; Zakaria,
2014:95).
Apparel fit standards are used to describe the quality of fit, on specific areas of a
garment, on the body of the wearer that evaluates garment positioning and
movement when the wearer is sitting, standing, walking or bending. Apparel
standards are evaluated for accuracy or errors by following accepted fit guidelines
and certain characteristics such as the wearer‟s body structural lines, body sections
and segments, as well as lines present in garment which consist of interior
seamlines, dart-lines, closures, pleats, tucks, pockets, bands, trims and decorations
(Liechty et al., 2010:46-47,59). According to Rasband and Liechty (2006:3),
garments with poor fitting standards are distracting and may lead to unwanted
attention to the wearer‟s appearance, therefore evaluating apparel fit standards is
important, because a garment created to fit well on an individual‟s body contributes
to the confidence and comfort of the wearer (Alexander et al., 2005:52).
The fit/drape of the garment on the wearer‟s body also influences the quality of the fit
and the overall appearance of a garment (Liechty et al., 2010:160). Every stage of
the production process has an influence on the quality of fit in garments (Bougourd,
2007:130). Nonetheless, standard sizing systems are usually voluntary, which
means that the majority of the clothing manufacturers do not follow them, as a result,
garment sizing standards vary per manufacturer (Winks, 1997:1; Alexander et al.,
2005:56). Voluntary garment sizing standards were initially developed by the
National Bureau of Standards in 1941 in the United States of America and were

37
revised in 1971. However, since the introduction of voluntary garment sizing
standards, the garment sizing system has been a disappointment, as not all
manufacturers and retailers are obliged to abide by these standards guidelines when
manufacturing garments (Barona-McRoberts,2005:21; Pandarum and Yu, 2015:199-
200). Consequently, this contributes to the potential for poor fitting garments
(Alexander et al., 2005:56; Pisut & Connell, 2007:368).
2.5 THE RELATIONSHIP BETWEEN BODY DIMENSIONS, BODY SHAPE AND
GARMENT FIT
Body dimensions are used as the foundation for establishing effective sizing systems
and manufacturing quality fitting garments (Strydom, 2006:60; Rasband & Liechty,
2006:4; Loker, 2007:256; Muthambi et al., 2015:63). According to Loker (2007:256),
to ensure a well-fitting garment, irrespective of how consumers perceive garment fit,
starts with collecting accurate body measurement data for use when constructing
garment pattern blocks.
An individual‟s body proportions influence how a garment balances and, the
positioning of structural lines on the body (Pisut & Connell, 2007:370; Liechty et al.,
2010: 48). The importance of creating garment patterns with the accurate body
dimension statistics is highly emphasised in the apparel industry (Loker, 2007:256).
According to Strydom and De Klerk (2010:75-76), body measurements are the
primary factors that contribute to garment fit and enhance the fit of ready-to-wear
clothing. Body measurements also form part of an essential requirement for sizing
systems, pattern and garment development.
Numerous international and national researchers, Alexander et al. (2005), Barona-
McRoberts (2005), Zwane and Magagula (2007), Mastamet-Mason (2008),
Nkambule (2010), Pandarum et al. (2011), and Muthambi (2012) conducted studies
on the relationship between female body shapes and garment fit.
38
In Africa, Zwane and Magagula (2007:286) studied Swazi women who purchased
ready-to-wear garments from size 34 to size 40 and Nkambule (2010:81), who
studied plus-size Swazi women concluded that most of the participants, in their
respective studies, were bottom-heavy or triangular body shaped. The respondents
also experienced garment fit problems on the lower parts of their bodies where the
garment at the waist was too loose and too tight at the hip, the buttocks and thigh
areas. The participants further expressed that the length of their garments was also
a problem, as 55% of the respondents from Nkambule‟s (2010) study indicated that
the trousers length was too long. These studies were; however, conducted for the
average and plus-sized women. Mastamet-Mason‟s (2008:64) study on Kenyan
women revealed similar findings to those of Zwane and Magagula‟s (2007) and
Nkambule‟s (2010) studies on Swazi women. Mastamet-Mason‟s (2008) Kenyan
study also observed a loose fit around the upper bodies of triangular shaped women.
Similarly, Muthambi‟s (2012:105) study on South African women of African descent,
with triangular body shapes, when comparing the manual measurements in dress
garments size 30 to 38, found that the garment fitted loosely on their upper bodies.
Pandarum et al.’s (2011) South African study focused on bra fit for plus-sized women
and this study found that 85% of the women were wearing the incorrectly sized bra,
and that the plus-sized women bra size ranges available in retail stores at the time,
did not accommodate all the women sampled in the study. The result was that, as
this study was conducted in conjunction with a bra manufacturer, the bra size ranges
for plus-sized women were extended to include other larger bra sizes after the study
was completed and consideration was given to the bra designs, styles and the
trimmings on these larger sized garments. However, all these studies‟ findings were
for the average and plus-sized women‟s garments and not for petite women.
A study by Alexander et al. (2005:57, 59) on 223 participants, aged between 18 and
29, enrolled in classes in a South Eastern University in the USA used four different
body shapes; the pear, rectangle, hourglass and the inverted triangular to study the
relationship between garment fit and the body shape. The study found that the
participants who identified their bodies as hourglass, rectangle and pear body
shapes were more prone to experience fit problems around their bust areas and did
not prefer wearing fitted tops. The pear and hourglass shaped participants reported
39
fit problems around their waist, hip and thigh areas and preferred more fitted trousers
and jackets that were not body hugging.
In the United States, Song et al.’s (2013) study further assessed the reliability of the
self-perceived lower body sizes and shapes of 83 college female students from a
university in the North-East region of the United States (U.S); ranging from garment
sizes 2 to 20 using the ASTM D5585-95 U.S standard for adult female Misses figure
type sizes. The researcher used 3D body scanning technology to capture the
female‟s body measurements and thereafter compared the captured data to the
female‟s self-reported information on their lower-body sizes and shapes, together
with assessing their relationship between body satisfaction and fit satisfaction. The
body sizes in Song et al.’s (2013:149) study were determined by dividing each
population variable into three categories based on percentile data, and using a body
shape and size categorisation method developed from Size USA 3D body scan data.
Three options were available for each listed body area (see Figure 2.11).

40
Figure 2.11: Observations of different female lower-body sizes and shapes
established by Song et al. (2013:149).
The results from Song et al.’s (2013:153-154) study indicated that approximately
50% of the respondents preferred a smaller waist, flat abdomen, medium-sized hips,
and thinner thighs, whilst they perceived their waist to be larger, bigger abdomen,
larger hips and thicker thighs. Although their perception of the above-mentioned
body areas had no relationship to how satisfied they were with their body and
garment fit, the hip area presented a weak association between body satisfaction
and fit satisfaction. The thigh area presented the second highest relationship
between body satisfaction and fit satisfaction for all the perceived body groups. The
findings further indicate that respondents that perceived their leg length to be short
whilst they would prefer their leg length to be longer, had a lower body and fit
satisfaction as compared to those who perceived their leg length to be long.
Additionally, the respondents preferred to have prominent buttocks.
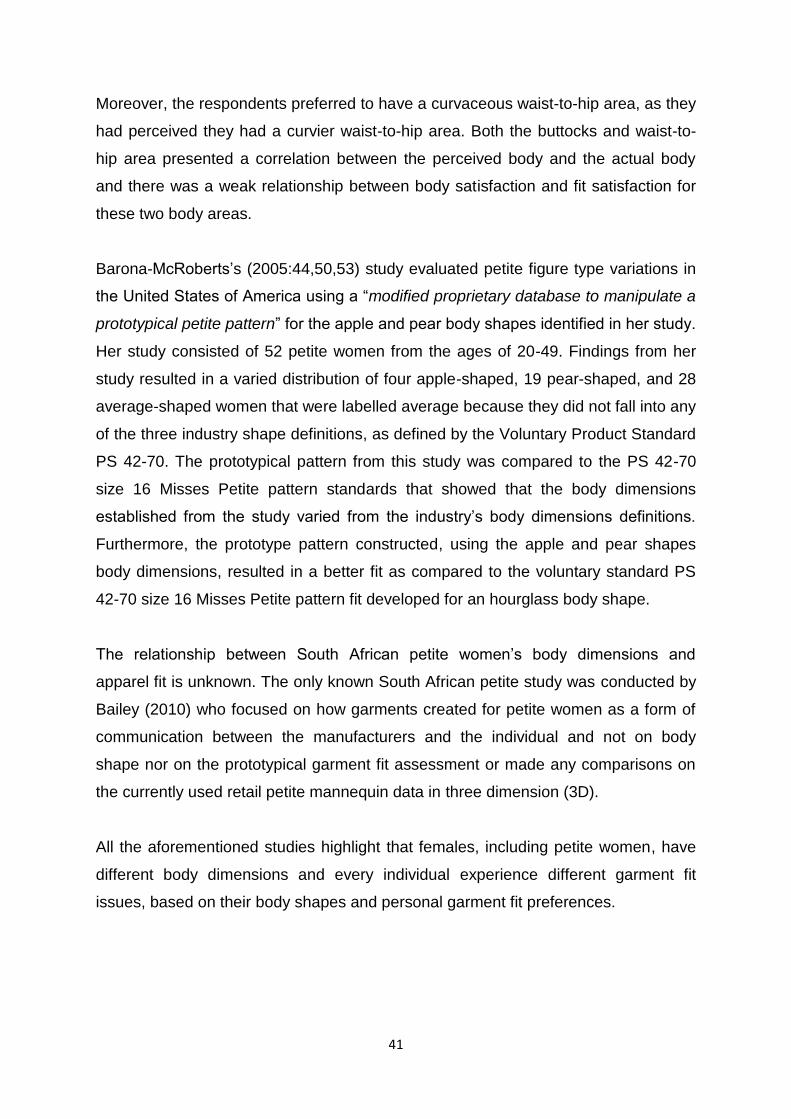
41
Moreover, the respondents preferred to have a curvaceous waist-to-hip area, as they
had perceived they had a curvier waist-to-hip area. Both the buttocks and waist-to-
hip area presented a correlation between the perceived body and the actual body
and there was a weak relationship between body satisfaction and fit satisfaction for
these two body areas.
Barona-McRoberts‟s (2005:44,50,53) study evaluated petite figure type variations in
the United States of America using a “modified proprietary database to manipulate a
prototypical petite pattern” for the apple and pear body shapes identified in her study.
Her study consisted of 52 petite women from the ages of 20-49. Findings from her
study resulted in a varied distribution of four apple-shaped, 19 pear-shaped, and 28
average-shaped women that were labelled average because they did not fall into any
of the three industry shape definitions, as defined by the Voluntary Product Standard
PS 42-70. The prototypical pattern from this study was compared to the PS 42-70
size 16 Misses Petite pattern standards that showed that the body dimensions
established from the study varied from the industry‟s body dimensions definitions.
Furthermore, the prototype pattern constructed, using the apple and pear shapes
body dimensions, resulted in a better fit as compared to the voluntary standard PS
42-70 size 16 Misses Petite pattern fit developed for an hourglass body shape.
The relationship between South African petite women‟s body dimensions and
apparel fit is unknown. The only known South African petite study was conducted by
Bailey (2010) who focused on how garments created for petite women as a form of
communication between the manufacturers and the individual and not on body
shape nor on the prototypical garment fit assessment or made any comparisons on
the currently used retail petite mannequin data in three dimension (3D).
All the aforementioned studies highlight that females, including petite women, have
different body dimensions and every individual experience different garment fit
issues, based on their body shapes and personal garment fit preferences.

42
2.6 CONSUMER‟S PERCEPTIONS ON GARMENT FIT AND THEIR BODY
SHAPES
The issue of garment fit is dependent on the consumer‟s individual preferences,
indicating that “a good fit” has multiple meanings (Alexander et al., 2005:61;
Kasambala et al., 2014:102; Pisut & Connell, 2007:369). Consumers perceive
garment fit as an important attribute to consider purchasing garments (Ashdown &
O'Connell, 2006:137). Consumers‟ attitudes and expectations towards their garment
sizes have an influence on their garment purchasing choices; a garment that fits well
is said to look better on the wearer‟s body and therefore, making the wearer to be
more confident and satisfied with the garment (Coury, 2015:8-9). Mass produced,
ready-to-wear garments are suggested to provide consumers with a “standardized”
sizing system to assist them in deciding which garments should fit them based on
their body sizes; however, the standardized sizing is not consistent across various
garment manufacturers and retailers (Alexander et al., 2005:56; Pisut & Connell,
2007:368). As a result, dissatisfaction with garment fit is frequently reported as a
major problem among female consumers who struggle with finding garments that fit
well without having to alter them (Alexander et al., 2005;55). Kasambala‟s (2013)
study on “ the exploration of female consumers’ perceptions of garment fit and the
effect of personal values on emotions” conducted on 62 female consumers from
Gauteng, Johannesburg showed that the majority of the participants in her study
were not able to accomplish their personal values through garment fit due to
“inconsistent, unreliable and inaccurate”, garment sizing which was observed to not
be suitable for the various body shapes present in South Africa , along with the
inaccessibility of certain ready-to-wear garment sizes currently sold in retail stores.
Garment manufacturers and retailers were recommended to take into consideration
characteristics such as the relations between consumer‟s body shape variations, fit
preferences and garment sizing when manufacturing ready-to-wear garments for
their target market (Kasambala et al., 2015:16). Coury (2015:1) further state that
garment manufacturers and retailers need a better understanding on their target
markets perceptions on garment fit and their body measurements in order to guide
them in purchasing garments that fit well.

43
According to Alexander et al. (2005:52) garments are used as a form of non-verbal
statement to either intentionally or unintentionally convey a message or project an
image to others. Consumers often buy garments as a form of self-expression or to
classify themselves with a certain social group. Alexander et al. (2005;53,59-60)
suggest that consumers garment fit satisfaction might have a relation to their body
satisfaction; indicating that the more satisfied the consumers are with their body
shapes, the more they will be satisfied with the fit of their garments. Consumers who
are likely to be more satisfied with their body shapes are inclined to prefer wearing a
more fitted garment. The most common fit preference for garments is the semi-fitted
garment which describes a garment that fits close to the wearer‟s body with added
ease and comfort, followed by a loosely fitted garment preference. (Alexander et al.,
2005:61; Kasambala et al., 2014:102; Pisut & Connell, 2007:369). Consumer‟s
feelings about their bodies have a substantial influence on their garment fit
preferences, including style/design preferences because the way a specific garment
sits on the wearers body have a potential of enhancing consumers perceptions and
feelings on their body shapes (Pisut & Connell, 2007:369; Coury, 2015:5). Kinley‟s
(2010) study on “the effect of clothing size on self‐esteem and body image” has
presented that there is a positive relationship between body image and self-esteem.
Kinley (2010:397) and Kasambala et al. (2014:95) state that body size is a
predictable influential factor in satisfaction with body image, which affects the
individual‟s self-esteem. Findings from Kinley (2010:407) further suggested that
women with small body shapes were more satisfied with their body shapes and had
an increased self-esteem when they fit into their expected garment size.
2.7 HOW THE INDUSTRY BASE-SIZE GARMENTS ARE TESTED FOR FIT
The apparel industry also uses fit models or tailoring mannequins to establish the fit
and drape of a given garment style on the body based on an industry established
base-size as determined by their target markets. The following is a discussion on the
different types of fit models used in the apparel industry to establish the foundation to
the live fit models used in the fit test evaluations, in this study.

44
2.7.1 Using fit models to test garment fit
Tama and Öndoğan‟s (2014:108) study state that fit sessions are the fundamental
foundation of evaluating the fit of a garment throughout the garment manufacturing
process and at each stage of the garment production and the development process
that influences the degree to which garment fit is achieved. Fit models may differ in
measurements and proportions, according to the retailer or manufacturer‟s target
market (Alexander et al., 2005:56). Bougourd (2007:130) states that there are three
forms used as fit models that represent the target consumer, namely: the dress form,
the human (live) fit model and the virtual fit model.
Consequently, garment fit sessions are conducted to evaluate the performance
parameters of the garment appearances such as the garment ease, set, line,
balance, together with the drape and the stretch properties of the fabric (Keiser &
Garner, 2003:318; Bougourd, 2007:134; Kadolph, 2008:91), to reduce errors in the
manufactured garment(s) (Liechty et al., 2010:3) for the retailer target market.
2.7.1.1 The dress form
A dress form is used by garment manufacturers to evaluate garment designs,
garment proportions and dimensional fit (Bougourd, 2007:130-131), mainly because
it is convenient to use as compared to a live human fit model and have consistent
measurements (Song et al., 2010:264). A dress form is a garment fitting
model/mannequin stand created as either a whole body, a half body, a torso or just
the lower half of the body in different dimensions as a representation of a human
body in a specific garment size (see Figure 2.12). However, Song et al. (2010)
further argument that a dress form does not accurately represent the shape of a
realistic human‟s physique. According to Joseph-Armstrong (2014:35), dress forms
are sometimes created using imperfect measurements that may not always be
similar on each side; consequently, using a dress form to evaluate the fit of garments
may result in problems of maintaining accuracy and consistency of the fit of
garments on a realistic human body shape (Song et al., 2010:264).
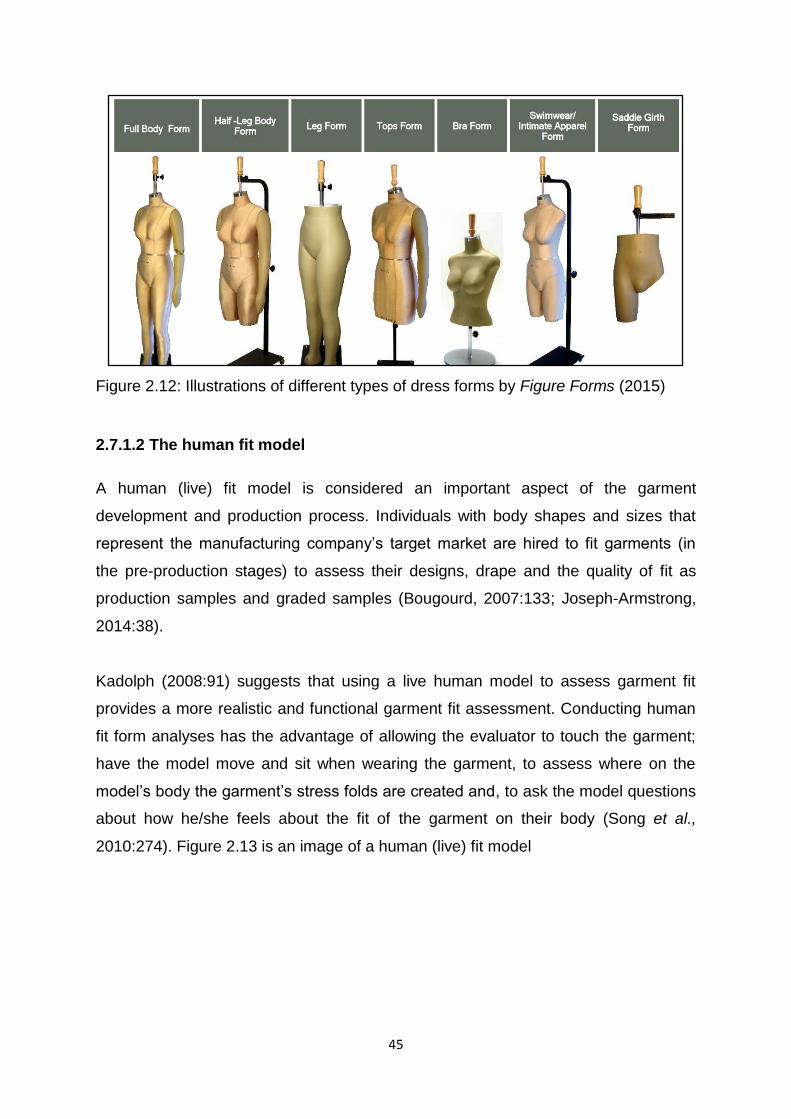
45
Figure 2.12: Illustrations of different types of dress forms by Figure Forms (2015)
2.7.1.2 The human fit model
A human (live) fit model is considered an important aspect of the garment
development and production process. Individuals with body shapes and sizes that
represent the manufacturing company‟s target market are hired to fit garments (in
the pre-production stages) to assess their designs, drape and the quality of fit as
production samples and graded samples (Bougourd, 2007:133; Joseph-Armstrong,
2014:38).
Kadolph (2008:91) suggests that using a live human model to assess garment fit
provides a more realistic and functional garment fit assessment. Conducting human
fit form analyses has the advantage of allowing the evaluator to touch the garment;
have the model move and sit when wearing the garment, to assess where on the
model‟s body the garment‟s stress folds are created and, to ask the model questions
about how he/she feels about the fit of the garment on their body (Song et al.,
2010:274). Figure 2.13 is an image of a human (live) fit model

46
Figure 2.13: An image of a human (live) fit model with garment fit evaluators
(Adapted from H&M, 2015).
2.7.1.3 The virtual fit model
According to Sohn and Sun (2013:74); Sayem and Bednall (2017:1) virtual fit models
are used as a marketing tool for presenting online shopping products and for
increasing efficiency in the garment product development process by providing
instant visual presentations of the garment. A virtual fit model minimises the amount
time and costs used for fit evaluation sessions tested on live human fit models or
dress forms and also decrease the need to make garment samples for garment
fitting (Apeagyei, 2010:65; Power et al., 2011:213). 3D full body scan data can be
exported for garment pattern modification and draping simulation, where 2D patterns
of the prototype garments are morphed onto a virtual fit model to create a 3D
appearance of the established garment (Kim & LaBat, 2013:171; Apeagyei & Otieno,
2007:354). An illustration of a virtual fit testing and pattern manipulation simulation
on a virtual fit model is presented in figure 2.14.

47
Figure 2.14: An illustration of a virtual fit testing and pattern manipulation simulation
on a virtual fit model in OptiTex® (Sohn & Sun, 2013:69)
A Computer Aided Design (CAD) system overlays and transforms the appearance of
the pattern onto the virtual model shape, thereafter, garment fit and pattern errors
such as design elements, material selection and assembly technique are checked in
order to refine the initial 2D pattern pieces (Sayem and Bednall, 2017:1). Garment
manufacturers can easily experiment with a variety of fabrics and patterns on a 3D
virtual model prior to manufacturing the actual, final garment (Apeagyei & Otieno,
2007:350). 3D full body scans can be utilised for reproducing a 3D virtual fit model to
evaluate acceptable garment fit for the targeted consumer (Sohn & Sun, 2013:67;
Apeagyei & Otieno, 2007:351). Figure 2.15 shows an image of a 3D body scan
transformed into a virtual fit model for garment fit test evaluations.
48
Figure 2.15: 3D body scan transformed into a virtual fit model for fit test evaluations
(Apeagyei, 2010:63)
According to Sohn and Sun (2013:67-68) currently, there are discussions on the
consistency and validity of virtual fit analysis for fit testing using 3D simulation
technology as the application of both 2D and 3D garment images on virtual models
entails accurate knowledge. The process requires sensitive detection of 3D full body
scan data and garment fabric drape to successfully test the fit of the garment on a
virtual model. However, visual presentation and analysis of the garment‟s fabric
drape simulation, including the garment grain, set, line, balance, and ease using
virtual 3D technology is considered to not be enough (often wrinkles on the garment
are not properly simulated) to ensure that the fit of the garment on a virtual fit model
provides accurate, satisfactory results. The appearance of a virtual model can
significantly differ from that of a real human model (Kim & LaBat, 2013:172; Sohn &
Sun, 2013:67; Apeagyei & Otieno, 2007:349,350). Additionally, virtual dressing
rooms with modified, animated avatars are currently introduced in selected retail
stores where customers are able to virtually try-on certain garments and preview the
fit and appearance on a realistic 3D simulated image of the garment on their 3D
virtual model before purchasing. Nonetheless, 3D virtual simulation technology is yet
to be fully explored and made widely available in the fashion industry (Apeagyei
2010:66; Kim & LaBat, 2013:172).
49
In the next section garment sizing systems and size charts are defined and the
researcher conceptualises garment sizing systems as a contributing factor to fit,
together with factors that influence the development of sizing systems.
2.8 GARMENT SIZING SYSTEMS
2.8.1 Garment sizing Systems, body measurements and size charts
Sizing systems are described with terms such as, sizing standards, size charts or
size specifications (LaBat, 2007:88). According to Petrova (2007:65), gaining a
better insight into a targeted population‟s anthropometric information is a common
starting point for establishing a sizing system. Petrova (2007:65) defines a sizing
system as a set of pre- determined garment measurements divided into standardised
size ranges with fixed intervals between sizes that is represented by a targeted
population‟s anthropometric data. A sizing system may refer to different types of size
charts. LaBat (2007:88) suggests that a sizing system consists of a series of size
charts with each size chart calculated to serve garment sizing requirements for
various body dimensions within a population. Schofield et al.’s (2005) study reiterate
that key body dimensions and garment pattern grading size intervals need to be
used in sizing systems to facilitate the establishment of size charts. Petrova
(2007:57), Taylor (2014), and Aldrich (2015:8-12) define a size chart as a table
presenting data consisting of body measurements established for a range of garment
sizes that differ in sizes based on the manufacturer, (see Table 2.1).
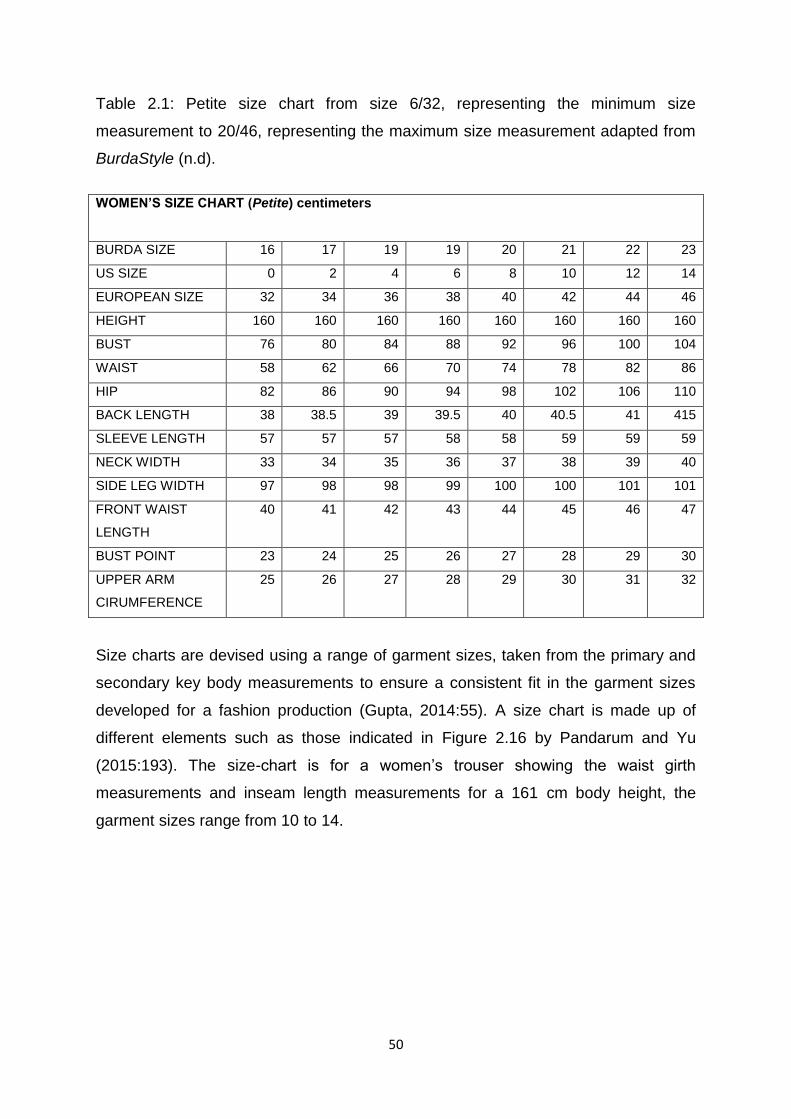
50
Table 2.1: Petite size chart from size 6/32, representing the minimum size
measurement to 20/46, representing the maximum size measurement adapted from
BurdaStyle (n.d).
WOMEN‟S SIZE CHART (Petite) centimeters
BURDA SIZE 16 17 19 19 20 21 22 23
US SIZE 0 2 4 6 8 10 12 14
EUROPEAN SIZE 32 34 36 38 40 42 44 46
HEIGHT 160 160 160 160 160 160 160 160
BUST 76 80 84 88 92 96 100 104
WAIST 58 62 66 70 74 78 82 86
HIP 82 86 90 94 98 102 106 110
BACK LENGTH 38 38.5 39 39.5 40 40.5 41 415
SLEEVE LENGTH 57 57 57 58 58 59 59 59
NECK WIDTH 33 34 35 36 37 38 39 40
SIDE LEG WIDTH 97 98 98 99 100 100 101 101
FRONT WAIST
LENGTH
40 41 42 43 44 45 46 47
BUST POINT 23 24 25 26 27 28 29 30
UPPER ARM
CIRUMFERENCE
25 26 27 28 29 30 31 32
Size charts are devised using a range of garment sizes, taken from the primary and
secondary key body measurements to ensure a consistent fit in the garment sizes
developed for a fashion production (Gupta, 2014:55). A size chart is made up of
different elements such as those indicated in Figure 2.16 by Pandarum and Yu
(2015:193). The size-chart is for a women‟s trouser showing the waist girth
measurements and inseam length measurements for a 161 cm body height, the
garment sizes range from 10 to 14.

51
Figure 2.16: A women‟s trouser size chart (Adapted from Pandarum and Yu,
2015:193)
Size charts are usually created by using average measurements for different
garment size ranges, developed to fit various body dimensions in a population or
target market (Vithanage et al., 2015:482). Vithanage et al. (2012:30) and Zakaria
(2014:95) emphasise that it is important to identify the target population for every
country and to develop an associated sizing system using measurements that will
improve garment sizing and fit, increasing customer satisfaction.
2.8.2 Developing sizing systems
Female consumers are said to be the least satisfied with how garments drape and fit
the shape and size of their bodies (Locker et al., 2005:12; Pisut & Cornell,
2007:375). Body measurements used to manufacture ready-to-wear garments in the
apparel industry do not cater for most of the female consumers (Vuruskan & Bulgun,
2011:46-47; Whitney, 2011:3; Alterations Needed, 2010; Kasambala, 2013:3).
Vithanage et al. (2012:30;59), Ka Wai YIP (2013:10), and Zakaria (2014:95) suggest
that it is important to identify target population‟s anthropometric measurements and
classify body shapes (Mastamet-Mason, 2008:224) for every country to develop its
own sizing system to improve sizing fit and increase customer satisfaction.
Identifying the correct body measurements for individuals in a target population for
the development of a sizing system makes it easier for manufacturers to produce
garments that fit well (Rasband & Liechty, 2006:4; Loker, 2007:256).

52
This may assist garment manufacturers in developing ready-to-wear garments in
sizes that will not only complement consumers‟ body statures but also minimise their
frustrations with garment sizing and fit (Rasband & Liechty, 2006:4; Strydom,
2006:60; Loker 2007:256; Williams, 2007).
2.8.2.1 Developing sizing systems using collected data from 3D full body
scanners
The use of a 3D full body scanner in garment manufacturing is still to be widely
recognised and adopted in South Africa, although internationally the technology
continues to contribute to clothing sizing and fit theory and a better understanding of
human body measurement, size, shape and body categorisation (Apeagyei,
2010:58). According to Yu (2004:164) and Pandarum and Yu (2015:187), 3D full
body scanners have been used in garment sizing and fit studies since the 1980s, to
facilitate and extract consistent, accurate, repeatable and non-intrusive body
measurements of individuals in a short period of time where privacy is highly
emphasised, since there is no physical contact between the operator and the subject
being scanned (Pandarum, 2009:4; Kouchi, 2014:67).
3D full body scanners are also said to be rapidly replacing traditional anthropometry,
developed as potential fit facilitators for varied body sizes and provide efficient
approaches for a broader scope of outlying data (Apeagyei 2010:58). Connell et al.
(2006:81) and Alexander et al. (2005:53) mention that 3D full body scanners provide
a means of capturing and analysing data scientifically with the aim of developing
patterns, which creates a direct link between the recorded data and the development
of designing patterns and garment construction (Petrova & Ashdown, 2008:228).
Thereby retailers and manufacturers can focus more on improving mass produced
and customised garments (Petrova & Ashdown, 2008:227-228; Ka Wai YIP,
2013:13-14).

53
Yu (2004:136-142) mentions that Japan was the first country to capture
anthropometric data using 2D and 3D profiles in the 1980‟s in Asia, followed by Hong
Kong‟s University of Science and Technology in 1998; and the Industrial Technology
Research Institute in 2000 in Taiwan. Yu (2004:143-145) further adds that in
America, body scanner development started in early 1964, but was not popular until
1985. Cyberware was the first company to revolutionise laser scanning in the middle
of the1980s, and thereafter announced the use of 3D body scanners for body shape
analysis in 1995. (TC)² introduced their first commercial 3D body scanner in the
apparel industry in 1998. In the U.K. the Loughborough Anthropometric Shadow
Scanner (LASS) was developed in 1987 and the U.K. Defence Clothing and Textile
Agency (DCTA) introduced an Auto-mate 3D measuring system in 1996, Wicks and
Wilson also developed a TriForm scanning system in 1996. In France, the
SYMCAD™ automated body scanner was established by Telmat Industrie in 1995.
Germany introduced a Tecmath ergonomic human stimulation scanner in 1995
which provided Vitus 2D and 3D scanners. Body scanners use different light
methods to scan a subject and different systems to extract the scanned data for the
subject.
There are different 3D body scanning systems currently in use in the apparel
industry; to name a few, the Human Solutions (e.g. Virtus Smart XXL) measures a
height range of 210 cm, width of 100 cm and 120 cm depth in approximately 10
seconds, using eight laser sensor heads and an optical triangulation laser method
(Human Solutions, 2015). Cyberware (e.g. Model WBX) extracts over 100 body
measurements in a time frame of 17 seconds. High-speed 3D measurements are
collected every 2 mm, using four scan heads to ensure the accuracy of the 3D head
data set from head to toe (Cyberware, 2011). Wicks and Wilson (TriForm™/TriBody)
uses invisible, harmless white light stripes and eight camera views to capture 3D
scans in about 12 seconds. Images generated from the 3D scans are automatically
analysed by the TriBody software, which is thereafter processed into a 3D cloud
model containing about 15 million 3D co-ordinates that can be saved into various
output formats (Apeagyei, 2010:60; The Edinburgh Virtual Environmental Centre,
nd). Telmat (SYMCAD™) consists of Telmat‟s turbo flash/3D system which uses
structured light to measure and develop an anthropometric database; and projecting
54
white light stripes to capture data. Full body measurements are captured in 0.5
seconds (Apeagyei, 2010:60; Telmat Industrie, 2015).
The CAESAR survey was conducted from 1998-2001, scanning male and female
subjects from 18-65 years age. The UK Department of Trade and national sizing
survey conducted in 2001-2002, used a (TC)² body scanner and discovered that
body shapes have changed from earlier identifications. The Size UK further carried
out a sizing survey in 2009 on 11,000 males and females from different parts of
Britain with the aim of identifying current body size and shape differences among
various populations (Apeagyei, 2010:58-59). The Size USA research collected
anthropometric data for more than 10,000 men and women aged from 18 and above
in 2003, using a (TC)² 3D body scanner. Levi‟s, a denim apparel brand, studied
60,000 3D body scans of consumers worldwide, to identify and resolve their denim fit
problems (Manuel, 2009:26-27; Rzepka, 2011:2-3).
In South Africa, Pandarum and Yu (2015:195), state that limited, but focused and
generic studies have been conducted in South Africa since 2004, using the (TC)²
NX12 and (TC)² NX16 body scanners. In 2006, Pandarum conducted a study
comprising of 12-year-old girls, their body measurements were compared to retail
bought school-grey uniforms. In 2009, a plus-sized women study on bra sizing and fit
was conducted with a local bra manufacturer, and Pandarum is currently conducting
a woman sizing and fit study of 1300 women (Pandarum, 2017).
However, the only known retailer initiated studies that collected anthropometric data
for the petite women market on a large scale are those of Edgars in 2003 and
Woolworths in 2014. Although, Edgars did not use a 3D full body scanner to collect
the body measurements, traditional anthropometry was used to collect the data to
accommodate the South African consumers within the petite clothing size range;
amongst others, is the Edcon Group. These garments in their stores are labelled,
e.g. “petite 6”, yet there are still large numbers of displeased petite consumers
(National Textile brief, 2007). The number of women sampled for the Edgars study is
unknown and the anthropometric data is propriety to the retailer, it is thus not
available for comparison in this study. In 2014, Woolworths, a South African retailer,
commissioned Avalon, an American mannequin manufacturer to collect 3D data

55
using a SYMCAD™ body scanner. The Woolworths study is reported to have
scanned a sample of 4000 men and women in their retail stores; however, the
results of this initiative have not been published (Woolworths Holdings Limited, 2014)
and the ratio of the number of men to women scanned is unknown. These are the
only two known studies to date carried out on a large scale in South Africa and none
of these studies were specifically focused on petite women and the data collected is
propriety to the retailer.
2.8.3 Classifying the anthropometric data into different body shapes based on
key body dimensions when developing sizing systems
The success of every sizing system is based on allocating the anthropometric data of
a population into different body shape classifications that are established by
relationships between body dimensions (Schofield & LaBat, 2005a:17; Strydom,
2006:60; Rasband & Liechty, 2006:4; Loker, 2007:256; Mastamet-Mason, 2008:224;
Muthambi et al., 2015:63). Key body dimensions are used to divide the population‟s
body measurements (Petrova, 2007:63; Strydom & De Klerk, 2006:81). A key body
dimension is the body measurement that has a strong relationship with most other
body dimensions and is one that is important in garment manufacturing (Petrova,
2007:63). Such measurements include the bust measurement for the upper body,
the waist measurement for both the upper and lower body and the hip measurement
for the lower body. Muthambi et al. (2015:63) and Petrova (2007:66) further state
that key body dimensions define the population‟s body shapes and should be
carefully selected to represent realistic body measurements that will assist garment
manufacturers in establishing effective sizing systems and provide a better fit in
manufactured garments.
In a sizing system, when developing size charts, the body measurements are divided
into different categories to evaluate the proportions and dimensions requirement for
each body shape (Schofield & LaBat, 2005a:17). The SABS published a garment
measurement standard in 2012, SANS 8559, with the aim of classifying body
measurements for pattern and garment manufacturing. Despite the SABS endorsing
the SANS 8559 pattern and garment sizing measurements five years ago, there are
56
still garment fit problems among consumers, as these standards are voluntary, and
hence the South African clothing retail and manufacturing sectors are not obliged to
use this (Pandarum, 2017). Mgwali (2014) claims that garment fit problems among
consumers still occur as retailers and manufacturers are not monitored on how they
size their garments because the majority of retailers and manufacturers use their
own size charts to label garments. This shows that there is a need for updated
current data and for developing sizing systems to fit various body shapes and sizes
in the female population including South African petite females.
2.8.4 Establishing the size ranges for a sizing system
Establishing the size ranges for a sizing system is usually conducted after selecting
key body dimensions and identifying the body shapes required for the development
of the sizing system (Petrova, 2007:72). LaBat (2007:88) states that sizing systems
are used to classify body shapes and segmenting their classified data into size
measurements for garment production with the aim of providing consistent and clear
garment sizing and labelling that will fit many consumers. Therefore, gaining a better
insight on a targeted population‟s anthropometric information is a common starting
direction for establishing size ranges for sizing systems (Petrova, 2007:65).
According to Petrova (2007:64), sizing systems only consist of size ranges that are
predetermined to fit a collectively populated target market and generally sizing
systems cater for 65% to 85% of the targeted population. This is determined by the
apparel industry that garments manufactured from the above-mentioned percentage
coverage have a potential of facilitating a good fit for majority of individuals in that
particular garment size group, minimising possible outliers that might distort the
sizing system. Petrova (2007:57) further suggests that a sizing system that has more
size groups indicates that each group will have a small number of individuals who
will be similar to one another in body measurements.
A population‟s size range is established by maximum and minimum values of the key
body dimensions, including the size interval which is the measurement difference
between two adjacent sizes (Petrova, 2007:64). The number of sizes in a sizing
57
system is defined by the value of the size intervals (Chan, 2014:188) together with
the required size ranges that will accommodate the population (Petrova, 2007:72).
2.8.5 The relationship between body measurements in sizing systems
Sizing systems usually use averages (Strydom & De Klerk, 2010:75-76; Chan,
2014:181) but other models such as regression analysis when calculating the
relationship between body measurements (Maree, 2007:240; Shin & Istook,
2007:137) are also used to generate sizing systems. Maree (2007:240) and Shin and
Istook (2007:137) refer to regression analysis as a statistical method commonly used
to estimate body measurements from one size to the next size by examining the
relationships between variables. Chan (2014:180-181) suggests that regression lines
use identified key body dimension values to determine appropriate size intervals in a
sizing system. A sizing sample is used as a base that represents body
measurements of all the full sizes where prototype size ranges are developed.
Patterns for the prototype size ranges are derived from a master pattern block
through pattern grading (Keiser & Garner, 2008: 356,372).
2.8.6 Garment sizing systems as a contributing factor to fit
Garment sizes are currently identified by labels on ready-to-wear garments that are
supposed to correspond to the measurements of a particular body size (Kinley,
2010:401). Variability in the methods used to designate garment sizes are believed
to be one of the many factors that influence consumer dissatisfaction with garment fit
(Barona-McRoberts, 2005:2). Manufacturers are usually uncertain as to the number
of size ranges to divide the population in. A sizing system that is divided into more
size ranges may result in a small number of individuals with similar body
measurements within each group. Dividing the size ranges in large numbers may
result in garment fit dissatisfaction and confusion. Conversely, an insufficient size
range group will result in many body measurement variations which may affect the
quality of fit for most of the individuals classified in that group (Petrova, 2007:57-59).

58
According to Alexander et al. (2005:56), Pisut and Connell (2007:368), and Otieno
(2008:68), most garment manufacturers and retailers today use their own sizing
standards, which may include vanity sizing to manufacture garments as a form of a
market differentiation tool or advantage. This means that garments indicating the
same size do not necessarily imply the same body and garment measurements in
each store (Loker et al., 2005:2; Pisut & Connell, 2007:368). Manufacturers and
retailers are said to constantly try to flatter consumers by creating smaller sizing
labels for garments instead of providing the actual size of the garment (LaBat,
2007:91). Garment manufacturers constantly change sizing measurements (Lee,
2005:27) into smaller size labels (Alexander et al., 2005:56; Pisut & Connell,
2007:368) for example, the use of size 10 measurements and labelling the garment
as a size 8 (Liechty et al., 2010:45-46). Consequently, the consistency of fit among
the assortment of apparel sizing systems is compromised (Shin, 2013:1).
The consumers‟ concern is that retailers offer a limited collection of fluctuating,
inconsistent and unpredictable garment sizes that differ in fit from store to store (Lee,
2005:25; Salusso et al., 2006:98). Consumers are therefore bound to come across
different sizes of garments that are labelled with similar size numbers or vice versa
(Loker et al., 2005:2; LaBat, 2007:91; Pisut & Connell, 2007:368). This results in
consumer dissatisfaction with the fit of the garment on their bodies (Petrova &
Ashdown, 2008:230). Furthermore, consumers invariably must go through the
process of trying on a number of garments before finding a garment that fits
reasonably well (Strydom, 2006:4; Kasambala, 2013:6). Doshi (2006:1) argues that
garment manufacturers are said to focus too much attention on the appearance of a
garment with less emphasis on its sizing and fit. Consequently, this results in
customer dissatisfaction while shopping for clothes (Petrova & Ashdown, 2008:230).
2.8.7 Communication of garment sizing systems
The communication of female garment sizing information has changed over time in
the ready-to-wear apparel industry. The success of every sizing system depends on
how it is communicated to the consumers. The sizing system must be clearly
explained so that consumers can easily understand them and easily select the

59
correct garment sizes (Kinley, 2010:401). Ashdown et al. (2005:2) suggest that
creating sizing systems based on the actual target population‟s anthropometric data
permits better fitting garments. Lee (2005:29) and Chun (2007:220-221) state that
size label communication is important when it comes to garment fit and garment
manufacturers should appropriately communicate sizing systems and size garments
in accordance with the targeted population to meet their market needs and help
consumers to select well-fitting garments.
Key body dimensions are often used when communicating garment sizing systems
because garment size labels mainly consist of key body dimensions. However, the
key body dimensions used on the size label do not solve the problem related to
garment fit. Unless consumers know how, and are able to take their own body
measurements accurately, they will not be able to select the correct garment size
(Faust & Carrier, 2010:120). The average consumer has very little knowledge on
how to evaluate their body dimensions against the key body dimensions that are
listed in size labels such as the bust, waist and hip measurements (Howarton & Lee,
2010:221). Petrova (2007:63) states that, without having knowledge of key body
dimensions and how to evaluate them against garment sizing measurements; it
becomes a challenge for consumers to select garments that fit well from different
brands in retail stores because garment sizing standards vary from manufacturer to
manufacturer. At times, size variations within the same manufacturers are not
directly communicated to the consumers (Kinley, 2010:401).
Chun (2007:223) suggests that selecting the correct garment size can only be
effective if the sizing systems are easy to understand and at the same time
constructed using the correct methods. Garment sizes for women were initially
considered in the USA based on the target markets age or body measurements
(Chun, 2007:224). Women‟s apparel is divided in a widespread variety of garment
shapes, styles and a much broader variation in how different garment styles are
designed to fit their bodies. This could be another attribute that confuses female
consumers, as manufacturers rarely include information on different fit and style
characteristics that may help female consumers with sizing choice when purchasing
their garments. Therefore, different garment styles may also have different sizing
and size labels (Faust & Carrier, 2010:120).

60
The fundamental objective of every garment manufacturer is to produce garments in
correct sizing labels to prevent garment returns and sale loss (Petrova, 2007:57).
Effective communication of sizing and fit on labels is essential for consumers to
select garments that fit well and for the apparel industry to improve their reputation
and sales of producing satisfactory fitting garments. According to Chun (2007:235),
sizing labels with incorrect information communicated on the garments results in
consumers wasting their time and add extra expense caused by the cost of transport
when returning the purchased garment.
Garment sizes are labelled in either “words” or by numbers, such as extra small,
small, medium and large or size 8 and size 10, etc. (Townsel, 2005:1). Chun
(2007:224) adds that garment labels usually contain numbers, alphabetical letters or
words with numerical relations to key body measurements. The South African
apparel industries allocate inches and centimetres to their garment sizes. They,
along with several countries, also use terms such as (small, medium and large),
codes (XS (extra small), S (small), M (medium), L (large), XL (extra-large) and XXL
(extra, extra-large) or numbers (8, 10, 12, 14, etc.) and pictograms (see Figure 2.17)
which consist of a sketch of the human body with specified body measurements for
sizing the fit of the garment (Chun, 2007:227; Zakaria & Gupta, 2014:30) and
thereby differentiate their garments sizes (Van Huyssteen, 2006:2625). Nonetheless,
the use of a pictogram for labelling the size of a garment has not yet been adopted
by the South African‟s clothing retailers (Kasambala, 2013:50), even though South
Africa has published a national standard titled SANS 1360-2 (2008). Nonetheless,
the industry use is voluntary (Pandarum, 2017).

61
Figure 2.17: A pictogram size description illustration for a female‟s sizing labelling
(Adapted from SANS 1360-2, 2008).
The use of symbols in conjunction with the key body dimensions in centimetres is
recommended by the International Standardisation Organisation (ISO) to provide
consumers with a quick communication of the body measurements for which the
garment was designed for (Chun, 2007:227). Lee (2005:29) further suggests that
sizing garments in number, letter or word size codes does not reflect body
dimensions and is confusing to consumers and does not easily assist them in finding
ready-to-wear garments that fit well in retail stores. As a result, consumers have to
try on several garments before finding a garment that fits well and comfortably.
The increase in the internationally traded imports and exports of clothing contributes
to the challenges of communicating the size dimensions of garments. The ISO
developed an anthropometric size labelling system in 1991, based on
communicating the key body dimensions (Chun, 2007:227). Thereafter, the ISO
established a size labelling system in conjunction with several countries such as
Russia, Australia, China and India with the purpose of co-ordinating international
sizing standards so that the mentioned countries could attempt to include
international standards in their national standards (Aldrich, 2007:46).

62
The purpose of sizing labels is to provide body measurements information as
garment size communication from manufacturers to enable consumers to make
better purchasing decisions in selecting ready-to-wear garments that would provide
them with a satisfactory fit (Chun, 2007:220). However, the establishment of
communicating satisfactory size labels to consumers is yet to be successful as Chun
(2007:220) further states that current size labels used on women‟s ready-to-wear
garments sold internationally, including South Africa, lack adequate information on
basic body measurements to guide consumers in choosing proper garment sizes.
According to Petrova and Ashdown (2008:230), size labels attached on garments
provide little information and do not communicate as to the body dimensions that
pertain to a specific garment. Kasambala‟s (2013:194) study on female consumers‟
perceptions of garment fit in South Africa revealed that South African female
consumers‟ perceptions on the sizes of ready-to-wear garments sold in South
African retail stores were inconsistent (21%) and unreliable with limited stock (16%).
Only a few of the participants thought that the size labels used on garments were
“inaccurate” (8%) and 15% of the sample expressed that the garment sizes was
reasonable. However, the study was not focused on garment label sizing for petite
women.
2.9 READY-TO-WEAR GARMENTS
According to Keiser and Garner (2003:93), and Zakaria and Gupta (2014:3), ready-
to-wear garments are mass-produced in predetermined sizes and large quantities,
designed with the purpose of being sold in stores, to be worn without alterations.
Zakaria and Gupta (2014) further state that ready-to-wear garments became popular
in the 1940s and were sold in retail stores as the customer demand increased.
However, there were often fit problems because of the various body shape
distinctions and therefore, the need for predetermined sizing systems for
manufacturing ready-to-wear garments in the apparel industry was established using
the most common size category for the average consumer.

63
Chun (2007:220) suggests that obtaining a good fit in ready-to-wear garments
requires an appropriate sizing system and effective pattern making using the correct
body measurements for the targeted consumer. Petite women were not catered for
in the apparel industry until 1977 but due to the increase of demand for petite ready-
to-wear garments; there is growth in opportunities for garment manufacturers to
cater for petite women. Additionally, manufacturer‟s still face challenges in providing
proper fitting ready-to-wear garments as female body shapes vary (Frings, 2014:80).
2.10 PETITE WOMEN‟S GARMENT CATEGORISATION
According to Kam (2006), it is not easy to categorise petite women‟s garments in
small, medium or large garment sizes, which makes it a difficult market to sell into
when it comes petite garment label sizing. Petite garment label sizes can vary from a
size 2 to 22 (Rayner, 1997:1), size 2 to 16 (Williams, 2007) or up to a size 18 (Bello,
1994), with Taylor‟s (2014) garment sizes alternating from a size 00p to16p, where
the “p” indicates petite.
Everyone‟s body height, frame, proportion, contour and posture differ and as a result
present challenges for petite women when they have to purchase ready-to-wear
garments in retail stores (Chen, 2011:308-309). Rayner (1997:1) and Trulypetite
(2007) suggest that petite garments focus on definite reductions in sizing and are
specifically created with an emphasis on a height measurement that is 163 cm and
shorter with a shorter trouser rise, taking into consideration their small body frames.
Furthermore, Kgarza (2013) mentions that petite women should choose garments
that are more fitted rather than a loose fit and should consist of small fabric prints so
that the garments do not overpower their body structure. Nonetheless, a possible
reason for petite consumers not being satisfied with their ready-to-wear garments,
according to Liu (2011), is that many garment manufacturers do not have a clear
understanding on how to categorise petite women‟s bodies.
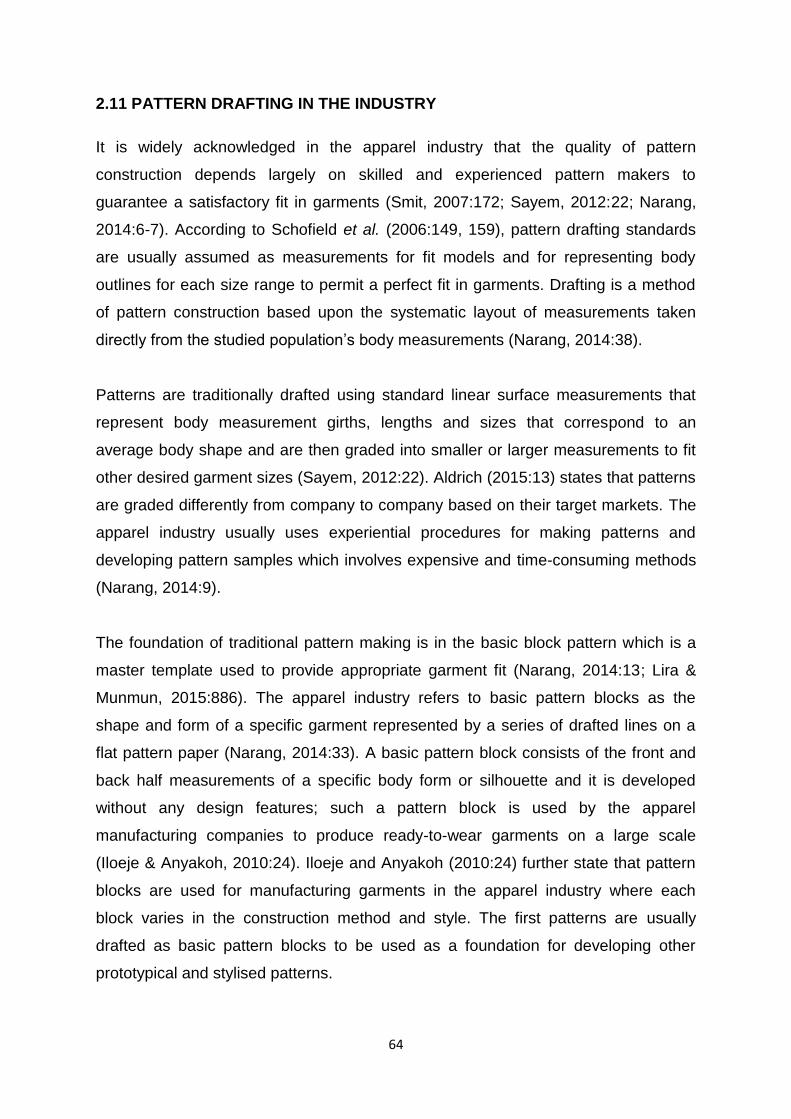
64
2.11 PATTERN DRAFTING IN THE INDUSTRY
It is widely acknowledged in the apparel industry that the quality of pattern
construction depends largely on skilled and experienced pattern makers to
guarantee a satisfactory fit in garments (Smit, 2007:172; Sayem, 2012:22; Narang,
2014:6-7). According to Schofield et al. (2006:149, 159), pattern drafting standards
are usually assumed as measurements for fit models and for representing body
outlines for each size range to permit a perfect fit in garments. Drafting is a method
of pattern construction based upon the systematic layout of measurements taken
directly from the studied population‟s body measurements (Narang, 2014:38).
Patterns are traditionally drafted using standard linear surface measurements that
represent body measurement girths, lengths and sizes that correspond to an
average body shape and are then graded into smaller or larger measurements to fit
other desired garment sizes (Sayem, 2012:22). Aldrich (2015:13) states that patterns
are graded differently from company to company based on their target markets. The
apparel industry usually uses experiential procedures for making patterns and
developing pattern samples which involves expensive and time-consuming methods
(Narang, 2014:9).
The foundation of traditional pattern making is in the basic block pattern which is a
master template used to provide appropriate garment fit (Narang, 2014:13; Lira &
Munmun, 2015:886). The apparel industry refers to basic pattern blocks as the
shape and form of a specific garment represented by a series of drafted lines on a
flat pattern paper (Narang, 2014:33). A basic pattern block consists of the front and
back half measurements of a specific body form or silhouette and it is developed
without any design features; such a pattern block is used by the apparel
manufacturing companies to produce ready-to-wear garments on a large scale
(Iloeje & Anyakoh, 2010:24). Iloeje and Anyakoh (2010:24) further state that pattern
blocks are used for manufacturing garments in the apparel industry where each
block varies in the construction method and style. The first patterns are usually
drafted as basic pattern blocks to be used as a foundation for developing other
prototypical and stylised patterns.

65
The methods of pattern making in the apparel industry are classified as either two-
dimensional patternmaking or three-dimensional patternmaking. The two-
dimensional patternmaking methods consist of pattern drafting and flat pattern
making by manipulating basic pattern blocks to fit the desired body or garment
measurements. The three-dimensional patternmaking methods consist of draping
the fabric directly on a dress form. Both the two-dimensional and three-dimensional
patternmaking methods are commonly used by fashion designers, patternmakers in
the industry and faculties in the fashion education fields (Narang, 2014:35-37).
This study focused on two-dimensional pattern drafting methods. The two-
dimensional patternmaking method is the most popular method for industrial pattern
makers as it is an efficient and logical technique to produce patterns for mass
production because it is easy to understand (Narang, 2014:33, 37).
The pattern production is the technique of working with two-dimensional standards
(viz. pattern paper) to develop pattern blocks (using either body or garment
measurements) which will assist in making garments for a three-dimensional body to
achieve the desired fit with the best possible utilisation of resources (Anand,
2011:358). According to Liechty et al. (2010:11-12) and Aldrich (2015:13), basic
pattern blocks are two-dimensional template outlines of garment pieces drafted on a
paperboard or cardboard that can be traced onto a fabric, cut out and assembled.
Aldrich (2004) further states that two-dimensional patterns are effective for creating
garment styles; the patterns are shaped on the pattern paper to represent the
desired garment style. The final drafted pattern is transferred onto a calico fabric and
joined together to form three-dimensional garments. Thereafter, the quality of the fit
of the constructed garment is checked on a selected mannequin or a human model‟s
body size and shape before manufacturing the actual garment on a fabric intended
for manufacturing the final garment (Tama & Öndoğan, 2014:110; Lira & Munmun,
2015:888). This is done to correct and confirm the measurements and to test the
quality of the garment fit obtained from the drafted patterns (Sayem, 2012:22).
Nonetheless, the apparel industry uses different pattern drafting methods to develop
their garments which are established according to every country‟s anthropometric
data. Therefore, it is essential to identify individuals‟ body dimensions and shapes
among their country‟s population (Tama & Öndoğan, 2014:108).

66
According to Joseph-Armstrong (2014:71), basic pattern blocks are usually drafted
without seam allowances, but the pattern blocks consist of darts that are partially cut-
out and punched with holes at the end of each dart to permit tracing precision when
manipulating the pattern to a desired garment style. The final manipulated pattern
pieces contain information such as seam allowance, grain line, garment size,
balance marks and decorative placements such as buttons, zips and pockets that
are stitched together to produce a sample garment (Narang, 2014:33). Narang
(2014:13) further states that the final manipulated pattern blocks have seamlines and
darts to make the pattern blocks fit well and flow with the curves of the body
silhouette. Seamlines and dart lines represent structural interior lines used in most
garments and they influence the silhouette of the garment (Liechty et al., 2010:20-
21). Fundamental horizontal seamlines are commonly positioned at the upper part of
the garment‟s shoulder and midriff body area, whilst the lower garment‟s horizontal
seamlines are positioned at the waist and hip area depending on the design of the
garment. In upper garments such as shirts, dart lines should be positioned in the
chest area and directed towards the bust and abdomen body protrusion whilst dart
lines in lower garments such as trousers, should be positioned in the waistline area
and directed toward the buttocks area. This is done to provide better fitting garments
with dart lines that fall softly on the wearer‟s body (Liechty et al., 2010:20-21;
Narang, 2014:33).
Basic shirt garments are mostly constructed from basic bodice pattern blocks, and
then adapted according to the designer‟s desired style. Kass (2011:6-7) defines a
bodice as an upper garment constructed with or without sleeves. Basic bodice
pattern blocks consist of a form body block with bust darts to permit a balanced
garment drape on the body and a sleeve block (see Figure 2.18 and Figure 2.19). A
basic bodice block is usually manufactured in fabrics that have a minimal stretch.
A bodice block consists of curves in the neckline and armhole areas; the bust area is
full, and it hollows at the waistline. Sleeve patterns are constructed to fit the bodice
armhole; the grain line should be aligned to provide a well-fitted sleeve that hangs
straight from the armhole to a required level on the arm (Joseph-Armstrong,
2014:45, 61).
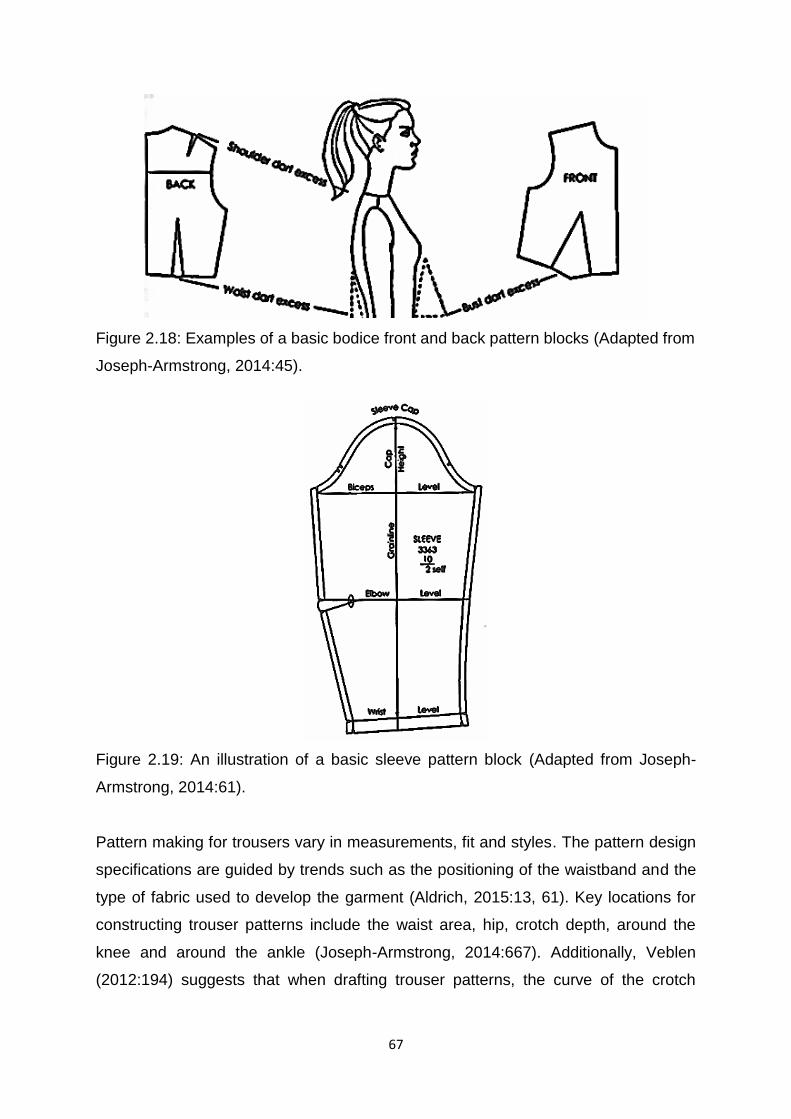
67
Figure 2.18: Examples of a basic bodice front and back pattern blocks (Adapted from
Joseph-Armstrong, 2014:45).
Figure 2.19: An illustration of a basic sleeve pattern block (Adapted from Joseph-
Armstrong, 2014:61).
Pattern making for trousers vary in measurements, fit and styles. The pattern design
specifications are guided by trends such as the positioning of the waistband and the
type of fabric used to develop the garment (Aldrich, 2015:13, 61). Key locations for
constructing trouser patterns include the waist area, hip, crotch depth, around the
knee and around the ankle (Joseph-Armstrong, 2014:667). Additionally, Veblen
(2012:194) suggests that when drafting trouser patterns, the curve of the crotch

68
should reflect the shape of a realistic figure crotch shape, pelvic structure, abdomen
and buttocks (see Figure 2.20).
Figure 2.20: Illustrations of back and front basic trouser pattern blocks (Adapted from
Joseph-Armstrong 2014:671).
2.11.1 Pattern grading
Pattern grading is a systematic process of increasing and decreasing size ranges
within a master pattern (Mullet et al., 2009:1). This process is mainly used in the
apparel industry to measure the difference between size ranges, since it reduces
product development costs and saves time; otherwise, each size range would have
to be developed and tested separately. Schofield and LaBat (2005b:135-136), Gupta
(2014:58), and Aldrich (2015:208-209) refer to pattern grading as scaling a master
pattern by increasing and decreasing the pattern block at the cardinal points to
create the next size (see Figure 2.21).

69
Figure 2.21: Examples of grading cardinal points on a basic master bodice (back and
front) pattern blocks (Adapted from Gupta 2014:59).
To achieve a reasonable garment fit, accurate body shapes and size measurements
should be used when drafting and grading patterns, in order to produce garments
with similar body shapes and size measurements as that of the targeted population.
According to Mullet et al. (2009:6-10), the apparel industry uses two different grading
systems to grade patterns, namely, the two-dimensional grading system and the
three-dimensional grading system. Two-dimensional grading systems are used by
most ready-to-wear garment manufacturers since they are simple, easy to use and
learn, but rely on assumptions of equally changing sizes in the front and back bodies
by following corresponding grade rules to grade a pattern block up and down (see
Figure 2.22) (Aldrich, 2015:208-209; Gupta, 2014:58; Schofield & LaBat, 2005b:135-
136). The standard pattern measurements are increased and decreased with
consideration given to the grade length, circumference and width of the desired
garment size (Joseph-Armstrong, 2014:15).

70
Figure 2.22: Back and front bodice block patterns graded one size up (Adapted from
Aldrich 2015:208).
In a two-dimensional grading system, the total circumference grade is graded in half
using half of the same measurements for the front and back pattern blocks to permit
easy grading. Conversely three-dimensional grading systems are more complex;
therefore, they are not commonly used in the ready-to-wear garment manufacturing
industry. Additionally, three-dimensional grading systems use arch measurements to
distribute throughout the total of the circumference grade without having to split the
back and front patterns (Mullet et al., 2009:6-10). Mullet et al. (2009) further suggest
that a two-dimensional pattern grading is suitable for developing a limited size range;
the total circumference grade is graded in half using half of the same measurements
for the front and back pattern blocks.
Pattern grading is common practice in the apparel industry, many manufacturing
companies, especially in the petite garment manufacturing sector, design petite
garments by simply scaling down or shortening regular sizes by means of adapting
the “average” women‟s measurements to fit petite women (Rayner, 1997:1; Liu,
2011). Keiser and Garner (2008:374) state that pattern grading differs according to
the size measurements that will accommodate size to size distinctions in the
required length, width and circumference which consist of the grades of various body
girths such as the bust, waist and hip measurements. According to Mullet et al.
(2009:15), the value of the circumference grade differs per country and
manufacturer, although the grade value assumptions are similar.

71
There is not much difference in grade lengths because adult vertical length
measurements do not change as much as their horizontal measurements. Horizontal
measurements changes in body weight in adulthood, whilst the vertical
measurements remain constant in height (Mullet et al., 2009:17). The patterns
developed in this petite sizing and fit study focused on one size range where grading
was not necessary, but half patterns were used for drafting the front and back of
each shirt and trouser pattern blocks; as this is a commonly used pattern block
drafting method in the apparel industry (Iloeje & Anyakoh, 2010:24).
Further information on the method of the procedure used for drafting the basic shirt
and trouser pattern blocks are discussed in Chapter 5.
2.12 CONCLUSION
This chapter has reviewed literature on women, including petite women‟s apparel
sizing and fit that indicate that most of the female consumers, including petite
females‟ experiences and problems with ready-to-wear garment sizing and fit. From
the literature, it is apparent that apparel manufacturing companies and retailers are
said to create garments for consumers of average height and weight, and as a result,
petite female consumers experience challenges in finding garments that fit well.
The collection of accurate and current body measurements and body shapes for a
targeted population emerged as the most important factor in achieving a good quality
fit in ready-to-wear garments. Establishing accurate body measurements ensures
that the correct garment pattern blocks are constructed in measurements that
correspond with the targeted population‟s body measurements to ensure better fitting
garments (Van Huyssteen, 2006:14). Therefore, determining accurate body
measurements, shapes and distinguishing effective information about garment sizing
and fit is essential as it allows manufacturers to create garments for consumers to
select better fitted garments easily (Chun, 2007:220).
The lack of information in garment sizing, the use of out-dated anthropometric data
and the absence of communication among garment manufacturers, along with vanity
sizing are some of the many challenges contributing to garment fit problems.
72
Variations in body shapes and sizes are repeatedly mentioned as the reason why
garment manufacturers are failing to produce proper fitting garments. An individual‟s
body proportions influence the position of structural lines and the balance of a
garment (Liechty et al., 2010: 48; Pisut & Connell, 2007:370). Pattern makers need
to consider body proportions when drafting patterns, as fit problems may occur due
to body proportional differences (Jones & Giddings, 2010).
Variations in petite women‟s ready-to-wear garment sizes indicate that garment
manufacturers do not adhere to or have access to current South African
anthropometric data and standard charts designed for petite women. Although,
Kasambala‟s (2013:193) study on consumers‟ perceptions of garment fit did not
focus on petite women, the results from the study revealed that problems mostly
encountered by South African women when purchasing ready-to-wear garments
were an improper fit. Hence, the correct and current data for developing sizing
systems to fit various body shapes and sizes of South African petite females is
essential in the sizing and fitting of a garment.
73
CHAPTER 3
RESEARCH METHODOLOGY
3.1 INTRODUCTION
The purpose of this chapter is to explain the procedures and methods used in this
petite women study; to obtain knowledge concerning the petite women‟s body
dimensions. This knowledge was utilised to create the experimental upper and lower
body dimensions size charts, used in the construction of the shirt and trouser
patterns and of the prototype garments, as well as to assess the prototype garment
fit test evaluations.
According to Babbie and Mouton (2007:49), the application and selection of
methodological approaches depends on the objectives of the study, to ensure that
scientific findings and valid conclusions can be drawn. The objectives of this study
are outlined in section 1.3. This chapter presents the research design that includes a
detailed explanation of the data sampling and the data collection techniques used,
along with the protocols followed to ensure that the quality of the data is maintained.
Finally, the ethical considerations that were applied throughout the study, is
discussed.
3.2 THE RESEARCH DESIGN
To answer the research questions posed and to fulfil the objectives of this petite
women study, the data collection and analysis adopted a mixed method, research
design, comprising both qualitative and quantitative methods to investigate the petite
women‟s body height and body dimensions and to assess garment fit. According to
Maree (2007:262), applying both qualitative and quantitative methods improves the
significance of a study and strengthens legitimacy in the objectives of the study by
providing flexible ways of data collection and analysis. Additionally, Matthews and
Kostelis (2011:133,138) state that mixed method studies usually permit different data
collection techniques and analysis which add value to various concepts within the
study.

74
The conceptual framework for this study was adapted from Ashdown (2007: xix),
(refer to Figure 1.2 in section 1.5), showing the petite women‟s measurements and fit
issues that were used as a guideline to determine the sizing methods for evaluating
the fit of the prototype shirt and trouser garments developed in this study on petite
women.
The data was collected using a (TC)² NX16 3D full body scanner and an Adam‟s®
medical scale. A demographic and psychographic questionnaire comprising of both
open-end and closed-ended questions inclusive of Likert and semantic differential
scales was used to collect the data from the psychographic questionnaire.
3.2.1 Selection of subjects (Sampling)
The subjects were selected using purposive and convenience sampling which falls
under the non-probability sampling method. The sampling strategy used in this petite
women study applied to a particular group of women that is not easily accessible
(Maree, 2007:76). The sampling strategy was guided by the study‟s objective, which
was to recruit and collect 3D full body scan data from a sample of women based on a
height range of 5‟ 4” (163 cm) and below, aged 20 to 54 years, of all the race
groupings “from all walks of life”, that are classed as petite residing in Gauteng
(Pretoria and Johannesburg area), South Africa. The sample size was based on The
Statistics South Africa (2011) and Statistics SA (2014) Gauteng women population
proportions. When applied, the resulting number of petite women that needed to be
recruited for the study was 200.
The 200 subjects‟ age distribution, race groupings and the total numbers of the
recruited subjects‟ is indicated in Table 3.1.
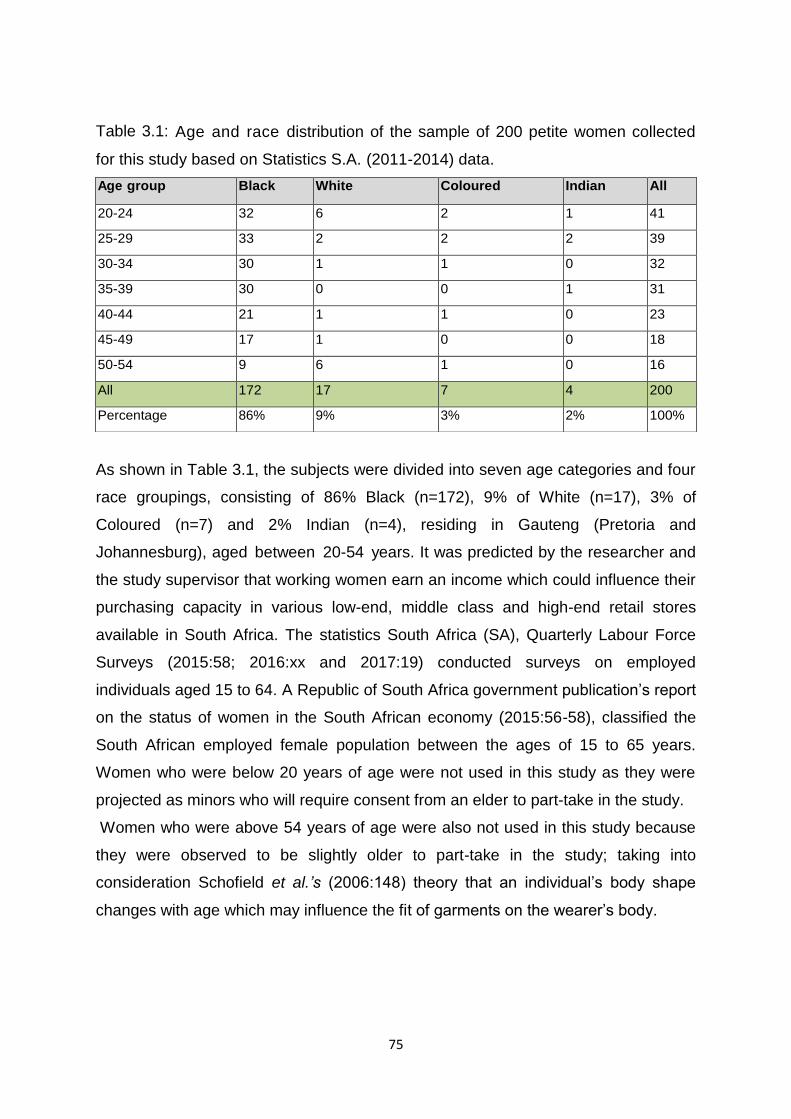
75
Table 3.1: Age and race distribution of the sample of 200 petite women collected
for this study based on Statistics S.A. (2011-2014) data.
As shown in Table 3.1, the subjects were divided into seven age categories and four
race groupings, consisting of 86% Black (n=172), 9% of White (n=17), 3% of
Coloured (n=7) and 2% Indian (n=4), residing in Gauteng (Pretoria and
Johannesburg), aged between 20-54 years. It was predicted by the researcher and
the study supervisor that working women earn an income which could influence their
purchasing capacity in various low-end, middle class and high-end retail stores
available in South Africa. The statistics South Africa (SA), Quarterly Labour Force
Surveys (2015:58; 2016:xx and 2017:19) conducted surveys on employed
individuals aged 15 to 64. A Republic of South Africa government publication‟s report
on the status of women in the South African economy (2015:56-58), classified the
South African employed female population between the ages of 15 to 65 years.
Women who were below 20 years of age were not used in this study as they were
projected as minors who will require consent from an elder to part-take in the study.
Women who were above 54 years of age were also not used in this study because
they were observed to be slightly older to part-take in the study; taking into
consideration Schofield et al.’s (2006:148) theory that an individual‟s body shape
changes with age which may influence the fit of garments on the wearer‟s body.
Age group Black White Coloured Indian All
20-24 32 6 2 1 41
25-29 33 2 2 2 39
30-34 30 1 1 0 32
35-39 30 0 0 1 31
40-44 21 1 1 0 23
45-49 17 1 0 0 18
50-54 9 6 1 0 16
All 172 17 7 4 200
Percentage 86% 9% 3% 2% 100%
76
The subjects sampled for this study was recruited on a convenience and voluntary
basis, the sample did not contain an overall population percentage representation in
each age category from the different race groups as the subjects were scanned
based on their availability. The recruitment criterion was based on the subject‟s body
height, as this is currently the commonly used criteria from other petite women
studies as mentioned in section 2.2. The range of heights, in these studies, were
from 5‟ 4” (163 cm) and below (Defty, 1988:16-18; Winks, 1990:74-76; Boston, 1992;
Rayner, 1997:1; Knowles, 2005:35,37,40; Townsel, 2005; Barona-McRoberts,
2005:10; Petite Resource, 2007; Williams, 2007; Bailey, 2010:1; Kgarza, 2013;
Simplicity, 2013; Lee, 2014; Taylor, 2014). The subjects were not pregnant and were
not wearing any prosthesis, at the time of scanning taking place.
The sample of 200 petite women was recruited by the researcher and an additional
recruiter, through either word of mouth (verbally approached to take part in the
study), referrals from willing subjects that had been scanned and by handing out
invitation letters, (see Appendix A for a copy of the letter). The invitation letter
included all the relevant information, informing the petite women subjects about the
procedure that will take place during the data collection process and explained what
was required of them and how the data will be used. The invitation flyer also included
the date, time and venue where the study will take place i.e. the UNISA, Florida
Science campus where the scanner is located and that the data will be collected in
total privacy, on conservative numbers and that no personal details of the subjects
will be used in the study.
The subjects were firstly requested to sign a consent form (see Appendix B) to obtain
their permission for them to take part in the study as guided by the Ethical Clearance
Number 2015/CAES/116 (see Appendix C for a reference acceptance letter).
Thereafter, they were verbally informed of all the procedures that will take place
during the data collection process, including guidelines concerning measurements
and scanning sessions, and other ethical considerations. A date and time slot were
allocated for the subjects based on their availability, as their participation was
voluntary. Transport to the UNISA, Florida, Science Campus was arranged for
subjects who could not transport themselves to the scanning venue. The researcher
77
subsequently ensured follow-ups with the additional recruiter and subjects to remind
them of their scanning date where applicable.
3.2.2 Data collection instruments used in the study
3.2.2.1 A demographic and psychographic questionnaire
The demographic and psychographic questionnaire used in this petite study
comprised of issues/concerns raised by other researchers within the literature from
previous studies, including questions about the subject‟s geographical and marketing
related information combined with overall body cathexis and self-perceived body
shapes, together with their manually collected anthropometric height and weight
measurements using an Adam‟s® medical scale, to address the objectives of this
study.
The questionnaire contained both closed-ended questions, that provided the
subjects with an assortment of possible answers to choose from, and open-ended
questions that allowed the subjects to freely write down detailed answers in their own
words and ranking scales (Maree, 2007:161). This study also included dichotomous
questions that only permitted two possible answer choices for the question asked,
multiple choice questions where the subjects could select three or more responses
from the questions asked, and filter and follow-up questions where the question was
divided into sub-classes that allowed further information to be obtained from one or
more of the sub-classes. The ranking questions were also used to determine how
the respondents ranked certain issues along with geographical questions that
required the participant to fill in answers regarding their profiles (Leedy & Ormrod,
2010:189). A Likert scale was used to measure the subjects‟ ordinal measure of their
attitude, for example, the range of garment sizes available to petite women
shoppers. A semantic differential scale was used to measure how the subjects
express their feelings, for example, ratings on their garment fit preferences.
The demographic questionnaire contained more focused on quantitative data and
was used to gather information on who the petite subjects‟ were, answering
questions such as each subject‟s age, height, weight, etc.

78
The psychographic questionnaire was used to collect qualitative data for the study
that allowed the researcher to gain a deeper understanding of the petite female
consumer‟s apparel sizing, fit preferences and problems/concerns that they
experience with ready-to-wear shirt and trouser garments they purchase in apparel
retail stores in South Africa. This was done to understand what was required to
create better fitting garments for petite women in the hope of reducing the subject‟s
frustration with the ready-to-wear shirt and trouser garment sizing and fit.
See Appendix D for an example of the demographic and psychographic
questionnaire used in this petite women study.
Every subjects study pack also included the consent form and a “thank you” letter of
appreciation for taking part in the study (see Appendix E). Printed copies of the
questionnaire were hand delivered to some of the subjects who were interested in
taking part in the study whilst the balance of subjects completed the form on their
scheduled date for scanning.
3.2.2.2 The equipment used to collect the anthropometric data
This study used a (TC)² NX16 3D full body scanner and an Adam‟s® medical scale
to collect and evaluate the anthropometric data used in this study. The 3D full body
scanner and the medical scale was calibrated before every data collection session,
as repeatability and precision are vital factors to consider when taking
anthropometric measurements, to achieve realistic and meaningful evaluations of the
collected data (Ka Wai YIP, 2013:14).
To collect the 200 petite women subject‟s 3D anthropometric data the researcher
used the (TC)² NX16 3D full body scanner available at the UNISA Florida Science
campus, in Gauteng (see Figure 3.1).
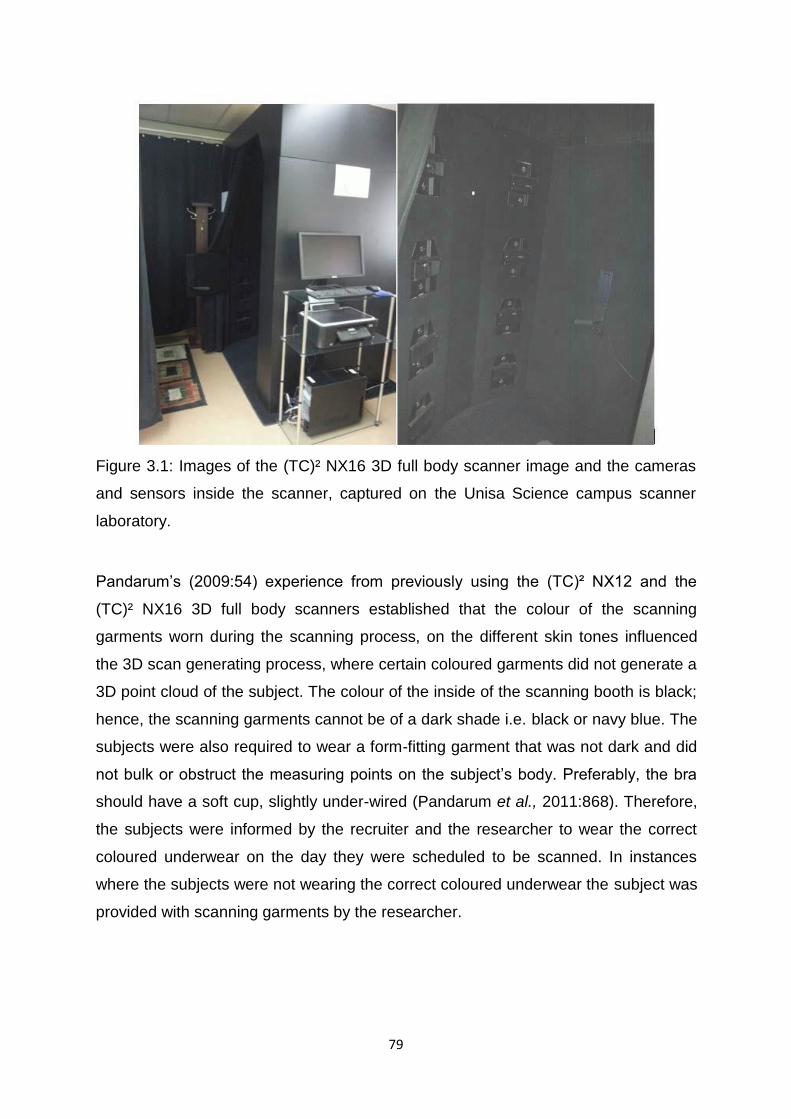
79
Figure 3.1: Images of the (TC)² NX16 3D full body scanner image and the cameras
and sensors inside the scanner, captured on the Unisa Science campus scanner
laboratory.
Pandarum‟s (2009:54) experience from previously using the (TC)² NX12 and the
(TC)² NX16 3D full body scanners established that the colour of the scanning
garments worn during the scanning process, on the different skin tones influenced
the 3D scan generating process, where certain coloured garments did not generate a
3D point cloud of the subject. The colour of the inside of the scanning booth is black;
hence, the scanning garments cannot be of a dark shade i.e. black or navy blue. The
subjects were also required to wear a form-fitting garment that was not dark and did
not bulk or obstruct the measuring points on the subject‟s body. Preferably, the bra
should have a soft cup, slightly under-wired (Pandarum et al., 2011:868). Therefore,
the subjects were informed by the recruiter and the researcher to wear the correct
coloured underwear on the day they were scheduled to be scanned. In instances
where the subjects were not wearing the correct coloured underwear the subject was
provided with scanning garments by the researcher.

80
Instructions on the scanning position were communicated to the subjects by the
researcher, as body positioning is important and should be standardised to obtain
similar and accurate body posture for all the scanned subjects. This was guided by
foot markings on the floor of the scanning booth of the (TC)² NX16 3D full body
scanner used in this study. Pandarum (2009:58) revised the instructions applicable to
the (TC)² NX16 3D full body scanner and suggested that the scanned body posture
should be relaxed and upright with the feet parallel to each other, at 350 mm apart to
facilitate posture and in-seam data extraction. The arms should be stretched 1100
mm apart holding onto the fixed handrails inside the (TC)² NX16 3D full body
scanner, with the right-hand thumb slightly hovering over the right hand grip to
activate the button that will start the 3D scan generating process. This process was
adopted throughout the entire data collection process (see Figure 3.2).
Figure 3.2: An illustration of the 3D scanning posture (Adapted from Pandarum,
2009:58).
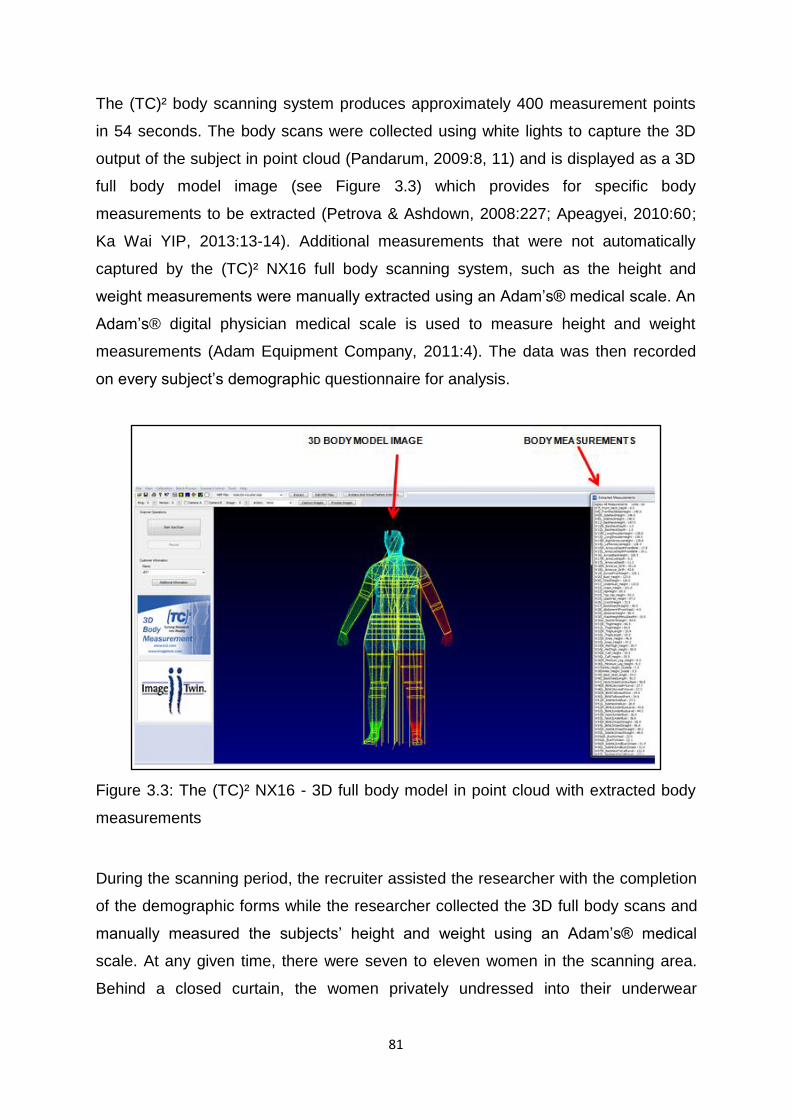
81
The (TC)² body scanning system produces approximately 400 measurement points
in 54 seconds. The body scans were collected using white lights to capture the 3D
output of the subject in point cloud (Pandarum, 2009:8, 11) and is displayed as a 3D
full body model image (see Figure 3.3) which provides for specific body
measurements to be extracted (Petrova & Ashdown, 2008:227; Apeagyei, 2010:60;
Ka Wai YIP, 2013:13-14). Additional measurements that were not automatically
captured by the (TC)² NX16 full body scanning system, such as the height and
weight measurements were manually extracted using an Adam‟s® medical scale. An
Adam‟s® digital physician medical scale is used to measure height and weight
measurements (Adam Equipment Company, 2011:4). The data was then recorded
on every subject‟s demographic questionnaire for analysis.
Figure 3.3: The (TC)² NX16 - 3D full body model in point cloud with extracted body
measurements
During the scanning period, the recruiter assisted the researcher with the completion
of the demographic forms while the researcher collected the 3D full body scans and
manually measured the subjects‟ height and weight using an Adam‟s® medical
scale. At any given time, there were seven to eleven women in the scanning area.
Behind a closed curtain, the women privately undressed into their underwear

82
garments before entering the scanning booth. The sampled 200 petite women
subjects were scanned three times in one session; generating automatically a 3D
coordinate set of cloud points from which body dimensions could be extracted.
Every subject data was provided with a consecutive number and subsequently stored
into a folder marked for the study. As a token of appreciation for taking part in the
study, every subject was also provided with a colour copy of their scans with the
extracted body measurements in centimetres, which they could use to custom fit
garments for themselves after ease was added and consideration given to the fabric
used.
The researcher also scanned a size 10/34, petite tailoring mannequin purchased by
UNISA from a well-known South African mannequin manufacturing company. The
scanning protocol adopted for scanning the mannequin was in the position as that
adopted by the subjects that were scanned in this study (see Figure 3.4). The height
measurement for the mannequin was obtained from information gathered from
Millam (2016), from Figure Forms that manufactured the mannequin for a large-scale
apparel retailer in 2003 that is still in use today.
Figure 3.4: A 3D full body scanned front and side view image of the petite tailoring
mannequin used in this study.

83
The measurements of the body landmarks required for constructing a basic shirt and
trouser garments were extracted using a researcher input measurement extraction
programme (mep), selected from the list of body landmarks available on the 3D
scanners measurement system. Extractions of the different mep landmarks collected
for this study for every subject and the petite tailoring mannequin is shown in Figure
3.5. The mep profile was programmed by the researcher and the researcher‟s study
supervisor, thus ensuring that the landmarks were extracted at the body points as
one would have taken using a dress-makers tape-measure, manually, for
constructing the prototype shirt and trouser fit test garments. This then ensured that
the prototype garments constructed from the size charts developed in this study used
the apparel industry standardised body landmarks for ready-to-wear garment
manufacturing.
Figure 3.5: Illustrations of different body landmark mep used in the extraction of the
3D data collected for this study.
The body landmark measurement points are explained further below as it was
extracted and used to programme the mep folder by the researcher.

84
The neck full measurement was taken around the neckline.
The shoulder length measurement was taken from where the neck ends to the
tip of the bone that connects the shoulder and the arm.
The armscye measurement was taken around the armhole.
The bicep measurement was taken at the fullest upper part around the upper
arm.
The elbow measurement was taken where the arm bends.
The wrist measurement was taken where the arm connects to the hand.
The sleeve length measurement was taken from the tip of the bone that
connects the shoulder to the arm, to the wrist
The neck to upper waist front measurement was taken as the vertical length
from the base of the front neckline (the top most prominent vertebra) to the
upper waist.
The neck to upper waist back measurement was taken as the vertical length
from the base of the back neckline (the top most prominent vertebra) to the
upper waist.
The chest measurement was taken above the bust area, going under the arm
and around the upper back.
The bust measurement was taken around the fullest part of the bust.
The under bust measurement was taken under the bust circumference.
The upper waist measurement was taken around the narrowest part of the
upper waist at the navel/midriff area. (The upper waist measurement was
included for the lower body dimensions for high waist trousers; although this
study was not focused on manufacturing high waist trousers, the data was
analysed for developing the size chart for the lower body dimensions).
The lower waist was taken 15 cm below the upper waist, at the lower waistline
between the upper waist and high hip area.
The high hip measurement was taken 10cm below the lower waist; around the
narrowest part of the buttock between the lower waist and the hipline.
The hip measurement was taken 20 cm below the lower waist; around the
fullest part of the hipline across the seat.
The top thigh measurement was taken around the fullest part of the upper leg.
The mid-thigh circumference measurement was taken at 10 cm above the
knee.
85
The knee circumference was taken around the centre of the knee area, where
the leg bends.
The calf circumference measurement was taken at a point between the
middle of the knee and ankle.
The ankle measurement was taken around the left leg over the ankle bone
that joins the leg and the foot.
The inseam measurement was taken as the vertical length inside the leg from
the crotch area to the ankle.
The outseam measurement was taken as the vertical length from the upper
waist to the ankle.
The crotch length front measurement was taken at the crotch area vertical
length to the front upper waist.
The crotch length back measurement was taken at the crotch area vertical
length to the back upper waist.
The extracted measurements of the 200 petite women subjects, together with the
petite tailoring mannequin‟s 3D scanned data were thereafter “batch processed” into
a Microsoft Excel spread sheet. According to Pandarum (2009:54) batch processing
allows the user to process multiple body data files without having to load and process
each scan individually into a Microsoft Excel spread sheet. This data, once captured,
was saved in the IBM SPSS Statistics 24 2016 software for further analysis as
discussed in Chapter 4. The individual scans were numbered consecutively and
saved; thereafter, a printed copy was handed to each scanned subject to keep. The
reference numbers of the scans were duplicated onto the subject‟s demographic and
psychographic questionnaire form. The demographic and psychographic
questionnaire was captured and coded on a Microsoft Excel spreadsheet for further
analysis.
86
3.3 UNIT OF ANALYSIS AND INTERPRETATION
The 200, 3D scanned petite subject‟s measurements and the 3D scanned petite
tailoring mannequin‟s measurements were analysed for this study using either
Microsoft Excel or imported into the IBM SPSS Statistics 24 2016 Software for
statistical analysis. The 3D scan body dimension data and every subject‟s body
height were extracted and recorded in centimetres and every subject‟s body weight
was recorded in kilograms.
As previously mentioned in section 1.5, the tailoring mannequin measurements is the
only currently acceptable “true values” of the apparel retail industry standard for
petite women, as there is no other petite, 3D scan, data measurements in South
Africa with which to compare the 3D scan data of the subjects collected during this
study. The analysis of the data in this study, did not differentiate between the
different race groupings, as garments sold by apparel retailers, in their retail outlets,
do not use “race grouping” as a criterion to code nor label ready-to-wear garments.
Gerber (2015) mentioned that the sample size used for testing the reliability and
validity, the questionnaire constructs, and the type of variables used in a
questionnaire will determine the statistical techniques to be used in the analysis of
the data collected in this petite women study. Hence, the results from the
demographic questions and psychographic data were analysed and interpreted
through descriptive statistics (IBM SPSS Statistics 24 software 2016) where data
conclusions were drawn from the petite women subject‟s sample from this study.
Maree (2007:183) suggests that statistics can be used to describe or represent the
collected data and are usually organised in different variables for each question on
the computer. The different types of data to be analysed consisted of nominal,
ordinal and ratio scales. Nominal scales consist of two or more categories that are
established from one other by different names, e.g. a person‟s gender: male or
female. Ordinal scales are similar to nominal scales; however, they also include
numerical scales and the data are usually grouped orderly or in sequences, e.g. a
level of agreement with a statement: agree, neutral, disagree or a person‟s level of
education: Grade 6-9 or Grade 12. Ratio scales have no existing measured attribute,
but the ratios can be taken out, e.g. the physical measurements: weight and height
(Maree, 2007:148; Leedy & Ormrod, 2010:262).
87
Results from responses to the demographic questionnaire and an analysis of the 3D
full body scanned data were analysed as the maximum and minimum scores,
frequencies and percentages distributions, medians, means (averages), standard
deviations, and the skewness distribution of the dataset. The maximum and
minimum scores represented the highest and the lowest range distributions of the
collected data for this petite women study.
The frequency distribution is summarised numerically where the frequency number
of the sampled subjects is presented in a table, together with the percentages of the
sample size (Maree 2007:184). The median is the centre of a distribution where the
distribution is split in half and the mean represents the average number of the data
distribution (Maree 2007:187-188; Leedy & Ormrod, 2010:266). The standard
deviation represents variations of data distributions from the data value (Leedy &
Ormrod, 2010:270). Skewness measures how far a distribution deviates from the
regularity (Maree, 2007:189-190; Leedy & Ormrod, 2010:264).
Graphical methods such as tables, graphs, charts, histograms, normal quantile-
quantile plots (Q-Q plots) and boxplots were included to aid the interpretation of the
results derived from the descriptive analysis. The descriptions of the histograms,
normal quantile-quantile plots (Q-Q plots) and boxplots are further discussed in
Chapter 4.
The findings from the subjects‟ responses gathered from the open-ended questions
asked in the psychographic questionnaire, were presented and formulated through
different concepts derived from the obtained words of the subjects‟ answers. Maree
(2007:105) refers to coding as a record of categorising data where the researcher
seeks for relationships between the transcripts. The researcher firstly categorised
the data into different categories, and thereafter linked the categorised data together
and established conclusions from the related data.
The data analysis and interpretations to aid the development of the experimental
upper and lower body size charts required for constructing the prototype shirt and
trousers fit test garments are discussed in Chapter 4.

88
3.4 THE UPPER AND LOWER BODY GARMENT STYLES USED IN THIS PETITE
WOMEN‟S STUDY
The garments manufactured in this study are briefly discussed below to provide the
background to the garments used in the fit test evaluations in Chapter 5 of this
dissertation.
3.4.1 Basic style - women‟s shirt
Shirt garments consist of different styles ranging from being decorative to plain, the
fit ranging from body hugging to loose in silhouette, fabric types and densities
(Brough, 2008:3). A basic shirt style was used in this study because of its simplicity
and that it does not have a lot of stylized features which makes it ideal for testing the
fit of the upper body measurements of the petite women subjects collected in this
study (see Figure 3.6).
Figure 3.6: An image of a basic shirt (Adapted from Patch 2009:76).
3.4.2 Basic style – women‟s trouser
Petite women‟s trousers are created with a shorter crotch and seat rise (Rayner,
1997:1). The front and back crotch allowances are the most vital parts that control
the foundation of trousers which generally are constructed based on the front and
back measurement ratios, considering measurements taken from the upper thigh.
According to Hamilton (2015:1), regardless of the current fashion trends, trouser
styles fall into three basic silhouettes, namely: fitted, straight and flared. Joseph-
Armstrong (2014:661) further identifies four main trouser styles which are trousers,
slacks, culottes (which hang away from the body) and jeans which are designed to fit
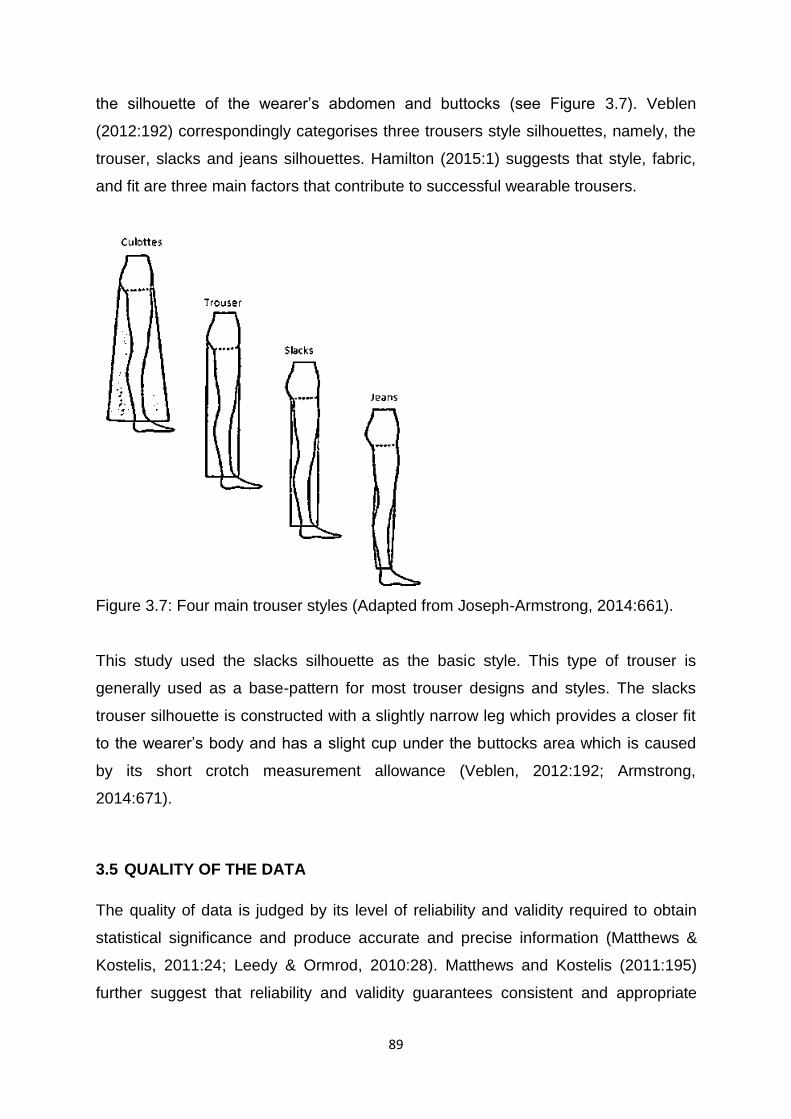
89
the silhouette of the wearer‟s abdomen and buttocks (see Figure 3.7). Veblen
(2012:192) correspondingly categorises three trousers style silhouettes, namely, the
trouser, slacks and jeans silhouettes. Hamilton (2015:1) suggests that style, fabric,
and fit are three main factors that contribute to successful wearable trousers.
Figure 3.7: Four main trouser styles (Adapted from Joseph-Armstrong, 2014:661).
This study used the slacks silhouette as the basic style. This type of trouser is
generally used as a base-pattern for most trouser designs and styles. The slacks
trouser silhouette is constructed with a slightly narrow leg which provides a closer fit
to the wearer‟s body and has a slight cup under the buttocks area which is caused
by its short crotch measurement allowance (Veblen, 2012:192; Armstrong,
2014:671).
3.5 QUALITY OF THE DATA
The quality of data is judged by its level of reliability and validity required to obtain
statistical significance and produce accurate and precise information (Matthews &
Kostelis, 2011:24; Leedy & Ormrod, 2010:28). Matthews and Kostelis (2011:195)
further suggest that reliability and validity guarantees consistent and appropriate
90
findings, thus enhancing the study‟s credibility. Therefore, this study was
benchmarked on previous 3D full body scanner studies conducted by Pandarum
(2006, 2009) and an on-going (2015) study and on a pilot sample of petite women
prior to conducting this study.
3.6 ETHICAL CONSIDERATIONS
Ethical considerations are the moral standards that should be considered in all
stages of a research project. These mainly consist of “Protection from harm,
informed consent and right to privacy” (Leedy et al., 2010:101). Matthews and
Kostelis (2011:146) regard ethics as issues that focuses on right or wrong principles
along with honest and responsible conduct applied to scientific studies. Leedy and
Ormrod (2010:101) advise that research studies that involve human beings as
participants must address their ethical considerations prior to commencing with the
study, throughout the study and after the study is conducted, to ensure that the
subjects are protected against deception, dangerous procedures and invasion of
their privacy. The researcher evaluated the measurement procedures and protocols,
thus ensuring that every subject was comfortable and kept informed throughout the
data collection process. Acts of politeness, honesty and understanding were
extended towards individuals taking part in the study throughout the entire data
collection process. Whenever participants required any clarity regarding the study,
the researcher offered all the possible assistance; if not, necessary
recommendations from qualified individuals were available to assist them.
Ethical issues relating to the dissertation‟s framework, the data collection process
and the contribution of the individuals to the study were addressed by seeking
approval for conducting the study from the College Ethics Committee of the College
of Agricultural and Environmental Sciences at University of South African (UNISA).
The ethical clearance reference number 2015/CAES/116, as presented in Appendix
C was obtained for this study. This ethical clearance number is a supplementary
application to be included within an existing approved generic ethical clearance
reference number: 2011/CAES/044 obtained under the 3D body scanner theme in
the Department of Life and Consumer Sciences at UNISA.
91
Creswell (2009:89) suggests that studies that include a consent form, which is a
participant information sheet, should be distributed to the participants to sign before
taking part in the study. Hence, the researcher ensured that all the subjects signed
their consent forms before collecting their body measurement data. The subjects
were informed about the purpose of the study and the procedures that took place,
emphasising that their participation was voluntary. According to Leedy and Ormrod
(2010:102-103), in any study, it is the researcher‟s responsibility to ensure that the
subject‟s information is not disclosed or unrestricted for other people to see unless
the participant approves. The researcher accentuated confidentiality by ensuring the
subjects that their data was not made public without their knowledge. The researcher
also retained all the returned documents in a safe place accessible only to the
researcher.
A raffle draw incentive was offered, to show the subjects that their time and
contribution in this study were appreciated and to avoid individual claims of the
incentive prize. Göritz (2006:58) and Laguilles et al. (2011:549) state that incentives
are used as a traditional motivation to increase people‟s willingness to participate in a
study. All 200 of the subjects who took part in the study were eligible for the incentive
offered in this study. The subjects were requested to complete a separate raffle draw
form that was drawn at the conclusion of this study data collection process, where
two lucky recipients shared a prize of R500 each.
According to Cobanoglu and Cobanoglu (2003:486), there are ethical considerations
when using incentives, such as honesty in allocating the promised incentive. The
subjects‟ completed raffle draw forms were stored in a closed box. The raffle was
drawn in an environment where each of the subjects had an equal chance of being
selected to win the lucky draw. The second ethical consideration suggested, was that
the researcher openly inform the participants about the conditions of the incentive.
The subjects were informed of the date and time when the lucky draw would be
conducted.
92
The raffle draw forms were kept separate from the completed demographic and
psychographic questionnaire forms used to collect data. Each subject completed the
questionnaire form without the researcher interfering or influencing the subjects‟
answers, so that no biasness occurred. However, clarity was provided to subjects
who had difficulty in completing the data forms. The subjects were encouraged to fill
in their correct contact details and residential addresses to ensure that they stand a
chance of being accessible when they win the prize or when contacted (as they had
indicated in the demographic form) to assist with the assessment of the prototype
garment fit test evaluations.
The following chapter presents the data analysis and interpretation of the data
collected in this study.

93
CHAPTER 4
DATA ANALYSIS AND INTERPRETATION
4.1 INTRODUCTION
In this chapter, the anthropometric data obtained from the 3D full body scans of the
petite women are statistically analysed to establish the most prevalent body shape
emerging from the data-set and to identify the key body dimensions to develop the
experimental size charts as set out in the objectives for this study. This chapter also
analyses the responses in the psychographic questionnaire of the subject‟s self-
perceptions of their body shapes and body proportions together with their ready-to-
wear apparel shopping behaviour when purchasing a basic shirt and trouser garment
in retail outlets.
The approach to the data analysis was to firstly “fill in” the missing areas (holes) in
the subjects‟ 3D scan surface that were not captured by the 3D full body scanner.
This was done by using the “MeshLab” software, thereby avoiding inaccurate
measurement values within the 3D full body scanned data as a result of missing
data, especially in the bust area. Cignoni et al. (2008: 47) defines MeshLab as a
mesh processing system that provides a set of tools for “editing, cleaning, healing,
inspecting, rendering and transforming” 3D surfaces arising from sensor
imperfections and low surface reflectivity of 3D scanned models.
The bust was the area that typically required re-construction as there were holes in
some of the scans. Descriptions on how the missing areas were filled and the
percentage of the sample are presented in the latter half of the following section.
Thereafter, the raw data was exported into a Microsoft Excel spreadsheet. The
statistical analysis of the 3D full body scanned data was performed using the IBM
SPSS Statistics 24 2016 software to develop size charts for the upper and lower
body dimensions for use in the garment fit test evaluations. The data from the
experimental upper and lower body size charts were used to create the prototype
shirt and trouser garment pattern blocks for a size 10/34 subject, to evaluate the
accuracy of the size charts developed in this study.

94
4.2 SUBJECTS‟ DEMOGRAPHIC AND BODY SHAPE INFORMATION
As mentioned in Chapter 3, 200 petite women subjects were recruited for the study
(refer to Table 3.1 in section 3.2.1 for the number and percentages of the subjects
within the different demographic group viz. Blacks, Coloureds, Indians and White).
The statistical distributions of the 200 subjects‟ age groups; weight and height
measurements are presented as graphs in Figure 4.1.
Figure 4.1: The age, weight and height measurements distributions of the 200, 3D
full body scanned South African petite women subjects collected for this study.
Figure 4.1 demonstrates that the ages of the 200 petite women subjects scanned in
this study ranged from 20 to 54. Their body weights ranged between 38 kilograms to
125 kilograms and their height measurements from 141 cm to 163 cm, with an
average height measurement of 157 cm. This addresses, Objective 1 of this study.
The subjects‟ body shapes were identified using the shape identification programme
installed in the (TC)² NX16 3D full body scanner to determine the most commonly
occurring body shapes of the 200 subjects that were 3D scanned.
The justification, for using the (TC)² NX16 3D full body scanner installed body shape
software as opposed to visually assessing the 3D full body scans to identify the

95
different and, hence, the predominantly emerging body shape in this study, was that
two previous research projects also used computer software to analyse body shapes
using 3D full body scanned data. These were the Figure Identification Technique
(FFIT©) for Apparel research, developed by Simmons et al. in 2004b and the Body
Shape Assessment Scale (BSAS©) developed by Connell et al. in 2006, both these
studies are within the scope of this study.
Similar to Simmons et al.’s (2004b) and Connell et al.’s (2006) studies as explained
in section 2.3.1, the body shape profiles extracted by the (TC)² NX16 3D full body
scanner in this study used the petite bust, upper waist, and hips girth proportions to
classify their body shapes. Four body shape profiles emerged from the data after
using the software, namely: the inverted triangular, hourglass, straight and the pear
shape profiles (see Table 4.1).
Table 4.1: The different body shapes that emerged from the 200, 3D scanned
subjects
BODY SHAPE PROFILE NUMBER PERCENTAGE
HOURGLASS 5 2.5%
INVERTED TRIANGULAR 7 3.5%
STRAIGHT 24 12%
PEAR 180 90%
Total 200 100%
Table 4.1 shows the number and percentage distributions of the different petite
women‟s body shapes for the 200 subjects‟ 3D data in this study. As noted the
majority of the 200 petite women subjects‟ 3D scanned body shapes were classified
as being a pear shape profile represented by 90% (n=180) of the subjects. The
balance of the shapes that were extracted from the 200, 3D full body scans included
the straight 12% (n=24), inverted triangular 3.5% (n=7), and the hourglass 2.5%
(n=5).
There was a crossover on 16 subjects scanned body shapes where the shape
profiles were categorised between two body profiles. This resulted in a total of 216
body shape representations, in 200 subjects.

96
The arising crossover body shape profiles were all included in the pear body shape
sample for further analysis. All five of the hourglass and 11 of the straight body
shapes crossed over into the pear body shape; this could be attributed to the body
shapes software‟s algorithms not being able to clearly distinguish between the body
outlines. The body shapes that had crossed over were included in the 180 petite
pear body shape profiles sample for further data analysis in this petite sizing and fit
study. The remaining 20 subjects were omitted from the data analysis because their
body shapes and proportions differed from the pear body shape profile.
Following in Figure 4.2, are examples of the pear body shape 3D profiles for
subjects that were identified as being small and plus-size women‟s body shape
profiles.
Figure 4.2: An example of the small and plus-size women‟s pear body shape
profiles.
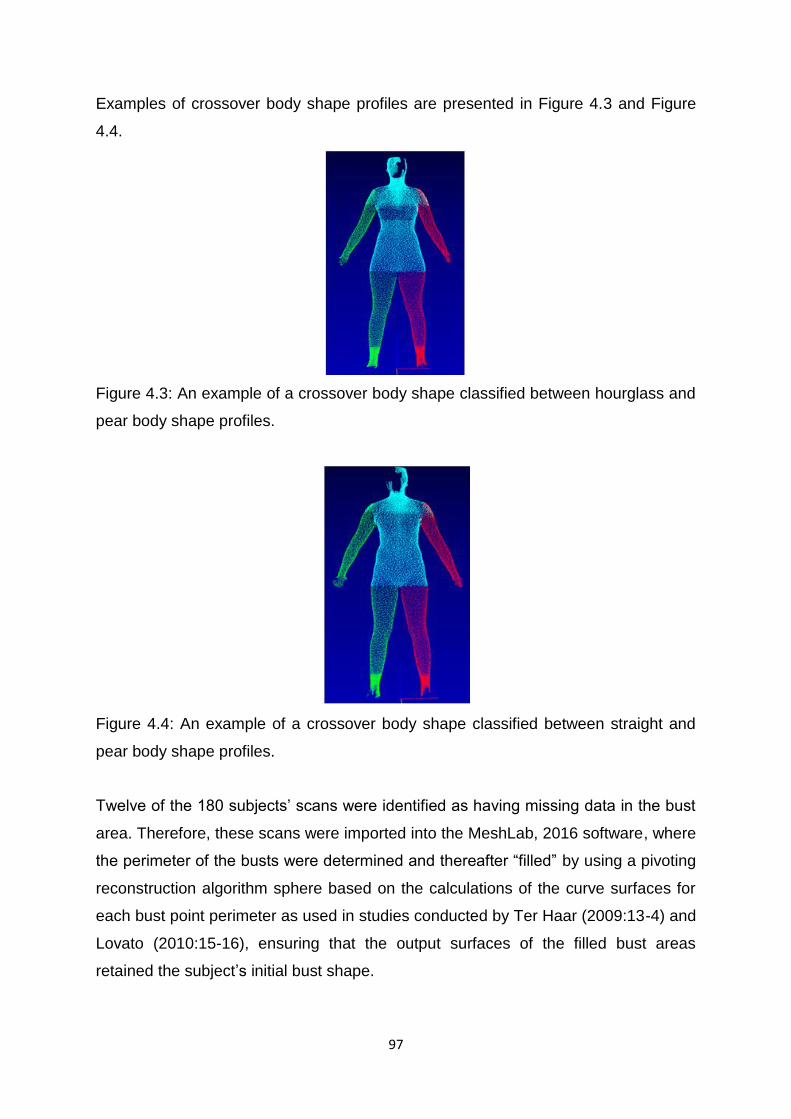
97
Examples of crossover body shape profiles are presented in Figure 4.3 and Figure
4.4.
Figure 4.3: An example of a crossover body shape classified between hourglass and
pear body shape profiles.
Figure 4.4: An example of a crossover body shape classified between straight and
pear body shape profiles.
Twelve of the 180 subjects‟ scans were identified as having missing data in the bust
area. Therefore, these scans were imported into the MeshLab, 2016 software, where
the perimeter of the busts were determined and thereafter “filled” by using a pivoting
reconstruction algorithm sphere based on the calculations of the curve surfaces for
each bust point perimeter as used in studies conducted by Ter Haar (2009:13-4) and
Lovato (2010:15-16), ensuring that the output surfaces of the filled bust areas
retained the subject‟s initial bust shape.
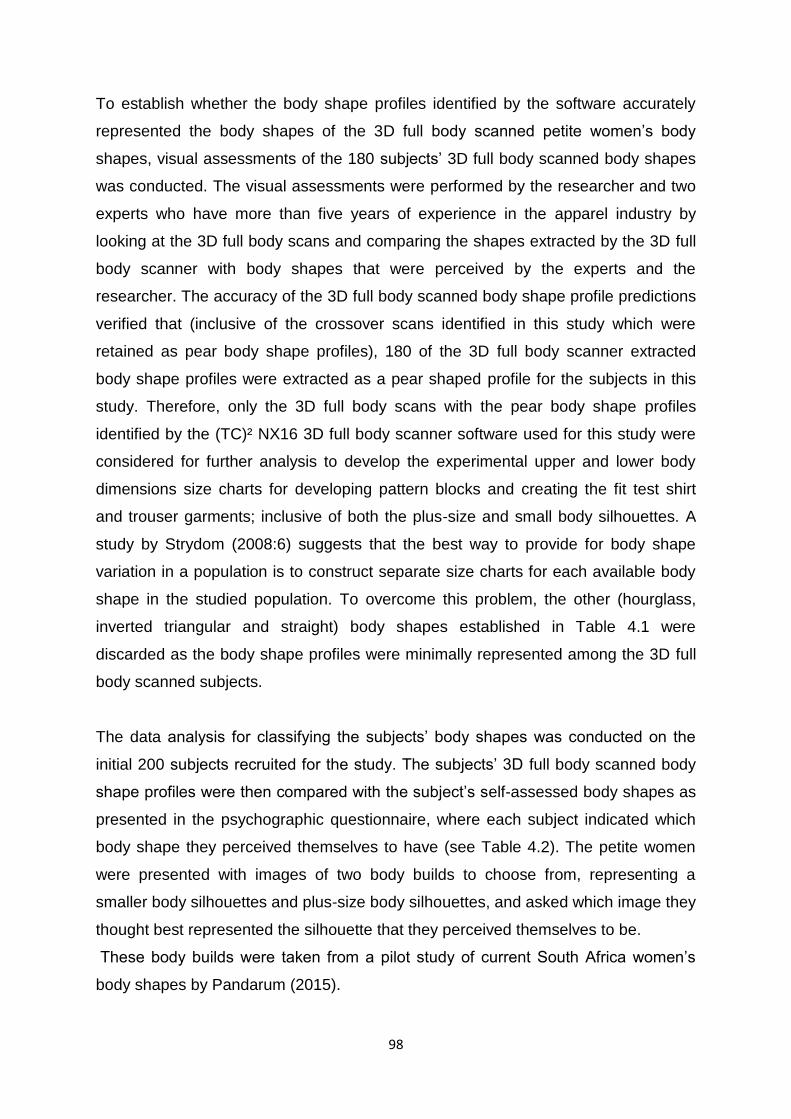
98
To establish whether the body shape profiles identified by the software accurately
represented the body shapes of the 3D full body scanned petite women‟s body
shapes, visual assessments of the 180 subjects‟ 3D full body scanned body shapes
was conducted. The visual assessments were performed by the researcher and two
experts who have more than five years of experience in the apparel industry by
looking at the 3D full body scans and comparing the shapes extracted by the 3D full
body scanner with body shapes that were perceived by the experts and the
researcher. The accuracy of the 3D full body scanned body shape profile predictions
verified that (inclusive of the crossover scans identified in this study which were
retained as pear body shape profiles), 180 of the 3D full body scanner extracted
body shape profiles were extracted as a pear shaped profile for the subjects in this
study. Therefore, only the 3D full body scans with the pear body shape profiles
identified by the (TC)² NX16 3D full body scanner software used for this study were
considered for further analysis to develop the experimental upper and lower body
dimensions size charts for developing pattern blocks and creating the fit test shirt
and trouser garments; inclusive of both the plus-size and small body silhouettes. A
study by Strydom (2008:6) suggests that the best way to provide for body shape
variation in a population is to construct separate size charts for each available body
shape in the studied population. To overcome this problem, the other (hourglass,
inverted triangular and straight) body shapes established in Table 4.1 were
discarded as the body shape profiles were minimally represented among the 3D full
body scanned subjects.
The data analysis for classifying the subjects‟ body shapes was conducted on the
initial 200 subjects recruited for the study. The subjects‟ 3D full body scanned body
shape profiles were then compared with the subject‟s self-assessed body shapes as
presented in the psychographic questionnaire, where each subject indicated which
body shape they perceived themselves to have (see Table 4.2). The petite women
were presented with images of two body builds to choose from, representing a
smaller body silhouettes and plus-size body silhouettes, and asked which image they
thought best represented the silhouette that they perceived themselves to be.
These body builds were taken from a pilot study of current South Africa women‟s
body shapes by Pandarum (2015).
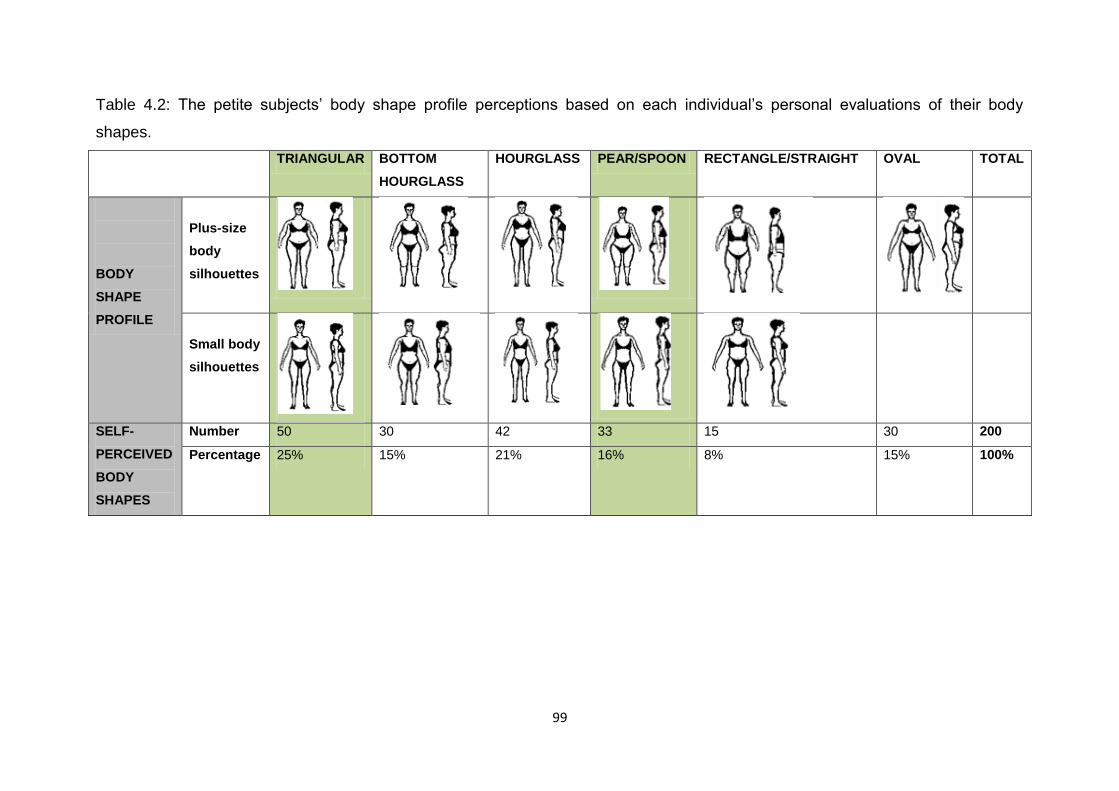
99
Table 4.2: The petite subjects‟ body shape profile perceptions based on each individual‟s personal evaluations of their body
shapes.
TRIANGULAR BOTTOM
HOURGLASS
HOURGLASS PEAR/SPOON RECTANGLE/STRAIGHT OVAL TOTAL
BODY
SHAPE
PROFILE
Plus-size
body
silhouettes
Small body
silhouettes
SELF-
PERCEIVED
BODY
SHAPES
Number 50 30 42 33 15 30 200
Percentage 25% 15% 21% 16% 8% 15% 100%
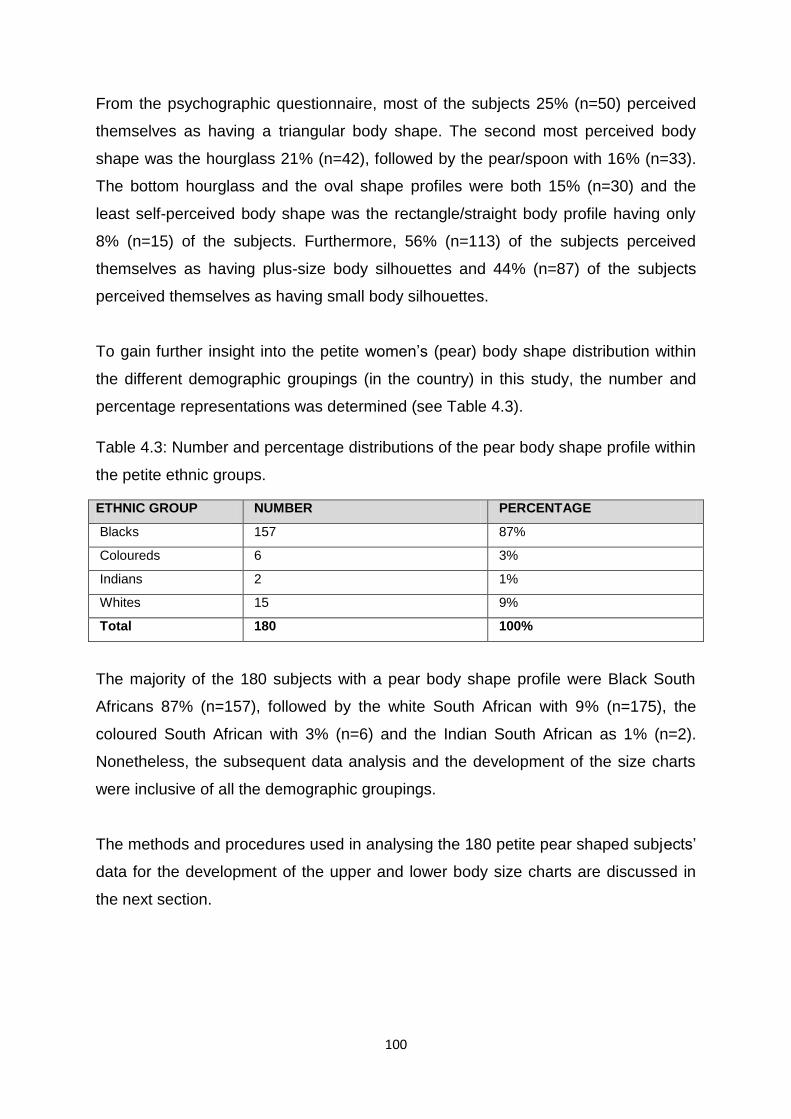
100
From the psychographic questionnaire, most of the subjects 25% (n=50) perceived
themselves as having a triangular body shape. The second most perceived body
shape was the hourglass 21% (n=42), followed by the pear/spoon with 16% (n=33).
The bottom hourglass and the oval shape profiles were both 15% (n=30) and the
least self-perceived body shape was the rectangle/straight body profile having only
8% (n=15) of the subjects. Furthermore, 56% (n=113) of the subjects perceived
themselves as having plus-size body silhouettes and 44% (n=87) of the subjects
perceived themselves as having small body silhouettes.
To gain further insight into the petite women‟s (pear) body shape distribution within
the different demographic groupings (in the country) in this study, the number and
percentage representations was determined (see Table 4.3).
Table 4.3: Number and percentage distributions of the pear body shape profile within
the petite ethnic groups.
The majority of the 180 subjects with a pear body shape profile were Black South
Africans 87% (n=157), followed by the white South African with 9% (n=175), the
coloured South African with 3% (n=6) and the Indian South African as 1% (n=2).
Nonetheless, the subsequent data analysis and the development of the size charts
were inclusive of all the demographic groupings.
The methods and procedures used in analysing the 180 petite pear shaped subjects‟
data for the development of the upper and lower body size charts are discussed in
the next section.
ETHNIC GROUP NUMBER PERCENTAGE
Blacks 157 87%
Coloureds 6 3%
Indians 2 1%
Whites 15 9%
Total 180 100%

101
4.3 PRINCIPAL COMPONENT ANALYSIS (PCA) FOR THE UPPER AND LOWER
BODY DIMENSIONS
In this section, the upper and the lower body dimensions of the 180 pear shaped
subjects were analysed separately. A total of 14 upper body dimensions required for
creating the shirt garments, and 13 lower body dimensions required for creating the
trouser garments for every 3D full body scanned subject was exported into the SPSS
software. Multivariate data analysis was used, to identify the relationship between
the body dimensions and how these correlate with each other. PCA was used to
identify the body dimensions that show a strong correlation with each other (Zakaria,
2014:104) and the correlation coefficient was used to measure the strength of the
relationship between the body dimensions extracted for this study.
In this study, a correlation matrix was calculated to identify the critical body
dimensions for the upper and lower body dimensions and to group the body
dimension variables into a smaller number of factors based on the factor loadings.
The datasets consisting of factor loadings are presented in the Principal Component
matrix, reported later in this chapter.
The correlation matrix used in calculating the factor loadings for determining the
relationships between the body dimensions in this study was derived and interpreted
using the guidelines and criteria provided by Maree (2007:234-236) and Leedy and
Ormrod (2010:273). These researchers stated that correlations measure the strength
of linear relationship between two quantitative variables, x and y. A correlation
coefficient that is closer to zero indicates a weak correlation between the two
variables. The values for a correlation coefficient are between -1 (minimum value)
and +1 (maximum value). The - sign indicates a negative relationship and the + sign
indicates a positive relationship between the two variables. Furthermore, a value of -
1 denotes a perfect negative relationship and a +1 value denotes a perfect positive
relationship. A positive correlation indicates that, if the key body measurement
increases, then the correlated body dimension also increases. A negative correlation
indicates that, if the key body measurement increases, then the correlated body
dimension decreases, while 0 means that there is no correlation between the body
dimensions (Zakaria, 2014:100).

102
Table 4.4 and Table 4.6 show the correlation matrices which present the correlations
between the studied variables in the upper and lower body dimensions required for
constructing the prototype shirt and trouser garment pattern blocks in this study. The
significance of the correlations is presented in Table 4.5 and Table 4.7.
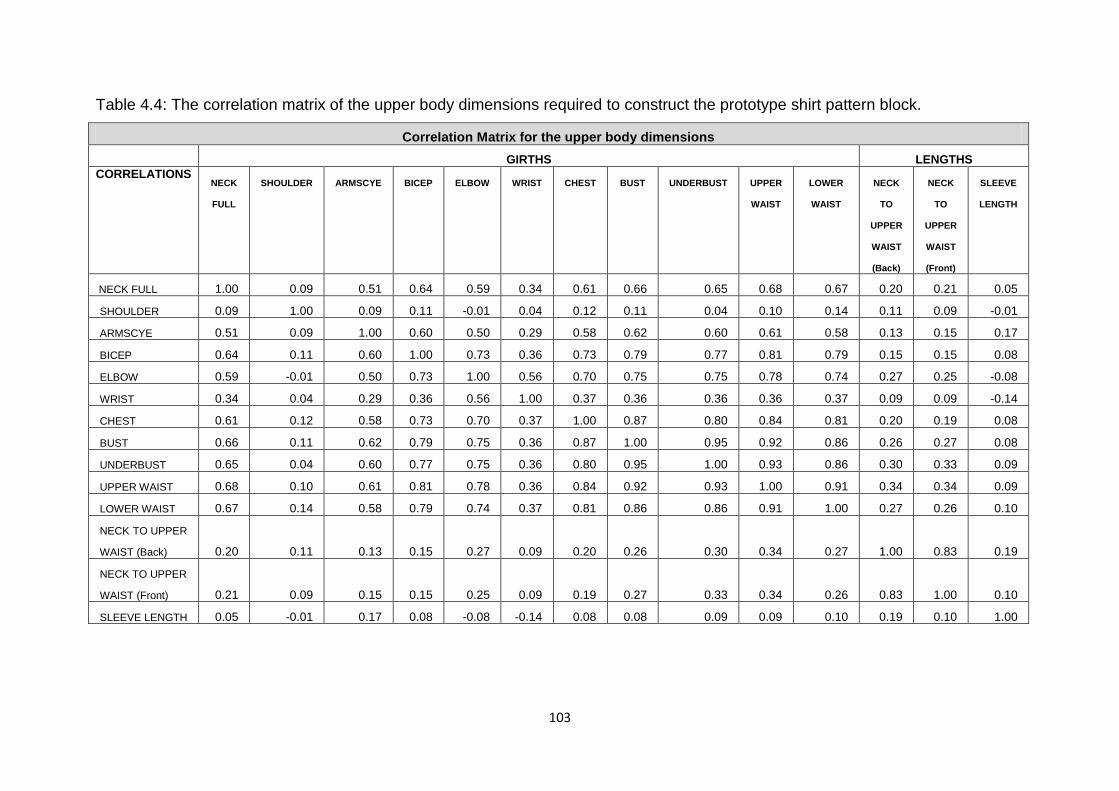
103
Table 4.4: The correlation matrix of the upper body dimensions required to construct the prototype shirt pattern block.
Correlation Matrix for the upper body dimensions
GIRTHS LENGTHS
CORRELATIONS NECK
FULL
SHOULDER ARMSCYE BICEP ELBOW WRIST CHEST BUST UNDERBUST UPPER
WAIST
LOWER
WAIST
NECK
TO
UPPER
WAIST
(Back)
NECK
TO
UPPER
WAIST
(Front)
SLEEVE
LENGTH
NECK FULL 1.00 0.09 0.51 0.64 0.59 0.34 0.61 0.66 0.65 0.68 0.67 0.20 0.21 0.05
SHOULDER 0.09 1.00 0.09 0.11 -0.01 0.04 0.12 0.11 0.04 0.10 0.14 0.11 0.09 -0.01
ARMSCYE 0.51 0.09 1.00 0.60 0.50 0.29 0.58 0.62 0.60 0.61 0.58 0.13 0.15 0.17
BICEP 0.64 0.11 0.60 1.00 0.73 0.36 0.73 0.79 0.77 0.81 0.79 0.15 0.15 0.08
ELBOW 0.59 -0.01 0.50 0.73 1.00 0.56 0.70 0.75 0.75 0.78 0.74 0.27 0.25 -0.08
WRIST 0.34 0.04 0.29 0.36 0.56 1.00 0.37 0.36 0.36 0.36 0.37 0.09 0.09 -0.14
CHEST 0.61 0.12 0.58 0.73 0.70 0.37 1.00 0.87 0.80 0.84 0.81 0.20 0.19 0.08
BUST 0.66 0.11 0.62 0.79 0.75 0.36 0.87 1.00 0.95 0.92 0.86 0.26 0.27 0.08
UNDERBUST 0.65 0.04 0.60 0.77 0.75 0.36 0.80 0.95 1.00 0.93 0.86 0.30 0.33 0.09
UPPER WAIST 0.68 0.10 0.61 0.81 0.78 0.36 0.84 0.92 0.93 1.00 0.91 0.34 0.34 0.09
LOWER WAIST 0.67 0.14 0.58 0.79 0.74 0.37 0.81 0.86 0.86 0.91 1.00 0.27 0.26 0.10
NECK TO UPPER
WAIST (Back) 0.20 0.11 0.13 0.15 0.27 0.09 0.20 0.26 0.30 0.34 0.27 1.00 0.83 0.19
NECK TO UPPER
WAIST (Front) 0.21 0.09 0.15 0.15 0.25 0.09 0.19 0.27 0.33 0.34 0.26 0.83 1.00 0.10
SLEEVE LENGTH 0.05 -0.01 0.17 0.08 -0.08 -0.14 0.08 0.08 0.09 0.09 0.10 0.19 0.10 1.00
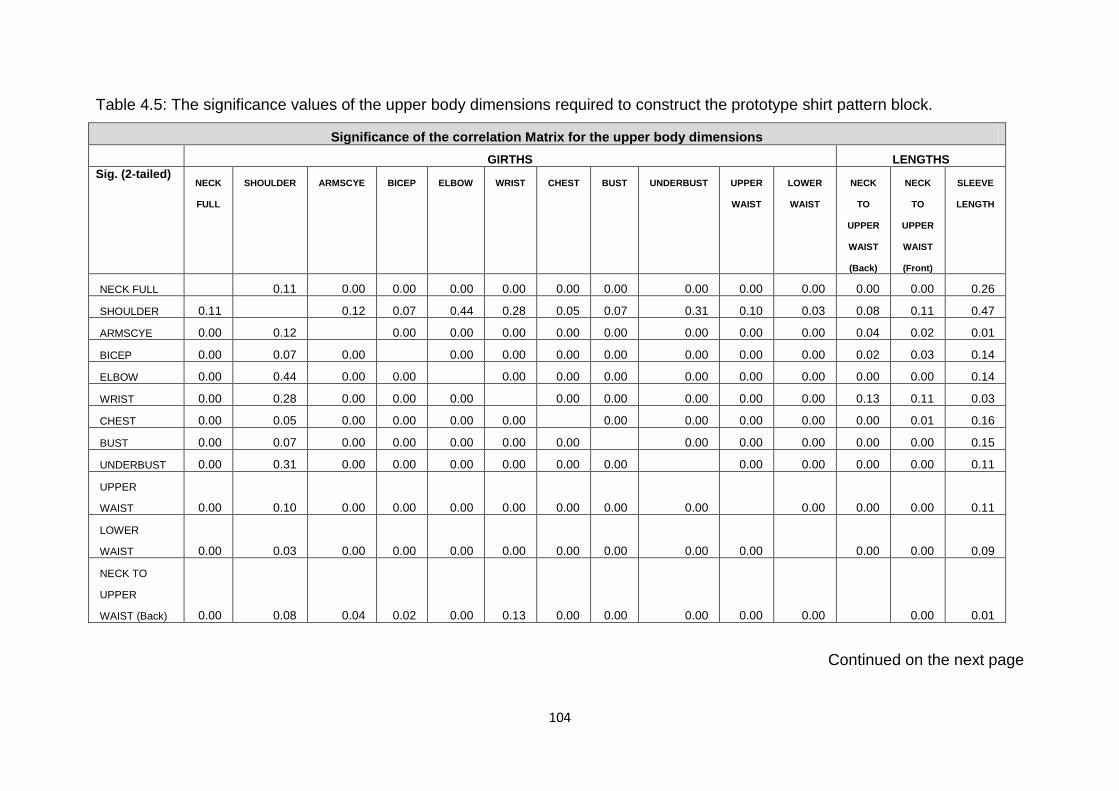
104
Table 4.5: The significance values of the upper body dimensions required to construct the prototype shirt pattern block.
Significance of the correlation Matrix for the upper body dimensions
GIRTHS LENGTHS
Sig. (2-tailed) NECK
FULL
SHOULDER ARMSCYE BICEP ELBOW WRIST CHEST BUST UNDERBUST UPPER
WAIST
LOWER
WAIST
NECK
TO
UPPER
WAIST
(Back)
NECK
TO
UPPER
WAIST
(Front)
SLEEVE
LENGTH
NECK FULL 0.11 0.00 0.00 0.00 0.00 0.00 0.00 0.00 0.00 0.00 0.00 0.00 0.26
SHOULDER 0.11 0.12 0.07 0.44 0.28 0.05 0.07 0.31 0.10 0.03 0.08 0.11 0.47
ARMSCYE 0.00 0.12 0.00 0.00 0.00 0.00 0.00 0.00 0.00 0.00 0.04 0.02 0.01
BICEP 0.00 0.07 0.00 0.00 0.00 0.00 0.00 0.00 0.00 0.00 0.02 0.03 0.14
ELBOW 0.00 0.44 0.00 0.00 0.00 0.00 0.00 0.00 0.00 0.00 0.00 0.00 0.14
WRIST 0.00 0.28 0.00 0.00 0.00 0.00 0.00 0.00 0.00 0.00 0.13 0.11 0.03
CHEST 0.00 0.05 0.00 0.00 0.00 0.00 0.00 0.00 0.00 0.00 0.00 0.01 0.16
BUST 0.00 0.07 0.00 0.00 0.00 0.00 0.00 0.00 0.00 0.00 0.00 0.00 0.15
UNDERBUST 0.00 0.31 0.00 0.00 0.00 0.00 0.00 0.00 0.00 0.00 0.00 0.00 0.11
UPPER
WAIST 0.00 0.10 0.00 0.00 0.00 0.00 0.00 0.00 0.00 0.00 0.00 0.00 0.11
LOWER
WAIST 0.00 0.03 0.00 0.00 0.00 0.00 0.00 0.00 0.00 0.00 0.00 0.00 0.09
NECK TO
UPPER
WAIST (Back) 0.00 0.08 0.04 0.02 0.00 0.13 0.00 0.00 0.00 0.00 0.00 0.00 0.01
Continued on the next page
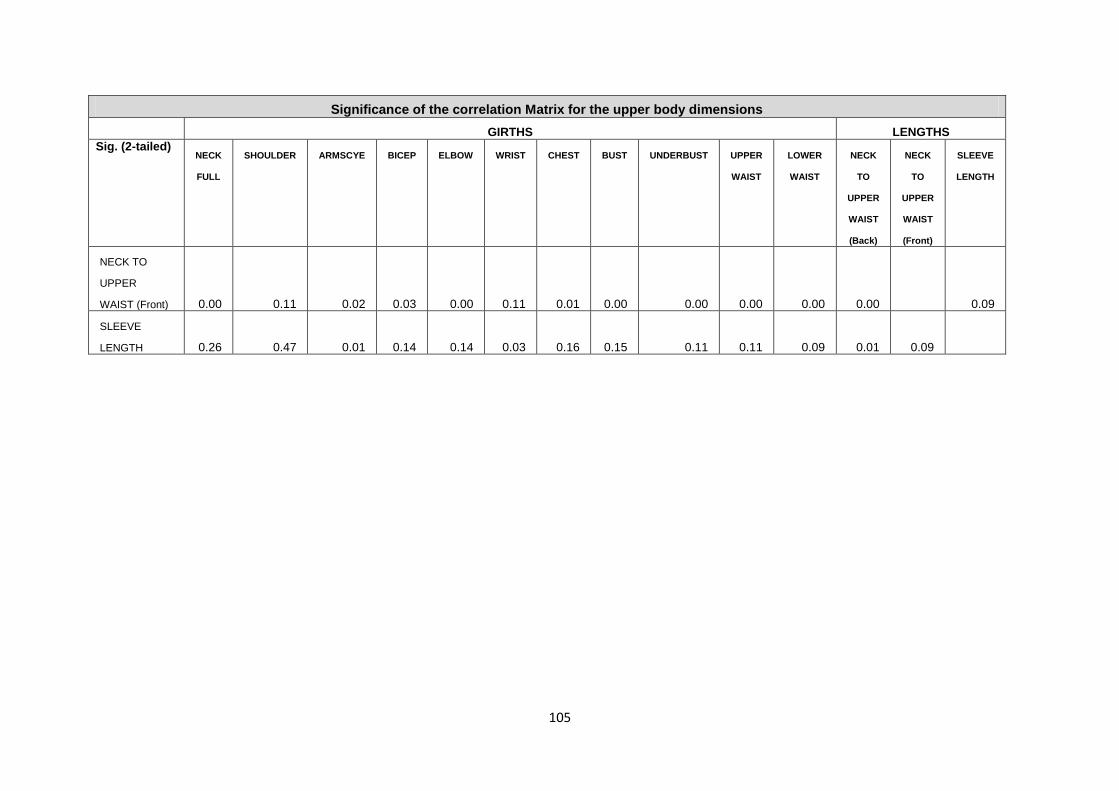
105
Significance of the correlation Matrix for the upper body dimensions
GIRTHS LENGTHS
Sig. (2-tailed) NECK
FULL
SHOULDER ARMSCYE BICEP ELBOW WRIST CHEST BUST UNDERBUST UPPER
WAIST
LOWER
WAIST
NECK
TO
UPPER
WAIST
(Back)
NECK
TO
UPPER
WAIST
(Front)
SLEEVE
LENGTH
NECK TO
UPPER
WAIST (Front) 0.00 0.11 0.02 0.03 0.00 0.11 0.01 0.00 0.00 0.00 0.00 0.00 0.09
SLEEVE
LENGTH 0.26 0.47 0.01 0.14 0.14 0.03 0.16 0.15 0.11 0.11 0.09 0.01 0.09
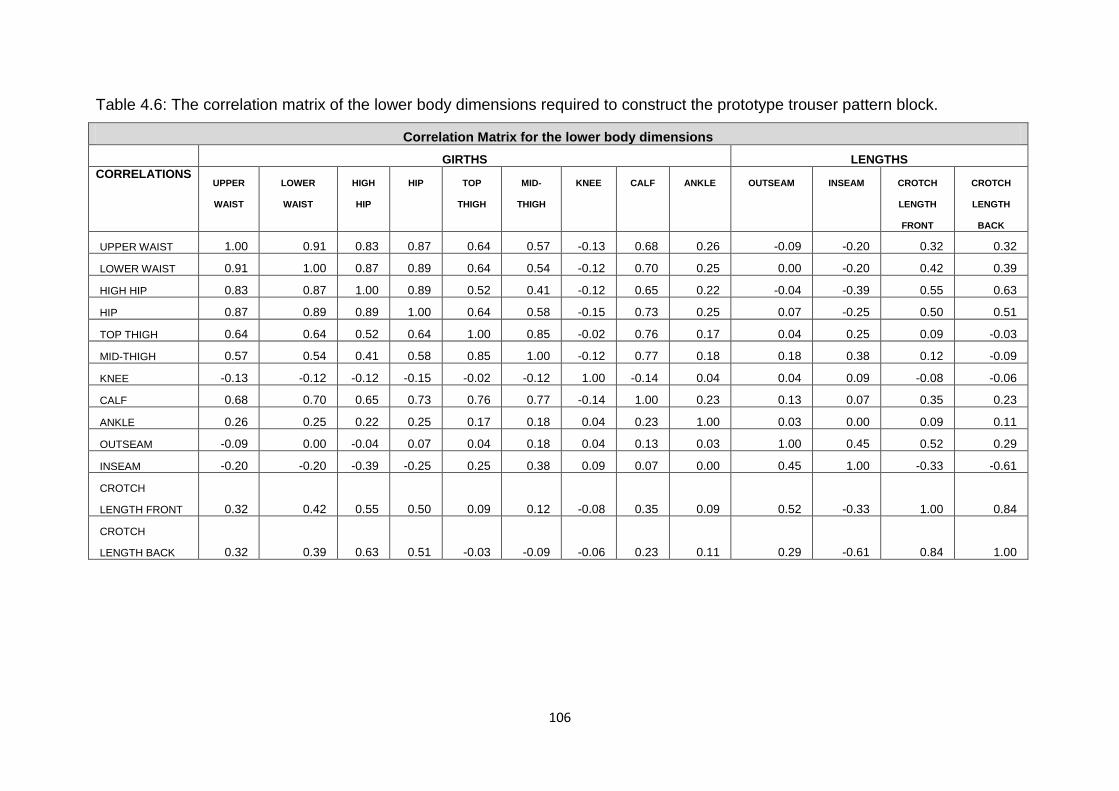
106
Table 4.6: The correlation matrix of the lower body dimensions required to construct the prototype trouser pattern block.
Correlation Matrix for the lower body dimensions
GIRTHS LENGTHS
CORRELATIONS UPPER
WAIST
LOWER
WAIST
HIGH
HIP
HIP TOP
THIGH
MID-
THIGH
KNEE CALF ANKLE OUTSEAM INSEAM CROTCH
LENGTH
FRONT
CROTCH
LENGTH
BACK
UPPER WAIST 1.00 0.91 0.83 0.87 0.64 0.57 -0.13 0.68 0.26 -0.09 -0.20 0.32 0.32
LOWER WAIST 0.91 1.00 0.87 0.89 0.64 0.54 -0.12 0.70 0.25 0.00 -0.20 0.42 0.39
HIGH HIP 0.83 0.87 1.00 0.89 0.52 0.41 -0.12 0.65 0.22 -0.04 -0.39 0.55 0.63
HIP 0.87 0.89 0.89 1.00 0.64 0.58 -0.15 0.73 0.25 0.07 -0.25 0.50 0.51
TOP THIGH 0.64 0.64 0.52 0.64 1.00 0.85 -0.02 0.76 0.17 0.04 0.25 0.09 -0.03
MID-THIGH 0.57 0.54 0.41 0.58 0.85 1.00 -0.12 0.77 0.18 0.18 0.38 0.12 -0.09
KNEE -0.13 -0.12 -0.12 -0.15 -0.02 -0.12 1.00 -0.14 0.04 0.04 0.09 -0.08 -0.06
CALF 0.68 0.70 0.65 0.73 0.76 0.77 -0.14 1.00 0.23 0.13 0.07 0.35 0.23
ANKLE 0.26 0.25 0.22 0.25 0.17 0.18 0.04 0.23 1.00 0.03 0.00 0.09 0.11
OUTSEAM -0.09 0.00 -0.04 0.07 0.04 0.18 0.04 0.13 0.03 1.00 0.45 0.52 0.29
INSEAM -0.20 -0.20 -0.39 -0.25 0.25 0.38 0.09 0.07 0.00 0.45 1.00 -0.33 -0.61
CROTCH
LENGTH FRONT 0.32 0.42 0.55 0.50 0.09 0.12 -0.08 0.35 0.09 0.52 -0.33 1.00 0.84
CROTCH
LENGTH BACK 0.32 0.39 0.63 0.51 -0.03 -0.09 -0.06 0.23 0.11 0.29 -0.61 0.84 1.00

107
Table 4.7: The significance values of the lower body dimensions required to construct the prototype trouser pattern block.
Significance of the correlation Matrix for the lower body dimensions
GIRTHS LENGTHS
Sig. (2-tailed) UPPER
WAIST
LOWER
WAIST
HIGH
HIP
HIP TOP
THIGH
MID-
THIGH
KNEE CALF ANKLE OUTSEAM INSEAM CROTCH
LENGTH
FRONT
CROTCH
LENGTH
BACK
UPPER WAIST 0.00 0.00 0.00 0.00 0.00 0.05 0.00 0.00 0.11 0.00 0.00 0.00
LOWER WAIST 0.00 0.00 0.00 0.00 0.00 0.05 0.00 0.00 0.50 0.00 0.00 0.00
HIGH HIP 0.00 0.00 0.00 0.00 0.00 0.06 0.00 0.00 0.31 0.00 0.00 0.00
HIP 0.00 0.00 0.00 0.00 0.00 0.03 0.00 0.00 0.17 0.00 0.00 0.00
TOP THIGH 0.00 0.00 0.00 0.00 0.00 0.37 0.00 0.01 0.28 0.00 0.11 0.33
MID-THIGH 0.00 0.00 0.00 0.00 0.00 0.05 0.00 0.01 0.01 0.00 0.05 0.12
KNEE 0.05 0.05 0.06 0.03 0.37 0.05 0.03 0.30 0.32 0.12 0.14 0.20
CALF 0.00 0.00 0.00 0.00 0.00 0.00 0.03 0.00 0.05 0.19 0.00 0.00
ANKLE 0.00 0.00 0.00 0.00 0.01 0.01 0.30 0.00 0.35 0.50 0.13 0.07
OUTSEAM 0.11 0.50 0.31 0.17 0.28 0.01 0.32 0.05 0.35 0.00 0.00 0.00
INSEAM 0.00 0.00 0.00 0.00 0.00 0.00 0.12 0.19 0.50 0.00 0.00 0.00
CROTCH
LENGTH FRONT 0.00 0.00 0.00 0.00 0.11 0.05 0.14 0.00 0.13 0.00 0.00 0.00
CROTCH
LENGTH BACK 0.00 0.00 0.00 0.00 0.33 0.12 0.20 0.00 0.07 0.00 0.00 0.00
108
The PCA provided the grouped factors for the correlation matrix. The correlation
coefficients show the strength and direction of the relationships between the
analysed body landmarks. The analysis extracted 14 upper body landmarks and 13
lower body landmarks for use in the construction of the prototype pattern blocks and
subsequently for the fitting test garments. The number of the body dimensions
extracted was the same as the number of the original body dimensions which
indicates that no data was omitted. The correlation coefficients observed in Table 4.4
and Table 4.6 are presented to measure the relationship between the body
dimensions extracted for developing the upper and lower body dimensions size
charts in this study.
This study established that the correlation within the body dimensions differed, some
of the body dimensions were observed to correlate strongly with specific body
dimensions where two paired sets of data were related (girths) but have weak
correlations with other body dimensions where the two paired datasets were not
related (girths and lengths). For example: the chest, bust, and underbust for the
upper body dimensions and the high hip and the hip for the lower body dimensions
represent girth measurements, show high correlations, indicating that they are
related to each other. However, they have low correlation values with the body
dimensions related to length measurements.
The significance values of the body dimensions were further analysed to measure
the mathematical probability of whether there is some evidence or no evidence at all
within the analysed data to suggest that linear correlation exists in the body
dimensions data taken from the subjects‟ 3D full body scanned data. The
significance values for testing the correlations related to the upper and lower body
dimensions are presented in Table 4.5 and Table 4.7.
According to Beaumont (2012:9) and Wasserstein and Lazar (2016:8) the standard
method that statisticians use to measure the significance of their experimental
analyses is the P-value for measuring the strength of the evidence against the null
hypothesis, which represents the probability that the analysed data was the result of
chance alone and would “have arisen if the null hypothesis were true”.

109
P-values decide whether to reject the null hypothesis or not. The smaller the P-value,
the stronger the evidence against the null hypothesis; P- values close to zero show
that the perceived variance is not likely to be unexpected, while P- values close to
one suggest that there are no variances between the clustered data other than by
coincidence. Thus, the significance rating depends on how close to zero the value is.
Should the P-value be a small number, it means that the probability is that the
prediction of the results, not by chance alone, accounts for the difference of the
analysed data. It can therefore be concluded that the results obtained from the 3D
full body scanned petite sample‟s body dimension correlation‟s data will produce
significant results, suggesting that the null hypothesis can be discarded with P-
values less than 0.05. Davies and Crombie (2009:2) consider P-values less than
0.05 to be an accepted standard probability that researchers use to produce
statistically significant results. The significance level of 0.05 was used for testing the
significance correlations of the body dimensions in this study.
The results of the significance correlations in this study were based on a two-tail
significance test. Two-tailed significance tests both the large and small values on
both ends of its distribution of the test value, regardless of the direction of the
hypothesised relationship, to provide evidence against the null hypothesis. The two-
tailed significance test in this study examines that the null hypothesis of a correlation
is “equal to 0.05”. The formula is often written as “H0: μ = 0.05” (Levine et al., 2008:
334-335).
The researcher had no prior knowledge as to which body dimensions had more
effective significance than the other. Hence, a two-sided hypothesis test was
appropriate. For this study, the statistical significance was determined with P-values.
The researcher tested the null hypothesis that is rejected if the P-values for the
correlations in the analysed upper and lower body dimensions were not equal to
0.05.

110
The significance values for the analysed data as observed in Table 4.5 and Table
4.7 show that most of correlations for the body dimensions had P-values that were
0.00 and some values were larger than 0.05, with only minor values of the
significance correlations having P-values equal to 0.05. The P-values observed in
the analysed data represent strong evidence against the null hypothesis, suggesting
a significant relationship between the analysed body dimensions; which means that
as one body dimension variable goes up or down so will the correlated body
dimension variable.
Beaumont (2012:9) suggests that the Bartlett‟s test of sphericity, together with the
Kaiser-Meyer-Olkin (KMO) can be used in SPSS to check whether the correlations
are valid for PCA. The Bartlett‟s test of sphericity and the Kaiser-Meyer-Olkin (KMO)
are further discussed later in this chapter. Age, height and weight were not
incorporated when defining the key (primary) body dimensions. Daniels (2008:45)
and Zakaria (2014:168-169) state that height and weight are not directly associated
with the fit of a garment, but they are used as a measure in assigning an individual to
a size group when developing size charts. It is also said that the body height and
weight classify the subject‟s body size and shape; height demonstrates the length
and weight demonstrates the thickness of the body.
The size chart for this study was constructed for the petite woman having an average
body height measurement of 157 cm; their body weight was between 37.6 kg -124.7
kg and, their age ranged from 20-54 years. Nonetheless, a correlation matrix was
initially performed inclusive of the age, height and weight to test how well the age,
height and weight correlate with the other body dimensions (see Table 4.8 and Table
4.10 for the age, height and weight correlations and the significance values in Table
4.9 and Table 4.11 for the upper and lower body dimensions).
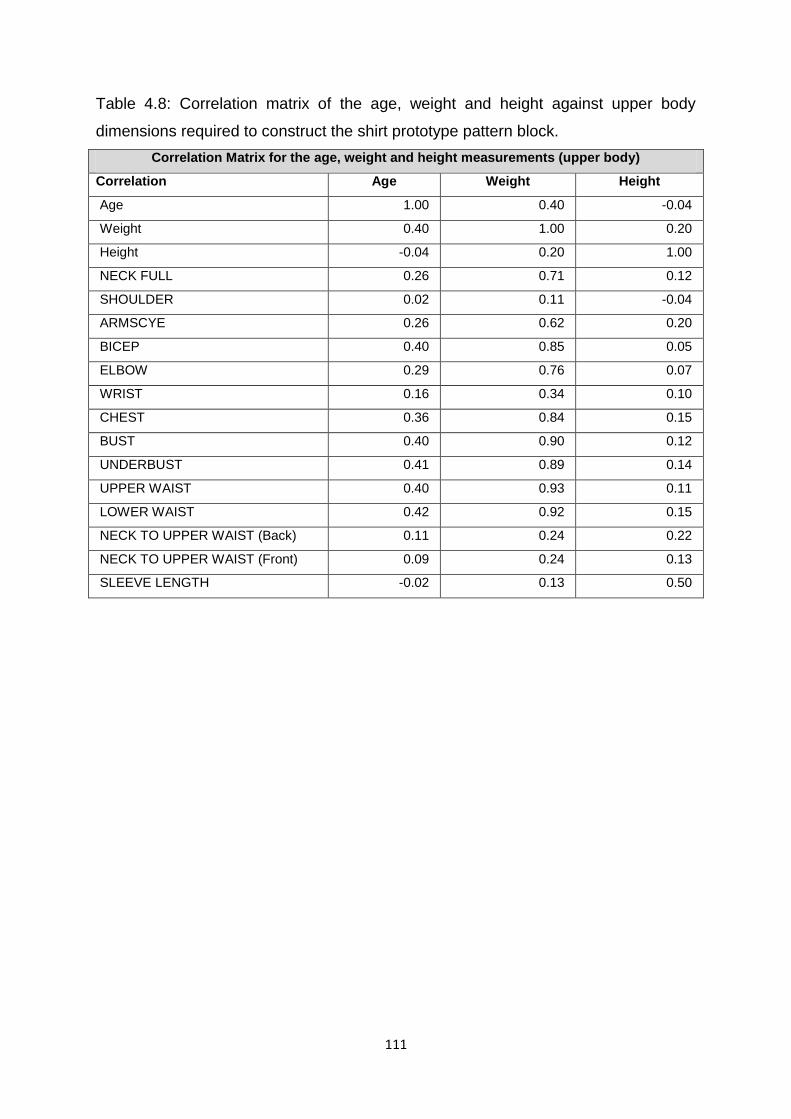
111
Table 4.8: Correlation matrix of the age, weight and height against upper body
dimensions required to construct the shirt prototype pattern block.
Correlation Matrix for the age, weight and height measurements (upper body)
Correlation Age Weight Height
Age 1.00 0.40 -0.04
Weight 0.40 1.00 0.20
Height -0.04 0.20 1.00
NECK FULL 0.26 0.71 0.12
SHOULDER 0.02 0.11 -0.04
ARMSCYE 0.26 0.62 0.20
BICEP 0.40 0.85 0.05
ELBOW 0.29 0.76 0.07
WRIST 0.16 0.34 0.10
CHEST 0.36 0.84 0.15
BUST 0.40 0.90 0.12
UNDERBUST 0.41 0.89 0.14
UPPER WAIST 0.40 0.93 0.11
LOWER WAIST 0.42 0.92 0.15
NECK TO UPPER WAIST (Back) 0.11 0.24 0.22
NECK TO UPPER WAIST (Front) 0.09 0.24 0.13
SLEEVE LENGTH -0.02 0.13 0.50

112
Table 4.9: The significance values of the age, weight and height against upper body
dimensions required to construct the prototype shirt pattern block.
Significance of the correlation Matrix for the age, weight and height measurements (upper
body)
Sig. (2-tailed) Age Weight Height
Age 0.00 0.32
Weight 0.00 0.00
Height 0.32 0.00
NECK FULL 0.00 0.00 0.05
SHOULDER 0.38 0.08 0.31
ARMSCYE 0.00 0.00 0.00
BICEP 0.00 0.00 0.27
ELBOW 0.00 0.00 0.17
WRIST 0.02 0.00 0.10
CHEST 0.00 0.00 0.02
BUST 0.00 0.00 0.05
UNDERBUST 0.00 0.00 0.03
UPPER WAIST 0.00 0.00 0.07
LOWER WAIST 0.00 0.00 0.02
NECK TO UPPER WAIST (Back) 0.07 0.00 0.00
NECK TO UPPER WAIST (Front) 0.11 0.00 0.04
SLEEVE LENGTH 0.42 0.05 0.00
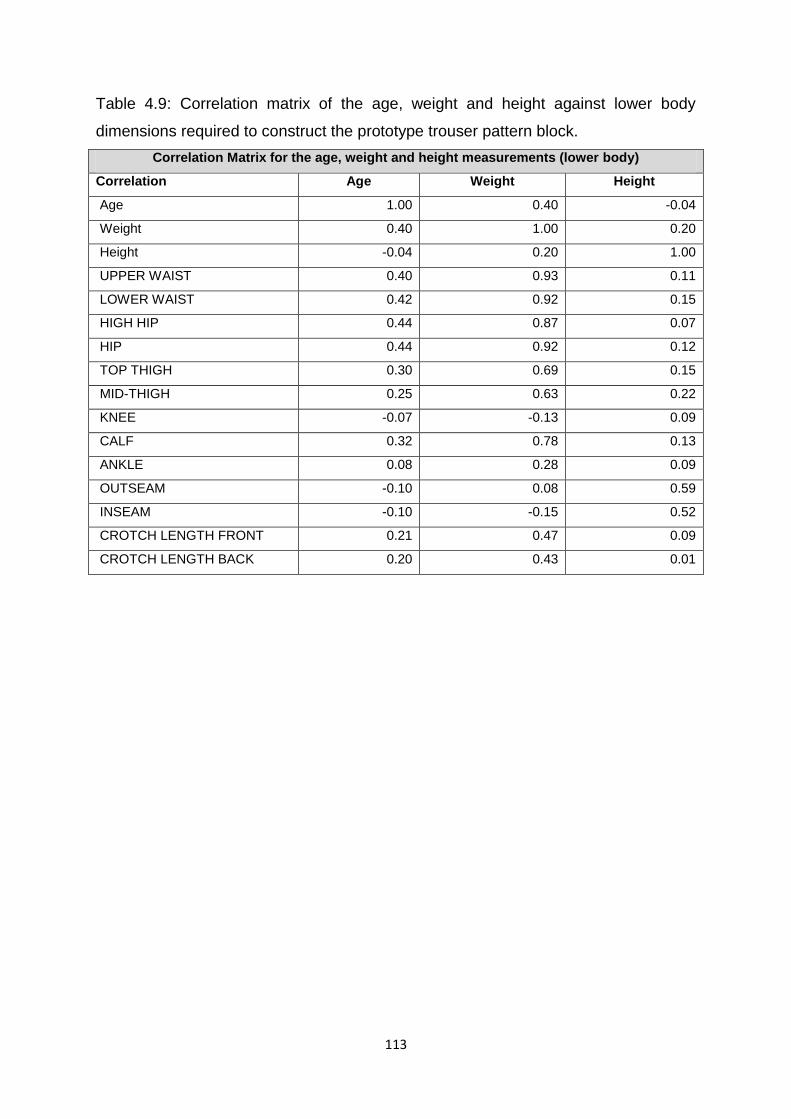
113
Table 4.9: Correlation matrix of the age, weight and height against lower body
dimensions required to construct the prototype trouser pattern block.
Correlation Matrix for the age, weight and height measurements (lower body)
Correlation Age Weight Height
Age 1.00 0.40 -0.04
Weight 0.40 1.00 0.20
Height -0.04 0.20 1.00
UPPER WAIST 0.40 0.93 0.11
LOWER WAIST 0.42 0.92 0.15
HIGH HIP 0.44 0.87 0.07
HIP 0.44 0.92 0.12
TOP THIGH 0.30 0.69 0.15
MID-THIGH 0.25 0.63 0.22
KNEE -0.07 -0.13 0.09
CALF 0.32 0.78 0.13
ANKLE 0.08 0.28 0.09
OUTSEAM -0.10 0.08 0.59
INSEAM -0.10 -0.15 0.52
CROTCH LENGTH FRONT 0.21 0.47 0.09
CROTCH LENGTH BACK 0.20 0.43 0.01

114
Table 4.10: The significance values of the age, weight and height against lower body
dimensions required to construct prototype trouser pattern block.
Significance of the correlation Matrix for the age, weight and height measurements (lower
body)
Sig. (2-tailed) Age Weight Height
Age 0.00 0.32
Weight 0.00 0.00
Height 0.32 0.00
UPPER WAIST 0.00 0.00 0.07
LOWER WAIST 0.00 0.00 0.02
HIGH HIP 0.00 0.00 0.17
HIP 0.00 0.00 0.06
TOP THIGH 0.00 0.00 0.03
MID-THIGH 0.00 0.00 0.00
KNEE 0.19 0.05 0.13
CALF 0.00 0.00 0.04
ANKLE 0.14 0.00 0.12
OUTSEAM 0.09 0.13 0.00
INSEAM 0.10 0.03 0.00
CROTCH LENGTH FRONT 0.00 0.00 0.12
CROTCH LENGTH BACK 0.00 0.00 0.47
As indicated in Table 4.8 and Table 4.10, there is a low correlation between the age
and height measurements when evaluated against both the upper and lower body
dimensions. Weight had significant correlations with nine upper body dimensions,
namely; neck full, armscye, bicep, elbow, chest, bust, underbust, upper waist and the
lower waist. The body dimensions with significant correlations with the weight
measurement in the lower body dimensions included seven body dimensions,
namely; the upper waist, lower waist, high hip, hip, top thigh, mid-thigh, and the calf.
It was evident from the results that weight strongly correlated with only the girth
measurements in both the upper and lower body dimensions, which endorse
Zakaria‟s (2014:96) study that the body weight is determined by the thickness of the
body. As a result, girth measurements were used as an alternative to the weight
measurement when analysing the size charts sizing measurements.

115
Similarly, since the height had no correlation with any of the body dimensions, both
the upper and lower body dimensions representing the petite women‟s body length
measurements were used when analysing the sizing measurements for the size
charts to be developed in this study.
The significance evidence in the analysed data in Table 4.9 and Table 4.11, for both
the upper and lower body dimensions show that most of the P-values observed for
the body dimensions were lower than 0.05 and therefore, were significantly
correlated between the body dimension parameters. There were minor values in the
analysed data that were not statistically significant. Nonetheless, the age, height and
weight were not included when defining the key (primary) body dimensions required
for developing the size charts in this study.
Prior to conducting the PCA, the Bartlett‟s Test of “Sphericity” and the Kaiser-Meyer-
Olkin (KMO) Test of Sampling Adequacy were used to authenticate whether or not
the factor analysis used to analyse the data was viable and to establish whether the
data can be well factored. This was done to ensure that the observed correlation
matrix was statistically reliable and that linear combinations exist within the data. The
KMO must be greater than 0.5 and the Bartlett‟s test must be less than 0.05 to be
considered significant for use. Values that are between 0.5 and 0.7 are average,
whilst values between 0.7 and 0.8 are good. Values between 0.8 and 0.9 are very
good in producing statistically valid data and values, above 0.9 indicate that the
results are the best for indicating whether the factor analysis will produce applicable
and well factored data (Zakaria, 2011:351; Beavers et al., 2013:4; Muslim et al.,
2014:18; Zakaria, 2014:104-05). Table 4.12 and Table 4.13 present KMO values and
the Bartlett's Test for the upper body dimensions required for developing the shirt
pattern block and the lower body measurements required for developing the trouser
pattern block.

116
Table 4.11: The Bartlett‟s Test of “Sphericity” and the Kaiser-Meyer-Olkin Test of
Sampling Adequacy (KMO) for the upper body dimensions.
KMO and Bartlett's Test for the upper body dimensions
Kaiser-Meyer-Olkin Measure of Sampling Adequacy. 0.89
Bartlett's Test of Sphericity Approx. Chi-Square 2330.81
df 91
Sig. 0.00
Table 4.12: The Bartlett‟s Test of “Sphericity” and the Kaiser-Meyer-Olkin Test of
Sampling Adequacy (KMO) for the lower body dimensions.
KMO and Bartlett's Test for the lower body dimensions
Kaiser-Meyer-Olkin Measure of Sampling Adequacy. 0.79
Bartlett's Test of Sphericity Approx. Chi-Square 2448.35
df 78
Sig. 0.00
As shown in Table 4.12 and Table 4.13, the Kaiser-Meyer-Olkin Test (KMO) values
were very good (0.89) for the upper body dimensions required for developing the
shirt pattern block; the lower body measurements were good (0.79), indicating that
the factor analysis data for both the upper and lower body dimensions were
applicable to produce well factored results. The Bartlett‟s test, representing both the
upper and lower body measurements, had a low significance value of 0.00, as a
result both the variables, as a set, were significantly correlated and, thus, the factor
analysis used in this research was appropriate. It can be further concluded that the
relationship between the body dimensions were good to great in rating. It can
therefore be assumed that the factor analysis can be performed and is likely to factor
well in the PCA.
PCA was performed on the data to gain several critical understandings into the
characteristics of the data. Gupta and Gangadhar (2004:459), Bagherzadeh et al.
(2010:925), and Zakaria (2011:349) suggest that PCA can assist in selecting
representative divisions of variables and establishing which variables may act in
performance together, as well as detecting how many variables may be expected to
have influences in the data analysis.

117
PCA was performed using the IBM SPSS Statistics 24 2016 statistical software and
an orthogonal method, called the varimax technique, was used to extract and
transform all the data collected by the 3D full body scanner into components. The
body dimensions in this study were extracted using PCA and the varimax rotation.
To establish the key (primary) body dimensions to be used when developing the
experimental size charts for this study, the collected 3D full body scanned data was
segmented into upper and lower body dimensions. This was done to identify the
number of component variables to be retained based on factor loadings.
The factor loadings extracted in this study were determined for both the upper and
lower body dimensions based on Eigen values greater than 1 to determine the
number of significant factors to retain. Eigen values represent the amount of
variance accounted for by a factor (body dimension). Eigen values that are greater
than 1 account for a meaningful amount of variance in the body dimensions and are
worthy of being retained (Yong & Pearce, 2013: 85; Zakaria, 2014:106).
Prior to establishing the Eigen values, the total percentage of variance and a screen
test plot of the 3D full body scanned data were analysed and performed respectively
to identify how many factors should be retained for further analysis (see Table 4.14
and Table 4.15).

118
Table 4.13: The total variance explained for the upper body dimensions required for developing the prototype shirt pattern block.
Total Variance Explained for the upper body dimensions
Component Initial Eigenvalues Extraction Sums of Squared Loadings Rotation Sums of Squared Loadings
Total % of Variance Cumulative% Total % of Variance Cumulative% Total % of Variance Cumulative%
1 7.3 52.2% 52.2% 7.3 52.2% 52.2% 6.8 48.7% 48.7%
2 1.7 12.3% 64.5% 1.7 12.3% 64.5% 2.1 15.1% 63.8%
3 1.1 8.2% 72.7% 1.1 8.2% 72.7% 1.2 8.9% 72.7%
4 1.0 7.2% 79.9%
5 0.7 5.2% 85.1%
6 0.5 3.7% 88.8%
7 0.5 3.3% 92.1%
8 0.3 2.2% 94.3%
9 0.2 1.5% 95.8%
10 0.2 1.4% 97.2%
11 0.2 1.2% 98.4%
12 0.1 1.0% 99.3%
13 0.1 0.4% 99.8%
14 0.0 0.3% 100.0%

119
Table 4.14: The total variance explained for the lower body dimensions required for developing the prototype trouser pattern block.
Total Variance Explained for the lower body dimensions
Component
Initial Eigenvalues Extraction Sums of Squared Loadings Rotation Sums of Squared Loadings
Total % of Variance Cumulative% Total % of Variance Cumulative% Total % of Variance Cumulative%
1 5.8 44.6% 44.6% 5.8 44.6% 44.6% 5.2 40.2% 40.2%
2 2.5 18.9% 63.5% 2.5 18.9% 63.5% 2.8 21.2% 61.4%
3 1.6 12.7% 76.2% 1.6 12.7% 76.2% 1.9 14.8% 76.2%
4 1.0 8.0% 84.2%
5 0.9 6.7% 90.9%
6 0.4 3.1% 94.0%
7 0.2 1.5% 95.5%
8 0.2 1.2% 96.7%
9 0.1 1.0% 97.7%
10 0.1 0.9% 98.6%
11 0.1 0.7% 99.2%
12 0.1 0.5% 99.7%
13 0.0 0.3% 100.0%

120
Table 4.14 show that the upper body dimensions had 52.2% of the variance
explained by the first component, 12.3% by the second component and 8.2% by the
third component. In Table 4.15, the lower body dimensions had 44.6% of the
variance explained by the first component, 18.9% by the second component and
12.7% by the third component. According to Zakaria (2014:107) the first few
components should explain at least 50% of the variance to prove the practicality of
PCA. Therefore, three components were retained for both the upper and lower body
dimensions showing the extracted and rotated cumulative percentages of 72.7% for
the upper body dimensions and the lower body dimensions showing the extracted
and rotated cumulative percentages of 76.2%, validating that the analysed data was
practical for use in PCA.
The Eigen values of each of the 14 upper body dimensions and 13 lower body
dimensions were derived. The scree plot was analysed to determine where the
Eigen value was greater than 1 to verify the number of components to retain for use
in this study. The scree plot is usually used together with the Eigen values to
determine the number of factors to retain; which is determined by the break point
(curve) of the line in the scree plot. The x-axis represents the components and the
Eigen values are along the y-axis. The first component accounts for the highest
amount of variance and has the highest Eigen value. The Scree plot has a cut-off
area, resulting in a line illustrating an “elbow” shape where the number of
components to be retained is limited (Yong & Pearce, 2013:85; Zakaria 2014:106).
Each component that appeared before the break point, at an Eigen value range that
was greater than 1 was considered to be meaningful and was retained for the
analysis in this study. The scree plots for retaining factor loadings for both the upper
and lower body dimensions required for developing the shirt and trouser pattern
blocks are illustrated in Figure 4.5 and Figure 4.6.

121
Figure 4.5: A scree plot for the upper body dimensions required for developing the
prototype shirt pattern block.
Figure 4.6: A scree plot for the lower body dimensions required for developing the
prototype trouser pattern block.
122
As shown in Figure 4.5 and Figure 4.6, the components (body dimensions) for the
Eigen values were greater than 1, for both the upper and lower body dimensions.
Based on the results from the scree plot, it was concluded that most of the variances
in the data could be accounted for by just above 4 component factor loadings for
both the upper and lower body dimensions; however only three component factor
loadings were practically significant for further analysis. The reason for considering
three component factor loadings for further data analysis is justified by all three
criteria‟s; the Eigen values, cumulative percentage of variance and the scree plots
used together, which all shows 3 factors for both the upper and lower body
dimensions.
The rotated component matrix established that the body dimension with the highest
loaded factors and strong correlations is a good predictor for secondary body
measurements when developing the experimental size charts for upper and lower
body dimensions. The rotated component matrix was used to identify the key body
dimensions existing in the three factor loadings. The component factor loadings are
presented in Table 4.16 and Table 4.17. The factor loadings provide an indication of
how strong the body dimensions have loaded onto a factor, meaning that body
dimensions with large factor loading values are more essential body measurement
landmarks required to develop the prototype shirt and trouser pattern blocks.
In this study, the body dimensions that were related to one other were clustered in
factor loadings to make the interpretations of the body dimensions more definite and
understandable. In situations where the body dimensions were loaded in multiple
components, the component with a higher loading of the body dimension was
considered and further reported.

123
Table 4.15: A rotated component matrix showing factor loadings for the upper body
dimensions required for developing the prototype shirt pattern block.
Rotated Component Matrix for the upper body dimensions
BODY DIMENSIONS
Component
1 2 3
GIRTHS BUST .928
UPPER WAIST .920
UNDERBUST .904
LOWER WAIST .903
CHEST .883
BICEP .879
ELBOW .788 .370
NECK FULL .742
ARMSCYE .728
LENGTHS NECK TO UPPER WAIST (Back) .950
NECK TO UPPER WAIST (Front) .946
SHOULDER
SLEEVE -.837
GIRTH WRIST .415 .604
As shown in Table 4.16: The highest loading per factor was considered when
reporting.
The factor loadings that were considered in Principal Component 1 were nine
girth related body dimensions for the upper body dimensions, i.e. the bust, upper
waist taken at navel/midriff area, underbust, lower waist taken 15 cm below the
upper waist, at the lower waistline between the upper waist and high hip area; the
chest, bicep, elbow, neck full and the armscye. Although, the bicep and elbow are
associated with the arm, for this study they were included in the girth
measurements as extracted in the component matrix.
Principal Component 2 loaded two length related body dimensions for the upper
body, i.e. the neck to upper waist back and the neck to upper waist front.
The factor loadings that were considered in Principal Component 3 were sleeve
related body dimensions, i.e. the sleeve length and the wrist. The shoulder length
was not loaded in any component; however, the shoulder is related to the sleeve
(arm) which clarifies the reason why it was included as part of the sleeve (arm)
related body dimensions.

124
Table 4.16: A rotated component matrix showing factor loadings for the lower body
dimensions required for developing the prototype trouser pattern block.
Rotated Component Matrix for the lower body dimensions
BODY DIMENSIONS
Component
1 2 3
GIRTHS TOP THIGH .888
CALF .872
UPPER WAIST .868
LOWER WAIST .860
HIP .848 .390
MID-THIGH .847 .365
HIGH HIP .748 .473 -.357
ANKLE .301
KNEE
LENGTHS CROTCH LENGTH BACK .929
CROTCH LENGTH FRONT .925
INSEAM -.435 .842
OUTSEAM .543 .804
Principal Component 1 loaded eight girth related body dimensions for the lower
body, i.e. the top thigh, calf, upper waist, lower waist, hip, mid-thigh, high hip and
the ankle. The knee was not loaded in any component; however, the knee is
related to most of the body dimensions in Component 1 which explains the
reason why it is included as part of the girth related body dimensions.
Principal Component 2 loaded two crotch length related body dimensions for the
lower body, i.e. the crotch length back and the crotch length front.
Principal Component 3 loaded two length related body dimensions for the lower
body, i.e. the inseam and the outseam lengths.
The selected key body dimensions in Table 4.16 and Table 4.17 are discussed
further in the latter part of this chapter.

125
The purpose of the factor loading analysis was to select key body dimensions for
developing the size charts for the upper and lower body dimensions in this study.
According to Zakaria (2014:96), key body dimensions are primary body dimensions
that define an individual‟s body size; they are used as control dimensions to develop
a sizing system and to assign garment size ranges to facilitate a good fit.
A body dimension is considered key (primary) when it plays an essential role in
assessing whether a specific garment is wearable and can cover the entire body of a
consumer or not; whilst a secondary dimension assesses the fit of a garment on the
wearer‟s body. Secondary dimensions are often used together with the key (primary)
body dimensions to define the full body size of a person. Mpampa et al. (2009:51)
state that for consistency in garment sizing, it is important that the key dimensions
are presented in a constant way by all manufacturers and retailers.
Various researchers, Gupta and Gangadhar (2004: 465), Strydom (2006: 234,236),
Petrova (2007:64,70), and Zakaria (2014:113) ascertain that the most commonly
used girth measurements that have proven to be useful and essential by garment
sizing and fit experts for establishing size charts for shirt garments is the bust for the
upper body; and the trouser garments is the hip for the lower body. Strydom‟s
(2006:232) study suggest that the most used key body dimensions for creating
trouser garments by South African garment manufacturers and retailers is the outer
leg length (outseam), the waist circumference and the hip circumference.
The results obtained from the component matrix in Table 4.16 and Table 4.17 were
used to identify the key body dimensions to consider when developing the
experimental petite upper and lower body dimensions size charts for constructing the
pattern blocks for creating the prototype shirt and trouser garments in this study. The
results are further discussed below.

126
4.3.1 Results of the component matrix for the upper body dimensions to be
used as key body dimensions when developing the size chart in this study
According to Gupta and Zakaria (2014:4), a high factor loading, indicates that the
body dimension is strongly associated with the other body dimensions loaded in the
component. However, Zakaria (2014:113-114) suggests that a high factor loading
does not necessarily mean those identified body dimensions should be selected as
key body dimensions, but should be easily recognised by the consumer since they
are used as an essential feature in garment size labelling that the consumers use as
a guideline for selecting their garment sizes when shopping.
The highest loading factors in each of the three components presented in Table 4.16
were evaluated for the selection of the key body dimensions to be used when
developing the upper body size chart in this study. As seen in Table 4.16, the bust
was the highest loading body dimension for the girth factor for component 1. The
upper waist (at navel/midriff), was also included as the key body dimension for the
girth measurement. Because of the varied abdominal protrusions occurring in
different individuals, the upper waist is a body dimension that could be used to
evaluate the wearability of the prototype shirt garments to be produced in this study.
The highest loaded body dimension in component 2 was a length related body
dimension; namely, the neck to upper waist back. The sleeve length was recognised
in component 3 as the highest loading body dimension.
The above-mentioned body dimensions namely, bust, upper waist, neck to upper
waist back and sleeve length, were identified among the variables to use as key
body dimensions when developing the size charts for constructing pattern blocks for
the prototype shirt garments.
4.3.2 Results of the component matrix for the lower body dimensions to be
used as key body dimensions when developing the size chart in this study
The highest loading factors in each of the three components presented in Table 4.17
were evaluated for the selection of the key body dimensions to be used when
developing the lower body size chart in this study. As seen in Table 4.17, the
127
component matrix recognised the top thigh as the highest loading body dimension to
the girth factor for component 1; followed by the calf. The above-mentioned body
dimensions have not been previously identified by researchers as essential body
dimensions for the lower body. Consumers are not familiar with using the top thigh
and calf measurements as a guideline for selecting their garment sizes when
shopping (Zakaria, 2014:113). The top thigh and calf body dimensions were not
considered as key body dimensions because they do not evaluate the wearability of
a trouser garment and consumers are not familiar with using those body dimensions
for selecting their trouser garment sizes (Mpampa et al., 2009:51; Zakaria,
2014:113). Including all these body dimensions as key body dimensions will lead to a
size label that has too many measurement sizing options for the consumers to
choose from, which will confuse them when shopping for their garments.
The upper waist, lower waist and the hip were considered as key body dimensions
for the girth measurement by researchers such as Gupta and Gangadhar (2004:
465), Strydom (2006: 232,234,236), Petrova, (2007:64, 70), Mastamet-Mason
(2008:77), and Zakaria (2014: 96,113). Therefore, the upper waist, lower waist and
hip girths were selected as critical body dimensions for component 1 to use when
developing size charts for the lower body dimensions in this study. The highest
loaded body dimension in component 2 was a length related body dimension;
namely, the crotch length back. The inseam length was recognised in component 3
as the highest loading body dimension. The component matrix identified the above-
mentioned body dimensions namely, upper waist, lower waist, hip, crotch length
back and inseam length as the variables to use as key body dimensions when
developing the size charts for constructing pattern block for the prototype trouser
garment.
The identified upper and lower key body dimensions are the important landmarks to
use for the classification of the upper and lower body size charts for the pear shaped
South African petite women. The results from the upper body dimensions identified
four key body dimensions and the lower body dimensions identified five key body
measurements as critical measurements required when developing prototype shirt
and trouser garments. The PCA performed in this study confirmed that the key body
128
dimensions established for developing the size charts for the upper and lower body
dimensions prove to be primary body dimensions.
Furthermore, most of the key body dimensions established in this study are also
commonly found and acknowledged in literature from other garment sizing and fit
studies such as Gupta and Gangadhar (2004: 465), Strydom (2006: 232,234,236),
Petrova, (2007:64, 70), and Zakaria (2014:113); apart from the neck to upper waist
back length, sleeve length for the upper body and the crotch length back and the
inseam for the lower body.
The next section describes and explains the methods and procedures used to
develop the upper and lower body dimensions size charts, using the key body
dimensions.
4.4 METHODS AND PROCEDURES FOR DEVELOPING THE EXPERIMENTAL
SIZE CHARTS FOR PETITE WOMEN IN SOUTH AFRICA
Objective 2 of this study was to develop the experimental size charts from the 3D full
body scanned extracted data collected in this study based on the upper body
dimensions required for creating the prototype shirt garments and lower body
dimensions required for creating the prototype trouser garments. The most prevalent
body shape was identified as the pear body shape profile; and the subjects within the
sample had an average height measurement of 157 cm. Therefore, a size chart for
the shirt and trouser garment prototypes for the South African petite women was
developed for the sample of women with pear shaped body profiles, with an average
height of 157 cm, and aged from 20-54 years.
The key body dimensions established in this study were used to generate the size of
the intervals on which the size ranges in the size charts were imposed. Regression
analysis was applied to determine the relationship between the established key
(primary) body dimensions and the secondary body dimensions to predict size
intervals and allocate the various sizes in the size charts. Regression analysis was
used to determine how a body dimension increases or decreases as the
measurement value of each key body dimension changes (Chan, 2014:170).

129
A descriptive statistical analysis for both the upper and lower body dimensions was
conducted to determine the range of various 3D full body scanned dimensions
required for the prototype basic shirt and trouser garments, to establish size ranges
for the size charts to be developed in this study. The collected data of the 3D full
body scanned petite body measurements were analysed to derive their mean,
standard deviation, skewness of the data, and the minimum and maximum values.
The mean value was used as a convenient indication for obtaining the central
(average) measurement number for the collected data and for establishing the size
ranges in the size charts, as suggested by Chan (2014:177). The standard deviation,
according to Leedy and Ormrod (2010:270) indicates how the analysed body
measurements are distributed and represents variations of data distributions from
the data. Skewness measures how far a distribution deviates from the regularity
(Maree, 2007:189-190 and Leedy & Ormrod, 2010:264).
The standard deviation and the skewness of the data were critically observed by the
researcher and statistician prior to conducting the regression coefficient analysis.
Appendix F and Appendix G present examples of the box plots and histogram
distributions for all the upper and lower body 3D full body scanned petite women‟s
data. The frequency distributions for all the observed body dimensions were
analysed to conclude visually the normality distribution of the analysed data, using
the graphical methods such as histograms, normal quantile-quantile plots (Q-Q plots)
and boxplots from the SPSS software. The histograms, normal Q-Q plots and
boxplots were produced in the SPSS software to show how the data was distributed
and present outliers in the data for each body dimension. A histogram that has a
dumb-bell shape indicates a normal distribution curve of the analysed data (Chan,
2014:170). The histograms provided a visual judgment about whether the distribution
is bell curve shaped. There was an observable bell-curve shape in most of the
histograms for the analysed data, with a few measurement values of the petite
women present in the lower and higher ends of the distribution. A Q-Q plot is a
graphical data analysis method that evaluates whether the analysed data
observations are derived from a normal distribution (Castillo-Gutiérrez et al.,
2012:243). Boxplots present information on where the analysed data is located, how
the data is spread and how skew the data lies (Hubert & Vandervieren, 2006:1).
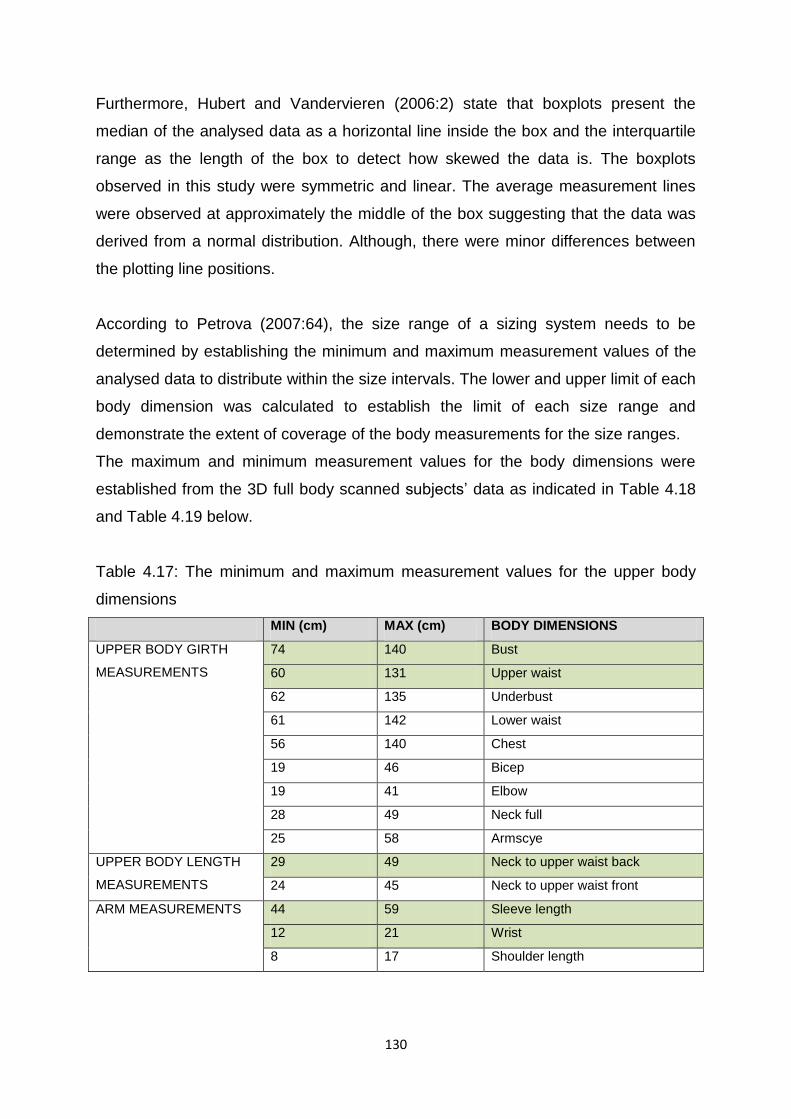
130
Furthermore, Hubert and Vandervieren (2006:2) state that boxplots present the
median of the analysed data as a horizontal line inside the box and the interquartile
range as the length of the box to detect how skewed the data is. The boxplots
observed in this study were symmetric and linear. The average measurement lines
were observed at approximately the middle of the box suggesting that the data was
derived from a normal distribution. Although, there were minor differences between
the plotting line positions.
According to Petrova (2007:64), the size range of a sizing system needs to be
determined by establishing the minimum and maximum measurement values of the
analysed data to distribute within the size intervals. The lower and upper limit of each
body dimension was calculated to establish the limit of each size range and
demonstrate the extent of coverage of the body measurements for the size ranges.
The maximum and minimum measurement values for the body dimensions were
established from the 3D full body scanned subjects‟ data as indicated in Table 4.18
and Table 4.19 below.
Table 4.17: The minimum and maximum measurement values for the upper body
dimensions
MIN (cm) MAX (cm) BODY DIMENSIONS
UPPER BODY GIRTH
MEASUREMENTS
74 140 Bust
60 131 Upper waist
62 135 Underbust
61 142 Lower waist
56 140 Chest
19 46 Bicep
19 41 Elbow
28 49 Neck full
25 58 Armscye
UPPER BODY LENGTH
MEASUREMENTS
29 49 Neck to upper waist back
24 45 Neck to upper waist front
ARM MEASUREMENTS 44 59 Sleeve length
12 21 Wrist
8 17 Shoulder length
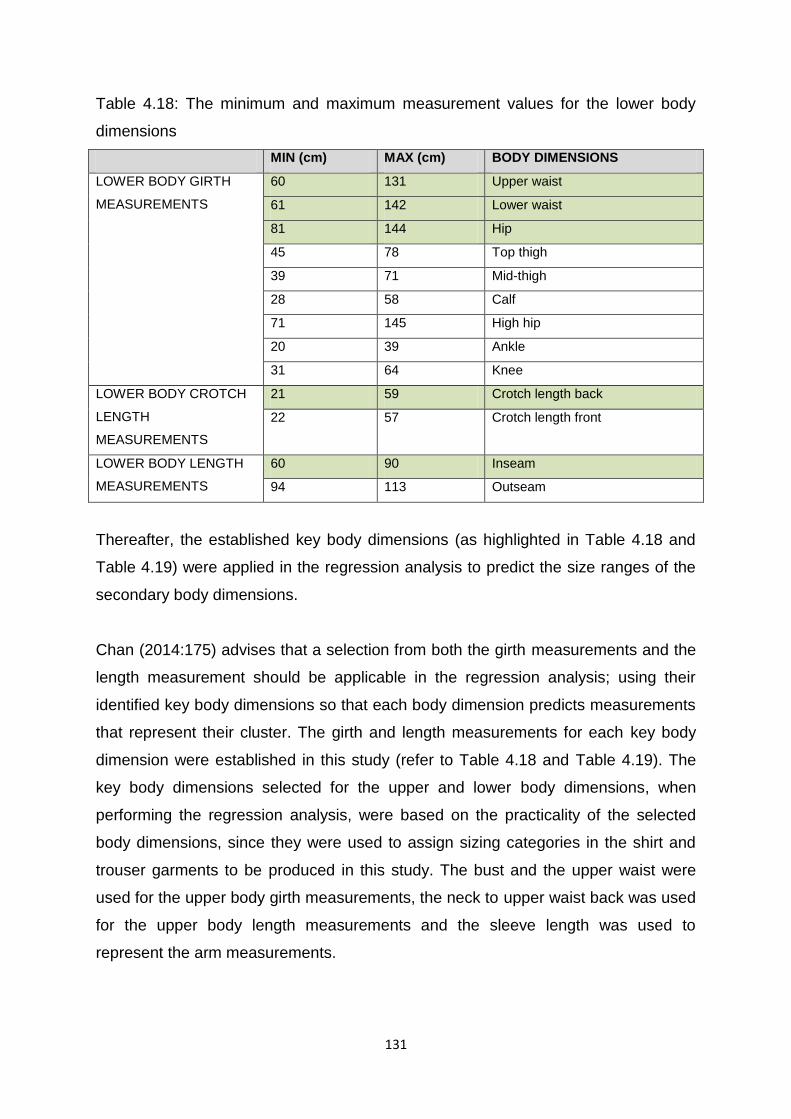
131
Table 4.18: The minimum and maximum measurement values for the lower body
dimensions
MIN (cm) MAX (cm) BODY DIMENSIONS
LOWER BODY GIRTH
MEASUREMENTS
60 131 Upper waist
61 142 Lower waist
81 144 Hip
45 78 Top thigh
39 71 Mid-thigh
28 58 Calf
71 145 High hip
20 39 Ankle
31 64 Knee
LOWER BODY CROTCH
LENGTH
MEASUREMENTS
21 59 Crotch length back
22 57 Crotch length front
LOWER BODY LENGTH
MEASUREMENTS
60 90 Inseam
94 113 Outseam
Thereafter, the established key body dimensions (as highlighted in Table 4.18 and
Table 4.19) were applied in the regression analysis to predict the size ranges of the
secondary body dimensions.
Chan (2014:175) advises that a selection from both the girth measurements and the
length measurement should be applicable in the regression analysis; using their
identified key body dimensions so that each body dimension predicts measurements
that represent their cluster. The girth and length measurements for each key body
dimension were established in this study (refer to Table 4.18 and Table 4.19). The
key body dimensions selected for the upper and lower body dimensions, when
performing the regression analysis, were based on the practicality of the selected
body dimensions, since they were used to assign sizing categories in the shirt and
trouser garments to be produced in this study. The bust and the upper waist were
used for the upper body girth measurements, the neck to upper waist back was used
for the upper body length measurements and the sleeve length was used to
represent the arm measurements.

132
The upper waist, lower waist and the hip were used for the lower body girth
measurements, the crotch length back was used to represent the crotch area and
the inseam was used for the lower body length measurements.
From the findings of the descriptive statistical analysis, it was concluded that the
numerical and graphical distributions of the analysed body dimensions provided a
more accurate representation of the data and of possible outliers present in the data.
Outliers were observed in the neck full, shoulder length, armscye, elbow, chest,
underbust, upper waist, neck to upper waist back, neck to upper waist front, mid-
thigh, calf, knee, outseam, inseam, crotch length front, and the crotch length back
showing measurement values that lie outside the main dataset.
4.4.1 Regression analysis for predicting the size ranges for the size charts
Sizing systems usually use regression analysis when calculating the relationship
between body measurements. Maree (2007:240) and Shin and Istook (2007:137)
refer to regression analysis as a statistical method commonly used to estimate body
measurements from one size to the next size by examining the relationships
between variables. Regression analysis may be used to predict the values of a
dependent variable from new values of an independent variable (Leedy & Ormrod,
2010:282). In the regression analysis for this study, the key body dimensions (the
bust, upper waist, neck to upper waist back and sleeve length for the upper key body
dimensions and the upper waist, lower waist, hip, crotch length back and inseam for
the lower key body dimensions) were used as independent variables, whilst the
secondary body dimensions (the underbust, lower waist, chest, bicep, elbow, neck
full, armscye, neck to upper waist front, shoulder length and wrist) for the upper
secondary body dimensions and the top thigh, calf, mid-thigh, high hip, ankle, knee,
crotch length front and outseam for the lower secondary body dimensions were used
as dependent variables.

133
According to Chan (2014:177), the regression analysis influences how garment
sizing for each person is assigned since the key body dimensions determine which
size group a specific person belongs to; based on their measurements. A
population‟s size range is established by the maximum and minimum values of the
key dimensions, including the size interval which is the measurement difference
between two adjacent sizes (Petrova, 2007:64). The number of sizes in a sizing
system is defined by the value of the size intervals (Chan, 2014:188) together with
the required size range that will accommodate the population (Petrova, 2007:72).
Chan (2014:180-181) suggests that, because the design of a sizing system is
determined in terms of convenience and is based on the fit and practicality, size
intervals should be systematically uniform between sizes to permit effective pattern
grading. Petrova and Ashdown (2012:268) state that size intervals may vary across
the size ranges; it may be smaller for the smaller sizes or increase for the larger
sizes. The point of change in the size intervals is called the break.
According to Chan (2014:179), garment size intervals often start from 3 cm to 8 cm
depending on the body dimension, standard of garment fit and many other factors. In
South African studies, Defty (1988:17-18) used 1 cm - 2 cm size intervals for the
bust and hip girth measurements; however, the size ranges were labelled in odd
numbers and the numbers were not corresponding with currently used size range
number labelling. Winks (1990:74-76) used a 4 cm - 6 cm size interval for the bust
and hip girth measurements; the size ranges were not defined. Bailey‟s (2010:1) size
intervals ranged from 1 cm for the bust, 2 cm for the waist and hip for a size chart
designed for South African petite women size 2/28 to size 6/30.
The guidelines on how the regression analysis was calculated to allocate the size
ranges in the size charts are presented in steps below.

134
Step 1:
To determine the size intervals for all the body dimensions in this study, firstly each
key body dimension was calculated by subtracting the minimum value from the
maximum value of that specific key body dimension, then dividing the difference by
the number of size ranges to be allocated in the size chart (see the calculations
below in sections 4.4.1.1 and 4.4.1.2, used to determine the size intervals for the
upper key body dimensions and the lower key body dimensions).
The size ranges in this study were designed to accommodate the 3D full body
scanned petite pear body shape measurements. Chan (2014:182) states that size
ranges are usually developed using an odd number. Size intervals are used to adjust
the sizing proportions of the analysed data into different size ranges as a scientific
estimate of garment fit (Salusso et al., 2006:99). Chan (2014:182) further advises
that the size ranges should not be restricted to a small range but should meet the
requirements of the population. Therefore, 11 size ranges were established for
developing the size charts in this study, using the minimum and maximum
measurement coverage of the body dimensions from the analysed 3D full body petite
pear shaped subjects‟ data. Other size ranges were tested, but 11 was found to be
the best number to use for developing the size charts in this study for the upper and
lower body dimensions.
4.4.1.1 Calculations for determining the size intervals for the upper key body
dimensions.
a. Calculations of the size intervals for the upper body girth related key
body dimensions
Upper waist: 131 - 60 = 71/11 = 6.4, which was rounded down to 6
Bust: 140 - 74 = 66/11= 6
b. Calculations of the size intervals for the upper body length related
key body dimension
Neck to upper waist back: 49 – 29 = 20/11 = 1.8, which was rounded up to 2
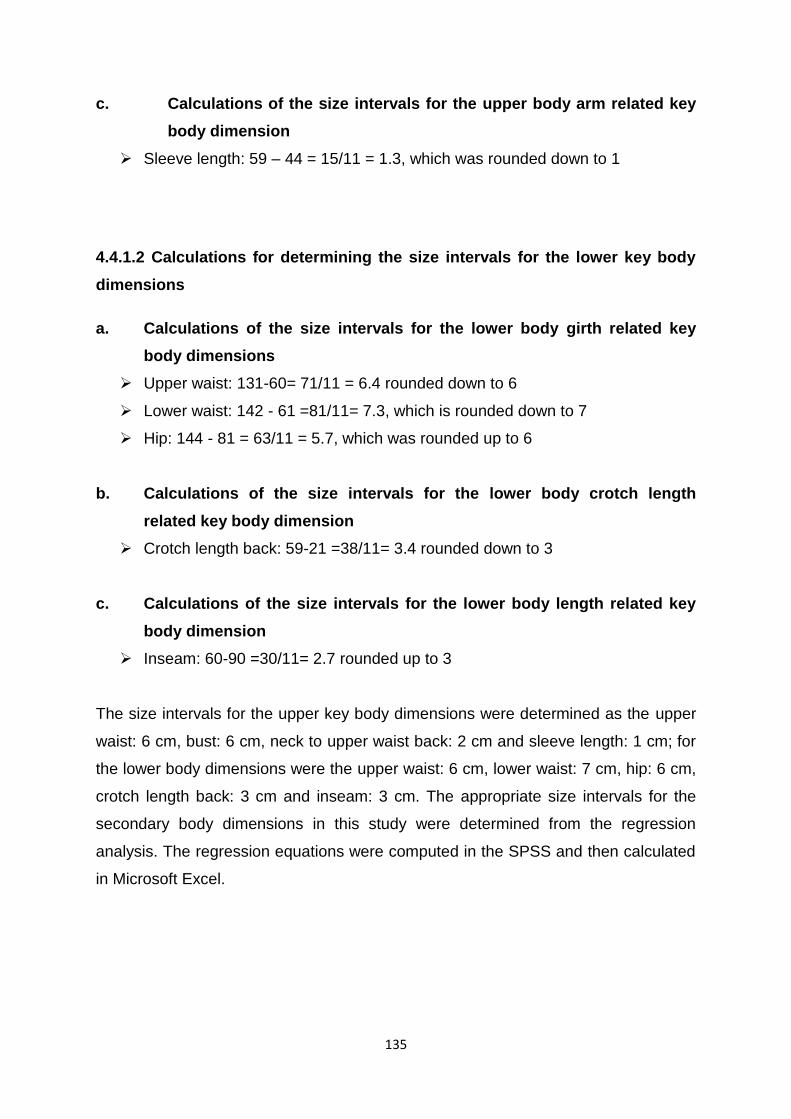
135
c. Calculations of the size intervals for the upper body arm related key
body dimension
Sleeve length: 59 – 44 = 15/11 = 1.3, which was rounded down to 1
4.4.1.2 Calculations for determining the size intervals for the lower key body
dimensions
a. Calculations of the size intervals for the lower body girth related key
body dimensions
Upper waist: 131-60= 71/11 = 6.4 rounded down to 6
Lower waist: 142 - 61 =81/11= 7.3, which is rounded down to 7
Hip: 144 - 81 = 63/11 = 5.7, which was rounded up to 6
b. Calculations of the size intervals for the lower body crotch length
related key body dimension
Crotch length back: 59-21 =38/11= 3.4 rounded down to 3
c. Calculations of the size intervals for the lower body length related key
body dimension
Inseam: 60-90 =30/11= 2.7 rounded up to 3
The size intervals for the upper key body dimensions were determined as the upper
waist: 6 cm, bust: 6 cm, neck to upper waist back: 2 cm and sleeve length: 1 cm; for
the lower body dimensions were the upper waist: 6 cm, lower waist: 7 cm, hip: 6 cm,
crotch length back: 3 cm and inseam: 3 cm. The appropriate size intervals for the
secondary body dimensions in this study were determined from the regression
analysis. The regression equations were computed in the SPSS and then calculated
in Microsoft Excel.

136
Step 2:
The SPSS statistical program was used to calculate the regression equations of the
form z= D+ (aw) + (bx) (where z represents the predicted secondary dimension
number, D represents the constant; a, b represents the coefficient constants and w,
x represents the key body dimensions). The regression calculation formula depends
on the number of key dimensions allocated in the PCA (see Table 4.16 for the upper
body dimensions and Table 4.17 for the lower body dimensions); indicating that one
or more than two key body dimensions can be used in each equation.
Thus, for example, the Chest girth =21.073 + 0.246 x Upper waist girth + 0.565 x
Bust girth.
The regression coefficient constants for the upper body dimensions are presented in
Table 4.20, Table 4.21 and Table 4.22. Table 4.23, Table 4.24 and Table 4.25
present the lower body dimensions, to predict the secondary body dimensions within
the size ranges for the size charts.
4.4.1.3 Calculations for determining the regression constants in the equations
that relate to the primary (upper key) body dimensions and the secondary
body dimensions
Table 4.19: Regression coefficient constants calculations for the upper body girth
related body dimensions.
Regression coefficient constants calculations for the upper body girth related body
dimensions
Secondary body dimension Constants Bust Upper waist
Chest 21.07 0.57 0.25
Underbust -6.69 0.61 0.41
Lower waist 2.13 0.17 0.92
Bicep 3.46 0.11 0.21
Elbow 4.38 0.07 0.18
Neck full 20.16 0.06 0.13
Armscye 14.50 0.16 0.11

137
Table 4.20: Regression coefficient constants calculations for the upper body length
related body dimension.
Regression coefficient constants calculations for the upper body length related body
dimension
Secondary body dimensions Constant Neck to upper waist back
Neck to upper waist front 5.88 0.72
Table 4.21: Regression coefficient constants calculations for the upper body arm
related body dimension
Regression coefficient constants calculations for the upper body arm related body dimension
Secondary body dimension Constants Sleeve length
Shoulder length 12.34 -0.00
wrist 19.85 -0.08
4.4.1.4 Calculations for determining the regression constants in the equations
that relate to the primary (lower key) body dimensions and the secondary body
dimensions
Table 4.22: Regression coefficient constants calculations for the lower body girth
related body dimensions
Regression coefficient constants calculations for the lower body girth related body
dimensions
Secondary body dimensions Constants Upper waist Lower
waist
Hip
Top thigh 23.88 0.14 0.08 0.15
Mid-thigh 15.88 0.17 -0.04 0.21
Calf 9.05 0.03 0.06 0.19
High hip 1.57 0.02 0.33 0.63
Ankle 19.27 0.06 0.01 0.02
Knee 46.11 -0.01 0.01 -0.06
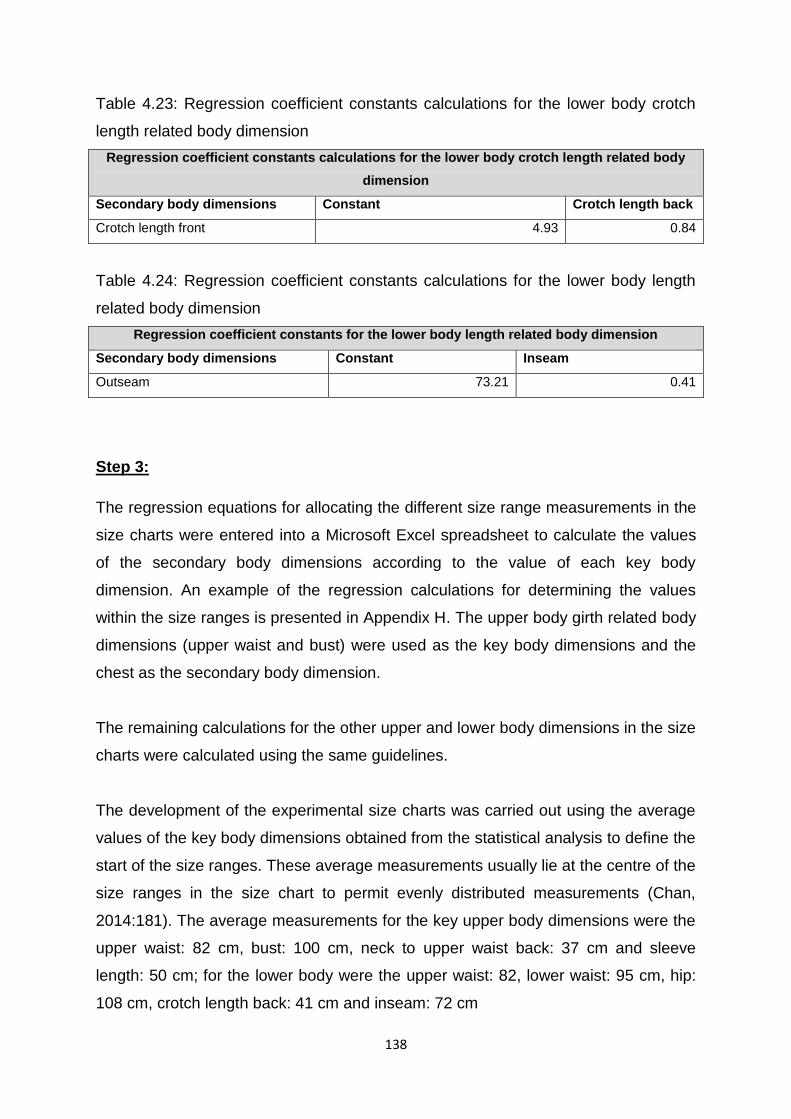
138
Table 4.23: Regression coefficient constants calculations for the lower body crotch
length related body dimension
Regression coefficient constants calculations for the lower body crotch length related body
dimension
Secondary body dimensions Constant Crotch length back
Crotch length front 4.93 0.84
Table 4.24: Regression coefficient constants calculations for the lower body length
related body dimension
Regression coefficient constants for the lower body length related body dimension
Secondary body dimensions Constant Inseam
Outseam 73.21 0.41
Step 3:
The regression equations for allocating the different size range measurements in the
size charts were entered into a Microsoft Excel spreadsheet to calculate the values
of the secondary body dimensions according to the value of each key body
dimension. An example of the regression calculations for determining the values
within the size ranges is presented in Appendix H. The upper body girth related body
dimensions (upper waist and bust) were used as the key body dimensions and the
chest as the secondary body dimension.
The remaining calculations for the other upper and lower body dimensions in the size
charts were calculated using the same guidelines.
The development of the experimental size charts was carried out using the average
values of the key body dimensions obtained from the statistical analysis to define the
start of the size ranges. These average measurements usually lie at the centre of the
size ranges in the size chart to permit evenly distributed measurements (Chan,
2014:181). The average measurements for the key upper body dimensions were the
upper waist: 82 cm, bust: 100 cm, neck to upper waist back: 37 cm and sleeve
length: 50 cm; for the lower body were the upper waist: 82, lower waist: 95 cm, hip:
108 cm, crotch length back: 41 cm and inseam: 72 cm

139
Step 4:
To allocate size ranges for the key body dimensions, the average measurements
(see the highlighted data in Table 4.26 to Table 4.31) established for each key body
dimension were calculated together with their assigned size intervals by either
subtracting or adding the size intervals from the average measurements. The size
ranges for the 3D full body scanned petite body measurements were arranged in
order, from the smallest body dimensions size measurements to the largest body
dimensions size measurements present in the dataset using the size intervals.
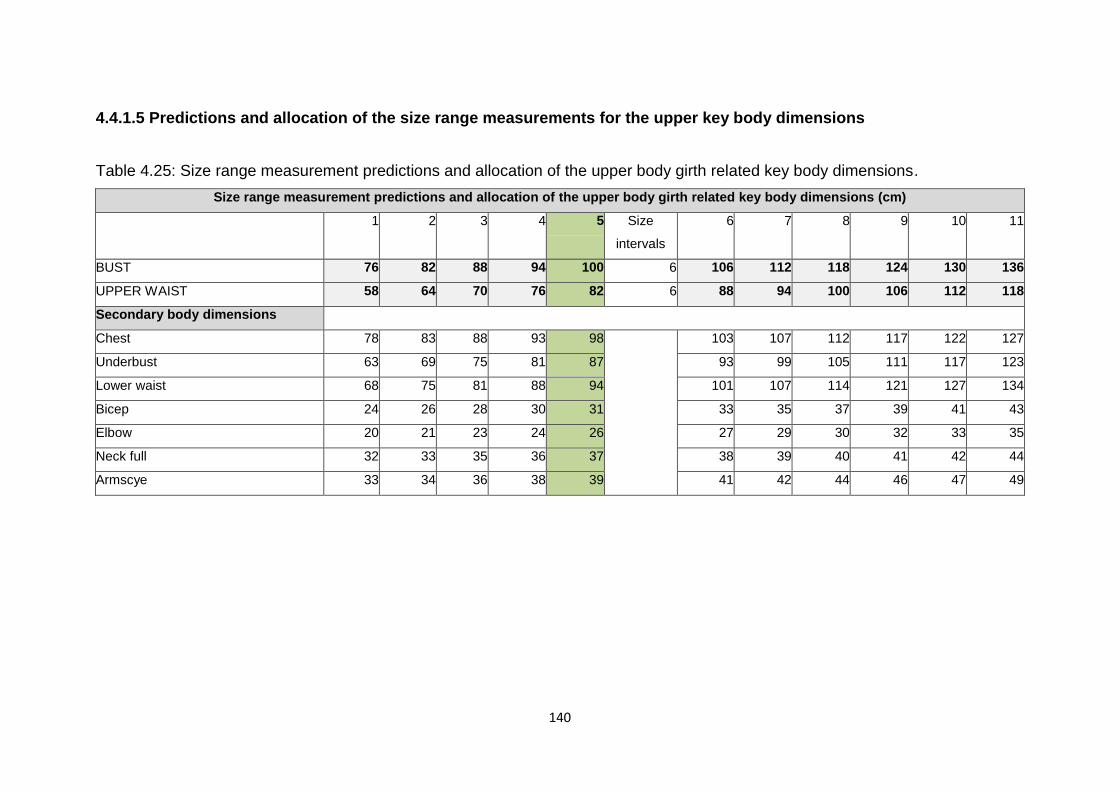
140
4.4.1.5 Predictions and allocation of the size range measurements for the upper key body dimensions
Table 4.25: Size range measurement predictions and allocation of the upper body girth related key body dimensions.
Size range measurement predictions and allocation of the upper body girth related key body dimensions (cm)
1 2 3 4 5 Size
intervals
6 7 8 9 10 11
BUST 76 82 88 94 100 6 106 112 118 124 130 136
UPPER WAIST 58 64 70 76 82 6 88 94 100 106 112 118
Secondary body dimensions
Chest 78 83 88 93 98 103 107 112 117 122 127
Underbust 63 69 75 81 87 93 99 105 111 117 123
Lower waist 68 75 81 88 94 101 107 114 121 127 134
Bicep 24 26 28 30 31 33 35 37 39 41 43
Elbow 20 21 23 24 26 27 29 30 32 33 35
Neck full 32 33 35 36 37 38 39 40 41 42 44
Armscye 33 34 36 38 39 41 42 44 46 47 49

141
Table 4.26: Size range measurement predictions and allocation of the upper body length related key body dimension.
Size range measurement predictions and allocation of the upper body length related key body dimension (cm)
1 2 3 4 5 Size
interval
6 7 8 9 10 11
NECK TO UPPER WAIST BACK 29 31 33 35 37 2 39 41 43 45 47 49
Secondary body dimension
Neck to upper waist front 27 28 30 31 32 34 35 37 38 40 41
Table 4.27: Size range measurement predictions and allocation of the upper body arm related key body dimension.
Size range measurement predictions and allocation of the upper body arm related key body dimension (cm)
1 2 3 4 5 Size
interval
6 7 8 9 10 11
SLEEVE LENGTH 46 47 48 49 50 1 51 52 53 54 55 56
Secondary body dimension
Shoulder length 12 12 12 12 12 12 12 12 12 12 12
Wrist 16 16 16 16 16 16 16 16 16 16 16
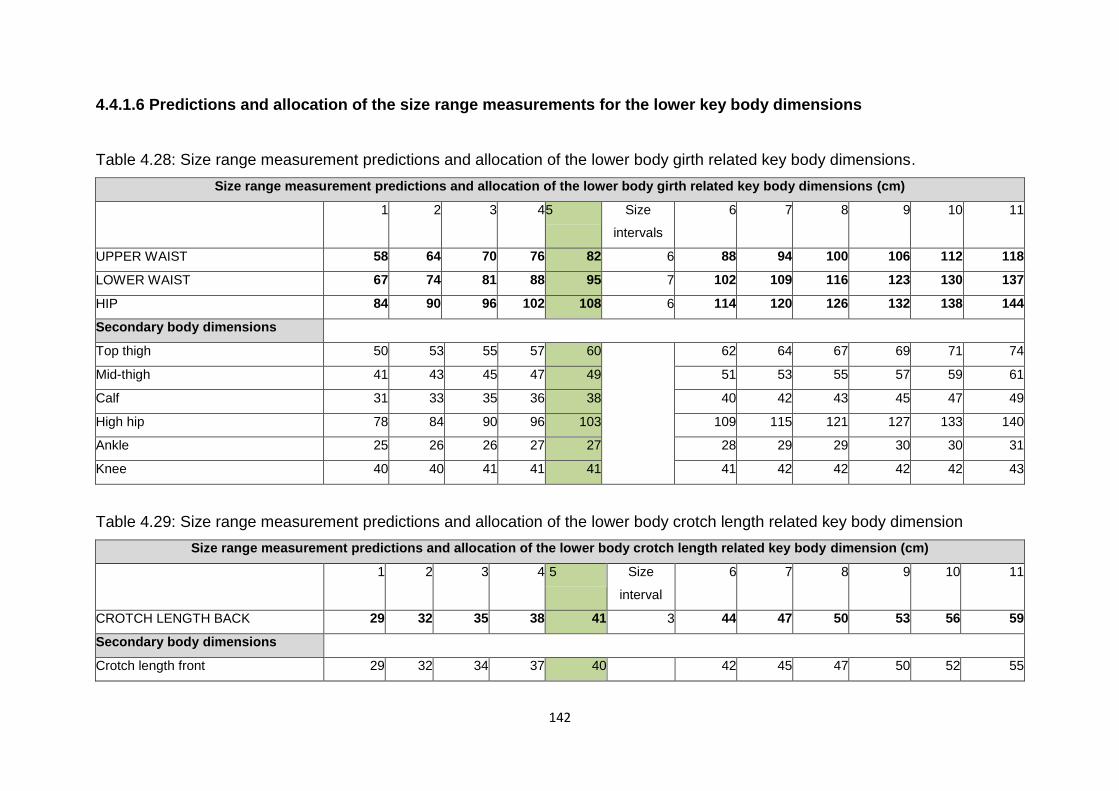
142
4.4.1.6 Predictions and allocation of the size range measurements for the lower key body dimensions
Table 4.28: Size range measurement predictions and allocation of the lower body girth related key body dimensions.
Size range measurement predictions and allocation of the lower body girth related key body dimensions (cm)
1 2 3 4 5 Size
intervals
6 7 8 9 10 11
UPPER WAIST 58 64 70 76 82 6 88 94 100 106 112 118
LOWER WAIST 67 74 81 88 95 7 102 109 116 123 130 137
HIP 84 90 96 102 108 6 114 120 126 132 138 144
Secondary body dimensions
Top thigh 50 53 55 57 60
62 64 67 69 71 74
Mid-thigh 41 43 45 47 49 51 53 55 57 59 61
Calf 31 33 35 36 38 40 42 43 45 47 49
High hip 78 84 90 96 103 109 115 121 127 133 140
Ankle 25 26 26 27 27 28 29 29 30 30 31
Knee 40 40 41 41 41 41 42 42 42 42 43
Table 4.29: Size range measurement predictions and allocation of the lower body crotch length related key body dimension
Size range measurement predictions and allocation of the lower body crotch length related key body dimension (cm)
1 2 3 4 5 Size
interval
6 7 8 9 10 11
CROTCH LENGTH BACK 29 32 35 38 41 3 44 47 50 53 56 59
Secondary body dimensions
Crotch length front 29 32 34 37 40 42 45 47 50 52 55

143
Table 4.30: Size range measurement predictions and allocation of the lower body length related key body dimension.
Size range measurement predictions and allocation of the lower body length related key body dimension (cm)
1 2 3 4 5 Size
interval
6 7 8 9 10 11
INSEAM 60 63 66 69 72 3 75 78 81 84 87 90
Secondary body dimensions
Outseam 98 99 100 102 103 104 105 107 108 109 110
These findings provided the framework for the development of the experimental upper and lower body size charts in this study. The
upper and lower body experimental size charts were developed for the South African petite women‟s prototype shirt and trouser
garments.
Table 4.32 and Table 4.33 below present the experimental size charts developed for South African petite women‟s prototype shirt
and trouser garments, including the size intervals for each size range.
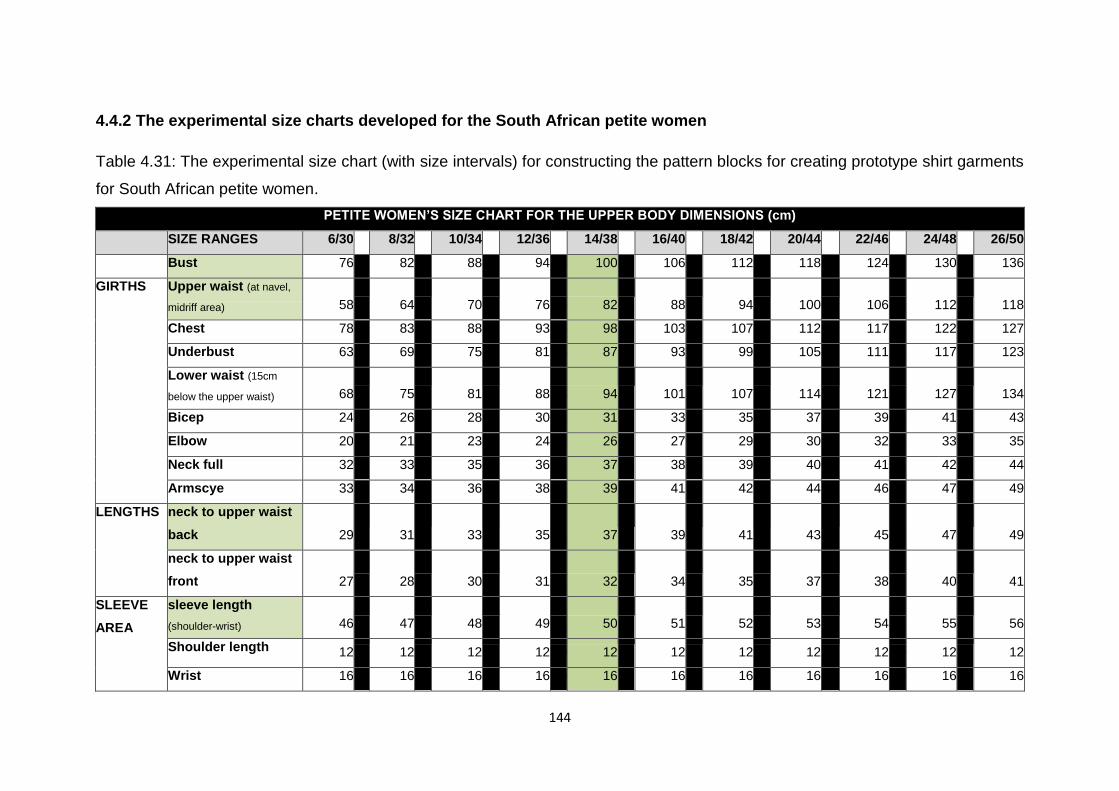
144
4.4.2 The experimental size charts developed for the South African petite women
Table 4.31: The experimental size chart (with size intervals) for constructing the pattern blocks for creating prototype shirt garments
for South African petite women.
PETITE WOMEN‟S SIZE CHART FOR THE UPPER BODY DIMENSIONS (cm)
SIZE RANGES 6/30 8/32 10/34 12/36 14/38 16/40 18/42 20/44 22/46 24/48 26/50
Bust 76 6 82 6 88 6 94 6 100 6 106 6 112 6 118 6 124 6 130 6 136
GIRTHS Upper waist (at navel,
midriff area) 58 6 64 6 70 6 76 6 82 6 88 6 94 6 100 6 106 6 112 6 118
Chest 78 5 83 5 88 5 93 5 98 5 103 4 107 5 112 5 117 5 122 5 127
Underbust 63 6 69 6 75 6 81 6 87 6 93 6 99 6 105 6 111 6 117 6 123
Lower waist (15cm
below the upper waist) 68 7 75 6 81 7 88 6 94 7 101 6 107 7 114 7 121 6 127 7 134
Bicep 24 2 26 2 28 2 30 1 31 2 33 2 35 2 37 2 39 2 41 2 43
Elbow 20 1 21 2 23 1 24 2 26 1 27 2 29 1 30 2 32 1 33 2 35
Neck full 32 1 33 2 35 1 36 1 37 1 38 1 39 1 40 1 41 1 42 2 44
Armscye 33 1 34 2 36 2 38 1 39 2 41 1 42 2 44 2 46 1 47 2 49
LENGTHS neck to upper waist
back 29 2 31 2 33 2 35 2 37 2 39 2 41 2 43 2 45 2 47 2 49
neck to upper waist
front 27 1 28 2 30 1 31 1 32 2 34 1 35 2 37 1 38 2 40 1 41
SLEEVE
AREA
sleeve length
(shoulder-wrist) 46 1 47 1 48 1 49 1 50 1 51 1 52 1 53 1 54 1 55 1 56
Shoulder length 12 0 12 0 12 0 12 0 12 0 12 0 12 0 12 0 12 0 12 0 12
Wrist 16 0 16 0 16 0 16 0 16 0 16 0 16 0 16 0 16 0 16 0 16
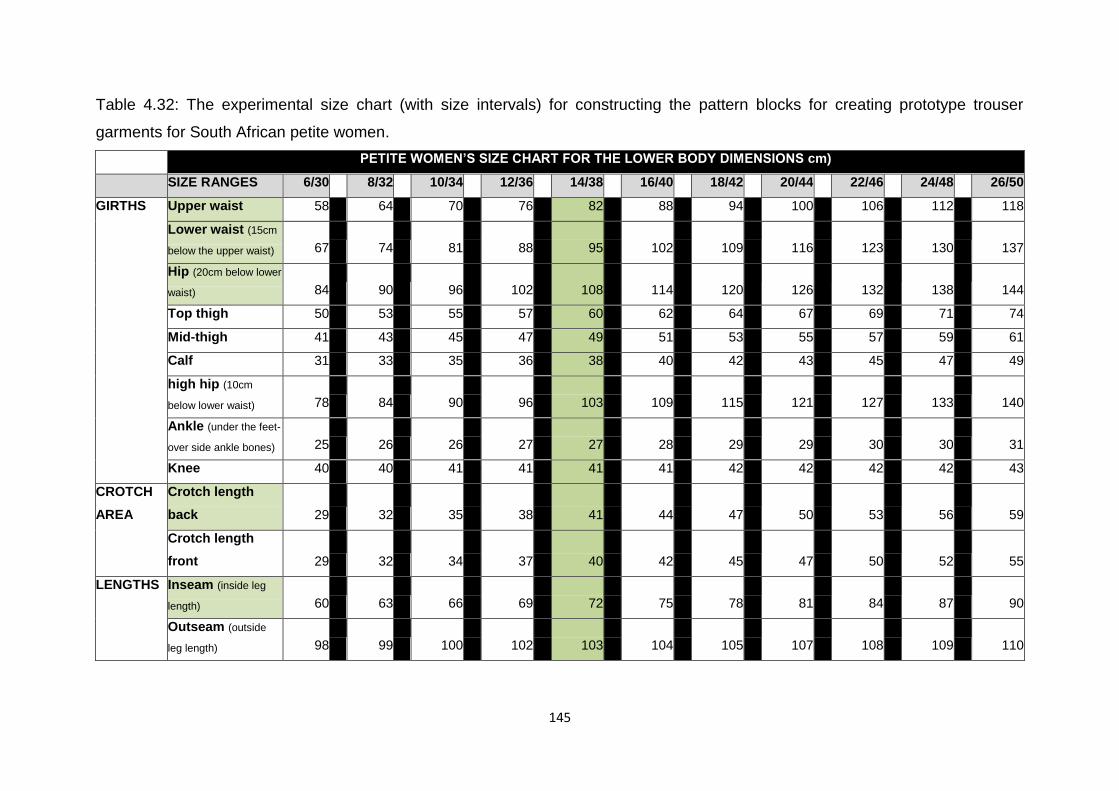
145
Table 4.32: The experimental size chart (with size intervals) for constructing the pattern blocks for creating prototype trouser
garments for South African petite women.
PETITE WOMEN‟S SIZE CHART FOR THE LOWER BODY DIMENSIONS cm)
SIZE RANGES 6/30 8/32 10/34 12/36 14/38 16/40 18/42 20/44 22/46 24/48 26/50
GIRTHS Upper waist 58 6 64 6 70 6 76 6 82 6 88 6 94 6 100 6 106 6 112 6 118
Lower waist (15cm
below the upper waist) 67 7 74 7 81 7 88 7 95 7 102 7 109 7 116 7 123 7 130 7 137
Hip (20cm below lower
waist) 84 6 90 6 96 6 102 6 108 6 114 6 120 6 126 6 132 6 138 6 144
Top thigh 50 3 53 22 55 57 3 60 2 62 2 64 3 67 2 69 2 71 3 74
Mid-thigh 41 2 43 2 45 2 47 2 49 2 51 2 53 2 55 2 57 2 59 2 61
Calf 31 2 33 2 35 1 36 2 38 2 40 2 42 1 43 2 45 2 47 2 49
high hip (10cm
below lower waist) 78 6 84 6 90 6 96 7 103 6 109 6 115 6 121 6 127 6 133 7 140
Ankle (under the feet-
over side ankle bones) 25 1 26 0 26 1 27 0 27 1 28 1 29 0 29 1 30 0 30 1 31
Knee 40 0 40 1 41 0 41 0 41 0 41 1 42 0 42 0 42 0 42 1 43
CROTCH
AREA
Crotch length
back 29 3 32 3 35 3 38 3 41 3 44 3 47 3 50 3 53 3 56 3 59
Crotch length
front 29 2 32 2 34 3 37 3 40 2 42 3 45 2 47 3 50 2 52 3 55
LENGTHS Inseam (inside leg
length) 60 3 63 3 66 3 69 3 72 3 75 3 78 3 81 3 84 3 87 3 90
Outseam (outside
leg length) 98 1 99 1 100 2 102 1 103 1 104 1 105 2 107 1 108 1 109 1 110

146
4.5 CALIBRATION OF SIZE CHARTS
The size 10/34 of the 3D full body scanned tailoring mannequin was used as a
standard to allocate the 3D subject‟s body scanned data into different size ranges;
since the tailoring mannequin‟s measurements were the only currently acceptable
“true values”, as there are no other petite 3D scan data measurements in South
Africa with which to compare the 3D scan data of the subjects collected during this
study. The measurement differences are compared in Table 4.34 for the upper body
and Table 4.35 for the lower body.
Table 4.33: The differences between the size 10/34 3D full body scanned petite
women‟s upper body measurements and the size 10/34 3D full body scanned petite
tailoring mannequin‟s measurements.
Body dimensions
Size 10/34 3D full body scanned petite women's measurements (in this study)
Measurement differences
Size 10/34 3D full body scanned petite tailoring mannequin measurements
UPPER BODY (cm)
Bust 88 -2 86
Upper waist 70 -1 69
Chest 88 -1 87
Underbust 75 -2 73
Lower waist 81 +4
85
Bicep 28 -1 27
Elbow 23 -3 20
Neck full 35 -1 34
Armscye 36 -3 33
Neck to upper waist back 33 +6
39
Neck to upper waist front 30 +5
35
sleeve length 48 +3
51
Shoulder length 12 0
12
Wrist 16 -1 15

147
Table 4.34: The differences between the size 10/34 3D full body scanned petite
women‟s lower body measurements and the size 10/34 3D full body scanned petite
tailoring mannequin‟s measurements.
Body dimensions
Size 10/34 3D full body scanned petite women's measurements (in this study)
Measurement differences
Size 10/34 3D full body scanned petite tailoring mannequin measurements
LOWER BODY (cm)
Upper waist 70 -1 69
Lower waist 81 +4
85
Hip 96 -1 95
Top thigh 55 -1 54
Mid-thigh 45 -4 41
Calf 35 -1 34
High hip 90 +2 92
Ankle 26 -1 25
Knee 41 -2 39
Crotch length back 35 +1
36
Crotch length front 34 +2
36
Inseam 66 +7 73
Outseam 100 +2 102
Table 4.34 and Table 4.35 present the size 10/34 garment measurements for the
mannequin‟s 3D full body scanned measurements when compared to the 3D full
body scanned subjects‟ measurements in the size charts developed for this study.
The above-mentioned measurements of the 3D full body scanned data were
observed as closest to that of the size 10/34 tailoring mannequin measurements and
were, therefore, used as a base size for labelling the size charts. A set of size ranges
from the remaining data were proportionally graded from this size. The size ranges
established from the 3D full body scanned subjects‟ data used for developing the
experimental size charts in this study ranged from size 6/30 to size 26/ 50.
The differences between the size 10/34 3D full body scanned petite women‟s upper
and lower body measurements and the size 10/34 3D full body scanned petite
tailoring mannequin‟s measurements are elaborated on below.
7 cm measurement differences were observed in the inseam. The size 10/34
tailoring mannequin‟s inseam measurement was 7 cm longer than the subjects‟
size 10/34 size range measurement.

148
6 cm measurement differences were observed in the neck to upper waist back.
The size 10/34 tailoring mannequin‟s neck to upper waist back measurement was
6 cm longer than the subjects‟ size 10/34 size range measurement.
5 cm measurement differences were observed in the neck to upper waist front.
The size 10/34 tailoring mannequin‟s neck to upper waist front measurement was
5 cm longer than the subjects‟ size 10/34 size range measurement.
4 cm measurement differences were observed in the lower waist and mid-thigh.
The size 10/34 tailoring mannequin‟s lower waist measurement was 4 cm bigger
than the subjects‟ size 10/34 size range measurement; although, the
mannequin‟s mid-thigh measurement was 4 cm smaller when compared to the
subjects‟ size 10/34 size range measurement.
3 cm measurement differences were observed in the elbow, armscye and sleeve
length. The size 10/34 tailoring mannequin‟s sleeve length measurement was 3
cm longer than the subjects‟ size 10/34 size range measurement. The
mannequin‟s elbow and armscye measurements were 3 cm smaller when
compared to the subjects‟ size 10/34 size range measurements.
2 cm measurement differences were observed in the bust, underbust, high hip,
crotch length front, knee and outseam. The size 10/34 tailoring mannequin‟s
bust, underbust, crotch length front and outseam measurements were 2 cm
bigger than the subjects‟ size 10/34 size range measurement; while the high hip,
knee measurements of the mannequin were 2 cm smaller compared to the
subjects‟ size 10/34 size range measurements.
1 cm measurement differences were observed in the upper waist, chest, bicep,
neck full, wrist, hip, top thigh, calf, ankle and crotch length back. The size 10/34
tailoring mannequin‟s upper waist, chest, bicep, neck full, wrist, hip, top thigh,
calf, ankle measurements were 1 cm bigger than the subjects‟ size 10/34 size
range measurements; while the crotch length back measurement was 1 cm
smaller when compared to the subjects‟ size 10/34 size range measurement.
The shoulder length measurements remained the same in both compared
measurements.
The results show that there were variations between the 3D full body scanned
subjects‟ measurements and the 3D full body scanned tailoring mannequin‟s
measurements that are currently used for creating shirt and trouser garments for

149
South African petite women. The data suggests that the size 10/34 subjects are
shorter than the mannequin, concluding that garments made to fit the mannequin are
likely to be too long for the subjects. This further suggests that South African petite
women are still likely to find challenges when shopping for their ready-to-wear shirt
and trouser garments in retail stores.
The 3D full body scanned data for the petite women was developed for the pear
body shape profile; however, the shape of the mannequin was unknown as it could
not be detected by the 3D full body scanner body shape software. Nonetheless, the
relationship between the 3D full body scanned measurements (see Table 4.34 and
Table 4.35) of the mannequin‟s bust, upper waist and hip body landmarks were used
to determine the shape of the mannequin; as above-mentioned body landmarks are
the most commonly used body landmarks used to identify and categorise different
body shapes through visual observations. The size 10/34 mannequin‟s bust (86 cm),
upper waist (69 cm) and hip (95 cm) measurement relationship were in accordance
with the bust (88 cm), upper waist (70 cm) and hip (96 cm) measurement
relationship of the pear body shaped size 10/34 size chart measurements. As a
result, the mannequin was classified as having a pear body shape profile. However,
visual shape classification observations of the mannequin suggested that the
mannequin had a crossover shape between the hourglass body shape and the pear
body shape profiles. Nonetheless, the pear shape profile was considered for
comparisons in this study.
The sizing specifications for each body dimension were developed adopting an
experimental approach. The size intervals were calculated from the founded
measurement values between each size range of the secondary body dimensions. A
personal conversation with the manager of a well-known petite tailoring mannequin
mentioned that there are no size charts developed specifically for petite women in
South Africa (Millam, 2016), therefore the grade rules for petite women‟s garment
sizing measurements are unknown. Size intervals are beneficial and applicable when
grading patterns to allow effective pattern grading from one size to another; from
either a smaller size to a larger size (or vice versa), according to the requirements of
the size chart and consumers (Chan, 2014:181).
150
In a sizing system, size intervals can either be the same or vary (Zakaria, 2011:350).
The size intervals for the primary (key) body dimensions remained the same. It was
observable that the size intervals in the developed, experimental upper body and
lower body size charts differed in each body dimension from one size range to
another, mostly in the secondary body dimensions. This could be determined by the
fact that actual human body measurements were used for this study. Although the
shape profile was similar, each body dimension differs in body proportions. The size
intervals of most of the key body dimensions, maintained similar corresponding
values between each size range.
This study was exploratory and cannot be applied to the widespread South African
population as the final data was limited to a 3D sample size of 180 pear body shaped
petite women; only residing in the Gauteng (Pretoria and Johannesburg) area. The
minimum and maximum measurement value limits of the analysed 3D pear body
shape scanned data were observed along with the minimum and maximum limits of
the body dimensions in the size charts to determine the accuracy of the size charts,
the percentage of the analysed sample covered by the developed size charts, and
possible errors within the size charts (see Table 4.36 and Table 4.37).
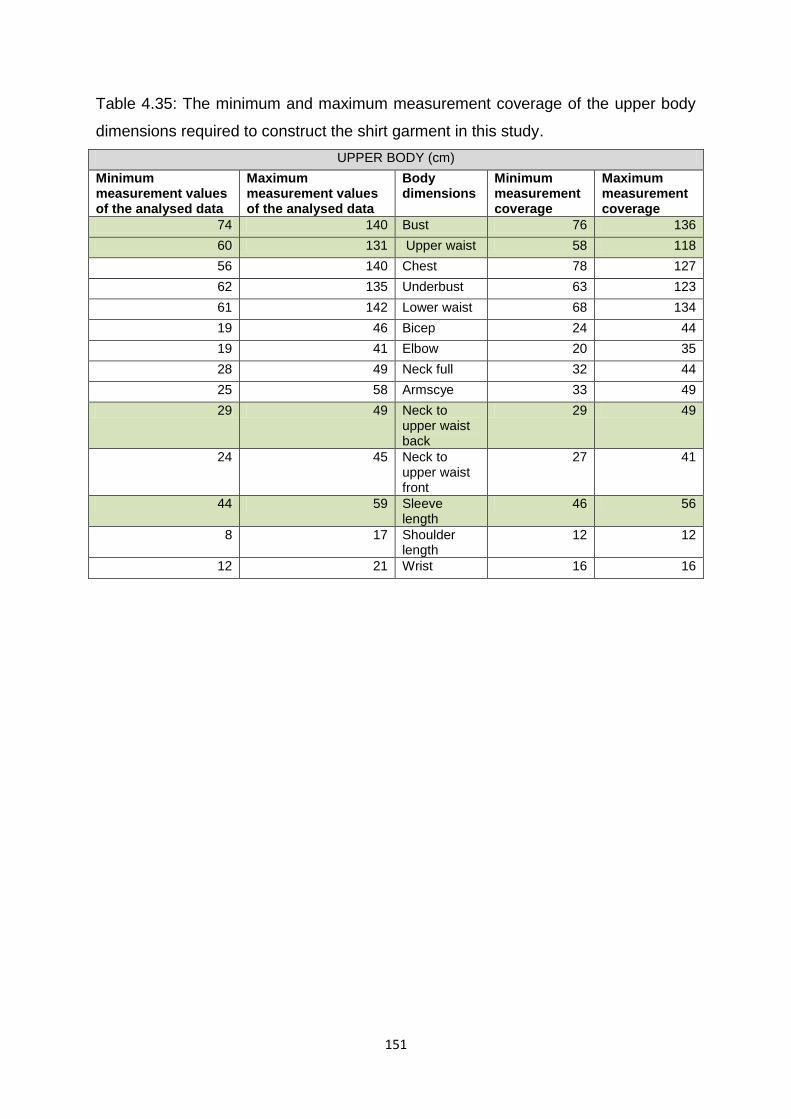
151
Table 4.35: The minimum and maximum measurement coverage of the upper body
dimensions required to construct the shirt garment in this study.
UPPER BODY (cm)
Minimum measurement values of the analysed data
Maximum measurement values of the analysed data
Body dimensions
Minimum measurement coverage
Maximum measurement coverage
74 140 Bust 76 136
60 131 Upper waist 58 118
56 140 Chest 78 127
62 135 Underbust 63 123
61 142 Lower waist 68 134
19 46 Bicep 24 44
19 41 Elbow 20 35
28 49 Neck full 32 44
25 58 Armscye 33 49
29 49 Neck to upper waist back
29 49
24 45 Neck to upper waist front
27 41
44 59 Sleeve length
46 56
8 17 Shoulder length
12 12
12 21 Wrist 16 16

152
Table 4.36: The minimum and maximum measurement coverage of the lower body
dimensions required to construct the trouser garment in this study.
LOWER BODY (cm)
Minimum of the analysed data
Maximum of the analysed data
Body dimensions
Minimum measurement coverage
Maximum measurement coverage
60 131 Upper waist 58 118
81 144 Hip 84 144
61 142 Lower waist 67 137
45 78 Top thigh 51 74
39 71 Mid-thigh 41 61
28 58 Calf 31 49
71 145 High hip 78 140
20 39 Ankle 25 31
31 64 Knee 39 42
21 59 Crotch length back
29 59
22 57 Crotch length front
29 55
60 90 Inseam 60 90
94 113 Outseam 98 110
Table 4.36 shows that extreme measurement values in the upper waist, bust, chest,
underbust, lower waist, shoulder length and wrist body dimensions that were not
covered in the developed size chart for this study. However, the bust (for the upper
body dimensions) and the hip (for the lower body dimensions) were used to
determine the extreme measurements that were not covered in the size chart. As
previously stated by various researchers, Gupta and Gangadhar (2004: 465),
Strydom (2006: 234,236), Petrova (2007:64,70), and Zakaria (2014:96, 113) the bust
and hip body dimensions are the most commonly used girth measurements that
have proven to be useful and important by garment sizing and fit experts for
establishing size charts. The observed extreme measurement values for both the
upper and lower body dimensions were only represented by a minimum number of 5
(3%) of the individuals from the analysed 180 pear shaped subjects‟ sample. The
percentage coverage of the developed upper body size chart measurements
represented 98% (n=177) of the 180, 3D full body scanned petite pear shaped
women‟s sample. One of the subjects‟ measurements was below the minimum
requirement limit and two of the subject‟s measurements were above the maximum
requirement limit.
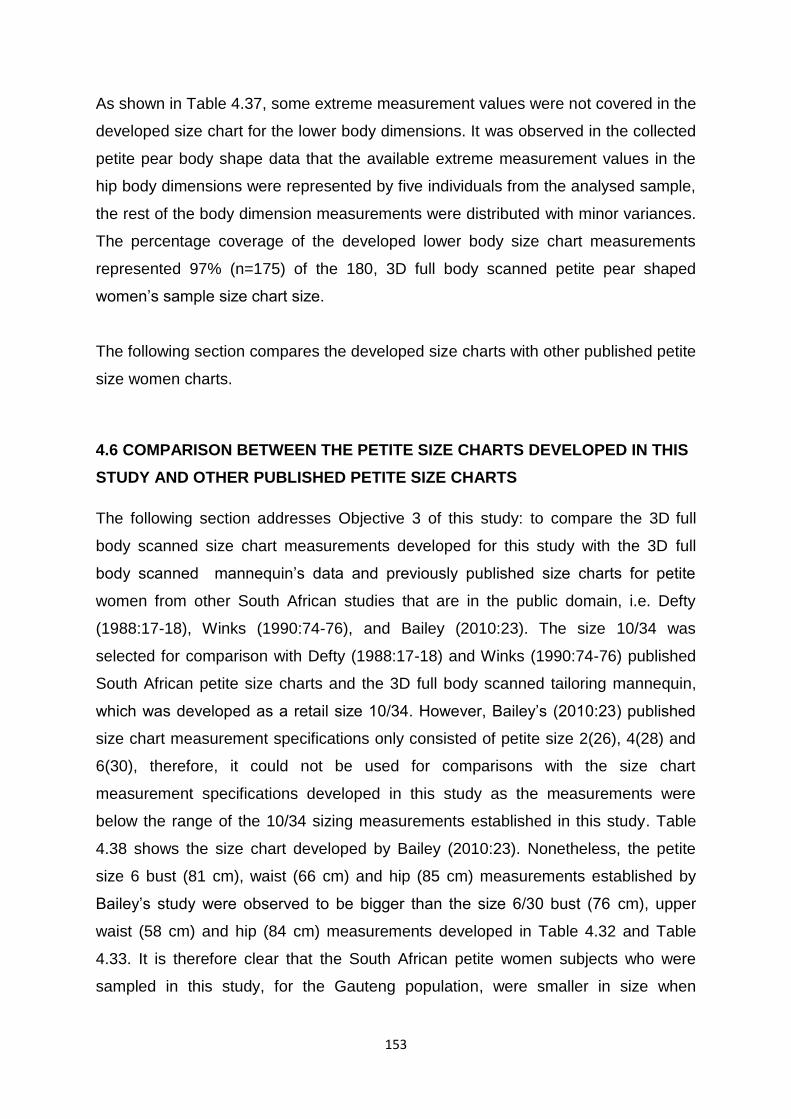
153
As shown in Table 4.37, some extreme measurement values were not covered in the
developed size chart for the lower body dimensions. It was observed in the collected
petite pear body shape data that the available extreme measurement values in the
hip body dimensions were represented by five individuals from the analysed sample,
the rest of the body dimension measurements were distributed with minor variances.
The percentage coverage of the developed lower body size chart measurements
represented 97% (n=175) of the 180, 3D full body scanned petite pear shaped
women‟s sample size chart size.
The following section compares the developed size charts with other published petite
size women charts.
4.6 COMPARISON BETWEEN THE PETITE SIZE CHARTS DEVELOPED IN THIS
STUDY AND OTHER PUBLISHED PETITE SIZE CHARTS
The following section addresses Objective 3 of this study: to compare the 3D full
body scanned size chart measurements developed for this study with the 3D full
body scanned mannequin‟s data and previously published size charts for petite
women from other South African studies that are in the public domain, i.e. Defty
(1988:17-18), Winks (1990:74-76), and Bailey (2010:23). The size 10/34 was
selected for comparison with Defty (1988:17-18) and Winks (1990:74-76) published
South African petite size charts and the 3D full body scanned tailoring mannequin,
which was developed as a retail size 10/34. However, Bailey‟s (2010:23) published
size chart measurement specifications only consisted of petite size 2(26), 4(28) and
6(30), therefore, it could not be used for comparisons with the size chart
measurement specifications developed in this study as the measurements were
below the range of the 10/34 sizing measurements established in this study. Table
4.38 shows the size chart developed by Bailey (2010:23). Nonetheless, the petite
size 6 bust (81 cm), waist (66 cm) and hip (85 cm) measurements established by
Bailey‟s study were observed to be bigger than the size 6/30 bust (76 cm), upper
waist (58 cm) and hip (84 cm) measurements developed in Table 4.32 and Table
4.33. It is therefore clear that the South African petite women subjects who were
sampled in this study, for the Gauteng population, were smaller in size when

154
compared to the women in Bailey‟s study on petite women, sampled in Cape Town.
The size 6 hip girth measurement for Bailey‟s size chart was only 1 cm larger than
the size 6 in this study.
Table 4.37: The petite women‟s size chart developed by Bailey (2010:23)
PETITE 2 PETITE 4 PETITE 6
BUST 79cm 80cm 81cm
WAIST 62cm 64cm 66cm
HIP 81cm 83cm 85cm
The comparable size 10/34 range by Defty (1988:17-18) and Winks (1990:74-76)
and the 3D full body scanned tailoring mannequin‟s data are tabulated in Table 4.39
for the upper body measurements and Table 4.40 for the lower body.

155
Table 4.38: Comparison between the size 10/34 petite size upper body measurements developed for this study with the 3D full
body scanned petite tailoring mannequin, Defty‟s (1988:17-18) and Winks‟ (1990:74-76) published South African petite size charts
that are in the public domain.
3D full body scanned data of the petite subjects (Size 10/34)
Differences between the 3D full body scanned petite subjects and the petite tailoring mannequin‟s measurements
3D full body scanned petite tailoring mannequin
Differences between the 3D full body scanned petite subjects and Defty‟s measurements
Defty (1988:17-18)
Differences between the 3D full body scanned petite subjects and Winks‟ measurements
Winks (1990:74-76) Based on the M body shape
HEIGHT (mean/average) 157cm +3 160cm -4 153cm +3 160cm
Measurements: (cm)
GIRTHS BUST 88 -2 86 0 88 0 88
UPPER WAIST (at navel, midriff area) 70
-1 69 -4 66 - -
NECK FULL 35 -1 34 - - - -
ARMSCYE 36 -3 33 - - - -
BICEP 28 -1 27 - - - -
ELBOW 23 -3 20 - - - -
CHEST 88 -1 87
UNDERBUST 75 -2 73 - - -
LOWER WAIST (15cm below the upper waist)
81
+4
85
-
-
-
-
LENGTHS NECK TO UPPER WAIST (front) 30
+5 35 +3 33 - -
NECK TO UPPER WAIST (back) 33
+6 39 - - - -
SLEEVE AREA SLEEVE LENGTH (shoulder-wrist) 48
+3
51
- -
-
-
SHOULDER LENGTH 12 0 12 - - - -
WRIST 16 -1 15 - - - -
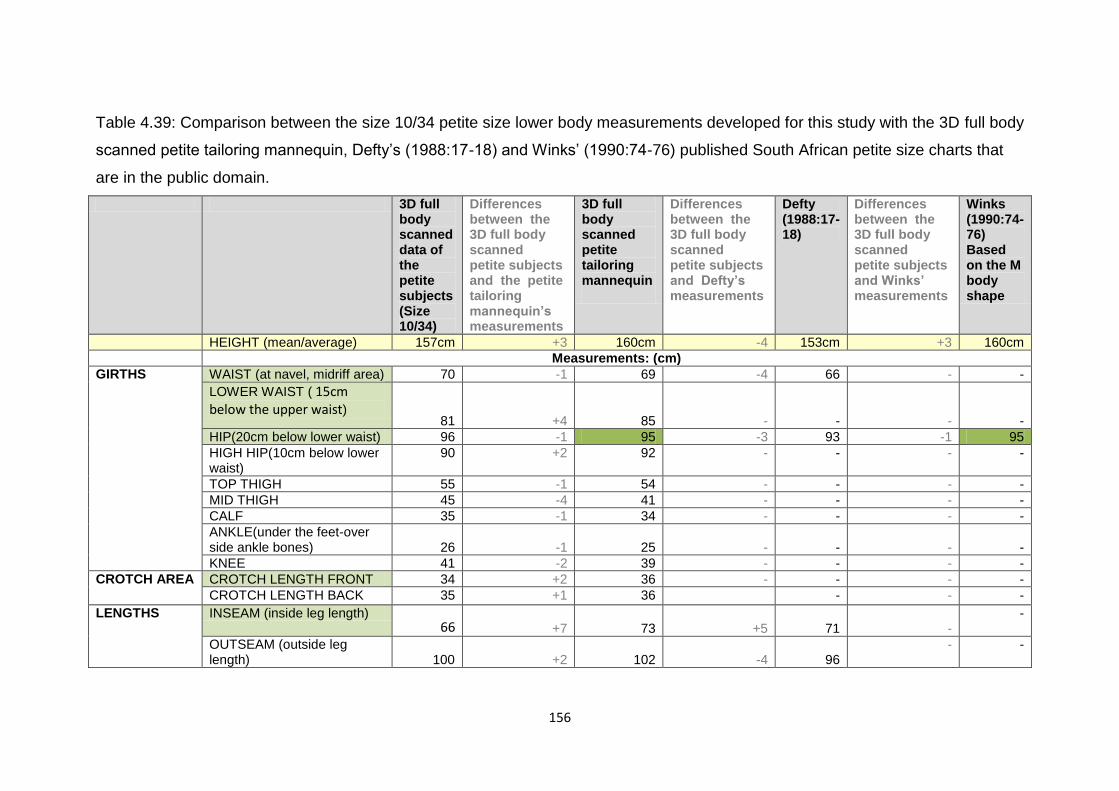
156
Table 4.39: Comparison between the size 10/34 petite size lower body measurements developed for this study with the 3D full body
scanned petite tailoring mannequin, Defty‟s (1988:17-18) and Winks‟ (1990:74-76) published South African petite size charts that
are in the public domain.
3D full body scanned data of the petite subjects (Size 10/34)
Differences between the 3D full body scanned petite subjects and the petite tailoring mannequin‟s measurements
3D full body scanned petite tailoring mannequin
Differences between the 3D full body scanned petite subjects and Defty‟s measurements
Defty (1988:17-18)
Differences between the 3D full body scanned petite subjects and Winks‟ measurements
Winks (1990:74-76) Based on the M body shape
HEIGHT (mean/average) 157cm +3 160cm -4 153cm +3 160cm
Measurements: (cm)
GIRTHS WAIST (at navel, midriff area) 70 -1 69 -4 66 - -
LOWER WAIST ( 15cm below the upper waist)
81
+4
85
-
-
-
-
HIP(20cm below lower waist) 96 -1 95 -3 93 -1 95
HIGH HIP(10cm below lower waist)
90 +2 92 - - - -
TOP THIGH 55 -1 54 - - - -
MID THIGH 45 -4 41 - - - -
CALF 35 -1 34 - - - -
ANKLE(under the feet-over side ankle bones)
26
-1
25
-
-
-
-
KNEE 41 -2 39 - - - -
CROTCH AREA CROTCH LENGTH FRONT 34 +2 36 - - - -
CROTCH LENGTH BACK 35 +1 36 - - -
LENGTHS INSEAM (inside leg length) 66 +7
73
+5
71
-
-
OUTSEAM (outside leg length) 100 +2
102
-4
96
- -

157
The shape of the size 10/34 petite mannequin was classified in section 4.5 as being
a pear body shape profile, based on the bust, upper waist and hip 3D scanned
measurements. Although the petite tailoring mannequin was headless, the height
was obtained from information gathered from Millam (2016), a well-known South
African mannequin manufacturing company that created the mannequin; who
disclosed that the mannequin was developed using a measurement specification
sheet established in 2003 for petite women based on a total body height
measurement of 160 cm. The scanned mannequin‟s measurements were
comparable with all the size 10/34 subjects‟ measurements developed in this study,
because both sets of data were derived from 3D full body scans. However, a
limitation of the comparison is that Defty (1988:17-18) and Winks‟ (1990:74-76) size
charts only listed a few measurements in their size charts that corresponded with the
measurement specifications derived for the size chart in this study.
Overall, seven body measurements; namely, the height, bust, waist, back length to
waist (front neck to upper waist), the hip, inside leg length (inseam) and the outside
leg length (outseam) from Defty‟s (1988:17-18) study were comparable with the body
measurements from the size ranges derived for this study see Defty‟s (1988:17-18)
size charts in Table 4.41 and Table 4.42.

158
Table 4.40: Size chart for short women used for comparing upper body dimensions
by Defty (1988:17).
SIZING CHART SHORT WOMEN – who, without shoes stand 153cm/60” in height.
SIZE 9 11 13 14 16 18 20 22 24
BUST in 31 33 34½ 36 38 40 42 44 46
cm 80 84 88 92 97 102 107 112 117
WAIST in 23 24½ 26 27½ 29½ 31½ 33½ 35½ 37½
cm 58 62 68 70 75 80 85 90 95
HIPS in 33½ 35 36½ 38 40 42 44 46 48
cm 85 89 93 97 102 107 112 117 122
HIP DEPTH in 8 8 8 8 8 8 8 8 8
cm 20 20 20 20 20 20 20 20 20
ACROSS BACK in 12 12½ 13½ 14 14½ 15 15½ 16 16½
cm 30.5 32 33 35.5 37 38 39.5 41 42
BACK LENGTH
TO WAIST
in 15 15 15 15 15 15 15 15 15
cm 38 38 38 38 38 38 38 38 38
FOREARM LENGTH in 17¼ 17¼ 17¼ 17¼ 17¼ 17¼ 17¼ 17¼ 17¼
cm 44 44 44 44 44 44 44 44 44
HINDARM LENGTH in 21¼ 21¼ 21¼ 21¼ 21¼ 21¼ 21¼ 21¼ 21¼
cm 54 54 54 54 54 54 54 54 54
SKIRT LENGTH
MIDCALF
in 26½ 26½ 26½ 26½ 26½ 26½ 26½ 26½ 26½
cm 66 66 66 66 66 66 66 66 66
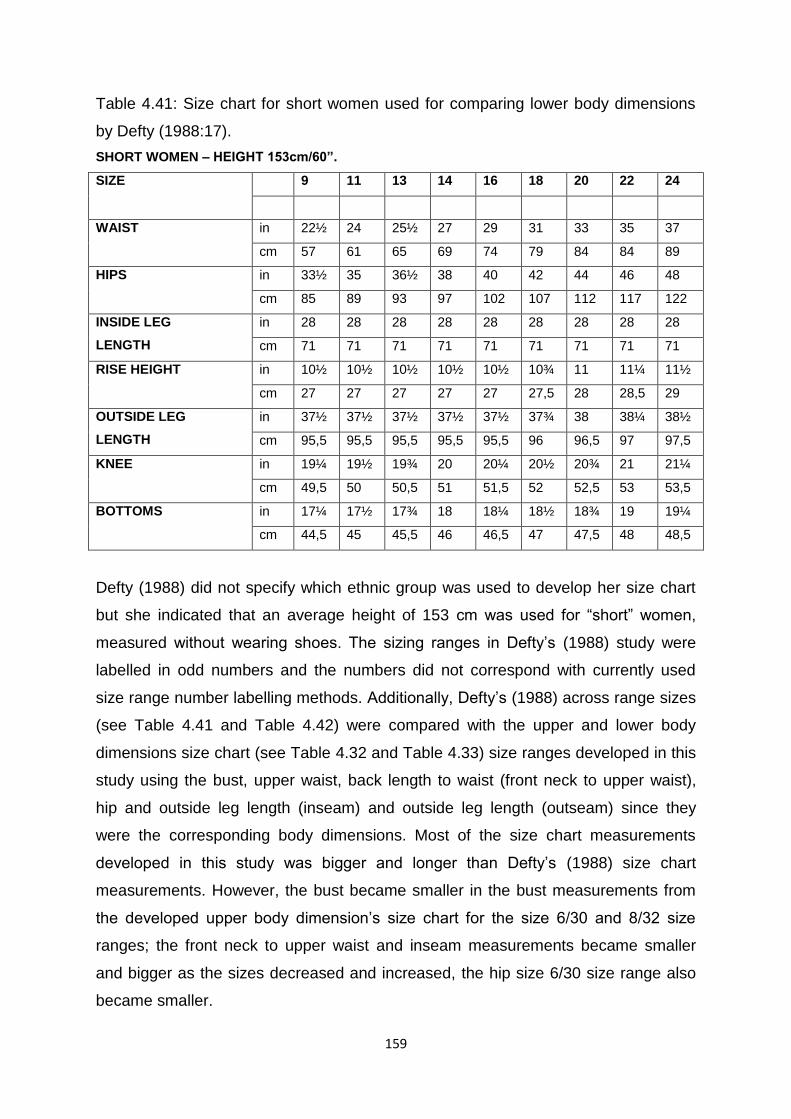
159
Table 4.41: Size chart for short women used for comparing lower body dimensions
by Defty (1988:17).
SHORT WOMEN – HEIGHT 153cm/60”.
SIZE 9 11 13 14 16 18 20 22 24
WAIST in 22½ 24 25½ 27 29 31 33 35 37
cm 57 61 65 69 74 79 84 84 89
HIPS in 33½ 35 36½ 38 40 42 44 46 48
cm 85 89 93 97 102 107 112 117 122
INSIDE LEG
LENGTH
in 28 28 28 28 28 28 28 28 28
cm 71 71 71 71 71 71 71 71 71
RISE HEIGHT in 10½ 10½ 10½ 10½ 10½ 10¾ 11 11¼ 11½
cm 27 27 27 27 27 27,5 28 28,5 29
OUTSIDE LEG
LENGTH
in 37½ 37½ 37½ 37½ 37½ 37¾ 38 38¼ 38½
cm 95,5 95,5 95,5 95,5 95,5 96 96,5 97 97,5
KNEE in 19¼ 19½ 19¾ 20 20¼ 20½ 20¾ 21 21¼
cm 49,5 50 50,5 51 51,5 52 52,5 53 53,5
BOTTOMS in 17¼ 17½ 17¾ 18 18¼ 18½ 18¾ 19 19¼
cm 44,5 45 45,5 46 46,5 47 47,5 48 48,5
Defty (1988) did not specify which ethnic group was used to develop her size chart
but she indicated that an average height of 153 cm was used for “short” women,
measured without wearing shoes. The sizing ranges in Defty‟s (1988) study were
labelled in odd numbers and the numbers did not correspond with currently used
size range number labelling methods. Additionally, Defty‟s (1988) across range sizes
(see Table 4.41 and Table 4.42) were compared with the upper and lower body
dimensions size chart (see Table 4.32 and Table 4.33) size ranges developed in this
study using the bust, upper waist, back length to waist (front neck to upper waist),
hip and outside leg length (inseam) and outside leg length (outseam) since they
were the corresponding body dimensions. Most of the size chart measurements
developed in this study was bigger and longer than Defty‟s (1988) size chart
measurements. However, the bust became smaller in the bust measurements from
the developed upper body dimension‟s size chart for the size 6/30 and 8/32 size
ranges; the front neck to upper waist and inseam measurements became smaller
and bigger as the sizes decreased and increased, the hip size 6/30 size range also
became smaller.

160
Furthermore, similar measurements were observed in the size 10/34 bust and size
6/30 upper waist measurements. Defty‟s (1988) outside leg length measurements
were smaller than the outseam measurements developed in this study for the lower
body dimensions size chart. The size 13 was selected for comparison, seeing that it
contained the best matching body measurements with the size 10/34 body
measurements established from the 3D full body scanned petite women‟s size chart
developed in this study; the measurement comparisons are presented in table 4.39
for the upper body dimensions and 4.40 for the lower body dimensions.
Only three body measurements; namely, the height, bust and hip from Winks‟
(1990:74-76) study were applicable for comparison with body measurements derived
for this study. Winks‟ (1990) data was collected using White, Black and Coloured
ethnic groups with an average height of 160 cm. Three body shapes, namely A, M
and H with body size distribution measurement distinctions were established from
the data; each body shape having different ranges of body size measurements (see
the different body shapes and size distribution chart in Table 4.43).
Table 4.42:The different body shapes and size distribution chart established by
Winks (1990:76)
161
A 160 cm height range and the third body size distribution range from the M body
shape best matched the size 10/34 body measurements developed from the petite
women‟s size chart developed in this study. As a result, this body shape and size is
reported in the comparison for this study. Findings from this study as shown in Table
4.39 and Table 4.40 demonstrate that there are notable differences between the size
10/34 3D full body scanned petite women subjects‟ measurements when compared
to the 3D full body scanned petite tailoring mannequin‟s measurements (developed
in 2003), Defty‟s (1988:17-18) and Winks‟ (1990:74-76) published South African
petite size charts that are in the public domain. There are; however, some similarities
amongst the compared measurements (refer to the highlighted measurement areas
in Table 4.39 and Table 4.40). The average height, bust and hip measurements were
the only common measurements present in all the compared petite size charts. For
that reason, the average height, bust and hip measurements are tabulated in Table
4.44, to consider the differences between the 3D full body scanned petite women
subject‟s size 10/34 body measurements and the 3D full body scanned mannequin‟s
measurements, together with Defty‟s (1988:17-18) and Winks‟ (1990:74-76) petite
size chart measurements.
Table 4.43: Measurement differences of the 3D full body scanned petite
measurements when compared to commonly occurring 3D full body scanned petite
mannequin measurements, Defty (1988:17-18) and Winks (1990:74-76) petite
measurements using the average height, bust and hip.
Size 10/34 3D full
body
scanned
petite
subjects‟
data
3D full body
scanned petite
mannequin
Defty
(1988:17-18)
Winks
(1990:74-76)
HEIGHT (average) 157 cm 160cm 153cm 160cm
Measurements: (cm)
Differences +3 -4 +3
BUST 88 86 88 88
Differences -2 0 0
HIP(20cm below lower waist) 96 95 93 95
Differences -1 -3 -1

162
The limitations of the comparison in Table 4.44 consider the lack of data for Defty
(1988) and Winks (1990). As shown in Table 4.44, the average of the petite heights
in this study was 157 cm. Both the average height range of the 3D full body scanned
mannequin and the average height range established by Winks (1990:74-76) was
160 cm; whilst the average height measured in Defty‟s (1988:17-18) study was 153
cm. There is a 3 cm height difference between both the 3D full body scanned
mannequin‟s average height measurement and Winks‟ average height measurement
when compared to the average height measurement established for the petite
women subjects in this study. Defty‟s average height measurement is lower by 4 cm
when compared to the average height established for the petite women subjects in
this study. The bust measurement established for the size 10/34 petite women
subjects is similar to that of Defty‟s (1988:17-18) and Winks‟ (1990:74-76) study. The
3D full body scanned mannequin‟s bust measurement is the only bust measurement
that is different with a minus 2 cm difference. The hip measurements of the 3D full
body scanned petite women subjects‟ data and Defty‟s measurements differs with 3
cm, while the 3D full body scanned petite mannequin and Winks‟ hip measurement
remain the same. Additionally, Defty included a waist measurement in her size chart
which was 68cm, 2cm smaller than the subjects‟ size 10/34 size range upper waist
measurement and 1 cm smaller than the mannequin‟s upper waist measurement.
The self-perceived perceptions obtained from the subject‟s responses in the
psychographic questionnaire are discussed in the next section.
4.7 THE PETITE SUBJECTS‟ PERCEPTIONS OBTAINED FROM THE
PSYCHOGRAPHIC QUESTIONNAIRE
Objective 4 was to investigate the petite women‟s perceptions of their body shapes
and body proportions together with their purchasing behaviour regarding their shirt
and trouser garments. The responses in the psychographic questionnaire were
evaluated to discover the petite women‟s satisfaction with their body shapes and
challenges they face when purchasing currently available ready-to-wear shirt and
trouser garments.

163
This section analysed the 180 sampled petite pear shaped subjects‟ responses to
gain insightful knowledge on their perceptions. A quantitative approach was used to
analyse most of the data which was reported as numbers, percentages and
frequencies. In some questions the subjects had an option of selecting more than
one answer; therefore, the number of the responses to those questions exceeded
the 180 sampled numbers. However, some responses were less than the 180
subjects sampled because some questions were left unanswered by the subjects.
The responses are discussed below.
The relationship between women‟s body shapes and garment fit is very important
(Liechty et al., 2010:160; Strydom & De Klerk, 2010:75-76). Body shapes are a
contributing factor to garment fit; hence the petite women‟s self-perceived body
shapes should be essential criteria when selecting ready-to-wear shirt and trouser
garments. The subjects‟ body proportions, satisfaction with their body parts, shirt and
trouser garment fit evaluations were further analysed to determine the influence of
their body shapes on garment fit.
Regarding the 180 petite women subjects‟ body proportions, 29% (n=53) of the
subjects perceived their body proportions to be a short torso with long legs; whereas
35% (n=63) of the subjects perceived their body proportions to be a long torso with
short legs and 35% (n=63) perceived to have evenly proportioned body proportions.
Only 1% (n=1) of the subjects was unsure which body proportion they have and,
therefore, did not select either of the provided three body proportions question.
The subjects‟ perceived proportions were compared with the bust to upper waist and
hip to upper waist ratios of the subjects‟ measurements derived from the 3D full body
scanner to compare their body proportions. Somewhat 82% (n=147) of the subjects
were observed to have short torso with long legs body proportions, while 15% (n=27)
of the subjects were observed to have long torso with short legs body proportions
and the remaining 3% (n=6) were observed to have evenly proportioned body
proportions. This indicates that most of the subjects have short upper torsos and
long legs. The subject who indicated that she was not sure of her body proportion
was classified as a having a short torso/long legs body proportion. The above-
mentioned body proportions are illustrated in Chapter 1, section 1.1.
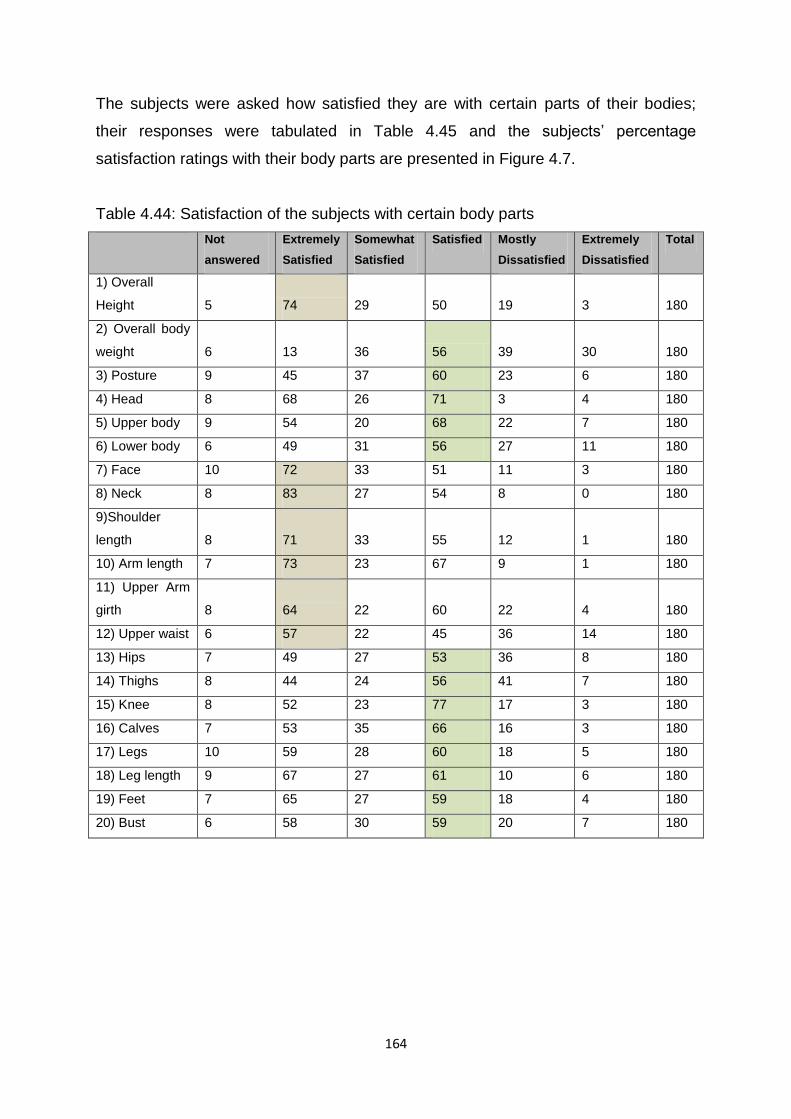
164
The subjects were asked how satisfied they are with certain parts of their bodies;
their responses were tabulated in Table 4.45 and the subjects‟ percentage
satisfaction ratings with their body parts are presented in Figure 4.7.
Table 4.44: Satisfaction of the subjects with certain body parts
Not
answered
Extremely
Satisfied
Somewhat
Satisfied
Satisfied Mostly
Dissatisfied
Extremely
Dissatisfied
Total
1) Overall
Height 5 74 29 50 19 3 180
2) Overall body
weight 6 13 36 56 39 30 180
3) Posture 9 45 37 60 23 6 180
4) Head 8 68 26 71 3 4 180
5) Upper body 9 54 20 68 22 7 180
6) Lower body 6 49 31 56 27 11 180
7) Face 10 72 33 51 11 3 180
8) Neck 8 83 27 54 8 0 180
9)Shoulder
length 8 71 33 55 12 1 180
10) Arm length 7 73 23 67 9 1 180
11) Upper Arm
girth 8 64 22 60 22 4 180
12) Upper waist 6 57 22 45 36 14 180
13) Hips 7 49 27 53 36 8 180
14) Thighs 8 44 24 56 41 7 180
15) Knee 8 52 23 77 17 3 180
16) Calves 7 53 35 66 16 3 180
17) Legs 10 59 28 60 18 5 180
18) Leg length 9 67 27 61 10 6 180
19) Feet 7 65 27 59 18 4 180
20) Bust 6 58 30 59 20 7 180
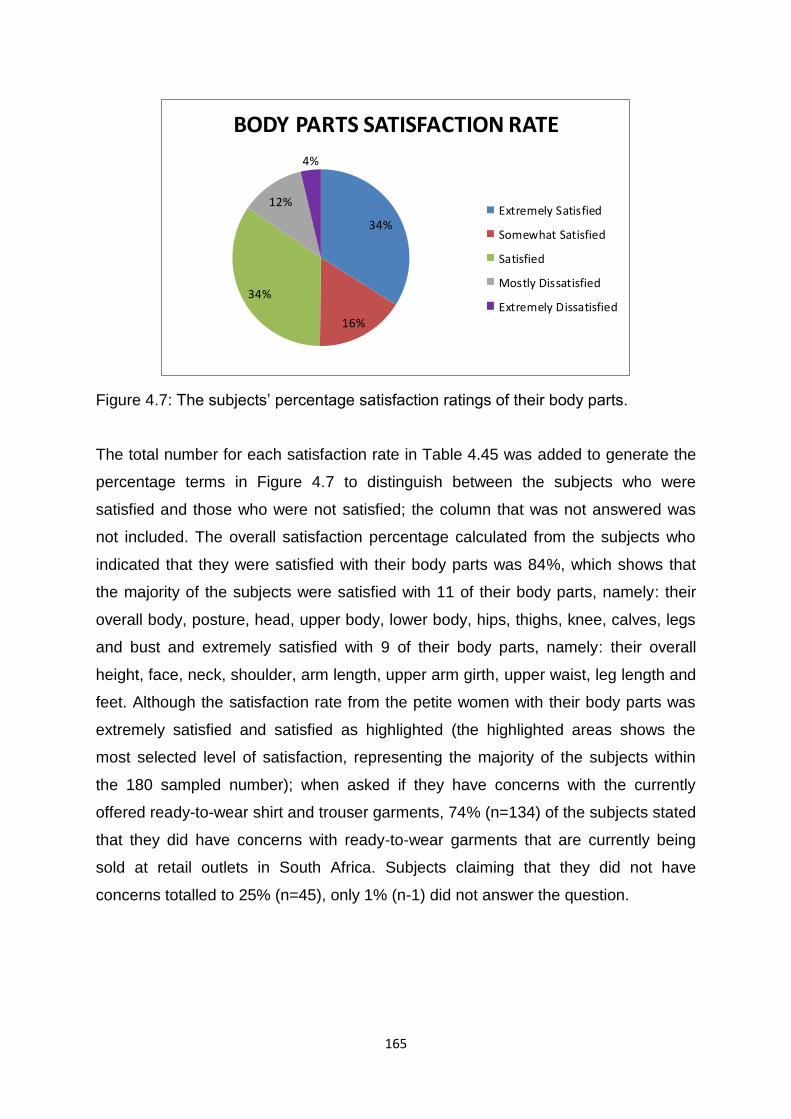
165
Figure 4.7: The subjects‟ percentage satisfaction ratings of their body parts.
The total number for each satisfaction rate in Table 4.45 was added to generate the
percentage terms in Figure 4.7 to distinguish between the subjects who were
satisfied and those who were not satisfied; the column that was not answered was
not included. The overall satisfaction percentage calculated from the subjects who
indicated that they were satisfied with their body parts was 84%, which shows that
the majority of the subjects were satisfied with 11 of their body parts, namely: their
overall body, posture, head, upper body, lower body, hips, thighs, knee, calves, legs
and bust and extremely satisfied with 9 of their body parts, namely: their overall
height, face, neck, shoulder, arm length, upper arm girth, upper waist, leg length and
feet. Although the satisfaction rate from the petite women with their body parts was
extremely satisfied and satisfied as highlighted (the highlighted areas shows the
most selected level of satisfaction, representing the majority of the subjects within
the 180 sampled number); when asked if they have concerns with the currently
offered ready-to-wear shirt and trouser garments, 74% (n=134) of the subjects stated
that they did have concerns with ready-to-wear garments that are currently being
sold at retail outlets in South Africa. Subjects claiming that they did not have
concerns totalled to 25% (n=45), only 1% (n-1) did not answer the question.
34%
16%
34%
12%
4%
BODY PARTS SATISFACTION RATE
Extremely Satisfied
Somewhat Satisfied
Satisfied
Mostly Dissatisfied
Extremely Dissatisfied

166
Table 4.46 and Table 4.47 represent how the currently available shirt and trouser
garments fit on certain parts of the subject‟s bodies. N= the number of the subjects
that answered.
Table 4.45: Body fit evaluation of shirt garments for the petite women subjects.
1 N 2 N 3 N No answer
Neckline Too high 30 Too low 49 No problem 92 9
Collar Too tight 33 Too loose 45 No problem 93 9
Across shoulders Too tight 37 Too loose 40 No problem 95 8
Across back Too tight 50 Too loose 46 No problem 76 8
Across bust Too tight 59 Too loose 52 No problem 61 8
Around upper waist Too tight 60 Too loose 37 No problem 74 9
Around hips Too tight 43 Too loose 46 No problem 83 8
Sleeve – Around upper arm Too tight 35 Too loose 55 No problem 80 10
Sleeve length Too short 39 Too long 60 No problem 71 10
Garment length Too short 52 Too long 52 No problem 63 13
Table 4.46: Body fit evaluation of trouser garments for the petite women subjects.
1 N 2 N 3 N No answer
Trouser- Around lower waist Too tight 60 Too loose 58 No problem 52 10
Trouser – Around hips Too tight 68 Too loose 44 No problem 57 11
Trouser – Around thighs Too tight 58 Too loose 37 No problem 73 12
Trouser – Crotch length Too short 39 Too long 49 No problem 78 14
Trouser – Length Too short 44 Too long 60 No problem 67 9
As shown in Table 4.46 and Table 4.47 the highlighted answers indicate the majority
of the subject‟s ready-to-wear shirt and trouser garment fit problems in each body
category. The results show that the number of the subjects who indicated that they
experienced fit problems (for example: either being too high or too low, too tight or
too loose, too short or too long) with their currently available shirt and trouser
garments when added together, were greater than the number of subjects who
indicated that they do not have problems. The exception to this was in the neckline,
collar and across shoulder where the highest number of petite females indicated that
they do not have a problem with their currently available shirt and trouser garments.
Of the petite women subjects who experienced problems with the fit of their ready-to-
wear shirt garments, the majority indicated that they found their shirt garment to have
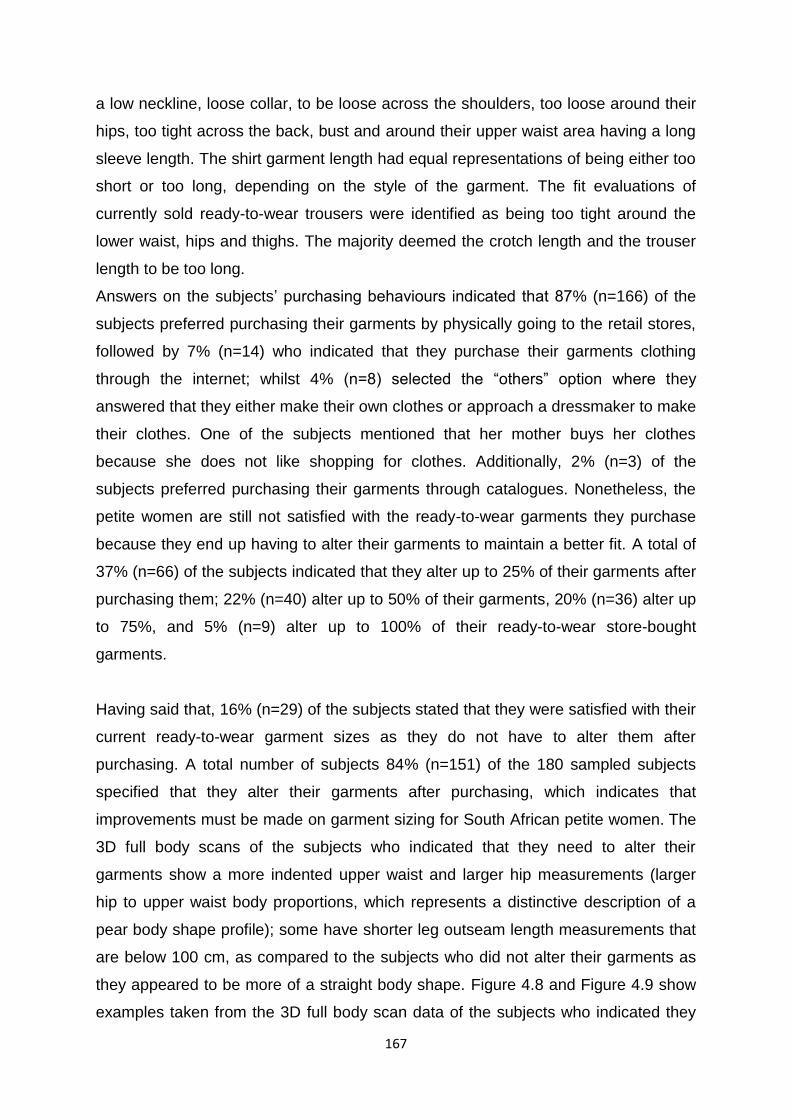
167
a low neckline, loose collar, to be loose across the shoulders, too loose around their
hips, too tight across the back, bust and around their upper waist area having a long
sleeve length. The shirt garment length had equal representations of being either too
short or too long, depending on the style of the garment. The fit evaluations of
currently sold ready-to-wear trousers were identified as being too tight around the
lower waist, hips and thighs. The majority deemed the crotch length and the trouser
length to be too long.
Answers on the subjects‟ purchasing behaviours indicated that 87% (n=166) of the
subjects preferred purchasing their garments by physically going to the retail stores,
followed by 7% (n=14) who indicated that they purchase their garments clothing
through the internet; whilst 4% (n=8) selected the “others” option where they
answered that they either make their own clothes or approach a dressmaker to make
their clothes. One of the subjects mentioned that her mother buys her clothes
because she does not like shopping for clothes. Additionally, 2% (n=3) of the
subjects preferred purchasing their garments through catalogues. Nonetheless, the
petite women are still not satisfied with the ready-to-wear garments they purchase
because they end up having to alter their garments to maintain a better fit. A total of
37% (n=66) of the subjects indicated that they alter up to 25% of their garments after
purchasing them; 22% (n=40) alter up to 50% of their garments, 20% (n=36) alter up
to 75%, and 5% (n=9) alter up to 100% of their ready-to-wear store-bought
garments.
Having said that, 16% (n=29) of the subjects stated that they were satisfied with their
current ready-to-wear garment sizes as they do not have to alter them after
purchasing. A total number of subjects 84% (n=151) of the 180 sampled subjects
specified that they alter their garments after purchasing, which indicates that
improvements must be made on garment sizing for South African petite women. The
3D full body scans of the subjects who indicated that they need to alter their
garments show a more indented upper waist and larger hip measurements (larger
hip to upper waist body proportions, which represents a distinctive description of a
pear body shape profile); some have shorter leg outseam length measurements that
are below 100 cm, as compared to the subjects who did not alter their garments as
they appeared to be more of a straight body shape. Figure 4.8 and Figure 4.9 show
examples taken from the 3D full body scan data of the subjects who indicated they
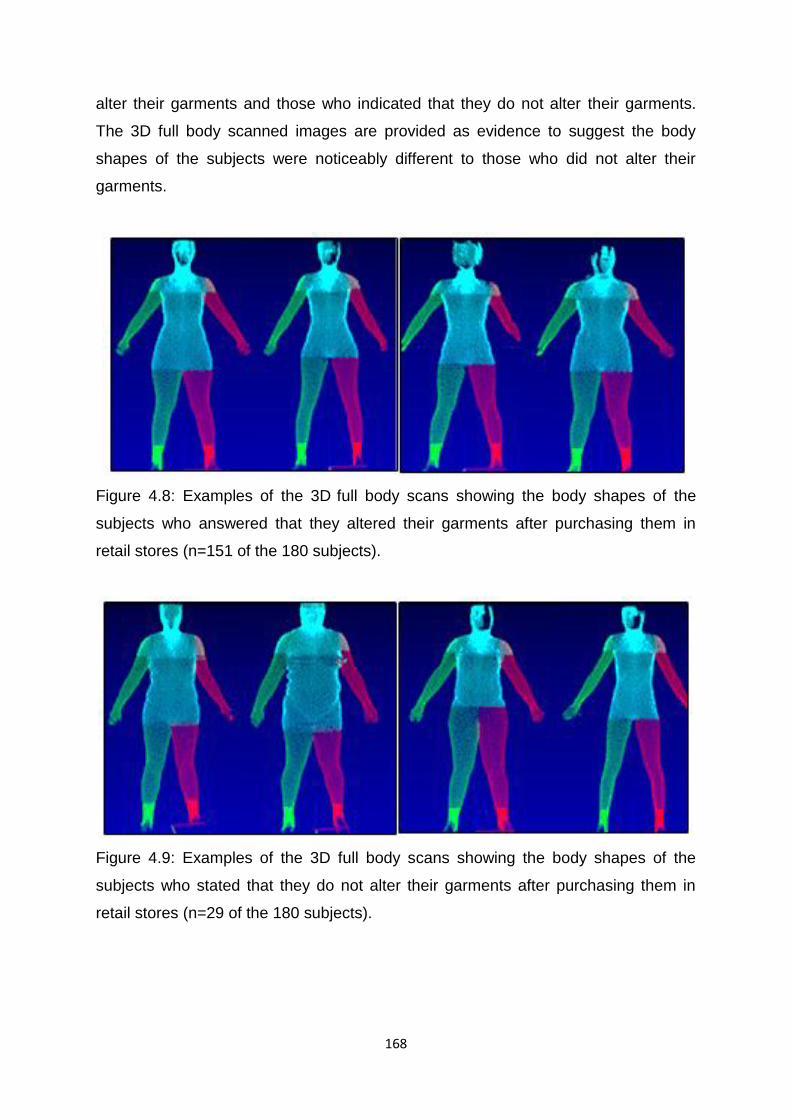
168
alter their garments and those who indicated that they do not alter their garments.
The 3D full body scanned images are provided as evidence to suggest the body
shapes of the subjects were noticeably different to those who did not alter their
garments.
Figure 4.8: Examples of the 3D full body scans showing the body shapes of the
subjects who answered that they altered their garments after purchasing them in
retail stores (n=151 of the 180 subjects).
Figure 4.9: Examples of the 3D full body scans showing the body shapes of the
subjects who stated that they do not alter their garments after purchasing them in
retail stores (n=29 of the 180 subjects).
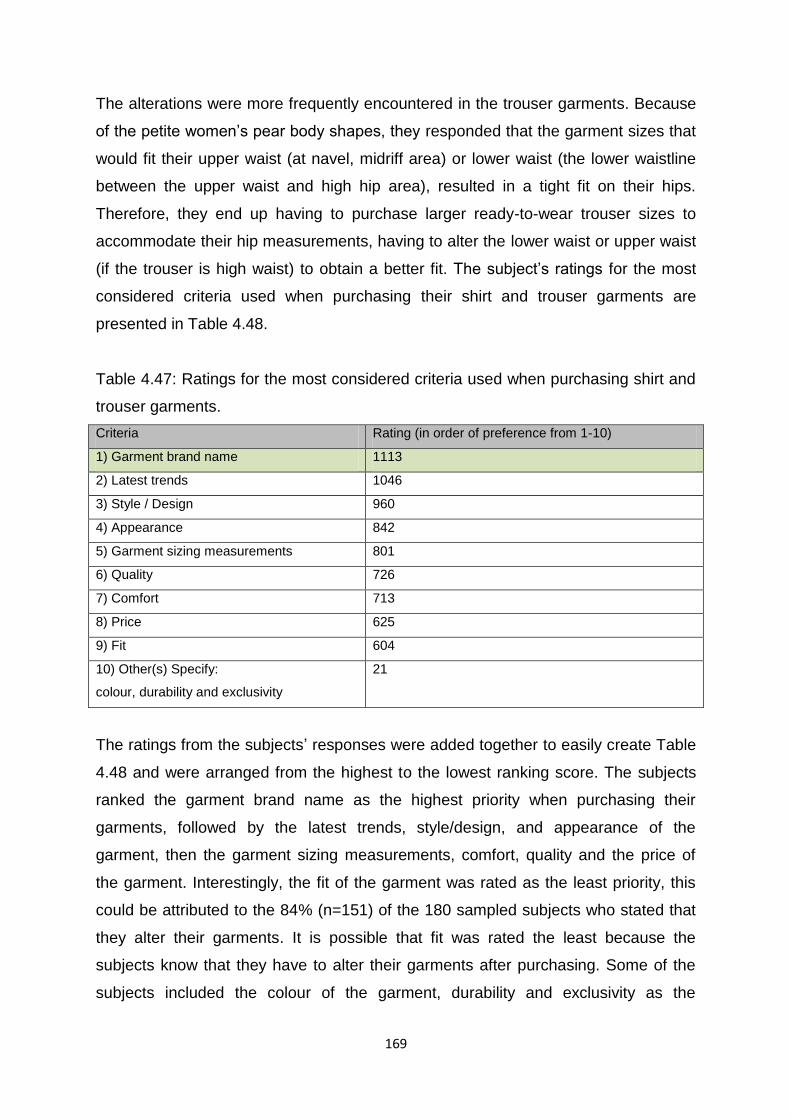
169
The alterations were more frequently encountered in the trouser garments. Because
of the petite women‟s pear body shapes, they responded that the garment sizes that
would fit their upper waist (at navel, midriff area) or lower waist (the lower waistline
between the upper waist and high hip area), resulted in a tight fit on their hips.
Therefore, they end up having to purchase larger ready-to-wear trouser sizes to
accommodate their hip measurements, having to alter the lower waist or upper waist
(if the trouser is high waist) to obtain a better fit. The subject‟s ratings for the most
considered criteria used when purchasing their shirt and trouser garments are
presented in Table 4.48.
Table 4.47: Ratings for the most considered criteria used when purchasing shirt and
trouser garments.
Criteria Rating (in order of preference from 1-10)
1) Garment brand name 1113
2) Latest trends 1046
3) Style / Design 960
4) Appearance 842
5) Garment sizing measurements 801
6) Quality 726
7) Comfort 713
8) Price 625
9) Fit 604
10) Other(s) Specify:
colour, durability and exclusivity
21
The ratings from the subjects‟ responses were added together to easily create Table
4.48 and were arranged from the highest to the lowest ranking score. The subjects
ranked the garment brand name as the highest priority when purchasing their
garments, followed by the latest trends, style/design, and appearance of the
garment, then the garment sizing measurements, comfort, quality and the price of
the garment. Interestingly, the fit of the garment was rated as the least priority, this
could be attributed to the 84% (n=151) of the 180 sampled subjects who stated that
they alter their garments. It is possible that fit was rated the least because the
subjects know that they have to alter their garments after purchasing. Some of the
subjects included the colour of the garment, durability and exclusivity as the

170
determining factor for their purchasing decisions. When asked what they use as a
guide for purchasing sizes that fit their bodies, the majority, 43% (n=77) of the
subjects stated that they use number labelling (e.g. size 10/34, 12/36, etc.) as the
size guide for purchasing their clothing; alphabet labelling (e.g. S for small, M for
medium, etc.) was second with 38% (n=68) of the subjects, followed by hang tags
13% (n=23) and lastly pictograms with 6% (n=12). Nevertheless, 75% (n=112) of the
subjects indicated that they do not select the same garment sizes from different retail
stores, whilst 25% (n=32) stated that they do select the same garment size. Table
4.49 and Table 4.50 present the garment sizes that the subjects perceive
themselves to be and are more likely to select when purchasing their ready-to-wear
shirt and trouser garments.
Table 4.48: Garment sizes that the subjects perceive themselves to be and are more
likely to select when purchasing their ready-to-wear shirt garments.
WOMEN‟S SHIRTS
Size ranges Number Percentage
2/26 4 1%
4/28 10 3%
6/30 30 9%
8/32 52 15%
10/34 84 25%
12/36 42 12%
14/38 32 10%
16/40 33 10%
18/42 32 10%
Other. Specify: 13 4%
Not answered 2 1%
Total 334 100%
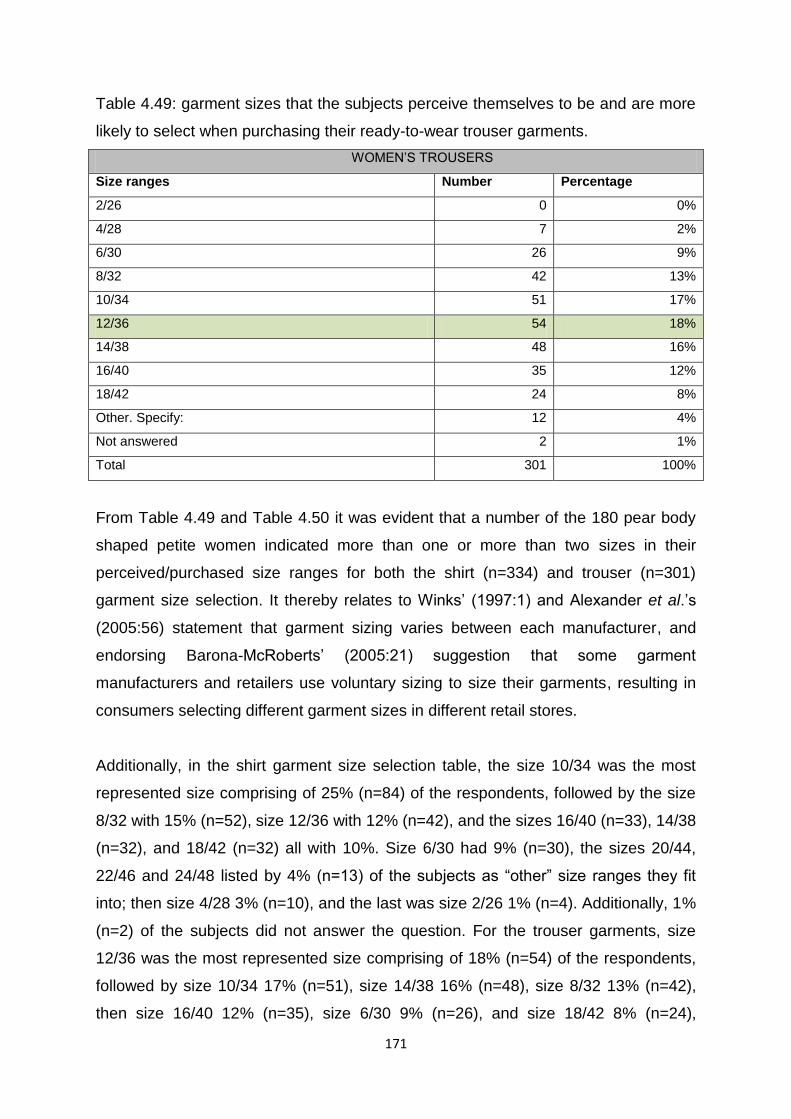
171
Table 4.49: garment sizes that the subjects perceive themselves to be and are more
likely to select when purchasing their ready-to-wear trouser garments.
WOMEN‟S TROUSERS
Size ranges Number Percentage
2/26 0 0%
4/28 7 2%
6/30 26 9%
8/32 42 13%
10/34 51 17%
12/36 54 18%
14/38 48 16%
16/40 35 12%
18/42 24 8%
Other. Specify: 12 4%
Not answered 2 1%
Total 301 100%
From Table 4.49 and Table 4.50 it was evident that a number of the 180 pear body
shaped petite women indicated more than one or more than two sizes in their
perceived/purchased size ranges for both the shirt (n=334) and trouser (n=301)
garment size selection. It thereby relates to Winks‟ (1997:1) and Alexander et al.‟s
(2005:56) statement that garment sizing varies between each manufacturer, and
endorsing Barona-McRoberts‟ (2005:21) suggestion that some garment
manufacturers and retailers use voluntary sizing to size their garments, resulting in
consumers selecting different garment sizes in different retail stores.
Additionally, in the shirt garment size selection table, the size 10/34 was the most
represented size comprising of 25% (n=84) of the respondents, followed by the size
8/32 with 15% (n=52), size 12/36 with 12% (n=42), and the sizes 16/40 (n=33), 14/38
(n=32), and 18/42 (n=32) all with 10%. Size 6/30 had 9% (n=30), the sizes 20/44,
22/46 and 24/48 listed by 4% (n=13) of the subjects as “other” size ranges they fit
into; then size 4/28 3% (n=10), and the last was size 2/26 1% (n=4). Additionally, 1%
(n=2) of the subjects did not answer the question. For the trouser garments, size
12/36 was the most represented size comprising of 18% (n=54) of the respondents,
followed by size 10/34 17% (n=51), size 14/38 16% (n=48), size 8/32 13% (n=42),
then size 16/40 12% (n=35), size 6/30 9% (n=26), and size 18/42 8% (n=24),
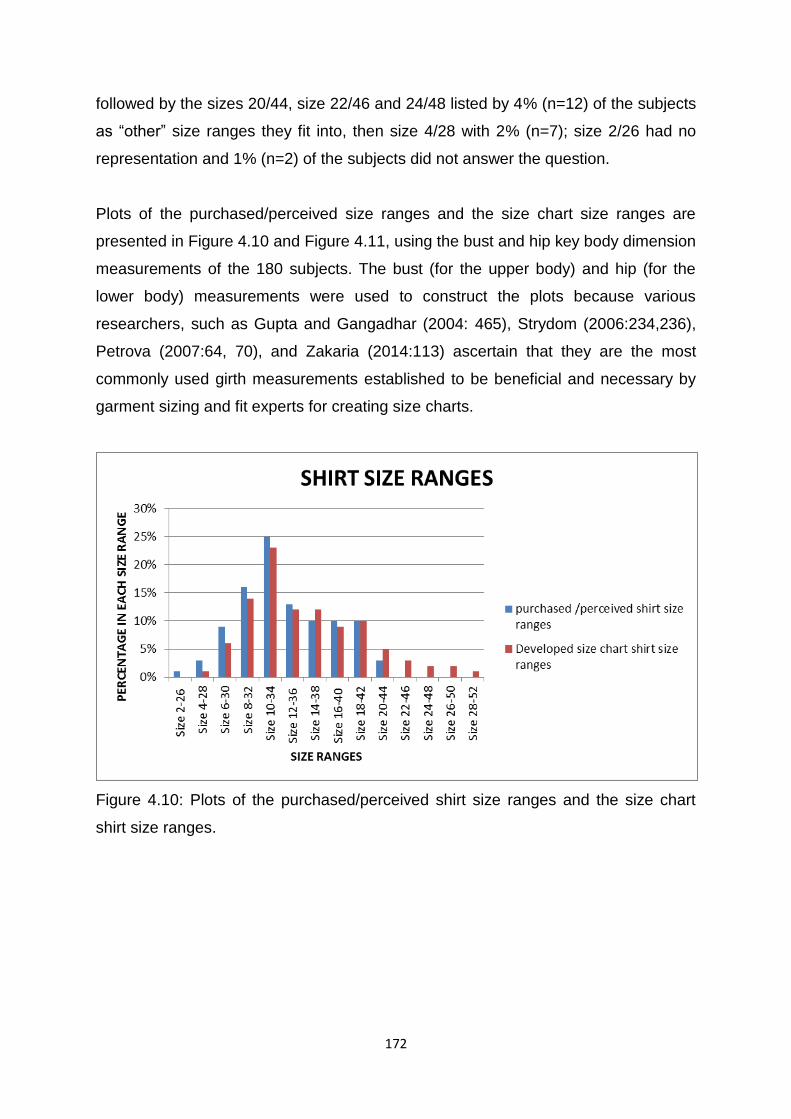
172
followed by the sizes 20/44, size 22/46 and 24/48 listed by 4% (n=12) of the subjects
as “other” size ranges they fit into, then size 4/28 with 2% (n=7); size 2/26 had no
representation and 1% (n=2) of the subjects did not answer the question.
Plots of the purchased/perceived size ranges and the size chart size ranges are
presented in Figure 4.10 and Figure 4.11, using the bust and hip key body dimension
measurements of the 180 subjects. The bust (for the upper body) and hip (for the
lower body) measurements were used to construct the plots because various
researchers, such as Gupta and Gangadhar (2004: 465), Strydom (2006:234,236),
Petrova (2007:64, 70), and Zakaria (2014:113) ascertain that they are the most
commonly used girth measurements established to be beneficial and necessary by
garment sizing and fit experts for creating size charts.
Figure 4.10: Plots of the purchased/perceived shirt size ranges and the size chart
shirt size ranges.

173
Figure 4.11: Plots of the purchased/perceived trouser size ranges and the size chart
trouser size ranges.
As observed in Figure 4.10 and Figure 4.11, for the ready-to-wear shirt size ranges,
most of the subjects were clustered in the size 10/34 size range whilst the majority of
the subjects‟ ready-to-wear trouser size ranges were clustered in the size 12/36 size
range. The following sizes 4/28 and 28/52 (for the upper body dimensions) and size
4/28 (for the lower body dimensions) are shown in the graph “as developed size
ranges” because there were a few subjects in these sizes, but the sizes could not be
included in the experimental size charts due to the maximum and minimum size
limitations that could be covered by the size charts. The results from the size range
representations for both the shirt and trouser garments validate the 90% (n=180)
pear body shape profiles extracted in this study on South African petite women, as
established in the study to have a heavy bottom body section where the hip area is
fuller and bigger than the upper body section (shoulder and bust area) of the body.
The range of garment sizes available in retail outlets was rated as being good by
39% (n=70), average by 32% (n=57), excellent by 11% (n=20), fair by 8% (n=15)
and poor by 7% (n=13) of the subjects; 3% (n=5) did not answer the question. From
the available garment size ratings, it was concluded that the range of garment sizes
currently offered for petite women in South Africa is good to average.
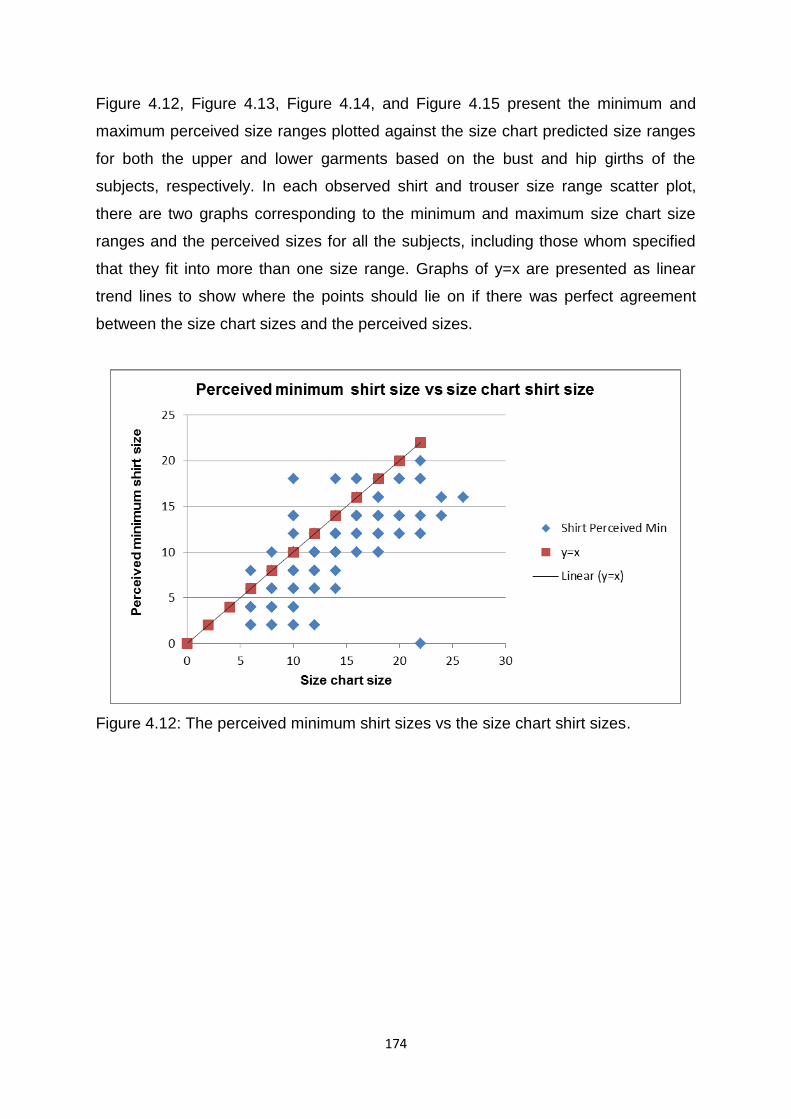
174
Figure 4.12, Figure 4.13, Figure 4.14, and Figure 4.15 present the minimum and
maximum perceived size ranges plotted against the size chart predicted size ranges
for both the upper and lower garments based on the bust and hip girths of the
subjects, respectively. In each observed shirt and trouser size range scatter plot,
there are two graphs corresponding to the minimum and maximum size chart size
ranges and the perceived sizes for all the subjects, including those whom specified
that they fit into more than one size range. Graphs of y=x are presented as linear
trend lines to show where the points should lie on if there was perfect agreement
between the size chart sizes and the perceived sizes.
Figure 4.12: The perceived minimum shirt sizes vs the size chart shirt sizes.

175
Figure 4.13: The perceived maximum shirt sizes vs the size chart shirt sizes.
Figure 4.14: The perceived minimum trouser sizes vs the size chart trouser sizes.
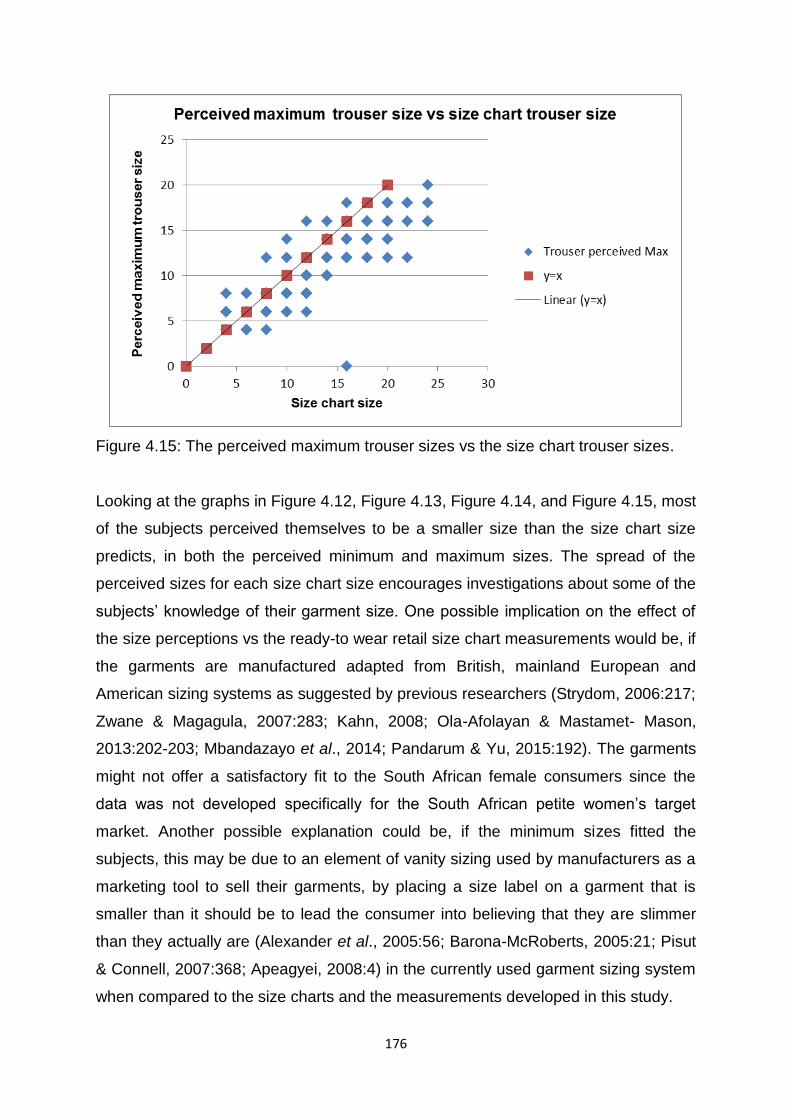
176
Figure 4.15: The perceived maximum trouser sizes vs the size chart trouser sizes.
Looking at the graphs in Figure 4.12, Figure 4.13, Figure 4.14, and Figure 4.15, most
of the subjects perceived themselves to be a smaller size than the size chart size
predicts, in both the perceived minimum and maximum sizes. The spread of the
perceived sizes for each size chart size encourages investigations about some of the
subjects‟ knowledge of their garment size. One possible implication on the effect of
the size perceptions vs the ready-to wear retail size chart measurements would be, if
the garments are manufactured adapted from British, mainland European and
American sizing systems as suggested by previous researchers (Strydom, 2006:217;
Zwane & Magagula, 2007:283; Kahn, 2008; Ola-Afolayan & Mastamet- Mason,
2013:202-203; Mbandazayo et al., 2014; Pandarum & Yu, 2015:192). The garments
might not offer a satisfactory fit to the South African female consumers since the
data was not developed specifically for the South African petite women‟s target
market. Another possible explanation could be, if the minimum sizes fitted the
subjects, this may be due to an element of vanity sizing used by manufacturers as a
marketing tool to sell their garments, by placing a size label on a garment that is
smaller than it should be to lead the consumer into believing that they are slimmer
than they actually are (Alexander et al., 2005:56; Barona-McRoberts, 2005:21; Pisut
& Connell, 2007:368; Apeagyei, 2008:4) in the currently used garment sizing system
when compared to the size charts and the measurements developed in this study.

177
In terms of how the petite women preferred the fit of ready-to-wear shirt and trouser
garments on their bodies, most of them 33% (n=60) indicated that they preferred
wearing close-fitting shirt garments, whilst 27% (n=49) preferred loose fitting,
followed by 23% (n=42) preferred semi-fitted, 11% (n=19) preferred figure hugging,
2% (n=3) preferred very loose-fitting shirts and 4% (n=7) did not answer the
question. With the trouser garments, the majority of the subjects 41% (n=78)
indicated that they preferred wearing close-fitting trousers, whilst 24% (n=46)
preferred semi-fitted, followed by 18% (n=32) preferred loose fitting, 10% (n=18)
preferred figure hugging, 1% (n=1) preferred very loose-fitting trousers and 7%
(n=14) did not answer the question. The size 10/34 subjects were observed to have
small to medium body silhouettes, therefore, based on the results of the ready-to-
wear shirt and trouser fit preferences, it was decided that the shirt and trouser
garments to be constructed in this study would either be close-fitted or semi-fitted to
the body as indicated by most of the subjects to be their most preferred garment fit.
The type of fabric used to make the garments will have an influence on the fit of the
shirt and trouser garments to be produced for garment fit test evaluations in this
study, hence the researcher chose a 100% calico cotton fabric for the fit test
evaluations to remove any bias during the fit evaluation assessments.
4.8 CONCLUSION
Sizing systems originate from body measurements and body shapes taken from a
specific population (Bye et al., 2006:66; Petrova, 2007:56) to permit accurate size
chart developments that will enhance better garment fit and enable the production of
garments that correspond with the analysed body shape.
In this chapter, the experimental upper and lower body size charts required to
construct the prototype shirt and trouser garments for South African petite women
who have pear body shape profiles as determined by the 3D installed software, were
developed. The experimental size charts were developed by statistically analysing
3D full body scanned data of 180 petite, pear shaped female subjects residing in the
Gauteng area. PCA and regression analysis were used to develop the experimental
size charts in this study.
178
The subjects‟ perceptions of their body shapes and body proportions, together with
evaluations and purchasing behaviour regarding their ready-to-wear shirt and trouser
garments were also analysed in this chapter. It can be concluded from the findings of
this chapter that, from the evidence of the sample of women in the study, the South
African petite women consumers are aware of the quality of fit and availability of
ready-to-wear shirt and trouser garments currently offered in retail stores. The petite
women also have some knowledge of their body shapes, how the garments fit on
their bodies and the meanings of various garment size descriptions used on garment
sizing labels. However, they lack knowledge of their own key body dimensions which
serve as indicators of suitable garment sizes.
The pear body shape profile (which has a narrow upper body and a wider lower body
circumference) identified to be dominant in this 3D study for South African petite
women differs from the western ideal body shape that appears to be balanced in
upper and lower body. Garments made for the ideal body shape use the apparel
industry‟s standard-sized body measurements. The sizing systems currently in use
for petite women do not accurately reflect the varied body dimensions, shapes and
proportions of the South African women of today (Pandarum & Yu, 2015:192). Hence
the purpose of this study was to collect 3D full body scanned data of actual, up-to-
date and accurate petite women‟s body measurements and develop an experimental
size charts for the upper and lower body dimensions with the aim of improving the fit
of the shirt and trouser garments manufactured for petite women in South African.
To determine whether the developed experimental size charts offer an improved,
overall quality of fit for South African petite women pear body shape profiles;
identified in this study, the following chapter presents the results of the size 10/34
upper and lower body size charts developed from the 3D full body scanned petite
women‟s data and a size 10/34 3D full body scanned petite tailoring mannequin‟s
data Thereafter a basic prototype shirt and trouser pattern blocks were constructed.
The garment development methods and procedures are also discussed in this
chapter.

179
CHAPTER 5
CONSTRUCTING THE BASIC SHIRT AND TROUSER PATTERN BLOCKS;
MANUFACTURING THE GARMENTS AND CONDUCTING GARMENT FIT TEST
EVALUATIONS
5.1 INTRODUCTION
This chapter reports on the evaluations conducted between a base sized 10/34
petite tailoring mannequin used by retailers and manufacturers, and the 3D petite
women anthropometric data collected in this study. The data was used to develop
size 10/34 fitting test pattern blocks for developing the prototype shirt and trouser
garments for fit test evaluations to fulfil objective 5 as specified in section 1.3. This
chapter further describes how the shirt and trouser garments were manufactured
using the pattern blocks drafted in this study. Moreover, this chapter reports on the
garment fit test evaluations of prototype shirt and trouser garments designed from
the 3D full body scanned subjects‟ size 10/34 measurements and the 3D full body
scanned mannequin‟s size 10/34 measurements.
The average height measurement of the subjects in this study was found to be 157
cm (see Figure 4.1) and only the pear-shaped petite women subjects‟ 3D scanned
body measurements were considered throughout the pattern construction process.
5.2 DEVELOPING THE PATTERN BLOCKS FOR CONSTRUCTING THE
PROTOTYPE SHIRT AND TROUSER GARMENTS
The entire concept of constructing standard patterns revolves around achieving
specific fit requirements for the end use of garments, since proper patternmaking
ensures a good fit for the target consumers. To be able to evaluate the accuracy of
the size chart measurements established in this study, the prototype shirt and
trouser pattern blocks were manually constructed from the size 10/34 3D full body
scanned subjects‟ body measurements as well as the measurements from a size
10/34 3D full body scanned petite tailoring mannequin used commercially, to
produce the shirt and trouser garments for fit test evaluations. These evaluations
180
also served to assess the relevance and accuracy of the mannequin to the fit of
garments on a selection of size 10/34 petite women.
5.2.1 Constructing the prototype shirt and trouser pattern blocks
The procedures for drafting the pattern blocks were adopted from Defty‟s (1988:22-
30) pattern making book, supplemented by the researcher‟s pattern making
experience. The justification for using Defty‟s pattern drafting method, in this study,
was that Defty (1988:17-18) is the only South African author who published upper
and lower body size charts for petite “short” women and additionally provided pattern
making instructions for drafting the bodice, sleeve for the shirt garments and the
“slacks” for the trouser garments.
The patterns developed in this petite sizing and fit study focused on one size range
(size 10/34) therefore pattern grading was not necessary. Half patterns were used
for constructing the front and back of each shirt and trouser pattern. Two-
dimensional pattern drafting methods were used to construct the patterns; these are
described in section 2.11. The basic pattern blocks consist of a set of plain, flattened
pattern pieces and adapted for a particular garment style. The design styles for the
prototype shirt and trouser garments constructed in this study have been presented
in sections 3.4.1 (Figure 3.6) and 3.4.2 (Figure 3.7).
Two sets of shirt and trouser patterns were drafted from the size chart size 10/34
subjects‟ size chart measurements and the size 10/34 petite tailoring mannequin‟s
measurements. Adjustments to the pattern blocks were made at the shoulder which
was shortened in length because Defty‟s pattern drafting method resulted in a longer
shoulder length measurement for both sets of the drafted prototype shirt pattern
blocks. The shirt front collar measurements were lowered by 1.5 cm to
accommodate movement in the neck area. Thereafter a skirt pattern was
incorporated into the shirt pattern design to extend the length of the shirt to the lower
waist as the initial shirt length ended at the upper waist area. The pattern
measurements for the prototype shirt sleeve were adjusted slightly at the armhole to
match the measurements collected in this study.

181
The trousers pattern blocks were created using the lower waist measurements
because the trouser was not intended to be high-waisted. The front and back crotch
lengths were lowered with 15 cm, as the crotch lengths were taken at the upper
waist area. 15 cm was the measurement distance used to measure the lower waist
from the upper waist when scanning the subjects. Thereafter, the pattern blocks
were shaped according to the desired fit of the garments. The tables of data used to
draft the prototype shirt and trouser pattern blocks are as indicated in Table 4.34 and
Table 4.35, in section 4.5.
The measurements on the two sets of shirts and trouser pattern blocks were further
compared to distinguish the shape differences in the pattern blocks (see Figure 5.1
and Figure 5.2). Both sets of pattern blocks were drafted for a pear body shape
profile as this was the body shape determined from the 3D full body scanned
measurements of the subjects and the petite tailoring mannequin. The size 10/34
mannequin‟s bust (86 cm), upper waist (69 cm) and hip (95 cm) measurement
relationship were established to be in accordance with the bust (88 cm), upper waist
(70 cm) and hip (96 cm) measurement relationship of the pear body shaped size
10/34 size chart measurements, and was therefore classified as a pear body shape
profile. However, visual shape classification observations of the petite mannequin
suggested that the mannequin had a crossover shape between the hourglass body
shape and the pear body shape profiles. Hence, the researcher found some
differences in the pattern blocks developed in this study using the size 10/34 upper
and lower body dimensions size chart measurements.
The girth measurements from the size 10/34 upper body dimensions size charts
developed in this study were larger than the girth measurements from the
mannequin‟s data. Furthermore, the bodice, sleeve and trouser pattern blocks were
shorter in length for both the shirt and trouser garments. The length of the shirt
garment created using the size 10/34 size chart measurements was 5.5 cm shorter
than the length of the shirt garment created using the size 10/34 mannequin‟s
measurements. This could be attributed to the neck to upper waist front (30 cm) and
back (33 cm) measurements from the size 10/34 size chart being shorter than the
neck to upper waist front (35 cm) and back (39 cm) measurements from the size
10/34 mannequin.
182
The trouser crotch lengths from the size 10/34 size chart data (front: 34 cm and
back: 35 cm) measurements were shorter than the crotch length (front: 36 cm and
back: 36 cm) measurements from the size 10/34 mannequin; the inseam (66 cm)
and the outseam (100 cm) from the size 10/34 size chart data were shorter than the
inseam (73 cm) and the outseam (102 cm) measurements from the size 10/34
mannequin. Hence the trouser pattern block drafted using the size 10/34 lower body
dimensions size chart measurements was shorter in garment length when compared
to the trouser pattern block drafted using the size 10/34 size mannequin
measurements.

183
Figure 5.1: Patterns blocks developed from the subjects‟ size chart, size 10/34 measurements collected in this study.
2
2 1
7
6
5
3
1
4
3
4

184
Figure 5.2: Patterns blocks developed from the size 10/34 tailoring mannequin measurements used in this study.
3
43
53
7
63
1 2
3
13
23
43
185
The shirt patterns were developed from seven pattern pieces, as shown in Figure 5.1
and Figure 5.2. The front left and right (1) basic shirt block patterns with darts (the
front patterns had button stands), back left and right (2) basic shirt block patterns
with darts, a standing collar (3) with a collar stand (4), a sleeve (5) and a sleeve cuff
(6) that had a bound placket (7). The trouser patterns, shown in Figure 5.1 and
Figure 5.2, consisted of four pieces: front left and right (1) trouser patterns, back left
and right (2) patterns, with a contoured 4 cm-wide front and back waistband (3) that
formed a tilted pants waist sitting at the lower waist area of the body and a fly-front
zipper closure (4); both the front and back trouser block pattern pieces had waist
darts: one for each side of the front patterns and two for each side of the back
patterns.
Wearing/functional ease and the design garment ease were considered when
drafting the shirt and trouser pattern blocks. Although in section 4.7, most of the
subjects indicated that they preferred close-fitted garments, it was noted that the
size 10/34 subjects had small to medium body silhouettes (according to their body
measurements) and their overall shirt and trouser garment fit preference ranged
between close-fitting to semi-fitted. Therefore, the pattern blocks for the shirt and
trouser garments were drafted as semi-fitted to allow ease of movement in the
garment since the fabric used to create the garments in this study was a non-
stretchable calico cotton fabric.
Calico fabric is an inexpensive alternative to other fabrics and is extensively used for
mock-ups of garments in the fashion industry (Redmore, 2012:10; Trish Newbery
Design, 2014). The calico fabric used for the shirt garment was lighter than the
calico fabric used to manufacture the trouser garment, to ensure that the shirt
garment was light in weight. 100% Natural Cotton Calico Fabric Medium weight, 190
grams per square metre (g/m²) was used for the shirt garments and 245 g/m² was
used for the trouser garments. Sewing and Craft Alliance (2008:1-2) suggest that
lightweight fabrics are best suited for shirt garments and medium to heavy fabrics for
trouser garments.
186
The basic shirt silhouette (see Figure 3.6) was used as the shirt style for this study.
Garment ease was added to the upper waist circumference: 0.75 cm on the front and
back sides, hip circumference 0.75 cm on the front and back sides, and sleeve
circumference 0.75 cm on the front and back sides to allow comfort and movement
in the garment. The overall left and right side of the shirt bodice and sleeve had a 1.5
cm ease value (front pattern ease value: 0.75 cm + back pattern ease value: 0.75
cm). Hemline measurements of 2 cm were added on the length of the shirt and
sleeve length for both the size 10/34 size chart measurements and the 3D full body
scanned size 10/34 mannequin‟s measurements.
The slacks silhouette (see Figure 3.7) was used as the basic trouser style for this
study. The patterns for the trousers were drafted as straight, semi-fitted trousers. Up
to 1.5 cm ease was added to the hip circumference and 1.5 cm knee circumference.
The added ease measurements were drafted to blend with the ankle (hemline) area.
Seam allowances of 2 cm were used on all the constructed shirt and trouser
garments. The amount of ease allowance used was based on the researcher‟s
personal experience, information gathered from pattern books and consultations with
two experts with experience in garment sizing and fit in the Department of Consumer
Science, clothing field. The length of the trouser garments was drafted to correspond
with the size 10/34 trouser inseam and out-seam measurements from the size chart
and the 3D full body scanned mannequin‟s measurements respectively.
The shirt and trouser sizing measurements together with the design styles of the
garments produced in this study were made to fit as smoothly as possible over the
subjects‟ largest body protrusions (bust for the shirt and hip for the trouser garments)
and easily hang on the wearer‟s body.
Methods and procedures on how the garments were manufactured are described
and discussed in the next section.
187
5.3 MANUFACTURING THE PROTOTYPE SHIRT AND TROUSER GARMENTS
Pattern pieces represent a piece of a garment and contain information such as seam
allowances, grain lines, garment sizes, balance marks, darts and button placements.
The pattern pieces are then sewn together to obtain a prototype garment style of a
fashion design illustration (Narang, 2014:33). To create the shirt and trouser
garments for this study, all the pattern pieces were cut from the calico fabric prior to
joining the pattern pieces together, using the same construction techniques to
ensure uniformity in the appearance of the test garments.
Two garments were created for each of the size 10/34 subjects‟ size chart
measurements and the size 10/34 petite tailoring mannequin‟s measurements to
avoid testing the fit of the garments on the subjects with one garment that could be
easily worn out and distort the quality of fit on the wearer‟s body. The measurements
(see Table 4.34 and Table 4.35) on each of the produced shirt and trouser garments
were cross-checked with that from the actual patterns for accuracy
The fabric grain and the garment line from the five elements associated with garment
fit mentioned in section 2.4.1.1 and 2.4.1.3 were considered when constructing the
shirt and trouser garments for this study. The positioning of the pattern grain lines,
when cutting the pattern pieces on the fabric, were set relative to the fabric grain to
ensure that the fabric of the garment draped correctly and conformed to the wearer‟s
body contour as required by the garment design style. The pattern pieces were
placed crosswise parallel to the finished edge of the fabric and lengthwise using the
grain line as a guideline to place the pattern pieces. Seamlines and dart lines were
marked as structural lines from the pattern pieces to be used as guidance when
stitching the shirt and trouser garments. This was done to permit accurate and even
garment lines that followed the body‟s natural silhouette, providing a proper garment
fit and appearance.
A fusible non-woven interlining was used to fuse the garment pieces that required
reinforcement; such as the collars, button stands, cuffs for the shirt garments and the
waistbands for the trouser garments. To allow closure in the garments, five buttons
were placed on the button stand of each of the finished shirt garments and one
188
button was placed on the trouser waistbands and coil zippers were inserted at the
front fly area. The sewing specifications used in this study to manufacture the shirt
and trouser garments ensured that the design requirements of the garments were
met by applying guidelines formulated by the ISO 4916:1991 stitch type standards.
The instruction manuals from the Empisal dress maker 270D free arm sewing
machine and the Empisal model S4D free arm overlocker sewing machine that were
used to assemble the prototype shirt and trouser garments were also followed. A
domestic sewing machine and a domestic overlock machine were used to
manufacture the shirt and trouser garments.
The speed of the sewing and overlock machines were kept moderate and controlled
to minimise a lot of heat generation when sewing the garments and to avoid seam
damage caused by cutting the fabric yarn during the sewing process. The lockstitch
and over locker stitch machine parameters were adjusted according to the
researcher‟s experience in sewing garments, keeping in mind the sewing and over
locker machine‟s manual book instructions. The same machine operator (the
researcher) was used to manufacture all the garments. The technical specifications
consisting of the structure of procedures used to assemble the shirt and trouser
garments manufactured in this study; along with the parameters specified for the
assembling process are presented in Appendix I.
5.4 GARMENT FIT TEST EVALUATIONS
Fit and wear test evaluations are important evaluators to achieve a good garment fit
(Smit 2007:9) and testing the fit of garments makes it easier for the tailor to identify
the functionality of the garment and resolve its fit problems. According to Petrova
and Ashdown (2012:271), testing the fit of garments made of measurements from
sizing systems should be performed by testing the garments on several participants
used as fit models. Each of the models should represent the measurements of the
sizes presented in the size chart table used to develop the garment sizes.
Petrova and Ashdown (2012) further suggest that it is essential to test the fit of a
garment on a selected number of individuals to ensure validity in the garment fit test
evaluations.

189
Considering that this study was exploratory in nature and that the fit test evaluations
are time consuming, the fit test evaluations were conducted on nine subjects that
took part in the study. Those subjects who had a pear body shape profile and whose
measurements, as extracted by the 3D full body scanner, corresponded to size
10/34 in the size chart, and who had indicated (on their demographic form) that they
were willing to partake in the fit test evaluations, were selected for the fit test
evaluations.
The bust (for the shirt garments) and the hip (for the trouser garments) were used
as the criteria for selecting the size 10/34 subjects. The bust and hip measurements
used to create the shirt and trouser garments in this study and the actual body
measurements of the participants selected for the fit test evaluations are presented
in Table 5.1. The size intervals established in the size charts presented in Table
4.32 and Table 4.33 were used to determine the minimum and maximum
measurement ranges for selecting the size 10/34 subjects for the fit test evaluations.

190
Table 50: Bust and hip dimensions of the size chart measurements, petite mannequin measurements and the selected subject‟s
actual body measurements.
BODY
DIMENSIONS
Size 10/34 size
chart
measurements
Size 10/34
mannequin
measurements
SUBJECTS ACTUAL 3D FULL BODY SCANNED MEASUREMENTS
1 2 3 4 5 6 7 8 9
HEIGHT 157cm 160cm 155cm 159cm 160cm 160cm 158cm 161cm 157cm 161cm 160cm
BUST
88 cm – 93.9 cm 86 cm 87 cm 88 cm 90 cm 92 cm 92 cm 90 cm 89 cm 93 cm 88 cm
HIP
96 cm – 101.9 cm 95 cm 98 cm 97 cm 98 cm 100 cm 97 cm 97 cm 98 cm 100 cm 97 cm

191
Garment fit sessions were scheduled with each subject. Prior to conducting the fit
test evaluations, the selected subjects were reminded of the objectives of the study.
The subjects were further informed on the amount of time needed to conduct the fit
evaluations and what was expected from them during the garment evaluation
process. A panel of two judges evaluated the fit qualities of the prototype shirt and
trouser garments created for this study. The garment fit evaluators were experts and
academics who had approximately 6 and 15 years respectively of experience in the
Consumer Science Clothing field and were clothing practical lecturers in the
department. The evaluators were provided with written standards, consisting of
descriptions of the criteria required to evaluate the quality of fit of the test garments.
This was done to enhance “interrater-reliability” in the garment test evaluations,
since the concept of fit varies for everyone (Leedy & Ormrod, 2010:93). The
standards for evaluating the fit of the constructed garments were designed to assess
the fit of the shirt and trouser garments which were applicable and relevant to the
garments tested. The specifications were based on relevant theory, applying the
principles formulated by Stamper et al. (2005); Liechty et al. (2010:54), and Marshall
et al. (2012).
The standards for evaluating the fit of the test garments were structured around the
five principle components of garment fit mentioned in section 2.4.1. The standards
that were used to evaluate the fit quality of the shirt and trouser test garments are
presented in Appendix J. A total of 18 standards were allocated for evaluating the
shirt garments and 17 standards for the trouser garments. The rating scales (from
the evaluators‟ independent ratings) for the fit of the prototype shirt and trouser
garment were further assessed to provide a quantitative measure of the quality of fit
for each assessed garment on each subject. The fit rating scales of each evaluator
for the tested garment and garment component are discussed in section 5.4.2 to
determine the overall fit ratings for each of the evaluated shirt and trouser garments.
192
5.4.1 Conducting the garment fit test evaluations
Traditionally, garment fit is described in terms of five components: ease, line, grain,
balance and set. The garment ease, line and grain components had been developed
thoroughly in the pattern construction and garment constructing process. The
garment set, and garment balance referred to in section 2.4.1.4 and 2.4.1.5 were
applicable for conducting the fit test evaluations. In this process, the direction, flow of
the fabric, and the number of wrinkles that caused specific problems in the shirt and
trouser garments were identified. Petrova and Ashdown (2012:271) advised that in
general, there are three types of wrinkles or stress folds that can occur in a garment,
namely: horizontal, vertical, and diagonal. Petrova and Ashdown (2012) further
suggest that each type of wrinkle or stress fold indicate different problems,
comprising of inadequate, excess, or an improper ease. Therefore, to identify fit
problems and to suggest garment alterations that would correct the problem;
garment experts should use their knowledge in analysing the wrinkle or stress folds
of a garment in both still and moving body positions.
Joseph-Armstrong (2014:50, 69) suggests that, when fitting bodice (shirt) garments
on a model, the garment‟s seam-lines should be well pressed with an iron that does
not have steam. Analysing a bodice (shirt) garment fit requires measuring areas that
need corrections and adjusting the patterns, thereafter transferring the adjusted
corrections on the constructed garment to acquire a good quality fit. The fit of the
bodice (shirt) sleeve is evaluated on its alignment and hang on the arm, together
with the appearance of the sleeve cap around the armhole. Conducting trouser fit
test evaluations requires the trouser to be constructed from a firm fabric and
thereafter tested on a model with the waistband and zipper attached to ensure a
good base for fit evaluation. Trouser fit is evaluated through three dimensions,
namely: the height, which is the length from the waist to the floor (or desired garment
length), the width, which is the distance between one side of the body to the other,
and the depth, which is the measured distance from the front to the back of the body
(Joseph-Armstrong, 2014:663). The pelvic bone structure along with the amount of
flesh on the wearer‟s stomach and buttocks must be considered when determining
the trouser crotch depth for fit evaluations (Veblen, 2012:193).

193
The fit test evaluations of the prototype shirt and trouser garments produced in this
study took place in a clothing laboratory at UNISA, Florida Campus. Photographic
images were taken of the nine subjects to authenticate the analysed data. The
criteria for the goodness of the semi-fitted shirt and trouser garments being
evaluated were established in section 5.2.1.
The subjects wore their undergarments for the garment fit test evaluations. The test
garments were labelled PS (for the subjects‟ measurements) and M (for the
mannequin‟s measurements) to avoid confusion and mixing up the garments. During
the garment fit evaluation sessions, each evaluator independently evaluated the
quality of the constructed shirt and trouser garments fit. The panel of evaluators
assessed the front, side, and back of the shirt and trouser size chart and mannequin
sized garments worn in turn by the petite size 10/34 subjects. The garment fit test
evaluators followed specified criteria to evaluate the fit of the tested shirt and trouser
garments. The fit evaluation data was summarised into three rating scale categories,
namely „good fit‟, „moderate fit‟, and „poor fit; further comments were reserved for the
evaluators to transcribe when evaluating the fit of the garments.
The evaluators carefully observed the fit of the shirt and trouser garments on human
subjects in standing and movement positions. The subjects were asked to perform
the movements continuously to assess whether the evaluated garment allowed the
wearer to perform common tasks without interference or resistance. During the fit
test evaluations, the evaluators asked the subjects to walk, sit, and go through a
normal range of body motions while wearing the garments to evaluate whether the
garment looked good on the body in terms of line, balance, and the grain of the
fabric. The subjects were encouraged to express their opinions of the quality of fit of
the tested garments during the fit test evaluations.
The analysis of the rating scales for the evaluated prototype shirt and trouser
garment prototypes are discussed in the next section.
194
5.4.2 Analysis of the shirt and trouser garment fit test evaluating rating scales
The quality of the fit of the prototype shirt and trouser garments were evaluated for
the different body dimension areas as indicated in the garment fit assessment
standards form, which is available in Appendix J. Three garment fit evaluating rating
scales were applied, namely: good, moderate and poor quality of fit were used to
evaluate the quality of the shirt and trouser garments, and to assign the evaluator‟s
scores on how they perceived the quality of the shirt and trouser garments. A good
rating scale (3) indicated that the garment fitted well, a moderate rating scale (2)
indicated that the fit of the garment was acceptable and a poor rating scale (1)
indicated that the garment did not fit well on the wearer‟s body. The results from the
garment fit test evaluations were further analysed by calculating the overall mean
values of the rated evaluating scales per evaluator, for each of the assessed
garment on each subject to determine the extent to which of the created garments
offered an overall good quality of fit (see Table 5.2 and Table 5.3 for the shirt
garments, and Table 5.4 and Table 5.5 for the trouser garments).

195
Table 5.1: The shirt garments rating scales assessed individually by each fit test evaluator (Subjects 1-5).
SHIRTS
Subject 1 Subject 2 Subject 3 Subject 4 Subject 5
SC M SC M SC M SC M SC M
Evaluators
EVALUATING STANDARDS 1 2 1 2 1 2 1 2 1 2 1 2 1 2 1 2 1 2 1 2
1. Compatibility & ease 2 2 2 2 3 2 2 1 DOES NOT FIT DOES NOT FIT 1 2 DOES NOT FIT 2 2 3 2
2. Garment rest 3 2 2 2 2 2 2 1 2 2 1 2 2 2
3. Drape front garment 3 3 3 3 3 2 2 2 2 2 2 1 2 2
4. Drape back garment 3 2 3 2 2 2 2 2 2 2 3 1 2 1
5. Neckline collar 3 3 3 3 3 3 2 2 3 3 3 3 3 3
6. Shoulders 2 2 2 2 3 2 2 1 2 2 3 3 3 3
7. Armholes 2 1 2 2 1 2 2 2 3 1 2 2 2 1
8. Sleeve length 3 2 1 1 3 2 1 1 2 2 2 2 2 1
9. Sleeve biceps 3 2 2 1 3 2 1 1 2 1 3 2 1 2
10. Sleeve elbow 2 3 2 3 2 2 2 1 2 2 2 2 2 2
11. Sleeve wrist 3 3 3 3 3 3 2 2 2 3 3 3 3 3
12. Ease bust 3 2 3 2 3 2 2 2 1 2 1 1 2 1
13. Closure alignment 3 3 3 2 3 3 2 1 2 3 2 2 2 2
14. Garment closure 3 2 3 2 2 2 2 2 1 2 2 1 2 1
15. Hems & finishes 3 2 3 3 1 2 3 3 3 3 3 3 2 3
16. Garment length 3 3 3 3 2 3 2 2 1 2 2 3 1 3
17. Comfortability & movement 3 2 2 2 3 2 2 1 2 2 2 2 2 1
18. Can the wearer sit? 3 3 3 2 3 3 2 2 3 3 3 2 2 2
OVERALL FIT (mean) 2.8 2.3 2.5 2.2 2.5 2.3 1.9 1.6 0.0 0.0 0.0 0.0 2.0 2.2 0.0 0.0 2.3 2.1 2.1 1.9
Evaluating scales: 3 = good quality of fit; 2 = moderate quality of fit; 1 = poor quality of fit
*SC = Size chart measurements; M = Mannequin measurements
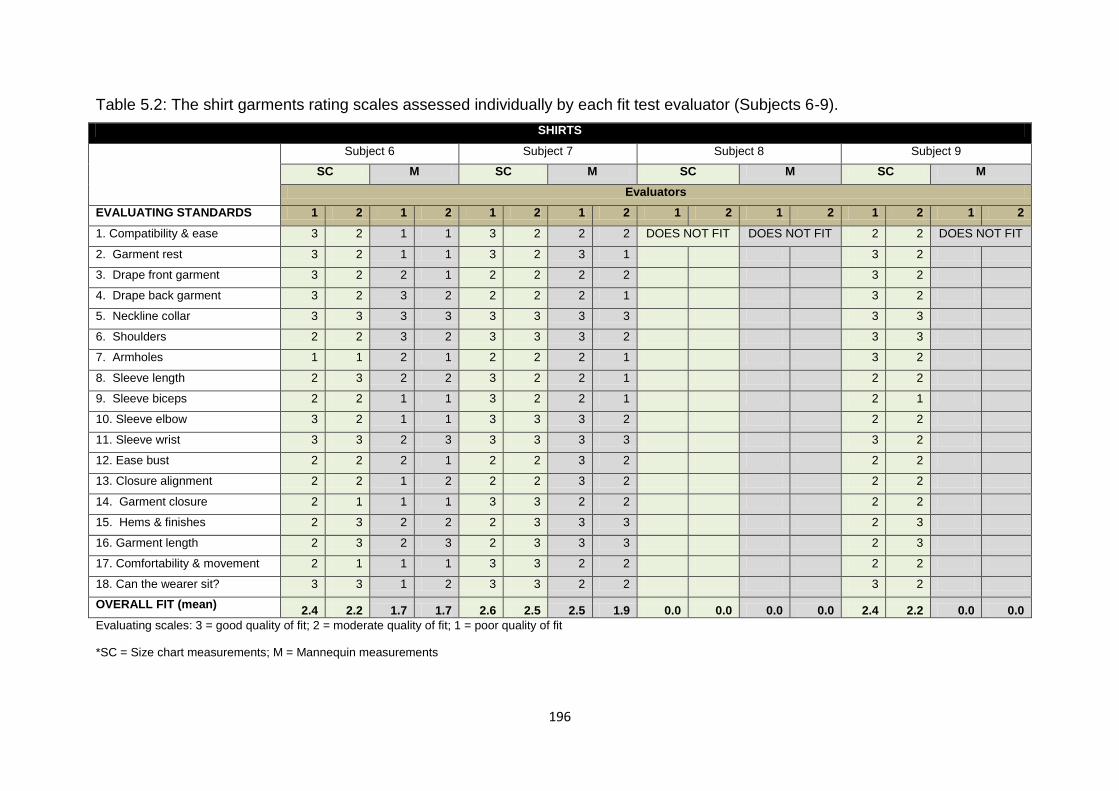
196
Table 5.2: The shirt garments rating scales assessed individually by each fit test evaluator (Subjects 6-9).
SHIRTS
Subject 6 Subject 7 Subject 8 Subject 9
SC M SC M SC M SC M
Evaluators
EVALUATING STANDARDS 1 2 1 2 1 2 1 2 1 2 1 2 1 2 1 2
1. Compatibility & ease 3 2 1 1 3 2 2 2 DOES NOT FIT DOES NOT FIT 2 2 DOES NOT FIT
2. Garment rest 3 2 1 1 3 2 3 1 3 2
3. Drape front garment 3 2 2 1 2 2 2 2 3 2
4. Drape back garment 3 2 3 2 2 2 2 1 3 2
5. Neckline collar 3 3 3 3 3 3 3 3 3 3
6. Shoulders 2 2 3 2 3 3 3 2 3 3
7. Armholes 1 1 2 1 2 2 2 1 3 2
8. Sleeve length 2 3 2 2 3 2 2 1 2 2
9. Sleeve biceps 2 2 1 1 3 2 2 1 2 1
10. Sleeve elbow 3 2 1 1 3 3 3 2 2 2
11. Sleeve wrist 3 3 2 3 3 3 3 3 3 2
12. Ease bust 2 2 2 1 2 2 3 2 2 2
13. Closure alignment 2 2 1 2 2 2 3 2 2 2
14. Garment closure 2 1 1 1 3 3 2 2 2 2
15. Hems & finishes 2 3 2 2 2 3 3 3 2 3
16. Garment length 2 3 2 3 2 3 3 3 2 3
17. Comfortability & movement 2 1 1 1 3 3 2 2 2 2
18. Can the wearer sit? 3 3 1 2 3 3 2 2 3 2
OVERALL FIT (mean) 2.4 2.2 1.7 1.7 2.6 2.5 2.5 1.9 0.0 0.0 0.0 0.0 2.4 2.2 0.0 0.0
Evaluating scales: 3 = good quality of fit; 2 = moderate quality of fit; 1 = poor quality of fit
*SC = Size chart measurements; M = Mannequin measurements
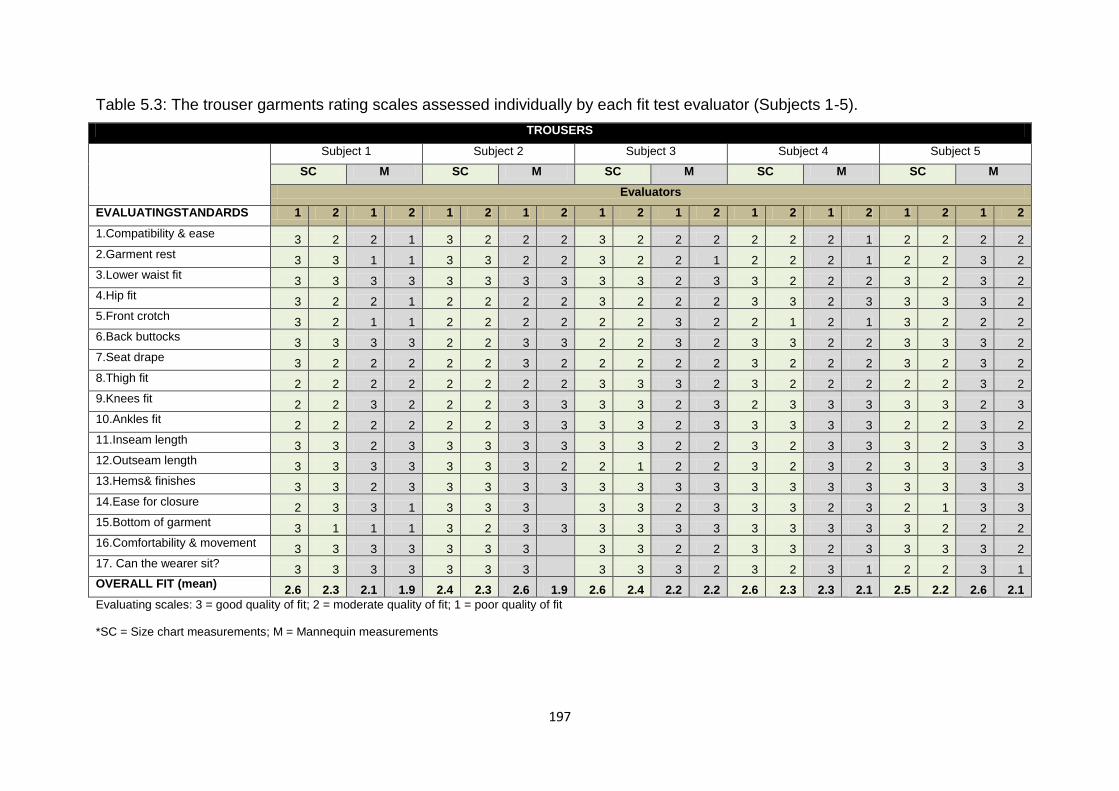
197
Table 5.3: The trouser garments rating scales assessed individually by each fit test evaluator (Subjects 1-5).
TROUSERS
Subject 1 Subject 2 Subject 3 Subject 4 Subject 5
SC M SC M SC M SC M SC M
Evaluators
EVALUATINGSTANDARDS 1 2 1 2 1 2 1 2 1 2 1 2 1 2 1 2 1 2 1 2
1.Compatibility & ease 3 2 2 1 3 2 2 2 3 2 2 2 2 2 2 1 2 2 2 2
2.Garment rest 3 3 1 1 3 3 2 2 3 2 2 1 2 2 2 1 2 2 3 2
3.Lower waist fit 3 3 3 3 3 3 3 3 3 3 2 3 3 2 2 2 3 2 3 2
4.Hip fit 3 2 2 1 2 2 2 2 3 2 2 2 3 3 2 3 3 3 3 2
5.Front crotch 3 2 1 1 2 2 2 2 2 2 3 2 2 1 2 1 3 2 2 2
6.Back buttocks 3 3 3 3 2 2 3 3 2 2 3 2 3 3 2 2 3 3 3 2
7.Seat drape 3 2 2 2 2 2 3 2 2 2 2 2 3 2 2 2 3 2 3 2
8.Thigh fit 2 2 2 2 2 2 2 2 3 3 3 2 3 2 2 2 2 2 3 2
9.Knees fit 2 2 3 2 2 2 3 3 3 3 2 3 2 3 3 3 3 3 2 3
10.Ankles fit 2 2 2 2 2 2 3 3 3 3 2 3 3 3 3 3 2 2 3 2
11.Inseam length 3 3 2 3 3 3 3 3 3 3 2 2 3 2 3 3 3 2 3 3
12.Outseam length 3 3 3 3 3 3 3 2 2 1 2 2 3 2 3 2 3 3 3 3
13.Hems& finishes 3 3 2 3 3 3 3 3 3 3 3 3 3 3 3 3 3 3 3 3
14.Ease for closure 2 3 3 1 3 3 3
3 3 2 3 3 3 2 3 2 1 3 3
15.Bottom of garment 3 1 1 1 3 2 3 3 3 3 3 3 3 3 3 3 3 2 2 2
16.Comfortability & movement 3 3 3 3 3 3 3
3 3 2 2 3 3 2 3 3 3 3 2
17. Can the wearer sit? 3 3 3 3 3 3 3
3 3 3 2 3 2 3 1 2 2 3 1
OVERALL FIT (mean) 2.6 2.3 2.1 1.9 2.4 2.3 2.6 1.9 2.6 2.4 2.2 2.2 2.6 2.3 2.3 2.1 2.5 2.2 2.6 2.1
Evaluating scales: 3 = good quality of fit; 2 = moderate quality of fit; 1 = poor quality of fit
*SC = Size chart measurements; M = Mannequin measurements
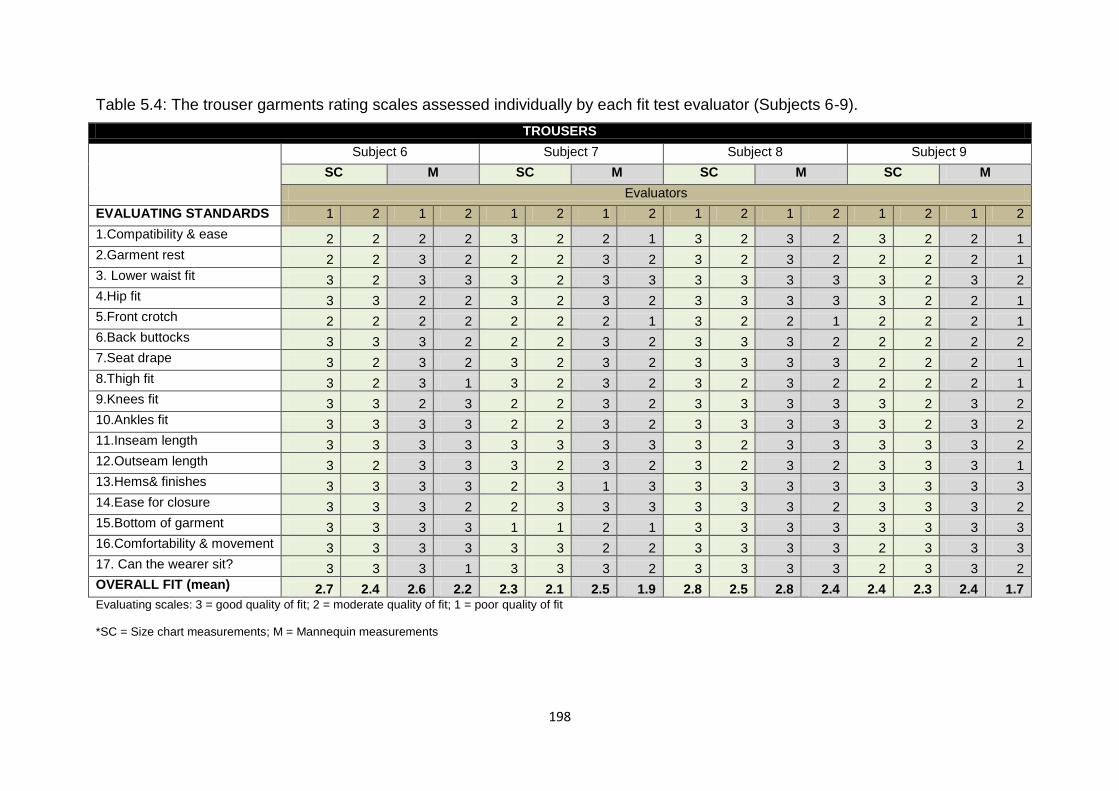
198
Table 5.4: The trouser garments rating scales assessed individually by each fit test evaluator (Subjects 6-9).
TROUSERS
Subject 6 Subject 7 Subject 8 Subject 9
SC M SC M SC M SC M
Evaluators
EVALUATING STANDARDS 1 2 1 2 1 2 1 2 1 2 1 2 1 2 1 2
1.Compatibility & ease 2 2 2 2 3 2 2 1 3 2 3 2 3 2 2 1
2.Garment rest 2 2 3 2 2 2 3 2 3 2 3 2 2 2 2 1
3. Lower waist fit 3 2 3 3 3 2 3 3 3 3 3 3 3 2 3 2
4.Hip fit 3 3 2 2 3 2 3 2 3 3 3 3 3 2 2 1
5.Front crotch 2 2 2 2 2 2 2 1 3 2 2 1 2 2 2 1
6.Back buttocks 3 3 3 2 2 2 3 2 3 3 3 2 2 2 2 2
7.Seat drape 3 2 3 2 3 2 3 2 3 3 3 3 2 2 2 1
8.Thigh fit 3 2 3 1 3 2 3 2 3 2 3 2 2 2 2 1
9.Knees fit 3 3 2 3 2 2 3 2 3 3 3 3 3 2 3 2
10.Ankles fit 3 3 3 3 2 2 3 2 3 3 3 3 3 2 3 2
11.Inseam length 3 3 3 3 3 3 3 3 3 2 3 3 3 3 3 2
12.Outseam length 3 2 3 3 3 2 3 2 3 2 3 2 3 3 3 1
13.Hems& finishes 3 3 3 3 2 3 1 3 3 3 3 3 3 3 3 3
14.Ease for closure 3 3 3 2 2 3 3 3 3 3 3 2 3 3 3 2
15.Bottom of garment 3 3 3 3 1 1 2 1 3 3 3 3 3 3 3 3
16.Comfortability & movement 3 3 3 3 3 3 2 2 3 3 3 3 2 3 3 3
17. Can the wearer sit? 3 3 3 1 3 3 3 2 3 3 3 3 2 3 3 2
OVERALL FIT (mean) 2.7 2.4 2.6 2.2 2.3 2.1 2.5 1.9 2.8 2.5 2.8 2.4 2.4 2.3 2.4 1.7 Evaluating scales: 3 = good quality of fit; 2 = moderate quality of fit; 1 = poor quality of fit
*SC = Size chart measurements; M = Mannequin measurements

199
As seen in Table 5.2 and Table 5.3, evaluator 1 rated the shirt garments created
from both the size 10/34 size chart and petite tailoring mannequin‟s measurements
higher than evaluator 2 for subjects 1, 2, 5 and 7, with broadly good-moderate quality
of fit rating scores. Subjects 4, 6 and 9‟s shirt garment fit quality produced by the
garments made from the size chart measurements were also rated higher by
evaluator 1, with fit rating scores considered to be broadly moderate. The shirt
garments created from the mannequin‟s measurements were considered to produce
a generally good-moderate quality of fit by the two fit test evaluators for subjects 1, 2,
5, 6 and 7. The garments created from the mannequin‟s measurements were rated
to offer the same (moderate) quality of fit on subject 6 by both fit test evaluators.
Subjects 3 and 8 did not fit into both evaluated shirt garments; whilst subjects 4 and
9 did not fit into the shirt garments produced from the mannequin‟s measurements.
The reasons are further elaborated in section 5.5 where the assessments of the shirt
and trouser garment fit test trial evaluations for the size 10/34 petite subjects are
presented.
Table 5.4 and Table 5.5 show that the trouser garments developed from both the
size 10/34 size chart and mannequin‟s measurements were rated high by evaluator
1 when compared to evaluator 2‟s garment fit score ratings for subjects 1, 2, 4, 5, 6,
7, 8, 9; and were considered to have generally good-moderate garment fit rating
scales. Subject 3 was also highly rated by evaluator 1 who considered the fit quality
to be good for the trouser garments created using the size 10/34 size chart. The
trouser garments produced from the mannequin measurements were considered to
offer subject 3 with only a broadly moderate quality of fit. Major disagreements were
observed in the fit of the trouser garment on subject 6‟s thigh area and whether the
subject was able to sit when wearing the garment created using the mannequin
measurements (see Table 5.5). Evaluator 1 rated the quality of fit on both evaluated
standards to be good, whilst evaluator 2 considered the fit of both evaluated
standards to be of poor quality. This is further elaborated in section 5.5.7.3.
Thereafter, the mean score rating values of each of the evaluating standards from
the shirt and trouser garments created using the size 10/34 chart and the
mannequin‟s measurements, per subject were compared with one another. Prior to
comparing the mean values of the evaluating standards, the averages of the
evaluators independent rating scores for each of the evaluating standards on each of

200
the assessed shirt and trouser garments were calculated for each subject; i.e. the
rated scores from both evaluator one and evaluator two were combined to establish
the combined mean value for each evaluating standard for each subject in the
assessed similar garment (for example; the shirt garment created using the size
chart measurements).
This calculation was applied for all the evaluated shirt and trouser garments created,
using both the size chart and mannequin measurements evaluated for each subject
who took part in the fit test evaluations. The criteria used for defining the quality of fit
using the mean values after averaging the evaluators independent rating scores was
the same as previously defined; 3 as a good fit, 2 as a moderate fit and 1 as a poor
fit. The comparative overall mean rating values are presented in Table 5.6 (for the
shirt garments) and Table 5.7 (for the trouser garments). The comparative mean
data is plotted in Appendix K to show the variations between the rating score means.

201
Table 5.5: Comparative mean ratings of the evaluated shirt garments per subject
SHIRT MEAN RATINGS
Subject 1 Subject 2 Subject 3 Subject 4 Subject 5 Subject 6 Subject 7 Subject 8 Subject 9
EVALUATING STANDARDS SC M SC M SC M SC M SC M SC M SC M SC M SC M
1. Compatibility & ease 2 2 2.5 1.5 DOES NOT FIT 1.5 DOES NOT FIT 2 2.5 2.5 1 2.5 2 DOES NOT FIT 2 DOES NOT FIT
2. Garment rest 2.5 2 2 1.5 2 1.5 2 2.5 1 2.5 2 2.5
3. Drape front garment 3 3 2.5 2 2 1.5 2 2.5 1.5 2 2 2.5
4. Drape back garment 2.5 2.5 2 2 2 2 1.5 2.5 2.5 2 1.5 2.5
5. Neckline collar 3 3 3 2 3 3 3 3 3 3 3 3
6. Shoulders 2 2 2.5 1.5 2 3 3 2 2.5 3 2.5 3
7. Armholes 1.5 2 1.5 2 2 2 1.5 1 1.5 2 1.5 2.5
8. Sleeve length 2.5 1 2.5 1 2 2 1.5 2.5 2 2.5 1.5 2
9. Sleeve biceps 2.5 1.5 2.5 1 1.5 2.5 1.5 2 1 2.5 1.5 1.5
10. Sleeve elbow 2.5 2.5 2 1.5 2 2 2 2.5 1 3 2.5 2
11. Sleeve wrist 3 3 3 2 2.5 3 3 3 2.5 3 3 2.5
12. Ease bust 2.5 2.5 2.5 2 1.5 1 1.5 2 1.5 2 2.5 2
13. Closure alignment 3 2.5 3 1.5 2.5 2 2 2 1.5 2 2.5 2
14. Garment closure 2.5 2.5 2 2 1.5 1.5 1.5 1.5 1 3 2 2
15. Hems & finishes 2.5 3 1.5 3 3 3 2.5 2.5 2 2.5 3 2.5
16. Garment length 3 3 2.5 2 1.5 2.5 2 2.5 2.5 2.5 3 2.5
17. Comfortability & movement 2.5 2 2.5 1.5 2 2 1.5 1.5 1 3 2 2
18. Can the wearer sit? 3 2.5 3 2 3 2.5 2 3 1.5 3 2 2.5
OVERALL MEAN RATINGS 2.6 2.4 2.4 1.8 0.0 0.0 2.1 0.0 2.2 2.0 2.3 1.7 2.6 2.2 0.0 0.0 2.3 0.0
Evaluating scales: 3 = good quality of fit; 2 = moderate quality of fit; 1 = poor quality of fit
*SC = Size chart measurements; M = Mannequin measurements

202
Table 5.6: Comparative mean ratings of the evaluated trouser garments per subject
TROUSER MEAN RATINGS
Subject 1 Subject 2 Subject 3 Subject 4 Subject 5 Subject 6 Subject 7 Subject 8 Subject 9
EVALUATING STANDARDS SC M SC M SC M SC M SC M SC M SC M SC M SC M
1.Compatibility & ease 2.5 1.5 2.5 2 2.5 2 2 1.5 2 2 2 2 2.5 1.5 2.5 2.5 2.5 1.5
2.Garment rest 3 1 3 2 2.5 1.5 2 1.5 2 2.5 2 2.5 2 2.5 2.5 2.5 2 1.5
3. Lower waist fit 3 3 3 3 3 2.5 2.5 2 2.5 2.5 2.5 3 2.5 3 3 3 2.5 2.5
4.Hip fit 2.5 1.5 2 2 2.5 2 3 2.5 3 2.5 3 2 2.5 2.5 3 3 2.5 1.5
5.Front crotch 2.5 1 2 2 2 2.5 1.5 1.5 2.5 2 2 2 2 1.5 2.5 1.5 2 1.5
6.Back buttocks 3 3 2 3 2 2.5 3 2 3 2.5 3 2.5 2 2.5 3 2.5 2 2
7.Seat drape 2.5 2 2 2.5 2 2 2.5 2 2.5 2.5 2.5 2.5 2.5 2.5 3 3 2 1.5
8.Thigh fit 2 2 2 2 3 2.5 2.5 2 2 2.5 2.5 2 2.5 2.5 2.5 2.5 2 1.5
9.Knees fit 2 2.5 2 3 3 2.5 2.5 3 3 2.5 3 2.5 2 2.5 3 3 2.5 2.5
10.Ankles fit 2 2 2 3 3 2.5 3 3 2 2.5 3 3 2 2.5 3 3 2.5 2.5
11.Inseam length 3 2.5 3 3 3 2 2.5 3 2.5 3 3 3 3 3 2.5 3 3 2.5
12.Outseam length 3 3 3 2.5 1.5 2 2.5 2.5 3 3 2.5 3 2.5 2.5 2.5 2.5 3 2
13.Hems & finishes 3 2.5 3 3 3 3 3 3 3 3 3 3 2.5 2 3 3 3 3
14.Ease for closure 2.5 2 3 3 3 2.5 3 2.5 1.5 3 3 2.5 2.5 3 3 2.5 3 2.5
15.Bottom of garment 2 1 2.5 3 3 3 3 3 2.5 2 3 3 1 1.5 3 3 3 3
16.Comfortability& movement 3 3 3 3 3 2 3 2.5 3 2.5 3 3 3 2 3 3 2.5 3
17.sit 3 3 3 3 3 2.5 2.5 2 2 2 3 2 3 2.5 3 3 2.5 2.5
OVERALL MEAN RATINGS 2.6 2.2 2.5 2.7 2.7 2.3 2.6 2.3 2.5 2.5 2.7 2.6 2.4 2.4 2.8 2.7 2.5 2.2
* Evaluating scales: 3 = good quality of fit; 2 = moderate quality of fit; 1 = poor quality of fit
*SC = Size chart measurements; M = Mannequin measurements
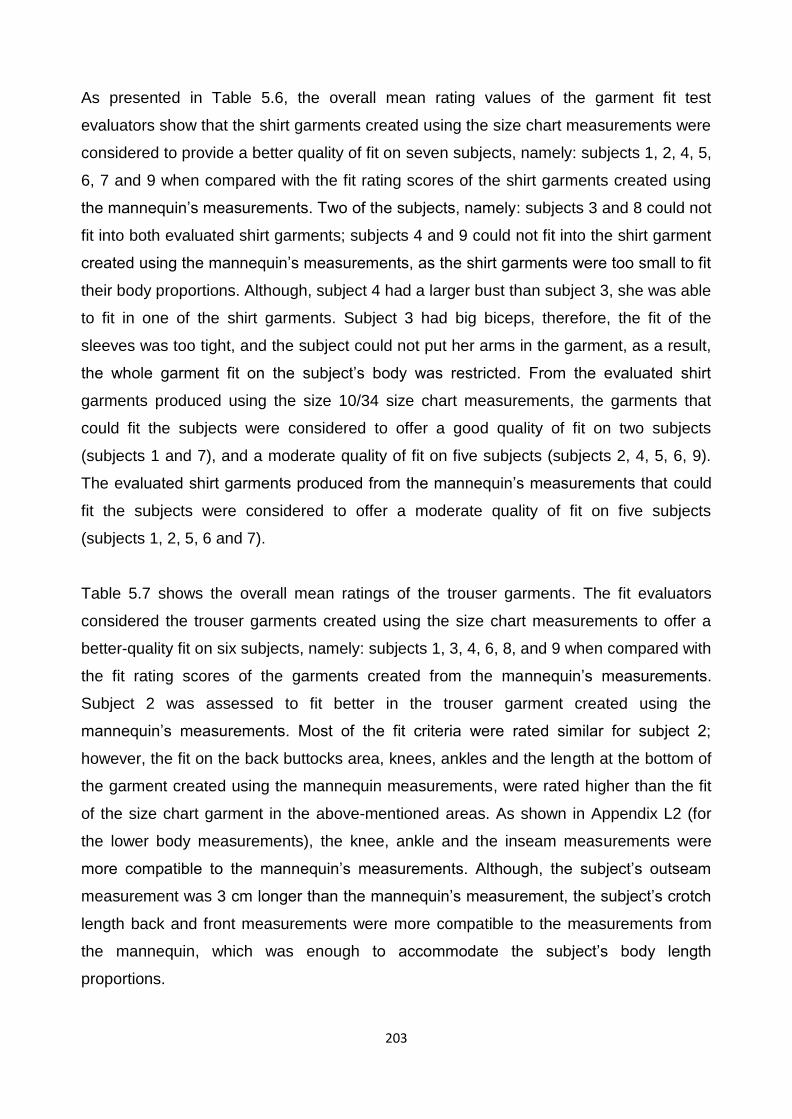
203
As presented in Table 5.6, the overall mean rating values of the garment fit test
evaluators show that the shirt garments created using the size chart measurements were
considered to provide a better quality of fit on seven subjects, namely: subjects 1, 2, 4, 5,
6, 7 and 9 when compared with the fit rating scores of the shirt garments created using
the mannequin‟s measurements. Two of the subjects, namely: subjects 3 and 8 could not
fit into both evaluated shirt garments; subjects 4 and 9 could not fit into the shirt garment
created using the mannequin‟s measurements, as the shirt garments were too small to fit
their body proportions. Although, subject 4 had a larger bust than subject 3, she was able
to fit in one of the shirt garments. Subject 3 had big biceps, therefore, the fit of the
sleeves was too tight, and the subject could not put her arms in the garment, as a result,
the whole garment fit on the subject‟s body was restricted. From the evaluated shirt
garments produced using the size 10/34 size chart measurements, the garments that
could fit the subjects were considered to offer a good quality of fit on two subjects
(subjects 1 and 7), and a moderate quality of fit on five subjects (subjects 2, 4, 5, 6, 9).
The evaluated shirt garments produced from the mannequin‟s measurements that could
fit the subjects were considered to offer a moderate quality of fit on five subjects
(subjects 1, 2, 5, 6 and 7).
Table 5.7 shows the overall mean ratings of the trouser garments. The fit evaluators
considered the trouser garments created using the size chart measurements to offer a
better-quality fit on six subjects, namely: subjects 1, 3, 4, 6, 8, and 9 when compared with
the fit rating scores of the garments created from the mannequin‟s measurements.
Subject 2 was assessed to fit better in the trouser garment created using the
mannequin‟s measurements. Most of the fit criteria were rated similar for subject 2;
however, the fit on the back buttocks area, knees, ankles and the length at the bottom of
the garment created using the mannequin measurements, were rated higher than the fit
of the size chart garment in the above-mentioned areas. As shown in Appendix L2 (for
the lower body measurements), the knee, ankle and the inseam measurements were
more compatible to the mannequin‟s measurements. Although, the subject‟s outseam
measurement was 3 cm longer than the mannequin‟s measurement, the subject‟s crotch
length back and front measurements were more compatible to the measurements from
the mannequin, which was enough to accommodate the subject‟s body length
proportions.

204
Additionally, most of the subject‟s measurements, except for the lower waist, hip, top
thigh and outseam measurements were closer to the measurements of the mannequin
(refer to appendix L2 for the lower body measurements). Subjects 5 and 7 were
considered to have the same quality of fit in both evaluated trouser garments. A good
quality of fit was assessed on eight subjects (subjects 1, 2, 3, 4, 5, 6, 8, 9) and subject 7
was considered to have a moderate quality of fit in the trouser garments created using
the size 10/34 size chart measurements. The trouser garments created using the
mannequin‟s measurements presented a good fit rating score on four of the observed
subjects (subjects 2, 5, 6, 8) and a moderate fit rating score on five of the subjects
(subjects 1, 3, 4, 7, 9).
Consequently, based on the fit test rating scales and mean value evaluations, the
findings demonstrate that the garments created using the size 10/34 petite size chart
measurements had the highest rating scores and produced better fitting garments than
the garments produced from the mannequin‟s measurements.
5.5 THE ASSESSMENTS OF THE SHIRT AND TROUSER GARMENT FIT TEST
EVALUATIONS FOR THE SIZE 10/34 PETITE SUBJECTS
The fit test evaluations for the size 10/34 petite tailoring mannequin are presented in
Figure 5.3. The fit was tested on the size 10/34 mannequin to highlight, more specifically,
the differences in fit between the two sets of the shirt and trouser garments created in
this study and, more importantly, to gain useful insight into the accuracy of the size
charts developed in this study for the upper and lower body dimensions.
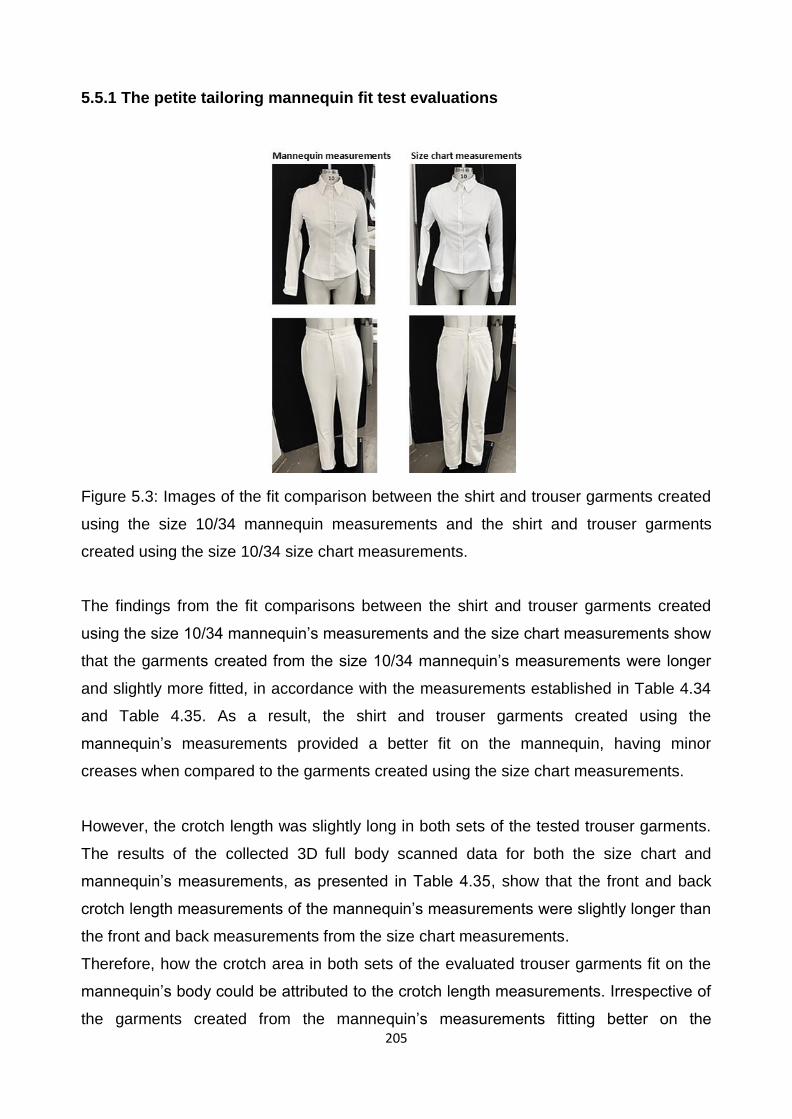
205
5.5.1 The petite tailoring mannequin fit test evaluations
Figure 5.3: Images of the fit comparison between the shirt and trouser garments created
using the size 10/34 mannequin measurements and the shirt and trouser garments
created using the size 10/34 size chart measurements.
The findings from the fit comparisons between the shirt and trouser garments created
using the size 10/34 mannequin‟s measurements and the size chart measurements show
that the garments created from the size 10/34 mannequin‟s measurements were longer
and slightly more fitted, in accordance with the measurements established in Table 4.34
and Table 4.35. As a result, the shirt and trouser garments created using the
mannequin‟s measurements provided a better fit on the mannequin, having minor
creases when compared to the garments created using the size chart measurements.
However, the crotch length was slightly long in both sets of the tested trouser garments.
The results of the collected 3D full body scanned data for both the size chart and
mannequin‟s measurements, as presented in Table 4.35, show that the front and back
crotch length measurements of the mannequin‟s measurements were slightly longer than
the front and back measurements from the size chart measurements.
Therefore, how the crotch area in both sets of the evaluated trouser garments fit on the
mannequin‟s body could be attributed to the crotch length measurements. Irrespective of
the garments created from the mannequin‟s measurements fitting better on the

206
mannequin, the overall fit on both sets of the assessed shirt and trouser garments
provided satisfactory results. However, the effect of the pear shaping of the subjects was
evident in the shirt garment created using the size 10/34 size chart measurements. The
garment was more curved and wide at the bottom part of the upper body. The trouser
fitted well but was slightly loose on the mannequin. The findings indicate that the shape
of the mannequin needs to be made slightly fuller at the lower part of the body, a little
curvier at the hip area and with slightly thicker legs.
Each subject‟s 3D full body scan and photographs of the fit test evaluations are
presented below. The fit test evaluations for each subject are documented with
photographs to validate the findings. Each subject‟s measurements, collected using the
3D full body scanner, are compared with the size chart measurements and
measurements from the mannequin in Appendix L, to demonstrate why the quality of the
explained fit was good, moderate or poor. The evaluating standard areas that were left
blank with no comments by the evaluators were not considered when reporting the
findings of the fit test data as this indicated that the evaluators observed no problems in
those areas.
Explained below are the fit test comparisons, comments and fitting issues with the
prototype shirt and trouser garments manufactured using the mannequin‟s
measurements and the size 10/34 upper and lower body dimensions size charts.
Furthermore, the study tested garment fit on the subjects who represented the size
variability within the lower-end to the higher-end of the established size 10/34 size range
measurements.

207
5.5.2 Fit test evaluations for Subject 1
Figure 5.4: The prototype shirt and trouser garments fitted on subject 1 and the subject‟s
3D full body scan
5.5.2.1 Subject 1 mannequin size 10/34 shirt fit test evaluations
Evaluator 1 considered the shirt test to pull around the arm, causing gatherings in the
back. Evaluator 1 further observed the back of the shoulder to rest loose on the subject‟s
body with some bulking in the back of the shirt, the subject‟s neck to upper waist back
length measurement was 7 cm shorter than the neck to upper waist back measurement
of the mannequin (refer to appendix L1 for the upper body measurements); hence some
bulking was observed on the shirt. The way the shirt draped in the front was considered
to look good by evaluator 1, whilst evaluator 2 observed creases under the bust area.
Although, the subject‟s under bust measurement was 1 cm smaller than the mannequin‟s
under bust measurement, the subject‟s upper waist measurement was 6 cm smaller than
the upper waist measurement of the mannequin. This produced an imbalance in the
shirt‟s proportions against the subject‟s body proportions. The fit of the shirt could also be
influenced by the subject‟s 155 cm height measurement, which was 5 cm shorter than
the mannequin‟s height measurement (see the height measurements in Table 5.1).
Evaluator 1 considered the darts at the front to be well placed.

208
The sleeve length was stated to be long by both evaluators, who perceived the sleeve to
hang over the cuff; the mannequin‟s sleeve length measurement was 6 cm longer than
the subjects sleeve length measurement. Evaluator 1 further indicated that the fit of the
sleeve on the bicep area was tight; the subject‟s bicep measurement was observed to be
3 cm bigger than the mannequin‟s bicep measurement, which was also 1 cm more than
the size interval used to allocate the bicep measurement from one size to another.
The subject‟s bicep measurement was further established to fit in the size 12/36 size
chart size range (see Table 4.32). Evaluator 2 indicated that the fit of the wrist
circumference was “ok”, because the subject‟s wrist measurement was 1 cm smaller than
the mannequin‟s measurements and further stated that the problem was the length of the
sleeve that was observed to be too long. The ease on the bust area was considered to
offer a good fit, with buttons placed at the right height by evaluator 1; whilst evaluator 2
observed some folds on the side of the bust area. The subject‟s bust measurement was
1 cm bigger than the mannequin‟s bust measurement. Evaluator 2 further indicated that
one of the buttons should be aligned with the bust area to permit a straight closure
alignment that doesn‟t pull. Furthermore, the hems and finishes of the evaluated shirt
were considered to provide a neat fit by evaluator 1.
5.5.2.2 Subject 1 size chart size 10/34 shirt fit test evaluations
The shirt was considered to have a comfortable ease with a loose upper waist fit by
evaluator 1, even though, the subject‟s upper waist measurement was 7 cm smaller
(refer to appendix L1 for the upper body measurements) than the size chart
measurement. The measurement difference between the subject‟s upper waist
measurement and the mannequin‟s upper waist measurement was 1 cm more than the
size interval used to allocate the upper waist measurement from one size to another in
the size chart developed for this study (see Table 4.32). As a result, the upper waist
measurement inclined to the size 8/30 size range. The fit of the neckline collar of the shirt
created using the size 10/34 size chart measurements was better than the fit of the
neckline collar created using the mannequin‟s measurements by evaluator 1, because
the subject‟s neck full measurement was the same as the neck full measurement from
the size 10/34 size chart range. The armholes were slightly loose at the back of the
shoulder area by evaluator 1.

209
The subject‟s armscye measurements were 3 cm smaller than the armscye
measurement from the size 10/34 size chart range, which was observed to be 1 cm more
than the size interval used to allocate the armscye measurements from one size to
another in the size chart developed for this study. Accordingly, the measurement was
below the size 10/34 size range (see Table 4.32). The sleeve length was considered to
be a little long by evaluator 2, with a 3 cm measurement difference. Evaluator 2 further
observed that the fit of the sleeve, at the bicep area to be much better than the fit of the
sleeve on the shirt created using the mannequin‟s measurements and some slight
wrinkles were evident, a 2 cm measurement difference was observed in the bicep area.
The fit of the sleeve around the elbow was considered to be a little tight but further stated
to produce a better fit by evaluator 1. The subject‟s elbow measurement was observed to
be 1 cm bigger than the size chart‟s elbow measurement. A little gaping was observed at
the bust area by both evaluators, irrespective of the subject‟s bust measurement being 1
cm smaller than the size chart bust measurement.
Evaluator 1 further stated that the shirt button may be positioned too low for the subject‟s
bust dimensions. Evaluator 2 considered the shirt closure to have a neat finish.
Furthermore, evaluator 1 indicated that there was enough ease for comfortability and
movement. The darts were considered to look good by both evaluators.
5.5.2.3 Subject 1 mannequin size 10/34 trouser fit test evaluations
Evaluator 1 considered the trouser to have a pleat between the lower waist and hip area
and further stated that the high hip area was bulging. Although the mannequin‟s lower
waist measurement was the same as the subject‟s lower waist measurement, the high
hip measurement was 2 cm bigger and the hip measurement was 3 cm smaller than the
subject‟s measurements (refer to appendix L1 for the lower body measurements).
Because the subject was 5 cm shorter than the mannequin (see Table 5.1), her upper
waist to hip body proportions may influence how the trouser sits on the subject‟s body.
The front crotch length was observed to be too long by the two evaluators; evaluator 1
further stated that the trouser was ill-fitting as the crotch hung too low for the model, the
mannequin‟s crotch length back and crotch length front measurements were 3 cm longer
than the subject‟s crotch length back and crotch length front measurements.
210
Therefore, the zip fly was considered to be too long by evaluator 2. The seat drape was
indicated to offer an overall good fit by evaluator 1, although both evaluators stated that
they observed creases in the trouser. The trousers inseam length measurement was
observed to be too long (7 cm) for the subject by the two evaluators, which resulted in
the trouser having creases from the thigh to the bottom of the trouser. Evaluator 1 further
stated that the hems and finishes of the trouser were bulking at the ankle, due to the
trouser length being too long. The darts were considered to be well positioned by both of
the evaluators.
5.5.2.4 Subject 1 size chart size 10/34 trouser fit test evaluations
The compatibility and ease of movement in the trouser was considered by evaluator 1 to
be better than in the trouser created using the mannequin‟s measurements, because
most of the size chart girth measurements were observed to be bigger than the
mannequin‟s measurements and were also observed to be more compatible to the
subject‟s measurements (refer to appendix L1 for the lower body measurements).
Evaluator 2 mentioned that she observed minor horizontal folds between waistline and
hip area; this could be attributed to the subject‟s upper waist measurement that was 6cm
smaller than her hip measurement which produced wrinkles between her upper waist and
hip area. The subject‟s lower waist measurement was 4 cm below the size 10/34 lower
waist measurement from the size chart; whereas the subject‟s hip measurement was 2
cm above the hip measurement established in the size 10/34 size chart measurements.
Although, both evaluators considered the front crotch length to be long, evaluator 1
further indicated that the fit was better than the crotch length on the trouser created using
the mannequin‟s measurements. The subject‟s crotch length back measurement was 2
cm smaller and crotch length front measurement was 1 cm shorter than the size chart
measurements, as opposed to the mannequin‟s measurements that were both 3 cm
longer. Both of the evaluators indicated that the length of the trouser was long; however,
evaluator 1 further indicated that the length was better than the length observed in the
trouser created using the mannequin‟s measurements and added that there were no
creases visible in the trouser. The subject‟s inseam and outseam length measurements
were observed to be more compatible with the inseam and outseam measurements
established in the size 10/34 size chart, as opposed to the inseam and outseam
measurements of the mannequin.
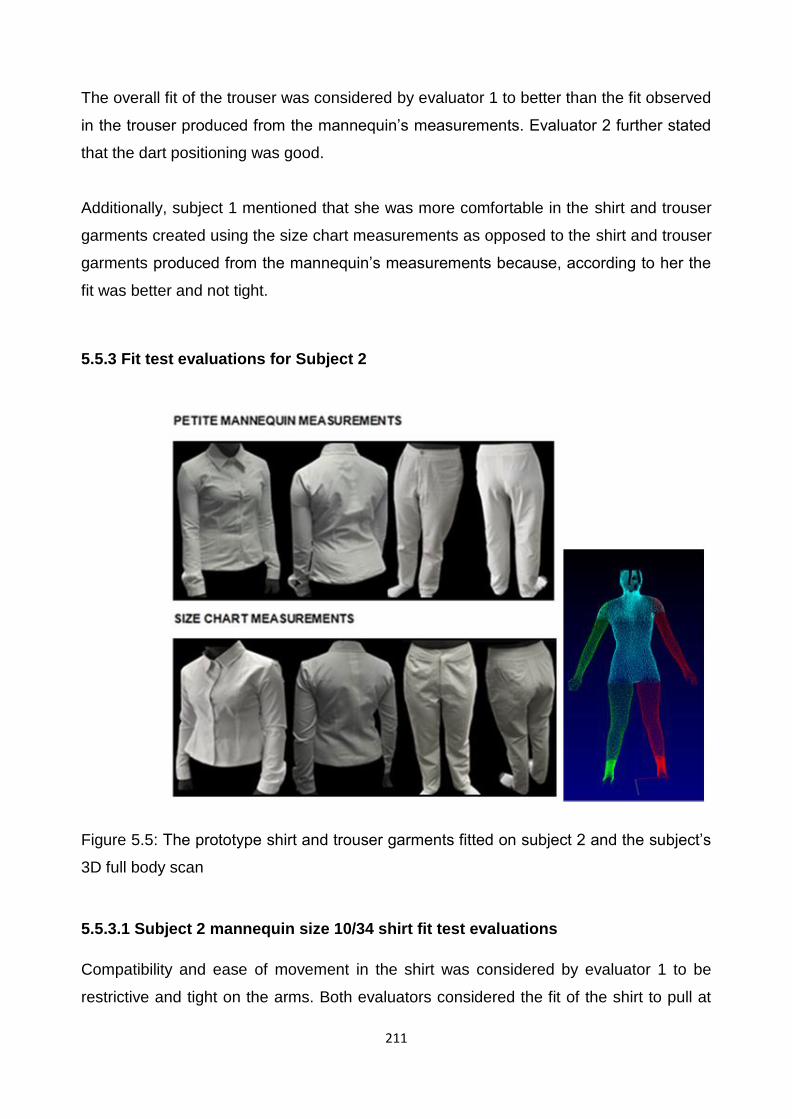
211
The overall fit of the trouser was considered by evaluator 1 to better than the fit observed
in the trouser produced from the mannequin‟s measurements. Evaluator 2 further stated
that the dart positioning was good.
Additionally, subject 1 mentioned that she was more comfortable in the shirt and trouser
garments created using the size chart measurements as opposed to the shirt and trouser
garments produced from the mannequin‟s measurements because, according to her the
fit was better and not tight.
5.5.3 Fit test evaluations for Subject 2
Figure 5.5: The prototype shirt and trouser garments fitted on subject 2 and the subject‟s
3D full body scan
5.5.3.1 Subject 2 mannequin size 10/34 shirt fit test evaluations
Compatibility and ease of movement in the shirt was considered by evaluator 1 to be
restrictive and tight on the arms. Both evaluators considered the fit of the shirt to pull at

212
the biceps and elbow and to be a little tight. The subject‟s bicep measurement was 3 cm
bigger and the elbow measurement was 4 cm bigger than the mannequin‟s bicep and
elbow measurements (refer to appendix L2 for the upper body measurements). The
measurement differences were (1 cm for the bicep) and 2 cm (for the elbow) more than
the size intervals used to allocate the bicep and elbow measurements from one size
range to another in the size chart developed for this study. Accordingly, the
measurements fell into the size 12/36 size range (see Table 4.32); hence movement was
slightly restricted in the shirt. The back part of the shirt was regarded to have some
gatherings and extra fabric in the middle by evaluator 2, the subject‟s neck to upper waist
back length measurement was 5 cm shorter than the mannequin‟s neck to upper waist
back measurement. The sleeve lengths were regarded to be too long by both evaluators.
The mannequin‟s sleeve length measurement was 5 cm longer than the subject‟s sleeve
length measurement. Additionally, the quality of fit in the darts was indicated by evaluator
2 to be good.
5.5.3.2 Subject 2 size chart size 10/34 shirt fit test evaluations
Evaluator 1 indicated that the subject‟s one shoulder was higher than the other; the
evaluator further suggested that this was common from results of carrying bags on one
side of the shoulder. Folds at the upper arm were observed by evaluator 2, who further
stated that the subject had sloping shoulders; as a result, some pulling was observed
towards the shoulder at the back of the shirt. Evaluator 1 indicated that the overall fit of
the shirt was better than the fit of the shirt created using the mannequin‟s measurements.
Most of the subject‟s measurements, such as the bust, upper waist, chest, underbust,
neck full, armscye, neck to upper waist back, neck to upper waist front and the sleeve
length (refer to appendix L2 for the upper body measurements) were more compatible to
the size 10/34 size chart measurements, when compared to the mannequin
measurements. Evaluator 1 further indicated that there was enough ease in the shirt,
permitting comfortability and movement. The darts were considered to be well position,
presenting a good quality of fit by evaluator 2.
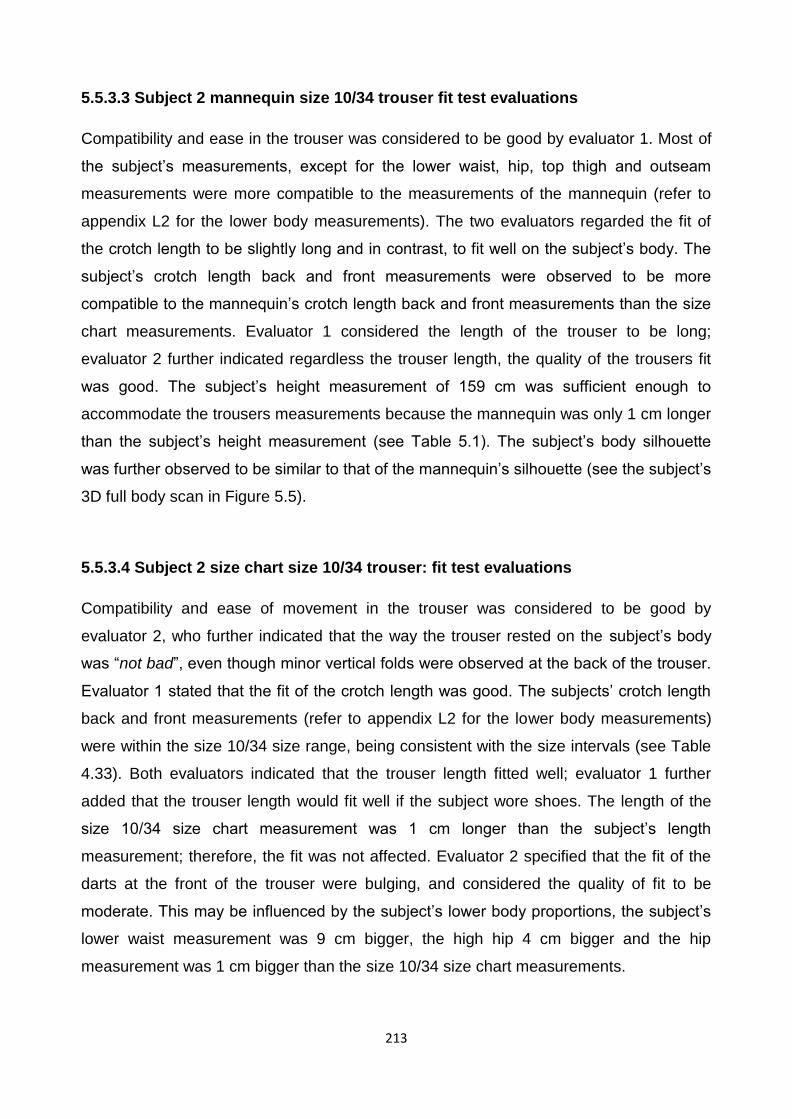
213
5.5.3.3 Subject 2 mannequin size 10/34 trouser fit test evaluations
Compatibility and ease in the trouser was considered to be good by evaluator 1. Most of
the subject‟s measurements, except for the lower waist, hip, top thigh and outseam
measurements were more compatible to the measurements of the mannequin (refer to
appendix L2 for the lower body measurements). The two evaluators regarded the fit of
the crotch length to be slightly long and in contrast, to fit well on the subject‟s body. The
subject‟s crotch length back and front measurements were observed to be more
compatible to the mannequin‟s crotch length back and front measurements than the size
chart measurements. Evaluator 1 considered the length of the trouser to be long;
evaluator 2 further indicated regardless the trouser length, the quality of the trousers fit
was good. The subject‟s height measurement of 159 cm was sufficient enough to
accommodate the trousers measurements because the mannequin was only 1 cm longer
than the subject‟s height measurement (see Table 5.1). The subject‟s body silhouette
was further observed to be similar to that of the mannequin‟s silhouette (see the subject‟s
3D full body scan in Figure 5.5).
5.5.3.4 Subject 2 size chart size 10/34 trouser: fit test evaluations
Compatibility and ease of movement in the trouser was considered to be good by
evaluator 2, who further indicated that the way the trouser rested on the subject‟s body
was “not bad”, even though minor vertical folds were observed at the back of the trouser.
Evaluator 1 stated that the fit of the crotch length was good. The subjects‟ crotch length
back and front measurements (refer to appendix L2 for the lower body measurements)
were within the size 10/34 size range, being consistent with the size intervals (see Table
4.33). Both evaluators indicated that the trouser length fitted well; evaluator 1 further
added that the trouser length would fit well if the subject wore shoes. The length of the
size 10/34 size chart measurement was 1 cm longer than the subject‟s length
measurement; therefore, the fit was not affected. Evaluator 2 specified that the fit of the
darts at the front of the trouser were bulging, and considered the quality of fit to be
moderate. This may be influenced by the subject‟s lower body proportions, the subject‟s
lower waist measurement was 9 cm bigger, the high hip 4 cm bigger and the hip
measurement was 1 cm bigger than the size 10/34 size chart measurements.
214
The measurement differences were irregular, as a result, some pulling, and gathers were
observed at the front of the trouser.
Additionally, subject 2 indicated that the shirt created from the mannequin measurements
was tight and that she preferred the trouser produced from the size chart measurements
because the fit was better, and the length was not too long.
5.5.4 Fit test evaluations for Subject 3
Figure 5.6: The prototype shirt and trouser garments fitted on subject 3 and the subject‟s
3D full body scan.
5.5.4.1 Subject 3 mannequin size 10/34 shirt fit test evaluations
The shirt created from the mannequin‟s measurements did not fit subject 3, therefore the
shirt could not be evaluated. Evaluator 1 indicated that the shirt could not fit because the
sleeves were too tight; whilst evaluator 2 considered the shirt to be too narrow for the
subject to put her arms in the shirt. The subject‟s bicep measurement was 8 cm bigger
and elbow measurement was 6 cm bigger than the mannequin‟s bicep and elbow
measurements (refer to appendix L3 for the upper body measurements). The subject‟s
bicep and elbow measurements were also observed to be compatible to the bigger size
ranges in the size chart (see Table 4.32); as a result, the fit of the whole shirt was
constrained on the subject‟s body.

215
5.5.4.2 Subject 3 size chart size 10/34 shirt fit test evaluations
The shirt created from the size chart measurements did not fit subject 3, therefore, the
shirt could not be evaluated. Evaluator 1 considered the shirt to be too tight and
evaluator 2 observed that the subject had bigger biceps and could not put her arms in the
shirt; therefore, it constrained the whole shirt to fit the subject‟s body. The subject‟s bicep
measurement was 35 cm (refer to appendix L3 for the upper body measurements).
The measurements difference between the subject‟s bicep measurement and the size
chart measurement was 7 cm more than the size interval used to allocate the bicep
measurement from one size range to another in the size chart developed for this study
(see Table 4.32). Accordingly, the subject‟s bicep measurement fell into the size 18/42
size range which was too big to fit into a size 10/34 size range.
5.5.4.3 Subject 3 mannequin size 10/34 trouser fit test evaluations
Evaluator 1 considered the high hip area to have minor fabric excess, whereas evaluator
2 observed small bulging caused by the little extra fabric between the waistline and hip
areas. The subject‟s high hip measurement was observed to be 3 cm below the
mannequin‟s high hip measurement (refer to appendix L3 for the lower body
measurements). Although, the lower waist and hip measurements were within the size
10/34 size range, the high hip measurement was observed to be below the size 10/34
size range established in the size chart developed for this study (see Table 4.33).
Evaluator 1 further stated that the fit of the trouser looked good, but more ease was
required. The subject‟s hip, top thigh, mid-thigh, crotch length back and the crotch length
front measurements were observed (refer to Appendix L3 for lower body measurements)
to be bigger than the mannequin‟s measurements; while the lower waist measurement
was 2 cm smaller. Evaluator 1 considered the overall fit of the trouser to be a little
comfortable. However, comfortability and movement were considered restrained by
evaluator 2, who further indicated that there was some pulling at the calves. The
subject‟s calf measurement was 36 cm; the measurement difference was 2 cm more than
the size interval used to allocate the calf measurements from one size range to another
in the size chart developed for this study.

216
The subject‟s calf measurement was further observed to fall into the size 12/36 size
range (see Table 4.33). Additionally, evaluator 2 stated that the darts on the trouser had
a moderate fit.
5.5.4.4 Subject 3 size chart size 10/34 trouser fit test evaluations
The compatibility and ease of the evaluated trouser was considered to look good and
having minor creases by evaluator 1. The trouser was regarded to fit at the hip area well
by evaluator 1, who further stated that the fit was much better than the fit of the trouser
created using the mannequin‟s hip measurement. The hip, top thigh, mid-thigh and high
hip measurements were observed to be more compatible to the size 10/34 size chart
measurements. The lower waist measurement was 2 cm bigger, while the outseam
measurement was similar to the size 10/34 size range outseam measurement (refer to
appendix L3 for the lower body measurements). Hence, the outseam length was
considered by both evaluators to fit better than the fit observed in the trouser
manufactured using the mannequin‟s measurements. Evaluator 2 further stated that the
length of the trouser became shorter when the subject was sitting, but the overall fit of
the trouser was considered to be comfortable in sitting and movement. Evaluator 1
regarded the fit of the trouser on the front thigh area to be good and further stated that
she observed minor fold lines at the knee area. However, evaluator 2 indicated a slightly
tight fit in the thigh area. The subject‟s top thigh measurement was 3 cm bigger and the
knee measurement was 1 cm bigger than the top thigh and mid-thigh measurements
established in the size 10/34 size chart. Additionally, the subject‟s top thigh measurement
was observed to be in the size 12/36 size range (see Table 4.33), indicating that the
subject‟s top thigh measurement was bigger than what the size chart predicted.
Furthermore, subject 3 stated that the fit on both analysed shirt and trouser garments
were “ok” but the fit that she preferred was the fit produced by the shirt and trouser
garments created from the size chart measurements.

217
5.5.5 Fit test evaluations for Subject 4
Figure 5.7: The prototype shirt and trouser garments fitted on subject 4 and the subject‟s
3D full body scan.
5.5.5.1 Subject 4 mannequin size 10/34 shirt fit test evaluations
The shirt created from the mannequin‟s measurements did not fit subject 4, therefore the
shirt could not be evaluated. Evaluator 2 considered the shirt to be so small that it
constrained the fitting on the subject‟s body. The subject‟s bust measurement (refer to
appendix L4 for the upper body measurements) was 92 cm, making the subject to be at
the higher end of the size 10/34 size range in the size chart (see Table 4.32) and was 6
cm bigger than the mannequin‟s bust measurement. The subject‟s size 10/34 size chart
bicep measurement was 4 cm bigger than the mannequin‟s bicep measurement.
5.5.5.2 Subject 4 size chart size 10/34 shirt fit test evaluations
The ease for the bust was indicated by evaluator 1 to make the shirt too close-fitting to
the body to accommodate the subject‟s bust measurement. The subject‟s bust
measurement (refer to appendix L4 for the upper body measurements) was 4cm bigger

218
than the established 3D full body scanned size 10/34 bust measurement established in
the size chart, but was within the size 10/34 size range. Evaluator 2 observed some
gaping in the bust area and further stated that this may be because the placement of the
button was not aligned with the subject‟s bust height. The two evaluators considered the
shirt closure to be close-fitting and evaluator 2 further suggested that more ease was
required in the bust area. Evaluator 2 indicated that the armholes were slightly pulling at
the back of the shirt because the sleeve was tight around the bicep area. Evaluator 1
further stated that the sleeves at the biceps area was tight and had visible wrinkles in the
sleeve area. The subject‟s bicep measurement was observed to be 3 cm above the
size10/34 size chart measurement and fell into the size 12/36 in the size chart developed
for this study (see Table 4.32). The subject‟s elbow measurement was similar to the size
10/34 elbow measurement. For that reason, the elbow measurement provided enough
ease for the subject to be able to fit into the shirt. However, the fit of the shirt around the
bicep area was too tight; hence the wrinkles were produced on the shirt. Both evaluators
observed the sleeve length to fit well. The subject‟s sleeve length measurement was 1
cm above the size10/34 size chart sleeve measurement. Evaluator 1 considered the
shirt‟s comfortability and movement to be good, while evaluator 2 indicated that the
overall shirt fit looked tight on the subject‟s body. The darts were stated by evaluator 2 to
produce a good quality of fit.
5.5.5.3 Subject 4 mannequin size 10/34 trouser fit test evaluations
Compatibility and ease in the trouser was considered to be gathering a little at the high
hip and a few wrinkles were observed at the crotch area by evaluator 1. The subject‟s
lower waist measurement was 2 cm bigger, the high hip measurement was 4 cm bigger
and the hip measurement was 5 cm bigger than the mannequin‟s measurements (refer to
appendix L4 for the lower body measurements). The subject was observed to have a
protruding stomach which may influence the fit of the trouser on the subject‟s body. The
fit of the trouser at the hip area was regarded to be pulling and a little tight by evaluator 1.
The subject‟s hip measurement was 100 cm, making the subject to be at the higher end
of the size 10/34 size range that was established in the size chart developed for this
study (see Table 4.33) and was 5 cm bigger than the mannequin‟s hip measurement. As
observed in Appendix L4 (for the lower body dimensions). The subject‟s inseam length
measurement was similar to the mannequin‟s inseam measurement, while the outseam
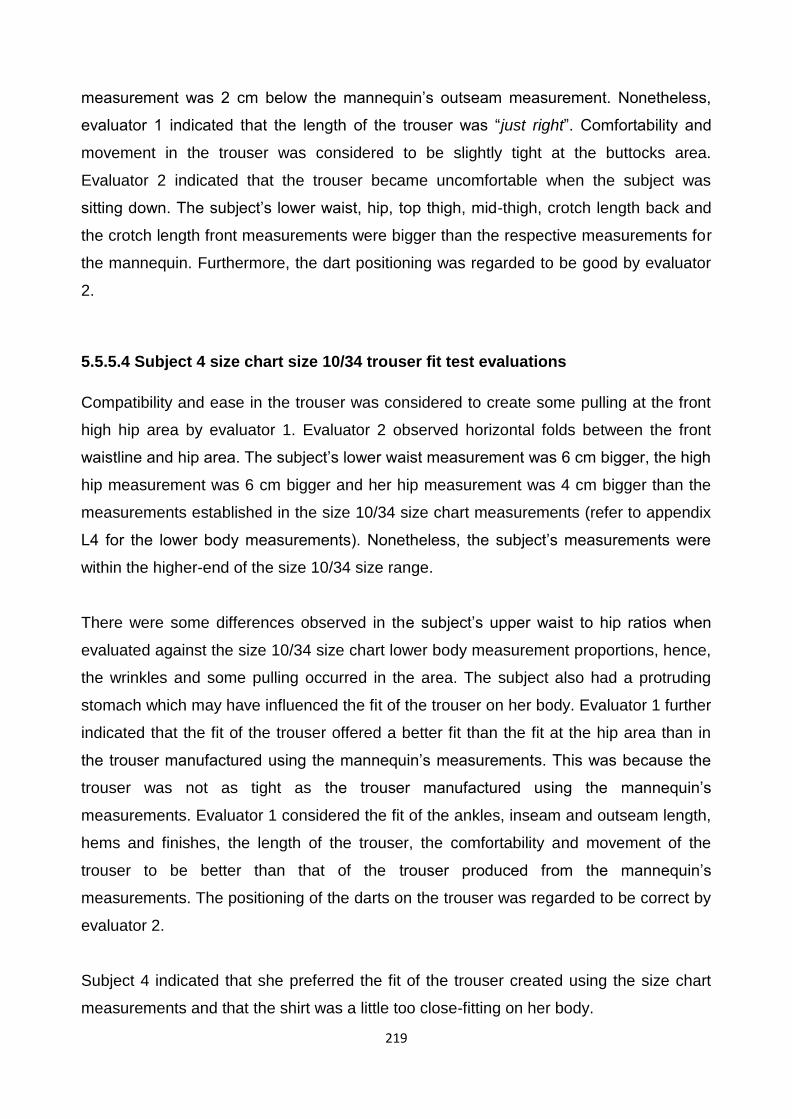
219
measurement was 2 cm below the mannequin‟s outseam measurement. Nonetheless,
evaluator 1 indicated that the length of the trouser was “just right”. Comfortability and
movement in the trouser was considered to be slightly tight at the buttocks area.
Evaluator 2 indicated that the trouser became uncomfortable when the subject was
sitting down. The subject‟s lower waist, hip, top thigh, mid-thigh, crotch length back and
the crotch length front measurements were bigger than the respective measurements for
the mannequin. Furthermore, the dart positioning was regarded to be good by evaluator
2.
5.5.5.4 Subject 4 size chart size 10/34 trouser fit test evaluations
Compatibility and ease in the trouser was considered to create some pulling at the front
high hip area by evaluator 1. Evaluator 2 observed horizontal folds between the front
waistline and hip area. The subject‟s lower waist measurement was 6 cm bigger, the high
hip measurement was 6 cm bigger and her hip measurement was 4 cm bigger than the
measurements established in the size 10/34 size chart measurements (refer to appendix
L4 for the lower body measurements). Nonetheless, the subject‟s measurements were
within the higher-end of the size 10/34 size range.
There were some differences observed in the subject‟s upper waist to hip ratios when
evaluated against the size 10/34 size chart lower body measurement proportions, hence,
the wrinkles and some pulling occurred in the area. The subject also had a protruding
stomach which may have influenced the fit of the trouser on her body. Evaluator 1 further
indicated that the fit of the trouser offered a better fit than the fit at the hip area than in
the trouser manufactured using the mannequin‟s measurements. This was because the
trouser was not as tight as the trouser manufactured using the mannequin‟s
measurements. Evaluator 1 considered the fit of the ankles, inseam and outseam length,
hems and finishes, the length of the trouser, the comfortability and movement of the
trouser to be better than that of the trouser produced from the mannequin‟s
measurements. The positioning of the darts on the trouser was regarded to be correct by
evaluator 2.
Subject 4 indicated that she preferred the fit of the trouser created using the size chart
measurements and that the shirt was a little too close-fitting on her body.

220
5.5.6 Fit test evaluations for Subject 5
Figure 5.8: The prototype shirt and trouser garments fitted on subject 5 and the subject‟s
3D full body scan.
5.5.6.1 Subject 5 mannequin size 10/34 shirt fit test evaluations
Compatibility and ease in the shirt was considered by the two evaluators to make for a
very tight fit around the subject‟s body. The subject‟s bust measurement (refer to
appendix L5 for the upper body measurements) was 92 cm. The mannequin‟s bust
measurement was 6 cm less than the subject‟s bust measurement. Additionally, the
subject‟s upper waist measurement was 7 cm bigger than the mannequin‟s measurement
and was observed to be in the size 12/36 size chart size range; while the lower waist
measurement was 87 cm, at the higher end of the size 10/34 size range that was
established in the size chart (see Table 4.32). The two evaluators stated that the bust
and upper waist areas were very close-fitting, heavily stretching and gaping; as a result,
the closure was too tight. Evaluator 2 further added that the shirt closure was not aligned
because of the observed tight fit in the shirt. The collar was stated to be slightly loose by
evaluator 1; the subject‟s full neck measurement was 2 cm below the mannequin‟s full
neck measurement. The fit of the armhole was considered to be tight fitting by the two
evaluators because the subject‟s armscye measurement was 4 cm above the

221
mannequin‟s armscye measurement. Both evaluators regarded the sleeves to fit tightly
on the subject‟s body at the biceps and elbows. The mannequin‟s bicep measurement
was 3 cm less than the subject‟s bicep measurement and the mannequin‟s elbow
measurement was 5 cm less.
The difference in the measurements was more than the established size interval
measurements used in the size chart (see Table 4.32) to establish the bicep and elbow
size ranges from one size to another. As a result, the bicep and elbow measurements
were observed to fall into the size 12/36 size range; hence movement was restricted at
the arms. The shirt‟s sleeve length was observed to fit too long on the subject‟s body; the
subject‟s sleeve length measurement was 6 cm shorter than the mannequin‟s sleeve
length measurement. Evaluator 1 regarded the hems and finishes to be of good quality.
Evaluator 2 observed the darts to be well positioned, offering a moderate quality of fit.
5.5.6.2 Subject 5 size chart size 10/34 shirt fit test evaluations
Evaluator 1 considered the compatibility and ease in the shirt to be a little tight, it was
further stated that the fit was better than the fit of the shirt produced from the
mannequin‟s measurements. The bust, upper waist, chest, underbust, bicep, elbow, neck
to upper waist front, sleeve length and wrist measurements were more compatible to the
size 10/34 size chart measurements than the measurements established for the
mannequin (refer to appendix L5 for the upper body measurements). The back of the
shirt was regarded to fit “just right” by evaluator 1; whilst evaluator 2 stated that the shirt
was tight and there were horizontal pleats at the upper waist and lower back part of the
shirt. The subject‟s neck to upper waist back measurement was 3 cm longer than the
size 10/34 size chart neck to upper waist back measurement and her upper waist
measurement was 6 cm bigger than the size 10/34 size chart measurement. It was
observed that the measurements fell into the starting point of the size 12/36 size chart
size range (see Table 4.32 for measurements); hence the observed tight fit in the shirt.
The sleeve length was regarded to be slightly long by evaluator 2, who observed a better
fit in the size 10/34 size chart shirt than the fit observed in the shirt created using the size
10/34 size chart measurement. A 3 cm difference was observed when comparing the
subject‟s and the size 10/34 size chart sleeve length measurements. Evaluator 1 stated
that the bust fit was too close-fitting; evaluator 2 further regarded the fit at the bust and

222
upper waist area to be tight and gaping. The subject‟s bust measurement was at the
higher end of the size 10/34 size range and 4 cm bigger than the size 10/34 size chart
bust measurement. The subject‟s upper waist measurement was 6 cm bigger than the
size 10/34 size chart measurement, which was further observed to be in the size 12/36
size range. Therefore, evaluator 1 suggested more ease should be added at the bust and
upper waist area. Both evaluators thought the shirt closure was too tight. Evaluator 2
further stated that due to the tightness of the fit, the closure alignment was not straight.
Additionally, evaluator 2 indicated that regardless the tight fit of the shirt, the subject was
able to move in the shirt, indicating that comfortability and movement in the shirt was
better than in the observed shirt created from the mannequin‟s measurements. Evaluator
2 also considered the darts to fit good and that is was well positioned.
5.5.6.3 Subject 5 mannequin size 10/34 trouser fit test evaluations
Evaluator 1 considered the compatibility and ease of the trouser to fit too tight on the
subject‟s body. Evaluator 2 observed fold lines at the front of the trouser. The fit at the
lower waist area was indicated by evaluator 2 to be a little tight, the subject‟s upper waist
measurement was 7 cm bigger than the mannequin‟s measurement (refer to appendix L5
for the lower body measurements) and was observed to be in the size 12/36 size chart
size range (see Table 4.33); her lower waist measurement was 2 cm bigger than the
mannequin‟s measurement. For that reason, the fit was observed to be tight. Evaluator 1
considered the fit of the trouser to be good at the hip area and evaluator 2 indicated that
the fit was body-hugging. As shown in Figure 5.8, the subject has a protruding stomach,
which may influence the quality of the trousers fit on the subject‟s body. Evaluator 2
further stated that comfortability and movement in the trouser was not satisfactory around
the tummy, lower waist and hip area. Both evaluators stated that the trouser was too long
for the subject. The subject‟s inseam measurement was 1 cm shorter and her outseam
measurement was 4 cm shorter than the mannequin‟s outseam and inseam
measurements. Evaluator 2 further indicated that the darts were good and well
positioned.
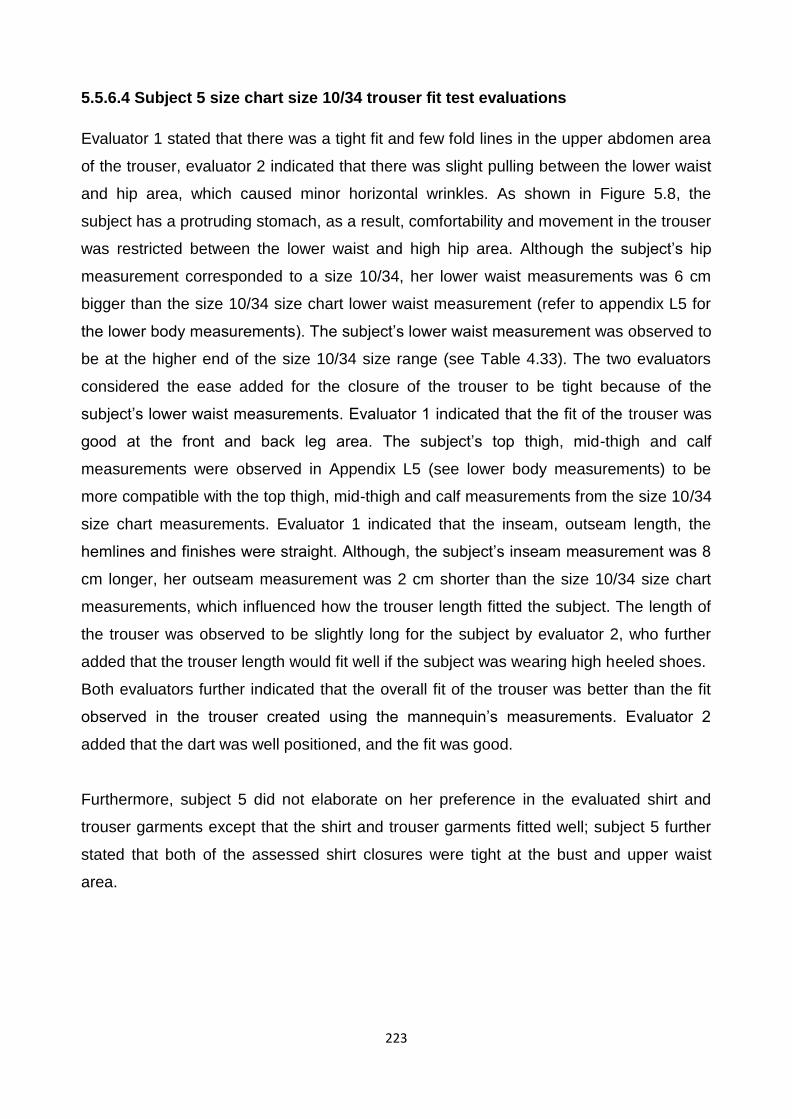
223
5.5.6.4 Subject 5 size chart size 10/34 trouser fit test evaluations
Evaluator 1 stated that there was a tight fit and few fold lines in the upper abdomen area
of the trouser, evaluator 2 indicated that there was slight pulling between the lower waist
and hip area, which caused minor horizontal wrinkles. As shown in Figure 5.8, the
subject has a protruding stomach, as a result, comfortability and movement in the trouser
was restricted between the lower waist and high hip area. Although the subject‟s hip
measurement corresponded to a size 10/34, her lower waist measurements was 6 cm
bigger than the size 10/34 size chart lower waist measurement (refer to appendix L5 for
the lower body measurements). The subject‟s lower waist measurement was observed to
be at the higher end of the size 10/34 size range (see Table 4.33). The two evaluators
considered the ease added for the closure of the trouser to be tight because of the
subject‟s lower waist measurements. Evaluator 1 indicated that the fit of the trouser was
good at the front and back leg area. The subject‟s top thigh, mid-thigh and calf
measurements were observed in Appendix L5 (see lower body measurements) to be
more compatible with the top thigh, mid-thigh and calf measurements from the size 10/34
size chart measurements. Evaluator 1 indicated that the inseam, outseam length, the
hemlines and finishes were straight. Although, the subject‟s inseam measurement was 8
cm longer, her outseam measurement was 2 cm shorter than the size 10/34 size chart
measurements, which influenced how the trouser length fitted the subject. The length of
the trouser was observed to be slightly long for the subject by evaluator 2, who further
added that the trouser length would fit well if the subject was wearing high heeled shoes.
Both evaluators further indicated that the overall fit of the trouser was better than the fit
observed in the trouser created using the mannequin‟s measurements. Evaluator 2
added that the dart was well positioned, and the fit was good.
Furthermore, subject 5 did not elaborate on her preference in the evaluated shirt and
trouser garments except that the shirt and trouser garments fitted well; subject 5 further
stated that both of the assessed shirt closures were tight at the bust and upper waist
area.
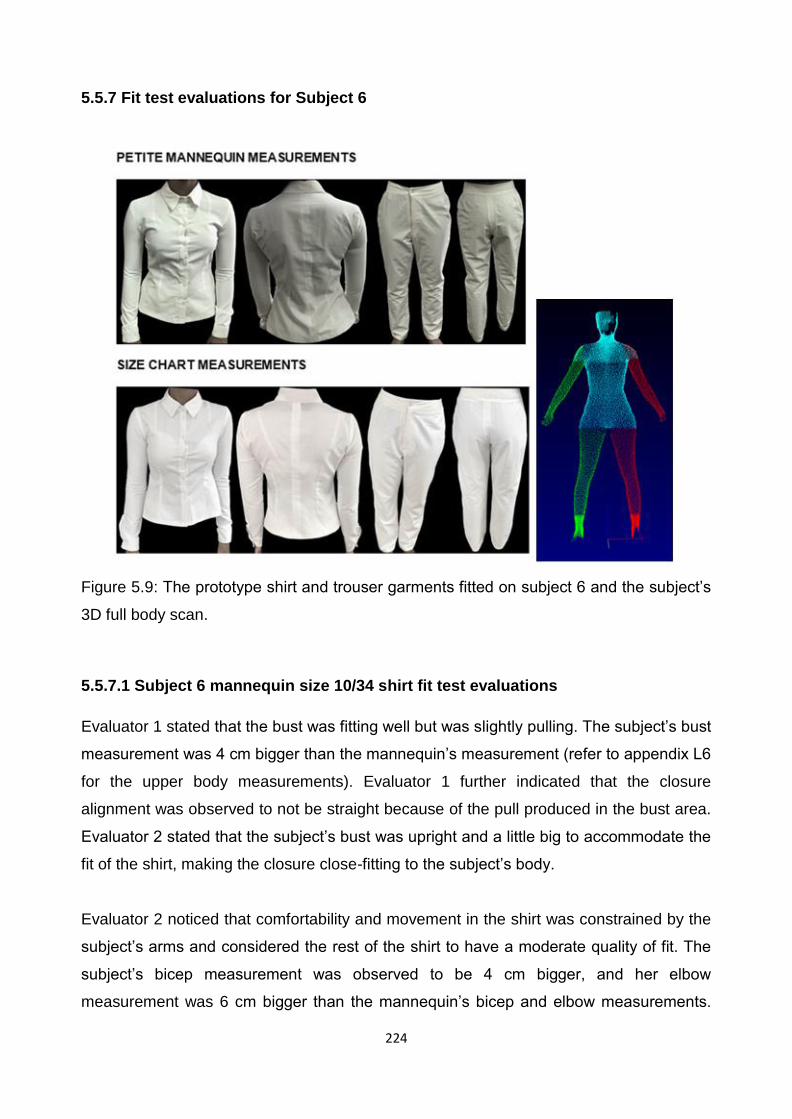
224
5.5.7 Fit test evaluations for Subject 6
Figure 5.9: The prototype shirt and trouser garments fitted on subject 6 and the subject‟s
3D full body scan.
5.5.7.1 Subject 6 mannequin size 10/34 shirt fit test evaluations
Evaluator 1 stated that the bust was fitting well but was slightly pulling. The subject‟s bust
measurement was 4 cm bigger than the mannequin‟s measurement (refer to appendix L6
for the upper body measurements). Evaluator 1 further indicated that the closure
alignment was observed to not be straight because of the pull produced in the bust area.
Evaluator 2 stated that the subject‟s bust was upright and a little big to accommodate the
fit of the shirt, making the closure close-fitting to the subject‟s body.
Evaluator 2 noticed that comfortability and movement in the shirt was constrained by the
subject‟s arms and considered the rest of the shirt to have a moderate quality of fit. The
subject‟s bicep measurement was observed to be 4 cm bigger, and her elbow
measurement was 6 cm bigger than the mannequin‟s bicep and elbow measurements.
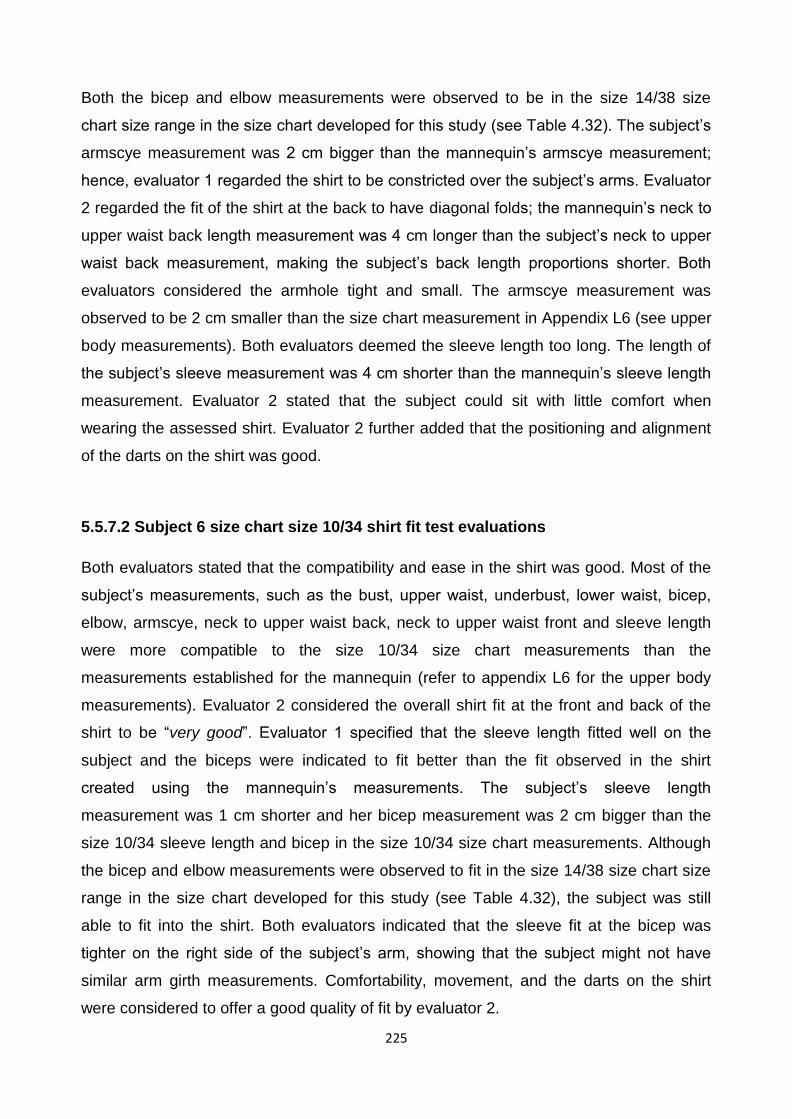
225
Both the bicep and elbow measurements were observed to be in the size 14/38 size
chart size range in the size chart developed for this study (see Table 4.32). The subject‟s
armscye measurement was 2 cm bigger than the mannequin‟s armscye measurement;
hence, evaluator 1 regarded the shirt to be constricted over the subject‟s arms. Evaluator
2 regarded the fit of the shirt at the back to have diagonal folds; the mannequin‟s neck to
upper waist back length measurement was 4 cm longer than the subject‟s neck to upper
waist back measurement, making the subject‟s back length proportions shorter. Both
evaluators considered the armhole tight and small. The armscye measurement was
observed to be 2 cm smaller than the size chart measurement in Appendix L6 (see upper
body measurements). Both evaluators deemed the sleeve length too long. The length of
the subject‟s sleeve measurement was 4 cm shorter than the mannequin‟s sleeve length
measurement. Evaluator 2 stated that the subject could sit with little comfort when
wearing the assessed shirt. Evaluator 2 further added that the positioning and alignment
of the darts on the shirt was good.
5.5.7.2 Subject 6 size chart size 10/34 shirt fit test evaluations
Both evaluators stated that the compatibility and ease in the shirt was good. Most of the
subject‟s measurements, such as the bust, upper waist, underbust, lower waist, bicep,
elbow, armscye, neck to upper waist back, neck to upper waist front and sleeve length
were more compatible to the size 10/34 size chart measurements than the
measurements established for the mannequin (refer to appendix L6 for the upper body
measurements). Evaluator 2 considered the overall shirt fit at the front and back of the
shirt to be “very good”. Evaluator 1 specified that the sleeve length fitted well on the
subject and the biceps were indicated to fit better than the fit observed in the shirt
created using the mannequin‟s measurements. The subject‟s sleeve length
measurement was 1 cm shorter and her bicep measurement was 2 cm bigger than the
size 10/34 sleeve length and bicep in the size 10/34 size chart measurements. Although
the bicep and elbow measurements were observed to fit in the size 14/38 size chart size
range in the size chart developed for this study (see Table 4.32), the subject was still
able to fit into the shirt. Both evaluators indicated that the sleeve fit at the bicep was
tighter on the right side of the subject‟s arm, showing that the subject might not have
similar arm girth measurements. Comfortability, movement, and the darts on the shirt
were considered to offer a good quality of fit by evaluator 2.

226
5.5.7.3 Subject 6 mannequin size 10/34 trouser fit test evaluations
The two evaluators considered the assessed trouser to be a little loose and bulging
around the hip area. Evaluator 2 observed a few diagonal pleats on sides between the
lower waist and hip. The fit of the trouser could be influenced by the subject‟s lower body
proportions, the subject‟s lower waist measurement was 5 cm smaller, high hip was 3 cm
smaller and hip was 2 cm bigger than the mannequin‟s measurements (refer to appendix
L6 for the lower body measurements). The trousers ease of closure was considered to
be pulling and not well aligned by evaluator 2, who further added that the darts offered a
good quality of fit. Major disagreements were evident when evaluating the fit of the
trouser on the subject‟s thigh area and whether the subject was able to sit when wearing
the trouser created using the mannequin measurements (see Table 5.5). Evaluator 1
rated the quality of fit on both evaluated standards to be good, whilst evaluator 2
considered the fit of both evaluated standards to be of poor quality. The subject‟s top
thigh measurement was similar to that of the mannequin and her mid-thigh measurement
was 3 cm bigger, making the trouser to be tight at the mid-thigh area when the subject
was sitting, hence the disagreement that occurred between the evaluators. Evaluator 1
further stated that the trouser length, hemlines and finishes were “just right”. The
subject‟s inseam length measurement was 2 cm shorter and the outseam measurement
was 1 cm below the mannequin‟s outseam measurement.
5.5.7.4 Subject 6 size chart size 10/34 trouser fit test evaluations
Compatibility and ease in the trouser was considered to be good by evaluator 1,
evaluator 2 observed minor folds between the lower waist and hip area at the front of the
trouser. The subject‟s lower waist measurement was 1 cm smaller, high hip was 1 cm
smaller and hip was 1 cm bigger than the size 10/34 size chart measurements (refer to
appendix L6 for the lower body measurements). This shows that the subject‟s above-
mentioned measurements, along with the mid-thigh and ankle measurements were more
compatible with the size 10/34 size chart measurements when compared to the
measurements established for the mannequin. Evaluator 1 observed a “very neat” fit in
the seat drape of the trouser. Evaluator 1 further stated that the trouser had a good
length, but the length might become shorter when the subject is sitting. Irrespective of the
subject‟s inseam length measurement being 9 cm shorter, and the outseam
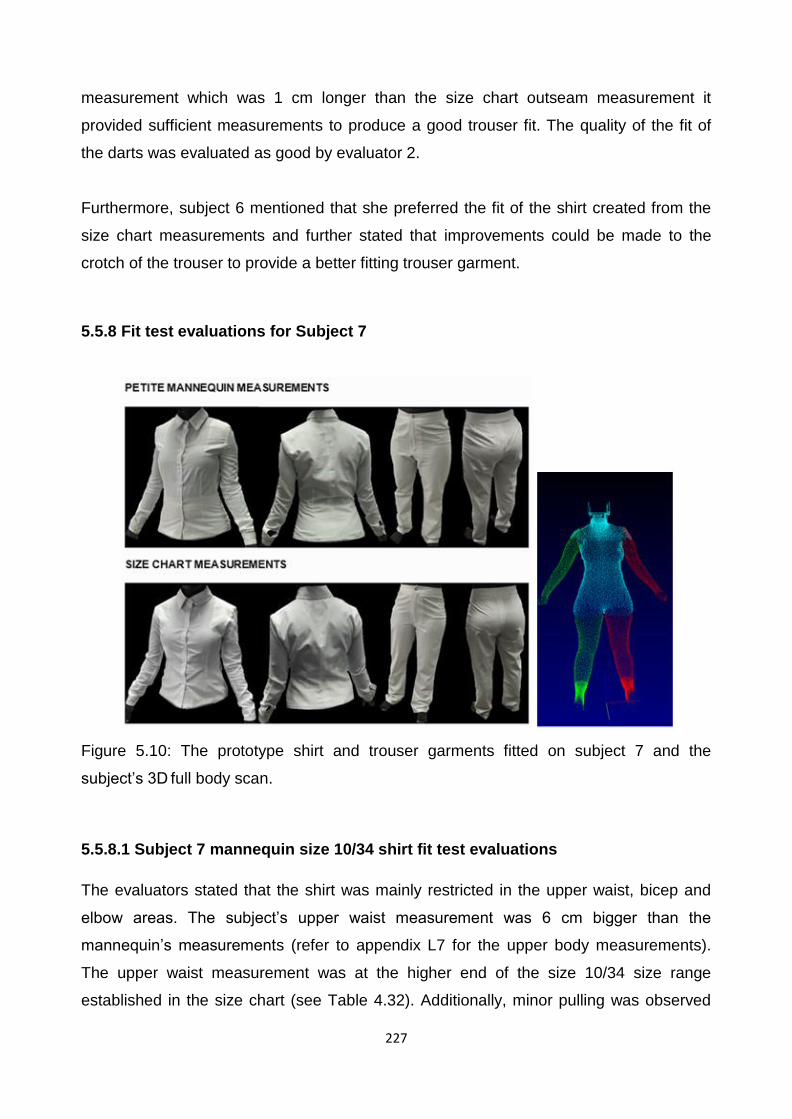
227
measurement which was 1 cm longer than the size chart outseam measurement it
provided sufficient measurements to produce a good trouser fit. The quality of the fit of
the darts was evaluated as good by evaluator 2.
Furthermore, subject 6 mentioned that she preferred the fit of the shirt created from the
size chart measurements and further stated that improvements could be made to the
crotch of the trouser to provide a better fitting trouser garment.
5.5.8 Fit test evaluations for Subject 7
Figure 5.10: The prototype shirt and trouser garments fitted on subject 7 and the
subject‟s 3D full body scan.
5.5.8.1 Subject 7 mannequin size 10/34 shirt fit test evaluations
The evaluators stated that the shirt was mainly restricted in the upper waist, bicep and
elbow areas. The subject‟s upper waist measurement was 6 cm bigger than the
mannequin‟s measurements (refer to appendix L7 for the upper body measurements).
The upper waist measurement was at the higher end of the size 10/34 size range
established in the size chart (see Table 4.32). Additionally, minor pulling was observed
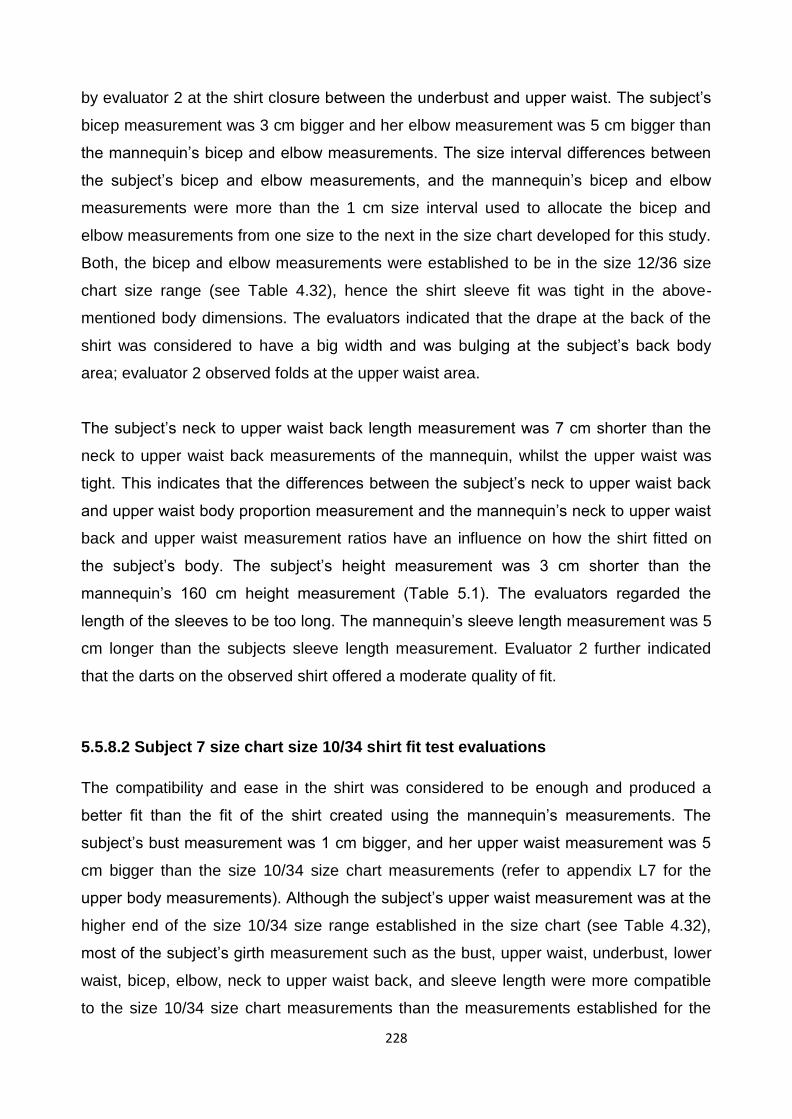
228
by evaluator 2 at the shirt closure between the underbust and upper waist. The subject‟s
bicep measurement was 3 cm bigger and her elbow measurement was 5 cm bigger than
the mannequin‟s bicep and elbow measurements. The size interval differences between
the subject‟s bicep and elbow measurements, and the mannequin‟s bicep and elbow
measurements were more than the 1 cm size interval used to allocate the bicep and
elbow measurements from one size to the next in the size chart developed for this study.
Both, the bicep and elbow measurements were established to be in the size 12/36 size
chart size range (see Table 4.32), hence the shirt sleeve fit was tight in the above-
mentioned body dimensions. The evaluators indicated that the drape at the back of the
shirt was considered to have a big width and was bulging at the subject‟s back body
area; evaluator 2 observed folds at the upper waist area.
The subject‟s neck to upper waist back length measurement was 7 cm shorter than the
neck to upper waist back measurements of the mannequin, whilst the upper waist was
tight. This indicates that the differences between the subject‟s neck to upper waist back
and upper waist body proportion measurement and the mannequin‟s neck to upper waist
back and upper waist measurement ratios have an influence on how the shirt fitted on
the subject‟s body. The subject‟s height measurement was 3 cm shorter than the
mannequin‟s 160 cm height measurement (Table 5.1). The evaluators regarded the
length of the sleeves to be too long. The mannequin‟s sleeve length measurement was 5
cm longer than the subjects sleeve length measurement. Evaluator 2 further indicated
that the darts on the observed shirt offered a moderate quality of fit.
5.5.8.2 Subject 7 size chart size 10/34 shirt fit test evaluations
The compatibility and ease in the shirt was considered to be enough and produced a
better fit than the fit of the shirt created using the mannequin‟s measurements. The
subject‟s bust measurement was 1 cm bigger, and her upper waist measurement was 5
cm bigger than the size 10/34 size chart measurements (refer to appendix L7 for the
upper body measurements). Although the subject‟s upper waist measurement was at the
higher end of the size 10/34 size range established in the size chart (see Table 4.32),
most of the subject‟s girth measurement such as the bust, upper waist, underbust, lower
waist, bicep, elbow, neck to upper waist back, and sleeve length were more compatible
to the size 10/34 size chart measurements than the measurements established for the
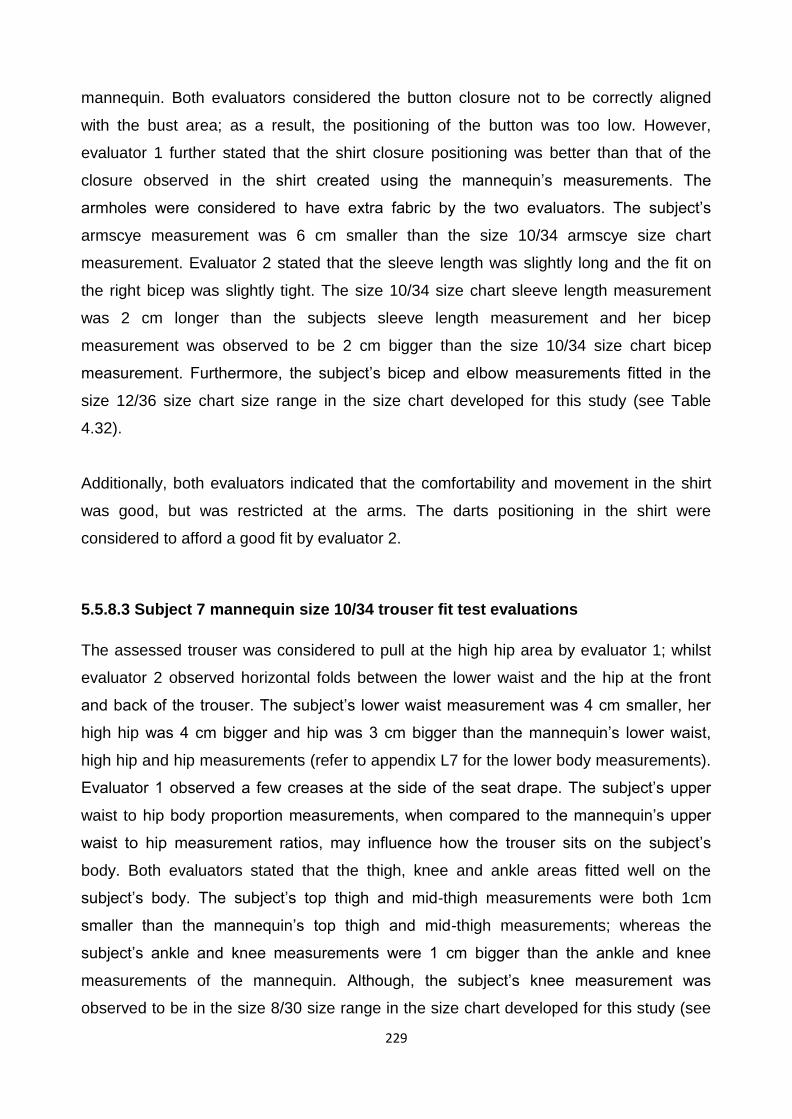
229
mannequin. Both evaluators considered the button closure not to be correctly aligned
with the bust area; as a result, the positioning of the button was too low. However,
evaluator 1 further stated that the shirt closure positioning was better than that of the
closure observed in the shirt created using the mannequin‟s measurements. The
armholes were considered to have extra fabric by the two evaluators. The subject‟s
armscye measurement was 6 cm smaller than the size 10/34 armscye size chart
measurement. Evaluator 2 stated that the sleeve length was slightly long and the fit on
the right bicep was slightly tight. The size 10/34 size chart sleeve length measurement
was 2 cm longer than the subjects sleeve length measurement and her bicep
measurement was observed to be 2 cm bigger than the size 10/34 size chart bicep
measurement. Furthermore, the subject‟s bicep and elbow measurements fitted in the
size 12/36 size chart size range in the size chart developed for this study (see Table
4.32).
Additionally, both evaluators indicated that the comfortability and movement in the shirt
was good, but was restricted at the arms. The darts positioning in the shirt were
considered to afford a good fit by evaluator 2.
5.5.8.3 Subject 7 mannequin size 10/34 trouser fit test evaluations
The assessed trouser was considered to pull at the high hip area by evaluator 1; whilst
evaluator 2 observed horizontal folds between the lower waist and the hip at the front
and back of the trouser. The subject‟s lower waist measurement was 4 cm smaller, her
high hip was 4 cm bigger and hip was 3 cm bigger than the mannequin‟s lower waist,
high hip and hip measurements (refer to appendix L7 for the lower body measurements).
Evaluator 1 observed a few creases at the side of the seat drape. The subject‟s upper
waist to hip body proportion measurements, when compared to the mannequin‟s upper
waist to hip measurement ratios, may influence how the trouser sits on the subject‟s
body. Both evaluators stated that the thigh, knee and ankle areas fitted well on the
subject‟s body. The subject‟s top thigh and mid-thigh measurements were both 1cm
smaller than the mannequin‟s top thigh and mid-thigh measurements; whereas the
subject‟s ankle and knee measurements were 1 cm bigger than the ankle and knee
measurements of the mannequin. Although, the subject‟s knee measurement was
observed to be in the size 8/30 size range in the size chart developed for this study (see

230
Table 4.33), the rest of the subject‟s lower body girth measurements permitted a good fit
in the trouser. Furthermore, the two evaluators indicated that the trouser length was too
long; evaluator 1 further stated that, because the trouser length was too long, some
wrinkles were observed from the knee area. The subject‟s inseam measurement was 6
cm shorter and her outseam measurement was 4 cm shorter than the mannequin‟s
inseam and outseam measurements. Evaluator 2 further added that the darts offered a
good quality of fit.
5.5.8.4 Subject 7 size chart size 10/34 trouser fit test evaluations
The subject‟s lower waist measurement was the same, her high hip was 6 cm bigger and
hip was 2 cm bigger than the size 10/34 size chart measurements (refer to appendix L7
for the lower body measurements). It is evident that the fit of the trouser on the subject‟s
body could be affected by her upper waist to hip body proportion measurements when
compared to the size 10/34 size chart upper waist to hip measurement ratios. Evaluator 1
indicated that the fit of the trouser at the back buttocks area had minor pulling on the side
and evaluator 2 considered the fit to be good, except for a few visible folds on the side of
the trouser. The fit of the trouser at the thighs, knees and ankles was indicated by both
evaluators to be good. The subject‟s top thigh measurement was 2 cm smaller and her
mid-thigh measurement was 5 cm smaller than the size 10/34 size chart top thigh, mid-
thigh and ankle measurements; her ankle measurement was similar and knee
measurement was 1 cm below the size 10/34 size chart ankle and knee measurements.
However, the subject‟s knee measurement was observed to be in the size 8/30 size
range in the size chart developed for this study (see Table 4.33). Nonetheless,
comfortability and ease of movement was considered by evaluator 1 to be better than the
comfortability and ease in the trouser produced from the mannequin‟s measurements.
Evaluator 2 stated that the trouser length was long, the subject‟s inseam measurement
was 1 cm shorter and the outseam measurement was 2 cm shorter than the size 10/34
size chart measurements. Evaluator 1 further indicated that the overall fit of the trouser
length was better than the fit observed in the trouser created from the mannequin‟s
measurements. The darts were offering a good quality of fit by evaluator 2.
Additionally, subject 7 stated that she preferred the fit of the shirt and trouser garments
created using the size chart measurements because the shirt produced from the
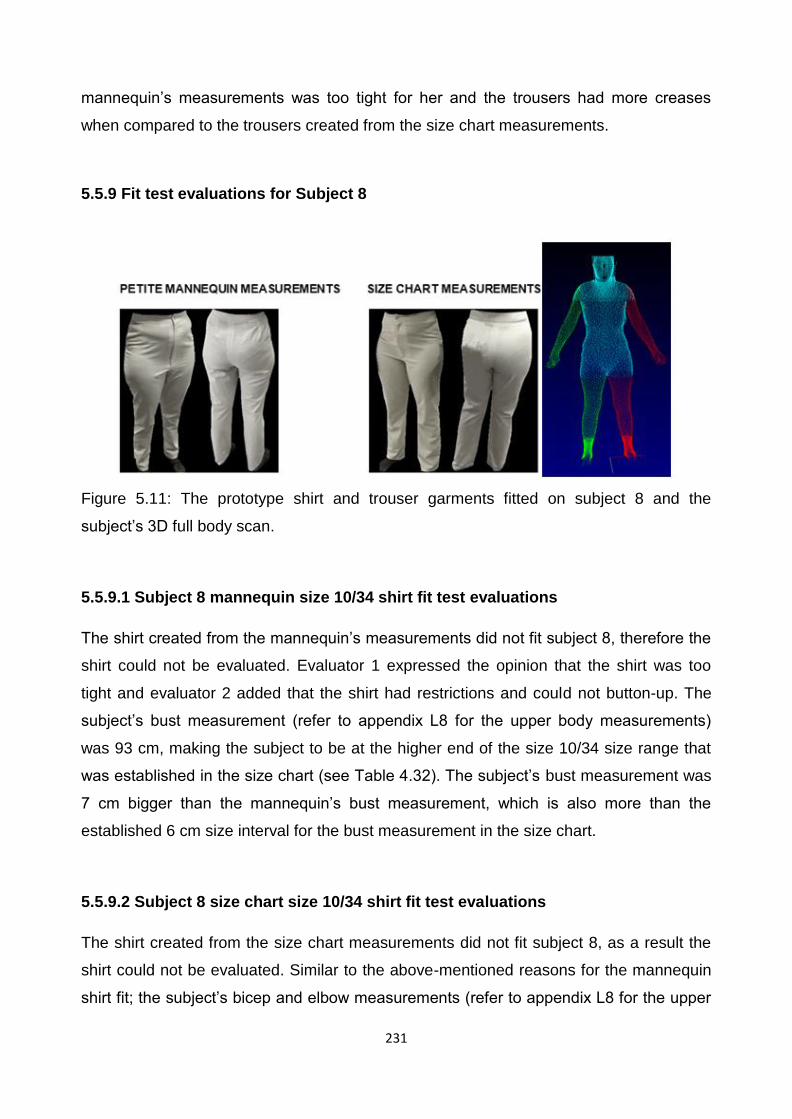
231
mannequin‟s measurements was too tight for her and the trousers had more creases
when compared to the trousers created from the size chart measurements.
5.5.9 Fit test evaluations for Subject 8
Figure 5.11: The prototype shirt and trouser garments fitted on subject 8 and the
subject‟s 3D full body scan.
5.5.9.1 Subject 8 mannequin size 10/34 shirt fit test evaluations
The shirt created from the mannequin‟s measurements did not fit subject 8, therefore the
shirt could not be evaluated. Evaluator 1 expressed the opinion that the shirt was too
tight and evaluator 2 added that the shirt had restrictions and could not button-up. The
subject‟s bust measurement (refer to appendix L8 for the upper body measurements)
was 93 cm, making the subject to be at the higher end of the size 10/34 size range that
was established in the size chart (see Table 4.32). The subject‟s bust measurement was
7 cm bigger than the mannequin‟s bust measurement, which is also more than the
established 6 cm size interval for the bust measurement in the size chart.
5.5.9.2 Subject 8 size chart size 10/34 shirt fit test evaluations
The shirt created from the size chart measurements did not fit subject 8, as a result the
shirt could not be evaluated. Similar to the above-mentioned reasons for the mannequin
shirt fit; the subject‟s bicep and elbow measurements (refer to appendix L8 for the upper

232
body measurements) were observed to be more than the established size interval
measurements in the size 10/34 size range established in the size chart developed for
this study. For that reason, the subject‟s bicep and elbow measurement effectively
shifted her to other bigger sizes. No comments were made by the evaluators.
5.5.9.3 Subject 8 mannequin size 10/34 trouser fit test evaluations
The assessed trouser was considered to offer a tight fit between the lower waist and hip
area by evaluator 1. The subject‟s measurements, especially as the lower waist
measurement was (91 cm) (refer to appendix L8 for the lower body measurements and
Table 4.33 for the lower body dimensions size chart measurements) which fell into a size
12/36 size range. Her hip measurements were at the higher end (100 cm) of the size
10/34 size range. Evaluator 2 stated that there was some tightness in the crotch area;
the subject‟s crotch length front measurement was 3 cm bigger than the mannequin‟s
crotch length front measurement. As shown in Figure 5.11, the subject had a bulging
stomach, evaluator 2 suggested that, that could possibly influence the tight fit observed
in the crotch. Evaluator 1 stated that the fit on the subject‟s ankles was a little tight and
as a result the trouser became slightly short when the subject was sitting. The subject‟s
ankle measurement was 3 cm bigger than the mannequin‟s ankle measurement, which
was more than the established size interval used in the size chart (see Table 4.33) to
establish the size ranges from one size to another in the size chart developed for this
study.
5.5.9.4 Subject 8 size chart size 10/34 trouser: fit test evaluations
Evaluator 2 stated that the fit was better than the fit of the trouser created using the
mannequin‟s measurements. The majority of the subject‟s lower body measurements
(refer to appendix L8 for the lower body measurements), such as the hip, top thigh, mid-
thigh, calf, ankle, crotch length back, inseam and outseam were more compatible with
the size chart measurements than the measurements from the mannequin.
Evaluator 1 considered the trouser length to become shorter at the ankles when the
subject was sitting, whilst evaluator 2 stated that the trouser length was “ok” for flat
shoes. As shown in Appendix L8 (see lower body measurements), the subject‟s inseam
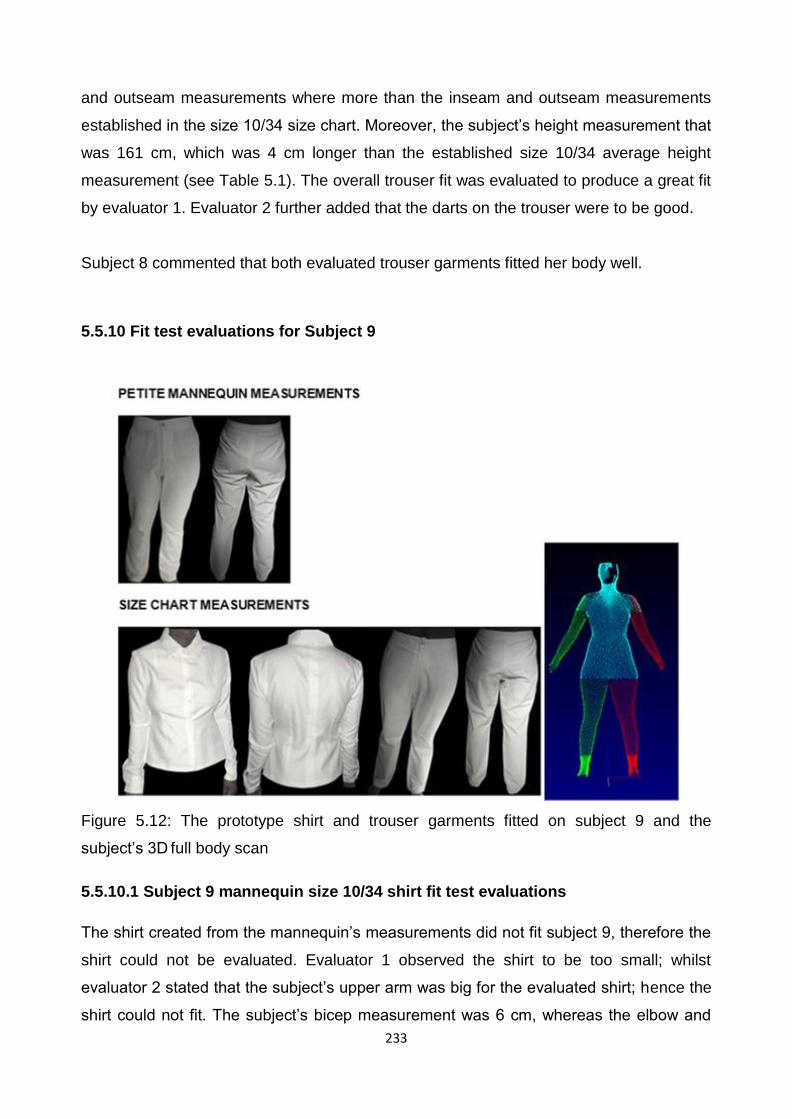
233
and outseam measurements where more than the inseam and outseam measurements
established in the size 10/34 size chart. Moreover, the subject‟s height measurement that
was 161 cm, which was 4 cm longer than the established size 10/34 average height
measurement (see Table 5.1). The overall trouser fit was evaluated to produce a great fit
by evaluator 1. Evaluator 2 further added that the darts on the trouser were to be good.
Subject 8 commented that both evaluated trouser garments fitted her body well.
5.5.10 Fit test evaluations for Subject 9
Figure 5.12: The prototype shirt and trouser garments fitted on subject 9 and the
subject‟s 3D full body scan
5.5.10.1 Subject 9 mannequin size 10/34 shirt fit test evaluations
The shirt created from the mannequin‟s measurements did not fit subject 9, therefore the
shirt could not be evaluated. Evaluator 1 observed the shirt to be too small; whilst
evaluator 2 stated that the subject‟s upper arm was big for the evaluated shirt; hence the
shirt could not fit. The subject‟s bicep measurement was 6 cm, whereas the elbow and
234
armscye measurement were both 4 cm bigger than the mannequin‟s measurements
(refer to appendix L9 for the upper body measurements).
The above-mentioned measurement differences were more than the 2 cm size interval
allocated to size the bicep and elbow measurements from one size to the next in the size
10/34 size chart developed in this study (see Table 4.32).
5.5.10.2 Subject 9 size chart size 10/34 shirt fit test evaluations
The shirt was considered by evaluator 1 to have folds at the arm area; evaluator 2 stated
that she observed minor pulls in the shirt but did not specify where in the shirt. The
sleeve length was stated to fit long by both evaluators; the size 10/34 size chart sleeve
length measurement (refer to appendix L9 for the upper body measurements) used to
manufacture the prototype shirt was 3 cm longer than the subject‟s sleeve length
measurement. Evaluator 2 indicated that the sleeve fit on the bicep was too tight, pulling
and restricting movement. Evaluator 1 additionally stated that comfortability and
movement in the shirt was constrained at the biceps, while the rest of the fit on the shirt
was observed to be of good quality. The subject‟s bicep measurement was 5 cm, bigger
than the mannequin‟s measurements; nonetheless, the rest of the arm girth
measurements permitted the subject to fit into the shirt. Evaluator 1 observed the bust
area to fit well, the subject‟s bust measurement was similar to the size 10/34 size chart
bust measurement. Evaluator 2 considered the closure alignment to be well aligned.
Evaluator 2 stated that the darts were well positioned and fitted well on the shirt garment.
5.5.10.3 Subject 9 mannequin size 10/34 trouser fit test evaluations
Evaluator 2 considered the overall fit of the trouser to be comfortable, even though, it
was a little big and bulging at the back. The subject‟s upper waist to hip body proportion
measurements, when compared to the mannequin‟s upper waist to hip measurement
ratios, may influence how the trouser sits on the subject‟s body. The subject‟s size 10/34
size chart lower waist measurement was 7 cm smaller than the mannequin‟s lower waist
measurement. The subject‟s size 10/34 size chart high hip measurement was 4 cm
smaller than the high hip measurement of the mannequin and her size 10/34 size chart
hip measurement was 2 cm smaller than the mannequin‟s measurements (refer to

235
appendix L9 for the lower body measurements). Additionally, evaluator 2 indicated that
the darts on the trouser were well positioned and produced a good fit.
The length of the trouser was considered to be a good length by evaluator 1, the
subject‟s inseam measurement was 1 cm shorter and the outseam measurement was 2
cm shorter than the mannequin‟s measurements. Evaluator 2 further suggested that the
length would fit better if the subject wore heels.
5.5.10.4 Subject 9 size chart size 10/34 trouser fit test evaluations
Evaluator 1 considered the compatibility and ease of the trouser to fit well albeit slightly
loosely. The subject‟s lower waist and high hip measurements were observed to be
smaller but more compatible to the size 10/34 size chart measurements (refer to
appendix L9 for the lower body measurements). Evaluator 1 further stated that the
trouser fit was better when compared to the fit of the trouser created using the
mannequin‟s measurements. The fit on the thigh area was considered to be loose by
evaluator 2, the subject‟s top thigh measurement was 4 cm smaller and mid-thigh
measurement was 6 cm smaller than the size 10/34 thigh measurements. Furthermore,
evaluator 2 indicated that the darts in the trouser to be well positioned and fit well on the
wearer‟s body.
Subject 9 commented that the shirt fitted her well. The subject further added that the
trouser created using the size chart measurements fitted her body well, according to her
fit preference; the lower waist and hip fitted her well, but the rest of the trouser garment
was slightly loose.
5.6 CONCLUSION
The findings from the shirt and trouser garment fit test evaluations showed that the two fit
evaluators considered the test garments developed from the experimental subject‟s size
10/34 size chart measurements to offer an improved overall quality of fit compared to the
quality of fit attained from the size 10/34 mannequin‟s measurements. Most of the shirt
and trouser garments fitted in this study were rated to have a good-moderate quality of
fit. Fit problems were observed and indicated in all the evaluated shirt and trouser
236
garments. Garments that were too large formed an unflattering appearance, whereas
garments that were too small restricted comfort and movement. The sleeve
circumference dimensions such as the bicep, elbow and some wrist areas were tight on
most of the subjects indicating that more ease should be added. This could indicate a
deficiency in the correlation between bust girth measurements with the sleeve arm girth
measurements. Surprisingly, the correlation coefficient between the bust and the bicep
was 0.79 and the bust and elbow was 0.75, indicating high correlations; whilst the bust
and wrist correlation was low (0.36, refer to Table 4.4). This shows that this is an area of
improvement that is required in the size chart. The fit of the trouser girth areas had
wrinkles because most of the length measurements were long for the subjects. This
could indicate a deficiency in the correlation between the thigh, knee and ankle
measurements with the trouser length (inseam and outseam) measurements and
suggest that the trouser garment‟s leg length should be made shorter.
The shirt sleeve lengths in the analysed size 10/34 subjects and size 10/34 mannequin
garments created for this study were found to be long; however, the mannequin‟s
measurements sleeve length was longer than the sleeve length of the shirt garment
created using the size 10/34 subjects. The crotch length was also observed to be longer
in both analysed garments. The bust areas in most of the evaluated shirt garments were
considered to be either gaping or, for some subjects, close-fitting. This could be
attributed to the placement of the buttons influenced by the position of the bust in some
of the shirt closure locations. The results on the quality of fit of most of the trousers were
indicated to be a loose fit which showed that less ease was required in the trouser
circumference measurements such as the thigh, knee and ankle areas. Most of the darts,
especially for the size 10/34 chart size measurements were considered to be well-
positioned, pointing in the right direction and sitting well on the subjects‟ bodies. The
length measurements in both the shirt sleeve and trouser garment indicate inaccuracies
in the correlations between the key (primary) body dimensions and the secondary body
dimensions. The correlation between the inseam and outseam measurements were 0.45,
which does not indicate a good correlation. This could indicate that the scanner does not
pick up these measurements. It is suggested that the length measurements of the shirt
and trouser garments could be improved by conducting a study on a larger petite
women‟s sample.
237
The quality of fit on most of the trouser garments created using the mannequin‟s
measurements was not considered to be satisfactory on the subject‟s bodies, despite the
fact that the circumference measurements (lower waist, high hip, hip, thigh, knee and
ankle areas) in the trouser garment were smaller than those of the trouser garment
created using the size 10/34 size chart measurements (see Table 4.35). The shape of
the size 10/34 mannequin was classified in section 4.5 as a pear body shape profile.
Although the shape profile of the mannequin was similar to that of the subjects, the body
proportions and height measurements differed. The elongated crotch length back and
crotch length front measurements may have an impact on the trouser length
measurements and the way the trouser garment fits of the subjects‟ pear shape bodies.
The front and back crotch length measurements in the trouser garments created using
the mannequin‟s measurements were established to be longer (see Table 4.34) when
compared to the front and back crotch length measurements of the trouser garment
created using the size 10/34 size chart measurements. As a result, the fit of the trouser
presented a “dropped” effect and did not sit in the correct body landmarks of the subjects‟
causing bulking and creases in the garment.
From the results, it is evident that the fit of the shirt and trouser garments was affected by
the height and body dimensions of the subjects (see Table 5.1). Because the nature of
this study is exploratory; despite being considered to have improved quality of fit, the
shirt garment length of the size 10/34 size chart measurements produced garment was
found to be shorter than that of the length of the shirt garment created using the
mannequin measurements, indicating that the upper proportion ratios of the size 10/34
mannequin was longer than that of the analysed 180 3D full body scanned pear shaped
subjects. Furthermore, as stated in section 4.7, objective 5; the findings from the
completed psychographic questionnaire indicated that South African petite women are
shorter. As a result, the fit of their shirt sleeve lengths and the trouser garment lengths
were mostly indicated by the subjects to be too long. This shows a deficiency in the
correlations between the key body dimensions and the shirt sleeve and trouser garment
length measurements; indicating that further analysis is required, possibly on a bigger
sample to improve the fit of the shirt and trouser garment lengths. However, the overall fit
of the evaluated shirt and trouser garment lengths was found to fit better for the garments
created using the size 10/34 size chart measurements.
238
In future, the researcher recommends adjusting the garment length measurements after
conducting garment fit test evaluations. According to Boorady (2011:346), pattern
alterations are necessary after conducting garment fit test evaluations to improve the
quality of the tested garment‟s fit. Boorady (2011) further suggests adjusting the
garments to have them function properly after altering the pattern as an added
requirement. However, the purpose of the study was to test the fit of the garments
created from the established 3D full body scanned measurements; therefore, further
measures to adjust the garments were not applicable for this study.
Additionally, it was observed by the researcher that the subjects that had smaller body
silhouettes and were on the smaller end of the size 10/34 size chart measurements such
as subject 1 (see Figure 5.4) experienced more garment fit problems, especially in the
trouser garments. The trouser garment created using the size 10/34 size chart
measurements was a little baggy and more wrinkles were observed in the garment
created using the size 10/34 mannequin measurements. Subjects with bigger biceps
such as subject 3, bigger bust measurements and a fuller abdomen area, such as
subject 5 experienced more fit problems in the shirt garment. This suggests further
studies on the different types of petite women‟s body silhouettes and body proportions
relative to garment sizing and fit.
In conclusion, the overall quality of fit of the shirt and trouser garments created from the
size 10/34 size chart measurements had a better fit than the garments produced from the
size 10/34 mannequin measurements. The size 10/34 mannequin measurements (Table
5.1) were observed to be less than the size 10/34 size chart measurements and the
measurements of the subject‟s actual body measurements. The fact that the mannequin
measurements were less than the subject‟s measurements suggested that the fit of the
shirt and trouser garments created from the mannequin measurements might not be as
good, as the garments were made to fit the mannequin.
The accuracy of fit for the shirt and trouser garments produced using the size chart
measurements was based only on the size 10/34 size range because this was the most
commonly perceived and encountered body size for the shirt and almost the most
commonly perceived size for the trousers with the sample of subjects. Furthermore, the
availability of the 3D full body scanned size 10/34 mannequin enabled the size 10/34
239
chart measurements to be compared with those of a mannequin currently used
commercially in the design and manufacture of garments for size 10/34 South African
subjects. The greater accuracy of the size 10/34 size chart measurements compared with
the size 10/34 mannequin measurements was validated by the fit test rating scales (see
Table 5.2 and Table 5.3) which presented high rating values from both the garment fit
evaluators in most of the garments created using the size 10/34 size chart
measurements.
The findings from the garment fit test evaluation rating scale analysis showed that the
shirt and trouser garments created using the size 10/34 measurements from the size
chart data provided the subjects with a better quality of fit than the shirt and trouser
garments created using the size 10/34 mannequin measurements that is currently
available for commercial use when making garments for South Afrian petite women. This
demonstrates the necessity of collecting raw data and using a population‟s actual
measurements when developing size charts for garment production. However,
deficiencies where observed in some areas where the fit of the garments was generally
not satisfactory, such as the shirt garment length, bicep elbow, wrist and sleeve length
measurements; the trousers crotch length, thigh, knee, ankle, inseam and outseam
length measurements. The standard deviations of the above-mentioned measurements
were observed to be greater for certain sizes in the size charts than others, indicating that
the correlations between the key (primary) body dimension and the seconday body
dimension variables may not have been good. This could indicate limitations in the
scanner as the scanner could not pick up the landmarks correctly or consistently,
especially in the length measurements. This is another source of error that could be due
to variations in the pear body shape profiles. Therefore, it may be neccesary for further
analysis on a larger sample, to assist in a more accurate and efficient sizing system that
provides better fitting garments.
It is acknowledged that the evaluation was only performed for size10/34 subjects, which
is limitation of the study. It is recommended that further evaluation should be done for the
smaller and larger size ranges.

240
CHAPTER 6
CONCLUSIONS, IMPLICATIONS, LIMITATIONS AND RECOMMENDATIONS FOR
FURTHER RESEARCH
6.1 INTRODUCTION
This chapter summarises the results obtained from the study on “Evaluating garment
sizing and fit for petite women using 3D full body scanned anthropometric data”. This
chapter concludes the dissertation by briefly reviewing the research purpose of this study
and the methods applied to collect, analyse and evaluate the data. Conclusions are
presented pertaining to the research questions posed and objectives set as indicated in
section 1.3 and Chapter 4. The implications of the findings are considered and possible
contributions to the existing systems of garment sizing for petite women is suggested,
together with recommendations to assist the South African garment retail industry.
Finally, the limitations of the study are acknowledged, and further studies relating to
garment fit are proposed. The researcher‟s personal reflections of the findings and
results are also included in this chapter.
6.2 SUMMARY OF THE RESEARCH METHODOLOGY
The motivation for this study was to gain some insight into garment fit issues experienced
by petite South African women. This was especially regarding their experiences and
challenges encountered in purchasing currently available ready-to-wear shirt and trouser
garments. A principal issue was the accuracy and relevance of size charts and
mannequins currently available for use in the manufacturing of garments for petite South
African women. To evaluate this and other fit issues, 200 petite subjects‟ 3D full body
scanned measurements were collected, using a (TC)² NX16 3D full body scanner. The
demographic profiles of the subjects included their ethnicity, height, weight and age. The
psychographic profile of the subject‟s perceptions regarding their body shapes and body
proportions together with evaluations and purchasing behaviours regarding their shirt and
trouser garments were also collected and analysed using quantitative and qualitative
methods; however, most of the data analysis consisted of a quantitative approach.
241
There are two influences on the fit issues, namely: the quantification of fit, which used
calculations of the subjects‟ height and weight measurements, collected using an
Adam‟s® medical scale to determine the subject‟s height and weight range. As well as
the calculations of the 3D full body scanned measurements to develop the upper and
lower body dimensions size charts for manufacturing prototype shirt and trouser
garments.
The average height measurement of the 200 petite subjects‟ sample was 157 cm and
their body weights were between 38 kg - 125 kg. Nonetheless, the comparison of the
subjects‟ weight measurements with garment sizing and fit was beyond the scope of this
study. The perception of fit consisted mainly of data that contained the expert‟s opinions
and evaluated data on the quality of fit on the evaluated shirt and trouser garments. The
perception also included the subjects‟ opinions gathered from a psychographic
questionnaire comprising of open-ended and closed-ended questions. The closed-ended
questions provided data for the subjects‟ demographics such as their ethnicity, height,
weight and age distributions. The open-ended questions provided data for the
psychographic profiles of the subjects‟ perceptions of their body shapes and body
proportions, together with evaluations and purchasing behaviour regarding their shirt and
trouser garments. The responses comprised each subject‟s perceptions, experiences
and challenges faced when purchasing currently available, ready-to-wear shirt and
trouser garments.
The key conclusions of this study which address the research questions posed and the
research objectives found in section 1.3, and are as follows:
6.3 KEY CONCLUSIONS FOR THE OBJECTIVES IN THIS STUDY
6.3.1 The body measurements and body shapes of the 200, 3D full body scanned
petite subjects
The first research objective was to analyse the 3D scanned body measurements and the
body shapes of the 200, 3D full body scanned petite women subjects collected in this
study.

242
The majority of the 200 petite women subjects‟ body shapes, represented by 90%
(n=180) of the 3D scanned subjects, were found to be pear shaped. Other shapes that
were extracted from the 200, 3D full body scanned data included the straight 12%
(n=24), inverted triangular 3.5% (n=7), and the hourglass 2.5% (n=5). There was a cross
over in certain body scans, 16 of the scanned subjects‟ body shapes were categorised
between two body shape profiles. As a result, the data resulted in a total of 216 body
shape representations, instead of the exact 200 petite women subjects‟ sampled number.
The 3D full body scanned data for the subjects with the pear body shape profile 90%
(n=180) were further used for data analysis to fulfil the other objectives of this study. The
pear body shape profile was prevalent in 87% (n=157) of the Black ethnic group, followed
by the Whites with 9% (n=15), then the Coloureds with 3% (n=6) and the Indian ethnic
group with 1% (n=2). Nonetheless, the subsequent data analysis and the development of
the upper and lower body dimensions size charts were inclusive of all the ethnic groups.
Recent South African academic studies by Muthambi (2012), Ola-Afolayan and
Mastamet-Mason (2013), and Makhanya et al. (2014) along with a petite study
conducted by Barona-McRoberts (2005:27) in the United States of America have also
shown that female consumers were becoming more triangular/pear shaped.
South African petite women have pear body shape profiles which consist of a wider hip
area than at the bust and shoulders. It is recommended that South African mannequin
manufacturers consider creating mannequins that have a curvier shape profile.
Although, the mannequin‟s 3D full body scanned bust, upper waist and hip measurement
relationship analysis (refer to section 4.5) suggested that the mannequin was also pear
body shaped; visual analysis of the mannequin observed a crossover shape between the
hourglass body shape and pear body shape profiles. Garment manufacturers and
designers should specifically target and cater for the pear body shape as a niche market
by incorporating garment sizing, fit measurements and design styles which are suitable
for the triangular /pear body shape profile.
243
6.3.2 The developed experimental upper and lower body dimensions size charts
from the 3D full body scanned petite subject‟s measurements.
The second research objective was to develop the experimental upper and lower body
dimensions size charts based on the body measurements corresponding to the most
prevalent body shape of the petite women subjects represented in this study. The most
prevalent body shape was identified as the pear body shape pertaining to 90% (n=180)
subjects. All the ethnic groups were represented in the size charts.
The methodology that was used to transform the 3D full body scanned anthropometric
data into experimental upper and lower body dimensions size chart specifications was as
follows:
The experimental upper (for shirt garments) and lower (for trouser garments) body
dimensions size charts were compiled using the results of the below-mentioned arranged
steps. The appropriate data consisting of the 180 3D full body scanned subjects‟ pear
body shape profile measurements was selected for statistical analysis. The size charts
were developed by statistically analysing the 3D full body scanned anthropometric data
of the subjects gathered in this study using a (TC)² NX16 3D full body scanner.
Microsoft Excel and the IBM SPSS Statistics 24 2016 were used to analyse the 3D full
body scanned data collected for this study. The upper and the lower body dimensions
were analysed separately. A total of 14 upper body dimensions were established for
developing prototype shirt garments and 13 lower body dimensions were established for
developing prototype trouser garments. Multivariate data analysis based on PCA was
used to analyse the 3D full body scanned data to gain several understandings into the
characteristics of the data (refer to section 4.3 for the PCA of the upper and lower body
dimensions).
The size charts for the upper and lower body dimensions were developed using the data
analysed in the PCA. The equations (see section 4.4) were derived, using regression
analysis, using the identified key (primary) body dimensions to predict the secondary
body dimensions and allocate the number of size ranges, as well as calculate the
increments in the measurements for the size intervals in the upper and lower body
dimensions size charts. A total of 11 size ranges consisting of the sizes 6/30 to 26/50
were established to accommodate the analysed 3D full body scanned subjects‟
244
measurements; covering 98% (n=177) for the upper body and 97% (n=175) for the lower
body of the 180, 3D full body scanned petite pear shaped women‟s sample.
The methodology used in this study may prove to be useful for developing size charts for
garment sizing in the garment manufacturing sector.
6.3.3 Comparing the collected 3D full body scanned petite women subject‟s upper
and lower body dimensions size chart measurements with previously published
size charts for petite women
The third research objective was to compare the collected 3D full body scanned petite
women subject‟s upper and lower body dimensions size chart measurements derived
from this study with previously published size charts for petite women by Defty (1988:17-
18), Winks (1990:74-76), and Bailey (2010:23) as well as the 3D full body scanned fit
mannequin‟s measurements to illustrate the key differences between the developed size
chart measurements and the measurements of the previously published size charts for
petite women.
In the absence of representative anthropometric data of South African petite women,
measurements were derived from a 3D full body scanned size 10/34 mannequin that was
available at the UNISA Florida Campus, Department of Consumer Science.
The size 10/34 mannequin was developed by a well-known South African mannequin
manufacturing company to represent the standard body measurements used in the
South African ready-to-wear garment industry. The mannequin measurements were the
only currently available sizing specifications to use since there are no other petite 3D
scan data measurements in South Africa with which to compare the 3D scanned data of
the subjects collected in this study. Hence, the mannequin‟s measurements, developed
for a standard sample size 10/34 size range were considered to be representative.
According to Millam (2016) sizing in the apparel industry is based on a standard sample
size 10/34.

245
The size 10/34 upper and lower body dimensions size chart measurements and the 3D
full body scanned mannequin measurements, were compared with Defty‟s (1988:17-18)
and Winks‟ (1990:74-76) published South African petite size charts. Bailey‟s (2010:23)
published size chart measurement specifications were not applicable for comparison in
this study as it consisted of petite sizes 2/26, 4/28 and 6/30. The size measurements
were below the range of the size 10/34 size range measurements established in this
study.
The subjects‟ average height defined in this study was 157 cm. The average height
range of both the 3D full body scanned mannequin and the average height range
established by Winks (1990:74-76) was 160 cm, whilst Defty‟s (1988:17-18) average
height was established to be 153 cm. Defty (1988:17-18) did not specify which ethnic
groups and body shapes were used to develop her size chart. Winks‟ (1990:74-76) data
were collected using White, Black and Coloured ethnic groups. Three body shapes,
namely A, M and H with body size distribution measurement distinctions were
established from Winks‟ (1990: 76) data. Each body shape having different ranges of
body size measurements (see the different body shapes and size distribution chart in
Table 4.43). The third body size distribution range from the M body shape best matched
the size 10/34 body measurements developed from the subjects‟ upper and lower body
dimensions size charts developed in this study.
The comparison between the size 10/34 size chart measurements and that of Defty‟s
(1988:17-18) and Winks‟ (1990:74-76) size charts was limited since the researchers only
listed a few measurements in their size charts that corresponded with the measurement
specifications derived for the upper and lower body dimensions size charts in this study.
Four body measurements; namely: the height, bust, waist and hip from Defty‟s (1988:17-
18) and only three body measurements; namely: the height, bust and hip from Winks‟
(1990:74-76) studies (see Table 4.43) were applicable for comparison with body
measurements derived for this study. The significant measurement differences and
similarities were established within the compared size charts.
The implications of the measurement differences in terms of garment fit, if garment
manufacturers were to use the older size charts by Defty‟s (1988:17-18) and Winks
(1990:74-76) are elaborated below.

246
In response to the research question, it is difficult to explicitly state how relevant Defty‟s
(1988:17-18) and Winks‟ (1990:74-76) size charts currently are by comparison with the
size charts developed in this study because of the limited comparable data that they
contain. On the evidence of bust and hip measurements alone, the subjects‟ size 10/34
bust measurements were the same as Winks‟ and Defty‟s bust measurements.
Therefore, it may be inferred that bust fit would be similar for the shirt garments. The fit of
the trouser garments at the hip would be similar if Winks‟ data was used to make the
trouser garment because Winks‟ hip measurement was only 1 cm smaller than the
subjects‟ size 10/34 hip measurement. Defty‟s hip measurement was 3 cm smaller than
the subjects‟ size 10/34 hip measurement. Therefore, manufacturing the trouser garment
using Defty‟s hip measurement may affect the fit of the garment on the subjects‟ body,
resulting in a slightly tight fit in the hip area.
6.3.4 Investigating the petite subject‟s perceptions of their body shapes and
proportions, together with their upper body and lower body garment evaluations
and purchasing behaviour.
The fourth research objective was to evaluate the extent to which the subjects were
satisfied with their shirt and trouser garment fit along with the challenges they face when
purchasing the currently available ready-to-wear shirt and trouser garments sold in South
Africa. The subjects‟ personal perceptions and preferences were analysed to identify
what they regarded as important when they considered the sizing and fit of their ready-to-
wear shirt and trouser garments.
Section 4.7 presents the subject‟s perceptions of their body shapes and experiences with
their currently sold ready-to-wear shirt and trouser garments. The findings from the
psychographic questionnaire showed that 16% (n=29) of the 180 pear shaped subjects
stated that they were satisfied with their current ready-to-wear garment sizes; 84%
(n=151) of the subjects stated that they were not satisfied.
Not all the subjects stated that they experienced problems with the fit of their currently
available shirt garments, but those were in the majority (see Table 4.42 and Table 4.43).
The subjects indicated that they found the ready-to-wear shirt garments to typically have
a low neckline, loose collar, to be loose across the shoulders, too loose around their hips,
247
too tight across the back, bust and around their upper waist area having a long sleeve
length.The shirt garment length had equal representations of being either too short or too
long depending on the style of the garment. The subjects‟ perceptions on the fit of
currently sold ready-to-wear trousers were considered to be too tight around the lower
waist, hips and thighs. The crotch length and the trouser length were indicated to be too
long.
The subjects‟ body proportions may have an influence on how the fit of the ready-to-wear
shirt and trouser garments fit on their bodies. Section 4.7 show that an equal number of
35% (n=63) of the subjects indicated that they perceived themselves to either have a
long torso/short legs or an evenly proportioned body, which was more than the 29%
(n=53) that stated that they have a body proportion of a short torso/long legs and only 1%
(n=1) of the subjects was not sure which body proportion she has.
The subjects‟ perceived proportions were further compared with the subjects‟
measurements derived from the 3D full body scanner, using bust to upper waist and hip
to upper waist ratios to compare their body proportions. The 3D full body scanned data
showed that 82% (n=147) of the subjects had a short torso with long legs body
proportions, while 15% (n=27) of the subjects had a long torso with short legs body
proportions. The remaining 3% (n=6) had evenly proportioned body proportions. The
above-mentioned body proportions are illustrated in Chapter 1, section 1.1. This shows a
deviation in the subjects‟ compared body proportions, indicating that not a lot of subjects
were aware of their body proportions to be able to select garments that are designed to
enhance their body proportions.
According to Kasambala (2013:8), female consumers experience different types of fitting
problems because of their varied body shapes which may influence their garment
preferences. The subjects who had the pear body shape profiles indicated that they
experience minimal fit problems in certain parts of their bodies when wearing their ready-
to-wear shirt garments. The ready-to-wear trousers were stated as the most challenging
in offering a better fit on their bodies as the trouser would fit their upper waist, lower waist
(15cm below the upper waist, at the lower waistline between the upper waist and high hip
area) but the fit would be tight on their hip area. As a result, they end up having to buy
bigger sizes to accommodate their hip measurements and having to alter the upper waist
and lower waist to obtain a better fit. The findings of this study are supported by

248
Alexander et al. (2005:52) and Kasambala et al. (2015:8) who established in their studies
that pear body shaped women are more likely to report fit problems at both the upper and
lower waist, hip and thigh areas.
The subjects revealed that they purchased their ready-to-wear shirt and trouser garments
at selected retailer outlets. The low-end and middle-end stores were amongst the most
preferred stores that the subjects selected to purchase their garments. 87% (n=166)
preferred purchasing their garments by physically going to the retail stores, 7% (n=14)
through the internet, 2% (n=3) through catalogues. Interestingly, 4% (n=8) selected the
“others” option where they stated that they either make their own clothes or get a
dressmaker to make their clothes and only one of the subjects mentioned that her mother
buys her clothes because she does not like shopping for clothes.
The subjects stated that their purchasing decisions are influenced mainly by the name of
the brand, followed by the latest trends, style/design, appearance of the garment, then
the garment sizing measurements, comfort and quality. The findings show that various
retail stores create garments catering for consumers with different lifestyles and income,
etc. The importance of a garment‟s brand name could suggest that the subjects some
sort of personal value for instance, associate the brand with a certain level of garment
quality and could also suggest associations to a certain level of the upcoming middle
class who can afford to buy branded garments; 66% (n=94) of the subjects in this study
indicated that they were from the working class category. Garments that are perceived to
have higher quality increase the customer‟s purchase decision and provide the selected
brand with a competitive advantage over other brand competitors (Coury, 2015:12). A
noticeable purchasing consumption in fashionable, trendy garments is perceived as
“latest trends, style/design” was regarded as the second and third important influences of
the subjects‟ purchasing decisions which may also epitomize this brand buying motive.
The price and, interestingly, the fit of the garment were regarded as the least priority; this
may be attributed to the 84% (n=151) of the 180 sampled subjects (as indicated in
section 4.7) who anticipated having to alter their garments after purchasing to maintain a
better fit. Some of the subjects included the colour of the garment, durability and
exclusivity as the determining factor for their purchasing decisions.
249
Majority of the subjects indicated that they preferred wearing close-fitting shirt garments
33% (n=60) and trouser garments 41% (n=78). According to Pisut and Connell,
(2007:376) and Alexander et al. (2005:59), there is a significant connection that exists
between body shape and garment fit preferences in relation to body cathexis. The
preference for close-fitting garments could be a reflection in the present fashion trends
for shirt and trouser garments being sold in the retail stores. However, correlations
between the subjects‟ body shapes, garment size measurements and the motives behind
their garment fit preferences were beyond the scope of this study and therefore were not
considered; this is further recommended for future studies.
Given the reasons behind the subject‟s perceptions of their body shapes and
experiences they encounter when shopping for their ready-to-wear shirt and trouser
garments, it is noted that there is some variability in the market of shirt and trouser
garments for South African petite female consumers. This can be the result of some
garment sizing and manufacturing issues that require further investigation.
6.3.5 Constructing basic pattern blocks for shirt and trousers patterns using the
3D full body scanned petite women subject‟s data for the developed experimental
size charts and the 3D scanned petite tailoring mannequin measurements; to aid
the manufacturing of the prototype shirt and trouser garments for the fit test
evaluations.
The fifth research objective was to develop shirt and trouser patterns from the data
collected in this study to aid the construction of the prototype shirt and trouser garments.
The shirt and trouser pattern blocks were sized according to the subjects‟ size 10/34 size
range measurements taken from the experimental upper and lower body dimensions size
charts developed using 3D full body scanned data and from the 3D full body scanned
size 10/34 mannequin specifications; thereafter, manufacture prototype shirt and trouser
garments for the fit test evaluations.
The manufactured shirt and trouser garments were evaluated by fit evaluators to assess
the quality of the shirt and trouser garments using three rating scale categories, namely:
of „good fit‟, „moderate fit‟, and „poor fit‟. The fit rating scales were analysed by the
researcher and thereafter conclusions were reported from the results. The results from
250
the overall fit quality of the fit rating scales and the evaluated data of the fit test
evaluations (see sections 5.4.2 and 5.5 for findings) showed that the test garments
manufactured from the subjects‟ size 10/34 size range measurements obtained from the
experimental upper and lower body size charts developed in this study were found to
have an overall better quality of fit than the shirt and trouser garments manufactured with
the size 10/34 mannequin measurements. Because the nature of this study is
exploratory, despite being considered to have improved quality of fit, the prototype shirt
garment‟s length was considered slightly short and the lengths of the sleeves too long.
The shirt width measurements were considered by the fit evaluators to fit well on both of
the assessed shirt garments; however, the bust area on both of the analysed shirts was
gaping in majority of the subjects and the sleeve was considered to be tight in most of
the evaluated garments. The prototype trouser‟s crotch length measurement was
considered to be long. However, the overall length of the trouser garment manufactured
from the size 10/34 size chart measurements was better than the mannequin‟s
measurement, which was too long. Based on the results from the overall fit of the
evaluated trouser garments, it is suggested that South African mannequin manufacturers
should consider creating mannequins with shortened crotch length measurements. The
trouser width measurements were considered to be slightly bigger on most of the
garments manufactured using the size chart measurements; regardless, the overall fit of
the trouser garments manufactured using the size chart measurements was evaluated to
fit better than the trousers produced from the mannequin‟s measurements on the majority
of the assessed subjects.
Deficiencies where observed in some body dimensions for the size 10/34 subject
measurements, when compared to the size 10/34 size chart measurements. The sleeve
circumference dimensions such as the bicep, elbow and some wrist areas were tight,
indicating that more ease should be added. This could indicate a deficiency in the
correlation between bust girth measurements with the sleeve arm girth measurements.
Deficiencies were also observed between the trouser garment girth measurements such
as the thigh, knee and ankle with the trouser garment length (inseam and outseam)
measurements, where the girth areas had wrinkles because most of the length
measurements were long for the subject.
251
Analysis on a larger sample is suggested, to provide an improvement on the correlations
between the key (primary) body dimensions and the secodary body dimensions, to
further assist in an efficient sizing system that provides better fitting garments. Although,
minor wrinkles were observed in some of the subjects‟ upper trouser area when
conducting the fit test evaluations, the waist to hip girth measurement correlations of the
size 10/34 size chart measurements seem to produce a better fit. The subjects indicated
in section 4.7 that they end up having to purchase larger ready-to-wear trouser sizes to
accommodate their hip measurements, having to alter the upper waist and lower waist to
obtain a better fit. Furthermore, some of the subject‟s girth and length measurements
when compared with the size 10/34 size chart size range measurements shifted to
another size range. It is suggested that a larger sample size needs to be carried out to
improve the accuracy of some of the measurements in the developed upper and lower
body dimensions size charts. The overall findings in this study demonstrate the
challenges with the quality of fit of the South African petite women‟s ready-to-wear shirt
and trouser garments produced from garment sizes based on the tailoring mannequin
considered in this study. It is suggested that improvements should be made to offer
South African petite women with better fitting shirt and trouser garments.
In conclusion, this study is the first study that has 3D scanned petite South African
women and the first to develop upper and lower body dimensions size charts based on
the scanned data. It is also the first study that has canvassed the opinions and
preferences of petite South African women in terms of their body shapes and sizes and
the issues that they experience when purchasing garments. The findings in response to
the research questions posed provided sufficient data to address the objectives in which
this study was designed. It is challenging to obtain an entirely satisfactory garment sizing
in a size chart for all the individuals in a population because of the variety of the body
shapes and proportions. Based on the tested garments manufactured using the size
10/34 size range, adjustment of the measurements in the body dimensions that seemed
to be deficient such as the shirt garment length, sleeve length, bicep, elbow and wrist
measurements; the trousers crotch length, inseam length, outseam length, thigh, knee
and ankle measurements are required to assist in a more accurate and efficient sizing
system that provides better fitting garments. The standard deviations of the above-
mentioned measurements were observed to be greater for certain sizes in the size charts
than others.
252
6.4 CONTRIBUTION OF THE STUDY TO GARMENT SIZING AND FIT RESEARCH
The importance of this study is its influence on the theory and methodology within the
field of garment sizing and fit for South African petite women. The construction of the size
10/34 prototype shirt and trouser garments manufactured using the developed
experimental size charts for the upper and lower body dimensions provided insight into
the relevance and accuracy of the size charts. The results from this study provided
improvement to the fit and sizing of shirt and trouser garments since the results provided
useful insight into the limitations of the petite mannequin. This study not only advances
the development of size charts for South African petite women using quantitative
methods. Qualitative data collection methods were also undertaken in the form of a
survey to provide understanding to the extent that South African petite women are
satisfied with the sizing and fit of the ready-to-wear of shirt and trouser garments
currently offered in retail stores in South Africa. Furthermore, it has created awareness of
the various petite consumers‟ body shapes, and the shirt and trouser sizing and fit issues
that South African petite women are experiencing to date. It was envisioned that this
might assist South African garment manufacturers and retailers in understanding and
interpreting the petite women‟s consumer‟s preferences and viewpoints regarding their
body shapes and challenges they encounter when shopping for ready-to-wear shirt and
trouser garments currently offered in retail stores. That way they can provide better fitting
shirt and trouser garments.
This study will contribute to the limited amount of published studies on “garment sizing
and fit” for South African petite women to improve the fit of South African petite women‟s
ready-to-wear garments. Additionally, the data will be available to students, garment
manufacturers and retailers in South Africa.
6.5 IMPLICATIONS AND LIMITATIONS OF THE STUDY
In this study, the limitations can be identified in terms of the sample and the measuring
instrument and the output of the analysed data. The most obvious limitation is that only
200 petite women aged between 20-54 from the African, White, Coloured and Indian
ethnic groups with a height range of 163 cm and below was included in this study. This
means that caution must be exercised in generalising the results to the broader South
253
African population. The purposive sample of subjects came from the Gauteng (Pretoria
and Johannesburg) area, with a predominance of 87% (n=157), Black subjects from the
analysed 180 petite pear shape sample. As a result, the population sample was not large
enough to accommodate a representative number of the subjects in all the ethnic groups.
Although, garments are not made specifically for ethnic groups, it would have been
preferred to obtain a population sample that accommodated all the ethnic groups, to get
a reflection of how the size charts might compare in relation to their varied body shapes.
Nonetheless, the sample in this study addressed the purpose of the study.
With regard to the measuring instruments, a (TC)² NX16 3D full body scanner, an
Adam‟s® medical scale and a demographic questionnaire were used to collect data in
this study. The limitations of the 3D full body scanner were observed in the identification
of the body landmarks by the scanner software.
From the subjects that were scanned, 12 of the subjects‟ bust surfaces were not
captured by the 3D full body scanner (see section 4.2). As a result, the missing areas
(holes) were filled using “MeshLab” 2016 software. The trouser garment manufactured
using the crotch length body landmarks extracted in the scanner were observed to fit too
long on the majority of the subjects‟ body; indicating that the accuracy of the crotch
length measurements might not have been accurately identified by the scanner software.
There were large discrepancies between the predicted/visually observed shapes (see
Table 2.1) and the self-perceived body shapes (see Table 4.2). Nonetheless, the most
commonly perceived body shape profile, namely; the triangular /pear/spoon body shape
41% (n=83) concurred with the most represented body shape profile extracted from the
subjects‟ 3D full body scanned data, namely; the pear body shape 90% (n=180). This
shows that, although not by a large number, there are some subjects who are aware and
have realistic perceptions about their body shapes. The study was limited to a
subcategory of the South African population since the anthropometric data used in the
development of the experimental upper and lower body dimensions size charts fell
between the sizes 6/30 to 26/50. The patterns constructed, and the produced garments
were limited to shirt and trouser garments using the size 10/34 size chart measurements
and the size 10/34 mannequin measurements. The other size ranges were not
considered to offer the unit of garment fit analysis as it was not within the scope of the
study. However, further evaluations of the other size ranges in the developed upper and
254
lower body dimensions size charts, possibly manufacturing prototype shirt and trouser
garments to fit the size ranges and undertaking further garment fit evaluations will be
necessary to be able to fully assess the accuracy and relevance of the developed size
charts in this study.
The quality of garment fit was attained from and limited to the produced size 10/34 shirt
and trouser test garments evaluated on nine subjects with appropriate body size
measurements. There were 11% (n=22) of the 180 pear shaped subjects who fell into the
size 10/34 size range. From the 22 size 10/34 subjects, 39% (n=14) indicated that they
were willing to assist with the garment fit test evaluations. However, only 39% (n=9) of
the 14 subjects that were willing to assist with the garment fit test evaluations were
available. Therefore, a non-representative sample was used to evaluate the quality of fit
of the test garments; nonetheless, the selected sample addressed the purpose of the
study.
Irrespective of the afore-mentioned limitations of this study, the implications of the
findings of this study should not be regarded as insignificant but by implication, the
findings of the study cannot be generalised among the general South African petite
female population.
6.6 RECOMMENDATIONS
It is evident from the literature reviewed in this study that Academic researchers should
collect data on a population sample of interest, and thereafter use that sample‟s data to
make scientific predictions about the population. This study was based on investigating
garment sizing and fit of petite female consumers residing in the Gauteng (Pretoria and
Johannesburg) area by evaluating their 3D full body scanned data and developing
experimental upper and lower body size chart for creating prototype shirt and trouser
garments.
A (TC)² NX16 3D full body scanner was used to collect data in this study, since there is
not much sizing and fit research conducted using modern technology. The use of the 3D
full body scanner to collect data in this study was proven to be effective. However, the
use of improved 3D full body scanners is recommended so that the 3D full body scanner
255
can capture data for people with bigger sizes without having missing body landmarks
(holes) caused by shaded areas and skinfolds and accurate crotch length
measurements. As presented in section 4.1, MeshLab 2016 software was used to fill
missing bust areas of twelve of the subjects scanned for this study, since the body
scanner did not capture the bust area.
It was observable that filling missing holes is time consuming and requires precision.
Nonetheless when filling the missing bust area holes for the twelve subjects in this study,
the researcher ensured that the output surfaces of the filled bust areas preserved their
pear body shape profiles.
The conceptual framework model established in Figure 1.2 section 1.5 suggests that
there are particular elements contributed by anthropometric data and body shape that
cause petite consumers to experience garment sizing and fit problems, which could be
used as a contribution to assist garment manufacturers and retailers in improving the
problems of shirt and trouser garment sizing and fit. The findings from the subject‟s
demographic data in section 4.7 and the findings from the garment fit test evaluations
suggest that the South African petite women are shorter; hence the fit of their shirt and
trouser garment lengths were mostly too long. Based on the findings of this study, it is
recommended that the South African garment manufacturing industry focus on
developing a sizing system that accommodates petite garment measurements, body
proportions and shape variations by understanding the unique needs of their target
market.
The subjects stated in the psychographic questionnaire that, due to the inconsistency
and unreliability of the sizing and labelling of currently available ready-to-wear shirt and
trouser garments, they find themselves having to purchase different sizes from different
retail stores (see Figure 4.12, Figure 4.13, Figure 4.14 and Figure 4.15 for the perceived
size ranges plotted against the size ranges predicted by the size charts). The subjects
indicated that they purchase their garments in various sections offered in store, namely
the average women‟s section 61% (n=118), the petite section 17% (n=33), the plus-size
women‟s section 14% (n=27), the kiddies section/children‟s department 7% (n=13) and
1% (n=2) of the subjects stated that they purchase their garments in any department.
This results in the subjects having to unavoidably try on their ready-to-wear shirt and
trouser garments before purchasing them, which is time consuming. Nonetheless, even

256
having to try on the garments, an overall number of subjects 84% (n=151) specified that
they alter their garments after purchasing, leaving only 16% (n=29) of the subjects who
stated that they were satisfied with their current ready-to-wear garment sizes and do not
have to alter them after purchasing.
Hence, it is advisable for garment manufacturers and designers to adopt a distinctive set
of size charts for the upper and lower body dimensions that are known to be suitable for
various petite women‟s body shapes which manufacturers could use for consistency in
garment sizing and fit to benefit both the garment retailers and petite female consumers.
It is also recommended that garment retailers consider offering special alteration services
for their petite customers seeing that most of them altered their shirt and trouser
garments after purchasing, which indicates that garment alterations seems to play a
significant role of adjusting the fit of their ill-fitting shirt and trouser garments for them to
achieve their desired quality of fit.
This study proved that identifying the target population‟s actual anthropometric
measurements and classifying the body shapes is important when developing size
charts, as this is an essential component for improving garment fit and increase customer
satisfaction.
6.7 FURTHER STUDIES
Garment sizing and fit is a very broad topic and there is great potential for future studies
in this area in South Africa. There is no accessible garment sizing system in the public
domain that is readily available for the South African garment manufacturers to use when
creating garments for petite women. The findings of the study suggest that the collection
of actual anthropometric body measurements using 3D full body scanners has the
potential of contributing to better fitting garments. As a result, improvements in the quality
of fit of ready-to-wear shirt and trouser garments for South African petite women may be
anticipated in areas such as the sleeve length as the subjects indicated in section 4.7
that the fit of their currently sold ready-to-wear shirt sleeve lengths were long; and their
currently sold ready-to-wear trouser waist to hip fit was not satisfactory for them as they
end up having to alter the trouser garment to achieve their desired fit.
257
The depth of studying different body shapes for different ethnic groups and developing
the prototype fit test garments in all the size ranges from the developed experimental
upper and lower body size charts has not been fully explored. Future studies should
explore studying the different body shapes identified for the South African petite women
and evaluate garment fit for each size range identified in the experimental shirt and
trouser size charts, as it is clear from the findings of this study that body shapes among
other factors affect garment sizing and fit. In a country such as South Africa, the
population consists of a diverse society of various ethnic groups and different body
shapes; and the findings of the study warrant repeating the study and developing
experimental upper and lower body size charts with other body shapes found within the
South African petite women population, such research has potential of accomodating
various body shapes and improving the overall quality of fit attained from ready-to-wear
shirt and trouser garments in South Africa, thus leading to increased levels of consumer
satisfaction. However, a large population is recommended to generate an acceptable
sample size for each ethnic group and body shapes.
The prototype shirt and trouser test garments were designed to accommodate the 10/34
size attained from the experimental upper and lower body size chart specifications for
South African petite women with pear shape body profiles and by implication, the
garment fit test garments manufactured in this study fundamentally offered the unit of
analysis with improved quality fit. The other size ranges from the developed experimental
upper and lower body size charts were not considered to offer the unit of garment fit
analysis as it was not within the scope of the study. Further studies are recommended to
evaluate the developed upper and lower body dimension size charts for the smaller and
larger size ranges, than the size 10/34. It is also recommended to look at more depth into
critical areas in the developed size charts where the fit issues were observed, such as
the bicep, elbow, wrist, sleeve length and the garment length in shirt garment; the trouser
crotch length, thigh, knee, ankle, inseam and outseam length measurements.
Additionally, creating shirt and trouser garments in the smaller and larger garment size
ranges with a representative sample is recommended in future for evaluating the quality
of the fit in the shirt and trouser test garments in order to generalise the findings.
It is further recommended that the proposed experimental upper and lower body size
charts for South African petite females with pear body shape to be transferred to garment

258
manufacturers and retailers using guidelines by the ISO to provide consumers with
improved satisfaction with the quality of ready-to-wear shirt and trouser garments and to
aid clear communication of garment sizing. Tables 4.46 and 4.47 presented how the
currently available shirt and trouser garments fit on certain parts of the subject‟s bodies.
The results showed that the number of the subjects who indicated that they experienced
fit problems with their currently available shirt and trouser garments when added
together, were greater than the number of subjects who indicated that they do not have
problems. A scope for further research is recommended regarding the correlations of the
subjects‟ responses to their body measurements.
The findings of the study show the necessity for conducting a study on a representative
antropometric data of the South African petite women population. Further studies could
compare body shapes, garment size measurements and the motives behind their
garment fit preferences of subjects.
Having said all of this, this is the first study to specifically 3D full body scan petite South
African women, develop and evaluate a set of size charts based on the scanned data
and assess their opinions and preferences. Therefore it represents a significant
contribution towards gaining a greater insight into garment fit issues for this group of
South African women.

259
LIST OF REFERENCES
AKTER, M. and M.R. KHAN. (2015). The effect of stitch types and sewing thread types
on seam strength for cotton apparel. International Journal of Scientific & Engineering
Research, vol. 6, no. 7, pp. 198-205.
ALDRICH, W. (2015). Metric pattern cutting for women’s wear. 6th Ed. United Kingdom:
Blackwell Publishing.
ALEXANDER, M., L.J. CONNELL and A.B. PRESLEY. (2005). Clothing fit preferences of
young female adult consumers. International Journal of Clothing Science and
Technology, vol. 17, no. 1, pp.52-64.
ALTERATIONS NEEDED. (2010). Body proportions and petiteness: why do some petites
look more petite than others? Available at: www.alterationsneeded.com/2010/01/body-
proportions-and-petiteness-why-do.html. [Accessed 27 November 2014]
ANAND, N. (2011). Pattern engineering and functional clothing. Indian Journal of Fibre &
Textile Research, vol. 36, no. 4, pp. 358-365.
ANN TAYLOR. (2014). Petite clothing. Available at:
http://www.anntaylor.com/petites/cata0004. [Accessed 16 October 2014]
APEAGYEI, P.R. and R. OTIENO. (2007). Usability of pattern customising technology in
the achievement and testing of fit for mass customisation. Journal of Fashion Marketing
and Management, vol. 11, no.3, pp. 349-365.
APEAGYEI, P.R. (2008). Significance of body image among UK female fashion
consumers: The cult of size zero, the skinny trend. International Journal of Fashion
Design, Technology and Education, vol. 1, no. 1, pp.3-11, March.
APEAGYEI, P.R. (2010). Application of 3D full body scanning technology to human
measurement for clothing Fit. International Journal of Digital Content Technology and its
Applications, vol. 4, no. 7, pp. 58-68.
260
ASHDOWN, S.P. and L. DUNNE. (2006). A study of automated custom fit: Readiness of
the technology for the apparel industry. International Journal & Apparel Association,
vol.24, no.2, pp.121-136.
ASHDOWN, S.P. (Ed). (2007). Sizing in clothing: developing effective sizing systems for
ready-to-wear clothing. England: Woodhead Publishing Limited.
ASHDOWN, S. P. and F. METE (2008). S08- CR03 Development of visual fit
assessment tool for apparel Firms. National Textile Centre Report: November 2008, p 1-
7. New York: Cornell University.
ASHDOWN, S. P. and E.K. O‟CONNELL. (2006). Comparison of test protocols for
judging the fit of mature women's apparel. Clothing and Textile Research Journal, vol.
24, no. 2, pp.137-146.
BABBIE, E. and J. MOUTON. (2007). The practice of social research. 7th ed. Cape
Town: Oxford University Press.
BABBIE, E. (2010). The practice of social research. 12th ed. Australia: Wadsworth.
BAGHERZADEN, R., M. LATIFI. and A.R. FARAMARZI. (2010). Employing a Three-
Stage Data Mining Procedure to Develop Sizing System. World Applied Sciences
Journal, vol. 8, no 8, pp. 923- 929.
BAILEY, C.S. (2010). Petite women: The reflection of confidence for petite women
through dress. Degree of Bachelors Technology. Cape Town: Cape Peninsula University
of Technology, Department of Fashion and Surface Design.
BARONA-MCROBERTS, L. (2005). Petite Women: Fit and body shape analysis. Masters
Dissertation. Louisiana: Louisiana state University and Agricultural and Mechanical
College. The School of Human Ecology.
BEAUMONT, R. (2012). An introduction to Principal Component Analysis & Factor
Analysis using SPSS 19 and R (psych package). Factor Analysis and Principal
Component Analysis (PCA), vol. 24, pp.8-9.
261
BEAVERS, A.S., J.W. LOUNSBURY., J.K. RICHARDS., S.W. HUCK., G.J. SKOLITS.
And S.L. ESQUIVEL. (2013). Practical considerations for using exploratory factor
analysis in educational research. Practical Assessment, Research & Evaluation, vol. 18,
no. 6, pp.1-13. ISSN 1531-7714.
BELLAPETITE MAGAZINE. (2009). What defines a petite woman? Height, weight or
both? Available at: http://bellapetite.com/what-is-a-petite-woman-height-weight-or-
both.html. [Accessed 16 October 2014]
BELLO, M. (1994). A big emphasis on petite fashion designers taking larger interest in
short women. Available at:
http://search.proquest.com/docview/253744208?accountid=14648. [Accessed 9 March
2015]
BOORADY, L.M. (2011). Functional clothing- Principles of fit. Indian Journal of Fibre &
Textile Research, vol. 36, pp.344-347.
BOSTON, L. (1992). Short, not sweet petite women are tired of cute clothes, and
manufacturers are listening. Available at:
http://search.proquest.com/docview/303572706?accountid=14648. [Accessed 9 March
2015]
BOUGOURD, J. (2007). Sizing systems, fit models and target markets. In: Ashdown
S.P(Ed). Sizing in clothing: developing effective sizing systems for ready to wear
clothing. New York. Woodhead Publishing.
BRANSON, D. and J. NAM. (2007). Materials and sizing. In S.P. ASHDOWN. (Ed),
Sizing in clothing: Developing effective sizing systems for ready-to-wear clothing, chap.
9. England: Woodhead Publishing Limited.
BROUGH, D. (2008). Neo-Dandy: Wearability, design innovation and the formal white
dress shirt for men. Masters Dissertation. Queensland University of Technology Creative
Industries. Department of Arts.
262
BURDASTYLE. (n.d). SizeChart_Petite_cms. Available at:
http://www.burdastyle.com/downloads/SizeChart_Womens_s_Cms.pdf. [Accessed 1
June 2016]
BYE, E., LABAT, K.L., and DELONG, M.R. 2006. Analysis of body measurement
systems for apparel. Clothing and Textiles Research Journal. 24(2): 66-79.
CASTILLO-GUTIERREZ, S., E. LOZANO-AGUILERA. and M.D. ESTUDILLO-
MARTINEZ. (2012). Selection of a Plotting Position for a Normal Q-Q Plot. R Script.
Journal of Communication and Computer, vol. 9, pp. 243-250.
CHAN, A. C. K. (2014). The development of apparel sizing systems from anthropometric
data. In D. GUPTA. and N ZAKARIA. Anthropometry, apparel sizing and design. United
Kingdom: Woodhead Publishing.
CHEN, C.M. (2007). Fit evaluation within the made-to-measure process. International
Journal of Clothing Science and Technology, vol. 19, no. 2, pp.131-144.
CHEN, C. (2011). Analysis of upper physical characteristics based on angle
measurements. Textile Research Journal, vol. 81, no. 3, pp. 301–310.
CHEN, Y., X. ZENG., M. HAPPIETTE. and P. BRUNIAUX. (2008). A New Method of
Ease Allowance Generation for Personalization of Garment Design. International Journal
of Clothing Science and Technology, vol. 20, pp. 161-173.
CHUN, J. (2007) Communication of sizing and fit. In: Ashdown S.P(Ed). Sizing in
clothing: developing effective sizing systems for ready to wear clothing. New York.
Woodhead Publishing.
CHUN, J. (2014). International apparel sizing systems and standardization of apparel
sizes. In D. GUPTA. and N. ZAKARIA. Anthropometry, apparel sizing and design. United
Kingdom: Woodhead Publishing.

263
CIGNONI, P., M. CORSINI. and G. RANZUGLIA. (2008). MeshLab: an open-source 3D
mesh processing system. ERCIM News, vol. 73, pp.47-48.
COBANOGLU, C. and N. COBANOGLU. (2003). The effect of incentives in web
surveys: application and ethical considerations. International Journal of Market
Research, vol. 45, no. 4, pp. 475-488.
COMMITTEE FOR PROTECTION OF HUMAN SUBJECT. (2015). CPHS Guidelines -
Compensation. University of California, pp.1-5, July.
CONNELL, L.J., P.V. ULRICH, E.L. BRANNON, M. ALEXANDER and A.B. PRESLEY.
(2006). Body shape assessment scale: instrument development for analyzing female
figures. Clothing and Textiles Research Journal, vol. 24, no. 2, pp.80-95.
COURY, N.L. (2015). Consumer perceptions of apparel fit satisfaction and sizing based
upon 3d body scanning and block garment assessment. Masters Dissertation. Arkansas:
University of Arkansas. Department of Human Environmental Sciences.
CRENNA, C. (1990). Styles for petite women have become big business. Available at:
http://search.proquest.com/docview/243506853?accountid=14648. [Accessed 9 March
2015]
CRESWELL, J.W. (2009). Research design: qualitative, quantitative and mixed methods
approaches. 3rd ed. Thousand Oaks Publications.
CYBERWARE. (2011). Whole Body Color 3D Scanner (Model WBX). Available at:
http://cyberware.com/products/scanners/wbx.html. [Accessed 12 August 2015]
DAANEN, H.A.M and F.B. TER HAAR. (2013). 3D whole body scanners revisited.
Elsevier Displays, vol. 34, pp. 270–275.
DANIELS, S.R. (2008). Body shape in children and adolescents. The Journal of
Pediatrics, vol. 152, no 1, pp. 45.

264
DAS, A. and R. ALAGIRUSAMY. (2010). Science in clothing comfort. New Delhi:
Woodhead Publishing India PVT LTD.
D‟APUZZO, N. (2009). Recent advances in 3D full body scanning with applications to
fashion and apparel. Available at: www.hometrica.ch. [Accessed 12 August 2015]
DAVIES, H.T. and I.K. CROMBIE. (2009). What are confidence intervals and p-values?
Hayward Medical Communications (Supported by Sanofi-Aventis). 2nd edition. What
is...? series, pp.1-8. April. Available at:
https://grunigen.lib.uci.edu/sites/all/docs/gml/what_are_conf_inter.pdf. [Accessed 2 June
2017]
DESMARTEAU, K. 2000. Let the fit revolution begin. Bobbin, vol. 42, no. 2, pp. 42-56.
DOSHI, G. (2006). Size and fit problem with readymade garment. Available at:
http://ezinearticles.com/?Size-And-Fit-Problem-With-Readymade-Garment&id=339778.
[Accessed 16 January 2015]
DEFTY, A. (1988). The fascinating art of creating patterns. Durban: Penprint (PTY) LTD.
THE EDINBURGH VIRTUAL ENVIRONMENTAL CENTRE. (n.d). Wicks & Wilson
Triform Body Scanner. Available at:
http://www.edvec.ed.ac.uk/html/services/bodyscanning/. [Accessed 12 August 2015]
EMPISAL. (n.d). Empisal dress maker 270D free arm sewing machine: Instruction
manual.
EMPISAL. (n.d). Empisal model S4D free arm overlocker sewing machine: Instruction
manual.
FAUST, M.E., S. CARRIER and P. BAPTISTE. (2006). Variations in Canadian women‟s
ready-to-wear standard sizes. Journal of Fashion Marketing and Management, vol. 10,
no. 1, pp.71-83.
265
FAUST, M.E. and S. CARRIER. (2009). A Proposal for a New Size Label to Assist
Consumers. Textile Research Journal, vol. 79, no. 6, pp.1446-1458.
FAUST, M.E. and S. CARRIER. (2010). Women‟s wear sizing: a new labeling system.
Journal of Fashion Marketing and Management, vol. 14, no. 1, pp.88-126.
FIELD, A. (2000). Discovering Statistics using SPSS for Windows: advanced techniques
for the beginner. London: Sage publications.
FIGURE FORMS. (2015). Technical fit mannequins, traditional dressmaking forms,
tailors dummies & display models. Available at: http://www.figureforms.co.za/. [Accessed
1June 2016]
FRINGS, G.S. (2014). Pearson new international edition fashion from concept to
consumer. Ninth edition. England: Pearson Education Limited.
FURR, M. (2008). Running Head: SIGNIFICANCE TESTING AND CORRELATIONS,
Testing the Statistical Significance of a Correlation. Wake Forest University. Department
of Psychology, pp. 1-32. Available at: http://psych.wfu.edu/furr/716/sigcorr.pdf. [Accessed
2 June 2017]
GERBER, H. (2015). Statistical data analysis, University of South Africa Statistician.
Personal Conversation.
GOODMAN, S. (2008). A Dirty Dozen: Twelve P-Value Misconceptions. Seminars in
Hematology, vol. 45, pp.135-140.
GŐRITZ, A.S. (2006). Incentives in Web studies: Methodological issues and a review.
International Journal of Internet Science, vol. 1, pp. 58-70.
GUPTA, D. and B.R. GANGADHAR. (2004). Communications: A statistical model for
developing body size charts for garments. International Journal of Clothing, vol. 16, no 5,
pp. 458-469.

266
GUPTA, D. (2014). Anthropometry and the design and production of apparel: an
overview. In D. GUPTA and N ZAKARIA. Anthropometry, apparel sizing and design.
United Kingdom: Woodhead Publishing.
GURARDA, A. (2008). Investigation of the seam performance of PET/Nylon-elastane
woven fabrics. Textile Research Journal, vol. 78, no. 1, pp. 21-27.
H&M, (2015). Fit Model. Available at:
https://career.hm.com/content/hmcareer/en_se/workingathm/what-can-you-do-
here/corporate/buying-and-design-/fit-model.html. [Accessed 1June 2016]
HACKSHAW, A. (2008). Understanding economics in United States History, Lesson 23
Bigger is better: The economics of mass product. Available at:
http://erj.ersjournals.com/content/32/5/1141. [Accessed 9 March 2015]
HAMILTON, W. (2015). Making Perfect Pants. Guide C-227. Cooperative Extension
Service. College of Agricultural, Consumer and Environmental Sciences. New Mexico
State University. pp. 1-12.
HOWARTON, R. and B. LEE. (2010). Market analysis of fit preferences of female
boomers. Journal of Fashion Marketing and Management, vol. 14, no. 2, pp.219-229.
HUANG, H. (2011). Development of 2D block patterns from fit feature-aligned flattenable
3D garments. PHD Thesis. Hong Kong: The Hong Kong Polytechnic University. Institute
of Textiles and Clothing.
HUBERT, M. and E. VANDERVIEREN. (2006). An adjusted boxplot for skewed
distributions. Technical Report TR-06-11. Department of Mathematics. Katholieke
Universiteit Leuven. Section of Statistics.
HUMAN SOLUTIONS. (2015). The Precise for fit-perfectionist, from scan directly to
production. Available at: http://www.human-
solutions.com/fashion/front_content.php?idcat=139&lang=7. [Accessed 12 August 2015]

267
ILOEJE, C.I and E.U. ANYAKOHA. (2010). Block pattern technology: A means of
revamping the clothing industry in Nigeria. Journal of Tropical Agriculture, Food,
Environment and Extension, vol. 9, no. 1, pp. 24-30.
INDIAN STANDARD IS 14854. (2000). Size designation of clothes – women‟s and girls‟
outerwear garments. India: Bureau of Indian Standards.
INTERNATIONAL STANDARD, ISO 4916. (1991). Textiles-Seam Types-Classification
and Terminology. 2nd ed. Switzerland.
INTERNATIONAL STANDARD, ISO 7250 -1 (2008). Basic human body measurements
for technological design. Part 1: Body measurement definitions and landmarks.
Switzerland.
INTERNATIONAL STANDARD, ISO 20685. (2010). 3-D scanning methodologies for
internationally compatible anthropometric database. 2nd ed. Switzerland.
INTERNATIONAL STANDARD, ISO 15535. (2012). General requirements for
establishing anthropometric databases. 3rd ed. Switzerland.
INTERNATIONAL STANDARD, DIS 8559. (2016). ISO/TC 133/WG1 Body
measurement. Draft amendment. Korea.
JOSEPH-ARMSTRONG, H. (2014). Pattern making for fashion for fashion design. Fifth
edition. England: Pearson education limited.
KADOLPH. S.J. (2008). Quality assurance for textiles and apparel. 2nd ed. Iowa State
University, New York: Fairchild Publications, Inc.
KAHN, T. Survey will get the measure of us all, so we can dress comfortably. Business
Day, 11 February 2008.
KASAMBALA, J. (2013). An exploration of female consumers’ perceptions of garment fit
and the effect of personal values on emotions. Masters Dissertation. South Africa:
University of South Africa. Department of Consumer Science.

268
KASAMBALA, J., E. KEMPEN and R. PANDARUM. (2014). Female consumers‟
perceptions of garment fit, personal values and emotions considering their body shapes.
The Retail and Marketing Review, vol.10, no.1, pp. 95-108.
KASAMBALA, J., E. KEMPEN and R. PANDARAM. (2015). Female consumers‟
perceptions of garment fit, personal values and emotions considering their body shapes.
The Retail and Marketing Review, vol. 10, no. 1, pp. 95-108.
KASS, A. (2011). The 20th Century of American Fashion: 1900 – 2000. Degree in Writing
Journalism and Freelance. 10 May. WRT 465.
KAUSHER, H. and S. SRIVASTAVA. (2016). A review on sizing systems for readymade
garments in India and different types of body shapes of females. International Journal of
Home Science, vol. 2, no. 3, pp. 136-138.
KA WAI YIP, J. (2013). An investigation of special lower body figures of females and the
related fit issues. Bachelor of Arts Honours Degree Dissertation. Hong Kong: The Hong
Kong Polytechnic University. Institute of Textiles & Clothing.
KEISER, S.J. and M.B. GARNER. (2003). Beyond design: the synergy of apparel product
development. Fairchild Publications
KEISER, S.J. and M.B. GARNER. (2008). Beyond design: the synergy of apparel product
development. 2nd ed. New York: Fairchild Publications
KGARZA, J. (2013). Petite Sewing: Achieving a Perfect Fit. Available at:
http://www.craftsy.com/blog/2013/03/petite-sewing/. [Accessed 9 March 2015]
KIM, S. (1993). Analysis of petite-sized women’s body proportions related to garment fit.
Doctorate Dissertation. United States: University of Minesota.
KIM, D. and. K LABAT. (2013). An exploratory study of users‟ evaluations of the
accuracy and fidelity of a three-dimensional garment simulation, Textile Research
Journal, vol. 83, no. 2, pp.171-184.
269
KIM, Y., H.K. SONG and S.P. ASHDOWN. (2016). Women‟s petite and regular body
measurements compared to current retail sizing conventions. International Journal of
Clothing Science and Technology, vol. 28, no. 1, pp.47 – 64.
KINLEY, T. R. (2010). The Effect of Clothing Size on Self‐Esteem and Body Image.
Family and Consumer Sciences Research Journal, vol.38, no.3, pp. 317-332.
KINLEY, T.R. (2010). Fit and shopping preferences by clothing benefits sought. Journal
of Fashion Marketing and Management, vol. 14, no. 3, pp.397-411.
KNOROVSKY, K. (2012). Does being petite mean you get short changed by the style
world? Available at: http://www.washingtonpost.com/express/wp/2012/03/02/the-height-
of-fashion/. [Accessed 9 March 2015]
KNOWLES, L.A. (2005). Practical Guide to Patternmaking for Fashion Designers:
Juniors, Misses and Women. London: Bloomsbury Publishing.
KOUCHI, M. (2014). Anthropometric methods for apparel design: body measurement
devices and techniques. In D. GUPTA and N ZAKARIA. Anthropometry, apparel sizing
and design. United Kingdom: Woodhead Publishing.
LABAT, K.L. (2007). Sizing standardization. In S.P. ASHDOWN (Ed). Sizing in clothing:
developing effective sizing systems for ready-to-wear clothing, chap. 3. England:
Woodhead Publishing Limited.
LAGUILLES, J.S., E.A. WILLIAMS and D.B. SAUNDERS. (2011). Can lottery incentives
boost web survey response rates? Findings from four experiments. Research in Higher
Education, vol. 52, no. 5, pp. 537-553.
LAITALA, K., I.G. KLEPP and B. HAUGE. (2011). Materialised ideals: sizes and beauty.
Journal of Current Cultural Research, vol. 3, pp.19-41.
LEE, B. (2005). Clothing and fit preferences of female baby boomers. Master‟s thesis.
Wisconsin-Stout: University of Wisconsin-Stout.

270
LEE, J.Y., C.L. ISTOOK, Y.J. NAM and S.M. PARK. (2007). Comparison of body shape
between USA and Korean women. International Journal of Clothing Science and
Technology, vol. 19, no. 5, pp.374-391.
LEE, J.K. (2014). Why don't more brands do petite-size clothing? Available at:
http://www.dailylife.com.au/dl-fashion/fashion-coverage/why-dont-more-brands-do-
petitesize-clothing-20140718-3c5d9.html. [Accessed 13 January 2015]
LEEDY, P.D. and J.E. ORMROD. (2010). Practical Research: Planning and Design. 9th
ed. New Jersey: Pearson Education, Inc.
LEVINE, D. M., D. STEPHAN, T.C. KREHBIEL and M.L. BERENSON. (2008). Statistics
for managers Microsoft Excel, chap. 9. Fifth edition. New Jersey: Prentice Hall.
LIDDELOW, J. (2016). What‟s your body shape? Available at: http://www.style-
makeover-hq.com/body-shape.html. [Accessed 10 March 2016].
LIECHTY, E.L., J.A. RASBAND. and D.N. POTTBERG-STEINECKERT. (2010). Fitting
and pattern alterations. 2nd ed. Fairchild.
LIN, W. (2014). Determination of Distance Ease at Crotch Curve for Customized Jeans.
Masters Dissertation. Texas: The University of Texas at Austin. Department of Science in
Textile and Apparel Technology.
LIRA, U.M.T. and I.A. MUNMUN. (2015). Pattern block emendation before design
manipulation to get accurate garment dimension according to size after washing and
finishing. International Journal of Scientific & Engineering Research, vol. 6, no. 6, pp.
886-890.
LIU, N.N. (2011). Women‟s struggle with being a smaller than small. Available at:
http://www.nwasianweekly.com/2011/05/women-struggle-with-being-a-size-smaller-than-
small/. [Accessed 02 February 2016]

271
LOKER, S., S. ASHDOWN and K. SCHOENFELDER. (2005). Size-specific analysis of
body scan data to improve apparel fit. Journal of Textile and Apparel, Technology and
Management, vol. 4, no. 3, pp.1-15.
LOVATO, C. (2010). Three-dimensional body scanning: methods and applications for
anthropometry. Doctorate Dissertation. Italy: University of Verona Studies. Department of
Neuropsychological, Morphological and Movement Sciences.
MAKHANYA, B.P., H.M. DE KLERK., K. ADAMSKI and A. MASTAMET-MASON. (2014).
Ethnicity, body shape differences and female consumers‟ apparel fit problems.
International Journal of Consumer Studies, vol. 38, no. 2, pp. 183-191.
MAKHANYA, B.P. (2015). Body shape characteristics, body cathexis and fit preferences
and problems of African and Caucasian women. Doctorate Dissertation. University of
Pretoria. Department of Consumer Science.
MANDAL, S. (2008). Studies on seam quality with sewing thread size, stitch density and
fabric properties. Masters Dissertation. Hong Kong: The Hong Kong Polytechnic
University. Institute of Textiles & Clothing.
MANUEL, M.B. (2009). Using 3D scan measurement data and body shape assessment
to build anthropometric measurements for tween girls. Doctorate Dissertation. Alabama:
Auburn University. Department of Philosophy.
MAREE, K. (Ed). (2007). First steps in research. Pretoria: Van Schaik Publishers.
MASTAMET- MASON, A. (2008). An explication of the problems with apparel fit
experienced by female Kenyan consumers in terms of their unique body shape
characteristics. Doctorate Dissertation. University of Pretoria. Department of Consumer
Science.
MATTHEWS, T.D. and K.T. KOSTELIS. (2011). Designing and conducting research in
health and human performance. 1st ed. United States of America: PB Printing.

272
MCKINNEY, E., S. GILL, A. DORIE and S. ROTH. (2017). Body-to-pattern relationships
in women‟s trouser drafting methods: Implications for apparel mass customization.
Clothing and Textiles Research Journal, vol. 35, no. 1, pp.16-32.
MBANDAZAYO, S., N. NKOSI and Y. MGWALI. Vanity sizing. Have we shrunk or our
clothes grown? Zest, 6 October 2014, p.10.
MGWALI, Y. (2014). No SA standard measurement yet. Available at: http://0-
infoweb.newsbank.com.oasis.unisa.ac.za/resources/doc/nb/news/150CB2775F50B940?
p=ASANB. [Accessed 19 August 2015]
MIDHA, V.K., A. MUKHOPADHYAY., R. CHATOPADHYAY and V.K. KOTHARI. (2009).
Studies on the Changes in Tensile Properties of Sewing Thread at Different Sewing
Stages. Textile Research Journal, vol. 79, no. 13, pp. 1155-1167.
MILLAM, R. (2016). Size charts for petite women, Senior Manager of a well-known South
African mannequin manufacturer. Personal Conversation.
MOLINO, P.L. (2007). What clothing is right for your body shape? Available at:
http://www.phillyfit.com/images_phillyfit2/Articles/Sep%3AOct2007/what-clothing-is-
right.pdf. [Accessed 12 December 2016]
MPAMPA, M.L., P.N. AZARIADIS and N.S. SAPIDIS. (2010). A new methodology for the
development of sizing systems for the mass customization of garments. International
Journal of Clothing Science and Technology, vol. 22, no. 1, pp. 49-68.
MULLET, K.K., C.L. MOORE and M. PREVATT-YOUNG. (2009). Concepts of pattern
grading: techniques for manual and computer grading. 2nd ed. New York: Fairchild
Books.
MUSLIM, E., B.N. MOCH., N.D. FILEINTI., M.A. PUSPASARI., T.M.L. SIBARANI. and
D.G.N. LAKSANA. (2014). The development of standard size for clothes of Indonesian
boys based on anthropometric data as a reference to formulate RSNI 0555:2013.
International Journal of Ergonomics, vol. 4, no. 2, pp. 15-23
273
MUTHAMBI, A. (2012). Proposed sizing for young South African women of African
descent with triangular shaped bodies. Masters Dissertation. Pretoria: University of
Pretoria. Department of Consumer Science.
MUTHAMBI, A., H.M. DE KLERK and A. MASTAMET-MASON. (2015). Sizing for
ethnicity in multi-cultural societies: Development of size specifications for young South
African women of African descent. Journal of Family Ecology and Consumer Sciences,
vol. 43, pp. 62-71.
NATIONAL TEXTILE RESEARCH BRIEF. (2007). Improved apparel sizing: fit and
Anthropometric 3d scan data. Available at: http://www.ntcresearch.org!pdf-
rotsIBref0607/S04-CR01-Q7.pdf. [Accessed 14 January 2015]
NARANG, V. (2014). Pattern development for menswear using block method: A fresh
approach. Doctorate Dissertation. New Delhi, India: National Institute of Fashion
Technology. Department of Philosophy.
NKABULE, M, T. (2010). Apparel Sizing and Fit Preferences and Problems of Plus‐size
Swazi working Women. Masters Dissertation. Pretoria: University of Pretoria. Department
of Consumer Science.
OLA-AFOLAYAN, O. and. A. MASTAMET-MASON (2013). A customised size chart for
the African pear-shaped plus-size South African women. 2013 DEFSA Conference
Proceedings. pp. 202-210.
OTIENO, R. (2008). Approaches in researching human measurement: MMU model of
utilizing anthropometric data to create size charts. EuroMed Journal of Business, vol. 3,
no. 1, pp.63-82.
PALMER, P. and M. ALTO. (2005). Fit for real people. Second edition. USA:
Palmer/Pletsch publishing.
PANDARUM, K., W. YU and L. HUNTER. (2011). 3-D Breast Anthropometry of Plus-
Sized Women in South Africa. Ergonomics Journal, vol. 54, no. 9, pp.866-875.

274
PANDARUM, K. (2009). Size prediction for plus-size women’s intimate apparel using a
3D body scanner. Masters Dissertation. Port Elizabeth: Nelson Mandela Metropolitan
University. Department of Textile Science.
PANDARUM, K. (2015). On-going Ph.D. study.
PANDARUM, K. and W. YU. (2015). Garment sizing and fit. In R. NAYAK and R.
PADHYE. Garment Manufacturing Technology. United Kingdom: Woodhead Publishing.
PANDARUM, K. (2017). On-going Ph.D. study.
PANDARUM, K. (2017). Garment sizing, manufacturing standards and garment fit
problems among consumers in South Africa, South African expert on the SANS
committee chaired by the SABS (South African Bureau of Standards). Personal
Conversation.
PAQUET, E. (2014). Segmentation and classification of anthropometric data for the
apparel industry. In D. GUPTA and N. ZAKARIA. Anthropometry, apparel sizing and
design. United Kingdom: Woodhead Publishing.
PARK, J. Y. NAM., K. CHOI., Y. LEE and K.H. LEE. (2009). Apparel consumers‟ type
and their shopping characteristics. Journal of Fashion Marketing and Management, vol.
13, no. 3, pp. 372-393.
PATCH, C. (2009). Design-It-Yourself Clothes: Patternmaking Simplified. New York:
Potter Craft
PEACOCK, J. (1997). Fashion Sourcebooks: The 1900’s with 332 illustrations. London:
Thames and Hudson
PETITE RESOURCE. (2007). What is Petite Clothing? Should You Wear a Petite Size?
Available at: http://petiteresource.com/resources/whar-is-petite-clothing. [Accessed 13
January 2015]
275
PETROVA, A. (2007). Creating sizing systems. In S.P. ASHDOWN (Ed). Sizing in
clothing: developing effective sizing systems for ready-to-wear clothing, chap. 2.
England: Woodhead Publishing Limited.
PETROVA, A. and S. P. ASHDOWN. (2008). Three-dimensional body scan data analysis
body size and shape dependence of ease values for pants‟ fit. Clothing and Textiles
Research Journal, vol. 26, no. 3, pp.227-252.
PETROVA, A. and S.P. ASHDOWN. (2012). Comparison of garment sizing systems.
Clothing and Textiles Research Journal, vol. 30, no. 4, pp.267-284
PISUT, G. and L.J. CONNELL. (2007). Fit preferences of female consumers in the USA.
Journal of Fashion Marketing and Management, vol. 11, no. 3, pp.366-379.
POWER, J., P.R. APEAGYEI and A.M. JEFFERSON. (2011). Integrating 3D Scanning
Data &Textile Parameters into Virtual Clothing. Proceedings of the 2nd International
Conference on 3D Body Scanning Technologies. Hometrica Consulting, pp. 213-224.
ISBN 978-3-033-03134-0
RASBAND, J.A and E.L.G. LIECHTY. (2006). Fabulous fit. 2nd ed. New York: Fairchild
Publications.
RAYNER, P. (1997). Big On Style Fashion Expert Gives Petite Women A Wardrobe
Boost. Available at: http://articles.mcall.com/1997-10-30/features/3175083_1_rita-
coronel-petite-women-petite-sizes. [Accessed 9 March 2015]
REDMORE, N. (2012). Woven Apparel Fabrics. In: Woven Textiles: Principles,
developments and applications. Cambridge: Woodhead Publishing Ltd. ISBN
9781845699307. Available at: http://eprints.hud.ac.uk/20088/. [Accessed 17 June 2016]
REPUBLIC OF SOUTH AFRICA. (2015). The status of women in the South African
economy. Department of women. Government Publication. Available at:
276
https://www.gov.za/sites/www.gov.za/files/Status_of_women_in_SA_economy.pdf.
[Accessed 12 October 2017]
RZEPKA, A.M. (2011). A Study of fit issues of women’s ready to wear and an
examination of the technology acceptance model for consumer adoption of 3D body
scanning for improved fit of denim Pants. Masters Dissertation. Michigan: Eastern
Michigan University. School of Technology Studies.
SALUSSO, C.J., J.J. BORKOWSKI., N. REICH. and E GOLDSBERRY. (2006). An
alternative approach to sizing apparel for women 55 and older. Clothing Textiles
Research Journal, vol. 24, no. 2, pp. 96-111.
SAYEM, A.S.H. (2012). Resizable outerwear templates for virtual design and pattern
flattening. Masters Dissertation. UK: University of Manchester. The Faculty of
Engineering and Physical Science.
SAYEM, A.S.H. and A. BEDNALL. (2017). A Novel Approach to Fit Analysis of Virtual
Fashion Clothing. 19th edition of the International Foundation of Fashion Technology
Institutes conference (iffti), pp. 1-28. 28-30 March.
SOUTH AFRICAN NATIONAL STANDARDS 1360-2. (2008). Size designation of
clothes- Part 2: Women‟s and girls‟ outerwear garments.
SCHOFIELD, N.A. and K.L. LABAT. (2005a). Exploring the relationships of grading,
sizing, and anthropometric data. Clothing and Textiles Research Journal, vol. 23, no.1,
pp. 13-27.
SCHOFIELD, N.A. and K.L. LABAT. (2005b). Defining and testing the assumptions used
in current apparel grading practice‟. Clothing and Textiles Research Journal, vol. 23,
no.3, pp. 135-150.
SCHOFIELD, N.A., S.P. ASHDOWN, J. HETHORN, K. LABAT and C.J. SALUSSO.
(2006). Improving pant fit for women 55 and older through an exploration of two pant
shapes. Clothing and Textiles Research Journal, vol. 24, no. 2, pp.147-160.
277
SCHOFIELD, N.A. 2007. Pattern grading. In ASHDOWN, S.P. (Ed). Sizing in clothing:
developing effective sizing systems for ready to wear apparel. Cambridge: Woodhead
Publishing in association with The Textiles Institute.
SEWING AND CRAFT ALLIANCE. (2008). Body types. Available at:
http://www.sewing.org/files/guidelines/10_105_body_types.pdf. [Accessed 12 December
2016]
SEWING AND CRAFT ALLIANCE. (2008). Cotton…The most popular fabric in the world.
Available at: http://www.sewing.org/files/guidelines/4_105_cotton.pdf. [Accessed 16
September 2017]
SHIN, S.J.H and C.L. ISTOOK. (2007). The importance of understanding the shape of
diverse ethnic female consumers for developing jeans sizing systems. International
Journal of Consumer Studies, vol. 32, no. 2, pp. 135-143.
SHIN, E. (2013). Exploring consumers' fit perceptions and satisfaction with apparel fit in
general. Graduate Theses and Dissertations. Paper 13184. Iowa: Iowa State University.
SIMMONS, K., C.L. ISTOOK and P. DEVARAJAN. (2004a). Female figure identification
technique (FFIT) for apparel. Part I: describing female shapes. Journal of Textile and
Apparel, Technology and Management, vol. 4, no. 1, pp.1-16.
SIMMONS, K., C.L. ISTOOK and P. DEVARAJAN. (2004b). Female figure identification
technique (FFIT) for apparel. Part II: development of shape sorting software. Journal of
Textile and Apparel, Technology and Management, vol. 4, no. 1, pp.1-15.
SIMPLICITY. (2013). Measurement charts (inches). Available at:
http://www.simplicity.com/t-sewing-measurement-charts.aspx#womenpetite. [Accessed
16 October 2014]
SMIT, N. (2007). Ease allowance and fit of selected female military upper garments.
Bachelor‟s Technology Dissertation. South Africa: Vaal University of Technology.
278
SONG, H. K. and. S. P. ASHDOWN. (2010). An Exploratory Study of the Validity of
Visual Fit Assessment From Three-Dimensional Scans. Clothing and Textiles Research
Journal, vol. 28, no. 4, pp. 263-278.
SONG, H. K. and. S. P. ASHDOWN. (2012). Development of Automated Custom-Made
Pants Driven by Body Shape. Clothing and Textiles Research Journal, vol. 30, no. 4, pp.
315-329.
SONG, H. K. and. S. P. ASHDOWN. (2013). Female Apparel Consumers‟ Understanding
of Body Size and Shape: Relationship Among Body Measurements, Fit Satisfaction, and
Body Cathexis. Clothing and Textiles Research Journal, vol. 31, no. 3, pp. 143-156.
SOHN, M.H. and L. SUN. (2013). An Exploratory Study of Virtual Fit Testing using 3D
Virtual Fit Models and Garment Simulation Technology in Technical Design. Proc. of the
4th International Conference on 3D Body Scanning Technologies, pp. 19-20. November.
STAMPER, A.A., S.H. SHARP and L.B. DONNELL. (2005). Evaluating Apparel Quality.
2nd ed. New York: Fairchild Fashion Group.
STATISTICS SOUTH AFRICA. (2011). Census 2011 mobile information. Available at:
http://mobi.statssa.gov.za/census2011/Population%20Groups.html. [Accessed 12
October 2015]
STATISTICS SOUTH AFRICA. (2014). Statistical release P0302. Mid-year population
estimates. Pretoria: Government Publication. Available at:
https://www.statssa.gov.za/publications/P0302/P03022014.pdf. [Accessed 12 October
2015]
STATISTICS SOUTH AFRICA. (2015). Statistical release P0211. Quarterly Labour Force
Survey. Pretoria: Government Publication. Available at:
https://www.statssa.gov.za/publications/P0211/P02111stQuarter2015.pdf. [Accessed 15
October 2017]
279
STATISTICS SOUTH AFRICA. (2016). Statistical release P0211. Quarterly Labour Force
Survey. Government Publication. Available at:
http://www.statssa.gov.za/publications/P0211/P02111stQuarter2016.pdf. [Accessed 15
October 2017]
STATISTICS SOUTH AFRICA. (2017). Statistical release P0211. Quarterly Labour Force
Survey. Government Publication. Available at:
https://www.statssa.gov.za/publications/P0211/P02112ndQuarter2017.pdf. [Accessed 15
October 2017]
SOHN, M. (2012). Analysis of Upper Body Measurement Change Using Motion Capture.
Doctorate Dissertation. Minnesota: University of Minnesota. Faculty of the Graduate
School.
STRYDOM, M. (2006). An evaluation of South African clothing related population
measures and sizing systems. Masters Dissertation. Pretoria: University of Pretoria.
Department of Consumer Science.
STRYDOM, M. and H.M. DE KLERK. (2006). The South African clothing industry:
problems experienced with body measurements. Journal of Family Ecology and
Consumer Science, vol. 34, pp.80-89.
STRYDOM, M. and H.M. DE KLERK. (2010). Key to good fit: Body measurement
problems specific to key dimensions. Journal of Family Ecology and Consumer Science,
vol. 38, pp.74-83.
TAMA, D. and Z. ÖNDOĞAN. (2014). Fitting Evaluation of Pattern Making Systems
According to Female Body Shapes. Fibres & Textiles in Eastern Europe, vol. 22, no.
4(106), pp.107-111.
TARAFDAR, N., R. KARMAKAR and M. MONDOL. (2007). The effect of stitch density on
seam performance of garments stitched from plain and twill fabrics. Man-made Textiles
in India, vol. 50, no. 8, pp.298-302.
280
TC². (2014). 3D Body Scanner. Available at: http://www.tc2.com/products/body-scanner/.
[Accessed 12 August 2015]
TER HAAR, F.B. (2009). Reconstruction and Analysis of Shapes from 3D Scans.
Doctorate Dissertation. Netherlands: Utrecht University.
TELMAT INDUSTRIE. (2015). TELMAT Industrie - 3D VISION Department. Available at:
http://www.symcad.com/eng/index.htm. [Accessed 12 August 2015]
TOWNSEL, L.J. (2005). Petite women would like to ditch junior-miss labels. Available at:
http://articles.chicagotribune.com/2005-11-02/features/0511020308_1_petite-women-
second-outfit-clothing. [Accessed 9 March 2015]
TRISH NEWBERY DESIGN. (2014). Calico fabric. Available at:
http://www.trishnewbery.com/knowledge/fabric-fibres-textiles-and-print/fabric-
header/fabric/calico-fabric/. [Accessed 05 May 2015]
VAN HYSSTEEN, S. (2006). Development of standardised sizing systems for the South
African children‟s wear market. Doctorate Dissertation. South Africa: University of
Pretoria.
VEBLEN, S. (2012). The complete photo guide to perfect fitting. USA: Creative
Publishing International, Inc.
VITHANAGE, C.P., T. S. S. JAYAWARDANA. and S. N. NILES. (2012). The
development of pant sizing system for Sri Lankan females. International Journal of
Research in Social Sciences, vol. 1, no. 1, pp. 30-38.
VITHANAGE, C.P., T. S. S. JAYAWARDANA., C. D. THILAKARATNE. and S. N. NILES.
(2015). Kernel-based clustering approach in developing apparel size charts. International
Journal of Engineering Sciences & Research Technology, vol. 4, no. 1, pp. 482- 488.

281
VURUSKAN, A. and E. BULGUN. (2011). Identification of female body shapes based on
numerical evaluations. International Journal of Clothing Science and Technology, vol. 23,
no. 1, pp.46-60.
WAHYUNI, A. (2012). The research design maze: Understanding paradigms, cases,
methods and methodologies. Journal of Applied Management Accounting Research, vol.
10, no. 1, pp. 69-80.
WASSERSTEIN, R.L. and N A. LAZAR. (2016). The ASA's statement on p-values:
context, process, and purpose. The American Statistician, DOI:
10.1080/00031305.2016.1154108, pp.1-17. Available at:
http://dx.doi.org/10.1080/00031305.2016.1154108. [Accessed 3 June 2017]
WATKINS, P. (2011). Designing with stretch fabrics. Indian Journal of Fibre & Textile
Research, vol. 36, pp.366-379.
WATSON, L. (1999). Vogue: Twentieth century fashion. London: Carlton Books Limited
WHITNEY, A. (2011). An empirical study on the market for customised clothing for Irish
females. Unpublished thesis (Master of Business in Business Strategy and Innovation
Management). Galway: Galway Mayo Institute of Technology, School of Business.
WILLIAMS-DAHLMAN, K. and J. SHELTON. (2004). The Petite Handbook. Available at:
http://www.amazon.com/dp/0975917307/?ref=cm_sw_r_pi_dp_.3YSub1N5CM7X.
[Accessed 11 January 2016]
WILLIAMS, C. (2007). Fashion show to offer ideas about shopping for petite women.
Available at:
http://triblive.com/x/pittsburghtrib/lifestyles/fashion/s_499078.html#axzz3U0mKTFWS.
[Accessed 9 March 2015]
WILLIAMS, B., A. ONSMAN. and T. BROWN. (2010). Exploratory factor analysis: A five
step guide for novices. Journal of Emergency Primary Health Care (JEPHC), vol. 8, no.
3, pp. 1-13

282
WINKS, J.M. 1990. The development of standard sizing systems for clothes. Masters
Dissertation. Port Elizabeth: Port Elizabeth University.
WINKS, J. (1997). Clothing sizes: international standards. Manchester: Redwood Books.
WOOLWORTHS HOLDING LIMITED. (2014). Record number of South Africans
measured in sizing data assists Woolworths in creating the „perfect fit‟. Press Release,
19 June. Available at:
http://www.woolworthsholdings.co.za/media/news_display.asp?Id2=670. [Accessed 11
July 2015]
YOO, S., S. KHAN. and C. RUTHERFOD-BLACK. (1999). Petite and tall-sized consumer
segmentation: Comparison of fashion involvement, pre-purchase clothing satisfaction
and clothing needs. Journal of Fashion Marketing and Management: An International
Journal, vol. 3, no 3, pp. 219 – 235.
YONG, A. G. and S. PEARCE. (2013). A beginner‟s guide to factor analysis: Focusing on
exploratory factor analysis. Tutorials in Quantitative Methods for Psychology, vol. 9, no 2,
pp. 74-94.
YU, W. (2004). Subjective assessment of clothing fit. In J. FAN, W. YU and L. HUNTER
(Eds). Clothing Appearance and Fit: Science and Technology, chap. 3. England:
Woodhead Publishing Limited.
ZAKARIA, N. (2011). Sizing system for functional clothing – Uniforms for school children.
Indian Journal of fibre & Textile Research, vol. 36, pp. 348-357.
ZAKARIA, N. (2014). Body shape analysis and identification of key dimensions for
apparel sizing systems. In D. GUPTA. and N ZAKARIA. Anthropometry, apparel sizing
and design. United Kingdom: Woodhead Publishing.
ZAKARIA, N. and D. GUPTA. (2014). Apparel sizing: existing sizing systems and the
development of new sizing systems. In D. GUPTA. and N ZAKARIA. Anthropometry,
apparel sizing and design. United Kingdom: Woodhead Publishing.

283
ZHENG, R., W. YU. and J.FAN. (2007). Development of a new Chinese bra sizing
system based on breast anthropometric measurements. International Journal of
Industrial Ergonomics, vol.37, no. 2007, pp. 697–705.
ZWANE, P.E. and N.A. MAGAGULA. (2007). Pattern design for women with
disproportionate figures: a case study for Swaziland. International Journal of Consumer
Studies, vol. 31, no. 3, pp. 283–287.

284
APPENDIX A: INVITATION LETTER
INVITATION TO TAKE PART IN A
3D FULL BODY SCANNING SIZING & FIT
STUDY FOR SOUTH AFRICAN FEMALE
CONSUMERS
Dear Participant
My name is Marion Phasha. I‟m a student completing a Master‟s Degree in the Department of
Life and Consumer Sciences situated on the Science Campus, University of South Africa
(UNISA). I am currently embarking on a 3D full body scanning study for South African women
(aged 18-55), on the Science Campus.
I would like to invite you to take part in this study. Please NOTE that the data is collected
anonymously and no personal details are attached to your 3D scan. As a token of my
appreciation you will be able to take away a colour copy of your scan including your body
measurements. A raffle will be drawn at the end of the study where two lucky subjects will share
a prize of R500.
Scanning will be conducted in your undergarments that may not be black or navy blue in colour.
Should you have any queries on this, please contact Marion Phasha on (078) 2177689 or
[email protected] , respectively.
This research uses a 3D full body Scanner to capture the body landmark measurement points of
the whole body in 6 seconds to capture the data. The method is quick, non-intrusive and uses
white light (like those found in your offices and homes) to capture the 3D scan and is, therefore,
safe to your health. A medical scale will also be used to measure your body height and your
weight. The measurements will be taken privately by a trained professional.
The data collected is for developing a size chart to improve the sizing and fit of South African
women‟s ready-to-wear clothing. The study intends to provide relevant up-to-date petite female
body dimensions, size information and also present statistical analysis on South African female
anthropometric demographics in Gauteng (Johannesburg and Pretoria).
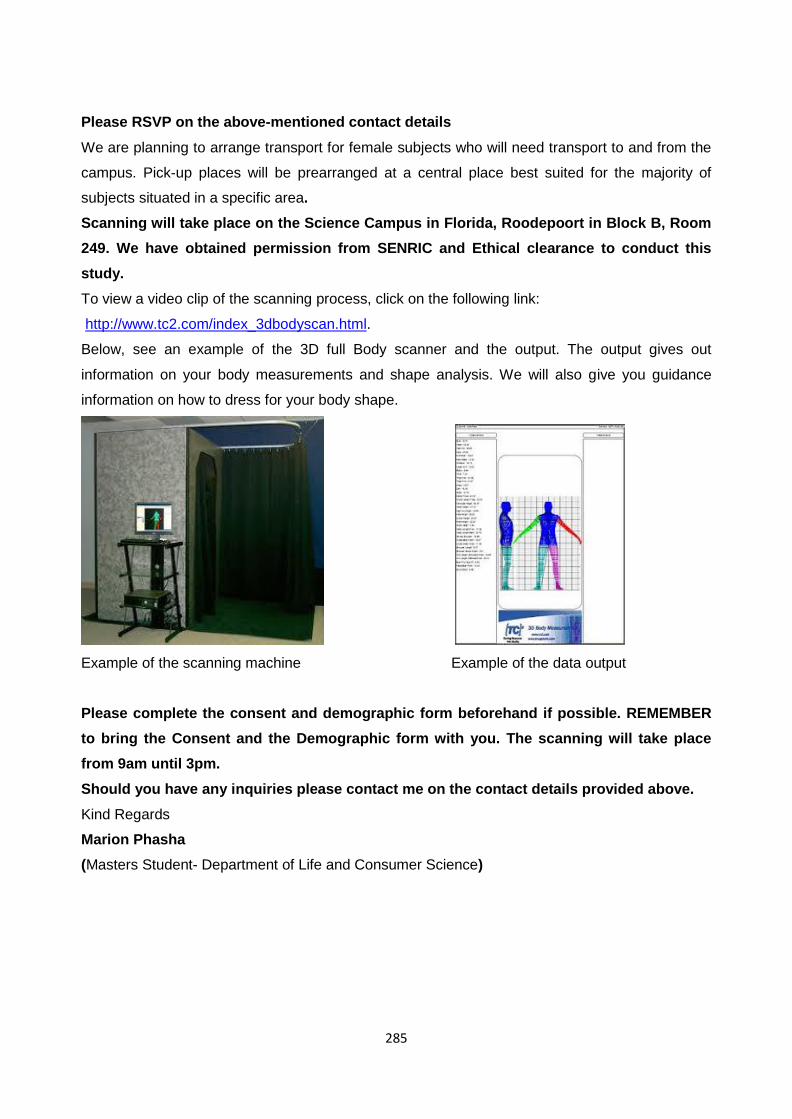
285
Please RSVP on the above-mentioned contact details
We are planning to arrange transport for female subjects who will need transport to and from the
campus. Pick-up places will be prearranged at a central place best suited for the majority of
subjects situated in a specific area.
Scanning will take place on the Science Campus in Florida, Roodepoort in Block B, Room
249. We have obtained permission from SENRIC and Ethical clearance to conduct this
study.
To view a video clip of the scanning process, click on the following link:
http://www.tc2.com/index_3dbodyscan.html.
Below, see an example of the 3D full Body scanner and the output. The output gives out
information on your body measurements and shape analysis. We will also give you guidance
information on how to dress for your body shape.
Example of the scanning machine Example of the data output
Please complete the consent and demographic form beforehand if possible. REMEMBER
to bring the Consent and the Demographic form with you. The scanning will take place
from 9am until 3pm.
Should you have any inquiries please contact me on the contact details provided above.
Kind Regards
Marion Phasha
(Masters Student- Department of Life and Consumer Science)
286
APPENDIX B: CONSENT FORM
TITLE OF RESEARCH PROJECT: EVALUATING GARMENT SIZING AND FIT FOR PETITE
WOMEN USING 3D BODY SCANNED ANTHROPOMETRIC DATA.
Dear Respondent
South Africa has varied female consumers with different body shapes and proportions. The
purpose of this study is to conduct a petite female sizing and fit study to identify their varied body
dimensions with the aim of acquiring accurate and up-to-date data using a 3D full body scanner
and a tape measure measurement for developing a petite women‟s size chart. You are therefore
kindly requested to give your input by answering the questionnaire and grant permission to be
scanned and measured.
Your participation is voluntary. You have the right to be a part of the study, choose not to
participate or to stop participating at any time without penalty. There are no right or wrong
answers. The information you will provide will strictly remain confidential and anonymous, it will
only be used for research purposes.
You will not directly benefit by participating in the study, however this study will indirectly benefit
you as a participant in the form of providing information that can be used to improve the sizing
and fit of petite women‟s clothing.
If you have any questions at any time about the study, you may contact the researcher at the
email [email protected] or my supervisor at [email protected] .
CONSENT
I, have read the above information relating to the research and have also heard the verbal
version, and declare that I understand it.
Signature of participant...........................................................................
Signed at …………………………………….. on ……………………………………………….
WITNESSES
1 ................................................................................................................
2 ..................................................................................................................
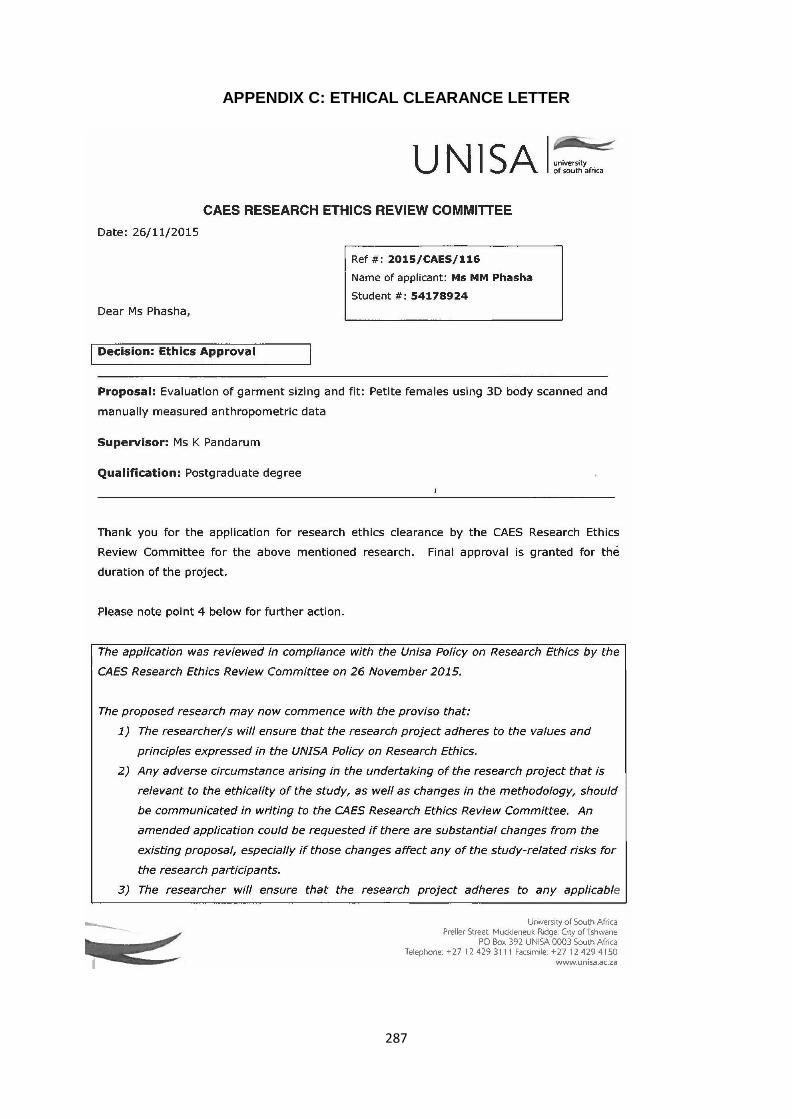
287
APPENDIX C: ETHICAL CLEARANCE LETTER

288
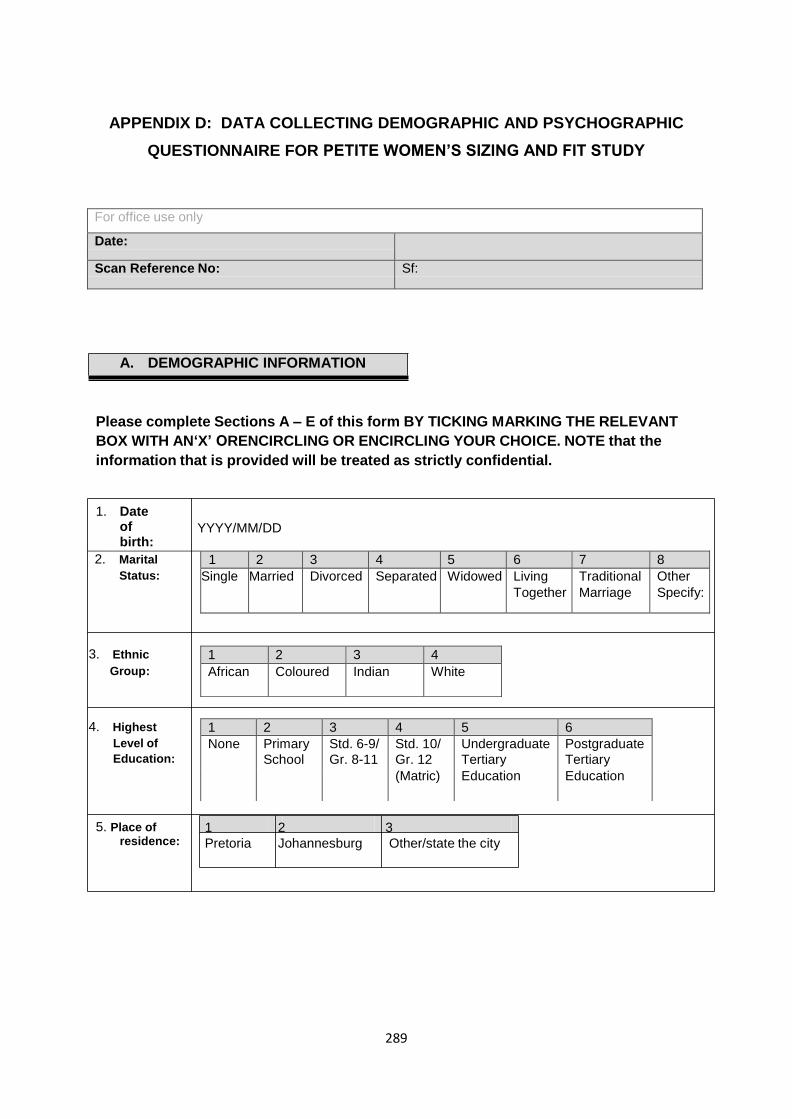
289
APPENDIX D: DATA COLLECTING DEMOGRAPHIC AND PSYCHOGRAPHIC
QUESTIONNAIRE FOR PETITE WOMEN‟S SIZING AND FIT STUDY
For office use only
Date:
Scan Reference No: Sf:
A. DEMOGRAPHIC INFORMATION
Please complete Sections A – E of this form BY TICKING MARKING THE RELEVANT
BOX WITH AN„X‟ ORENCIRCLING OR ENCIRCLING YOUR CHOICE. NOTE that the
information that is provided will be treated as strictly confidential.
1. Date of birth:
YYYY/MM/DD
2. Marital 1 2 3 4 5 6 7 8
Status: Single Married Divorced Separated Widowed Living
Together
Traditional
Marriage
Other
Specify:
5. Place of residence:
1 2 3
Pretoria Johannesburg Other/state the city
3. Ethnic 1 2 3 4
Group: African Coloured Indian White
4. Highest 1 2 3 4 5 6
Level of None Primary Std. 6-9/ Std. 10/ Undergraduate Postgraduate
Education: School Gr. 8-11 Gr. 12 Tertiary Tertiary
(Matric) Education Education

290
B. MARKETING INFORMATION
The following questions are related to your choice of clothes. Please choose one from
the option/s below.
6. How do you usually purchase your clothes? Please encircle the relevant option(s).
1) Physically going to the shops
2) Through catalogues
3) Through internet/online shopping
4) Other(s) please specify:…...............................................................................................
7. In the space next to the ready-to-wear garment listed below, please indicate the retail
outlet (from the retail outlets listed above) you think supplies garments that provide the
best fit for your body.
Retail outlet(s)
Zara 1
Topshop 2
Truworths 3
Woolworths 4
Edgars 5
Identity 6
Legit 7
Mr Price 8
Other(s) Please specify: 9
8. From which section in a retail store do you normally purchase your garments? Please
encircle the relevant option.
1) The average women‟s section
2) The petite women‟s section
3) The plus-size women‟s section
4) The kiddies section/ children‟s department
5) Other(s) please specify: …..................................................................................................
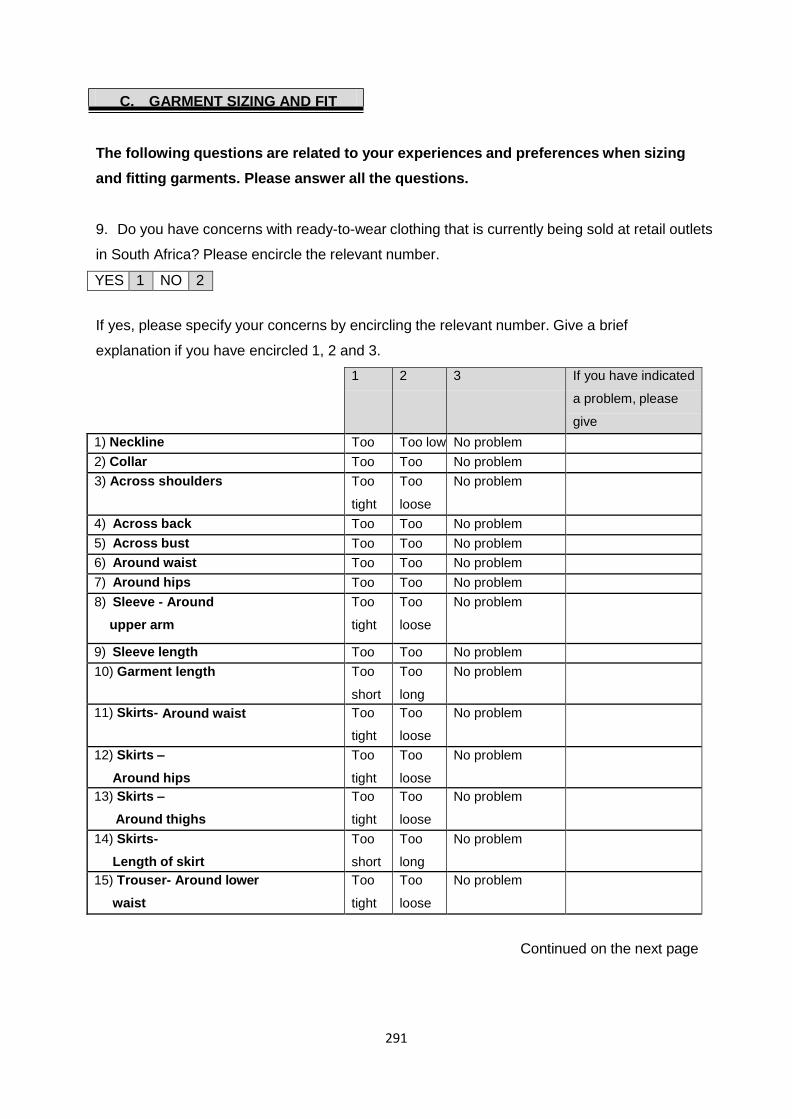
291
C. GARMENT SIZING AND FIT
The following questions are related to your experiences and preferences when sizing
and fitting garments. Please answer all the questions.
9. Do you have concerns with ready-to-wear clothing that is currently being sold at retail outlets
in South Africa? Please encircle the relevant number.
YES 1 NO 2
If yes, please specify your concerns by encircling the relevant number. Give a brief
explanation if you have encircled 1, 2 and 3.
1 2 3 If you have indicated
a problem, please
give
us a brief
explanation of what
you mean
1) Neckline Too
high
Too low No problem
2) Collar Too
tight
Too
loose
No problem
3) Across shoulders Too
tight
Too
loose
No problem
4) Across back Too
tight
Too
loose
No problem
5) Across bust Too
tight
Too
loose
No problem
6) Around waist Too
tight
Too
loose
No problem
7) Around hips Too
tight
Too
loose
No problem
8) Sleeve - Around
upper arm
Too
tight
Too
loose
No problem
9) Sleeve length Too
short
Too
long
No problem
10) Garment length Too
short
Too
long
No problem
11) Skirts- Around waist Too
tight
Too
loose
No problem
12) Skirts –
Around hips
Too
tight
Too
loose
No problem
13) Skirts –
Around thighs
Too
tight
Too
loose
No problem
14) Skirts-
Length of skirt
Too
short
Too
long
No problem
15) Trouser- Around lower
waist
Too
tight
Too
loose
No problem
Continued on the next page
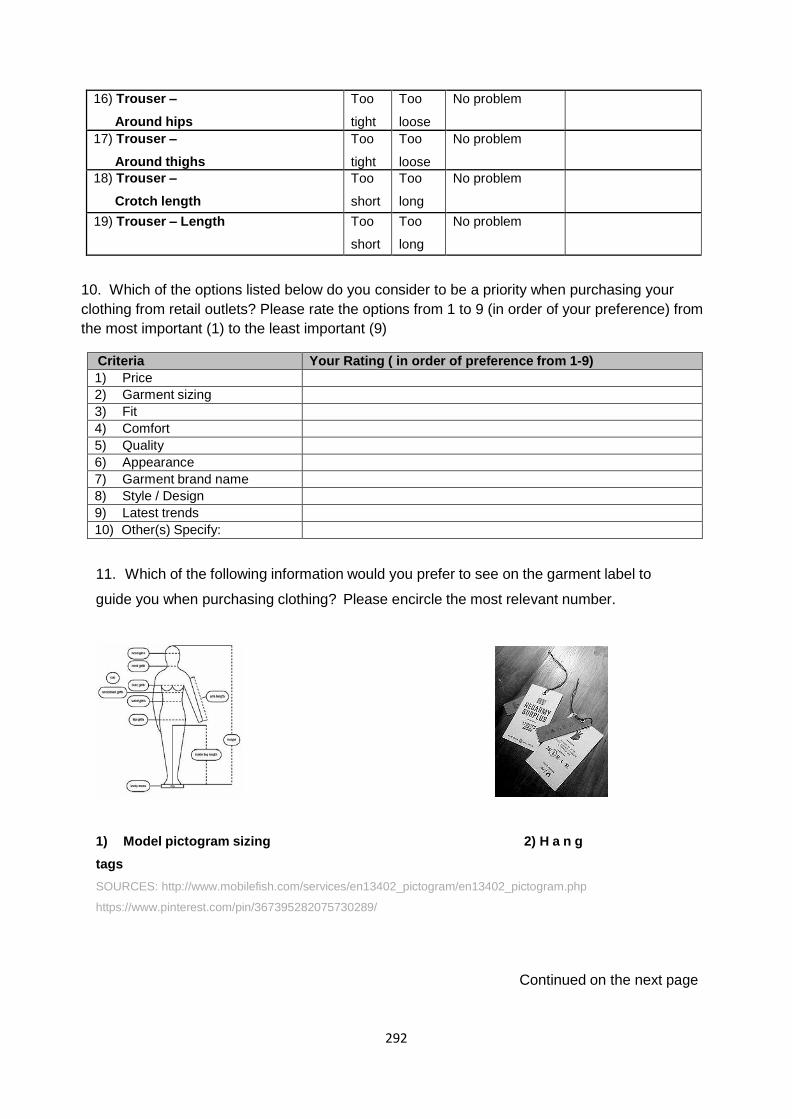
292
16) Trouser –
Around hips
Too
tight
Too
loose
No problem
17) Trouser –
Around thighs
Too
tight
Too
loose
No problem
18) Trouser –
Crotch length
Too
short
Too
long
No problem
19) Trouser – Length Too
short
Too
long
No problem
10. Which of the options listed below do you consider to be a priority when purchasing your
clothing from retail outlets? Please rate the options from 1 to 9 (in order of your preference) from
the most important (1) to the least important (9)
Criteria Your Rating ( in order of preference from 1-9)
1) Price
2) Garment sizing
measurements
3) Fit
4) Comfort
5) Quality
6) Appearance
7) Garment brand name
8) Style / Design
9) Latest trends
10) Other(s) Specify:
11. Which of the following information would you prefer to see on the garment label to
guide you when purchasing clothing? Please encircle the most relevant number.
1) Model pictogram sizing 2) H a n g
tags
SOURCES: http://www.mobilefish.com/services/en13402_pictogram/en13402_pictogram.php
https://www.pinterest.com/pin/367395282075730289/
Continued on the next page
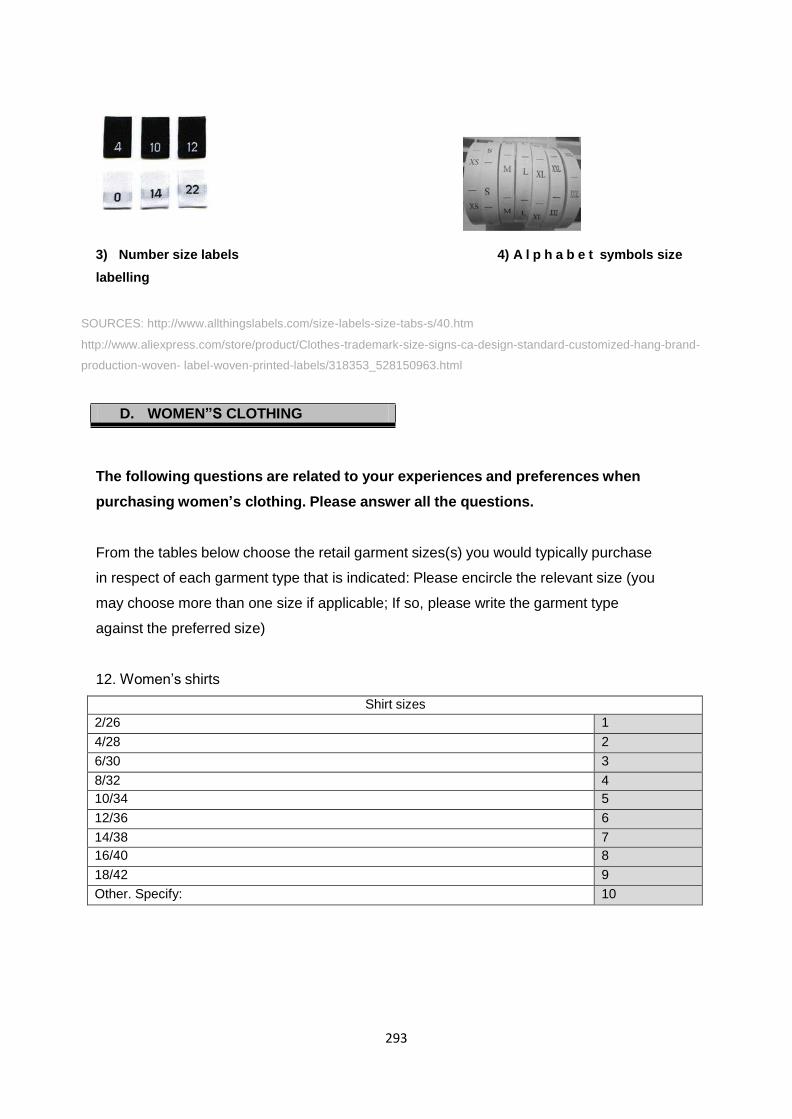
293
3) Number size labels 4) A l p h a b e t symbols size
labelling
SOURCES: http://www.allthingslabels.com/size-labels-size-tabs-s/40.htm
http://www.aliexpress.com/store/product/Clothes-trademark-size-signs-ca-design-standard-customized-hang-brand-
production-woven- label-woven-printed-labels/318353_528150963.html
D. WOMEN”S CLOTHING
The following questions are related to your experiences and preferences when
purchasing women‟s clothing. Please answer all the questions.
From the tables below choose the retail garment sizes(s) you would typically purchase
in respect of each garment type that is indicated: Please encircle the relevant size (you
may choose more than one size if applicable; If so, please write the garment type
against the preferred size)
12. Women‟s shirts
Shirt sizes
2/26 1
4/28 2
6/30 3
8/32 4
10/34 5
12/36 6
14/38 7
16/40 8
18/42 9
Other. Specify: 10
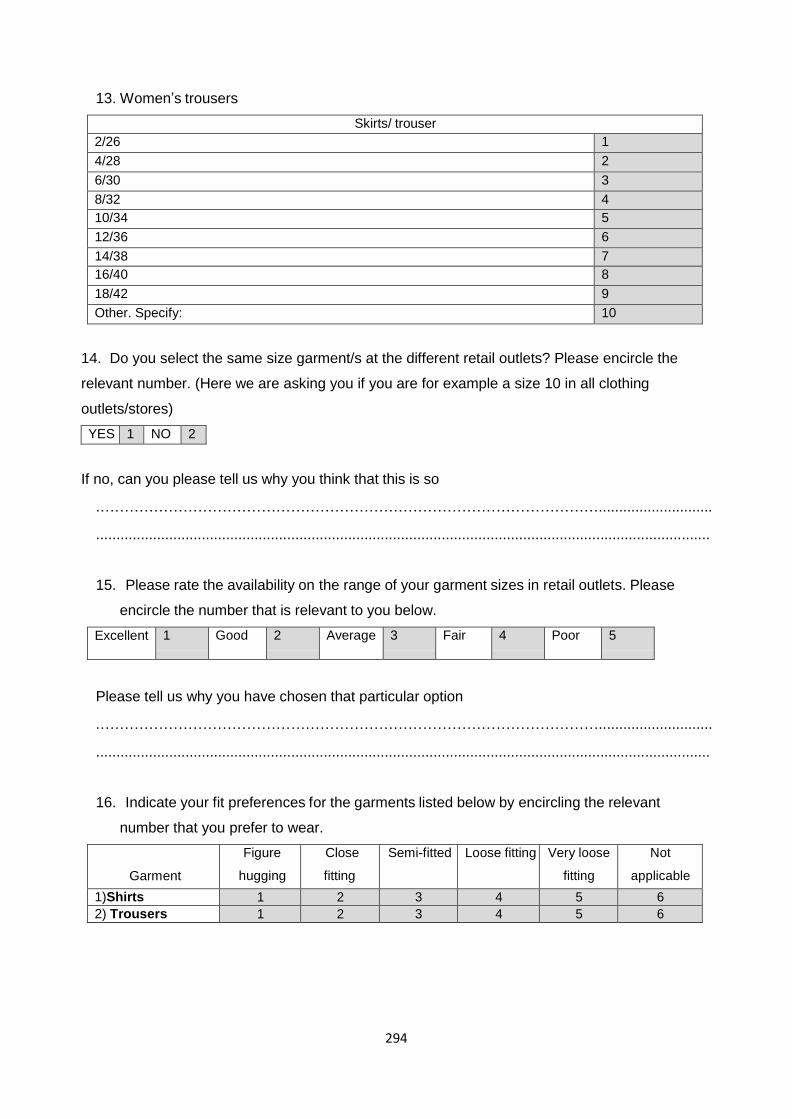
294
13. Women‟s trousers
Skirts/ trouser
sizes 2/26 1
4/28 2
6/30 3
8/32 4
10/34 5
12/36 6
14/38 7
16/40 8
18/42 9
Other. Specify: 10
14. Do you select the same size garment/s at the different retail outlets? Please encircle the
relevant number. (Here we are asking you if you are for example a size 10 in all clothing
outlets/stores)
YES 1 NO 2
If no, can you please tell us why you think that this is so
.…………………………………………………………………………………………............................
.......................................................................................................................................................
15. Please rate the availability on the range of your garment sizes in retail outlets. Please
encircle the number that is relevant to you below.
Excellent 1 Good 2 Average 3 Fair 4 Poor 5
Please tell us why you have chosen that particular option
.…………………………………………………………………………………………............................
.......................................................................................................................................................
16. Indicate your fit preferences for the garments listed below by encircling the relevant
number that you prefer to wear.
Garment
Figure
hugging
Close
fitting
Semi-fitted Loose fitting Very loose
fitting
Not
applicable
1)Shirts 1 2 3 4 5 6
2) Trousers 1 2 3 4 5 6

295
17. What percentage of a retail-bought garment do you alter to fit properly? Please
encircle the relevant number?
0% 1
Up to 25% 2
Up to 50% 3
Up to 75% 4
Up to 100% 5
E. BODY CATHEXIS AND SHAPES
The following questions are related to your perception of your body shape and
proportions. Please answer all the questions.
18. On a scale of 1 to 5, where 1 is extremely satisfied and 5 extremely dissatisfied,
please rate your satisfaction or dissatisfaction with your body parts by ticking the
relevant column.
1
Extremely
Satisfied
2
Somewhat
Satisfied
3
Satisfied
4
Mostly
Dissatisfied
5
Extremely
Dissatisfied
1) Overall Height
2) Overall Body weight
3) Posture
4) Head
5) Upper body
6) Lower body
7) Face
8) Neck
9) Shoulder
10) Arm length
11) Upper arm girth
Continued on the next page
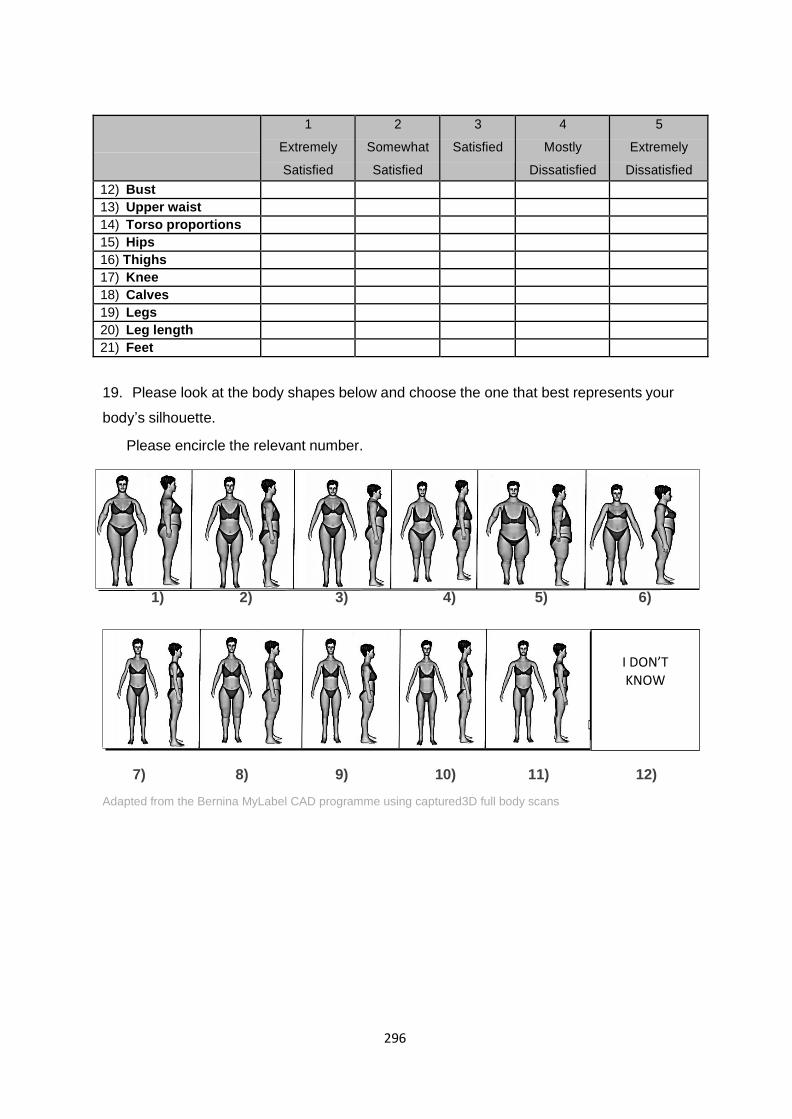
296
1
Extremely
Satisfied
2
Somewhat
Satisfied
3
Satisfied
4
Mostly
Dissatisfied
5
Extremely
Dissatisfied
12) Bust
13) Upper waist
14) Torso proportions
15) Hips
16) Thighs
17) Knee
18) Calves
19) Legs
20) Leg length
21) Feet
19. Please look at the body shapes below and choose the one that best represents your
body‟s silhouette.
Please encircle the relevant number.
1) 2) 3) 4) 5) 6)
I DON‟T KNOW
7) 8) 9) 10) 11) 12)
Adapted from the Bernina MyLabel CAD programme using captured3D full body scans
I DON’T KNOW
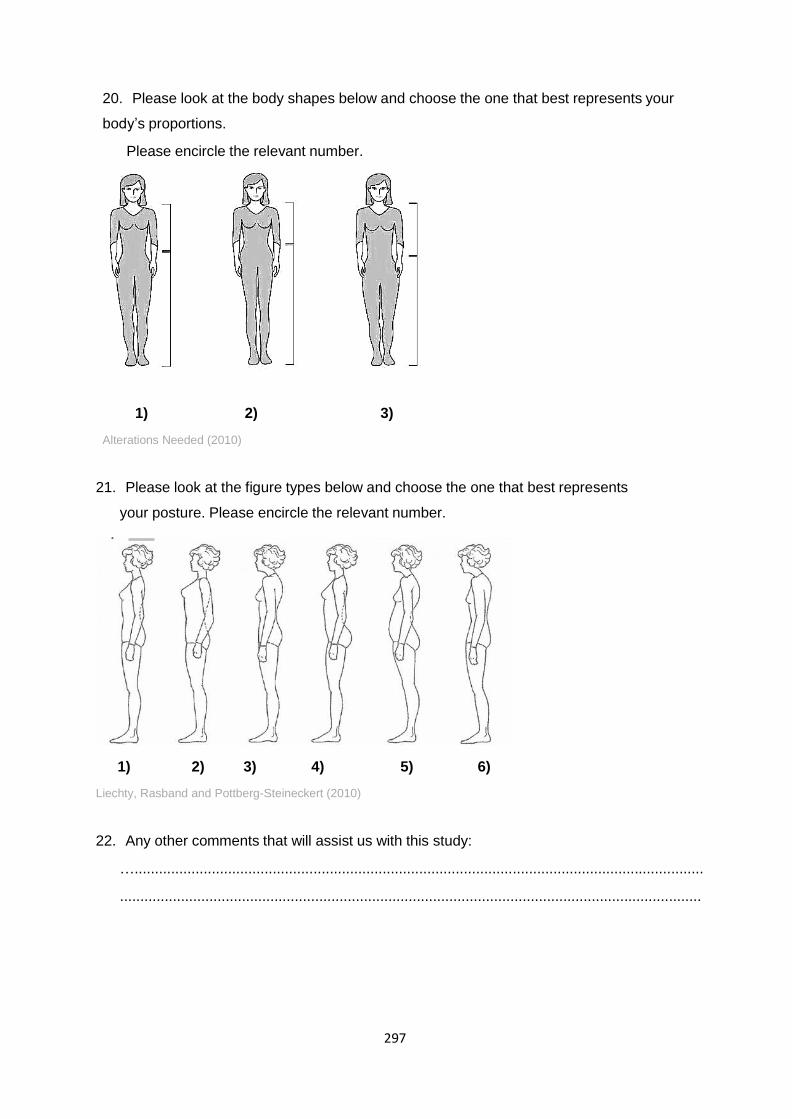
297
20. Please look at the body shapes below and choose the one that best represents your
body‟s proportions.
Please encircle the relevant number.
1) 2) 3)
Alterations Needed (2010)
21. Please look at the figure types below and choose the one that best represents
your posture. Please encircle the relevant number.
1) 2) 3) 4) 5) 6)
Liechty, Rasband and Pottberg-Steineckert (2010)
22. Any other comments that will assist us with this study:
…............................................................................................................................................
...............................................................................................................................................

298
23. Will you be willing to assist us with the fit test evaluations of the garments developed
from this study?
YES 1 NO 2
If yes, please provide us with your contact details below:
Telephone number:
….........................................................................................
Cell number:
…...........................................................................................
Email address: ….............................................................................
THANK YOU FOR TAKING PART IN THE STUDY.
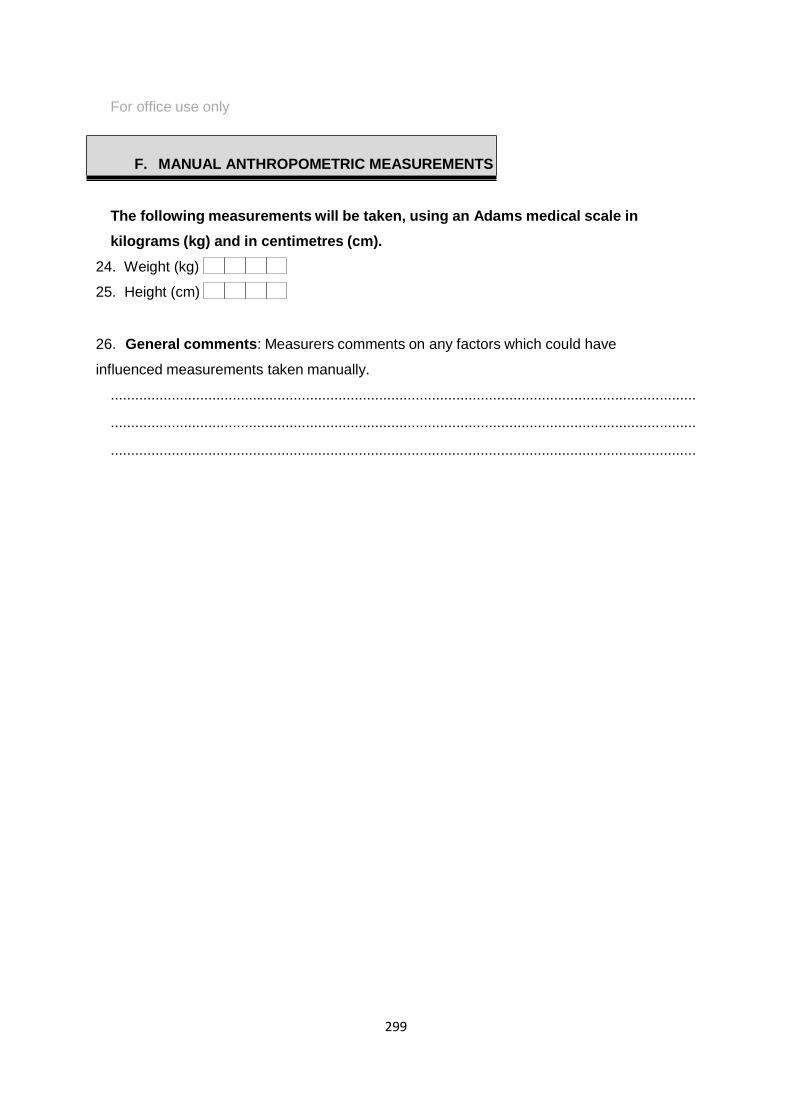
299
For office use only
F. MANUAL ANTHROPOMETRIC MEASUREMENTS
FOR OFFICE USE ONLY
The following measurements will be taken, using an Adams medical scale in
kilograms (kg) and in centimetres (cm).
24. Weight (kg)
25. Height (cm)
26. General comments: Measurers comments on any factors which could have
influenced measurements taken manually.
................................................................................................................................................
................................................................................................................................................
................................................................................................................................................

300
APPENDIX E: LETTER OF APPRECIATION
Department of Life And Consumer Science
Private bag X6 Florida
South Africa 1710
Dear Subject/Participant
The Researcher would like to thank you for participating in this study, and as a token of my
appreciation find attached, a colour copy of your scan with your body measurements. The
analysed data will be used for post-graduate research within the Consumer Sciences
Department at UNISA.
Kind Regards
Marion Phasha
(Consumer Science Research Masters student)

301
APPENDIX F: EXAMPLES OF THE BOX PLOTS, HISTOGRAMS AND DATA DISTRIBUTIONS OF THE 3D FULL BODY
SCANNED PETITE SUBJECTS‟ UPPER PEAR BODY DIMENSIONS
NECK FULL

302
SHOULDER

303
ARMSCYE

304
BICEP

305
ELBOW

306
WRIST

307
CHEST

308
BUST
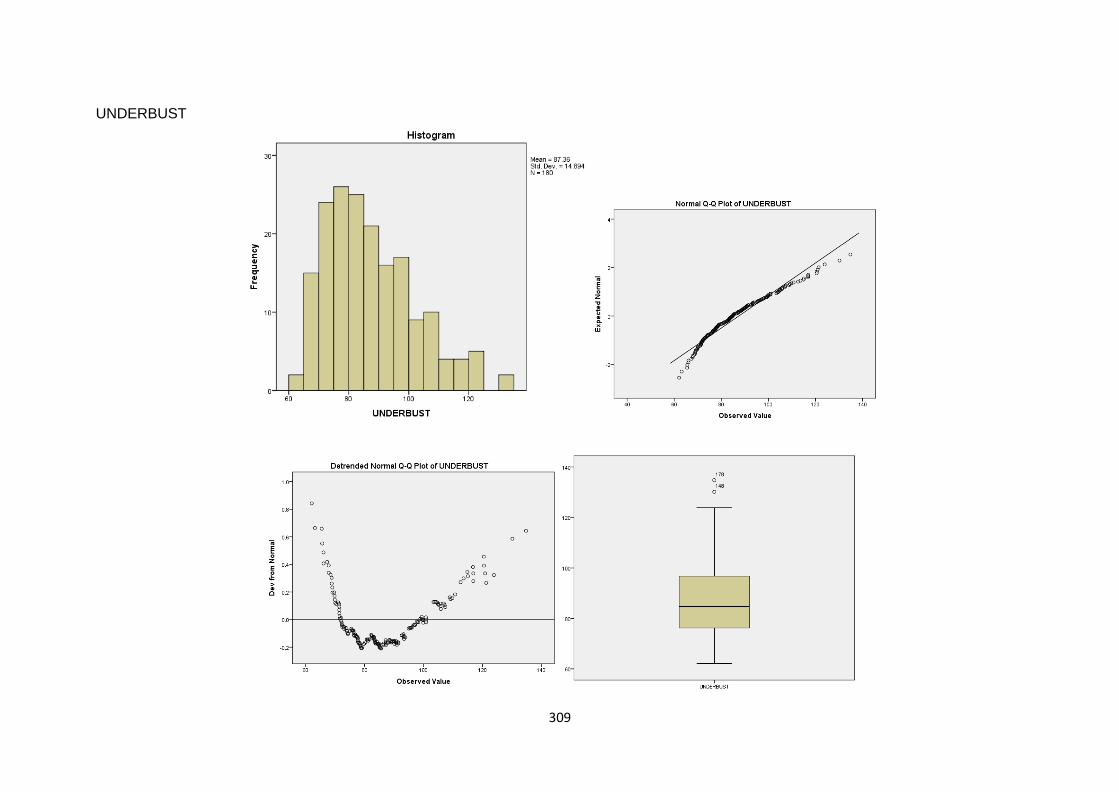
309
UNDERBUST
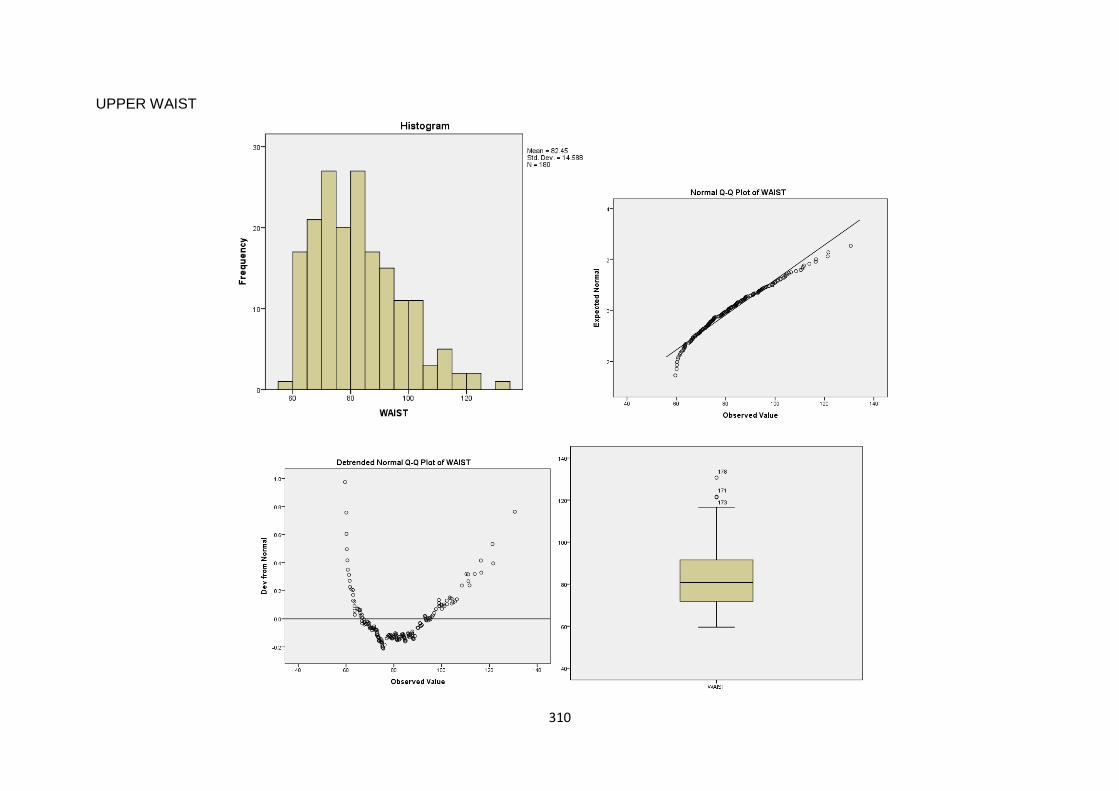
310
UPPER WAIST

311
LOWER WAIST
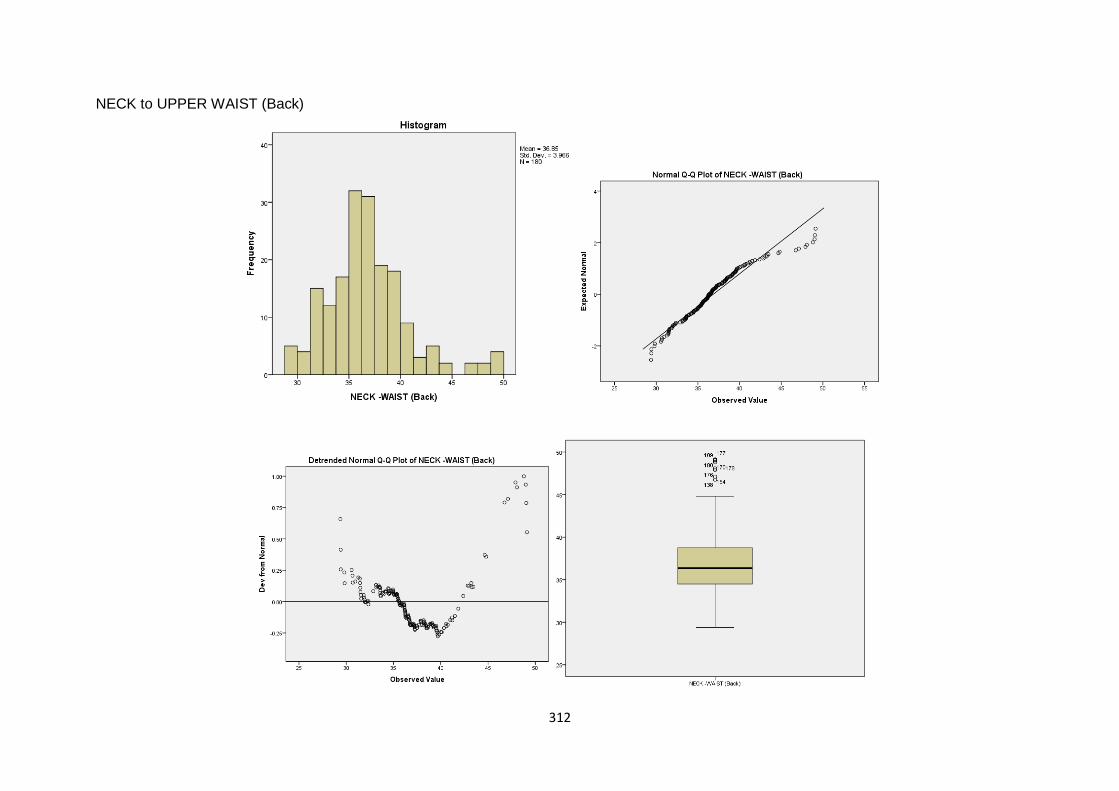
312
NECK to UPPER WAIST (Back)

313
NECK to UPPER WAIST (Front)

314
SLEEVE LENGTH
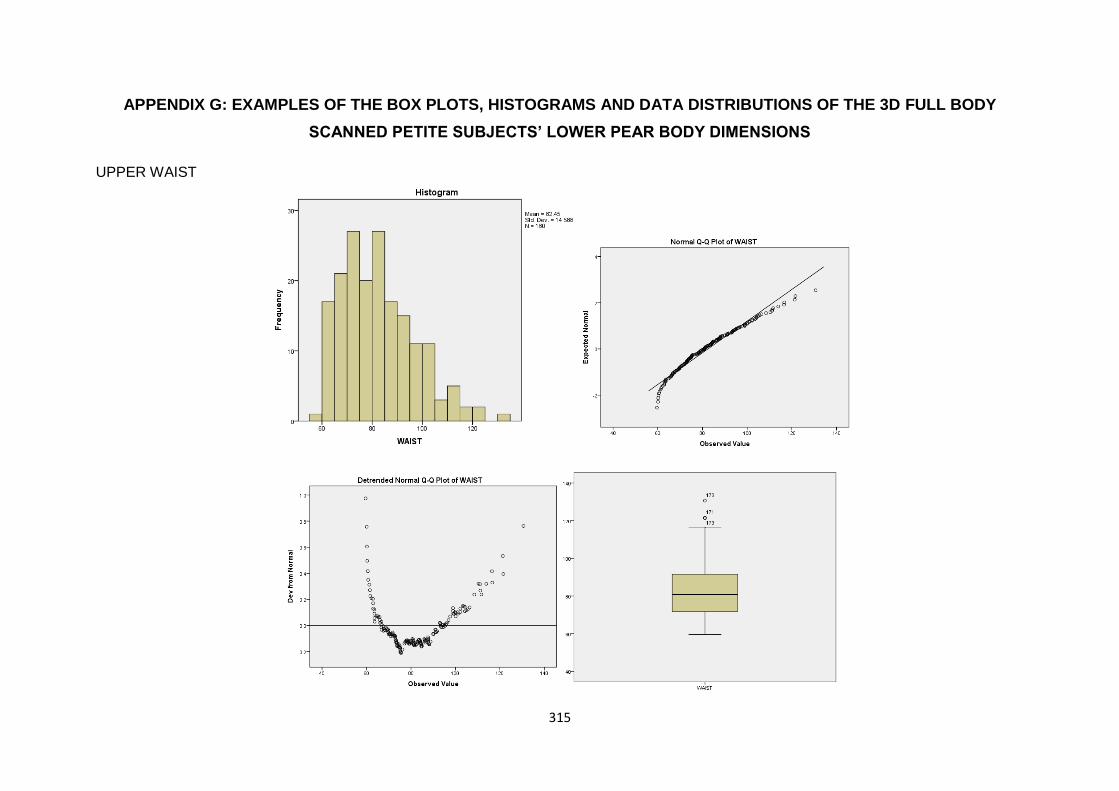
315
APPENDIX G: EXAMPLES OF THE BOX PLOTS, HISTOGRAMS AND DATA DISTRIBUTIONS OF THE 3D FULL BODY
SCANNED PETITE SUBJECTS‟ LOWER PEAR BODY DIMENSIONS
UPPER WAIST

316
LOWER WAIST

317
HIP

318
HIGH HIP
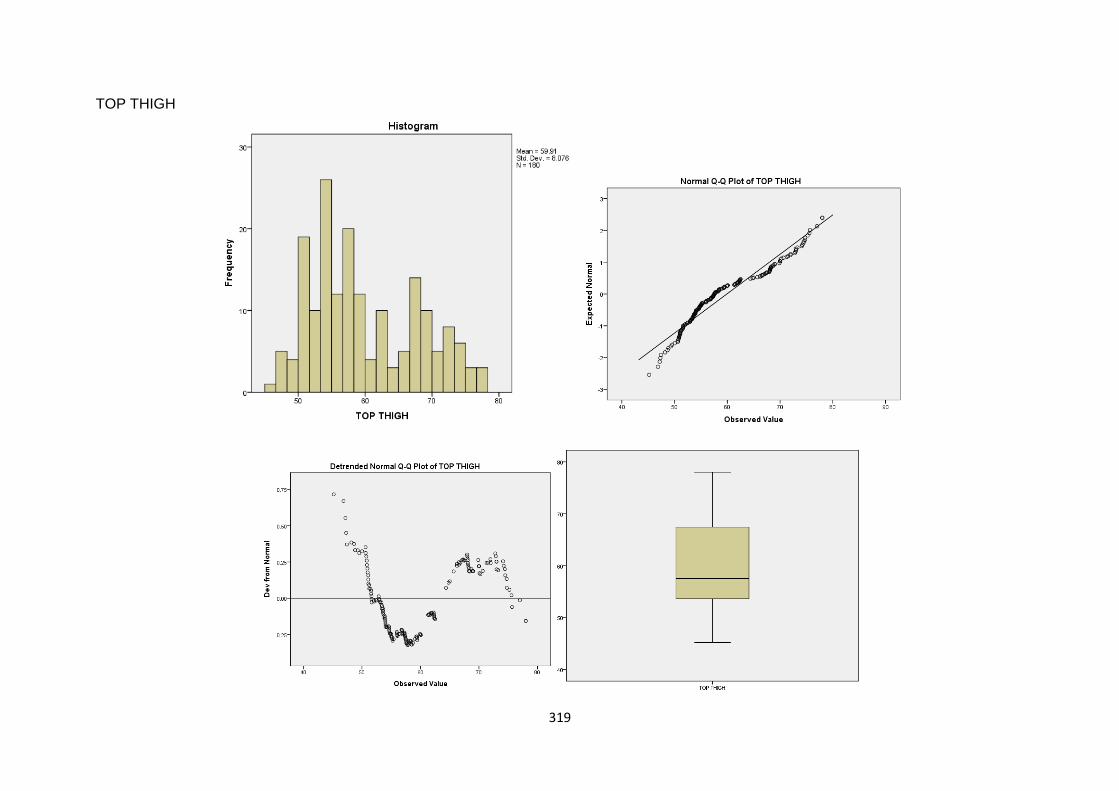
319
TOP THIGH
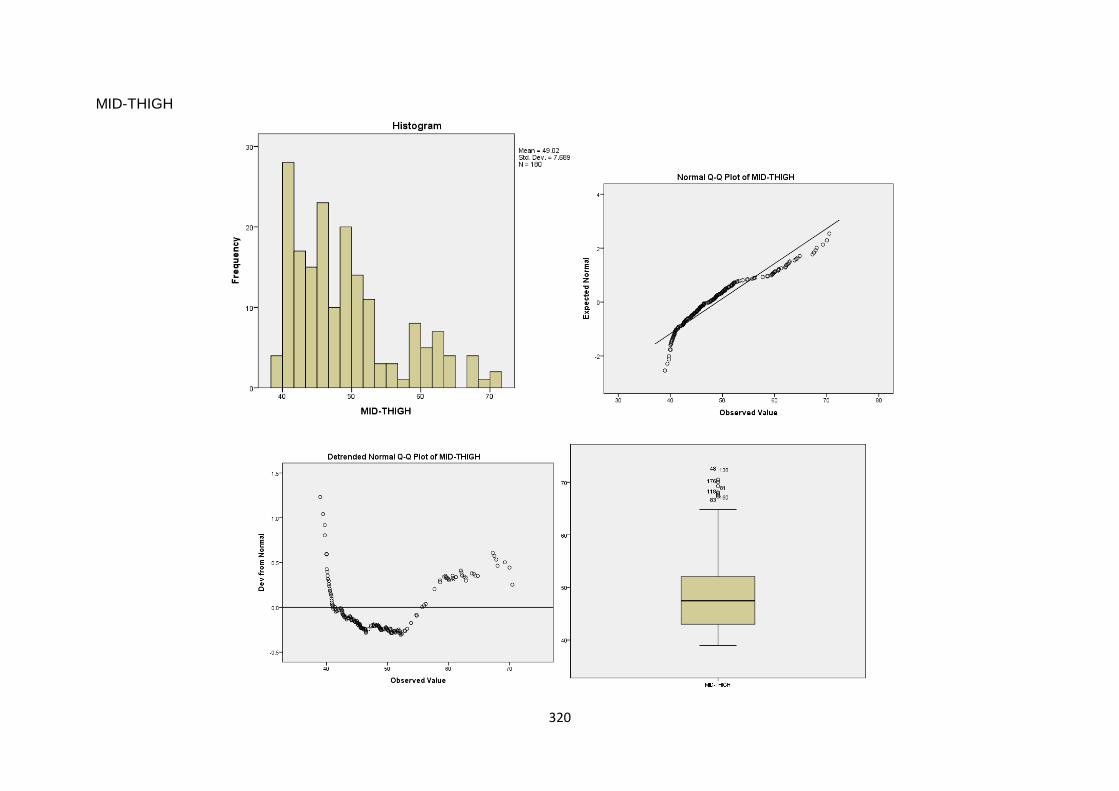
320
MID-THIGH
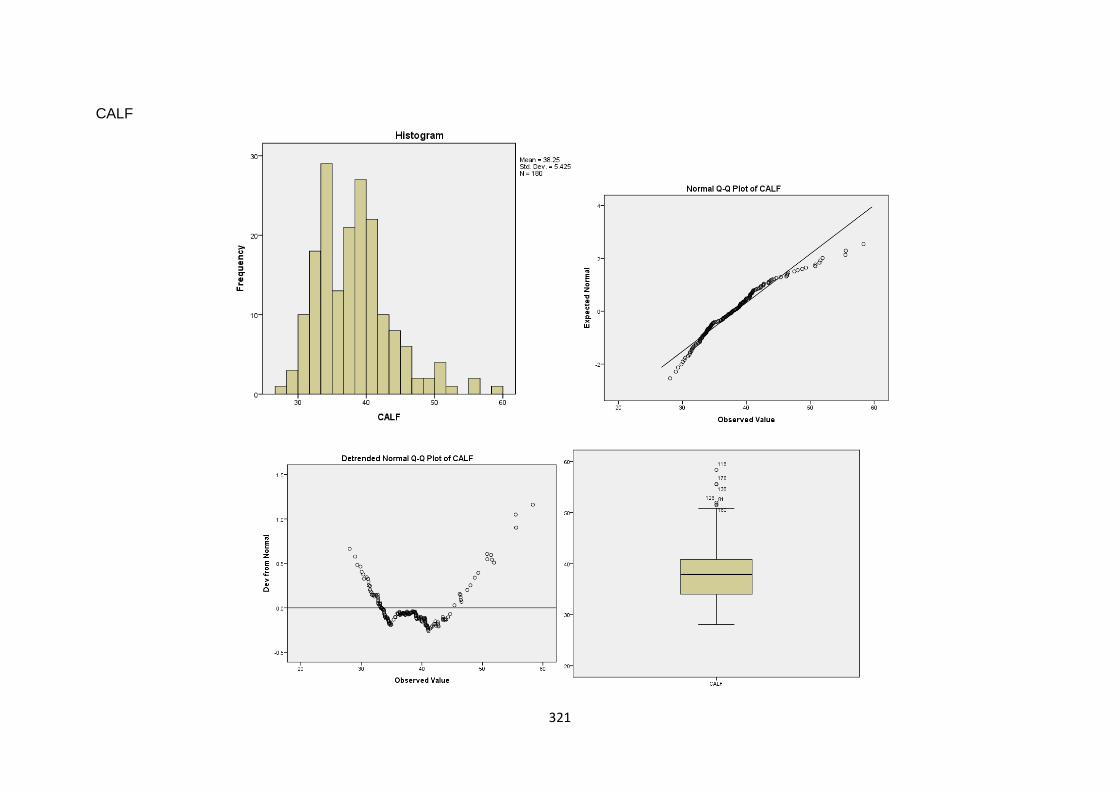
321
CALF
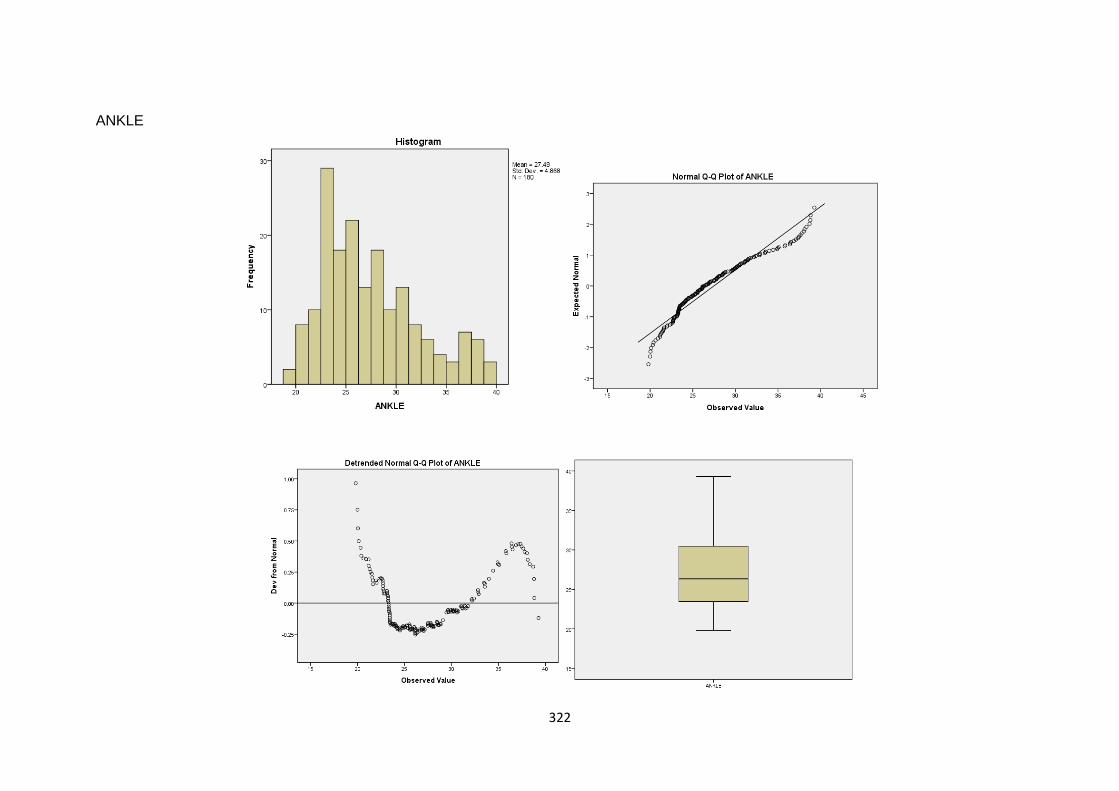
322
ANKLE

323
KNEE
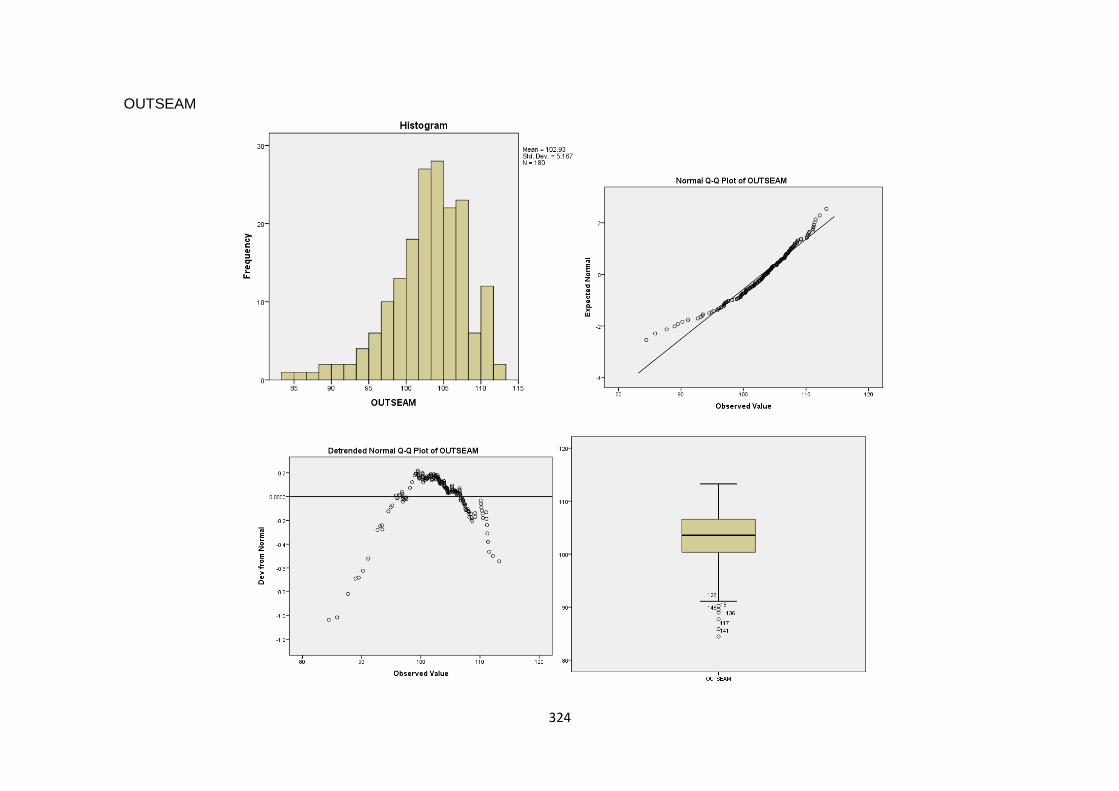
324
OUTSEAM

325
INSEAM
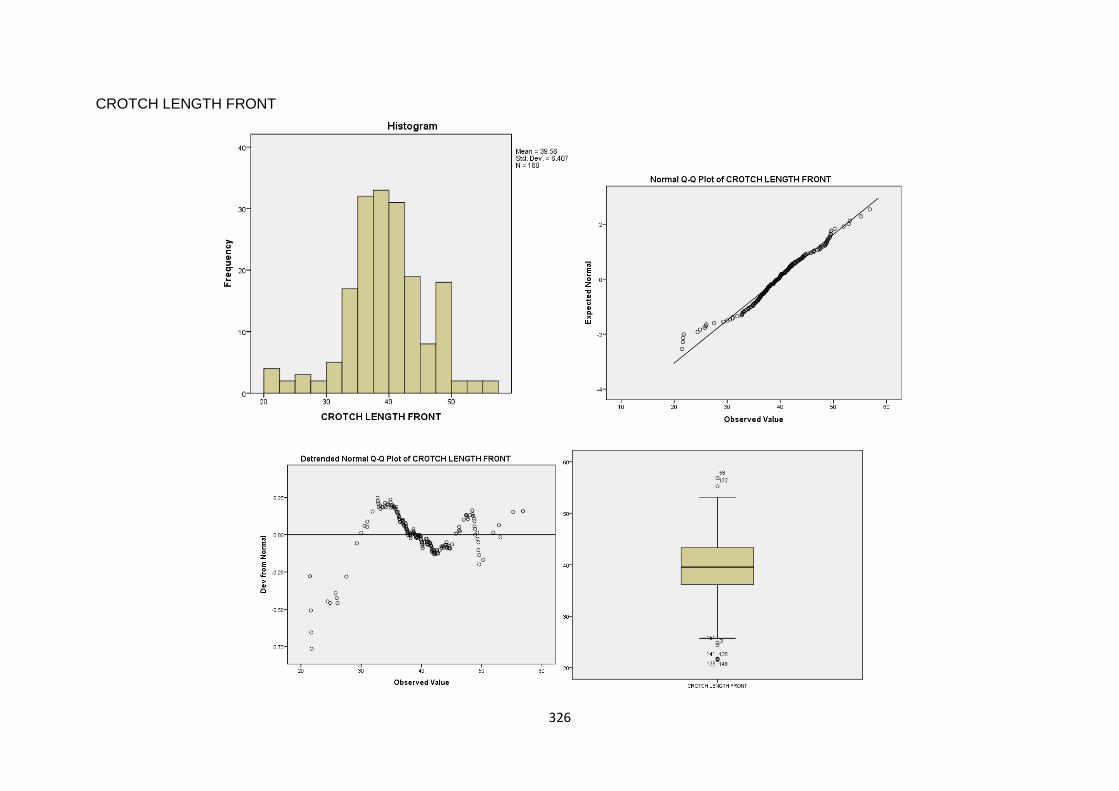
326
CROTCH LENGTH FRONT
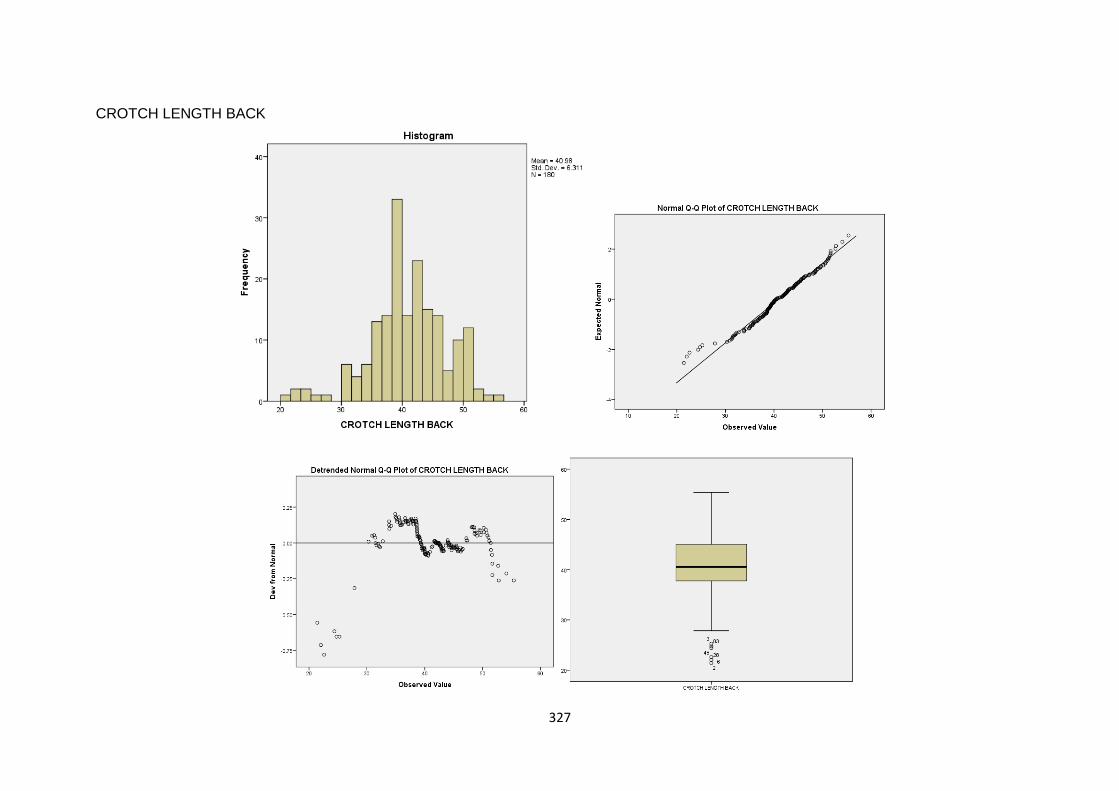
327
CROTCH LENGTH BACK
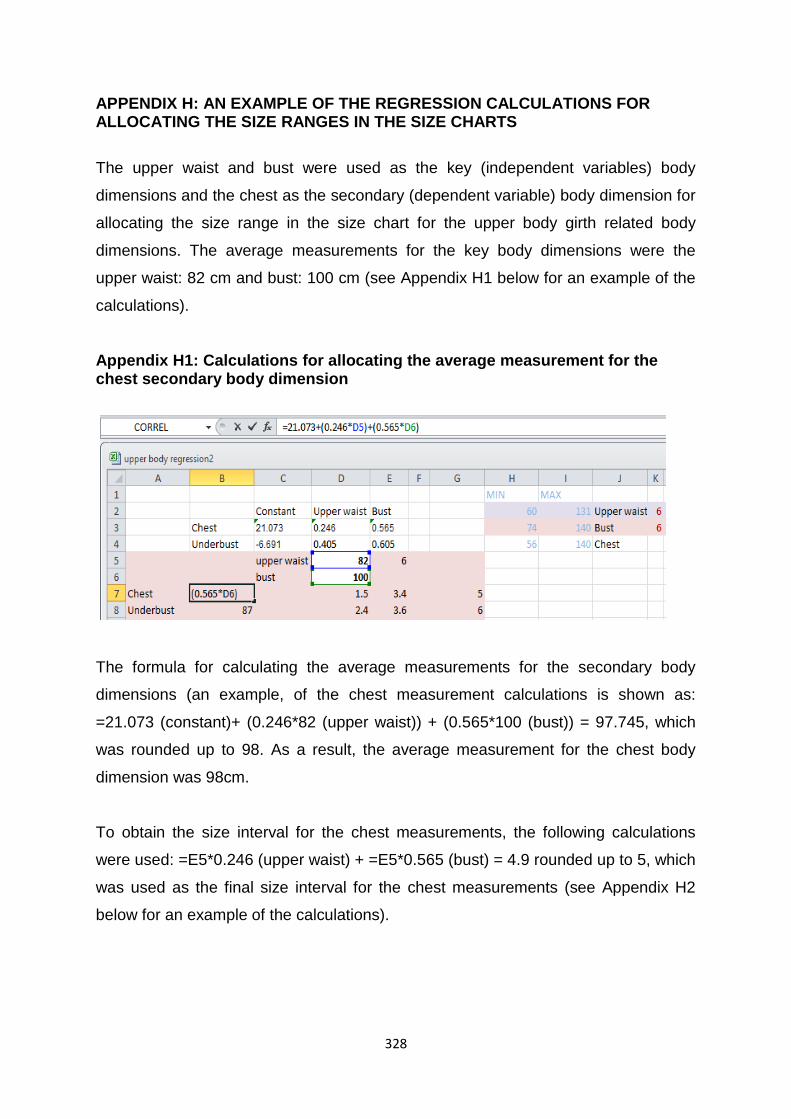
328
APPENDIX H: AN EXAMPLE OF THE REGRESSION CALCULATIONS FOR ALLOCATING THE SIZE RANGES IN THE SIZE CHARTS
The upper waist and bust were used as the key (independent variables) body
dimensions and the chest as the secondary (dependent variable) body dimension for
allocating the size range in the size chart for the upper body girth related body
dimensions. The average measurements for the key body dimensions were the
upper waist: 82 cm and bust: 100 cm (see Appendix H1 below for an example of the
calculations).
Appendix H1: Calculations for allocating the average measurement for the chest secondary body dimension
The formula for calculating the average measurements for the secondary body
dimensions (an example, of the chest measurement calculations is shown as:
=21.073 (constant)+ (0.246*82 (upper waist)) + (0.565*100 (bust)) = 97.745, which
was rounded up to 98. As a result, the average measurement for the chest body
dimension was 98cm.
To obtain the size interval for the chest measurements, the following calculations
were used: =E5*0.246 (upper waist) + =E5*0.565 (bust) = 4.9 rounded up to 5, which
was used as the final size interval for the chest measurements (see Appendix H2
below for an example of the calculations).

329
Appendix H2: Calculations for allocating the size interval for the chest secondary body dimension
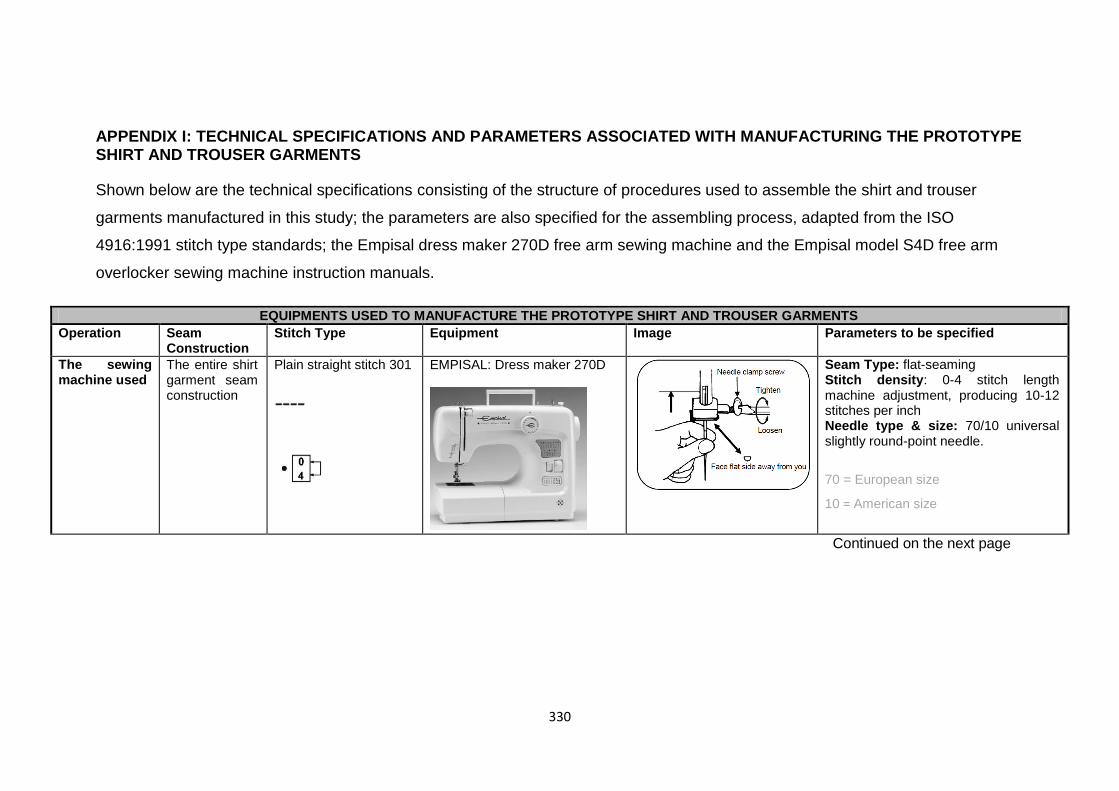
330
APPENDIX I: TECHNICAL SPECIFICATIONS AND PARAMETERS ASSOCIATED WITH MANUFACTURING THE PROTOTYPE SHIRT AND TROUSER GARMENTS
Shown below are the technical specifications consisting of the structure of procedures used to assemble the shirt and trouser
garments manufactured in this study; the parameters are also specified for the assembling process, adapted from the ISO
4916:1991 stitch type standards; the Empisal dress maker 270D free arm sewing machine and the Empisal model S4D free arm
overlocker sewing machine instruction manuals.
EQUIPMENTS USED TO MANUFACTURE THE PROTOTYPE SHIRT AND TROUSER GARMENTS
Operation Seam Construction
Stitch Type
Equipment Image Parameters to be specified
The sewing machine used
The entire shirt garment seam construction
Plain straight stitch 301
EMPISAL: Dress maker 270D
Seam Type: flat-seaming Stitch density: 0-4 stitch length machine adjustment, producing 10-12 stitches per inch Needle type & size: 70/10 universal slightly round-point needle.
70 = European size
10 = American size
Continued on the next page

331
The over locker used
Fabric edges of the entire shirt garment
504 Overedge
EMPISAL: Model S4D
Seam Type: flat-seaming, narrow over lock Stitch density: 2.0 - 3.5 mm Needle type & size: HA×1 No.11-14 130/705H No. 80-90 Three threads were used instead of four. Only the left needle was used, the over locking width was 6mm (0.24).
Threads used - - -
Thread Type/size: Seralon M120/1000m threads Thread composition: 100% polyester threads
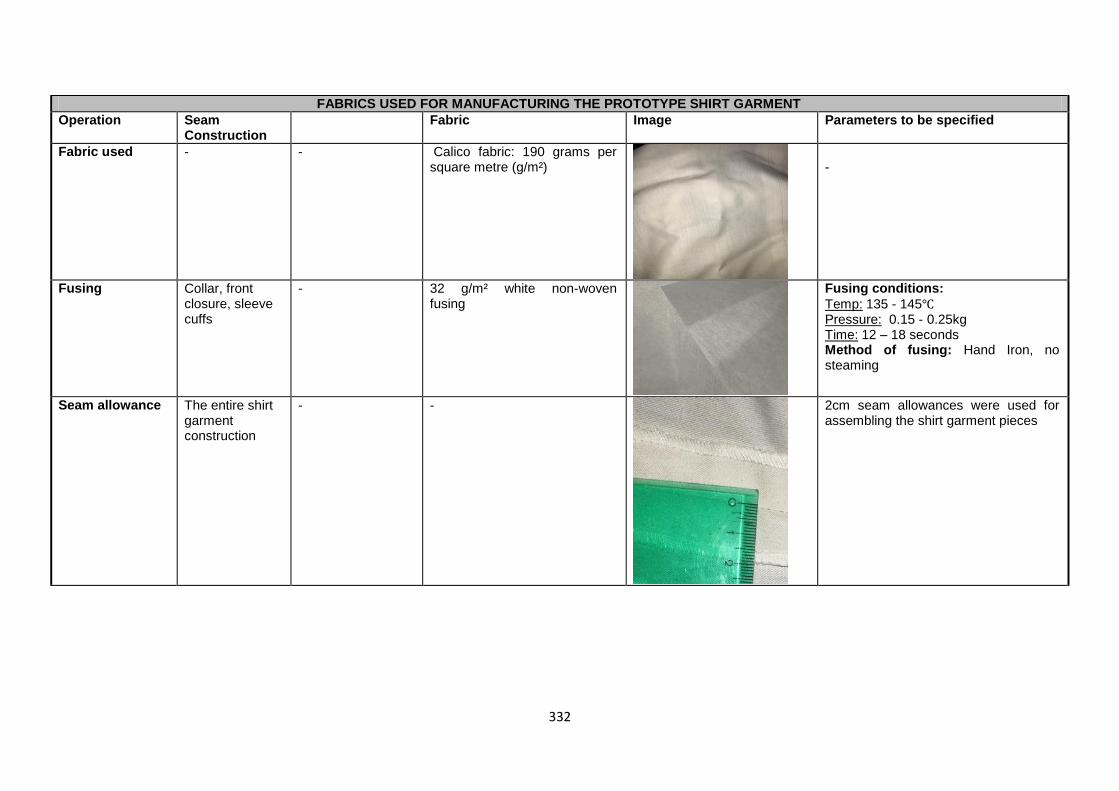
332
FABRICS USED FOR MANUFACTURING THE PROTOTYPE SHIRT GARMENT
Operation Seam Construction
Fabric Image Parameters to be specified
Fabric used - -
Calico fabric: 190 grams per square metre (g/m²)
-
Fusing Collar, front closure, sleeve cuffs
- 32 g/m² white non-woven fusing
Fusing conditions:
Temp: 135 - 145℃ Pressure: 0.15 - 0.25kg Time: 12 – 18 seconds Method of fusing: Hand Iron, no steaming
Seam allowance The entire shirt garment construction
- -
2cm seam allowances were used for assembling the shirt garment pieces
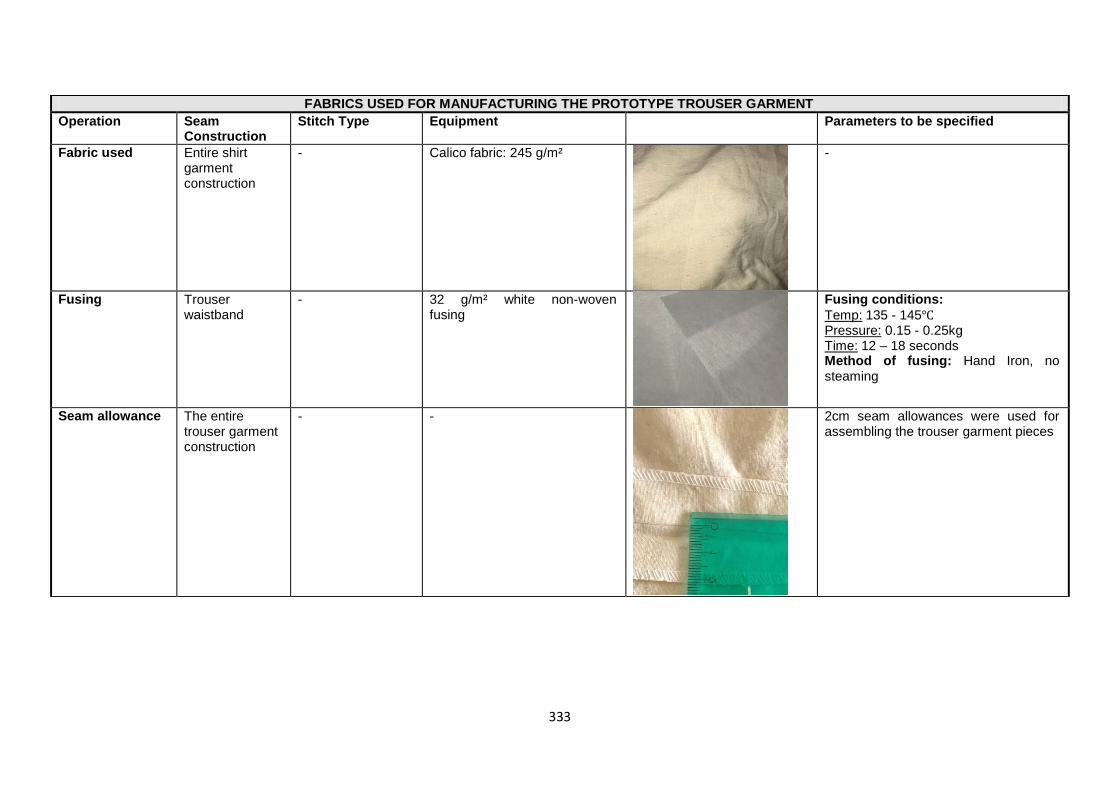
333
FABRICS USED FOR MANUFACTURING THE PROTOTYPE TROUSER GARMENT
Operation Seam Construction
Stitch Type
Equipment Parameters to be specified
Fabric used Entire shirt garment construction
-
Calico fabric: 245 g/m²
-
Fusing Trouser waistband
- 32 g/m² white non-woven fusing
Fusing conditions:
Temp: 135 - 145℃ Pressure: 0.15 - 0.25kg Time: 12 – 18 seconds Method of fusing: Hand Iron, no steaming
Seam allowance The entire trouser garment construction
- -
2cm seam allowances were used for assembling the trouser garment pieces
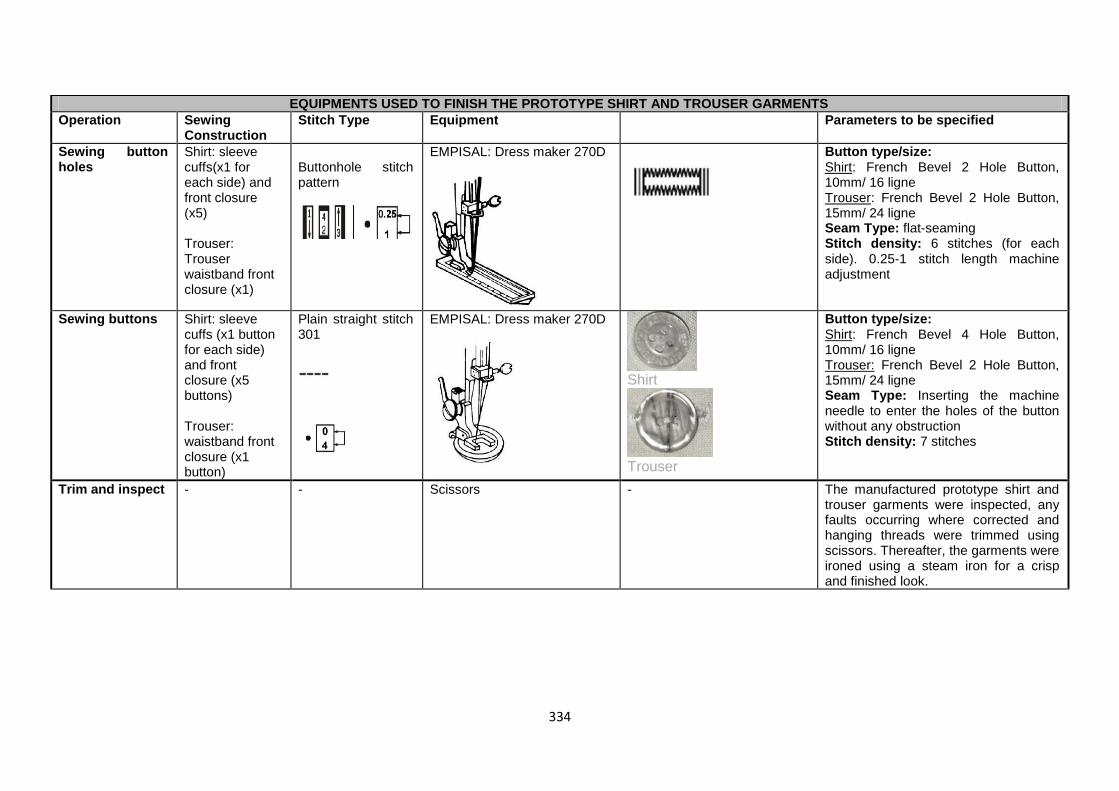
334
EQUIPMENTS USED TO FINISH THE PROTOTYPE SHIRT AND TROUSER GARMENTS
Operation Sewing Construction
Stitch Type
Equipment Parameters to be specified
Sewing button holes
Shirt: sleeve cuffs(x1 for each side) and front closure (x5) Trouser: Trouser waistband front closure (x1)
Buttonhole stitch pattern
EMPISAL: Dress maker 270D
Button type/size: Shirt: French Bevel 2 Hole Button, 10mm/ 16 ligne Trouser: French Bevel 2 Hole Button, 15mm/ 24 ligne Seam Type: flat-seaming Stitch density: 6 stitches (for each side). 0.25-1 stitch length machine adjustment
Sewing buttons
Shirt: sleeve cuffs (x1 button for each side) and front closure (x5 buttons) Trouser: waistband front closure (x1 button)
Plain straight stitch 301
EMPISAL: Dress maker 270D
Shirt
Trouser
Button type/size: Shirt: French Bevel 4 Hole Button, 10mm/ 16 ligne Trouser: French Bevel 2 Hole Button, 15mm/ 24 ligne Seam Type: Inserting the machine needle to enter the holes of the button without any obstruction Stitch density: 7 stitches
Trim and inspect -
-
Scissors
- The manufactured prototype shirt and trouser garments were inspected, any faults occurring where corrected and hanging threads were trimmed using scissors. Thereafter, the garments were ironed using a steam iron for a crisp and finished look.

335
APPENDIX J: STANDARDS FOR THE GARMENT FIT TEST EVALUATIONS SHIRT FIT TEST EVALUATIONS STANDARDS
GOOD
MODERATE
POOR
COMMENTS:
Evaluators
1. There is compatibility and ease in the garment (No pulls or tucks)
2. The garment is steady and rests well on the body ( No stretching or gathering)
3. There is a smooth drape at the front of the garment (Not too tight, no creases)
4. There is a smooth drape at the back of the garment (Not too tight, no creases)
5. Garment collar lies smooth against base of the neck (Does not stretch or have gatherings)
6. The shoulders lie flat and balanced (No pulling or rippling)
7. The armholes do not constrict, have gatherings or pull away from the body
8. The sleeves are accurately positioned, fits and hang well (Not too short or too long)
9. The sleeve biceps area fits well (No pulls or gatherings)
10. The sleeve elbow area fits well (No pulls or gatherings)
11. The sleeve wrist area fits well (No pulls or gatherings)
12. The bust area fits well with adequate ease (There are no gaps or pulling)
13. The closure location is balanced (Buttons and buttonholes are correctly aligned)
14. There is enough ease for closure (Not too tight or loose)
15. Hems and finishes are parallel and smooth (No bulking)
16. The garment is at the right length and is evenly hemmed (Not too short or too long)
17. Is there comfortability and movement when wearing the garment?
18. Can the wearer sit comfortably when wearing the garment?
Adapted from Stamper et al. (2005), Liechty et al. (2010:54) and Marshall et al. (2012).
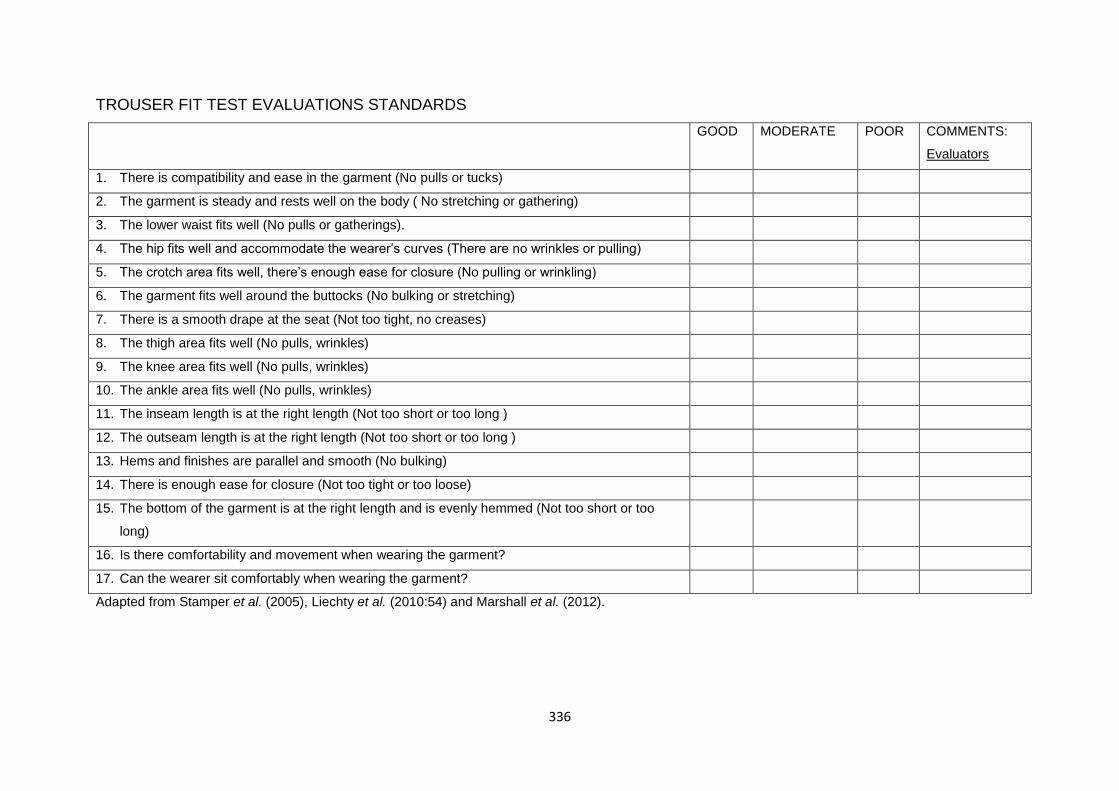
336
TROUSER FIT TEST EVALUATIONS STANDARDS
GOOD
MODERATE
POOR
COMMENTS:
Evaluators
1. There is compatibility and ease in the garment (No pulls or tucks)
2. The garment is steady and rests well on the body ( No stretching or gathering)
3. The lower waist fits well (No pulls or gatherings).
4. The hip fits well and accommodate the wearer‟s curves (There are no wrinkles or pulling)
5. The crotch area fits well, there‟s enough ease for closure (No pulling or wrinkling)
6. The garment fits well around the buttocks (No bulking or stretching)
7. There is a smooth drape at the seat (Not too tight, no creases)
8. The thigh area fits well (No pulls, wrinkles)
9. The knee area fits well (No pulls, wrinkles)
10. The ankle area fits well (No pulls, wrinkles)
11. The inseam length is at the right length (Not too short or too long )
12. The outseam length is at the right length (Not too short or too long )
13. Hems and finishes are parallel and smooth (No bulking)
14. There is enough ease for closure (Not too tight or too loose)
15. The bottom of the garment is at the right length and is evenly hemmed (Not too short or too
long)
16. Is there comfortability and movement when wearing the garment?
17. Can the wearer sit comfortably when wearing the garment?
Adapted from Stamper et al. (2005), Liechty et al. (2010:54) and Marshall et al. (2012).
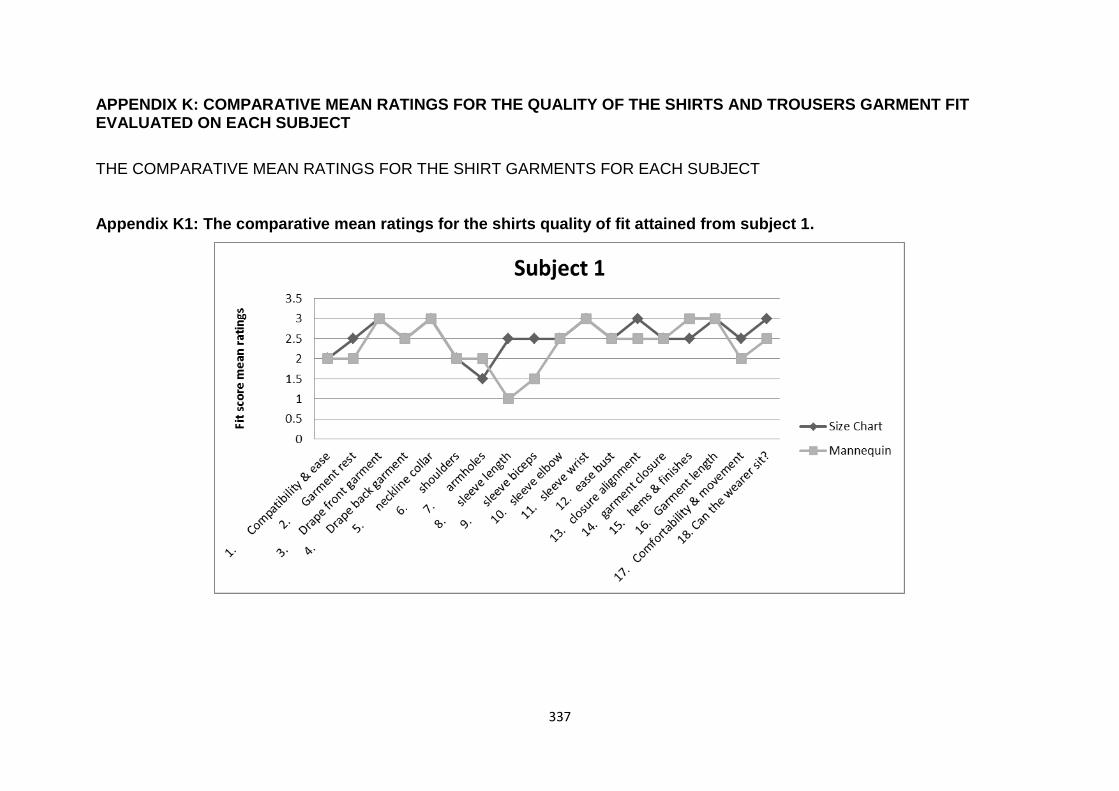
337
APPENDIX K: COMPARATIVE MEAN RATINGS FOR THE QUALITY OF THE SHIRTS AND TROUSERS GARMENT FIT EVALUATED ON EACH SUBJECT
THE COMPARATIVE MEAN RATINGS FOR THE SHIRT GARMENTS FOR EACH SUBJECT
Appendix K1: The comparative mean ratings for the shirts quality of fit attained from subject 1.
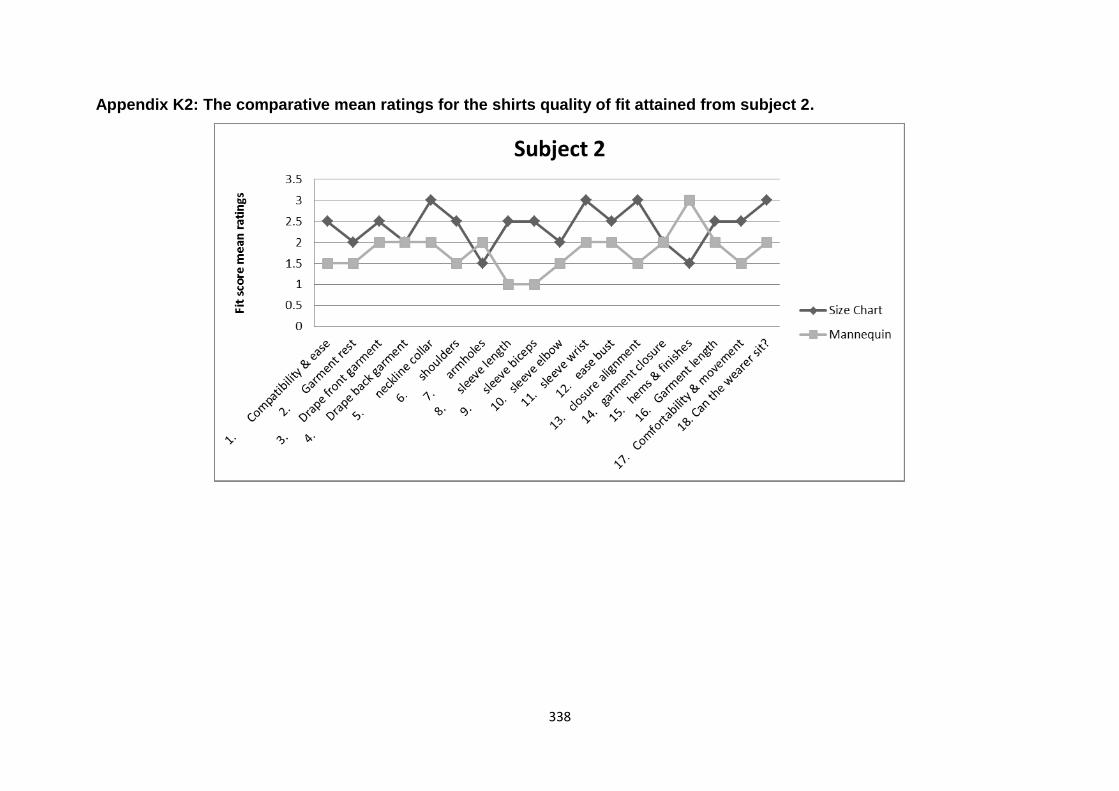
338
Appendix K2: The comparative mean ratings for the shirts quality of fit attained from subject 2.
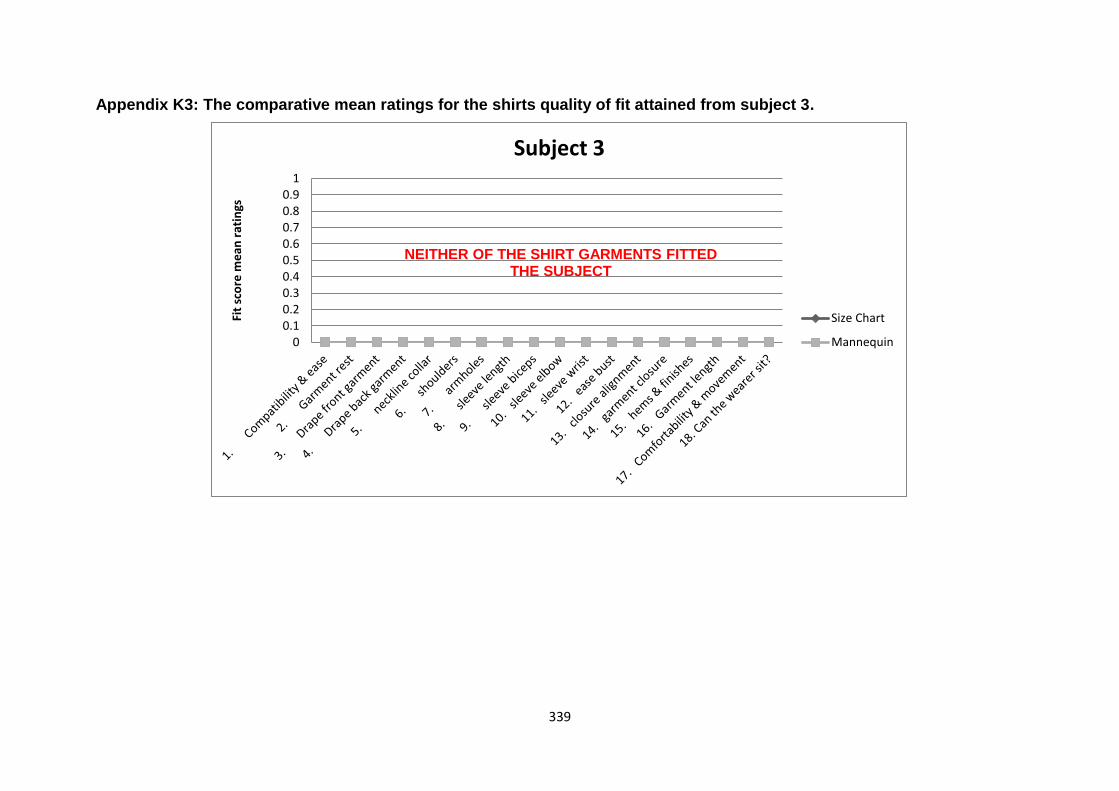
339
Appendix K3: The comparative mean ratings for the shirts quality of fit attained from subject 3.
00.10.20.30.40.50.60.70.80.9
1
Fit
sco
re m
ean
rat
ings
Subject 3
Size Chart
Mannequin
NEITHER OF THE SHIRT GARMENTS FITTED
THE SUBJECT

340
Appendix K4: The comparative mean ratings for the shirts quality of fit attained from subject 4.
THE MANNEQUIN‟S MEASUREMENTS GARMENT DID NOT
FIT THE SUBJECT
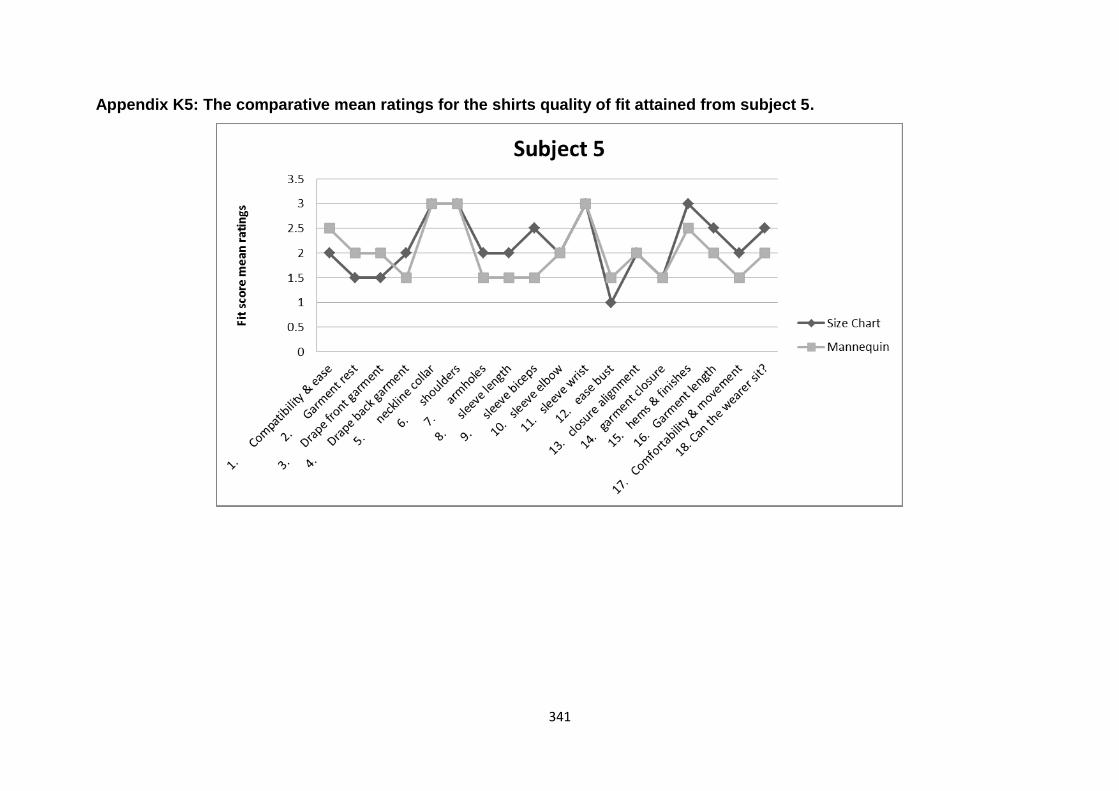
341
Appendix K5: The comparative mean ratings for the shirts quality of fit attained from subject 5.

342
Appendix K6: The comparative mean ratings for the shirts quality of fit attained from subject 6.

343
Appendix K7: The comparative mean ratings for the shirts quality of fit attained from subject 7.

344
Appendix K8: The comparative mean ratings for the shirts quality of fit attained from subject 8.
NEITHER OF THE SHIRT GARMENTS FITTED
THE SUBJECT

345
Appendix K9: The comparative mean ratings for the shirts quality of fit attained from subject 9.
THE MANNEQUIN‟S MEASUREMENTS GARMENT DID NOT
FIT THE SUBJECT
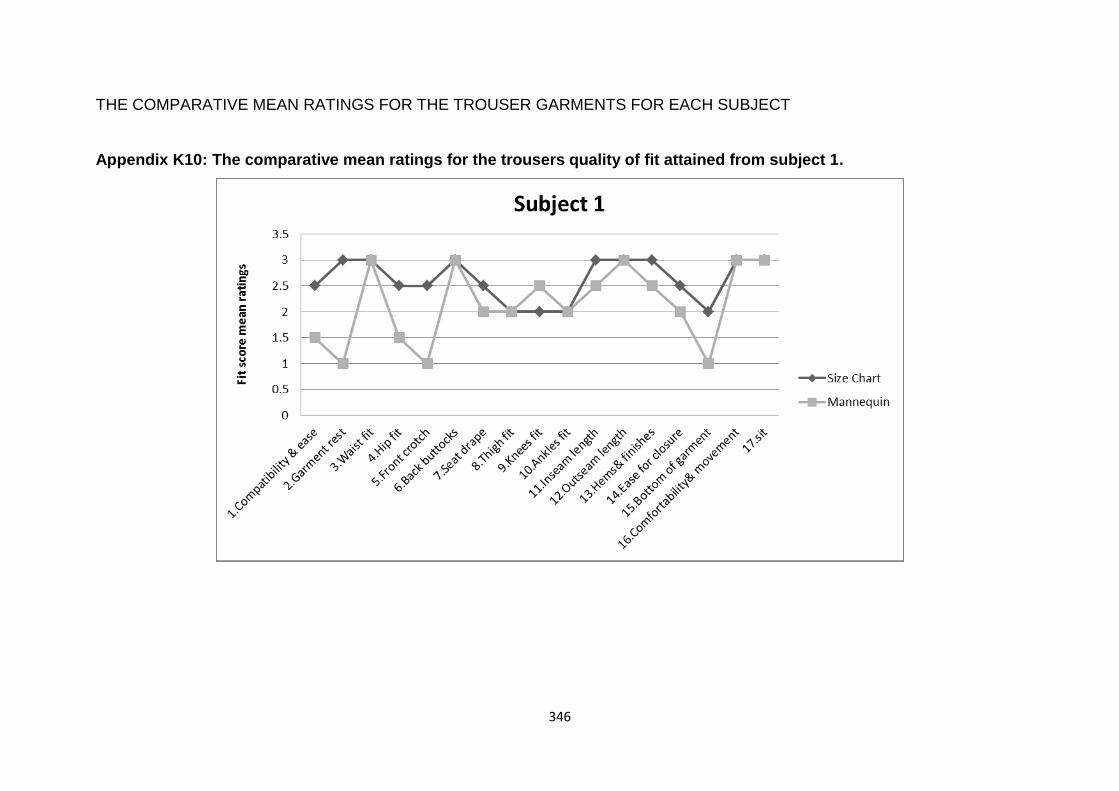
346
THE COMPARATIVE MEAN RATINGS FOR THE TROUSER GARMENTS FOR EACH SUBJECT
Appendix K10: The comparative mean ratings for the trousers quality of fit attained from subject 1.
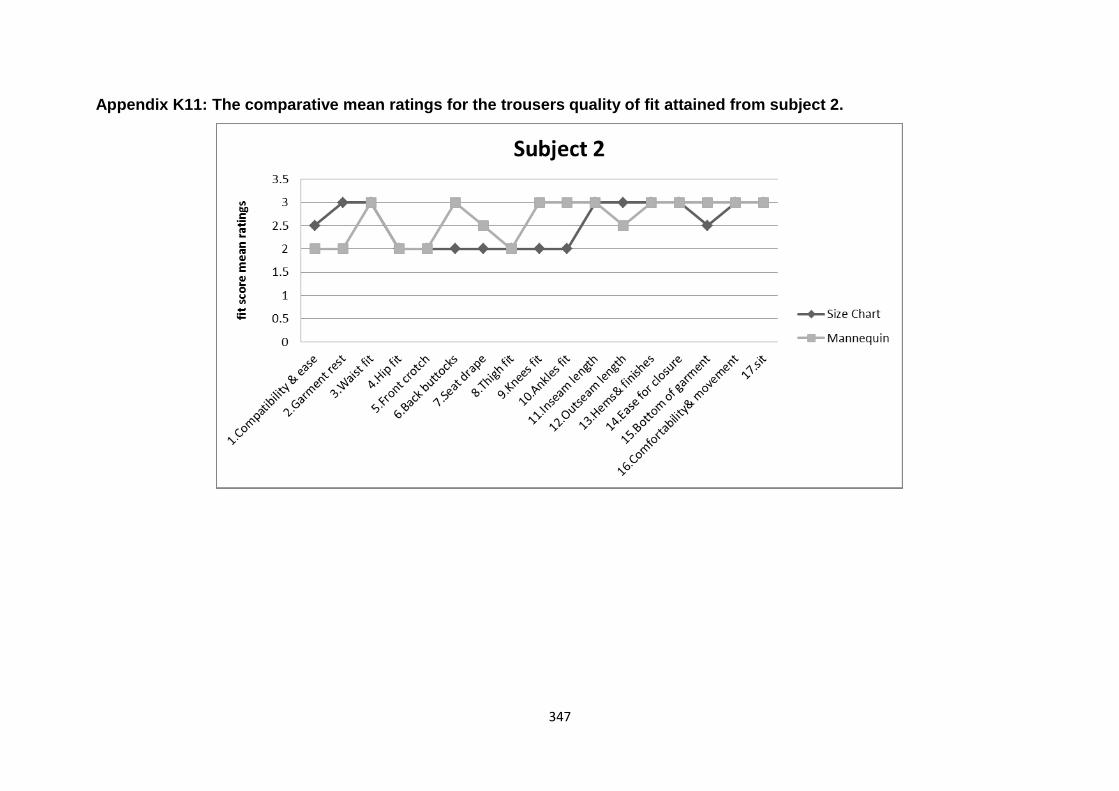
347
Appendix K11: The comparative mean ratings for the trousers quality of fit attained from subject 2.

348
Appendix K12: The comparative mean ratings for the trousers quality of fit attained from subject 3.
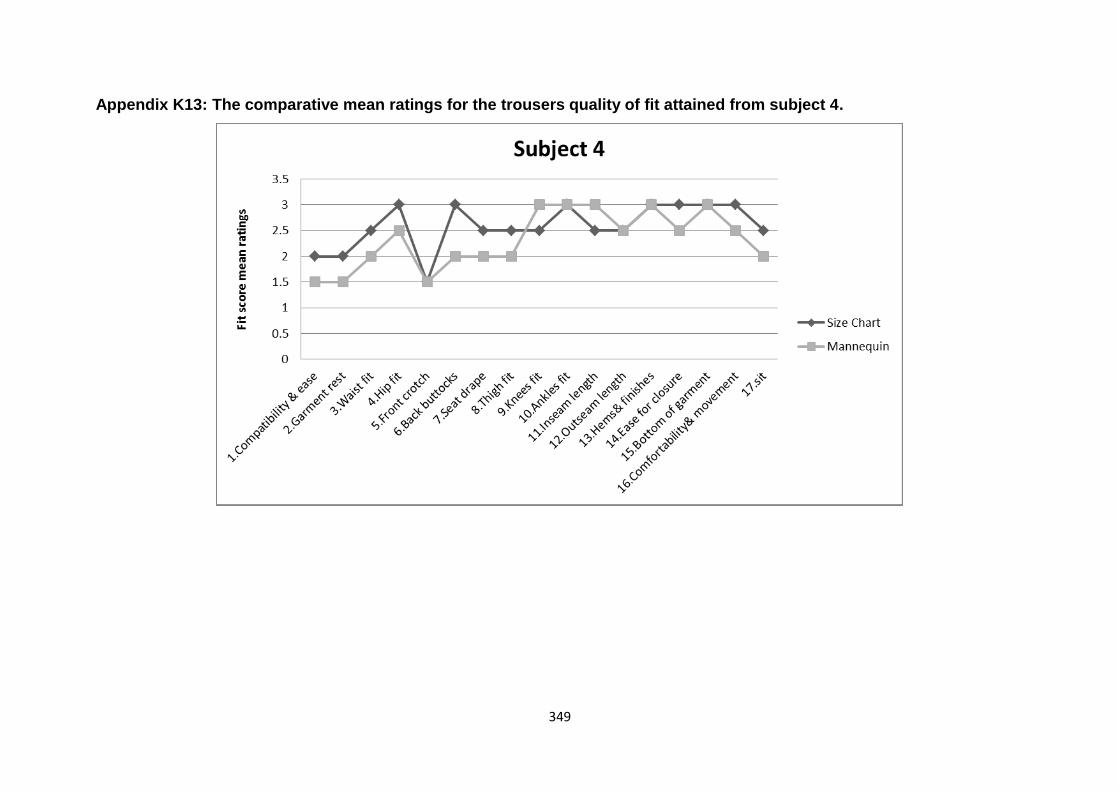
349
Appendix K13: The comparative mean ratings for the trousers quality of fit attained from subject 4.

350
Appendix K14: The comparative mean ratings for the trousers quality of fit attained from subject 5.

351
Appendix K15: The comparative mean ratings for the trousers quality of fit attained from subject 6.
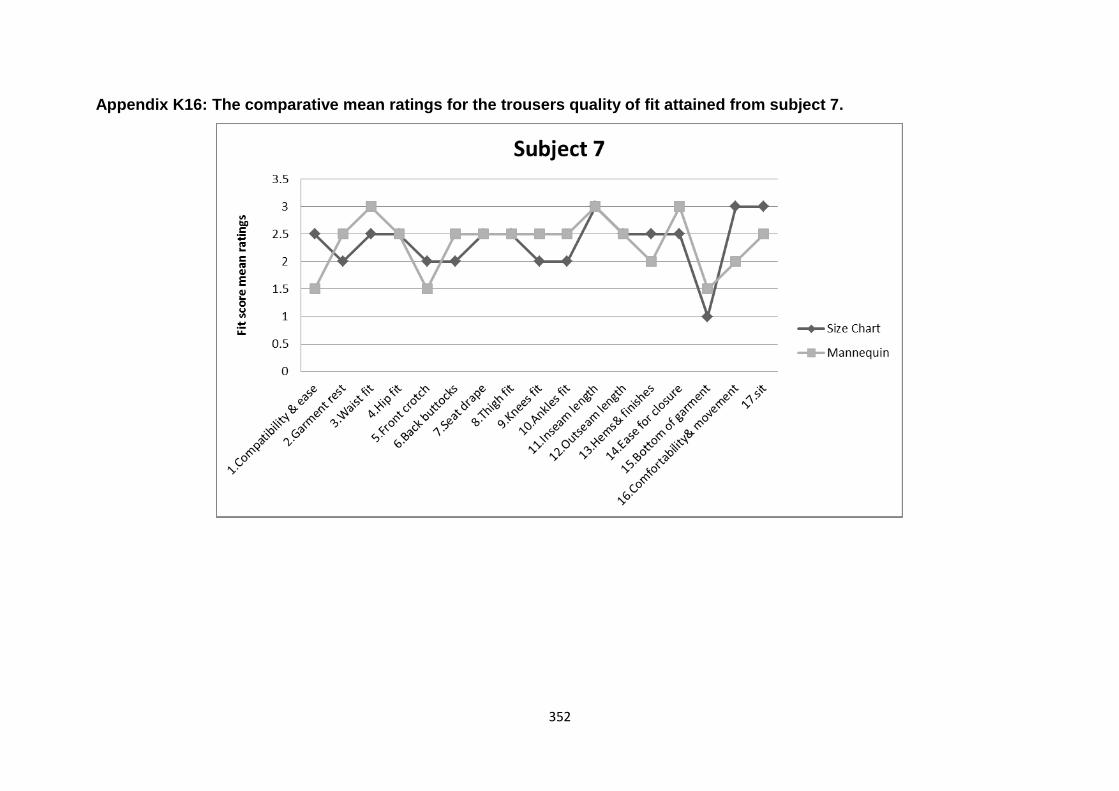
352
Appendix K16: The comparative mean ratings for the trousers quality of fit attained from subject 7.
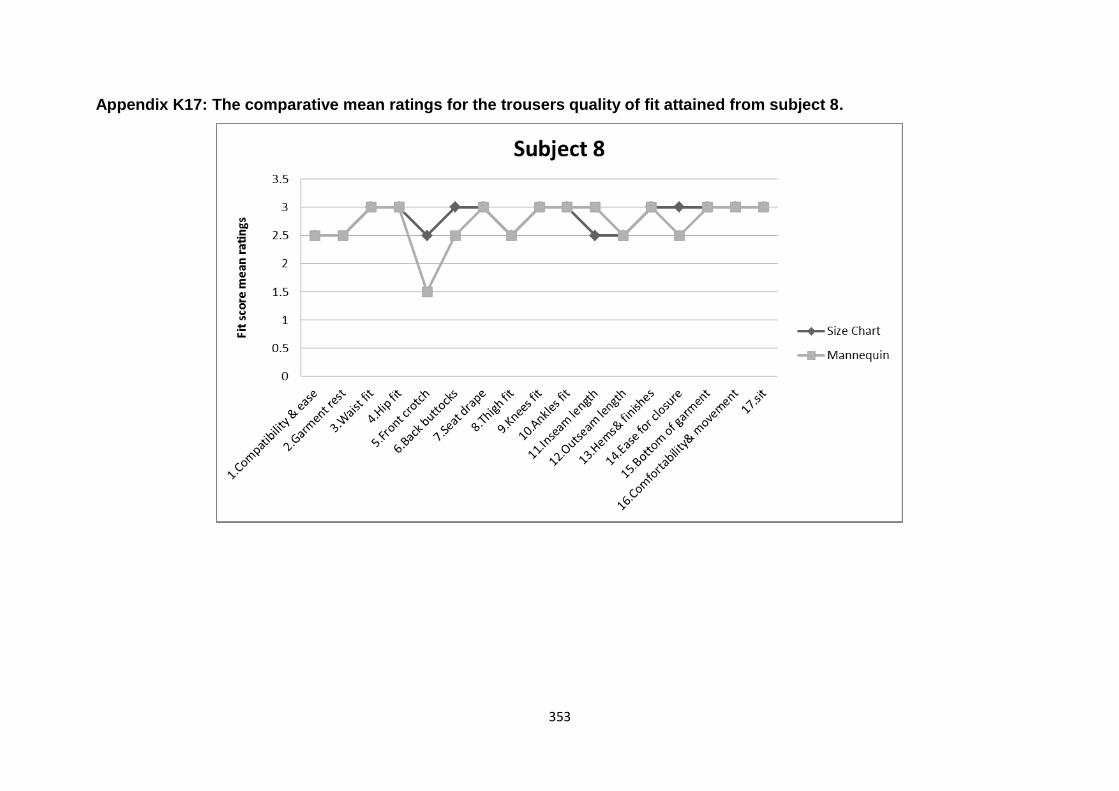
353
Appendix K17: The comparative mean ratings for the trousers quality of fit attained from subject 8.
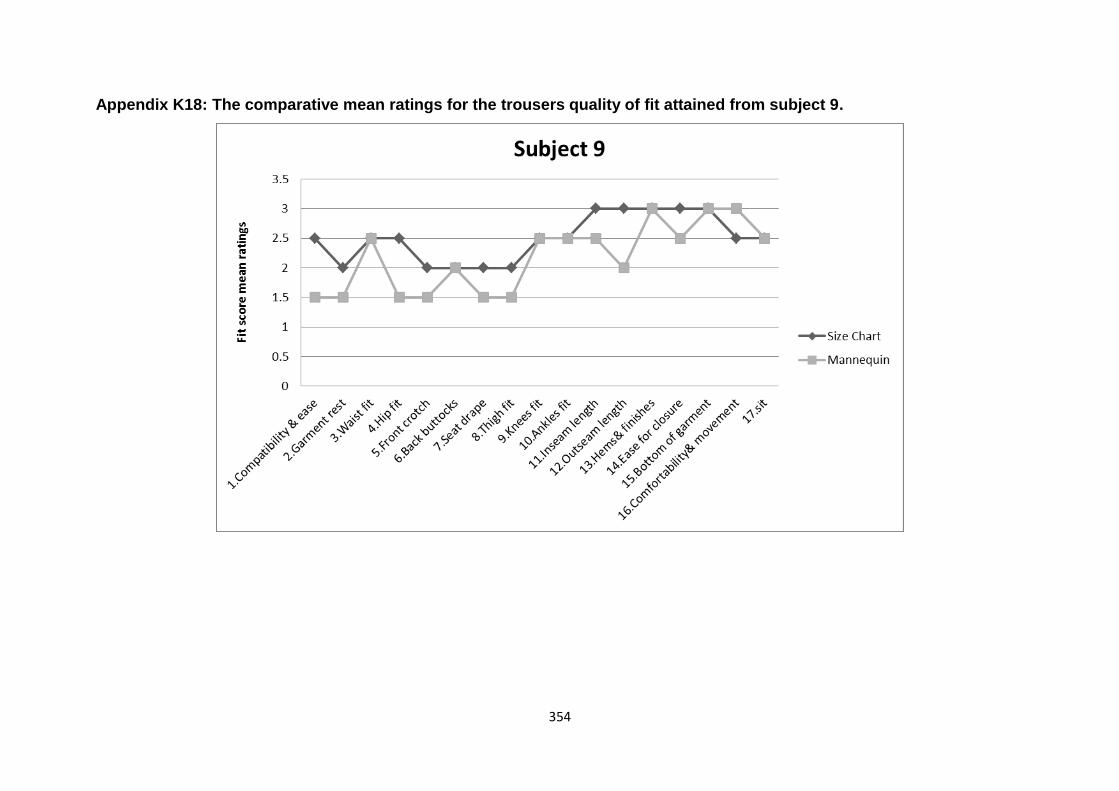
354
Appendix K18: The comparative mean ratings for the trousers quality of fit attained from subject 9.
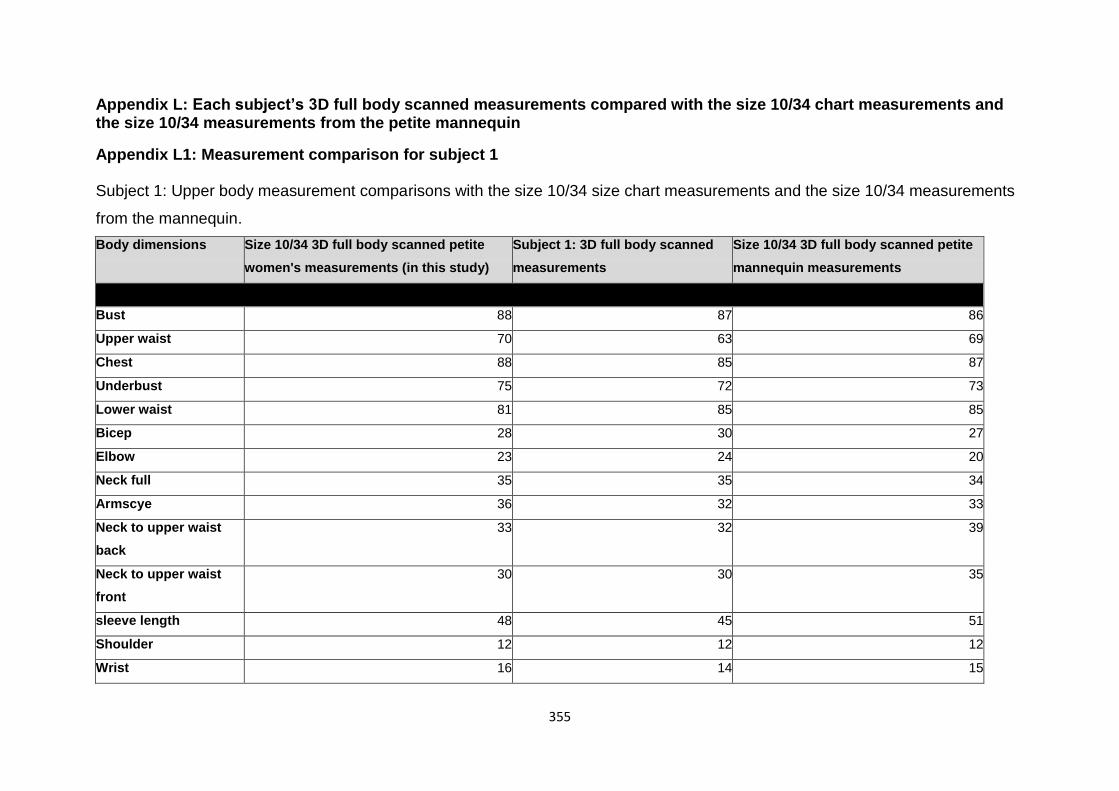
355
Appendix L: Each subject‟s 3D full body scanned measurements compared with the size 10/34 chart measurements and the size 10/34 measurements from the petite mannequin
Appendix L1: Measurement comparison for subject 1
Subject 1: Upper body measurement comparisons with the size 10/34 size chart measurements and the size 10/34 measurements
from the mannequin.
Body dimensions Size 10/34 3D full body scanned petite
women's measurements (in this study)
Subject 1: 3D full body scanned
measurements
Size 10/34 3D full body scanned petite
mannequin measurements
UPPER BODY
Bust 88 87 86
Upper waist 70 63 69
Chest 88 85 87
Underbust 75 72 73
Lower waist 81 85 85
Bicep 28 30 27
Elbow 23 24 20
Neck full 35 35 34
Armscye 36 32 33
Neck to upper waist
back
33 32 39
Neck to upper waist
front
30 30 35
sleeve length 48 45 51
Shoulder 12 12 12
Wrist 16 14 15

356
Subject 1: Lower body measurement comparisons with the size 10/34 size chart measurements and the size 10/34 measurements
from the petite mannequin.
Body dimensions Size 10/34 3D full body scanned petite
women's measurements (in this study)
Subject 1: 3D full body
scanned measurements
Size 10/34 3D full body scanned petite
mannequin measurements
LOWER BODY
Upper waist 70 63 69
Lower waist 81 85 85
Hip 96 98 95
Top thigh 55 56 54
Mid-thigh 45 41 41
Calf 35 35 34
High hip 90 90 92
Ankle 26 23 25
Knee 41 38 39
Crotch length back 35 33 36
Crotch length front 34 33 36
Inseam 66 66 73
Outseam 100 96 102
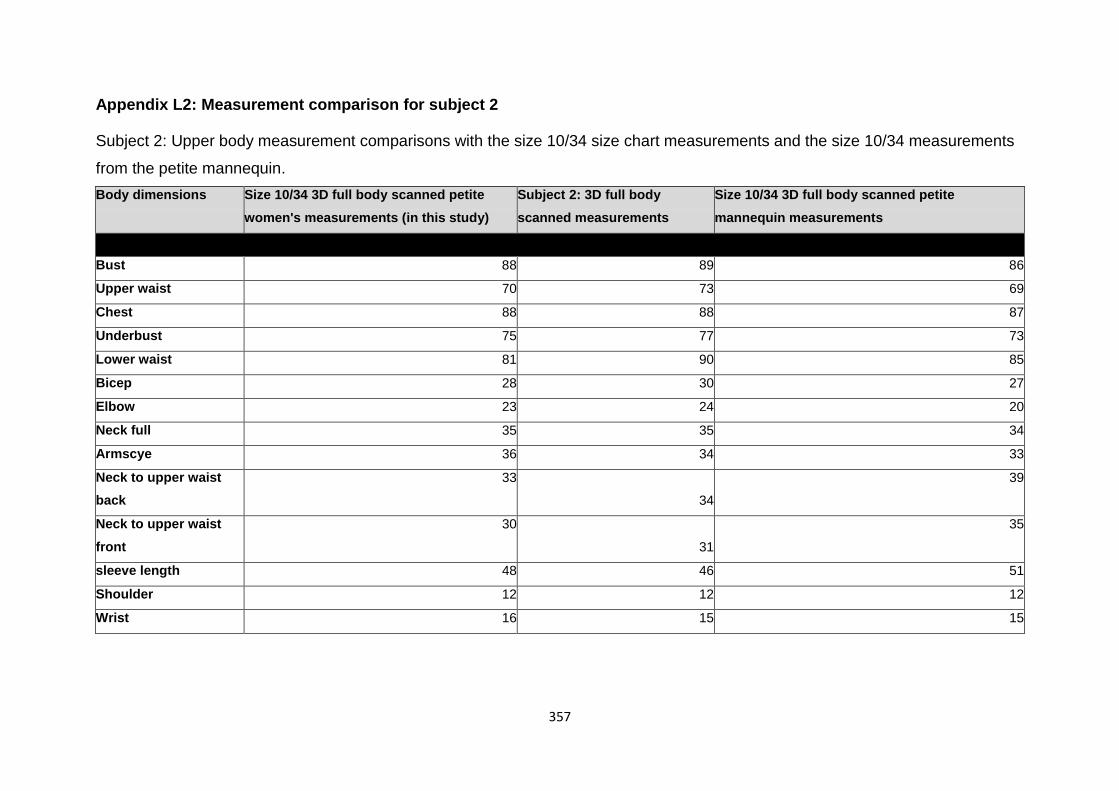
357
Appendix L2: Measurement comparison for subject 2
Subject 2: Upper body measurement comparisons with the size 10/34 size chart measurements and the size 10/34 measurements
from the petite mannequin.
Body dimensions Size 10/34 3D full body scanned petite
women's measurements (in this study)
Subject 2: 3D full body
scanned measurements
Size 10/34 3D full body scanned petite
mannequin measurements
UPPER BODY
Bust 88 89 86
Upper waist 70 73 69
Chest 88 88 87
Underbust 75 77 73
Lower waist 81 90 85
Bicep 28 30 27
Elbow 23 24 20
Neck full 35 35 34
Armscye 36 34 33
Neck to upper waist
back
33
34
39
Neck to upper waist
front
30
31
35
sleeve length 48 46 51
Shoulder 12 12 12
Wrist 16 15 15

358
Subject 2: Lower body measurement comparisons with the size 10/34 size chart measurements and the size 10/34 measurements
from the petite mannequin.
Body dimensions Size 10/34 3D full body scanned petite
women's measurements (in this study)
Subject 2: 3D full body
scanned measurements
Size 10/34 3D full body scanned petite
mannequin measurements
LOWER BODY
Upper waist 70 73 69
Lower waist 81 90 85
Hip 96 97 95
Top thigh 55 55 54
Mid-thigh 45 40 41
Calf 35 33 34
High hip 90 94 92
Ankle 26 23 25
Knee 41 36 39
Crotch length back 35 37 36
Crotch length front 34 35 36
Inseam 66 72 73
Outseam 100 99 102

359
Appendix L3: Measurement comparison for subject 3
Subject 3: Upper body measurement comparisons with the size 10/34 size chart measurements and the size 10/34 measurements
from the petite mannequin.
Body dimensions Size 10/34 3D full body scanned petite
women's measurements (in this study)
Subject 3: 3D full body
scanned measurements
Size 10/34 3D full body scanned petite
mannequin measurements
UPPER BODY
Bust 88 90 86
Upper waist 70 70 69
Chest 88 87 87
Underbust 75 70 73
Lower waist 81 83 85
Bicep 28 35 27
Elbow 23 26 20
Neck full 35 34 34
Armscye 36 33 33
Neck to upper waist
back
33
36
39
Neck to upper waist
front
30
34
35
sleeve length 48 48 51
Shoulder 12 13 12
Wrist 16 16 15

360
Subject 3: Lower body measurement comparisons with the size 10/34 size chart measurements and the size 10/34 measurements
from the petite mannequin.
Body dimensions Size 10/34 3D full body scanned petite
women's measurements (in this study)
Subject 3: 3D full body
scanned measurements
Size 10/34 3D full body scanned petite
mannequin measurements
LOWER BODY
Upper waist 70 70 69
Lower waist 81 83 85
Hip 96 98 95
Top thigh 55 58 54
Mid-thigh 45 46 41
Calf 35 36 34
High hip 90 89 92
Ankle 26 25 25
Knee 41 39 39
Crotch length back 35 37 36
Crotch length front 34 39 36
Inseam 66 82 73
Outseam 100 100 102

361
Appendix L4: Measurement comparison for subject 4
Subject 4: Upper body measurement comparisons with the size 10/34 size chart measurements and the size 10/34 measurements
from the petite mannequin.
Body dimensions Size 10/34 3D full body scanned petite
women's measurements (in this study)
Subject 4: 3D full body
scanned measurements
Size 10/34 3D full body scanned petite
mannequin measurements
UPPER BODY
Bust 88 92 86
Upper waist 70 74 69
Chest 88 89 87
Underbust 75 76 73
Lower waist 81 87 85
Bicep 28 31 27
Elbow 23 23 20
Neck full 35 33 34
Armscye 36 34 33
Neck to upper waist
back
33
35
39
Neck to upper waist
front
30
32
35
sleeve length 48 47 51
Shoulder 12 12 12
Wrist 16 14 15

362
Subject 4: Lower body measurement comparisons with the size 10/34 size chart measurements and the size 10/34 measurements
from the petite mannequin.
Body dimensions Size 10/34 3D full body scanned petite
women's measurements (in this study)
Subject 4: 3D full body
scanned measurements
Size 10/34 3D full body scanned petite
mannequin measurements
LOWER BODY
Upper waist 70 74 69
Lower waist 81 87 85
Hip 96 100 95
Top thigh 55 58 54
Mid-thigh 45 44 41
Calf 35 34 34
High hip 90 96 92
Ankle 26 20 25
Knee 41 39 39
Crotch length back 35 43 36
Crotch length front 34 38 36
Inseam 66 73 73
Outseam 100 100 102

363
Appendix L5: Measurement comparison for subject 5
Subject 5: Upper body measurement comparisons with the size 10/34 size chart measurements and the size 10/34 measurements
from the petite mannequin.
Body dimensions Size 10/34 3D full body scanned petite
women's measurements (in this study)
Subject 5: 3D full body
scanned measurements
Size 10/34 3D full body scanned petite
mannequin measurements
UPPER BODY
Bust 88 92 86
Upper waist 70 76 69
Chest 88 89 87
Underbust 75 79 73
Lower waist 81 87 85
Bicep 28 30 27
Elbow 23 25 20
Neck full 35 32 34
Armscye 36 37 33
Neck to upper waist
back
33
36
39
Neck to upper waist
front
30
31
35
sleeve length 48 45 51
Shoulder 12 12 12
Wrist 16 15 15

364
Subject 5: Lower body measurement comparisons with the size 10/34 size chart measurements and the size 10/34 measurements
from the petite mannequin.
Body dimensions Size 10/34 3D full body scanned petite
women's measurements (in this study)
Subject 5: 3D full body
scanned measurements
Size 10/34 3D full body scanned petite
mannequin measurements
LOWER BODY
Upper waist 70 76 69
Lower waist 81 87 85
Hip 96 97 95
Top thigh 55 55 54
Mid-thigh 45 42 41
Calf 35 35 34
High hip 90 92 92
Ankle 26 24 25
Knee 41 36 39
Crotch length back 35 36 36
Crotch length front 34 37 36
Inseam 66 74 73
Outseam 100 98 102

365
Appendix L6: Measurement comparison for subject 6
Subject 6: Upper body measurement comparisons with the size 10/34 size chart measurements and the size 10/34 measurements
from the petite mannequin.
Body dimensions Size 10/34 3D full body scanned petite
women's measurements (in this study)
Subject 6: 3D full body
scanned measurements
Size 10/34 3D full body scanned petite
mannequin measurements
UPPER BODY
Bust 88 90 86
Upper waist 70 72 69
Chest 88 86 87
Underbust 75 74 73
Lower waist 81 80 85
Bicep 28 31 27
Elbow 23 26 20
Neck full 35 33 34
Armscye 36 35 33
Neck to upper waist
back
33
35
39
Neck to upper waist
front
30
30
35
sleeve length 48 47 51
Shoulder 12 13 12
Wrist 16 15 15

366
Subject 6: Lower body measurement comparisons with the size 10/34 size chart measurements and the size 10/34 measurements
from the petite mannequin.
Body dimensions Size 10/34 3D full body scanned petite
women's measurements (in this study)
Subject 6: 3D full body
scanned measurements
Size 10/34 3D full body scanned petite
mannequin measurements
LOWER BODY
Upper waist 70 72 69
Lower waist 81 80 85
Hip 96 97 95
Top thigh 55 54 54
Mid-thigh 45 44 41
Calf 35 34 34
High hip 90 89 92
Ankle 26 26 25
Knee 41 37 39
Crotch length back 35 40 36
Crotch length front 34 39 36
Inseam 66 75 73
Outseam 100 101 102

367
Appendix L7: Measurement comparison for subject 7
Subject 7: Upper body measurement comparisons with the size 10/34 size chart measurements and the size 10/34 measurements
from the petite mannequin.
Body dimensions Size 10/34 3D full body scanned petite
women's measurements (in this study)
Subject 7: 3D full body
scanned measurements
Size 10/34 3D full body scanned petite
mannequin measurements
UPPER BODY
Bust 88 89 86
Upper waist 70 75 69
Chest 88 87 87
Underbust 75 76 73
Lower waist 81 81 85
Bicep 28 30 27
Elbow 23 24 20
Neck full 35 31 34
Armscye 36 30 33
Neck to upper waist
back
33
32
39
Neck to upper waist
front
30
30
35
sleeve length 48 46 51
Shoulder 12 11 12
Wrist 16 15 15

368
Subject 7: Lower body measurement comparisons with the size 10/34 size chart measurements and the size 10/34 measurements
from the petite mannequin.
Body dimensions Size 10/34 3D full body scanned petite
women's measurements (in this study)
Subject 7: 3D full body
scanned measurements
Size 10/34 3D full body scanned petite
mannequin measurements
LOWER BODY
Upper waist 70 75 69
Lower waist 81 81 85
Hip 96 98 95
Top thigh 55 53 54
Mid-thigh 45 40 41
Calf 35 39 34
High hip 90 96 92
Ankle 26 26 25
Knee 41 40 39
Crotch length back 35 37 36
Crotch length front 34 36 36
Inseam 66 67 73
Outseam 100 98 102

369
Appendix L8: Measurement comparison for subject 8
Subject 8: Upper body measurement comparisons with the size 10/34 size chart measurements and the size 10/34 measurements
from the petite mannequin.
Body dimensions Size 10/34 3D full body scanned petite
women's measurements (in this study)
Subject 8: 3D full body
scanned measurements
Size 10/34 3D full body scanned petite
mannequin measurements
UPPER BODY
Bust 88 93 86
Upper waist 70 74 69
Chest 88 90 87
Underbust 75 79 73
Lower waist 81 91 85
Bicep 28 34 27
Elbow 23 26 20
Neck full 35 34 34
Armscye 36 38 33
Neck to upper waist
back
33
40
39
Neck to upper waist
front
30
33
35
sleeve length 48 48 51
Shoulder 12 13 12
Wrist 16 17 15
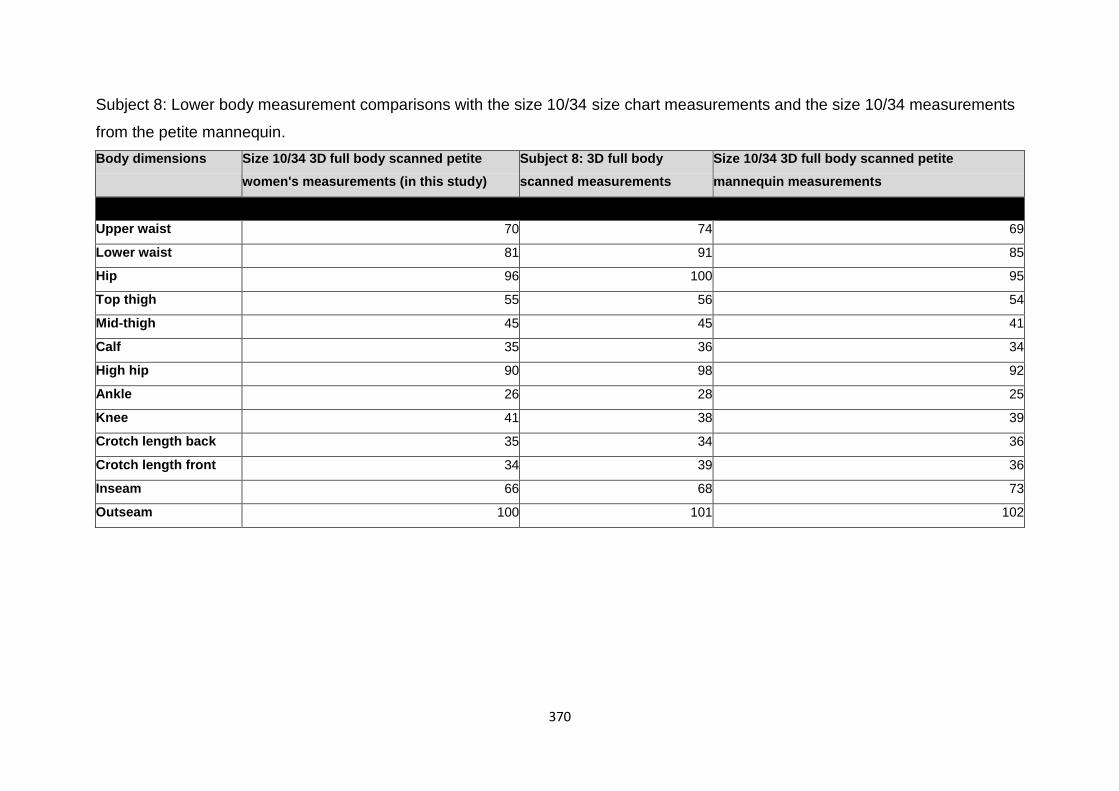
370
Subject 8: Lower body measurement comparisons with the size 10/34 size chart measurements and the size 10/34 measurements
from the petite mannequin.
Body dimensions Size 10/34 3D full body scanned petite
women's measurements (in this study)
Subject 8: 3D full body
scanned measurements
Size 10/34 3D full body scanned petite
mannequin measurements
LOWER BODY
Upper waist 70 74 69
Lower waist 81 91 85
Hip 96 100 95
Top thigh 55 56 54
Mid-thigh 45 45 41
Calf 35 36 34
High hip 90 98 92
Ankle 26 28 25
Knee 41 38 39
Crotch length back 35 34 36
Crotch length front 34 39 36
Inseam 66 68 73
Outseam 100 101 102

371
Appendix L9: Measurement comparison for subject 9
Subject 9: Upper body measurement comparisons with the size 10/34 size chart measurements and the size 10/34 measurements
from the petite mannequin.
Body dimensions Size 10/34 3D full body scanned petite
women's measurements (in this study)
Subject 9: 3D full body
scanned measurements
Size 10/34 3D full body scanned petite
mannequin measurements
UPPER BODY
Bust 88 88 86
Upper waist 70 66 69
Chest 88 86 87
Underbust 75 78 73
Lower waist 81 74 85
Bicep 28 33 27
Elbow 23 24 20
Neck full 35 33 34
Armscye 36 37 33
Neck to upper waist
back
33
36
39
Neck to upper waist
front
30
31
35
sleeve length 48 45 51
Shoulder 12 12 12
Wrist 16 14 15

372
Subject 9: Lower body measurement comparisons with the size 10/34 size chart measurements and the size 10/34 measurements
from the petite mannequin.
Body dimensions Size 10/34 3D full body scanned petite
women's measurements (in this study)
Subject 9: 3D full body
scanned measurements
Size 10/34 3D full body scanned petite
mannequin measurements
LOWER BODY
Upper waist 70 66 69
Lower waist 81 74 85
Hip 96 97 95
Top thigh 55 51 54
Mid-thigh 45 39 41
Calf 35 32 34
High hip 90 88 92
Ankle 26 21 25
Knee 41 34 39
Crotch length back 35 39 36
Crotch length front 34 38 36
Inseam 66 72 73
Outseam 100 100 102