european pollution outbreaks during ace 2: lofted aerosol plumes observed with raman lidar at the...
TRANSCRIPT
European pollution outbreaks during ACE 2:Lofted aerosol plumes observed with Ramanlidar at the Portuguese coast
Albert Ansmann,1 Frank Wagner,2 Dietrich Althausen,1
Detlef Muller,1 Andreas Herber,3 and Ulla Wandinger1
Abstract. During the Second Aerosol Characterization Experiment (ACE 2) in thesummer of 1997, four pollution outbreaks from the European continent were monitored atSagres (37�N, 9�W), Portugal, by applying the Raman lidar technique at a wavelength of532 nm. The findings are presented in terms of vertical profiles of the volume extinctioncoefficient of the particles, the backscatter coefficient, the extinction-to-backscatter ratio(lidar ratio), the relative humidity, and the geometrical and optical depths of the marineboundary layer and the continental aerosol layers aloft. The lidar-derived optical depthsare compared with results of simultaneously conducted star photometer observations.During all outbreaks, similar aerosol profiles were observed. Above the cold marineboundary layer the warm continental pollution plume extended from about 500 to amaximum height of 3500 m. Strong temperature inversions prohibited mixing of the twolayers. The ACE 2 mean optical depths of the marine boundary layer and the aerosollayers aloft were about 0.05 and 0.1, respectively. Maximum values of the optical depth inthe pollution plumes were close to 0.25 at 532 nm. On average, the free-troposphericlayers contributed about 60% to the total optical depth at the coast. Volume extinctioncoefficients were mainly between 30 and 70 Mm�1, and the lidar ratios ranged from 30 to80 sr in the polluted continental air.
1. Introduction
The Second Aerosol Characterization Experiment (ACE 2)was the third experiment coordinated by the InternationalGlobal Atmospheric Chemistry Project (IGAC) that addressedthe properties of the atmospheric aerosol relevant to radiativeforcing and climate (“ACE-2” special issue in Tellus, Series B,52(2), 2000). A series of integrated field campaigns such asACE 1 (“ACE 1” special issue in Journal of Geophysical Re-search, 103(D13), 15,971–16,758, 1998), the TroposphericAerosol Radiative Forcing Observational Experiment (“TAR-FOX” special issue in Journal of Geophysical Research,104(D2), 1943–2320, 1999), ACE 2, the Lindenberg AerosolCharacterization Experiment (LACE, 1998), the Indian OceanExperiment (INDOEX, 1999), or ACE ASIA (2001) have beenconducted to provide the data needed for a better consider-ation of aerosols in global climate models and to reduce in thisway the overall uncertainty in the calculation of climate forcingby aerosols.
A major focus of ACE 2 was the characterization of anthro-pogenic aerosols from the European continent as they moveout over the North Atlantic Ocean. The North Atlantic expe-riences episodic outbreaks of highly polluted air masses fromthe European and North American continents. The outbreaksfrom Europe usually occur in the southeastern and southern
areas of the North Atlantic along the southeastern flanks of thesubtropical anticyclone. During summer a persistent subtrop-ical anticyclone is normally located to the west of the Azoresresulting in northeasterly trade winds over the major part ofthe ACE 2 experimental area and relatively clean maritime airmasses that are transported around the northern periphery ofthe anticyclone. After the passage of a cold front in themidlatitudes, the anticyclone will temporally extend northeast-ward causing advection of polluted air from Europe throughthe lower atmosphere of the area. Outbreaks of Europeanpollution are thus modulated by the passages of midlatitudecyclones.
When the continental aerosol plumes are advected acrossthe coastline and over colder water, they are forced to riseabove the cool oceanic air (marine boundary layer). In thisway, polluted air from near the surface may reach higher alti-tudes and enter the free troposphere, while the near-surfaceair remains clean [Angevine et al., 1996]. As a consequence, aconsiderable part of the continental boundary layer particlesmay be transported over thousands of kilometers without re-moval by washout processes. Numerous measurements madewithin continental pollution plumes over the North Atlantic[Carlson and Prospero, 1972; Angevine et al., 1996; Karyampudiet al., 1999; Hartley et al., 2000; Flamant et al., 2000; Wagner,2000], the South Atlantic [Browell et al., 1996; Chatfield et al.,1996], and the Indian Ocean [Ansmann et al., 2000; Muller etal., 2000a, 2001a, 2001b] showed such a layered aerosol struc-ture over the Oceans. Asian particles were found in remoteareas of the Pacific Ocean [Kaneyasu and Murayama, 2000]and in North America [Jaffe et al., 1999] caused by free-tropospheric aerosol transport.
Thus anthropogenic particles may have a much larger influ-
1Institute for Tropospheric Research, Leipzig, Germany.2Meteorological Institute, University of Munich, Munich, Germany.3Alfred Wegener Institute for Polar Research, Potsdam, Germany.
Copyright 2001 by the American Geophysical Union.
Paper number 2000JD000091.0148-0227/01/2000JD000091$09.00
JOURNAL OF GEOPHYSICAL RESEARCH, VOL. 106, NO. D18, PAGES 20,725–20,733, SEPTEMBER 27, 2001
20,725
ence on the global climate than presently modeled. In climatemodels these particles are mainly present in the boundary layerover the continents and are deposited after 2 to 4 days orwithin a range of less than 2000 km within the source region[Rodhe, 1999]. In the free troposphere the lifetime of theparticles is of the order of weeks.
To understand the radiative impact, it is essential to know atwhich heights the base and the top of the outbreak plume arelocated. Aerosol radiative forcing depends on the atmo-sphere’s albedo, and it makes a significant difference in theradiative impact whether the aerosol particles are above acloudy marine boundary layer or between the clouds within theboundary layer [Haywood and Shine, 1997]. The uppermostaerosol layer in the lower troposphere has the largest effect onthe radiation budget [Quijano et al., 2000a]. Ignoring the ver-tical distribution of particles also introduces significant uncer-tainties in the retrieval of the particle optical depth from sat-ellite radiance measurements [Quijano et al., 2000b].
Lidars are excellent tools for describing the height-resolvedcharacteristics of pollution outbreaks. Modern aerosol lidartechnology [Ansmann et al., 1992; Ferrare et al., 1998; Muller etal., 2000b; Althausen et al., 2000] allows the profiling of micro-physical properties such as the volume size distribution, thesurface-area and volume concentrations of the particles, therefractive index characteristics, and of the optical propertiessuch as the volume extinction and backscatter coefficients un-der ambient conditions. In contrast, ground-based and space-borne radiometers deliver column information only, hence sev-eral aerosol layers of different origin above each other cannotbe resolved by these instruments. Airborne in situ observationsoften suffer from the fact that the measurements are per-formed after drying the aerosol, i.e., under nonambient, low-humidity conditions. It can never be excluded that a part of thelarge and strongly light scattering particles are lost due tolimitations of the inlet system. Aircraft measurements can pro-vide us with a limited glimpse of snapshot-like data only,whereas lidar can observe pollution outbreaks continuously.
In order to monitor pollution outbreaks from the Europeancontinent, a sophisticated six-wavelength aerosol lidar[Althausen et al., 2000] was deployed for several months atSagres, 37�N, 9�W, in southern Portugal. The lidar observa-tions were conducted during the Intensive Field Phase of ACE2 lasting from June 16 to July 24 1997. Sun and star photo-meter observations of the particle optical depth and radio-sonde measurements of pressure, temperature, and relativehumidity complemented the activities.
In section 2 the ACE 2 lidar field site, the instruments, themethods applied to determine the aerosol parameters, and theuncertainties in these calculations are briefly described. Sec-tion 3 presents the main findings of the ACE 2 observationsbased on vertical profiles of particle extinction, backscattering,lidar ratio at 532 nm, and relative humidity. These profileswere determined during nighttime, by applying the Ramanlidar technique [Ansmann et al., 1992]. The lidar observationsof the particle optical depth are compared with star photo-meter measurements at 531 nm. Four pollution outbreaks andseveral so-called reference cases representing clean marineconditions were monitored.
Observations of the extinction-to-backscatter ratio can beused to identify the aerosol type [Ackermann, 1998]. Large,less-absorbing marine or desert-dust particles cause a smalllidar ratio of 20–30 sr, whereas small, considerably absorbinganthropogenic particles typically lead to lidar ratios between 50
and 80 sr. A global lidar-ratio climatology is needed for animproved estimation of the optical depth of aerosol layers fromobservations with widely used, simple backscatter lidars. In thenear future a spaceborne lidar will map the global aerosoldistribution in terms of particle backscatter-coefficient profilesfor several years [Winker, 1999]. At least then global data setsof aerosol-type-dependent lidar ratios are required to allow atrustworthy global mapping of vertically resolved opticaldepths. These data are needed for a proper description ofaerosols in climate models. The observations presented in sec-tion 3 contribute to the lidar-ratio climatology. They illustratehow complicated the lidar-ratio profile can look in anthropo-genically disturbed environments.
This first in a series of three papers provides an introductioninto the extensive observations with the advanced multiwave-length aerosol lidar. The second paper (A. Ansmann et al.,European pollution outbreaks during ACE 2: Optical particleproperties inferred from multiwavelength lidar and star/Sunphotometry, submitted to Journal of Geophysical Research,2001) deals with the spectral characteristics of the height-resolved optical properties of the pollution plumes based onthe full set of optical data derived from lidar, Sun photometer,and star photometer measurements. The third paper (D. Mul-ler et al., European pollution outbreaks during ACE 2: Micro-physical particle properties and single-scattering albedo in-ferred from multiwavelength lidar data, submitted to Journal ofGeophysical Research, 2001) discusses the microphysical prop-erties of the pollution plumes.
2. Sagres Lidar SiteSagres is located at the southwestern tip of Portugal. The
lidar was deployed about 2 km west of Sagres at the militarybase Radio Naval de Sagres and positioned about 100 m northof the shoreline at an elevation of 50 m above mean sea level.Except for periods of northeasterly winds, the air was advectedfrom out over the Atlantic Ocean to the ACE 2 field site. Mostof the time, even during pollution outbreaks, Sagres was wellwithin the cold marine boundary layer.
The multiwavelength aerosol lidar is described in detail byAlthausen et al. [2000]. Two Nd:YAG and two dye lasers serveas radiation sources and transmit pulses at 355, 400, 532, 710,800, and 1064 nm. A beam combiner aligns all six laser beamsonto one optical axis. The combined beam can be directed intothe atmosphere into any zenith angle from �90� to 90� bymeans of a steerable mirror. During ACE 2, observations weretypically made at zenith angles of �30� or �60� (over theocean) or 30� and 60� (over land).
In addition to the return signals elastically backscattered byair molecules and particles at the laser wavelengths, Ramansignals from nitrogen molecules at 607 nm and from watervapor molecules at 660 nm resulting from the 532-nm primarywavelength were detected during ACE 2. The results pre-sented here are based on the 532-, 607-, and 660-nm signals.
From the ratio of the elastic backscatter signal and therespective nitrogen Raman signal, particle backscatter coeffi-cients can be calculated very accurately [Ansmann et al., 1992].The nitrogen Raman signal profiles permit one to determinethe profile of the particle extinction coefficient [Ansmann et al.,1990]. The Raman signal is very weak, and so this techniquecan only be carried out at night by using relatively long inte-gration times of 30 min to several hours. The measured ratiosof the water vapor Raman to the nitrogen Raman signals
ANSMANN ET AL.: RAMAN LIDAR OBSERVATIONS OF EUROPEAN POLLUTION20,726
provide profiles of the water vapor mixing ratio [Melfi et al.,1969; Rajan et al., 1994]. By using the temperature informationof a radiosonde ascent at the lidar site the relative humidity isobtained. About 100 radiosondes (Vaisala RS80) werelaunched during ACE 2 to measure air pressure, temperature,and relative humidity.
The incomplete overlap between the laser beam and thereceiver field of view for ranges less than about 3 km is con-sidered in the data analysis. The correction is based on overlapfunctions which follow from measurements with the systemunder clean, purely marine conditions by applying the tech-nique suggested recently by Wandinger and Ansmann [2001].Because of routinely performed readjustments of the transmit-ter-receiver configuration during the campaign the actual over-lap function may slightly vary from the one used in the dataevaluation. The introduced uncertainties become larger than50% in the near-field range so that reliable extinction coeffi-cients can only be obtained for heights above about 700 to1000 m. Since the calculation of the backscatter coefficient andthe water vapor mixing ratio is based on signal ratios, whichcancel out the overlap effect, these profiles are reliable downto the surface.
The overlap-corrected signal profiles are averaged over 1 to2 hours and smoothed before calculating the backscatter andhumidity profiles. The window lengths are 180 m in the case ofthe backscatter coefficients, and 180–360 m below 1500 m and360–720 m above 1500 m in the case of the humidity profiles.In the calculation of the extinction coefficients the Ramansignals are processed by applying the least squares technique[Whiteman, 1999]. Window lengths between 300 and 600 mbelow about 2000 m and 600 to 900 m above 2000 m were usedhere. Signal profiles indicating clouds were removed beforesignal averaging. As mentioned, most lidar observations wereobtained at elevation angles of 30� and 60� so that the verticalresolution is a factor of 1.15 to 2 higher.
The lidar ratio is simply calculated from the ratio of theextinction coefficient to the backscatter coefficient. The differ-ent window lengths used in the determination of the two pa-rameters do not affect the solution significantly as long as thebackscatter coefficient is smoothly varying with height. Thiswas mostly the case for the observations presented in section 3.
In the calculations of the aerosol parameters the air densitydecrease with height has to be corrected, and the Rayleighscattering contribution to total scattering must be subtracted.These molecular effects are determined from the pressure andtemperature profiles measured with radiosonde. Furthermore,the wavelength dependence of particle extinction and trans-mission properties between 532 nm (wavelength at which lightextinction occurs between the lidar and the backscatter region)and 607 nm (wavelength at which light extinction occurs on theway back to the lidar) has to be estimated when values for 532nm are presented. Finally, the backscatter profile must becalibrated in a height region with negligible particle scattering(only Rayleigh scattering).
Extensive error analyses were performed by Ansmann et al.[1992] and Ferrare et al. [1998]. By applying Gaussian’s law oferror propagation and assuming reasonable uncertainties inthe input parameters mentioned above and the overlap func-tion assumed, the remaining systematic uncertainties are5–10% (backscatter coefficient, relative humidity) and 10–25%for the extinction coefficient. The total (statistical and system-atic) errors are indicated in the figures by error bars.
The Raman lidar measurements were accompanied by ob-
servations of the particle optical depth with several Sun pho-tometers and a star photometer. The star photometer mea-sures the light spectrum of two stars at different elevationangles and permits the retrieval of the particle optical depth at10 wavelengths between 391 and 1043 nm under the assump-tion of horizontally homogeneous aerosol conditions [Herber etal., 1997; Leiterer et al., 1998]. In this study, the 531-nm channelwas used for comparison with lidar-derived optical depth val-ues. The uncertainty in the star photometer observations of theoptical depth is assumed to be about 0.01 to 0.015 in cloudlesscases.
3. ObservationsFour pollution outbreaks were observed during ACE 2. The
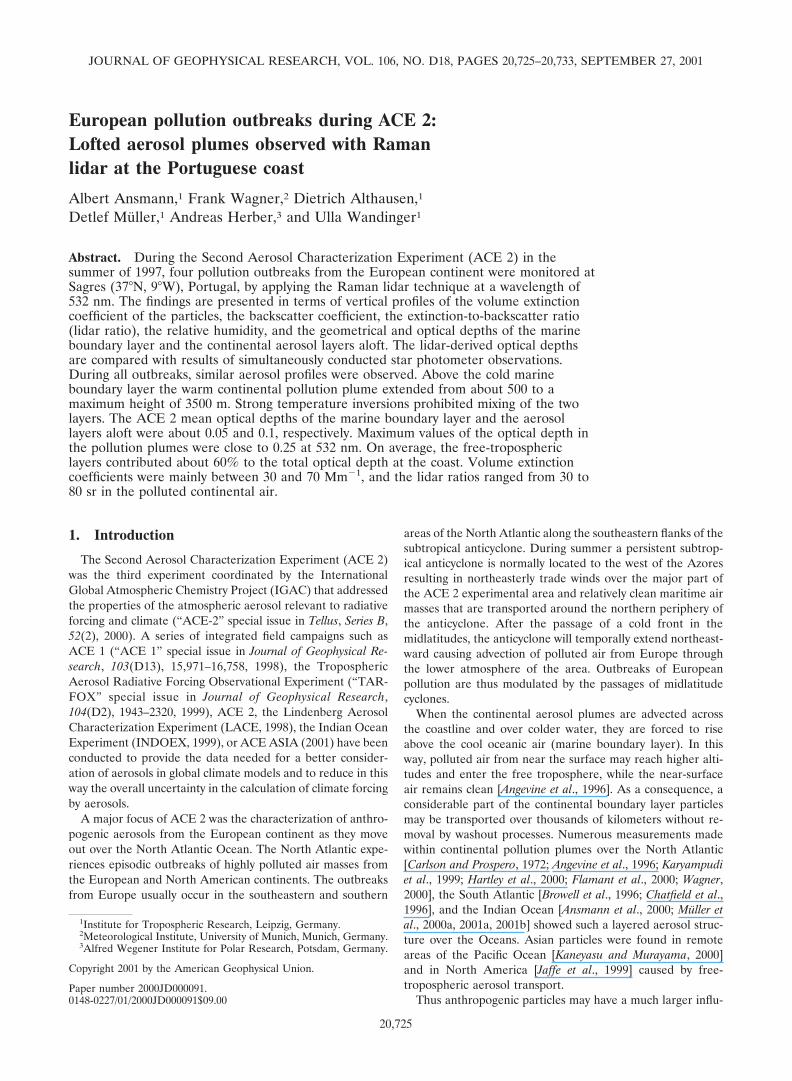
strongest occurred on July 17–21, 1997. Figure 1 shows thebackward trajectories arriving at Sagres at 1500 m (850 hPa)during this outbreak. Figure 2 presents an example of a lidarmeasurement conducted in the early morning of July 19, 1997.The shallow marine boundary layer caused a strong backscat-ter peak up to a height of 500 m. Above that layer a secondlayer extended from 500 m to the region of 3000–3500 m.According to the backward trajectory in Figure 1 for July 19,1997, the aerosol layer aloft was advected from western andcentral European regions. A similar advection pattern wasfound in other height levels of the plume.
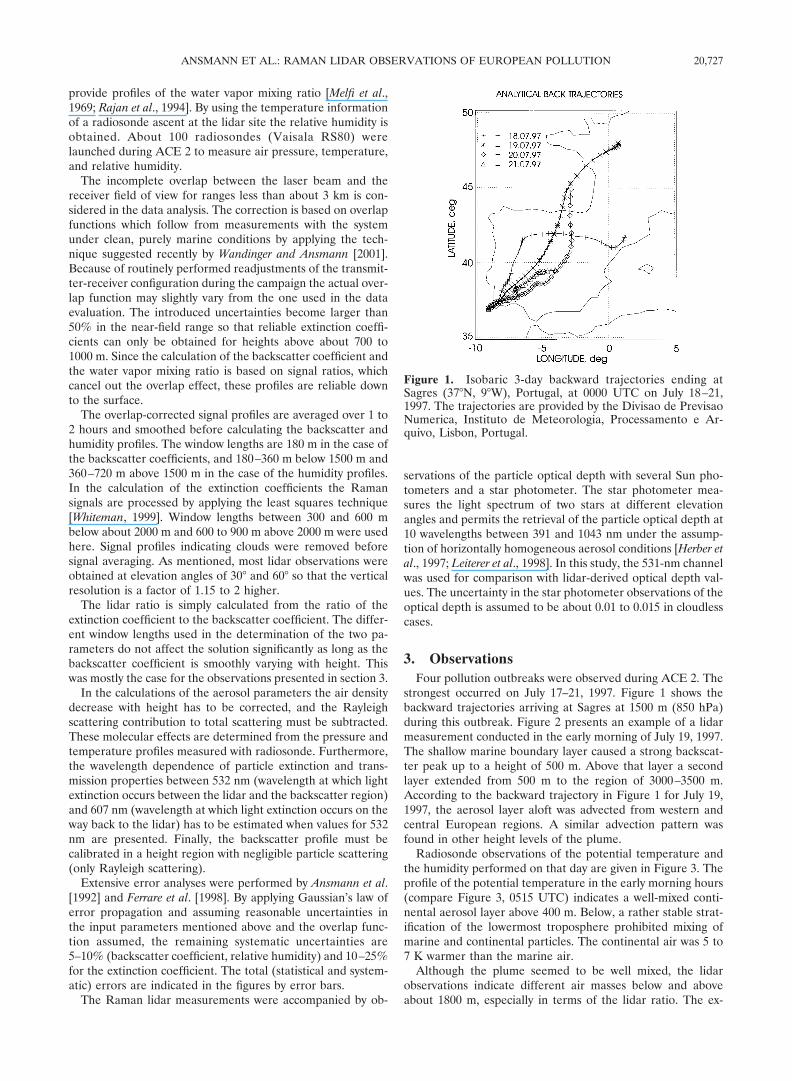
Radiosonde observations of the potential temperature andthe humidity performed on that day are given in Figure 3. Theprofile of the potential temperature in the early morning hours(compare Figure 3, 0515 UTC) indicates a well-mixed conti-nental aerosol layer above 400 m. Below, a rather stable strat-ification of the lowermost troposphere prohibited mixing ofmarine and continental particles. The continental air was 5 to7 K warmer than the marine air.
Although the plume seemed to be well mixed, the lidarobservations indicate different air masses below and aboveabout 1800 m, especially in terms of the lidar ratio. The ex-
Figure 1. Isobaric 3-day backward trajectories ending atSagres (37�N, 9�W), Portugal, at 0000 UTC on July 18–21,1997. The trajectories are provided by the Divisao de PrevisaoNumerica, Instituto de Meteorologia, Processamento e Ar-quivo, Lisbon, Portugal.
20,727ANSMANN ET AL.: RAMAN LIDAR OBSERVATIONS OF EUROPEAN POLLUTION
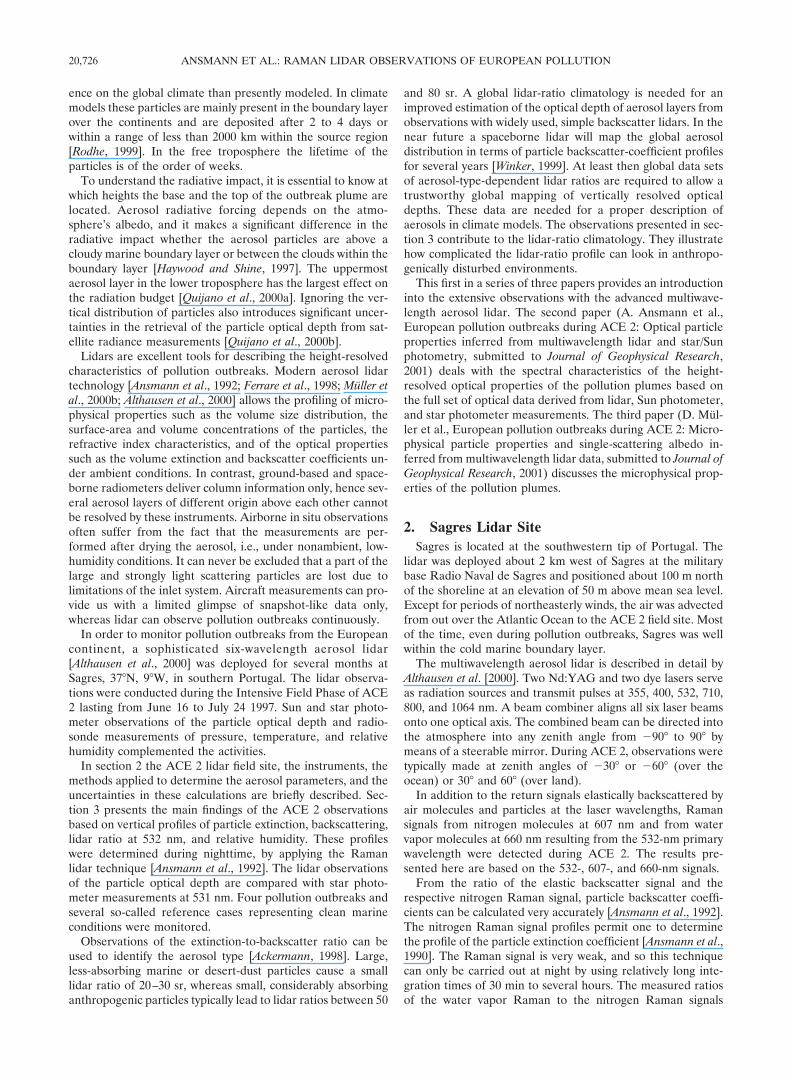
tinction-to-backscatter ratio depends on the size distributionand the chemical composition (refractive index) of the parti-cles. The lidar ratio changes with variations in particle size andvariations in the contribution of absorption to light extinction.Values larger than 70 sr at heights above 1900 m in Figure 2indicate the presence of small, highly absorbing particles. Themicrophysical particle properties will be discussed in detail inpart 3 of this series. The decrease of the lidar ratio at heightsabove 2400 m is then caused by significant water uptake of theparticles when the relative humidity reaches values close to90%. Water uptake leads to an increase of the particle size andto a decrease of the absorption/extinction ratio. The assump-tion of particle growth is consistent with the rapid increase ofthe backscatter coefficient above 2400 m.
Lidar ratios around 40 sr below 1800 m height (at low rel-ative humidity) may indicate less-absorbing (rural) particles[Evans, 1988; Takamura et al., 1994; Anderson et al., 2000] ormixtures of marine and continental particles. For large, marineparticles the lidar ratio was typically found below 25 sr asdiscussed below.
In Figure 4, observations performed each evening duringthis major outbreak event are shown. As can be seen, thegeneral features of the plume did not change much over thedays. Persistent layering with a sharp boundary between theshallow marine layer and the continental plume was observedthroughout the 4-day period. Radiosonde temperature profilesgenerally showed strong inversions at the top of the marineboundary layer. The optical depth of the 3-km thick continen-tal plume varied between 0.14 and 0.24 at 532 nm. Accordingto the star photometer observations the total optical depth wasbetween 0.24 and 0.27. Thus the aerosol layer aloft contributed55–90% to the total optical depth during this event.
During the first 3 days of the outbreak, lidar ratios of 50–70sr were mainly observed in the upper part of the pollutionplume. Small, anthropogenic particles dominated in this re-gion. As mentioned, values around 40 sr and lower may indi-cate less-absorbing particles or mixtures of marine and conti-nental particles. A comparably small amount of large particles(large scattering efficiency) can already reduce the lidar ratio.
In contrast to the pollution case, Figure 5 shows two obser-vations performed under clean marine conditions. The air wasadvected from the Atlantic Ocean and not contaminated byemissions from the European continent. The free tropospherewas dry and rather clean. The lidar ratio assumed low valuesfrom 20 to 25 sr. Note the large backscatter peaks close to thesurface. Values between 5 and 15 Mm�1 sr�1 were often ob-served during ACE 2 and correspond to volume scatteringcoefficients of the marine particles between 112.5 and 337.5
Figure 2. Particle backscatter coefficient (BC), particle extinction coefficient (EC), and lidar ratio (LR) at532 nm, and relative humidity (RH) measured with lidar (lid) and with radiosonde (rs) launched at 0515 UTCon July 19, 1997. Lidar signal profiles were recorded on July 19, 1997, between 0358 and 0445 UTC(0458–0545 local time). Error bars indicate one standard deviation caused by statistical and systematic errors.The lidar ratio is calculated from the backscatter (180-m signal smoothing length) and extinction data (600-msmoothing length) presented. For comparison, the thin dashed line shows the lidar ratio when the samesmoothing length of 600 m is used in both the backscatter and extinction calculations. Extinction coefficientsbelow 800 m are estimated from the backscatter coefficients by assuming reasonable lidar ratios (middle plot,dotted line).
Figure 3. Radiosonde profiles of potential temperature andrelative humidity at indicated launch times. Strong tempera-ture inversions in the lower troposphere prohibited mixing ofmarine and continental particles aloft.
ANSMANN ET AL.: RAMAN LIDAR OBSERVATIONS OF EUROPEAN POLLUTION20,728
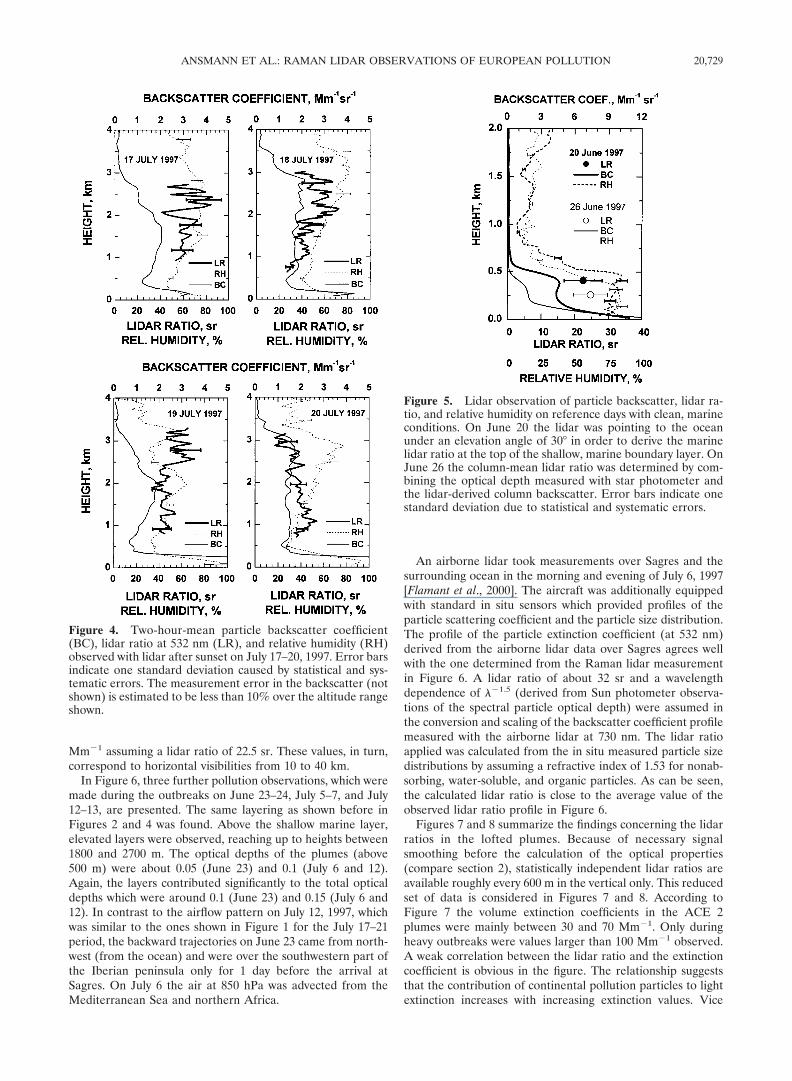
Mm�1 assuming a lidar ratio of 22.5 sr. These values, in turn,correspond to horizontal visibilities from 10 to 40 km.
In Figure 6, three further pollution observations, which weremade during the outbreaks on June 23–24, July 5–7, and July12–13, are presented. The same layering as shown before inFigures 2 and 4 was found. Above the shallow marine layer,elevated layers were observed, reaching up to heights between1800 and 2700 m. The optical depths of the plumes (above500 m) were about 0.05 (June 23) and 0.1 (July 6 and 12).Again, the layers contributed significantly to the total opticaldepths which were around 0.1 (June 23) and 0.15 (July 6 and12). In contrast to the airflow pattern on July 12, 1997, whichwas similar to the ones shown in Figure 1 for the July 17–21period, the backward trajectories on June 23 came from north-west (from the ocean) and were over the southwestern part ofthe Iberian peninsula only for 1 day before the arrival atSagres. On July 6 the air at 850 hPa was advected from theMediterranean Sea and northern Africa.
An airborne lidar took measurements over Sagres and thesurrounding ocean in the morning and evening of July 6, 1997[Flamant et al., 2000]. The aircraft was additionally equippedwith standard in situ sensors which provided profiles of theparticle scattering coefficient and the particle size distribution.The profile of the particle extinction coefficient (at 532 nm)derived from the airborne lidar data over Sagres agrees wellwith the one determined from the Raman lidar measurementin Figure 6. A lidar ratio of about 32 sr and a wavelengthdependence of ��1.5 (derived from Sun photometer observa-tions of the spectral particle optical depth) were assumed inthe conversion and scaling of the backscatter coefficient profilemeasured with the airborne lidar at 730 nm. The lidar ratioapplied was calculated from the in situ measured particle sizedistributions by assuming a refractive index of 1.53 for nonab-sorbing, water-soluble, and organic particles. As can be seen,the calculated lidar ratio is close to the average value of theobserved lidar ratio profile in Figure 6.
Figures 7 and 8 summarize the findings concerning the lidarratios in the lofted plumes. Because of necessary signalsmoothing before the calculation of the optical properties(compare section 2), statistically independent lidar ratios areavailable roughly every 600 m in the vertical only. This reducedset of data is considered in Figures 7 and 8. According toFigure 7 the volume extinction coefficients in the ACE 2plumes were mainly between 30 and 70 Mm�1. Only duringheavy outbreaks were values larger than 100 Mm�1 observed.A weak correlation between the lidar ratio and the extinctioncoefficient is obvious in the figure. The relationship suggeststhat the contribution of continental pollution particles to lightextinction increases with increasing extinction values. Vice
Figure 4. Two-hour-mean particle backscatter coefficient(BC), lidar ratio at 532 nm (LR), and relative humidity (RH)observed with lidar after sunset on July 17–20, 1997. Error barsindicate one standard deviation caused by statistical and sys-tematic errors. The measurement error in the backscatter (notshown) is estimated to be less than 10% over the altitude rangeshown.
Figure 5. Lidar observation of particle backscatter, lidar ra-tio, and relative humidity on reference days with clean, marineconditions. On June 20 the lidar was pointing to the oceanunder an elevation angle of 30� in order to derive the marinelidar ratio at the top of the shallow, marine boundary layer. OnJune 26 the column-mean lidar ratio was determined by com-bining the optical depth measured with star photometer andthe lidar-derived column backscatter. Error bars indicate onestandard deviation due to statistical and systematic errors.
20,729ANSMANN ET AL.: RAMAN LIDAR OBSERVATIONS OF EUROPEAN POLLUTION
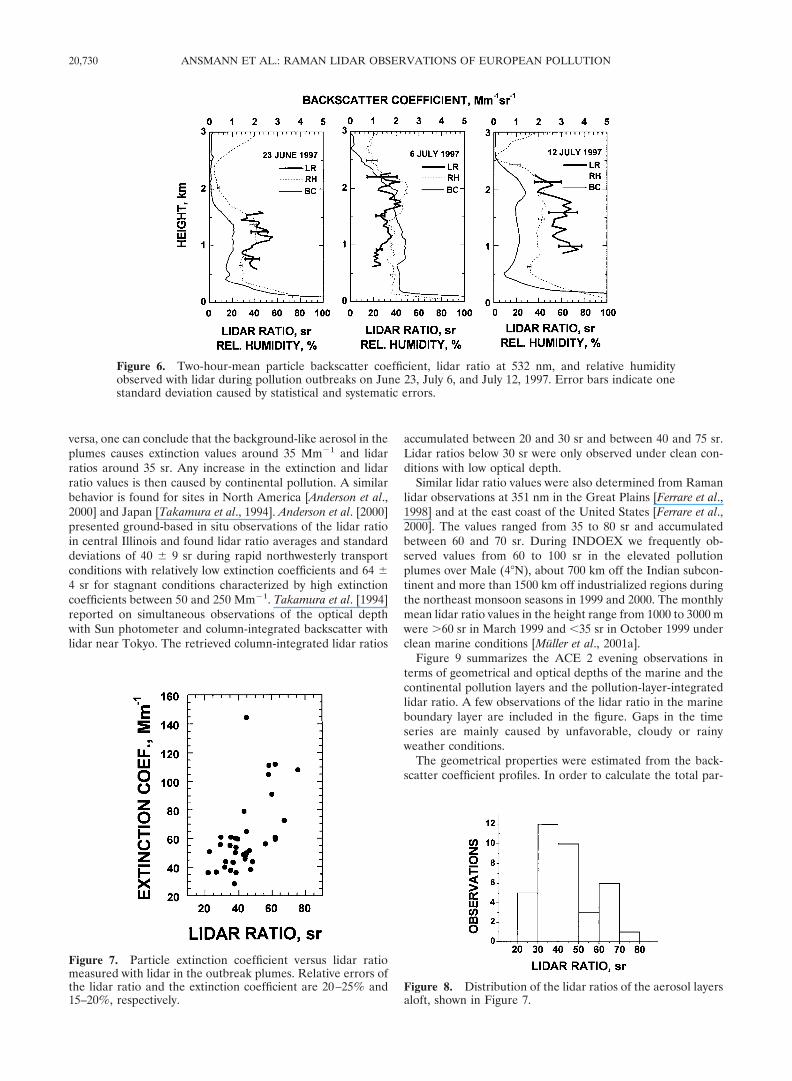
versa, one can conclude that the background-like aerosol in theplumes causes extinction values around 35 Mm�1 and lidarratios around 35 sr. Any increase in the extinction and lidarratio values is then caused by continental pollution. A similarbehavior is found for sites in North America [Anderson et al.,2000] and Japan [Takamura et al., 1994]. Anderson et al. [2000]presented ground-based in situ observations of the lidar ratioin central Illinois and found lidar ratio averages and standarddeviations of 40 � 9 sr during rapid northwesterly transportconditions with relatively low extinction coefficients and 64 �4 sr for stagnant conditions characterized by high extinctioncoefficients between 50 and 250 Mm�1. Takamura et al. [1994]reported on simultaneous observations of the optical depthwith Sun photometer and column-integrated backscatter withlidar near Tokyo. The retrieved column-integrated lidar ratios
accumulated between 20 and 30 sr and between 40 and 75 sr.Lidar ratios below 30 sr were only observed under clean con-ditions with low optical depth.
Similar lidar ratio values were also determined from Ramanlidar observations at 351 nm in the Great Plains [Ferrare et al.,1998] and at the east coast of the United States [Ferrare et al.,2000]. The values ranged from 35 to 80 sr and accumulatedbetween 60 and 70 sr. During INDOEX we frequently ob-served values from 60 to 100 sr in the elevated pollutionplumes over Male (4�N), about 700 km off the Indian subcon-tinent and more than 1500 km off industrialized regions duringthe northeast monsoon seasons in 1999 and 2000. The monthlymean lidar ratio values in the height range from 1000 to 3000 mwere �60 sr in March 1999 and �35 sr in October 1999 underclean marine conditions [Muller et al., 2001a].
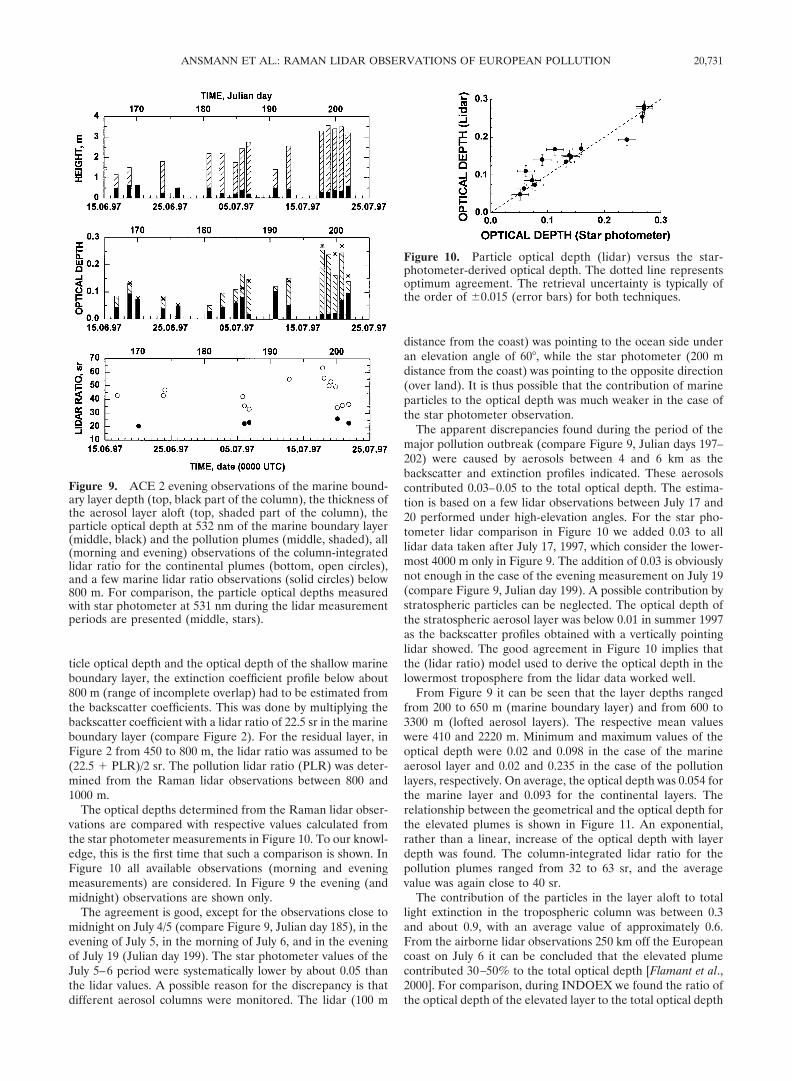
Figure 9 summarizes the ACE 2 evening observations interms of geometrical and optical depths of the marine and thecontinental pollution layers and the pollution-layer-integratedlidar ratio. A few observations of the lidar ratio in the marineboundary layer are included in the figure. Gaps in the timeseries are mainly caused by unfavorable, cloudy or rainyweather conditions.
The geometrical properties were estimated from the back-scatter coefficient profiles. In order to calculate the total par-
Figure 6. Two-hour-mean particle backscatter coefficient, lidar ratio at 532 nm, and relative humidityobserved with lidar during pollution outbreaks on June 23, July 6, and July 12, 1997. Error bars indicate onestandard deviation caused by statistical and systematic errors.
Figure 7. Particle extinction coefficient versus lidar ratiomeasured with lidar in the outbreak plumes. Relative errors ofthe lidar ratio and the extinction coefficient are 20–25% and15–20%, respectively.
Figure 8. Distribution of the lidar ratios of the aerosol layersaloft, shown in Figure 7.
ANSMANN ET AL.: RAMAN LIDAR OBSERVATIONS OF EUROPEAN POLLUTION20,730
ticle optical depth and the optical depth of the shallow marineboundary layer, the extinction coefficient profile below about800 m (range of incomplete overlap) had to be estimated fromthe backscatter coefficients. This was done by multiplying thebackscatter coefficient with a lidar ratio of 22.5 sr in the marineboundary layer (compare Figure 2). For the residual layer, inFigure 2 from 450 to 800 m, the lidar ratio was assumed to be(22.5 � PLR)/2 sr. The pollution lidar ratio (PLR) was deter-mined from the Raman lidar observations between 800 and1000 m.
The optical depths determined from the Raman lidar obser-vations are compared with respective values calculated fromthe star photometer measurements in Figure 10. To our knowl-edge, this is the first time that such a comparison is shown. InFigure 10 all available observations (morning and eveningmeasurements) are considered. In Figure 9 the evening (andmidnight) observations are shown only.
The agreement is good, except for the observations close tomidnight on July 4/5 (compare Figure 9, Julian day 185), in theevening of July 5, in the morning of July 6, and in the eveningof July 19 (Julian day 199). The star photometer values of theJuly 5–6 period were systematically lower by about 0.05 thanthe lidar values. A possible reason for the discrepancy is thatdifferent aerosol columns were monitored. The lidar (100 m
distance from the coast) was pointing to the ocean side underan elevation angle of 60�, while the star photometer (200 mdistance from the coast) was pointing to the opposite direction(over land). It is thus possible that the contribution of marineparticles to the optical depth was much weaker in the case ofthe star photometer observation.
The apparent discrepancies found during the period of themajor pollution outbreak (compare Figure 9, Julian days 197–202) were caused by aerosols between 4 and 6 km as thebackscatter and extinction profiles indicated. These aerosolscontributed 0.03–0.05 to the total optical depth. The estima-tion is based on a few lidar observations between July 17 and20 performed under high-elevation angles. For the star pho-tometer lidar comparison in Figure 10 we added 0.03 to alllidar data taken after July 17, 1997, which consider the lower-most 4000 m only in Figure 9. The addition of 0.03 is obviouslynot enough in the case of the evening measurement on July 19(compare Figure 9, Julian day 199). A possible contribution bystratospheric particles can be neglected. The optical depth ofthe stratospheric aerosol layer was below 0.01 in summer 1997as the backscatter profiles obtained with a vertically pointinglidar showed. The good agreement in Figure 10 implies thatthe (lidar ratio) model used to derive the optical depth in thelowermost troposphere from the lidar data worked well.
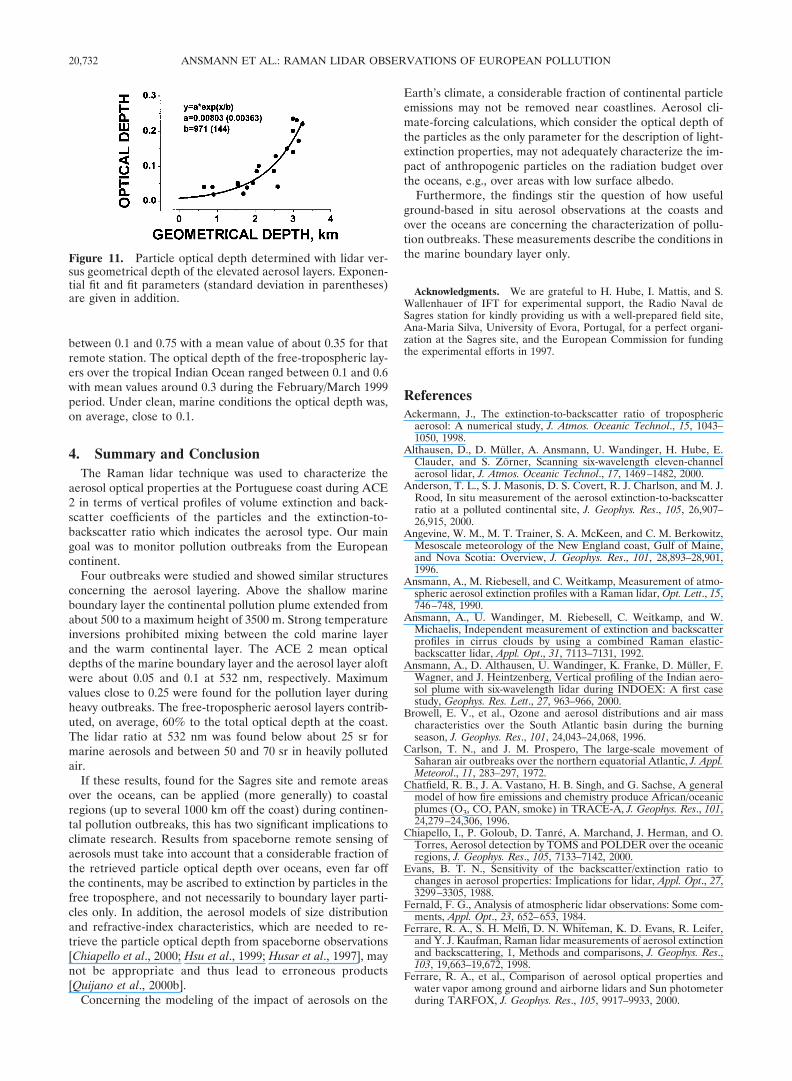
From Figure 9 it can be seen that the layer depths rangedfrom 200 to 650 m (marine boundary layer) and from 600 to3300 m (lofted aerosol layers). The respective mean valueswere 410 and 2220 m. Minimum and maximum values of theoptical depth were 0.02 and 0.098 in the case of the marineaerosol layer and 0.02 and 0.235 in the case of the pollutionlayers, respectively. On average, the optical depth was 0.054 forthe marine layer and 0.093 for the continental layers. Therelationship between the geometrical and the optical depth forthe elevated plumes is shown in Figure 11. An exponential,rather than a linear, increase of the optical depth with layerdepth was found. The column-integrated lidar ratio for thepollution plumes ranged from 32 to 63 sr, and the averagevalue was again close to 40 sr.
The contribution of the particles in the layer aloft to totallight extinction in the tropospheric column was between 0.3and about 0.9, with an average value of approximately 0.6.From the airborne lidar observations 250 km off the Europeancoast on July 6 it can be concluded that the elevated plumecontributed 30–50% to the total optical depth [Flamant et al.,2000]. For comparison, during INDOEX we found the ratio ofthe optical depth of the elevated layer to the total optical depth
Figure 9. ACE 2 evening observations of the marine bound-ary layer depth (top, black part of the column), the thickness ofthe aerosol layer aloft (top, shaded part of the column), theparticle optical depth at 532 nm of the marine boundary layer(middle, black) and the pollution plumes (middle, shaded), all(morning and evening) observations of the column-integratedlidar ratio for the continental plumes (bottom, open circles),and a few marine lidar ratio observations (solid circles) below800 m. For comparison, the particle optical depths measuredwith star photometer at 531 nm during the lidar measurementperiods are presented (middle, stars).
Figure 10. Particle optical depth (lidar) versus the star-photometer-derived optical depth. The dotted line representsoptimum agreement. The retrieval uncertainty is typically ofthe order of �0.015 (error bars) for both techniques.
20,731ANSMANN ET AL.: RAMAN LIDAR OBSERVATIONS OF EUROPEAN POLLUTION
between 0.1 and 0.75 with a mean value of about 0.35 for thatremote station. The optical depth of the free-tropospheric lay-ers over the tropical Indian Ocean ranged between 0.1 and 0.6with mean values around 0.3 during the February/March 1999period. Under clean, marine conditions the optical depth was,on average, close to 0.1.
4. Summary and ConclusionThe Raman lidar technique was used to characterize the
aerosol optical properties at the Portuguese coast during ACE2 in terms of vertical profiles of volume extinction and back-scatter coefficients of the particles and the extinction-to-backscatter ratio which indicates the aerosol type. Our maingoal was to monitor pollution outbreaks from the Europeancontinent.
Four outbreaks were studied and showed similar structuresconcerning the aerosol layering. Above the shallow marineboundary layer the continental pollution plume extended fromabout 500 to a maximum height of 3500 m. Strong temperatureinversions prohibited mixing between the cold marine layerand the warm continental layer. The ACE 2 mean opticaldepths of the marine boundary layer and the aerosol layer aloftwere about 0.05 and 0.1 at 532 nm, respectively. Maximumvalues close to 0.25 were found for the pollution layer duringheavy outbreaks. The free-tropospheric aerosol layers contrib-uted, on average, 60% to the total optical depth at the coast.The lidar ratio at 532 nm was found below about 25 sr formarine aerosols and between 50 and 70 sr in heavily pollutedair.
If these results, found for the Sagres site and remote areasover the oceans, can be applied (more generally) to coastalregions (up to several 1000 km off the coast) during continen-tal pollution outbreaks, this has two significant implications toclimate research. Results from spaceborne remote sensing ofaerosols must take into account that a considerable fraction ofthe retrieved particle optical depth over oceans, even far offthe continents, may be ascribed to extinction by particles in thefree troposphere, and not necessarily to boundary layer parti-cles only. In addition, the aerosol models of size distributionand refractive-index characteristics, which are needed to re-trieve the particle optical depth from spaceborne observations[Chiapello et al., 2000; Hsu et al., 1999; Husar et al., 1997], maynot be appropriate and thus lead to erroneous products[Quijano et al., 2000b].
Concerning the modeling of the impact of aerosols on the
Earth’s climate, a considerable fraction of continental particleemissions may not be removed near coastlines. Aerosol cli-mate-forcing calculations, which consider the optical depth ofthe particles as the only parameter for the description of light-extinction properties, may not adequately characterize the im-pact of anthropogenic particles on the radiation budget overthe oceans, e.g., over areas with low surface albedo.
Furthermore, the findings stir the question of how usefulground-based in situ aerosol observations at the coasts andover the oceans are concerning the characterization of pollu-tion outbreaks. These measurements describe the conditions inthe marine boundary layer only.
Acknowledgments. We are grateful to H. Hube, I. Mattis, and S.Wallenhauer of IFT for experimental support, the Radio Naval deSagres station for kindly providing us with a well-prepared field site,Ana-Maria Silva, University of Evora, Portugal, for a perfect organi-zation at the Sagres site, and the European Commission for fundingthe experimental efforts in 1997.
ReferencesAckermann, J., The extinction-to-backscatter ratio of tropospheric
aerosol: A numerical study, J. Atmos. Oceanic Technol., 15, 1043–1050, 1998.
Althausen, D., D. Muller, A. Ansmann, U. Wandinger, H. Hube, E.Clauder, and S. Zorner, Scanning six-wavelength eleven-channelaerosol lidar, J. Atmos. Oceanic Technol., 17, 1469–1482, 2000.
Anderson, T. L., S. J. Masonis, D. S. Covert, R. J. Charlson, and M. J.Rood, In situ measurement of the aerosol extinction-to-backscatterratio at a polluted continental site, J. Geophys. Res., 105, 26,907–26,915, 2000.
Angevine, W. M., M. T. Trainer, S. A. McKeen, and C. M. Berkowitz,Mesoscale meteorology of the New England coast, Gulf of Maine,and Nova Scotia: Overview, J. Geophys. Res., 101, 28,893–28,901,1996.
Ansmann, A., M. Riebesell, and C. Weitkamp, Measurement of atmo-spheric aerosol extinction profiles with a Raman lidar, Opt. Lett., 15,746–748, 1990.
Ansmann, A., U. Wandinger, M. Riebesell, C. Weitkamp, and W.Michaelis, Independent measurement of extinction and backscatterprofiles in cirrus clouds by using a combined Raman elastic-backscatter lidar, Appl. Opt., 31, 7113–7131, 1992.
Ansmann, A., D. Althausen, U. Wandinger, K. Franke, D. Muller, F.Wagner, and J. Heintzenberg, Vertical profiling of the Indian aero-sol plume with six-wavelength lidar during INDOEX: A first casestudy, Geophys. Res. Lett., 27, 963–966, 2000.
Browell, E. V., et al., Ozone and aerosol distributions and air masscharacteristics over the South Atlantic basin during the burningseason, J. Geophys. Res., 101, 24,043–24,068, 1996.
Carlson, T. N., and J. M. Prospero, The large-scale movement ofSaharan air outbreaks over the northern equatorial Atlantic, J. Appl.Meteorol., 11, 283–297, 1972.
Chatfield, R. B., J. A. Vastano, H. B. Singh, and G. Sachse, A generalmodel of how fire emissions and chemistry produce African/oceanicplumes (O3, CO, PAN, smoke) in TRACE-A, J. Geophys. Res., 101,24,279–24,306, 1996.
Chiapello, I., P. Goloub, D. Tanre, A. Marchand, J. Herman, and O.Torres, Aerosol detection by TOMS and POLDER over the oceanicregions, J. Geophys. Res., 105, 7133–7142, 2000.
Evans, B. T. N., Sensitivity of the backscatter/extinction ratio tochanges in aerosol properties: Implications for lidar, Appl. Opt., 27,3299–3305, 1988.
Fernald, F. G., Analysis of atmospheric lidar observations: Some com-ments, Appl. Opt., 23, 652–653, 1984.
Ferrare, R. A., S. H. Melfi, D. N. Whiteman, K. D. Evans, R. Leifer,and Y. J. Kaufman, Raman lidar measurements of aerosol extinctionand backscattering, 1, Methods and comparisons, J. Geophys. Res.,103, 19,663–19,672, 1998.
Ferrare, R. A., et al., Comparison of aerosol optical properties andwater vapor among ground and airborne lidars and Sun photometerduring TARFOX, J. Geophys. Res., 105, 9917–9933, 2000.
Figure 11. Particle optical depth determined with lidar ver-sus geometrical depth of the elevated aerosol layers. Exponen-tial fit and fit parameters (standard deviation in parentheses)are given in addition.
ANSMANN ET AL.: RAMAN LIDAR OBSERVATIONS OF EUROPEAN POLLUTION20,732
Flamant, C., et al., Airborne lidar measurements of aerosol spatialdistribution and optical properties over the Atlantic Ocean during aEuropean pollution outbreak of ACE-2, Tellus, Ser. B, 52, 662–677,2000.
Hartley, W. S., P. V. Hobbs, J. L. Ross, P. B. Russell, and J. M.Livingston, Properties of aerosols aloft relevant to direct radiativeforcing off the mid-Atlantic coast of the United States, J. Geophys.Res., 105, 9859–9885, 2000.
Haywood, J. M., and K. P. Shine, Multi-spectral calculations of thedirect radiative forcing of the tropospheric sulphate and soot aero-sols using a column model, Q. J. R. Meteorol. Soc., 123, 1907–1930,1997.
Herber, A., S. Debatin, J. Graeser, H. Gernandt, K. H. Schulz, A.Naebert, J. Gundermann, and G. Alekseeva, Measurements of thespectral optical depth of aerosols with moon and star light duringpolar night 1994/95 and 1995/96 in Ny-Ålesund, Spitzbergen, in IRS’96: Current Problems in Atmospheric Radiation, edited by W. L.Smith and K. Stamnes, pp. 19–22, A. Deepak, Hampton, Va., 1997.
Hsu, N. C., J. R. Herman, O. Torres, B. N. Holben, D. Tanre, T. F.Eck, A. Smirnov, B. Chatenet, and F. Lavenu, Comparison of theTOMS aerosol index with Sun photometer aerosol optical thickness:Results and applications, J. Geophys. Res., 104, 6269–6279, 1999.
Husar, R. B., J. M. Prospero, and L. L. Stove, Characterization oftropospheric aerosols over the oceans with the NOAA advancedvery high resolution radiometer optical thickness operational prod-uct, J. Geophys. Res., 102, 16,889–16,909, 1997.
Jaffe, D., et al., Transport of Asian air pollution to North America,Geophys. Res. Lett., 26, 711–714, 1999.
Kaneyasu, N., and S. Murayama, High concentration of black carbonover middle latitudes in the North Pacific Ocean, J. Geophys. Res.,105, 19,881–19,890, 2000.
Karyampudi, V. M., et al., Validation of the Saharan Dust PlumeConceptual Model using lidar, Meteosat, and ECMWF data, Bull.Am. Meteorol. Soc., 80, 1045–1075, 1999.
Leiterer, U., G. Alekseeva, V. Galkin, H. Dier, J. Guldner, A. Naebert,T. Naebert, V. Novikov, H. Rentsch, and G. Sakunov, Water vaporcolumn content and optical depths measurements by a sun- andstarphotometer, Contrib. Atmos. Phys., 71, 401–420, 1998.
Melfi, S. H., J. D. Lawrence, and M. P. McCormick, Observation ofRaman scattering by water vapor in the atmosphere, Appl. Phys.Lett., 15, 295–297, 1969.
Muller, D., F. Wagner, D. Althausen, U. Wandinger, and A. Ansmann,Physical properties of the Indian aerosol plume on 25 March 1999 ofthe Indian Ocean Experiment, Geophys. Res. Lett., 27, 1403–1406,2000a.
Muller, D., F. Wagner, U. Wandinger, A. Ansmann, M. Wendisch, D.Althausen, and W. von Hoyningen-Huene, Microphysical particleparameters from extinction and backscatter lidar data by inversionwith regularization: Experiment, Appl. Opt., 39, 1879–1892, 2000b.
Muller, D., K. Franke, F. Wagner, D. Althausen, A. Ansmann, andJ. Heintzenberg, Vertical profiling of optical and physical particleproperties over the tropical Indian Ocean with six-wavelength lidar,1, Seasonal cycle, J. Geophys. Res., in press, 2001a.
Muller, D., K. Franke, F. Wagner, D. Althausen, A. Ansmann,J. Heintzenberg, and G. Verver, Vertical profiling of optical andphysical particle properties over the tropical Indian Ocean withsix-wavelength lidar, 2, Case studies, J. Geophys. Res., in press,2001b.
Quijano, A. L., I. N. Sokolik, and O. B. Toon, Radiative heating ratesand direct radiative forcing by mineral dust in cloudy atmosphericconditions, J. Geophys. Res., 105, 12,207–12,219, 2000a.
Quijano, A. L., I. N. Sokolik, and O. B. Toon, Influence of the aerosolvertical distribution on the retrievals of aerosol optical depth fromsatellite radiance measurements, Geophys. Res. Lett., 27, 3457–3460,2000b.
Rajan, S., T. J. Kane, and C. R. Philbrick, Multiple-wavelength Ramanlidar measurements of atmospheric water vapor, Geophys. Res. Lett.,21, 2499–2502, 1994.
Rodhe, H., Human impact on the atmospheric sulfur balance, Tellus,Ser. A–B, 51, 110–122, 1999.
Takamura, T., Y. Sasano, and T. Hayasaka, Tropospheric aerosoloptical properties derived from lidar, sun photometer, and opticalparticle counter measurements, Appl. Opt., 33, 7132–7140, 1994.
Wagner, F., Kombinierte Mehrwellenlangen-Lidar-Photometer-Messungen von optischen und physikalischen Partikelparameternwahrend ACE-2, Ph.D. thesis, 117 pp., Inst. for Tropospheric Res.,Leipzig, Germany, Aug. 2000.
Wandinger, U., and A. Ansmann, Experimental determination of thelidar overlap profile with Raman lidar, Appl. Opt., in press, 2001.
Whiteman, D. N., Application of statistical methods to the determi-nation of slope in lidar data, Appl. Opt., 38, 3360–3369, 1999.
Winker, D., Global observations of aerosols and clouds from combinedlidar and passive instruments to improve radiation budget and cli-mate studies, Earth Obs., 11, 22–25, 1999.
D. Althausen, A. Ansmann, D. Muller, and U. Wandinger, Institutefor Tropospheric Research, Permoserstr. 15, 04318 Leipzig, Germany.([email protected]; [email protected]; [email protected];[email protected])
A. Herber, Alfred Wegener Institute for Polar Research, Postfach600149, 14401 Postdam, Germany. ([email protected])
F. Wagner, Meteorological Institute, University of Munich,Theresienstrasse 37, 80333 Munich, Germany. ([email protected])
(Received October 26, 2000; revised April 24, 2001;accepted April 26, 2001.)
20,733ANSMANN ET AL.: RAMAN LIDAR OBSERVATIONS OF EUROPEAN POLLUTION

20,734