european integration, productivity growth and real convergence: evidence from the new member states
TRANSCRIPT

THE WILLIAM DAVIDSON INSTITUTE AT THE UNIVERSITY OF MICHIGAN BUSINESS SCHOOL
European Integration, Productivity Growth and Real Convergence
By: Taner M. Yigit and Ali M. Kutan
William Davidson Institute Working Paper Number 657 February 2004
European Integration, Productivity Growth
and Real Convergence
Taner M. Yigita
Bilkent University
and
Ali M. Kutanb
Southern Illinois University, Edwardsville; ZEI, Bonn; and WDI, Michigan.
_________________________________________________________________________________________________________________
aCorresponding author: Department of Economics, Bilkent University, Bilkent, 06800 Ankara-Turkey. Tel: +90 (312) 2901898, Fax: +90 (312) 2665140, E-mail: [email protected] bEconomics and Finance Department, School of Business, Southern Illinois University Edwardsville, IL 62026-1102, The Center for European Integration Studies (ZEI), Bonn, and The William Davidson Institute (WDI), Michigan. E-mail: [email protected] We thank Jesus Crespo-Cuaresma, Kostas Drakos, Balázs Egert, Lucjan T. Orlowski, Erinc Yeldan, the participants of the 7th International ERC, and the participants of the 49th East Jour Fixe, where earlier versions of this paper was presented, for their valuable comments.

European Integration, Productivity Growth
and Real Convergence
Abstract
This paper derives a stochastic endogenous growth model that investigates the impact of
European Union integration on convergence and productivity growth. We deviate from the
general strand of literature by not only deriving a theoretical model for the effects of
integration on the rate of economic growth, but also by using more appropriate estimation
techniques. The outcome of a series of panel and structural break tests examining the
accession process of five recent members to the Union generally show improved rates of
productivity growth and convergence to EU standards. We then draw from the experience of
these recent members to derive implications for the first-round EU candidate countries.
Subsequent tests on the first-round candidate countries find a high level of heterogeneity in
growth rates, and a fast-paced convergence to EU standards.
Keywords : European integration, growth, transition economies, convergence
JEL: O52, O4, P2

1. Introduction
In an age where many former communist countries strive to become a member of the
European Union (EU) and policy circles discuss how best to synchronize the policies so that
the existing members “all” benefit, it is natural to ask whether the EU membership pays off
and eliminates the divergence of EU’s incumbents over time. To answer this question, we
formulate and test a stochastic endogenous growth model that investigates the impact of EU
integration on convergence and productivity growth. We achieve this by combining the ideas
in Rivera-Batiz & Romer (hereafter, RB-R, 1991) and Lee, Pesaran & Smith (LPS, 1997),
complemented later on by a battery of structural break and panel data tests.
This paper contributes to the literature in significant ways. First, we extend the stochastic
neoclassical growth model of LPS by implementing the ‘integration parameter’ of RB-R to
analyze the effects of accession into the Union. We assume that integration to a wider body of
knowledge that comes with (prospective) membership into the EU leads to higher returns to
scale by enhancing the effectiveness of capital, hence speeding up the convergence process.
Second, we test the findings of our theoretical model by utilizing the methodology by LPS,
which provides a sound framework regarding the variables that should be included in the
estimation1. The use of this technique especially fits our analysis since it corrects for the false
inference in convergence when technological progress or sufficient heterogeneity are not
adequately accounted for. Third, we complement the LPS tests with a series of structural
break tests to validate the implications of the theoretical model regarding changes in the
parameters of the growth process. Finally, we apply our modified theoretical model to the
case of real convergence of the candidate transition economies to gain insight on the prospects
of their integration to the EU by drawing from the experience of recent EU members during
pre- and post-membership periods. To our best knowledge, our work is the first research that
brings theory and empirics together to analyze the impact of integration on convergence and
productivity growth.
There are some related studies that complement ours. Henrekson, Thorstensson &
Thorstensson (1997) examine the role of trade and institutional integration on economic
growth, using a purely empirical approach on European Community (EC) and European Free
Trade Area (EFTA) countries along with a sample of OECD countries. Using a cross-
sectional and pooled OLS study, their study finds that joining the EU or EFTA enhances
growth. Crespo-Cuaresma, Ritzberger-Grünwald, and Silgoner (2002) examine the impact of
1 Earlier studies use rather ad hoc specifications with many control variables to test for convergence, developing models that have very little reliance on growth theory.
European integration on economic growth of current EU members, using a panel regression.
They find that the length of EU membership has a significant and positive effect on growth,
and it is higher for poorer countries, suggesting an asymmetric impact of EU membership.
These studies solely focus on a regression analysis of the relation between membership and
growth without providing an underlying theoretical framework or projections for the
candidate economies. Martin and Velázquez (2001), Wagner and Hlouskova (2002) and
Boldrin and Canova (2003) provide a descriptive analysis of how different experiences of
convergence of the recent EU members affected economic growth after joining the EU and
derive lessons from these countries’ experience for the candidate countries. Employing
different growth scenarios, they examine the beneficial effects of the EU membership and
how long it would take for the candidate countries to fully complete the convergence process.
They emphasize the importance of national policies to achieve a sustained period of
significant growth above EU averages and hence real convergence towards the EU standards.
Our paper extends the analysis in these papers by providing not only an in depth
theoretical foundation on the effects of integration, but also empirically testing for its
implications on the specific aspects of growth, namely productivity and convergence. We also
contribute to the literature by using a variety of estimation techniques that have less room for
false inference due to impositions of homogeneity or neglecting of productivity growth. In
addition, like in Martin and Velázquez (2001), Wagner and Hlouskova (2002) and Boldrin
and Canova (2003), we provide lessons for the candidate economies by focusing the empirical
evidence from the recent EU members. In this sense, we merge the two related but distinct
literatures on integration and enlargement.
This paper is organized as follows. Section 2 sets up our theoretical model. We describe
our estimation technique and data in Section 3, while Section 4 reports the empirical results.
Section 5 discusses the importance of real convergence for the candidate countries and
provides some preliminary estimates of convergence and productivity developments for these
economies. The last section provides a summary of the key findings of the paper, along with
its policy implications.
2. Theoretical framework
With developments in the econometrics field, 1990s have witnessed an abundance of
studies on neoclassical growth theory and its implication of convergence. These empirical
analyses of convergence fall into two categories. The first class of tests studies the cross-

sectional correlation between initial per capita output levels ( ,0iy ) and the subsequent speed of
growth ( , ,0i t iy y− ).
( )1, ,0 ,0 ,i t i i i tT y y yα β ε− − = + + (1)
A negative correlation (or 0β < ) is interpreted as convergence since it implies that countries
with lower per capita output will grow faster (Dowrick & Nguyen, 1989; Barro, 1991; Barro
and Sala-i-Martin, 1992). The second set of tests utilizes time series analysis to examine the
long-run behavior of output per capita differences across countries (Quah, 1992; Bernard and
Durlauf, 1995).
, , , , , , ,0
i t j t i j i j r i j t rr
y y κ π ε∞
−=
− = +∑ (2)
A zero mean-stationary difference in output levels of country i and j implies that long term
forecasts of output differences between the two countries converge to zero. A later study by
Bernard & Durlauf (1996) cautions the practitioners by showing that cross sectional tests
could exhibit negative correlation even without the existence of convergence, while time
series tests could give misleading results when applied to countries in transition, still far away
from their long-run equilibrium.
Recent adoption of panel-data estimation techniques combines the dynamics in time series
with cross sectional variation in analyses of convergence. One group of authors utilizes panel
unit root techniques to check for the existence of a common stochastic trend as evidence of
convergence across a panel of countries (e.g., Evans and Karras, 1996; Evans, 1998, Fleissig
and Strauss, 2001). Recent applications of this technique (e.g., Kočenda, 2001) assume
homogeneity in growth rates across panel countries studied. Kutan and Yigit (2004), however,
show Kočenda’s evidence for convergence is sensitive to the assumption of homogeneity in
growth rates, and that further investigation, especially allowing for heterogeneity, is
necessary. That is why we choose to employ dynamic panel data estimation techniques with
the assumption of unobservable country-specific heterogeneity (Islam, 1995; Lee, Pesaran &
Smith, 1997; Nerlove, 2000).
We choose to follow the methodology employed in LPS because it stands out from the
rest of the studies by including an explicit link, rather than an ad hoc stochastic specification,
between economic theory and their econometric model. Their work also allows for the
maximum amount of heterogeneity in growth rates across the panel. We expand their model to
incorporate an endogenous growth suggestion by RB-R to analyze the impact of European
Union membership on the per capita GDP of recent entrants. The next section elaborates on
this model.
2.1 Derivation of testable implications
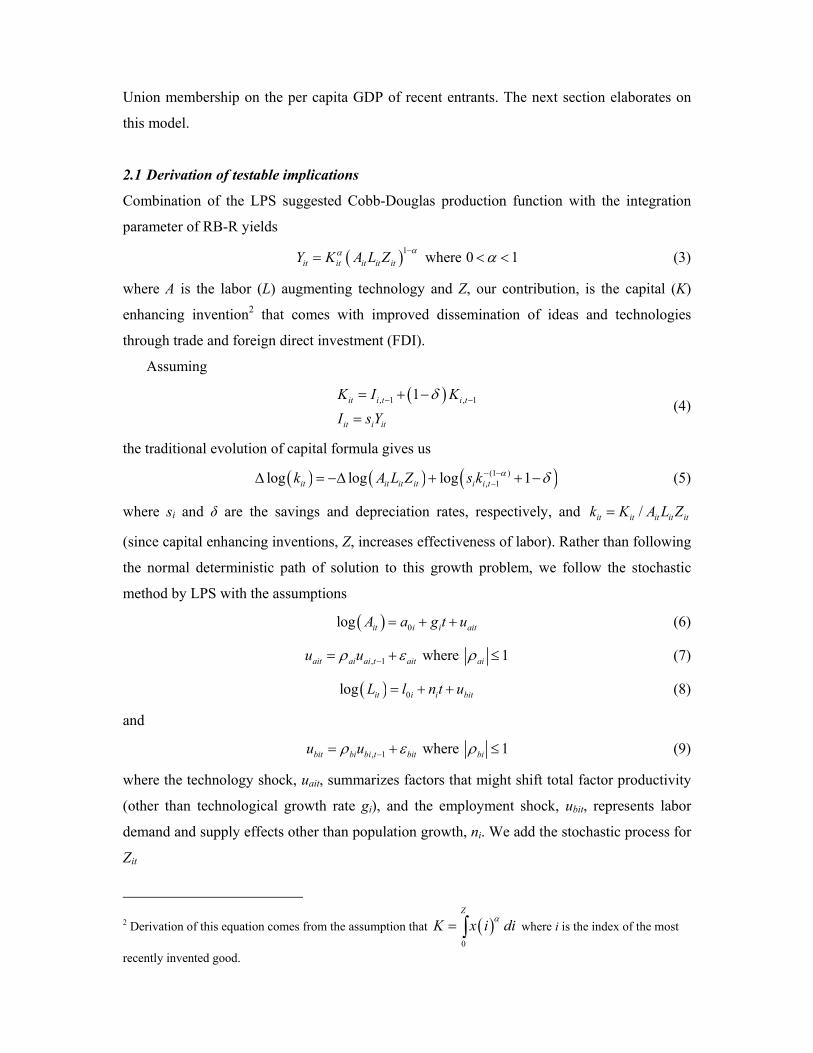
Combination of the LPS suggested Cobb-Douglas production function with the integration
parameter of RB-R yields
( )1 where 0 1it it it it itY K A L Z αα α−= < < (3)
where A is the labor (L) augmenting technology and Z, our contribution, is the capital (K)
enhancing invention2 that comes with improved dissemination of ideas and technologies
through trade and foreign direct investment (FDI).
Assuming
( ), 1 , 11it i t i t
it i it
K I KI s Y
δ− −= + −
= (4)
the traditional evolution of capital formula gives us
( ) ( ) ( )(1 ), 1log log log 1it it it it i i tk A L Z s k α δ− −−∆ = −∆ + + − (5)
where si and δ are the savings and depreciation rates, respectively, and /it it it it itk K A L Z=
(since capital enhancing inventions, Z, increases effectiveness of labor). Rather than following
the normal deterministic path of solution to this growth problem, we follow the stochastic
method by LPS with the assumptions
( ) 0log it i i aitA a g t u= + + (6)
, 1 where 1ait ai ai t ait aiu uρ ε ρ−= + ≤ (7)
( ) 0log it i i bitL l n t u= + + (8)
and
, 1 where 1bit bi bi t bit biu uρ ε ρ−= + ≤ (9)
where the technology shock, uait, summarizes factors that might shift total factor productivity
(other than technological growth rate gi), and the employment shock, ubit, represents labor
demand and supply effects other than population growth, ni. We add the stochastic process for
Zit
2 Derivation of this equation comes from the assumption that ( )
0
Z
K x i diα= ∫ where i is the index of the most
recently invented good.

( ) 0log it i i citZ z t uζ= + + (10)
and assume the same autocorrelation as in the case of technological process only for
notational simplicity.
Using the fact that expected change in capital is zero in the steady state and omitting the
subscript i, we obtain
( )(1 )log 1n g E sk αζ δ− −∞
+ + = + − (11)
Utilizing Jensen’s inequality, this term equals
( )(1 )log( )log 1kn g se hαζ δ∞− −+ + = + − + (12)
Approximation of the nonlinear term in this equation around ( )logE k∞ yields
( ) ( )(1 )1 1log 1 1 logt t tsk kα δ γ λ ξ− −− −+ − = − − + (13)
where tξ is the error of approximation and
( ) [ ]
[ ]
(1 ) log( )
(1 ) log( )
11 0
1
E k
E k
s ese
α
α
αλ
δ
∞
∞
− −
− −
−− = >
+ − (14)
and
( ) ( ) [ ](1 )log( )log 1 1 log( )kse E kαγ δ λ∞− −∞= + − + − (15)
For small values of , , , , and n g hζ δ , they simplify to
( )( )1 1 n g hλ α δ ζ− ≈ − + + + − (16)
and
( ) ( ) ( )log logn g h n g h s n g hγ ζ ζ δ ζ δ≈ + + − + + + + − − + + + − (17)
In the deterministic version the linearization is done around the steady state k and u’s are
assumed to be zero. For h equaling zero, the term (1 λ− ) is the measure of beta convergence.
Defining output per capita as
( )logt t t tY x a z kL
α= = + + (18)
where a is log(A) and z is log(Z) and tt
t t t
KkA L Z
= , it is easy to see that
( ) ( ) ( )( )1 0 0 11 t a c
t t t t
x a z g t u ux a z n g u
ζα ζ γ λ
α− − − − + − − −
∆ = ∆ + ∆ + − + + − ∆ + − −
(19)
Using equations from (6) to (10), we can rewrite this as
( )( ) 11t t tx g t x eµ λ ζ λ −= + − + + + (20)
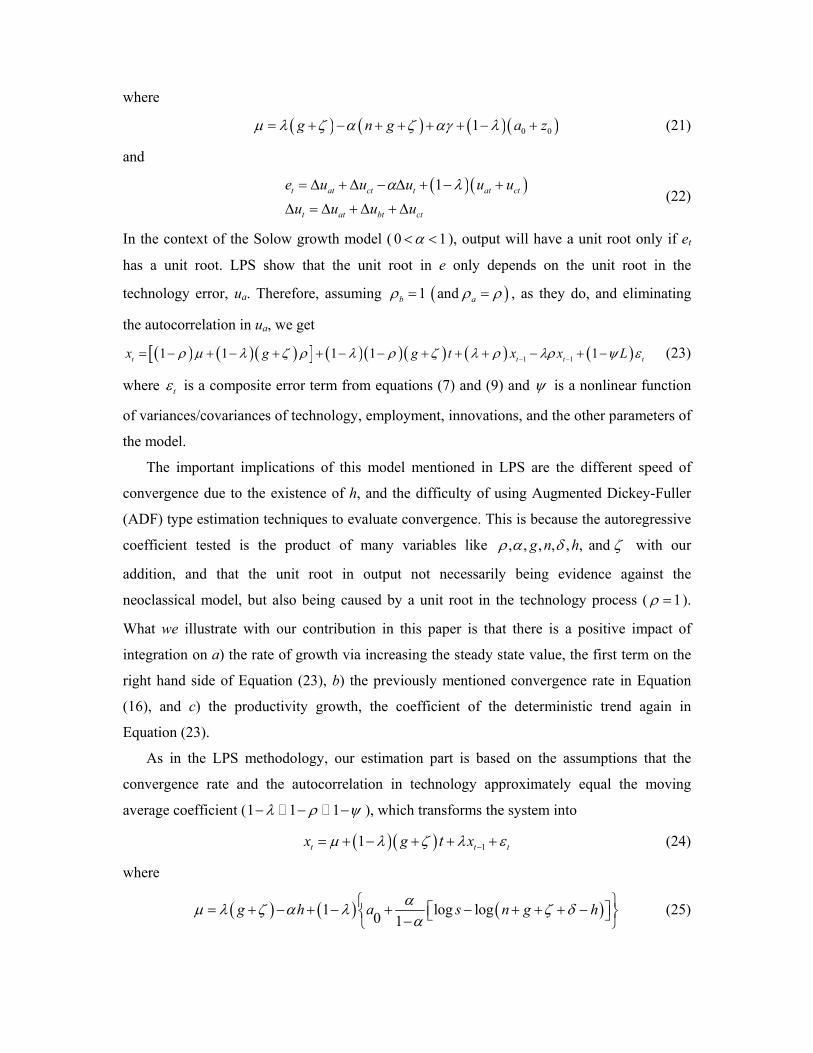
where
( ) ( ) ( )( )0 01g n g a zµ λ ζ α ζ αγ λ= + − + + + + − + (21)
and
( )( )1t at ct t at ct
t at bt ct
e u u u u uu u u u
α λ= ∆ + ∆ − ∆ + − +
∆ = ∆ + ∆ + ∆ (22)
In the context of the Solow growth model ( 0 1α< < ), output will have a unit root only if et
has a unit root. LPS show that the unit root in e only depends on the unit root in the
technology error, ua. Therefore, assuming ( )1 and b aρ ρ ρ= = , as they do, and eliminating
the autocorrelation in ua, we get
( ) ( )( )[ ] ( )( )( ) ( ) ( )1 11 1 1 1 1t t t tx g g t x x Lρ µ λ ζ ρ λ ρ ζ λ ρ λρ ψ ε− −= − + − + + − − + + + − + − (23)
where tε is a composite error term from equations (7) and (9) and ψ is a nonlinear function
of variances/covariances of technology, employment, innovations, and the other parameters of
the model.
The important implications of this model mentioned in LPS are the different speed of
convergence due to the existence of h, and the difficulty of using Augmented Dickey-Fuller
(ADF) type estimation techniques to evaluate convergence. This is because the autoregressive
coefficient tested is the product of many variables like , , , , , , and g n hρ α δ ζ with our
addition, and that the unit root in output not necessarily being evidence against the
neoclassical model, but also being caused by a unit root in the technology process ( 1ρ = ).
What we illustrate with our contribution in this paper is that there is a positive impact of
integration on a) the rate of growth via increasing the steady state value, the first term on the
right hand side of Equation (23), b) the previously mentioned convergence rate in Equation
(16), and c) the productivity growth, the coefficient of the deterministic trend again in
Equation (23).
As in the LPS methodology, our estimation part is based on the assumptions that the
convergence rate and the autocorrelation in technology approximately equal the moving
average coefficient (1 1 1λ ρ ψ− − − ), which transforms the system into
( )( ) 11t t tx g xtµ λ ζ λ ε−= + − + + + (24)
where
( ) ( ) ( )1 log log0 1g h a s n g hαµ λ ζ α λ ζ δ
α = + − + − + − + + + − −
(25)

This system is a modified version of the typically adopted method of convergence testing with
the addition of increases in the steady state term and the productivity growth. For estimation
of ( ) and gλ ζ+ separately, LPS suggests rewriting the equation
( )
, 1
it i i i it
it i i t it
x c g t uu u
ζλ η−
= + + +
= + (26)
Separating ( ) and gλ ζ+ prevents any false inferences about convergence that could have
resulted from a unit root in productivity growth. After the estimation of these equations, one
could use these estimates to derive iµ by noting that
( ) ( )1i i i i i ic gµ λ λ ζ= − + + (27)
It is apparent that one cannot identify both g and ζ from these estimations, but a sudden
change in the integration process could generate a structural shift in the GDP per capita.
Results for the tests for these structural breaks are reported in Section 5.
Prior to estimation of the system in Equation (26), LPS suggests demeaning (across i) to
remove the cross-correlation between countries caused by the common time component.
Therefore, the estimated system becomes
( ) ( ) ( )
( ) ( ) ( ), 1 1
it t i i i it t
it t i i t t it t
x x c c g g t u u
u u u u
ζ ζ
λ η η− −
− = − + + − − + −
− = − + − (28)
where the common component coefficients are obtained from a similar regression
( )1
t
t t t
x c g t u
u u
ζ
λ η−
= + + +
= + (29)
Finally, coefficient values in Equation (26) are obtained by adding the estimates of Equation
(28) to those of Equation (29).
There are important differences in our modified LPS model from all of studies that test for
conditional convergence. The first one is that we have an explicit constant term µi,
representing differences in steady states rather than arbitrarily attaching a set of variables to
control for differences in steady states. Despite the benefits of control variables in general,
unnecessarily increasing the number of explanatory variables in dynamic panel studies is
likely to increase the cross-correlation between sample countries, leading to size problems in
the final estimation. The second difference is the fact that we allow for heterogeneity in
technological growth rates across panel countries. LPS show that failure to account for this
possible variation will bias the convergence rates, resulting in slower convergence findings.
Third and more importantly, we apply the same methodology to a different idea to illustrate
that exposure to a wider knowledge base results in increased rates of productivity growth and
convergence as shown in equations (16) and (24). We do this by measuring the most recent
members’ convergence rates and productivity growth before and after joining the EU. We
complement the outcome of these tests with the results from a series of structural break tests
to find that integration does generally create the intended difference. Finally we expand our
results to comment on an important question: are the first-group EU candidate countries
following a similar path as the recent members, and will they and the EU benefit from a
union?
3. Data and empirical methodology
3.1. Data
Our data set consists of quarterly GDP per capita from 13 countries; the earlier five
members3, for the first stage estimations, and eight EU candidates4 for the latter stage of the
estimations. The sample period for the member countries is from 1980 to 2002, while the
candidate country data range is chosen to be between 1993 and 2002.5 We exclude Slovenia
and Cyprus in the estimations due to data limitations. We construct real GDP per capita data
based on purchasing power parity (PPP) values. Finally, since the classical definition of
convergence refers to the log of real GDP per capita, we take the natural logarithm of all the
series.
3.2 An overview of the estimation technique
We test Equation (26) for pre- and post-membership periods of the 5 recent members
using Least Squares with Dummy Variables (LSDV) methodology. We choose this method
over more complicated techniques such as the Exact Maximum Likelihood used in the LPS
(1997) paper, as well as GMM or 3SLS, due to small number of cross sectional units and a
much larger quantity of time series observations6. The fact that our sample countries are not
randomly drawn from a large population and arguments by Baltagi (1995) lead us to the
choice of fixed effects estimation over random effects.
3 Spain, Portugal, Austria, Finland, and Sweden 4 The Czech Republic, Estonia, Hungary, Latvia, Lithuania, Malta, Poland, and the Slovak Republic 5 Pre-93 period is highly unstable, reflecting the shock effects of the early 1990 reforms. 6 The bias associated with dynamic panel datasets is going to be negligible with such a high T and a low N (Judson and Owen, 1999; Nickell, 1981).

We demean each series with French GDP/capita as the proxy for convergence to EU
standards7. Then, using the reduced form coefficients from Equation (28) and the French
coefficients8 from Equation (29), we obtain the structural parameters of Equation (26).
Utilizing these coefficients, we next check the assumption of heterogeneity versus common
efficiency growth (g), common convergence rate (1-λ), and finally common g and common
(1-λ). Likelihood ratio tests are used to establish the best fitting model among the four options.
When the LR tests are not sufficient in providing a model of choice, we refer to the Akaike
criterion to make a final determination. Results for Spain and Portugal (members since 1986)
are displayed in Table 1 while the results for Austria, Finland, and Sweden (members since
1995) can be found in Table 2.
Next, not being able to identify the shift parameter, ζ , caused by the integration process in
Equation (26), we resort to two structural break tests, to examine the validity of our theory.
Structural break tests are important for our paper not only because the theory section can't
separate the impact of integration from the previous values of the parameters, namely the
identification problem, but also the break tests are the direct tests of our theory displayed in
Equation (26). The first test we use is the stochastic multiple-break test developed by Bai &
Perron (1998) and the other one is a single break test by Banerjee et al. (1992) (later extended
by Sen, 2003). We apply these tests on the recent five EU member countries to examine the
impact of integration on the growth and convergence processes. We abstain from any PPP
adjustment in this section to measure structural changes more accurately9.
The Bai-Perron (henceforth BP) methodology considers the following multiple structural
break model, with m breaks (m+1 regimes)
t t t j ty x z uβ δ′ ′= + + (30)
for 1 1,.....,j jt T T−= + and 1,...., 1.j m= + ty is the observed dependent variable at time t; tx (p
x 1) and tz (q x 1) are the vector of covariates, β and jδ are the corresponding vectors of
coefficients, and u is the disturbance term at time t. The break points (T) are treated as
unknown, and are estimated together with the unknown coefficients when T observations are
7 Unit root is rejected using Im-Pesaran-Shin (2003) test for each panel, which enables us to refer to (1-λ) as the convergence rate. Also convergence can also be verified from the opposite signs on the intercept and slope parameters of the trend model in Tables 1-7. Tomljanovic & Vogelsang (2002) indicate that a converging country with an initial per-capita income lower than the French average must exhibit a positive growth trend. 8 We use OLS to derive the estimates for these coefficients. 9 GDP per capita in real terms is used in the estimations.
available. In the terminology of BP, this is a partial structural change model, in the sense that
β does not change, and is effectively estimated over the entire sample. If p = 0, this becomes
a pure structural change model where all coefficients are subject to change.
The procedure for detecting structural breaks, suggested by Bai and Perron, is the
following. First, calculate the UDMAX and WDMAX10 statistics. These are double maximum
tests, where the null hypothesis of no structural breaks is tested against the alternative of an
unknown number of breaks. These tests are used to determine if at least one structural break is
present. In addition, the SupF(0|l) is a series of Wald tests for the hypothesis of 0 breaks vs. l
breaks. In this paper, the maximum number of breaks (l) is chosen to be 3. If these tests show
evidence of at least one structural break, then the number of breaks can be determined by the
sequential SupF(l+1|l). If this test is significant at the 5 percent level, then l+1 breaks are
chosen. Finally, we choose the number of breaks by the Bayesian Information Criteria (BIC).
Unfortunately, detecting multiple structural changes in the existence of trending terms or
possible unit roots, as in our model specification, is quite difficult. For instance, the
restrictions that BP mention on the application of their methodology are that a) one should not
allow for a unit root, and that b) when a lagged dependent variable is used, autocorrelation in
the error term cannot be allowed. Despite their claim of being able to include trending terms
in the regression, estimating a pure structural break model, in which all the coefficients could
change, generated non-convergence in our estimations (especially for the trend variable)11.
Therefore, it is almost impossible to simultaneously derive structural breaks in the mean, AR
parameter, and the trend term using the BP methodology. We tried to bypass this problem by
estimating two versions of the system: first, a de-trended version to measure the breaks in the
convergence rate (under the assumption of constant trend), and the second on the differenced
version where the constant term represents the trend coefficient (and the mean break is
undetectable). Results for these tests are displayed in Tables 3 and 4.
We also apply another strand of the literature that allows for only a ‘single break’, but
permits for unit roots in the existence of trend and mean breaks, namely an extension of
Banerjee et al. (1992) by Sen (2003). We utilize the sequential F-test to test for three types of
model originally suggested by Perron (1989): the crash model allowing for a break in the
intercept, the changing growth model allowing for a break in the trend, and finally the mixed
model that allows for breaks in both the intercept and the slope (AR parameter is assumed as
constant) . The general model we use is
10 UDMAX stands for equally weighted double maximum test while WDMAX refers to the weighted version. 11 There are working papers at early draft stages addressing this problem of the methodology.

( ) ( ) 0 1 2 3 11
kc c
t t b t b t j t j tj
y µ µ DU T µ DT T µ t y c y eα − −=
= + + + + + +∑ (31)
where DUt( cbT ) is the indicator function that equals 1 after the break date c
bT , DTt( cbT ) equals
(t - cbT ) if t > c
bT . Also in Equation (31), 0µ and 2µ are the mean and trend before possible
breaks, and α is the autoregression parameter. We add k additional regressors, 1
k
j t jj
c y −=∑ , to
the model for possible serial correlation in the disturbance term. Lag length is chosen using
the methodology suggested by Ng & Perron (1995).
Sequential maximum F-test statistics presented in Sen (2003) is:
( ) ( )( ) ( ) ( ) ( )( ) ( )11
2
1
T
t b b t b t b b bt
F T R T r R X T X T R R T r q Tθ θ σ−−
=
′ ′ ′= − −
∑ (32)
where 1 1( ) (1, ( ), , ( ), , , ...., )t b t b t b t t t kX T DU T t DT T y y y− − −′= ∆ ∆ , r is the restriction matrix, q is
the number of restrictions, ( )2bTσ equals ( ) ( ) ( )( )2
1
1
5T
t t b bt
T k y x T Tθ−
=
′− − −∑ , and ( )bTθ is
the OLS estimator of , ,0 1 2 3 1( , , , ,..., )kc cθ µ µ µ µ α ′= in Equation (31). For instance, if we
want to allow for a unit root in case of trend and mean break, i.e. test for
0 1 3: 1, 0, 0H α µ µ= = = , we use the restriction matrix (0,0,1)r ′= with the appropriate R.
The results for Sen (2003) test are reported in Table 5. Please note that in our study, we
restrict our tests to cases where trend does not coexist with a unit root since there is no
economic rationale for that to happen in the case of real GDP/capita data.
Finally, we apply the LPS methodology to 8 first-group candidate countries. We run two
versions of this test first after demeaning with French GDP/capita as above, and then using the
group mean to test for conditional convergence “within” these specific groups to examine
their economic integration and strength of their ties. We again use LR-tests and AIC criterion
to pick the level of heterogeneity allowed. The results are displayed in Tables 6 and 7.
4. Empirical evidence
4.1. Convergence
The critical question we try to answer is whether membership to the EU leads to faster
convergence and higher productivity rates. The answer to this question is not only important

for EU policymakers, but also the candidate countries planning to join soon. Higher level of
convergence and productivity would indicate less adjustment, smaller fiscal costs and hence
less stabilization funds. To shed some light on these issues, we focus on the experience of the
recent EU members by studying their performances before and after the membership, initially
using the LPS methodology described above. Results for the LSDV tests are reported in Table
1 for Spain and Portugal (members since 1986) and for Austria, Finland, and Sweden
(members since 1995) in Table 2. These are followed by the results of the structural change
tests in Tables 3 to 5.
Findings in Tables 1 and 2 provide an interesting picture of the effects of integration to the
Union. Our theoretical model’s implication was that all of the parameters in the equation,
, , and gµ ζ λ+ , should increase with membership into the Union. The most recent EU
members comply more with the theoretical implications than the older ones. This finding
suggests that the older members already enjoyed the benefits of economic and trade
liberalization within the region before they formally became EU members and the benefits of
integration hence occur within a few years after joining, so it is a relatively fast process. This
finding is consistent with evidence in Ben-David (1996) who shows that the prospect of an
EU membership exerts a positive impact on potential entrants’ economic performance prior to
their entry. This finding is encouraging for the candidate economies because it suggests that
they would acquire the benefits of EU membership relatively quickly once they join in.
Before interpreting the results in Tables 1 to 2 (also 6 and 7 later on) further, the reader
should note that different blocks in the rows of these tables display differing levels of
heterogeneity in the parameters of the model, g, µ, and (1-λ), representing productivity growth
rate, the steady state level, and the convergence rate, respectively. Prior to commenting, we
first pick the specification that likelihood-ratio tests reveal and then move on to the
interpretation of those results. For instance, looking at the results for Spain and Portugal in
Table 1, we note that the model of choice is common convergence rate option before
becoming a member, and common productivity growth and convergence (by Akaike criterion)
after membership. In these specifications, the only increase occurs in the estimates of the
steady states. This switch in the model specification shows an increase in homogeneity after
joining the EU indicating a strong integration into the common standards.
In Table 2, there also is a switch in the specification, though not very strong. The preferred
model (by AIC) in pre-membership is the common productivity growth, switching to common
convergence rate afterwards. In these options, we see not only the implications of the theory
section (increase in all coefficients) generally holding with a few exceptions, but also a higher

degree of harmonization, namely in the convergence rate. Finland stands out from the rest of
the group by having experienced a significant benefit in their productivity after membership.
There also is a very healthy increase in the convergence rate of the group compared to the EU
standards.
4.2 Structural change tests
Next, we apply the stochastic structural break tests by Bai & Perron (1998) and Sen
(2003) on individual country real GDP per capita data to investigate whether integration leads
to any changes in the coefficients of Equation (26). For the Bai & Perron test, we use two
modifications on the original data, namely the de-trended and the differenced versions. The
difficulty of analyzing pure structural break models in the existence of time trends and
possible nonstationarity compel us to de-trend the data to focus on the convergence rate and
difference it to examine the productivity growth (trend coefficient). We interpret the results,
as mentioned above, by first looking at the results of the double maximum tests to determine
whether there is ‘any break’, and then focusing on the sequential test for the consecutive
breaks. Along with reporting these statistics and their significance levels, the tables also report
the dates and the direction of the structural changes in the parameters of interest after the
breaks.
The results of beak tests, especially the BP multiple break test can be affected by several
factors, e.g., the degree of international technology spillovers, given by the amount of FDI
and imports, developments in the Exchange Rate Mechanism (ERM), and business cycles.
The differences in macroeconomic policies pursued as well as progress in structural reforms
and institutional developments can also cause structural breaks in data. Given significant
diversity across countries with respect to above factors, it is difficult to identify the exact
factors that might cause every structural break. For our purposes, however, the critical point is
whether there is a significant break around the time of EU accession.
The results of Table 3, which report the breaks in the convergence rates, confirm increased
convergence rates in Austria, Spain and Sweden coinciding with their membership dates
(within the confidence interval of the reported dates). Austria shows another break at around
1988, most likely due to one of the above factors. Finland’s break in the end of 1990 could be
the result of a finding of the ERM recovery since post-1992 is in the confidence interval of
this break. Finally Sweden shows two other breaks; first one in early 1980s, and the other one
coinciding with the ERM recovery, while Portugal does not have any structural break in its
convergence rate.

In Table 4, the results are mixed. Despite the confirmatory increases of productivity in
Austria and Portugal coincident with their membership, Spain and Sweden show dates
possibly due to the other factors mentioned above. We again notice the same structural breaks
in Austria (1986Q2) and Finland (at the beginning of 1990), later followed by a decrease in
the productivity after the ERM crisis. Combining the outcome of both tables indicates the
positive impact of the membership into the Union, either through an increase in productivity
or the convergence rate or both, like in Austria.
Next, we examine the results of the Sen (2003) test that searches for the single “big”
change either in the trend (productivity) and/or the mean (steady state). The results of this test
are more easily interpretable since the test concentrates on the largest break. Table 5 reports
the sequential F-max statistics, the dates and directions of the structural changes. The first line
for each country represents the break test only in the trend (same as Banerjee et al., 1992),
while the second line adds a break test for the mean as well (Sen, 2003). We obtain critical
values for both tests since the original studies assume iid errors and exclude serial correlation.
First observation is that there is a significant break in each test, though mostly at differing
dates between the two versions of the test. Allowing for mean changes brings forth recessions
as the choice of break points (Austria, Finland, Spain, and Sweden). Increased rates of
productivity in Finland, Portugal and Spain around their membership dates, however, clearly
support the implications of our theory. Portugal stands out by showing increased productivity
in both versions of the test.
Correct inferences from the structural break tests are quite difficult, especially with
complicated dynamics as our model. Different methods may produce different results, which
is a natural outcome of the issues related to the structural change literature. The results can be
sensitive to assuming a single break or multiple breaks; or whether the break is in the trend,
the mean or whether it is a nonlinear system (regime switching). Despite such concerns, the
reported results are encouraging because they generally suggest positive changes in the
productivity growth and are significantly stronger compared to the panel data tests;
convergence or the steady states are never negative at the time of accession, which is
supportive of our theory.
5. Are candidate countries converging?
Raising the candidate countries’ per capita income to the EU level serves as the most
tangible proof of the success of integration. Within these countries, significant progress
toward per capita income convergence is seen as key in securing the political assent of the
population to both transition and membership in the EU. For the EU countries, such income
growth is important if excessive population movements from the new members to the old are
to be avoided and if the EU's budget is not to be strained by transfers to lagging economies.
Besides above considerations, evidence on real convergence of the candidate economies
towards the EU standards and productivity developments also has important implications for
the design of an optimal policy towards the euro zone. First, according to the Balassa-
Samuelson effect, higher labor productivity leads to higher - structural - inflation that, through
positive inflation differential, provokes a real appreciation of the currency. At the same time,
increasing per capita income also increases domestic demand that puts some pressure on
domestic prices, hence the real appreciation. (Égert, 2002 and Égert et. al, 2004). An optimal
monetary policy therefore requires a good understanding of the real convergence process.
Second, achieving some real convergence in the early stages of the integration process would
make it easier for the candidate countries to satisfy the Maastricht criteria on nominal
convergence such as low inflation and stable exchange rates. The supreme goal of integration
is economic growth and thus real convergence and nominal convergence, with nominal
stability, underpins real convergence. Finally, once admitted into the EMU, policymakers in
accession countries will not be able to use monetary policy any longer to achieve further real
convergence.
Despite its significance, this issue has not received much attention in the literature. 12
Only a few studies examine real convergence prospects for candidate economies. Kočenda
(2001) studies the convergence of macroeconomic fundamentals in several groups of
transition economies. Utilizing a commonly employed panel unit root technique and a sample
period from January 1991 to December 1998, he finds considerable real convergence. Kutan
and Yigit (2004) report a lower level of real economic convergence than those reported by
Kočenda when a more recent panel estimation approach developed by Im, Pesaran, and Shin
(2003), which allows for more heterogeneity in the convergence rates, is utilized. Brada et al.
(2003) find clear evidence of increasing real sector convergence between some of the first-
round candidate countries and EU.
In all the above studies, industrial output is utilized as a proxy for real convergence.
Estrin et al. (2001) examine the convergence of candidate countries' per capita income to that
of the EU average. They find that, for the period 1970-1998, none of the transition-economy
candidate countries exhibited convergence with the EU countries. Because the greater part of
12 Focus has been on nominal convergence. See, among others, studies by Backé et al. (2002), Brada and Kutan (2001, Čihák and Holub (2001, 2003), Janáčková (2000), and Richards and Tersman (1996).
the sample period reflects the candidate countries' performance under communism, and
because it also incorporates the output decline of the early years of the transition, this finding
is not surprising, nor may it be entirely germane to the issue of convergence in the context of
EU accession.
These limited studies do not use a theoretical framework, nor take into account of the role
played by the integration parameter. The EU candidate economies have received significant
amount of FDI from the EU and also increased their trade with them in the last decade. Such
“imported” technological spillovers based on a less costly way of imitation of foreign
innovations through both FDI and imports of goods are expected to help spur economic
growth in the candidate countries. Our theoretical model is therefore also applicable to the
EU candidate economies. The presence of sufficient stock of human capital endowment in
these economies, which affects their ability to imitate technical progress, also complements
the positive effects of new technologies created through FDI and trade (Lucas, 1988 and
Nelson and Phelps, 1966). Thus, opening up to trade and FDI inflows in the framework of
integration process raises productivity and hence stimulates real convergence.
Our theoretical model emphasizes the importance of including the capital enhancing
invention variable, Z, in the endogenous growth models to capture the effects of international
technology spillovers on productivity and convergence. It is therefore important to provide
some preliminary estimates of real convergence for the candidate countries as well, indicating
their progress so far. These preliminary results are useful to evaluate their further progress
following their EU accession. Tables 6 and 7 report the results.
Table 6 analyzes convergence of the candidate economies to the EU standards, using
French per capita GDP as a proxy, by applying the LSDV methodology. Relying on the
results of LR tests and AIC criterion, we observe heterogeneity in each parameter estimate
reported in Table 6. All likelihood ratio tests reject common growth rates and steady states at
a minimum of 95% significance level indicating that all of these countries have distinct paces
of progress toward the EU standards. Focusing on the first block, we also note a fairly fast
convergence rate of some these countries like the Czech Republic, Hungary and Slovakia to
the French GDP/capita since traditional estimates of non-OECD and oil importing countries
average around 0.27. This finding is encouraging for these candidate countries because it
indicates speedy convergence to EU income levels and a higher standard of living in the
future.
We can’t help but observe that the results also validate the LPS claim that increased
heterogeneity raises the convergence speed. Comparing the first two sections of the table

shows that convergence rates fall significantly when we constrain the productivity growth
rates to be the same throughout the sample. Finally, we note the high productivity gains in
Poland and Hungary,13 and the lack of convergence of Malta to the Union, reflecting the
differences in the amount of trade with the EU and FDI inflows from the EU. Of course,
macroeconomic policies pursued by countries have also been an important factor for the
convergence to EU standards.14
Results of Table 7 point to the common convergence rate option as the model of choice.
The high convergence rate to the group average indicates a fast pace of integration within the
group to common standards. Such a finding is consistent with earlier studies that find
significant real convergence among the candidate transition economies (e.g., Brada et. al
(2003), Kočenda, 2001 and Kutan and Yigit, 2003). This result indicates that despite the
differences in their progress toward the EU standards, the candidate countries do not have
significant outliers in the process of within group harmonization. This result is important for
EU policymakers because it signals that the candidate countries would be integrated by the
time they join the EU, and there may not be a need to admit countries one by one based on
their level of integration with the EU. The last notable outcome is the negativity of some
productivity gains, in this and most other parts of the table, due to the outstanding
performance of Poland and Hungary.
7. Concluding observations and policy implications
We examine the impact of EU integration on productivity growth and convergence for
recent EU entrants and use their experience to draw lessons for the candidate economies. We
deviate from the general strand of literature by deriving an explicit formulation of theoretical
effects of integration by introducing a new variable that captures the effects of international
technology spillovers. We also provide empirical evidence on the theoretical implications of
the model, using panel data estimation techniques and a battery of structural break tests.
The results regarding recent EU members reveal three interesting observations. First,
downward bias in the convergence rate is confirmed when heterogeneity in productivity rates
is not allowed. Comparison of the first two sections of all the tables shows slower
13 Available empirical evidence supports this finding. In analyzing the impacts of FDI on labor productivity levels on manufacturing sectors Hungary, Poland and the Czech Republic, Barrell and Holland (2000) report significant productivity improvements in most sectors, while Schoors and van der Tol (2002) find that the presence of foreign firms creates positive spillover effects on productivity of local firms in Hungary. 14 Kaminski and Riboud (2000) emphasize the importance of the stability of macroeconomic policies pursued in Hungary.

convergence rates resulting from the imposition of a common productivity assumption.
Second, almost all coefficient estimates are positively affected with membership to the EU.
This result is supported by structural change tests of Bai and Perron (1998) and Sen (2003).
Third, there is an increasing amount of harmonization, especially in convergence rates.
Regarding the candidate countries, in addition to the above observations, there is also a
significant level of variation towards their progress to the EU standards of living. Some
countries like the Czech Republic, Hungary, Slovakia, and Poland stand out in terms of
productivity growth or convergence rates, while others seem to do poorly. An important
policy implication of the heterogeneity result is that the candidate economies would exhibit
different productivity and convergence levels, following their entry. At this stage, regional
and structural funds, similar to those provided to the recent EU members, may be useful to
help the poorer candidate countries catch up. However, evidence indicates that such funds are
not able to generate long-run growth effects (Boldrin and Canova, 2003).
The candidate countries’ economic conditions today look similar to those of Spain and
Portugal at the time of their entry (Boldrin and Canova, 2003). Therefore, the costs and gains
from joining the EU will likely to be similar to those experienced by these entrants. This
observation, along with the harmonization experience these countries’ growth rates display,
signals that the differences in productivity and convergence levels are expected to fade out
over time, a finding that is also supported by the increasing homogeneity within the candidate
countries.
A larger and richer EU market with no exchange rate risk, which the recent entrants were
not able to enjoy, will further facilitate the convergence process for the candidate economies.
National policies encouraging further trade and FDI flows with the EU, as well as free labor
and capital mobility, along with supply side and fiscal reforms, will therefore play a much
more important role to achieve growth rates higher than EU averages and hence real
convergence. The evidence of positive impact of integration on growth rates and productivity
reported in this paper suggests that gained benefits over time will be more than outweigh the
expected short-run consequences of the accession process, thereby making Europe a more
prosperous place for all the parties involved.

References Backè, P., J. Fidrmuc, T. Reininger, and, F. Schardax. “Price Dynamics in Central and Eastern
European EU Accession Countries” Emerging Markets Finance and Trade, 2002, 39(3);
42-78.
Bai, J. and P. Perron. “Estimating and Testing Linear Models with Multiple Structural
Changes” Econometrica, 1998, Vol. 66; pp. 47-68
Baltagi, B. “Econometric Analysis of Panel Data”, Ch. 8 (Chichester, England; John Wiley,
and Sons), 1995.
Banerjee, A., R. L. Lumsdaine, and J. H. Stock, “Recursive and Sequential Tests of the Unit-
Root and Trend Break Hypothesis: Theory and International Evidence,” Journal of
Business and Economics Statistics, 1992, 10, 271-287.
Barrel, R. and D. Holland. “Foreign Direct Investment and Enterprise Restructuring in Central
Europe,” Economics of Transition, 2000, 82, 477-504.
Barro, R. J. “Economic Growth in a Cross Section of Countries” Quarterly Journal of
Economics, 1991, 106(2); 407-43.
Barro, R. J., and X. Sala-i-Martin. “Convergence” Journal of Political Economy, 1992,
100(2); 223-51.
Ben-David, B. “Trade and Convergence among Countries” Journal of International
Economics, 1996, 40, 279-98.
Bernard, A. B. and S. N. Durlauf. “Convergence in International Output” Journal of Applied
Econometrics, 1995, 10(2); 97-108.
Bernard, A. B. and S. N. Durlauf. “Interpreting Tests of Convergence Hypothesis” Journal of
Econometrics, 1996, 71(1-2); 161-73.
Boldrin, M. and F. Canova. “Regional Policies and EU Enlargement” CEPR Discussion Paper
No. 3744, 2003.
Brada, J. C. and A. M. Kutan. “The Convergence of Monetary Policy between Candidate
Countries and the European Union”. Economic Systems, Vol. 25, No.3, (Sept. 2001);
215-231.
Brada, J. C., A. M. Kutan, and S. Zhou. “Real and Monetary Convergence between the
European Union and Transition-Economy Candidate Countries: Market Integration and
Policy Coordination” Working Paper, Center for European Integration Studies, Bonn,
2003 (Forthcoming: Journal of Banking and Finance).

Čihák, M. and T. Holub. “Convergence of Relative Prices and Inflation in Central and Eastern
Europe” IMF Working Paper 01/124, 2001.
Čihák, M. and T. Holub. “Price Convergence to the EU: What Do the 1999 ICP Data Tell
Us?” The Czech National Bank Working Paper 02/2003, 2002.
Crespo-Cuaresma, J., D. Ritzberger-Grünwald, and M.A. Silgoner. “Growth, Convergence
and EU Membership” National Bank of Austria Working Paper No. 62, 2002.
Dowrick, S. and D. Nguyen. “OECD Comparative Economic Growth 1950-85: Catch-Up and
Convergence” American Economic Review, 1989, 79(5); 1010-30.
Égert, B. “ Investigating the Balassa-Samuelson Hypothesis in Transition: Do We Understand
What We See? A Panel Study” Economics of Transition, 2002, Vol. 10(2), 273-309.
Égert, B., I. Drine, K. Lommtzsxh, and C. Rault. “The Balassa-Samuelson Effect in Central
and Eastern Europe: Myth or Reality?” 2004, (Forthcoming) Journal of Comparative
Economics.
Estrin, S., G. Urga, and S. Lazarova. “Testing for Ongoing Convergence in Transition
Economies, 1970 to 1998”. Journal of Comparative Economics, Vol. 29, No.4 (Dec.
2001); 677-691.
Evans, P. “Using Panel Data to Evaluate Growth Theories” International Economic Review,
1998, 39; 295-306.
Evans, P. and G. Karras. “Convergence Revisited” Journal of Monetary Economics, 1996, 37;
249-65.
Fleissig, A. and J. Strauss. “Panel Unit-Root Tests of OECD Stochastic Convergence” Review
of International Economics, February 2001, 9(1); 153-62.
Henrekson, M., J. Thorstensson, and R. Thorstensson. “Growth Effects of European
Integration” European Economic Review 41, 1997; 1537-57.
Im, Kyung S., Pesaran, M. Hashem, Yongcheol Shin. “Testing for Unit Roots in
Heterogeneous Panels” Journal of Econometrics, 2003, 115(1); 53-74.
Islam, N. “Growth Empirics: A Panel Data Approach” Quarterly Journal of Economics, 1995,
110(4); 1127-70.
Janáčková, Stanislava, “Price Convergence and the Readiness of the Czech Economy for
Accession to the European Union” Eastern European Economics, Vol. 38, No. 4, (July-
August, 2000); 73-91.
Judson, R. A. and A. L. Owen. “Estimating Dynamic Panel Data Models: a Guide for
Macroeconomists”, 1999; Economics Letters 65; 9-15.

Kaminski, B. and M. Riboud. “Foreign Investment and Restructuring: The Evidence from
Hungary”, Technical Paper 453, The World Bank, Washington, D.C.
Kočenda, E. “Macroeconomic Convergence in Transition Economies”, Journal of
Comparative Economics, Vol. 29, No. 1, March 2001; 1-23.
Kutan, A. M. and T. M. Yigit. “Nominal and Real Stochastic Convergence within the
Transition Economies: Panel Evidence” Forthcoming: Journal of Comparative
Economics.
Lee, K., M. H. Pesaran, and R. Smith. “Growth and Convergence in Multi-country Empirical
Stochastic Solow Model” Journal of Applied Econometrics, 1997, 12(4); 357-92.
Lucas, R.E. “On the Mechanics of Economic Development” Journal of Monetary Economics,
1998, 22(1), 111-31.
Martin, C. and F. J. Velázquez. “An Assessment of Real Convergence of Less Developed EU
Members: Lessons for the CEEC Candidates” Working Paper No. 5/2001, European
Economy Group.
Nelson, R. and E. Phelps. “Investment in Humans, Technological Diffusion and Economic
Growth.” American Economic Review, 1966, 61, 69-75.
Nerlove, M. “Growth Rate Convergence, Fact or Artifact? An Essay on Panel Data
Econometrics” Panel data econometrics: Future directions: Papers in honor of
Professor Pietro Balestra, 2000; 3-33, Elsevier Science, North-Holland.
Ng S., and P. Perron, “Unit Root Tests in ARMA Models with Data-Dependent Methods for
the Selection of the Truncation Lag,” Journal of American Statistical Association, 1995,
90, 268-281.
Quah, D. “International Patterns of Growth: Persistence in Cross-Country Disparities”
Working Paper (London School of Economics, London), 1992.
Richards, Anthony J. and Tersman, Gunnar H. R., “Growth , Nontradables, and Price
Convergence in the Baltics.” Journal of Comparative Economics, Vol. 23, No 2,
(October, 1996); 121-145.
Rivera-Batiz, R. A., and P. M. Romer. “Economic Integration and Growth” Quarterly Journal
of Economics 56, 1991; 531-55.
Schoors, K. and B. van der Tol. “Foreign Direct Investment Spillovers Within and Between
Sectors: Evidence from Hungarian Data.” Working Paper 2002/157, Gent University,
October 2002
Sen, A., “On Unit-Root Tests When the Alternative Is a Trend-Break Stationary Process,”
Journal of Business & Economics Statistics, 2003, 21; 174-184.

Tomljanovic, M., and T. J. Vogelsang. “Are U.S. Regions Converging? Using New
Econometric Methods to Examine Old Issues,” Empirical Economics, 2002, 27; 49-62.
Wagner, M. and J. Hlouskova. “The CEEC10's Real Convergence Prospects” CEPR
Discussion Paper Paper No. 3318, 2002.

Table 1: Growth in Spain and Portugal before and after joining the EU (demean with France)
Coefficient Portugal (pre-1986)
Spain (pre-1986)
Portugal (post-1986)
Spain (post-1986)
All heterogeneous g 0.18*** 0.07*** 0.10*** 0.07*** µ 3.02 3.84 0.65 0.70
1-λ 0.59* 0.58** 0.09*** 0.09*** LR = 7.16*** Common productivity growth LR = 0.99 g 0.07*** 0.08*** µ -0.13 3.86 0.47 0.73
1-λ 0.01 0.58** 0.06*** 0.10*** LR = 0.001 Common convergence rate LR = 0.00 g 0.18*** 0.07*** 0.10*** 0.07*** µ 2.99 3.87 0.65 0.70
1-λ 0.58*** 0.09***
LR = 12.96*** Common productivity and convergence rate LR = 1.88§
g 0.17* 0.07** µ 0.67 0.77 0.51 0.53
1-λ 0.10*** 0.07*** Notes: g represents technological/productivity growth, µ is a mixed variable that shows different steady states, and 1-λ is the convergence rate. Growth rates are annualized values. Values for µ rather than c are reported in these tables due to the implications of the theoretical section about this parameter. Significance values are not reported for µ since it is composed of the product of three parameters. Critical values used for LR tests are 3.84 (2.71) for 2
1χ (first two tests) and 5.99 (4.61) for 22χ (last test). *** indicates significance at 99% while ** and
* correspond to significance at 95% and 90%, respectively. § indicates choice by AIC criterion.
Table 2: Growth in Austria-Finland-Sweden before and after joining the EU (demean with France)
Coefficient Austria (pre-1995)
Finland (pre-1995)
Sweden (pre-1995)
Austria (post-1995)
Finland (post-1995)
Sweden (post-1995)
All heterogeneous g 0.05* 0.045 0.045 0.045 0.08*** 0.045 µ 1.56 0.52 1.25 2.57 2.46 4.40
1-λ 0.20*** 0.06*** 0.15*** 0.32*** 0.33*** 0.56* LR = 2.09§ Common productivity growth LR = 4.34 g 0.05* 0.045 µ 1.63 0.42 1.25 2.56 0.15 4.20
1-λ 0.20*** 0.05*** 0.15*** 0.32*** 0.01*** 0.53** LR = 3.27 Common convergence rate LR = 0.90§ g 0.06* 0.045 0.045 0.045 0.08*** 0.045 µ 0.88 0.90 0.89 2.96 2.75 3.00
1-λ 0.11*** 0.37*** LR = 7.38 Common productivity and convergence rate LR = 12.17*** g 0.045 0.045 µ 0.91 0.92 0.92 0.97 0.95 0.95
1-λ 0.11*** 0.12*** Notes: Insignificance for g indicates replacement with the productivity rate and steady state coefficient estimates for France, namely 0.045. Significance values are not reported for µ since it is composed of the product of three parameters. Critical values used for LR tests are 9.49 (7.78) for 2
4χ and 5.99 (4.61) for 22χ .

Table 5: BP Structural Break Test Results in Autoregressive Coefficient (Convergence Rate) Country UDmax WDmax Sequential (2|1) Sequential (3|2) BIC choice Break dates
at 5% 1987Q4 ↓ Austria 18.80*** 47.06*** 14.79** 0.06 0 1996Q3 ↑
Finland 28.33*** 62.17*** 4.77 0.05 2 1990Q3 ↑ Portugal 5.60 7.13 11.85** 12.50** 2
Spain 32.17*** 80.54*** 0.04 0.0004 0 1984Q3 ↑ 1982Q4 ↑ 1993Q3 ↑ Sweden 289.44*** 724.48*** 0.01 28.23*** 0 1996Q4 ↑
Notes: A maximum of three breaks are allowed due to sample size. UDMAX and WDMAX results are for the double maximum tests of Bai & Perron (1998). The sequential tests examine the likelihood of having i+1 breaks given that i breaks exist. BIC choice column refers to the number of breaks according to the Bayesian Information Criterion. The confidence intervals for the break dates are not reported to save space. Break dates are reported when the double maximum tests point to the existence of at least one break.
Table 6: BP Structural Break Test Results in the Trend Coefficient (Productivity Growth) Country UDmax WDmax Sequential (2|1) Sequential (3|2) BIC choice Break dates
at 5% 1986Q2 ↓ Austria 11.88*** 19.21*** 8.66** 5.56 0 1994Q2 ↑ 1989Q3 ↑
Finland 30.27*** 46.12*** 12.33*** 2.09 2 1992Q3 ↓
Portugal 7.92* 17.63*** 3.63 4.29 0 1984Q3 ↑
Spain 9171.7*** 22857.0*** 4.57 1.22 0 1997:03 ↓ Sweden 11.74 18.98 2.11 4.29 0 1984:03 ↑
Notes: The autoregressive coefficient is held constant to capture the gradual breaks in the trend as opposed to sudden ones.
Notes: Critical values derived in Monte Carlo simulations for sequential F-max test are 7.93, and 9.17 for stationary break models at 90%, and 95%, respectively. ∆M represents a change in the mean, while ∆T is the change in trend.
Table 7: Single break test (Sen, 2003) results for trend and mean breaks Austria Finland Sweden
F-max Date ∆M ∆T F-max Date ∆M ∆T F-max Date ∆M ∆T Trend alone 63.12** 1987Q
2 ( + ) 14.80** 1996Q2 ( + ) 11.59** 1990Q3 (− )
Trend + Mean 11.40** 1992Q
4 (− )** ( + ) 76.72** 1991Q3 (− )** ( + ) 79.32** 1992Q1
(− )*
* ( + )
Portugal Spain F-max Date ∆M ∆T F-max Date ∆M ∆T Trend alone 14.96** 1984Q
1 ( + ) 65.00** 1986Q4 ( + )
Trend + Mean 32.40** 1985Q
4 ( + ) ** ( + ) 36.10** 1993Q2 (− )** ( + )
*
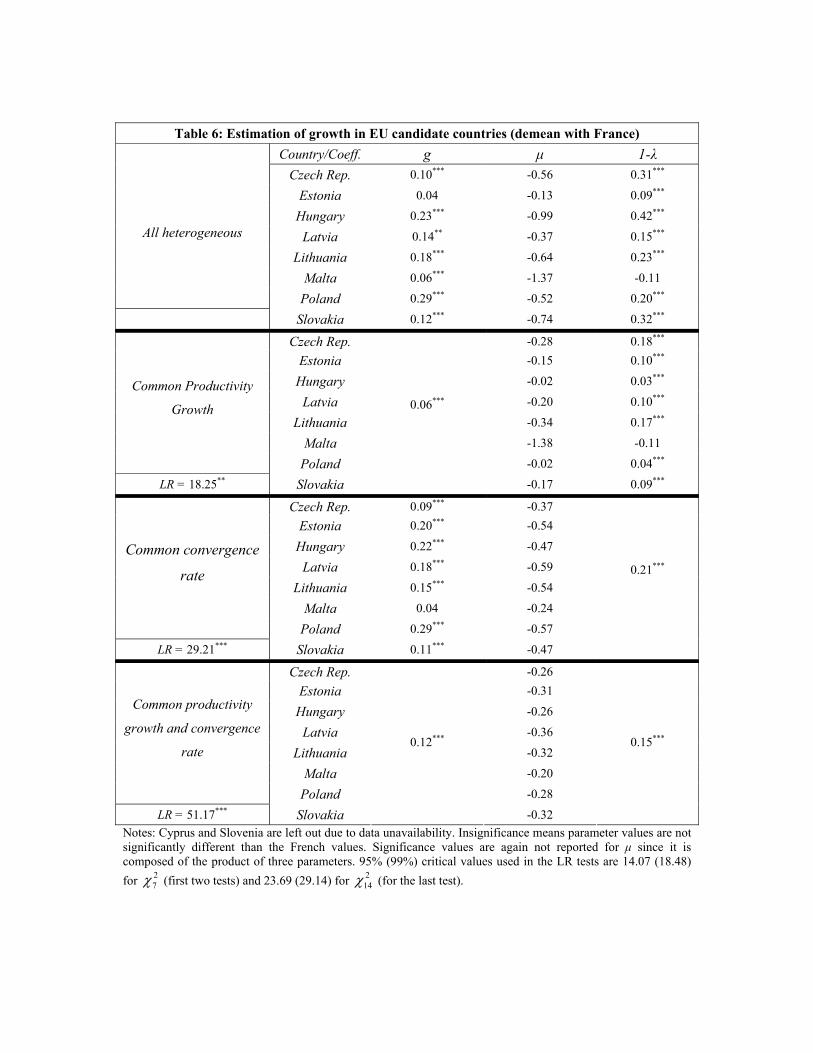
Table 6: Estimation of growth in EU candidate countries (demean with France) Country/Coeff. g µ 1-λ
Czech Rep. 0.10*** -0.56 0.31***
Estonia 0.04 -0.13 0.09***
Hungary 0.23*** -0.99 0.42***
Latvia 0.14** -0.37 0.15***
Lithuania 0.18*** -0.64 0.23***
Malta 0.06*** -1.37 -0.11
All heterogeneous
Poland 0.29*** -0.52 0.20*** Slovakia 0.12*** -0.74 0.32***
Czech Rep. -0.28 0.18*** Estonia -0.15 0.10***
Hungary -0.02 0.03***
Latvia -0.20 0.10***
Lithuania -0.34 0.17***
Malta -1.38 -0.11
Common Productivity
Growth
Poland -0.02 0.04***
LR = 18.25** Slovakia
0.06***
-0.17 0.09***
Czech Rep. 0.09*** -0.37 Estonia 0.20*** -0.54
Hungary 0.22*** -0.47
Latvia 0.18*** -0.59
Lithuania 0.15*** -0.54
Malta 0.04 -0.24
Common convergence
rate
Poland 0.29*** -0.57
LR = 29.21*** Slovakia 0.11*** -0.47
0.21***
Czech Rep. -0.26 Estonia -0.31
Hungary -0.26
Latvia -0.36
Lithuania -0.32
Malta -0.20
Common productivity
growth and convergence
rate
Poland -0.28
LR = 51.17*** Slovakia
0.12***
-0.32
0.15***
Notes: Cyprus and Slovenia are left out due to data unavailability. Insignificance means parameter values are not significantly different than the French values. Significance values are again not reported for µ since it is composed of the product of three parameters. 95% (99%) critical values used in the LR tests are 14.07 (18.48) for 2
7χ (first two tests) and 23.69 (29.14) for 214χ (for the last test).

Table 7: Estimation of growth in EU candidate countries (demean with group average) Country/Coeff. g µ 1-λ
Czech Rep. -0.07*** 0.14 0.25***
Estonia 0.01 -0.02 0.14***
Hungary 0.03** 0.04 0.35***
Latvia 0.03** -0.23 0.36***
Lithuania 0.06*** -0.24 0.35***
Malta -0.10** 0.21 0.19***
All heterogeneous
Poland 0.09*** -0.19 0.50*** Slovakia -0.04 0.00 0.19***
Czech Rep. -0.01 0.06*** Estonia -0.05 0.17***
Hungary 0.04 0.35***
Latvia -0.25 0.37***
Lithuania -0.18 0.31***
Malta 0.01 0.07***
Common Productivity
Growth
Poland -0.04 0.27***
LR = 16.22** Slovakia
0.04***
-0.04 0.09***
Czech Rep. -0.07*** 0.17 Estonia 0.06*** -0.12
Hungary 0.04*** 0.02
Latvia 0.02* -0.18
Lithuania 0.04* -0.17
Malta -0.12*** 0.36
Common convergence
rate
Poland 0.10*** -0.12
LR = 10.07 Slovakia -0.06*** 0.04
0.29***
Czech Rep. 0.04 Estonia -0.01
Hungary 0.04
Latvia -0.07
Lithuania -0.03
Malta 0.10
Common productivity
growth and convergence
rate
Poland 0.01
LR = 54.27*** Slovakia
-0.01
-0.02
0.15***
Notes: 95% (99%) critical values used in the LR tests are 14.07 (18.48) for 27χ (first two tests) and 23.69
(29.14) for 214χ (for the last test).

DAVIDSON INSTITUTE WORKING PAPER SERIES - Most Recent Papers The entire Working Paper Series may be downloaded free of charge at: www.wdi.bus.umich.edu
CURRENT AS OF 2/26/04 Publication Authors Date No. 657: European Integration, Productivity Growth and Real Convergence
Taner M. Yigit and Ali M. Kutan Feb. 2004
No. 656: The Impact of News, Oil Prices, and Global Market Developments on Russian Financial Markets
Bernd Hayo and Ali M. Kutan Feb. 2004
No. 655: Politics and Economic Reform in Malaysia Bryan K. Ritchie Feb. 2004 No. 654: The Evolution of Income Inequality in Rural China Dwayne Benjamin, Loren Brandt
and John Giles Feb. 2004
No. 653: The Sources of Real Exchange Fluctuations in Developing Countries : an Econometric Investigation
Imed Drine and Christophe Rault Feb. 2004
No. 652: Ownership, Control and Corporate Performance After Large-Scale Privatization
Jan Hanousek, Evzen Kocenda and Jan Svejnar
Feb. 2004
No. 651: Czech Social Reform/Non-reform: Routes, Actors and Problems
Jiri Vecernik Feb. 2004
No. 650: Financial Integration, Exchange Rate Regimes in CEECs, and Joining the EMU: Just Do It...
Maurel Mathilde Feb. 2004
No. 649: Corporate Investments, Liquidity and Bank Financing: Empirical Evidence from an Emerging Market
Arun Khanna Feb. 2004
No. 648: Financial Constraints in Investment – Foreign Versus Domestic Firms. Panel Data Results From Estonia, 1995-1999.
Tomasz Mickiewicz, Kate Bishop and Urmas Varblane
Feb. 2004
No. 647: Legal Minimum Wages and the Wages of Formal and Informal Sector Workers in Costa Rica
T. H. Gindling and Katherine Terrell
Feb. 2004
No. 646: Employment Expectations and Gross Flows by Type of Work Contract
Catalina Amuedo-Dorantes and Miguel Á. Malo
Jan. 2004
No. 645: Transition on the Shop Floor - The Restructuring of a Weaving Mill, Hungary 1988-97
János Köllő Jan. 2004
No. 644: Fighting “Low Equilibria” by Doubling the Minimum Wage ? Hungary’s Experiment
Gábor Kertei and János Köllő Jan. 2004
No. 643: Mind the Break! Accounting for Changing Patterns of Growth during Transition
Jan Fidrmuc and Ariane Tichit Jan. 2004
No. 642: The Monetary Approach to Exchange Rates in the CEECs Jesús Crespo-Cuaresma, Jarko Fidrmuc and Ronald MacDonald
Jan. 2004
No. 641: Community Norms and Organizational Practices: The Legitimization of Wage Arrears in Russia, 1992-1999
John S. Earle, Andrew Spicer and Klara Sabirianova Peter
Jan. 2004
No. 640: Trust in Transition: Cross Country and Firm Evidence Martin Raiser, Alan Rousso, and Franklin Steves
Jan. 2004
No. 639: What Makes Small Firms Grow? Finance, Human Capital, Technical Assistance, and the Business Environment in Romania
J. David Brown, John S. Earle and Dana Lup
Jan. 2004
No. 638: The Politics of Economic Reform in Thailand: Crisis and Compromise
Allen Hicken Jan. 2004
No. 637: How Much Restructuring did the Transition Countries Experience? Evidence from Quality of their Exports
Yener Kandogan Jan. 2004
No. 636: Estimating the Size and Growth of Unrecorded Economic Activity in Transition Countries: A Re-Evaluation of Eclectric Consumption Method Estimates and their Implications
Edgar L. Feige and Ivana Urban Dec. 2003
No. 635: Measuring the Value Added by Money Vlad Ivanenko Nov. 2003 No. 634: Sensitivity of the Exporting Economy on the External Shocks: Evidence from Slovene Firms
Janez Prašnikar, Velimir Bole, Aleš Ahcan and Matjaž Koman
Nov. 2003
No. 633: Reputation Flows: Contractual Disputes and the Channels for Inter-firm Communication
William Pyle Nov. 2003
No. 632: The Politics of Development Policy and Development Policy Reform in New Order Indonesia
Michael T. Rock Nov. 2003
No. 631: The Reorientation of Transition Countries’ Exports: Changes in Quantity, Quality and Variety
Yener Kandogan Nov. 2003