european forest types and forest europe sfm indicators: tools for monitoring progress on forest...
TRANSCRIPT
Forest Ecology and Management xxx (2013) xxx–xxx
Contents lists available at ScienceDirect
Forest Ecology and Management
journal homepage: www.elsevier .com/locate / foreco
European Forest Types and Forest Europe SFM indicators: Toolsfor monitoring progress on forest biodiversity conservation
0378-1127/$ - see front matter � 2013 Elsevier B.V. All rights reserved.http://dx.doi.org/10.1016/j.foreco.2013.07.004
⇑ Corresponding author. Address: University of Tuscia, Department for Innova-tion in Biological, Agro-food and Forest systems, Via San Camillo de Lellis SNC,01100 Viterbo, Italy. Tel.: +39 0761 357 417; fax: +39 0761 357 389.
E-mail address: [email protected] (A. Barbati).
Please cite this article in press as: Barbati, A., et al. European Forest Types and Forest Europe SFM indicators: Tools for monitoring progress on fordiversity conservation. Forest Ecol. Manage. (2013), http://dx.doi.org/10.1016/j.foreco.2013.07.004
A. Barbati a,⇑, M. Marchetti b, G. Chirici b, P. Corona c
a University of Tuscia, Department for Innovation in Biological, Agro-food and Forest Systems, Viterbo, Italyb University of Molise, Department of BioScience and Territory, Isernia, Italyc Consiglio per la ricerca e la sperimentazione in agricoltura, Forestry Research Centre (CRA-SEL), Arezzo, Italy
a r t i c l e i n f o
Article history:Available online xxxx
Keywords:European Forest TypesSustainable forest managementBiodiversity indicatorsPolicy makingMonitoringForest Europe
a b s t r a c t
Since 2003 the MCPFE-Forest Europe process has adopted a set of Pan-European Indicators that hasbecome a policy instrument to monitor, evaluate and report progress towards sustainable forest manage-ment (SFM). Two new experimental tools have been introduced in the framework of the «State of Forestsand Sustainable Forest Management in Europe 2011»: (i) pilot reporting by 14 classes of European ForestTypes (EFTs) for a selection of quantitative SFM indicators; (ii) key parameters for monitoring progress forall quantitative indicators.
The main aim of this paper is to discuss whether reporting by EFTs of key forest biodiversity-relatedparameters can improve the way forest biodiversity conservation policy targets are addressed and eval-uated in Europe. Accordingly, data on SFM indicators for a sample of European countries (ranging from 6to 28, depending on indicators) have been processed and analyzed in a pilot study using a question-dri-ven approach, so that information from monitoring could direct policy action.
The main findings show that:
– forest area has been significantly increasing (>0.2% per year) in the period 2000–2010; however,annual changes in forest cover by EFTs reveal a polyedric picture at country level, in terms of gainand loss of forest habitat dominated by native and introduced tree species;
– old even aged forests (>140 yrs) are fairly consistent (>5%) only in a few countries and limited to spe-cific EFTs;
– in naturally species-poor EFTs (e.g. Boreal forest, Alpine coniferous forest, Broadleaved evergreen for-est) single species stands cover from 15–100% of the total area, while in species rich EFTs (e.g. Meso-phytic deciduous forest, Thermophilous deciduous forest) the maximum share of single species is inthe order of 30%;
– deadwood amount ranges from 9 to 26 m3 ha�1, a value which is however far below natural referencevalues found in European old growth forests (160 m3 ha�1).
Findings from this test demonstrate that reporting of key forest biodiversity-related parameters byEFTs enables question-driven monitoring in many ways: (i) reporting by EFTs helps to interpret the var-iability in the values taken by the indicators explicitly considering ecological differences between EFTs;(ii) temporal trends in forest area can be interpreted in terms of expansion or loss of forest habitats dom-inated by native and introduced tree species; (iii) progress in implementing biodiversity friendly strate-gies (e.g. increasing share of old even aged forests, promotion of multispecies stands and accumulation ofdeadwood) can be quantitatively evaluated against baselines.
� 2013 Elsevier B.V. All rights reserved.
1. Background: biodiversity conservation and sustainable forest Donald and Lane (2004) there is a substantial convergence of crite-
management in EuropeSustainable forest management (SFM) is widely accepted as themain goal for forest policy and practice. As demonstrated by Mc
ria and indicators (C&I) to measure progress towards SFM, acrossdifferent regions and forest biomes of the globe: the Montreal pro-cess (MP), the Forest Europe process (FE, formerly Ministerial Con-ference on the Protection of Forests in Europe – MCPFE) and theInternational Tropical Timber Organisation (ITTO). The sustainableuse of forest resources is also recognized as a focal area by the Con-vention on Biological Diversity (CBD, 2010a,b).
est bio-
2 A. Barbati et al. / Forest Ecology and Management xxx (2013) xxx–xxx
There is also global consensus in conceiving SFM as a balancingact between forest biodiversity conservation targets (MP C1; FE C4;ITTO C5, CBD Aichi Targets A3–4 and B7) and the maintenance ofthe health and productive capacity of forest ecosystems and theirrole in watersheds and the global carbon cycle.
Implementation of international commitments for SFM Europecan build on the endorsement of the Pan-European C&I for SFMby the forest ministers of the (46) signatories countries (MCPFE,2002) and on the political foundation of the EU (27) countries,whereas this is not the case for the MP and ITTO processes(McDonald and Lane, 2004). The set of Pan-European Indicatorsfor SFM was selected on the basis of rigorous, scientifically andpolicy robust criteria to monitor, evaluate and report progress to-wards sustainable forest management in Forest Europe region(MCPFE, 2003a), a wide forest area currently covering over 1 bil-lion hectares, 25 percent ca of the world total (Forest Europe,UNECE and FAO, 2011). The system is based on set of 35 quanti-tative and 17 qualitative indicators and it is meant to facilitatethe evaluation of the achievements towards each criterion’s goalsand the subsequent progress in SFM advancement. The formula-tion of seven SFM indicators under criteria 1, 2 and 4 (1.1 forestarea, 1.2 growing stock, 1.3 age structure and/or diameter distri-bution, 2.4 forest damage, 4.1 tree species composition, 4.3 natu-ralness, 4.5 deadwood) requires data to be specified by foresttypes.
The forest types classes applied in the first two MCPFE reports(MCPFE, 2003b, 2007) are three broad species groups: broad-leaved forest, coniferous forest, mixed broadleaved and coniferousforest. The State of Europe’s Forests 2011 (Forest Europe, UNECEand FAO, 2011) introduced two new experimental tools to im-prove the quality of information reported by quantitative indica-tors: (i) pilot reporting by 14 classes of European Forest Types(EFTs) for a selection of quantitative SFM indicators; (ii) keyparameters for selected quantitative indicators to measure pro-gress towards the achievement of SFM policy targets under eachindicator.
These new experimental tools could represent a step forward inthe way indicators are applied in a policy context to answer keyquestions for biodiversity conservation (EEA, 2012): Where weare now? Where we may be heading? What are the main pressuresthat need to be countered through policy measures?
Building up well-targeted forest biodiversity conservation poli-cies will become even more strategic in the future. The forest sec-tor, as a whole, will face increasing cross-sectoral complexityrelated to four major challenges (Forest Europe, UNECE and FAO,2011):– to halt biodiversity loss in the EU by 2020;– to meet the ambitious 20/20/20 targets for renewable energy,
without undermining sustainability as regards wood supplyand all other functions;
– to make a major contribution to climate change mitigation andadaptation, without neglecting the other dimensions of SFM;
– to support the development of green economy.
In this scenario, to halt biodiversity loss could be a David vs.Goliath challenge, as clearly highlighted in the last State of Eur-ope’s forest report (Forest Europe, UNECE and FAO, 2011): if thefuture is marked by more intensive silviculture, higher woodprices and higher harvests, notably for energy use, would thisbe compatible with an improvement of forest biodiversitycondition?
The focus of this paper is to propose new approaches to improvethe way the state of forest biodiversity is assessed and monitoredusing the current set of Forest Europe SFM indicators.
The paper is specifically aimed to discuss whether:
Please cite this article in press as: Barbati, A., et al. European Forest Types anddiversity conservation. Forest Ecol. Manage. (2013), http://dx.doi.org/10.1016/
(i) the reporting of SFM indicator values by the 14 EFTs can pro-vide a more clear message on the state of forest biodiversity,at the level appropriate for the policy pools that influenceforest management decision making;
(ii) the integration of EFTs and key parameters for indicators canbe an effective way to introduce question-driven monitoringin Forest Europe reporting and, accordingly, to steer policyaction towards quantified forest biodiversity conservationtargets.
Accordingly, the paper is structured as follows:Section 2 introduces the main concepts behind the EFTs as part
of the SFM monitoring system of Forest Europe; the issue of ques-tion-driven monitoring key parameters for indicators by EFTs isintroduced, as a way to quantitatively measure progress made bySFM in implementing conditions more favorable to forest biodiver-sity conservation or development;
Section 3 presents data on key parameters processed fromavailable country information on SFM indicators collected duringthe pilot reporting carried out within Forest Europe;
Section 4 outlines final remarks and recommends a possiblepathway for improving the way links between sustainable forestmanagement and biodiversity conservation are addressed in forestpolicies.
2. Methodological framework
Most of the forest types based Forest Europe indicators wereoriginally devised to illustrate the status, changes and trends in se-lected components of forest biological diversity (4.1 tree speciescomposition, 4.3 deadwood) or in the level of anthropogenic mod-ification of forest communities (4.3 naturalness). However, the po-tential of using indicators to answer policy questions (and drawingsound conclusions from them) is currently hampered by twofactors:
1. the forest type classification based on three broad classes(broadleaved forest, coniferous forest, mixed broadleaved andconiferous forest) does not provide an ecologically sound con-text to frame indicator values, from country to Pan-Europeanscale (where we are now?);
2. lack of an explicit link between forest biodiversity indicatorsand forest biodiversity conservation policy questions (wherewe may be heading? What are the main threats to be counteredby policies?)
This section outlines a methodological proposal to address lim-itations above, which is then applied based on a test reporting inSection 3.
2.1. European Forest Types classification: providing a suitableecological context
A forest type classification is aimed to stratify a large forest ter-ritory into a discrete number of smaller and more homogeneousecologically units to facilitate the analysis, interpretation andreporting of forest data, especially concerning biodiversity relatedinformation (Larsson, 2001; Mc Roberts et al., 2011). Given thewide geographical scope of Forest Europe reporting, aggregationof indicators values by three broad species groups implies reducingthe information conveyed by the indicators, across a range of spa-tial scales (country, regional, Pan-European). This smoothing effectis particularly evident in countries characterized by high variability
Forest Europe SFM indicators: Tools for monitoring progress on forest bio-j.foreco.2013.07.004
A. Barbati et al. / Forest Ecology and Management xxx (2013) xxx–xxx 3
in natural ecological conditions and level of naturalness. For in-stance, in a country like the UK indicator values (tree speciescomposition, deadwood, naturalness) from non-native Sitka spruceplantations are aggregated and averaged with values from nativeScots pine forest; likewise, in France, Italy and Spain, the indicatorsvalues of coniferous forests of the Alpine biogeographical regionare averaged with those of the Mediterranean one.
In order to overcome these limitations, the European ForestTypes scheme has been proposed as alternative for reporting underForest Europe process, according to more ecologically sound units(EEA, 2006; Barbati et al., 2007). Since 2006, the MCPFE process hasorganized consultative activities with representatives from mem-ber countries to discuss the potential of applying the European For-est Types (EFTs) as a forest type framework for Pan-Europeanreporting. Based on gained experience, some improvements wereintroduced to refine the EFT classification in order to ensure it berepresentative and comprehensive of the variety of forest condi-tions at Pan-European level.
The revised classification system is conceived to classify stockedforest land of the Pan-European region, into 14 Categories and 78Types (Table 1).
The 14 categories of the EFT represent groups of ecologicallydistinct forest communities dominated by specific assemblages oftrees. The category level is conceived to identify and reflect signif-icant breaking points in the continuum of natural and anthropo-genic factors affecting the state of European forests. The firstlogical breaking point is when the native vegetation of a site is re-placed by forest stands predominantly consisting of tree speciesthat are not native to Europe or, otherwise, tree species native toEurope but not naturally occurring within the borders of a givencountry. This breaking point allows to clearly distinguish forestswith extremely low degree of naturalness (Cat. 14) from the restof European forests (Cat. 1–13). Categories 1–10 and 13 corre-spond, to forests communities dominated by specific assemblagesof trees native to Europe. The forest physiognomy of categories 1–10 is mainly determined by the latitudinal/altitudinal zonation ofEuropean vegetation and by inner climatic and edaphic variationtherein. Categories 11–12 include azonal forest communities.
The Type level is mainly intended to describe, and further doc-ument, the variety and the character of forest communities cov-ered by each category. Types correspond to a finer level ofdivision of the category in term of tree species composition; thetype level facilitates cross-links with other forest types classifica-tion systems applied at national level (e.g. within National ForestInventories; see Mc Roberts et al., 2011), or at EU level like Natura2000 forest habitats (for cross-links see EEA, 2006).
Statistically-designed inventories, such as National ForestInventories (NFIs), provide the best coverage possible, in relationto currently available data sources of forest information in Europe,to monitor SFM Forest Europe indicators. The main strength of NFIsis a scientifically rigorous, design-based, statistical estimationmethod that produces periodical estimates of forest attributes withknown sampling variability and quantifiable measurement error(Corona et al., 2010, 2011). Although methods (i.e. definitions, pro-tocols and sampling designs) to assess biodiversity related vari-ables from NFI data are non-standardized in Europe,harmonization techniques have been fully tested for internationalreporting of forest biodiversity indicators (Chirici et al., 2011,2012; Ståhl et al., 2012; Rondeux et al., 2012).
In this perspective, the EFTs scheme is proposed as a tool tofacilitate the analysis of (harmonized) estimates of biodiversityindicators in a meaningful way: aggregating and averaging datafrom NFIs ground plots with respect to ecologically homogeneousstrata of European relevance, i.e. the 14 EFTs categories. Opera-tional guidelines for the implementation of the classification (Ta-
Please cite this article in press as: Barbati, A., et al. European Forest Types anddiversity conservation. Forest Ecol. Manage. (2013), http://dx.doi.org/10.1016/
ble 2) allow countries to use a flexible approach to theclassification of national forest area into EFTs, based on bestavailable data sources (NFIs ground plots and forest maps, forestmanagement plans).
Mc Roberts et al. (2011) demonstrated the feasibility of applica-tion of the EFTs scheme: more than 8000 NFIs ground plots from 14countries, covering the main biogeographical regions of Europe,have been classified into the 14 EFTs categories mainly using infor-mation on the geographic location of plots, tree species and diam-eter distribution.
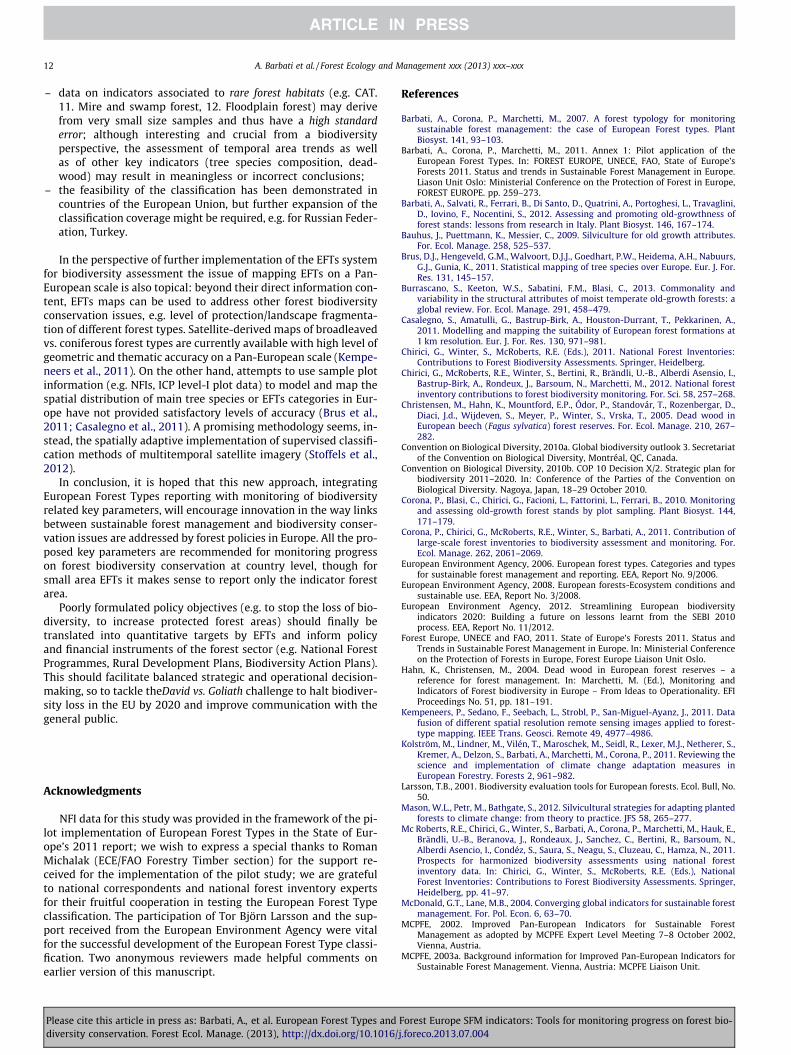
An alternative approach to classify a national forest area byEFTs is to establish the so-called label-to-label bridges with aforest type classification scheme available in the country tostratify forest area (Ståhl et al., 2012). Bridging functions canbe used to reclassify, say, classes of a national forest map or for-est type classes used within a NFI. The data sources and ap-proaches used for implementing the EFTs classification atcountry level clearly affect the quality of the estimates. For in-stance, in Italy according to Corona et al. (2011) total forest cov-er can be classified into 11 categories showing relatively highdiversity (eveness index = 0.6); such a variability is damped (7categories) when mapping EFTs by establishing bridges with aforest map derived from Corine Land Cover 2006 (Fig. 1): thisis understandable as the NFI is able to capture relative rareand small forest habitats (e.g. Categories 5, 13) which are toosmall to be represented in the national scale forest map.
2.2. Question-driven monitoring of forest biodiversity indicators
Forest biodiversity indicators are required not only to be eco-logically meaningful, but also policy relevant: indicators shouldsend a clear message at a level appropriate for policy and SFM deci-sion-making. According to the last State of Europe’s forest report(Forest Europe, UNECE and FAO, 2011) regulatory instruments(e.g. laws on forest and nature conservation, national biodiversitystrategies, implementation of Habitats and Birds Directive, actionplans on invasive species) are the most widely applied policy toolsto address forest biodiversity conservation in Europe; interestingly,although several countries have reported efforts to implement bio-diversity conservation in SFM practice, no country reported quan-tified forest biodiversity targets that related directly to specificbiodiversity indicators.
The integration of EFTs and key parameters for monitoring indi-cators can be a pathway to introduce question-driven monitoringin Forest Europe reporting and, accordingly, to steer policy actiontowards to quantified conservation targets. Key parameters shouldquantify, as far as possible, conditions favorable for biodiversityconservation or threats that need to be countered by policy action;to this end, Table 3 outlines links between Forest Europe SFM indi-cators and biodiversity related key parameters. These key parame-ters make the following assumptions explicit:
1. the higher the share of forest dominated by introduced tree spe-cies, the greater the disturbance to native forest biodiversity,especially in the case of invasive tree species (EEA, 2008; ForestEurope, UNECE and FAO, 2011);
2. the age structure of European forests is dominated by even-agedstands (Forest Europe, UNECE and FAO, 2011); increasing the areaof old even-aged forest stands (>140 years) opens room for man-aging forests towards old-growthness, with positive effects onforest structural diversification and biodiversity (Bauhus et al.,2009); this forest management strategy is topical as the area ofhigh forests approaching biological maturity is generally far lar-
Forest Europe SFM indicators: Tools for monitoring progress on forest bio-j.foreco.2013.07.004
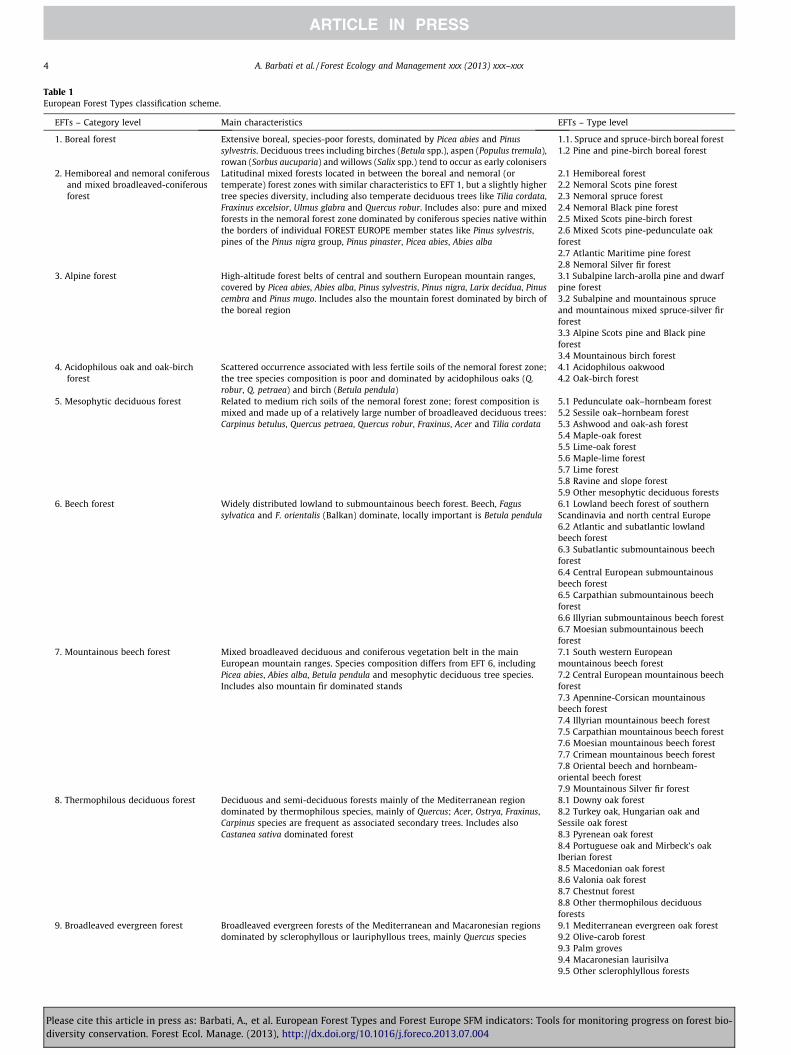
Table 1European Forest Types classification scheme.
EFTs – Category level Main characteristics EFTs – Type level
1. Boreal forest Extensive boreal, species-poor forests, dominated by Picea abies and Pinussylvestris. Deciduous trees including birches (Betula spp.), aspen (Populus tremula),rowan (Sorbus aucuparia) and willows (Salix spp.) tend to occur as early colonisers
1.1. Spruce and spruce-birch boreal forest1.2 Pine and pine-birch boreal forest
2. Hemiboreal and nemoral coniferousand mixed broadleaved-coniferousforest
Latitudinal mixed forests located in between the boreal and nemoral (ortemperate) forest zones with similar characteristics to EFT 1, but a slightly highertree species diversity, including also temperate deciduous trees like Tilia cordata,Fraxinus excelsior, Ulmus glabra and Quercus robur. Includes also: pure and mixedforests in the nemoral forest zone dominated by coniferous species native withinthe borders of individual FOREST EUROPE member states like Pinus sylvestris,pines of the Pinus nigra group, Pinus pinaster, Picea abies, Abies alba
2.1 Hemiboreal forest2.2 Nemoral Scots pine forest2.3 Nemoral spruce forest2.4 Nemoral Black pine forest2.5 Mixed Scots pine-birch forest2.6 Mixed Scots pine-pedunculate oakforest2.7 Atlantic Maritime pine forest2.8 Nemoral Silver fir forest
3. Alpine forest High-altitude forest belts of central and southern European mountain ranges,covered by Picea abies, Abies alba, Pinus sylvestris, Pinus nigra, Larix decidua, Pinuscembra and Pinus mugo. Includes also the mountain forest dominated by birch ofthe boreal region
3.1 Subalpine larch-arolla pine and dwarfpine forest3.2 Subalpine and mountainous spruceand mountainous mixed spruce-silver firforest3.3 Alpine Scots pine and Black pineforest3.4 Mountainous birch forest
4. Acidophilous oak and oak-birchforest
Scattered occurrence associated with less fertile soils of the nemoral forest zone;the tree species composition is poor and dominated by acidophilous oaks (Q.robur, Q. petraea) and birch (Betula pendula)
4.1 Acidophilous oakwood4.2 Oak-birch forest
5. Mesophytic deciduous forest Related to medium rich soils of the nemoral forest zone; forest composition ismixed and made up of a relatively large number of broadleaved deciduous trees:Carpinus betulus, Quercus petraea, Quercus robur, Fraxinus, Acer and Tilia cordata
5.1 Pedunculate oak–hornbeam forest5.2 Sessile oak–hornbeam forest5.3 Ashwood and oak-ash forest5.4 Maple-oak forest5.5 Lime-oak forest5.6 Maple-lime forest5.7 Lime forest5.8 Ravine and slope forest5.9 Other mesophytic deciduous forests
6. Beech forest Widely distributed lowland to submountainous beech forest. Beech, Fagussylvatica and F. orientalis (Balkan) dominate, locally important is Betula pendula
6.1 Lowland beech forest of southernScandinavia and north central Europe6.2 Atlantic and subatlantic lowlandbeech forest6.3 Subatlantic submountainous beechforest6.4 Central European submountainousbeech forest6.5 Carpathian submountainous beechforest6.6 Illyrian submountainous beech forest6.7 Moesian submountainous beechforest
7. Mountainous beech forest Mixed broadleaved deciduous and coniferous vegetation belt in the mainEuropean mountain ranges. Species composition differs from EFT 6, includingPicea abies, Abies alba, Betula pendula and mesophytic deciduous tree species.Includes also mountain fir dominated stands
7.1 South western Europeanmountainous beech forest7.2 Central European mountainous beechforest7.3 Apennine-Corsican mountainousbeech forest7.4 Illyrian mountainous beech forest7.5 Carpathian mountainous beech forest7.6 Moesian mountainous beech forest7.7 Crimean mountainous beech forest7.8 Oriental beech and hornbeam-oriental beech forest7.9 Mountainous Silver fir forest
8. Thermophilous deciduous forest Deciduous and semi-deciduous forests mainly of the Mediterranean regiondominated by thermophilous species, mainly of Quercus; Acer, Ostrya, Fraxinus,Carpinus species are frequent as associated secondary trees. Includes alsoCastanea sativa dominated forest
8.1 Downy oak forest8.2 Turkey oak, Hungarian oak andSessile oak forest8.3 Pyrenean oak forest8.4 Portuguese oak and Mirbeck’s oakIberian forest8.5 Macedonian oak forest8.6 Valonia oak forest8.7 Chestnut forest8.8 Other thermophilous deciduousforests
9. Broadleaved evergreen forest Broadleaved evergreen forests of the Mediterranean and Macaronesian regionsdominated by sclerophyllous or lauriphyllous trees, mainly Quercus species
9.1 Mediterranean evergreen oak forest9.2 Olive-carob forest9.3 Palm groves9.4 Macaronesian laurisilva9.5 Other sclerophlyllous forests
4 A. Barbati et al. / Forest Ecology and Management xxx (2013) xxx–xxx
Please cite this article in press as: Barbati, A., et al. European Forest Types and Forest Europe SFM indicators: Tools for monitoring progress on forest bio-diversity conservation. Forest Ecol. Manage. (2013), http://dx.doi.org/10.1016/j.foreco.2013.07.004

Table 1 (continued)
EFTs – Category level Main characteristics EFTs – Type level
10. Coniferous forests of theMediterranean, Anatolian andMacaronesian regions
Varied group of coniferous forests in Mediterranean, Anatolian and Macaronesianregions, from the coast to high mountains. Dry and often poorly-developed soilslimit tree growth. Several tree species, including a number of endemics, of Pinus,Abies and Juniperus species
10.1 Mediterranean pine forest10.2 Mediterranean and Anatolian Blackpine forest10.3 Canarian pine forest10.4 Mediterranean and Anatolian Scotspine forest10.5 Alti-Mediterranean pine forest10.6 Mediterranean and Anatolian firforest10.7 Juniper forest10.8 Cypress forest10.9 Cedar forest10.10 Tetraclinis articulata stands10.11 Mediterranean yew stands
11. Mire and swamp forest Wetland forests on peaty soils widely distributed in the boreal region. Water andnutrient regimes determine the dominant tree species: Pinus sylvestris, Picea abiesor Alnus glutinosa
11.1 Spruce mire forest11.2 Pine mire forest11.3 Alder swamp forest11.4 Birch swamp forest11.5 Pedunculate oak swamp forest11.6 Aspen swamp forest
12. Floodplain forest Riparian and riverine species-rich forests characterized by different assemblagesof species of Alnus, Betula, Populus, Salix, Fraxinus, Ulmus
12.1 Riparian forest12.2 Fluvial forest12.3 Mediterranean and Macaronesianriparian forest
13. Non-riverine alder, birch or aspenforest
Pioneer forests dominated by Alnus, Betula or Populus 13.1 Alder forest13.2 Italian alder forest13.3 Birch forest13.4 Aspen forest
14. Introduced tree species forest Forests dominated by introduced tree species (sensu Pan-European indicator 4.4),occurring on a wide range of site conditions which otherwise would developforests of above categories. Introduced tree species can be identified at regional(recommended) or national level and comprise: – tree species that are not nativeto Europe (e.g. Eucalyptus spp., Robinia pseudoacacia, Acacia dealbata, Ailanthusaltissima, Prunus serotina, Quercus rubra, Fraxinus alba, Picea sitkensis, Pinuscontorta, Pinus banksiana, Pseudotsuga menziesii, Tsuga heterophylla); – tree speciesnative to Europe, but not naturally occurring within the borders of individualFOREST EUROPE member states; – tree species native only in some regions of anindividual FOREST EUROPE country
–
Table 2Data sources and approaches for the classification of national forest area according to European Forest Types.
Data source Approach for the implementation Thresholds for dominant forest species
Forest maps (national foresttypes classification based onactual forest vegetation)
Reclassification of national forest types to EFTs (‘label tolabel’ bridging functions)
Original NFIs plot-based data,DBH information available
Species dominance and assignment to an EFTs category basedon basal area of dominant tree types and dominant forestspecies
Coniferous/broadleaved deciduous/broadleaved evergreen species(single or group of species), which accounts for more than 50% ofbasal area
Original NFIs plot-based data,tree crown cover/number oftrees available
Species dominance and assignment to an EFTs category basedon tree crown cover/number of trees of dominant tree typesand dominant forest species
Coniferous/broadleaved deciduous/ broadleaved evergreen species(single or group of species), which accounts for more than 75% ofthe crown cover/number of trees
A. Barbati et al. / Forest Ecology and Management xxx (2013) xxx–xxx 5
ger than forest ‘‘undisturbed by man’’ in European countries,mostly represented by small and strictly protected remnantsconfined to forests reserves (Barbati et al., 2012);
3. reducing the share of single-species stands by promoting theestablishment of tree species mixtures is not only a way to sup-port a large variety of forest species, but also a strategic oppor-tunity to stabilize forest productivity, to increase resilience andto contribute to risk minimization in forest stands; managingforest towards multi-species stands is especially recommendedto tackle the negative effects of climate change in Europe (Kol-ström et al., 2011), including forest plantations dominated byintroduced tree species (Mason et al., 2012).
Please cite this article in press as: Barbati, A., et al. European Forest Types anddiversity conservation. Forest Ecol. Manage. (2013), http://dx.doi.org/10.1016/
However, there are natural constraints in Europe that need tobe considered when targeting forest management towards spe-cies mixtures, that are well captured by EFTs classes. At high lat-itudes, altitudes, or under certain ecological limiting conditions(peatland, poor soils) single-species, mainly coniferous, forestsnaturally dominate (Cat. 1, 3, 4, 10, 11). In the boreal forestzone, mixed forests are associated only with the early stages ofstand development or to rich soils, whereas they are naturallymore frequent in central and southern Europe, in mesophyticor thermophilous deciduous broadleaved deciduous forests (Cat.5, 8) or in riparian and riverine forest communities (Cat. 12).The rationale of this key parameter is not to quantify if the shareof single-species stand is good, bad, adequate or only 70% of
Forest Europe SFM indicators: Tools for monitoring progress on forest bio-j.foreco.2013.07.004
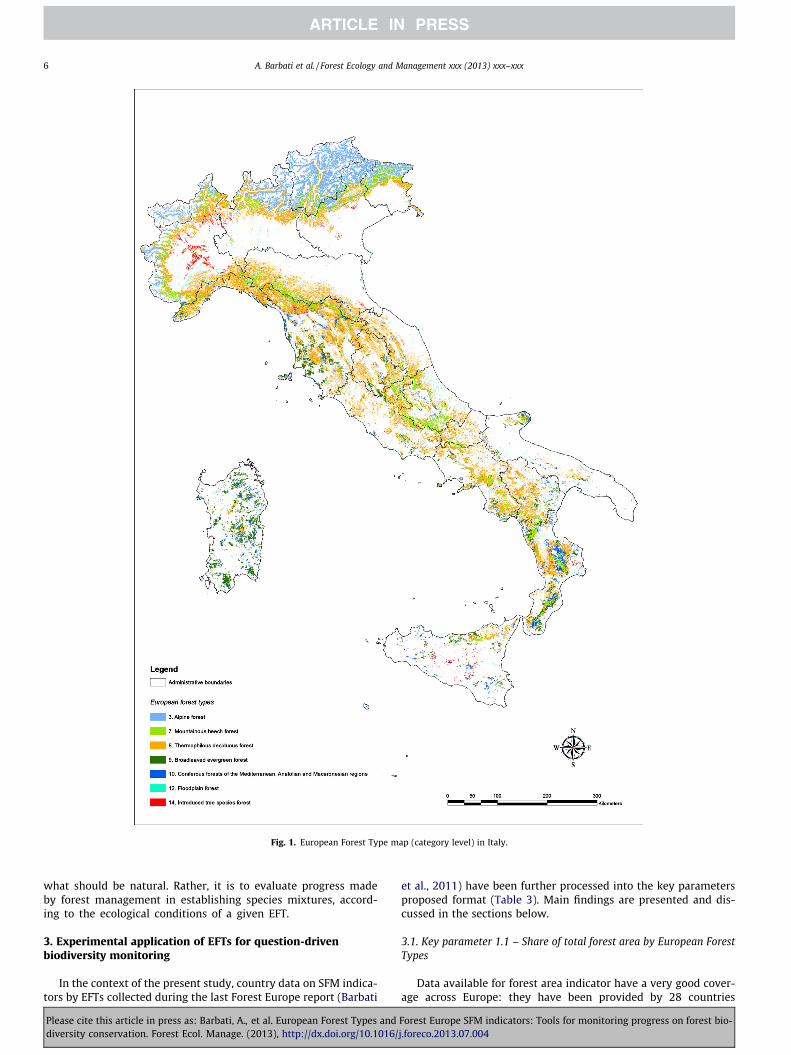
Fig. 1. European Forest Type map (category level) in Italy.
6 A. Barbati et al. / Forest Ecology and Management xxx (2013) xxx–xxx
what should be natural. Rather, it is to evaluate progress madeby forest management in establishing species mixtures, accord-ing to the ecological conditions of a given EFT.
3. Experimental application of EFTs for question-drivenbiodiversity monitoring
In the context of the present study, country data on SFM indica-tors by EFTs collected during the last Forest Europe report (Barbati
Please cite this article in press as: Barbati, A., et al. European Forest Types anddiversity conservation. Forest Ecol. Manage. (2013), http://dx.doi.org/10.1016/
et al., 2011) have been further processed into the key parametersproposed format (Table 3). Main findings are presented and dis-cussed in the sections below.
3.1. Key parameter 1.1 – Share of total forest area by European ForestTypes
Data available for forest area indicator have a very good cover-age across Europe: they have been provided by 28 countries
Forest Europe SFM indicators: Tools for monitoring progress on forest bio-j.foreco.2013.07.004
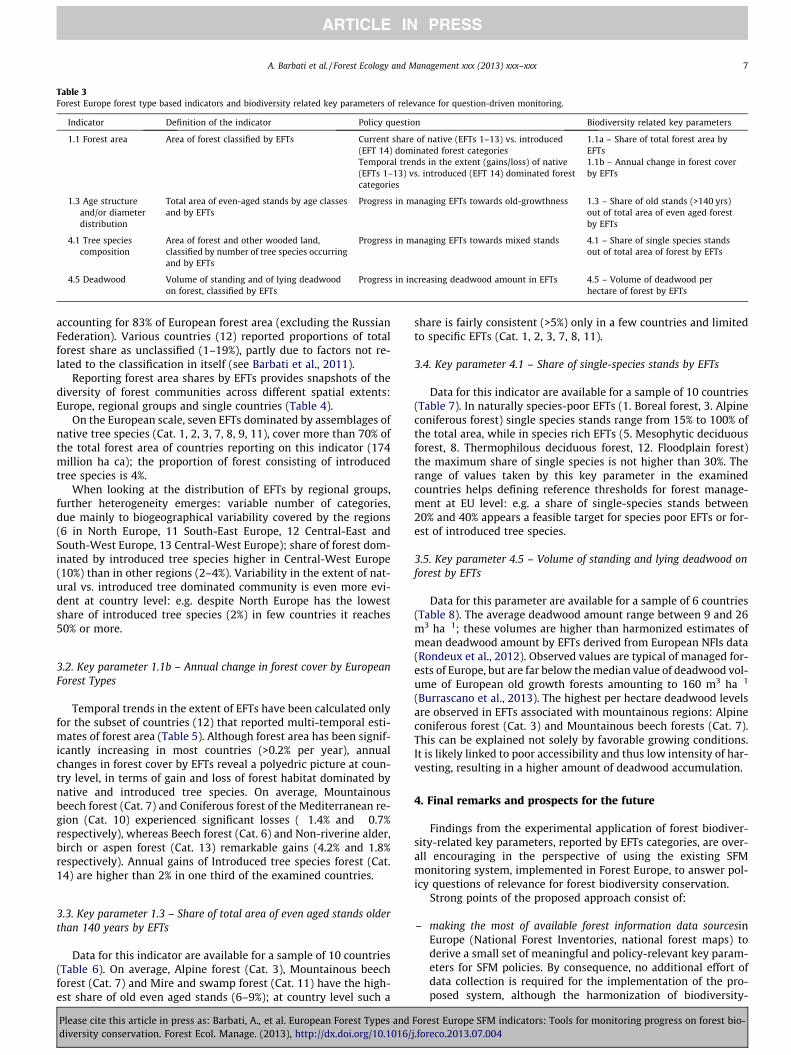
Table 3Forest Europe forest type based indicators and biodiversity related key parameters of relevance for question-driven monitoring.
Indicator Definition of the indicator Policy question Biodiversity related key parameters
1.1 Forest area Area of forest classified by EFTs Current share of native (EFTs 1–13) vs. introduced(EFT 14) dominated forest categories
1.1a – Share of total forest area byEFTs
Temporal trends in the extent (gains/loss) of native(EFTs 1–13) vs. introduced (EFT 14) dominated forestcategories
1.1b – Annual change in forest coverby EFTs
1.3 Age structureand/or diameterdistribution
Total area of even-aged stands by age classesand by EFTs
Progress in managing EFTs towards old-growthness 1.3 – Share of old stands (>140 yrs)out of total area of even aged forestby EFTs
4.1 Tree speciescomposition
Area of forest and other wooded land,classified by number of tree species occurringand by EFTs
Progress in managing EFTs towards mixed stands 4.1 – Share of single species standsout of total area of forest by EFTs
4.5 Deadwood Volume of standing and of lying deadwoodon forest, classified by EFTs
Progress in increasing deadwood amount in EFTs 4.5 – Volume of deadwood perhectare of forest by EFTs
A. Barbati et al. / Forest Ecology and Management xxx (2013) xxx–xxx 7
accounting for 83% of European forest area (excluding the RussianFederation). Various countries (12) reported proportions of totalforest share as unclassified (1–19%), partly due to factors not re-lated to the classification in itself (see Barbati et al., 2011).
Reporting forest area shares by EFTs provides snapshots of thediversity of forest communities across different spatial extents:Europe, regional groups and single countries (Table 4).
On the European scale, seven EFTs dominated by assemblages ofnative tree species (Cat. 1, 2, 3, 7, 8, 9, 11), cover more than 70% ofthe total forest area of countries reporting on this indicator (174million ha ca); the proportion of forest consisting of introducedtree species is 4%.
When looking at the distribution of EFTs by regional groups,further heterogeneity emerges: variable number of categories,due mainly to biogeographical variability covered by the regions(6 in North Europe, 11 South-East Europe, 12 Central-East andSouth-West Europe, 13 Central-West Europe); share of forest dom-inated by introduced tree species higher in Central-West Europe(10%) than in other regions (2–4%). Variability in the extent of nat-ural vs. introduced tree dominated community is even more evi-dent at country level: e.g. despite North Europe has the lowestshare of introduced tree species (2%) in few countries it reaches50% or more.
3.2. Key parameter 1.1b – Annual change in forest cover by EuropeanForest Types
Temporal trends in the extent of EFTs have been calculated onlyfor the subset of countries (12) that reported multi-temporal esti-mates of forest area (Table 5). Although forest area has been signif-icantly increasing in most countries (>0.2% per year), annualchanges in forest cover by EFTs reveal a polyedric picture at coun-try level, in terms of gain and loss of forest habitat dominated bynative and introduced tree species. On average, Mountainousbeech forest (Cat. 7) and Coniferous forest of the Mediterranean re-gion (Cat. 10) experienced significant losses (�1.4% and �0.7%respectively), whereas Beech forest (Cat. 6) and Non-riverine alder,birch or aspen forest (Cat. 13) remarkable gains (4.2% and 1.8%respectively). Annual gains of Introduced tree species forest (Cat.14) are higher than 2% in one third of the examined countries.
3.3. Key parameter 1.3 – Share of total area of even aged stands olderthan 140 years by EFTs
Data for this indicator are available for a sample of 10 countries(Table 6). On average, Alpine forest (Cat. 3), Mountainous beechforest (Cat. 7) and Mire and swamp forest (Cat. 11) have the high-est share of old even aged stands (6–9%); at country level such a
Please cite this article in press as: Barbati, A., et al. European Forest Types anddiversity conservation. Forest Ecol. Manage. (2013), http://dx.doi.org/10.1016/
share is fairly consistent (>5%) only in a few countries and limitedto specific EFTs (Cat. 1, 2, 3, 7, 8, 11).
3.4. Key parameter 4.1 – Share of single-species stands by EFTs
Data for this indicator are available for a sample of 10 countries(Table 7). In naturally species-poor EFTs (1. Boreal forest, 3. Alpineconiferous forest) single species stands range from 15% to 100% ofthe total area, while in species rich EFTs (5. Mesophytic deciduousforest, 8. Thermophilous deciduous forest, 12. Floodplain forest)the maximum share of single species is not higher than 30%. Therange of values taken by this key parameter in the examinedcountries helps defining reference thresholds for forest manage-ment at EU level: e.g. a share of single-species stands between20% and 40% appears a feasible target for species poor EFTs or for-est of introduced tree species.
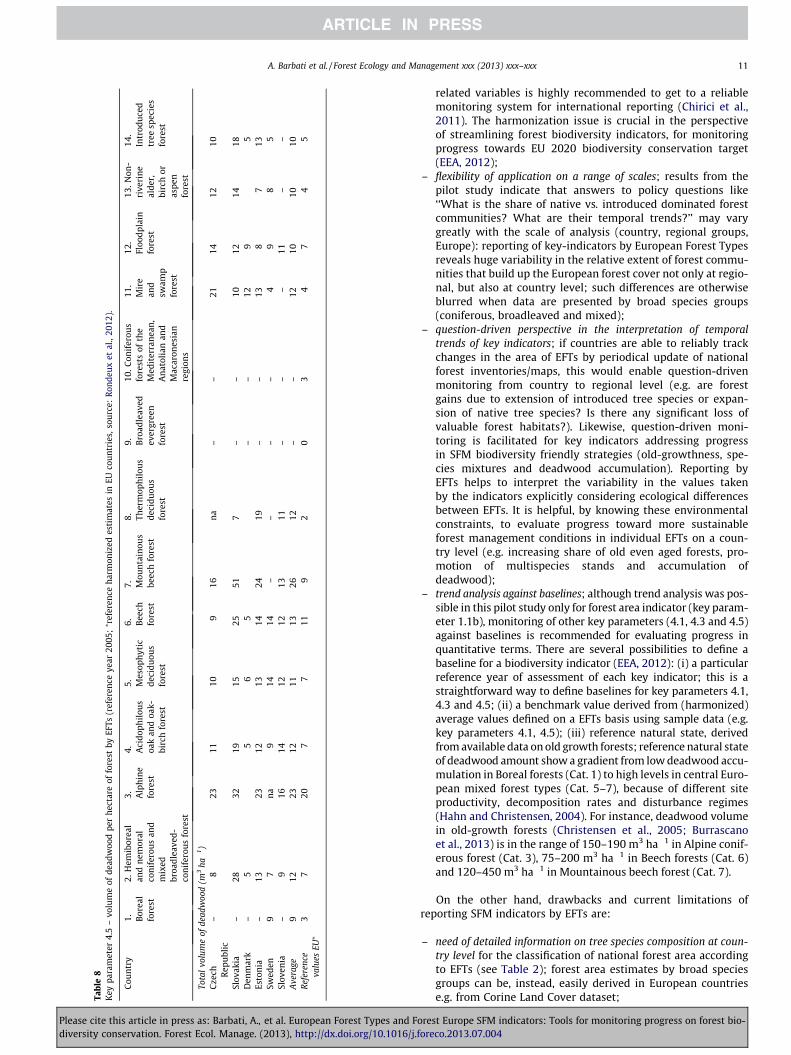
3.5. Key parameter 4.5 – Volume of standing and lying deadwood onforest by EFTs
Data for this parameter are available for a sample of 6 countries(Table 8). The average deadwood amount range between 9 and 26m3 ha�1; these volumes are higher than harmonized estimates ofmean deadwood amount by EFTs derived from European NFIs data(Rondeux et al., 2012). Observed values are typical of managed for-ests of Europe, but are far below the median value of deadwood vol-ume of European old growth forests amounting to 160 m3 ha�1
(Burrascano et al., 2013). The highest per hectare deadwood levelsare observed in EFTs associated with mountainous regions: Alpineconiferous forest (Cat. 3) and Mountainous beech forests (Cat. 7).This can be explained not solely by favorable growing conditions.It is likely linked to poor accessibility and thus low intensity of har-vesting, resulting in a higher amount of deadwood accumulation.
4. Final remarks and prospects for the future
Findings from the experimental application of forest biodiver-sity-related key parameters, reported by EFTs categories, are over-all encouraging in the perspective of using the existing SFMmonitoring system, implemented in Forest Europe, to answer pol-icy questions of relevance for forest biodiversity conservation.
Strong points of the proposed approach consist of:
– making the most of available forest information data sourcesinEurope (National Forest Inventories, national forest maps) toderive a small set of meaningful and policy-relevant key param-eters for SFM policies. By consequence, no additional effort ofdata collection is required for the implementation of the pro-posed system, although the harmonization of biodiversity-
Forest Europe SFM indicators: Tools for monitoring progress on forest bio-j.foreco.2013.07.004

Table 4Key parameter 1.1a - Share of total forest area by EFTs (reference year 2010, except: ⁄ = 2005; ⁄⁄ = 2010).
Country/Region 1.Borealforest
2.Hemiborealandnemoralconiferousandmixedbroadleaved-coniferousforest
3.Alpineforest
4.Acidophilousoak and oak-birch forest
5.Mesophyticdeciduousforest
6.Beechforest
7.Mountainousbeech forest
8.Thermophilousdeciduousforest
9.Broadleavedevergreenforest
10. Coniferousforests of theMediterranean,Anatolian andMacaronesianregions
11.Mireandswampforest
12.Floodplainforest
13. Non-riverinealder,birch oraspenforest
14.Introducedtree speciesforest
Unclassifiedforest
TOTALForestarea
Share of European Forest Types area (% of total forest area)Denmark 0 5 0 5 16 14 0 0 0 0 0 6 0 49 5 100Estonia 43 2 0 0 0 0 0 0 0 0 14 0 41 0 0 100Finland 70 2 1 0 0 0 0 0 0 0 20 0 7 0 0 100Iceland 0 0 10 0 0 0 0 0 0 0 0 0 20 70 0 100Latvia 12 37 0 0 0 0 0 0 0 0 8 0 36 0 8 100Lithuania 0 51 0 0 6 0 0 0 0 0 17 1 24 0 0 100Norway 53 11 10 0 0 0 0 0 0 0 6 0 17 2 0 100Sweden 53 22 4 0 0 0 0 0 0 0 10 0 8 2 0 100North Europe 54 15 4 0 0 0 0 0 0 0 13 0 12 2 0 100Austria 0 32 29 0 5 8 10 0 0 0 0 2 1 1 12 100Belgium 0 0 0 15 21 11 0 0 0 0 1 2 0 42 7 100France 0 12 3 15 20 4 13 13 5 3 1 3 2 5 2 100Germany 0 56 1 0 15 13 4 0 0 0 3 0 4 4 0 100Ireland 0 0 0 3 6 0 0 0 0 0 2 1 3 85 0 100Netherlands 0 30 0 11 22 4 0 0 0 0 0 0 8 25 1 100Switzerland⁄ 0 21 40 0 10 14 5 3 0 0 0 1 2 0 3 100United Kingdom⁄⁄ 0 3 0 10 11 2 0 0 0 0 0 2 2 52 19 100Central-West Europe 0 27 6 7 16 7 8 6 2 1 1 1 3 11 4 100Belarus 8 62 0 1 1 0 0 0 0 0 13 1 14 0 0 100Czech Republic 0 61 15 0 6 7 3 0 0 0 3 2 2 2 0 100Hungary 0 0 0 7 26 7 0 8 0 0 0 2 3 47 0 100Poland 0 64 3 1 9 3 4 0 0 0 1 3 10 0 0 100Slovakia 0 7 23 0 16 25 11 2 0 0 0 1 1 2 11 100Ukraine 0 32 7 0 25 1 4 0 0 1 1 6 13 4 6 100Central-East Europe 2 47 5 1 13 3 3 1 0 0 4 3 10 4 2 100Italy 0 1 14 0 2 1 11 39 10 4 0 1 1 4 12 100Spain 0 2 3 1 1 0 1 9 31 29 0 1 0 5 18 100South-West Europe 0 2 6 1 1 1 5 19 24 20 0 1 1 4 16 100Bulgaria 0 8 21 0 9 11 3 43 0 0 0 0 0 5 0 100Croatia 0 1 2 3 22 9 29 12 4 3 0 10 0 4 0 100Cyprus 0 0 0 0 0 0 0 1 0 99 0 0 0 1 0 100Slovenia 0 6 3 2 9 39 34 7 0 0 0 0 0 0 0 100South-East Europe 0 6 12 1 12 15 15 27 1 4 0 3 0 4 0 100Total 22 21 5 2 7 3 4 5 4 4 6 1 7 4 4 100
8A
.Barbatiet
al./ForestEcology
andM
anagement
xxx(2013)
xxx–xxx
Pleasecite
thisarticle
inpress
as:Barbati,A
.,et
al.EuropeanForest
Typesand
ForestEurope
SFMindicators:
Toolsfor
monitoring
progresson
forestbio-
diversityconservation.Forest
Ecol.Manage.(2013),http://dx.doi.org/10.1016/j.foreco.2013.07.004

Table 5Key parameter 1.1b – Annual change in forest cover by EFTs (calculated on a compound interest basis). Rating (% points) is calculated on annual change of total forest area (source: Forest Europe, UNECE and FAO, 2011).
Country 1.Borealforest
2. Hemiboreal andnemoral coniferous andmixed broadleaved-coniferous forest
3.Alphineforest
4.Acidophilousoak and oak-birch forest
5.Mesophyticdeciduousforest
6.Beechforest
7.Mountainousbeech forest
8.Thermophilousdeciduousforest
9.Broadleavedevergreenforest
10. Coniferous forestsof the Mediterranean,Anatolian andMacaronesian regions
11. Mireandswampforest
12.Floodplainforest
13. Non-riverinealder, birchor aspenforest
14.Introducedtree speciesforest
Totalforestarea
Rating
Annual change in forest cover by EFTs and total forest area (1990–2010, except� 2000–2010)Estonia� 0.2 1.5 – – – – – – – – �1.5 – �0.2 �3.3 �0.2 *
Finland �0.1 �0.9 �1.0 – – – – – – – 0.6 – 0.6 2.4 0.0 **
Iceland – – 0.0 – – – – – – – – – 8.4 8.0 6.4 *****
Lithuania� – 0.1 � – �0.9 – – – – – 1.3 0.7 2.2 0.0 0.7 *****
North EuropeBelgium� – – – �0.1 0.8 1.0 – – – – 1.2 0.7 – 0.0 0.2 ****
Ireland – – – 2.7 2.7 – – – – – 2.3 3.5 2.7 2 3 2.3 *****
Central-West EuropeSlovakia� – �2.2 �0.5 �0.3 0.6 23.5 �9.8 1.1 – – 1.1 3.9 �2.1 �0.2 0.1 ***
Ukraine – 0.1 0.2 0.2 0.2 0.2 0.2 0.0 – 0.3 0.2 0.2 0.7 0.2 0.2 ****
Central-East EuropeBulgaria – �0.4 �0.1 2 2 0.4 2.3 1.3 – �3.7 – – – 9.9 0.8 *****
Croatia – 0.2 0.3 0.2 0.2 0.2 0.2 0.2 0.2 0.2 – 0.2 – 0.1 0.2 ****
Cyprus – – – – – – – 0.6 – 0.4 – – – 0.0 0.4 *****
Slovenia – 0.3 0.3 0.3 0.3 0.3 0.3 0.2 – – – 0.0 – – 0.3 *****
South-East EuropeAverage 0.1 �0.2 �0.1 0.5 0.8 4.2 �1.4 0.6 0.2 �0.7 0.7 1.3 1.8 1.1 0.9 *****
Rating thresholds.* <�0.2** �0.2–0.0*** 0.0–0.1**** 0.1–0.2***** > 0.2
A.Barbati
etal./Forest
Ecologyand
Managem
entxxx
(2013)xxx–
xxx9
Pleasecite
thisarticle
inpress
as:Barbati,A
.,et
al.EuropeanForest
Typesand
ForestEurope
SFMindicators:
Toolsfor
monitoring
progresson
forestbio-
diversityconservation.Forest
Ecol.Manage.(2013),http://dx.doi.org/10.1016/j.foreco.2013.07.004
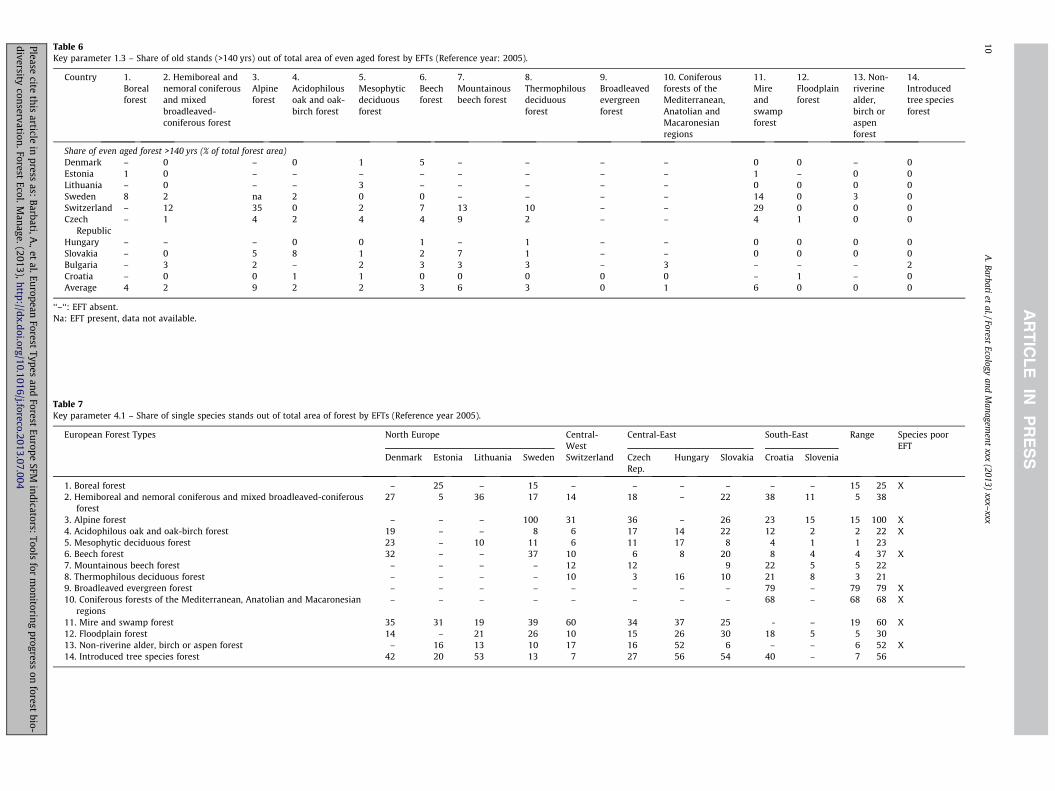
Table 6Key parameter 1.3 – Share of old stands (>140 yrs) out of total area of even aged forest by EFTs (Reference year: 2005).
Country 1.Borealforest
2. Hemiboreal andnemoral coniferousand mixedbroadleaved-coniferous forest
3.Alpineforest
4.Acidophilousoak and oak-birch forest
5.Mesophyticdeciduousforest
6.Beechforest
7.Mountainousbeech forest
8.Thermophilousdeciduousforest
9.Broadleavedevergreenforest
10. Coniferousforests of theMediterranean,Anatolian andMacaronesianregions
11.Mireandswampforest
12.Floodplainforest
13. Non-riverinealder,birch oraspenforest
14.Introducedtree speciesforest
Share of even aged forest >140 yrs (% of total forest area)Denmark – 0 – 0 1 5 – – – – 0 0 – 0Estonia 1 0 – – – – – – – – 1 – 0 0Lithuania – 0 – – 3 – – – – – 0 0 0 0Sweden 8 2 na 2 0 0 – – – – 14 0 3 0Switzerland – 12 35 0 2 7 13 10 – – 29 0 0 0Czech
Republic– 1 4 2 4 4 9 2 – – 4 1 0 0
Hungary – – – 0 0 1 – 1 – – 0 0 0 0Slovakia – 0 5 8 1 2 7 1 – – 0 0 0 0Bulgaria – 3 2 – 2 3 3 3 – 3 – – – 2Croatia – 0 0 1 1 0 0 0 0 0 – 1 – 0Average 4 2 9 2 2 3 6 3 0 1 6 0 0 0
‘‘–‘‘: EFT absent.Na: EFT present, data not available.
Table 7Key parameter 4.1 – Share of single species stands out of total area of forest by EFTs (Reference year 2005).
European Forest Types North Europe Central-West
Central-East South-East Range Species poorEFT
Denmark Estonia Lithuania Sweden Switzerland CzechRep.
Hungary Slovakia Croatia Slovenia
1. Boreal forest – 25 – 15 – – – – – – 15 25 X2. Hemiboreal and nemoral coniferous and mixed broadleaved-coniferous
forest27 5 36 17 14 18 – 22 38 11 5 38
3. Alpine forest – – – 100 31 36 – 26 23 15 15 100 X4. Acidophilous oak and oak-birch forest 19 – – 8 6 17 14 22 12 2 2 22 X5. Mesophytic deciduous forest 23 – 10 11 6 11 17 8 4 1 1 236. Beech forest 32 – – 37 10 6 8 20 8 4 4 37 X7. Mountainous beech forest – – – – 12 12 9 22 5 5 228. Thermophilous deciduous forest – – – – 10 3 16 10 21 8 3 219. Broadleaved evergreen forest – – – – – – – – 79 – 79 79 X10. Coniferous forests of the Mediterranean, Anatolian and Macaronesian
regions– – – – – – – – 68 – 68 68 X
11. Mire and swamp forest 35 31 19 39 60 34 37 25 - – 19 60 X12. Floodplain forest 14 – 21 26 10 15 26 30 18 5 5 3013. Non-riverine alder, birch or aspen forest – 16 13 10 17 16 52 6 – – 6 52 X14. Introduced tree species forest 42 20 53 13 7 27 56 54 40 – 7 56
10A
.Barbatiet
al./ForestEcology
andM
anagement
xxx(2013)
xxx–xxx
Pleasecite
thisarticle
inpress
as:Barbati,A
.,et
al.EuropeanForest
Typesand
ForestEurope
SFMindicators:
Toolsfor
monitoring
progresson
forestbio-
diversityconservation.Forest
Ecol.Manage.(2013),http://dx.doi.org/10.1016/j.foreco.2013.07.004
Tabl
e8
Key
para
met
er4.
5–
volu
me
ofde
adw
ood
per
hect
are
offo
rest
byEF
Ts(r
efer
ence
year
2005
;⁄ r
efer
ence
harm
oniz
edes
tim
ates
inEU
coun
trie
s,so
urce
:Ro
ndeu
xet
al.,
2012
).
Cou
ntr
y1. B
orea
lfo
rest
2.H
emib
orea
lan
dn
emor
alco
nif
erou
san
dm
ixed
broa
dlea
ved-
con
ifer
ous
fore
st
3. Alp
hin
efo
rest
4. Aci
doph
ilou
soa
kan
doa
k-bi
rch
fore
st
5. Mes
oph
ytic
deci
duou
sfo
rest
6. Bee
chfo
rest
7. Mou
nta
inou
sbe
ech
fore
st
8. Ther
mop
hilo
us
deci
duou
sfo
rest
9. Bro
adle
aved
ever
gree
nfo
rest
10.C
onif
erou
sfo
rest
sof
the
Med
iter
ran
ean
,A
nat
olia
nan
dM
acar
ones
ian
regi
ons
11.
Mir
ean
dsw
amp
fore
st
12.
Floo
dpla
info
rest
13.N
on-
rive
rin
eal
der,
birc
hor
aspe
nfo
rest
14.
Intr
odu
ced
tree
spec
ies
fore
st
Tota
lvo
lum
eof
dead
woo
d(m
3ha�
1)
Cze
ch Rep
ubl
ic–
823
1110
916
na
––
2114
1210
Slov
akia
–28
3219
1525
517
––
1012
1418
Den
mar
k–
55
65
––
129
5Es
ton
ia–
1323
1213
1424
19–
–13
87
13Sw
eden
97
na
914
14–
––
–4
98
5Sl
oven
ia–
916
1412
1213
11–
––
11–
–A
vera
ge9
1223
1211
1326
12–
–12
1010
10R
efer
ence
valu
esEU⁄
37
207
711
92
03
47
45
A. Barbati et al. / Forest Ecology and Management xxx (2013) xxx–xxx 11
Please cite this article in press as: Barbati, A., et al. European Forest Types and Fdiversity conservation. Forest Ecol. Manage. (2013), http://dx.doi.org/10.1016/j.
related variables is highly recommended to get to a reliablemonitoring system for international reporting (Chirici et al.,2011). The harmonization issue is crucial in the perspectiveof streamlining forest biodiversity indicators, for monitoringprogress towards EU 2020 biodiversity conservation target(EEA, 2012);
– flexibility of application on a range of scales; results from thepilot study indicate that answers to policy questions like‘‘What is the share of native vs. introduced dominated forestcommunities? What are their temporal trends?’’ may varygreatly with the scale of analysis (country, regional groups,Europe): reporting of key-indicators by European Forest Typesreveals huge variability in the relative extent of forest commu-nities that build up the European forest cover not only at regio-nal, but also at country level; such differences are otherwiseblurred when data are presented by broad species groups(coniferous, broadleaved and mixed);
– question-driven perspective in the interpretation of temporaltrends of key indicators; if countries are able to reliably trackchanges in the area of EFTs by periodical update of nationalforest inventories/maps, this would enable question-drivenmonitoring from country to regional level (e.g. are forestgains due to extension of introduced tree species or expan-sion of native tree species? Is there any significant loss ofvaluable forest habitats?). Likewise, question-driven moni-toring is facilitated for key indicators addressing progressin SFM biodiversity friendly strategies (old-growthness, spe-cies mixtures and deadwood accumulation). Reporting byEFTs helps to interpret the variability in the values takenby the indicators explicitly considering ecological differencesbetween EFTs. It is helpful, by knowing these environmentalconstraints, to evaluate progress toward more sustainableforest management conditions in individual EFTs on a coun-try level (e.g. increasing share of old even aged forests, pro-motion of multispecies stands and accumulation ofdeadwood);
– trend analysis against baselines; although trend analysis was pos-sible in this pilot study only for forest area indicator (key param-eter 1.1b), monitoring of other key parameters (4.1, 4.3 and 4.5)against baselines is recommended for evaluating progress inquantitative terms. There are several possibilities to define abaseline for a biodiversity indicator (EEA, 2012): (i) a particularreference year of assessment of each key indicator; this is astraightforward way to define baselines for key parameters 4.1,4.3 and 4.5; (ii) a benchmark value derived from (harmonized)average values defined on a EFTs basis using sample data (e.g.key parameters 4.1, 4.5); (iii) reference natural state, derivedfrom available data on old growth forests; reference natural stateof deadwood amount show a gradient from low deadwood accu-mulation in Boreal forests (Cat. 1) to high levels in central Euro-pean mixed forest types (Cat. 5–7), because of different siteproductivity, decomposition rates and disturbance regimes(Hahn and Christensen, 2004). For instance, deadwood volumein old-growth forests (Christensen et al., 2005; Burrascanoet al., 2013) is in the range of 150–190 m3 ha�1 in Alpine conif-erous forest (Cat. 3), 75–200 m3 ha�1 in Beech forests (Cat. 6)and 120–450 m3 ha�1 in Mountainous beech forest (Cat. 7).
On the other hand, drawbacks and current limitations ofreporting SFM indicators by EFTs are:
– need of detailed information on tree species composition at coun-try level for the classification of national forest area accordingto EFTs (see Table 2); forest area estimates by broad speciesgroups can be, instead, easily derived in European countriese.g. from Corine Land Cover dataset;
orest Europe SFM indicators: Tools for monitoring progress on forest bio-foreco.2013.07.004
12 A. Barbati et al. / Forest Ecology and Management xxx (2013) xxx–xxx
– data on indicators associated to rare forest habitats (e.g. CAT.11. Mire and swamp forest, 12. Floodplain forest) may derivefrom very small size samples and thus have a high standarderror; although interesting and crucial from a biodiversityperspective, the assessment of temporal area trends as wellas of other key indicators (tree species composition, dead-wood) may result in meaningless or incorrect conclusions;
– the feasibility of the classification has been demonstrated incountries of the European Union, but further expansion of theclassification coverage might be required, e.g. for Russian Feder-ation, Turkey.
In the perspective of further implementation of the EFTs systemfor biodiversity assessment the issue of mapping EFTs on a Pan-European scale is also topical: beyond their direct information con-tent, EFTs maps can be used to address other forest biodiversityconservation issues, e.g. level of protection/landscape fragmenta-tion of different forest types. Satellite-derived maps of broadleavedvs. coniferous forest types are currently available with high level ofgeometric and thematic accuracy on a Pan-European scale (Kempe-neers et al., 2011). On the other hand, attempts to use sample plotinformation (e.g. NFIs, ICP level-I plot data) to model and map thespatial distribution of main tree species or EFTs categories in Eur-ope have not provided satisfactory levels of accuracy (Brus et al.,2011; Casalegno et al., 2011). A promising methodology seems, in-stead, the spatially adaptive implementation of supervised classifi-cation methods of multitemporal satellite imagery (Stoffels et al.,2012).
In conclusion, it is hoped that this new approach, integratingEuropean Forest Types reporting with monitoring of biodiversityrelated key parameters, will encourage innovation in the way linksbetween sustainable forest management and biodiversity conser-vation issues are addressed by forest policies in Europe. All the pro-posed key parameters are recommended for monitoring progresson forest biodiversity conservation at country level, though forsmall area EFTs it makes sense to report only the indicator forestarea.
Poorly formulated policy objectives (e.g. to stop the loss of bio-diversity, to increase protected forest areas) should finally betranslated into quantitative targets by EFTs and inform policyand financial instruments of the forest sector (e.g. National ForestProgrammes, Rural Development Plans, Biodiversity Action Plans).This should facilitate balanced strategic and operational decision-making, so to tackle theDavid vs. Goliath challenge to halt biodiver-sity loss in the EU by 2020 and improve communication with thegeneral public.
Acknowledgments
NFI data for this study was provided in the framework of the pi-lot implementation of European Forest Types in the State of Eur-ope’s 2011 report; we wish to express a special thanks to RomanMichalak (ECE/FAO Forestry Timber section) for the support re-ceived for the implementation of the pilot study; we are gratefulto national correspondents and national forest inventory expertsfor their fruitful cooperation in testing the European Forest Typeclassification. The participation of Tor Björn Larsson and the sup-port received from the European Environment Agency were vitalfor the successful development of the European Forest Type classi-fication. Two anonymous reviewers made helpful comments onearlier version of this manuscript.
Please cite this article in press as: Barbati, A., et al. European Forest Types anddiversity conservation. Forest Ecol. Manage. (2013), http://dx.doi.org/10.1016/
References
Barbati, A., Corona, P., Marchetti, M., 2007. A forest typology for monitoringsustainable forest management: the case of European Forest types. PlantBiosyst. 141, 93–103.
Barbati, A., Corona, P., Marchetti, M., 2011. Annex 1: Pilot application of theEuropean Forest Types. In: FOREST EUROPE, UNECE, FAO, State of Europe’sForests 2011. Status and trends in Sustainable Forest Management in Europe.Liason Unit Oslo: Ministerial Conference on the Protection of Forest in Europe,FOREST EUROPE. pp. 259–273.
Barbati, A., Salvati, R., Ferrari, B., Di Santo, D., Quatrini, A., Portoghesi, L., Travaglini,D., Iovino, F., Nocentini, S., 2012. Assessing and promoting old-growthness offorest stands: lessons from research in Italy. Plant Biosyst. 146, 167–174.
Bauhus, J., Puettmann, K., Messier, C., 2009. Silviculture for old growth attributes.For. Ecol. Manage. 258, 525–537.
Brus, D.J., Hengeveld, G.M., Walvoort, D.J.J., Goedhart, P.W., Heidema, A.H., Nabuurs,G.J., Gunia, K., 2011. Statistical mapping of tree species over Europe. Eur. J. For.Res. 131, 145–157.
Burrascano, S., Keeton, W.S., Sabatini, F.M., Blasi, C., 2013. Commonality andvariability in the structural attributes of moist temperate old-growth forests: aglobal review. For. Ecol. Manage. 291, 458–479.
Casalegno, S., Amatulli, G., Bastrup-Birk, A., Houston-Durrant, T., Pekkarinen, A.,2011. Modelling and mapping the suitability of European forest formations at1 km resolution. Eur. J. For. Res. 130, 971–981.
Chirici, G., Winter, S., McRoberts, R.E. (Eds.), 2011. National Forest Inventories:Contributions to Forest Biodiversity Assessments. Springer, Heidelberg.
Chirici, G., McRoberts, R.E., Winter, S., Bertini, R., Brändli, U.-B., Alberdi Asensio, I.,Bastrup-Birk, A., Rondeux, J., Barsoum, N., Marchetti, M., 2012. National forestinventory contributions to forest biodiversity monitoring. For. Sci. 58, 257–268.
Christensen, M., Hahn, K., Mountford, E.P., Ódor, P., Standovár, T., Rozenbergar, D.,Diaci, J.d., Wijdeven, S., Meyer, P., Winter, S., Vrska, T., 2005. Dead wood inEuropean beech (Fagus sylvatica) forest reserves. For. Ecol. Manage. 210, 267–282.
Convention on Biological Diversity, 2010a. Global biodiversity outlook 3. Secretariatof the Convention on Biological Diversity, Montréal, QC, Canada.
Convention on Biological Diversity, 2010b. COP 10 Decision X/2. Strategic plan forbiodiversity 2011–2020. In: Conference of the Parties of the Convention onBiological Diversity. Nagoya, Japan, 18–29 October 2010.
Corona, P., Blasi, C., Chirici, G., Facioni, L., Fattorini, L., Ferrari, B., 2010. Monitoringand assessing old-growth forest stands by plot sampling. Plant Biosyst. 144,171–179.
Corona, P., Chirici, G., McRoberts, R.E., Winter, S., Barbati, A., 2011. Contribution oflarge-scale forest inventories to biodiversity assessment and monitoring. For.Ecol. Manage. 262, 2061–2069.
European Environment Agency, 2006. European forest types. Categories and typesfor sustainable forest management and reporting. EEA, Report No. 9/2006.
European Environment Agency, 2008. European forests-Ecosystem conditions andsustainable use. EEA, Report No. 3/2008.
European Environment Agency, 2012. Streamlining European biodiversityindicators 2020: Building a future on lessons learnt from the SEBI 2010process. EEA, Report No. 11/2012.
Forest Europe, UNECE and FAO, 2011. State of Europe’s Forests 2011. Status andTrends in Sustainable Forest Management in Europe. In: Ministerial Conferenceon the Protection of Forests in Europe, Forest Europe Liaison Unit Oslo.
Hahn, K., Christensen, M., 2004. Dead wood in European forest reserves – areference for forest management. In: Marchetti, M. (Ed.), Monitoring andIndicators of Forest biodiversity in Europe – From Ideas to Operationality. EFIProceedings No. 51, pp. 181–191.
Kempeneers, P., Sedano, F., Seebach, L., Strobl, P., San-Miguel-Ayanz, J., 2011. Datafusion of different spatial resolution remote sensing images applied to forest-type mapping. IEEE Trans. Geosci. Remote 49, 4977–4986.
Kolström, M., Lindner, M., Vilén, T., Maroschek, M., Seidl, R., Lexer, M.J., Netherer, S.,Kremer, A., Delzon, S., Barbati, A., Marchetti, M., Corona, P., 2011. Reviewing thescience and implementation of climate change adaptation measures inEuropean Forestry. Forests 2, 961–982.
Larsson, T.B., 2001. Biodiversity evaluation tools for European forests. Ecol. Bull, No.50.
Mason, W.L., Petr, M., Bathgate, S., 2012. Silvicultural strategies for adapting plantedforests to climate change: from theory to practice. JFS 58, 265–277.
Mc Roberts, R.E., Chirici, G., Winter, S., Barbati, A., Corona, P., Marchetti, M., Hauk, E.,Brändli, U.-B., Beranova, J., Rondeaux, J., Sanchez, C., Bertini, R., Barsoum, N.,Alberdi Asencio, I., Condéz, S., Saura, S., Neagu, S., Cluzeau, C., Hamza, N., 2011.Prospects for harmonized biodiversity assessments using national forestinventory data. In: Chirici, G., Winter, S., McRoberts, R.E. (Eds.), NationalForest Inventories: Contributions to Forest Biodiversity Assessments. Springer,Heidelberg, pp. 41–97.
McDonald, G.T., Lane, M.B., 2004. Converging global indicators for sustainable forestmanagement. For. Pol. Econ. 6, 63–70.
MCPFE, 2002. Improved Pan-European Indicators for Sustainable ForestManagement as adopted by MCPFE Expert Level Meeting 7–8 October 2002,Vienna, Austria.
MCPFE, 2003a. Background information for Improved Pan-European Indicators forSustainable Forest Management. Vienna, Austria: MCPFE Liaison Unit.
Forest Europe SFM indicators: Tools for monitoring progress on forest bio-j.foreco.2013.07.004

A. Barbati et al. / Forest Ecology and Management xxx (2013) xxx–xxx 13
MCPFE, 2003b. State of Europe’s Forests 2003. The MCPFE Report on SustainableForest Management in Europe. Vienna, Austria: MCPFE Liaison Unit.
MCPFE, 2007. State of Europe’s Forest 2007. The MCPFE report on sustainable forestmanagement in Europe. Ministerial Conference on the Protection of Forests inEurope, Liaison Unit Warsaw.
Rondeux, J., Bertini, R., Bastrup-Birk, A., Corona, P., Latte, N., McRoberts, R.E., Ståhl,G., Winter, S., Chirici, G., 2012. Assessing deadwood using harmonized nationalforest inventory data. For. Sci. 58, 269–283.
Please cite this article in press as: Barbati, A., et al. European Forest Types anddiversity conservation. Forest Ecol. Manage. (2013), http://dx.doi.org/10.1016/
Ståhl, G., Cienciala, E., Chirici, G., Lanz, A., Vidal, C., Winter, S., McRoberts, R.E.,Rondeux, J., Schadauer, K., Tomppo, E., 2012. Bridging national and referencedefinitions for harmonizing forest statistics. For. Sci. 58, 214–223.
Stoffels, J., Mader, S., Hill, J., Werner, W., Ontrup, G., 2012. Satellite-based stand-wise forest cover type mapping using a spatially adaptive classificationapproach. Eur. J. For. Res. 131, 1071–1089.
Forest Europe SFM indicators: Tools for monitoring progress on forest bio-j.foreco.2013.07.004