imaging nanoclusters in the constant height mode of the dynamic sfm
TRANSCRIPT

C. Barth, O. H. Pakarinen, A. S. Foster, and C. R. Henry, Imaging nanoclusters in theconstant height mode of the dynamic SFM, Nanotechnology 17, S128 (2006).
© 2006 Institute of Physics Publishing
Reprinted with permission.
http://www.iop.org/journals/nano

INSTITUTE OF PHYSICS PUBLISHING NANOTECHNOLOGY
Nanotechnology 17 (2006) S128–S136 doi:10.1088/0957-4484/17/7/S05
Imaging nanoclusters in the constantheight mode of the dynamic SFMClemens Barth1,3, Olli H Pakarinen2, Adam S Foster2 andClaude R Henry1
1 CRMCN-CNRS, Campus de Luminy, Case 913, 13288 Marseille Cedex 09, France4
2 Helsinki University of Technology, Laboratory of Physics, PO Box 1100, FIN-02015 HUT,Finland
E-mail: [email protected]
Received 21 August 2005, in final form 20 January 2006Published 10 March 2006Online at stacks.iop.org/Nano/17/S128
AbstractFor the first time, high quality images of metal nanoclusters which wererecorded in the constant height mode of a dynamic scanning forcemicroscope (dynamic SFM) are shown. Surfaces of highly ordered pyrolyticgraphite (HOPG) were used as a test substrate since metal nanoclusters withwell defined and symmetric shapes can be created by epitaxial growth. Weperformed imaging of gold clusters with sizes between 5 and 15 nm in bothscanning modes, constant � f mode and constant height mode, and comparedthe image contrast. We notice that clusters in constant height images appearmuch sharper, and exhibit more reasonable lateral shapes and sizes incomparison to images recorded in the constant � f mode. With the help ofnumerical simulations we show that only a microscopically small part of thetip apex (nanotip) is probably the main contributor for the image contrastformation. In principle, the constant height mode can be used for imagingsurfaces of any material, e.g. ionic crystals, as shown for the systemAu/NaCl(001).
(Some figures in this article are in colour only in the electronic version)
1. Introduction
The study of metal nanoclusters deposited on oxide surfacesforms a large domain in catalysis, since these model systemsprovide great insight into the nature of fundamental catalyticreactions [1, 2]. A characterization of the clusters concerningtheir structure and morphology is of utmost importance, andhas previously been done mainly by high resolution TEM [3]and STM [3, 4]. For an in situ characterization and forsubstrates of insulating materials such as MgO or Al2O3, onlythe scanning force microscope can be used. Especially in itsdynamic mode, the SFM offers in principle the ability to imagesurfaces with high resolution—in the best case with atomicresolution [5–7].
However, for a characterization of the cluster size andshape, the scanning force microscope was mainly used in the
3 Author to whom any correspondence should be addressed.4 The CRMCN is associated with the University of Aix-Marseille II and III.
contact mode [8, 9]. In this mode, the tip apex stronglyinfluences the shape and size of small clusters in the imagesdue to tip convolution [10–13] which can be partially reducedby numerical reconstruction [14, 15]. Only a few workscan be found in the literature which deal with dynamicSFM imaging of nanoclusters so far [16–18]. Recently, westarted to study the contrast formation in dynamic SFM ofnanoclusters which were imaged in the topography imagingmode. We found out that the tip apex is also the main limitingfactor [19, 20]—similar to the characteristics appearing in thecontact mode [10]: as soon as the cluster size is smaller thanthe tip apex, the tip is mostly imaged [19].
In this paper we propose to use another scanning modeof the dynamic SFM for imaging nanoclusters—the constantheight mode. This mode is similar to the one frequentlyused in scanning tunnelling microscopy (STM), especiallyfor real time STM [21, 22], and was already introduced indynamic SFM for atomic resolution imaging of insulatingsurfaces [23]. It is a complementary scanning mode to the
0957-4484/06/070128+09$30.00 © 2006 IOP Publishing Ltd Printed in the UK S128
Constant height mode imaging of clusters
topography imaging mode, which images the lateral shape andsize of nanoclusters.
We recorded images in the constant height mode of thedynamic SFM of gold nanoclusters grown on HOPG with thetunnelling current and the detuning as the feedback signal. Thissurface served as a test system, offering small clusters withwell defined, symmetric shapes. We could observe a significantimprovement of the image quality in constant height images.The clusters exhibit lateral shapes and sizes which are morephysically representative than the ones which can be seen intopography images of the same clusters. We show that the highquality is likely due to a strong tip–surface interaction betweenan atomistic small part of the tip, called the nanotip, and thecluster. Due to the nanotip, the tip convolution effect is reducedto a large extent.
2. Experiment
2.1. Samples and instruments
HOPG samples were bought from Union Carbon Corporation(UCAR, USA) and cleaved in air prior to their transfer intoUHV. The samples were further annealed in UHV at 400 ◦Covernight in order to remove possible contaminants from thesurface. Crystals of NaCl had a purity of ∼99.5% and wereproduced in our laboratory by the Czochralski growth methodin a similar way as described in [24, 25]. The surfacesof the crystals were prepared by UHV cleavage at roomtemperature parallel to the (001) cleavage plane with highprecision [26]. After cleavage the crystals were annealed ina UHV oven at 100 ◦C for 30 min in order to reduce chargingafter cleavage [26, 27].
Gold clusters were epitaxially grown by condensing acalibrated beam of neutral gold atoms from a Knudsen cellon HOPG and NaCl(001) surfaces at a temperature larger than450 and at 200 ◦C, respectively. We used a constant flux ofneutral gold atoms of 1 × 10¹³ atoms cm−2 s−1 (no nucleationof clusters in the gold beam).
Scanning force experiments were performed at roomtemperature in UHV (∼10−10 mbar base pressure) with adynamic SFM (Omicron STM/AFM) equipped with a digitaldemodulator (Nanosurf). Dynamic SFM measures the changein frequency (detuning � f ) of an oscillating cantilever due tothe interaction of a tip at the end of the cantilever with thesurface [5–7]. Before taking measurements, the fast scanningdirection was changed during scanning in the constant � fmode by an adjustment of the scanning angle until the fastscanning direction was parallel to the surface with an error ofa few degrees. We used p-doped silicon cantilevers (1.5 � cm,Nanosensors) which we did not sputter before experiments,and hence were oxidized by exposure to the ambient. The tipswere regularly in contact with the surface before taking images,so that the tip apex was most probably covered by a thin siliconoxide layer and with material of the surfaces.
2.2. Imaging modes
The set-up of our SFM is based on the beam-deflectionprinciple [28] and equals the design of Howald et al [29]. Thedynamic mode of the SFM is realized as described in [30] andfurther characterized in [31, 32]. With the help of figure 1 we
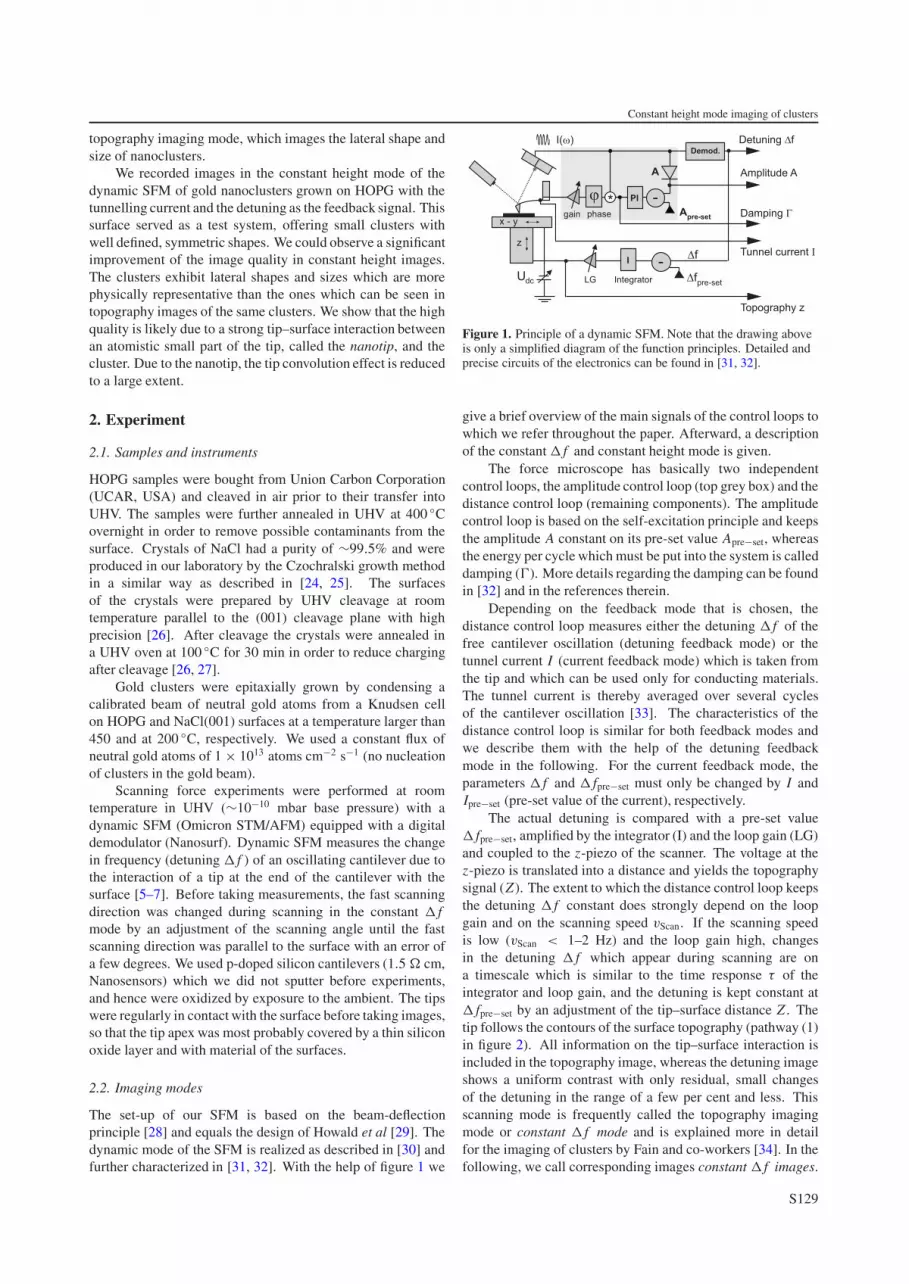
Figure 1. Principle of a dynamic SFM. Note that the drawing aboveis only a simplified diagram of the function principles. Detailed andprecise circuits of the electronics can be found in [31, 32].
give a brief overview of the main signals of the control loops towhich we refer throughout the paper. Afterward, a descriptionof the constant � f and constant height mode is given.
The force microscope has basically two independentcontrol loops, the amplitude control loop (top grey box) and thedistance control loop (remaining components). The amplitudecontrol loop is based on the self-excitation principle and keepsthe amplitude A constant on its pre-set value Apre−set, whereasthe energy per cycle which must be put into the system is calleddamping (�). More details regarding the damping can be foundin [32] and in the references therein.
Depending on the feedback mode that is chosen, thedistance control loop measures either the detuning � f of thefree cantilever oscillation (detuning feedback mode) or thetunnel current I (current feedback mode) which is taken fromthe tip and which can be used only for conducting materials.The tunnel current is thereby averaged over several cyclesof the cantilever oscillation [33]. The characteristics of thedistance control loop is similar for both feedback modes andwe describe them with the help of the detuning feedbackmode in the following. For the current feedback mode, theparameters � f and � fpre−set must only be changed by I andIpre−set (pre-set value of the current), respectively.
The actual detuning is compared with a pre-set value� fpre−set, amplified by the integrator (I) and the loop gain (LG)and coupled to the z-piezo of the scanner. The voltage at thez-piezo is translated into a distance and yields the topographysignal (Z ). The extent to which the distance control loop keepsthe detuning � f constant does strongly depend on the loopgain and on the scanning speed vScan. If the scanning speedis low (vScan < 1–2 Hz) and the loop gain high, changesin the detuning � f which appear during scanning are ona timescale which is similar to the time response τ of theintegrator and loop gain, and the detuning is kept constant at� fpre−set by an adjustment of the tip–surface distance Z . Thetip follows the contours of the surface topography (pathway (1)in figure 2). All information on the tip–surface interaction isincluded in the topography image, whereas the detuning imageshows a uniform contrast with only residual, small changesof the detuning in the range of a few per cent and less. Thisscanning mode is frequently called the topography imagingmode or constant � f mode and is explained more in detailfor the imaging of clusters by Fain and co-workers [34]. In thefollowing, we call corresponding images constant � f images.
S129

C Barth et al
Figure 2. A drawing explaining the differences between the constant� f mode (1) and the constant height mode (4). Pathways (2) and (3)correspond to intermediate scanning conditions between both modes.
If the tunnelling current is used as the feedback signal, thescanning mode and corresponding images are called constantcurrent mode and constant current images, respectively.
As soon as the loop gain decreases and/or the scanningspeed increases, the distance control loop is no longer capableof regulating on constant detuning � f = � fpre−set. The finitetime response τ is larger than the time in which changes in� f appear. The result is that the tip only partially follows thetopography (pathways (2) and (3) in figure 2). The longer thetime response, the more the topography becomes blurred andthe more a contrast in the � f image develops. Further, dueto the long integral response of the distance control loop, amemory of the tip pathway is present so that the cluster profilesin Z along the fast scanning direction become asymmetric,which we will explain in detail in section 3.1.
For very small loop gains and high scanning speeds, thetip follows only the inclination of the surface with respect tothe fast scanning direction (pathway (4) in figure 2) and, in theextreme case, only in the surface plane. The detuning imagethen includes all information on the tip–surface interaction,whereas the topography image includes only the surface plane,which is mostly inclined to the fast scanning direction. Thelatter scanning mode is frequently called constant height modefor both feedback modes. Corresponding images are calledconstant height images in the following.
3. Loop characteristics
In this section we discuss and compare the main features inimages of the signals z, � f and I which were recorded inthe constant current and detuning mode with the same types ofimages recorded in the constant height mode. Since HOPG is aconductor, we first used the tunnelling current as the feedbacksignal of the distance control loop. Then we show that constantheight mode imaging can also be performed if the detuning � fis used as a feedback signal.
3.1. Current feedback mode
In the first set of experiments we used the tunnelling current Ias the feedback signal for the distance control loop for imaginggold clusters on the HOPG surface. In figure 3 three imagesof the signals Z (a), � f (b) and I (c) are shown, whichwere recorded simultaneously during one measurement in the
Distance (nm) Distance (nm)
Distance (nm)
Cu
rren
t (p
A)
Hei
gh
t (n
m)
Det
un
ing
(H
z)Figure 3. Gold clusters on HOPG imaged in the constant I modewith the tunnelling current as the feedback signal. The images showthe topography Z (a), detuning � f (b) and tunnelling current I (c).All images were slightly FFT filtered except the topography image.The arrows indicate the fast scanning direction. (d) Drawing of thedetuning versus distance curves above HOPG and the clusters.� f� f mode is the pre-set value of the detuning for the measurementshown in figure 5. Gold with a nominal thickness of 3 ML wasdeposited at 500 ◦C with additional annealing for 10 min at 500 ◦C.(37 × 37 nm2, Ipre−set = 0.01 nA (mean value), UDC = 0.5 V,LG = 6.7, vScan = 100 nm s−1 (2.7 Hz), f0 = 267.9 kHz,k = 32 N m−1, Ap−p = 6.4 nm.)
constant I mode. During scanning, the scanning speed andloop gain5 were adjusted so that the tunnelling current wasnearly constant at each position in the image. The image ofthe tunnelling current shows only slight changes from the pre-set value Ipre−set.
The topography image in figure 3(a) shows two clusterswhich are attached at a cleavage step of HOPG. They appearwith an apparent mean size of ∼15 nm and a height of ∼2.5 nmand exhibit relatively flat top facets with straight edges. Thedetuning image (b) also shows a strong contrast of the clusterswith similar lateral shapes. The detuning above the clusters issmaller (� fCluster = −1 Hz) than above the HOPG surface(� fHOPG = −4 Hz), so that it seems that the tip–clusterdistance was larger than the one above the HOPG surface.However, due to the very small tip–surface distances, which
5 The scale for the loop gain of our dynamic SFM is logarithmic. The valuesmentioned in this paper are the same as the ones which are used for the remotecontrol of the SFM.
S130
Constant height mode imaging of clusters
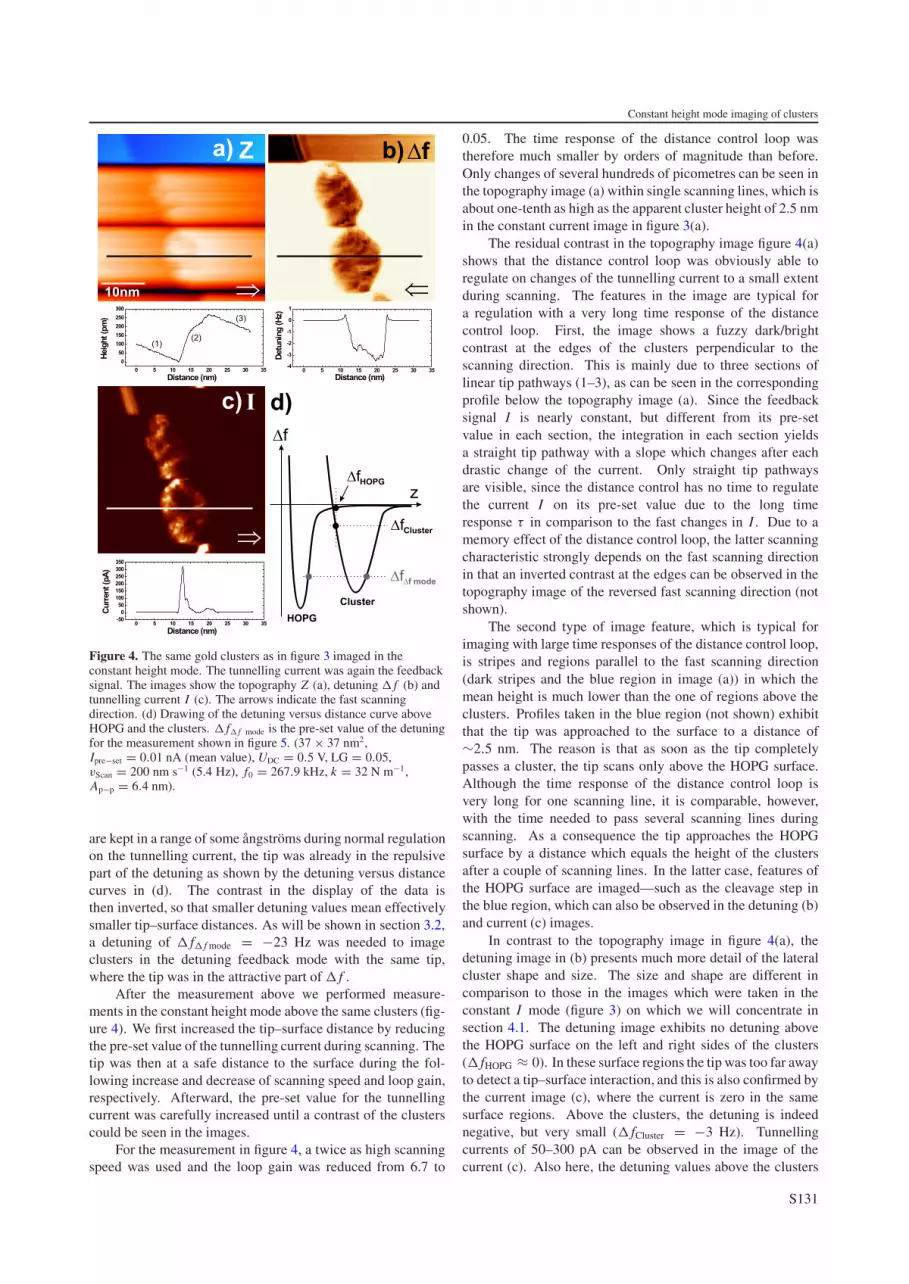
Figure 4. The same gold clusters as in figure 3 imaged in theconstant height mode. The tunnelling current was again the feedbacksignal. The images show the topography Z (a), detuning � f (b) andtunnelling current I (c). The arrows indicate the fast scanningdirection. (d) Drawing of the detuning versus distance curve aboveHOPG and the clusters. � f� f mode is the pre-set value of the detuningfor the measurement shown in figure 5. (37 × 37 nm2,Ipre−set = 0.01 nA (mean value), UDC = 0.5 V, LG = 0.05,vScan = 200 nm s−1 (5.4 Hz), f0 = 267.9 kHz, k = 32 N m−1,Ap−p = 6.4 nm).
are kept in a range of some angstroms during normal regulationon the tunnelling current, the tip was already in the repulsivepart of the detuning as shown by the detuning versus distancecurves in (d). The contrast in the display of the data isthen inverted, so that smaller detuning values mean effectivelysmaller tip–surface distances. As will be shown in section 3.2,a detuning of � f� f mode = −23 Hz was needed to imageclusters in the detuning feedback mode with the same tip,where the tip was in the attractive part of � f .
After the measurement above we performed measure-ments in the constant height mode above the same clusters (fig-ure 4). We first increased the tip–surface distance by reducingthe pre-set value of the tunnelling current during scanning. Thetip was then at a safe distance to the surface during the fol-lowing increase and decrease of scanning speed and loop gain,respectively. Afterward, the pre-set value for the tunnellingcurrent was carefully increased until a contrast of the clusterscould be seen in the images.
For the measurement in figure 4, a twice as high scanningspeed was used and the loop gain was reduced from 6.7 to
0.05. The time response of the distance control loop wastherefore much smaller by orders of magnitude than before.Only changes of several hundreds of picometres can be seen inthe topography image (a) within single scanning lines, which isabout one-tenth as high as the apparent cluster height of 2.5 nmin the constant current image in figure 3(a).
The residual contrast in the topography image figure 4(a)shows that the distance control loop was obviously able toregulate on changes of the tunnelling current to a small extentduring scanning. The features in the image are typical fora regulation with a very long time response of the distancecontrol loop. First, the image shows a fuzzy dark/brightcontrast at the edges of the clusters perpendicular to thescanning direction. This is mainly due to three sections oflinear tip pathways (1–3), as can be seen in the correspondingprofile below the topography image (a). Since the feedbacksignal I is nearly constant, but different from its pre-setvalue in each section, the integration in each section yieldsa straight tip pathway with a slope which changes after eachdrastic change of the current. Only straight tip pathwaysare visible, since the distance control has no time to regulatethe current I on its pre-set value due to the long timeresponse τ in comparison to the fast changes in I . Due to amemory effect of the distance control loop, the latter scanningcharacteristic strongly depends on the fast scanning directionin that an inverted contrast at the edges can be observed in thetopography image of the reversed fast scanning direction (notshown).
The second type of image feature, which is typical forimaging with large time responses of the distance control loop,is stripes and regions parallel to the fast scanning direction(dark stripes and the blue region in image (a)) in which themean height is much lower than the one of regions above theclusters. Profiles taken in the blue region (not shown) exhibitthat the tip was approached to the surface to a distance of∼2.5 nm. The reason is that as soon as the tip completelypasses a cluster, the tip scans only above the HOPG surface.Although the time response of the distance control loop isvery long for one scanning line, it is comparable, however,with the time needed to pass several scanning lines duringscanning. As a consequence the tip approaches the HOPGsurface by a distance which equals the height of the clustersafter a couple of scanning lines. In the latter case, features ofthe HOPG surface are imaged—such as the cleavage step inthe blue region, which can also be observed in the detuning (b)and current (c) images.
In contrast to the topography image in figure 4(a), thedetuning image in (b) presents much more detail of the lateralcluster shape and size. The size and shape are different incomparison to those in the images which were taken in theconstant I mode (figure 3) on which we will concentrate insection 4.1. The detuning image exhibits no detuning abovethe HOPG surface on the left and right sides of the clusters(� fHOPG ≈ 0). In these surface regions the tip was too far awayto detect a tip–surface interaction, and this is also confirmed bythe current image (c), where the current is zero in the samesurface regions. Above the clusters, the detuning is indeednegative, but very small (� fCluster = −3 Hz). Tunnellingcurrents of 50–300 pA can be observed in the image of thecurrent (c). Also here, the detuning values above the clusters
S131
C Barth et al
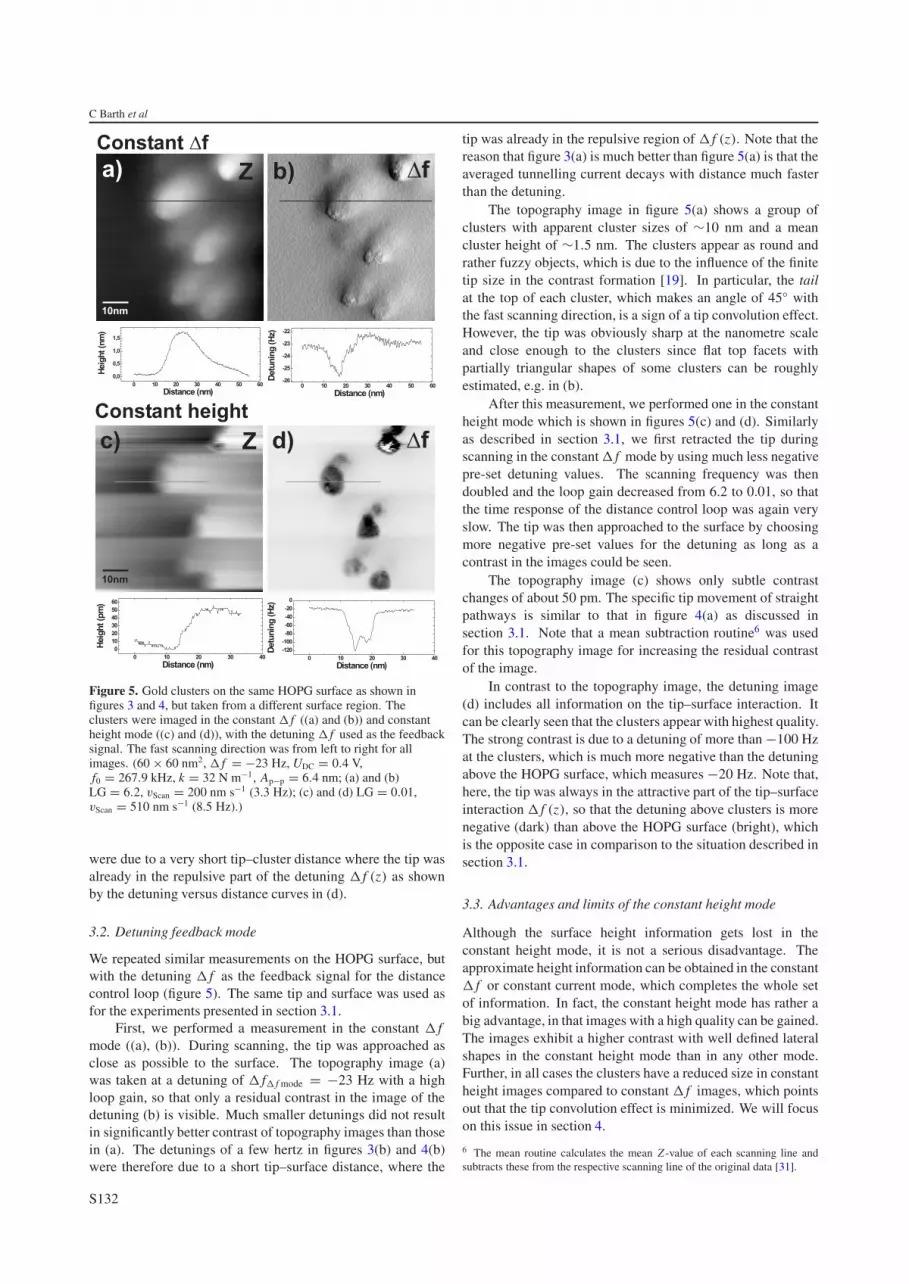
Figure 5. Gold clusters on the same HOPG surface as shown infigures 3 and 4, but taken from a different surface region. Theclusters were imaged in the constant � f ((a) and (b)) and constantheight mode ((c) and (d)), with the detuning � f used as the feedbacksignal. The fast scanning direction was from left to right for allimages. (60 × 60 nm2, � f = −23 Hz, UDC = 0.4 V,f0 = 267.9 kHz, k = 32 N m−1, Ap−p = 6.4 nm; (a) and (b)LG = 6.2, vScan = 200 nm s−1 (3.3 Hz); (c) and (d) LG = 0.01,vScan = 510 nm s−1 (8.5 Hz).)
were due to a very short tip–cluster distance where the tip wasalready in the repulsive part of the detuning � f (z) as shownby the detuning versus distance curves in (d).
3.2. Detuning feedback mode
We repeated similar measurements on the HOPG surface, butwith the detuning � f as the feedback signal for the distancecontrol loop (figure 5). The same tip and surface was used asfor the experiments presented in section 3.1.
First, we performed a measurement in the constant � fmode ((a), (b)). During scanning, the tip was approached asclose as possible to the surface. The topography image (a)was taken at a detuning of � f� f mode = −23 Hz with a highloop gain, so that only a residual contrast in the image of thedetuning (b) is visible. Much smaller detunings did not resultin significantly better contrast of topography images than thosein (a). The detunings of a few hertz in figures 3(b) and 4(b)were therefore due to a short tip–surface distance, where the
tip was already in the repulsive region of � f (z). Note that thereason that figure 3(a) is much better than figure 5(a) is that theaveraged tunnelling current decays with distance much fasterthan the detuning.
The topography image in figure 5(a) shows a group ofclusters with apparent cluster sizes of ∼10 nm and a meancluster height of ∼1.5 nm. The clusters appear as round andrather fuzzy objects, which is due to the influence of the finitetip size in the contrast formation [19]. In particular, the tailat the top of each cluster, which makes an angle of 45◦ withthe fast scanning direction, is a sign of a tip convolution effect.However, the tip was obviously sharp at the nanometre scaleand close enough to the clusters since flat top facets withpartially triangular shapes of some clusters can be roughlyestimated, e.g. in (b).
After this measurement, we performed one in the constantheight mode which is shown in figures 5(c) and (d). Similarlyas described in section 3.1, we first retracted the tip duringscanning in the constant � f mode by using much less negativepre-set detuning values. The scanning frequency was thendoubled and the loop gain decreased from 6.2 to 0.01, so thatthe time response of the distance control loop was again veryslow. The tip was then approached to the surface by choosingmore negative pre-set values for the detuning as long as acontrast in the images could be seen.
The topography image (c) shows only subtle contrastchanges of about 50 pm. The specific tip movement of straightpathways is similar to that in figure 4(a) as discussed insection 3.1. Note that a mean subtraction routine6 was usedfor this topography image for increasing the residual contrastof the image.
In contrast to the topography image, the detuning image(d) includes all information on the tip–surface interaction. Itcan be clearly seen that the clusters appear with highest quality.The strong contrast is due to a detuning of more than −100 Hzat the clusters, which is much more negative than the detuningabove the HOPG surface, which measures −20 Hz. Note that,here, the tip was always in the attractive part of the tip–surfaceinteraction � f (z), so that the detuning above clusters is morenegative (dark) than above the HOPG surface (bright), whichis the opposite case in comparison to the situation described insection 3.1.
3.3. Advantages and limits of the constant height mode
Although the surface height information gets lost in theconstant height mode, it is not a serious disadvantage. Theapproximate height information can be obtained in the constant� f or constant current mode, which completes the whole setof information. In fact, the constant height mode has rather abig advantage, in that images with a high quality can be gained.The images exhibit a higher contrast with well defined lateralshapes in the constant height mode than in any other mode.Further, in all cases the clusters have a reduced size in constantheight images compared to constant � f images, which pointsout that the tip convolution effect is minimized. We will focuson this issue in section 4.
6 The mean routine calculates the mean Z -value of each scanning line andsubtracts these from the respective scanning line of the original data [31].
S132
Constant height mode imaging of clusters
Figure 6. Gold clusters deposited on the NaCl(001) surface (0.6 MLgold at 170 ◦C). The clusters were imaged in the constant heightmode with the detuning as the feedback signal. They are attached atcleavage steps of the NaCl(001) surface. The fast scanning directionwas from left to right for both images. ((a) 100 × 100 nm2,� f = −51.6 Hz, vScan = 1502 nm s−1 (15 Hz); (b) 26 × 26 nm2,� f = −51 Hz, vScan = 302 nm s−1 (11.5 Hz); all, UDC = 3.3 V,LG = 0.1, f0 = 274.4 kHz, k = 44 N m−1, Ap−p = 13.6 nm.)
The constant height mode can be used in principle forsurfaces of any material and cluster size. We also testedthe application of the constant height mode for surfaces ofinsulators like on the (001) surface of NaCl on which wedeposited 0.6 ML of gold at 170 ◦C. The image in figure 6(a)also shows the same high quality contrast of clusters as in thecase of Au/HOPG. In images with a higher magnification (b)the lateral shape of some clusters can be clearly seen—thelabelled cluster forms an elongated hexagon, probably due to athree-dimensional cluster shape of a truncated octahedron on athreefold symmetry axis, which is known to occur at the earlystage of epitaxy of gold on NaCl(001) [35].
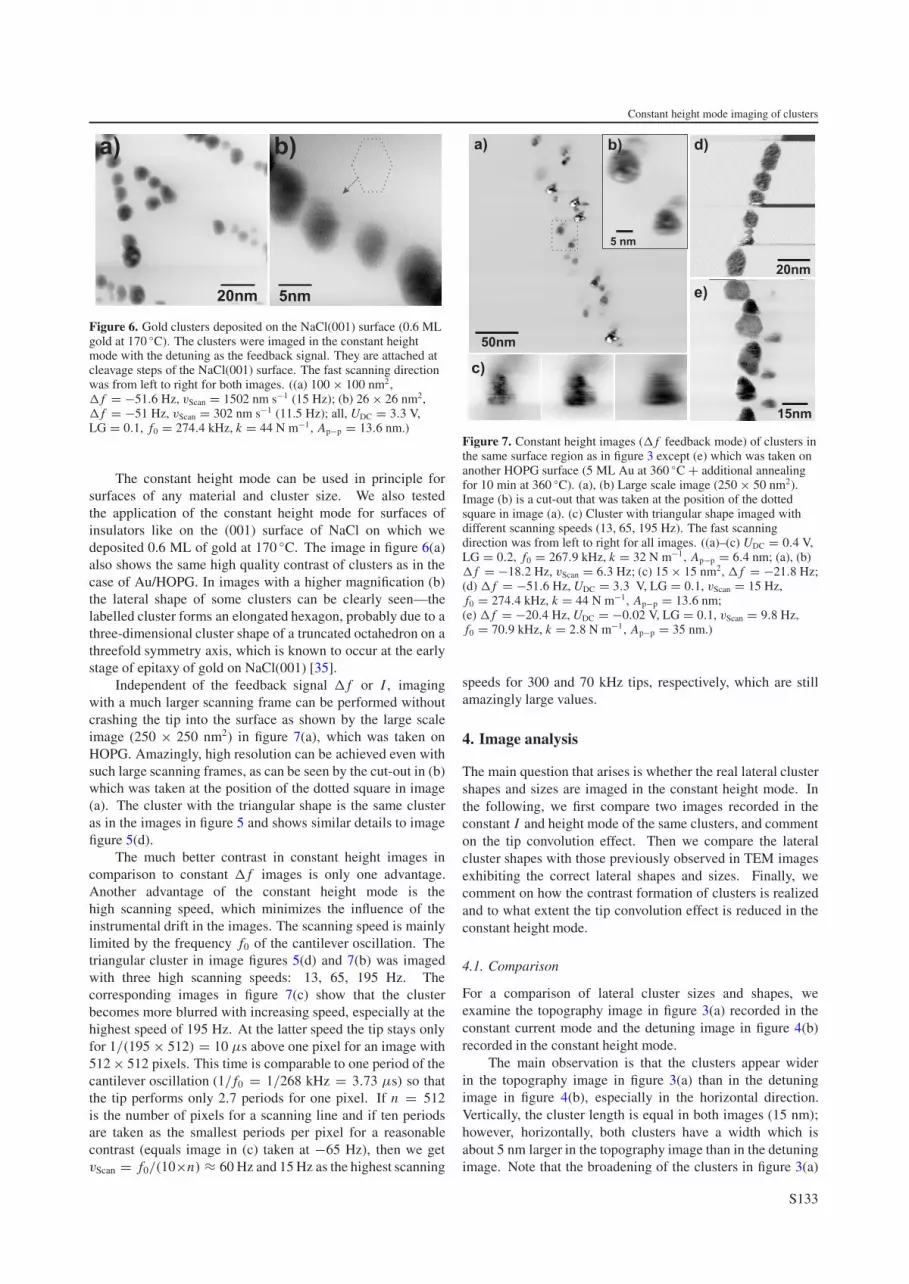
Independent of the feedback signal � f or I , imagingwith a much larger scanning frame can be performed withoutcrashing the tip into the surface as shown by the large scaleimage (250 × 250 nm2) in figure 7(a), which was taken onHOPG. Amazingly, high resolution can be achieved even withsuch large scanning frames, as can be seen by the cut-out in (b)which was taken at the position of the dotted square in image(a). The cluster with the triangular shape is the same clusteras in the images in figure 5 and shows similar details to imagefigure 5(d).
The much better contrast in constant height images incomparison to constant � f images is only one advantage.Another advantage of the constant height mode is thehigh scanning speed, which minimizes the influence of theinstrumental drift in the images. The scanning speed is mainlylimited by the frequency f0 of the cantilever oscillation. Thetriangular cluster in image figures 5(d) and 7(b) was imagedwith three high scanning speeds: 13, 65, 195 Hz. Thecorresponding images in figure 7(c) show that the clusterbecomes more blurred with increasing speed, especially at thehighest speed of 195 Hz. At the latter speed the tip stays onlyfor 1/(195 × 512) = 10 µs above one pixel for an image with512 × 512 pixels. This time is comparable to one period of thecantilever oscillation (1/ f0 = 1/268 kHz = 3.73 µs) so thatthe tip performs only 2.7 periods for one pixel. If n = 512is the number of pixels for a scanning line and if ten periodsare taken as the smallest periods per pixel for a reasonablecontrast (equals image in (c) taken at −65 Hz), then we getvScan = f0/(10×n) ≈ 60 Hz and 15 Hz as the highest scanning
Figure 7. Constant height images (� f feedback mode) of clusters inthe same surface region as in figure 3 except (e) which was taken onanother HOPG surface (5 ML Au at 360 ◦C + additional annealingfor 10 min at 360 ◦C). (a), (b) Large scale image (250 × 50 nm2).Image (b) is a cut-out that was taken at the position of the dottedsquare in image (a). (c) Cluster with triangular shape imaged withdifferent scanning speeds (13, 65, 195 Hz). The fast scanningdirection was from left to right for all images. ((a)–(c) UDC = 0.4 V,LG = 0.2, f0 = 267.9 kHz, k = 32 N m−1, Ap−p = 6.4 nm; (a), (b)� f = −18.2 Hz, vScan = 6.3 Hz; (c) 15 × 15 nm2, � f = −21.8 Hz;(d) � f = −51.6 Hz, UDC = 3.3 V, LG = 0.1, vScan = 15 Hz,f0 = 274.4 kHz, k = 44 N m−1, Ap−p = 13.6 nm;(e) � f = −20.4 Hz, UDC = −0.02 V, LG = 0.1, vScan = 9.8 Hz,f0 = 70.9 kHz, k = 2.8 N m−1, Ap−p = 35 nm.)
speeds for 300 and 70 kHz tips, respectively, which are stillamazingly large values.
4. Image analysis
The main question that arises is whether the real lateral clustershapes and sizes are imaged in the constant height mode. Inthe following, we first compare two images recorded in theconstant I and height mode of the same clusters, and commenton the tip convolution effect. Then we compare the lateralcluster shapes with those previously observed in TEM imagesexhibiting the correct lateral shapes and sizes. Finally, wecomment on how the contrast formation of clusters is realizedand to what extent the tip convolution effect is reduced in theconstant height mode.
4.1. Comparison
For a comparison of lateral cluster sizes and shapes, weexamine the topography image in figure 3(a) recorded in theconstant current mode and the detuning image in figure 4(b)recorded in the constant height mode.
The main observation is that the clusters appear widerin the topography image in figure 3(a) than in the detuningimage in figure 4(b), especially in the horizontal direction.Vertically, the cluster length is equal in both images (15 nm);however, horizontally, both clusters have a width which isabout 5 nm larger in the topography image than in the detuningimage. Note that the broadening of the clusters in figure 3(a)
S133
C Barth et al
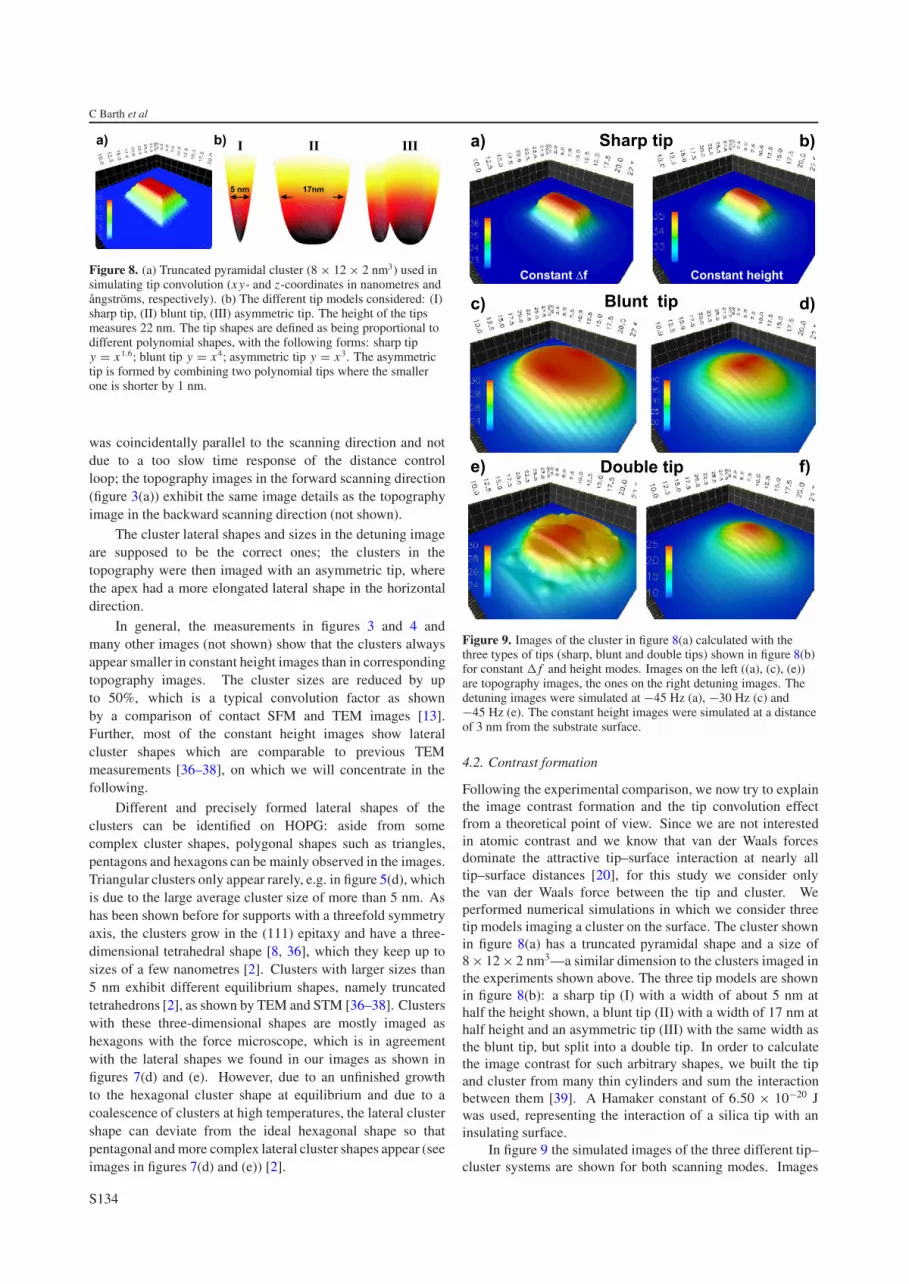
Figure 8. (a) Truncated pyramidal cluster (8 × 12 × 2 nm3) used insimulating tip convolution (xy- and z-coordinates in nanometres andangstroms, respectively). (b) The different tip models considered: (I)sharp tip, (II) blunt tip, (III) asymmetric tip. The height of the tipsmeasures 22 nm. The tip shapes are defined as being proportional todifferent polynomial shapes, with the following forms: sharp tipy = x1.6; blunt tip y = x4; asymmetric tip y = x3. The asymmetrictip is formed by combining two polynomial tips where the smallerone is shorter by 1 nm.
was coincidentally parallel to the scanning direction and notdue to a too slow time response of the distance controlloop; the topography images in the forward scanning direction(figure 3(a)) exhibit the same image details as the topographyimage in the backward scanning direction (not shown).
The cluster lateral shapes and sizes in the detuning imageare supposed to be the correct ones; the clusters in thetopography were then imaged with an asymmetric tip, wherethe apex had a more elongated lateral shape in the horizontaldirection.
In general, the measurements in figures 3 and 4 andmany other images (not shown) show that the clusters alwaysappear smaller in constant height images than in correspondingtopography images. The cluster sizes are reduced by upto 50%, which is a typical convolution factor as shownby a comparison of contact SFM and TEM images [13].Further, most of the constant height images show lateralcluster shapes which are comparable to previous TEMmeasurements [36–38], on which we will concentrate in thefollowing.
Different and precisely formed lateral shapes of theclusters can be identified on HOPG: aside from somecomplex cluster shapes, polygonal shapes such as triangles,pentagons and hexagons can be mainly observed in the images.Triangular clusters only appear rarely, e.g. in figure 5(d), whichis due to the large average cluster size of more than 5 nm. Ashas been shown before for supports with a threefold symmetryaxis, the clusters grow in the (111) epitaxy and have a three-dimensional tetrahedral shape [8, 36], which they keep up tosizes of a few nanometres [2]. Clusters with larger sizes than5 nm exhibit different equilibrium shapes, namely truncatedtetrahedrons [2], as shown by TEM and STM [36–38]. Clusterswith these three-dimensional shapes are mostly imaged ashexagons with the force microscope, which is in agreementwith the lateral shapes we found in our images as shown infigures 7(d) and (e). However, due to an unfinished growthto the hexagonal cluster shape at equilibrium and due to acoalescence of clusters at high temperatures, the lateral clustershape can deviate from the ideal hexagonal shape so thatpentagonal and more complex lateral cluster shapes appear (seeimages in figures 7(d) and (e)) [2].
Figure 9. Images of the cluster in figure 8(a) calculated with thethree types of tips (sharp, blunt and double tips) shown in figure 8(b)for constant � f and height modes. Images on the left ((a), (c), (e))are topography images, the ones on the right detuning images. Thedetuning images were simulated at −45 Hz (a), −30 Hz (c) and−45 Hz (e). The constant height images were simulated at a distanceof 3 nm from the substrate surface.
4.2. Contrast formation
Following the experimental comparison, we now try to explainthe image contrast formation and the tip convolution effectfrom a theoretical point of view. Since we are not interestedin atomic contrast and we know that van der Waals forcesdominate the attractive tip–surface interaction at nearly alltip–surface distances [20], for this study we consider onlythe van der Waals force between the tip and cluster. Weperformed numerical simulations in which we consider threetip models imaging a cluster on the surface. The cluster shownin figure 8(a) has a truncated pyramidal shape and a size of8 × 12 × 2 nm3—a similar dimension to the clusters imaged inthe experiments shown above. The three tip models are shownin figure 8(b): a sharp tip (I) with a width of about 5 nm athalf the height shown, a blunt tip (II) with a width of 17 nm athalf height and an asymmetric tip (III) with the same width asthe blunt tip, but split into a double tip. In order to calculatethe image contrast for such arbitrary shapes, we built the tipand cluster from many thin cylinders and sum the interactionbetween them [39]. A Hamaker constant of 6.50 × 10⁻²⁰ Jwas used, representing the interaction of a silica tip with aninsulating surface.
In figure 9 the simulated images of the three different tip–cluster systems are shown for both scanning modes. Images
S134
Constant height mode imaging of clusters
(a) and (b) show that the sharp tip gives a fairly representativeimage of the cluster in both imaging modes. The constantheight image (b) provides a finer image of the cluster, but thedifference is not very significant. Tip convolution is muchmore clearly demonstrated in the images with the blunt tip,shown in (c) and (d). Although the outline of the cluster can beestimated at the centre of the image, convolution of the blunttip with the cluster causes the contrast to be smeared out. Herethe difference between the imaging modes is more pronounced,with the constant height image being closer to the real lateralcluster size, if not the lateral shape.
For the asymmetric tip, the topography image (e) clearlyshows the effect of the double apex. The outline of the clustercan be seen, with a similar, but extended, contrast to that ofthe sharp tip shown in (a) at the centre of the image. However,the lower part of the image shows that the cluster is effectivelyimaged again by the second apex, producing a weak shadowcontrast feature. However, the detuning image gives a muchbetter representation of the lateral cluster shape (f).
The simulations clearly demonstrate that in the constantheight mode the convolution effect of the tip can besignificantly reduced for blunt and asymmetric/multiple tips.Sharp tips, however, provide an excellent image of the clusterin either mode. In terms of multiple tips, the simulationsagree well with experiments—the measurements shown infigure 5 exactly represent qualitatively what is demonstratedin simulations shown in figures 9(e) and (f).
However, for the images shown in figures 3 and 4 it isalso clear that none of these simplistic tip models reproducethe difference between the two modes. The simulations lead usto another, more complex model, which probably explains thehigh contrast of clusters in our images and which was alreadyintroduced in atomic resolution imaging [23]. It is clear thatthe tip apex is not smoothly round as in the case of our tipmodels, but rather composed by one or several microscopicsmall nanotips. Since only the sharp tip (I) yields a strongcontrast in the simulations (figures 9(a) and (b)), we stronglyanticipate that mainly nanotips, which might have even smallersize than the sharp tip (I), contribute to the contrast formationof clusters in the constant height mode.
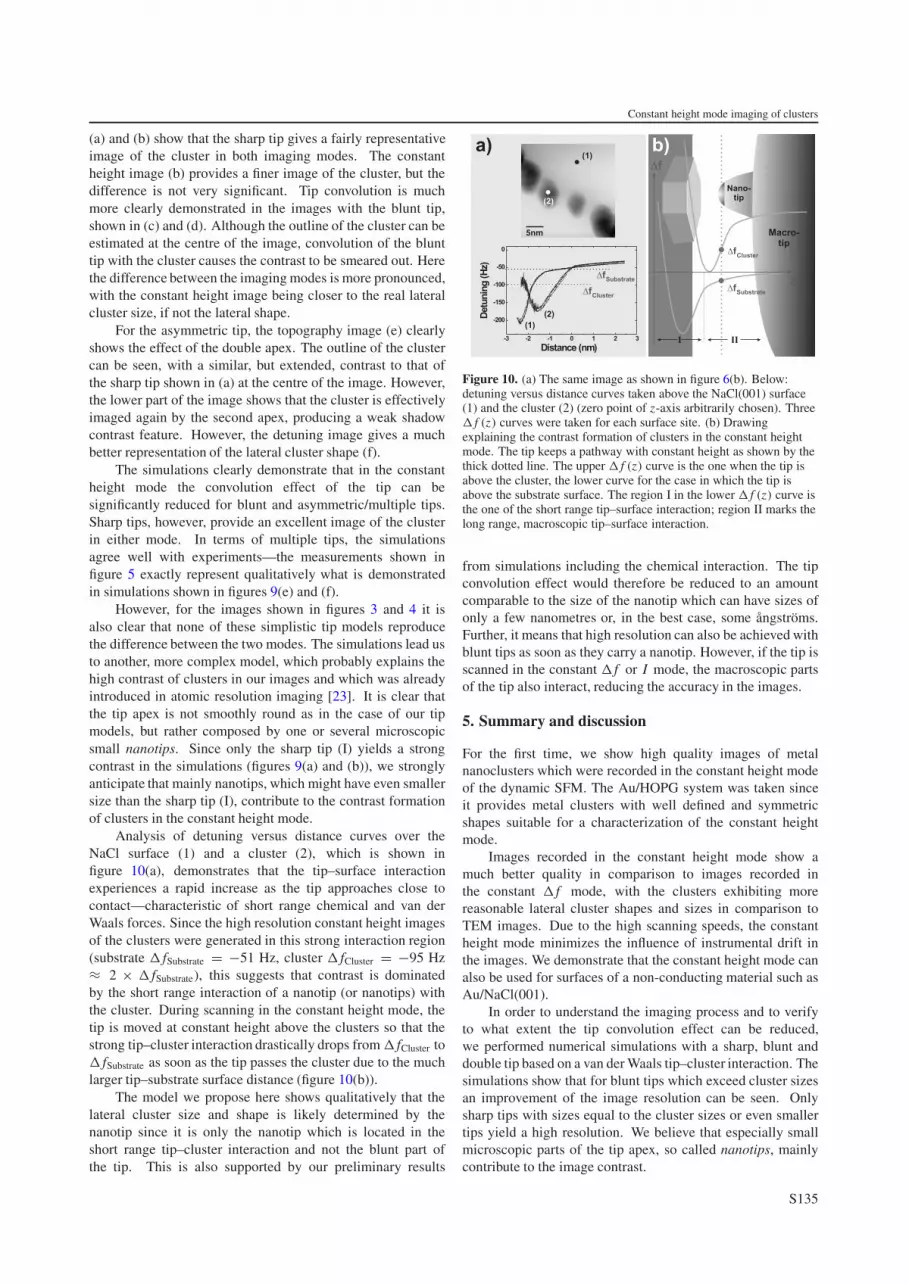
Analysis of detuning versus distance curves over theNaCl surface (1) and a cluster (2), which is shown infigure 10(a), demonstrates that the tip–surface interactionexperiences a rapid increase as the tip approaches close tocontact—characteristic of short range chemical and van derWaals forces. Since the high resolution constant height imagesof the clusters were generated in this strong interaction region(substrate � fSubstrate = −51 Hz, cluster � fCluster = −95 Hz≈ 2 × � fSubstrate), this suggests that contrast is dominatedby the short range interaction of a nanotip (or nanotips) withthe cluster. During scanning in the constant height mode, thetip is moved at constant height above the clusters so that thestrong tip–cluster interaction drastically drops from � fCluster to� fSubstrate as soon as the tip passes the cluster due to the muchlarger tip–substrate surface distance (figure 10(b)).
The model we propose here shows qualitatively that thelateral cluster size and shape is likely determined by thenanotip since it is only the nanotip which is located in theshort range tip–cluster interaction and not the blunt part ofthe tip. This is also supported by our preliminary results
Figure 10. (a) The same image as shown in figure 6(b). Below:detuning versus distance curves taken above the NaCl(001) surface(1) and the cluster (2) (zero point of z-axis arbitrarily chosen). Three� f (z) curves were taken for each surface site. (b) Drawingexplaining the contrast formation of clusters in the constant heightmode. The tip keeps a pathway with constant height as shown by thethick dotted line. The upper � f (z) curve is the one when the tip isabove the cluster, the lower curve for the case in which the tip isabove the substrate surface. The region I in the lower � f (z) curve isthe one of the short range tip–surface interaction; region II marks thelong range, macroscopic tip–surface interaction.
from simulations including the chemical interaction. The tipconvolution effect would therefore be reduced to an amountcomparable to the size of the nanotip which can have sizes ofonly a few nanometres or, in the best case, some angstroms.Further, it means that high resolution can also be achieved withblunt tips as soon as they carry a nanotip. However, if the tip isscanned in the constant � f or I mode, the macroscopic partsof the tip also interact, reducing the accuracy in the images.
5. Summary and discussion
For the first time, we show high quality images of metalnanoclusters which were recorded in the constant height modeof the dynamic SFM. The Au/HOPG system was taken sinceit provides metal clusters with well defined and symmetricshapes suitable for a characterization of the constant heightmode.
Images recorded in the constant height mode show amuch better quality in comparison to images recorded inthe constant � f mode, with the clusters exhibiting morereasonable lateral cluster shapes and sizes in comparison toTEM images. Due to the high scanning speeds, the constantheight mode minimizes the influence of instrumental drift inthe images. We demonstrate that the constant height mode canalso be used for surfaces of a non-conducting material such asAu/NaCl(001).
In order to understand the imaging process and to verifyto what extent the tip convolution effect can be reduced,we performed numerical simulations with a sharp, blunt anddouble tip based on a van der Waals tip–cluster interaction. Thesimulations show that for blunt tips which exceed cluster sizesan improvement of the image resolution can be seen. Onlysharp tips with sizes equal to the cluster sizes or even smallertips yield a high resolution. We believe that especially smallmicroscopic parts of the tip apex, so called nanotips, mainlycontribute to the image contrast.
S135
C Barth et al
To our mind, the results presented here form a large stepforward in the microscopy of metal nanoclusters which is veryimportant for the characterization of the cluster structure andmorphology in catalysis. In future we will perform furthercomparisons between calculated and experimental images ofsimilar clusters with an additional comparison with TEM inorder to unambiguously prove our model of nanotips. The mostambitious objective is, however, to receive high resolution ontop of the clusters, e.g. atomic resolution in this specific mode.
Acknowledgments
We thank L Tocco for stimulating discussions. This workwas supported by the European Community through the STRPGSOMEN. Olli H Pakarinen and Adam S Foster are grateful tothe Academy of Finland and the TEKES project SURFOX forfunding.
References
[1] Henry C R 2003 Reaction dynamics on supported metalclusters Surface Dynamics ed D P Woodruff (Amsterdam:Elsevier Science) p 247
[2] Henry C R 2003 Adsorption and reaction at supported modelcatalysts Catalysis and Electrocatalysis at NanoparticleSurfaces ed A Wieckowski, E R Savinova andC G Vayenas (New York: Dekker) p 239
[3] Henry C R 1998 Surf. Sci. Rep. 31 231[4] Valden M, Lai X and Goodman D W 1998 Science 281 1647[5] Morita S, Wiesendanger R and Meyer E 2002 Noncontact
Atomic Force Microscopy (Berlin: Springer)[6] Giessibl F J 2003 Rev. Mod. Phys. 75 949[7] Hofer W A, Foster A S and Shluger A L 2003 Rev. Mod. Phys.
75 1287[8] Fererro S, Piednoir A and Henry C R 2001 Nano Lett. 1 227[9] Højrup-Hansen K, Ferrero S and Henry C R 2004 Appl. Surf.
Sci. 226 167[10] Xu S and Arnsdorf M F 1994 J. Microsc. 173 199[11] Wilder K, Quate C, Singh B, Alvis R and Arnold W H 1996
J. Vac. Sci. Technol. B 14 4004[12] Castle J E and Zhdan P A 1997 J. Phys. D: Appl. Phys. 30 722[13] Ferrero S, Højrup-Hansen K and Henry C R 2005 Surf. Sci.
submitted
[14] Villarrubia J S 1997 J. Res. Natl Inst. Stand. Technol. 102 425[15] Todd B A and Eppell S J 2001 Surf. Sci. 491 473[16] Pang C L, Raza H, Haycock S A and Thornton G 2000 Surf.
Sci. 460 L510[17] Haas G, Menck A, Brune H, Barth J V, Venables J A and
Kern K 2000 Phys. Rev. B 61 11105[18] Tait S L, Ngo L T, Yu Q M, Fain S C and Campbell C T 2005
J. Chem. Phys. 122 64712[19] Barth C and Henry C R 2004 Nanotechnology 15 1264[20] Pakarinen O H, Barth C, Foster A S, Nieminen R M and
Henry C R 2005 Phys. Rev. B submitted[21] Bryant A, Smith D P E and Quate C F 1986 Appl. Phys. Lett.
48 832[22] Wiesendanger R 1998 Scanning Probe Microscopy and
Spectroscopy (Cambridge: Cambridge University Press)[23] Barth C, Foster A S, Reichling M and Shluger A L 2001
J. Phys.: Condens. Matter 13 2061[24] Grange G and Mutaftschiev B 1975 Surf. Sci. 47 723[25] Grange G, Landers R and Mutaftschiev B 1976 Surf. Sci.
54 445[26] Barth C, Claeys C and Henry C R 2005 Rev. Sci. Instrum.
76 83907[27] Barth C and Henry C R 2006 Nanotechnology 17 S155–61[28] Meyer G and Amer N M 1988 Appl. Phys. Lett. 53 1045[29] Howald L, Meyer E, Luthi R, Haefke H, Overney R,
Rudin H and Guntherodt H J 1993 Appl. Phys. Lett. 63 117[30] Albrecht T R, Grutter P, Horne D and Rugar D 1991 J. Appl.
Phys. 69 668[31] Omicron SCALA Technical Reference and Software Manuals[32] Couturier G, Boisgard R, Dietzel D and Aime J P 2005
Nanotechnology 16 1346[33] Luthi R, Meyer E, Bammerlin M, Baratoff A, Lehmann T,
Howald L, Gerber Ch and Guntherodt H J 1996 Z. Phys. B100 165
[34] Fain S C Jr, Polwarth C A, Tait S L, Campbell C T andFrench R H 2006 Nanotechnology 17 S121–7
[35] Kern R, Le Lay G and Metois J-J 1979 Current Topics inMaterial Science 3 vol 3, ed E Kaldis (Amsterdam:North-Holland) chapter 3, p 139
[36] Humbert A, Pierrisnard R, Sangay S, Chapon C, Henry C R andClaeys C 1989 Europhys. Lett. 10 533
[37] Granjeaud S, Yckache K, Dayez M, Humbert A, Chapon C andHenry C R 1993 Microsc. Microanal. Microstruct. 4 409
[38] Chapon C, Granjeaud S, Humbert A and Henry C R 2001 Eur.Phys. J. A. P. 13 23
[39] Cooper K, Gupta A and Beaudoin S 2001 J. Colloid InterfaceSci. 234 284
S136