european and national dimension in research - Электронная
TRANSCRIPT

MINISTRY OF EDUCATION OF BELARUS
Polotsk State University
EUROPEAN AND NATIONAL DIMENSION IN RESEARCH
TECHNOLOGY
Electronic collected materials of XII Junior Researchers’ Conference (Novopolotsk, May 13 – 14, 2020)
26
Обновляется 1 раз в год
Novopolotsk 2020

UDC 082 PUBLISHING BOARD:
Prof. Dzmitry Lazouski (chairperson); Dr. Yury Holubeu (vice-chairperson); Mr. Siarhei Piashkun (vice-chairperson); Dr. Maryia Putrava; Dr. Tatsiana Hardziayonak
РЕДАКЦИОННАЯ КОЛЛЕГИЯ:
д-р техн. наук, проф. Д. Н. Лазовский (председатель); канд. техн. наук, доц. Ю. П. Голубев (зам. председателя); С. В. Пешкун (зам. председателя); канд. филол. наук, доц. М. Д. Путрова; канд. филол. наук, доц. Т. М. Гордеёнок
EUROPEAN AND NATIONAL DIMENSION IN RESEARCH. TECHNOLOGY = ЕВРОПЕЙСКИЙ И НАЦИОНАЛЬНЫЙ КОНТЕКСТЫ В НАУЧНЫХ ИССЛЕДОВАНИЯХ : Electronic collected materi-als of XII Junior Researchers’ Conference, Novopolotsk, May 13-14, 2020 / Polotsk State Univer-sity ; ed. D. Lazouski [et al.]. – Novopolotsk, 2020. – 1 CD-ROM.
Издается с 2017 года (в печатном виде – с 2009 г.). Сборник включен в Государственный регистр информационного ресурса. Регистрационное сви-
детельство 3981711557 от 17.04.2017 г.
Первые два печатных издания вышли под заглавием «Материалы конференции молодых уче-ных», третье – «Национальный и европейский контексты в научных исследованиях» в 3 томах: «Гума-нитарные науки», «Экономика» и «Технология».
В настоящем электронном сборнике «Европейский и национальный контексты в научных исследова-ниях. Технология» представлены работы молодых ученых по геодезии и картографии, химической техноло-гии и машиностроению, информационным технологиям, строительству и радиотехнике.
Предназначены для работников образования, науки и производства. Будут полезны студентам, магистрантам и аспирантам университетов.
The first two conferences were issued under the heading “Materials of junior researchers’ confer-ence”, the third – “National and European dimension in research” in 3 parts: “Humanities”, “Economics”, “Technology”.
In this Electronic collected materials “National and European dimension in research. Technology” works in the fields of geodesy, chemical technology, mechanical engineering, information technology, civil engineering, and radio-engineering are presented.
It is intended for trainers, researchers and professionals. It can be useful for university graduate and post-graduate students.
211440, ул. Блохина, 29, г. Новополоцк,
Тел. 8 (0214) 50-57-09, e-mail: [email protected]
Технический редактор Дарьянова Татьяна Александровна Компьютерная верстка Дарьяновой Татьяны Александровны Компьютерный дизайн обложки Мухоморовой Марии Сергеевны
госрегистрации 3981711557. ISBN 978-985-531-698-6 © Полоцкий государственный университет, 2020
MATERIALS OF XII JUNIOR RESEARCHERS’ CONFERENCE 2020
Architecture and Civil Engineering
3
ARCHITECTURE AND CIVIL ENGINEERING
UDC 711.04
TRANSFORMATION OF THE ESTABLISHED OBJECT-SPATIAL ENVIRONMENT OF THE STUDENT HOSTEL
M. LEVKOVICH, S. TRUKHANOVICH,
O. LAZARENKO, M. KRUGLIKOVA
Polotsk State University, Belarus
The inconsistency of the existing subject-spatial environment of typical student dormitories, built in the XX
century, with the modern requirements of students'socialization during their studies at the university is revealed.
Improving the comfort of living without reconstruction of hostels is possible due to the transformation of the sub-
ject environment. The developed plans for minimum redevelopment of floors, subject filling of the spatial envi-
ronment of living rooms, taking into account anthropological, ergonomic, environmental requirements, will pro-
vide students with comfortable living.
Keywords: student dormitory, subject-spatial environment, design, transformation.
Introduction The subject - spatial human environment, with unconditional compliance with the functional
purpose, should provide comfort, contribute to the formation of a positive emotional and psychological back-
ground of life. Comfort for students living in a dormitory is especially significant. In the post-Soviet space and in
the Republic of Belarus, a large number of dormitory buildings were built in the 70-80s of the last century. They
are characterized by corridor and sectional layouts with living rooms on floors without built-in domestic, sanitary
and technical equipment. Most of these buildings are still in use and do not meet the modern requirements for
this category of housing. Reconstruction of hostels requires large financial costs and time. The purpose of this
study is to increase the efficiency of the student home, its comfort with minimal redevelopment, which does not
require a change in the structural design of the building and reconstruction of engineering equipment by trans-
forming the subject environment using modular and transformable furniture, colorizing techniques, navigation,
and the use of innovative materials and technologies.
Main part. Consider the prevailing spatial environment of four typical hostels using hostel No. 3 of Polotsk
State University as an example.
− 5-storey buildings, frameless, corridor type, with load-bearing longitudinal brick walls. On the ground
floor there are administrative, storage rooms, assembly and rehearsal rooms as well as male and female shower
rooms.
− On the next four floors there are living rooms for 2 to 4 students, two kitchens, women’s, men's toi-
lets, a washroom, a general purpose room.
Subject - spatial environment analysis of the premises revealed:
− on the 11.8m2 kitchens 2 gas stoves, 2 tables and 2 sinks are located, which is not enough for students
living on the floor, the area of the room does not allow placing additional equipment;
− the location of male and female showers on the first floor of the hostel creates inconvenience in use,
in addition, there are 5 showers in the female shower room, with more than 100 female people, this amount
does not comply with hygiene standards;
− there are 4 cabins in the women's toilet rooms, for more than 30 female people living on the floor,
this amount does not comply with hygiene standards;
− dormitories do not provide laundry rooms, rooms for classes and recreation;
− the area of the living quarters, as well as the filling with furniture, complies with the applicable re-
quirements and standards [1,2], but they do not provide for the design of residential areas for recreational activ-
ities and meals.
In order to optimize the living conditions of students with a minimum change in space-planning decisions,
the following developments were proposed.
1. On each residential floor, attach one living room with an area of 14m2 to the area of the kitchen prem-
ises and place additional equipment taking into account ergonomic requirements, the correct selection of finish-
ing materials and creation easy access to work surfaces.
MATERIALS OF XII JUNIOR RESEARCHERS’ CONFERENCE 2020
Architecture and Civil Engineering
4
2. Place shower rooms on each residential floor by remodeling a 19.6m living room2 located near the toi-
let rooms, the necessary plumbing equipment with accession to existing risers.
3. To increase the area of women's toilets on each residential floor to accommodate additional toilet cab-
ins, combining the area of toilets, airlock and a toilet for staff, using materials that have high requirements for
abrasion, shock, hygiene. The toilet for staff should be moved to the 1st floor.
4. On each residential floor, combine one living room with an area of 14m2, with rooms for washing, stor-
age of equipment, to convert the obtained space for the laundry room, placing 3 washing and drying machines
with accession to existing risers.
5. At each residential area, re-equip storage facilities with an area of 28.8 m2 into common rooms and
studies.
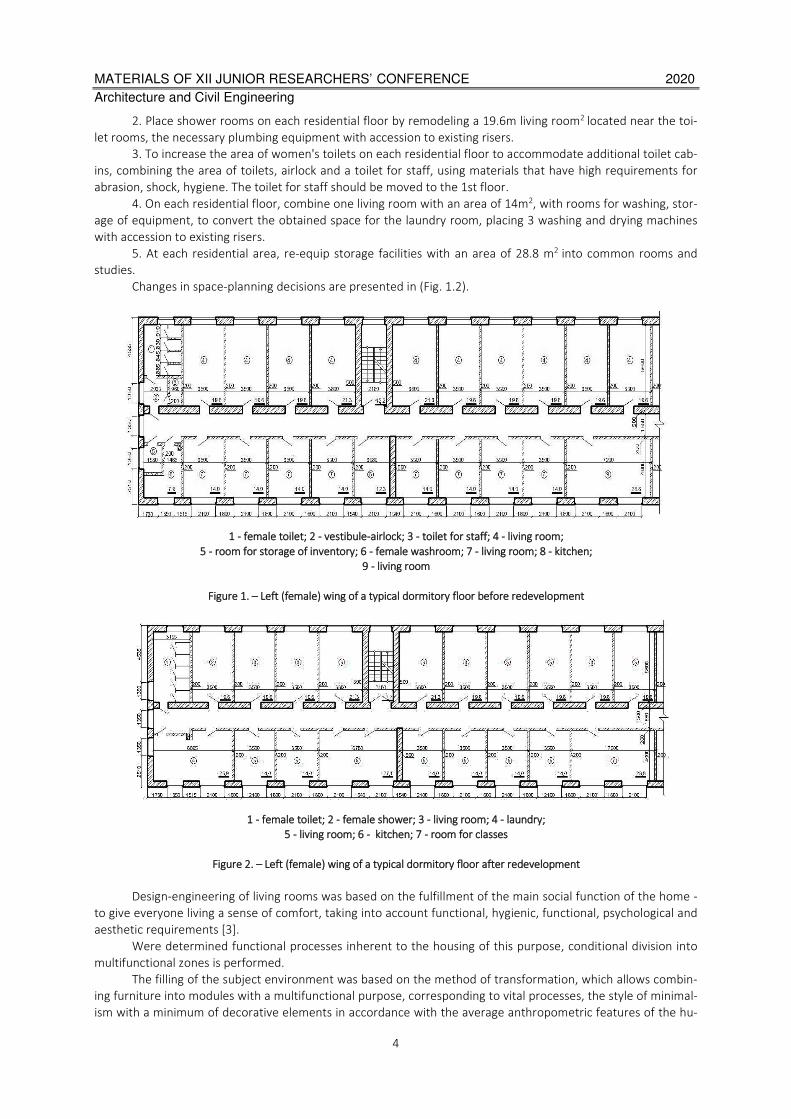
Changes in space-planning decisions are presented in (Fig. 1.2).
1 - female toilet; 2 - vestibule-airlock; 3 - toilet for staff; 4 - living room;
5 - room for storage of inventory; 6 - female washroom; 7 - living room; 8 - kitchen;
9 - living room
Figure 1. – Left (female) wing of a typical dormitory floor before redevelopment
1 - female toilet; 2 - female shower; 3 - living room; 4 - laundry;
5 - living room; 6 - kitchen; 7 - room for classes
Figure 2. – Left (female) wing of a typical dormitory floor after redevelopment
Design-engineering of living rooms was based on the fulfillment of the main social function of the home -
to give everyone living a sense of comfort, taking into account functional, hygienic, functional, psychological and
aesthetic requirements [3].
Were determined functional processes inherent to the housing of this purpose, conditional division into
multifunctional zones is performed.
The filling of the subject environment was based on the method of transformation, which allows combin-
ing furniture into modules with a multifunctional purpose, corresponding to vital processes, the style of minimal-
ism with a minimum of decorative elements in accordance with the average anthropometric features of the hu-
MATERIALS OF XII JUNIOR RESEARCHERS’ CONFERENCE 2020
Architecture and Civil Engineering
5
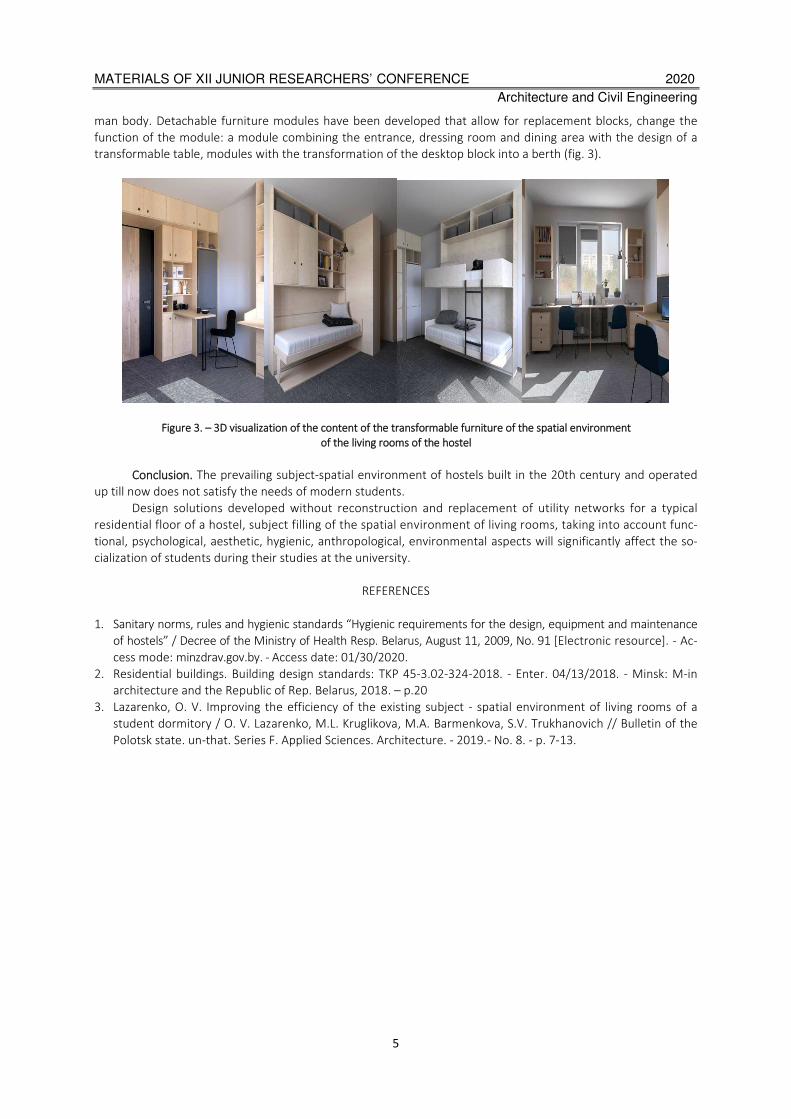
man body. Detachable furniture modules have been developed that allow for replacement blocks, change the
function of the module: a module combining the entrance, dressing room and dining area with the design of a
transformable table, modules with the transformation of the desktop block into a berth (fig. 3).
Figure 3. – 3D visualization of the content of the transformable furniture of the spatial environment
of the living rooms of the hostel
Conclusion. The prevailing subject-spatial environment of hostels built in the 20th century and operated
up till now does not satisfy the needs of modern students.
Design solutions developed without reconstruction and replacement of utility networks for a typical
residential floor of a hostel, subject filling of the spatial environment of living rooms, taking into account func-
tional, psychological, aesthetic, hygienic, anthropological, environmental aspects will significantly affect the so-
cialization of students during their studies at the university.
REFERENCES
1. Sanitary norms, rules and hygienic standards “Hygienic requirements for the design, equipment and maintenance
of hostels” / Decree of the Ministry of Health Resp. Belarus, August 11, 2009, No. 91 [Electronic resource]. - Ac-
cess mode: minzdrav.gov.by. - Access date: 01/30/2020.
2. Residential buildings. Building design standards: TKP 45-3.02-324-2018. - Enter. 04/13/2018. - Minsk: M-in
architecture and the Republic of Rep. Belarus, 2018. – p.20
3. Lazarenko, O. V. Improving the efficiency of the existing subject - spatial environment of living rooms of a
student dormitory / O. V. Lazarenko, M.L. Kruglikova, M.A. Barmenkova, S.V. Trukhanovich // Bulletin of the
Polotsk state. un-that. Series F. Applied Sciences. Architecture. - 2019.- No. 8. - p. 7-13.

MATERIALS OF XII JUNIOR RESEARCHERS’ CONFERENCE 2020
Architecture and Civil Engineering
6
UDC 32.01+72.01
ARCHITECTURE AND ART AS A KEY ELEMENT OF POLITICAL CULTURE OF THE SOCIETY
N. PAULAVA
Secondary School 9, Pinsk, Belarus
M. KAZLOU
Belarus State Economic University, Minsk
The problem of political culture and the influence of art and architecture on it in the form of basic symbols
and markers as a basis that determines the identity of its carriers are analyzed in the article. The importance of
preserving one’s own culture, dominant and repressive cultures in the modern world by means of restoration of
historical heritage as symbols of political culture itself, is emphasized.
Today, the world is again on the verge of new disasters, crises and wars. It must be accepted that the ide-
as of globalization, that people set their hopes on, were not realized. In essence, we returned to the starting
positions, the echoes of the stages passed, which philosophers and scientists wrote about in their works. Here
we can recall O. Spengler, J. Ortega y Gasset, E. Fromm, D. Orwell, H. Marcuse, H. Arendt, A. Huxley. One way or
another, they all wrote about a crisis in society, the emergence of a mass person, the rise to power of authoritar-
ian and totalitarian regimes, and the general decline of culture in the world. These topics are on agenda nowa-
days, too. It is now that they are starting to talk about the revival of nationalism, the emergence of radical
movements and the election victory in different countries of the populists with their policies of protectionism.
However, culture plays a key role in all this. If it is developed, many horrors and catastrophes can be avoided.
Saying so one does not understand the essence of culture itself. If once own culture is high, other cultures will
seem low, therefore, the latter should be enriched by their own culture, which seems ideal and perfect on its
own. Many European countries were led by this idea during the period of geographical discoveries and colonial
expansion.
Culture proved to be extremely diverse and cannot be simulated with other high cultures. Today, this can
be observed in economics and politics. For example, S. Huntington wrote, comparing the economic indicators of
several countries, the following: “looking at the economic statistics of Ghana and South Korea thirty years ago, in
the early 1990s, I was struck by the similarity of the indicators of these countries. ... Three decades later, South
Korea has become an industrial giant. ... In Ghana, where per capita income was only one-fifteenth of that of
South Korea, nothing similar was observed. How can such sharp changes in development be explained? Un-
doubtedly, many factors played a role here, but, it seems that the matter was primarily due to cultural differ-
ences. South Koreans valued frugality, skillful investment, education, organization, and discipline. The people of
Ghana had different values. In other words, cultures are serious” [1, p. 9]. Huntington offers an interesting way
of development, which implies the following: “is it possible with the help of political or other tools to transform
the culture or remove the barriers that arise on the way to progress?” [1, p. 12]. In this case, in our opinion, at-
tempts to impose culture are doomed to failure, as it will in any case have different levels for the population.
What options can be found to solve this problem?
First of all, one should understand what are the constitutes of a political culture and what are its oppor-
tunities to influence culture in general? Political culture can be analyzed as a part of culture in general, but with
its own characteristics, which just create a mechanism for the dissemination of culture itself. So what does the
term political culture mean? "In the broadest sense, it is a way of life of the people." However, political scientists
“use this term in a narrower sense: here it refers to the psychological orientation of people and denotes a cer-
tain“ psychological matrix ”that defines people's attitude to such phenomena as a party, government, constitu-
tion, as all this is expressed in beliefs, values and symbols” [2, p. 252]. In this case, it is highly important to pay
attention to the problem of symbols in political culture, what are they and what is their semantic meaning? We
will not go into the details of symbolism [3] and its psychological characteristics, but simply dwell on the tradi-
tional scheme of political symbols.
So, for any person, symbolism is first of all a coat of arms, a flag and an anthem. However, they cannot
always reflect the full content of political culture and culture as a whole. We can give examples of a change in
symbolism after revolutions and referenda, when they were changed depending on the political realities of a
group of people who came to power. A case in point is the return of historical symbols on the territory of the
former USSR or the CMEA countries with their modifications, retouching and withdrawal of some attributes of
MATERIALS OF XII JUNIOR RESEARCHERS’ CONFERENCE 2020
Architecture and Civil Engineering
7
these symbols themselves. An example is the emblem of People’s Republic of Poland. In Belarus, however, his-
torical symbols were replaced with new ones through a referendum or former USSR symbols were transformed.
Therefore, today in Belarus one can observe the presence of two symbols representing the coats of arms of Bel-
arus: the official coat of arms and historical symbols recognized at the state level and used by the opposition. On
the one hand, this is a problem that shows the complexity of political symbolism and its impact on society as a
whole. Moreover, in other countries with a stronger culture, similar situations or even more radical changes oc-
curred. For example, the coats of arms of France, Italy, and Ireland have appeared recently, but at the same time
they are not the main political symbols of these countries: the shamrock is a more significant symbol of Ireland,
in France it is a royal lily or Lorraine cross which were used at the time of the resistance movement during World
War II. In Belarus, unfortunately, the cross of Euphrosyne of Polotsk is treated more like a religious symbol, alt-
hough its historical and political burden is very significant in society. Confirmation of the importance of these
symbols for a citizen is an understanding of his identity, which S. Huntington spoke about. He wrote about the
US flag, concluding that “since the Civil War, Americans are accustomed to paying tribute to the national flag.
“Stars and Stripes” gradually acquired a religious status, turned into an icon, became a symbol of national identi-
ty for Americans ... However, this flag has never had the meaning it acquired after September 11, 2001” [4, p.
22-23]. The personification of the flag and coat of arms as symbols of the nation is of great importance. These
symbols may change depending on the political course and power, but at the same time, the identity itself is
preserved. But there is a more significant symbolic environment, which is not limited to only one or a small
group of symbols of political culture. At the same time, it is important to understand what identity is, because
there one finds an important feature. So, S. Huntington wrote that “identity is the identity of an individual or
group. It is a product of self-identification, the understanding that you or I have special qualities that distinguish
me from you and us from them. Identity is inherent even by a newborn, in whom it is determined by such attrib-
utes as gender, name, parents, citizenship. ... Identity, as a group of researchers formulated, “correlates with the
images of individuality and distinctiveness (“self”) reproduced by the actor, and is formed (and also changes over
time) due to the relationship of a person with significant characters from his environment”. As long as people
interact with their environment they have no choice but to define themselves through relations with others and
to identify the revealed similarities and differences” [4, p. 50-51]. In this case, the formation of identity, especial-
ly at an early age, is influenced by a cultural landscape that defines and socializes a person living in a certain ter-
ritory. It can be nature itself, the physical features of the territory - mountains, deserts, forests, swamps or ob-
jects created by man, namely: architecture. Its importance in the formation of identity is huge, it is a significant
part, if not the basis, of culture itself and political culture as a whole. For a political culture, architecture is a
symbolic landscape, a space that forms the human environment, filling it with meaning. It should be emphasized
that most architectural monuments that have symbolic significance, for example, various palaces, tombs or reli-
gious buildings, carry a touch of power relations, that is, they make up the space of the political life of the popu-
lation. The essence of this can be imagined and shown through the capital of the state and major cities of the
country. Most often this is the quintessence of the ideas of the authorities or the ruler. The most important his-
torical and architectural monuments are concentrated in this city. Capitals are moving or building in a new place.
In certain cases, they capture and transfer their residences there. Moreover, they can be destroyed to the
ground in order to erase the entire identity and historical past of former greatness. The main thing is that archi-
tecture becomes a marker and a symbol of power. An example of this is the imperial capitals, which throughout
their existence created a cultural and political space that contains and conveys symbols of the political culture of
an entire state, even if the capital was later destroyed. Two cities can be recalled, that influenced the main archi-
tectural styles existing in Europe - Athens and Rome. Their model was a certain standard for subsequent archi-
tects and their powerful customers. In other words, the architectural environment of the city affects the political
culture and is one of the main elements of the constitution of the individual. The layout of streets and the scope
of construction are aimed at ensuring that a person identifies himself with this architecture, monuments and is
proud of them. In this vein, Paris, London, Berlin and Moscow are built. The task of these cities and their archi-
tecture is to transfer its repressive culture and power to future generations through the city spirit. It should also
be understood that the core of the architectural style will be represented by a local design, however, the ex-
change with other styles enriches and fills it in with new content. For example, the Moscow Kremlin, where one
can find the influence of architects from Italy. But over time, the features are leveled and one’s own style and its
cultural content are created. This illustrates another variable representing a civilizational characteristic that is
transmitted through architecture to political culture. In other words, the emergence of civilizations with all their
attributes is observed. More over according to S. Huntington: “it is impossible to imagine the development of
the mankind in isolation from civilizations” [5, p. 22-23]. The understanding of civilization is a separate issue, but
MATERIALS OF XII JUNIOR RESEARCHERS’ CONFERENCE 2020
Architecture and Civil Engineering
8
it should be kept in mind that it can also manifest itself in architecture. An example is Belarus, which is on a civili-
zational break. In Belarus the influence of two civilizations is vivid and this can be found both in political culture
and in architecture as a whole. However, this confrontation created a distinctive culture with its own architec-
tural school, the examples of which are various churches, cathedrals and city planning. It is one’s own, unique
culture that develops in the breaking period that helps the ethnic group or nation survive in the conditions of
global cataclysms. Unfortunately, political culture underlines the current situation in Belarus. In fact, Belarus was
not lucky in this regard – it suffered greatly from numerous wars and the most terrible social constructs and po-
litical regimes were realized here. To understand this, one should compare the restoration plans of Minsk and
Warsaw, where completely different ways in the cultural and architectural direction were chosen. These cities
suffered almost equally - more than 80 percent of the cities was destroyed, but the symbolism and, apparently,
political culture are significantly different. In Warsaw, an ideal replica of the old city was restored from ruins to
show its identity and political culture. In Minsk, it was decided to build an ideal new city - the “city of the sun" [6]
- to transmit and reproduce the totalitarian ideology and its culture. A classical antique architecture called the
"Stalin Empire", rather than constructivism or modernity, was used. What is characteristic, after the construction
of the central part of the city, a similar situation continued, for example, the demolition of the old Nemiga. Thus
the power makes space through architecture and reproduce political culture within the framework of the system
created by it. As far as political culture is concerned, even today, analyzing the architecture of Minsk, one should
admit that it is still visible how the authoritarian culture is reproduced, although there are pointed elements of
historical monuments restoration works, however, these are only certain examples. It can be said with no doubt
that Minsk is the bearer of a political culture that does not exist anymore; it has lost its originality in Jewish quar-
ters and in the district royal city. Reproduction in Minsk of a "patrial political culture" is expressed through the
construction of buildings that are not suitable for the city and the destruction of historical buildings in the city
center. At the moment, a similar situation is observed not only in the capital: for example, in the ancient city of
Polotsk [7]. Today, near the main architectural symbol of the city - “Polotsk Sofia”, the construction of a cadet
corps building is being held on site of the upper castle. Archaeological excavations and a museum could have
been much more appropriate at this place. This would underline the urgent problem of the nation wants to sur-
vival of the nation in the era when culture has finally begun playing an important role in the world again. The
government should pay more attention to the historical heritage and its restoration. In other words, the creation
and return of symbols that will help raise the level of culture in general and political culture in particular. An ex-
ample is the neighboring Republic of Lithuania, which restored the Lower Castle as a symbol of the state and
nation. Now the Castle of Batoria in Grodno is being restored in Belarus, but this is only a little fragment of what
can be restored as a symbolic space of the nation. In other words, the people of Belarus should strive to change
the architectural appearance and political culture of the state.
REFERENCES
1. Культура имеет значение: Каким образом ценности способствуют обществ. прогрессу / Под ред.
Л.Харрисона и С. Хантингтона. - М.: Моск. шк. полит. исслед., 2002. - 315 с.
2. Хейвуд, Э. ПОЛИТОЛОГИЯ / Э. Хейвуд. - М.: ЮНИТИ-ДАНА, 2005. - 544 с.
3. Морозов, И. Основы культурологии. Архетипы культуры / И. Морозов. – Мн.: ТетраСистемс, 2001. -
607 с.
4. Хантингтон, С. Кто мы? : Вызовы американской национальной идентичности / С. Хантингтон. - М.: ACT,
2004. - 635 с.
5. Хантингтон, С. Столкновение цивилизаций / С. Хантингтон. – М.: АСТ, 2003. – 603 с.
6. Клинов, А. Минск: путеводитель по Городу Солнца / А. Клинов. – М.: Ад Маргинем Пресс, 2013. - 127 с.
7. Тарасов, С. Мнение: сборник эссе / С. Тарасов. – М.: издание автора, 2014. - 142 с.
MATERIALS OF XII JUNIOR RESEARCHERS’ CONFERENCE 2020
Architecture and Civil Engineering
9
UDC 698.7
DEVICE FOR ADAPTING PEOPLE WITH DISTURBANCES OF HEARING AND VISION IN AREA
V. SYSOY, V. KHVATYNEC
Polotsk State University, Belarus
The article discusses the main devices used to create a barrier-free environment in both public and resi-
dential buildings. The advantages are highlighted and directions for the use of each device are noted.
Every day, a person with a disability is faced with difficulties associated with the lack of a barrier-free en-
vironment in buildings and in the territories adjacent to them. The absence or disturbance of the sensory organs,
allowing orientation in area, play an important role in interaction with the environment. Often they have to intu-
itively adapt to the environment in which they are located.
At the moment, modern technology allows us to adapt the environment for visually impaired or blind
people, as well as for people with hearing impairment. For them, the main reference point in area are sensory
(tactile) and sound devices.
Equipment and materials designed to ensure accessibility for blind and hard of hearing people can be di-
vided into the following categories:
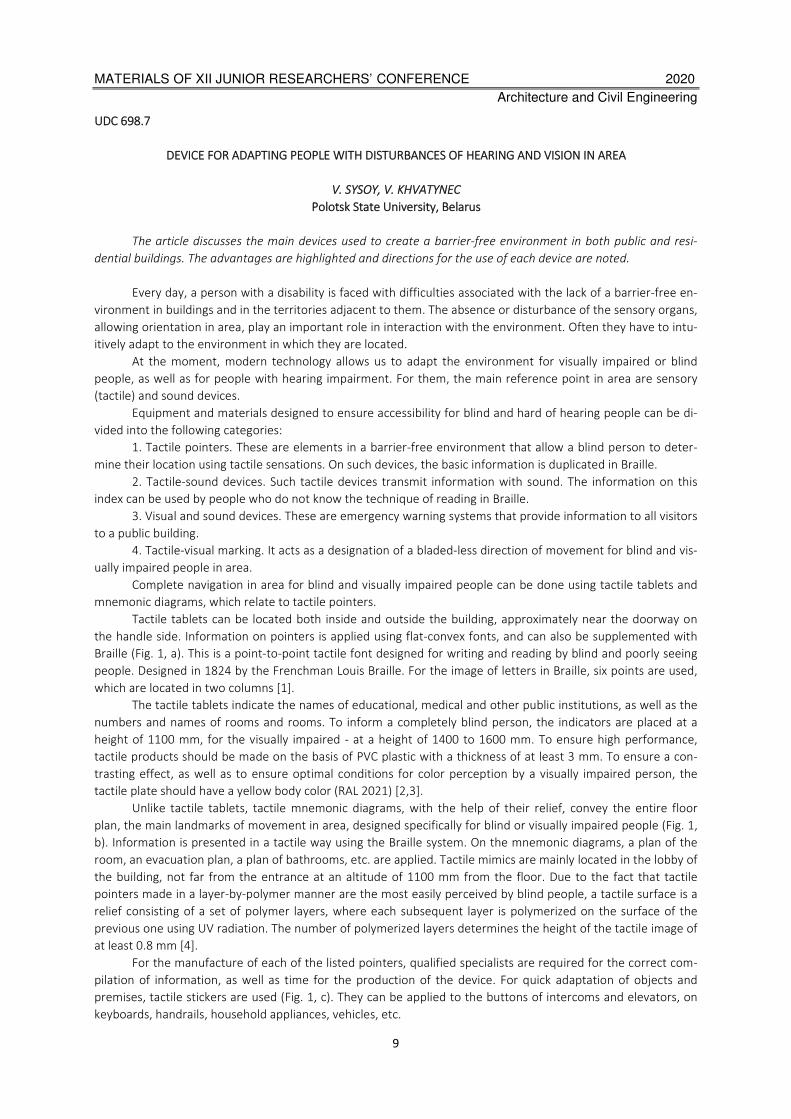
1. Tactile pointers. These are elements in a barrier-free environment that allow a blind person to deter-
mine their location using tactile sensations. On such devices, the basic information is duplicated in Braille.
2. Tactile-sound devices. Such tactile devices transmit information with sound. The information on this
index can be used by people who do not know the technique of reading in Braille.
3. Visual and sound devices. These are emergency warning systems that provide information to all visitors
to a public building.
4. Tactile-visual marking. It acts as a designation of a bladed-less direction of movement for blind and vis-
ually impaired people in area.
Complete navigation in area for blind and visually impaired people can be done using tactile tablets and
mnemonic diagrams, which relate to tactile pointers.
Tactile tablets can be located both inside and outside the building, approximately near the doorway on
the handle side. Information on pointers is applied using flat-convex fonts, and can also be supplemented with
Braille (Fig. 1, a). This is a point-to-point tactile font designed for writing and reading by blind and poorly seeing
people. Designed in 1824 by the Frenchman Louis Braille. For the image of letters in Braille, six points are used,
which are located in two columns [1].
The tactile tablets indicate the names of educational, medical and other public institutions, as well as the
numbers and names of rooms and rooms. To inform a completely blind person, the indicators are placed at a
height of 1100 mm, for the visually impaired - at a height of 1400 to 1600 mm. To ensure high performance,
tactile products should be made on the basis of PVC plastic with a thickness of at least 3 mm. To ensure a con-
trasting effect, as well as to ensure optimal conditions for color perception by a visually impaired person, the
tactile plate should have a yellow body color (RAL 2021) [2,3].
Unlike tactile tablets, tactile mnemonic diagrams, with the help of their relief, convey the entire floor
plan, the main landmarks of movement in area, designed specifically for blind or visually impaired people (Fig. 1,
b). Information is presented in a tactile way using the Braille system. On the mnemonic diagrams, a plan of the
room, an evacuation plan, a plan of bathrooms, etc. are applied. Tactile mimics are mainly located in the lobby of
the building, not far from the entrance at an altitude of 1100 mm from the floor. Due to the fact that tactile
pointers made in a layer-by-polymer manner are the most easily perceived by blind people, a tactile surface is a
relief consisting of a set of polymer layers, where each subsequent layer is polymerized on the surface of the
previous one using UV radiation. The number of polymerized layers determines the height of the tactile image of
at least 0.8 mm [4].
For the manufacture of each of the listed pointers, qualified specialists are required for the correct com-
pilation of information, as well as time for the production of the device. For quick adaptation of objects and
premises, tactile stickers are used (Fig. 1, c). They can be applied to the buttons of intercoms and elevators, on
keyboards, handrails, household appliances, vehicles, etc.
MATERIALS OF XII JUNIOR RESEARCHERS’ CONFERENCE 2020
Architecture and Civil Engineering
10
а
b
c
a - tactile braille label; b - tactile mnemonic diagram; c - tactile sticker on the handrail
Figure 1. – Tactile pointers
Tactile-sound devices include tactile tablets and tactile mnemonic circuits equipped with special sound
panels. Such elements transmit tactile information with sound. These stands are widespread at socially signifi-
cant objects: museums, exhibition halls, libraries, park areas, metro, city center. Each device is equipped with a
clear-relief image, basic information duplicated using the Braille system, as well as sound buttons with profes-
sional voice acting [5].
Visual-audible warning systems, sound beacons are the most common devices for voice informing visually
impaired and blind people. They are located in the lobby of the building with pre-recorded sound tracks, to en-
sure comfortable movement of people with limited mobility in area. Also, these systems additionally alert people
with general information about this institution.
а b c
а - warning (conical); b - guide (longitudinal); c - rotary (diagonal)
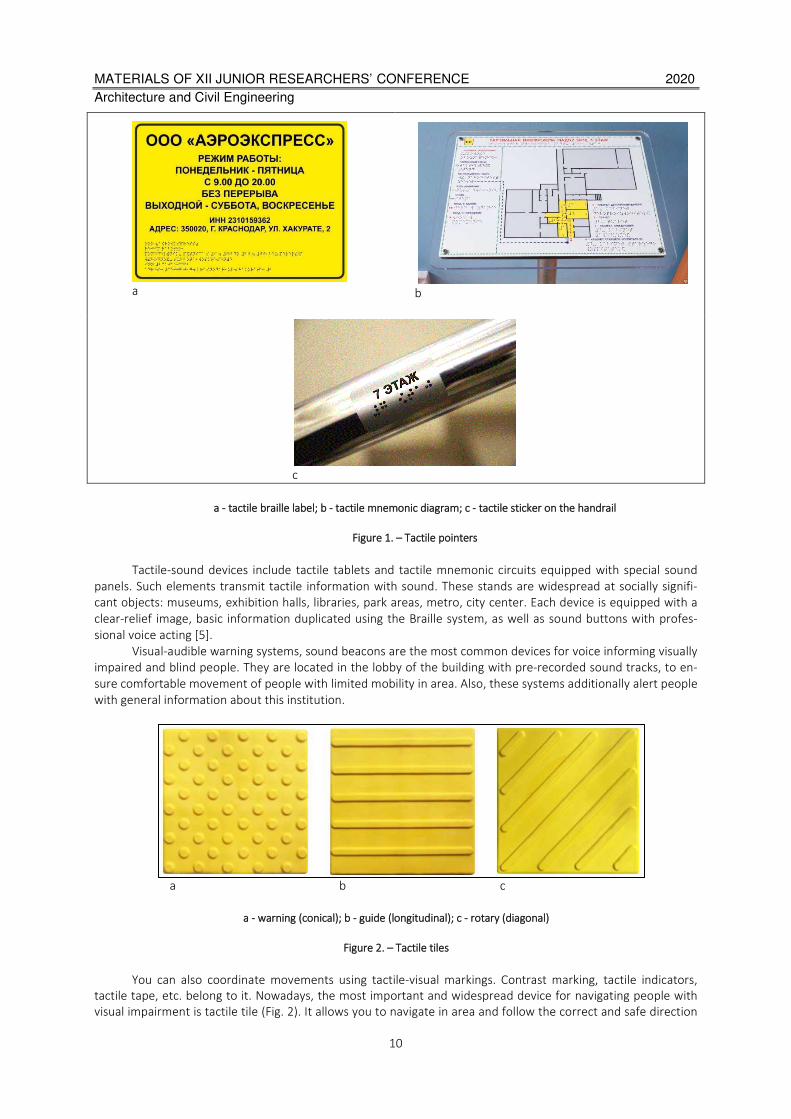
Figure 2. – Tactile tiles
You can also coordinate movements using tactile-visual markings. Contrast marking, tactile indicators,
tactile tape, etc. belong to it. Nowadays, the most important and widespread device for navigating people with
visual impairment is tactile tile (Fig. 2). It allows you to navigate in area and follow the correct and safe direction

MATERIALS OF XII JUNIOR RESEARCHERS’ CONFERENCE 2020
Architecture and Civil Engineering
11
of movement [6]. The most common are three types: conical, longitudinal and diagonal. The cone tile serves to
inform the obstacles to the movement of people with disabilities. To direct the path of movement and to inform
about the turn, longitudinal and diagonal tactile tiles are used respectively.
Tactile PVC and TPU eco-tile Designed for laying both outdoors and indoors. It is made using raw materi-
als after recycling. To ensure long-term performance, the tile must be made of high-quality thermoplastic elas-
tomer with a hardness on the Shore scale of not more than 85 units on the scale A. To ensure high performance
on abrasion, the product must be painted in the total weight of the material. Product color RAL 2021 [7].
In public areas with low maneuverability, a self-adhesive tactile tile and tactile tape are used for naviga-
tion. Also, carpet and rubber coverings, as well as materials contrasting in color and texture with the main coat-
ing, can be used as tactile guides.
The proper use of devices for the adaptation of people with visual and hearing impairments in area will
help to properly coordinate the movement of the mobility impaired population. Creating a barrier-free environ-
ment allows people with disabilities to fully function in area and society.
REFERENCES
1. Конвертер Брайля [Электронный ресурс]. – 2020. – Режим доступа: http://braille.su/braille-font.php. –
Дата доступа 04.03.2020
2. Тифлоцентр «Вертикаль» [Электронный ресурс]. – 2020. – Режим доступа:
https://tiflocentre.ru/taktilnye-tablichki.php. – Дата доступа: 02.03.2020
3. ООО "Тифлографика" //Комплексная адаптация зданий и сооружений для людей с ограниченными
возможностями [Электронный ресурс]. – 2020. – Режим доступа: http://tiflografika.com. – Дата доступа:
05.03.2020
4. Тифлоцентр «Вертикаль» [Электронный ресурс]. – 2020. – Режим доступа:
https://tiflocentre.ru/taktilnye-mnemoshemy.php. – Дата доступа: 05.03.2020
5. Альфа среда // Создание безбарьерной среды [Электронный ресурс. – 2014. – Режим доступа:
https://www.alfasreda.ru. – Дата доступа: 05.03.2020
6. Брестский областной исполнительный комитет [Электронный ресурс]. – 2020. – Режим доступа:
http://brest-region.gov.by/attachments/article/7268/7268.pdf. – Дата доступа: 05.03.2020
7. Тифлоцентр «Вертикаль» [Электронный ресурс]. – 2020. – Режим доступа:
https://tiflocentre.ru/taktilnaja-plitka-jekoserija.php. – Дата доступа: 05.03.2020
MATERIALS OF XII JUNIOR RESEARCHERS’ CONFERENCE 2020
Architecture and Civil Engineering
12
UDC 539.374
COMPARATIVE ANALYSIS OF ELASTIC-PLASTIC PROCESSES AT COMPLEX ACTIVE LOADING
AND LOADING WITH UNLOADING
A. BOBROV, I. ZAZERSKI, A. SHCHERBO
Polotsk State University, Belarus
In the article, there are the results of comparative analysis of phenomenon of delay of vector and scalar
properties for paths of active loading and paths with unloading during elastic-plastic deformation. An attempt
has been made to classify broken paths of active loading by extracting from them those in which fractures do not
significantly affect the appearance of the process image and can be equated to simple loading and those where
such simplification is unacceptable.
The simplest type of complex loading is two-link paths with fracture angle in the ranges: (0-90 °) - active
loading and (90-180 °) - paths with unloading [1], [2], [6], [8]. The researched broken paths can be considered as
a set of several two-link paths [3], [4]. The results of comparative analysis of experimental studies of two-link and
polygonal paths are presented below.
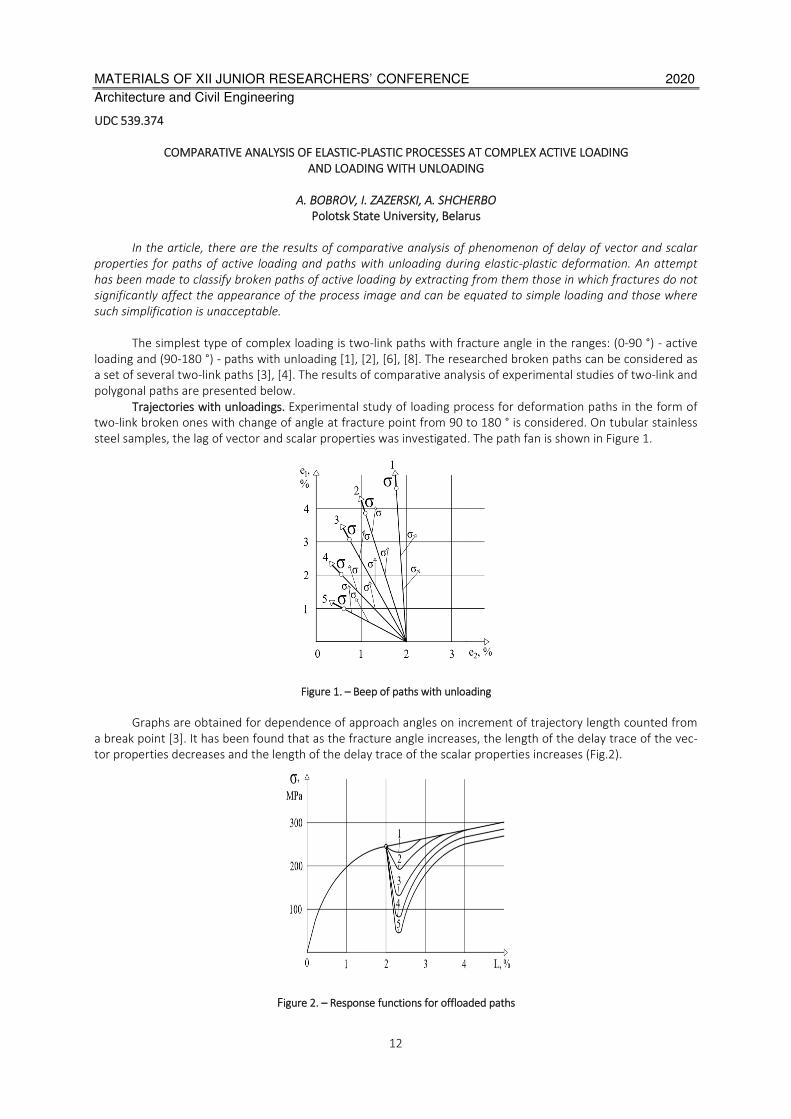
Trajectories with unloadings. Experimental study of loading process for deformation paths in the form of
two-link broken ones with change of angle at fracture point from 90 to 180 ° is considered. On tubular stainless
steel samples, the lag of vector and scalar properties was investigated. The path fan is shown in Figure 1.
Figure 1. – Beep of paths with unloading
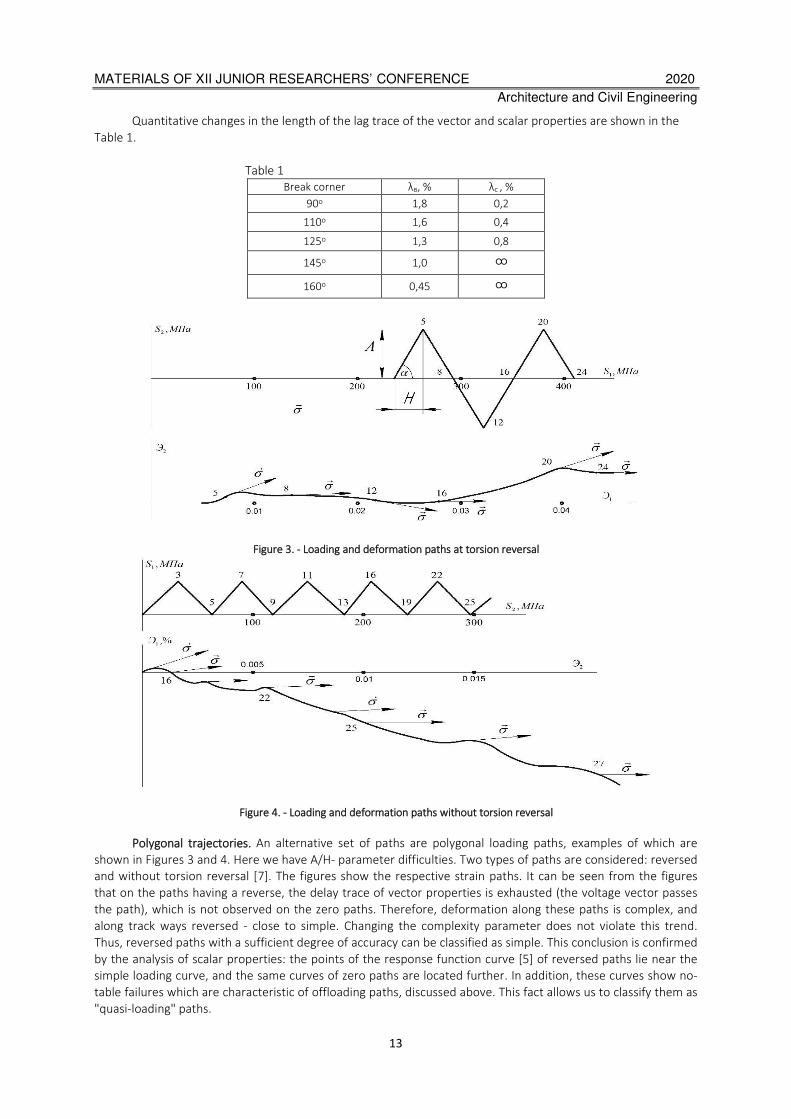
Graphs are obtained for dependence of approach angles on increment of trajectory length counted from
a break point [3]. It has been found that as the fracture angle increases, the length of the delay trace of the vec-
tor properties decreases and the length of the delay trace of the scalar properties increases (Fig.2).
Figure 2. – Response functions for offloaded paths
MATERIALS OF XII JUNIOR RESEARCHERS’ CONFERENCE 2020
Architecture and Civil Engineering
13
Quantitative changes in the length of the lag trace of the vector and scalar properties are shown in the
Table 1.
Table 1
Break corner λв, % λс , %
90о 1,8 0,2
110о 1,6 0,4
125о 1,3 0,8
145о 1,0 ထ
160о 0,45 ထ
Figure 3. - Loading and deformation paths at torsion reversal
Figure 4. - Loading and deformation paths without torsion reversal
Polygonal trajectories. An alternative set of paths are polygonal loading paths, examples of which are
shown in Figures 3 and 4. Here we have A/Н- parameter difficulties. Two types of paths are considered: reversed
and without torsion reversal [7]. The figures show the respective strain paths. It can be seen from the figures
that on the paths having a reverse, the delay trace of vector properties is exhausted (the voltage vector passes
the path), which is not observed on the zero paths. Therefore, deformation along these paths is complex, and
along track ways reversed - close to simple. Changing the complexity parameter does not violate this trend.
Thus, reversed paths with a sufficient degree of accuracy can be classified as simple. This conclusion is confirmed
by the analysis of scalar properties: the points of the response function curve [5] of reversed paths lie near the
simple loading curve, and the same curves of zero paths are located further. In addition, these curves show no-
table failures which are characteristic of offloading paths, discussed above. This fact allows us to classify them as
"quasi-loading" paths.

MATERIALS OF XII JUNIOR RESEARCHERS’ CONFERENCE 2020
Architecture and Civil Engineering
14
REFERENCES
1. Ильюшин А.А. Пластичность. – М., 1963.
2. Родионов В.К., Шишмарев О.А., Щербо А.Г. Экспериментальное исследование некоторых
закономерностей пластического деформирования стали. В сб.: Прикладные проблемы прочности и
пластичности. – Горький, 1982.
3. Шишмарев О.А., Щербо А.Г. Исследование некоторых сложных процессов нагружения стали с
разгрузками. // Прикладная механика. – 1982. - 3.
4. Шишмарев О.А., Щербо А.Г. Образ процесса нагружения для двухзвенных ломаных траекторий
деформации с углом излома более 90о. // Изв. АН СССР. Сер. Механика твердого тела. -1982. - 5.
5. Белл Дж.Ф. Экспериментальные основы механики деформируемых твердых тел. –М., 1984.
6. Щербо А.Г. Экспериментальная проверка постулата изотропии для траекторий нагружения с
разгрузками. // Прикладная механика. – 1990. - 1.
7. Щербо А.Г. Экспериментальное исследование образа процесса упругопластического деформирования
при активном сложном нагружении по траекториям с множественными изломами. // Вестник ПГУ.
Фундаментальные науки. Т.1 3, 2009г.
8. Щербо А.Г. Сравнительный анализ двухзвенных процессов упругопластического деформирования для
разных материалов // Сборник научных трудов "Инженерные проблемы строительства и эксплуатации
сооружений", 2. Новополоцк, ПГУ, 2006 г.
MATERIALS OF XII JUNIOR RESEARCHERS’ CONFERENCE 2020
Architecture and Civil Engineering
15
UDC 691.322.7
RATIONAL WAYS TO USE FIBER CONCRETE
A. BRIL, V. KHVATYNEC
Polotsk State University, Belarus
During the analysis, the most rational areas of application of fiber-reinforced concrete and the influence of
various fibers on the physico-mechanical characteristics of concrete were identified. The positive effect of dis-
persed concrete reinforcement on their performance is described.
Nowadays, the use of a new generation of reinforced concrete is developing. Fiber concrete is a new type
of concrete with interspersed fibers throughout the volume. Depending on the origin, the fibers are divided into
three types: fiberglass, steel and synthetic fibers.
In the course of studying the material in [1], the most rational areas of application of fiber-reinforced
concrete were revealed, such as prefabricated elements and structures: pipelines, beams, railway sleepers, float-
ing dock modules, explosion-proof structures, piles, heating elements, street fittings, etc. and also monolithic
structures, floors of industrial buildings, defense structures, roads, water dams, irrigation canals, etc. These de-
signs are widely used abroad and have proven their effectiveness. Fiber reinforcement increases the ratio of
tensile strengths during compression and tension, which leads to increased concrete efficiency.
In the work of Sofienko N.V., Pelyarchuk N.N. and Popova O.N. [2] the use of fiber-reinforced concrete as
a promising material in construction was examined. According to its characteristics, fiber-reinforced concrete is
suitable for the construction of structures subject to dynamic loads and thin-walled structures with great dura-
bility. The achievement of the economic effect is due to a change in the technology of obtaining and erecting
structures from fiber-reinforced concrete and its new properties. The use of fiber-reinforced concrete increases
the service life of structures, which leads to a reduction in the cost of their operation during the life of the struc-
ture.
In the article Durachenko A.V. [3] examined the use of fiber-reinforced concrete in the construction of
Russia. Steel fiber concrete has been widely used in the construction of runways and roads, their difference in
increased resistance to pulsating loads, abrasion and atmospheric influences. Fiber concrete is also used in in-
dustrial and civil engineering. Enclosing elements, floors, walls, partitions, coatings, pipes, channels and many
others are made from it. The economic effect is achieved due to greater wear resistance, durability, serviceabil-
ity and increased safety during seismic activity.
In [4], the effect of basalt fiber on the physico-mechanical characteristics of self-compacting concrete is
studied. After 28 days, self-compacting fiber-reinforced concrete gains strength of 104.5 MPa, Poisson's ratio of
0.17, elastic modulus of 63.9 GPa, and water absorption of 2.2%. The indicators of these characteristics make it
possible to use them in high-level resource-saving construction, the construction of nuclear power plants, reser-
voirs, bridges, tunnels, offshore structures, runways, aerodrome coatings, launch complexes for space ships and
other special structures.
The work [5] describes the use of fiberglass concrete for building decoration. Technological properties
make it possible to give fiberglass concrete almost any shape, geometry, texture and relief. Its plasticity and
lightness allow architects to embody any ideas. When using concrete with the addition of glass fiber for decora-
tive finishes, you can not worry about the increased load on the foundation, due to the lightness of the thin-
walled composite material. The disadvantage of this building material is its cost, but, here we have the reduction
in the cost of strengthening the bearing walls and foundations, so the high cost is unproven.
Lesovik V.S. in article [6] examines the use of fiber-reinforced concrete in seismically active areas. Most of
all in the world Arabic countries are affected by seismic activity, for them, along with the effectiveness of con-
struction, is its cost. The use of fiber-reinforced concrete increases plasticity during compression and tension,
shear resistance increases, without special detailing of seismic resistance, adequate resistance to deformation of
the potential and damage to tolerance can be achieved. In this case, it is possible not to accept special details for
the earthquake resistance of structures and buildings, which is an economic factor. It also makes it possible to
reconstruct buildings that were built without seismic adaptability.
Gafarova in the article [7] describes the use of various types of fiber. The physico-mechanical characteris-
tics of fiber-reinforced concrete depend on the type of fiber. Polypropylene and nylon fibers have a low modulus
of elasticity, which does not provide a qualitative increase in the strength of concrete. Due to the fact, that poly-

MATERIALS OF XII JUNIOR RESEARCHERS’ CONFERENCE 2020
Architecture and Civil Engineering
16
propylene fiber is not subjected to corrosion, it has found application in the construction of hydraulic structures,
bulk floors, offshore structures. Environmental friendliness, heat resistance, durability are characteristic for bas-
alt fiber. Concrete with basalt fiber has high physical and mechanical characteristics: tensile strength, heat re-
sistance, durability, low creep, high crack resistance, etc. Also for fiber-reinforced concrete, fiberglass is com-
mon. It reduces the cost of concrete and improves operational and technical characteristics. Steel fiber is the
most effective. Concrete with the addition of steel fibers increases the compressive and bending strength, has
high impact resistance, crack resistance and low brittleness, which is a consequence of increasing the resistance
of concrete in all directions.
In [8], the study is devoted to the influence of various fibers on the characteristics of fiber concrete. In in-
dustrial construction, steel fiber reinforced concrete is more often used, since when it is used, the coating thick-
ness is reduced by 40-50% without loss of strength and performance characteristics in comparison with ordinary
concrete. The use of steel fiber leads to an increase in ductility, frost resistance and bearing capacity. Fiberglass
concrete has been widely used, since glass fibers are not subjected to corrosion. The disadvantage of glass fibers
is low alkali resistance, which leads to the possibility of using glass fiber only in chemically inert environments.
Seclofibroconcrete is very plastic and does not lose its strength characteristics when stained. Basalt fiber has
high physico-mechanical properties, chemical resistance and weather resistance, which is also environmentally
friendly. The use of basalt fiber reduces shrinkage cracks and increases the technical and economic indicators of
the structure as a whole.
REFERENCES
1. Сухова, С.И. Фибробетон / С.И. Сухова. – Наука ЮУрГУ: материалы 67-й научной конференции. 2015. –
1636 с.
2. Софиенко, Н.В. Фибробетон / Н.В. Софиенко, Н.Н. Пелярчук, О.Н. Попов. – Перспективные материалы в
технике и строительстве. – Томск, 2015. – 528 с.
3. Дураченко, А.В. Фибробетон для строительной индустрии / А.В. Дураченко. – Молодёжь и научно-
технический прогресс; Сборник докладов VII международной научно-практическая конференции
студентов, аспирантов и молодых ученых. – Старый оскол, 2014. – 192 с.
4. Стечишин, М.С. Самоуплотняющийся фибробетон / М.С. Стечишин, О.Р. Позняк. – Сборник научных
трудов sworld. – Иваново, 2014. – 80 с.
5. Дроков, А.В. Фибробетон для декоративной отделки зданий санаторно-оздоровительных комплексов /
А.В. Дроков, В.Л. Курбатов. – Фундаментальные основы строительного материаловеденья. – Белгород,
2017. – 299 с.
6. Лесовик, В.С. Фибробетон для сейсмостойкого строительства / В.С. Лесовик, М.Х.И. Шакарная. –
Белгородская область: прошлое, настоящее, будущее. – Белгород, 2011. – 61 с.
7. Гафарова, Н.Е. Фибробетон для монолитного строительства / Н.Е. Гафарова, Международный журнал
прикладных и фундаментальных исследований 3. – Белгород, 2017. – 11 с.
8. Окольникова Г.Э. Анализ свойств различных видов фибробетонов / Г.Э. Окольникова, А.П. Белов, Е.В.
Слинькова. – Системные технологии. – Москва, 2018. – 206 с.

MATERIALS OF XII JUNIOR RESEARCHERS’ CONFERENCE 2020
Architecture and Civil Engineering
17
UDC 621.785
THE STUDY OF THE ELECTRIC STRENGTH OF COMPOSITE MATERIALS
BASED ON A POLYMER MATRIX
A. TOCHILO, D. TARASHKEVICH, T. MOLODECHKINA
Polotsk State University, Belarus
The results of studies of polymer-based composite materials are presented. The characteristics of electrical
resistivity and strength are measured. Recommendations on the practical application of the investigated materi-
als are given.
The development of modern technology has led to the emergence of materials that have exceptional per-
formance. Polymeric materials can have a molecular weight of from several thousand to several million.[1]
Distinctive properties of polymers are :
− Low rate of thermal conductivity. That is why some polymers can be used as insulation during
some work;
− A high coefficient of LTEC is caused by a relatively high mobility of the bonds and a constant change in
the strain coefficient;
− Despite the high rate of thermal expansion coefficient, polymer materials are ideal for spray-
ing. Recently, it is often possible to meet a situation where the polymer is applied to the surface in the form of a
thin layer to give the metal and other materials anti-corrosion properties. Modern application technologies
make it possible to obtain a thin protective film;
− The specific gravity can vary in a rather wide range depending on the specific composition;
− A fairly high tensile strength from a part is caused by increased ductility. The resistivity can vary over a
fairly wide range. An example of such polymers is hard PVC, which has 10 17 Ohm × cm;
− The coefficient of linear expansion is from 70 to 200 × 10 -6 per degree Celsius;
− To enhance the rigidity and strength of polymeric materials, various reinforcing fillers are introduced
into their composition: fiberglass, carbon fibers, carbon -containing nanoparticles, metal - carbon nanocompo-
sites, etc.
− Good dielectric properties allow the use of polymeric material without fear of electric shock. That is
why polymers are often used to create tools and equipment designed to work with electricity.
The interest in polymeric materials is caused by the fact that every year the share of polymers accounts
for an increasing number of products. Products from composite materials are used in everyday
life, electronics, agriculture, construction. Today, polymeric materials are found in various states of aggregation
such as glue, grease, sealant, paint, some solid polymeric materials. Solid composites are widely used in the
production of a wide variety of equipment. As previously noted, composites based on a polymer matrix have
high elasticity, due to which silicone, rubber, foam rubber and other similar polymeric materials were ob-
tained .[2]
Of particular interest is the material that is used to seal the housings of devices, electronic compo-
nents. An important characteristic for such materials is the electrical resistance .
It is known, that there are two paths of current flow of solid dielectrics: through the insulator and on its
surface. Therefore, to assess the ability of a dielectric to conduct electric current in these directions, the con-
cepts of volume and surface resistances are used. [3]
By volumetric ( ρ v ) is meant the resistance that a dielectric possesses when direct current flows through
its volume. The bulk resistance depends, besides other things, on the structure and composition of the material.
Surface ( ρ s ) is the resistance that a dielectric possesses when direct current flows over its sur-
face. Surface resistance depends on the state of the surface of the material through which current flows.
The article presents the results of studies of composite materials based on polymer matrix. Silicone and
acrylic were chosen as matrix materials .
The methodology for determining the specific volume and surface electrical resistance was carried out
according to GOST 6433.2-71 [4]
The results of the studies are presented in table 1.

MATERIALS OF XII JUNIOR RESEARCHERS’ CONFERENCE 2020
Architecture and Civil Engineering
18
Table 1. - Specific surface and volume resistance
Material ρ s Ohm * m ρ v Ohm * m
Acrylic Sealant
Clean 13.5 * 10 8 5 * 10 9
Fiberglass (Fiber) 1.6 * 10 6 11.4 * 10 7
Fiberglass (Canvas) 1.0 * 10 6 8.4 * 10 9
Coal 10% 1.0 * 10 6 1.7 * 10 9
Coal 20% 1.2 * 10 6 2.1 * 10 9
Soot 10% 1.2 * 10 6 11.1 * 10 7
Soot 20% 1.0 * 10 6 10.2 * 10 8
PC10% 3.09 * 10 8 4 * 10 8
PC20% 1.3 * 10 6 24 * 10 9
Material ρ s Ohm * m ρ v Ohm * m
Siliconesealant
Clean 13.5 * 10 8 ∞
Fiberglass (Fiber) 2.3 * 10 10 ∞
Fiberglass (Canvas) 2.3 * 10 10 ∞
Coal 10% 1.0 * 10 6 ∞
Coal 20% 0.9 * 10 6 ∞
Soot 10% 0.8 * 10 6 ∞
Soot 20% 0.8 * 10 6 (34 * 10 6 ) ∞
PC10% 0.9 * 10 6 ∞
PC20% 0.8 * 10 6 ∞
From the analysis of the results shown in table 1, the material based on silicone matrix with filler in the
form of fiberglass has the highest surface electrical resistivity. Materials with silicone matrix with filler in the
form of 20 % RS-5402 have the smallest surface electrical resistivity, and the material with filler in the form of
20 % carbon black has the same resistance.
Since the test material can be used for sealing the enclosure, a very important characteristic is electric
strength. Strength in the broad sense is understood as the ability of the body to withstand the destruction that
occurs as a result of external forces. The destruction of the polymer material takes place under the influence of
electrical forces that determine the electrical resistance.
,
where U CR - breakdown voltage between conductors, V; d is the thickness of the dielectric layer, microns.
Having determined the value of EPr, it is possible to choose the optimal thickness of electrical insulating
coatings with a margin of electrical strength.
It is known, that the electrical strength of the material depends on the composition, structure, concentra-
tion and type of filler material, thickness. This allowed us to determine the parameters of the study of
the dielectric strength. [2]
Table 2 shows the results of tests of silicone and acrylic samples for electrical strength.
Table 2. - The results of the test for the electric strength of silicone sealants
Filler VoltagekV The thickness of the material,
microns Breakdown
E ol , V / cm
V / cm
Silicone sealant
Clean 25.5 1.735 not 1.4 * 10 8
Fiberglass (Fiber) 27.3 1.713 not 1.6 * 10 8
Fiberglass (Canvas) 26.5 1.395 thereis 1.89 * 10 8
Coal 10% 26.5 1.705 not 1.55 * 10 8
Coal20% 26.5 1.842 not 1.43 * 10 8
Soot 10% 26.8 1.751 not 1.53 * 10 8
Soot 20% 26.8 1.893 not 1.41 * 10 8
PC10% 26.5 1.802 not 1.47 * 10 8
PC20% 26.5 1.827 not 1.45 * 10 8

MATERIALS OF XII JUNIOR RESEARCHERS’ CONFERENCE 2020
Architecture and Civil Engineering
19
Filler VoltagekV The thickness of the material,
microns
Breakdown E ol , V / cm
Acrylic sealant
Clean 10.4 0.867 thereis 1.19 * 10 8
Fiberglass (Fiber) 21.5 1.313 not 1.63 * 10 8
Fiberglass (Canvas) 8.7 0.988 thereis 8.8 * 10 7
Coal 10% 9.3 1.015 thereis 9.16 * 10 7
Coal 20% 10.4 1.010 thereis 1.02 * 10 8
Soot 10% 11.4 0.942 thereis 1.2 * 10 8
Soot 20% 9.8 0.856 thereis 1.14 * 10 8
PC10% 11.5 1.066 thereis 1.07 * 10 8
PC20% 7.8 1.332 thereis 5.8 * 10 7
From the analysis of table 2, we can conclude: silicone sealants have greater electrical strength than
acrylic.
Composites based on a silicone matrix had the greatest electric strength .
Our research allows us to establish the dependence of E pr composites on the type and amount of filler.
The highest dielectric strength was found in materials based on a silicone matrix filled with fiberglass (in fiber).
The conducted studies will allow us to propose composite materials as sealants for electronic components.
REFERENCES
1. Фетисов Т.П. Материаловедение и технология металлов: Учебник для студ. высш. техн. учеб. заведений
/ Т.П. Фетисов, М.Г. Карпман, В.Л. Матюнин и др. : под. Ред. Т.П. Фетисова. - М.: Высшая шк., 2007. -
639 с.
2. Евстифеев, В.В. и др. Электротехнические материалы, пластмассы, резины, композиты: Учебное
пособие/ В.В. Евстифеев, М.С. Корытов. – Омск: Изд-во СибАДИ, 2009. – 36 с.
3. Волков Г.М. Материаловедение: Учебник Г. М. Волков, В.М. Зуев. - М.: Издательский центр
«Академия», 2008. – 400 с.
4. ГОСТ 6433.2-71 (СТ СЭВ 2411-80) Материалы электроизоляционные твердые. Методы определения
электрического сопротивления при постоянном напряжении Сб. ГОСТов. -М.: Издательство стандартов,
1994
MATERIALS OF XII JUNIOR RESEARCHERS’ CONFERENCE 2020
Architecture and Civil Engineering
20
UDC 691
THE INFLUENCE OF THE MICROSTRUCTURE ON THE ACOUSTIC PROPERTIES OF BUILDING MATERIALS
I. PANIN, A. SACHYUKA, E. BOROVKOVA
Polotsk State University, Belarus
The analysis of the structure of single-layer and two-layer samples, as well as a physical explanation
of the propagation of sound waves in building materials of various structures. A comparative analysis of the
soundproofing and sound absorbing properties of the applied samples is given. Determining the sound
transmission of building materials and their combinations.
Introduction. Acoustics (from the Greek. Acustikos - listening) is the science of sound. Building acoustics
solves the problem of ensuring a normal sound mode in rooms for various purposes. The main task of modern
building acoustics is to reduce the level of noise pollution in rooms. Noises are called sounds caused by various
reasons, but not carrying useful information. Noise has a negative effect on the mental and physical health of a
person. Reducing the level of noise pollution of the environment in which a person is located is an important
biomedical and social task [1]. Noise arising in the room can be divided into external and internal. The main
source of external noise in residential development are vehicles. Noise is usually characterized from a physical
and physiological point of view. The physical characteristic of noise includes the magnitude of sound pressure
and the distribution of this pressure over frequencies — the noise spectrum. The physiological characteristic of
noise is determined by its effect on the human body; medium- and especially high-frequency noise is the most
harmful [2].
One of the key parameters that affects labor productivity, creativity and health is acoustic comfort.
Acoustic factors such as sound insulation and sound absorption play an important role in the design of work and
living spaces. Electronics, heating, ventilation and air conditioning, mechanical appliances and other noise-
producing equipment in the office, as well as the people themselves, are the main sources of noise in the room.
Leisure places such as restaurants, cafes, cinemas and theaters require a separate approach to acoustic design.
Task formulation. In the research, we consider the main properties of acoustic materials in order to obtain
information about the principle of propagation of sound waves in them, as well as their practical application, and
we study the macro and micro structures of each sample using an Axiovert-10 microscope. The basic elements of
the designed and manufactured training acoustic camera, which is further used to study the acoustic character-
istics of building materials are described. As building materials, samples from drywall, wood concrete, foam plas-
tic, foam rubber, ecotherm, armstrong were studied both individually and in combination.
Methods of research. The measurements were carried out in one-third octave bands with geometric mean
frequencies of 100-8000 Hz, in accordance with TKP 45-2.04-154-2009 [3]. Prepared samples of the studied ma-
terials with dimensions of 40x45 with different thicknesses are placed in an acoustic chamber. Measurement of
sound pressure level in the sound camera and sound waves, followed by the output of the output data.
Working process. The study used a training acoustic camera [4] and samples of the studied materials.
First, sound transmission was measured in an empty chamber, then with the test materials being placed in the
chamber, and sound transmission, sound absorption, and sound reflection coefficients were calculated. Sound
absorption depends on the frequency and in practice is expressed by the sound absorption coefficient:
2
1
1Е
Е=α (1)
where 1α - sound absorption coefficient;
1Е - energy of the absorbed sound wave;
2Е - energy of the incident sound wave.
Similarly, the reflection coefficient can be determined by the formula:
2
3
2Е
Е=α (2)
where 2α - sound reflection coefficient;
3Е - energy of the reflected sound wave.
MATERIALS OF XII JUNIOR RESEARCHERS’ CONFERENCE 2020
Architecture and Civil Engineering
21
And the sound transmission coefficient is then defined as:
2
4
3Е
Е=α
(3)
4Е - energy of the transmitted sound wave.
Also considering that:
1321 =++ ααα (4)
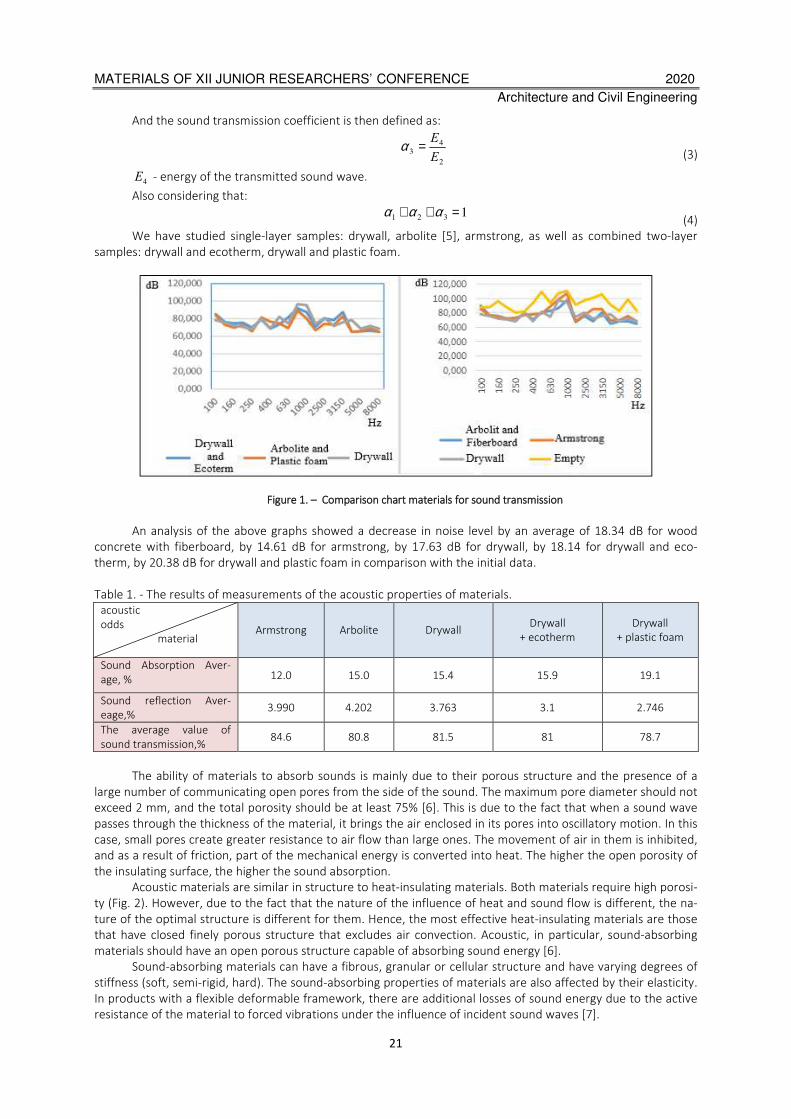
We have studied single-layer samples: drywall, arbolite [5], armstrong, as well as combined two-layer
samples: drywall and ecotherm, drywall and plastic foam.
Figure 1. – Comparison chart materials for sound transmission
An analysis of the above graphs showed a decrease in noise level by an average of 18.34 dB for wood
concrete with fiberboard, by 14.61 dB for armstrong, by 17.63 dB for drywall, by 18.14 for drywall and eco-
therm, by 20.38 dB for drywall and plastic foam in comparison with the initial data.
Table 1. - The results of measurements of the acoustic properties of materials.
acoustic
odds
material Armstrong Arbolite Drywall
Drywall
+ ecotherm
Drywall
+ plastic foam
Sound Absorption Aver-
age, % 12.0 15.0 15.4 15.9 19.1
Sound reflection Aver-
eage,% 3.990 4.202 3.763 3.1 2.746
The average value of
sound transmission,% 84.6 80.8 81.5 81 78.7
The ability of materials to absorb sounds is mainly due to their porous structure and the presence of a
large number of communicating open pores from the side of the sound. The maximum pore diameter should not
exceed 2 mm, and the total porosity should be at least 75% [6]. This is due to the fact that when a sound wave
passes through the thickness of the material, it brings the air enclosed in its pores into oscillatory motion. In this
case, small pores create greater resistance to air flow than large ones. The movement of air in them is inhibited,
and as a result of friction, part of the mechanical energy is converted into heat. The higher the open porosity of
the insulating surface, the higher the sound absorption.
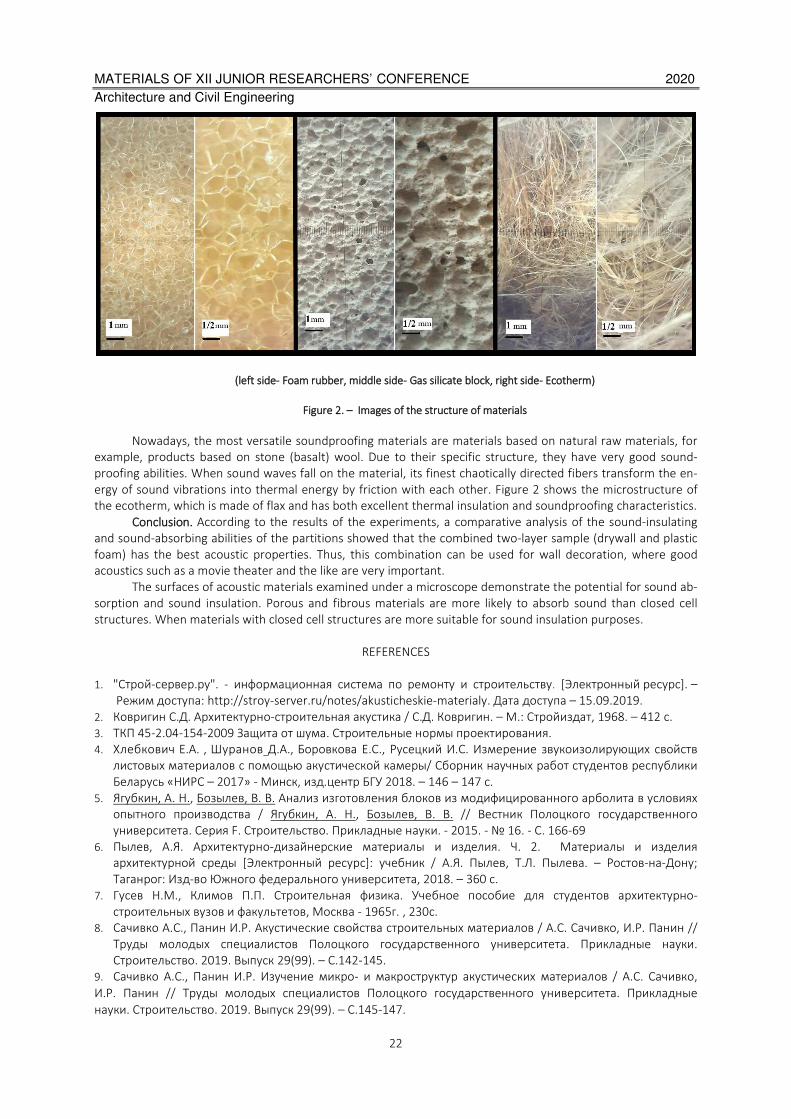
Acoustic materials are similar in structure to heat-insulating materials. Both materials require high porosi-
ty (Fig. 2). However, due to the fact that the nature of the influence of heat and sound flow is different, the na-
ture of the optimal structure is different for them. Hence, the most effective heat-insulating materials are those
that have closed finely porous structure that excludes air convection. Acoustic, in particular, sound-absorbing
materials should have an open porous structure capable of absorbing sound energy [6].
Sound-absorbing materials can have a fibrous, granular or cellular structure and have varying degrees of
stiffness (soft, semi-rigid, hard). The sound-absorbing properties of materials are also affected by their elasticity.
In products with a flexible deformable framework, there are additional losses of sound energy due to the active
resistance of the material to forced vibrations under the influence of incident sound waves [7].
MATERIALS OF XII JUNIOR RESEARCHERS’ CONFERENCE 2020
Architecture and Civil Engineering
22
(left side- Foam rubber, middle side- Gas silicate block, right side- Ecotherm)
Figure 2. – Images of the structure of materials
Nowadays, the most versatile soundproofing materials are materials based on natural raw materials, for
example, products based on stone (basalt) wool. Due to their specific structure, they have very good sound-
proofing abilities. When sound waves fall on the material, its finest chaotically directed fibers transform the en-
ergy of sound vibrations into thermal energy by friction with each other. Figure 2 shows the microstructure of
the ecotherm, which is made of flax and has both excellent thermal insulation and soundproofing characteristics.
Conclusion. According to the results of the experiments, a comparative analysis of the sound-insulating
and sound-absorbing abilities of the partitions showed that the combined two-layer sample (drywall and plastic
foam) has the best acoustic properties. Thus, this combination can be used for wall decoration, where good
acoustics such as a movie theater and the like are very important.
The surfaces of acoustic materials examined under a microscope demonstrate the potential for sound ab-
sorption and sound insulation. Porous and fibrous materials are more likely to absorb sound than closed cell
structures. When materials with closed cell structures are more suitable for sound insulation purposes.
REFERENCES
1. "Строй-сервер.ру". - информационная система по ремонту и строительству. [Электронный ресурс]. –
Режим доступа: http://stroy-server.ru/notes/akusticheskie-materialy. Дата доступа – 15.09.2019.
2. Ковригин С.Д. Архитектурно-строительная акустика / С.Д. Ковригин. – М.: Стройиздат, 1968. – 412 с.
3. ТКП 45-2.04-154-2009 Защита от шума. Строительные нормы проектирования.
4. Хлебкович Е.А. , Шуранов Д.А., Боровкова E.С., Русецкий И.С. Измерение звукоизолирующих свойств
листовых материалов с помощью акустической камеры/ Сборник научных работ студентов республики
Беларусь «НИРС – 2017» - Минск, изд.центр БГУ 2018. – 146 – 147 c.
5. Ягубкин, А. Н., Бозылев, В. В. Анализ изготовления блоков из модифицированного арболита в условиях
опытного производства / Ягубкин, А. Н., Бозылев, В. В. // Вестник Полоцкого государственного
университета. Серия F. Строительство. Прикладные науки. - 2015. - 16. - С. 166-69
6. Пылев, А.Я. Архитектурно-дизайнерские материалы и изделия. Ч. 2. Материалы и изделия
архитектурной среды [Электронный ресурс]: учебник / А.Я. Пылев, Т.Л. Пылева. – Ростов-на-Дону;
Таганрог: Изд-во Южного федерального университета, 2018. – 360 с.
7. Гусев Н.М., Климов П.П. Строительная физика. Учебное пособие для студентов архитектурно-
строительных вузов и факультетов, Москва - 1965г. , 230с.
8. Сачивко А.С., Панин И.Р. Акустические свойства строительных материалов / А.С. Сачивко, И.Р. Панин //
Труды молодых специалистов Полоцкого государственного университета. Прикладные науки.
Строительство. 2019. Выпуск 29(99). – С.142-145.
9. Сачивко А.С., Панин И.Р. Изучение микро- и макроструктур акустических материалов / А.С. Сачивко,
И.Р. Панин // Труды молодых специалистов Полоцкого государственного университета. Прикладные
науки. Строительство. 2019. Выпуск 29(99). – С.145-147.
MATERIALS OF XII JUNIOR RESEARCHERS’ CONFERENCE 2020
Architecture and Civil Engineering
23
UDC 624.072
CONCERNING THE QUESTION OF CALCULATING A BEAM WITH A HINGE-ROD CHAIN
J. FARRAN, L. SIARHEYEVA, L. TURISHEV
Polotsk State University, Belarus
We consider the calculation of a statically indeterminate combined system consisting of a beam and a
hinge-rod chain of a general form for the action of an arbitrary vertical load. The qualitative regularities of the
internal forces in the rods of the hinge-rod chain are established. Depending on the scheme of interaction of the
chain with the beam, the calculation of combined systems with and without a horizontal reaction support is con-
sidered. Finite formulas are obtained for determining the internal forces in such systems.
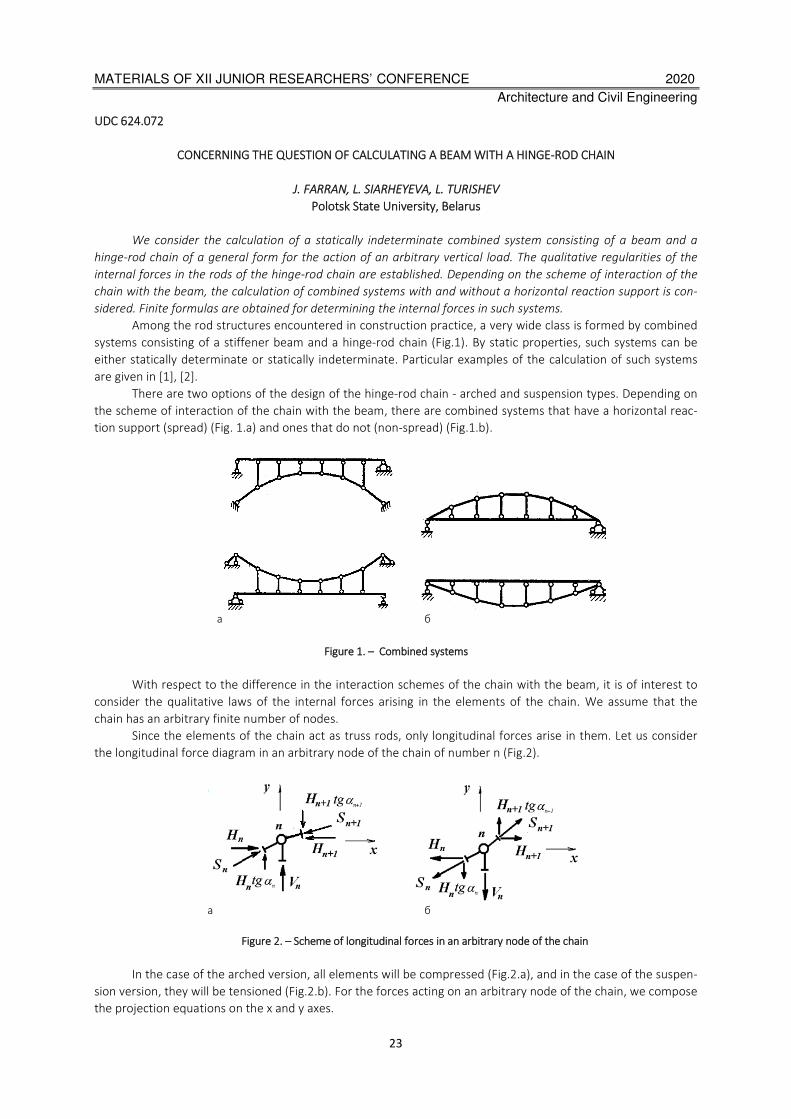
Among the rod structures encountered in construction practice, a very wide class is formed by combined
systems consisting of a stiffener beam and a hinge-rod chain (Fig.1). By static properties, such systems can be
either statically determinate or statically indeterminate. Particular examples of the calculation of such systems
are given in [1], [2].
There are two options of the design of the hinge-rod chain - arched and suspension types. Depending on
the scheme of interaction of the chain with the beam, there are combined systems that have a horizontal reac-
tion support (spread) (Fig. 1.a) and ones that do not (non-spread) (Fig.1.b).
а б
Figure 1. – Combined systems
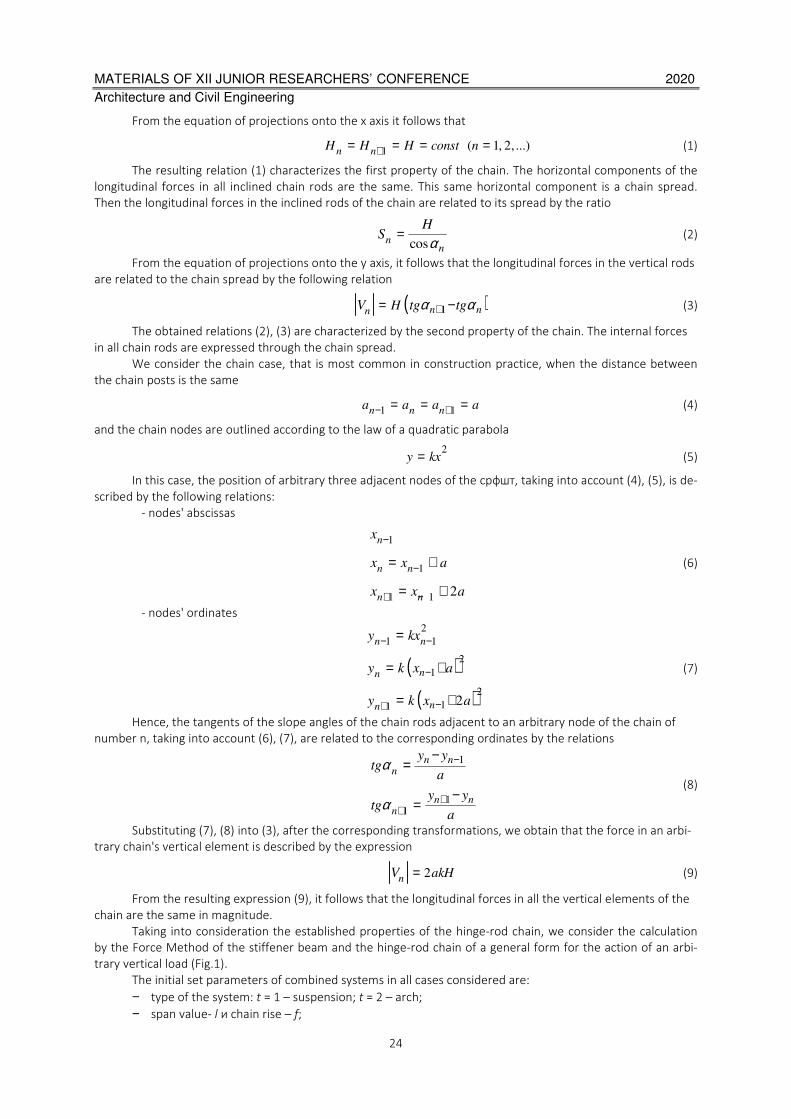
With respect to the difference in the interaction schemes of the chain with the beam, it is of interest to
consider the qualitative laws of the internal forces arising in the elements of the chain. We assume that the
chain has an arbitrary finite number of nodes.
Since the elements of the chain act as truss rods, only longitudinal forces arise in them. Let us consider
the longitudinal force diagram in an arbitrary node of the chain of number n (Fig.2).
а б
Figure 2. – Scheme of longitudinal forces in an arbitrary node of the chain
In the case of the arched version, all elements will be compressed (Fig.2.a), and in the case of the suspen-
sion version, they will be tensioned (Fig.2.b). For the forces acting on an arbitrary node of the chain, we compose
the projection equations on the x and y axes.
MATERIALS OF XII JUNIOR RESEARCHERS’ CONFERENCE 2020
Architecture and Civil Engineering
24
From the equation of projections onto the x axis it follows that
1 ( 1, 2, ...)n nH H H const n+= = = = (1)
The resulting relation (1) characterizes the first property of the chain. The horizontal components of the
longitudinal forces in all inclined chain rods are the same. This same horizontal component is a chain spread.
Then the longitudinal forces in the inclined rods of the chain are related to its spread by the ratio
cosnn
HS α= (2)
From the equation of projections onto the y axis, it follows that the longitudinal forces in the vertical rods
are related to the chain spread by the following relation
( )1n nn HV tg tgα α+= − (3)
The obtained relations (2), (3) are characterized by the second property of the chain. The internal forces
in all chain rods are expressed through the chain spread.
We consider the chain case, that is most common in construction practice, when the distance between
the chain posts is the same
1 1n n na a a a− += = = (4)
and the chain nodes are outlined according to the law of a quadratic parabola
2y kx= (5)
In this case, the position of arbitrary three adjacent nodes of the срфшт, taking into account (4), (5), is de-
scribed by the following relations:
- nodes' abscissas
1
1
1 12
n
n n
n n
x
x x a
x x a
−
−
+ −
= +
= +
(6)
- nodes' ordinates
( )( )
2
1 1
2
1
2
112
n n
nn
nn
y kx
y k x a
y k x a
− −
−
−+
=
= +
= +
(7)
Hence, the tangents of the slope angles of the chain rods adjacent to an arbitrary node of the chain of
number n, taking into account (6), (7), are related to the corresponding ordinates by the relations
1
11
n nn
n nn
y ytg
a
y ytg
a
α
α
−
++
−=
−=
(8)
Substituting (7), (8) into (3), after the corresponding transformations, we obtain that the force in an arbi-
trary chain's vertical element is described by the expression
2n akHV = (9)
From the resulting expression (9), it follows that the longitudinal forces in all the vertical elements of the
chain are the same in magnitude.
Taking into consideration the established properties of the hinge-rod chain, we consider the calculation
by the Force Method of the stiffener beam and the hinge-rod chain of a general form for the action of an arbi-
trary vertical load (Fig.1).
The initial set parameters of combined systems in all cases considered are:
− type of the system: t = 1 – suspension; t = 2 – arch;
− span value- l и chain rise – f;
MATERIALS OF XII JUNIOR RESEARCHERS’ CONFERENCE 2020
Architecture and Civil Engineering
25
− number of panels - p;
− load parameters - places of application and direction of concentrated and distributed loads, values of
their modules and intensities;
− stiffness beam parameters — elastic modulus of the material - Eb, area - Ab and moment of inertia - Ib
of the cross section;
− chain elements parameters - elastic modulus of the material of the belt rods - Es, the elastic modulus
of the material of the struts (vertical elements) - Ev, the cross-sectional area of the rods of the belt - As, the cross-
sectional area of the struts - Av.
The derived parameters of combined systems in all cases considered are:
− belt panel length - al
p= ;
− number of nodes in the chain - 1y
k p= + ;
− number of rods in the belt of the chain - sk p= ;
− number of struts in the chian - 1v
k p= − .
− The geometry of the hinge-rod chain of the calculated combined systems is characterized by;
− outline law of the chain's axis – y(x);
− coordinates of the chains nodes - ( ) 1, ...,k yy k k= ;
− length of the belt's rods - ( ) ( )2 2
1= 1, ...,
ks k kl y y a k p+ − + = ;
− angle of the chain rods - ( )1= 1, ...,
k kk
y ytg k p
aα +−
= ;
− length of the struts - ( ) 1, ...,kv v
l k k= .
The considered spreader and non-spreader combined systems for both options of the structural design of
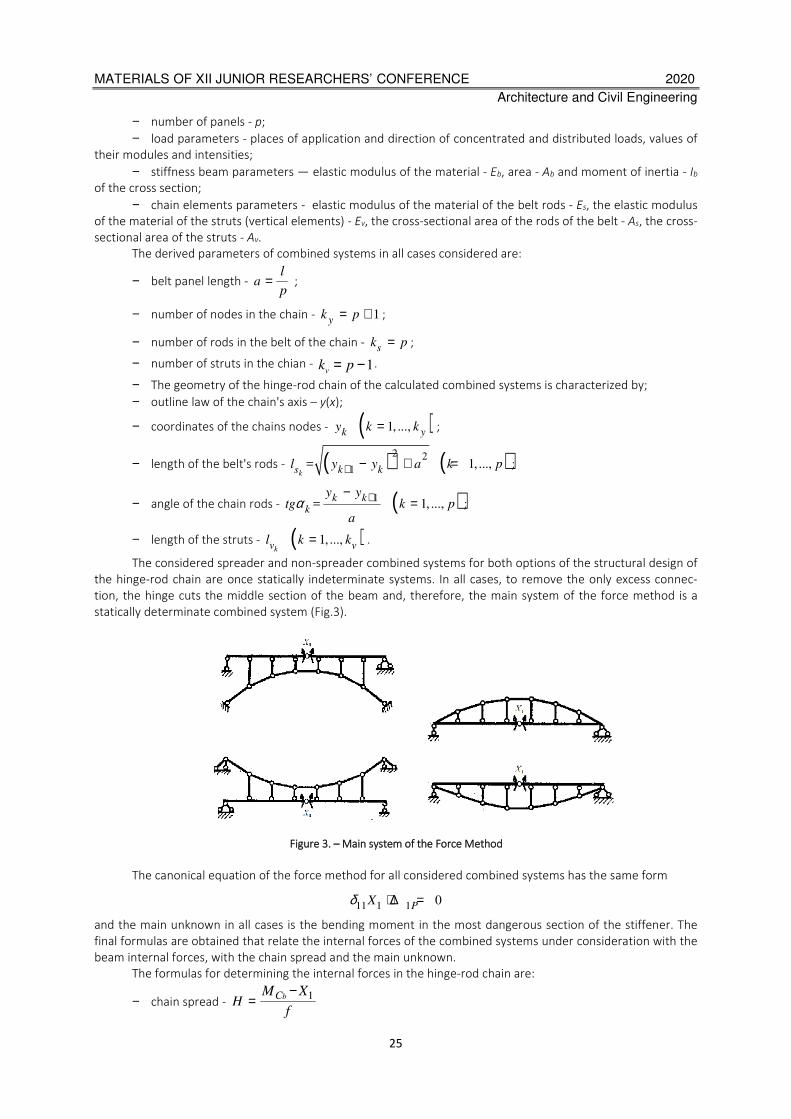
the hinge-rod chain are once statically indeterminate systems. In all cases, to remove the only excess connec-
tion, the hinge cuts the middle section of the beam and, therefore, the main system of the force method is a
statically determinate combined system (Fig.3).
Figure 3. – Main system of the Force Method
The canonical equation of the force method for all considered combined systems has the same form
11 1 10PXδ + ∆ =
and the main unknown in all cases is the bending moment in the most dangerous section of the stiffener. The
final formulas are obtained that relate the internal forces of the combined systems under consideration with the
beam internal forces, with the chain spread and the main unknown.
The formulas for determining the internal forces in the hinge-rod chain are:
− chain spread - 1bC
HM X
f=
−
MATERIALS OF XII JUNIOR RESEARCHERS’ CONFERENCE 2020
Architecture and Civil Engineering
26
− longitudinal force in the belt's rods - ( )1= 1,...,
cos
bCk
k
SM X
k pf α
−=
− longitudinal force in the struts - ( )11
= ( - ) 1,...,bC
vk k kV tg tgM X
k kf
α α+−
=
The formulas for determining the internal forces in the stiffener beam are:
− non-spread combined systems of any type
1
1
1
( ) ( ) ( )
( ) ( )
b
b
b
Cb
Cb
C
M x M x y x
Q x Q tg x
N
X M
f
X M
f
X M
f
α
= +
= +
−
−
−=
− spread combined systems of any type
1
1
( ) ( ) ( )
( ) ( )
0
b
b
Cb
Cb
M x M x y x
Q x Q tg x
N
X M
f
X M
fα
= +
= +
=
−
−
The established properties of the hinge-rod chain and the resulting final formulas for determining the in-
ternal forces in the considered combined systems are of practical importance and can be used both when de-
signing new and when strengthening existing combined systems consisting of a beam and a hinge-rod chain.
REFERENCES
1. Борисевич, А. А. Строительная механика: учебное пособие для вузов/ А.А. Борисевич, Е.М. Сидорович,
В.И. Игнатюк. - Минск: БНТУ, 2009. - 756 с.
2. Дарков, А.В. Строительная механика: Учебник для вузов. / А. В. Дарков, Н.Н. Шапошников. - СПб.: Изд.
Лань, 2010.- 656 с.
MATERIALS OF XII JUNIOR RESEARCHERS’ CONFERENCE 2020
Architecture and Civil Engineering
27
UDC 72.025.5
TRANSFORMATION OF MOGILEV'S PUBLIC SPACES
H. PUTRYNA, V. MATVELCHUK
Polotsk State University, Belarus
The article discusses the concept and feasibility of urban public spaces. The conversion methods are given
on the example of the central historical part of the city of Mogilev. Brief characteristics of the selected objects are
given. Conceptual proposals for improving the urban environment have been made.
Keywords: public space, square, historical status, complex, pedestrian space.
Introduction. On a city-wide scale public spaces can be represented by a combination of elements such as
pedestrian streets, squares, parks, squares, boulevards, territories in front of public buildings adjacent to houses
of the territory, etc. Spaces of this type are designed to facilitate the content of trade, the organization of lei-
sure, cultural the development of citizens, the development of their social skills, regardless of their financial situ-
ation, ethnicity or gender. Consequently urban public spaces should be accessible, safe and comfortable in the
first place.
The image of large European cities is often collected in the minds of people on the basis of the real ap-
pearance of historically developed public spaces. An example of this is Red Square in Moscow, concluded be-
tween the Moscow Kremlin and China-City, or the Triumphal Route in Paris, which originates from the Louvre
and ends in the defense quarter [1].
Main part. The historical center of Mogilev was formed on the right high bank of the Dnieper. The old city
was a commercial and religious center. As part of the Grand Duchy of Lithuania, the city had the right to hold
two fairs a year, and Magdeburg law allowed the city to acquire the town hall and accordingly the square in front
of it. All of the above facts testify to the high social activity of the townspeople and the organization of various
open public spaces, which now have historical significance.
The public spaces of Mogilev, discussed further in the article, namely squares, squares and boulevards,
are adjacent to the main streets of the city - Pervomaiskaya Street and the pedestrian Leninskaya Street. In
figure 1 is a situation scheme showing the main objects under consideration and the elements surrounding
them. Therefore the fragment under study consists of an invitation site in front of the building of the cultural
institution “Mogilev Regional Philharmonic”, an avenue of heroes of the Mogilev region, the theater square,
Herzen Square, the square of the Episcopal Palace, as well as the Slava Square and the Maxim Gorky Park. The
common problem of these components of the urban environment is not rational functional use, not devel-
oped infrastructure and service system, and many territories are simply empty. The reason for this may be
planning decisions of these territories that do not meet modern requirements, outdated equipment, inappro-
priate small architectural forms and the absence of a barrier-free environment. In an ideal situation, each of
these spaces should fulfill several functions and have many scenarios for using them by the townspeople or
guests of the regional center. However, it is worth noting that there is no single universal solution, therefore,
each of the objects should be considered separately, taking into account its historical status and in combina-
tion with the surrounding buildings.
Compositionally the Slava Square is a node to which extended axial elements lead. A steep relief deter-
mined the completion of Pervomaiskaya Street with a dead end adjacent to the square. Located on the right
bank of the Dnieper, it has become a natural, viewing platform. A huge territory is occupied by the Memorial
complex "Fighters for Soviet power." The complex includes a twenty-meter stela symbolizing victory, eternal
flame, the mass grave of the Red Army soldiers who died in 1920. The bronze bas-reliefs on the mass grave de-
pict the themes: «Collectivization», «October Revolution», «Defense of Mogilev in 1941», «Partisan movement»
and «Post-war time» [2]. The attitude of citizens towards the memorial complex is ambiguous. Large monumen-
tal forms cause a lot of controversy among the modern generation. However, it should be recognized that al-
most all excursions and city tours include visits to this square and neighboring attractions. In order to preserve
the memory of the bloody events that befell residents of Mogilev the history of Belarusians in general, zoning of
the territory should be carried out delicately.
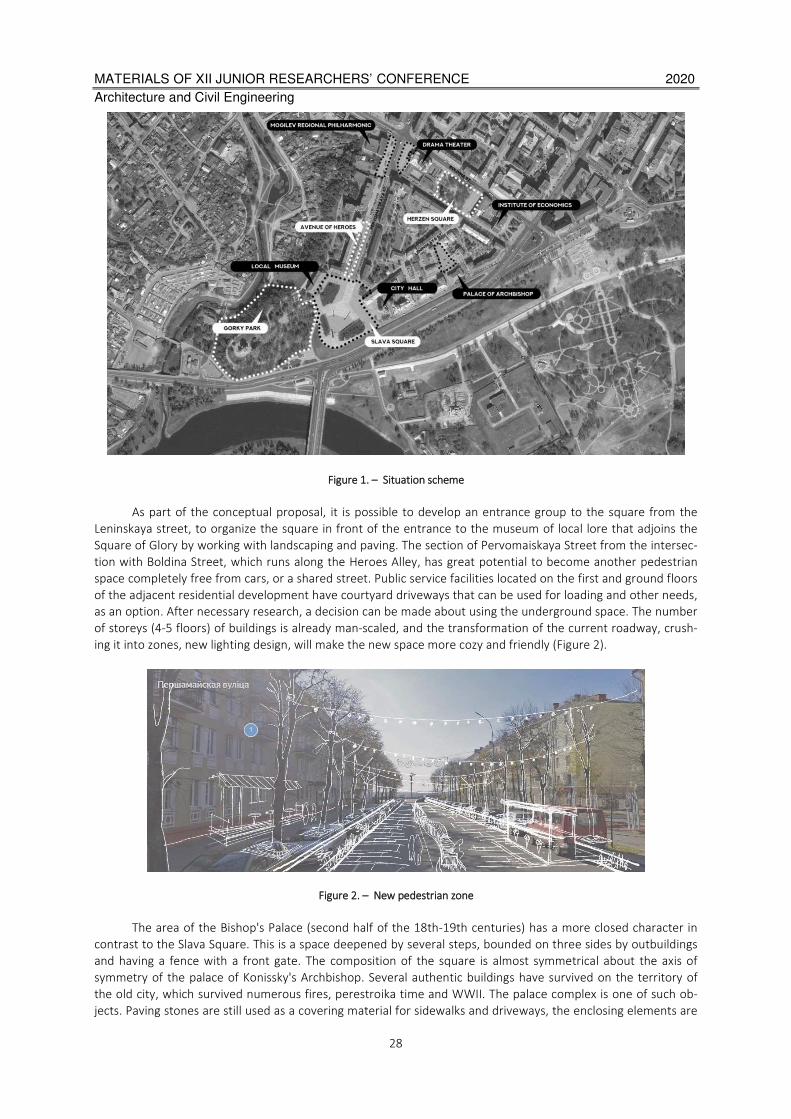
MATERIALS OF XII JUNIOR RESEARCHERS’ CONFERENCE 2020
Architecture and Civil Engineering
28
Figure 1. – Situation scheme
As part of the conceptual proposal, it is possible to develop an entrance group to the square from the
Leninskaya street, to organize the square in front of the entrance to the museum of local lore that adjoins the
Square of Glory by working with landscaping and paving. The section of Pervomaiskaya Street from the intersec-
tion with Boldina Street, which runs along the Heroes Alley, has great potential to become another pedestrian
space completely free from cars, or a shared street. Public service facilities located on the first and ground floors
of the adjacent residential development have courtyard driveways that can be used for loading and other needs,
as an option. After necessary research, a decision can be made about using the underground space. The number
of storeys (4-5 floors) of buildings is already man-scaled, and the transformation of the current roadway, crush-
ing it into zones, new lighting design, will make the new space more cozy and friendly (Figure 2).
Figure 2. – New pedestrian zone
The area of the Bishop's Palace (second half of the 18th-19th centuries) has a more closed character in
contrast to the Slava Square. This is a space deepened by several steps, bounded on three sides by outbuildings
and having a fence with a front gate. The composition of the square is almost symmetrical about the axis of
symmetry of the palace of Konissky's Archbishop. Several authentic buildings have survived on the territory of
the old city, which survived numerous fires, perestroika time and WWII. The palace complex is one of such ob-
jects. Paving stones are still used as a covering material for sidewalks and driveways, the enclosing elements are
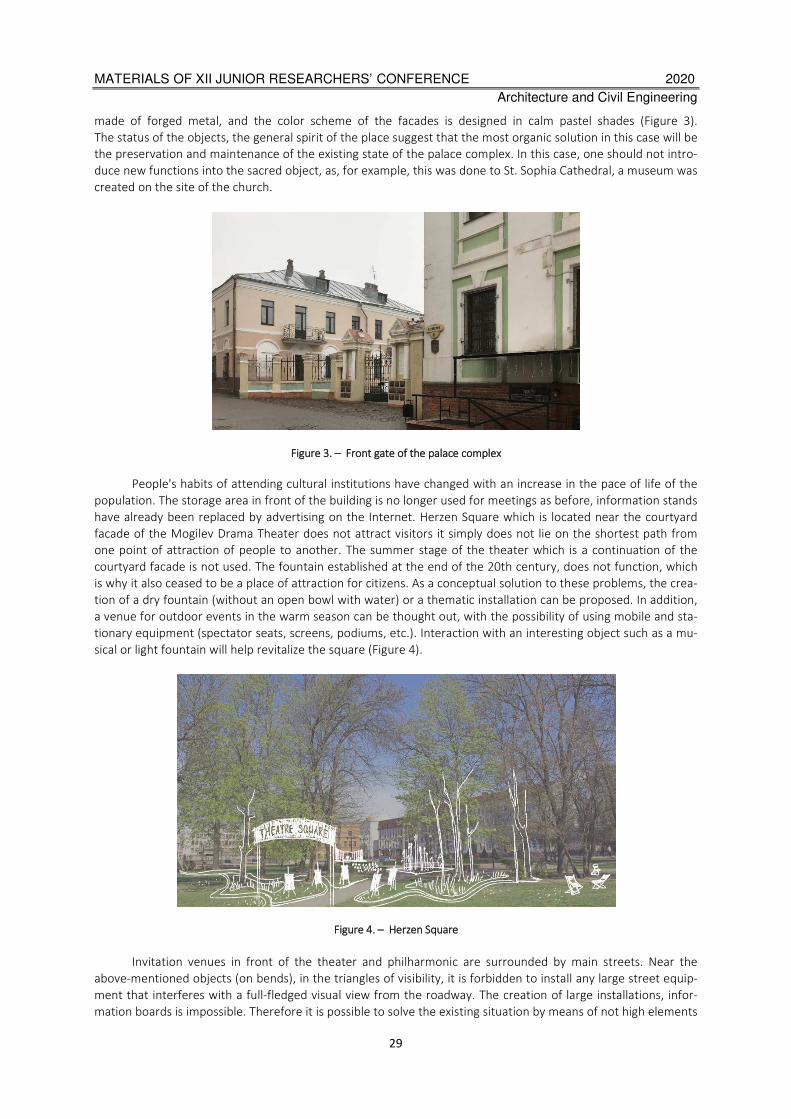
MATERIALS OF XII JUNIOR RESEARCHERS’ CONFERENCE 2020
Architecture and Civil Engineering
29
made of forged metal, and the color scheme of the facades is designed in calm pastel shades (Figure 3).
The status of the objects, the general spirit of the place suggest that the most organic solution in this case will be
the preservation and maintenance of the existing state of the palace complex. In this case, one should not intro-
duce new functions into the sacred object, as, for example, this was done to St. Sophia Cathedral, a museum was
created on the site of the church.
Figure 3. – Front gate of the palace complex
People's habits of attending cultural institutions have changed with an increase in the pace of life of the
population. The storage area in front of the building is no longer used for meetings as before, information stands
have already been replaced by advertising on the Internet. Herzen Square which is located near the courtyard
facade of the Mogilev Drama Theater does not attract visitors it simply does not lie on the shortest path from
one point of attraction of people to another. The summer stage of the theater which is a continuation of the
courtyard facade is not used. The fountain established at the end of the 20th century, does not function, which
is why it also ceased to be a place of attraction for citizens. As a conceptual solution to these problems, the crea-
tion of a dry fountain (without an open bowl with water) or a thematic installation can be proposed. In addition,
a venue for outdoor events in the warm season can be thought out, with the possibility of using mobile and sta-
tionary equipment (spectator seats, screens, podiums, etc.). Interaction with an interesting object such as a mu-
sical or light fountain will help revitalize the square (Figure 4).
Figure 4. – Herzen Square
Invitation venues in front of the theater and philharmonic are surrounded by main streets. Near the
above-mentioned objects (on bends), in the triangles of visibility, it is forbidden to install any large street equip-
ment that interferes with a full-fledged visual view from the roadway. The creation of large installations, infor-
mation boards is impossible. Therefore it is possible to solve the existing situation by means of not high elements

MATERIALS OF XII JUNIOR RESEARCHERS’ CONFERENCE 2020
Architecture and Civil Engineering
30
of improvement of the environment: landscaping (lawn, flower beds, flower beds, undersized shrubs), the ar-
rangement of seats.
Conclusion. The proposals for transforming Mogilev’s public territories are based on the idea of creating
individual, unique and modern urban spaces meeting current modern living standards. Which could adapt to the
needs of citizens depending on the time of day or the time of year.
REFERENCES
1. Paris Digest. Paris city guide since 1997//Triumphal way walk in Paris [Электронный ресурс]. - 2020. –
Режим доступа: https://www.parisdigest.com/paris_tours/paris_triomphal_way_walking_tour.htm. – Дата
доступа: 01.03.2020.
2. 2.Holiday.by// Мемориальный комплекс «Борцам за советскую власть» в Могилеве [Электронный
ресурс]. - 2012. – Режим доступа: https://www.holiday.by/by/skarb/784-memorialnyj-kompleks-borcam-za-
sovetskuju-vlast-v-mogileve. – Дата доступа: 01.03.2020.
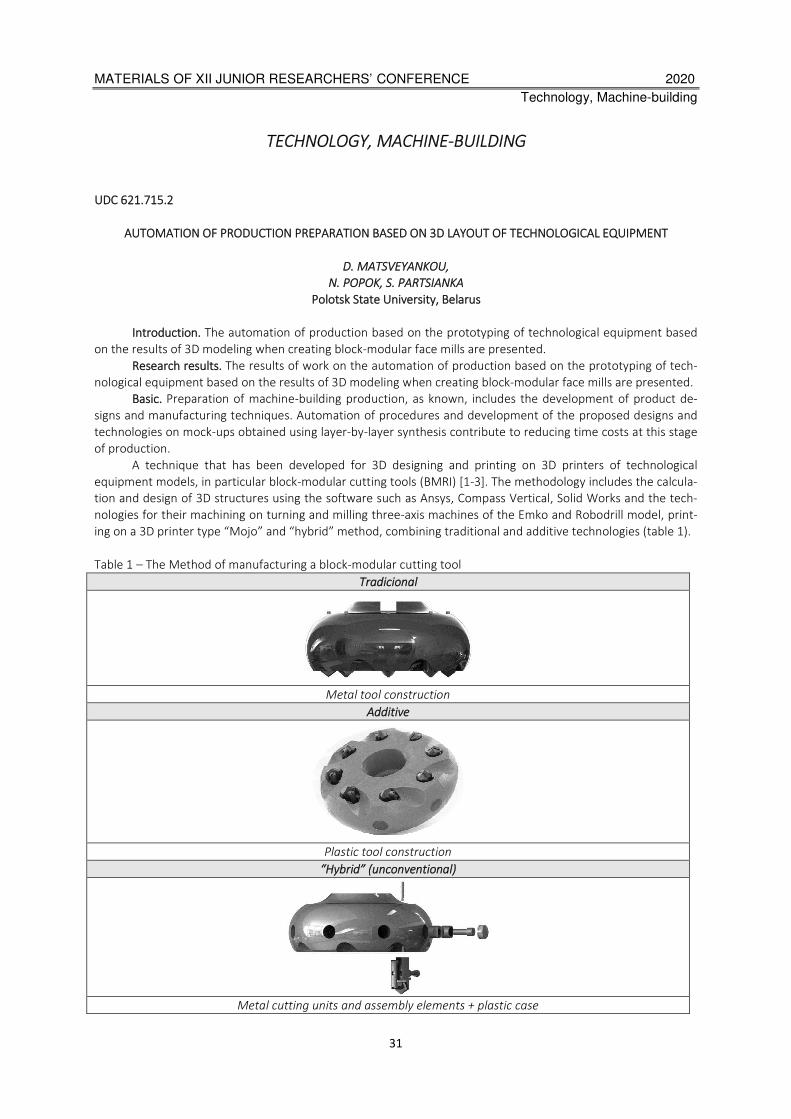
MATERIALS OF XII JUNIOR RESEARCHERS’ CONFERENCE 2020
Technology, Machine-building
31
TECHNOLOGY, MACHINE-BUILDING
UDC 621.715.2
AUTOMATION OF PRODUCTION PREPARATION BASED ON 3D LAYOUT OF TECHNOLOGICAL EQUIPMENT
D. MATSVEYANKOU,
N. POPOK, S. PARTSIANKA
Polotsk State University, Belarus
Introduction. The automation of production based on the prototyping of technological equipment based
on the results of 3D modeling when creating block-modular face mills are presented.
Research results. The results of work on the automation of production based on the prototyping of tech-
nological equipment based on the results of 3D modeling when creating block-modular face mills are presented.
Basic. Preparation of machine-building production, as known, includes the development of product de-
signs and manufacturing techniques. Automation of procedures and development of the proposed designs and
technologies on mock-ups obtained using layer-by-layer synthesis contribute to reducing time costs at this stage
of production.
A technique that has been developed for 3D designing and printing on 3D printers of technological
equipment models, in particular block-modular cutting tools (BMRI) [1-3]. The methodology includes the calcula-
tion and design of 3D structures using the software such as Ansys, Compass Vertical, Solid Works and the tech-
nologies for their machining on turning and milling three-axis machines of the Emko and Robodrill model, print-
ing on a 3D printer type “Mojo” and “hybrid” method, combining traditional and additive technologies (table 1).
Table 1 – The Method of manufacturing a block-modular cutting tool
Tradicional
Metal tool construction
Additive
Plastic tool construction
“Hybrid” (unconventional)
Metal cutting units and assembly elements + plastic case
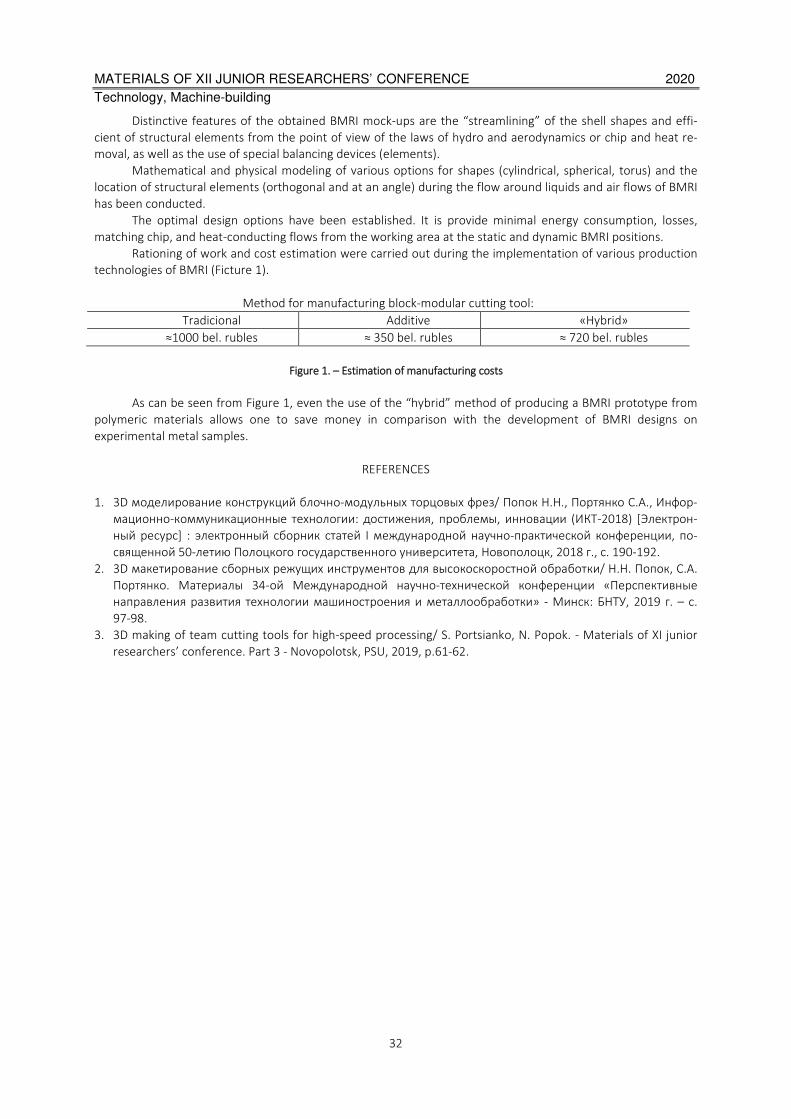
MATERIALS OF XII JUNIOR RESEARCHERS’ CONFERENCE 2020
Technology, Machine-building
32
Distinctive features of the obtained BMRI mock-ups are the “streamlining” of the shell shapes and effi-
cient of structural elements from the point of view of the laws of hydro and aerodynamics or chip and heat re-
moval, as well as the use of special balancing devices (elements).
Mathematical and physical modeling of various options for shapes (cylindrical, spherical, torus) and the
location of structural elements (orthogonal and at an angle) during the flow around liquids and air flows of BMRI
has been conducted.
The optimal design options have been established. It is provide minimal energy consumption, losses,
matching chip, and heat-conducting flows from the working area at the static and dynamic BMRI positions.
Rationing of work and cost estimation were carried out during the implementation of various production
technologies of BMRI (Ficture 1).
Method for manufacturing block-modular cutting tool:
Tradicional Additive «Hybrid»
≈1000 bel. rubles ≈ 350 bel. rubles ≈ 720 bel. rubles
Figure 1. – Estimation of manufacturing costs
As can be seen from Figure 1, even the use of the “hybrid” method of producing a BMRI prototype from
polymeric materials allows one to save money in comparison with the development of BMRI designs on
experimental metal samples.
REFERENCES
1. 3D моделирование конструкций блочно-модульных торцовых фрез/ Попок Н.Н., Портянко С.А., Инфор-
мационно-коммуникационные технологии: достижения, проблемы, инновации (ИКТ-2018) [Электрон-
ный ресурс] : электронный сборник статей I международной научно-практической конференции, по-
священной 50-летию Полоцкого государственного университета, Новополоцк, 2018 г., с. 190-192.
2. 3D макетирование сборных режущих инструментов для высокоскоростной обработки/ Н.Н. Попок, С.А.
Портянко. Материалы 34-ой Международной научно-технической конференции «Перспективные
направления развития технологии машиностроения и металлообработки» - Минск: БНТУ, 2019 г. – с.
97-98.
3. 3D making of team cutting tools for high-speed processing/ S. Portsianko, N. Popok. - Materials of XI junior
researchers’ conference. Part 3 - Novopolotsk, PSU, 2019, p.61-62.
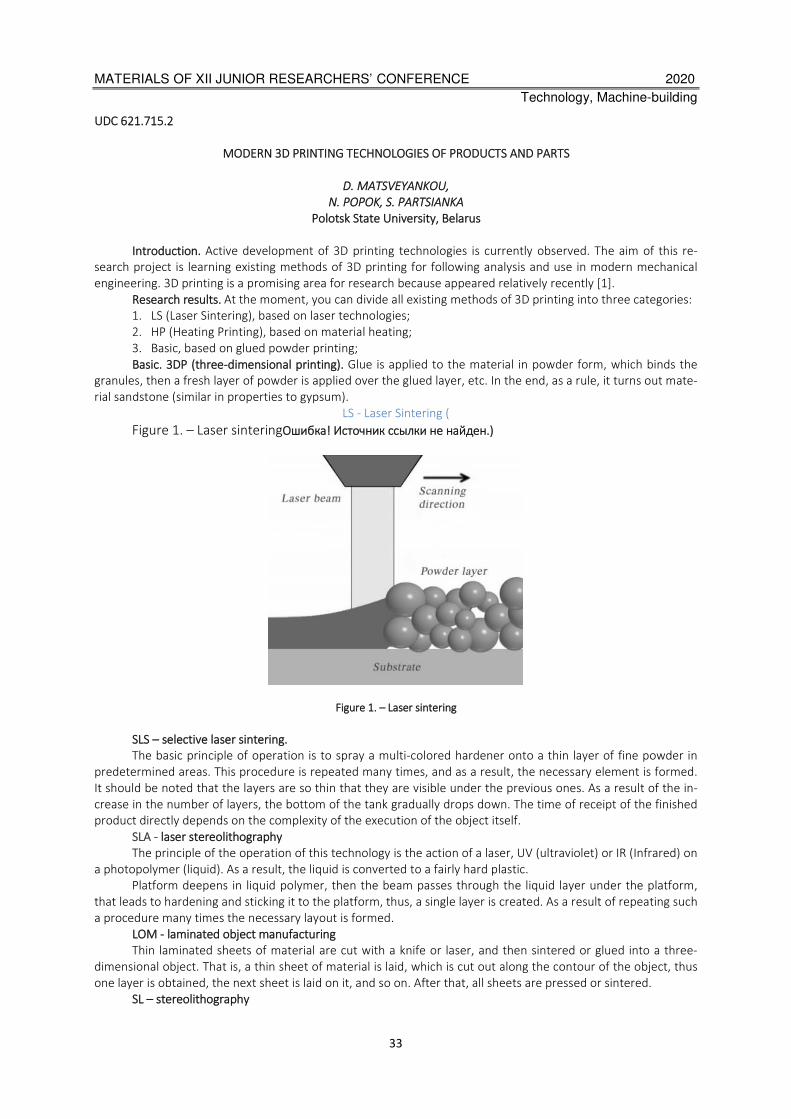
MATERIALS OF XII JUNIOR RESEARCHERS’ CONFERENCE 2020
Technology, Machine-building
33
UDC 621.715.2
MODERN 3D PRINTING TECHNOLOGIES OF PRODUCTS AND PARTS
D. MATSVEYANKOU,
N. POPOK, S. PARTSIANKA
Polotsk State University, Belarus
Introduction. Active development of 3D printing technologies is currently observed. The aim of this re-
search project is learning existing methods of 3D printing for following analysis and use in modern mechanical
engineering. 3D printing is a promising area for research because appeared relatively recently [1].
Research results. At the moment, you can divide all existing methods of 3D printing into three categories:
1. LS (Laser Sintering), based on laser technologies;
2. HP (Heating Printing), based on material heating;
3. Basic, based on glued powder printing;
Basic. 3DP (three-dimensional printing). Glue is applied to the material in powder form, which binds the
granules, then a fresh layer of powder is applied over the glued layer, etc. In the end, as a rule, it turns out mate-
rial sandstone (similar in properties to gypsum).
LS - Laser Sintering (
Figure 1. – Laser sinteringОшибка! Источник ссылки не найден.)
Figure 1. – Laser sintering
SLS – selective laser sintering.
The basic principle of operation is to spray a multi-colored hardener onto a thin layer of fine powder in
predetermined areas. This procedure is repeated many times, and as a result, the necessary element is formed.
It should be noted that the layers are so thin that they are visible under the previous ones. As a result of the in-
crease in the number of layers, the bottom of the tank gradually drops down. The time of receipt of the finished
product directly depends on the complexity of the execution of the object itself.
SLA - laser stereolithography
The principle of the operation of this technology is the action of a laser, UV (ultraviolet) or IR (Infrared) on
a photopolymer (liquid). As a result, the liquid is converted to a fairly hard plastic.
Platform deepens in liquid polymer, then the beam passes through the liquid layer under the platform,
that leads to hardening and sticking it to the platform, thus, a single layer is created. As a result of repeating such
a procedure many times the necessary layout is formed.
LOM - laminated object manufacturing
Thin laminated sheets of material are cut with a knife or laser, and then sintered or glued into a three-
dimensional object. That is, a thin sheet of material is laid, which is cut out along the contour of the object, thus
one layer is obtained, the next sheet is laid on it, and so on. After that, all sheets are pressed or sintered.
SL – stereolithography
MATERIALS OF XII JUNIOR RESEARCHERS’ CONFERENCE 2020
Technology, Machine-building
34
There is a small bath with liquid polymer. The laser beam passes over the surface, and in this place the
polymer polymerizes under the influence of UV (ultraviolet). After one layer is ready, the platform with the part
is lowered, the liquid polymer fills the void, the next layer is baked, and so on. Sometimes the opposite happens:
platform with the part rises up, the laser is respectively located below ...
After printing by this method, the object requires post-processing - removal of excess material and sup-
port, sometimes the surface is ground. Depending on the required properties of the final object, the model is
baked in the so-called ultraviolet ovens.
Photopolymer is often toxic therefore, when working with him, you need to use protective equipment
and respirators.
Polyjet
Photopolymer shoots in small doses from thin nozzles, as in inkjet printing, and immediately polymerizes
on the surface of the manufactured device under the influence of ultraviolet radiation. An important feature
that distinguishes PolyJet from stereolithography, is the ability to print various materials.
LENS - laser engineered net shaping
Material in powder form is blown from the nozzle and arrives at the focused laser beam. Part of the pow-
der flies past, and the part that falls into the laser focus instantly sinter and layer by layer forms a three-
dimensional part.
DMLS - direct metal laser sintering
Powdered metal consumable enters the working chamber in a volume necessary to printing one layer. A
special roller smoothes the powder equally over the entire surface, while removing excess from the chamber.
The laser sinteres the fresh material with the existing layer according to the original model (picture 1). This pro-
cess continues until the printing of the part is complete.
HP - Heating Printing (Ошибка! Источник ссылки не найден.)
Figure 2. – Heating Printing
MJM - multi jet modeling
In this method, the light curing of the polymer is carried out through the influence of UV (ultraviolet)
flash. The molten acrylic photopolymer (plastic) is applied to the printing platform using the head. On this plat-
form, the plastic lends itself to being illuminated by a halogen lamp, resulting in hardening of the material. The
procedure is repeated many times to achieve the desired result. An important detail is the supporting of pro-
truding or overhanging parts, which is carried out using household wax.
DLP - digital light processing

MATERIALS OF XII JUNIOR RESEARCHERS’ CONFERENCE 2020
Technology, Machine-building
35
DLP is quite similar in its technological process to MJM (multi jet modeling). A clear difference is the ef-
fect of the projector on the model with the usual light flux to obtain polymer cure. The photopolymer is added to
the cell as it is consumed. During the printing process, the machine closes to prevent the model from flashing.
The protruding parts are also supported by the use of wax. Which removal technology is the same.
FDM - fused deposition modeling
FDM is the creation of inkjet technology. Using this technology, the printer operates directly from plastic
coils tucked into the extruder. The main principle of work is the melting of a plastic rod, the formation of a drop
from it and applying it to a moving platform in a given place.
EBM - electron beam melting
Additive manufacturing method similar to selective laser sintering (SLS), but using a high-energy electron
beam in vacuum instead of a laser. As with SLS (selective laser sintering), the consumable for EBM (electron
beam melting) is typically a powder pulverized to a powder consistency using ball mills. As a material, titanium,
alloys based on it and some steel grades are usually used.
DIW - direct ink writing
Robocasting is an additive technology that implements layer-by-layer 3D printing of an object by extru-
sion of “ink” through the forming hole of the head of a 3D printer. "Ink" comes out of the nozzle in a liquid state,
but immediately takes the desired shape due to its plasticity. This distinguishes robocasting from fusion model-
ing, since it does not require hardening or drying of the "ink", they immediately take the desired shape.
EBF - electron beam freeform fabrication
The manufacture of electronic forms in vacuum by electron beam melting, where a wire of one or anoth-
er metal is used as a consumable material. It is carried out by analogy with EBM (electron beam melting), and
the difference is that the metal is fed into the electron beam melting zone, as was said, in the form of a wire, not
a powder.
SHS - selective heating sintering
Melting layers of thermoplastic or metal powder by thermal radiation. The peculiarity of the method is
that all layers are baked immediately, since the radiation enters through a special mask, which directs heat to
those points where it is necessary to fix the layer.
DED - directed energy deposition
One of the additive processes, according to which building material and energy for its fusion are supplied
simultaneously to the place of construction of the product.
Powder material using a special device is spread out in a thin layer of the order of several tens of microns
on the installation desktop in accordance with the obtained 3D model. And this happens almost simultaneously
with sintering. In other words, a layer of building material is not formed here, but the material is fed to a specific
place where energy is currently being supplied and where the process of forming the part is going on. Just as the
welder introduces the material (electrode) to the place where the melt zone is formed due to the electric arc.
REFERENCES
1. Using of 3d modelling and rapid photoryping technologies during the design of constructions of block-
module surface cuttings/ S. Portsianko, N. Popok - Materials of IX junior researchers’ conference. Part 3 - No-
vopolotsk, PSU, 2017, p.214-215.
MATERIALS OF XII JUNIOR RESEARCHERS’ CONFERENCE 2020
Technology, Machine-building
36
UDC 752.85.953
ON THE POSSIBLE APPLICATION OF TUBERCLES ON PUMPING IMPELLER
TO DECREASE HYDRAULIC RESISTANCE
E. OVCHAROV, A. VARONIN
Polotsk State University, Belarus
This article is devoted to the biomimicry engineering approaches. The main idea of a tubercle technology
and its advantage are presented. The conveniences of the usage of pumping impellers with tubercles in the main
pipeline transport were formulated. It was also suggested to make profound learning of application of the tuber-
cle technology in rotating devices.
Life has existed on earth for billions of years and during that time life has learnt what works, what is ap-
propriate here, and what lasts here. The idea is that we should be looking at living organisms, at these mentors,
at these biological elders that have figured out how to create a sustainable world. Rather than inventing it from
scratch we should take our cues from them. These organisms are the consummate engineers, they are consum-
mate chemists and technologists. They have learned how to do it in the context. The core idea behind biomimic-
ry is that the best ideas might not be ours, they might already have been invented.
Biomimicry is a practice that learns from and mimics the strategies found in nature to solve human design
challenges. Biomimicry offers an empathetic, interconnected understanding of how life works and ultimately
where we fit in. Biomimicry is an innovation inspired by the nature. It is a new discipline in which the people that
make our world: chemists, architects, material scientists and product designers, draw engineering ideas from
evolution.
Solutions to global challenges are all around us. Here can be shown some biomimicry examples [1].
The first instance is the shopping Eastgate centre located in Harare, Zimbabwe. Rather than using a tradi-
tional fuel-based air-conditioning system to regulate temperature within the building, the Eastgate Centre is
designed to exploit more passive and energy-efficient mechanisms of climate control. This building saved 10% on
costs up-front by not purchasing an air-conditioning system. Architect Mick Pearce worked with the construction
company Arup to design the Eastgate Centre. Pearce was inspired by models of internal temperature regulation
in termite mounds.
The more streamlined Shinkansen train not only travels more quietly, it now travels 10% faster and uses
15% less electricity. Eiji Nakatsu, an engineer with JR West and a birdwatcher, used his knowledge of the splash-
less water entry of kingfishers and silent flight of owls to decrease the sound generated by the trains. Kingfishers
move quickly from air, a low-resistance (low drag) medium, to water, a high-resistance medium. The kingfisher’s
beak provides an almost ideal shape for such an impact.
EvoLogic developed and patented their Sweep Spread Carrier technology to manage the challenging con-
ditions presented by ocean waters. They developed underwater sensors that can transmit frequencies similar to
those emitted by dolphins. These sensors can be used to detect underwater earthquakes and therefore aid in
tsunami warning systems. They can also be used for guiding ships. The device is based on eight years of research
on the physics of dolphin communication. According to the website [2], dolphins and whales have adapted to
the situation under water very well, communicating over long distances. They chirp and sing across a broad fre-
quency bandwidth. This continuous change of frequencies not only serves to transmit information, but also to
compensate for sources of interference such as echoes and noise.
As we can see biomechanics is able to be used in engineering industry and the main pipeline transport is
not an exception as a complex of industrial dangerous objects which have to comply with the regulative re-
quirements. The applications of pipelines span domestic, commercial and industrial purposes. Pipelines can be
used to carry natural gas to homes, jet fuel to airports, and crude oil to refineries. The efficient transport of oil
from production wells to oil refineries would be impossible without the use of an elaborate network of pipelines.
This important midstream oil and gas component is also critical to the transfer of finished petroleum products to
end-users or dependent industries. The use of expansive networks of pipelines ensures that domestic and indus-
trial users have access to an uninterrupted flow of vital, energy generating gases and liquids. At the same time
the industry is quite energy intensive. The main pipeline transport accounted for more than 4% of total world
transportation energy consumption [3].
MATERIALS OF XII JUNIOR RESEARCHERS’ CONFERENCE 2020
Technology, Machine-building
37
The facilities of pipeline transport can be divided into site and linear objects. The ideas of engineering bi-
onics, in their turn, can be applied to both of them. As to the linear part of an oil transport the ideas of the Aus-
trian inventor Viktor Schauberger [4,5], who was inspired by nature, are extremely important for the designers
of modern gas pipelines, oil pipelines, water lines of hydro stations and all other types of pipeline transport. The
thing is about using the phenomenon of swirling flow in pipelines, which is still not used as a positive effect. This
approach can be used to reduce the dynamic resistance of main pipelines and water lines of hydroelectric power
plants. Swirling the flow along the central axis with usage of elementary butterfly inserts or placing a curled
spring inside the pipe can significantly reduce the energy costs of moving the contents of any transport pipe. The
cost of upgrading the transport pipe with such inserts are minimal. At the moment, a huge part of the energy
produced in the world is used precisely for pumping oil and gas products. Reducing these energy costs through
trunk transportation, even if only by a few percent, can be of immense importance.
As to the site facilities they are presented by a reservoir park, an oil metering unit with filters, the main
pumping and booster pumping stations, a pressure control unit and nodes with safety devices, the units for
starting and receiving treatment devices, the technological pipelines with shutoff valves. Among them the most
important and responsible part is the main pumps which require a lot of electrical energy in order to transform
the rotation energy into the kinetic energy. In this case, the observation of nature can help to solve the engi-
neering problem of improving the operating parameters of a pump.
Humpback whales are the only whales that have bumpy leading edges on their flippers and that can have
some important engineering consequences. Scientists ran some fluid dynamic simulations of wings with tuber-
cles and wings without tubercles. It turned out that the tubercles increased the lift and simultaneously reduced
the drag. For a specialist who works on wing performance, that is a spectacular achievement to be able to in-
crease the lift and reduce the drag at the same time. Further investigations followed with several researchers
involved. Soon it became clear that these bumps give benefits. Tubercles focus the flow between the bumps.
That focused flow helps to keep the flow attached to the wing and it also helps to isolate the lift in-between the
tubercles on the reason of existence of a high-lift region [6].
Moreover, something that improved the performance in the water could also bring big benefits in the air.
WhalePower Corporation is a Canadian company established in Toronto. It creates energy efficient rotating de-
vices for different applications. The WhalePower team developed prototypes and tested them. As a result, there
were 20 percent energy savings, improved efficiency, greater stability and greater durability. The tests have
shown that blades with tubercles are more energy-efficient and quieter than standard blades [7].They literally
revolutionize low speed performance far beyond any conventional blades. Scientific studies have established
that the addition of tubercles to the leading edges of airfoils directly addresses the fundamental limitations of
conventional aerodynamic performance:
- tubercle airfoils display enhanced stable lift;
- tubercles keep drag low even at high pitch angles;
- tubercles dramatically improve stall angle (pitch) performance;
- tubercle airfoils deliver stable operation over an unmatched range of pitch angles and better still, when
they do stall, they stall gradually.
This technology can be used for such equipment as wind turbines, fans, compressors and pumps. We
propose to apply this technology to the main oil pumps, which will lead not only to a quieter and more stable
operation of the equipment, but also to a decrease in hydraulic resistance and a more rational use of energy. In
pumps, tubercles can be made by cutting spades of pumping impeller with notches. It is difficult to talk about
the exact numbers of hydraulic resistance at the moment. To do this, it is necessary to conduct research with
special software programs and, possibly, in a wind tunnel, which demand many scientific resources.
The tubercle effect is a phenomenon where tubercles or large 'bumps' on the leading edge of
an airfoil can improve its aerodynamics. Tubercle technology is both sustainable and unique. The technology is
not very widespread in the world yet. However, it is proved that this technology has certain advantages in the
operation of various kinds of equipment in different industries compared to blades with straight leading edge.
Tubercles are a technology for the future.
REFERENCES
1. Официальный сайт Американского института биомимикрии [Электронный ресурс] / Институт биоми-
микрии.— Режим доступа: https://biomimicry.org/biomimicry-examples/. — Дата доступа: 10.02.2020.

MATERIALS OF XII JUNIOR RESEARCHERS’ CONFERENCE 2020
Technology, Machine-building
38
2. Официальный сайт сообщества изучения бионики [Электронный ресурс] / Институт бионики. — Режим
доступа: https://asknature.org/idea/evologics-underwater-sensor/ – Дата доступа: 11.02.2020.
3. Официальный сайт Американского информационного энергетического агентства [Электронный ресурс]
/ Американское информационное энергетическое агенства. — Режим доступа:
http://www.un.org/en/development/desa/policy/wesp/wesp_archive/2012chap2.pdf – Дата доступа:
16.02.2020.
4. В.Шаубергер. Энергия воды. Изд-во: Яуза, Москва, 2007
5. А.Я. Милович. Основы динамики жидкости (гидродинамика). Гос. энергетич. изд-во, 1933. стр.157
6. Официальный сайт международной консалтинговой компании в области биотехнологических исследо-
ваний [Электронный ресурс] / – Консалтинговая компания «Biomimicry». — Режим доступа:
https://biomimicry.net/examples – Дата доступа: 22.02.2020.
7. Официальный сайт международной консалтинговой компании [Электронный ресурс] / – Консалтинго-
вая компания «WhalePower». — Режим доступа: https://whalepower.com/examples – Дата доступа:
22.02.2020.
MATERIALS OF XII JUNIOR RESEARCHERS’ CONFERENCE 2020
Technology, Machine-building
39
UDC 614.87
THE INFLUENCE OF OFFICE ENVIRONMENT ON THE HEALTH OF WORKERS
V. PALAVY. A. SAFRONAVA
Polotsk State University, Belarus
The article analyzes a complex of indoor factors of office environment, which influence the health status of
personnel, and the main measures to reduce the adverse impact of this factors.
In modern society office workers include the majority of professions and jobs combined with a set of fea-
tures of the office environment. Nowadays, office work can range from secretarial, clerical, accounting, com-
mercial, economic, informative, technological, research, legal to administrative, coordinating, management. In
developed countries the number of office workers is constantly increasing, in the U.S. it is about 60% of the
working population.
In the office environment many factors are harmful for the health of office workers. Among such factors
are air environment factors, external physical factors, ergonomics, work intensity and tension, psychosocial fac-
tors.
Microclimate. Microclimatic discomfort is the most common problem in the office environment. To de-
termine the necessary parameters of microclimate in offices the civilized world uses two major international
standards ANSI/ASHRAE 55-2010 [3] and ISO 7730:2005 [9], which are based on mathematical models of Fanger,
one of which was developed for general temperature comfort (PMV model) [6], and the model of "draughts" [7].
The PMV model considers the combined effects of four physical factors (temperature, air velocity, average radia-
tion temperature, relative humidity) and two "human" factors (clothes and movement). Standard ISO 7730:2005
introduces 3 categories of micro climatic room conditions and allows (for category C) the presence in a room of
up to 15% of people experiencing general temperature discomfort. Graphical representation of Fanger's "com-
fort zone" has become a part of the international standards, which are now complemented by a computer-based
computation algorithm. The general micro climatic comfort is closely connected with local factors ("draughts",
floor surface temperature, radiation temperature asymmetry, vertical temperature difference) which determine
the local temperature comfort of dwelling houses, which is also taken into account in the standards.
Air dryness is one of the main factors affecting the overall well-being, eye and mucous membrane condi-
tion, upper respiratory tract and skin of office workers. Low humidity increases the survival rate of rhino-viruses
and influenza viruses as well as increases the "hanging" period of dust in the room air preventing the aggrega-
tion of fine aerosols in the large aerosol. High air humidity promotes the growth of fungi, bacteria and some res-
piratory viruses. Both low and very high humidity are incompatible with the use of artificial ionization - heavy
ions will form in dry air and charged hydro-aerosols in humid air.
Air mobility is one of the key factors determining micro climatic comfort as it affects skin temperature
and humidity, convective and evaporate heat loss and generally thermal perception.
Aerosol pollution. In the air of office buildings there are aerosols (solid, liquid, colloidal; organic and non-
organic composition; biological and non-biological nature) of varying degrees of dispersion. These are organic,
mineral and synthetic fibres (furniture, carpets, clothes, fabrics, building materials), including paper and book
dust, suspensions of household chemicals, copying and multiplying equipment, tobacco smoke, down and pollen
of plants, microorganisms of bacterial, viral, fungal and other nature - living and in the form of spores; epidermis
and hair of people, detritus and insect faeces, etc. One cubic centimeter of office air contains up to 5 million
different particles.
Office dust is the most powerful sensitizer. Small particles of biological nature have the highest allergenic-
ity. Exposure to paper dust of office workers in Finland has been shown to be associated with symptoms of eye
irritation, upper respiratory tract, shortness of breath, skin inflammation, tonsils, middle ear infection and chron-
ic bronchitis [10].
Chemical pollution (gases). Office gaseous toxicants can be divided into 2 main groups:
1) external genesis (entering the premises from the outside);
2) internal genesis (produced by construction and finishing materials, paints, furniture, equipment, clean-
ing, detergents, deodorizing agents, plants, etc.); in this group special attention should be paid to anthropotoxins
(gases of human metabolism - carbon dioxide, nitrogen dioxide, hydrogen sulfide, acetone, ammonia, amines,
phenols, etc.).

MATERIALS OF XII JUNIOR RESEARCHERS’ CONFERENCE 2020
Technology, Machine-building
40
The first group includes primarily the combustion products of automotive fuels and industrial emissions
from the street into buildings. These are many substances and compounds, both inorganic and organic, many of
which are carcinogens. Radon and its decomposition products should be considered separately. Radon is a radi-
oactive gas, a potential carcinogen; it stands alone because it has strictly specific features of penetration from
the ground and accumulation in the lower floors of buildings, and requires special ventilation measures to re-
duce the dose load on people who come into contact with it.
The second group consists of volatile organic compounds represented by almost all classes of organic
chemistry (aliphatic limit and unsaturated hydrocarbons, aromatic, terpene, halogen-containing, aldehydes,
phenols, alcohols, acids, ketones, amines and other compounds), carbon dioxide and nitrogen oxides, tobacco
smouldering gases, ozone emitted during the work of office equipment.
It should be taken into account that the majority of gases in office premises can usually be of "external"
or "internal" origin, but at a sufficient distance from major highways and industrial objects, and with the proper
organization of air intake for ventilation needs, the contribution of external sources to the overall air pollution of
offices is not so significant.
Is also important to bear in mind that the perceived quality of air is not a universal measure of its harmful
effects on health, the sensory reactions of the body to many toxicants are not quantitatively related to their tox-
icity. Some dangerous gases are not at all felt even at high concentrations (for example, radon, carbon dioxide,
carbon monoxide have no odor), while the gases of human metabolism (for example, hydrogen sulfide or nitro-
gen dioxide), extremely unpleasant in the sensations, almost never reach in the real conditions of office premis-
es of concentrations dangerous to health, which does not eliminate the need to purify the air from such gases in
order to eliminate physiological and psychological discomfort in people.
Carbon dioxide (CO2 ) is the main pollutant of office space; it is the main anthropotoxin and is often used as an
indicator of total air pollution connected with the presence of people in enclosed spaces. Carbon dioxide in very low
concentrations (from 0.2%) already causes a feeling of breathing discomfort, drowsiness, rapid fatigue, headaches.
Volatile Organic Compounds (VOCs) is a set of groups of organic compounds that differ in many aspects.
The biological effect of many VOCs is additive, and often potentiated. Hundreds of organic compounds are pre-
sent in office air, with concentrations of most substances relatively low (tens of µg/m3). The levels of many VOCs
can increase dramatically, many times exceeding MPC, during commissioning of the building, repair of premises,
replacement of coatings, installation of new furniture and equipment, cleaning and washing, and in other cases
of household chemicals. High levels of some VOCs in office air can persist for months (and even years), for ex-
ample, after repairs or new furniture.
Biological pollution. Among all the variety of organic particles present in the air of office premises, the
greatest impact on human health are microorganisms - fungi, bacteria, viruses. A close link has been established
between the presence of microorganisms in the air and various allergic reactions (allergic dermatitis, rhinitis,
asthma, non-specific allergic alveolitis). Many types of allergies, respiratory diseases, "chronic fatigue syndrome"
are associated with the presence of spores of fungi and mycotoxins in the air, which weaken the immune system
and suppress the function of the alveolus.
Aerionization. Among the factors that have an adverse effect on the well-being and health of people stay-
ing indoors for a long time, the lack of aeroions is of particular importance. Availability of sufficient concentra-
tion of ions in the air is one of the most important aspects of air quality, comfortable and "healthy" environment
in general. Practice shows that concentration traces of aeroions in offices are close to zero, artificial ionization of
office premises is almost nowhere.
External physical factors. Among the physical factors of an office space, electromagnetic fields (EMF) and light-
ing should be evaluated first. The main sources of EMFs in office premises are electrical wiring inside buildings, distri-
bution boards, elevator equipment, cell phone broadcast antennas on roofs or near buildings, fixed and mobile
phones, computers, computer networks, office equipment, household appliances. The number of EMF sources is very
high, as a result of which the personnel of a modern office is exposed to a multitude of electromagnetic radiation of
different frequency ranges at the same time. Scientific data confirming unfavorable influence of EMFs on hemopoiesis,
endocrine, central nervous system, anti-tumor protection are gradually accumulating.
Ergonomics, intensity and tension of work. The main ergonomic unfavorable factors in the office are the
forced sitting work position, physical inactivity, many hours of visual tension in front of the monitor, static-
dynamic hand tension working on the keyboard, etc.
The widespread usage of computers in offices has created the problem of monotony of physical, visual and
mental stress due to high repeatability and reduced workspace movements. According to the literature, the frequency
of musculoskeletal disorders among office workers can reach 80%. The most frequent are tendons of the wrist (com-
puter mouse syndrome), elbow and shoulder joints. The imperfect design of tables and chairs provokes osteochon-
MATERIALS OF XII JUNIOR RESEARCHERS’ CONFERENCE 2020
Technology, Machine-building
41
drosis, venous blood stagnation in the lower limbs. Prolonged work on the computer causes vision overload, which
provokes "dry eye syndrome", leads to asthenopia, increases the risk of myopia and glaucoma. Long-term computer
work increases the risk of cardiovascular, gastrointestinal, immune, endocrine and mental disorders.
Psychosocial factors. Unlike traditional domestic hygienic approach to assessment of harmful working
conditions from the point of view of priority of parameters of production environment and labor process (physi-
cal severity and tension), psychosocial and organizational factors of health risk take one of the leading places in
the scale of harmful working conditions of office workers abroad.
Due to the unfavourable psychological climate in the team and shortcomings in the organization of work,
approximately one third of office workers often or very often experience emotional stress and anxiety at work,
suffer from sleep disorders and depressive states. The main factors of professional risk of cardiovascular diseases
in office workers are organizational factors, personnel management policy, content of work process [13].
Working at the computer implies constant concentration of attention, which often leads to the development of
mental fatigue. Processing large amounts of information (especially in conditions of zeitnot) becomes an additional
stressful factor. Such stress on the background of a pronounced computer, Internet and gaming addiction (growing in
modern society) forms a prolonged exhaustion, reduced work rate, loss of concentration and self-control, apathy.
Among the main measures to reduce the adverse impact of office environment factors can be referred to:
1. Use of modern air conditioning and ventilation systems, ionizers and humidifiers, airing the room.
2. Use of special screens and protective filters against electromagnetic radiation, laying electrical wiring in
shielding boxes. Interior and exterior walls finishing with shielding paint. Use of modern LCD monitors. Discon-
nection of unused electromagnetic radiation sources.
3. In addition to windows, light pipes and lanterns can be used as sources of natural light in office premis-
es. Artificial and natural light sources should provide general, local and area lighting.
4. Rationalization of work and rest regimes, optimization of work rate, proper organization of the work
place, allocation of separate rest zones. Application of industrial gymnastics. Occasionally, a gymnastic ball may
be used as an alternative to a sitting chair.
5. Activities to improve the aesthetic conditions of work include a rational painting of the premises. Col-
our can affect a person's psyche and aesthetic perception. It not only changes the state of the visual analyzer,
but also affects the well-being and mood, and therefore on the performance of the person.
6. Conducting workplace assessments, occupational health and safety instructions, and medical examina-
tions.
REFERENCES
1. СанПиН от 11.10.2017 92. Требования к контролю воздуха рабочей зоны, гигиенических нормативов
"Предельно допустимые концентрации вредных веществ в воздухе рабочей зоны", "Ориентировочные
безопасные уровни воздействия вредных веществ в воздухе рабочей зоны", "Предельно допустимые
уровни загрязнения кожных покровов вредными веществами".
2. ГОСТ 30494—2011. Здания жилые и общественные. Параметры микроклимата в помещениях. Межго-
сударственный стандарт.
3. ANSI/ASHRAE Standard 55-2010. American Society of Heating Refrigerating and Air Conditioning Engineers.
Thermal Environmental Conditions for Human Occupancy (Supersedes ANSI/ASHRAE Standard 55- 2004 and
55-1992). Atlanta, GA: ASHRAE. 2010.
4. ANSI/ASHRAE Standard 62-2001. American Society of Heating Refrigerating and Air Conditioning Engineers
(ASHRAE, 2001). Ventilation for Acceptable Indoor Air Quality. Atlanta, GA: ASHRAE. 2001.
5. Cohen A. et al. // Comparative quantification of health risks: global and regional burden of disease attributa-
ble to selected major risk factors, M. Ezzati et al., WHO, Geneva, 2004, p.1353-1434.
6. Fanger P.O. // ASHRAE Transactions. 1967. 73 (2). P. III4.1—III4.20.
7. Fanger P.O., Melikov H., Hanzawa H., Ring J. // Energy and Buildings. 1988. 12. P. 21—39.
8. ISCO-08. International Standard Classification of Occupations — 2008. International Labor Organization, 2008.
9. ISO 7730:2005. International Standards Organization (ISO). Ergonomics of the thermal environment — Ana-
lytical determination and interpretation of thermal comfort using calculation of the PMV and PPD indices and
local thermal comfort criteria. Geneva: Switzerland: ISO. 2005.
10. Jaakkola M.S., Yang L., Ieromnimon A., Jaakkola J.J.K. // Occup. Environm. Med. 2007. 64. Р. 178—184.
11. Mendell M. J. // Indoor Air. 1993. 3. Р. 227— 236.
12. Seppanen O.A., Fisk W.J., Mendell M.J. // Ibid. 1999. 9. Р.226—252.
13. Theorell T. // Gesundheitswesen. 1995. 57 (3). Р.130—134.
MATERIALS OF XII JUNIOR RESEARCHERS’ CONFERENCE 2020
Technology, Machine-building
42
UDC 517.983
TWO-DIMENSIONAL INTEGRAL TRANSFORM WITH THE MEIJER G-FUNCTION IN THE KERNEL
IN THE SPACE OF SUMMABLE FUNCTIONS
M. PAPKOVICH, O. SKOROMNIK
Polotsk State University, Belarus
Two-dimensional integral transformation with the Meijer G-function in the kernel in the space of summa-
ble functions on a domain 2 1 1R R R+ + += × was studied. ,2νL - theory of a considered integral transformation was
constructed. Conditions for the boundedness and one-to-one operator of such a transformation from one ,2νL -
space to another were given, an analogue of the integration formula in parts was proved, various integral repre-
sentations for the transformation under consideration were established. The results generalize the well know
findings for corresponding one-dimensional integral transformation.
Keywords: two-dimensional integral G- transformation, Meijer G- function, two-dimensional Mellin trans-
formation, the space of integrable functions, fractional integrals and derivatives.
Introduction. Let us consider the following integral G-transformation
1, p
1,q
( )m,np,q ( )
0
(G )(x) G xt (t) t (x 0)i
jf f d
∞ = >
∫a
b, (1.1)
where 21 2x ( , )x x R= ∈ ; 2
1 2t ( , )t t R= ∈ - vectors, 2R - two-dimensional Euclidean space; 2
1
x t k kk
x t=
⋅ = ∑ – their
scalar product, particularly 2
1
x 1 kk
x=
⋅ = ∑ for ( )1 1,1= ; x t> means 1 1 2 2,x t x t> > and similarly for signs ≥ , < ,
≤ ;
0 0 0
:∞ ∞ ∞
=∫ ∫ ∫ ; 1,2,...N = - space of natural numbers, 0 0N N= ∪ , 20 0 0N N N= × ,
2 1 1 2x , x 0R R R R+ + += × = ∈ > [1, §28.4];
21 2 0m ( , )m m N= ∈ и 1 2m =m ; 2
1 2 0n ( , )n n N= ∈ и 1 2n =n ;
21 2 0p ( , )p p N= ∈ и 1 2p =p ; 2
1 2 0q ( , )q q N= ∈ и 1 2q =q ; (0 m q, 0 n p)≤ ≤ ≤ ≤ ;
1 2( , )i i ia a=a , 1 pi≤ ≤ ,
1 2,i ia a C∈ ( 1 1 2 21 , 1i p i p≤ ≤ ≤ ≤ );
1 2( , )j j jb b=b , 1 qj≤ ≤ ,
1 2,j jb b С∈ ( 1 1 2 21 ,1j q j q≤ ≤ ≤ ≤ );
( )1 2,k k k= ∈ N N N= × ( )1 2,k N k N∈ ∈ – index with 1 2! ! !k k k= and 1 2k k k= + ;
kD1 2
1 2( ) ( )
k
k kx x
∂=∂ ∂
; 1 2td d t d t= ⋅ ; 1 2( ) ( , )f t t=t ; 1, pm, n
p,q1,q
( )G xt
( )
i
j
a
b - function such as:
2 1,1, p ,m, n
p,q ,1,q 1,1
( )( )G xt G
( ) ( )
k kk k
k kk k
i pi m nk kp q
j j qk
ax t
b=
=
∏a
b, (1.2)
which is a product of Meijer G- functions [ ],,
m np qG z [2, chapter 6].
This paper is devoted to the study of transformation (1.1) in weighted spaces ,2νL , 21 2( , ) Rν = ν ν ∈
1 2( )ν = ν , 2 (2,2)= , integrable functions 1 2( ) ( , )f f x x=x on 2R+ , for which ,2
f ν < ∞ , where
2 1
1 1
1/2
22 1 2 11 2 1 22 1,2
( , )
R R
f x x f x x dx dx
+ +
ν ⋅ − ν ⋅ −ν
= < ∞
∫ ∫ .
MATERIALS OF XII JUNIOR RESEARCHERS’ CONFERENCE 2020
Technology, Machine-building
43
The conditions of boundedness and mutual uniqueness of the transformation operator (1.1) from one
space ,2νL to another are given, an analogue of the integration formula by parts is proved, various integral rep-
resentations for the transformation under consideration are established. The results obtained generalize those
obtained earlier for the corresponding one-dimensional G – transformation [2, ch. 6].
Preliminary information. For integer non-negative , , ,m n p q (0 , 0 )m q n p≤ ≤ ≤ ≤ , for ,i ja b C∈ with
C, the set of complex numbers (1 , 1 )i p n q≤ ≤ ≤ ≤ Meijer G- function is a function defined via the Mellin-Barnes
type integral:
1, ,
, ,1
( ) ,...,
( ) ,...,
p pm n m np q p q
q q
a a aG z G z
b b b
= =
1,, ,, ,
1,
( ) 1( ) , 0
( ) 2
i pm n m n sp q p q
j q L
aG z s z ds z
b i
− = ≠
π ∫G , (2.1)
where
1,, ,
, ,1,
( ) ( )
( ) ( )
i p pm n m np q p q
j q q
a as s
b b
= =
G G
1 1
1 1
( ) (1 )
( ) (1 )
m n
j ij i
p q
i ji n j m
b s a s
a s b s
= =
= + = +
Γ + Γ − −
Γ + Γ − −
∏ ∏
∏ ∏. (2.2)
Here L is specially selected endless contour leaving the poles ( 1, 2,..., ; 0,1,2,...)js b k j m k= − − = = on
the left, and the poles 1 ( 1, 2,..., ; 0,1,2,...)js a k j n k= − + = = – on the right, and the empty products, if they
occur, are taken to be one. For more details on the theory of the G-function (2.1), see [2, ch. 6].
G - transformation is called the integral transformation [2, formula (6.1.1)]
( ) 1,,,
1,0
( )( ) ( )
( )
i pm np q
j q
aGf x G xt f t dt
b
∞ =
∫ , (2.3)
containing Meijer G - function (2.1) in the kernel.
Introduce the space ,rνL of Lebesgue measurable, generally speaking, complex-valued functions f in
R (0, )+ = ∞ , for which ,r
f ν < ∞ , where
1
,0
( ) (1 , R )r r
r
dtf t f t r
t
∞ν
ν
= ≤ < ∞ ν ∈ ∫ , (2.4)
Notice that
1 1, ( , )
, (1 , R )rr rL R t
f f rν −ν +
= ≤ < ∞ ν ∈L
.
For the function , (1 2)rf rν∈ ≤ ≤L Mellin transformation fM is determined by equality [2], [3]
)( ) ( ) ( ; , R)sf s f e e d s it t+∞
τ τ
−∞= τ = ν + ν ∈∫(M . (2.5)
If , ,1, Re( )rf sν ν∈ = ν∩L L , then (2.5) coincides with the usual Mellin transformation:
* 1
0
)( ) ( ) ( ) sf s f s f t t dt+∞
−= = ∫(M . (2.6)
Two-dimensional Mellin transformation of the function 1 2(x) ( , )f f x x= , 1 20, 0x x> > , is defined by
formula [3, formula1.4.42]:
2
* 1)( ) ( ) ( t) t t
R
f f f d
++
−= = ∫s
s s(M , (2.7)
2 21 2( , ) : 0( 1,2)jR t t R t j++ = = ∈ > =t , 1 2( , ), ( 1,2)js s s C j= ∈ =s .
Inverse Mellin transformation for 21 2x ( , )x x R++= ∈ is given by formula [3, formula (1.4.43)]:
[ ]1 2
1 1
21 2
1)(x) ( ) (x) x ( )
(2 )
i i
i i
g g g di
γ + ∞ γ + ∞− − −
γ − ∞ γ − ∞=
π∫ ∫
ss s s(M M , Re( ) ( 1, 2)j js jγ = = . (2.8)
MATERIALS OF XII JUNIOR RESEARCHERS’ CONFERENCE 2020
Technology, Machine-building
44
The formula of Mellin transformation from G - transformation (2.3) for “enough good” functions f has
the form [1, (6.1.2)]
(M1,,
,1,
( ))( ) ( )(1 )
( )
i pm np q
j q
aGf s s f s
b
= −
MG , (2.9)
where ,, ( )
m np q sG are given (2.2).
We will need the following constants defined through the parameters of the G-function (2.1) [1, formulas
(6.1.5) – (6.1.11)]:
1min [Re( )], 0,
, 0,
jj m
b m
m
≤ ≤− >α = −∞ =
11 max[Re( )], 0,
, 0;
ii n
a n
n
≤ ≤− >β = ∞ =
(2.10)
* 2( )a m n p q= + − − ; (2.11)
q p∆ = − ; (2.12)
*1a m n p= + − ; *
2a m n q= + − ; (2.13)
1 1 2
q p
j ij i
p qb a
= =
−µ = − +∑ ∑ . (2.14)
We call the exceptional set of GE the set ( )sG , is defined in (2.2), of real numbers ν such that
1α < − ν < β and ( )sG has a zero on the line Re( ) 1s = − ν .
,2νL - теория G- преобразования
Introduce a two-dimensional analogue of the function (2.2):
m,np,q ( ) ≡sG
2 1,1, p ,m ,np,q ,
1,q 1,1
( )( )
( ) ( )
k kk k
k kk k
i pi m nkp q
j j qk
as
b=
=
∏a
sb
G G . (3.1)
We call the exceptional set ofGE of the function m,n
p,q ( )sG the set of vectors 21 2( , ) Rν = ν ν ∈ 1 2( )ν = ν
such that 1 1 11α < − ν < β , 2 2 21α < − ν < β , and the functions type (2.2) 1 1
1 1
,1,
( )m n
p qsG , 2 2
2 2
,2,
( )m n
p qsG have a zero on
the line 1 1Re( ) 1s = − ν , 2 2Re( ) 1s = − ν , respectively.
Apply two-dimensional Mellin transformation (2.7) to G - transformation (1.1) and taking into account
(2.9), we get the following formula for “enough good” functions f:
( ) 1, pm,np,q
1,q
( )G ( ) ( )(1 )
( )
i
j
f f
= −
a
s s sb
M MG , (3.2)
where m,np,q ( )sG is given (3.1).
To formulate statements representing the ,2νL theory of G-transformation (1.1) we need the following
two-dimensional analogues of constants (2.10) – (2.14):
11 1
11
1
1
min Re( ) , 0,
, 0,
jj m
b m
m
≤ ≤ − > α = −∞ =
, 1
1 1
11
1
1
1 max Re( ) , 0,
, 0,
ii n
a n
n
≤ ≤ − > β = ∞ =
(3.3)
22 2
21
2
2
min Re( ) , 0,
, 0,
jj m
b m
m
≤ ≤ − > α = −∞ =
, 2
2 2
21
2
2
1 max Re( ) , 0,
, 0,
ii n
a n
n
≤ ≤ − > β = ∞ =
(3.4)
1 1 1 1 12( ) ,a m n p q∗ = + − − 2 2 2 2 22( )a m n p q∗ = − − − ; (3.5)
1 1 1 2 2 2, ;q p q p∆ = − ∆ = − (18) (3.6)
1 1 1 1
1 1 2 2
1 1 2 21 2
1 1 1 1
, ,2 2
q p q p
j i j ij i j i
p q p qb a b a
= = = =
− −µ = − + µ = − +∑ ∑ ∑ ∑ (21) (3.7)
MATERIALS OF XII JUNIOR RESEARCHERS’ CONFERENCE 2020
Technology, Machine-building
45
Denote by [ ],X Y the set of bounded linear operators acting from a Banach space X into a Banach
space Y .
From [2, theorem 3.6 and 3.7, theorems 6.1 and 6.2, corollary 6.1.1 and 6.2.1], representation (3.2) and
direct verification we get the ,2νL - theory of G- transformation (1.1).
Theorem 1. We suppose that
1 1 11α < − ν < β , 2 2 21α < − ν < β , 1 2ν = ν , (3.8)
and either of the conditions:
1 2 0a a∗ ∗> 0, > (3.9)
or
[ ] [ ]* *1 2 1 1 1 2 2 20, 0, 1 Re( ) 0, 1 Re( ) 0a a= = ∆ − ν + µ ≤ ∆ − ν + µ ≤ . (3.10)
holds.
Then we have the results:
a) There is a one-to-one transformation ,2 1 ,2G [ , ]ν −ν∈ L L such that (3.2) holds for ,2f ν∈L and
Re( ) 1= − νs .
If [ ] [ ]* *1 2 1 1 1 2 2 20, 0, 1 Re( ) 0, 1 Re( ) 0a a= = ∆ − ν + µ = ∆ − ν + µ = и ν ∉
GE , then the transformation
G maps ,2νL onto 1 ,2−νL .
b) If ,2f ν∈L и ,2g ν∈L ,then the relation holds
( ) ( )0 0
(x) G (x) x G (x) (x) xf g d f g d∞ ∞
=∫ ∫ . (3.11)
c) Let 2
1 1( , ) Cλ = λ λ ∈ and ,2f ν∈L . If Re( )λ > −ν , then the transformation (1.1) is given by
1(G )(x) x x
x
df
d
−λ λ+= 1,pm,n 1p 1,q 1
1,q0
, ( )xt (t) t
( ) , 1
i
j
G f d∞
++ +
−λ
−λ − ∫
a
b, (26) (3.12)
when Re( )λ < −ν is given by
1(G )(x) x x
x
df
d
−λ λ+= − 1,pm 1,np 1,q 1
1,q0
( ) ,xt (t) t
1, ( )
i
j
G f d∞
++ +
−λ
−λ − ∫
a
b. (3.13)
d) The transformation G f is independent of ν in the sense that, if ν and νɶ satisfy (3.8) and either (3.9)
or (3.10), and if the transformations G f and G fɶ are defined in ,2νL and ,2νɶL ,respectively, by (3.2), then
G f = G fɶ for f ∈ ,2ν ∩ɶL ,2νL .
e) If 1 2 0a a∗ ∗> 0, > or if * *1 20, 0,a a= = [ ]1 1 11 Re( ) 0,∆ − ν + µ < [ ]2 2 21 Re( ) 0∆ − ν + µ < , then G f is
given in (1.1) for ,2f ν∈L .
Corollary 1. Let 1 1 2 2,α < β α < β and let one of the following conditions hold:
a) 1 2 0a a∗ ∗> 0, > ;
b) 1 2 1 20, 0, 0a a∗ ∗= = ∆ > 0,∆ > и 1 21 2
1 2
Re( ) Re( ),
µ µα < − α < −
∆ ∆ ;
c) 1 2 1 20, 0, 0a a∗ ∗= = ∆ < 0,∆ < и 1 21 2
1 2
Re( ) Re( ),
µ µβ > − β > −
∆ ∆;
d) 1 2 1 20, 0, 0a a∗ ∗= = ∆ = 0,∆ = и 1 2Re( ) 0,Re( ) 0µ ≤ µ ≤ .
Then the G-transformation can be defined on ,2νL with 1 1 1 1 2 1,α < ν < β α < ν < β , 1 2ν = ν .
Theorem 2. Let
1 1 11α < − ν < β , 2 2 21α < − ν < β , 1 2ν = ν ,
and either of the following conditions holds :

MATERIALS OF XII JUNIOR RESEARCHERS’ CONFERENCE 2020
Technology, Machine-building
46
a) 1 2 0a a∗ ∗> 0, > ;
b) 1 2 1 1 1 2 2 20, 0, Re( ) Re( )a a∗ ∗= = ∆ (1− ν ) + µ < 0, ∆ (1− ν ) + µ < 0 .
Then for ,2f ν∈L and x 0> ( )G (x)f is given in (1.1)
Corollary 2. Let 1 1 2 2,α < β α < β and let one of the following conditions hold:
a) 1 2 0a a∗ ∗> 0, > ;
b) 1 2 1 20, 0, 0a a∗ ∗= = ∆ > 0,∆ > и 1 21 2
1 2
Re( ) 1 Re( ) 1,
µ + µ +α < − α < −
∆ ∆;
c) 1 2 1 20, 0, 0a a∗ ∗= = ∆ < 0,∆ < и 1 21 2
1 2
Re( ) 1 Re( ) 1,
µ + µ +β > − β > −
∆ ∆;
d) 1 2 1 20, 0, 0a a∗ ∗= = ∆ = 0,∆ = и 1 2Re( ) 0,Re( ) 0µ ≤ µ ≤ .
Then G-transformation can be defined by (1.1) in ,2νL with 1 1 1 1 2 1,α < ν < β α < ν < β , 1 2ν = ν .
REFERENCES
1. Самко, С.Г. Интегралы и производные дробного порядка и некоторые их приложения / С.Г. Самко,
А.А. Килбас, О. И. Маричев. – Мн.: Наука и техника, 1987. – 688с.
2. Kilbas A.A., Saigo M.H. H - Transforms. Theory and Applications. – London [etc.]: Chapman and Hall.
CRC Press, 2004. – 401 p.
3. Kilbas A.A., Srivastava H.M., Trujillo J.J. Theory and applications of fractional differential equations. North –
Holland Mathematics Studies 204. Amsterdam: Elsevier.xv, 2006. – 523 p.
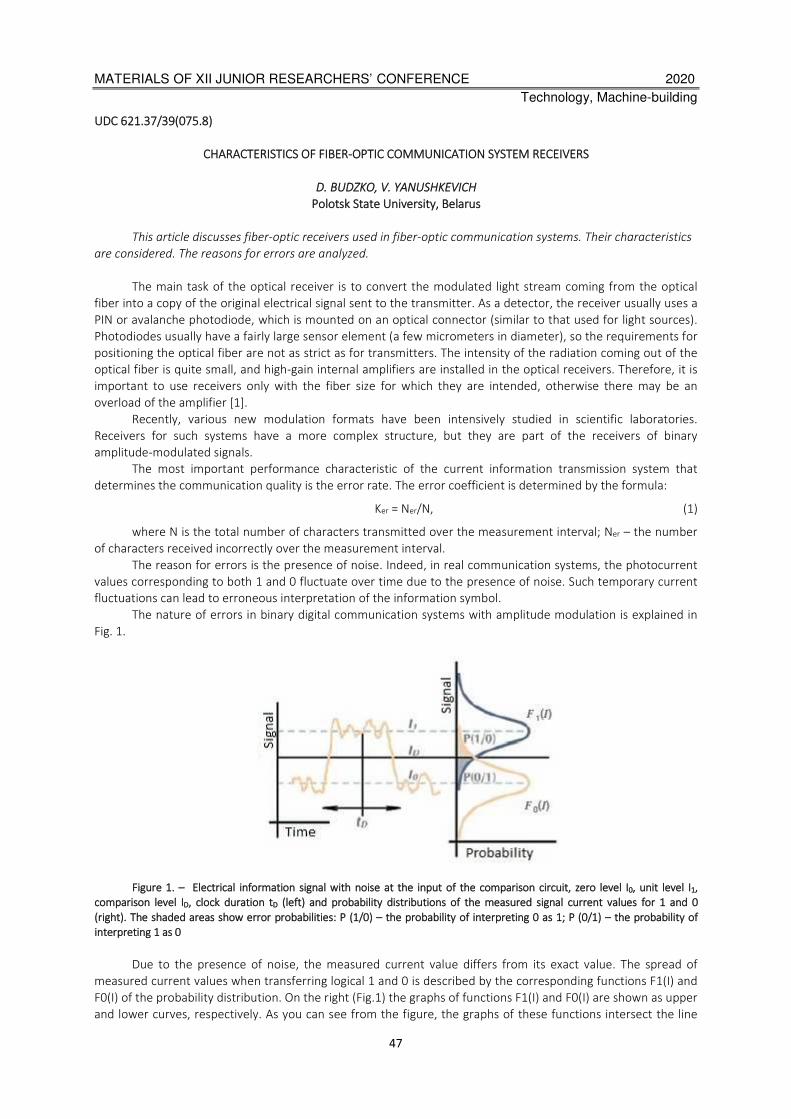
MATERIALS OF XII JUNIOR RESEARCHERS’ CONFERENCE 2020
Technology, Machine-building
47
UDC 621.37/39(075.8)
CHARACTERISTICS OF FIBER-OPTIC COMMUNICATION SYSTEM RECEIVERS
D. BUDZKO, V. YANUSHKEVICH
Polotsk State University, Belarus
This article discusses fiber-optic receivers used in fiber-optic communication systems. Their characteristics
are considered. The reasons for errors are analyzed.
The main task of the optical receiver is to convert the modulated light stream coming from the optical
fiber into a copy of the original electrical signal sent to the transmitter. As a detector, the receiver usually uses a
PIN or avalanche photodiode, which is mounted on an optical connector (similar to that used for light sources).
Photodiodes usually have a fairly large sensor element (a few micrometers in diameter), so the requirements for
positioning the optical fiber are not as strict as for transmitters. The intensity of the radiation coming out of the
optical fiber is quite small, and high-gain internal amplifiers are installed in the optical receivers. Therefore, it is
important to use receivers only with the fiber size for which they are intended, otherwise there may be an
overload of the amplifier [1].
Recently, various new modulation formats have been intensively studied in scientific laboratories.
Receivers for such systems have a more complex structure, but they are part of the receivers of binary
amplitude-modulated signals.
The most important performance characteristic of the current information transmission system that
determines the communication quality is the error rate. The error coefficient is determined by the formula:
Ker = Ner/N, (1)
where N is the total number of characters transmitted over the measurement interval; Ner – the number
of characters received incorrectly over the measurement interval.
The reason for errors is the presence of noise. Indeed, in real communication systems, the photocurrent
values corresponding to both 1 and 0 fluctuate over time due to the presence of noise. Such temporary current
fluctuations can lead to erroneous interpretation of the information symbol.
The nature of errors in binary digital communication systems with amplitude modulation is explained in
Fig. 1.
Figure 1. – Electrical information signal with noise at the input of the comparison circuit, zero level I0, unit level I1,
comparison level ID, clock duration tD (left) and probability distributions of the measured signal current values for 1 and 0
(right). The shaded areas show error probabilities: P (1/0) – the probability of interpreting 0 as 1; P (0/1) – the probability of
interpreting 1 as 0
Due to the presence of noise, the measured current value differs from its exact value. The spread of
measured current values when transferring logical 1 and 0 is described by the corresponding functions F1(I) and
F0(I) of the probability distribution. On the right (Fig.1) the graphs of functions F1(I) and F0(I) are shown as upper
and lower curves, respectively. As you can see from the figure, the graphs of these functions intersect the line
MATERIALS OF XII JUNIOR RESEARCHERS’ CONFERENCE 2020
Technology, Machine-building
48
corresponding to the ID comparison voltage level. This means that there is some probability of an incorrect
interpretation of the received signal. Such probability is usually very small, but different from 0. The probability P
(1/0) of an erroneous interpretation of 0 as 1 is determined by the area under the part of the distribution
function F0(I) cut off by the ID comparison level. Similarly, the probability P (0/1) of an erroneous interpretation
of 1 as 0 is determined by the area under the part of the distribution function F1(I) that is cut off by the ID
comparison level.
If the transmission probability is equal to 0 and 1, the error coefficient is determined by a simple
expression:
Ker = 1 / 2 (Р (1/0) + Р (0/1)), (2)
Under the assumption of a Gaussian noise distribution with zero average intensity values and standard
deviations σ1, σ2 for 1 and 0, respectively, the error coefficient is determined by the expression:
Ker(Q)
2
1 1exp( ) ( )
2 22 2Q
x Qdx erfc
∞
= − =π ∫
, (3)
Where is an indicator of the quality of the received signal [2].
REFERENCES
1. Оптоволоконные линии связи [Electronic resource]. – Электронные данные. – Mode of access:
https://www.avclub.pro. – Date of access: 13.01.2020.
2. Убайдуллаев Р.Р. Протяженные ВОЛС на основе EDFA. Lightwave Russian Edition, 1, 2003, с. 22–28.
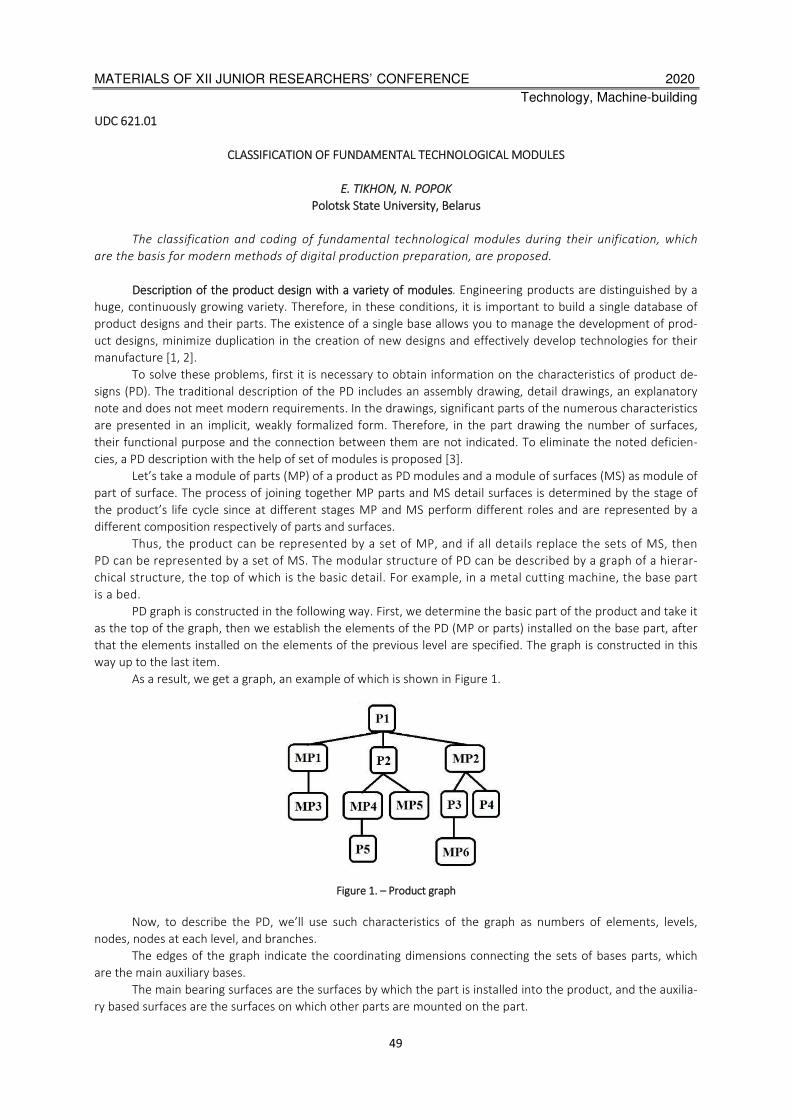
MATERIALS OF XII JUNIOR RESEARCHERS’ CONFERENCE 2020
Technology, Machine-building
49
UDC 621.01
CLASSIFICATION OF FUNDAMENTAL TECHNOLOGICAL MODULES
E. TIKHON, N. POPOK
Polotsk State University, Belarus
The classification and coding of fundamental technological modules during their unification, which
are the basis for modern methods of digital production preparation, are proposed.
Description of the product design with a variety of modules. Engineering products are distinguished by a
huge, continuously growing variety. Therefore, in these conditions, it is important to build a single database of
product designs and their parts. The existence of a single base allows you to manage the development of prod-
uct designs, minimize duplication in the creation of new designs and effectively develop technologies for their
manufacture [1, 2].
To solve these problems, first it is necessary to obtain information on the characteristics of product de-
signs (PD). The traditional description of the PD includes an assembly drawing, detail drawings, an explanatory
note and does not meet modern requirements. In the drawings, significant parts of the numerous characteristics
are presented in an implicit, weakly formalized form. Therefore, in the part drawing the number of surfaces,
their functional purpose and the connection between them are not indicated. To eliminate the noted deficien-
cies, a PD description with the help of set of modules is proposed [3].
Let’s take a module of parts (MP) of a product as PD modules and a module of surfaces (MS) as module of
part of surface. The process of joining together MP parts and MS detail surfaces is determined by the stage of
the product’s life cycle since at different stages MP and MS perform different roles and are represented by a
different composition respectively of parts and surfaces.
Thus, the product can be represented by a set of MP, and if all details replace the sets of MS, then
PD can be represented by a set of MS. The modular structure of PD can be described by a graph of a hierar-
chical structure, the top of which is the basic detail. For example, in a metal cutting machine, the base part
is a bed.
PD graph is constructed in the following way. First, we determine the basic part of the product and take it
as the top of the graph, then we establish the elements of the PD (MP or parts) installed on the base part, after
that the elements installed on the elements of the previous level are specified. The graph is constructed in this
way up to the last item.
As a result, we get a graph, an example of which is shown in Figure 1.
Figure 1. – Product graph
Now, to describe the PD, we’ll use such characteristics of the graph as numbers of elements, levels,
nodes, nodes at each level, and branches.
The edges of the graph indicate the coordinating dimensions connecting the sets of bases parts, which
are the main auxiliary bases.
The main bearing surfaces are the surfaces by which the part is installed into the product, and the auxilia-
ry based surfaces are the surfaces on which other parts are mounted on the part.
MATERIALS OF XII JUNIOR RESEARCHERS’ CONFERENCE 2020
Technology, Machine-building
50
The graph node has information about the PD element characteristics. For example, if a node reflects a
detail, then its mass, overall dimensions, material, etc. are indicated. It is advisable to show the characteristics of
the nodes in tabular form.
Depending on the level of the PD detail description, graphs of three levels can be built. They are MP and
parts not included in their composition (first level), details (second level), MS (third level).
Similarly, the surface of the part is intended to perform, respectively, some service functions. These
modules are denoted as MPF and MSF.
According to the functional feature, MPF and MSF should be divided into functional technological mod-
ules (MFT, MST) and service functional modules (MFS, MSS).
MFT is a PD part with which the PD performs its official function;
MFS is a PD part which allows the MFT to fulfill its purpose.
MST is a combination of a part surfaces, with the help of which the part performs the corresponding ser-
vice function;
MSS is a combination of surfaces with the help of which MST fulfills its purpose.
Combination of MPF parts and the MSF part surfaces on a functional basis ensures the unambiguity of
their definitions.
For example, in the case of a lathe a spindle assembly with a chuck (MFT1) for setting the workpiece and
a tool holder (MFT2) for installing the tool act as a MFT.
To ensure the law of relative motion of the MFT1 and MFT2, the gear box MFS1, the gear box MFS2, and
the engine MFS3 serve as the MFS.
In the case of an MTF vehicle, a body for placing a load (MFT1) and a chassis (MFT2) to ensure the
movement of the vehicle are used, and as an MFS are an engine (MFS1), a transmission (MFS2) and other devic-
es that ensure that the MFT performs its functions.
As for the part, it is generally needed for the product to perform the workflow and is used for installing
other parts on it. Therefore, the base modules and work surface modules act as MST for the part.
For example, in a gear wheel, a set of side surfaces of the teeth for transmitting torque and a second MST
— a set of bases: an end, a hole, and a side surface of the key groove for mounting a gear in the product act as
one MST.
To fulfill its official purpose, the listed MST are combined into a part with the help of connecting surfaces
united in MSS.
Classification of functional technology modules. For the presentation of the details of the MSF set, the fol-
lowing classification is proposed.
By their service, all MSF can be divided into three classes: basing (MSB), working (MSW) and connecting
(MSC). Such a division of the MSF gives them an unambiguous definition and is the main difference and ad-
vantage of this classification.
The next step in the development of the classification of the MSF is the division of each class into sub-
classes, groups and subgroups. Therefore, further each MSF class should be subdivided according to the con-
structive and geometrical features.
In Fig.2. a classification of MSF types is given, from which it follows that it contains 26 types of MSF, 14 of
which are of MSBs type and 6 are of MSW and MSC types. Their examples are shown in Fig.3.
For the top of the graph we take the PSB, which acts as a set of main bases for the part. At the second
level MSF are located, the design base of which is the first MSF level. At the next level, there are MSFs, the de-
sign base of which is the MPF of the previous level, and this continues to the last MSF details.
The graph of the MSF details shows its structure at the modular level, the MSF composition and the level of
the design complexity. On the edges of the graph the MSF coordinating dimensions tolerances can be indicated.
Conclusion. The description of a product structure with the help of a hierarchical graph at the first level
makes it possible to identify functional technological modules of the product and, on their basis, to construct a
unified classification of products as exploitation objects. Representation of parts by a set of modules allows to
identify modules of based, working and connecting surfaces and on their basis to build a single classification of
parts, focused on different stages of the product life cycle.
The proposed unified methodological base allows you to manage the development of product de-
signs, eliminate duplication in the creation of new designs and effectively develop technologies for their
manufacture.
MATERIALS OF XII JUNIOR RESEARCHERS’ CONFERENCE 2020
Technology, Machine-building
51
Figure 2. – Classification of MSP
Figure 3. – Examples of constructive design types of MSF
REFERENCES
1. Базров, Б.М. Модульнаятехнологиявмашиностроении / Б.М. Базров. - М.: Машиностроение, 2001. –
368с.
2. Попок, Н.Н.Мобильная реорганизация машиностроительного производства / Н.Н. Попок. – Минск: Тех-
нопринт, 2001. – 396 с.
3. Конструирование и оснащение технологических комплексов / А.М. Русецкий, П.А. Витязь, М.Л. Хейфец
[и др.]; Под общ. ред.А.М. Русецкого. – Минск: Беларус. навука, 2014. – 316 с.
MATERIALS OF XII JUNIOR RESEARCHERS’ CONFERENCE 2020
Technology, Machine-building
52
UDK 621.01
DEVELOPMENT OF BLOCK-MODULAR CUTTING TOOLS FOR CNC MACHINES
D. BASHLACHIOV, N. POPOK
Polotsk State University, Belarus
Modular tool systems, including the types of tool modules, mechanisms for fastening of modules, tool sys-
tems for multi-purpose processing have been analysed, which has allowed us to determine current trends in the
design and production of tool systems. The design schemes of various types of block-modular cutting tools are
considered and the designs of a cutter and countersink for their application on CNC machines "Robodril" are pro-
posed.
Introduction. A large reserve for improving the efficiency of mechanical engineering is put in creating a ra-
tional system of tool support for domestic enterprises based on the experience of leading foreign companies,
such as Sandvik Coromant (Sweden), Mitsubishi (Japan), Iscar (Israel), Hertel (Germany), and others.[1] The sys-
tems proposed by the companies provide for the design of a wide range of cutting tools with unified design ele-
ments for each type of tool, the use of advanced technologies for their production, including the application of
wear-resistant coatings on the blades, development of recommendations for the operation mode of cutting
tools taking into account the properties of processed and tool materials, diagnostics and repair of tools during
operation. This approach to the tool supply of enterprises allows to reduce the range of cutting tools, to increase
their service life and, ultimately, to reduce material and financial costs for the design, production and operation
of cutting tools. [2, 3]
Main part. Currently, the Department of Technology and Equipment of Machine-building Industry is work-
ing on the design and manufacture of block-modular cutting tools for CNC milling machines of the company Fa-
nuc.[4, 5].
Distinctive features of the tools for these machines are the use of cone shanks of the Japanese standard
JIS B6339 and limited overall dimensions of housing modules.
Figure 1 shows the design diagram of the end mill for a CNC milling machine. The tool blocks 1 are in-
stalled in the holes of the housing module 2. The blocks are attached to the housing module using a clamp con-
sisting of a thrust pin 3 and a threaded pin 4. The housing module with attached tool blocks is mounted on a
shank 5 and clamped with a screw 7. Face keys 6 prevent the housing module from turning and make it rigid.
The cap fitting 8 is screwed into the shank to tighten the cutter into the machine spindle.
Figure 1. – Design diagram of the end mill
MATERIALS OF XII JUNIOR RESEARCHERS’ CONFERENCE 2020
Technology, Machine-building
53
Fig. 2 shows a 3D model of the end mill design.
Figure 2. – -3D model of the end mill design
A design diagram of a countersink for a CNC milling machine (Fig. 3) includes tool blocks 1, which are installed
in the holes of the housing module 2. The tool blocks are installed in the housing module at an angle of 15°, which
allows you to process blind holes and get a groove with a 90 ° angle. The blocks are fixed in the housing module using a
clamp consisting of a thrust pin 3 and a threaded pin 4. The housing module with fixed tool blocks is mounted on the
shank 5 and clamped with a screw 7. Face keys 6 prevent the housing module from turning and make it rigid. The cap
fitting 8 is screwed into the shank to tighten the countersink into the machine spindle.
Figure 3. - structural diagram of the countersink
Fig. 4 shows a 3D model of the countersink design.
Figure 4. – 3D model of the countersink construction

MATERIALS OF XII JUNIOR RESEARCHERS’ CONFERENCE 2020
Technology, Machine-building
54
Conclusion. The considered construction diagrams of various types of block-modular cutting tools and the
proposed design of the cutter and countersink for their application on CNC machine tools "Robodril", the distinc-
tive features of which are: shank B30, and the minimum possible size of the tool blocks, which made it possible
to produce a face mill and countersink Ø63mm in diameter and the number of tool blocks equal to 2-3 pieces.
REFERENCES
1. Попок Н.Н. Анализ тенденций проектирования инструментальных систем. Часть 1. Термины и системы
обозначений режущих пластин, державок и модулей. Вестник ПГУ. Серия В. Промышленность. При-
кладные науки 3, 2012г. - с.71-81.
2. Попок Н.Н. Анализ тенденций проектирования инструментальных систем. Часть 2. Механизмы крепле-
ния модулей. Вестник ПГУ. Серия В. Промышленность. Прикладные науки 11, 2012г. с.11-19.
3. Попок Н.Н. Анализ тенденций проектирования инструментальных систем. Часть 3. Инструментальные
системы для многоцелевой обработки. Вестник ПГУ. Серия В. Промышленность. Прикладные науки
3, 2013г. с.19-37.
4. Конструирование и оснащение технологических комплексов / А.М.Русецкий [и др.]; под общ. ред.
А.М.Русецкого – Минск: Беларус. наука, 2014. – 316с.
5. Попок Н.Н., Максимчук А.С., Портянко С.А. Совершенствование системы закрепления режущих пластин
и блоков резцовых в блочно-модульных режущих инструментах. Вестник ПГУ. Серия В. Промышлен-
ность. Прикладные науки 3, 2015. – С.16-22.
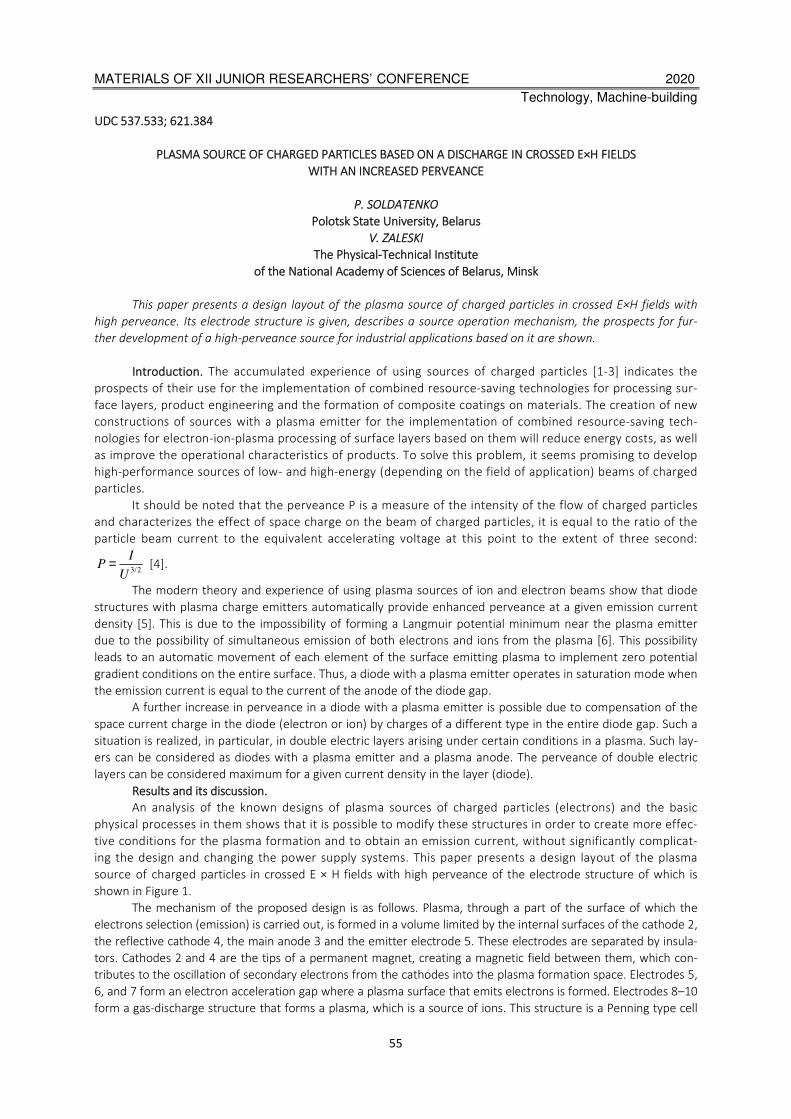
MATERIALS OF XII JUNIOR RESEARCHERS’ CONFERENCE 2020
Technology, Machine-building
55
UDC 537.533; 621.384
PLASMA SOURCE OF CHARGED PARTICLES BASED ON A DISCHARGE IN CROSSED E×H FIELDS
WITH AN INCREASED PERVEANCE
P. SOLDATENKO
Polotsk State University, Belarus
V. ZALESKI
The Physical-Technical Institute
of the National Academy of Sciences of Belarus, Minsk
This paper presents a design layout of the plasma source of charged particles in crossed E×H fields with
high perveance. Its electrode structure is given, describes a source operation mechanism, the prospects for fur-
ther development of a high-perveance source for industrial applications based on it are shown.
Introduction. The accumulated experience of using sources of charged particles [1-3] indicates the
prospects of their use for the implementation of combined resource-saving technologies for processing sur-
face layers, product engineering and the formation of composite coatings on materials. The creation of new
constructions of sources with a plasma emitter for the implementation of combined resource-saving tech-
nologies for electron-ion-plasma processing of surface layers based on them will reduce energy costs, as well
as improve the operational characteristics of products. To solve this problem, it seems promising to develop
high-performance sources of low- and high-energy (depending on the field of application) beams of charged
particles.
It should be noted that the perveance P is a measure of the intensity of the flow of charged particles
and characterizes the effect of space charge on the beam of charged particles, it is equal to the ratio of the
particle beam current to the equivalent accelerating voltage at this point to the extent of three second:
3/2
IP
U= [4].
The modern theory and experience of using plasma sources of ion and electron beams show that diode
structures with plasma charge emitters automatically provide enhanced perveance at a given emission current
density [5]. This is due to the impossibility of forming a Langmuir potential minimum near the plasma emitter
due to the possibility of simultaneous emission of both electrons and ions from the plasma [6]. This possibility
leads to an automatic movement of each element of the surface emitting plasma to implement zero potential
gradient conditions on the entire surface. Thus, a diode with a plasma emitter operates in saturation mode when
the emission current is equal to the current of the anode of the diode gap.
A further increase in perveance in a diode with a plasma emitter is possible due to compensation of the
space current charge in the diode (electron or ion) by charges of a different type in the entire diode gap. Such a
situation is realized, in particular, in double electric layers arising under certain conditions in a plasma. Such lay-
ers can be considered as diodes with a plasma emitter and a plasma anode. The perveance of double electric
layers can be considered maximum for a given current density in the layer (diode).
Results and its discussion.
An analysis of the known designs of plasma sources of charged particles (electrons) and the basic
physical processes in them shows that it is possible to modify these structures in order to create more effec-
tive conditions for the plasma formation and to obtain an emission current, without significantly complicat-
ing the design and changing the power supply systems. This paper presents a design layout of the plasma
source of charged particles in crossed E × H fields with high perveance of the electrode structure of which is
shown in Figure 1.
The mechanism of the proposed design is as follows. Plasma, through a part of the surface of which the
electrons selection (emission) is carried out, is formed in a volume limited by the internal surfaces of the cathode 2,
the reflective cathode 4, the main anode 3 and the emitter electrode 5. These electrodes are separated by insula-
tors. Cathodes 2 and 4 are the tips of a permanent magnet, creating a magnetic field between them, which con-
tributes to the oscillation of secondary electrons from the cathodes into the plasma formation space. Electrodes 5,
6, and 7 form an electron acceleration gap where a plasma surface that emits electrons is formed. Electrodes 8–10
form a gas-discharge structure that forms a plasma, which is a source of ions. This structure is a Penning type cell
MATERIALS OF XII JUNIOR RESEARCHERS’ CONFERENCE 2020
Technology, Machine-building
56
[8]. At the same time, the magnetic field generated by the cathodes 8, 9 forms a certain magnetic focusing system
for an accelerated electron beam propagating along the axis of this gas-discharge structure until it leaves the
source in the process chamber.
1 – plasma gas inlet channel; 2 – cathode; 3 – main anode;
4 – reflective cathode; 5 – emitter electrode; 6 – auxiliary cathode; 7 – accelerating electrode; 8, 10 – cathodes; 9 – anode; 11 –
flange for mounting the structure to the working chamber; 14 – insulators
Figure 1. – Appearance of the developed source layout with increased perveance
The electrodes of the developed model of the electron source are connected to the power supply system
separately, each discharge structure has its own discharge power supply. It was assumed that the relationship of
separately controlled discharges in the structure will contribute to an increase in the degree of gas ionization at
reduced pressure. The mechanism of operation, which provides an increase in perveance, is as follows: the elec-
tron beam formed in the upper chamber (electrodes 2-5, Fig. 1) after acceleration enters the structure formed
by the electrodes of the lower chamber (electrodes 8-10 Fig. 1), where a low-pressure discharge forms a plasma
emitting ions. The generated electron beam, propagating along the axis in this structure, increases the degree of
plasma ionization in this discharge. Ions propagate into the upper structure, increase gas ionization in the elec-
tron selection region and the emission current density, and partially compensate for the electron space charge in
the accelerating gap, which generally leads to an increase in the source perveance.
The implementation of this mechanism is evidenced by a change in the slope of the current-voltage
characteristics of extraction in the presence (Fig. 2, curves 4-6 and Fig. 3, curves 3-5) of discharge initiation
in the lower discharge chamber (electrodes 8-10 of Fig. 1) in comparison with its absence (Fig. 2, curves 1-3
and Fig. 3, curves 1, 2). The type of characteristics indicates a weak effect on the source perveance of the
discharge current and gas inlet (pressure in the discharge chamber) in the working range of the stable exist-
ence of the discharge. From the presented characteristics it is seen that the determining effect on the
source perveance is exerted by the presence of an additional discharge in the lower discharge chamber
(electrodes 8–10 of Fig. 1).
MATERIALS OF XII JUNIOR RESEARCHERS’ CONFERENCE 2020
Technology, Machine-building
57
Figure 2. – Current I7 (into Faraday cylinder) in the absence of (1-3) and the presence (4-6) discharge initiation in the low-
er discharge chamber (electrodes 8-10, Fig. 1) for various gas inlets Q:
Id in the upper chamber (electrodes 2-5, Fig. 1) 200 mA, discharge voltage 420 V;
Id in the upper chamber (electrodes 8-10, Fig. 1) 180 mA, discharge voltage 410 V.
Gas inlet Q: 1, 4 – 0,05∙10-4 l/sec; 2, 5 – 0,1∙10-4 l/sec; 3, 6 – 0,38∙10-4 l/sec
Figure 3. – Current I7 (into Faraday cylinder) in the absence of (1-2) and the presence (3-5) discharge initiation in the lower
discharge chamber (electrodes 8-10, Fig. 1) for various discharge currents in the upper and lower chambers:
1-5 – gas inlet Q – 0,1∙10-4 l/sec;
Id in the upper chamber (electrodes 2-5, Fig. 1) 1, 3, 5 - 200 mA, discharge voltage 420 V; 2, 4 – 240 mA, discharge volt-
age 450 V;
3, 4 - Id in the lower chamber (electrodes 8-10, Fig. 1) 180 mA, discharge voltage 410 V; 5 - Id in the lower chamber
(electrodes 8-10, Fig. 1) 210 mA, discharge voltage 430 V.
Gas inlet Q: 1, 4 – 0,05∙10-4 l/sec; 2, 5 – 0,1∙10-4 l/sec; 3, 6 – 0,38∙10-4 l/sec
Conclusion. Along with known methods that increase the switching of the electron current from plasma
to the accelerating gap (emission current) in plasma sources of charged particles, a significant increase in the

MATERIALS OF XII JUNIOR RESEARCHERS’ CONFERENCE 2020
Technology, Machine-building
58
perveance of plasma sources of both high-energy and low-energy beams is provided by filling the electron-
accelerating gap with ions that compensate for the space charge of the electron beam. Moreover, to increase
the perveance of plasma electron sources in a continuous mode, it is advisable to use an accelerating electrode
in the form of a plasma surface that accelerates electrons and, at the same time, emits ions into the gap acceler-
ating electrons. For this, the accelerating electrode must be an element of the electrode gas-discharge structure
forming the plasma. Between the electron-emitting plasma and the plasma of the accelerating electrode, a
double electric layer is formed with a high perveance for the accelerated electron beam.
The obtained results indicate the possibility and prospects of using the developed source for developing a
high-perveance source for industrial applications.
REFERENCES
1. Плазменные эмиссионные системы с ненакаливаемыми катодами для ионно-плазменных технологий
В.Т. Барченко [и др] / под ред. В.Т. Барченко. – СПб.: СПбГЭТУ «ЛЭТИ», 2011. – 220 с.
2. Антонович Д.А. Плазменные эмиссионные системы для электронно-лучевых технологий. Часть 1 /
Д.А. Антонович, В.А. Груздев, В.Г. Залесский, П.Н. Солдатенко, И.Л Поболь / Вестник ПГУ. Сер. С: Фунда-
ментальные науки. – 2016. – 12. – С. 37 – 44
3. Антонович Д.А. Плазменные эмиссионные системы для электронно-лучевых технологий. Часть 2 /
Д.А. Антонович, В.А. Груздев, В.Г. Залесский, П.Н. Солдатенко / Вестник ПГУ. Сер. С: Фундаментальные
науки. – 2017. – 4 – С. 45–51
4. Молоковский С. И., Сушков А. Д. «Интенсивные электронные и ионные пучки» - Л.: «Энергия», 1972.
5. Залесский, В. Г. Эмиссионные и электронно-оптические системы плазменных источников электронов :
дис. … д-ра физ.-мат. наук : 01.04.04 / В. Г. Залесский. – Минск, 2015. – 316 л.
6. Чен, Ф. Введение в физику плазмы / Ф. Чен. – М.: Мир, 1987. – 398 с.
7. Antonovich D.A. Plasma emission systems for electron and ion-beams technologies / D.A. Antonovich, V.A.
Gruzdev, V.G. Zalesski, I.L. Pobol, P.N. Soldatenko // High Temperature Material Processes (An International
Quarterly of High-Technology Plasma Processes) v. – 21 is. 2. P 143-159.
8. Penning FM. Coating by Cathode Disintegration. US Patent 2,146,025; N.V. Philips, Gloeilampenfabrieken, Eind-
hoven, The Netherlands; 1939
MATERIALS OF XII JUNIOR RESEARCHERS’ CONFERENCE 2020
Technology, Machine-building
59
UDC 517.926+517.977
CRITERION OF UNIFORM FULL CONTROLLABILITY FOR LINEAR DISCRETE SYSTEMS
WITH VARIABLE STRUCTURE
A. KOZLOV, T. ALEKSANDROVICH
Polotsk State University, Belarus
Introduction. One of the actively developing sections of the theory of dynamical systems today is the the-
ory of control of the asymptotic characteristics of linear dynamic (discrete and continuous) systems [1]. The
main effective tools used in it and appearing initially in the theory of control of finite-dimensional linear dynamic
systems [2] were the controllability matrix (Kalman matrix), as well as the property of uniform complete control-
lability of a linear controllable differential system. The aim of this work is to introduce the properties of uniform
full controllability for linear controlled discrete systems with a varying structure and to obtain a coefficient crite-
rion for the presence of such a property in these systems based on the controllability matrix. The results ob-
tained are planned to be used in future in solving the problems of controlling the asymptotic characteristics of
the above-mentioned discrete systems.
Materials and methods. In the present work, the object of study is linear controlled discrete systems with
a changing structure, for which the property of their uniform complete controllability is introduced and studied.
In the study, methods of the theory of matrices, the theory of discrete dynamic systems, and also the theory of
control of linear dynamic systems are used.
Results and its discussion. In case 0 1, , ..., , ...
tn n n and
0 1, , ..., , ...
tr r r two sequences of positive integers,
the linear discrete equation is considered to be
1= ,
t t t t tx A x B u+ + = 0,1, 2, ... ,t (1)
in which t
A – 1
( )t t
n n+ × - matrices, t
B – 1
( )t t
n r+ × - matrices, and sequence t
u at every moment of time takes
values in space rtR (it plays the role of input). Equation (1) relates to the unknown sequence
nt
tx ∈R at points
t and 1.t +
Definition 1 [3]. The relation (1) for 0,t
u ≡ = 0,1, 2, ... ,t that is, a system of the form
1= , = 0,1, 2, ... ,
t t tx A x t+
is called a homogeneous system with a changing structure.
The ( )t
n nτ× - matrix (Cauchy matrix [3]) ,t
X τ is defined in the following way:
,=X Iτ τ τ (Iτ – identity transformation into
nτR );
, 1 2=
t t tX A A Aτ − − τ⋅ ⋅… at > .t τ
By analogy with [4], the concept of uniform complete controllability of system (1) is introduced.
Definition 2. System (1) is called σ - uniformly and completely controllable system, if such numbers
as σ ∈N and > 0,γ exist, which for any initial point in time τ ∈N and in any initial state 0
nx τ∈R there is con-
trol = ( ),u u t = , 1, , 1,t τ τ + τ + σ −… satisfying inequality ( )u t xτγ for all = , 1, , 1,t τ τ + τ + σ −… and
as such the solution of system (1) with this control and the initial condition 0
=x xτ satisfies equality
= 0 .n
x τ+σσ ∈R
The controllability matrix is considered [3]
1
, , 1 , 1== T T
j j j jjW X B B X
τ+σ−τ τ+σ τ+σ + τ+σ +τ∑
with sizes .n nτ+σ τ+σ×

MATERIALS OF XII JUNIOR RESEARCHERS’ CONFERENCE 2020
Technology, Machine-building
60
Theorem. System (1) is uniformly and completely controllable if and only if such numbers as σ ∈N and
> 0,α exist, which for any number τ ∈N for every vector nτ+σξ ∈R inequality holds
1 2
, , 1 , 1== ( ) .T T T T
j j j jjW X B B X
τ+σ−τ τ+σ τ+σ + τ+σ +τ
ξ ξ ξ ⋅ ⋅ ξ α ξ∑
Conclusion. The results presented above will allow us to solve the problem of controlling the asymptotic
characteristics of linear discrete systems with a varying structure.
The work was carried out in the framework of the State program of scientific research “Convergence-
2020” (subprogram 1, task 1.2.01).
REFERENCES
1. Makarov E.K., Popova S.N. Controllability of asymptotic invariants of non-stationary linear systems. Minsk:
Belarus. Navuka, 2012.
2. Kalman R., Falb P., Arbib M. Essays on the mathematical theory of systems. M., 2004
3. Gaishun I.V. Linear systems with a varying structure. Controllability and observability // Differential equa-
tions. - 2000. - T. 36, No. 11. - C. 1544-1549.
4. Tonkov E. L. Criterion for uniform controllability and stabilization of a linear recurrent system // Differential
equations. - 1979. - T. 15, No. 10. - S. 1804–1813.
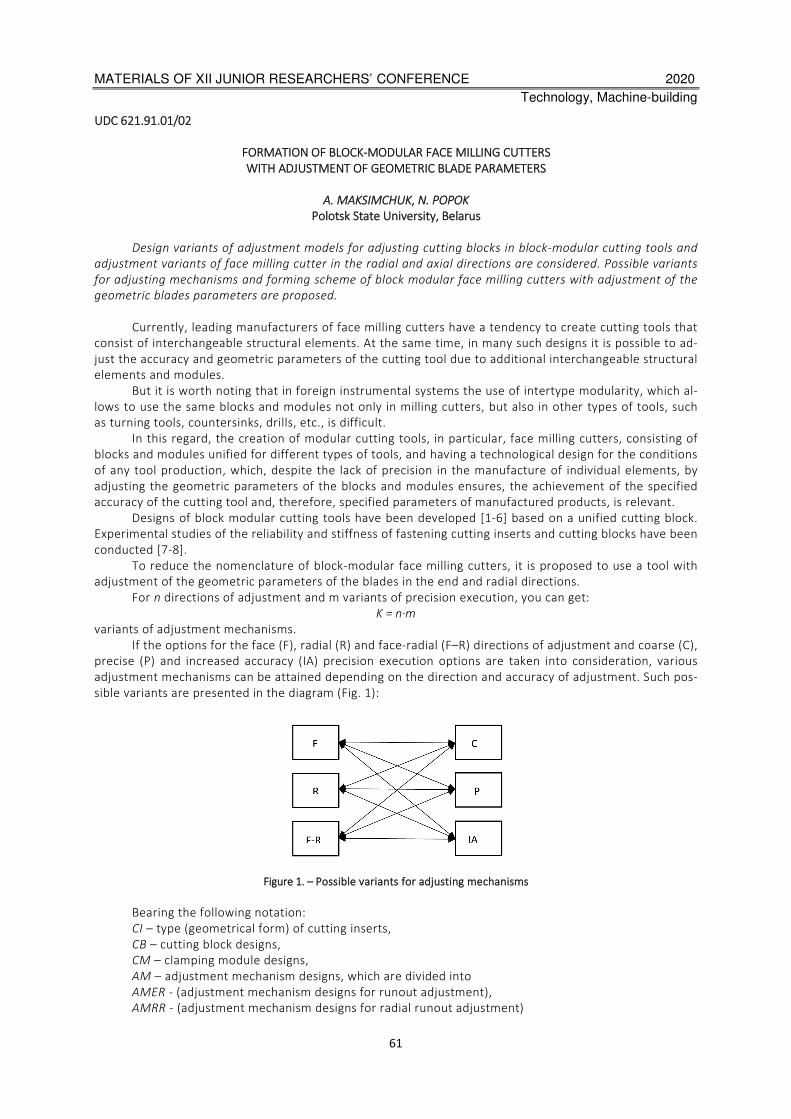
MATERIALS OF XII JUNIOR RESEARCHERS’ CONFERENCE 2020
Technology, Machine-building
61
UDC 621.91.01/02
FORMATION OF BLOCK-MODULAR FACE MILLING CUTTERS
WITH ADJUSTMENT OF GEOMETRIC BLADE PARAMETERS
A. MAKSIMCHUK, N. POPOK
Polotsk State University, Belarus
Design variants of adjustment models for adjusting cutting blocks in block-modular cutting tools and
adjustment variants of face milling cutter in the radial and axial directions are considered. Possible variants
for adjusting mechanisms and forming scheme of block modular face milling cutters with adjustment of the
geometric blades parameters are proposed.
Currently, leading manufacturers of face milling cutters have a tendency to create cutting tools that
consist of interchangeable structural elements. At the same time, in many such designs it is possible to ad-
just the accuracy and geometric parameters of the cutting tool due to additional interchangeable structural
elements and modules.
But it is worth noting that in foreign instrumental systems the use of intertype modularity, which al-
lows to use the same blocks and modules not only in milling cutters, but also in other types of tools, such
as turning tools, countersinks, drills, etc., is difficult.
In this regard, the creation of modular cutting tools, in particular, face milling cutters, consisting of
blocks and modules unified for different types of tools, and having a technological design for the conditions
of any tool production, which, despite the lack of precision in the manufacture of individual elements, by
adjusting the geometric parameters of the blocks and modules ensures, the achievement of the specified
accuracy of the cutting tool and, therefore, specified parameters of manufactured products, is relevant.
Designs of block modular cutting tools have been developed [1-6] based on a unified cutting block.
Experimental studies of the reliability and stiffness of fastening cutting inserts and cutting blocks have been
conducted [7-8].
To reduce the nomenclature of block-modular face milling cutters, it is proposed to use a tool with
adjustment of the geometric parameters of the blades in the end and radial directions.
For n directions of adjustment and m variants of precision execution, you can get:
K = n·m
variants of adjustment mechanisms.
If the options for the face (F), radial (R) and face-radial (F–R) directions of adjustment and coarse (C),
precise (P) and increased accuracy (IA) precision execution options are taken into consideration, various
adjustment mechanisms can be attained depending on the direction and accuracy of adjustment. Such pos-
sible variants are presented in the diagram (Fig. 1):
Figure 1. – Possible variants for adjusting mechanisms
Bearing the following notation:
CI – type (geometrical form) of cutting inserts,
CB – cutting block designs,
CM – clamping module designs,
AM – adjustment mechanism designs, which are divided into
AMER - (adjustment mechanism designs for runout adjustment),
AMRR - (adjustment mechanism designs for radial runout adjustment)
MATERIALS OF XII JUNIOR RESEARCHERS’ CONFERENCE 2020
Technology, Machine-building
62
AMERR - (adjustment mechanism designs for end and radial runout adjustment),
HM – housing module designs,
BMFMC – block modular face milling cutter designs, were received:
1. Generalised code for forming adjustable block-modular face milling cutters:
CI ∪ CB ∪ CM ∪ AM(AMER ∪ AMRR ∪ AMERR) ∪ HM → BMFMC
2. Scheme of forming adjustable block-modular face milling cutters in tabular form (Fig.2)/
Figure 2. – Scheme of forming adjustable block-modular face milling cutters
Based on the proposed code and the scheme for forming block-modular face milling cutters, designs
of block-modular face milling cutters with various variants for adjusting geometric parameters have been
proposed. The proposed scheme for the formation of block-modular face milling cutters can simplify the
work with a wide range of elements as it is easy to formalise and, therefore, to automate the design pro-
cess of tools.
REFERENCES
1. Конструирование и оснащение технологических комплексов/ А.М. Русецкий[и др.]; под общей ред.
А.М. Русецкого – Минск: Беларус. навука, 2014– 316 с.
2. Патент BY 563, В23В1/00, 27/12. Многолезвийный блочно-модульный режущий инструмент/ Попок
Н.Н., Терентьев В.А., заявка 4 2001.12.11
3. Патент BY 3127, В23В1/00, 27/00. Многолезвийный блочно-модульный режущий инструмент/ Попок
Н.Н., Сидикевич А.В., Терентьев В.А., Хмельницкий Р.С., Сопиков И.Я. заявка 5 2006.10.30
4. Мобильная реорганизация машиностроительного производства / Н.Н. Попок. – Минск : Технопринт,
2001. – 396 с.
5. Патент по заявке а2011025. Способ устновки сменной режущей пластины в режущем инструменте /
Н.Н. Попок, В.А. Терентьев, Р.С. Хмельницкий, А.В. Сидикевич, И.Я. Сопиков; дата публ. 2011.01.06. Вы-
дан 2014.12.12.
6. Патент по заявке а2011026. Режущий инструмент с режущей пластиной / Н.Н. Попок, В.А. Терентьев,
Р.С. Хмельницкий, А.В. Сидикевич, И.Я. Сопиков; дата публ.2011.01.06. Выдан 2014.12.12
7. Совершенствование системы закрепления пластин режущих и блоков резцовых в блочно-модульных
режущих инструментах/ Н.Н. Попок, А.С. Максимчук, С.А. Портянко – Вестник ПГУ, сер. В. Промышлен-
ность. Прикладные науки. 3, 2015г. – с. 16-22
8. Совершенствование конструкций блочно-модульных торцовых фрез на основе исследования характе-
ристик процесса резания/ Н.Н. Попок, А.С. Максимчук, С.А. Портянко – Вестник ПГУ, сер. В. Промыш-
ленность. Прикладные науки. 3, 2017 г. – с. 22-29.
MATERIALS OF XII JUNIOR RESEARCHERS’ CONFERENCE 2020
Technology, Machine-building
63
UDC 331.45
DIGITAL TRANSFORMATION IN ENSURING OCCUPATIONAL SAFETY IN THE OIL AND GAS INDUSTRY
V. SAMUSEVICH
The University of Civil Protection of the Ministry for Emergency Situations of the Republic of Belarus
Y. BULAUKA
Polotsk State University, Belarus
The analysis of the used digital tools of integrated solutions for ensuring occupational safety has been car-
ried out. It has been demonstrated that modern digital information and communication technologies have specif-
ic features and perform some of the functions of occupational safety specialists, which allow relevant services to
switch to a new algorithm for ensuring occupational safety at work.
Keywords: occupational safety, digital tools.
Introduction. On the basis of the analysis of the global level of occupational injuries, experts of the Inter-
national Labor Organisation have come to the conclusion that there are approximately 340 million registered
work accidents each year of which 2.3 million are fatal, every minute 4 people die from work-related injuries and
diseases. About 650 thousand deaths per year are registered in the working area from exposure to hazardous
substances alone. The economic damage to society from adverse and hazardous working conditions is up to 4%
of the world GDP. At the same time, it is well known that one dollar of the funds invested in the improvement of
working conditions at a production site makes a profit of about $2.6 [1-8].
Results, their discussion and perspectives. According to official data of the National Statistical Committee of
the Republic of Belarus, the total number of victims of industrial accidents has grown in the organisations of the
Belneftekhim company over the last three years of observation. The dynamics of occupational injuries at the
organisations of Belneftekhim obtained according to the data [9] is shown in figure 1. The main causes of acci-
dents at work in the organisations of Belneftekhim are the same as elsewhere in the country, namely: violation
of labour protection requirements by the injured; personal negligence; unsatisfactory organisation of hazardous
work; violation of labour protection requirements by other workers.
Figure 1. - The number of the injured in industrial accidents
at the organisations of the Belneftekhim company
The unstable situation in the field of occupational safety and health at large industrial enterprises makes
it necessary to reduce the risk of industrial injuries through the development and implementation of more effi-
cient preventive measures [6-8]. The era of digital economy, "Industry 4.0", and the development of the Internet
of things, dictate the need for growth of IT and Smart-development ("Smart Technology") in various enterprise
management systems, including occupational health and safety management systems.
MATERIALS OF XII JUNIOR RESEARCHERS’ CONFERENCE 2020
Technology, Machine-building
64
The development of preventive measures to reduce the number of industrial injures and occupa-
tional diseases requires of specialists in the field of labour protection to take into account and systematical-
ly study a large flow of information, to be able to analyse complex industrial situations, to predict events
and provide timely information and balanced decisions on expediency of implementing certain preventive
measures. This causes the necessity to use digital tools of integrated solutions for ensuring occupational
safety and health. The analysis of the current state of this issue has determined the purpose of this study.
We have analysed modern digital tools of integrated solutions used to ensure occupational safety at work,
and they can be ranked by areas of activity [6-8]:
1) Occupational health and safety training: Olimpoks system (OOO A-P, Russia), OLIMPOKS training and
controlling system and OLIMPOKS: Instruction system (OOO "TERMIKA", Russia), online training system LMS
(Learning Management System) and VR (Virtual Reality) simulators (VRC CROC, Russia); VR-training, employee
training system using virtual reality (Cerevrum Inc., jointly elaborated in Russia and the United States of America)
and others.
2) Control over compliance with occupational health and safety requirements: "Production Control" inte-
grated system of work safety (ISWS) ("Vizitech" company, Russia), mobile phone application "I am an inspector"
(Rostrud, Russia).
3) Organisation of work on occupational safety (automated working station (AWS) for occupational
safety specialists): "Occupational safety" for 1 C: Enterprises 8 (Inform Service Group, Russia), "1C. Production
safety. Occupational safety" (INTERS, Russia), online service ("Abie System", Russia), information management
system "Industrial safety and labour protection" (OOO "BREALIT", Russia), cloud service "MyObject" (Living сore,
Russia), AWS Occupational safety (ODO "Expertcentre", Belarus), system Q4 Safety (Engica, USA).) It should be
noted that on the Russian market alone there are more than a hundred specialised AWS products which allow to
reduce time for planning and organisation of work, to process large amount of information faster and to simplify
labour-consuming monotonous work.
4) Prevention of accidents: “Smart” video analytics (Russian CROC, DSSL and other companies), “Elec-
tronic medical examination system” (EDISON, Russia)
5) Personal protective equipment (PPE): "Smart" hardhat (several companies: Human, ROSOMZ, Soft-
line), other wearable devices (MTS and Megafon, Russia)
Digital simulators and equipment simulators, 3D virtual reality technology for skills training implemented
in the process of training for occupational safety specialists can significantly improve the efficiency of staff train-
ing by creating an interactive learning environment as close to the real as possible. Replacing the traditional form
of instruction by Smart-Technology is feasible due to the higher capacity of the visual sensory system compared
to the auditory one. The visual perception of information activates the right hemisphere of the brain, which
forms figurative thinking that promotes the transfer of information into the subconscious memory. The use of
mobile applications allows users, regardless of the location of an employee, to properly prepare for the test of
knowledge on occupational safety, passing trial tests, even staying offline.
Conclusion. The analysis of the used digital tools of integrated solutions for the purpose of ensuring occu-
pational health and safety at work has shown that these technologies are already mandatory and necessary tools
for occupational health services, especially at facilities in the oil and gas industry, characterised by increased
explosion and fire hazards. Digital innovations are characterised by extensive functionality and are applied in
various areas of work in the field of occupational safety.
REFERENCES
1. Анализ производственного травматизма на нефтеперерабатывающем предприятии/ Ю.А. Булавка //
Вестник Полоцкого государственного университета. Сер. B, Промышленность. Прикладные науки.–
2011 . – 3. - С. 130-137.
2. Современное состояние и совершенствование методики экспертной оценки профессионального риска
на рабочих местах/ Ю.А. Булавка // Вестник Полоцкого государственного университета. Сер. B, Про-
мышленность. Прикладные науки.– 2013 . – 3. С.156-163.
3. Совершенствование технологии экспертной оценки профессионального риска на рабочих местах / Ю.А.
Булавка //Безопасность жизнедеятельности. – 2013. – 7. – С.9- 15.
4. Развитие комплексной оценки профессионального риска путем учета суммарной вредности условий тру-
да/Ю.А. Булавка // Гигиена и санитария.– 2013. – 4. – С.47-54

MATERIALS OF XII JUNIOR RESEARCHERS’ CONFERENCE 2020
Technology, Machine-building
65
5. Нечетко-множественный подход к экспертной оценке профессиональных рисков на примере условий
труда работников нефтеперерабатывающего завода / Ю.А. Булавка // Вестник Полоцкого государ-
ственного университета. Сер. С, Фундаментальные науки.– 2013 . – 12. – С.59-66.
6. Использование цифровых инструментов интегрированных решений в области охраны труда /Ю.А. Бу-
лавка, В.Н. Самусевич// Вестник Полоцкого государственного университета. Сер. B, Промышленность.
Прикладные науки.– 2019 . – 11. - С. 120-129.
7. The improving of the safety level of the equipment working under excessive pressure/K.Y. Kozhemyatov, Y.A.
Bulauka// Topical Issues of Rational Use of Natural Resources 2019- Litvinenko (Ed) , 2020 Taylor & Francis
Group, London, https://doi.org/10.1201/9781003014638, .-Volume 2 - P.546-552.
8. Occupational health and safety in the industry 4.0 era: A cause for major concern?/ Adel Badri, Bryan Bou-
dreau-Trudel, Ahmed Saâdeddine Souissi//Safety Science. - 109.-November 2018.- pp. 403-411.
9. Итоги работы семинара по вопросам предупреждения производственного травматизма в организациях
концерна «Белнефтехим» и Министерства промышленности /И. Рубан//Нефтехимия. Новости.-.2019.–
Режим доступа: https://belchemoil.by/news/obshhestvo/v-centre-vnimaniya-chelovek/dumaj-delaj-ne-
vlezaj-itogi-raboty-seminara-po-preduprezhdeniy-proizvodstvennogo-travmatizma
MATERIALS OF XII JUNIOR RESEARCHERS’ CONFERENCE 2020
Technology, Machine-building
66
UDC 62:658.382.3
ANALYSIS OF EQUIPMENT OPERATION TIME AT THE REFINERY
Y. BULAUKA, K. KOZHEMYATOV
Polotsk State University, Belarus
The results of the analysis of the service life of equipment operating under excess pressure at the Belarus-
ian oil refineries are presented, directions for improving industrial safety when working with this type of equip-
ment are proposed in this study. The average service life of equipment operating under excessive pressure at the
studied enterprise has been identified.
Keywords: oil refinery, industrial safety, accident rate, equipment
Introduction. The enterprises of the oil refining industry are some of the most explosive objects. The high
fire and explosive level of these enterprises is explained by the presence of a large amount of hydrocarbons that
circulate in the process [1-13]. Emergency depressurisation of the technological equipment at a refinery plant
can cause a major accident with concomitant emissions of toxic substances, destruction and damage of expen-
sive equipment, breakdown of the technological processes, fires and explosions [14-16]. Every year approximately
20,000 major accidents occur in the oil and gas industry in the world, and in recent years there has been an increase of
the accident rate in the oil refining industry [17-21]. Several examples of such accidents are:
− An accident in March 2005 at the isomerisation unit of one of the largest US refineries owned by Brit-
ish Petroleum in Texas City. There was a powerful explosion, followed by a strong fire. 15 people were killed and
over 70 were injured;
− On May 29, in 2008, a hydrogen-containing mixture exploded in a hydrogen compressor unit for the
secondary processing of oil at the Kirishi Refinery, and then a fire occurred. One person died on the spot, four
died in hospital. The damage from the accident amounted to 107 million Rubles;
− On August 7, 2011 there was a fire at the Khabarovsk refinery. Spilled fuel and pumping station
burned on a total area of 50 m2 3 people were injured and 2 died;
− On June 15, 2014 at the gas fractionation unit of the Achinsk refinery there was a leak of hydrocarbon
gas, which led to a major explosion and fire. 8 people died, 7 were hospitalised, the total number of the injured
was 24 people. The damage amounted to approximately $ 800 million.
In the CIS countries there is a targeted state policy in the field of industrial safety. However, the state of
accidents at work place continues to be a complex socio-economic problem.
Statistics show that the major accidents at oil refineries in most cases are due to leaks of flammable
liquids and vapours or hydrocarbon gas. The reasons of their occurrence are as follows:
− violation of the rules of operation, technological regulations (27% of cases);
− defects in construction and installation works, low quality of installation and repairing of equipment
(21%);
− defects in the manufacture of equipment and materials (16%);
− deviation from the requirements of the design and technical documentation (12%);
− equipment deterioration, product leaks through gaskets, mechanical seals, oil seals, equipment corro-
sion, furnace burnout in furnaces (11%);
− constructive imperfection of equipment (5%);
− external natural and man-made impacts (5%);
− imperfection of design solutions, etc. (less than % 3).
Improving the resiliency and trouble-free operation of equipment under excessive pressure at oil
refineries, are now particularly relevant directions to improve the level of industrial safety for the industry. This
fact has determined the purpose of this study.
Research methods. Equipment operating under excessive pressure at a Belarusian full-cycle oil refinery
has been taken as a research object; equipment such as columns, vessels and reactors has been studied; heat
exchangers (including crystallisers), separators and filters. The expert-statistical and analytical methods have
been applied on the basis of a comprehensive analysis of repairing documentation for the period of 2008-2018
as well as the terms of operation of equipment functioning under excessive pressure at the Belarusian oil
refineries.

MATERIALS OF XII JUNIOR RESEARCHERS’ CONFERENCE 2020
Technology, Machine-building
67
Results and discussion. With the purpose of determination of the current state of equipment during
shutdown repairs, as well as during technical diagnostics, and determination of the suitability for further
operation and extension of the life cycle of equipment that has worked out a standard period the following
combination of non-destructive testing methods is usually used: visual inspection in accessible places; ultrasonic
thickness measurement of housing elements and nozzles; ultrasonic defectoscopy of welds, as well as control of
the continuity of the base metal; penetration test; hydrostatic test.
Columns at a research plant accounts for 6% of the total number of equipment. According to GOST
31838-2012, this type includes cylindrical vertical vessels of constant or variable cross-sections, equipped with
internal heat and mass transfer devices (plates or packing), as well as assistant units (liquid inlets, devices for set-
up packed elements, etc.). providing a process (for example, rectification or direct heat exchange between
steam (gas) and liquid, etc.). The analysis of repair documentation for the period of 2008-2018 has shown that
the highest frequency of work is achieved by replaced nozzles with conditional passage up to DN100 (37% of the
scope of work), replacing internal devices (23%), replacing nozzles with conditional passage DN100 and more
(21%), while less frequently repairs take place on the base metal and metal of the body welds (about 19% of the
work).
For the columns the replacement of internal devices usually means the replacement of the supporting
elements of the plates welded to the vessel body, which have become unusable in the result of corrosive wear
under the influence of the working medium. It is controlled visually and with the help of measuring devices. An
effective way to increase safety is to widely use the technology of welding support elements through shims
welded directly to the body of the vessels. If it is necessary to repair this unit, the support element is cut out and
a new one is welded to the shim plate without touching the body of the vessel.
At the same time, there is no possibility of mechanical damage to the body when re-disassembling the
support element. It also excludes its local overheating and changes in the metal structure as a result of overheat-
ing. It favorably affects to the period of further operation of this equipment. This method can also be applied to
elements welded outside vessels, such as service platforms, booms, supporting elements of level gauge columns,
etc.
Separators make up 6% of the total number of the examined equipment, belong to the settling items.
Separators are similar in design to columns, but have smaller size and are equipped with fewer plates or an over-
flow plate for separating liquids by density. According to the maximum frequency of the types of repairs carried
out by separators the work is performed on replaced nozzles with conditional passage of up to DN 100 (76% of
the work); a small percentage falls on other types of repairs (repair of base metal and metal of body welds - 11%
conditional passage of DN 100 or more - 9%, replacement of internal devices - 4%).
Filters make up 7% of the total number of the examined equipment, belong to the apparatus for the im-
plementation of the filtering process. The most frequent repairs on filters are made for replacing nozzles with
conditional passage of up to DN100 (71% of works), a small percentage are for other types of repairs (repairing
base metal and metal of body welds - 19% and replacing fittings with conditional passage DN100 and more -
10%). The reason for this is that this type of equipment has low average life.
Reactors make up 2% of the total number of the examined equipment, belong to vessels in which chemi-
cal reactions take place including those with the use of a catalyst. As a rule, the presence of high pressure and
temperature is observed. According to the maximum frequency of conducted repairs of reactors, repairs are
made on the base metal and metal of the protective casing welds that were repaired (75% of the scope of work),
13% of the repairs mean replacing the internal devices of the reactors.
The small number of repairs of this type of equipment is explained by the large margin of safety used in
manufacturing, due to the high operating pressures and temperatures, and the difficulty of carrying out repair
on thick buildings. When defects are detected, this type of equipment is changed entirely to ensure trouble-free
operation during the overhaul period.
Almost a single type of repair that is applied to the equipment of this type is repairing of the protective
case, which is designed to protect the sprayed concrete lining from the corrosive effects of the working medium
in the old types of reactors. From the point of view of improving reliability it is advisable to switch to modern
bimetallic reactors.
Vessels make up to 41% of the total number of the examined equipment. According to TR CU 032/2013
vessels are hermetically closed containers (divided into fixed and mobile). This type of equipment is designed for
conducting chemical, thermal and other technological processes, and also for the storage and transportation of
gases, liquids, and other substances. The replacement of nozzles with conditional passage of up to DN100 (70%
of the scope of work) has the highest frequency of repairs of vessels, 15% of the amount of work involved re-
MATERIALS OF XII JUNIOR RESEARCHERS’ CONFERENCE 2020
Technology, Machine-building
68
placing nozzles with conditional passage of up to DN100 and more and repair of the base metal and metal of the
body welds.
Heat exchangers make up 37% of the total number of examined equipment. According to GOST 31842-
2012 heat exchangers are the equipment designed to transfer heat under non-isothermal operating conditions.
According to the maximum frequency of the types of heat-exchange equipment repairs carried out, work on
repairing the base metal and metal of the welds (31% of the work), work on replacing nozzles with conditional
passage up to DN 100 (30% of the work) and replacing and repairing, are allocated partition walls of distribution
chambers (24% of the scope of work).
The main defects detected in tube bundles of heat exchangers include:
− corrosive wear-out of pipe bundle pipes. It is controlled by hydraulic tests in the annular space;
− corrosive wear-out and thinning of the metal in the area of rolling tubes in tube plates.
− corrosive wear-out and thinning of the metal in the area of rolling tubes in tube plates. It is controlled
by hydraulic testing in the annular space.
Reducing the number of operational defects and extending the time for maintenance-free operation of heat
exchange equipment can be achieved by introducing strict control over the operation of this equipment. Often, the
gaps in the places of rolling of the pipes are caused by the deformation of the pipes by the excessive pressure in the
annular space during the filling of the apparatus. The filling of the apparatus must be made starting with the tube
bundle for the purpose of balance the pressure and reduce the probability of deformation of the tube.
Similar in construction are rigid tube-shell heat exchangers. Detected defects are the same as in shell-
and-tube heat exchangers with removable tubular system. At the same time, there is no possibility of visual
control of the inner surface of the case. To increase the level of control and detect defects at earlier stages,
maps of wall thickness measurements with an increased number of control points are compiled for heat
exchangers of these types compared to heat exchangers with a movable pipe system. In addition, rigid tube heat
exchangers are supplied with bellows expansion joints to compensate for temperature expansions.
Compensators are made of thin-walled stainless steel. At the same time, based on the practical experience of
operating devices with a lens compensator, there was often a situation in which the wall thickness of the case
had sufficient margin to the screening thickness and the lens compensator became unusable due to corrosive
erosion wear. Repair of heat exchangers of this type is impractical because of a non-dismountable design. So
disassembly, replacement of worn-out sections of the shell or tube bundle pipes, replacement of a compensator,
and the following assembly, are comparable in cost to new heat exchangers.
A specific type of heat exchange equipment is scraper chillers, that are additionally equipped with a scraper
axle inside the internal tubes of heat exchangers. At the enterprise under study such equipment makes only 1% of the
total number of equipment items, but the average lifetime of the chillers is significant - 49.2 years. The analysis of the
repair documentation for repairs carried out on chillers showed that the only type of repair is the replacement of
internal or less often external pipes, as the main wear parts of this type of equipment. In addition to the corrosive
effects of the environment, the wear of the inner tubes is influenced by the friction of the scrapers. At axial
displacement of the axle during assembly, or uneven wear of the bearings, there is increased wear-out of the
composite gaskets of the shaft scrapers, and then friction of the metal scraper on the inner surface of the pipes. At the
same time, there is no possibility to control the condition of the scraper gaskets and the internal pipes of the chiller
because the pipes are inaccessible for full visual inspection, it is impossible to conduct ultrasonic thickness gauging.
Ultrasonic thickness gauging of external pipes, visual inspection of internal pipes in accessible places using a flashlight
along the pipe axis, as well as a hydraulic test for tightness and density of internal pipes, are used to assess the state of
these technical devices. If a defect is suspected or traces of mechanical wear-out are detected, the inner tube is
replaced. At the same time, in such devices it is advisable to use pipes made of solid steel grades to reduce mechanical
wear-out of the internal surface of the pipes.
Table 1 shows the average service life of equipment operating under excessive pressure at the Belarusian
refineries.
Table 1. – Lifetime of equipment operating under excessive pressure at the refinery.
Type of equipment operating under overpressure Average life at the refinery, years
Columns 38,6
Vessels 34,8
Reactors 32,8
Heat exchangers 31,2
Separators 28,3
Filters 25,0
MATERIALS OF XII JUNIOR RESEARCHERS’ CONFERENCE 2020
Technology, Machine-building
69
The table shows that the columns, vessels, and reactors are operated the longest. At the same time, the
service life of the vessels working under excessive pressure declared by the developer is usually 20 years.
The comprehensive analysis of the life cycle of equipment operating under excessive pressure at the
Belarusian oil refineries showed that nozzles with conditional passage of up to DN100, base metal and metal of
the body welds of various equipment are subject to a high risk of increased wear-out during operation.
The reason for the frequent replacement of nozzles with a small conditional passage is associated with a
small margin between the executive and rejecting thicknesses of nozzles.
For example, a pipe with a nominal thickness of 4 mm is most often used for the nozzle of DN50 by
strength calculation. In accordance with the instructions for revision, repair and rejection which are applied at
the enterprise under study, the rejection thickness for the DN50 connection pipe is 2.0 mm, unless otherwise
greater value is indicated in the strength calculation. The executive wall thickness as a result of an error in the
manufacture is often about 3.8-3.9 mm. At the same time, in practice such nozzles are rejected with a thickness
of 2.5-2.7 mm, as an approaching rejection to improve the reliability and infallibility of work during the overhaul
period and to prevent the process installation from stopping due to the omission of the product. In this case,
even with a corrosion rate of up to 0.1 mm / year the thickness of the nozzle is not enough even for the declared
service life of the vessel (usually 20 years). From practical experience, the replacement of such nozzles during
the repair with heavy walled ones of about 6-8 mm leads to trouble-free operation of these units throughout the
life cycle of the equipment until they are replaced.
Thus, as a way to increase the industrial safety of the equipment operating under excessive pressure, it is
proposed that the new equipment is coordinated with the developers to reach an increase in the thickness of
the fittings with conditional passage of up to DN100. At the same time, despite the slight increase in the cost of
such equipment, it is possible to achieve maintenance-free operation of the equipment even after the end of the
designated service life. The reasons for repairing the base metal and weld metal are hidden metallurgical defects
and weld defects that were not detected during the manufacture of the vessel (apparatus), as well as the ag-
gressive influence of the working medium of the vessel (apparatus), the formation of stagnant zones, the accu-
mulation of solid particles from the working medium (scale, contamination, etc.), which are monitored visually
and using ultrasonic thickness gauging. Ultrasonic and penetrant tests can be additionally performed in places
suspicious of defects. In our opinion, in order to minimise the number of repairs of this type, it is necessary to
strengthen the incoming control for the newly installed equipment. Also it is necessary to strengthen control
over the selection of material for a specific working medium and operating parameters such as temperature and
pressure and to ensure strict adherence to operation regulations. In the newly designed equipment modern
technical solutions are applied to minimise the number of stagnant zones.
Conclusion. The results of the research on the comprehensive life cycle analysis of equipment operating
under excessive pressure can be effectively used to increase the level of industrial safety, reduce the risk of acci-
dents at oil refineries and petrochemical plants.
REFERENCES
1. The improving of the safety level of the equipment working under excessive pressure/K.Y. Kozhemyatov, Y.A.
Bulauka// Topical Issues of Rational Use of Natural Resources 2019- Litvinenko (Ed), 2020 Taylor & Francis
Group, London, https://doi.org/10.1201/9781003014638, .-Volume 2 - P.822-831.
2. Emergency sorbents for oil and petroleum product spills based on vegetable raw materials / Y A Bulauka, K I
Mayorava, Z Ayoub // IOP Conference Series: Materials Science and Engineering. – 2018. – Vol. 451 (1).- art.
no. 012218.- DOI: 10.1088/1757-899X/451/1/012218
3. Analysis of equipment life cycle at oil refinery/ Kozhemyatov K.Y., Bulauka Y.A. // IOP Conference Series: Ma-
terials Science and Engineering. – 2019. – Vol. 687.- art. No 066038.- DOI:10.1088/1757-
899X/687/6/066038
4. Analysis of the life cycle of equipment operating under excessive pressure at an oil refinery/K.Y. Kozhemya-
tov, Y.A. Bulauka// Scientific Conference Abstracts of XV International Forum-Contest of Students and Young
Researchers « Topical issues of rational use of natural resources», St. Petersburg, May 13-17, 2019.- Saint-
Petersburg Mining University. - St. Petersburg,2019.-P. 211
5. Булавка Ю.А. Анализ производственного травматизма на нефтеперерабатывающем предприятии //
Вестник Полоцкого государственного университета. Сер. B, Промышленность. Прикладные науки.–
2011 . – 3. - С. 130-137

MATERIALS OF XII JUNIOR RESEARCHERS’ CONFERENCE 2020
Technology, Machine-building
70
6. Кожемятов К.Ю., Булавка Ю.А. Проблемы обеспечения безопасности при эксплуатации теп-
ло6.обменного оборудования на НПЗ // Материалы пятой Всероссийской студенческой научно-
технической конференции «Интенсификация тепло-массообменных процессов, промышленная без-
опасность и экология» (23–25 мая 2018 г., Казань). – Казань: Изд-во Казан. ун-та, 2018. –С.403-406
7. Кожемятов К.Ю., Булавка Ю.А. Повышение надежности эксплуатации теплообменного оборудования
на нефтеперерабатывающем заводе // Сборник докладов 72-й Международной молодежной науч-
ной конференции «Нефть и газ – 2018» (23-26 апреля 2018 г. Москва). – Том 2.-М.: Издательский
центр РГУ нефти и газа (НИУ) имени И.М. Губкина, 2018. –С.189
8. Кожемятов К.Ю., Булавка Ю.А. Анализ практического опыта эксплуатации теплообменного оборудова-
ния на нефтеперерабатывающем заводе // Безопасность современные технологии в энергетике. Все-
российская специализированная научно-практической конференции молодых специалистов (с меж-
дународным участием), 29–30 марта 2018. cб. докл.: М.: ОАО «ВТИ», – 2018. – С.299-304.
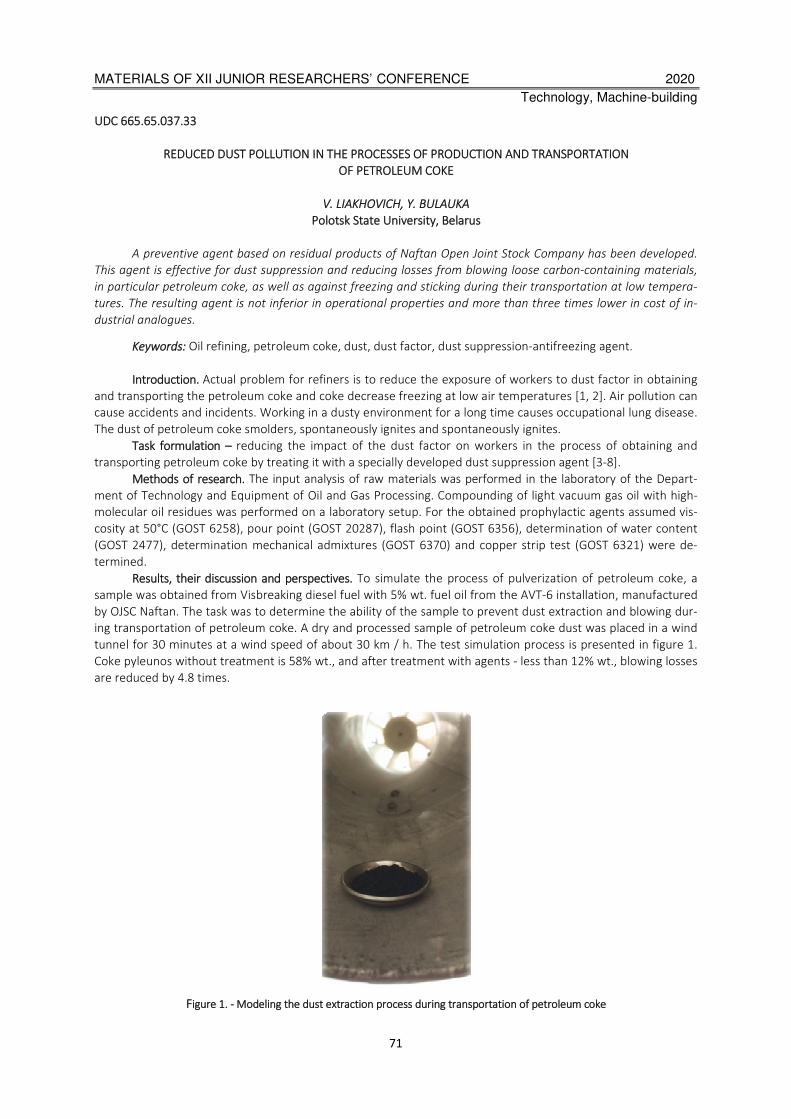
MATERIALS OF XII JUNIOR RESEARCHERS’ CONFERENCE 2020
Technology, Machine-building
71
UDC 665.65.037.33
REDUCED DUST POLLUTION IN THE PROCESSES OF PRODUCTION AND TRANSPORTATION
OF PETROLEUM COKE
V. LIAKHOVICH, Y. BULAUKA
Polotsk State University, Belarus
A preventive agent based on residual products of Naftan Open Joint Stock Company has been developed.
This agent is effective for dust suppression and reducing losses from blowing loose carbon-containing materials,
in particular petroleum coke, as well as against freezing and sticking during their transportation at low tempera-
tures. The resulting agent is not inferior in operational properties and more than three times lower in cost of in-
dustrial analogues.
Keywords: Oil refining, petroleum coke, dust, dust factor, dust suppression-antifreezing agent.
Introduction. Actual problem for refiners is to reduce the exposure of workers to dust factor in obtaining
and transporting the petroleum coke and coke decrease freezing at low air temperatures [1, 2]. Air pollution can
cause accidents and incidents. Working in a dusty environment for a long time causes occupational lung disease.
The dust of petroleum coke smolders, spontaneously ignites and spontaneously ignites.
Task formulation – reducing the impact of the dust factor on workers in the process of obtaining and
transporting petroleum coke by treating it with a specially developed dust suppression agent [3-8].
Methods of research. The input analysis of raw materials was performed in the laboratory of the Depart-
ment of Technology and Equipment of Oil and Gas Processing. Compounding of light vacuum gas oil with high-
molecular oil residues was performed on a laboratory setup. For the obtained prophylactic agents assumed vis-
cosity at 50°C (GOST 6258), pour point (GOST 20287), flash point (GOST 6356), determination of water content
(GOST 2477), determination mechanical admixtures (GOST 6370) and copper strip test (GOST 6321) were de-
termined.
Results, their discussion and perspectives. To simulate the process of pulverization of petroleum coke, a
sample was obtained from Visbreaking diesel fuel with 5% wt. fuel oil from the AVT-6 installation, manufactured
by OJSC Naftan. The task was to determine the ability of the sample to prevent dust extraction and blowing dur-
ing transportation of petroleum coke. A dry and processed sample of petroleum coke dust was placed in a wind
tunnel for 30 minutes at a wind speed of about 30 km / h. The test simulation process is presented in figure 1.
Coke pyleunos without treatment is 58% wt., and after treatment with agents - less than 12% wt., blowing losses
are reduced by 4.8 times.
Figure 1. - Modeling the dust extraction process during transportation of petroleum coke
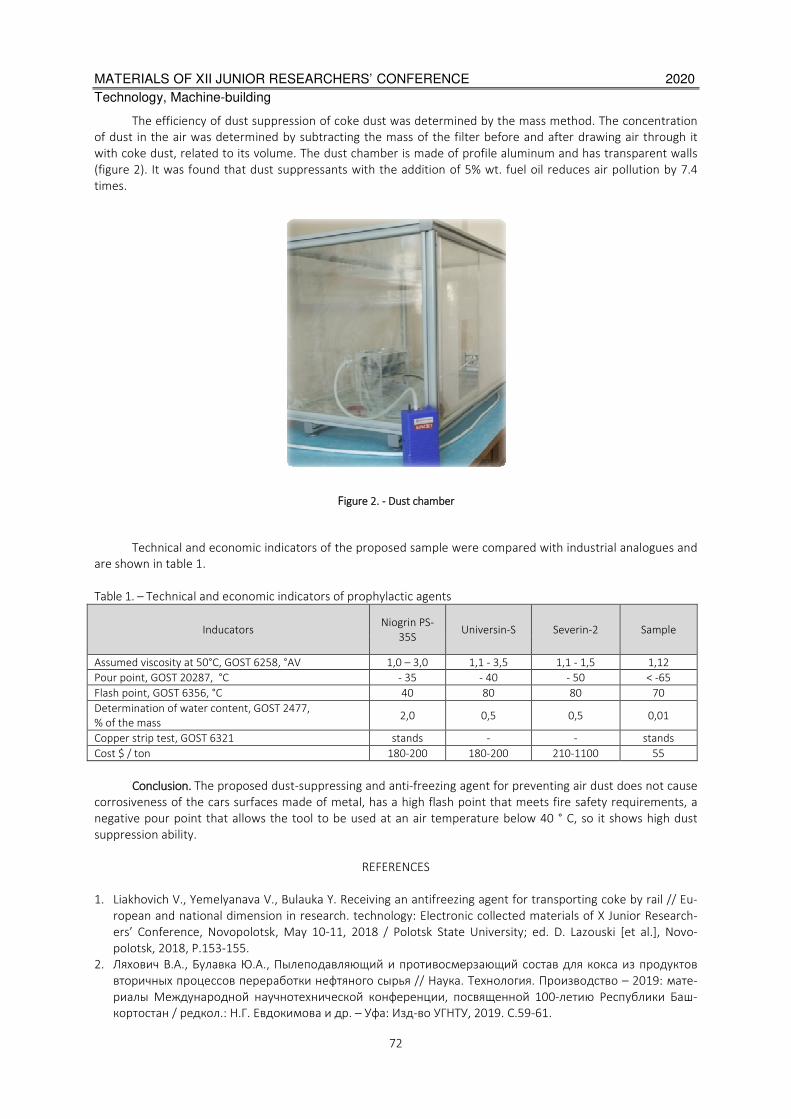
MATERIALS OF XII JUNIOR RESEARCHERS’ CONFERENCE 2020
Technology, Machine-building
72
The efficiency of dust suppression of coke dust was determined by the mass method. The concentration
of dust in the air was determined by subtracting the mass of the filter before and after drawing air through it
with coke dust, related to its volume. The dust chamber is made of profile aluminum and has transparent walls
(figure 2). It was found that dust suppressants with the addition of 5% wt. fuel oil reduces air pollution by 7.4
times.
Figure 2. - Dust chamber
Technical and economic indicators of the proposed sample were compared with industrial analogues and
are shown in table 1.
Table 1. – Technical and economic indicators of prophylactic agents
Inducators Niogrin PS-
35S Universin-S Severin-2 Sample
Assumed viscosity at 50°C, GOST 6258, °AV 1,0 – 3,0 1,1 - 3,5 1,1 - 1,5 1,12
Pour point, GOST 20287, °С - 35 - 40 - 50 < -65
Flash point, GOST 6356, °С 40 80 80 70
Determination of water content, GOST 2477,
% of the mass 2,0 0,5 0,5 0,01
Copper strip test, GOST 6321 stands - - stands
Cost $ / ton 180-200 180-200 210-1100 55
Conclusion. The proposed dust-suppressing and anti-freezing agent for preventing air dust does not cause
corrosiveness of the cars surfaces made of metal, has a high flash point that meets fire safety requirements, a
negative pour point that allows the tool to be used at an air temperature below 40 ° C, so it shows high dust
suppression ability.
REFERENCES
1. Liakhovich V., Yemelyanava V., Bulauka Y. Receiving an antifreezing agent for transporting coke by rail // Eu-
ropean and national dimension in research. technology: Electronic collected materials of X Junior Research-
ers’ Conference, Novopolotsk, May 10-11, 2018 / Polotsk State University; ed. D. Lazouski [et al.], Novo-
polotsk, 2018, Р.153-155.
2. Ляхович В.А., Булавка Ю.А., Пылеподавляющий и противосмерзающий состав для кокса из продуктов
вторичных процессов переработки нефтяного сырья // Наука. Технология. Производство – 2019: мате-
риалы Международной научнотехнической конференции, посвященной 100-летию Республики Баш-
кортостан / редкол.: Н.Г. Евдокимова и др. – Уфа: Изд-во УГНТУ, 2019. С.59-61.

MATERIALS OF XII JUNIOR RESEARCHERS’ CONFERENCE 2020
Technology, Machine-building
73
3. Ляхович В.А., Булавка Ю.А., Способ улучшения пылеподавления при получении и транспортировке
нефтяного кокса // Системы обеспечения техносферной безопасности: материалы V Всероссийской
научной конференции и школы для молодых ученых (с международным участием) (г. Таганрог 4-5 ок-
тября 2019 г.) – Таганрог: ЮФУ, 2019. – С. 69-70
4. V. Liakhovich, Y. Bulauka, Method to reduce freezing and improve dust suppression when receiving and
transporting petcoke // Scientific Conference of XV International Forum-Contest of Students and Young Re-
searchers «Topical issues of rational use of natural resources», St. Petersburg, May 13-17, 2019.- Saint-
Petersburg Mining University. - St. Petersburg,2019.- P. 24.
5. Ляхович В.А., Булавка Ю.А., Способы подавления пылеобразования при транспортировке углеродсо-
держащих материалов // Промышленная безопасность и охрана труда: практика, обучение, иннова-
ции: сб. материалов Международной заочной научно-практической конференции. – Минск: УГЗ, 2019.-
С.26-29.
6. Ляхович В.А., Булавка Ю.А., Снижение воздействия пылевого фактора на работников при получении и
транспортировке нефтяного кокса // Безопасность – 2019 : материалы докладов XXIV Всероссийской
студенческой научно–практ. конф. с междунар. участием «Проблемы экологической и промышлен-ной
безопасности современного мира» (г. Иркутск, 16–19 апр. 2019 г.). – Иркутск : Изд-во ИРНИТУ, 2019. –
С.129-131.
7. Ляхович В.А., Булавка Ю.А., Способ снижения смерзания и улучшения пылеподавления при получении
и транспортировке нефтяного кокса // Сборник тезисов докладов 73-й Международной молодежной
научной конференции «Нефть и газ – 2019» (22-25 апреля 2019 г. Москва). – Том 5.– М.: Издательский
центр РГУ нефти и газа (НИУ) имени И.М. Губкина, 2019. –С.468-469.
8. Ляхович В.А., Булавка Ю.А., Профилактическое средство против смерзания, прилипания и пылеподав-
ления сыпучих углеродсодержащих материалов // Сборник научных работ студентов Республики Бела-
русь «НИРС 2018» / редкол. : И. А. Старовойтова (пред.) [и др.]. — Минск : Изд. центр БГУ, 2019. - С.
186.
MATERIALS OF XII JUNIOR RESEARCHERS’ CONFERENCE 2020
Technology, Machine-building
74
UDC 537.533
ON THE POSSIBILITY OF FORMING COMBINED BEAMS OF CHARGED PARTICLES
IN A PLASMA SOURCE BASED ON A DISCHARGE IN CROSSED E×H FIELDS
E. MALYUSHCHENKO, D. ANTONOVICH
Polotsk State University, Belarus
In this work, the experimental electrode structure of a plasma electron-ion source for the joint formation
of electron and ion beams is proposed, a number of characteristics are given, and the prospects for further devel-
opment of an electron-ion source for industrial application on its basis are shown
Keywords: plasma source of charged particles, electron-ion influence, electron beams, compensated ion
beams.
Introduction. Sources of ion and electron beams make it possible to realize an extensive cluster of mod-
ern innovative technologies for processing, modifying, and creating new materials. In some cases of such tech-
nologies, a significant increase in their quality and equipment performance is possible when implementing simul-
taneous exposure to electron and ion beams. Currently, this technology is usually provided using separate elec-
tron and ion sources. In this case, gas-discharge electrode structures, in which magnetron discharges are excit-
ed, [1, 2] are the most widely used for the formation of plasma surfaces emitting ion or electron beams, or dis-
charges with oscillations of Penning type electrons (PIG) [3] or with a hollow cathode [4, 5]. Under technological-
ly necessary conditions of low gas pressure, thermal cathodes are used to reduce the discharge voltage and the
density of the emitting plasma in gas-discharge structures [6]. However, this is a drawback of sources, due to the
low durability of thermal cathodes in gas discharges.
In these discharges, the emitting plasma is separated from the electrodes of the gas-discharge structure
by near-wall electric layers, the parameters of which are determined by the potential difference between the
plasma and each electrode, as well as the plasma density, as is accepted (at present) by the condition that the
electric field strength at the plasma boundary is equal to zero [7] . The emitting plasma surface, as is customary,
also obeys this condition [8]; therefore, the electron (ion) optical conditions in the interval of electron (ion) ac-
celeration and beam formation depend on the position and shape of the emitting plasma boundary, i.e. on ac-
celerating voltage and electrode geometry and their potential. This creates certain difficulties in the formation of
large section beams [9].
However, the well-known [10] effect of the possible formation of a secondary plasma in the accelerating
gap can provide a significant improvement in the emission-optical properties of a source with a plasma emitter:
a decrease in the beam divergence due to a decrease in the radial potential gradient in the accelerating gap;
increase in emission current due to the reverse flow of charges from the secondary plasma into the emitting
plasma [11]; as well as increasing the perveance of the accelerating system due to the partial compensation of
the space charge of the beam.
The foregoing suggests the following. First, the possibility of creating a plasma object with electrostatic
layers in it, capable of ensuring the formation of ion and electron beams combined in a single space. Secondly,
the multifactorial nature of such a structure and the lack of necessary algorithms currently complicate the nu-
merical simulation of such structures. Thirdly, the experimental study of such structures at this stage seems to
be most effective for creating technological sources of combined ion-electron beams.
In this paper, we propose a concept and a design developed on its basis for a single multi-discharge struc-
ture that is capable of forming combined or alternating ion-electron beams, as well as some experimental results
of the formation of such beams.
Physical concept and electrode structure of the experimental source . A sketch of the electrode structure
of the developed model of the electron-ion source is shown in Fig. 1. The model is an emitting plasma generator
formed in a volume limited by the inner surfaces of cathodes 2 and 4, anode 3, and emitter electrode 5 (dis-
charge chamber I). Electrodes 6 and 7 form an electron acceleration gap where a plasma surface is formed that
emits electrons. Electrodes 8-12 form a gas-discharge structure forming a plasma, which is a source of atomizing
ions. This structure consists of two “Penning” type discharge cells (II and III) connected in series (along the axis)
[3]. Elements of this structure 9 and 11 are the anodes of the discharge cells; elements 8, 10 and 12 - cathodes,
which are simultaneously pole tips of permanent magnets. It can be assumed that in these cells, both the elec-
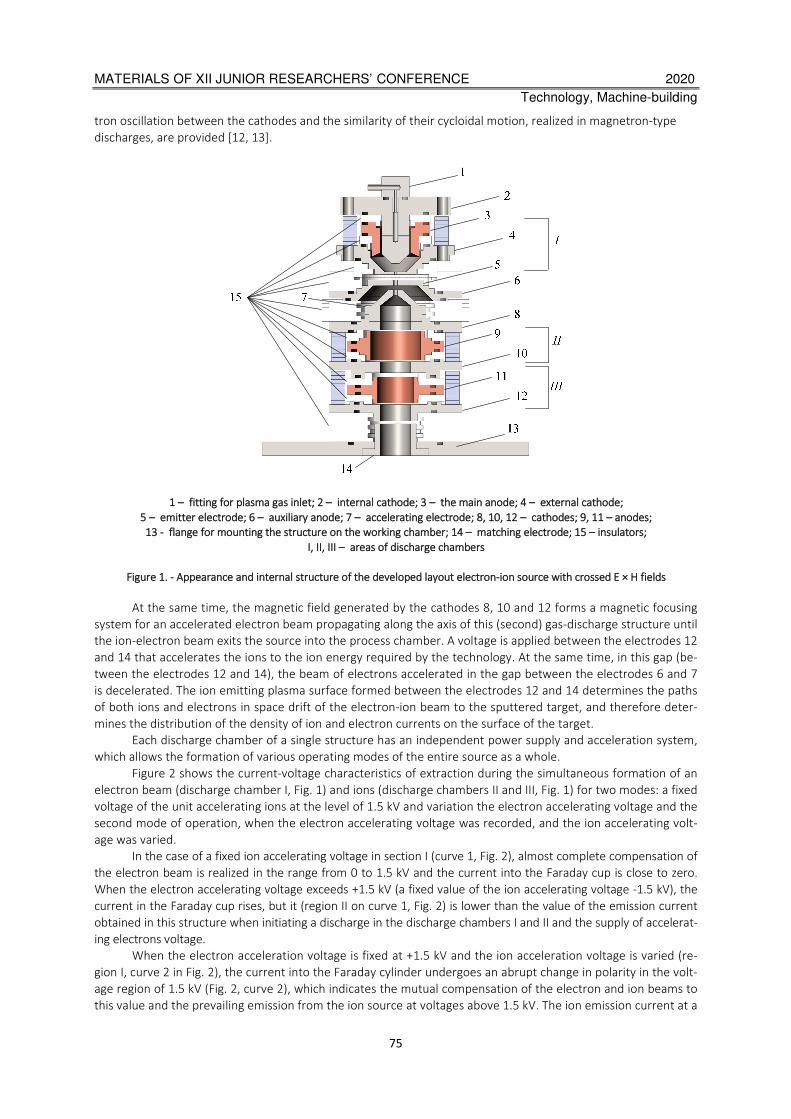
MATERIALS OF XII JUNIOR RESEARCHERS’ CONFERENCE 2020
Technology, Machine-building
75
tron oscillation between the cathodes and the similarity of their cycloidal motion, realized in magnetron-type
discharges, are provided [12, 13].
1 – fitting for plasma gas inlet; 2 – internal cathode; 3 – the main anode; 4 – external cathode;
5 – emitter electrode; 6 – auxiliary anode; 7 – accelerating electrode; 8, 10, 12 – cathodes; 9, 11 – anodes;
13 - flange for mounting the structure on the working chamber; 14 – matching electrode; 15 – insulators;
I, II, III – areas of discharge chambers
Figure 1. - Appearance and internal structure of the developed layout electron-ion source with crossed E × H fields
At the same time, the magnetic field generated by the cathodes 8, 10 and 12 forms a magnetic focusing
system for an accelerated electron beam propagating along the axis of this (second) gas-discharge structure until
the ion-electron beam exits the source into the process chamber. A voltage is applied between the electrodes 12
and 14 that accelerates the ions to the ion energy required by the technology. At the same time, in this gap (be-
tween the electrodes 12 and 14), the beam of electrons accelerated in the gap between the electrodes 6 and 7
is decelerated. The ion emitting plasma surface formed between the electrodes 12 and 14 determines the paths
of both ions and electrons in space drift of the electron-ion beam to the sputtered target, and therefore deter-
mines the distribution of the density of ion and electron currents on the surface of the target.
Each discharge chamber of a single structure has an independent power supply and acceleration system,
which allows the formation of various operating modes of the entire source as a whole.
Figure 2 shows the current-voltage characteristics of extraction during the simultaneous formation of an
electron beam (discharge chamber I, Fig. 1) and ions (discharge chambers II and III, Fig. 1) for two modes: a fixed
voltage of the unit accelerating ions at the level of 1.5 kV and variation the electron accelerating voltage and the
second mode of operation, when the electron accelerating voltage was recorded, and the ion accelerating volt-
age was varied.
In the case of a fixed ion accelerating voltage in section I (curve 1, Fig. 2), almost complete compensation of
the electron beam is realized in the range from 0 to 1.5 kV and the current into the Faraday cup is close to zero.
When the electron accelerating voltage exceeds +1.5 kV (a fixed value of the ion accelerating voltage -1.5 kV), the
current in the Faraday cup rises, but it (region II on curve 1, Fig. 2) is lower than the value of the emission current
obtained in this structure when initiating a discharge in the discharge chambers I and II and the supply of accelerat-
ing electrons voltage.
When the electron acceleration voltage is fixed at +1.5 kV and the ion acceleration voltage is varied (re-
gion I, curve 2 in Fig. 2), the current into the Faraday cylinder undergoes an abrupt change in polarity in the volt-
age region of 1.5 kV (Fig. 2, curve 2), which indicates the mutual compensation of the electron and ion beams to
this value and the prevailing emission from the ion source at voltages above 1.5 kV. The ion emission current at a
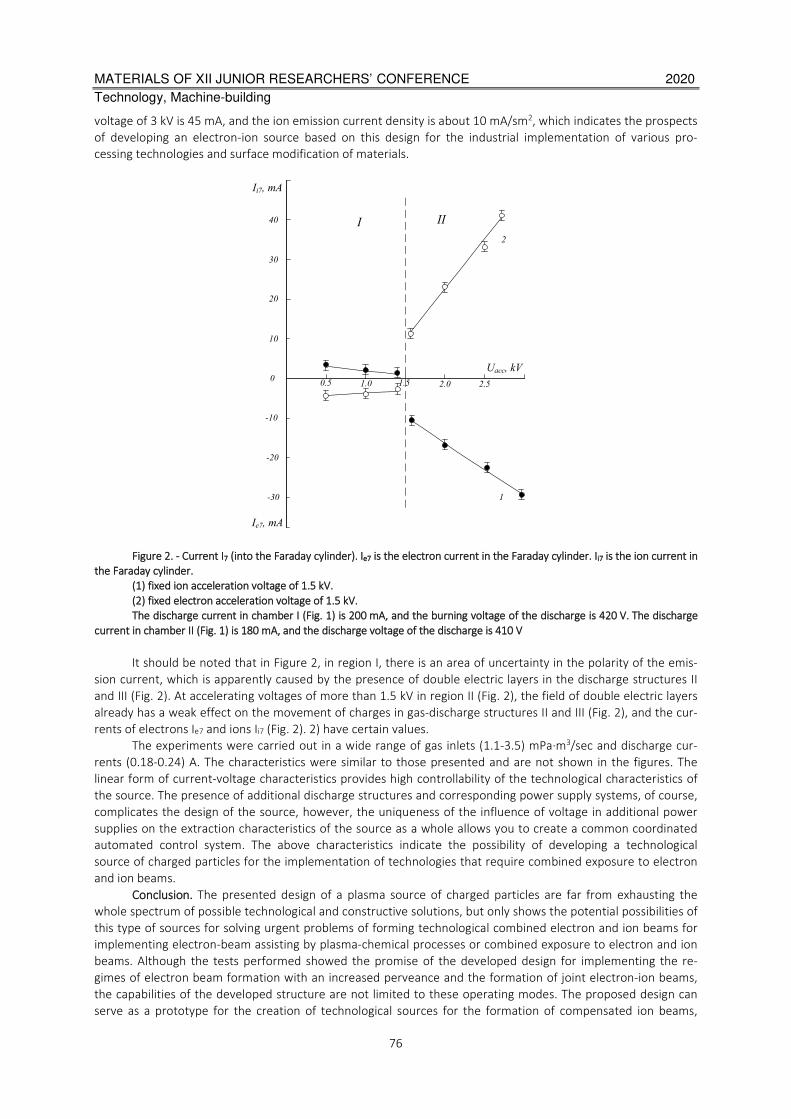
MATERIALS OF XII JUNIOR RESEARCHERS’ CONFERENCE 2020
Technology, Machine-building
76
voltage of 3 kV is 45 mA, and the ion emission current density is about 10 mA/sm2, which indicates the prospects
of developing an electron-ion source based on this design for the industrial implementation of various pro-
cessing technologies and surface modification of materials.
00.5 1.0 1.5 2.0
10
20
30
Uacc, kV
Ii7, mА
1
2
40
2.5
I II
-10
-20
-30
Ie7, mА
Figure 2. - Current I7 (into the Faraday cylinder). Ie7 is the electron current in the Faraday cylinder. Ii7 is the ion current in
the Faraday cylinder.
(1) fixed ion acceleration voltage of 1.5 kV.
(2) fixed electron acceleration voltage of 1.5 kV.
The discharge current in chamber I (Fig. 1) is 200 mA, and the burning voltage of the discharge is 420 V. The discharge
current in chamber II (Fig. 1) is 180 mA, and the discharge voltage of the discharge is 410 V
It should be noted that in Figure 2, in region I, there is an area of uncertainty in the polarity of the emis-
sion current, which is apparently caused by the presence of double electric layers in the discharge structures II
and III (Fig. 2). At accelerating voltages of more than 1.5 kV in region II (Fig. 2), the field of double electric layers
already has a weak effect on the movement of charges in gas-discharge structures II and III (Fig. 2), and the cur-
rents of electrons Ie7 and ions Ii7 (Fig. 2). 2) have certain values.
The experiments were carried out in a wide range of gas inlets (1.1-3.5) mPa∙m3/sec and discharge cur-
rents (0.18-0.24) A. The characteristics were similar to those presented and are not shown in the figures. The
linear form of current-voltage characteristics provides high controllability of the technological characteristics of
the source. The presence of additional discharge structures and corresponding power supply systems, of course,
complicates the design of the source, however, the uniqueness of the influence of voltage in additional power
supplies on the extraction characteristics of the source as a whole allows you to create a common coordinated
automated control system. The above characteristics indicate the possibility of developing a technological
source of charged particles for the implementation of technologies that require combined exposure to electron
and ion beams.
Conclusion. The presented design of a plasma source of charged particles are far from exhausting the
whole spectrum of possible technological and constructive solutions, but only shows the potential possibilities of
this type of sources for solving urgent problems of forming technological combined electron and ion beams for
implementing electron-beam assisting by plasma-chemical processes or combined exposure to electron and ion
beams. Although the tests performed showed the promise of the developed design for implementing the re-
gimes of electron beam formation with an increased perveance and the formation of joint electron-ion beams,
the capabilities of the developed structure are not limited to these operating modes. The proposed design can
serve as a prototype for the creation of technological sources for the formation of compensated ion beams,

MATERIALS OF XII JUNIOR RESEARCHERS’ CONFERENCE 2020
Technology, Machine-building
77
beams of neutral atoms, or for the implementation of alternating or simultaneous exposure to beams of both
types of charged particles. Such sources can become a unique universal tool for applying film coatings for various
purposes [11-13]. Such systems may be of interest as individual sources, as well as cells of a multi-bit source for
forming an effect on large areas.
REFERENCES
1. Plasma emission systems for electron and ion-beams technologies / D. A. Antonovich [et al.] // High Temper-
ature Material Processes: An International Quarterly of High-Technology Plasma Processes. – 2017. – Vol. 21,
iss. 2. – P. 143–159. https://doi.org/10.1615/HighTempMatProc.2017024672
2. Физика и технология плазменных эмиссионных систем / под общ. ред. В. Т. Барченко. СПб.: Изд-во
СПбГЭТУ «ЛЭТИ», 2014. 286 с.
3. Кузьмичёв, А. И. Магнетронные распылительные системы. Кн. 1. Введение в физику и технику магне-
тронного распыления. – Киев: Аверс, 2008. – 244 с.
4. Penning FM. Coating by Cathode Disintegration. US Patent 2,146,025; N.V. Philips, Gloeilampenfabrieken,
Eindhoven, The Netherlands; 1939
5. Москалев, Б.И. Разряд с полым катодом / Б.И. Москалев. – М.: Энергия, 1969. – 184 с.
6. Крейндель Ю.Е. Плазменные источники электронов. – М.: Атомиздат, 1977. – 145 с.
7. Алямовский И.В. Электронные пучки и электронные пушки. – М.: Сов. Радио, 1966. – 454 с.
8. Груздев, В.А. О механизме возникновения электрического поля в плазме при эмиссии электронов / В.А.
Груздев, В.Г. Залесский // Вестник Полоц. гос. ун-та. Сер. С, Фундаментальные науки. – 2014. – 4. – С.
103–108.
9. Груздев, В.А. Формирование эмиссионного тока в плазменных эмиттерах электронов. / В.А. Груздев, В.Г.
Залесский // Прикладная физика. – 2009. – 5. – C. 82–90.
10. Gruzdev, V.A. Electron-optical characteristics of the beam generated by the electron plasma sources / V.A Gruzdev,
V.G. Zalesski // Electrotechnica and electronica (Bulgaria). – 2014 – V. 49, 5-6. – Р. 264–268.
11. Gruzdev V.A. Emission current formation in plasma electron emitters / V.A. Gruzdev, V.G. Zaleski // Plasma
Physics Reports. – 2010. – 36. – p. 1191-1198
12. Залесский, В. Г. Эмиссионные и электронно-оптические системы плазменных источников электронов : дис.
… д-ра физ.-мат. наук : 01.04.04 / В. Г. Залесский. – Минск, 2015. – 316 с.
13. Gruzdev V.A. Universal plasma electron source / V.A. Gruzdev, V.G. Zaleski, D.A. Antonovich, Y.P. Golubev //
Vacuum. – 2005. – 77. – p. 399-405.
14. Zaleski V.G. Peculiarities of plasma electron sources operation at high pressures / V.G. Zaleski, D.A. Antono-
vich // Journal of Physics D: Applied Physics. – 2007. – 40. – p.7771-7777.
MATERIALS OF XII JUNIOR RESEARCHERS’ CONFERENCE 2020
Technology, Machine-building
78
UDC 537.533
ELECTROMECHANICAL MEASURING UNIT OF ELECTRON BEAM DIAGNOSTICS APPARATUS
R. PUGACH, S. ABRAMENKO
Polotsk State University, Belarus
In this paper, we formulate a list of the main characteristics of the electron beam responsible for its tech-
nological properties and to be diagnosed, and propose the design of the electromechanical unit of the developed
system that diagnoses the parameters of electron beams formed in electron-optical systems based on plasma
emitters.
Introduction. Expanding the possibilities of industrial application of plasma emitter-based beam devices
requires solving a number of theoretical and practical problems. In particular, scientific and practical interest is
the development of electron-optical systems (EOS) of such a design that would provide maximum efficiency by
reducing the beam divergence in the region of its primary formation, i.e. a search is required for the optimal
geometry of the electrodes of the gas-discharge structure and the accelerating gap [1].
To optimize the EOS, it is advisable to use the parameters of the electron beams responsible for its quali-
ty: the beam divergence, its brightness, and generalizing these characteristics are emittance [2]. In turn, for their
measurement, it is necessary to develop diagnostic equipment. Moreover, for the automatic processing of in-
formation (construction of three-dimensional surfaces, determination of the phase portrait of the beam, calcula-
tion of emittance and brightness), it is necessary to develop appropriate software. A similar complex, including
an electromechanical device, a control system and a software package, can be used not only to optimize the
designs of plasma sources under development, but also other beam devices in order to increase their technolog-
ical efficiency and beam quality.
In this paper, a list of the main characteristics of the electron beam, responsible for its technological
properties and subject to diagnosis, is formulated and the design of the electromechanical unit of the developed
diagnostic system is proposed.
Physicotechnical parameters for evaluating the technological capabilities of electron beams. Plasma elec-
tron sources should provide the parameters that are necessary for the implementation of certain modes of elec-
tron beam exposure. These parameters include the following:
− emission current density;
− energy efficiency associated with the efficiency of switching the electronic component of the dis-
charge current forming the emitting plasma into the beam;
− the value of the flow (pressure) of the plasma-forming gas.
Emission current density – jе depends on the plasma density (value of the discharge current) and the re-
sult of the superposition of the field of the parietal layer with the length of the layer ll in the emission channel of
radius r0 and the field of the accelerating electrode. In the near-wall layer, a negative (potential inhibiting for
electrons) drop in potential is usually realized, and for ll > r0 the electrons leave the plasma in the accelerating
gap through the potential barrier. The accelerating field penetrating the emission channel(s) reduces the poten-
tial barrier for electrons and, accordingly, increases the density of the emission current. In this case, the emission
of electrons is carried out from the open plasma boundary, and then the emission current density becomes
equal to the density of the thermal current of the electrons in the plasma, significantly exceeding the current
density to the electrodes of the discharge chamber (discharge current). When the field of the accelerating elec-
trode penetrates the discharge chamber through the emission channel, the emitting plasma surface may exceed
the area of the emission channel. In this case, a beam crossover is formed in the channel, in which the current
density is higher than the density in the plasma.
Extraction efficiency – α = ie/id characterizes the degree of electron switching into the emission chan-
nel(s). There ie emission current (in PES coinciding with the beam current), id – discharge current.
Energy efficiency (energy price of an electron in a beam). The parameter characterizes the efficiency of
the plasma emitter and is determined by the ratio ieНэP Ud
α= = , where P – power spent on plasma formation
(discharge power); Ud – discharge voltage.
MATERIALS OF XII JUNIOR RESEARCHERS’ CONFERENCE 2020
Technology, Machine-building
79
For plasma emitters operating in stationary mode, the energy efficiency is comparable to or slightly higher
than the value for thermal cathodes (Нэ = 10-2 – 10-3). In a pulsed mode with a sufficiently large duty cycle (when
using pulsed discharges in PES), the energy efficiency increases by orders of magnitude [3].
The value of the flow rate of the plasma-forming gas Q characterizes the gas efficiency of the PIEL and is
determined by the necessary pressure in the gas-discharge structure, at which the plasma with the necessary
parameters is formed. Since the final element of the gas-dynamic system providing gas inlet is the emission
channel through which gas enters the accelerating gap, the maximum value of Q is determined by the required
electric strength of the electron beam acceleration gap.
Complex characteristics of electron beams. When assessing the technological suitability of an electron
beam for the implementation of a specific technological process, as a rule, they are limited to comparing the
density of the beam power and the electron energy in the beam ( p jU= and W eUe = , where j – beam cur-
rent density, U – accelerating voltage) with required parameters [4]. However, at the stage of designing elec-
tron-beam devices, optimizing the geometry of the EOS to increase the efficiency of the electron gun in specific
gas-dynamic conditions, as well as developing new technologies, it becomes necessary to obtain, compare, and
correct as more specific parameters (divergence, current density distribution, electron plasma temperature,
maximum beam diameter), as well as complex characteristics that allow you to compare beams (emittance,
brightness) by determining their quality. To evaluate each of the particular characteristics, there are developed
methods that allow them to be studied depending on external conditions. However, all these parameters are
interconnected and a change in one leads to a change in the other. This situation makes it difficult to compare
the quality of the beams based on one of the parameters. Therefore, to obtain an integral characteristic of the
quality of the beam and their comparative analysis, it is advisable to use complex characteristics, which, in par-
ticular, include the following:
Beam brightness - the value corresponding to the beam current, which passes into a unit solid angle,
based on a unit area dI
Bd dS
=Ω
, where dΩ – solid angle at which the beam passes, dS – area on which the
solid angle rests.
Another complex characteristic of the beam is emittance. In a first approximation, the emittance is the
area of the phase portrait of the electron beam in the plane (x, x ’) and / or, if necessary, in the plane (y, y’), if
the beam does not have radial symmetry. If x and y coordinates are in the plane perpendicular to the direction
of beam propagation (z axis), and x ’and y’ are the components of the radial velocity of the electron beam, which
determine the beam divergence ( ,x y∆Θ ) in the xz and yz planes, respectively, the emittance can be deter-
mined by the following expressions
1Э dxdxx π
′= ∫ 1
Э dydyy π′= ∫ Э Э Эz x y=
If the phase portrait is an ellipse, then the brightness and emittance are interconnected by the ratio
2 2 4( ) ( )0 0 0 0( )( )
dI I I IB
d dS x x y yr Э Эx yπ ππ π π
= ≈ ≈ =′ ′Ω ∆ ∆Θ
. To estimate the brightness of an axisymmetric
beam, one can use the expression 4 2
IB
Эxπ=
The beam divergence angle can be estimated as
2 21max 2
kT kT kTx e e exm eUz z e ускme z
υ∆Θ
υ υ π ππ υ
′= = = = = , where Те – electron temperature in electron volts,
which can be defined as: 2maxkT eUxe π ′=
Of greatest interest are three-dimensional surfaces constructed by measuring emittance. Such surfaces
make it possible to effectively conduct visual comparisons of the quality of the beams when any external param-
eters change, and also to calculate most of the parameters of the electron beams (divergence, diameter, current
density distribution, etc.). However, to build three-dimensional surfaces, it is necessary to provide storage and
processing of a large amount of information, as well as high speed of its reading. Therefore, to carry out such
measurements, it is necessary to develop and produce diagnostic equipment that allows one to construct a
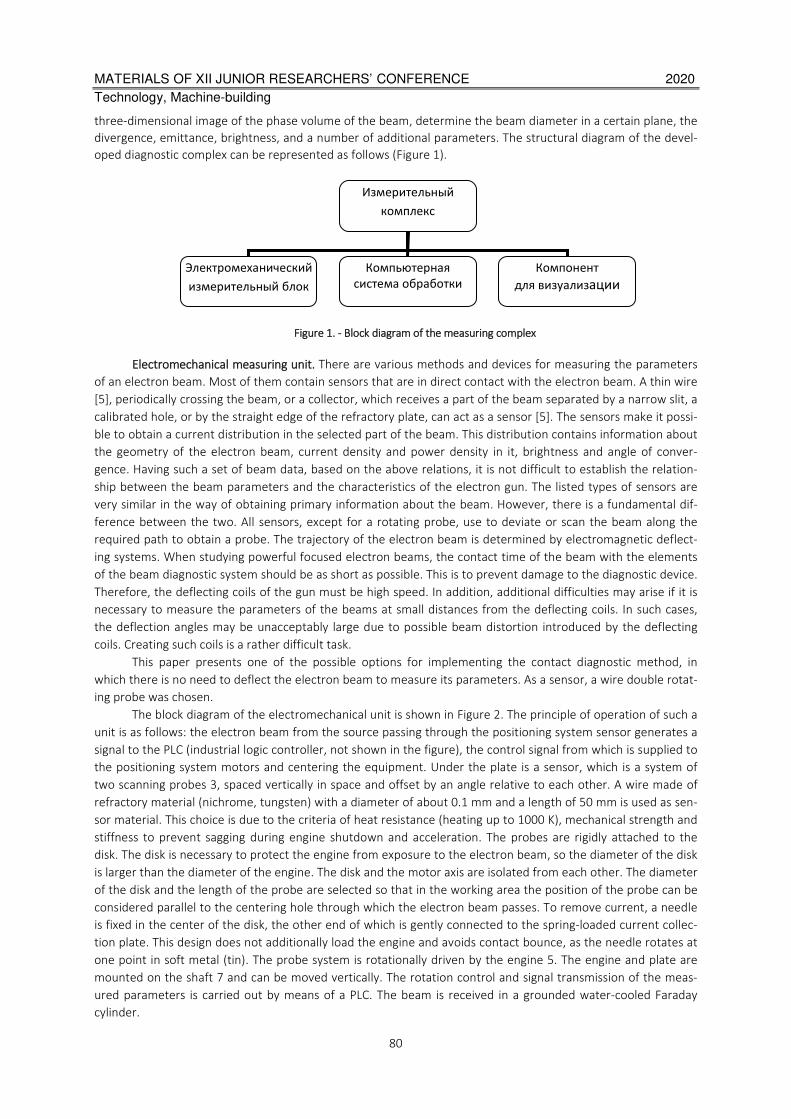
MATERIALS OF XII JUNIOR RESEARCHERS’ CONFERENCE 2020
Technology, Machine-building
80
three-dimensional image of the phase volume of the beam, determine the beam diameter in a certain plane, the
divergence, emittance, brightness, and a number of additional parameters. The structural diagram of the devel-
oped diagnostic complex can be represented as follows (Figure 1).
Figure 1. - Block diagram of the measuring complex
Electromechanical measuring unit. There are various methods and devices for measuring the parameters
of an electron beam. Most of them contain sensors that are in direct contact with the electron beam. A thin wire
[5], periodically crossing the beam, or a collector, which receives a part of the beam separated by a narrow slit, a
calibrated hole, or by the straight edge of the refractory plate, can act as a sensor [5]. The sensors make it possi-
ble to obtain a current distribution in the selected part of the beam. This distribution contains information about
the geometry of the electron beam, current density and power density in it, brightness and angle of conver-
gence. Having such a set of beam data, based on the above relations, it is not difficult to establish the relation-
ship between the beam parameters and the characteristics of the electron gun. The listed types of sensors are
very similar in the way of obtaining primary information about the beam. However, there is a fundamental dif-
ference between the two. All sensors, except for a rotating probe, use to deviate or scan the beam along the
required path to obtain a probe. The trajectory of the electron beam is determined by electromagnetic deflect-
ing systems. When studying powerful focused electron beams, the contact time of the beam with the elements
of the beam diagnostic system should be as short as possible. This is to prevent damage to the diagnostic device.
Therefore, the deflecting coils of the gun must be high speed. In addition, additional difficulties may arise if it is
necessary to measure the parameters of the beams at small distances from the deflecting coils. In such cases,
the deflection angles may be unacceptably large due to possible beam distortion introduced by the deflecting
coils. Creating such coils is a rather difficult task.
This paper presents one of the possible options for implementing the contact diagnostic method, in
which there is no need to deflect the electron beam to measure its parameters. As a sensor, a wire double rotat-
ing probe was chosen.
The block diagram of the electromechanical unit is shown in Figure 2. The principle of operation of such a
unit is as follows: the electron beam from the source passing through the positioning system sensor generates a
signal to the PLC (industrial logic controller, not shown in the figure), the control signal from which is supplied to
the positioning system motors and centering the equipment. Under the plate is a sensor, which is a system of
two scanning probes 3, spaced vertically in space and offset by an angle relative to each other. A wire made of
refractory material (nichrome, tungsten) with a diameter of about 0.1 mm and a length of 50 mm is used as sen-
sor material. This choice is due to the criteria of heat resistance (heating up to 1000 K), mechanical strength and
stiffness to prevent sagging during engine shutdown and acceleration. The probes are rigidly attached to the
disk. The disk is necessary to protect the engine from exposure to the electron beam, so the diameter of the disk
is larger than the diameter of the engine. The disk and the motor axis are isolated from each other. The diameter
of the disk and the length of the probe are selected so that in the working area the position of the probe can be
considered parallel to the centering hole through which the electron beam passes. To remove current, a needle
is fixed in the center of the disk, the other end of which is gently connected to the spring-loaded current collec-
tion plate. This design does not additionally load the engine and avoids contact bounce, as the needle rotates at
one point in soft metal (tin). The probe system is rotationally driven by the engine 5. The engine and plate are
mounted on the shaft 7 and can be moved vertically. The rotation control and signal transmission of the meas-
ured parameters is carried out by means of a PLC. The beam is received in a grounded water-cooled Faraday
cylinder.
Измерительный
комплекс
Электромеханический
измерительный блок
Компьютерная
система обработки
Компонент
для визуализации
MATERIALS OF XII JUNIOR RESEARCHERS’ CONFERENCE 2020
Technology, Machine-building
81
1 - positioning system sensor; 2 - plate; 3 - system of a double scanning probe; 4 - two-position coordinate table;
5 - rotation motor; 6 - positioning engines; 7 - shaft vertical movement; 8 - engine vertical movement;
9 - optocoupler; 10 - Faraday Cylinder
Figure 2. - Structure of the electromechanical unit of the diagnostic equipment
Conclusion. The presented electromechanical unit allows you to automatically remove the current distri-
bution to the probe and translate it and the main characteristics of the electron beam into the software envi-
ronment to calculate the required characteristics and visualize the measured parameters and can be a prototype
for the development of industrial systems for diagnosing the parameters of electron beams.
REFERENCES
1. Antonovich D.A. Plasma emission systems for electron and ion-beams technologies / D.A. Antonovich, V.A.
Gruzdev, V.G. Zalesski, I.L. Pobol, P.N. Soldatenko // High Temperature Material Processes (An International
Quarterly of High-Technology Plasma Processes) v. – 21 is. 2. P 143-159.
2. Окс, Е. М. Источники электронов с плазменным катодом: физика, техника, применения / Е. М. Окс. –
Томск: Изд-во НТЛ, 2005. – 216 с.
3. Плазменные эмиссионные системы с ненакаливаемыми катодами для ионно-плазменных технологий /
В.Т. Барченко [и др.], под общ. ред. В.Т. Барченко. – СПб.: Изд-во СПбГЭТУ «ЛЭТИ», 2011. – 220 с.
4. Белюк С.И. Промышленное применение электронных источников с плазменным эмиттером / C.И. Бе-
люк, И.В. Осипов, Н.Г. Ремпе / Изв. ВУЗов. Физика. – 2001. – Т. 44, 9. – С. 77–84.
5. Залесский, В. Г. Эмиссионные и электронно-оптические системы плазменных источников электронов :
дис. … д-ра физ.-мат. наук : 01.04.04 / В. Г. Залесский. – Минск, 2015. – 316 л.
MATERIALS OF XII JUNIOR RESEARCHERS’ CONFERENCE 2020
Technology, Machine-building
82
UDC 378.17:537.87
THE ANALYSIS OF ELECTROMAGNETIC ENVIRONMENT CREATED
BY A LINEAR SERIES OF PERSONAL COMPUTERS IN CLASSROOM OF UNIVERSITY OF CLASSICAL TYPE
М. SHYMANSKAYA, Y. BULAUKA
Polotsk State University, Belarus
Analysis of the electromagnetic environment created by a linear series of personal computers in the
classroom of university of classical type. The zones of the most significant impact of EMR from computer-class
equipment on students are identified.
Keywords. Personal computer; electromagnetic radiation; university
Introduction. The electromagnetic environment in computer classes of educational institutions is character-
ized by the presence of various sources of electromagnetic fields of different intensity and a fairly wide frequency
range. the most dangerous local source of electromagnetic fields is the video terminal – VDT) - a computer com-
plex: displays, system blocks, uninterruptible power supplies [1].
Method of research. The analysis of the electromagnetic environment generated in a training facility of
the belarusian University of linear rows of computers, additionally the study of light levels and weather condi-
tions in the area. The object of study is the process of forming the electric and magnetic field intensity created
by a linear series of computers in the computer class of the University.
The purpose of the study was to perform an analysis of the electromagnetic environment created by a
linear series of personal computers in a classical-type University classroom. To achieve this goal, the following
tasks were solved: 1. To investigate the sanitary and hygienic parameters of the computer class of the University
of the classical type; 2. To study the features of the distribution of the electromagnetic field created by comput-
ers in educational premises. 3. Develop recommendations for controlling the field strength in computer classes.
Research result. The study of weather conditions in the room was performed using the meteomer МЭС-
200А. Results are presented in table 1.
It is determined that the parameters of microclimate after one hour after the start of class do not exceed
the limits regulated by norms [2].
Table 1. – The parameters of the microclimate of a computer class
Parameter Actual value Optimal microclimate parameter for [2]
Air temperature, °C 20.3 19-21
Relative humidity, % 58 58 at a temperature of 20°C
Air speed, m/s 0.06 No more than 0.1
An equally important parameter that is normized in educational institutions is the illumination in class-
rooms. The room where students or employees use the video display terminal must have both natural and artifi-
cial lighting. Natural lighting should be provided through North -, North-East -, East -, West -, and North-West-
oriented light openings, and the natural light coefficient shouldn't be lower than 1.5 %. The study was carried
out under combined lighting (a combination of natural one-sided lateral with artificial General uniform), with the
orientation of the light opening to the North-West. Figure 1 shows the change in the natural light coefficient (%)
and the light index at a height equal to the table surface (E, in Lux) at distances from 1 to 6 meters from the light
opening. At a distance of 6 m from the window, the indicators of the light environment increase, because artifi-
cial light begins to prevail.
Despite the fact that the value of the natural illumination coefficient corresponds to the standards in all
points of the room (more than 1.5%), the illumination at the height of working surface is several times lower
than the required 300-500 Lux [2], which significantly reduces the efficiency of visual work.
It is well known that the side and back walls of a computer monitor and other components are powerful
source of electromagnetic radiation, with different frequency ranges of operation, for example: the frequency of
50 Hz is typical for a network monitor, a power supply transformer; 20-100 kHz of a static voltage Converter in a
pulse power supply; 48-160 Hz of frame scan and synchronization units; 15-110 kHz-a line scan and synchroniza-
tion unit; 50 Hz -1000 MHz of a system unit (processor); 20-100 kHz of uninterruptible power supplies, etc. [3].
According to [2], the following maximum permissible levels of electromagnetic fields from VDT are set, given in
table 2.
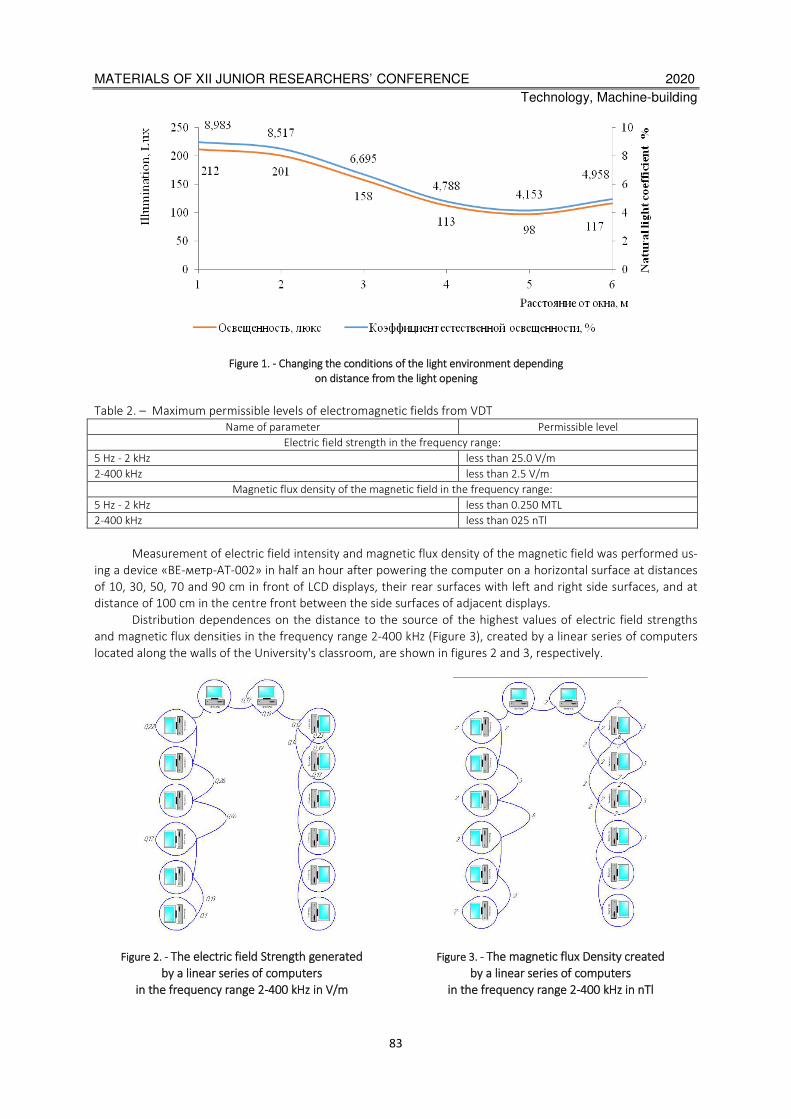
MATERIALS OF XII JUNIOR RESEARCHERS’ CONFERENCE 2020
Technology, Machine-building
83
Figure 1. - Changing the conditions of the light environment depending
on distance from the light opening
Table 2. – Maximum permissible levels of electromagnetic fields from VDT
Name of parameter Permissible level
Electric field strength in the frequency range:
5 Hz - 2 kHz less than 25.0 V/m
2-400 kHz less than 2.5 V/m
Magnetic flux density of the magnetic field in the frequency range:
5 Hz - 2 kHz less than 0.250 MTL
2-400 kHz less than 025 nTl
Measurement of electric field intensity and magnetic flux density of the magnetic field was performed us-
ing a device «ВЕ-метр-АТ-002» in half an hour after powering the computer on a horizontal surface at distances
of 10, 30, 50, 70 and 90 cm in front of LCD displays, their rear surfaces with left and right side surfaces, and at
distance of 100 cm in the centre front between the side surfaces of adjacent displays.
Distribution dependences on the distance to the source of the highest values of electric field strengths
and magnetic flux densities in the frequency range 2-400 kHz (Figure 3), created by a linear series of computers
located along the walls of the University's classroom, are shown in figures 2 and 3, respectively.
Figure 2. - The electric field Strength generated
by a linear series of computers
in the frequency range 2-400 kHz in V/m
Figure 3. - The magnetic flux Density created
by a linear series of computers
in the frequency range 2-400 kHz in nTl
MATERIALS OF XII JUNIOR RESEARCHERS’ CONFERENCE 2020
Technology, Machine-building
84
It should be noted that in the frequency range from 5 Hz to 2 kHz, the electric field strength values at all
observation points do not exceed 0.01 V/m, which means that there is minimal or no EMI influence in the speci-
fied frequency range.
Analysis of the characteristics of the distribution of the intensities of electric fields in the frequency range
of 2-400 kHz, is shown in figure 2 allowed us to establish that despite the absence of exceeding the RC (the value
of 0.65 V/m 4 times below the permissible limits) the range of VDT manifests itself as antenna array, there is a
growth with distance from sources, likely because of the imposition of AMY. A similar relationship is observed in
the distribution of the magnetic flux density shown in figure 3. There is also no excess of norms for this indicator,
the maximum value of 6 nTl is 4 times lower than the PDU. The maximum EMI falls in the middle of the linear
row of computers, and closer to the edges of the row it falls off.
For one of the VDT, an in-depth analysis of the EMR propagation from the distance from the source in the
horizontal plane (on the sides of the world) at a height of one meter from the floor was performed, the results of
which are shown in figures 4-6.
Figure 4. - Value of the intensity of the alternating electric field VDT
in the frequency range 2..400 kHz in V/m
Figure 5. - Value of the magnetic flux density, VDT
in the frequency range 2..400 kHz in nTl
MATERIALS OF XII JUNIOR RESEARCHERS’ CONFERENCE 2020
Technology, Machine-building
85
Figure 6. - Value of the magnetic flux density, VDT
in the frequency range of 5 Hz-2 kHz in MTL
Analysis of the EMI prevalence from the distance from the source in the horizontal plane showed that
with increasing distance from one VDT, which is part of a linear series of computers, both the field strength and
the magnetic flux density increases and exceeds the field strength and magnetic flux density created by one indi-
vidual computer.
Conclusion. The analysis of the electromagnetic environment created by a linear series of personal com-
puters in a classical-type University classroom allowed us to come to the conclusion that it is necessary to meas-
ure the electric field strength and magnetic flux density in the range 2..400 kHz at a distance of 0.5 meters from
the monitor, as prescribed by the rules, and 1 meter, where it is possible to exceed the remote control for EMI,
due to the fact that the linear range of VDT can manifest itself as an antenna array.
REFERENCES
1. Исследование электромагнитных полей в окружающей среде от оборудования компьютерного ком-
плекса с позиции допустимых требований по электромагнитной безопасности/ Викторов В. А., Мешал-
кин В. А., Салтыков В. М. // Системы управления, связи и безопасности, 4, 2019., С.246-261.
2. Санитарные нормы и правила «Требования при работе с видеодисплейными терминалами и элек-
тронно-вычислительными машинами», утвержденны Постановлением Министерства здравоохранения
Республики Беларусь 28.06.2013 59.
3. Электромагнитная обстановка, формируемая в компьютерных учебных классах / В. Д. Сахацкий, Ю. Па-
лиенко // Науково-практична конференція науково-педагогічних працівників, науковців, аспірантів та
співробітників академії : збірник тез доповідей. Укр. інж.-пед. акад. - Харків :2012. - Ч. 6. - С. 25.
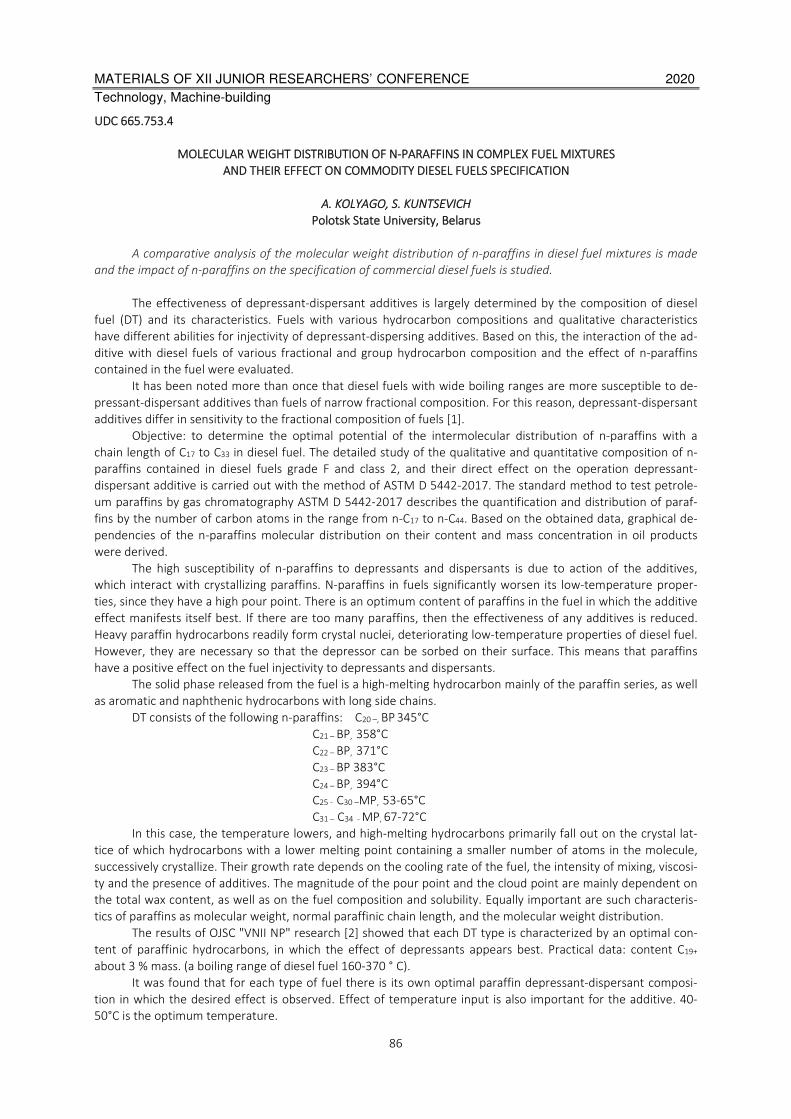
MATERIALS OF XII JUNIOR RESEARCHERS’ CONFERENCE 2020
Technology, Machine-building
86
UDC 665.753.4
MOLECULAR WEIGHT DISTRIBUTION OF N-PARAFFINS IN COMPLEX FUEL MIXTURES
AND THEIR EFFECT ON COMMODITY DIESEL FUELS SPECIFICATION
A. KOLYAGO, S. KUNTSEVICH
Polotsk State University, Belarus
A comparative analysis of the molecular weight distribution of n-paraffins in diesel fuel mixtures is made
and the impact of n-paraffins on the specification of commercial diesel fuels is studied.
The effectiveness of depressant-dispersant additives is largely determined by the composition of diesel
fuel (DT) and its characteristics. Fuels with various hydrocarbon compositions and qualitative characteristics
have different abilities for injectivity of depressant-dispersing additives. Based on this, the interaction of the ad-
ditive with diesel fuels of various fractional and group hydrocarbon composition and the effect of n-paraffins
contained in the fuel were evaluated.
It has been noted more than once that diesel fuels with wide boiling ranges are more susceptible to de-
pressant-dispersant additives than fuels of narrow fractional composition. For this reason, depressant-dispersant
additives differ in sensitivity to the fractional composition of fuels [1].
Objective: to determine the optimal potential of the intermolecular distribution of n-paraffins with a
chain length of C17 to C33 in diesel fuel. The detailed study of the qualitative and quantitative composition of n-
paraffins contained in diesel fuels grade F and class 2, and their direct effect on the operation depressant-
dispersant additive is carried out with the method of ASTM D 5442-2017. The standard method to test petrole-
um paraffins by gas chromatography ASTM D 5442-2017 describes the quantification and distribution of paraf-
fins by the number of carbon atoms in the range from n-C17 to n-C44. Based on the obtained data, graphical de-
pendencies of the n-paraffins molecular distribution on their content and mass concentration in oil products
were derived.
The high susceptibility of n-paraffins to depressants and dispersants is due to action of the additives,
which interact with crystallizing paraffins. N-paraffins in fuels significantly worsen its low-temperature proper-
ties, since they have a high pour point. There is an optimum content of paraffins in the fuel in which the additive
effect manifests itself best. If there are too many paraffins, then the effectiveness of any additives is reduced.
Heavy paraffin hydrocarbons readily form crystal nuclei, deteriorating low-temperature properties of diesel fuel.
However, they are necessary so that the depressor can be sorbed on their surface. This means that paraffins
have a positive effect on the fuel injectivity to depressants and dispersants.
The solid phase released from the fuel is a high-melting hydrocarbon mainly of the paraffin series, as well
as aromatic and naphthenic hydrocarbons with long side chains.
DT consists of the following n-paraffins: С20 –, BP 345°С
С21 – BP, 358°С
С22 – BP, 371°С
С23 – BP 383°С
С24 – BP, 394°С
С25 - С30 –MP, 53-65°С
С31 – С34 - MP, 67-72°С
In this case, the temperature lowers, and high-melting hydrocarbons primarily fall out on the crystal lat-
tice of which hydrocarbons with a lower melting point containing a smaller number of atoms in the molecule,
successively crystallize. Their growth rate depends on the cooling rate of the fuel, the intensity of mixing, viscosi-
ty and the presence of additives. The magnitude of the pour point and the cloud point are mainly dependent on
the total wax content, as well as on the fuel composition and solubility. Equally important are such characteris-
tics of paraffins as molecular weight, normal paraffinic chain length, and the molecular weight distribution.
The results of OJSC "VNII NP" research [2] showed that each DT type is characterized by an optimal con-
tent of paraffinic hydrocarbons, in which the effect of depressants appears best. Practical data: content С19+
about 3 % mass. (a boiling range of diesel fuel 160-370 ° C).
It was found that for each type of fuel there is its own optimal paraffin depressant-dispersant composi-
tion in which the desired effect is observed. Effect of temperature input is also important for the additive. 40-
50°C is the optimum temperature.
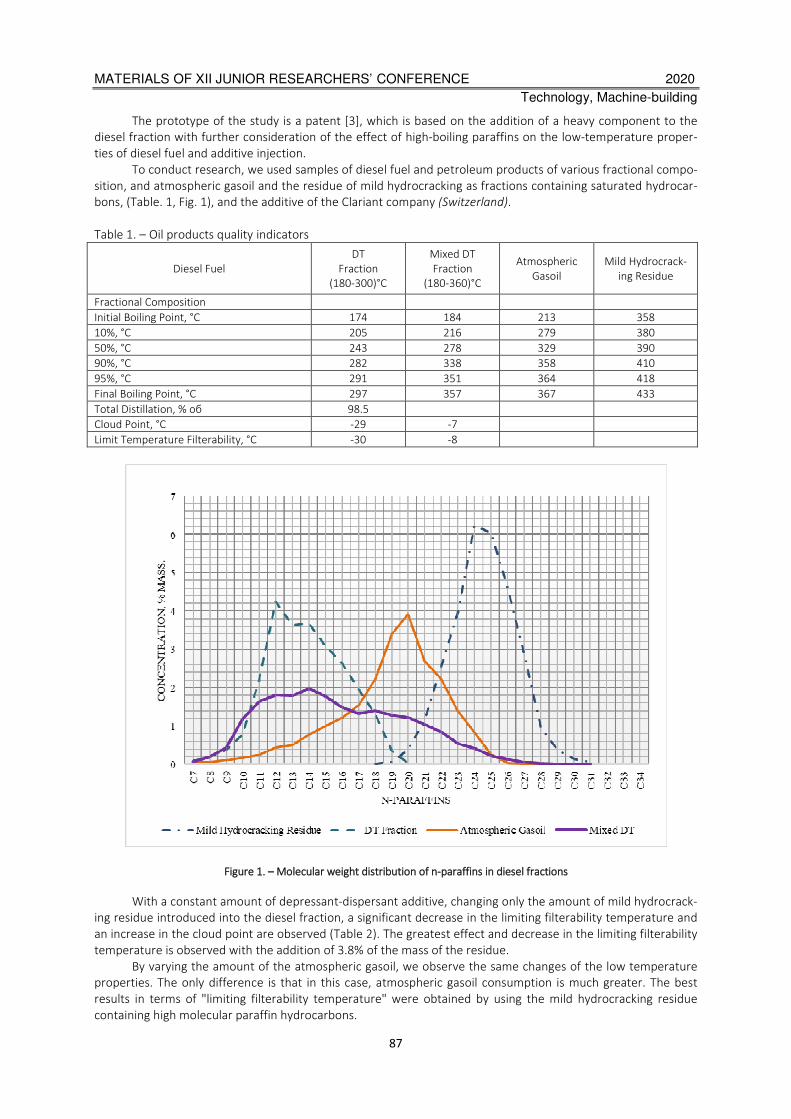
MATERIALS OF XII JUNIOR RESEARCHERS’ CONFERENCE 2020
Technology, Machine-building
87
The prototype of the study is a patent [3], which is based on the addition of a heavy component to the
diesel fraction with further consideration of the effect of high-boiling paraffins on the low-temperature proper-
ties of diesel fuel and additive injection.
To conduct research, we used samples of diesel fuel and petroleum products of various fractional compo-
sition, and atmospheric gasoil and the residue of mild hydrocracking as fractions containing saturated hydrocar-
bons, (Table. 1, Fig. 1), and the additive of the Clariant company (Switzerland).
Table 1. – Oil products quality indicators
Diesel Fuel
DT
Fraction
(180-300)°С
Mixed DT
Fraction
(180-360)°С
Atmospheric
Gasoil
Mild Hydrocrack-
ing Residue
Fractional Composition
Initial Boiling Point, °С 174 184 213 358
10%, °С 205 216 279 380
50%, °С 243 278 329 390
90%, °С 282 338 358 410
95%, °С 291 351 364 418
Final Boiling Point, °С 297 357 367 433
Total Distillation, % об 98.5
Сloud Point, °С -29 -7
Limit Temperature Filterability, °С -30 -8
Figure 1. – Molecular weight distribution of n-paraffins in diesel fractions
With a constant amount of depressant-dispersant additive, changing only the amount of mild hydrocrack-
ing residue introduced into the diesel fraction, a significant decrease in the limiting filterability temperature and
an increase in the cloud point are observed (Table 2). The greatest effect and decrease in the limiting filterability
temperature is observed with the addition of 3.8% of the mass of the residue.
By varying the amount of the atmospheric gasoil, we observe the same changes of the low temperature
properties. The only difference is that in this case, atmospheric gasoil consumption is much greater. The best
results in terms of "limiting filterability temperature" were obtained by using the mild hydrocracking residue
containing high molecular paraffin hydrocarbons.
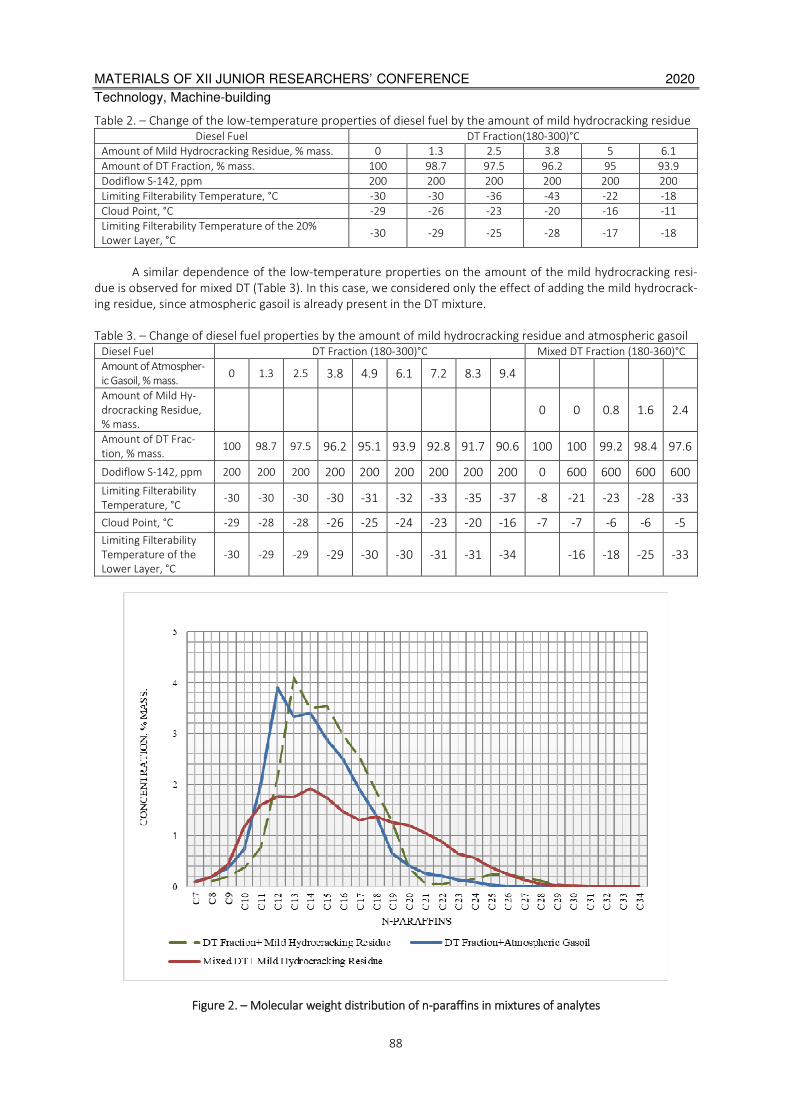
MATERIALS OF XII JUNIOR RESEARCHERS’ CONFERENCE 2020
Technology, Machine-building
88
Table 2. – Change of the low-temperature properties of diesel fuel by the amount of mild hydrocracking residue
Diesel Fuel DT Fraction(180-300)°С
Amount of Mild Hydrocracking Residue, % mass. 0 1.3 2.5 3.8 5 6.1
Amount of DT Fraction, % mass. 100 98.7 97.5 96.2 95 93.9
Dodiflow S-142, ppm 200 200 200 200 200 200
Limiting Filterability Temperature, °С -30 -30 -36 -43 -22 -18
Cloud Point, °С -29 -26 -23 -20 -16 -11
Limiting Filterability Temperature of the 20%
Lower Layer, °С -30 -29 -25 -28 -17 -18
A similar dependence of the low-temperature properties on the amount of the mild hydrocracking resi-
due is observed for mixed DT (Table 3). In this case, we considered only the effect of adding the mild hydrocrack-
ing residue, since atmospheric gasoil is already present in the DT mixture.
Table 3. – Change of diesel fuel properties by the amount of mild hydrocracking residue and atmospheric gasoil
Diesel Fuel DT Fraction (180-300)°С Mixed DT Fraction (180-360)°С Amount of Atmospher-
ic Gasoil, % mass. 0 1.3 2.5 3.8 4.9 6.1 7.2 8.3 9.4
Amount of Mild Hy-
drocracking Residue,
% mass.
0 0 0.8 1.6 2.4
Amount of DT Frac-
tion, % mass. 100 98.7 97.5 96.2 95.1 93.9 92.8 91.7 90.6 100 100 99.2 98.4 97.6
Dodiflow S-142, ppm 200 200 200 200 200 200 200 200 200 0 600 600 600 600
Limiting Filterability
Temperature, °С -30 -30 -30 -30 -31 -32 -33 -35 -37 -8 -21 -23 -28 -33
Cloud Point, °С -29 -28 -28 -26 -25 -24 -23 -20 -16 -7 -7 -6 -6 -5
Limiting Filterability
Temperature of the
Lower Layer, °С
-30 -29 -29 -29 -30 -30 -31 -31 -34 -16 -18 -25 -33
Figure 2. – Molecular weight distribution of n-paraffins in mixtures of analytes

MATERIALS OF XII JUNIOR RESEARCHERS’ CONFERENCE 2020
Technology, Machine-building
89
The graph (Fig. 2) shows that paraffin hydrocarbons С23-С31 and higher provide the injectivity of addi-
tives and promote their action, thereby improving the low-temperature properties of diesel fuel. The heavier
fractions of atmospheric gasoil and the mild hydrocracking residue can significantly lower the temperature of
the limiting filterability temperature.
Thus, the method and systematic approach to studying the effect of n-paraffins in the composition of
complex fuel mixtures allows to increase the forecast of the operation and quality characteristics of commercial
fuels.
REFERENCES
1. Капустин В.М. Нефтяные и альтернативные топлива с присадками и добавками. – М.: КолосС, 2008. –
232 с.
2. Веретенникова Т.Н., Николаева В.Г., Энглин Б.А. Влияние сераорганических соединений на низкотем-
пературные свойства дизельных топлив и их восприимчивость к присадкам // Моторные, реактивные
топлива: Сб. тр. Всесоюзного НИИ по переработке нефти 1977. 20. С. 134-139.
3. COLD FLOW RESPONSE OF DIESEL FUELS BY FRACTION REPLACEMENT : WO/2008/148137, IPS C10L 1/08 /
Petrus Nicolaas Johannes Roets, Vanderbijlpark (ZA); Delanie Lamprecht, Vanderbijlpark (ZA); assignee: Sasol
Technology (Pty) Ltd. Johannesburg (ZA). - PCT/ZA2008/000043; May 30, 2008; pub. date:
04.12.2008//WIPO - 2008.
MATERIALS OF XII JUNIOR RESEARCHERS’ CONFERENCE 2020
Technology, Machine-building
90
UDC 665.662.5
THE DIRECTIONS FOR RATIONAL USE OF RESIDUAL PRODUCT OF THE PROCESS «UNICRACKING»
P. HRYSHYN, A. YERMAK
Polotsk State University, Belarus
Introduction. The possibility of obtaining white oils from petroleum raw materials is considered. The prop-
erties of the residual product of the hydrocracking process purified with activated clay are studied. The possibility
of using the adsorption method of purification in the production of white oils is shown.
The residual product of the hydrocracking process of vacuum gasoil obtained by the "Unicracking" tech-
nology is a complex mixture of high-boiling compounds, consisting mainly of paraffinic and naphthenic hydro-
carbons with ultra-low sulfur content. This product can be used not only as a component of low-sulfur fuel oil,
but also as a raw material for the production of lower olefins [1], which are the raw material base of the modern
petrochemical industry; obtaining base oils corresponding to group III according to API classification [2]; and
greases [3].
One of the perspective areas of complex processing for refining residual product of the process "Untrack-
ing" is the production of white oils. These oils can be used both for technical purposes and in medicine, pharma-
cology and cosmetology. The most important indicators of the white oils quality, in addition to kinematic viscosi-
ty, density and flash point, are: pour point, color and content of aromatic hydrocarbons. White oils should be a
colorless oily, transparant, non-fluorescent, odorless and tasteless liquid.
To prepare white oils, the residual product of the "Unicracking" process must be dewaxed and thoroughly
cleaned. The traditional method of producing white oils is sulfuric acid purification of oil fractions. But this
method is not effective for the purification of the studied raw materials. White oils can be obtained by deep hy-
drogenation of the residual product of the hydrocracking process [4]. However, the implementation of this tech-
nology requires large investments.
One of the most effective and relatively simple ways to obtain white oils from the residual product of the
hydrocracking process is the adsorption purification method.
One of the most important technical indicators for white oil is the percentage distribution of hydrocar-
bons. Special requirements are imposed on the content of aromatic hydrocarbons, since they are toxic. Tech-
nical white oils should contain aromatic hydrocarbon less than 7% of the total mass, and medical white oils
should contain less than 0.1%. Another important indicator is color in accordance with ASTM D 1500. For both
technical and medical white oils, this indicator, as determined by ASTM D 1500, should be less than 0.5 [5].
To achieve these indicators by adsorption cleaning of the residual product of the vacuum gas oil hy-
drocracking process, it is necessary to select an effective adsorbent. In industry, bleaching clays are used as ad-
sorbents. Adsorption cleaning can significantly improve the color and storage stability of oils and fats. Different
classes of bleaching clays are used for cleaning.
The first group forms a class of highly active, mainly based on montmorillonite, selected HPBE clays (high
performance bleaching earth). This group includes, in particular, acid-activated montmorillonites, and acid acti-
vation is carried out in an expensive way: by dealumination of unburned clays with concentrated acids at high
temperatures. Using this method, the selected clays are obtained with a very high specific surface area and a
large pore volume. The disadvantage of these highly active bleaching clays is that due to acid dealumination,
large amount of acidic, salt-rich wastewater accumulates during production, which can only be treated or dis-
posed of using expensive processes.
Another group forms a class of naturally active clays. These natural bleaching clays have been used for
cleaning fats and oils for hundreds of years. These naturally active systems (also known as floridine or fuller's
earth) can be obtained at a very low cost. However, they have very little bleaching ability, so most of them are
not suitable for cleaning difficultly bleached oils and fats.
The trade-off between low production costs and acceptable activity is represented by the third class of
bleaching clays, the so-called surface-activated SMBE systems (surface modified bleaching earth; surface-
activated bleaching clays). Here, small amounts of acid are introduced into the naturally active unburned clay
and this achieves "in situ" activation. For this method, unburned clays containing attapulgite and hormite are
used. They have a very high specific surface area for natural unburned clays: from about 100 to 180 m2/g, and
the pore volume from about 0.2 to 0.35 ml/g. Since the salts formed during acid activation, or the unreacted

MATERIALS OF XII JUNIOR RESEARCHERS’ CONFERENCE 2020
Technology, Machine-building
91
portion of the acids are not washed out, they remain on the product and at least partially also precipitate in the
pores. Because of this, acid-activated bleaching clays usually do not achieve the same efficiency as is achieved
with highly active bleaching clays (HPBE) obtained by acid dealumination. However, the simple production
method allows for relatively economical production, since acidic wastewater does not accumulate. [6].
Studies have shown that the adsorption purification of the residual product of the hydrocracking process
using active clay can produce white oil. The properties of the purified product are shown in the table.
Table. – The properties of the purified product
Parameter Value
Kinematic viscosity at 40°С, mm2/sec 40,82
Kinematic viscosity at 100°С, mm2/sec с 6,88
Viscosity index 127
Refractive index at 50°С 1,4558
Refractive index at 20°С 1,4661
Colour, units (ASTM D 1500) 0
Density at 20°С, kg/m3 842,0
Acid value, mg КОН/gr. 0,0014
Group composition, % by weight.:
− paraffin-naphthenic hydrocarbons 99,72
− 1 group of aromatic hydrocarbons 0,27
− 2 group of aromatic hydrocarbons 0
− group of aromatic hydrocarbons 0
− group of aromatic hydrocarbons 0
− resins 0,01
Based on the quality indicators of the resulting product, we can conclude that this oil is suitable for tech-
nical needs. During the adsorption process on activated clay, the adsorbent is tarred and it changes its color
from white to coal-black. In this regard, there is a need for further purification and regeneration of the adsor-
bent [7].
Conclusion. One of the promising and relatively simple ways to obtain technical white oils is the adsorp-
tion purification of the residual product of the vacuum gas oil hydrocracking process using active clays. The re-
sulting product can be used as technical white oils.
REFERENCES
1. Свойства и перспективные направления переработки остаточного продукта процесса «Юникрекинг» /
А.А. Ермак; С.В. Покровская; И.В. Бурая; Е.В. Сюбарева и др. // Вестник Полоцкого государственного
университета. Серия B. Промышленность. Прикладная наука. 2015. – 11. – c. 115-120:
http://elib.psu.by:8080/handle/123456789/14387
2. Базовые масла: http://www.naftan.by/ru/p_oil_base.aspx
3. Смазочная композиция на основе отходов нефтехимии для консервации техники / Ю.А. Булавка:
http://elib.psu.by:8080/handle/123456789/21985
4. Разработка технологии получения белых масел для эмульсионных вакцин из остаточных продуктов-
гидрокрекинга / Пиголева Ирина Владимировна. //РГУ нефти и газа имени Губкина. // 2018 – с. 26-28.
5. Использование белых масел и некоторые требования к ним // [Электронный ресурс]. – Режим доступа:
http://autokomplekt.com/info/articles/the-use-of-white-oils-and-some-requirements
6. Патент RU 2379104. МПК B01J 20/12. Глины с высокой удельной поверхность для получения отбельных
глин, а также способ активирования этих глин. / Шурц Клаус (DE). Заявка 2007145413/15, Заявлено
08.06.2005; Опубл. 20.01.2010. Бюл. 2
7. Ермак А.А., Гришин П.Ф., Артеменок Н.А. Перспективы применения активированной глины для до-
очистки остаточного продукта процесса «Юникрекинг» // Вестник Полоцкого государственного универ-
ситета. Серия B, Промышленность. Прикладные науки. - 2019. - 3 . – С.111-117
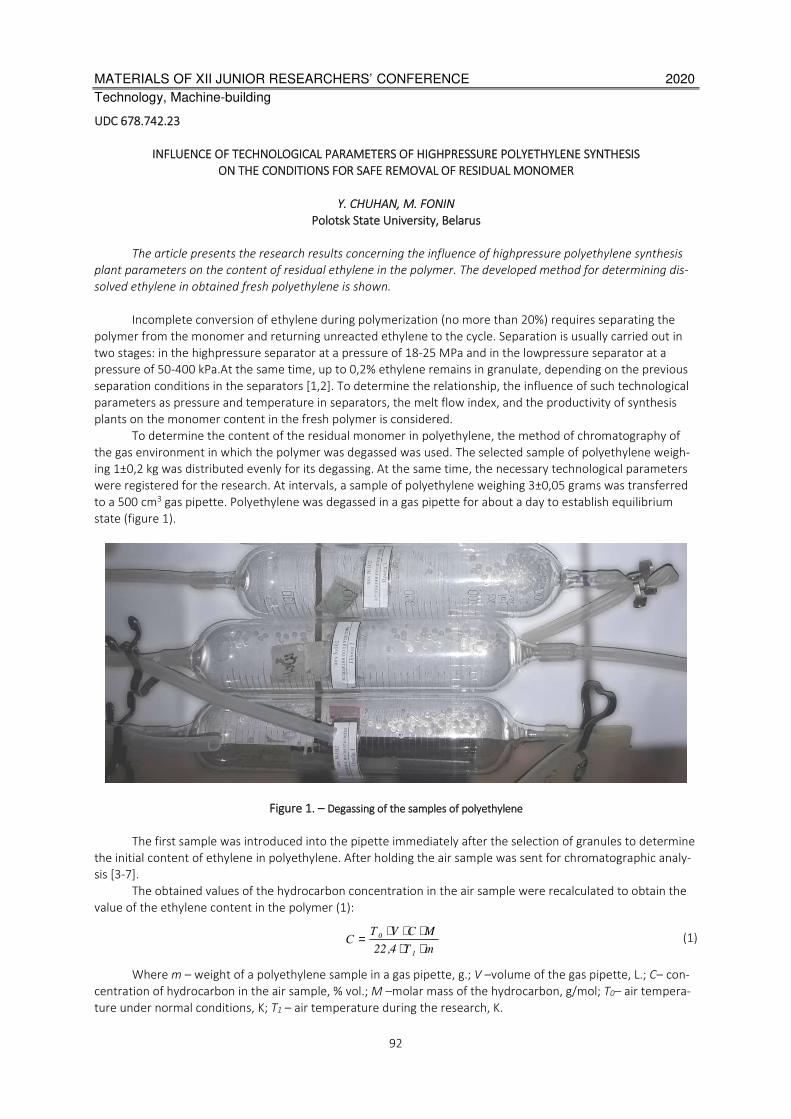
MATERIALS OF XII JUNIOR RESEARCHERS’ CONFERENCE 2020
Technology, Machine-building
92
UDC 678.742.23
INFLUENCE OF TECHNOLOGICAL PARAMETERS OF HIGHPRESSURE POLYETHYLENE SYNTHESIS
ON THE CONDITIONS FOR SAFE REMOVAL OF RESIDUAL MONOMER
Y. CHUHAN, M. FONIN
Polotsk State University, Belarus
The article presents the research results concerning the influence of highpressure polyethylene synthesis
plant parameters on the content of residual ethylene in the polymer. The developed method for determining dis-
solved ethylene in obtained fresh polyethylene is shown.
Incomplete conversion of ethylene during polymerization (no more than 20%) requires separating the
polymer from the monomer and returning unreacted ethylene to the cycle. Separation is usually carried out in
two stages: in the highpressure separator at a pressure of 18-25 MPa and in the lowpressure separator at a
pressure of 50-400 kPa.At the same time, up to 0,2% ethylene remains in granulate, depending on the previous
separation conditions in the separators [1,2]. To determine the relationship, the influence of such technological
parameters as pressure and temperature in separators, the melt flow index, and the productivity of synthesis
plants on the monomer content in the fresh polymer is considered.
To determine the content of the residual monomer in polyethylene, the method of chromatography of
the gas environment in which the polymer was degassed was used. The selected sample of polyethylene weigh-
ing 1±0,2 kg was distributed evenly for its degassing. At the same time, the necessary technological parameters
were registered for the research. At intervals, a sample of polyethylene weighing 3±0,05 grams was transferred
to a 500 cm3 gas pipette. Polyethylene was degassed in a gas pipette for about a day to establish equilibrium
state (figure 1).
Figure 1. – Degassing of the samples of polyethylene
The first sample was introduced into the pipette immediately after the selection of granules to determine
the initial content of ethylene in polyethylene. After holding the air sample was sent for chromatographic analy-
sis [3-7].
The obtained values of the hydrocarbon concentration in the air sample were recalculated to obtain the
value of the ethylene content in the polymer (1):
mТ4,22
MСVТС
1
0
⋅⋅⋅⋅⋅
= (1)
Where m – weight of a polyethylene sample in a gas pipette, g.; V –volume of the gas pipette, L.; С– con-
centration of hydrocarbon in the air sample, % vol.; М –molar mass of the hydrocarbon, g/mol; T0– air tempera-
ture under normal conditions, K; T1 – air temperature during the research, K.
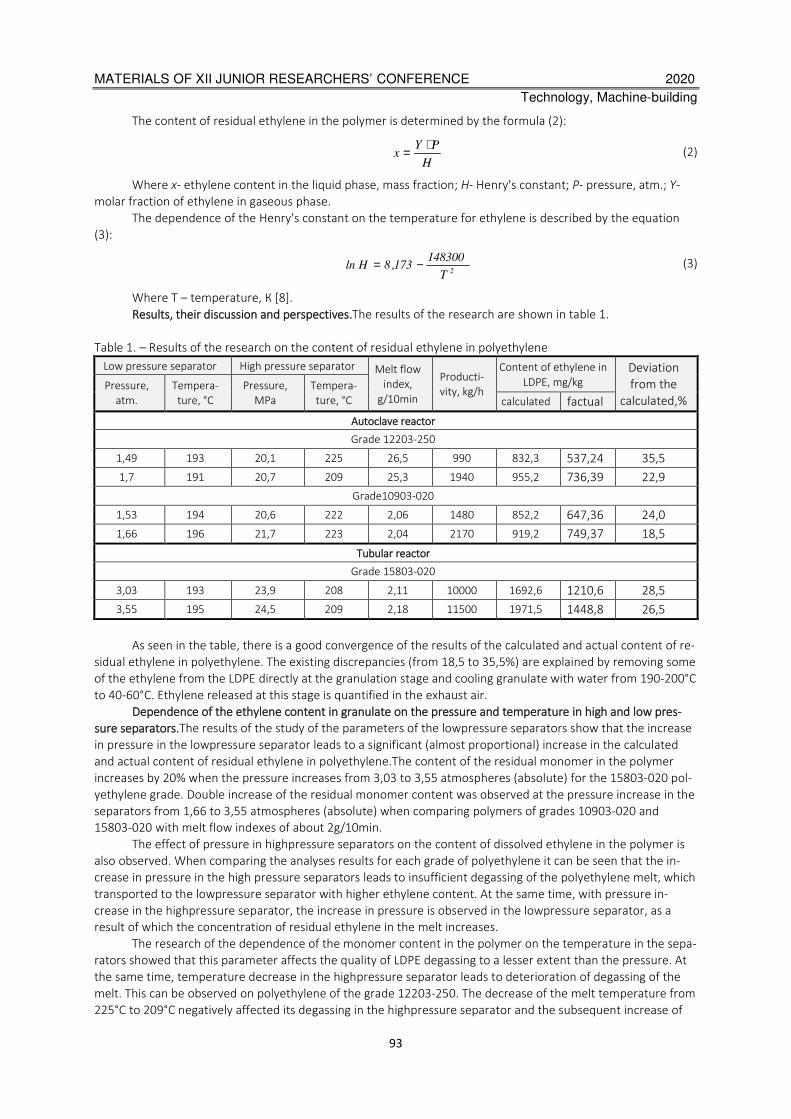
MATERIALS OF XII JUNIOR RESEARCHERS’ CONFERENCE 2020
Technology, Machine-building
93
The content of residual ethylene in the polymer is determined by the formula (2):
H
PYx
⋅= (2)
Where х- ethylene content in the liquid phase, mass fraction; Н- Henry's constant; P- pressure, atm.; Y-
molar fraction of ethylene in gaseous phase.
The dependence of the Henry's constant on the temperature for ethylene is described by the equation
(3):
2T
148300173,8Hln −= (3)
Where Т – temperature, К [8].
Results, their discussion and perspectives.The results of the research are shown in table 1.
Table 1. – Results of the research on the content of residual ethylene in polyethylene
Low pressure separator High pressure separator Melt flow
index,
g/10min
Producti-
vity, kg/h
Content of ethylene in
LDPE, mg/kg
Deviation
from the
calculated,%
Pressure,
atm.
Tempera-
ture, °C
Pressure,
MPa
Tempera-
ture, °C calculated factual
Autoclave reactor
Grade 12203-250
1,49 193 20,1 225 26,5 990 832,3 537,24 35,5
1,7 191 20,7 209 25,3 1940 955,2 736,39 22,9
Grade10903-020
1,53 194 20,6 222 2,06 1480 852,2 647,36 24,0
1,66 196 21,7 223 2,04 2170 919,2 749,37 18,5
Tubular reactor
Grade 15803-020
3,03 193 23,9 208 2,11 10000 1692,6 1210,6 28,5
3,55 195 24,5 209 2,18 11500 1971,5 1448,8 26,5
As seen in the table, there is a good convergence of the results of the calculated and actual content of re-
sidual ethylene in polyethylene. The existing discrepancies (from 18,5 to 35,5%) are explained by removing some
of the ethylene from the LDPE directly at the granulation stage and cooling granulate with water from 190-200°C
to 40-60°C. Ethylene released at this stage is quantified in the exhaust air.
Dependence of the ethylene content in granulate on the pressure and temperature in high and low pres-
sure separators.The results of the study of the parameters of the lowpressure separators show that the increase
in pressure in the lowpressure separator leads to a significant (almost proportional) increase in the calculated
and actual content of residual ethylene in polyethylene.The content of the residual monomer in the polymer
increases by 20% when the pressure increases from 3,03 to 3,55 atmospheres (absolute) for the 15803-020 pol-
yethylene grade. Double increase of the residual monomer content was observed at the pressure increase in the
separators from 1,66 to 3,55 atmospheres (absolute) when comparing polymers of grades 10903-020 and
15803-020 with melt flow indexes of about 2g/10min.
The effect of pressure in highpressure separators on the content of dissolved ethylene in the polymer is
also observed. When comparing the analyses results for each grade of polyethylene it can be seen that the in-
crease in pressure in the high pressure separators leads to insufficient degassing of the polyethylene melt, which
transported to the lowpressure separator with higher ethylene content. At the same time, with pressure in-
crease in the highpressure separator, the increase in pressure is observed in the lowpressure separator, as a
result of which the concentration of residual ethylene in the melt increases.
The research of the dependence of the monomer content in the polymer on the temperature in the sepa-
rators showed that this parameter affects the quality of LDPE degassing to a lesser extent than the pressure. At
the same time, temperature decrease in the highpressure separator leads to deterioration of degassing of the
melt. This can be observed on polyethylene of the grade 12203-250. The decrease of the melt temperature from
225°C to 209°C negatively affected its degassing in the highpressure separator and the subsequent increase of

MATERIALS OF XII JUNIOR RESEARCHERS’ CONFERENCE 2020
Technology, Machine-building
94
the load on the lowpressure separator, which led to the increase of residual ethylene concentration in polyeth-
ylene [9].
Dependence of the ethylene content in granulate on the polymer melt flow indexes. The research showed
that polyethylene grade 12203-250 with a melt flow index of 25g/10min is degassed more completely in com-
parison with LDPE grade 10903-020, which has a melt flow index of 2g/10min. When comparing the ethylene
content in polyethylene with a melt flow index of 26,5g/10min and polyethylene with a melt flow index of 2,06
g/10min it was observed that at almost the same pressure in the lowpressure separator, the ethylene content in
polyethylene of 12203-250 was 20% lower than in LDPE of 10903-020. As a polymer with a high melt flow index
has lower viscosity, this allows to degas it better in high and low pressure separators, especially after removing
ethylene from the melt, which is in the form of bubbles.
The relationship between the productivity and ethylene content in fresh polyethylene.The effect of synthe-
sis productivity on polymer degassing can be seen in all three grades of polyethylene. When comparing the pro-
cess parameters and the content of dissolved monomer in the LDPE, it can be seen that an increase in productiv-
ity leads to pressure increase in the separators. This is due to the fact that increase in productivity leads to de-
crease of time the melt presence in the separators. There is also increase in the pressure drop between appa-
ratuses, resistances of which increase with increasing productivity.
Thus, the influence of such parameters as temperature and pressure in separators, melt flow index, and
plant productivity on the concentration of residual ethylene in granulated polyethylene was confirmed.
REFERENCES
1. Фонин, М. Ф., Салтанова, В. Б. Растворимость и диффузия этилена в свежеполученном полиэтилене
высокого давления / М. Ф. Фонин, В. Б. Салтанова // — Новополоцк: ОНПО «Пластполимер», 1981. — 6
с.
2. Полиэтилен высокого давления. Научно-технические основы промышленного синтеза / А. В. Поляков,
Ф. И. Дунтов, А. Э. Софиев и др. — Л.: Химия, 1988. — 200 c.
3. Салтанова, В. Б., Фонин, М. Ф., Евдокимова, Т. Н. Определение остаточного мономера в свежеполучен-
ных гранулах полиэтилена высокого давления / В. Б. Салтанова, М. Ф. Фонин, Т. Н. Евдокимова // —
Новополоцк: ОНПО «Пластполимер», 1980. – 3 с.
4. Фонин, М. Ф., Салтанова, В. Б. Газохроматографическое определение остаточного мономера в свеже-
полученных гранулах полиэтилена высокого давления / М. Ф. Фонин, В. Б. Салтанова // Экспресс-
информация «Охрана окружающей среды и очистка промышленных газов. Выпуск 7» : сб. ст. /-М.: НИИ
ТЭХИМ, 1981. – с.15-16.
5. Хроматографы аналитические газовые. Общие технические требования и методы испытаний : ГОСТ
26703-93. – Взамен ГОСТ 26703-87 ;введ. РБ 01.01.1996. – Минск : Госстандарт Республики Беларусь,
1996. – 20 с.
6. Хромос. Программа управления хроматографом, сбора и обработки хроматографических данных. Ру-
ководство пользователя – Дзержинск : ООО «ХРОМОС», 2018. – 89 с.
7. Методика выполнения измерений индивидуальных углеводородов в газовых выбросах завода «По-
лимир» ОАО «Нафтан» методом газовой хроматографии : МВИ.МН 1950-2010. – Взамен МВИ.МН 1950-
2003 ; введ. 15.03.2010 – Завод «Полимир» ОАО «Нафтан», 2010. – 42 с.
8. Maloney, D. P., Prausnitz, J. M. Solubilities of ethylene and other organic solutes in liquid, low-density poly-
ethylene in the region 124° to 300°C / D. P. Maloney, J. M. Prausnitz // AlChE Journal, Vol 22, 1, 1976, — P.
74-82.
9. Недокунев, В. В., Матвеева, Л. М. Влияние давления и температуры в отделителе высокого давления на
фазовое равновесие системы этилен-полиэтилен / В. В. Недокунев, Л. М. Матвеева // — Новополоцк:
ОНПО «Пластполимер», 1984. — 15 с.

MATERIALS OF XII JUNIOR RESEARCHERS’ CONFERENCE 2020
Technology, Machine-building
95
UDC 620.178.162.42
DETERMINATION OF THE WEAR VALUE OF ULTRAHIGH MOLECULAR WEIGHT
POLYETHYLENE DEPENDING ON ADDITIVES
D. LAPATSIN, Y. HAS, A. DUDAN
Polotsk State University, Belarus
Introduction. In recent years, there has been increased interest in new synthetic polymers that have a num-
ber of unique properties. Among these polymers, the most interesting is ultra-high molecular weight polyethylene
(UHMWPE) due to the presence of a whole complex of valuable properties.
UHMWPE includes polyethylene (PE) having a molecular weight of more than 1.5∙106. Products obtained
from UHMWPE are characterized by a low coefficient of friction, as well as high wear resistance. In addition, they
have high resistance to aggressive environments, as well as increased frost resistance.
UHMWPE is used where conventional PE grades and many other polymers cannot withstand harsh oper-
ating conditions. UHMWPE can act as a substitute for other, more expensive materials, such as steel, bronze,
polyamides, fluoroplastics, and can beсome the only material suitable for the purpose.
The main methods for producing UHMWPE are: sintering, pressing, gel-forming, REM-extrusion, as well
as spraying on the surface of products using electrostatic method and hot-flame spraying. [1]
Sintering is the heating process when UHMWPE powder compressed to a different degree changes into a
monolithic or porous body.
The process of obtaining blanks (products) by sintering consists of two operations:
1) pressing the powder in a mold without heating;
2) sintering of the obtained blanks (products) in the free state when heated.
The sintering method can be used to produce blanks (products) weighing from tens of grams to several
tens of kilograms.
If it is necessary to obtain a porous product with a density of 600 kg/m3, it is advisable to maintain a spe-
cific pressure of about 8 MPa, and if it is necessary to produce a monolithic product with a density of 930 kg/m3,
then the specific pressure should be increased to 85-90 MPa. [2]
Task formulation: to determine the degree of wear of UHMWPE depending on the additive and determine
the most effective modification.
Results and discussion. The following types of samples were used to determine wear depending on the
UHMWPE modification:
- Sample #1: UHMWPE without additives;
- Sample #2: UHMWPE + 70% Fe/B4C;
- Sample #3: UHMWPE + 70% W/B4C.
All samples are made by sintering and represent a cylinder with a diameter of 10 mm. As a counterbody,
a disk Ø 70 х 6 mm from hardened steel ШХ - 15 was chosen.
Tribological tests were carried out on a universal friction machine MODEL: MMW-1A of a vertical type
with computer control. This model allows you to keep the load force constant with a deviation of ± 2 N. The
relative error in measuring the friction force did not exceed ± 2% in the liquid lubrication mode.
Before conducting the study in order to reduce the surface roughness and, as a result, to improve the
accuracy of the data obtained, the samples were subjected to grinding on emery paper with P600 grit.
All samples were tested under the same friction mode, with the following parameters: loading force: 471
N; specific load: 2 MPa; sliding speed: 0.1 m/s; distance traveled by samples: 1000 m.
Samples without modifiers were also tested at a speed of 0.5 m/s and 1 m/s, but during the tests, the
friction force exceeded the maximum recorded by the friction machine. At a speed of 0.5 m/s, the friction force
reached a critical value after 300 s, while at a speed of 1 m/s it occurred within the first 10 seconds. This is due
to the fact that the samples were tested in the absence of a lubricant. Therefore, samples with modifiers were
not tested at these speeds.
During the tests, the values of the friction force and the friction coefficient with a frequency of once
every 1 s were recorded in real time with the ability to save to a file. The obtained data were accumulated in a
graphical and textual form and, after approximation, were analyzed.
A weighting method was used to estimate the amount of wear. The samples were weighed on RADWAG
AS 60/220/C/2/N scales, which allow measuring the weight with an accuracy to 10 micrograms. This method
MATERIALS OF XII JUNIOR RESEARCHERS’ CONFERENCE 2020
Technology, Machine-building
96
consists of determining the difference between the weight of the samples before the test and after.
Subsequently, the mass wear was converted to absolute wear . The density of samples without modifiers was
assumed to be 0.94 g/cm3, and with modifiers 0.95 g/cm3.
The histogram (fig.1) shows a comparison of the absolute wear of the samples in µm. Moreover, the wear
of the first and second samples differs slightly, which can be due to the error of converting mass wear to abso-
lute. It can be said that the Fe/B4C additive does not affect the wear of UHMWPE. The wear of the third sample
is 10 times less than the wear of the first two samples. This indicates that the effectiveness of the W/B4C additive
is quite high. The high wear resistance of the third sample indicates that this composition is applicable to the
manufacture of parts that work in heavily loaded nodes. For example, rollers, gears, support bushings, grease-
free bearings, guides, and more. [3]
Figure 1. – Histogram of friction surface wear
Conclusion. Testing of samples with various additives showed that the lowest degree of wear is observed
in the sample No. 3 containing the additive W/B4C. The use of this additive can significantly reduce wear com-
pared to the samples without additives, while the additive Fe/B4C does not give a positive effect.
REFERENCES
1. Галибеев, С.С. Сверхвысокомолекулярный полиэтилен. Тенденции и перспективы / С.С. Галибеев,
Р.З. Хайруллин, В.П. Архиреев // Вестник казанского технологического университета. – 2008. – 2. –
С. 50-55.
2. К наиболее распространенным методам переработки СВМПЭ следует отнести спекание, горячее прес-
сование, плунжерную экструзию. // КиберПедия — информационный ресурс [Электронный ресурс]. –
Режим доступа: https://cyberpedia.su/6x7dae.html. – Дата доступа: 01.03.2020.
3. СВМПЭ волокно: способ получения, свойства, применение // Хелпикс.Орг - Интернет помощник [Элек-
тронный ресурс]. – Режим доступа: https://helpiks.org/8-90847.html. – Дата доступа: 01.03.2020.
MATERIALS OF XII JUNIOR RESEARCHERS’ CONFERENCE 2020
Technology, Machine-building
97
UDC 665.662.3
EFFICIENCY IMPROVEMENT OF THE AROMATIC HYDROCARBONS EXTRACTION PROCESS
FROM CATALYSATE OF REFORMING AND CO-PRODUCTS OF AROMATIC SECTIONS AT A REFINERY
D. YUKHNO, A. YARMAK
Polotsk State University, Belarus
The issues of relevance of the production of aromatic hydrocarbons and, accordingly, the intensification of
the extraction of aromatic hydrocarbons by selective solvents are considered. The performance characteristics
and physicochemical properties of various extractants are compared. The optimal component for TEG was de-
termined to obtain a mixed solvent. The effectiveness of the usage of such an extractant in the intensification of
the aromatic hydrocarbons extraction by selective solvents is estimated.
Introduction.Proclivity by UN human rights activists and environmental activists to the idea of abandoning
fossil fuels are gradually gaining popularity both among some countries and among automobile concerns, and oil
companies carry out unitary reorientations of their refineries to zero fuel production, as it is supposed, to search
the economic efficiency of such an operating mode of oil refineries in the current global market and the possibil-
ity of transition to a policy of companies to completely refuse to produce fuel. In addition, the existing environ-
mental zones and the policy of banning certain types of internal combustion engines in some cities, as well as
the production of cars with low fuel consumption, coupled with the policy of updating an outdated fleet, actually
set the volume of fuel output at oil refineries, the need for which is constantly decreasing in Europe.However, in
general, an increase in demand for petroleum fuels for the next 20 years is forecasted throughout the world [1].
The reorientation of refineries is possible in the direction of reducing production capacity or with an in-
crease in the production of raw materials for petrochemistry or its final products.
Demand for petrochemicals in the world continues to grow rapidly, far outstripping global GDP
growth.Therefore, from the point of view of maintaining the profitability of the enterprise and the guaranteed
return on investment projects, the priority direction of the development of the oil refinery is to increase the
production of the feedstock for the petrochemistry or its finished products. This policy can be seen in the "Strat-
egy of the petrochemical complex until 2030" of the Belarusian State Concern for Oil and Chemistry, in China,
measures are being taken to accelerate the development of petrochemistry; in Russia, the aim is to increase
non-resource exports.
Task formulation. Aromatic hydrocarbons are the basic substances used in industry for the production of
a variety of chemical products.The global growth in demand for low molecular weight aromatic hydrocarbons is,
on average, 3-5% per year. This is due to the increasing demand for aromatic hydrocarbons produced, primarily
paraxylene [2, 3].
Currently, the main source for the production of monocyclic aromatic hydrocarbons (benzene, toluene,
xylene) are catalysts for the reforming of gasoline fractions [4]. Catalytic reforming products represent a mixture
of aromatic, naphthenic and paraffinic hydrocarbons mixed with unsaturated hydrocarbons.It can be either
narrow fractions containing, respectively, benzene, toluene or xylenes, or wide fractions containing a mixture of
aromatic hydrocarbons. In addition to catalytic reforming products, by-products of the aromatic section of the
refinery are also used to produce monocyclic aromatic hydrocarbons. The separation of high purity individual
aromatic hydrocarbons (99 - 99.9%) from these blended products is a complex task associated with the usage of
a number of processes [5].
Monocyclic aromatic hydrocarbons are recovered from these mixtures by liquid extraction with selective
solvents. Refinery process units using 90–95% glycol solutions (DEG, TEG, and tetraethylene glycol) are widely
used [6].The disadvantages of the existing process used at most refineries in the CIS countries, using the LG-35-8
/ 300B unit as an example, are mainly due to the imperfection of the technological scheme of the extraction unit
designed by Lengiproneftekhim (Lengiprogaz in the 1960s) according to the extraction laboratory of
VNIIneftekhim.One of these is the high consumption of risicle (100–110% for raw materials), which leads to a
decrease in the extractor productivity and a decrease in the actual concentration of extractant in the system and
its selectivity.
For the successful realization of the separation of hydrocarbon raw materials, the used extractant must
satisfy a number of requirements, the most important of which are high selectivity and solvent ability. However,
an extractant that fully complies with the requirements of modern technology hasn’t been found yet. The sol-
vent triethylene glycol (TEG), currently used in the domestic industry, has a good capacity in relation to aromatic
MATERIALS OF XII JUNIOR RESEARCHERS’ CONFERENCE 2020
Technology, Machine-building
98
hydrocarbons for the separation of aromatic hydrocarbons, but it has low selectivity and solvent ability, which
forces the process to be carried out at high extractant ratios to raw materials and elevated temperature and
pressure, which leads to additional material and energy costs. In addition, it has a high viscosity and heating ca-
pacity, which contributes to a decrease of coefficient of efficiency of contact devices; it is necessary to maintain
a high mass ratio of solvent to raw materials and a large consumption of recycle stock and high costs for
the separation of the extract with the solvent [2, 7].All these disadvantages are associated with the fact that TEG
is a strongly associated solvent due to the existence of two hydroxyl groups and the formation of stable intermo-
lecular hydrogen bonds. Besides, triethylene glycol has strong toxic properties.By the degree of impact on the
human body, triethylene glycol is a moderately dangerous substance, it belongs to the 3rd substance hazard
category. The maximum allowable concentration (MAC) of technical triethylene glycol in the air of the working
area of industrial premises is 10 mg / m3.
The low dissolving capacity of TEG leads to the necessity to increase the temperature of the extraction
process to 150 ° C, however, this reduces the stability of π-complexes with arenes and the selectivity of the ex-
tractant.The high selectivity of TEG by molecular weight is also due to the strong association of its molecules. In
the transition from benzene to xylenes, the energy expenditure sharply increases when the arene molecules
dissolve to form a cavity in the solvent structure, as a result, the critical solution temperature increases sharply,
and the distribution coefficients and the degree of extraction decrease.
The high viscosity of the TEG leads to a decrease in the efficiency of the plates of extraction columns,
which is much lower than for plates of columns of extractive distillation.
Therefore, improving the technology for the separation of complex hydrocarbon mixtures in order to re-
duce energy costs by reducing the solvent to feed ratio and the process temperature is an urgent scientific and
technical task.
Methods of research.One way to solve this problem is to use mixed-type extractants.Their use allows
more flexible implementation of extraction processes for the separation of hydrocarbon mixtures during
processing of raw materials of variable composition due to changes in the extraction and physicochemical
properties of extractants [4].
There are solvents that are devoid of the above drawbacks, however, a complete replacement of the sol-
vent would lead to a partial or complete replacement of technological equipment, which, given the growing
costs of reorienting to the course of petrochemicals, does not have a high profitability.
Therefore, the best of the methods of intensification of extraction, which avoids significant material costs,
and especially reconstruction / change of the technological scheme, is the use of mixed solvents [2, 8].
Results, their discussion and perspectives.Currently, there are many options for additions to TEG:
sulfolane, N-methylpyrrolidone, diglycolamine, dimethyl sulfoxide, N-formyl morpholline, ethyl alcohol, etc. [2,
9-11]. Their comparison, presented in [11], defines N-methylpyrrolidone as the most suitable.
Table 1 shows the comparative characteristics of selective solvents used in industry, where – is
the efficiency criterion.
Table 1. – The selectivity and dissolving capacity of aromatic hydrocarbon extractants
Extractant Т, °С
0
1
bγ
Triethylene glycol 30
80
60,6
30,4
3,86
3,02
15,7
10,1
7,24
0,168
0,126
0,259
0,331
4,1
3,3
Tetraethyleneglycol 30
70
37,7
24,8
2,46
2,48
15,3
10,0 7,54
0,171
–
0,407
0,403
6,2
4,0
Sulfolane 30
80
72,0
38,4
2,43
2,49
29,6
15,4 13,9
0,154
0,112
0,412
0,402
12,2
6,2
Dimethylsulfoxide 20
60
92,0
48,0
3,83
3,03
24,0
15,8 11,4
0,169
0,126
0,261
0,330
6,3
5,2
N-formylmorpholine 30
61,7
34,6
24,7
2,03
1,99
17,1
12,4 10,0
0,133
0,115
0,493
0,503
8,4
6,2
N-methylpyrrolidone 30
60
14,2
9,9
1,08
1,08
13,1
9,17 7,90
0,086
0,057
0,926
0,926
12,1
8,5
According to the efficiency criterion, when separating the model system “hexane-benzene”, sulfolane and
N-methylpyrrolidone are at the same level, and when separating the system “cyclohexane-benzene” N-
MATERIALS OF XII JUNIOR RESEARCHERS’ CONFERENCE 2020
Technology, Machine-building
99
methylpyrrolidone should be more effective even in comparison with sulfolane. When comparing the
physicochemical properties of the extractants (Table 2), the following conclusions can be drawn: sulfolane has a
high melting point, which may limit its use; N-methylpyrrolidone has the lowest dynamic viscosity, which will
increase the efficiency of the contact steps; N-methylpyrrolidone is less toxic than sulfolane.
Table 2. – Physico-chemical properties of arene extractants
Extractant B.P.,°С M.P.,°С ,
MPa∙s , , ,
MAC,
Triethylene glycol 1,1242 285 -4,3 49,0 2,17 71,6 45,57 10
Tetraethyleneglycol 1,1247 327,3 -6,2 61,3 2,14 88,8 45
(20 °С) 10
Sulfolane 1,2604
(30 °С) 285 28,4
10,0
(30 °С)
1,34
(30 °С)
61,5
(30 °С)
60,33
(40 °С) 50
Dimethylsulfoxide 1,0960 189 18,45 2,473 2,05 57,28 43,49 20
N-formylmorpholine 1,1528 244 20…21 9,37 1,97 46,06 – –
N-methylpyrrolidone 1,0328 202 -24 1,65 1,97 53,06 39,91 100
When choosing the optimal extractant, it is also necessary to take into account their thermal and
chemical stability and corrosion activity. Sulfolan is a chemically inert substance and is thermally stable up to
220 ° C. Sulfolan, both watercut and anhydrous, has insignificant corrosion activity even at 200 ° C. N-
methylpyrrolidone is a corrosive substance. However, corrosion is caused by the corrosive activity not of N-
methylpyrrolidone itself, but of the products of chemical transformation during its heating, hydrolysis and contact with
air. N-methylpyrrolidone has almost the same comprehensive efficiency criterion with sulfolane, however, its
operation is hampered by its corrosivity, which is easily leveled out by introducing a corrosion inhibitor into the
system, lowering the process temperature, and maintaining the system under a slight overpressure. Upon that the
main disadvantage of sulfolane is that under normal conditions it is a solid. Therefore, for its keeping and pumping, it
is necessary to keep it in a heated state. Also, sulfolane has a maximum allowable concentration 2 times lower than
that of N-methylpyrrolidone, which requires additional measures to protect people when using it.
However, with a logical attempt to add N-methylpyrrolidone to TEG to obtain a mixed extractant, it is not
as effective.In the 1990s, studies were conducted at the St. Petersburg State Technological Institute in
conjunction with Kirishinefteorgsintez LLC to develop a mixed extractant for the extraction of aromatic
hydrocarbons from reformate of fraction 62 - 105 ºС, the results of which were implemented on the LG-35- 8 /
300Bunit LLC “PO“ Kirishinefteorgsintez ”in 1999 –2000.
To increase the dissolving capacity of TEG, it was proposed to use mixtures of it with various solvents: N-
methylpyrrolidone, dimethylformamide, furfural, propylene carbonate, morpholine, acetone, dioxane. However,
all these solvents, increasing the dissolving ability, reduce its selectivity.
The TEG-sulfolane mixture is devoid of this drawback, exhibiting both higher selectivity and increased dis-
solving capacity with respect to arenes.A complete replacement of TEG with sulfolane would lead to the need
for a substantial reconstruction of existing extraction plants.When using sulfolane, the recycle stock and extract
are stripped in separate columns, and in the process with TEG, in a combined column.The arenas are steamed
from sulfolane in a larger diameter vacuum column; a vacuum-generating system is necessary (due to the low
partial pressure of aromatic hydrocarbons over the solvent).
Effective mixed extractants, as well as individual solvents, should not be strongly associated.
The mixing of TEG with N-methylpyrrolidone, dimethylformamide, N-methylcaprolactam is accompanied
by an exothermic effect (ΔНЕ<0 )which can be explained by the formation of intermolecular hydrogen bonds. In
contrast to these systems, the mixing of TEG with sulfolane occurs with an endothermic effect. Positive
deviations from Raoul’s law in the TEG – sulfolane system, taking into account close boiling points and pressures
of saturated steam of the components, leads to the formation of an azeotropic mixture and a decrease in the
temperature in the stripping column when arenes are distilled from the extract phase.Thus, the regeneration of
the mixed extractant is facilitated in comparison with the regeneration of individual TEG and sulfolane.
The most important advantage of using the mixed TEG – sulfolane extractant is that the mass ratio to the
feed is reduced from 8: 1 for TEG to 4.9: 1 when the sulfolane content in the mixture with TEG is 28-30% wt. At
the same time, the transfer of the LG-35-8 / 300B installation to a mixed solvent with a sulfolane content of 28-
30% wt. mixed with TEG was carried out without a significant change in the technological scheme.
The increase in the ratio of sulfolane: TEG to 60: 40% wt. would reduce the temperature of the extraction
process, as well as the mass ratio of the mixed extractant to the raw material to 3: 1 and the recycle stock con-

MATERIALS OF XII JUNIOR RESEARCHERS’ CONFERENCE 2020
Technology, Machine-building
100
sumption from 80 - 100 to 30% wt. on raw materials. However, to reduce the temperature of the extraction pro-
cess, it is necessary to install a heat interchanger for cooling the regenerated extractant discharged from the
stripping column at 150 ° C [12, 13].
According to the research results, the amount of saturated hydrocarbons in the extract remains less,
which is due to the increased selectivity of the extractant with a weight ratio TEG: sulfolane ratio of 1: 1, com-
pared with 0.27 : 1 [13].
Reducing the water content in the mixed extractant is possible only to a level that ensures its boiling point at a
normal pressure of not more than 150 ° C, which allows the use of water vapor with a pressure of about 1 MPa in the
boiler of the stripping column. In this case, selective solvents (sulfolane and TEG) are thermally stable. An increase in
the content of sulfolane in the mixed extractant with the same water content also leads to a decrease in the boiling
point of the mixture. This can be explained by the greater degree of non-ideality of the water - sulfolane system com-
pared to the water - TEG system. At the same time, an increase in the sulfolane content, as well as a decrease in the
water content, leads to an increase in the solvent ability of the mixed extractant.
Conclusion.Thus, the use of such a mixed extractant allows not only to reduce the energy costs of the
process, but also by reducing the weight ratio of the extractant to the raw material to increase the productivity
of the plant, which affects the determination of design capacity and, accordingly, the cost of new extraction
plants, if necessary for the modernized / new aromatic block.Both reducing energy costs and increasing plant
productivity reduces the cost of production of aromatic hydrocarbons, which allows you to increase the profit of
the enterprise.
REFERENCES
1. Прогноз развития энергетики мира и России до 2040 года / Под ред.А.А. Макарова, Л.М. Григорьева,
Т.А. Митровой. – М.: ИНЭИ РАН и Аналитический центр ПРФ, 2014. – 175 с.
2. Капизова, Н.Б. Исследование факторов, влияющих на степень извлечения ароматических углеводоро-
дов из риформата в процессе жидкостной экстракции /Н.Б. Капизова, О.Н. Каратун // Башкирский хи-
мический журнал. – 2013. –Т. 20. – 2. –C.37-41
3. Брагинский О. Б. Мировая нефтехимическая промышленность. – М.: Наука, 2003. – 555с.
4. Мухамадиев, А.И. Экстракция ароматических углеводородов смешанными растворителями морфолин-
этаноламин и морфолин-этиленгликоль: дисс. на соиск.уч. степ.канд. хим. наук : 02.00.13 / А.И. Муха-
мадиев; Казанский гос. техн.ин-т. – Казань, 2002. – 175 с.: ил.
5. Адельсон, С.В. Технология нефтехимического синтеза: учеб. для вузов / С.В. Адельсон, Т.П. Вишнякова,
Я.М. Паушкин. – 2-е изд., перераб. – М.: Химия, 1985. – 608 с.: ил.
6. Балыбердина, И.Т. Физические методы переработки и использования газа: учебник для вузов / И.Т.
Балыбердина. – М.: Недра, 1988. – 248 с.: ил.
7. Гайле, А. А. Селективные растворители. Разделение и очистка углеводородсодержащего сырья / А.А.
Гайле, В.Е. Сомов, Г.Д.Залищевский. – СПб: Химиздат, 2008.– 736 с.
8. Weissermel, K. Industrial organic chemistry / K. Weissermel, H.-J. Arpe. – Weinheim: VCH, 2003.– 464 p.
9. Способ экстракции ароматических углеводородов: пат. 2202529 Российская Федерация: МПКC07C7/10 / Е.
И.Грушова (BY),А. В. Кучук (BY);патентообладатель:Бел. гос.техн. ун-т (BY).,заяв. 04.05.2001 ;опуб. 20.04.2003.
10. Способ извлечения ароматических углеводородов из смесей с неароматическими углеводородами :
пат. 2127718 Российская Федерация : МПКC07C7/10, C07C15/02/ В.Е.Сомов,А.А.Гайле,О.М. Варшав-
ский,Л.В. Семенов,Н.Б. Марусина,Е.А.Кайфаджян;патентообладатель: ОАО «Киришинефтеоргсинтез»,
заяв. 18.12.1996 ;опуб. 20.03.1999.
11. Покровская, С. В. Влияние состава смешанного растворителя N-метилпирролидон–триэтиленгликоль–
вода на качество получаемых экстракта и рафината при проведении процесса экстракции ароматиче-
ских углеводородов из риформатов / С. В. Покровская, В.В. Кудрявцев // Вестник Полоцкого государ-
ственного университета. Серия B, Промышленность. Прикладные науки. – 2016. – 3. – c. 147-152.
12. Гайле,А.А. Экстракция аренов С6–С8 из объединенного риформата смешанным экстрагентомтриэти-
ленгликоль—сульфолан—вода / А. А. Гайле, Г.Д. Залищевский, Л.Л. Колдобская, А.С. Ерженков, И. А.
Соловых // Химия и технология топлив и масел. – 2009. – 4(554). – с.3-6.
13. Гайле,А.А. Фазовое равновесие жидкость — жидкость в системах насыщенные углеводороды — арены
С6–С8 — смешанный экстрагент /А. А. Гайле, А.С. Ерженков, Л.Л. Колдобская, И.А. Соловых // Химия и
технология топлив и масел. – 2011. – 2(564). – с.35-38.

MATERIALS OF XII JUNIOR RESEARCHERS’ CONFERENCE 2020
Technology, Machine-building
101
UDC 661.715.6
RECEIVING OIL COKE ON THE BASIS OF HEAVY RESIDUAL OIL
FROM THE CHEMICAL WORKS “POLYMIR” (OJSC “NAFTAN”)
E. SHULHA, S. YAKUBOVSKY
Polotsk State University, Belarus
Heavy residual oil (HRO) as a by-product of hydrocarbon pyrolysis, is a mixture of various groups of hydro-
carbons, mainly aromatic, with a boiling point above 1600С. At present this product does not find rational use. It
is used as boiler fuel. This article presents the results of a study on the possible use of HRO as a raw material for
the production of petroleum coke.
The creation of a raw material base for the production of electrodes is one of the current directions in the
industry, as coke with a sulphur content of up to 1% is used in the production of graphitized electrodes, pur-
chased by import [1,2].
Needle coke is used to produce high quality graphite electrodes. Electrodes should have high mechanical
strength, electrical conductivity, low sulphur content and low thermal expansion coefficient (TEC) [3].
This study assesses the suitability of use of heavy residual oil from the Polymir plant of OJSC Naftan to
produce petroleum coke and petroleum pitch.
The heavy residual oil from "Polymir" plant of OJSC "Naftan" has been studied taking into account several
points connected with the suitability of raw materials use for oil coke production. The main quality markers of
raw materials for oil coke production are the composition and molecular structure of all its components. The
composition of raw materials and the molecular structure of its components depend on the reactivity of raw
material, quantitative and qualitative indices of the coking process and the main operational properties of the
obtained coke.
The chemical composition of raw materials is determined by simple methods of chemical analysis. How-
ever, data on molecular structure are still extremely insufficient. But data on the structure of high-molecular oil
compounds which are available at this moment in some cases can be considered orientative when solving cer-
tain scientific and practical problems [4].
A very important characteristics in the analysis of coking feedstocks is the amount of carbon residue. Con-
radson method is usually used and feedstock is heated in a standard gas-heated instrument [5]. Toluene insolu-
ble substances/a-fraction asphaltenes are determined by the Marcusson method. Also, the pitch of the pyrolysis
resin was extracted with a mixture of aliphatic and aromatic solvents to study its suitability for coking feed.
Initially, a heavy pyrolysis resin was dispersed in Engler. Essence of method lies in separation of oil prod-
uct into its component fractions due to their different final boiling points. The results obtained show that about
1-1.5% hydrocarbons contained in the HRO boil at temperatures up to 180 ° C. The largest amount of hydrocar-
bons boil in the range 180-210 ° C (the so-called "blue-green oil"). Fractions boiling in the ranges 210-220 ° C,
210-230 ° C, 210-240 ° C make up 15%.
Thus, at the fractional distillation of HRO about 50% is the solid vat residue (pitch).
The next step was to determine toluene insoluble substances/a-fraction. The method is based on differ-
ent solubility of pitch components and consists in treatment of weighed sample with toluene followed by weigh-
ing of filtered and dried undissolved residue. Three pitch weighed samples were taken for analysis with boiling
temperature intervals of 220 - end of boiling, 230 -end of boiling, 240 - end of boiling.
The results showed that the content of substances insoluble in toluene in the tested samples is minimal
and makes up 0.2% wt. For each fraction tested. Thus, the raw material is suitable for producing petroleum coke,
including needle coke, as according to the current standards, the content of α-fraction should not be more than
8-11 wt%.
The pakes were extracted with a mixture of solvents. Essence of method is in extraction of pitch with mix-
ture of aliphatic and aromatic solvents for subsequent coking of extract. Mixture of nefras and solvent with end
boiling point in the range 130-185 °C was used as mixture of aliphatic and aromatic solvents. The ratio of mix-
ture of nefras and solvent and resin residue was 2:1 - 3:1 by weight.
During the study, it was found that with the increase of the solvent content in the solvent mixture and
with the increase of the extraction time, the amount of insoluble residue also increased, so that the quality of
the resulting coke would decrease.

MATERIALS OF XII JUNIOR RESEARCHERS’ CONFERENCE 2020
Technology, Machine-building
102
As the extraction temperature increases, the yield of the insoluble residue also increases, which will ad-
versely affect the yield of the possible coke produced.
The isolation of asphaltenes by Marcuson method showed that the weight of asphaltenes was 1.5 g or
15% by weight for the 220-fbp fraction, 17% for the 230-fbp fraction and 20% for 240-fbp fraction..
The obtained data are consistent with the norms for asphaltenes content in the raw material for produc-
tion of needle coke.
The presented results of the study suggest that heavy pyrolysis resin can be used as raw material for pro-
duction of petroleum coke for electrode industry.
REFERENCES
1. Varietyofheavyresidualoilapplications /ShulhaA., VashkovaN., Jakubovskij S.//European and national dimen-
sion in research. Technology = Европейскийинациональныйконтекстывнаучныхисследованиях : Electronic
collected materials of XI Junior Researchers’ Conference, Novopolotsk, May 23-24, 2019 / Polotsk State Uni-
versity ; ed. D. Lazouski [etal.]. – Novopolotsk, 2019. -P.96-97
2. Направления использования тяжёлой смолы пиролиза /Е.А. Шульга, Н.С. Вашкова//Электронный сбор-
ник трудов молодых специалистов Полоцкий государственный университет. Сер. Промышленность.–
Выпуск 30(100).–С.336-337
3. Перспектива расширения сырьевой базы для получения игольчатого кокса / И.Р. Хайрудинов, А.А. Ти-
хонов, М.М. Ахметов // Башкирский химический журнал. – 2011. - 3.
4. Нефтяной кокс. / Красюков А.Ф. – М. Химия, 1966. - 264 с
5. Нефтяной кокс. / Гимаев Р.Н. – М.: Химия, 1992. – 80 с
MATERIALS OF XII JUNIOR RESEARCHERS’ CONFERENCE 2020
Technology, Machine-building
103
UDC 665.7.038.2:547.29
INFLUENCE OF CARBOXYLIC ACIDS ON FILTERABILITY AND QUALITY LEVEL OF SYNTHETIC LOW ALKALINE CALCIUM
SULFONATE (DETERGENT-DISPERSANT MOTOR OIL ADDITIVE)
V. LENCHIKOV1, D. DABRAVOLSKI2, А. UTKIN2, I. BURAYA1
1 Polotsk State University, Belarus 2 JVLL “LLK-NAFTAN”, Novopolotsk, Belarus
The study examined the conditions of synthetic low alkaline calcium sulfonate (SLCS) synthesis, which is
added to motor oils as a detergent-dispersant additive. In particular, the effect of the introduction of carboxylic
acids at the stage of SLCS synthesis on such characteristics of the additive as the observable filterability, volume
filtration rate, volume fraction of sediment and kinematic viscosity was studied. For the obtained additive sam-
ples the average sizes of particles dispersed in the volume were measured using the dynamic light scattering
method (DLS) and the basic physicochemical parameters were determined.
Keywords: detergent-dispersant oil additives, lubricants, filterable sulfonate additives, calcium sulfonate.
Introduction. This article discusses the preparation of synthetic low-alkaline calcium sulfonate (total base
number< 50 mg KOH/g) based on high molecular weight sulfonic acid (dialkylbenzenesulfonic acid (DABSA)) as a
detergent-dispersant additive to motor oils. Synthesis of low alkaline sulfonates using synthetic high molecular
weight sulfonic acids (synthetic acids of average molecular weight 450 Da or more) is associated with certain
problems. Calcium salts of high molecular weight sulfonic acids are viscous materials prone to the formation of
supramolecular complexes with irregular structure. This creates certain problems in the process of their synthe-
sis and then utilization. Moreover, it is possible that calcium hydroxide particles can be included in the formed
aggregates during the synthesis process. This kind of dispersed system can be classified as filled concentrated, in
which interactions between existing supramolecular formations are possible. So, this leads to the enlargement of
the latter. The dispersed system in this case is thermodynamically and kinetically unstable due to aggregation
and subsequent sedimentation of the existing particles. Inability to resist aggregation leads to coagulation of sol
particles of calcium hydroxide with their subsequent coalescence (irreversible fusion), which leads to sedimenta-
tion as a result. Moreover, the aggregation of sol particles can lead to the formation of a macrophase of calcium
hydroxide or to the transition of the sol into a gel in the case of presence of a surfactant. Furthermore, by rheo-
logical properties such structures can be considered as dilatants, i.e. they tend to increase their viscosity with an
increase in shear deformations. This fact complicates filtration or makes it completely impossible. Thus, in order
to create calcium sulfonates stable in quality level, it is necessary to increase somehow their ability to resist ag-
gregation.
There are methods of producing sulfonates with a low alkaline number in which carboxylic acids are used
[1]. It is expected that carboxylic acids prevent the formation of gel-like products, reduce the viscosity of the
obtained additive and reduce the amount of sediment. As a result, this provides fluid, filterable products. This
effect is probably a consequence of the interaction of carboxylic acid with the fractions of calcium hydroxide
particles of the size lying in the region of tens of nanometers. Such particles have a large free energy reserve and
therefore easily undergo various transformations. This allows their selective removal. Also, particles of such sizes
are presumptively able to clog the pores of the filter, and this also complicates the filtering process.
The purpose of this study is to synthesize SLCS with acceptable filterability. To accomplish this task acetic
acid is added at the stage of additive synthesis. Acetic acid reacts with the excess base to form an acetate which
can be dispersed in the sulfonate soap media in the product.
Experiment
Reagents. Using the previous studies on the selection of raw materials for the synthesis of low alkaline
calcium sulfonate and results received by JVLL “LLK-NAFTAN”, high molecular weight DABSA (M = 460 g /mol)
with an active component content of 84% by mass was selected. The spindle oil SN-150, calcium hydroxide,
technical toluene, technical acetic acid “analytical grade”, distilled water satisfy all quality requirements. At the
filtration stage of the obtained product, Celite-545 diatomaceous earth was used.
Apparatus. For the neutralization reaction, a three-necked flask connected to a mixer, a thermometer and
a backward cooler was used. A water bath was used to control the temperature in the reactor. A rotary evapora-
tor was used to remove toluene and water. A Malvern Zetasizer Nano ZS DLS spectrometer was used to deter-
mine the average particle sizes.
MATERIALS OF XII JUNIOR RESEARCHERS’ CONFERENCE 2020
Technology, Machine-building
104
Tests. The average molecular weight of the DABSA was determined in accordance with ASTM D-3712. The
ASTM D-664 test was used to determine the total acid number. The total base number of products was deter-
mined potentiometrically in accordance with ASTM D4739-17.
Procedures. The reactions occurring during the synthesis are described by the following chemical equa-
tions:
1) Preparation of neutral calcium sulfonate:
(1)
2) Preparation of basic calcium sulfonate:
(2)
3) Preparation of calcium acetate:
3 2 3 2 22 ( ) ( ) 2СH COOH Ca OH CH COO Ca H O+ = + (3)
As part of the study, a number of SLCS (with the active substance content of 42% wt.) syntheses were car-
ried out using variable amounts of acetic acid relative to the amount of calcium hydroxide used in the synthesis
(see reactions 1,2).
After completion of the synthesis process, 100 ml of the product was centrifuged to determine the vol-
ume fraction of sediment. Also, after completion of the synthesis process, the SLCS solution was subjected to the
removal of toluene and water on a vacuum rotary evaporator at 150°C and 15 kPa since, according to literature,
even a small amount of water can significantly impair the filterability of the product [2].
The dehydrated product was then filtered in an apparatus simulating the operation of a press filter (Fig-
ure 1). Filtration was carried out at elevated temperature (in the range of 80 – 90°С) and at 0,2 MPa. A diatoma-
ceous earth fill layer was used as an aid. The layer was poured over ashless paper filter.
1 - tank; 2 - mixing device; 3 - pump; 4 - pressure vessel with support for the filter; 5 - measuring cylinder;
6 - filtrate circulation line; 7-manometer; 8 - electric heater; 9 - thermocouple with temperature indication
Figure 1. – Sketch of a laboratory filtration unit
MATERIALS OF XII JUNIOR RESEARCHERS’ CONFERENCE 2020
Technology, Machine-building
105
Results and discussion. The preferred kinematic viscosity of the low alkaline sulfonate additives at 100°C is
300 cSt or less, most preferably 30-100 cSt. The volume fraction of sediment in the product before filtration in
the most preferred variant is in the range from 0,1 to 0,6% vol. To establish the filtration intensity, the volume
filtration rates were determined and the filtration diagrams for three samples were plotted (Fig. 2). On that ba-
sis, to compare the obtained filtration results, such terms as “well-filtered sample” and “poorly filtered sample”
were introduced.
Figure 2. – Filtration diagrams of SLCS samples
The attempt to filter sample 1 was unsuccessful due to the high sediment content in combination with
high viscosity, the observed filterability was unsatisfactory. This example shows that the preparation of low alka-
line calcium sulfonate from high molecular weight sulfonic acid in accordance with the known [2] method, using
the raw materials adopted in this study, leads to the formation of an unfilterable product. The observed filtera-
bility in the case of samples 2 and 3 improved as evidenced by the positive dynamics of the volume filtra-
tion rate increase compared to sample 1. However, during the filtration of the sample 2 the filter quickly
clogged as can be seen from the fall-off in the volume filtration rate. Physicochemical quality characteristics of
the filtered samples are presented in the Table 1.
Table1. – Quality characteristics of SLCS samples
Characteristic Sample number
1 2 3
Observed filterability Poor Poor Good
Volume fraction of sediment, % vol. 3,50 1,50 1,00
Volume filtration rate, ml/hour 192,93 266,89 547,72
Total base number, mg KOH/g 3,72 7,48 12,58
Total acid number, mg KOH/g 1,87 2,07 2,00
Kinematic viscosity at 100 °C, cSt 760,00 561,00 356,00
There are trends of decrease in the volume fraction of sediment and the kinematic viscosity of the ob-
tained products with the increase of the acetic acid amount. The increase in alkaline number is due to an in-
crease in the amount of calcium acetate in the product.
For the filtered samples the average size of the dispersed particles was determined using DLS spectrome-
try. The results are presented in figure 3.
As can be seen from the PSDs of the obtained samples, the amount of small-sized dispersed particles
tends to decrease as the acetic acid content in the starting mixture increases.
Analyzing the total results one can conclude that in the synthesis of SLCS based on high molecular weight
dialkylbenzenesulfonic acid, the addition of some carboxylic acid, in particular acetic acid, has a positive effect
on the quality of the product. The tendency to form gel-like viscous products is reduced. The product has better
filterability than the product obtained according to the existing technology. However, not all quality characteris-
MATERIALS OF XII JUNIOR RESEARCHERS’ CONFERENCE 2020
Technology, Machine-building
106
tics have reached acceptable levels. The product still has too high viscosity and a volume fraction of sediment.
This article does not establish the exact reasons for all the above-mentioned facts - this will be the basis for fur-
ther research.
0
10
20
30
0.1 1 10 100 1000 10000
Inte
nsity
(P
erc
ent)
Size (d.nm)
Size Distribution by Intensity
Record 184: Sample 2 (3% CH3COOH) Record 186: Sample 3 (6%CH3COOH)
Record 187: Sample 1 (0% CH3COOH)
Figure 3. – Particle size distributions (PSDs) for the obtained SLCS samples
REFERENCES
1. US patent EP 0 875 502 A1, 04/04/1998
2. Ali Celik, Bilsen Besergil. Determination of synthesis conditions of neutral calcium sulfonate, so-called deter-
gent-dispersant//Industrial Lubrication and Tribology – 2004. – Vol.56. 4 – P. 226-230
3. O.L. Glavati. Physics and Chemistry of Dispersant Additives to Oils - Kiev: Naukova Dumka, 1989.- 184 p.
MATERIALS OF XII JUNIOR RESEARCHERS’ CONFERENCE 2020
ICT, Electronics, Programming, Geodesy
107
ICT, ELECTRONICS, PROGRAMMING, GEODESY
UDC 551.24
GIS-MODELLING OF THE CRYSTALLINE BASEMENT OF THE TERRITORY OF BELARUS
IN DIFFERENT GEOLOGICAL AGES
P. DOLHI
Polotsk State University, Belarus
As part of this work, GIS modeling of the crystalline basement of the territory of Belarus for various geo-
logical epochs, including data on the fault network, was performed using ESRI ArcGIS software. As an example, a
comparison of surfaces in the modern era and in the late Devonian is given. A map of the difference in basement
marks between the specified epochs is constructed. This work is important for understanding modern geodynam-
ics of fractal zones in Belarus.
The crystalline basement of the earth's crust is a complex natural structure. The main interrelated factors
determining the structure of the crystalline basement specific areas include: the capacity of the asthenosphere,
the topography (the folded deformations), the pattern of the fractures (disjunctive breaks), age and composition
of rocks composing the basement, neotectonic activity of its structures.
The territory of Belarus has a heterogeneous structure of the crystalline basement. The power of the as-
thenosphere varies from 30 to 130 km. The surface of the crystalline basement is within the range of 0 to 6.5 km
below the ground surface. According to the structural zoning, there are three granulite complexes in the crystal-
line basement of Belarus: the Belarusian-Baltic, Vitebsk, and Braginsky zones; the Osnitsk-Mikashevichi volcano-
plutonic belt, as well as the Central Belarusian, Inchukalna zones, and the Central Pripyat block.
The formation of the crystalline basement took place during the archean – early proterozoic and is divid-
ed into proto-oceanic, transitional and continental stages. During the proto-oceanic stage (early archaea), the
entire territory of modern Belarus was covered by the ocean. At this time, all three granulite complexes were
formed, as well as the Minsk block. During the transition stage (late archaea – early Proterozoic), a Central Bela-
rusian deflection was formed. Last, during the continental stage (the second half of the early Proterozoic), the
Osnitsk-Mikashevichi volcanoplutonic belt was formed.
In accordance with the surface topography of the basement, the territory of Belarus is divided into posi-
tive, negative and transitional institutions: the Belarusian anteclise, the Latvian saddle, Orsha depression, Zhlobin
saddle, Pripyat trough, the Podlaska-Brest depression, the Polesye saddle and little structures coming into the
country is only marginal. Within each of them, tectonic structures of a smaller order are distinguished: protru-
sions, steps, horsts, grabens, domes, mulds, structural bays, etc.
All tectonic structures are intersected by a network of fractures. Fractures play a crucial role in the for-
mation of the basement. They define the boundaries of structural complexes and tectonic structures of the
highest order , as well as form structures of the lowest order - horsts, grabens, protrusions, steps. Modern
movements of the earth's crust and a number of other geophysical processes are manifested along the fractures
[1].
All the fractures of the crystalline basement of Belarus are divided into structure that emerged in the ear-
ly Archean (mostly meridional and submeridional stretch) – early Proterozoic and postconsolidation (early Prote-
rozoic – Riphean, latitudinal and sublatitudinal).
About half of the ancient basement fractures are active in the current geological epoch, which is con-
firmed by a number of studies [2,3,5].
Modeling the formation of the crystalline basement will allow us to better understand the processes of
modern endogenous geodynamics, and to correlate the location and dynamics of deep fractures with tectonic
structures of all orders.
Modelling of the crystalline basement of Belarus was carried out according to the monograph by
A.Makhnach (А. Махнач, 2001). The monograph presents maps of tectonic structures of Belarus in high detail, as
well as paleotectonic maps of the Eastern European platform for different periods of geological history: the late
MATERIALS OF XII JUNIOR RESEARCHERS’ CONFERENCE 2020
ICT, Electronics, Programming, Geodesy
108
Baikal, Caledonian, Hercynian folds, the beginning of the Devonian period, and pre-Carboniferous time. The book
also provides maps of discontinuous violations. The geographical reference of raster maps in the GIS package
was performed to the geometry of the contour of the administrative borders of Belarus, plotted according to
Openstreetmap data. Vector layers such as "structure-forming Fractures", "postconsolidation Fractures", and
"(paleo)isohypses" (showing the absolute level of the Basement surface) were created for each of the maps. For
the Pripyat trough, dot marks are also applied.
Using the 3D Analyst module of ESRI ArcGIS software, TIN models of the Basement for different epochs
are constructed based on the layer height attribute "(paleo-)isohypses" and the layer height attribute of dot
markers, using fractures as barriers.
For example, let's compare the surface of the crystalline basement in the modern era and in the late
Frasnian time of the Devonian, on the eve of the separation of the Pripyat trough.
a b
a – recent time, b – late Frasnian time of the Devonian
Figure 1. – Model of crystalline basement of Belarus with the designation of the fractal network
Using the Surface Difference tool of the 3D Analyst module, we will find the difference between the
basement surface in Devonian time and in the modern era. (fig. 2).
Figure 2. – Map of the difference in the height of the surface of the crystalline basement
of the territory of Belarus between the late Devonian era and the recent time

MATERIALS OF XII JUNIOR RESEARCHERS’ CONFERENCE 2020
ICT, Electronics, Programming, Geodesy
109
According to the obtained map, it can be concluded that in addition to the Pripyat deflection, the regions
in the Podlasko-Brest and Orsha depressions experienced lowering, while the rest of the country experienced a
slight rise. Possible errors may be related to different details and different authorship of the source data. The
research will continue with the involvement of new sources and new instruments of analysis.
REFERNCES
1. Гарецкий Р.Г., Каратаев Г.И. О постановке геолого-геофизических исследований в геопатогенных зонах
Беларуси./ Р.Г. Гарецкий, Г.И. Каратаев // Лiтасфера. – 2012. - 2 (37). – с. 83-94. (Russian)
2. Матвеев А.В. Геоактивные зоны на территории Беларуси./ А.В. Матвеев // Лiтасфера. – 2015. - 1 (42).
с. 64-70. (Russian)
3. Матвеев А.В., Ковалёв А.А., Нечипоренко Л.А., Шишонок Н.А., Кононович С.И., Чиберкус Ю.Н. Совре-
менные горизонтальные движения земной коры на территории Воложинского и Солигорского геоди-
намических полигонов (Беларусь)./ А.В. Матвеев и др. // Лiтасфера – 2002. – 1(16) (Russian)
4. Махнач А.С., Гарецкий Р.Г., Матвеев А.В. Геология Беларуси. Мн.: Институт геологических наук НАН Бе-
ларуси, 2001. – 815 с. (Russian)
5. Шароглазова Г.А., Товбас С.К., Маркович К.И. Инструментальные исследования современной геодина-
мики в Полоцком регионе./ Г.А. Шароглазова, С.К. Товбас, К.И. Маркович// Вестник Полоцкого государ-
ственного университета. Серия F. Строительство. Прикладные науки. – 2015. - 16. – с. 153-155. (Rus-
sian)
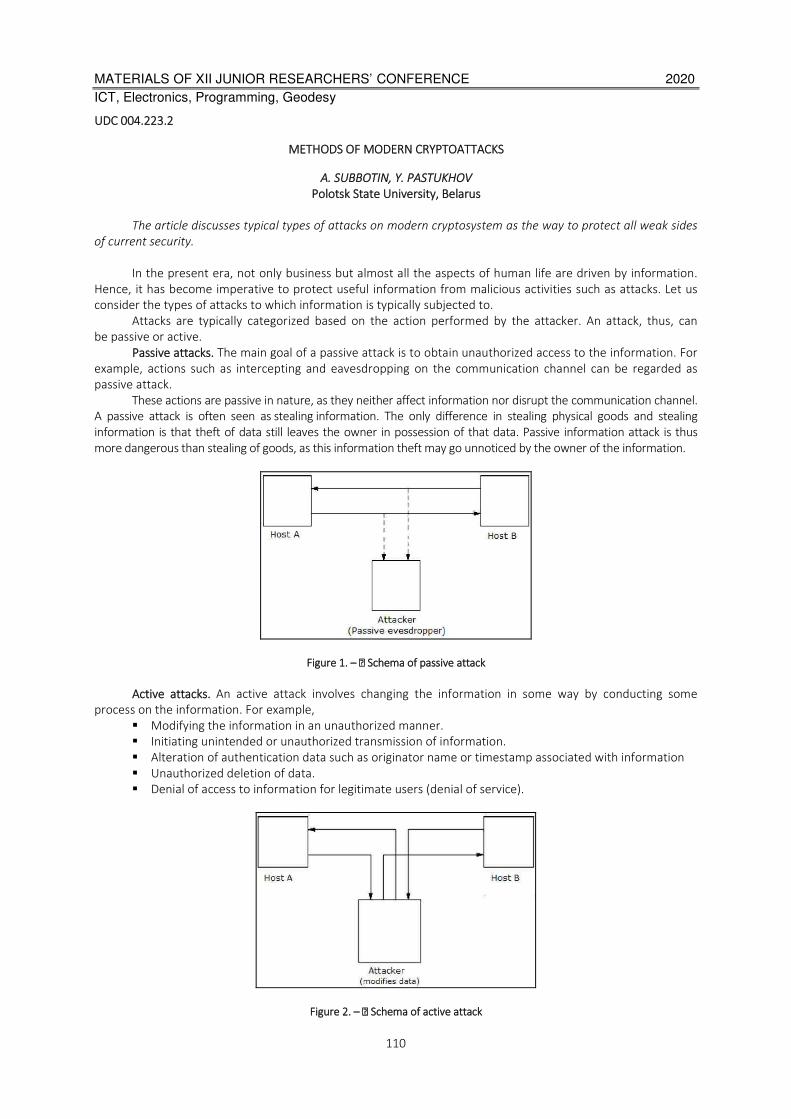
MATERIALS OF XII JUNIOR RESEARCHERS’ CONFERENCE 2020
ICT, Electronics, Programming, Geodesy
110
UDC 004.223.2
METHODS OF MODERN CRYPTOATTACKS
A. SUBBOTIN, Y. PASTUKHOV
Polotsk State University, Belarus
The article discusses typical types of attacks on modern cryptosystem as the way to protect all weak sides
of current security.
In the present era, not only business but almost all the aspects of human life are driven by information.
Hence, it has become imperative to protect useful information from malicious activities such as attacks. Let us
consider the types of attacks to which information is typically subjected to.
Attacks are typically categorized based on the action performed by the attacker. An attack, thus, can
be passive or active.
Passive attacks. The main goal of a passive attack is to obtain unauthorized access to the information. For
example, actions such as intercepting and eavesdropping on the communication channel can be regarded as
passive attack.
These actions are passive in nature, as they neither affect information nor disrupt the communication channel.
A passive attack is often seen as stealing information. The only difference in stealing physical goods and stealing
information is that theft of data still leaves the owner in possession of that data. Passive information attack is thus
more dangerous than stealing of goods, as this information theft may go unnoticed by the owner of the information.
Figure 1. – Schema of passive attack
Active attacks. An active attack involves changing the information in some way by conducting some
process on the information. For example,
Modifying the information in an unauthorized manner.
Initiating unintended or unauthorized transmission of information.
Alteration of authentication data such as originator name or timestamp associated with information
Unauthorized deletion of data.
Denial of access to information for legitimate users (denial of service).
Figure 2. – Schema of active attack
MATERIALS OF XII JUNIOR RESEARCHERS’ CONFERENCE 2020
ICT, Electronics, Programming, Geodesy
111
Cryptography provides many tools and techniques for implementing cryptosystems capable of preventing
most of the attacks described above.
Cryptographic attacks. The basic intention of an attacker is to break a cryptosystem and to find the
plaintext from the ciphertext. To obtain the plaintext, the attacker only needs to find out the secret decryption
key, as the algorithm is already in public domain.
Hence, he applies maximum effort towards finding out the secret key used in the cryptosystem. Once the
attacker is able to determine the key, the attacked system is considered as broken or compromised.
Based on the methodology used, attacks on cryptosystems are categorized as follows −
• Ciphertext Only Attacks (COA) − In this method, the aacker has access to a set of ciphertext(s). He
does not have access to corresponding plaintext. COA is said to be successful when the corresponding plaintext
can be determined from a given set of ciphertext. Occasionally, the encryption key can be determined from this
attack. Modern cryptosystems are guarded against ciphertext-only attacks.
• Known Plaintext Attack (KPA) − In this method, the aacker knows the plaintext for some parts of the
ciphertext. The task is to decrypt the rest of the ciphertext using this information. This may be done by
determining the key or via some other method. The best example of this attack is linear cryptanalysis against
block ciphers.
• Chosen Plaintext Attack (CPA) − In this method, the aacker has the text of his choice encrypted. So he
has the ciphertext-plaintext pair of his choice. This simplifies his task of determining the encryption key. An
example of this attack is differential cryptanalysis applied against block ciphers as well as hash functions. A
popular public key cryptosystem, RSA is also vulnerable to chosen-plaintext attacks.
• Dictionary Attack − This aack has many variants, all of which involve compiling a ‘dictionary’. In
simplest method of this attack, attacker builds a dictionary of ciphertexts and corresponding plaintexts that he
has learnt over a period of time. In future, when an attacker gets the ciphertext, he refers to the dictionary to
find the corresponding plaintext.
• Brute Force Attack (BFA) − In this method, the aacker tries to determine the key by aemp~ng all
possible keys. If the key is 8 bits long, then the number of possible keys is 28 = 256. The attacker knows the
ciphertext and the algorithm, now he attempts all the 256 keys one by one for decryption. The time to complete
the attack would be very high if the key is long.
• Birthday Attack − This aack is a variant of brute-force technique. It is used against the cryptographic
hash function. When students in a class are asked about their birthdays, the answer is one of the possible 365
dates. Let us assume the first student's birthdate is 3rd Aug. Then to find the next student whose birthdate is
3rd Aug, we need to enquire 1.25 365 ≈ 25 students.
Similarly, if the hash function produces 64 bit hash values, the possible hash values are 1.8x10¹⁹. By
repeatedly evaluating the function for different inputs, the same output is expected to be obtained after about
5.1x10⁹ random inputs.
If the attacker is able to find two different inputs that give the same hash value, it is a collision and that
hash function is said to be broken.
• Man in Middle Attack (MIM) − The targets of this aack are mostly public key cryptosystems where
key exchange is involved before communication takes place.
o Host A wants to communicate to host B, hence requests public key of B.
o An attacker intercepts this request and sends his public key instead.
o Thus, whatever host A sends to host B, the attacker is able to read.
o In order to maintain communication, the attacker re-encrypts the data after reading with his public
key and sends to B.
o The attacker sends his public key as A’s public key so that B takes it as if it is taking it from A.
• Side Channel Attack (SCA) − This type of aack is not against any par~cular type of cryptosystem or
algorithm. Instead, it is launched to exploit the weakness in physical implementation of the cryptosystem.
• Timing Attacks − They exploit the fact that different computa~ons take different times to compute on
processor. By measuring such timings, it is be possible to know about a particular computation the processor is
carrying out. For example, if the encryption takes a longer time, it indicates that the secret key is long.
• Power Analysis Attacks − These aacks are similar to ~ming aacks except that the amount of power
consumption is used to obtain information about the nature of the underlying computations.
• Fault analysis Attacks − In these aacks, errors are induced in the cryptosystem and the attacker
studies the resulting output for useful information.

MATERIALS OF XII JUNIOR RESEARCHERS’ CONFERENCE 2020
ICT, Electronics, Programming, Geodesy
112
Conclusion. The attacks on cryptosystems described here are highly academic, as majority of them come
from the academic community. In fact, many academic attacks involve quite unrealistic assumptions about
environment as well as the capabilities of the attacker. For example, in the chosen-ciphertext attack, the
attacker requires an impractical number of deliberately chosen plaintext-ciphertext pairs. It may not be practical
altogether.
Nonetheless, the fact that any attack exists should be a cause of concern, particularly if the attack
technique has some potential for improvement.
REFERNCES
1. Арванова С.М., Дыгов М.М., Методы современных криптоатак. // Научный альманах. 2015. 7 (9).
2. Материал из www.tutorialspoint.com. Attacks on cryptosystems [Электронный ресурс]. Режим доступа:
https://www.tutorialspoint.com/cryptography/attacks_on_cryptosystems.htm. Дата доступа: 20.09.2019.

MATERIALS OF XII JUNIOR RESEARCHERS’ CONFERENCE 2020
ICT, Electronics, Programming, Geodesy
113
UDC 528.46:528.88
THE USE OF REMOTE SENSING DATA IN THE DESIGN
OF DISTRICT BOUNDARIES
M. MAKAROVA
Polotsk State University, Belarus
The article is devoted to the planning and carrying out of cartographic works on the normalization of the
area boundaries of the Republic of Belarus using medium and high resolution remote sensing data of Earth. It
explains the introduction and use of actual satellite images as additional information for detection and design of
accounting objects in order to improve the efficiency of work.
The spatial or territorial organization of the state is a dynamic entity. Processing actual location bounda-
ries in some areas is more intensive, than in others. Therefore, it is important to establish a mechanism for clari-
fying the boundaries, dimensions, functions and competencies in the management structure of the administra-
tive-territorial units. Shortcomings in the location of the borders of administrative-territorial units of the Repub-
lic of Belarus, including districts and regions, are a deterrent to improving the efficiency of state regulation and
management in the field of land use and protection of lands.
Normalization and establishment of administrative-territorial units boundaries (ATU) started in Belarus in
2015. Nowadays the work has been finished in Minsk, Brest, and Grodno regions. The main goal of normalization
and establishing the boundaries of the Republic of Belarus ATU is ensuring the efficient organization of state
regulation and control, including the use and land conservation [1].
This work is carried out by the Republican Unitary Enterprise Belgiprozem Design Institute and its subsidi-
aries, in cooperation with land management agencies of local executive committees, and other organizations
within in The State Committee on Property of the Republic of Belarus [2].
The main objectives of land management in order to normalize and establish the boundaries of districts
(regions) under consideration are as follows:
− elimination of defects in the location of the border, including by combining physical (actual land use)
and legal borders;
− uniform presentation of the normalized border on all planning and cartographic materials, as well as
in the Land Information System (LIS) of the Republic of Belarus (LIS RB);
− preparation of Materials (as the main land management documentation) to establish the boundaries
of regions and their constituent areas;
− the use of the above Materials in the prescribed manner when registering districts and regions in the
ATU and TU registry and making changes to the credentials of the land cadastre of the Republic of Belarus [2].
The main task at the stage of laboratory works is to obtain high-quality cartographic material. The base
scale is 1:10 000 (for activities on normalization and establishment of the boundaries of ATU, predetermining
their precision and technology) [3]. Overview maps of village councils and district boundaries are in a scale of
1:50 000, area - 1: 200 000 [4].
To perform works on establishment of the boundaries the following cartographic materials are used in
the Republic of Belarus:
− Map of administrative-territorial division of the Republic of Belarus;
− District land use maps of scale 1: 50 000;
− Common Registry data (coordinates of turning points of boundaries, cadastral maps duty);
− general plans of settlements;
− forest management plans;
− land management plans with the boundaries of rural settlements;
− last updates of topographical maps, plans and photoplans scale of 1: 50,000, 1: 25,000, 1: 10,000, 1:
5000-1: 500 [4].
The collected documents and materials are examined and evaluated in terms of accuracy and complete-
ness, suitability for use.
An example of designing a normalized section of a district border is shown in Figure 1. It shows that it is
advisable to draw a new border along the border of land types, for which it is sufficient to use orthophoto in
office conditions without the need for fields surveys of the presented plot.
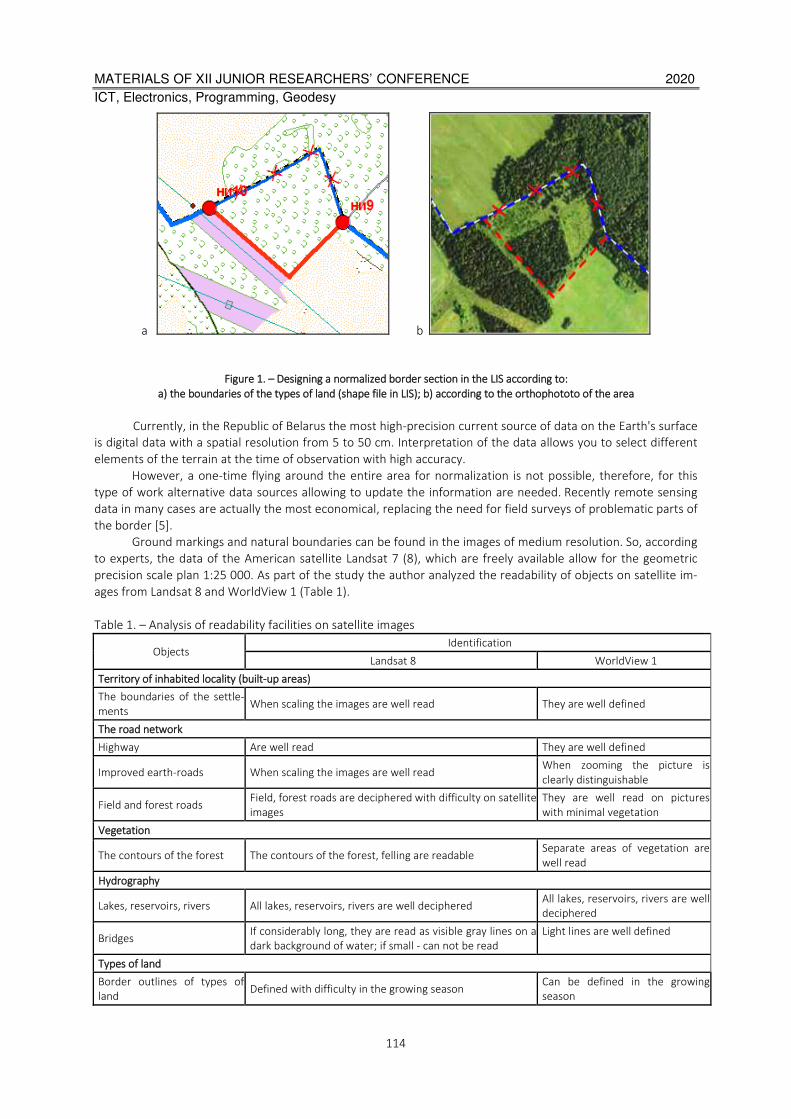
MATERIALS OF XII JUNIOR RESEARCHERS’ CONFERENCE 2020
ICT, Electronics, Programming, Geodesy
114
а b
Figure 1. – Designing a normalized border section in the LIS according to:
a) the boundaries of the types of land (shape file in LIS); b) according to the orthophototo of the area
Currently, in the Republic of Belarus the most high-precision current source of data on the Earth's surface
is digital data with a spatial resolution from 5 to 50 cm. Interpretation of the data allows you to select different
elements of the terrain at the time of observation with high accuracy.
However, a one-time flying around the entire area for normalization is not possible, therefore, for this
type of work alternative data sources allowing to update the information are needed. Recently remote sensing
data in many cases are actually the most economical, replacing the need for field surveys of problematic parts of
the border [5].
Ground markings and natural boundaries can be found in the images of medium resolution. So, according
to experts, the data of the American satellite Landsat 7 (8), which are freely available allow for the geometric
precision scale plan 1:25 000. As part of the study the author analyzed the readability of objects on satellite im-
ages from Landsat 8 and WorldView 1 (Table 1).
Table 1. – Analysis of readability facilities on satellite images
Objects Identification
Landsat 8 WorldView 1
Territory of inhabited locality (built-up areas)
The boundaries of the settle-
ments When scaling the images are well read They are well defined
The road network
Highway Are well read They are well defined
Improved earth-roads When scaling the images are well read When zooming the picture is
clearly distinguishable
Field and forest roads Field, forest roads are deciphered with difficulty on satellite
images
They are well read on pictures
with minimal vegetation
Vegetation
The contours of the forest The contours of the forest, felling are readable Separate areas of vegetation are
well read
Hydrography
Lakes, reservoirs, rivers All lakes, reservoirs, rivers are well deciphered All lakes, reservoirs, rivers are well
deciphered
Bridges If considerably long, they are read as visible gray lines on a
dark background of water; if small - can not be read
Light lines are well defined
Types of land
Border outlines of types of
land Defined with difficulty in the growing season
Can be defined in the growing
season

MATERIALS OF XII JUNIOR RESEARCHERS’ CONFERENCE 2020
ICT, Electronics, Programming, Geodesy
115
Open access to the images of the earth surface in various resolution and ranges from the Ikonos satellite,
WorldView-2, QuickBird, SPOT, IRS, Landsat determines the opportunities to use them. For the application of
satellite imagery provided by free services Yandex, Google Earth, Google Maps, Bing Maps , etc. specialized
software SAS.Planeta is used.
The use of remote sensing data requires evaluation of the following factors:
− Access to the territory of satellite resources (including the possibility of obtaining data on a given
date);
− Possibility of identifying natural boundaries and recognition of image borders in an area;
− The accuracy of the planned position coordinated points;
− Determination of the boundaries in the desired coordinate system;
− Time and labor for the definition and specification of borders [3].
The study of satellite images of varying resolution, obtained from imaging systems, allows us to conclude
that a significant portion of linear and other facilities is needed to determine the location and boundaries of de-
sign, easily distinguishable in the photographs. The accuracy of determining the coordinates of these data can
not meet the requirements of 1: 10 000. However, they can be used to update the existing data with high reso-
lution for sparsely populated areas, or areas, where intensity of economic activity varies for the early detection
of these changes [5].
REFERENCES
1. Помелов, А.С. Структурирование земельных ресурсов и регулирование землепользования в Беларуси /
А.С. Помелов. – Минск: РУП «БелНИЦзем», 2013. – 528 с
2. Помелов, А. О нормализации границ административно-территориальных единиц Республики Бела-
русь / А. Помелов, В. Грищенко, А. Коробкин // Земля Беларуси. – 2014. – 2. – С. 18-22
3. Земельно-информационная система Республики Беларусь. Порядок создания: ТКП 055-2006.-Введ.
01.03.2007.-Минск: Гос. комитет по имуществу Респ. Беларусь, 2006.-111 с
4. Методические указания по нормализации и установлению границ административно-территориальных
единиц Республики Беларусь, утв. приказом респ. унитар. предп. «Проект. ин-т Белгипрозем» от
11.04.2016 20. – Минск: УП «Проектный институт Белгипрозем». – 2016. – 31 с
5. Макарова, М. Геоинформационное обеспечение нормализации и установления границ районов Рес-
публики Беларусь / М. Макарова, А. Помелов // Земля Беларуси. – 2016. – 3. – С. 35-39
MATERIALS OF XII JUNIOR RESEARCHERS’ CONFERENCE 2020
ICT, Electronics, Programming, Geodesy
116
UDC 004.02
DESIGNING OF INTERNET SHOP OF TELEGRAM
M. TAUSTY, T. RUDKOVA
Polotsk State University, Belarus
The article presents a statement about the need to create a web application that can help in acquiring
Telegram channels of various contents. The basic requirements for designing the functionality and interface of a
web resource are discussed.
Currently, online stores are convenient resources for users, because they allow you to quickly and easily
order goods and services from personal computers without leaving your home. Therefore, we can conclude that
they are also beneficial for store owners.
After analyzing the current trends in the modern market, we can conclude that the development of an
online store that can effectively sell Telegram channels is of immediate interest, because at the moment there
are no full analogues of such a resource. Thus, the unique character in this segment is demonstrated.
Since the online store functions as a display window representing available goods and services, it seems
advisable to develop a web application that will allow you to place products, grouping them by type and price.
Therefore, basing on the analysis of the subject area, the main requirements for the development of the
Telegram channels online store were identified:
- viewing news on the main page regarding the domain of the site;
- viewing reviews in the online store;
- viewing video content on the main page of the site;
- selecting channels by category;
- channel filtering;
- purchase of channels;
- contacting the site administration through the "About Us" section;
- selection of channels on the topic;
- search for channels on all pages of the site;
- site administration;
- ability to update news content on the main page;
- change of the catalog of goods;
- animated design;
- breadcrumbs.
The functional configuration of the resource being developed can be represented as a set of subsystems:
- viewing, editing and creating a news subsystem (allows you to view the latest news on various topics on
the online store home page: five news pages can be placed on the online store home page; the online store ad-
ministrator is the only person who can edit and create news) ;
- viewing, editing and creating feedback in the subsystem of the online store (allows you to scan reviews
on the main page of the online store: you can place seven reviews on the main page; the review includes a text,
a photo of the client and a link to the social network where it was made);
- viewing, editing and creating a subsystem of categories (the user can choose a category at his discretion;
the administrator can edit the categories; each category has a name and its own unique URL);
- subsystem of order options (each user can buy goods through the online store, just click the “BUY” but-
ton under the goods and specify your personal data).
The process of developing an online store interface begins with a home page on which the following ele-
ments should be placed:
- a drop-down menu that allows users to select a catalog of categories of Telegram channels;
- a news carousel, which allows users to view all the news regardless of the user, the change of news oc-
curs automatically, it is also possible to change the news using a computer mouse;
- a search panel is a search for a channel by its name (a message appears with possible hints when search-
ing);
- a feedback carousel, which allows users to view the opinions of customers who have already used the
services of the site (automatic feedback moves automatically, there is also a feedback function).

MATERIALS OF XII JUNIOR RESEARCHERS’ CONFERENCE 2020
ICT, Electronics, Programming, Geodesy
117
The following items should be placed on the channel list page:
- a drop-down menu that allows you to select sorting;
- a button "Sort", which allows you to sort;
- a search panel is a search for a channel by its name and category (when searching, a hint appears with
possible hints);
- a “BUY” button, which allows you to make purchases, when you click, a page with a form appears;
- an element "breadcrumbs", allowing you to go to the previous page;
- a Telegram channel logo;
- a logo of the online store, when users click on it, they are redirected to the home page of the site;
- a price of the Telegram channel.
On the Telegram-bot page, all standard elements of the Telegram messenger will be placed.
As can be seen from the above, the presented page templates demonstrate the process of developing the
basic functionalities of this web resource. An online channel store will not only be able to replace the search for
channels on questionable online forums or websites, but also provide a transparent and secure purchase.
REFERENCES
1. Wikipedia. [Электронный ресурс] // – Режим доступа https://ru.wikipedia.org/wiki/ telegram. Дата обра-
щения 18.09.2018.
2. ТСТ [Электронный ресурс] // – Режим доступа: https://te-st.ru/2016/06/08/chatbots/. – Дата доступа:
20.09.2018..
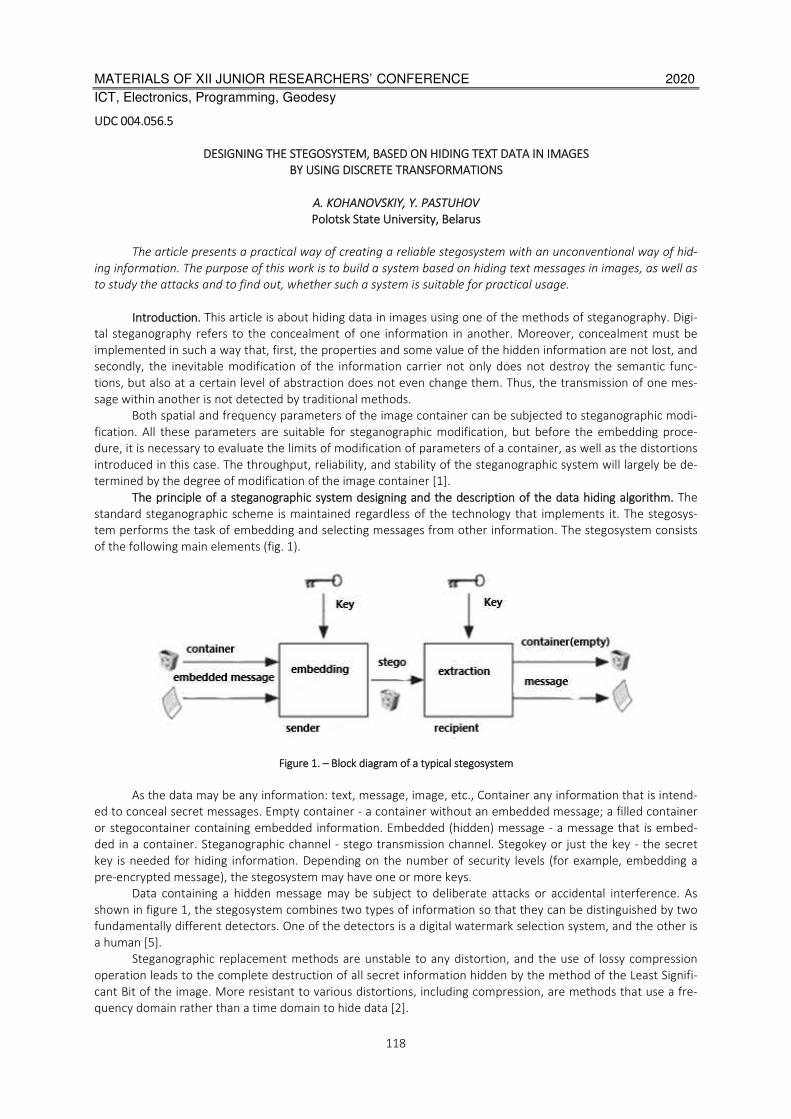
MATERIALS OF XII JUNIOR RESEARCHERS’ CONFERENCE 2020
ICT, Electronics, Programming, Geodesy
118
UDC 004.056.5
DESIGNING THE STEGOSYSTEM, BASED ON HIDING TEXT DATA IN IMAGES
BY USING DISCRETE TRANSFORMATIONS
A. KOHANOVSKIY, Y. PASTUHOV
Polotsk State University, Belarus
The article presents a practical way of creating a reliable stegosystem with an unconventional way of hid-
ing information. The purpose of this work is to build a system based on hiding text messages in images, as well as
to study the attacks and to find out, whether such a system is suitable for practical usage.
Introduction. This article is about hiding data in images using one of the methods of steganography. Digi-
tal steganography refers to the concealment of one information in another. Moreover, concealment must be
implemented in such a way that, first, the properties and some value of the hidden information are not lost, and
secondly, the inevitable modification of the information carrier not only does not destroy the semantic func-
tions, but also at a certain level of abstraction does not even change them. Thus, the transmission of one mes-
sage within another is not detected by traditional methods.
Both spatial and frequency parameters of the image container can be subjected to steganographic modi-
fication. All these parameters are suitable for steganographic modification, but before the embedding proce-
dure, it is necessary to evaluate the limits of modification of parameters of a container, as well as the distortions
introduced in this case. The throughput, reliability, and stability of the steganographic system will largely be de-
termined by the degree of modification of the image container [1].
The principle of a steganographic system designing and the description of the data hiding algorithm. The
standard steganographic scheme is maintained regardless of the technology that implements it. The stegosys-
tem performs the task of embedding and selecting messages from other information. The stegosystem consists
of the following main elements (fig. 1).
Figure 1. – Block diagram of a typical stegosystem
As the data may be any information: text, message, image, etc., Container any information that is intend-
ed to conceal secret messages. Empty container - a container without an embedded message; a filled container
or stegocontainer containing embedded information. Embedded (hidden) message - a message that is embed-
ded in a container. Steganographic channel - stego transmission channel. Stegokey or just the key - the secret
key is needed for hiding information. Depending on the number of security levels (for example, embedding a
pre-encrypted message), the stegosystem may have one or more keys.
Data containing a hidden message may be subject to deliberate attacks or accidental interference. As
shown in figure 1, the stegosystem combines two types of information so that they can be distinguished by two
fundamentally different detectors. One of the detectors is a digital watermark selection system, and the other is
a human [5].
Steganographic replacement methods are unstable to any distortion, and the use of lossy compression
operation leads to the complete destruction of all secret information hidden by the method of the Least Signifi-
cant Bit of the image. More resistant to various distortions, including compression, are methods that use a fre-
quency domain rather than a time domain to hide data [2].

MATERIALS OF XII JUNIOR RESEARCHERS’ CONFERENCE 2020
ICT, Electronics, Programming, Geodesy
119
The vast majority of computer steganography methods are based on two key principles:
− files that do not require absolute accuracy (in this case, image files) can be modified without losing
their functionality;
− the human senses are unable to reliably distinguish minor changes in files modified in this way, and /
or there is no special tool that would be able to perform this task.
The basic approaches to implementing computer steganography methods within an information envi-
ronment are based on selecting insignificant fragments of this environment and replacing existing information
with information that needs to be hidden.
Considered in this paper, the Koch-Zhao algorithm for embedding information uses the frequency domain
of the container and consists in the relative replacement of the values of the coefficients of the discrete cosine
transformation (DCT) [3].
The image is divided into 8×8 blocks (in our case, 2×2, 3×3, and 4×4 blocks) of pixels, and a Discrete Co-
sine Transform is applied to each block. Each block is suitable for recording one bit of information.
The hiding algorithm will be as follows:
iterate the image with a double array in 8 steps;
at each iteration, we create a temporary array of 8×8 pixels, each element of which will be a set of
three pixel colors;
we apply a DCT to this array, and get an array of coefficients of size 8×8;
select 2 coefficients and calculate their difference modulo;
if the difference is less than or equal to 25, then assign the first coefficient a positive value of the sec-
ond + constant, or the same, but with a minus sign (this is called bit transfer);
if the difference is less than or equal to -25, then we perform the same actions only for the second
coefficient;
then the reverse DCT is applied to translate our coefficients back into the spatial domain;
then copy the color values to the image.
Advantages of the method:
resistance to JPEG compression with a low compression ratio.
Disadvantages:
noticeable visual distortion of the container image with a large threshold value of the difference be-
tween the DCT coefficients of the blocks;
small message size than can be embedded.
Estimation of the implemented system stability. Each image has unique properties that can be used as a
basis for dividing them into classes.
1. Images with a small number of colors (4-16) and large areas filled with a single color.
2. Computer-generated images with smooth color transitions.
3. Photorealistic images.
4. Photorealistic images with business graphics overlay.
5. Map images.
6. Space images.
To ensure that data is hidden in image containers, you must select images that contain areas with sharp
color transitions and object borders, since they can hide small changes in the intensity of the color components
of the container pixel in relation to neighboring pixels (fig. 2). Modified pixels in the drawing are grayed out. You
can see that even a slight change in the intensity of some color component of individual pixels, in areas filled
with a single color (fig. 2B), increases the possibility of visual or computer detection of the fact of steganographic
data hiding.
It is advisable to analyze the contents of image containers using a mathematical transformation that al-
lows you to select its frequency parameters and evaluate the contribution of individual frequencies to the image
composition. One of these transformations is the discrete cosine transform [3], which is applied to images by
means of n×n pixel windows. Discrete cosine transformation allows you to get information about sharp and
smooth borders of image colors, areas filled with a single color or with a gradient color change, etc.
It is advisable to assess the suitability of the image for steganographic modification in two stages.
At the first stage, images are divided into classes according to the relative weight of their spatial frequen-
cies. Positive results were obtained using spectral classification of images, which allows them to be divided into 8
classes [4]. Classes 1 through 3 describe images with the highest relative weight of low frequencies; classes 4
through 7 differentiate images by spectral components concentrated in areas close to the low-frequency and /
or high-frequency ranges; the eighth class separates images that have a uniform spectrum within the entire con-
sidered range.
MATERIALS OF XII JUNIOR RESEARCHERS’ CONFERENCE 2020
ICT, Electronics, Programming, Geodesy
120
(a) the region of sharp transition of colors,
(b) area filled with a single color
Figure 2. – Color planes of modified image areas
In the second stage, the throughput of the container image is evaluated by excluding areas that are not
suitable for modification, such as those filled with a single color or a gradient color change. It is possible to de-
tect such regions in an image when analyzing its spectral composition (the presence of borders in the image
leads to an increase in the contribution of medium and high frequencies), and when evaluating changes in the
intensity of a pixel in relation to neighboring pixels.
In the Koch-Zhao method, it is undesirable to use images with a small number of colors and large areas
filled with a single color (in particular, white) to ensure that data is hidden in image containers. Since in this case,
after encryption, the image will clearly show the fact of hiding information.
The following types of attacks are distinguished for the Koch-Zhao method:
1. Attacks against the embedded message, directed to removal of or damage to the integrated infor-
mation through the manipulation of the filled container. The attack methods included in this category are not
aimed at evaluating and highlighting the message. Examples of such attacks in this paper are image compression.
2. The attack against the embedded message is directed to the use of filters. In this case, the message
remains in the image, but the ability to receive it is lost. This category includes attacks such as attacks using ef-
fects in various photo editors.
3. The attack against the embedded message is directed to the use of geometric transformations. This
category of attacks is related to truncation and changing the dimension of our image.
4. An attack aimed at changing the brightness and contrast of an image. This type of attack is associated
with a significant change in the image.
Conclusion. Research in the field of steganography is a very promising area of information protection,
since in the modern world the task of transmitting secret information is on a par with hidden communication,
i.e. hiding the fact of transmitting messages. Therefore, it is necessary to continue research in this area to find
new, effective, methods or improve existing ones. In this paper, we considered the method of embedding infor-
mation in images. The most promising method, however, requires improvement in terms of bandwidth, and the
probability of correct extraction of embedded bits of information. The efficiency of using the Discrete Cosine
Transformation in this method for image compression is explained by the fact that it well models the image pro-
cessing process in the human vision system (HVS), separates the "significant" details from the "insignificant"
ones. This means that it is more appropriate to use it in the case of an active violator. The software product is
implemented and ready for use with the possibility of further development.
REFERENCES
1. Садов, В. С. Компьютерная стеганография / В. С. Садов. – М: МГВРК, 2012. – 289 с.
2. Грибунин, В. Г. Цифровая стеганография / В. Г. Грибунин. – М.: СОЛОН-Пресс, 2002. – 272 с.

MATERIALS OF XII JUNIOR RESEARCHERS’ CONFERENCE 2020
ICT, Electronics, Programming, Geodesy
121
3. Тихоненко, С.Г. Формирование критерия качества фильтрованных изображений / С. Г. Тихоненко //
Тезисы докладов IX республиканской научной конференции студентов и аспирантов РБ, Гродно, 26-27
мая 2004 г. В 8-ми частях / Гродненский гос. университет; редкол.: А. И. Жук. – Гродно, 2004. – Ч.6. – С.
241– 243. 40.
4. Чернявский, А.Ф. Оценка информационных потерь при фильтрации изображений / А.Ф. Чернявский,
С.Г. Тихоненко, В.С. Садов // Информатика. – 2005. – 3(7). – С. 52–59.
5. Matsui K., Tanaka K., and Nakamura Y. Digital signature on a facsimile document by recursive MH coding
/ Symposium On Cryptography and In-formation Security, 1989.
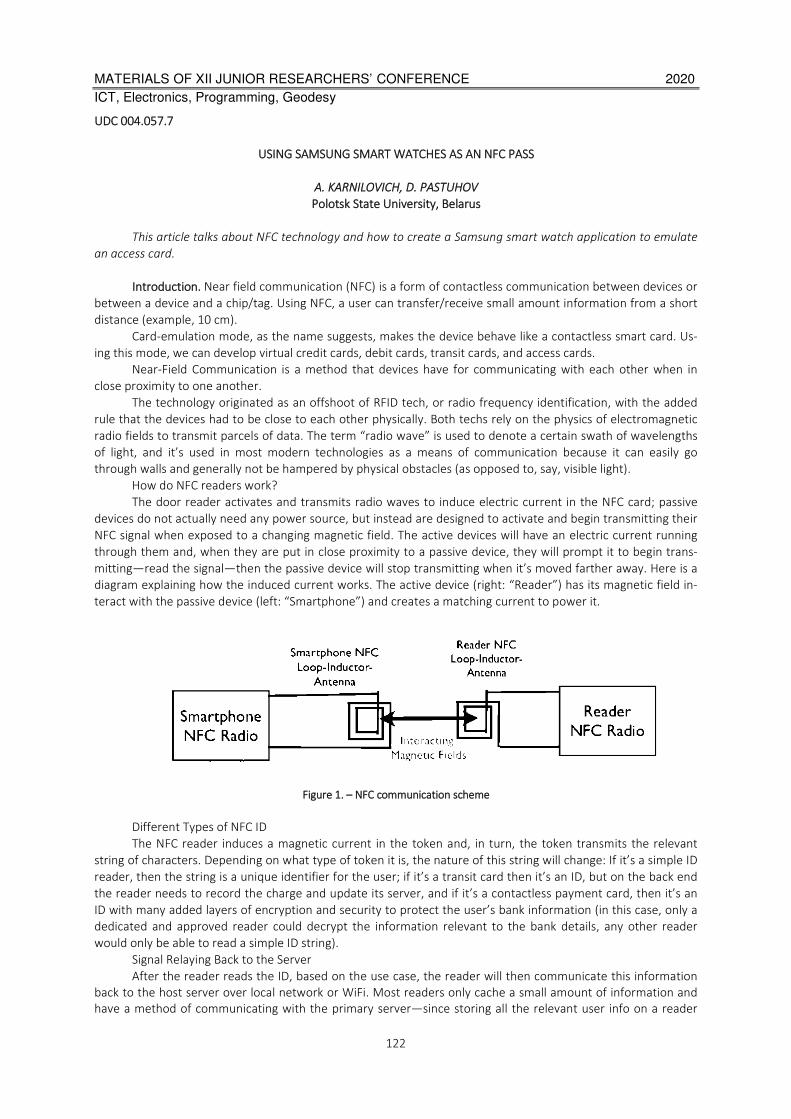
MATERIALS OF XII JUNIOR RESEARCHERS’ CONFERENCE 2020
ICT, Electronics, Programming, Geodesy
122
UDC 004.057.7
USING SAMSUNG SMART WATCHES AS AN NFC PASS
A. KARNILOVICH, D. PASTUHOV
Polotsk State University, Belarus
This article talks about NFC technology and how to create a Samsung smart watch application to emulate
an access card.
Introduction. Near field communication (NFC) is a form of contactless communication between devices or
between a device and a chip/tag. Using NFC, a user can transfer/receive small amount information from a short
distance (example, 10 cm).
Card-emulation mode, as the name suggests, makes the device behave like a contactless smart card. Us-
ing this mode, we can develop virtual credit cards, debit cards, transit cards, and access cards.
Near-Field Communication is a method that devices have for communicating with each other when in
close proximity to one another.
The technology originated as an offshoot of RFID tech, or radio frequency identification, with the added
rule that the devices had to be close to each other physically. Both techs rely on the physics of electromagnetic
radio fields to transmit parcels of data. The term “radio wave” is used to denote a certain swath of wavelengths
of light, and it’s used in most modern technologies as a means of communication because it can easily go
through walls and generally not be hampered by physical obstacles (as opposed to, say, visible light).
How do NFC readers work?
The door reader activates and transmits radio waves to induce electric current in the NFC card; passive
devices do not actually need any power source, but instead are designed to activate and begin transmitting their
NFC signal when exposed to a changing magnetic field. The active devices will have an electric current running
through them and, when they are put in close proximity to a passive device, they will prompt it to begin trans-
mitting—read the signal—then the passive device will stop transmitting when it’s moved farther away. Here is a
diagram explaining how the induced current works. The active device (right: “Reader”) has its magnetic field in-
teract with the passive device (left: “Smartphone”) and creates a matching current to power it.
Figure 1. – NFC communication scheme
Different Types of NFC ID
The NFC reader induces a magnetic current in the token and, in turn, the token transmits the relevant
string of characters. Depending on what type of token it is, the nature of this string will change: If it’s a simple ID
reader, then the string is a unique identifier for the user; if it’s a transit card then it’s an ID, but on the back end
the reader needs to record the charge and update its server, and if it’s a contactless payment card, then it’s an
ID with many added layers of encryption and security to protect the user’s bank information (in this case, only a
dedicated and approved reader could decrypt the information relevant to the bank details, any other reader
would only be able to read a simple ID string).
Signal Relaying Back to the Server
After the reader reads the ID, based on the use case, the reader will then communicate this information
back to the host server over local network or WiFi. Most readers only cache a small amount of information and
have a method of communicating with the primary server—since storing all the relevant user info on a reader

MATERIALS OF XII JUNIOR RESEARCHERS’ CONFERENCE 2020
ICT, Electronics, Programming, Geodesy
123
would be impractical, insecure, and would result in too bulky a product. The server will then authenticate the
request and prompt the reader to perform some relevant action, be it unlocking a door, communicating with a
bank server, unlocking a subway turnstile, etc. This all happens behind-the-scenes and instantaneously (depend-
ing on the strength of the WiFi signal) guarantees the end user a seamless experience.
Main section. All current models of Samsung smart watches work on the Tizen operating system. Tizen is
a user-interactive and service-oriented open source project that allows creating feature-rich applications for
multiple device categories.
The Tizen Near Field Communication service enables information exchange between NFC-enabled devic-
es (called "peers") or tags. The NFC-enabled devices can share contacts, photos, and videos, and can act as smart
cards. You can use an NFC-enabled device to send NDEF messages to NFC tags to implement a variety of activi-
ties, such as paying the grocery bill or downloading a coupon. With application controls, you can launch NFC
applications when NFC-related operations occur.
The main features of the NFC API include:
− NFC device management: you can manage NFC connectivity by enabling or disabling the NFC service.
− NFC tag and peer detection: you can receive notifications when an NFC tag or peer device has been
detected.
− NDEF message manipulation: you can handle NDEF messages by first creating NDEF records, and then
adding the records to an NDEF message.
− NDEF data exchange: you can exchange NDEF data between tags and peers.
− NFC card emulation: you can enable NFC card emulation and monitor the secure element transaction
carried out by the device.
− NFC host-based card emulation (HCE): you can handle HCE events and transactions.
An NFC tag is a chip, which can securely store personal information, such as debit card numbers or con-
tact details. The methods of the NFCTag interface (in mobile and wearable applications) are used to access an
NFC tag for reading or writing information. Tizen supports the following NFC tag types: GENERIC_TARGET,
ISO14443_A, ISO14443_4A, ISO14443_3A, MIFARE_MINI, MIFARE_1K, MIFARE_4K, MIFARE_ULTRA,
MIFARE_DESFIRE, ISO14443_B, ISO14443_4B, ISO14443_BPRIME, FELICA, JEWEL and ISO15693.
The NFC forum defines the NFC data exchange format (NDEF) for encapsulating the data exchanged be-
tween two NFC-enabled devices or an NFC-enabled device and an NFC tag. An NDEF message can store data in
various formats, such as text, Multipurpose Internet Mail Extension (MIME) type object, or ultra-short RagTime
Document (RTD). The NFC tags use NDEF for exchanging messages. Tizen provides the NDEFMessage interface
(in mobile and wearable applications) to define an NDEF message.
An NDEF message is composed of multiple records. An NDEF record is created using the NDEFRecord in-
terface and is identified by record type, ID, and payload.
A record in an NDEF message can be created by using the following payload types:
− Text. The NDEF record content is created using text format. The NDEFRecordText interface is used to
create the text format payload using the text, languageCode, and encoding attributes.
− URI. The NDEF record content is created using a URI. The NDEFRecordURI interface is used to create
the URI type payload using the uri attribute.
− Media. The NDEF record content is created using a media format. The NDEFRecordMedia interface is
used to create the media format payload using the mimeType attribute.
Managing NFC Connectivity
To use the Application and NFC APIs, the application has to request permission by adding the privileges to
the config.xml file. To use NFC, retrieve the default NFC adapter using the getDefaultAdapter() method of the
NFCAdapter interface.
To enable or disable the NFC service:
1. To get the default NFC adapter, use the getDefaultAdapter() method and prepare an ApplicationCon-
trol object to request the NFC switching operation.
2. Define the event listener for the launchAppControl() method.
3. Define the event handler for an application control, which implements the ApplicationCon-
trolDataArrayReplyCallback interface.
4. If necessary, request launching the NFC Settings with nfcSwitchAppControl as a parameter.
Using NFC Card Emulation
You can enable NFC card emulation and monitor the secure element transaction-taking place using the
NFCAdapter interface. The device carries out the secure element transaction. The Tizen application can detect

MATERIALS OF XII JUNIOR RESEARCHERS’ CONFERENCE 2020
ICT, Electronics, Programming, Geodesy
124
the transaction, but does not take part in it. Interpreting the transaction data requires knowledge about the data
protocol the transaction uses. With the required knowledge, the application can detect whether the transaction
was successful.
To enable or disable the NFC card emulation and detect secure element transactions:
1. Declare the required variables and obtain the NFCAdapter object using the getDefaultAdapter()
method of the NFCManager interface.
2. To enable NFC card emulation, change the value of the cardEmulationMode attribute to 'AL-
WAYS_ON'.
3. To be notified when the type of an active NFC secure element changes, use the addActiveSecureEl-
ementChangeListener() method of the NFCAdapter interface.
4. To be notified when a NFC secure element transaction data is exchanged, use the addTransaction-
EventListener() method of the NFCAdapter interface.
5. Remove the registered listeners when they are no longer necessary and disable NFC card emulation
Using NFC Host-based Card Emulation
You can handle HCE (host-based card emulation) events and transactions taking place using the
NFCAdapter interface. HCE is an on-device technology that permits a device to perform card emulation on an
NFC-enabled device without relying on access to a secure element. The transaction data is routed to the host
application directly, instead of routing to a secure element. The Tizen application can detect the transaction and
can take part in it.
To detect NFC HCE events and manage AID (Application ID):
1. Specify an AID value for receiving HCE transaction events. To tell the platform which AID groups are
requested by the application, a metadata element must be included in the config.xml file.
2. Declare the required variables and obtain the NFCAdapter object using the getDefaultAdapter()
method of the NFCManager.
3. To detect the HCE event, use the addHCEEventListener() method of the NFCAdapter interface to regis-
ter a listener. Use the sendHostAPDUResponse() method of the NFCAdapter interface to send a host APDU re-
sponse to a contactless front-end. (APDU - Application Protocol Data Unit - is defined in the ISO/IEC 7816-4 spec-
ification.)
4. To register an AID for a specific category and secure element type, use the registerAID() method of
the NFCAdapter interface.
5. To retrieve the registered AIDs for a specific category and secure element type, use the getAIDsFor-
Category() method of the NFCAdapter interface.
6. Remove the registered listeners when they are no longer necessary, and disable NFC card emulation
Conclusion. Using a smart watch as a pass can be very convenient. Implementing an appli-
cation that allows you to emulate an access card is not so difficult if the pass used only works
on ID transfer. If the pass uses a secure transaction, then for its emulation it is necessary to
know the data transfer protocol.
REFERENCES
1. How to Use an NFC Reader for Access Control [Electronic resource]. –Mode of access:
https://www.getkisi.com/lessons/how-to-use-an-nfc-reader/. –Date of access: 4.03.2020.
2. Tizen Web Guides [Electronic resource]. –Mode of access:
https://developer.tizen.org/development/guides/web-application/. –Date of access: 4.03.2020.
3. How to Copy or Clone Access Cards and Key Fobs [Electronic resource]. – Mode of access:
https://www.getkisi.com/blog/how-to-copy-access-cards-and-keyfobs/. – Date of access: 4.03.2020.

MATERIALS OF XII JUNIOR RESEARCHERS’ CONFERENCE 2020
ICT, Electronics, Programming, Geodesy
125
UDC 004.055
DESIGNING INTERFACES OF THE SPORT CLUB SITE
K. BARYSIONAK, A. OSKIN
Polotsk State University, Belarus
The article presents a practical way to create an interface for a sports club website. The main goals of the
site, the tasks of the web service, and the basics of building an interactive interface prototype were set.
Introduction. Website should represent sports club on the Internet, maintain its positive and modern
reputation, introduce visitors to the services of the club, provide convenient and user-friendly interface to
facilitate the process of familiarizing with the services and further interaction with the site.
The purpose of the site is to introduce visitors to the club, its activities, services, prices, as well as to help
make the first steps towards a healthy lifestyle in general, to provide information on training methods and
nutrition. Also, the main goals include:
− attracting an audience to the club;
− saving the club's clients and administration time;
− providing current information on training and nutrition.
The objectives of the web site should be oriented towards achieving the set goals. The objectives of this
project are:
1. registration for training online;
2. filling in the data using forms;
3. communication with the user via a feedback form;
4. publication of current information on training and nutrition;
5. correct and fast search for necessary information;
6. convenient functionality and visually appealing content.
Creation of an interactive interface prototype. The prototype is a visual structure of the site, which gives
an idea of what a web resource will look like [1]. It represents the structure of the future site as well as its
individual pages outside the design elements, colors, images and branding. The site prototype is made with the
help of modular grid and Axure RP 8 program, which allows you to create interactive prototypes with the ability
to view the result in a browser for visualization [2].
At the top of each prototype page is a static unit with a logo and a menu. At the bottom of the site is a
block with information about the club, contact details, club addresses and links to social networks.
On the screen shown on picture 1, at the top there is a site menu with links to the home page and
registration, or a link to sign in to your personal account, which is accompanied by an icon.
Below is a block with information about the goals of the site. This location will help to ensure that the
user who came to the site, will immediately pay attention to this block. In order to attract attention, it contains
pictures of medium size, which fit into the overall design. Below is a block with the features of training, also
accompanied by images.
Right after them you can see a list of what our club specializes in and what services it provides, all this
information is presented in large text with icons explaining it.
Further, you can find information about prices for the services of the club, a block with the type of
subscription, below which you can see all the options provided to the owner of the subscription for the specified
price in the block.
Then, the user has the opportunity to get acquainted with the information about the coaching staff, their
images, service record, achievements, methods on which they train, personal information.
As a conclusion, there is a photo gallery, each image illustrates a certain service of the club, all images
have the same stylistics and interactivity, which activates after cursor pointing.
At the end of the page there is a block with information about the site, contact form, working hours and
links to social networks.
You can see the main page on figure 1. The page represents the location of the blocks presented on the
web site.
MATERIALS OF XII JUNIOR RESEARCHERS’ CONFERENCE 2020
ICT, Electronics, Programming, Geodesy
126
Figure 1. – Main page prototype
Figure 2 shows the prototype of the "Personal Cabinet" page. The page represents two blocks, one - the
menu of the personal cabinet, and the second shows the information of the menu item. Each of the blocks
contains unique information about training plans, their schedule, as well as nutrition. You can choose the desired
date and time, and then make an appointment for a training session. After confirming the appointment, a
training reminder will appear in your personal cabinet.
Figure 2. – Personal Cabinet page prototype

MATERIALS OF XII JUNIOR RESEARCHERS’ CONFERENCE 2020
ICT, Electronics, Programming, Geodesy
127
On the screen with the registration form, the prototype of which is shown on figure 3, the user must
enter contact details and send, then he will be registered and will be able to use the functions of a personal
cabinet.
Figure 3. – Part of the registration prototype
On the screen of the personal cabinet the user can see the tabs with the recording of training, meals and
the training itself. On the screen of entering contact information there is a verification of the correctness of
entered data. In case the user enters the data incorrectly, the resource will not let it pass on.
Conclusion. Basic interface constructions are described in this article. The necessary sections of the
software were formulated, for each of them was designed a prototype on the basis of which you can create a
graphical image of the site screen, and then the web site itself.
REFERENCES
1. Tilda.com [Электронный ресурс]. Режим доступа: http://tilda.education/cours/web-design/prototypes/. –
Дата доступа: 18.09.2019.
2. Axure.com [Электронный ресурс]. Режим доступа: https://www.axure.com/. – Дата доступа: 19.09.2019.

MATERIALS OF XII JUNIOR RESEARCHERS’ CONFERENCE 2020
ICT, Electronics, Programming, Geodesy
128
UDC 004.021
POSTMAN PLATFORM FOR API DEVELOPMENT IN THE MOBILE APPLICATION
"MUSICIANS OF RUSSIA"
M. SHERSHNEU, A. OSKIN
Polotsk State University, Belarus
This article describes a modern way of testing software, in particular the server part of the application (API
- application programming interface). There you can find an example of usage Postman in the development
process of the server part of the mobile application "Musicians of Russia".
Introduction. Testing process is an essential part of creation software product. The main purpose of
testing process is an investigation conducted to provide stakeholders with information about the quality of the
software product under test. The following type of the software errors can be distinguished:
functional errors (adding goods to the basket order doesn’t work, it’s impossible to leave a comment on
the user’s post, the search by keywords doesn’t work);
user interface errors (the text doesn’t fit within the boundaries of the designated area, the image isn’t
displayed, the wrong size or font of the text);
logical errors (it’s possible to select the date of birth in the future during the registration process, make
an order without leaving contact details for communication);
content errors (spelling and punctuation errors);
usability errors (clearing the filled form fields during validation data process, it’s impossible to save your
current progress, not user friendly interface);
security errors (sql-injections, public access to the private data) [1].
There are a lot of different tools for the software testing. In more details we will consider the testing
process of the API with usage of Postman tools. Thanks to the Postman we are able to find and prevent
functional, logical and security errors, and on the next step we will figure out how to do it.
Main Postman features. Postman is one of the most popular tool which is used in API testing. The
application allows developers easily create, share, test and document API. In fact it’s very useful, because
developers can create and save HTTP requests, as well as read their responses. Also we are able to create
different test scenarios, which allow us to increase the coverage of the application source code. There are some
advantages of the Postman:
always around - in order to use Postman it’s enough to login with your account, what simplify access to
the files anytime, anywhere;
collections usage - the Postman allows users to create collections for the API calls. Each collection may
contains several queries. It helps you better to organize your test instructions;
collaboration - collections can be imported and exported. A direct link is also can be used to exchange
collections;
creation of environments - you are able to use the same collections for different test environments,
what allow to prevent test duplications;
tests creation - for every API call you are able to add control points, such as checking for a successful
HTTP response status, which helps ensure test coverage;
automated testing - using Collection Runner or Newman, tests can be run in several iterations, saving
your time fore repeated test cases;
debugging - the Postman console helps you verify what data what received during the API call, what
makes debugging tests easier [2].
The most powerful features are collections and automated testing, we are during the development
process.
There are several steps, which you need to do to make HTTP request with Postman:
1) select a GET request from the list of suggested request types;
2) in the address bar you need to insert the API url address that we are going to call;
3) click button Send;
4) after request submission we should see successful execution result, HTTP status 200 tells us about it;
5) in the result section you are able to see the array of users in the JSON format.
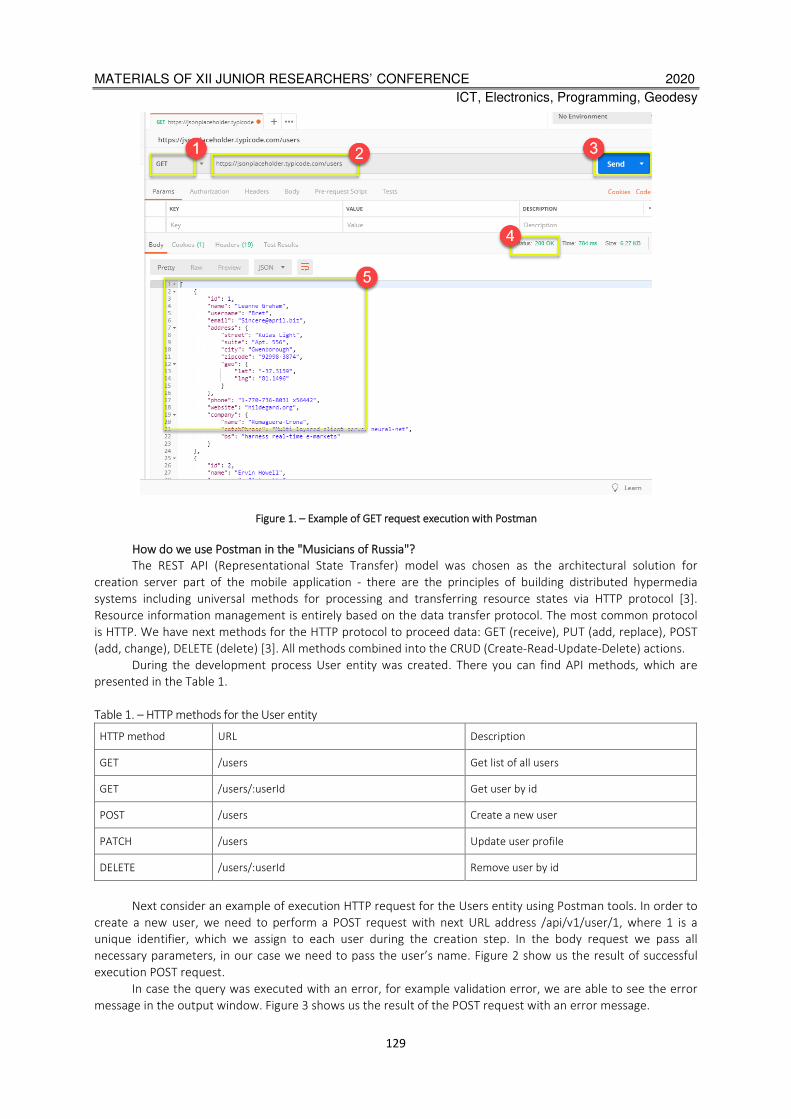
MATERIALS OF XII JUNIOR RESEARCHERS’ CONFERENCE 2020
ICT, Electronics, Programming, Geodesy
129
Figure 1. – Example of GET request execution with Postman
How do we use Postman in the "Musicians of Russia"?
The REST API (Representational State Transfer) model was chosen as the architectural solution for
creation server part of the mobile application - there are the principles of building distributed hypermedia
systems including universal methods for processing and transferring resource states via HTTP protocol [3].
Resource information management is entirely based on the data transfer protocol. The most common protocol
is HTTP. We have next methods for the HTTP protocol to proceed data: GET (receive), PUT (add, replace), POST
(add, change), DELETE (delete) [3]. All methods combined into the CRUD (Create-Read-Update-Delete) actions.
During the development process User entity was created. There you can find API methods, which are
presented in the Table 1.
Table 1. – HTTP methods for the User entity
HTTP method URL Description
GET /users Get list of all users
GET /users/:userId Get user by id
POST /users Create a new user
PATCH /users Update user profile
DELETE /users/:userId Remove user by id
Next consider an example of execution HTTP request for the Users entity using Postman tools. In order to
create a new user, we need to perform a POST request with next URL address /api/v1/user/1, where 1 is a
unique identifier, which we assign to each user during the creation step. In the body request we pass all
necessary parameters, in our case we need to pass the user’s name. Figure 2 show us the result of successful
execution POST request.
In case the query was executed with an error, for example validation error, we are able to see the error
message in the output window. Figure 3 shows us the result of the POST request with an error message.
MATERIALS OF XII JUNIOR RESEARCHERS’ CONFERENCE 2020
ICT, Electronics, Programming, Geodesy
130
Figure 2. – Example of POST request execution with Postman
Figure 3. – Example of POST request execution with validation error
Conclusion. In the article was presented Postman application, the advantages of using the tool to test the
API. Also the way of usage Postman was described during the development of the server part of the real mobile
application "Musicians of Russia".

MATERIALS OF XII JUNIOR RESEARCHERS’ CONFERENCE 2020
ICT, Electronics, Programming, Geodesy
131
REFERENCES
1. Guru99. Postman Tutorial for Beginners with API Testing Example [Electronic resource]. - Mode of access:
https://guru99.com/postman-tutorial.html. Date of access: 22.02.2020;
2. Wikipedia. Software testing [Electronic resource]. - Mode of access:
https://en.wikipedia.org/wiki/software_testing. Date of access: 22.02.2020;
3. Wikipedia. REST [Electronic resource]. - Mode of access: https://en.wikipedia.org/wiki/rest. Date of access:
22.02.2020.
MATERIALS OF XII JUNIOR RESEARCHERS’ CONFERENCE 2020
ICT, Electronics, Programming, Geodesy
132
UDC 004.5; 004.921
GRADUATES WEBSITE IN EDUCATION
V. TSYBULSKY, I. BURACHONAK
Polotsk State University, Belarus
This article discusses the creation of a website for work at the university on the example of the resource of
St. Petersburg State University "Alumni Association of St. Petersburg State University".
Nowadays we live in the century of information technology and most people communicate with each
other through the Internet. Previously, after graduating from university, many classmates tried to keep in touch
with each other, but contact information or addresses could easily be lost, after which, communication could
stop. People talked through letters, rarely could talk on the phone. Currently, letters in envelopes, as well as mi-
nute calls have been replaced by various instant messengers, online chats, social networks, as well as the oppor-
tunity to talk with anyone around the clock on the phone.
For graduates, it is necessary to create a site on which they can find their classmates, people with whom
they were friends while studying at the university, contact them according to the information provided on the
site, and invite everyone to come together, as in the good old days.
When creating the site, it was possible to find very few such resources that will help graduates to get to-
gether, or to find their friends. On the basis of analogues, the website "Graduates" was created.
In order for it to function well, it was necessary to raise all the archives from the beginning of the opening
of the educational institution and get all the data, at least from the very first issue. All the collected information
about the graduate is uploaded to the site on which he can register with his name, valid at the time of training,
diploma number, as well as e-mail, which, upon registration, will receive a password to enter. After registration,
in his personal account, the user will see information about himself that was stored at the university, but he can
enter his personal data. In addition, each user can upload photos to the site, as this will help facilitate the search
for their friends on the site.
Another feature of this site is that not only site administrators, but also registered users can post ads. The
user, in his personal account, can create an advertisement of whatever he wants and send for publication on the
main page of the site, but it will not be published, since immediately it is sent for review and editing to the ad-
ministrator to prevent the possibility of publishing ads off-topic.
Why is the site universal? The site has an admin panel where the administrator can configure everything
as he needs, so the site can be embedded in various universities, and even in schools. Using such a resource, you
can not do without a database. Since the project was done in PHP (Hypertext Preprocessor), a decision was
made to use the MySQL database management system (8.0) to organize data storage. It is also convenient, it is
possible to convert data and the administrator does not need to fill it in manually, he just needs to click a button,
select an Excel file and all information about university graduates will be uploaded to the database and displayed
on the site. But there is a small nuance for the data to load correctly, you need to enter them in the correct or-
der into the Excel file. In addition to entering information through an Excel file, you can manually enter one rec-
ord, as well as edit or delete it.
If the user is interested in any question, he can contact technical support at any time, where they can
help him solve it.
Another of the main features of this site is the ability to search for graduates in the following input fields:
1. Last name.
2. Name.
3. Patronymic.
4. The group.
5. Year of release.
6. Faculty.
7. Specialty.
8. The form of training.
All specified fields are optional. If the user does not enter anything, then all university graduates will be
displayed. An example of a graduate search page is shown in picture 2. The data is filtered by the fields of the
faculty, specialty, and the user’s training form can be obtained from the list, which is also loaded from the data-
base.

MATERIALS OF XII JUNIOR RESEARCHERS’ CONFERENCE 2020
ICT, Electronics, Programming, Geodesy
133
Figure 1. – Personal Information Editing Page
Figure 2. – Graduate Search Page
In their personal accounts, graduates can create ads that appear on the main page. I think that this func-
tion is very convenient, it’s easier to gather your classmates for some kind of meeting, because you don’t need
to call everyone and invite them, especially since some may not have information about contact numbers. To
make sure that the graduate has created an ad with acceptable content, it is moderated, and as soon as the ad-
ministrator makes sure that the content of the advertisement really meets the requirements, he makes it visible
to all graduates, however, if the announcement has obscene content, the administrator has the option to edit it.
In the process of developing a software product, all the restrictions imposed on the database by the sub-
ject area were observed, thus maintaining the integrity of the system. The integrity constraint lies in the absence
in the relations of records with the same primary key values, as well as in the absence of records in which the
primary key value is not specified. This restriction works due to compliance with the basic properties of the pri-
mary key.
An important feature of modern DBMSs is the standard means of maintaining the integrity of databases
when changing and deleting records in relationships.
For foreign keys, the integrity constraint is that the value of the primary key must be equal to the value of
the foreign key, i.e. each attribute value must be undefined.
Storage of the necessary data is implemented in the free relational database management system MySQL
8.0, which has advantages over analogues:
MATERIALS OF XII JUNIOR RESEARCHERS’ CONFERENCE 2020
ICT, Electronics, Programming, Geodesy
134
1. A large number of plug-ins and auxiliary applications that help simplify the work with databases;
2. A wide selection of tools that allows you to implement almost any project;
3. There are many built-in security features that work by default;
4. equally easily can be used to work with small and large volumes of data;
5. Due to some standards used, there is a high system performance.
The university consists of several faculties. Each faculty has several departments, and several specialties
and forms of training may also be present. Thus, each student is listed in the faculty, in a particular department,
specialty and form of training and has unique personal data. Thus, including all options for combining a graduate
with a university, the following scheme was developed, shown in picture 3.
Figure 3. – Relational database schema
When implementing this relational database schema, the SQL language features were used to the maxi-
mum. SQL (Structured Query Language - Structured Query Language) is a universal computer language used to
create, modify and manage data in relational databases.
Thanks to the developed database, as well as the user interface, a software product was implemented
that can be used in any educational institution.
Thus, the developed software product contributes to the education among students of pride in their na-
tive university, their involvement in one of the best universities in the country and the world, in the elite of a
modern intellectual society, and will also allow the promotion of the outstanding achievements of its graduates.
Conclusion. This site is already at the stage of implementation in the educational institution “Polotsk State
University”. The developed product will facilitate the work of university employees. With ease it will be possible
to inform all graduates about a planned event in honor of them. In addition, graduates have the opportunity to
find their classmates by search provided on the site, enter information about themselves in their personal ac-
count.
REFERENCES
1. Unity User Manual [Электронный ресурс] / – Access mode http://www.php-s.ru/self-teacher. – Access
date: 16.09.2018.
MATERIALS OF XII JUNIOR RESEARCHERS’ CONFERENCE 2020
ICT, Electronics, Programming, Geodesy
135
UDC 338.46
MOBILE APPLICATION FOR PERSONAL FITNESS TRAINING
A. MISIUKEVICH
Polotsk State University, Belarus
Personal training is best-done face-to-face, but technologies assist to offer better results.
Is your business maximizing profit? Are you utilizing digital-based business solutions to get success?
Digital tools are set to amend training for the better in the future. Here are five points where these tools will be
helpful.
1. VIRTUAL PERSONAL TRAINING
The investment in personal training of club members is near 10 percent, a lot of them choose to get
support from the growing numbers of applications. Nowadays if club owners want to increase market coverage
and receive new revenue, they should be in trend and offer online personal training. Clubs can enlarge personal
training with clients using centralized digital programming —and not just those who are regularly in the club but
also those who is at home, or travel on business or on holiday. Consuming online programming allows clubs to
analyze which programs and virtual workouts are most demanded. That, in turn, can unlock new revenue stream
opportunities.
2. DIGITAL PROGRAMMING
Access to a digital library of fitness exercises allows clubs to provide template workouts, advice on
exercise techniques and software development innovation, all available to personal trainers and clients at the
click of a button on their devices. This improves the personal training and member experience, also it is much
more productive than paper-based systems, saving much time for gym floor staff to deliver other areas of the
business.
3. ONLINE ORDERS AND PAYMENTS
Keeping track of payments, credits, sessions, subscriptions, and cancellations manually are hugely time-
consuming actions. Nowadays digital systems are able to cover and automate personal training bookings and
payments, including handling auto-renewals, multiple subscriptions, personal training approaches and push
notifications to keep clients posted and motivated. It saves a lot of time for personal trainers, allowing them to
spend it interacting with clients rather than working on papers. The solutions for online bookings create
operational transparency and speed up internal processes. Centralized reporting tools also allow observer real-
time performance analysis. It enables fitness club owners to make programming and operational decisions based
on evidence rather than feeling. Simplifying the payment process provides studio owners more time to focus on
delivery while clients have the convenient and quite fast option of purchasing packages without the necessity to
stand in line. Also, it allows keeping track of bookings and viewing training programs.
4. PERSONAL TRAINING MARKETING AND EDUCATION
Retention of talented personal trainers is a challenge for many operators. To create successful, financially
viable businesses to keep and support personal trainers it's needed to be done more. A successful personal
trainer will not have a good reason to look for an alternative workplace. At the same time, there are not so
many opportunities in terms of business training, marketing, and further education, either at the point of
qualification or during employment.
5. TRAINER PERFORMANCE
To get the ability to anticipate potential pitfalls before they appear digital solutions can offer monitoring
and assessing the result of the club and individual staff in real-time. To avoid issues there is a possibility to set up
performance parameters via the online application and track them weekly, it gives to clubs the best chance of
anticipating challenges. Digital technologies and programming advancements are a brilliant tool for clubs and
studios to integrate in order to support staff in delivery and time efficiency and in the enhancement of member
experience.
CONCLUSION. The advantage of mobile application for personal training consists of enhancing business
efficiency and member service through a butch of online business and member management solutions. Staff and
client management apps are becoming more and more popular in the fitness industry. With the help of these
mobile applications, you can streamline your business and give your clients a more convenient method to

MATERIALS OF XII JUNIOR RESEARCHERS’ CONFERENCE 2020
ICT, Electronics, Programming, Geodesy
136
interact with your facility. Such technology has become the biggest software market in the world as it truly helps
optimize your business in every way. All data is now in one place, saving you time and energy.The days when you
had to keep track of different documents in various places are gone [1].
REFERENCES
1. WellnessLiving Blog. (2019, September 23). 6 Fitness Industry Technology Trends To Boost Your Business.
Retrieved 5 March 2020, from https://www.wellnessliving.com/knowledge-sharing/technology-trends-boost-
your-gym/

MATERIALS OF XII JUNIOR RESEARCHERS’ CONFERENCE 2020
ICT, Electronics, Programming, Geodesy
137
UDC 004.05
HOW TO SELECT CORRECT TEST CASES FOR AUTOMATED TESTING
I. MISEVICH, Y. PASTUKHOV
Polotsk State University, Belarus
I am planning to cite down a few important points based on my experience how to select the correct test
cases for automation and determine various other factors that will produce better test results and benefits.
Automated testing is a Software testing technique to test and compare the actual outcome with the ex-
pected outcome. It can be achieved by writing test scripts or using automation testing tools.Automated testing
is used to automate repetitive tasks and other testing tasks which is difficult to perform manually.
Automated testing can be defined as a way to run a set of tests over and over again without having to ex-
ecute them manually. Introducing automation tests in your test strategy is a way to save money and time.
One of the most commonly automated test suites is the regression test suite. Regression, as you may al-
ready know, is the test that is done at the end of testing a new module to ensure that none of the existing mod-
ules have been affected by it.
It is repeated after each new iteration of testing and the main test cases stay fixed with usually a few new
additions after a new iteration. As it is frequently run almost all the test teams try to automate this pack.
The smoke testing is a famous test performed in the test life cycle. These are post-build tests, they are
executed immediately after some structure is given out of the application to ensure that the application is still
functioning after the structure is done.
This is a small test suite and is something that will be executed many times and thereby it makes sense to
automate it. These tests will usually be of a functional nature and depending on the type of application a tool
picked for them.
Most of the testing projects are trying to translate their manual test cases to automated ones to improve
productivity and coverage.
One of the key steps to commence Automation Testing is – selecting the appropriate test cases.
Automation does not overpower or replaces Manual Testing but it compliments it. Like Manual, Automa-
tion needs a strategy with proper planning, monitoring & control. Automation, when implemented correctly, can
become an asset to the team, project and ultimately to the organization.
There are many advantages of Automation. Here are a few important to mention:
1. Useful to execute routine tasks like Smoke tests and Regression tests.
2. Useful in preparing the Test data.
3. Helps to execute the Test cases which involve complex business logic.
4. Good to execute the cross-platform test cases (like different OS, browsers, etc.)
5. Great to execute the test cases which are a bit difficult to execute manually.
6. When the number of iterations of the test case executions is not known.
Stakeholders often feel that automated tests act as a support tool for Manual Testing, so it’s vital to un-
derstand that automation is the best way to increase the effectiveness, efficiency, and coverage of testing. It not
only saves time but also improves accuracy as repetitive tasks through the manual approach pronged to human
errors and which can be time-consuming.
One of the most basic mistakes which testers make is NOT Selecting the correct test cases for automa-
tion.
There is no standard procedure for determining the correct test cases for automation. It all depends on
the application you are testing.
Step 1: Identify the parameters on which you will base your test case as a candidate for automation.
As of now, I am identifying the following parameters, you can have your own parameters depending on
your application.
1. Test case executed with different sets of data.
2. Test case executed with different browsers.
3. Test case executed with different environments.
4. Test case executed with complex business logic
5. Test case executed with a different set of users

MATERIALS OF XII JUNIOR RESEARCHERS’ CONFERENCE 2020
ICT, Electronics, Programming, Geodesy
138
6. Test case involves a large amount of data
7. Test case has any dependency
8. Test case requires Special data
Step 2: Break each application into modules. For each module, analyze and try to identify the test cases
which should be automated based on the parameters.
Step 3: Consolidate and group the number of test cases for each module.
Step 4: We should also take into account the following attributes:
1. Purchasing and licensing cost of the tool
2. Time to develop the scripts
3. Time to maintain the scripts.
4. Time to analyze the results manually and automatically
5. Time and cost to train the resources.
6. Management overheads
Automating a 100% application is a big task. Not that it is impossible, but it requires proper planning and
monitoring and of course; some time. There are lots of permutations and combinations of data, n number of
environments with n number of authentication and authorization attributes that need to be validated and hence
require a strategy to automate.
In most cases, we prefer to Automate the Regression suite (here are some challenges in automating re-
gression suite in an agile environment) as it contains a larger number of test cases. In that case, we can break
down the regression suits into smaller suits and decide to run the appropriate suite as per the release require-
ment.
Let’s suppose that a regression suite contains 1500 test cases, you can break it to 3 suits of 500 test cases
per suit and automate it.
Instead of automating the entire suite, you can opt for phase-wise automation. In other words, you can
follow the prototype model for developing the automation suite. Create a structure or framework with the im-
plementation of fewer numbers of test cases and start using that and gradually enhance it by adding more test
cases to it.
REFERENCES
1. Википедия [Электронный ресурс] / Автоматизированное тестирование — Режим доступа:
https://ru.wikipedia.org/wiki/%D0%90%D0%B2%D1%82%D0%BE%D0%BC%D0%B0%D1%82%D0%B8%D0%B7
%D0%B8%D1%80%D0%BE%D0%B2%D0%B0%D0%BD%D0%BD%D0%BE%D0%B5_%D1%82%D0%B5%D1%81
%D1%82%D0%B8%D1%80%D0%BE%D0%B2%D0%B0%D0%BD%D0%B8%D0%B5. — Дата доступа:
26.09.2019.
2. habr [Электронный ресурс] / Автоматизация тестирования программных систем — Режим доступа:
https://habr.com/ru/post/160257. — Дата доступа: 26.09.2019.
3. QA Academy [Электронный ресурс] / Автоматизация тестирования — Режим доступа: https://qa-
academy.by/qaacademy/news/avtomatizaciya-testirovaniya/. — Дата доступа: 26.09.2019.
MATERIALS OF XII JUNIOR RESEARCHERS’ CONFERENCE 2020
ICT, Electronics, Programming, Geodesy
139
UDC 621.391.812
WIRELESS TRANSMISSION OF TELEMETRY DATA TO LONG DISTANCE
I. SHPAK, S. ABRAMENKO
Polotsk State University, Belarus
The article presents a practical experiment of the developed module which uses one of the varieties of
LPWAN (Low-power Wide-area Network) technology. The system is based on UBN (Ultra NarrowBand).
Technical characteristics. An ultra narrowband receiver is highly selective and it can reject noise and inter-
ference. It enters the receiver outside its narrow bandwidth, enabling an acceptable signal-to-noise ratio to be
achieved with a relatively weak received signal. Consequently, transmitter power levels can be low and the ef-
fective range of transmissions may be greater than would typically be the case for technologies which do not
provide such selectivity. Some other radio technologies, such as direct sequence spread spectrum and chirp
spread spectrum[1], employ alternative approaches to selectively extract signals from interference and noise.
Typical UNB systems operate with a bandwidth of a few 10s to a few 100s Hz[2] and are used for the transmis-
sion and reception of digital signals [3].
The use of highly selective filters in UNB receivers can provide very effective rejection of UNB signals from
other UNB devices on adjacent carrier frequencies, permitting the operation of many devices in a limited geo-
graphical area.
UNB technology is often used where links from very high numbers of devices are needed, with relatively
small amounts of data being exchanged on each link. Some such applications can be found in the Internet of
things, with UNB being one of the technologies that have been used to implement Low-Power Wide Area Net-
works. [4]. Short infrequent transmissions with low transmit power can enable long-life, battery-powered opera-
tion of UNB devices connected in a LPWAN.
Typical properties of UNB devices operating in the UHF spectrum below 1 GHz have been described by
ETSI; whilst specific UNB-based protocols for the implementation of LPWAN have also been standardised (along-
side others) by ETSI.
System characteristics. The distance test in urban development was carried out using the developed
module based on the AX8052F143 chip with the installed TCXO thermally compensated generator. We used
software settings optimized for data transmission over long distances - 1200 bit / s, deviation ± 1.75 kHz, BW
filter Rx 10 kHz. Frequency offset compensation was performed for each packet:
• output power: 15 dBm;
• frequency: 868 MHz;
• Location: Vitebsk, Belarus.
In the calculations, a Friis formula and a two-beam propagation model were used to obtain a realistic es-
timate of the communication range. The two-beam model takes into account the earth's surface, the influence
of which will always reduce the attainable distance. The model takes into account various building materials,
which are used to estimate the distance inside buildings more accurately.
The reviewed field test examples demonstrate the importance of considering antenna height and line of
sight limitations in order to achieve greater distance for both direct visibility scenarios and indoor communica-
tions.
Results. The results obtained during transmission inside the building with the receiver located on the
staircase of the 9th floor and the transmitter located on the 1st floor of the staircase: signal level at the receiver
input: -95 dBm, 5% of the packets are lost.
The results obtained during data transmission in urban areas, when the receiver was placed on the balco-
ny of the 7th floor, amounted to: distance 740m, signal level at the receiver input -110dBm.
Conclusions. The developed system meets the expected characteristics (range, power consumption, signal
level) and allows you to implement a cost-effective product for the Internet of things.
REFERENCES
1. IEEE Computer Society, (August 31, 2007). IEEE Standard 802.15.4a-2007. New York, NY: IEEE.

MATERIALS OF XII JUNIOR RESEARCHERS’ CONFERENCE 2020
ICT, Electronics, Programming, Geodesy
140
2. Anteur, Mehdi; Deslandes, Vincent; Thomas, Nathalie; Beylot, Andre-Luc (December 2015). Ultra Narrow
Band Technique for Low Power Wide Area Communications. IEEE Global Communications Conference
(GLOBECOM).
2. ETSI TR103 435 System Reference document; Short Range Devices Technical characteristics for Ultra Narrow
Band SRDs operating in the UHF spectrum below 1 GHz CA, USA, 2015.
3. Low Power Wide Area Networks: An Overview, Published in 2015 IEEE Global Communications Conference
(GLOBECOM).
MATERIALS OF XII JUNIOR RESEARCHERS’ CONFERENCE 2020
ICT, Electronics, Programming, Geodesy
141
UDC 003.26
DIGITAL WATERMARKING AS AN IMAGE PROTECTION METHOD
A. SIVAHRAKAU, Y. PASTUKHOV
Polotsk State University, Belarus
This article presents the classification of digital watermarks. The types of embedding algorithms are ana-
lyzed, their main advantages and disadvantages are highlighted.
Introduction. In the era of computers, the most common violations of intellectual property are: plagia-
rism, "piracy", changing information, faking information, unfair competition.
When storing, distributing and transferring intellectual property, digital watermarks are often used as
protection. Digital watermark is a special tag embedded in the digital segment, in order to monitor the dissemi-
nation of information over communication networks, to provide information search in multimedia databases.
Usually, we don’t see a digital watermark on image, the original image, and the image with the integrated digital
watermark, are visually indistinguishable by the human eyes.
Digital Watermarks Classification. The term “Digital watermarking” got its name from a method of protec-
tion against counterfeiting securities. Currently, various methods for applying watermarks have been developed:
1) According to the degree of perception: visible and invisible. Invisible are divided into: fragile, semi-fragile, re-
sistant.
2) By degree of reversibility: reversible and irreversible.
3) By embedding method: linear, non-linear, fractal coding.
4) By embedment area: spatial and using container conversion. Container conversions are divided into
frequency based and moment based.
An embedded watermark can be either visible to the eye or invisible. The second option is more common
and is divided into fragile, resistant (robust) and semi-fragile watermarks. In the case of a fragile watermark sys-
tem, the watermark is destroyed after any minor changes to the container. Such marks are necessary for signal
authentication (digital fingerprints). Robust signs, on the contrary, must protect from many types of attacks: af-
fine transformations (turns, cropping), compression, and others. Only such marks are used to determine author-
ship, since they are difficult to destroy. Semi-fragile watermark is a mark with selective complexity. Such a sign
may allow certain transformations of the container, collapsing from others [3].
Embedding algorithms are divided into reversible and irreversible. Reversible algorithms allow you to ex-
tract the watermark and completely restore the container for further work. Such algorithms are used for medical
and military purposes, where any distortion of images is strictly prohibited. Irreversible algorithms, when remov-
ing the watermarks, make changes to the original container, so when developing such algorithms, the develop-
er's goal is to reduce the level of distortion to the minimum.
More complex reversible methods are algorithms based on modifications of the image histograms and on
the intentional adjustment of the difference between adjacent pairs of pixels. The first group is simple to imple-
ment and uses a minimum of information for decoders, but the disadvantages are the limitation of the embed-
ding size, which depends on the number of occurrences of the maximum brightness points. The second group of
algorithms allows you to embed large amounts of information in the message, but the quality of the marked
image is worse.
There are linear and nonlinear methods of applying watermarks and methods using fractal coding, based
on the assumption that the image is self-similar [2]. Linear algorithms are divided into embedding algorithms
(additive) when a digital image is added to a digital message, and fusion algorithms when one image is embed-
ded into another image, for example a logo.
Also, many developers have proposed the use of correlation algorithms. But the use of such algorithms is
justified if the user needs to retrieve a hidden message, and the main container is perceived as noise (an irre-
versible method). The main advantage of merging algorithms over embedding algorithms is the assumption of a
slight distortion of the watermark during extraction.
Spatial domain algorithms embed watermark into the original image. Their advantage is that there is no
need to perform image conversions. Watermark in such methods is usually implemented due to the manipula-
tion of brightness or color components. The disadvantage of such algorithms is the rather weak resistance to
various image processing operations.

MATERIALS OF XII JUNIOR RESEARCHERS’ CONFERENCE 2020
ICT, Electronics, Programming, Geodesy
142
Frequency-based algorithms based on image transformations are more complicated, because before im-
plementing watermark, it is necessary to “redistribute the energy” of the container in order to embed the mes-
sage in special spectral regions. Due to this decomposition of the image, the watermark becomes robust to at-
tacks.
The greatest difficulty is the introduction of the watermark into the low-frequency region, containing
most of the image energy, because non-optimal implementation can lead to significant distortion of the contain-
er. This complexity is also an advantage, since any attempt by an attacker to extract the watermark from the
low-frequency region will also lead to significant image distortion. Thus, when embedding the watermark into
the frequency area of the image, it is necessary to observe a compromise between the size of the embedded
watermark and the quality of the stegano container [4].
Methods based on the moments of images are used to protect the watermark from the geometric trans-
formations of the container. However, they have a narrow focus, and their main disadvantage is the low level of
security from other types of attacks.
Conclusion. Digital watermarks are currently the most effective means of protecting the copyright of mul-
timedia works. This is one of the main ways to prevent copyright infringement on the Internet. This area is de-
veloping rapidly, so there are many different types of embedding. Today, there are a large number of methods
for implementing the watermark, each of which has its own advantages and disadvantages, which must be taken
into account when using one or another method to protect multimedia data from illegal distribution and modifi-
cation.
REFERENCES
1. Osborne C., vsn Schyndel R., Tirkel A. A Digital Watermark // IEEE Intern. Conf. on Image Processing, 1994. P.
86-90.
2. Gribunin V.G., Okov I.N., Tyrincev V.I. Digital steganography. : SOLON-Press 2002. 272 p.
2. Balakin A.V., Eliseev A.S., Gufan A.U. / Using steganographic methods to protect text information М.: T-comm
Telecommunications and transport, 2009. P 42-50.
3. Elshoura, S.M. A secure high capacity full-gray-scale-level multi-image information hiding and secret image
authentication scheme via Tchebichef moments / S.M. Elshoura, D.B. Megherbi // Signal Processing: Image
Communication. 2013. – Vol. 28. P. 531–552.

MATERIALS OF XII JUNIOR RESEARCHERS’ CONFERENCE 2020
ICT, Electronics, Programming, Geodesy
143
UDC 004.588
DEVELOPMENT OF A TRAINING PLATFORM FOR JUNIOR SPECIALISTS
IN THE FIELD OF TESTING SOFTWARE
A. DYSIN, O. GOLUBEVA
Polotsk State University, Belarus
This article describes the concept of developing a training platform for testing software and the most
suitable tools for the development of lodging. The key points in the program are described.
Recently, the popularity of the information technology industry has been growing. The number of com-
panies engaged in information technology services is becoming more and more. The demand for developers and
testing specialists is also increasing.
Many IT companies organize their own laboratories in which they train future specialists from scratch.
However, not everyone who wants to get a well-paid position is worthy to study at the expense of the company
in such laboratories.
Inexperienced junior developers fill the labour market in the field of information technology. For many
beginner testers and developers, it is not so easy to find their first job, even after successful graduation from
higher or secondary special educational institutions, as well as specialized courses.
Employers, as a rule, are not ready to hire employees without commercial sky experience. Thus, there
was a need to help beginners and young professionals get the experience necessary for their future work.
One of the most popular and most sought-after professions in the information industry nowadays is a
software tester. Therefore, the subject of work on the training platform is a set of services that will allow future
specialists to improve their professional skills.
Testing is a process that contains all the activities of the life cycle, both dynamic and static, related to the
planning, preparation and evaluation of a software product and connected with work in order to determine that
they meet the described requirements, show that they are suitable for the stated purposes and for identifying
defects [1].
A software tester is an experienced professional who takes part in testing a component or a system [1].
Figuratively expressed, the main goal of a tester is “to understand what the project currently needs,
whether the project receives what is necessary or appropriate and, if it does not, how to change the situation for
the better ” [2].
It is the responsibility of a testing specialist to search for probable errors and failures in its function, posi-
tioning the test object (system, component, etc.). A tester models different situations that may arise in the pro-
cess of using the subject of testing so that developers were able to correct the detected errors before the prod-
uct goes into implementation to real users.
In this article we would like to describe the development of a platform for testing. This board is the form
with private links to resources, which will contain both theoretical information on the topic and cases from the
developers’ and testers’ practice. As in any sphere of information services, about 70% of testing is practice, then
there is an ability of testers to find errors in applications. Thus, a platform will be developed in the game, where
within a limited time it will be necessary to find the maximum number of defects.
This is a kind of a training base for future experts in the field of testing. To provide structured learning,
the training platform will be divided into three modules: “Testing Web applications”, “Testing mobile applica-
tions”, “Testing Desktop applications. " There will be an opportunity to train their skills separately depending on
the chosen specialization.
To ensure that the tasks are completed correctly, there are modal windows in which the user will indicate
the following data:
- the component in which the error was detected;
- type of testing;
- criticality of error.
In addition to the practical tasks faced by a specialist in testing, there is a large amount of work connect-
ed with writing test documentation (check lists, test cases, defect reports, test reports, test plans, etc.). A defect
report is a document containing a report of any deficiency in a component or a system, which can lead a com-
ponent or a system to the inability to perform the required function [1]. This document should contain correct,
uniform terminology describing the elements of the user interface and event data elements that cause errors.

MATERIALS OF XII JUNIOR RESEARCHERS’ CONFERENCE 2020
ICT, Electronics, Programming, Geodesy
144
In general, it consists of the following fields:
- header (brief description of the problem, project, application component, version, severity,
priority, status, author, appointment);
- environment;
- description (reproduction steps, actual result, expected result);
- additions (attached file) [3].
As a part of the development of this service, it will be possible to describe, as a tester believes, identified
errors and save them in your account.
The prototype is the popular paid Atlassian Jira system used in commercial projects that allows you to de-
scribe and create reports on errors found in the system or component [4].
The platform will be developed using the popular Vue.js front-end framework, the base MySQL data and
Node.js. Vue.js – an open source JavaScript framework for creating custom tools.
It easily integrates into projects using other JavaScript libraries. It may be fun Design as a web framework
for developing single-page reactive-style applications [5].
The necessary qualities of a tester are logical thinking, attentiveness, quick-wittedness, good memory, the
ability to learn and adapt to existing tasks, quickly switch from one type of task to another. Patience, persever-
ance, creativity and ability to work in a team are also important. Moreover, a tester acts simultaneously as a us-
er, and as an expert, and therefore must have a certain way of thinking: be able to reproduce behaviour of the
user of the product and analyze the behaviour of the system, the input parameters and the results obtained
from the point of view of the engineer. Thus, after using the training platform, future testing experts will also be
able to improve the qualities necessary for the work. In conclusion, we would like to mention that this platform
will be further developed and not only testers can become highly qualified specialists, but also software drivers.
REFERENCES
1. Standard glossary of terms used in Software Testing [Электронный ресурс]. – 2014. – Режим доступа:
https://www.rstqb.org/ru/istqb-downloads.html. – Дата доступа: 23.09.2019.
2. Куликов, С.С. Тестирование программного обеспечения: базовый курс / С. С. Куликов. — Минск: Четы-
ре четверти, 2017. – 312 с.
3. Центр подготовки IT специалистов [Электронный ресурс] / Bug-report. – 2016. – Режим доступа:
https://qalight.com.ua/baza-znaniy/bug-report. – Дата доступа: 24.09.2019.
4. Atlassian Jira Software [Электронный ресурс]. – 2016. – Режим доступа:
https://www.atlassian.com/ru/software/jira – Дата доступа: 24.09.2019.
5. The Progressive JavaScript Framework [Электронный ресурс]. – 2014. – Режим доступа: https://vuejs.org/
- Дата доступа: 25.09.2019.

MATERIALS OF XII JUNIOR RESEARCHERS’ CONFERENCE 2020
ICT, Electronics, Programming, Geodesy
145
UDC 528.852.1
COMPUTATIONAL COMPLEXITY OF ALGORITHMS FOR FORMATION OF RADAR IMAGES
T. DROVOSEKOVA, R. BOHUSH
Polotsk State University, Belarus
In this paper the basic algorithms for spaceborne Synthetic Aperture Radar data-focusing are considered.
The comparative analysis of computational complexity for them is presented.
Introduction. The process of forming a radar image is called focusing of a radio hologram and is per-
formed at the stage of primary processing of radar data. It includes irradiation of the Earth's surface with a prob-
ing signal, reception and processing of echo signals (responses) reflected from points on the Earth's surface, and
the actual formation of radar images.
Currently, to get high spatial resolution of the obtained radar images, radars with a synthetic antenna ap-
erture (SAR) are used. When moving in orbit, the SAR antenna emits short frequency or phase modulated pulses
with a given repetition rate. The synthesis of the aperture is the result of successive reception of the responses
of the probing signals by the antenna at a different position relative to the source of these responses. For each
radiation of the probing signal, one line of the radio hologram is recorded. The number of radio hologram lines
depends on the frequency of the probing signals and the flight time of the radar.
Types of computational complexity of algorithms. By computational complexity we understand the func-
tion of work volume dependence that is performed by some algorithm on the size of the input data. The volume
of work is usually measured by abstract concepts of time and space, called computing resources. The theory of
computational complexity arose from the need to compare the performance of algorithms, clearly describe their
behavior (runtime and amount of required memory) depending on the size of the input data. The time complexi-
ty of an algorithm is a function of the size of the input data, equal to the maximum number of elementary opera-
tions performed by the algorithm to solve an instance of a task of a specified size. By analogy with time complex-
ity, the spatial complexity of the algorithm is determined, only here they show not only the number of elemen-
tary operations, but the amount of memory used. Despite the fact that the function of the time complexity of
the algorithm in some cases can be determined exactly, in most cases it is meaningless to look for its exact value,
because, firstly, the exact value of the time complexity depends on the definition of elementary operations, and
secondly, with increasing the size of the input data, the contribution of constant factors and lower order terms
appearing in the expression for the exact time of operation becomes extremely insignificant.
Consideration of large input data and estimation of the operating time of order growth, the algorithm
leads to the concept of asymptotic complexity of the algorithm. Moreover, an algorithm with less asymptotic
complexity is more efficient for all input data, with the possible exception of, possibly, small data. Currently, the
asymptotic complexity of most mathematical operations, functions, and transformations is calculated.
Analysis of the computational complexity of focusing algorithms. For primary processing of PCA data, the
following algorithms are used: Range Doppler (RD), Chirp Scaling Algorithm (CSA), Range Migration Algorithm
(RMA), as well as their modifications: Range Doppler Algorithm (RDA), Extended Nonlinear Chirp Scaling Algo-
rithm (ECS).
The essence of the RD and RDA algorithms is as follows: using the fast Fourier transform (FFT) method,
the spectrum of the input signal is obtained, the resulting spectrum is multiplied by the spectrum of the refer-
ence function (range compression), and the inverse Fourier transform (IFFT)) is performed. For azimuth com-
pression, matched filtering in the frequency domain in azimuth is used. The change in the Doppler frequency
depends on the range, therefore, a separate filter is used for each column of the RGG. To compensate for range
migration, an array of range-compressed data is converted into range / Doppler frequency coordinates and each
column of the data array is added with the corresponding frequency offset (RCMC – Range Cell Migration Cor-
rection) [1].
The CSA and ECS algorithms are designed based on alignment of curvature (range migration) in the two-
dimensional frequency domain so as to have congruent range migration paths. This is achieved by the successive
use of FFT in azimuth, multiplying the obtained spectrum by the LFM support (LFM scaling), FFT in range, multi-
plying by the phase function (correction of average range migration) and subsequent IFFs in range with phase
correction distorted during LFM scaling and IFFT in azimuth [2].
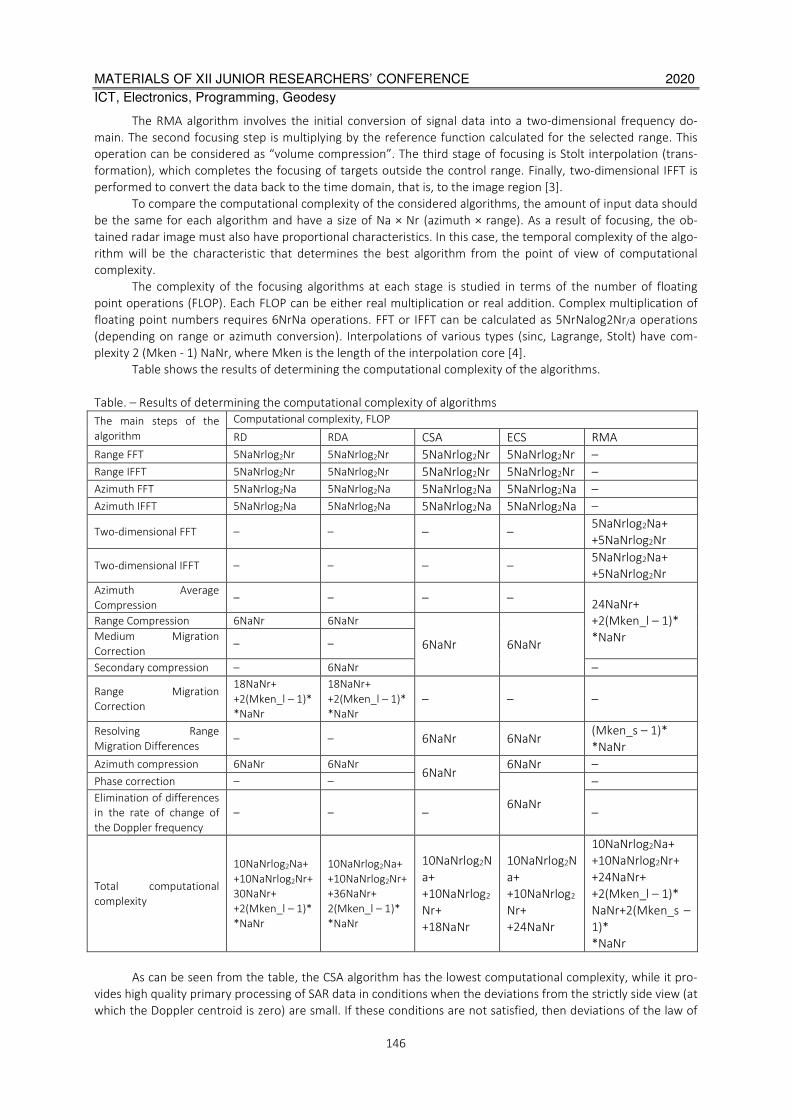
MATERIALS OF XII JUNIOR RESEARCHERS’ CONFERENCE 2020
ICT, Electronics, Programming, Geodesy
146
The RMA algorithm involves the initial conversion of signal data into a two-dimensional frequency do-
main. The second focusing step is multiplying by the reference function calculated for the selected range. This
operation can be considered as “volume compression”. The third stage of focusing is Stolt interpolation (trans-
formation), which completes the focusing of targets outside the control range. Finally, two-dimensional IFFT is
performed to convert the data back to the time domain, that is, to the image region [3].
To compare the computational complexity of the considered algorithms, the amount of input data should
be the same for each algorithm and have a size of Na × Nr (azimuth × range). As a result of focusing, the ob-
tained radar image must also have proportional characteristics. In this case, the temporal complexity of the algo-
rithm will be the characteristic that determines the best algorithm from the point of view of computational
complexity.
The complexity of the focusing algorithms at each stage is studied in terms of the number of floating
point operations (FLOP). Each FLOP can be either real multiplication or real addition. Complex multiplication of
floating point numbers requires 6NrNa operations. FFT or IFFT can be calculated as 5NrNalog2Nr/a operations
(depending on range or azimuth conversion). Interpolations of various types (sinc, Lagrange, Stolt) have com-
plexity 2 (Mken - 1) NaNr, where Mken is the length of the interpolation core [4].
Table shows the results of determining the computational complexity of the algorithms.
Table. – Results of determining the computational complexity of algorithms
The main steps of the
algorithm
Computational complexity, FLOP
RD RDA CSA ECS RMA
Range FFT 5NaNrlog2Nr 5NaNrlog2Nr 5NaNrlog2Nr 5NaNrlog2Nr –
Range IFFT 5NaNrlog2Nr 5NaNrlog2Nr 5NaNrlog2Nr 5NaNrlog2Nr –
Azimuth FFT 5NaNrlog2Na 5NaNrlog2Na 5NaNrlog2Na 5NaNrlog2Na –
Azimuth IFFT 5NaNrlog2Na 5NaNrlog2Na 5NaNrlog2Na 5NaNrlog2Na –
Two-dimensional FFT – – – – 5NaNrlog2Na+
+5NaNrlog2Nr
Two-dimensional IFFT – – – – 5NaNrlog2Na+
+5NaNrlog2Nr
Azimuth Average
Compression – – – –
24NaNr+
+2(Mken_l – 1)*
*NaNr
Range Compression 6NaNr 6NaNr
6NaNr 6NaNr Medium Migration
Correction – –
Secondary compression – 6NaNr –
Range Migration
Correction
18NaNr+
+2(Mken_l – 1)*
*NaNr
18NaNr+
+2(Mken_l – 1)*
*NaNr
– – –
Resolving Range
Migration Differences – – 6NaNr 6NaNr
(Mken_s – 1)*
*NaNr
Azimuth compression 6NaNr 6NaNr 6NaNr
6NaNr –
Phase correction – –
6NaNr
–
Elimination of differences
in the rate of change of
the Doppler frequency
– – – –
Total computational
complexity
10NaNrlog2Na+
+10NaNrlog2Nr+
30NaNr+
+2(Mken_l – 1)*
*NaNr
10NaNrlog2Na+
+10NaNrlog2Nr+
+36NaNr+
2(Mken_l – 1)*
*NaNr
10NaNrlog2N
a+
+10NaNrlog2
Nr+
+18NaNr
10NaNrlog2N
a+
+10NaNrlog2
Nr+
+24NaNr
10NaNrlog2Na+
+10NaNrlog2Nr+
+24NaNr+
+2(Mken_l – 1)*
NaNr+2(Mken_s –
1)*
*NaNr
As can be seen from the table, the CSA algorithm has the lowest computational complexity, while it pro-
vides high quality primary processing of SAR data in conditions when the deviations from the strictly side view (at
which the Doppler centroid is zero) are small. If these conditions are not satisfied, then deviations of the law of

MATERIALS OF XII JUNIOR RESEARCHERS’ CONFERENCE 2020
ICT, Electronics, Programming, Geodesy
147
change of the Doppler frequency from the linear one and the dependence of the Doppler centroid on the dis-
tance arise. In the CSA and ECS algorithms, these facts are not taken into account, which leads to a decrease in
the quality of the synthesized radar images.
The RD and RDA algorithms have the greatest flexibility and allow to obtain high-quality radar images
even with sufficiently large deviations from strictly lateral viewing. But at the same time they require more float-
ing-point operations than CSA and ECS algorithms.
The RMA algorithm is accurate even if the aperture is very wide or there is a significant deviation of the
radar from a strictly side view, however, Stolt interpolation requires a significant amount of mathematical opera-
tions. The RMA algorithm is not used to focus radar data from space SAR, because it is based on the Stolt trans-
form.
REFERENCES
1. Po-Chih Chen, Jean-Fu Kiang. An Improved Range-Doppler Algorithm for SAR Imaging at High Squint Angles.
Progress In Electromagnetics Research M, Vol. 53, 41–52, 2017
2. R.K. Raney, H. Runge, R. Bamler, I.G. Cumming, F.H. Wong. Precision SAR Processing Using Chirp Scaling. IEEE
Transactions on Geoscience and Remote Sensing, 32(4):786-799, July 1994
3. I.G. Cumming, Y.L. Neo, F.H. Wong. Interpretations of the Omega-K Algorithm and Comparisons with other
Algorithms. In Proceedings of the IEEE International Geoscience and Remote Sensing Symposium, IGARSS'03,
Toulouse, July 21-25, 2003
4. Y. Yuan, S. Chen, S. Zhang, H. Zhao. A chirp scaling algorithm for forward-looking linear-array SAR with con-
stant acceleration. IEEE Geosci. Remote Sens. Lett. 2018, 15, 88–91.
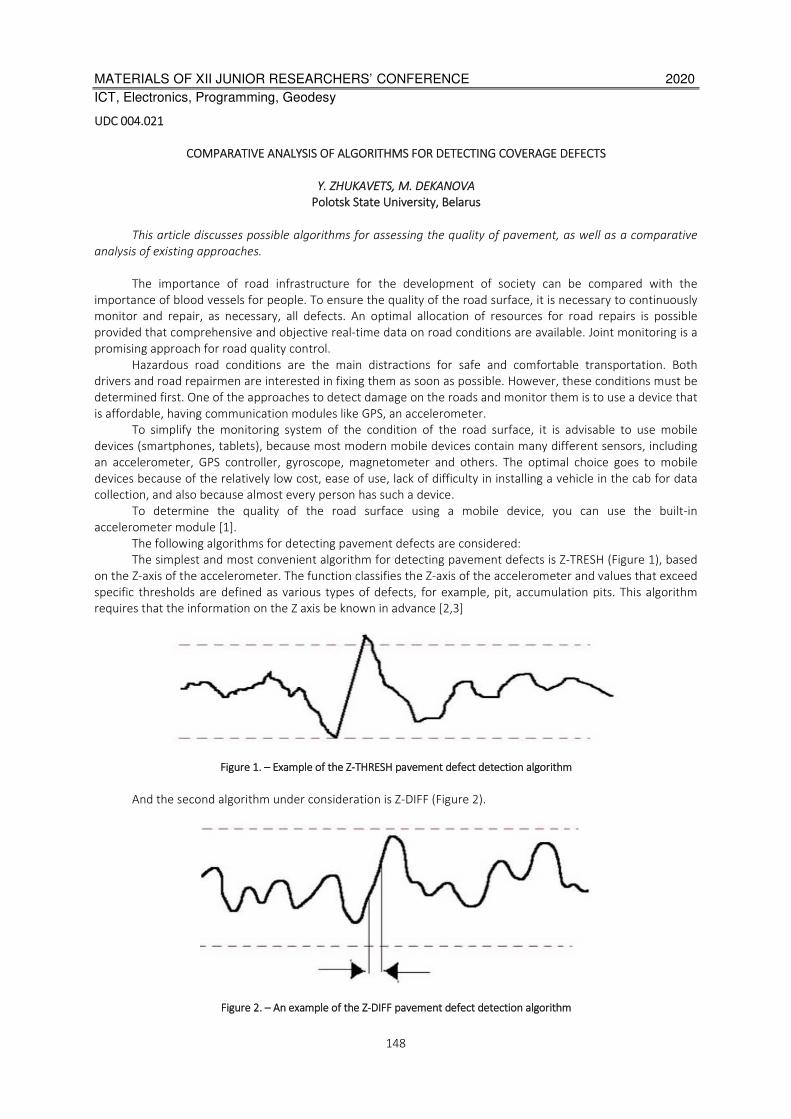
MATERIALS OF XII JUNIOR RESEARCHERS’ CONFERENCE 2020
ICT, Electronics, Programming, Geodesy
148
UDC 004.021
COMPARATIVE ANALYSIS OF ALGORITHMS FOR DETECTING COVERAGE DEFECTS
Y. ZHUKAVETS, M. DEKANOVA
Polotsk State University, Belarus
This article discusses possible algorithms for assessing the quality of pavement, as well as a comparative
analysis of existing approaches.
The importance of road infrastructure for the development of society can be compared with the
importance of blood vessels for people. To ensure the quality of the road surface, it is necessary to continuously
monitor and repair, as necessary, all defects. An optimal allocation of resources for road repairs is possible
provided that comprehensive and objective real-time data on road conditions are available. Joint monitoring is a
promising approach for road quality control.
Hazardous road conditions are the main distractions for safe and comfortable transportation. Both
drivers and road repairmen are interested in fixing them as soon as possible. However, these conditions must be
determined first. One of the approaches to detect damage on the roads and monitor them is to use a device that
is affordable, having communication modules like GPS, an accelerometer.
To simplify the monitoring system of the condition of the road surface, it is advisable to use mobile
devices (smartphones, tablets), because most modern mobile devices contain many different sensors, including
an accelerometer, GPS controller, gyroscope, magnetometer and others. The optimal choice goes to mobile
devices because of the relatively low cost, ease of use, lack of difficulty in installing a vehicle in the cab for data
collection, and also because almost every person has such a device.
To determine the quality of the road surface using a mobile device, you can use the built-in
accelerometer module [1].
The following algorithms for detecting pavement defects are considered:
The simplest and most convenient algorithm for detecting pavement defects is Z-TRESH (Figure 1), based
on the Z-axis of the accelerometer. The function classifies the Z-axis of the accelerometer and values that exceed
specific thresholds are defined as various types of defects, for example, pit, accumulation pits. This algorithm
requires that the information on the Z axis be known in advance [2,3]
Figure 1. – Example of the Z-THRESH pavement defect detection algorithm
And the second algorithm under consideration is Z-DIFF (Figure 2).
Figure 2. – An example of the Z-DIFF pavement defect detection algorithm

MATERIALS OF XII JUNIOR RESEARCHERS’ CONFERENCE 2020
ICT, Electronics, Programming, Geodesy
149
The Z-DIFF algorithm is based on the accelerometer readings along the Z axis. Unlike the Z-TRESH
algorithm, the Z-DIFF algorithm searches for two consecutive values, the difference of which is above a certain
threshold level. The algorithm detects rapid changes in vertical acceleration, according to which it is possible to
classify the type of road surface defect. As for the previous algorithm, it is necessary that information about the
position of the Z axis be known.
In the article, the test results of the used Z-THRESH and Z-DIFF algorithms are presented in Table 1.
Table 1. – The results of the applied algorithms Z-THRESH and Z-DIFF.
Class Z-TRESH Z-DIFF
Large pits 3(100%) 3(100%)
Small pits 15(83%) 16(89%)
Cracks 31(78%) 36(90%)
Hatches 10(59%) 17(100%)
Pit accumulation 25(83%) 27(90%)
Average 84(78%) 99(92%)
Based on the results of Table 1, in order to develop a system for monitoring the quality of pavement, it is
concluded that the Z-DIFF algorithm is an accurate algorithm.
REFERENCES
1. Accelerometr [Electronic resource]. Access mode:https://ru.wikipedia.org/wiki/Акселерометр Access date:
25.09.2019.
2. Jakob Eriksson, Lewis Girod, Bret Hull, Ryan Newton, Samuel Madden, Hari Balakrishnan. The Pothole Patrol:
Using a Mobile Sensor Network for Road Surface Monitoring. В кн.: The Sixth Annual International confer-
ence on Mobile Systems, Applications and Services (MobiSys 2008). Breckenridge, CO, USA. 2008. June. С.
29-39. ISBN: 978-1-60558-139-2. 2. Prashanth Mohan, Venkata N. Padmanabhan, Ramachandran Ramjee.
Nericell: Rich Monitoring of Road and Traffic Conditions using Mobile Smartphones. В кн.: SenSys'08 - Pro-
ceedings of the 6th ACM Conference on Embedded 30 Networked Sensor Systems. Raleigh, NC, USA. 2008.
November. С. 323-336. ISBN: 978-1-59593-990-6.
3. Real-time pothole detection using an accelerometer [Electronic resource]. Access mode:
https://www.researchgate.net/publication/224253154. Access date: 25.09.2019.
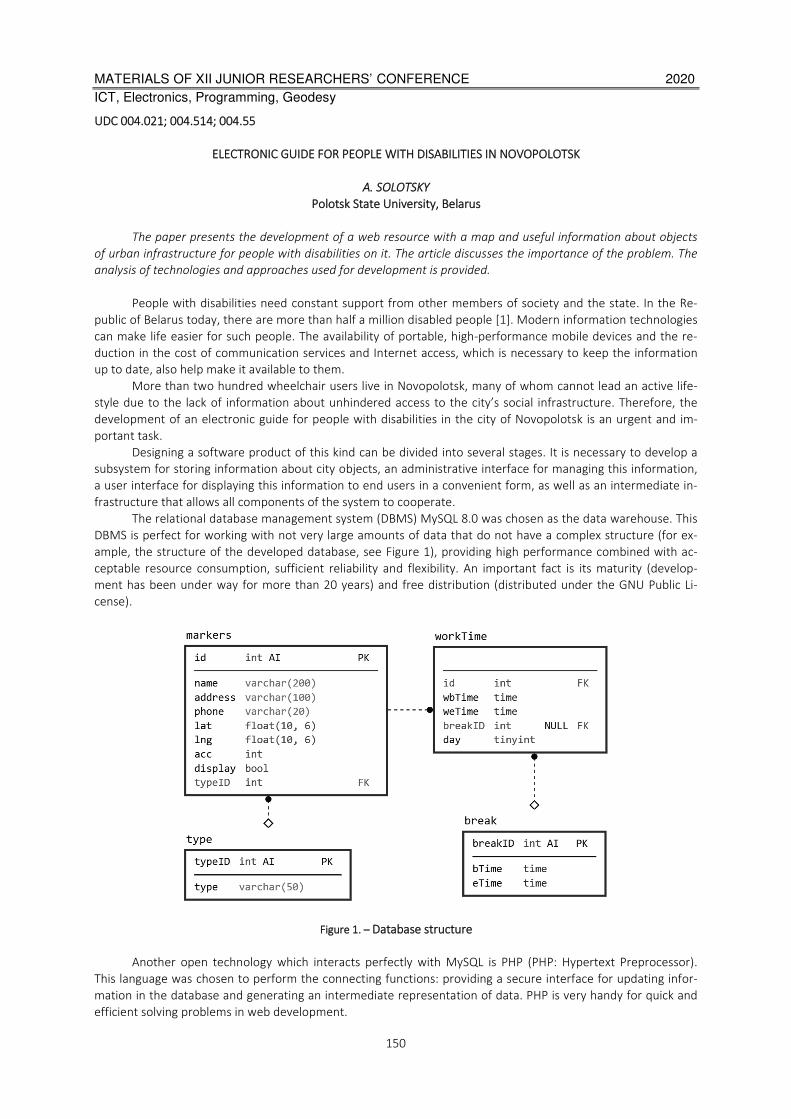
MATERIALS OF XII JUNIOR RESEARCHERS’ CONFERENCE 2020
ICT, Electronics, Programming, Geodesy
150
UDC 004.021; 004.514; 004.55
ELECTRONIC GUIDE FOR PEOPLE WITH DISABILITIES IN NOVOPOLOTSK
A. SOLOTSKY
Polotsk State University, Belarus
The paper presents the development of a web resource with a map and useful information about objects
of urban infrastructure for people with disabilities on it. The article discusses the importance of the problem. The
analysis of technologies and approaches used for development is provided.
People with disabilities need constant support from other members of society and the state. In the Re-
public of Belarus today, there are more than half a million disabled people [1]. Modern information technologies
can make life easier for such people. The availability of portable, high-performance mobile devices and the re-
duction in the cost of communication services and Internet access, which is necessary to keep the information
up to date, also help make it available to them.
More than two hundred wheelchair users live in Novopolotsk, many of whom cannot lead an active life-
style due to the lack of information about unhindered access to the city’s social infrastructure. Therefore, the
development of an electronic guide for people with disabilities in the city of Novopolotsk is an urgent and im-
portant task.
Designing a software product of this kind can be divided into several stages. It is necessary to develop a
subsystem for storing information about city objects, an administrative interface for managing this information,
a user interface for displaying this information to end users in a convenient form, as well as an intermediate in-
frastructure that allows all components of the system to cooperate.
The relational database management system (DBMS) MySQL 8.0 was chosen as the data warehouse. This
DBMS is perfect for working with not very large amounts of data that do not have a complex structure (for ex-
ample, the structure of the developed database, see Figure 1), providing high performance combined with ac-
ceptable resource consumption, sufficient reliability and flexibility. An important fact is its maturity (develop-
ment has been under way for more than 20 years) and free distribution (distributed under the GNU Public Li-
cense).
Figure 1. – Database structure
Another open technology which interacts perfectly with MySQL is PHP (PHP: Hypertext Preprocessor).
This language was chosen to perform the connecting functions: providing a secure interface for updating infor-
mation in the database and generating an intermediate representation of data. PHP is very handy for quick and
efficient solving problems in web development.
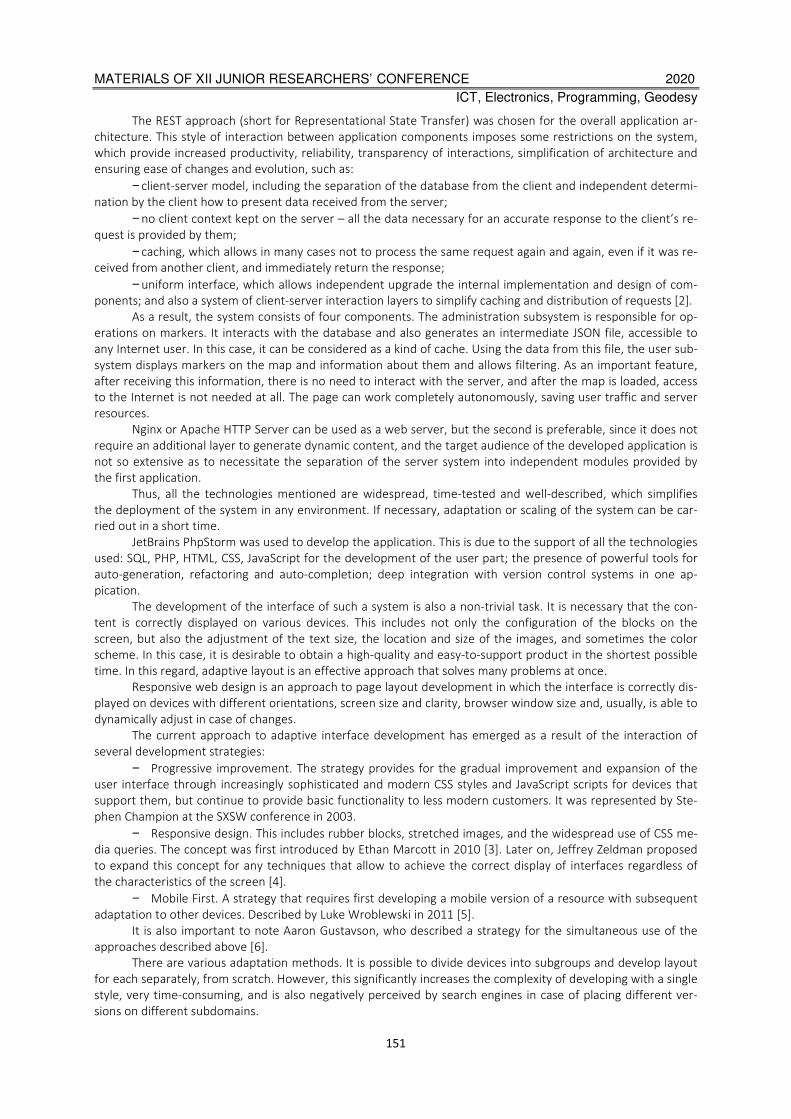
MATERIALS OF XII JUNIOR RESEARCHERS’ CONFERENCE 2020
ICT, Electronics, Programming, Geodesy
151
The REST approach (short for Representational State Transfer) was chosen for the overall application ar-
chitecture. This style of interaction between application components imposes some restrictions on the system,
which provide increased productivity, reliability, transparency of interactions, simplification of architecture and
ensuring ease of changes and evolution, such as:
− client-server model, including the separation of the database from the client and independent determi-
nation by the client how to present data received from the server;
− no client context kept on the server – all the data necessary for an accurate response to the client’s re-
quest is provided by them;
− caching, which allows in many cases not to process the same request again and again, even if it was re-
ceived from another client, and immediately return the response;
− uniform interface, which allows independent upgrade the internal implementation and design of com-
ponents; and also a system of client-server interaction layers to simplify caching and distribution of requests [2].
As a result, the system consists of four components. The administration subsystem is responsible for op-
erations on markers. It interacts with the database and also generates an intermediate JSON file, accessible to
any Internet user. In this case, it can be considered as a kind of cache. Using the data from this file, the user sub-
system displays markers on the map and information about them and allows filtering. As an important feature,
after receiving this information, there is no need to interact with the server, and after the map is loaded, access
to the Internet is not needed at all. The page can work completely autonomously, saving user traffic and server
resources.
Nginx or Apache HTTP Server can be used as a web server, but the second is preferable, since it does not
require an additional layer to generate dynamic content, and the target audience of the developed application is
not so extensive as to necessitate the separation of the server system into independent modules provided by
the first application.
Thus, all the technologies mentioned are widespread, time-tested and well-described, which simplifies
the deployment of the system in any environment. If necessary, adaptation or scaling of the system can be car-
ried out in a short time.
JetBrains PhpStorm was used to develop the application. This is due to the support of all the technologies
used: SQL, PHP, HTML, CSS, JavaScript for the development of the user part; the presence of powerful tools for
auto-generation, refactoring and auto-completion; deep integration with version control systems in one ap-
pication.
The development of the interface of such a system is also a non-trivial task. It is necessary that the con-
tent is correctly displayed on various devices. This includes not only the configuration of the blocks on the
screen, but also the adjustment of the text size, the location and size of the images, and sometimes the color
scheme. In this case, it is desirable to obtain a high-quality and easy-to-support product in the shortest possible
time. In this regard, adaptive layout is an effective approach that solves many problems at once.
Responsive web design is an approach to page layout development in which the interface is correctly dis-
played on devices with different orientations, screen size and clarity, browser window size and, usually, is able to
dynamically adjust in case of changes.
The current approach to adaptive interface development has emerged as a result of the interaction of
several development strategies:
− Progressive improvement. The strategy provides for the gradual improvement and expansion of the
user interface through increasingly sophisticated and modern CSS styles and JavaScript scripts for devices that
support them, but continue to provide basic functionality to less modern customers. It was represented by Ste-
phen Champion at the SXSW conference in 2003.
− Responsive design. This includes rubber blocks, stretched images, and the widespread use of CSS me-
dia queries. The concept was first introduced by Ethan Marcott in 2010 [3]. Later on, Jeffrey Zeldman proposed
to expand this concept for any techniques that allow to achieve the correct display of interfaces regardless of
the characteristics of the screen [4].
− Mobile First. A strategy that requires first developing a mobile version of a resource with subsequent
adaptation to other devices. Described by Luke Wroblewski in 2011 [5].
It is also important to note Aaron Gustavson, who described a strategy for the simultaneous use of the
approaches described above [6].
There are various adaptation methods. It is possible to divide devices into subgroups and develop layout
for each separately, from scratch. However, this significantly increases the complexity of developing with a single
style, very time-consuming, and is also negatively perceived by search engines in case of placing different ver-
sions on different subdomains.
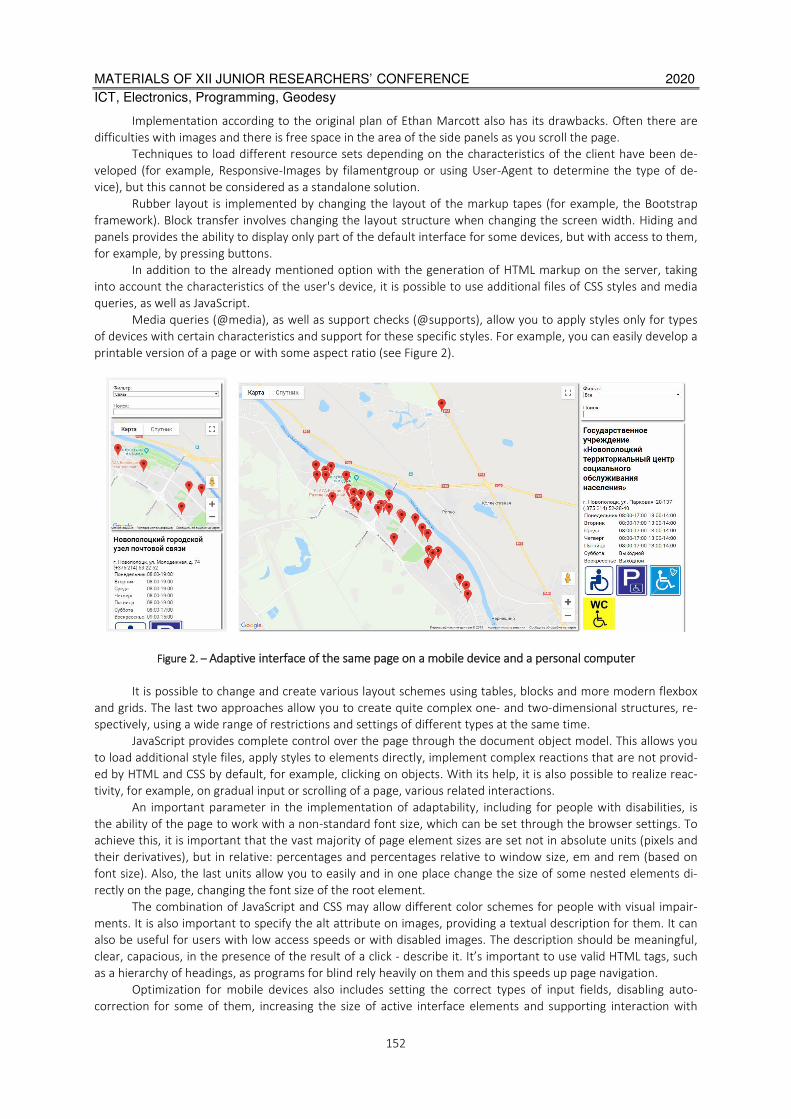
MATERIALS OF XII JUNIOR RESEARCHERS’ CONFERENCE 2020
ICT, Electronics, Programming, Geodesy
152
Implementation according to the original plan of Ethan Marcott also has its drawbacks. Often there are
difficulties with images and there is free space in the area of the side panels as you scroll the page.
Techniques to load different resource sets depending on the characteristics of the client have been de-
veloped (for example, Responsive-Images by filamentgroup or using User-Agent to determine the type of de-
vice), but this cannot be considered as a standalone solution.
Rubber layout is implemented by changing the layout of the markup tapes (for example, the Bootstrap
framework). Block transfer involves changing the layout structure when changing the screen width. Hiding and
panels provides the ability to display only part of the default interface for some devices, but with access to them,
for example, by pressing buttons.
In addition to the already mentioned option with the generation of HTML markup on the server, taking
into account the characteristics of the user's device, it is possible to use additional files of CSS styles and media
queries, as well as JavaScript.
Media queries (@media), as well as support checks (@supports), allow you to apply styles only for types
of devices with certain characteristics and support for these specific styles. For example, you can easily develop a
printable version of a page or with some aspect ratio (see Figure 2).
Figure 2. – Adaptive interface of the same page on a mobile device and a personal computer
It is possible to change and create various layout schemes using tables, blocks and more modern flexbox
and grids. The last two approaches allow you to create quite complex one- and two-dimensional structures, re-
spectively, using a wide range of restrictions and settings of different types at the same time.
JavaScript provides complete control over the page through the document object model. This allows you
to load additional style files, apply styles to elements directly, implement complex reactions that are not provid-
ed by HTML and CSS by default, for example, clicking on objects. With its help, it is also possible to realize reac-
tivity, for example, on gradual input or scrolling of a page, various related interactions.
An important parameter in the implementation of adaptability, including for people with disabilities, is
the ability of the page to work with a non-standard font size, which can be set through the browser settings. To
achieve this, it is important that the vast majority of page element sizes are set not in absolute units (pixels and
their derivatives), but in relative: percentages and percentages relative to window size, em and rem (based on
font size). Also, the last units allow you to easily and in one place change the size of some nested elements di-
rectly on the page, changing the font size of the root element.
The combination of JavaScript and CSS may allow different color schemes for people with visual impair-
ments. It is also important to specify the alt attribute on images, providing a textual description for them. It can
also be useful for users with low access speeds or with disabled images. The description should be meaningful,
clear, capacious, in the presence of the result of a click - describe it. It’s important to use valid HTML tags, such
as a hierarchy of headings, as programs for blind rely heavily on them and this speeds up page navigation.
Optimization for mobile devices also includes setting the correct types of input fields, disabling auto-
correction for some of them, increasing the size of active interface elements and supporting interaction with

MATERIALS OF XII JUNIOR RESEARCHERS’ CONFERENCE 2020
ICT, Electronics, Programming, Geodesy
153
them through touches, the widespread use of autocomplete, refusal to track guidance (replacing it with touch-
es).
The developed application meets all the requirements of the subject area, the tables of the created data-
base meet the requirements of normalization, which ensures the integrity and consistency of information. The
most suitable and modern programming languages and development environments, key technologies and ap-
proaches for creating adaptive interfaces, including those adapted for use by people with disabilities, were used
to create the application.
REFERENCES
1. Численность инвалидов, получающих пенсию в органах по труду и социальной защите | Министерство
труда и социальной защиты Республики Беларусь. Официальный сайт [Электронный ресурс]. – Режим
доступа: http://www.mintrud.gov.by/ru/chislinv. – Дата доступа: 09.09.2019.
2. Fielding Dissertation: CHAPTER 5: Representational State Transfer (REST) [Электронный ресурс]. – Режим
доступа: https://www.ics.uci.edu/~fielding/pubs/dissertation/rest_arch_style.htm. – Дата доступа:
11.09.2019.
3. Responsive Web Design – A List Apart [Электронный ресурс]. – Режим доступа:
https://alistapart.com/article/responsive-web-design/ – Дата доступа: 02.09.2019.
4. Responsive Design. I don't think that word means what you think it means. | Zeldman on Web & Interaction
Design [Электронный ресурс]. – Режим доступа: http://www.zeldman.com/2011/07/06/responsive-design-
i-dont-think-that-word-means-what-you-think-it-means/ – Дата доступа: 02.09.2019.
5. Вроблевски Л. Сначала мобильные! – М.: Манн, Иванов и Фербер, 2012. – 176 с.
6. Gustafson A. Adaptive Web Design: Crafting Rich Experiences with Progressive Enhancement. – Easy Readers,
2011. – 114 с.

MATERIALS OF XII JUNIOR RESEARCHERS’ CONFERENCE 2020
ICT, Electronics, Programming, Geodesy
154
UDC 004.4'234
THE INSIDE OF HEADLESS CHROME
M. BALABASH, A. OSKIN
Polotsk State University, Belarus
In this paper, we define headless web browsers and how to use them. The main components of the Head-
less Chrome web browser and the interaction protocol are considered.
Introduction. A headless browser is a great tool for automated testing and server environments where
you don't need a visible UI shell. For example, you may want to run some tests against a real web page, create a
PDF of it, or just inspect how the browser renders an URL.
Headless browsers provide automated web page management in an environment with all modern web
platform features. They provide special programming interfaces for interacting with the runtime and allow you
to control the web browser, execute code in its environment and receive any available information from the
context of the web browser.
Chromium is an open browser implementation based on WebKit. Google Chrome is a branded version of
Chromium, which has proprietary codecs, integrations with Google services, etc. Headless Chrome is a headless
version of the Google Chrome browser. And that is we gonna explore.
Blink is a browser engine. Blink is a fork of the WebCore component of WebKit, which was originally a fork
of the KHTML and KJS libraries from KDE. It is used in Chrome starting at version 28, Microsoft Edge starting at
version 79, Opera (15+), Vivaldi, Amazon Silk and other Chromium-based browsers and frameworks.
The Chrome DevTools protocol is used as the management interface (API). Chrome DevTools is a set of
tools for web developers, built directly into the Google Chrome browser.
Chromium Components. The lowest level is a Platform layer.
1. Ozone, the abstract window manager in Chrome, is what the window manager of the operating system
interacts with. On Linux, it is either an X-server or Wayland. On Windows, it is a Windows window manager.
2. Scheduler - the same scheduler that deals with the synchronization of threads and processes, because
Chrome is a multi-process application.
3. Net - a network component that parses HTTP, creates headers, etc.
The Content layer is the largest component Chrome has.
1. Blink - a WebCore-based web engine from WebKit for working with HTML and CSS; V8 (JavaScript en-
gine); API for all extensions we use in Chrome. It also includes the DevTools protocol.
2. The Content API is an interface with which you can very easily use all the features of the web engine.
Since there are a lot of things inside Blink (several hundred thousand interfaces), in order not to get lost in all
these methods and functions, you need a Content API.
Headless layer level.
1. Headless library.
2. Embedder API interface for embedding Headless library in the application.
3. Client API is an interface that Puppeteer uses.
Application Layer
1. Your application (Embedding app).
2. Gadgets, for example, Headless shell.
Chrome DevTools protocol. All front-end developers (and not only they) came across the Chrome Dev-
Tools protocol, because they used the Chrome developer panel or the remote debugger, or Chrome develop-
ment tools. If you run the developer tools remotely, communication with the browser occurs using the DevTools
protocol. When you install debugger, see code coverage, use geolocation or something else - all this is controlled
using DevTools.
The protocol has 2 components:
1. DevTools target - the tab that you inspect.
2. DevTools client - for example, this is a developer panel that is launched remotely.
They communicate using simple JSON:
1. There is an identifier for the command, the name of the method to be executed, and some parame-
ters.

MATERIALS OF XII JUNIOR RESEARCHERS’ CONFERENCE 2020
ICT, Electronics, Programming, Geodesy
155
2. The answer also looks very simple: an identifier that is needed because all the commands that are exe-
cuted using the protocol are asynchronous. In order for us to always be able to compare which response to
which team we received, we need an identifier.
3. Result.
Puppeteer. This is a library developed by the Chrome team (available for several programming languages)
that provides a high-level API for controlling Chrome or Chromium using the DevTools protocol.
It provides a high-level API to control headless (or full) Chrome. And hides away the complexities of the
DevTools protocol and takes care of redundant tasks like launching a debug instance of Chrome. It's similar to
other automated testing libraries like Phantom and NightmareJS, but it only works with the latest versions of
Chrome.
Among other things, Puppeteer can be used to easily take screenshots, create PDFs, navigate pages, and
fetch information about those pages, measure and diagnose performance indicators, intercept of network re-
quests / responses, test Chrome extensions, automate form submission, user interface testing, keyboard input,
etc.
Playwright. Playwright is a Node library to automate the Chromium, WebKit and Firefox browsers with a
single API. It enables cross-browser web automation that is ever-green, capable, reliable and fast.
Headless is supported for all the browsers on all platforms. This solution has all abilities that Puppeteer
has, but also supports WebKit and Firefox browsers. Playwright also has really similar to Puppeteer programming
API.
Conclusion. Headless Chrome is a tool that allows you test our web applications and automate interac-
tions with them. DevTools protocol has a rich set of features that allows you to develop complete and independ-
ent software solutions for a wide range of tasks (monitoring web applications, development environment VS
Code). The ability to receive information, execute code, and automate browser actions opens up many possibili-
ties.
REFERENCES
1. GitHub [Electronic resource] Headless Chrome Node.js API. Access Mode: https://github.com/ Google-
Chrome / puppeteer. Access date: 09/27/19.
2. ChromeDevtools [Electronic resource] Chrome DevTools Protocol Viewer. Access Mode:
https://chromedevtools.github.io/devtools-protocol/. Access date: 09/27/19.
2. Chromium [Electronic resource] The Chromium Projects. Access Mode: https: // www.chromium.org/. Access
date: 09/27/19.
MATERIALS OF XII JUNIOR RESEARCHERS’ CONFERENCE 2020
ICT, Electronics, Programming, Geodesy
156
UDC 512.7
ON QUESTION ABOUT THE INTERPOLATION POLYNOMIAL OF THE FUNCTION f(λ)
P. SINYAK, N. GUR'YEVA
Polotsk State University, Belarus
Let different argument values be given 1λ , 2λ , …, sλ and function values )λ( kf , )λ( kf ′ , …,
)λ()1(
k
mkf−
real or complex variable functions and its derivatives up to and including order )1( −km with the
specified argument values, where 1=k , 2, …, s.
There is a polynomial )λ(p of degree )1( −n , where smmmn +++= ...21 . This polynomial satisfies the
conditions:
)λ()λ( kk fp = ,
)λ()λ( kk fp ′=′ , (1)
)λ()λ()1()1(
k
m
k
m kk fp−− = .
The polynomial )λ(p is called the Lagrange-Sylvester interpolation polynomial of a function )λ(f under
interpolation conditions (1).
To solve the problem of interpolating a function )λ(f by a polynomial )λ(p we find the defining poly-
nomial
sm
s
mm)λλ(...)λλ()λλ()λ(ψ 21
21 −⋅⋅−⋅−= , where smmmn +++= ...21 . (2)
Next, we build the right rational fraction
sm
s
mm
pp
)λλ(...)λλ()λλ(
)λ(
)λ(ψ
)λ(21
21 −⋅⋅−⋅−= ,
which decomposes into a sum of elementary fractions
∑=
−++
−+
−=
−
s
k k
km
m
k
k
m
k
k k
kk
p
1
21
)λλ(
α...
)λλ(
α
)λλ(
α
)λ(ψ
)λ(1
. (3)
To determine the coefficients jiα of the presented decomposition multiply both parts by km
k )λλ( − ,
then we get
)λ(ψ
)λ(
k
p, where
km
k
k)λλ(
)λ(ψ)λ(ψ
−= . (4)
Substituting kλλ = into a )λ(ψ
)λ(
k
p and into a
)1(
)λ(ψ
)λ(−
j
k
p, where 1=j , 2, …, km ,
we find
)1(
λλ)λ(ψ
)λ(
)!1(
1α
−
=
−=
j
k
jk
k
f
j. (5)
From equality (3) multiplying both parts by )λ(ψ , we uniquely define a polynomial )λ(p :
[ ] )λ(ψ)λλ(α...)λλ(αα)λ(1
211
k
s
k
m
kkmkkkk
kp ⋅−++−+= ∑
=
− . (6)
The expression in square brackets is the sum of the first members km of the Taylor series.
Consider a special case of a function )λ(f : λ)λ( ef = .
We construct an interpolation polynomial )λ(p under the following conditions:
1λ1 = , 2λ2 = , 3λ3 = ,
ep =)1( , 2)2( ep = , 3
)3( ep = .

MATERIALS OF XII JUNIOR RESEARCHERS’ CONFERENCE 2020
ICT, Electronics, Programming, Geodesy
157
First of all, we compose the defining polynomial
321 )3λ()2λ()1λ()λ(ψmmm −⋅−⋅−= ,
and define
21 =m , 12 =m , 13 =m .
Then
4112321 =++=++= mmmn .
Therefore, we seek a polynomial of degree
3141 =−=−n .
=−⋅−+−⋅−−−⋅−⋅
−+= )2λ()1λ(4
)3λ()1λ()3λ()2λ()1λ(4
5
2)λ(
23
22 ee
eep
=−⋅−++−⋅−+−+−−
−+= )2λ(λ)21λ(4
)3λ()λ21λ()6λ2λ3λ()1λ(4
5
2
23
222 ee
ee
=++++−−+−−+−
−+= )λ42λ-2-λ2λ-λ(4
)λ6λ23λλ3λ()6λ5λ(4
5
4
λ5
2
2233
22322 ee
eee
−+−+
−++−+−+
+−=
23
2
9λ7
4
5
4
45λ)57(λ
44
53
223
23233
2 ee
ee
eeeee
ee
e.
So, the interpolation polynomial )λ(p for a function λ)λ( ef = for 1λ1 = , 2λ2 = , 3λ3 = , ep =)1( ,
2)2( ep = , 3
)3( ep = , ep =′ )1( , 2)2( ep =′ , 3
)3( ep =′ has the form:
−+−+
−++−+−+
+−=
23
2
9λ7
4
5
4
45λ)57(λ
44
5)λ(
322
32323
32 e
ee
eee
eeee
ee
p .
REFERENCES
1. Головина, Л.И. Линейная алгебра и некоторые её приложения / Л.И. Головина. – М. Наука. – 1975. –
480 с.
2. Фаддеев, Д.К. Вычислительные методы линейной алгебры / Д.К. Фаддеев, В.Н. Фаддеева. – М. Наука. –
1960. – 655 с.
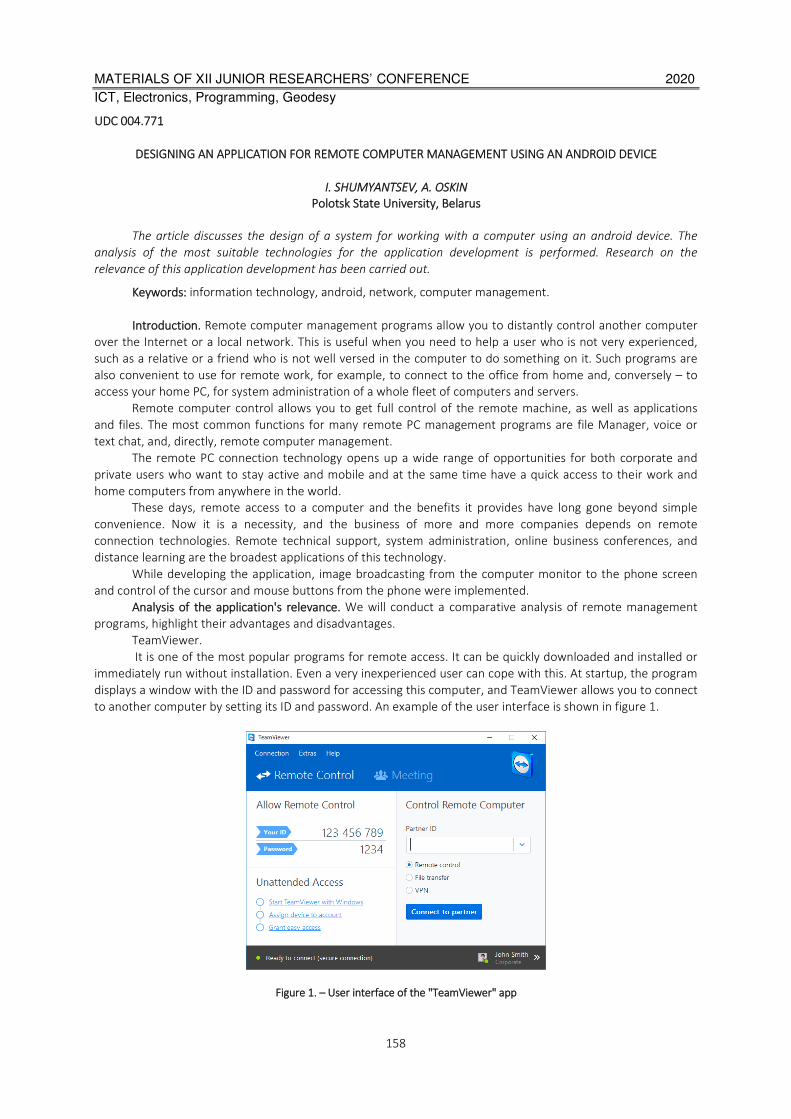
MATERIALS OF XII JUNIOR RESEARCHERS’ CONFERENCE 2020
ICT, Electronics, Programming, Geodesy
158
UDC 004.771
DESIGNING AN APPLICATION FOR REMOTE COMPUTER MANAGEMENT USING AN ANDROID DEVICE
I. SHUMYANTSEV, A. OSKIN
Polotsk State University, Belarus
The article discusses the design of a system for working with a computer using an android device. The
analysis of the most suitable technologies for the application development is performed. Research on the
relevance of this application development has been carried out.
Keywords: information technology, android, network, computer management.
Introduction. Remote computer management programs allow you to distantly control another computer
over the Internet or a local network. This is useful when you need to help a user who is not very experienced,
such as a relative or a friend who is not well versed in the computer to do something on it. Such programs are
also convenient to use for remote work, for example, to connect to the office from home and, conversely – to
access your home PC, for system administration of a whole fleet of computers and servers.
Remote computer control allows you to get full control of the remote machine, as well as applications
and files. The most common functions for many remote PC management programs are file Manager, voice or
text chat, and, directly, remote computer management.
The remote PC connection technology opens up a wide range of opportunities for both corporate and
private users who want to stay active and mobile and at the same time have a quick access to their work and
home computers from anywhere in the world.
These days, remote access to a computer and the benefits it provides have long gone beyond simple
convenience. Now it is a necessity, and the business of more and more companies depends on remote
connection technologies. Remote technical support, system administration, online business conferences, and
distance learning are the broadest applications of this technology.
While developing the application, image broadcasting from the computer monitor to the phone screen
and control of the cursor and mouse buttons from the phone were implemented.
Analysis of the application's relevance. We will conduct a comparative analysis of remote management
programs, highlight their advantages and disadvantages.
TeamViewer.
It is one of the most popular programs for remote access. It can be quickly downloaded and installed or
immediately run without installation. Even a very inexperienced user can cope with this. At startup, the program
displays a window with the ID and password for accessing this computer, and TeamViewer allows you to connect
to another computer by setting its ID and password. An example of the user interface is shown in figure 1.
Figure 1. – User interface of the "TeamViewer" app
MATERIALS OF XII JUNIOR RESEARCHERS’ CONFERENCE 2020
ICT, Electronics, Programming, Geodesy
159
Advantages: the program has several main modes of operation: remote management, file transfer, chat,
demonstration of your desktop. The program allows you to configure round-the-clock access to your computer,
which will be convenient for system administration. The speed of work is quite decent, there are versions for all
mobile platforms, for various operating systems, which is very pleasing. A simple and intuitive interface, plus a
number of additional utilities to expand the program's functionality, will be useful for remote support services.
Disadvantages: although the program is free, it’s only for non-commercial use, but also, when working
with it for more than 5 minutes, a number of difficulties arise, for example, TV can block a remote connection
session, recognizing it as commercial use. For round-the-clock remote access or administration of multiple
computers, computer network, you have to pay for additional program modules. The cost of the program is high.
LiteManager.
It is a simple, but quite powerful program. It consists of two parts, the first is the Server that you need to
install or run on a remote computer and the Viewer, which allows you to manage another computer. To work,
the program requires a little more skills and experience from the Manager, although working with the server is
even easier than in TeamViewer, the server can be installed once and no more actions are needed from the user,
the ID will always be constant, it can even be set manually, which is very convenient for remembering. The
LiteManager Free version is free for personal and commercial use. An example of the user interface is shown in
figure 2.
Figure 2. – User interface of the "LiteManager" application
Advantages: in addition to the main remote access modes: remote management, file transfer, chat, task
Manager, registry editor, there are also unique functions in the program, such as inventory, screen recording,
and remote installation. The program is free to use on 30 computers, it can be used for round-the-clock access
without any additional modules. There are no restrictions on working hours. You can configure your own server
ID to configure the corporate support service. The program does not have any time limits and locks.
Disadvantages: there are no mobile platforms or versions for other systems, there are restrictions on 30
computers in the free version, to administer more, you need to purchase a license. Some specific operating
modes are only available in the Pro version.
RAdmin.
It is one of the first remote management programs and well-known in its circle and I cannot but mention
it. It is designed rather for system administration and the main focus is on security. The program consists of two
components: a server component and a client component. It requires installation, it wouldn’t be easy for an
inexperienced user to deal with it, the program is designed to work via the IP address mainly, which is not very
convenient for providing technical support via the Internet. The program is paid, but has a free test period. An
example of the user interface is shown in figure 3.
Advantages: the program has a high speed of operation, especially in a good network, there is an
increased reliability and security thanks to the video capture driver of the desktop. There is a built-in Intel AMT
technology, which allows you to connect to the BIOS of a remote computer and configure it. Only the main
modes of operation are implemented: remote management, file transfer, chat, etc.
MATERIALS OF XII JUNIOR RESEARCHERS’ CONFERENCE 2020
ICT, Electronics, Programming, Geodesy
160
Figure 3. – User interface of the "RAdmin" application
Disadvantages: there is almost no way to work without an IP address, i.e. to connect by ID. There is no
client for mobile systems. There is no free version, only a test period of 30 days. To work with the program, you
need the skills of an experienced user. When connecting a video, the driver may disable the Aero graphical shell,
sometimes the screen flashes.
The considered analogs do not fully satisfy the optimal functionality of the application being developed.
The advantageous difference between the developed application and its analogues is that in this application the
load on the network is much lower than that of the above-mentioned analogues. It is also worth noting that this
application uses much less computer resources (processor, RAM).
Tools for solving the problem. You must select the Protocol for network communication between the
server program and the client program.
Network sockets are divided into two main types – TCP and UDP. The choice of socket depends entirely
on the functionality of the application and the tasks it will solve.
TCP is a Protocol that uses the secure connection principle. This means that you establish a connection
between two computers, and then send data between them just as if you were writing information to a file on
one computer and reading it from the same file on the other. In this case, the connection is considered reliable
and consistent – that is, all information that you send is guaranteed to reach the recipient in the same order in
which it was sent. Also, a TCP connection can be considered a continuous data stream – the Protocol itself takes
care of splitting data into packets and sending them over the network [1].
UDP is one of the key elements of TCP / IP, a set of network protocols for the Internet [2]. With UDP,
computer applications can send messages (in this case called datagrams) to other hosts over an IP network
without the need for a pre-message to set up special transmission channels or data paths. The Protocol was
developed by David P. Reed in 1980 [3].
In this case, the use of the TCP Protocol is not allowed, since our program is tied to real-time network
interaction. For many aspects of the program, such as user clicks or changes in the state of the screen, it doesn't
matter what happened a second ago, but only the most current state of the computer is important. The network
part of this application are as follows: each iteration of the loop, the server sends to the client the report in the
form of pictures, while the client sends the server the commands that must run without delay (pressing buttons,
moving the cursor), and each iteration the server processes the received data, updating the current status of the
screen and sends the screenshot to an array of bytes to the client so that the user rendered a new frame. So, in
this application, if a packet is lost during transmission over the network, all server processes are suspended until
the packet is delivered again. On the client side, the image freezes, and data will not reach the server either,
since the server cannot accept new packets. When a lost package finally arrives, it contains outdated information
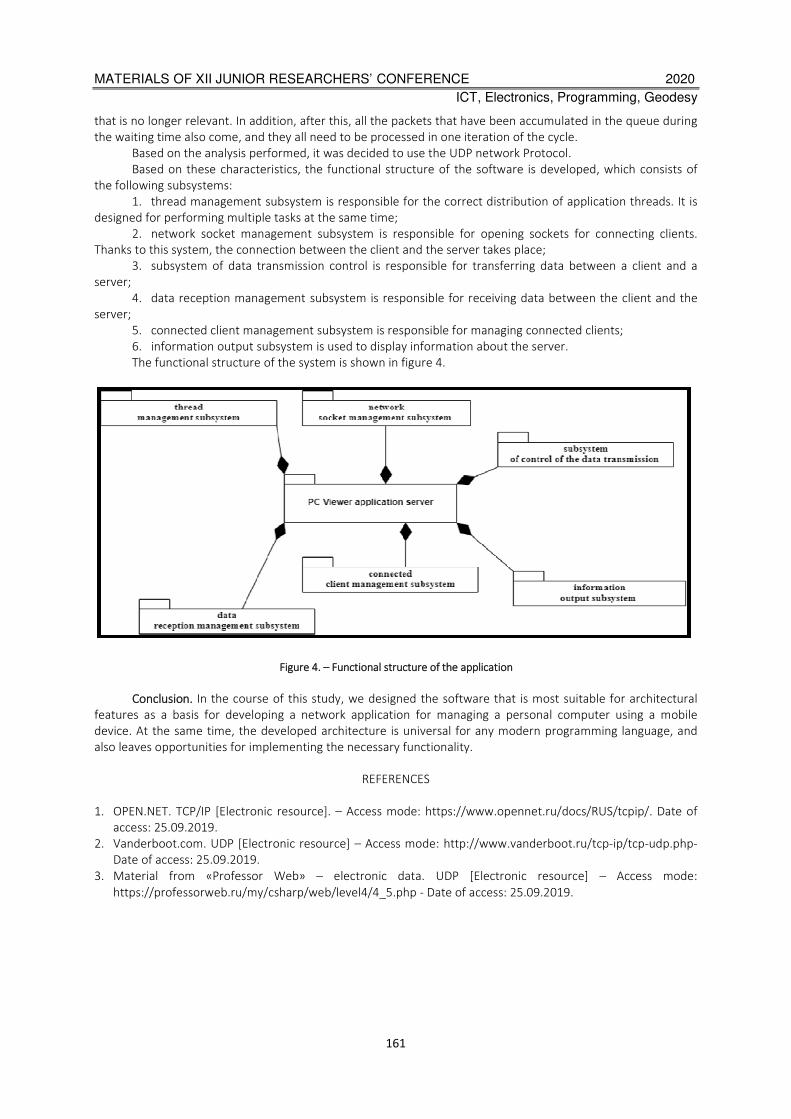
MATERIALS OF XII JUNIOR RESEARCHERS’ CONFERENCE 2020
ICT, Electronics, Programming, Geodesy
161
that is no longer relevant. In addition, after this, all the packets that have been accumulated in the queue during
the waiting time also come, and they all need to be processed in one iteration of the cycle.
Based on the analysis performed, it was decided to use the UDP network Protocol.
Based on these characteristics, the functional structure of the software is developed, which consists of
the following subsystems:
1. thread management subsystem is responsible for the correct distribution of application threads. It is
designed for performing multiple tasks at the same time;
2. network socket management subsystem is responsible for opening sockets for connecting clients.
Thanks to this system, the connection between the client and the server takes place;
3. subsystem of data transmission control is responsible for transferring data between a client and a
server;
4. data reception management subsystem is responsible for receiving data between the client and the
server;
5. connected client management subsystem is responsible for managing connected clients;
6. information output subsystem is used to display information about the server.
The functional structure of the system is shown in figure 4.
Figure 4. – Functional structure of the application
Conclusion. In the course of this study, we designed the software that is most suitable for architectural
features as a basis for developing a network application for managing a personal computer using a mobile
device. At the same time, the developed architecture is universal for any modern programming language, and
also leaves opportunities for implementing the necessary functionality.
REFERENCES
1. OPEN.NET. TCP/IP [Electronic resource]. – Access mode: https://www.opennet.ru/docs/RUS/tcpip/. Date of
access: 25.09.2019.
2. Vanderboot.com. UDP [Electronic resource] – Access mode: http://www.vanderboot.ru/tcp-ip/tcp-udp.php-
Date of access: 25.09.2019.
3. Material from «Professor Web» – electronic data. UDP [Electronic resource] – Access mode:
https://professorweb.ru/my/csharp/web/level4/4_5.php - Date of access: 25.09.2019.

MATERIALS OF XII JUNIOR RESEARCHERS’ CONFERENCE 2020
ICT, Electronics, Programming, Geodesy
162
UDC 004.415.24
ENSURING INFORMATION SECURITY WHEN SERIALIZING JAVA OBJECTS
M. MAKARYCHEV, V. MAKARYCHEVA, A. OSKIN
Polotsk State University, Belarus
This paper describes how to serialize Java objects with support for encryption and electronic signature.
Based on existing tools in Java, its own implementation with fixed security settings is proposed.
Today, Java is the most popular programming language according to the TIOBE Index. Java supports the
object-oriented programming (OOP) paradigm. This means that any data is represented as objects of some class.
One of the characteristics of the object is the state – information characterizing the object.
Often the state of an object needs to be saved to a file, database, or transferred over the network. Serial-
ization is used for this. Serialization is the process of converting the state of an object into a data stream. Dese-
rialization is the reverse process. Serialization of objects of some class is possible only when this class imple-
ments the Serializable interface.
In special cases, the serialization mechanism can be customized. Firstly, using the transient modifier, you
can reverse the serialization of a certain field of the class. Secondly, you can change serialization behavior by
defining methods:
– private void writeObject(ObjectOutputStream out) throws IOException;
– private void readObject(ObjectInputStream in) throws IOException, ClassNotFoundException.
Thirdly, in the place of implementation of the Serializable interface, you can implement the Externalizable
interface and define its methods:
– public void writeExternal(ObjectOutput out) throws IOException;
– public void readExternal(ObjectInput in) throws IOException, ClassNotFoundException.
In this case, the serialization protocol is determined by the developer.
Sometimes a serialized object is required to be cryptographically secure. Cryptographic protection refers
to ensuring confidentiality, monitoring the integrity and authenticity of information. The serialization control
methods listed above have a significant drawback: you need to change the source code of the class. For exam-
ple, a class must contain encryption and decryption algorithms for its fields. The developers of Java Cryptography
Architecture (JCA) and Java Cryptography Extension (JCE) solved this problem and introduced two classes: Seale-
dObject and SignedObject.
A SealedObject instance acts like a wrapper around another object. It contains an encrypted version of
the serialized representation of the wrapped object. The following conditions are required to create an instance
of SealedObject:
– the wrapped class must be serializable;
– the constructor, in addition to the wrapped object, requires an instance of the Cipher class, which is a
cryptographic cipher [1].
Encrypted content can be decrypted and deserialized to obtain the original object. To do this, you must
call one of the overloaded getObject() methods on the SealedObject instance [1].
A SignedObject instance also acts as a wrapper around another object. It contains the wrapped object in
serialized form, as well as information about the signature required to verify the authenticity and integrity of the
wrapped object. To create an instance of SignedObject, the following conditions must be met.
– The wrapped class must be serializable.
– The constructor needs the private key of the signer, represented by an instance of the PrivateKey class.
– The constructor needs a signature generation mechanism, represented by an instance of the Signature
class [1].
Once the SignedObject instance has been created or obtained as a result of deserialization, you can verify
the integrity of the wrapped object and the alleged authenticity of the signer. To do this, you must call the veri-
fy() method, passing it the public key and an instance of the Signature class, with which SignedObject was origi-
nally created [1].
Using the getObject() method, you can get an encapsulated object. The encapsulated object is deserial-
ized before returning. It is worth noting that SignedObject does not encrypt the content, so you can get a
wrapped object without first checking the sender's authenticity or integrity [1].

MATERIALS OF XII JUNIOR RESEARCHERS’ CONFERENCE 2020
ICT, Electronics, Programming, Geodesy
163
Having examined these classes and their dependencies in detail, you will notice that they also require
quite a lot of settings before using them. We solved this problem and wrote classes for working by default with
SealedObject and SignedObject.
For convenient use of SealedObject, the class SealedObjectCreator was written. It contains instances of
the Key and Cipher classes. These instances are initialized in the SealedObjectCreator constructor. To initialize
the Key, a KeyGenerator with the AES algorithm is used, which generates a 256-bit key using a SecureRandom
instance with the SHA1PRNG algorithm. To initialize Cipher, the AES algorithm is used in GCM mode without a
padding scheme (AES/GCM/NoPadding), the constant Cipher.ENCRYPT_MODE and the key obtained earlier are
passed to the init() method of the Cipher instance [2]. SealedObjectCreator provides getter methods and an in-
stance method for creating a SealedObject:
public SealedObject newSealedObject(Serializable wrappedObject) [3].
For convenient use of SignedObject, the SignedObjectCreator class was written. It contains instances of
the Signature and KeyPair classes. These instances are initialized in the SignedObjectCreator constructor. Signa-
ture is initialized using the SHA512withECDSA algorithm. To initialize KeyPair, a KeyPairGenerator with an EC
algorithm is used, which generates a 521-bit key using a SecureRandom instance with the SHA1PRNG algorithm
[3]. SignedObjectCreator provides getter methods and an instance method for creating a SignedObject:
public SignedObject newSignedObject(Serializable wrappedObject).
For testing, the User class was created with the string fields name, phone, email and with the integer field
id. The object of this class was constructed as follows:
final User user = new User(1L, “John”, “8-047-429-28-05”, “[email protected]”).
Using SealedObjectCreator, an instance of SealedObject was created, which was written to the file. An
example of the contents of the file is shown in Figure 1.
Figure 1 shows that the information about the user object is encrypted. After deserializing the resulting
SealedObject instance, you can call the getObject() method with the key from the SealedObjectCreator instance.
In this case, the decrypted user object will be returned.
Using SignedObjectCreator, an instance of SignedObject was created, which was written to the file. An
example of the contents of the file is shown in Figure 2.
Figure 2 shows that the information about the user object is not encrypted. For example, the phone
number is highlighted in gray. Data types and other technical information are also visible here. It is worth noting
that the file is written in binary form, and in a simple text editor you can read only string values. This file also
carries digital signature information. If you change the contents of the file or pass the Signature instance differ-
ent from the one provided by SignedObjectCreator to the verify() method of the deserialized instance of
SignedObject, the verify() method will return false. This means that the integrity or authenticity of the data is
compromised. Although the user object can be successfully obtained using the getObject() method of the
SignedObject class.
Figure 1. – Serialized SealedObject content

MATERIALS OF XII JUNIOR RESEARCHERS’ CONFERENCE 2020
ICT, Electronics, Programming, Geodesy
164
Figure 2. – Serialized SignedObject content
So, the classes SealedObjectCreator and SignedObjectCreator are a useful addition to SealedObject and
SignedObject. They allow you to configure secure serializable objects by default and manage them.
REFERENCES
1. Protect information with the SignedObject and SealedObject classes [Electronic resource] / – Mode of access:
https://www.javaworld.com/article/2076237/signed-and-sealed-objects-deliver-secure-serialized-
content.html. – Date of access: 03.02.2020.
2. Security Best Practices: Symmetric Encryption with AES in Java and Android [Electronic resource] / – Mode of
access: https://proandroiddev.com/security-best-practices-symmetric-encryption-with-aes-in-java-
7616beaaade9. – Date of access: 05.02.2020.
3. Encryption and Decryption in Java Cryptography [Electronic resource] / – Mode of access:
https://www.veracode.com/blog/research/encryption-and-decryption-java-cryptography. – Date of access:
05.02.2020.

MATERIALS OF XII JUNIOR RESEARCHERS’ CONFERENCE 2020
ICT, Electronics, Programming, Geodesy
165
UDC 62-5
SWIVEL MECHANISM FOR ANTENNA
WITH GPS SENSOR AND LAN CONTROL
U. HARDZIAYONAK, I. RUSETSKI
Polotsk State University, Belarus
This article discusses the method of developing a rotary device with a GPS sensor and the ability to control
the position of the antenna remotely from the workplace using a LAN connection.
Introduction. All that is needed for the development of the device is a reduction in the size of the case, a
decrease in the weight of the device itself, and a higher antenna rotation speed. To compensate for the resulting
deficiencies the device should be built-in and programmed to support network connections.
Task formulation. As a rule, to develop a device, we need to determine our technical characteristics, on
the basis of which the elemental base of the developed device will be largely determined, and the operating
conditions of this device must also be determined.
Technical details:
- The executive part of the motor has a power of 500W ± 10%;
- Connector for wired LAN;
- The presence of a GPS module;
- The device has several types of antenna rotation;
- The BRIGHTNESS adjustment knob allows you to adjust the brightness of the display;
- Using the VERTICAL knob, azimuth control is provided from 0 to 360º;
- Using the HORIZONTAL knob, you can control the elevation from 0 to 90º.
Operating conditions for use:
- Range of operating temperatures from minus 20 to plus 60 ° C;
- Atmospheric pressure 84 - 106 kPa;
- Relative humidity of 80% at a temperature of no more than 50 ° C.
- The overall dimensions of the device should not exceed 190x110x95mm, the mass should be no more
than 3kg.
The device must be powered from a 24 V DC network.
Methods of research. The following basic elements were selected for the rotary device:
- Encoder-OCD-EIB1B-10V-IXARC;
- Microcontroller-ATmega328p-32KB Flash 2.5V / 3.3V / 5V-Vercial;
- Display-WH1602A-5V-WINSTAP;
- Motor-ZY1016-350W 24V2750 RPM-Funsport;
- GPS module - Beitan BN-880;
The principle of operation of the device is based on the processing of signals transmitted from control devices to
the controller, followed by rotation of the device. The device consists of a control part, a controller and an
actuator.
The actuator consists of several parts. The necessary signal received by the controller is processed and
then transmitted to the motors of the device.
This rotary device is designed to rotate and accurately position even the largest television antennas to
ensure the best signal reception. The rotation of the motor is synchronized with the position of the rotary switch
on the control unit. This is achieved through the use of high-precision synchronous motors. The connecting ca-
bles between the controller and the motor are under safe voltage. After the end of the operating cycle, the de-
vice automatically turns off and does not consume current until you turn it on again by turning the switch on the
control unit.
Based on the structural diagram, you can determine the principle of operation of the device
− The signal from the encoder is fed to the programmed microcontroller.
− From the microcontroller, the processed signal is sent to the display on which the angle of rotation of
the antenna will be displayed.
− The microcontroller also receives a signal to the actuator that will rotate the antenna horizontally and
vertically.

MATERIALS OF XII JUNIOR RESEARCHERS’ CONFERENCE 2020
ICT, Electronics, Programming, Geodesy
166
After a thorough analysis of the available data, the structural diagram, you can begin to develop a func-
tional diagram on which there will be more components of the device, as well as the device itself will be divided
into separate blocks for convenience in drawing up the electrical circuit.
The GPS sensor in this device is required for:
− Accurate location of the antenna;
− Accurate determination of the direction of the antenna;
− The exact azimuthal position (if the antenna was moved by a person to another place).
In the device under development, an absolute encoder was used. In the absolute encoder, the entire ro-
tation circle is divided into a certain number of sectors, most often the same size. These sectors are numbered.
The encoder at work gives the number of the sector in which it is currently located. Therefore, it is called abso-
lute.
With this type of encoder, you can always determine by what angle relative to the zero sector the encod-
er is turned at a particular moment, that is, when turning it, it gives the values of the sector numbers to the max-
imum value. Then it goes back to zero. If the encoder shaft is turned in the other direction, then it will start to
produce opposite values. [2]
Microcontroller ATMega328 is an 8-bit low-power CMOS microcontroller based on advanced AVR RISC
architecture.
ATmega328 / P - the microcontroller of the AVR family, like all the others, has an 8-bit processor and al-
lows you to execute most commands in a single clock cycle.
The reprogrammable read-only memory (EPROM) stores the microcontroller's program of work, as well
as the values of the coefficients and constants necessary to calculate the value of the rotation value from the
signals received from the sensor.
The random access memory stores intermediate values of variables necessary for calculating the meas-
ured temperature values.
I / O ports provide information exchange between the microcontroller and peripheral devices relative to
it. These ports vary in purpose and functionality.
Atmega328p is used to receive the supplied signal, process it and transmit it to the actuator. ATmega328
/ P - the microcontroller of the AVR family, like all the others, has an 8-bit processor and allows you to execute
most commands in a single clock cycle.[1]
This microcontroller uses 5V power.
A display is an electronic device designed to visually display information. The display in most cases
can be called the part of the finished device used to display digital, alphanumeric or graphic information
electronically.
It is necessary to distinguish between the concepts of “display”, as part of the device, and a monitor,
which can have different types of displays - CRT, LCD, plasma, and so on. For example, a mobile phone has a dis-
play for displaying information, but it can also have a remote (plug-in) monitor.
Some displays serve as indicators. But you should distinguish between the concepts of “display” and “in-
dicator”. An indicator is a device (device, element) that reflects any process, the state of the observed object.
Indicators can be, for example, raster, segment, arrow, acoustic, tactile and so on [3]. For example, the TV dis-
play is not an indicator, and the audio indicator is not a display.
Previously, in technology, only raster devices were called displays, and only segment devices were called
indicators, but now modern multifunction indicators are also called displays.
Conclusion. As a result of the article on the topic “Swivel mechanism with GPS sensor and LAN control”,
the following results were obtained:
− The requirements for the developed device were formulated.
− The development of a structural diagram of the device.
− The development of a functional diagram of the device.
After the implementation of the above points, the economic justification of the thesis project was carried
out, the total cost of the product was calculated. Information about analogues showed that the developed de-
vice is more competitive in price, and is not inferior to them in characteristics. Therefore, the production of this
device can be considered economically and technically feasible.

MATERIALS OF XII JUNIOR RESEARCHERS’ CONFERENCE 2020
ICT, Electronics, Programming, Geodesy
167
REFERENCES
1. Микроконтроллер Atmega328 – описание, характеристики http://www.tools.ru/fluke/opt_refl.htm [Элек-
тронный ресурс]. – Электронные данные. – Режим доступа: http://robolive.ru/mikrokontroller-
atmega328-opisanie-xarakteristiki/ Дата доступа: 20.09.2019
2. Материал из electrosam – информационно познавательный сайт. Энкодеры. Виды и работа. Особенно-
сти и применение. [Электронный ресурс]. – Электронные данные. – Режим доступа:
https://electrosam.ru/glavnaja/slabotochnye-seti/oborudovanie/enkodery/ Дата доступа: 20.09.2019
3. Материал из Википедии — свободной энциклопедии. Дисплей [Электронный ресурс]. – Электронные
данные. – Режим доступа: http://ru.wikipedia.org/wiki/Дисплей. Дата доступа: 20.09.2019

MATERIALS OF XII JUNIOR RESEARCHERS’ CONFERENCE 2020
ICT, Electronics, Programming, Geodesy
168
UDC 004.047
CREATING A MINESWEEPER GAME USING THE JAVA PROGRAMMING LANGUAGE
D. MAROZAU, O. GOLUBEVA
Polotsk State University, Belarus
In this article, we will look at the structure of the code on which the game "Minesweeper" is based and
show step by step the methods that are used to create games like this. The Java language that is used for building
is one of the most common and universal programming languages.
First, let's create a Game Object class (Fig.1), it will represent the cell that will make up our field for the
game. In this class, you will need parameters such as:
Figure 1. –Cell coordinates x, y (simple integers);
• cell States: isMine (whether it is a mine or not), isOpen (whether we have already opened the cell or
not), isFlag (whether we have set a flag on the cell or not);
• the count of mines adjacent to this cell countMineNeighgors(integer).
We also create a constructor for this class.
The next step is to build the MinesweeperGame class, which will represent the processes that take place
inside the game. Here we need parameters (Fig.2) such as:
• the size of the side of the SIDE field (an immutable number);
• two-dimensional array of gameField objects (consisting of objects of the GameObject class);
• displaying the state of cells in the field: MINE, FLAG, CLOSED (immutable rows);
• counters: countFlags (how many flags are available for use), countClosedTiles (number of closed cells);
• the state in which the game is located is Game Stopped (if true, it ends the game and does not allow the
player to perform further actions).
Figure 2. – Now we can start describing the processes that occur in the game. Let's create an Initialize()
method (Fig.3 and 4) that is available for external use.
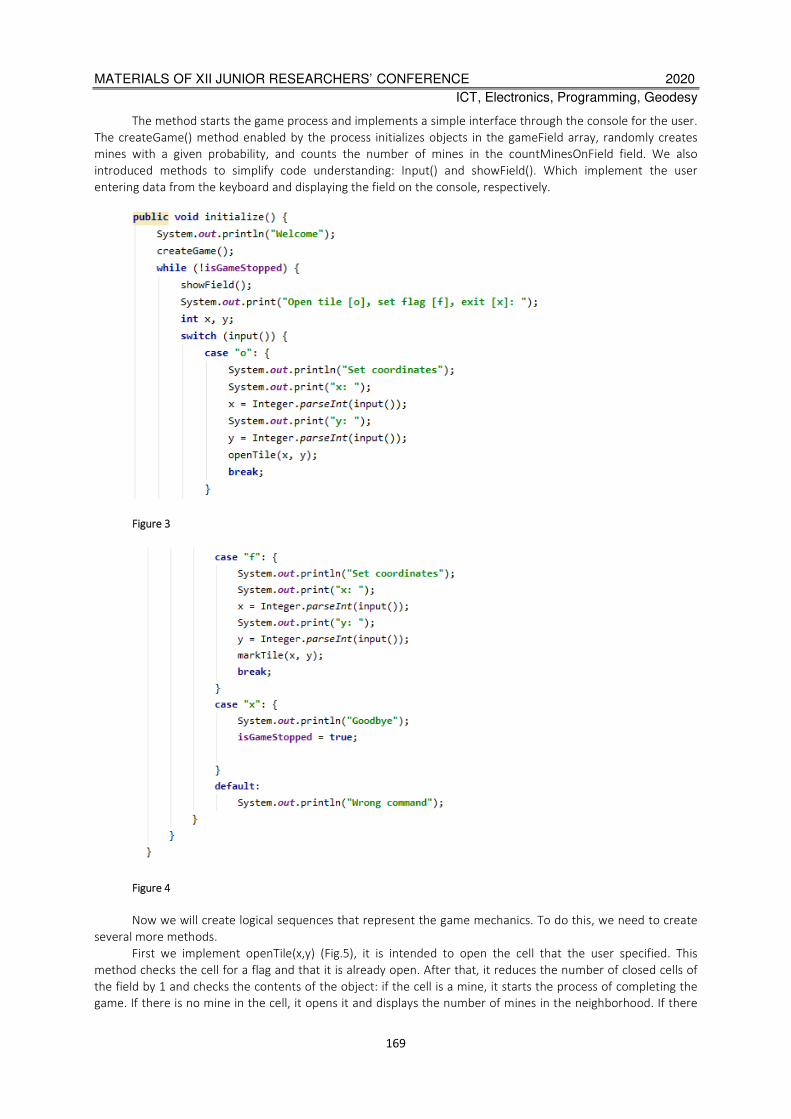
MATERIALS OF XII JUNIOR RESEARCHERS’ CONFERENCE 2020
ICT, Electronics, Programming, Geodesy
169
The method starts the game process and implements a simple interface through the console for the user.
The createGame() method enabled by the process initializes objects in the gameField array, randomly creates
mines with a given probability, and counts the number of mines in the countMinesOnField field. We also
introduced methods to simplify code understanding: Input() and showField(). Which implement the user
entering data from the keyboard and displaying the field on the console, respectively.
Figure 3
Figure 4
Now we will create logical sequences that represent the game mechanics. To do this, we need to create
several more methods.
First we implement openTile(x,y) (Fig.5), it is intended to open the cell that the user specified. This
method checks the cell for a flag and that it is already open. After that, it reduces the number of closed cells of
the field by 1 and checks the contents of the object: if the cell is a mine, it starts the process of completing the
game. If there is no mine in the cell, it opens it and displays the number of mines in the neighborhood. If there
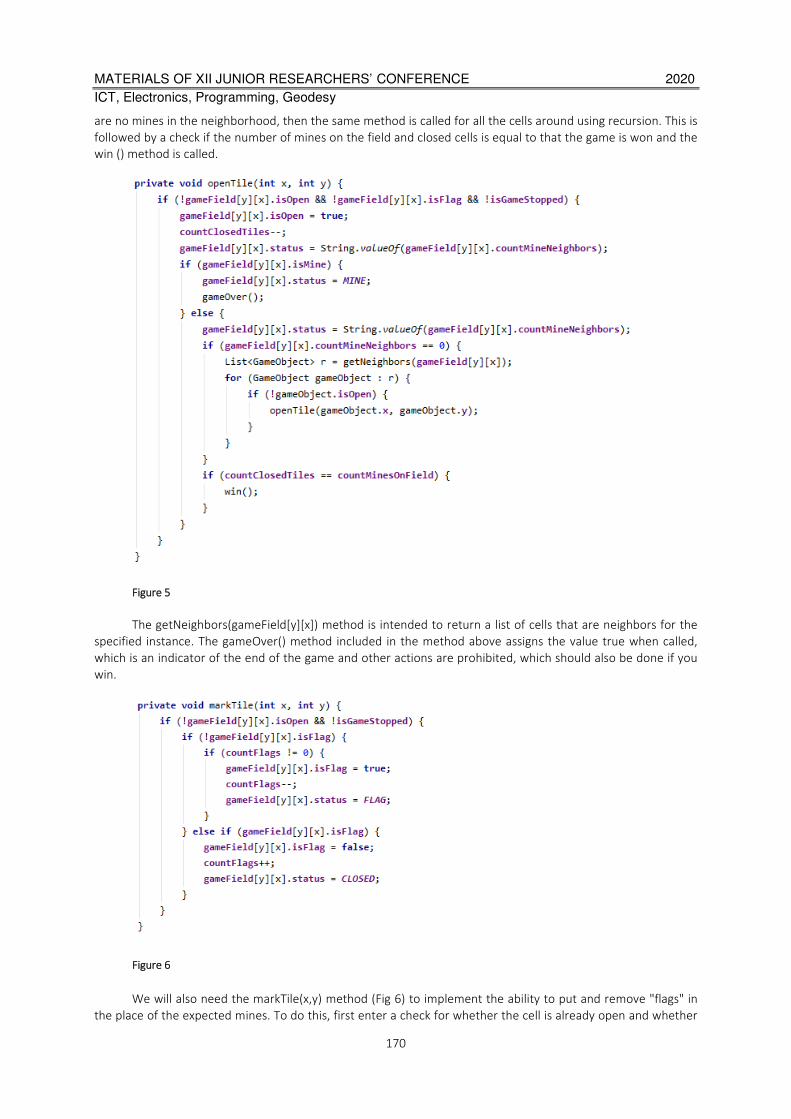
MATERIALS OF XII JUNIOR RESEARCHERS’ CONFERENCE 2020
ICT, Electronics, Programming, Geodesy
170
are no mines in the neighborhood, then the same method is called for all the cells around using recursion. This is
followed by a check if the number of mines on the field and closed cells is equal to that the game is won and the
win () method is called.
Figure 5
The getNeighbors(gameField[y][x]) method is intended to return a list of cells that are neighbors for the
specified instance. The gameOver() method included in the method above assigns the value true when called,
which is an indicator of the end of the game and other actions are prohibited, which should also be done if you
win.
Figure 6
We will also need the markTile(x,y) method (Fig 6) to implement the ability to put and remove "flags" in
the place of the expected mines. To do this, first enter a check for whether the cell is already open and whether

MATERIALS OF XII JUNIOR RESEARCHERS’ CONFERENCE 2020
ICT, Electronics, Programming, Geodesy
171
the game is not over. This is followed by a sequence of actions depending on whether the cell has a flag: if it
does not exist, we set it and change the cell status in the field; otherwise, we return the cell to its original values.
After implementing all these actions, we can already start the game(Fig 8) by simply creating an object of
the MinesweeperGame class and calling its initialize() method (Fig.7).
Figure 7
Figure 8
REFERENCES
1. B.Eckel “Java Philosophy”
2. K. Sierra, B.Bates “Head first Java”

MATERIALS OF XII JUNIOR RESEARCHERS’ CONFERENCE 2020
ICT, Electronics, Programming, Geodesy
172
UDC 004.021
THE DESIGN OF WEB INTERFACE FOR DIALOGUE WITH THE INTRODUCTION OF A CHAT BOT.
K. SAMSONOV, Y. KRAVCHENKO
Polotsk State University, Belarus
This article discusses how to build the user interface for a chat bot.
Introduction. Long Polling is a technology that allows you to receive information about new developments
with the "long queries." The server receives the request, but it doesn’t send a response to it immediately, but
only when there is an event (for example, a new message comes) or a specified waiting time elapses. Using this
approach, you can instantly display important events in your application. Using the User Long Poll API You can-
not send a message to this use method.
Callback API is a tool for tracking user activity in your community VKontakte. With it, you can realize, for
example, the following: Bot has to send instant replies to incoming messages. System of automatic moderation
of content.
The main section. Callback API sends a notification to your server, as a desired event happens in the
community. An event can be anything: a comment to a photo, a new record on the wall, joining the community,
sending messages, etc.
To connect the Callback API in the community you need to specify the address of the script on your server
and select the events you want to receive. For example, if your bot has to recognize the text commands, mark
the event "incoming message"
.
Figure 1. – Communication with the chat bot
Long Polling is a technology that allows you to receive information about new developments with the
"long queries." The server receives the request, but it doesn’t send a response to it immediately, but only when
there is an event (for example, comes a new message) or a specified waiting time elapses. Using this approach,

MATERIALS OF XII JUNIOR RESEARCHERS’ CONFERENCE 2020
ICT, Electronics, Programming, Geodesy
173
you can instantly display important events in your application. Using the User Long Poll API You cannot send a
message to this use method. Before connecting to Long Poll server needs to retrieve data session (server, key,
ts) method messages. Get Long Poll Server. We recommend to transfer the actual version number of the Long
Poll in lp_version parameter.
Then make a request like this:
https: // $ server act = a_check & key = $ key & ts = $ ts & wait = 25 & mode = 2 & version = 2?
It uses the following parameters:
key - a secret session key;
server - the server address;
ts - the number of the last event, since you want to receive data;
wait - wait time (as some proxy servers terminate the connection after 30 seconds, we recommend that
you wait = 25). Maximum value - 90.
mode - additional response options. The amount of option codes from the list:
2 - receive attachments;
8 - Returns the extension of the set of events;
32 - return pts (required for operation of the methodmessages.getLongPollHistorywithout restriction in
the last 256 events);
64 - in the event with the code 8 (each got online) to return additional information in the field $ extra
(see.The structure of the event);
128 - return random_id field (random_id can be transmitted when sending a message bymessages.send).
version - version. Current version: 3. For Version 0 (default), identifiers communities will be coming in
group_id + 1000000000 format for backward compatibility. We recommend using the latest version.
For the first request within the meaning of the session for the server parameters, key, and ts must be re-
ceived by messages.getLongPollServer. In subsequent requests use the same server and the key and the new
value ts, which come to you in a response from Long Poll server.
Conclusion. This article describes the basic elements of the construction of interface for a chat bot and
presents examples and results.
REFERENCES
1. Wikipedia - free encyclopedia [Electronic resource] / Access mode: https://ru.wikipedia.org/wiki/Web-
application/. - Access date: 10/12/2017.
2. Javascript tutorial / Access mode: https://www.learnjavascript.ru/. - Access date: 10/14/2018.
3. Wikipedia - free encyclopedia [Electronic resource] / Access mode:
https://ru.wikipedia.org/wiki/Javascript_(programming language)/. - Yes access: 06/04/2018.
4. Third normal form [Electronic resource]. - Electronic data. - Access mode: http:
//ru.wikipedia.org/wiki/Third_normal_form - Access date: 05/21/2018.
5. Visual Studio Code [Electronic resource]. - Electronic data. - Access mode: https://code.visualstudio.com/ -
Access date: 02/17/2018.
6. Kasper System development of testing sites [Electronic resource]. - Electronic data. - Access mode:
https://www.kasper.by/blog/testirovanie-saita/
7. Spring Security [Electronic resource]. - Electronic data. - Access mode: http://static.springsource.org/spring-
security/site/ - Access date: 02/28/2018.
MATERIALS OF XII JUNIOR RESEARCHERS’ CONFERENCE 2020
ICT, Electronics, Programming, Geodesy
174
UDC 004.432
SWIFT OBJECT-ORIENTED PROGRAMMING LANGUAGE: FEATURES AND ADVANTAGES
Y. KANIAYEU, I. RUSETSKI
Polotsk State University, Belarus
Swift is a general-purpose programming language built using a modern approach to safety, performance,
usability and software design patterns.
Mobile application development industry in the last five years has multiplied in leaps and bounds, chang-
ing the way businesses function worldwide. With enterprises aligning mobile apps to their productivity in recent
times, and with the rapid innovation in mobile devices across platforms, it calls for mobile app developers to
write several versions of an application for many different platforms using a single language and many pieces of
reusable code [1].
The iOS platform is a proprietary platform made by Apple. The iOS platform constituents are available for
phone devices and tablet devices: Iphone and Ipad. Apps could be developed for the iOS platform, and then tar-
get the same app to both an iPhone and an iPad. For building apps for iOS, one must have an Apple developer
account and the Xcode IDE on a Mac computer. Xcode comes with all the required Apple development toolkit:
SDKs, a code editor, compile/build tools, simulators, and a debugger. Apps can be built for iOS devices either by
using the native iOS SDK with Objective-C and Swift or with the various cross platform technologies that are writ-
ten against the SDK of that framework, but targeted for iOS [2].
Swift is a general-purpose, multi-paradigm, object-oriented, functional, imperative and block structured
language. It is the result of the latest research on programming languages and is built using a modern approach
to safety, software design patterns by Apple Inc. It is the brand new programming language for iOS application,
macOS application, watchOS application and tvOS application. Soon it became one of top 5 programming lan-
guages and gained popularity among Apple developer community over the few years of time replacing the old
school Objective C [3].
Brief history. Chris Lattner began the development of Swift in the year 2010 and collaborated with other
programmers at Apple in the course of the development of this language. The language ideas for Swift were tak-
en from Rust, Objective-C, Ruby, Haskell, C#, CLU, Python, and a range of other programming languages.
Swift was introduced at Apple's 2014 Worldwide Developers Conference (WWDC). It underwent an up-
grade to version 1.2 during 2014 and a more major upgrade to Swift 2 at WWDC 2015. Initially a proprietary lan-
guage, version 2.2 was made open-source software under the Apache License 2.0 on December 3, 2015, for Ap-
ple's platforms and Linux.
Through version 3.0 the syntax of Swift went through significant evolution, with the core team making
source stability a focus in later versions.
Swift 4.0, released in 2017, introduced several changes to some built-in classes and structures. Code writ-
ten with previous versions of Swift can be updated using the migration functionality built into Xcode.
Swift 5, released in March 2019, introduced a stable binary interface on Apple platforms, allowing the
Swift runtime to be incorporated into Apple operating systems. It is a source compatible with Swift 4. Swift 5.1
was officially released in September 2019. Swift 5.1 is built on the previous version of Swift 5 by extending the
stable features of the language to compile-time with the introduction of module stability. The introduction of
module stability makes it possible to create and share binary frameworks that will work with future releases of
Swift [4].
Key programming features. Swift includes features that make code easier to read and write, while giving
the developer the control needed in a true system programming language. Swift supports inferred types to make
code cleaner and less prone to mistakes, and modules eliminate headers and provide namespaces. Memory is
managed automatically, and you don’t even need to type semi-colons. Swift also borrows from other languages,
for instance the named parameters brought forward from Objective-C are expressed in a clean syntax that
makes APIs in Swift easy to read and maintain [5].
Swift is a protocol-oriented programming language, such programming paradigm is used from the release
time of Swift 2.0. in this approach, design protocols are similar to classes but this serves better compared to ob-
ject-oriented programming. Since the concepts like structs and enums don’t work properly as a struct cannot
inherit from another struct, neither can an enum inherit from another enum. So inheritance which is one of the
fundamental object-oriented concepts cannot be applied to value types. On the other hand, value types can in-
MATERIALS OF XII JUNIOR RESEARCHERS’ CONFERENCE 2020
ICT, Electronics, Programming, Geodesy
175
herit from protocols. The concepts used in protocol-oriented paradigm are: protocol extensions, inheritance and
compositions.
Similarly to C# and in contrast to most other OO languages, Swift offers built-in support for objects using
either pass-by-reference or pass-by-value semantics, the former using the class declaration and the latter using
struct. Structs in Swift have almost all the same features as classes: methods, implementing protocols and using
the extension mechanisms. For this reason, Apple terms all data generically as instances, versus objects or val-
ues. Structs do not support inheritance, however.
An important new feature in Swift is option types, which allow references or values to operate in a man-
ner similar to the common pattern in C, where a pointer may refer to a value or may be null. This implies that
non-optional types cannot result in a null-pointer error; the compiler can ensure this is not possible.
Advantages. The features of Swift are designed to work together to create a language that is powerful, yet
fun to use. Some advantages of Swift include:
- Safety. Swift was designed to improve the code safety for iOS products. It was created as a type-safe and
memory-safe language. Type safety means that the language itself prevents type errors. The importance of type
memory safety is that it helps avoid vulnerabilities associated with dangling or uninitialized pointers. These types
of errors are the most common in development and difficult to find and debug. These advantages of the Swift
language make it more attractive. Swift, on the other hand, doesn’t use pointers. If you miss a pointer in the
code, perhaps nil value, the app will crash. This approach allows programmers to find and fix bugs quickly. As a
result, the code will be cleaner and easier to understand. Such features as generics, optionals, and type interfer-
ence make an app developed in Swift less inclined to contain unnoticed bugs. [6]
- Dynamic libraries support. Dynamic libraries are the executable parts of code that can be linked to an
app. The difference between dynamic libraries and static libraries is that dynamic libraries can be linked to any
program during run-time. The shared code is loaded once and can be used by a large number of programs. This
code can be updated, changed or recompiled without recompiling the application that uses this library. Dynamic
libraries are automatically included in the AppStore’s download package. Static libraries are linked at the last
step of the compilation process after the program is placed in memory.
- Perfomance. From its earliest conception, Swift was built to be fast. Using the high-performance LLVM
compiler technology, Swift code is transformed into optimized native code that gets the most out of modern
hardware. The syntax and standard library have also been tuned to make the most obvious way to write your
code to perform the best whether it runs in the watch on your wrist or across a cluster of servers. Swift is a suc-
cessor to both the C and Objective-C languages. It includes low-level primitives such as types, flow control, and
operators. It also provides object-oriented features such as classes, protocols, and generics, giving developers
the performance and power they demand.
- Open Source. Swift is developed in the open at Swift.org, with source code, a bug tracker, forums, and
regular development builds available for everyone. This broad community of developers, both inside Apple as
well as hundreds of outside contributors, work together to make Swift even more stable and powerful. Open-
source Swift can be used on Linux to build Swift libraries and applications. The open-source binary builds provide
the Swift compiler and standard library, Swift REPL and debugger (LLDB), and the core libraries, so one can jump
right in to Swift development.
Despite its tender age and the attendant controversy, Swift already has a number of prominent success
stories. Some of the companies that chose the new language are Lyft, LinkedIn, Coursera, Pandora, Vimeo, Twit-
ter, Fitbit, and Groupon. Moreover, Facebook and Uber are reported to have shown significant interest in Swift.
Swift has become a more mature language with the latest update, but there are a lot of things to fix. Apple is
creating its own ecosystem with a stable ABI over its platforms, but it still lacks tooling and support for earlier
versions, which might be fixed in the next releases. Thus, Swift adoption will continue to grow, which soon might
lead to a complete displacement of Objective-C as the leading first-class language for iOS mobile application de-
velopment. Though Swift and Objective-C can coexist, that is libraries written in Objective-C and Objective-C util-
ities can be used in Swift, Apple is making it very obvious that Swift is the new default choice for developing iOS
apps. Swift is an easier, simpler, and a more compact language compared to Objective-C. Objective-C developers
should not have any trouble moving over to Swift.
REFERENCES
1. Dzone - Reasons Why Startups Choose Swift. – [Electronic resource] – Mode of access:
https://dzone.com/articles/7-reasons-why-startups-choose-swift-over-objective/. – Date of access:
03.03.2020.

MATERIALS OF XII JUNIOR RESEARCHERS’ CONFERENCE 2020
ICT, Electronics, Programming, Geodesy
176
2. IBM Developer - Choosing the best programming language for mobile app development. – [Electronic re-
source] – Mode of access: https://developer.ibm.com/technologies/mobile/articles/choosing-the-best-
programming-language-for-mobile-app-development/. – Date of access: 03.03.2020.
3. GeeksForGeeks - Introduction to Swift Programming; - [Electronic resource] – Mode of access:
https://www.geeksforgeeks.org/introduction-to-swift-programming/. – Date of access: 03.03.2020.
4. Wikipedia – Swift programming language. – [Electronic resource] – Mode of access:
https://en.wikipedia.org/wiki/Swift/. – Date of access: 03.03.2020.
5. Swift – About Swift. – [Electronic resource] – Mode of access: https://swift.org/about/. – Date of access:
03.03.2020.
6. Altexsoft - The Good and the Bad of Swift Programming Language. – [Electronic resource] – Mode of access:
https://www.altexsoft.com/blog/engineering/the-good-and-the-bad-of-swift-programming-language/. – Date
of access: 03.03.2020.
MATERIALS OF XII JUNIOR RESEARCHERS’ CONFERENCE 2020
ICT, Electronics, Programming, Geodesy
177
UDK 621.371: 550.837.6
INTERACTION OF PULSED ELECTROMAGNETIC WAVES
WITH ENVIRONMENTS OVER HYDROCARBON DEPOSITS
A. KOCHANOV, V. YANUSHKEVICH
Polotsk State University, Belarus
The article presents the results of the interaction of electromagnetic waves in the mode of pulsed signals
with the environments over hydrocarbon deposits. The behavior of the components of the dielectric constant of
an anisotropic environment over the reservoir in the mode of pulsed signals based on the quasi-hydrodynamic
approach is investigated. An analysis of the constituent components of the dielectric constant of the medium over
hydrocarbons for electromagnetic waves with right and left circular polarizations, depending on the pulse fre-
quency.
Introduction. Methods for the search for hydrocarbon deposits are based on the analysis of electrophysi-
cal and electrochemical processes in anisotropic environment over hydrocarbon deposits [1 - 4]. Similar studies
for plasma-like media make it possible to use existing solutions for studying the interaction of electromagnetic
waves (EMW) with hydrocarbon deposits when studying plasma based on the quasi-hydrodynamic approach [5 -
8]. The propagation of radio-pulse signals in the environment above the reservoir can be the basis for many
methods of hydrocarbon exploration [9 - 10]. The relevance of the tasks considered in this work is to improve
the existing electromagnetic methods of geological exploration and to develop new methods for searching,
identifying oil and gas (hydrocarbon) deposits, which are a strategic type of mineral resources. The
characteristics of the environment above the reservoir during the propagation of electromagnetic waves with
right and left circular polarizations are determined, which increases the information content of the methods of
contouring and allocation of hydrocarbon deposits. It is shown that the research results can be used to identify
the environment above the deposits by the nature and value of the total and difference components of the
dielectric constant of the anisotropic layer.
The interaction of the medium over hydrocarbon deposits with pulsed signals. Consider the process of in-
teraction of EMW with hydrocarbon deposits in the pulse mode of the form:
2
)(2
)(sin
2
)(2
)(sin
2)(
0
0
0
0
и
и
и
и
иU
fS τωω
τωω
τωω
τωωτ
⋅+
⋅+
+⋅−
⋅−
⋅⋅
= , (1)
Where 2
Uи
τ⋅=1 – amplitude ; f2 ⋅π⋅=ω − frequency ; ωо – carrier frequency ;
иτ − pulse width.
The process of interaction of electromagnetic waves with local switching on the propagation path of radio
waves can be represented in the form of an oblique incidence of a plane wave with vertical polarization in a me-
dium with parameters ε0, μ0, δ0 on an infinite surface with anisotropic impedance. This EMW is excited using a
portable transmitter that moves along the studied profile.
It is of interest to analyze the frequency characteristics of combinational components.
LLL
RRR
j
j
εεεεεεεεεε
ωω
ImRe)(
ImRe)(
21
21
+=−=+=+=
ɺɺɺ
ɺɺɺ
.
(2)
The expressions (2) contain matrix elements:
1 2
2 1
3
0
0
0 0
j
j
ε εε ε ε
ε
− = i
ɺ ɺ
ɺɶ ɺ ɺ
ɺ
(3)
Information on the properties of the anisotropic medium is contained in the components of the tensor
(3) 1 2 3, , ,ε ε εɺ ɺ ɺ that are studied in various modes of interaction of the environment with EMW. The calculation of
the components of the dielectric constant tensors was carried out on the basis of experimentally obtained pa-
rameters of the environment over hydrocarbon deposits [3]: electrical conductivity rδ =10-5 s/m; particle
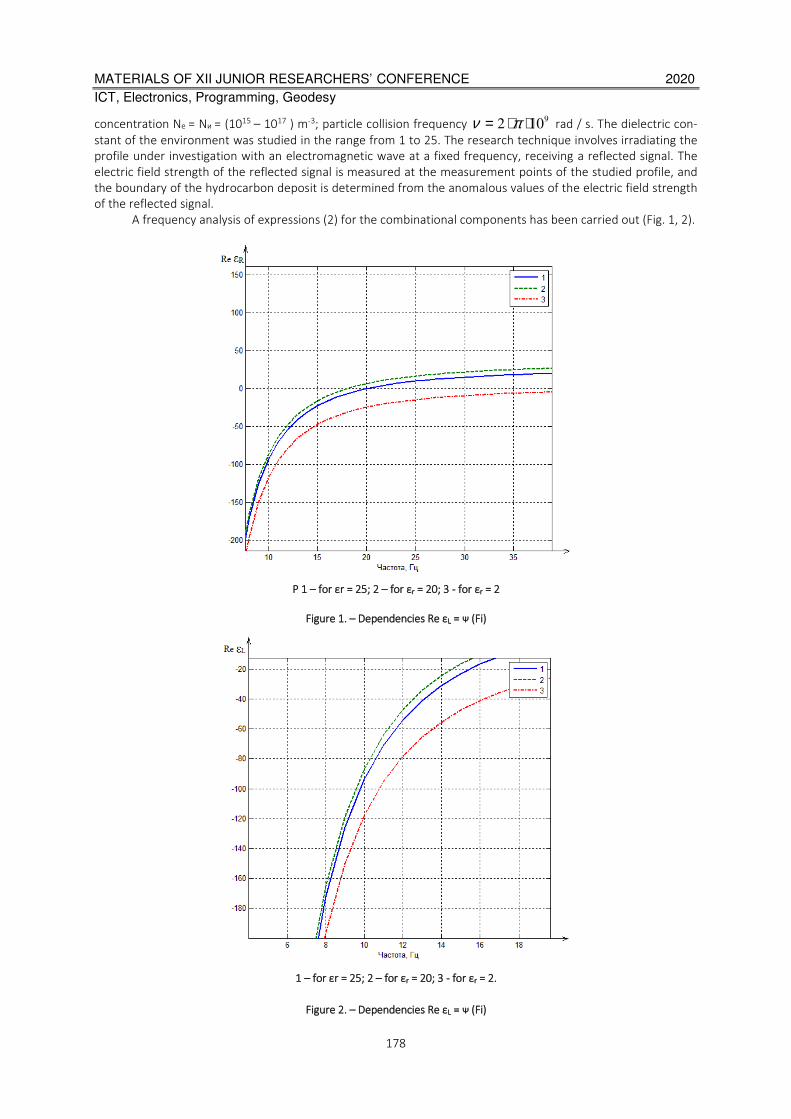
MATERIALS OF XII JUNIOR RESEARCHERS’ CONFERENCE 2020
ICT, Electronics, Programming, Geodesy
178
concentration Nе = Nи = (1015 – 1017 ) m-3; particle collision frequency 9
2 10ν π= ⋅ ⋅ rad / s. The dielectric con-
stant of the environment was studied in the range from 1 to 25. The research technique involves irradiating the
profile under investigation with an electromagnetic wave at a fixed frequency, receiving a reflected signal. The
electric field strength of the reflected signal is measured at the measurement points of the studied profile, and
the boundary of the hydrocarbon deposit is determined from the anomalous values of the electric field strength
of the reflected signal.
A frequency analysis of expressions (2) for the combinational components has been carried out (Fig. 1, 2).
P 1 – for ԑr = 25; 2 – for ԑr = 20; 3 - for ԑr = 2
Figure 1. – Dependencies Re εL = ᴪ (Fi)
1 – for ԑr = 25; 2 – for ԑr = 20; 3 - for ԑr = 2.
Figure 2. – Dependencies Re εL = ᴪ (Fi)

MATERIALS OF XII JUNIOR RESEARCHERS’ CONFERENCE 2020
ICT, Electronics, Programming, Geodesy
179
There was conducted an analysis of the interaction of the anisotropic layer over hydrocarbons with EMW
in the mode of radio-pulse signals. The AC dielectric permittivity tensor is derived over hydrocarbon deposits in
the mode of radio-pulse signals. The results of the study can be investigated in exploratory geophysics. In this
connection, it should be noted:
- AC dielectric permittivity tensor over hydrocarbon deposits in the mode of radio-pulse signals can be
used to determine the electrodynamic characteristics of the environment above the reservoir in a wide frequen-
cy range of the probed signals when the pulse frequency changes;
- studies can be used to determine the characteristics of the environment over the reservoir during the
propagation of EMW with right and left circular polarizations, which increases the information content of the
contouring and separation of hydrocarbon deposits.
REFERENCES
1. Гололобов, Д. В. Фазовые методы идентификации углеводородных залежей / Д.В. Гололобов, А.О.Рак,
В.Ф.Янушкевич / Инженерный вестник. – Мн. –2001. – 1(20). – С. 16-18.
2. Гололобов, Д.В. Взаимодействие ЧМ-сигналов с анизотропной средой / Д. В. Гололобов, Н. В. Цывис, В.
Ф. Янушкевич, С. В. Калинцев, Д. Л. Хадыко / Проблемы проектирования и производства радиоэлек-
тронных средств. Сборник мат-ов 2 межд. научно-техн. конференции 15-17мая 2002г. – Новополоцк,
2002. – C.300-303.
3. Moskvichew, V.N. Interraction of electromagnetic waves (EMW) with anisotropic inclusion in communication
line / V.N. Moskvichew // 9-th Microw. Conf. NICON – 91, Rydzyna, May 20-22, 1991. – Vol. 1. – P. 240-
244.
4. Levashov, S.P. Electric-resonance sounding method and its application for, geological-geophysical and engi-
neering-geological investigations / S. P. Levashov // 66nd EAGE Conference and Technical Exhibition, Paris,
France, 7–10 June 2003 (CD-ROM Abstracts volume).
5. Adamovskiy, E. Simulation of electromagnetic waves interaction with hydrocarbon deposits / E. Adamovskiy,
V. Yanushkevich // 8 Junior researchers conference European and national dimension in research. In 3 Parts.
– Part 3. TECHNOLOGY. – PSU, Novopolotsk, 2016. – V. 179 – 183.
6. Янушкевич, В.Ф. Взаимодействие электромагнитных волн с анизотропными средами над углеводород-
ными залежами в режиме радиоимпульсных сигналов. / . В.Ф. Янушкевич, K.И. Кременя, М.М. Иванов,
Т.В. Молодечкина. Вестник ПГУ. Серия С. Фундаментальные науки. Физика. Новополоцк, 2016. – 12. –
С. 45 – 50.
7. Иванова, К.И. Способ геоэлектроразведки углеводороднoй залежи с использованием радиоимпульс-
ных сигналов. Фундаментальные и прикладные исследования в современном мир / К.И. Иванова, В.Ф.
Янушкевич // Материалы XV Международной НТК . 4 октября 2016г.– Том 1. – Санкт – Петербург. –
С.107 – 111.
8. Янушкевич, В.Ф. Электромагнитные методы поиска и идентификации углеводородных залежей /
В.Ф.Янушкевич. – Новополоцк, ПГУ, 2017. – 232c.
9. Гололобов, Д.В. Электродинамические параметры подводных источников в поле поверхностной элек-
тромагнитной волны / Д.В.Гололобов, В.Н. Москвичев, Г.П.Турук, В.Ф.Янушкевич / Тез. докл. 35 Всерос-
сийской Межвузовской НТК. – Владивосток. – 1992. –Т1,ч.1. – С.59 – 62.
10. Янушкевич, В.Ф. Моделирование двухчастотного взаимодействия электромагнитных волн с углеводо-
родной залежью / В.Ф. Янушкевич. Приборы. Справочный журнал. –1999. – 10. – С.27 – 29.
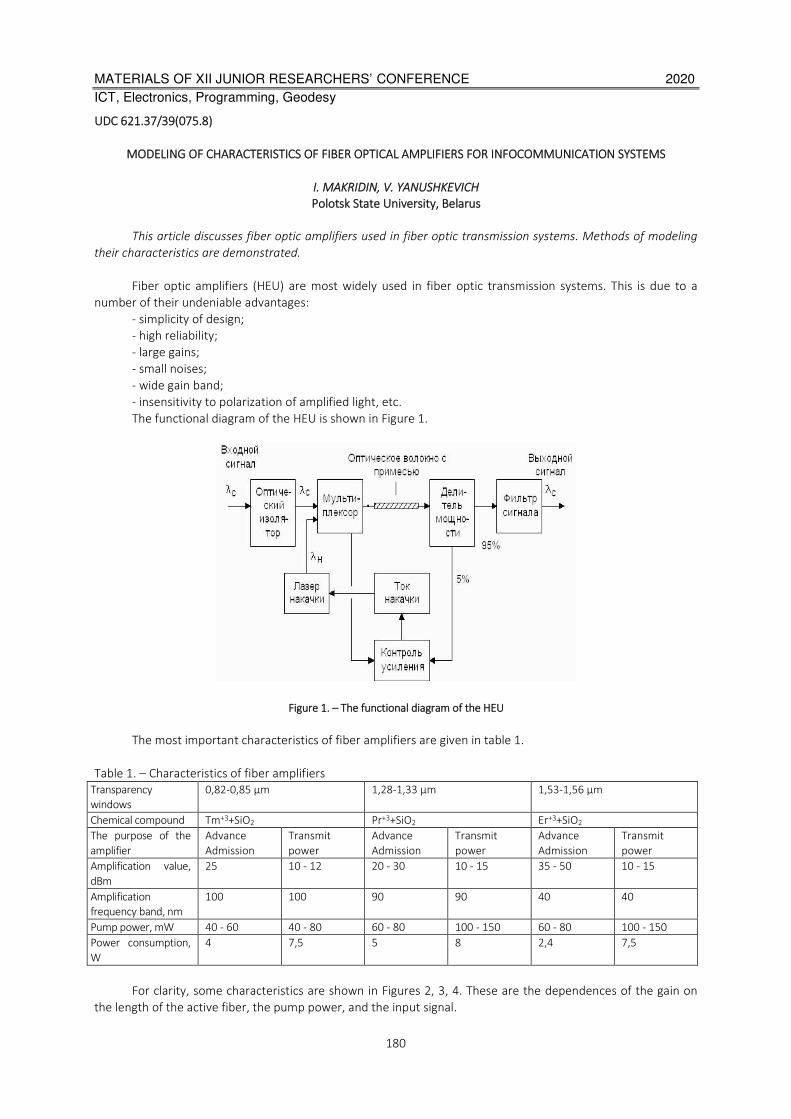
MATERIALS OF XII JUNIOR RESEARCHERS’ CONFERENCE 2020
ICT, Electronics, Programming, Geodesy
180
UDC 621.37/39(075.8)
MODELING OF CHARACTERISTICS OF FIBER OPTICAL AMPLIFIERS FOR INFOCOMMUNICATION SYSTEMS
I. MAKRIDIN, V. YANUSHKEVICH
Polotsk State University, Belarus
This article discusses fiber optic amplifiers used in fiber optic transmission systems. Methods of modeling
their characteristics are demonstrated.
Fiber optic amplifiers (HEU) are most widely used in fiber optic transmission systems. This is due to a
number of their undeniable advantages:
- simplicity of design;
- high reliability;
- large gains;
- small noises;
- wide gain band;
- insensitivity to polarization of amplified light, etc.
The functional diagram of the HEU is shown in Figure 1.
Figure 1. – The functional diagram of the HEU
The most important characteristics of fiber amplifiers are given in table 1.
Table 1. – Characteristics of fiber amplifiers
Transparency
windows
0,82-0,85 μm 1,28-1,33 μm 1,53-1,56 μm
Chemical compound Tm+3+SiO2 Pr+3+SiO2 Er+3+SiO2
The purpose of the
amplifier
Advance
Admission
Transmit
power
Advance
Admission
Transmit
power
Advance
Admission
Transmit
power
Amplification value,
dBm
25 10 - 12 20 - 30 10 - 15 35 - 50 10 - 15
Amplification
frequency band, nm
100 100 90 90 40 40
Pump power, mW 40 - 60 40 - 80 60 - 80 100 - 150 60 - 80 100 - 150
Power consumption,
W
4 7,5 5 8 2,4 7,5
For clarity, some characteristics are shown in Figures 2, 3, 4. These are the dependences of the gain on
the length of the active fiber, the pump power, and the input signal.
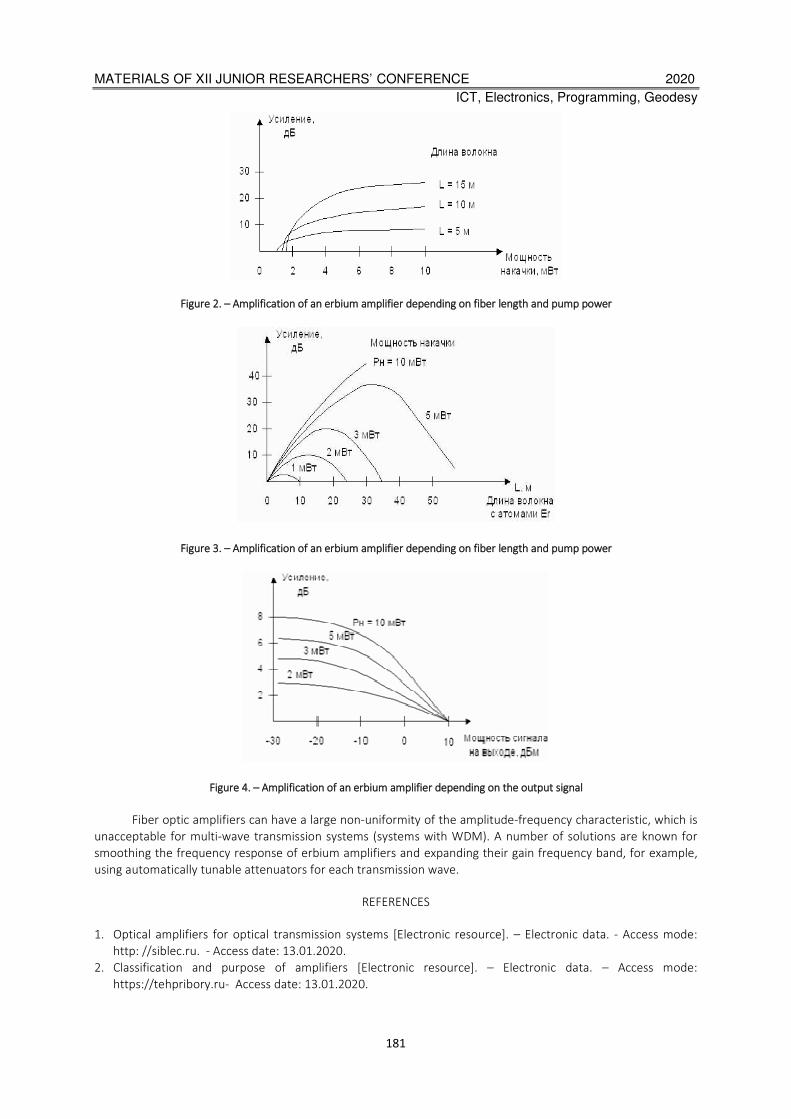
MATERIALS OF XII JUNIOR RESEARCHERS’ CONFERENCE 2020
ICT, Electronics, Programming, Geodesy
181
Figure 2. – Amplification of an erbium amplifier depending on fiber length and pump power
Figure 3. – Amplification of an erbium amplifier depending on fiber length and pump power
Figure 4. – Amplification of an erbium amplifier depending on the output signal
Fiber optic amplifiers can have a large non-uniformity of the amplitude-frequency characteristic, which is
unacceptable for multi-wave transmission systems (systems with WDM). A number of solutions are known for
smoothing the frequency response of erbium amplifiers and expanding their gain frequency band, for example,
using automatically tunable attenuators for each transmission wave.
REFERENCES
1. Optical amplifiers for optical transmission systems [Electronic resource]. – Electronic data. - Access mode:
http: //siblec.ru. - Access date: 13.01.2020.
2. Classification and purpose of amplifiers [Electronic resource]. – Electronic data. – Access mode:
https://tehpribory.ru- Access date: 13.01.2020.
MATERIALS OF XII JUNIOR RESEARCHERS’ CONFERENCE 2020
ICT, Electronics, Programming, Geodesy
182
UDC 004.05; 004.921
DIGITAL DISTRIBUTION. INFFLUENCE OF ONLINE SERVICES FOR USERS AND DEVELOPERS.
EXTERNAL PAYMENT SYSTEM AND ITS INFLUENCE ON SERVICE SECURITY
N. MEDVEDEV, I. BURACHONAK
Polotsk State University, Belarus
This paper presents digital distribution and its importance for the distribution of software products. Also
online services, and their impact on business and the ability of users to manage the purchased goods are
considered. Additionally, it also presents an external payment system for an online service and its impact on the
overall reliability of online service in general. Various systems will also be considered and the comparison of them
will be made.
Distribution of goods occupies an important part of the history since the founding of trade. It allows you
to effectively find new customers and sell the right goods, regardless of location. One of the methods of
distribution is digital distribution. The importance of digital distribution has played an important role since the
development of the Internet: it allows you to quickly and safely distribute software or distribute advertising of it.
In fact, everybody uses it nowadays: from simple users to experienced businessmen and distributors. This means
that in addition to digital software, it is possible to distribute other products, ranging from ordinary items to very
rare things. So now there are many online shops where you can buy absolutely everything. To better understand
the problem of product distribution on the Internet, we will research the concept of digital distribution and the
way it affects the trade via the Internet.
Digital distribution is a method for distributing digital content without using a tangible medium, usually
consisting of downloading via the Internet to a user's terminal device [1]. The advantage of digital distribution is
easy, quick search and purchase of copies of the necessary software.
There are several options for distributing software over the Internet.
The main protocols used in digital distribution are HTTP, P2P and FTP. Systems that distribute proprietary
software usually contain technical means of copyright protection that prevent the buyer from selling/distributing
his copy of the software (programs).
There are several options for purchasing software rights:
1. PayPlay - products will be available only after their purchase.
2. Try before you buy - user downloads the program and gets the opportunity to use it for some time. In
case the user wants to continue using the full version of the program, he must pay. After that (as a rule) a special
serial number is provided, by entering which the user gets the opportunity to use the program for an unlimited
time.
3. Advertising - in this case, the program is absolutely free, but the user is shown advertising in the
program, on display of which the software owner earns.
4. Subscription - monthly payment for the right to use the program or programs from a specific set
provided by a digital distributor. There are also single subscriptions for one specific program and for a different
period (including unlimited) [1].
For the implementation of digital distribution is used online service, where you can get all the necessary
goods for the mentioned methods.
The main products of digital distribution are:
Books - electronic books are the most popular and the main difference from a traditional purchase is the
storage in an indefinite amount in an electronic book reader or any electronic device supporting the book
format.
Music - the main representatives are online buying or streaming. In the first case, the artist’s album or
several of his songs are purchased for the specified amount, and in the second case, free access to listening to
the songs of the specified artist is provided for subscription or under the specified conditions. The main
difference from the traditional purchase of physical media is easy access to music files and the ability to store in
unlimited quantities on a certain device.
Films - the main representatives are also online purchase or subscription. In the first case, for the
specified amount of money unlimited access to a particular film or series is given, and in the second case for a
specified period of time an access to viewing through the service where the subscription was made is given.

MATERIALS OF XII JUNIOR RESEARCHERS’ CONFERENCE 2020
ICT, Electronics, Programming, Geodesy
183
he main difference from the traditional form is easy access to the video and the ability to store in unlimited
quantities on a certain device.
Video Games - the main representatives are also online purchase or subscription. In the first case, for a
specified amount of money unlimited access is given to a certain film or series, and in the second case, access to
viewing through the service where the subscription was made is given for a certain amount of time. The
difference from the traditional form is also easy access to video and the ability to store in unlimited quantities on
a certain device.
In addition to online services, a launcher may be included. Launchers are the programs that allow you to
install, to launch and play purchased or activated software. These are programs such as iTunes, Spotify, Steam,
Netflix, etc. The main advantage is storage of all purchased software under your account, the automated process
of downloading application from the server and installing it on user's machine.
The main impact of digital distribution over traditional retailing can be seen in areas such as:
Books – some companies like Bookmasters Distribution have spent $4.5 million on hardware upgrades to
work with more users. In addition, the vice president of Perseus Books Group noted a 68 percent increase with
the transition to e-books and the Independent Publishers Group announced sales growth of 23 percent in the
first quarter of 2012 [2].
Music - the growth of digital distribution has led to a 2-fold drop in CD sales over the course of the 2000s.
The development of systems such as iTunes and later Spotify contributed to the independent distribution of
music. In addition, since the beginning of digital sales, the increase from 160 million in 2004 to 795 million in
2006 was noted, with remittances ranging from $397 million to US$2 billion [2].
Films - due to digital distribution, there has been a sharp transition of films and series to platforms such
as YouTube, Netflix, Amazon Prime, etc. In addition, due to the services, one can note the growing popularity of
views on Smart-TV, computers, smartphones, game consoles and tablets [2].
Video games - the main development of digital distribution began in 2004 with the release of the Steam
platform, which, instead of selling games gives rights to store game by accepting an agreement (result of rules
violation store has a full right to withdraw product or user profile). Since the late 2000s, digital distribution of games
has been reached an increasingly broad audience, with major game publishers and retailers have focusing more on
digital sales - including Steam, PlayStation Store, Amazon.com, GAME, GameStop and the others. And as a result, the
sale of physical media fell from $5.03 billion in 2007 to $2.15 billion. According to a Superdata Research, revenue from
games sold in this way worldwide reached around $6.2 billion per month during February 2016. In early 2019, services
such as Epic Games, Rockstar Games Launcher, battle.net and Bethesda Game Launcher were developed, which led to
competition, as it’s profitable for companies to use their own service. For example, Ubisoft with the release of Tom
Clancy's Division 2 under the Uplay service received 4.5 times more income than other services, which led to the
decision to release their products only under their own service.
Thus, one can point out a noticeable increase in digital distribution and its replacement by the traditional
sale of physical media.
In addiction any digital distribution should have a good and reliable payment system.
A payment system is an essential part of any online service where payments are necessary, because
without it there cannot be any possibility of trading. The payment itself can occur both in the internal system
and through external systems, where the system we specified will execute the transaction. But first, we have to
understand the concept of e-commerce, internal and external payment systems and their features.
E-commerce is a sphere of the economy that includes all financial and trading transactions carried out
using computer networks, and business processes associated with such transactions. To e-commerce include:
1. Electronic information interchange (Electronic Data Interchange, EDI),
2. Electronic Funds Transfer (EFT),
3. Electronic commerce (e-trade),
4. Electronic money (e-cash),
5. Electronic marketing (e-marketing),
6. Electronic banking (e-banking),
7. Electronic insurance services (e-insurance) [1].
Electronic payment system - a system of payments between financial institutions, business organizations
and Internet users when buying and selling goods and for various services via the Internet. Such systems are
electronic versions of traditional payment systems and are divided into:
1. Debit (working with electronic checks and digital cash);
2. Credit (working with credit cards) [2].
Figure 1 will show the purchase scheme of payment system.
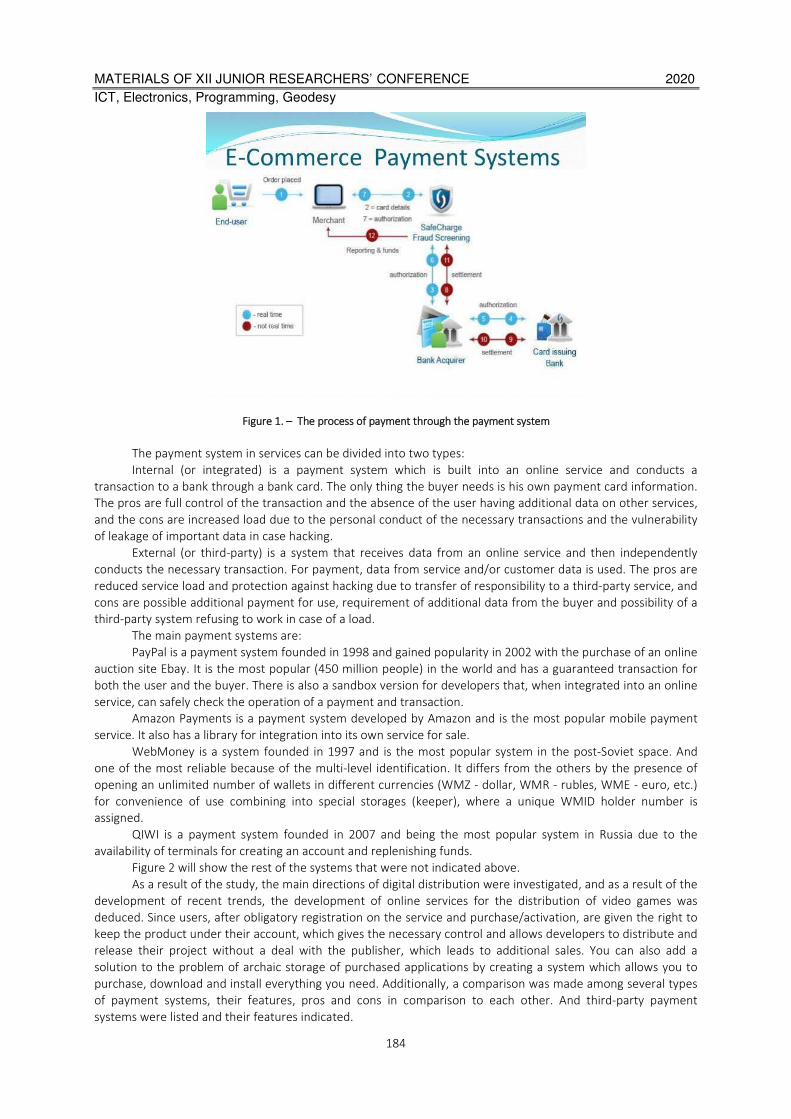
MATERIALS OF XII JUNIOR RESEARCHERS’ CONFERENCE 2020
ICT, Electronics, Programming, Geodesy
184
Figure 1. – The process of payment through the payment system
The payment system in services can be divided into two types:
Internal (or integrated) is a payment system which is built into an online service and conducts a
transaction to a bank through a bank card. The only thing the buyer needs is his own payment card information.
The pros are full control of the transaction and the absence of the user having additional data on other services,
and the cons are increased load due to the personal conduct of the necessary transactions and the vulnerability
of leakage of important data in case hacking.
External (or third-party) is a system that receives data from an online service and then independently
conducts the necessary transaction. For payment, data from service and/or customer data is used. The pros are
reduced service load and protection against hacking due to transfer of responsibility to a third-party service, and
cons are possible additional payment for use, requirement of additional data from the buyer and possibility of a
third-party system refusing to work in case of a load.
The main payment systems are:
PayPal is a payment system founded in 1998 and gained popularity in 2002 with the purchase of an online
auction site Ebay. It is the most popular (450 million people) in the world and has a guaranteed transaction for
both the user and the buyer. There is also a sandbox version for developers that, when integrated into an online
service, can safely check the operation of a payment and transaction.
Amazon Payments is a payment system developed by Amazon and is the most popular mobile payment
service. It also has a library for integration into its own service for sale.
WebMoney is a system founded in 1997 and is the most popular system in the post-Soviet space. And
one of the most reliable because of the multi-level identification. It differs from the others by the presence of
opening an unlimited number of wallets in different currencies (WMZ - dollar, WMR - rubles, WME - euro, etc.)
for convenience of use combining into special storages (keeper), where a unique WMID holder number is
assigned.
QIWI is a payment system founded in 2007 and being the most popular system in Russia due to the
availability of terminals for creating an account and replenishing funds.
Figure 2 will show the rest of the systems that were not indicated above.
As a result of the study, the main directions of digital distribution were investigated, and as a result of the
development of recent trends, the development of online services for the distribution of video games was
deduced. Since users, after obligatory registration on the service and purchase/activation, are given the right to
keep the product under their account, which gives the necessary control and allows developers to distribute and
release their project without a deal with the publisher, which leads to additional sales. You can also add a
solution to the problem of archaic storage of purchased applications by creating a system which allows you to
purchase, download and install everything you need. Additionally, a comparison was made among several types
of payment systems, their features, pros and cons in comparison to each other. And third-party payment
systems were listed and their features indicated.

MATERIALS OF XII JUNIOR RESEARCHERS’ CONFERENCE 2020
ICT, Electronics, Programming, Geodesy
185
Figure 2. – Basic payment systems
Based on the analysis, it’s planned to develop a project whose main task is to provide conditions for the
distribution of non-gaming software with the ability to launch purchased applications using a special launcher. In
addition, it was decided to use the external PayPal payment system for the implementation of the project
because of satisfaction with security indicators, ease of payment through the service and libraries available for
different programming languages.
REFERENCES
1. Цифровая дистрибуция. [Электронный ресурс] / BMU. – Режим доступа:
https://ru.bmstu.wiki/Цифровая_дистрибуция. – Дата доступа: 18.02.2020.
2. Digital Distribution. [Электронный ресурс] / Wikipedia. – Режим доступа:
https://en.wikipedia.org/wiki/Digital_distribution. – Дата доступа: 18.02.2020.
3. Электронная коммерция. [Электронный ресурс] / Wikipedia. – Режим доступа:
https://ru.wikipedia.org/wiki/Электронная_коммерция. – Дата доступа: 19.02.2020.
4. Система электронных платежей. [Электронный ресурс] / Wikipedia. – Режим досту-
па:https://ru.wikipedia.org/wiki/Система_электронных_платежей. – Дата доступа: 19.02.2020.
MATERIALS OF XII JUNIOR RESEARCHERS’ CONFERENCE 2020
ICT, Electronics, Programming, Geodesy
186
UDC 004.05; 004.921
MODERN TOOLS
FOR SCALABLE WEB DEVELOPMENT
V. TALDYKIN
Polotsk State University, Belarus
In this work we analyze modern approaches to web development and explore a set of tools, including
the vue.js JavaScript framework and the cloud based virtual Firebase server for the subsequent creation of
an adaptive dynamic website of the cinema with the possibility of three-dimensional display of halls with the
screen, a convenient interactive process of choosing places for reservations and a custom admin panel.
In this work, we analyze modern approaches to web development and study a promising set of tools, in-
cluding vue.js [1] JavaScript framework for component application development, a library of graphic components
quasar [2], a scalable real-time database Firestore, an effective authentication system, cloud data storage and
hosting from Firebase (google) [3], as well as the most relevant CSS specifications, such as flex [4] and grid [5]
layout for efficient construction of responsive layout of web pages, and tools for compact presentation of the
html code – (template engine pug [6]) and of the CSS styles (CSS-preprocessor stylus [7]).
Using this stack of web-technologies, we develop a modern adaptive dynamic web-site of a cinema net-
work with the possibility of three-dimensional display of halls and a convenient interactive process of choosing
places for booking. The created unique administration system allows authorized administrators directly on the
site to manage data of the web application and receive various statistical information on the activity of the users.
To ensure the best perception of the site by users, will be implemented an interactive 3d-model of the
cinema hall, which is used (on wide browser screens) when booking a place to demonstrate the advantages and
disadvantages of specific places when watching a movie. On the site, users have the opportunity to view a movie
poster and detailed information for each of the films After registration or authorization by e-mail, the user will
have the opportunity to choose the date and time of the session and book a ticket for the movie he liked. Upon
successful booking of a ticket, the user will see an electronic ticket with a unique reservation code. Using this
code, the user will be able to pay for the ticket he booked at the box office immediately before watching the
movie.
Information about movies and cinema sessions will be stored in the Firebase real-time Firestore database.
To provide the ability to quickly manipulate this data, will be created a separate administrator page directly on
the website. Only authorized users with administrator rights will have access this page, and it will be possible to
delete / add / edit a movie on it, including uploading a poster (image) and trailer (video file) to the Firebase cloud
storage. There is also ability for administrator to edit sessions, view occupied seats (with details) on a two-
dimensional plan of the cinema, manually add occupied seats (when offline buying tickets), as well as edit other
session parameters (ticket price, etc.).
Important components of the frontend of modern web sites are: organic design, adaptive layout and in-
teractivity. Note that website design should be carried out within the framework of a single own or existing de-
sign system, and to date, the most popular is material design from google [8]. Adaptive layout of the site involves
the use of transformations to display page content depending on the device (desktop computer, tablet,
smartphone, etc.) used for web surfing. For example, on the smartphone’s screens, the site’s navigation menu
can change from the line display mode to the form of a drop-down menu when a button is pressed. And finally,
the interactivity of the site implies the presence of graphical interface components that respond to user actions
(drop-down menus, tooltips, etc.).
Development of the user interfaces (frontend parts) of such sites using only the standard (and only possi-
ble) html, CSS and JavaScript web languages is an extremely difficult task, which is why today we have acquired:
1. html template engines, which allows creating reusable compact html-code; one of the most popular is
pug [6];
2. CSS-preprocessors, which allows to create compact CSS styles; one of the most popular is stylus [7];
3. JavaScript frameworks, which allow scalable component development of dynamic web applications;
one of the most popular is vue.js [1] and its associated library of graphical components named quasar [2].
In recent years, serverless systems have become more relevant for the backend part of applications, al-
lowing one to use already configured virtual servers, the functionality of which can be close to the capabilities

MATERIALS OF XII JUNIOR RESEARCHERS’ CONFERENCE 2020
ICT, Electronics, Programming, Geodesy
187
obtained when using own server. One of the most common serverless systems is Firebase from google [3], which
allows to significantly reduce labor costs when developing applications due to the lack of the need to inde-
pendently configure the server and deploy the application to the server.
The task of deploying a modern application on the own server becomes extremely difficult due to the
need to develop a security system, optimize the load, back up data, etc. In this regard, the use of cloud technol-
ogies and serverless application architectures is becoming more and more popular. In this case the custom serv-
er is replaced with a virtual one provided by the provider of the corresponding service. At the same time, part
(and sometimes significant) of the important opportunities that exist when using the own server is certainly lost,
in particular, the processing of critical and private data that cannot be fully processed on the client side for secu-
rity reasons. So, for example, validation of data before saving to the database can certainly be done on the client
side, and it is really carried out for quick reaction of the application to incorrectly entered data, which significant-
ly reduces the load on the server, however, on the client side the data can always be falsified, which makes it
necessary mandatory revalidation of data on the server side. A convenient compromise is achieved by the Fire-
base system, which offers a complete serverless system with a wide range of features for developers, including:
1. Hosting - full hosting for web-applications. Created or updated web-application can be uploaded to
Firebase using one console command, it is also possible to connect the own domain name for free;
2. Storage - cloud storage that allows users to display relevant files in a web application, as well as dy-
namically save user files;
3. Cloud Firestore - scalable real-time nosql database;
4. Cloud Functions - a system that makes it possible to load in Firebase specific own JavaScript functions
that are performed during specified operations (reading from the database, registering a new user, etc.). This
feature is significant because it allows to partially remove the main limitation of serverless approaches - the ina-
bility to execute essentially server-side code (for example, analysis of the correctness of CAPTCHA recognition,
etc.);
5. Authentication - a system for registering and authenticating users in a web application by email and
password, phone number, social network account, etc.
Today, due to the rapid development and growing popularity of the Internet, for almost any company,
organization, or a thematically related group of people, it is important to place relevant information on the In-
ternet that is accessible to citizens interested in it. Information on the Internet is placed in the form of static web
sites or dynamic web applications, and in many cases duplication of the site / application functionality in the
form of a mobile or desktop application is also important. The set of web technologies considered in this work
makes it possible to develop attractive applications with minimal time.
REFERENCES
1. Vue, javascript framework, official site [Electronic resource]. – Mode of access: https://vuejs.org – Date of
access: 01.03.2020.
2. Quasar, javascript library/framework, official site [Electronic resource]. – Mode of access: https://quasar.dev
– Date of access: 01.03.2020.
3. Firebase, Google cloud service, official site [Electronic resource]. – Mode of access:
https://firebase.google.com/ – Date of access: 01.03.2020.
4. Flex css layout, documentation [Electronic resource]. – Mode of access:
https://www.w3schools.com/css/css3_flexbox.asp – Date of access: 01.03.2020.
5. Grid css layout, documentation [Electronic resource]. – Mode of access:
https://www.w3schools.com/css/css_grid.asp – Date of access: 01.03.2020.
6. Pug, html- template engine, official site [Electronic resource]. – Mode of access: https://pugjs.org – Date of
access: 01.03.2020.
7. Stylus, css preprocessor, official site [Electronic resource]. – Mode of access: http://stylus-lang.com – Date
of access: 01.03.2020.
8. Material design, documentation [Electronic resource]. – Mode of access: https://material.io/design/ – Date
of access: 01.03.2020.

MATERIALS OF XII JUNIOR RESEARCHERS’ CONFERENCE 2020
ICT, Electronics, Programming, Geodesy
188
UDC 003.042
ATTACKS ON THE STEGANOGRAPHIC SYSTEM OF DIGITAL
WATERMARKS AND PROTECTION AGAINST THEM
I. ISAKAU, Y. PASTUKHOV
Polotsk State University, Belarus
In this paper, we examine a list of possible attacks on a stegosystem of digital watermarks, and ways to
counter these attacks.
Classification of attacks on the DW. DW must satisfy the conflicting requirements of visual (audio) stealth
and robustness to the basic signal processing operations. In the future, without loss of generality, we will assume
that the image is used as a container.
We turn to the message embedding system by modifying the least significant bit (LSB) of the pixels. Al-
most any method of image processing can lead to the destruction of a significant part of the embedded mes-
sage. For example, consider the operation of calculating a moving average over two adjacent pixels ,
which is the simplest example of low-pass filtering. Let the values of the pixels a and b be even or odd with a
probability . Then the value of the least significant bit will change after averaging in half the cases. A change
in the quantization scale, say, from 8 to 7 bits, can also lead to the same effect. A similar effect is exerted by los-
sy image compression. Moreover, the use of noise purification methods using noise estimation and subtraction
will distort the vast majority of bits of a hidden message. [1] There are also much more harmful image pro-
cessing operations for the DW, for example, scaling, rotation, truncation, pixel permutation . The situation is
aggravated by the fact that the conversion of stego messages can be carried out not only by the violator, but
also by the legitimate user, or be a consequence of errors during transmission over the communication channel.
A shift of several pixels may result in non-detection of the DW in the detector. Analog video recorders, as
a rule, somewhat shift the image due to the uneven rotation of the tape drive engine or the wear of the tape.
The shift can be invisible to the eye, but lead to the destruction of the DW.
Now consider the attacks specific to DW systems. The following categories of attacks against such stego-
systems can be distinguished [3].
1. Attacks against the built-in message - aimed at removing or damaging the DW by manipulating the
stego. Attack methods that fall into this category do not try to evaluate and highlight a watermark. Examples of
such attacks include linear filtering, image compression, adding noise, aligning the histogram, changing the con-
trast, etc.
2. Attacks against the stode detector - aimed at hindering or making impossible the correct operation of
the detector. In this case, the watermark in the image remains, but the possibility of its reception is lost. This
category includes attacks such as affine transformations (i.e. scaling, shifts, rotations), image truncation, pixel
permutation, etc.
3. Attacks against the protocol for the use of DW - mainly associated with the creation of false DW, false
stego, inversion of DW, the addition of several DW.
4. Attacks against the DW itself - aimed at evaluating and extracting the DW from the stego message, if
possible without distorting the container. This group includes such attacks as collusion attacks, statistical averag-
ing, methods for cleaning signals from noise, some types of nonlinear filtering [4] and others.
It should be noted that the classification of attacks under consideration is not the only possible and com-
plete one. In addition, some attacks (such as noise removal) can be categorized into several categories.
In accordance with this classification, all attacks on DW systems can be divided into four groups:
1) attacks aimed at removing the DW;
2) geometric attacks aimed at distorting the container;
3) cryptographic attacks;
4) attacks against the protocol used to embed and verify the DW.
Methods of counteracting attacks on DW systems. In the simplest DW stegosystems, a pseudo-random
sequence is used when embedding, which is a realization of white Gaussian noise and does not take into account
the properties of the container. Such systems are practically unstable to most of the attacks discussed above. To
increase the robustness of stegosystems, a number of improvements can be proposed [2].
MATERIALS OF XII JUNIOR RESEARCHERS’ CONFERENCE 2020
ICT, Electronics, Programming, Geodesy
189
In a robust stegosystem, the correct choice of pseudo-random sequence parameters is necessary. It is
known that in this case, systems with spreading the spectrum can be very robust with respect to attacks such as
adding noise, compression, etc. It is believed that the DW should be detected with a sufficiently strong low-pass
filtering (7x7 filter with a rectangular characteristic). Therefore, the signal base must be large, which reduces the
bandwidth of the stego channel. In addition, the memory bandwidth used as a key must be cryptographically
secure.
The reason for the instability of the DW systems with the expansion of the spectrum to such attacks is
due to the fact that the sequence used for embedding usually has a zero mean. After averaging over a sufficient-
ly large number of implementations, the DW is deleted. A special method of constructing a watermark is known
that is directed against such an attack. In this case, the codes are developed in such a way that with any averag-
ing there always remains a non-zero part of the sequence (static component). Moreover, it is possible to restore
the rest of the sequence (dynamic component). The disadvantage of the proposed codes is that their length in-
creases exponentially with the increase in the number of distributed protected copies. A possible way out of this
situation is the use of hierarchical coding, that is, the assignment of codes for a group of users. Some of the
analogies here are with Code Division Multiple Cellular (CDMA) cellular systems.
Various countermeasures have been proposed to solve the problem of property rights. The first way is to
build an irreversible DW algorithm. The DW must be adaptive to the signal and be embedded using a unidirec-
tional function, for example, a hash function. The hash function converts 1000 bits of the original image V into
the bit sequence , . Further, depending on the value of two embedding functions of the
DW are used. If , then the function is used, if , then the function
, where - is the i-th image coefficient,, - is the i-th bit of the embedded message. It is
assumed that such an algorithm for the formation of the DW will prevent falsification.
The second way to solve the problem of property rights is to embed in the DW a certain time stamp pro-
vided by a third, trusted party. In the event of a conflict, a person with an earlier time stamp on the image is
considered the real owner.
One of the principles of building a robust DW is to adapt its spectrum. A number of studies have shown
that the envelope of the spectrum of an ideal DW should repeat the envelope of the spectrum of the container.
The spectral power density of the DW, of course, is much less. With such a spectral envelope, the Wiener filter
gives the worst estimate of the DW possible: the variance of the error values reaches the variance of the filled
container values. In practice, adaptation of the DW spectrum is possible by local assessment of the container
spectrum. On the other hand, the methods of embedding DW in the field of transformation achieve this goal
through adaptation in the field of transformations. [4]
To protect against attacks such as affine transformation, you can use an additional (reference) DW. This
DW does not contain information, but is used to “register” the transformations performed by the violator. There
is a predistortion circuit in the DW detector that performs the inverse transform. There is an analogy with the
test sequences used in communication. However, in this case, the attack can be directed precisely against the
supporting DW. Another alternative is to embed the DW in visually significant areas of the image that cannot be
removed from it without significant degradation. Finally, we can place the stego in the conversion-invariant coef-
ficients. For example, the amplitude of the Fourier transform is invariant to image shift (in this case, only the
phase changes).
Another method of protection against such attacks is a block detector. The modified image is divided into
blocks of 12x12 or 16x16 pixels, and all possible distortions are analyzed for each block. That is, the pixels in the
block undergo rotations, permutations, etc. For each change, the correlation coefficient of the DW is deter-
mined. The transformation, after which the correlation coefficient turned out to be the largest, is considered to
be actually performed by the violator. Thus, it becomes possible to reverse the distortions introduced by the
intruder. The possibility of this approach is based on the assumption that the intruder will not significantly dis-
tort the container (this is not in his interests).
Conclusion. Summing up, we can say with confidence that you can protect yourself from every attack by
knowing all the details of this attack, and you should always close the vulnerabilities of your system and conduct
attacks against it by testing for resistance to them. Carrying out attacks on our own CEH, we analyze its vulnera-
bility to this attack, which in the end we can close. It is impossible to fully ensure the security of our CEH, be-
cause while we close one vulnerability, the attacker is looking for a new one, and this race between the attacker
and the computer security specialist will be eternal. The surest way to defend this is an “attack”, if we ourselves
can identify vulnerabilities, then we can successfully close them, this remains the main aspect of the work of KB
experts - the study and practice of attacks, and the development of defense systems.

MATERIALS OF XII JUNIOR RESEARCHERS’ CONFERENCE 2020
ICT, Electronics, Programming, Geodesy
190
REFERENCES
1. Sadov, V.S. Computer steganography (Lecture notes) / V.S. Sadov - Minsk: BSU, 2010 .-- 211 p.
2. Schneier, B. Secrets and lies. Data Security in the Digital World / B. Schneier - St. Petersburg: Peter, 2003. -
368 p.
3. Gribunin, V.G. Digital steganography / V.G. Gribinin - Moscow: “Academy”, 2009. - 265 p.
4. Shelukhin, O.I. Steganography. Algorithms and software implementation / O.I. Shelukhin / S.D. Kanaev -
Moscow: “Hot Line - Telecom”, 2017. - 592 p.
MATERIALS OF XII JUNIOR RESEARCHERS’ CONFERENCE 2020
ICT, Electronics, Programming, Geodesy
191
UDC 681.322
REVIEW OF METHODS FOR SMARTPHONE APPLICATION FOOT SIZE ESTIMATION FROM IMAGES
I. ZAKHARAVA, R. BOHUSH
Polotsk State University, Belarus
The task of obtaining real-world coordinates of an object is quite challenging. In this paper proposed
brief explanation of algorithms dedicated to overcome this challenge. They were analyzed including their
advantages and disadvantages in application to possible implementation in smartphone app.
Introduction. The Internet technologies grow rapidly. With that traditional approach from selling goods di-
rectly to the customer in offline switched to the online space. Nowadays more and more shops use Internet to per-
form commercial transactions. Online stores have a variety of products and it helps to the customers to purchase a
product with the better price. Also there is no need to go out and all shopping can be performed right inside the
house. The online retailers trying to make system even more comfortable and all payment procedure can take
about 2 minutes.
But online shopping has some disadvantages too. For instance, a customer has to buy a product without
seeing actually how it looks like. Customers may click and buy some product that is not really required by them. The
electronic images of a product are sometimes misleading. The color, appearance in real may not match with the
electronic images. If the size does not fit the customer want to return goods back. A big percentage of refund leads
to business owner money loss.
The buyers also can choose wrong size that does not fit to their body parameters and get bad experience
items purchasing in online stores. To avoid this experience some online shops propose free fitting when the currier
deliver all purchased good and then taking back things that does not fit to the customer by the appearance or size.
But it consumes a lot of time and money as well.
This problem became very crucial for the shoe shopping. Correct foot measurements requires a trained skills
and special instruments like calipers for linear measurements that used for heights, lengths and widths calculation
as well as measuring tape for girths. The accuracy of final results depends of skills level.
To make process of foot size estimation more comfortable for the customer a lot of companies propose im-
age processing algorithms to acquire and measure surface of the foot. In this paper we will review approaches that
can be used in application to this task.
Algorithms review. Nowadays, state-of the art approaches can be separated on the few categories. Some
of approaches use additional sensor to achieve more information about object. For example, approach present-
ed in [1] use RGB-D cameras. A RGB-D image is simply a combination of a RGB image and its corresponding
depth image. A depth image is an image channel in which each pixel relates to a distance between the image
plane and the corresponding object in the RGB image. The image of the foot pictured on the A4 sheet with the
set of AR codes. The depth map obtained from an image converted to cloud points. After performed noise re-
moval algorithm and performed a 2-Dprincipal component analysis (PCA) to find the long-axis and the short-axis
of the 2-D foot print. Measurement error for proposed algorithm varies from the left and right foot. Also it de-
pends on measurement type. In this paper were evaluated measurements of foot length, width and girth. For
the left foot the minimal deviation in length measurements was 2.1 mm, in width it was 1.45 and for girth this
value was 2.76. For the right foot the minimal deviation was 1,18 for foot length, 1.32 for width and 2,16 for
girth. Proposed approach has a big inaccuracy that can be crucial for shoe size measurements. Also it uses hard-
ware that cannot be used in average smartphone application.
The next algorithm presented in [2] also use RGB-D camera to measure an accurate distance to an object
and from with that information obtain real world measurements. The RGB image from the camera goes to Con-
volutional Neural Network (CNN) from [3] for object detection. As output it produce bounding box that isolate
object of interest from the background to perform more accurate measurements. Than was performed recalcu-
lation from image coordinates to real world measurements using e LIDAR/IR sensor. For hardware this algorithm
use smartphone Lenovo TangoPhab 2 phone that collects point cloud of depth data. The main problem that
phone can obtain RGB information at 30 fps(frames per second) and depth information at 5 fps. Also, there is a
spatial shift between camera coordinates and depth sensor. Moreover, during experiments was found that IR
sensor has missing spots in black or metallic surface. Proposed approach has deviation from 3 to 10 cm. These
values are too big to take this approach into account for foot measurements.
MATERIALS OF XII JUNIOR RESEARCHERS’ CONFERENCE 2020
ICT, Electronics, Programming, Geodesy
192
In [4] presented another algorithm that uses depth information with image data to obtain real world
measurements of on-tree mango fruits. For fruit detection was used cascade classifier with HOG features. Than
was perdormid sematic segmentation of fruit area with Otsu[5] method in CIE Lab color space. After was per-
formed filtration of mango peduncle with following dilatation. Than object geometrically filtered to check that
the object has elliptical shape. The following operation is real world size calculation using the data from depth
sensor. As mentioned earlier approach that use additional sensors to acquire depth information cannot be used
by average smartphone owner.
Some of them use a template to compare image distance with real world measurements. In [6] authors
presented algorithm that use A4 sheet of white paper as a pattern. The foot in a black sock is standing near or on
the white pattern. The algorithm requires 3 photos with the different views of the foot. For each photo per-
formed Canny edge detection to find edges of the pattern and foot. They are distinguished by the algorithm us-
ing geometrical information about form and size of template. The extracted template contour is refined with the
Snakes algorithm from [7]. Than the foot size is recalculated using real world coordinates of the template. In
paper mentioned that the accuracy is strongly associated with the shooting angle. If the angle is 10˚ than meas-
urement error is equal to 1,5 mm. But if the angle if 15 degrees the error becomes 3,4 mm. Also, proposed ap-
proach do not use specific algorithm to extract points of a foot and there can be errors due to complicated back-
ground.
In [8] proposed an algorithm to estimate the size of rain drops. Authors take the videos of rain drops as
input. All videosequence separates on frames that processed and each frame is threated as individual image.
Each image goes to filtering and morphological operations to extract raindrop shape from background. For real
world measurements performed static pixel to millimeter ratio. Proposed algorithm unsuitable in application to
foot measuring via smartphone app due to static ration for coordinates recalculation and weak algorithms for
object detection.
In [9] performed comparison of an app that use template and the booth with mirrors. An app uses 3 im-
ages of the foot on A4 white sheet. The paper used for camera calibration and real world size calculation. The 3
images should contain the foot pictured on the top and from both sides’ also known as zenithal, lateral and me-
dian views. Than authors use 5 points landmark extraction to accurate measurements of foot length, toes girth,
toes width, ball girth, ball width, instep girth and instep height. The booth for foot measurement contains mir-
rors that also present foot in 3 points of view. To distance between camera and booth bottom is a constant val-
ue and real world values are simply recalculated by it. The error for every measurement amounted from 0.5 mm
to 2.2 mm for the app and from to 0,6 mm for 1.8 mm the booth.
Some researches focused their attention on stereo photogrammetry. In [10] is presented approach to ob-
tain real world measurements of objects of interest for object tracking. The input image pictured by set of cam-
eras. They are mounted on a stable bar with the stable distance of 413 mm. The object detected by fast and
adaptive median background subtraction algorithm from [11]. Real world coordinates recalculated using camera
rig distance. Authors performs static camera calibration using «chessboard» pattern. The error of measurements
lays above the 10%. Proposed algorithm does not use any additional operations to reduce noise from an image
which is leads to false positive result of the detector. Also, static calibration with the pattern requires skills and
knowledge which makes it harder to potential implementation in smartphone app.
Another one algorithm presented in [12] uses the system of two cameras that mounted on the static dis-
tance. In paper proposed enhanced algorithm for tomatoes detection. That use active contour model from [7]
with shape constant. As shape constant is used ellipse. On the detection algorithm output there are four pro-
posals of tomato location and authors manually choose the best of them. For stereo image formation was used
set of features. These features obtained by SIFT [13] descriptors. The best match between them is calculated
using Euclidean distance measurement. The camera parameters are determined once, at the beginning of the
season, by observing a calibration pattern at different positions and orientations in the scene. This method was
first tested under ideal acquisition conditions and using manual segmentation. In this case, the percentage error
between the actual radius and the estimated size was always less than 10 % with most (91 %) of the error less
than 5 %, which demonstrate the robustness of radius estimation. The complete system was also applied to es-
timate the size of tomatoes cultivated in open fields for the agriculture season 2013. The percentage error was
less than 10 % in most of the cases, despite the poor quality of images during this season (small size, pixelated
images).Proposed approach also require static camera calibration and cannot be applied by average smartphone
user.
In [14] reported that object of interest size also obtained using two cameras which are not movably fixed.
The input images converted to gray colorspace. After, medial filtering for noise reduction was performed. Than
MATERIALS OF XII JUNIOR RESEARCHERS’ CONFERENCE 2020
ICT, Electronics, Programming, Geodesy
193
performed simple background subtraction algorithm that assume that firs frame is background. That binarized
image goes to morphological processing. This is followed by object detection using connected components algo-
rithm from [15]. The real world measurements were calculated using the distance between two cameras. Pro-
posed algorithms works very fast and achieved error deviation at ± 3 cm. This is very high value and proposed
approach cannot be applied to our task. Also in paper presented images that does not contain complicated
background and these algorithm unsuitable for real world scenarios.
Similar to previous work the authors [16] propose an algorithm of object detection and size estimation in
underwater areas. Two camera located on the static distance between each other and both of the previously
calibrated with pattern. Then performed object detection using background subtraction algorithm. For each ob-
ject is calculated the centre of mass and these values used for the following calculation of real-world coordi-
nates. The main disadvantages of proposed approaches are the same as previous: calibration is difficult to per-
form by the average app consumer and not accurate algorithm for object detection that almost unsuitable for
real world scene.
Some approaches uses surprising algorithms and non-standard sensor types to measure the object. For
example in [17] reported on their attempts to use a standard flatbed scanner - the type that would normally be
found in the office environment for digitizing documents - to scan the foot sole and translate the output to a 3D
form. The distance of the sole away from the scanner glass was estimated using the albedo of the sole surface
and the pixel intensity of the resulting image, inspired by techniques used in the analysis of satellite images. The
authors claim they are able to achieve an average error of <1 mm, in line with those achieved by more expensive
scanning systems, however the system was tested using a foot model with a uniform color and it was noted that
scanning a real foot, especially those with damage or injury could present problems for the reconstruction pro-
cess. And proposed approach cannot use smartphone software as well.
Finally, at this moment a lot of attention focused on Neural Network (NN) approaches dedicated to this
problem. There we will review not only algorithms dedicated to real-world object size estimation but and dense
map calculation algorithms. As we mentioned earlier some approaches use RGB-D information to obtain object
size. There we look at the state-of-the art algorithms that can help us get depth information without sensors.
In [18] presented algorithm that use stereo images. First of all images goes to stereo matching part. In
this paper used algorithm mentioned in [19]. It uses SVM classification with Laplacian of Gaussian (LOG) trans-
form and Euclidean distance correlation function. The Laplacian measures directed edge intensities over
some area smoothed by the Gaussian. The depth map is obtained after this step. Then the depth map goes to
three layer feed forward network that produce bounding boxes from it. This algorithm was tested on low resolu-
tion images. In contrast, smartphone cameras have much higher resolution that example of images that was
proposed in paper. Consequently, there has to be much more inputs and hidden layers in NN architecture.
In [20] was used stereo matching algorithm too. There is stereo matching is performed using CNN. The
architecture contains 8 layers. For the first 3 of them images processed independently. Than performed features
concatenation. The final layer, projects the output to two real numbers that are fed through a softmax function,
producing a distribution over the two classes (good match and bad match. The final stereo matching is per-
formed by coss-based cost aggregation from [21]. Than is performed matching cost refinement by enforcing
smoothness constraints on the disparity image. Proposed algorithm is more accurate than late approaches but it
is too heavy for smartphone application.
In [23] was performed depth estimation using CNN architecture U-Net[24]. As input used original inage,
lense parameters and binned depth map calculated like in [25]. As output they get simulation of sensor image
and depth map. Proposed approach has the lowest values of distortion error. Unfortunately, it still heavy
weighted approach for smartphone owners.
Conclussion. There is a lot approaches dedicated to digital foot measurements. Some of them has meas-
urement accuracy even higher that mutual methods. At the same time automated approaches much faster and
cheaper than hand crafted. Also the data obtain from this algorithm can be used for health insurance, shoes rec-
ommendations, deceases diagnostics and so on.
Proposed review showed that for digital measurements widely used different techniques that trying to
maximize cost and accuracy , reduce processing time and learning period for average user. Bringing researchers
in the field, scanning equipment manufacturers, orthotic, footwear companies, users and other stakeholders
together to further explore these issues may result in cross disciplinary activity needed to resolve current needs
and issues.
Currently almost every state-of-the art smartphone has more than one frontal camera that means that
approaches that use stereo photogrammetry can be applied for our task. Also, algorithms that use foot land-
marks to extract more contextual information from an image seem very promising too.

MATERIALS OF XII JUNIOR RESEARCHERS’ CONFERENCE 2020
ICT, Electronics, Programming, Geodesy
194
The CNN approaches mentioned there are heavy and cannot be implemented in smartphone app, but
there is a chance to improve CNN architecture to make it more suitable for mobile devices.
REFERENCES
1. Yang-Sheng Ch. Estimation of 3-D Foot Parameters Using Hand-Held RGB-D Camera/ Ch.Yang-Sheng, Ch. Yu-
Chun, K. Peng-Yuan, Sh. Sheng-Wen, H. Yi-Ping // In Proc of . ACCV 2014 Workshops, At Singapore, Volume:
LLCN 9010. – 2015.-P. 407-418
2. Object Localization and Size Estimation from RGB-D Images. [Электронный ресурс].–Режим доступа:
https://arxiv.org/pdf/1808.00641.pdf. – Дата доступа: 04.03.2020
3. Tensorflow Object Detection AP[Электронный ресурс].–Режим
доступа:.https://github.com/tensorflow/models/tree/master/research/object_detection. – Дата доступа:
04.03.2020
4. Zhenglin W. On-Tree Mango Fruit Size Estimation Using RGB-D Images/ W. Zhenglin , W. Kerry // Sensors. –
2017 . – Vol.17. – P. 2738 - 2753
5. Otsu N. A threshold selection method from gray-level histograms/ N. Otsu // Automatica.- 1975.-Vol.11. – P.
23–27.
6. Беляев, С. Определение размеров стопы человека по фотографиям/ С. Ю. Беляев, В. Г. Шубников //
Научно-технические ведомости СПбГПУ. Информатика. Телекоммуникации. Управление. – 2014. –
.2(193). – С. 23–30
7. Kass, M. Snakes: Active contour models/ M. Kass, P. Andrew,. W. Terzopoulos ,D. Terzopoulos // International
Journal of Computer Vision. – 1988. – Vol. 1. – P. 321-331.
8. Thurai M. Measurements and Modeling of the Full Rain Drop Size Distribution/ M. Thurai, M. , V.N. Bringi, P.
Gatlin, W. Petersen, M. Wingo // Atmosphere. – 2019 . – Vol.10. - 1. – P. 39-55
9. Ballester A. Low-cost data-driven 3D reconstruction and its applications/ A. Ballester, E. Parrilla, J. Vivas, A.
Piérola, J Uriel, S.-A. Puigcerver-Palau, P. Piqueras, Paola,C. Solves, M. Rodríguez, J. González, S. Alemany // In
Proc. of 6th International Conference and Exhibition on 3D Body Scanning technologies, At Lugano, Switzer-
land, Volume: Technical Session 10: RGB-D Sensors & Low Cost Systems.- 2015
10. Kollmitzer Ch.Object Detection and Measurement Using Stereo Images / Ch. Kollmitzer// In Proc of Multi-
media Communications, Services and Security: 5th International Conference, MCSS 2012. – 2012. – P. 287 –
297
11. Lo B. P. L.Automatic congestion detection system for underground platforms/ B. P. L. Lo , S. A. Velastin // In
Proc. of 2001 International Symposium on Intelligent Multimedia, Video and Speech Processing. ISIMP 2001
(IEEE Cat. No.01EX489. – 2001. - P. 158-161.
12. Verma U.Segmentation and size estimation of tomatoes from sequences of paired images./ U.Verma, F.
Rossant, I. Bloch. // EURASIP Journal on Image and Video Processing. – 2015.- Vol. 33
13. Lowe D. G. Object recognition from local scale-invariant features/ D. G. Lowe //In. Proc. of the International
Conference on Computer Vision – 1999. - .Vol. 2. – P. 1150–1157.
14. Mustafah Y.M. Stereo vision images processing for real-time object distance and size measurements/ Y. M.
Mustafah, R. Noor, H. Hasbi and A. W. Azma // 2012 International Conference on Computer and Communica-
tion Engineering (ICCCE). - 2012 . - P. 659-663.
15. B. Horn Robot Vision, MIT Press, 1986, Chap. 4.
16. A real-time stereo vision system fordistance measurement andunderwater image restoration. [Электронный
ресурс].–Режим доступа: http://www2.ene.unb.br/mylene/pubs/2016-08-
JournaloftheBrazilianSocietyofMechanicalSciencesandEngineering.pdf. – Дата доступа: 04.03.2020
17. Martedi S. Shape measurement system of foot sole surface from flatbed scanner image/ S. Martedi, H. Saito,
M. Servières// In Proc. of . MVA2009 IAPR Conference on Machine Vision Applications.- 2009. - P. 2-5.
18. Zhao L. Stereo- and Neural Network-Based Pedestrian Detection/ L. Zhao, Ch. Thorpe //. Intelligent Transpor-
tation Systems, IEEE Transactions. – 2000.-Vol. 1. - 3. -P. 148 - 154.
19. Small Vision Systems: Hardware and Implementation [Электронный ресурс].–Режим
доступа:https://www.cs.cmu.edu/~motionplanning/papers/sbp_papers/integrated1/konolidge_stereo_visio
n.pdf. – Дата доступа: 04.03.2020
20. Computing the Stereo Matching Cost with a Convolutional Neural Network [Электронный ресурс].–Режим
доступа: https://arxiv.org/pdf/1409.4326.pdf. – Дата доступа: 04.03.2020

MATERIALS OF XII JUNIOR RESEARCHERS’ CONFERENCE 2020
ICT, Electronics, Programming, Geodesy
195
21. Zhang, K. Cross-basedlocal stereo matching using orthogonal integral images/K. Zhang, J. Lu, G. Lafruit//
.Circuits and Systems for Video Technology, IEEE Transactions.-2009.-Vol. 19. - 7. – P.1073–1079.
22. Hirschmuller H. Stereo processing bysemiglobal matching and mutual information / H. Hirschmuller
//.Pattern Analysis and Machine Intelligence, IEEE Transactionson. – 2008. – Vol. 30.- 2 . – P. 328–341.
23. Chang J. Deep Optics for Monocular Depth Estimation and 3D Object Detection/ J. Chang,G. Wetzstein// .
Conference: 2019 IEEE/CVF International Conference on Computer Vision (ICCV). .-2019 . – P.10192-10201
24. Ronneberger O. U-net: Convolutional networks for biomedical image segmentation / O. Ronneberger, Ph.
Fischer, Th. Brox//. In Proc of International Conference on Medical image com-puting and computer-assisted
intervention. – 2015 . – P. 234–241
25. Hasinoff S,W. A layer-based restoration framework for variable-aperture photography/ S.W Hasinoff , K. N
Kutulako// In Proc of Computer Vision, 2007. ICCV 2007. IEEE 11th In-ternational Conference. – 2017, - P. 1–8
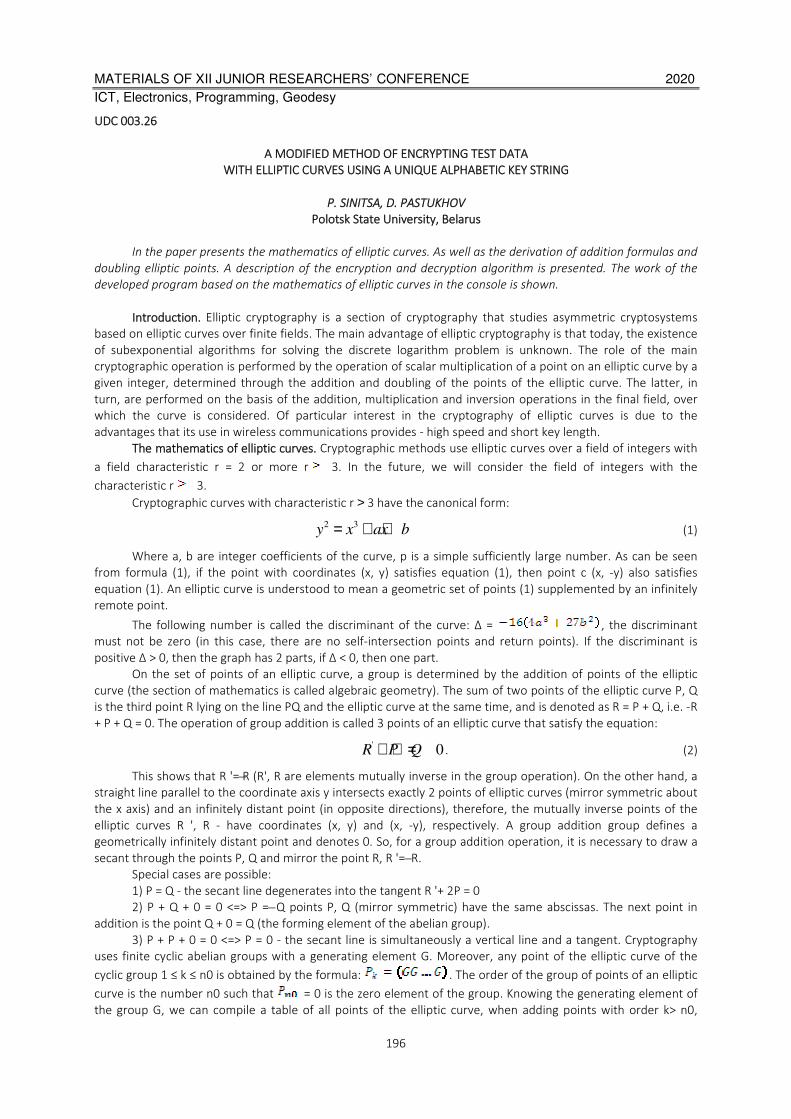
MATERIALS OF XII JUNIOR RESEARCHERS’ CONFERENCE 2020
ICT, Electronics, Programming, Geodesy
196
UDC 003.26
A MODIFIED METHOD OF ENCRYPTING TEST DATA
WITH ELLIPTIC CURVES USING A UNIQUE ALPHABETIC KEY STRING
P. SINITSA, D. PASTUKHOV
Polotsk State University, Belarus
In the paper presents the mathematics of elliptic curves. As well as the derivation of addition formulas and
doubling elliptic points. A description of the encryption and decryption algorithm is presented. The work of the
developed program based on the mathematics of elliptic curves in the console is shown.
Introduction. Elliptic cryptography is a section of cryptography that studies asymmetric cryptosystems
based on elliptic curves over finite fields. The main advantage of elliptic cryptography is that today, the existence
of subexponential algorithms for solving the discrete logarithm problem is unknown. The role of the main
cryptographic operation is performed by the operation of scalar multiplication of a point on an elliptic curve by a
given integer, determined through the addition and doubling of the points of the elliptic curve. The latter, in
turn, are performed on the basis of the addition, multiplication and inversion operations in the final field, over
which the curve is considered. Of particular interest in the cryptography of elliptic curves is due to the
advantages that its use in wireless communications provides - high speed and short key length.
The mathematics of elliptic curves. Cryptographic methods use elliptic curves over a field of integers with
a field characteristic r = 2 or more r 3. In the future, we will consider the field of integers with the
characteristic r 3.
Cryptographic curves with characteristic r > 3 have the canonical form:
2 3y x ax b= + + (1)
Where a, b are integer coefficients of the curve, p is a simple sufficiently large number. As can be seen
from formula (1), if the point with coordinates (x, y) satisfies equation (1), then point c (x, -y) also satisfies
equation (1). An elliptic curve is understood to mean a geometric set of points (1) supplemented by an infinitely
remote point.
The following number is called the discriminant of the curve: Δ = , the discriminant
must not be zero (in this case, there are no self-intersection points and return points). If the discriminant is
positive Δ > 0, then the graph has 2 parts, if Δ < 0, then one part.
On the set of points of an elliptic curve, a group is determined by the addition of points of the elliptic
curve (the section of mathematics is called algebraic geometry). The sum of two points of the elliptic curve P, Q
is the third point R lying on the line PQ and the elliptic curve at the same time, and is denoted as R = P + Q, i.e. -R
+ P + Q = 0. The operation of group addition is called 3 points of an elliptic curve that satisfy the equation:
'0R P Q+ + = . (2)
This shows that R '= R (R', R are elements mutually inverse in the group operation). On the other hand, a
straight line parallel to the coordinate axis y intersects exactly 2 points of elliptic curves (mirror symmetric about
the x axis) and an infinitely distant point (in opposite directions), therefore, the mutually inverse points of the
elliptic curves R ', R - have coordinates (x, y) and (x, -y), respectively. A group addition group defines a
geometrically infinitely distant point and denotes 0. So, for a group addition operation, it is necessary to draw a
secant through the points P, Q and mirror the point R, R '= R.
Special cases are possible:
1) P = Q - the secant line degenerates into the tangent R '+ 2P = 0
2) P + Q + 0 = 0 <=> P = Q points P, Q (mirror symmetric) have the same abscissas. The next point in
addition is the point Q + 0 = Q (the forming element of the abelian group).
3) P + P + 0 = 0 <=> P = 0 - the secant line is simultaneously a vertical line and a tangent. Cryptography
uses finite cyclic abelian groups with a generating element G. Moreover, any point of the elliptic curve of the
cyclic group 1 ≤ k ≤ n0 is obtained by the formula: . The order of the group of points of an elliptic
curve is the number n0 such that = 0 is the zero element of the group. Knowing the generating element of
the group G, we can compile a table of all points of the elliptic curve, when adding points with order k> n0,
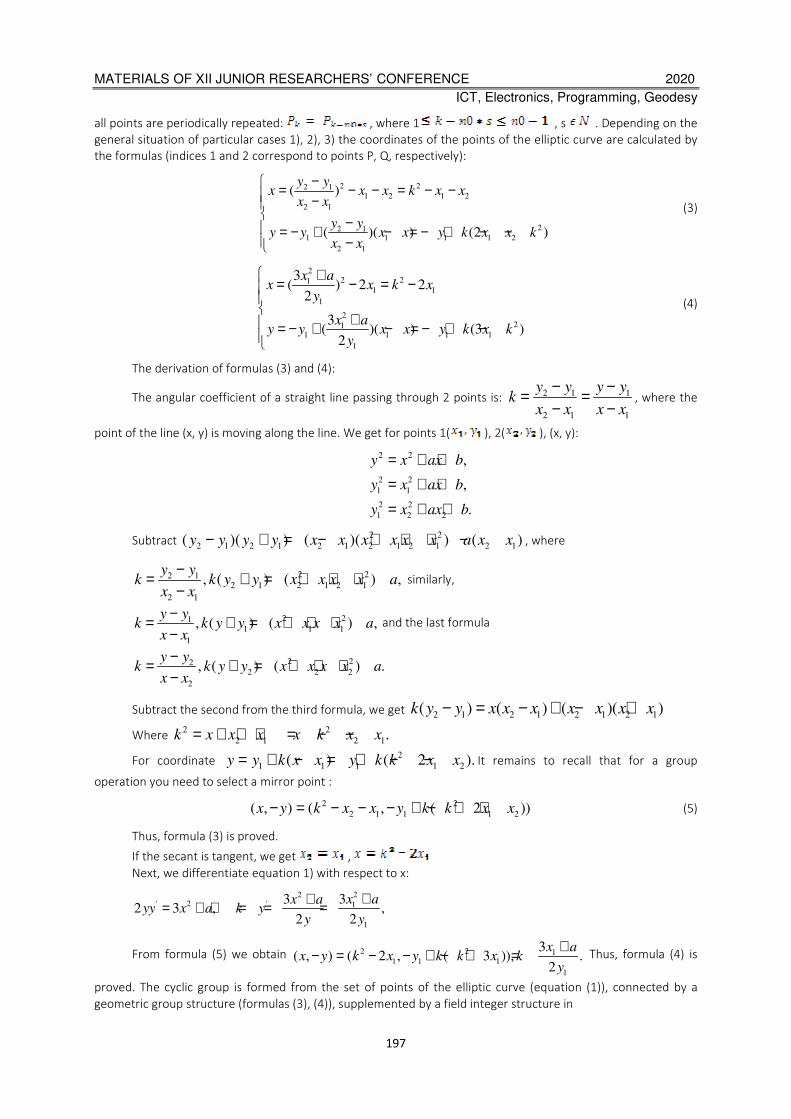
MATERIALS OF XII JUNIOR RESEARCHERS’ CONFERENCE 2020
ICT, Electronics, Programming, Geodesy
197
all points are periodically repeated: , where 1 , s . Depending on the
general situation of particular cases 1), 2), 3) the coordinates of the points of the elliptic curve are calculated by
the formulas (indices 1 and 2 correspond to points P, Q, respectively):
2 22 1
1 2 1 2
2 1
22 1
1 1 1 1 2
2 1
( )
( )( ) (2 )
y yx x x k x x
x x
y yy y x x y k x x k
x x
− = − − = − − − − = − + − = − + − − −
(3)
2
2 21
1 1
1
2
21
1 1 1 1
1
3( ) 2 2
2
3( )( ) (3 )
2
x ax x k x
y
x ay y x x y k x k
y
+= − = −
+ = − + − = − + −
(4)
The derivation of formulas (3) and (4):
The angular coefficient of a straight line passing through 2 points is: 2 1 1
2 1 1
y y y yk
x x x x
− −= =− −
, where the
point of the line (x, y) is moving along the line. We get for points 1( ), 2( ), (x, y):
Subtract 2 2
2 1 2 1 2 1 2 1 2 1 2 1( )( ) ( )( ) ( )y y y y x x x x x x a x x− + = − + + + − , where
2 22 1
2 1 2 1 2 1
2 1
, ( ) ( ) ,y y
k k y y x x x x ax x
−= + = + + +−
similarly,
2 21
1 1 1
1
, ( ) ( ) ,y y
k k y y x x x x ax x
−= + = + + +−
and the last formula
2 22
2 2 2
2
, ( ) ( ) .y y
k k y y x x x x ax x
−= + = + + +−
Subtract the second from the third formula, we get 2 1 2 1 2 1 2 1( ) ( ) ( )( )k y y x x x x x x x− = − + − +
Where 2 2
2 1 2 1.k x x x x k x x= + + ⇔ = − −
For coordinate 2
1 1 1 1 2( ) ( 2 ).y y k x x y k k x x= + − = + − − It remains to recall that for a group
operation you need to select a mirror point :
2 2
2 1 1 1 2( , ) ( , ( 2 ))x y k x x y k k x x− = − − − + − + + (5)
Thus, formula (3) is proved.
If the secant is tangent, we get ,
Next, we differentiate equation 1) with respect to x:
22
' 2 ' 1
1
332 3 , ,
2 2
x ax ayy x a k y
y y
++= + ⇔ = = =
From formula (5) we obtain 2 2 1
1 1 1
1
3( , ) ( 2 , ( 3 )), .
2
x ax y k x y k k x k
y
+− = − − + − + = Thus, formula (4) is
proved. The cyclic group is formed from the set of points of the elliptic curve (equation (1)), connected by a
geometric group structure (formulas (3), (4)), supplemented by a field integer structure in
2 2
2 2
1 1
2 2
1 2 2
,
,
.
y x ax b
y x ax b
y x ax b
= + += + +
= + +
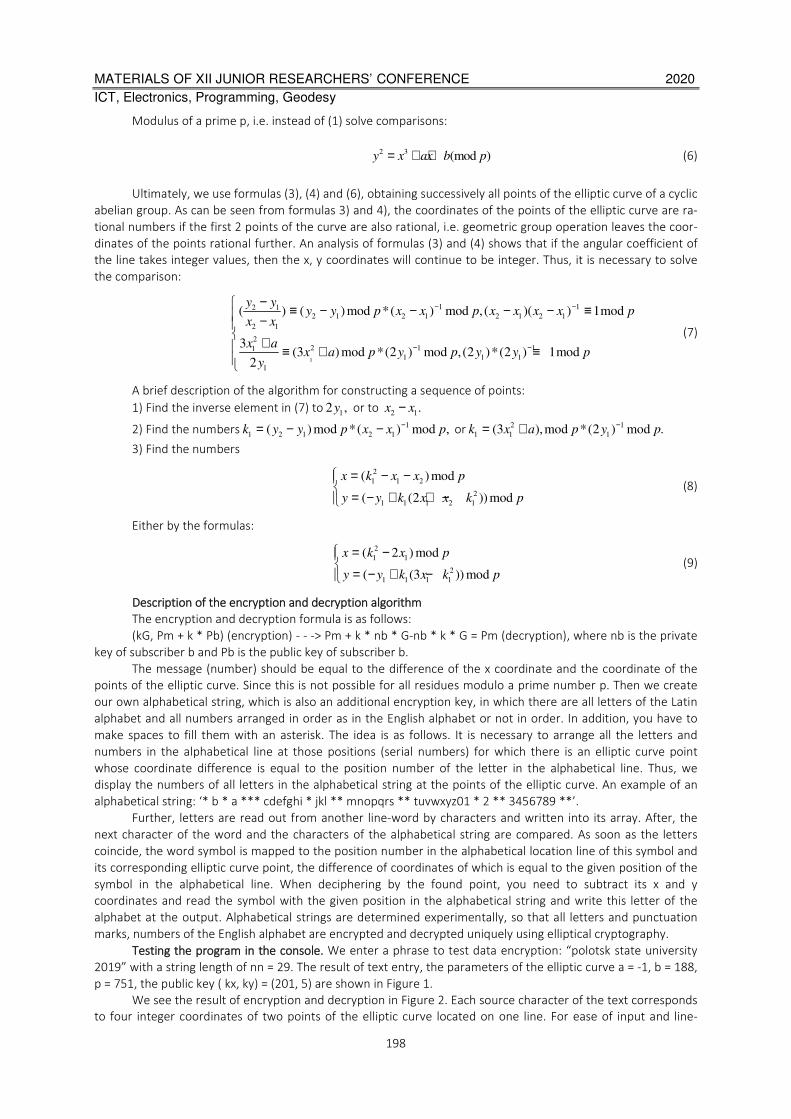
MATERIALS OF XII JUNIOR RESEARCHERS’ CONFERENCE 2020
ICT, Electronics, Programming, Geodesy
198
Modulus of a prime p, i.e. instead of (1) solve comparisons:
2 3
(mod )y x ax b p= + + (6)
Ultimately, we use formulas (3), (4) and (6), obtaining successively all points of the elliptic curve of a cyclic
abelian group. As can be seen from formulas 3) and 4), the coordinates of the points of the elliptic curve are ra-
tional numbers if the first 2 points of the curve are also rational, i.e. geometric group operation leaves the coor-
dinates of the points rational further. An analysis of formulas (3) and (4) shows that if the angular coefficient of
the line takes integer values, then the x, y coordinates will continue to be integer. Thus, it is necessary to solve
the comparison:
1
1 12 1
2 1 2 1 2 1 2 1
2 1
2
2 1 11
1 1 1
1
( ) ( ) mod *( ) mod , ( )( ) 1mod
3(3 ) mod *(2 ) mod , (2 )*(2 ) 1mod
2
y yy y p x x p x x x x p
x x
x ax a p y p y y p
y
− −
− −
− ≡ − − − − ≡ − + ≡ + ≡
(7)
A brief description of the algorithm for constructing a sequence of points:
1) Find the inverse element in (7) to1
2 ,y or to 2 1
.x x−
2) Find the numbers 1
1 2 1 2 1( ) mod *( ) mod ,k y y p x x p−= − − or 2 1
1 1 1(3 ),mod *(2 ) mod .k x a p y p−= +
3) Find the numbers
2
1 1 2
2
1 1 1 2 1
( ) mod
( (2 )) mod
x k x x p
y y k x x k p
= − −
= − + + − (8)
Either by the formulas:
2
1 1
2
1 1 1 1
( 2 ) mod
( (3 )) mod
x k x p
y y k x k p
= −
= − + − (9)
Description of the encryption and decryption algorithm
The encryption and decryption formula is as follows:
(kG, Pm + k * Pb) (encryption) - - -> Pm + k * nb * G-nb * k * G = Pm (decryption), where nb is the private
key of subscriber b and Pb is the public key of subscriber b.
The message (number) should be equal to the difference of the x coordinate and the coordinate of the
points of the elliptic curve. Since this is not possible for all residues modulo a prime number p. Then we create
our own alphabetical string, which is also an additional encryption key, in which there are all letters of the Latin
alphabet and all numbers arranged in order as in the English alphabet or not in order. In addition, you have to
make spaces to fill them with an asterisk. The idea is as follows. It is necessary to arrange all the letters and
numbers in the alphabetical line at those positions (serial numbers) for which there is an elliptic curve point
whose coordinate difference is equal to the position number of the letter in the alphabetical line. Thus, we
display the numbers of all letters in the alphabetical string at the points of the elliptic curve. An example of an
alphabetical string: ‘* b * a *** cdefghi * jkl ** mnopqrs ** tuvwxyz01 * 2 ** 3456789 **’.
Further, letters are read out from another line-word by characters and written into its array. After, the
next character of the word and the characters of the alphabetical string are compared. As soon as the letters
coincide, the word symbol is mapped to the position number in the alphabetical location line of this symbol and
its corresponding elliptic curve point, the difference of coordinates of which is equal to the given position of the
symbol in the alphabetical line. When deciphering by the found point, you need to subtract its x and y
coordinates and read the symbol with the given position in the alphabetical string and write this letter of the
alphabet at the output. Alphabetical strings are determined experimentally, so that all letters and punctuation
marks, numbers of the English alphabet are encrypted and decrypted uniquely using elliptical cryptography.
Testing the program in the console. We enter a phrase to test data encryption: “polotsk state university
2019” with a string length of nn = 29. The result of text entry, the parameters of the elliptic curve a = -1, b = 188,
p = 751, the public key ( kx, ky) = (201, 5) are shown in Figure 1.
We see the result of encryption and decryption in Figure 2. Each source character of the text corresponds
to four integer coordinates of two points of the elliptic curve located on one line. For ease of input and line-
MATERIALS OF XII JUNIOR RESEARCHERS’ CONFERENCE 2020
ICT, Electronics, Programming, Geodesy
199
by-line reading, the same cipher in one column is written to the text file balka1.txt. We see a complete
coincidence of the cipher in two stages.
In addition, it is also seen that the random number k = 17 introduced into the program in Figure 1 and
recorded by the program in the text file balka2.txt also match.
Figure 1. – Entering data into the program
The encryption protocol indicates the coordinates of the point of the elliptic curve corresponding to each
input character and the difference of the coordinates of the x-y point, which is equal to the position of the
original character in the alphabetical string. For example, from a point of an elliptic curve with coordinates (xm,
ym) we can determine ( ) ( ), 680,657 , 680 657 23xm ym des xm xy= = − = − = the original character using the
alphabetical string (the numbering of characters in the alphabetical string starts from zero, therefore 23des =
matches 24 characters, i.e. Latin letter p (Fig. 2 below).
Figure 2. – The result of the operation of encryption (left) and decryption (right)
Indeed, the phrase “polotsk state university 2019” begins with the letter p. Second character
( ) ( ), 266,244 , 266 244 22xm ym des xm xy= = − = − = matches 23 in a row character in the alphabetical string,
i.e. latin letter o, which corresponds to the second letter in the word polotsk. It can be seen from the console
that the cipher has other coordinates than the coordinates of the point of the elliptic curve, the difference of
coordinates of which is the position of the symbol, that is, in the clear, the cipher does not contain the
coordinates of the message points. We also see that all points of the text give the check function a value of zero,
that is, all points are points of an elliptic curve
Conclusion. The development of encryption and its methods has led to their widespread prevalence. Now
it is not difficult for the end user to encrypt a partition on a hard disk or correspondence and establish a secure

MATERIALS OF XII JUNIOR RESEARCHERS’ CONFERENCE 2020
ICT, Electronics, Programming, Geodesy
200
connection to the Internet. Due to the fact that encryption and other information technologies penetrate our
everyday lives, the number of computer crimes is growing. One way or another, encrypted information is an
object of protection, which, in turn, must be subject to legal regulation.
REFERENCES
1. Gdanov O.N., Zolotarev B.B. Methods and means of cryptographic information protection,167p.
2. Bolotov A.A., Gashkov S.V., Frolov A.B., Chasovskih A.A. An elementary introduction to elliptical cryptography.
3. Recjmmended Eliptic Curves for Govement Use.
4. SEC 2/ Recommended Eliptic Curves Domain Parametres.
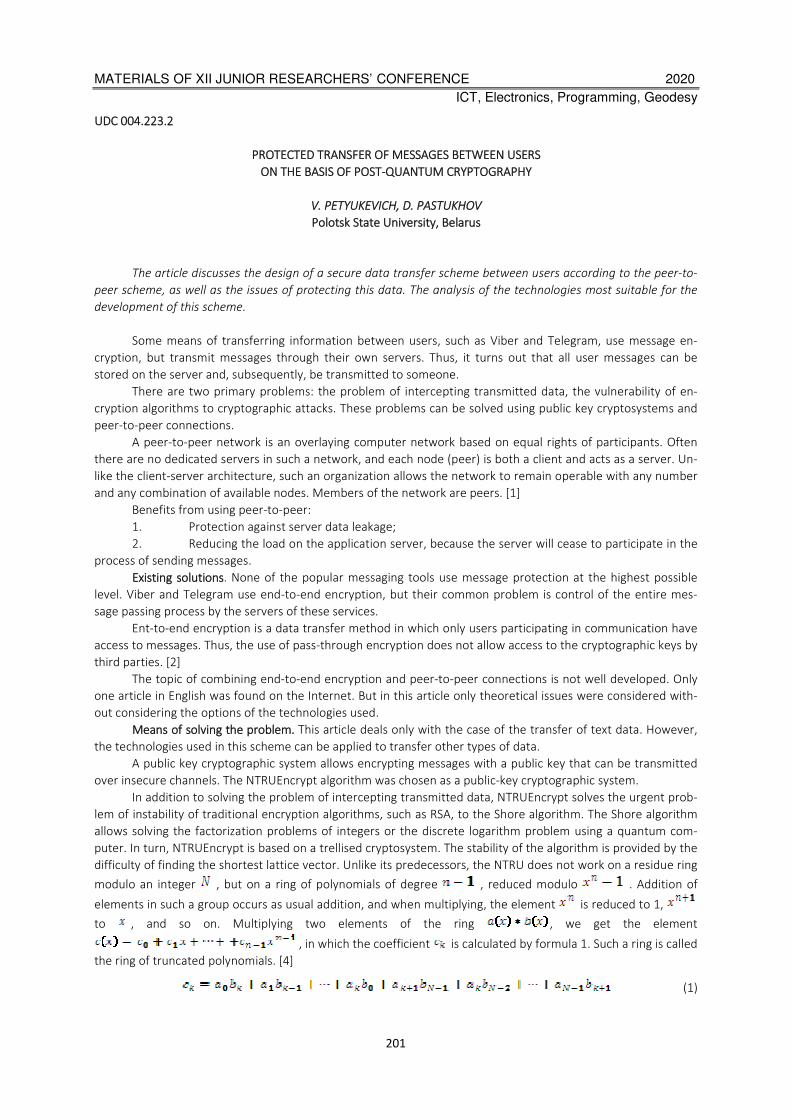
MATERIALS OF XII JUNIOR RESEARCHERS’ CONFERENCE 2020
ICT, Electronics, Programming, Geodesy
201
UDC 004.223.2
PROTECTED TRANSFER OF MESSAGES BETWEEN USERS
ON THE BASIS OF POST-QUANTUM CRYPTOGRAPHY
V. PETYUKEVICH, D. PASTUKHOV
Polotsk State University, Belarus
The article discusses the design of a secure data transfer scheme between users according to the peer-to-
peer scheme, as well as the issues of protecting this data. The analysis of the technologies most suitable for the
development of this scheme.
Some means of transferring information between users, such as Viber and Telegram, use message en-
cryption, but transmit messages through their own servers. Thus, it turns out that all user messages can be
stored on the server and, subsequently, be transmitted to someone.
There are two primary problems: the problem of intercepting transmitted data, the vulnerability of en-
cryption algorithms to cryptographic attacks. These problems can be solved using public key cryptosystems and
peer-to-peer connections.
A peer-to-peer network is an overlaying computer network based on equal rights of participants. Often
there are no dedicated servers in such a network, and each node (peer) is both a client and acts as a server. Un-
like the client-server architecture, such an organization allows the network to remain operable with any number
and any combination of available nodes. Members of the network are peers. [1]
Benefits from using peer-to-peer:
1. Protection against server data leakage;
2. Reducing the load on the application server, because the server will cease to participate in the
process of sending messages.
Existing solutions. None of the popular messaging tools use message protection at the highest possible
level. Viber and Telegram use end-to-end encryption, but their common problem is control of the entire mes-
sage passing process by the servers of these services.
Ent-to-end encryption is a data transfer method in which only users participating in communication have
access to messages. Thus, the use of pass-through encryption does not allow access to the cryptographic keys by
third parties. [2]
The topic of combining end-to-end encryption and peer-to-peer connections is not well developed. Only
one article in English was found on the Internet. But in this article only theoretical issues were considered with-
out considering the options of the technologies used.
Means of solving the problem. This article deals only with the case of the transfer of text data. However,
the technologies used in this scheme can be applied to transfer other types of data.
A public key cryptographic system allows encrypting messages with a public key that can be transmitted
over insecure channels. The NTRUEncrypt algorithm was chosen as a public-key cryptographic system.
In addition to solving the problem of intercepting transmitted data, NTRUEncrypt solves the urgent prob-
lem of instability of traditional encryption algorithms, such as RSA, to the Shore algorithm. The Shore algorithm
allows solving the factorization problems of integers or the discrete logarithm problem using a quantum com-
puter. In turn, NTRUEncrypt is based on a trellised cryptosystem. The stability of the algorithm is provided by the
difficulty of finding the shortest lattice vector. Unlike its predecessors, the NTRU does not work on a residue ring
modulo an integer , but on a ring of polynomials of degree , reduced modulo . Addition of
elements in such a group occurs as usual addition, and when multiplying, the element is reduced to 1,
to , and so on. Multiplying two elements of the ring , we get the element
, in which the coefficient is calculated by formula 1. Such a ring is called
the ring of truncated polynomials. [4]
(1)
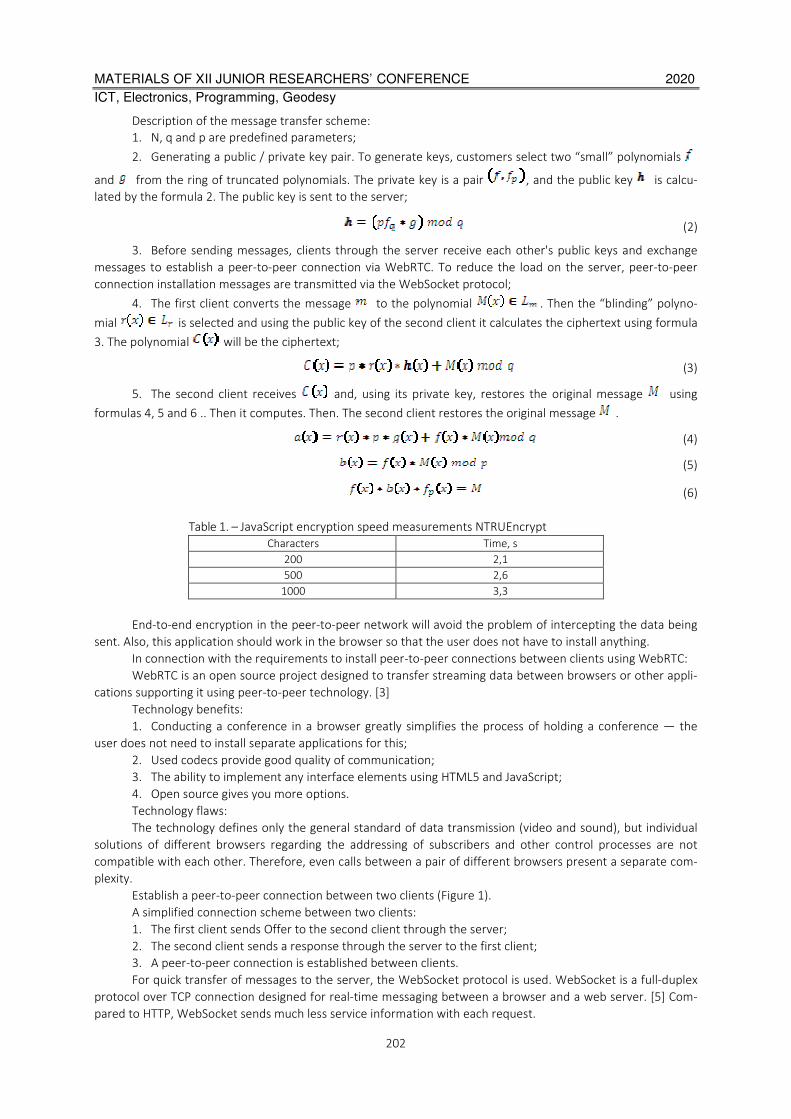
MATERIALS OF XII JUNIOR RESEARCHERS’ CONFERENCE 2020
ICT, Electronics, Programming, Geodesy
202
Description of the message transfer scheme:
1. N, q and p are predefined parameters;
2. Generating a public / private key pair. To generate keys, customers select two “small” polynomials
and from the ring of truncated polynomials. The private key is a pair , and the public key is calcu-
lated by the formula 2. The public key is sent to the server;
(2)
3. Before sending messages, clients through the server receive each other's public keys and exchange
messages to establish a peer-to-peer connection via WebRTC. To reduce the load on the server, peer-to-peer
connection installation messages are transmitted via the WebSocket protocol;
4. The first client converts the message to the polynomial . Then the “blinding” polyno-
mial is selected and using the public key of the second client it calculates the ciphertext using formula
3. The polynomial will be the ciphertext;
(3)
5. The second client receives and, using its private key, restores the original message using
formulas 4, 5 and 6 .. Then it computes. Then. The second client restores the original message .
(4)
(5)
(6)
Table 1. – JavaScript encryption speed measurements NTRUEncrypt
Characters Time, s
200 2,1
500 2,6
1000 3,3
End-to-end encryption in the peer-to-peer network will avoid the problem of intercepting the data being
sent. Also, this application should work in the browser so that the user does not have to install anything.
In connection with the requirements to install peer-to-peer connections between clients using WebRTC:
WebRTC is an open source project designed to transfer streaming data between browsers or other appli-
cations supporting it using peer-to-peer technology. [3]
Technology benefits:
1. Conducting a conference in a browser greatly simplifies the process of holding a conference — the
user does not need to install separate applications for this;
2. Used codecs provide good quality of communication;
3. The ability to implement any interface elements using HTML5 and JavaScript;
4. Open source gives you more options.
Technology flaws:
The technology defines only the general standard of data transmission (video and sound), but individual
solutions of different browsers regarding the addressing of subscribers and other control processes are not
compatible with each other. Therefore, even calls between a pair of different browsers present a separate com-
plexity.
Establish a peer-to-peer connection between two clients (Figure 1).
A simplified connection scheme between two clients:
1. The first client sends Offer to the second client through the server;
2. The second client sends a response through the server to the first client;
3. A peer-to-peer connection is established between clients.
For quick transfer of messages to the server, the WebSocket protocol is used. WebSocket is a full-duplex
protocol over TCP connection designed for real-time messaging between a browser and a web server. [5] Com-
pared to HTTP, WebSocket sends much less service information with each request.

MATERIALS OF XII JUNIOR RESEARCHERS’ CONFERENCE 2020
ICT, Electronics, Programming, Geodesy
203
Figure 1. – Peer-to-peer connection between two clients
Conclusion. In the course of this study, a scheme for secure data transfer between users using a post-
quantum encryption algorithm in a peer-to-peer network was designed. WebRTC was used to establish a peer-
to-peer connection in the browser. For encryption, the NTRUEncrypt algorithm was used. It should be noted that
the developed scheme leaves the opportunity for revision and introduction of additional protective equipment.
REFERENCES
1. Материал из Википедии – свободной энциклопедии. Одноранговая сеть [Электронный ресурс]. Режим
доступа: https://ru.wikipedia.org/wiki/Одноранговая_сеть. Дата доступа: 20.09.2019.
2. Бутакова Н.Г., Семененко В.А., Федоров Н.В. Криптографическая защита информации: учебное пособие
для вузов.- М.:Изд-во МГИУ, 2011. C 91–102
3. Материал из Википедии – свободной энциклопедии. WebRTC [Электронный ресурс]. Режим доступа:
https://ru.wikipedia.org/wiki/WebRTC. Дата доступа: 20.09.2019.
4. Материал из Википедии — свободной энциклопедии. NTRUEncrypt [Электронный ресурс]. Режим до-
ступа: https://ru.wikipedia.org/wiki/NTRUEncrypt. Дата доступа: 20.09.2019.
5. Материал из Википедии — свободной энциклопедии. WebSocket [Электронный ресурс]. Режим досту-
па: https://ru.wikipedia.org/wiki/WebSocket. Дата доступа: 20.09.2019.
MATERIALS OF XII JUNIOR RESEARCHERS’ CONFERENCE 2020
ICT, Electronics, Programming, Geodesy
204
UDC 004.004.658.2
APPROACHES TO DEVELOPING AN INTERFACE FOR AN AUTOMATED INFORMATION SYSTEM
FOR MANAGING A THRIFT STORE
V. GONCHAROV, A. OSKIN
Polotsk State University, Belarus
The article presents a practical way to create an interface for working with an automated information
system.the analysis of technologies that are most suitable for the development of this system is Carried out. Task,
implementation of an interface prototype based on web technologies.
Keywords: automated information system, Commission shop, programming language, 1C: Enterprise,
database, analog, prototype, interface.
Introduction. Today, almost every second product of human activity offered to the buyer is related to high
technologies. This means that it not only meets specific human needs, but is also the embodiment of scientific
and engineering thought. The automated information system being developed is aimed at significantly
facilitating the work of the Commission store. In addition to providing the user with convenient access to all
data, the system simplifies the maintenance of working documentation.
In this automated information system, the process of creating an application interface is used for direct
interaction of the application with the database, which combines all the necessary information for output
directly to the information system. The interface is created by adding the necessary components to 1C and then
configuring them. The interface of any information system has components that allow the program to interact
with the user.
Thus, this system being developed will provide a convenient mechanism for storing and selling
Commission products, as well as processing information on Commission products.
Analogues and prototypes. There are several analogues and prototypes of the Commission store
information system. The first analogue and prototype was the product "Commission store 1.1". The program is
designed for making payments to the Commission store's customers, accounting for the receipt, sale and return
of goods. Printing and recognition of barcodes.
Features of the program:
– maintaining a directory of operations, departments, and units of measurement;
– maintaining a directory of clients (legal and individuals) with their basic data;
– maintaining product balances for each committer, the ability to view balances, turnover of any
product, amounts of payments and debts to the committer on any day;
– quick entry of receipt, sale, revaluation and return operations, including using a barcode scanner.
Ability to select operations using filters;
– printing invoices and receipts, product labels with barcodes; - printing a report on the amounts to be
paid, calculating the Committee debt and the amount of commissions;
– printing of the register of accepted and sold goods for any day, the list of available goods in the
context of committees or departments;
– module for the cashier's workplace;
– enter sales in the database and output the receipt directly to the cash register (supplied separately).
Requires BDE 5.xx + InterBase 4.2 or higher.
The next analogue and prototype, which is an IP developed in 1C, is called "Commission trading 4.1.3".
The author of the program is Sergey Komkov. Interface language: Russian. Operating systems: Win 9x, Win NT,
Win ME, Win CE, Win 2000, Win 2003 Server, Win XP, Win 2008 Server, Win Vista, Win 7. This program was
created on February 26, 2004.
Briefly: accounting for goods on the account cards of the Committee with an indication of the contract
price and the percentage of Commission.
Details: Commission trading-accounting for goods on the account cards of the Committee with the
indication of the contract price and the percentage of Commission. Documents to be generated: the account
card of the Committee, the act of markdown of the product, the act of removing the product from sale, the
product report, price tags.
Figure 1 shows the interface of the demo version of the information system "Commission trading 4.1.3".
MATERIALS OF XII JUNIOR RESEARCHERS’ CONFERENCE 2020
ICT, Electronics, Programming, Geodesy
205
Figure 1. – Interface of the program "Commission trading 4.1.3".
The next analogue and prototype of the "Commission store" is the program for automating grocery stores
"Mini-Shop".
Opportunities:
– "Mini-Shop" – a simple and convenient free accounting program in grocery stores, household
chemical stores, etc.;
– "Mini-Shop" is the first program in our line of programs for automating trade and warehouse
operations of grocery and similar stores (see also Laitik-Shop and Kors MAG);
– accounting in grocery stores, household chemical stores, household goods, etc.;
– used for a large flow of sales;
– allows you not to enter data about each sale;
– calculation of the balance between the product released to the point and the delivered revenue;
– calculation of debts for the point of sale;
– reconciliation of balances on a point using inventories;
– warehouse operations: receipts, returns to the supplier;
– operations with retail outlets: vacation, return, entering balances (inventory);
– cash transactions: revenue, debt write-off;
– printing invoices;
– batch accounting;
– report (inventory inventory, settlements with the point of sale);
– 1 warehouse and 1 point of sale;
– up to 10 items in the invoice for the arrival and release of goods.
Examples of the work are shown in figures 2-4.
Figure 2. - "Receipt Invoice" Interface».
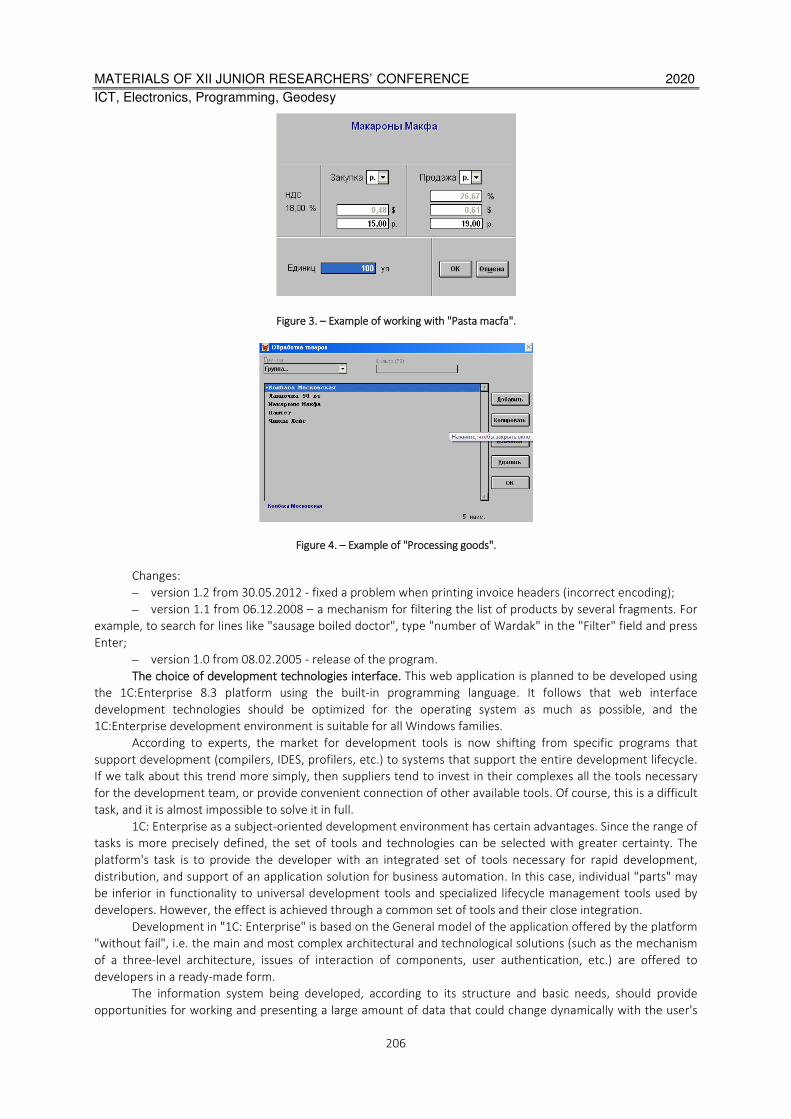
MATERIALS OF XII JUNIOR RESEARCHERS’ CONFERENCE 2020
ICT, Electronics, Programming, Geodesy
206
Figure 3. – Example of working with "Pasta macfa".
Figure 4. – Example of "Processing goods".
Changes:
– version 1.2 from 30.05.2012 - fixed a problem when printing invoice headers (incorrect encoding);
– version 1.1 from 06.12.2008 – a mechanism for filtering the list of products by several fragments. For
example, to search for lines like "sausage boiled doctor", type "number of Wardak" in the "Filter" field and press
Enter;
– version 1.0 from 08.02.2005 - release of the program.
The choice of development technologies interface. This web application is planned to be developed using
the 1C:Enterprise 8.3 platform using the built-in programming language. It follows that web interface
development technologies should be optimized for the operating system as much as possible, and the
1C:Enterprise development environment is suitable for all Windows families.
According to experts, the market for development tools is now shifting from specific programs that
support development (compilers, IDES, profilers, etc.) to systems that support the entire development lifecycle.
If we talk about this trend more simply, then suppliers tend to invest in their complexes all the tools necessary
for the development team, or provide convenient connection of other available tools. Of course, this is a difficult
task, and it is almost impossible to solve it in full.
1C: Enterprise as a subject-oriented development environment has certain advantages. Since the range of
tasks is more precisely defined, the set of tools and technologies can be selected with greater certainty. The
platform's task is to provide the developer with an integrated set of tools necessary for rapid development,
distribution, and support of an application solution for business automation. In this case, individual "parts" may
be inferior in functionality to universal development tools and specialized lifecycle management tools used by
developers. However, the effect is achieved through a common set of tools and their close integration.
Development in "1C: Enterprise" is based on the General model of the application offered by the platform
"without fail", i.e. the main and most complex architectural and technological solutions (such as the mechanism
of a three-level architecture, issues of interaction of components, user authentication, etc.) are offered to
developers in a ready-made form.
The information system being developed, according to its structure and basic needs, should provide
opportunities for working and presenting a large amount of data that could change dynamically with the user's
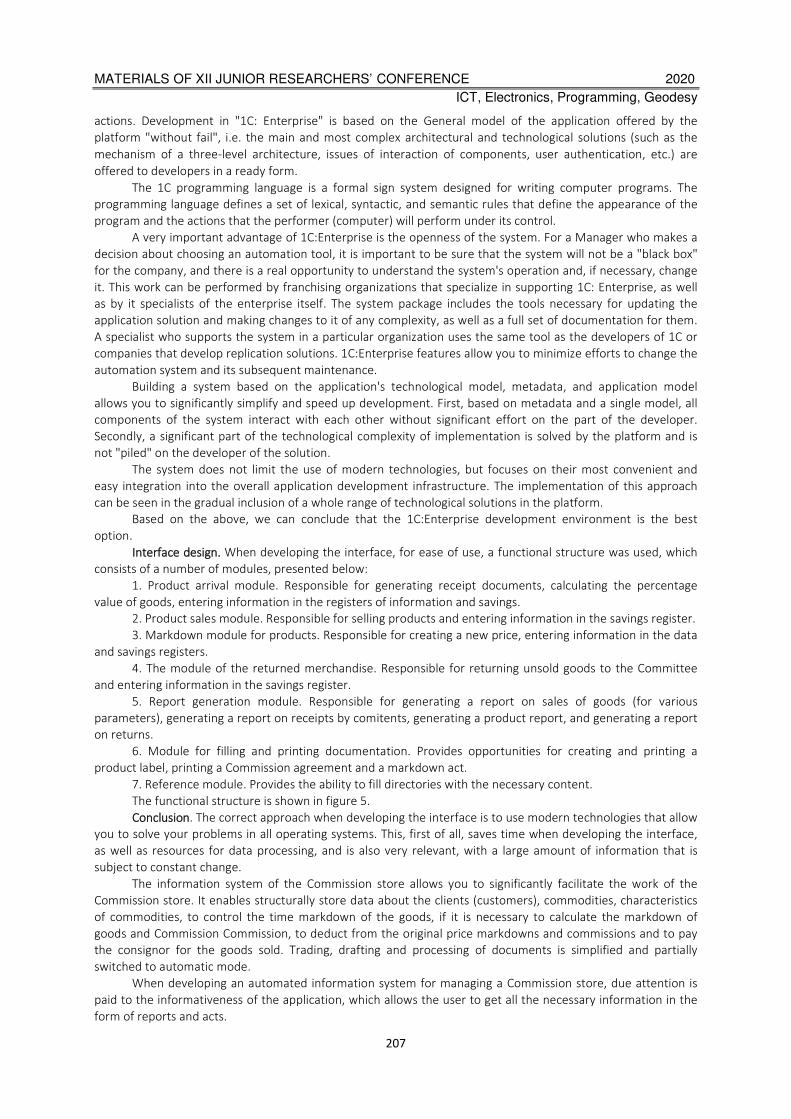
MATERIALS OF XII JUNIOR RESEARCHERS’ CONFERENCE 2020
ICT, Electronics, Programming, Geodesy
207
actions. Development in "1C: Enterprise" is based on the General model of the application offered by the
platform "without fail", i.e. the main and most complex architectural and technological solutions (such as the
mechanism of a three-level architecture, issues of interaction of components, user authentication, etc.) are
offered to developers in a ready form.
The 1C programming language is a formal sign system designed for writing computer programs. The
programming language defines a set of lexical, syntactic, and semantic rules that define the appearance of the
program and the actions that the performer (computer) will perform under its control.
A very important advantage of 1C:Enterprise is the openness of the system. For a Manager who makes a
decision about choosing an automation tool, it is important to be sure that the system will not be a "black box"
for the company, and there is a real opportunity to understand the system's operation and, if necessary, change
it. This work can be performed by franchising organizations that specialize in supporting 1C: Enterprise, as well
as by it specialists of the enterprise itself. The system package includes the tools necessary for updating the
application solution and making changes to it of any complexity, as well as a full set of documentation for them.
A specialist who supports the system in a particular organization uses the same tool as the developers of 1C or
companies that develop replication solutions. 1C:Enterprise features allow you to minimize efforts to change the
automation system and its subsequent maintenance.
Building a system based on the application's technological model, metadata, and application model
allows you to significantly simplify and speed up development. First, based on metadata and a single model, all
components of the system interact with each other without significant effort on the part of the developer.
Secondly, a significant part of the technological complexity of implementation is solved by the platform and is
not "piled" on the developer of the solution.
The system does not limit the use of modern technologies, but focuses on their most convenient and
easy integration into the overall application development infrastructure. The implementation of this approach
can be seen in the gradual inclusion of a whole range of technological solutions in the platform.
Based on the above, we can conclude that the 1C:Enterprise development environment is the best
option.
Interface design. When developing the interface, for ease of use, a functional structure was used, which
consists of a number of modules, presented below:
1. Product arrival module. Responsible for generating receipt documents, calculating the percentage
value of goods, entering information in the registers of information and savings.
2. Product sales module. Responsible for selling products and entering information in the savings register.
3. Markdown module for products. Responsible for creating a new price, entering information in the data
and savings registers.
4. The module of the returned merchandise. Responsible for returning unsold goods to the Committee
and entering information in the savings register.
5. Report generation module. Responsible for generating a report on sales of goods (for various
parameters), generating a report on receipts by comitents, generating a product report, and generating a report
on returns.
6. Module for filling and printing documentation. Provides opportunities for creating and printing a
product label, printing a Commission agreement and a markdown act.
7. Reference module. Provides the ability to fill directories with the necessary content.
The functional structure is shown in figure 5.
Conclusion. The correct approach when developing the interface is to use modern technologies that allow
you to solve your problems in all operating systems. This, first of all, saves time when developing the interface,
as well as resources for data processing, and is also very relevant, with a large amount of information that is
subject to constant change.
The information system of the Commission store allows you to significantly facilitate the work of the
Commission store. It enables structurally store data about the clients (customers), commodities, characteristics
of commodities, to control the time markdown of the goods, if it is necessary to calculate the markdown of
goods and Commission Commission, to deduct from the original price markdowns and commissions and to pay
the consignor for the goods sold. Trading, drafting and processing of documents is simplified and partially
switched to automatic mode.
When developing an automated information system for managing a Commission store, due attention is
paid to the informativeness of the application, which allows the user to get all the necessary information in the
form of reports and acts.
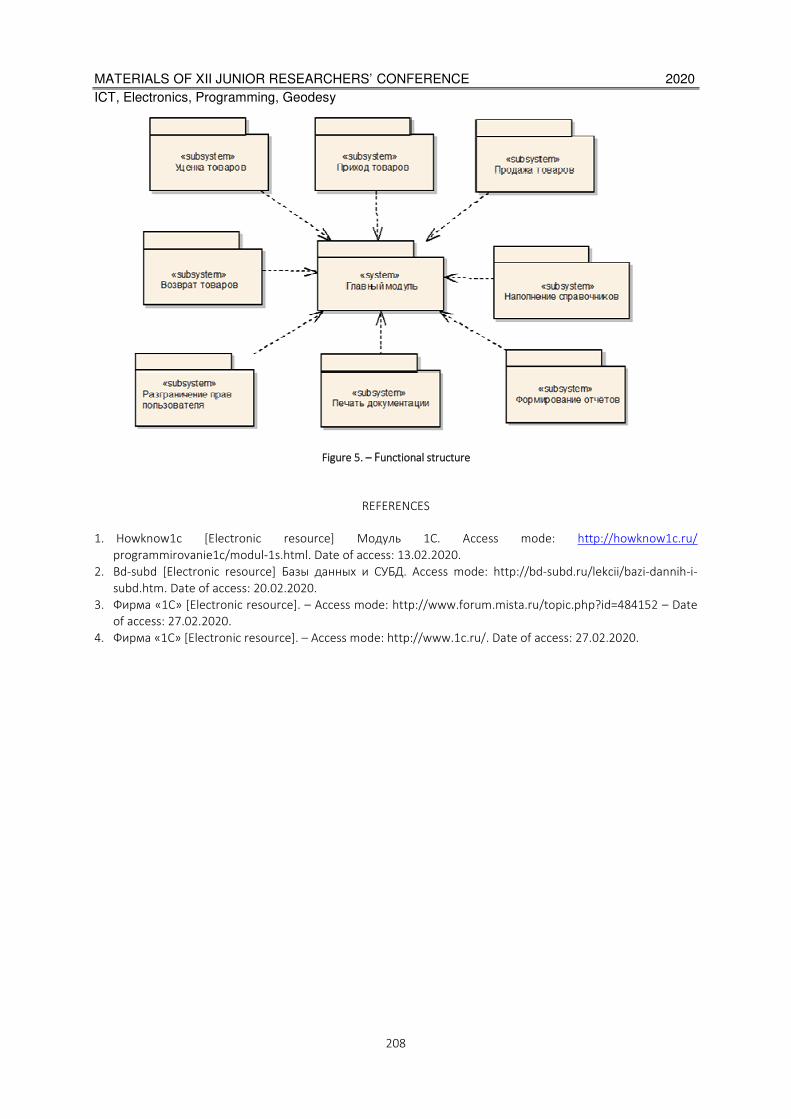
MATERIALS OF XII JUNIOR RESEARCHERS’ CONFERENCE 2020
ICT, Electronics, Programming, Geodesy
208
Figure 5. – Functional structure
REFERENCES
1. Howknow1c [Electronic resource] Модуль 1C. Access mode: http://howknow1c.ru/
programmirovanie1c/modul-1s.html. Date of access: 13.02.2020.
2. Bd-subd [Electronic resource] Базы данных и СУБД. Access mode: http://bd-subd.ru/lekcii/bazi-dannih-i-
subd.htm. Date of access: 20.02.2020.
3. Фирма «1С» [Electronic resource]. – Access mode: http://www.forum.mista.ru/topic.php?id=484152 – Date
of access: 27.02.2020.
4. Фирма «1С» [Electronic resource]. – Access mode: http://www.1c.ru/. Date of access: 27.02.2020.
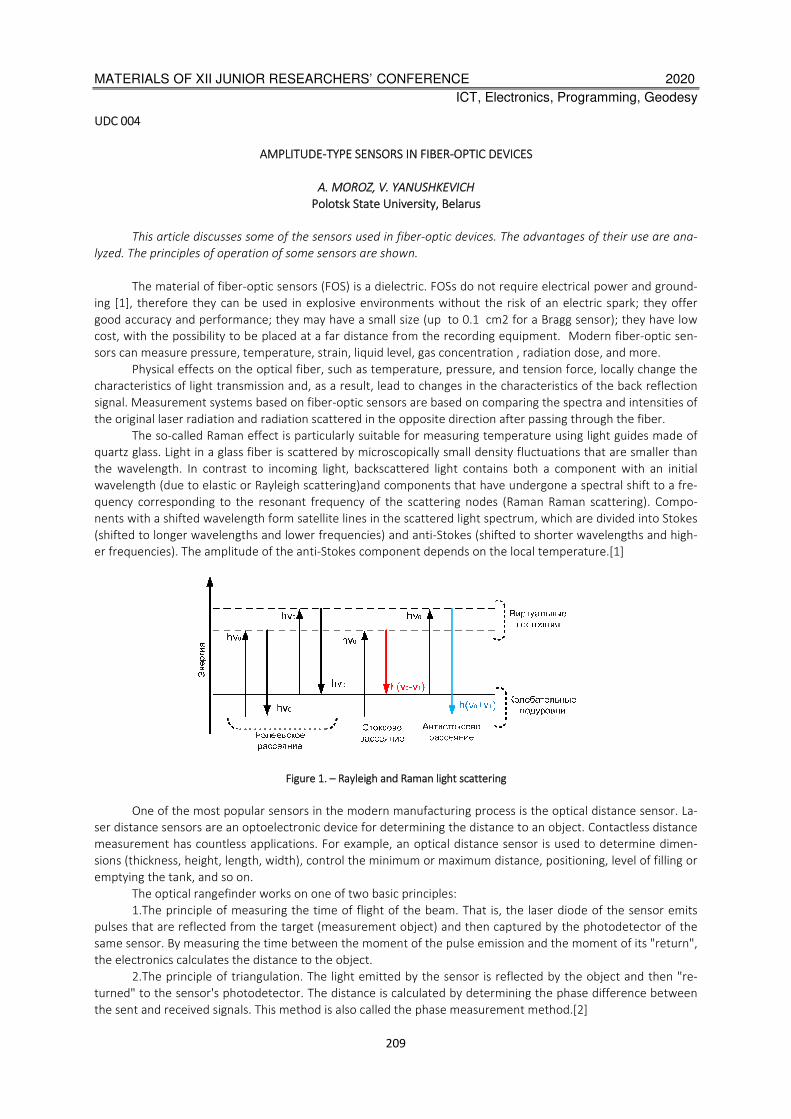
MATERIALS OF XII JUNIOR RESEARCHERS’ CONFERENCE 2020
ICT, Electronics, Programming, Geodesy
209
UDC 004
AMPLITUDE-TYPE SENSORS IN FIBER-OPTIC DEVICES
A. MOROZ, V. YANUSHKEVICH
Polotsk State University, Belarus
This article discusses some of the sensors used in fiber-optic devices. The advantages of their use are ana-
lyzed. The principles of operation of some sensors are shown.
The material of fiber-optic sensors (FOS) is a dielectric. FOSs do not require electrical power and ground-
ing [1], therefore they can be used in explosive environments without the risk of an electric spark; they offer
good accuracy and performance; they may have a small size (up to 0.1 cm2 for a Bragg sensor); they have low
cost, with the possibility to be placed at a far distance from the recording equipment. Modern fiber-optic sen-
sors can measure pressure, temperature, strain, liquid level, gas concentration , radiation dose, and more.
Physical effects on the optical fiber, such as temperature, pressure, and tension force, locally change the
characteristics of light transmission and, as a result, lead to changes in the characteristics of the back reflection
signal. Measurement systems based on fiber-optic sensors are based on comparing the spectra and intensities of
the original laser radiation and radiation scattered in the opposite direction after passing through the fiber.
The so-called Raman effect is particularly suitable for measuring temperature using light guides made of
quartz glass. Light in a glass fiber is scattered by microscopically small density fluctuations that are smaller than
the wavelength. In contrast to incoming light, backscattered light contains both a component with an initial
wavelength (due to elastic or Rayleigh scattering)and components that have undergone a spectral shift to a fre-
quency corresponding to the resonant frequency of the scattering nodes (Raman Raman scattering). Compo-
nents with a shifted wavelength form satellite lines in the scattered light spectrum, which are divided into Stokes
(shifted to longer wavelengths and lower frequencies) and anti-Stokes (shifted to shorter wavelengths and high-
er frequencies). The amplitude of the anti-Stokes component depends on the local temperature.[1]
Figure 1. – Rayleigh and Raman light scattering
One of the most popular sensors in the modern manufacturing process is the optical distance sensor. La-
ser distance sensors are an optoelectronic device for determining the distance to an object. Contactless distance
measurement has countless applications. For example, an optical distance sensor is used to determine dimen-
sions (thickness, height, length, width), control the minimum or maximum distance, positioning, level of filling or
emptying the tank, and so on.
The optical rangefinder works on one of two basic principles:
1.The principle of measuring the time of flight of the beam. That is, the laser diode of the sensor emits
pulses that are reflected from the target (measurement object) and then captured by the photodetector of the
same sensor. By measuring the time between the moment of the pulse emission and the moment of its "return",
the electronics calculates the distance to the object.
2.The principle of triangulation. The light emitted by the sensor is reflected by the object and then "re-
turned" to the sensor's photodetector. The distance is calculated by determining the phase difference between
the sent and received signals. This method is also called the phase measurement method.[2]

MATERIALS OF XII JUNIOR RESEARCHERS’ CONFERENCE 2020
ICT, Electronics, Programming, Geodesy
210
Figure 2. – Principle of operation of the laser rangefinder
REFERENCES
1. Оптические датчики температуры [Электронный ресурс]. – Электронные данные. – Режим доступа:
http: // www.nсtech.by. - Дата доступа: 13.01.2020.
2. Дальномер [Электронный ресурс]. – Электронные данные. – Режим доступа: https://tehpribory.ru- Да-
та доступа: 13.01.2020.
MATERIALS OF XII JUNIOR RESEARCHERS’ CONFERENCE 2020
ICT, Electronics, Programming, Geodesy
211
UDC 004.221
DEVELOPMENT OF A SYSTEM FOR HIDDEN INFORMATION IN A SOUND ENVIRONMENT
I. ANDREYEU, D. PASTUKHOV
Polotsk State University, Belarus
This article discusses various algorithms for hiding information in a sound environment and their ad-
vantages. In the course of research, the optimal version of the algorithm has been chosen.
Introduction. The task of reliable protection and concealment of information comes since the earliest
times. Even in ancient times, various methods were used to protect important information from prying eyes of
wanderers, the Polybius square and the first shift ciphers. Later ciphers of simple replacement (Arthur Conan
Doyle's story “Dancing Men”) and permutation ciphers (Cardan grille) appeared. In the XVIII century, the code
“according to the book” arose, which can be considered as the development of Caesar’s cipher (used by the hero
Yu. Semenov - Stirlitz in the novel “17 Moments of Spring”).
But all ciphers have finite strength and can be decrypted in a finite period of time. Steganography, which
hides the very fact of transmitting a secret message, helps to solve this problem.
The main section. The article will examine the steganographic methods of hiding information in sound
files, both from the point of view of resistance to attacks, and from the point of view of maintaining an accepta-
ble quality of the sound signal.
The least significant bits method is used for digital representation of the audio signal and is suitable for
use at any communication speeds. When converting an audio signal into digital form, there is always a sampling
noise that does not introduce significant distortion. The “noise” bits correspond to the lower bits of the digital
representation of the signal, which can be replaced by hidden data. This method has extremely low stegosity and
simple implementation. A change in the sound signal can be detected.
Broadband coding methods use the same principles as the methods of hiding data in images. Their es-
sence lies in the slight simultaneous modification of a number of certain bits of the container while hiding one
bit of information. This method has medium resistance to attacks and distortions and is difficult to implement.
The sound signal is practically unchanged.
The echo hiding method hides data by incorporating the echo into the audio signal. It is known that at
small time shifts the echo signal is almost indistinguishable by ear. Therefore, if certain time delays are intro-
duced, the value of which does not exceed the detection threshold, then, dividing the initial sound signal into
segments, you can enter the corresponding echo signal in each of them, depending on the hidden bit. This
method is stego-proof and difficult to implement. The sound signal is practically unchanged.
Phase hiding methods are used for both analog and digital signals. They use the fact that a smooth phase
change cannot be determined by ear. In such methods, the protected data is encoded either by a specific phase
value or by a phase change in the spectrum. Changes in the sound file using this method cannot be detected
using human hearing, but it is extremely difficult to extract information at the slightest damage to the signal.
As for musical stegosystems, the musical form of the sound environment occupies most of the infor-
mation space of the Internet. In addition, it is widely used in general purpose radio networks and is distributed
on electronic information carriers, which, due to the development of computer technology, have become wide-
spread. In this regard, the use of the music environment to conceal information messages seems quite promis-
ing. To conceal data, methods based on the modification of those parameters of the musical environment that
can be qualitatively described in music theory can be used. The musical environment has its own textual display
in the form of notes and other signs that allow adequately to reflect the musical work and its internal structure
with such elements as notes, scales, periods, measures, cadences, chords, motives, modulations, tones, various
types of development, sequences, etc. The construction of musical fragments obeys syntactic rules that can be
described, which allows you to build logical relationships and, accordingly, a description of the structures of mu-
sical works.
Musical stegosystems provide information hiding in the musical environment by analogy with the improv-
isation of musical works. Essentially, improvisation is such a change in a musical work or its fragments that pre-
serves the main themes of the original work in the form of melodies, but at the same time expands the image of
the musical theme with other features that complement the main image that were not in the main musical work.
The main difference between musical steganography and improvisation is that the goal is not to expand the im-

MATERIALS OF XII JUNIOR RESEARCHERS’ CONFERENCE 2020
ICT, Electronics, Programming, Geodesy
212
ages of the basic musical work, but to make changes that preserve the melody of the main work, comply with all
the rules for constructing this work, and at the same time encode the message to be hidden without distorting
the main theme of the work.
A fragment of a musical work can be described as a logical structure. An analogue of a text sentence word
in a musical work will be one beat of a melody, and fragments shared by censorship will be considered an ana-
logue of a sentence in music. Typically, a piece of music consists of a series of phrases that consist of measures.
The introduction of the text into a musical work is carried out in separate sentences, each of which can be com-
pared with a separate melody. Next, a musical display of the expanded musical composition with a hidden mes-
sage embedded in it is formed. Based on the musical representation of the extension, its musical realization is
carried out using modern computer systems, which are software and hardware sound synthesizers. The musical
stegosystem is highly resistant to attacks and almost impossible to detect, however, to implement this system,
you need to spend a huge amount of resources.
Conclusion. In this article, algorithms for hiding data in sound files have been considered, the operation
of the musical stegosystem has been described, and the conclusion has been drawn on the optimal method for
implementing the system.
REFERENCES
1. Мельников В.В. Защита информации в компьютерных системах. Электронинформ, 1997. — 368 с.
2. Барабаш А.В., Шанкин г.п. История криптографии. Ч.l. — М.: Гелиос АРВ, 2002.—240 с.
3. Домарев В.В. Защита информации и безопасность компьютерных систем. — К.: Издательство ДиаСофт,
1999. — 480 с.
4. Ярочкин В.И. Безопасность информационных систем. — М.: Ось-86, 1996. — 320с.
5. Романец Ю.В., Тимофеев П.А., Шаньгин В.Ф. Защита информации в компьютерных системах и сетях/Под
ред. В.Ф. Шаньгина; 2-е изд., перераб. и доп. — М.: Радио и связь, 2001. — 376 с.
6. Герасименко В.А., Малюк А.А. Основы защиты информации. — М.: МГИФИ, 1997. — 538 с.

MATERIALS OF XII JUNIOR RESEARCHERS’ CONFERENCE 2020
ICT, Electronics, Programming, Geodesy
213
UDC 004. 622
APPROACHES TO THE INTERFACE DEVELOPMENT
FOR THE AUTOMATED INFORMATION SYSTEM OF THE INSPECTION ON THE MATTERS OF THE MINOR,
POLOTSK REGIONAL EXECUTIVE COMMITTEE
K. MARKEVICH, A. OSKIN
Polotsk State University, Belarus
The article presents a practical way to create an interface for working with the commission for minors. The
analysis of the technologies most suitable for the development of this system is carried out. Task, implementation
of a prototype of an interface are based on windows - form.
Introduction. The automation and creation of information systems are currently one of the most re-
source-intensive areas of technogenic society. One of the reasons for the active development of this area is that
automation serves as the basis for a radical change in management processes that plays an important role in the
activities of man and society. Control systems arise, the action of which is aimed at maintaining or improving the
operation of an object using a control device (a set of means for collecting, processing, transmitting information
and generating control signals or commands) [1].
The automated information system (AIS) is a set of software and hardware designed to automate activi-
ties related to the storage, transmission and processing of information.
AIS are, on the one hand, a type of information systems (IP) and, on the other hand, automated systems
(AS), as a result of which they are often called IP or AS.
AIS can be defined as a complex of automated information technologies designed for information ser-
vices – organized continuous technological process of preparation and delivery to consumers of scientific, mana-
gerial and other information used for decision-making, in accordance with the needs to maintain effective activi-
ties [2].
The choice of interface development technologies. The choice of means for solving the problem proceed-
ed from the kind of software and hardware needed for development. Here the choice was made in favor of the
Windows 10 operating system.
Microsoft Visual Studio 2017 was chosen as the development environment for the project due to the fol-
lowing reasons:
1 Flexible support structure for an object-oriented programming approach.
2 Ease and simplicity of project development. This property includes the implementation of all kinds of
hints in the source code editor, wide possibilities for working with project resource files, such as image files,
icons, cursors, menus, accelerators.
3 The presence of a powerful debugger to detect errors in the implementation of the program.
4 A large amount of documentation on the capabilities of the development environment, on the types of
modules used and descriptions of the main functions.
5 When developing a project, there are many options for setting the optimization of a developed project,
for example, optimizing the size of an executable program module, or optimizing its execution speed.
6 Support for working with services, both by means of API functions, and at the level of special built-in
service designers.
7 The productivity of the program is improved due to special built-in libraries of functions – .NET Frame-
work 7.4.2. It all depends on the version of the components installed in the operating system.
8 Relatively small system requirements for installing the environment and for its launch.
The object-oriented language C # was chosen as the programming language for writing the application.
This choice is due to the fact that this language is a key language in working with the .NET Framework. For the
implementation of the project, the necessary and sufficient version of this set of libraries is the .NET Framework
4.7.2. This version is necessary to maintain work at the application level with databases and organize networking
between individual program modules.
Interface Design. When designing the interface, the tabbed structure was applied. With the information
logically divided by tabs, simplifying its search, it does not clutter the home page and does not need to create
additional forms.
The main information about the violators is stored in a database, with the ability to take action over it, af-
ter selecting the appropriate data. This structure is the simplest and most understandable for users with

MATERIALS OF XII JUNIOR RESEARCHERS’ CONFERENCE 2020
ICT, Electronics, Programming, Geodesy
214
a different level of personal computer skills. Using standards of controls allows you to minimize the time spent
learning how to work with the application.
To visualize some operations, user interface components were created. The developed components and
their descriptions are presented in Table 1.1.
Table 1.1. – List of developed custom components
Component Name Component Assignment
Button_Open Implementing a button for selecting a document
Button_Save Saving a copy of the document as amended
FilterTextBox Filtering data from a database
PrintCheckBox Implementing an element to print a document while saving
dataGridView Implementing a control to display the current state of the database
Using the program, the user interacts with the document generation subsystem. The program in its com-
position has a separate window through which the user receives all the necessary information.
All functionality can be divided into specific tasks, each of which has its own method. A list of several
methods and their significance are shown in table 1.2.
Table 1.2. – List of application methods
Method name Purpose
Form1 It contains the implementation of the interface element, which displays all the
information from the database
FindAndReplace Contains the implementation of part of the program for working with a document
CreateWordDocument Describes a method that performs text substitution
Conclusion. The correct approach when developing an application is to use modern technologies that al-
low you to solve your problems. This primarily saves time in developing the interface, as well as resources for
data processing. This is very relevant, with a lot of information that is subject to constant change.
The win - form technology is considered, which allows creating an adaptive interface of any complexity,
while maintaining its functionality and attractive appearance. Based on the results of this work, the possibility of
their application to the built interface and dynamic query processing was described.
REFERENCES
1. Официальный сайт справочной информации. [Электронный ресурс]. Режим доступа
https://www.bibliofond.ru/view.aspx. Дата доступа – 16.06.2019 г.
2. Официальный сайт справочной информации. [Электронный ресурс]. Режим доступа
https://dic.academic.ru/dic.nsf/ruwiki/334809. Дата доступа – 16.06.2019 г.
3. Официальный сайт справочной информации. [Электронный ресурс]. Режим доступа
https://dic.academic.ru/dic.nsf/ruwiki/1338302. Дата доступа – 16.06.2019 г.
MATERIALS OF XII JUNIOR RESEARCHERS’ CONFERENCE 2020
ICT, Electronics, Programming, Geodesy
215
UDC 004.588
IMPORTANCE OF JSX AND CSS ON THE EXAMPLE OF THE DEVELOPED GAME WEB APPLICATION
“LEARNING CSS FEATURES”
R. GUSEVSKY, I. BURACHONAK
Polotsk State University, Belarus
The rationale for the development of modern gaming applications is given. The technologies used to cre-
ate web applications are analyzed. CSS technologies and JSX technology are considered in detail, with the aim of
using them for demonstration in the form of an entertaining game "Learning CSS Features".
Most people spend their free time in games, especially children and teenagers. There is such an approach
to learning as submitting material for study while playing that will be useful and interesting to people of any age.
Under this topic, a cross-platform, gaming web application “Learning CSS Features” is developed.
At the initial stage of its development, the "web" consisted only of static HTML pages and when the ad-
dress was opened, the server returned the page content. Page-making, styles, scripts – everything was in the
mass. With the development of Internet technologies, there are more and more single-page web applications,
where the main part of the logic is focused on the client side. On any Uniform Resource Locator (URL), the server
gives the same static HTML, and the JavaScript code in the user's browser determines the current address and
makes a request to the server for the necessary data. When you click on the link, the page does not reload en-
tirely, but the URL is updated, and the JavaScript code makes a new request for the next page. The emergence of
web applications has fundamentally changed the approach to development. There are new special frameworks
designed for creating web applications with a large amount of code and complex user interface logic. Rendering
(the process of getting an image from a model using a computer program) of data now takes place on the client,
the page resources store static html templates that are filled with data received from the server. The most suita-
ble way to organize such a mass of code is the component approach. Each more or less independent block is
made out into a separate component, with its own styles, template and JavaScript (JS), and then the whole page
is assembled from these blocks. This approach is implemented by most modern JS frameworks, but with one
difference: Angular, Ember encourage the creation of a separate file with a template, and React offers to write
HTML inside JS [1]. The technology that allows us to write HTML inside JS is JavaScript XML (JSX) technology.
JSX is a technology that was introduced by React. This technology extends The JavaScript syntax, which
looks similar to XML. Many people think that using JSX is like a mixture of HTML and JavaScript, but this is not
exactly true, we can also manipulate CSS. JSX is mainly used as building blocks in React. Essentially, JSX is nothing
more than a component in which we can control page making, logic, and styles. Everything is in one place, which
already gives a huge advantage in development.
CSS is considered as cascading style sheets, which are a consequence of the further development of
HTML and give us the opportunity to move to the next level of presentation of information. Style sheets allow
you to separate the semantic content of the page and its design. When learning CSS, you may encounter a num-
ber of problems: different styles, properties, and technologies for layout of blocks and tables. HTML is said to be
a markup language that is a tool for creating hyperlinks, inserting images, tables, and much more [2].
In the modern world, web technologies and programming languages are developing rapidly, hence,
the number of web developers, as well as users who want to learn or develop their programming skills, is
increasing. However, when studying web technologies, many people face various problems, and spend a lot
of time searching for solutions. In order to facilitate the study of CSS, it is proposed to develop a web appli-
cation that focuses on teaching the complex CSS properties and its layout technologies: flexbox, grid layout,
working with animation, positioning elements on a web page using the position property. Thanks to visuali-
zation and game presentation, the technologies under consideration will become more accessible for stud-
ying and memorizing material. You can hardly become a programmer just by playing. But you can get a pos-
itive charge at the start, study the basic algorithmic constructs and programming logic, acquire the skills of
action planning in solving practical problems [3].
When implementing this web application, it is planned to use the following technologies: ReactJS as a
framework on the client side, the Node.JS software platform and the Express framework as well as the Javascript
programming language for developing the server side. ReactJS is an open source JavaScript library for developing
single-page and mobile applications. Its goal is to provide high speed, simplicity and scalability.
MATERIALS OF XII JUNIOR RESEARCHERS’ CONFERENCE 2020
ICT, Electronics, Programming, Geodesy
216
As a library for developing user interfaces, React is often used with other libraries such as Redux [4].
Node.js is a software platform based on the V8 engine (translating JavaScript into machine code) that turns Ja-
vaScript from a highly specialized language into a general-purpose language [5]. Express is a minimalistic and
flexible web framework for Node.js applications, providing an extensive set of functions for mobile and web ap-
plications [6]. JavaScript is a full-fledged dynamic programming language that is applied to an HTML document
and can provide dynamic interactivity on websites [7].
The application will consist of two pages: the main page with the listed items of the studied technologies
and various CSS properties, and a dynamically loaded page with the game itself, which characterizes the selected
technology.
Next, we will describe the layout technologies and properties that are used in the application and which
people have most problems with. In CSS, there are 4 most problematic technologies: flexbox, grid layout, work-
ing with animation, positioning elements on a web page using the position property.
Flexbox is a new way to place blocks on a page. This is a technology created specifically for the layout of
elements, as opposed to floats. With Flexbox, you can easily align elements horizontally and vertically, change
the direction and order of elements, stretch blocks to the full height of the parent, or nail them to the bottom
edge [8]. But there is one aspect – this technology is not supported by all browsers:
1) IE: 11.0, 10.0 -ms-;
2) Firefox: 28.0, 18.0 -moz-;
3) Chrome: 29.0, 21.0 -webkit-;
4) Safari: 6.1 -webkit-;
5) Opera: 12.10 -webkit-;
6) iOS Safari: 6.1 -webkit;
7) Opera Mini: 8;
8) Android Browser: 4.4, 4.1 -webkit;
9) Chrome for Android: 44.
Problems with this technology occur when the support for older browsers plays a huge role, in this case,
you need to abandon this technology. However, at the moment the development is moving towards using new
technologies rather than supporting older browsers. It should be noted that many users do not know what
properties exist and how to use them for the correct arrangement of elements. There is both the old syntax and
the new one, and each of them has its own aspects and this also needs to be sorted out. Thus, all these aspects
will be considered in the developed application.
The next technology to be considered is Grid layout. Grid layout-brings a two-dimensional layout tool to
the web, with the ability to place elements in rows and columns. A CSS grid can be used to achieve many differ-
ent layouts. It divides the page into large regions, or defines relationships in terms of size, position, and layer,
between parts of the control built from HTML primitives. Like tables, Grid layout allows the author to position
elements in columns and rows. However, unlike tables, Gridlayout does not have a content structure, so it is not
possible to include a large number of layouts in tables [9].
CSS3-animation makes sites dynamic. It animates web pages, improving user interaction. Unlike CSS3
transitions, animation creation is based on keyframes, which allow you to automatically play and repeat effects
for a given time, as well as stop the animation inside the loop.
CSS3 animation can be used for almost all html elements, as well as for pseudo-elements :before and
:after. When creating an animation, you should not forget about possible performance problems, since changing
some properties requires a lot of resources [10].
Next, consider the CSS position property, which sets the way the element is positioned relative to the
browser window or other objects on the web page. This property takes 4 basic values:
1) Absolute – it indicates that the element is absolutely positioned, while other elements are displayed
on the web page as if there was no absolutely positioned element. The position of the element is set by the left,
top, right, and bottom properties, and the position property of the parent element also affects the position. So,
if the parent value of position is set to static or there is no parent, then the coordinates are counted from the
edge of the browser window. If the parent's position value is set to fixed, relative or absolute, then the coordi-
nates are counted from the edge of the parent element;
2) Fixed – this property is close to absolute in its action, but unlike it, it is bound to the point specified
by the left , top, right, and bottom properties on the screen and does not change its position when scrolling the
web page.

MATERIALS OF XII JUNIOR RESEARCHERS’ CONFERENCE 2020
ICT, Electronics, Programming, Geodesy
217
3) Relative – the position of the element is set relative to its original location. Adding the left , top, right,
and bottom properties changes the item's position and moves it one way or another from its original location;
4) Static elements are displayed as usual. Using the left, top, right, and bottom properties does not pro-
duce any results.
5) Inherit-inherits the value of the parent [11].
Thus, the above- described CSS technologies and properties will initially be included in the web applica-
tion being developed in order to eliminate developers' weaknesses, as well as to introduce and provide the cor-
rect knowledge base for users to work with these technologies.
Conclusion. All the nuances described in the article will be taken into account in the developed web appli-
cation. When developing software, most people are looking for certain technologies that will fit their criteria. If
you consider JSX as a way to use it together with ReactJS, it has a number of advantages that can be supple-
mented with various libraries, which will help you quickly and efficiently develop software. In the future, it is
planned to refine this application by adding new CSS technologies.
REFERENCES
1. Web2Studio.Yarkiye resheniya(Bright decisions) Available at: http://webstudio2u.net/ru/programming/127-
programming.html (Accessed at 07.02.2020).
2. Habr. Interesnyye stat'i po programmirovaniyu (Interesting programming articles)Available at:
https://habr.com/ru/post/311226 (Accessed at 01.02.2020).
3. Habr. Igry, kotoryye uchat programmirovaniyu (Games that teach programming) Available at:
https://m.habrahabr.ru/post/273003 (Accessed at 07.02.2020).
4. ReactJS / Wikipedia– 2020. Available at: https://ru.wikipedia.org/wiki/React(Accessed at 08.02.2020).
5. NodeJS / Wikipedia. – 2020. Available at: https://ru.wikipedia.org/wiki/Node.js(Accessed at 08.02.2020).
6. Express. Freymvork veb-prilozheniy Node.js (Web application framework Node.js)– 2020. Available at:
http://expressjs.com/ru. (Accessed at 08.02.2020).
7. Osnovy Javascript/MDN (Javascriptbasics/MDN) – 2020. Available at:
https://developer.mozilla.org/ru/docs/Learn/Getting_started_with_the_web/JavaScript_basics (Accessed at
08.02.2020).
8. СSS 3 flexbox. Opisaniye vsekh svoystv modulya, primery verstki(Description of all module properties, layout
examples – 2020. Available at: https://html5book.ru/css3-flexbox (Accessed at 12.02.2020).
9. CSS Grid Layout/MDN– 2020. Available at: https://developer.mozilla.org/ru/docs/Web/CSS/CSS_Grid_Layout
(Accessed at 13.02.2020).
10. CSS3-animatsiya(CSS3 animation)– 2020. Available at: https://html5book.ru/css3-animation. (Accessed at
14.02.2020).
11. Position / htmlbook.ru– 2020. Available at: http://htmlbook.ru/css/position. (Accessed at 14.02.2020).

MATERIALS OF XII JUNIOR RESEARCHERS’ CONFERENCE 2020
ICT, Electronics, Programming, Geodesy
218
UDC 004.75
SYSTEM FOR STATIC OBJECTS DETECTION IN VIDEO
WITH DIFFERENT ROADWAYS AND CLOUD TECHNOLOGIES USAGES
V. PLIASOV, O. MIKHNOVICH
Polotsk State University, Belarus
This article deals with the main points in the architecture of static objects detection in video with different
roadways system using Amazon Web Services (AWS) cloud services. The author considers what parts this system
includes and what protocol will be used in order to send video to the server.
Currently, computer vision is used to solve various problems: self-driven vehicles, identification of objects
on photos / videos, facial recognition, etc.
Computer vision is an interdisciplinary scientific field that deals with how computers can be made to gain
high-level understanding from digital images or videos. From the perspective of engineering, it seeks to auto-
mate tasks that the human visual system can do.
Computer vision tasks include methods for acquiring, processing, analyzing and understanding digital im-
ages, and extraction of high-dimensional data from the real world in order to produce numerical or symbolic
information, e.g. in the forms of decisions [1].
In order to implement a system for static and dynamic objects detection on a video sequence, we need to
define the necessary steps of the algorithm:
1. Pre-processing video. At this stage, it is necessary to stabilize the frame of the video sequence.
2. Road Detection on a video:
a. Highlighting edges on the road. For highlight edges on the video frame usually Sobel operator is used,
that can solve the task well [2]. The highlight edges process is necessary to determine the threshold values for
the perspective transformation of each frame.
b. Perspective transformation of a frame of a video sequence. For this is used transformation of a video
frame into a bird's-eye view:
а) b)
( a) a video frame before applying the transformation, b) the resulting frame
Figure 1. – The perspective transformation of a video frame
c. Detection of road lines. Sobel operator can easily solve this task in order to detect road lines.
d. Detection of the road curvature. In order to find the curvature of the road, it is necessary to use a
second-order polynomial. The formula is described in expression (1).
, 1)
where A , B , C are variables of the function y.
In order to find the radius of curvature, it is necessary to solve a differential equation of the 2nd order by
the formula (2):
2)
MATERIALS OF XII JUNIOR RESEARCHERS’ CONFERENCE 2020
ICT, Electronics, Programming, Geodesy
219
After solving this equation, the radius of the road curvature is obtained, thereafter this value can be ap-
plied to the original video frame. Figure 2 shows the highlighting of the road on the video frame:
Figure 2. – Obtaining the road curvature and highlighting it on the original video frame
3. Detecting objects on the road.
Image segmentation process. For image segmentation, the WaterShed algorithm is used, which is already
implemented using the OpenCV library. The result of segmentation is illustrated in Fig. 3.
Figure 3. – Detect objects on the road using image segmentation
Cloud computing is the on-demand availability of computer system resources, especially data storage and
computing power, without direct active management by the user. The term is generally used to describe data
centers available to many users over the Internet. Large clouds, predominant today, often have functions dis-
tributed over multiple locations from central servers. If the connection to the user is relatively close, it may be
designated an edge server [3].
The system for static objects detection on a video with different roadways will be distributed system of
multiple applications: the client side of the system (a program that performs general video processing from the
device), the server side (represented AWS services). Figure 4 shows the entire system architecture.
The client side is represented by an application that performs the following actions on an incoming video
stream from the device inside a vehicle:
1. Pre-processing:
a. Aligning color balance.
b. White balance.
c. Noise reduction.
2. Video compression. This operation is necessary to reduce the transmitted traffic between cloud ser-
vices and the client side.
3. Post-processing.
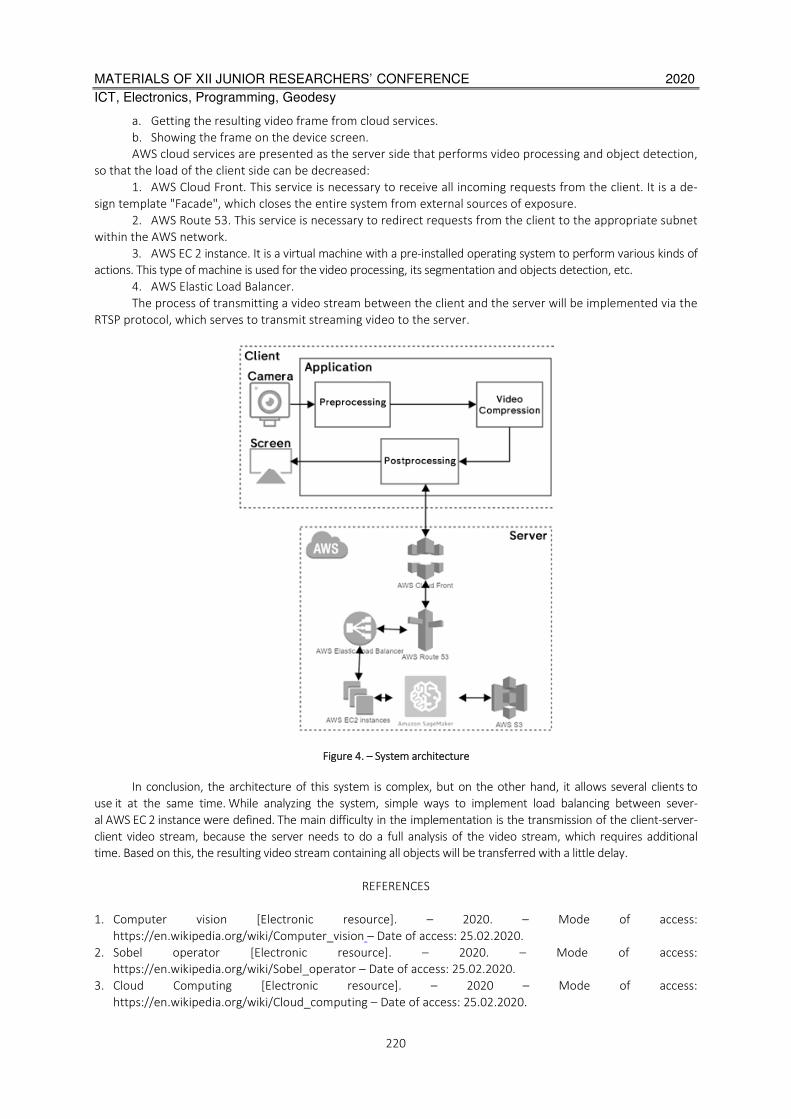
MATERIALS OF XII JUNIOR RESEARCHERS’ CONFERENCE 2020
ICT, Electronics, Programming, Geodesy
220
a. Getting the resulting video frame from cloud services.
b. Showing the frame on the device screen.
AWS cloud services are presented as the server side that performs video processing and object detection,
so that the load of the client side can be decreased:
1. AWS Cloud Front. This service is necessary to receive all incoming requests from the client. It is a de-
sign template "Facade", which closes the entire system from external sources of exposure.
2. AWS Route 53. This service is necessary to redirect requests from the client to the appropriate subnet
within the AWS network.
3. AWS EC 2 instance. It is a virtual machine with a pre-installed operating system to perform various kinds of
actions. This type of machine is used for the video processing, its segmentation and objects detection, etc.
4. AWS Elastic Load Balancer.
The process of transmitting a video stream between the client and the server will be implemented via the
RTSP protocol, which serves to transmit streaming video to the server.
Figure 4. – System architecture
In conclusion, the architecture of this system is complex, but on the other hand, it allows several clients to
use it at the same time. While analyzing the system, simple ways to implement load balancing between sever-
al AWS EC 2 instance were defined. The main difficulty in the implementation is the transmission of the client-server-
client video stream, because the server needs to do a full analysis of the video stream, which requires additional
time. Based on this, the resulting video stream containing all objects will be transferred with a little delay.
REFERENCES
1. Computer vision [Electronic resource]. – 2020. – Mode of access:
https://en.wikipedia.org/wiki/Computer_vision – Date of access: 25.02.2020.
2. Sobel operator [Electronic resource]. – 2020. – Mode of access:
https://en.wikipedia.org/wiki/Sobel_operator – Date of access: 25.02.2020.
3. Cloud Computing [Electronic resource]. – 2020 – Mode of access:
https://en.wikipedia.org/wiki/Cloud_computing – Date of access: 25.02.2020.
MATERIALS OF XII JUNIOR RESEARCHERS’ CONFERENCE 2020
ICT, Electronics, Programming, Geodesy
221
UDC 004.41
APPLICATION MONITORING WITH SPRING BOOT ACTUATOR
E. BOBROVICH, A. OSKIN
Polotsk State University, Belarus
The article introduces a way to monitor and controls Spring Boot applications using Actuator. It describes
the functionality of this tool, settings and integration with external application monitoring systems.
After the application is developed and deployed in a working environment, it is very important to monitor
its performance. Enterprise applications are changing and becoming multi-level, distributed between different
servers or even continents, moving to the clouds. Therefore, such complex distributed applications require con-
trol, as in some companies they are the basis of business. Application performance monitoring solves the tasks
of monitoring, managing the availability and directly application performance.
Spring Boot Actuator is a subproject in the Spring Boot project. The Spring Boot Actuator module helps
you monitor and manage your Spring Boot application by providing ready-to-use features such as health checks,
audits, metrics collection, HTTP tracing, etc.
Actuator also integrates with external application monitoring systems such as Prometheus, Graphite,
DataDog, Influx, Wavefront, New Relic and many others. These systems provide excellent dashboards, graphs,
analytics and alarms to help you monitor and manage your application from a single interface. Actuator uses
Micrometer, a facade of application metrics, to integrate with these external application monitoring systems.
This makes it very easy to connect any application monitoring system with minimal settings.
To enable Actuator, you just need to add the dependency to the Spring Boot application package manag-
er. Examples of dependencies for Maven and Gradle are shown in Listings 1 and 2, respectively.
Listing 1 – Add a dependency to a Maven project
<dependencies>
<dependency>
<groupId>org.springframework.boot</groupId>
<artifactId>spring-boot-starter-actuator</artifactId>
</dependency>
</dependencies>
Listing 2 – Add a dependency to a Gradle project
dependencies
compile("org.springframework.boot:spring-boot-starter-actuator")
Actuator creates several so-called endpoints that can be accessed via HTTP or JMX so that you can track
and interact with your application. For example, there is a /health endpoint that provides basic application
health information. The /metrics endpoint shows some useful metric data, such as used JVM memory, system
CPU usage, open files, and more.
By default, all endpoints open through JMX, but only /health and /info are provided through HTTP. To ac-
cess all endpoints via HTTP, add the management.endpoints.web.exposure.include = * property in the applica-
tion.properties file. If you need to add access only to some endpoints, then you should list the id of these end-
points in the property value.
A list of available endpoints available via HTTP can be obtained from the base endpoint /actuator. The list
of end points is presented in the table.
The /health endpoint shows only a simple UP or DOWN state. For complete information, including the
status of each health indicator that was checked during the health check, add the manage-
ment.endpoint.health.show-details = always property to the application.properties file. After that, /health dis-
plays more information, including details of the DiskSpaceHealthIndicator, which starts as part of the application
health check process. If a database is connected to your application, then /health will show the current state of
connection to it. You can also create your own health indicator by implementing the HealthIndicator interface or
by extending the AbstractHealthIndicator class.

MATERIALS OF XII JUNIOR RESEARCHERS’ CONFERENCE 2020
ICT, Electronics, Programming, Geodesy
222
Table. –Spring Boot Actuator endpoints and description
ID Description
auditevents Exposes audit events information for the current application
beans Displays a complete list of all the Spring beans in your application
caches Exposes available caches
conditions Shows the conditions that were evaluated on configuration and auto-configuration classes
and the reasons why they did or did not match
configprops Displays a collated list of all @ConfigurationProperties
env Exposes properties from Spring’s ConfigurableEnvironment
flyway Shows any Flyway database migrations that have been applied
health Shows application health information
httptrace Displays HTTP trace information (by default, the last 100 HTTP request-response exchanges)
info Displays arbitrary application info
integrationgraph Shows the Spring Integration graph
loggers Shows and modifies the configuration of loggers in the application
liquibase Shows any Liquibase database migrations that have been applied
metrics Shows ‘metrics’ information for the current application
mappings Displays a collated list of all @RequestMapping paths
scheduledtasks Displays the scheduled tasks in your application
sessions Allows retrieval and deletion of user sessions from a Spring Session-backed session store
shutdown Lets the application be gracefully shutdown. Disabled by default
threaddump Performs a thread dump
The /metrics endpoint lists all the metrics you can track. To get detailed information about a particular
metric, you need to pass the metric name to a URL, like this
http://localhost:8080/actuator/metrics/MetricName. In response, the details of the metric in JSON format will
be received.
The endpoint /loggers displays a list of all loggers configured in the application with the appropriate log-
ging levels. You can also view information about an individual logger by passing its name in the URL, for example:
http://localhost:8080/actuator/loggers/name. The endpoint /loggers also allows you to change the logging
level of the specified logger during application execution. This functionality will really be useful in cases where
your application encounters problems with work, and you want to enable DEBUG logging for a while to get more
detailed information about the problem.
The endpoint /info displays arbitrary information about your application. Actuator obtains assembly in-
formation from the META-INF/build-info.properties file, Git information from the git.properties file. It also dis-
plays any information available in the environment properties with the info key. You can add properties with the
info key in the application.properties file as in Listing 3.
Listing 3 – Add custom information to Spring Boot Info Actuator
Endpoints Spring Boot Actuator is recommended to protect against unauthorized access. If Spring Securi-
ty is present in your application, then these endpoints will be protected by default. You can also set your own
security settings for them.
Spring Boot Actuator allows you to implement your custom breakpoints. To get the endpoint, you need a
bean that can be created using the @Component annotation. To access the endpoint, you must specify the id
parameter in the @Endpoint annotation, which will be responsible for the path /actuator/id. The annotations
@ReadOperation, @WriteOperation, @DeleteOperation process HTTP GET, POST and DELETE, respectively, and
execute the methods that apply.
It provided a description of a powerful tool for controlling, monitoring and managing applications - Spring
Boot Actuator. This Spring Boot subproject has the ability to flexibly configure, customize, and create custom

MATERIALS OF XII JUNIOR RESEARCHERS’ CONFERENCE 2020
ICT, Electronics, Programming, Geodesy
223
endpoints. Actuator can be used with external monitoring systems, which allows the user to work with all met-
rics and parameters through a single interface
REFERENCES
1. Spring Boot Actuator Web API Documentation [Electronic resource] / Spring Docs – 2020 – Mode of access :
https://docs.spring.io/spring-boot/docs/current/actuator-api/html/ – Date of access : 25.02.2020.
2. Spring Boot Actuator: Production-ready features [Electronic resource] / Spring Docs – 2020 – Mode of ac-
cess : https://docs.spring.io/spring-boot/docs/current/reference/html/production-ready-endpoints.html –
Date of access : 25.02.2020.
MATERIALS OF XII JUNIOR RESEARCHERS’ CONFERENCE 2020
ICT, Electronics, Programming, Geodesy
224
UDC 004.054
TEST-DRIVEN DEVELOPMENT - DEVELOPMENT THROUGH TESTING: ADVANTAGES AND DISADVANTAGES
N. GURTOVENKO, O. GOLUBEVA
Polotsk State University, Belarus
This article is devoted to the TDD development method. Its advantages and disadvantages are analyzed.
Introduction. Software testing is a procedure that allows you to confirm or deny the efficiency of the code
and the correctness of its operation. During testing, the input data is transmitted to the application and the exe-
cution of a certain command is requested, after which the results are checked for compliance with the standard,
if the result is as expected, the test is considered passed. This procedure can be automated, in this case, check-
ing the operability and correct operation of the application in comparison with manual testing is much faster,
more complete and actually more often.
To create a successful IT project, an important step is the selection of a development methodology that
contains its own approach to the process of creating programs in the form of steps, tasks, actions. There are
many such methods, each has its own advantages and disadvantages, and the choice mainly depends on the
task. One of them is Test-Driven Development method – development through testing. Methods of counteract-
ing attacks on DW systems.
The main part. TDD is a software development process that requires a programmer to write an automat-
ed test case for the required functionality (initially faulty), then add the minimum code necessary to pass the
test and, finally, reorganize the code and make sure that the automated tests still pass. In traditional methods,
code is first written, and then test cases are developed to test the code. In TDD, test cases (usually called unit
tests) to satisfy the requirement are written before the implementation begins.
TDD consists of a “red – green – refactor” cycle
Stage Red. A test is written that represents the necessary behavior of the system, then a stub method is
created so that you can quickly assemble the project. The test compiles, but does not return the desired result.
There is a need to write a program.
Stage Green. Minimal code is written that would allow the test to execute correctly. In reality, this means
that code is written without structure, without design, without any design patterns. Now there is a need to give
the code a “beautiful look”.
Refactoring phase. The external structure of the code changes, without changing its external behavior.
This division into methods, adding elements of a design pattern, creating additional classes, etc. The sequence of
steps in a cycle is very important. The principle of the Test First method implies that only code is written that is
absolutely necessary for all tests to pass successfully.
The TDD operation algorithm can be described as follows:
• Add a test for new (not yet implemented) functionality or for playing an existing bug.
When developing through testing, adding each new feature to the program begins with writing a test. In-
evitably, this test will not pass because the corresponding code has not been written yet. (If the written test
passes, it means that either the proposed "new" functionality already exists or the test has flaws.) To write a
test, the developer must clearly understand the requirements for the new feature. For this, possible usage sce-
narios and user stories are considered. New requirements may also entail changes to existing tests. This distin-
guishes development through testing from techniques when tests are written after the code has already been
written: it makes the developer focus on requirements before writing code - a subtle but important difference.
• Run all tests and make sure the new test fails.
At this point, verify that the tests just written do not pass. This stage also checks the tests themselves: a
written test can always take place and, accordingly, be useless. New tests should not pass for obvious reasons.
This will increase the confidence (although it will not guarantee completely) that the test really tests what it was
designed for.
• Write a code that will pass the test:
o Run the tests and make sure that they all were successful: passing the new test confirms the imple-
mentation of the new functionality or correcting the existing error, and passing the rest allows you to make sure
that the previously implemented functionality is still working correctly.
o To do refactoring and optimization - it is advisable to carry out improvement of maintainability and
speed of performance already after it turned out to achieve verifiable performance.
MATERIALS OF XII JUNIOR RESEARCHERS’ CONFERENCE 2020
ICT, Electronics, Programming, Geodesy
225
o Restart tests and make sure they still pass successfully.
o Repeat cycle.
The described cycle is repeated, realizing more and more new functionality. Steps should be made small,
from 1 to 10 changes between test runs. If the new code does not satisfy the new tests or the old tests stop
passing, the programmer should return to debugging. When using third-party libraries, you should not make
such small changes that literally test the third-party library itself, and not the code that uses it, unless there is a
suspicion that the library contains errors.
Methodology advantages:
• Reduced debugging time. If you do not use the TDD methodology, it will take less than pure time to
write code. However, the time spent on tests pays off when debugging code and catching errors - and this part
of the development process is always present, because it is almost impossible to write code without a single er-
ror, and this is normal. Thanks to TDD, there is no need to guess where the error is located, the tested code is
easier to maintain.
• Convenience of changeability. Coverage with tests helps to avoid the situation when, when changing
the code in one place, an error occurs in a completely different part of the code. In the end, this allows you to
safely change or refactor the code, because if something goes wrong, then the tests will immediately handle the
emergency situation.
• Tests, especially if they are written in an expressive style, can serve as the technical documentation of
the project, which describes how the code should work. Such documentation is very useful for new developers
in the project who, in order to get involved in the work, must first deal with the code. The test in this case serves
as a concrete example of the use of code. Full coverage of the code with tests provides a huge practical docu-
mentation of the code that reflects the real state of the system.
• Modularity. One of the principles of development through testing provides that each function per-
forms a certain, small part of the work, because it is simply impossible to test the “omnipotent” method, which
performs a dozen functions in several threads. All this forces the program to be divided into modules so that all
branches of the code can be tested.
• Full tests. There is a big difference between writing regular tests and TDD tests. When tests are writ-
ten after implementation, it is likely to receive defective tests due to the fact that not all scenarios of the meth-
od can be taken into account. For example, it may be considered that the written method works because it
passes the test, but in fact it may turn out that not all conditions are covered in the method with tests. Using
TDD prevents this from happening because the condition cannot appear in code without a test.
• TDD is the best way to ensure that tests actually cover all requirements, not just code. In addition,
TDD helps you avoid falling into the “trap”: adding functionality that the client does not really need, but would
be nice to have.
Disadvantages TDD:
• The ability to apply TDD is not always available. There are tasks that cannot be solved only with the
help of tests. For example, these are tasks in the field of data security and interactions between processes.
Sometimes it’s difficult to immediately imagine how the module will look. In addition, it is impossible to solve
with the help of TDD the development of databases, compilers and interpreters of programming languages, it is
impossible to automate testing of the graphical interface and distributed objects.
• Initial requirements cannot always be understood and correctly interpreted. As a result, you can get
an error in the test, in the code and in understanding. The danger of the situation lies in the fact that it seems
that everything works correctly, because the tests pass the green stage. On all this, you can lose a lot of time.
• The need for test support. The base of the code with one hundred percent coverage of tests is almost
doubled. And besides, this entire database needs to be documented, maintained, and refactored.
Conclusion. This methodology allows us to achieve the creation of an application suitable for automatic
testing and a very good coverage of the code with tests, since TK is translated into the language of automatic
tests, that is, everything that the program should do is checked. TDD also often simplifies software implementa-
tion: since redundancy is eliminated - if a component passes the test, then it is considered ready. If the existing
tests pass, but the component does not work as expected, this means that the tests do not yet reflect all the
requirements and this is an occasion to add new tests.
The architecture of software products developed in this way is usually better (in applications that are
suitable for automatic testing, the responsibility between the components is usually very well distributed, and
complex procedures that are performed are decomposed into many simple ones). The stability of the application

MATERIALS OF XII JUNIOR RESEARCHERS’ CONFERENCE 2020
ICT, Electronics, Programming, Geodesy
226
developed through testing is also higher due to the fact that all the main functional capabilities of the program
are covered by tests and their performance is constantly checked. Accompanying projects where everything or
almost everything is tested is very high - developers may not be afraid to make changes to the code, if some-
thing goes wrong, the results of automatic testing will inform about this.
REFERENCES
1. Imprium.ru [Electronic resource]. Access mode : https://imprium.ru/articles/test-based-development. – Ac-
cess date : 09/20/2019.
2. Proglib.io. Programming site [Electronic resource]. Access mode : https://proglib.io/p/test-driven-
development/. –Access date : 09/20/2019.
3. Itvdn.com. Programming site [Electronic resource]. Access mode : https://itvdn.com/en/video/test-driven-
development. – Access date : 09/20/2019.

MATERIALS OF XII JUNIOR RESEARCHERS’ CONFERENCE 2020
ICT, Electronics, Programming, Geodesy
227
UDC 004.223.2
DEVELOPING A SYSTEM FOR HIDDEN INFORMATION USING A TRANSPOSITION CIPHER
A. SMALIAK, D. PASTUKHOV
Polotsk State University, Belarus
This article discusses: an algorithm for hiding data using a permutation cipher and the main functions of
the developed software product.
Introduction. The problem of protecting information by transforming it, excluding it from being read by an
outsider, has worried the human mind since ancient times. The history of cryptography is the same age as the
history of human language. Moreover, in the beginning, writing itself was a cryptographic system, since in an-
cient societies only the elite owned it. The sacred books of Ancient Egypt, Ancient India are examples of this.
Main section. To develop a software tool for the organization and functioning of the program, you must
select the development environment with which the design will be carried out.
To develop this application, C # was chosen.
The main functions of the developed software product are data encryption and decryption.
A permutation cipher is a symmetric encryption method in which elements of the original plaintext are in-
terchanged. Elements of the text can be individual characters (the most common case), pairs of letters, triples of
letters, a combination of these cases and so on.
Permutation cipher algorithm:
The original message is divided into blocks of length m, where m is the key length.
The key in the permutation cipher is as follows:
Permutation Cipher: Key
The first line of the table shows the numbers of the block characters in order, and the second line shows
the numbers of the positions that these characters should occupy in the encrypted text block.
Coding is carried out by permutation of letters. Thus, the first character from the source block should be
rearranged in second place, second in fourth, third in first, fourth in third.
If you encrypt the word coffee with this key, you get the word phkeo.
Decryption is performed in reverse order. Using the specified key as an example: put the second charac-
ter from the encrypted block in first place, fourth in second, first in third, third in fourth.
When using any block cipher (permutation cipher is no exception), a situation may arise when the text is
not divided into equal blocks of length m. That is, the remainder of dividing the length of the text n by the length
of the key m is not equal to zero.
In such cases, the length of the original message is increased by m - (n% m) characters so that it is divided
into equal blocks of length m.
Listing 1 – Transposition cipher
1:: class Transposition
2::
3:: private int[] key = null;
4:: public void SetKey(int[] _key)
5::
6:: key = new int[_key.Length];
7:: for (int i = 0; i < _key.Length; i++)
8:: key[i] = _key[i];
9::
10:: public void SetKey(string[] _key)

MATERIALS OF XII JUNIOR RESEARCHERS’ CONFERENCE 2020
ICT, Electronics, Programming, Geodesy
228
11::
12:: key = new int[_key.Length];
13:: for (int i = 0; i < _key.Length; i++)
14:: key[i] = Convert.ToInt32(_key[i]);
15::
16:: public void SetKey(string _key)
17::
18:: SetKey(_key.Split(' '));
19::
20:: public string Encrypt(string input)
21::
22:: for (int i = 0; i < input.Length % key.Length; i++)
23:: input += input[i];
24:: string result = "";
25:: for (int i = 0; i < input.Length; i += key.Length)
26::
27:: char[] transposition = new char[key.Length];
28:: for (int j = 0; j < key.Length; j++)
29:: transposition[key[j] - 1] = input[i + j];
30:: for (int j = 0; j < key.Length; j++)
31:: result += transposition[j];
32::
33:: return result;
34::
35:: public string Decrypt(string input)
36::
37:: string result = "";
38:: for (int i = 0; i < input.Length; i += key.Length)
39::
40:: char[] transposition = new char[key.Length];
41:: for (int j = 0; j < key.Length; j++)
42:: transposition[j] = input[i + key[j] - 1];
43:: for (int j = 0; j < key.Length; j++)
44:: result += transposition[j];
45::
46:: return result;
47::
Conclusion. This article examined the information hiding algorithm using a permutation cipher, as well as
the main functions of the software product being developed.
REFERENCES
1. А. П. Алферов, А. Ю. Зубов, А. С. Кузьмин, А. В. Черёмушкин. Основы криптографии. — Гелиос АРВ,
2002. — ISBN 5-85438-137-0.
2. А. В. Бабаш, Г. П. Шанкин. Криптография. — М. СОЛОН-ПРЕСС, 2007. — ISBN 5-93455-135-3.
3. Фред Б. Риксон. Коды, шифры, сигналы и тайная передача информации. — Астрель, 2011. — ISBN 978-
5-17-074391-9.
4. Дориченко С. А., Ященко В. В. 25 этюдов о шифрах: Популярно о современной криптографии. — Теис,
1994. — ISBN 5-7218-0014-3.
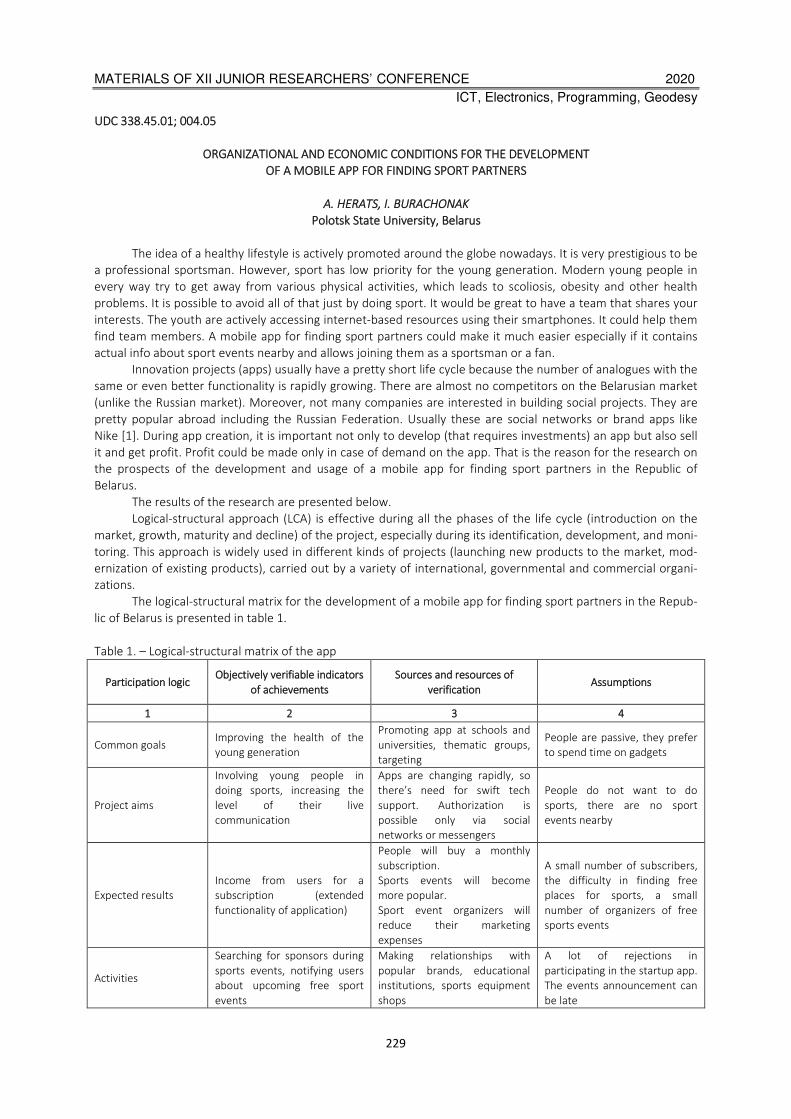
MATERIALS OF XII JUNIOR RESEARCHERS’ CONFERENCE 2020
ICT, Electronics, Programming, Geodesy
229
UDC 338.45.01; 004.05
ORGANIZATIONAL AND ECONOMIC CONDITIONS FOR THE DEVELOPMENT
OF A MOBILE APP FOR FINDING SPORT PARTNERS
A. HERATS, I. BURACHONAK
Polotsk State University, Belarus
The idea of a healthy lifestyle is actively promoted around the globe nowadays. It is very prestigious to be
a professional sportsman. However, sport has low priority for the young generation. Modern young people in
every way try to get away from various physical activities, which leads to scoliosis, obesity and other health
problems. It is possible to avoid all of that just by doing sport. It would be great to have a team that shares your
interests. The youth are actively accessing internet-based resources using their smartphones. It could help them
find team members. A mobile app for finding sport partners could make it much easier especially if it contains
actual info about sport events nearby and allows joining them as a sportsman or a fan.
Innovation projects (apps) usually have a pretty short life cycle because the number of analogues with the
same or even better functionality is rapidly growing. There are almost no competitors on the Belarusian market
(unlike the Russian market). Moreover, not many companies are interested in building social projects. They are
pretty popular abroad including the Russian Federation. Usually these are social networks or brand apps like
Nike [1]. During app creation, it is important not only to develop (that requires investments) an app but also sell
it and get profit. Profit could be made only in case of demand on the app. That is the reason for the research on
the prospects of the development and usage of a mobile app for finding sport partners in the Republic of
Belarus.
The results of the research are presented below.
Logical-structural approach (LCA) is effective during all the phases of the life cycle (introduction on the
market, growth, maturity and decline) of the project, especially during its identification, development, and moni-
toring. This approach is widely used in different kinds of projects (launching new products to the market, mod-
ernization of existing products), carried out by a variety of international, governmental and commercial organi-
zations.
The logical-structural matrix for the development of a mobile app for finding sport partners in the Repub-
lic of Belarus is presented in table 1.
Table 1. – Logical-structural matrix of the app
Participation logic Objectively verifiable indicators
of achievements
Sources and resources of
verification Assumptions
1 2 3 4
Common goals Improving the health of the
young generation
Promoting app at schools and
universities, thematic groups,
targeting
People are passive, they prefer
to spend time on gadgets
Project aims
Involving young people in
doing sports, increasing the
level of their live
communication
Apps are changing rapidly, so
there’s need for swift tech
support. Authorization is
possible only via social
networks or messengers
People do not want to do
sports, there are no sport
events nearby
Expected results
Income from users for a
subscription (extended
functionality of application)
People will buy a monthly
subscription.
Sports events will become
more popular.
Sport event organizers will
reduce their marketing
expenses
A small number of subscribers,
the difficulty in finding free
places for sports, a small
number of organizers of free
sports events
Activities
Searching for sponsors during
sports events, notifying users
about upcoming free sport
events
Making relationships with
popular brands, educational
institutions, sports equipment
shops
A lot of rejections in
participating in the startup app.
The events announcement can
be late
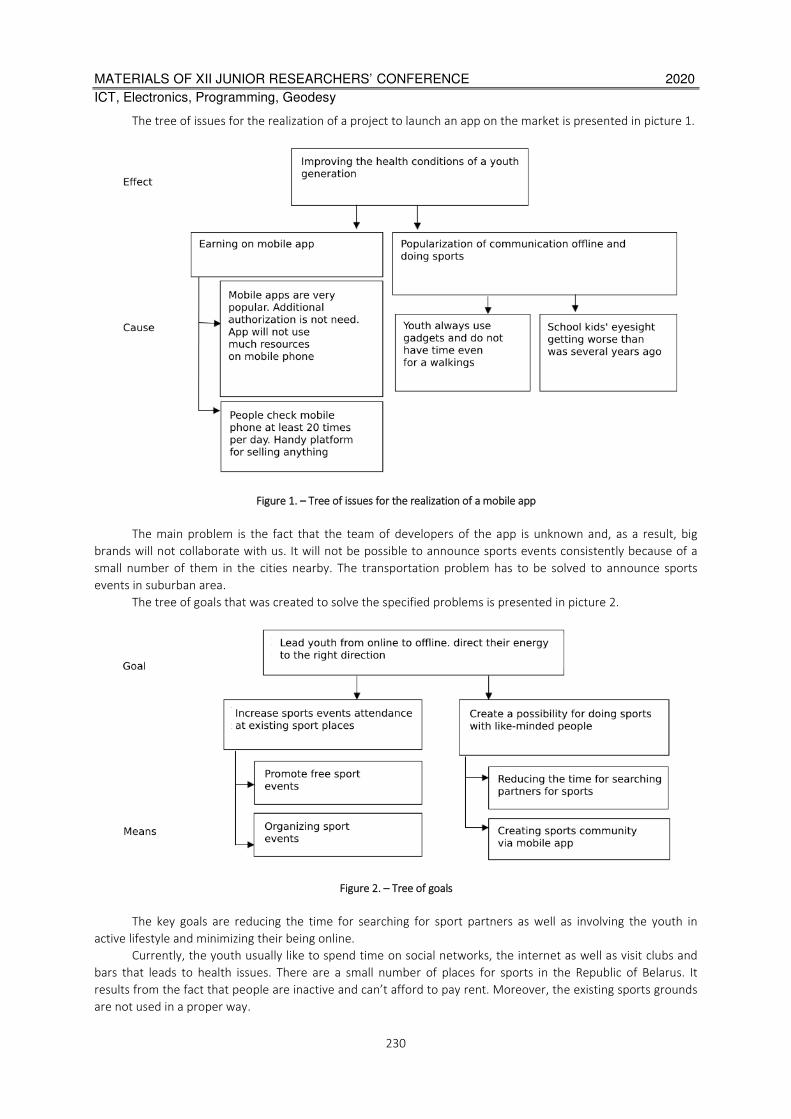
MATERIALS OF XII JUNIOR RESEARCHERS’ CONFERENCE 2020
ICT, Electronics, Programming, Geodesy
230
The tree of issues for the realization of a project to launch an app on the market is presented in picture 1.
Figure 1. – Tree of issues for the realization of a mobile app
The main problem is the fact that the team of developers of the app is unknown and, as a result, big
brands will not collaborate with us. It will not be possible to announce sports events consistently because of a
small number of them in the cities nearby. The transportation problem has to be solved to announce sports
events in suburban area.
The tree of goals that was created to solve the specified problems is presented in picture 2.
Figure 2. – Tree of goals
The key goals are reducing the time for searching for sport partners as well as involving the youth in
active lifestyle and minimizing their being online.
Currently, the youth usually like to spend time on social networks, the internet as well as visit clubs and
bars that leads to health issues. There are a small number of places for sports in the Republic of Belarus. It
results from the fact that people are inactive and can’t afford to pay rent. Moreover, the existing sports grounds
are not used in a proper way.
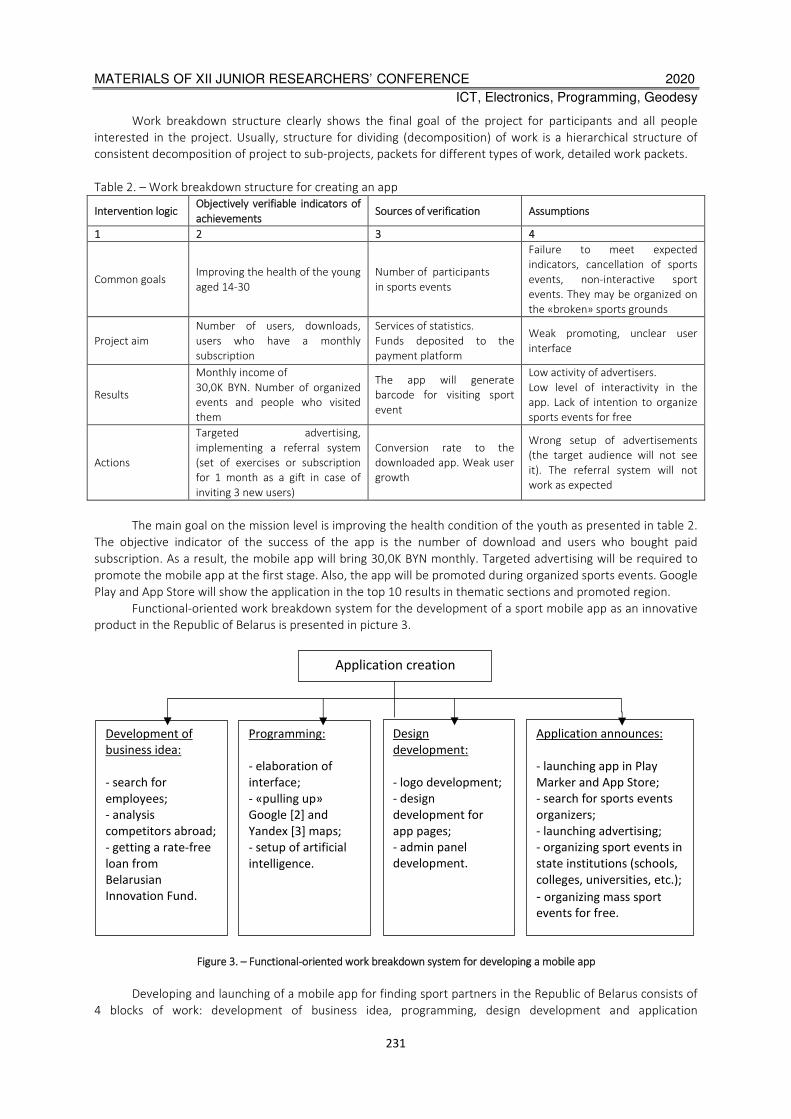
MATERIALS OF XII JUNIOR RESEARCHERS’ CONFERENCE 2020
ICT, Electronics, Programming, Geodesy
231
Work breakdown structure clearly shows the final goal of the project for participants and all people
interested in the project. Usually, structure for dividing (decomposition) of work is a hierarchical structure of
consistent decomposition of project to sub-projects, packets for different types of work, detailed work packets.
Table 2. – Work breakdown structure for creating an app
Intervention logic Objectively verifiable indicators of
achievements Sources of verification Assumptions
1 2 3 4
Common goals Improving the health of the young
aged 14-30
Number of participants
in sports events
Failure to meet expected
indicators, cancellation of sports
events, non-interactive sport
events. They may be organized on
the «broken» sports grounds
Project aim
Number of users, downloads,
users who have a monthly
subscription
Services of statistics.
Funds deposited to the
payment platform
Weak promoting, unclear user
interface
Results
Monthly income of
30,0K BYN. Number of organized
events and people who visited
them
The app will generate
barcode for visiting sport
event
Low activity of advertisers.
Low level of interactivity in the
app. Lack of intention to organize
sports events for free
Actions
Targeted advertising,
implementing a referral system
(set of exercises or subscription
for 1 month as a gift in case of
inviting 3 new users)
Conversion rate to the
downloaded app. Weak user
growth
Wrong setup of advertisements
(the target audience will not see
it). The referral system will not
work as expected
The main goal on the mission level is improving the health condition of the youth as presented in table 2.
The objective indicator of the success of the app is the number of download and users who bought paid
subscription. As a result, the mobile app will bring 30,0K BYN monthly. Targeted advertising will be required to
promote the mobile app at the first stage. Also, the app will be promoted during organized sports events. Google
Play and App Store will show the application in the top 10 results in thematic sections and promoted region.
Functional-oriented work breakdown system for the development of a sport mobile app as an innovative
product in the Republic of Belarus is presented in picture 3.
Figure 3. – Functional-oriented work breakdown system for developing a mobile app
Developing and launching of a mobile app for finding sport partners in the Republic of Belarus consists of
4 blocks of work: development of business idea, programming, design development and application
Programming:
- elaboration of
interface;
- «pulling up»
Google [2] and
Yandex [3] maps;
- setup of artificial
intelligence.
Development of
business idea:
- search for
employees;
- analysis
competitors abroad;
- getting a rate-free
loan from
Belarusian
Innovation Fund.
Design
development:
- logo development;
- design
development for
app pages;
- admin panel
development.
Application announces:
- launching app in Plаy
Marker and App Store;
- search for sports events
organizers;
- launching advertising;
- organizing sport events in
state institutions (schools,
colleges, universities, etc.);
- organizing mass sport
events for free.
Application creation
MATERIALS OF XII JUNIOR RESEARCHERS’ CONFERENCE 2020
ICT, Electronics, Programming, Geodesy
232
announcement. It is planned to borrow an interest-free loan for developing and launching the project. School
kids and students will be the main users of the developed application. Public and private educational institutions
will be the main advertising places. Along with this, advertising is planned on social networks where all the target
audience (the youth) are located. This project is very important for the government because its main goal is the
youth health improvement. Also, the project will create demand for places for sports which will lead to reduced
rental rates of sports grounds. This means that school kids and students will be able to afford it. The mobile app
will allow people to find sport partners and jointly rent sport places as well as organize free events to involve the
youth in sport. The basic functionality of the app is presented in picture 4.
Figure 4. – Basic functionality of the mobile app
Thus, this article presents the main principles of launching a mobile app for finding sport partners and
justifies the resources for its implementation. Hopefully, the use of the developed app will lead to the growing
number of people who do sports and will help them to create and join teams as well as reduce rental rates of
sports grounds. The detailed investigation of the issues presented in the article helped to avoid a lot of mistakes
during the development of the project.
The project has high social orientation because it corresponds to the priority areas of the Government
Action Program of the Republic of Belarus for 2016 – 2020 (Resolution of the Council of Ministers of the Republic
of Belarus 05.04.2016 274) on issues of socio-economic development of the country and focuses on the
improvement of the level and quality of life in the Republic of Belarus.
REFERENCES
1. Nike Training Club App. NTC Premium. Nike.com [Electronic resource]. – Access mode:
https://www.nike.com/ntc-app. – Date of access: 03.02.2020.
2. Geo-location APIs | Google Maps Platform | Google Cloud [Electronic resource]. – Access mode:
https://cloud.google.com/maps-platform. – Date of access: 05.02.2020.
3. Yandex.Maps API – Yandex Technologies [Electronic resource]. – Access mode:
https://tech.yandex.com/maps. – Date of access: 05.02.2020.
4. The system of distance business education – Innovation project: concepts, main stages of creating and
developing [Electronic resource]. – Access mode: http://www.tehnopark.by/business/207.html. – Date of
access: 07.02.2020.

MATERIALS OF XII JUNIOR RESEARCHERS’ CONFERENCE 2020
ICT, Electronics, Programming, Geodesy
233
UDC 004.415.25
MEANS OF MOVEMENT OF THE USER MODEL IN THE VIRTUAL REALITY APPLICATION
M. SERGEEV, A. OSKIN
Polotsk State University, Belarus
In this paper, we examine different means of movement of the user model in the vr application and ex-
plore how they can effect human player.
The effect of staying in virtual reality. To this day, the most urgent issue of developing virtual reality appli-
cations is minimizing the discomfort associated with the dissonance of the organs of the audio-visual attitude
and spatial orientation organs during the use of virtual reality applications.
The basis of this discomfort is the player’s movement in the virtual world. In total, five movement options
are distinguished: natural movement, teleportation, physical movement, artificial movement and vehicles.
Teleportation, in fact, transfers the entire fixed game space to the place indicated by the player, other-
wise the player, as with natural movement, is limited to the physical space registered by the sensors. Vehicles
help limit motion sickness by allowing the player to have a visual anchor in the form of a virtual object within
which the player moves in the virtual world. Physical movement allows the player to move themselves with
some physical actions, such as flapping wings, which leads to the expected result for the player and reduces the
motion sickness effect [1][2].
Artificial movement gives the player more freedom than other options and is suitable for creating action
games and quest-labyrinths, it is controlled with the minimum movements for the player (pressing a button on
the controller), which is familiar to most users and makes it easier to transfer existing games in VR [1].
During the development of the application, three of the five types were implemented, namely: teleporta-
tion, physical movement and artificial movement. Natural movement is inherent in the very essence of detecting
virtual reality equipment with sensors, so that it consists of the project initially. Transport movement was not
implemented due to the inappropriate artistic theme of the project.
Engineering of the application. Application was implemented using Unreal Engine 4.
Based on the characteristics, requirements and standards of the structure of such projects, a functional
diagram was compiled, consisting of the modules presented below:
1. MotionControllerPawn - a player model containing a camera, collisions, additional objects and part of
the logical structure of the player’s actions.
2. BP_MotionController - a model of the player’s controller that contains the logic of the player’s interac-
tion with the outside world.
3. BP_ClimbObj - an object for the physical movement of the player.
4. BP_Button - the parent object of the button.
5. BP_Portal - a child of the button responsible for teleporting the player to a specific point.
Implementation of movement. The most common type of movement in virtual reality applications is tele-
portation. In the basic template project of virtual reality of the Unreal Engine 4 engine, there is an implemented
system of teleportation, which is the main system for moving the basic project. This type of teleportation trans-
fers the player’s model to the point indicated by the player on the playing field.
This project implements a different type of teleportation. Unlike the type indicated above, the player
does not control the exact position in which he will move. Moving by pressing the button object (BP_Portal) in
the virtual world and has a fixed value. At the same time, during the movement itself, the image is darkened,
which can significantly reduce the motion sickness effect.
The BP_Portal function, shown in Figure 1, performing the movement is called Event Button Action, and
has, in addition to the Add Actor Local Off-set, which moves the player to the teleportation endpoint, the Start
Camera Fade function blocks at the beginning and end of the movement, which darkens the image, returning it
after the end of the movement.
To implement the player’s movement in a horizontal plane with voiced steps, a solution was developed,
shown in Figure 2.
A position value is read from the joystick (for Oculus) or the touchpad (for HTC Vive), which changes from
-1 to 1 along the X and Y axes. This value is passed to the Moving Forward function for the Y axis and Moving
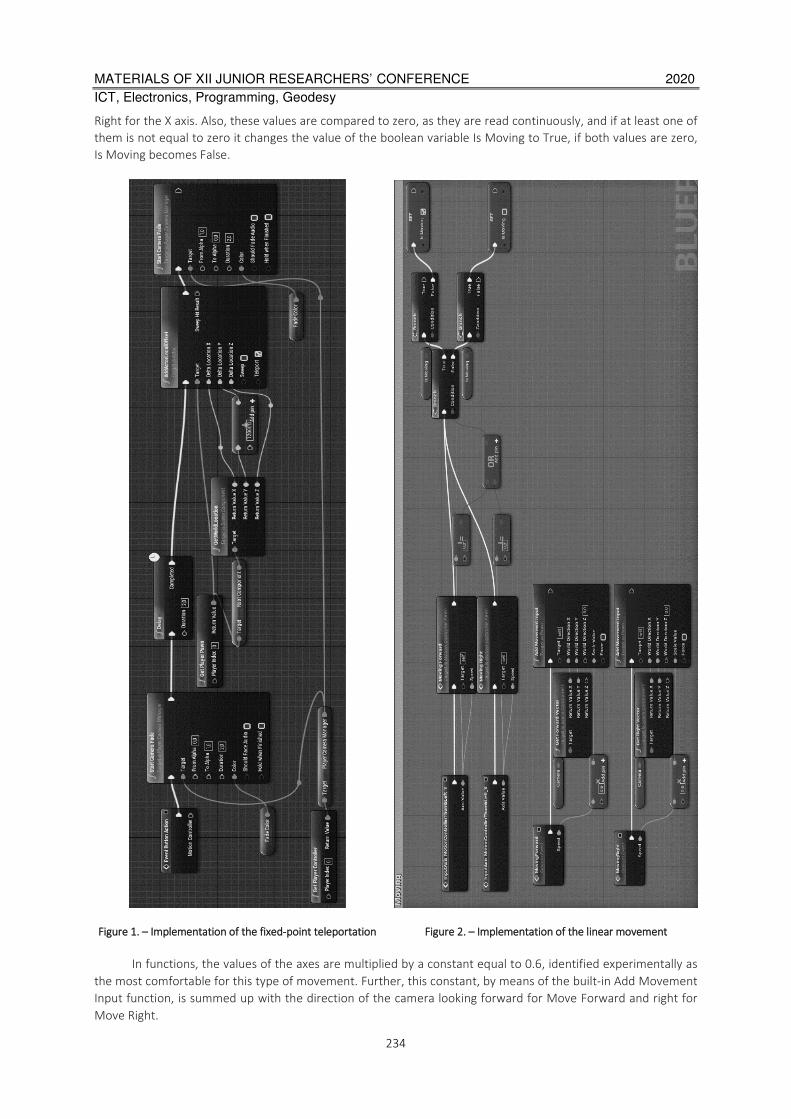
MATERIALS OF XII JUNIOR RESEARCHERS’ CONFERENCE 2020
ICT, Electronics, Programming, Geodesy
234
Right for the X axis. Also, these values are compared to zero, as they are read continuously, and if at least one of
them is not equal to zero it changes the value of the boolean variable Is Moving to True, if both values are zero,
Is Moving becomes False.
Figure 1. – Implementation of the fixed-point teleportation
Figure 2. – Implementation of the linear movement
In functions, the values of the axes are multiplied by a constant equal to 0.6, identified experimentally as
the most comfortable for this type of movement. Further, this constant, by means of the built-in Add Movement
Input function, is summed up with the direction of the camera looking forward for Move Forward and right for
Move Right.

MATERIALS OF XII JUNIOR RESEARCHERS’ CONFERENCE 2020
ICT, Electronics, Programming, Geodesy
235
At such a speed of movement, during testing, the average time of a game session before the onset of dis-
orientation was checked. According to the testing data obtained at the first game session, the average value of
its duration is 6 minutes. When repeated, the time can increase up to 30 minutes without the occurrence of a
simulator disease.
Physical movement is implemented by the interaction of several modules: a controller component that
stores the 3D model of the controller and its animation BP_MotionController, a component of the MotionCon-
trollerPawn player that stores all the basic user functionality, the interface that connects the player and the
components with which it interacts, and a component of surfaces for vertical movement BP_ClimbObj, which
stores a model of a surface primitive for vertical movement, as well as specially created material for a simplified
perception of objects of that type. In addition, the BP_ClimbObj component stores the logic of movement along
vertical surfaces.
The logic of such a movement is as follows: the player has two controllers, each of which interacts with an
object of a certain type (a special wall for moving). At the moment the interaction begins, the entire player’s
model begins to move relative to the point at which the interaction of the controller and the object began, this
movement occurs with the help of the controller, the model of which is fixed at the above point.
Conclusion. Any given type of movement can be used in virtual reality application. Nevertheless, it de-
pends on the specific genre or goal of the project. And, of course, it is important to understand the effect of vir-
tual interactions on the organism of the user. Summing up, one of the most crucial things in vr project is to
choose accurate type of movement and implement it carefully.
REFERENCES
1. Unreal Engine VR для разработчиков / Митч Маккефри; [пер. с англ. Н.И. Веселко, О.В. Максименковой,
А.А. Незнанова]. – М. : Эксмо, 2019. – 256 с.
2. UXplanet “Motion sickness in VR” by Anastasiia Ku [Электронный ресурс]. – Режим доступа:
https://uxplanet.org/motion-sickness-in-vr-3fa8a78216e2. – Дата доступа: 11.09.2019.
3. Unreal Engine 4 Documentation [Электронный ресурс]. – Режим доступа:
https://docs.unrealengine.com/en-us/ – Дата доступа: 10.09.2019.
4. Unreal Engine 4 Документация [Электронный ресурс]. – Режим доступа: https://uengine.ru/docs – Дата
доступа: 10.09.2019.
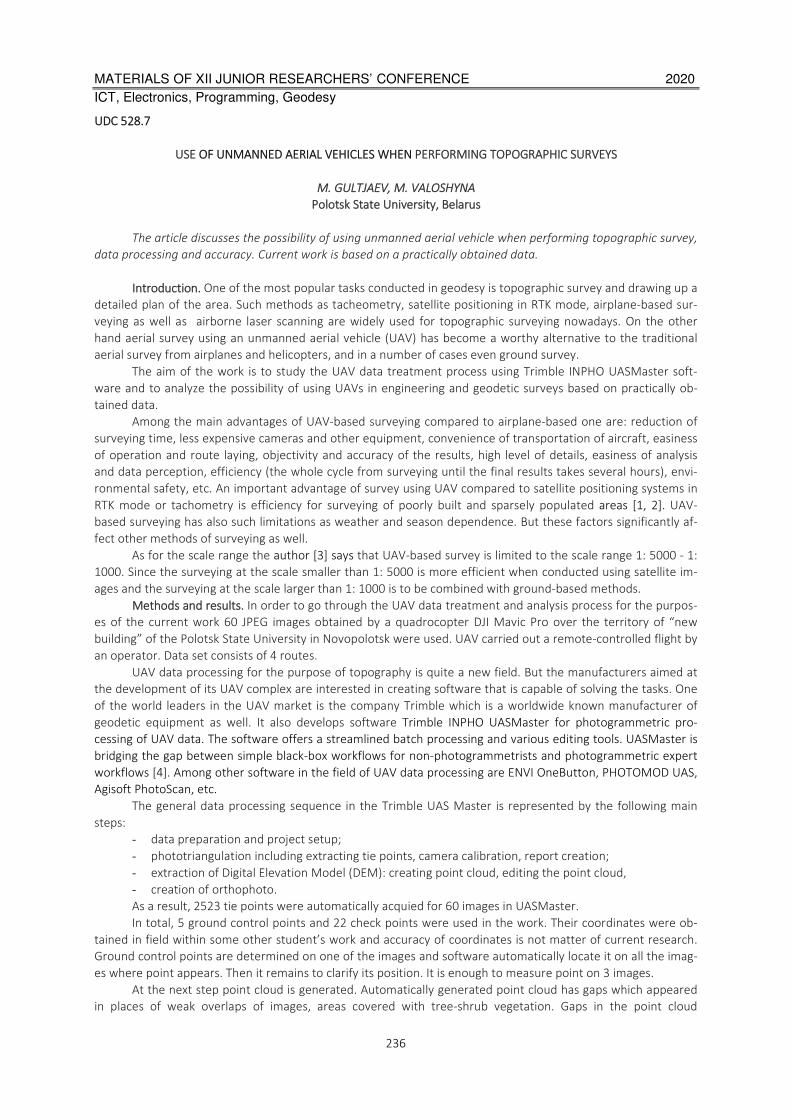
MATERIALS OF XII JUNIOR RESEARCHERS’ CONFERENCE 2020
ICT, Electronics, Programming, Geodesy
236
UDC 528.7
USE OF UNMANNED AERIAL VEHICLES WHEN PERFORMING TOPOGRAPHIC SURVEYS
M. GULTJAEV, M. VALOSHYNA
Polotsk State University, Belarus
The article discusses the possibility of using unmanned aerial vehicle when performing topographic survey,
data processing and accuracy. Current work is based on a practically obtained data.
Introduction. One of the most popular tasks conducted in geodesy is topographic survey and drawing up a
detailed plan of the area. Such methods as tacheometry, satellite positioning in RTK mode, airplane-based sur-
veying as well as airborne laser scanning are widely used for topographic surveying nowadays. On the other
hand aerial survey using an unmanned aerial vehicle (UAV) has become a worthy alternative to the traditional
aerial survey from airplanes and helicopters, and in a number of cases even ground survey.
The aim of the work is to study the UAV data treatment process using Trimble INPHO UASMaster soft-
ware and to analyze the possibility of using UAVs in engineering and geodetic surveys based on practically ob-
tained data.
Among the main advantages of UAV-based surveying compared to airplane-based one are: reduction of
surveying time, less expensive cameras and other equipment, convenience of transportation of aircraft, easiness
of operation and route laying, objectivity and accuracy of the results, high level of details, easiness of analysis
and data perception, efficiency (the whole cycle from surveying until the final results takes several hours), envi-
ronmental safety, etc. An important advantage of survey using UAV compared to satellite positioning systems in
RTK mode or tachometry is efficiency for surveying of poorly built and sparsely populated areas [1, 2]. UAV-
based surveying has also such limitations as weather and season dependence. But these factors significantly af-
fect other methods of surveying as well.
As for the scale range the author [3] says that UAV-based survey is limited to the scale range 1: 5000 - 1:
1000. Since the surveying at the scale smaller than 1: 5000 is more efficient when conducted using satellite im-
ages and the surveying at the scale larger than 1: 1000 is to be combined with ground-based methods.
Methods and results. In order to go through the UAV data treatment and analysis process for the purpos-
es of the current work 60 JPEG images obtained by a quadrocopter DJI Mavic Pro over the territory of “new
building” of the Polotsk State University in Novopolotsk were used. UAV carried out a remote-controlled flight by
an operator. Data set consists of 4 routes.
UAV data processing for the purpose of topography is quite a new field. But the manufacturers aimed at
the development of its UAV complex are interested in creating software that is capable of solving the tasks. One
of the world leaders in the UAV market is the company Trimble which is a worldwide known manufacturer of
geodetic equipment as well. It also develops software Trimble INPHO UASMaster for photogrammetric pro-
cessing of UAV data. The software offers a streamlined batch processing and various editing tools. UASMaster is
bridging the gap between simple black-box workflows for non-photogrammetrists and photogrammetric expert
workflows [4]. Among other software in the field of UAV data processing are ENVI OneButton, PHOTOMOD UAS,
Agisoft PhotoScan, etc.
The general data processing sequence in the Trimble UAS Master is represented by the following main
steps:
- data preparation and project setup;
- phototriangulation including extracting tie points, camera calibration, report creation;
- extraction of Digital Elevation Model (DEM): creating point cloud, editing the point cloud,
- creation of orthophoto.
As a result, 2523 tie points were automatically acquied for 60 images in UASMaster.
In total, 5 ground control points and 22 check points were used in the work. Their coordinates were ob-
tained in field within some other student’s work and accuracy of coordinates is not matter of current research.
Ground control points are determined on one of the images and software automatically locate it on all the imag-
es where point appears. Then it remains to clarify its position. It is enough to measure point on 3 images.
At the next step point cloud is generated. Automatically generated point cloud has gaps which appeared
in places of weak overlaps of images, areas covered with tree-shrub vegetation. Gaps in the point cloud
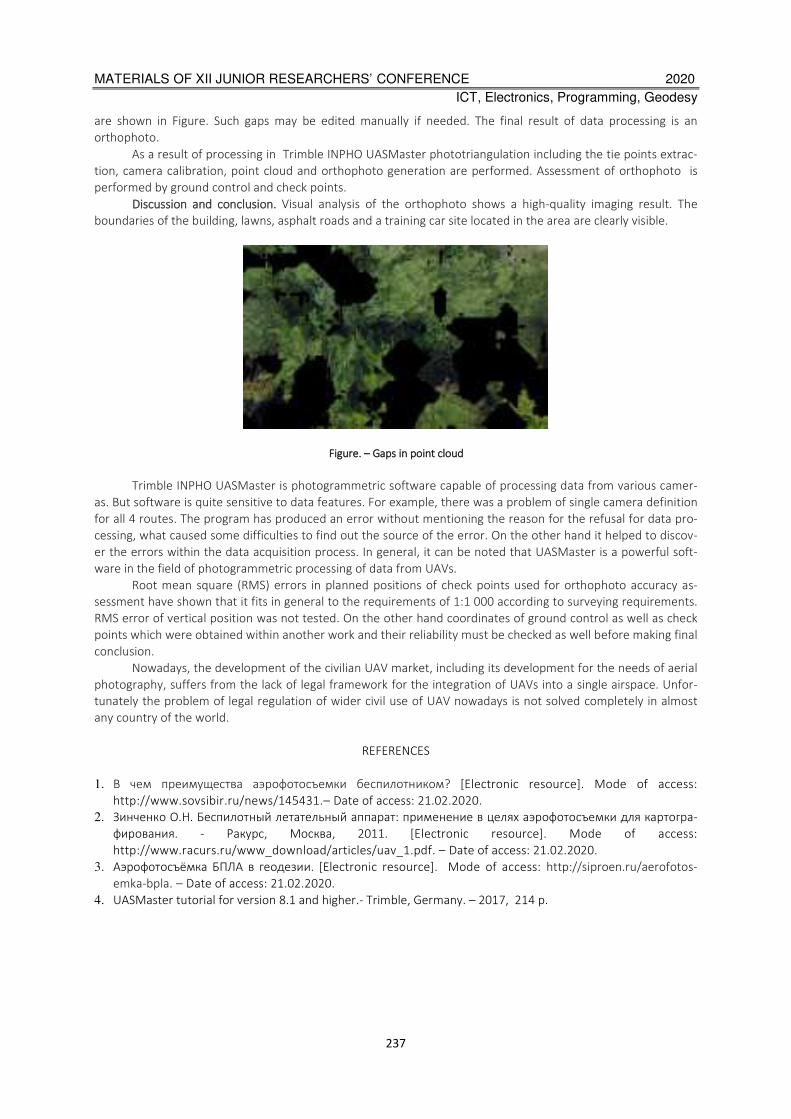
MATERIALS OF XII JUNIOR RESEARCHERS’ CONFERENCE 2020
ICT, Electronics, Programming, Geodesy
237
are shown in Figure. Such gaps may be edited manually if needed. The final result of data processing is an
orthophoto.
As a result of processing in Trimble INPHO UASMaster phototriangulation including the tie points extrac-
tion, camera calibration, point cloud and orthophoto generation are performed. Assessment of orthophoto is
performed by ground control and check points.
Discussion and conclusion. Visual analysis of the orthophoto shows a high-quality imaging result. The
boundaries of the building, lawns, asphalt roads and a training car site located in the area are clearly visible.
Figure. – Gaps in point cloud
Trimble INPHO UASMaster is photogrammetric software capable of processing data from various camer-
as. But software is quite sensitive to data features. For example, there was a problem of single camera definition
for all 4 routes. The program has produced an error without mentioning the reason for the refusal for data pro-
cessing, what caused some difficulties to find out the source of the error. On the other hand it helped to discov-
er the errors within the data acquisition process. In general, it can be noted that UASMaster is a powerful soft-
ware in the field of photogrammetric processing of data from UAVs.
Root mean square (RMS) errors in planned positions of check points used for orthophoto accuracy as-
sessment have shown that it fits in general to the requirements of 1:1 000 according to surveying requirements.
RMS error of vertical position was not tested. On the other hand coordinates of ground control as well as check
points which were obtained within another work and their reliability must be checked as well before making final
conclusion.
Nowadays, the development of the civilian UAV market, including its development for the needs of aerial
photography, suffers from the lack of legal framework for the integration of UAVs into a single airspace. Unfor-
tunately the problem of legal regulation of wider civil use of UAV nowadays is not solved completely in almost
any country of the world.
REFERENCES
1. В чем преимущества аэрофотосъемки беспилотником? [Electronic resource]. Mode of access:
http://www.sovsibir.ru/news/145431.– Date of access: 21.02.2020.
2. Зинченко О.Н. Беспилотный летательный аппарат: применение в целях аэрофотосъемки для картогра-
фирования. - Ракурс, Москва, 2011. [Electronic resource]. Mode of access:
http://www.racurs.ru/www_download/articles/uav_1.pdf. – Date of access: 21.02.2020.
3. Аэрофотосъёмка БПЛА в геодезии. [Electronic resource]. Mode of access: http://siproen.ru/aerofotos-
emka-bpla. – Date of access: 21.02.2020.
4. UASMaster tutorial for version 8.1 and higher.- Trimble, Germany. – 2017, 214 p.
MATERIALS OF XII JUNIOR RESEARCHERS’ CONFERENCE 2020
ICT, Electronics, Programming, Geodesy
238
UDC 004.42
WEB APPLICATION FOR SMALL BUSINESS MANAGEMENT
V. KUPTSOV, O. GOLUBEVA
Polotsk State University, Belarus
This article describes the importance of developing and implementing software for managing small and
medium-sized businesses in the Republic of Belarus. The paper also has a description of the developed software,
technologies used in the development process, as well as the architecture of the application.
Small and medium-sized business in the Republic of Belarus plays an important role in the socio-economic
development of the country. It contributes to the formation of a competitive environment, provides growth in
the production of consumer goods. Thanks to it, the service sector expands, and the economy is given additional
stability. The importance of small business is also determined by its features such as the ability to quickly re-
spond to consumer demand and quickly meet it, quickly respond to changes in market conditions and demon-
strate high maneuverability. What is more, small business provides the country with many new jobs. This, in
turn, leads to a reduction in the number of unemployed people.
Due to the low level of competition and strong fragmentation of the market, small business in Belarus can
develop quite successfully. In every area, from the supply of household and computer equipment to the sale of
food products, there is a certain growth reserve.
The business environment of Belarus is formed mainly from small and medium-sized companies. Due to
the rapid growth in the number of small companies, there is a need for software for business management. Such
applications allow to manage the warehouse, goods, orders, managers, customers, etc. Thus, the user can facili-
tate and accelerate the conduct of his business, increase sales and, accordingly, increase the level of income of
the organization [1].
One of the most powerful tools in the arsenal of modern leaders are automated systems of the Enterprise
Resource Planning (ERP) class. ERP class systems are a full-featured set of applications integrated among them-
selves that allows you to create a unified environment for automating the planning, accounting, control, analysis
and management of enterprise business processes in the field of financial, inventory, production and logistics
flows, accounting, personnel management, regulation of relations with counterparties, reporting, etc.
The company's resource management systems are being introduced in order to combine all the compa-
ny’s divisions and all the necessary functions in one computer system that will serve the current needs of these
divisions. Thanks to the one-time input of data into the mutual database of the company, information can be
used simultaneously by any number of users of the system, which increases the effectiveness of both planning
and control, as well as ensures the coherence of actions of all parts of the enterprise and the productivity of
management in general.
ERP systems with a web interface make it possible to combine geographically remote branches and divi-
sions of the company and involve them in a single information space. Enterprise management systems allow you
to create a kind of information channels that can connect the enterprise with partner companies to provide
them with access to the enterprise database and exchange the necessary information. As a result of such coop-
eration, a single information archive is formed, which allows optimizing the supply processes, deliveries and oth-
er types of joint activities, as well as bringing the whole process of interaction to a whole new level [2].
Implementation of the enterprise management system makes the company's business processes more
transparent, increasing its attractiveness to investors, and, therefore, allows attracting additional investments
for further development of production.
The developed system is based on the client-server architecture, in which tasks or network load are dis-
tributed between service providers, called servers, and service customers, called clients. The Internet is used as a
medium for client-server interaction.
MVC concept is used on the backend side – Model-View-Controller – a scheme for dividing application
data, user interface and control logic into three separate components: model, view and controller. This architec-
ture allows the software to be more flexible, so that each component can be modified independently [3].
Backend of the application is written in PHP language. Laravel was chosen as a framework because it is a free
and open-source. It is intended for the development of web applications following the MVC architectural pattern
and based on Symfony framework. Some of the features of Laravel are a modular packaging system with a dedi-
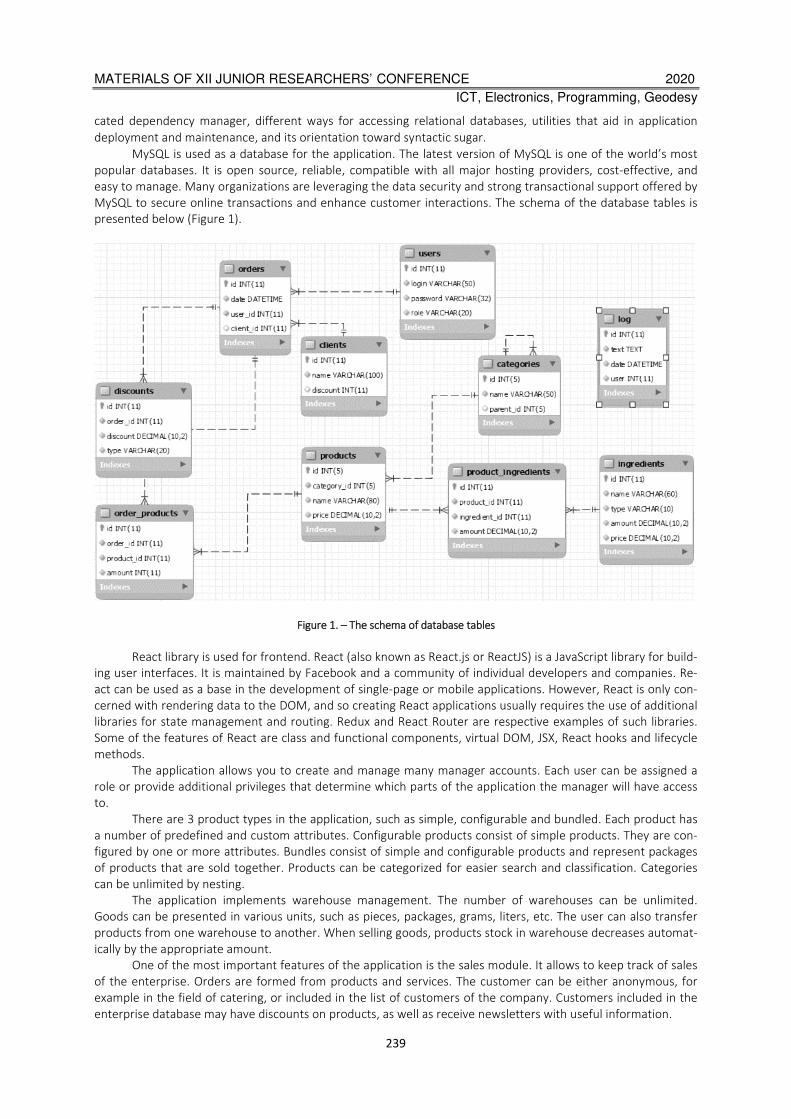
MATERIALS OF XII JUNIOR RESEARCHERS’ CONFERENCE 2020
ICT, Electronics, Programming, Geodesy
239
cated dependency manager, different ways for accessing relational databases, utilities that aid in application
deployment and maintenance, and its orientation toward syntactic sugar.
MySQL is used as a database for the application. The latest version of MySQL is one of the world’s most
popular databases. It is open source, reliable, compatible with all major hosting providers, cost-effective, and
easy to manage. Many organizations are leveraging the data security and strong transactional support offered by
MySQL to secure online transactions and enhance customer interactions. The schema of the database tables is
presented below (Figure 1).
Figure 1. – The schema of database tables
React library is used for frontend. React (also known as React.js or ReactJS) is a JavaScript library for build-
ing user interfaces. It is maintained by Facebook and a community of individual developers and companies. Re-
act can be used as a base in the development of single-page or mobile applications. However, React is only con-
cerned with rendering data to the DOM, and so creating React applications usually requires the use of additional
libraries for state management and routing. Redux and React Router are respective examples of such libraries.
Some of the features of React are class and functional components, virtual DOM, JSX, React hooks and lifecycle
methods.
The application allows you to create and manage many manager accounts. Each user can be assigned a
role or provide additional privileges that determine which parts of the application the manager will have access
to.
There are 3 product types in the application, such as simple, configurable and bundled. Each product has
a number of predefined and custom attributes. Configurable products consist of simple products. They are con-
figured by one or more attributes. Bundles consist of simple and configurable products and represent packages
of products that are sold together. Products can be categorized for easier search and classification. Categories
can be unlimited by nesting.
The application implements warehouse management. The number of warehouses can be unlimited.
Goods can be presented in various units, such as pieces, packages, grams, liters, etc. The user can also transfer
products from one warehouse to another. When selling goods, products stock in warehouse decreases automat-
ically by the appropriate amount.
One of the most important features of the application is the sales module. It allows to keep track of sales
of the enterprise. Orders are formed from products and services. The customer can be either anonymous, for
example in the field of catering, or included in the list of customers of the company. Customers included in the
enterprise database may have discounts on products, as well as receive newsletters with useful information.

MATERIALS OF XII JUNIOR RESEARCHERS’ CONFERENCE 2020
ICT, Electronics, Programming, Geodesy
240
It is often necessary to be able to view sales statistics for a specific period for further analysis.
Possible use cases:
• determine which products are sold better than others;
• what goods and services sell poorly;
• track sales for a specific period, for example, day, week, month.
The created software product allows to increase the efficiency of business management of the company,
increase the productivity of managers. The program does not require installation and can be used on computers,
on tablets and mobile devices as well.
The application interface is designed in such a way as to achieve maximum convenience and ease of use.
Even a user unfamiliar with the program will be able to quickly and easily understand it.
REFERENCES
1. Национальная Библиотека Беларуси [Электронный ресурс] / Малый и средний бизнес – Режим досту-
па: https://infocenter.nlb.by/ekonomika-i-biznes/malyy-biznes/ – Дата доступа: 25.02.2020
2. Хабрахабр [Электронный ресурс] / Что такое ERP система – Режим доступа:
https://habrahabr.ru/post/333018/ – Дата доступа: 01.03.2020
3. Wikipedia [Electronic Resource] / Model-View-Controller — Wikipedia – Mode of access:
https://en.wikipedia.org/wiki/Model-View-Controller – Date of access: 03.03.2020

MATERIALS OF XII JUNIOR RESEARCHERS’ CONFERENCE 2020
ICT, Electronics, Programming, Geodesy
241
UDC 004.4’22
CONVERTING SPEECH TO TEXT USING JAVASCRIPT
M. LAPKOUSKI, D. PIATKIN
Polotsk State University, Belarus
This article is about the process of working with the Web Speech API. This is a very powerful browser
interface that allows to record human speech and convert it to text. We will also consider the way to use it
for the opposite procedure of reading lines with a human voice.
Convert speech to text. The Web Speech API is actually divided into two completely independent interfac-
es: SpeechRecognition for understanding human voice and turning it into text, and SpeechSynthesis for reading
lines aloud with a computer-generated voice.
The speech recognition API is surprisingly accurate for the free browser feature. It recognized correctly
almost all my conversations and knew which words are combined into meaningful phrases. It also allows you to
dictate special characters such as breakpoints, question marks, and newlines. An example is shown in Listing 1
[1].
The first thing to do is to check if the user has access to the API and show the corresponding error mes-
sage. Unfortunately, the speech-to-text conversion API is only supported in Chrome and Firefox (with a
checkmark), so many users are likely to see this message.
Listing 1 - checking if the user has access to the API
try
var SpeechRecognition = window.SpeechRecognition || window.webkitSpeechRecognition;
var recognition = new SpeechRecognition();
catch(e)
console.error(e);
$('.no-browser-support').show();
$('.app').hide();
Recognition variable will give us access to all API methods and properties. There are various options avail-
able, but we will only set the recognition.continuous parameter. This will allow users to speak with longer pauses
between words and phrases.
Before we can use voice recognition, we also need to set up several event handlers. Most of them just lis-
ten to changes in recognition status. An example is shown in Listing 2.
Listing 2 - setting up event handlers before using voice recognition
try
var SpeechRecognition = window.SpeechRecognition || window.webkitSpeechRecognition;
var recognition = new SpeechRecognition();
catch(e)
console.error(e);
$('.no-browser-support').show();
$('.app').hide();
However, there is a special onresult event, which is very important. It is executed every time the user says
a word or several words in quick succession, giving us access to a text transcription of what was said.
When we write something using the onresult handler, we save it in a global variable and display it in the
text area. An example is shown in Listing 3.
Listing 3 - recognition.onresult event handler
recognition.onresult = function(event)
// event is a SpeechRecognitionEvent object.
// It stores the entire recorded dialog

MATERIALS OF XII JUNIOR RESEARCHERS’ CONFERENCE 2020
ICT, Electronics, Programming, Geodesy
242
// We only need the current dialog / phrase
var current = event.resultIndex;
// Get the text of what was said.
var transcript = event.results[current][0].transcript;
// Add text to the content of our text document.
noteContent += transcript;
noteTextarea.val(noteContent);
The code above is a bit simplified. There is a very strange error on Android devices, due to which every-
thing repeats twice. There is no official solution, but I managed to solve the problem without any obvious side
effects. With this error in mind, the code looks like this [2]:
Listing 4 - a simplified code from the previous listing that solves the problem of repeating the output text
twice on Android devices
var mobileRepeatBug = (current == 1 && transcript == event.results[0][0].transcript);
if(!mobileRepeatBug)
noteContent += transcript;
noteTextarea.val(noteContent);
Everything is set up, now you can start using the browser voice recognition function. To start with, you
just need to call the start () method:
Listing 5 - calling the start () method to start voice recognition
$('#start-record-btn').on('click', function(e)
recognition.start();
);
In this case, the browser will ask users to give permission. If permission is given, the device microphone
will be activated.
The browser will listen for some time, and each recognized phrase or word will be transformed into the
text. The API will stop listening automatically after a couple of seconds of silence or when it is stopped manually.
Listing 6 - handling the event of pressing the stop button for converting speech to text
$('#pause-record-btn').on('click', function(e)
recognition.stop();
);
Convert text to speech. Speech synthesis is actually very simple. The API is accessible through the
speechSynthesis object, and there are several methods for playing, pausing, and other things related to sound.
There are also some interesting features that change pitch, speed, and even the reader’s voice.
All that is needed for demonstration is the speak () method. It expects one argument - an instance of the
SpeechSynthesisUtterance class.
Listing 7 shows all the code needed to read a line.
Listing 7 - reading text aloud with a computer synthesized voice
function readOutLoud(message)
var speech = new SpeechSynthesisUtterance();
// Устанавливаем атрибуты текста и голоса.
speech.text = message;
speech.volume = 1;
speech.rate = 1;
speech.pitch = 1;
window.speechSynthesis.speak(speech);
Conclusion. The article examined a method for converting human speech into text using the Web Speech
API. A method for converting text into human speech by a computer-synthesized voice was also investigated.

MATERIALS OF XII JUNIOR RESEARCHERS’ CONFERENCE 2020
ICT, Electronics, Programming, Geodesy
243
In an era when voice assistants have become more popular than ever, a similar API provides a quick way
to create bots that understand and speak human language.
Adding voice control to applications can also be a great way to improve accessibility. Visually impaired us-
ers can use both speech-to-text and text-to-speech user interfaces.
The speech synthesis and speech recognition APIs work quite well and easily handle various languages
and accents. Unfortunately, at the moment they have limited browser support, which limits their use in produc-
tion.
REFERENCES
1. Web Speech API – Web APIs | MDN [Electronic resource] - Access mode: https://developer.mozilla.org/en-
US/docs/Web/API/Web_Speech_API - Access date: 24.02.2019.
2. HTML5 Speech Recognition API - codeburst [Electronic resource] - Access mode: https://codeburst.io/html5-
speech-recognition-api-670846a50e92 - Access date: 24.02.2019.
3. Interfaces Web API | MDN [Electronic resource] - Access mode:
https://developer.mozilla.org/ru/docs/Web/API - Access date: 25.02.2019.
4. Interface events [Electronic resource] – Access mode: https://learn.javascript.ru/event-details - Access date:
25.02.2019.

MATERIALS OF XII JUNIOR RESEARCHERS’ CONFERENCE 2020
ICT, Electronics, Programming, Geodesy
244
UDC 004.4
EFFICIENCY OF USING CRYSTAL PROGRAMMING LANGUAGE
FOR APPLICATION IMPLEMENTATION
O. MIKHNOVICH, O. MIKHNOVICH
Polotsk State University, Belarus
This article discusses the capabilities of the Сrystal programming language and its advantages over the C
and Ruby programming languages using the implementation of the Tower of Hanoi problem as an example.
Nowadays, there are many different programming languages. Some of them allow developers to write
well-readable and efficient codes, while others allow you to focus on the productivity of the future product. Pro-
gramming languages by type-checking are usually divided into two categories. They are static and dynamic. Stat-
ic examples are C, Java, C#. Dynamic examples are Python, JavaScript, Ruby. Ruby is one of the popular dynamic
interpreted programming languages.
Ruby has an operating system-independent multithreading implementation, strong dynamic typing, gar-
bage collection, and many other features. In terms of syntax, it is close to the Perl and Eiffel languages, in the
object-oriented approach to Smalltalk. Also, some features of the language are taken from Python, Lisp, Dylan,
and Clu. Nowadays, Ruby is used with the Rails framework. However, Ruby has its drawbacks. The most signifi-
cant drawback of Ruby is its performance. Consider Crystal programming language as a more productive alterna-
tive to Ruby [1].
Crystal is a general-purpose, object-oriented programming language, designed and developed by Ary
Borenszweig, Juan Wajnerman. Crystal is statically typed and has Ruby-like syntax. The first official release of the
language took place in June 2014. The language compiler was originally written in Ruby until it was rewritten in
Crystal in 2013. The language is under active development. Despite the similarities in syntax, Crystal is much
more efficient than Ruby to compile into machine code using LLVM, while sacrificing dynamic aspects of the lan-
guage. According to the test results, Crystal shows similar performance with the C language. The language uses
the Boehm garbage collector, has a macro system, it supports generics, as well as overloading methods and op-
erators [2].
Crystal is a programming language with the following goals:
1. Have a syntax like Ruby (but compatibility with it is not a goal).
2. Be statically type-checked, but without having to specify the type of variables or method arguments.
3. Be able to call C code by writing bindings to it in Crystal.
4. Have compile-time evaluation and generation of code, to avoid boilerplate code.
5. Compile to efficient native code.
To compare Crystal performance, we take two programming languages: Ruby and C. The choice fell on
these languages since Crystal is positioned as a technology balanced between these languages. To compare the
performance, we implement the solution of the Tower of Hanoi problem.
The Tower of Hanoi [3] (also called the Tower of Brahma or Lucas' Tower and sometimes pluralized as
Towers) is a mathematical game or a puzzle. It consists of three rods and a few disks of different sizes, which can
slide onto any rod. The puzzle starts with the disks in a neat stack in ascending order of size on one rod, the
smallest at the top, thus making a conical shape.
There are several approaches to the solution (recursively, a “triangular” solution, a cyclic solution). All of
them give identical results. We implement a recursive solution.
The implementation of the solution in Ruby is presented in the listing below.
require ‘benchmark’
N=20
A=Array.new
B=Array.new
C=Array.new
LOG = false

MATERIALS OF XII JUNIOR RESEARCHERS’ CONFERENCE 2020
ICT, Electronics, Programming, Geodesy
245
def move(n, source, target, auxiliary)
if n > 0
move(n - 1, source, auxiliary, target)
target.append(source.pop)
print "********\n#A\n#B\n#C\n" if LOG
move(n - 1, auxiliary, target, source)
end
end
def run()
(1..N).each |v| A << v
A.reverse
move(N, A, C, B)
end
puts "\nRuby work time: #Benchmark.measure run() "
The implementation of the solution in Crystal is presented in the listing below.
require "benchmark"
N = 20
A = Array(Int32).new
B = Array(Int32).new
C = Array(Int32).new
LOG = false
def move(n, source, target, auxiliary)
if n > 0
move(n - 1, source, auxiliary, target)
target << source.pop
print "********\n#A\n#B\n#C\n" if LOG
move(n - 1, auxiliary, target, source)
end
end
def run()
(1..N).each |v| A << v
A.reverse
move(N, A, C, B)
end
puts "\nCrystal work time: #Benchmark.measure run() "
Listings with solutions to the Tower of Hanoi problem in C, Crystal and Ruby are available on GitHub [4].
After starting the solutions in the selected languages, we obtain the following results (in seconds) (ta-
ble 1).
Table 1. –Performance Tests (Tower of Hanoi Problem)
Language Test 1 Test 2 Test 3 Average values
C 0.000895 0.000957 0.000955 0.000936
Crystal 0.021738 0.021611 0.013851 0.019067
Ruby 0.364303 0.359521 0.359140 0.360988
After analyzing the results, we can conclude that Crystal programming language combines, as in C, per-
formance, and readablility, and conciseness; as in Ruby, its syntax and can be used to develop software products

MATERIALS OF XII JUNIOR RESEARCHERS’ CONFERENCE 2020
ICT, Electronics, Programming, Geodesy
246
for operating systems of the Unix family. As far as the minuses of this language go, they are a weak community
and a small number of libraries so far.
REFERENCES
1. Ruby [Electronic resource] – Mode of access: https://www.ruby-lang.org/. – Date of access: 20.01.2020.
2. Crystal [Electronic resource] – Mode of access: https://crystal-lang.org/. – Date of access: 20.01.2020.
3. The Tower of Hanoi [Electronic resource] – Mode of access: https://en.wikipedia.org/wiki/Tower_of_Hanoi/.
– Date of access: 20.01.2020.
4. Crystal benchmark [Electronic resource] – Mode of access: https://github.com/olegmikhnovich/cr-rb-c-
benchmark/. – Date of access: 20.01.2020.
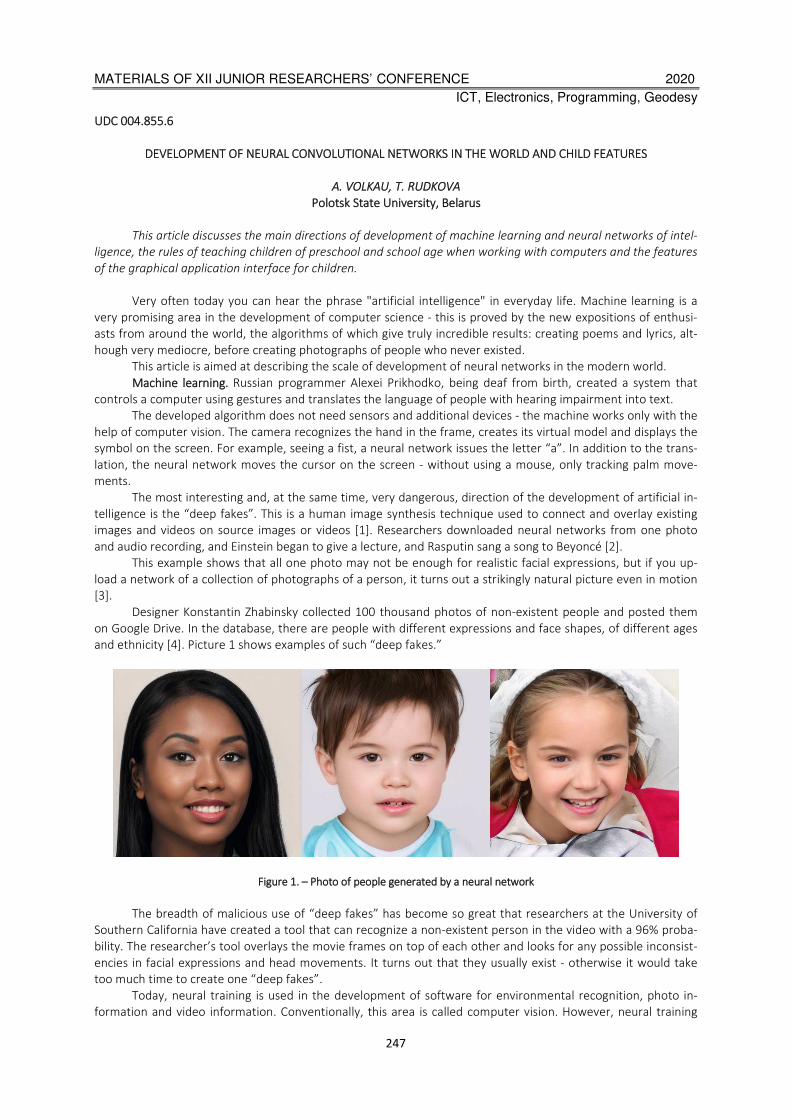
MATERIALS OF XII JUNIOR RESEARCHERS’ CONFERENCE 2020
ICT, Electronics, Programming, Geodesy
247
UDC 004.855.6
DEVELOPMENT OF NEURAL CONVOLUTIONAL NETWORKS IN THE WORLD AND CHILD FEATURES
A. VOLKAU, T. RUDKOVA
Polotsk State University, Belarus
This article discusses the main directions of development of machine learning and neural networks of intel-
ligence, the rules of teaching children of preschool and school age when working with computers and the features
of the graphical application interface for children.
Very often today you can hear the phrase "artificial intelligence" in everyday life. Machine learning is a
very promising area in the development of computer science - this is proved by the new expositions of enthusi-
asts from around the world, the algorithms of which give truly incredible results: creating poems and lyrics, alt-
hough very mediocre, before creating photographs of people who never existed.
This article is aimed at describing the scale of development of neural networks in the modern world.
Machine learning. Russian programmer Alexei Prikhodko, being deaf from birth, created a system that
controls a computer using gestures and translates the language of people with hearing impairment into text.
The developed algorithm does not need sensors and additional devices - the machine works only with the
help of computer vision. The camera recognizes the hand in the frame, creates its virtual model and displays the
symbol on the screen. For example, seeing a fist, a neural network issues the letter “a”. In addition to the trans-
lation, the neural network moves the cursor on the screen - without using a mouse, only tracking palm move-
ments.
The most interesting and, at the same time, very dangerous, direction of the development of artificial in-
telligence is the “deep fakes”. This is a human image synthesis technique used to connect and overlay existing
images and videos on source images or videos [1]. Researchers downloaded neural networks from one photo
and audio recording, and Einstein began to give a lecture, and Rasputin sang a song to Beyoncé [2].
This example shows that all one photo may not be enough for realistic facial expressions, but if you up-
load a network of a collection of photographs of a person, it turns out a strikingly natural picture even in motion
[3].
Designer Konstantin Zhabinsky collected 100 thousand photos of non-existent people and posted them
on Google Drive. In the database, there are people with different expressions and face shapes, of different ages
and ethnicity [4]. Picture 1 shows examples of such “deep fakes.”
Figure 1. – Photo of people generated by a neural network
The breadth of malicious use of “deep fakes” has become so great that researchers at the University of
Southern California have created a tool that can recognize a non-existent person in the video with a 96% proba-
bility. The researcher’s tool overlays the movie frames on top of each other and looks for any possible inconsist-
encies in facial expressions and head movements. It turns out that they usually exist - otherwise it would take
too much time to create one “deep fakes”.
Today, neural training is used in the development of software for environmental recognition, photo in-
formation and video information. Conventionally, this area is called computer vision. However, neural training
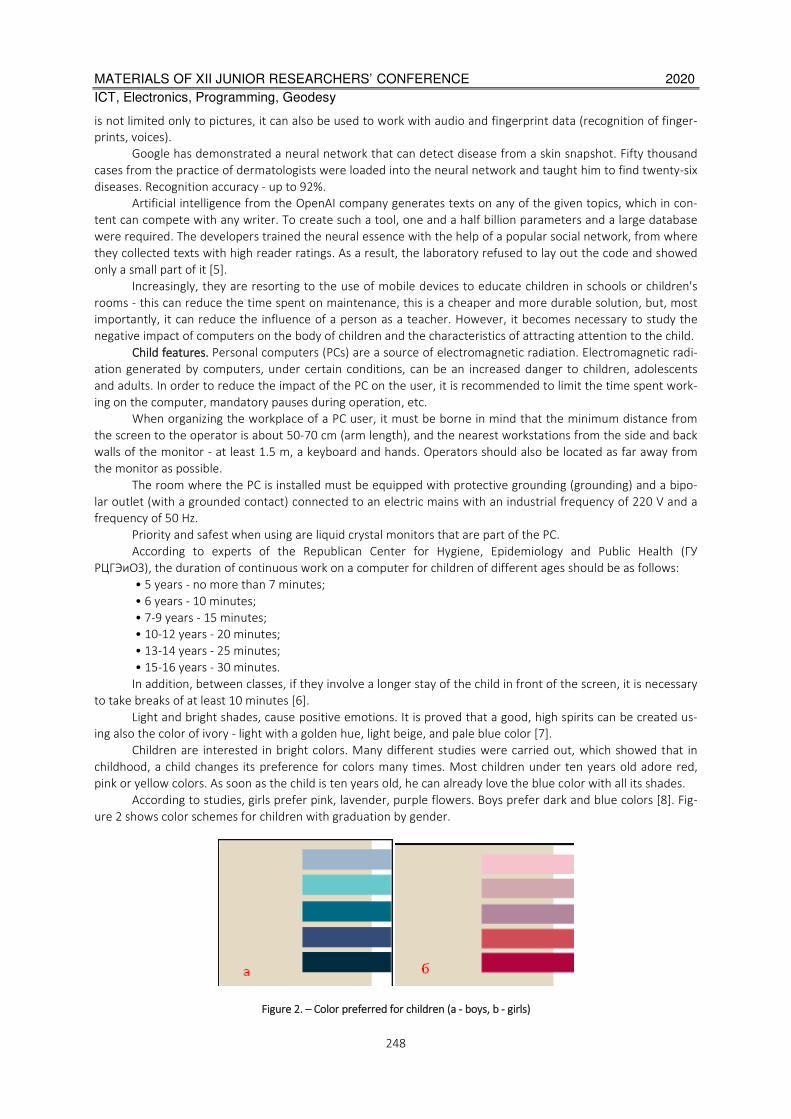
MATERIALS OF XII JUNIOR RESEARCHERS’ CONFERENCE 2020
ICT, Electronics, Programming, Geodesy
248
is not limited only to pictures, it can also be used to work with audio and fingerprint data (recognition of finger-
prints, voices).
Google has demonstrated a neural network that can detect disease from a skin snapshot. Fifty thousand
cases from the practice of dermatologists were loaded into the neural network and taught him to find twenty-six
diseases. Recognition accuracy - up to 92%.
Artificial intelligence from the OpenAI company generates texts on any of the given topics, which in con-
tent can compete with any writer. To create such a tool, one and a half billion parameters and a large database
were required. The developers trained the neural essence with the help of a popular social network, from where
they collected texts with high reader ratings. As a result, the laboratory refused to lay out the code and showed
only a small part of it [5].
Increasingly, they are resorting to the use of mobile devices to educate children in schools or children's
rooms - this can reduce the time spent on maintenance, this is a cheaper and more durable solution, but, most
importantly, it can reduce the influence of a person as a teacher. However, it becomes necessary to study the
negative impact of computers on the body of children and the characteristics of attracting attention to the child.
Child features. Personal computers (PCs) are a source of electromagnetic radiation. Electromagnetic radi-
ation generated by computers, under certain conditions, can be an increased danger to children, adolescents
and adults. In order to reduce the impact of the PC on the user, it is recommended to limit the time spent work-
ing on the computer, mandatory pauses during operation, etc.
When organizing the workplace of a PC user, it must be borne in mind that the minimum distance from
the screen to the operator is about 50-70 cm (arm length), and the nearest workstations from the side and back
walls of the monitor - at least 1.5 m, a keyboard and hands. Operators should also be located as far away from
the monitor as possible.
The room where the PC is installed must be equipped with protective grounding (grounding) and a bipo-
lar outlet (with a grounded contact) connected to an electric mains with an industrial frequency of 220 V and a
frequency of 50 Hz.
Priority and safest when using are liquid crystal monitors that are part of the PC.
According to experts of the Republican Center for Hygiene, Epidemiology and Public Health (ГУ
РЦГЭиОЗ), the duration of continuous work on a computer for children of different ages should be as follows:
• 5 years - no more than 7 minutes;
• 6 years - 10 minutes;
• 7-9 years - 15 minutes;
• 10-12 years - 20 minutes;
• 13-14 years - 25 minutes;
• 15-16 years - 30 minutes.
In addition, between classes, if they involve a longer stay of the child in front of the screen, it is necessary
to take breaks of at least 10 minutes [6].
Light and bright shades, cause positive emotions. It is proved that a good, high spirits can be created us-
ing also the color of ivory - light with a golden hue, light beige, and pale blue color [7].
Children are interested in bright colors. Many different studies were carried out, which showed that in
childhood, a child changes its preference for colors many times. Most children under ten years old adore red,
pink or yellow colors. As soon as the child is ten years old, he can already love the blue color with all its shades.
According to studies, girls prefer pink, lavender, purple flowers. Boys prefer dark and blue colors [8]. Fig-
ure 2 shows color schemes for children with graduation by gender.
Figure 2. – Color preferred for children (a - boys, b - girls)

MATERIALS OF XII JUNIOR RESEARCHERS’ CONFERENCE 2020
ICT, Electronics, Programming, Geodesy
249
If the application is designed for children of any gender and age, the optimal solution for this is an inter-
face that would satisfy all color requests. Figure 3 shows a color palette for children of any gender.
Figure 3. – Color preferred for children (a - boys, b - girls)
Conclusion. This article discusses the features of teaching children when working with computers, as well
as some aspects of choosing a color scheme for the interior or graphical application interfaces.
This article discusses the main ways of development of neural networks in the modern world. The result
of this article can be considered as the potential for the development of computer science.
REFERENCES
1. Wikipedia.org [Electronic resource]. - Access mode: https://ru.wikipedia.org/wiki/Deepfake ¬– Access date
09/19/2019.
2. GoogleInc. YouTube video hosting [Electronic resource]. - Access mode:
[https://www.youtube.com/watch?v=9Ctm4rTdVTU] - Date of access 09.19.2019.
3. GoogleInc. YouTube [Electronic resource]. - Access mode:
[https://www.youtube.com/watch?v=HG_NZpkttXE&feature=youtu.be&has_verified=1] - Date of access
09.19.2019.
4. GoogleInc. Google Disk Cloud Storage [Electronic resource] - Access mode:
[https://drive.google.com/drive/folders/1wSy4TVjSvtXeRQ6Zr8W98YbSuZXrZrgY] - Date of access:
09/19/2019.
5. OpenAI [Electronic resource]. - Access mode: [https://openai.com/blog/better-language-models/#sample8] -
Date of access: 09/19/2019.
6. Internet portal Helper [Electronic resource]. - Access mode: http://www.helper.by/kompyuteri-i-
zdorove.html. - Date of access: 05/15/2019.
7. Internet portal Lock-Collor [Electronic resource]. - Access mode: https://lookcolor.ru/populyarnye-
ottenki/cvet-slonovoj-kosti-ajvori-chast-vtoraya/. - Date of access: 05/15/2019.
8. Z.A. Kireeva. “The study of color preferences of a person and their interaction with personal characteristics”
// Humanities. - S. 98-99.
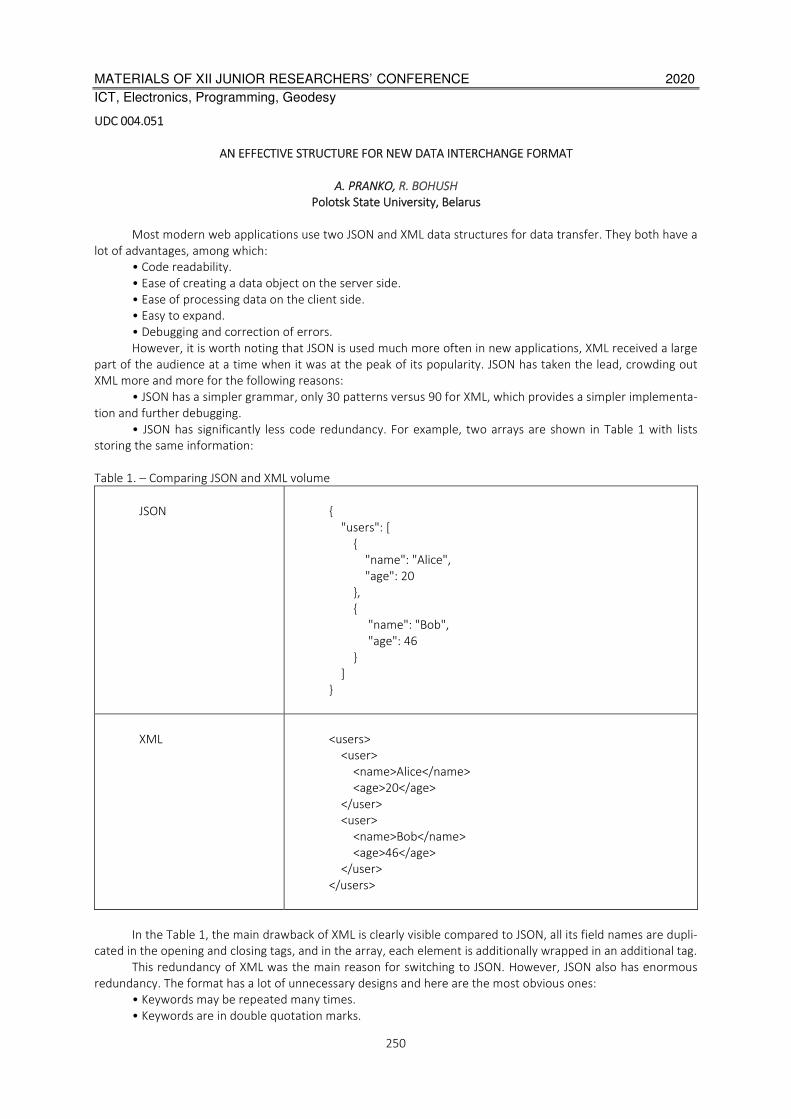
MATERIALS OF XII JUNIOR RESEARCHERS’ CONFERENCE 2020
ICT, Electronics, Programming, Geodesy
250
UDC 004.051
AN EFFECTIVE STRUCTURE FOR NEW DATA INTERCHANGE FORMAT
A. PRANKO, R. BOHUSH
Polotsk State University, Belarus
Most modern web applications use two JSON and XML data structures for data transfer. They both have a
lot of advantages, among which:
• Code readability.
• Ease of creating a data object on the server side.
• Ease of processing data on the client side.
• Easy to expand.
• Debugging and correction of errors.
However, it is worth noting that JSON is used much more often in new applications, XML received a large
part of the audience at a time when it was at the peak of its popularity. JSON has taken the lead, crowding out
XML more and more for the following reasons:
• JSON has a simpler grammar, only 30 patterns versus 90 for XML, which provides a simpler implementa-
tion and further debugging.
• JSON has significantly less code redundancy. For example, two arrays are shown in Table 1 with lists
storing the same information:
Table 1. – Comparing JSON and XML volume
JSON
"users": [
"name": "Alice",
"age": 20
,
"name": "Bob",
"age": 46
]
XML
<users>
<user>
<name>Alice</name>
<age>20</age>
</user>
<user>
<name>Bob</name>
<age>46</age>
</user>
</users>
In the Table 1, the main drawback of XML is clearly visible compared to JSON, all its field names are dupli-
cated in the opening and closing tags, and in the array, each element is additionally wrapped in an additional tag.
This redundancy of XML was the main reason for switching to JSON. However, JSON also has enormous
redundancy. The format has a lot of unnecessary designs and here are the most obvious ones:
• Keywords may be repeated many times.
• Keywords are in double quotation marks.
MATERIALS OF XII JUNIOR RESEARCHERS’ CONFERENCE 2020
ICT, Electronics, Programming, Geodesy
251
• The colon and the value separate the keyword.
• If this is not the end of the object, then you need to set a comma after the value.
• Arrays and objects are surrounded by brackets.
• Lines must also be inside quotation marks.
• Numbers are written in a string, which also adversely affects their size.
It is also worth noting that JSON and XML have a readable form only in a formatted version, when trans-
ferred, they are cleaned of extra spaces and hyphens, losing this quality.
Considering all these shortcomings, a new data structure was designed. The structure is represented in
binary form.
To solve the problem of repeatability of keywords for each, a unique id of two bytes will be set and the
entire list of keywords will be located at the beginning of the message. Before each word, its id of two bytes and
the length (also 2 bytes) of the keyword in bytes will be written in order to know which piece of the message to
take next as a keyword. Before all this list there will be the first 2 bytes storing the total length of the list of key-
words. Thus, long key glories will be recorded only once, and then in the main structure they will be recorded
using id which occupies only 2 bytes.
Next, after the list of keywords, the main data structure will go. Any data will begin with its type occupy-
ing 1 byte. In the structure, I highlighted the following data types:
• Object - after the type, the total number of bytes that this object occupies should be indicated. This val-
ue will occupy 2 bytes. And then the data inside the object will go as a list. All of them will have a key id in front
of their type.
• Array - repeats the structure of the object, only you do not need to specify id before the type, all ob-
jects will be numbered from scratch during parsing.
• Integer - will always occupy 4 bytes, so after the type you do not need to specify its length.
• Fractional number - will have a double representation and a length of 8 bytes, which also makes it un-
necessary to specify the length.
• String - after specifying the type, you must specify the total number of bytes that this string occupies.
All this will provide the structure with the same flexibility that JSON has, but will deprive it of enormous
redundancy. Now all field names are repeated once at the beginning of the structure, to determine a field in an
object, you only need to indicate the id of the name, which takes only 2 bytes, its type (1 byte) and, if it is a
string, array or object, the length of the value. As a result, we get that to declare a field, only 3 or 5 bytes are
needed, not counting the value itself. At the same time, in JSON, to define a field, you must specify its full name,
which can take unlimited length, the name must be in quotation marks, each of which takes one byte, followed
by a colon, which takes another byte, and if the value is a string, an array or an object, that value should still be
in quotation marks or brackets (depending on type) which will add 2 more extra bytes. As a result, we have fixed
3 or 5 bytes in the new structure, when in JSON we have a field name occupying at least 1 character (byte) and
the same 3 or 5 bytes for additional formatting.
The main drawback of the structure is its complete unreadability. But since JSON is transmitted in an un-
formatted form, before working with it, it is formatted into a convenient structure. My structure can easily re-
peat JSON so that when working with it can be parsed in JSON and when passing back. This will allow people to
easily work with it and transfer data with minimal redundancy.
It is also worth noting that there is a scenario in which my structure is more redundant - this is the case
when the data does not have fields with the same name. However, it must be taken into account that such data,
as a rule, are not large and the losses will be negligible. This structure is aimed at reducing redundancy during
the transfer of large amounts of data, and these are usually arraying with repeatedly repeating objects that have
a similar structure, and therefore the fields will be duplicated many times. Savings in the transfer of such struc-
tures will greatly exceed losses in the transfer of small objects, which will positively affect both the transmission
speed and the amount of traffic.
REFERENCES
1. Gusfield Dan. Algorithms on Strings, Trees and Sequences: Computer Science and Computational Biology - 1
edition (May 28, 1997).
2. Extensible Markup Language (XML) 1.0 (Fifth Edition), W3C Recommendation 26 November 2008 – Mode of
access: https://www.w3.org/TR/xml/. - Date of access: 15.02.2020.
3. Introducing JSON – Mode of access: https://www.json.org/json-en.html. - Date of access: 15.02.2020.
MATERIALS OF XII JUNIOR RESEARCHERS’ CONFERENCE 2020
ICT, Electronics, Programming, Geodesy
252
UDC 534.781
ROLE OF THE WEB PORTFOLIO IN INCREASING COMPETITIVENESS OF UNIVERSITY GRADUATES
H. BELSKI, I. BURACHONAK
Polotsk State University, Belarus
This article discusses the role of compiling a personal portfolio and its impact on improving the competi-
tiveness of university graduates for their future work.
The Republic of Belarus on May 15, 2015 at the Conference of Ministers of Education of the Member
States of the European Higher Education Area (Yerevan) became the 48th participant in the Bologna process -
the process of convergence and harmonization of education systems in Europe to create a single European
space for higher education.
The priority tasks of the Bologna process are the creation of a European higher education space designed
to stimulate the competitiveness of the European higher education system and its attractiveness, as well as cre-
ate opportunities for students' mobility and their further employment [1].
This process poses the most important task for any university, (including the educational institution
"Polotsk State University") the preparation of a competitive and sought-after specialist in the labor market.
As practice shows, in several countries there is a decrease in the quality of education at the first stage due
to the introduction of shortened training periods. Many graduates do not fully meet the requirements of em-
ployers: universities graduate with general ideas about professional activity, in most cases students are not
ready for operational inclusion in this field of activity [2]. Traditional forms and methods of training students do
not contribute to the optimization of the formation process of such components of a professional culture.
In fact, the leading form of organization of training is the subject system, in which the student usually
solves the tasks of a particular academic discipline, usually without connecting them with the leading goal of
higher education - the formation of professionalism [3].
Self-realization in the field of professional activity requires specific personal work, and its implementa-
tion, of course, must be taught. It follows that the task of designing an educational system that provides the stu-
dent with a real opportunity to get an idea of the key competencies of a professional should be considered by
pedagogy with a hight priority.
Today, in the context of the implementation of new educational standards, the university should provide
not only the process of developing specialist competencies, but also tracking and presenting the results and
achievements of its activities to the future employer. One of the modern technologies for preparing a student
for future professional activity, which allows him to effectively plan and evaluate the process and the results of
his training, is the technology of compiling a portfolio that is rapidly developing in foreign higher education.
Compiling a portfolio of students in such a system separates teaching, training and assessment as much
as possible by organically integrating these three components into the educational process, which allows you to
combine a quantitative and qualitative assessment of student abilities by analyzing a variety of educational and
cognitive products. This system encourages not only assessment, but also self-esteem and self-esteem of stu-
dents, as well as self-analysis and self-control of the student. And the portfolio itself is aimed at the cooperation
of the teacher and the student in order to assess the achievements, efforts and progress in learning. And the
portfolio itself is a form of continuous assessment in the process of continuing education, which shifts the em-
phasis from the hard factors of traditional assessment to the flexible conditions of an alternative student as-
sessment [4].
“Portfolio” in the broad sense of the word is a way to record, accumulate and evaluate the individual
achievements of a student over a certain period of his studies. The portfolio is actively used in foreign education
systems, which classify it as “authentic” individualized assessments focused on new forms of student assess-
ment. This allows teachers to consider the results achieved by the student in a variety of activities: educational,
creative, social, communicative and others, and is also an important element of a practice-oriented approach to
education. In a foreign tradition, a portfolio is defined as “a collection of student work and results that demon-
strates his efforts, successes and achievements in various fields” [5].
Portfolio is one of the conditions for increasing student motivation, the formation of reflection skills. Ac-
cording to E. S. Polat, a portfolio is a tool for self-assessment of a student’s own cognitive, creative work, reflec-
tion of his own activity [5].

MATERIALS OF XII JUNIOR RESEARCHERS’ CONFERENCE 2020
ICT, Electronics, Programming, Geodesy
253
Based on the foregoing, a web service is being developed in the training system for future highly qualified
personnel to host an online portfolio.
For universities in the Republic of Belarus, this topic is more relevant than ever, which is why the main
task is to develop a web service that would help students in compiling their future portfolio. You can observe the
prototype of the developed web service in Figure 1
Figure 1. – The prototype of the developed electronic student portfolio
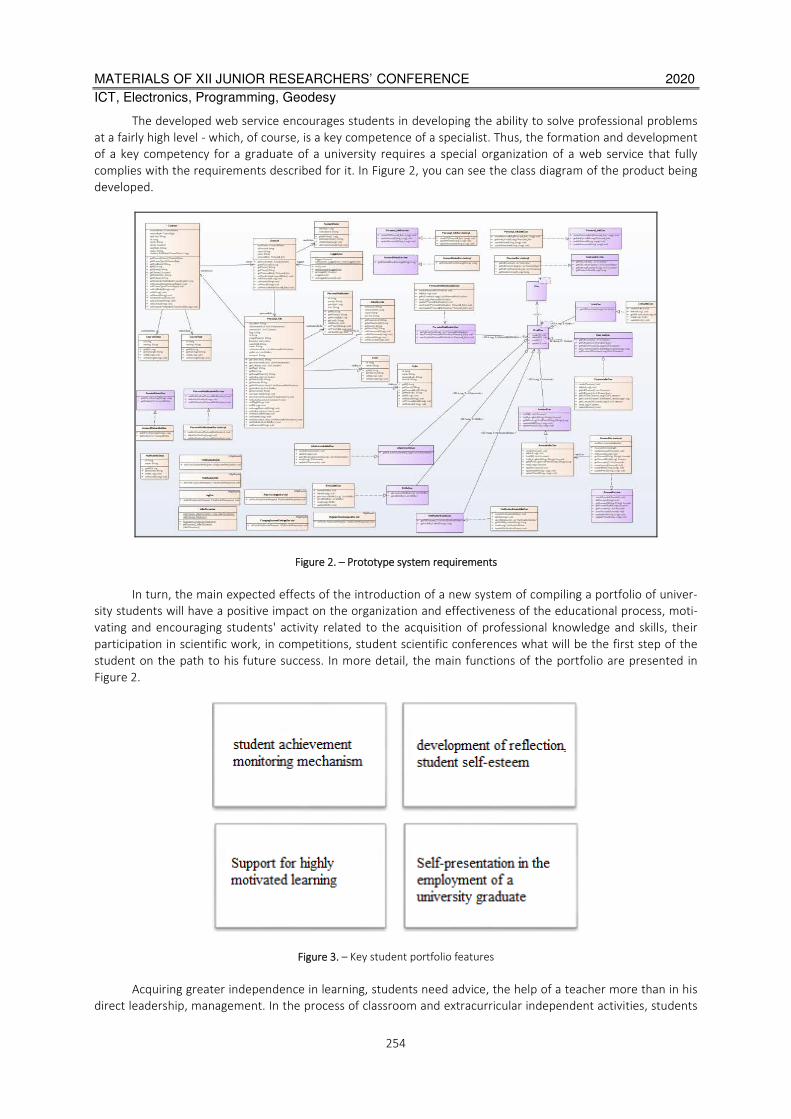
MATERIALS OF XII JUNIOR RESEARCHERS’ CONFERENCE 2020
ICT, Electronics, Programming, Geodesy
254
The developed web service encourages students in developing the ability to solve professional problems
at a fairly high level - which, of course, is a key competence of a specialist. Thus, the formation and development
of a key competency for a graduate of a university requires a special organization of a web service that fully
complies with the requirements described for it. In Figure 2, you can see the class diagram of the product being
developed.
Figure 2. – Prototype system requirements
In turn, the main expected effects of the introduction of a new system of compiling a portfolio of univer-
sity students will have a positive impact on the organization and effectiveness of the educational process, moti-
vating and encouraging students' activity related to the acquisition of professional knowledge and skills, their
participation in scientific work, in competitions, student scientific conferences what will be the first step of the
student on the path to his future success. In more detail, the main functions of the portfolio are presented in
Figure 2.
Figure 3. – Key student portfolio features
Acquiring greater independence in learning, students need advice, the help of a teacher more than in his
direct leadership, management. In the process of classroom and extracurricular independent activities, students
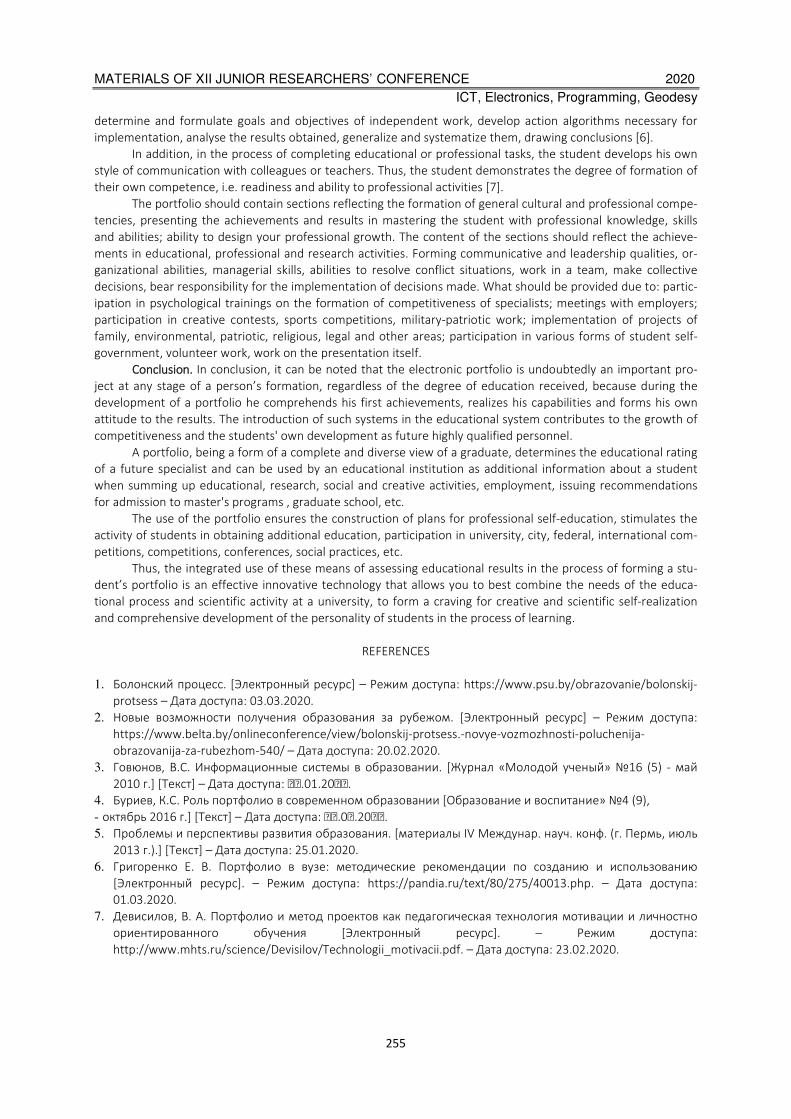
MATERIALS OF XII JUNIOR RESEARCHERS’ CONFERENCE 2020
ICT, Electronics, Programming, Geodesy
255
determine and formulate goals and objectives of independent work, develop action algorithms necessary for
implementation, analyse the results obtained, generalize and systematize them, drawing conclusions [6].
In addition, in the process of completing educational or professional tasks, the student develops his own
style of communication with colleagues or teachers. Thus, the student demonstrates the degree of formation of
their own competence, i.e. readiness and ability to professional activities [7].
The portfolio should contain sections reflecting the formation of general cultural and professional compe-
tencies, presenting the achievements and results in mastering the student with professional knowledge, skills
and abilities; ability to design your professional growth. The content of the sections should reflect the achieve-
ments in educational, professional and research activities. Forming communicative and leadership qualities, or-
ganizational abilities, managerial skills, abilities to resolve conflict situations, work in a team, make collective
decisions, bear responsibility for the implementation of decisions made. What should be provided due to: partic-
ipation in psychological trainings on the formation of competitiveness of specialists; meetings with employers;
participation in creative contests, sports competitions, military-patriotic work; implementation of projects of
family, environmental, patriotic, religious, legal and other areas; participation in various forms of student self-
government, volunteer work, work on the presentation itself.
Conclusion. In conclusion, it can be noted that the electronic portfolio is undoubtedly an important pro-
ject at any stage of a person’s formation, regardless of the degree of education received, because during the
development of a portfolio he comprehends his first achievements, realizes his capabilities and forms his own
attitude to the results. The introduction of such systems in the educational system contributes to the growth of
competitiveness and the students' own development as future highly qualified personnel.
A portfolio, being a form of a complete and diverse view of a graduate, determines the educational rating
of a future specialist and can be used by an educational institution as additional information about a student
when summing up educational, research, social and creative activities, employment, issuing recommendations
for admission to master's programs , graduate school, etc.
The use of the portfolio ensures the construction of plans for professional self-education, stimulates the
activity of students in obtaining additional education, participation in university, city, federal, international com-
petitions, competitions, conferences, social practices, etc.
Thus, the integrated use of these means of assessing educational results in the process of forming a stu-
dent’s portfolio is an effective innovative technology that allows you to best combine the needs of the educa-
tional process and scientific activity at a university, to form a craving for creative and scientific self-realization
and comprehensive development of the personality of students in the process of learning.
REFERENCES
1. Болонский процесс. [Электронный ресурс] – Режим доступа: https://www.psu.by/obrazovanie/bolonskij-
protsess – Дата доступа: 03.03.2020.
2. Новые возможности получения образования за рубежом. [Электронный ресурс] – Режим доступа:
https://www.belta.by/onlineconference/view/bolonskij-protsess.-novye-vozmozhnosti-poluchenija-
obrazovanija-za-rubezhom-540/ – Дата доступа: 20.02.2020.
3. Говюнов, В.С. Информационные системы в образовании. [Журнал «Молодой ученый» 16 (5) - май
2010 г.] [Текст] – Дата доступа: .01.20.
4. Буриев, К.С. Роль портфолио в современном образовании [Образование и воспитание» 4 (9),
- октябрь 2016 г.] [Текст] – Дата доступа: .0.20.
5. Проблемы и перспективы развития образования. [материалы IV Междунар. науч. конф. (г. Пермь, июль
2013 г.).] [Текст] – Дата доступа: 25.01.2020.
6. Григоренко Е. В. Портфолио в вузе: методические рекомендации по созданию и использованию
[Электронный ресурс]. – Режим доступа: https://pandia.ru/text/80/275/40013.php. – Дата доступа:
01.03.2020.
7. Девисилов, В. А. Портфолио и метод проектов как педагогическая технология мотивации и личностно
ориентированного обучения [Электронный ресурс]. – Режим доступа:
http://www.mhts.ru/science/Devisilov/Technologii_motivacii.pdf. – Дата доступа: 23.02.2020.
MATERIALS OF XII JUNIOR RESEARCHERS’ CONFERENCE 2020
ICT, Electronics, Programming, Geodesy
256
UDC 004.41
CLEAN ARCHITECTURE FOR ANDROID APPLICATIONS
R. KRASKO, A. OSKIN
Polotsk State University, Belarus
The article describes the features of developing a mobile Android application using a clean architecture. A
set of tools for software implementation of this approach was proposed.
Introduction. The architecture of the application is the most important aspect in software development -
it must be reliable, stable, flexible in testing, easy to expand and change. At the same time, the architecture
should be understandable for developers with different levels of knowledge and experience to ensure ease of
maintenance.
Clean acchitecture. When using pure architecture the entire application code is divided into levels that
adhere to one rule: the internal level does not need to know anything about the external. The internal level con-
tains business logic, and its external implementation, depending on the platform. This approach should also
meet other requirements:
− independence on tools. Architecture should not rely on the existence of any library. This allows you
to use with minimal cost to change the implementation of business logic [1];
− database independence, business logic should not be tied to specific databases [1];
− independent of any external agent, business logic should not know anything about the interaction in
external data sources [1].
The figure shows the various levels and components of the architecture and their interaction.
Figure. – Components of clean architecture
Presentation level:
− for this layer MVP (Model VIew Presenter) pattern is selected, using of MVVM is also possible;
− view is an implementation of the passive view pattern and provides a set of interfaces that must be
implemented by components from the Android SDK (Fragment, Activity, Adapter, Custom View) [2]
− presenter is the intermediary between the user interface and business logic. It must be platform
independent to improve code testability [2];
− frameworks JUnit and Mockito for testing. Esspresso is also used for integration tests.

MATERIALS OF XII JUNIOR RESEARCHERS’ CONFERENCE 2020
ICT, Electronics, Programming, Geodesy
257
Domain level:
− contains use cases, which are the most primitive parts of the business logic of the application for
maximum simplicity and the possibility of their further reuse;
− frameworks JUnit and Mockito for testing.
Data level:
− the repository pattern is responsible for the interface on which use cases from the domain level can
receive the necessary data [3];
− implementation of caching is also possible at this level;
− frameworks JUnit, Mockito and Robolectrick for testing.
Device level:
− Contains implementations of platform-dependent functionality: notifications, sensors, various man-
agers, and so on.
Communication between layers, navigation:
− dependency injection using Dagger 2 framework;
− data flow between layers using RxJava framework;
− Cicerone framwork for navigation;
Сonclusion. The features of using clean architecture when developing applications for Android mobile de-
vices were described. A set of tools for implementing this approach is proposed. This architecture is flexible in
support, easy to test and very convenient when working in large teams with specialists of various levels.
REFERENCES
1. Clean architecture for Android and iOS [Electronic resource] / Apptractor © 2020 – Mode of access:
https://apptractor.ru/develop/chistaya-arhitektura-na-android-i-ios.html – Date of access: 27.02.2020.
2. Model–view–presenter [Electronic resource] / Wikipedia © 2020. – Mode of access:
https://en.wikipedia.org/wiki/Model–view–presenter – Date of access: 27.02.2020.
3. Repository [Electronic resource] / Martinfowle © 2020. – Mode of access:
https://martinfowler.com/eaaCatalog/repository.html – Date of access: 27.02.2020.

MATERIALS OF XII JUNIOR RESEARCHERS’ CONFERENCE 2020
ICT, Electronics, Programming, Geodesy
258
UDC 004.9
ECONOMIC COMPONENT OF DEVELOPMENT OF THE WEB SERVICE
FOR THE SUBMISSION OF ANNOUNCEMENTS, IMPACT ASSESSMEN
OF THE INFORMATION ENVIRONMENT ON THE ECONOMY
V. LESNITSKY, I. BURACHENOK
Polotsk State University, Belarus
The article provides information on the economic part of developing a web application for posting ads.
The information on the main stages of application development, types of work and their economic component is
also provided.
The methodology for designing information systems describes the process of creating and maintaining
software in the form of a life cycle. The life cycle of software development is a period of time that begins from
the moment when a decision on the need to develop a system is made and ends when it is completely out of use
by all users. The software is the end product of the system development process.
Traditionally, the following main stages of the software life cycle are distinguished:
• requirements analysis and design (task setting, obtaining technical specifications, development of speci-
fications, development of decision algorithms);
• implementation (coding of the designed system);
• testing and debugging (checking the program for compliance with all the requirements for it, identifying
defects);
• acceptance by the customer and revision (final acceptance tests, correction of identified errors).
At the stage of analysis and design, drawing up a specification of the requirements for software is one of the
most important goals. Without this, it is impossible to proceed to the next steps. Components should be described
with such precision that would allow their implementation to begin. Because of its importance, this work is considered
as a separate phase and takes about 20% of the time allotted for the completion of the thesis (2.5 weeks).
At the implementation phase, a software code is compiled which is based on the software project created at
the design stage. The division into components creates the prerequisites for the division of labor, i.e. when the team of
programmers is involved in coding systems. Its implementation takes 7 weeks (58.33% of the allotted time).
The testing and debugging phase is essentially a system reliability check, where the main goal is to find
out if the created system meets the user's requirements. This stage implies a series of tests designed to identify
errors in the implementation of the project. If the latter are discovered, they must be corrected. This stage is
allocated 12.5% of the time, i.e. 1.5 weeks.
At the final stage: the stage of sending the application to the customer, acceptance tests are carried out.
Based on the results of these tests, the customer can voice some wishes, make minor adjustments, according to
which the system should be finalized. At this stage, the remaining week of working time is allotted.
A graphical representation of the proportion of time spent for each of the stages of developing a web
service for submitting ads in total is presented in Figure 1.
Types of work
In addition to dividing the life cycle into stages and phases, eight types of work can be distinguished that
are performed in the process of creating a software product:
1. Requirement analysis and planning. It ensures the development of specifications, analysis and modifi-
cation of functional, technical, and interface requirements.
2. Designing products. It includes the definition, specification, analysis and modification of the hardware
and software architecture of the project program and database.
3. Programming. Detailed design, coding, autonomous debugging and integration of individual program
components, as well as programmer work planning, database development, documentation of individual com-
ponents and organization of programming at the component level.
4. Planning for debugging.
5. Verification. The process of checking the correctness of requirements, debugging products and ac-
ceptance tests.
6. Project management. Project planning and control, control and regulation of contracts, communica-
tion with users.
7. Quality control. Development and control, standard and technical checks of software tools and devel-
opment processes.
8. Documentation. Development and adjustment of user manuals and operators.
MATERIALS OF XII JUNIOR RESEARCHERS’ CONFERENCE 2020
ICT, Electronics, Programming, Geodesy
259
Figure 1. – Diagram of the distribution of time during project development
The division of the software life cycle into stages, phases and stages, as well as a more detailed descrip-
tion of the work performed during their development, production and operation, is necessary for a detailed de-
termination of the costs required for these purposes.
Product costing
Assessing the cost of software and determining the economic effect of the developer involves the prepa-
ration of cost estimates, which, according to the Decree of the Ministry of Economy of the Republic of Belarus,
the Ministry of Finance of the Republic of Belarus and the Ministry of Labor and Social Protection of the Republic
of Belarus dated on 10.30.08, No. 210/161/151 “About the main provisions on the composition of costs included
in the cost of production (work, services) ” includes the following cost items:
1. Electricity - since the product is an application, when it is developed, computers that consume elec-
tricity are used;
2. Materials and components - consumables spent on creating a product;
3. The basic salary of executing agents is the cost of issuing salaries to employees working on a project;
4. Additional salary - the cost of paying premiums, risks, holidays, etc.
5. Deductions for social needs - the costs of tax fees, to the fund for protecting the population, insur-
ance, etc.
6. Depreciation - contingency costs;
7. Costs for special equipment - costs associated with the acquisition of specialized equipment;
8. Other direct costs - the costs of preparing and acquiring various kinds of information.
The impact of cost items on the final cost of a product can be seen in the diagram shown in Figure 2.
According to the diagram presented in Figure 2, we can conclude that the main costs of the product being
developed, regardless of the development time, are the payment of wages to employees.
The customer pays the developer the full amount of the costs of the project, including profit. After paying
taxes from the profit, the developer remains at the disposal of the net profit from the project. Due to the fact
that the software is developed for a single object, net profit can be considered as the economic effect of the
developer from the implemented software.
The sale price of products is formed on the basis of the planned cost of production, all types of estab-
lished taxes and profits, as well as the quality, consumer properties of the products and market conditions.
MATERIALS OF XII JUNIOR RESEARCHERS’ CONFERENCE 2020
ICT, Electronics, Programming, Geodesy
260
Figure 2 .- Cost structure for the development of a training application
Conclusion
Thus, the cost of electricity will reach 50.67 (rubles), materials and components - 32.6 (rubles), the base
salary of executing agents - 3600 (rubles), additional salary of executing agents - 360 (rubles), deductions for
social needs - 1370 , 16 (rubles), depreciation - 39.68 (rubles), other direct expenses - 180 (rubles), expenses for
special equipment - 0 (rubles)
Thus, the cost price of this software was fixed to 5633.11 (rubles), and the selling price including VAT
7773.69 (rubles)
REFERENCES
1. Habr.com [Electronic resource]. - Access mode: https://www.habr.com. - Date of access: 09.24.2019.
2. Richpro.ru - financial magazine [Electronic resource]. - Access mode: http://richpro.ru. - Date of access:
09.24.2019.

MATERIALS OF XII JUNIOR RESEARCHERS’ CONFERENCE 2020
ICT, Electronics, Programming, Geodesy
261
UDC 004.223.2
MAIN ASPECTS DESIGNING A WEB APPLICATION FOR WORKING WITH PATIENT'S MEDICAL DATA
Y. MIANITSKI, D. PASTUKHOV
Polotsk State University, Belarus
The article presents the main aspects of architectural features for the design of protected medical infor-
mation systems. The algorithm of technology of distribution of access rights to medical information is considered.
The principles and technologies for designing data storage interfaces are considered.
Keywords: information technology, medical information system, data encryption, data security.
Introduction. At the moment, many health care institutions use paper document circulation to store out-
patient patient database in the Republic of Belarus. This approach, since the development of information tech-
nologies, has been significantly inferior in effectiveness to electronic medical systems for storing and processing
patient medical data. In this case, electronic systems have a number of advantages [1]:
- Quality improvement of management of medical, administrative and financial activities in a healthcare
organization through the comprehensive introduction of an electronic medical file and an electronic voucher,
provision of additional electronic services for automatic self-service for patients;
- Reduction of time required for medical paperwork by obtaining ready-made data from databases and
computer input;
- Reduction of time required to report and provide a roster of services based on automatically generat-
ed templates;
- Medical staff optimization of the health care institutions;
- Provision of an operational control over the performance evaluations of the clinic, examination of the
medical care quality by logging data and preparation of the reporting sample;
- Enhancement of the information reliability about the indicators of treatment and diagnostic work and
financial activity using methods of cryptographic protection of information;
- The throughput increase of healthcare institutions by reducing the time spent working with the out-
patient file and other documents, and as a result – the reduction of queues;
- Provision of telemedicine opportunities for communication between the doctor and the patient, alto-
gether with a сonsultation between doctors.
These criteria undoubtedly prove the effectiveness of these systems, as well as the relevance of their de-
velopment and implementation of such information systems in the health care system.
Based on the above characteristics and requirements of the system, the functional structure of the de-
veloped software was designed. It consists of the following subsystems:
1. User authorization subsystem. It is responsible for granting the access rights to data for the current
user in accordance with the role, authorization in the app.
2. User profile configuration subsystem. It is responsible for changing the doctors’ personal data.
3. Subsystem for working with information. It is responsible for information searching, extracting the
necessary information in accordance with a specific request, and conveniently displaying information based on
filters for various criteria using the graphical interface.
4. Subsystem for working with a pharmaceutical storehouse. It provides the ability to select a medicine
on the basis of symptoms and contraindications. Management and tracking of the information about the status
of medicines in the warehouse.
5. Data editing subsystem. It provides the administrator with the ability to edit information about doc-
tors and medical institutions in the app.
Means of problem solving. The basis of the developing system is the ability to store, accumulate and pro-
cess data. Also, in this case, medical data must be stored in a strictly systematic form based on the rules of main-
taining medical records and have a clear interrelation.
Based on this data a relational database is to be used to store entities and the SQL query language to
build the database. In this case, using a relational database will allow to formally and unambiguously determine
the limitations of the database integrity in terms of its conceptual scheme.
Since medical data is strictly regulated it is advisable to use official documents for drawing up outpatient
medical records during system development [2], and present a separate list of the type of examination or data
collection as a separate entity associated with the patient.
MATERIALS OF XII JUNIOR RESEARCHERS’ CONFERENCE 2020
ICT, Electronics, Programming, Geodesy
262
Obviously it is important to form some architecture when implementing an app. In this case, the MVC
pattern is suitable for interaction with the database. It represents an interaction of 3 elements: model, view, and
controller [3]. A model is some data that describes a subject area and some operations can be performed on it.
This information can be also provided to the user on the graphical interface.
The view is this very graphical interface. Through this interface users of the system will send data to the
controller to perform the task. The controller in turn implements some algorithms to get data from the view,
process it and send it back.
Also, one of the advantages of such systems is the ability to transmit information in the form of a stream-
ing video message. The implementation of this functionality will allow to conduct video consultations and exam-
inations, which will undoubtedly reduce the time for patient care allowing to unload health care institutions. To
implement this system, we will use WebRTC technology.
This is a technology that allows Internet applications to capture video and audio media streams optionally
without resorting to intermediary services and protocols. The set of standards that WebRTC technology includes
allows data exchange and teleconferencing in node-to-node mode[4].
Figure 1. - General architectural scheme of the web application for working
with the patient's medical outpatient data
Based on the fact that this system is designed to store confidential patient data it is necessary to develop
a system of authentication and cryptographic protection of data.
To provide authentication a user entity in the database with different types of roles, such as patient, doc-
tor, administrator etc. should be created while dividing the access levels to the algorithms for working with data
according to the actual level of access to medical documentation. Also, the separation of rights to use algorithms
should be implemented both at the database level, through the role editor and through the controller, using
verification at the coding stage.
The following technologies are used for secure data transmission over the Internet:
- The HTTPS Protocol is a standard for data transfer between different machines, which defines what should
act as a signal for the start of transmission, how data is designated and so on. In this case, data is encrypted using the
SSL Protocol, which makes it problematic not only to intercept but also to obtain confidential information[5].
- The SRTP Protocol is a real-time Transport Protocol (RTP) extension profile that appends additional
security features such as message authentication, privacy, and listening protection. This Protocol will be used
when transmitting video messages [6].
- The AES cipher is a symmetric block encryption algorithm. This type of encryption will use the same
symmetric key. This is the best option for the system being developed, since such systems are also protected by
legal agreements on non-disclosure to individuals. The encryption method used will be used to encrypt sensitive
data at the database level.
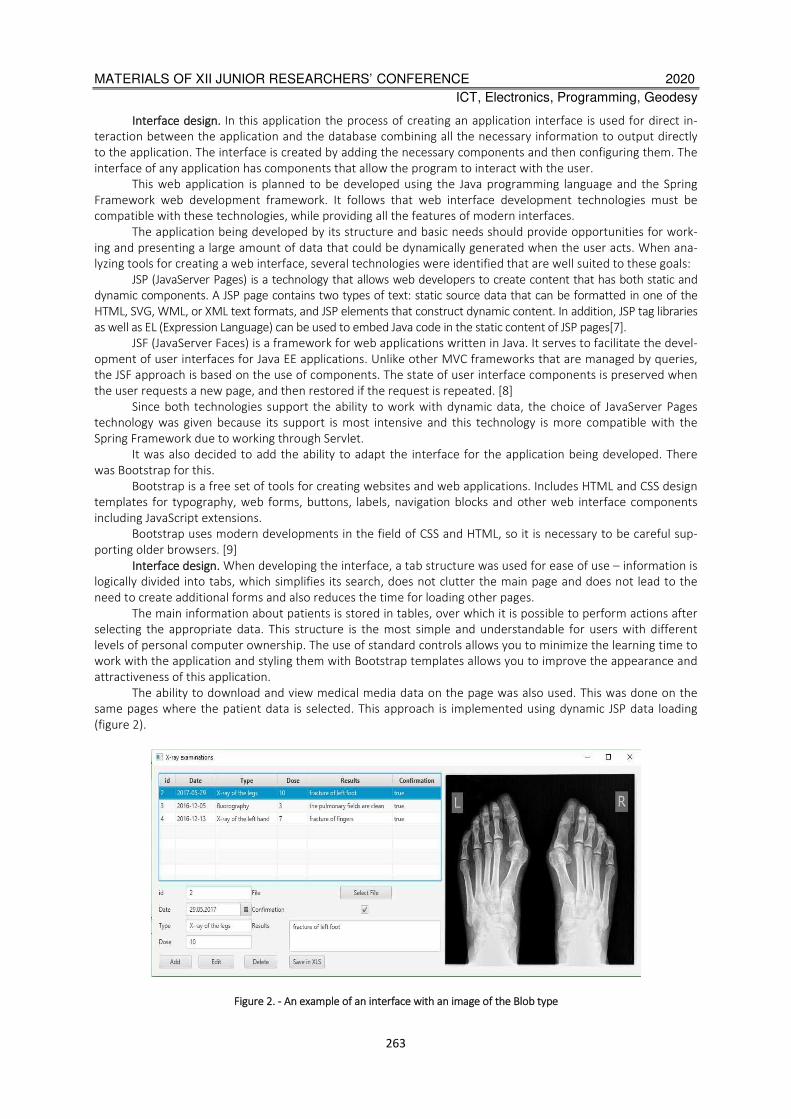
MATERIALS OF XII JUNIOR RESEARCHERS’ CONFERENCE 2020
ICT, Electronics, Programming, Geodesy
263
Interface design. In this application the process of creating an application interface is used for direct in-
teraction between the application and the database combining all the necessary information to output directly
to the application. The interface is created by adding the necessary components and then configuring them. The
interface of any application has components that allow the program to interact with the user.
This web application is planned to be developed using the Java programming language and the Spring
Framework web development framework. It follows that web interface development technologies must be
compatible with these technologies, while providing all the features of modern interfaces.
The application being developed by its structure and basic needs should provide opportunities for work-
ing and presenting a large amount of data that could be dynamically generated when the user acts. When ana-
lyzing tools for creating a web interface, several technologies were identified that are well suited to these goals:
JSP (JavaServer Pages) is a technology that allows web developers to create content that has both static and
dynamic components. A JSP page contains two types of text: static source data that can be formatted in one of the
HTML, SVG, WML, or XML text formats, and JSP elements that construct dynamic content. In addition, JSP tag libraries
as well as EL (Expression Language) can be used to embed Java code in the static content of JSP pages[7].
JSF (JavaServer Faces) is a framework for web applications written in Java. It serves to facilitate the devel-
opment of user interfaces for Java EE applications. Unlike other MVC frameworks that are managed by queries,
the JSF approach is based on the use of components. The state of user interface components is preserved when
the user requests a new page, and then restored if the request is repeated. [8]
Since both technologies support the ability to work with dynamic data, the choice of JavaServer Pages
technology was given because its support is most intensive and this technology is more compatible with the
Spring Framework due to working through Servlet.
It was also decided to add the ability to adapt the interface for the application being developed. There
was Bootstrap for this.
Bootstrap is a free set of tools for creating websites and web applications. Includes HTML and CSS design
templates for typography, web forms, buttons, labels, navigation blocks and other web interface components
including JavaScript extensions.
Bootstrap uses modern developments in the field of CSS and HTML, so it is necessary to be careful sup-
porting older browsers. [9]
Interface design. When developing the interface, a tab structure was used for ease of use – information is
logically divided into tabs, which simplifies its search, does not clutter the main page and does not lead to the
need to create additional forms and also reduces the time for loading other pages.
The main information about patients is stored in tables, over which it is possible to perform actions after
selecting the appropriate data. This structure is the most simple and understandable for users with different
levels of personal computer ownership. The use of standard controls allows you to minimize the learning time to
work with the application and styling them with Bootstrap templates allows you to improve the appearance and
attractiveness of this application.
The ability to download and view medical media data on the page was also used. This was done on the
same pages where the patient data is selected. This approach is implemented using dynamic JSP data loading
(figure 2).
Figure 2. - An example of an interface with an image of the Blob type

MATERIALS OF XII JUNIOR RESEARCHERS’ CONFERENCE 2020
ICT, Electronics, Programming, Geodesy
264
REFERENCES
1. Informatization of outpatient clinics [Electronic resource]. Access mode:
http://minzdrav.gov.by/ru/static/informatization/inform_apzveno. Mode of access: 20.01.2020.
2. Registration of a medical card of an outpatient [Electronic resource] - access Mode:
https://www.bsmu.by/downloads/kafedri/k_poli_ter/stud/v1.pdf . Mode of access: 24.02.2020.
3. Model-View-Controller [Electronic resource]:https://ru.wikipedia.org/wiki/Model-View-Controller. Mode of
access: 24.02.2020.
4. WebRTC API [Electronic resource]: https://developer.mozilla.org/ru/docs/Web/API/WebRTC_API . Mode of
access: 24.02.2020.
5. HTTPS Protocol - what is it? [Electronic resource]: http://fb.ru/article/221368/protokol-https---chto-takoe.
Mode of access: 24.02.2020.
6. SRTP — what is a secure real-time data transfer Protocol? [Electronic resource]:
https://www.3cx.ru/webrtc/srtp/. Mode of access: 24.02.2020.
7. Material from Wikipedia, a free encyclopedia. Java Server Pages [Electronic resource]:
https://ru.wikipedia.org/wiki/JSP Mode of access: 24.02.2020.
8. Material from Wikipedia, a free encyclopedia. JavaServer_Faces [Electronic resource]. Mode of access:
https://ru.wikipedia.org/wiki/JavaServer_Faces . Mode of access: 24.02.2020.
9. Material from Wikipedia, a free encyclopedia. Bootstrap [Electronic resource]. Mode access:
https://ru.wikipedia.org/wiki/Bootstrap_(framework)]. Mode of access: 24.02.2020.
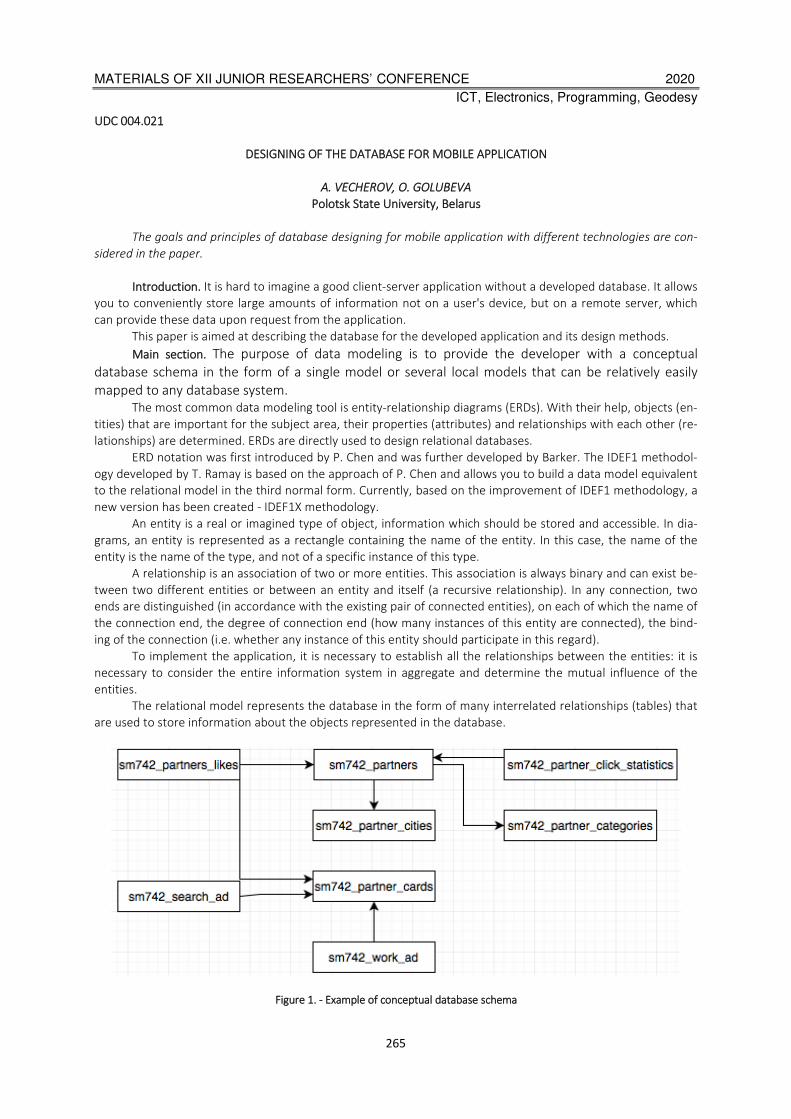
MATERIALS OF XII JUNIOR RESEARCHERS’ CONFERENCE 2020
ICT, Electronics, Programming, Geodesy
265
UDC 004.021
DESIGNING OF THE DATABASE FOR MOBILE APPLICATION
A. VECHEROV, О. GOLUBEVA
Polotsk State University, Belarus
The goals and principles of database designing for mobile application with different technologies are con-
sidered in the paper.
Introduction. It is hard to imagine a good client-server application without a developed database. It allows
you to conveniently store large amounts of information not on a user's device, but on a remote server, which
can provide these data upon request from the application.
This paper is aimed at describing the database for the developed application and its design methods.
Main section. The purpose of data modeling is to provide the developer with a conceptual
database schema in the form of a single model or several local models that can be relatively easily
mapped to any database system.
The most common data modeling tool is entity-relationship diagrams (ERDs). With their help, objects (en-
tities) that are important for the subject area, their properties (attributes) and relationships with each other (re-
lationships) are determined. ERDs are directly used to design relational databases.
ERD notation was first introduced by P. Chen and was further developed by Barker. The IDEF1 methodol-
ogy developed by T. Ramay is based on the approach of P. Chen and allows you to build a data model equivalent
to the relational model in the third normal form. Currently, based on the improvement of IDEF1 methodology, a
new version has been created - IDEF1X methodology.
An entity is a real or imagined type of object, information which should be stored and accessible. In dia-
grams, an entity is represented as a rectangle containing the name of the entity. In this case, the name of the
entity is the name of the type, and not of a specific instance of this type.
A relationship is an association of two or more entities. This association is always binary and can exist be-
tween two different entities or between an entity and itself (a recursive relationship). In any connection, two
ends are distinguished (in accordance with the existing pair of connected entities), on each of which the name of
the connection end, the degree of connection end (how many instances of this entity are connected), the bind-
ing of the connection (i.e. whether any instance of this entity should participate in this regard).
To implement the application, it is necessary to establish all the relationships between the entities: it is
necessary to consider the entire information system in aggregate and determine the mutual influence of the
entities.
The relational model represents the database in the form of many interrelated relationships (tables) that
are used to store information about the objects represented in the database.
Figure 1. - Example of conceptual database schema

MATERIALS OF XII JUNIOR RESEARCHERS’ CONFERENCE 2020
ICT, Electronics, Programming, Geodesy
266
In accordance with the entities highlighted above, a set of necessary database tables is defined, which is
presented in Table 1.
Table 1. – List of database tables
Table name Description
Partners List of all partners
Partner_Cities List of all cities
Partner_Categories List of all partner’s categories
Partner_Click_Statistics User click statistics on partner pages
Partners_Likes Partners ratings
Partner_Cards List of all users
Search_Ad List of ads from music groups
Work_Ad List of job vacancies
An important advantage of databases is the ability to store grouped data in different tables and establish
relationships between these tables by means of keys and the subsequent combination of these data into a single
database. This allows to reduce the redundancy of the data that is stored, to simplify the organization of re-
quests for their receipt.
The primary key serves as an integrity constraint within the same table for identification, since primary
key field cannot be repeated or be empty. An important condition is that each table can contain only one prima-
ry key.
To organize relationships between two or more tables, secondary keys are used. They serve as con-
straints on the integrity of the relationships of several tables, because the subordinate table cannot refer to non-
existent records of the main table (which allows the construction of integral data models).
There are three connections types between the tables:
− «one-to-many»,
− «one-to-one»,
− «many-to-many».
«One-to-many» connection is the most popular connection type for relational databases. To ensure ref-
erential integrity, a foreign key is created in the child table through which a link to the child table is organized. A
prerequisite is that the foreign key must match the primary key of the parent table by the composition of the
fields.
It is also very important to choose a database management system. There are a lot of different DBMS’s:
− MySQL;
− SQL Server;
− SQLight;
− PostgreSQL;
− MongoDB
These databases are different, have their own advantages and disadvantages. It is convenient to use the
MySQL DBMS to develop the presented database, since it is open and free, and also supports many types of data
required during development.
Conclusion. The paper examined the main goals and principles of modeling the database for mobile appli-
cation. Besides, the main entities of the designed database were considered.
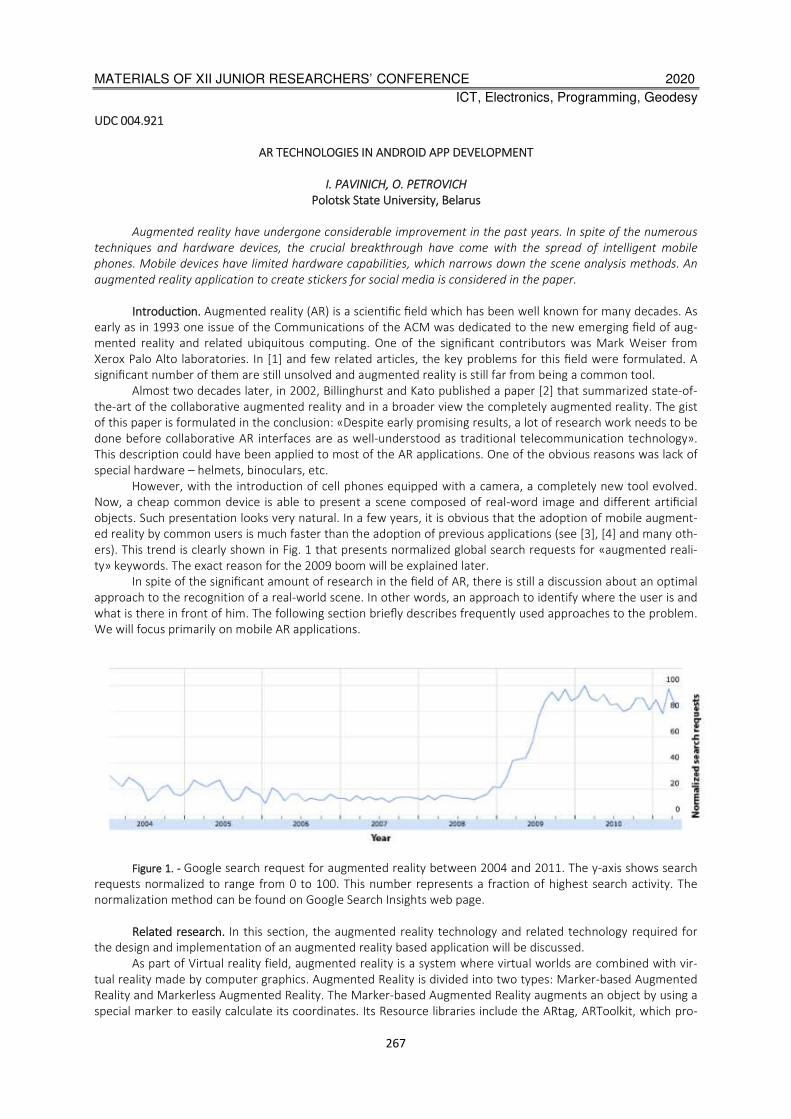
MATERIALS OF XII JUNIOR RESEARCHERS’ CONFERENCE 2020
ICT, Electronics, Programming, Geodesy
267
UDC 004.921
AR TECHNOLOGIES IN ANDROID APP DEVELOPMENT
I. PAVINICH, O. PETROVICH
Polotsk State University, Belarus
Augmented reality have undergone considerable improvement in the past years. In spite of the numerous
techniques and hardware devices, the crucial breakthrough have come with the spread of intelligent mobile
phones. Mobile devices have limited hardware capabilities, which narrows down the scene analysis methods. An
augmented reality application to create stickers for social media is considered in the paper.
Introduction. Augmented reality (AR) is a scientific field which has been well known for many decades. As
early as in 1993 one issue of the Communications of the ACM was dedicated to the new emerging field of aug-
mented reality and related ubiquitous computing. One of the significant contributors was Mark Weiser from
Xerox Palo Alto laboratories. In [1] and few related articles, the key problems for this field were formulated. A
significant number of them are still unsolved and augmented reality is still far from being a common tool.
Almost two decades later, in 2002, Billinghurst and Kato published a paper [2] that summarized state-of-
the-art of the collaborative augmented reality and in a broader view the completely augmented reality. The gist
of this paper is formulated in the conclusion: «Despite early promising results, a lot of research work needs to be
done before collaborative AR interfaces are as well-understood as traditional telecommunication technology».
This description could have been applied to most of the AR applications. One of the obvious reasons was lack of
special hardware – helmets, binoculars, etc.
However, with the introduction of cell phones equipped with a camera, a completely new tool evolved.
Now, a cheap common device is able to present a scene composed of real-word image and different artificial
objects. Such presentation looks very natural. In a few years, it is obvious that the adoption of mobile augment-
ed reality by common users is much faster than the adoption of previous applications (see [3], [4] and many oth-
ers). This trend is clearly shown in Fig. 1 that presents normalized global search requests for «augmented reali-
ty» keywords. The exact reason for the 2009 boom will be explained later.
In spite of the significant amount of research in the field of AR, there is still a discussion about an optimal
approach to the recognition of a real-world scene. In other words, an approach to identify where the user is and
what is there in front of him. The following section briefly describes frequently used approaches to the problem.
We will focus primarily on mobile AR applications.
Figure 1. - Google search request for augmented reality between 2004 and 2011. The y-axis shows search
requests normalized to range from 0 to 100. This number represents a fraction of highest search activity. The
normalization method can be found on Google Search Insights web page.
Related research. In this section, the augmented reality technology and related technology required for
the design and implementation of an augmented reality based application will be discussed.
As part of Virtual reality field, augmented reality is a system where virtual worlds are combined with vir-
tual reality made by computer graphics. Augmented Reality is divided into two types: Marker-based Augmented
Reality and Markerless Augmented Reality. The Marker-based Augmented Reality augments an object by using a
special marker to easily calculate its coordinates. Its Resource libraries include the ARtag, ARToolkit, which pro-
MATERIALS OF XII JUNIOR RESEARCHERS’ CONFERENCE 2020
ICT, Electronics, Programming, Geodesy
268
vides the calculation of a fast and accurate coordinate while making a real-time augmented reality system. The
Markeless Augmented Reality does not use a special marker. Instead it uses the information of the objects in the
image to augment the object. This method detects the image’s 3D object’s corners and then uses the original
form of the object as the object’s augmented position.
Android is a mobile OS, made on Linux Canal technology. It has various APIs through which application
can be made using Java and X.M.L. Through these, API’s Android has interoperability in that the mobile device
can be applied to other various devices and sensors. Compared to the conventional computers environment,
mobile devices have higher mobility and portability which is an advantage, but there is the limitation of user in-
put and the output of the result, which is a disadvantage. However, a mobile device has a camera, G.P.S, gyro
sensor, etc. Therefore, it can use various information related to a user’s location, that is, the user’s current loca-
tion, direction and degree of inclination, send this information to the server, get other various additional infor-
mation through the APIs, and display it on the user’s device.
When displaying information on an augmented reality screen, there are basic problems/limits faced in-
cluding rendering, information congestion, human factor etc. Information congestion is an information-reading
problem caused by the increase in information. Due to this, there is a need to maintain important data and the
information filtering technic to reduce the amount of information. Information filtering's main elements include
the following: user's goal, the relationship between that goal and each object, user's position, etc. Rendering
deletes/removes the real objects and does real rendering too. To improve visibility, the Human Factor is used
and it comprises delay, adaptation, tiredness and eye tiredness, etc.
Design and implement. Creating funny and cool stickers and making meme stickers for WhatsApp have never
been so easy and quick. In implemented sticker maker app for Android, one can easily create and cut out their own
stickers using their personal photos or any other photo they have in their library. The process to make a cool sticker is
as simple as choosing a photo, making necessary crops, add any desired element or text to the sticker, and export the
final result to any social network one wants. So, if one uses WhatsApp a lot and is already tired of default sticker packs
and other available meme stickers each pack can be filled with up to 30 funny stickers and memes.
Sticker maker app for Android comes with a clean and neat design and the interface is so user-friendly that one
will be able to create a funny meme sticker even if they are totally new to the concept of photo editing or creating
stickers. The high-quality graphics, smooth animations, range of different customization tools, the option to create
endless sticker packs, easy to use editing tools, and intuitive interface, make this sticker maker app the #1 choice when
it comes to finding the best editing app to create stickers for WhatsApp and other social messaging applications.
While there are so many other photo editing apps to create one’s own sticker packs, there are just a few
reasons why we believe this photo editor app to create personal sticker packs, can easily become one’s best tool
to make unique memes and stickers:
One. It is super user-friendly and the intuitive interface designed to ensure one would get used to the
whole process of making a sticker without having to worry about going through a complex procedure.
Two. The wide range of available funny elements to add to the stickers along with the unlimited customi-
zation options (such as changing the font, color and resizing photo) make sure one can easily create unique
sticker packs with no limitations.
Three. Not only one can export their personal sticker packs and memes to WhatsApp, but they can also
share the created stickers to any other apps and social messaging services.
And since the entire features of this sticker maker app are available for free, there is no harm giving it a
try and explore the features for oneself.
Conclusion. In contrast with the current augmented reality technology, this paper has detailed analysis,
research. The testing and exploration of augmented reality technology has been carried out. The augmented
reality-based app considered in this paper is made up of the combination of virtual objects, the real world, and
sensor data received from sensors.
REFERENCES
1. Weiser, Mark. Some computer science issues in ubiquitous computing / V.S. Sadov - Minsk: BSU, 1993 —75-
84 pp.
2. Billinghurst, Mark and Kato, Hirokazu. Collaborative augmented reality / Billinghurst, Mark and Kato, Hi-
rokazu - St. Petersburg: Peter, 2002. – 64-70 pp.
3. Kroeker, Kirk. Mainstreaming augmented reality / Kroeker, Kirk - Moscow: “Academy”, 2010. – 19-21 pp.
4. Bimber, O. and Raskar, R. Spatial Augmented Reality: Merging Real and Virtual Worlds / Bimber, O. and
Raskar, R - Moscow: “Hot Line - Telecom”, 2005.
MATERIALS OF XII JUNIOR RESEARCHERS’ CONFERENCE 2020
ICT, Electronics, Programming, Geodesy
269
UDC 621.37/39(075.8)
REFLECTOMETER WITH SPECTRAL SEPARATION OF SIGNALS
N. SYTOVA, V. YANUSHKEVICH
Polotsk State University, Belarus
The characteristics of a reflectometer with spectral separation of the signal are studied. The measure-
ments and parameters of the optical fiber in the operating wavelength range of 1550 nm are analyzed. The per-
spective of the use of the study results in telecommunication systems for servicing fiber optic communication lines
is considered.
The relevance of the study is explained by the need to improve the quality of fiber optic transmission sys-
tems in response to the increased data transmission traffic and lack of optical fibers in the fiber optic backbone
network.
When measured with a spectrometric reflectometer, the main parameters of the optical fibers that affect
the signal transmission are evaluated:
1. Attenuation of the optical fiber.
The attenuation coefficient is a = aa + ad + aat + ac + ai, where
aa и ad are attenuation coefficients, caused by losses in the absorption and dissipation of light energy;
aat is attenuation coefficient, caused by impurities in the optical fiber;
ac is additional (cable) losses, caused by twisting, deformation and bending of the optical fiber;
ai is loss of infrared absorption.
Losses in optical fiber occur due to the two processes of absorption and scattering. Absorption is deter-
mined by the properties of quartz, which is the main material for the manufacture of high-quality optical fibers.
Scattering is highly dependent on the wavelength as well as manufacturing technology and composition of opti-
cal fiber.
In measurements, a reflectometer with spectral separation is easily defined by macro-bends (fiber bends
with a radius less than the minimum allowable radius). In this case, additional losses occur, significantly affecting
the total attenuation of the optical line.
With a change in the operating wavelength, attenuation in the cable in dB/km changes (table 1), which
causes a change in the reflectogram angle.
When comparing losses at three wavelengths of 1310 nm, 1490 nm, and 1550 nm, macro-bends give
greater attenuation at a longer wavelength. 1550 nm macro-bends are best defined.
The difference is particularly noticeable for multimode fibers.
Table 1. – Attenuation measurement
Wavelength Requirements G.652.D,
type A
Requirements G.652.D,
type B
Requirements G.652.D,
type C
1310 нм ≤ 0.34 ≤ 0.33 ≤ 0.35
1550 нм ≤ 0.21 ≤ 0.19 ≤ 0.21
1625 нм ≤ 0.24 ≤ 0.22 ≤ 0.23
2. Dispersion and bandwidth of the optical fiber.
The dispersion results both in limiting the transmission bandwidth over the cable and in reducing the
length of the regeneration section.
When light travels through an optical fiber there are significant limitations. The signal at the receiving end
is blurred and distorted, and the longer the line, the more distorted the transmitted signal is.
The parameters of frequency band ΔF and transmission distance L are interdependent.
The ratio between them for short lines is
where values with index x are required, without it are specified.
In long lines, in which the process has already been established the following quadratic law of the ratio
applies:

MATERIALS OF XII JUNIOR RESEARCHERS’ CONFERENCE 2020
ICT, Electronics, Programming, Geodesy
270
3. The propagation coefficient, the transmission speed of optical fiber, and wave resistance depend on
the fiber length. The greater the length of the fiber, the worse the signal is to noise ratio. The ratio of the aver-
age optical radiation power of the signal to the average optical radiation power of the noise in the frequency
band of the optical channel is expressed in dB.
Optical signal to optical noise ratio is one of the most important characteristics of fiber optic communica-
tion lines, determining the quality of information transmission, maximum transmission distance, the stability of
the signal.
It has been found that the reflectometer signal level is more than 29 dB; the spectra of adjacent channels
expand to a critical level of more than 0.8 nm. When the power is less than 29 dBm the traffic quality does not
deteriorate, and the power of the backscattered radiation meets the specified value.
Studies have shown that the reflectometry method with frequency division by wavelength provides
measurement accuracy of more than 99%, allows to quickly determine the location of fiber damage, performs
quality control during emergency operations, monitors unauthorized access to the fiber optical highway.
REFERENCES
1. Скляров О.К. Волоконно-оптические сети и системы связи. Учебное пособие. 2-е изд., СПб.: Издатель-
ство «Лань», 2010. — 272 с.
2. Листвин A.B., Листвин В.Н. Рефлектометрия оптических волокон. – М.: ЛЕСАРарт, 2005 —208с.
MATERIALS OF XII JUNIOR RESEARCHERS’ CONFERENCE 2020
ICT, Electronics, Programming, Geodesy
271
UDC 004.42
ANALYSIS OF INTERNET PORTAL DEVELOPMENT
A. STANOVOY, O. PETROVICH
Polotsk State University, Belarus
The article presents the results of the analysis of Internet portal development. The World Wide Web is an
ever-evolving network that has gone far ahead of its concept in the early 1990s, when its creation was deter-
mined by specific tasks. High-tech experiments at CERN (The European Particle Physics Laboratory, known today
as the owner of the Large Hadron Collider) produced an incredibly large amount of data that was too large to be
disseminated among the participating scientists scattered around the world.
Introduction. Currently, the main source of information is the Internet. As information grows in size and
complexity, we are faced with increasing content and user management challenges. Be it a seller of certain
goods and services or the head of a large corporation, they need to create an Internet portal in order to conduct
their work efficiently and bring information from diverse sources together in a uniform way. We will also focus
on creating corporate Internet portals [1].
Main part. Portals are a class of software systems for which the terminology and classification have not
been fully developed yet. You can find various definitions of the concept of “portal” and its software implemen-
tations that are different in functionality.
The following definitions are most commonly found in the literature:
1) a portal is an integrated and personalized web-interface for users to access information, applications
and means of cooperation;
2) a portal is a tool for managing intellectual property, e.g. various kinds of information and data. The por-
tal brings information from diverse sources together in a uniform way, i.e. organizes, categorizes and personaliz-
es it in order to present it in the right way, at the right time, in the right place;
3) portals are websites that are focused on specific audiences and communities and provide content ag-
gregation, i.e. the delivery of information to the appropriate audience; collaboration and community support
services (employees, customers, shareholders); services and applications giving access to the target audience.
Let us compare a Web site with a portal. A Web site is a set of logically interconnected pages accessible
through a Web browser via HTTP; a portal is a Web site that has a wide range of functions. Portals provide the
user community with expanded functionality and centralized access to the necessary information and services.
Portals can be classified according to various criteria. In the classification below the main criteria are the
portal topics, target audience, tasks solved by the portal and the technologies used (Fig. 1).
According to the topic criterion, portals can be divided into horizontal and vertical.
Information and thematic content and functions of the horizontal portal are aimed at a wide range of us-
ers. On the Internet, such portals are called mega-portals (Yahoo !, Yandex, etc.), because they provide infor-
mation (weather, news, etc.) and functions (search for sites, sending e-mail, etc. ) useful to almost all web users.
Vertical portals provide a complete list of the necessary information and functions for a specific and nar-
row circle of users. An example of industrial vertical portals can be portals for insurance, automotive, etc.
If the target audience of the portal is not be limited, the portal is open, otherwise the portal is closed.
Open portals are available to a wide community of users. Most often, such portals are placed on the Internet.
Closed portals provide access to a limited circle of users [2].
User registration in such portals usually goes through the verification stage, when the right of the person
registered to access the portal is confirmed by authorized persons. This type usually includes portals located in
corporate networks of organizations. They are intended for company employees and are known as B2E portals.
According to the target task criterion, the portal can be focused on the performance of one or more
tasks. Several classes of portals can be distinguished, and each portal can be assigned to one or more classes:
1) Analytical portals allow decision makers to receive and create reports.
2) News portals deliver updated content on a specific topic or group of topics.
3) Business process support portals implement specific functions and support specific processes and ap-
plications, e.g. B2B, B2E, or B2C portals.
4) Collaboration portals provide users with virtual space for coordination and collaboration.
5) Solution search portals are designed to attract experts to solve problems. To do this, the portal keeps
track of users and their competencies, which allows you to select experts in specific areas of knowledge, find
them and use their expertise in solving problems.
MATERIALS OF XII JUNIOR RESEARCHERS’ CONFERENCE 2020
ICT, Electronics, Programming, Geodesy
272
6) Document management portals.
7) Portals for managing structured information.
8) Knowledge management portals. They are called upon to help the company make better use of its ex-
plicit and implicit knowledge by managing knowledge at each stage of its life cycle - at the stages of identifica-
tion, creation, storage, distribution and use.
9) Portals-catalogs organize available information resources and search for the necessary resources.
10) Portals-electronic markets connect sellers and buyers with each other, providing specific information
about markets, goods and services.
11) ASP portals (ASP, Application Service Provider) are designed to provide services to other companies,
that is, they are B2B type portals. They provide an opportunity for client companies to lease both goods and ser-
vices.
Figure 1. – Portal Classification
According to the technologies used criterion, portals can be divided into traditional and semantic. In tra-
ditional portals, information is processed regardless to its semantics.
Semantic portals are a new class of portals that contain a knowledge model of a certain subject area and
use it to process information based on semantics. In addition to traditional technologies, actively developing
semantic technologies are used to implement such portals.
The approaches, technologies and standards used both within the framework of the portal infrastructure
and in the implementation of its functional modules are common. This allows us to describe the generalized ar-
chitecture of the portal, covering the potential functionality.
At the user interface level, a thin client (Web browser) is used that can visualize the presentation of in-
formation described in HTML. To use some functionality of the portal, the user can use some other client appli-
cations (for example, email client, RSS client, etc.).
To implement the portal infrastructure, there are a number of widely used technologies and application
servers. The most common application servers include software products such as Microsoft IIS, Apache HTTP
MATERIALS OF XII JUNIOR RESEARCHERS’ CONFERENCE 2020
ICT, Electronics, Programming, Geodesy
273
Server, Oracle Application Server. Relational databases are used as data storages, accessed using OLEDB, ODBC,
JDBC, etc. Such programming technologies as ASP, ASP.NET, PHP, JSP and others are used. The visual presenta-
tion is described in HTML, which is interpreted by the user's web browser.
Although the approaches to the development and implementation of portals can be considered suffi-
ciently developed in terms of methods and the technologies used, there is an objective need for their develop-
ment. This need is justified by the development of telecommunication technologies that make information more
accessible, as well as an objective increase in the volume of information.
The portal is such an information system (IS) that provides the user community with unified access to the
information space, and therefore the problem of improving the quality of information processes is especially
relevant. One of the approaches to solving this problem is the transition to the semantic level in the collection,
processing, accumulation, storage, retrieval and dissemination of information. This approach is being developed
within the framework of the Semantic Technologies area [3].
Conclusion. An Internet portal is a website that provides the Internet user with various interactive ser-
vices that operate within the same website. Horizontal, vertical, mixed and corporate Internet portals can be
distinguished. A corporate Internet portal is a complex designed not only for advertising goods and services, but
also for the effective organization of the company's internal and external information space. In its most general
form, a corporate portal is understood as a link between the end user and the internal information base. Repre-
senting a company on the Internet is essential for business development. The main goal of creating corporate
Internet portals is to increase the profitability of the business. When creating corporate Internet portals, the
main emphasis is on the convenience of obtaining information, on maintaining various levels of information ac-
ces. When developing such portals, technological platforms of major software manufacturers are used. The most
popular technology platforms are Oracle, IBM, Microsoft, SAP.
REFERENCES
1. Wikipedia [Electronic resource]. - Electronic data. - Access mode: http: // ru.wikipedia.org , access date:
29.02.2020.
2. Kuznetsov, М. PHP. The practice of creating Web sites / M. Kuznetsov, I. Simdyanov. - M.: BHV-Petersburg,
2012. - 458 p.
3. Alexandrov, A.V. Creation of web-pages and web-sites / A.V. Alexandrov, G.G. Sergeev, S.P. Kostin. M. 2012 -
190 p.
MATERIALS OF XII JUNIOR RESEARCHERS’ CONFERENCE 2020
ICT, Electronics, Programming, Geodesy
274
UDC 621.371.39
THE STUDY OF THE CHARACTERISTICS OF THE 3G ANTENNA FROM CHANGES
IN THE MATERIAL OF THE CONDUCTOR
A. STANOVOY, V. YANUSHKEVICH
Polotsk State University, Belarus
The article presents the design results of a GSM antenna depending on the material of the conductor. In
connection with the development of electronic devices and communication systems, there is a need for GSM an-
tennae. The use of antennae in radio systems allows increasing the capabilities of radio communication systems,
radar systems, since the amount of information that is transmitted per unit of time is directly proportional to the
signal frequency band; it also allows for high noise immunity of communication channels and improves accuracy
in assessing the relative orientation of moving objects.
Introduction. An antenna is a device for radiation and reception of radio waves. [1]
The shape, size and design of antennae vary depending on the length of the emitted or received waves
and the antenna destination. Antennae are used in the form of a piece of wire, combinations of such segments,
reflective metal mirrors of various configurations, cavities with metal walls in which slots are cut (a slot antenna),
spirals of metal wires and others. [2]
A GSM antenna is the most common antenna with a fairly narrow radiation pattern in the horizontal and
vertical planes. An antenna consists of a set of elements: an active vibrator and several passive vibrators, one of
which is a reflector, and the others work in the mode of directors. Reflectors weaken the radiation in the rear
direction, directors amplify the signal in the right direction. All vibrators are parallel and lie in the same plane,
which determines the polarization of the antenna. Such an antenna is called a “wave channel” antenna or a
“Uda-Yagi” antenna. [3]
Main part. The calculation of the antenna allows us to obtain only approximate results, since it is neces-
sary to take into account many interrelated factors (the length and thickness of vibrators, the distance between
them), and is associated with cumbersome calculations. Therefore, most often antenna design, selecting all their
sizes experimentally, adhere to the following rules:
1) for a given operating wave λ, calculate and set the length of the active vibrator 2l taking into account
the shortening ∆l
2) set the length of the reflector 2 lp by 5 - 10% longer than the length of the active vibrator, and the dis-
tance between the vibrators is about 0.2 λ;
3) using the field indicator, measure the field strength E_O (towards the active vibrator) and E_180 (to-
wards the reflector), and adjusting the distance dp between the vibrators and the length of the reflector achieve
the minimum ratio E_180⁄E_O. for a system of two vibrators;
4) add a director, the length of which 2l_q is set shorter by 10 - 15% of the active length, and the distance
a_d to the last is about 0.2 λ, and the minimum ratio E_180⁄E_O is achieved by adjus~ng the specified dimen-
sions. For a system of three vibrators (this may require a slight adjustment of the reflector);
5) add successively second, third, etc. directors and make similar adjustments.
The shape of the radiation pattern (DN), the standing wave ratio (CWS) and the reflection coefficient
(S11) are calculated for the frequency from 1.92 GHz to 2.17 GHz, the material is copper. The antenna has a di-
rectional radiation in the direction of 0 °, in the direction of -180 ° there is a reverse low radiation of the radia-
tion pattern as shown in Figure 1. The antenna has good matching properties in the frequency range from 1.99
GHz to 2.17 GHz (Figure 2). The reflection coefficient from the input decreases from 0 dB at 1.92 GHz to -10.4 dB
at 2.17 GHz, at 2.045 GHz, the reflection coefficient is -6 dB.
The shape of the radiation pattern (DN), the standing wave ratio (CWS) and the reflection coefficient
(S11) are calculated for the frequency from 1.92 GHz to 2.17 GHz, the material is aluminum. The antenna has
directional radiation in the 0 ° direction and is more directional. In the direction of -180 °, the backward radiation
of the beam is observed (Figure 4). In the frequency range from 1.98 GHz to 2.17 GHz, good matching properties
are observed (Figure 5). The magnitude of the reflection coefficient from the input decreases from -3.9 dB at a
frequency of 1.92 GHz to -4.58 dB at a frequency of 2.17 GHz. At a frequency of 2.045 GHz, the reflection coeffi-
cient is -4.3 dB (Figure 6).
MATERIALS OF XII JUNIOR RESEARCHERS’ CONFERENCE 2020
ICT, Electronics, Programming, Geodesy
275
Figure 1. - Antenna pattern (copper)
Figure 2. - Antenna standing wave ratio (copper)
Figure 3. – S11 antenna parameter (copper)
MATERIALS OF XII JUNIOR RESEARCHERS’ CONFERENCE 2020
ICT, Electronics, Programming, Geodesy
276
Figure 4. - Antenna pattern (aluminum)
Figure 5. - Antenna standing wave ratio (aluminum)
Figure 6. – S11 antenna parameter (aluminum)

MATERIALS OF XII JUNIOR RESEARCHERS’ CONFERENCE 2020
ICT, Electronics, Programming, Geodesy
277
Conclusion. In connection with the development of radio-electronic devices and communication systems,
there is a need for GSM antennas. The use of antennae in radio systems allows you to increase the capabilities of
radio communication systems, a radar, as the amount of information transmitted per unit of time is directly pro-
portional to the frequency band of the signal; it also allows for high noise immunity of communication channels
and improves accuracy when assessing the relative orientation of moving objects. A change in the material of
the conductor affects the radiation pattern, its width and back radiation, as well as the SWR and reflection coef-
ficient. From the data obtained, the optimal characteristics were shown, the material is cooper.
REFERENCES
1. GOST 24375-80. Radio communication. Terms and Definitions. 1986
2. Mob [Electronic resource]. - Electronic data. - Access mode: http: //mob.uа, access date: 21.02.2019
3. O.A., Yurtsev Yu 82 Traveling wave antennas, antenna arrays, short, medium and long wave antennas. At 3
pm - Part 3: Methodological manual for the course "Antennas and microwave devices" for students of the
specialty "Radio Engineering". –Mn .: BSUIR, 2001. - 72 p., Ill. 60.
MATERIALS OF XII JUNIOR RESEARCHERS’ CONFERENCE 2020
ICT, Electronics, Programming, Geodesy
278
UDC 004.223.2
«SMART RECIPE BOOK» APP
A. SKUKOVSKAYA, T. RUDKOVA
Polotsk State University, Belarus
The article discusses an application for storing recipes with the function of counting calories and selecting
the optimal dishes. The analysis of the technologies used to develop this application is carried out. The relevance
of the development of this application is considered.
Introduction. Currently, a large number of people are switching from paper to electronic media. The
popularity of using electronic media is determined not only by the convenience of adding and storing
information, but also by the presence of additional functions for processing large amounts of data. Electronic
storage is not limited to professional use, it is also popular in everyday life, for example, in the form of
notebooks.
Along with information technology, sports and healthy nutrition are actively popularized, which makes
the introduction of information technology in the field of a healthy lifestyle relevant. At the moment, a large
number of applications for sports, calorie counting and menu compilation are being created, which confirms the
relevance of the created application.
The Smart Recipe Book app is convenient data storage, as well as a tool for creating a useful and tasty
menu, and selecting dishes based on users’ physical characteristics.
This article is aimed at describing the database, its design methods and the technologies used to create
the developed application.
Main section. Designing a software product begins with designing the database needed to store all the
application information. In accordance with the subject area and purpose of the application, the database stores
information about users, recipes, products, cooking technologies and the values of proteins, fats and
carbohydrates (PFC), both for recipes and for individual users, based on their physical characteristics.
Database development is performed using data modeling. The purpose of data modeling is to develop a
conceptual database schema in the form of one model or several local models that can be relatively easily
mapped to any database system. The most common data modeling tool is entity-relationship diagrams (ERDs).
Using ERD, the DFD data storage devices are detailed, diagrams are documented, informational aspects of the
business system are documented, including the identification of objects, entities, the properties of these objects
— attributes and their relationships with other objects (relationships).
Entity is a set of instances of real or abstract objects (people, events, states, ideas, objects, etc.) that
share common attributes or characteristics. Each entity must have a unique identifier. Each entity instance must
be uniquely identified and distinguished from all other instances of this entity type. Each entity must have some
properties:
• a unique name;
• one or more attributes that either belong to the entity or are inherited through communication;
• one or more attributes that uniquely identify each entity instance.
• any number of relationships with other model entities.
Relationship is an association between entities in which each instance of one entity is associated with an
arbitrary (including zero) number of instances of the second entity, and vice versa.
An attribute (Attribute) represents a type of characteristic or property associated with a variety of real or
abstract entities - objects (people, places, events, states, ideas, objects, etc.). An attribute instance is a specific
characteristic of an individual element of a set. An attribute instance is determined by the type of characteristic
and its value, called the attribute value. An entity instance must have a single specific value for the associated
attribute [1].
In the course of the analysis of knowledge and database development, the main entities were identified,
which are described below.
The Dish essence describes dishes that can have a large number of recipes, characterized by name, type
(for example: soup, salad), belonging to the national cuisine of a country, type of event for which this dish is
being prepared (for example: breakfast, New Year ).
The recipe essence describes one of the possible recipes for a particular dish, characterized by its name,
number of servings, calorie content, attachment to a specific dish.

MATERIALS OF XII JUNIOR RESEARCHERS’ CONFERENCE 2020
ICT, Electronics, Programming, Geodesy
279
The Products essence describes the products characterized by the name, calorie content and PFC
indicators.
Ingredients essence describes the ingredients of a recipe characterized by the number of grams and
linked to the recipe and product.
The technology of preparation eesence describes the steps for preparing the recipe characterized by the
description, duration, number of action.
The user entity contains the usernames and passwords of users registered in the application.
The User’s characteristics essence describes the parameters of the user (weight, height, age), BJU
indicators for the user, the required number of calories and the date the characteristics were added.
Favorite recipes essence describes recipes that the user liked and is characterized by priority.
Based on the selected basic entities, we distinguish under the entities to the main entities:
For the Dish entity, we distinguish the entity by type, event type, and national cuisine.
For the Recipe entity, select the type of recipe for the entity.
For the Technology of cooking essence, we select an action for the essence.
To implement the application, it was necessary to establish all the relationships between the entities: it was
necessary to consider the entire information system in aggregate and determine the mutual influence of the entities.
The relational model represents a database in the form of a set of interrelated relationships (tables) that
are used to store information about objects represented in the database.
One of the most important advantages of relational databases is that it is possible to store logically
grouped data in different tables and specify the relationships between them, combining them into a single
database. Such data organization allows us to reduce the redundancy of stored data, simplifies their input and
organization of queries and reports.
In each database table, a primary key may exist. The primary key is understood as a field or a set of fields
that uniquely (uniquely) identify an entry. The primary key should be minimally sufficient: it should not contain
fields whose removal from the primary key will not affect its uniqueness.
To organize relationships between two or more tables, secondary keys are used. They serve as
constraints on the integrity of the relationships of several tables, because the subordinate table cannot refer to
non-existent records of the main table (which allows the construction of integral data models).
There are three types of relationships between tables:
− one-to-many,
− one-to-one,
− many-to-many.
One-to-many relationships are the most common for relational databases. To ensure referential integrity,
a foreign key is created in the child table through which a link to the child table is organized. A prerequisite is
that the foreign key must match the composition of the fields with the primary key of the parent table [2].
The primary and foreign keys of the relationships of the designed database are presented in table 1.
Table 1. - Primary and foreign keys of relations
Table name Primary key Foreign key
1 Dish IDDish IDTypeOfDishes, IDNatianality,
IDEventType
2 TypeOfDishes IDTypeOfDishes -
3 NationalCuisine IDNationality -
4 EventTypeDishes IDEventType -
5 Recipe IDRecipe IDDish
6 Products IDProduct -
7 Ingridients IDIngridient IDProduct, IDRecipe
8 TypeOfRecipe IDTypeOfRecipe -
9 RelRecipeType IDRel IDRecipe, IDTypeOfRecipe
10 CookingTechnology IDTechnology IDRecipe, IDAction
11 Action IDAction -
12 User IDUser -
13 UserFeatures IDFeatures IDUser
14 FavouriteRecipe IDFavouriteRecipe IDRecipe, IDUser

MATERIALS OF XII JUNIOR RESEARCHERS’ CONFERENCE 2020
ICT, Electronics, Programming, Geodesy
280
MSSQL 2014 was used to create the information database. To create the application, the Microsoft Visual
Studio 2017 development environment was used.
To create the application, C # was chosen. C # is a programming language that combines object-oriented
and context-oriented concepts. C # belongs to a family of languages with C-like syntax, of which its syntax is
closest to C ++ and Java. The language has strict static typing, supports polymorphism, operator overloading,
pointers to class member functions, attributes, events, properties, exceptions, comments in XML format [1].
MSSQL Server was used to create the database due to its good compatibility with the selected
programming language and ease of use.
Connection to the database was carried out using the Entity Framework, this framework provides quick and
easy connection to the database and convenient work with it using the built-in functions. Entity Framework presents a
special object-oriented technology based on the .NET framework for working with data. If traditional ADO.NET tools
allow you to create connections, commands and other objects for interacting with databases, the Entity Framework
represents a higher level of abstraction, which allows you to abstract from the database itself and work with data
regardless of the type of storage. If at the physical level the programmer operates with tables, indexes, primary and
foreign keys, then at the conceptual level that the Entity Framework offers, he already works with objects [2].
To ensure the functionality and ease of use of the information system, an application was created that
allows you to add new recipes, add, delete, edit information about yourself, about your favorite recipes, display
information about recipes and select the best dishes for each application user.
When creating databases, one of the important tasks is to ensure data integrity. Integrity (from the English
integrity - intactness, inviolability, safety, integrity) - is understood as the correctness of the data at any time. But this
goal can be achieved only within certain limits: the DBMS cannot control the correctness of each individual value
entered into the database. To do this, there are a number of tools that help the developer minimize the possibility of
violating the integrity of the database data: triggers, checks («check»), uniqueness («unique»), etc. A trigger is a stored
procedure of a special type that is automatically executed when a given event occurs [3].
In this application, triggers are also used to automatically calculate the calorie content of dishes and user
characteristics. Table 2 summarizes the main uses of constraints and triggers.
Table 2. – Table Constraints and Triggers
Table name Description
1 Ingridients
When adding a new ingredient, the calorie content of the whole dish is
recalculated
When adding a new ingredient, the UNIQUE restriction applies to the
combination of the recipe and the product
2 Recipe When a recipe is deleted, all tables associated with it are deleted
3 CookingTechnology When adding new technology, the calorie content of the entire dish is
recalculated depending on the action
4 UserFeatures When changing weight, age and height, the values of PFC and calories
are recounted
5 RelRecipeType When adding a new type of recipe, the UNIQUE restriction applies to
the combination of recipe and type
In addition, to ensure data integrity, there are triggers for adding, deleting and modifying tables.
Using Windows Forms, an intuitive and easy-to-use user interface was created.
Conclusion. The developed application meets all the requirements of the subject area, the tables of the
created database meet the requirements of normalization, which ensures the integrity and consistency of infor-
mation.
The most suitable and modern programming languages and development environments were used to
create the application.
REFERENCES
1. Progoredia [Electronic resource]. Access mode: http://progopedia.ru/language/csharp/. Access date:
02/17/2020.
2. METANIT.COM. Programming site [Electronic resource]. Access Mode:
https://metanit.com/sharp/entityframework/1.1.php. Access date: 02/17/2020.
3. Studme.org [Electronic resource]. Access Mode: https://studme.org/93824/informatika/triggery. Access
date: 02/20/2020.
281
CONTENTS
ARCHITECTURE AND CIVIL ENGINEERING
Levkovich M., Trukhanovich S., Lazarenko O., Kruglikova M. Transformation of the established object-spatial
environment of the student hostel ................................................................................................................................ 3
Paulava N., Kazlou M. Architecture and art as a key element of political culture of the society ................................ 6
Sysoy V., Khvatynec V. Device for adapting people with disturbances of hearing and vision in area ......................... 9
Bobrov A., Zazerski I., Shcherbo A. Comparative analysis of elastic-plastic processes
at complex active loading and loading with unloading ............................................................................................... 12
Bril A., Khvatynec V. Rational ways to use fiber concrete ............................................................................................ 15
Tochilo A., Tarashkevich D., Molodechkina T. The study of the electric strength of composite materials
based on a polymer matrix ........................................................................................................................................... 17
Panin I., Sachyuka A., Borovkova E. The influence of the microstructure on the acoustic properties
of building materials ...................................................................................................................................................... 20
Farran J., Siarheyeva L., Turishev L. Concerning the question of calculating a beam
with a hinge-rod chain................................................................................................................................................... 23
Putryna H., Matvelchuk V. Transformation of Mogilev's public spaces ...................................................................... 27
TECHNOLOGY, MACHINE-BUILDING
Matsveyankou D., Popok N., Partsianka S. Automation of production preparation
based on 3D layout of technological equipment ......................................................................................................... 31
Matsveyankou D., Popok N., Partsianka S. Modern 3D printing technologies of products and parts ....................... 33
Ovcharov E., Varonin A. On the possible application of tubercles on pumping impeller
to decrease hydraulic resistance .................................................................................................................................. 36
Palavy V., Safronava A. The influence of office environment on the health of workers ........................................... 39
Papkovich M., Skoromnik O. Two-dimensional integral transform with the meijer g-function
in the kernel in the space of summable functions....................................................................................................... 42
Budzko D., Yanushkevich V. Characteristics of fiber-optic communication system receivers ................................... 47
Tikhon E., Popok N. Classification of fundamental technological modules................................................................. 49
Bashlachiov D., Popok N. Development of block-modular cutting tools for CNC machines ...................................... 52
Soldatenko P., Zaleski V. Plasma source of charged particles based on a discharge in crossed e×h fields
with an increased perveance ........................................................................................................................................ 55
Kozlov A., Aleksandrovich T. Criterion of uniform full controllability for linear discrete systems
with variable structure .................................................................................................................................................. 59
Maksimchuk A., Popok N. Formation of block-modular face milling cutters
with adjustment of geometric blade parameters ........................................................................................................ 61
Samusevich V., Bulauka Y. Digital transformation in ensuring occupational safety
in the oil and gas industry ............................................................................................................................................. 63
Bulauka Y., Kozhemyatov K. Analysis of equipment operation time at the refinery .................................................. 66
Liakhovich V., Bulauka Y. Reduced dust pollution in the processes of production and transportation
of petroleum coke ......................................................................................................................................................... 71
Malyushchenko E., Antonovich D. On the possibility of forming combined beams of charged particles
in a plasma source based on a discharge in crossed e×h fields .................................................................................. 74
Pugach R., Abramenko S. Electromechanical measuring unit of electron beam diagnostics apparatus .................. 78
Shymanskaya M., Bulauka Y. The analysis of electromagnetic environment created
by a linear series of personal computers in classroom of university of classical type ............................................... 82
Kolyago A., Kuntsevich S. Molecular weight distribution of n-paraffins in complex fuel mixtures
and their effect on commodity diesel fuels specification ........................................................................................... 86
Hryshyn P., Yermak A. The directions for rational use of residual product of the process «unicracking» ................ 90

282
Chuhan Y., Fonin M. Influence of technological parameters of highpressure polyethylene synthesis
on the conditions for safe removal of residual monomer .......................................................................................... 92
Lapatsin D., Has Y., Dudan A. Determination of the wear value of ultrahigh molecular weight polyethylene
depending on additives ................................................................................................................................................. 95
Yukhno D., Yarmak A. Efficiency improvement of the aromatic hydrocarbons extraction process
from catalysate of reforming and co-products of aromatic sections at a refinery .................................................... 97
Shulha E., Yakubovsky S. Receiving oil coke on the basis of heavy residual oil
from the chemical works “Polymir” (OJSC “Naftan”) ................................................................................................ 101
Lenchikov V., Dabravolski D., Utkin A., Buraya I. Influence of carboxylic acids on filterability
and quality level of synthetic low alkaline calcium sulfonate (detergent-dispersant motor oil additive) .............. 103
ICT, ELECTRONICS, PROGRAMMING, GEODESY
Dolhi P. GIS-modelling of the crystalline basement of the territory of Belarus
in different geological ages ......................................................................................................................................... 107
Subbotin A., Pastukhov Y. Methods of modern cryptoattacks .................................................................................. 110
Makarova M. The use of remote sensing data in the design of district boundaries ............................................... 113
Tausty M., Rudkova T. Designing of internet shop of Telegram ................................................................................ 116
Kohanovskiy A., Pastukhov Y. Esigning the stegosystem, based on hiding text data in images
by using discrete transformations .............................................................................................................................. 118
Karnilovich A., Pastuhov D. Using Samsung smart watches as an NFC pass ............................................................. 122
Barysionak K., Oskin A. Designing interfaces of the sport club site ........................................................................... 125
Shershneu M., Oskin A. Postman platform for API development in the mobile application
"Musicians of Russia" .................................................................................................................................................. 128
Tsybulsky V., Burachonak I. Graduates website in education .................................................................................... 132
Misiukevich A. Mobile application for personal fitness training ................................................................................ 135
Misevich I., Pastukhov Y. How to select correct test cases for automated testing .................................................. 137
Shpak I., Abramenko S. Wireless transmission of telemetry data to long distance.................................................. 139
Sivahrakau A., Pastukhov Y. Digital watermarking as an image protection method ................................................ 141
Dysin A., Golubeva O. Development of a training platform for junior specialists
in the field of testing software .................................................................................................................................... 143
Drovosekova T., Bohush R. Computational complexity of algorithms for formation of radar images .................... 145
Zhukavets Y., Dekanova M. Comparative analysis of algorithms for detecting coverage defects ........................... 148
Solotsky A. Electronic guide for people with disabilities in Novopolotsk.................................................................. 150
Balabash M., Oskin A. The inside of headless chrome ............................................................................................... 154
Sinyak P., Gur'yeva N. On question about the interpolation polynomial of the function f(λ) ................................. 156
Shumyantsev I., Oskin A. Designing an application for remote computer management
using an android device .............................................................................................................................................. 158
Makarychev M., Makarycheva V., Oskin A. Ensuring information security when serializing Java objects .............. 162
Hardziayonak U., Rusetski I. Swivel mechanism for antenna with GPS sensor and LAN control ............................. 165
Marozau D., Golubeva O. Creating a minesweeper game using the Java programming language ......................... 168
Samsonov K., Kravchenko Y. The design of web interface for dialogue with the introduction of a Chat Bot ......... 172 Kaniayeu Y., Rusetski I. Swift object-oriented programming language: features and advantages .......................... 174
Kochanov A., Yanushkevich V. Interaction of pulsed electromagnetic waves
with environments over hydrocarbon deposits ......................................................................................................... 177
Makridin I., Yanushkevich V. Modeling of characteristics of fiber optical amplifiers
for infocommunication systems ................................................................................................................................. 180
Medvedev N., Burachonak I. Digital distribution. Inffluence of online services for users and developers.
External payment system and its influence on service security ............................................................................... 182
Taldykin V. Modern tools for scalable web development ......................................................................................... 186
Isakau I., Pastukhov Y. Attacks on the steganographic system of digital
watermarks and protection against them .................................................................................................................. 188
283
Zakharava I., Bohush R. Review of methods for smartphone application foot size estimation from images ........ 191
Sinitsa P., Pastukhov D. A modified method of encrypting test data
with elliptic curves using a unique alphabetic key string .......................................................................................... 196
Petyukevich V., Pastukhov D. Protected transfer of messages between users
on the basis of post-quantum cryptography.............................................................................................................. 201
Goncharov V., Oskin A. Approaches to developing an interface for an automated information system
for managing a thrift store .......................................................................................................................................... 204
Moroz A., Yanushkevich V. Amplitude-type sensors in fiber-optic devices ............................................................... 209
Andreyeu I., Pastukhov D. Development of a system for hidden information in a sound environment ................. 211
Markevich K., Oskin A. Approaches to the interface development for the automated information system
of the inspection on the matters of the minor, polotsk regional executive committee ......................................... 213
Gusevsky R., Burachonak I. Importance of JSX and CSS on the example of the developed game web application
“learning CSS features” ............................................................................................................................................... 215
Pliasov V., Mikhnovich O. System for static objects detection in video
with different roadways and cloud technologies usages .......................................................................................... 218
Bobrovich E., Oskin A. Application monitoring with spring boot actuator ................................................................ 221
Gurtovenko N., Golubeva O. Test-driven development - development through testing:
advantages and disadvantages ................................................................................................................................... 224
Smaliak A., Pastukhov D. Developing a system for hidden information using a transposition cipher .................... 227
Herats A., Burachonak I. Organizational and economic conditions for the development
of a mobile app for finding sport partners ................................................................................................................. 229
Sergeev M., Oskin A. Means of movement of the user model in the virtual reality application ............................. 233
Gultjaev M., Valoshyna M. Use of unmanned aerial vehicles when performing topographic surveys ................... 236
Kuptsov V., Golubeva O. Web application for small business management ............................................................. 238
Lapkouski M., Piatkin D. Converting speech to text using JAVAscript ....................................................................... 241
Mikhnovich O., Mikhnovich O. Efficiency of using crystal programming language
for application implementation .................................................................................................................................. 244
Volkau A., Rudkova T. Development of neural convolutional networks
in the world and child features ................................................................................................................................... 247
Pranko A., Bohush R. An effective structure for new data interchange format ....................................................... 250
Belski H., Burachonak I. Role of the web portfolio in increasing competitiveness of university graduates ............ 252
Krasko R., Oskin A. Clean architecture for android applications ............................................................................... 256
Lesnitsky V., Burachonak I. Economic component of development of the Web service for the submission
of announcements, impact assessmen of the information environment on the economy .................................... 258
Mianitski Y., Pastukhov D. Main aspects designing a web application for working
with patient's medical data ......................................................................................................................................... 261
Vecherov A., Golubeva O. Designing of the database for mobile application ........................................................... 265
Pavinich I., Petrovich O. AR technologies in android app development.................................................................... 267
Sytova N., Yanushkevich V. Reflectometer with spectral separation of signals ........................................................ 269
Stanovoy A., Petrovich O. Analysis of Internet portal development .......................................................................... 271
Stanovoy A., Yanushkevich V. The study of the characteristics of the 3G antenna from changes
in the material of the conductor ................................................................................................................................ 274
Skukovskaya A., Rudkova T. «Smart recipe book» app .............................................................................................. 278