estimation of burst pressure of corroded pipeline using finite element analysis (fea)
TRANSCRIPT

Estimation of Burst Pressure of Corroded Pipeline using Finite Element Analysis (FEA)
Saravanan Karuppanan1,a, Azmi Abdul Wahab1,b, Santosh Patil1,c and Mohamad Armiya Zahari1,d
1Department of Mechanical Engineering, Universiti Teknologi PETRONAS, Bandar Seri Iskandar, 31750 Tronoh, Perak, Malaysia
[email protected], [email protected], [email protected], [email protected]
Keywords: Finite Element Analysis, burst pressure, ASME B31G, DNV-RP-F101
Abstract. One major concern in maintaining pipeline structural integrity is failure due to corrosion
defects. Various tests and codes had been established to assess the corroded pipelines. Burst test is
one of the tests being conducted in the lab to assess the integrity of the pipelines. The advancement
in computer technology had made the Finite Element Analysis (FEA) capable to simulate the burst
test numerically. The objective of this study is to estimate the burst pressure of a corroded pipeline
by using FEA. First, Ultrasonic Testing (UT) scan was carried out to establish the corroded pipe
profile. FEA was then conducted to simulate the experimental procedure of the actual burst test.
Several models were built and simulated by considering the number of defects, their depth and
shape as the varying parameter in each simulation. All models were properly constrained and
pressurized internally in determining the burst pressure (pb) of the corroded pipeline. The result
obtained by FEA was analyzed and compared to the actual burst test, ASME B31G and DNV-RP-
F101 codes. Lastly the best model of FEA was proposed.
Introduction
Pipelines had been used for oil and gas transmission all over the world nowadays. They are the
reliable and safest way to transmit the product to be processed in the plant and distributed to the
customers. It appears that, the major concern of the pipeline is maintaining its integrity to ensure it
is safe and effective during operation to avoid unforeseen failure. One of the pipeline integrity
concerns is corrosion defects on its surface.
Corrosion will deteriorate the pipes and causes the metal loss on the pipe’s surface. This will
result in wall thinning of the pipes. The wall thinning on a pipeline due to corrosion, usually results
in localized pit with different depths and uneven shapes on its external and internal surfaces [1].
After a certain period, the wall thinning on the surface will be greater and at peak point, the pipes
will crack and leak. If accident happens in a pipeline with fluid flowing with high pressure, the pipe
may burst and may cause operation shutdown, equipment failure and injury to the surrounding
people. Hence, the burst pressure of the corroded pipeline has to be determined so that precaution
can be taken to avoid accidents.
Burst pressure is the maximum pressure that the pipes can sustain before they burst, or may also
be defined as the point right before failure occurs. Factors that contribute to the determination of the
burst pressure are the material quality, thickness of the pipes, heat and others. Burst pressure is
determined by burst test in a lab where the pipe is pressurized until it bursts and the corresponding
pressure is recorded as burst pressure.
Burst test enables the operator to assess the fitness for service and structural integrity of corroded
pipes. However, the burst test has its own limitations which are (a) it cannot be carried out for all
pipes along the pipeline due to time constraint (b) it involves very high cost to be carried out (c) due
to the complexity of the procedures before and after the test. Therefore, FEA is a more viable option
for simulation of the burst test instead of performing the tests in the lab.
Advanced Materials Research Vol. 879 (2014) pp 191-198© (2014) Trans Tech Publications, Switzerlanddoi:10.4028/www.scientific.net/AMR.879.191
All rights reserved. No part of contents of this paper may be reproduced or transmitted in any form or by any means without the written permission of TTP,www.ttp.net. (ID: 203.135.191.3-08/01/14,01:13:29)

The objectives of this study are to estimate the burst pressure (pb) of a corroded pipeline by FEA
using ANSYS software and to compare the results obtained by FEA with the experimental value
and also the numerical codes, namely ASME B31G and DNV-RF-F101. The effects of the number
of defects, their depth and shape will be investigated. Finally, the best model for ANSYS simulation
of corroded pipeline will be proposed.
Literature Review
Extensive studies have been conducted to assess the integrity of pipes due to the corrosion
defects under internal pressure. This includes experimental burst tests performed in the lab. The
obstacles faced in performing experimental burst tests include the high cost of the tests, safety
precaution and the lengthy procedures to gather the results. The advancement in the computer
technology has given an alternative way for the assessment of corroded pipeline. FEA has several
advantages over the experimental method, namely the reduction of cost and time to complete the
assessment. It is also capable to estimate the burst pressure of corroded pipelines with reasonably
accuracy.
T.A. Netto et al. [2] studied the effects of corrosion defects on the burst pressure of pipeline. In
their work, physical experiment as well as the numerical analysis using FEA software ABAQUS
were carried out. Several pipes with idealized corrosion defects were tested for the burst pressure
experimentally and simulated using ABAQUS. ASME B31G and DNV-RP-F101 were used as the
reference codes of their research. Three types of pipes with grades of API X52, API X65 and API
X77 were tested. They found that the burst pressure is dependent on the major parameters such as
the defect depth and defect geometry.
Tomas Szary [3] highlighted the extensive development of the numerical model using ANSYS.
Special emphasis was put on realistic defect modeling where the descriptions of limitations,
boundary conditions and FEM model characteristics were discussed. He had also simplified the
steps of the analysis with a developed procedure where all the parameters and variable are included
through a specific input window. The author found that the burst pressure of corroded pipeline is
dependent on the defect geometry and material properties. The defect shape plays an important role
because it influences the stress distribution.
M. Kamayaa et al. [4] discussed the importance of plastic deformation consideration to estimate
the burst pressure of pipeline. 3D elastic–plastic FEA was conducted to examine the influence of
the material and length of wall thinning on the failure pressure. Wall thinning was assumed to be of
uniform depth circumferentially within the straight pipe. They evaluated the influence of the
material and flaw length experimentally and by FEA. The validity of FEA was confirmed by
comparing its results with the experimental results as shown in Table 1.
Table 1: Comparison of failure pressure obtained
by burst tests and finite element analysis [4]
Length of
flaw [mm]
Burst Test
[MPa]
FEA
[MPa]
72.5 17.49 17.90
50 18.07 18.13
25 23.90 22.90
Methodology
Experimental work. The burst test was conducted experimentally in the Universiti Teknologi
PETRONAS’s lab. The pipe’s dimensions and mechanical properties of the material are presented
in Table 2 and Table 3, respectively.
192 Advanced Materials Conference (AMC 2012)
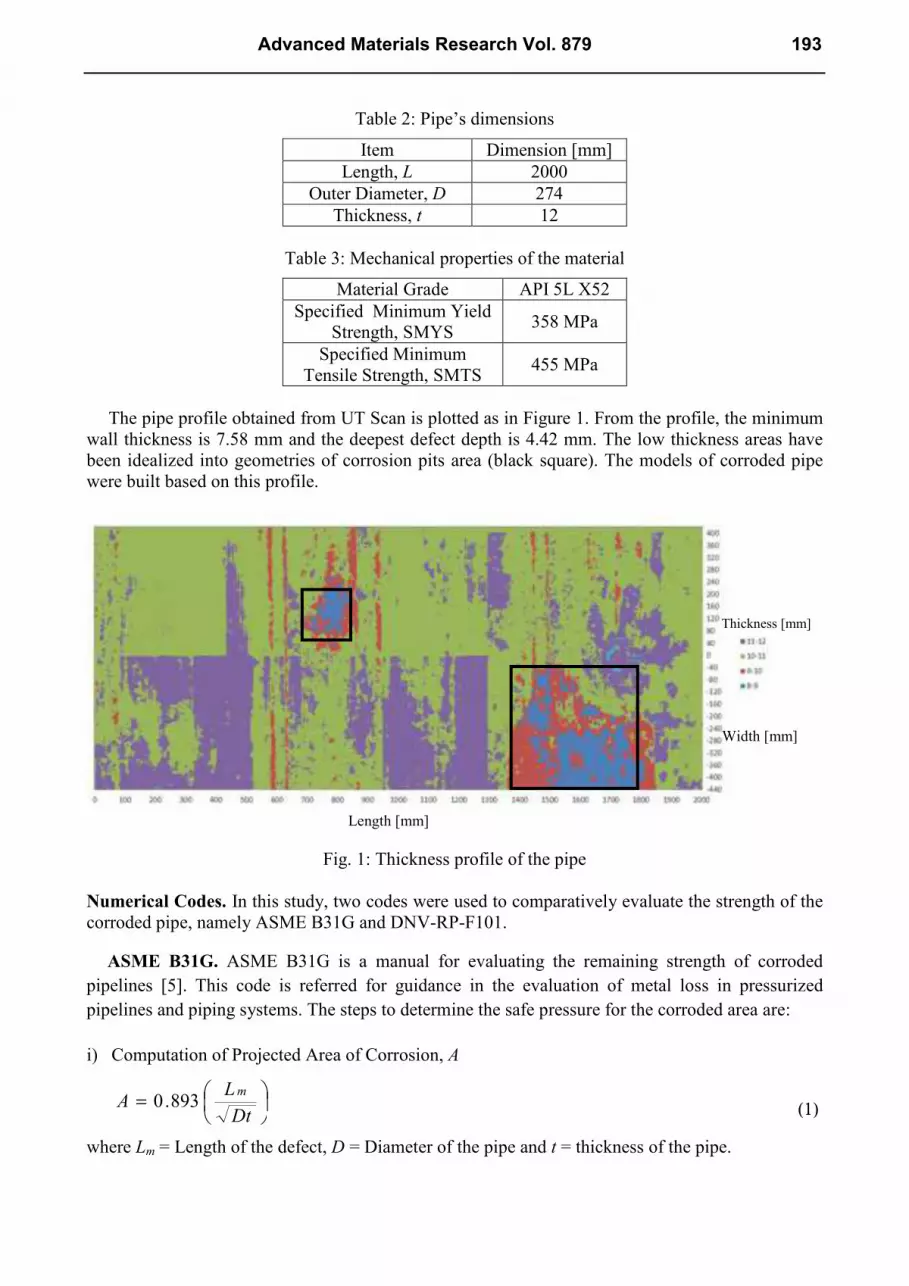
Table 2: Pipe’s dimensions
Item Dimension [mm]
Length, L 2000
Outer Diameter, D 274
Thickness, t 12
Table 3: Mechanical properties of the material
Material Grade API 5L X52
Specified Minimum Yield
Strength, SMYS 358 MPa
Specified Minimum
Tensile Strength, SMTS 455 MPa
The pipe profile obtained from UT Scan is plotted as in Figure 1. From the profile, the minimum
wall thickness is 7.58 mm and the deepest defect depth is 4.42 mm. The low thickness areas have
been idealized into geometries of corrosion pits area (black square). The models of corroded pipe
were built based on this profile.
Fig. 1: Thickness profile of the pipe
Numerical Codes. In this study, two codes were used to comparatively evaluate the strength of the
corroded pipe, namely ASME B31G and DNV-RP-F101.
ASME B31G. ASME B31G is a manual for evaluating the remaining strength of corroded
pipelines [5]. This code is referred for guidance in the evaluation of metal loss in pressurized
pipelines and piping systems. The steps to determine the safe pressure for the corroded area are:
i) Computation of Projected Area of Corrosion, A
893.0
=
Dt
LA
m
(1)
where Lm = Length of the defect, D = Diameter of the pipe and t = thickness of the pipe.
Length [mm]
Thickness [mm]
Width [mm]
Advanced Materials Research Vol. 879 193
ii) Computation of Maximum Allowable Operating Pressure (MAOP), P
P = 2StFT/D (2)
where S = Specified minimum yield strength, F = Appropriate design factor and T = Temperature
de-rating factor from the appropriate B31 code.
iii) Computation of Safe Maximum Pressure, P’
For A < 4,
( )
(3)
13
21
3
21
1.1'
2
+−
−
=
At
d
t
d
PP
For A > 4,
(4) 11.1'
−=
t
dPP
where d = depth of the defect.
DNV-RP-F101. DNV gives recommendations to assess corroded pipelines subject to internal
pressure, and internal pressure combined with longitudinal compressive stresses. This code is
capable to evaluate single defects, interacting defects and complex shaped defects [6]. The
allowable corroded pipe pressure is determined from the equations below:
i) Calculation of Maximum Acceptable Defect Depth, (d/t)*
( ) [ ] (5) /StD)/(*/ tdtdtd dmeas ε+=
where (d/t)meas = measured (relative) defect depth, εd = factor for defining a fractile value for the
corrosion depth, d = depth of the defect and t = thickness of the pipe.
ii) Calculation of Length Correction Factor, Q
(6) 31.01
2
+=
Dt
lQ
where l = longitudinal length of corroded region and D = nominal outside diameter of the pipe.
iii) Calculation of Allowable Corroded Pressure, pcorr
( )( )
( )( )
*/
1
*/12
−−
−=
Q
tdtD
tdtfp
d
dum
corrγ
γγ
(7)
where γm = partial safety factor for longitudinal corrosion model prediction, fu = tensile strength to
be used in design and γd = partial safety factor for corrosion depth.
194 Advanced Materials Conference (AMC 2012)
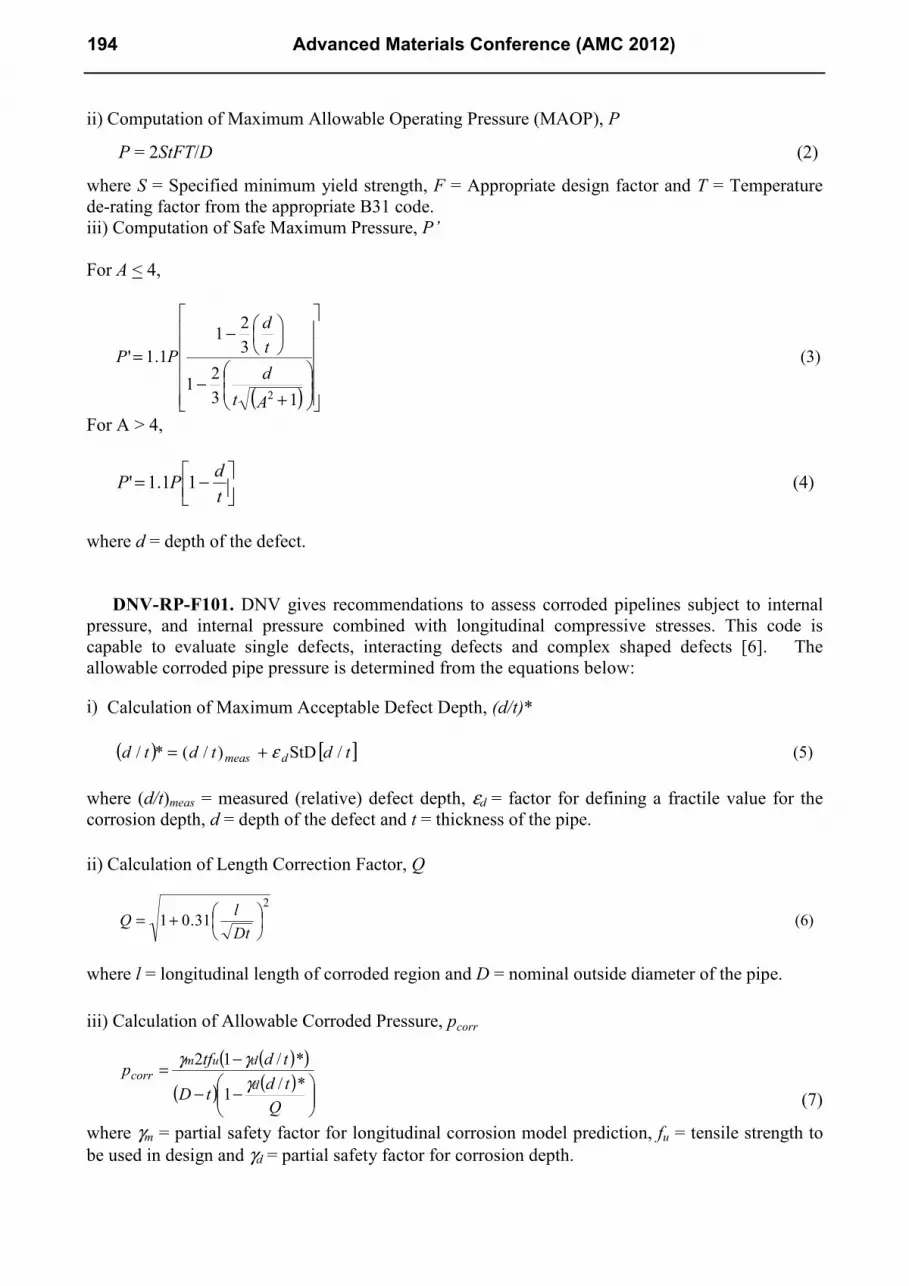
FE Modeling. All models were created based on the corroded pipe profile and idealized corrosion
pits area. The models were varied in defect depth, defect number and corrosion area geometry. The
models parameters and models idealization used for this study are summarized in Table 4 and
Figure 2, respectively.
Table 4: Modeling parameters
Model Defect depth, d [mm] Geometry Size [mm]
Model 1 4.19 Rectangle l = 390 mm; w = 400 mm
Model 2 4.42 Rectangle l = 150 mm; w = 160 mm
Model 3 4.19 and 4.42 Rectangle l = 390 mm; w = 400 mm
and
l = 150 mm; w = 160 mm
Model 4 4.42 Rectangle +
3 mm fillet
l = 150 mm; w = 160 mm
Model 5 4.42 Oval l = 150 mm; w = 160 mm
Model 1 and 2:
Model 3:
Model 4:
Model 5:
Fig. 2: Model idealizations
In this study, nonlinear analysis was considered. During failure simulation, the pipeline material
was subjected to large structural deformation due to loading beyond the material’s yielding point. If
a structure experiences large deformations, the change in geometric configuration can cause the
structure to respond nonlinearly [7]. Consequently, the non-linear stress-strain relationship and the
changes in geometry due to large displacement require a non-linear analysis [8]. The non-linear
simulation requires the input of stress-strain values for the material model. Figure 3 shows the
stress-strain graph for pipe steel X52 used in this analysis.
l2=150mm l l1=390mm
d1 d2
d2
l2=150mm l
d2
l2 = 150mm
l
d
Advanced Materials Research Vol. 879 195

Fig. 3: Stress-strain curve for pipe steel X52
For these models, the element type used was SOLID95 which is defined by 20 nodes with 3
degree of freedom (DOF) at each node (i.e. displacements in x, y and z directions). All models were
properly meshed by considering the divisions of elements, aspect ratio and size of the elements, as
in Figure 4.
Fig. 4. Finite element model of the defect, mesh and boundary conditions
Symmetric boundary conditions were imposed whenever possible, as in Figure 4. By imposing
this condition, the models can be built into half or quarter of the pipe’s dimension in order to reduce
the size of the problem and to keep the calculation time as low as possible. The effect of end-caps
was simulated by constraining the end nodes of the pipe. The nodes were fixed from moving in x, y
and z direction.
Considering the operating condition of cylindrical pipe, internal pressure, p was applied to the
internal surface of the model as varying parameter in the ANSYS simulation, as in Figure 4. The
internal pressure, p was increased gradually until the von Mises stress in the entire ligament, σe was
equal to the specified minimum tensile strength, SMTS of the pipe [9]. At that moment, the pipe
was considered to burst.
Results and Discussion
After modeling, meshing and applying all the constraints and loads to the models, the burst
pressure values for every model were determined in post processing stage. The models were
simulated with incremental internal pressure loading, p until the von Mises stress, σe values of the
entire ligament are equal to the specified minimum tensile strength, SMTS of the pipe, 455 MPa.
Figure 5 shows the von Mises plot for Model 1.
The failure pressure results for each model obtained from FEA, ASME B31G and DNV-RP-F101
are tabulated in Table 5. The percentage difference between the FEA result and the experimental
burst test result is also included. The experimental burst pressure value for the sample is 38.5 MPa.
The comparison of the results is shown in Figure 6.
All degrees of
freedom fixed
Symmetric
Boundary
Conditions
pressure
defect
196 Advanced Materials Conference (AMC 2012)

Fig. 5: von Mises stress plot for Model 1
Table 5 : Comparisons of failure pressure
Model
Burst Pressure Results [MPa] FEA to Actual burst
test difference [%] FEA
ASME
B31G
DNV-RP-
F101
Model 1 29.4 22.5 22.9 23.6
Model 2 28.8 28.8 25.6 25.2
Model 3 28.8 22.5 22.9 25.2
Model 4 29.8 28.9 25.8 22.6
Model 5 38.1 31.0 28.9 1.0
Fig. 6: Comparisons of FEA results to ASME B31G, DNV-RP-F101 and actual burst test results
Generally the burst pressure results determined by the codes are lower as compared to the FEA
results. If compared to the experimental result, we can conclude that the codes are conservative.
Meanwhile the burst pressure results determined by FEA are dependent on the idealized geometries
of the defect.
Burst pressure value for Model 1 is higher than in Model 2. The defect in Model 1 is longer and
wider than the defect in Model 2. However the defect in Model 2 is deeper than the defect in Model
1. This shows that the defect depth is the controlling factor as compared to the width and length of
the defect. Therefore accurate defect depth determination is vital in the estimation of burst pressure.
In Model 3, both defects in Model 1 and 2 have been included in the analysis. The result
obtained is the same as the result for Model 2. This means that there is no interaction between both
defects and the burst pressure value is controlled by the defect with deeper depth.
In Model 1, 2 and 3 the defect was idealized as a rectangular shaped defect. It was also noticed
that the failure occurred at the sharp corners of the rectangular shaped defect. In order to reduce the
Advanced Materials Research Vol. 879 197
stress concentration of these corners, fillet was introduced to the edge of the defect as in Model 4.
The result shows that the burst pressure value has increased by 3.5%.
In Model 5, the defect was idealized as oval shaped defect. This increased the burst pressure
value significantly and the value found is closer to the value determined experimentally. Therefore,
in this analysis, idealization of the defect as oval shaped defect is the most appropriate choice in
determining the burst pressure.
Conclusion
The objectives of this study are achieved where the burst pressure value have been determined
through FEA and compared to the codes and experimental results. The FEA results are dependent
on the defect depth and shape. In this study, the defects idealized in Models 1-4 give very
conservative estimates. Model 5 with oval shaped defect is the appropriate choice for the
determination of burst pressure in the pipeline experiencing general corrosion. FEA proved to be an
excellent method for estimation of burst pressure of corroded pipeline. This method can save cost,
time, reduce the complexity of experimental procedure and reduce risk of lab work. Simulation in
ANSYS is faster, reliable and user friendly. However the corrosion profile determination and
accurate idealization of defect is vital for accurate determination of burst pressure of a corroded
pipeline.
References
[1] A. deS. Brasunas, Corrosion Basics: An Introduction, Houston, Texas USA, National
Association of Corrosion Engineers (NACE), 1984. [2] T.A. Netto, U.S. Ferraz and S.F. Estefen, The Effect of Corrosion Defects on The Burst Pressure
of Pipelines, Journal of Constructional Steel Research, 61(8) (2008) 1185-1204. [3] Tomasz Szary, The Finite Element Method Analysis for Assessing the Remaining Strength of
Corroded Oil Field Casing and Tubing, PhD Dissertation, Faculty of Earth Sciences, Geotechnical
and Mining, Freiberg University, Germany, 10.9.2006. [4] M. Kamayaa, T. Suzuki and T. Meshii, Failure Pressure of Straight Pipe with Wall Thinning
under Internal Pressure, International Journal of Pressure Vessels and Piping, 85 (2008) 628-634. [5] ASME, Manual for Determining the Remaining Strength of Corroded Pipelines: A Supplement
of ASME B31 Code for Pressure Piping, American Society of Mechanical Engineers, USA, 1991. [6] DNV, Reliability of Corroded Pipes Finite Element Analysis, Report no. 96-3392, Revision
no.1, Hovik, Norway, 1997. [7] C.T. Belachew, M.C. Ismail and S. Karuppanan, Burst Strength Analysis of Corroded Pipelines
by Finite Element Method, Journal of Applied Science, 11(10) (2011) 1845-1850. [8] ANSYS Release 11.0, ANSYS Structural Analysis Guide, ANSYS Inc. Canonsburg, PA, 2009. [9] J.B. Choi, B.K. Goo, J.C. Kim, Y.J. Kim and W.S. Kim, Development of Limit Load Solutions
for Corroded Gas Pipelines, International Journal of Pressure Vessels and Piping, 80(2) (2003) 121-
128.
198 Advanced Materials Conference (AMC 2012)