anchorage of naturally-corroded, plain bars in reinforced
TRANSCRIPT
THESIS FOR THE DEGREE OF LICENTIATE OF ENGINEERING
Anchorage of naturally-corroded, plain bars inReinforced Concrete structures
SAMANTA ROBUSCHI
Department of Architecture and Civil EngineeringDivision of Structural Engineering
CHALMERS UNIVERSITY OF TECHNOLOGY
Göteborg, Sweden 2019

Anchorage of naturally-corroded, plain bars in Reinforced Concrete structuresSAMANTA ROBUSCHI
© SAMANTA ROBUSCHI, 2019
Thesis for the degree of Licentiate of EngineeringLic /Architecture and Civil Engineering / Chalmers University of Technology
Department of Architecture and Civil EngineeringDivision of Structural EngineeringChalmers University of TechnologySE-412 96 GöteborgSwedenTelephone: +46 (0)31-772 1000
CoverIn the picture: testing of beam 14H.
Printed by Chalmers ReproserviceGöteborg, Sweden 2019
Anchorage of naturally-corroded, plain bars in Reinforced Concrete structuresThesis for the degree of Licentiate of EngineeringSAMANTA ROBUSCHIDepartment of Architecture and Civil EngineeringDivision of Structural EngineeringChalmers University of Technology
ABSTRACTReinforced Concrete (RC) is the most common construction material in existing struc-tures. However, RC structures are susceptible to deterioration over time, with corrosionof the reinforcing steel as most common mechanism. Corrosion reduces strength and duc-tility provided by the reinforcement bars and affects their interaction with the concrete.Research on the structural effects of corrosion commonly focuses on deformed bars andapplies artificial corrosion. Performance is evaluated based on testing the bond betweenthe bars and the concrete. Plain (smooth) reinforcing bars, as typical in older structures,are seldom studied. Plain bars interact differently with concrete, due to the absenceof ribs. Additionally, doubts on the relevance of artificial corrosion methods have beenraised. Thus, there is a lack of knowledge on the effects of corrosion of plain bars, andnaturally corroded specimens are the ideal mean of acquiring it.
This work investigates the bond of naturally corroded, plain reinforcement bars bytesting specimens taken from the edge beams of a decommissioned, 80-year-old bridge.Pilot tests were performed to investigate possible test configurations, to which a total of 20beams were subjected to displacement-controlled 3-point bending. The beams presenteddifferent levels of damage, and the corrosion level of each tensile reinforcement bar wasafterwards measured using of a 3D scanner. All but three of the tested specimens were ableto anchor the yield force of the bars after the opening of one or two major bending cracksin the middle. Bending failure, not bond strength, limited the load-carrying capacity forthe majority of test specimens. At large deflections, end-slip of the reinforcement barswas observed; thus, anchorage limited the deformation capacity.
The average bond strength was evaluated separately in the unyielded and in the yieldedzones. The average bond strength in the unyielded zone was found to be equal to 7.4MPa, with a standard deviation of 3.3 MPa. The casting position was identified as animportant factor. Bottom-cast bars had higher bond strength when uncorroded, but weremore prone to external cracks in the bond region and consequently loss of bond strengthfor small corrosion levels. Top-cast bars had lower bond strength when uncorroded,but reached higher bond strength with increasing corrosion levels, due to the absence ofexternal cracks. These differences are likely the result of a higher density of the concretesurrounding the bottom-cast bars. In the yielded zones, substantial loss of bond strengthwas observed, with an average of 1 MPa. This affected the overall structural behaviour,which was observed to change from beam to arch action for larger deflections. To conclude,the results improve our understanding of the behaviour of older structures with plain barsand will enable, in the long run, improved assessment methods.
Keywords: plain reinforcement bars, anchorage, bond, corrosion, concrete.
iii


"Begin at the beginning," the King said gravely,and go on till you come to the end: then stop"
Lewis Carroll, Alice in Wonderland
v


AcknowledgementsThe work presented in this thesis was accomplished at the Division of StructuralEngineering, at Chalmers University of Technology (Göteborg), between March2017 and March 2019. The research project was funded by Trafikverket andFormas, to which the author wishes to express her gratitude.I am sincerely grateful to my supervisor, Prof. Karin Lundgren, for the contin-
uous moral and scientific support. Karin has been always available, with valuablecomments and good ideas. She truly believes that there is no such thing as astupid question. Special thanks also go to my co-supervisor, Ignasi Fernandez.Many good ideas in this work come from him. I would like to thank as well myother two co-supervisors, Kamyab Zandi and Mathias Flansbjer. To all the fourof you, I wish to express my gratitude for all the support I have received. Withoutthe countless fruitful discussions, this work would not have been possible in thepresent form. I look forward to continue working with you. I would also liketo thank the other members of the Reference Group, for the good ideas and thevaluable discussions.Special thanks go to the research engineers, Sebastian Almfeldt and Anders
Karlsson, for their invaluable help and infinite patience. This work has beencarried out mostly in the lab, and without your help it would not have beenpossible at all.I could not possibly forget to thank my colleagues at the Division of Structural
Engineering, for their support and friendship. Going to work is never a burdenwith such colleagues. I am particularly thankful to Carlos Gil and Mattias Blom-fors: so many good ideas happened over a coffee. Special thanks go to the visitingguests, Xiaotong Yu and Jakob Sumearll, for the many fruitful discussions. Manythanks go to Jakob, without whom this thesis would have had very long sentencesand no Oxford´s commas.I would also like to thank my family and friends in Italy; we live far from each
other, but they have always been there when I needed support. Lastly, I wouldlike to express my gratitude to my boyfriend, Felix Eriksson. You are the mostcurious, captivating human being I know. But most of all, you appreciate thewisdom behind studying existing structures; not-existing structures are, indeed,hard to find.
vii


Thesis
This thesis presents a summary and an extension to the following appendedpapers:
[I] K. Lundgren, S. Robuschi, and K. Zandi. Methodology for testing rebar-concrete bond in specimens from decommisioned structures. Submitted.
[II] S. Robuschi, K. Lundgren, I. Fernandez, and M. Flansbjer. Anchorage ofnaturally corroded plain reinforcement bars in flexural members. Submitted.
These publications are always referred to as paper I and II according to thelabeling in the list above.
AUTHOR’S CONTRIBUTION TO JOINTLY WRITTEN PAPERS
The appended papers were prepared in collaboration with co-authors. In thefollowing, the contribution of the author of this licentiate thesis to the appendedpapers is described.
In Paper I, the author participated in the planning of the paper and also in theplanning and execution of two of the three presented examples of experimentalseries. The author contributed to the writing of the sections regarding thoseexperiments, and with comments and discussions on the remaining paper.
In Paper II, the author composed the literature study, participated in the plan-ning, and was responsible for the execution of the experimental program. Theauthor performed the analysis of the data, participated in the discussion of theresults, and took responsibility for the planning and writing of the paper.
ix

additional publications by the author
In addition to the appended papers, the author has also contributed to thefollowing publications:
S. Robuschi, K. Lundgren, I. Fernandez, K. Zandi, and M. Flansbjer. “An-chorage capacity of corroded smooth reinforcement bars in existing rein-forced structures”. In: Proceedings of the 12th fib International PhD Sympo-sium in Civil Engineering (2018), 1039–1046.S. Robuschi, I. Fernandez, K. Zandi, and K. Lundgren. “Assessment of theload-carrying capacity of existing structures with corroded smooth reinforce-ment bars.” In: Proceedings of XXIII Nordic Concrete Research SymposiumVol.B (Issue 3 2017), pp. 255–258.
x

Contents
Abstract iii
Acknowledgements vii
Thesis ix
Contents xi
1 Introduction 11.1 Background . . . . . . . . . . . . . . . . . . . . . . . . . . . . . . 11.2 Scope and Objectives . . . . . . . . . . . . . . . . . . . . . . . . . 31.3 Method and Scientific Approach . . . . . . . . . . . . . . . . . . . 31.4 Limitations . . . . . . . . . . . . . . . . . . . . . . . . . . . . . . . 41.5 Original Features . . . . . . . . . . . . . . . . . . . . . . . . . . . 51.6 Outline . . . . . . . . . . . . . . . . . . . . . . . . . . . . . . . . . 5
2 Theoretical framework 72.1 Plain Reinforcement Bars . . . . . . . . . . . . . . . . . . . . . . . 72.2 Effect of corrosion on the bond of plain reinforcement bars . . . . 92.3 Effect of corrosion on flexural members . . . . . . . . . . . . . . . 102.4 Artificial and Natural Corrosion . . . . . . . . . . . . . . . . . . . 11
3 Overview of the experimental program 133.1 Gullspång bridge . . . . . . . . . . . . . . . . . . . . . . . . . . . . 143.2 Material properties . . . . . . . . . . . . . . . . . . . . . . . . . . 15
3.2.1 Concrete . . . . . . . . . . . . . . . . . . . . . . . . . . . . 163.2.2 Reinforcement bars . . . . . . . . . . . . . . . . . . . . . . . 16
3.3 Designing of the test setups . . . . . . . . . . . . . . . . . . . . . . 17
4 Results 23
5 Conclusions and Outlook 275.1 General conclusions . . . . . . . . . . . . . . . . . . . . . . . . . . 275.2 Outlook (and future research) . . . . . . . . . . . . . . . . . . . . 28
Appendices 29
A Material properties of the concrete 31
xi

A.1 Cylindrical compressive strength . . . . . . . . . . . . . . . . . . . 31A.2 Stress-strain relationship in compression . . . . . . . . . . . . . . . 32
References 35
xii

1 Introduction
1.1 BackgroundConcrete is one of the oldest and most widely used materials in the history ofmankind: concrete floors dated 1400-1200 BC can still be observed in the Royalpalace of Tiryns, Greece. The world´s largest unreinforced concrete dome, thePantheon’s dome in Rome, dates back to about 126 AD. The first iron-reinforcedconcrete building dates back to 1853; in 1904, the first skyscraper using reinforcedconcrete was built in Cincinnati. In a survey dated 2011, about 86% of bridges inEurope were estimated to be made with reinforced or pre-stressed concrete [20].Nowadays, reinforced concrete structures constitute a large part of the world’sinfrastructure.The durability of reinforced concrete (RC) structures started to be questioned
years after the first structure was built. Today, corrosion of the steel reinforce-ments is known to be the most common cause of deterioration in RC structures[3]. Within the last few decades, a number of structural failures have been at-tributed to corrosion damages [4]. Two substances are commonly responsible forthe initiation of the corrosion process: carbon dioxide, unavoidably present inthe atmosphere, and chlorides, which are generally a result of exposure to marineenvironment or de-icing salts. The process of corrosion initiates with the depas-sivation of the reinforcement embedded in concrete, and eventually leads to theorigination of the corrosion products. This can lead to extensive damages, ableto compromise the function and structural integrity of the structure.The degradation process is linked to the nature of the corrosion product. Corro-
sion products occupy a larger volume than uncorroded steel and induces normalpressure on the surrounding concrete, eventually causing the concrete cover tocrack and spall. Simultaneously, corrosion results in a loss of cross-sectional areaof the reinforcement bar, and thus a decrease in load-carrying capacity and duc-tility of the bar. Both effects can compromise the overall structural behaviour ofthe structure. Hence, in recent years, research has been focusing on acquiring fur-ther knowledge on the corrosion process, with the ultimate goal of more preciselyassessing existing RC structures.A correct assessment of the corrosion damage allows for realistic estimations of
the service life. This is not only needed to guarantee the safety of the structurebut would also possibly avoid needless rebuilding and, consequently, be greatlybeneficial from both an economical and environmental point of view. Present-day
1

2 Chapter 1. Introduction
society requires RC structures to perform longer and withstand a higher load-carrying capacity than originally designed for. Furthermore, climate change isforeseen to increase the impact of corrosion on infrastructures [29]: higher carbondioxide concentration, warmer climate, and more frequent freezing cycles willexpedite the development of corrosion. Understanding the consequences of suchphenomena on structures is therefore of the highest importance.The oldest operative reinforced concrete structures were built with plain rein-
forcement bars. Plain bars are no longer utilized in new constructions, since theintroduction of deformed bars allowed for higher anchorage capacity through theuse of ribs. The use of plain reinforcement bars drastically diminished approxi-mately prior the mid-60s, but with large differences between countries. Swedenintroduced deformed bars during the 40s; Italy maintained use of plain bars upto the 70s, to which a large part of the existing infrastructure contains plain re-inforcement bars; and, in the UK, plain bars re-emerged for a few years in themid-1970s as a result of steel shortage due to industrial unrest.Current research is primarily oriented towards the effects of corrosion on de-
formed bars; in particular, researchers tend to investigate the impact of corrosionon the bond between the steel and the surrounding concrete; this is most sig-nificantly linked to the assessment of anchorage zones [19]. Bond of deformedbars is commonly studied as the result of three contributing mechanisms: chem-ical adhesion, friction, and mechanical interlocking between ribs and concrete,the latter giving the highest contribute to the total bond strength. The bond ofplain reinforcement bars is substantially different from the one of deformed bars.Due to the absence of ribs, mechanical interlock acts only on micro-level, betweenthe concrete and the surface roughness of the reinforcement bar. Thus, frictionand chemical adhesion play a more fundamental role. Given that a) structureswith plain reinforcement bars are still in use; b) they are most likely affected bycorrosion damages; and c) their bond properties cannot be directly compared toexisting literature, which is based on the use of deformed bars, an investigationis necessary into the behaviour of corroded, plain reinforcement bars.Several recent studies highlight the importance of the topic, testing the bond
strength of plain uncorroded bars [26] [14], and ultimately applying artificial cor-rosion to the bars to observe its affect on the steel-concrete bond, both throughpull-out tests and flexural tests[6] [7]. However, there are doubts on the soundnessof artificial corrosion methods [22][24][31][30].Testing naturally corroded specimens taken from decommissioned structures
offers the opportunity of studying corrosion as the result of exposure to naturalenvironments, without the need of using electrical current to accelerate the corro-sion process. In recent years, a few studies on naturally corroded specimens withdeformed bars were successfully carried out [16] [25], but to the knowledge of theauthor there are no published results for the case of plain reinforcement bars. Ac-cordingly, there is a need for experiments on naturally corroded structures with

3
plain reinforcement bars.
1.2 Scope and ObjectivesThe aim of this work is to increase knowledge that could contribute to the as-sessment of older RC structures with plain reinforcement bars. The work focuseson the effect of corrosion damages in the anchorage zone, by testing naturallycorroded specimens taken from a decommissioned structure. Within the overallvision of the project, the following objectives are identified:
• To find efficient ways to test the anchorage in specimens taken from existingstructures by studying the methods discussed in the literature and considernecessary improvements;
• To study the effect of different levels of corrosion on the overall behaviourand on the anchorage of bars in flexural members;
• To identify factors influencing the bond strength of plain reinforcement barsin existing structures;
Although not answered in this thesis, additional objectives were defined to meetthe overall aim of the project. The following objectives were taken into consid-eration while designing the experimental part of the project, though their resultswill be presented in future work:
• To investigate the effect of corrosion on the anchorage capacity of flexuralmembers with plain reinforcement bars with end-hooks in the anchoragezone;
• To investigate the effect of corrosion on the bond-slip relationship of corroded,plain reinforcement bars;
• To utilize the knowledge acquired through experimental work to developnumerical models that link data from visual inspection to the remainingload-carrying capacity of RC structures with plain reinforcement bars.
1.3 Method and Scientific ApproachThis work primarily comprised the design and execution of an experimental pro-gram aimed at fulfilling the objectives stated in section 1.2. All the results pre-sented in this work are the outcome of the designed structural tests and the cor-responding observations. Necessary reference was made to relevant literature forthe experimental design and data analysis. All the experiments were conductedon specimens taken from the edge beams of a 80-years old decommissioned bridge
4 Chapter 1. Introduction
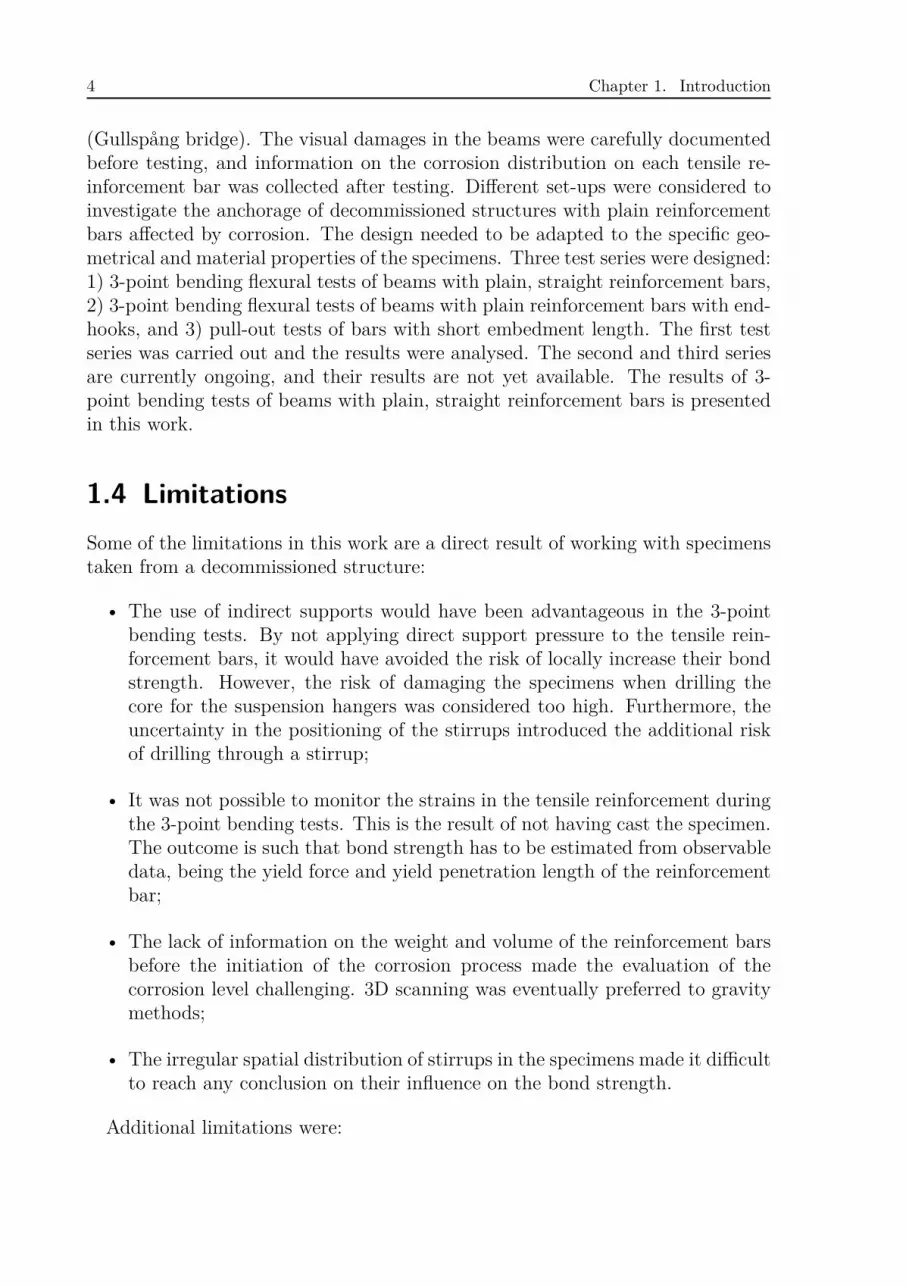
(Gullspång bridge). The visual damages in the beams were carefully documentedbefore testing, and information on the corrosion distribution on each tensile re-inforcement bar was collected after testing. Different set-ups were considered toinvestigate the anchorage of decommissioned structures with plain reinforcementbars affected by corrosion. The design needed to be adapted to the specific geo-metrical and material properties of the specimens. Three test series were designed:1) 3-point bending flexural tests of beams with plain, straight reinforcement bars,2) 3-point bending flexural tests of beams with plain reinforcement bars with end-hooks, and 3) pull-out tests of bars with short embedment length. The first testseries was carried out and the results were analysed. The second and third seriesare currently ongoing, and their results are not yet available. The results of 3-point bending tests of beams with plain, straight reinforcement bars is presentedin this work.
1.4 LimitationsSome of the limitations in this work are a direct result of working with specimenstaken from a decommissioned structure:
• The use of indirect supports would have been advantageous in the 3-pointbending tests. By not applying direct support pressure to the tensile rein-forcement bars, it would have avoided the risk of locally increase their bondstrength. However, the risk of damaging the specimens when drilling thecore for the suspension hangers was considered too high. Furthermore, theuncertainty in the positioning of the stirrups introduced the additional riskof drilling through a stirrup;
• It was not possible to monitor the strains in the tensile reinforcement duringthe 3-point bending tests. This is the result of not having cast the specimen.The outcome is such that bond strength has to be estimated from observabledata, being the yield force and yield penetration length of the reinforcementbar;
• The lack of information on the weight and volume of the reinforcement barsbefore the initiation of the corrosion process made the evaluation of thecorrosion level challenging. 3D scanning was eventually preferred to gravitymethods;
• The irregular spatial distribution of stirrups in the specimens made it difficultto reach any conclusion on their influence on the bond strength.
Additional limitations were:

5
• The use of a jack hammer to extract the bars from the beams after the 3-point bending tests resulted in damage to some of the samples. Damagedbars were removed from the database;
• Only the end-displacements of the tensile reinforcement bars were monitoredduring testing. In two experiments, the reinforcement bars in the (theoret-ical) compressive zone showed signs of end-slipping, but no data on theirdisplacement was collected;
• The use of a directly supported 3-point bending test leads to the introductionof support pressure in the anchorage zone. Even though narrow supportswere used to limit this effect, this can possibly locally enhance the measuredbond strength;
• Few studies are present in literature on corroded plain reinforcement bars.This made it difficult to properly compare the results with similar studies.
.
1.5 Original FeaturesPlain reinforcement bars are the object of very few recent works, and no investi-gation including both plain reinforcement bars and natural corrosion exist to theknowledge of this author. This study introduces the following results as originalfindings:
• Naturally corroded edge beams were taken from a 80-year old decommis-sioned bridge;
• The anchorage of plain reinforcement bars subjected to natural corrosiondamages was investigated;
• The anchorage was investigated by designing different test set-ups to becarried out on specimens extracted from the same structure, with the aim ofreaching a comprehensive view of the anchorage behaviour;
• The remaining bond strength at yielding is taken into account and evaluatedseparately from the bond strength in the unyielded zone.
1.6 OutlineThis thesis consists of an introductory part and two appended papers.The outline of the work is as follows:

6 Chapter 1. Introduction
Chapter 1 provides a background and presents the aim, method, limitations,and original features of the study;
Chapter 2 introduces the theoretical framework of the study by reviewingstate-on-the-art knowledge on the bond capacity of plain reinforcement bars,with and without corrosion damages;
Chapter 3 presents an overview of the experimental program;
Chapter 4 presents the main findings from the experimental program;
Chapter 5 addresses the main conclusions from this study and advances sug-gestions for future research.

2 Theoretical frameworkThis chapter aims at establishing the theoretical framework to this work by pre-senting state-of-the-art knowledge on the bond of plain reinforcement bars and onthe effect of corrosion on structures reinforced with such bars.
2.1 Plain Reinforcement BarsThe first RC structures were constructed with plain bars. Plain bars were eventu-ally replaced with the introduction of deformed bars. The use of deformed bars inRC construction became common during the mid-1900s, though implementationdiffered between countries: Sweden adopted them in the 1940s, Canada, USA,and Australia in the mid-1950s, and Italy maintained use of plain reinforcementbars for about 20% of RC structures through the 1980s [28]. The bond behaviorof plain bars is fundamentally different than that of deformed bars. Deformedbars increased bond capacity through the introduction of ribs to interlock withthe surrounding concrete. Their bond is the result of three different mechanisms:chemical adhesion, friction, and mechanical interlocking between the ribs of thereinforcement bars and concrete. The latter provides the largest contributionto the bond strength; the bearing action of the ribs transfers inclined forces tothe concrete. These forces are generally divided into a longitudinal component(bond), and a normal component (splitting stress). The splitting stress resultingfrom bond action can result in splitting failure, while pull-out failure originatesfrom the failure of the concrete between the ribs (Fig.2.1). On the other hand,plain reinforcement bars, having no ribs, rely mostly on adhesion and friction fortransferring forces; mechanical interlock takes place only on a micro level, betweenthe concrete and the surface roughness of the steel bar. Friction, being a functionof the normal stresses on the bar, increases with increasing confinement, and, asa result, the bond capacity of plain reinforcement bars depends on the level ofconfinement of the bar itself [21] (Fig.2.1). Sliding friction [1], as to indicate thewedging action of small particles of concrete detached by the initiation of the slip,contributes to the residual bond of plain bars.Factors such as the density of the concrete surrounding the bar and the casting
position are expected to have higher impact on the bond of plain reinforcementbars. Top-cast bars are more likely to be surrounded by less dense concrete. Thisis the result of settlement of the aggregate below the bar and the accumulation ofbleed water at the bar [2]. Lower density results in a lower bond strength than for
7

8 2 Theoretical framework
bottom-cast bars [6], since the decreased confinement reduces the normal stresseson the bar.
tb
tb
Failure
surface
Failure
surface
Figure 2.1: Failure surface: plain bars (left) and deformed bars (right) at pull-out.
In Model Code 2010 [15], the bond of hot-rolled plain reinforcement bars iscalculated as a function of the concrete compressive strength, expressed in MPa(0.3√fcm). This peak value is assumed to correspond to 0.1mm of slip. Good
and poor bond conditions (depending on the confinement of the bar) are distin-guished, and a reduction factor of 0.5 is suggested for the case of poor conditions(0.15
√fcm). Alternatively, both empirical and simplified expressions to estimate
the bond strength of plain bars embedded in concrete can be sourced from theliterature. These equations are most commonly based on results of simple pull-out tests [26] [27] [23] [14] [8]. In an attempt to appear consistent with deformedbars, many of these expressions are a function of the compressive strength. E.g.,Verderame et al.[27] estimated the maximum bond strength to 31% of the square-root of the concrete cylindrical compressive strength, in MPa, while Melo et al.[23]and Feldman and Bartlett[14] took additionally into consideration, respectively,the yield stress of steel (Melo et al.), the surface roughness, and the developmentlength (Feldman and Barlett).When investigating the influence of surface roughness on the bond of plain re-
inforcement bars, Feldman and Barlett[14] observed a relationship between bondcapacity and surface roughness. Since the bars used in the past are expected topresent a rougher surface than those produced today, in order to simulate thesurface roughness typical to older rebars, the study opted to sandblast new barsprior to lab testing. Gustavson [17] studied the influence of concrete density andsurface roughness on the bond behaviour of three-wire strands and found that anincrease in the micro-roughness of the strand surface strongly increased adhesionin the initial bond response. The study on three-wire stands also determined arelationship between the bond strength of non-corroded bars with an increase ofthe concrete density. Support pressure (a supplemental source of compressive con-finement of the reinforcing bars), has also been linked to increased bond strength[21].

9
2.2 Effect of corrosion on the bond of plainreinforcement bars
Corrosion affects RC structures in different ways:
• Corrosion changes the properties of the bar itself; by reducing the cross-section of the bar it decreases both strength and ductility;
• Corrosion products occupy a larger volume than the uncorroded steel. Thisintroduces pressure between the bar and the surrounding concrete. As thecorrosion product continues to develop, this pressure may induce crackingand/or splitting of the concrete cover;
• Corrosion introduces a layer of corrosion product that is substantially weakerthan the original steel-concrete interface.
The two last points, by affecting the concrete-steel interface, influence the bondbetween the steel and the surrounding concrete. Cairns et al.[5] performed a studyon the changes in friction characteristics of the interface between corroded rein-forcement and concrete using artificial corrosion methods; the results indicatedthat the corrosion product does not impair friction characteristics for specimensshowing less than 1.0 mm surface cracks. It was concluded that volumetrical ex-pansion is the effect of corrosion that has the highest impact on the bond capacity.Volumetric expansion affects the bond between plain bars and the surroundingconcrete in different ways: if no cracks are present in the anchorage region, the in-crease in mechanical pressure provided by the corrosion product would noticeablyincrease friction, as friction is a function of the normal stresses on the concrete-steel interface [7]. There is a limit, however, to this phenomena, in that excessivepressure is likely to split the concrete cover and consequently lead to a loss ofconfinement.An additional factor that is likely to have an impact on the way corrosion
affects the bond capacity is the difference in concrete density between top-castand bottom-cast bars. This has been shown in tests by Cairns et al. [6]. Thetests investigated the bond behaviour of artificially corroded plain bars usingRILEM pull-out tests and "beam-end" tests. The results show that the reportedbond capacity of top-cast bars substantially increased with the introduction ofsmall levels of corrosion. The bond capacity of corroded top-cast rebars increasedto match the measured capacity of uncorroded bottom-cast bars. Bottom-castbars, on the other hard, performed better in an uncorroded state but were moreprone to crack and therefore to lose bond capacity with increasing corrosion level.Stirrups were found to be of high importance for maintaining bond capacity withincreasing corrosion level.

10 2 Theoretical framework
2.3 Effect of corrosion on flexural membersCairns et al.[7] investigated the effect of corrosion on the behaviour of flexuralmembers with plain bars. A consistent increase in strength was observed in theartificially corroded beams when compared to non-corroded specimens. The ad-ditional strength was attributed primarily to the increase in bond due to thevolumetric expansion of the corrosion product inducing normal pressure. Mostof the tested beams were subject to flexural failure, preceded by yielding of thetensile reinforcements. Although the tests did not include anchorage failure (nomeasurement of the peak bond capacity), the bond was observed to influence theload-carrying capacity of the beams. The decrease in bond capacity due to yield-ing of the tensile reinforcement led to a change in the load-carrying mechanism,from purely flexural behaviour to a hybrid arching/flexural action.A similar mechanism was observed in studies by Dong et al.[9] and Feldman
et al.[13]. Both studies investigated the influence of bond capacity on the failuremechanism of flexural beams. Dong et al.[9] performed 4-point bending testson twenty, artificially corroded, RC beams with deformed bars. A transitionfrom beam to arch action was observed in the later loading stages in connectionto a degraded bond capacity in the bars due to corrosion. Feldman et al.[13]investigated the transition from beam action to arch action in flexural memberswith plain bars, observing the bond strength distribution along the length of thetensile reinforcement. High bond stresses were observed adjacent to the supportsfor beams where shear was carried principally by arch action. Arch action wasassociated with a marked reduction of flexural stiffness. The change from flexuralto arch action can be explained by analysing the relationship between the shearforce, V , and the bending moment, M , in a section x [9]:
V = dM(x)dx
(2.1)
Considering M(x) is equal to the force, F (x), in the bar, multiplied by the leverarm, z(x), equation 2.1 can be rewritten as:
V = dF (X)dx
z(x) + F (x)dz(x)dx
(2.2)
The first term in equation 2.2 represents beam/flexural action: the force in thebar decreases outside the high moment region, while the lever arm is constant.Shear forces need to transfer from the reinforcement to the surrounding concretethrough bond for beam action to occur. Low bond capacity limits the amountof beam/flexural action. The second term represents arch action: the decrease ofthe moment outside the high moment region is linked to the decrease of the leverarm, but the force in the bars is constant. Pure arch action does not involve thetransfer of forces between the tensile reinforcement and the surrounding concrete.

11
A decrease of bond capacity, due to, e.g., yielding of the tensile reinforcements,corresponds thus to a transition from beam action to arch action.
2.4 Artificial and Natural CorrosionAll available literature pertaining to the assessment of RC structures with cor-roded, plain reinforcement included the application of artificial corrosion tech-niques to simulate corroded conditions. Artificial corrosion techniques are popu-lar due to a substantially reduced waiting time in the exposure of specimens. Itis possible to simulate 30-years of corrosion in a matter of a few months. Themost commonly used method for artificially inducing corrosion is the impressedcurrent technique (or galvanostatic method). This technique applies a constantcurrent from a DC source to the rebar embedded in concrete to induce corrosion.Chlorides are often used as depassivating substance, either by adding salt to theconcrete during the mixing process or by exposing a pre-cracked specimen to ahighly concentrated salt solution.Although the use of artificial corrosion has evident benefits, several uncertain-
ties have been raised on how well it captures real-time corrosion formation thatwould occur naturally in RC structures. Austin et al.[24] observed differencesin the electrochemistry behind natural and artificial, chloride-induced corrosion.The primary electrochemical difference from naturally corroded system was thegradual reduction of the local pH due to electrolysis of the pore water. This maylower the critical chloride concentration required to induce corrosion and acceler-ate the degradation process. Saifullah and Clark [22] showed that differing currentdensity has an effect on the bond strength. Yuan et al.[31] found that differentcorrosion-induction methods led to different surface characteristics in corrodedsteel bars. The galvanostatic method produces a homogeneously corroded sur-face, whereas naturally corroded specimen commonly display surface heterogene-ity with randomly distributed pitting. Williamson and Clark [30] tested artificiallycorroded plain bars with different levels of corrosion (0−20%) and current density(0.25−2mA/cm2). The current density was found to be responsible for changes inthe morphology of the corrosion product and, consequently, in the bond strength.Testing naturally corroded specimens taken from decommissioned structures
offers an alternative to the use of artificial corrosion methods. This allows forthe study of damages due to many factors influencing the aging processes of RCstructures, such as corrosion, creep, and freezing-thawing cycles. Examples ofsuccessful studies on naturally corroded specimens can be found in [16] [25] [32].To the knowledge of the author there are no published studies on specimens withnaturally corroded, plain, reinforcement bars.


3 Overview of the experimentalprogram
The experimental program was designed to test and obtain data on the anchorageof plain reinforcement bars from the edge beams of a naturally corroded 80-yearold bridge. Fig.3.1 gives an overview of the experimental program, includingfuture plans.
bar starts
to slip
20 Three-Point bending
tests
deflection
load
end-slip
load
bar1
bar2
Cleaning,3D scanning
and cutting of the bars
l
uy
= unyielded
anchorage
length
Corrosion level
Tensile tests
of the
unyielded bar
f
y,s
BOND
STRENGTH
Edge beams
Gullspång bridge1935 - 2016
Reinforced
concrete bridge
with plain bars
Fy = Yield force
0.9 m
l1,uy
yield penetration
l2,uy
tb
tb
tb
tb
tb
tb
F
y
f
y,s
174 Pull-out tests
of 5cm, 7.5cm,
10cm.
Fτ
Cleaning and
3D scanning
Corrosion level
Pull-out
force
BOND
STRENGTH
0.9 m
7 Three-Point bending
tests with end and
spliced-hooks
0.9 m
50 m
Hook
capacity
TEST SERIES 2 TEST SERIES 3
TEST SERIES 1
Figure 3.1: Overview of the tests planned from the edge beams of Gullspång bridge.
13

14 3 Overview of the experimental program
Three different test series were planned:
1. 20 3-point bending tests of beams with plain reinforcement bars;
2. 7 3-point bending tests of beams with plain reinforcement bars featuringend-hooks and positioned in two different configurations (4 with one pair ofhooks and 3 with spliced hooks);
3. 174 pull-out tests of reinforcement bars with various embedment length (5,7.5 and 10 cm).
This thesis focuses on the first test series, as the other two are still ongoing. Abrief overview of the remaining two experimental series is provided.
3.1 Gullspång bridgeGullspång bridge (Fig.3.2) was built in 1935 and torn down in 2016 due to heavycorrosion damages. The edge beams were carefully taken out, cut in segments anddesignated to be used for research. Having been exposed for 81 years to weatherconditions that include snow, freezing-thawing cycles and wind, as well as to de-icing salts and traffic loads, the beams presented different cracks on their surface,and spalling strongly affected the geometry in some locations (Fig.3.2). Signs ofcorrosion were clearly visible, but not uniformly distributed.
Figure 3.2: Gullspång bridge: view of the bridge before demolition (left) and exposedtensile reinforcement bars and spalling in an edge beam (right).Photos courtesy of Ignasi Fernandez
The edge beams were characterized by φ6 stirrups, open on the bottom sidewith respect to the original position on the bridge and 2φ16 plain reinforcementbars, top and bottom (Fig.3.3). The concrete cover varied approximately be-tween 20 and 55 mm, but was reported equal to 34 mm in the original drawings.

15
30
0250
Remaining partof the cut-offbridge slab
INNER SIDE OFTHE BRIDGE
OUTER SIDE OFTHE BRIDGE
Φ16
Φ6/c300mmTO TI
BIBO
Figure 3.3: The beam cross-section geometry (according to the original drawings)is shown on the left. Photographs of two beam cross-sections are shown on the right.Bar naming convention is as follows: TO= Top-Outer, TI= Top-Inner, BO= Bottom-Outer and BI= Bottom-Inner. The remaining part of the slab-deck is clearly visibleto the right. All dimensions are in mm.
Average cross-section dimensions were 300x250 mm. All specimens containedapproximately a 50 mm part of the slab deck. Spacing of the stirrups rangedbetween 100 and 450mm, in contrast to the typical 300mm spacing referenced onthe drawings.All specimens underwent visual inspection prior to testing, to record exact
measurements of the cross-section geometry and locations (and width) of existingcracks. The average opening of the cracks was measured with an optical micro-scope and their location and length were documented and photographed. Dataon cracks was used to group the anchorage zones into three different categories:anchorage zones with cracks smaller than 0.5 mm (C1), anchorage zones withcracks between 0.5 and 1 mm (C2), and anchorage zones with cracks with morethan 1 mm of average opening (C3). Additional categories, ’reference’ (R) and’severely damaged’ (S) were added to provide low and upper bound groupings ofdamage state.
3.2 Material properties
The original drawings cited an average concrete compressive strength of 30MPaand a nominal yield strength of reinforcement of 300MPa. This information wasnot consistent with test measurements from a field survey dated 1988. The steelyield point was recorded at approximately 250MPa, and the concrete compressivestrength approximately 45MPa. The increased compressive capacity is consistentwith the age of the bridge. Further material tests were therefore performed toreach a more comprehensive knowledge on the material properties of the speci-mens.

16 3 Overview of the experimental program
3.2.1 ConcreteEight concrete cores (100x200mm) were drilled according to EN 12504-1:2009 [12]and tested for cylindrical compressive strength, fc, according to EN 12390-3:2009[11]. The result was an average compressive strength of 45.6 MPa, with a standarddeviation of 4.6 MPa.Three additional cores (100X200mm) were tested to characterize the concrete
compressive curve. The result was an average compressive strength of 47.6 MPa,with a standard deviation of 0.4 MPa, and an average elastic modulus of 27.4GPa, with a standard deviation of 3.3 MPa. Wedge splitting tests are plannedto characterize the behaviour of the concrete in tension. Further information onthe concrete material properties can be found in PaperI (Section ??) and in theAppendix (Section A).
3.2.2 Reinforcement barsAfter testing, the tensile reinforcement bars of the beams tested in 3-point bendingwere extracted, cleaned, 3D scanned, and tested in tension. The results wereused to evaluate the bond strength of the bars in the beam tests. Additionally,uncorroded bars were extracted from untested segments of the bridge. The resultsfrom uncorroded bars were used to characterize the mechanical properties of thesteel. From 27 tests, the tensile behaviour of the bars could be estimated to anaverage yield stress of 259.6 ± 10.1 MPa. Further information can be found inPaper II (Section ??).Two bars were subjected to additional tests so as to characterize the material
properties of the steel. The bars were uncorroded and extracted from an untestedsegment of the bridge. Each bar was loaded first in tension until indication ofstrain hardening and then unloaded. The bars were then reloaded until rup-ture. Fig. 3.4 shows good agreement with the hypothesis of isotropic hardening,meaning that, by testing the already hardened bar in tension, it was possible toestimate, with good confidence, the force reached in the bar when the first testwas interrupted.

17
0 0.05 0.1 0.15 0.2 0.25 0.3 0.35 0.4 0.45
0
10
20
30
40
50
60
70
Figure 3.4: Example of tensile test of an uncorroded reinforcement bar from Gull-spång bridge: the same bar was loaded in two different stages to better capture themechanical properties of the steel.
The rebar type and quality reflect common practice at time of construction.Bars were generally of lower capacity compared to the modern counterparts andanchorage was assured through use of end-hooks, when it was common to havelow yield strength and anchorage was achieved by means of bending the bars inhooks.
3.3 Designing of the test setupsTesting specimens taken from decommissioned structures present some challenges.Test set-ups must be adapted to the given material and geometrical properties.Modifications often risk damaging the specimens and must be done carefully.Another complication is that the geometrical properties, such as concrete coverand stirrup spacing, often vary from specimen to specimen. Appropriate, non-destructive methods to investigate the characteristics of each specimen are needed.Design of the test set-up was divided in three main phases:
• Phase 1: a study was conducted into available literature and finite element(FE) modeling was employed to assess possible set-up configurations;
• Phase 2: three prospective test configurations were tested in-lab as part of apilot investigation. The results of this study would inform the test procedure;
• Phase 3: The test set-ups for the experimental campaign was chosen byanalysing and comparing the results of the pilot study.
In the preliminary phase, the following general design requirements were estab-lished:
• The test set-up should have a high chance to reach anchorage failure;

18 3 Overview of the experimental program
• The test set-up must be simple and easy to carry out without need forstrengthening of the specimen;
• The tensile reinforcements must be disturbed as little as possible;
• Clear boundary conditions must be established for comparison with a FEmodel;
• The test set-up must allow for testing both bottom-cast and top-cast bars.
Two 4-point bending tests and a 3-point bending test were tested in a pilot study.Descriptions and details of the pilot testing is given in Paper I (Section ??). Adirectly supported 3-point bending test was selected to provide the best collectionof results, owing to the simplicity of the test set-up and the well defined crackpattern, characterized by a single bending crack underneath the load plate. The4-point bending test was not selected due to higher uncertainties in the crackpattern. Three bending cracks were observed in the high moment region beforeend-slip of the reinforcements, leading to higher scatter in the anchorage lengthof the bars.Twenty beam specimens were tested. Figure 3.5 gives details on the beam
geometry and the 3-point bending test configuration. The tested beams were 900mm long, with a theoretical span of 700 mm. They were supported on one side bya narrow support (50x100 mm) and a full support (50x250mm) on the oppositeside. Both the load plate and the two supports consisted of a steel block and athin wood-fibre layer inserted between steel and concrete. The aim of the narrowsupport was to minimize the effect of support pressure. To meet this objective,a smaller support plate was positioned in the middle of the beam (between thebars) and specifically located on the side expected to have anchorage failure. Thespecimen was specifically cut to have a stirrup external to the narrow support tohelp redistribute the higher concentrated stresses generated by the support. Onthe opposite end, at the location of the full support, the ends of the reinforcing barswere restrained from anchorage failure by means of a bolt/washer configuration.However, out of the first four tests, two beams showed bending of the washersand unwanted slipping of the restrained tensile reinforcements. It was opted notto restrained the reinforcement bars, but to monitor the end-slip on both sidesfor subsequent beams.

19
30
0
900
700
75
narrow support
full support
40
50
stirrup
100
50
90
450 350
300
4
5
°
4
5
°
34
100
250
Figure 3.5: Experimental set-up and view of the narrow support for a beam testedupside-down compared to its position on the bridge.
Due to the high cracking and low bending moment in the cross section of thebeams, it became necessary to include the effect of bar yielding on the anchorage ofthe tensile reinforcements. Yielding of the reinforcement bars took place in all butone of the 20 beams tested 1, the low yield strength of the tensile reinforcementresulting in the bars reaching yield stress near the time of opening of the firstbending crack. Yielding, by reducing the diameter of the bar, results in a local lossof bond strength. Slipping of the tensile reinforcement took place after the openingof one or two major bending cracks and yielding of the tensile reinforcements. InFig.3.6, the typical crack patterns exhibited by the specimens are shown. With thegiven design of the beams and the condition of the specimen, it was not possibleto initiate shear failure before anchorage failure.
Generated with GO M C orrelate 2017
5/5
17H
[%]
0.000
0.200
0.400
0.600
0.800
1.000
1.200
1.400
1.600
1.800
2.000
X
Y
Z
13 .01 .2015
230 Geometry reference: 1
O riginal alignment
Generated with GO M C orrelate 2017
3/3
9B
[%]
0.000
0.200
0.400
0.600
0.800
1.000
1.200
1.400
1.600
1.800
2.000
X
Y
Z
13 .01 .2015
217 Geometry reference: 1
O riginal alignmentFigure 3.6: Beam 17H (Left) and Beam 9B (Right): example of typical crack pat-terns, as captured by Digital Image Correlation (DIC) cameras.
The second series of tests designed for the specimen from Gullspång bridgeconsisted of seven 3-point bending tests where the bars were bent into hooks.1 A total of 4 rebars slipped without yielding in the anchorage zone. However, only one beam
(10I) had both the tensile reinforcement bars failing in anchorage without yielding

20 3 Overview of the experimental program
This is typical of anchorage regions in structures with plain bars. The hooksappeared in one of two configurations (See Fig.3.7):
• The tensile reinforcement bars have a single pair of hooks at one end. Thisis typical for specimens cut from the ends of the edge beams;
• The tensile reinforcement bars are spliced, and two pairs of hooks are present.This was a typical feature every 6-8 m along the length of the edge beams,given the maximum length limitations of rebars at the time of construction.
The test configuration is similar to that used for the beams without hooks. Oneexception is that all rebars were restrained at the ends through use of a nut/washerfixture. The objective was to assess the anchorage capacity of the hooks and notthe end-slip of the straight reinforcement. At the time of printing of this thesis, thebeams were already tested, but data on the corrosion level of the bars are still to beobtained. The tensile reinforcement bars are to be cleaned and 3D scanned, andthe results are to be processed. The two categories of beams exhibited differentfailure modes in the structural tests. The 3 beams with spliced hooks failed inshear. The 4 beams with end-hooks failed in bending. Failure of the hooks wasnot observed in any of the tests.
RESTRAINS
SPLICED HOOKS
RESTRAINS
RESTRAINS
END HOOKS
900 900
Figure 3.7: Test set-up for beams with end hooks (left) and spliced hooks (right). Allmeasurements in mm.
The third series of tests was designed to avoid the situation of reinforcementreaching the yield point. Direct pull-out tests were performed using cut sections(50, 75 and 100 mm in thickness ) from untested segments of the edge beamsfrom Gullspång bridge. The test set-up required drilling, threading, and insertinga threaded rod in the individual rebars. Thereafter, each individual rebar waspulled out using a hydraulic load cell. A special rig was designed and produced(See Fig.3.8). This consisted of three legs, two of which could be length-adjustedto account for any skew angle between bar and cut concrete surface. The need ofavoiding yielding of bars gave an upper limit of 100 mm embedment length. Thelower limit was set to 50 mm, for feasible cutting of concrete slices and drilling (20mm deep) not to affect the major part of the length. Based on these arguments,

21
embedment lengths of 50, 75, and 100 mm were chosen. There was a total of 174bars, of which 104 were in concrete without visible damage, 35 had cracks, and35 had some spalling of the concrete cover. At the time of printing of this thesis,all the reinforcement bars were tested, extracted from the cross-sections, and arein the process of being cleaned and 3D scanned. A rough first approximation ofthe bond stress at peak shows value comparable to the flexural tests in the firsttest series and a large scatter.
Figure 3.8: Pull-out test set-up


4 ResultsIn this section, an overview of the 3-point bending test series is provided anddiscussed. These results are presented and discussed further in Paper II (Section??). A total of 20 beams were tested in 3-point bending. Slip of the tensilereinforcement bars was observed in 18 of them, after the opening of one or twobending cracks. The other two beams experienced rupture of the bolt/washersystem used in an attempt to prevent anchorage failure on one end of the beam.Section 3.3 details the rationale behind this restraint system. 9 beams were testedas positioned on the bridge, and 11 were tested upside-down.In Fig.4.1, mid-span deflection is plotted as a function of the applied load.
The applied load was sourced from the hydraulic load cell and the mid-spandeflection was extrapolated from data obtained with Digital Image Correlation.The initiation of slip of the reinforcement bars, for each test specimen, is marked.Colors are used to differentiate the observed external damage respective to theconcrete surrounding the individual rebars and the marker symbol indicates top-cast and bottom-cast positioning.
0 5 10 15 20 25Mid-span Deflection [mm]
0
50
100
150
200
250
Load
[kN
]
17C
10I 10I
16K
RCSTop CastBottom Cast
Figure 4.1: Load-Mid-span deflection curves for the 3-point bending tests. The mark-ers show where each bar started to slip; colours indicate the level of damage in theanchorage zone. The influence of the cast position is shown by asterisk for top-castand squares for bottom-cast bars. The names of the beams where end-slip of one ormore bars took place without yielding are marked.
23

24 4 Results
All the beams were characterized by the opening of one, or maximum two,major bending cracks localized in the mid span. In most cases, yielding of tensilereinforcement was noted shortly after cracking; though, anchorage failure didoccur for 4 bars in three beams preceeding tensile yielding. In all other bars,the force was increased beyond strain-hardening condition of the reinforcementbefore the eventual slip of rebars and loss of load. Thus, the bars started to slipat a point when other failure mechanisms had already initiated. The anchoragecapacity did not limit the load-carrying capacity of the specimen. Thus, theanchorage was enough to carry the yield force. End-slip was observed at a laterstage, when yielding of the reinforcements locally decreased the bond strength.The deformation capacity was therefore affected by the anchorage failure.After the 3-point bending tests, the tensile reinforcement bars were extracted
from the beams, cleaned and 3D scanned. Measurements from the 3D scan datawere used to estimate the corrosion level as the loss of cross sectional area. 3Dscanning allowed as well for the identification of the yielded length of the bar. Toaccount for the effect of yielding on the bond strength, a ’yielded’ zone was dis-tinguished from an ’unyielded’ zone. The bond strength was evaluated separatelyfor each zone, using data acquired from tensile testing of the tensile reinforcementbars. Paper II (Section ??) contains detailed information on the evaluation of thebond strength.In Fig.4.2, the average corrosion level of the bars is presented and plotted against
the calculated bond strength in the unyielded zone. Different colours denote thedeterioration classification introduced in Section 3.1, based on visual inspection ofthe beams prior to testing. Separating the results by bar position highlights theinfluence of casting position on the bond strength. This showed to be a criticalfactor relative to maximum average bond strength.Considering first the bars with no relevant corrosion amounts, top-cast bars
were found to have a lower bond strength than bottom-cast bars. This is believedto be due to different densities of the surrounding concrete, where lower densityconcrete provides less confining pressure and thus reduced friction. Consideringtop-cast bars with small amounts of corrosion product, the bond strength is foundto increase up to values comparable with the bond strength of bottom-cast barswithout corrosion. Top-cast bars present as well less external cracks than bottom-cast bars for the same corrosion level. Bottom-cast bars are shown to lose bondstrength with increasing corrosion levels.It is interesting to note that the average bond strength calculated from the
results of the experiment was significantly higher than data available in liter-ature.This conclusion even acknowledges the high scatter in the results. Theaverage bond strength of the bars was calculated as 7.39 MPa, with a standarddeviation of 3.33 MPa; in contrast, Cairns et al. [6] presents measured bondstrengths between 1 and 3 MPa. One explanation for the different outcomes be-tween this study and the literature is that no previous study made use of naturally

25
0
2
4
6
8
10
12
14
Avera
ge
Bo
nd
Str
eng
th [M
Pa]
Top-Outer Top-Inner
-2 0 2 4 6 8 10 12
Average Corrosion Level [%]
0
2
4
6
8
10
12
14
Avera
ge B
ond S
trength
[M
Pa]
Bottom-Outer
-2 0 2 4 6 8 10 12
Average Corrosion Level [%]
Bottom-Inner
Many specimens had
extensive external damages
in this location and the bars
fell off during cutting of the
specimens indicating zero
bond strength.
Figure 4.2: The average bond strength in the unyielded zone is plotted against theaverage corrosion level. Different colours are used to indicate the level of damage inthe anchorage zone visible before the test. Results from different positions in the crosssection are displayed separately: top-outer (left, top), top-inner (right, top), bottom-outer (bottom, left), bottom-inner (bottom, right). The shadowed area represents theaccuracy in the evaluation of the corrosion level at zero, due to the uncertainties inthe reference area of the uncorroded bars
corroded specimens. Factors to be expected to contribute to this difference are aswell: the difference in casting techniques ( concrete in 1930s was usually stampedinstead of being vibrated), the surface roughness of the bars, the presence of activesupport pressure, and the evaluation method.In Fig. 4.3, the average corrosion level of the bars is presented and plotted
against the calculated bond strength in the yielded area. The results presented arather small scatter, with an average of about 1 MPa. They also show a noticeable

26 4 Results
loss of bond strength after yielding (about 90% loss compared to the bond strengthin the unyielded zone of the same rebar). However, less data were available dueto damages in the extraction process of the bars.
110 120 130 140 150 160 170 180
Yielded length [mm]
0
0.5
1
1.5
Ave
rag
e B
on
d S
tre
ng
th (
yie
ld z
on
e)
[MP
a]
Top Cast
Bottom cast
Figure 4.3: The average bond strength in the yielded zone is plotted against the lengthof the yielded zone in the tested bar. The influence of the cast position is shown byasterisk for top-cast and squares for bottom-cast bars.

5 Conclusions and Outlook
5.1 General conclusionsThe scope of this work was to investigate the bond of plain reinforcement barssubjected to natural corrosion damage in concrete. The major outcomes of thisinvestigation are as follows:
• Testing of specimens sourced from decomissioned structures allows for a com-prehensive overview of material and geometrical characteristics typical of el-der constructions. Some of these aspects, such as surface roughness of thereinforcement bars, different casting techniques, and aggregate sizes may leadto differing results as compared to tests on newly produced specimens;
• Testing of specimens sourced from existing structures requires adaptationsof conventional test configurations to meet the particular conditions of thesample specimen. This introduces additional challenges. More than oneseries of tests may be needed to fully characterize the intended phenomena;
From the outcome of the first test series, where 3-point bending tests were con-ducted on twenty, naturally corroded beams, the following conclusions were drawn:
• The loss of bond strength due to yielding of the bar was the main causeof anchorage loss in the tensile reinforcements. The bond strength in theyielded area was equal to about 10% of the bond strength in the unyieldedzone of the same rebar;
• The casting position was recognized as an important factor for the bond ofplain bars, attributed to concrete density. The different casting positionsinteract differently with the corrosion;
• Bottom-cast bars have a higher bond strength than top-cast bars when neg-ligible amounts of corrosion are present;
• Bottom-cast bars lose bond strength with increasing corrosion level. Theconcrete surrounding the bar was found prone to spalling cracks for smallamounts of corrosion;
• Top-cast bars gain bond strength with small amounts of corrosion. The bondstrength of corroded top-cast bars was in the range of the bond strength ofuncorroded bottom-cast bars;
27

28 5 Conclusions and Outlook
5.2 Outlook (and future research)The following is suggested for future research:
• To analyze the results from the second and third test series, briefly introducedin this thesis (beams with hooks and pull-out tests). This will provide furtherknowledge on the anchorage and the bond of plain reinforcement bars, andon how it is affected by corrosion.
• The impact of additional confinement caused by the supports in the 3-pointbending test can be evaluated numerically using non-linear, FE modeling;
• Results from the experimental study can be used to calibrate a bond-slipmodel to be used in FE modelling for the assessment of structures with plainreinforcement bars, as a function of the corrosion level;
• Visible, external damage can be linked to the anchorage capacity of naturallycorroded plain reinforcement bars;
• Advanced, non-destructive tomography techniques, such as neutron imaging,could be used to observe the distribution and the composition of the corrosionproduct in naturally corroded specimens. The results can be compared toartificially corroded specimens, possibly with similar properties;
• Additional tests of specimens with naturally corroded plain bars can helpvalidate the results of this work. The specimens can be taken from a differentstructure, possibly exposed to a different environment;
• Tests on artificially corroded specimens would make an interesting compari-son with the results of this work. The specimens can have similar character-istics to the specimens used in this work. Influencing factors such as surfaceroughness of the bars and different casting techniques can be investigated ina controlled environment.

Appendices


Appendix A
Material properties of the concrete
In this appendix the results of the tests characterising the compressive behaviourof the concrete are given. Two different tests results are presented: the cylindricalcompressive strength and the stress-strain relationship in compression.
A.1 Cylindrical compressive strength
Eight concrete cores (100x200mm) were drilled according to EN 12504-1:2009 [12]and tested for cylindrical compressive strength, fc, according to EN 12390-3:2009[11]. The result was an average compressive strength of 45.6 MPa, with a standarddeviation of 4.6 MPa (See Table A.1).
Table A.1: Cylindrical compressive strength, fc, results.
Core ID Height [mm] Diameter [mm] Density [kg/m3] Compressive force [kN] fc [MPa]
17D 198 100 2400 402 51.0
10G-A 200 100 2380 378 48.0
14D 198 100 2380 346 43.9
18A 197 100 2360 388 48.9
10C 199 100 2380 358 45.4
16B 196 100 2390 293 37.1
14H 198 100 2370 382 48.5
10G-B 200 100 2380 328 41.6
Average 198 100 2380 359 45.6
Std 1.4 0 12 36 4.6
31

32 A Material properties of the concrete
A.2 Stress-strain relationship in compressionThree cores (100X200mm) were tested to characterize the concrete compressivecurve. The stabilized secant modulus of elasticity Ec,s was measured accordingto EN12390-13:2013 (method B). After determination of the modulus of elastic-ity, the stress-strain diagram in compression were obtained in accordance withEN12390-3:2009 [11] and EN12390-13:2013 [10], with the exception that the loadwas applied in displacement-control with a displacement rate of 0.2 mm/min. Thecompressive strength, fc, was defined as the peak stress shown on the compressivecurve. The results of these tests are given in Fig. A.1 and Table A.2.
Table A.2: Cylindrical compressive curves results.
Core ID Height [mm] Diameter [mm] Density [kg/m3] EC,s [GPa] fc [MPa]
17G 194.2 100.1 2350 25.1 47.3
10H 198.3 100.1 2381 31.1 47.4
10G 195.2 100.1 2365 26 48.1
Average 195.9 100.1 2365 27.4 47.6
Std 2.1 0 16 3.3 0.4
-0.1 0 0.1 0.2 0.3 0.4 0.5 0.6
0
10
20
30
40
50
Figure A.1: Stress-strain curves of tested cores 17G, 10H, and 10G.
Two of the three tested cores showed a change in the elastic slope at low stresses.This is not usual, however, there are two possible explanations to this behaviour.A change of stiffness in the ascending branch of the stress-strain curve often indi-cates frost-damage in the concrete sample [18]. This is likely linked to the presenceof randomly oriented micro-cracks prior testing, resulting from freeze-thaw cycles.Large strains at peak stresses and a more ductile behavior are generally as well

33
associated with frost-damage concrete. However, Hanjari et al. [18] observed asignificant decrease of the compressive strength at peak stress in presence of frostdamages. This did not apply to the three tested specimens. There was no sig-nificant difference in the compressive strength at peak between the three testedsamples, even if only two of the three showed changes in the ascending branchof the elastic slope. A second reason for such behavior could be found in theunevenness of the external surface of the cores. At the surface, cut-off parts oflarge aggregates were observed. This may have introduced uneven deformationsin the core. Wedge-splitting tests are planned for characterizing the behaviour ofthe concrete in tension. This will allow to further investigate this behaviour.


References[1] Duff Abrams. “Test of Bond Between Concrete and Steel”. PhD thesis. 1913
(cit. on p. 7).[2] ACI Committee 408. “ACI 408R-03 Bond and Development of Straight Re-
inforcing Bars in Tension”. In: American Concrete Institute (2003), pp. 1–49(cit. on p. 7).
[3] B. Bell. “Sustainable bridges.” In: European Railway Bridge Problems D1.3(2004) (cit. on p. 1).
[4] Luca Bertolini, Bernhard Elsener, Pietro Pedeferri, and Rob Polder. Corro-sion of steel in Concrete. Prevention, Diagnosis, Repair. Weinheiim, Ger-many, 2004, p. 392. isbn: 3527308008 (cit. on p. 1).
[5] J. Cairns, Y. Du, and D. Law. “Influence of corrosion on the friction char-acteristics of the steel/concrete interface”. In: Construction and BuildingMaterials 21.1 (2007), pp. 190–197. issn: 09500618. doi: 10 . 1016 / j .conbuildmat.2005.06.054 (cit. on p. 9).
[6] J Cairns, Y Du, and D Law. “Residual bond strength of corroded plainround bars”. In: ConRes 58.4 (2006), pp. 221–231. issn: 00249831. doi:10.1680/macr.2006.58.4.221 (cit. on pp. 2, 8, 9, 24).
[7] J. Cairns, Y. Du, and D. Law. “Structural performance of corrosion-damagedconcrete beams”. In: Magazine of Concrete Research 60.5 (2008), pp. 359–370. issn: 0024-9831. doi: 10.1680/macr.2007.00102. url: http://www.scopus.com/inward/record.url?eid=2-s2.0-57849162791&partnerID=tZOtx3y1 (cit. on pp. 2, 9, 10).
[8] John Cairns and Lisa Feldman. “Strength of laps and anchorages of plainsurface bars”. In: November 2017 (2018), pp. 1782–1791. doi: 10.1002/suco.201700242 (cit. on p. 8).
[9] Wei Dong, Jiabing Ye, Yuki Murakami, Hideki Oshita, Shuichi Suzuki, andTomoaki Tsutsumi. “Residual load capacity of corroded reinforced concretebeam undergoing bond failure”. In: Engineering Structures 127 (2016), pp. 159–171. issn: 18737323. doi: 10.1016/j.engstruct.2016.08.044. url: http://dx.doi.org/10.1016/j.engstruct.2016.08.044 (cit. on p. 10).
[10] EN 12390-13 (2013) Testing hardened concrete: Determination of secantmodulus of elasticity in compression. Standard. Brussels, Belgium: EuropeanStandardization, 2013 (cit. on p. 32).
35

36 References
[11] EN 12390-3 (2009) Testing harded concrete. Part 3: Compressive strengthof test specimens. Standard. Brussels, Belgium: European Standardization,2009 (cit. on pp. 16, 31, 32).
[12] EN 12504-1 (2009) Testing concrete in structures. Cored specimens. Taking,examining and testing in compression. Standard. Brussels, Belgium: Euro-pean Standardization, 2009 (cit. on pp. 16, 31).
[13] Lisa R. Feldman and F. Michael Bartlett. “Bond in flexural members withplain steel reinforcement”. In: ACI Structural Journal 105.5 (2008), pp. 552–560. issn: 08893241. doi: 10.14359/19938 (cit. on p. 10).
[14] Lisa R. Feldman and F. Michael Bartlett. “Bond strength variability inpullout specimens with plain reinforcement”. In: ACI Structural Journal102.6 (2005), pp. 860–867. issn: 08893241 (cit. on pp. 2, 8).
[15] FIB. fib Model Code. September. 2013, pp. 152–189. isbn: 9783433604090.doi: 10.1002/9783433604090.ch6. url: http://doi.wiley.com/10.1002/9783433604090.ch6 (cit. on p. 8).
[16] Raoul François, Inamullah Khan, and Vu Hiep Dang. “Impact of corrosion onmechanical properties of steel embedded in 27-year-old corroded reinforcedconcrete beams”. In: Materials and Structures/Materiaux et Constructions46.6 (2013), pp. 899–910. issn: 13595997. doi: 10.1617/s11527-012-9941-z (cit. on pp. 2, 11).
[17] R. Gustavson. “Experimental studies of the bond response of three-wirestrands and some influencing parameters”. In:Materials and Structures/Materiauxet Constructions 37.266 (2004), pp. 96–106. issn: 13595997. doi: 10.1617/13909 (cit. on p. 8).
[18] Kamyab Zandi Hanjari, Peter Utgenannt, and Karin Lundgren. “Experimen-tal study of the material and bond properties of frost-damaged concrete”.In: Cement and Concrete Research 41.3 (2011), pp. 244–254. issn: 00088846.doi: 10.1016/j.cemconres.2010.11.007. url: http://dx.doi.org/10.1016/j.cemconres.2010.11.007 (cit. on pp. 32, 33).
[19] R. A. Imbsen, W. D. Liu, R. A. Schamber, and R. V. Nutt. Strength evalu-ation of existing reinforced concrete bridges. 1987, p. 133. isbn: 0309044154(cit. on p. 2).
[20] Ingo Kaundinya and Frank Heimbecher. “F 2011 D200 Identification andClassification of European Bridge and Tunnel Types”. In: SeRoN—Securityof Road Transport Networks (FP7-ICT-SEC-2007-1 Grant Agreement no.225354)(2011), pp. 1–8. url: http://www.seron-project.eu/download/Full-paper_IABSE_IASS_2011_Kaundinya.pdf (cit. on p. 1).

37
[21] K. Lundgren. “Effect of corrosion on the bond between steel and concrete:an overview”. In: Magazine of Concrete Research 59.6 (2007), pp. 447–461.issn: 0024-9831. doi: 10.1680/macr.2007.59.6.447. url: http://www.icevirtuallibrary.com/doi/10.1680/macr.2007.59.6.447 (cit. onpp. 7, 8).
[22] Saifullah M and Clark LA. “Effect of corrosion rate on the bond strengthof corroded reinforcement”. In: Proceedings of International Conference onCorrosion and Corrosion Protection ofSteel in Concrete (1994), 591–602.doi: 10.5006/1.3287722 (cit. on pp. 2, 11).
[23] José Melo, Tiziana Rossetto, and Humberto Varum. “Experimental studyof bond–slip in RC structural elements with plain bars”. In: Materials andStructures/Materiaux et Constructions 48.8 (2015), pp. 2367–2381. issn:13595997. doi: 10.1617/s11527-014-0320-9 (cit. on p. 8).
[24] S. A. Austin, R. Lyons, and M. J. Ing. “Electrochemical behavior of steel-reinforced concrete during accelerated corrosion testing”. In: Corrosion 60.2(2004), pp. 203–212. issn: 00109312. doi: 10.5006/1.3287722 (cit. on pp. 2,11).
[25] Mohammad Tahershamsi, Kamyab Zandi, Karin Lundgren, and Mario Plos.“Anchorage of naturally corroded bars in reinforced concrete structures”. In:Magazine of Concrete Research 66.14 (2014), pp. 729–744. issn: 0024-9831.doi: 10.1680/macr.13.00276. url: http://www.icevirtuallibrary.com/doi/10.1680/macr.13.00276 (cit. on pp. 2, 11).
[26] Gerardo M. Verderame, Paolo Ricci, Giovanni De Carlo, and Gaetano Man-fredi. “Cyclic bond behaviour of plain bars. Part I: Experimental investi-gation”. In: Construction and Building Materials 23.12 (2009), pp. 3499–3511. issn: 09500618. doi: 10.1016/j.conbuildmat.2009.07.002. url:http://dx.doi.org/10.1016/j.conbuildmat.2009.07.002 (cit. on pp. 2,8).
[27] Gerardo M. Verderame, Giovanni De Carlo, Paolo Ricci, and Giovanni Fab-brocino. “Cyclic bond behaviour of plain bars. Part II: Analytical investi-gation”. In: Construction and Building Materials 23.12 (2009), pp. 3512–3522. issn: 09500618. doi: 10.1016/j.conbuildmat.2009.07.001. url:http://dx.doi.org/10.1016/j.conbuildmat.2009.07.001 (cit. on p. 8).
[28] Gerardo Mario Verderame, Paolo Ricci, Marilena Esposito, and FilippoCarlo Sansiviero. “Le Caratteristiche Meccaniche degli Acciai Impiegati nelleStrutture in c.a. realizzate dal 1950 al 1980”. In: XXVI Convegno NazionaleAICAP (2011) (cit. on p. 7).

38 References
[29] Xiaoming Wang, Mark G. Stewart, and Minh Nguyen. “Impact of climatechange on corrosion and damage to concrete infrastructure in Australia”.In: Climatic Change 110.3-4 (2012), pp. 941–957. issn: 01650009. doi: 10.1007/s10584-011-0124-7 (cit. on p. 2).
[30] Sarah J. Williamson and Leslie A. Clark. “Effect of Corrosion and Loadon Reinforcement Bond Strength”. In: Structural Engineering International12.2 (2002), pp. 117–122. doi: 10.2749/101686602777965559. eprint: https://doi.org/10.2749/101686602777965559. url: https://doi.org/10.2749/101686602777965559 (cit. on pp. 2, 11).
[31] Yingshu Yuan, Yongsheng Ji, and Surendra Shah. “Comparison of two ac-celerated corrosion techniques for concrete structures”. In: ACI StructuralJournal 104 (May 2007), pp. 344–347 (cit. on pp. 2, 11).
[32] Wenjun Zhu, Raoul François, David Cleland, and Dario Coronelli. “Failuremode transitions of corroded deep beams exposed to marine environment forlong period”. In: Engineering Structures 96 (2015), pp. 66–77. issn: 1873-7323. doi: 10.1016/j.engstruct.2015.04.004. url: http://dx.doi.org/10.1016/j.engstruct.2015.04.004 (cit. on p. 11).