estimating the contribution of carnivorous waterbirds to nutrient loading in freshwater habitats
TRANSCRIPT
APPLIED ISSUES
Estimating the contribution of carnivorous waterbirdsto nutrient loading in freshwater habitats
STEFFEN HAHN, SILKE BAUER AND MARCEL KLAASSEN
Centre for Limnology, Netherlands Institute of Ecology (NIOO-KNAW), Maarssen, The Netherlands
SUMMARY
1. We estimated nitrogen (N) and phosphorus (P) loading into wetlands by carnivorous
waterbirds with alternative physiological models using a food-intake and an excreta-
production approach. The models were applied for non-breeding and breeding Dutch
inland carnivorous waterbird populations to quantify their contribution to nutrient
loading on a landscape scale.
2. Model predictions based on food intake exceeded those based on excretion by 59–62%
for N and by 2–36% for P, depending on dietary assumptions. Uncertainty analysis
indicated that the intake model was most affected by errors in energy requirement, while
the excretion model was dependent on faecal nutrient composition.
3. Per capita loading rate of non-breeders increased with body mass from 0.3–0.8 g
N day)1 and 0.15 g P day)1 in little gulls Larus minutus to 4.5–11.5 g N day)1 and 2.1–3.2 g
P day)1 in great cormorants Phalacrocorax carbo. For breeding birds, the estimated nutrient
loading by a family unit over the entire breeding period ranged between 17.6–443.0 g N
and 8.6 g P for little tern Sterna albifrons to 619.6–1755.6 g N and 316.2–498.1 g P for great
cormorants.
4. We distinguished between external (i.e. importing) and internal (i.e. recycling) nutrient
loading by carnivorous waterbirds. For the Netherlands, average external-loading
estimates ranged between 38.1–91.5 tonnes N and 16.7–18.2 tonnes P per year, whilst
internal-loading estimates ranged between 53.1–140.5 tonnes N and 25.2–39.2 tonnes P and
per year. The average contribution of breeding birds was estimated to be 17% and 32% for
external and internal loading respectively. Most important species were black-headed gull
Larus ridibundus and mew gull Larus canus for external loading, and great cormorant and
grey heron Ardea cinerea for internal loading.
5. On a landscape scale, loading by carnivorous waterbirds was of minor importance for
freshwater habitats in the Netherlands with 0.26–0.65 kg N ha)1 a)1 and 0.12–0.16 kg
P ha)1 a)1. However, on a local scale, breeding colonies may be responsible for significant
P loading.
Keywords: eutrophication, faeces, nitrogen, phosphorus, waterfowl
Introduction
Waterbirds produce faeces rich in phosphorus (P) and
nitrogen (N) and are therefore often considered as
important nutrient loaders for freshwater habitats
(e.g. Leentvaar, 1967; McColl & Burger, 1976; Hoyer &
Correspondence: Steffen Hahn, Centre for Limnology,
Netherlands Institute of Ecology, PO Box 1299, 3600 BG
Maarssen, The Netherlands. E-mail: [email protected]
Freshwater Biology (2007) 52, 2421–2433 doi:10.1111/j.1365-2427.2007.01838.x
� 2007 The Authors, Journal compilation � 2007 Blackwell Publishing Ltd 2421
Canfield, 1994). Especially their local aggregations
during communal roosting, over-wintering flocking
(Post et al., 1998) and colonial breeding (Hutchinson,
1950; Bildstein, Blood & Frederick, 1992) might result
in substantial inputs of nutrients into aquatic habitats.
Nutrient loading by herbivorous waterbirds, which
regularly forage at terrestrial sites and excrete at
wetland sites during resting (Ebbinge, Canters &
Drent, 1975; Manny, Johnson & Wetzel, 1994), has
received considerable attention in the literature (e.g.
Post et al., 1998; Kitchell et al., 1999). The impact of
carnivorous waterbirds on nutrient loading is more
difficult to determine, partly because of their highly
diverse foraging behaviour. Piscivorous species like
grebes (Podicipididae), diving ducks (Aythyini) and
cormorants (Phalacrocoracidae) often forage and excrete
within the same system, hence contributing to internal
loading and a more rapid cycling of nutrients by
making locally fixed nutrients available for primary
production (Vanni, 2002). Other species like gulls
(Laridae), regularly feed on distant, often terrestrial
resources but defecate in wetlands during breeding
and roosting (Gwiazda, 1996). Therefore, they are
considered as external loaders, acting as vectors for
allochthonous input of nutrients.
Generally, the diet of carnivorous waterbirds,
though variable, is characterized by a higher digest-
ibility, energetic value and protein content than the
diet of herbivores (Karasov, 1990). Moreover, the high
protein and therefore N content in animals is associ-
ated with higher P contents (Sterner & Elser, 2002),
resulting in higher N and P excretion in carnivorous
birds compared with herbivorous birds of similar size
(e.g. Kear, 1963; Bruinderink, 1989; Marion et al.,
1994). Therefore, local nutrient and notably P loading
by carnivorous waterbirds may exceed those by
herbivorous waterbirds and account for up to half of
the total P input in certain aquatic habitats (Portnoy,
1990; Bales et al., 1993).
The population sizes of many carnivorous water-
bird species have greatly increased in Europe over the
last three decades, e.g. by more than 20% in at least
two-thirds of all breeding populations of great cor-
morants Phalacrocorax carbo (L.) and grey herons Ardea
cinerea L. (for European species reviewed in: BirdLife
International, 2004), and they may therefore be
suspected to substantially impact the nutrient dynam-
ics of wetlands. However, estimates of nutrient
loading by carnivorous waterbirds are lacking despite
their need in conservation and management actions.
Therefore, we estimated nutrient loading by carnivor-
ous waterbirds on inland freshwater habitats using a
modelling approach based on species-specific food
requirements and faecal production. We used data on
waterbird populations in The Netherlands to exem-
plify the potential impact of carnivorous waterbirds at
a regional scale targeting: (i) the quantification of
nutrients added annually by external and internal
loaders, (ii) the determination of the proportion of
non-breeding and breeding birds on nutrient import,
and (iii) the identification of the most important
species contributing to nutrient loading.
Methods
In the modelling, we distinguished between breeding
and non-breeding birds. For both groups, we calcu-
lated nutrient input using two approaches. First, we
developed an intake model based on nutrient concen-
trations of ingested food, the birds’ daily energy
requirements and the assumption that birds are in
steady-state with respect to the focal nutrient. In the
second approach – the excretion model – we used
nutrient concentrations in the daily excrement pro-
ductions directly. Hereafter, we use X in our notations
to denote the nutrient of interest, i.e. P or N. Dry mass
is used in all compositional data on food and faeces
and fresh mass is used when referring to the body
mass of birds.
Nutrient loading models for non-breeding birds
The daily nutrient loading contributed by a non-
breeding bird (Xnb, g day)1) is the portion A of its
total nutrient release, Xtotal, which is deposited into
the water:
Xnb ¼ A� Xtotal ð1Þ
For the intake model, Xtotal results from the amount
of food ingested (Mintake, g day)1) and its nutrient
composition (Xintake, mg g)1). Mintake was derived
from the allometric relationship for body mass (M, g)
dependent daily energy requirement [DER ¼101.0195 ± 0.039 · M (g) 0.6808 ± 0.018 kJ day)1; Nagy, Gir-
ard & Brown, 1999], the gross energy content of food
(E, kJ g)1) and its apparent metabolizable energy
coefficient (AM). The latter gives the proportion of
2422 S. Hahn et al.
� 2007 The Authors, Journal compilation � 2007 Blackwell Publishing Ltd, Freshwater Biology, 52, 2421–2433
utilizable energy per unit food (Karasov, 1990). Hence
the complete intake model is given with:
Xnb�intake ¼ A� DER
E�AM� Xintake ð2Þ
In the excretion model, Xtotal is a function of the
total amount of excrements produced per day (Mexcr)
and its nutrient concentration (Xexcr, mg g)1). Assu-
ming a fixed ratio a between food intake and excre-
tion, total excrement production could thus be
calculated as:
Mexcr ¼ a� DER
E�AMð3Þ
and consequently, Xnb-excr as:
Xnb�excr ¼ A� a� DER
E�AM� Xexcr ð4Þ
For carnivorous diets, Karasov (1990) reported
values for E and AM of 23.9 ± 0.46 (SE) kJ g)1 and
0.76 ± 0.013 (SE) respectively. For a we assumed a
value of 0.395 ± 0.039 (SE) based on herring gulls
Larus argentatus Pon. (Nixon & Oviatt, 1973), black-
headed gulls Larus ridibundus L. (Dobrowolski, Ko-
zakiewicz & Leznicka, 1993) and grey herons Ardea
cinerea L. (Marion 1988 cited in Marion et al., 1994).
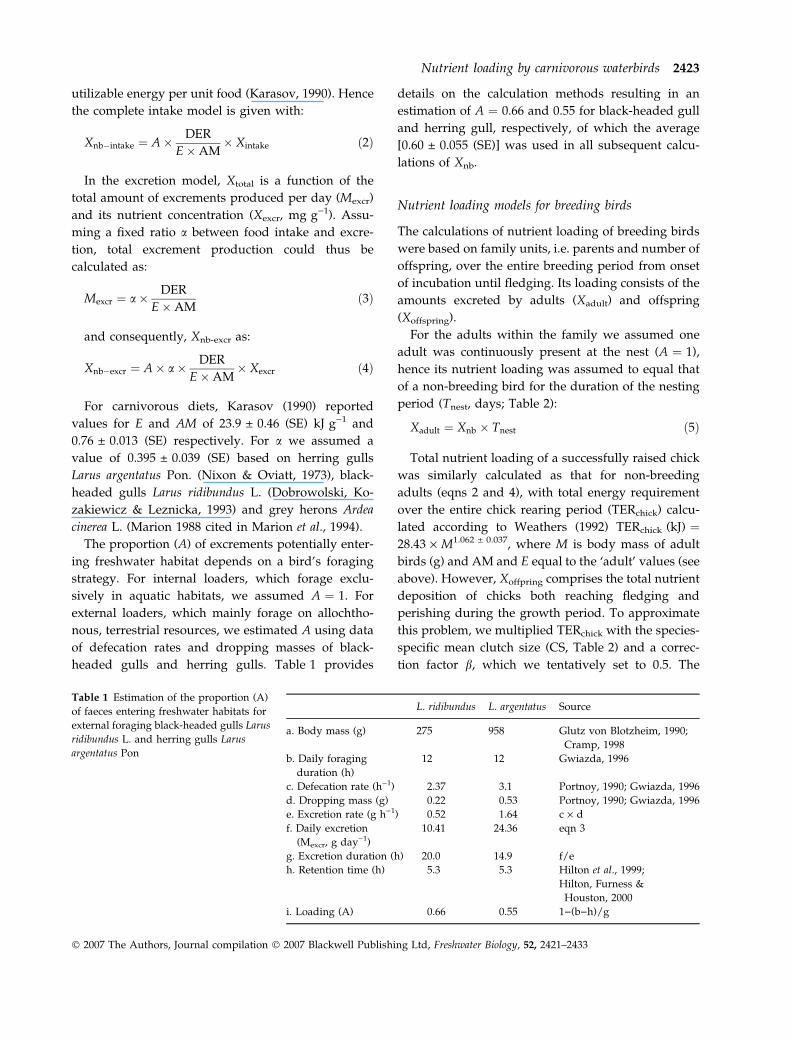
The proportion (A) of excrements potentially enter-
ing freshwater habitat depends on a bird’s foraging
strategy. For internal loaders, which forage exclu-
sively in aquatic habitats, we assumed A ¼ 1. For
external loaders, which mainly forage on allochtho-
nous, terrestrial resources, we estimated A using data
of defecation rates and dropping masses of black-
headed gulls and herring gulls. Table 1 provides
details on the calculation methods resulting in an
estimation of A ¼ 0.66 and 0.55 for black-headed gull
and herring gull, respectively, of which the average
[0.60 ± 0.055 (SE)] was used in all subsequent calcu-
lations of Xnb.
Nutrient loading models for breeding birds
The calculations of nutrient loading of breeding birds
were based on family units, i.e. parents and number of
offspring, over the entire breeding period from onset
of incubation until fledging. Its loading consists of the
amounts excreted by adults (Xadult) and offspring
(Xoffspring).
For the adults within the family we assumed one
adult was continuously present at the nest (A ¼ 1),
hence its nutrient loading was assumed to equal that
of a non-breeding bird for the duration of the nesting
period (Tnest, days; Table 2):
Xadult ¼ Xnb � Tnest ð5Þ
Total nutrient loading of a successfully raised chick
was similarly calculated as that for non-breeding
adults (eqns 2 and 4), with total energy requirement
over the entire chick rearing period (TERchick) calcu-
lated according to Weathers (1992) TERchick (kJ) ¼28.43 · M1.062 ± 0.037, where M is body mass of adult
birds (g) and AM and E equal to the ‘adult’ values (see
above). However, Xoffpring comprises the total nutrient
deposition of chicks both reaching fledging and
perishing during the growth period. To approximate
this problem, we multiplied TERchick with the species-
specific mean clutch size (CS, Table 2) and a correc-
tion factor b, which we tentatively set to 0.5. The
Table 1 Estimation of the proportion (A)
of faeces entering freshwater habitats for
external foraging black-headed gulls Larus
ridibundus L. and herring gulls Larus
argentatus Pon
L. ridibundus L. argentatus Source
a. Body mass (g) 275 958 Glutz von Blotzheim, 1990;
Cramp, 1998
b. Daily foraging
duration (h)
12 12 Gwiazda, 1996
c. Defecation rate (h)1) 2.37 3.1 Portnoy, 1990; Gwiazda, 1996
d. Dropping mass (g) 0.22 0.53 Portnoy, 1990; Gwiazda, 1996
e. Excretion rate (g h)1) 0.52 1.64 c · d
f. Daily excretion
(Mexcr, g day)1)
10.41 24.36 eqn 3
g. Excretion duration (h) 20.0 14.9 f/e
h. Retention time (h) 5.3 5.3 Hilton et al., 1999;
Hilton, Furness &
Houston, 2000
i. Loading (A) 0.66 0.55 1)(b)h)/g
Nutrient loading by carnivorous waterbirds 2423
� 2007 The Authors, Journal compilation � 2007 Blackwell Publishing Ltd, Freshwater Biology, 52, 2421–2433
resulting values of b · CS exceeded values of breed-
ing success, as the number of successfully fledged
chicks per nest, by 38% (median, Table 2). Moreover,
nutrient excretion of growing chicks was corrected for
tissue synthesis by subtracting the total amount of N
and P fixed in a chick’s body (Xsyn), assuming average
nutrient contents of complete bird bodies of 2.82% N
and 0.46% P fresh body mass (reviewed in Dierenfeld,
Alcorn & Jacobsen, 2002). Body mass increase during
chick growth was calculated as the difference between
body mass at hatch, which corresponded to 72% fresh
egg mass (Romanoff & Romanoff, 1949; Rahn & Ar,
1974), and adult body mass (Table 2).
Thus Xoffspring for the intake and excretion models
was:
Xoffspring�intake ¼ b�CS� TERchick
AM�E�Xintake�Xsyn
� �
ð6Þ
Xoffspring�excr ¼ b�CS� a�TERchick
AM�E�Xexcr�Xsyn
� �
ð7Þ
Model sensitivity and uncertainty analysis
We conducted a sensitivity analysis to determine the
parameter(s) most influencing the model output.
Therefore, all input parameters were successively
varied by ±10% and then, changes in model output
were related to the changes in the focal input
parameter by calculating the sensitivity coefficient
[SC ¼ (R)10% ) R+10%)/R/(P)10% ) P+10%)/P with R
the model output and P the focal parameter,
Hamby, 1994]. The sensitivity coefficient (SC) gives
direction and magnitude of the resulting output
changes: values of |SC| > 1 indicate dispropor-
tionally high changes and values of SC ¼ 0 indicate
no effect of the considered parameter on model
output.
Moreover, as the empirical estimates of all para-
meters varied to different magnitudes, this raised
the question of how these estimation uncertainties
would impact the models’ nutrient loading predic-
tions. Therefore, we conducted Monte Carlo simu-
lations for all species where all model parameter
values were randomly varied assuming a normal
distribution around the mean ± SE (or ±10% if SE
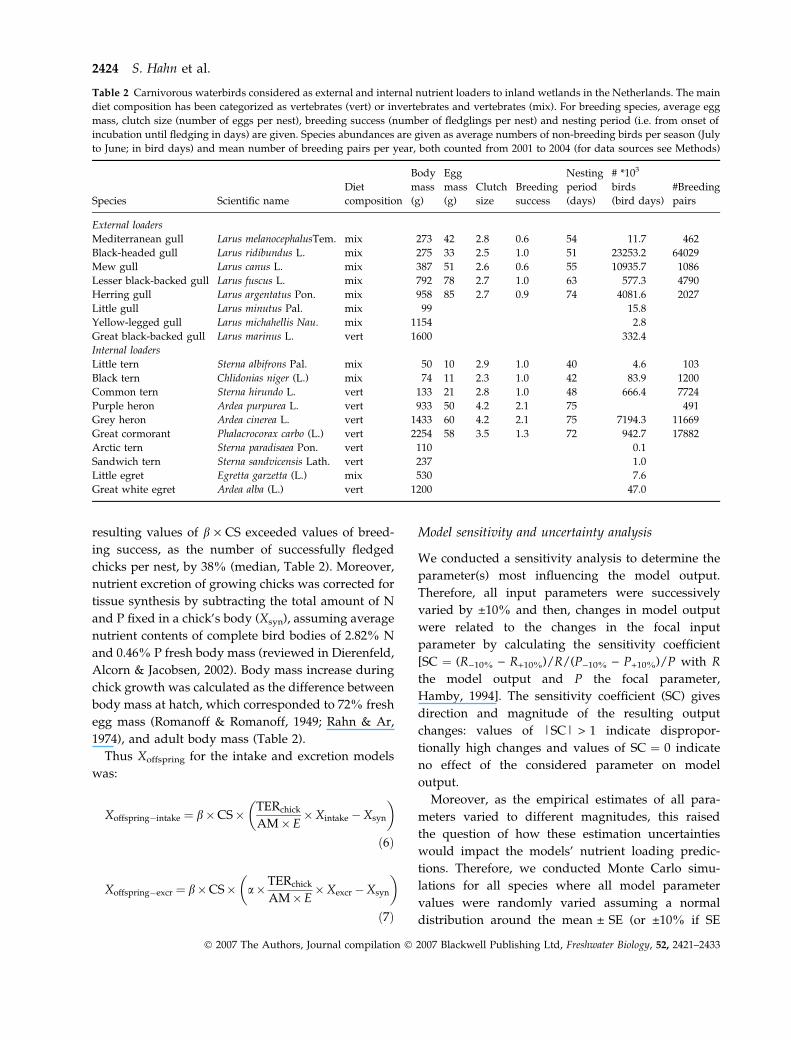
Table 2 Carnivorous waterbirds considered as external and internal nutrient loaders to inland wetlands in the Netherlands. The main
diet composition has been categorized as vertebrates (vert) or invertebrates and vertebrates (mix). For breeding species, average egg
mass, clutch size (number of eggs per nest), breeding success (number of fledglings per nest) and nesting period (i.e. from onset of
incubation until fledging in days) are given. Species abundances are given as average numbers of non-breeding birds per season (July
to June; in bird days) and mean number of breeding pairs per year, both counted from 2001 to 2004 (for data sources see Methods)
Species Scientific name
Diet
composition
Body
mass
(g)
Egg
mass
(g)
Clutch
size
Breeding
success
Nesting
period
(days)
# *103
birds
(bird days)
#Breeding
pairs
External loaders
Mediterranean gull Larus melanocephalusTem. mix 273 42 2.8 0.6 54 11.7 462
Black-headed gull Larus ridibundus L. mix 275 33 2.5 1.0 51 23253.2 64029
Mew gull Larus canus L. mix 387 51 2.6 0.6 55 10935.7 1086
Lesser black-backed gull Larus fuscus L. mix 792 78 2.7 1.0 63 577.3 4790
Herring gull Larus argentatus Pon. mix 958 85 2.7 0.9 74 4081.6 2027
Little gull Larus minutus Pal. mix 99 15.8
Yellow-legged gull Larus michahellis Nau. mix 1154 2.8
Great black-backed gull Larus marinus L. vert 1600 332.4
Internal loaders
Little tern Sterna albifrons Pal. mix 50 10 2.9 1.0 40 4.6 103
Black tern Chlidonias niger (L.) mix 74 11 2.3 1.0 42 83.9 1200
Common tern Sterna hirundo L. vert 133 21 2.8 1.0 48 666.4 7724
Purple heron Ardea purpurea L. vert 933 50 4.2 2.1 75 491
Grey heron Ardea cinerea L. vert 1433 60 4.2 2.1 75 7194.3 11669
Great cormorant Phalacrocorax carbo (L.) vert 2254 58 3.5 1.3 72 942.7 17882
Arctic tern Sterna paradisaea Pon. vert 110 0.1
Sandwich tern Sterna sandvicensis Lath. vert 237 1.0
Little egret Egretta garzetta (L.) mix 530 7.6
Great white egret Ardea alba (L.) vert 1200 47.0
2424 S. Hahn et al.
� 2007 The Authors, Journal compilation � 2007 Blackwell Publishing Ltd, Freshwater Biology, 52, 2421–2433
was not available, i.e. Tnest, CS, Xintake of mixed
food, and Xsyn). To identify the most uncertain
factor within each model, we additionally simulated
nutrient loadings for black-headed gull (external
loader) and great cormorant (internal loaders) by
consecutively setting one parameter constant and
varying the remaining parameters as stated above.
For each model, we ran 30 000 simulations and
compared model outputs, i.e. variation of predic-
tions in nutrient loading, by calculating coefficients
of variation (CV) using square root-transformed
output data.
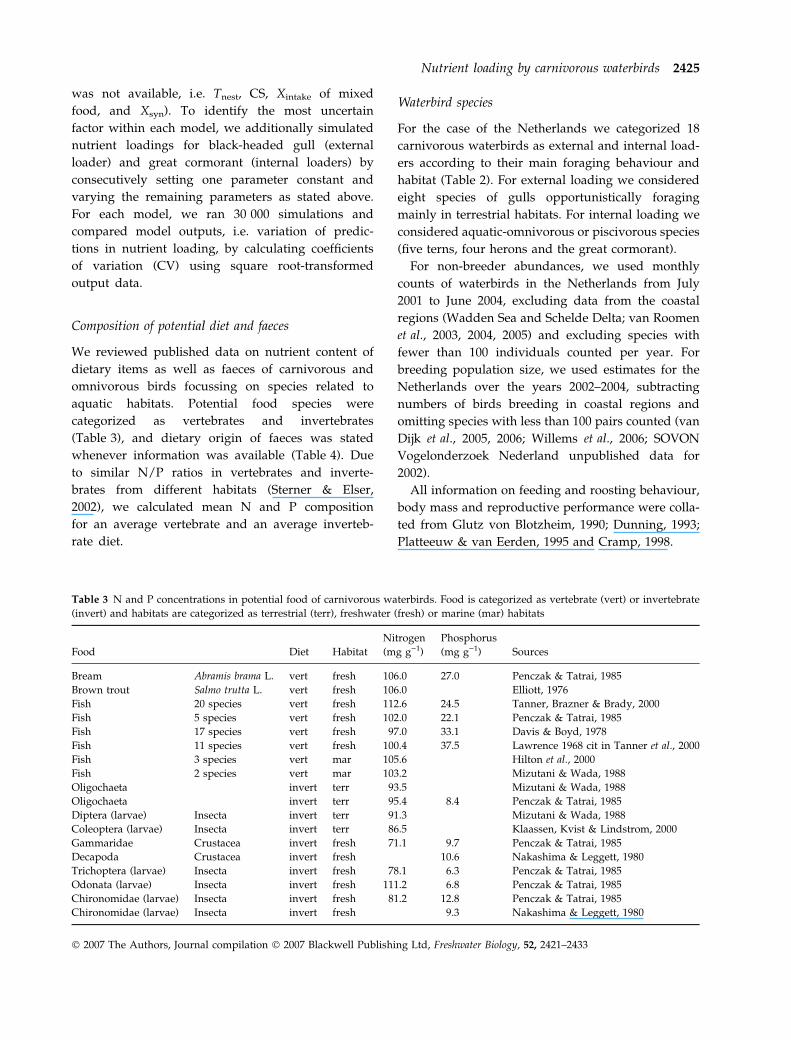
Composition of potential diet and faeces
We reviewed published data on nutrient content of
dietary items as well as faeces of carnivorous and
omnivorous birds focussing on species related to
aquatic habitats. Potential food species were
categorized as vertebrates and invertebrates
(Table 3), and dietary origin of faeces was stated
whenever information was available (Table 4). Due
to similar N/P ratios in vertebrates and inverte-
brates from different habitats (Sterner & Elser,
2002), we calculated mean N and P composition
for an average vertebrate and an average inverteb-
rate diet.
Waterbird species
For the case of the Netherlands we categorized 18
carnivorous waterbirds as external and internal load-
ers according to their main foraging behaviour and
habitat (Table 2). For external loading we considered
eight species of gulls opportunistically foraging
mainly in terrestrial habitats. For internal loading we
considered aquatic-omnivorous or piscivorous species
(five terns, four herons and the great cormorant).
For non-breeder abundances, we used monthly
counts of waterbirds in the Netherlands from July
2001 to June 2004, excluding data from the coastal
regions (Wadden Sea and Schelde Delta; van Roomen
et al., 2003, 2004, 2005) and excluding species with
fewer than 100 individuals counted per year. For
breeding population size, we used estimates for the
Netherlands over the years 2002–2004, subtracting
numbers of birds breeding in coastal regions and
omitting species with less than 100 pairs counted (van
Dijk et al., 2005, 2006; Willems et al., 2006; SOVON
Vogelonderzoek Nederland unpublished data for
2002).
All information on feeding and roosting behaviour,
body mass and reproductive performance were colla-
ted from Glutz von Blotzheim, 1990; Dunning, 1993;
Platteeuw & van Eerden, 1995 and Cramp, 1998.
Table 3 N and P concentrations in potential food of carnivorous waterbirds. Food is categorized as vertebrate (vert) or invertebrate
(invert) and habitats are categorized as terrestrial (terr), freshwater (fresh) or marine (mar) habitats
Food Diet Habitat
Nitrogen
(mg g)1)
Phosphorus
(mg g)1) Sources
Bream Abramis brama L. vert fresh 106.0 27.0 Penczak & Tatrai, 1985
Brown trout Salmo trutta L. vert fresh 106.0 Elliott, 1976
Fish 20 species vert fresh 112.6 24.5 Tanner, Brazner & Brady, 2000
Fish 5 species vert fresh 102.0 22.1 Penczak & Tatrai, 1985
Fish 17 species vert fresh 97.0 33.1 Davis & Boyd, 1978
Fish 11 species vert fresh 100.4 37.5 Lawrence 1968 cit in Tanner et al., 2000
Fish 3 species vert mar 105.6 Hilton et al., 2000
Fish 2 species vert mar 103.2 Mizutani & Wada, 1988
Oligochaeta invert terr 93.5 Mizutani & Wada, 1988
Oligochaeta invert terr 95.4 8.4 Penczak & Tatrai, 1985
Diptera (larvae) Insecta invert terr 91.3 Mizutani & Wada, 1988
Coleoptera (larvae) Insecta invert terr 86.5 Klaassen, Kvist & Lindstrom, 2000
Gammaridae Crustacea invert fresh 71.1 9.7 Penczak & Tatrai, 1985
Decapoda Crustacea invert fresh 10.6 Nakashima & Leggett, 1980
Trichoptera (larvae) Insecta invert fresh 78.1 6.3 Penczak & Tatrai, 1985
Odonata (larvae) Insecta invert fresh 111.2 6.8 Penczak & Tatrai, 1985
Chironomidae (larvae) Insecta invert fresh 81.2 12.8 Penczak & Tatrai, 1985
Chironomidae (larvae) Insecta invert fresh 9.3 Nakashima & Leggett, 1980
Nutrient loading by carnivorous waterbirds 2425
� 2007 The Authors, Journal compilation � 2007 Blackwell Publishing Ltd, Freshwater Biology, 52, 2421–2433
Results
Nutrient content of food and faeces
In the spectrum of potential food species, vertebrates
had significantly higher N and P concentrations than
invertebrates (for N: t14 ¼ 3.34, P ¼ 0.005; for P: t10 ¼7.71, P ¼ 0.001). The nutrient content of a pure
vertebrate diet was 104 ± 1.6 mg N g)1 (± SE used
throughout unless otherwise noted) and 28.8 ± 2.8 mg
P g)1 (Table 3). For a mixed diet consisting of equal
shares of vertebrates and invertebrates nutrient con-
centration was calculated to 96.3 ± 7.78 mg N g)1 and
19.0 ± 9.86 mg P g)1 respectively.
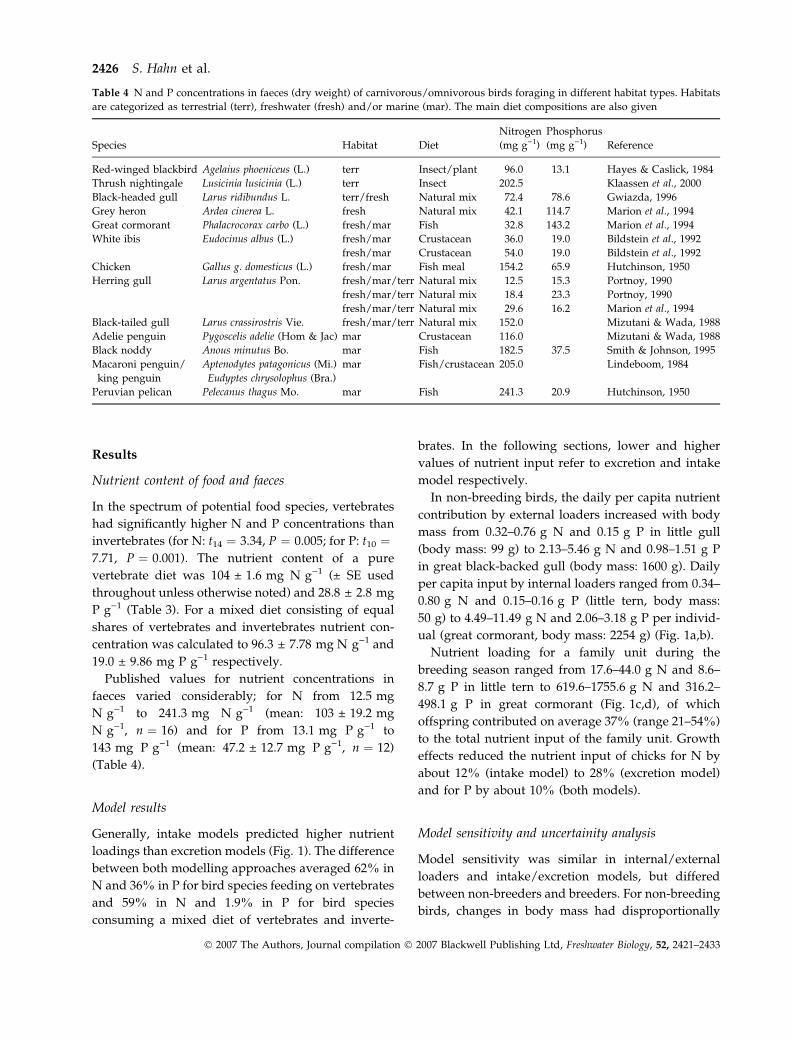
Published values for nutrient concentrations in
faeces varied considerably; for N from 12.5 mg
N g)1 to 241.3 mg N g)1 (mean: 103 ± 19.2 mg
N g)1, n ¼ 16) and for P from 13.1 mg P g)1 to
143 mg P g)1 (mean: 47.2 ± 12.7 mg P g)1, n ¼ 12)
(Table 4).
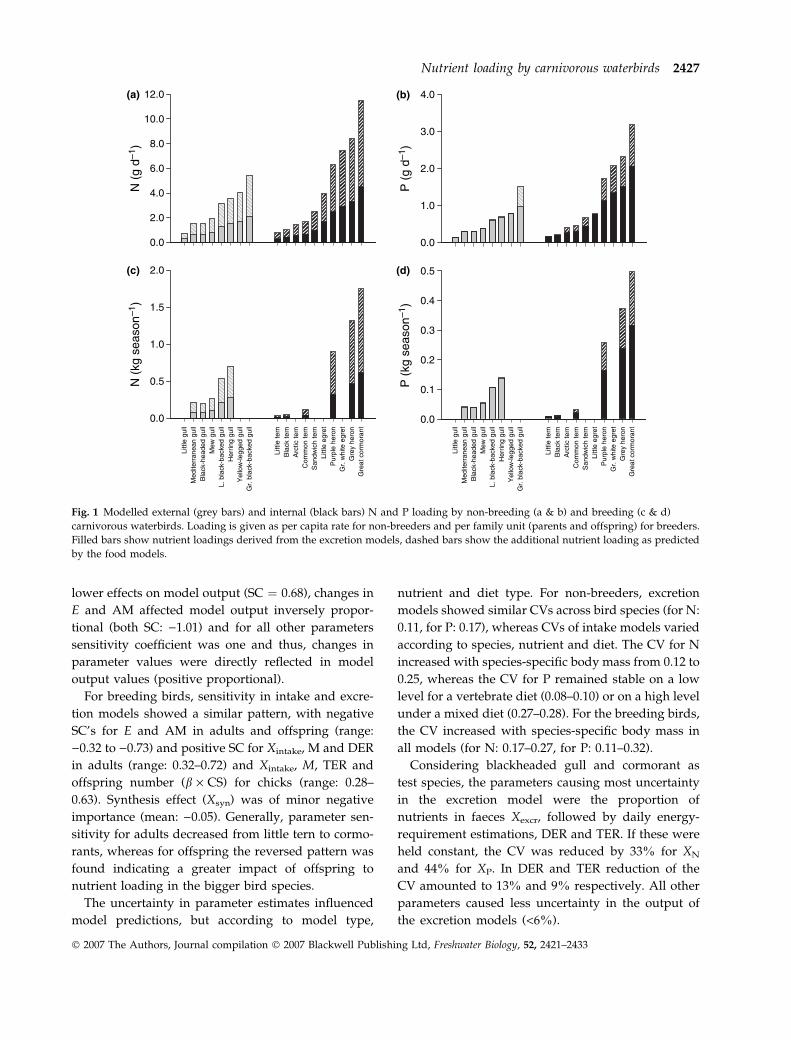
Model results
Generally, intake models predicted higher nutrient
loadings than excretion models (Fig. 1). The difference
between both modelling approaches averaged 62% in
N and 36% in P for bird species feeding on vertebrates
and 59% in N and 1.9% in P for bird species
consuming a mixed diet of vertebrates and inverte-
brates. In the following sections, lower and higher
values of nutrient input refer to excretion and intake
model respectively.
In non-breeding birds, the daily per capita nutrient
contribution by external loaders increased with body
mass from 0.32–0.76 g N and 0.15 g P in little gull
(body mass: 99 g) to 2.13–5.46 g N and 0.98–1.51 g P
in great black-backed gull (body mass: 1600 g). Daily
per capita input by internal loaders ranged from 0.34–
0.80 g N and 0.15–0.16 g P (little tern, body mass:
50 g) to 4.49–11.49 g N and 2.06–3.18 g P per individ-
ual (great cormorant, body mass: 2254 g) (Fig. 1a,b).
Nutrient loading for a family unit during the
breeding season ranged from 17.6–44.0 g N and 8.6–
8.7 g P in little tern to 619.6–1755.6 g N and 316.2–
498.1 g P in great cormorant (Fig. 1c,d), of which
offspring contributed on average 37% (range 21–54%)
to the total nutrient input of the family unit. Growth
effects reduced the nutrient input of chicks for N by
about 12% (intake model) to 28% (excretion model)
and for P by about 10% (both models).
Model sensitivity and uncertainity analysis
Model sensitivity was similar in internal/external
loaders and intake/excretion models, but differed
between non-breeders and breeders. For non-breeding
birds, changes in body mass had disproportionally
Table 4 N and P concentrations in faeces (dry weight) of carnivorous/omnivorous birds foraging in different habitat types. Habitats
are categorized as terrestrial (terr), freshwater (fresh) and/or marine (mar). The main diet compositions are also given
Species Habitat Diet
Nitrogen
(mg g)1)
Phosphorus
(mg g)1) Reference
Red-winged blackbird Agelaius phoeniceus (L.) terr Insect/plant 96.0 13.1 Hayes & Caslick, 1984
Thrush nightingale Lusicinia lusicinia (L.) terr Insect 202.5 Klaassen et al., 2000
Black-headed gull Larus ridibundus L. terr/fresh Natural mix 72.4 78.6 Gwiazda, 1996
Grey heron Ardea cinerea L. fresh Natural mix 42.1 114.7 Marion et al., 1994
Great cormorant Phalacrocorax carbo (L.) fresh/mar Fish 32.8 143.2 Marion et al., 1994
White ibis Eudocinus albus (L.) fresh/mar Crustacean 36.0 19.0 Bildstein et al., 1992
fresh/mar Crustacean 54.0 19.0 Bildstein et al., 1992
Chicken Gallus g. domesticus (L.) fresh/mar Fish meal 154.2 65.9 Hutchinson, 1950
Herring gull Larus argentatus Pon. fresh/mar/terr Natural mix 12.5 15.3 Portnoy, 1990
fresh/mar/terr Natural mix 18.4 23.3 Portnoy, 1990
fresh/mar/terr Natural mix 29.6 16.2 Marion et al., 1994
Black-tailed gull Larus crassirostris Vie. fresh/mar/terr Natural mix 152.0 Mizutani & Wada, 1988
Adelie penguin Pygoscelis adelie (Hom & Jac) mar Crustacean 116.0 Mizutani & Wada, 1988
Black noddy Anous minutus Bo. mar Fish 182.5 37.5 Smith & Johnson, 1995
Macaroni penguin/
king penguin
Aptenodytes patagonicus (Mi.)
Eudyptes chrysolophus (Bra.)
mar Fish/crustacean 205.0 Lindeboom, 1984
Peruvian pelican Pelecanus thagus Mo. mar Fish 241.3 20.9 Hutchinson, 1950
2426 S. Hahn et al.
� 2007 The Authors, Journal compilation � 2007 Blackwell Publishing Ltd, Freshwater Biology, 52, 2421–2433
lower effects on model output (SC ¼ 0.68), changes in
E and AM affected model output inversely propor-
tional (both SC: )1.01) and for all other parameters
sensitivity coefficient was one and thus, changes in
parameter values were directly reflected in model
output values (positive proportional).
For breeding birds, sensitivity in intake and excre-
tion models showed a similar pattern, with negative
SC’s for E and AM in adults and offspring (range:
)0.32 to )0.73) and positive SC for Xintake, M and DER
in adults (range: 0.32–0.72) and Xintake, M, TER and
offspring number (b · CS) for chicks (range: 0.28–
0.63). Synthesis effect (Xsyn) was of minor negative
importance (mean: )0.05). Generally, parameter sen-
sitivity for adults decreased from little tern to cormo-
rants, whereas for offspring the reversed pattern was
found indicating a greater impact of offspring to
nutrient loading in the bigger bird species.
The uncertainty in parameter estimates influenced
model predictions, but according to model type,
nutrient and diet type. For non-breeders, excretion
models showed similar CVs across bird species (for N:
0.11, for P: 0.17), whereas CVs of intake models varied
according to species, nutrient and diet. The CV for N
increased with species-specific body mass from 0.12 to
0.25, whereas the CV for P remained stable on a low
level for a vertebrate diet (0.08–0.10) or on a high level
under a mixed diet (0.27–0.28). For the breeding birds,
the CV increased with species-specific body mass in
all models (for N: 0.17–0.27, for P: 0.11–0.32).
Considering blackheaded gull and cormorant as
test species, the parameters causing most uncertainty
in the excretion model were the proportion of
nutrients in faeces Xexcr, followed by daily energy-
requirement estimations, DER and TER. If these were
held constant, the CV was reduced by 33% for XN
and 44% for XP. In DER and TER reduction of the
CV amounted to 13% and 9% respectively. All other
parameters caused less uncertainty in the output of
the excretion models (<6%).
N (
g d–
1 )
0.0
2.0
4.0
6.0
8.0
10.0
12.0
(c) (d)
(a) (b)
0.0
1.0
2.0
3.0
4.0
Littl
e gu
llM
edite
rran
ean
gull
Bla
ck-h
eade
d gu
llM
ew g
ull
L. b
lack
-bac
ked
gull
Her
ring
gull
Yel
low
-legg
ed g
ull
Gr.
bla
ck-b
acke
d gu
ll
Littl
e te
rnB
lack
tern
Arc
tic te
rnC
omm
on te
rnS
andw
ich
tern
Littl
e eg
ret
Pur
ple
hero
nG
r. w
hite
egr
etG
rey
hero
nG
reat
cor
mor
ant
Littl
e te
rnB
lack
tern
Arc
tic te
rnC
omm
on te
rnS
andw
ich
tern
Littl
e eg
ret
Pur
ple
hero
nG
r. w
hite
egr
etG
rey
hero
nG
reat
cor
mor
ant
Littl
e gu
llM
edite
rran
ean
gull
Bla
ck-h
eade
d gu
llM
ew g
ull
L. b
lack
-bac
ked
gull
Her
ring
gull
Yel
low
-legg
ed g
ull
Gr.
bla
ck-b
acke
d gu
ll
N (
kg s
easo
n–1 )
P (
g d–
1 )P
(kg
sea
son–
1 )0.0
0.5
1.0
1.5
2.0
0.0
0.1
0.2
0.3
0.4
0.5
Fig. 1 Modelled external (grey bars) and internal (black bars) N and P loading by non-breeding (a & b) and breeding (c & d)
carnivorous waterbirds. Loading is given as per capita rate for non-breeders and per family unit (parents and offspring) for breeders.
Filled bars show nutrient loadings derived from the excretion models, dashed bars show the additional nutrient loading as predicted
by the food models.
Nutrient loading by carnivorous waterbirds 2427
� 2007 The Authors, Journal compilation � 2007 Blackwell Publishing Ltd, Freshwater Biology, 52, 2421–2433
Uncertainty in the intake models was primarily
caused by the energy-requirement estimations in both
the non-breeder and breeder model. If their variation
was kept constant, models improved by 47% (DER for
non-breeder) and by 11–25% (TER + DER in the
breeder model). The second most important single
parameter was Xintake, with a reduction in CV by 11%
in both models. The remaining parameters did not
affect model predictions substantially (<6% reduction
in CV).
Case study – inland Dutch wetlands
Total predicted annual loading of both internal and
external loaders for non-coastal Dutch wetlands
ranged between 83.3–211.9 tonnes N and 39.3–52.1
tonnes P in 2001/02 and 98.8–250.7 tonnes N and
46.4–62.1 tonnes P between 2003 and 2004; 58%
(excretion model) to 65% (intake model) were contri-
buted by internal loaders (Table 5). Increased loading
was attributed to the effects of non-breeding birds; the
ratio of non-breeders to breeders increased from 1.7 to
2.3 and 4.3 to 5.1 for internal and external loaders
respectively. Considering a total area of 3.57 · 105 ha
of Dutch freshwater bodies (http://statline.cbs.nl),
the average annual loading amounted to 0.26–0.65 kg
N ha)1 and to 0.12–0.16 kg P ha)1.
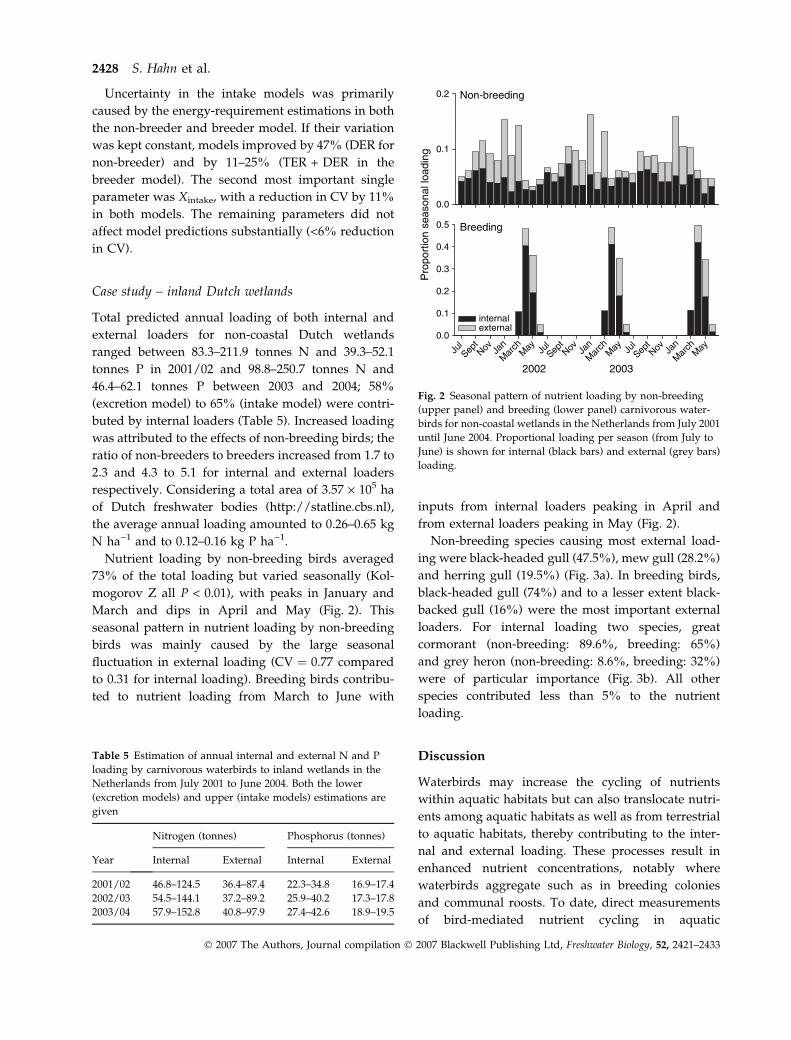
Nutrient loading by non-breeding birds averaged
73% of the total loading but varied seasonally (Kol-
mogorov Z all P < 0.01), with peaks in January and
March and dips in April and May (Fig. 2). This
seasonal pattern in nutrient loading by non-breeding
birds was mainly caused by the large seasonal
fluctuation in external loading (CV ¼ 0.77 compared
to 0.31 for internal loading). Breeding birds contribu-
ted to nutrient loading from March to June with
inputs from internal loaders peaking in April and
from external loaders peaking in May (Fig. 2).
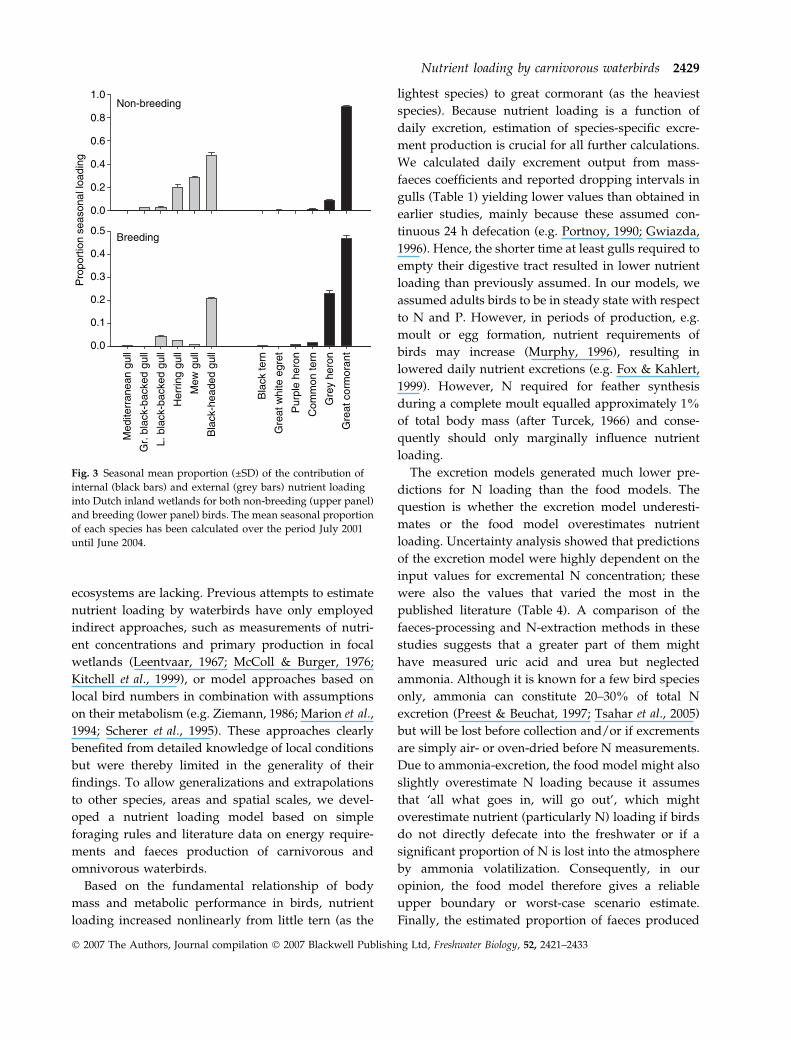
Non-breeding species causing most external load-
ing were black-headed gull (47.5%), mew gull (28.2%)
and herring gull (19.5%) (Fig. 3a). In breeding birds,
black-headed gull (74%) and to a lesser extent black-
backed gull (16%) were the most important external
loaders. For internal loading two species, great
cormorant (non-breeding: 89.6%, breeding: 65%)
and grey heron (non-breeding: 8.6%, breeding: 32%)
were of particular importance (Fig. 3b). All other
species contributed less than 5% to the nutrient
loading.
Discussion
Waterbirds may increase the cycling of nutrients
within aquatic habitats but can also translocate nutri-
ents among aquatic habitats as well as from terrestrial
to aquatic habitats, thereby contributing to the inter-
nal and external loading. These processes result in
enhanced nutrient concentrations, notably where
waterbirds aggregate such as in breeding colonies
and communal roosts. To date, direct measurements
of bird-mediated nutrient cycling in aquatic
Table 5 Estimation of annual internal and external N and P
loading by carnivorous waterbirds to inland wetlands in the
Netherlands from July 2001 to June 2004. Both the lower
(excretion models) and upper (intake models) estimations are
given
Year
Nitrogen (tonnes) Phosphorus (tonnes)
Internal External Internal External
2001/02 46.8–124.5 36.4–87.4 22.3–34.8 16.9–17.4
2002/03 54.5–144.1 37.2–89.2 25.9–40.2 17.3–17.8
2003/04 57.9–152.8 40.8–97.9 27.4–42.6 18.9–19.5
Pro
port
ion
seas
onal
load
ing
0.0
0.1
0.2
2002
JulSep
tNov Ja
n
Mar
chM
ay JulSep
tNov Ja
n
Mar
chM
ay JulSep
tNov Ja
n
Mar
chM
ay
2003
0.0
0.1
0.2
0.3
0.4
0.5
internal external
Non-breeding
Breeding
Fig. 2 Seasonal pattern of nutrient loading by non-breeding
(upper panel) and breeding (lower panel) carnivorous water-
birds for non-coastal wetlands in the Netherlands from July 2001
until June 2004. Proportional loading per season (from July to
June) is shown for internal (black bars) and external (grey bars)
loading.
2428 S. Hahn et al.
� 2007 The Authors, Journal compilation � 2007 Blackwell Publishing Ltd, Freshwater Biology, 52, 2421–2433
ecosystems are lacking. Previous attempts to estimate
nutrient loading by waterbirds have only employed
indirect approaches, such as measurements of nutri-
ent concentrations and primary production in focal
wetlands (Leentvaar, 1967; McColl & Burger, 1976;
Kitchell et al., 1999), or model approaches based on
local bird numbers in combination with assumptions
on their metabolism (e.g. Ziemann, 1986; Marion et al.,
1994; Scherer et al., 1995). These approaches clearly
benefited from detailed knowledge of local conditions
but were thereby limited in the generality of their
findings. To allow generalizations and extrapolations
to other species, areas and spatial scales, we devel-
oped a nutrient loading model based on simple
foraging rules and literature data on energy require-
ments and faeces production of carnivorous and
omnivorous waterbirds.
Based on the fundamental relationship of body
mass and metabolic performance in birds, nutrient
loading increased nonlinearly from little tern (as the
lightest species) to great cormorant (as the heaviest
species). Because nutrient loading is a function of
daily excretion, estimation of species-specific excre-
ment production is crucial for all further calculations.
We calculated daily excrement output from mass-
faeces coefficients and reported dropping intervals in
gulls (Table 1) yielding lower values than obtained in
earlier studies, mainly because these assumed con-
tinuous 24 h defecation (e.g. Portnoy, 1990; Gwiazda,
1996). Hence, the shorter time at least gulls required to
empty their digestive tract resulted in lower nutrient
loading than previously assumed. In our models, we
assumed adults birds to be in steady state with respect
to N and P. However, in periods of production, e.g.
moult or egg formation, nutrient requirements of
birds may increase (Murphy, 1996), resulting in
lowered daily nutrient excretions (e.g. Fox & Kahlert,
1999). However, N required for feather synthesis
during a complete moult equalled approximately 1%
of total body mass (after Turcek, 1966) and conse-
quently should only marginally influence nutrient
loading.
The excretion models generated much lower pre-
dictions for N loading than the food models. The
question is whether the excretion model underesti-
mates or the food model overestimates nutrient
loading. Uncertainty analysis showed that predictions
of the excretion model were highly dependent on the
input values for excremental N concentration; these
were also the values that varied the most in the
published literature (Table 4). A comparison of the
faeces-processing and N-extraction methods in these
studies suggests that a greater part of them might
have measured uric acid and urea but neglected
ammonia. Although it is known for a few bird species
only, ammonia can constitute 20–30% of total N
excretion (Preest & Beuchat, 1997; Tsahar et al., 2005)
but will be lost before collection and/or if excrements
are simply air- or oven-dried before N measurements.
Due to ammonia-excretion, the food model might also
slightly overestimate N loading because it assumes
that ‘all what goes in, will go out’, which might
overestimate nutrient (particularly N) loading if birds
do not directly defecate into the freshwater or if a
significant proportion of N is lost into the atmosphere
by ammonia volatilization. Consequently, in our
opinion, the food model therefore gives a reliable
upper boundary or worst-case scenario estimate.
Finally, the estimated proportion of faeces produced
0.0
0.2
0.4
0.6
0.8
1.0
Med
iterr
anea
n gu
ll
Gr.
bla
ck-b
acke
d gu
ll
L. b
lack
-bac
ked
gull
Her
ring
gull
Mew
gul
l
Bla
ck-h
eade
d gu
ll
Bla
ck te
rn
Gre
at w
hite
egr
et
Pur
ple
hero
n
Com
mon
tern
Gre
y he
ron
Gre
at c
orm
oran
t
Pro
port
ion
seas
onal
load
ing
0.0
0.1
0.2
0.3
0.4
0.5
Non-breeding
Breeding
Fig. 3 Seasonal mean proportion (±SD) of the contribution of
internal (black bars) and external (grey bars) nutrient loading
into Dutch inland wetlands for both non-breeding (upper panel)
and breeding (lower panel) birds. The mean seasonal proportion
of each species has been calculated over the period July 2001
until June 2004.
Nutrient loading by carnivorous waterbirds 2429
� 2007 The Authors, Journal compilation � 2007 Blackwell Publishing Ltd, Freshwater Biology, 52, 2421–2433
by external loaders and imported into wetlands, a, has
to be considered as a tentative estimate only; the
estimation of a was based on two field studies only
(Portnoy, 1990; Gwiazda, 1996). In carnivorous water-
birds food retention time is longer (Table 3) and daily
excretion rate is lower (e.g. Gould & Fletcher, 1978)
than in herbivorous waterbirds; moreover gulls fre-
quently use aquatic sites for resting and comfort
behaviour during the day. So, it is very likely that a
higher proportion of their faeces (60% in our model)
enter a focal wetland than in herbivorous waterbirds
(<20%, Ebbinge et al., 1975; Manny, Wetzel & John-
son, 1975).
Case study: Dutch inland wetlands
When incorporating seasonal abundance of water-
birds at landscape scale our loading model suggests
that carnivorous waterbirds are only of minor import-
ance for N loading into Dutch freshwaters. The
estimated total annual amount of 260–650 g N per
hectare for both external and internal loaders is
negligible compared to estimated N input from
agriculture, precipitation and point emissions ranging
between 5 and 5000 kg N ha)1 a)1 (van Puijenbroek,
Janse & Knoop, 2004). Even similar estimates of
allochthonuous N input by herbivorous waterbirds
(Hahn S. et al., unpubl. data) exceeded external
carnivorous loadings by 1.6–4 times.
However, a different picture appears for P loading.
Phosphorus loading from agriculture and other exter-
nal sources is estimated to be between 0.15 and 390 kg
P ha)1 a)1 (van Puijenbroek et al., 2004). Because the
diet and faeces of carnivorous waterbirds contained a
relatively high P concentration, and carnivorous and
herbivorous waterbirds can use the same freshwater
habitats, their joint P contribution may significantly
affect the primary production of the often P-limited
wetlands impacting wetland nutrient budgets at a
landscape scale (Karl, 2000; Wassen et al., 2005). On a
local scale the effects may even be more dramatic and
not only with respect to P but also N. We calculated
that one-fourth of the annual loading is concentrated
around breeding colonies, especially colonies of great
cormorants and black-headed gulls. The fertilizing
effect of such concentrations for a particular lake will
clearly depend on lake size and depth, regular water
mixing within the annual cycle as well as the
magnitude of nutrient loading from other sources.
For instance, in shallow lakes with a euphotic zone
down to the bottom an immediate response of
phytoplankton is very likely. Besides such a direct
and immediate impact on lake productivity, avian
contributed nutrients may also enter the sediments
and be released over longer time periods (McColl &
Burger, 1976; Bales et al., 1993). Additionally, colonies
of waterbirds almost always persist over many years
leading to an accumulating fertilizing effect and a
potentially delayed effect of avian nutrient loadings
(Hobara et al., 2005; Ellis, Farina & Witman, 2006).
Our results showed that the loading effect of non-
breeders was higher than that of breeding birds,
amounting to 68% and 83% of the internal and external
loading respectively. In extreme cases roosting gulls
contribute up to 60% of total P input (Bales et al., 1993).
Non-breeding birds, being much less restrictive in their
habitat choice than breeding birds, can use almost all
larger waterbodies for resting and roosting, leading to
a less aggregated pattern of nutrient release at a
landscape scale than for breeding birds.
The most numerous carnivorous waterbird species,
which profited from recent agricultural and urban
developments, were also largely responsible for the
external loading, especially black-headed gull and
mew gull with their high affinity for pasture feeding
habitats (e.g. Honza & Modry, 1994). For internal
loading, both breeding and non-breeding great cor-
morants appeared to be of considerable importance.
However, albeit qualified as internal loaders, these
birds may be responsible for a considerable translo-
cation of nutrients between freshwater bodies. Great
cormorant populations have increased markedly over
the last three decades; from 4470 to 23 325 breeding
pairs in the Netherlands alone (van Eerden & Gre-
gersen, 1995; van Dijk et al., 2006). This has also
resulted in a considerable lengthening of feeding
trips, and distances of up to 30 km between feeding
and breeding sites are not unusual (Platteeuw & van
Eerden, 1995), often connecting different freshwater
systems.
Our loading model verified the potentially signifi-
cant role of carnivorous waterbirds for nutrient
loading, in particular that of P. The model can easily
be applied to a range of species and spatial scales. To
improve model estimations, we suggest obtaining
additional data of species-specific excretion perform-
ances and related nutrient composition of faeces in
future empirical studies. Furthermore, such studies
2430 S. Hahn et al.
� 2007 The Authors, Journal compilation � 2007 Blackwell Publishing Ltd, Freshwater Biology, 52, 2421–2433
should pay particular attention to phenology and
long-term development of roosts of non-breeding
birds. Hitherto, most attention has been paid to the
nutrient loading by breeding birds, whereas our
calculations also indicate the potentially important
role of non-breeding birds.
Acknowledgments
We are thankful to L. Bakker, B. Nolet and W. Rip for
stimulating discussions on the subject. B. Voslamber
(SOVON) kindly provided additional data of breeding
pair numbers in 2002. Additionally, we would like to
thank two anonymous reviewers for helpful com-
ments on an earlier version of the manuscript. The
study was financially supported by Waternet. This is
publication 4112 of The Netherlands Institute of
Ecology (NIOO-KNAW).
References
Bales M., Moss B., Phillips G., Irvine K. & Stansfield J.
(1993) The changing ecosystem of a shallow, brackish
lake, Hickling Broad, Norfolk, UK. 2. Long-term trends
in water chemistry and ecology and their implications
for restoration of the lake. Freshwater Biology, 29, 141–
165.
Bildstein K.L., Blood E. & Frederick P. (1992) The relative
importance of biotic and abiotic vectors in nutrient
transport. Estuaries, 15, 147–157.
BirdLife International. (2004) Birds in the European Union:
a Status Assessment. BirdLife International, Wagenin-
gen, The Netherlands.
Bruinderink G.W.T.A. (1989) The impact of wild geese
visiting improved grasslands in the Netherlands.
Journal of Applied Ecology, 26, 131–146.
Cramp S. (1998) The Complete Birds of the Western
Palearctic. Oxford University Press, Oxford.
Davis J.A. & Boyd C.E. (1978) Concentrations of selected
elements and ash in Bluegill (Lepomis macrochirus) and
certain other freshwater fish. Transactions of the Ameri-
can Fisheries Society, 107, 862–867.
Dierenfeld E.S., Alcorn H.L. & Jacobsen K.L. (2002)
Nutrient composition of whole vertebrate prey (excluding
fish) Fed in Zoos. U.S. Department for Agriculture,
Beltsville, MD.
van Dijk A.J., Dijksen L., Hustings F., Koffijberg K.,
Schoppers J., Teunissen W., van Turnhout C., van der
Weide M.J.T., Zoetebier D. & Plate C. (2005) Broedvogels
in Nederland in 2003. SOVON Vogelonderzoek Neder-
land, Beek-Ubbergen.
van Dijk A.J., Dijksen L., Hustings F., Koffijberg K.,
Oosterhuis R., van Turnhout C., van der Weide M.J.T.,
Zoetebier D. & Plate C.L. (2006) Broedvogels in Neder-
land in 2004. SOVON Vogelonderzoek Nederland,
Beek-Ubbergen.
Dobrowolski K.A., Kozakiewicz A. & Leznicka B. (1993)
The role of small mammals and birds in transport of
matter through the shore zone of lakes. Hydrobiologia,
251, 81–93.
Dunning J.B. (1993) CRC Handbook of avian body masses.
CRC Press, Boca Raton, FL.
Ebbinge B., Canters K. & Drent R. (1975) Foraging
routines and estimated daily food intake in barnacle
geese wintering in the northern Netherlands. Wildfowl,
26, 5–19.
van Eerden M.R. & Gregersen J. (1995) Long-term
changes in the northwest European population of
cormorants Phalacrocorax carbo sinensis. Ardea, 83, 61–
79.
Elliott J.M. (1976) Body composition of brown trout
(Salmo trutta L.) in relation to temperature and ration
size. Journal of Animal Ecology, 45, 273–289.
Ellis J.C., Farina J.M. & Witman J.D. (2006) Nutrient
transfer from sea to land: the case of gulls and
cormorants in the Gulf of Maine. Journal of Animal
Ecology, 75, 565–574.
Fox A.D. & Kahlert J. (1999) Adjustments to nitrogen
metabolism during wing moult in greylag geese, Anser
anser. Functional Ecology, 13, 661–669.
Glutz von Blotzheim U.N. (1990) Handbuch der Voegel
Mitteleuropas. Aula-Verlag, Wiesbaden.
Gould D.J. & Fletcher M.R. (1978) Gull droppings and
their effect on water quality. Water Research, 12, 665–
672.
Gwiazda R. (1996) Contribution of water birds to nutrient
loading to the ecosystem of mesotrophic reservoir.
Ekologia Polska, 44, 289–297.
Hamby D.M. (1994) A review of techniques for param-
eter sensitivity analysis of environmental models.
Environmental Monitoring and Assessment, 32, 135–154.
Hayes J.P. & Caslick J.W. (1984) Nutrient deposition in
cattail stands by communally roosting blackbirds and
starlings. American Midland Naturalist, 112, 320–331.
Hilton G.M., Houston D.C., Barton N.W.H., Furness R.W.
& Ruxton G.D. (1999) Ecological constraints on diges-
tive physiology in carnivorous and piscivorous birds.
Journal of Experimental Zoology, 283, 365–376.
Hilton G.M., Furness R.W. & Houston D.C. (2000) The
effects of diet switching and mixing on digestion in
seabirds. Functional Ecology, 14, 145–154.
Hobara S., Koba K., Osono T., Tokuchi N., Ishida A. &
Kameda K. (2005) Nitrogen and phosphorus
Nutrient loading by carnivorous waterbirds 2431
� 2007 The Authors, Journal compilation � 2007 Blackwell Publishing Ltd, Freshwater Biology, 52, 2421–2433
enrichment and balance in forests colonized by cor-
morants: implications of the influence of soil adsorp-
tion. Plant and Soil, 268, 89–101.
Honza M. & Modry M. (1994) The flock-feeding system
of the adult black-headed gull (Larus ridibundus) and
the food of its nestlings. Folia Zoologica, 43, 237–244.
Hoyer M.V. & Canfield D.E. (1994) Bird abundance and
species richness on Florida lakes – influence of trophic
status, lake morphology, and aquatic macrophytes.
Hydrobiologia, 280, 107–119.
Hutchinson G.E. (1950) The biogeochemistry of verteb-
rate excretion. Bulletin of the American Museum of
Natural History, 96, 1–554.
Karasov W.H. (1990) Digestion in birds: chemical and
physiological determinants and ecological implica-
tions. Studies in Avian Biology, 13, 391–415.
Karl D.M. (2000) Aquatic ecology - phosphorus, the staff
of life. Nature, 406, 31–33.
Kear J. (1963) The agricultural importance of wild goose
droppings. The Wildfowl Trust Annual Report 1961–62,
14, 72–77.
Kitchell J.F., Schindler D.E., Herwig B.R., Post D.M.,
Olson M.H. & Oldham M. (1999) Nutrient cycling at
the landscape scale: the role of diel foraging migrations
by geese at the Bosque del Apache National Wildlife
Refuge, New Mexico. Limnology and Oceanography, 44,
828–836.
Klaassen M., Kvist A. & Lindstrom A. (2000) Flight costs
and fuel composition of a bird migrating in a wind
tunnel. Condor, 102, 444–451.
Leentvaar P. (1967) Observations in guanotrophic envi-
ronments. Hydrobiologia, 29, 441–489.
Lindeboom H.J. (1984) The nitrogen pathway in a
penguin rookery. Ecology, 65, 269–277.
Manny B.A., Wetzel R.G. & Johnson W.C. (1975) Annual
contribution of carbon, nitrogen and phosphorus by
migrant Canada geese to a hardwater lake. Verhandlun-
gen der Internationalen Vereinigung fuer Theoretische und
Angewandte Limnologie, 19, 949–951.
Manny B.A., Johnson W.C. & Wetzel R.G. (1994) Nutrient
additions by waterfowl to lakes and reservoirs: pre-
dicting their effects on productivity and water-quality.
Hydrobiologia, 280, 121–132.
Marion L., Clergeau P., Brient L. & Bertru G. (1994) The
importance of avian-contributed nitrogen (N) and
phosphorus (P) to lake Grand-Lieu, France. Hydrobio-
logia, 280, 133–147.
McColl J.G. & Burger J. (1976) Chemical inputs by a
colony of Franklins gulls nesting in cattails. American
Midland Naturalist, 96, 270–280.
Mizutani H. & Wada E. (1988) Nitrogen and carbon
isotope ratios in seabird rookeries and their ecological
implications. Ecology, 69, 340–349.
Murphy M.E. (1996) Nutrition and metabolism. In: Avian
Energetics and Nutritional Ecology (Ed. C. Carey), pp.
31–60, Chapman and Hall, New York.
Nagy K.A., Girard I.A. & Brown T.K. (1999) Energetics of
free-ranging mammals, reptiles, and birds. Annual
Review of Nutrition, 19, 247–277.
Nakashima B.S. & Leggett W.C. (1980) Natural sources
and requirements of phosphorus for fishes. Canadian
Journal of Fisheries and Aquatic Sciences, 37, 679–686.
Nixon S.W. & Oviatt C.A. (1973) Ecology of a New
England salt-marsh. Ecological Monographs, 43, 463–498.
Penczak T. & Tatrai I. (1985) Contribution of bream,
Abramis brama (L), to the nutrient dynamics of lake
Balaton. Hydrobiologia, 126, 59–64.
Platteeuw M. & van Eerden M.R. (1995) Time and energy
constraints of fishing behaviour in breeding cormo-
rants Phalacrocorax carbo sinensis at lake Ijsselmeer, the
Netherlands. Ardea, 83, 223–234.
Portnoy J.W. (1990) Gull contributions of phosphorus
and nitrogen to a Cape Cod kettle pond. Hydrobiologia,
202, 61–69.
Post D.M., Taylor J.P., Kitchell J.F., Olson M.H., Schindler
D.E. & Herwig B.R. (1998) The role of migratory
waterfowl as nutrient vectors in a managed wetland.
Conservation Biology, 12, 910–920.
Preest M.R. & Beuchat C.A. (1997) Ammonia excretion by
hummingbirds. Nature, 386, 561–562.
van Puijenbroek P.J.T.M., Janse J.H. & Knoop J.M. (2004)
Integrated modelling for nutrient loading and ecology
of lakes in the Netherlands. Ecological Modelling, 174,
127–141.
Rahn H. & Ar A. (1974) Avian egg - incubation time and
water loss. Condor, 76, 147–152.
Romanoff A.L. & Romanoff A.J. (1949) The Avian Egg.
Wiley, New York.
van Roomen M.W.J., van Winden E.A.J., Koffijberg K.,
Kleefstra R., Ottens G. & Voslamber B. (2003) Water-
vogels in Nederland in 2001/02. SOVON Vogelonderzoek
Nederland, Beek-Ubbergen.
van Roomen M., van Winden E., Koffijberg K., Boele A.,
Hustings F., Kleefstra R., Schoppers J. & van Turnhout
C. (2004) Watervogels in Nederland in 2002/03. SOVON
Vogelonderzoek Nederland, Beek-Ubbergen.
van Roomen M., van Winden E., Hustings F., Koffijberg K.,
Kleefstra R., SOVON Ganzen- en zwanenwerkgroeop &
Soldaat L. (2005) Watervogels in Nederland in 2003/04.
SOVON Vogelonderzoek Nederland, Beek-Ubbergen.
Scherer N.M., Gibbons H.L., Stoops K.B. & Muller M.
(1995) Phosphorus loading of an urban lake by bird
droppings. Lake and Reservoir Management, 11, 317–327.
Smith J.S. & Johnson C.R. (1995) Nutrient inputs from
seabirds and humans on a populated coral cay. Marine
Ecology Progress Series, 124, 189–200.
2432 S. Hahn et al.
� 2007 The Authors, Journal compilation � 2007 Blackwell Publishing Ltd, Freshwater Biology, 52, 2421–2433
Sterner R.W. & Elser J.J. (2002) Ecological stoichiometry.
The biology of elements from molecules to the biosphere.
Princeton University Press, Princeton.
Tanner D.K., Brazner J.C. & Brady V.J. (2000) Factors
influencing carbon, nitrogen, and phosphorus content
of fish from a Lake Superior coastal wetland.
Canadian Journal of Fisheries and Aquatic Sciences, 57,
1243–1251.
Tsahar E., del Rio C.M., Izhaki I. & Arad Z. (2005) Can
birds be ammonotelic? Nitrogen balance and excretion
in two frugivores. Journal of Experimental Biology, 208,
1025–1034.
Turcek F.J. (1966) On plumage quantity in birds. Ekologia
Polska, 14, 617–634.
Vanni M.J. (2002) Nutrient cycling by animals in fresh-
water ecosystems. Annual Review of Ecology and Sys-
tematics, 33, 341–370.
Wassen M.J., Venterink H.O., Lapshina E.D. & Tanne-
berger F. (2005) Endangered plants persist under
phosphorus limitation. Nature, 437, 547–550.
Weathers W.W. (1992) Scaling nestling energy require-
ments. Ibis, 134, 142–153.
Willems F., van Turnhout C., Loos W.-B. & Zoetebier D.
(2006) Belang van het Nederlandse duin- en kustgebied voor
broedvogels. SOVON Vogelonderzoek Nederland, Beek-
Ubbergen.
Ziemann H. (1986) Zur Einschaetzung des Phosphoreint-
rages in Gewaesser durch Wasservoegel, dargestellt
am Beispiel der Talsperre Kelbra. [Estimation of
phosphorus input into freshwater by waterbirds
exemplified from the Kelbra water reservior (Ger-
many).]. Acta Ornithoecologica, 1,2, 145–153.
(Manuscript accepted 6 June 2007)
Nutrient loading by carnivorous waterbirds 2433
� 2007 The Authors, Journal compilation � 2007 Blackwell Publishing Ltd, Freshwater Biology, 52, 2421–2433