essential amino acid composition of a balanced chick diet
TRANSCRIPT
Utah State University Utah State University
DigitalCommons@USU DigitalCommons@USU
All Graduate Theses and Dissertations Graduate Studies
5-1961
Essential Amino Acid Composition of a Balanced Chick Diet Essential Amino Acid Composition of a Balanced Chick Diet
Donald Christensen Dobson Utah State University
Follow this and additional works at: https://digitalcommons.usu.edu/etd
Part of the Nutrition Commons
Recommended Citation Recommended Citation Dobson, Donald Christensen, "Essential Amino Acid Composition of a Balanced Chick Diet" (1961). All Graduate Theses and Dissertations. 1631. https://digitalcommons.usu.edu/etd/1631
This Dissertation is brought to you for free and open access by the Graduate Studies at DigitalCommons@USU. It has been accepted for inclusion in All Graduate Theses and Dissertations by an authorized administrator of DigitalCommons@USU. For more information, please contact [email protected].
Ir,iiliililiiiiill 39060 01731 3742
ESSENTIAL AMINO ACID COMPOSITION
OF A BALANCED CHICK DIET
by
Donald Christensen Dobson
A dissertation submitted in partial fulfillment of the requirements for the degree
of
DOCTOR OF PHILOSOPHY
in
Nutrition and Biochemistry
Approved:
~jCH Professor ..
Head of ~Mtmeot
1Yeal? of Graduate Studi~s
UTAH STATE UNIVERSITY Logan, Utah
1961
TABLE OF CONTENTS
Page
Introduction • • 0 • • " 0 " • 1
Need of study 0 • • 0 0 0 6
Purpose of study • • <I> • • • • • e 7
Method used • • • 0 • 0 • 0 0 • • e 8
Experimental • • • • • • • • • " • • 0 10
Amino acid detel~~nation • • • • • • • • • • • 10
Method of protein hydrolysis' • • • • • • 10
Method of amino acid analysis of proteins " • " 10
Buffer solution • 0 • · • • 0 It • • 10
Ion exchange resin • • 0 • " • " • • 11
Ion exchapge columns • 0 0 0 " • 11
CO.D'S t a nt volume pumps 0 • • • • • 0 • 11
Fraction collector " • • " • • 0 • • • 11
Operation of columns 0 • e • • • • 12
Analyzing the fractions • " • • • • 0 • 13
Calculating amino' ac:ict G9~tent .e>f hydro,lyzate • 14
Cystine determination • 0 " " • • • 16
Results of amino acid determination • • • • 16
Studies to determine a balanced mixture of essential amino acids in a chick diet 0 0 • • • 20
General procedure • 0 • <I> 0 • e • • 0 20
Methods for d,etecting amino acid balance • • 28
The addition of individual essential am~no acids to a diet 0 • • 0 • 0 • • • • () 30
The increasing Of. the._,-"ssel'lti~1 ~mino, .acids in the diet with the· exception elY" one 0 .. 33
The removal of a constant per cent of each essential amino acid from the diet • 35
Development of a basal diet • 40
Studies to determine a balanced mixture of essential amino acids in a chick diet • 45
Comparison of balanced essential amino acid diet with some laboratory rations • 53
Discussion • • 59
Summary • • 64
Literature cited. 65
Appendix • • • • 68
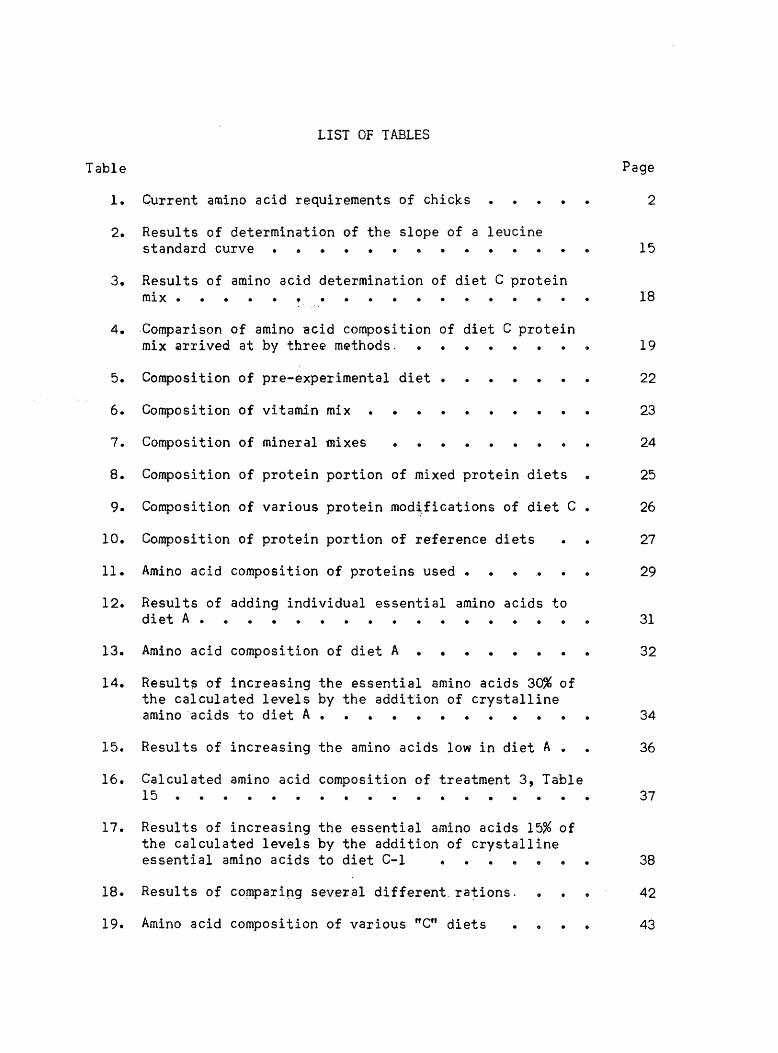
LIST OF TABLES
Table Page
1. Current amino acid requirements of chicks 2
2. Results of determination of the slope of a leucine standard curve • • • 15
3. Results of amino acid determination of diet C protein mix • • 18
4. Comparison of amino acid composition of diet C protein mix Qrrived at by tbre~ m~thods. 19
5. Composition of pre-experimental diet. 22
6. Composition of vitamin mix • 23
7. Composition of mineral mixes • 24
8. Composition of protein portion of mixed protein diets 25
9. Composition of various protein modifications of diet C 26
10. Composition of protein portion of reference diets 27
11. Amino acid composition of proteins used. •
12. Results of adding individual essential amino acids to diet A.. • • •
13. Amino acid composition of diet A • • •
14. Results of increasing the essential amino acids 30% of the calculated levels by the addition of crystalline
29
31
32
amino 'acids to diet A •• • 34
15. Results of increasing the amino acids low in diet A 36
16. Calculated amino acid composition of treatment 3, Table 15 • • 37
17. Results of increasing the essential amino acids 15% of the calculated levels by the addition of crystalline essential amino acids to diet C-l • 38
18. Results of cOplparing several different. rations. 42
19. Amino acid composition of various "Cft diets 43
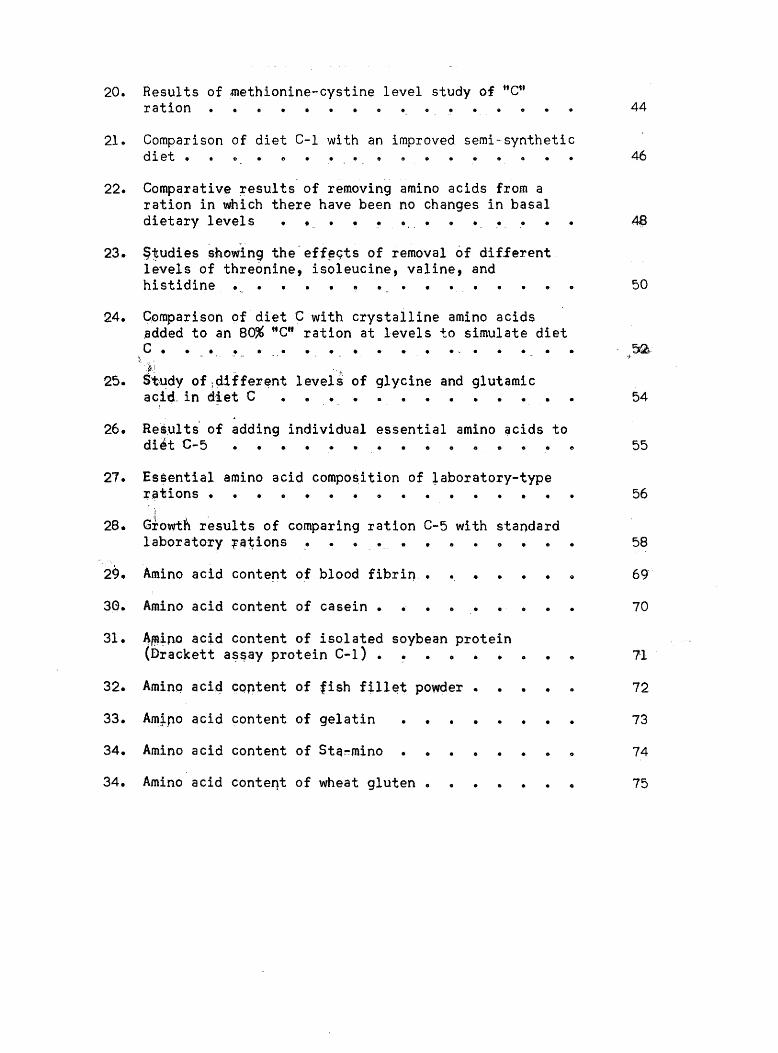
20. Results of methionine-cystine level study of "C" ration • • 44
21. Comparison of diet C-l with an improved semi-synthetic diet • • • • 46
22. Comparativ~ ~esults of removing amino acids from a ration in which there have been no changes in basal dietary levels •• ••• • ,e 4$
23. §~udies showing the'eff~Gts of removal of different levels of threonine, isoleucine, valine, and histidine .~ • • • •• 50
24. Comparison of· diet C with crystalline amino acids added to an 80% tiC" ration at levels to simulate diet c • • • • • • • • • •
25. PI
Study of;different levels of glycine and glutamiC acid. in d'iet C .• • • •
26. Re.ults of adding individual essential amino ~cids to diet C-5 •• •• •••••
21. Essential amino acid composition of laboratory-type r.ations • • •
. )
28. G~owth results of comparing ration C-5 with standard laboratory rations •
2~. Amino acid content of blood fibrin • • •
30. Amino acid content of casein • •
31. A~~no acid content of isolated soybean protein (Drackett a~~ay protein C-I). • •
32. Aminq aci~ cQptent of fish fillet powder • • •
33. Am~ro acid content of gelatin • •
34. Amino acid content of Sta~mino • • •
34. Amino acid conte~t of wheat gluten • •
•
55
56
58
69
70
• 71
72
73
74
75
INTRODUCTION
The scientific balancing of diets has resulted in a series of
studies to determine a standard for amino acid adequacy of a chick
ration. These studies have shown that some amino ·acids are required
in a chick diet more than others; they are termed "essential amino
acids". Proteins used in formulating rations vary widely in essential
amino acid content. Because of this variation, it can no lOAger be
said that a diet with so much protein (N x 6025) is adequate to meet
the chick's need for optimum performance. Many papers have been
published showing the results of experiments for determining the
minimum levels of amino acids required in a chick's ration.
Almquist (1947, 1952) has written two review papers on this
subject and each year publishes a review of the current papers in the
May issue of the Proceeding of the Annual Meeting of the Nutrition
Council of the American Feed Manufacturers Association.
The SUb-committee on Poultry Nutrition of the National Research
Council's Committee on Animal Nutrition was appointed in 1943 and
charged with preparing nutrient requirement standards for poultry.
This committee considered all available data and incorporated this
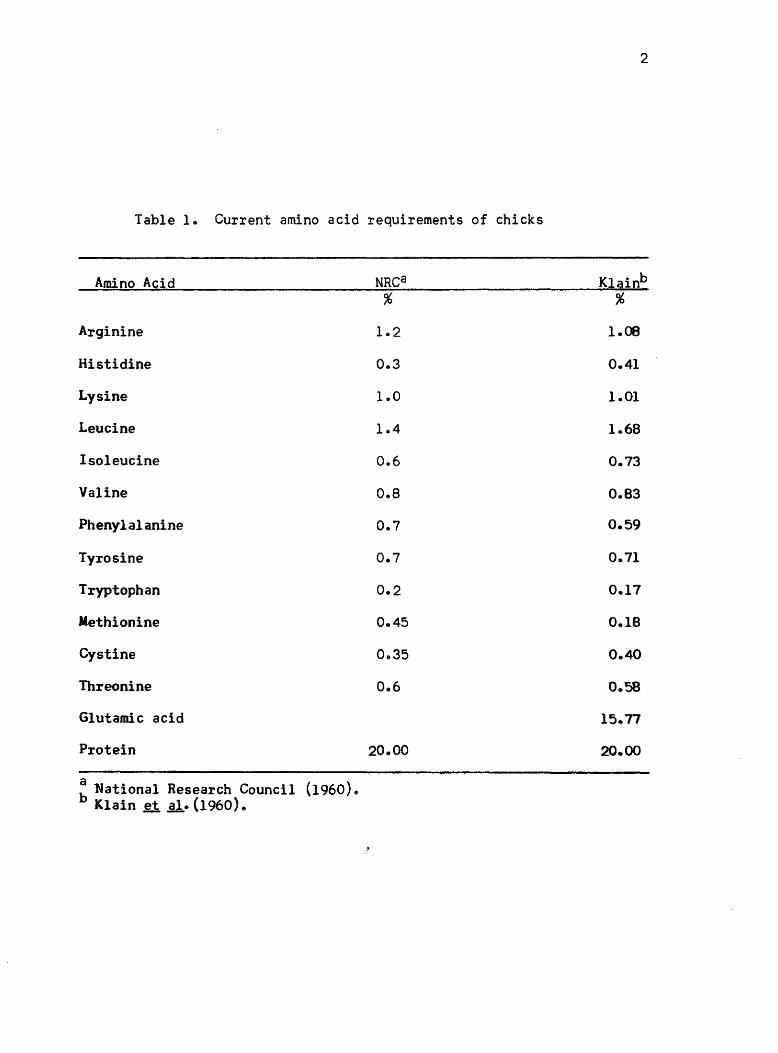
information into tables of nutrient requirements. The most recent set
of requirement values for amino acids for chicks is given in Table 1
(National Research Council, 1960).
The common understanding of ttrequirementft is that there is a
minimum level of an amino acid required in a chick diet which should
be equalled or reasonably exceeded. There are many factors that seem
2
Table 1. Current amino acid requirements of chicks
Amino Acid NRCa Klainb % %
Arginine 1.2 1.08
Histidine 0.3 0.41
Lysine 1.0 1.01
Leucine 1.4 1.68
Isoleucine 0.6 0.73
Valine 0.8 0.83
Phenylalanine 0.7 0.59
Tyrosine 0.7 0.71
Tryptophan 0.2 0.17
Methionine 0.45 0.18
Cystine 0&35 0.40
Threonine 0.6 0.58
Glutamic acid 15.77
Protein 20.00 20.00
: ~ational Research Council (1960) • Klain ~ sl.(1960).
3
to influence the minimum requirement in a ration, and as a result there
is much confusion as to what is the absolute desirable level of each
individual amino acid in a chick ration.
Almquist (1952) concluded from reviewing the literature available
at that time that relative proportions of indispensable amino acids in
the diet were more important than protein level. Recently, interest
has been focused by Wietlake et £1. (1954) and others on what appeared
to be the high arginine requirement of chicks fed a casein-cerelose
type diet. Klain et sl. (1959) demonstrated that the arginine require
ment of the chicks fed a crystalline amino acid diet formulated to
simulate the composition of casein was of the same order as that
noted on diets containing casein. These results suggest that this
increased arginine requirement was primarily due to the amino acid
content of casein.
Anderson and Dobson (1959), in studying the apparent high arginine
requirement of a 20% protein, casein chick diet, found that part, if not
all the increased arginine requirement was due to the "imbalancetf or
high level of essential amino acids in the casein ration. Their study
showed that two rations, one a casein diet and the other a mixed protein
diet, with equal protein levels (N x 6.25) but differing in amino acid
composition, required different levels of arginine to obtain equal growth
rate of chicks. The casein diet with 13.0% total essential amino acid
content required about 30% more arginine than the mixed protein diet
which contained 9.7% of total essential amino acids. The authors were
able to reduce the arginine required for optimum growth of chicks fed
a casein diet by reducing the casein level in the diet and making up
the reduction in protein with non-essential amino acids. These investi
gators and Fisher ~ glo (1960) were able to increase the amount of
4
arginine required in a chick diet by adding essential amino acids to a
mixed protein diet to simulate a casein dieto
Anderson and Dobson (1959) further found that the lysine require
ment was influenced in a similar mannere They presented limited data
indicating that threonine, methionine, histidine and valine requirements
also increased as the level of essential amino acids in the diet was
increased. These findings would agree with the recent report of Nelson
et £1. (1960) in which it was shown that the methionine requirement
increased as the protein level increased.
The basic approach that has been used in determining the amino
acid requirements has been to formulate a ration that was low in a par
ticular amino acid and then add graded amounts of it until the level was
reached that appeared to support maximal rate of gain. The value
obtained was then considered to be the minimum requirement for the chicke
Often experiments are conducted with other proteins which indicate that
more or less than this value was needed. There are numerous reports in
the literature where this approach has been used in defining the require
ment for specific amino acidse The results of Anderson and Dobson (1959)
and Fisher ~ £1. (1960) would suggest that the requirement that was
determined by the addition of amino acids to a particular protein would
be applicable to that protein alone or similar proteins and would not
necessarily reflect the chick's absolute need. A serious limitation of
this approach has been that workers have not consideled the levels of
the other amino acids in the ration except to make sure they equalled
or reasonably exceeded the National Research Council requirements.
Recently Klain ~~. (1960) used a different approach in determin
ing amino acid requirements. These investigators started with a diet
composed of crystalline amino acids in the same proportions as found in
5
the fat-free chick carcass at levels equivalent to 20% dietary protein.
They fed graded levels of each amino acid to determine their optimum
levels in the diet; once this level was determined, it was used there
after. L-isomers of the amino acids, with the exception of methionine,
were used in arriving at concentrations giving maximum response. After
having once established the desirable level of isoleucine, valine,
threonine, or phenylalanine, the racemic forms were used at twice the
level. The amino acid requirements that were calculated by fitting
regression lines to the data are given in Table 1. The growth rate of
chicks in this work did not approach that of a complete protein control.
Theoretically there should be advantages in using crystalline amino
acid diets in the determination of the chick's need for amino acids.
Early studies by Almquist and Grau (1944), Luckey g1~. (1957), and
others in which crystalline amino acids have been used as the only
source of protein were unsatisfactory because of poor chick growth.
More recently, Fisher and Johnson (1957), Fox et £1. (1958), and Klain
et ~. (1960) have been able to feed amino acid rations where the growth
rate was vastly improved, but still the growth rate was not equal to that
of chicks fed diets of intact proteins. Glista (1951) demonstrated that
chicks force-fed a diet containing free amino acids would grow at a rate
comparable to those fed diets containing intact proteins. The difficulty
involved was the unpalatability of crystalline amino acid diets. In
order to make the rations more palatable, workers have used high fat
levels in the rations so that in a sense, they were feeding diets that
were not typical of commercial type rations. The high costs of
crystalline amino acid diets has made extensive work almost prohibitive.
Most workers in amino acid nutrition have used some DL-amino acids in
order to reduce the cost of such work. The use of racemic mixtures has
6
been another limiting factor in using crystalline amino acids for dietary
studies. For many amino acids, the D-isomer was assumed to be biologi
cally inactive. According to Almquist (1956), there has been little
research conducted to determine the influence of the D-isomer on the
requirement of the essential amino acids or its effect on non-essential
amino acids. Therefore, it has remained questionable whether to use
large quantities of DL-amino acids until more research has determined
the absolute effect of these D-isomers on the biological active isomers.
Intact proteins have been used in extensive studies to amino acid
requirements. The advantages of using intact protein in chick diets
have been that chicks grow at "normal" rates and costs of such studies
are not so great. There have, however, been limitations to the use of l
a diet made up of intact protein. Generally it has been very difficult
to obtain a particular level of each amino acid in a diet. A diet cannot
be balanced so long as there are excesses of essential amino acids.
Another limitation of intact protein has been in the degree of the avail
ability of the amino acids to the chicks. Intact proteins vary in amino
acid composition so that by using average composition values, an
absolute statement of amino acid content in the basal has been limited.
Need of Study
The summation of the total essential amino acids (except glycine)
contained in a standard 20% protein chick diet is 8.3% according to
National Research Council (1960) recommendations, whereas in most
practical diets it is about 10-11%. Based on current recommendations,
there are 2-3% essential amino acids in a ration that are not defined.
This "excess" essential amino acid could be anyone or many. The effect
of these excess amino acids on the utilization of all amino acids in the
diet is not known.
7
Much work has been done by Harper (1959) and others where an amino
acid imbalance has been brought about by increasing one amino acid in
relatively large quantities, but there has not been much thought given
to moderate excesses of essential amino acids. Since an amino acid
"imbalance" has been shown in a casein diet that has been considered
to have only moderate excesses of amino acids and has been used widely
as a chick reference diet, it becomes very important that a great deal
of consideration be given to amino acid balance in chick rations. In
view of the above evidence, whenever an amino acid urequirement" is
determined, it should be done with a ration that is as nearly balanced
in amino acids as possible.
The concept that the requirement for each essential amino acid
depends upon the amount of the other essential amino acids in the diet
implies that a balanced amino acid mixture should be best from the
standpoint of growth and protein efficiency. Or conversely that under
a given set of conditions, including a given total essential amino acid
level in the diet, there is one particular amino acid mixture which would
be better for a given chick than any other possible mixture. The "best"
combination of amino acids in a ration is not known. Klain et sl. (1959)
presents evidence that unon-essential" amino acids have an important
function in chick diets. It appears reasonable from their data that the
best combination of amino acids will include all amino acids. The
importance of each one of the amino acids will not be the same especially
in view of the chicks' ability to synthesize some at different rates
than others.
Purpose of Study
The purpose of this study was to develop a chick ration that was
balanced in essential amino acids.
8
The objectives were in two phases:
1. Determination of amino acid content of proteins by ion exchange
chromatography.
2. Determination of a balanced mixture of essential amino acids in
a chick diet by growth studies.
Method Used
The approach to formulating a chick diet balanced in essential amino
acids that was used in this study involved three steps:
1. To formulate a ration based on the essential amino acid composi
tion of fat-free chick carcass.
2. To conduct chick experiments to determine the relative high or
low amino acids in the diet.
3. To formulate a new ration based on the previous results and
conduct further experiments.
Any method used in determining a balanced mixture of amino acids in
a chick diet will have limitations. The procedure used in this study
will be a different approach than used previously. Proteins that are
considered to be excellent (when properly supplemented) were used in
formulating the diets calculated as close to the desirable level as
possible by using intact proteins. The diets were then supplemented
with crystalline amino acids to give the desired level of each amino
acid in the diet.
The approach to a balanced mixture of amino acids in a chick diet
appeared feasible only through a series of successive approximations
using each amino acid as a variable. In order to limit the scope of
this study the twelve "essential" amino acids, arginine, histidine,
lysine, leucine, isoleucine, valine, phenylalanine, tyrosine, tryptophan,
methionine, cystine, and threonine were selected to studye
9
The amino acid content of the intact proteins was determined by ion
exchange chromatography. These determinations were not completed until
most of the chick growth studies were completed. Until the analysis
was completed, the values of Block and Weiss (1956), Drackett Products
CompaAY '1955) and A. E. Staley'Manufacturing Company (1953) were used
in ta1tulating the amino acid content of the diets.
EXPERIMENTAL
Amino Acid Determination
Method of protein hydrolysis
The conventional acid hydrolysis method was used in this study.
10
Approximately a 100 mg. sample ~s weighed out into a tube, five mlo of
6N HCl were added; and the tube was sealed. The sealed tube was placed
in a constant temperature oven at 1100 C for approximately 20 hours.
The contents of the tube were quantitatively transferred to a 50 mlo
beaker with distilled water and dried in a vacuum desiccator. The
residue was dissolved in a minimum of distilled water and dried again.
This process was repeated twice more. The residue remaining was trans
ferred quantitatively to a 100 mI. volumetric flask, using pH 2 buffer
Moore and Stein (1954), to effect the transfer. One milliliter of
protein hydrolyzate solution was used in the analysis representing
approximately one mg. of protein.
Method of amino acid analysis of proteins
The amino acid analyses were performed by ion exchange chromato
graphy on a sulfonated polystyrene resin. The procedure was based on
that of Moore et ale (1958) and Spackman et £1. (1958) which utilized a
uniform fine mesh resin. The procedure that was used reduced the time
of complete amino acid determination of the regular fraction collector
method from 48 hours to about 24-28 hours. The automatic recording
method was combined with the fraction collector method in order to
increase the flow rate as compared to regular fraction collector methodso
Buffer solutions. These were prepared exactly as described by
Moore ~ ale (1958) for the automatic recording method.
11
Ion exchange resin. The ion exchange resin used in the columns
was a finely ground Amberlite IR-120 as described by Moore et £1. (1958)0
The resin was prepared and sized as described by these investigators.
The columns were packed with the fractions suggested for the automatic
recording system. The 166 cm. column was packed according to the method
of Moore et ale (1958). The 30 cm. column was packed according to the
method described by Kimmel and Smith (1958).
Ion exchange columns. Three columns were needed for the modified
procedures Two 0.9 cm. x 166 cm. columns with ground glass joints
attached for the acidic and neutral amino acids and one 0.9 Cffio x 30 cme
column with ground glass joints attached for the basic amino acids. It
was more efficient to have two long columns so that one could be
recharging while the other one was in use. These columns have been
described by Moore ~ £1. (1958).
Constant volume pumps. Two constant volume pumps as described by
Spackman ~ a1. (1958) were used; one pump for the 166 cmo columns, and
the other for the 30 cm. column. The de-aerated buffers were pumped
through one-sixteenth inch diameter tygon tubing to the columns as
described by these researchers for the automatic system. The flow rate
through the columns was approximately 25 mI. per hour for the 166 cmo
column and 30 mI. per hour for the 30 cm. column. It was found on the
last run that it was more advantageous to have the flow rate from both
columns the same (25 mI. per hour) thus removing the necessity of
adjustment of tbe time interval. Once the constant volume pumps are
set for a specific rate of delivery, they do not require much more in
the way of adjustments.
Fraction collector. A time/flow fraction collector was used to
collect the fractions. Two milliliter fractions were collected in each
12
tube. The amount of buffer that was delivered was checked periodically
throughout the run by weighing the amount of buffer in each tubeo The
fraction collector was controlled by a 30-minute cycle timer. The timer
did not seem to be more precise than about! 3-5%.
Operations of columns. The procedure for operating the columns was
the same as described by Moore ~ £1. (1958) and Spackman (1958). Some
processes were slightly modified as described here in more detail. The
pH 3.25 buffer above the ion exchange resin was carefully removed with
a hypodermic syringe with a piece of one-sixteenth inch diameter tygon
tubing attached. One milliliter of the protein hydrolyzate solution
was added to the· column with a bent 1 ml. pipette in a manner not to
disturb the surface of the resin. The solution was forced into the
resin with nitrogen gas until the liquid disappeared. The pressure used
during the addition was about five pounds. The sample was rinsed into
the resin with three 0.2 mI. portions of the pH 2 buffer, making sure
to rinse the sides of the tube and not disturb the resin surface. The
buffer was forced through the columns after each rinse. Following the
final rinse, the pH 3.25 buffer to be used in the analysis was added
back with the hypodermic syringe. The buffer line was attached,
volumetric pump started, and samples were collected. The buffer change
from pH 3.25 to pH 4.25 in the long column was manually made after about
110-114 tubes had been collected. This varied slightly with very small
differences in pH of the buffers.
It was necessary to recharge or regenerate the long column after
the completion of an analysis. The procedure is described as follows:
The constant temperature bath was closed off the column, and the buffer
above the resin was removed; 0.2 N NaOH was forced through the column
at room temperature with nitrogen gas at about seven pounds pressureo
13
The NaOH was allowed to go about two-thirds the way through the column,
and then the excess NaOH solution above the resin was removed. To
complete the recharging process of the long column, pH 3.25 buffer was
added to the column, the volumetric pump attached, and the buffer was
added to the column, the volumetric pump attached, and the buffer pumped
through until the NaOH was gone. The NaOH solution changed the color of
the resin so that the solution fronts could be determined by inspection.
The constant temperature water bath pump was connected to the column,
and 500 C water was pumped through the water jacket of the column.
The pH 3.25 buffer was pumped through for about another hour before the
column was ready for use. It was found necessary to do the recharging
at room temperature and to maintain the long column at room temperature
when not in use for long periods to reduce the collection of air above
the sintered glass plate. The delivery end of all columns had to be
closed when not in use.
The short column does not require regeneration so that as soon as
the run was completed, the volumetric pump was shut off and the end of
the column closed off until the next determination.
Analyzinathe fractions. The ninhydrin reagent was described by
Moore ~~. (1958). An automatic pipetting machine was purchased for
pipetting the ninhydrin reagent, but the reagent reacted with the tubing
so that it could not be used for pipetting the ninhydrin. The ninhydrin
reagent was made fresh for each hundred tubes when that many were to be
run together. One milliliter was manually pipetted into each two ml.
fraction. As soon as the ninhydrin reagent was pipetted into a rack of
50 tubes, the tubes were shaken and placed into a pan of boiling water
for 15 minutes. The samples were immediately removed from the boiling
water and three ml. of 50-50 v/v water-ethanol solution were pipetted
14
into them with the automatic pipettero The samples were then cooled in
cold tap water. The samples were removed from the cold water and shaken
in the rack for about 100 shakes. This method for developing the samples
was given by Moore and Stein (1954).
The optical density of the samples was then read on the spectro
photometer at 570 mUG for all amino acids except proline and hydroxy
proline which were read at 440 mUG The tubes without amino acids were
used as the blanks for the spectrophotometer, against which the samples
were read. When there was a buffer change a new blank tube was selected" ..
The tubes which required dilution before the optical densi ty cO.uld be
read were diluted with the 1:1 water-ethanol solution.
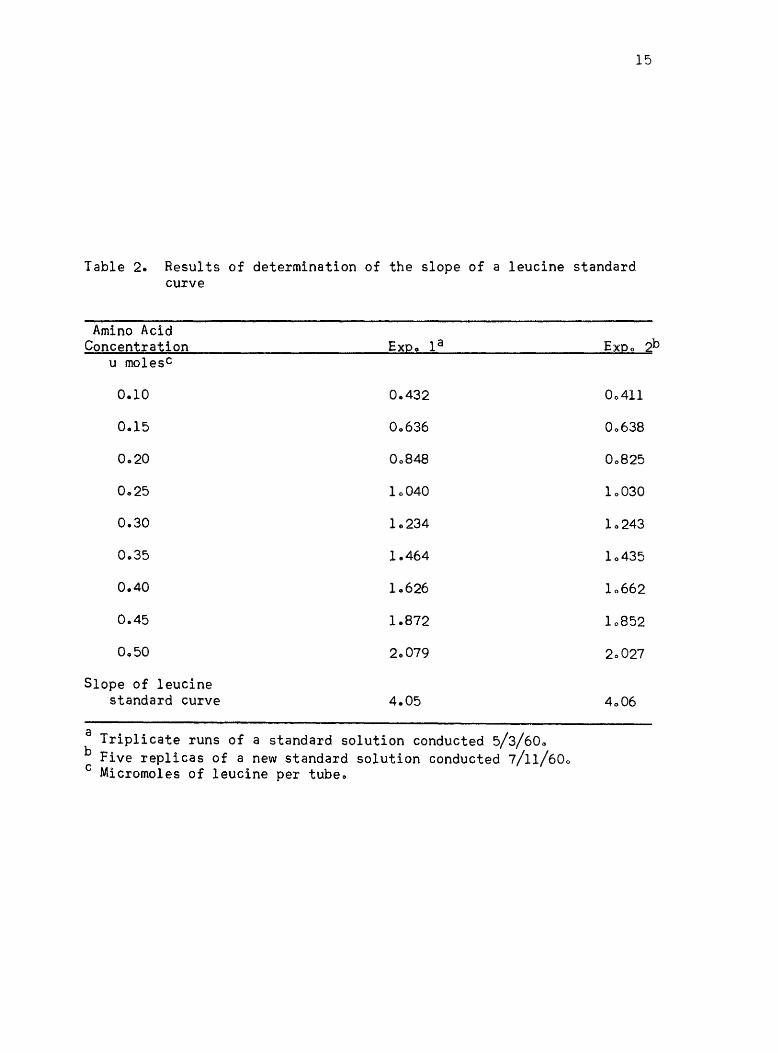
Calculating amino acid content of hydrolyzate. Leucine was used
as reference amino acid for calculating the amino acid content of
protein as it had been by Moore and Stein (1954). Two leucine standard
curve experiments were conducted, and the slope of the line was calcu
lated from this data by the least squares method. The results of this
determination are given in Table 2. The slope of the leucine standard
curve was 4.06. The color yields from amino acids on a molar basis
relative to leucine were given by Moore and Stein (1954). Using the
slope of the leucine standard curve and the color yield from amino
acids on a molar basis relative to leucine, the amino acid content for
each protein was calculated. A correction factor was applied for
methionine recovery because according to Moore et £I. (1958) the recovery
for this amino acid is 95%. The recovery for all the other amino acid
was reported by these workers to be 100% ! 3%, and no recovery correction
factors were used.
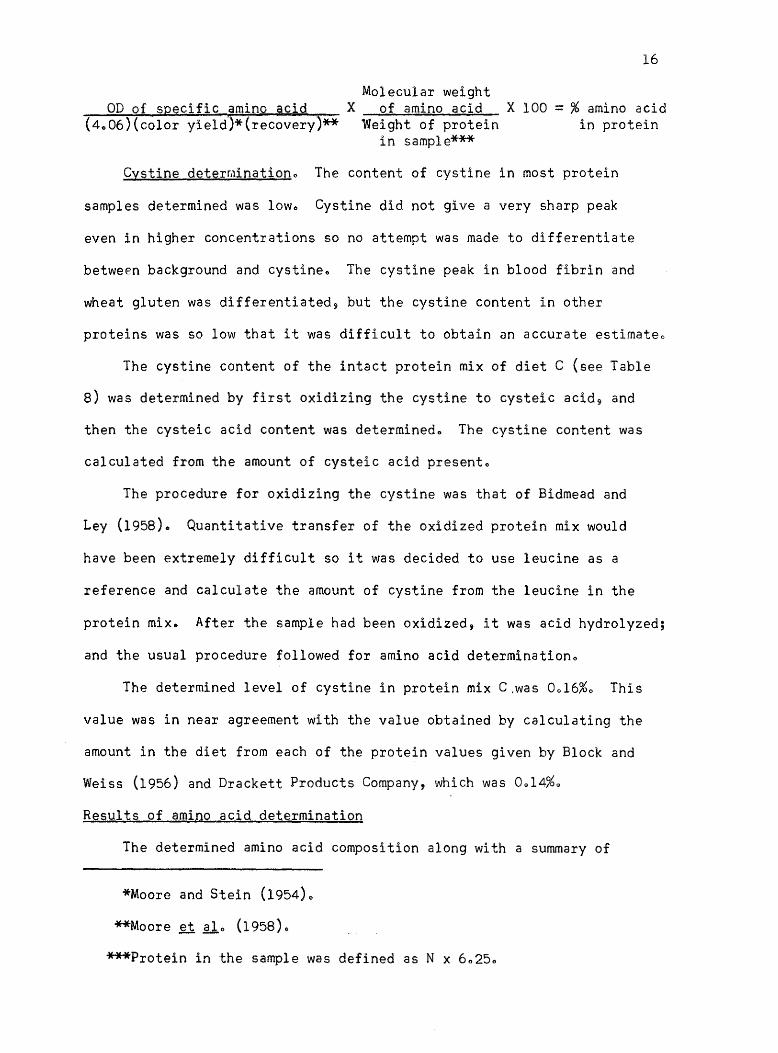
The following detailed equation was used in calculating the amino
acid present in the sample:
15
Table 2. Results of determination of the slope of a leucine standard curve
Amino Acid Concentration
u molesc
0.10
0,,15
0.30
0.35
0.40
0.45
Slope of leucine standard curve
Expo la
0.432
00636
00848
10040
1.234
1.464
1.626
1.872
20079
4.05
a Triplicate runs of a standard solution conducted 5/3/600 b Five replicas of a new standard solution conducted 7/11/600 c Micromoles of leucine per tubeo
Expo
00411
00638
00825
10030
10243
10435
10662
10852
20027
4006
2b
16
Molecular weight ~_O;::;.:D~o~f~so:::.tp~e::..=c~ir..:f:..=i-=c~a.:.:.:m~i~n,:;:.o-.1llo9,;;;;,;cl=-· d~:.--- X of amino acid (4006)(color yield)*(recovery)** Weight of protein
in sample***
X 100 = % amino acid in protein
Cystine deterrllination 0 The content of cystine in most protein
samples determined was lowo Cystine did not give a very sharp peak
even in higher concentrations so no attempt was made to differentiate
between background and cystine. The cystine peak in blood fibrin and
wheat gluten was differentiated, but the cystine content in other
proteins was so low that it was difficult to obtain an accurate estimateo
The cystine content of the intact protein mix of diet C (see Table
8) was determined by first oxidizing the cystine to cysteic acid 9 and
then the cysteic acid content was determinedo The cystine content was
calculated from the amount of cysteic acid presento
The procedure for oxidizing the cystine was that of Bidmead and
Ley (1958)0 Quantitative transfer of the oxidized protein mix would
have been extremely difficult so it was decided to use leucine as a
reference and calculate the amount of cystine from the leucine in the
protein mix. After the sample had been oxidized, it was acid hydrolyzed;
and the usual procedure followed for amino acid determinationo
The determined level of cystine in protein mix C.was 0016%0 This
value was in near agreement with the value obtained by calculating the
amount in the diet from each of the protein values given by Block and
Weiss (1956) and Drackett Products Company, which was 0014%0
Results of amino acid determination
The determined amino acid composition along with a summary of
*Moore and Stein (1954)0
**Moore et alo (1958)0
***Protein in the sample was defined as N x 60250
17
published values ofr the proteins l Casein, isolated soybean protein
(Drackett assay protein C-l)~ blood fibrin~ fish fillet9 gelatin 9 Sta~
mino type A, and wheat gluten are given in Tables 29-350 The amino
acid values given by Block and Weiss (1956) are listed for each protein
where they are availablee The amino acid content of Drackett assay
protein C-l and Sta-mino type A are the values listed by the manu
facturers along with determined valueso The amino acid values of the
individual proteins determined by other workers using ion exchange
chromatography are given as comparison when they are availableo
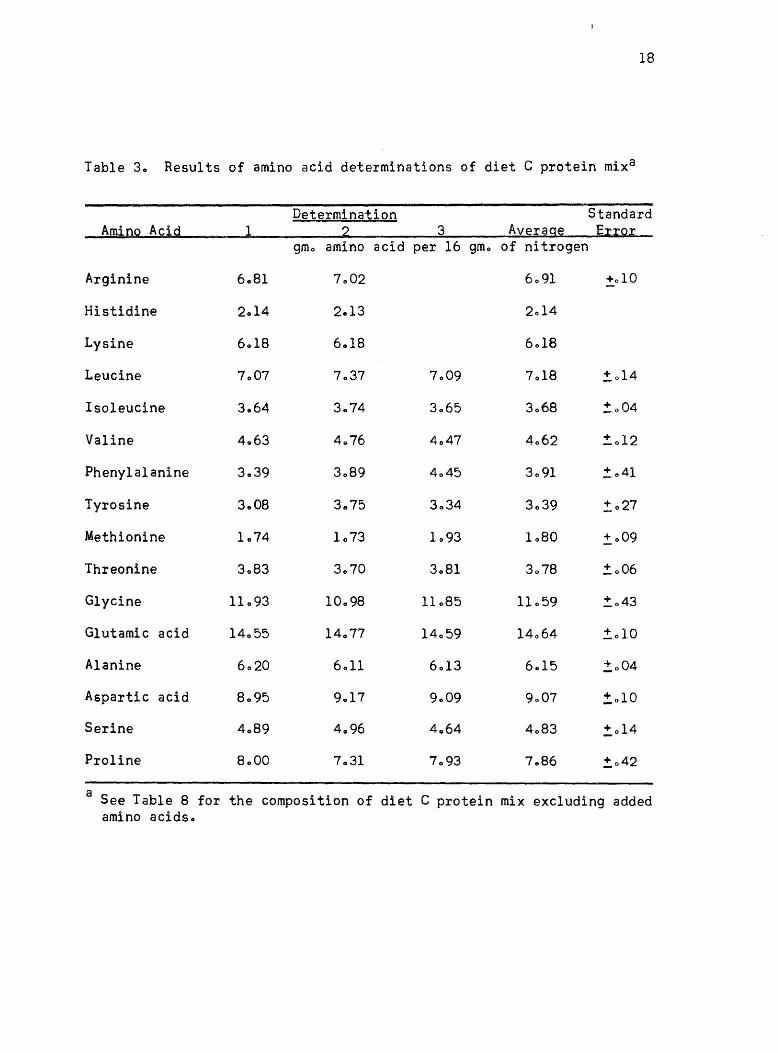
Three separate samples of the diet C protein mix, before any
crystalline amino acids (see Table 8) were added, were analyzed for
amino acid contentQ These values are given in Table 30 There were
three complete determinations made on the long column and only two on
the short columno The standard error was calculated for each amino
acido The average standard error for the long column was ~ 305%0 The
short column had less variationo The average standard error of this
column was ~ 102%0
Table 4 gives a comparison of the amino acid composition of the
intact protein mixture of diet C derived by three different methodso
The first column of values was calculated from actual determinations
of the protein mixtureo The second column was derived by using amino
acid values for individual proteins obtained by actual determination
and then calculating the amino acid content from these valueso The
third set of values were obtained by using values of Block and Weiss
(1956) for casein, gelatin, and blood fibrin; Drackett Products Company
(1955) values for Drackett assay protein C-l; and the Ao E. Staley
Manufacturing Company listed values for Sta-mino type Ao Tryptophan
was not determined so that published values were usedo The cystine
18
Table 3. Results of amino acid determinations of diet C protein mixa
Determination Standard Am10Q A~1g 1 2 3 Av~rag~ E;[;[Q;[
gmo amino acid per 16 gmo of nitrogen
Arginine 6.81 7.02 6091 +010
Histidine 2014 2.13 2014
Lysine 6018 6.18 6018
Leucine 7.07 7037 7.09 7018 !o14
Isoleucine 3.64 3.74 3065 3068 !.o04
Valine 4.63 4,,76 4047 4062 !. 0 12
Phenylalanine 3.39 3089 4045 3091 :t: 041
Tyrosine 3.08 3.75 3034 3.39 ,!027
Methionine 1.74 1073 1093 1080 !.o09
Threonine 3083 3070 3081 3078 !. 006
Glycine 11093 10098 11085 11059 !.o43
Glutamic acid 14055 14077 14059 14064 !.010
Alanine 6020 6011 6013 6 .. 15 !.o04
Aspartic acid 8095 9 .. 17 9.09 9.07 :!:,010
Serine 4089 4096 4064 4083 !,014
Proline 8000 7031 7093 7086 !,042
a See Table 8 for the composition of diet C protein mix excluding added amino acids"
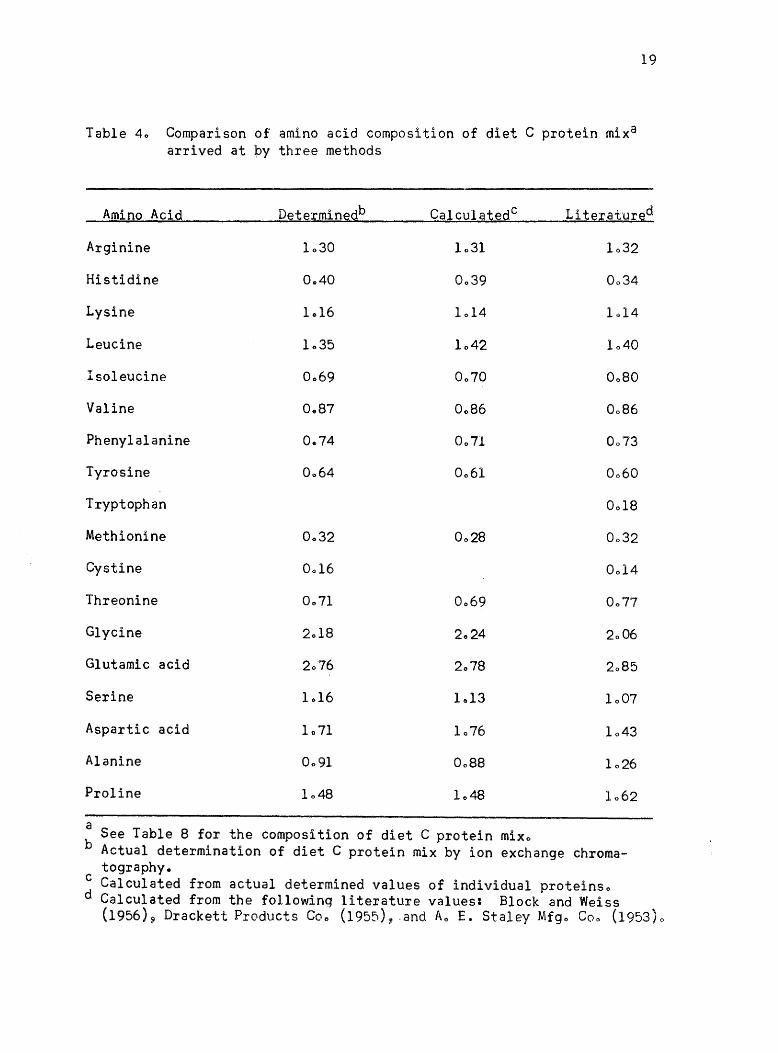
Table 40 Comparison of amino acid composition of diet C protein mix8
arrived at by three methods
19
Amino Acid Determinedb CalculatedC Literat'Ured
Arginine 1030 1031
Histidine 0 .. 40 0039
Lysine 1.16 1014 1014
Leucine 1035 1042 1040
Isoleucine 0069 0070 0080
Valine 0087 0086
Phenylalanine 0 .. 74 0071
Tyrosine 0064 0061
Tryptophan 0018
Methionine 0032
Cystine 0014
Threonine 0071
Glycine
Glutamic acid 2076
Serine 1016 1013 1007
Aspartic acid 1071 1076 1043
Alanine 0091 1026
Proline
a See Table 8 for the composition of diet C protein mixo
b Actual determination of diet C protein mix by ion exchange chromatography.
c Calculated from actual determined values of individual proteinso d Calculated from the fo11owinq literature values: Block and Weiss
(1956)~ Drackett Products Coo (1955), .and Ao E. Staley Mfgo Coo (1953)0
20
content of each protein was not determined~ but the cystine content of
diet C protein mix was calculated from the cysteic acid content of an
oxidized protein sampleo
In generalt there was fair agreement with the three methods of
arriving at the essential amino acid content of diet C protein mixo
There are three amino acids--histidine, isoleucine, and threonine--in
which there were differences that were probably not due just to varia
tions in determinationso These values were either due to differences in
protein samples or else in estimating average valueso If the values of
Block and Bolling (1951) for the proteins used in diet C were used for
calculating histidine and threonine content~ values would be obtained
that are essentially the same as the determined values listedo The
values for isoleucine content in diet C protein mix derived from actual
determinations of a complete diet C protein mix or from the determined
values of individual protein sources in the diet were consistently lower·
than the values commonly used in calculating this amino aeido The
reason for this difference was not apparento The isoleucine content of
a balanced amino acid diet agrees better with the National Research
Council (1960) requirement when the determined values are usedo
Studies to Determine a Balanced Mixture of
Essential Amino Acids in a Chick Diet
General procedure
The chicks used in this study were commercial broiler type chickso
Vantress male crossed with Hubbard female chicks from the Utah State
University Poultry Farm were usedo Eight straight-run chicks were used
in each experimental group except one experiment which shall be identi
fiedo
The chicks were started for a preliminary period (2-6 days) on a
21
"depletion" diet so that the yolk would be mostly absorbed and the chicks
would become more sensitive to dietary changes before being placed on
experiment. During the preliminary period, ground wheal was fed to
the chicks before starting the first four chick experiments and the
diet in Table 5 was fed before all other experiments.
The birds were individually weighed after the preliminary period
and sorted into w.ight groups of about three gram divisions. The birds
were randomly selected from the weight groups, wing banded and placed
on experiment. The group weight was obtained at this time. The duration
of the experiment was usually from eight to eleven days, or until the
group consuming the most feed had consumed one kilogram of feedo The
birds were writhed in"'dividually at the termination of theexperimento
The birds were reared in electrically heated batteries. Feed and water
were supplied 14 libitum.
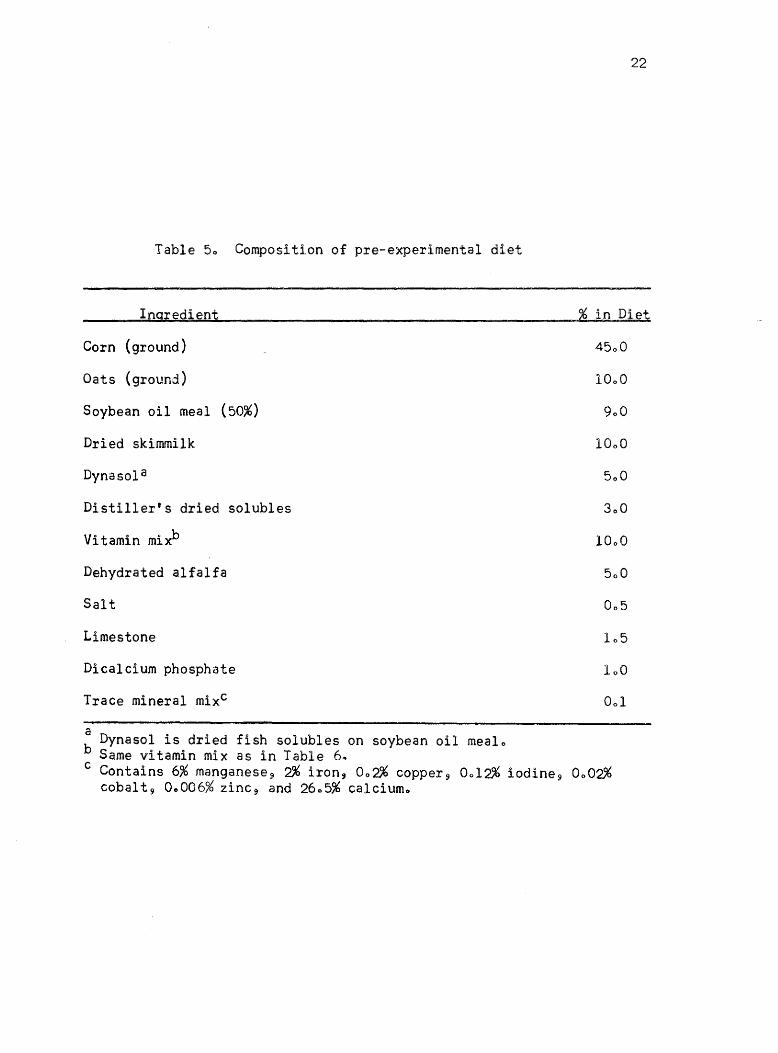
The purified ration used in this study was a standard purified
type ration which included~ Fat, vitamin mix, mineral ~ix, protein
source and carbohydrate. The fat used throughout the study was either
refined cottonseed oil or refined corn oil and was fed at a level of 3%
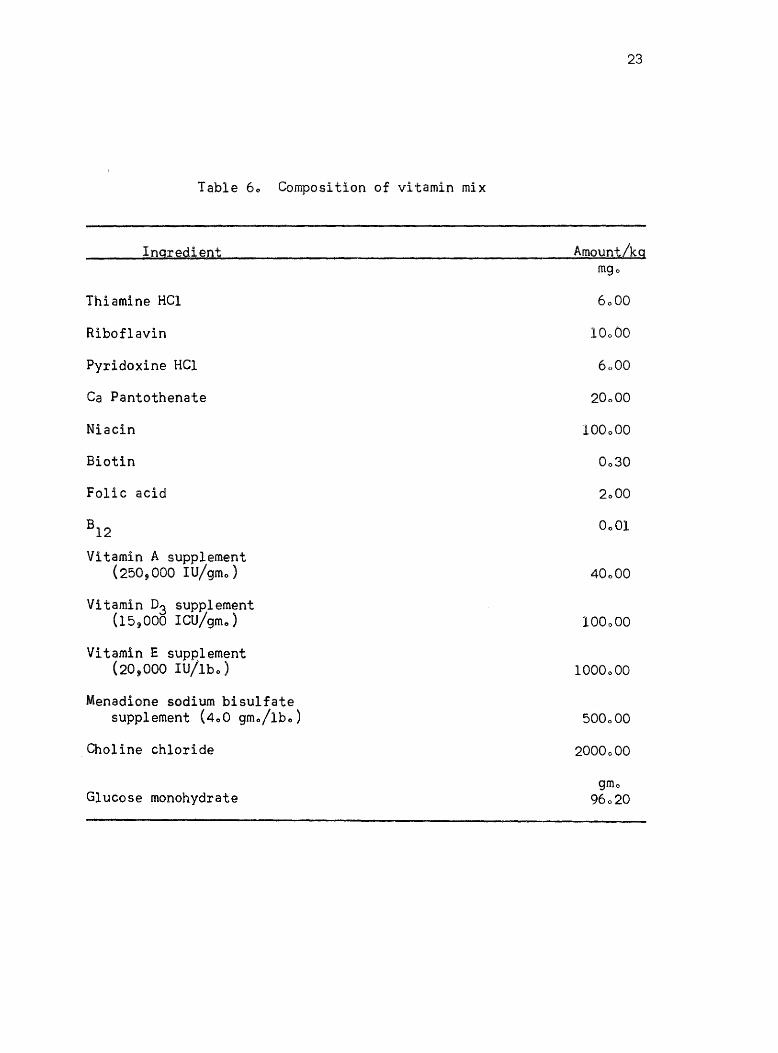
of the diet. The composition of the vitamin mix is given in Table 6.
This mix was added at the level of 10% of the diet and was constant in
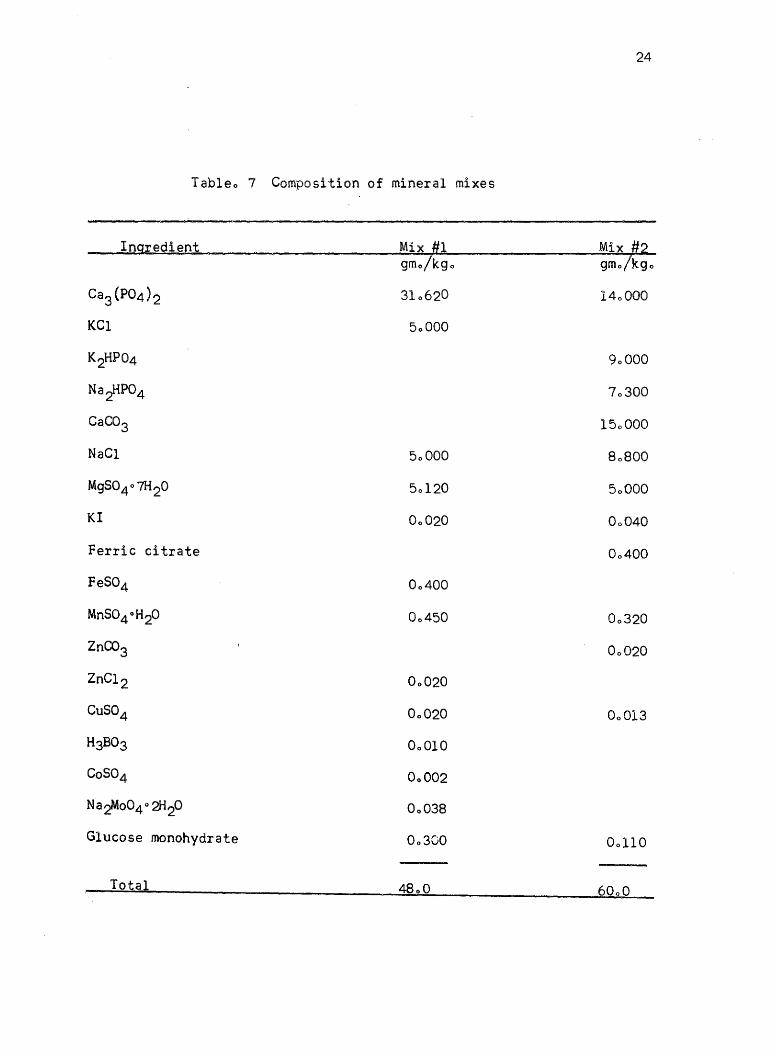
each experiment. Two mineral mixes were used (see Table 7); 408% of
mineral mix 1 was used in the first experiments and 6.0% of mineral mix
2 was used for the rest of the experiments. The composition of the
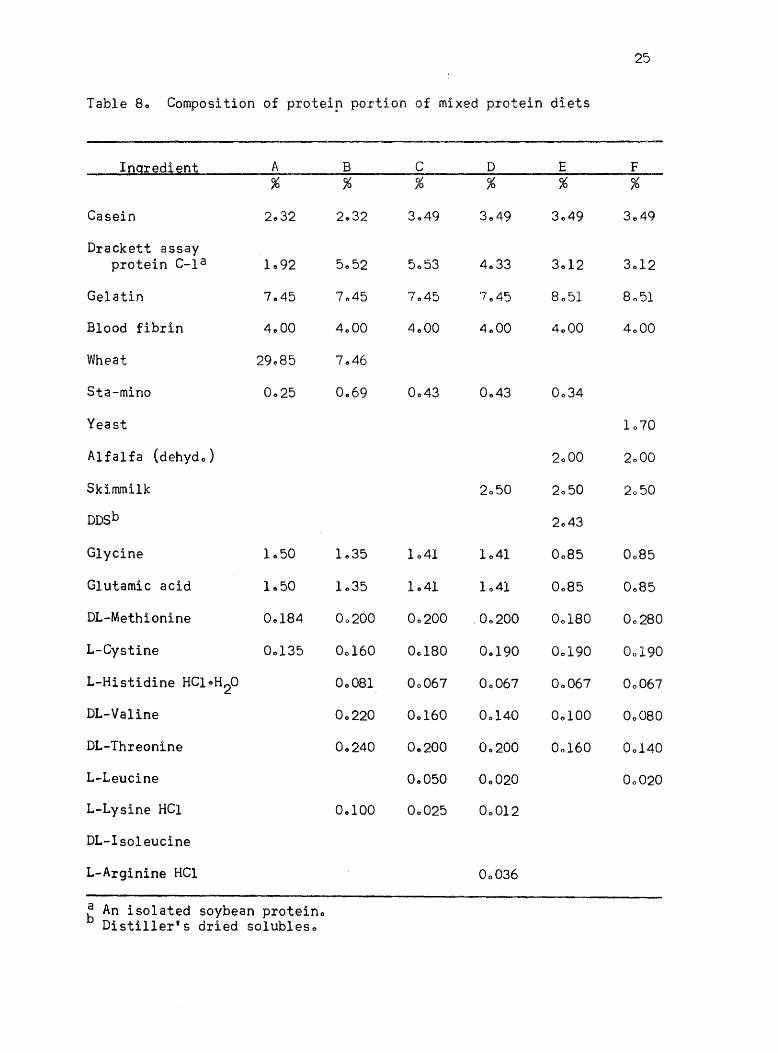
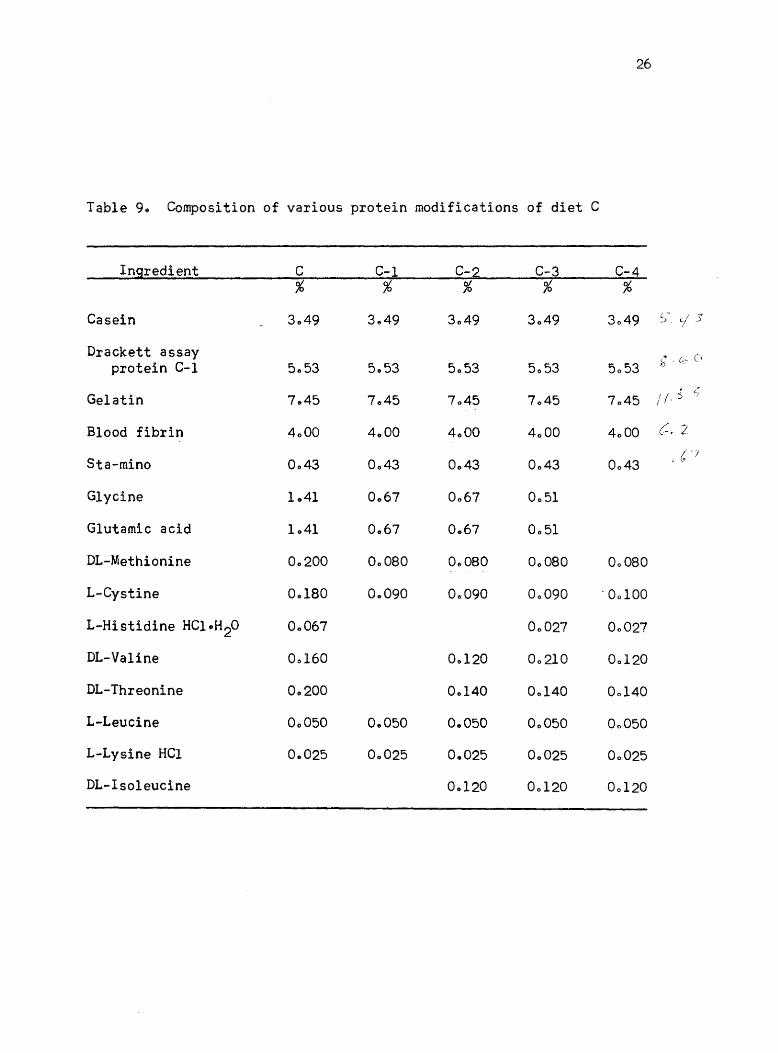
protein portion of the various mixed protein diets is given in Tables
8 and 9. The composition of reference diet proteins is given in Table
10. The source of carbohydrate was glucose monohydrate (Cerelose)9 and
it was added to make- up the ration to l~
22
Table 50 Composition of pre-experimental diet
Ingredient % in Diet
Corn (ground) 4500
Oats (ground) 1000
Soybean oil meal (50%)
Dried skimmilk
Dynaso1 8
Distiller's dried solubles
Vitamin mixb
Dehydrated alfalfa
Salt
Limestone
Dicalcium phosphate
Trace mineral mixc
a Dynasol is dried fish solubles on soybean oil mealo b Same vitamin mix as in Table 6~ c Contains 6% manganese 9 2% iron, 002% copper 9 0012% iodine9 0002%
cobalt9 00006% zinc 9 and 2605% calciuffio
23
Table 60 Composition of vitamin mix
Ingredient Amount/kg
Thiamine HCl
Riboflavin
Pyridoxine HCI
Ca Pantothenate
Niacin
Biotin
Folic acid
B12
Vitamin A supplement (250,000 IU/gmo)
Vitamin D3 supplement (15,000 leU/gmo)
Vitamin E supplement (20,000 lU/lbo)
Menadione sodium bisulfate supplement (400 gmo/1bo)
Choline chloride
Glucose monohydrate
lOobO
20000
100 0 00
40000
100000
1000000
500000
2000000
gmo 96020
24
Tableo 7 Composition of mineral mixes
Ingredient Mix #1 Mix 11.2 gmo/kgo gmo/kgo
Ca3 (P04)2 310620 140000
KCl 50000
K2HP04 90000
NaiiP04 70300
CaC03 150000
NaGl 50000 80800
MgS0407H20 50120 50000
KI 00020 00040
Ferric citrate 00400
FeS04 00400
MnS04 oH20 00450 00320
ZnC03 00020
ZnCl 2 00020
CuS04 00020 00013
H3B03 00010
CoS04 00002
Natto04°2li20 00038
Glucose monohydrate 00300 00110
To:ftal 4800 6000
25
Table 80 Composition of proteir portion of mixed protein diets
Ingredient A B C D E F % % % % % %
Casein 2032 2.32 3049 3049 3049 3049
Drackett assay protein C-la 1092 5052 5053 4033 3012 3012
Gelatin 7.,45 7045 7045 7045 8051 8051
Blood fibrin 4000 4000 4000 4000 4000 4000
Wheat 29085 7.,46
Sta-mino 0025 0.,69 0043 0043 0034
Yeast 1070
Alfalfa (dehydo) 2000 2000
Skimmilk 2050 2050 2050
DDSb 2043
Glycine 1050 1035 1041 1041 0085 0085
Glutamic acid 1050 1035 1041 1041 0085 0085
DL-Methionine 00184 00200 00200 00200 00180 00280
L-Cystine 00135 00160 00180 00190 00190 00190
L-Histidine HC1oH2O 00081 00067 00067 00067 00067
DL-Valine 00220 00160 00140 00100 00080
DL-Threonine 00240 00200 00200 00160 00140
L-Leucine 00050 00020 00020
L-Lysine HC1 00100 00025 00012
DL-Isoleucine
L-Arginine HCl 00036
~ An isolated soybean protein., Distiller's dried so1ubleso
26
Table 90 Composition of various protein modifications of diet C
Ingredient C C-1 C-2 C-3 C-4 % % % % %
Casein 3049 3&49 3049 3049 3049 S l-/ S
Drackett assay ;; . (,00 c' protein C-1 5053 5053 5053 5053 5053
Gelatin 7045 7045 7045 7045 7045 / ;. 5 1./
Blood fibrin 4000 44100 4000 4000 4000 (. 2
Sta-mino 0043 0043 04143 0043 0043 C' ox
Glycine 14141 04167 0067 0051
Glutamic acid 1041 0067 0 .. 67 0051
DL-Methionine 00200 00080 0,,080 00080 00080
L-Cystine 0.180 0,,090 00090 0,,090 '00100
L-Histidine HC1 oH2O 00067 00027 00027
DL-Va1ine 00160 00120 00210 00120
DL-Threonine 00200 00140 00140 00140
L-Leucine 00050 00050 041050 00050 00050
L-Lysine He1 0.025 00025 0.025 00025 00025
DL-Iso1eucine 00120 00120 00120
27
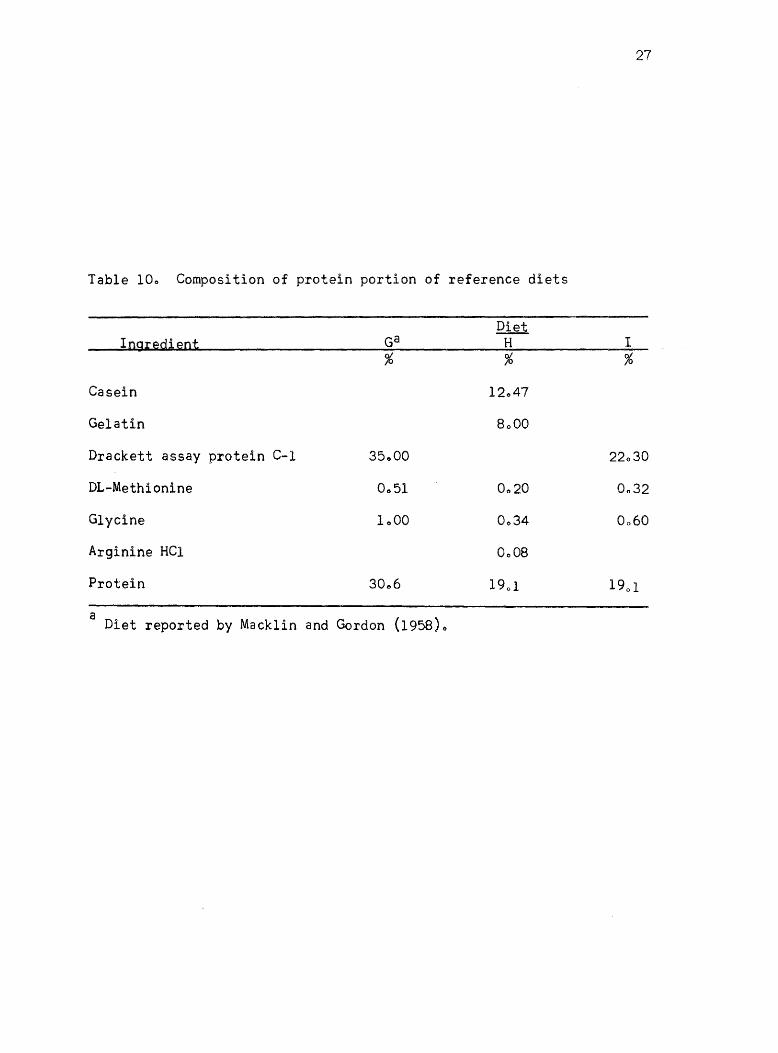
Table 10e Composition of protein portion of reference diets
Diet I09.ed1eo:t Ga H I
% % %
Casein 12047
Gelatin 8000
Drackett assay protein C-1 35000 22030
DL-Methionine 0051 0020 0032
Glycine 1000 0034 0060
Arginine HCl 0008
Protein 30.,6 19 0 1 190 1
a Diet reported by Macklin and Gordon (1958)0
28
Equal amounts of glycine and L-glutamic acid were used in maintain
ing the ni trogen content of the diets approximately constant when majoI'
changes were made in amino acid levelso When there were only small
additions to a complete ration 9 these were added at the expense of the
carbohydrate"
The proteins used in these studies were: Blood fibrin obtained
from Armour and Company~ casein from Nutritional Biochemicals Company,
gelatin from Swift and Company, isolated soybean protein (Drackett assay
protein C-l) from Drackett Products Company~ and Sta-mino type A (acid
hydrolyzate of vegetable protein) from the E. A" Staley Manufacturing
Company"
Amino acid content of proteins given in Table 11 was used in
calculating the amino acid content of dietso
Methods for_detecting amino acid balance
After considering the vast amount of work that had been done in
determining amino acid requirements 9 it did not serm reasonable that
existing approaches were sensitive enough to determine the best balance
of amino acids in a dieto In order to develop a diet that was balanced
in amino acids~ it was necessary to use some other method than what had
been used" Any method for studying amino acid balance must fill the
following requirementsl (1) it must be as sensitive as possible to
amino acid changes~ (2) it must be able to reflect excesses as well as
deficiencies in amino acids, (3) it must be economically feasibleo
Three approaches were used in developing a method which was sensi
tive to amino acid balance" These were; (1) the addition of individual
essential amino acids to a diet; (2) the increasing of all the essential
amino acids in the diet with the exception of one, keeping nitrogen
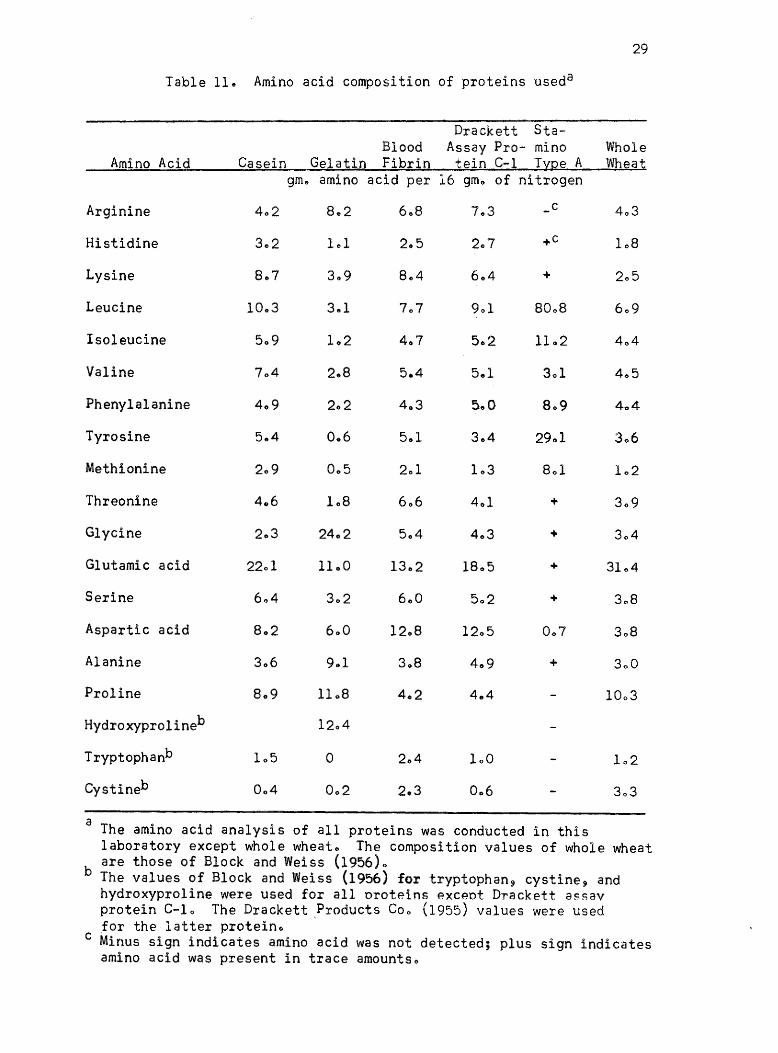
Table 11. Amino acid composition of proteins useda
Amino Acid
Arginine
Histidine
Lysine
Leucine
Isoleucine
Valine
Phenylalanine
Tyrosine
Methionine
Threonine
Glycine
Glutamic acid
Serine
Aspartic acid
Alanine
Proline
Hydroxyprolineb
Tryptophanb
Cystineb
Drackett StaBlood Assay Pro- mino
Casein Gelatin Fibrin tein C-l Type A gm. amino acid per 16 gmo of nitrogen
c
8.7 +
8008
1102
5.4
409
5.4 0.6 2901
606 401 +
2402 +
1100 1805 +
600 +
12.8 12.5
409 +
o
2.3
a The amino acid analysis of all proteins was conducted in this
29
Whole Wheat
4-04
306
laboratory except whole wheato The composition values of whole wheat are those of Block and Weiss (1956)0
b The values of Block and Weiss (1956) for tryptophan, cystine, and hydroxyproline were used for all oroteins exceot Drackett assay protein C-10 The Drackett ?roducts Coo (1955) values were used for the latter protein.
c Minus sign indicates amino acid was not detected; plus sign indicates amino acid was present in trace amounts.
30
approximately constant; (3) the removal of a constant per cent of each
essential amino acid from the diet, maintaining nitrogen constanto
The addition of individual essential amino acids to a dieto Several
experiments were conducted in which the calculated essential amino acid
content of the diet was approximately in the same ratio as that found
in the fat-free carcass of chicks based on the values given by Williams
et £10 (1954) and Price et £10 (1953)0 The suboptimum protein level of
16% was arbitrarily chosen so that the limiting amino acids could be
detected easiero Individual amino acids were added at various levels
to the 16% protein dieto Improvements in the diet were found to be slow
after a few of the most deficient amino acids were detected because
the biological variation was too great to detect small responseso
The protein level of the diet was increased to about 21% (diet A9
Table 8), keeping the amino acid content in the same ratio as in the
low protein dieto The results of adding individual amino acids to
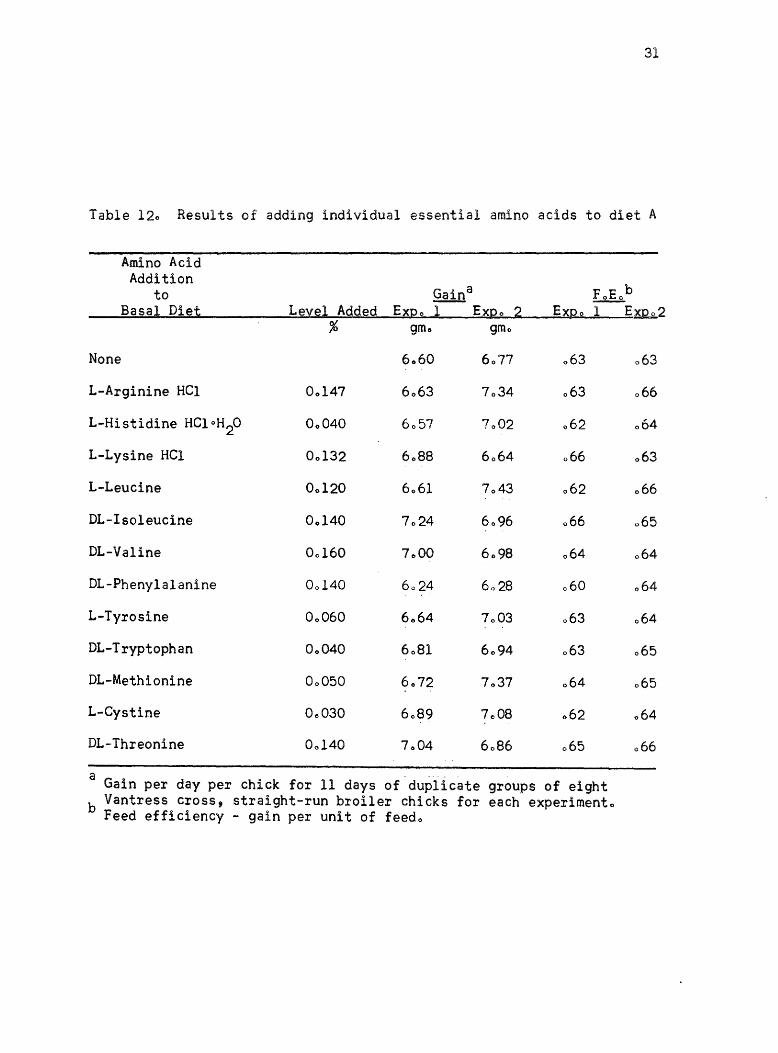
this diet in two experiments are given in Table 120 As shown in
experiment 1, it was difficult to detect significant differences
between the various treatments, but it appeared that possibly increasing
the isoleucine in the ration gave a growth responseo The isoleucine
level was increased by 0003% in experiment 20 Considering the results
of experiments 1 and 2, it was difficult to determine whether any
response due to additional amino acids to diet A would be detectableo
The only result of increasing the dietary protein level was an increase
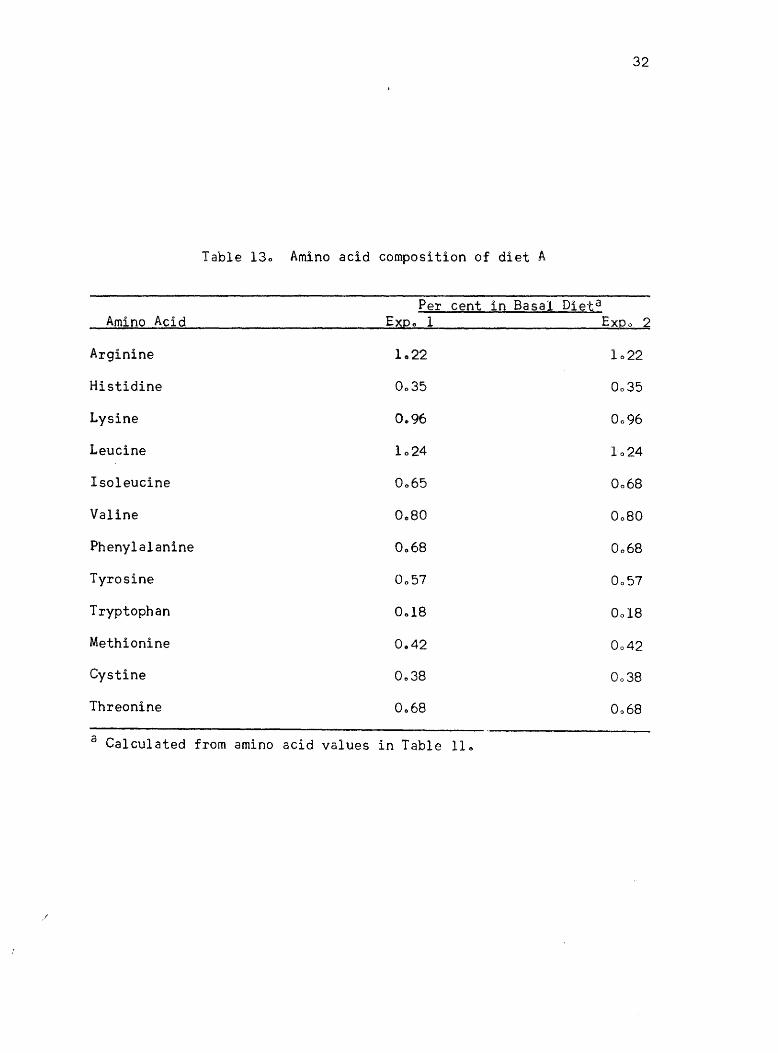
in growth rate of chickso The calculated amino acid content of diet A
for experiments 1 and 2 is given in Table 130 The results of these two
experiments indicate that little or no more progress could be made by
using this approacho
31
Table 120 Results of adding individual essential amino acids to diet A
Amino Acid Addition
to Gaina FoEob Basal Diet Level Added EXQo 1 EXQo 2 E~Qo 1 E~Q02
% gmo gmo
None 6060 6077 063 063
L-Arginine HCl 00147 6063 7034 063 066
L-Histidine HCloH2O 00040 6057 7002 062 064
L-Lysine HCl 00132 6088 6064 066 063
L-Leucine 00120 6061 7043 062 066
DL-Isoleucine 00140 7024 6096 066 065
DL-Valine 00160 7000 6098 064 064
DL-Phenyla1anine 00140 6024 6028 060 064
L-Tyrosine 00060 6064 7003 063 064
DL-Tryptophan 00040 6081 6094 063 065
DL-Methionine 00050 6072 7037 064 065
L-Cystine 00030 6089 7008 062 064
DL-Threonine 00140 7004 6086 065 066
a -. --groups of eight Gain per day per chick for 11 days of duplicate
b Vantress cross, straight-run broiler chicks for each expeximento Feed efficiency - gain per unit of feedo
32
Table 130 Amino acid composition of diet A
Per cent in Basal Dieta Amino Acid Expo 1 Expo 2
Arginine 1022 1022
Histidine 0035 0035
Lysine 0.96 0096
Leucine 1024 1024
Isoleucine 0 .. 65 0068
Valine Oc80 0080
Phenylalanine 0068 0068
Tyrosine 0057 0057
Tryptophan 0.,18 0018
Methionine 0&42 0042
Cystine 0 .. 38 0038
Threonine 0 .. 68 0068
a Calculated from amino acid values in Table 11 ..
/
33
The increasing of the essential amino acids in the diet with the
exception of onee It was very evident that the approach of adding
individual amino acids to a diet with the amino acids in the approximate
ratio as found in the chick carcass did not indicate the amino acid
balance e Thereforeg a method was needed that would identify which
amino acids in the basic diet were in relatively high or low levelsa
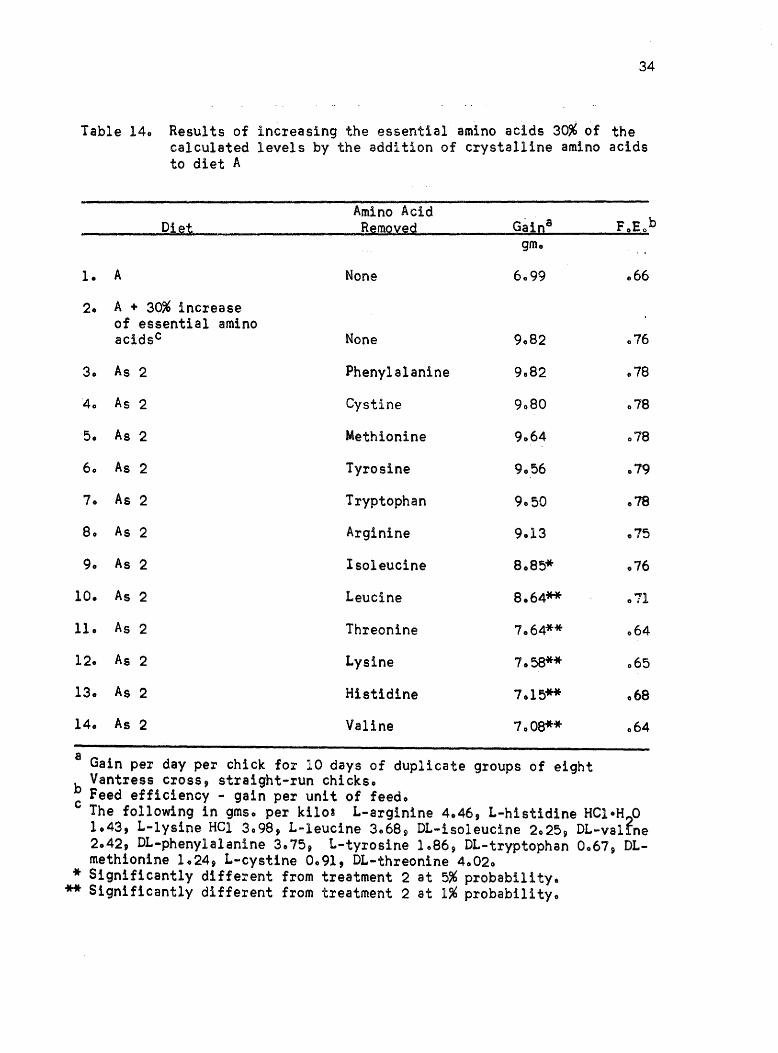
The next experiment was planned to test the amino acid balance of
diet A~ The plan of the experiment was to increase the essential amino
acids 30% of their level in diet A at the expense of glycine and glutamic
acid thus keeping total nitrogen approximately constanto The experi
mental outline and results of this experiment are given in Table 140
If the essential amino acids were in balanced proportions for the chick 9
about the same growth rate would be expected to result from the removal
of each amino acido As can be seen from the results 9 there were
significant differences in the growth rate due to omitting each essential
amino acido There was also a marked difference in feed efficiency~
According to Duncan's Multiple Range Test 9 (Duncan, 1955) the growth
rate of chicks on the diets deficient in valine 9 histidine j lysine 9
threonine, and leucine were statistically different at the 1% level and
isoleucine at the 5% level from diet A supplemented with the "essential"
amino acidse Assuming from previous experiments that diet A was a
fairly well balanced ration, it appeared that the requirement for each
essential amino acid was not affected in the same manner by increasing
the total essential amino acids in the dieta This assumption did not
seem reasonable in view of the reports in the literature that showed
that the requirements for essential amino acids increased as the
protein and essential amino acid levels increasedo
Another experiment was planned in which all the amino acids that
34
Table 140 Results of increasing the essential amino acids 30% of the calculated levels by the addition of crystalline amino acids to diet A
Diet
1. A
20 A + 30% increase of essential amino acidsc
30 As 2
40 As 2
50 As 2
60 As 2
70 As 2
80 As 2
90 As 2
10. As 2
11. As 2
12. As 2
130 As 2
14. As 2
Amino Acid Remoyed
None
None
Phenylalanine
Cystine
Methionine
Tyrosine
Tryptophan
Arginine
Isoleucine
Leucine
Threonine
Lysine
Histidine
Valine
gmo
6099
9082
9082
9080
9064
9056
9.50
9013
8085*
8064**
7064**
7.58**
7.15**
7.08**
a Gain per day per chick for 10 days of duplicate groups of eight Vantress cross, straight-run chickso
066
076
.78
.78
.78
079
078
075
076
.71
.64
065
068
064
b Feed efficiency - gain per unit of feedo c The following in gmso per kilos L-arginine 4046, L-histidine HeloH 0
1.43, L-lysine Hel 3098, L-leucine 3.68 9 DL-isoleucine 2.25 p DL-val~ne 2.42, DL-phenylalanine 3.75, L-tyrosine 1.86, DL-tryptophan 0067, OLmethionine 1.24, L-cystine 0.91, OL-threonine 4.020
* Significantly different from treatment 2 at 5% probability. ** Significantly different from treatment 2 at 1% probability.
35
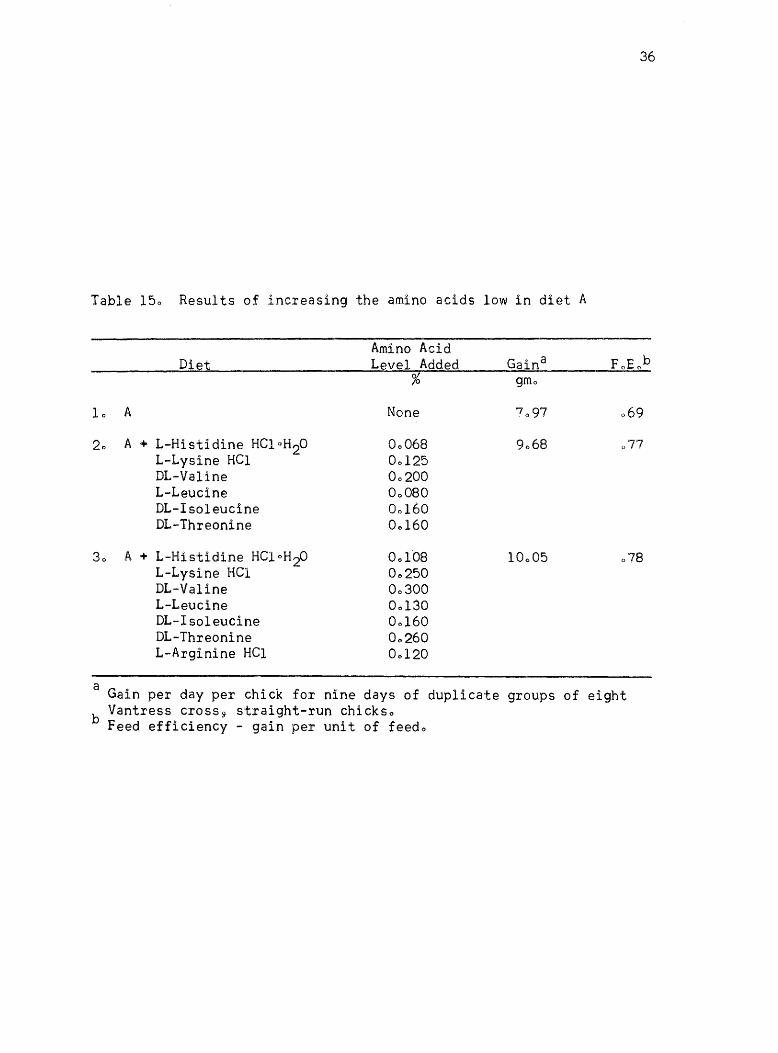
appeared limiting (valine9 hist~dine, lysine, threonine, and leucine)
were added to diet A and were included in one tr~atmento The "limiting"
a!Uinoacids were fed at two levels, and the arginine was increased in
treatment 30 The results of this experiment are given in Table 150
These results show that the addition of a group of amino ~cids
that appeared to be limiting to diet A increased the growth rate of the
chicks and improved the feed efficiencyo It appeared from these results
that the amino acids in diet A were not balancedo It was only when all
the limiting amino acids were added to diet A that a real improvement
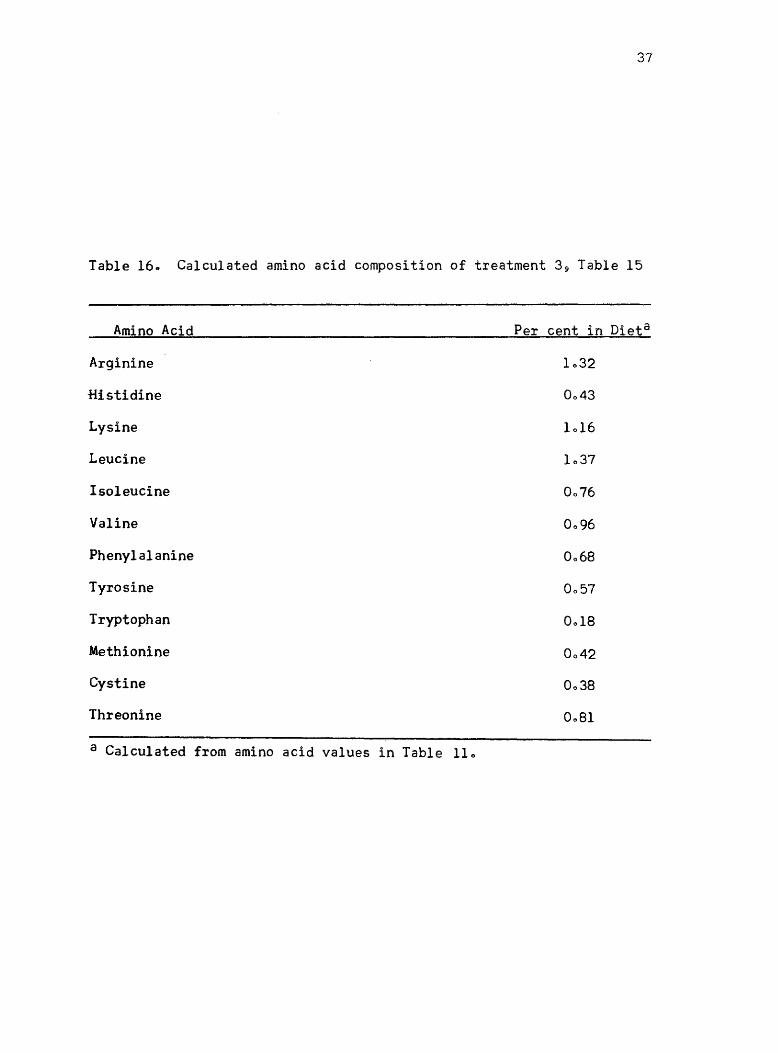
in chick performance was notedo The calculated amino acid levels of the
diet that gave the best growth rate in this experiment (treatment 3~
Table 15) is given in Table 160
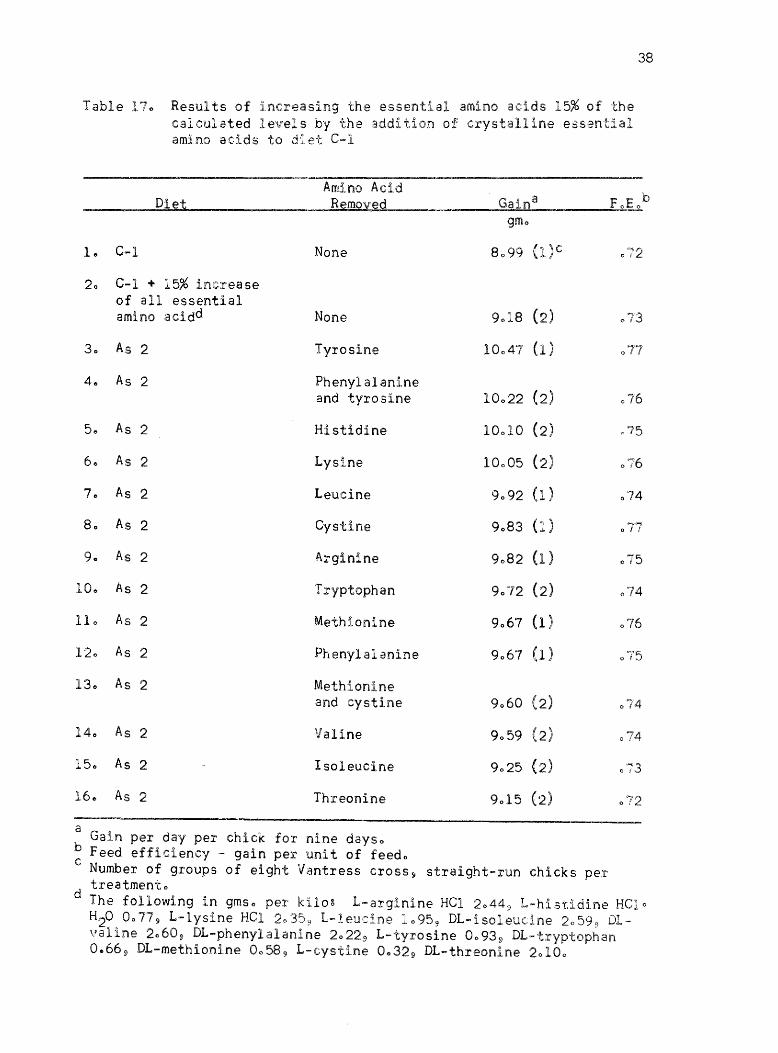
Based on the amino acid levels in Table 16~ a ration (diet C-l,
Table 9) was developed for continued amino acid balance studieso To
further study amino acid balance in diet C-1, another experiment was
conducted in whi.ch the calculated essential amino acid content was
increased 15% above the levels of diet C-lo In order to test the amino
acid balance of the diet, each essential amino acid was left out of the
increased amino acid mixtureo The experimental outline and results
from this experiment are given in Table 170 These results showed that
there were not as marked differences between the treatments as in the
previous experimento It appeared that the isoleucine and threonine
content of the basal diet was relatively low 9 but due to variation no
definite conclusion could be madeo It appeared from these results that
the sensitivity of this approach would limit further improvement in the
balance of the amino acids in the dieto
The removal of a constant per cent of each essential amino acid
from the dieto Almquist (1956) has plotted the per cent weight gain of
36
Table 150 Results of increasing the amino acids low in diet A
Amino Acid Diet Level Added
% gmo
10 A None 069
20 A + L-Histidine HCloH2O 00068 L-Lysine HCI 00125
077
DL-VaIine 00200 L-Leucine 00080 DL-Isoleucine 00160 DL-Threonine 00160
30 A + L-Histidine HCloH2O 001'08 L-Lysine HCl 00250
078
DL-VaIine 00300 L-Leucine 00130 DL-Isoleucine 00160 DL-Threonine 00260 L-Arginine HCI 00120
a Gain per day per chick for nine days of duplicate groups of eight Vantress cross 9 straight-run chickso
b Feed efficiency - gain per unit of feedo
37
Table 160 Calculated amino acid composition of treatment 3 9 Table 15
Amino Acid
Arginine
Histidine
Lysine
Leucine
Isoleucine
Valine
Phenylalanine
Tyrosine
Tryptophan
Methionine
Cystine
Threonine
a Calculated from amino acid values in Table 110
Per cent in Dieta
1032
0043
1016
1037
0076
0096
0068
0057
0018
0042
0038
0 .. 81
38
Table 170 Results of incr,easing the essent:lal amino acids 15% of the calculated levels by the addition of crystalline essential amino acids to diet C-l
Amino Acid ____ ~ __ ~D~1~et~ ______________ ~R~em~o~v~e~d~ ____ ~ _____ G~a~~9n~a ________ ~F~oEob
1" C-l
20 C-l + 15% increase of all essential amino acidd
30 As 2
40 As 2
5e As 2
60 As 2
70 As 2
80 As 2
90 As 2
10.. As 2
110 As 2
120 As 2
130 As 2
140 As 2
150 As 2
160 As 2
None
None
Tyrosine
Phenylalanine and tyrosine
Histidine
Lysi,ne
Leucine
Cystine
Arginine
Tryptophan
Methionine-
Phenylalanine
Methionine and cystine
Valine
Isoleucine
Threonine
a Gain per day per chick for nine dayso
b Feed efficiency - gain per unit of feedo
gmo
10022 (2)
10010 (2)
10005 (2)
9092 (1)
9083 (1)
9082 (1)
9072 (2)
9067 (1)
9067 (1)
9060 (2)
9059 (2)
9025 (2)
9015 (2)
077
076
.75
076
014
075
074
076
075
0'"'74
073
C Number of groups of eight Ventress cross so straight-run chicks pel' treatmento
d The following in gmso per kilo~ L-arginine Hel 2044 9 L-histidine HClo H20 0077 9 L-lysine Hel 2~359 L-leucine 1095 9 DL-isoleuclne 2059 9 D1.valine 2060 9 DL-phenylalanine 2022 9 L-tyrosine 00935) DL-tryptophan 0.66 9 DL-methioni.ne 0058 9 L-cyst.ine 0.,32 9 DL-threonine 20100
39
chicks as a function of the log of the amino acid content of the diet
at various dietary levelse He found that the values obtained from
plotting the responses to various levels of the amino acids studied
fell on a straight line. The response lines obtained for the amino
acids tryptophan9 methionine, lysine and arginine were parallel.
Almquist concluded that the parallelism of the response lines was
evidence of a constant ratio of requirements for all essential amino
acids. Theoretically based on Almquist's report, it should be possible
to obtain an equal growth rate depression with the removal of a constant
per cent of any essential amino acid from a balanced mixture of amino
acids.
It was arbitrarily decided to reduce 20% of each individual
essential amino acid in the diet, one at a timeo In order to reduce
the levels of the essential amino acids in the diet, it was necessary
to remove 20% of the protein mixture and then add c~ystalline essential
amino acids to simulate the original diet. The diet was maintained
approximately isonitrogenous by the nitrogen from the "inactive"
D-isomers of the essential amino acids and equal quantities of glycine
and L-glutamic acid.
The following were used in replacing essential amino acids removed
by the reduction in protein mix: L:-histidine-HC1-H20, L-lysine HCl,
L-arginine ~Cl, L-leucine, DL-isoleucine, DL-valine, DL-phenylalanine 9
L-tyrosinep DL-tryptophan, DL-methionine, L-cystine, DL-threonineo The
D-isomers of methionine and phenylalanine were considered to be biologi
cally active (Fel~ !! £1. 1959)0 All other D-isomers used were con
sidered inactive for essential amino acid functions. Th~refore9 the
DL-amino acids in this catagory were added at twice the level of the
L-amino acido
40
In view of the cost of amino acids, most of this work was done with
single lots on each treatment except the complete protein control which
was usually fed to three lotso
This method described was used in the section of this thesis
enti tIed tOStudies to determine a balanced mixture of essential amino
acids in a chick dietHo The same basic purified ration (diet C-l)
Table 9~ was used throughout and the results are presented in that
sectiono
Development of a basal diet
In the early part of this study, it was thought desirable to have
wheat in the diet; therefore~ ground wheat was included in diet A
(Table 8) as a major ingrediente Wheat is a product that varies in
amino acid content" Since the objective was "amino acids"~ a more
uniform sourCe of amino acids was requiredo
A constant source of wheat had been used in the early studies
so that errors in amino acid composition calculations in diet A should
have been constant errorso The carbohydrates in wheat introduce other
complications in determining the amino acid content using common acid
hydrolysis methods for hydrolyzing proteinso Since amino acid
deficiencies had been found in diet A~ which would have required
excessive amino supplementation to correct, it was necessary to develop
a new ration that contained approximately the essential amino acid
levels listed in Table 160
This diet should contain protein sources with as little variation
between lots in amino acid content as possible j therefore purified
proteins were usedo It was necessary to balance the diet as closely as
41
possible to the desired levels with intact proteins:t requiring a minimum
of crystalline amino acid supplementation u
An experiment was planned and conducted in which several different
rations were formulated~ diets B through F (Table 8)~ with approximately
the same calculated amino acid levels and protein content~ Some of
these diets contained some crude materials as sources of unidentified
factors to determine if crude materials were ne€ded8 The results of
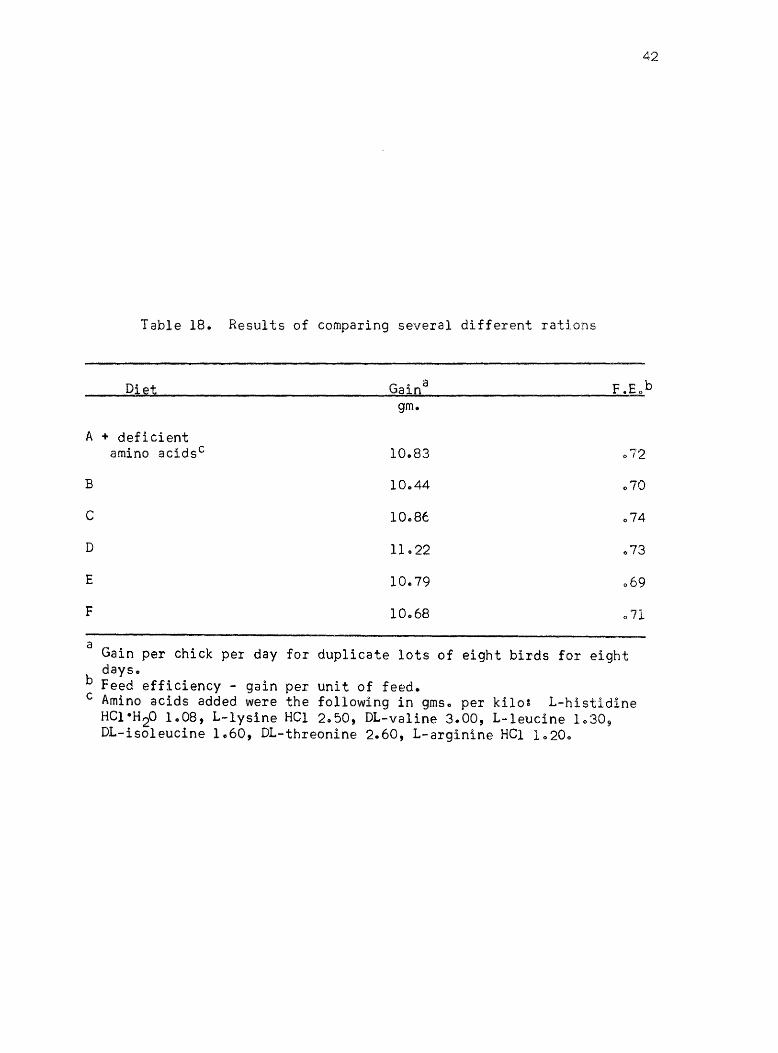
this study are given in Table 18. There were no statistically signifi
cant differences in these resultse
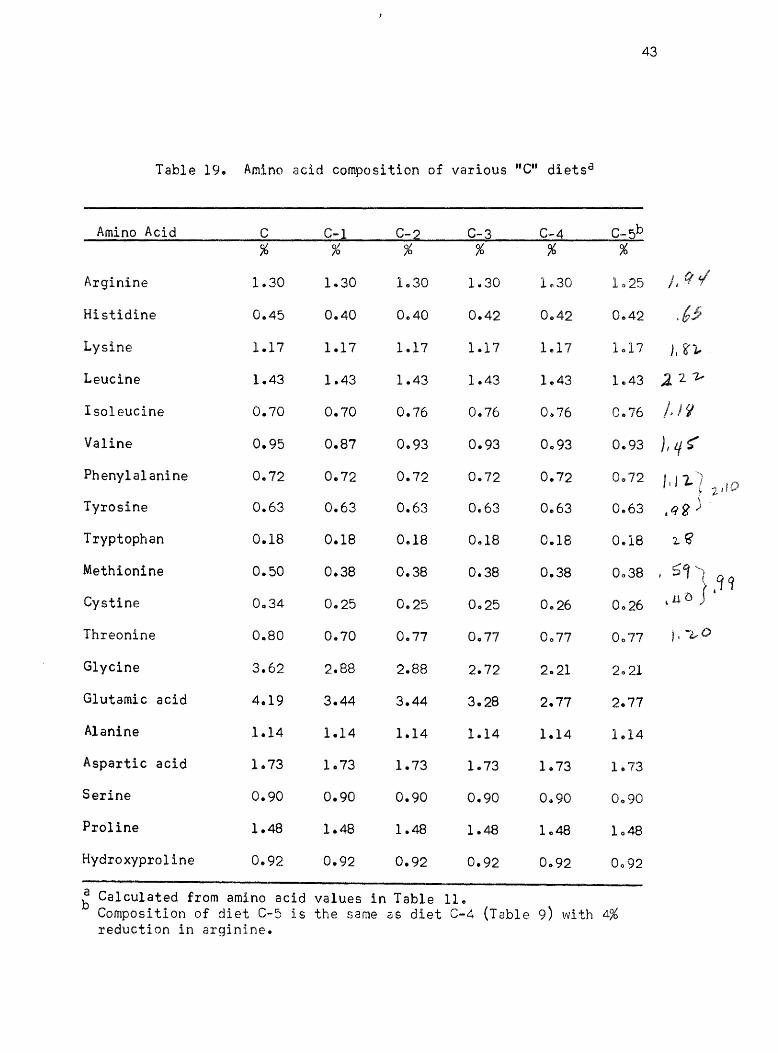
Diet C protein mix (Table 8) being composed entirely of purified
protein sources was selected to continue the amino acid balance studles~
The calculated amino acid composition of diet C and its modifications
are given in Table 19.
Jhe three amino acids, histidine, valine, and threonine that were
being added to ration C are expensive amino acids, and it was desirabl.e
to know whether they were required for optimum chick growth" Two
experiments were conducted to test this need. There was no difference
in the growth rate of chicks fed diets with or without these added amino
acids. The feed efficiencies of the two treatments of the two groups
were the sameo There was no advantage in adding these amino acids to
diet C at this timeo
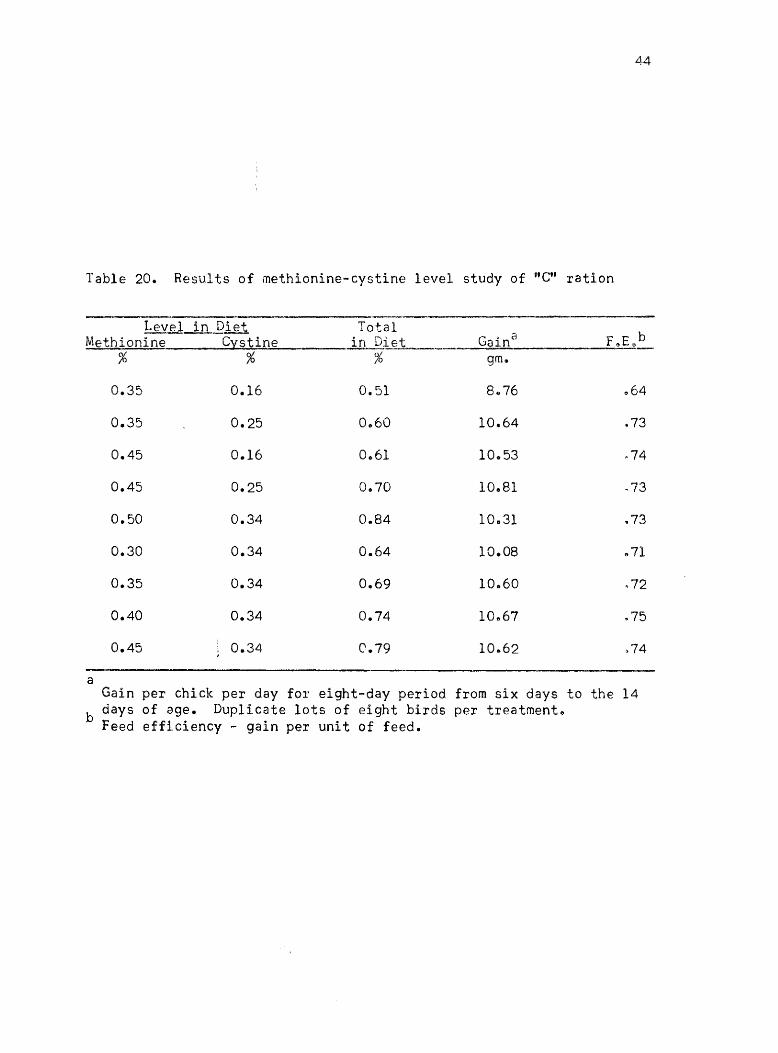
There are conflicting reports in the literature giving the
methionine-cystine requirement from approximately 0047% up to 008% of
a 20% protein ratior" Klain et &~ (1960), Almquist (1952)0 The next
experiment was conducted to test the optimum level in ration C. The
experimental results are given in Table 200 The results showed that
less than 0884% methionine-cystine was adequate and that the optimum
level appeared to be approximately Oe6% or about 0035% methionine and
42
Table 18. Results of comparing several different rations
Diet Gain a
gm.
A + deficient amino acidsc 10.83 072
B 10.44 070
C 10.,86 074
D 11.22
E 10 .. 79 069
F 10068 071
a Gain per chick per day for duplicate lots of eight birds for eight days ..
b Feed efficiency - gain per unit of feed. c Amino acids added were the following in gms o per ki1o~ L-histidine
HC1·H 20 1008, L-lysine HCl 2.50, DL-va1ine 3.00, L-1eucine 1030~ DL-iso1eucine 1060, DL-threonine 2.60, L-arginine HCl 10200
43
Table 19. Amino acid composition of various "C" diets d
Amino Acid C C-l C-2 C-3 C-4 C-5b
% % % % % %
Arginine 1.30 1 .. 30 1.30 1.30 1.,30 1025 ). fI (
Histidine 0.45 0.40 0.40 0.42 0042 0.42 6 " , ~.j;
Lysine 1.17 1.17 1 .. 17 1.17 1.17 1017 ), '?~
Leucine 1.43 1.43 1.43 1.43 1.43 1.43 2 2 1;
Isoleucine 0.70 0.70 0.76 0.76 0,,76 0 .. 76 j" l'l
Valine 0.95 0.87 0.93 0.93 0093 0.,93 ), if ~
Phenylalanine 0.,72 0.72 0.72 0.72 0.72 0072 /,11.-) ;:,,10 ~
Tyrosine 0.63 0.63 0.63 0.,63 0.63 0.63 ,q~ j
Tryptophan 0.18 0.18 0.18 0.18 0.18 0 .. 18 2..~
Methionine 0.50 0.38 0.38 0.38 0.38 0038 ..-"'~ "--,
,::J {q q
Cystine 0 .. 34 0.25 0.25 0.25 0.26 0026 \u D J I
Threonine 0.80 0.70 0.77 0.77 0077 0077 J,i.,..D
Glycine 3.62 2.88 2.88 2.72 2.21 2021
Glutamic acid 4.19 3.44 3.44 3.28 2.77 2.77
Alanine 1.14 1.14 1.14 1.14 1.14 1.14
Aspartic acid 1.73 1.73 1.73 1.73 1.73 1.73
Serine 0.90 0.90 0.90 0.90 0.90 0090
Proline 1.48 1.48 1.48 1.48 1.48 1048
Hydroxyproline 0.92 0.92 0.92 0.92 0.92 0092
~ Calculated from amino acid values in Table 11 .. Composition of diet C-5 is the same as diet C-4 (Table 9) with 4% reduction in arginine.
44
Table 20. Results of methionine-cystine level study of "G" ration
--------------------Level ill.j2iet Total _M,;:;;,e..::;.,;th ..... l.~· o:;..;,n.o.;;i;;..-.;n;;,..::;e. ____ C_y...;::;s...::;t.=i,;..;:.n.;::;.,.e ____ i n J)j_~._
% % %
0.35 0.16 0.51 8 .. 76 .. 64
0.35 0.25 104>64 ,,73
0.45 0.16 10.53 ~74
0.45 0.25 0.70 10.81
0.50 0.34 0.84 10.31 .. 73
0.30 0.34 0.64 10.08 ot71
0.35 0.34 0.69 10 .. 60 .. 72
0.40 0.34 0.74 10.67 ~75
0.45 0.34 0.79 10.62 )74
a Gain per chick per day for eight-day period from six days to the 14
b days of age. Duplicate lots of eight birds per treatment .. Feed efficiency - gain per unit of feed.
0025% cystine. In order to have a slight safety factor, the levels
of 0.39% methionine and 0026% cystIne were selectedc
45
The composition of the protein mix with reduced histidine9 valine~
threonine, ~ethionine, and cystine is given in Table 9 (ration C-l)o
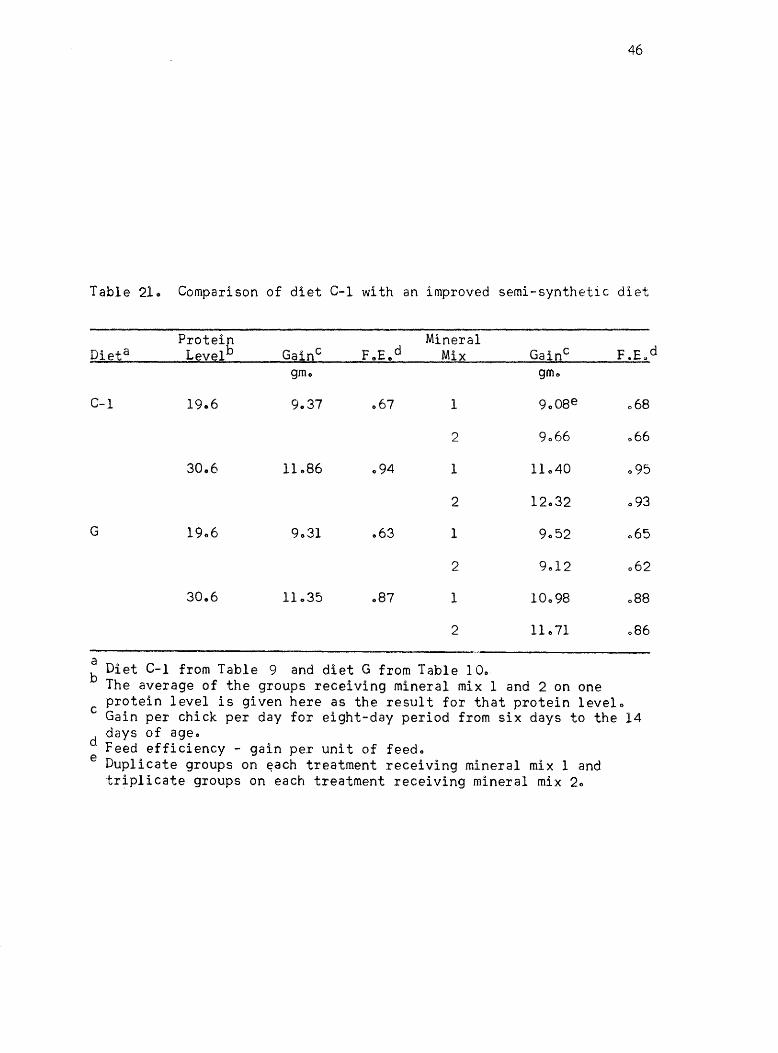
The next experiment was to compare the growth rate of chicks fed
mi~tures C-l and G (Table 10)0 The protein mix of ration G has been
reported as being capable of producing a high rate of growth by Macklin
and Gordon (1958)&
Both protein mixtures were fed at 3006% and 19&6% protein levelso
Two mineral mixes were used at each protein level: Mineral mix 1 and
mineral mix 2 (Table 7)0 The vitamin mix, used by Macklin and Gordon
(1958), with 16% added fat was used in the 3006% protein dietso The
1906% protein diets contained the vitamin mix in Table 6 with 3%
added fate
Table 21 gives the results of t~is experimento The growth rate
of chicks fed ration C-l was slightly better at both protein levels so
that it was concluded that ration C-l was as good as diet G. The
mineral mix 2 appeared to improve the growth rate of chicks fed ration
C-l more than mineral mix 1 previously usedo Ration C-l appears to be
a more efficient ration at both protein levelso Ration C-l with the
mineral mix 2 was used as the basal diet for the amino acid balance
studieso
Studies to determine a balanced mixture of essential amino acids in a
chick diet
The method used in determining the amino acid balan~e was that of
removing part of the total protein of the ration and then adding back
to the diet crystalline essential amino acids to the original level of
the diet with the exception of the one amino acid in questiono The
46
Table 210 Comparison of diet C-l with an improved semi-synthetic diet
Mineral Protein Levelb FoE.d Mix Gainc F.E.,d
gmo
C-l 19.6 9.37 .67 1 900Se 068
2 066
30.6 094 1 11 .. 40 095
2 12032 .. 93
G 9031 .63 1 9052 .. 65
2 062
30.6 11 .. 35 oS7 1 10 .. 98 oS8
2 11 .. 71 086
a Diet C-1 from Table 9 and diet G from Table 10. b The average of the groups receiving mineral mix 1 and 2 on one
protein level is given here as the result for that protein level .. c Gain per chick per day for eight-day period from six days to the 14
days of age. d Feed efficiency - gain per unit of feedo e Duplicate groups on ~ach treatment receiving mineral mix 1 and
triplicate groups on each treatment receiving mineral mix 20
47
nitrogen was maintained constant wit~ the addition of equal amounts of
glycine and L-glutamic acid. The intact prote~n portion of diet C
(Table 9) remained constant throughout these studiese Slight variations
in individual amino acid additions were made~ as results ~ndicated that
they should be alteredo The modifications made in protein (amino acid)
content of diet C are given in Table 9 and amino acid composition of
these diets are given in Table 19&
Several experiments were conducted in which the same per cent of
individual amino acids was removed. The data from these expe~iments
were expressed on a relative basis, to the control diet so that data
could be pooled. In most experiments the individual treatments were
single replicas so that by pooling as many experiments,as possible9
the data becomes more meaningful. In each experiment the control
ration was fed to at l~ast three replicaso
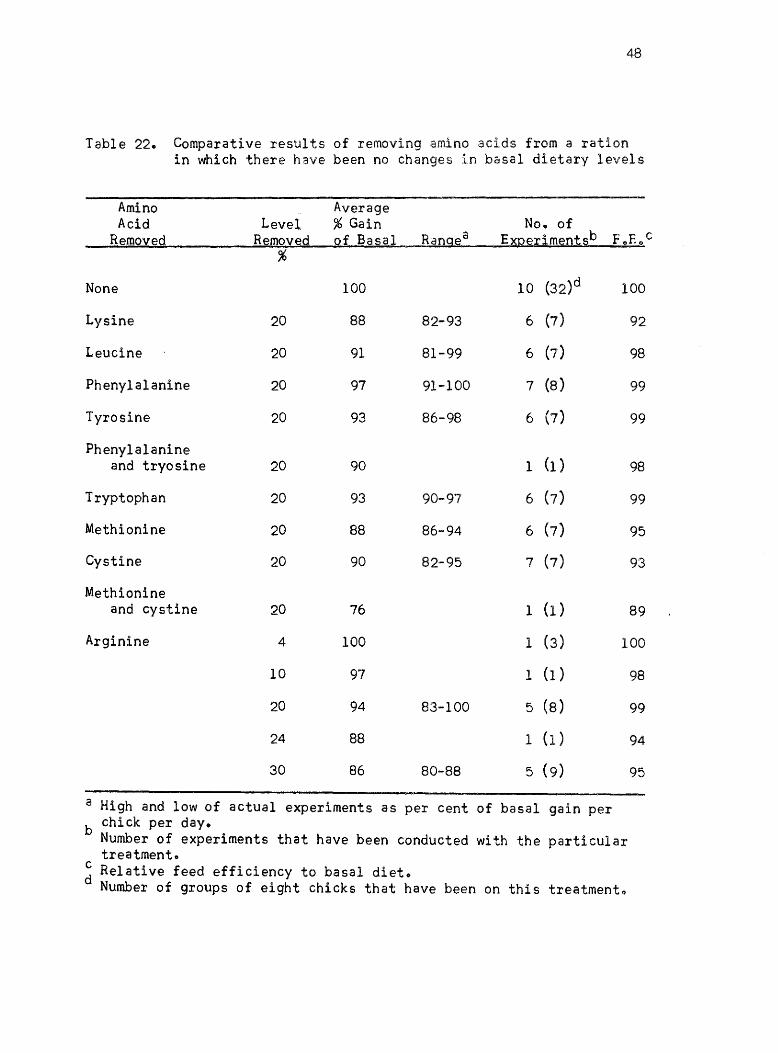
The results with those amino acids where there have been no changes
from initial dietary levels are given in Table 22. Omitting 20% ()fthe
dietary level of lysine, leucine, tryptophan, m~thionine, and cystine
all gave approximately the same per cent of gain per day. The values
for methionine and cystine as single amino acids are within the same
range of the others; but if they are considered as one amino acid
because of their interrelationship, then the value of 76% of basal gain9
obtained when 20% of the total methionine-cystine level was omitted 9 is
too low. The results would indicate the total methionine-cystine
content in the diet was low in relation to the other amino acidso
Information obtained by Anderson (1961) since this work was completed
would indicate that the methionine-cystine levels were lowo
The results with arginine have been somewhat erratico There have
been experiments where the removal of 20% of it from the basal ration
48
Table 22. Comparative results of removing amino acids from a ration in which there have been no changes in basal dietary levels
Amino Acid
Removed Level
Removed
Average % Gain of Basal
No. of Experimentsb FoEoc
%
None 100 10 (32)d
6 (7)
100
Lysine
Leucine
Phenylalanine
Tyrosine
Phenylalanine and tryosine
Tryptophan
Methionine
Cystine
Methionine and cystine
20 88
20 91
20 97
20 93
20 90
20 93
20 88
20 90
20 76
82-93
81-99
91-100
86-98
90-97
86-94
82-95
6 (7)
7 (8)
6 (7)
1 (1)
6 (7)
6 (7)
7 (7)
92
98
99
99
98
99
95
93
89
Arginine 4 100
1 (1)
1 (3)
1 (1)
5 (8)
1 (1)
5 (9)
100
10 97
20 94 83-100
24 88
30 86 80-88
a High and low of actual experiments as per cent of basal gain per b chick per day.
Number of experiments that have been conducted with the particular treatment.
~ Relative feed efficiency to basal diet. Number of groups of eight chicks that have been on this treatmento
98
99
94
95
49
resulted in a marked growth depression while in some there was no
growth depression.. The results of the removal of several different
levels of arginine from the basal diet are given in Table 220 The
growth depression that has been obtained when 30% of the arginine was
removed from the diet have resulted in relatively lower growth than
the removal of 20% of the other essential amino acids, while a 20%
removal has resulted in a relatively higher growth rateo The balanced
level probably lies between these two values. One experiment was
conducted with a 4 and 24% removal of the arginine in the dieto There
was no reduction in performance of birds receiving the 4% reduction in
the arginine levele The 24% reduction in arginine level in the diet
resulted in 88% of the basal gaino This value was within the range of
that observed with the other essential amino acidso \
indicate that the Itbalancedtt dietary level for arginine would be
approximately 1025% of the diet as shown in Table 19 as diet C-5"
The values obtained for phenylalanine and tyrosine as individual
amino acids appeared to be high when compared to the other amino acidso
Phenylalanine and tryosine functions in thE diet jre known tc ~e
interrelated so that possibly they should be treated as one amino acid"
The growth depression was about the same as with other amino acids when
20% of total phenylalanine-tyrosine was removed as shown in Table 220
This appeared to be a better method of studying the phenylalanine and
tyrosine balance.
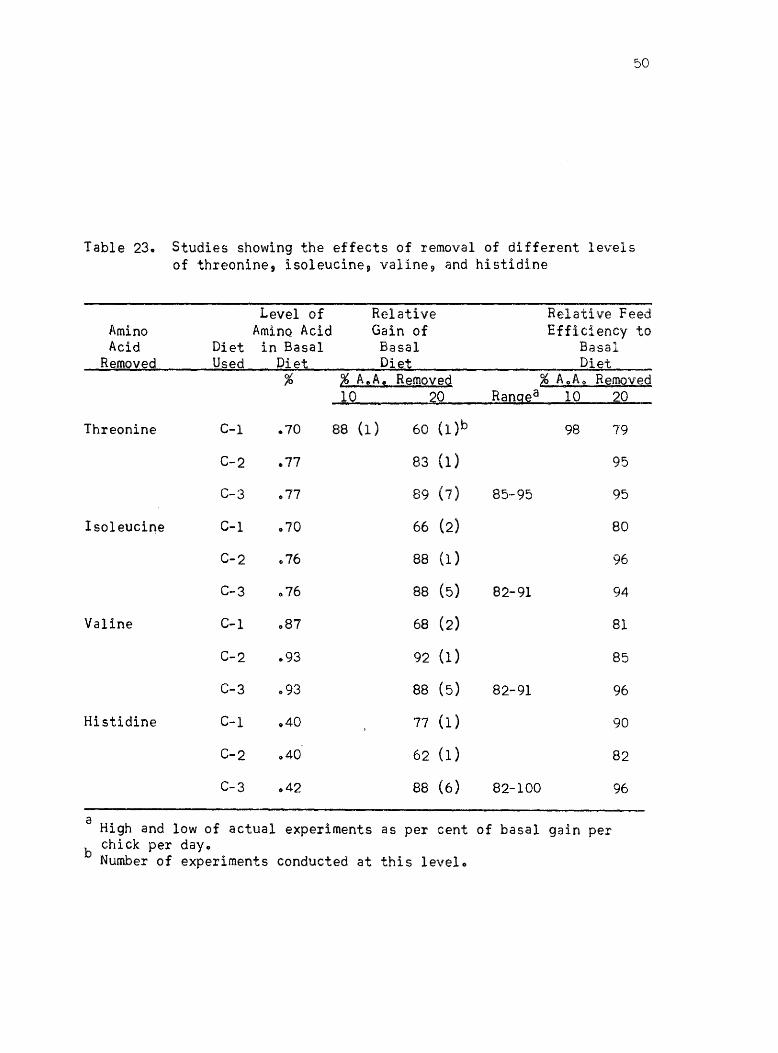
The dietary levels of four amino acids--threonine, isoleucine 9
valine, and histidine--were changed from the original levels in the
diet C-Ie The results of studies with these four amino acids are
presented in Table 230 The first experiment conducted with diet C-l
to determine the amino acid balance indicated that 0,,70% threonine in
:)0
Table 23., Studies showing the effects of removal of different levels of threonine, isoleucine, valine 9 and histidine
Level of Relative Relative Feed Amino AminQ Acid Gain of Efficiency to Acid Diet in Basal Basal Basal
Removed Used Di~t Die:t Di~t % ~ A.,A., Removed ~ A.,A .. Removed
10 20 Rangea 10 20
Threonine C-1 .70 88 (1) 60 (l)b 98 79
C-2 .77 83 (1) 95
C-3 .77 89 (7) 85-95 95
Isoleucine C-l .70 66 (2) 80
C-2 076 88 (1 ) 96
C-3 .76 88 (5) 82-91 94
Valine C-l .87 68 (2) 81
C-2 .93 92 (1) 85
C-3 .93 88 (5) 82-91 96
Histidine C-1 .40 77 (1 ) 90
C-2 040 62 (1) 82
C-3 .42 88 (6) 82-100 96
a High and low of actual experiments as per cent of basal gain per b chick per day.
Number of experiments conducted at this level.
51
the diet was too Iowa Another experiment was conducted in which only
10% of the threonine was removed and 88% of the basal gain resulted
which indicated that was approximately the level that should be in the
diet after 20% removaL., The threonine level of the diet was increased
to OQ77%, and then the 20% reduction gave 89% average gain of the
basal gain for seven experimentso
The 20% reduction of isoleucine and valine levels in diet C-l was
found to give lower relative per cent gain than the other essential
amino acids, which is represented by 66 and 68% of the basal gain
respectivelyo The basal levels were increased for isoleucine from 0070%
to 0.76% and valine from 0.87% to 0093%0 Several experiments conducted
at these levels resulted in 88% of the basal growth for each one of the
amino acids with 20% reduction in dieto
The results of removing 20% of the histidine level indicated that
the level of 0.40% in the diet was too lowe After adjustments were made
in the C-l ration by the addition of threonine, isoleucine, and valine 9
another experiment was conducted before any changes were made in the
histidine contento As can be seen from results with the C-2 diet 9
removal of 20% of the histidine resulted in 78% of the growth on basal
diet which was relatively lower than that from the other essential
amino acids. When the histidine level was increased from 0040% to
0.42%, the results of six experiments showed an average of 88% of gain
of chicks fed the basal dieto
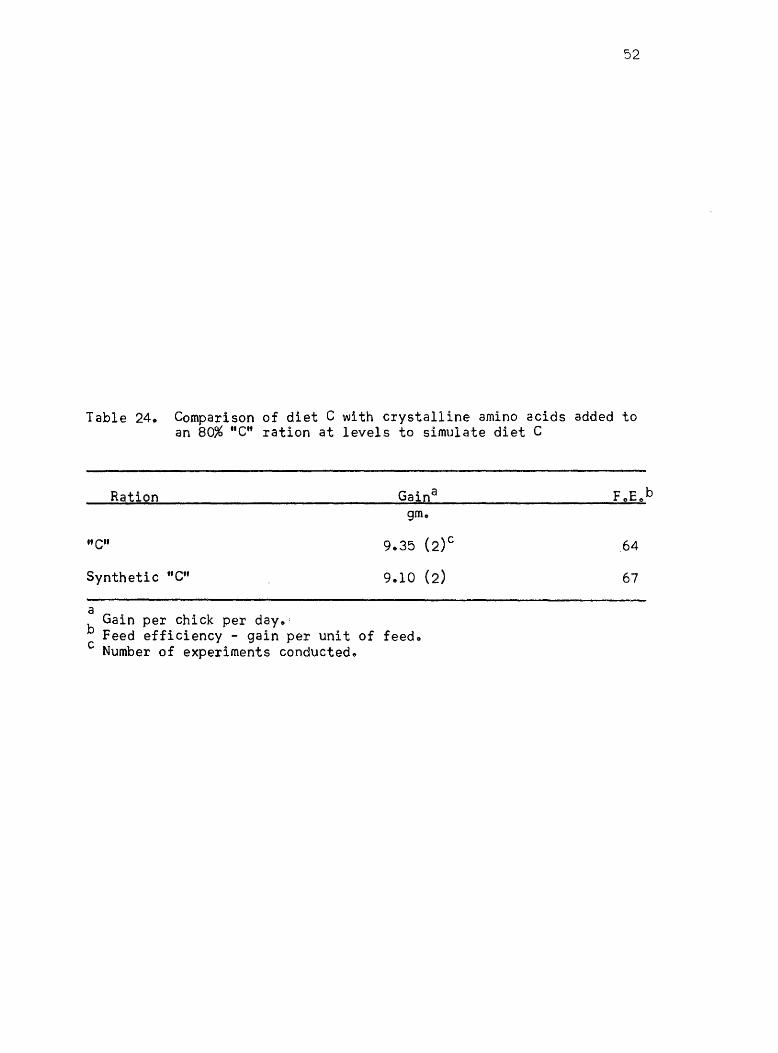
During the Course of conducting the balance studies, a group was
included periodically to see if replacing 20% of the intact protein
with crystalline amino acids reduced growth rateo The results of two
experiments are given in Table 240 Chicks fed diet C gained at a rate
of 9035 grams per day per chick while those receiving 80% of the
52
Table 24_ Comparison of diet C with crystalline amino acids added to an 80% tiC" ration at levels to simulate diet C
Ration
It Cit
Synthetic ftC"
a Gain per chick per day.'
b Feed efficiency - gain per unit of feedo c Number of experiments conducted.
64
67
53
protein mix of diet C supplemented with crystalline amino acids to
simulate diet C gained 9010 grams per dayo Chicks receiving the
synthetic mixture were slightly more efficient in feed utilizationo
Anderson, (1961) in studies along these lines~ has not found signifi
cant differences between the two types of dietso In view of these
results, it appeared that the method of adding crystalline amino acids
to replace part of the natural protein did not interfere with the
performance potential of the birdso
Non-essential amino acids were not studied specifically, but
since there was a high level of addition of glycine and glutamic acid
in diet C, parallel studies have been conducted to test the need for
these amino acids in diet Co The results given in Table 25 did not
indicate the addition of these amino acids was neededo The chicks fed
the diets without either glycine or L-glutamic acid appeared to perform
as well as those receiving the amino acidso Diet C-4 does not include
any additional glycine or L-glutamic acido
The addition of each amino acid at 10% of its level in the complete
diet was used to test the adequacy of the amino acid levels of diet C-5
(Table 19) in one experimento As shown by the results in Table 26 9
there did not appear to be any consistent differenceso
Comparison of balanced essential amino acid diet with some laboratory
rations
One experiment was conducted to compare the Itbalanced" essential
amino acid diet with some common laboratory type rations (diets Hand
1)0 The protein composition of these rations is given in Table 101'
The minerals, vitamins, and fat content are the same for all three
dietso The calculated amino acid composition is given in Table 270
The calculated protein content of each ration is the sameQ The most
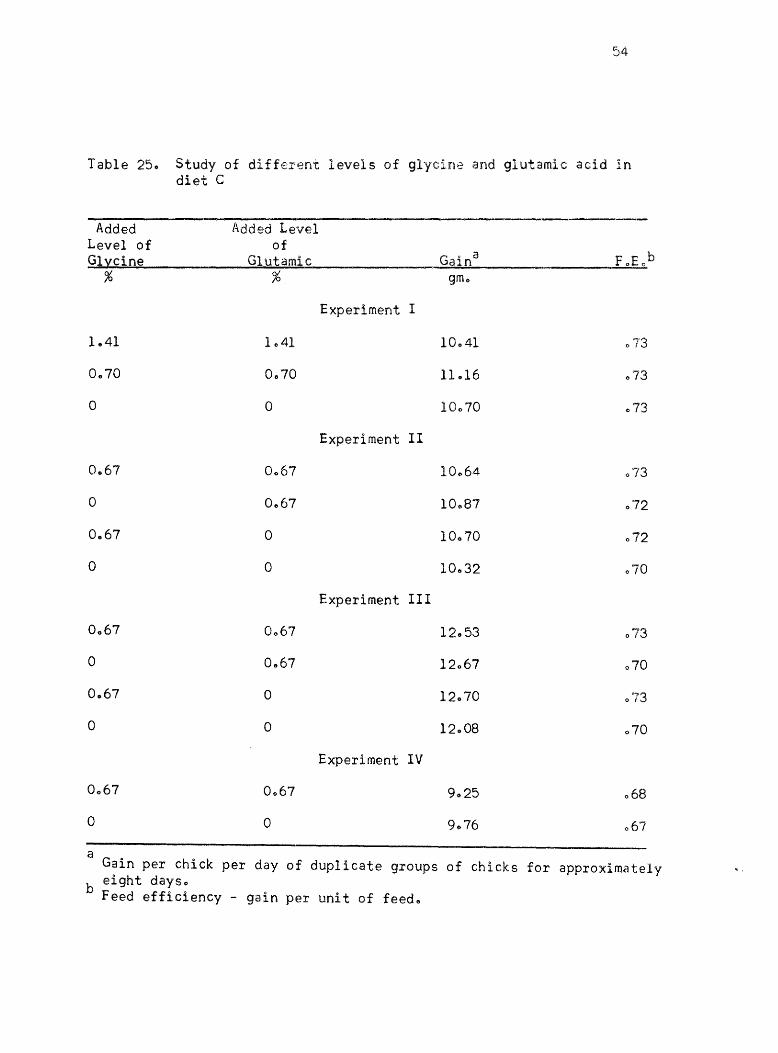
54
Table 25" Study of different levels of glycine and glutamic acid In diet C
Added Level of Glycine
%
l.,4l
0 .. 70
o
o
o
0.,67
o
o
0067
o
Added Level of
Glutamic
0.,70
o
0.,67
o
a
0.,67
0067
o
o
0 .. 67
o
gmo
Experiment I
10 .. 41 .. 73
11 .. 16 073
10070 073
Experiment II
10 .. 64 .. 73
072
10.,70 072
10 .. 32 070
Experiment III
12053 073
12067 070
12070 073
12 .. 08 070
Experiment IV
068
9076 067
a G . aln per chick per day of duplicate groups of chicks for approximately
b eight days .. Feed efficiency - gain per unit of feed ..
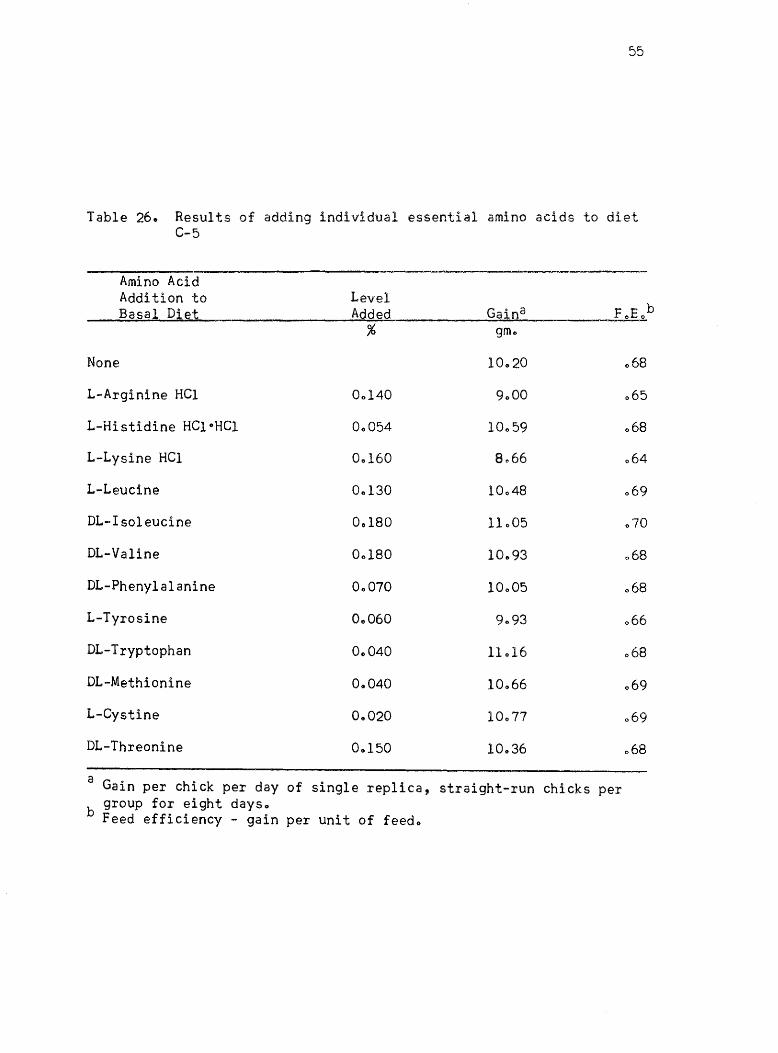
55
Table 26. Results of adding individual essential amino acids to diet C-5
Amino Acid Addition to Level
b Basal Diet Added Gaina ~ % gmo
None 10.20 068
L-Arginine HCl 00140 9000 065
L-Histidine HCloHCl 00054 10059 068
L-Lysine HC1 0.160 8,,66 064
L-Leucine 00130 10048 069
DL-Isoleucine 00180 11005 070
DL-Valine 00180 10.93 068
DL-Phenylalanine 00070 10005 068
L-Tyrosine 00060 9093 066
DL-Tryptophan 00040 11016 068
DL-Methionine 00040 10066 069
L-Cystine 0.020 10077 069
DL-Threonine 00150 10036 068
a Gain per chick per day of single replica, straight-run chicks per group for eight dayso
b Feed efficiency - gain per unit of feedo
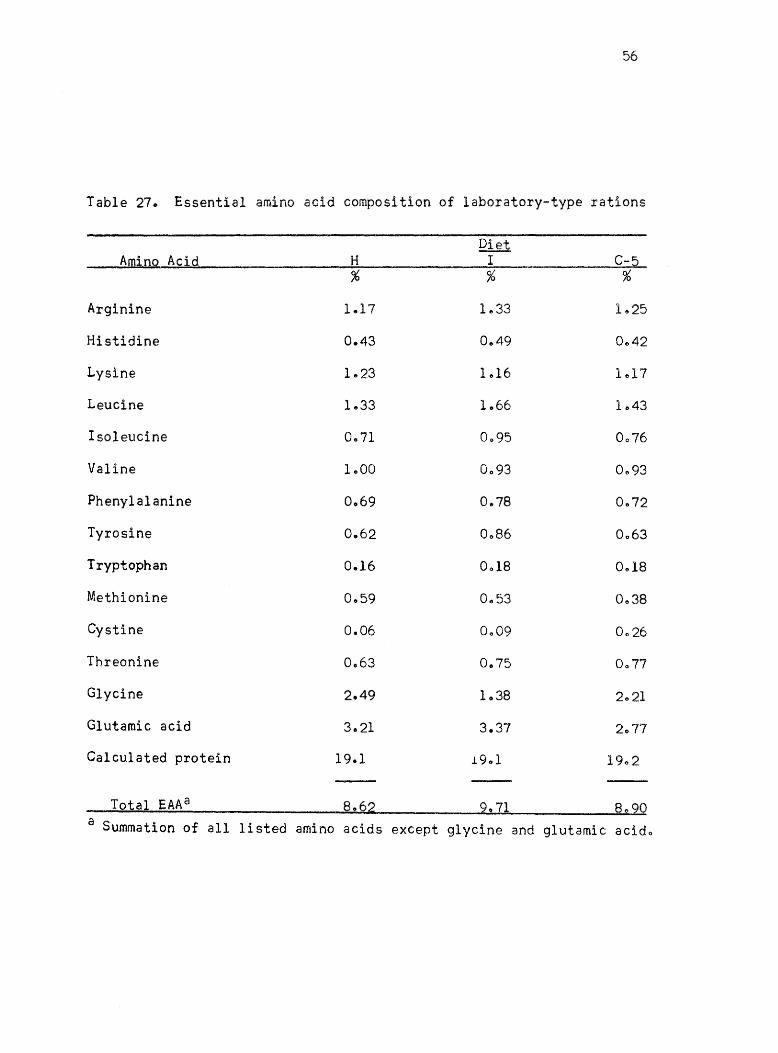
56
Table 27. Essential amino acid composition of laboratory-type rations
Diet Amlco Acid H I C-5
% % %
Arginine 1.17 1.33 1.25
Histidine 0.43 0.49 Ot>42
Lysine 1.23 1.16 1.17
Leucine 1.33 1.66 1.43
Isoleucine 0.71 0,,95 0076
Valine 1000 0093 0.,93
Phenylalanine 0.69 0.78 0 .. 72
Tyrosine 0.62 0.86 0.,63
Tryptophan 0.16 0.,18 0t>18
Methionine 0.59 0.53 0.,38
Cystine 0.06 0.09 0.,26
Threonine 0063 0.75 0.77
Glycine 2.49 1038 2 .. 21
Glutamic acid 3.21 3.37 2 .. 77
Calculated protein 19.1 19.1 19,,2
Total EAAa 8062 2071 8·20 a Summation of all listed amino acids except glycine and glutamic acid.
57
noticeable differences are in the essential amino acid contento The
results are given in Table 280 Growth Tate of the chic.ks was statisti~·
cally different at the ~\% level.. These l'esults indicated that diet
C-5 was an improved semi-synthetic diet.
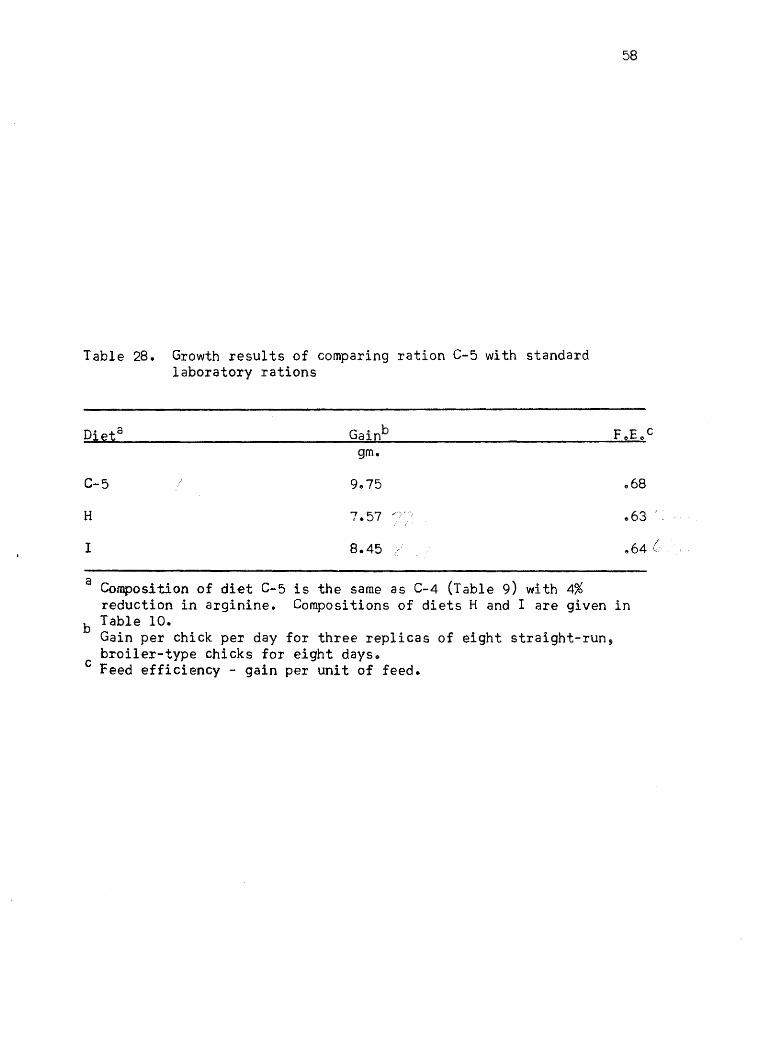
Table 28. Growth results of comparing ration C-5 with standard laboratory rations
Die:ta Gainb gm.
C-5 9.75
H 7.57
I 8.45
58
FeEe c
e68
.. 63
,,64 (
a Composition of diet C-5 is the same as C-4 (Table 9) with 4% reduction in arginine. Compositions of diets H and I are given in
b Table 10. Gain per chick per day for three replicas of eight straight-run, broiler-type chicks for eight days.
c Feed efficiency - gain per unit of feed.
59
DISCUSSION
A more accurate estimate of amino acid content of proteins by
actual determinations is one means of reducing the limitations of
using intact protein sources. There is always the question as to the
biological availability of the amino acids in intact proteins. No
attempt was made in this study to differentiate between the chemically
determined values and biological availability. It was assumed that
there would be no significant differences between them. Further work
would be needed to determine if there would be any differences.
The mechanics of conducting the amino acid determination as was
done in this study can be improved through improvement 1n laboratory
procedures. In the opinion of this author, more precision and accuracy
could be gained by using a IO-minute cycle timer rather than a 30=
minute cycle timer as was used in this study, on the time/flow fraction
collector. This seemed to be the biggest source of variation in the
fractions from the ion exchange columns. Once the constant volume
pumps were adjusted they seemed to be able to remain relatively constanta
Other improvements in refining the technique of amino acid
determinations could be made, such as determining a standard slope and
recovery from the column of each amino acid. Due to variation in the
laboratory procedure, it was decided that it would be as accurate to
use the relative leucine color values of Moore and Stein (1954) and a
determined leucine standard curve in calculating the amount of the amino
acids present.
There is considerable variation in published results of amino acid
60
determinations of proteins. In view of the biological variation of the
chicks, the error in the amino acid determination was probably less
than that of the chick assaye The agreement of the amino acid
composition of diet C protein obtained by two separate methods indicates
that at least the errors made have been consistent in these determina
tions. It would be desirable to determine the cystine and the trypto
phan content of each protein.
There has been considerable research conducted in defining a
chick's requirement for amino acids, and there is still research being
done in endeavoring to refine this information. The results presented
in this report are in general agreement with this earlier research 9 but
show that small differences in a balanced amino acid diet make major
differences in chick performance.
Working on this assumption that there does exist a set of amino
acid requirement values which, if equalled or moderately exceeded would
be an adequate diet, does not seem to be the best way of defining a
chick's need for amino acidse It appears that amino acid balance per
se must be considered more in detail than has been done in the past.
Almquist (1956) and others suggested that a better way of stating amino
acid requirements would be in terms of per cent of t.he protein of the
diet. This suggestion would certainly indicate amino acid balance~ but
there has been little work done on the problem. One of the reasons for
this has been the formidable task of studying twelve variables in a
diet at one timee The methods used in tllis study of developing a diet
that was balanced in essential amino acids made it possible to study
the twelve "essential" acids at one time in one diet.
Due to experimental variation, it was very difficult to detect much
improvement in chick performance with addition of amino acids to a
61
ration containing amino acids in approximate ratio as found in fat-free
chi~k carcaSSe A more sensitive method for detecting amino acid balance
was then developede The method of attempting to obtain equal growth
rate by the reduction of each essential amino acid has not been previ
ously reported to the knowledge of the authoro This method can be
approached in two ways; (1) by increasing the essenti81 amino acids
in the diet a constant amount with the exception of one, or (2) by the
removal of a constant per cent of each essential amino aicd from the
diete The nitrogen content of the diet is maintained constant in both
approachese
The ability to detect amino acid deficiencies or excesses by
increasing the essential amino acids in the diet except one was limited
because of normal variation of the chickso It could be expected that
this approach would be less sensitive than the latter approach of
-removing each amino acid from a diet, because chicks are more sensitive
to small amino acid changes when the total protein or essential amino
acids are present at lower levelse
Removing a constant per cent of each essential amino acid from the
diet with the objective of obtaining equal growth rate reduction appears
to be more sensitive to amino acid balance in a diete It was much
easier to detect that diet C-l was relatively low in threonine~
isoleucine, and valine than by increasing the essential amino acids in
the dieto More work should be done by using this method in balancing
of diets made up of different proteins or different combinations of the
same proteins observing whether the same results could be obtainedo
The chief advantage of the new method of detecting amino acid
balance is that multiple deficiencies and excesses in amino acids can
be detected. Of course there will be limitations~ but possibly not as
62
many as by previous methodse As with all biological tests~ one of the
most serious limitations will be individual variations of animalso
Biological variation is magnified when wOTking with marginal dietso
The per cent of the basal growth resulting from removal of 20% of
the individual amino acids was approximately 90%" The sensitivity is
probably not much more than! 5% with the limited number of birds on
each treatmentG In future work, this could be overcome with more
chicks per treatment, more replications and longer experimentso
Anderson (1961) has found that the margin between a balanced diet and
an imbalanced diet increases in longer term experimentso
The feed efficiency of the chicks given the various diets was not
used in determining the adequacy of the dieto Feed efficiency~ along
with gain of the birds, should have been considered more because it
appears from Table 22 that the removal of some amino acids gave an
equal growth depression, but varied in feed efficiency~ It did not
appear that feed efficiency was as sensitive an index to use in
measuring small dietary differences as was the growth rate of chickso
It would increase the sensitivity of amino acid balance studies if a
reliable index could be worked out that would include both growth rate
and feed efficiencYe
In this study no attempt was made either to prove or disprove the
constant ratio of amino acid requirements as shown by Almquist~ but
his theory appeared to be a basis for the hypothesis that equal chick
growth would result from the removal of the same per cent of each amino
acido Probably as the technique of measuring biological differences is
refined there will be exceptions to this hypothesiso
The amino acid content of diet C-5 (Table 18) though a well
balanced mixture is not the beste Anderson (1961) in using an index
63
which includes the feed efficiency of the chick has found that the
methionine-cystine levels are a little lowo In order to obtain the
very best balanced ration, it will be necessary to continue to make
more successive approximations; at the same time, it will probably
require new and better methods of detecting amino acid balance. This
will be a slow process and will take much effort and time.
The practical application of this study would be a comparison with
current standards. Only one comparison was made with the "balanced"
ration and two laboratory-type diets with equal calculated protein
levels. These results (Table 28) show that chicks fed a balanced
ration performed better than those receiving either diet H or 10 Since
this study was completed, Anderson (1961) has conducted experiments
comparing diets balanced to National Research Council (1960) standards
and those balanced with the values reported here. He has found that
chicks receiving the latter balanced amino acid diet were able to grow
faster and utilize their feed more efficiently.
In conclusion, the method or defining the levels of essential
amino acids in a diet in terms of balanced proportions rather than as
minimum levels appears to be a better method for more efficient use of
amino acids. There has been some progress made in this study in the
balancing of essential amino acids in a chick diet. It is not known
how far the methods used can go in defining the chick's absolute
requirements. New and better techniques for determining amino acid
balance will probably have to be developed before the final goal is
reached.
SUMMARY
The amino acid composition of casein~ gelatin, blood fibrin~
Drackett assay protein C-l, Sta-mino type A, fish fillet, and wheat
gluten was determined and is reported.
64
An improved method for determining the balance of amino acids in
a chick ration has been developed.
The essential amino acid composition of a better balanced chick
ration was found to be as follows: Arginine 1.25, histidine 0042,
lysine 1.17, leucine 1.43, isoleucine 0.76, valine 0093, phenylalanine
tyrosine 1.35, tryptophan 0.18, methionine-cystine 0~64, threonine 00770
LITERATURE CITED
Almquist, H.J., 1947 .. Evaluation of amino acid requirements by observations on the chick.. J .. Nutri tion 34: 543--563.
65
Almquist, H.J .. , 1952. Amino acid requirements of chickens and turkeys--a review. Poultry Sci" 31: 966-9810
Almquist, H.J., 1956. The requirement for amino acids in Amino Acid Handbook. R.J .. Block and K"Wo Weiss" 1956 Edition" Charles C. Thomas Publisher, Springfield, Ill. Chapter 70
Almquist, H.J., and CsR. Grau, 1944. The amino acid requirements of the chick. Jc Nutrition 2§: 325-331.
Anderson, J.O o , 1961 .. Unpublished data from experiments conducted at Utah State University ..
Anderson, J.O., and D.C .. Dobson, 1959. Amino acid requirements of the chick.. 20 Effect of total essential amino acid level in the diet on the arginine and lysine requiremento Poultry Sci. 38: 1140-1150.
Bidmead, D.S., and F.J. Ley, 1958. Quantitative amino acid analysis of food proteins on single ion exchange column. Biochemo et Bioph. Acta 22: 562.
Block, R~Jo, and D. Bolling, 1951. The Amino Acid Composition of Proteins and Foods. Charles C. Thomas, publisher, Springfield 9
Ill. 2nd ed.
Block, R.J., and D.W. Weiss, 1956. Amino Acid Handbook .. Charles CG
Thomas, publisher, Springfield, Ill.
Drackett Products Company, The, 1955. Drackett Assay Protein C-l~ Technical Bulletin. Cincinnati, Ohio.
Duncan, D.B., 1955. Multiple range and multiple F testso Biometrics il: 1-42.
Fell, R.V., W"S. Wilkinson, and A"B. Watts, 1959. The utilization by the chick of D and L amino acids in liquid and dry dietso POUltry Scia 38: 1203.
Fisher, H., and D. Johnson, Jr., 19570 An improved free amino acid diet for growing chickso POUltry Scio 36: 444-4450
Fisher, Ho, Ro Sapiro~ and Pc Griminger, 19600 Further aspects of amino ~~i~ imhalance with special reference to the hiqh arqinine requirement of chicks fed casein dietso J e Nutrition 723 16-220
66
Fox, M.R.S., G.N. Briggs, and L.a. Ortig, 1958. Studies of amino acid diets for the chick.J. Nutrition 64: 475-482.
Glista, W.A., H.H. Mitchell, and H.M. Scott, 19510 The amino acid requirement of the chick. Poultry Sci~ 30: 9150
Grassman, w., K. Hannig, and M. Plockl, 1955. Eine methode zur quantitativen bestimmung der aminosaurenzusammensetzung von Eeiweisshydrolysaten durch kombination von e1ektrophorese und chromatographie. Ztschr. Physiol. Chern. 299: 258-2770 As taken from Block and Weiss (1956).
Harper, A.Ee, 1959. Amino acid balance and imbalance. I. Dietary level of protein and amino acid imbalance. J. Nutrition 68: 405-418.
Kimmel, J.R., ano E.L. Smith, 1958. The amino acid composition of crystalline pumpkin seed globulin, edestin, C-phycocyanirr-and R-phycoervthrin. Bulletin De La Societe DeChimie Biologique 40: 2049-2065.
Klain, G.J., H.M. Scott, and B.C. Johns0n) 1959. Arginine requirements of chicks fed a crystalline a~:no acid diet simulating the composition of casein. Poultry Sci. 38: 488, 489.
Klain, G.J., H.M. Scott, and B.C. Johnson, 1959. Utilization of nutrients in a crystalline amino acid diet as influenced by certain non-essential amino acids. Poultry Sci. 38: 4897490.
Klain, G.J. H.M. Scott, and B.C. Johnson, 1960. The amino acid requirement of the growing chick fed a crystalline amino acid diet. Poultry Sci.~: 39-44.
Kraut, H., E. Kofranyi, H. Telschow, and M. 'Weber, 1955. Aminosaurebestimmung in Nahrungsmitteln durch chromatographie an Starkesaulen. Hoppe-Seyler's Zeitschrift fur Physiologische Chemie. 301: 165-184.
Longenecker, J.B., and N~L. Hause, 1959. Relationship between plasma amino acids and composition of the ingested protein. Arch. Bioch. and Biophyo 84: 46-59.
Luckey, T.D., P.R. Moore, C.A. Elvehjem, and E.B. Hart, 1947. Growth of chicks on purified and synthetic diets containing amino acids. Proc. Soc. Exp. BioI. Med. 64: 384-351.
Macklin, L.J., and R.S. Gordon, 1958. Rapid growth of chickens fed an improved semi-synthetic diet. Poultry Sci. 37: 1460-1461.
Miller, S~, V.E. Ruttinger, E.S. Kovach, and I.G. Macy, 19520 The amino acids in nine food proteins as determined by three methods. Pan Am. Med. Womans J. 59: 9-15 as taken from Block and Weiss (1956) ~ -
67
Moore, S~, and W.H. Stein, 1954. Procedures for the chromatographic determination of amino acids on four per cent cross-linked sulfonated polystrene resinso J" Biological Chern., 211g 893-906"
Moore, S., and W$Ho Stein, 19540 A modified ninhydrin reagent for the photometric detel'lnination of amino acid and related compoundso J" Biological Chem~ 211: 907--9130
Moore, 5", D.H9 Spackman, and W~HG Stein J 1958~ Chromatography of amino acids on sulfonated polystyrene resins~ Analytical Chemistry 30: 1185-1190 ..
National Research Council, 1960~ Nutrient requirements for domestic animals" NOe 1~ Nutrient requirements for poultry~ Washington, DoC.
Nelson, T.S., R.J e Young, R.B. Bradfield, JoB. Anderson, LoCo Norris~ F.W.., Hill, and MoL. Scott, 1960. Studies on the sulfur amino acid requirement of the chicko Poultry Sci,,~: 308-3140
Price, W.Ao, JTe, MoWo Taylor, and w.e. Russel1 9 19530 The retention of essential amino acids by the growing chicko Jo Nutrition 51: 413-4220
Spackman, D.H., W.H. Stein, and 5. Moore j 1958. Automatic recording apparatus for use in the chromatography of amino acids. Analytical Chemistry 30; 1190-12060
Staley~ A.E .. Manufactul'ing Company, 1953. Sta-mino type Ao Technical Data Sheet. Decatur, Illinois.
Wietlake, AoW., AoG. Hogan, B.L. O'Dell, and HoLo Kempster, 19540 Amino acid deficiencies of casein as a source of protein for the chicks J" Nutrition 52: 311-323.
Williams, H.H .. , L.V. Cultin, J .. Abraham, J.K .. Loosli, and LoAo Maynard, 1954.. Estimation of growth requirement for amino acids by assay of the carcass.. J. Biological Chem .. 208: 277-2860

APPENDIX
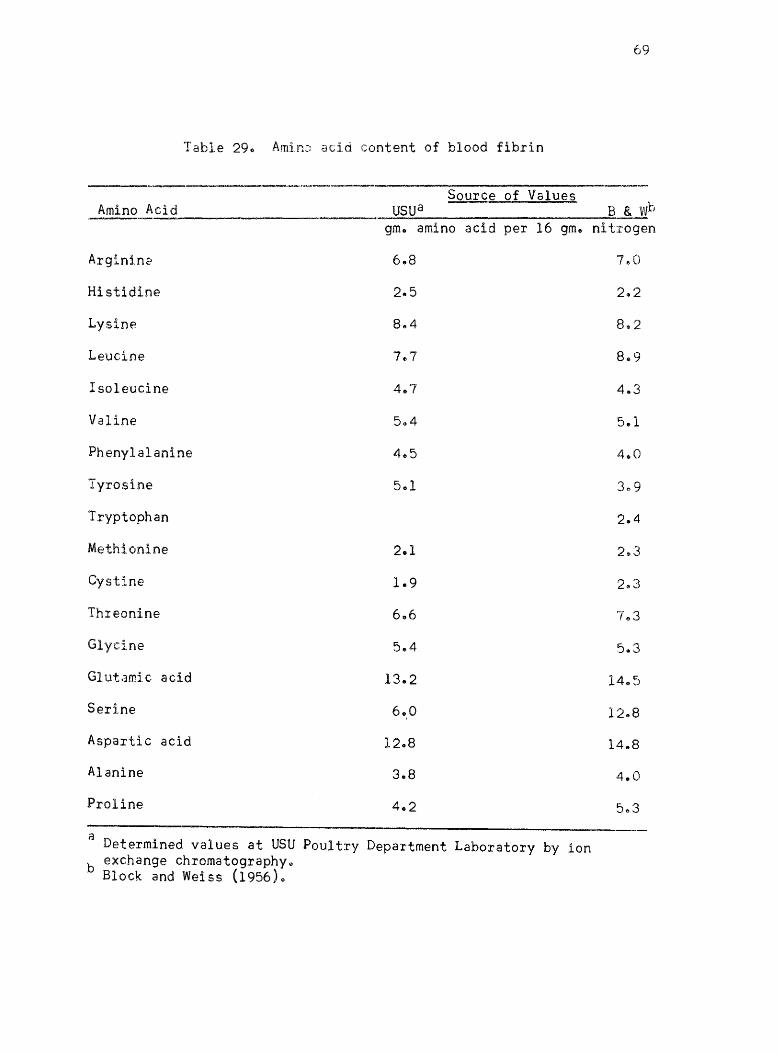
Table 29. Amine acid content of blood fibrin
Source of Values Amino Acid USU a
. --gm. amino acid per 16 gm~
Argini.ne 6.8
Histidine 2.5
Lysine 8.4
Leucine 7,,7
Isoleucine 407
Valine 504
Phenylalanine 405
Tyrosine 5.1
Tryptophan
Methionine 2.1
Cystine 1.9
Threoni,ne 606
Glycine 5.4
Glutamic acid 13.2
Serine 6.,0
Aspartic acid 12.8
Alanine 3 .. 8
Proline 4.2
a Determined values at USU Poultry Department Laboratory by ion exchange chromatography.
b Block and Weiss (1956)0
69
B & Wb nitrogen
7 .. 0
2 .. 2
8~2
8.9
4 .. 3
5,,1
400
309
2 .. 4
2,,3
2.3
7,,3
5 .. 3
14",5
12 .. 8
14 .. 8
4.0
503
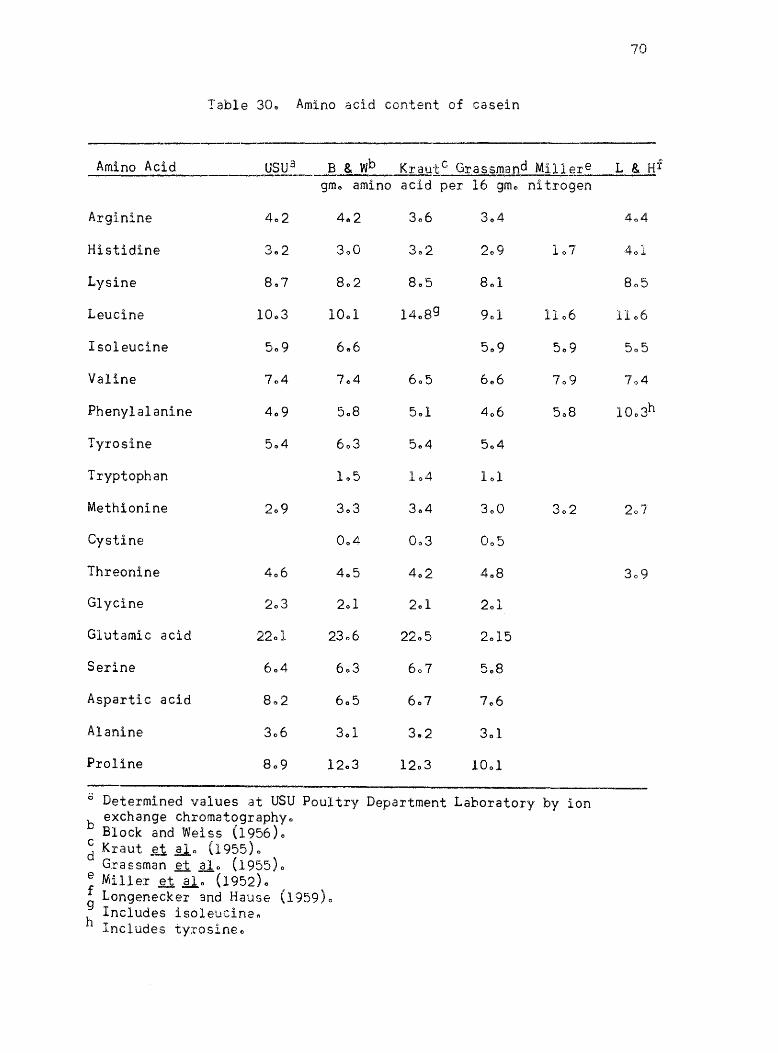
70
Table 300 Amino acid content of casein
Amino Acid USUa B & Wb Kraut C Grassmand Miller e L & Hf ,--.;;;..;;...,.;;...
gmo amino acid per 16 gmo nitrogen
Argini.ne
Histidine
Lysine 8 .. 7
Leucine 1001 1106
Isoleucine
Valine
Phenylalanine
Tyrosine 504 504
Tryptophan 1 .. 5 101
Methionine 303
Cystine 004
Threonine 405 408
Glycine 201
Glutamic acid
Serine 508
Aspartic acid
Alanine 301
Proline 1001
a Determined values at USU Poultry Department Laboratory by ion b exchange chromatography ..
Block and Weiss (1956)0 ~ Kraut ~ ~o (1955)0
Grassman et alo (1955)0 e Miller et alo (1952)0 ~ Longenecke;-and Hause (1959)0 h Includes isoleucinen
Includes tyrosineo
1106
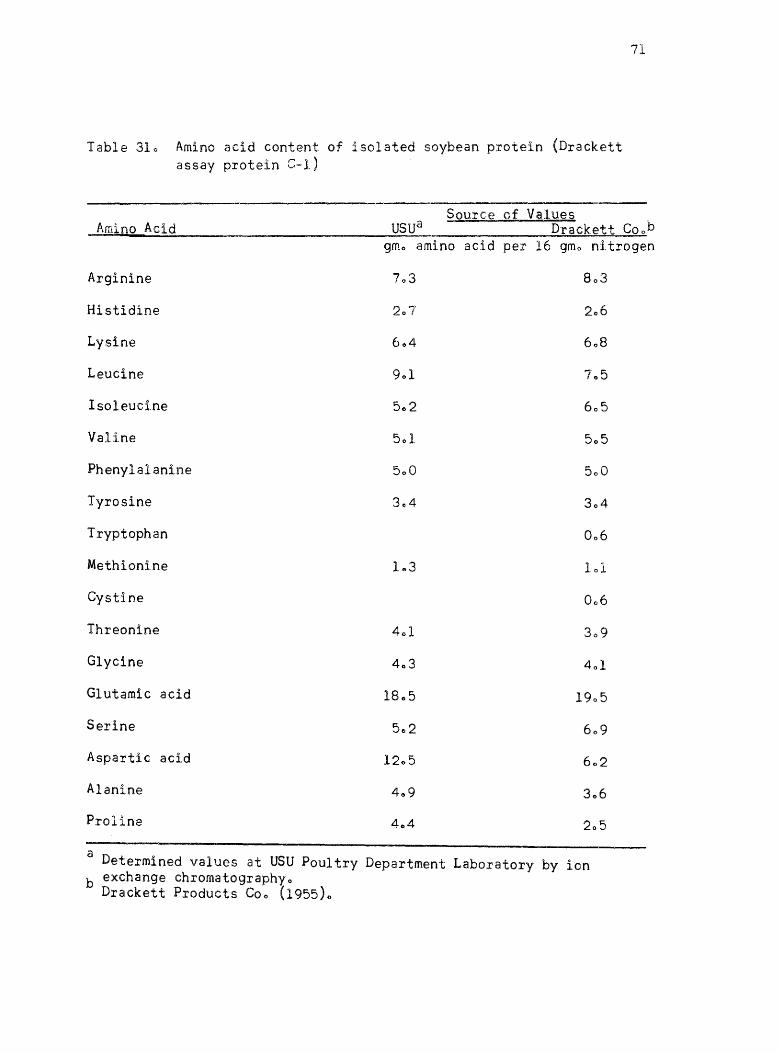
Table 310 Amino acid content of isolated soybean protein (Drackett assay protein C-l)
Source of Values
71
Amino Acid USUa Drackett Coo b
Arginine
Histidine
Lysine
Leucine
Isoleucine
Valine
Phenylalanine
Tyrosine
Tryptophan
Methionine
Cystine
Threonine
Glycine
Glutamic acid
Serine
Aspartic acid
Alanine
Proline
gmo amino acid per 16 gmo nitrogen
7 .,", I 0"
lSe5
409
803
206
60S
705
605
505
500
304
006
101
006
309
401
1905
609
602
3e6
205
a Determined values at USU Poultry Department Laboratory by ion
b exchange chromatographyo Drackett Products Coo (1955)0
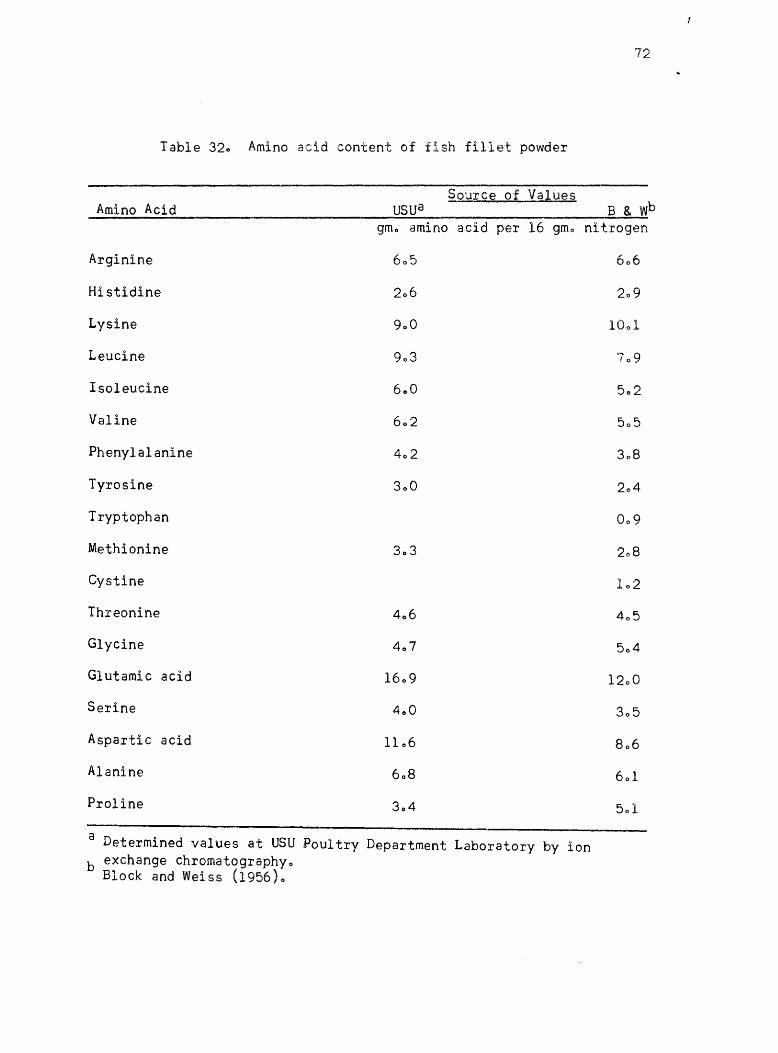
72
Table 32c Amino acid content of fish fillet powder
Source of Values Amino Acid usua B & Wb
gmc amino acid per 16 gmo nitrogen
Arginine
Histidine
Lysine
Leucine
Isoleucine 600
Valine
Phenylalanine
Tyrosine
Tryptophan
Methionine
Cystine
Threonine
Glycine
Glutamic acid
Serine
Aspartic acid
Alanine
Proline
a Determined values at USU Poultry Department Laboratory by ion b exchange chromatographyo
Block and Weiss (1956)0
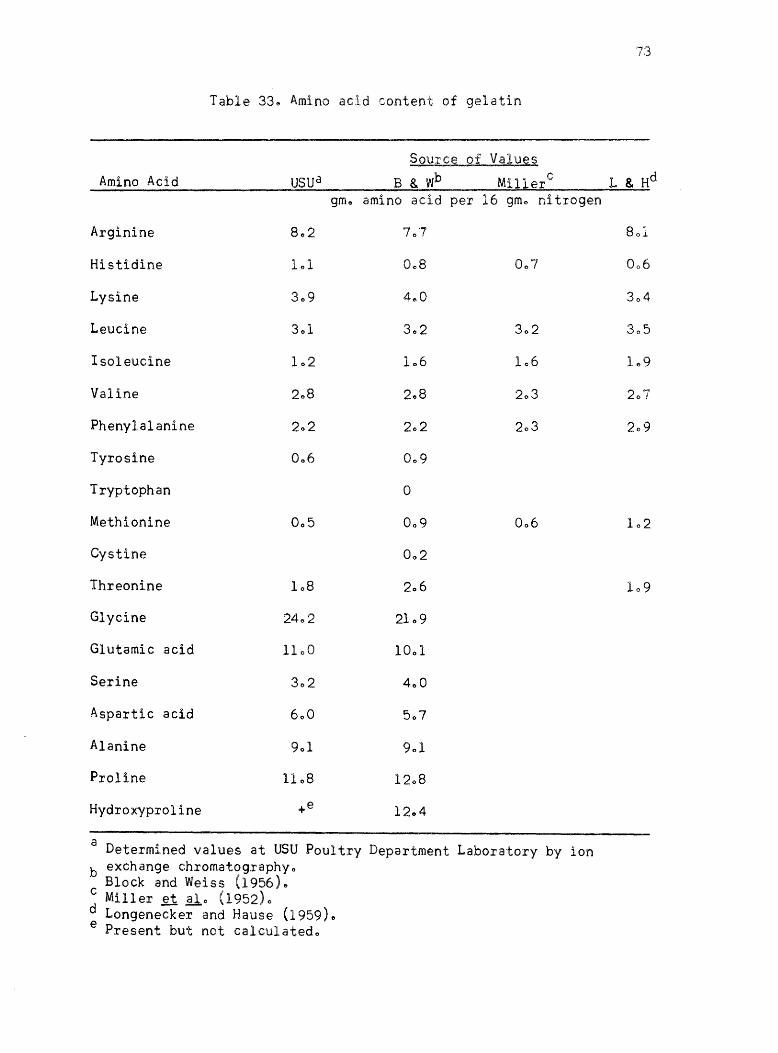
Table 33., Amino acid content of gelatin
Source of Values
Amino Acid USUa B & Wb Miller c
gme amino acid per 16 gmo nitrogen
Arginine 8.,2 "7 -. I 0 !
Histidine 101 0.,8 007
Lysine 3,,9 4,,0
Leucine 301 302 302
Isoleucine 102 106 106
Valine 208 208 2,,3
Phenylalanine 202 2,,2 203
Tyrosine 006 009
Tryptophan 0
Methionine 005 009 006
Cystine 002
Threonine 108 206
Glycine 2402 2109
Glutamic acid 1100 1001
Serine 302 400
Aspartic acid 600 507
Alanine 901 9,,1
Proline 1108 1208
Hydroxyproline +e 12,,4
a Determined values at USU Poultry Department Laboratory by ion b exchange chromatography"
Block and Weiss (1956)" c Miller et lio (1952)" d Longenecker and Hause (1959)" e Present but not calculated"
7:3
L & Hd
801
006
304
305
109
207
209
102
109
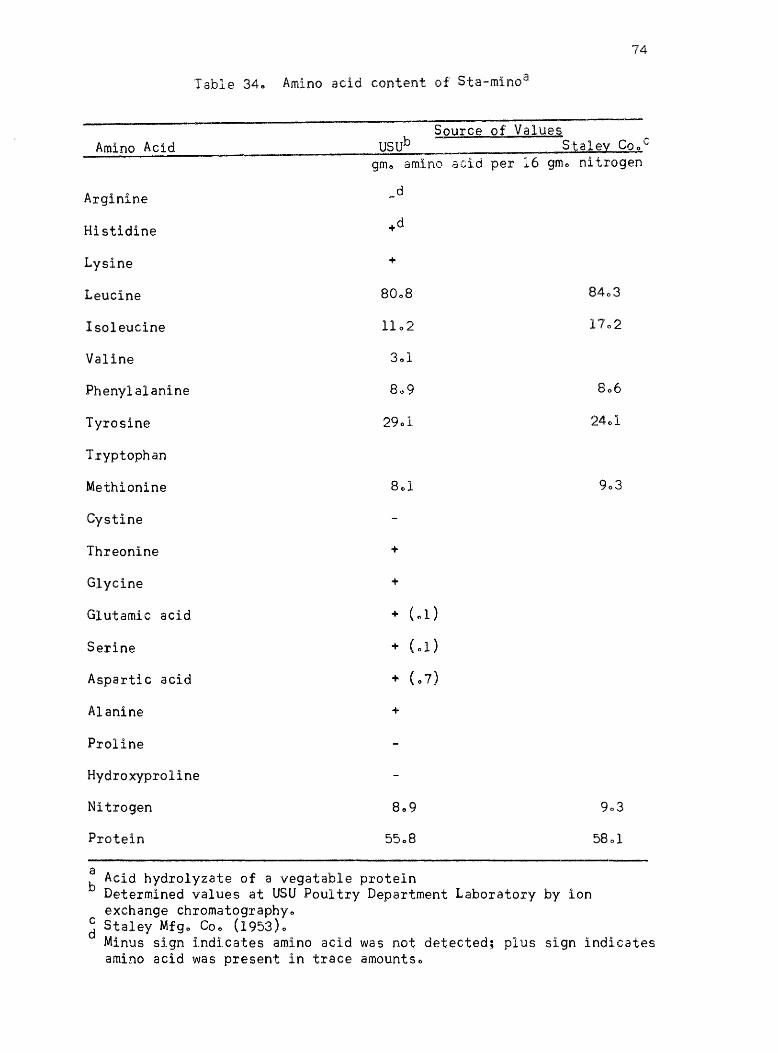
74
Table 34 .. Amino acid content of Sta-minoa
Source of Values Amino Acid USUb Staley Cooc
gme amino acid per 16 gme nitrogen
Arginine d
Histidine
Lysine +
Leucine 8403
Isoleucine 1102
Valine 301
Phenylalanine 806
Tyrosine 2901 2401
Tryptophan
Methionine
Cystine
Threonine +
Glycine +
Glutamic acid
Serine
Aspartic acid
Alanine +
Proline
Hydroxyproline
Nitrogen 8e9
Protein 5801
a Acid hydrolyzate of a vegatable protein b Determined values at USU Poultry Department Laboratory by ion
exchange chromatographye ~ Staley Mfg .. Coo (1953)0
Minus sign indicates amino acid was not detected; plus sign indicates amino acid was present in trace amountso
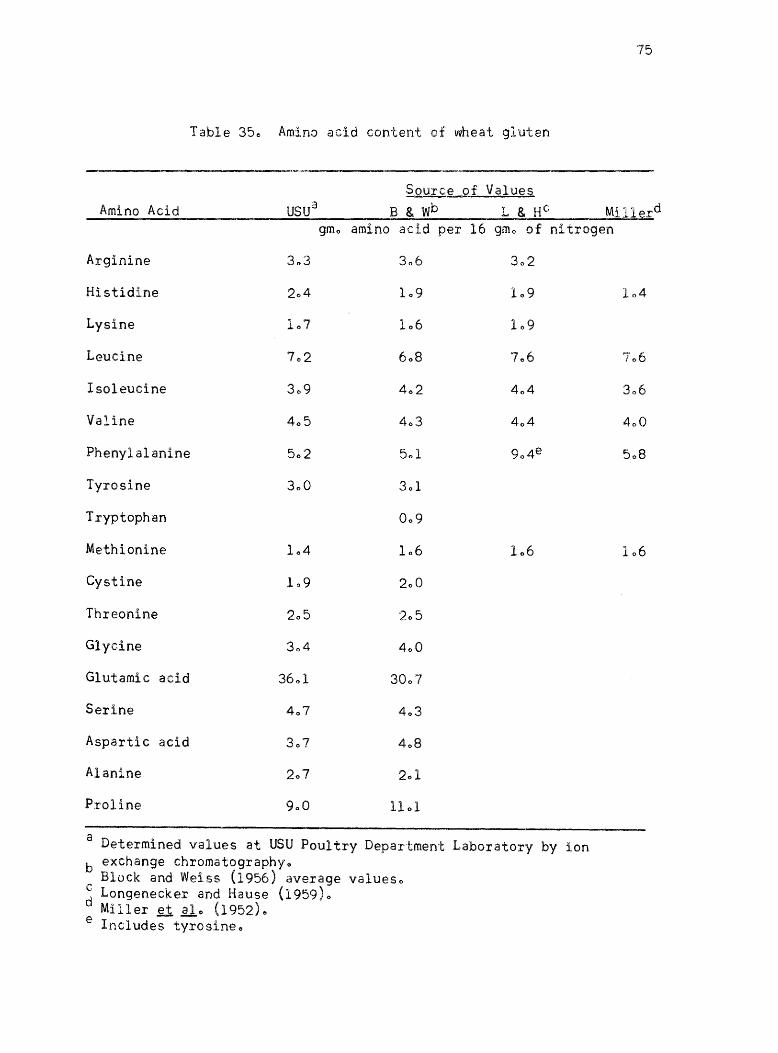
75
Table 35e Amino aci.d content of wheat gluten
Source of Values Amino Acid USUa B & Wb L & He Millerd
gmo amino acid per 16 gme of nitrogen
Arginine 303 306 302
Histidine 204 109 109 104
Lysine 107 106 109
Leucine 702 608 706 706
Isoleucine 309 402 404 306
Valine 405 403 404 400
Phenylalanine 502 501 904e 508
Tyrosine 300 301
Tryptophan 009
Methionine 104 106 106 106
Cystine 109 200
Threonine 205 205
Glycine 304 400
Glutamic acid 3601 3007
Serine 407 403
Aspartic acid 307 408
Alanine 207 2el
Proline 900 1101
a Determined values at USU Poultry Department Laboratory by ion
b exchange chromatographyo Block and Weiss (1956) average valueso
~ Longenecker and Hause (1959)0 Miller ~ £10 (1952)0
e Includes tyrosineo