environmentally sustainable transport - main principles and
TRANSCRIPT

Environmentally Sustainable Transport - Main
Principles and Impacts
Manfred BreithauptTransport Advisor

Imagine China, 2010 Carlos Pardo, 2008
The adverse impacts of growth in motorization - in economic, environmental and social terms - are ruining the quality of life in
our cities and our global climate.

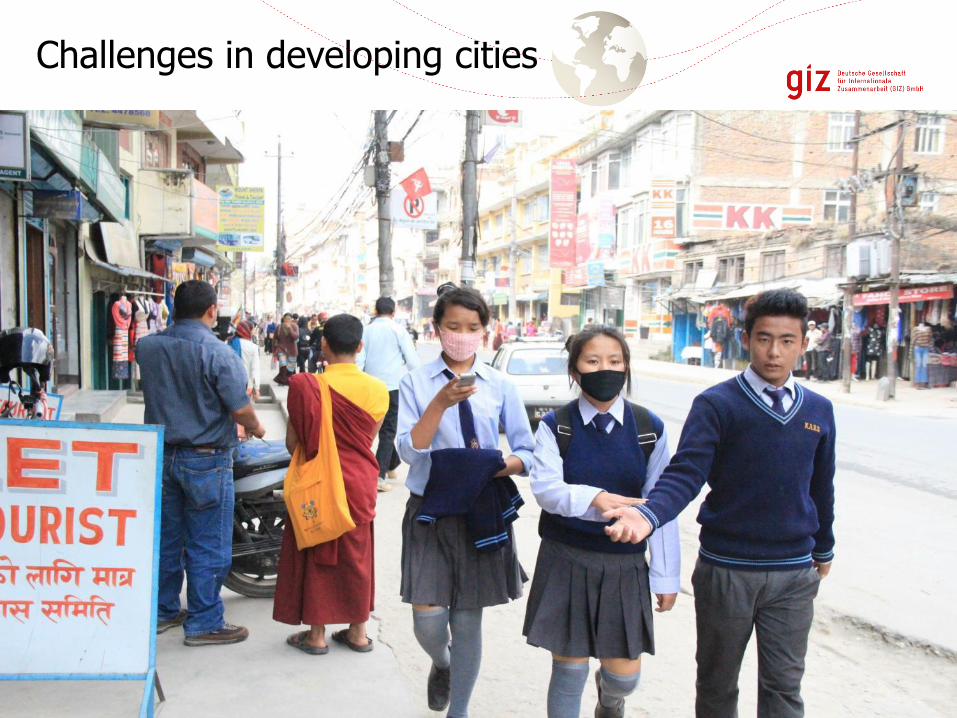
In most cities, mobility is stil dominated by personal motorized transport. Many people choose cars to move around…
Challenges in developing cities

• Photos bkk
12.10.2


Challenges in developing cities
Road transport is a major contributor to air pollution and climate change.Transport contributes to aprox. 25% of energy-related CO2 emissions and is still
growing!
Challenges in developing cities

Challenges in developing cities
Worldwide, 1.3 Million road deaths and up to 50 Million people injured per year
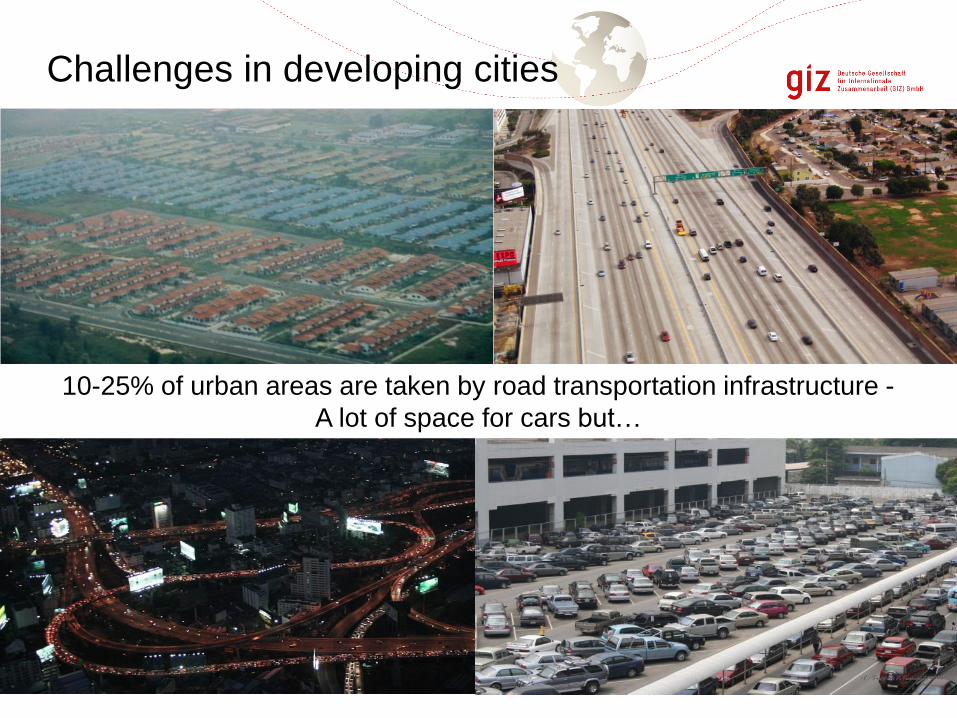
Challenges in developing cities
10-25% of urban areas are taken by road transportation infrastructure -
A lot of space for cars but…

…where is the space for people? the silent pedestrian, the invisible cyclist must be seen
Challenges in developing cities

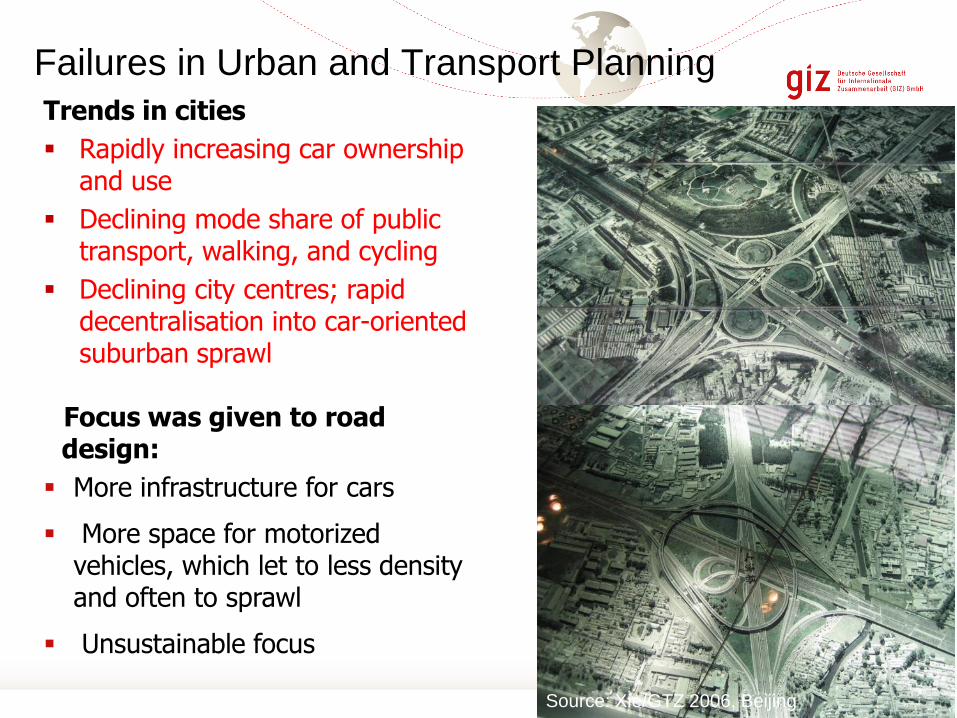
Failures in Urban and Transport Planning
Source: Xie/GTZ 2006, Beijing
Trends in cities
▪ Rapidly increasing car ownership and use
▪ Declining mode share of public transport, walking, and cycling
▪ Declining city centres; rapid decentralisation into car-oriented suburban sprawl
Focus was given to road design:
▪ More infrastructure for cars
▪ More space for motorized vehicles, which let to less density and often to sprawl
▪ Unsustainable focus

Road construction can never keep up with demand. Road building is an
expensive way of dealing with travel demand. With already now 1,3 billion cars on
our planet, where will this end? Some forecasts see 4 billion cars by 2050. This
scenario calls for sustainable options.
Source: Karl Fjellstrom

Possible approaches…
16
Known as
Automobile centered Approach
Traditional Approach Sustainable Approach
Contemporary Approach, planning to improve access , planning for people, moving people not cars
Alternative 1: Alternative 2:
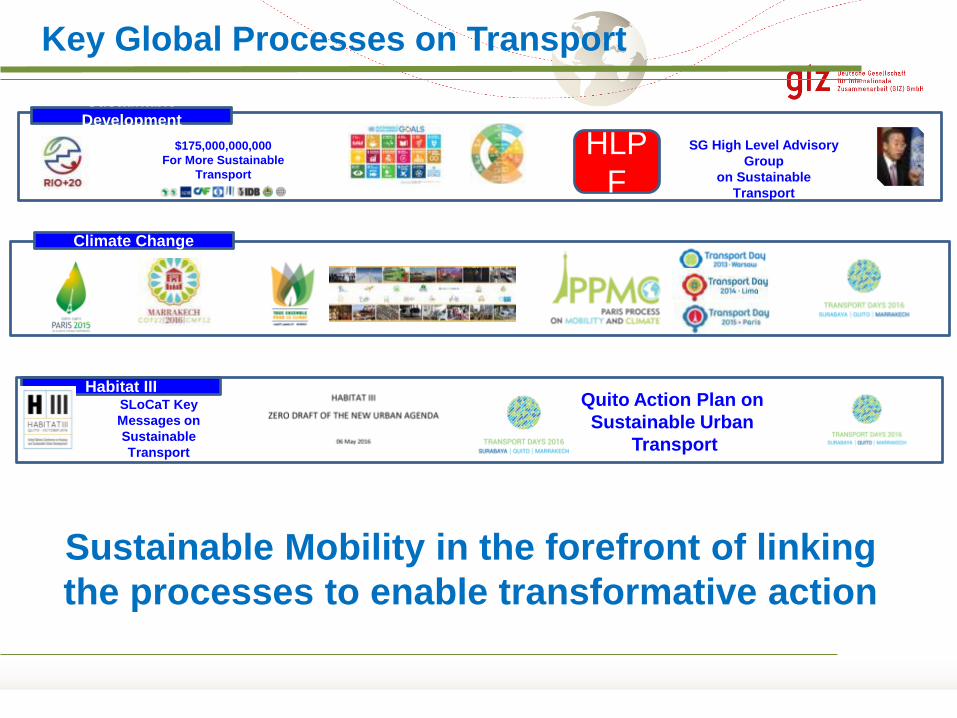
Climate Change
Sustainable
Development
Habitat III
$175,000,000,000
For More Sustainable
Transport
SG High Level Advisory
Group
on Sustainable
Transport
Quito Action Plan on
Sustainable Urban
Transport
SLoCaT Key
Messages on
Sustainable
Transport
HLP
F
Key Global Processes on Transport
Sustainable Mobility in the forefront of linking
the processes to enable transformative action

New Urban
Agenda
Walking / Cycling
Mobility Plans
Road Safety
Climate Change – Air
Quality
Sustainable Transport
Infrastructure
Freight Transport
Land Use Planning
Inclusive Transport
Transit oriented
Transport-RelevantReferences in NUA:30 x Transport21 x Mobility7 x Connectivity3 x Walking
Sustainable Transport in New Urban Agenda
Transport-Relevant Components of NUA

How does this translate into
revised planning approaches and
policies leading to more livable
cities?
12.10.2

… the impact of the traditional/automobile oriented approach
to land use and transport planning?

Planning Level
Traffic dependent on major arterial roads even for short Local Trips!

All traffic concentrates on few arterial roads..
Dhaka current situation
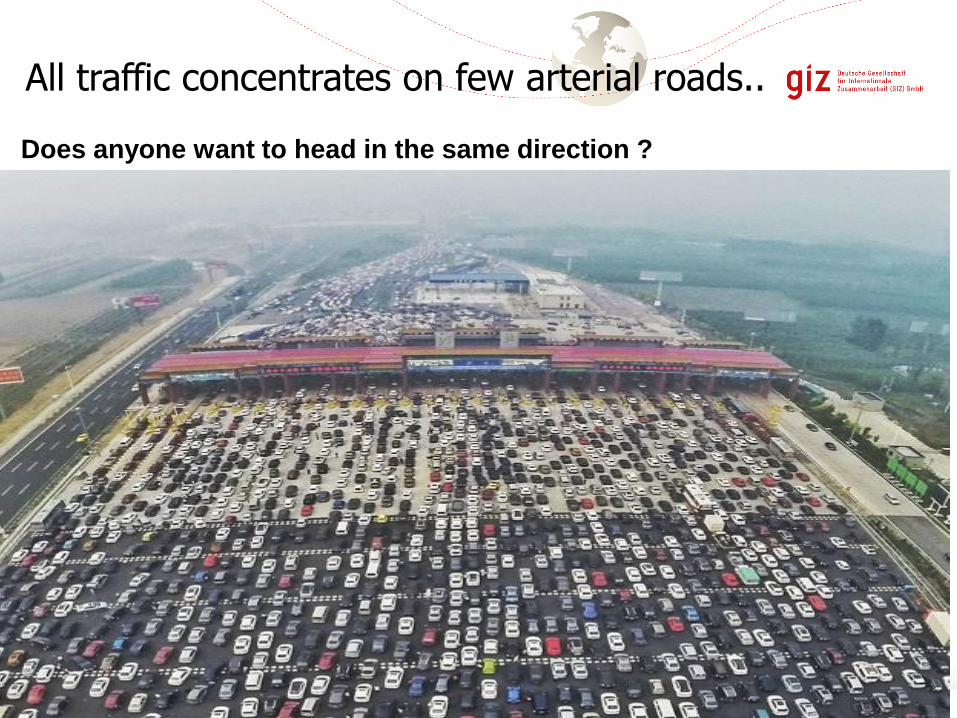
All traffic concentrates on few arterial roads..
Does anyone want to head in the same direction ?
Dhaka current situation

The traditional automobile oriented approach of planning has and will result in
an increased number and length of trips, which
means :
× increased expenses on fuel,
× traffic congestion,
× strain on road infrastructure,
× increase in number of accidents/fatalities,
x increased pollution
× excessive dependence on roads,
× adverse impact on human health.
To address the dynamic complexities of
urban systems, a multi-disciplinary,
Integrated Transport Planning Process is
needed
To summarise

Paradigm shift
Achieving greater sustainability in transport means...
... investing in schemes and
initiatives that improve
accessibility and developing
more liveable cities based on non-
motorized transport and public
transport (and its integration).
Transmilenio, 2005
Solution: What are the options for making cities more liveable?

Why focus on liveable, sustainable,
resilient, compact and attractive cities?
• A liveable city is a city that provides a high quality of life for its citizens
• This requires:
• Economic strength
• Social balance
• Ecological viability
• All these elements are interdependent
London Brussels Vienna

Other factors:
• Political and social environment (Safety/Crime)
• Socio-cultural environment
• Medical and health considerations
• Schools and education
• Recreation
• Availability of goods/services
• Economic environment (banking services)
• Housing
• Natural environment
What influences Liveability?
Direct transport related
factors:
▪ Infrastructure
▪ Accessibility
▪ Quality of architecture
▪ Urban design
▪ Public Transportation
▪ Public places
▪ ...etc.
Livable Cities & Urban Life

• Vienna, Austria (1st)
• Zurich, Switzerland (2nd)
• Auckland, New Zealand (3rd )
• Munich, Germany (4th)
• Vancouver, Canada (5th)
▪ Düsseldorf, Germany (6th)
▪ Frankfurt, Germany (7th)
▪ Geneva, Switzerland (8th)
▪ Copenhagen, Denmark (9th)
▪ Sydneyy, Australia (10th)
Mercer Quality of Living Survey 2015 – Top 10 (worldwide):
Vienna Zurich Munich
Source: VBZ Zurich, 2009, http://vbz.ch.
Rankings of Quality of Living
Livable Cities & Urban Life
Source: Mercer, 2015.

Six key factors for deciding where to locate a business
% of businesses who consider this to be an ‘absolutely essential’ location factor
Livable Cities & Urban Life
Locational factors

Source: City of MünsterMu
Traditional focus was given to road design: More infrastructure for cars, more space for motorized vehicles, unsustainable focus: Question is, how to use limited road space best
Tackling the Problem

AVOID/Reduce Reducing the need to travel
SHIFT Changing mode choice or at least
keep the mode share of NMT
IMPROVEIncreasing the energy efficiency of vehicles, fuels and transport
operations
Carlos Pardo, 2008
Claudio Varano, 2004 2010
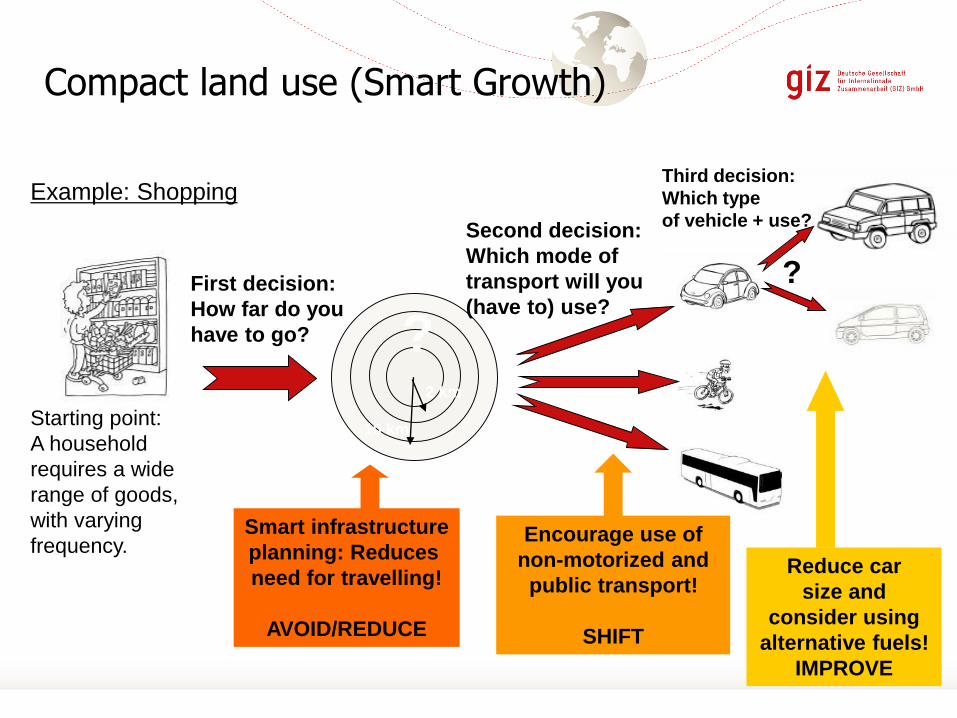
Example: Shopping
Starting point:
A household
requires a wide
range of goods,
with varying
frequency.
First decision:
How far do you
have to go?
2 km
10 km
?
Second decision:
Which mode of
transport will you
(have to) use?
?
Smart infrastructure
planning: Reduces
need for travelling!
AVOID/REDUCE
Reduce car
size and
consider using
alternative fuels!
IMPROVE
Encourage use of
non-motorized and
public transport!
SHIFT
Third decision:
Which type
of vehicle + use?
Compact land use (Smart Growth)

AdoptSustainable Transportation Policy and strategies
Source: Bicycle Innovation Lab

Leadership
World’s best systems were developed with high levels of political support
With strong political will, anything is possible
Enrique PeñalosaFormer mayor of Bogota
Jaime LernerFormer mayor of Curitiba
Lee Myung-bakMayor of Seoul
Principle 1: Strong political will and longer term goals

With strong political anything is possible
From WRI

Principle 2
Create strong and powerful Metropolitain
Planning Authorities (covering the greater
Metropolitan Area)
12.10.2

Regular results:
Lviv, Ukraine © Armin Wagner, Mathias Merforth

▪ Under-resourced institutions, lacking in overall capacity to plan, execute,
maintain and deliver affordable sustainable urban transport.
▪ Fragmented policy formulation and implementation with lack of co-
operation among multiple ministries and transport agencies. In many
cities between 15 and 40 different institutions involved in UT planning
and mangement.
▪ Lack of finances for transport infrastructure and public transport services
resulting in extensive institutional and governmental support,
concessions and subsidies.
▪ Insufficient financial procedures and accounting/audit systems.
▪ Procedural constraints that impede the delivery of urban transport
infrastructure and services.
▪ Inadequate legal and enforcement frameworks and capacities needed
for urban transport and land-use developments.
▪ Absence of comprehensive information systems and public participation.
Overall Challenges in Dev. Cities
Lack of a single lead Authority

▪ Centre-level
Ministries (Road transport and Highways, Urban Development, Railways, Heavy
Industries, Environment, Home, Housing and Urban Poverty Alleviation, Finance,
Petroleum and Natural Gas) – policy making, financial assistance, standard setting
Planning Commission- Five year plans
▪ State -or provincial level
▪ Transport Department- Vehicle licensing and registration; emission norms
State Transport Undertakings- Inter and intra city Public transport (bus) provision
State Development Authorities- carry out city and satellite town planning
The Public Works Department- has responsibility for roads and bridges in the cities
Pollution control board- enforces emission norms
Labour department- enforces labour laws
Finance Department- budgetary allocations, impose and collect different taxes
▪ City-level
▪ Local municipal government- provides roads, infrastructure like bus stands, regulates
traffic along with Traffic Police, controls construction, etc.
Local city development authority-discharges town planning functions
Traffic Police-regulates traffic
Departments or SOE s plan and manage bus operations
Multiple Actors (an Example)

Traditional Transport Planning Sustainable Urban Mobility Planning
Focus on traffic Focus on people
Primary objective:
Traffic flow capacity and speed
Primary objectives:
Accessibility and quality of life
Political mandates and planning by
experts
Important stakeholders are actively involved
Domain of traffic engineers Interdisciplinary planning
Infrastructure as the main topic Combination of infrastructure, market, services,
information, and promotion
Investment-guided planning Cost efficient achievement of goals
Focus on large and costly projects Gradual efficiency increase and optimisation
Limited impact assessment Intensive evaluation of impacts and shaping of a
learning process
„If you plan for cars and traffic,
you get cars and traffic.“
„If you plan for people and places,
you get people and places.“
Source: Rupprecht Consult, quotations b yFred Kent, President of „Project for Public Space“:
Urban mobility planning allows to overcome antiquated paradigms
of transport planning
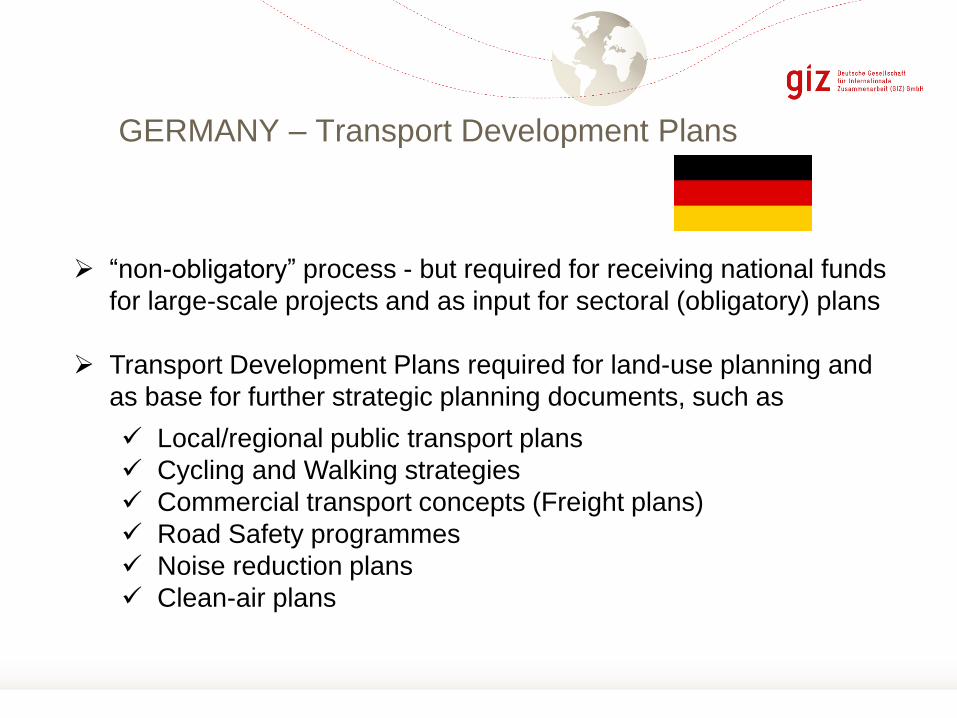
GERMANY – Transport Development Plans
➢ “non-obligatory” process - but required for receiving national funds
for large-scale projects and as input for sectoral (obligatory) plans
➢ Transport Development Plans required for land-use planning and
as base for further strategic planning documents, such as
✓ Local/regional public transport plans
✓ Cycling and Walking strategies
✓ Commercial transport concepts (Freight plans)
✓ Road Safety programmes
✓ Noise reduction plans
✓ Clean-air plans

Example: Integrated Mobility Planning in Berlin
The Power of Urban Mobility Plans

There is an urgent requirement for all metropolitan areas to
develop integrated urban transport planning authorities (such
as UMTAs), with the target to overcome fragmented and
often unfocused planning by the previous multilevel
horizontal and vertical Authorities
Examples:
• LTA, Singapore
• TfL, London
• Many European Cities
• Curitiba

Status Quo in most Developing Cities
• Insufficient physical integration of various modes
(Rail, Metro, Bus, informal PT) and between PT and
NMT
• No integrated and transparent time schedules
• Insufficient cooperation between PT operators
• Signage, customer information systems on PT
options, arrival times , connecting services , and fares
not appropriate ,and therefore discouraging PT use
• Each change of mode normally requires the purchase
of another ticket
• No uniform service level standards among modes
and operators
12.10.2
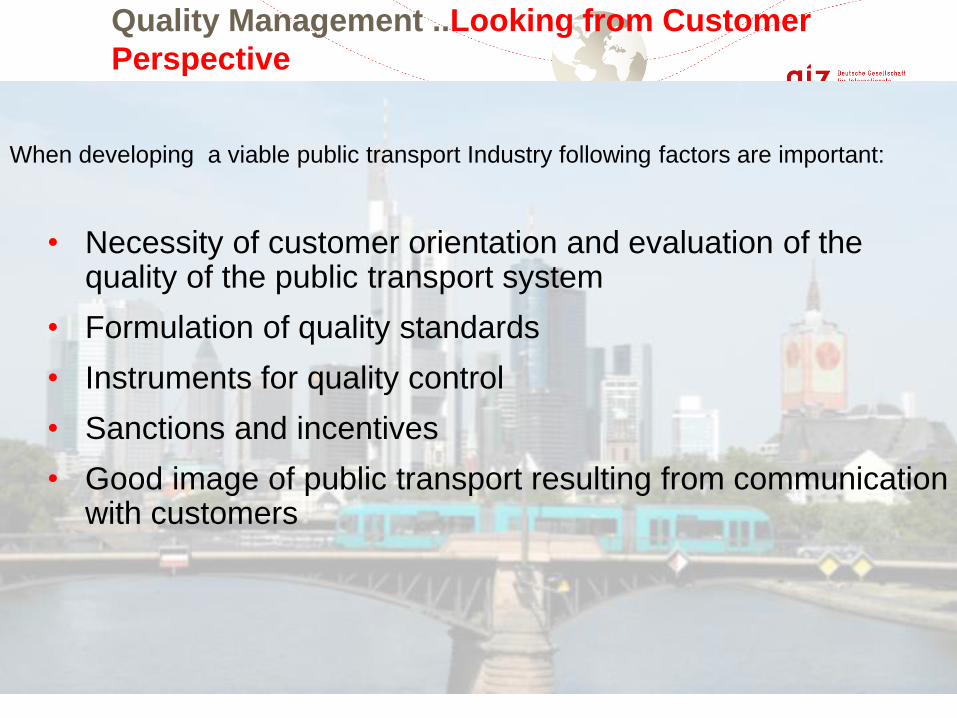
Quality Management ..Looking from Customer
Perspective
When developing a viable public transport Industry following factors are important:
• Necessity of customer orientation and evaluation of the quality of the public transport system
• Formulation of quality standards
• Instruments for quality control
• Sanctions and incentives
• Good image of public transport resulting from communication with customers
12.10.2

The need for a strong PT Regulator (Where does it
work?
A Public Transport Regulator is normally responsible for 7 basic
processes➢ Determination of Policies, Plans and Programs
➢ Management of contracts with operators
➢ Supervision
➢ Evaluation of the operation
➢ Regulation
➢ Internal programs and administration
➢ Solution of Controversies

1. Urban Redevelopment Authority (URA): Spacial and
Urban Dev Planning
2. LTA: providing plans and basic transport infrastucture
3. Regulator (Public Transport Council PTC)
• PTC is an independent body to safeguard the interests of
passengers by ensuring adequate public transport,
reasonable fares and at the same time ensuring the financial
viability of operators
• PTC has 16 members from a wide cross-section of society
and
Public Transport Operators (PTOs) operate buses and trains
Singapore

Key Functions of PTC
Licensing of Bus Services
Regulation of Bus Service Standards
Regulation of Bus/Train Fares
Feedback & Communications
Policy Review & Development
Regulation of
Penalty Fee
Regulation of Ticket Payment Services
Licensing of Bus Service Operators
Corporate Management & Services

PT Passenger Satisfaction (%) in 2010
• Security & safety 91
• Accessibility 90
• Comfort 80
• Travel time 85
• Waiting time 68
• In terms of percentage of overall satisfaction, 96% were
satisfied with MRT services compared to 92.5% for bus
services
Singapore

(S)UMPS are a powerful tool align urban transport systems with policy targets!
The Power of (Sustainable) Urban Mobility Plans
Sustainable Development
Goals
✓ Economic & social
development
✓ Environmental & urban
development
✓ Social equity &
inclusiveness
Complementary Plans
Harmonization with Urban
development plans, air quality
plans, land use plans, noise
reduction plans, climate
action plans, etc.

INDIA – Comprehensive Mobility Plans
“A CMP presents a long-term vision of desirable mobility patterns
(people and goods) for a city and provides strategy and policy measures
to achieve this vision. It follows the guidelines set forth by National
Urban transport Plan which emphasizes on NMT measures, PT systems
and sustainable systems”
Source: CMP Preparation Toolkit - Guidelines and Toolkits for Urban
Transport Development in Medium Sized Cities in India – MoUD/ADB
- National Urban Transport Policy
from 2005: Comprehensive process
description, funding program +
national guidance
- Toolkits (Guidelines) revised in
2014 (I have worked on the toolkits under a GEF
project)

Key Messages

SUMP Policy Elements in the EU
SUMP as an instrument to meet European policy targets and to solve local transport problems
• EU Recommendation to all
Member States to develop
national legal framework for
SUMP and support cities
• EU facilitates Europe-wide
coordination and funds
research and innovation
activities
• EU and national support for
SUMP preparation is taking
off
• Quality SUMPs are increasingly
a pre-condition to attract
(major) urban transport funding
from EU (incl. Structural and
Investment Funds)
SUMP is becoming mainstream!

Urban Mobility Plans:National Approaches and Local Practice
- In cooperation with
- Now available at www.sutp.org in
English, Portuguese , Indonesian
and Spanish language

Principle 3
12.10.2
Urban development and integrated
urban transport and urban land use
plans

The principles of the sustainable approach
High density, compact
development
Mixed land uses
Transit oriented
development
Pedestrian / NMT scale
of development

High density / compact development
High density does not necessarily mean high-rise
• High rises require large setback that result in similar density as low rise development
• Mid-rise development (say 80% residences in 6-10 storeyapartments) is optimal.
• It is important to note that most S. Asian cities already have high densities
Historically, cities were compact
Automobile oriented
planning led to expansive cities
Barcelona, Spain – Source: http://www.indie-
holidays.com/destinations.php?city=2

Source: Wikipedia/demographia 2014
Delhi:
22.3mil/1943sq.km29,700 person per square kilometer
Dhaka:
15.1mil/347sq.km(44,100 per square kilometer)
http://www.newgeography.com
/content/002808-world-urban-
areas-population-and-density-
a-2012-update
Mumbai:
16.1mil/546sq.km(30,900 per square kilometer)

Mixed land use (at the neighborhood scale)
At the neighborhood scale
• Provision of daily amenities and services, (grocery stores, shops, schools, doctors, play grounds, parks, etc), within walking distance of every residence
65
Advantages
• Encourages walking / bicycling
• Socially optimal
• Permissible mixed use zones can respond to market forces
Caution
• Complimentary, and not conflicting mixed uses, should be located together. For example: hospital and open auditorium should not be located together
Mixed use can be horizontal
(same area) or vertical
(same building)
Source:
http://www.leighton.com.au/photo_galleries/plot_9_mi
xed_use_development_images.html/section/122/page
/2

Encourage Compact and Mixed Land use
• Mixed Land-use reduces the necessity to make some trips
• Distance traveled is greatly reduced
Source: GTZ Photo DVD

Robin Hickman, 2008
Robin Hickman, 2006


Transit oriented development
Principles of TOD
• High traffic/commuter attractors & generators to be located closest to the transit station. Such as business, commercial, institutional, high density housing
• Decreasing density of development moving further away from the station
• Strong NMT connectivity and infrastructure to the stations
• Seamless interchange between transit modes and corridors
www.embarqindia.org 69
Transmilenio BRT - Source:
http://www.setop.es.gov.br/images/TRANSMILENIO.jpg
Source: http://www.compassblueprint.org/node/49

TOD Plan
300
Mete
r
450
Mete
r
• Core station area (400m):
Pedestrian access generates a
significant portion of transit trips.
• Primary catchment area (800m):
Bike and pedestrian access are
major contributors to ridership
• Secondary catchment area (1.5 km):
Bike, feeder transit, and auto are the
primary access modes to and from
the stop or station.
Influence Zones of Transit Stops

TOD Case: Curitiba, Brazil
197
4
200
6
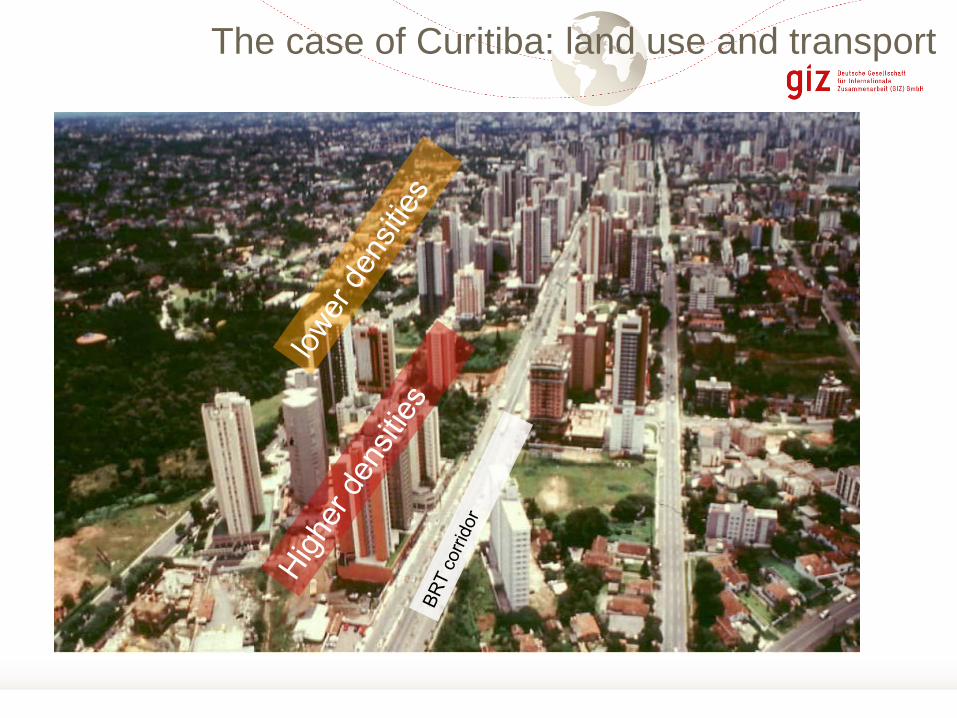
The case of Curitiba: land use and transport

TOD effects mode shift …
• 28% of Curitiba’s BRT riders previously travelled by car.
• Curitiba’s BRT has caused a reduction of about 27 million auto trips per
year, saving about 27 million litres of fuel annually.
• Compared to eight other Brazilian cities of its size, Curitiba uses about 30%
less fuel per capita, resulting in one of the lowest rates of ambient air
pollution levels in Brazil.
• Today about 1,100 buses make 12,500 trips every day, serving more than
1.3 million passengers—50 times the number from 20 years ago.
… case of Curitiba
Source: http://www.urbanhabitat.org/node/344

TOD creates real estate value …
• According to the Hong Kong Planning Standards and Guidelines: “Planning
for new railways will be integrated with land use planning to optimize the
development opportunities around railway stations ... such that the walking
distance between railway stations ... and major housing, employment,
shopping ... could be less than 500 meters, and all facilities/nodes are
inter-connected with well-planned pedestrian walkway network”.
• Developers have to pay a premium for land closer to the transit station
• Incentive is given for direct NMT connectivity, (sidewalks, skywalks) to the
stations, and support infrastructure (benches, bike parking, low-end retail)
… case of Hong Kong
Source: http://www.prdbay.com/UploadFile/20110330140011e.pdf

The principles of the sustainable approach
High density, compact
development
Mixed land uses
Transit oriented
development
Pedestrian / NMT scale
of development

Walkability comparison
Source: http://www.walkscore.com/walkable-neighborhoods.shtml

Building setback and walkability
Cleveland, OH – USA – Source: Google Street
View
Buildings located far from the
footpath
Parking located between footpath
and buildings
No shade for pedestrians
Result
• No pedestrians on the street!

Buildings abutting
foothpath edge
Parking relegated to the back of buildings
Buildings provide shade for
pedestrians
Result
• Pedestrians aplenty!
Building setback and walkability
London, UK – Source: Google Street View

Shreya Gadepalli, 2003Manfred Breithaupt, 2006

Manfred Breithaupt, 2006
Principle 4
Public (Service) Transport Reform
12.10.2

Just to recall: Main Components of integrated Urban
Transport • Public Transport with
priority over all other
modes on the road
• Non-motorized transport
• Creating/conserving
public space
• PT Integration
• TDM measures
• Vehicles and fuels
(Technol. may support)
• Proper institutional set
up
12.10.2
Do you see these factors here?

And…we have it all on this
photo…

Unattractive public transport systems
• Insufficient physical integration of various
public transport modes and between public
transport, walking, cycling and private car
• No integrated and transparent time
schedules
• Signage, customer information on
timetables (Metro Rio), connecting services
and fares not appropriate
Discouraging the use of public transport

Why is public transport often considered to be unattractive?
• Insufficient cooperation between public transport operators
• Each change of mode normally requires the purchase of another ticket
• No uniform service level standards among modes and operators
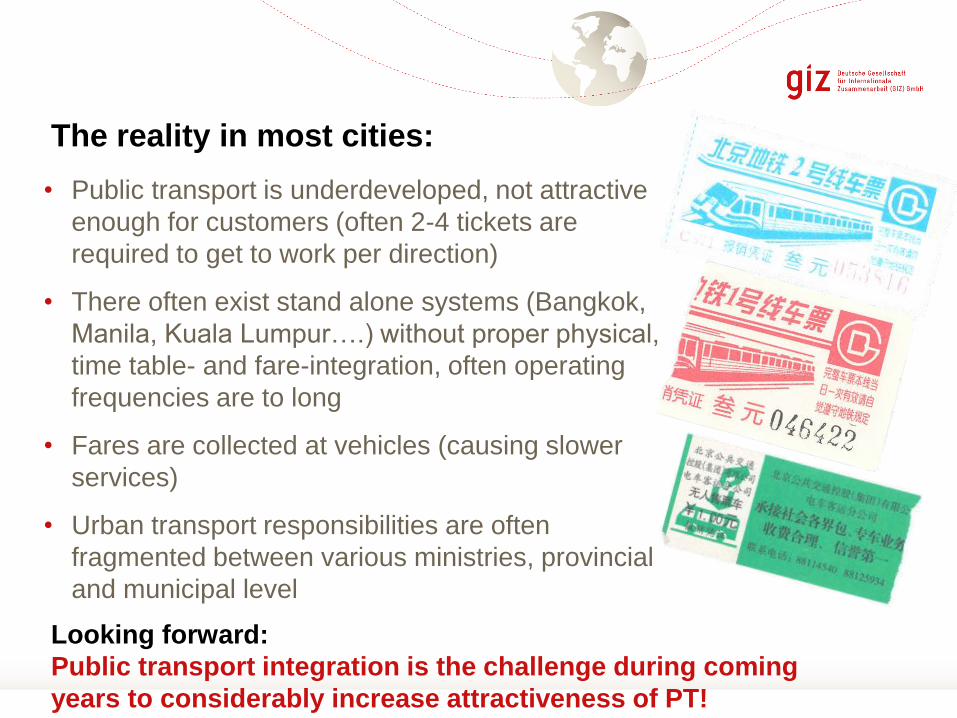
• Public transport is underdeveloped, not attractive
enough for customers (often 2-4 tickets are
required to get to work per direction)
• There often exist stand alone systems (Bangkok,
Manila, Kuala Lumpur….) without proper physical,
time table- and fare-integration, often operating
frequencies are to long
• Fares are collected at vehicles (causing slower
services)
• Urban transport responsibilities are often
fragmented between various ministries, provincial
and municipal level
The reality in most cities:
Looking forward:
Public transport integration is the challenge during coming
years to considerably increase attractiveness of PT!
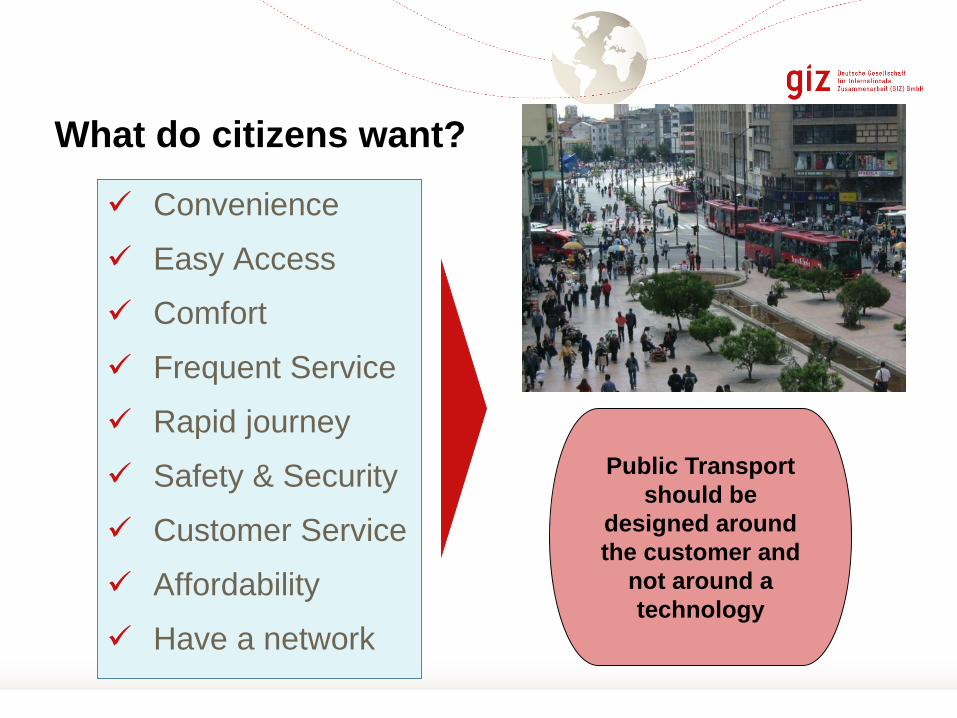
✓ Convenience
✓ Easy Access
✓ Comfort
✓ Frequent Service
✓ Rapid journey
✓ Safety & Security
✓ Customer Service
✓ Affordability
✓ Have a network
Public Transport
should be
designed around
the customer and
not around a
technology
What do citizens want?
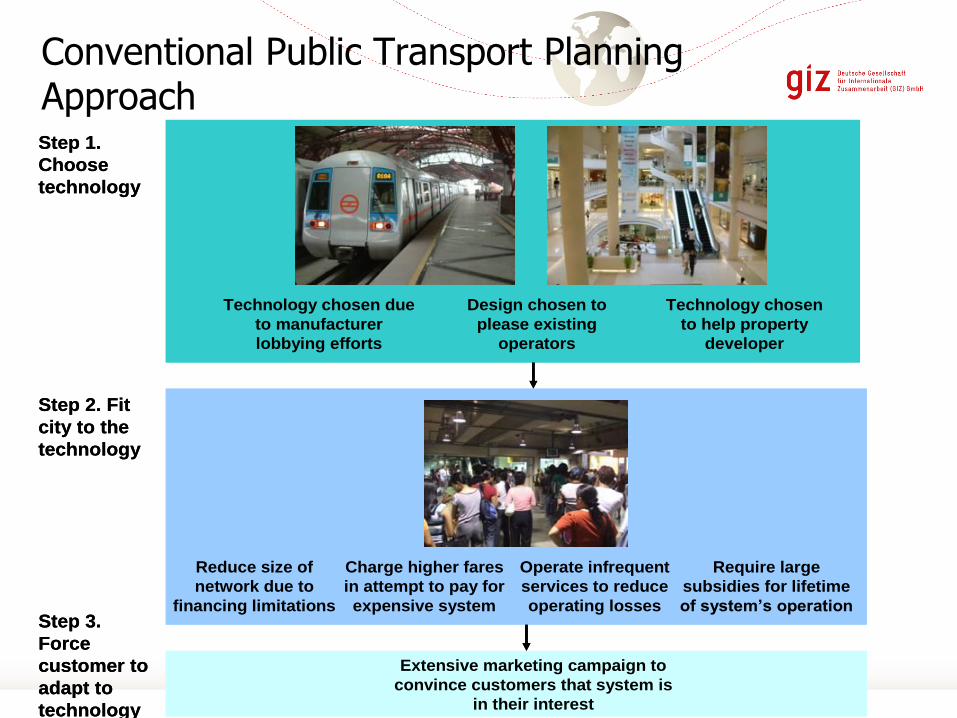
Conventional Public Transport Planning ApproachStep 1.
Choose
technology
Step 2. Fit
city to the
technology
Step 3.
Force
customer to
adapt to
technology
Technology chosen
to help property
developer
Design chosen to
please existing
operators
Technology chosen due
to manufacturer
lobbying efforts
Reduce size of
network due to
financing limitations
Charge higher fares
in attempt to pay for
expensive system
Require large
subsidies for lifetime
of system’s operation
Extensive marketing campaign to
convince customers that system is
in their interest
Operate infrequent
services to reduce
operating losses
Step 1.
Choose
technology
Step 2. Fit
city to the
technology
Step 3.
Force
customer to
adapt to
technology
Technology chosen
to help property
developer
Design chosen to
please existing
operators
Technology chosen due
to manufacturer
lobbying efforts
Reduce size of
network due to
financing limitations
Charge higher fares
in attempt to pay for
expensive system
Require large
subsidies for lifetime
of system’s operation
Extensive marketing campaign to
convince customers that system is
in their interest
Operate infrequent
services to reduce
operating losses

The innovative and successful approach
Rapid travel
time
Few transfers
Frequent
service
Safe vehicle
operation
Secure
environment
Low fare cost
Comfortable and
clean system
Full network of
destinations
Short walk to
station from
home / office
Friendly and
helpful staff
Step 1.
Design a
system from
customer’s
perspective
Step 2.
Evaluate
customer-
driven
options from
municipality
perspective
Step 3.
Decision
Low
infrastructure
costs
Traffic reduction
benefits
Economic /
employment
benefits
Environmental
benefits
Social equity
benefits
City image
Technology decision based on customer
needs and municipality requirements

Equivalency road width: In order to carry 20,000 automobile commuters PHPD, a highway must be at least 18 lanes wide.
(assumption 1.2 passengers per automobile). And what s the capacity of the 22 lanes in front Miracle Hotel? 17000 per dir.
190001500-
2000
Mixed
Traffic
40000 –
60000
Heavy Rail/
Metro
60000 –
90000
Suburban
Rail(e.g. Mumbai)
14000
Cyclists
9000
BRT
single lanePedestrians
5000
Regular
Bus(BRT
double lane)
Light Rail
18000 –
20000
(people per hour on 3.5 m wide lane in the city – PPHPD [PAX/hour/direction])
Source: Botma & Papendrecht, TU Delft 1991 and own figures
PPHPD
Range ()
2000 8000 14000 16000,
Curitiba
19000 20000 43000,
Bogota
80000,
HKK>100000,
Mumbai
Maximum
PPHPD
achieved&
where ()
Why Public transport Priority? Corridor Capacity

Comparing the costs
BRT
US$ 0.5 – 15 millon / km
Tram
US$ 10 – 25 millon / km
Light Rail Transit (LRT)
US$ 15 – 40 millon / km
Urban commuter rail
US$ 25 – 60 millon / km
Elevated rail
US$ 50 - 125 millon / km
Metro
US$ 60 millon – 320 millon / km
Image source: Manfred Breithaupt Lloyd Wright

BRT can be very
productive
Guangzhou, China
35,800 pax/day/km
Source: EMBARQ

BRT can be very
high speed
Istanbul, Turkey
42 km/h
Source: EMBARQ

Light Rail Transit
Budapest Tram
Photo by Carlosfelipe Pardo

<<
<
SUTP,TDMSUTP,TDM

BRT – Intermediate to High Capacity Transit

Key from customer perspective: Professionalism in service provision
• Are the stations and the fleet clean?
• Do the drivers have good road etiquettes?
Slid
es d
evelo
ped o
rigin
ally
by
Llo
yd W
right

Remember, at the beginning we stated that the PT mode share in Asian cities did not increase. What to do?: 2 main issues
Public Transport – Quality Control
Public Transport – Integration
(physical, fare, institutions, timetables)
Ways to achieve increase in PT ridership…

And….. Translating policy to targetsExample of Singapore
Land Transport
Master plan
“Making public transport a
choice mode”‘’Managing road usage” “Meeting the diverse
needs of people”
- 85% of commuters to
complete their door-to-door
journeys within 60 minutes
during morning peak by
improved transfers and
priority
- Double rail transit network
to 278 km by 2020
- Increase bus speeds to 20-
25km/hr from 16-19km/hr by
allotting all-day bus priority
- Increase overall public
transport ridership from 63%
to 70% by 2020
- Designed to limit the
number of cars that use
the roadway system by
engaging in electronic road
pricing,
- Allowing market forces to
set parking policies, and
- Strictly limiting the
number of vehicle
registration issued
- Engaging the community,
enhancing accessibility by
providing barrier-free facilities
and keeping fares as low as
possible, making transfer
stations into “lifestyle hubs,”
and promoting the use of
bicycles and other clean
vehicles
Policy/Base
document
Objectives
Targets

Principle 5
Enhance and maintain safe Non
Motorized Transport Infrastrucure
12.10.2

SPACE: Priority
Lloyd Wright
Question:
Where is the footpath?
and
Whose is the footpath?

SPACE : Enjoyable
It is a
footpath, not
a stair case


SPACE: Comfort
Pedestrian overpasses
uncomfortable
and people seldom use
them.

Mobility Options like:
▪ Enhancing Non-
Motorized Transport
(like Walking and
Cycling)
Different forms of Mobility
Image Source: GIZ-SUTP

Walking areas, proper sidewalks, cycling network, and car-restricted zones
▪ More safety for citizens
▪ More pedestrian space
▪ More traffic calming
measures
▪ Preserve architectural
heritage and aesthetic
value
Brandenburger Tor, Berlin
Promoting Public Space

12.10.2
Promoting cycling: Amsterdam
Promoting NMT

12.10.2
Promoting cycling: Amsterdam
Promoting NMT

Street design: Example from Rotterdam

Lyon’s waterfront with
bike share
Will our children find
our cities as
entertaining as playing
a video game?
Source: Slide developed by ITDP
Measures for Promoting Public Space
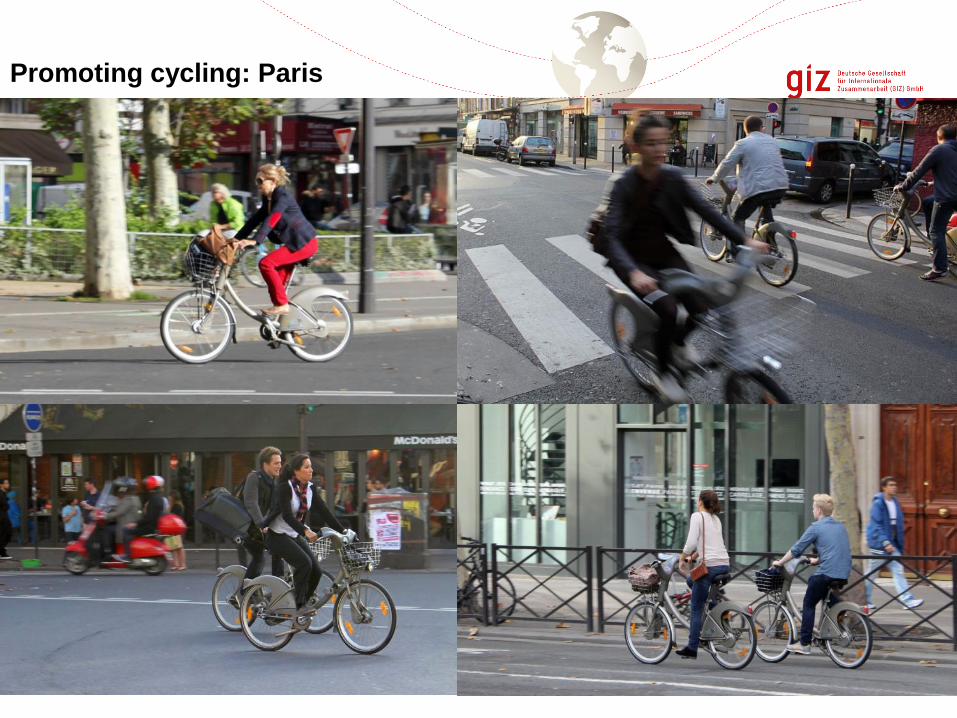
Promoting cycling: Paris

▪ “Velib” public bike scheme started in
July 2007 as PublicPrivatePartnership
▪ Can be used with public transport
SmartCard, short-term subscription,
credit cards, …
▪ Has more than 20,000 bikes and more
than 1,200 stations
▪ 110,000 rentals daily
▪ Vandalism and road safety remain an
issue
Promoting cycling: Paris

Manfred Breithaupt, 2006
Judiza Zahir, 2008
Li Shanshan and Liu Shaokun, 2010Manfred Breithaupt, 2006

Armin Wagner, 2006
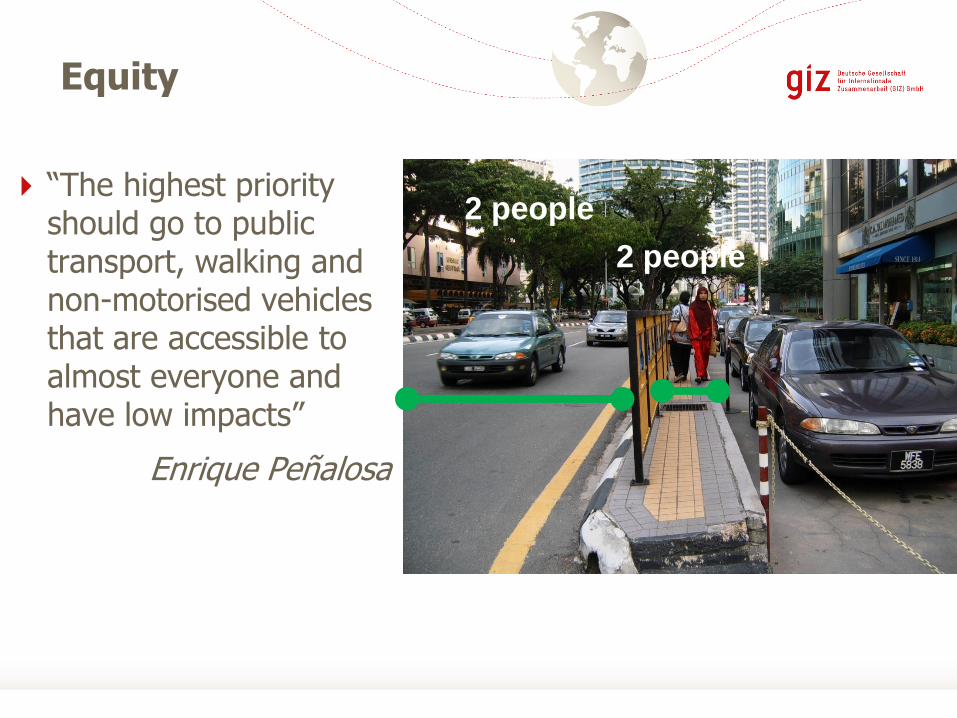
Equity
“The highest priority should go to public transport, walking and non-motorised vehicles that are accessible to almost everyone and have low impacts”
Enrique Peñalosa
2 people
2 people

Induced
Bicycle Traffic
Cycling in
Copenhagen
increased by
100% from
1990 to 2000
MODAL SPLIT: 37% go to work on bicycle
23% use car
33% use public transport
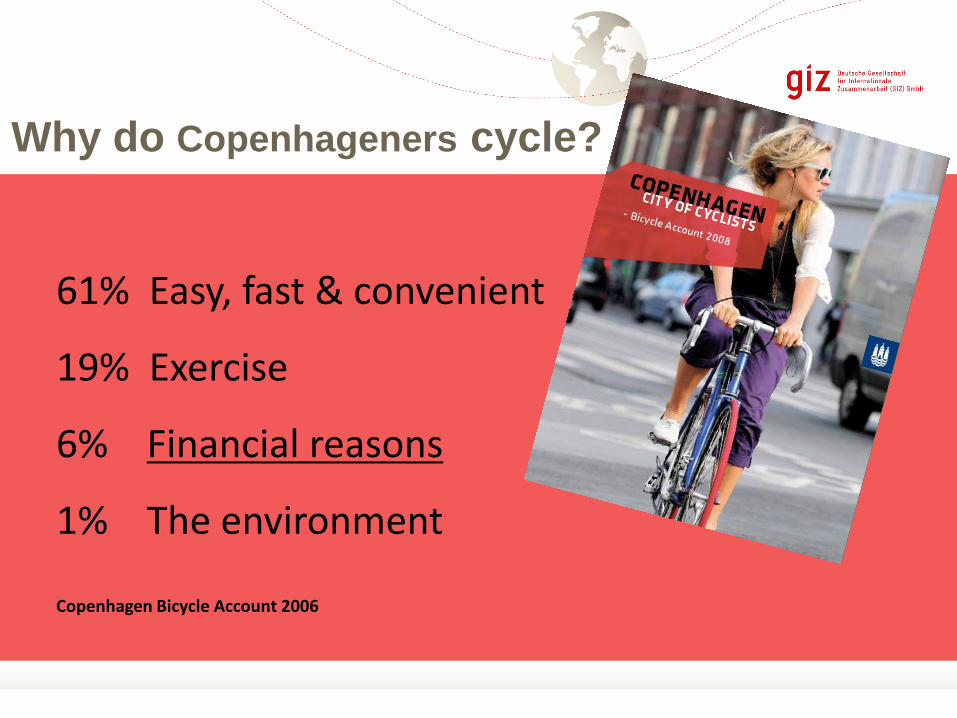
Why do Copenhageners cycle?
61% Easy, fast & convenient
19% Exercise
6% Financial reasons
1% The environment
Copenhagen Bicycle Account 2006

Muenster, Germany- the German
cycling City
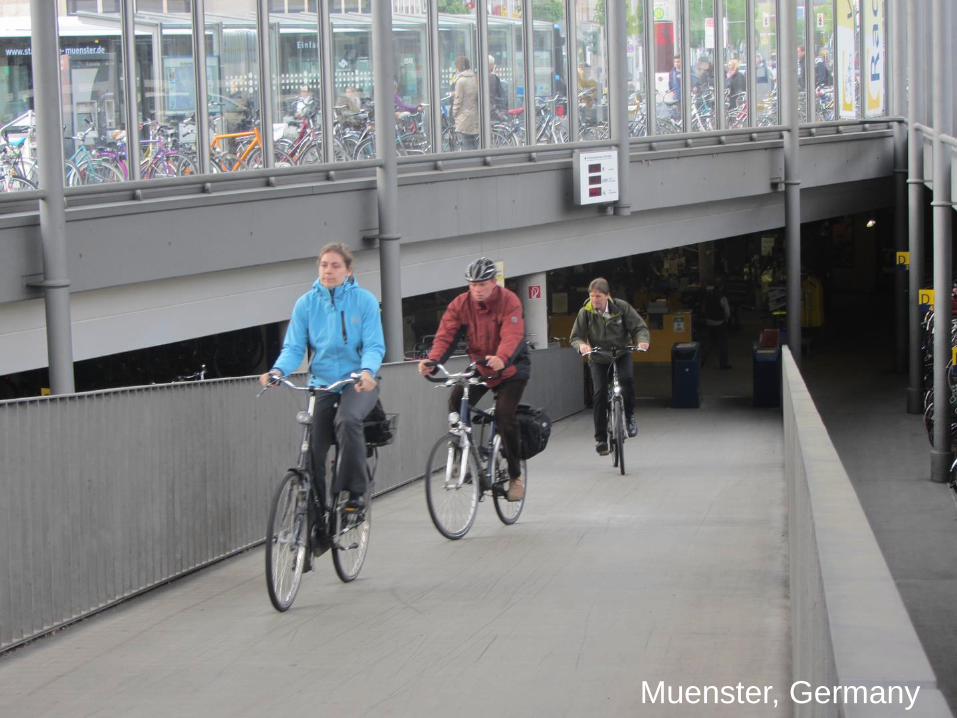
Muenster, Germany


“In terms of infrastructure, what differentiates advanced cities are not highways or subways but quality sidewalks and cycleways”
Enrique Penalosa, former Mayor of Bogota, Colombia

Principle 6
Integrate all means of Public Transport
(incl. Informal Transport) with NMT and
shared Mobility Offers
12.10.2
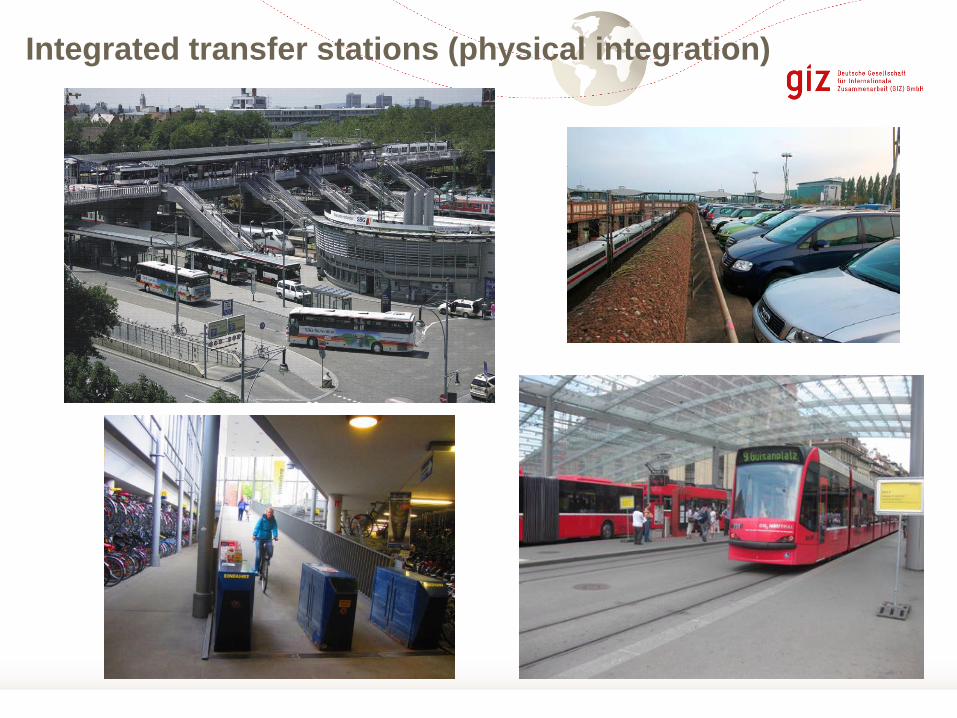
Integrated transfer stations (physical integration)

Modal Integration
• Can an individual take his/her
bicycle? Is it easy to walk? Should
he/she can drive to the station?

Integrated Information & Timetable planning

Cycle Integration

Local PublicTransport System in Frankfurt -
Corporate Design
12.10.2From TraffiQ

International Experiences: Munich
• Münchner
Verkehrsverbund
• „1 network, 1
timetable, 1 tariff“
• Includes all public
transport modes with
different operators
• Bus, tram, subway,
light rail, suburban
trains, …
Image source left & above: MVG

Integrated Fares & Ticketing
One timetable
One fare
One ticket
Includes all public
transport modes with
different operators

Again key… Public Transport priority
Is PT prioritized over
other modes?

Network coverage
• Can I reach the CBD, shopping
district, my home?

Example: Regional Alliance (RMV) -
Structure
Members of the RMV
(The Rhine Main Transit Alliance-Hesse,Germany)
27 partners constitute the
RMV Supervisory Board, thereof:
• 15 rural districts
• 4 large cities (e.g. Frankfurt)
• 7 medium-sized towns
• The federal state of Hessen
• 368 Local authority districts within the
RMV area
• 153 Transport companies
• 112 fare systems harmonised and
integrated
12.10.2
017
The Area of the RMV

Ideal: Going for service Contracts for increased Quality
Quality Management - Possible quality indicators
• Availability(frequency of service, seating capacity, stand-by vehicles, ...)
• Accessibility (Accessibility of stops, travel speed, transfers, ...)
• Customer information (Schedule displays and leaflets, sales points, information in case of disruptions, ...)
• Schedule, punctuality
• Customer service(Conduct of personnel, complaints management, marketing, ...)
• Equipment, comfort, special services(Equipment of vehicles, design, cleanliness, style of driving, ...)
• Safety(technical safety, personnel, emergency telephones, ...)
• Environmental standards(CO2 emissions and fuel consumption, noise levels inside / outside, ...)

The Oslo Metro Customer Charter
12.10.2017
1. We leave on schedule.
2. We will not leave early.
3. You will be informed of an approaching stop.
4. You will always know where we are going.
5. Information will be available before you board.
6. Information will be available on board.
7. We will answer your questions.
8. You will be informed when things go wrong.
9. Carriers will be clean, making your journey pleasant.
10. We will reply when you write to us.
11. We will listen to you.
12. We pay if you arrive late.


Principle 7
Transport Demand Management
(using the push and pull Approach)
12.10.2

Congestion Index
Source: TomTom Traffic Index 2017

with the objectives to
Transport Demand Management shall
• Urban areas require proper road networks
• New roads attract more traffic and reduce the viability of public transport
• Transport benefits will be offset by future congestion
• reduce traffic congestion
• reduce adverse effects on the environment or public health
• generate additional revenue to improve public transport and NMT by pricing mechanisms
• reduce the total volume of traffic
• promote shifts towards more sustainable modes of transport
The challenges in urban transport and TDM

Transport demand management measures (including fiscal policies)
Land use development controls: extremely important, not covered here
Public transport integration: we talked abt it
Parking controls and management : covered here
Regulatory controls such as odd/even systems: important TDM measure
Physical measures such as bus and pedestrian priority: we talked abt it
Pricing & charges through fuels, annual taxes (dealt with in another
presentation durch EMDS) : covered here
Congestion charging: covered here
TDM policies should never be implemented as isolated instruments, but – for being
successful – have always to be embedded in a comprehensive framework of
Transport Demand Management measures.
Transport Demand Management measures

Transport Demand Management (TDM)
Rationale: “Demand for transport services is not given, but depends on transportation policies, pricing, investments & choices”
Definition: „TDM is a strategy which aims to maximize the efficiency of the urban transport system by
discouraging unnecessary private vehicle use and promoting more effective, healthy and environmental-
friendly modes of transport, in general being public transport and non-motorised transport“.

The Shift: Thinking Demand instead of Supply
Supply side Demand side
New
highways
HOV
lanes
HOT
lanes
Adding
lanes
Public transport
improvements
Toll roads
Area license
or fee
Parking
control
Cordon
tolls
Taxation
policyPublic transport
priority
Congestion
charges
Adapted from Derek Turner Consulting

Travel Demand Management: A Toolbox
Planning
Regulation
EconomicInformation
Technology

Travel Demand Management: A Toolbox
What? Example
Regulato
ry
Instrume
nts
Physical RestraintPedestrian
zones
Parking
Management
Parking
Maximums
Access RestrictionsLow Emission
Zone
Speed Restrictions30 km/h in build-
up areas
Regulation

Case Study: Odd-Even Schemes
Prohibition on motor vehicles from
being driven into central areas on
certain days of the week.
• Mexico City
• Bogota
• Sao Paulo
• Manila
Multiple side-effects limit their
effectiveness.

✓ Extensive toolbox available
✓ TDM with high impact…
✓ reduction of pollution,
travel times and
accidents
✓ …often achievable at low
cost
Regarding Economic
Instruments, being part of
TDM, more in Session 4 this
afternoon
Source: Carlos Pardo
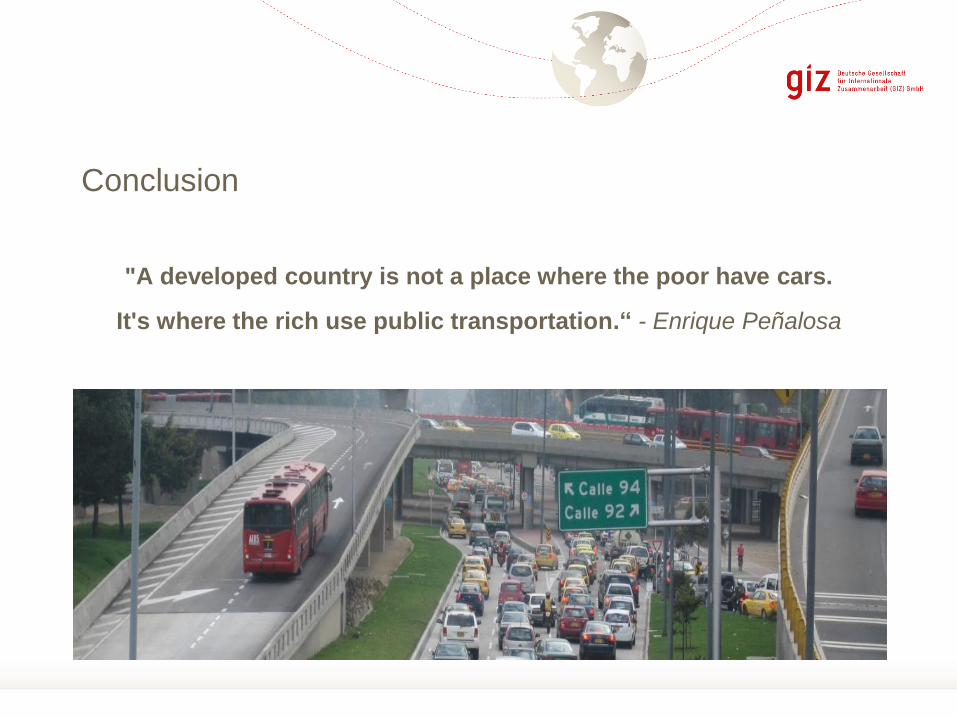
Conclusion
"A developed country is not a place where the poor have cars.
It's where the rich use public transportation.“ - Enrique Peñalosa

12.10.2
Further reading
„Transportation
Demand Management“
118 pages, full colour
document
Free download on
www.sutp.org

Principle 8
Financing Sustainable Urban Transport
…….We ll talk about it in Module 4
12.10.2

Principle 9
Sharing Knowledge and Transferring
Experience
12.10.2

Training Courses: Worldwide Experience
Until 2017, we have
implemented 170 courses with
6000 participants across all
continents
GIZ’s global role on Sustainable Transport
Sustainable Urban Transport
Bus Rapid Transit
Bus Regulation and Planning
Non-motorized Transport
Transport Demand Management
Development of Parking
Strategies
Development of Bike Sharing
Systems
Raising Public Awareness

Training course manuals
• Bus Rapid Transit
• Public Awareness and Behavioural Change
• Non-motorised Transport
• Cycling-inclusive Policy Development: A Handbook
• Travel Demand Management
• Mass Transport Options
• Bus Regulation and Planning
• Financing Urban Transport
WWW.capsut.org

Non-European
Cities:
✓ Bogotá
✓ Curitiba
✓Singapore
✓Tokyo
Europe:
✓ Zurich
✓ Vienna
✓ Berlin
✓Amsterdam
✓ Groningen
✓ Copenhagen
✓ Freiburg
✓Muenster
Summing up: International Experiences reglivable Cities
All of these successes featured an integrated and packaged approach:
1. High-quality public transport
2. Improved conditions for walking and bicycling
3. Effective integration of modes
4. Supportive land-use policies
5. Car-restriction measures and other TDM measures
6. Strong institutional background

• Integrated Transport Policy: PT, NMT and IMT
• Modal Share of PT 36%
• More than 2/3 of journeys are done by PT and NMT (active transport or EST)
• Vienna top ranked in quality of living surveys conducted by the British consultancy firm Mercer during years 2009 to 2012
Examples: Vienna (#1 Quality of living Index)Public Transport and NMT(PT and NMT not for poorer cities, but smart solutions, promoting growth and attractive-ness. Proven to be a success factor for highincome and successful cities)
Source: M. Breithaupt, 2009, http://www.wien.gv.at.
International Experiences
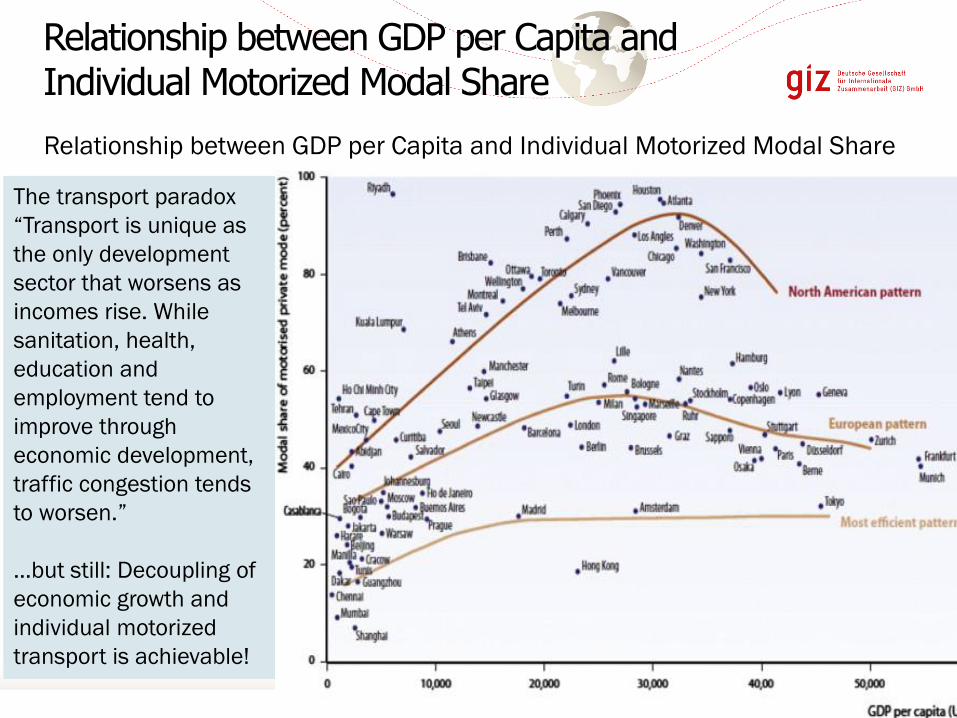
Relationship between GDP per Capita and Individual Motorized Modal Share
Source: IEA, Energy Technology Perspectives, Paris 2008
Relationship between GDP per Capita and Individual Motorized Modal Share
The transport paradox
“Transport is unique as
the only development
sector that worsens as
incomes rise. While
sanitation, health,
education and
employment tend to
improve through
economic development,
traffic congestion tends
to worsen.”
…but still: Decoupling of
economic growth and
individual motorized
transport is achievable!

Thanks!
Manfred Breithaupt
+1702010559
www.sutp.org
www.capsut.org
Photo: Carlos Pardo / FlickR
sustainableurbantransportproject
_SUTP
www.sutp.org; www.capsut.org