environmental economics (en 610)
TRANSCRIPT

Environmental Economics (EN 610)
Degree Programme: MBA Corporate Management
Semester II: 2016/17
Course Instructor: Dr. Chongela, J.
SJUT - FOCB

1.Introduction
• Definitions:EnvironmentEconomicsEnvironmental economicsResource economics
Course instructor: Dr. Chongela, J.

Environment
• Environment refers to a unit of nature consisting of animals, plants, micro organisms, chemicals and physical factors such as water, air, soil/land, noise, congestion (traffic).
• Hence, environment is the interaction of biotic and abiotic factors such as animals, plants, air, water, soil, noise, etc.
Course instructor: Dr. Chongela, J.

Economics
• Economics is the study of the allocation of scarce resources.
Note that the theories of economics can be applied to any scarce resource, not just traditional commodities.
Economics is not simply about profits or money. It applies anywhere constraints are faced, so that choices must be made.
Economists study how incentives affect people’s behavior.
Course instructor: Dr. Chongela, J.

Environmental economics
• Environmental economics is an area of economics dealing with the relationship between the economy and the environment. Environmental economists study the economics of natural resources from both sides - their extraction and use, and the waste products returned to the environment. They also study how economic incentives hurt or help the environment, and how they can be used to create sustainable policies and environmental solutions.
Course instructor: Dr. Chongela, J.

Environmental and natural resource economics
• Environmental and natural resource economics is the application of the principles of economics to the study of how environmental and natural resources are developed and managed.
Natural resources – resources provided by nature that can be divided into increasingly smaller units and allocated at the margin.
Environmental resources – resources provided by nature that are indivisible.
Natural resources serve as inputs to the economic system. Environmental resources are affected by the system (e.g. pollution).
Course instructor: Dr. Chongela, J.

Why Study Environmental Economics
To apply economic tools to solve environmental problems.
To formulate environmental policies.To study how environmental and natural
resources are developed and managed.
Course instructor: Dr. Chongela, J.

Uniqueness of environmental economics
• Market failures: When market failures exist, government intervention may be appropriate. Market failure can result from market power, externalities, asymmetric flow of market information, public goods and /common property resources.
• Dynamics: The decision to consume a good today typically does not affect the ability to consume it tomorrow. However, the decision to use natural resources today does affect what will be available tomorrow.
Course instructor: Dr. Chongela, J.

Uniqueness of environmental economics
Irreversibility: Damage to natural resources has long term effects. For example, if the natural resource is damaged, future generations would be unable to enjoy its beauty. This is not as large a problem for normal consumer goods.
Linkages between the economic and ecological system: An interdisciplinary understanding of the environment, political science, etc. necessary to be a good environmental economist.
Course instructor: Dr. Chongela, J.

2. ECONOMIC PERSPECTIVES ON THE ENVIRONMENT
• The economic analysis of environmental issues can be approached from two different perspectives.
Environmental economics Ecological economics.
Course instructor: Dr. Chongela, J.

Environmental economics
• Environmental economists recognize that the environment has value, but tend to focus on environmental values in human terms, specifically those that can be measured monetarily.

Ecological economics
• Ecological economics places greater emphasis on sustainability of the ecosystem by stressing that all economic activity occurs within the broader biological and physical systems that support life.
• Thus ecological economists are more likely to see the value of nature as something extending beyond any monetary estimates.

Economic perspectives on the environment
• The environmental issues can be addressed by three economic perspectives:
SustainabilityValueLimit to growth• Sustainability: it can be defined as providing future generations
of humans the capacity to be at least as well-off as the current generation.
• Sustainability can be categorized into:Weak sustainabilityStrong sustainability

Weak sustainability• Weak sustainability refers to the natural capital
depletion is justified as long as it is compensated for with increases in human-made capital; assumes that human-made capital can substitute for most types of natural capital.
• According to weak sustainability, natural capital (such as the quality of air and water, the amount of wildlife habitat, and effective nutrient cycling) is largely substitutable with produced capital (such as factories, roads, and schools) and human capital (such as knowledge and productive skills).

Weak sustainability
• For example, a developing nation could cut down its forests, replacing them with plantations and sawmills, or destroy its natural fisheries and replace them with aquaculture facilities where fish are raised in pens for human consumption. This would meet the definition of weak sustainability, provided that the productive value of the new facilities was at least equal to that of the former natural systems.

strong sustainability
• Ecological economics tends to advocate for strong sustainability, which does not consider natural capital substitutable with other types of capital. Instead, the objective of strong sustainability is to maintain the overall level of natural capital over time.
• In general, advocates of strong sustainability argue that natural systems should be maintained intact wherever possible.
• For example water supplies - as natural resources which must be preserved under all circumstances.

Value• The differences between environmental and ecological
economics in defining sustainability translate to different conceptions of “value.” As environmental economics defines sustainability based on human well-being, the environment has value only to the extent that it is useful to humans. Some of these uses may involve extracting natural resources, such as harvesting trees or fish, but humans may also place value on passive uses of the environment such as watching a sunset or knowing that unspoiled places exist in the world.

Value
• The key concept in defining value according to environmental economics is the willingness-to-pay (WTP) principle. This states that the economic value of something is equivalent to the maximum amount of money people are willing to pay for it. So if Iam willing to pay, say, a maximum of $50 to ensure the protection of an endangered species, then $50 is the value of that species to me.

Limits to Growth
• The limits to economic growth. Measured as the sum of each country’s gross domestic product (GDP) versus population growth.
• Can such growth continue without approaching or exceeding ecological limits?.

3. APPLICATIONS OF ECONOMIC THEORY TO THE ENVIRONMENT
3.1 Environmental Externalities:• The concept of externalities is central to
environmental economics. In economic terms, a market transaction creates an externality when it impacts someone other than the buyer and the seller. For example, a firm which pollutes a river while manufacturing automobile harms those who use the river for fishing, swimming, or drinking water.

Negative externality• Negative externalities: harmful side effects, or
unintended consequences, of economic activity that affect persons, or entities (such as the environment) that are not among the economic actors directly responsible for the activity.
• This negative externality might be measured in monetary terms – for example, the lost revenues of professional fishers. Some damages may be more difficult to measure but no less important – for example, health costs caused by toxins in the water, or the loss of enjoyment by those who can no longer swim in the polluted water.

Positive externalities
• Positive externalities: the positive impacts of a market transaction which affect those not involved in the transaction.
• Some economic activities may bring benefits to people other than those involved in the activity. These third parties benefit from what economists call positive externalities.
• Example Solar panels: each solar panel installed reduces emissions of carbon dioxide, and thus benefits society as a whole.

3.2 Public Goods and Common Property Resources
• In this section we consider the allocation of common property resources and public goods. These are resources and goods that are usually not privately owned, leading to different outcomes both in terms of economic equilibrium and environmental externalities.

3.2 Public Goods and Common Property Resources
• Private goods are excludable, meaning that the legal owners of them can prevent other people from enjoying the goods’ benefits. For example, if I am the owner of an automobile, I can legally prevent anyone else from using it. But many natural resources are non excludable, meaning that the benefits of these resources are available to anyone. For example, in absence of regulation an ocean fishery can be accessed by anyone, or the atmosphere is freely available to all as a repository of pollution.

• Economists differentiate between public goods and common property resources. While both of these are non excludable, they differ in terms of whether multiple people can benefit from them at the same time. Public goods are non rival, meaning that many people can enjoy these goods at the same time, without affecting the quantity or quality of the good available to others. An example of a public good is national defense – the benefits I get from national defense do not diminish the benefits others receive.

• Common property resources are more often rival, meaning that use of the resource by one person reduces the quantity or quality of the resource available to others. An example of a common property resource would be groundwater. If I withdrawal some groundwater, that water is not available for others to use.

Management of public goods• Public goods are both non excludable and non rival.
Consider national defense as an example of a public good. Could we rely upon some mega-corporation to provide national defense in a market setting? No, because there would be no way for the corporation to sell the product to individual buyers. No individual would have an incentive to pay because they could receive essentially the same level of benefits without paying. Thus the “equilibrium” quantity of public goods in a market setting is normally zero, as no company would want to produce something that no one is willing to pay for.

• Perhaps we could rely on donations to supply public goods. This is done with some public goods, such as public radio and television. Also, some environmental groups conserve habitats that, while privately owned, can be considered public goods because they are open for public enjoyment. Donations, however, generally are not sufficient for an efficient provision of public goods. Since public goods are nonexclusive, each person can receive the benefits of public goods regardless of whether they pay. So while some people may be willing to donate money to public radio, many others simply listen to it without paying anything. Those who benefit from public goods but do not pay are called free riders.

4. VALUING THE ENVIRONMENT
• The total economic value of a natural system is the sum of all the benefits people are willing to pay for. Thus the total economic value of a National Forest would be the sum of any profits obtained from timber harvesting, the willingness to pay of all those who recreate in the forest, the value of the ecosystem services such as soil erosion prevention and carbon storage, and the nonuse benefits people obtain by simply knowing the forest exists.

• Environmental economics measures value according to the willingness-to-pay principle. Ecological economic is more likely to consider the inherent value of natural capital. In either case, economists recognize that the environment has value beyond just its market uses, such as supplying timber, fish, and agricultural land. Thus we need to assess whether natural resources should be used for market benefits such as these, or non-market benefits, including:

1. Recreation: natural sites provide places for outdoor recreation including camping, hiking, fishing, hunting, and viewing wildlife.
2. Ecosystem services: these are tangible benefits obtained freely from nature as a result of natural processes, including nutrient recycling, flood protection by wetlands, waste assimilation, carbon storage in trees, water purification, and pollination by bees.
3. Nonuse benefits: these are non-tangible benefits that we obtain from nature. Nonuse benefits include the psychological benefits that people gain just from knowing that natural places exist, even if they will never visit them. The value that people get from knowing that ecosystems and species will be available to future generations is another type of nonuse benefit.

4.1 Cost-Benefit Analysis
• Environmental economists use the technique of Cost-Benefit Analysis (CBA) to estimate the net benefits (i.e., the benefits minus the costs) of proposed projects or policies measuring impacts in monetary units.

4.1 Cost- Benefit Analysis• The basic steps of a cost-benefit analysis are relatively
straightforward:1. List all costs and benefits of the project or policy proposal.
Typically this is done for several different scenarios.2. Convert all costs and benefits to monetary values. Some
values can be obtained based on market analysis, while other values will require nonmarket valuation.
3. Add up all the costs and benefits to determine the net benefits of each scenario. Sometimes the results are expressed as a ratio (i.e., benefits divided by costs).
4. Choose the scenario that is the most economically efficient.

how to value costs and benefits that occur in the future
• Discounting the future: Economists incorporate this concept into CBA through discounting. Discounting effectively reduces the weight placed on any cost or benefit that occurs in the future, relative to the same impact occurring now. The further the cost or benefit occurs in the future, the less weight is given to that impact. In order to compare an impact that occurs in the present to an impact that occurs in the future, the future impact must be converted to an equivalent present value using the following formula:
• PV (Xn) = Xn / (1 + r)n ........................................ (1)

• Where: PV is the present value; Xn is the monetary value of the cost or benefit, n is the number of years in the future the impact occurs and r is the discount rate—the annual rate by which future impacts are reduced, expressed as a proportion (i.e., r = 0.03 for a 3% discount rate).

• A simple example will illustrate how discounting works. Suppose we are analyzing a proposal to improve air quality. Assume that the cost of this proposal, including the installation of new pollution control equipment, is $10 million, to be paid right now. The benefits of cleaner air are estimated to be $20 million, but these benefits will occur 25 years in the future. Should we proceed with this proposal?
• In order to obtain the present value of the $20 million benefit, we need to choose a discount rate. Suppose we apply a discount rate of 5%. The present value of the benefits would be:
• PV = $20,000,000 / (1.05)25 = $5,906,055• As the present value of the $20 million benefit is only about $6
million, it does not make economic sense to pay $10 million now to obtain this benefit.
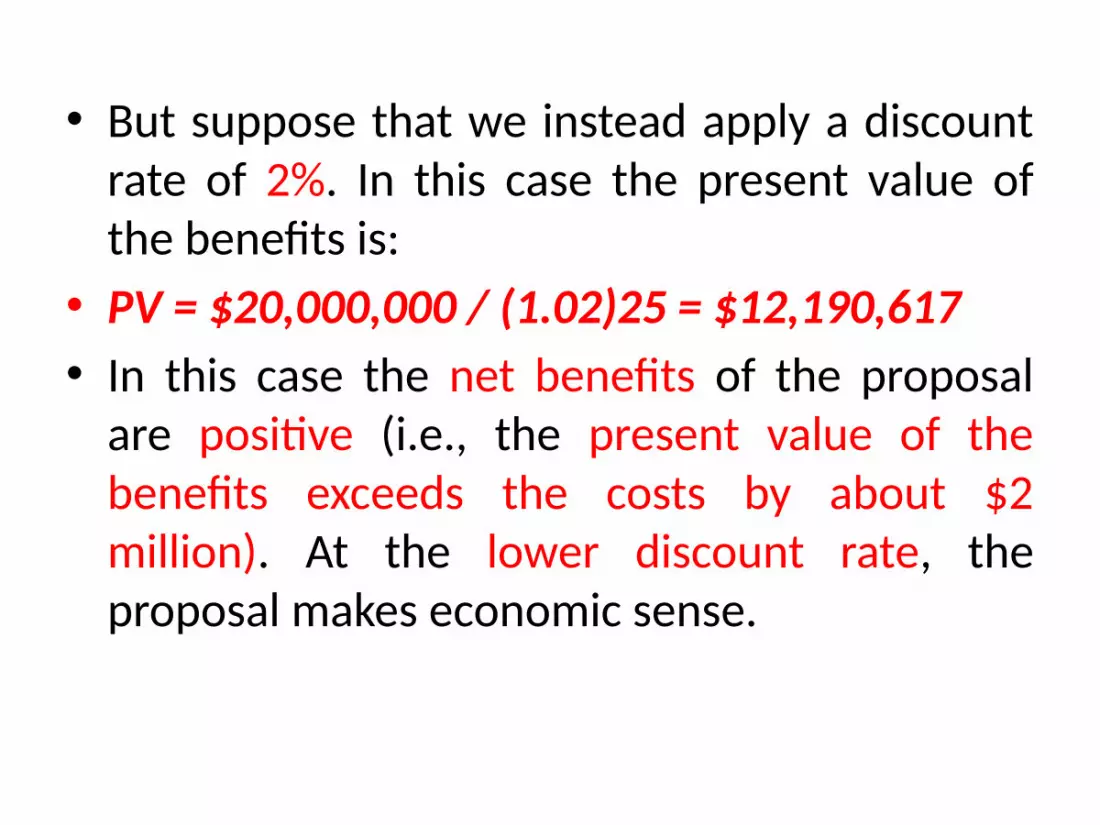
• But suppose that we instead apply a discount rate of 2%. In this case the present value of the benefits is:
• PV = $20,000,000 / (1.02)25 = $12,190,617• In this case the net benefits of the proposal
are positive (i.e., the present value of the benefits exceeds the costs by about $2 million). At the lower discount rate, the proposal makes economic sense.

5.Environmental policy options
In devising policies to internalize environmental externalities. Decision-makers have several policy options (approaches), and each one is appropriate depends on the particular context.
The four basic environmental policy options are: Pollution standards Technology based regulationPollution taxesTradable pollution permits

5.1 Pollution standards
• Pollution standards regulate environmental impacts by setting allowable pollution levels or specifying the acceptable uses of a product or process.
• Many people experience pollution standards at an annual automobile inspection.
• Cars must meet certain standards for tailpipe emissions; if your car fails, you must correct the problem before receiving an inspection sticker.
• The clear advantage of standards is that they can specify a definite result.

• This is particularly important in the case of substances that pose a clear hazard to public health.
• By imposing a uniform rule on all producers, we can be sure that no factory or product will produce hazardous levels of pollutants.
• In extreme cases, a regulation can simply ban a particular pollutant, as has been the case with DDT (a toxic pesticide) in most countries.

• However, requiring all firms or products to meet the same standard is often not cost- effective.
• The overall cost of a regulation can be lowered if firms that can reduce pollution at low marginal costs reduce pollution more than firms that have high marginal reduction costs.
• Thus requiring all firms to reduce pollution by the same amount, or to meet the same standard, is not the least-cost way to achieve a given level of pollution reduction.
• Another problem with standards is that once firms meet the standard they have little incentive to reduce pollution further.

5.2 Technology based regulation
• A second approach to environmental regulation is to require that firms or products incorporate a particular pollution-control technology.
• For example, in 1975 the United States required that all new automobiles include a catalytic converter to reduce tailpipe emissions.
• While auto manufacturers are free to design their own catalytic converters, each must meet certain emissions specifications.

• Perhaps the main advantage of technology-based regulation is that enforcement and monitoring costs are relatively low.
• Unlike a pollution standard, which requires that firms’ pollution levels be monitored to ensure compliance of pollution standard.
• a technology-based approach might only require an occasional check to ensure that the equipment is installed and functioning properly.

• Technology-based approaches may not be cost-effective, because they do not provide firms the flexibility to pursue a wide range of options.
• Technology-based approaches may, however, offer a cost advantage due to standardization.
• If all firms must adopt a specific technology, then widespread production of that technology may drive down its production cost down over time.

5.3 Pollution taxes
• Pollution taxes, along with tradable pollution permits, are considered market-based approaches to pollution regulation because they send information to polluters about the costs of pollution without mandating that firms take specific actions.
• Individual firms are not required to reduce pollution under a market-based approach, but the regulation creates a strong incentive for action.
• A pollution tax reflects the principle of internalizing externalities. If producers must bear the costs associated with pollution by paying a tax, they will find it in their interests to reduce pollution so long as the marginal costs of reducing pollution are less than the tax.

• Figure 1 illustrates how an individual firm will respond in the presence of a pollution tax.
• Qmax is the level of pollution emitted without any regulation.
• The curve MCR shows the marginal cost of pollution reduction for the firm.
• If a pollution tax equal to T is imposed, the firm will be motivated to reduce pollution to level Qtax, at a total cost of B (equal to the area under their MCR curve between Qtax and Qmax).
• If the firm maintained pollution at Qmax it would have to pay a tax of (B + C) on these units of pollution.
• Thus the firm saves area C by reducing pollution to Qtax.

• After reducing pollution to Qtax, the firm will still need to pay a tax on its remaining units of pollution, equal to area A.
• The total cost to the firm from the pollution tax is the sum of its reduction costs and tax payments, or areas (A + B).
• This is less than areas (A + B + C), which is what they would have to pay in taxes if they undertook no pollution reduction.
• The firm’s response to the tax is cost-effective, as any other level of pollution different from Qtax would impose higher costs.

Figure 1: A Firm’s Response to a Pollution Tax
T
Qtax Qmax
Pollution level
Tax levelMCR
A B
C
Marginal costs/

• All other firms in the industry will determine how much to reduce their pollution based on their own MCR curve.
• Assuming that each firm is acting in a cost-effective manner, the total cost of pollution reduction is minimized.
• Those firms that can reduce pollution at low costs will reduce pollution more than firms that face higher costs.
• This is the main advantage of market-based approaches to pollution regulation—they achieve a given level of pollution reduction at the lowest overall cost.
• In other words, they are economically efficient compared to pollution standards or technology-based approaches.

5.4 Tradable pollution permits• Economic efficiency in pollution control is clearly an advantage. • One disadvantage of pollution taxes, however, is that it is very difficult to predict
the total amount of pollution reduction a given tax will produce. It depends on the shape of each firm’s MCR curve, which is usually not known to policymakers.
• An alternative is to set up a system of tradable pollution permits. • The total number of permits issued equals the desired target level of pollution. • These permits can then be allocated freely to existing firms or sold at auction. • Once allocated, they are fully tradable, or transferable, among firms or other
interested parties. • Firms can choose for themselves whether to reduce pollution or to purchase
permits for the pollution they emit.• But the total volume of pollution emitted by all firms cannot exceed a maximum
amount equal to the total number of permits.

• Those firms with higher MCR curves will generally seek to purchase permits so they don’t have to pay high pollution reduction costs.
• Firms that can reduce pollution at lower cost may be willing to sell permits, as long as they as they can receive more money for the permits than it would cost them to reduce pollution.
• With this system private groups interested in reducing pollution could purchase permits and permanently retire them, thus reducing total emissions below the original target level.
• Pollution permits are normally valid only for a specific time period. After this period expires the government can choose to issue fewer permits, resulting in lower overall pollution levels in the future.
• A detailed analysis of tradable permits, demonstrates that a given level of pollution reduction is achieved at the same total cost as a tax.
• Thus whether one prefers pollution taxes or tradable permits depends on factors other than pollution reduction costs (however, the administrative costs of the approaches may differ). Taxes are generally easier to understand and implement.
• But taxes are politically unpopular, and firms may prefer a permit system if they believe they can successfully lobby to receive the permits for free.

• The main difference between the two approaches is where the uncertainty lies. With pollution taxes, firms have certainty about the cost of emissions, which makes it easier for them to make decisions about long-term investments. But the resulting level of total pollution with a tax is unknown in advance. If pollution levels turn out to be higher than expected, then the government might have to take the unpopular step of raising taxes further.
• With a permit system, the level of pollution is known because the government sets the number of available permits. But the price of permits is unknown, and permit prices can vary significantly over time.
• This has been the case with the European permit system for carbon emissions. The price of permits initially rose to around €30/ton in 2006, shortly after the system was instituted. But then prices plummeted all the way down to €0.10/ton in 2007 when it became evident that too many permits had been allocated. After some changes to the system, prices rose back to over €20/ton in 2008 but then fell again down to less than €3/ton in 2013.
• Such price volatility makes it difficult for firms to decide whether they should make investments in technologies to reduce emissions.
6.Economic analysis of environmental policy issues
• The focus is on three current environmental policy issues:
Fisheries managementAgriculture Climate change.

6.1. Fisheries Management
• Without sufficient regulation ocean fisheries are likely to be subject to the tragedy of the commons.
• Individual fishers have little incentive to practice conservation, for they know that if they do not catch the available fish, someone else probably will.
• Technological improvements that make it easier to find and catch fish only make matters worse.
• With the introduction of modern vessels like commercial trawlers, fishing is often an operation of massive harvesting without discrimination.

• Fishers can now “wipe out entire populations of fish and then move on either to a different species or to a fishing area in some part of the world.”
• Fisheries are examples of renewable resources, which regenerate over time through natural processes. One basic rule for renewable resource management derived from ecological principles is that harvest levels should be kept below the maximum sustained yield (MSY). In other words, the annual harvest of the resource should be no more than what is regenerated annually through natural processes.

• The world’s fisheries are classified into three categories, based on a comparison between harvest levels and the MSY:
Underfished: Fisheries with harvest levels below their MSY. A potential may exist to increase harvest levels.
Fully fished: Fisheries with harvest levels approximately equal to their MSY. Increasing production is not ecologically sustainable.
Overfished: Fisheries with harvest levels above their MSY.

• Strict management plans are needed to improve the biological health of these fisheries (although such plans are normally not currently in place).
• As shown in Figure 2, the world’s fisheries are becoming more exploited over time. In recent decades the percentage of fisheries classified as overfished has more than doubled.
• Meanwhile, the percentage of fisheries that are underfished, with the potential for expanded harvest, has decreased from about 40% to 10%.
• The depleted state of fisheries is due to overfishing and increasing habitat degradation.

Figure 2. Status of the World’s Fisheries, 1974 – 2011
Underfished
Fully fished
Overfished
Years
Percentages of fisheries
0
1020
30
405060
7080
90
100
1974
1978
1982
1986
1990
1994
1998
2002
2006
2010
2014

Global Fish Production and Consumption
• People in developed countries currently consume 25 percent of the global fish catch.
• The other 75 percent is consumed in the developing world, where fish is an important protein source.
• Increasing population and income in developing countries will likely produce steady growth in the global demand for fish and fish products.

• Figure 3 shows global fish production from 1950 to 2012.
• World fish harvest of naturally-occurring stocks steadily increased from 1950 until 1990.
• However, since then the wild catch has leveled off at about 90 million tons annually.
• This is consistent with the decline in underfished stocks shown in Figure 2.

• But the global fish harvest has continued to increase as an increasing share of the total catch is produced using aquaculture – essentially fish farming.
• As of 2012, about 42% of global fish production was due to aquaculture.
• While aquaculture has provided a means to meet the growing global demand for fish, a challenge is to reduce the environmental impacts associated with aquaculture.
• Per-capita fish consumption has doubled globally since the 1960s.

• The greatest growth has occurred in developing countries, driven by population growth, higher incomes, and improved distribution infrastructure.
• However, the expansion of fish consumption has been highly uneven.
• China has been responsible for most of the increase in global fish consumption, while many countries in Sub-Saharan Africa have seen fish consumption remain constant or even decrease.

Figure 3. Global Fish Production, 1950 – 2012
0
20
40
60
80
100
120 140
160
1950 1960 1970 1980 1990 2000 2010 2020
Years
Fish production
(Million tones)
Wild catch
Aquaculture

Sustainable Fisheries Policies
• In the case of a common property resource such as a fishery, economic incentives work in a perverse way.
• In response to declining yields, operators increase their effort, often investing in more efficient equipment, which accelerates the decline of the fishery.

Sustainable Fisheries Policies• Although identifying the maximum sustainable yield for a
fishery can help maintain an individual species, the issues of ecological sustainability are more complex.
• Depleting one species may lead to an irreversible change in ocean ecology as other species fill the ecological niche formerly occupied by the harvested Fishing techniques such as trawling, in which nets are dragged along the bottom of the ocean, are highly destructive to all kinds of benthic (bottom-dwelling) life.
• In large areas of the Atlantic, formerly productive ocean floor ecological communities have been severely damaged by repeated trawling.

• The World Bank and FAO stress the critical need to reform fisheries management:
Failure to act implies increased risks of fish stock collapses, increasing political pressure for subsidies, and a sector that, rather than being a net contributor to global wealth, is an increasing drain on society.
The most critical reform is the effective removal of the open access condition from marine capture fisheries and the institution of secure marine tenure and property rights systems.

Reforms in many instances would also involve the reduction or removal of subsidies that create excess fishing effort and fishing capacity.
Rather than subsidies, the World Bank has emphasized investment in quality public goods such as science, infrastructure, and human capital, in good governance of natural resources, and in an improved investment climate.

• From an economic point of view, the tragedy of the commons occurs because important productive resources; fisheries in this case are treated as free resources, and are therefore overused.
• One potential solution is to privatize fisheries, in the hopes that owners would manage fisheries for sustainable profitability.
• However, an ocean fishery does not permit the private ownership solution. The oceans have been called a common heritage resource; because they belong to everyone and no one is excludable.

• But under the 1982 Law of the Sea treaty, agreed to under United Nations auspices, nations can claim territorial rights to many important offshore fisheries.
• They can then limit access to these fisheries by requiring a fishing license within their Exclusive Economic Zones (EEZs), which normally extend 200 miles from their coastlines.
• Within each country’s EEZ, they can implement the economic policies discussed above, including charging fishing license fees or instituting individual transferable quotas.
• To determine the maximum sustainable yield, policymakers must consult marine biologists.

6.2. Sustainable Agriculture • The expansion of fish consumption, progress on
reducing hunger has been uneven across global regions. • As shown in Figure 11, the greatest progress has
occurred in Asia and Latin America. • The reduction in malnourishment has been less
significant in Africa and Oceania. Even as the percentage of malnourished people has decreased in Africa, the actual number of people affected by hunger has increased from 182 to 227 million, due to population growth.

• The reduction in malnourishment is not only attributed to increased food production, but also to higher incomes and wider food availability.
• One factor that hasn’t contributed to the increase in the global food supply is an expansion of agricultural land.
• according to the World Bank agricultural land area has remained relatively constant since the early 1990s.
• Instead, improvements in agricultural technology and efficiency have been the drivers leading to a larger food supply.

• With the human population projected to increase to 9.6 billion by 2050 according to the United Nations, can we further increase the global food supply to meet expected demands?
• Even as diets change with higher incomes and changing preferences, most researchers conclude that the answer is yes.
• However, there are several important caveats to this conclusion:

• Biofuel expansion: Biofuels are fuels made from living organisms, most commonly crops such as corn and sugar cane.
• Currently, less than 10% of the world’s crops are used for biofuels and other industrial uses.
• While some expansion of biofuels is expected, a significant reallocation of crops away from human consumption toward biofuels could reduce the ability to meet future food demands.
•

• Climate change: The impact of climate change on agricultural production is not precisely known.
• While production could increase in some areas due to an expansion of the growing season, such as in Canada and Russia, the net impact of long-term climate change on global food production is expected to be negative.
• Environmental damage: While total agricultural production may rise, this may mask long-term damage to water, soil, and ecological systems.

Environmental Impacts of Modern Agriculture
• In addition to being affected by a changing environment, modern agricultural practices impact the environment on local and global scales.
• We consider four environmental impacts in this section:
Deforestation Soil erosion Use of chemical inputs Emissions of greenhouse gases

Deforestation
• While the overall land area devoted to agriculture globally has not significantly changed recently, new lands are constantly brought into agricultural production as the productivity of existing plots decline.
• Through the practice of slash-and-burn agriculture, primarily practiced in tropical regions, land is cleared for farming by first cutting and burning the existing vegetation.

• The remaining ash infuses the soil with nutrients, which are then used to support agriculture.
• However, the soils in tropical forests tend to be nutrient-poor.
• Thus once the nutrients from the burnt vegetation are depleted, often in a matter of a few years, farmers must move on to new lands and repeat the cycle.

• While slash-and-burn agriculture has primarily been practiced on a small scale by subsistence farmers, increasingly deforestation is occurring as a result of large-scale commercial agriculture.
• According to a 2012 report prepared for the governments of the UK and Norway:
Commercial agriculture (including livestock) is the most important driver of deforestation in Latin America leading to around 2/3 of total deforested area.
In both Africa and (sub)tropical Asia commercial agriculture accounts for around 1/3 of deforestation and is of similar importance as subsistence agriculture.
Based on this synthesis of nationally reported data, agriculture is estimated to be the proximate driver for around 80% of deforestation worldwide.

Soil erosion
• Soil erosion results in economic losses as agricultural land becomes less productive.
• In the United States, annual economic losses from soil erosion have been estimated at around $40 billion, and globally the cost is 10 times higher.
• Soil erosion also results in environmental problems. • For example, when eroded soil is deposited into
rivers and lakes it can harm the health of these ecosystems.

• Soil erosion can also contribute to air pollution when winds carry off exposed soils.
• Rates of soil erosion can be significantly reduced by implementing good agricultural practices that minimize soil disturbance, reduce soil exposure to the elements, and slow down water runoff.
• For example, rather than intensively tilling the soil prior to planting, in which nearly all plant residue is buried below the surface.
• The practice of conservation tillage leaves at least 30% of these residues on the soil surface in order to reduce soil exposure and slow runoff.

Use of chemical inputs
• A third environmental impact of agriculture is the release of numerous chemicals into the environment.
• The widespread use of pesticides, herbicides, and other chemicals has clearly increased agricultural productivity and reduced global hunger.
• But this has come at an environmental cost. • The negative impacts of these chemicals first came to
light in the 1960s, most famously with the publication of Rachel Carson’s Silent Spring.

• Environmental problems are also associated with the application of fertilizers to agricultural crops.
• For example, nitrogen fertilizers can run off into waterways and promote algal blooms (a process known as eutrophication) that can kill fish and other aquatic animals.
• The production of fertilizers, along with other agricultural chemicals, can release toxic chemicals into air and water.
• The production of phosphorus fertilizer in India leads to air pollution from sulfur dioxide and heavy metals.
• Inhalation of the emissions from fertilizer plants have been associated with increased risk of autoimmune disorders and lung disease.

Emissions of greenhouse gases
• Agriculture directly contributes to climate change by releasing various gases into the atmosphere.
• According to the United States Environmental Protection Agency, most of the total greenhouse gas emissions related to agriculture is due to nitrous oxide released by fertilizer application and methane released by the digestive process of farm animals.
• Overall, agriculture is responsible for about 10% of total U.S. greenhouse gas emissions.

• But other estimates suggest that agriculture’s contribution to climate change is much greater.
• Indirectly, the overall food production system contributes to climate change in other ways besides direct emissions, including:
• As stated earlier, agriculture is responsible for the majority of deforestation globally.
• Forests natural store carbon, thus reducing the amount of carbon in the atmosphere.

• The decomposition of agricultural wastes also releases greenhouse gases into the atmosphere.
• These wastes are responsible for 3-4% of global greenhouse gas emissions.
• When all these other factors are considered, the overall contribution to greenhouse gas emissions from agriculture may be much higher than the 11-15% often quoted:

6.3 Global Climate Change
• Global warming, more accurately described as climate change, has become a major environmental and economic issue in recent decades.
• The vast majority of scientists concur that global climate change is in significant part caused by human actions, in particular the increased emissions of various greenhouse gases (GHGs).
• These gases act much like the glass in a greenhouse—allowing solar radiation to penetrate, but then trapping it and increasing temperatures.

• While most greenhouse gases exist naturally in the earth’s atmosphere and make life possible on earth, human activities have increased the concentration of many of these gases, as well as introduced entirely new greenhouse gases into the atmosphere.
• The most important greenhouse gas emitted by humans is carbon dioxide (CO2), which is formed when fossil fuels (coal, oil, and natural gas) are burned.
• Other greenhouse gases include methane, nitrous oxide, and chlorofluorocarbons (CFCs).

Data and Projections • As shown in Figure 13 global emissions of
carbon dioxide have increased significantly over the last couple of decades, and are projected to increase a further 34% between 2015 and 2040.
• We see that virtually all of the increase in emissions in the coming decades will be a result of higher emissions in developing (non-OECD) countries.

• However, most of the carbon emitted from human activities so far has come from developed nations.
• Also, CO2 emissions per capita are much higher in developed countries, and will continue to be so for the future.
• For example, annual CO2 emissions per capita are currently about 18 tons in the United States, 9 tons in Germany, 7 tons in China, 2 tons in India, and 0.3 tons in Kenya.

• As atmospheric concentrations of GHGs increase, the world is expected to become warmer, on average.
• Not all regions will warm equally, and some regions may actually become cooler.
• Warmer average temperatures increase evaporation, which in turn leads to more frequent precipitation.
• But again, all regions will not be affected equally. • In general, already wet areas will become wetter
and dry areas will become drier.

• Climate change is also expected to result in more frequent and more intense tropical storms.
• The melting of polar ice caps and glaciers will contribute to rising sea levels.
• Sea levels are also rising because the volume of ocean water expands when it is heated.
• Among the ecological and human effects climate change are higher rates of species extinctions, lower average agricultural production, reduced freshwater availability, higher rates of several diseases, and increased risk of violent regional conflicts.

• Global average temperatures have already increased by about one degree Celsius (1.8 degrees Fahrenheit) over the last several decades.
• At a 2009 international meeting on climate change in Copenhagen, Denmark, more than 130 nations agreed that it was necessary to limit the eventual warming to no more than two degrees Celsius, based on the scientific consensus that warming above this level is likely to cause dangerous impacts.

• Climate scientists have developed complex models to predict how much average temperatures will increase as carbon dioxide concentrations in the atmosphere increase.
• Because there are considerable uncertainties in predicting long-term climate trends, these models have produced a range of potential outcomes.
• Adding to the uncertainty in models, the extent of warming will also be influenced by the policy decisions made in the next couple of decades.

• The Intergovernmental Panel on Climate Change (IPCC) is an organization created by the United Nations to assess the science of climate change.
• A 2013 IPCC report estimated that ambitious policy efforts, with global CO2 emissions peaking by 2020 and rapidly declining thereafter, could limit warming to the two degree Celsius target.
• However, as Figure 13 suggests, this scenario is highly unlikely based on current emissions projections.