economics of environmental policy in turkey
TRANSCRIPT

UN
CO
RR
EC
TED
PR
OO
F
Please cite this article in press as: Telli, C., et al., Economics of environmental policy in Turkey, Journalof Policy Modeling (2007), doi:10.1016/j.jpolmod.2007.03.001
ARTICLE IN PRESS+ModelJPO 5629 1–21
Journal of Policy Modeling xxx (2007) xxx–xxx
Economics of environmental policy in Turkey3
A general equilibrium investigation of the4
economic evaluation of sectoral emission5
reduction policies for climate change�6
Cagatay Telli a, Ebru Voyvoda b,∗, Erinc Yeldan c,d
a State Planning Organization, Ankara, Turkey7b Department of Economics, Middle East Technical University,8
06531 Ankara, Turkey9c Bilkent University, Turkey10
d University of Massachusetts, Amherst, United States11
Received 1 October 2006; received in revised form 1 February 2007; accepted 1 March 2007
12
Abstract13
Research on climate change has intensified on a global scale as evidence on the costs of global warming14
continues to accumulate. Confronted with such evidence, the European Union set in late 2006 an ambitious15
target to reduce its greenhouse gas emissions, by 2020, to 20% below the level of 1990; and invited the rest16
of the developed economies and the developing world to take part with the Kyoto Protocol. Turkey is the17
only country that appears in the Annex-I list of the United Nations’ Rio Summit and yet an official target for18
CO2 emission reductions has still not been established. Thus, as part of its accession negotiations with the19
EU, Turkey will likely to face significant pressures to introduce its national plan on climate change along20
with specific emission targets and the associated abatement policies.21
Given this motivation, we utilize a computable general equilibrium model for Turkey to study the eco-22
nomic impacts of the intended policy scenarios of compliance with the Kyoto Protocol and we report on the23
general equilibrium effects of various possible environmental abatement policies in Turkey over the period24
2006–2020. The model is in the Walrasian tradition with 10 production sectors and a government operat-25
ing within an open macroeconomy environment. It accommodates flexible production functions, imperfect26
substitution in trade and open unemployment. We focus on CO2 emissions and distinguish various basic27
� The views and policy recommendations expressed in the paper are solely those of the authors’ and by no means reflectthe institutions and the governing bodies stated above. All usual caveats apply.
∗ Corresponding author. Tel.: +90 312 210 2056.E-mail addresses: [email protected] (C. Telli), [email protected] (E. Voyvoda), [email protected],
[email protected] (E. Yeldan).
1 0161-8938/$ – see front matter © 2007 Published by Elsevier Inc. on behalf of Society for Policy Modeling.2 doi:10.1016/j.jpolmod.2007.03.001

UN
CO
RR
EC
TED
PR
OO
F
Please cite this article in press as: Telli, C., et al., Economics of environmental policy in Turkey, Journalof Policy Modeling (2007), doi:10.1016/j.jpolmod.2007.03.001
ARTICLE IN PRESS+ModelJPO 5629 1–21
2 C. Telli et al. / Journal of Policy Modeling xxx (2007) xxx–xxx
sources of gaseous pollution in the model. Our results suggest that the burden of imposing emission control28
targets and the implied abatement costs could be quite high, and that there is a need to finance the expanded29
abatement investments from scarce domestic resources. Policies for environmental abatement via carbon30
and/or increased energy taxes further suffer from very adverse employment effects. This suggests that a31
first-best policy would necessarily call for a simultaneous reduction on the existing tax burden on producers32
elsewhere together with introduction of environmental taxes.33
© 2007 Published by Elsevier Inc. on behalf of Society for Policy Modeling.34
Keywords: Environmental policy; Equilibrium; Climate change; Global warming; Greenhouse35
36
Research on climate change has intensified on a global scale as evidence on the costs of global37
warming continues to accumulate. A special report that appeared in the Financial Times (3138
October 2006), for instance, underlines that “releasing 550 parts per million (ppm) of CO2 in the39
earth’s atmosphere would incur a high probability of raising global temperatures by more than40
2 ◦C above the pre-industrial levels”, an upper limit which is regarded as the safety zone for our41
planet’s climate. The analytics of costs and benefits of possible effective action to curb climate42
change have been tackled, in turn, in a recent well-celebrated report by Sir Nicholas Stern.1 The43
Stern report argued that efforts to stabilize greenhouse concentrations at between 450 and 550 ppm44
by 2050 would incur a one-off cost of only 1% of global economic output (equivalent to 200645
US$ 651 billion). It also warned that, failure to take immediate action would risk the future of46
the global economy by shrinking the world output by as much as 5–20 percent over the next two47
centuries. This cost would be due to the likely disruptions to the working people’s productivity,48
due to widespread of new forms of bacteria and loss of amenities.49
It was mainly in response to this evidence that in late 2006 the European Union set, what50
can be called as the most ambitious goal for impeding climate change, cutting its greenhouse51
gas emissions, by 2020, to 20% below the level of 1990. The EU further announced plans to52
go further and declared that it would raise its targets to 30% below the 1990 levels by 2020 to53
encourage the rest of the developed economies and the developing world to take part with the Kyoto54
Protocol.55
Against this background, Turkish environmental policy is at a crossroad. As part of its bid56
for full membership in the European Union, Turkey is under significant pressure to comply with57
the Kyoto Protocol, and to constrain its CO2 emissions and other gaseous pollutants over the58
next 6 years. Yet, as a newly emerging, developing market economy, Turkey has not yet achieved59
stability in its energy utilization and gaseous emissions either as a ratio to its GDP or in per capita60
terms. Turkey is among the 25 countries with the fastest rate of growth in industrial use of energy61
sources (OECD, 2004). Turkish Statistical Institute (TURKSTAT) data indicate, for instance, that62
on a per capita basis, consumption of electrical power in Turkey has increased by 6-fold from63
1980 to 2005. TURKSTAT estimates that aggregate CO2 emissions from fossil fuel at 223.4 Gg64
as of 2004, and will reach 343 Gg by 2010 and to 615 Gg by 2020. This suggests a secular rise65
of the ratio of the total CO2 emissions to GDP from 0.632 million tonnes/billion TRY in 2005 to66
0.689 million tonnes/billion TRY in 2020.67
Under these uncertainties, Turkey’s global standing in terms of its international abatement68
requirements is also a matter of controversy, as it is the only country that appears in the so-called69
Annex-I list of the Rio Summit of the United Nations and yet an official target for CO2 emission70
1 “The Economics of Climate Change” available on line at: http://www.hm-treasury.gov.uk.
UN
CO
RR
EC
TED
PR
OO
F
Please cite this article in press as: Telli, C., et al., Economics of environmental policy in Turkey, Journalof Policy Modeling (2007), doi:10.1016/j.jpolmod.2007.03.001
ARTICLE IN PRESS+ModelJPO 5629 1–21
C. Telli et al. / Journal of Policy Modeling xxx (2007) xxx–xxx 3
reductions has still not been established. Thus, as part of its accession negotiations with the EU,71
Turkey will likely to face significant pressure to introduce its national plan on climate change72
along with specific emission targets and the associated abatement policies.73
The current arsenal of Turkish environmental policy instruments is mostly limited to energy74
taxes, environmental impact assessments, and pollution penalties. Yet, it is a clearly recognized75
fact that these instruments will not suffice under a more active environmental policy design and will76
need to be expanded to include other forms of policy measures such as additional pollution taxes,77
emission trading and permits, and abatement investments towards reduced energy intensities.78
However, given the current lack of an adequate quantitative modeling paradigm for environmental79
policy analysis in Turkey, the effectiveness of such policy interventions and their economic impacts80
are not obvious and hence the need for the construction and utilization of policy simulation models81
for environmental policy analysis.282
This paper fills this gap and aims to guide policy makers to respond with additional measures83
that may include broad, market-based incentives designed to accelerate technology development84
and deployment in Turkey. Its main policy objective is to enable Turkey to integrate sustainable85
development principles into national development planning and implementation of environmental86
policy objectives both at the macroeconomic and sectoral levels. To this end, we build a dynamic,87
multi-sectoral macroeconomic model in the tradition of computable general equilibrium (CGE)88
paradigm to study issues of environmental and macroeconomic policy interactions over both the89
commodity and the factor markets, and the impact of various policies on the environment and on90
greenhouse gas abatement.91
We organize the paper under five sections. First, we introduce and provide an analytical eval-92
uation of the key environmental indicators and the energy intensity of the Turkish economy in93
the medium/long run. We describe the analytical model in Section 2. In Section 3, we utilize94
the model to develop a “base-run” against which alternative policy scenarios can be contrasted,95
while in Section 4 we utilize the CGE apparatus as a laboratory device and study the general96
equilibrium effects of various possible environmental abatement policies. We conclude in Section97
5.98
1. Macroeconomics of environmental policy in Turkey99
1.1. Towards Kyoto100
Increased awareness on the threat of global warming and climate change has intensified in101
late 1980s. Given strong evidence that a major source of global warming was increased gaseous102
pollution (CO2 emissions, in particular), the initial response was the adoption of the United Nations103
Framework Convention on Climate Change (UNFCCC) which was issued at the Rio Summit of104
1992. Under the UNFCCC the so-called Annex-I countries committed, on a voluntary basis, to105
limit their gaseous emissions to 1990 levels. The OECD (1992) and EU countries further joined to106
form the Annex-II bloc and agreed to provide technical and financial assistance to those countries107
that remained outside the Annex-I to aid their environmental policies to reduce greenhouse gas108
(GHG) emissions.109
2 Building models for environmental policy analysis, although scarce for Turkey, is quite a common application inliterature. Goulder and Pizer (2006) provide a brief survey of research on economics of climate change, including theoreticalinsights and empirical findings to offer guidance to policy makers. Adkins and Garbaccio (1999) give a bibliography ofonly computable general equilibrium model applications to environmental issues.

UN
CO
RR
EC
TED
PR
OO
F
Please cite this article in press as: Telli, C., et al., Economics of environmental policy in Turkey, Journalof Policy Modeling (2007), doi:10.1016/j.jpolmod.2007.03.001
ARTICLE IN PRESS+ModelJPO 5629 1–21
4 C. Telli et al. / Journal of Policy Modeling xxx (2007) xxx–xxx
Table 1Commitments of the EU countries under the burden sharing agreement of the Kyoto Protocol
Country Target(%)
CO2 equivalent of 1990 emissions(million tonnes)
CO2 equivalent of target emissionsfor 2008–2012 (million tonnes)
Germany −21 1208 955Austria −13 78 68Belgium −7 139 129United Kingdom −12.5 790 691Denmark −21 72 57Finland 0 65 65France 0 546 546Holland −6 217 204Ireland 13 57 64Spain 15 302 348Sweden 4 66 68Italy −6.5 543 507Luxemburg −28 14 10Portugal 27 69 87Greece 25 99 124
Total −8 4264 3922
Source: International Energy Agency (2005).
Based on voluntary participation, the specific economic and political components of such110
commitments of the Convention remained ambiguous.3 This led to culmination of efforts towards111
binding commitments as signed in the Kyoto Protocol in December 1997. Accordingly, the Annex-112
I countries agreed to reduce, on average, their gaseous emissions by 5.2% relative to 1990 levels113
over the period, 2008–2012. The transition economies, however, were granted the exception of114
establishing a different base period (rather than 1990) given their special circumstances4 (see115
Table 1 on the commitment of the EU countries under the “Burden Sharing” Agreement of the116
Kyoto Protocol).117
Turkey, being a member of the OECD, was initially listed in both Annexes-I and II of the118
UNFCCC, 1992. However, claiming for its special circumstances, it declined to be a participant119
to the Convention. During the 7th Conference of Parties held in Marrakech in 2001 Turkey was120
granted its omission from the Annex-II, and its “special circumstances” was recognized as an121
Annex-I country. Turkey has signed the UNFCCC as the 189th participant on 24 May 2004.122
Yet, currently Turkey does not have any emission targets, and has not been a party to the Kyoto123
Protocol.124
1.2. Key environmental indicators of Turkey125
In this paper, we focus mainly on CO2 emissions as the key indicator of environmental pollution.126
Turkey displays a mid-score in its emission coefficients in comparison to the world and the OECD127
averages. By 2002, with a per capita CO2 emissions of 2.8 tonnes, Turkey lies significantly below128
3 See http://www.unfccc.de for a full discussion of the UNFCCC and the Kyoto Protocol.4 The Kyoto Protocol further recognized the system of Flexibility Mechanisms composed of Joint Implementation,
Clean Development Mechanism, and Emission Trading. The emission trading mechanism recognizes the allowance fortrading the national emission/reduction permits to meet aggregate national quantitative targets. I
UN
CO
RR
EC
TED
PR
OO
F
Please cite this article in press as: Telli, C., et al., Economics of environmental policy in Turkey, Journalof Policy Modeling (2007), doi:10.1016/j.jpolmod.2007.03.001
ARTICLE IN PRESS+ModelJPO 5629 1–21
C. Telli et al. / Journal of Policy Modeling xxx (2007) xxx–xxx 5
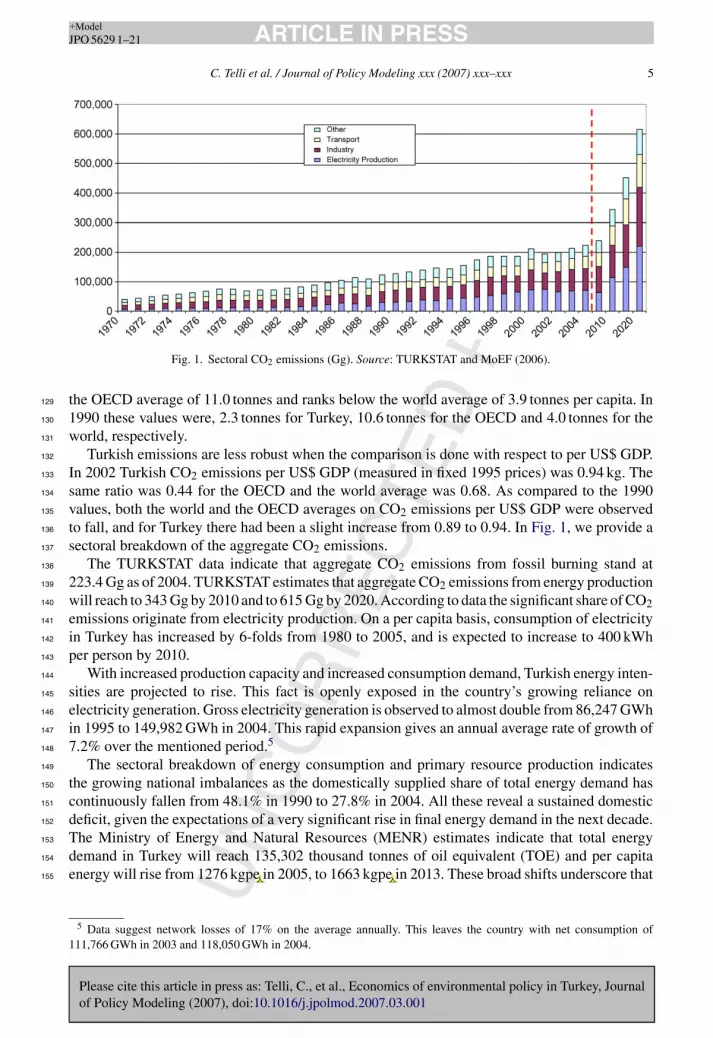
Fig. 1. Sectoral CO2 emissions (Gg). Source: TURKSTAT and MoEF (2006).
the OECD average of 11.0 tonnes and ranks below the world average of 3.9 tonnes per capita. In129
1990 these values were, 2.3 tonnes for Turkey, 10.6 tonnes for the OECD and 4.0 tonnes for the130
world, respectively.131
Turkish emissions are less robust when the comparison is done with respect to per US$ GDP.132
In 2002 Turkish CO2 emissions per US$ GDP (measured in fixed 1995 prices) was 0.94 kg. The133
same ratio was 0.44 for the OECD and the world average was 0.68. As compared to the 1990134
values, both the world and the OECD averages on CO2 emissions per US$ GDP were observed135
to fall, and for Turkey there had been a slight increase from 0.89 to 0.94. In Fig. 1, we provide a136
sectoral breakdown of the aggregate CO2 emissions.137
The TURKSTAT data indicate that aggregate CO2 emissions from fossil burning stand at138
223.4 Gg as of 2004. TURKSTAT estimates that aggregate CO2 emissions from energy production139
will reach to 343 Gg by 2010 and to 615 Gg by 2020. According to data the significant share of CO2140
emissions originate from electricity production. On a per capita basis, consumption of electricity141
in Turkey has increased by 6-folds from 1980 to 2005, and is expected to increase to 400 kWh142
per person by 2010.143
With increased production capacity and increased consumption demand, Turkish energy inten-144
sities are projected to rise. This fact is openly exposed in the country’s growing reliance on145
electricity generation. Gross electricity generation is observed to almost double from 86,247 GWh146
in 1995 to 149,982 GWh in 2004. This rapid expansion gives an annual average rate of growth of147
7.2% over the mentioned period.5148
The sectoral breakdown of energy consumption and primary resource production indicates149
the growing national imbalances as the domestically supplied share of total energy demand has150
continuously fallen from 48.1% in 1990 to 27.8% in 2004. All these reveal a sustained domestic151
deficit, given the expectations of a very significant rise in final energy demand in the next decade.152
The Ministry of Energy and Natural Resources (MENR) estimates indicate that total energy153
demand in Turkey will reach 135,302 thousand tonnes of oil equivalent (TOE) and per capita154
energy will rise from 1276 kgpe in 2005, to 1663 kgpe in 2013. These broad shifts underscore that155
5 Data suggest network losses of 17% on the average annually. This leaves the country with net consumption of111,766 GWh in 2003 and 118,050 GWh in 2004.

UN
CO
RR
EC
TED
PR
OO
F
Please cite this article in press as: Telli, C., et al., Economics of environmental policy in Turkey, Journalof Policy Modeling (2007), doi:10.1016/j.jpolmod.2007.03.001
ARTICLE IN PRESS+ModelJPO 5629 1–21
6 C. Telli et al. / Journal of Policy Modeling xxx (2007) xxx–xxx
Turkey has not yet stabilized its energy demand, and pressures of a newly industrialized economy156
continues to be felt.6157
Given the limited substitution possibilities for energy use and the unstable/dynamic character158
of the production activities, it becomes hard to offer viable guidelines on the available menu of159
abatement policies.160
2. The algebraic structure of the model161
Given the above overview of the economic and political realm, we now develop our analytical162
CGE model for Turkey to study issues of environmental abatement and its economic impacts.163
Although there is a variety of CGE modeling exercises for Turkey, environmental modeling164
applications are relatively new and scarce. Roe and Yeldan (1996), Boratav, Turel, & Yeldan165
(1996), Sahin (2004) and Kumbaroglu (2003), Tunc, Turut-Asik, & Akbostanci (2006) are among166
the few contributions in this respect.7167
The model that we present here should be considered as a first step to establish a “base-path”168
over 2006–2020 against which the socio-economic impacts of alternative policy scenarios are169
investigated. “Dynamics” are integrated via “exogenous” updating of the static model into a170
medium-run of 15 years using estimates on average population growth, investment behavior on171
the part of both private and public sectors, and total factor productivity (TFP) growth.172
The supply-side of the economy is modeled as 10 aggregate sectors. In line with our focus173
on environmental policy evaluation, the disaggregation scheme of the overall economy develops174
into the energy sectors and critical sectors of GHG pollutions in detail. It thus, aggregates a large175
number of other activities that, although being far more important contributors to total gross176
output, are not germane to the climate problem. The sectors that we specify are: Agricultural Pro-177
duction (AG); Coal Mining (CO); Petroleum and Gas (PG); Refined Petroleum (RP); Electricity178
Production (EL); Cement Production (CE); Paper Production (PA); Iron and Steel Production179
(IS); Transportation (TR); and a composite of remaining manufacturing, services and primary180
industries sectors of the economy (OE). Labor, capital and a composite of primary energy inputs,181
electricity, petroleum and gas and coal, together with intermediate inputs comprise the sectorial182
factors of production.183
2.1. Production structure, factor endowments184
Fig. 2 represents the general production structure of the model. In what follows, we provide a185
bird’s-eye overview of the model, and invite the interested reader to contact us directly for further186
documentation of its full algebraic structure. Sectoral production is modeled via two-stage pro-187
duction technology where at the second stage, gross output is produced through a Cobb–Douglas188
6 The MENR also estimates investment needs for meeting the increased pace of industrialization and needs of newconsumption. Accordingly, Turkey will need to invest a total of US$ 233.4 billion over 2005–2020. US$ 5.1 billion ofthis sum is expected to be spent over coal exploration and production and US$ 104.8 billion (about 43%) is expected tobe spent on electricity generation.
7 Apart from CGE applications, there is also a relatively small number of studies that try to fill in the gap of multi-dimensional need for studying energy–environment–economy issues for Turkey. Karakaya and Ozcag (2001) analyze aset of economic instruments that may be relevant to use for sustainable development under climate change. Ediger andHuvaz (2006), with the aid of a decomposition analysis provide estimates of sectoral energy usage in Turkish economy.Lise (2006) decomposes factors that explain CO2 emissions between 1980 and 2003 for Turkey.

UN
CO
RR
EC
TED
PR
OO
F
Please cite this article in press as: Telli, C., et al., Economics of environmental policy in Turkey, Journalof Policy Modeling (2007), doi:10.1016/j.jpolmod.2007.03.001
ARTICLE IN PRESS+ModelJPO 5629 1–21
C. Telli et al. / Journal of Policy Modeling xxx (2007) xxx–xxx 7
Fig. 2. Flows of commodities, factors and emissions in the model.
technology defining capital (K), labor (L), intermediate inputs—excluding primary energy inputs189
(ID) and primary energy composite (ENG) as factors of production:190
XSi = AXi
⎡⎣KλK,i
i LλL,ii
⎛⎝∏
j
IDλID,j,i
⎞⎠ ENGλE,i
i
⎤⎦ (1)191
where i: AG, CO, PG, RP, EL, CE, PA, IS, TR, OE.192
In Eq. (1), AX is the technology level parameter, λK,i, λL,i, λE,i denote the shares of capital193
input, the labor input and the energy input in the value of gross output in sector i.194
At the initial stage of the production technology in each sector, the primary energy composite is195
produced along a constant elasticity of substitution (CES) production function using the primary196
energy inputs, coal, petroleum and gas and electricity:197
ENGi = AEi[κCO,iID
−ρxiCO,i + κPG,iID
−ρxiPG,i + κEL,iID
−ρxiEL,i
]−1/ρxi (2)198
Under the above production technology, differentiation of the minimum cost per unit of primary199
energy inputs gives the sectoral demand for coal, petroleum and gas and electricity:200
IDj,iENGi
=[
κj,iPENGi
AEi−pxi (1 + CO2tNj)PCi
]1/(1+ρxi)(3)201
where j: CO, PG, EL.202
Sectoral demands for labor, capital, energy composite and intermediate inputs arise from the203
profit-maximization behavior of the representative firm in each sector.204
To capture the extent of informalization in the labor markets, a wide ranging phenomenon of205
the Turkish manufacturing industry (see e.g., Agenor, Jensen, Verghis, & Yeldan, 2007; Ercan &206
Tansel, 2006; Telli, Voyvoda, & Yeldan (in press); Tunalı, 2003), we introduce open unemployment207
via a fixed nominal wage. Physical capital, in turn, is regarded mobile, and it is the difference in208
sectoral profit rates that leads to the sectoral allocation of aggregate investments in within-period209
dynamics of the model.

UN
CO
RR
EC
TED
PR
OO
F
Please cite this article in press as: Telli, C., et al., Economics of environmental policy in Turkey, Journalof Policy Modeling (2007), doi:10.1016/j.jpolmod.2007.03.001
ARTICLE IN PRESS+ModelJPO 5629 1–21
8 C. Telli et al. / Journal of Policy Modeling xxx (2007) xxx–xxx
2.2. Environmental emissions and taxation210
Three basic sources of CO2 emissions are distinguished in the model: (i) due to (primary and211
secondary) energy usage, (ii) due to industrial processes, and (iii) due to energy use of households.212
Total CO2 emission in the economy is the sum over from all these sources. Following Gunther et213
al. (1992), the emissions from industrial processes is regarded to depend on the level of industrial214
activity, and is regarded proportional to gross output:215
CO2EMINDi = δiXSi (4)216
On the other hand, total emissions due to energy usage originate from two sources: sectoral217
emissions due to combustion of primary energy fuels (coal and petroleum and gas), and sectoral218
emissions due to combustion of secondary energy fuels (refined petroleum):219
TOTCO2ENG =∑i
⎡⎣∑
j
(CO2EMINMj,i + CO2EMENG
j,i )
⎤⎦ (5)220
Under both sources, the mechanism of emission is dependent on the level of pollutant-emitting221
inputs (energy input at primary and at secondary levels) in each sector:222
CO2EMENGj,i = �j,iIDij, j = CO,PG (6)223
CO2EMINMj,i = εj,iIDj,i, j = RP (7)224
Finally, total emission of CO2 in the use of energy by households is given by:225
TOTCO2HH =∑i
ψiCDi (8)226
where ψi is the coefficient of emissions of CO2 in private consumption (CDi) of the basic fuels227
coal (CO) and refined petroleum (RP) by households.228
Carbon tax is introduced via at rates CO2tP, CO2tNi and CO2tCi per tonnes of carbon diox-229
ide emitted, on production, on intermediate input usage, and on consumption, respectively. The230
revenues are directly added to the revenue pool of the government budget.231
2.3. Income generation and demand232
Returns to labor input, net of social security taxes, constitute the private household net labor233
income. Net profit transfer of the enterprise income to private household is mainly composed of234
returns to capital as a factor of production. Thus, the primary sources of income, together with the235
secondary sources of income from public and foreign transfers constitute the total private income236
to the households. Private households save a constant fraction, sp of their income. The residual237
aggregate private consumption is distributed into sectoral components through exogenous (and238
calibrated) shares.239
Aggregate public consumption is specified to be a constant fraction of aggregate public income.240
The government carries on income transfers to the households, to the enterprises and to the241
social security system in fixed proportions of government revenues net of interest payments.242
Furthermore, the government is constrained by an exogenously set target of a primary surplus/GNP243

UN
CO
RR
EC
TED
PR
OO
F
Please cite this article in press as: Telli, C., et al., Economics of environmental policy in Turkey, Journalof Policy Modeling (2007), doi:10.1016/j.jpolmod.2007.03.001
ARTICLE IN PRESS+ModelJPO 5629 1–21
C. Telli et al. / Journal of Policy Modeling xxx (2007) xxx–xxx 9
ratio.8 Fiscal closure is imposed by setting public investment demand as a residual variable to244
adjust endogenously, given the available net fiscal revenues.245
The resultant public sector borrowing requirement, PSBR is either financed by domestic246
borrowing, DomDebtG or by foreign borrowing �ForDebtG.247
2.4. General equilibrium and dynamics248
The overall model is brought into equilibrium through endogenous adjustments of prod-249
uct prices to clear the commodity markets and balance of payments accounts. With nominal250
wages fixed in each period, equilibrium in the labor market is sustained through adjustments251
of employment.The aggregate saving-investment balance (Walras’ Law) is maintained by the252
following:253
PrivSAV + GovSAV + �CAdef = PrivINV + GovINV (9)254
The CAdef in the equation above determines the current account balance in foreign prices and255
equals to the export revenues, the remittances and private and public foreign borrowing on the256
revenue side, and the import bill, profit transfers abroad and interest payments on the accumulated257
private and public debt stocks on the expenditures side.258
The private and public components of the external capital inflows are fixed in their for-259
eign exchange terms. The additional endogenous variable of the system to close is the private260
investments, PrivINV.261
The model updates the annual values of the exogenously specified variables and the policy262
variables in an attempt to characterize the 2006–2020 growth trajectory of the economy. In-263
between periods, first we update the capital stocks with new investment expenditures net of264
depreciation. Labor endowment is increased by the population growth rate. Similarly, technical265
factor productivity rates are specified in a Hicks-neutral manner.266
We also account for the evolution of debt stocks. Given aggregate PSBR, government’s foreign267
borrowing is taken as a constant ratio:268
�ForBorG = (gfborrat)PSBR (10)269
while the rest is met by domestic borrowing.270
Finally, the exchange rate, ε, is set as the ‘numeraire’ of the system.271
3. Calibration and the base-path for 2003–2020272
All policy scenarios are portrayed with respect to a base-run reference scenario. Having cali-273
brated the parameter values, we construct a benchmark economy for the 2003–2020 period, under274
the following:275
• No specific environmental policy action/taxation/quota (business-as-usual environmental pol-276
icy).277
• 2% annual total factor productivity growth rate on average (differentiated for agriculture and278
industry sectors).279
8 The current target for the ratio of the primary surplus (excess of public sector revenues over non-interest publicexpenditures) to the GNP is 6.5% under the ongoing stand-by with the IMF (2003–2008).

UN
CO
RR
EC
TED
PR
OO
F
Please cite this article in press as: Telli, C., et al., Economics of environmental policy in Turkey, Journalof Policy Modeling (2007), doi:10.1016/j.jpolmod.2007.03.001
ARTICLE IN PRESS+ModelJPO 5629 1–21
10 C. Telli et al. / Journal of Policy Modeling xxx (2007) xxx–xxx
Fig. 3. Base-run real GDP (billion TRY, fixed 2003 prices). Source: Authors’ computations.
Fig. 4. Base-run total CO2 emissions from energy (million tonnes). Source: Authors’ computations.
• Exogenously determined foreign capital inflows.280
• Endogenous (flexible) real exchange rate under the constraint of the current account balance.281
• Exogenously fixed real wage rate.282
• Fiscal policy in accordance with the announced policy rule of targeted primary surplus.283
Fig. 3 portrays the likely path of the real GDP under the base-run, the reference model. As284
observed, the annual real GDP growth rate stays around 6% throughout the 2003–2020 period285
and the real GDP reaches to a value of 952.7 billion TRY by 2020. Fig. 4, on the other hand,286
illustrates the CO2 emissions from energy (fuel combustion) as compared to point estimates of the287
same variable by TURKSTAT. As the figure clearly indicates, the values are comparable to that288
of TURKSTAT, reported to reach 615.4 million tonnes of CO2 by 2020.9 As the decomposition289
analysis of Lise (2006) shows, as in any other relatively fast growing economy, the biggest290
contributor to the rise in CO2 emissions in Turkey is the expansion of the economy (scale effect).291
The recent projections of the OECD show that Turkey has an annual growth potential of above292
9 The growth path is projected to generate an aggregate CO2 emission level of 656.4 million tonnes in 2020.

UN
CO
RR
EC
TED
PR
OO
F
Please cite this article in press as: Telli, C., et al., Economics of environmental policy in Turkey, Journalof Policy Modeling (2007), doi:10.1016/j.jpolmod.2007.03.001
ARTICLE IN PRESS+ModelJPO 5629 1–21
C. Telli et al. / Journal of Policy Modeling xxx (2007) xxx–xxx 11
7% (OECD, 2004). UNDP and the World Bank (2003) provide a projection of a 6-fold increase293
in greenhouse gas emissions by 2025 with respect to 1990 level. The study foresees an annual294
increase of 5.9% in final energy consumption. Given different projections of the growth paths295
to an extent, we thus observe that the base-run values are well within the ranges reported by296
TURKSTAT and the international agencies.297
Under this growth path of the base-run, given that the production technology parameters are298
constant, the CO2 emissions per real GDP also show an increasing trend, by showing almost 10%299
increase in 2020, compared to 2003 value.300
4. CGE analysis of alternative environmental policy scenarios301
Now we turn to implementing alternative environmental policy scenarios using our modeling302
framework. In what follows, we will group our policy interventions into two broad categories: first,303
we will implement tax and quota based instruments with no additional abatement investments.304
That is the production–emission structure of the economy remains as it is. The environmental305
tax revenues (or subsidy costs) is administered through the central fiscal budget with no further306
design on investments to change the energy use and production structure of the economy. Under307
the second categorization, a more active environmental policy stance is taken and the implemented308
policy instruments are complemented with an active abatement investment policy. The abatement309
investment is funded either from environmental tax revenues or from other sources, such as foreign310
credit and/or national savings.311
First we ask the straight question: “what will the economic impacts of maintaining lower CO2312
emissions in the aggregate for the Turkish economy?”313
4.1. Implement carbon emission quotas directly314
What if one imposes a straightforward, direct quota on the Turkish industries complemented315
by pollutant fees? What happens to the economic variables of direct quotas on aggregate CO2316
emissions over the 2005–2020 time horizon? Assuming that such quotas are enforced with the317
accompaniment of pollutant fees, what is the tax burden? How will this burden affect the producers318
and investors in their production plans? And consumers? Finally, what will be the net effect of319
this policy framework on government’s fiscal balances, on trade balance, and on unemployment?320
These are the questions that we would like to tackle in this first set of scenarios. To this321
end, we impose a straight aggregate quota of three alternative levels on the 2005–2020 growth322
path of the Turkish economy: (i) 90% quota (i.e., reducing emission by 10% of the base-run?);323
(ii) 80% quota; and (iii) 60% quota. To enforce the quotas, a pollutant fee system is activated.324
The fees are to be paid according to the polluter pays principle and are to be collected by the325
fiscal authority directly. No other possible use of such funds for further environmental pol-326
icy such as abatement investments or any subsidization is envisaged. Thus, in a nutshell this327
scenario gives the very basic, command and control approach in achieving CO2 emission tar-328
gets. The simplicity of this scenario is desirable as its results will offer us the most direct and329
basic outcomes of a very clear policy instrument to achieve the CO2 goals in the most straight-330
forward manner. We then build over this simple framework and reach more complex policy331
packages, yet at each level the outcomes derived from this basic framework will be used as a332
benchmark.333
Table 2 portrays a set of key variables under different quota and tax policies. If a quota of 90%334
is imposed, the rate of growth of GDP is reduced and total GDP falls by 7.1% in comparison335

UN
CO
RR
EC
TED
PR
OO
F
Please cite this article in press as: Telli, C., et al., Economics of environmental policy in Turkey, Journalof Policy Modeling (2007), doi:10.1016/j.jpolmod.2007.03.001
ARTICLE IN PRESS+ModelJPO 5629 1–21
12 C. Telli et al. / Journal of Policy Modeling xxx (2007) xxx–xxx
Table 2The incidence of CO2 emission quotas and taxes on energy input
Base-run Under 90%quota
Under 80%quota
Under 60%quota
Under 10% taxon energy
Under 20% taxon energy
GDP (2003 prices, billions TRY)2006 436.051 412.656 387.652 328.629 431.689 427.3722008 490.023 461.451 430.940 359.300 483.061 476.3322012 606.458 565.996 522.894 422.468 591.978 578.3982020 952.704 876.495 795.750 608.880 908.290 868.182
Private investment (2003 prices, billions TRY)2006 127.822 119.389 110.556 91.443 126.578 125.3682008 141.668 131.680 121.197 98.470 139.669 137.7622012 173.476 159.829 145.450 114.121 169.229 165.2762020 279.287 253.973 227.087 167.785 265.604 265.604
Total CO2 emissions (million tonnes)2006 276.953 249.258 221.562 166.172 243.775 217.5072008 315.187 283.668 252.150 189.112 276.557 246.0142012 401.368 361.231 321.094 240.821 349.440 308.5682020 656.399 590.759 525.119 393.839 559.679 484.719
Total CO2 emissions as a ratio to GDP (million tonnes/billion TRY)2006 0.635 0.604 0.572 0.506 0.565 0.5092008 0.643 0.615 0.585 0.526 0.573 0.5162012 0.662 0.638 0.614 0.570 0.590 0.5332020 0.689 0.674 0.6160 0.647 0.616 0.558
CO2 tax revenues as a ratio to GDP (%)2006 4.131 8.597 18.349 0.470 0.8492008 3.815 7.941 16.928 0.471 0.8522012 3.203 6.660 14.061 0.474 0.8562020 2.057 4.218 8.169 0.478 0.863
Source: Authors’ computations.
to the base-run 2020 value. In contrast, if the quota is set at 60% of aggregate emissions of the336
base-path, the GDP of 2020 is observed to fall to 602 billion TRY. This implies a reduction of337
36.8%.338
Our results indicate that the CO2 quotas affect the economy in a non-linear fashion. Higher339
rates of CO2 restrictions have an increasingly higher burden with subsequent production losses.340
The overall elasticity of emission gains to GDP losses is −1.1, that is a 40% reduction in CO2341
emissions through an outright quota is associated with a 36.8% loss of GDP. In this case, summing342
over the whole analyzed period, 2006 – 2020, the cumulative loss of GDP amounts to 1145 billions343
2003 TRY.344
The scenario is accompanied with a CO2 tax to enforce the emission quotas. We find that total345
incidence of the CO2 tax revenues as a ratio to the GDP is marginal for the 90% quota target.346
Yet, for enforcing a quota of 80%, the necessary tax burden is almost 10% upon implementation,347
and remains above 5% for the remaining of the projected time horizon. If a quota of 60% is348
imposed the tax burden is 20% to the GDP and falls only to 12% in 2020. Thus, the model results349
suggest that for a return of 40% reduction in aggregate emissions in 2020, a CO2 tax of 12%350
to the GDP is to be implemented. No wonder, this is an important interference to the economy351
and our results reveal that attempts to restrict the path of CO2 emissions using fiscal measures352

UN
CO
RR
EC
TED
PR
OO
F
Please cite this article in press as: Telli, C., et al., Economics of environmental policy in Turkey, Journalof Policy Modeling (2007), doi:10.1016/j.jpolmod.2007.03.001
ARTICLE IN PRESS+ModelJPO 5629 1–21
C. Telli et al. / Journal of Policy Modeling xxx (2007) xxx–xxx 13
alone will necessitate a very high tax incidence and significant deadweight loss? In other words,353
the sensitivity of the production units to fiscal tax measure is very low, and that restricting CO2354
emissions in a growing economy is very costly and is very difficult to enforce.355
The increased tax burden generates strong crowding-out effects and calls for reductions in356
private investments. Private investment expenditures are cut by 4% under the 90% quota but the357
rate of reduction is very non-linear as above (see Table 2). Under the 60% CO2 quota, the private358
investment expenditures are reduced almost by half.359
The fall in private expenditures is the major reason of the fall in aggregate GDP and the conse-360
quent rise of unemployment. These macroeconomic outcomes of course are very crude approxima-361
tions of reality. Needless to mention, the outright transfer of CO2 tax monies to the central budget362
with no further environmental policy in action clearly is inferior to one that can be complemented363
with further alternatives. Before turning towards these issues, however, it would be informative to364
study the microeconomic (sectoral) substitution possibilities of the environmental policy at hand,365
and for this purpose we turn our attention next to an energy tax, rather than a direct carbon tax.366
4.2. Economic effects of taxing energy input use in production367
Our framework admits three sources of energy inputs: coal, petroleum and gas, and electricity.368
Given the substitution possibilities between energy sources and factor use (capital and labor), the369
cost minimization procedures will signal the producers to save on energy utilization and thereby370
reduce CO2 emitted. We implement the energy taxation policy at two levels: 10 and 20% tax.371
The energy taxation at 10% leads to a reduction of total CO2 emissions by 14.2% by 2020. If372
the tax rate is set at 20%, the abatement rate reaches to 25.3% (see Table 2). The energy taxation373
seems to have higher policy effectiveness in combating CO2 pollution at the aggregate level in374
contrast to taxing overall emissions. Since the major source of CO2 pollutants originate from375
energy use, a taxation policy destined to economize on energy intensities seem to produce more376
efficient results to this end.377
The overall tax burden of the current policy further illustrates this point. The model results378
suggest that the fiscal tax revenues from a 10% energy tax reach to only 0.48% of the GDP, and379
that from the imposition of 20% tax is 0.85% of the GDP. Thus, in contrast to the significant380
burden of overall carbon taxes experienced in the previous scenarios, the energy taxation seem to381
carry lesser distortion to the domestic economy.382
The loss in GDP from the imposition of a 20% energy tax rate is 7.4% in 2020 in compari-383
son to the base-run (business-as-usual). Thus, to summarize, the model results suggest that the384
20% energy taxation reduces overall CO2 emissions by 25.3%, and is accompanied by a loss of385
aggregate GDP by 8.8% over the base-run by 2020. In contrast, the same figures were 14.2% CO2386
abatement rate in return to 10% energy tax and a loss of 3.9% in GDP level in 2020.387
These results contrast with the very adverse effects of the current policy on the employment388
levels. The results indicate significant unemployment rates under the taxation regimes. The rate389
of open unemployment is observed to reach 15% under the 10% tax rate, and reaches 19% for390
the imposition of the 20% tax rate on energy use. In contrast, the base-run path reveals a rate of391
unemployment of around 10% for most of the modeled time horizon (Fig. 5).392
The rise of the unemployment rate under this scenario is due to the imposed distortions on cost393
minimization by introducing input taxes. To the extent that labor is complementary to energy use,394
the consequent rise in the costs of energy use leads to a fall in the demand for labor as well. With395
limited factor substitution possibilities in the medium run, producers meet the increased energy396
costs by cutting demand not only for energy use, but also for labor employment, as well.397

UN
CO
RR
EC
TED
PR
OO
F
Please cite this article in press as: Telli, C., et al., Economics of environmental policy in Turkey, Journalof Policy Modeling (2007), doi:10.1016/j.jpolmod.2007.03.001
ARTICLE IN PRESS+ModelJPO 5629 1–21
14 C. Telli et al. / Journal of Policy Modeling xxx (2007) xxx–xxx
Fig. 5. Unemployment rate under alternative energy tax scenarios. Source: Authors’ computations.
These results suggest that a proper mix of environmental taxation should be accompanied398
with reductions in labor taxes and/or increased employment subsidies. Such a policy mix seems399
to be a superior policy in achieving both CO2 abatement targets and maintaining employment400
rates across sectors. Furthermore, one observes a clear need for supplementing the market-based401
incentives along with direct abatement investments to reduce energy intensities and improve upon402
the existing pollution technologies.403
4.3. Environmental policy instruments with abatement investments404
An important issue in developing policies for the mitigation of GHG emissions is to determine a405
“feasible” set of policies to generate emission reductions and to make investments in energy-saving406
technologies. Estimating both the costs and effectiveness of these policies in emission-reduction is407
a very important, yet a challenging issue. For instance, a recent study on the “Economic Evaluation408
of Sectoral Emission Reduction Objectives for Climate Change” conducted for EU countries409
project a marginal cost as low as 20–25 per tonnes CO2 eq. in 1999 D for the EU countries.10 The410
marginal cost is estimated to be 1999 D 3.7 billion annually during the first budget period of the411
protocol (2008–2012), which is equivalent to about 0.06% of EU gross domestic product in 2010.412
For the Turkish economy a similar study has yet to address the issues of estimating the costs413
of feasible policies to make investments in especially energy-saving, emission-reducing and cost-414
effective technological change that would be attractive to producers. In the absence of precise tech-415
nological cost-benefit estimates of such investments, we compare alternatives of burden-sharing416
between different groups in the economy, under a reference abatement-investment scenario.417
4.4. Abatement investments affecting capital accumulation418
Specifically, in the reference abatement-investment scenario, we follow the State Planning419
Organization (SPO) estimates and implement energy-saving (CO2 emission-reducing) abatement-420
investments of 1.5% of the GDP in 2006–2020. The SPO’s estimate is that such investments421
10 The projection is developed by the National Technical University of Athens, Ecofys and AEA Technology and analyzedwith the GENESIS database. It is based on EU-wide allocation of least-cost objective for different sectors.

UN
CO
RR
EC
TED
PR
OO
F
Please cite this article in press as: Telli, C., et al., Economics of environmental policy in Turkey, Journalof Policy Modeling (2007), doi:10.1016/j.jpolmod.2007.03.001
ARTICLE IN PRESS+ModelJPO 5629 1–21
C. Telli et al. / Journal of Policy Modeling xxx (2007) xxx–xxx 15
Table 3The incidence of abatement investments
Base-run Under abatement investmentaffecting capital account
Under abatement investmentfinanced by energy taxes
Under abatement investmnetfinanced by foreign aid
GDP (2003 prices, billions TRY)2006 436.051 429.929 418.168 436.0512008 490.023 478.235 461.035 490.0232012 606.458 579.218 544.509 606.4582020 952.704 868.749 755.019 952.704
Private investment (2003 prices, billions TRY)2006 127.822 126.166 122.037 127.8222008 141.668 138.436 131.672 141.6682012 173.476 165.776 131.672 173.4762020 279.287 254.034 204.211 279.287
Total CO2 emissions (million tonnes)2006 276.953 272.201 238.617 276.0382008 315.187 304.734 266.294 312.0632012 401.368 375.168 322.941 392.0842020 656.399 571.459 460.917 624.091
Total CO2 emissions as a ratio to GDP (million tonnes/billion TRY)2006 0.635 0.633 0.571 0.6332008 0.643 0.637 0.578 0.6372012 0.662 0.648 0.593 0.6472020 0.689 0.658 0.610 0.655
Source: Authors’ computations.
will help reducing the energy-input related emission coefficients by 5%. We will adhere to this422
assumption in modeling of the abatement investment scenarios.423
The question is “what will happen, if total abatement investments (estimated at 1.5% of GDP424
annually in 2006–2020) are undertaken by both the private and public production units to achieve425
a 5% reduction in emission coefficients of the primary-energy inputs?” As the cost is undertaken426
totally by the investing sectors of the economy, it is clear that abatement investments will nec-427
essarily absorb a portion of funds away from physical capital accumulation. Thus, compared to428
base-run, the aggregate capital stock is expected to be reduced by the extent of such abatement429
investments.430
Table 3 illustrates the simulated paths of the real GDP, private investment and CO2 emissions431
under the base-run and three alternatives: under abatement investments affecting capital accu-432
mulation, under abatement investments financed by energy-input taxation, and under abatement433
investments financed by foreign aid.434
The deceleration of the rate of physical capital investments becomes the major reason in the435
slow down of the GDP growth.11 The real GDP under the scenario is found to be 5% lower than the436
corresponding value under base-run. Thus, the GDP growth rate is lower as well. This lower growth437
performance emerges as a result of the fall in the pace of capital accumulation, since a portion of438
investment now has been allocated for energy-saving, emissions-reducing technological change.439
11 Because we have kept a positive growth rate for the change in total factor productivity growth at a rate of 2% we haveassumed no additional (ad hoc) effects of the abatement investments on further improvements in the rate of growth oftechnology.

UN
CO
RR
EC
TED
PR
OO
F
Please cite this article in press as: Telli, C., et al., Economics of environmental policy in Turkey, Journalof Policy Modeling (2007), doi:10.1016/j.jpolmod.2007.03.001
ARTICLE IN PRESS+ModelJPO 5629 1–21
16 C. Telli et al. / Journal of Policy Modeling xxx (2007) xxx–xxx
As investments lead to more efficient use of energy inputs and the emission coefficients on440
primary energy usage are effectively reduced, total CO2 emissions are reduced. Such an appli-441
cation brings a total reduction of 549.3 million tonnes of CO2 throughout 2003–2020 period.442
This value amounts to almost 7.5% of total emission level of the base-run. The annual reduc-443
tion values indicate an average of 7.2% throughout the period, but as the reduction technology444
settles in, gains from emissions become more visible reaching as high as 15% of the baseline in445
2020.446
4.5. Abatement investments under tax-financing versus foreign aid policies447
Having observed the (potential) trade-off effects in allocation of funds towards abatement448
investments and away from capital investments (causing reduction in GDP), we next search449
for alternatives to finance the abatement investments. One alternative is that the government450
carries out the necessary investment expenditures (amounting to 1.5% of GDP, annually between451
2006 and 2020), yet imposes additional taxes on the usage of polluting energy inputs (primary452
and secondary) in the production sectors to finance the investment projects. We find that the453
intermediate energy usage tax policy results in a tax rate of 23% on the usage of refined petroleum454
(RP), petroleum and gas (PG) and coal (CO) in the production sectors.455
The other alternative that we explore in this study is inspired by one “flexible” mechanism of456
the Kyoto protocol: the joint implementation (JI) mechanism that may be used by Annex-I parties457
to fulfill their own Kyoto targets.12 We assume the JI mechanism would offer incentives for the458
developed countries (Annex-II) to be actively involved in projects; towards emission reductions.459
So, in this scenario, we assume the abatement investments are financed by some form of foreign460
aid.461
When abatement investments are financed by taxation of energy inputs, the pace of economic462
activity slows down, compared to both the baseline scenario and the scenario under foreign aid.463
The scenario under foreign aid generates much favorable growth rates compared to the other two464
cases, nevertheless since the economic activity is high, the total CO2 emissions also rises. Yet,465
the abatement investments (which we assume effective in emission reduction) still accomplish a466
3% reduction of total CO2 emissions, compared to base-run.467
Before making commitments on possible policy alternatives, we find it informative to study the468
microeconomic sectoral) results of the scenarios we analyze. In Table 4, we display the outputs469
of the production sectors represented in our model economy.470
In comparison to the base-run, the sectoral output productions and sectoral emission reductions471
are quite parallel under the first scenario of abatement investments financed by funds away from472
capital accumulation, since the production sectors are bound to take this measure towards CO2473
emission reductions in an indiscriminate manner. Therefore, the overall economy is affected474
proportionally. On the other hand, financing of abatement investments by energy-input taxation475
works quite selectively: the sectors that experience the highest reduction (in comparison to base-476
run), in their output levels are the most energy-intensive sectors. Over 2006–2020, the output477
12 The basic principles of the JI mechanism are defined in Article 6 of the protocol:
“For the purpose of meeting its commitments . . . any party included in Annex-I may transfer to, or acquire from,any other such party emission reduction units resulting from projects aimed at reducing anthropogenic emissionsby sources or enhancing anthropogenic removals by sinks of GHGs in any sector of the economy provided thatcertain (participation) requirements are fulfilled.”

UNCORRECTED PROOF
Pleasecite
thisarticle
inpress
as:Telli,C.,etal.,E
conomics
ofenvironm
entalpolicyin
Turkey,Journal
ofPolicy
Modeling
(2007),doi:10.1016/j.jpolmod.2007.03.001
AR
TIC
LE
IN P
RE
SS
+Model
JPO5629
1–21
C.Tellietal./JournalofPolicy
Modeling
xxx(2007)
xxx–xxx17
Table 4Sectoral outputs under alternative scenarios (in 2003 prices, billions TRY)
Base-run Under abatement investmentaffecting capital account
Under abatement investmentfinanced by energy taxes
2006 2012 2020 2006 2012 2020 2006 2012 2020
AG: Agriculture 87.2 122.6 191.2 86.0 117.3 175.0 85.2 114.3 161.1CO: Coal mining 2.1 2.7 4.0 2.0 2.6 3.6 2.0 2.4 3.1PG: Crude petroleum, gas 1.4 2.1 3.6 1.4 2.0 3.3 1.1 1.6 2.6PA: Paper and paper products 5.3 7.7 12.5 5.2 7.3 11.4 5.1 7.1 10.4RP: Refined petroleum products 27.7 39.9 65.0 27.3 38.2 59.5 19.0 25.8 37.6CE: Cement production 6.0 8.5 13.7 5.9 8.2 12.5 5.6 7.4 10.5IS: Iron and steel 17.3 26.8 47.5 17.1 25.6 43.3 15.7 22.5 34.7EL: Electricity production 11.9 16.3 25.3 11.7 15.6 23.1 9.9 12.6 16.9TR: Transport services 85.4 123.2 199.2 84.2 117.9 182.6 77.5 106.6 155.7OE: Other economy 495.8 680.0 1058.4 488.7 648.9 963.1 478.3 609.1 828.3
Source: Authors’ computations.

UN
CO
RR
EC
TED
PR
OO
F
Please cite this article in press as: Telli, C., et al., Economics of environmental policy in Turkey, Journalof Policy Modeling (2007), doi:10.1016/j.jpolmod.2007.03.001
ARTICLE IN PRESS+ModelJPO 5629 1–21
18 C. Telli et al. / Journal of Policy Modeling xxx (2007) xxx–xxx
reduction in agriculture (AG) is around 7.5% on average whereas it reaches to 16.5% in iron and478
steel industry (IS), 22.9% in electricity production (EL), 24.8% in petroleum and gas (PG) and479
35.7% in refined petroleum production (RP) sectors. Then again, the largest savings from CO2480
emissions also take place in these sectors. The overall emission reduction reaches to 53% in coal481
mining (CO) and 23.2% in iron and steel (IS) by 2020. Note that the proportions of output and482
CO2 emissions reductions are not comparable in a linear fashion, since both variables depend on483
the substitution possibilities of both energy inputs in production among themselves and with the484
other inputs as well.485
The scenario under foreign aid has no direct effect on output/investment/input demand deci-486
sions of the production sectors, yet by offering funds to finance abatement investments, generates487
a proportional decrease in the sectoral CO2 emissions of the economy.488
5. Conclusion489
In this paper, we utilize a computable general equilibrium model for Turkey to study the eco-490
nomic impacts of the intended policy scenarios of compliance with the Kyoto Protocol. Turkey491
is the only country that appears in the Annex-I list of the Rio Summit and yet an official target492
for CO2 emission reductions has still not been established. Thus, as part of its accession nego-493
tiations with the EU, it will likely to face significant pressures to introduce its national plan on494
climate change along with specific emission targets and the associated abatement policies. Given495
this motivation, we report on the general equilibrium effects of various possible environmental496
abatement policies in Turkey over the period 2006–2020.497
Several policy conclusions emerge from our analysis:498
• Our modeling results suggest that the burden of possible imposition of direct carbon emission499
quotas would be quite high. This burden will necessitate a significant tax imposition on the500
producers to enforce the CO2 quotas. According to our results, imposition of CO2 quota at 60%501
level to the base-run calls for a carbon tax of 20–15% over 2006–2020. The GDP loss incurred502
under this scenario is above 30% as of 2020.503
• Such a tax burden will likely lead to tax evasion practices, and will encourage the underground504
(informal) economy. Thus, it will likely lead to increased informalization of the production505
activities. The already high levels of producer tax incidences reduce the effectiveness of506
additional carbon taxation opportunities significantly.507
• In contrast to a direct “CO2 quota-cum-carbon tax” policy, taxation of energy use in sectoral508
production seems to produce viable results. In returns to a 20% energy tax for producers,509
aggregate CO2 emissions are reduced by 25.8% with a loss of GDP of 8.8% by the end of510
2020. The energy taxation policy suffers strongly, however, from its very adverse employ-511
ment effects. Unemployment rates rise significantly as a result of the introduced energy512
taxes. With limited substitution possibilities in input mix among labor and energy inputs,513
producers are bound to cut back labor employment as they are faced with increased energy514
costs.515
• The taxation policies suggest very clearly that possible interventions of new environmental516
taxes would have adverse outcomes either on employment or on sectoral output levels directly.517
A more effective policy would necessarily call for a simultaneous reduction on the existing tax518
burden on producers elsewhere together with introduction of environmental taxes. A reduction519
of employment taxes can be implemented along with the imposition of energy tax use. Such520
a policy would be conducive in attaining CO2 abatement targets together with employment521

UN
CO
RR
EC
TED
PR
OO
F
Please cite this article in press as: Telli, C., et al., Economics of environmental policy in Turkey, Journalof Policy Modeling (2007), doi:10.1016/j.jpolmod.2007.03.001
ARTICLE IN PRESS+ModelJPO 5629 1–21
C. Telli et al. / Journal of Policy Modeling xxx (2007) xxx–xxx 19
incentives. Various studies show that using such tax revenues to finance reductions in the522
already existing (and mostly distortionary) taxes on employment, production, or sales can523
achieve superior outcomes with attaining environmental targets at lower cost—perhaps even524
at a positive net gain (see for example, Goulder, Parry, Williams, & Burtraw, 1999; Parry &525
Oates, 2000; Parry, Williams, & Goulder, 1999).526
• Overall, however, a first-best environmental policy has to call for further incentives towards527
reducing energy intensities in production through more efficient production methods. By itself528
this is no easy task and certainly comes at significant investment cost. Modeling results suggest529
that leaving the burden of the abatement investments to production sectors alone create sig-530
nificantly adverse results in terms of overall economic performance. According to our results,531
abatement investments that amount to 1.5% of GDP annually call for 23% tax rate on energy532
(primary and secondary) input usage.533
• Further indirect taxes on the production sectors would likely trigger unfavorable dynamics in534
production and employment. Parallel to the reduction in output, one observes adverse outcomes535
on already high unemployment rates of the economy.536
• The advantageous environment likely to be produced by foreign aid on abatement invest-537
ments displays high economic growth attained together with reductions in CO2 emissions.538
An annual flow of foreign aid/credit of 1.5% as a ratio to the GDP designed to cover the539
costs of abatement investments for adoption of the “best available technologies” help reduce540
Turkish CO2 emissions by 4.9% in 2020 and by a cumulative of 199.1 million tonnes over541
the whole analyzed period. By way of a caveat, it should be clear that designing such an542
international aid/credit system for the developing countries in their efforts towards abatement543
investments is by no means an easy task, and one should be aware that international coordi-544
nation and cooperation, although crucial, could be difficult to achieve. The Protocol, as an545
international attempt itself, has been criticized for defining mechanisms that are too bureau-546
cratic and cumbersome. Aldy, Barett, & Stavins (2003), for instance, point out to ambiguities547
in the existing institutional framework at the global scale, and identify more than a dozen com-548
peting approaches with regard to international carbon taxation and international technology549
standards.550
• A second caveat concerns the boundaries of our modeling paradigm. The CGE model is a tech-551
nical laboratory device where the adjustment path as characterized by the simulation exercises552
reflects a “well-defined” and “smooth” general equilibrium system, based on consumer and553
producer optimization in the absence of any rigidities and/or structural bottlenecks. Thus, the554
adjustments of the model economy in response to various policy shocks should not be taken as555
a measure of the global stability properties of the real economy, but rather as a direct outcome556
of the laboratory characteristics of a set of macroeconomic simulations. For these reasons,557
our results should at best be regarded as approximations of the long-run equilibrium effects558
of environmental and investment policies on production, employment, current account, capital559
accumulation and consumer welfare.560
• Finally, it should be noted that the model fails to identify the welfare benefits and possi-561
ble productivity gains from reduced CO2 emissions. Reductions in gaseous pollutants, for562
instance, are likely to lead to improved health conditions, enabling increases in labor pro-563
ductivity. Likewise, reductions in gaseous emissions would likely lead to further productivity564
gains in, say agriculture and food availability, due to improved climatic conditions. In the565
absence of detailed cost–benefit analysis of reducing CO2 emissions on a microlevel, we had566
to abstain from making ad hoc assumptions on such favorable external incidence of abatement567
investments.

UN
CO
RR
EC
TED
PR
OO
F
Please cite this article in press as: Telli, C., et al., Economics of environmental policy in Turkey, Journalof Policy Modeling (2007), doi:10.1016/j.jpolmod.2007.03.001
ARTICLE IN PRESS+ModelJPO 5629 1–21
20 C. Telli et al. / Journal of Policy Modeling xxx (2007) xxx–xxx
Uncited references568
Bovenberg and Goulder (2001), Devarajan, Lewis, & Robinson (1995), IEA (2005), Kornelis,569
de la Jager, & Hendriks (2001), Mansur and Whalley (1984), UNCTAD (2003), UNCTAD (2001)570
and Weistzman (1974).571
Acknowledgements572
Project support for this study was provided by the Government of Turkey and the United573
Nations Development Program on Economic Evaluation for Policy Making under the UNDP-GEF574
Project: “Enabling Activities For The Preparation Of Turkey’s Initial National Communication575
To The UNFCCC” prepared for UNDP and the Ministry of Environment and Forestry, Repub-576
lic of Turkey. The authors gratefully acknowledge the diligent research assistance of Bengisu577
Vural and Cagacan Deger, and the invaluable suggestions provided by Bill Gibson, Yasemin578
Orucu, Katalin Zaim and by the “Climate Change Team” of the Ministry, headed by Ms. Gunay579
Apak.580
References581
Adkins, L. G., & Garbaccio, R. F. (1999). A bibliography of CGE models applied to environmental issues. Mimeo: US582
Environmental Protection Agency, Office of Policy, Office of Economy and Environment.583
Agenor, P. R., Jensen, H. T., Verghis, M., & Yeldan, E. (2007). Disinflation, fiscal sustainability, and labor market584
adjustment in Turkey (Chapter 7). In A. Richard, A. Izquierdo, & H. T. Jensen (Eds.), Adjustment policies, poverty585
and unemployment: The IMMPA framework. Blackwell Publishing/Oxford University Press.586
Aldy, J. E., Barett, S., & Stavins, R. N. (2003). Thirteen plus one: A comparison of alternative climate policy architectures.587
Climate Policy, 3(4), 373–397.588
Boratav, K., Turel, O., & Yeldan, E. (1996). Dilemmas of structural adjustment and environmental policies under instability:589
Post-1980 Turkey. World Development, 24(2), 373–393.590
Bovenberg, L., & Goulder, L. (2001). Neutralizing the adverse industry impacts of CO2 abatement policies: What does it591
cost. In C. Carrao & G. Metcalf (Eds.), Behavioral and distributional effects of environmental policies. University of592
Chicago Press.593
Devarajan, S., Lewis, J., & Robinson, S. (1995). Getting the model right: The general equilibrium approach to adjustment594
policy (Chapters 2 and 3). Cambridge University Press.595
Ediger, V. S., & Huvaz, O. (2006). Examining the sectoral energy use in Turkish economy (1980–2001) with the help of596
decomposition analysis. Energy Conservation and Management, 47, 732–745.597
Ercan, H. & Tansel, A. (2006). How to approach the challenge of reconciling labor flexibility with job security and598
social cohesion in Turkey. Paper of the Turkish expert group’s preparation for European Council’s FORUM 2005.599
Strasbourg.600
Goulder, L., Parry, I., Williams, R., & Burtraw, D. (1999). The cost effectiveness of alternative instruments for environ-601
mental protection in a second-best setting. Journal of Public Economics, 72(3), 329–360.602
Goulder, L. & Pizer, W. (2006). The economics of climate change. NBER working paper no. 11923. http://www.nber.org/603
papers/w11923.604
International Energy Agency (2005, February). Industrial competitiveness under the European Union emissions trading605
scheme. IAE Information Paper.606
Karakaya, E., & Ozcag, M. (2001). Surdurulebilir Kalkınma ve Iklim Degisikligi: Uygulanabilecek Iktisadi Aracların607
Analizi. In First conference and fiscal policy in transition economies.608
Kornelis, B., de la Jager, D., & Hendriks, C. (2001). Economic evaluation of sectoral emission reduction objectives for609
climate change: Comparison of top-down and bottom-up analysis of emission reduction opportunities for CO2 in610
European Union. Memorandum.611
Kumbaroglu, S. G. (2003). Environmental taxation and economic effects: A computable general equilibrium analysis for612
Turkey. Journal of Policy Modeling, 25, 795–810.613
Lise, W. (2006). Decomposition of CO2 emissions over 1980–2003 in Turkey. Energy Policy, 34, 1841–1852.614

UN
CO
RR
EC
TED
PR
OO
F
Please cite this article in press as: Telli, C., et al., Economics of environmental policy in Turkey, Journalof Policy Modeling (2007), doi:10.1016/j.jpolmod.2007.03.001
ARTICLE IN PRESS+ModelJPO 5629 1–21
C. Telli et al. / Journal of Policy Modeling xxx (2007) xxx–xxx 21
Mansur, A., & Whalley, J. (1984). Numerical specification of applied general equilibrium models: Estimation, calibration615
and data. In H. E. Scarf & J. B. Shoven (Eds.), Applied general equilibrium analysis. Cambridge: Cambridge University616
Press.617
OECD (2004). Economic survey: Turkey. http://www.oecd.org/dataoecd/42/47/33821199.pdf.618
Parry, I., & Oates, W. (2000). Policy analysis in the presence of distorting taxes. Journal of Policy Analysis and Manage-619
ment, 19, 603–614.620
Parry, I., Williams, R. R., & Goulder, L. (1999). When can carbon abatement policies increase welfare? The fundamental621
role of distorted factor markets. Journal of Environmental Economics and Management, 37(1), 52–84.622
Roe, T. L., & Yeldan, E. (1996). How doctor’s prescriptions may fail: Environmental policy analysis under alternative623
market structures. METU Studies in Development, 23(4), 577–600.624
Sahin, S. (2004). An economic policy discussion of the GHG emission problem in Turkey from a sustainable development625
perspective within a regional general equilibrium model: TURCO. Sorbonne: Universite Paris I Pantheon.626
Telli, C., Voyvoda, E., & Yeldan, E. (in press). Modeling general equilibrium for socially responsible macroeconomics:627
Seeking for the alternatives to fight jobless growth in Turkey. METU Studies in Development.628
Tunalı, I. (2003). Background study on the labour market and employment in Turkey. Prepared for the European Training629
Foundation.630
Tunc, G. I., Turut-Asik, S., & Akbostanci, E. (2006). CO2 emissions vs. CO2 responsibility: An input–output approach631
for the Turkish economy. ERC Working Paper, No. 06/04.632
UNCTAD (2001). Trade and development report. New York and Geneva.633
UNCTAD (2003). Trade and development report. New York and Geneva.634
UNDP & World Bank (2003). Energy and environment review: Synthesis report Turkey, Washington, ESM273, 273/03.635
Energy Sector Management Assistant Programme.636
Weistzman, M. L. (1974). Prices vs. quantities. Review of Economic Studies 41(4), 477–491.637