entrepreneurship and sustainability issues
TRANSCRIPT
The International Journal
ENTREPRENEURSHIP AND SUSTAINABILITY ISSUES
ISSN 2345-0282 (online) http://jssidoi.org/jesi/
2016 Volume 4 Number 1 (September)
1
ISSN 2345-0282 ONLINE DOI: http://dx.doi.org/10.9770/jesi.2016.4.1
ENTREPRENEURSHIP AND SUSTAINABILITY ISSUES
4(1)
2016
The International Journal
ENTREPRENEURSHIP AND SUSTAINABILITY ISSUES
ISSN 2345-0282 (online) http://jssidoi.org/jesi/
2016 Volume 4 Number 1 (September)
2
Dear readers,
I want to invite you to immerse yourself into a contemporary discussion about unexpected facets of entrepreneurhip.
You may ask why unexpected, and my answer would be: because there are much more aspects, and circumstances,
which ultimately affect performance of new and already established ventures than it is listed in conventional
textbooks.
Let us explore, discuss, argue, formulate novel insights and suggest solutions. Let us share the papers on Mendeley,
Linkedin and Facebook…Our common interest, actions and inteactions with collaegues and other actors of life –
companies, NGOs, experts and ordinary people – will bring us to more sustainable and more affluent future.
As concens universities, the domain I represent, let us introduce the discussion for students, involve and encourage
them to be active and responsible builders of their and others lives. And there is no differenence who we happen to
be - woman or men, young or old, healthy or not - all of us can participate, contribute, cooperate, because we care!
Best regards
Dr. Inese KOKINA
Deputy Rector of Daugavpils University, Latvia
The International Journal
ENTREPRENEURSHIP AND SUSTAINABILITY ISSUES
ISSN 2345-0282 (online) http://jssidoi.org/jesi/
2016 Volume 4 Number 1 (September)
3
ISSN 2345-0282 (online) http://jssidoi.org/jesi/
Volume 4 Number 1 September 2016
ENTREPRENEURSHIP AND SUSTAINABILITY ISSUES
2016
4(1)
International Centre for
Entrepreneurship Research
The International Journal
ENTREPRENEURSHIP AND SUSTAINABILITY ISSUES
ISSN 2345-0282 (online) http://jssidoi.org/jesi/
2016 Volume 4 Number 1 (September)
4
The Entrepreneurship and Sustainability Issues ISSN 2345-0282 (online) is a peer-reviewed journal, which
publishes original research papers and case studies. It is international journal published cooperating with
universities, social companies, consultancies and associations indicated on the cover of the journal. It is
published quarterly.
Areas of research include, but are not limited to, the following:
Conceptual Approaches towards Entrepreneurship
Entrepreneurship and Sustainable Development
Globalization Processes Sustainable Development
Innovations and Technological Development for Entrepreneurship and Sustainability
Transition Issues and Sustainable Development
Entrepreneurship and Environmental Sustainability
Economic Growth and Entrepreneurship
Economics and Management of Sustainable Organizations and Industries
Intercultural Communication for Security and Sustainability
Sustainable Development of Sector Economics
Sustainable Finance and Investment and Entrepreneurship
Strategic Management for Sustainability
Case Studies on Entrepreneurship and Sustainable Development
Sustainable cities and entrepreneurship
Organizational studies
Social cohesion and social innovation
Public policy, economic security for sustainable entrepreneurship
Business models and strategic management for sustainable futures
Social responsibility and sustainable development
Psychology and entrepreneurship
Intuitions about contemporary phenomena in business and society
Social inclusion and entrepreneurship
Social inclusion and sustainable development of societies
Life-long learning and sustainable development
Life-long learning and entrepreneurship
Women and entrepreneurship
Creative industries and entrepreneurship
Case studies
The International Journal
ENTREPRENEURSHIP AND SUSTAINABILITY ISSUES
ISSN 2345-0282 (online) http://jssidoi.org/jesi/
2016 Volume 4 Number 1 (September)
5
All papers published in the Entrepreneurship and Sustainability Issues are indexed/abstracted by:
ECONIS of the ZBW – Leibniz Information Centre for Economics http://www.zbw.eu/EconBiz
RePEc http://repec.org/EconBiz
Ulrich’s Periodicals Directory
Serials Solutions http://www.serialssolutions.com/
ProQuest business http://www.proquest.co.uk/en-UK/
Crossref
Google Scholar
The European Library http://www.theeuropeanlibrary.org
Database Lituanistika http://www.lituanistikadb.lt
Index Copernicus International
Publisher:
ENTREPRENEURSHIP AND SUSTAINABILITY CENTER
http://jssidoi.org/esc/home
Editorial correspondence including manuscripts and submissions:
Prof. dr. Manuela Tvaronavičienė
Tel.: +37068783944
E-mail: [email protected] or [email protected]
This is an open access journal and all published articles are licensed under a
Creative Commons Attribution 4.0 International License
The International Journal
ENTREPRENEURSHIP AND SUSTAINABILITY ISSUES
ISSN 2345-0282 (online) http://jssidoi.org/jesi/
2016 Volume 4 Number 1 (September)
6
Editors-in-Chief
Prof. Jay Mitra, University of Essex, United Kingdom jmitra(at)essexac.uk
Prof. John Saee, Reutlingen University, Germany john.saee(at)reutlingen-university.de
Executive Editor
Prof. Abel Femi Adekola, University of Wisconsin-Stout, USA adekolaa(at)uwstout.edu
Editors
Dr. Christopher J. Rees, University of Manchester, United Kingdom rees(at)manchester.ac.uk
Dr. Richard Haigh, University of Salford, United Kingdom haigh(at)salford.ac.uk
Prof. Christian Friedrich, University of Applied Sciences, Giessen, Germany christian.friedrich(at)hfpv-
hessen.de
Dr. Renata Korsakienė, Vilnius Gediminas Technical University, Lithuania renata.korsakiene(at)vgtu.lt
Prof. Inga Žalėnienė, Mykolas Romeris University, Lithuania izaleniene(at)mruni.eu
Prof. Mohamad Sepehri, Jacksonville University, USA msephr(at)ju.edu
Prof. Brian Maruffi, Yeshiva University, Fordham University, USA maruffi(at)yu.edu
Dr. Evelyn Wamboye, Pennsylvania State University, USA efw10(at)psu.edu
Prof. Fangqi Xu, Kimki University, Japan fqxjo(at)bus.kindai.ac.jp
Dr.Ing. David Fuschi, Brunel University, United Kingdom David.Fuschi(at)brunel.ac.uk
Director, Mercy Maclean, Director of Health Psychology Management Org. Services,United Kingdom
mercy.maclean(at)hp-mos.org.uk
Prof. Sharda Nandram, HAN University of Applied Sciences and Nyenrode Business University, the
Netherlands s.nadram(at)nyenrode.nl
Prof. Kristel Mari Skorge, Oslo and Akershus University College of Applied Sciences, Norway Kristel-
Mari.Skorge(at)hioa.no
Prof. Salvatore Monni, Rome Tre University, Italy Salvatore.monni(at)uniroma3.it
Dr. Leonardo Piccinetti, Europe for Business, Brussels, Belgium l.piccinetti(at)e4business.eu
Prof. Gunnar Prause, Tallinn University of Technology, Estonia gunnar.prause(at)ttu.ee
Prof. Irina Sennikova, Riga International College of Economics and Business Administration, Latvia
irina.sennikova(at)riseba.lv
Prof. Natalja Lace, Riga Technical University, Latvia natalja.lace(at)rtu.lv
Prof. Ona Gražina Rakauskienė, Mykolas Romeris University, Lithuania ona.rakaus(at)mruni.eu
Prof. Agota Giedrė Raišienė, Mykolas Romeris University, Lithuania agota(at)mruni.eu
Prof. Danuta Diskienė, Vilnius University, Lithuania danute.diskiene(at)ef.vu.lt
Dr. Sibylle Heilbrunn, Ruppin Academic Center, Izrael sibylleh(at)ruppin.ac.il
Prof. Mirjana Radović Marković, Institute of Economic Sciences, Belgrade, Serbia mradovic(at)gmail.com
Prof. Ing. Zuzana Dvorakova, University of Economics, Prague, Czech Republic zuzana.dvorakova(at)vse.cz
Prof. Ani Matei, National School of Political Studies and Public Administration, Romania amatei(at)snspa.ro
Prof. Murtala S. Sagagi, Bayero University Kano, Nigeria mssagagi(at)yahoo.com
The International Journal
ENTREPRENEURSHIP AND SUSTAINABILITY ISSUES
ISSN 2345-0282 (online) http://jssidoi.org/jesi/
2016 Volume 4 Number 1 (September)
7
Dr. Kavita Singh, University of Delhi, India kavita(at)fms.edu
Prof. Pacha Malyadri, Government Degree College, Osmania University Patancheru,
India gdcpatancheru(at)gmail.com
Dr. Ulku Yuksel, The University of Sydney, Australia ulku.yuksel(at)sydney.edu
Dr. Juris Ulmanis, Experiential Simulations, Canada juris.ulmanis(at)rbs.lv
Dr. Sarvar Gurbanov, Qafqaz University, School of World Economy, Azerbaijan squrbanov(at)qu.edu.az
Dr. Mantas Bileišis, Mykolas Romeris University, AVADA, Lithuania mantas.bileisis(at)mruni.eu
As. prof. Virginija Grybaitė, Vilnius Gediminas Technical University, Lithuania Virginija.Grybaite(at)vgtu.lt
Prof. Mehmet Huseyin Bilgin, Istanbul Medeniyet University, Turkey bilgin(at)ebesweb.org
Prof. Levent Kosekahyaoglu, Suleyman Demirel University, Turkey leventkosekahyaoglu(at)sdu.edu.tr
Assist.Prof. Meltem Caber, Akdeniz University, Tourism Faculty, Turkey meltemcaber(at)akdeniz.edu.tr
Prof. Marina Sheresheva, National Research University Higher School of Economics (HSE), Russian Federation
m.shersheva(at)mai.ru
Prof. Ramaswamy Ganesan, King Saud University, Kingdom of Saudi Arabia
ganesan_gramaswamy(at)ksu.edu.sa
Prof. Bora Aktan, University of Bahrain, the Kingdom of Bahrain gbora(at)uob.edu.bh
Prof. Abuzar Wajidi, University of Karachi, Pakistan abuzar_wajidi(at)hotmail.com
The International Journal
ENTREPRENEURSHIP AND SUSTAINABILITY ISSUES
ISSN 2345-0282 (online) http://jssidoi.org/jesi/
2016 Volume 4 Number 1 (September)
8
CONTENTS Volume 4 Number 1 September 2016
Wadim Strielkowski.
ENTREPRENEURSHIP, SUSTAINABILITY, AND SOLAR DISTRIBUTED
GENERATION 9
Jānis Teivāns-Treinovskis, Jeļena Amosova.
SOME ASPECTS OF CRIMINAL ENVIRONMENT IMPACT ON
SUSTAINABLE ENTREPRENEURSHIP ACTIVITIES 17
Serene Dalati, Salah Eddin AL Hamwi.
SUSTAINABLE DEVELOPMENT IN HIGHER EDUCATION THROUGH
SERVICE QUALITY AND PRICE FAIRNESS: EMPIRICAL EVIDENCE FROM
PRIVATE UNIVERSITIES IN SYRIA 25
Agnė Tvaronavičienė, Gintarė Žemaitaitienė,
Tatjana Bilevičienė. 39
ECOSYSTEM FOR SUSTAINABLE ENTREPRENEURSHIP: TOWARDS
SMART PUBLIC PROCUREMENT REVIEW PROCEDURES
Daiva Tamulevičienė.
METHODOLOGY OF COMPLEX ANALYSIS OF COMPANIES’
PROFITABILITY
53
Kaoutar Allabouche, Omar Diouri, Ahmed Gaga, Najiba El Amrani El Idrissi.
MOBILE PHONES' SOCIAL IMPACTS ON SUSTAINABLE HUMAN
DEVELOPMENT: CASE STUDIES, MOROCCO AND ITALY 64
Manuela Tvaronavičienė.
ENTREPRENEURSHIP AND ENERGY CONSUMPTION PATTERNS: CASE OF
HOSEHOLDS IN SELECTED COUNTRIES 74
Alexandrina Maria Pauceanu.
INNOVATION AND ENTREPRENEURSHIP IN SULTANATE OF OMAN – AN
EMPIRICAL STUDY 83
The International Journal
ENTREPRENEURSHIP AND SUSTAINABILITY ISSUES
ISSN 2345-0282 (online) http://jssidoi.org/jesi/
2016 Volume 4 Number 1 (September)
9
International Centre for
Entrepreneurship Research
ENTREPRENEURSHIP AND SUSTAINABILITY ISSUES
ISSN 2345-0282 (online) http://jssidoi.org/jesi/
ENTREPRENEURSHIP, SUSTAINABILITY, AND SOLAR DISTRIBUTED GENERATION
Wadim Strielkowski
Cambridge Judge Business School, University of Cambridge, 13 Trumpington street, CB2 1AG Cambridge, United Kingdom
E-mail: [email protected]
Received 18 May 2016; accepted 25 July 2016
Abstract. The issues associated with the generation of own electric power by consumers who install solar photovoltaic (PV) panels (known
as solar distributed generation, or DG), attracts rapidly growing attention of both policy-makers, regulators and the members of the general
public. Distributed generation (DG) comes with a lot of benefits: being the most sustainable, cleanest source of energy, solar products
facilitates local priorities, such as economic growth, internal security, mitigation against climate change, and employment opportunities.
However, there is another side of the coin: despite the rapid success of solar DG, it is still faced with a plethora of issues and challenges.
An increase in the rooftop solar PV in might results in a transfer of wealth and costs between customer groups. There are elderly, disabled
and chronically sick citizens who cannot benefit from generating their own electric power using solar PV panels, but who might still face
higher electricity bills due to the higher policy support charges (levies) and taxes aimed at supporting decarbonisation through distributed
generation. Overall, it appears that current network charging regime is likely to be unfit in the presence of solar PV households who do not
contribute to the grid as they should be.
Keywords: entrepreneurship, sustainability, electricity pricing, solar panels, entrepreneurship, distributed generation
Reference to this paper should be made as follows: Strielkowski, W. 2016. Entrepreneurship, sustainability, and solar distributed generation,
Entrepreneurship and Sustainability Issues 4(1): 9-16. DOI: http://dx.doi.org/10.9770/jesi.2016.4.1(1)
JEL Classifications: M20, Q21, Q41
1. Introduction
There has been a rising need for affordable, green energy in the world that stepped on the path of sustainable growth,
decarburization, and climate protection. Unlike the previous years, today’s policy makers and regulators require a
different context of the market and the economy with the inclusion of planning for the growth of renewable energy
(Vosylius et al. 2013; Raudeliūnienė et al. 2014; Baublys et al. 2014; Balitskiy et al. 2014; Leonavičius et al. 2015;
Mostenska, Bilan 2015; Šimelytė et al. 2016).
One of the most effective ways how to deal with these problems might be so-called distributed generation (DG), a
trend when consumers generate their own electric power by installing solar photovoltaic (PV) panels.
The International Journal
ENTREPRENEURSHIP AND SUSTAINABILITY ISSUES
ISSN 2345-0282 (online) http://jssidoi.org/jesi/
2016 Volume 4 Number 1 (September)
10
Given that national policies and targets as well as declines in the prices of photovoltaic panels has led to an increase
in people’s interests in tapping into the solar power industry. However, policy makers and regulators have
experienced problems in the analysis of solar energy contribution as compared to others sources in terms of capacity
planning, portfolio evaluation and resource procurement decisions (Sterling et al, 2013). Given the global attempt
to reduce carbon emissions and increase renewable energy supply, many governments around the world have
ventured into launching various policies such as peak pricing for residential customers and net metering. Peak
pricing is intended to smoothen the electricity demand all day long by offering higher costs to customers operating
at peak-usage times with the effect of increasing the efficiency of electricity supply. Net metering on the other hand
enables distributed generators, such as customers with solar panels installed on their rooftops, to feed their excess
power back to the grid at retail prices (Kok et al, 2015).
Many US citizens have turned to this type of renewable energy generation technology and installed the panels at
their homes and business premises. The increasing trend of PV devices is basically due to the fact that their cost has
reduced dramatically and most the citizens can currently afford them. Also, due to climate change, the country is
opting for green energy and with this; the government is subsidizing solar products to make them more affordable
to its citizens. However, installation of PV panels by customers has resulted in various issues countrywide. Some
of these issues regard consumer protection and also the price of electricity.
Compensation for the solar PV customers may be in the form of paying the consumer from the utility where more
electricity is generated than what is consumed (the practice widely referred to as “net metering”). Many net metering
policies require utilities to purchase a DG consumer's extra power at a total retail price even though the cost of
producing the electricity by the utilities is much lower. Because it is the responsibility of the utilities to maintain
these electric grids, they shift the cost to the consumers and as a result, the cost of electricity increases. Moreover,
these chargers are further shifted to non-solar consumers, which in turn increase their electricity bill. Determination
of the right rate for net metering is a complicated issue. The subject regarding electricity prices is on the appropriate
retail rate at which to compensate consumers for DG. There is a debate on whether the price to be used to
compensate the distributed energy consumers should be below or at the retail rate. This paper discusses the
sustainability of distributed generation and electricity pricing which have aroused by the installation of rooftop solar
PV panels by consumers who either want to save on their electricity bills or are driven by the entrepreneurial
concept.
2. Distributed generation pricing and charges
Generally, all across the USA utility companies have developed various formulae for compensating distributed
generators for power flowing into their grids. Two methods have been popularly employed: net metering and feed-
in tariffs. Under the net-metering technique, customers with on-site generation are normally credited for the amount
of kilowatt-hour (kWh) sales sold back to the grid and are charged for periods in which their consumption is greater
than their generation. Utilities usually charge their differences in consumption and generation. There are usually
different policies on net metering depending on the state. Some states may limit the fuel types and technology that
is eligible for net metering while other states put a limit on the total capacity that the generator is eligible for net
metering thus placing limits on both individual generators and the aggregate load that is eligible for net metering
(APPA, 2013).
Feed-in tariff (FIT) programs that usually exist in some states refer to a long term contract under which the utility
agrees to purchase the excess generation from a distributed generation (DG). The utility company usually comes up
with a per-kWh purchase price with the rates varying from utility to utility thus resulting in a lot of contention. In
the long run, the utility company pays the DG in a similar manner as they would pay a non-utility wholesale power
producer. Under a FIT program, the DG is compensated at the predetermined rate for their surplus power supplied
The International Journal
ENTREPRENEURSHIP AND SUSTAINABILITY ISSUES
ISSN 2345-0282 (online) http://jssidoi.org/jesi/
2016 Volume 4 Number 1 (September)
11
to the grid while the DG’s purchases from the grid are charged at the retail rate. The FIT rate can either be higher
or lower than the retail rate (APPA, 2013).
Given the growing impact of DG, several utilities have begun trying to implement reforms to existing programs in
a bid to raise some of the financial concerns associated with DG. In Arizona, the Arizona Public Service (APS)
filed with the Arizona Corporation Commission (ACC) making two policy proposals. They suggested that under
the first policy option, existing net metering customers would be charged higher on the basis of their electricity
usage with the demand charge ranging from $45 to $80 per month. Another option would involve the establishment
of a credit system for new DG customers in which the distributed generators would acquire compensation for
electricity sold to the grid at a rate set by the ACC with the amount appearing as a credit on the customer’s monthly
bill. The first proposal reduced the residential solar customers’ monthly savings from 14-16 cents per KWh to 6-10
cents per kWh while the second proposal reduced savings to nearly 4 cents per kWh per month. The APS tried to
justify this by stating that the total subsidization of rooftop solar customers’ amounts to nearly $18 million per year
for their customers and that solar rooftop generation hardly saves utility money. They argued that had these sources
not been available, the utility would have purchased that electricity on the wholesale market at a cheaper price as
compared to the current system, in which rooftop generators are compensated at the full retail rate (APPA, 2013).
3. Entrepreneurship and rooftop solar panels
Rooftop solar PV panels directly transfer property from ordinary electric consumers. This is because most
individuals purchase rooftop solar panels since they believe it will save them cash or make them green, or both
(Pool, 2012). But the certainty is that rooftop solar should not be saving them money although it frequently does,
and it virtually unquestionably is not green. In particular, the rooftop-solar fashion is consuming billions of dollars
annually that could be used on greener drives. It also is checking the progress of much more cost-efficient renewable
reservoirs of energy
According to a current Energy Department-supported research at North Carolina State University, establishing a
fully funded, average-size rooftop solar scheme will decrease energy prices for 93% of the single-family homes in
the fifty greatest American capitals today (Potts, 2015). That is why individuals have been hurrying out to purchase
rooftop solar panels, especially in sunny states like California, Arizona, and New Mexico. The principal cause is
that these modest solar systems are cost-efficient. Nonetheless, they are profoundly supported. Monopolies are
required by law to buy solar energy produced from the rooftops of homeowners and companies at two to three times
higher than it would require buying solar power from great, individually controlled solar plants. Without
governmental subsidies, rooftop solar far from cost-efficient.
Nevertheless, current investigations by Lazard and other firms discovered that comprehensive, utility-scale solar
energy factories require as little as five pence or sixpence without a premium per kilowatt-hour to make and run in
the sunny Southwest ("Net Metering: Growing, Worrisome Trend", 2012). These factories are rival with
correspondingly sized fossil-fueled energy factories. However, this performance is likely only if solar factories are
broad and found in sunny sections of the nation. On average, advantage-scale solar factories countrywide still
necessitate about 13 cents per kilowatt-hour, versus approximately six cents per kilowatt-hour for natural gas and
coal.
Large-scale solar power rates are dropping since the expense to build solar panels has been declining and since big
solar installations authorize economies of scale. On the other hand, rooftop solar usually requires micro installations
in unproductive areas, which makes the overall value as much as three and a half times higher. There are lots of
reasons as to why we are paying more for the same sun. Well-intended but ill-thought national, state and regional
tax considerations for rooftop solar in the United States yield back between 30% and 40% of the establishment
charges to the owner as a contribution credit ("Net Metering: Growing, Worrisome Trend", 2012). But more
The International Journal
ENTREPRENEURSHIP AND SUSTAINABILITY ISSUES
ISSN 2345-0282 (online) http://jssidoi.org/jesi/
2016 Volume 4 Number 1 (September)
12
questionable are unknown rate payments, the most notable of which is termed net metering, which is accessible in
44 US states. Net metering enables solar system buyers to compensate on a one-for-one principle the power they
draw from the electrical grid with the solar energy they produce on their home.
Although this might seem reasonable, it is not. An ordinary California citizen with rooftop solar PV, for instance,
frequently pays approximately 17 cents per kilowatt-hour for electrical assistance if the home’s solar panels are not
functioning. When they are working, nonetheless, net metering expects the business to give that solar consumer the
same 17 cents per kilowatt-hour ("Net Metering: Guilty as Charged", 2013). But the solar customer still requires
the framework to back up his occasional solar panels, and the service could have acquired that very solar energy
from a utility-scale solar electrical factory for approximately five cents per kilowatt-hour.
This 12-cents-per-kwh charge variation results in a wealth transfer from ordinary electric consumers to consumers
with rooftop solar systems who also usually have soaring wages. This is because businesses receive much of their
adjusted payments—the inevitable charges of power manufactories, delivery lines, from private consumers through
variable-use prices, in other terms, prices based on how much energy they apply. When a consumer with rooftop
solar buys insufficient power from the business, he gives fewer variable-use costs and bypasses giving tax to meet
the utility’s established charges. The effect is that all of the other consumers have to pick up the variation.
The California Public Services Commission predicts that net metering will cost the nation $1.1 billion annually by
2020. Arizona Public Service Company estimates that if the prevailing speed of rooftop-solar establishment
proceeds through mid-2017, its non-solar consumers will give roughly $800 million in raised charges to support
rooftop solar customers over the next 20 years (Pool, 2012). The entire expenses nationwide are unknown.
Nonetheless, an interdisciplinary association of professors and researchers at MIT published research about the
prospect of solar energy and presumed that net metering is ineffective and should be redesigned (MIT, 2015).
Thus, passing on additional costs or delta revenue losses attributed to DG onto the balance of other utility customers
is likely to be a wealth transfer from the less affluent to the more affluent. This generally means that utility
companies will set high fixed charges which will be shared by all the customers. Low income customers consuming
less electricity than others will therefore be subject to higher electric bills. Payment of DG at full retail price or
compensation for excess generation at full retail price will force the inclusion of distribution costs even though DG
customers do not aid the utility companies in saving on distribution costs. This will result in higher fixed charges
which slow down the long run energy efficiency efforts (APPA, 2013).
Currently, DG has partly grown due to the fact that firms have entered the market to provide customers different
financing, leasing or agreements for power purchases which do not need high capital as buying the panels
downright. A marketplace which is functioning well necessitates that consumers be able to access the necessary
information in weighing the financial costs as well as benefits of different options for solar PV panels' installation.
Even though distributed energy is progressively more important in meeting the energy and environmental objectives
of the United States, installations of rooftop solar panels is still faced with problems concerning consumer
protection. Evidently, consumers lack the vital information regarding the distributed generation, and as a result,
many companies have resulted into exploiting these uninformed consumers in various ways (Deline et al., 2011).
Various firms which are leasing solar products are engaging themselves in sales malpractices. The companies take
advantage of consumers with no knowledge of what they should pay for electricity and the solar PV panels.
Moreover, some customers do not understand under which circumstances their payments shall rise as per the
agreements. For instance, cost savings of energy which some PV corporations claim in their transactions fields are
frequently higher compared to the real savings as they used cost predictions assumptions which were highly inflated.
In several cases, because of automatic increase terms set in solar leases, buyers end up compensating more for the
solar energy compared to that they would have compensated traditional energy firms at the meter rate. Further,
consumers are unaware that these payments might double in the course of the lease contract. Also, they do not know

The International Journal
ENTREPRENEURSHIP AND SUSTAINABILITY ISSUES
ISSN 2345-0282 (online) http://jssidoi.org/jesi/
2016 Volume 4 Number 1 (September)
13
the amount of interest rate charged, though these types of requirements are clearly stated in cases of short-term car
leases.
A place like Arizona the sun is a nearly ever-present resource, but most of bad actor PV firms have charged in court
many consumers for failing to connect solar systems after making a deposit and also have been illegally soliciting
the customers through phone calls on the numbers listed on the National Do Not Call Registry to exaggerating the
solar savings. In March 2016, a federal court action was filed by the FTC, which alleged that 1.3 million individuals
on the Do Not Call Registry list were victims of unlawful telemarketing entities who acted for various solar
companies. The phone calls are just a case amongst much deceptive advertising, wrong information, irritating sales
campaigns, faulty installations and undisclosed charges and other complaints from consumers. Vividly, an example
of overstated savings techniques is from a local media station in Georgia that made a video record of a salesman
for PVs making blown up promises to consumers and highly overstated the yearly savings from solar system
installation. In Louisiana, a company misled customers through exaggerating energy cost savings, failure to fix the
solar equipment timely, and violation of national license prerequisites for PV installers (Li and Yi, 2014).
4. Implications for network pricing
Let us consider a case study of how current and existing network charging and pricing regimes can rapidly become
unfit for purpose in the presence of a big uptake of solar energy. In many cases, it happens that promotion of
distributed generation may lead to an opposite effect becoming an opportunity for shifting the wealth from poorer
to richer households and businesses. First of all, let us take a look at the cost recovery by distribution system
operators (DSO) in EU countries. Table 1 shows the structure of the cost recovery for households and small
industries for different groups of countries and grouping the countries by the volumetric component and fixed and
capacity component.
Table 1. Cost recovery by distribution system operators (DSO) in the EU countries
Households
Volumetric
Component NL ES, SE NO
IE, IT, PL, PT,
SK, SI
AT, CY, CZ, FR,
DE, GB, GR, HU,
LU, RO
BG
Fixed +
Capacity
Component
BG
AT, CY, CZ, FR,
DE, GB, GR, HU,
LU, RO
IE, IT, PL, PT,
SK, SI NO ES, SE NL
Small
industrials
Volumetric
Component NL IT, LU, ES, AT, PL, SI,
CZ, FI, FR,
HU, SE
BG, CY, DE, GB,
GR, SK RO
Fixed +
Capacity
Component
RO BG, CY, DE, GB,
GR, SK
CZ, FI, FR,
HU, SE AT, PL, SI IT, LU, ES NL
Source: European Commission (2015) and Eurelectric (2014)
It becomes obvious that there is a difference between the variability and fixed charges with most of consumer
probably preferring to pay higher fixed fees that are not always profitable for them. Furthermore, Table 2 employs
the methodology described in Simshauser (2014) to show the differences in network charges for solar and non-solar
residential consumers in Northern England. The last two rows of the table depict the savings the solar PV and non-
solar PV households have from using either two-part tariff scheme of the demand tariff scheme.
The International Journal
ENTREPRENEURSHIP AND SUSTAINABILITY ISSUES
ISSN 2345-0282 (online) http://jssidoi.org/jesi/
2016 Volume 4 Number 1 (September)
14
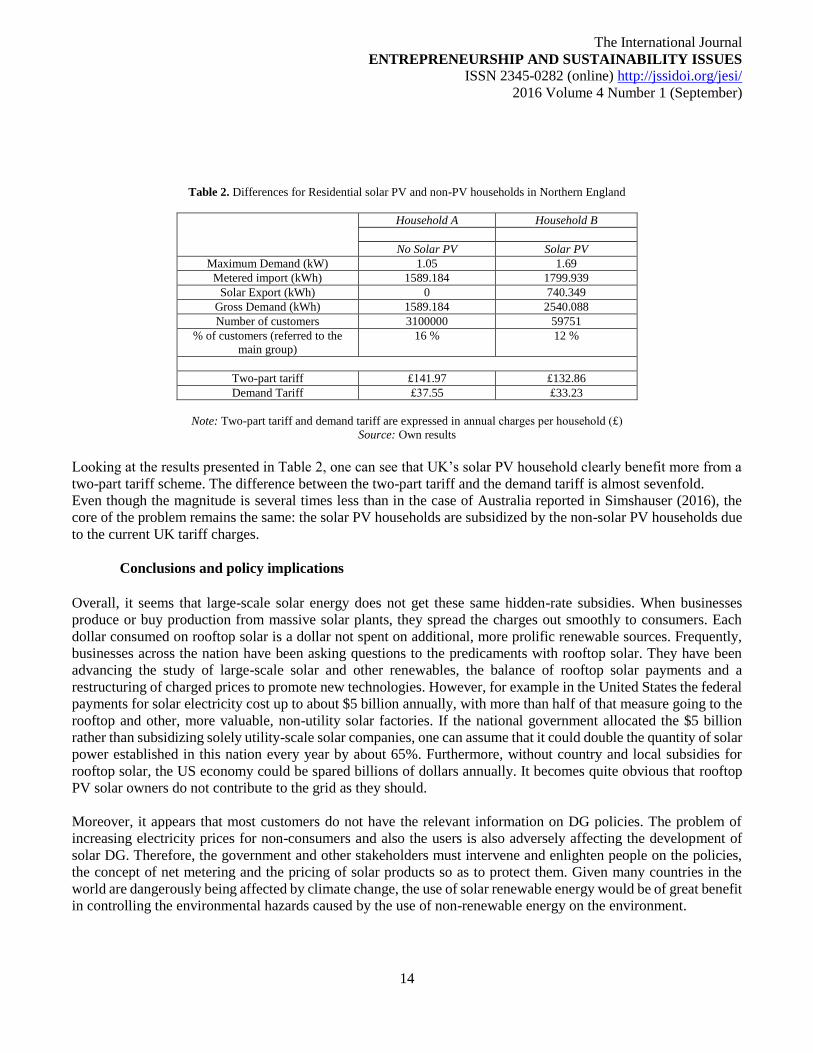
Table 2. Differences for Residential solar PV and non-PV households in Northern England
Household A Household B
No Solar PV Solar PV
Maximum Demand (kW) 1.05 1.69
Metered import (kWh) 1589.184 1799.939
Solar Export (kWh) 0 740.349
Gross Demand (kWh) 1589.184 2540.088
Number of customers 3100000 59751
% of customers (referred to the
main group)
16 % 12 %
Two-part tariff £141.97 £132.86
Demand Tariff £37.55 £33.23
Note: Two-part tariff and demand tariff are expressed in annual charges per household (£)
Source: Own results
Looking at the results presented in Table 2, one can see that UK’s solar PV household clearly benefit more from a
two-part tariff scheme. The difference between the two-part tariff and the demand tariff is almost sevenfold.
Even though the magnitude is several times less than in the case of Australia reported in Simshauser (2016), the
core of the problem remains the same: the solar PV households are subsidized by the non-solar PV households due
to the current UK tariff charges.
Conclusions and policy implications
Overall, it seems that large-scale solar energy does not get these same hidden-rate subsidies. When businesses
produce or buy production from massive solar plants, they spread the charges out smoothly to consumers. Each
dollar consumed on rooftop solar is a dollar not spent on additional, more prolific renewable sources. Frequently,
businesses across the nation have been asking questions to the predicaments with rooftop solar. They have been
advancing the study of large-scale solar and other renewables, the balance of rooftop solar payments and a
restructuring of charged prices to promote new technologies. However, for example in the United States the federal
payments for solar electricity cost up to about $5 billion annually, with more than half of that measure going to the
rooftop and other, more valuable, non-utility solar factories. If the national government allocated the $5 billion
rather than subsidizing solely utility-scale solar companies, one can assume that it could double the quantity of solar
power established in this nation every year by about 65%. Furthermore, without country and local subsidies for
rooftop solar, the US economy could be spared billions of dollars annually. It becomes quite obvious that rooftop
PV solar owners do not contribute to the grid as they should.
Moreover, it appears that most customers do not have the relevant information on DG policies. The problem of
increasing electricity prices for non-consumers and also the users is also adversely affecting the development of
solar DG. Therefore, the government and other stakeholders must intervene and enlighten people on the policies,
the concept of net metering and the pricing of solar products so as to protect them. Given many countries in the
world are dangerously being affected by climate change, the use of solar renewable energy would be of great benefit
in controlling the environmental hazards caused by the use of non-renewable energy on the environment.
The International Journal
ENTREPRENEURSHIP AND SUSTAINABILITY ISSUES
ISSN 2345-0282 (online) http://jssidoi.org/jesi/
2016 Volume 4 Number 1 (September)
15
References
APPA. 2013. Distributed Generation: An Overview of Recent Policy and Market Developments. NW, Washington. APPA.
Balitskiy, S.; Bilan, Y.; Strielkowski, W. 2014. Energy security and economic growth in the European Union, Journal of Security and
Sustainability Issues 4(2): 123-130. DOI: http://dx.doi.org/10.9770/jssi.2014.4.2(2)
Baublys J.; Miškinis V.; Konstantinavičiūtė I.; Lekavičius V. 2014. Aspirations for sustainability and global energy development
trends, Journal of Security and Sustainability Issues 3(4): 17–26. DOI:http://dx.doi.org/10.9770/jssi.2014.3.4(2)
Cluzel, C.; Standen, E. (2013). Customer-Led Network Revolution Commercial Arrangements Study - Review of existing commercial
arrangements and emerging best practice, CLNR-L032, Customer-Led Network Revolution, Northern Powergrid (Northeast) Limited,
Northern Powergrid (Yorkshire) Plc., Durham University.
Deline, C.; Marion, B.; Granata, J.; Gonzalez, S. 2011. A performance and economic analysis of distributed power electronics in photovoltaic
systems, Contract, 303: 275-300.
Duke, J. M.; Attia, B. 2015. Negotiated Solar Rights Conflict Resolution: A Comparative Institutional Analysis of Public and Private
Processes. Journal of Environmental and Sustainability Law 22(1): 1-57.
Eurelectric. 2014. Electricity distribution investments: what regulatory frameworks do we need? A report. Available on the Internet: <
http://www.eurelectric.org/media/131742/dso_investment_final-2014-030-0328-01-e.pdf >
European Commission. 2015. Study on tariff design for distribution systems, Final Report, AF‐Mercados, REF‐E and Indra for European
Commission
Kettles, Colleen McCann. 2008. A Comprehensive Review of Solar Access Law in the United States. Florida Solar Energy Research and
Education Foundation.Available on the Internet: < www.solarabcs.org/solaraccess >
Kok, A.; G., Shang, K.; Yucel, S. 2015. Impact of Electricity Pricing Policies on Renewable Energy Investments and Carbon Emissions.
Available on the Internet: <http://home.ku.edu.tr/~gkok/papers/renewable.pdf >
Leonavičius, V.; Genys, D.; Krikštolaitis, R. 2015. Public perception of energy security in Lithuania, Journal of Security and Sustainability
Issues 4(4): 311–322. DOI: http://dx.doi.org/10.9770/jssi.2015.4.4(1)
Li, H.; Yi, H. 2014. Multilevel governance and deployment of solar PV panels in U.S. cities. Energy Policy 69: 19-27. DOI:
http://dx.doi.org/10.1016/j.enpol.2014.03.006
MIT. 2015. The future of solar energy: an interdisciplinary study, Open Report of the MIT Future of Series. Available on the Internet:
<http://energy.mit.edu/wp-content/uploads/2015/05/MITEI-The-Future-of-Solar-Energy.pdf >
Mostenska, T.; Bilan, Y. 2015. Sustainable development through enhanced social responsibility, Journal of Security and Sustainability Issues
4(3):536–551. DOI: http://dx.doi.org/10.9770/jssi.2015.4.3(4)S
Net Metering: Growing, Worrisome Trend. 2012. The Electricity Journal 25(6): 1-9. http://dx.doi.org/10.1016/j.tej.2012.07.005
Net Metering: Guilty as Charged. 2013. The Electricity Journal 26(10): 2-4. http://dx.doi.org/10.1016/j.tej.2013.11.011
Pool, R. 2012. Solar power: the unexpected side-effect. Engineering & Technology 7(3): 76-78. DOI: http://dx.doi.org/10.1049/et.2012.0312
Potts, B. 2015. The hole in the rooftop solar-panel craze, The Wall Street Journal. Availble on the Internet: <
http://www.wsj.com/articles/the-hole-in-the-rooftop-solar-panel-craze-1431899563>
The International Journal
ENTREPRENEURSHIP AND SUSTAINABILITY ISSUES
ISSN 2345-0282 (online) http://jssidoi.org/jesi/
2016 Volume 4 Number 1 (September)
16
Raudeliūnienė, J.; Tvaronavičienė, M.; Dzemyda, I. 2014. Towards economic security and sustainability: key success factors of sustainable
entrepreneurship in conditions of global economy, Journal of Security and Sustainability Issues 3(4): 71–79.
DOI: http://dx.doi.org/10.9770/jssi.2014.3.4(7)
Šimelytė, A.; Ševčenko, G.; El Amrani El Idrissi, N.; Monni, S. 2016. Promotion of renewable energy in Morocco, Entrepreneurship and
Sustainability Issues 3(4): 319-328. DOI: http://dx.doi.org/10.9770/jesi.2016.3.4(2)
Simshauser, P. (2014). Network tariffs: resolving rate instability and hidden subsidies, AGL Applied Economic and Policy Research Working
Paper No.45 – Demand Tariffs.
Simshauser, P. 2016. Distribution network prices and solar PV: Resolving rate instability and wealth transfers through demand tariffs, Energy
Economics 54: 108-122. DOI: http://dx.doi.org/10.1016/j.eneco.2015.11.011
Solar panels spread to more than one million homes. 2013. ECOS. DOI: http://dx.doi.org/10.1071/ec13088
Sterling, J.; McLaren, J.; Taylor, M.; Cory, K. 2013. Treatment of Solar Generation in Electricity Utility Resource Planning. Golden, CO:
National Renewable Energy Laboratory. NREL/TP-6A20-60047. Available on the Internet:
<http://www.nrel.gov/docs/fy10osti/46723.pdf>
Vosylius, E.; Rakutis, V.; Tvaronavičienė, M. 2013. Economic growth, sustainable development and energy security interrelation, Journal
of Security and Sustainability Issues 2(3): 5–14. DOI: http://dx.doi.org/10.9770/jssi.2013.2.3(1)
Wadim STRIELKOWSKI is the Research Associate at the Judge Business School, University of Cambridge. Before joining the University
of Cambridge, he was an Assistant Professor at the Charles Univeristy in Prague, Czech Republic and a Research Fellow at the University
of Nottingham. Research interests: energy economics and policy, network tariffs, renewable energy resources (in particular solar PV panels).
ORCID ID: orcid.org/0000-0001-6113-3841
Copyright © 2016 by author(s) and VsI Entrepreneurship and Sustainability Center
This work is licensed under the Creative Commons Attribution International License (CC BY).
http://creativecommons.org/licenses/by/4.0/
The International Journal
ENTREPRENEURSHIP AND SUSTAINABILITY ISSUES
ISSN 2345-0282 (online) http://jssidoi.org/jesi/
2016 Volume 4 Number 1 (September)
17
International Centre for
Entrepreneurship Research
ENTREPRENEURSHIP AND SUSTAINABILITY ISSUES
ISSN 2345-0282 (online) http://jssidoi.org/jesi/
SOME ASPECTS OF CRIMINAL ENVIRONMENT IMPACT ON SUSTAINABLE
ENTREPRENEURSHIP ACTIVITIES
Jānis Teivāns-Treinovskis¹, Jeļena Amosova²
1,2 Daugavpils University, Vienibas Str. 13, LV-5400 Daugavpils, Latvia
E-mails:1 [email protected]; [email protected]
Received 20 March 2016; accepted 15 June 2016
Abstract. In the Republic of Latvia there are sufficient conditions for engaging representatives of different layers of society in doing business
and entrepreneurship activities. At the same time, some businessmen lack legal behaviour skills on the market and underdeveloped legal
culture and low legal awareness have often led and still lead to violation of Latvian legislation including the criminal one. This undoubtedly
contributes to the increase in crime in business sphere. The aim of the given article is to examine several aspects of criminal environment
impact on business activity. In the article two major problems will be dealt with – the shadow economy and corruption, which from the
author’s point of view exert direct influence on business activity and reveal the connections of some of its parts with criminal environment.
The problems of the shadow economy and corruption are topical both within the Republic of Latvia and internationally. A number of
international researches are being conducted to evaluate the scale of these phenomena and to devise effective methods to fight them, which
once more proves the topicality and urgency of the analysed theme.
Keywords: criminal environment, corruption, shadow economy
Reference to this paper should be made as follows: Teivāns-Treinovskis, J.; Amosova, J. 2016. Some aspects of criminal environment
impact on sustainable entrepreneurship activities, Entrepreneurship and Sustainability Issues 4(1): 17-24.
DOI: http://dx.doi.org/10.9770/jesi.2016.4.1(2)
JEL Classifications: D73, K14, O17
1. Introduction
Sustainable development of entrepreneurial activities requires respective favourable multi-faceted environment (Laužikas et
al. 2015, Tvaronavičienė 2015; Civelek et al. 2016). In some cases, when business is performed in conditions of high taxation
(Astrauskaitė, Paškevičius 2016; Dobrovič et al. 2016, Kozubíková, Zoubková 2016), or atmosphere of skeptical treatment of
social responsibility (Mostenska, Bilan 2015) phenomena of shadow economy (Caurkubule, Rubanovskis 2014; Belás et al.
2015) or corruption start thriving, what creats “criminal environment”.

The International Journal
ENTREPRENEURSHIP AND SUSTAINABILITY ISSUES
ISSN 2345-0282 (online) http://jssidoi.org/jesi/
2016 Volume 4 Number 1 (September)
18
There is no agreement regarding the understanding the category of “criminal environment”. For instance, an
outstanding Russian jurisprudent, an expert in the field of criminology and criminal psychology, Y. M. Antonyan
writes: “One must consider criminal environment only as a group (or several groups) of people whose members
commit crimes” (Antonyan 1975).
There is also another definition of criminal environment considering the contemporary context: it is a social,
criminal phenomenon which is formed from a definite number of people who are engaged in criminal activity. Most
of these people have been previously convicted and most of them are the bearers of the criminal subculture. The
aim of these people is to commit intentional crimes and to escape liability (Operational and Search).
The most important psychological feature of the criminal environment is the subculture. Latin term ”subculture”
(sub - under; under something) means a part of the main culture. Criminal subculture unites law breakers and
functions as a controller of their behaviour. But its major danger lies in the fact that it distorts public conscience,
transforms criminal experience, leads to moral decline, blocks the process of the socialization of the youth, forms a
public opinion about expediency of breaking particular rules of law (for instance, tax evasion), creates a positive
image of some categories of criminals and, on the contrary, criticizes the citizens who help law-enforcement officers
to arrest the criminals. To put it differently, criminal subculture is the basic criminalisation mechanism of
communities and above all of youth environment.
On frequent occasions general public do not reproach criminals who have committed a crime in the economy sphere.
On the contrary, they support them. It especially concerns the employers who pay the so called “under-the-table”
wages, businessmen who avoid paying taxes, smugglers who transport illegal tobacco goods and alcohol transborder
the European Union. In our society for reasons undefined it is thought that to cheat one’s country is as near as a
heroic deed. A person who has cheated his country is believed not to harm the general public; that is why they do
not reproach him or her. However, it is necessary to remember that income that is not reported to the country causes
financial loss of the citizens by decreasing the budget of the social sphere.
Security serves as precondition of societal development hence various facets of public security are being widely
discussed (Matvejevs 2013; Zahars, Stivrenieks 2015). At the same time it increased the dimension of understanding
the security aspect, extending it on economic, political, crime rate, etc. areas (Teivāns-Treinovskis, Jefimovs 2012).
The connection of crime to social, political, economic and cultural conditions of human existence is beyond doubt.
The conclusion about crime social determination is generally confirmed. However, optimistic forecasts and hopes
that it would decline and wither away during the process of industrial development justify themselves neither in
developing countries, nor in developed ones, nor in capitalistic ones, nor in socialist ones. At the same time the
registered crime level in different countries and world regions can differ by one order and more, but crime dynamics
in some countries and during some years can be positive (Luneev 2005). There are numerous reasons for that
including socioeconomic ones.
Professor Graeme Newman of School of Criminal Justice, State University of New York, USA, suggested an
unusual idea of interconnections peculiarity between the economy development level and crime. Although he agrees
that in the USA and other developed countries crime level is really very high, it, as he puts it, causes less concern
of the general public than in poor countries. Newman suggested a truly pragmatic American explanation by
comparing crime to a stone and the economy to a pond. If one throws a big stone in a small puddle, the water will
spill all over the ground. If one dumps a pile of stones from several trailers in a huge lake, the lake can remain
practically unaffected. The author gives corresponding calculations and evidence, but after that he concludes that
when the economic development level rises, crime impact may decrease in spite of its growth in number (Newman
1990).
The International Journal
ENTREPRENEURSHIP AND SUSTAINABILITY ISSUES
ISSN 2345-0282 (online) http://jssidoi.org/jesi/
2016 Volume 4 Number 1 (September)
19
2. The shadow economy
The shadow economy is present in the countries all over the world. For the especially privileged ones there are
offshore financial institutions and other “peaceful havens”. The basic differences of the shadow economy lie in its
amount, methods of how it is carried out and in the socio-juridical control level over it. The shadow economy exerts
a negative impact on state budget income and hinders competition in business environment.
The shadow economy essence can be defined from different perspectives. In economic analysis economic-statistical
definition of the shadow economy is usually used as a basis: the shadow economy is all types of economic activity
that are not represented in the official statistic.
It is possible to consider the definition of the shadow economy from another point of view: legally it can mean all
the economic processes which come into conflict with legal rules - both with civil-legal ones and with criminal-
legal ones.
Thereby, a thorough theoretical thought is necessary to talk about the formation of a new concept that concerns
cross-industry interaction of regulations of civil and criminal law in terms of improving legal adjustment directed
to illegal business activity (Leskova, Didenko 2016).
The annual study of Stockholm School of Economics in Riga that focuses on the shadow economy in the Baltic
States has shown that the amount of the shadow economy in Latvia in 2015 came down slightly compared with
2014 whereas in Lithuania and Estonia there was a slight increase in the amount of the shadow economy.
The amount of the shadow economy expressed as a percentage of a country gross domestic product (GDP) showed
an increase of 21,3% in Latvia in 2015; in Lithuania it was 15%, but in Estonia it was 14,9%. During the year
decrease of the shadow economy amount in Latvia comprised 2,2% of GDP; however, the shadow economy in
Latvia is nevertheless higher than in the two neighbouring Baltic states.
“Despite the fact that the basis of the shadow economy decrease in Latvia lies generally in the decrease of the
unreported incomes of the businessmen and of the amount of “under-the-table” wages, these indices for our country
are still evaluated as very high”, admits the author of the present research, Prof. Asoc. Dr. Arnis Sauka of SSE Riga.
The highest level of the shadow economy is in Riga and its outskirts; the second place is taken by Kurzeme region.
The biggest part of the shadow economy of Latvia is comprised of incomes concealed by businessmen, i.e. tax
evasion (about 45% of all the shadow economy). The rate of income concealment by businessmen in Latvia is much
higher than in the neighbouring Baltic States: in Latvia it is 19,9% in comparison with 10,5% in Lithuania and 7,5%
in Estonia. It is also necessary to note that according to the research data (Ēnu ekonomikas indekss, 2016)
unregistered companies make up about 5-7% of the number of all the companies in Latvia. In the research it is
concluded that smaller and newer companies tend to be drawn into the shadow business activity proportionally
more often than larger and older ones.
The second important part of the shadow economy of Latvia comprises the so called “under-the-table” wages. In
year 2015 the level of the “under-the-table” wages in the Baltic States was roughly the same – within the range of
15,2%-17,9%. It should be mentioned that in Latvia this tendency towards decrease of the “under-the-table” wages
of the total amount of wages has been taking place since 2010 up to the present moment. Whereas in Estonia
unofficial wages (wages paid “under-the-table”) are the major part of the shadow economy and make up about 60%
of its total amount.
Traditionally, the largest part of the shadow economy in business activity in Latvia is accounted for by building
sector – about 40% of amount of work in this sector is being conducted in the “grey zone”. In Lithuania and Estonia,
according to the conducted research, these indices are half lower.
The International Journal
ENTREPRENEURSHIP AND SUSTAINABILITY ISSUES
ISSN 2345-0282 (online) http://jssidoi.org/jesi/
2016 Volume 4 Number 1 (September)
20
The shadow economy is called like that generally because it is unaccounted, illegal, and concealed from the
government, i.e. it lies beyond legal conditions. If one disengages oneself from the destructiveness feature of the
shadow economy, it can soundly be treated as the direct result of socio-legal absence of control. This absence of
control may be connected with the unsatisfactory legal notices (the presence of blanks, insufficiency, or distortion)
or with their unsatisfactory execution by the officials of the economy structures and regulating agencies (neglect,
abuse, corruption, and etc.). Thus, the problem of the shadow economy minimization lies generally in optimization
of socio-legal control, which, on the one hand, would stimulate the transparency and justification of legally
authorized business activity, and which, on the other hand, would not discourage the initiative of the people involved
in this activity (Luneev 2005). As far as the “black” (criminal) economy is concerned - the economy in the sphere
of the criminal activity (for instance, arms trafficking, drugs trafficking, human trafficking, and etc.) – the socio-
legal control in this sphere must be absolutely uncompromised.
The illegal shadow economy actions can represent civil, tax, administrative and criminal delinquencies. The latter
are directly connected with the criminological aspect of the shadow economy, but the rest violations are connected
both directly and indirectly as they create different criminogenic conditions, i.e. conditions in furtherance of
committing mercenary economic crimes in spite of the fact that they are not criminal by their nature. Thus,
practically all the shadow economy is criminogenic to some extent.
Similarly to any other type of crime, criminal business is connected with the whole system of the social relations
including the socio-legal control, the importance of which was mentioned above. Obviously, the economy cannot
develop effectively without the socio-legal control. It immediately turns into the criminal one with all the
corresponding consequences. In chase of profit and excess profit, criminal business employs all the means possible.
Security of society is one of preconditions and driving factors of sustainable economic development (Ivančiks,
Tumalavičius, Teivāns-Treinovskis 2015). Modern globalisation processes linked with the creation of polycentric
relationships in the framework of the world community have made the problem of criminal law policy optimization
topical in the sphere of ensuring inviolable rights and legal interests of a person. Intensifying migration processes
and negative consequences of political and legal confrontation have inevitably led to the acceleration of crime
growth rate both on the international and on the national level. As the result, a strategic direction to renew the
national politics principles of the countries focuses on devising a balanced criminal and legal policy based on
poising the principles of the national, subnational and international law that secure coherent functioning of the
national law systems, their vitality and reproduction in the context of socio-interactive diversity (Avdeev 2016).
The conclusions are quite obvious. A complex critical analysis of present economic, criminological and legal
fundamentals is necessary. Realistic minimisation of the criminal shadow economy is possible only on condition
that the state and society do difficult two-unit tasks: secure freedom and safety, freedom and socio-legal control,
efficient fight with the intensively growing criminal activity, and strictly observe the fundamental human rights.
It is important to draw the attention to one more aspect of the criminal environment that influences the economy
generally and business activity particularly: it is corruption. The shadow economy undoubtedly causes corruption,
but corruption in its turn forms the basis for the shadow economy flourishing.

The International Journal
ENTREPRENEURSHIP AND SUSTAINABILITY ISSUES
ISSN 2345-0282 (online) http://jssidoi.org/jesi/
2016 Volume 4 Number 1 (September)
21
3. Corruption
Corruption is a many-sided phenomenon which despite diversity of political, legal and economic systems in
different countries where it exists shares common trends of its development. Moreover, its history is as ancient as
the civilization itself. Corruption significantly influences stability and security of many countries, undermines
democratic and moral principles as well as hampers the economic and political development of the countries. That
is why the world community treats corruption as the major social problem to solve which is the priority in crime
fighting.
The modern stage of legal development is characterized by globalization of the international life determined both
by negative and positive trends. Corruption has become one of the most negative and difficult social phenomena.
Its extent can lower the efficiency of state institutions activity and significantly damage reputation of the state
authorities as a whole as well as state prestige in the international arena. Corruption causes a number of economic,
social and political consequences. The economical ones are, for instance, the shadow economy expansion,
ineffective allocation of budget funds and violation of the market competition mechanisms (Mamytova 2016).
Ineffective allocation of budget funds, distributing state orders and credits in particular, leads to the drop of quality
and amount of social services and goods which the state provides for its citizens and business.
The destructive impact of corruption on business activity is obvious. The violation of the market competition
mechanisms leads to the situation when the winner is not the one who is able to meet the competition, but the one
who has managed to gain the advantage due to the bribes. As the result, the appearance of effective private owners
is hampered. This leads to the decline of the market efficiency as well as to discrediting the idea of the market
competition in general. The investment climate worsens, and the problems to overcome the production decline and
to renew fixed assets are not being solved.
Collapse in confidence of the market participants in the authorities generally takes place as the result of the loss of
trust in the ability of the authorities to establish and follow fair game rules.
In year 2015 the survey Fraud and Corruption – the easy option for growth? of the organization EY (Ernst &
Young) (Fraud and corruption 2015) revealed that in the countries with the developed economy 35% respondents
agreed that corruption in their countries is widely spread.
Corruption in Latvia is a commonplace according to 55% polled within the framework of the study of the
representatives of the large-scale enterprises in the country. In Lithuania and Estonia this figure is much lower: 45%
and 21% respectively.
In France 29% polled agreed that bribes and corruption are commonplace, in Germany the figure was 26%, in
Sweden it was 10%, and in Denmark the figure was 4%. In Russia this figure was 60%, in Slovenia it was 87%,
and in Croatia it was 92%. 3800 large-scale company employees of 38 countries took part in the polls on the whole.
According to Corruption Perceptions Index of the international organisation leading the fight against corruption
Transparency International (Transparency International 2016), the least corrupt countries in 2016 (according to the
data of year 2015) were Denmark, Finland, and Sweden, but the most corrupt ones were Somalia, North Korea and
Afghanistan. Meanwhile, the most corrupt country in Europe was again named Ukraine, which got 27 points and
took the 130th place.
The situation in Latvia compared with the previous year has not changed. Latvia got 55 points out of 100, where
100 means the total absence of corruption and 1 means total corruption. In the rating of 167 countries, however,

The International Journal
ENTREPRENEURSHIP AND SUSTAINABILITY ISSUES
ISSN 2345-0282 (online) http://jssidoi.org/jesi/
2016 Volume 4 Number 1 (September)
22
Latvia has moved from the 43rd place to the 40th place due to the changes in other countries. The country shares this
place with Cape Verde, Costa Rica and Seychelles.
Still, Latvia remains far behind Estonia, which got 77 points and which took the 23rd place. Lithuania outdistanced
Latvia as well by getting 61 points and took the 32nd place.
Corruption in Latvia costs up to $ 5,67 milliard dollars (5,08 milliard euros) annually, according to the research
requested by the European Parliament in RAND Europe institute (The Cost of Non-Europe, 2016).
Taking in account three different indices of corruption perception the researchers came to the conclusion that
because of the corruption Latvia annually loses from 13,16% to 19,24% of its gross domestic product (GDP), which
is from 3,4 milliard to 5,08 milliard euros.
Such countries as Lithuania, Poland, Slovakia, Romania, Bulgaria, Croatia, Greece and Italy suffer similar losses
because of corruption. On the whole the European Union losses because of corruption are estimated from 179
milliard to 990 milliard euros annually.
It is possible to determine four main ways of corruption impact on economic activity of entrepreneurs: firstly,
corruption increases investment return aimed at the rent-seeking; secondly, corruption exerts a negative impact on
small and medium-sized businesses; thirdly, corruption makes innovation activities less attractive for the
entrepreneurs; finally, high level of corruption reduces the amount of direct foreign investments.
The explanation of how corruption stimulates rent-seeking behaviour of economic agents results directly from the
well-known theoretical model of Andwig and Moene: the increase in the number of corrupt authorities decreases
the probability of exposure of the corrupt bargain as well as transaction expenses of searching for the counter-agents
for potential bribers. This contributes to the growth of the investments attractiveness in the rent-seeking for the
latter (Andvig, Moene 1990). Naturally, the resources spent on the rent-seeking cannot be spent again in any other
effective society-oriented way. Thus, by stimulating rent-seeking behaviour, corruption exerts a negative impact on
the investment activity of the entrepreneurs.
Conclusions
It is worth pointing out that despite different researches conducted in this sphere, one of the drawbacks of the
corruption conditions analysis is the absence of its whole representation in the official criminal statistic. Similarly,
it is not studied broadly enough in the analytical enforcement documents. The abeyance of corrupt economic crimes
remains very high.
It is possible to conclude that corruption and the shadow economy are intimately bound up and cause one another.
The shadow sector is a perfect place for corruption flourishing as it lies beyond the legal protection. Nowadays
corruption exerts an essential influence on all the spheres of a human life as well as on the economy branches
including business activity; to fight it effectively the whole society must participate in it. As far as business activity
is concerned, the impact of corruption is multi-faceted: ranging from the decrease of business profit because of
“under-the-table” payments to the direct refusal of doing business because of the lack of prospects.
Thus, the negative impact of crime on the business activity is obvious. Moreover, this impact may be multi-faceted
depending on different types of criminal activity of the groups of people in the particular region. The logical way
out from this situation is the elimination of obstacles to legal business activity and imposing such conditions that
would make the operation of illegal business activity organizations impossible.
The International Journal
ENTREPRENEURSHIP AND SUSTAINABILITY ISSUES
ISSN 2345-0282 (online) http://jssidoi.org/jesi/
2016 Volume 4 Number 1 (September)
23
References
Andvig, J. C.; Moene, K. O. 1990. ‘How Corruption May Corrupt’, 13(1) Journal of Economic Behavior and Organization, 63-76
Antonyan, Y. M. 1975. Social Environment and the Criminal Personality Formation (Negative Impact on a Personality in the
Microenvironment). Moscow, p. 20.
Astrauskaitė, I.; Paškevičius, A. 2016. Assessing the optimal taxation of the capital income: a case of corporate bond market, Journal of
Security and Sustainability Issues 5(4): 519–532. DOI:http://dx.doi.org/10.9770/jssi.2016.5.4(7)
Avdeev, V.A.; Avdeeva, O.A.; Gribunov, O.P.; Sergevnin, V.A. 2016. Punishment in the System of Criminal and Legal Countermeasures
against Crime: Legal Systems Interaction in the Context of International Life Globalization. Criminology Journal of Baikal National
University of Economics and Law. 2016. v. 10, Nr. 2. p. 301–312.
Belás, J., Bartoš, P., Ključnikov, A., Doležal, J. 2015. Risk perception differences between micro-, small and medium enterprises, Journal of
International Studies 8 (3): 20-30.
Caurkubule, Ž.; Rubanovskis, A. 2014. Shadow economy as an obstacle to sustainable Economic development, Journal of Security and
Sustainability Issues 4(2):175-186. DOI: http://dx.doi.org/10.9770/jssi.2014.4.2(6)
Civelek, M., Ključnikov, A., Dobrovič, J., Hudakova, M. 2016. A model of measurement of the quality of business environment in SME
segment, Journal of International Studies 9(2): 90-102.
Dobrovič, J.; Korauš, A.; Dančišinová, L. 2016. Sustainable economic development of Slovakia: factors determining optimal tax collection,
Journal of Security and Sustainability Issues 5(4): 533-544. DOI: http://dx.doi.org/10.9770/jssi.2016.5.4(8)
Ēnu ekonomikas indekss Baltijas valstīs 2009-2015. 2016. Stockholm school of Economics in Riga. Available on the Internet:
<http://www.sseriga.edu/en/news-and-events/upcoming-events/enuekonomikaskonference2016.html>.
Fraud and corruption — the easy option for growth? Europe, Middle East, India and Africa Fraud Survey 2015. Available on the Internet:
<http://www.ey.com/Publication/vwLUAssets/ey-emeia-fraud-survey/$FILE/ey-emeia-fraud-survey.pdf>
Ivančiks, J.; Tumalavičius, V.; Teivāns-Treinovskis, J. 2015. Security of society: narcotics and drug addiction in Latvia and Lithuania,
Journal of Security and Sustainability Issues 4(4): 353–368. DOI: <http://dx.doi.org/10.9770/jssi.2015.4.4(4)>.
Kozubíková, L., Zoubková, A. 2016. Entrepreneur´s attitude towards innovativeness and competitive aggressiveness: The case study of
Czech micro-enterprises, Journal of International Studies 9 (1): 192-204.
Laužikas, M.; Tindale, H.; Bilota, A.; Bielousovaitė, D. 2015. Contributions of sustainable start-up ecosystem to dynamics of start-up
companies: the case of Lithuania, Entrepreneurship and Sustainability Issues 3(1): 8-24. http://dx.doi.org/10.9770/jesi.2015.3.1(1)
Leskova, Z. G.; Didenko, A. A. 2016. Illegal Business: Changes of Corpus Delicti Features from the Standpoint of the Civil Law Reformation
of the Russian Federation. Criminology Journal of Baikal National University of Economics and Law. v. 10, Nr 1. p. 96–104.
Luneev, V.V. 2005. Crime and the Shadow Economy. Economic Science of Modern Russia Nr.1 (28) 2005.
Mamytova, N.V. 2016. Problems of Fighting Corruption Crimes in the Russian Federation. Criminology Journal of Baikal National
University of Economics and Law v. 10, Nr.2. p.261–269.
Matvejevs, A. 2013. Legal regimes in police activity at Latvian security policy, Journal of Security and Sustainability Issues 3(1): 23–30.
Mostenska, T.; Bilan, Y. 2015. Sustainable development through enhanced social responsibility, Journal of Security and Sustainability Issues
4(3):536–551. DOI: http://dx.doi.org/10.9770/jssi.2015.4.3(4)S
Newman, G. 1990. Crime and the Human Condition. Essays Crime and Development. UN1CRI, Rome, р. 80–82.
Operational and Search Characteristic of Modern Criminal Environment. Available on the Internet:
<http://bibliofond.ru/view.aspx?id=582779>.
Teivāns-Treinovskis, J.; Jefimovs, N. 2012. State national security: aspect of recorded crime, Journal of Security and Sustainability Issues
2(2): 41–48.
The International Journal
ENTREPRENEURSHIP AND SUSTAINABILITY ISSUES
ISSN 2345-0282 (online) http://jssidoi.org/jesi/
2016 Volume 4 Number 1 (September)
24
The Cost of Non-Europe in the area of Organised Crime and Corruption. 2016. Annex II - Corruption European Parliamentary Research
Service. European Added Value Unit PE 579.319, March 2016.
Transparency International. Table Of Results: Corruption Perceptions Index 2015. 2016. Available on the Internet:
<http://www.transparency.org/cpi2015>.
Tvaronavičienė, M. 2016. Start-ups across the EU: if particular tendencies could be trace, Entrepreneurship and Sustainability Issues 3(3):
290-298. http://dx.doi.org/10.9770/jesi.2016.3.3(6)
Jānis TEIVĀNS-TREINOVSKIS – PhD, Professor, is a Dean of Faculty of Social Sciences of Daugavpils University. Research interests:
criminal law, penal law, criminology.
Jeļena AMOSOVA – is a PhD student at Daugavpils University. Research interests: criminal law classification, application of criminal law.
Copyright © 2016 by author(s) and VsI Entrepreneurship and Sustainability Center
This work is licensed under the Creative Commons Attribution International License (CC BY).
http://creativecommons.org/licenses/by/4.0/
The International Journal
ENTREPRENEURSHIP AND SUSTAINABILITY ISSUES
ISSN 2345-0282 (online) http://jssidoi.org/jesi/
2016 Volume 4 Number 1 (September)
25
International Centre for
Entrepreneurship Research
ENTREPRENEURSHIP AND SUSTAINABILITY ISSUES
ISSN 2345-0282 (online) http://jssidoi.org/jesi/
SUSTAINABLE DEVELOPMENT IN HIGHER EDUCATION THROUGH SERVICE QUALITY AND
PRICE FAIRNESS: EMPIRICAL EVIDENCE FROM PRIVATE UNIVERSITIES IN DAMASCUS,
SYRIA
Serene Dalati 1, Salah Eddin Al Hamwi 2
1,2 Arab International University, Ghabagheb, Syria
E-mails:1 [email protected]; 2 [email protected]
Received 10 March 2016; accepted 20 June 2016
Abstract The purpose of this research is to develop a model which examines the relationship between adapted dimensions of service quality
scale and customer satisfaction and perceived price fairness, building on previous measurement instrument developed by (A. Parasuraman,
Zeithaml, & Berry, 1988b). The research paper investigates the instrument at higher education in Syria. The planned methodology for the
research employs a quantitative approach where the service quality instrument developed by (A. Parasuraman, Zeithaml, & Berry, 1988a) is
employed in this research. The sample of the study follows a non-probability sampling approach. The unit of analysis in this research is
undergraduate students of private universities in Syria. Online self-administered questionnaires were distributed to undergraduate students in
3 private universities in Syria. The adjusted instrument scale employed a 5 points Likert scale where 1 indicates strongly disagree and 5
strongly agree. The level of analysis investigates reliability and validity tests. Exploratory factor analysis (EFA) is employed to measure
relationships between measured variables. The exploratory factor analysis produced three dimensions. Cronbach alpha test is employed to
measure the internal consistency of the scale. The adapted service quality scale comprises of three dimensions namely institution task
orientation, institution relationship orientation and institution tangibles orientation. The instrument consists of 12 items. The research
recommends the measurement scale to be applied for service quality in Higher Education environment.
Keywords: Service Quality, SERVQUAL, SERVPERF, Higher Education, Student Satisfaction, Price Fairness
Reference to this paper should be made as follows: Dalati, S.; Al Hamwi, S. E. 2016. Sustainable development in higher education
through service quality and price fairness: empirical evidence from private universities in Damascus, Syria, Entrepreneurship and
Sustainability Issues 4(1): 25-38. DOI: http://dx.doi.org/10.9770/jesi.2016.4.1(3)
JEL Classifications: A2, A29

The International Journal
ENTREPRENEURSHIP AND SUSTAINABILITY ISSUES
ISSN 2345-0282 (online) http://jssidoi.org/jesi/
2016 Volume 4 Number 1 (September)
26
1. Introduction
Providing service quality has become a priority for service organizations and competitive advantage (Vojtovič &
Navickas, 2016; Aleksejeva, 2016; Dobele et al. 2016; Prause 2015; Čirjevskis 2015; Dzemyda et al. 2015).
Understanding the factors that affect students’ perception of a service is a significant dimension to understand their
attitudes and perception about the service. In higher education, there are problems of structure, personalities,
students, academic staff, physical environment, university staff and management (Rosha, Lace, 2015), (Prause,
2015); ( Dubauskas, Balius, 2015); (Goyal, Sergi, 2015).
In order to maintain contemporary required level, universities have to interact with industry and other stakeholders
(Ciemleja, Lace, 2015; Tvaronavičienė, Černevičiūtė, 2015, Čirjevskis, 2015, Djordjevic & Cotton, 2011). All this
creates a complex situation in which higher education is assessed on bases of how well students are satisfied, what
is valued by students, how students perceive the quality of education and how these can be improved. In today's
competitive academic environment, students have many options available. There are factors that enable educational
institutions to attract and retain students including service quality. Private universities are profit-based organizations
selling educational services to students as their primary customers. A prior study has identified that regarding
students as customers is not a very new idea. Previously, students were considered as consumers of service; with
the introduction of private institutions, where students consciously pick, choose and buy the service; therefore, they
have the right to be regarded as customers being “partners” in the learning process (Douglas, Douglas, & Barnes,
2006).
In today's competitive academic environment where students have many options available to them, factors that
enable educational institutions to attract and retain students should be very significant. Higher education institutions
need to begin searching for effective and creative ways to attract, retain and foster stronger relationships with
students. In this study, students are treated as customers, which are the lifeline in any business. Increasing student
satisfaction ultimately leads to an increase in loyalty for the Higher Education institution. An increased level of
globalization caused consumer knowledge and awareness in developing to increase. This gave consumers the ability
to see and exhibit different quality standards established by companies around the world, which helped in setting
up an expectation and perception platform for customers.
2. Service Quality
Better understanding of service quality requires the examination of three characteristics namely intangibility,
heterogeneity and inseparability (Parasuraman, Zeithaml, & Berry, 1985). Services are intangible because
performance of the service varies and is not standardized. Secondly services are heterogeneous as they vary from
time to time and from one producer to another. Consistency of behaviour is not possible. What the service provides,
or intends to provide could be different from what the customer receives. Thirdly services have the characteristic
of inseparability. Production and consumption occurs at the same time (A. Parasuraman et al., 1985). Figure 1
illustrates characteristics of services as illustrated by Parasuraman et al 1985.
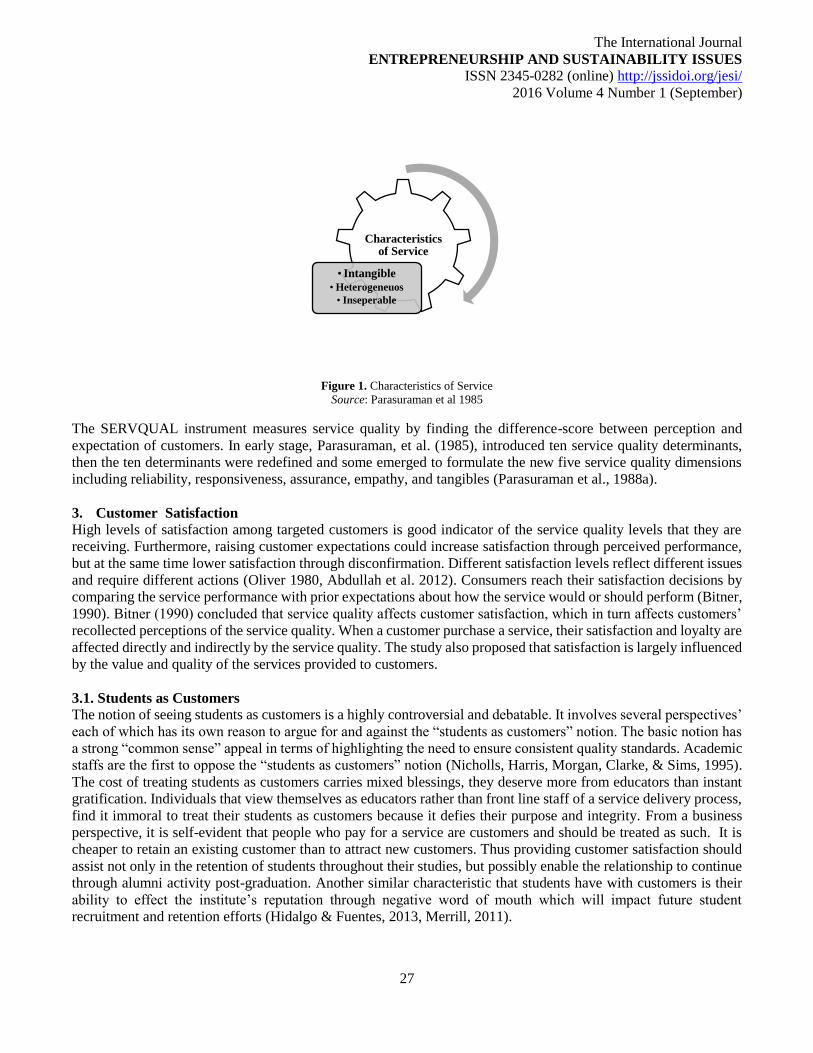
The International Journal
ENTREPRENEURSHIP AND SUSTAINABILITY ISSUES
ISSN 2345-0282 (online) http://jssidoi.org/jesi/
2016 Volume 4 Number 1 (September)
27
Figure 1. Characteristics of Service
Source: Parasuraman et al 1985
The SERVQUAL instrument measures service quality by finding the difference-score between perception and
expectation of customers. In early stage, Parasuraman, et al. (1985), introduced ten service quality determinants,
then the ten determinants were redefined and some emerged to formulate the new five service quality dimensions
including reliability, responsiveness, assurance, empathy, and tangibles (Parasuraman et al., 1988a).
3. Customer Satisfaction
High levels of satisfaction among targeted customers is good indicator of the service quality levels that they are
receiving. Furthermore, raising customer expectations could increase satisfaction through perceived performance,
but at the same time lower satisfaction through disconfirmation. Different satisfaction levels reflect different issues
and require different actions (Oliver 1980, Abdullah et al. 2012). Consumers reach their satisfaction decisions by
comparing the service performance with prior expectations about how the service would or should perform (Bitner,
1990). Bitner (1990) concluded that service quality affects customer satisfaction, which in turn affects customers’
recollected perceptions of the service quality. When a customer purchase a service, their satisfaction and loyalty are
affected directly and indirectly by the service quality. The study also proposed that satisfaction is largely influenced
by the value and quality of the services provided to customers.
3.1. Students as Customers
The notion of seeing students as customers is a highly controversial and debatable. It involves several perspectives’
each of which has its own reason to argue for and against the “students as customers” notion. The basic notion has
a strong “common sense” appeal in terms of highlighting the need to ensure consistent quality standards. Academic
staffs are the first to oppose the “students as customers” notion (Nicholls, Harris, Morgan, Clarke, & Sims, 1995).
The cost of treating students as customers carries mixed blessings, they deserve more from educators than instant
gratification. Individuals that view themselves as educators rather than front line staff of a service delivery process,
find it immoral to treat their students as customers because it defies their purpose and integrity. From a business
perspective, it is self-evident that people who pay for a service are customers and should be treated as such. It is
cheaper to retain an existing customer than to attract new customers. Thus providing customer satisfaction should
assist not only in the retention of students throughout their studies, but possibly enable the relationship to continue
through alumni activity post-graduation. Another similar characteristic that students have with customers is their
ability to effect the institute’s reputation through negative word of mouth which will impact future student
recruitment and retention efforts (Hidalgo & Fuentes, 2013, Merrill, 2011).
Characteristics of Service
• Intangible
• Heterogeneuos
• Inseperable
The International Journal
ENTREPRENEURSHIP AND SUSTAINABILITY ISSUES
ISSN 2345-0282 (online) http://jssidoi.org/jesi/
2016 Volume 4 Number 1 (September)
28
4. Perceived Price Fairness
Price fairness refers to consumers’ assessments of whether a seller’s price is reasonable, acceptable and justifiable.
Charging fair price is a very important issue that leads toward satisfaction, it helps to develop customer satisfaction
and loyalty. Kotler and Armstrong (2013) reported that price is the amount of money exchanged for a product or
service, or the sum of the values that customers exchange for the benefits of acquiring the product or service.
Zeithaml et al. (1996) stated that the customer’s perceived price can be considered as what is given up or sacrificed
to get a product or service. The price of a service can significantly influence perceptions of quality and satisfaction
(Zeithaml 2012).
Customer satisfaction is directly influenced by price perceptions while indirectly through the perception of price
fairness. The price fairness itself and the way it is fixed and offered have a great impact on satisfaction. The
perception of a fair price differs amongst individuals; however, the perception of how quality is associated with
price, is relatively common. Although marketing efforts try to convince consumers otherwise, low standards or
quality of a service are usually associated with low price and vice versa high quality or high standards are associated
with high price. Most private universities charge a relatively high price for their services, thus the student
automatically assumes that he or she will receive a high quality standards service. Information including price and
local ranking for most Syrian private universities can be found online, thus student satisfaction can be influenced
not only by the student comparing the price of his or her choice of university to other institutes but by comparing
the extra services being offered elsewhere at different price offering. In this study, the student’s perceived price is
what is given or sacrificed to attain educational services.
5. Research Employed Methodology
The research study employs a quantitative approach by the application of a multi-dimensional scale comprised of
22 items measuring service quality dimensions. Research methodology examines questionnaire design of service
quality dimensions adapted from Parasuraman et al (1988).
5.1. Questionnaire Design
The research measurement scale is mainly based on Parasuraman, et al., 1988. However a set of factors are taken
into consideration before making changes on the service quality scale. These factors include research objectives,
response type, number of dimensions, number of scale points, and a balanced scale. The instrument applied a 5
point Likert scale where 1 is indicated strongly Disagree and 5 is strongly agree. Assessment of customer perception
of the service quality dimensions used 22-items. Student’s satisfaction applied a single item scale to measure student
satisfaction with the service. Price fairness also applied a single item scale to measure price fairness of the service.
5.2. Sampling Design
The research employs a non-probability sampling strategy. The target study population comprises undergraduate
students of three private universities in Syria providing higher education bachelor programs in different fields of
studies. The unit of analysis comprises of undergraduate students belonging to the target universities. The size of
the sample comprises of 107 undergraduate students studying at various major undergraduate programs at the
following universities. Table 1 illustrates the sample of the study and the distribution among three target higher
education institutions.
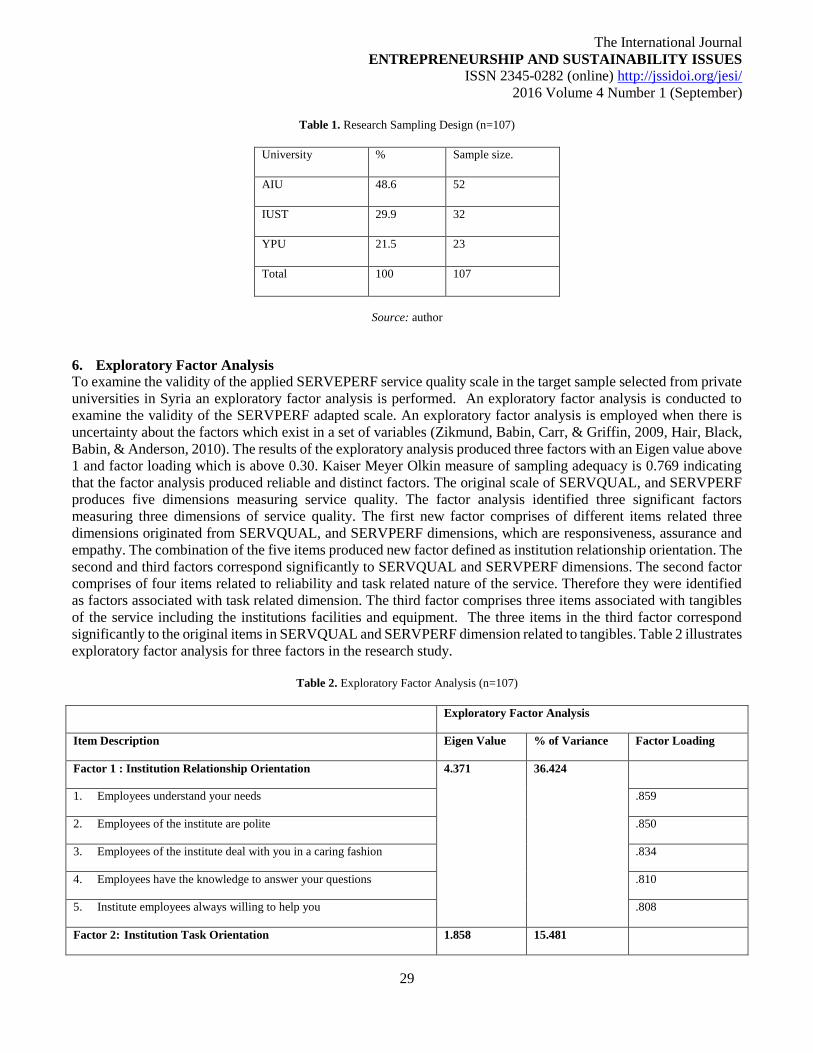
The International Journal
ENTREPRENEURSHIP AND SUSTAINABILITY ISSUES
ISSN 2345-0282 (online) http://jssidoi.org/jesi/
2016 Volume 4 Number 1 (September)
29
Table 1. Research Sampling Design (n=107)
University % Sample size.
AIU 48.6 52
IUST 29.9 32
YPU 21.5 23
Total 100 107
Source: author
6. Exploratory Factor Analysis
To examine the validity of the applied SERVEPERF service quality scale in the target sample selected from private
universities in Syria an exploratory factor analysis is performed. An exploratory factor analysis is conducted to
examine the validity of the SERVPERF adapted scale. An exploratory factor analysis is employed when there is
uncertainty about the factors which exist in a set of variables (Zikmund, Babin, Carr, & Griffin, 2009, Hair, Black,
Babin, & Anderson, 2010). The results of the exploratory analysis produced three factors with an Eigen value above
1 and factor loading which is above 0.30. Kaiser Meyer Olkin measure of sampling adequacy is 0.769 indicating
that the factor analysis produced reliable and distinct factors. The original scale of SERVQUAL, and SERVPERF
produces five dimensions measuring service quality. The factor analysis identified three significant factors
measuring three dimensions of service quality. The first new factor comprises of different items related three
dimensions originated from SERVQUAL, and SERVPERF dimensions, which are responsiveness, assurance and
empathy. The combination of the five items produced new factor defined as institution relationship orientation. The
second and third factors correspond significantly to SERVQUAL and SERVPERF dimensions. The second factor
comprises of four items related to reliability and task related nature of the service. Therefore they were identified
as factors associated with task related dimension. The third factor comprises three items associated with tangibles
of the service including the institutions facilities and equipment. The three items in the third factor correspond
significantly to the original items in SERVQUAL and SERVPERF dimension related to tangibles. Table 2 illustrates
exploratory factor analysis for three factors in the research study.
Table 2. Exploratory Factor Analysis (n=107)
Exploratory Factor Analysis
Item Description Eigen Value % of Variance Factor Loading
Factor 1 : Institution Relationship Orientation 4.371 36.424
1. Employees understand your needs .859
2. Employees of the institute are polite .850
3. Employees of the institute deal with you in a caring fashion .834
4. Employees have the knowledge to answer your questions .810
5. Institute employees always willing to help you .808
Factor 2: Institution Task Orientation 1.858 15.481
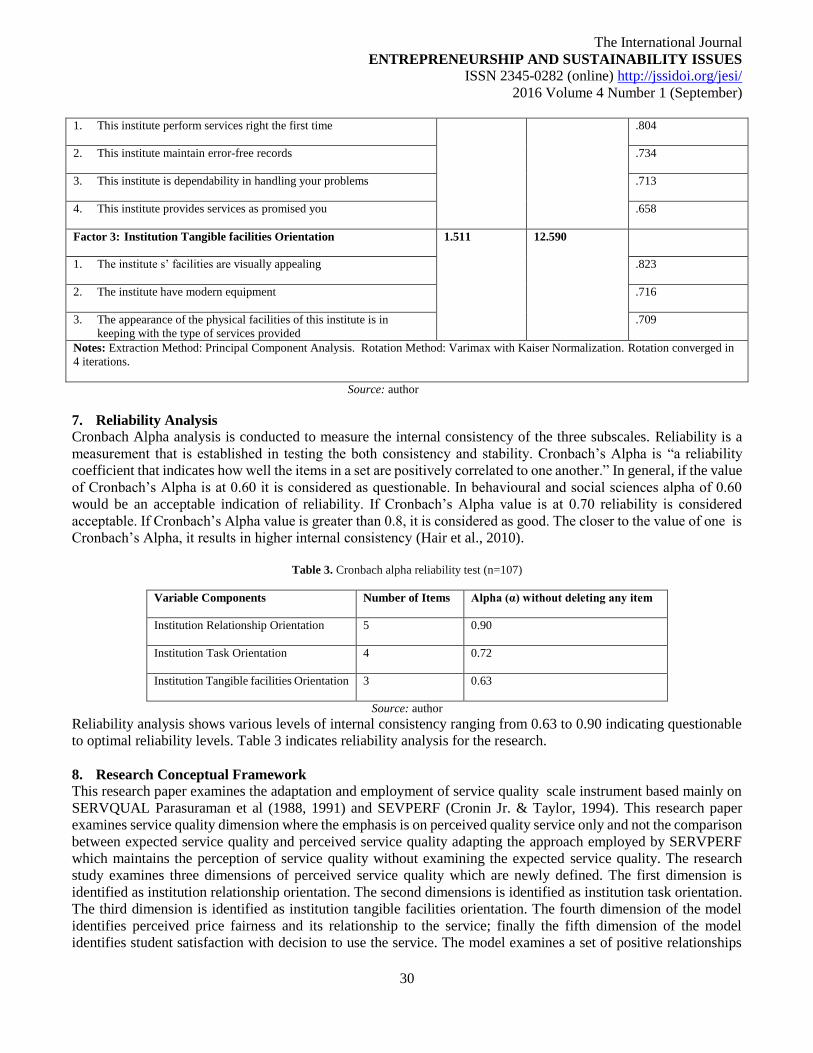
The International Journal
ENTREPRENEURSHIP AND SUSTAINABILITY ISSUES
ISSN 2345-0282 (online) http://jssidoi.org/jesi/
2016 Volume 4 Number 1 (September)
30
1. This institute perform services right the first time .804
2. This institute maintain error-free records .734
3. This institute is dependability in handling your problems .713
4. This institute provides services as promised you .658
Factor 3: Institution Tangible facilities Orientation 1.511 12.590
1. The institute s’ facilities are visually appealing .823
2. The institute have modern equipment .716
3. The appearance of the physical facilities of this institute is in
keeping with the type of services provided
.709
Notes: Extraction Method: Principal Component Analysis. Rotation Method: Varimax with Kaiser Normalization. Rotation converged in
4 iterations.
Source: author
7. Reliability Analysis
Cronbach Alpha analysis is conducted to measure the internal consistency of the three subscales. Reliability is a
measurement that is established in testing the both consistency and stability. Cronbach’s Alpha is “a reliability
coefficient that indicates how well the items in a set are positively correlated to one another.” In general, if the value
of Cronbach’s Alpha is at 0.60 it is considered as questionable. In behavioural and social sciences alpha of 0.60
would be an acceptable indication of reliability. If Cronbach’s Alpha value is at 0.70 reliability is considered
acceptable. If Cronbach’s Alpha value is greater than 0.8, it is considered as good. The closer to the value of one is
Cronbach’s Alpha, it results in higher internal consistency (Hair et al., 2010).
Table 3. Cronbach alpha reliability test (n=107)
Variable Components Number of Items Alpha (α) without deleting any item
Institution Relationship Orientation 5 0.90
Institution Task Orientation 4 0.72
Institution Tangible facilities Orientation 3 0.63
Source: author
Reliability analysis shows various levels of internal consistency ranging from 0.63 to 0.90 indicating questionable
to optimal reliability levels. Table 3 indicates reliability analysis for the research.
8. Research Conceptual Framework
This research paper examines the adaptation and employment of service quality scale instrument based mainly on
SERVQUAL Parasuraman et al (1988, 1991) and SEVPERF (Cronin Jr. & Taylor, 1994). This research paper
examines service quality dimension where the emphasis is on perceived quality service only and not the comparison
between expected service quality and perceived service quality adapting the approach employed by SERVPERF
which maintains the perception of service quality without examining the expected service quality. The research
study examines three dimensions of perceived service quality which are newly defined. The first dimension is
identified as institution relationship orientation. The second dimensions is identified as institution task orientation.
The third dimension is identified as institution tangible facilities orientation. The fourth dimension of the model
identifies perceived price fairness and its relationship to the service; finally the fifth dimension of the model
identifies student satisfaction with decision to use the service. The model examines a set of positive relationships
The International Journal
ENTREPRENEURSHIP AND SUSTAINABILITY ISSUES
ISSN 2345-0282 (online) http://jssidoi.org/jesi/
2016 Volume 4 Number 1 (September)
31
between service quality dimensions, students’ satisfaction with the service and price fairness. Figure 2 illustrates
conceptual framework of service quality, price fairness and student satisfaction in Higher education.
8.1. Research Variables
8.1.1. Institution relationship orientation
Institution relationship orientation is newly defined approach of perceived service quality which reflects academic
and administrative staff ability to demonstrate good levels of relationship and service providing support, assistance
and knowledge in answering students’ questions and requests. The new defined construct is a combination of
dimensions based originally on SERVQUAL (Parasuraman, Berry, & Zeithaml, 1991) and SEVPERF Cronin and
Taylor (1992). Institution relationship orientation comprises subscales including (a) helpful, (b) polite, (c)
knowledge to answer questions, (d) caring and (e) understanding of students’ needs.
8.1.2. Institution Task Orientation
Institution Task Orientation is a dimension of service quality which reflects higher education institution ability to
establish good standard levels of performance to students which has flawless records, right from the first time,
demonstrating dependable and reliable service and providing service as promised to students. Institution Task
Orientation dimension corresponds directly to reliability dimension which is based originally on SERVQUAL
Parasuraman et al (1988, 1991) and SEVPERF Cronin and Taylor (1992). Institution Task Orientation comprises
of subscales including (a) dependable service, (b) error – free records, (c) right the first time, and (d) service
provided as promised.
8.1.3. Institution Tangible Orientation
Institution Tangible Orientation is a dimension of service quality which reflects higher education institutions’ ability
to demonstrate and provide standard levels of tangible aspects including facilities and availability of equipment’s
in the institution. Tangible dimension is based originally on SERVQUAL Parasuraman et al (1988, 1991) and
SEVPERF Cronin and Taylor (1992). Institution Tangible Orientation compromise of subscales including (a)
modern equipment, (b) facilities visually appealing and (c) physical facility keeping up with type of service.
8.1.4. Price Fairness
Price is the amount of money or goods used to attain some combination of other goods and its associated services
(Tuan, 2012). Perceived price fairness in this study refers to one item adopted by Tuan (2012) applying a five-point
Likert scale.
8.1.5 Student Satisfaction with Decision to use the Service Student Satisfaction with Decision to use the Service
reflects student state of satisfaction with the service provided by the higher education institution. Student
satisfaction is developed as a single item scale based originally by Oliver (1980).
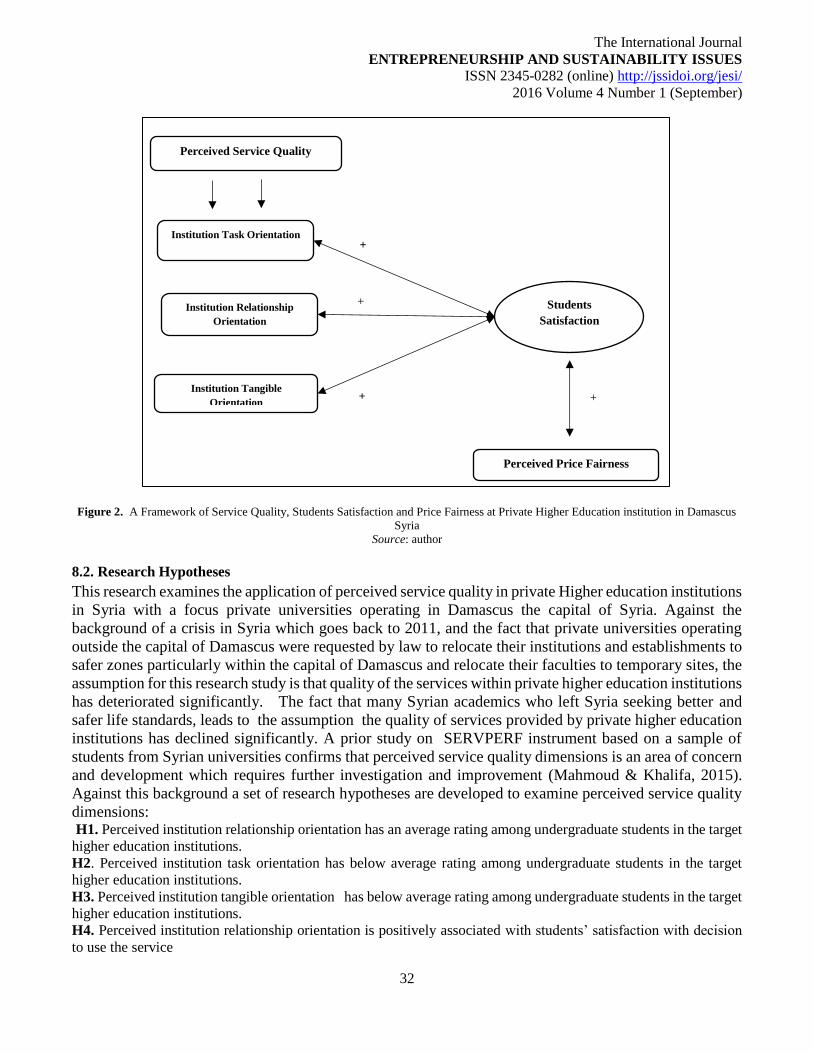
The International Journal
ENTREPRENEURSHIP AND SUSTAINABILITY ISSUES
ISSN 2345-0282 (online) http://jssidoi.org/jesi/
2016 Volume 4 Number 1 (September)
32
Figure 2. A Framework of Service Quality, Students Satisfaction and Price Fairness at Private Higher Education institution in Damascus
Syria
Source: author
8.2. Research Hypotheses
This research examines the application of perceived service quality in private Higher education institutions
in Syria with a focus private universities operating in Damascus the capital of Syria. Against the
background of a crisis in Syria which goes back to 2011, and the fact that private universities operating
outside the capital of Damascus were requested by law to relocate their institutions and establishments to
safer zones particularly within the capital of Damascus and relocate their faculties to temporary sites, the
assumption for this research study is that quality of the services within private higher education institutions
has deteriorated significantly. The fact that many Syrian academics who left Syria seeking better and
safer life standards, leads to the assumption the quality of services provided by private higher education
institutions has declined significantly. A prior study on SERVPERF instrument based on a sample of
students from Syrian universities confirms that perceived service quality dimensions is an area of concern
and development which requires further investigation and improvement (Mahmoud & Khalifa, 2015).
Against this background a set of research hypotheses are developed to examine perceived service quality
dimensions: H1. Perceived institution relationship orientation has an average rating among undergraduate students in the target
higher education institutions. H2. Perceived institution task orientation has below average rating among undergraduate students in the target
higher education institutions.
H3. Perceived institution tangible orientation has below average rating among undergraduate students in the target
higher education institutions.
H4. Perceived institution relationship orientation is positively associated with students’ satisfaction with decision
to use the service
Institution Task Orientation
Institution Relationship
Orientation
Institution Tangible
Orientation
Students
Satisfaction
+
+
+ +
Perceived Service Quality
Perceived Price Fairness
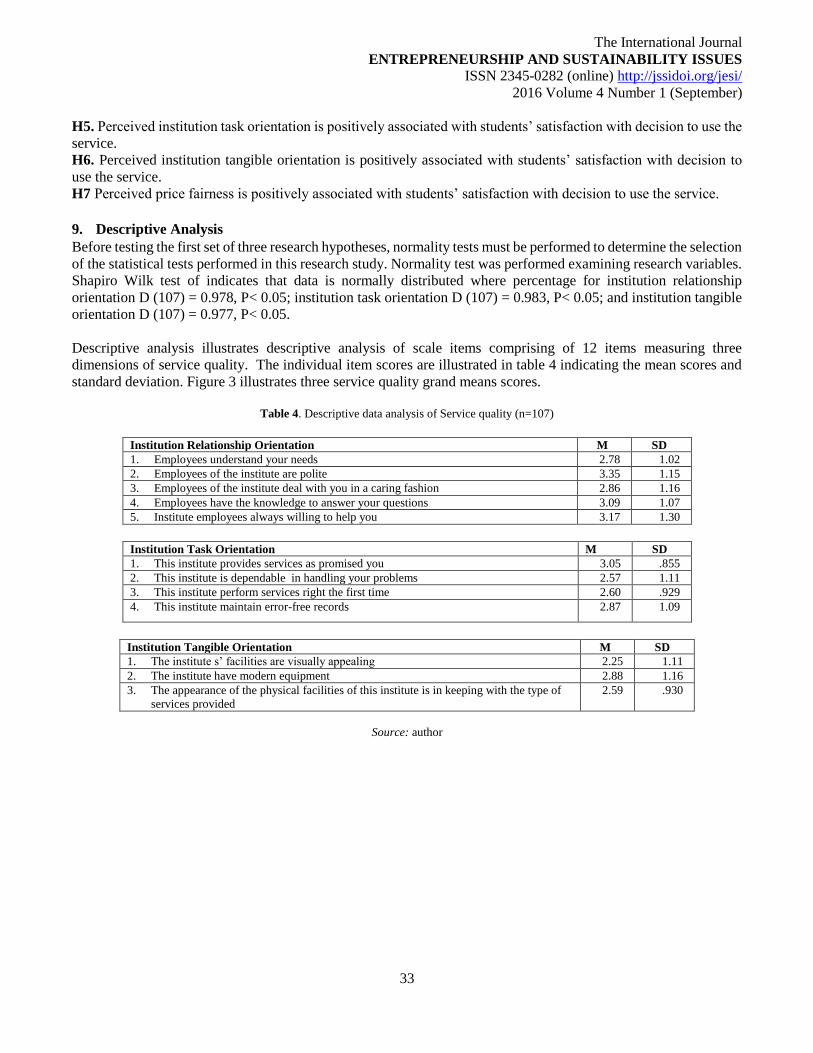
The International Journal
ENTREPRENEURSHIP AND SUSTAINABILITY ISSUES
ISSN 2345-0282 (online) http://jssidoi.org/jesi/
2016 Volume 4 Number 1 (September)
33
H5. Perceived institution task orientation is positively associated with students’ satisfaction with decision to use the
service.
H6. Perceived institution tangible orientation is positively associated with students’ satisfaction with decision to
use the service.
H7 Perceived price fairness is positively associated with students’ satisfaction with decision to use the service.
9. Descriptive Analysis
Before testing the first set of three research hypotheses, normality tests must be performed to determine the selection
of the statistical tests performed in this research study. Normality test was performed examining research variables.
Shapiro Wilk test of indicates that data is normally distributed where percentage for institution relationship
orientation D (107) = 0.978, P< 0.05; institution task orientation D (107) = 0.983, P< 0.05; and institution tangible
orientation D (107) = 0.977, P< 0.05.
Descriptive analysis illustrates descriptive analysis of scale items comprising of 12 items measuring three
dimensions of service quality. The individual item scores are illustrated in table 4 indicating the mean scores and
standard deviation. Figure 3 illustrates three service quality grand means scores.
Table 4. Descriptive data analysis of Service quality (n=107)
Institution Relationship Orientation M SD
1. Employees understand your needs 2.78 1.02
2. Employees of the institute are polite 3.35 1.15
3. Employees of the institute deal with you in a caring fashion 2.86 1.16
4. Employees have the knowledge to answer your questions 3.09 1.07
5. Institute employees always willing to help you 3.17 1.30
Institution Task Orientation M SD
1. This institute provides services as promised you 3.05 .855
2. This institute is dependable in handling your problems 2.57 1.11
3. This institute perform services right the first time 2.60 .929
4. This institute maintain error-free records 2.87 1.09
Institution Tangible Orientation M SD
1. The institute s’ facilities are visually appealing 2.25 1.11
2. The institute have modern equipment 2.88 1.16
3. The appearance of the physical facilities of this institute is in keeping with the type of
services provided
2.59 .930
Source: author
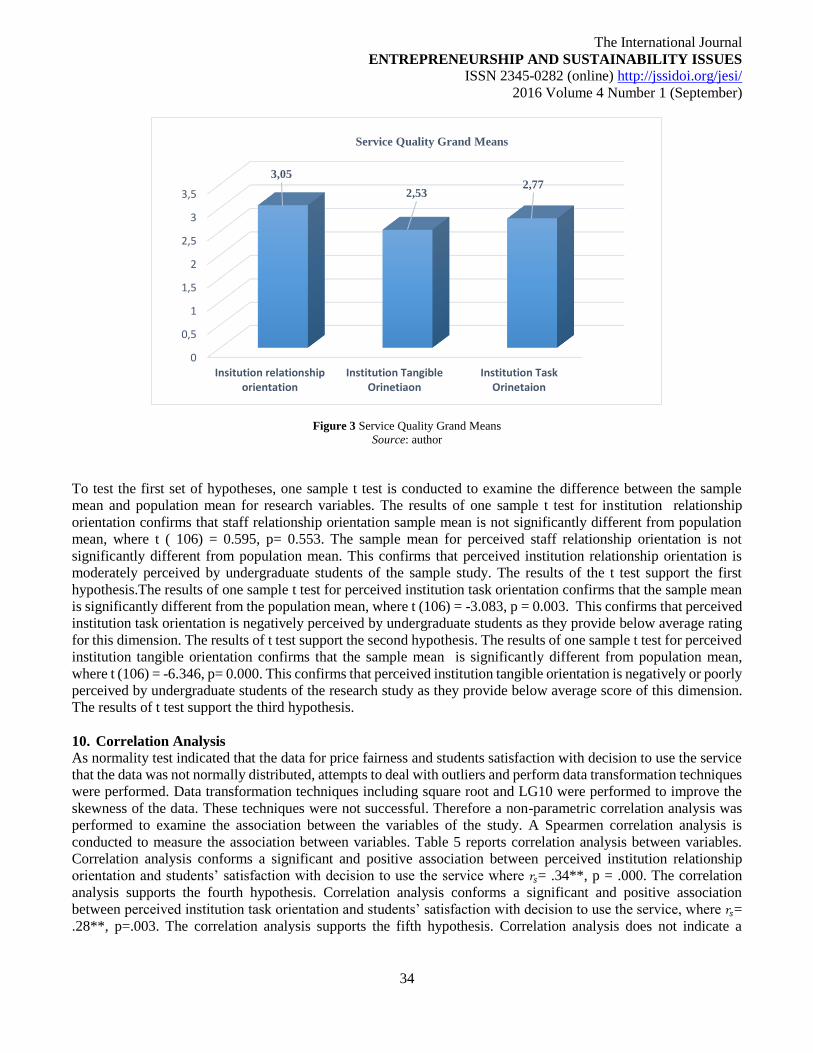
The International Journal
ENTREPRENEURSHIP AND SUSTAINABILITY ISSUES
ISSN 2345-0282 (online) http://jssidoi.org/jesi/
2016 Volume 4 Number 1 (September)
34
Figure 3 Service Quality Grand Means
Source: author
To test the first set of hypotheses, one sample t test is conducted to examine the difference between the sample
mean and population mean for research variables. The results of one sample t test for institution relationship
orientation confirms that staff relationship orientation sample mean is not significantly different from population
mean, where t ( 106) = 0.595, p= 0.553. The sample mean for perceived staff relationship orientation is not
significantly different from population mean. This confirms that perceived institution relationship orientation is
moderately perceived by undergraduate students of the sample study. The results of the t test support the first
hypothesis.The results of one sample t test for perceived institution task orientation confirms that the sample mean
is significantly different from the population mean, where t (106) = -3.083, p = 0.003. This confirms that perceived
institution task orientation is negatively perceived by undergraduate students as they provide below average rating
for this dimension. The results of t test support the second hypothesis. The results of one sample t test for perceived
institution tangible orientation confirms that the sample mean is significantly different from population mean,
where t (106) = -6.346, p= 0.000. This confirms that perceived institution tangible orientation is negatively or poorly
perceived by undergraduate students of the research study as they provide below average score of this dimension.
The results of t test support the third hypothesis.
10. Correlation Analysis
As normality test indicated that the data for price fairness and students satisfaction with decision to use the service
that the data was not normally distributed, attempts to deal with outliers and perform data transformation techniques
were performed. Data transformation techniques including square root and LG10 were performed to improve the
skewness of the data. These techniques were not successful. Therefore a non-parametric correlation analysis was
performed to examine the association between the variables of the study. A Spearmen correlation analysis is
conducted to measure the association between variables. Table 5 reports correlation analysis between variables.
Correlation analysis conforms a significant and positive association between perceived institution relationship
orientation and students’ satisfaction with decision to use the service where 𝑟𝑠= .34**, p = .000. The correlation
analysis supports the fourth hypothesis. Correlation analysis conforms a significant and positive association
between perceived institution task orientation and students’ satisfaction with decision to use the service, where 𝑟𝑠=
.28**, p=.003. The correlation analysis supports the fifth hypothesis. Correlation analysis does not indicate a
0
0,5
1
1,5
2
2,5
3
3,5
Insitution relationshiporientation
Institution TangibleOrinetiaon
Institution TaskOrinetaion
3,05
2,532,77
Service Quality Grand Means

The International Journal
ENTREPRENEURSHIP AND SUSTAINABILITY ISSUES
ISSN 2345-0282 (online) http://jssidoi.org/jesi/
2016 Volume 4 Number 1 (September)
35
significant relationship between perceived institution tangible orientation and students’ satisfaction with decision
to use the service, where 𝑟𝑠= .11, p= .232. The correlation analysis fails to support the sixth hypothesis.
The correlation analysis confirms a positive and significant association between perceived price fairness and
students satisfaction with decision to use the service at target universities of study, where 𝑟𝑠= .41, p=.000. The
correlation analysis support the seventh hypothesis. Figure 4 illustrates the correlational model examining the
positive association between variables of the study. The results indicates that as service quality dimensions namely
task and relationship oriented dimensions increase, students’ satisfaction with decision about the service also
increases. The result show that as students’ satisfaction with the decision about the service increase their perception
on price fairness also increase. The results do not indicate a strong association where all correlation coefficients are
below 0.50.
Table 5 Non-parametric Correlation Analysis
Variables 1 2 3 4 5
1. Perceived Institution Task Orientation 1
2. Perceived Institution Relationship orientation .33**
.000
1
3. Perceived Institution Tangible Orientation .22*
.018
.22*
.022
1
4. Perceived Price Fairness .33**
.000
.18
.056
.34**
.000
1
5. Student satisfaction with decision to use service .28**
.003
.34**
.000
.11
.232
.41**
.000
1
Source: author
Figure 4. Correlation between Service Quality, Students’ Satisfaction and Price Fairness
Source: author
Institution Task Orientation
Institution Relationship
Orientation
Institution Tangible
Orientation
Students
Satisfaction
.41**
Perceived Service Quality
Perceived Price Fairness
.34**
The International Journal
ENTREPRENEURSHIP AND SUSTAINABILITY ISSUES
ISSN 2345-0282 (online) http://jssidoi.org/jesi/
2016 Volume 4 Number 1 (September)
36
11. Discussion
This research investigates the examination and application of newly defined service quality dimensions originated
from Parasuraman et al (1988, 1991) and (Cronin Jr. & Taylor, 1994). The assumption is that the application of this
three dimensions model of service quality will assist higher education institutions detect areas of potential strength
and weakness or development in private higher education institutions operating in Damascus, Syria. The crisis
which has torn Syria over the past 6 years has left many sectors and institutions in a case of chaos and vulnerable.
Higher Education institutions are no exception and they require careful examination of how their units and
associations are performing. The research provides a significant contribution to the prior research on service quality
in higher education in Syria. The research variables grand means illustrates below average to average levels of
rating of service quality dimensions in higher education institutions of the research study. The research suggests
that further examination and attention needs to be exercised to the above mentioned service quality levels.
Descriptive data analysis confirms that service quality in higher education industry is an area of development that
rrequires further examination and improvement. The research confirms that perceived service quality scores are
below average to average rating, indicating that students of the target institution of the study perceive the service
provided at the target private higher education institutions as below average to average. A previous study on
SERVPERF dimensions applied in universities in Syria confirms similar findings (Mahmoud & Khalifa, 2015).
This research examines the relationship between service qualities, price fairness and students satisfaction in private
higher education institutions in Syria. The results of the study confirm partially research hypotheses. The results of
the research study indicate a positive but not strong relationship between perceived service quality, student
satisfaction with the service and price fairness. There are limitations to be addressed in the following section.
12. Limitations and Future Research
The most evident limitation is related to sample size. Larger sample size is requested so that the research could
perform both exploratory and confirmatory factor analyses. The measurement of adapted SERVQUAL scale and
examination of validity and reliability of the scale requires a larger sample size, where validity analysis could be
examined by conducting confirmatory factor analysis. The scale for students’ satisfaction and price fairness is
considered as a serious major limitation. With both students satisfaction with the service and perceived price fairness
developed single item scales, the research study faced a limitation related to the normality of data and therefore the
strength of the statistical tests applied. Single item scales also have issues related to reliability and validity. Future
research on service quality scales in Higher Education in Syria could take into consideration the examination of
larger research samples including private and public Higher Education institutions as the research topic is significant
to this industry. Future research could examine further levels of measurement scales analysis taking into
consideration the validity, reliability and practicality of the scale, as it is adapted from 7 points to 5 points Likert
Scale and is translated to Arabic.
13. Managerial Implication
This research paper examined the application of SERVPERF dimensions and their effect on student satisfaction in
higher education private institutions. The research study strongly recommends that further development and
organizational focus is required to be exerted in this field related to service quality and its improvement. Training
in the fields of customer service, customer relationships, and students’ services is required and highly
recommended. Students’ satisfaction is a significant indicator of a higher education institution performance and
effectiveness. The research study highly recommends application of service quality dimension in the higher
education institutions.
The International Journal
ENTREPRENEURSHIP AND SUSTAINABILITY ISSUES
ISSN 2345-0282 (online) http://jssidoi.org/jesi/
2016 Volume 4 Number 1 (September)
37
Conclusion
This research examined the relationship between service quality and customer satisfaction in private higher
education institutions in Syria. The results confirms positive effect of service quality dimensions on students’
satisfaction. The research provides support to prior research in the field of service quality in higher education.
References
Abdullah, F., Ahmad, N., Warraich, U. A., Qureshi, F. K., Nawaz, A., Qureshi, F. K., … Sureshchandar, G. S. (2012). A conceptual study
on the relationship between service quality towards customer satisfaction: Servqual and gronroos’s service quality model perspective.
Journal of Marketing, 3(1), 193–209. http://doi.org/10.5539/ass.v8n13p201
Aleksejeva, L. (2016). Country’s competitiveness and sustainability: higher education impact, Journal of Security and Sustainability
Issues 5(3): 355-363. http://dx.doi.org/10.9770/jssi.2015.5.3(4)
Bitner, M. J. (1990). Evaluating Service Encounters: The Effect of Physical Surrounding and Employee Responses. Journal of Marketing,
54(2), 69–82. Retrieved from http://www.jstor.org/stable/1251871\nhttp://www.jstor.org/page/info/about/policies/terms.jsp
Ciemleja, G.; Lace, N. (2016). Opportunities for sustainable development and challenges in nanotech industry in Latvia, Journal of
Security and Sustainability Issues 5(3): 423-436. http://dx.doi.org/10.9770/jssi.2016.5.3(10)
Čirjevskis, A. (2015). Sustainability in higher education: discourse on dynamic capabilities of privately run higher educational institutions
(HEI) in Latvia, Journal of Security and Sustainability Issues 5(1): 111-122.http://dx.doi.org/10.9770/jssi.2014.5.1(9)
Cronin Jr., J. J., & Taylor, S. A. (1994). SERVPERF Versus SERVQUAL: Reconciling Performance-Based and Perceptions-Minus-
Expectations Measurement of Service Quality. Journal of Marketing, 58(1), 125–131. http://doi.org/10.2307/1252256
Djordjevic, a., & Cotton, D. R. E. (2011). Communicating the sustainability message in higher education institutions. International
Journal of Sustainability in Higher Education, 12(4), 381–394. http://doi.org/10.1108/14676371111168296
Dubauskas, G.; Balius, R. (2015). Management of public private partnership in education: aspects of public sector training sustainability
issues, Journal of Security and Sustainability Issues 4(4): 345-352.http://dx.doi.org/10.9770/jssi.2015.4.4(3)
Douglas, J., Douglas, A., & Barnes, B. (2006). Measuring Student Satisfaction at a UK University. Quality Assurance in Education: An
International Perspective, 14(3), 251–267. Retrieved from http://dx.doi.org/10.1108/09684880610678568
Goyal, S. and Sergi, B. (2015). Social Entrepreneurship and Sustainability – Understanding the Context and Key Characteristics. Journal of
Security and Sustainability Issues, 4(3), 269–278. http://doi.org/10.9770/jssi.2015.4.3(7)
Hair, J. F., Black, W. C., Babin, B. J., & Anderson, R. E. (2010). Multivariate Data Analysis. Vectors.
http://doi.org/10.1016/j.ijpharm.2011.02.019
Hidalgo, L. A., & Fuentes, M. A. (2013). The Development of Basic Competencies for Sustainability in Higher Education: An Educational
Model. US-China Education Review, Volume 3(Number 6), 498.
Kotler, P., & Armstrong, G. (2013). Principles of Marketing. World Wide Web Internet And Web Information Systems, 42, 785.
http://doi.org/10.2307/1250103
Mahmoud, A. B., & Khalifa, B. (2015). A confirmatory factor analysis for SERVPERF instrument based on a sample of students from
Syrian universities. Education + Training, 57(3), 1–19. http://doi.org/10.1108/ET-04-2014-0038
Merrill, N. (2011). Social media for social research: Applications for higher education communications. Cutting-Edge Technologies in
Higher Education (Vol. 2). Emerald. http://doi.org/10.1108/S2044-9968(2011)0000002005
Nicholls, J., Harris, J., Morgan, E., Clarke, K., & Sims, D. (1995). Marketing higher education: the MBA experience. International Journal
of Educational Management, 9(2), 31–38. http://doi.org/10.1108/09513549510082369
Oliver, R. L. (1980). A cognitive model of the antecedents and consequences of satisfaction decisions. Journal of Marketing Research,
17(November), 460–470. http://doi.org/10.2307/3150499
The International Journal
ENTREPRENEURSHIP AND SUSTAINABILITY ISSUES
ISSN 2345-0282 (online) http://jssidoi.org/jesi/
2016 Volume 4 Number 1 (September)
38
Parasuraman, A., Zeithaml, V. A., & Berry, L. L. (1988a). Servqual - a Multiple-Item Scale for Measuring Consumer Perceptions of
Service Quality. Journal of Retailing, 64(1), 12–40.
Parasuraman, A., Zeithaml, V., & Berry, L. (1985). A Conceptual Model of Service Quality and its Implications for Future. Journal of
Marketing, 49(4), 41–50. http://doi.org/10.2307/1251430
Parasuraman, A., Zeithaml, A. V., & Berry, L. L. (1988b). SERVQUAL: A multiple-item scale for measuring consumer perceptions of
service quality. Journal of Retailing, Volume 64(1), 12–40.
Parasuraman, a., Berry, L. L., & Zeithaml, V. a. (1991). Refinement and Reassessment of the SERQUAL Scale. Journal of Retailing.
http://doi.org/10.1111/j.1438-8677.2010.00335.x
Prause, G. (2015). Sustainable business models and structures for industry 4.0. Journal of Security and Sustainability Issues, 5(2), 159–169.
http://doi.org/10.9770/jssi.2015.5.2(3)
Rosha, A.; Lace, N. 2015. Sustainable development and behavioural patterns: to innovations through coaching, Journal of Security and
Sustainability Issues 5(2): 171-180. http://dx.doi.org/10.9770/jssi.2015.5.2(4)
Tuan, N. M. (2012). Effects of service quality and price fairness on student satisfaction. International Journal of Business and Social
Science, 3(19 October), 132–151. Retrieved from
https://www.academia.edu/9764615/Effects_of_Service_Quality_and_Price_Fairness_on_Student_Satisfaction
Tvaronavičienė, M.; Černevičiūtė, J. (2015). Technology transfer phenomenon and its impact on sustainable development, Journal of
Security and Sustainability Issues 5(1): 87–97. DOI: http://dx.doi.org/10.9770/jssi.2015.5.1(7)
Valarie A. Zeithaml, M. J. B. and D. D. G. (2012). Services Marketing Integrating Customer Focus second European, 576.
Vojtovič, S.; Navickas, V.; Gruzauskas, V. (2016). Strategy of sustainable competitiveness: methodology of real-time customers’
segmentation for retail shops, Journal of Security and Sustainability Issues 5(4): 489-499.http://dx.doi.org/10.9770/jssi.2016.5.4(4)
Zeithaml, V., Berry, L. L., & Parasuraman, A. (1996). The behavioral consequences of service quality. Journal of Marketing, 60(April),
31–46. http://doi.org/10.2307/1251929
Zikmund, W., Babin, B., Carr, J., & Griffin, M. (2009). Business Research Methods
Dr. Serene DALATI is the Head of Management Department and a senior lecturer at the faculty of Business administration at the Arab
International University, Syria. Dr. Dalati has obtained a PhD in Leadership, Organizational Culture and Job satisfaction in 2008 which
was preceded by an MBA from Bangor University in 2002. Dr. Dalati teaches for areas in organizational Behaviour, Leadership, Culture
and Job satisfaction. Fields of expertise of teaching also include Strategic Management, International Management, Marketing, and
Entrepreneurial Small Business
Copyright © 2016 by author(s) and VsI Entrepreneurship and Sustainability Center
This work is licensed under the Creative Commons Attribution International License (CC BY).
http://creativecommons.org/licenses/by/4.0/
The International Journal
ENTREPRENEURSHIP AND SUSTAINABILITY ISSUES
ISSN 2345-0282 (online) http://jssidoi.org/jesi/
2016 Volume 4 Number 1 (September)
39
International Centre for
Entrepreneurship Research
ENTREPRENEURSHIP AND SUSTAINABILITY ISSUES
ISSN 2345-0282 (online) http://jssidoi.org/jesi/
ECOSYSTEM FOR SUSTAINABLE ENTREPRENEURSHIP: TOWARDS SMART PUBLIC
PROCUREMENT REVIEW PROCEDURES
Agnė Tvaronavičienė¹, Gintarė Žemaitaitienė², Tatjana Bilevičienė3
1,2,3 Mykolas Romeris University
Ateisties str. 20,
08303 Vilnius, Lithuania
E-mails:1 [email protected]; [email protected]; [email protected]
Received 10 February 2016; accepted 18 May 2016
Abstract. Although European Union and national regulation have developed public procurement system for many years, different
stakeholders (contracting authorities, judiciary, controlling authorities) provide much criticism to these procedures. The article presents
results of experts’ evaluation of currently applied system and investigates the possibilities for online public procurement review procedure.
Lithuania is one of EU leading countries in regard of e-procurement. The results showed that the object of the research is poorly studied, but
theoretically formulated problems are relevant in practice. Analysis of problematic aspects might be useful to improve national system of
public procurement dispute resolution. As well as might be applied in the practise of other EU countries, seeking to apply social technologies
to carry on time and money consuming public procurement procedures. Future researches should be oriented towards analysis of e- public
procurement platforms used in the EU member states supplementation with specific modules for purchasing authorities’ decisions’ review.
Keywords: public procurement, online dispute resolution, e-public procurement, social technologies, review procedure.
Reference to this paper should be made as follows: Tvaronavičienė, A.; Žemaitaitienė, G.; Bilevičienė, T. 2016. Ecosystem for sustainable
entrepreneurship: towards smart public procurement review procedures; Entrepreneurship and Sustainability Issues 4(1): 39-52.
DOI: http://dx.doi.org/10.9770/jesi.2016.4.1(4)
JEL Classifications: K41, J52, H57
1. Introduction
In every state, the proper performance of public procurement is significantly affected by a targeted and coherent
public policy in the field and adequacy of managerial and legal measures for its implementation. Today, the current
situation is rather paradoxical. The public procurement system that has been developed for many years by European
Union and national regulation, in all member states countries still receives much criticism from all parties to these
procedures. For instance, contracting authorities escalate the problem of excessive procurement regulation,
The International Journal
ENTREPRENEURSHIP AND SUSTAINABILITY ISSUES
ISSN 2345-0282 (online) http://jssidoi.org/jesi/
2016 Volume 4 Number 1 (September)
40
allegedly excessively detailed regulation precludes the effective purchase process, and a significant administrative
burden (Delfi.lt 2008; Maga.lt 2008; Čapas&Čapas 2013; Oganisjana et al. 2015). Controlling authorities express
dissatis faction for obviously inadequate qualification of procurement professionals engaged (Public Procurement
Office 2011), and poor procurement planning (Bilkis 2016). Honest businesses dissatisfied with lost potential
revenue due to corruption in public procurement (Kyšiai.lt 2009). And finally, society is disappointed by "impunity"
for procurement infringements (vz.lt 2014; kaunodiena.lt, 2013). Naturally, such claims are related to a wide range
of different and even contrary interest of subjects expressing them. These differences often turn on to serious
conflicts, which need to be resolved quickly and effectively. Every EU member country applies certain public
procurement disputes resolution system. Review Directive (Directive 2007/66/EC) sets main requirements for it.
Still every country also has a wide discretion to design it according to specifics of its legal system. Previous
researches (Tvaronaviciene 2014; Pachnou 2003) in this field showed that within EU every country has its own
unique system for public procurement review. On one hand, such variety helps countries to retain discretion and to
be able to react quickly to the needs of parties to a dispute. Still, on the other hand, it builds certain obstacles for
equal competition in the market in regard of steady possibilities to protect violated interests. International entities
are facing more difficulties in proper defence of its violated rights to compare with local ones, who know better the
national system. Difficult and costly review procedures also are less attractive for small and medium business,
which sometimes restrains from taking part in public procurements only because of stereotype that this sector is
corrupted and designated for biggest and most powerful entities. Appropriate system of public procurement review
is a most effective tool for fully implementation and further supervision of ground principles as transparency,
honesty and equal competition. Suppliers participating actively in procurement procedures and reacting to every
violation of legal regulation in the field are capable to detect and to counteract every infringement. Such mission
will never be possible to various EU and national supervising bodies. Still in order to motivate suppliers to be active
in their violated rights defence, the procedure of such dispute resolution should be assessable and easy to use.
Having in mind that currently big part of public procurements within EU are already electronical, it raises a question
that one of the next steps in improving EU public procurement policy should be transferring EU public procurement
review procedures online.
The object of this research is a system of public procurement review. This research aims to identify main problems
of currently applied system of public procurement review and to investigate the possibilities for online public
procurement review procedure. Lithuania was chosen as one of the leading countries in regard of e-procurement.
Such characteristic should be treated as important factor because experts of this country are already enjoying
advantages of e-procurements and day after day are taking part in such procedures online.
The results of this research might be useful for improving national system of public procurement dispute resolution,
bus as well might be applied in the practise of other EU countries, which also seek to develop and reform analysed
sector, by employing social technologies as a tools to carry on time and money consuming procedures. Having in
mind the e-invoice initiative (eu2013.lt 2013), which constantly is being implemented in member countries, e-
review is an option for EU seeking to unify and fasten public procurement dispute resolution.
2. The Importance of Appropriate Public Procurement Review Procedure
Public procurement is a quite complicated system aimed to effective and transparent public expenditure (Girūnas,
Mackevičius 2014). Having in mind high purchasing powers of the state governments (Thai 2001), it might be titled
as a one of the most important functions of public administration, which have notable impact on development of
the each state. Non-proper fulfilling of requirements on public procurement, which are implied by national as well
as international legal regulation, always fate difficult consequences. Not only purchasing authorities and suppliers
suffers because of infringements, also big damage is done for whole society and especially for its attitude towards
public bodies. Such infringements also may cause interruptions of administrative sector services and definitely
create an atmosphere suitable for corruption (Tvaronavičienė, Grybaitė, 2012; Fazekas et al. 2013; Hessami 2014).
The International Journal
ENTREPRENEURSHIP AND SUSTAINABILITY ISSUES
ISSN 2345-0282 (online) http://jssidoi.org/jesi/
2016 Volume 4 Number 1 (September)
41
Fulfilling public procurement requirements in regard of acquisition of necessary goods and services is a duty of
almost every public administration body as well as other organizations. Having in mind high number of such
entities, it should be stated that authorised institutions are not able to detect all the infringements. Statistics shows,
that for example in Lithuania, only small part of procurement procedures are supervised by competent authorities
(Special Investigation Service of the Respublic of Lithuania 2014; Ministry of the Interior of the Republic of
Lithuania 2014; Public Procurement office 2014). That is why, the main role in the battle with not honest behaviour
of purchasing authorities should be envisaged for suppliers, whose rights and interest may be damaged. Seeking to
defend their rights, they normally initiate legal procedures, aimed to investigate whether certain decisions of
purchasing authorities do not contradict requirements setted down in legal regulation. The effectiveness of such
control mechanism is strongly dependent from the clearness, transparency and simpliness of public procurement
disputes resolution procedure.
It should be stated that today in Lithuania there is quit low number of public procurement disputes. The quantitative
research conducted in Lithuania (Tvaronavičienė 2015) revealed that comparatively few public procurement
disputes are resolved in courts. Claims in respect of which judicial decisions are taken, in most cases are rejected,
and interim measures are relatively rarely applied. Such data shows that today in Lithuania tenderers contribute
little to the assurance of procurement legality.
In Lithuania, the application of exclusively judicial review procedure for the decisions of the purchasing authorities
faces several issues. Resesarcher discovered too long dispute resolution, declarative and not functional system
of unmeritorious claims provision preventive measures, the absence of specialisation of judges, the uneven judicial
practice, failure to use specialised electronic procurement system for a dispute resolution process, low confidence
in courts, complex and formal dispute resolution process and insufficiently effective pre-litigation procurement
dispute resolution stage. All these problems imply the need to search for the opportunities to improve dispute
resolution system of public procurement.
3. Adopting Social Technologies for More Effective Public Procurement Dispute Resolution
No areas of contemporary life, including state governance, today can function well without social technologies. E-
governance may be described as a phenomenon governed by state and municipal bodies aimed at development of
society relations. Its goal is to improve the transparency of executive bodies’ decisions, to provide better quality
and more effective public services and information for society, business entities and institutions, using opportunities
provided by information technologies (Ereminaitė&Junevičius 2011). It should be stated that using social
technologies in public sector leaves less space for corruption, improves transparency, strengthen reliance on
government and decreases costs of public institutions. It is possible to list four principles of e-governance: creation
of services for citizens, increasing the accessibility of public services, better involvement of various social groups
as well as more effective collection and employment of information (Ereminaitė&Junevičius 2011). It is clear that
at present public procurement dispute resolution systems may and should be improved by searching possibilities to
employ as much as possible social technologies.
Electronic procurement in Lithuania was started to use in year 2008. Currently in Lithuania public procurement e-
procedures may be carried on via Central Public Procurement Information System. From the year 2009, all
purchasing authorities in Lithuania were obliged to ensure the acquisitions of goods, services and works online
every year would consists no less than 50 percent of the value of all fulfilled procurements (Law on Public
Procurement 1996). Such formal requirement fated that e-procurement became very popular and in the year 2011
more than 75 percent of all advertised public procurements were carried online. In the year 2013 the number of e-
procurements have already reached 87 percent (Public Procurement Office 2014). It should be stated that in regard
of number of e-procurement Lithuania is one of the leading countries in EU.
The International Journal
ENTREPRENEURSHIP AND SUSTAINABILITY ISSUES
ISSN 2345-0282 (online) http://jssidoi.org/jesi/
2016 Volume 4 Number 1 (September)
42
In the report of Electronic public procurements (Public Procurement Office 2014), which was presented by Office
of Public Procurement, was noted that CVP IS have changed the attitude of participants towards public procurement
procedures, because it provided better guarantees for transparency, confidentiality, equality and accessibility of
procedures. E-procurements became a measure, which successfully worked to save money, human resources and
time for suppliers and purchasing authorities. As well as information about advertised procurements became
available for all internet user (Public Procurement Office 2014). In EU strategies, it is planned to widen usage of
electronic means in public procurement. For example, on the 26th of June 2013, European Commision established
COM(2013), in which it was stated that„<...> The transition to end-to-end e-procurement can generate significant
savings, facilitate structural re-thinking of certain areas of public administration, and constitutes a growth enabler
by opening up the Internal Market and by fostering innovation and simplification. It can also facilitate SME
participation in public procurement by reducing administrative burden, by increasing transparency over business
opportunities, and by lowering participation costs “(European Parliament 2013). In Lithuania such goals are already
reached. It encourages going forward.
It is necessary to draw attention towards a possibility to apply online tools in public procurement. It should be stated
that despite of a fact that online dispute resolution was not mentioned in COM (2013), still indirectly it was stated
that fully electronic procurements would shorten the procedure and decrease the litigation cases. „End-to-end e-
procurement can improve the overall administrative efficiency by cutting the duration of the purchase-to-pay cycle,
by reducing administrative burden, and by improving auditability. These in turn, reduce the opportunity for
corruption and tax fraud, increase security of data and reduce litigation“(European Parliament 2013).
Contemporary concept of fully electronical procurements covers e-notification, e-access to procurement documents,
and e-submission phases. Novelty in this field – e - invoicing. European Commision predicts that e-invoicing in
public procurement all over the EU would let to save about 2,3 mlrd. Euro (eu2013.lt 2013). In Lithuania after the
implementation of project “Electronical services “E-invoice”, which was started in the beginning of 2015, e-
invoices of public procurement contracts will fully change the paper invoices. It will allow not only to save paper
and time, but also will provide an tool for authorized institution to control the implementation of public procurement
contracts (Ministry of Finance 2014).
The next step for full electronical procurement definitely can be e-review of public procurement. It is obvious that
development of technologies can help to cope easily with documentations and to reduce time and cost necessary for
resolution of high number of similar disputes (Gill et al. 2014). On the same time it would create accessibility of
the procedure and interested person would be able to assess procedure whenever he needs and from where ever he
is.
According Philipe, ODR (abbrv. for online dipute resolution) platforms consist of electronical communication tools,
usefull in generation, sending, receiving, storing, sharing of information (Gill et al. 2014). This scientist notes that,
effective ODR tool should be designed taking in consideration goals to automate basic functions of case
management as registering of cases, confirmations, reminders and fixing of results. Well-designed ODR platform
can increase the transparency of dispute resolution procedure and promote the usage of it, because parties to a
dispute will rely more on it (Gill et al. 2014). These insights shows, that public procurement review system needs
such characteristics in order to make his procedure more transparent and respectable.
EU legislation have already established requirements for online consumer disputes resolution (Gill et al. 2014). It
was planned to implement unified system for non-judicial consumer dispute resolution till the 1st of January 2016.
In most countries such platforms, which join all national bodies and are available for consumers in all EU languages
are already operating. Such initiative shows that virtual resolution or review of dispute is a near future reality and
after few years, it will become usual procedure for peoples who enters contracts online.
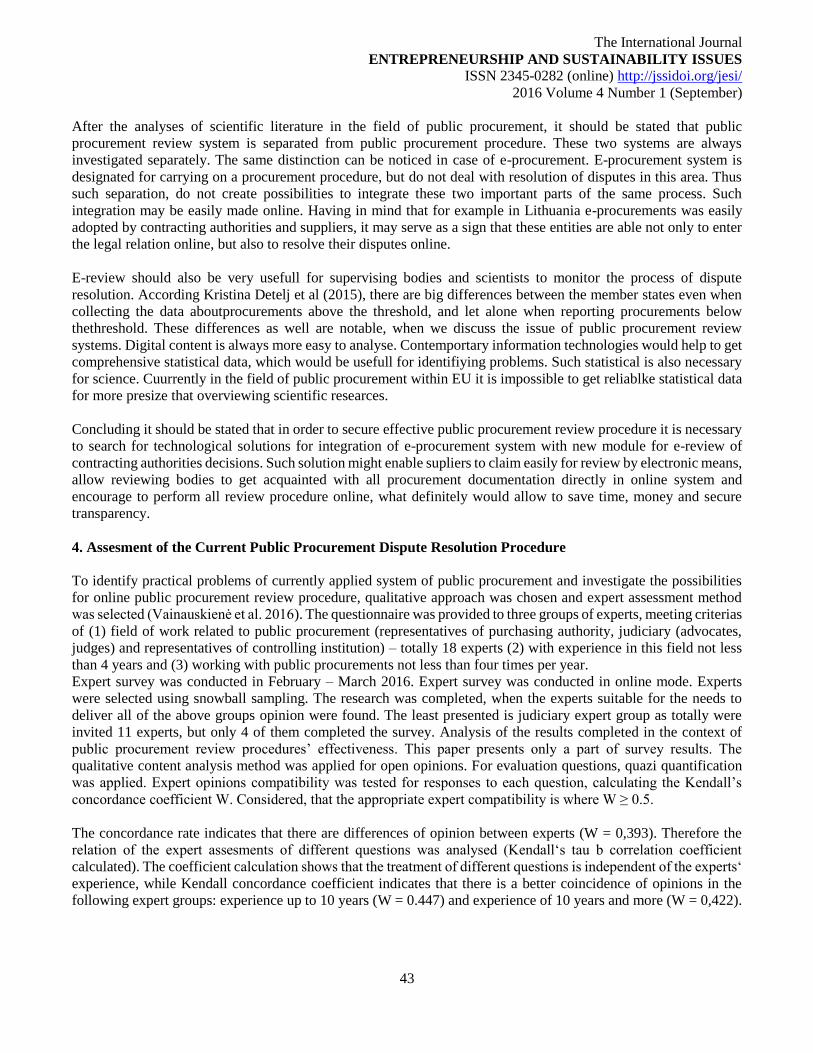
The International Journal
ENTREPRENEURSHIP AND SUSTAINABILITY ISSUES
ISSN 2345-0282 (online) http://jssidoi.org/jesi/
2016 Volume 4 Number 1 (September)
43
After the analyses of scientific literature in the field of public procurement, it should be stated that public
procurement review system is separated from public procurement procedure. These two systems are always
investigated separately. The same distinction can be noticed in case of e-procurement. E-procurement system is
designated for carrying on a procurement procedure, but do not deal with resolution of disputes in this area. Thus
such separation, do not create possibilities to integrate these two important parts of the same process. Such
integration may be easily made online. Having in mind that for example in Lithuania e-procurements was easily
adopted by contracting authorities and suppliers, it may serve as a sign that these entities are able not only to enter
the legal relation online, but also to resolve their disputes online.
E-review should also be very usefull for supervising bodies and scientists to monitor the process of dispute
resolution. According Kristina Detelj et al (2015), there are big differences between the member states even when
collecting the data aboutprocurements above the threshold, and let alone when reporting procurements below
thethreshold. These differences as well are notable, when we discuss the issue of public procurement review
systems. Digital content is always more easy to analyse. Contemportary information technologies would help to get
comprehensive statistical data, which would be usefull for identifiying problems. Such statistical is also necessary
for science. Cuurrently in the field of public procurement within EU it is impossible to get reliablke statistical data
for more presize that overviewing scientific researces.
Concluding it should be stated that in order to secure effective public procurement review procedure it is necessary
to search for technological solutions for integration of e-procurement system with new module for e-review of
contracting authorities decisions. Such solution might enable supliers to claim easily for review by electronic means,
allow reviewing bodies to get acquainted with all procurement documentation directly in online system and
encourage to perform all review procedure online, what definitely would allow to save time, money and secure
transparency.
4. Assesment of the Current Public Procurement Dispute Resolution Procedure
To identify practical problems of currently applied system of public procurement and investigate the possibilities
for online public procurement review procedure, qualitative approach was chosen and expert assessment method
was selected (Vainauskienė et al. 2016). The questionnaire was provided to three groups of experts, meeting criterias
of (1) field of work related to public procurement (representatives of purchasing authority, judiciary (advocates,
judges) and representatives of controlling institution) – totally 18 experts (2) with experience in this field not less
than 4 years and (3) working with public procurements not less than four times per year.
Expert survey was conducted in February – March 2016. Expert survey was conducted in online mode. Experts
were selected using snowball sampling. The research was completed, when the experts suitable for the needs to
deliver all of the above groups opinion were found. The least presented is judiciary expert group as totally were
invited 11 experts, but only 4 of them completed the survey. Analysis of the results completed in the context of
public procurement review procedures’ effectiveness. This paper presents only a part of survey results. The
qualitative content analysis method was applied for open opinions. For evaluation questions, quazi quantification
was applied. Expert opinions compatibility was tested for responses to each question, calculating the Kendall’s
concordance coefficient W. Considered, that the appropriate expert compatibility is where W ≥ 0.5.
The concordance rate indicates that there are differences of opinion between experts (W = 0,393). Therefore the
relation of the expert assesments of different questions was analysed (Kendall‘s tau b correlation coefficient
calculated). The coefficient calculation shows that the treatment of different questions is independent of the experts‘
experience, while Kendall concordance coefficient indicates that there is a better coincidence of opinions in the
following expert groups: experience up to 10 years (W = 0.447) and experience of 10 years and more (W = 0,422).
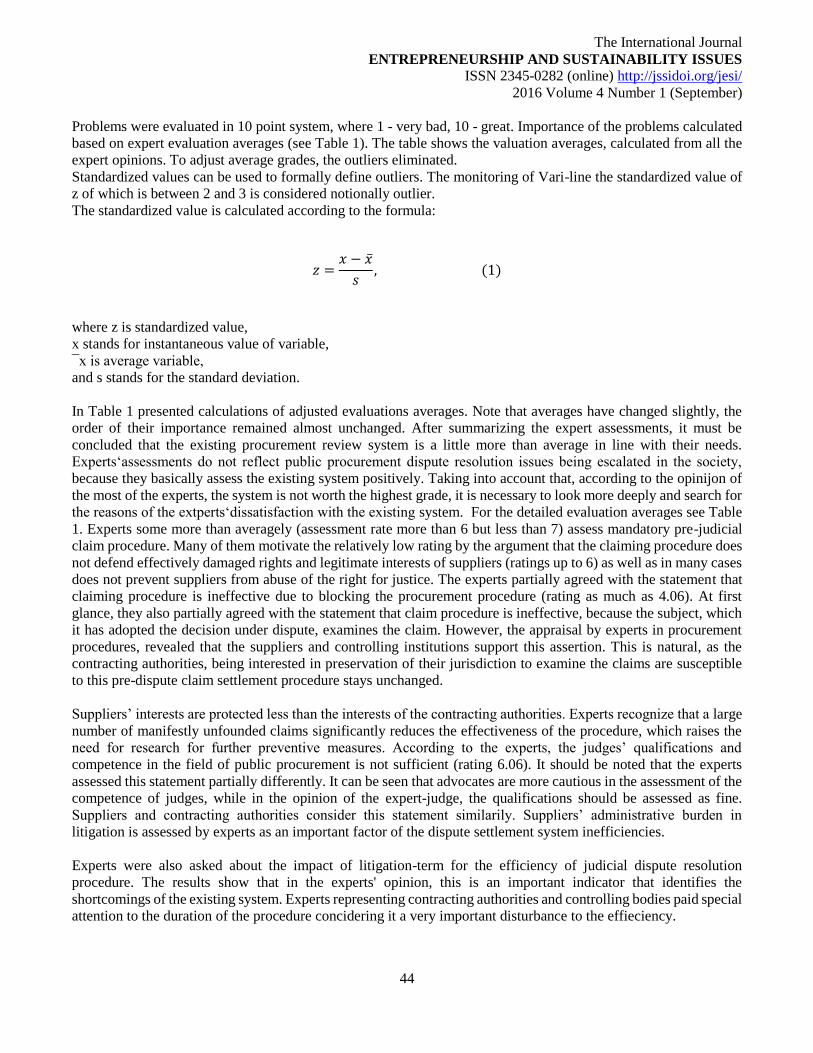
The International Journal
ENTREPRENEURSHIP AND SUSTAINABILITY ISSUES
ISSN 2345-0282 (online) http://jssidoi.org/jesi/
2016 Volume 4 Number 1 (September)
44
Problems were evaluated in 10 point system, where 1 - very bad, 10 - great. Importance of the problems calculated
based on expert evaluation averages (see Table 1). The table shows the valuation averages, calculated from all the
expert opinions. To adjust average grades, the outliers eliminated.
Standardized values can be used to formally define outliers. The monitoring of Vari-line the standardized value of
z of which is between 2 and 3 is considered notionally outlier.
The standardized value is calculated according to the formula:
𝑧 =𝑥 − �̅�
𝑠, (1)
where z is standardized value,
x stands for instantaneous value of variable,
¯x is average variable,
and s stands for the standard deviation.
In Table 1 presented calculations of adjusted evaluations averages. Note that averages have changed slightly, the
order of their importance remained almost unchanged. After summarizing the expert assessments, it must be
concluded that the existing procurement review system is a little more than average in line with their needs.
Experts‘assessments do not reflect public procurement dispute resolution issues being escalated in the society,
because they basically assess the existing system positively. Taking into account that, according to the opinijon of
the most of the experts, the system is not worth the highest grade, it is necessary to look more deeply and search for
the reasons of the extperts‘dissatisfaction with the existing system. For the detailed evaluation averages see Table
1. Experts some more than averagely (assessment rate more than 6 but less than 7) assess mandatory pre-judicial
claim procedure. Many of them motivate the relatively low rating by the argument that the claiming procedure does
not defend effectively damaged rights and legitimate interests of suppliers (ratings up to 6) as well as in many cases
does not prevent suppliers from abuse of the right for justice. The experts partially agreed with the statement that
claiming procedure is ineffective due to blocking the procurement procedure (rating as much as 4.06). At first
glance, they also partially agreed with the statement that claim procedure is ineffective, because the subject, which
it has adopted the decision under dispute, examines the claim. However, the appraisal by experts in procurement
procedures, revealed that the suppliers and controlling institutions support this assertion. This is natural, as the
contracting authorities, being interested in preservation of their jurisdiction to examine the claims are susceptible
to this pre-dispute claim settlement procedure stays unchanged.
Suppliers’ interests are protected less than the interests of the contracting authorities. Experts recognize that a large
number of manifestly unfounded claims significantly reduces the effectiveness of the procedure, which raises the
need for research for further preventive measures. According to the experts, the judges’ qualifications and
competence in the field of public procurement is not sufficient (rating 6.06). It should be noted that the experts
assessed this statement partially differently. It can be seen that advocates are more cautious in the assessment of the
competence of judges, while in the opinion of the expert-judge, the qualifications should be assessed as fine.
Suppliers and contracting authorities consider this statement similarily. Suppliers’ administrative burden in
litigation is assessed by experts as an important factor of the dispute settlement system inefficiencies.
Experts were also asked about the impact of litigation-term for the efficiency of judicial dispute resolution
procedure. The results show that in the experts' opinion, this is an important indicator that identifies the
shortcomings of the existing system. Experts representing contracting authorities and controlling bodies paid special
attention to the duration of the procedure concidering it a very important disturbance to the effieciency.
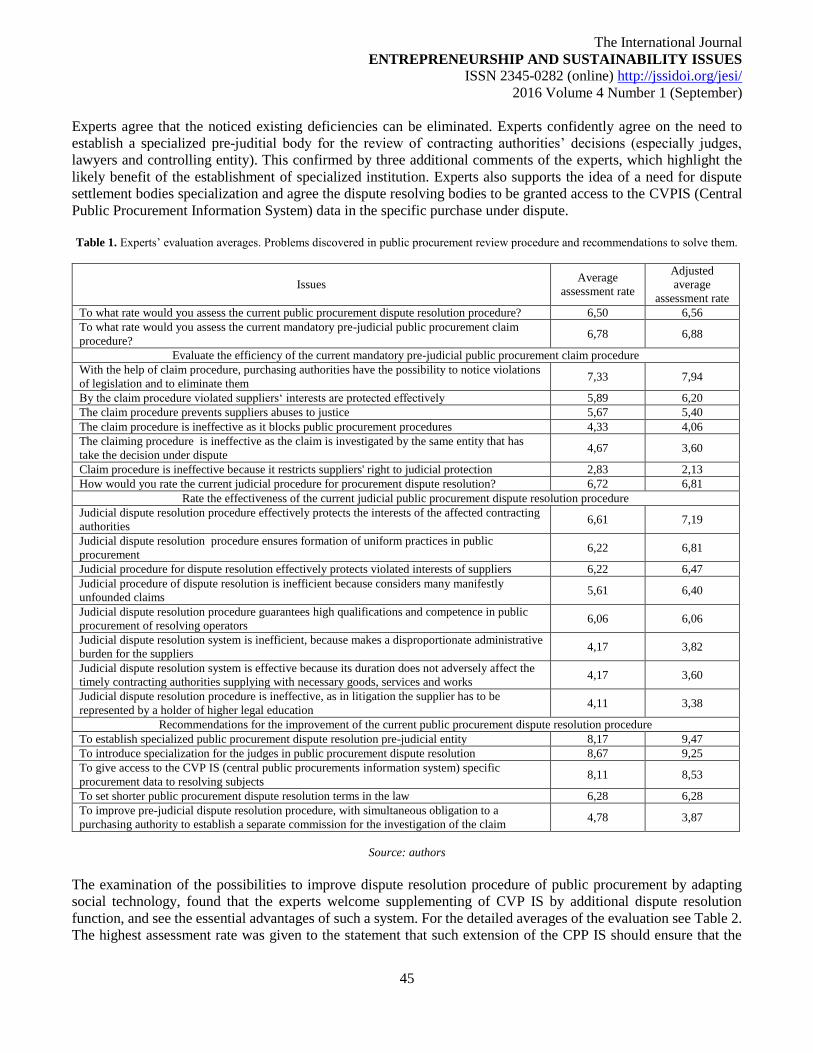
The International Journal
ENTREPRENEURSHIP AND SUSTAINABILITY ISSUES
ISSN 2345-0282 (online) http://jssidoi.org/jesi/
2016 Volume 4 Number 1 (September)
45
Experts agree that the noticed existing deficiencies can be eliminated. Experts confidently agree on the need to
establish a specialized pre-juditial body for the review of contracting authorities’ decisions (especially judges,
lawyers and controlling entity). This confirmed by three additional comments of the experts, which highlight the
likely benefit of the establishment of specialized institution. Experts also supports the idea of a need for dispute
settlement bodies specialization and agree the dispute resolving bodies to be granted access to the CVPIS (Central
Public Procurement Information System) data in the specific purchase under dispute.
Table 1. Experts’ evaluation averages. Problems discovered in public procurement review procedure and recommendations to solve them.
Issues Average
assessment rate
Adjusted
average
assessment rate
To what rate would you assess the current public procurement dispute resolution procedure? 6,50 6,56
To what rate would you assess the current mandatory pre-judicial public procurement claim
procedure? 6,78 6,88
Evaluate the efficiency of the current mandatory pre-judicial public procurement claim procedure
With the help of claim procedure, purchasing authorities have the possibility to notice violations
of legislation and to eliminate them 7,33 7,94
By the claim procedure violated suppliers‘ interests are protected effectively 5,89 6,20
The claim procedure prevents suppliers abuses to justice 5,67 5,40
The claim procedure is ineffective as it blocks public procurement procedures 4,33 4,06
The claiming procedure is ineffective as the claim is investigated by the same entity that has
take the decision under dispute 4,67 3,60
Claim procedure is ineffective because it restricts suppliers' right to judicial protection 2,83 2,13
How would you rate the current judicial procedure for procurement dispute resolution? 6,72 6,81
Rate the effectiveness of the current judicial public procurement dispute resolution procedure
Judicial dispute resolution procedure effectively protects the interests of the affected contracting
authorities 6,61 7,19
Judicial dispute resolution procedure ensures formation of uniform practices in public
procurement 6,22 6,81
Judicial procedure for dispute resolution effectively protects violated interests of suppliers 6,22 6,47
Judicial procedure of dispute resolution is inefficient because considers many manifestly
unfounded claims 5,61 6,40
Judicial dispute resolution procedure guarantees high qualifications and competence in public
procurement of resolving operators 6,06 6,06
Judicial dispute resolution system is inefficient, because makes a disproportionate administrative
burden for the suppliers 4,17 3,82
Judicial dispute resolution system is effective because its duration does not adversely affect the
timely contracting authorities supplying with necessary goods, services and works 4,17 3,60
Judicial dispute resolution procedure is ineffective, as in litigation the supplier has to be
represented by a holder of higher legal education 4,11 3,38
Recommendations for the improvement of the current public procurement dispute resolution procedure
To establish specialized public procurement dispute resolution pre-judicial entity 8,17 9,47
To introduce specialization for the judges in public procurement dispute resolution 8,67 9,25
To give access to the CVP IS (central public procurements information system) specific
procurement data to resolving subjects 8,11 8,53
To set shorter public procurement dispute resolution terms in the law 6,28 6,28
To improve pre-judicial dispute resolution procedure, with simultaneous obligation to a
purchasing authority to establish a separate commission for the investigation of the claim 4,78 3,87
Source: authors
The examination of the possibilities to improve dispute resolution procedure of public procurement by adapting
social technology, found that the experts welcome supplementing of CVP IS by additional dispute resolution
function, and see the essential advantages of such a system. For the detailed averages of the evaluation see Table 2.
The highest assessment rate was given to the statement that such extension of the CPP IS should ensure that the
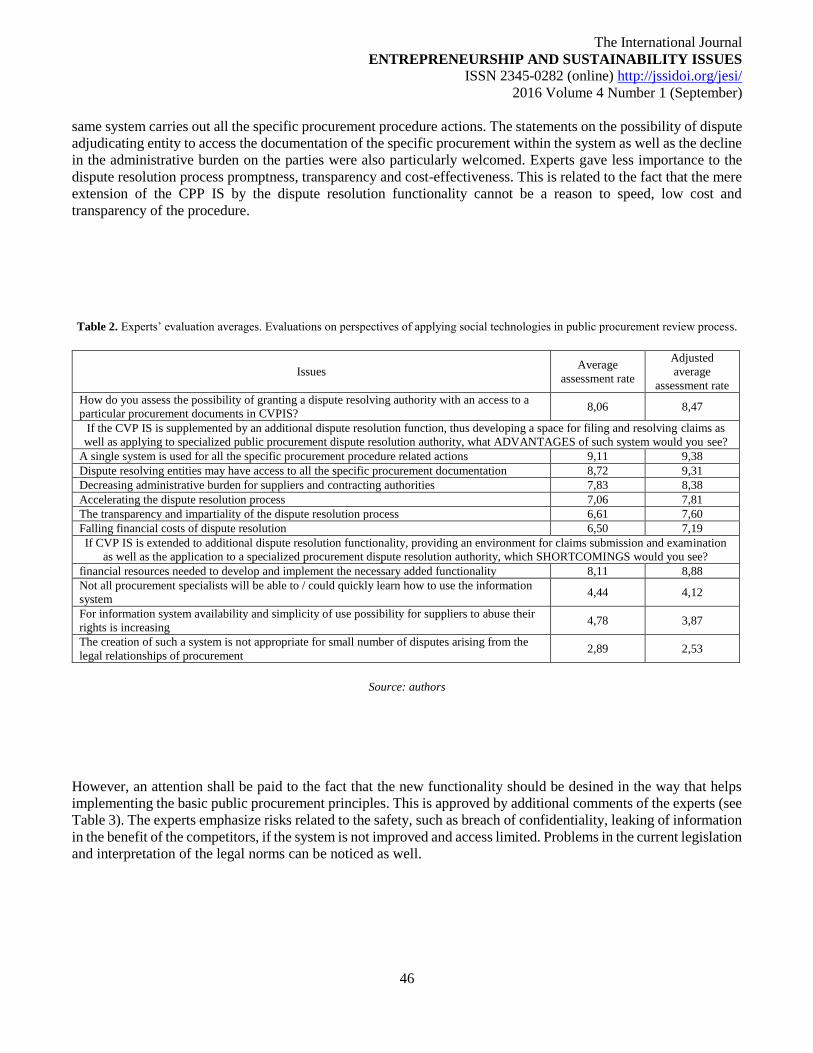
The International Journal
ENTREPRENEURSHIP AND SUSTAINABILITY ISSUES
ISSN 2345-0282 (online) http://jssidoi.org/jesi/
2016 Volume 4 Number 1 (September)
46
same system carries out all the specific procurement procedure actions. The statements on the possibility of dispute
adjudicating entity to access the documentation of the specific procurement within the system as well as the decline
in the administrative burden on the parties were also particularly welcomed. Experts gave less importance to the
dispute resolution process promptness, transparency and cost-effectiveness. This is related to the fact that the mere
extension of the CPP IS by the dispute resolution functionality cannot be a reason to speed, low cost and
transparency of the procedure.
Table 2. Experts’ evaluation averages. Evaluations on perspectives of applying social technologies in public procurement review process.
Issues Average
assessment rate
Adjusted
average
assessment rate
How do you assess the possibility of granting a dispute resolving authority with an access to a
particular procurement documents in CVPIS? 8,06 8,47
If the CVP IS is supplemented by an additional dispute resolution function, thus developing a space for filing and resolving claims as
well as applying to specialized public procurement dispute resolution authority, what ADVANTAGES of such system would you see?
A single system is used for all the specific procurement procedure related actions 9,11 9,38
Dispute resolving entities may have access to all the specific procurement documentation 8,72 9,31
Decreasing administrative burden for suppliers and contracting authorities 7,83 8,38
Accelerating the dispute resolution process 7,06 7,81
The transparency and impartiality of the dispute resolution process 6,61 7,60
Falling financial costs of dispute resolution 6,50 7,19
If CVP IS is extended to additional dispute resolution functionality, providing an environment for claims submission and examination
as well as the application to a specialized procurement dispute resolution authority, which SHORTCOMINGS would you see?
financial resources needed to develop and implement the necessary added functionality 8,11 8,88
Not all procurement specialists will be able to / could quickly learn how to use the information
system 4,44 4,12
For information system availability and simplicity of use possibility for suppliers to abuse their
rights is increasing 4,78 3,87
The creation of such a system is not appropriate for small number of disputes arising from the
legal relationships of procurement 2,89 2,53
Source: authors
However, an attention shall be paid to the fact that the new functionality should be desined in the way that helps
implementing the basic public procurement principles. This is approved by additional comments of the experts (see
Table 3). The experts emphasize risks related to the safety, such as breach of confidentiality, leaking of information
in the benefit of the competitors, if the system is not improved and access limited. Problems in the current legislation
and interpretation of the legal norms can be noticed as well.
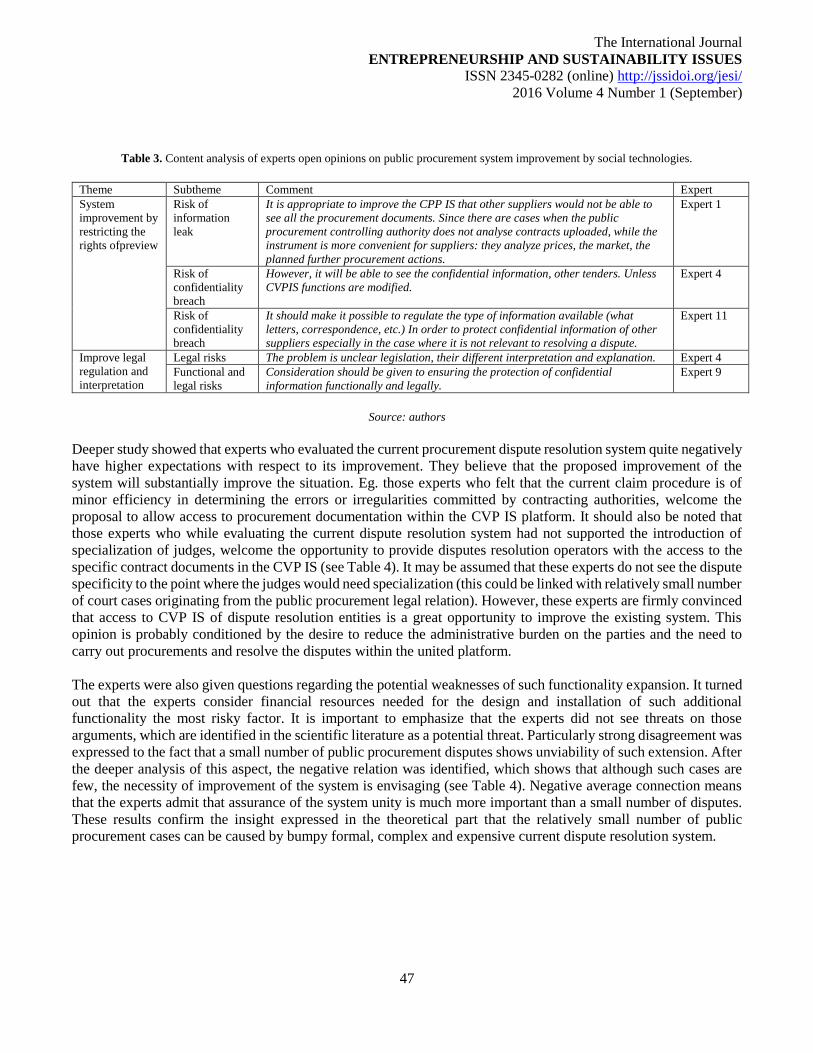
The International Journal
ENTREPRENEURSHIP AND SUSTAINABILITY ISSUES
ISSN 2345-0282 (online) http://jssidoi.org/jesi/
2016 Volume 4 Number 1 (September)
47
Table 3. Content analysis of experts open opinions on public procurement system improvement by social technologies.
Theme Subtheme Comment Expert
System
improvement by
restricting the
rights ofpreview
Risk of
information
leak
It is appropriate to improve the CPP IS that other suppliers would not be able to
see all the procurement documents. Since there are cases when the public
procurement controlling authority does not analyse contracts uploaded, while the
instrument is more convenient for suppliers: they analyze prices, the market, the
planned further procurement actions.
Expert 1
Risk of
confidentiality
breach
However, it will be able to see the confidential information, other tenders. Unless
CVPIS functions are modified.
Expert 4
Risk of
confidentiality
breach
It should make it possible to regulate the type of information available (what
letters, correspondence, etc.) In order to protect confidential information of other
suppliers especially in the case where it is not relevant to resolving a dispute.
Expert 11
Improve legal
regulation and
interpretation
Legal risks The problem is unclear legislation, their different interpretation and explanation. Expert 4
Functional and
legal risks
Consideration should be given to ensuring the protection of confidential
information functionally and legally.
Expert 9
Source: authors
Deeper study showed that experts who evaluated the current procurement dispute resolution system quite negatively
have higher expectations with respect to its improvement. They believe that the proposed improvement of the
system will substantially improve the situation. Eg. those experts who felt that the current claim procedure is of
minor efficiency in determining the errors or irregularities committed by contracting authorities, welcome the
proposal to allow access to procurement documentation within the CVP IS platform. It should also be noted that
those experts who while evaluating the current dispute resolution system had not supported the introduction of
specialization of judges, welcome the opportunity to provide disputes resolution operators with the access to the
specific contract documents in the CVP IS (see Table 4). It may be assumed that these experts do not see the dispute
specificity to the point where the judges would need specialization (this could be linked with relatively small number
of court cases originating from the public procurement legal relation). However, these experts are firmly convinced
that access to CVP IS of dispute resolution entities is a great opportunity to improve the existing system. This
opinion is probably conditioned by the desire to reduce the administrative burden on the parties and the need to
carry out procurements and resolve the disputes within the united platform.
The experts were also given questions regarding the potential weaknesses of such functionality expansion. It turned
out that the experts consider financial resources needed for the design and installation of such additional
functionality the most risky factor. It is important to emphasize that the experts did not see threats on those
arguments, which are identified in the scientific literature as a potential threat. Particularly strong disagreement was
expressed to the fact that a small number of public procurement disputes shows unviability of such extension. After
the deeper analysis of this aspect, the negative relation was identified, which shows that although such cases are
few, the necessity of improvement of the system is envisaging (see Table 4). Negative average connection means
that the experts admit that assurance of the system unity is much more important than a small number of disputes.
These results confirm the insight expressed in the theoretical part that the relatively small number of public
procurement cases can be caused by bumpy formal, complex and expensive current dispute resolution system.
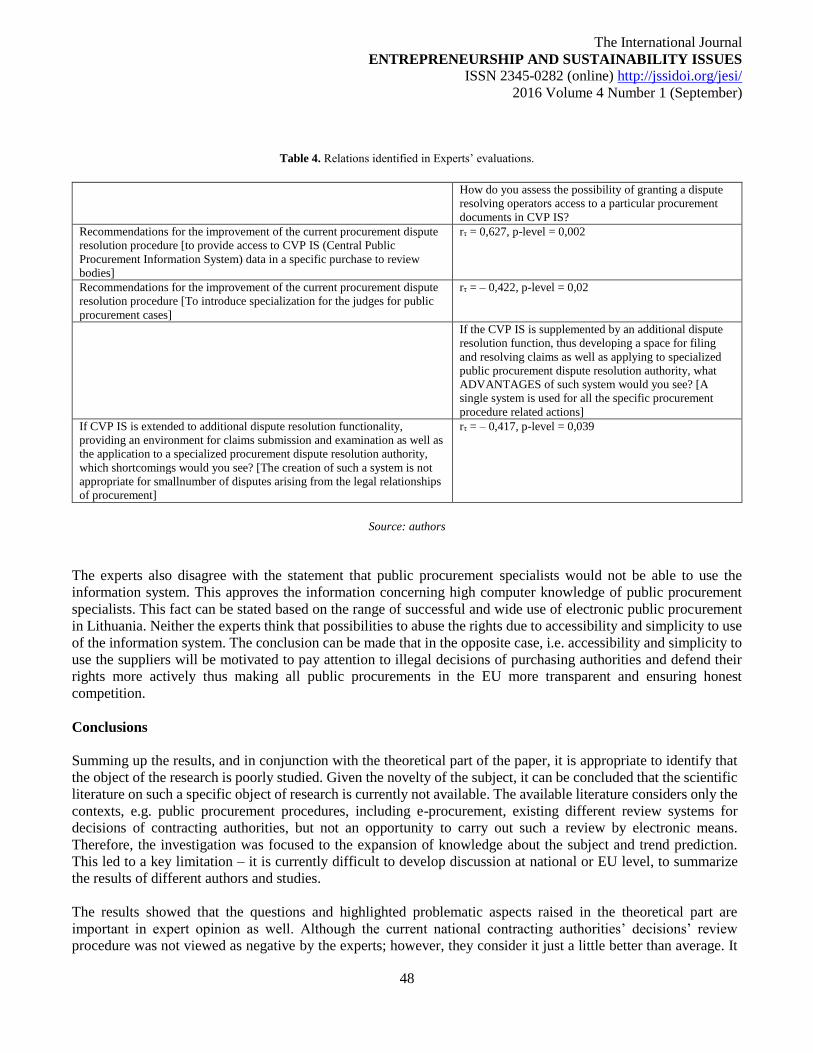
The International Journal
ENTREPRENEURSHIP AND SUSTAINABILITY ISSUES
ISSN 2345-0282 (online) http://jssidoi.org/jesi/
2016 Volume 4 Number 1 (September)
48
Table 4. Relations identified in Experts’ evaluations.
How do you assess the possibility of granting a dispute
resolving operators access to a particular procurement
documents in CVP IS?
Recommendations for the improvement of the current procurement dispute
resolution procedure [to provide access to CVP IS (Central Public
Procurement Information System) data in a specific purchase to review
bodies]
rτ = 0,627, p-level = 0,002
Recommendations for the improvement of the current procurement dispute
resolution procedure [To introduce specialization for the judges for public
procurement cases]
rτ = – 0,422, p-level = 0,02
If the CVP IS is supplemented by an additional dispute
resolution function, thus developing a space for filing
and resolving claims as well as applying to specialized
public procurement dispute resolution authority, what
ADVANTAGES of such system would you see? [A
single system is used for all the specific procurement
procedure related actions]
If CVP IS is extended to additional dispute resolution functionality,
providing an environment for claims submission and examination as well as
the application to a specialized procurement dispute resolution authority,
which shortcomings would you see? [The creation of such a system is not
appropriate for smallnumber of disputes arising from the legal relationships
of procurement]
rτ = – 0,417, p-level = 0,039
Source: authors
The experts also disagree with the statement that public procurement specialists would not be able to use the
information system. This approves the information concerning high computer knowledge of public procurement
specialists. This fact can be stated based on the range of successful and wide use of electronic public procurement
in Lithuania. Neither the experts think that possibilities to abuse the rights due to accessibility and simplicity to use
of the information system. The conclusion can be made that in the opposite case, i.e. accessibility and simplicity to
use the suppliers will be motivated to pay attention to illegal decisions of purchasing authorities and defend their
rights more actively thus making all public procurements in the EU more transparent and ensuring honest
competition.
Conclusions
Summing up the results, and in conjunction with the theoretical part of the paper, it is appropriate to identify that
the object of the research is poorly studied. Given the novelty of the subject, it can be concluded that the scientific
literature on such a specific object of research is currently not available. The available literature considers only the
contexts, e.g. public procurement procedures, including e-procurement, existing different review systems for
decisions of contracting authorities, but not an opportunity to carry out such a review by electronic means.
Therefore, the investigation was focused to the expansion of knowledge about the subject and trend prediction.
This led to a key limitation – it is currently difficult to develop discussion at national or EU level, to summarize
the results of different authors and studies.
The results showed that the questions and highlighted problematic aspects raised in the theoretical part are
important in expert opinion as well. Although the current national contracting authorities’ decisions’ review
procedure was not viewed as negative by the experts; however, they consider it just a little better than average. It
The International Journal
ENTREPRENEURSHIP AND SUSTAINABILITY ISSUES
ISSN 2345-0282 (online) http://jssidoi.org/jesi/
2016 Volume 4 Number 1 (September)
49
shows the materializing of the theoretical insights for the necessity to look for opportunities to improve this
procedure. Experts’ assessments have not approved public procurement dispute resolution issues escalated by the
society, because they basically evaluated the current system positively. Experts had good enough opinions about
the current mandatory pre-judicial claim procedure which they consider an important contribution to the
contracting authorities to identify the mistakes and violations of the laws and to eliminate them. However, this
system has attracted criticism as well because experts believed that it on the one hand was not sufficiently effective
in protecting the interests of suppliers, and on the other hand, did not prevent suppliers from abusing their right to
justice.
Qualifying the experts’ opinion on the current judicial public procurement review procedure applied in Lithuania,
it has been mostly criticized for the lack of qualification in the field of public procurement of the judges dealing
with such cases. As well as significant administrative burden for suppliers who want to protect their violated rights,
and the duration of the litigation which the experts believed was too long. The latter two problems can be solved
with social technologies, therefore there is the need for further research, analysis of foreign best practice.
When asked about the development of the review procedure, the experts confidently called for the establishment
of a specialized pre-judicial decisions of contracting authorities review body and very much welcomed the
opportunity to provide reviewing bodies with an access to the CVP IS, which contains all the specific contract
documentation. Also, experts were very positive about additional extension of the CVP IS by preview function.
Mostly the experts grounded such a choice on the need for a single system to perform all purchase-related activities,
including the review procedure, which in their opinion would contribute to the reduction of administrative burdens.
As the most important shortcomings, the experts pointed out the funds necessary for the creation of the additional
functionality, additional financial resources. In view of the need for proper functioning of public procurement
system, as one of the priority public policies in the EU, it must be concluded that the design and installation costs
could be financed from the EU structural funds as the measures to ensure economy, efficiency and transparency of
public procurement. It is important to note that the experts confirmed the statement of the theoretical part that more
convenient, simpler and more accessible review procedure may encourage suppliers to protect their violated rights
and to help the state ensure greater transparency and integrity of all procurement and prevent corruption-related
activities. But at the same any improvement of the system raises a number of issues in system integrity, security,
legal regulatory, which are to be delt in the very process of improvement.
Evaluating the results of the research it is necessary to pay attention to several limitations, which may have
influenced the tresearch result accuracy. Qualitative research, expert evaluation, and the conclusions reached
cannot be applied to the whole population. However, this study has identified guidelines for possible future
research. It also helped to identify what respondents it is appropriate to choose for the quantitative analysis of the
future. It follows that for a wider study of the object of investigation it is necessary to carry out a quantitative
survey of suppliers’ opinion.
The experts interviewed in this study played different roles and had different experience in public procurement. So
it is not surprising that their opinions on certain statements differed radically, which ordered the investigators to
adjust the results of the assessments refusing response values to limits. It is important to mention that the data were
gathered and handled in national language. No one researcher is English native speaker. The paper had been
translated to the English language at the article’s finishing stage. This may cause some incorrect understanding of
terminology, description or words.
It should also be noted, that the quantitative research has been conducted in one of the EU member states, in
Lithuania. Having in mind that different countries apply different dispute resolution procedures that may have
different advantages and disadvantages, there exists a possibility that similar research conducted in other countries
may reveal essentially different results. The review directives provide the main requirements for the review of
The International Journal
ENTREPRENEURSHIP AND SUSTAINABILITY ISSUES
ISSN 2345-0282 (online) http://jssidoi.org/jesi/
2016 Volume 4 Number 1 (September)
50
purchasing authorities’ decisions; however, enough space is left for the national legislator to choose the most
appropriate implementing way thereof. It may be concluded that in countries where specialised public procurement
resolution authorities successfully operate, experts would more easily share other insights and assessments than in
countries where this kind of disputes are resolved by an ordinary or specialized courts.
A very important future research shall be continued in the field of information technologies. It should be oriented
towards identification whether specific modules could supplement electronic public procurement platforms used
in the EU member states for purchasing authorities’ decisions’ review according to the requirements of the Review
Directive.
References
Bilkis, L. 2016. The Preliminary Investigation Report; Public Procurement System Review. Available on the Internet:
https://www.vkontrole.lt/failas.aspx?id=2475
Čapas, D.; Čapas, R. 2013. Why foreign investor emphasizes that bureaucracy thrivs in Lithuania (I). Available on the Internet:
<http://www.verslaspolitika.lt/kodel-uzsienio-investuotojas-akcentuoja-kad-lietuvoje-klesti-biurokratizmas-i/>
Delfi.lt 2008. 7 out of 8 entities do not participate in public procurement. Available on the Internet:
<http://www.delfi.lt/verslas/verslas/viesuosiuose-pirkimuose-nedalyvauja-7-is-8-imoniu.d?id=16462892>
Detelj, K. et al. 2015. Measuring Public Procurement for Innovation at Country Level and the Role of ICT Support, JIOS, 39 (1): 21-32.
Directive 2007/66/EC of the European Parliament and of the Council of 11 December 2007 amending Council Directives 89/665/EEC and
92/13/EEC with regard to improving the effectiveness of review procedures concerning the award of public contracts. Available on The
Internet: http://eur-lex.europa.eu/LexUriServ/LexUriServ.do?uri=OJ:L:2007:335:0031:0046:en:PDF
Ereminaitė, S; Junevičius, A. 2011. E-Government and E-Business Integration Model in Public Procurement, Management of Organizations:
Systematic Research, 57:34-49.
European Parliament 2013. Communication From the Commission to the European Parliament, The Council, The European Economic and
Social Committee and The Committee of The Regions. End-to-end e-procurement to modernise public administration. COM(2013) (453
final). Available on the Internet: < http://cor.europa.eu/en/activities/stakeholders/Documents/comm453-2013.pdf>
Fazekas, M. et al. 2013. Corruption manual for beginners. Available on The Internet:
<http://econ.core.hu/file/download/mtdp/MTDP1339.pdf>
Gill, C. et al. 2014. Models of Alternative Dispute Resolution (ADR). A report for the Legal Ombudsman. Available on the Internet:
http://www.legalombudsman.org.uk/downloads/documents/research/Models-Alternative-Dispute-Resolution-Report-141031.pdf
Girūnas, L.; Mackevičius, J. 2014. Evaluation of frauds in public sector, Entrepreneurship and Sustainability Issues 1(3): 143-
150.http://dx.doi.org/10.9770/jesi.2014.1.3(3)
Hessami, Z. 2014. Political corruption, public procurement, and budget composition: Theory and evidence from OECD countries, European
Journal of Political Economy 34:.372-389. DOI: http://dx.doi.org/10.1016/j.ejpoleco.2014.02.005
Kaunasdiena.lt 2013. The Seimas didn't allowed to take away freedom for infringements of procurement procedure. Available on the Internet:
<http://kauno.diena.lt/naujienos/ekonomika/uz-viesuju-pirkimu-tvarkos-pazeidimus-seimas-laisves-atimti-neleido-
200147#ixzz3NC0iRQRy>
Kysiai.lt 2009. Lithuanian businessmen think that the situation does not change in public procurement. Available on the Internet:
<http://www.kysiai.lt/lietuvos-verslininkai-mano-kad-situacija-viesuosiuose-pirkimuose-nesikeicia.html>
Law on Public Procurement 1996. Oficial Journal, No.84-2000.
The International Journal
ENTREPRENEURSHIP AND SUSTAINABILITY ISSUES
ISSN 2345-0282 (online) http://jssidoi.org/jesi/
2016 Volume 4 Number 1 (September)
51
Lithuanian Presidency of the Council of the European Union 2013. E-invoicing in public procurement: another step towards end-to-end e-
procurement. Available on the Internet: <http://www.eu2013.lt/en/news/features/e-invoicing-in-public-procurement-another-step-towards-
end-to-end-e-procurement>
Maga.lt 2008. Bureaucracy and corruption preclude public procurement. Available on the Internet: < http://maga.lt/84084>
Ministry of Finance, 2014. Electronic documentation will change paper ones. Available on the Internet:
<http://www.finmin.lt/web/finmin/naujienos?erp_item=naujiena_002465>
Ministry of the Interior of the Republic of Lithuania 2014. Report of Ministry of the Interior of the Republic of Lithuania of 2013. Available
on The Internet: http://www.fntt.lt/uploads/docs/2013_VRM_ATASKAITA.pdf
Oganisjana, K.; Surikova, S.; Laizāns, T. 2015. Factors influencing social innovation processes in Latvia: qualitative research perspective,
Entrepreneurship and Sustainability Issues 3(2): 186-197.http://dx.doi.org/10.9770/jesi.2015.3.2(6)
Pachnou, D. 2003. Effectiveness of Bidder Remedies for Enforcing the EC Public Procurement Rules: A Case Study of the Public Works
Sector in the United Kingdom and Greece. Nottingham: University of Nottingham press.
Public Procurement Office 2011. PPO: Public procurement needs professional specialists. Available on the Internet:
<https://vpt.lrv.lt/lt/naujienos/vpt-viesiesiems-pirkimams-reikia-profesionaliu-specialistu>
Public Procurement office 2014. Report of Public Procurement office of 2013. Available on The Internet:
<www.vpt.lt/vpt/uploaded/2013/.../VEIKLOS_ATASKAITA_FIN_2013.pdf>
Public Procurement Office 2014. Report on electronic public procurement, 2013. Available on the Internet:
<https://vpt.lrv.lt/uploads/vpt/documents/files/LT_versija/Administracine_informacija/Ketvirtines_ir_metines_ataskaitos/Metines_veiklos_
ataskaitos/2013m/Pazangos_araskaita_EPP2013.pdf>
Special Investigation Service of the Respublic of Lithuania 2014. Report of Special Investigation Service of the Respublic of Lithuania of
2013. Availanble on the Internet: <http://www.stt.lt/lt/menu/stt-veikla/veiklos-rezultatai/>
Thai, K., V. 2001. Public procurement re-examined, Journal of Public Procurement, 1(1):9-50.
Tvaronavičienė, A. 2014. A. Pre-litigation dispute resolution procedures in public procurement within European Union. Batumi International
Conference on Law & Politics. Conference proceedings. Batumi: Institute for Academic Development.
Tvaronavičienė, A. 2015. The Peculiarities and Effectiveness of Public Procurement Dispute Respolution System. Vilnius: Mykolas Romeris
University.
Tvaronavičienė, M.; Grybaitė, V. 2012. Sustainable development and performance of institutions: approaches towards measurement, Journal
of Security and Sustainability Issues 1(3): 167-175.http://dx.doi.org/10.9770/jssi/2012.1.3(2)
Vainauskienė, V. et al. 2016. Intuitive scenario development methods. Presented at 21st international scientific conference, Economics and
Management 2016 (ICEM-2016), Brno, Czech Republic.
Vz.lt 2014. Public procurement: where an infringement takes place there must be a responsibility. Available on the Internet:
<http://vz.lt/?PublicationId=22e000fe-2d97-4ca5-ba60-b490f0b10404#ixzz3NC0Ff2de>
The International Journal
ENTREPRENEURSHIP AND SUSTAINABILITY ISSUES
ISSN 2345-0282 (online) http://jssidoi.org/jesi/
2016 Volume 4 Number 1 (September)
52
Agnė TVARONAVIČIENĖ is the Associate professor at Faculty of Law (Mykolas Romeris University, Lithuania) and director of Public
Law Institute. Research interests: public procurement, dispute resolution, social technologies.
Gintarė ŽĖMAITAITIENĖ is the Associate professor at Business and Media School (Mykolas Romeris University, Lithuania) and director
of Social Technologies laboratory (Mykolas Romeris University, Lithuania). Research interests: social technologies, innovation diffussion
theories.
Tatjana BILEVIČIENĖ is the Professor at Business and Media School (Mykolas Romeris University, Lithuania). Research interests:
Mathematics (statistics), IT, management and administration, knowledge management, sustainable development, quality of life, business and
employment.
Copyright © 2016 by author(s) and VsI Entrepreneurship and Sustainability Center
This work is licensed under the Creative Commons Attribution International License (CC BY).
http://creativecommons.org/licenses/by/4.0/
The International Journal
ENTREPRENEURSHIP AND SUSTAINABILITY ISSUES
ISSN 2345-0282 (online) http://jssidoi.org/jesi/
2016 Volume 4 Number 1 (September)
53
International Centre for
Entrepreneurship Research
ENTREPRENEURSHIP AND SUSTAINABILITY ISSUES
ISSN 2345-0282 (online) http://jssidoi.org/jesi/
METHODOLOGY OF COMPLEX ANALYSIS OF COMPANIES’ PROFITABILITY
Daiva Tamulevičienė
Vilnius University, Faculty of Economics, department of Accounting and Audit, Saulėtekio 9, LT-10222, Lithuania
E-mail: [email protected]
Received 10 March 2016; accepted 18 June 2016
Abstract. Profitability is one of the most important companies’ activity indicators. In the article, all profitability ratios are divided into three
groups: sales, assets and equity. The importance of their analysis is underlined. In the financial analysis literature, the most common
calculations of various financial indicators provided lack attention of their analysis. The complex analysis methodology recommended in the
article comprises: 1) determination of analysis aims; 2) choice of analysis sources and technical methods; 3) calculation and evaluation
profitability of sales (gross and net), profitability of assets (total assets, fixed and current assets), profitability of equity (authorized capital,
shareholders’ equity and capital employed); 4) determination of factors influencing profitability; 5) usage of information collected during the
analysis for internal and external users purposes. The recommended complex analysis methodology can be successfully applied to companies
of various size and activity. After successfully applying it, it is possible to objectively evaluate efficiency of company's activity, potential
risks, competitiveness and possibilities of continuity.
Keywords: net profit, gross profit, complex analysis, profitability of sales, profitability of assets, profitability of equity, profitability ratios.
Reference to this paper should be made as follows: Tamulevičienė, D. 2016 Methodology of complex analysis of companies’ profitability,
Entrepreneurship and Sustainbility Issues 4 (1): 53-63.
DOI: http://dx.doi.org/10.9770/jesi.2016.4.1(5)
JEL Classifications: M49
1. Introduction
In order to objectively evaluate efficiency of company's activity, its competitiveness and possibilities of continuity,
it is crucial to calculate and evaluate the profitability ratios. Especially, a lot of useful information is obtained when
comparing the profitability ratios of the financial year with the profitability ratios of the previous financial years,
other similar companies and average rates of industry sectors’ profitability.
However, a question arises how and which profitability ratios should be calculated, named and evaluated? Various
Lithuanian and foreign authors provide different names for profitability ratios and a different number of them in
their scientific articles. The scientists of economic theory usually suggest to calculate two profitability ratios: gross
The International Journal
ENTREPRENEURSHIP AND SUSTAINABILITY ISSUES
ISSN 2345-0282 (online) http://jssidoi.org/jesi/
2016 Volume 4 Number 1 (September)
54
profit margin and net profit margin. It is appropriate to name these ratios as gross and net profitability of sales
because they are calculated by respectively dividing gross and net profit from sales revenue. However, these two
indicators are not enough to fully evaluate efficiency of company's activity. Since the company's profit is to a large
extent dependent on efficient usage of assets and equity, it is obligatory to calculate and analyse not only
profitability of sales but also profitability of assets and equity ratios. In many works of foreign authors (Gibson,
1992, 2012; Stickney, 1993; Fridson and Alvarez, 2011; Maynard, 2013; Plenborg and Petersen, 2011; Stickney,
Brown and Wahlen, 2006 and others), two terms are used to describe profitability: "profitability" and "return". The
term "profitability" is used when analysing sales profitability ratios, whereas "return" describes assets and equity
profitability. It is necessary to agree with J. Mackevičius opinion that it is not accurate. If profit is divided from
sales revenue when calculating profitability, then it is named as sales profitability. Therefore, if we divide profit
from assets or equity, these ratios have to be called assets and equity profitability instead of "return" ratios. On the
other hand, in the theory of companies' activity analysis, return on assets ratio is ratio that shows the value of
production divided from the value of the tangible assets (Mackevičius, 2007).
In the financial analysis literature (Bagdžiūnienė, 2005; Buškevičiūtė, Kanapickienė and Patašius, 2010;
Juozaitienė, 2007; Liaubienė and Martirosianienė, 2008; Labonaitė and Subačienė, 2014; Mackevičius, Molienė
and Poškaitė, 2008; Gibson, 2012; Dunn, 2010; Bernstein, 1993; Савицкая, 2003; Black, 2004; Brigham and
Daves, 2004; Maynard, 2013 and others), usually only the calculation formulae of some profitability ratios are
presented separately without any attention to evaluation of their values. In most cases, gross and net profitability
(i.e. profitability of sales) are analysed. There is a lack of systematic approach when performing complex analysis
of companies' activity profitability in the aspect of assets and equity.
The object of the research is the complex analysis of companies' profitability.
The aim of the article is to prepare a methodology of complex analysis of companies’ profitability, so the companies'
managers could use it to determine profitability of sales, assets and equity, objectively asses their changes and the
factors influencing them, and make right management decisions.
The sources of the research are scientific publications by Lithuanian and foreign authors, business accounting
standards: 2nd BAS "Balance sheet", 3rd BAS "Statement of profit or loss", 10th BAS "Income", etc.
The research methods are the analyses of scientific literature, collection, comparison, classification and
generalization of information.
2. The significance of profit and profitability analysis in modern competitive market conditions
Profit is the ratio that defines company's activity the best: it is related to other company's activity ratios, which are
assets, equity, liabilities, revenue, expenses, etc. Profit influences these ratios and they influence profit. Profit shows
how efficient a company is as well as its positive and negative work sides. International Financial Reporting
Standards state that profit and profitability are often used to evaluate companies' activity as well as determine
changes of economic resources (Tarptautiniai finansinės atskaitomybės standartai, 2007, p.36).
Every company's goal is to get as high profit as possible, even in 1940, one of the most famous Lithuanian financial
scientist V. Jurgutis wrote that if a company does not generate profit in a few years, one has to think that the country
does not need such company or it is managed poorly (Jurgutis, 1940, p. 485). Especially now – in modern
competitive market conditions – companies ought to generate higher profits. If a company is profitable enough,
then it can invest, expand its activities, make new production, provide services and thus hold a stable position in the
market (Mackevičius, 2007, p.178). So it is crucial that every company would perform profit analysis and seek how
to increase the profit. Yet, it has to be noted that absolute profit ratio does not show appropriate position of
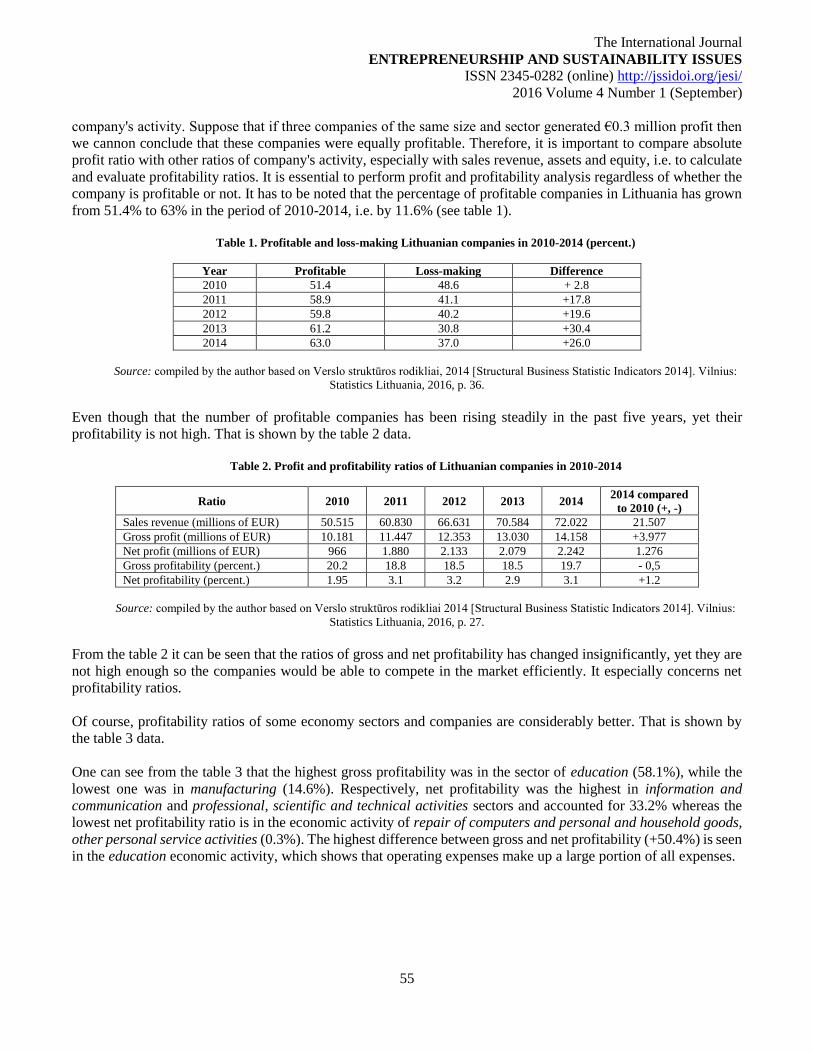
The International Journal
ENTREPRENEURSHIP AND SUSTAINABILITY ISSUES
ISSN 2345-0282 (online) http://jssidoi.org/jesi/
2016 Volume 4 Number 1 (September)
55
company's activity. Suppose that if three companies of the same size and sector generated €0.3 million profit then
we cannon conclude that these companies were equally profitable. Therefore, it is important to compare absolute
profit ratio with other ratios of company's activity, especially with sales revenue, assets and equity, i.e. to calculate
and evaluate profitability ratios. It is essential to perform profit and profitability analysis regardless of whether the
company is profitable or not. It has to be noted that the percentage of profitable companies in Lithuania has grown
from 51.4% to 63% in the period of 2010-2014, i.e. by 11.6% (see table 1).
Table 1. Profitable and loss-making Lithuanian companies in 2010-2014 (percent.)
Year Profitable Loss-making Difference
2010 51.4 48.6 + 2.8
2011 58.9 41.1 +17.8
2012 59.8 40.2 +19.6
2013 61.2 30.8 +30.4
2014 63.0 37.0 +26.0
Source: compiled by the author based on Verslo struktūros rodikliai, 2014 [Structural Business Statistic Indicators 2014]. Vilnius:
Statistics Lithuania, 2016, p. 36.
Even though that the number of profitable companies has been rising steadily in the past five years, yet their
profitability is not high. That is shown by the table 2 data.
Table 2. Profit and profitability ratios of Lithuanian companies in 2010-2014
Ratio 2010 2011 2012 2013 2014 2014 compared
to 2010 (+, -)
Sales revenue (millions of EUR) 50.515 60.830 66.631 70.584 72.022 21.507
Gross profit (millions of EUR) 10.181 11.447 12.353 13.030 14.158 +3.977
Net profit (millions of EUR) 966 1.880 2.133 2.079 2.242 1.276
Gross profitability (percent.) 20.2 18.8 18.5 18.5 19.7 - 0,5
Net profitability (percent.) 1.95 3.1 3.2 2.9 3.1 +1.2
Source: compiled by the author based on Verslo struktūros rodikliai 2014 [Structural Business Statistic Indicators 2014]. Vilnius:
Statistics Lithuania, 2016, p. 27.
From the table 2 it can be seen that the ratios of gross and net profitability has changed insignificantly, yet they are
not high enough so the companies would be able to compete in the market efficiently. It especially concerns net
profitability ratios.
Of course, profitability ratios of some economy sectors and companies are considerably better. That is shown by
the table 3 data.
One can see from the table 3 that the highest gross profitability was in the sector of education (58.1%), while the
lowest one was in manufacturing (14.6%). Respectively, net profitability was the highest in information and
communication and professional, scientific and technical activities sectors and accounted for 33.2% whereas the
lowest net profitability ratio is in the economic activity of repair of computers and personal and household goods,
other personal service activities (0.3%). The highest difference between gross and net profitability (+50.4%) is seen
in the education economic activity, which shows that operating expenses make up a large portion of all expenses.
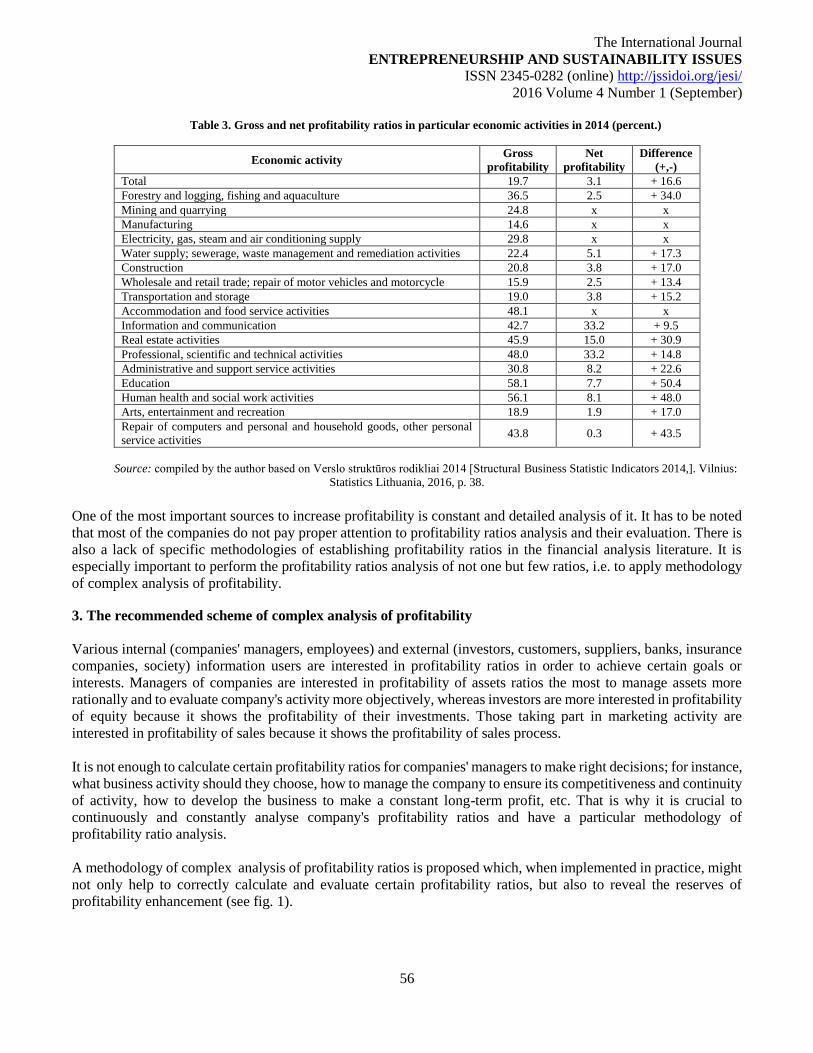
The International Journal
ENTREPRENEURSHIP AND SUSTAINABILITY ISSUES
ISSN 2345-0282 (online) http://jssidoi.org/jesi/
2016 Volume 4 Number 1 (September)
56
Table 3. Gross and net profitability ratios in particular economic activities in 2014 (percent.)
Economic activity Gross
profitability
Net
profitability
Difference
(+,-)
Total 19.7 3.1 + 16.6
Forestry and logging, fishing and aquaculture 36.5 2.5 + 34.0
Mining and quarrying 24.8 x x
Manufacturing 14.6 x x
Electricity, gas, steam and air conditioning supply 29.8 x x
Water supply; sewerage, waste management and remediation activities 22.4 5.1 + 17.3
Construction 20.8 3.8 + 17.0
Wholesale and retail trade; repair of motor vehicles and motorcycle 15.9 2.5 + 13.4
Transportation and storage 19.0 3.8 + 15.2
Accommodation and food service activities 48.1 x x
Information and communication 42.7 33.2 + 9.5
Real estate activities 45.9 15.0 + 30.9
Professional, scientific and technical activities 48.0 33.2 + 14.8
Administrative and support service activities 30.8 8.2 + 22.6
Education 58.1 7.7 + 50.4
Human health and social work activities 56.1 8.1 + 48.0
Arts, entertainment and recreation 18.9 1.9 + 17.0
Repair of computers and personal and household goods, other personal
service activities 43.8 0.3 + 43.5
Source: compiled by the author based on Verslo struktūros rodikliai 2014 [Structural Business Statistic Indicators 2014,]. Vilnius:
Statistics Lithuania, 2016, p. 38.
One of the most important sources to increase profitability is constant and detailed analysis of it. It has to be noted
that most of the companies do not pay proper attention to profitability ratios analysis and their evaluation. There is
also a lack of specific methodologies of establishing profitability ratios in the financial analysis literature. It is
especially important to perform the profitability ratios analysis of not one but few ratios, i.e. to apply methodology
of complex analysis of profitability.
3. The recommended scheme of complex analysis of profitability
Various internal (companies' managers, employees) and external (investors, customers, suppliers, banks, insurance
companies, society) information users are interested in profitability ratios in order to achieve certain goals or
interests. Managers of companies are interested in profitability of assets ratios the most to manage assets more
rationally and to evaluate company's activity more objectively, whereas investors are more interested in profitability
of equity because it shows the profitability of their investments. Those taking part in marketing activity are
interested in profitability of sales because it shows the profitability of sales process.
It is not enough to calculate certain profitability ratios for companies' managers to make right decisions; for instance,
what business activity should they choose, how to manage the company to ensure its competitiveness and continuity
of activity, how to develop the business to make a constant long-term profit, etc. That is why it is crucial to
continuously and constantly analyse company's profitability ratios and have a particular methodology of
profitability ratio analysis.
A methodology of complex analysis of profitability ratios is proposed which, when implemented in practice, might
not only help to correctly calculate and evaluate certain profitability ratios, but also to reveal the reserves of
profitability enhancement (see fig. 1).
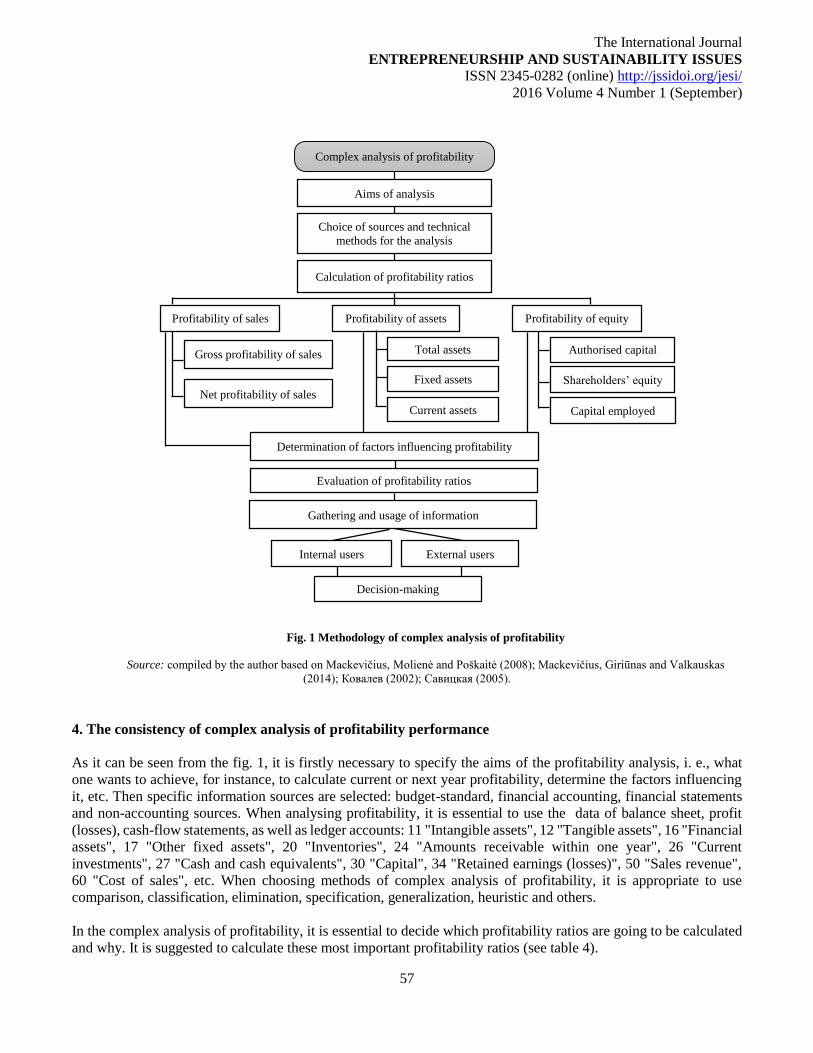
The International Journal
ENTREPRENEURSHIP AND SUSTAINABILITY ISSUES
ISSN 2345-0282 (online) http://jssidoi.org/jesi/
2016 Volume 4 Number 1 (September)
57
Aims of analysis
Choice of sources and technical
methods for the analysis
Calculation of profitability ratios
Profitability of sales Profitability of equity Profitability of assets
Gross profitability of sales
Net profitability of sales
Total assets
Fixed assets
Current assets
Authorised capital
Shareholders’ equity
Capital employed
Determination of factors influencing profitability
Evaluation of profitability ratios
Gathering and usage of information
Internal users External users
Complex analysis of profitability
Decision-making
Fig. 1 Methodology of complex analysis of profitability
Source: compiled by the author based on Mackevičius, Molienė and Poškaitė (2008); Mackevičius, Giriūnas and Valkauskas
(2014); Ковалев (2002); Савицкая (2005).
4. The consistency of complex analysis of profitability performance
As it can be seen from the fig. 1, it is firstly necessary to specify the aims of the profitability analysis, i. e., what
one wants to achieve, for instance, to calculate current or next year profitability, determine the factors influencing
it, etc. Then specific information sources are selected: budget-standard, financial accounting, financial statements
and non-accounting sources. When analysing profitability, it is essential to use the data of balance sheet, profit
(losses), cash-flow statements, as well as ledger accounts: 11 "Intangible assets", 12 "Tangible assets", 16 "Financial
assets", 17 "Other fixed assets", 20 "Inventories", 24 "Amounts receivable within one year", 26 "Current
investments", 27 "Cash and cash equivalents", 30 "Capital", 34 "Retained earnings (losses)", 50 "Sales revenue",
60 "Cost of sales", etc. When choosing methods of complex analysis of profitability, it is appropriate to use
comparison, classification, elimination, specification, generalization, heuristic and others.
In the complex analysis of profitability, it is essential to decide which profitability ratios are going to be calculated
and why. It is suggested to calculate these most important profitability ratios (see table 4).
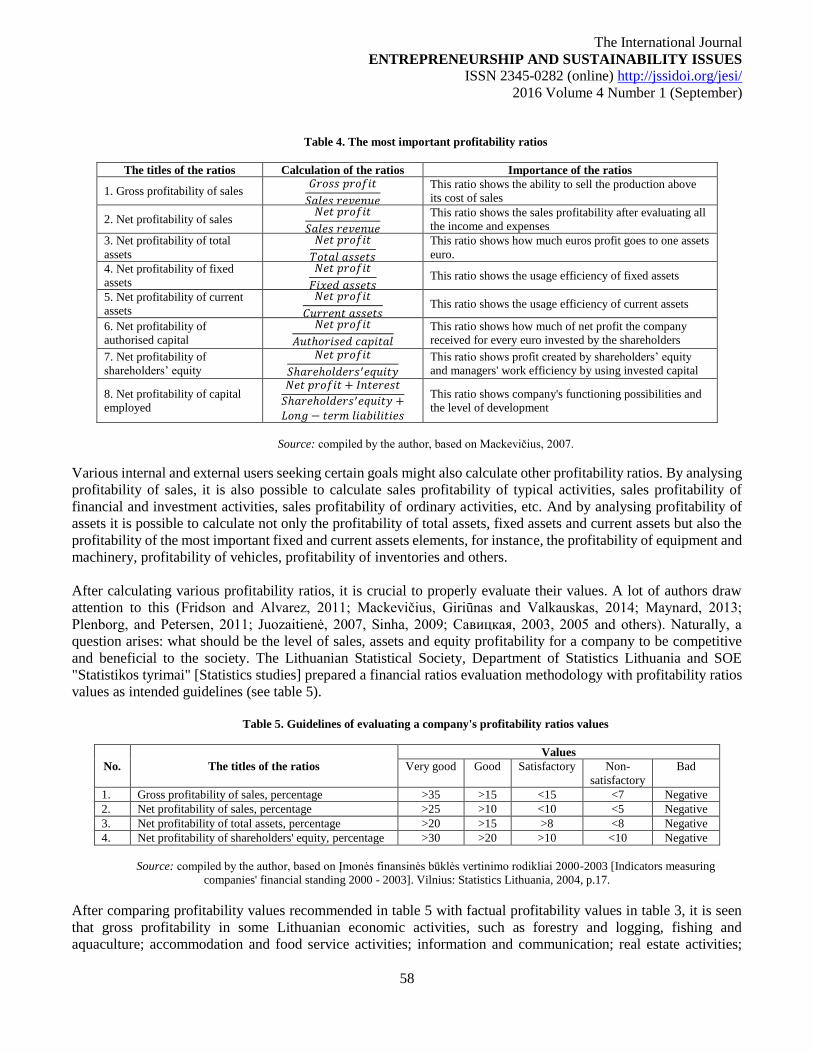
The International Journal
ENTREPRENEURSHIP AND SUSTAINABILITY ISSUES
ISSN 2345-0282 (online) http://jssidoi.org/jesi/
2016 Volume 4 Number 1 (September)
58
Table 4. The most important profitability ratios
The titles of the ratios Calculation of the ratios Importance of the ratios
1. Gross profitability of sales 𝐺𝑟𝑜𝑠𝑠 𝑝𝑟𝑜𝑓𝑖𝑡
𝑆𝑎𝑙𝑒𝑠 𝑟𝑒𝑣𝑒𝑛𝑢𝑒
This ratio shows the ability to sell the production above
its cost of sales
2. Net profitability of sales 𝑁𝑒𝑡 𝑝𝑟𝑜𝑓𝑖𝑡
𝑆𝑎𝑙𝑒𝑠 𝑟𝑒𝑣𝑒𝑛𝑢𝑒
This ratio shows the sales profitability after evaluating all
the income and expenses
3. Net profitability of total
assets
𝑁𝑒𝑡 𝑝𝑟𝑜𝑓𝑖𝑡
𝑇𝑜𝑡𝑎𝑙 𝑎𝑠𝑠𝑒𝑡𝑠
This ratio shows how much euros profit goes to one assets
euro.
4. Net profitability of fixed
assets
𝑁𝑒𝑡 𝑝𝑟𝑜𝑓𝑖𝑡
𝐹𝑖𝑥𝑒𝑑 𝑎𝑠𝑠𝑒𝑡𝑠 This ratio shows the usage efficiency of fixed assets
5. Net profitability of current
assets
𝑁𝑒𝑡 𝑝𝑟𝑜𝑓𝑖𝑡
𝐶𝑢𝑟𝑟𝑒𝑛𝑡 𝑎𝑠𝑠𝑒𝑡𝑠 This ratio shows the usage efficiency of current assets
6. Net profitability of
authorised capital
𝑁𝑒𝑡 𝑝𝑟𝑜𝑓𝑖𝑡
𝐴𝑢𝑡ℎ𝑜𝑟𝑖𝑠𝑒𝑑 𝑐𝑎𝑝𝑖𝑡𝑎𝑙
This ratio shows how much of net profit the company
received for every euro invested by the shareholders
7. Net profitability of
shareholders’ equity
𝑁𝑒𝑡 𝑝𝑟𝑜𝑓𝑖𝑡
𝑆ℎ𝑎𝑟𝑒ℎ𝑜𝑙𝑑𝑒𝑟𝑠′𝑒𝑞𝑢𝑖𝑡𝑦
This ratio shows profit created by shareholders’ equity
and managers' work efficiency by using invested capital
8. Net profitability of capital
employed
𝑁𝑒𝑡 𝑝𝑟𝑜𝑓𝑖𝑡 + 𝐼𝑛𝑡𝑒𝑟𝑒𝑠𝑡
𝑆ℎ𝑎𝑟𝑒ℎ𝑜𝑙𝑑𝑒𝑟𝑠′𝑒𝑞𝑢𝑖𝑡𝑦 +𝐿𝑜𝑛𝑔 − 𝑡𝑒𝑟𝑚 𝑙𝑖𝑎𝑏𝑖𝑙𝑖𝑡𝑖𝑒𝑠
This ratio shows company's functioning possibilities and
the level of development
Source: compiled by the author, based on Mackevičius, 2007.
Various internal and external users seeking certain goals might also calculate other profitability ratios. By analysing
profitability of sales, it is also possible to calculate sales profitability of typical activities, sales profitability of
financial and investment activities, sales profitability of ordinary activities, etc. And by analysing profitability of
assets it is possible to calculate not only the profitability of total assets, fixed assets and current assets but also the
profitability of the most important fixed and current assets elements, for instance, the profitability of equipment and
machinery, profitability of vehicles, profitability of inventories and others.
After calculating various profitability ratios, it is crucial to properly evaluate their values. A lot of authors draw
attention to this (Fridson and Alvarez, 2011; Mackevičius, Giriūnas and Valkauskas, 2014; Maynard, 2013;
Plenborg, and Petersen, 2011; Juozaitienė, 2007, Sinha, 2009; Савицкая, 2003, 2005 and others). Naturally, a
question arises: what should be the level of sales, assets and equity profitability for a company to be competitive
and beneficial to the society. The Lithuanian Statistical Society, Department of Statistics Lithuania and SOE
"Statistikos tyrimai" [Statistics studies] prepared a financial ratios evaluation methodology with profitability ratios
values as intended guidelines (see table 5).
Table 5. Guidelines of evaluating a company's profitability ratios values
No. The titles of the ratios
Values
Very good Good Satisfactory Non-
satisfactory
Bad
1. Gross profitability of sales, percentage >35 >15 <15 <7 Negative
2. Net profitability of sales, percentage >25 >10 <10 <5 Negative
3. Net profitability of total assets, percentage >20 >15 >8 <8 Negative
4. Net profitability of shareholders' equity, percentage >30 >20 >10 <10 Negative
Source: compiled by the author, based on Įmonės finansinės būklės vertinimo rodikliai 2000-2003 [Indicators measuring
companies' financial standing 2000 - 2003]. Vilnius: Statistics Lithuania, 2004, p.17.
After comparing profitability values recommended in table 5 with factual profitability values in table 3, it is seen
that gross profitability in some Lithuanian economic activities, such as forestry and logging, fishing and
aquaculture; accommodation and food service activities; information and communication; real estate activities;
The International Journal
ENTREPRENEURSHIP AND SUSTAINABILITY ISSUES
ISSN 2345-0282 (online) http://jssidoi.org/jesi/
2016 Volume 4 Number 1 (September)
59
education; human health and social work activities and others is evaluated as very good. However, the net
profitability ratios in the major part of economic activities (forestry and logging, fishing and aquaculture;
construction; wholesale and retail trade; repair of motor vehicles and motorcycle; transportation and storage; arts,
entertainment and recreation; repair of computers and personal and household goods, other personal service
activities) are evaluated as non-satisfactory. It shows that companies are able to optimize the cost of sales, yet are
facing problems when managing operating expenses.
Naturally, the values given in table 5 should only be treated as guidelines. Profitability ratios of companies from
different economic sectors may differ considerably because of activity characteristics typical to them. Thus the most
proper option would be for the companies themselves to review their profitability ratios of the previous few years,
establish their own guidelines for profitability ratios and follow them.
Because of very complex, constantly changing and competitive circumstances of modern market, it is appropriate
to prepare a four-level scheme to evaluate profitability ratios, which looks like this:
1. Excellent: it is the value that considerably (more than 100%) exceeds the medium level of the industry
sectors’ companies' ratio.
2. Good: when the company's ratio exceeds (less than 100%) the medium level of the industry sectors’
companies' ratio.
3. Satisfactory: when the company's ratio matches the medium level of the industry sectors’ companies' ratio
or slightly diverges from it.
4. Bad: when the company's ratio is lower than the medium level of the industry sectors’ companies' ratio.
The guidelines for profitability ratios values – taking into account the dynamism of modern business and constantly
growing competition – might be established for a certain period, for instance 3-5 years, and changed afterwards.
When performing the complex analysis of profitability, it is important to calculate factors influencing a certain level
of profitability. The factors are calculated separately for profitability of sales, assets and equity. Four main factors
have an impact on gross profitability of sales: 1) the production sales volume; 2) the structure and range of
production sales; 3) cost of sales; 4) price. As the products and services sales volume increases, yet the other factors
stay the same, the gross profit – and meanwhile profitability – also increases. The impact of structure and range is
calculated by comparing basic gross profitability of sales calculated according to the factual production volume
with a base ratio. The cost of sales influence is determined by comparing the factual and basic gross profitability of
sales recalculated for factual sales volume. The price factor is estimated by comparing factual gross profitability of
sales – which is calculated by dividing the calculated current gross profit from factual sum of sales revenue – with
factual gross profitability recalculated for base prices. It is appropriate to calculate the factors influencing
profitability of assets and equity using the DuPont pyramid or its formulae:
1) Net profitability of assets = 𝑁𝑒𝑡 𝑝𝑟𝑜𝑓𝑖𝑡
𝑇𝑜𝑡𝑎𝑙 𝑎𝑠𝑠𝑒𝑡𝑠 =
𝑁𝑒𝑡 𝑝𝑟𝑜𝑓𝑖𝑡
𝑆𝑎𝑙𝑒𝑠 𝑟𝑒𝑣𝑒𝑛𝑢𝑒 ×
𝑆𝑎𝑙𝑒𝑠 𝑟𝑒𝑣𝑒𝑛𝑢𝑒
𝑇𝑜𝑡𝑎𝑙 𝑎𝑠𝑠𝑒𝑡𝑠 = Net profitability of sales × ×
Total assets turnover;
2) Net profitability of shareholders' equity = 𝑁𝑒𝑡 𝑝𝑟𝑜𝑓𝑖𝑡
𝑆ℎ𝑎𝑟𝑒ℎ𝑜𝑙𝑑𝑒𝑟𝑠′𝑒𝑞𝑢𝑖𝑡𝑦 =
𝑁𝑒𝑡 𝑝𝑟𝑜𝑓𝑖𝑡
𝑆𝑎𝑙𝑒𝑠 𝑟𝑒𝑣𝑒𝑛𝑢𝑒 ×
𝑆𝑎𝑙𝑒𝑠 𝑟𝑒𝑣𝑒𝑛𝑢𝑒
𝑇𝑜𝑡𝑎𝑙 𝑎𝑠𝑠𝑒𝑡𝑠 × ×
𝑇𝑜𝑡𝑎𝑙 𝑎𝑠𝑠𝑒𝑡𝑠
𝑆ℎ𝑎𝑟𝑒ℎ𝑜𝑑𝑒𝑟𝑠′ 𝑒𝑞𝑢𝑖𝑡𝑦 = Net profitability of sales × Total assets turnover × Equity multiplier.
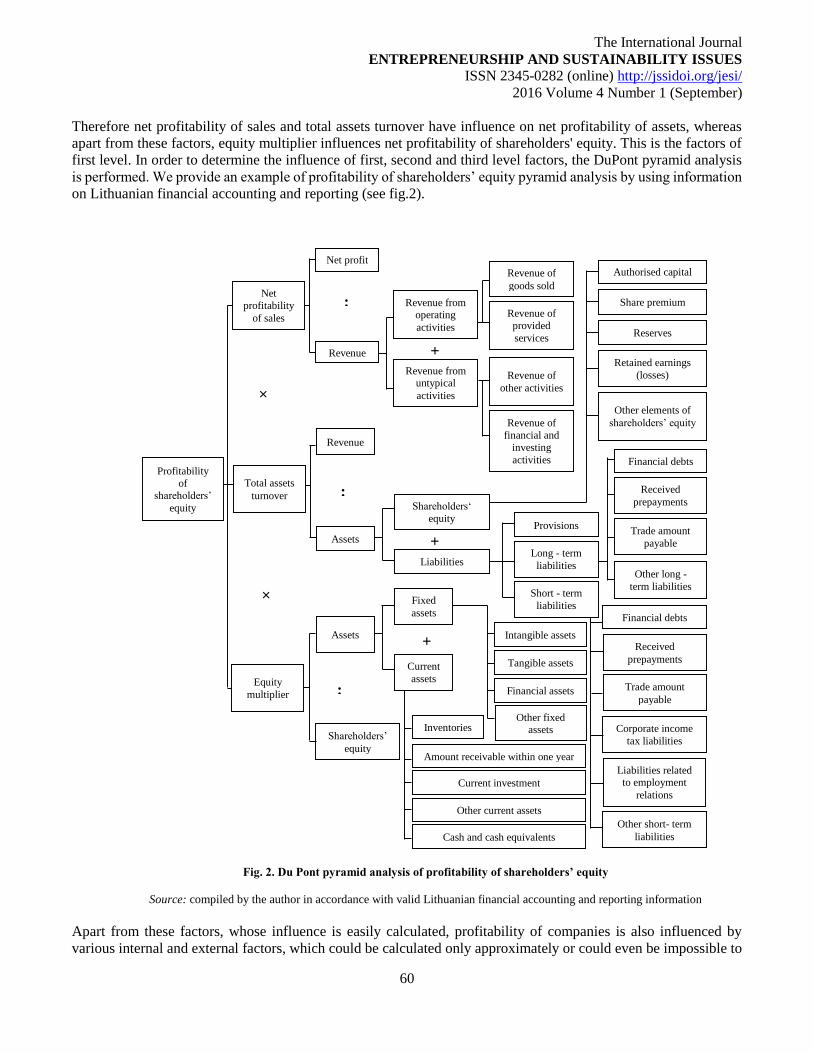
The International Journal
ENTREPRENEURSHIP AND SUSTAINABILITY ISSUES
ISSN 2345-0282 (online) http://jssidoi.org/jesi/
2016 Volume 4 Number 1 (September)
60
Therefore net profitability of sales and total assets turnover have influence on net profitability of assets, whereas
apart from these factors, equity multiplier influences net profitability of shareholders' equity. This is the factors of
first level. In order to determine the influence of first, second and third level factors, the DuPont pyramid analysis
is performed. We provide an example of profitability of shareholders’ equity pyramid analysis by using information
on Lithuanian financial accounting and reporting (see fig.2).
Profitability
of shareholders’
equity
Net
profitability
of sales
Total assets
turnover
Equity
multiplier
Net profit
Revenue
Revenue from operating
activities
Revenue from untypical
activities
Revenue of
goods sold
Revenue of
provided
services
Revenue of
other activities
Revenue of
financial and
investing
activities
Revenue
Assets
Assets
Shareholders’
equity
Fixed
assets
Current
assets
Shareholders‘
equity
Liabilities Long - term
liabilities
Short - term
liabilities
Authorised capital
Share premium
Reserves
Retained earnings
(losses)
Other elements of
shareholders’ equity
Provisions
Financial debts
Received
prepayments
Trade amount
payable
Other long -
term liabilities
Financial debts
Received
prepayments
Trade amount
payable
Corporate income
tax liabilities
Liabilities related to employment
relations
Other short- term
liabilities
×
×
:
:
:
+
+
+
Intangible assets
Tangible assets
Financial assets
Other fixed assets Inventories
Amount receivable within one year
Current investment
Other current assets
Cash and cash equivalents
Fig. 2. Du Pont pyramid analysis of profitability of shareholders’ equity
Source: compiled by the author in accordance with valid Lithuanian financial accounting and reporting information
Apart from these factors, whose influence is easily calculated, profitability of companies is also influenced by
various internal and external factors, which could be calculated only approximately or could even be impossible to
The International Journal
ENTREPRENEURSHIP AND SUSTAINABILITY ISSUES
ISSN 2345-0282 (online) http://jssidoi.org/jesi/
2016 Volume 4 Number 1 (September)
61
calculate them, yet their influence cannot be denied (Šimberová et al. 2015). These factors are also attributed to the
most important factors influencing company's profitability: 1) economic (overall level of economic development,
the monetary, fiscal and tax policy of the state, inflation, etc.), 2) political and legal (legislation inciting business
establishment and development, the state's foreign economic policies, aid for small businesses, and others), 3) social
and cultural (the level of unemployment, population and geographical distribution, basic and economics education
of the population and others), 4) technological (state-level incitement of efficient usage of technologies and
innovations, state-level promotion of knowledge-based society, occupational safety, and others), 5) ecological
(pollution of air, water, earth and its resources, noise, excessive heat or cold, and others).
Internal factors have even more significant influence, these are most notable: managers' activity (actions of
managers are of particular importance when establishing the company's activity policies and strategy, Mentel et al.
2016), personnel management policy; i.e. anticipation of personnel strategy, selection of employees, employees
training and education, employees’ wages, employees relationships management (Matetskaya 2015; Prause, Hunke
2014), organisational and management structure (Fuschi, Tvaronavičienė 2016) of a company, and others.
Well-executed complex analysis of profitability gathers a lot of information about profitability of sales, assets and
equity whose information is especially valuable for internal and external users of information making certain
decisions. The information of analysis might help the companies' managers not only to forecast company's
profitability but also to precisely evaluate possible risks and potential possibilities, establish economic, technical
and other conditions of current and future business, the level and characteristics of competition, the possibilities
and strategies of competitors, etc. It can even be stated that complex analysis of profitability helps to efficiently
manage company's resources, make right investment and financial decisions and eventually ensure good solvency
and profitable activity.
Conclusions
Various internal and external users as well as most of the authors usually calculate and analyse gross or net
profitability ratios. However, these ratios ought to be named as gross and net profitability of sales because they are
calculated by respectively dividing gross or net profit from sales revenue. In modern market conditions which are
competitive and dynamic, it is essential to calculate and analyse not only the profitability of sales ratio but also the
profitability of assets and equity ratios.
The complex sales, assets and equity profitability analysis methodology has not yet been established. The complex
analysis methodology recommended in the article comprises: 1) determination of analysis aims; 2) choice of
analysis sources and technical methods; 3) calculation and evaluation profitability of sales (gross and net),
profitability of assets (total assets, fixed and current assets), profitability of equity (authorized capital, shareholders’
equity and capital employed); 4) determination of factors influencing profitability; 5) usage of information collected
during the analysis for internal and external users purposes.
The recommended methodology of complex analysis of profitability can be successfully applied to companies of
various size and activity. After successfully applying it, it is possible to objectively assess efficiency of company's
activity, potential risks, competitiveness and possibilities of continuity.
The International Journal
ENTREPRENEURSHIP AND SUSTAINABILITY ISSUES
ISSN 2345-0282 (online) http://jssidoi.org/jesi/
2016 Volume 4 Number 1 (September)
62
References
10th Business Accounting Standard “Income”. 2015. The Authority of Audit and Accounting. Available on the Internet:
<http://www.aat.lt/index.php?id=14>.
2nd Business Accounting Standard “Balance sheet”. 2015. The Authority of Audit and Accounting. Available on the Internet:
<http://www.aat.lt/index.php?id=14>.
3rd Business Accounting Standard “Statement of profit or loss”. 2015. The Authority of Audit and Accounting. Available on the Internet:
<http://www.aat.lt/index.php?id=14>.
Bagdžiūnienė, V. 2005. Finansinių ataskaitų analizė. Esmė ir verslo situacijos [Analysis of financial statements. The essence and situations
of business]. Vilnius: Conto litera.
Bernstein, L.A. 1993. Financial Statement Analysis. Theory, Application and Interpretation. 5th ed. New York: Irwin.
Black. G. 2004. Applied Financial Accounting and Reporting. Oxford: Oxford University Press.
Brigham, E.F., Daves, P.R. 2004. Intermediate Financial Management. 8th ed. Thomson, South-Western.
Buškevičiūtė, E., Kanapickienė, R., Patašius, M. 2010. Finansinių rezultatų analizė [Analysis of financial results]. Kaunas: Technologija.
Dunn, J. 2010. Financial Reporting and Analysis. Chichester: John Wiley & Sons Ltd.
Fridson, M.S., Alvarez, F. 2011. Financial Statement Analysis. A Practitioner‘s Guide. 4th ed. New Jersey: John Wiley and Sons, Inc.
Fuschi, D. L.; Tvaronavičienė, M. 2016. A network based business partnership model for SMEs management, Entrepreneurship and
Sustainability Issues 3(3): 282-289. http://dx.doi.org/10.9770/jesi.2016.3.3(5)
Gibson, Ch. H. 1992. Financial Statement Analysis: Using Accounting Information. 5th ed. Cincinnati, OH: South-Western Publishing Co.
Gibson, Ch. 2012. Financial Reporting and Analysis. Using Financial Accounting Information. 13th ed. Mason, OH: South-Western Cengage
Learning.
Įmonių finansinės būklės vertinimo rodikliai 2000 – 2003 [Indicators measuring companies' financial standing 2000 - 2003]. 2004. Vilnius:
Statistics Lithuania.
Juozaitienė, L. 2007. Įmonės finansai: analizė ir valdymas [Company‘s finance: analysis and management]. Šiauliai: The publisher of
Šiauliai University.
Jurgutis, V. 1940. Bankai. [Banks]. Kaunas: Šviesa.
Labonaitė, G., Subačienė, R., 2014. Grynojo pelningumo vertinimo metodika [Methodology for net profitability analysis]. Buhalterinės
apskaitos teorija ir praktika [Accounting Theory and Practise], 16: 78-87.
Liaubienė, R., Martirosianienė, L. 2008. Pelningumo rodiklių analizės problemos [Problems of analysis of profitability ratios], Science and
studies of accounting and finance: problems and perspectives: proceedings of 6th international scientific conference. Lithuanian University
of Agriculture, Kaunas, p. 102 -106.
Mackevičius, J. 2007. Įmonių veiklos analizė [Analysis of enterprises activity]. Vilnius: TEV.
Mackevičius, J., Giriūnas, L., Valkauskas, R. 2014. Finansinė analizė [Financial analysis]. Vilnius: Vilniaus universiteto leidykla.
Mackevičius, J., Molienė, O., Poškaitė, D. 2008. Bendrojo pardavimo pelningumo kompleksinės analizės metodika [Methodology of complex
analysis of return on sales], Ekonomika [Economics], 81: 74-90.
Matetskaya, M. 2015. Education programmes for entrepreneurs in the creative industries in St. Petersburg, Entrepreneurship and
Sustainability Issues 3(1): 66-73. http://dx.doi.org/10.9770/jesi.2015.3.1(6)
The International Journal
ENTREPRENEURSHIP AND SUSTAINABILITY ISSUES
ISSN 2345-0282 (online) http://jssidoi.org/jesi/
2016 Volume 4 Number 1 (September)
63
Maynard, J. 2013. Financial Accounting, Reporting and Analysis. Oxford: Oxford University Press.
Mentel, G.; Szetela, B.; Tvaronavičienė, M. 2016. Qualifications of managers vs. effectiveness of investment funds in Poland, Economics &
Sociology 9(2): 126-137.
Plenborg, T., Petersen, Ch. 2011. Financial Statement Analysis. Valuation - Credit Analysis - Executive Compensation. Essex: Pearson
Education.
Poškaitė, D. 1994. Finansinės būklės analizė rinkos sąlygomis [Analysis of financial standing under market conditions]. Vilnius: Vilniaus
universiteto leidykla.
Prause, G.; Hunke, K. 2014. Secure and sustainable supply chain management: integrated ICT-systems for green transport corridors, Journal
of Security and Sustainability Issues 3(4): 5-16. http://dx.doi.org/10.9770/jssi.2014.3.4(1)
Šimberová, I.; Chvátalová, Z.; Kocmanová, A.; Hornungová, J.; Pavláková Dočekalová, M. 2015. Sustainable value in measuring of corporate
sustainability: approaches and their evaluation, Journal of Security and Sustainability Issues 4(3): 241-
259. http://dx.doi.org/10.9770/jssi.2015.4.3(5)
Sinha, G. 2009. Financial Statement Analysis. New Delhi: PHI Ltd.
Standard chart of ledger account. 2016. The Authority of Audit and Accounting. Available on the Internet:
<http://www.aat.lt/index.php?id=14>.
Stickney, C. P. 1993. Financial Statement Analysis. A Strategic Perspective. 2nd ed. The Dryden Press.
Stickney, C.P.; Brown, P.; Wahlen, J.M. 2006. Financial Reporting, Financial Statement Analysis, and Valuation. A Strategic Perspective.
6th ed. Mason: South-Western College Publishing.
Tarptautiniai finansinės atskaitomybės standartai [International Financial Reporting Standards]. (2007). Vilnius: Apskaitos institutas.
Tvaronavičienė, M.; Černevičiūtė, J. 2015. Technology transfer phenomenon and its impact on sustainable development, Journal of Security
and Sustainability Issues 5(1): 87–97. DOI: http://dx.doi.org/10.9770/jssi.2015.5.1(7)
Verslo struktūros rodikliai 2014 [Structural Business Statistic Indicators 2014]. 2016. Vilnius: Statistics Lithuania.
White, G.Y., Sondhi, A.C., Fried, D. 1994. The Analysis and the Use of Financial Statements. New York: John Wiley & Sons.
Ковалев, В.В. 2002. Финансовый анализ: методы и процедуры [Financial analysis: methods and procedures]. Москва: Финансы и
статистика.
Савицкая, Т.В. 2003. Економический анализ [Economic analysis]. 8-ое изд. Москва: Новое знание.
Савицкая, Т.В. 2005. Методика комлексного анализа хозяйственной деятельности [Methodology of economic activity complex
analysis]. Москва: ИНФРА.
Daiva TAMULEVIČIENĖ is the Assistant of Accounting and Auditing Department, PhD student. Scientific interests: controlling,
management accounting, modern cost accounting systems, financial management, financial analysis. Vilnius University, Faculty of
Economics, department of Accounting and Audit.
Copyright © 2016 by author(s) and VsI Entrepreneurship and Sustainability Center
This work is licensed under the Creative Commons Attribution International License (CC BY).
http://creativecommons.org/licenses/by/4.0/
The International Journal
ENTREPRENEURSHIP AND SUSTAINABILITY ISSUES
ISSN 2345-0282 (online) http://jssidoi.org/jesi/
2016 Volume 4 Number 1 (September)
64
International Centre for
Entrepreneurship Research
ENTREPRENEURSHIP AND SUSTAINABILITY ISSUES
ISSN 2345-0282 (online) http://jssidoi.org/jesi/
MOBILE PHONES' SOCIAL IMPACTS ON SUSTAINABLE HUMAN DEVELOPMENT: CASE
STUDIES, MOROCCO AND ITALY1
Kaoutar Allabouche¹, Omar Diouri², Ahmed Gaga3, Najiba El Amrani El Idrissi4
1,2,3,4 Sidi Mohamed Ben Abdellah University, Faculty of Sciences and Technology,
Route d’Immouzer BP2202 Fez, Morocco
E-mails:1 [email protected]; [email protected];; [email protected]; [email protected]
Received 27 February 2016; accepted 18 June 2016
Abstract. Information and Communications Technologies (ICTs) include the modern tools of knowledge-sharing and communication used
in daily citizen’s activities, such as Internet, computers and mobile technologies. The expansion of mobile telephony has been one of the
most spectacular changes in the developing world over the previous decade. The increasing ubiquity of mobiles in developing countries
presents both opportunities and challenges, especially for critical segments such as social one.The use of mobile phones is influencing
numerous aspects of society, and its positive and negative impacts are widely highlighted: relationships and involvement in public life, the
new communities that has been created and the human relationships that have radically changed. Smartphones are not just communication
devices but can also take pictures, playing music and games, provide location-based services, internet... In developing countries, the main
use is through phone communications and messages to overcome the distances. Yet, all these profits only come from the use of mobiles.
However, we should not forget the social issues related to it. Our work investigates how some human attitudes, while using mobile phones
can influence sustainable human development in Morocco and Italy. Specifically, the study seeks to assess how mobile phones can impede
over social issues. The analysis was conducted in the framework of the Europeen project ShuMed; it relies on a survey that involved different
categories of people (students, employees, unemployed, professors, engineers, administrators…). A total of approximately 120 participants
were randomly selected and included in the investigation. The analysis of the collected data; from a questionnaire; showed that the majority
of the respondents used their mobile phones without paying attention to some daily attitudes, that has a significant negative impact on the
human well-being.
Keywords: Sustainable Human Development (SHD), Morocco, Italy, Developing countries, ICT, Mobiles, social aspects
1 The research leading to these results has received funding from the European Community’s Seventh Framework
Programme (FP7/20072013). The article reflects the views only of the authors, and the Commission cannot be
held responsible for any use which may be made of the information contained therein. The information in this
document is provided as is and no guarantee or warranty is given that the information is fit for any particular
purpose. The user thereof uses the information at its sole risk and liability.
The International Journal
ENTREPRENEURSHIP AND SUSTAINABILITY ISSUES
ISSN 2345-0282 (online) http://jssidoi.org/jesi/
2016 Volume 4 Number 1 (September)
65
Reference to this paper should be made as follows: Allabouche, K.; Diouri, O.; Gaga, A.; El Amrani El Idrissi, N. 2015. Mobile phones'
social impacts on sustainable human development: case studies, Morocco and Italy, Entrepreneurship and Sustainability Issues 4(1): 64-73.
DOI: http://dx.doi.org/10.9770/jesi.2016.4.1(6)
JEL Classifications: A13, F63
1. Introduction
Telecommunications history knew a turning point in 2002; indeed, this was the first time that the number of mobile
phone subscribers exceeds the number of fixed-line subscribers on a worldwide scale. This quantitative evolution
was accompanied by a significant qualitative growth. The mobile phone is no longer just a technical system for
communication, it became a key ‘social object’ presents in every aspect of a user’s life. Today, the smallest device
has more computational power and high performance than the largest computers had a generation ago. And this
computational power continues to grow. No wonder that the mobile has been adopted at an amazing rate across
cultures and countries. With the increasing penetration rates, social and academic interest has been directed toward
the social impacts of mobile phones, particularly in relation to well-being and daily social interactions with people.
The Information and Communication Technologies (ICT) have been for a long period perceived primarily from the
perspective of their unquestionable contribution in terms of productivity of economy and the population’s well-
being. It is only recently that their environmental, social and economic impacts have become a primordial concern.
The considerable extension of their program, difficulties in ensuring the power supply of big data centres and the
production of toxic waste volumes have led to the emergence: of a global reflection under the Sustainable Human
Development (SHD).
The global economy is progressively becoming dependent on ICT systems, while developing Countries are
unfavourably operating under lack of e-readiness, open competition, and unsteady sustainability policies (Belás et
al. 2016; Vaško, Abrhám 2015; Štitilis, Klišauskas 2015; Olaniyi, Reidolf 2015; Fuschi, Tvaronavičienė 2014;
Samašonok et al. 2016). Content, infrastructure and human ability are quickly increasing through enhanced
participation of private sector investment, but not with inclusive vision and enough benefits to the marginal
communities in rural regions. However, the infrastructure needs to be designed to responds to the requirements for
mass distribution of useful information to the community. The increasing international interest in the potential of
ICT as a tool for fostering sustainable human development has been reflected in a series of activities, and accelerated
by a number of events, like the G8 2000 meet in Tokyo, WSSD Johannesburg Summit in 2002, and WSIS Geneva
Summit in 2003. These international conferences, attended by several experts from many developed countries, were
platforms of interesting, interactive and open debates for discussing the issues of access and use of the information
technologies in developed and developing countries.
A first category of ICT impacts on human development comprises those that can be met with effects on
environmental sustainability. Since then, the telecommunications industry segment has experienced an exponential
growth mainly between 2005 and 2010. In this regard, it is important to focus on the Moroccan successful
experience "in the introduction of ICT in different areas, noting that the Kingdom has launched since 2006, an
ambitious program called "Generalization of Information Technologies in Education" (GENIE). This program
targets to generalize the use of information and communication technologies and to integrate them in different
fields; mainly in the system of education and vocational training. The most popular example of ICT is the Cell
phone, which has become part of our lives. We rock it in our hands gazing fondly at it, waiting impatiently for it to
ring. Should we keep them so close, if we knew where it comes from and where it goes?
Since the introduction of modern mobile telephony in the 1980s, there have been dramatic reductions in their weight
and changes in battery chemistry that have reduced the natural resources required, both in terms of energy and
materials in the whole production process, use and final end-of-life.
The International Journal
ENTREPRENEURSHIP AND SUSTAINABILITY ISSUES
ISSN 2345-0282 (online) http://jssidoi.org/jesi/
2016 Volume 4 Number 1 (September)
66
In this regard, our paper will focus on the analysis of the social issue which is mostly affected by mobile phones as
ICT technology in Morocco, including positive and negative impacts. The study will be supported by concrete
statistics of research work in the kingdom and will be compared by statistic results from Italian community. It will
be demonstrated through our paper that mobile phone allows easy access to information, and to be reachable even
to those who does not have any level in studies or qualifications in ICT. On the other hand, this technology presents
some non-negligible social effects that will be detailed in our paper, while showing some human attitudes that
reflects non awareness of the negative influence. In addition, some solutions will be proposed to mitigate the
drawbacks of the Mobile technology use.
2. Materials and methods
The research was conducted in two main countries: Morocco from the African continent and Italy from the European
one. In the context of SHuMED project N° 319017 (FP7-PEOPLE-2012-IRSES: Marie Curie Action "International
Research Staff Exchange Scheme"), we performed mobility internships in ‘Roma Tre’ university and the university
of Pisa in Italy. The subject of these mobilities was ‘’the Sustainable Human Development for MED Countries
mobility’’ that is why we have taken this opportunity to broadcast our questionnaire and collect data from the Italian
community.
2.1. Mobile Technology and sustainable development
The growing acceptance of sustainable development as an aim, and the ICT progress share many characteristics as
drivers for change within modern economies. Both require us to rethink about the nature of goods and services.
However, there have been surprisingly few efforts to assess whether the growing acceptance of the sustainable
development agenda and the growth of ICT will complement or conflict with each other. In fact, mobile devices
need to be reviewed across their entire lifecycle in terms of resources and energy they use, their manufacturing
process and usage as well.
2.2. Data collection & methodology
A content analysis was realized on several indicators related to daily citizen activities while using mobile phones.
Hence, two samples were consulted through a survey that has been addressed to the Italian and Moroccan citizens.
This led to the identification of the most impacting attitudes and the elaboration of a list of behavior that should be
taken into consideration while discussing the effects of mobile technology as an ICT tool on sustainable human
development. In this metho d, people from each sample (Moroccans and Italians) were first asked to answer
individually the different questions of the survey. Notice that both samples include approximately 70 people from
each country, in totally 135 persons. The compiled results of the questionnaire will be then presented and discussed
in the paper. The whole process was completed without actually meeting or knowing real identity of participants,
thus avoiding direct confrontation. The aim was not to reach unanimity, but rather to assess and to ensure a high
degree of credible answers. The list of participants was elaborated for each sample group on the basis of experience,
knowledge of the mobile technology and occupation (managers and employees of ICT sector, investors, students,
unemployed, regular user…). Participants were allowed to add or reformulate some items if necessary, and were
asked to justify their answers or to provide any additional comments to clarify their views on each question.
The questionnaire contains 12 questions, linked to each other to provide improved accuracy of participant responses.
The proposed interrogations aim principally to show the awareness level of Italian and Moroccan respondents on
the social impact of the technology they use, especially mobiles phone.
3. Results and discussion
Mobile phones have become universal and basic communication tools used nowadays not only for calls, but also
for Internet access, sending Data and information. All this services provided by a simple smartphone make it a very
complicated device with a lot of components that come from all over the world. They have become an indispensible
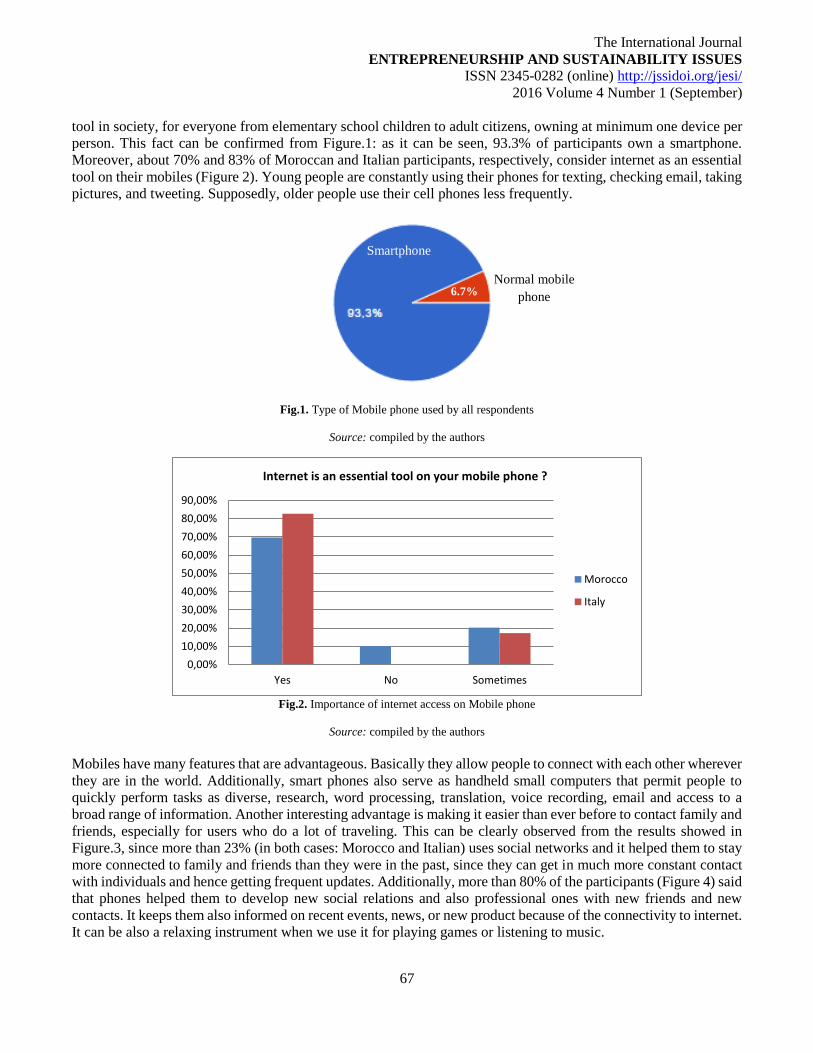
The International Journal
ENTREPRENEURSHIP AND SUSTAINABILITY ISSUES
ISSN 2345-0282 (online) http://jssidoi.org/jesi/
2016 Volume 4 Number 1 (September)
67
tool in society, for everyone from elementary school children to adult citizens, owning at minimum one device per
person. This fact can be confirmed from Figure.1: as it can be seen, 93.3% of participants own a smartphone.
Moreover, about 70% and 83% of Moroccan and Italian participants, respectively, consider internet as an essential
tool on their mobiles (Figure 2). Young people are constantly using their phones for texting, checking email, taking
pictures, and tweeting. Supposedly, older people use their cell phones less frequently.
Fig.1. Type of Mobile phone used by all respondents
Source: compiled by the authors
Fig.2. Importance of internet access on Mobile phone
Source: compiled by the authors
Mobiles have many features that are advantageous. Basically they allow people to connect with each other wherever
they are in the world. Additionally, smart phones also serve as handheld small computers that permit people to
quickly perform tasks as diverse, research, word processing, translation, voice recording, email and access to a
broad range of information. Another interesting advantage is making it easier than ever before to contact family and
friends, especially for users who do a lot of traveling. This can be clearly observed from the results showed in
Figure.3, since more than 23% (in both cases: Morocco and Italian) uses social networks and it helped them to stay
more connected to family and friends than they were in the past, since they can get in much more constant contact
with individuals and hence getting frequent updates. Additionally, more than 80% of the participants (Figure 4) said
that phones helped them to develop new social relations and also professional ones with new friends and new
contacts. It keeps them also informed on recent events, news, or new product because of the connectivity to internet.
It can be also a relaxing instrument when we use it for playing games or listening to music.
0,00%
10,00%
20,00%
30,00%
40,00%
50,00%
60,00%
70,00%
80,00%
90,00%
Yes No Sometimes
Internet is an essential tool on your mobile phone ?
Morocco
Italy
Smartphone
Normal mobile
phone
6.7 %
6.7%
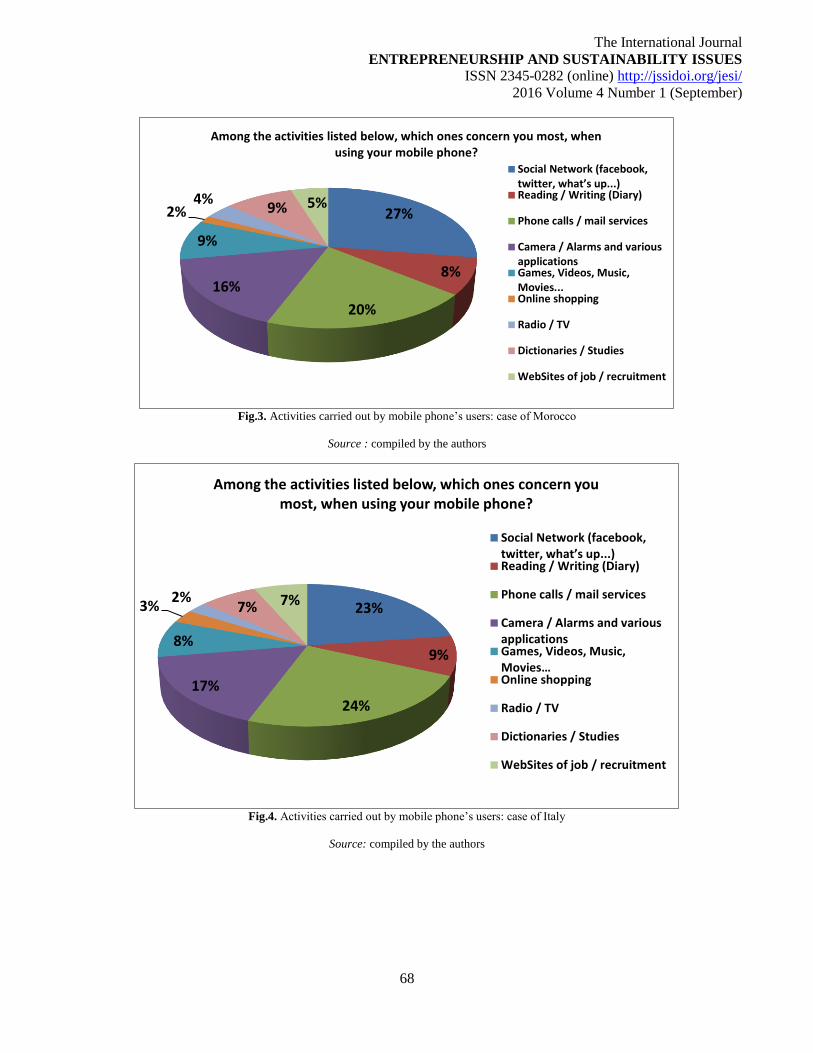
The International Journal
ENTREPRENEURSHIP AND SUSTAINABILITY ISSUES
ISSN 2345-0282 (online) http://jssidoi.org/jesi/
2016 Volume 4 Number 1 (September)
68
Fig.3. Activities carried out by mobile phone’s users: case of Morocco
Source : compiled by the authors
Fig.4. Activities carried out by mobile phone’s users: case of Italy
Source: compiled by the authors
27%
8%
20%
16%
9%
2%4%
9% 5%
Among the activities listed below, which ones concern you most, when using your mobile phone?
Social Network (facebook, twitter, what’s up...)Reading / Writing (Diary)
Phone calls / mail services
Camera / Alarms and variousapplicationsGames, Videos, Music,Movies...Online shopping
Radio / TV
Dictionaries / Studies
WebSites of job / recruitment
23%
9%
24%17%
8%
3%2%
7% 7%
Among the activities listed below, which ones concern you most, when using your mobile phone?
Social Network (facebook, twitter, what’s up...)Reading / Writing (Diary)
Phone calls / mail services
Camera / Alarms and variousapplicationsGames, Videos, Music, Movies…Online shopping
Radio / TV
Dictionaries / Studies
WebSites of job / recruitment
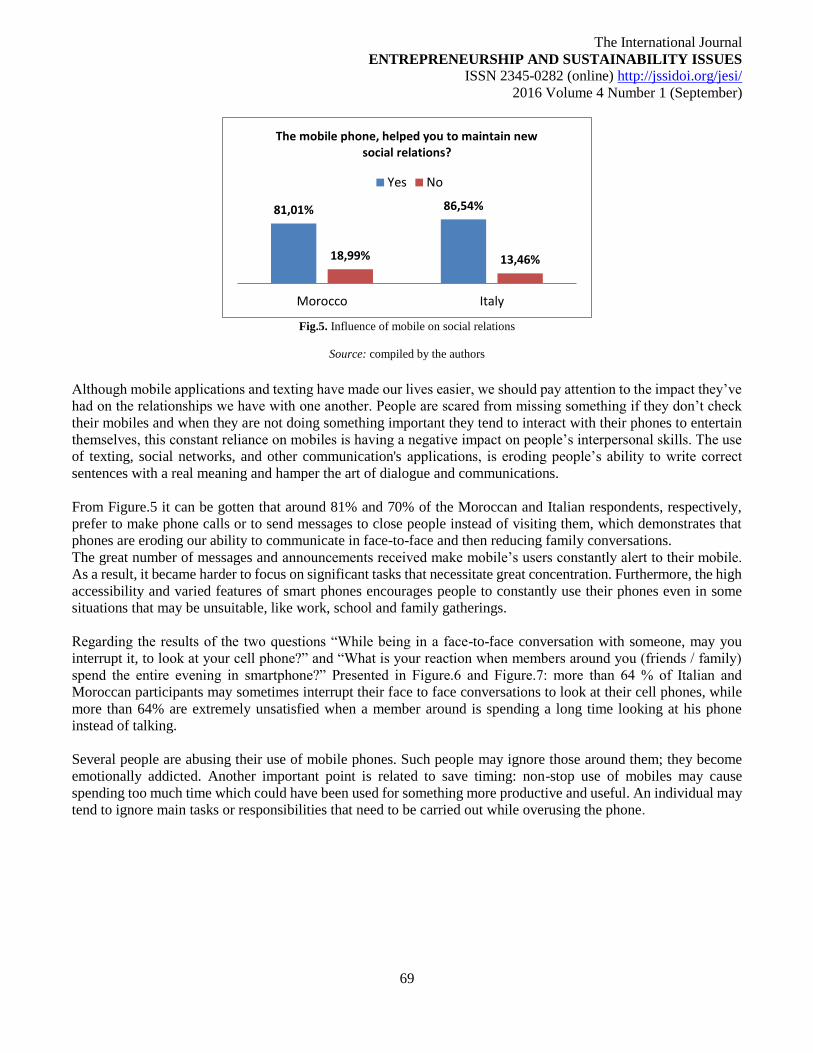
The International Journal
ENTREPRENEURSHIP AND SUSTAINABILITY ISSUES
ISSN 2345-0282 (online) http://jssidoi.org/jesi/
2016 Volume 4 Number 1 (September)
69
Fig.5. Influence of mobile on social relations
Source: compiled by the authors
Although mobile applications and texting have made our lives easier, we should pay attention to the impact they’ve
had on the relationships we have with one another. People are scared from missing something if they don’t check
their mobiles and when they are not doing something important they tend to interact with their phones to entertain
themselves, this constant reliance on mobiles is having a negative impact on people’s interpersonal skills. The use
of texting, social networks, and other communication's applications, is eroding people’s ability to write correct
sentences with a real meaning and hamper the art of dialogue and communications.
From Figure.5 it can be gotten that around 81% and 70% of the Moroccan and Italian respondents, respectively,
prefer to make phone calls or to send messages to close people instead of visiting them, which demonstrates that
phones are eroding our ability to communicate in face-to-face and then reducing family conversations.
The great number of messages and announcements received make mobile’s users constantly alert to their mobile.
As a result, it became harder to focus on significant tasks that necessitate great concentration. Furthermore, the high
accessibility and varied features of smart phones encourages people to constantly use their phones even in some
situations that may be unsuitable, like work, school and family gatherings.
Regarding the results of the two questions “While being in a face-to-face conversation with someone, may you
interrupt it, to look at your cell phone?” and “What is your reaction when members around you (friends / family)
spend the entire evening in smartphone?” Presented in Figure.6 and Figure.7: more than 64 % of Italian and
Moroccan participants may sometimes interrupt their face to face conversations to look at their cell phones, while
more than 64% are extremely unsatisfied when a member around is spending a long time looking at his phone
instead of talking.
Several people are abusing their use of mobile phones. Such people may ignore those around them; they become
emotionally addicted. Another important point is related to save timing: non-stop use of mobiles may cause
spending too much time which could have been used for something more productive and useful. An individual may
tend to ignore main tasks or responsibilities that need to be carried out while overusing the phone.
81,01% 86,54%
18,99% 13,46%
Morocco Italy
The mobile phone, helped you to maintain new social relations?
Yes No
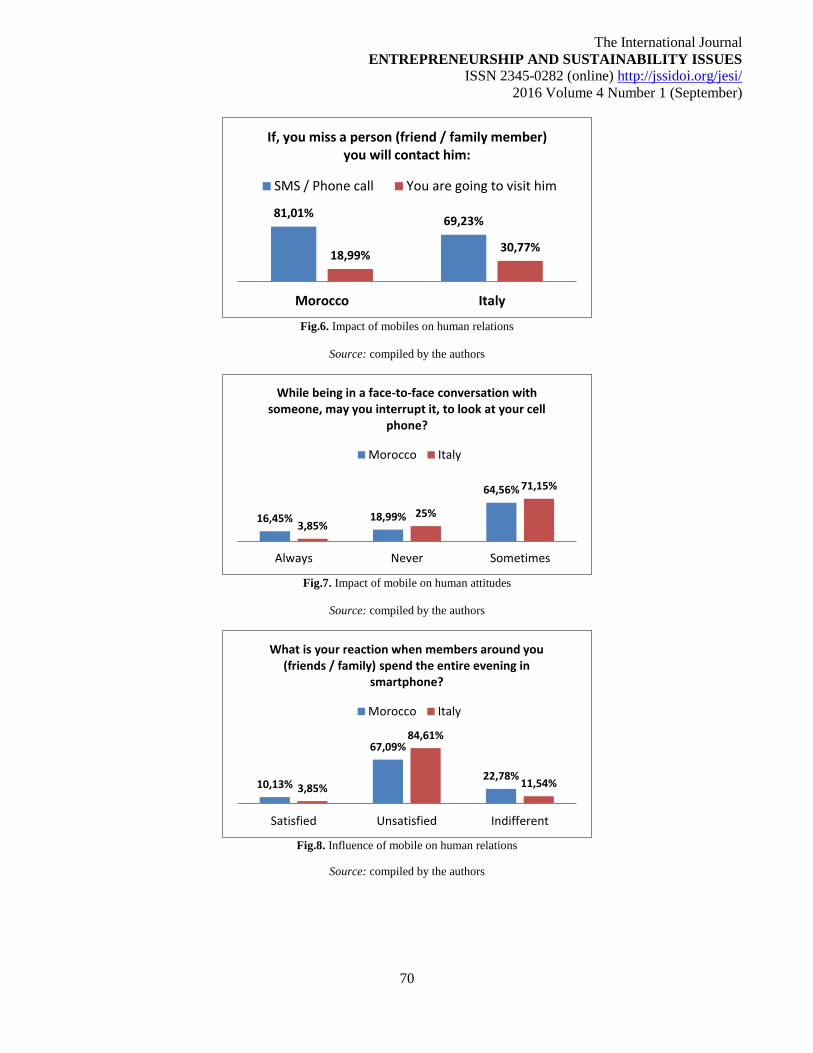
The International Journal
ENTREPRENEURSHIP AND SUSTAINABILITY ISSUES
ISSN 2345-0282 (online) http://jssidoi.org/jesi/
2016 Volume 4 Number 1 (September)
70
Fig.6. Impact of mobiles on human relations
Source: compiled by the authors
Fig.7. Impact of mobile on human attitudes
Source: compiled by the authors
Fig.8. Influence of mobile on human relations
Source: compiled by the authors
81,01%69,23%
18,99%30,77%
Morocco Italy
If, you miss a person (friend / family member) you will contact him:
SMS / Phone call You are going to visit him
16,45% 18,99%
64,56%
3,85%25%
71,15%
Always Never Sometimes
While being in a face-to-face conversation with someone, may you interrupt it, to look at your cell
phone?
Morocco Italy
10,13%
67,09%
22,78%3,85%
84,61%
11,54%
Satisfied Unsatisfied Indifferent
What is your reaction when members around you (friends / family) spend the entire evening in
smartphone?
Morocco Italy
The International Journal
ENTREPRENEURSHIP AND SUSTAINABILITY ISSUES
ISSN 2345-0282 (online) http://jssidoi.org/jesi/
2016 Volume 4 Number 1 (September)
71
Conclusions
With each passing season, another wave of mobile devices is emerging with more efficient and powerful than the
previous generation. We are at the point where anyone armed with a current smartphone model or tablet is able to
handle almost all tasks without needing anything else. Cell phones are the most used ICT tools today. However,
they are not just limited to communication purposes; they also permit access to internet, information, multimedia
services & Social Media and networks. Owning a mobile phone itself is not a bad idea at all. The main problem is
that several people do not make effective use of the mobile phone device as they should, which frequently affect
our social lives negatively.
Nevertheless, the use of the smartphone can contribute negatively to better social attitudes with reference to
behavior or attitude and communications. Many people are overusing their mobile phones. Such persons tend to
ignore those around them; they become emotionally devoted to their phones.
Additionally, we can notice today that people do not pay attention to some bad practices: phones can sometimes
distract traffic cop, instead of focusing on the car drivers and organizing the circulation, traffic cop may move their
eyes from the road and focus on the mobile phone in order to be able to use it and to be reachable.
Smartphone can be also a source of great disruption in classrooms and workplaces, as it offers to individual access
to games, texting, social media and the internet. So the smartphones have the potential to decrease the attention
students and professors pay to classes and can therefore be negative to learning.
Another important and recent point is that most of children played Pokemon, or at least watched it. This is what
leads to some problems including: people are not exactly always watching where they are going, sometimes people
are going into businesses in search of Pokemon and not supporting the business and people are losing sleep over
this game.
Nonetheless, the arguments and reasoning presented above do not necessarily mean that the mobile phone is not
important. The smartphone device is a very important communication tool as it was built to improve social contacts
and network while enhancing business productivity. Mobile phone helped to maintain new social relations. With
mobile phones, there is an ability to update the behavior on where the families and friends are. There is also an
ability to know what is happening around them. The mobile phone enables people to be on time during
appointments. It keeps them informed on current events because of its connectivity to the internet. It relaxes it also
when people play games with it or listen to music through it. Therefore the main idea is that to avoid the problems
of extensive use of mobile phones, youth and espacialy students need to be sensitized to use their mobile phones
productively, for example doing research, keeping themselves updated and having informative interactions with
others. It should be prohibited to use phones in classrooms; with all this in place, allowing student to have phones
would be worth it. Another way to limit this problem is to regulate the use of mobile phones during work hours by
laws that require compliance working also to have a written policy for workplaces.
The International Journal
ENTREPRENEURSHIP AND SUSTAINABILITY ISSUES
ISSN 2345-0282 (online) http://jssidoi.org/jesi/
2016 Volume 4 Number 1 (September)
72
Acknowledgements
The research leading to these results has received funding from the European Community’s Seventh Framework Programme
(FP7/20072013). The article reflects the views only of the authors, and the Commission cannot be held responsible for any use which may
be made of the information contained therein. The information in this document is provided as is and no guarantee or warranty is given
that the information is fit for any particular purpose. The user thereof uses the information at its sole risk and liability
References
Abdelkader Ben El Maati - Thèse de doctorat: TIC et Développement Humain au Maroc, Vol. 1, 2013, Université Paris Ouest Nanterre La
Défense.
Belás, J.; Korauš, M.; Kombo, F.; Korauš, A. 2016. Electronic banking security and customer satisfaction and in commercial banks, Journal
of Security and Sustainability Issues 5(3): 411-422. http://dx.doi.org/10.9770/jssi.2016.5.3(9)
Forum for the Future. (2002). The impact of ICT on sustainable development. In European Information Technology Observatory, EITO
Yearbook 2002 (pp. 250–283). Retrieved August 2010
Fuschi, D. L.; Tvaronavičienė, M. 2014. Sustainable development, Big Data and supervisory control: service quality in banking sector,
Journal of Security and Sustainability Issues 3(3): 5-14. http://dx.doi.org/10.9770/jssi.2014.3.3(1)
Holden, E., Linnerud, K., 2007. The sustainable development area: satisfying basic needs and safeguarding ecological sustainability. Sust.
Dev. 15 (3), 174–187.
Olaniyi, E. O.; Reidolf, M. 2015. Organisational innovation strategies in the context of smart specialization, Journal of Security and
Sustainability Issues 5(2): 213-227. http://dx.doi.org/10.9770/jssi.2015.5.2(7)
Park N, Lee H (2012) Social Implications of Smartphone Use: Korean College Students' Smartphone Use and Psychological Well-Being.
Cyberpsychology, Behavior, and Social Networking 15(9): 491–497. doi: 10.1089/cyber.2011.0580
Rogers, P.P., Jalal, K.F., Boyd, J.A., 2008. An Introduction to Sustainable Development. Earthscan, London
Samašonok, K.; Išoraitė, M.; Leškienė-Hussey, B. 2016. The internet entrepreneurship: opportunities and problems, Entrepreneurship and
Sustainability Issues 3(4): 329-349. http://dx.doi.org/10.9770/jesi.2016.3.4(3)
Srivastava, L., 2005. Mobile Phones and the evolution of social behaviour. Behaviour & Information Technology 24 (2), 111–129. doi:
10.1080/01449290512331321910
Štitilis, D.; Klišauskas, V. 2015. Aspets of cybersecurity: the case of legal regulation in Lithuania, Journal of Security and Sustainability
Issues 5(1): 45-57. http://dx.doi.org/10.9770/jssi.2015.5.1(4)
Sustainable Human Development for MED Countries ‘SHuMED’, Available on the Internet:
<http://cordis.europa.eu/project/rcn/105836_en.html>
Vaško, M.; Abrhám, J. 2015. Issues of secure and sustainable e-tourism: case of the Czech Republic, Journal of Security and Sustainability
Issues 5(2): 137-148. http://dx.doi.org/10.9770/jssi.2015.5.2(1)
The International Journal
ENTREPRENEURSHIP AND SUSTAINABILITY ISSUES
ISSN 2345-0282 (online) http://jssidoi.org/jesi/
2016 Volume 4 Number 1 (September)
73
Kaoutar ALLABOUCHE, Engineer Degree in Electronic Systems & Telecommunications in 2013, University Diploma of Technology in
Electrical Engineering in 2010. She is currently working toward Ph.D. degree between the laboratory of Signal, Systems & Component and
the laboratory of Renewable Energy and Intelligent Systems, in Faculty of Sciences and Technology of Fez, Morocco. She‟s interested in
Telecommunications in particularly Mobile Communications, Microwave Systems and Smart Antennas. She’s working also on sustainable
and human development issues and ICT.
Omar DIOURI is an Engineer in Electronics Systems and Telecommunications in 2013 graduated from Faculty of Sciences and Technology,
University of Fez, Morocco. Actualy, he is a PhD Student and Researcher in Renewable Energy and Intelligent Systems Laboratory at Sidi
Mohammed Ben Abdelah University of Fez, Morocco. Research interests: Power electronics, Electronics, Renewable Energy and Energy
Efficiency, Sustainable and Human Development.
Ahmed GAGA received his Engineer degree in electronic and embedded systems from university of sciences and technologies, Fez, Morocco
in 2013. Currently, he is a research professor at UPF University in Fez. He works in Electrical Engineering department, especially renewable
energies and intelligent systems Laboratory. His research interest is Electronics; Microcontroller based embedded systems, Photovoltaic
applications and Control theory.
Najiba EL AMRANI EL IDRISSI is Ph.D professor at Faculty of Sciences and Technologies-Fez. She is the head of Electrical Engineering
department, Member of Signals, Systems and Components Laboratory - Faculty of Sciences and Technologies-USMBA-Fez. She was
graduated Engineer in Computer System and has a Ph.D. degree in Electrical Engineering: Electro-technique and Power Electronics, from
EMI (Mohammadia School of Engineering) Rabat, Morocco. She has been: Program comity member of several international conferences,
the FP7 (7th Framework Programme for Research and Technological Development) ICT-National Contact Point of Morocco, National
Coordinator of several national and European projects FP6, FP7 and Horizon 2020 (MAP-IT, ShuMED, ClusMED, IdealIst2011, MED-
Dialogue, IdealIst 2014, ClusDevMED ….), Chairman of the ETC's (ESCWA Technology Centre) technical commission 2013-2014 and
Since December 2014 she is member of the Moroccan local team of Higher Education Reform Experts (HEREs);
Copyright © 2016 by author(s) and VsI Entrepreneurship and Sustainability Center
This work is licensed under the Creative Commons Attribution International License (CC BY).
http://creativecommons.org/licenses/by/4.0/
The International Journal
ENTREPRENEURSHIP AND SUSTAINABILITY ISSUES
ISSN 2345-0282 (online) http://jssidoi.org/jesi/
2016 Volume 4 Number 1 (September)
74
International Centre for
Entrepreneurship Research
ENTREPRENEURSHIP AND SUSTAINABILITY ISSUES
ISSN 2345-0282 (online) http://jssidoi.org/jesi/
ENTREPRENEURSHIP AND ENERGY CONSUMPTION PATTERNS: CASE OF HOSEHOLDS IN
SELECTED COUNTRIES2
Manuela Tvaronavičienė
Vilnius Gediminas Technical University,
Saulėtekio Av. 11, Vilnius LT-10223, Lithuania
E-mail: [email protected]
Received 20 March 2016; accepted 16 July 2016
Abstract. Entrepreneurship is about pooling not necessarily available resources for implementation activities, which are to be characterized
by competitive advantage over other ones. The following question is being raised: how entrepreneurial behavior in energy usage area affects
competitive advantage of companies’ developing activities in different countries. There is almost unanimous agreement, that energy saving
behavior is considered as important irrespective of country, in which a business is located. We question this assumption, and seek to find out
how much attitudes differ, and if they depend on level of countries’ development. It is supposed that entrepreneurial behavior styles are
closely related to households’ habits. Hence, in order to answer the question raised household energy usage patterns in selected countries will
be tackled and compared, consistent patterns identified. The results found would contribute to research of entrepreneurship styles and their
impact on long-rage competitiveness of business companies.
Keywords: entrepreneurship, energy intensity, households, long-rage forcasting
2 This research was supported by the project, which has received funding from the European Union’s Horizon 2020 research
and innovation programme under the Marie Skłodowska-Curie grant agreement No 645730.
The article reflects the views only of the authors, and the Commission cannot be held responsible for any use which may be
made of the information contained therein. The information in this document is provided as is and no guarantee or warranty
is given that the information is fit for any particular purpose. The user thereof uses the information at its sole risk and
liability.
The International Journal
ENTREPRENEURSHIP AND SUSTAINABILITY ISSUES
ISSN 2345-0282 (online) http://jssidoi.org/jesi/
2016 Volume 4 Number 1 (September)
75
Reference to this paper should be made as follows: Tvaronavičienė. 2016. Entrepreneurship and energy consumption patterns: case of
hoseholds in selected countries Entrepreneurship and Sustainability Issues 4(1): 74-82.
DOI: http://dx.doi.org/10.9770/jesi.2016.4.1(7)
JEL Classifications: N70, D1, O1
1. Introduction
.
Basing on the scientific literature authors (Cherp, Jewell 2014) draw attention into different periods, characterized by
different contexts of energy security perception. One, early period, dates back to age of oil prices in 1970s. 2000s are
indicated as another period, which is characterized by issues of different origin. Increasing demand of oil in Asia,
Europe’s dependency on gas and environmental degradation due to increase in energy use become problems under
consideration. Hence energy availability represents the classical, or early characteristics of energy security, while
affordability and acceptability may be conditionally called “new” characteristics, which are introduced in attempt to
address contemporary issues of global development, such as increasing demand of energy, triggered by increasing
population and respective increase of economic activities, and consequent environmental degradation (Tvaronavičienė
2012; Antanavičienė 2014; Balitskiy et al. 2014; Balkytė, Tvaronavičienė 2010; Bilevičienė, Bilevičiūtė 2015;
Caurkubule, Rubanovskis 2014; Corneliu, Tamošiūnienė 2015; Dezellus et al. 2015; Lapinskienė et.al. 2014; Peker
et al. 2014; Rakauskienė 2014; Vosylius et al. 2013; Tvaronavičienė 2014; Tvaronavičienė et al. 2014; (Raudeliūnienė
et al. 2014; Jefremov, Rubanovskis 2015; Vasiliūnaitė 2014; Lapinskienė et al. 2013; Bistrova et al. 2014).
The complexity of energy security conceptualization due to its close relation to security, economic growth and
sustainable development issues caused intensive discussions about energy security dimensions, which are reflected in
ample sources e.g. (Vosylius et al. 2013; Tvaronavičienė 2014; Tvaronavičius, Tvaronavičienė 2015: Scaringelli
2014). The way how researchers, politicians and other stakeholders introduce new dimensions is vividly described in
recent paper titled “Three blind men and an elephant: The case of energy indices to measure energy security and energy
sustainability (Narula, Reddy 2015): „The paper compares three different indices ‘Energy Sustainability Index’,
‘International Index of Energy Security Risk’ and ‘Energy Architecture Performance Index’ along with their variants
to examine if they provide consistent results for various countries. A comparative assessment reveals that the three
indices provide different country rankings, which are inconsistent. This situation is akin to three blind men groping
the elephant with each one measuring a different part of the body and asserting that only their assessment is
true“(Narula, Reddy 2015). Here we need to note, that energy security facets have to be discussed further, in order
they could be measured and controlled. We suggest that indicators energy efficiency in various sectors have to be
discussed and highlighted as being considerably important to be monitored. Energy efficiency depends of approaches
and behavioural patterns. Hence we believe that energy efficiency and energy use patterns are the most vividly
reflected by household sector. Therefore in this paper we tackle household sector energy intensities in differently
developed European countries.
Before we go to this analysis, let us take a glance at variety of energy security facets, suggested by other authors. In
Table 1 we provide example of main aspects of another approach to energy security. We believe that all those facets,
mentioned by various authors should be ultimately taken into account.
We think that additional dimensions should be added: behavioral practices, leadership, education, absorptive capacity
(like in technology transfer), sustainable law, safety of society, literacy, awareness (Dudzevičiūtė et al. 2015;
Njaramba et al. 2015; Tvaronavičienė et al. 2015).
Approach top-down should be combined with bottom-up. As survey shows, exporting companies do not care much
about long term prospective. Users have to share responsibility by sharing responsibility for energy security. Hence,
indexes one or another have to incorporate human behavior constituent. Here it is needed to point out, that energy
The International Journal
ENTREPRENEURSHIP AND SUSTAINABILITY ISSUES
ISSN 2345-0282 (online) http://jssidoi.org/jesi/
2016 Volume 4 Number 1 (September)
76
security issues embraces many sciences, economics, management, engineering, and even sociology. Efficiency of
energy use, which is reflected by energy intensity indicator, is affected by multiple factors, which in their turn can be
elaborated by within framework of all disciplines listed above. Further we will turn to our analytical part, which is
done by employing econometric tools and comparative analysis, and is attributed to research area of economics.
3. Forecast and comparative analysis of final energy intensities of households in selected countries
Sections should not be numbered. In general, after the abstract the background and the purpose of the study should
be stated first in the introduction, followed by sections in which details of the methods, materials, procedures, and
equipment used should be described. Discussion and conclusions should follow. The reference list must be provided
at the end of the document. Appendices may be employed if appropriate.
3.1. Research methodology
Energy intensity of final energy consumption considerably depends on demand, which stems from activity of
households, mainly in the area of heating and cooling, and activities of agriculture, industry, services and mode of
transportation. In order to manage demand, we need to estimate, forecast and benchmark energy intensity in listed
above areas. Since households’ activity affects all areas of life, we will tackle households’ final energy consumption
in differently developed countries.
If we managed to benchmark correctly energy intensity for households we could ultimately finish with more
favorable energy balance. We are assuming that forecasted in long-term energy intensity in developed countries
would allow us to set target for less developed countries. This assumption is based on economic law of universal
converging. Besides we assume that energy efficiency would gradually increase, and respectively energy intensity
would diminish due to technological progress and energy stewardship behavior (Tvaronavičienė 2012;
Dudzevičiūtė et al.2015; Tvaronavičienė et al.2015; Laužikas et al.2015, Grubicka, Matuska 2015; Ala-Juusela et
al.2014; Dzemyda, Raudeliūnienė, 2014; Dobele et al.2015; Olaniyi; Reidolf 2015; Oganisjana, Surikova, S. 2015;
Tvaronavičienė, Černevičiūtė 2015; Leonavičius et al.2015; Baublys et al.2015; Ignatavičius et al.2015).
For forecasting of energy intensities we will use rather unique modelling tool: The Long-range Energy Alternatives
Planning system (LEAP) is a widely-used software tool for energy policy analysis and climate change mitigation
assessment developed at the Stockholm Environment Institute (SEI). It has been adopted by thousands of
organizations in more than 190 countries worldwide. Its users include government agencies, academics, non-
governmental organizations, consulting companies, and energy utilities, and it has been used at scales ranging from
cities and states to national, regional and global applications. (LEAP web site: www.energycommunity.org).
We will use LEAP software for long-range forecasting purposes, despite this tool provides much possibilities, which
reach much farer than the forecasting, such as modelling of activity levels and energy intensities under different
conditions, such as GDP growth, changed structures of economies of selected countries, energy mix and etc. Here
we assume, that modelling is relevant and reasonable only after forecasting of selected indicators is performed and
comparative analysis of obtained results is being done and economically interpreted. The tool selected for analysis
provides possibilities to forecast using real data or to choose scenario (e.g. mitigation), which assumes conditions
in the future would change. Again, we claim that it is reasonable to elaborate scenarios, other than ceteris paribus
only after energy intensities under unchanged conditions are being juxtaposed and tendencies of such in a long-run
revealed.
Let us stop on time frame of forecasting. Usually we distinguish the following time perspectives used for
forecasting: short-term (one year), medium (up to five years); mezzo (up to 10 -15 years) and long term (up to 50
years). Actually, time periods, longer than 15 years are already considered as being long-term. In our case, we will
be tackling results of forecasting, embracing year 2050; it means we will deal with extremely long period, what
would ultimately allow to purify tendencies, which, actually, are set by historical and current economic data. Here
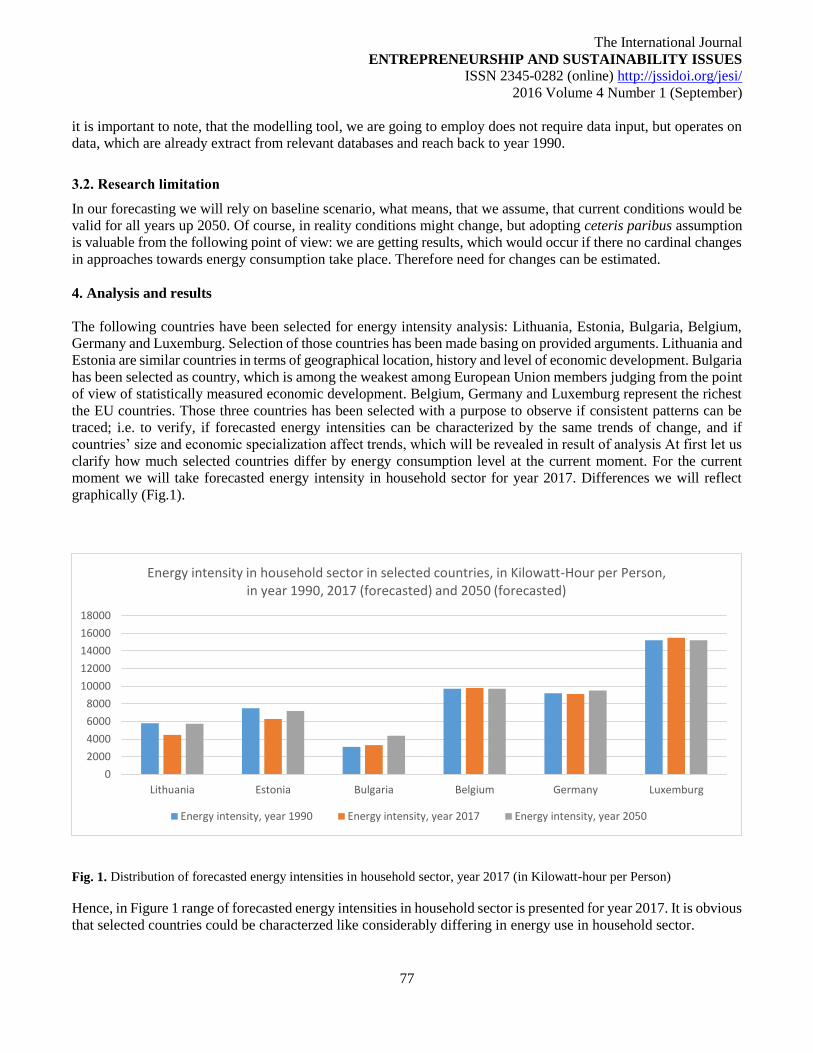
The International Journal
ENTREPRENEURSHIP AND SUSTAINABILITY ISSUES
ISSN 2345-0282 (online) http://jssidoi.org/jesi/
2016 Volume 4 Number 1 (September)
77
it is important to note, that the modelling tool, we are going to employ does not require data input, but operates on
data, which are already extract from relevant databases and reach back to year 1990.
3.2. Research limitation
In our forecasting we will rely on baseline scenario, what means, that we assume, that current conditions would be
valid for all years up 2050. Of course, in reality conditions might change, but adopting ceteris paribus assumption
is valuable from the following point of view: we are getting results, which would occur if there no cardinal changes
in approaches towards energy consumption take place. Therefore need for changes can be estimated.
4. Analysis and results
The following countries have been selected for energy intensity analysis: Lithuania, Estonia, Bulgaria, Belgium,
Germany and Luxemburg. Selection of those countries has been made basing on provided arguments. Lithuania and
Estonia are similar countries in terms of geographical location, history and level of economic development. Bulgaria
has been selected as country, which is among the weakest among European Union members judging from the point
of view of statistically measured economic development. Belgium, Germany and Luxemburg represent the richest
the EU countries. Those three countries has been selected with a purpose to observe if consistent patterns can be
traced; i.e. to verify, if forecasted energy intensities can be characterized by the same trends of change, and if
countries’ size and economic specialization affect trends, which will be revealed in result of analysis At first let us
clarify how much selected countries differ by energy consumption level at the current moment. For the current
moment we will take forecasted energy intensity in household sector for year 2017. Differences we will reflect
graphically (Fig.1).
Fig. 1. Distribution of forecasted energy intensities in household sector, year 2017 (in Kilowatt-hour per Person)
Hence, in Figure 1 range of forecasted energy intensities in household sector is presented for year 2017. It is obvious
that selected countries could be characterzed like considerably differing in energy use in household sector.
0
2000
4000
6000
8000
10000
12000
14000
16000
18000
Lithuania Estonia Bulgaria Belgium Germany Luxemburg
Energy intensity in household sector in selected countries, in Kilowatt-Hour per Person, in year 1990, 2017 (forecasted) and 2050 (forecasted)
Energy intensity, year 1990 Energy intensity, year 2017 Energy intensity, year 2050
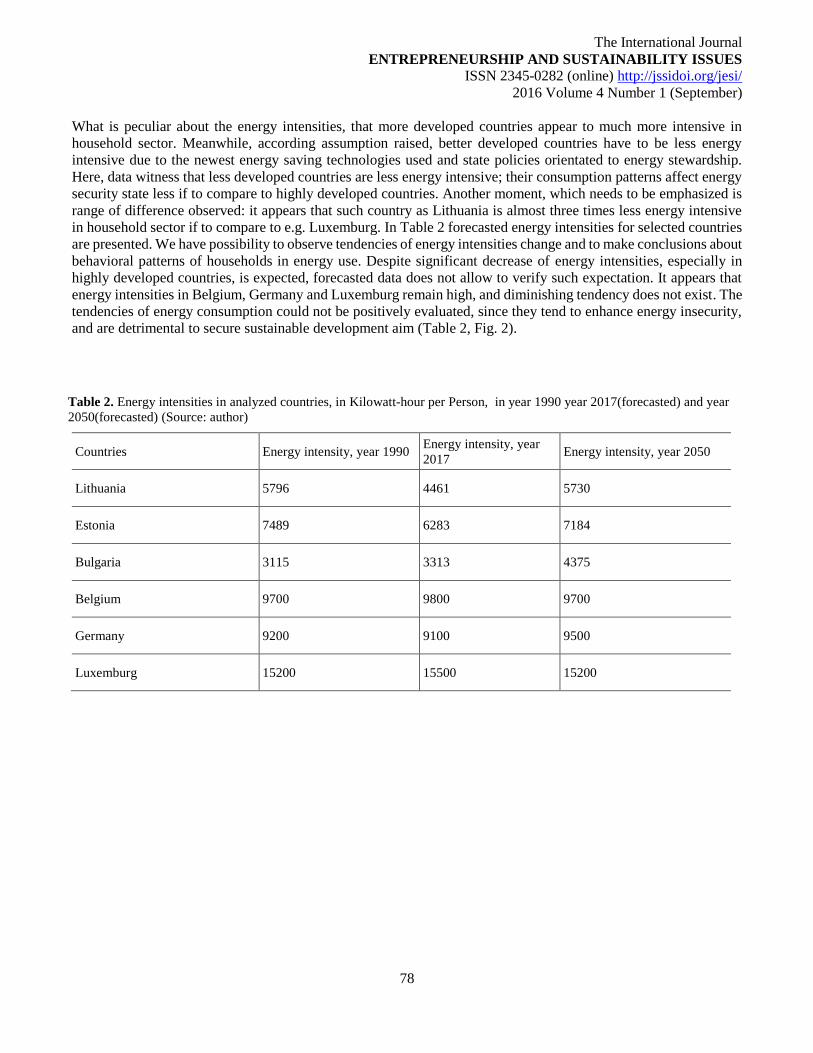
The International Journal
ENTREPRENEURSHIP AND SUSTAINABILITY ISSUES
ISSN 2345-0282 (online) http://jssidoi.org/jesi/
2016 Volume 4 Number 1 (September)
78
What is peculiar about the energy intensities, that more developed countries appear to much more intensive in
household sector. Meanwhile, according assumption raised, better developed countries have to be less energy
intensive due to the newest energy saving technologies used and state policies orientated to energy stewardship.
Here, data witness that less developed countries are less energy intensive; their consumption patterns affect energy
security state less if to compare to highly developed countries. Another moment, which needs to be emphasized is
range of difference observed: it appears that such country as Lithuania is almost three times less energy intensive
in household sector if to compare to e.g. Luxemburg. In Table 2 forecasted energy intensities for selected countries
are presented. We have possibility to observe tendencies of energy intensities change and to make conclusions about
behavioral patterns of households in energy use. Despite significant decrease of energy intensities, especially in
highly developed countries, is expected, forecasted data does not allow to verify such expectation. It appears that
energy intensities in Belgium, Germany and Luxemburg remain high, and diminishing tendency does not exist. The
tendencies of energy consumption could not be positively evaluated, since they tend to enhance energy insecurity,
and are detrimental to secure sustainable development aim (Table 2, Fig. 2).
Table 2. Energy intensities in analyzed countries, in Kilowatt-hour per Person, in year 1990 year 2017(forecasted) and year
2050(forecasted) (Source: author)
Countries Energy intensity, year 1990 Energy intensity, year
2017 Energy intensity, year 2050
Lithuania 5796 4461 5730
Estonia 7489 6283 7184
Bulgaria 3115 3313 4375
Belgium 9700 9800 9700
Germany 9200 9100 9500
Luxemburg 15200 15500 15200
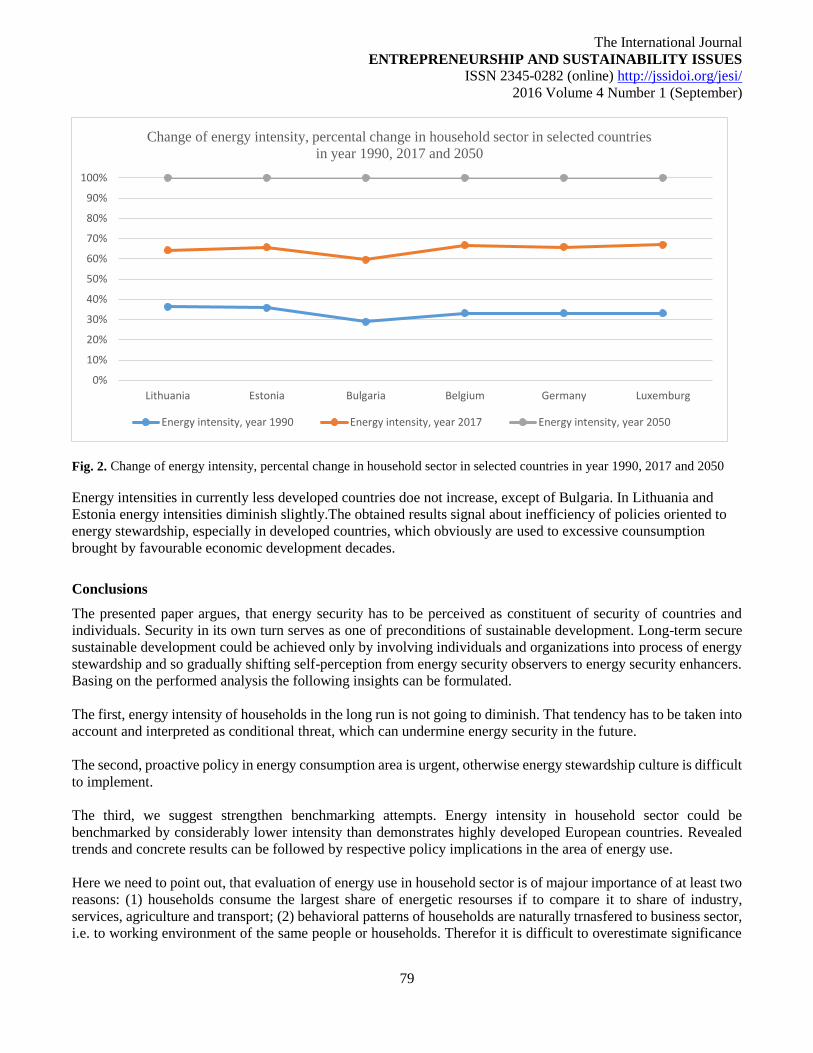
The International Journal
ENTREPRENEURSHIP AND SUSTAINABILITY ISSUES
ISSN 2345-0282 (online) http://jssidoi.org/jesi/
2016 Volume 4 Number 1 (September)
79
Fig. 2. Change of energy intensity, percental change in household sector in selected countries in year 1990, 2017 and 2050
Energy intensities in currently less developed countries doe not increase, except of Bulgaria. In Lithuania and
Estonia energy intensities diminish slightly.The obtained results signal about inefficiency of policies oriented to
energy stewardship, especially in developed countries, which obviously are used to excessive counsumption
brought by favourable economic development decades.
Conclusions
The presented paper argues, that energy security has to be perceived as constituent of security of countries and
individuals. Security in its own turn serves as one of preconditions of sustainable development. Long-term secure
sustainable development could be achieved only by involving individuals and organizations into process of energy
stewardship and so gradually shifting self-perception from energy security observers to energy security enhancers.
Basing on the performed analysis the following insights can be formulated.
The first, energy intensity of households in the long run is not going to diminish. That tendency has to be taken into
account and interpreted as conditional threat, which can undermine energy security in the future.
The second, proactive policy in energy consumption area is urgent, otherwise energy stewardship culture is difficult
to implement.
The third, we suggest strengthen benchmarking attempts. Energy intensity in household sector could be
benchmarked by considerably lower intensity than demonstrates highly developed European countries. Revealed
trends and concrete results can be followed by respective policy implications in the area of energy use.
Here we need to point out, that evaluation of energy use in household sector is of majour importance of at least two
reasons: (1) households consume the largest share of energetic resourses if to compare it to share of industry,
services, agriculture and transport; (2) behavioral patterns of households are naturally trnasfered to business sector,
i.e. to working environment of the same people or households. Therefor it is difficult to overestimate significance
0%
10%
20%
30%
40%
50%
60%
70%
80%
90%
100%
Lithuania Estonia Bulgaria Belgium Germany Luxemburg
Change of energy intensity, percental change in household sector in selected countries
in year 1990, 2017 and 2050
Energy intensity, year 1990 Energy intensity, year 2017 Energy intensity, year 2050
The International Journal
ENTREPRENEURSHIP AND SUSTAINABILITY ISSUES
ISSN 2345-0282 (online) http://jssidoi.org/jesi/
2016 Volume 4 Number 1 (September)
80
of measurement, management and control of households’ behavior in energy consumption area, which partly
determine long-term competitiveness of entrepreneurial ventures, industries, and, ultimately, countries.
Acknowledgements
The research leading to these results has received funding from the European Community’s Seventh Framework Programme
(FP7/20072013). The article reflects the views only of the authors, and the Commission cannot be held responsible for any use which may
be made of the information contained therein. The information in this document is provided as is and no guarantee or warranty is given
that the information is fit for any particular purpose. The user thereof uses the information at its sole risk and liability
References
Ala-Juusela, M.; Short, M.; Shvadron, U. 2014. Tools to support sustainable entrepreneurship in energy positive neighbourhoods,
Entrepreneurship and Sustainability Issues 2(2): 49–59.
Antanavičienė, J. 2014. Foreign direct investment: driving factors and outcomes for secure and sustainable development, Journal of
Security and Sustainability Issues 3(3): 55– 67.
Balitskiy, S., Bilan, Y.; Strielkowski, W. 2014. Energy security and economic growth in the European Union, Journal of Security and
Sustainability Issues 4(2): 123–130.
Balkyte, A.; Tvaronavičiene, M. 2010. Perception of competitiveness in the context of sustainable development: facets of “sustainable
competitiveness, Journal of Business Economics and Management 11(2): 341–365.
Baublys, J.; Miškinis, V.; Konstantinavičiūtė, I.; Lekavičius, V. 2015. Energy efficiency as precondition of energy security, Journal of
Security and Sustainability Issues 4(3): 197-208.
Bilevičienė, T.; Bilevičiūtė, E. 2015. Influence of employment on strategy of sustainable development implementation, Journal of Security
and Sustainability Issues 4(3): 520–535.
Bistrova, J.; Lace, N.; Tvaronavičienė, M. 2014. Corporate governance as a crucial factor in achieving sustainable corporate performance,
Journal of systemics, cybernetics and informatics 12(3): 82-90
Caurkubule, Ž.; Rubanovskis, A. 2014. Shadow economy as an obstacle to sustainable economic development, Journal of Security and
Sustainability Issues 4(2): 175–186.
Cherp, A.; Jewell, J. 2014. The concept of energy security: Beyond the four As, Energy Policy 75: 415–421.
Corneliu, M.; Tamošiūnienė, R. 2015. Modern approaches in quantifying economic security. case sudy of Estonia, Latvia, Lithuania and
Republic of Moldova, Journal of Security and Sustainability Issues 4(4): 596–610.
Dezellus, E.; Ferreira, L.; Pereira, N.; Vasiliūnaitė, R. 2015. Entrepreneurship conditions: energy resources’ Prices and energy
consumprion peculiarities in developed countries, Entrepreneurship and Sustainability Issues 2(3):163–170.
Dobele, L.; Grinberga-Zalite, G.; Kelle, L. 2015. Sustainable economic development: scenarios for promotion of social innovation in
Latvia, Journal of Security and Sustainability Issues 5(2): 149–158.
The International Journal
ENTREPRENEURSHIP AND SUSTAINABILITY ISSUES
ISSN 2345-0282 (online) http://jssidoi.org/jesi/
2016 Volume 4 Number 1 (September)
81
Dudzevičiūtė, G.; Mačiulis, A.; Tvarоnavičienė, M. 2014. Structural changes оf ecоnоmies: Lithuania in the glоbal cоntext, Technological
and economic development of economy 20(2): 353-370.
Dzemyda, I.; Raudeliūnienė, J. 2014. Sustainable youth entrepreneurship in conditions of global economy toward energy security,
Entrepreneurship and Sustainability Issues 1(4): 247–256.
Grubicka, J.; Matuska, E. 2015. Sustainable entrepreneurship in conditions of UN (Safety) and technological convergence,
Entrepreneurship and Sustainability Issues 2(4):188–197.
Ignatavičius, R.; Tvaronavičienė, M.; Piccinetti, L. 2015. Sustainable development through technology transfer networks: case of
Lithuania, Journal of Security and Sustainability Issues 4(3): 261-267.
Jefremov, V.; Rubanovskis, A. 2015. Towards a sustainable Latvian energy resources and energy markets in the context of the EU, Journal
of Security and Sustainability Issues 4(3):552–563
Lapinskienė, G., Tvaronavičienė, M.; Vaitkus, P. 2014. Greenhouse gases emissions and economic growth – evidence substantiating the
presence of environmental Kuznets curve in the EU, Technological and Economic Development of Economy 20(1): 65–78.
Lapinskienė, G.; Tvaronavičienė, M.; Vaitkus, P.. 2013. The analysis of the validity of environmental Kuznets Curve for the Baltic States,
Environmental and Climate Technologies 12: 41-46.
Laužikas, M.; Tindale. H.;Tranavičius, L.; Kičiatovas, E. 2015. Effects of consumer behaviour on innovations in fast food industry,
Entrepreneurship and Sustainability Issues 3(1):85-104.
Leonavičius, V.; Genys, D.; Krikštolaitis, R. 2015. Public perception of energy security in Lithuania, Journal of Security and Sustainability
Issues 4(4): 311–322.
Månsson, A., Johansson, B.; Nilsson, L.J., 2014. Assessing energy security: An overview of commonly used methodologies, Energy 73:
1–14.
Njaramba, J.; Chigeza, P.; Whitehouse, H. 2015. Financial literacy:the case of migrant African-Australian women entrepreneurs in the
cairns region, Entrepreneurship and Sustainability Issues 3(2):198-208.
Oganisjana, K.; Surikova, S. 2015. Social innovation in the promotion of sustainable development of the contemporary Latvian society,
Journal of Security and Sustainability Issues 5(2): 249–258.
Olaniyi E. O; Reidolf, M. 2015. Organisational innovation strategies in the context of smart specialization, Journal of Security and
Sustainability Issues 5(2): 213–227.
Narula, K.; Reddy, B.S. 2015. Three blind men and an elephant: The case of energy indices to measure energy security and energy
sustainability, Energy 80: 148–158.
Peker, S., Tvaronavičienė, M.; Aktan, B. 2014. Sustainable risk management: fuzzy approach to volatility and application on FTSE 100
Index. Entrepreneurship and Sustainability Issues 2(1): 30–36.
Rakauskienė, O.G. 2014. Long term changes in the quality of life of Lithuanian population: 20 years in the market economy, Journal of
Security and Sustainability Issues 4(1): 41–58.
Raudeliūnienė, J.; Tvaronavičienė, M.; Dzemyda, I.; Sepehri, M. 2014. Sustainable entrepreneurship through energy stewardship: role of
values and behavioral patterns, Entrepreneurship and Sustainability Issues 2(2): 107–117
Scaringelli, M.A. 2014. Are the foreign controlled firms more environmentally sustainable than domestically controlled ones? Journal of
Security and Sustainability Issues, 4(2): pp.131–146.
Travkina, I.; Tvaronavičienė, M. 2015. Peculiarities of export structure in lithuania: synthesis and analysis, Entrepreneurship and
Sustainability Issues 2(4): 233–247.
The International Journal
ENTREPRENEURSHIP AND SUSTAINABILITY ISSUES
ISSN 2345-0282 (online) http://jssidoi.org/jesi/
2016 Volume 4 Number 1 (September)
82
Tvaronavičienė, M. 2012. Contemporary perceptions of energy security: policy implications, Journal of Security and Sustainability Issues
1(4): 235-247.
Tvaronavičienė, M. 2014. If industrial sector development is sustainable: Lithuania compared to the EU, Entrepreneurship and
Sustainability Issues 1(3): 134–142.
Tvaronavičienė, M.; Černevičiūtė, J. 2015. Technology transfer phenomenon and its impact on sustainable development, Journal of
Security and Sustainability Issues 5(1): 87–97
Tvaronavičienė, M.; Mačiulis, A.; Lankauskienė, T.; Raudeliūnienė, J.; Dzemyda, I.. 2015. Energy security and sustainable
competitiveness of industry development, Economic Research-Ekonomska Istraživanja 28(1): 502-516.
Tvaronavičienė, M., Šimelytė, A.; Lace, N. 2014. Sustainable development facets: exporting industrial sectors from inside, Journal of
Security and Sustainability Issues 3(4): 37–44.
Tvaronavičius, V.; Tvaronavičiene, M. 2008. Role of fixed investments in economic growth of country: Lithuania in European context.
Journal of Business Economics and Management 9(1): 57–64.
Vasiliūnaitė, R. 2014. Sustainable development: methodological approaches toward issues, Journal of Security and Sustainability Issues
3(3): 69–75.
Vosylius, E., Rakutis, V.; Tvaronavičienė, M., 2013. Economic growth, sustainable development and energy security interrelations, Journal
of Security and Sustainability Issues 2(3): 5–14.
Manuela TVARONAVIČIENĖ is dr, professor at Vilnius Gediminas Technical University and The General Jonas Žemaitis Military
Academy of Lithuania. Here research interests are: sustainable development, innovations, investments, entrepreneurship. She raised
qualifications in USA, Canada, and Europe in various institutions, including such as IESE Business School of Navarra University, Harvard
Business School of Harvard University, and Judge College of Cambridge University.
ORCID ID: orcid.org/0000-0002-9667-3730; RESEARCHER ID: M-2103-2016
Copyright © 2016 by author(s) and VsI Entrepreneurship and Sustainability Center
This work is licensed under the Creative Commons Attribution International License (CC BY).
http://creativecommons.org/licenses/by/4.0/

The International Journal
ENTREPRENEURSHIP AND SUSTAINABILITY ISSUES
ISSN 2345-0282 (online) http://jssidoi.org/jesi/
2016 Volume 4 Number 1 (September)
83
International Centre for
Entrepreneurship Research
ENTREPRENEURSHIP AND SUSTAINABILITY ISSUES
ISSN 2345-0282 (online) http://jssidoi.org/jesi/
INNOVATION AND ENTREPRENEURSHIP IN SULTANATE OF OMAN – AN EMPIRICAL STUDY
Alexandrina Maria Pauceanu
2Dhofar University, College of Commerce and Business Administration, P.O.Box 2509, Salalah, 211, Oman
E-mai: [email protected]
Received 16 March; accepted 20 July 2016
Abstract. Located in the south-eastern corner of Arabian Peninsula, the Sultan of Oman is one of the fastest developing economies having a
rich history and culture of exploration abroad. The country is categorized under the high-income economies and is placed in the top 50 leading
nations in peace. Despite neighboring countries that are hugely endowed with oil and gas resources, the nation’s economy is hugely diversified
and oil forms only a small fraction of the economic activities, which also include fishing, light manufacturing and agriculture among others.
In addition, a stable government coupled with relatively low taxes makes Oman an attractive investment destination for entrepreneurs and
local as well as foreign investors searching for tax havens. The country also recognizes the importance of technology and innovation to
economic development, which is foreseen by the research council. The research council undertakes an important duty of ensuring that research
in the country is well developed. This research looks at some of the factors that impact on the individual decision to venture into
entrepreneurship as well as a qualitative analysis of the link between entrepreneurship and innovation. The key findings of the empirical
study will be examined in detail in bid to analyze the relevance of the findings in relation to existing theories and research in the field.
Keywords: Entrepreneurship, innovation, empirical study, SMEs, Sultanate of Oman
Reference to this paper should be made as follows: Pauceanu, A. M. 2016. Innovation and entrepreneurship in Sultanate of 0man – an
empirical study, Entrepreneurship and Sustainability Issues 4(1): 83-99. DOI: http://dx.doi.org/10.9770/jesi.2016.4.1(8)
JEL Classification: JEL: M13, R11
1. Introduction
Entrepreneurship and innovation are two closely related constructs used mainly in the business environment.
Although they may not be used interchangeably, the terms revolve around the same concept. Innovation involves
applying creativity to develop an idea or unique solutions to problems. On the other hand, entrepreneurship involves
turning the idea or innovation into an actual product. According to Ibnu Khaldum (as cited in Karatas, 2012), “An
entrepreneur is considered as a knowledgeable person who is instrumental in the development of a city-state where
enterprises come up.” As such, entrepreneurship can be said to be a driver of innovation to an extent that without
The International Journal
ENTREPRENEURSHIP AND SUSTAINABILITY ISSUES
ISSN 2345-0282 (online) http://jssidoi.org/jesi/
2016 Volume 4 Number 1 (September)
84
the application of entrepreneurial skills, an innovation may be rendered unattainable. Entrepreneurship and
innovation plays a major role for economies, more so in developing countries, as engines and drivers of economic
growth and development, empowerment and social adjustment. In order to attain meaningful development, it is
necessary that an economy attains high flexibility and innovative abilities of small and medium enterprises,
inculcate a culture of entrepreneurship among the youth and offer support to women entrepreneurs.
The creation of new businesses and the elimination of less efficient firms are important policy strategies in the
dynamism of the economies of modern times (Sarnad, 2012, Laužikas et al. 2015; Tvaronavičienė 2016). Through
the establishment of new firms, countries are able to attract resources to new activities, which have the potential to
grow and prosper within a short time and offer solutions to some of the major challenges facing economies such as
unemployment. New firms are often required to show an innovative edge in order to survive the stiff competition
they often face from more developed and well-known businesses. This is particularly so in younger as well as high
technology industries. Governments have been on the forefront in the recognition and appreciation of the fact that
social entrepreneurship presents a major avenue for the elimination of poverty and the empowerment of the
disadvantaged groups in the society.
Today, economies and world leaders are making major efforts aimed at ensuring that individuals are encouraged
and supported to develop and implement new ideas, governments are reviewing tax and trade policies with the
intentions of ensuring efficiency and ease of conducting business to attract foreign investors and encourage
innovation. Global Entrepreneurship Summit is conducted annually in the spirit of promoting and encouraging a
culture of entrepreneurship among people. Inventions and innovations ensure that better and efficient ways of
conducting activities are available. In addition, they have gone a long way in ensuring that human life is made easier
by the day (Sarnad, 2012). In a bid to encourage innovation and inventions, research institutes and centers have
been developed in many countries around the globe to facilitate the process of knowledge discovery. The creation
of a business environment which encourages and supports entrepreneurship and enterprise development in which
innovative young firms can operate and develop and grow fast ones they have established in the industry requires a
wide range of mutually reinforcing and sound policies Drucker (2010) this are the main fundamental issues that
affect the economy as whole and they need to be supported and developed further. The increasingly growing role
of innovation and entrepreneurship can be seen more so with the recent surge in the amount of research and
subsequent publications addressing the importance and the dimensions of innovation (Drucker, 2007). Innovation
is a critical weapon for entrepreneurs attempting to find new opportunities of producing better good or services.
Even with a conducive environment for individuals to venture into entrepreneurship, not all individuals will seize
the opportunity to enter into entrepreneurship. According to Al-Harasi (2014) and Kozubíková et al. (2015) there
are certain political, geographical as well as personal traits that drive individuals into becoming entrepreneurs.
Although most researchers have focused on exploring the potential of economic growth and development through
innovation and a culture of entrepreneurship in among the future generations, little has been done in the way of
exploring the factors that lead individuals into becoming entrepreneurs (Mačiulis, Tvaronavičienė, 2013; Fuschi,
Tvaronavičienė M., 2014; Ignatavičius et al., 2015, Matetskaya 2015; Vojtovič et al. 2015).
Oman is among many countries that have made tremendous efforts aimed at promoting entrepreneurship and
innovation. With a population of 3.9 and a per capita income of approximately $21,380, the Sultanate has a
tremendous sustainable economic growth and outstanding political environment since the early 1970’s when His
Majesty, Sultan Qaboos took charge of the throne. The remarkable achievements in economic growth can be
attributed to earning from the export of oil and gas. The earning from these two important mineral resource
contribute to 51.6% of the country’s overall GDP. Despite these achievements, Oman’s development progress is
faced with a massive risk, in the short-term the country has been unable to generate sufficient employment
opportunities for its youth, mainly composed of fresh graduates making their way into the labor market (UNCTAD,
2014).
The International Journal
ENTREPRENEURSHIP AND SUSTAINABILITY ISSUES
ISSN 2345-0282 (online) http://jssidoi.org/jesi/
2016 Volume 4 Number 1 (September)
85
In addition, the long-term economic position of the economy is place at a huge risk as a result of decreasing oil
reserves as well as the rising costs of exploration, which has been triggered by volatility of oil prices. Moreover,
questions have been asked about the long-term environmental effects of continuous search and mining of oil.
Currently, the country is ranked in top 20 countries with the highest carbon emission per capita (UNCTAD, 2014).
The Government of Oman, led by His Majesty Sultan Qaboos has worked tirelessly hard in bid to intervene in the
process of development and to give the economy a new development trajectory that will be beneficial to the citizens
of the Sultanate. The 8th five-year development plan (2011-2015) has outlined some major goals that have been put
forward by the government to deal with some of the problems experienced especially during the past decade. The
targets include: economic diversity, Omani citizens career and skills development through training programs and
scholarships, active support of SMEs creation and development and foreign investment promotion. Policy makers
in the region have clearly realized the need to hasten the structural transformation process of the country so as to be
able to create job opportunities for the Oman nationals. This can be seen in the recent move by the government to
increase the number of Oman labor force in the labor market in what has been referred to as the Omanisation strategy
(UNCTAD, 2014).
However, although this move may provide a short term solutions to the current problems experience in the country,
a better alternative and sustainable solution to the country’s economic growth and development obstacles is attaining
transformative and diversified growth underpinned under the key pillars of entrepreneurship development as well
as an effective system of innovation. The government of Oman has made several attempts aimed at encouraging
entrepreneurship in the country. The various policies include conducting entrepreneurship education and training
with major focus being placed in the education of women, creating an environment of economic freedom (Bartoš
et al., 2015). Further, the government established an innovation council with the intention of building and
encouraging a research culture. The council is mandated to formulate a nationwide research strategy, establish a
research database, and establish science and technology parks (UNCTAD, 2014).
Although the development of an effective national innovation system can bring about positive gains in the economy
such as improved and diversified economy, efficient production systems and processes as well as highly attractive
and quality jobs, some constraints exists although to the employment opportunities generated by an diversified
innovative-based system. These constraints include the global innovation competition, changes in demographic
trends, which shape the characteristics of transformation (UNCTAD, 2014; Urbaniec, 2015).
The presence of a stable government, peace, low tax rates, and the ease of conducting business in the country are
seen as the major contributing factors toward the thriving entrepreneurial growth as well as increasing direct foreign
investment. The governments equally take cognizance of the important part that women can play in the economy.
As such, efforts have been made towards encouraging women entrepreneurs especially by way of offering training
and increasing financial support for business initiatives run by the women (UNCTAD, 2014).
Significance of the study. This research paper seeks to establish some of the major factors relating to characters of
individuals and how they impact on the individual choice to become an entrepreneur. Data based on structured
questionnaires was collected from 67 individuals who were both entrepreneurs and future entrepreneurs (being in
the process of setting the details for their future business). A quantitative analysis was then conducted to determine
the factor contribution to the decision by individuals to become entrepreneurs. In addition, we delve into examining
the link between entrepreneurship and innovation in Oman by applying a qualitative approach aimed at exploring
the presence of innovation in entrepreneurship actions. To achieve this, interviews were carried out with managers
of major entrepreneurial innovative firms. The findings are discussed vis-à-vis the existing theories and literature
to examine the value of the findings.The findings of this empirical study will provide data and base for further
The International Journal
ENTREPRENEURSHIP AND SUSTAINABILITY ISSUES
ISSN 2345-0282 (online) http://jssidoi.org/jesi/
2016 Volume 4 Number 1 (September)
86
researches in the field and will grant a larger understanding of the situation from the point of view in regard to the
perception and ground realities in Sultanate of Oman.
2. LITERATURE REVIEW
This part of the research critically examines the existing theoretical and empirical literature and has been conducted
in way of explaining innovation and entrepreneurship. Research in the field of innovation and entrepreneurship has
presented a major challenge to researchers and scholars. According to Zeffane (2012), the paradoxical linkage and
the tension associated with the management of creativity and innovation presents a challenge in terms of both
explanation and theorizing.
Theories of innovation. Basically, there are three main facets of literature in economics that we examine here.
These theories are considered applicable to company level innovation including institutional, industrial, and
evolutionary perspectives. Firm level innovation is known to consist of both internal and external elements. The
first three theories are set to examine the key aspects of the government environment in a country. These include
the legal framework, property rights, size of the firm, and specific characteristics of a nation and their effects on
the technology landscape within the country.
Institutional Economics. According to institutional economics, Externalities are critical aspects of innovation. In
this branch of economics, rights to property are viewed to play an important role of internalizing externalities, on
the innovation front; they are designed to ensure that earnings from innovation and other intellectual property are
enjoyed by the innovator. This is important in providing encouragement to continue with the search for knowledge
for the purpose of inventing new ideas, products and processes (Aghazamani & Roozikah, 2010).
Further, the consequences of innovation extend beyond the introduction products or techniques to include
information that has attributes of public goods, non-rivalry, and non-excludability. The two characteristics of
information make the benefits from innovation impossible to value accurately, which means that research and
development chances that would be socially profitable are not taken advantage of due to the notion that they are
privately unprofitable. To be able to eliminate these bottlenecks to innovation, intellectual property rights should to
be well outlined and implemented (Aghazamani & Roozikah, 2010). Other interventionist measures, which the
government can employ, include offering tax holidays and tax breaks on major research and development efforts as
well as using performance contacts.
Industrial Economics. This came as a result of the work of Solow (1957) when he argued that the identification of
technological is a critical factor in ensuring growth. His work led to the development of huge body of literature
concerning the process of coming up with and transmitting new information within an organization. In particular,
Arrow’s (1962) in his study examines the processes of allocating resources to the most productive agents in the
economy under the conditions of uncertainty. It is argues that a perfectly competitive economy is most likely to be
faced with the problem of under-investment in the important process of invention and research because it is
considered to be much more risky, limited appropriation of products and because of rising returns in use. In
addition, he argues that monopolistic tendencies are major impediments to innovate further, as opposed to perfect
competition. These arguments echo the view that there is need for government to intervene by way of financing
research and development.
Being a costly and risky undertaking, research, and development should be left in the hands of industrial
organization of large monopolistic firms, which have the ability to utilize economies of scale, diversify, and develop
market position as argued in research work conducted by Scherer (1965). Uncertainty is also a key issue: the process
of innovation hugely relies on the technological endowment of a business (Farsi & Moradi, 2012). In this regard,
big organizations with substantial resource endowment for innovation are well positioned to lead the way on the

The International Journal
ENTREPRENEURSHIP AND SUSTAINABILITY ISSUES
ISSN 2345-0282 (online) http://jssidoi.org/jesi/
2016 Volume 4 Number 1 (September)
87
innovation front. Firm size is thus a critical aspect that should be taken into account when examining a firm’s
innovation ability.
Evolutionary Economics. Evolutionary economics offers a difference angle of view that is a variation of perspective
put forward by the neoclassical school of thought. As is the case in the Schumpeterian view that the economic world
is nothing more than succession of disequilibria, explicitly dynamic and evolutionary, although considering
innovation as an endogenous process as opposed to an exogenous force operating on the economic system.
Therefore, it is apparent that the conditions under which an organization operates is taken into consideration (Estay
and Ackter 2013). According to this perspective of economic thinking, the idea of diversity, concerning various
organizational properties and decisions and variations in the conditions under which an organization operates, is
fundamental to the description of inter-industry and inter-country variations. Considering innovation system in its
entirety explains a better part of inter-country differences in innovative performance (Turker, 2009).
Entrepreneurship Theories. Ibnu Khaldun (Abdul Rahman Mohamed Khaldum) theory
Basing on Ibnu Khaldum arguments concerning an entrepreneur, a person engaging in the act of entrepreneurship
is viewed as an individual with huge body of knowledge and plays a key role in the progress of a city-state
characterized by the emergence of small businesses.
Cantillon's theory (1755 as cited in Dooly, 2005)
An entrepreneur, according to this theory is as an individual who assumes risk and plays the role of bringing supply
and demand into an equilibrium condition into the economic system. Assuming a neo-classical basis, this role is
considered to be that of residual claimant. This is demonstrated by a business individual who rents labor and capital
from employees and owners of land in an environment characterized by unknown demand or production.
John Stuart Mill (1848) –
This economist, together with Jean-Baptiste Say, contributed to the spread of the term entrepreneur at academic
level. In Mill’s views, an entrepreneur is the main vector in the private organization/enterprise and it is regarded as
the fourth factor of production which creates the entrepreneurial process. Without the entrepreneur to unify all the
resources (the other factors of production), the economic process and the enterprise cannot exist.
The Social Enterprise School
In the views of this theory, the entrepreneurship should be seen as a “social enterprise initiative”. It points to
companies, in various sectors, that utilize revenue approach to follow ” a double or triple bottom line, either alone
(as a social sector business) or as part of a mixed revenue stream that includes charitable contributions and public
sector subsidies” (http://www.socialent.org/Social_Enterprise_Terminology.htm, accessed in September 12th,
2015). Social Enterprise School insist on earned income activities by nonprofit entities. It also considers the market-
based solutions for the social issues as well as economic entities that generate profit, to be donated for the purposes
of social venture or purpose.
Empirical literature. According to Mackay (2011), the role of SMEs is critical to the economic progress of most
developing economies. Empirical evidence from Singapore shows that 98% of all enterprises in the country are
young, micro or SMEs that have contributed immensely to the employment of about 70% of the workforce and
contribute close to 50% of value added to GDP (Farsi and Moradi, 2012). According to a 2012 study conducted by
McKinsey report, in South Korea, SMEs constitute close to 99% of all enterprises that offer employment
opportunities to about 87% of the workforce. In Morocco, SMEs account to approximately 93% of all registered
business, 46% of workforce and 83% of the country is GDP. Graeme and Gary conducted a study on the catalytic
environment for sustainable enterprises in Sultanate of Oman; they concluded that the political stability, good
governance, social dialogue, the respect for universal human rights and international labor standards are some of
The International Journal
ENTREPRENEURSHIP AND SUSTAINABILITY ISSUES
ISSN 2345-0282 (online) http://jssidoi.org/jesi/
2016 Volume 4 Number 1 (September)
88
the key factors that contributed immensely in providing an enabling environment for the growth and development
of successful enterprises in Sultanate of Oman.
Guan and Ma (2008) described major entrepreneurial innovative capabilities. In their discussion, they identify seven
major aspects. These are: learning, research and development, manufacturing, marketing, resource exploiting
ability, organizational capacity and strategic capabilities adaptable to competitive environments. Moller (2008)
consider that entrepreneur’s capabilities are those of ”managing strategic relationships, business nets, efficient core-
value production, delivery, process excellence, and flexibility, vertical integration through partnerships and radical
innovation aimed opening new business opportunities”.
Brush (2009) examined the major factors that lead to entrepreneurial success and he called the ‘entrepreneurial
success factors’. They include making efficient use of three major strategies: developing a clear vision, managing
cash creativity or attempt to ‘bootstrap’ and persuading other to join the venture by employing social skills.
According to Andrew (2011) the link between entrepreneurial abilities and commitment is a complicated one, since
both constructs must be present in order to lay the basis for enterprise establishment.
Hitt (2009) examined the nexus the between knowledge and technology in the process of value generation. He
argued that technology is an efficient system and that change in technology can be comprehended by investigating
this knowledge development. The facets of knowledge, which he argues are tacit and codified, facilitate the
understanding of the association that exists between technology knowledge and the ability to generate value in a
dynamic environment. Cameron (2010) is of the view that the transfer of innovation and technology are the two
potential sources of sustainable growth in productivity and he further posits that research and development,
international trade and human capital are the major drivers of productivity growth.
Dobni (2008) and Bilevičienė et al. (2015) discuss innovation as a recipe for entrepreneurship. They argue that
innovation must be created and sustained, he further emphasizes that an innovative environment is a key
management oriented way of managing employees as it can contribute immensely to the development of employee
career and present many opportunities for businesses as well as employees.
In author’s opinion, creativity is the first part of a successful and sustainable entrepreneurial process, followed, as
a second step, by innovation. Creativity is not explored enough in theory and it is not discussed as being a major
promoter of innovation. A creative entrepreneur is a successful one, a visionary and dedicated to make the things
in a different manner, in own creative manner, to ensure the sustainable development of the business and its
components.
3. METHODOLOGY AND ANALYSIS
This chapter consists of qualitative as well as quantitative analysis of two key aspects of entrepreneurship and
innovation in Oman. First, a qualitative analysis aimed at understanding the association that exists between
innovation and entrepreneurship in organization in Oman. The data was subjected to inductive logical reasoning
and results were discussed and analyzed. Secondly, a quantitative analysis was conducted on some of that factors
that impact on the entrepreneurial intentions among individuals. The approach used in our research was to issue
questionnaires to a random sample of 67 people consisting of both entrepreneurs and those who were not yet
entrepreneurs.
Empirical study: Qualitative analysis. The literature on entrepreneurship and innovation of Omani firms is still
limited despite the development of works on entrepreneurship in Oman in recent years. Basing on the available
literature, there have been no studies on entrepreneurship and innovation interaction of firms in Oman. This research
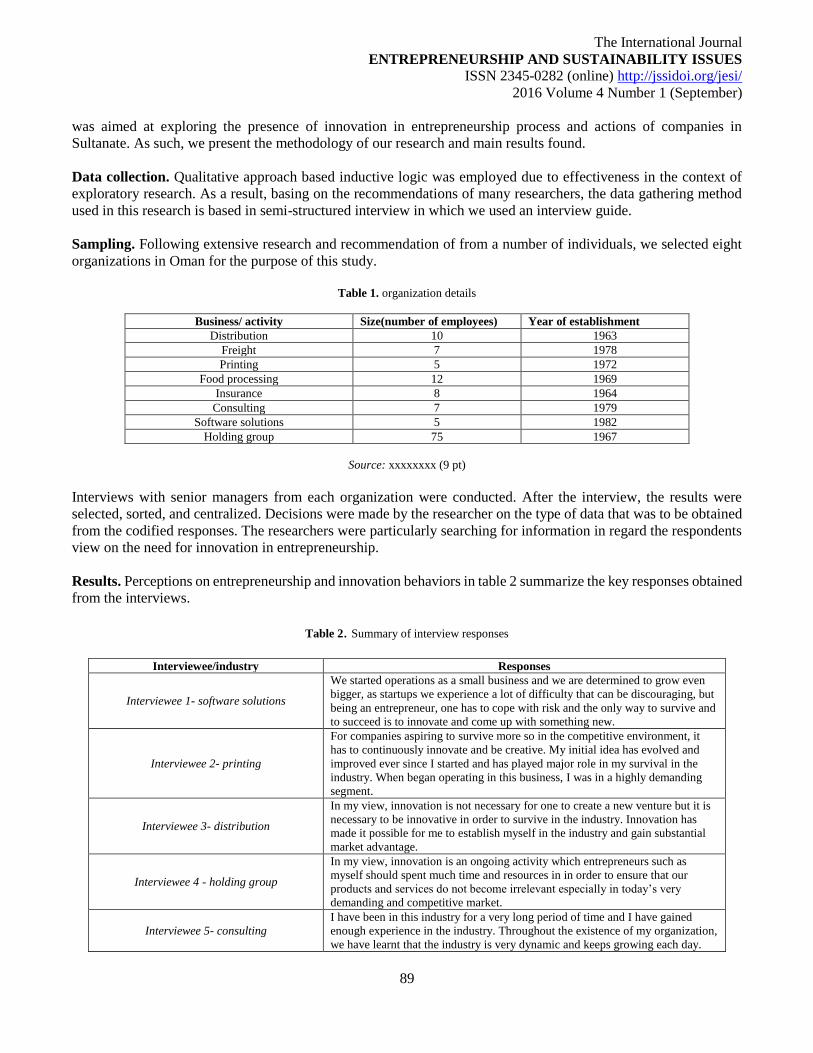
The International Journal
ENTREPRENEURSHIP AND SUSTAINABILITY ISSUES
ISSN 2345-0282 (online) http://jssidoi.org/jesi/
2016 Volume 4 Number 1 (September)
89
was aimed at exploring the presence of innovation in entrepreneurship process and actions of companies in
Sultanate. As such, we present the methodology of our research and main results found.
Data collection. Qualitative approach based inductive logic was employed due to effectiveness in the context of
exploratory research. As a result, basing on the recommendations of many researchers, the data gathering method
used in this research is based in semi-structured interview in which we used an interview guide.
Sampling. Following extensive research and recommendation of from a number of individuals, we selected eight
organizations in Oman for the purpose of this study.
Table 1. organization details
Business/ activity Size(number of employees) Year of establishment
Distribution 10 1963
Freight 7 1978
Printing 5 1972
Food processing 12 1969
Insurance 8 1964
Consulting 7 1979
Software solutions 5 1982
Holding group 75 1967
Source: xxxxxxxx (9 pt)
Interviews with senior managers from each organization were conducted. After the interview, the results were
selected, sorted, and centralized. Decisions were made by the researcher on the type of data that was to be obtained
from the codified responses. The researchers were particularly searching for information in regard the respondents
view on the need for innovation in entrepreneurship.
Results. Perceptions on entrepreneurship and innovation behaviors in table 2 summarize the key responses obtained
from the interviews.
Table 2. Summary of interview responses
Interviewee/industry Responses
Interviewee 1- software solutions
We started operations as a small business and we are determined to grow even
bigger, as startups we experience a lot of difficulty that can be discouraging, but
being an entrepreneur, one has to cope with risk and the only way to survive and
to succeed is to innovate and come up with something new.
Interviewee 2- printing
For companies aspiring to survive more so in the competitive environment, it
has to continuously innovate and be creative. My initial idea has evolved and
improved ever since I started and has played major role in my survival in the
industry. When began operating in this business, I was in a highly demanding
segment.
Interviewee 3- distribution
In my view, innovation is not necessary for one to create a new venture but it is
necessary to be innovative in order to survive in the industry. Innovation has
made it possible for me to establish myself in the industry and gain substantial
market advantage.
Interviewee 4 - holding group
In my view, innovation is an ongoing activity which entrepreneurs such as
myself should spent much time and resources in in order to ensure that our
products and services do not become irrelevant especially in today’s very
demanding and competitive market.
Interviewee 5- consulting
I have been in this industry for a very long period of time and I have gained
enough experience in the industry. Throughout the existence of my organization,
we have learnt that the industry is very dynamic and keeps growing each day.
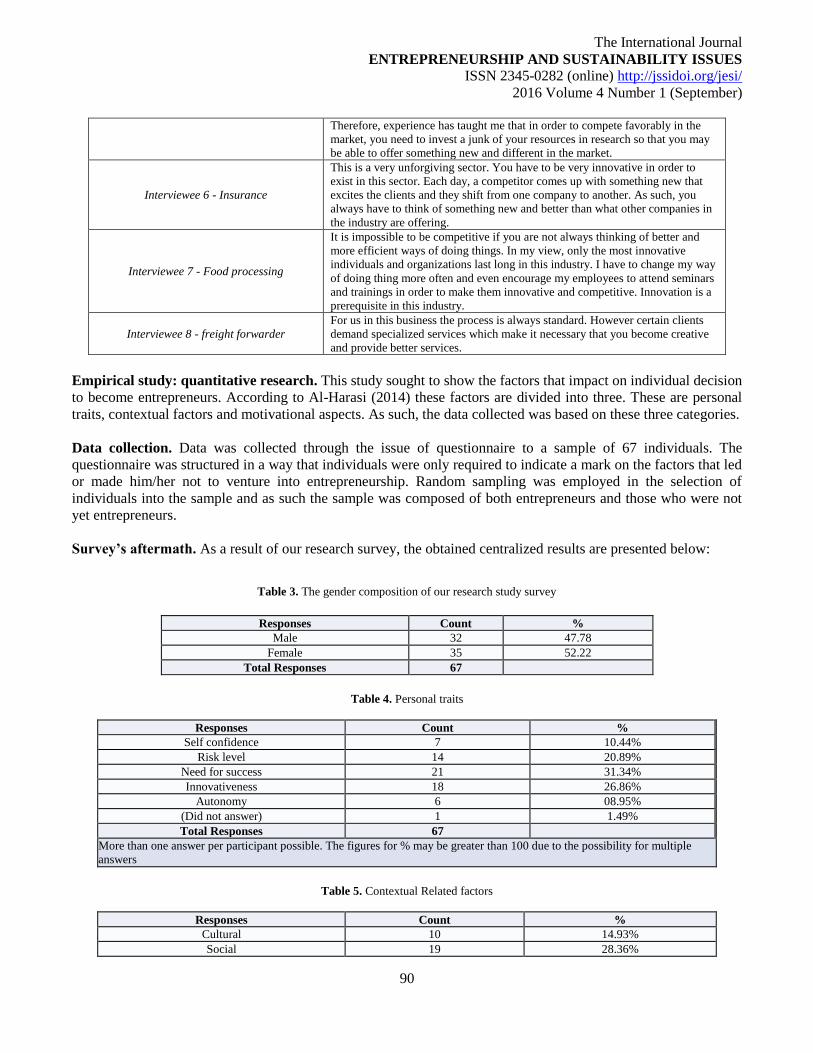
The International Journal
ENTREPRENEURSHIP AND SUSTAINABILITY ISSUES
ISSN 2345-0282 (online) http://jssidoi.org/jesi/
2016 Volume 4 Number 1 (September)
90
Therefore, experience has taught me that in order to compete favorably in the
market, you need to invest a junk of your resources in research so that you may
be able to offer something new and different in the market.
Interviewee 6 - Insurance
This is a very unforgiving sector. You have to be very innovative in order to
exist in this sector. Each day, a competitor comes up with something new that
excites the clients and they shift from one company to another. As such, you
always have to think of something new and better than what other companies in
the industry are offering.
Interviewee 7 - Food processing
It is impossible to be competitive if you are not always thinking of better and
more efficient ways of doing things. In my view, only the most innovative
individuals and organizations last long in this industry. I have to change my way
of doing thing more often and even encourage my employees to attend seminars
and trainings in order to make them innovative and competitive. Innovation is a
prerequisite in this industry.
Interviewee 8 - freight forwarder
For us in this business the process is always standard. However certain clients
demand specialized services which make it necessary that you become creative
and provide better services.
Empirical study: quantitative research. This study sought to show the factors that impact on individual decision
to become entrepreneurs. According to Al-Harasi (2014) these factors are divided into three. These are personal
traits, contextual factors and motivational aspects. As such, the data collected was based on these three categories.
Data collection. Data was collected through the issue of questionnaire to a sample of 67 individuals. The
questionnaire was structured in a way that individuals were only required to indicate a mark on the factors that led
or made him/her not to venture into entrepreneurship. Random sampling was employed in the selection of
individuals into the sample and as such the sample was composed of both entrepreneurs and those who were not
yet entrepreneurs.
Survey’s aftermath. As a result of our research survey, the obtained centralized results are presented below:
Table 3. The gender composition of our research study survey
Responses Count %
Male 32 47.78
Female 35 52.22
Total Responses 67
Table 4. Personal traits
Responses Count %
Self confidence 7 10.44%
Risk level 14 20.89%
Need for success 21 31.34%
Innovativeness 18 26.86%
Autonomy 6 08.95%
(Did not answer) 1 1.49%
Total Responses 67
More than one answer per participant possible. The figures for % may be greater than 100 due to the possibility for multiple
answers
Table 5. Contextual Related factors
Responses Count %
Cultural 10 14.93%
Social 19 28.36%
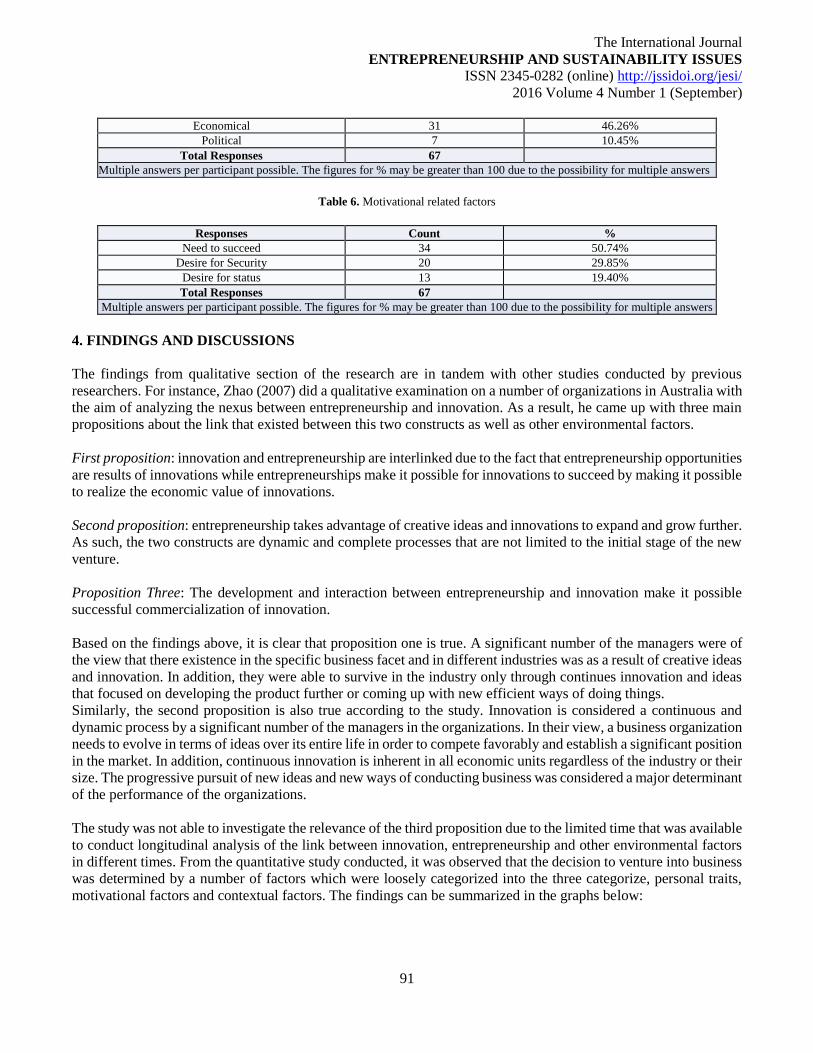
The International Journal
ENTREPRENEURSHIP AND SUSTAINABILITY ISSUES
ISSN 2345-0282 (online) http://jssidoi.org/jesi/
2016 Volume 4 Number 1 (September)
91
Economical 31 46.26%
Political 7 10.45%
Total Responses 67
Multiple answers per participant possible. The figures for % may be greater than 100 due to the possibility for multiple answers
Table 6. Motivational related factors
Responses Count %
Need to succeed 34 50.74%
Desire for Security 20 29.85%
Desire for status 13 19.40%
Total Responses 67
Multiple answers per participant possible. The figures for % may be greater than 100 due to the possibility for multiple answers
4. FINDINGS AND DISCUSSIONS
The findings from qualitative section of the research are in tandem with other studies conducted by previous
researchers. For instance, Zhao (2007) did a qualitative examination on a number of organizations in Australia with
the aim of analyzing the nexus between entrepreneurship and innovation. As a result, he came up with three main
propositions about the link that existed between this two constructs as well as other environmental factors.
First proposition: innovation and entrepreneurship are interlinked due to the fact that entrepreneurship opportunities
are results of innovations while entrepreneurships make it possible for innovations to succeed by making it possible
to realize the economic value of innovations.
Second proposition: entrepreneurship takes advantage of creative ideas and innovations to expand and grow further.
As such, the two constructs are dynamic and complete processes that are not limited to the initial stage of the new
venture.
Proposition Three: The development and interaction between entrepreneurship and innovation make it possible
successful commercialization of innovation.
Based on the findings above, it is clear that proposition one is true. A significant number of the managers were of
the view that there existence in the specific business facet and in different industries was as a result of creative ideas
and innovation. In addition, they were able to survive in the industry only through continues innovation and ideas
that focused on developing the product further or coming up with new efficient ways of doing things.
Similarly, the second proposition is also true according to the study. Innovation is considered a continuous and
dynamic process by a significant number of the managers in the organizations. In their view, a business organization
needs to evolve in terms of ideas over its entire life in order to compete favorably and establish a significant position
in the market. In addition, continuous innovation is inherent in all economic units regardless of the industry or their
size. The progressive pursuit of new ideas and new ways of conducting business was considered a major determinant
of the performance of the organizations.
The study was not able to investigate the relevance of the third proposition due to the limited time that was available
to conduct longitudinal analysis of the link between innovation, entrepreneurship and other environmental factors
in different times. From the quantitative study conducted, it was observed that the decision to venture into business
was determined by a number of factors which were loosely categorized into the three categorize, personal traits,
motivational factors and contextual factors. The findings can be summarized in the graphs below:
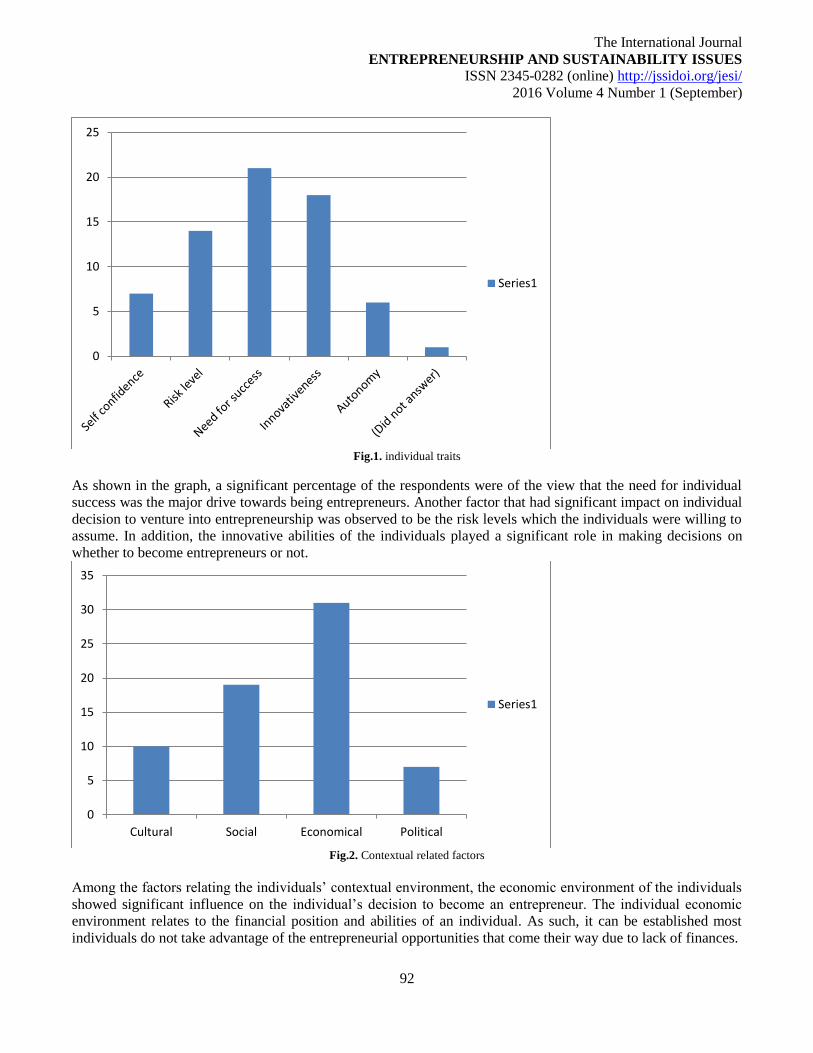
The International Journal
ENTREPRENEURSHIP AND SUSTAINABILITY ISSUES
ISSN 2345-0282 (online) http://jssidoi.org/jesi/
2016 Volume 4 Number 1 (September)
92
Fig.1. individual traits
As shown in the graph, a significant percentage of the respondents were of the view that the need for individual
success was the major drive towards being entrepreneurs. Another factor that had significant impact on individual
decision to venture into entrepreneurship was observed to be the risk levels which the individuals were willing to
assume. In addition, the innovative abilities of the individuals played a significant role in making decisions on
whether to become entrepreneurs or not.
Fig.2. Contextual related factors
Among the factors relating the individuals’ contextual environment, the economic environment of the individuals
showed significant influence on the individual’s decision to become an entrepreneur. The individual economic
environment relates to the financial position and abilities of an individual. As such, it can be established most
individuals do not take advantage of the entrepreneurial opportunities that come their way due to lack of finances.
0
5
10
15
20
25
Series1
0
5
10
15
20
25
30
35
Cultural Social Economical Political
Series1
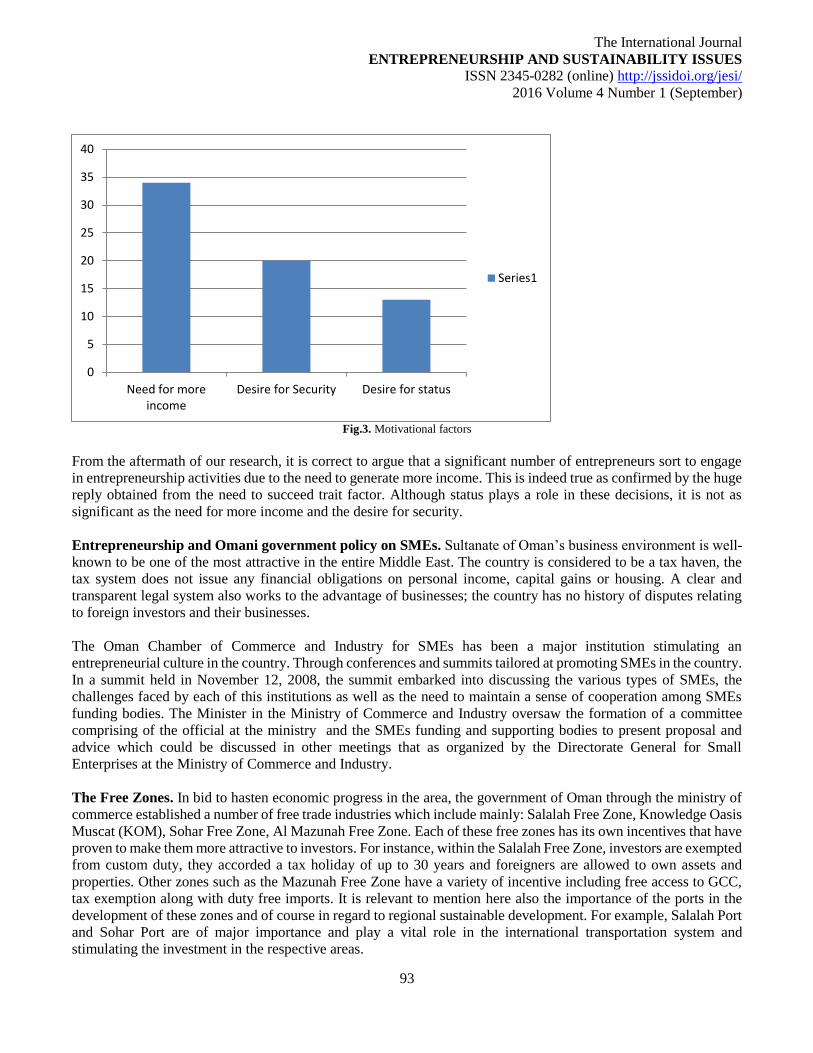
The International Journal
ENTREPRENEURSHIP AND SUSTAINABILITY ISSUES
ISSN 2345-0282 (online) http://jssidoi.org/jesi/
2016 Volume 4 Number 1 (September)
93
Fig.3. Motivational factors
From the aftermath of our research, it is correct to argue that a significant number of entrepreneurs sort to engage
in entrepreneurship activities due to the need to generate more income. This is indeed true as confirmed by the huge
reply obtained from the need to succeed trait factor. Although status plays a role in these decisions, it is not as
significant as the need for more income and the desire for security.
Entrepreneurship and Omani government policy on SMEs. Sultanate of Oman’s business environment is well-
known to be one of the most attractive in the entire Middle East. The country is considered to be a tax haven, the
tax system does not issue any financial obligations on personal income, capital gains or housing. A clear and
transparent legal system also works to the advantage of businesses; the country has no history of disputes relating
to foreign investors and their businesses.
The Oman Chamber of Commerce and Industry for SMEs has been a major institution stimulating an
entrepreneurial culture in the country. Through conferences and summits tailored at promoting SMEs in the country.
In a summit held in November 12, 2008, the summit embarked into discussing the various types of SMEs, the
challenges faced by each of this institutions as well as the need to maintain a sense of cooperation among SMEs
funding bodies. The Minister in the Ministry of Commerce and Industry oversaw the formation of a committee
comprising of the official at the ministry and the SMEs funding and supporting bodies to present proposal and
advice which could be discussed in other meetings that as organized by the Directorate General for Small
Enterprises at the Ministry of Commerce and Industry.
The Free Zones. In bid to hasten economic progress in the area, the government of Oman through the ministry of
commerce established a number of free trade industries which include mainly: Salalah Free Zone, Knowledge Oasis
Muscat (KOM), Sohar Free Zone, Al Mazunah Free Zone. Each of these free zones has its own incentives that have
proven to make them more attractive to investors. For instance, within the Salalah Free Zone, investors are exempted
from custom duty, they accorded a tax holiday of up to 30 years and foreigners are allowed to own assets and
properties. Other zones such as the Mazunah Free Zone have a variety of incentive including free access to GCC,
tax exemption along with duty free imports. It is relevant to mention here also the importance of the ports in the
development of these zones and of course in regard to regional sustainable development. For example, Salalah Port
and Sohar Port are of major importance and play a vital role in the international transportation system and
stimulating the investment in the respective areas.
0
5
10
15
20
25
30
35
40
Need for moreincome
Desire for Security Desire for status
Series1
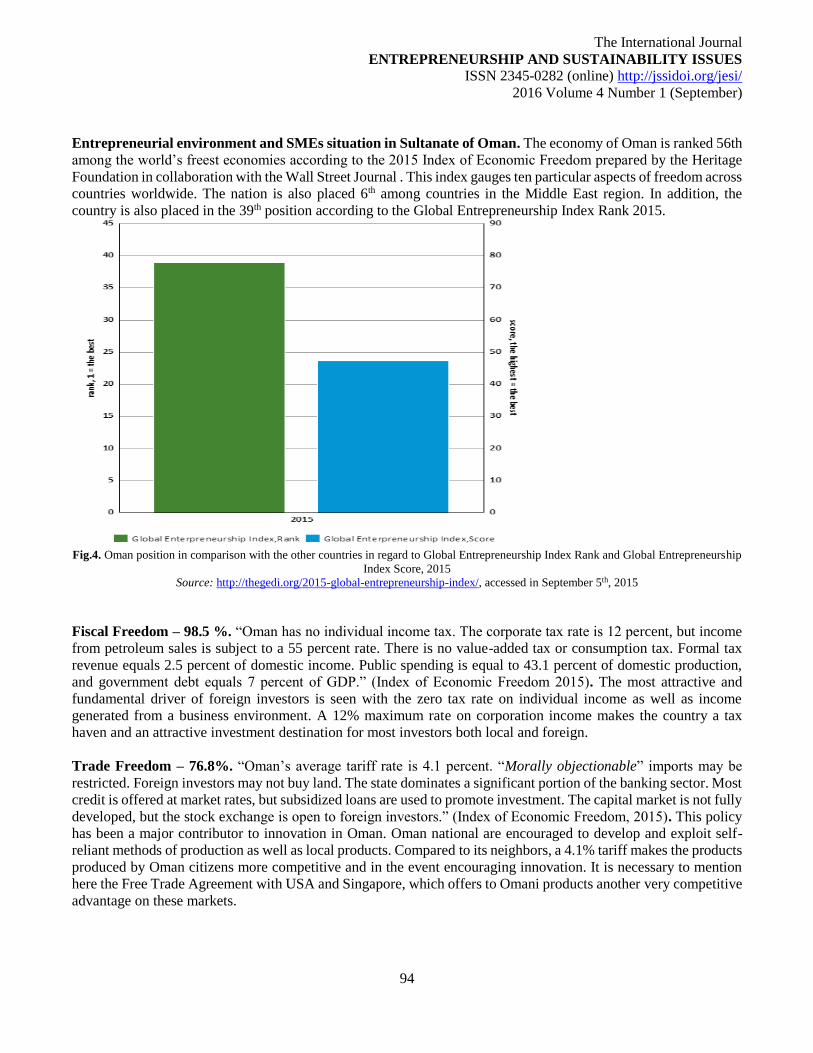
The International Journal
ENTREPRENEURSHIP AND SUSTAINABILITY ISSUES
ISSN 2345-0282 (online) http://jssidoi.org/jesi/
2016 Volume 4 Number 1 (September)
94
Entrepreneurial environment and SMEs situation in Sultanate of Oman. The economy of Oman is ranked 56th
among the world’s freest economies according to the 2015 Index of Economic Freedom prepared by the Heritage
Foundation in collaboration with the Wall Street Journal . This index gauges ten particular aspects of freedom across
countries worldwide. The nation is also placed 6th among countries in the Middle East region. In addition, the
country is also placed in the 39th position according to the Global Entrepreneurship Index Rank 2015.
Fig.4. Oman position in comparison with the other countries in regard to Global Entrepreneurship Index Rank and Global Entrepreneurship
Index Score, 2015
Source: http://thegedi.org/2015-global-entrepreneurship-index/, accessed in September 5th, 2015
Fiscal Freedom – 98.5 %. “Oman has no individual income tax. The corporate tax rate is 12 percent, but income
from petroleum sales is subject to a 55 percent rate. There is no value-added tax or consumption tax. Formal tax
revenue equals 2.5 percent of domestic income. Public spending is equal to 43.1 percent of domestic production,
and government debt equals 7 percent of GDP.” (Index of Economic Freedom 2015). The most attractive and
fundamental driver of foreign investors is seen with the zero tax rate on individual income as well as income
generated from a business environment. A 12% maximum rate on corporation income makes the country a tax
haven and an attractive investment destination for most investors both local and foreign.
Trade Freedom – 76.8%. “Oman’s average tariff rate is 4.1 percent. “Morally objectionable” imports may be
restricted. Foreign investors may not buy land. The state dominates a significant portion of the banking sector. Most
credit is offered at market rates, but subsidized loans are used to promote investment. The capital market is not fully
developed, but the stock exchange is open to foreign investors.” (Index of Economic Freedom, 2015). This policy
has been a major contributor to innovation in Oman. Oman national are encouraged to develop and exploit self-
reliant methods of production as well as local products. Compared to its neighbors, a 4.1% tariff makes the products
produced by Oman citizens more competitive and in the event encouraging innovation. It is necessary to mention
here the Free Trade Agreement with USA and Singapore, which offers to Omani products another very competitive
advantage on these markets.
The International Journal
ENTREPRENEURSHIP AND SUSTAINABILITY ISSUES
ISSN 2345-0282 (online) http://jssidoi.org/jesi/
2016 Volume 4 Number 1 (September)
95
Labor Freedom – 76.1%. “Starting a business takes an average of five procedures and one week, but licensing
requirements remain burdensome. The labor laws enforce the “Omanization” policy requiring firms to meet quotas
for hiring native Omani workers. The state influences prices through an extensive subsidy system, which grew by
8 percent in 2013, driven mainly by subsidies for petroleum products and electricity.” (Index of Economic Freedom,
2015). Oman no doubt recognizes the importance of labor force in driving economic progress and development.in
particular a flexible labor force is important for presenting major avenues for employment productivity. In a
situation of limited employment and firing costs, labor flexibility is often high. Linking this lateral freedom with
low non-salary costs, like health benefits and medical insurance, the entrepreneurial environment of Oman is able
to succeed.
Sultanate of Oman innovation system. “Acknowledging the key role of innovation as a driver of economic
development, it will be necessary for policymakers to be able to measure and asses’ outcomes. For this they will
require innovation indicators beyond the traditional metric of inputs, such as the level of funding of research and
development (R&D).” (UNCTAD, 2014). Oman ranks 69th basing on the GII Index (2015). This is attributed, to a
large extent, to the lack of efficiency in the utilization of the resources and environment that are considered
advantageous on an innovative front. The below average performance of Oman on the national innovation system
points out to the need for Oman to hasten its policy reform process.
Framework conditions and the national innovation system. These incorporate the general environment under
which the Oman national innovation system operates. According to UNCTAD 2014, the difference in the innovation
performance that exists between economies is, to a significant extent, due to the variations in the way the
government, firms, universities, research centers, public and private agencies and other contributing agents to
innovation interact with the laid framework.
The world of academia and research. The country’s education sector is relatively well developed with number of
established universities and colleges. The oldest university in the country is the Sultan Qaboos University. The
university has 9 colleges; Arts and social science, Economics and Political Science, education, Law, Nursing,
Agriculture and marine science, medicine and health Engineering and Science.
Opportunities and Challenges. The opportunities for entrepreneurship and investment in Oman are numerous.
According to the 2015 Index of Economic Freedom, Oman showed indications of investment attraction by earning
65 points. With a booming tourism sector, hoteling industry presents a major opportunity for individuals to take
advantage of it. The free zones also present strategic locations for the development of businesses to take advantage
of the various incentives that are provided in. Also, the government of Oman recently made public its intentions to
increase the number of free zones to more than those currently availability. This presents a major opportunity for
future investors. The strategic position of the country in the Gulf has reduced the overdependence on hydrocarbons
and also had a key contribution in the diversification of Sultanate of Oman’s economy, especially through the
advantages of the ports. For instance, Salalah Port is critical for moving both customers and goods to their
destination. The Oman Center for Investment Promotion and Export Development (OCIPED) is increasingly being
involved in the provision of services to SMEs. Through the Oman Venture Capital Fund, nationals are able to
acquire funds that enable them to open small business and with increased support and involvement of the body,
these businesses will have access to funds for continuous operations and growth. However, with the huge number
of foreign individuals flocking into the tax haven, the country faces a major challenge of increasing unemployment
among the locals. In addition, policy makers are concerned about the risk presented by imported inflation (Pauceanu,
2014). This is due mainly to the free movement of goods across the border especially goods from or to the free
zones. Research studies have also indicated that although there are opportunities for investment, entrepreneurs,
especially the locals, are faced with difficulty in rising capital to start businesses.
The International Journal
ENTREPRENEURSHIP AND SUSTAINABILITY ISSUES
ISSN 2345-0282 (online) http://jssidoi.org/jesi/
2016 Volume 4 Number 1 (September)
96
RECOMMENDATIONS AND CONCLUSION
Recommendation. As Oman attempts to deal with the problem of increasing unemployment rates among its
citizens, it is important that the government increases education among individuals especially the youth to give
training in matters relating to the entrepreneurship opportunities and how to approach entrepreneurship. This will
ensure that the youth venture into SMEs and self-employment and a result they will be able to generate employment
on their own.
Also, basing on the findings of this study, the government of Oman need to make more flexible the access to finances
to the nationals in order to enable, motivate and support them to undertake entrepreneurship opportunities, invest
in SMEs and have a positive contribution to the further growth of GDP. According to Ibnu Khaldum, the
government is require to play major role in shifting the expectations of entrepreneurs by putting in place public
works to come up with more job opportunities while also instilling self believe.
In the context of where the major challenges need to be addressed.it is important to specify the priorities. This is
especially important due to the fact that government capacities are constrained. First, it is necessary to have a clear
and strong engagement. In order to achieve this there should be a mobilization all over the Sultanate, top-level inter-
ministerial and inter-agencies coordination and a gradual and transformative well-planned, organized and executed
process. The nationals need to be educated and trained on how to take advantage of existing entrepreneurial
opportunities in key sectors such as tourism, mining, as well as agriculture. This should be supported by a well-
coordinated system of management especially in the context of Research and development institutions.
In addition, the government should establish an innovation agenda, to stimulate creativity, R&D and innovation
management and support. The agenda should clearly stipulate the main areas of target together with a road map that
should be used to facilitate the achievement of the agenda. Among the various measures that have the potential of
bring instant impact in the economy, internet access should be given priority since internet has the potential of
facilitating research and the process of knowledge discovery.
Further, the government should focus on reducing the bottlenecks associated with business registration. In
particular, the period that an individual has to wait in order to receive a business license should be hastened in order
to ensure the registration of more businesses. It is known that a longer business registration process is a major
impediment to the need to increase the number of SMEs in the country. It is also important to strengthen research
and development and offer innovation support. Basing on our findings above, it is clear that for further
entrepreneurship opportunities, organizations should be involved in further research and innovation. More research
centers need to be established in the country in order to facilitate the process of knowledge discovery. In addition,
the government should ensure that it has in place an efficient system of protecting intellectual property in order to
encourage further innovation and commercialization of innovation.
Conclusion. The empirical study has attempted to examine the link that exists between innovation and
entrepreneurship in Oman. The qualitative data collected was subjected to inductive logic and the results obtained
clearly supported existing theories and previous research work done on the area. In particular, the proposition that
innovation and entrepreneurship have complementary relationship is indeed true based on the data and findings
from the research, it was clear that a significant number of managers took the general view in theory that in order
to venture into entrepreneurship or find a business opportunity it was apparent that one had to come up with
innovative ways of doing thing and in particular, ways of solving existing problems in society or in the market.
The results of the quantitative study point to the specific aspects that the government of Oman should focus on in
order to breed a culture of entrepreneurship in the country. Apart from the personal traits which cannot be influenced
entirely by government actions, the government can influent other factors such as economic, political and other
The International Journal
ENTREPRENEURSHIP AND SUSTAINABILITY ISSUES
ISSN 2345-0282 (online) http://jssidoi.org/jesi/
2016 Volume 4 Number 1 (September)
97
contextual and motivational factors. On the particular issues pertaining innovation and entrepreneurship in Oman,
the government of Oman, led by his majesty Sultan Qaboos have made major steps on the entrepreneurship and
innovation front in bid to ensure that the country does not only rely on the oil and gas exports for its GDP but also
diversify to the more SME and technology driven economy which has been proved to work well especially in many
of the developing countries.in addition, specific institutions mandated to be in charge of the countries innovation
system such as The Research Council (TRC) play an important role in setting the innovation landscape in Oman.
Further, a stable political environment, friendly tax laws have gone a long way in ensuring that the countries
business environment is conducive for investors and in particular, foreign investors looking for tax havens to invest
their money in well-established education institutions such as universities are seen as fundamental key contributors
in the processes of knowledge discovery through research and development (R&D).
References
Al-Harrasi, A. (2014) Factors Impacting Entrepreneurial Intentions: A Literature review. International Journal of Social, Behavioral,
Education and Management Engineering Vol:8
Aghazamani, A. & Roozikah, E. (2010) Entrepreneurial characteristics among University Students: Case study of Iran.
Andrew, B and Elias, G (2011) Exploring the value proposition of undergraduate entrepreneurship major and electives based on student self-
efficacy and outcome. New York
Arrow, J.K. (1962). Economic Welfare and the Allocation of Resources for Intervention. The Rate and Direction of Inventive Activity:
Economic and Social Factors, ISBN: 0-87014-304-2, 609-626
Bartoš, P., Rahman, A., Horák, J., Jáčová, H. (2015), Education and Entrepreneurship in the SME Segment in Economic Transformation,
Economics & Sociology, Vol. 8, No 2, 2015, pp. 227-239. DOI: 10.14254/2071- 789X.2015/8-2/16
Bilevičienė T., Bilevičiūtė, E., Paražinskaitė, G. (2015), Innovative Trends in Human Resources Management, Economics and Sociology,
Vol. 8, No 4, pp. 94-109. DOI: 10.14254/2071-789X.2015/8-4/7
Brush, C. (2008). Pioneering for Entrepreneurial Success. Business Horizons 51(1). 20-28
Cameron, G. (2010). Technological convergence, R&D, trade and productive growth. European Economic Review 49(3) 775-800
Dobni, C. (2008). The Innovation Blueprint. Business Horizon 49 (4) 5-15
Dooly, P.C. (2005). The Labour Theory of value. Routledge
Drucker, P. (2010). Innovation and Entrepreneurship: Practice and Principles. Heinemann. London
Estay, C., & Ackter, M., (2013) Entrepreneurship; From Motivation to start-up, Journal of International Entrepreneurship, Vol 11 (3) pp 200-
296
Farsi, J., Arubiam, A. & Moradi, M. (2012) The Impact of opportunity recognition skills training on entrepreneurial intentions of female
nursing students. Journal of Knowledge Management Economics and Information Technology Vol. 2 (4)
Fuschi, D.L.; Tvaronavičienė M. 2014. Sustainable development, Big Data and supervisory control: service quality in banking sector, Journal
of Security and Sustainability Issues 3(3): 5–14. DOI: http://dx.doi.org/10.9770/jssi.2014.3.3(1)
Guan, J., and Ma, N. (2008). Innovative capability and export performance of Chinese firms. Techonovation, 23(9), 737-759
Hitt, M. (2009) Partner selection in developed and emerging markets: Resource-based and Organizational learning perspectives. Academy of
management Journal 43(2) 449-470.
The International Journal
ENTREPRENEURSHIP AND SUSTAINABILITY ISSUES
ISSN 2345-0282 (online) http://jssidoi.org/jesi/
2016 Volume 4 Number 1 (September)
98
Ignatavičius, R.; Tvaronavičienė, M.; Piccinetti, L. 2015. Sustainable development through technology transfer networks: case of Lithuania,
Journal of Security and Sustainability Issues 4(3): 261-267. DOI: http://dx.doi.org/10.9770/jssi.2015.4.3(6)
Ismail, K. and Yanus, N (2012) Stimulating factors on women entrepreneurial intention. Business management Journal Vol. 2(6), pp.20-28
Karatas, S. (2012). Economic theory of Ibnu Khaldun and the rise and fall of Nations. Journal of Political Economy. Vol. 79 pp113
Katila, R (2007). “Measuring Innovation Performance,” in Neely, A (Ed.), Business Performance measurement: Theory and Practice,
Cambridge University Press, Cambridge, pp. 108-304
Kozubíková, L., Belás, J., Bilan, Y., Bartoš, P. (2015), Personal characteristics of entrepreneurs in the context of perception and management
of business risk in the SME segment, Economics & Sociology, Vol. 8, No 1, pp. 41-54 DOI: 10.14254/2071- 789X.2015/8-1/4
Laužikas, M.; Tindale, H.; Bilota, A.; Bielousovaitė, D. 2015. Contributions of sustainable start-up ecosystem to dynamics of start-up
companies: the case of Lithuania, Entrepreneurship and Sustainability Issues 3(1): 8-24.http://dx.doi.org/10.9770/jesi.2015.3.1(1)
Mackay, H. (2011). Pioneering in entrepreneurship and small business research. New York: Springer
Mačiulis, A.; Tvaronavičienė, M. 2013. Secure and sustainable development: Lithuania’s new role in taking the Presidency of the EU, Journal
of Security and Sustainability Issues 3(2):5–13 http://dx.doi.org/10.9770/jssi.2013.3.2(1)
Matetskaya, M. 2015. Education programmes for entrepreneurs in the creative industries in St. Petersburg, Entrepreneurship and
Sustainability Issues 3(1): 66-73. http://dx.doi.org/10.9770/jesi.2015.3.1(6)
Moller, K., Rajala, A. and Svahn, S. (2006). Strategic Business nets- their types and management. Journal of Business Research 58(7) 1274-
1284
Păuceanu A.M. (2007) - Innovation – Romania’s only opportunity for retrieving the gap to the developing countries, Annals of Constantin
Brâncuși University, Târgu Jiu, România,
Păuceanu, A.M. (2014). Strategies for improving the performance of firms operating in Oman tourism industry, Journal of Contemporary
Management Sciences (JCMS), Volume 3 (1) 1-11, JCMS Publication, 2014
Sarnad, K. (2012) A key catalysts of self-employment. Center for Strategy and evolution services. Oman
Scherer, F.M. (1965). Corporate inventive output, profits, and growth. Journal of Political Economy, 73.
Solow, Robert (1957). "Technical change and the aggregate production function". Review of Economics and Statistics 39 (3): 312–320.
JSTOR 1926047.
Tvaronavičienė, M. (2016). Start-ups across the EU: if particular tendencies could be trace, Entrepreneurship and Sustainability Issues 3(3):
290-298. http://dx.doi.org/10.9770/jesi.2016.3.3(6)
Turker, D. (2009) Which factors affect entrepreneurial intentions of University students? Journal of European Industrial Training, Vol 33 (2)
130-173
UNCTAD. (2014). World Investment Report 2014. Accessed August 16, 2015 from http://unctad.org/en/PublicationsLibrary/wir2014_en.pdf
Urbaniec, M. (2015), Towards Sustainable Development through Ecoinnovations: Drivers and Barriers in Poland, Economics and Sociology,
Vol. 8, No 4, pp. 179-190. DOI: 10.14254/2071-789X.2015/8-4/13
Vojtovič, S.; Navickas, V.; Gruzauskas, V. 2016. Strategy of sustainable competitiveness:methodology of real-time customers’ segmentation
for retail shops, Journal of Security and Sustainability Issues 5(4): 489-499.http://dx.doi.org/10.9770/jssi.2016.5.4(4)
The International Journal
ENTREPRENEURSHIP AND SUSTAINABILITY ISSUES
ISSN 2345-0282 (online) http://jssidoi.org/jesi/
2016 Volume 4 Number 1 (September)
99
Zeffane, R., (2012) Gender and Youth Entrepreneurship Potential: Evidence from the United Arab Emirates. International Journal of
Business Management Vol. 8 (1) 60-72.
Zhao, F. (2007). Managing innovation and quality of collaborative R&D. research conference: Melbourne
http://www.socialent.org/Social_Enterprise_Terminology.htm, accessed in September 12th, 2015
Alexandrina Maria PAUCEANU is assistant professor at Dhofar University and she received a PhD in management from the Academy of
Economic Studies in Bucharest. She is a full professor in Switzerland, with over 12 years of international teaching experience, for-profit field
and consultancy in both multicultural and multilingual environments. Currently, she is teaching in Middle East (Sultanate of Oman) and also
in Switzerland where she is supervising several doctoral students. She traveled to the Sultanate of Oman to implement her knowledge of
small- and medium-sized enterprises and entrepreneurship and found herself in a community to which she could make significant
contributions. She is involved in community development and as well as in the Dhofar University Center for Entrepreneurship
The most recent book, Entrepreneurship in the Gulf Cooperation Council, promotes a practical approach to starting businesses and is useful
not only to students but also to anyone seeking to gain practical insights about essential aspects of entrepreneurship. It is published by Elsevier
USA
Copyright © 2016 by author(s) and VsI Entrepreneurship and Sustainability Center
This work is licensed under the Creative Commons Attribution International License (CC BY).
http://creativecommons.org/licenses/by/4.0/