entrepreneurship and sustainability issues 8(3)
TRANSCRIPT
http://jssidoi.org/jesi/
ISSN 2345-0282 ONLINE http://doi.org/10.9770/jesi.2021.8.3
ENTREPRENEURSHIP AND SUSTAINABILITY ISSUES
8(3)
2021
ENTREPRENEURSHIP AND SUSTAINABILITY ISSUES
ISSN 2345-0282 (online) http://jssidoi.org/jesi/
2021 Volume 8 Number 3 (March)
http://doi.org/10.9770/jesi.2021.8.3
Publisher
http://jssidoi.org/esc/home
Volume 8 Number 3 March 2021
ENTREPRENEURSHIP AND SUSTAINABILITY ISSUES
2021
8(3)
The Entrepreneurship and Sustainability Issues ISSN 2345-0282 (online) is a peer-reviewed journal, which
publishes original research papers and case studies. It is international journal published cooperating with
universities, social companies, consultancies and associations. It is published quarterly.
Areas of research include, but are not limited to, the following:
Areas of research include, but are not limited to, the following:
Conceptual/Practical Approaches and Methodologies towards Sustainable Entrepreneurship
Globalization, Internationalization and Solutions for Low-Carbon Economies of Scope or Scale
Innovations and Technology Transfer Pilot Results Advancing Entrepreneurship and Sustainability
Information Technologies (IT) and Information Communication Technologies (ICT) for Entrepreneurship Sustainability,
and Socio-Economic Innovations
Environmental Engineering for Sustainability and Entrepreneurial Applications/Ventures
Smart Electricity Grid Solutions for Sustainable Entrepreneurship
Implementation of Renewable Energies (e.g. Harvesting, Storage, New Technologies Being Deployed/Developed, Innovative
Market or Business Model Paradigms, etc.)
Entrepreneurship, Security and Safety
Sustainable Development, Entrepreneurship, Safety
Threats to Society, Entrepreneurship and Regional Development
Security and Safety of Countries, Regions and Society as Precondition of Sustainable Development and Sustainable
Entrepreneurship
Boarder Guard Issues. Regional Development and Entrepreneurship
Migration and Sustainable Regional Development and Entrepreneurship
Terrorism, International Crime, Regional Development and Sustainability
Security and Safety Models for Sustainable Development of Societies and Businesses
Emerging Business Drivers, Opportunities, or Constraints in Future Sectors of Current Markets
Retrofitting Techniques and Technologies Near-Zero Energy Demand Buildings
Urban Planning and Advanced Construction Materials for Energy-Efficiency or Smart Cities
Modern Economics in the Context of Security, Comfort, or Legislation
PPPs for Developments in Sustainable Entrepreneurship, Finance, and Investments
Accounting and Entrepreneurship Issues
Sustainable Entrepreneurship in the Context of Management or Life-Long Learning
Strategic Management Practices and Creative Marketing Techniques for Sustainability
Organizational Studies and Sustainable Entrepreneurship
Entrepreneurship in the Context of Marketing, ICT, and Creative Industries
Intercultural Communication for Sustainable Entrepreneurship
Institutions and Entrepreneurship
Case Studies on Entrepreneurship and Sustainable Development
Social Cohesion and Social Innovation and Social Entrepreneurship
Business Models and Strategic Management for Sustainable, Secure and Safe Futures
Corporate Social Responsibility and Sustainable Development
Entrepreneurship in the Context of Psychology, Education, or Women
Intuitions about Emerging Phenomena in Business and Society
Start-Ups, Spin-Offs, SMEs in the Context of Market Growth And Exit
Global Value Chain Management for Sustainable Entrepreneurship
Knowledge Management for Sustainable Entrepreneurship, Safety and Security
All papers published in the Entrepreneurship and Sustainability Issues are indexed/abstracted by:
ECONIS of the ZBW – Leibniz Information Centre for Economics http://www.zbw.eu/EconBiz
RePEc http://repec.org/EconBiz
Ulrich’s Periodicals Directory
Serials Solutions http://www.serialssolutions.com/
ProQuest business http://www.proquest.co.uk/en-UK/
Crossref
Google Scholar
The European Library http://www.theeuropeanlibrary.org
Database Lituanistika http://www.lituanistikadb.lt
Index Copernicus International
Publisher:
ENTREPRENEURSHIP AND SUSTAINABILITY CENTER
http://jssidoi.org/esc/home
Editorial correspondence including manuscripts and submissions:
Prof. dr. Manuela Tvaronavičienė
Tel.: +37068783944
E-mail: [email protected] or [email protected]
This is an open access journal and all published articles are licensed under a
Creative Commons Attribution 4.0 International License
International Editorial Board
ENTREPRENEURSHIP AND SUSTAINABILITY ISSUES ISSN 2345-0282 (online)
Editors-in-Chief
Prof. Abel Femi Adekola, Wilkes University, USA
Editors
Prof. Salvatore Monni, Rome Tre University, Italy
Prof. Armenia Androniceanu, The Bucharest University of Economic Studies, Faculty of Administration and
Public Management, Bucharest, Romania
Prof. Fernando García, Department of Economics and Social Sciences, Faculty of Busines Administration and
Management, Universitat Politecnica de Valencia (Polytechnic university of Valencia), Spain
Prof. Małgorzata Porada Rochoń, Faculty of Management and Economics of Services, University of Szczecin,
Poland
Prof. Francisco Guijarro, Universitat Politecnica de Valencia (Polytechnic university of Valencia), Spain
Dr. Nadia Simoes, Instituto Universitário de Lisboa (ISCTE-IUL), ISCTE Business School Economics Department,
Portugal
Dr. Michal Fabuš, School of Economics and Management in Public Administration in Bratislava
Dr. Christopher J. Rees, University of Manchester, United Kingdom
Dr. Richard Haigh, University of Salford, United Kingdom
Director, Mercy Maclean, Health Psychology Management Org. Services, United Kingdom
Prof. Sharda Nandram, HAN University of Applied Sciences and Nyenrode Business University, the Netherlands
Assoc. prof. Dr. Ing. Rastislav Rajnoha, Tomas Bata University in Zlín, Czech Republic, Paneuropean University
Bratislava, Slovak Republic
Prof. Inga Žalėnienė, Mykolas Romeris University, Lithuania
Prof. Kristel Mari Skorge, Oslo and Akershus University College of Applied Sciences, Norway
Dr. Leonardo Piccinetti, Europe for Business, Brussels, Belgium
Prof. Gunnar Prause, Tallinn University of Technology, Estonia
Prof. Irina Sennikova, Riga International College of Economics and Business Administration, Latvia
Prof. Natalja Lace, Riga Technical University, Latvia
Prof. Ona Gražina Rakauskienė, Mykolas Romeris University, Lithuania
Prof. Danuta Diskienė, Vilnius University, Lithuania
Prof. Mirjana Radović Marković, Institute of Economic Sciences, Serbia
Prof. Ing. Zuzana Dvorakova, University of Economics, Czech Republic
Prof. Ani Matei, National School of Political Studies and Public Administration, Romania
Prof. Givi Bedianashvili, European University, Ivane Javakhishvili Tbilisi State University, Georgia
Dr. Kavita Singh, University of Delhi, India
Dr. Ulku Yuksel, The University of Sydney, Australia
Dr. Juris Ulmanis, Experiential Simulations, Canada
Dr. Sarvar Gurbanov, Qafqaz University, School of World Economy, Azerbaijan
Prof. Mehmet Huseyin Bilgin, Istanbul Medeniyet University, Turkey
Assist.Prof. Meltem Caber, Akdeniz University, Tourism Faculty, Turkey
Prof. Marina Sheresheva, Lomonosov Moscow State University, Russian Federation
Prof. Bora Aktan, University of Bahrain, the Kingdom of Bahrain
Prof. Svetlana Drobyazko, European academy of sciences, Coventry, UK
Prof. Małgorzata Porada Rochoń, Faculty of Management and Economics of Services, University of Szczecin,
Poland

Field editorial board members
MS. Ing. Sylvain Robert, Commissariat a L'Energie Atomique CEA, Gif-sur-Yvette, France
Prof. Wolfgang Birk, Computer Science, Lulea tekniska Universitet, Sweden
MSC. Johan Desmedt, Unit Energy Technology, Genk, Belgium
Dr. Edoardo Patti, Politecnico di Torino, Italy
Dr. Ilias Lamprinos, Intracom Holdings SA, Telco Software Department, Greece
Volume 8 Number 3 March 2021
CONTENTS
Kanittha Pattanasing, Somnuk Aujirapongpan, Supit Ritkaew,
Anuman Chanthawong, Sirichai Deelers.
THE IMPACT OF DYNAMIC CAPABILITIES AND DYNAMIC PERFORMANCE
MEASUREMENT ON COMPETITIVE PERFORMANCE: EVIDENCE FROM THAI
HOTEL ENTREPRENEURS 10-28
Agus Suman, Dwi Budi Santoso, Ronny Ersya Novianto Putra.
THE ROLE OF LOCAL FINANCIAL INSTITUTIONS FOR FARMER
INDEPENDENCE: A CASE STUDY OF MALANG AND BATU 29-39
Urszula Widelska, Marta Jarocka, Laima Jeseviciute-Ufartiene, Zivile Jezerske.
CUSTOMER ORIENTATED LEADER – CONTRIBUTION TO FUTURE RESEARCH 40-52
Erika Župerkienė, Ligita Šimanskienė, Daiva Labanauskaitė, Julija Melnikova,
Vida Davidavičienė.
THE COVID-19 PANDEMIC AND RESILIENCE OF SMEs IN LITHUANIA 53-65
Hanna Shevchenko, Mykola Petrushenko, Borys Burkynskyi, Nina Khumarova,
Alina Kodzhebash.
INPUT-OUTPUT ANALYSIS OF RECREATIONAL ASSETS WITHIN THE
INCLUSIVE SUSTAINABLE DEVELOPMENT IN UKRAINE 90-109
Vera Komarova, Natalya Selivanova-Fyodorova, Oksana Ruza,
Jerzy Kazmierczyk, Iluta Arbidane.
MODERN TRENDS IN THE ECONOMIC DIFFERENCES BETWEEN
COUNTRIES AND WITHIN THEM: COMPARISON OF THE WORLD
AND THE EUROPEAN UNION 110-121
Monika Adamczyk, Alina Betlej.
SOCIAL DETERMINANTS OF DIGITAL EXCLUSION IN AN
AGEING SOCIETY. THE CASE OF POLAND 122-135
Andrea Cori, Mattia Granata, Keti Lelo, Salvatore Monni.
MAPPING COOPERATIVES IN ITALY 136-163
Margarita Išoraitė, Gintarė Gulevičiutė.
A STUDY OF ONLINE ENTREPRENEURSHIP EDUCATION
UNDER CONDITIONS OF A PANDEMIC 179-192
Beata Gavurova, Matus Kubak.
THE EFFICIENCY EVALUATION OF PUBLIC PROCUREMENT
OF MEDICAL EQUIPMENT 193-209
Giedrė Strakšienė, Henrika Ruginė, Laura Šaltytė-Vaisiauskė.
CHARACTERISTICS OF DISTANCE WORK ORGANIZATION
IN SMEs DURING THE COVID-19 LOCKDOWN: CASE OF WESTERN
LITHUANIA REGION 210-225
Michał Comporek, Magdalena Kowalska, Anna Misztal.
THE SUSTAINABLE DEVELOPMENT OF TRANSPORT ENTERPRISES
IN THE CONTEXT OF MACROECONOMIC CONDITIONS. THE CASE OF
CENTRAL AND EASTERN EUROPEAN COUNTRIES 226-247
Ieva Meidutė – Kavaliauskienė, Gitana Dudzevičiūtė, Agnė Šimelytė, Nijolė Maknickienė.
SUSTAINABILITY AND REGIONAL SECURITY IN THE CONTEXT OF LITHUANIA 248-266
Kamran Ahmed Siddiqui, Mohammad Emad Al-Shaikh, Ishtiaq Ahmed Bajwa,
Abdulaziz Al-Subaie.
IDENTIFYING CRITICAL SUCCESS FACTORS FOR UNIVERSITY BUSINESS
INCUBATORS IN SAUDI ARABIA 267-279
Vanessa Pertuz , Luis Francisco Miranda, Arturo Charris-Fontanilla,
Lorena Pertuz-Peralta.
UNIVERSITY-INDUSTRY COLLABORATION:
A SCOPING REVIEW OF SUCCESS FACTORS 280-290
Kamran Ahmed Siddiqui, Mohammad Emad Al-Shaikh, Ishtiaq Ahmed Bajwa, Omar Alenzi.
VENTURE CAPITAL CHALLENGES IN SAUDI ARABIA 291-302
Le Dinh Hac , Dinh Tran Ngoc Huy, Nguyen Ngoc Thach, Bui Minh Chuyen,
Pham Thi Hong Nhung, Tran Duc Thang, Tran Tuan Anh.
ENHANCING RISK MANAGEMENT CULTURE FOR SUSTAINABLE GROWTH
OF ASIA COMMERCIAL BANK - ACB IN VIETNAM UNDER MIXED EFFECTS
OF MACRO FACTORS 291-307
Tomas Davulis, Ligita Gasparėnienė, Evaldas Raistenskis.
ASSESSMENT OF THE SITUATION CONCERNING PSYCHOLOGICAL
SUPPORT TO THE PUBLIC AND BUSINESS IN THE EXTREME CONDITIONS:
CASE OF COVID-19 308-322
Kristina Samašonok, Agnė Juškevičienė.
SOCIAL COMPETENCE-BASED PROGNOSTIC POSSIBILITIES OF CREATIVITY
EXPRESSION AMONG STUDENTS OF SOCIAL PROFILE 324-339
Romel Ramón González-Díaz, Ángel Eduardo Acevedo-Duque,
Santos Lucio Guanilo Gómez, Elena Cachicatari Vargas.
BUSINESS COUNTERINTELLIGENCE AS A STRATEGY TO SHIELD
SMES FROM THE COMPETITION 340-352
Olha Bezpalova, Maryna Yunina, Svitlana Korohod, Kristina Rezvorovich,
Tsahik Ohanisian.
LEGAL REGULATION OF ENTREPRENEURIAL ACTIVITY IN THE
NATIONAL SECURITY SYSTEM 340-355
Marcel Lincényi, Jaroslav Čársky.
THE EFFECTIVENESS OF FUNDS SPENT ON THE CAMPAIGN
WITH REGARD TO THE RESULTS OF THE ELECTIONS IN THE SLOVAK REPUBLIC 356-366
Lidiia Karpenko, Oleksandr Ignatenko, Olena Taranenko, Iryna Oliinyk,
Ripsime Khrenova-Shymkina.
LAYER AND STRUCTURAL COMPONENTS OF MODERN INVESTMENT
SECURITY OF THE COUNTRY 367-383
Anatolii Kulish, Oleksandr Yunin, Olha Us, Iryna Shapovalova, Ivan Yaromii. SMUGGLING AS A THREAT TO ECONOMIC SECURITY OF THE STATE 384-399
Kostiantyn Buhaichuk, Nataliia Varenia, Vitalii Khodanovych, Maryna Kriepakova,
Valentyn Seredynskyi.
LEGAL ASPECTS OF MIGRATION REGULATION AS A FACTOR
OF NATIONAL SECURITY 402-419
Tetiana Kolomoiets, Nelli Tsybulnyk, Oleksandr Moroz, Vitaliy Prymachenko,
Vadym Khashev.
INFLUENCE OF SHADOW ECONOMY LEGALIZATION ON NATIONAL
SECURITY OF UKRAINE 420-437
Oleksandr Ilchenko, Oksana Brusakova, Yuliia Burchenko, Artem Yaroshenko,
Yaroslav Bagan.
THE ROLE OF A DEFENCE INDUSTRY IN THE SYSTEM OF NATIONAL
SECURITY: A CASE STUDY 438-454
Oleksii Shumilo, Ivan Lytvyn, Volodymyr Shablystyi, Tetiana Kornyakova,
Irina Popovich
LEGAL MECHANISM TO ENSURE NATIONAL SECURITY IN THE FIELD
OF USE OF NATURAL RESOURCES 455-470
Oleksandr Bryhinets, Roman Shapoval, Alona Bakhaieva, Vitalii Pchelin,
Andrii Fomenko.
PROBLEMS OF INTELLECTUAL PROPERTY IN THE NATIONAL SECURITY
SYSTEM OF THE COUNTRY 471-486
Ladislav Mura, Zuzana Hajduová.
MEASURING EFFICIENCY BY USING SELECTED DETERMINANTS IN
REGIONAL SMEs 487-503
Marinko Škare, Sanja Radolović, Manuela Tvaronavičienė.
MANAGING THE INSTITUTIONAL ENVIRONMENT AND
IMPACT ON THE COMPETITIVENESS OF TRANSITIONAL ECONOMIES 504-526
Aneta Wysokińska-Senkus, Justyna Górna.
TOWARDS SUSTAINABLE DEVELOPMENT: RISK MANAGEMET
FOR ORGANIZATIONAL SECURITY 527-544
Leszek Borowiec.
DIRECT SUBSIDIES AND COMPENSATION FUNDS IN
FINANCING OF UNIVERSAL POSTAL 545-564
Daiva Labanauskaitė, Erika Župerkienė, Alexander Kumpf,
Ligita Šimanskienė, Francesca Dobmann, Sophie - Marie Koller.
DEVELOPMENT OF DIGITAL AND ENTREPRENEURIAL
COMPETENCES FOR THE FUTURE LABOUR MARKET NEEDS 565-581
Gábor Kincses, Mihály Ormos, Zsolt Bartha.
MOTIVATIONAL PECULIARITIES OF ELITE WOMEN TENNIS
PLAYERS FROM THE POST-SOCIALIST COUNTRIES 582-591
Mykola Sidak, Edita Hajnišová, Michal Fabus.
DETERMINATION OF OBJECTIVES AND RESPONSIBILITIES OF
PUBLIC ADMINISTRATION BODIES IN CORRELATION WITH LEGAL
AND MANAGERIAL ASPECTS: A STUDY OF SLOVAK REPUBLIC 592-603
Nur Hayati Abd Rahman, Shafinar Ismail, Eeng Ahman, Aas Nurasyiah,
Neni Sri Wulandari.
THE EFFECT OF REGULATORY PERFORMANCE ON ECONOMIC GROWTH 604-617
Andrey Zahariev, Anelia Radulova, Aleksandrina Aleksandrova, Mariana Petrova.
FISCAL SUSTAINABILITY AND FISCAL RISK IN THE EU: FORECASTS AND
CHALLENGES IN TERMS OF COVID-19 618-632
Agnė Tvaronavičienė, Natalija Kaminskienė, Irena Žemaitaitytė, Maria Cudowska.
TOWARDS MORE SUSTAINABLE DISPUTE RESOLUTION IN COURTS: EMPIRICAL
STUDY ON CHALLENGES OF THE COURT-CONNECTED MEDIATION IN LITHUANIA 633-653
Luis Enrique Valdez-Juárez, Dolores Gallardo-Vázquez, Elva Alicia Ramos-Escobar.
ENTREPRENEURIAL ORIENTATION AND CSR: A DYNAMIC CAPABILITY IN
THE CORPORATE PERFORMANCE OF MEXICAN SMES 654-680
Krzysztof Waliszewski, Anna Warchlewska.
HOW WE CAN BENEFIT FROM PERSONAL FINANCE MANAGEMENT
APPLICATIONS DURING THE COVID-19 PANDEMIC? THE POLISH CASE 681-699
ENTREPRENEURSHIP AND SUSTAINABILITY ISSUES
ISSN 2345-0282 (online) http://jssidoi.org/jesi/
2021 Volume 8 Number 3 (March)
http://doi.org/10.9770/jesi.2021.8.3(1)
Publisher http://jssidoi.org/esc/home
10
THE IMPACT OF DYNAMIC CAPABILITIES AND DYNAMIC PERFORMANCE MEASUREMENT
ON COMPETITIVE PERFORMANCE: EVIDENCE FROM THAI HOTEL ENTREPRENEURS*
Kanittha Pattanasing 1, Somnuk Aujirapongpan 2*, Supit Ritkaew 3, Anuman Chanthawong 4,
Sirichai Deelers 5
1Faculty of Maejo University-Chumphon, Maejo University, Chumphon, 86170, Thailand 2,3 School of Management, Walailak University, Nakhon Si Thammarat, 80160, Thailand
4Faculty of Management Sciences, Surathani Rajabhat University, Surat Thani, 84000, Thailand 5 Faculty of Management Science, Silpakorn University, Petchaburi, 76120, Thailand
E-mails: [email protected]; 2*[email protected] (Corresponding author); 3 [email protected];
[email protected]; [email protected]
Received 14 August 2020; accepted 18 October 2020; published 30 March 2021
Abstract. This research aims to provide empirical evidence on the causal relationships among the effects of dynamic capabilities and the
dynamic performance measurement on high performance organizations (HPOs) and the competitive performance of hotel businesses in a
world-class tourism destination of Thailand. The research using questionnaires to collect data from 115 hotel businesses located at a world
class tourism destination in Thailand. The data were first analysed using descriptive statistics and then confirmatory factor analysis and
structural equation modelling were conducted. The study results reveal that the causal relationship model fit the empirical data (2 = 74.39,
p-value = 0.15, 2/df = 1.18, CFI = 0.99, GFI = 0.92, NFI = 0.96, RMSEA = 0.04, and SRMR = 0.03). In addition, the results also indicate
that the dynamic capabilities have a direct positive effect on dynamic performance measurement. The study reflects that being a HPO not
only has a direct positive effect on competitive performance but is also a complete mediator in transferring the effects of the dynamic
capabilities and dynamic performance measurement to competitive performance. Under an increasingly dynamic environment, traditional
performance measurement innovations that only consider measurement and management tend to lead to imperfections and lower benefits.
Additionally, traditional performance measurements are static characteristics; therefore, it is essential to catch up with the dynamic
environment. This research will provide empirical evidence of the causal relationship of how dynamic capabilities and dynamic
performance measurement affect a HPO and competitive performance towards excellence under a dynamic environment.
Keywords: Dynamic Capabilities; Dynamic Performance Measurement; High Performance Organization
Reference to this paper should be made as follows: Pattanasing, K., Aujirapongpan, S., Ritkaew, S., Chanthawong, A., Deelers, S. 2021.
The impact of dynamic capabilities and dynamic performance measurement on competitive performance: evidence from Thai hotel
entrepreneurs. Entrepreneurship and Sustainability Issues, 8(3), 10-28. http://doi.org/10.9770/jesi.2021.8.3(1)
JEL Classifications: E22, G34, M40
* This research was partially supported by the new strategic research (P2P) project, and it also was supported by Institute of
Research and Innovation, Walailak University, Thailand.
ENTREPRENEURSHIP AND SUSTAINABILITY ISSUES
ISSN 2345-0282 (online) http://jssidoi.org/jesi/
2021 Volume 8 Number 3 (March)
http://doi.org/10.9770/jesi.2021.8.3(1)
Make your research more visible, join the Twitter account of ENTREPRENEURSHIP AND SUSTAINABILITY ISSUES:
@Entrepr69728810
11
1. Introduction
The World Tourism Organization (UNWTO) has ranked Thailand as one of the ten most popular tourist
destinations on the globe )UNWTO, 2019). Subsequently, the hotel business, the core business of the country’s tourism
industry, has been continuously expanded and experienced crucial competition while attempting to maximize its number
of customers. It is undeniable that quality of service is the heart of the hotel business since quality enhances customers’
satisfaction and loyalty. Service quality also increases market share, provides satisfying returns to investors while
reducing costs and the risk from price competition, and, above all, creates competitive capabilities
(Lu, Berchoux, Marek, & Chen, 2015). Amid the current critically competitive environment, the survival of the
hotel business, therefore, depends on the quality of the service provided to satisfy its customers (Moshin &
Lockyer, 2010). Furthermore, it becomes imperative for hotel management to study and comprehend excellent
service practices so that their organizations can achieve improved performance and be better than other
organizations. In other words, in order to create sustainable competitive advantages for an organization, a hotel’s
service has to be excellent )Lu et al. 2015).
Thompson, Peteraf, Gambel & Strickland (2016) stated that a firm with a tendency to be more efficient than its
competitors is the one with strategies and the abilities to practically perform according to the strategies. Likewise,
Roshan & Jenson (2014) mentioned that having good competitive strategies does not mean that the organization
can achieve its goals unless the strategies are efficiently performed. The main factor in implementing these
strategies is a management system and measurement linked with the organizational strategies (Giovannoni &
Maraghini, 2013). De Waal, Goedegebuure & Hinfelaar’s (2015) study reveals that the management system and
its performance results are strongly connected with a high performance organization (HPO) at a significant level.
Obviously, the management system and the performance results of the enhancing and driving behaviours play
important roles in creating overall performance regarding both financial and nonfinancial matters. (Aujirapongpan
& Hareebin, 2020)
Nevertheless, with today’s environment becoming increasingly more dynamic, the original performance
measurement that solely considered evaluation and management tends to lead to imperfections and lower benefits
(Srimai, Radford, & Wright, 2011), which is similar to the traditional measurement of fixed characteristics. Since
it is essential to catch up with the dynamic environment, Kennerley & Neely (2003) proposed that performance
measurement be managed in a dynamic operational pattern in order to maintain relationships and efficiency. It is
imperative that the process of managing a performance measurement system reflect the organizational
components’ relationships (e.g., the system of manpower, infrastructure, culture, etc.) in transformed performance
contexts and strategies. Bititci, Turner & Begemann (2000) additionally explained the necessity of dynamic
performance measurement as the need to examine and respond to a firm’s internal and external environmental
changes and the necessity to review and prioritize its domestic goals. Bititci et al. (2000) further proposed that a
dynamic performance measurement system should contain (1) an external control system, which will examine and
continuously send signals of external environmental transformation to an organization; (2) an internal control
system, which will continuously inspect and send signals on the changes within an organization; (3) a
performance review system, which will allow important information to be part of the decision–making; and (4) a
transmittal system toward real practice, which will perform based on the renewed strategies and component
priorities. Moreover, Bititci, Nudurupati, Turner & Creighton (2002) indicated that dynamic performance
measurement depends on a repetitive environment or circle, ongoing information technology development and
new creations to support management decisions, and day-to-day operations. Kennerley & Neely (2003) also
confirmed that a lack of effective information technology obstructs the utilization of a performance measurement
system.
ENTREPRENEURSHIP AND SUSTAINABILITY ISSUES
ISSN 2345-0282 (online) http://jssidoi.org/jesi/
2021 Volume 8 Number 3 (March)
http://doi.org/10.9770/jesi.2021.8.3(1)
Make your research more visible, join the Twitter account of ENTREPRENEURSHIP AND SUSTAINABILITY ISSUES:
@Entrepr69728810
12
The above details indicate that effective performance management is a sustainable practice connected with
strategies in every organizational activity, and effective performance management has to be dynamic in order to
continuously build a repetitive circle and develop and create new information technology leading to uninterrupted
systematic organizational learning and self-learning. Subsequently, ongoing consistency is created to be in line
with new required positions or, in other words, the ability to be dynamically consistent is created so that an
organization can achieve better performance measurements than its competitors (Srimai et al., 2011).
There is, however, some confusion in the literature on how the utilization of a performance measurement system
affects the overall operations of an organization. De Waal, Beatrice, & Heijden (2015) showed that the impact of
management on performances is not clearly understood. In addition, Bourne, Melnyk, Bititci, Platts & Andersen
(2014) indicated that many studies on this impact towards on firm performances provide contradictory results
since some studies claimed that the management of performance results helps increase both financial and
nonfinancial outcomes of the organization while others found disadvantages of using a performance management
system. Obviously, the comprehension of this issue is still far from perfect (Bourne et al., (2014). Additionally,
among the papers investigating organizations having better performances than their competitors, or HPOs, none
clearly studies the causal relationship (De Waal & Goedgeburre, 2017) since they mostly reveal the relationship
between the conceptual framework of an HPO and the operational improvement. Similarly, Keller (2011) stated
that there are several studies assessing organizations that perform better than their competitors; yet, the reason
why they are better is unclear. Parnell, Dent, O’Regan & Hughes (2012) pointed out that the differences in
performance outcomes can be because of local conditions, product types, service delivery methods,
developmental history, cultural diversity, industrial complications, or even luck.
The aim of this paper is to provide empirical evidence on the causal relationship of dynamic capabilities and
dynamic performance measurement with HPOs and performance results. The theoretical management framework
was collected to create the frame of the reasons for different performance outcomes, and the framework included
3 main factors: (1) dynamic capabilities, (2) dynamic performance measurement, and (3) HPOs. The findings lead
to the creation of guidelines for managing organizations towards intelligence in dynamic environments.
2. Theoretical Framwork
Dynamic Capabilities and High Performance Organizations
De Waal, Goedegebuure & Akaraborworn (2014) defined the phrase “high performance organization - HPO” as
an organization that can reach its financial goals for a duration of 5 years or more in which such achievement does
not have to be higher than other firms in the same field, whereas Holbeche (2005) stated that the core factors or
components of a high performance organization is dynamic capabilities and innovation. Likewise, Eisenhardt &
Martin (2000) explained that the ability to be dynamic means that a firm is effective and conducts the best
practices; and De Waal (2012) stated that in the literature related to the perceptions of resource-based and
dynamic capabilities, there are many important factors leading to an organization achieving high performance. For
this paper, three components are set to explain dynamic capabilities: (1) sensing capability, (2) learning
capability, and (3) innovative and reconfiguring capability.
Sensing capability is the ability to perceive and understand business changes, opportunities, and obstructions that
threaten an organization while recognizing its existing capabilities compared to its competitors in order to adjust
and improve itself to be better (Teece, 2012). Blackman, Buick, O'Donnell, O'Flynn, & West’s (2012) study
ENTREPRENEURSHIP AND SUSTAINABILITY ISSUES
ISSN 2345-0282 (online) http://jssidoi.org/jesi/
2021 Volume 8 Number 3 (March)
http://doi.org/10.9770/jesi.2021.8.3(1)
Make your research more visible, join the Twitter account of ENTREPRENEURSHIP AND SUSTAINABILITY ISSUES:
@Entrepr69728810
13
concluded that an organization able to respond and blend into the transformed environment must hold
management and employees jointly responsible for performance outcomes, comprehend that their roles are
significant for the firm and be able to attain the dynamic capabilities necessary to be a HPO by knowing that
improved capabilities to manage operations will upgrade all levels of the firm towards high performance.
Learning capability is the ability to absorb, digest or learn new things externally and later adjust or apply this
knowledge by blending the new knowledge with existing knowledge to create new knowledge for an organization
and the ability to transmit this new knowledge throughout the entire firm (Teece, 2012). However, this practice
overlaps knowledge management. Aujirapongpan, Vadhanasindhu, Chandrachai & Cooparat (2010) explained
that knowledge management is a process of dynamic characters being related to an individual’s ability to manage
the data, information technology, knowledge, activities, experiences, beliefs, values and creativities in his/her firm
in order to create new knowledge or new conceptions. Different organizational capabilities need to be developed
to allow the access, exchange, transmission, and dissemination of the knowledge so that such knowledge can be
efficiently applied in real practices. Bagorogoza & De Waal’s (2010) study on the relationship between
knowledge management and high performance using the performance results of a financial institution in Uganda
disclosed that knowledge management affects organizational operations through high performance; or, in other
words, knowledge management improves an organization and allows it to become high performance, which
further leads to more effective operations.
Innovative and reconfiguring capability is the ability to transform, transfer, blend or integrate resources and
competencies to construct a new capability (MacInerney-May, 2011) that accordingly leads to various creations of
new products, services and processes (Wang &Ahmed, 2007; Lazonick & Prencipe, 2005) that are beneficial to
the firm. There are several studies presenting the relationship between the innovative capability and performance
results of an organization (Rujirawanich, Addison, & Smallman, 2011; Phusavat, Comepa, Sitko-Lutek & Ooi,
2011) and claiming that the innovative capability is a factor increasing competitive capabilities and the ability to
create new ideas towards achieving high performance (Noordin & Mohtar, 2013) . That is, a firm with dynamic
capabilities composed of abilities in perceiving, learning, innovating and reconfiguring can upgrade its status.
This is represented as the following hypothesis:
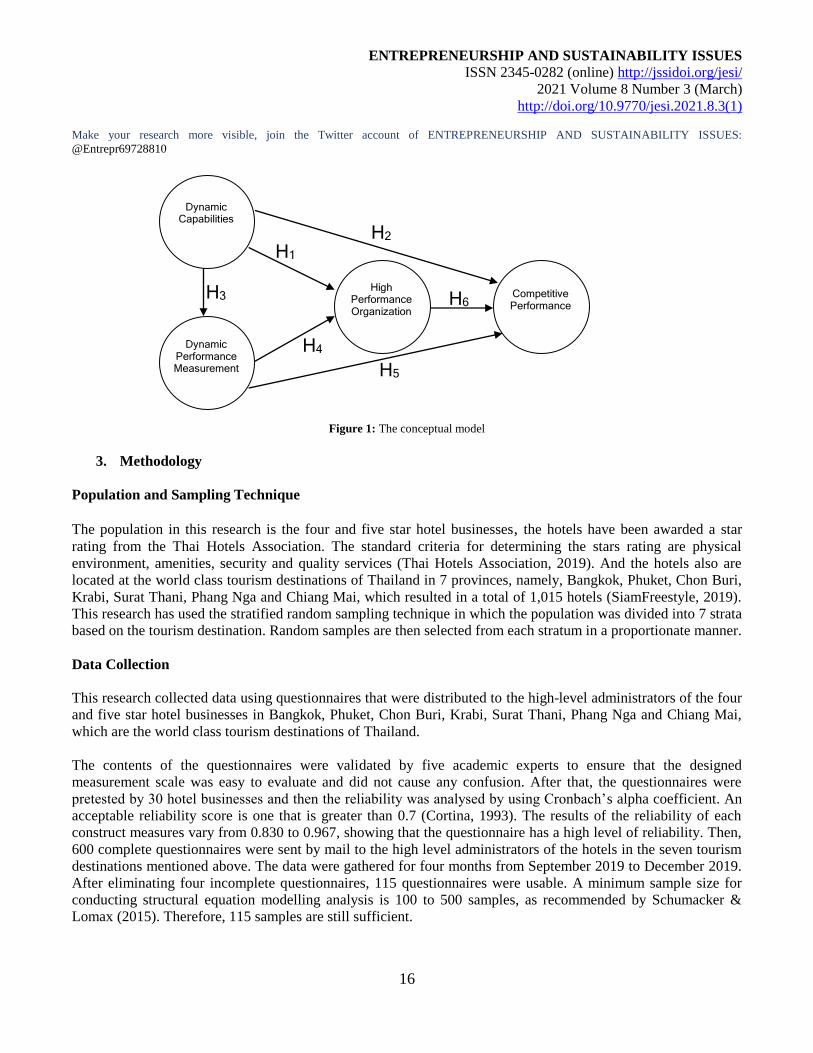
Hypothesis 1: Dynamic capabilities have a positive significant relationship with a HPO.
Dynamic Capabilities and Competitive Performance
Breznik & Lahovnik ) 2016) indicated that an organization with dynamic capabilities is capable of building
competitive competencies that accordingly affect its operations, which is in line with Li & Liu (2014), who
posited that dynamic capabilities have a positive significant effect on competitive advantages. Similarly, Teece
(2012) stated that a firm with dynamic capabilities, which include abilities to perceive, grasp opportunities,
reconfigure resources and transform knowledge consistent with the unstable opportunities and its environment,
could create and maintain its competitive advantages. This occurs since the main sources of these competitive
advantages are the capabilities related to a firm, such as its human resource (Barney & Clark, 2007; Newbert,
2007) and marketing competencies ) Kor & Mahoney, 2005) , the latter of which are the abilities to identify
customers’ needs, especially the process of creating knowledge on marketing (Barrales-Molina, Martínez-López,
& Gázquez-Abad, 2014). In addition, other capabilities such as management, research and development, and
innovation are also imperative for an organization (Birchall & Tovstiga, 2005). This is supported by Breznik &
Lahovnik’s )2016) paper stating that organizations focusing on dynamic capabilities tend to have good practices
ENTREPRENEURSHIP AND SUSTAINABILITY ISSUES
ISSN 2345-0282 (online) http://jssidoi.org/jesi/
2021 Volume 8 Number 3 (March)
http://doi.org/10.9770/jesi.2021.8.3(1)
Make your research more visible, join the Twitter account of ENTREPRENEURSHIP AND SUSTAINABILITY ISSUES:
@Entrepr69728810
14
or high performance regarding organizational competency, such as strong management emphasizing a reward
system, clear communication, fairness in all levels, open policies, trustfulness between employees and
management, etc. Moreover, Breznik & Lahovnik )2016) also revealed that a certain level of utilizing dynamic
capabilities enables them to distinguish high performing and low performing organizations through evaluating the
performances, which include consideration of financial and non-financial data. It is obvious that a firm with high
dynamic capabilities has higher overall performance than one with low dynamic capabilities. Thus, the next
hypothesis is given as follows:
Hypothesis 2: Dynamic capabilities have a positive significant relationship with competitive performance.
Dynamic Capabilities and Dynamic Performance Measurement
A performance measurement system plays an important role in managing a firm to become efficient and effective
(Kennerley & Neely, 2002), and being dynamic in unstable environments is an essential factor in selecting the
format of a control system or performance measurement system. Bastian & Muchilish’s (2012) paper on the
relationship between the perception of environmental instability and performance measurement shows that
perceiving environmental instability has a positive relationship at a significant level with a performance
measurement system, both financial and nonfinancial aspects, whereas Hoque (2004) claimed that environmental
instability has an indirect effect on a firm’s operations through the use of a nonfinancial performance
measurement system. Aujirapongpan & Hareebin (2020) additionally disclosed that dynamic capabilities have a
positive relationship with dynamic performances. If a firm has dynamic capabilities and is able to perceive
environment instability, subsequently, it contains the dynamic performance to be able to respond to the
environmental instability. This is stated in the following hypothesis:
Hypothesis 3: Dynamic capabilities have a positive significant relationship with competitive performance.
Dynamic Performance Measurement, HPOs and Competitive Performance
The measurement control and operational management system is a key factor in practical improvement.
Kennerley & Neely (2002) claimed that a performance measurement system plays an important role in managing
a firm to be efficient and effective, whereas Wisner, Epstein & Bagozzi (2003) indicated that practices conducted
according to the mechanisms of a management control system can lead to superior performance. Epstein & Roy
(2003) also demonstrated that a performance measurement system comprised of different operating, societal,
environmental and economic indices enables a firm to progress towards sustainable superior performance. De
Waal et al.’s (2015) paper further reveals a strong significant relationship between the components of a
performance management system and the components of a HPO.
Ittner, Larcker & Randall (2003), Henri (2006), and Pavlov & Bourne, (2011) pointed out that a performance
measurement system has a positive effect on a firm’s operations, and Bastian & Muchilish’s (2012) paper used a
nonfinancial performance measurement system to find that the measurement system has a positive relationship
with a firm’s performance results. Moreover, Teeratansirikool, Siengthai, Badir & Charoenngam (2013) unveiled
that a financial performance measurement system has a positive relationship with a firm’s operational outcomes
while a nonfinancial performance measurement is not related to these outcomes. Thus, practices according to the
mechanisms of a performance measurement system enable an organization to achieve higher status; however,
ENTREPRENEURSHIP AND SUSTAINABILITY ISSUES
ISSN 2345-0282 (online) http://jssidoi.org/jesi/
2021 Volume 8 Number 3 (March)
http://doi.org/10.9770/jesi.2021.8.3(1)
Make your research more visible, join the Twitter account of ENTREPRENEURSHIP AND SUSTAINABILITY ISSUES:
@Entrepr69728810
15
since the present environment is becoming more dynamic, Kennerley & Neely (2003) proposed that performance
measurement must be managed dynamically, and Bititci et al. (2000) explained the necessity of having dynamic
performance measurement as “being dynamic is essential for inspection and response to environmental
transformations, both internal and external of an organization.” Therefore, the next hypotheses are stated as
follows:
Hypothesis 4: Dynamic performance measurement has a positive significant relationship with a HPO.
Hypothesis 5: Dynamic performance measurement has a positive significant relationship with competitive
performance.
HPO and Competitive Performance
The focus of this paper is on a performance measurement of HPOs. The HPO is defined as “an organization that
achieves financial and non-financial results that are exceedingly better than those of its peer group over a period
of five years or more.” How the organization practice of a HPO compares to that of its peers can be done by
considering the results of their competitive performance )De Waal et al, 2014).
Since the HPO framework was developed, there have been many studies uncovering a positive relationship
between HPO scores and competitive performance (De Waal & Gordgeburre, 2017). For instance, De Waal’s
(2012) studies on gigantic European international companies in the retail industry discloses that there is a clear
direct link between HPO scores and financial results since companies with the highest HPO scores have the
highest financial results, and, in contrast, the companies with the lowest HPO scores have the lowest financial
results. In addition, Pett, Sie, & Wolff’s (2016) study on the hotel business in France explained that the
characteristics based on an HPO framework have direct positive relationships with competitive performance.
Moreover, De Waal & Gordgeburre (2017) revealed that the firm performances of many organizations were
improved after applying the HPO framework for 2 years or more such as Irina University College in Tanzania,
Nabil Bank Limited in Nepal, a British consortium of IT companies, a banana grower and exporter in the
Philippines and a Dutch cable company. Hence, the following hypothesis is proposed:
Hypothesis 6: Being a HPO has a positive significant relationship with competitive performance.
Therefore, the conceptual model with the developed hypotheses of this research is shown in Figure 1.
ENTREPRENEURSHIP AND SUSTAINABILITY ISSUES
ISSN 2345-0282 (online) http://jssidoi.org/jesi/
2021 Volume 8 Number 3 (March)
http://doi.org/10.9770/jesi.2021.8.3(1)
Make your research more visible, join the Twitter account of ENTREPRENEURSHIP AND SUSTAINABILITY ISSUES:
@Entrepr69728810
16
Figure 1: The conceptual model
3. Methodology
Population and Sampling Technique
The population in this research is the four and five star hotel businesses, the hotels have been awarded a star
rating from the Thai Hotels Association. The standard criteria for determining the stars rating are physical
environment, amenities, security and quality services (Thai Hotels Association, 2019). And the hotels also are
located at the world class tourism destinations of Thailand in 7 provinces, namely, Bangkok, Phuket, Chon Buri,
Krabi, Surat Thani, Phang Nga and Chiang Mai, which resulted in a total of 1,015 hotels (SiamFreestyle, 2019).
This research has used the stratified random sampling technique in which the population was divided into 7 strata
based on the tourism destination. Random samples are then selected from each stratum in a proportionate manner.
Data Collection
This research collected data using questionnaires that were distributed to the high-level administrators of the four
and five star hotel businesses in Bangkok, Phuket, Chon Buri, Krabi, Surat Thani, Phang Nga and Chiang Mai,
which are the world class tourism destinations of Thailand.
The contents of the questionnaires were validated by five academic experts to ensure that the designed
measurement scale was easy to evaluate and did not cause any confusion. After that, the questionnaires were
pretested by 30 hotel businesses and then the reliability was analysed by using Cronbach’s alpha coefficient. An
acceptable reliability score is one that is greater than 0.7 (Cortina, 1993). The results of the reliability of each
construct measures vary from 0.830 to 0.967, showing that the questionnaire has a high level of reliability. Then,
600 complete questionnaires were sent by mail to the high level administrators of the hotels in the seven tourism
destinations mentioned above. The data were gathered for four months from September 2019 to December 2019.
After eliminating four incomplete questionnaires, 115 questionnaires were usable. A minimum sample size for
conducting structural equation modelling analysis is 100 to 500 samples, as recommended by Schumacker &
Lomax (2015). Therefore, 115 samples are still sufficient.
Dynamic Capabilities
Dynamic Performance Measurement
High Performance Organization
Competitive Performance
H3
H1
H4
H2
H5
H6
ENTREPRENEURSHIP AND SUSTAINABILITY ISSUES
ISSN 2345-0282 (online) http://jssidoi.org/jesi/
2021 Volume 8 Number 3 (March)
http://doi.org/10.9770/jesi.2021.8.3(1)
Make your research more visible, join the Twitter account of ENTREPRENEURSHIP AND SUSTAINABILITY ISSUES:
@Entrepr69728810
17
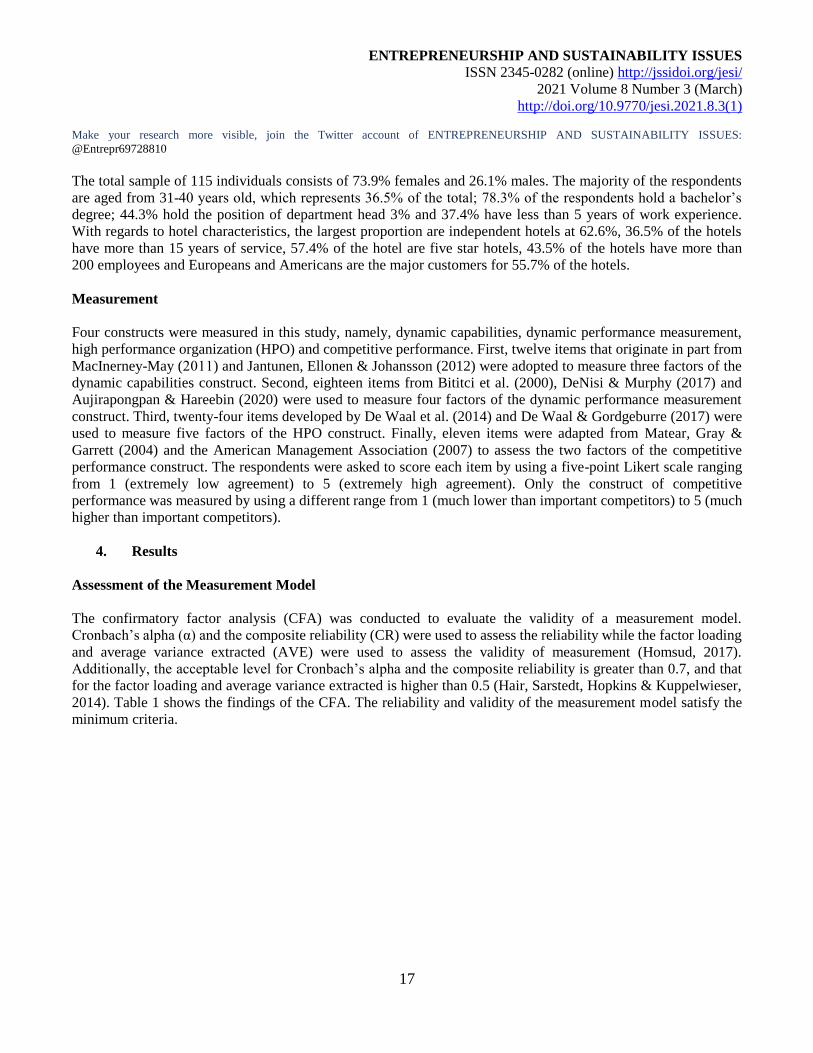
The total sample of 115 individuals consists of 73.9% females and 26.1% males. The majority of the respondents
are aged from 31-40 years old, which represents 36.5% of the total; 78.3% of the respondents hold a bachelor’s
degree; 44.3% hold the position of department head 3% and 37.4% have less than 5 years of work experience.
With regards to hotel characteristics, the largest proportion are independent hotels at 62.6%, 36.5% of the hotels
have more than 15 years of service, 57.4% of the hotel are five star hotels, 43.5% of the hotels have more than
200 employees and Europeans and Americans are the major customers for 55.7% of the hotels.
Measurement
Four constructs were measured in this study, namely, dynamic capabilities, dynamic performance measurement,
high performance organization (HPO) and competitive performance. First, twelve items that originate in part from
MacInerney-May (2011) and Jantunen, Ellonen & Johansson (2012) were adopted to measure three factors of the
dynamic capabilities construct. Second, eighteen items from Bititci et al. (2000), DeNisi & Murphy (2017) and
Aujirapongpan & Hareebin (2020) were used to measure four factors of the dynamic performance measurement
construct. Third, twenty-four items developed by De Waal et al. (2014) and De Waal & Gordgeburre (2017) were
used to measure five factors of the HPO construct. Finally, eleven items were adapted from Matear, Gray &
Garrett (2004) and the American Management Association (2007) to assess the two factors of the competitive
performance construct. The respondents were asked to score each item by using a five-point Likert scale ranging
from 1 (extremely low agreement) to 5 (extremely high agreement). Only the construct of competitive
performance was measured by using a different range from 1 (much lower than important competitors) to 5 (much
higher than important competitors).
4. Results
Assessment of the Measurement Model
The confirmatory factor analysis (CFA) was conducted to evaluate the validity of a measurement model.
Cronbach’s alpha (α) and the composite reliability (CR) were used to assess the reliability while the factor loading
and average variance extracted (AVE) were used to assess the validity of measurement (Homsud, 2017).
Additionally, the acceptable level for Cronbach’s alpha and the composite reliability is greater than 0.7, and that
for the factor loading and average variance extracted is higher than 0.5 (Hair, Sarstedt, Hopkins & Kuppelwieser,
2014). Table 1 shows the findings of the CFA. The reliability and validity of the measurement model satisfy the
minimum criteria.
ENTREPRENEURSHIP AND SUSTAINABILITY ISSUES
ISSN 2345-0282 (online) http://jssidoi.org/jesi/
2021 Volume 8 Number 3 (March)
http://doi.org/10.9770/jesi.2021.8.3(1)
Make your research more visible, join the Twitter account of ENTREPRENEURSHIP AND SUSTAINABILITY ISSUES:
@Entrepr69728810
18
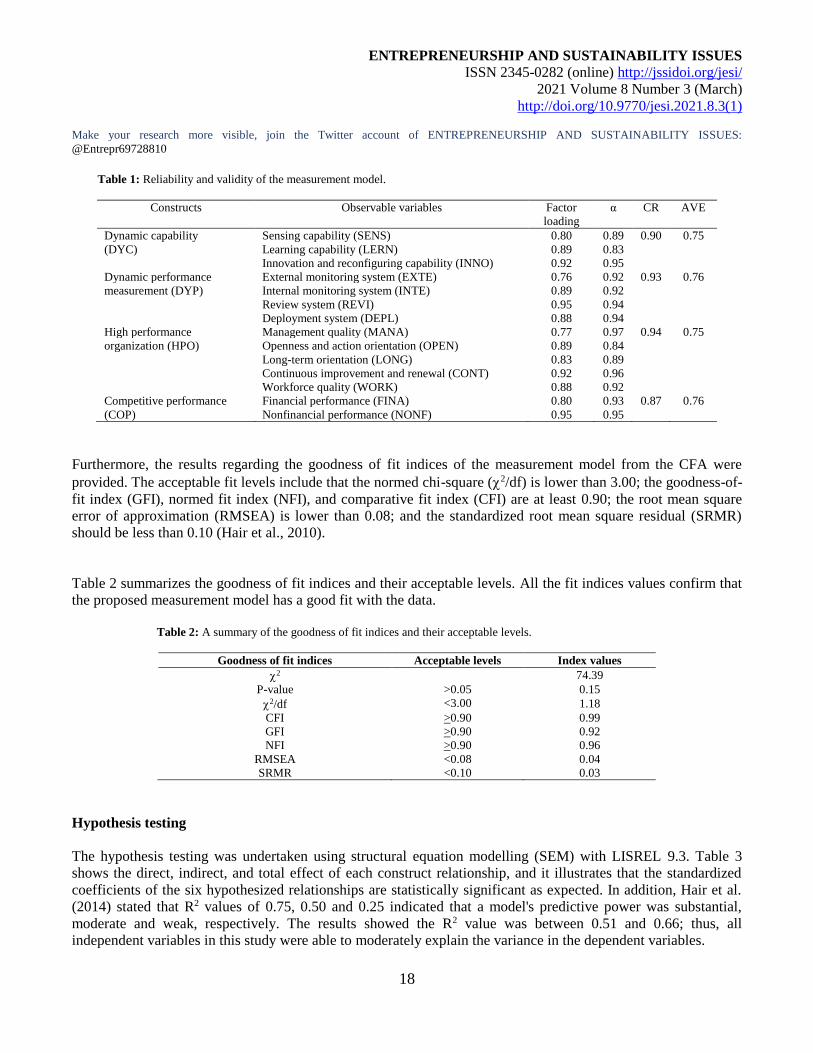
Table 1: Reliability and validity of the measurement model.
Constructs Observable variables Factor
loading
α CR AVE
Dynamic capability Sensing capability (SENS) 0.80 0.89 0.90 0.75
(DYC) Learning capability (LERN) 0.89 0.83
Innovation and reconfiguring capability (INNO) 0.92 0.95
Dynamic performance External monitoring system (EXTE) 0.76 0.92 0.93 0.76
measurement (DYP) Internal monitoring system (INTE) 0.89 0.92
Review system (REVI) 0.95 0.94
Deployment system (DEPL) 0.88 0.94
High performance Management quality (MANA) 0.77 0.97 0.94 0.75
organization (HPO) Openness and action orientation (OPEN) 0.89 0.84
Long-term orientation (LONG) 0.83 0.89
Continuous improvement and renewal (CONT) 0.92 0.96
Workforce quality (WORK) 0.88 0.92
Competitive performance Financial performance (FINA) 0.80 0.93 0.87 0.76
(COP) Nonfinancial performance (NONF) 0.95 0.95
Furthermore, the results regarding the goodness of fit indices of the measurement model from the CFA were
provided. The acceptable fit levels include that the normed chi-square (2/df) is lower than 3.00; the goodness-of-
fit index (GFI), normed fit index (NFI), and comparative fit index (CFI) are at least 0.90; the root mean square
error of approximation (RMSEA) is lower than 0.08; and the standardized root mean square residual (SRMR)
should be less than 0.10 (Hair et al., 2010).
Table 2 summarizes the goodness of fit indices and their acceptable levels. All the fit indices values confirm that
the proposed measurement model has a good fit with the data.
Table 2: A summary of the goodness of fit indices and their acceptable levels.
Goodness of fit indices Acceptable levels Index values
2 74.39
P-value >0.05 0.15
2/df <3.00 1.18
CFI >0.90 0.99
GFI >0.90 0.92
NFI >0.90 0.96
RMSEA <0.08 0.04
SRMR <0.10 0.03
Hypothesis testing
The hypothesis testing was undertaken using structural equation modelling (SEM) with LISREL 9.3. Table 3
shows the direct, indirect, and total effect of each construct relationship, and it illustrates that the standardized
coefficients of the six hypothesized relationships are statistically significant as expected. In addition, Hair et al.
(2014) stated that R2 values of 0.75, 0.50 and 0.25 indicated that a model's predictive power was substantial,
moderate and weak, respectively. The results showed the R2 value was between 0.51 and 0.66; thus, all
independent variables in this study were able to moderately explain the variance in the dependent variables.
ENTREPRENEURSHIP AND SUSTAINABILITY ISSUES
ISSN 2345-0282 (online) http://jssidoi.org/jesi/
2021 Volume 8 Number 3 (March)
http://doi.org/10.9770/jesi.2021.8.3(1)
Make your research more visible, join the Twitter account of ENTREPRENEURSHIP AND SUSTAINABILITY ISSUES:
@Entrepr69728810
19
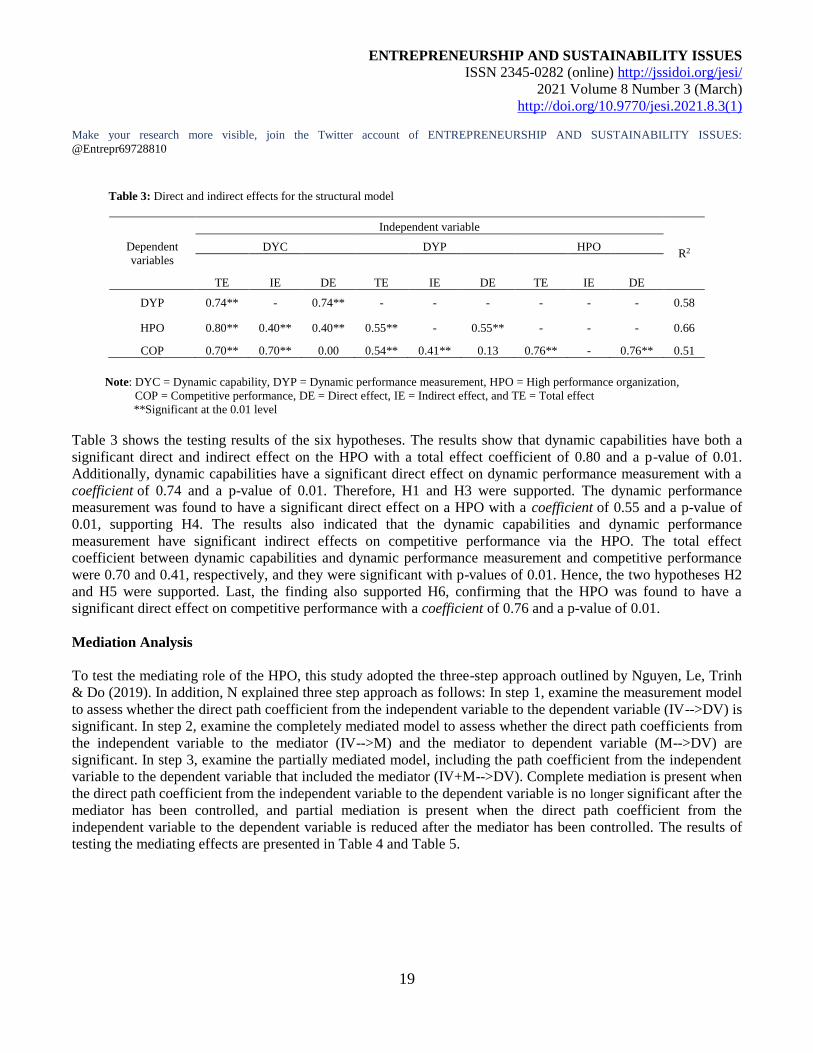
Table 3: Direct and indirect effects for the structural model
Dependent
variables
Independent variable
R2 DYC DYP HPO
TE IE DE TE IE DE TE IE DE
DYP 0.74** - 0.74** - - - - - - 0.58
HPO 0.80** 0.40** 0.40** 0.55** - 0.55** - - - 0.66
COP 0.70** 0.70** 0.00 0.54** 0.41** 0.13 0.76** - 0.76** 0.51
Note: DYC = Dynamic capability, DYP = Dynamic performance measurement, HPO = High performance organization,
COP = Competitive performance, DE = Direct effect, IE = Indirect effect, and TE = Total effect
**Significant at the 0.01 level
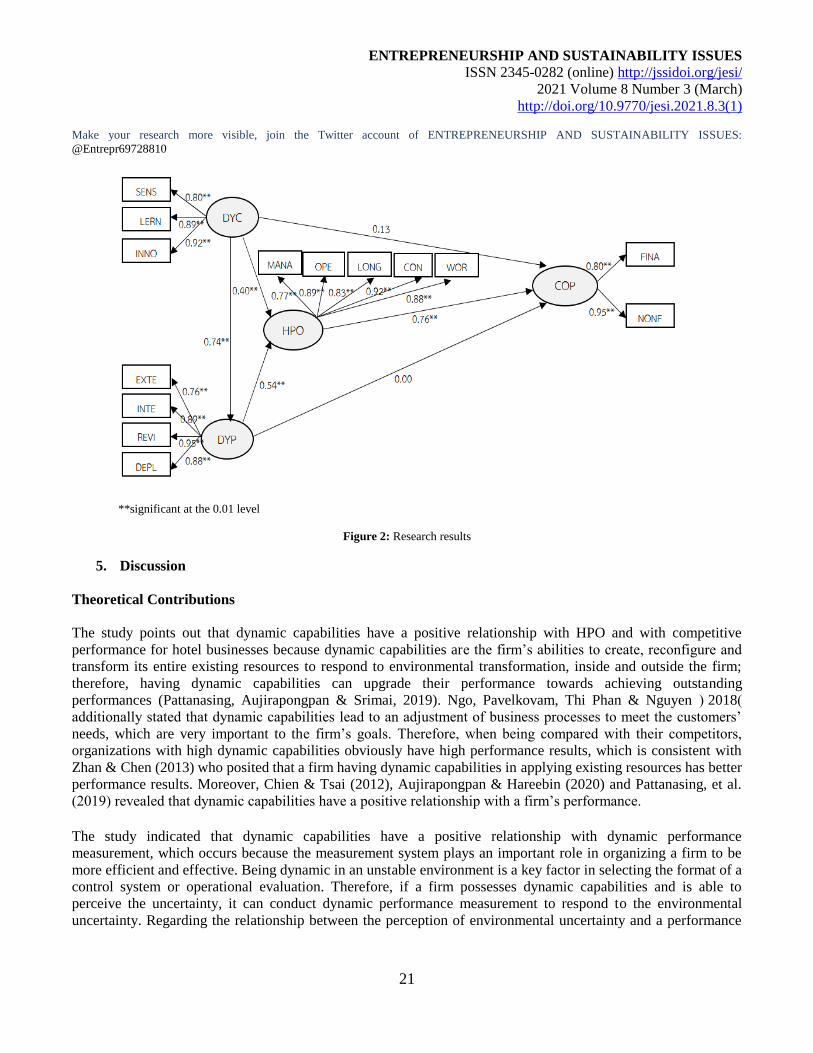
Table 3 shows the testing results of the six hypotheses. The results show that dynamic capabilities have both a
significant direct and indirect effect on the HPO with a total effect coefficient of 0.80 and a p-value of 0.01.
Additionally, dynamic capabilities have a significant direct effect on dynamic performance measurement with a
coefficient of 0.74 and a p-value of 0.01. Therefore, H1 and H3 were supported. The dynamic performance
measurement was found to have a significant direct effect on a HPO with a coefficient of 0.55 and a p-value of
0.01, supporting H4. The results also indicated that the dynamic capabilities and dynamic performance
measurement have significant indirect effects on competitive performance via the HPO. The total effect
coefficient between dynamic capabilities and dynamic performance measurement and competitive performance
were 0.70 and 0.41, respectively, and they were significant with p-values of 0.01. Hence, the two hypotheses H2
and H5 were supported. Last, the finding also supported H6, confirming that the HPO was found to have a
significant direct effect on competitive performance with a coefficient of 0.76 and a p-value of 0.01.
Mediation Analysis
To test the mediating role of the HPO, this study adopted the three-step approach outlined by Nguyen, Le, Trinh
& Do (2019). In addition, N explained three step approach as follows: In step 1, examine the measurement model
to assess whether the direct path coefficient from the independent variable to the dependent variable (IV-->DV) is
significant. In step 2, examine the completely mediated model to assess whether the direct path coefficients from
the independent variable to the mediator (IV-->M) and the mediator to dependent variable (M-->DV) are
significant. In step 3, examine the partially mediated model, including the path coefficient from the independent
variable to the dependent variable that included the mediator (IV+M-->DV). Complete mediation is present when
the direct path coefficient from the independent variable to the dependent variable is no longer significant after the
mediator has been controlled, and partial mediation is present when the direct path coefficient from the
independent variable to the dependent variable is reduced after the mediator has been controlled. The results of
testing the mediating effects are presented in Table 4 and Table 5.
ENTREPRENEURSHIP AND SUSTAINABILITY ISSUES
ISSN 2345-0282 (online) http://jssidoi.org/jesi/
2021 Volume 8 Number 3 (March)
http://doi.org/10.9770/jesi.2021.8.3(1)
Make your research more visible, join the Twitter account of ENTREPRENEURSHIP AND SUSTAINABILITY ISSUES:
@Entrepr69728810
20
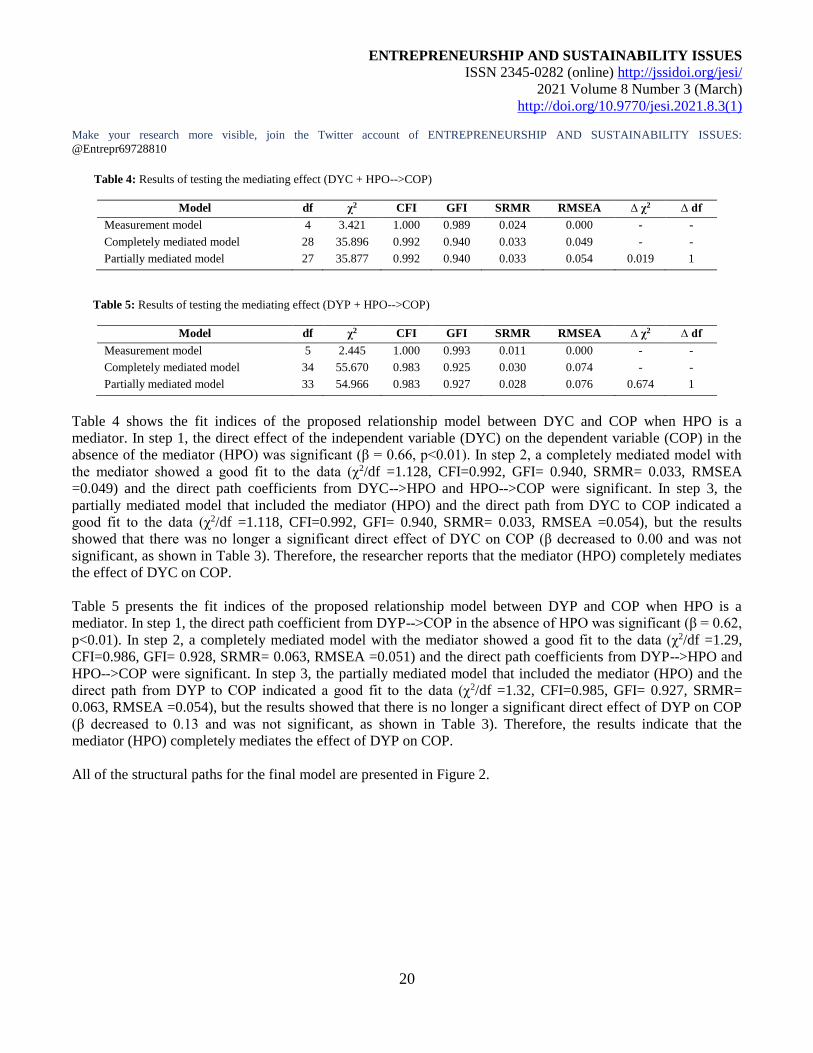
Table 4: Results of testing the mediating effect (DYC + HPO-->COP)
Model df χ2 CFI GFI SRMR RMSEA ∆ χ2 ∆ df
Measurement model 4 3.421 1.000 0.989 0.024 0.000 - -
Completely mediated model 28 35.896 0.992 0.940 0.033 0.049 - -
Partially mediated model 27 35.877 0.992 0.940 0.033 0.054 0.019 1
Table 5: Results of testing the mediating effect (DYP + HPO-->COP)
Model df χ2 CFI GFI SRMR RMSEA ∆ χ2 ∆ df
Measurement model 5 2.445 1.000 0.993 0.011 0.000 - -
Completely mediated model 34 55.670 0.983 0.925 0.030 0.074 - -
Partially mediated model 33 54.966 0.983 0.927 0.028 0.076 0.674 1
Table 4 shows the fit indices of the proposed relationship model between DYC and COP when HPO is a
mediator. In step 1, the direct effect of the independent variable (DYC) on the dependent variable (COP) in the
absence of the mediator (HPO) was significant (ꞵ = 0.66, p<0.01). In step 2, a completely mediated model with
the mediator showed a good fit to the data (χ2/df =1.128, CFI=0.992, GFI= 0.940, SRMR= 0.033, RMSEA
=0.049) and the direct path coefficients from DYC-->HPO and HPO-->COP were significant. In step 3, the
partially mediated model that included the mediator (HPO) and the direct path from DYC to COP indicated a
good fit to the data (χ2/df =1.118, CFI=0.992, GFI= 0.940, SRMR= 0.033, RMSEA =0.054), but the results
showed that there was no longer a significant direct effect of DYC on COP (ꞵ decreased to 0.00 and was not
significant, as shown in Table 3). Therefore, the researcher reports that the mediator (HPO) completely mediates
the effect of DYC on COP.
Table 5 presents the fit indices of the proposed relationship model between DYP and COP when HPO is a
mediator. In step 1, the direct path coefficient from DYP-->COP in the absence of HPO was significant (ꞵ = 0.62,
p<0.01). In step 2, a completely mediated model with the mediator showed a good fit to the data (χ2/df =1.29,
CFI=0.986, GFI= 0.928, SRMR= 0.063, RMSEA =0.051) and the direct path coefficients from DYP-->HPO and
HPO-->COP were significant. In step 3, the partially mediated model that included the mediator (HPO) and the
direct path from DYP to COP indicated a good fit to the data (χ2/df =1.32, CFI=0.985, GFI= 0.927, SRMR=
0.063, RMSEA =0.054), but the results showed that there is no longer a significant direct effect of DYP on COP
(ꞵ decreased to 0.13 and was not significant, as shown in Table 3). Therefore, the results indicate that the
mediator (HPO) completely mediates the effect of DYP on COP.
All of the structural paths for the final model are presented in Figure 2.
ENTREPRENEURSHIP AND SUSTAINABILITY ISSUES
ISSN 2345-0282 (online) http://jssidoi.org/jesi/
2021 Volume 8 Number 3 (March)
http://doi.org/10.9770/jesi.2021.8.3(1)
Make your research more visible, join the Twitter account of ENTREPRENEURSHIP AND SUSTAINABILITY ISSUES:
@Entrepr69728810
21
**significant at the 0.01 level
Figure 2: Research results
5. Discussion
Theoretical Contributions
The study points out that dynamic capabilities have a positive relationship with HPO and with competitive
performance for hotel businesses because dynamic capabilities are the firm’s abilities to create, reconfigure and
transform its entire existing resources to respond to environmental transformation, inside and outside the firm;
therefore, having dynamic capabilities can upgrade their performance towards achieving outstanding
performances (Pattanasing, Aujirapongpan & Srimai, 2019). Ngo, Pavelkovam, Thi Phan & Nguyen ) 2018)
additionally stated that dynamic capabilities lead to an adjustment of business processes to meet the customers’
needs, which are very important to the firm’s goals. Therefore, when being compared with their competitors,
organizations with high dynamic capabilities obviously have high performance results, which is consistent with
Zhan & Chen (2013) who posited that a firm having dynamic capabilities in applying existing resources has better
performance results. Moreover, Chien & Tsai (2012), Aujirapongpan & Hareebin (2020) and Pattanasing, et al.
(2019) revealed that dynamic capabilities have a positive relationship with a firm’s performance.
The study indicated that dynamic capabilities have a positive relationship with dynamic performance
measurement, which occurs because the measurement system plays an important role in organizing a firm to be
more efficient and effective. Being dynamic in an unstable environment is a key factor in selecting the format of a
control system or operational evaluation. Therefore, if a firm possesses dynamic capabilities and is able to
perceive the uncertainty, it can conduct dynamic performance measurement to respond to the environmental
uncertainty. Regarding the relationship between the perception of environmental uncertainty and a performance
ENTREPRENEURSHIP AND SUSTAINABILITY ISSUES
ISSN 2345-0282 (online) http://jssidoi.org/jesi/
2021 Volume 8 Number 3 (March)
http://doi.org/10.9770/jesi.2021.8.3(1)
Make your research more visible, join the Twitter account of ENTREPRENEURSHIP AND SUSTAINABILITY ISSUES:
@Entrepr69728810
22
measurement system, this is consistent with Bastian & Muchilish (2012) who stated that perceiving environmental
uncertainty has a significantly positive relationship with a performance measurement system.
Dynamic performance measurement has a positive relationship with HPO, and this occurs because the practices
following the mechanisms of a management control system can lead to higher performance (Wisner et al., 2003),
which agrees with Epstein & Roy (2003), who stated that a performance measurement system enables a firm to
achieve higher and more sustainable performance. This is consistent with De Waal et al. (2015), who disclosed
strong significant relationships between the components of a system and both managing performance results and
HPO. This study additionally finds that dynamic performance measurement has a positive relationship with
competitive performances for hotel businesses, which is due to having measurement control and performance
results management systems as key factors in their operational enhancement. Kennerley & Neely (2002) stated
that a performance measurement system plays an important role in making a firm more efficient and effective,
which is compatible with Ittner et al. (2003) and Henri (2006), who found that a performance measurement
system has a positive effect on the performance results of an organization.
This study shows that HPO has a positive relationship with competitive performance, and this occurs because a
HPO is an organization that has illustrated its excellent achievements in various management aspects )American
Management Association, 2007). Moreover, a HPO is an organization with a strong management pattern that
focuses on achieving its goals. Furthermore, it is a place of learning that pays attention to its stakeholders and
emphasizes human resource management to ensure that its employees possess skills and perform the tasks to the
best of their abilities while the organization continuously improves its products, processes and services. These
components lead a HPO to become the best and be ahead of its competitors; subsequently, its performance results
are also at a higher level. All statements are in line with De Waal’s (2012) work on gigantic European
international companies in the retail business, which exemplifies that there is a clear direct link between means,
HPO scores and financial results since companies with the highest HPO scores achieve the best financial results
whereas the ones with the lowest HPO scores are those with the lowest financial results. This work is correlated
with the studies on Peruvian mining companies (De Waal & Escalante, 2011), manufacturing firms in Tanzania
(Godfrey, 2010) and hotel businesses in France (Pett, et al., 2016) in which they all claim that characteristics
based on a HPO framework have positive direct relationships with competitive performance results.
The study further finds that HPO is a complete mediator between the dynamic capabilities and competitive
performance of hotel business. Additionally, HPO is a complete mediator between the dynamic performance
measurement and competitive performance of the firm. This shows that dynamic capabilities and dynamic
performance measurement are essential to a firm’s competitive performance. In other words, dynamic capabilities
and dynamic performance measurement help to enhance a HPO and accordingly lead to improved performance
results, which is in line with Bagorogoza & de Waal (2010) who indicated that HPO is a mediator between
knowledge management and organizational performance. This study additionally reveals that learning capability
or knowledge management is beneficial to an organization and it becomes one of the indicators of dynamic
capabilities. Moreover, Pattanasing, et al. (2019) discovered that HPO completely mediates dynamic capabilities
and organizational performance.
Managerial Implications
The findings of this paper can be used as a guideline for hotel management; that is, the management’s awareness
of the creation of dynamic capabilities becomes mandatory in order to upgrade its firm into a HPO and further
ENTREPRENEURSHIP AND SUSTAINABILITY ISSUES
ISSN 2345-0282 (online) http://jssidoi.org/jesi/
2021 Volume 8 Number 3 (March)
http://doi.org/10.9770/jesi.2021.8.3(1)
Make your research more visible, join the Twitter account of ENTREPRENEURSHIP AND SUSTAINABILITY ISSUES:
@Entrepr69728810
23
achieve better performance than its firm’s competitors. Dynamic capabilities are related to an ability to perceive
opportunities or obstacles that may impact the firm; thus, management needs to focus on observing and predicting
various transformation trends, which include customers’ behaviours, competitors’ strategies, technologies, or even
regulations and controls. The sooner this happens, the better it will be for immediate adjustments or corrections.
Moreover, for the benefit of an organization, additional attention should be given to learning capability or
learning management, innovative capability and resource reconfiguration related to the ability to create new
capabilities within the firm. Hence, management is obliged to focus on seeking and bringing in new knowledge
into its firm, integrating that new knowledge with the existing knowledge, and, at the same time, enhancing the
atmosphere of knowledge exchange that subsequently leads to practical improvement and service development
towards excellence. External experts or outsourcing might be used for the less significant activities of the firm,
such as obtaining customers through online and offline agencies, etc., in which the experts or outsourcing can do
better than the personnel of the hotel business.
Furthermore, hotel management needs to strongly pay attention to dynamic performance measurement, since it is
the integrated operating system that is connected to the strategies of all the activities within an organization.
Meanwhile, being dynamic initiates a circle of repetition, development and creation of new information
technology that accordingly helps the firm systematically learn more while continuously creating and conducting
self-improvement to be consistent with the new required status. The findings of this paper also uncover that
dynamic performance measurement helps upgrade a firm to become a HPO and further leads to the firm’s best
practices. In developing dynamic performance measurement, the management is compelled to focus on the
following: (1) setting up an external control system, including determining indicators for the performance results
in order to assess significant parameters and represent external environmental transformation as the firm’s input;
(2) determining an internal control system, including setting up indicators of performance results so that
considerable parameters are examined to represent internal environmental transformation; (3) creating an
inspection system to review the efficiency of the performances, which include reporting performance outcomes to
those concerned, focusing on promoting strong points and correcting weak points so that immediate actions for
improvement can occur; and (4) creating a deployment system for effective performance, which includes giving
attention to employees’ participation in setting up goals and indicators, and more importantly, the performance
measurement system must be consistent with a reward system.
Limitations and Future Research
The data of this study were analysed by an analytical structural equation modelling method and the accuracy is
based on the sampling size. As Kline (2011) stated, this modelling method is a statistical tool that requires a large
size of a sampling group, that is, the number of samples should be 20 for every 1 observable variable. This paper
consists of 4 hidden variables subdivided into 14 observable variables, making the total of 280 samples. However,
since the number of returned questionnaires did not meet expectations, the final number of samples was only 115,
which is lower than the set standard. Hence, there might be some limitations in the accuracy of the statistics in the
findings. Moreover, this study develops a structural model among dynamic capabilities, dynamic performance
measurement, HPO, and the competitive performance results of hotels in the global tourist attractions of Thailand;
therefore, there might be some limitations to the broad application of these findings. Thus, in order to come up
with more universal conclusions that can be broadly utilized, the structural model can be applied for future studies
of other businesses, e.g., producer groups, service groups of financial institutes, healthcare services, educational
services or even hotel businesses in other global tourist attractions.
ENTREPRENEURSHIP AND SUSTAINABILITY ISSUES
ISSN 2345-0282 (online) http://jssidoi.org/jesi/
2021 Volume 8 Number 3 (March)
http://doi.org/10.9770/jesi.2021.8.3(1)
Make your research more visible, join the Twitter account of ENTREPRENEURSHIP AND SUSTAINABILITY ISSUES:
@Entrepr69728810
24
References American Management Association. (2007). How to build a high-performance organizations. Retrieved from
http://www.amajapan.co.jp/j/pdf/HRI_ HIGH-PERFORMANCE_Organization.pdf
Aujirapongpan, S., & Hareebin, Y. (2020). The effect of strategic intuition, business analytic, networking capabilities and dynamic strategy
on innovation performance: The empirical study Thai Processed Food Exporters. Journal of Asian Finance, Economics and
Business, 7(1), 259-268. https://doi.org/10.13106/jafeb.2020.vol7.no1.259
Aujirapongpan, S., & Pattanasing, K. (2020). Integrated performance measurement of local hotels in the context of a global tourism
destination: A case study of Samui Island, Thailand. Asian Academy of Management Journal, 25(1), 1-23.
https://doi.org/10.21315/aamj2020.25.1.1
Aujirapongpan, S., Vadhanasindhu, P., Chandrachai, A., & Cooparat, P. (2010), Indicators of knowledge management capability for KM
effectiveness. VINE Journal of Information and Knowledge Management Systems, 40(2), 183-203.
https://doi.org/10.1108/03055721011050677
Bagorogoza, J., & de Waal, A. A. (2010). The role of knowledge management in creating and sustaining high performance
organisations: The case of financial institutions in Uganda. World Journal of Entrepreneurship, Management and
Sustainable Development, 6(4), 307-324. https://doi.org/10.1108/20425961201000023
Barney, J. B., & Clark, D. N., (2007). Resource-based theory: Creating and sustaining competitive advantage. Oxford, England: Oxford
University Press.
Barrales-Molina, V., Martínez-López, F. J., & Gázquez-Abad, J. C. (2014). Dynamic marketing capabilities: Toward an integrative
framework. International Journal of Management Reviews, 16(4), 397-416. https://doi.org/10.1111/ijmr.12026
Bastian, E., & Muchlish, M. (2012). Perceived environment uncertainty, business strategy, performance measurement systems and
organizational performance. Procedia - Social and Behavioral Sciences, 65, 787 – 792.
https://doi.org/10.1016/j.sbspro.2012.11.200
Birchall, D., & Tovstiga, G. (2005). Capabilities for strategic advantage: Leading through technological innovation. Basingstoke,
England: Palgrave Macmillan.
Bititci, U. S., Nudurupati, S. S., Turner, T. J., & Creighton, S. (2002). Web enabled performance management systems: Management
implications. International Journal of Operation & Production Management, 22(11), 1273-1287.
https://doi.org/10.1108/01443570210450310
Bititci, U. S., Turner, T., & Begemann, C. (2000). Dynamics of performance measurement systems. International Journal of Operations &
Production Management, 20(6), 692-704. https://doi.org/10.1108/01443570010321676
Blackman, D., Buick, F., O'Donnell, M., O'Flynn, J., & West, D. (2012). Developing High Performance: Performance Management in the
Australian Public Service. Crawford School Working Paper, No. 12-09, Crawford School of Public Policy, Australian
National University, Canberra.
Bourne, M., Melnyk, S., Bititci, U., Platts, K., Andersen, B., & Onsøyen, L. E. (2014). Emerging issues in performance measurement.
Management Accounting Research, 25(2), 117-118. https://doi.org/10.1016/j.mar.2013.07.002
Breznik, L., & Lahovnik, M. (2016). Dynamic capabilities and competitive advantage: Finding from case studies. Management, 21(Special
Issue), 167-185.
Chien, S.Y., & Tsai, C.H. (2012). Dynamic capability, knowledge, learning, and firm performance. Journal of Organizational
Change Management, 25(3), 434-444. http://dx.doi.org/10.1108/09534811211228148
ENTREPRENEURSHIP AND SUSTAINABILITY ISSUES
ISSN 2345-0282 (online) http://jssidoi.org/jesi/
2021 Volume 8 Number 3 (March)
http://doi.org/10.9770/jesi.2021.8.3(1)
Make your research more visible, join the Twitter account of ENTREPRENEURSHIP AND SUSTAINABILITY ISSUES:
@Entrepr69728810
25
Cortina, J. M. (1993). What is coefficient alpha? An examination of theory and applications”, Journal of applied psychology, 78(1), 98-
104. https://doi.org/10.1037/0021-9010.78.1.98
DeNisi, A. S., & Murphy, K. R. (2017). Performance appraisal and performance management: 100 years of progress? Journal of Applied
Psychology, 102(3), 421– 433. https://doi.org/10.1037/apl0000085
De Waal, A. A. (2012). Characteristics of High Performance Organizations. Business Management and Strategy, 3(1), 28-45.
DOI: https://doi.org/10.5296/bms.v3i1.869
De Waal, A. A., Beatrice, I. J. M., & Heijden, V. D. (2015).The Role of Performance Management in Creating and Maintaining a High-
Performance Organization. Journal of Organization Design, 4(1), 1-11. https://doi.org/10.7146/jod.17955
De Waal, A. A., & Escalante, O. G. (2011). Does the application of corporate social responsibility support a high performance organization
in achieving better results?, the case of mining multinationals in Peru. International Journal of Sustainable Strategic
Management, 3(1), 33-49. https://doi.org/10.1504/IJSSM.2011.040778
De Waal, A. A., Duong, H., & Ton, V. (2009). High performance in Vietnam: the case of the Vietnamese banking industry. Journal of
Transnational Management, 14(3), 179-201. https://doi.org/10.1080/15475770903120196
De Waal, A. A., Goedegebuure, R., & Akaraborworn, C. T. (2014). Adapting the high performance organization framework to the Thai
context. Measuring Business Excellence, 18(2), 28-38. https://doi.org/10.1108/MBE-08-2013-0043
De Waal, A. A., & Goedegebuure, R. (2017). Investigating the causal link between a management improvement technique and
organizational performance: The case of the HPO framework. Management Research Review, 40(4), 429-450.
https://doi.org/10.1108/MRR-03-2016-0058
De Waal, A. A, Goedegebuure, R., & Hinfelaar, E. (2015). Developing a scale for measuring high performance partnerships. Journal of
Strategy and Management, 8(1), 87-108. https://doi.org/10.1108/JSMA-07-2014-0065
Eisenhardt, K. M., & Martin, J. A. (2000). Dynamic capabilities: what are they?. Strategic Management Journal, 21(10-11), 1105-1121.
https://doi.org/10.1002/1097-0266(200010/11)21:10/11<1105::aid-smj133>3.0.co;2-e
Epstein, M. J., & Roy, M. J. (2003). Making the business case for sustainability: Linking social and environmental actions to financial
performance. Journal of Corporate Citizenship, 9(Spring). 79-96
Giovannoni, E., & Maraghini, M. P. (2013). The challenges of integrated performance measurement system: Integrating mechanisms for
integrate measures. Accounting, Auditing & Accountability Journal, 26(6), 978-1008. https://doi.org/10.1108/AAAJ-04-
2013-1312
Godfrey, S. (2010). An assessment of high performance organizations (HPOs) in the manufacturing industry in Tanzania. Master thesis,
Tumaini University College, Tanzania.
Hair, J. F.,Sarstedt, M., Hopkins, L., & G. Kuppelwieser, V. (2014). Partial least squares structural equation modeling (PLS-SEM): An
emerging tool in business research. European Business Review, 26(2), 106-121. https://doi.org/10.1108/EBR-10-
2013-0128
Henri, J. F. (2006). Management control system and strategy: A resourced base view perspective. Accounting Organization and Society,
31(6), 529-588. https://doi.org/10.1016/j.aos.2005.07.001
Holbeche, L. (2005). High Performance Organization: Creating dynamic stability and sustainable success. Roffey Park Management
Institute, New York.
Homsud, N. (2017). The Effect of Residents’ Attitude toward Tourism on their Pro-Tourism Behaviour: A Case Study of Hua-Hin
Prachubkirikhan. Mediterranean Journal of Social Sciences, 8(6), 135-142. https://doi.org/10.1515/mjss-2017-0050
ENTREPRENEURSHIP AND SUSTAINABILITY ISSUES
ISSN 2345-0282 (online) http://jssidoi.org/jesi/
2021 Volume 8 Number 3 (March)
http://doi.org/10.9770/jesi.2021.8.3(1)
Make your research more visible, join the Twitter account of ENTREPRENEURSHIP AND SUSTAINABILITY ISSUES:
@Entrepr69728810
26
Hoque, Z. (2004). A contingency model of the association between strategy, environmental uncertainty and performance measurement:
Impact on organizational performance. International Business Review, 13(4), 485- 502.
https://doi.org/10.1016/j.ibusrev.2004.04.003
Ittner, C., Larcker, D., & Randall, T. (2003). Performance Implications of strategic performance measurement in financial service firms.
Accounting, Organizations and Society, 28(7-8), 715-741. https://doi.org/10.1016/S0361-3682(03)00033-3
Jantunen, A., Ellonen, H., & Johansson, A. (2012). Beyond appearances – do dynamic capabilities of innovative firms actually differ?.
European Management Journal, 30, 141-155. https://doi.org/10.1016/j.emj.2011.10.005
Keller, G. F. (2011). Comparing the affects of management practices on organizational performance between for-profit and not-for-profit
corporations in Southeast Wisconsin. Journal of Business & Economics Research, 9(3), 29-37.
https://doi.org/10.19030/jber.v9i3.4127
Kennerley, M., & Neely, A. (2002). A framework of the factors affecting the evolution of performance measurement systems. International
Journal of Operations & Production Management, 22(11), 1222-1245. https://doi.org/10.1108/01443570210450293
Kennerley, M., & Neely, A. (2003). Measuring performance in a changing business Environment. International Journal of Operations &
Production Management, 23(2), 213-229. https://doi.org/10.1108/01443570310458465
Kor, Y. Y., & Mahoney, J. T. (2005). How dynamics, management, and governance of resource deployments influence firm-level
performance. Strategic Management Journal, 26(5), 489–496. https://doi.org/10.1002/smj.459
Lazonick, W., Prencipe, A. (2005). Dynamic capabilities and sustained innovation: Strategic control and financial commitment at Rolls-
Royce Plc. Industrial and Corporate Change, 14(3), 501-542. https://doi.org/10.1093/icc/dth061
Li, D. Y., & Liu, J. (2014). Dynamic capabilities, environmental dynamism, and competitive advantage: Evidence from China. Journal of
Business Research, 67(1), 2793-2799. https://doi.org/10.1016/j.jbusres.2012.08.007
Lu, C., Berchoux, C., Marek, M. W., & Chen, B. (2015). Service quality and customer satisfaction: qualitative research
implications for luxury hotels. International Journal of Culture, Tourism and Hospitality Research, 9(2), 168-182.
https://doi.org/10.1108/IJCTHR-10-2014-0087
MacInerney-May, K. (2011). The Value of Dynamic Capabilities for Strategic Management. Doctoral Dissertation, Universität zu Köln,
Stuttgart, Germany.
Matear, S., Gray, B. J., & Garrett, T. (2004). Market orientation, brand investment, new service development, market position and
performance for service organisations. International Journal of Service Industry Management, 15(3), 284-301.
https://doi.org/10.1108/09564230410540944
Mohsin, A., & Lockyer, T. (2010). Customer perceptions of service quality in luxury hotels in New Delhi, India: An explorator y
study. International Journal of Contemporary Hospitality Management, 22(2), 160-173.
https://doi.org/10.1108/09596111011018160
Ngo, V.M , Pavelkova, D., Thi Phan, Q.P., & Nguyen, N.V. (2018). Customer relationship management (CRM) in small and medium
tourism enterprises: Dynamic capabilities perspective. Tourism and Hospitality Management, 24(1), 63-86.
https://doi.org/10.20867/thm.24.1.11
Nguyen, P.V., Le, H.T.N., Trinh, T.V.A., & Do, H.T.S. (2019). The effects of inclusive leadership on job performance through mediators.
Asian Academy of Management Journal, 24(2), 63–94. https://doi.org/10.21315/aamj2019.24.2.4
Noordin, M. A., & Mohtar, S. (2013). Innovation capability: A critical review of its role in determining firm performance. Research
Journal of Social Science & Management, 3(4), 220-226.
Parnell, J. A., Dent, E.B., O’Regan, N. & Hughes, T. (2012). Managing performance in a volatile environment: contrasting perspectives on
luck and causality. British Journal of Management, 23, S104-S118. https://doi.org/10.1111/j.1467-8551.2012.00815.x
ENTREPRENEURSHIP AND SUSTAINABILITY ISSUES
ISSN 2345-0282 (online) http://jssidoi.org/jesi/
2021 Volume 8 Number 3 (March)
http://doi.org/10.9770/jesi.2021.8.3(1)
Make your research more visible, join the Twitter account of ENTREPRENEURSHIP AND SUSTAINABILITY ISSUES:
@Entrepr69728810
27
Pattanasing, K., Aujirapongpan, S., & Srimai, S. (2019). Dynamic Capabilities and High performance organization of Hotel Business:
Empirical Investigation into World Class Tourism Desination. Tourism and Hospitality Management, 25(2), 377-401.
https://doi.org/10.20867/thm.25.2.8
Pavlov A., & Bourne, M. (2011). Explaining the effects of performance measurement on performance – an organizational routines
perspective. International Journal of Operations and Production Management, 31(1), 101-122.
https://doi.org/10.1108/01443571111098762
Pett, T., Sie, L., & Wolff, J. (2016). Revisiting SME Performance: Examining the Role of Entrepreneurial Orientation and High
Performance Organization Attributes. United States Association for Small Business and Entrepreneurship.
ConferenceProceedings; Boca Raton: HF1-HF21, Retrieved from https://search.proquest.com/docview/1774571882?pq-
origsite=gscholar&fromopenview=true
Phusavat, K., Comepa, N., Sitko-Lutek, A., & Ooi, K. B. (2011). Interrelationships between intellectual capital and performance. Industrial
Management & Data Systems, 111(6), 810-829. https://doi.org/10.1108/02635571111144928
Roshan, D., & Jenson J. E. (2014). Study on performance measurement systems: Measures and metrics. International Journal of Scientific
and Research Publications, 4(9), 1-9. http://citeseerx.ist.psu.edu/viewdoc/download?doi=10.1.1.656.1128&rep=rep1&type=pdf#page=578
Rujirawanich, P., Addison, R., & Smallman, C. (2011). The effects of cultural factors on innovation in a Thai SME. Management Research
Review, 34(12), 1264-1279. https://doi.org/10.1108/01409171111186397
Schumacker, R. E., & Lomax, R. G. (2015). A Beginner’s Guide to Structural Equation Modeling (4th ed.). New York, NY: Routledge.
SiamFreestyle. )2019). Hotels & Resorts Sort by Provinces. Retrieved from http://www.siamfreestyle.com/hotel-resort/
Srimai, S., Radford, J., & Wright, C. (2011). Evolutionary paths of performance measurement: An overview of its recent development.
International Journal of Productivity and Performance Management, 60(7), 662-687.
https://doi.org/10.1108/17410401111167771
Teece, D. J. (2012). Dynamic Capabilities: Routines versus Entrepreneurial Action. Journal of Management Studies, 49(8), 1395-1401.
https://doi.org/10.1111/j.1467-6486.2012.01080.x
Teeratansirikool, L., Siengthai, S., Badir, Y., & Charoenngam, C. (2013). Competitive strategies and firm performance: The mediating role
of performance measurement. International Journal of Productivity and Performance Management, 62(2), 168-184.
https://doi.org/10.1108/17410401311295722
Thai Hotels Association. (2019). Standard Guide for tourism accommodation, Retrieve from http://www.thaihotels.org/
Thompson, A. A., Peteraf, M. A., Gambel, J. E., & Stricklland III, A. J. (2016). Crafting & executing strategy: The quest for competitive
advantage, concepts and readings (20nd ed.). NY: McGrew-Hill Education.
Wang, C. L., & Ahmed, P. K. (2007). Dynamic Capabilities: A Review and Research Agenda. International Journal of Management
Reviews, 9(1), 31-51. https://doi.org/10.1111/j.1468-2370.2007.00201.x
Wisner, P. S., Epstein, M. J., & Bagozzi, R. (2003). Managing what matters: Managerial control processes and actions that influence
firm performance. Working Paper. TX: Rice University.
World Tourism Organization (2019), International Tourism Highlights, 2019 Edition, UNWTO, Madrid,
https://doi.org/10.18111/9789284421152
Zhan, W., & Chen, R. (2013). Dynamic capability and IJV performance: The effect of exploitation and exploration capabilities. Asia
Pacific Journal of Management, 30(2), 601–632. https://doi.org/10.1007/s10490-010-9235-3
ENTREPRENEURSHIP AND SUSTAINABILITY ISSUES
ISSN 2345-0282 (online) http://jssidoi.org/jesi/
2021 Volume 8 Number 3 (March)
http://doi.org/10.9770/jesi.2021.8.3(1)
Make your research more visible, join the Twitter account of ENTREPRENEURSHIP AND SUSTAINABILITY ISSUES:
@Entrepr69728810
28
Acknowledgements
This research was partially supported by the new strategic research (P2P) project, Walailak University, Thailand.
About Authors
Kanittha PATTANASING, Ph.D., is a lecturer in entrepreneurial management and business of Entrepreneurial Management Department,
Maejo University-Chumphon, Maejo University, Thailand. She received her Ph.D. in business administration from Walailak University.
Her publications have appeared in various national and international academic journals about innovation management, entrepreneurship
and business administration.
ORCID ID: https://orcid.org/0000-0002-7452-3552
Somnuk AUJIRAPONGPAN, Ph.D., is an associate professor in accounting and director of Graduate Study in Innovation Management
and Business Development Program, School of Management, Walailak University, Thailand. He received his Ph.D. in technopreneurship
and innovation management from Chulalongkorn University. His professional expertises are managerial accounting, cost accounting,
knowledge management, innovation management and entrepreneurship development. His publications have appeared in various national
and international academic journals about managerial accounting, entrepreneurship and business development. He also is a corresponding
author of this article who provides the intellectual input, designs and approves the protocols to be followed in the study.
ORCID ID: https://orcid.org/0000-0001-6275-9053
Supit RITKAEW, Ph.D., is an assistant professor in applied mathematics of Innovation Management and Business Development Graduate
Study Program of Walailak University. He received his Ph.D. in applied mathematics from University of Innsbruck, Austria. His
publications have appeared in various national and international academic journals about business analytics and entrepreneurship.
ORCID ID: https://orcid.org/0000-0003-0543-7730
Anuman CHANTHAWONG, Ph.D., is an assistant professor in economices of Faculty of Management Sciences, Suratthani Rajabhat
University and graduated in field of Energy Economics and Planning from Asian Institute of Technology, Thailand. His publications have
appeared in various national and international academic journals which related to economics and management.
ORCID ID: https://orcid.org/0000-0002-5860-5964
Sirichai DEELERS, Ph.D., is an assistant professor in management of Faculty of Management Science, Silpakorn University, Thailand.
He received his Ph.D. in management from Silpakorn University. His publications have appeared in various national and international
academic journals about innovation management, business administration and information management.
ORCID ID: https://orcid.org/0000-0002-6521-1795
Make your research more visible, join the Twitter account of ENTREPRENEURSHIP AND SUSTAINABILITY ISSUES:
@Entrepr69728810
Copyright © 2021 by author(s) and VsI Entrepreneurship and Sustainability Center
This work is licensed under the Creative Commons Attribution International License (CC BY).
http://creativecommons.org/licenses/by/4.0/
ENTREPRENEURSHIP AND SUSTAINABILITY ISSUES
ISSN 2345-0282 (online) http://jssidoi.org/jesi/
2021 Volume 8 Number 3 (March)
http://doi.org/10.9770/jesi.2021.8.3(2)
Publisher http://jssidoi.org/esc/home
10
THE ROLE OF LOCAL INFORMAL FINANCIAL INSTITUTIONS FOR SUSTAINABILITY OF
FARMERS: A CASE STUDY OF MALANG AND BATU *
Agus Suman 1, Dwi Budi Santoso 2*, Ronny Ersya Novianto Putra 3
1,2,3 Jurusan Ilmu Ekonomi, Fakultas Ekonomi dan Bisnis, Universitas Brawijaya, Malang, Indonesia
Email: 2* [email protected] (Corresponding author)
Received 24 August 2020; accepted 26 October 2020; published 30 March 2021
Abstract. The majority of Indonesian farmers are entirely dependent on the activities in the agricultural sector. However, the current
agricultural system tends to works against farmers' welfare. This study aims to examine the role of local informal financial institutions in
creating sustainable farmer welfare using a qualitative approach. The results of the study indicate that there is a dominant role of local
informal financial institutions. This domination causes farmers to become helpless during harvest season, resulting in farmers' dependence
on local informal financial institutions and their inability to enjoy sustainable welfare.
Keywords: independent farmers; local financial institutions; farmers' welfare
Reference: Suman, A., Santoso, D.B., Putra, R.E.N. 2021. The role of local informal financial institutions for sustainability of farmers: a
case study of Malang and Batu. Entrepreneurship and Sustainability Issues, 8(2), 29-39. http://doi.org/10.9770/jesi.2021.8.3(2)
JEL Classification: Q12, P36, 018
1. Introduction
About 75% of Indonesian farmers depend on narrow agricultural land, which is less than 0.5 hectares (BPS,
2014). Therefore, government policy is needed to empower farmers to enjoy sustainable prosperity. Previous
research has shown that agricultural sector development policies often create the phenomenon of 'elite capture'
and pseudo welfare for farmers (Putra and Suyatna, 2018). Indirectly, this phenomenon makes it difficult for
farmers to access information on agricultural cultivation and post-harvest activities so that they suffer losses. Such
an event is due to the behavior of non-agricultural actors who monopolize information. As a result, farmers'
*This research was supported by Grant Professor of the Faculty of Economics and Business through the Fund Tax State
Revenue (PNBP) Brawijaya University (2019), with the number Contract Agreement: 03075/UN10.F02/PN/2019.
ENTREPRENEURSHIP AND SUSTAINABILITY ISSUES
ISSN 2345-0282 (online) http://jssidoi.org/jesi/
2021 Volume 8 Number 3 (March)
http://doi.org/10.9770/jesi.2021.8.3(2)
Make your research more visible, join the Twitter account of ENTREPRENEURSHIP AND SUSTAINABILITY ISSUES:
@Entrepr69728810
11
income growth has slowed down due to reduced agricultural land and weak agrarian culture (Lubis, 2014;
Partadireja, 1974).
In building independence, farmers need complete information without pressure or intervention from non-
agricultural actors, both in the cultivation process and in post-harvest activities (Mubyarto, 1994b). Farmers will
be able to enjoy complete information through strengthening three things, namely agricultural institutions, culture,
and socio-economic ties among farmers, as well as farmers' strong bargaining position. All of which will
contribute to a sustainable increase in farmer income (Arsanti and Bohme, 2018; Khan et al., 2017; Priesel et al.,
2017; Christensen, 2014).
Empirical evidence in Sesbany's (2008) research shows that the control of information by non-agricultural actors,
namely local financial institutions, causes farmers to have low bargaining power due to lack of market access,
partial information, and small capital. Therefore, it is difficult for farmers to set prices and increase their income.
The same thing was expressed by Christensen (2014), who states that a strong farmer institution will enable
farmers to make independent decisions in more profitable cultivation and post-harvest activities.
Therefore, this study seeks to describe how significant the role of informal local financial institutions is in
realizing farmer independence; whether this role will achieve farmer independence as indicated through the
process of empowering farmers and strengthening the existing agricultural culture (Wulandari et al., 2017;
Akobeng, 2017; Suman and Putra, 2015), or actually causing the impoverishment of farmers (Besser et al., 2017;
Wulandari et al., 2015; Sajogyo, 2005). The research results are expected to be able to provide an overview,
especially for policymakers and formal and informal financial institutions to play an active role in building
independence, increasing bargaining power, and empowering farmers. The ideas presented in this study are
presented in two parts. First is an explanation of the freedom of cultivation that has been strived for by farmers as
well as the factors that make the role of local financial institutions weak in influencing their autonomy. The
second is an explanation of the role of strong local financial institutions in creating post-harvest independence and
the factors that cause it.
2. Literature Review
Farmers 'independence, according to Mubyarto (1994a), is a picture of farmers' consistency in developing their
farming business without being tied to other parties, either directly or indirectly, in striving for productivity,
existence, and sustainability of their independence. There are six indicators of farmer independence that need to
be built and achieved according to Sajogyo (2005), namely as follows: (a) active participation of farmers
accompanied by an increase in the quality and capability of human resources, (b) increased tenure of land and
productive assets per agricultural workforce, (c) equal distribution of productive assets, technology and financing
per agricultural workforce, (d) diversification of agriculture in a broad sense, (e) development of independent
rural financial institutions and, (f) development of agricultural institutions and agricultural resources. Suyatna et
al., (2016) stated that the prerequisite for strengthening the six indicators is the development of access to (a)
equitable land ownership; (b) pro-farmer inputs and production; (c) markets that provide welfare for farmers; and
(d) freedom to organize and determine a production space that is more collaborative with outsiders and mutually
beneficial. Independent cultivation must build institutional strengthening and agricultural culture to realize
productive intentions and cooperation between farmers in increasing pre-production productivity and during
production.
The phenomenon in the United States studied by Christensen (2014) shows the role of the government in building
independent farmer cultivation through the creation of the Staying Put institution, which connects farmers' needs
ENTREPRENEURSHIP AND SUSTAINABILITY ISSUES
ISSN 2345-0282 (online) http://jssidoi.org/jesi/
2021 Volume 8 Number 3 (March)
http://doi.org/10.9770/jesi.2021.8.3(2)
Make your research more visible, join the Twitter account of ENTREPRENEURSHIP AND SUSTAINABILITY ISSUES:
@Entrepr69728810
12
in farming and ensures that the commodities produced are distributed to the market. The institution is useful
because it utilizes local knowledge and bonds between farmers. Meanwhile, research by Preisel et al. (2017)
explains that government intervention is needed to strengthen culture and social relationships between farmers in
determining the cultivation process. Starting from the processing stage, selecting agricultural production facilities,
to recruiting independent workers who are oriented towards increasing income. and productivity. It can be done
by strengthening socio-economic motivation and farmer empowerment strategies that are appropriate to the
farmer's local culture.
On the other hand, Khan et al. (2018) explained that government intervention would have an impact on
strengthening the independence of farmers in the pre-production and production stages, as well as stabilizing
prices and the post-harvest market. In the pre-production and production stages, farmers are facilitated by
increasing their knowledge and skills, certification of production quality, mapping of grown commodities,
measuring the quality of agricultural inputs, as well as improving agrarian technology and measuring
productivity. Furthermore, the ideal post-harvest independence must build mutually beneficial collaboration
between farmers and non-agricultural actors to form the power of information on prices and markets. Thus,
farmers can increase networking and bargaining power to create better value-added.
The study conducted by Utama et al. (2019) explains that the concept of the Ba'i As-Salam contract promoted by
Islamic banks in Indonesia can provide comprehensive information on the market for farmers. Islamic banks will
assist farmers in obtaining information on prices and profitable market opportunities. Meanwhile, Arsanti and
Bohme (2018) examined cooperation between farmers and seed companies on organic chili commodities in
increasing productivity and ensuring price stability. The company will regulate the marketing and production
aspects, which include land management and the selection of production infrastructure to improve the quality and
quantity of products. Thus, the commodity produced can be accepted by the market. Furthermore, strengthening
farmers through the use of technology was reviewed by Flor et al. (2016) in which agricultural research institutes
work with farmers to ensure increased productivity and price certainty. These efforts have increased the real
welfare of farmers because they can cut the distribution chain without harming the end-level farmers and traders.
Ideally, farmer self-reliance development should be inclusive and oriented towards improving sustainable farmer
welfare. For this reason, a collaboration between farmers and stakeholders is needed to create a productivity
ecosystem that is more applicable and in line with the development of science and technology. The absence of this
collaboration has the potential to reduce the interest of the farming community, which in turn will make Indonesia
dependent on food imports and shrink the supply of agricultural commodities (Purwanegara et al., 2018; Soeparno
et al., 2018). In realizing this, competitive farmers, have the power to make decisions, have social inter-social ties,
and post-harvest activities are needed that are more equitable and benefit all parties. In the agricultural trade
system, there should be no party who takes personal benefits, and there should also be parties who experience
dependence resulting in a pattern of impoverishment directly or indirectly (Putra and Suyatna, 2018). Failure to
achieve ideal farmer independent development will result in not creating sustainable farmers' income and will
create dependence on farmers to maintain their existence (Suseno and Suyatna, 2006).
3. Research Method
This study uses a qualitative method with a phenomenological approach. The stages of data collection in this
study are observation, interviews, and documentation. Data collection was carried out in three villages in Malang
Regency and Batu City, namely Tegalweru, Bocek, and Beji, from March to August 2019. In the early stages,
researchers observed by looking for facts in the field regarding the role of informal financial institutions in
ENTREPRENEURSHIP AND SUSTAINABILITY ISSUES
ISSN 2345-0282 (online) http://jssidoi.org/jesi/
2021 Volume 8 Number 3 (March)
http://doi.org/10.9770/jesi.2021.8.3(2)
Make your research more visible, join the Twitter account of ENTREPRENEURSHIP AND SUSTAINABILITY ISSUES:
@Entrepr69728810
13
agricultural activities. From the points that have been gathered, in-depth interviews were conducted with
informants, including farmers and non-farmer actors, to explore the information obtained. Determination of
informants in the study using the snowball sampling method. Finally, documentation is carried out to find hidden
facts that have not been obtained in the previous stages. The information collected was then analyzed using a
comprehensive data analysis technique. The first stage of the analysis is coding to map the reliability and strength
of the data. Furthermore, the information is sorted, analyzed, and interpreted to obtain findings. These findings are
then matched with supporting documents in the form of study results and research findings with similar themes to
strengthen the resulting analysis (Skovdal and Cornish, 2015).
4. Results and Discussions
The results of the study found that the independence of farmer cultivation was influenced by the strong
attachment to agricultural culture and networking among farmers. However, the post-harvest freedom of farmers
is very dependent on local informal financial institutions because of their mastery of price and market information
and the strength of the capital of these institutions. Therefore, farmers' bargaining power and networking are
fragile, resulting in the impoverishment of farmers.
4.1. The Role of Informal Local Financial Institutions in Agricultural Cultivation Independence
Based on the analysis of the data that has been collected, it is known that the willingness to work productively and
the strong Indonesian agricultural culture causes farmers to make decisions for land cultivation, selection of
agricultural production facilities, and the need for labor independently. There are two farmer groups studied,
namely citrus farmers and maize farmers. The two commodities have different cultivation periods in which
oranges require a long cultivation period of ten months, while sweet corn has a shorter cultivation period of
between forty to ninety days. Citrus farmers, in general, still have strong socio-economic and economic ties in
their communities. On the other hand, maize farmers have social interactions in the form of factions/blocks, which
result in a weak socio-economic link within their group as a whole (quotation from the interview is attached).
The land management aspect is classified into three things, namely land use, selection of land management
techniques, and selection of processes for increasing land productivity. In this case, the independent nature of
farmers will be influenced by land ownership status, where farmers who own land tend to be freer to make
decisions. On the other hand, farmers who rent agricultural land tend to choose a quick management system to
optimize income because they have to pay land rent. In general, the farmers studied used semi-modern tillage
techniques. It can be done because farmers have extensive knowledge as a result of long experience in
understanding the characteristics of the commodities planted. The agricultural policy carried out by the
government is felt by farmers only as a formality and has not yet achieved community empowerment. Farmers
independently learn the procedures for increasing productivity, especially in paying attention to the nutrients
needed by commodities to grow well, as well as pest control.
Furthermore, in making decisions about the use of production facilities, which include seeds, fertilizers, and
pesticides, farmers consider the expected quality, quantity, and productivity. Farmers will tend to choose the most
expensive seeds that are considered to have the best product marketing opportunities. Meanwhile, to choose
fertilizers and pesticides, farmers decide to rejuvenate nutrients in agricultural land with organic fertilizers. The
action is carried out due to the decline in land quality caused by the green revolution that was carried out during
the New Order era. These findings are in line with Suseno and Suyatna (2006). When planting begins, farmers
will carefully measure the amounts of fertilizers and pesticides used to ensure the quality and productivity of the
ENTREPRENEURSHIP AND SUSTAINABILITY ISSUES
ISSN 2345-0282 (online) http://jssidoi.org/jesi/
2021 Volume 8 Number 3 (March)
http://doi.org/10.9770/jesi.2021.8.3(2)
Make your research more visible, join the Twitter account of ENTREPRENEURSHIP AND SUSTAINABILITY ISSUES:
@Entrepr69728810
14
commodities produced. On the one hand, it is hoped that these commodities will be economically profitable. On
the other hand, products are also expected to be safe when consumed by end consumers.
The decision making for the need for labor is carried out based on the availability of agricultural labor offers in
each region. Currently, there are only a few workers who are interested in working as agrarian laborers because
they are considered not having high wages as in non-agricultural sectors, for example, as construction workers; as
Putra and Suyatna (2018) findings. This phenomenon has led to an increase in the bargaining power of
farmworkers. In each village, the landowner and farm laborers make an agreement regarding the wages that would
be given as compensation for working on the land. The laborers' wages are based on the length of time needed to
increase the productivity of the farm and the types of activities that are a burden to farm laborers.
Currently, the government has not yet produced an ideal policy in connecting the agricultural sector with related
stakeholders to increase the existence, bargaining power, productivity, and real welfare of farmers. If this
continues, it is not surprising that farmers are forced to struggle on their own, which results in farmers'
dependence on non-farmer actors who have complete information independently. As a result, the welfare of
farmers is difficult to improve (Khan et al., 2018; Preisel et al., 2017; Christensen, 2014).
4.2. The Role of Informal Local Financial Institutions in Post Harvest Self-Reliance
In post-harvest activities, farmers become bound by decisions of local informal financial institutions. This
institution fully controls the pricing, quality of production, and the harvest marketing system. It is because local
informal financial institutions have full control over information on prices, capital strength, and marketing
networks, which are not shared with farmers. Therefore, farmers do not have the power to determine the things
mentioned above, resulting in low bargaining power and the creation of faux post-harvest independence. It means
that local informal financial institutions entirely regulate farmers' income.
Market price information circulating among farmers is limited to discussions between farmers. The actual market
price is only known by local informal financial institutions due to their advantage in the marketing network and
the capital strength to buy commodity farmers at any price level, according to the estimates of the local informal
financial institution. Generally, the institution will buy commodities from farmers at a price level of 25-40 percent
lower than the market price. The margin for the purchase is entirely the right of the local financial institution.
Sometimes, farmers and local financial institutions bargain to set prices. It is not uncommon for farmers to only
receive a predetermined amount. It is because each farmer has a contract with an informal local financial
institution. The trust factor between informal financial institutions and farmers results in the formation of a
patron-client relationship pattern, which in the long run leads to a pattern of the impoverishment of farmers.
Tables 1 and 2 show the price system used for citrus and sweet corn commodities at the research location. For the
citrus commodity (Table 1), there are two price-fixing mechanisms by local financial institutions, namely using
grade and average prices. The citrus products cultivated by farmers are the varieties of Baby Java, Pontianak
Siem, and Batu 55. During the harvest season, the rate applied is the lowest price, while the highest price will
depend on the offering value in the market. When the supply is low, the highest price will be applied because
local financial institutions need a high supply to meet market needs before and after the main harvest. These local
financial institutions usually supply to industrial markets and supermarkets.
Meanwhile, for sweet corn (Table 2), local informal financial institutions apply a partnership pattern by offering
two assistance schemes. In the first scheme, the institution provides capital assistance for cultivation, which must
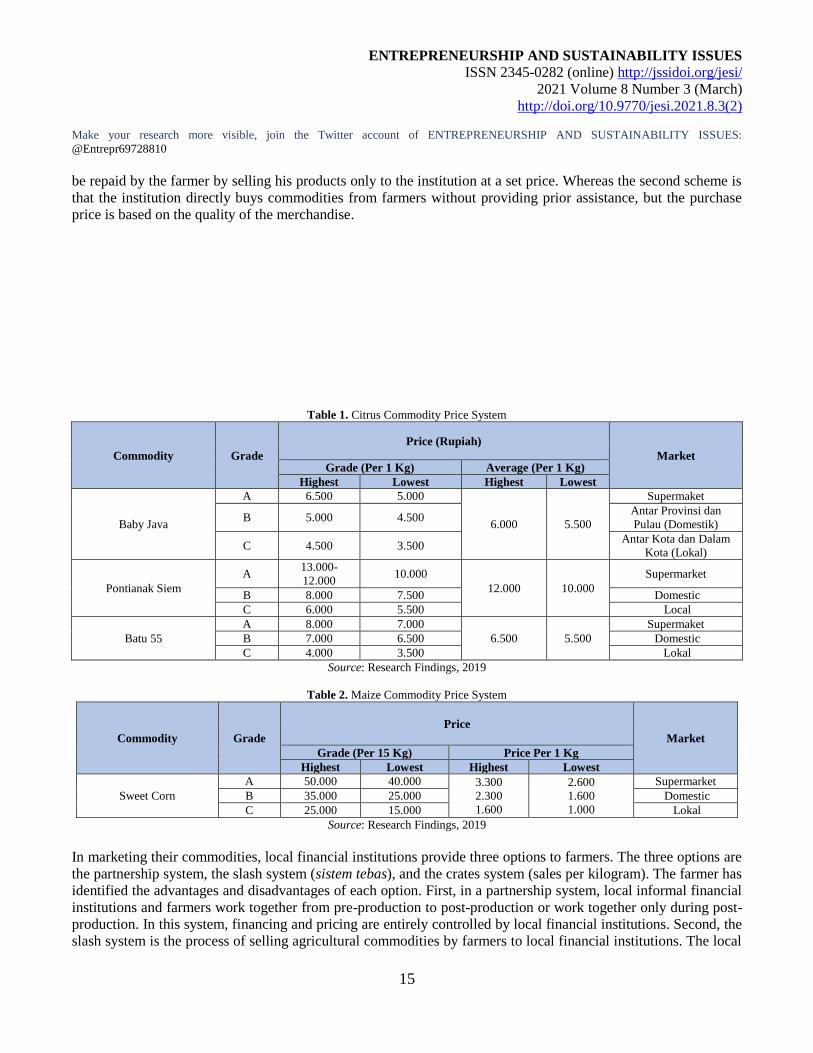
ENTREPRENEURSHIP AND SUSTAINABILITY ISSUES
ISSN 2345-0282 (online) http://jssidoi.org/jesi/
2021 Volume 8 Number 3 (March)
http://doi.org/10.9770/jesi.2021.8.3(2)
Make your research more visible, join the Twitter account of ENTREPRENEURSHIP AND SUSTAINABILITY ISSUES:
@Entrepr69728810
15
be repaid by the farmer by selling his products only to the institution at a set price. Whereas the second scheme is
that the institution directly buys commodities from farmers without providing prior assistance, but the purchase
price is based on the quality of the merchandise.
Table 1. Citrus Commodity Price System
Commodity Grade
Price (Rupiah)
Market Grade (Per 1 Kg) Average (Per 1 Kg)
Highest Lowest Highest Lowest
Baby Java
A 6.500 5.000
6.000 5.500
Supermaket
B 5.000 4.500 Antar Provinsi dan
Pulau (Domestik)
C 4.500 3.500 Antar Kota dan Dalam
Kota (Lokal)
Pontianak Siem
A 13.000-
12.000 10.000
12.000 10.000
Supermarket
B 8.000 7.500 Domestic
C 6.000 5.500 Local
Batu 55
A 8.000 7.000
6.500 5.500
Supermaket
B 7.000 6.500 Domestic
C 4.000 3.500 Lokal
Source: Research Findings, 2019
Table 2. Maize Commodity Price System
Commodity Grade
Price
Market
Grade (Per 15 Kg) Price Per 1 Kg
Highest Lowest Highest Lowest
Sweet Corn
A 50.000 40.000 3.300
2.300
1.600
2.600
1.600
1.000
Supermarket
B 35.000 25.000 Domestic
C 25.000 15.000 Lokal
Source: Research Findings, 2019
In marketing their commodities, local financial institutions provide three options to farmers. The three options are
the partnership system, the slash system (sistem tebas), and the crates system (sales per kilogram). The farmer has
identified the advantages and disadvantages of each option. First, in a partnership system, local informal financial
institutions and farmers work together from pre-production to post-production or work together only during post-
production. In this system, financing and pricing are entirely controlled by local financial institutions. Second, the
slash system is the process of selling agricultural commodities by farmers to local financial institutions. The local
ENTREPRENEURSHIP AND SUSTAINABILITY ISSUES
ISSN 2345-0282 (online) http://jssidoi.org/jesi/
2021 Volume 8 Number 3 (March)
http://doi.org/10.9770/jesi.2021.8.3(2)
Make your research more visible, join the Twitter account of ENTREPRENEURSHIP AND SUSTAINABILITY ISSUES:
@Entrepr69728810
16
financial institution determines the price standard in this system. Furthermore, the agency will sort the products
based on their quality and quantity for sale in different market segments. The quality of the commodities will, of
course, result in different prices.
The third pattern, the crates pattern, is only applied to citrus commodities. In this system, plastic crates or baskets
with a carrying capacity of 35 kg are used to weigh commodities. Of the commodities weighed in the crates, two
kilograms of net weight will be deducted. One kilogram of empty containers will be borne by the farmer, while
the institution will bear the price of one kilogram of rotten oranges. Thus, the average weight of oranges in the
crate is 33 Kg. The crates pattern has two pricing systems based on grade and average, where the majority of
farmers agree to use the average system to maintain the price level. Basically, the grading system is used to
increase aggregate income.
Pricing, crop quality, and marketing systems that are entirely tied to local informal financial institutions show a
pattern of farmer dependence on the role of local financial institutions in post-harvest independence. This
dependence is understandable because the farmers are only trying to survive on their own to maintain agriculture.
It seems that the policies and institutional systems formulated by the government weaken the bargaining power of
farmers and reduce agricultural productivity. Subsidized fertilizers are often distributed late, and the price
becomes expensive when farmers need it. Besides, the land conversion process is accelerating and does not take
into account the availability of agricultural land for sustainable food sovereignty. Farmers have not enjoyed the
method of ultra credit financing for farmers at the grassroots (Suyatna et al., 2016). In fact, post-harvest
independence for farmers requires comprehensive information on the market in the form of price stability and
farmer-market networks. The institution should be built and managed by farmers and a combination of farmer
groups independently (Utama et al., 2019; Arsanti and Bohme, 2018; Flor et al., 2016)
4.3. Relationship of Post-Harvest Self-Reliance with Farmers Impoverishment
The domination of the role of local informal financial institutions in post-harvest activities can create a pattern of
the impoverishment of farmers, either directly or indirectly. The deepening of these two patterns can be explored
as recommendations for future research. The two patterns are in the form of (a) creating a sustainable dependence
on the productivity and welfare of farmers; and (b) asymmetric information processing on prices. In general,
farmers do not have a large capital capacity to exist and be productive. These two patterns have unwittingly
created a structured and sustainable process of impoverishment of farmers.
The system of unwritten agreements between farmers and local informal financial institutions can lead to farmer
dependence. As a result, farmers cannot enjoy real welfare that is proportional to the efforts they have made.
Furthermore, the absence of social ties among farmer groups causes farmers to move away from the mutual
cooperation system, which actually will strengthen sustainable farmer group independence. Currently, farmers are
often apathetic and try their own way without thinking about the social attachments of farmers in the past
Indonesian agricultural culture in the form of mutual cooperation (gotong royong). Structurally, it is necessary to
improve the mutual cooperation system as a strong social bond to reduce farmers' dependence on local informal
financial institutions. Basically, mutual cooperation is not only the responsibility of farmers but also the
government to facilitate collaboration between farmers and related stakeholders in the business, industrial, and
academic world.
Furthermore, the asymmetric information used by local informal financial institutions should be resolved. This
information gap is in the form of marketing networks both in traditional markets, between islands and in retail,
ENTREPRENEURSHIP AND SUSTAINABILITY ISSUES
ISSN 2345-0282 (online) http://jssidoi.org/jesi/
2021 Volume 8 Number 3 (March)
http://doi.org/10.9770/jesi.2021.8.3(2)
Make your research more visible, join the Twitter account of ENTREPRENEURSHIP AND SUSTAINABILITY ISSUES:
@Entrepr69728810
17
which have different price standards based on the quality and quantity of local commodities. Local informal
financial institutions currently benefit from these price differences. Meanwhile, farmers can only get prices based
on agreements that have been made with local informal financial institutions. Indirectly, this asymmetric
information closes efforts to increase income and create sustainable farmer independence. Without clear price
information and adequate capital, farmers will continue to be in the shadow of massive impoverishment by local
informal financial institutions. For this reason, once again, facilitation from the government is needed in creating
cross-stakeholder collaboration (Slamet et al., 2017; Besser et al., 2017). The collaboration aims to improve
farmer welfare by providing access to market price information for farmers, increasing farmer empowerment-
based partnership opportunities, and increasing the capacity and capability of farmers in general.
5. Conclusion
Currently, farmers can be said to have been independent in agricultural land processing activities as a result of
Indonesia's strong agrarian culture. However, in post-harvest activities, farmers become dependent on the role of
local informal financial institutions. This is due to the limited capital owned by farmers and limited information
controlled by local informal financial institutions. With control of this information, financial institutions can
create a marketing system that provides multiple benefits to the institution, thereby reducing farmer welfare.
Two patterns of post-harvest farmer self-reliance are (a) creating sustainable dependence on farmer productivity
and welfare; and (b) robust pricing information asymmetric processes. For this reason, the government needs to
intervene and make policies that integrate the process of empowering farmers with cooperation in the business
and industrial world. These government intervention efforts can be supported by an approach to mutual
collaboration and culture, as well as a reliable kinship system in agricultural culture in Indonesia. Without this
approach, the negative impact of the domination of local informal financial institutions cannot be minimized in
real terms.
References
Akobeng, Eric. (2017). Safety Net For Agriculture: Effect of Idiosynoratio Income Shock on Remittance Payments. International Journal of
Social Economics, 44(1), 2-20. https://doi.org/10.1108/IJSE-12-2014-0271
Arsanti, I.W., Bohme, M.H. (2018). Organic Vegetable Production in Java-Challenge for the Chili Growers. IOP Conf.Series: Earth and
Environmental Science 215, 012035, 1-6. https://doi.org/10.1088/1755-1315/215/1/012035
Besser, T., Jurt, C., dan Mann, S. (2017). Agricultural Structure and Farmers' Interconnections With Rural Communities. International
Jurnal of Social Economics, 44(3), 362-376. https://doi.org/10.1108/IJSE-09-2015-0237
Berner, S, Derler, H, Rehorska R, Babst,S, Seebacher, U. (2019). Roadmapping to Enhance Local Food Supply: Case Study of a City-
Region in Austria. Sustainability (Switzerland) 11, 4, Article Number 3876. https://doi.org/10.3390/su11143876.
Christensen, A. (2014). Staying Put: The Endeavors and Wisdoms of Farmers in Twenty-First-Century Sustainable Agriculture. Humanity
& Society, 38(3), 295-313. https://doi.org/10.1177/0/605976/4537795
Flor, R.J, Singleton, G, Casimero, M, Abidin, Z, Razak, N, Maat, H, Leeuwis, C. (2018). Farmers, Institutions, and Technology in
Agricultural Change Processes: Outcomes from Adaptive Research on Rice Production in Sulawesi, Indonesia. International
Journal of Agricultural Sustainability, 14(2), 166-186. https://doi.org/10.1080/14735903.2015.1066976
Lubis, Z. (2014). Indonesian Agriculture Sector: Important but Negligible. Social Sciences (Pakistan), 9(6), 456-459.
https://doi.org/10.3923/sscience.2014.456.459
Khan, M.Z, Ullah, R., Nawaz, A, Ashraf, E. (2018). Farmers' Empowerment by Farm Services Centers: A Pedagogic Approach for
Sustainable Development. Sarhad Journal of Agriculture, 34(2), 225-232. https://doi.org/10.17582/journal.sja/2018/34.2.225.232
Mubyarto. (1994 a). Introduction to Agricultural Economics (Pengantar Ekonomi Pertanian). Jakarta: LP3ES.
Mubyarto. (1994 b). Politics of Agriculture and Rural Development (Politik Pertanian dan Pembangunan Pedesaan). Jakarta: Sinar
Harapan.
Mubyarto. (2004). Neoliberalism and the Economic Crisis (Neoliberalisme & Krisis Ilmu Ekonomi). Yogyakarta: PUSTEP UGM.
Sajogyo. (2005). Empowerment of the People's Economy in the Globalization Stage (Pemberdayaan Ekonomi Rakyat Dalam Kancah
Globalisasi). Jakarta: Sajogyo Inti Utama and the Association of Agricultural Economics.
ENTREPRENEURSHIP AND SUSTAINABILITY ISSUES
ISSN 2345-0282 (online) http://jssidoi.org/jesi/
2021 Volume 8 Number 3 (March)
http://doi.org/10.9770/jesi.2021.8.3(2)
Make your research more visible, join the Twitter account of ENTREPRENEURSHIP AND SUSTAINABILITY ISSUES:
@Entrepr69728810
18
Saqib, Shahab E, Kowornu, John K.M., Ahmad, Mokbul Morshed, Panezai, Sanaullah. (2017). Subsistence Farmers' Access to Agricultural
Credit and its Adequacy Some Empirical Evidences from Pakistan. International Journal of Social Economics, 45(4), 644-660.
https://doi.org/10.1108/IJSE-12-2016-0347
Sesbany. 2008. Strengthening Farmers 'Institutions to Improve Farmers' Bargaining Positions (Penguatan Kelembagaan Petani untuk
Meningkatkan Posisi Tawar Petani). Medan: STTP.
Slamet, Alim Setiawan, Nakayasu, Akira, dan Ichikawa, Masahiro. (2017). Small-Scale Vegetable Farmers' Participation in Modern Retail
Market Channels in Indonesia: The Determinants of and Effects on Their Income. Agriculture 7(11)
https://doi.org/10.3390/agriculture7020011
Skovdal, M, Cornish, F. (2015).Qualitative Research for Development A Guide for Practitioners.UK: Practical Action Publishing.
Suman, A dan Putra, REN. (2015). Towards Development More Inclined On Farmers (A Study CaseOf Jatiguwi Village-Sumberpucung
District-Malang Regency). Procedia –Social and Behavioral Sciences, 211 C, 342-347.
https://doi.org/10.1016/j.sbspro.2015.10.044
Suseno, D dan Suyatna, H. (2006). Quo Vadis Indonesian Farmers! Negligance of the Nation's Children from the Agriculture Sector (Quo
Vadis Petani Indonesia! Terhempasnya Anak Bangsa dari Sektor Pertanian). Yogyakarta: Penerbit Aditya Media.
Soeparno, H, Perbangsa, A.S, Pardamean, B. (2018). Best Practices of Agriculture Information System in the Context of Knowledge and
Innovation. 2018 International Conference on Information Management and Technology (ICIMTech), IEEE, 489-494.
https://doi.org/10.1109/ICIMTech.2018.8528187
Suyatna, H. Suharko. Kusumasari, B. Margono, S.A. Suparlan. Subagyo, A. Ranintya, R. Hastutiningtyas, N. (2016). Agricultural
Liberalization, Climate Change and Farmer Marginalization: Studies in Sleman and Gunungkidul Regencies (Liberalisasi
Pertanian, Perubahan Iklim dan Marginalisasi Petani: Studi di Kabupaten Sleman dan Gunungkidul). Yogyakarta: Penerbit Gava
Media.
Partadireja, Ace. (1974) Rural Credit: The Ijon System. Bulletin of Indonesian Economic Studies, 10(3), 54-71.
https://doi.org/10.1080/0074917412332559
Preissel, S, Zander, P, Knierim, A. (2017). Sustanining Farming on Marginal Land: Farmers' Convictions, Motivations and Strategies in
Northeastern Germany. European Society for Rural Sociology. Sociologia Ruralis, 57(51), 682-708.
https://doi.org/10.1111/soru.12168
Putra, REN dan Suyatna, H. (2018). Genealogy of Power in Policy Development of Organic Agriculture in "Pardikan Region" Java
(Genealogi Kuasa dalam Kebijakan Pengembangan Pertanian Organik di “Wilayah Pardikan” Jawa). Journal of Sociological
Thought (Jurnal Pemikiran Sosiologi), 5(1), 69-84. https://doi.org/10.22146/jps.v5i1.35403
Purwanegara, M.S., Aprianingsih, A, Hanniel, J.J, Ismail, W.K.W. (2018). Bringing Collaborative Inclusiveness to Indonesian
Agribussiness in West Java Thorough Online Platform. International Journal of Agricultural Resources, Governance, and Ecology,
1, 1-19. https://doi.org/10.1504/IJARGE.2018.090848
Utama, S, Suwarsi, A.A, Listiono. (2019). The Role of Islamic Banking in Agriculture Financing (Case Study of Indonesian Agriculture
Sector). Humanities & Social Sciences Reviews, 7(2), 261-269. https://doi.org/10.18510/hssr.2019.7230
Wulandari, E., Meuwissen, M.P.M. and Oude Lansink, A.G.J.M. (2015). "Comparing farmers knowledge about finance with the
requirements set by finance providers: an in-depth assessment for horticulture in Indonesia", paper presented in 29th International
Conference of Agricultural Economists in Milan, International Association of Agricultural Economists (IAAE), 9-15 August.
Wulandari, E., Meuwissen, M.P.M., Karmana M.H, and Oude Lansink, A.G.J.M. (2017). Performance and Access to Finance in Indonesian
Horticulture. British Food Journal, 119(3), 625-638. https://doi.org/10.1108/BFJ-06-2016-0236
Acknowledgments
This research was supported by Grant Professor of the Faculty of Economics and Business through the Fund Tax State
Revenue (PNBP) Brawijaya University (2019), with the number Contract Agreement: 03075/UN10.F02/PN/2019.
ENTREPRENEURSHIP AND SUSTAINABILITY ISSUES
ISSN 2345-0282 (online) http://jssidoi.org/jesi/
2021 Volume 8 Number 3 (March)
http://doi.org/10.9770/jesi.2021.8.3(2)
Make your research more visible, join the Twitter account of ENTREPRENEURSHIP AND SUSTAINABILITY ISSUES:
@Entrepr69728810
19
Agus SUMAN is Professor of Economy Development/Economy Political, Faculty of Economics and Business, Universitas
Brawijaya Malang. Currently being given the mandate as Dean of the Faculty of Cultural Sciences, Universitas Brawijaya
(2017-present). Research interests: economy development, economy political, and local economy development.
ORCID ID: https://orcid.org/0000-0001-8963-1738
Dwi Budi SANTOSO is Associate Professor in the Department of Economics of the Faculty of Economics and Business,
Brawijaya University Malang. Currently Director of Development Economics and Society Study Center Faculty of
Economics and Business, University of Brawijaya Malang. Research interests: economy development and development
planning.
ORCID ID: https://orcid.org/0000-0002-5991-2632
Ronny Ersya Novianto PUTRA is a researcher who studies the people's economy and farmers' welfare. The founder of
Gardana Indonesia and Ecodeus Institute. Research interests: economy society, farmer welfare studies, and local economy
development.
ORCID ID: https://orcid.org/0000-0003-0688-2449
Attachment
a. Excerpts from The Interviews Listed in 4.1.
“Mas, karena jeruk (komoditas buah-buahan) waktunya panjang, mengakibatkan para petani itu makin guyub, ya terkadang
kalau ada masalah batang (komoditas jeruk) gitu terkadang dibahas bersama antar petani, terus gawe pupuk lan mes (pestisida)
opo seng tepat (lalu pakai pupuk dan pestisida apa yang tepat), bahkan soal harga upah buruh tani antar petani sudah saling
bersepakat, pokok kalau tandur (pra-produksi sampai produksi) kami sangat saling membantu satu sama lainnya, ya begitu mas
yang diajarkan bapak-bapak kami kepada kami, sehingga sampai sekarang masih tetap begitu”.
(Because oranges require a long planting period, the farmers get together. Sometimes, if there is a problem with the crop, we will
discuss it together. The best use of fertilizers and pesticides, even the wages of farm laborers, the farmers will agree. The point is,
in agricultural matters, we help each other because that is what our parents taught us, from the past until now) (Interview with
KYI, 2019)
“Waduh mas, nek petani sayur iku saiki kyok dewe-dewe nek mulai tandur sampai nek ono masalah pas tandur, kyok angel mas
gotong royong iku, pokok kepingin e oleh koyoh cepet mas terus, wes ora peduli ambik kancane (Aduh mas, kalau petani sayur-
mayur sekarang suka sendiri-sendiri (individualistik) mulai pra produksi-produksi sampai kalau ada masalah dalam pra-
produksi-produksi, sulit sekali mas untuk gotong royong, inginnya dapat pendapatan cepat terus, tanpa peduli sama teman
(petani lainnya)”
(Unfortunately, the vegetable (maize) farmers now go their separate ways, both during the planting period and beyond. They
hardly want to help each other. They want to get a lot of results immediately and don't care about their friends' problems.)
(Interview with SPO, 2019).
“Mas, gotong royong petani itu masih kuat di Bocek, kalau soal nandur saja (budidaya) antar petani masih saling bantu mas, ya
meskipun kalau kurang modal buat nandur (budidaya) banyak yang ngambil ke bakul (lembaga keuangan lokal), terkadang
sama bakul dipengaruhi tapi petani punya cara sendiri dan pilihan sendiri buat nentukan bibitmya, ya pupuk, ya pestisida, ya
berapa jumlah buruh taninya, yang penting dalam urusan nandur petani tetap berpegang teguh pada budaya gotong royong
bapak-bapak kami dulu dalam bertani mas, meskipun petani gak punya modal besar tapi urusan nandur petani punya harga diri
untuk tetap mandiri mas”
(Cooperation between farmers in Bocek is still strong, especially in terms of planting. As for the problem of capital,
unfortunately, we also have difficulties so that we cannot help each other. They generally borrow money from the institutions.
Sometimes, the institutions will influence what kind of commodity to be planted. Although farmers ultimately have their way of
planting products. Starting from seeds, pesticides, to wages. What is important is that we farmers still stick to the methods our
father taught us. Even though we as farmers do not have capital, at least we still have our pride to remain independent in
agriculture) (Interview with MA, 2019)
ENTREPRENEURSHIP AND SUSTAINABILITY ISSUES
ISSN 2345-0282 (online) http://jssidoi.org/jesi/
2021 Volume 8 Number 3 (March)
http://doi.org/10.9770/jesi.2021.8.3(2)
Make your research more visible, join the Twitter account of ENTREPRENEURSHIP AND SUSTAINABILITY ISSUES:
@Entrepr69728810
20
b. Excerpts from The Interviews Listed in 4.2.
“Petani itu sudah pasrah sama bakul (Lembaga Keuangan Lokal), harga kami tidak tau, yang kami tau ada grade dan rata-rata
terus kami bisa pilih pakai kilonan dan tebas kalau jual ke mereka, kalau ada utang ke bakul wah malah kita diatur wes
(Wah,pasti kita akan diatur sudah), pakai kiloan atau tebas, begitu pula harganya, petani cuma iya-iya, yang penting jeruk kita
habis, utang kita gak ada dan kita dapat tanam lagi dan ada tabungan sedikit, gitu aja sudah kita syukuri mas” (Hasil
Wawancara dengan PU, 2019).
(We farmers have surrendered to them (local informal financial institutions). We don't know the price. What we do know is the
grade and average price, and we can choose the system to sell to them. If we owe them money, we will a lot of arrangements.
Farmers can only accept. We are grateful enough if our oranges sold out, we have no debt, we can plant more, and have savings.)
(Interview with PU, 2019)
“Kalau jagung manis ini mas, pasrah wes (menyerahkan kepada) sama bakulnya (lembaga keuangan lokal, walaupun kita bisa
mandiri soal bibit, pupuk dan pestisida, masio (meskipun) belinya (bibit, pupuk, pestisida) dari berhutang ke bakulnya (lembaga
keuangan lokal). Mas kalau panennya raya gitu bakulnya pinter harga terendah yang berikan ke petani, lah kalau gak panen
raya baru harga tertinggi. Ya, kalau untung dapat harga tertinggi utang bisa lunas penuh dan dapat untung lumayan, tapi kalau
rugi dapat harga terendah utang dicicil mas, panen lagi berdoa biar dapat harga tertinggi supaya nutup utang yang lalu, kalau
gak ya pulih terikat sudah sama bakulnya (lembaga keuangan lokal) mas sampai utangnya lunas, jadi petani harus berhati-hati.
Intinya mas, petani cuma bisa bersyukur, kalau bakulnya (lembaga keuangan lokal) makin (semakin) kaya-kaya mas”.
(We leave the sweet corn business to the seller (a local informal financial institution). Even though we can be independent, we
still owe all of our farming equipment. When the big harvest arrives, the seller will give the lowest price to the farmers. When its
not (big harvest time), we will get the highest price so that we will profit and be able to repay our debt. We can only pray for a
good price so that we can pay our debts. The point is we can only be grateful for what we get, while they (local informal financial
institutions) become getting richer) (Interview with HJ0, 2019)
“Bakul (lembaga keuangan lokal kalau di Beji sini biasanya petaninya suruh panen dulu, bakul bawa ke pasar, harganya petani
gak tau, yang petani tau dapat berapa ton/kuintal yang dibawa ke pasar, terus nanti kalau dari pasar bakul (lembaga keuangan
lokal) nyeritakno oleh rego sak mene koyo e sak mene (lembaga keuangan lokal menceritakan dapat harga di pasar berapa,
kemudian dapat hasil berapa), terus dari hasil itu kalau petani utang yang dipotong tergantung kesepakatan sisanya ya jadi
pendapatan buat petani, yang penting dapat berapa-pun disyukuri mas”
(In Beji, generally, the sellers (local informal financial institutions) will ask us, farmers, to harvest first. Then they bring to the
market, where we don't know anything about the price. What the farmers know is how many tons we collected. Upon their return,
the seller will tell us how much they got and how much our share is. From this result, if we have debt, it will be immediately
deducted according to the agreement. Meanwhile, the rest is for our daily use. We can only be grateful no matter what we get))
(Interview with SPO, 2019).
Make your research more visible, join the Twitter account of ENTREPRENEURSHIP AND SUSTAINABILITY ISSUES:
@Entrepr69728810
___________________________________________________________________________________________
__ Copyright © 2021 by author(s) and VsI Entrepreneurship and Sustainability Center
This work is licensed under the Creative Commons Attribution International License (CC BY).
http://creativecommons.org/licenses/by/4.0/
ENTREPRENEURSHIP AND SUSTAINABILITY ISSUES
ISSN 2345-0282 (online) http://jssidoi.org/jesi/
2021 Volume 8 Number 3 (March)
http://doi.org/10.9770/jesi.2021.8.3(3)
Publisher http://jssidoi.org/esc/home
40
CUSTOMER ORIENTATED LEADER – CONTRIBUTION TO FUTURE RESEARCH*
Urszula Widelska ¹, Marta Jarocka 2, Laima Jeseviciute-Ufartiene 3, Zivile Jezerske 4
1,2 Bialystok University of Technology, Wiejska Street 45A, Bialystok Poland 3,4 Vilnius Gediminas Technical University Saulėtekio al. 11, Vilnius 10221, Lithuania
E-mails:1 [email protected] ; 2 [email protected]; 3 [email protected]; 4 [email protected]
Received 12 February 2020; accepted 20 December 2020; published 30 March 2020
Abstract. Both leadership and customer orientation are widely described in management sciences. As independent cognitive categories,
they are a frequent subject of research. Customer orientation is still evolving mainly due to the dynamics of changes in the company's
environment. The perception of the company as a system and being at the same time a visionary, a strategist and a decision-maker and
having an impact on the employees’ subject is responsible for the client's benefits and the creation of its value resulting from building a
relationship. This is the role of the leaders in enterprises. The assumption of such an assumption is justified, because in practice marketing
orientation means creating a company mission based on values significant for the client, ensuring the participation of all employees in
creating growing values for the client and including it in the process of creating value. Nowaday we can talk about a customer-oriented
leader. The aim of the study is to identify types of customer-oriented leaders in the commercial and service sector, and to systematize
knowledge in terms of leadership and customer orientation. The choice of the sector resulted from the often close and direct relationships
that take place in the exchange process. Methods of the research: quantitative studies Computer Assisted Web Interviewing (CAWI),
monographic/descriptive method, cluster analysis.
Keywords: leadership; customer orientation; trade and service sector; innovations
Reference to this paper should be made as follows: Widelska, U., Jeseviciute-Ufartiene, L., Jezerske, Z. 2021. Customer orientated leader
– contribution to future research, Entrepreneurship and Sustainability Issues, 8(3), 40-52. http://doi.org/10.9770/jesi.2021.8.3(3)
JEL Classifications: M112, M331, M551
* The studies have been carried out as part of a project financed by the National Science Center in Poland, reg. No. 2017/01/
X / HS4 / 01009).
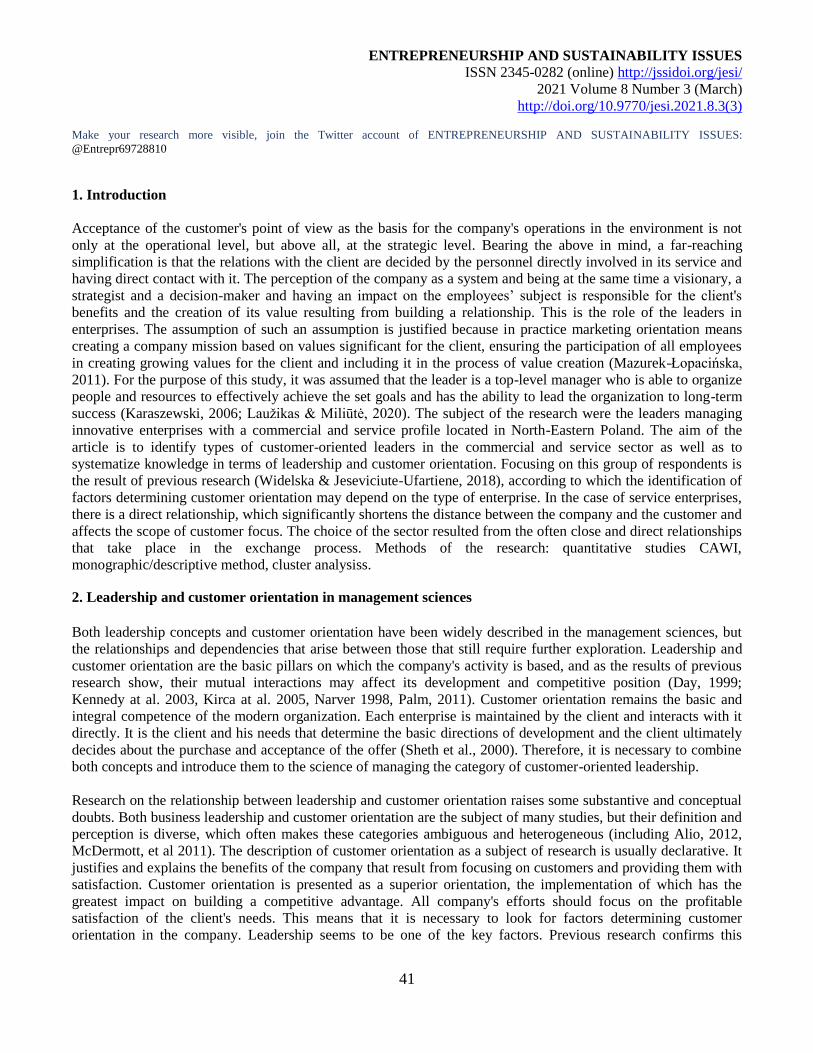
ENTREPRENEURSHIP AND SUSTAINABILITY ISSUES
ISSN 2345-0282 (online) http://jssidoi.org/jesi/
2021 Volume 8 Number 3 (March)
http://doi.org/10.9770/jesi.2021.8.3(3)
Make your research more visible, join the Twitter account of ENTREPRENEURSHIP AND SUSTAINABILITY ISSUES:
@Entrepr69728810
41
1. Introduction
Acceptance of the customer's point of view as the basis for the company's operations in the environment is not
only at the operational level, but above all, at the strategic level. Bearing the above in mind, a far-reaching
simplification is that the relations with the client are decided by the personnel directly involved in its service and
having direct contact with it. The perception of the company as a system and being at the same time a visionary, a
strategist and a decision-maker and having an impact on the employees’ subject is responsible for the client's
benefits and the creation of its value resulting from building a relationship. This is the role of the leaders in
enterprises. The assumption of such an assumption is justified because in practice marketing orientation means
creating a company mission based on values significant for the client, ensuring the participation of all employees
in creating growing values for the client and including it in the process of value creation (Mazurek-Łopacińska,
2011). For the purpose of this study, it was assumed that the leader is a top-level manager who is able to organize
people and resources to effectively achieve the set goals and has the ability to lead the organization to long-term
success (Karaszewski, 2006; Laužikas & Miliūtė, 2020). The subject of the research were the leaders managing
innovative enterprises with a commercial and service profile located in North-Eastern Poland. The aim of the
article is to identify types of customer-oriented leaders in the commercial and service sector as well as to
systematize knowledge in terms of leadership and customer orientation. Focusing on this group of respondents is
the result of previous research (Widelska & Jeseviciute-Ufartiene, 2018), according to which the identification of
factors determining customer orientation may depend on the type of enterprise. In the case of service enterprises,
there is a direct relationship, which significantly shortens the distance between the company and the customer and
affects the scope of customer focus. The choice of the sector resulted from the often close and direct relationships
that take place in the exchange process. Methods of the research: quantitative studies CAWI,
monographic/descriptive method, cluster analysiss.
2. Leadership and customer orientation in management sciences
Both leadership concepts and customer orientation have been widely described in the management sciences, but
the relationships and dependencies that arise between those that still require further exploration. Leadership and
customer orientation are the basic pillars on which the company's activity is based, and as the results of previous
research show, their mutual interactions may affect its development and competitive position (Day, 1999;
Kennedy at al. 2003, Kirca at al. 2005, Narver 1998, Palm, 2011). Customer orientation remains the basic and
integral competence of the modern organization. Each enterprise is maintained by the client and interacts with it
directly. It is the client and his needs that determine the basic directions of development and the client ultimately
decides about the purchase and acceptance of the offer (Sheth et al., 2000). Therefore, it is necessary to combine
both concepts and introduce them to the science of managing the category of customer-oriented leadership.
Research on the relationship between leadership and customer orientation raises some substantive and conceptual
doubts. Both business leadership and customer orientation are the subject of many studies, but their definition and
perception is diverse, which often makes these categories ambiguous and heterogeneous (including Alio, 2012,
McDermott, et al 2011). The description of customer orientation as a subject of research is usually declarative. It
justifies and explains the benefits of the company that result from focusing on customers and providing them with
satisfaction. Customer orientation is presented as a superior orientation, the implementation of which has the
greatest impact on building a competitive advantage. All company's efforts should focus on the profitable
satisfaction of the client's needs. This means that it is necessary to look for factors determining customer
orientation in the company. Leadership seems to be one of the key factors. Previous research confirms this
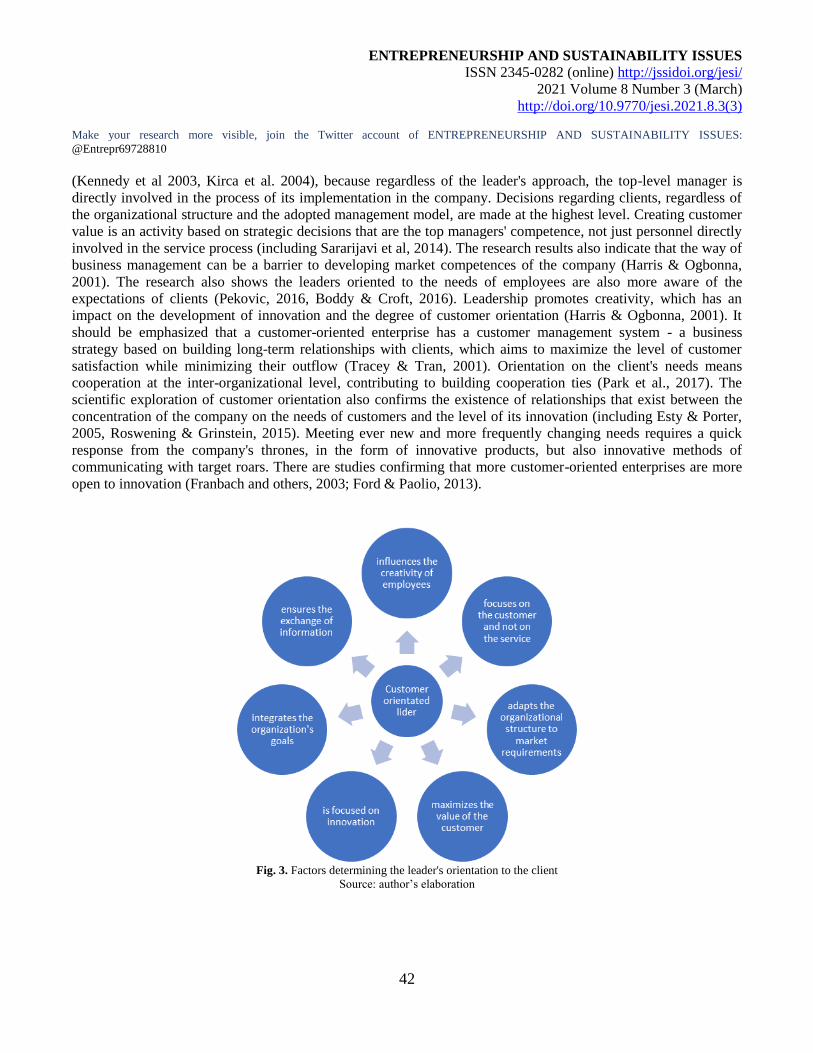
ENTREPRENEURSHIP AND SUSTAINABILITY ISSUES
ISSN 2345-0282 (online) http://jssidoi.org/jesi/
2021 Volume 8 Number 3 (March)
http://doi.org/10.9770/jesi.2021.8.3(3)
Make your research more visible, join the Twitter account of ENTREPRENEURSHIP AND SUSTAINABILITY ISSUES:
@Entrepr69728810
42
(Kennedy et al 2003, Kirca et al. 2004), because regardless of the leader's approach, the top-level manager is
directly involved in the process of its implementation in the company. Decisions regarding clients, regardless of
the organizational structure and the adopted management model, are made at the highest level. Creating customer
value is an activity based on strategic decisions that are the top managers' competence, not just personnel directly
involved in the service process (including Sararijavi et al, 2014). The research results also indicate that the way of
business management can be a barrier to developing market competences of the company (Harris & Ogbonna,
2001). The research also shows the leaders oriented to the needs of employees are also more aware of the
expectations of clients (Pekovic, 2016, Boddy & Croft, 2016). Leadership promotes creativity, which has an
impact on the development of innovation and the degree of customer orientation (Harris & Ogbonna, 2001). It
should be emphasized that a customer-oriented enterprise has a customer management system - a business
strategy based on building long-term relationships with clients, which aims to maximize the level of customer
satisfaction while minimizing their outflow (Tracey & Tran, 2001). Orientation on the client's needs means
cooperation at the inter-organizational level, contributing to building cooperation ties (Park et al., 2017). The
scientific exploration of customer orientation also confirms the existence of relationships that exist between the
concentration of the company on the needs of customers and the level of its innovation (including Esty & Porter,
2005, Roswening & Grinstein, 2015). Meeting ever new and more frequently changing needs requires a quick
response from the company's thrones, in the form of innovative products, but also innovative methods of
communicating with target roars. There are studies confirming that more customer-oriented enterprises are more
open to innovation (Franbach and others, 2003; Ford & Paolio, 2013).
Fig. 3. Factors determining the leader's orientation to the client
Source: author’s elaboration
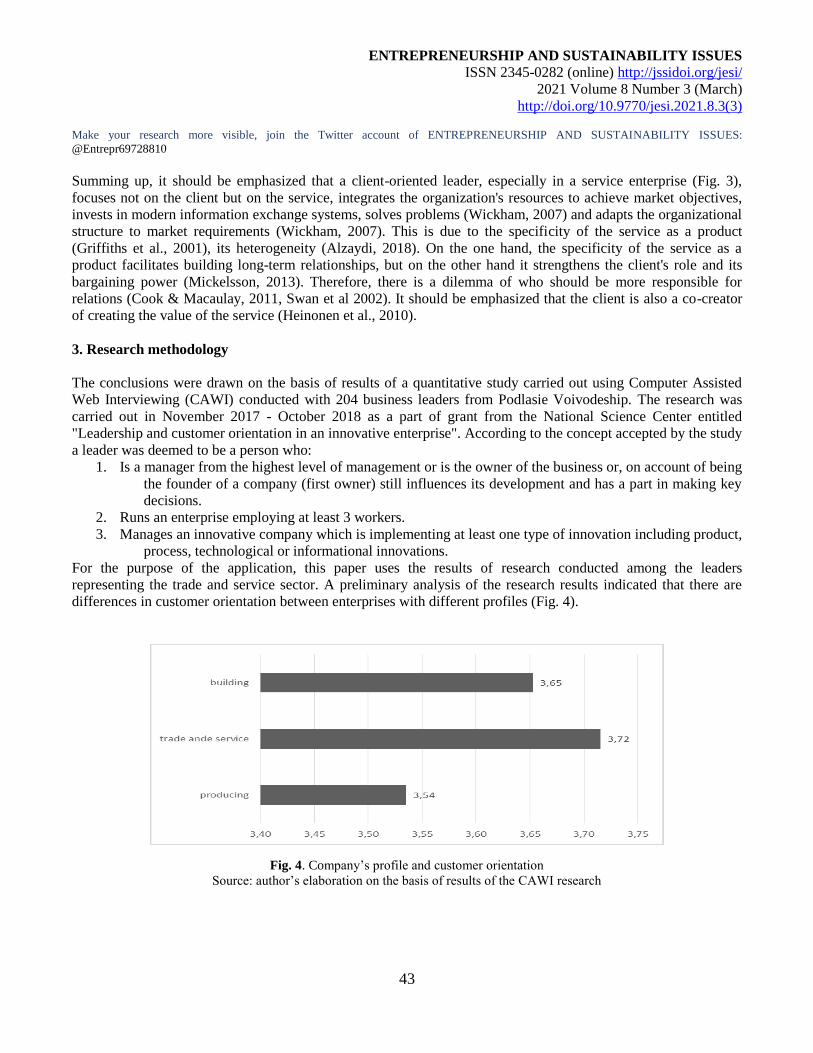
ENTREPRENEURSHIP AND SUSTAINABILITY ISSUES
ISSN 2345-0282 (online) http://jssidoi.org/jesi/
2021 Volume 8 Number 3 (March)
http://doi.org/10.9770/jesi.2021.8.3(3)
Make your research more visible, join the Twitter account of ENTREPRENEURSHIP AND SUSTAINABILITY ISSUES:
@Entrepr69728810
43
Summing up, it should be emphasized that a client-oriented leader, especially in a service enterprise (Fig. 3),
focuses not on the client but on the service, integrates the organization's resources to achieve market objectives,
invests in modern information exchange systems, solves problems (Wickham, 2007) and adapts the organizational
structure to market requirements (Wickham, 2007). This is due to the specificity of the service as a product
(Griffiths et al., 2001), its heterogeneity (Alzaydi, 2018). On the one hand, the specificity of the service as a
product facilitates building long-term relationships, but on the other hand it strengthens the client's role and its
bargaining power (Mickelsson, 2013). Therefore, there is a dilemma of who should be more responsible for
relations (Cook & Macaulay, 2011, Swan et al 2002). It should be emphasized that the client is also a co-creator
of creating the value of the service (Heinonen et al., 2010).
3. Research methodology
The conclusions were drawn on the basis of results of a quantitative study carried out using Computer Assisted
Web Interviewing (CAWI) conducted with 204 business leaders from Podlasie Voivodeship. The research was
carried out in November 2017 - October 2018 as a part of grant from the National Science Center entitled
"Leadership and customer orientation in an innovative enterprise". According to the concept accepted by the study
a leader was deemed to be a person who:
1. Is a manager from the highest level of management or is the owner of the business or, on account of being
the founder of a company (first owner) still influences its development and has a part in making key
decisions.
2. Runs an enterprise employing at least 3 workers.
3. Manages an innovative company which is implementing at least one type of innovation including product,
process, technological or informational innovations.
For the purpose of the application, this paper uses the results of research conducted among the leaders
representing the trade and service sector. A preliminary analysis of the research results indicated that there are
differences in customer orientation between enterprises with different profiles (Fig. 4).
Fig. 4. Company’s profile and customer orientation
Source: author’s elaboration on the basis of results of the CAWI research
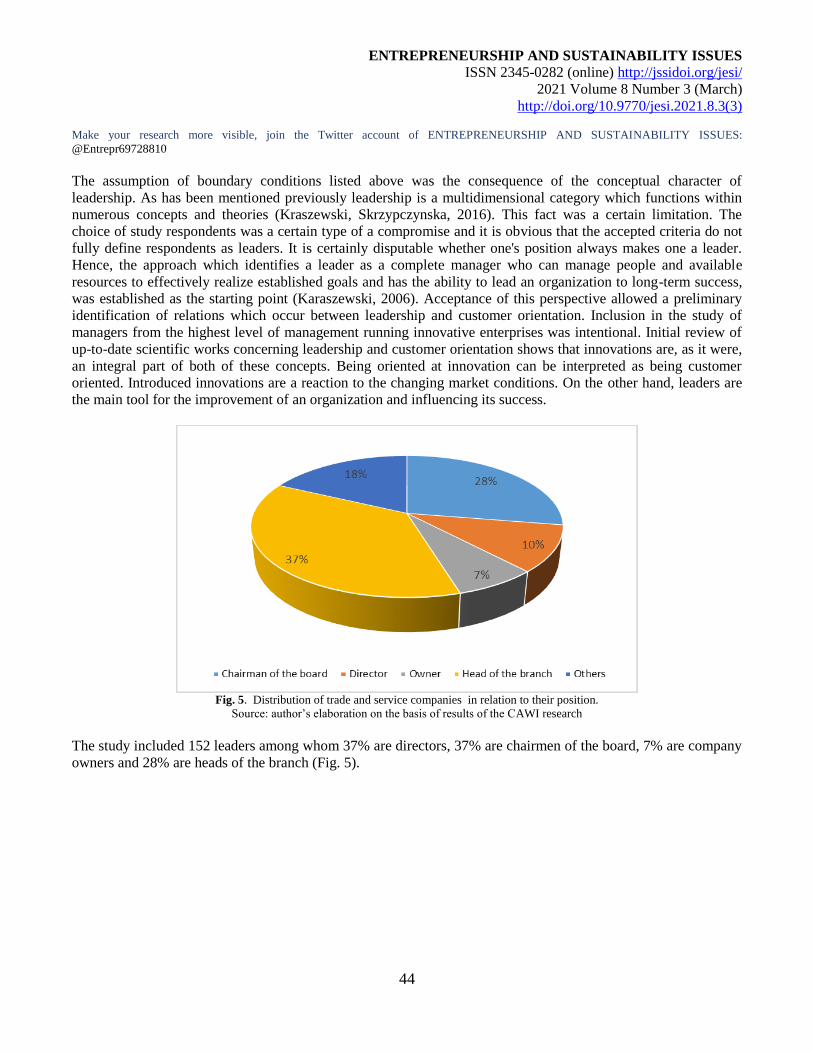
ENTREPRENEURSHIP AND SUSTAINABILITY ISSUES
ISSN 2345-0282 (online) http://jssidoi.org/jesi/
2021 Volume 8 Number 3 (March)
http://doi.org/10.9770/jesi.2021.8.3(3)
Make your research more visible, join the Twitter account of ENTREPRENEURSHIP AND SUSTAINABILITY ISSUES:
@Entrepr69728810
44
The assumption of boundary conditions listed above was the consequence of the conceptual character of
leadership. As has been mentioned previously leadership is a multidimensional category which functions within
numerous concepts and theories (Kraszewski, Skrzypczynska, 2016). This fact was a certain limitation. The
choice of study respondents was a certain type of a compromise and it is obvious that the accepted criteria do not
fully define respondents as leaders. It is certainly disputable whether one's position always makes one a leader.
Hence, the approach which identifies a leader as a complete manager who can manage people and available
resources to effectively realize established goals and has the ability to lead an organization to long-term success,
was established as the starting point (Karaszewski, 2006). Acceptance of this perspective allowed a preliminary
identification of relations which occur between leadership and customer orientation. Inclusion in the study of
managers from the highest level of management running innovative enterprises was intentional. Initial review of
up-to-date scientific works concerning leadership and customer orientation shows that innovations are, as it were,
an integral part of both of these concepts. Being oriented at innovation can be interpreted as being customer
oriented. Introduced innovations are a reaction to the changing market conditions. On the other hand, leaders are
the main tool for the improvement of an organization and influencing its success.
Fig. 5. Distribution of trade and service companies in relation to their position.
Source: author’s elaboration on the basis of results of the CAWI research
The study included 152 leaders among whom 37% are directors, 37% are chairmen of the board, 7% are company
owners and 28% are heads of the branch (Fig. 5).
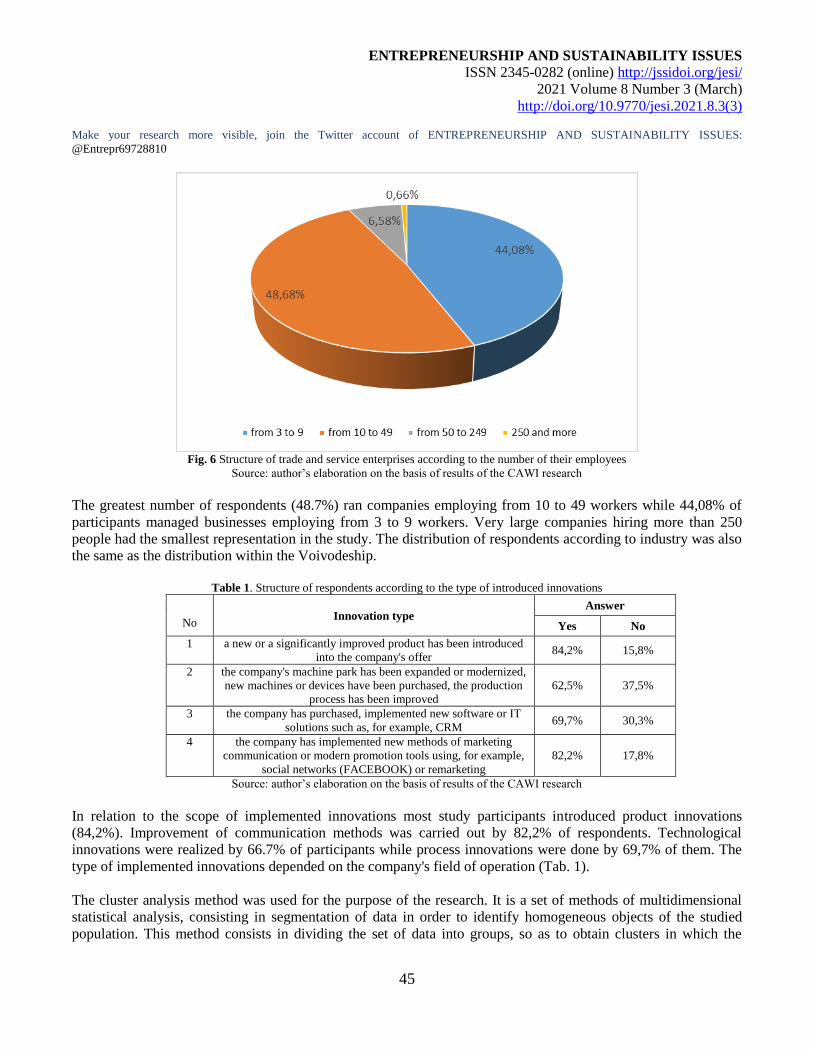
ENTREPRENEURSHIP AND SUSTAINABILITY ISSUES
ISSN 2345-0282 (online) http://jssidoi.org/jesi/
2021 Volume 8 Number 3 (March)
http://doi.org/10.9770/jesi.2021.8.3(3)
Make your research more visible, join the Twitter account of ENTREPRENEURSHIP AND SUSTAINABILITY ISSUES:
@Entrepr69728810
45
Fig. 6 Structure of trade and service enterprises according to the number of their employees
Source: author’s elaboration on the basis of results of the CAWI research
The greatest number of respondents (48.7%) ran companies employing from 10 to 49 workers while 44,08% of
participants managed businesses employing from 3 to 9 workers. Very large companies hiring more than 250
people had the smallest representation in the study. The distribution of respondents according to industry was also
the same as the distribution within the Voivodeship.
Table 1. Structure of respondents according to the type of introduced innovations
Innovation type Answer
No Yes No
1 a new or a significantly improved product has been introduced
into the company's offer 84,2% 15,8%
2 the company's machine park has been expanded or modernized,
new machines or devices have been purchased, the production
process has been improved
62,5% 37,5%
3 the company has purchased, implemented new software or IT
solutions such as, for example, CRM 69,7% 30,3%
4 the company has implemented new methods of marketing
communication or modern promotion tools using, for example,
social networks (FACEBOOK) or remarketing
82,2% 17,8%
Source: author’s elaboration on the basis of results of the CAWI research
In relation to the scope of implemented innovations most study participants introduced product innovations
(84,2%). Improvement of communication methods was carried out by 82,2% of respondents. Technological
innovations were realized by 66.7% of participants while process innovations were done by 69,7% of them. The
type of implemented innovations depended on the company's field of operation (Tab. 1).
The cluster analysis method was used for the purpose of the research. It is a set of methods of multidimensional
statistical analysis, consisting in segmentation of data in order to identify homogeneous objects of the studied
population. This method consists in dividing the set of data into groups, so as to obtain clusters in which the
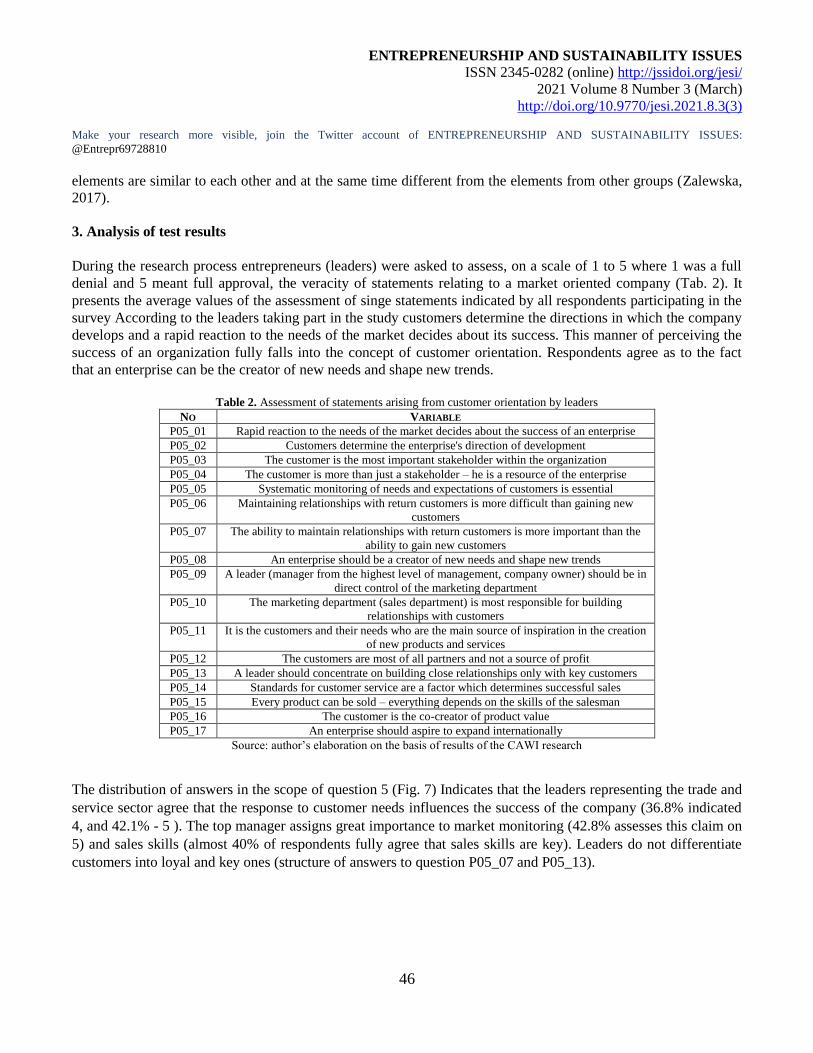
ENTREPRENEURSHIP AND SUSTAINABILITY ISSUES
ISSN 2345-0282 (online) http://jssidoi.org/jesi/
2021 Volume 8 Number 3 (March)
http://doi.org/10.9770/jesi.2021.8.3(3)
Make your research more visible, join the Twitter account of ENTREPRENEURSHIP AND SUSTAINABILITY ISSUES:
@Entrepr69728810
46
elements are similar to each other and at the same time different from the elements from other groups (Zalewska,
2017).
3. Analysis of test results
During the research process entrepreneurs (leaders) were asked to assess, on a scale of 1 to 5 where 1 was a full
denial and 5 meant full approval, the veracity of statements relating to a market oriented company (Tab. 2). It
presents the average values of the assessment of singe statements indicated by all respondents participating in the
survey According to the leaders taking part in the study customers determine the directions in which the company
develops and a rapid reaction to the needs of the market decides about its success. This manner of perceiving the
success of an organization fully falls into the concept of customer orientation. Respondents agree as to the fact
that an enterprise can be the creator of new needs and shape new trends.
Table 2. Assessment of statements arising from customer orientation by leaders
NO VARIABLE
P05_01 Rapid reaction to the needs of the market decides about the success of an enterprise
P05_02 Customers determine the enterprise's direction of development
P05_03 The customer is the most important stakeholder within the organization
P05_04 The customer is more than just a stakeholder – he is a resource of the enterprise
P05_05 Systematic monitoring of needs and expectations of customers is essential
P05_06 Maintaining relationships with return customers is more difficult than gaining new
customers
P05_07 The ability to maintain relationships with return customers is more important than the
ability to gain new customers
P05_08 An enterprise should be a creator of new needs and shape new trends
P05_09 A leader (manager from the highest level of management, company owner) should be in
direct control of the marketing department
P05_10 The marketing department (sales department) is most responsible for building
relationships with customers
P05_11 It is the customers and their needs who are the main source of inspiration in the creation
of new products and services
P05_12 The customers are most of all partners and not a source of profit
P05_13 A leader should concentrate on building close relationships only with key customers
P05_14 Standards for customer service are a factor which determines successful sales
P05_15 Every product can be sold – everything depends on the skills of the salesman
P05_16 The customer is the co-creator of product value
P05_17 An enterprise should aspire to expand internationally
Source: author’s elaboration on the basis of results of the CAWI research
The distribution of answers in the scope of question 5 (Fig. 7) Indicates that the leaders representing the trade and
service sector agree that the response to customer needs influences the success of the company (36.8% indicated
4, and 42.1% - 5 ). The top manager assigns great importance to market monitoring (42.8% assesses this claim on
5) and sales skills (almost 40% of respondents fully agree that sales skills are key). Leaders do not differentiate
customers into loyal and key ones (structure of answers to question P05_07 and P05_13).
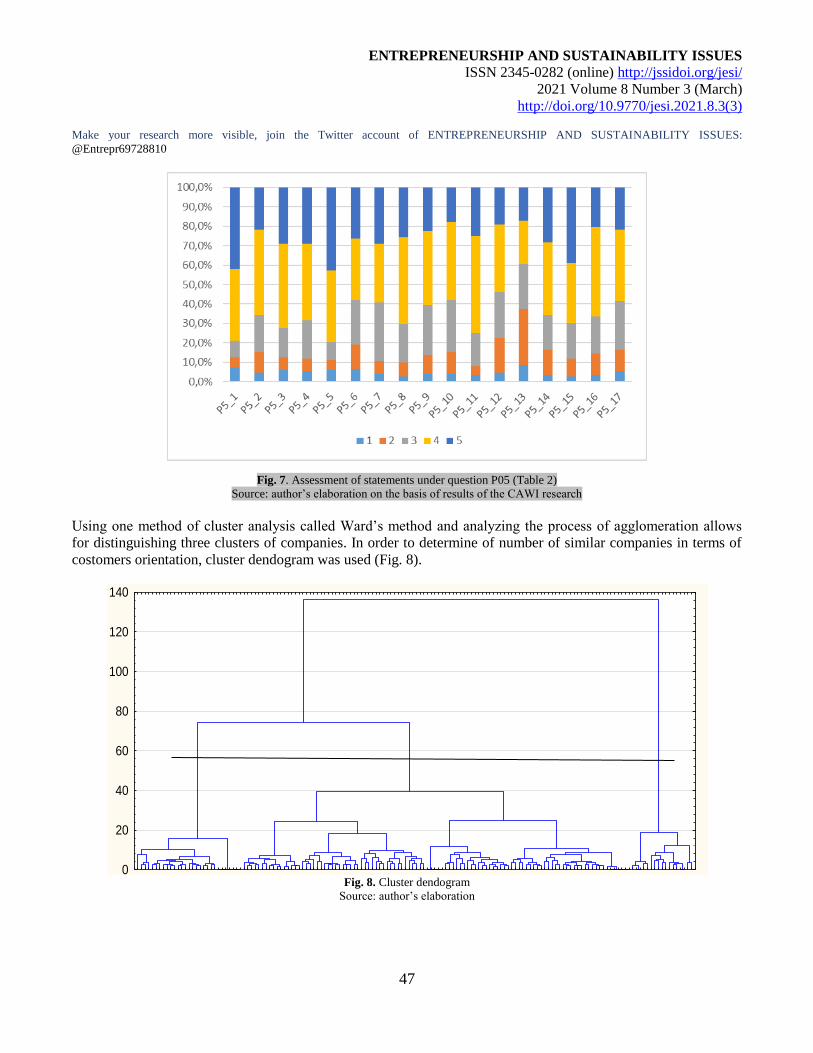
ENTREPRENEURSHIP AND SUSTAINABILITY ISSUES
ISSN 2345-0282 (online) http://jssidoi.org/jesi/
2021 Volume 8 Number 3 (March)
http://doi.org/10.9770/jesi.2021.8.3(3)
Make your research more visible, join the Twitter account of ENTREPRENEURSHIP AND SUSTAINABILITY ISSUES:
@Entrepr69728810
47
Fig. 7. Assessment of statements under question P05 (Table 2)
Source: author’s elaboration on the basis of results of the CAWI research
Using one method of cluster analysis called Ward’s method and analyzing the process of agglomeration allows
for distinguishing three clusters of companies. In order to determine of number of similar companies in terms of
costomers orientation, cluster dendogram was used (Fig. 8).
Diagram drzewa
53
75
27
20
122
116
54
123
82
42
32
113
86
17
135
111
63
14
126
37
44 7
119
112
108
76
28
22 6
140
152
151
144
79
57
56
149
146
141
50
150
145
147
148 4
131
127
117
60
96
41
125
91
58
73
19
77
62
61
121 5
115
74
21
81
97
139
13
109
103
35
29 8
12
52
85
45
95 3
124
110
107
71
23
94
68
67
78
34
31
98
48
15
105
59
36
120
142
33
88
83 9
132
80
143
51
130
114
30
106
10
136
26
118
87
25
102
100
92
133
99
64
70
66
89
90
43
16
138
104
84
69
65
11 2
46
128
40
49
24
129
72
39
93
38
134
137
101
55
18
47 1
0
20
40
60
80
100
120
140
Odle
gło
ść w
iąz.
Fig. 8. Cluster dendogram
Source: author’s elaboration
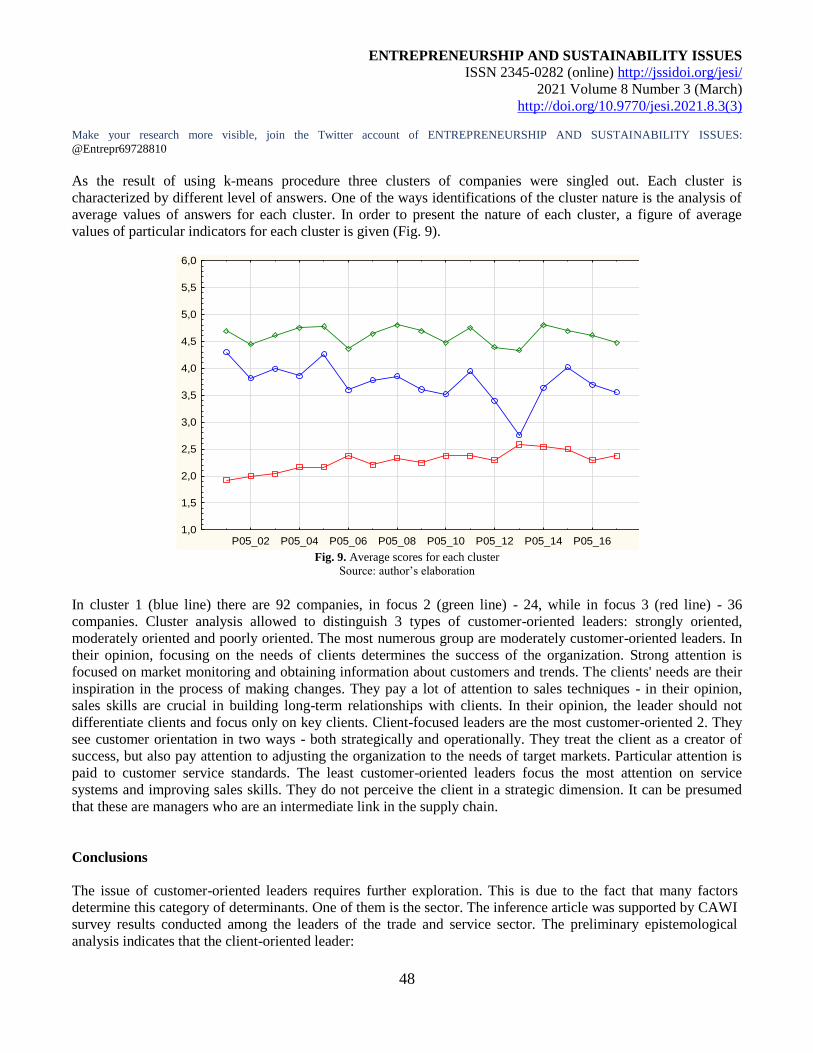
ENTREPRENEURSHIP AND SUSTAINABILITY ISSUES
ISSN 2345-0282 (online) http://jssidoi.org/jesi/
2021 Volume 8 Number 3 (March)
http://doi.org/10.9770/jesi.2021.8.3(3)
Make your research more visible, join the Twitter account of ENTREPRENEURSHIP AND SUSTAINABILITY ISSUES:
@Entrepr69728810
48
As the result of using k-means procedure three clusters of companies were singled out. Each cluster is
characterized by different level of answers. One of the ways identifications of the cluster nature is the analysis of
average values of answers for each cluster. In order to present the nature of each cluster, a figure of average
values of particular indicators for each cluster is given (Fig. 9).
Wykr. średnich każd. skupienia
Skupien. 1 Skupien. 2 Skupien. 3
P05_02 P05_04 P05_06 P05_08 P05_10 P05_12 P05_14 P05_16
Zmienne
1,0
1,5
2,0
2,5
3,0
3,5
4,0
4,5
5,0
5,5
6,0
Fig. 9. Average scores for each cluster
Source: author’s elaboration In cluster 1 (blue line) there are 92 companies, in focus 2 (green line) - 24, while in focus 3 (red line) - 36
companies. Cluster analysis allowed to distinguish 3 types of customer-oriented leaders: strongly oriented,
moderately oriented and poorly oriented. The most numerous group are moderately customer-oriented leaders. In
their opinion, focusing on the needs of clients determines the success of the organization. Strong attention is
focused on market monitoring and obtaining information about customers and trends. The clients' needs are their
inspiration in the process of making changes. They pay a lot of attention to sales techniques - in their opinion,
sales skills are crucial in building long-term relationships with clients. In their opinion, the leader should not
differentiate clients and focus only on key clients. Client-focused leaders are the most customer-oriented 2. They
see customer orientation in two ways - both strategically and operationally. They treat the client as a creator of
success, but also pay attention to adjusting the organization to the needs of target markets. Particular attention is
paid to customer service standards. The least customer-oriented leaders focus the most attention on service
systems and improving sales skills. They do not perceive the client in a strategic dimension. It can be presumed
that these are managers who are an intermediate link in the supply chain.
Conclusions
The issue of customer-oriented leaders requires further exploration. This is due to the fact that many factors
determine this category of determinants. One of them is the sector. The inference article was supported by CAWI
survey results conducted among the leaders of the trade and service sector. The preliminary epistemological
analysis indicates that the client-oriented leader:
ENTREPRENEURSHIP AND SUSTAINABILITY ISSUES
ISSN 2345-0282 (online) http://jssidoi.org/jesi/
2021 Volume 8 Number 3 (March)
http://doi.org/10.9770/jesi.2021.8.3(3)
Make your research more visible, join the Twitter account of ENTREPRENEURSHIP AND SUSTAINABILITY ISSUES:
@Entrepr69728810
49
• focuses on the client and not on the service;
• adapts the organizational structure to market requirements;
• integrates the organization's goals;
• provides information exchange;
• affects the creativity of employees;
• is focused on innovation;
• maximizes the value of the customer.
Conducted cluster analysis confirms the importance of customer orientation in the commercial and service sector.
The separated groups point to a high degree of concentration, which is appropriate for enterprises of this type.
However, there are leaders characterized by low level of orientation and focusing primarily on the operational
sphere. The test results submitted should be regarded as preliminary.
References
Allio, R.J. (2012). Leaders and leadership – many theories, but what advice reliable?, Strategy&Leadership, 41(1), 4-14.
Alzaydi, Z. M., Al-Hajla, A., Nguyen, B., Jayawardhena, C. (2018). A review of service quality and service delivery: Towards a customer
co-production and customer-integration approach. Business Process Management Journal, 24(1), 295-328. https://doi.org/10.1108/
Boddy, C.R., Croft, R. (2016). Marketing in a time of toxic leadership, Qualitative Market Research: An International Journal. 19(1), 44-
64.
Cook, S., Macaulay S., (1997). Customer service: what’s a smile got to do with it?. Managing Service Quality: An International Journal,
7(5), 248-252. https://doi.org/10.1108/09604529710172890
Day, G. S. (1999). Creating a market-driven organization, Sloan Management Review, 41(1), 11-22.
Deschamps, J-P. (2005). Different Leadership skills for different innovation strategies. Strategy & Leadership, 33(5), 31-38.
Esty, D.C. & Porter, M.E. (2005). National environmental performance: an empirical analysis of policy results and determinants.
Environment and Development Economics, 10(4), 391-434.
Foley, A. & Fahy, J. (2004). Towards a further understanding of the development of market orientation in the firm: a conceptual framework
based on the market-sensing capability. Journal of Strategic Marketing, 12(4), 219-230.
Ford, D. & Paladino, A. (2013). Enabling innovation through strategic synergies. Journal of Product Innovation Management, 30(6), 1058-
1072.
Gallarza, M.G. & Gil-Saura, I. (2011). The value of value: further excursions on the meaning and role of customer value, Journal of
Consumer Behaviour, 10(4), 179-191.
Griffiths, B.E. & Amos, D. (2001). A customer‐supplier interaction model to improve customer focus in turbulent markets. Managing
Service Quality. An International Journal, 11(1), 57-67. https://doi.org/10.1108/09604520110366151
Harris, L.C. & Ogbonna, E. (2001). Leadership style and market orientation: an empirical study. European Journal of Marketing, 35(5/6),
744-764.
Hunitie, M. (2018). Impact of strategic leadership on strategic competitive advantage through strategic thinking and strategic planning: a
bi-meditational research. Business: Theory and Practice, 19, 322-330. https://doi.org/doi.org/10.3846/btp.2018.32
ENTREPRENEURSHIP AND SUSTAINABILITY ISSUES
ISSN 2345-0282 (online) http://jssidoi.org/jesi/
2021 Volume 8 Number 3 (March)
http://doi.org/10.9770/jesi.2021.8.3(3)
Make your research more visible, join the Twitter account of ENTREPRENEURSHIP AND SUSTAINABILITY ISSUES:
@Entrepr69728810
50
Karaszewski, R. (2006). Nowoczesne systemy zarządzania jakością (Modern quality management systems). Toruń: TNOiK.
Kennedy, K.N., Goolsby, J.R. & Arnould, E.J. (2003). Implementing a customer orientation: extension of theory and application. Journal
of Marketing, 67(4), 67-81.
Khalifa, A.S. (2004). Customer value: a review of recent literature and an integrative configuration. Management Decision, 42(5/6), 645-
666.
Kibbeling, M., der Bij, H. & Weele, A. (2013). Market orientation and innovativeness in supply chains: supplier’s impact on customer
satisfaction. Journal of Product Innovation Management, 30(3), 500-515.
Kirca, A.H., Jayachandran, S. & Bearden, W.O. (2005). Market orientation: a meta-analytic review and assessment of its antecedents and
impact on performance. Journal of Marketing, 69(2), 24-41.
Kraszewski, R. & Skrzypczynska, K. (2016). Przywództwo w biznesie (Business leadership). Toruń: TNOiK.
Laužikas, M., & Miliūtė, A. (2020). Human resource management effects on sustainability of high-tech companies: what Lithuania and
South Korea can learn from each other. Insights into Regional Development, 2(2), 562-579. https://doi.org/10.9770/IRD.2020.2.2(5)
Mazurek – Lopacinska, K. (2011). Orientacja na klienta (Customer Focus). Warszawa: PWE.
Mickelsson, K-J. (2013). Customer activity in service. Journal of Service Management, 24(5), 534-552. https://doi.org/10.1108/JOSM-04-
2013-0095
Narver, J.C. & Slater, F.S. (1990). The effect of a market orientation on business profitability, Journal of Marketing, 54(October), 20-35.
Palm, P. (2011). Customer orientation in real‐estate companies: The espoused values of customer relations. Property Management, 29(2),
130-145. https://doi.org/10.1108/02637471111122435
Pekovic, S., Rolland, S., & Gatigin, H. (2016). Customer orientation and organizational innovation: the case study of environmental
management practices. Journal of Business & Industrial Marketing, 31(7), 835-848.
Rosenzweig, S. & Grinstein, A. (2015). How resource challenges can improve firm innovation performance: identifying coping strategies.
Creativity and Innovation Management, 25(1), 110-128.
Saarijarvi, H., Kuusela, H., Neilimo, K. & Narvanen, E. (2014). Disentangling customer orientation – executive perspective. Business
Process Management Journal, 20(5), 663-677.
Sheth, J.N., Sisodia, R.S. & Sharma, A. (2000). The antecedents and consequences of customer-centric marketing, Academy of Marketing
Science, 28(1), 55-66.
Tracey, M. & Tan, C. (2001). Empirical analysis of supplier selection and involvement, customer satisfaction, and firm performance.
Supply Chain Management: An International Journal, 6(4), 174-88.
Wickham, P. (2007). Framing strategic communication for the growth‐orientated organization. Business Strategy Series, 1(8), 64-71,
https://doi.org/10.1108/17515630710686905
Zuraik, A. & Kelly, L. (2018). The role of CEO transformational leadership and innovation climate in exploration and exploitation.
European Journal of Innovation Management, 78-98.li, V. (2012). Forecasting Exchange Rates: a Comparative Analysis. International
Journal of Business and Social Science, 3(10), 31-45. https://doi.org/10.12846/j.em.2015.02.06
ENTREPRENEURSHIP AND SUSTAINABILITY ISSUES
ISSN 2345-0282 (online) http://jssidoi.org/jesi/
2021 Volume 8 Number 3 (March)
http://doi.org/10.9770/jesi.2021.8.3(3)
Make your research more visible, join the Twitter account of ENTREPRENEURSHIP AND SUSTAINABILITY ISSUES:
@Entrepr69728810
51
Acknowledgements
The studies have been carried out as part of a project financed by the National Science Center in Poland, reg. No. 2017/01/
X / HS4 / 01009).
Urszula WIDELSKA
ORCID ID: 0000-0002-4273-936X
Marta JAROCKA
ORCID ID: 0000-0002-2610-8007
Laima JESEVICIUTE-UFARTIENE
ORCID ID: 0000-0001-9054-368X
Zivile JEZERSKE ORCID ID: 0000-0002-3137-8159
___________________________________________________________________________________________Copyright © 2021 by author(s) and VsI Entrepreneurship and Sustainability Center This work is licensed under the Creative Commons Attribution International License (CC BY).
http://creativecommons.org/licenses/by/4.0/
ENTREPRENEURSHIP AND SUSTAINABILITY ISSUES
ISSN 2345-0282 (online) http://jssidoi.org/jesi/
2021 Volume 8 Number 3 (March)
http://doi.org/10.9770/jesi.2021.8.3(4)
Publisher http://jssidoi.org/esc/home
53
THE COVID-19 PANDEMIC AND RESILIENCE OF SMEs IN LITHUANIA*
Erika Župerkienė ¹, Ligita Šimanskienė ², Daiva Labanauskaitė 3, Julija Melnikova 4, Vida Davidavičienė 5
1,2,3,4 Klaipeda University, S. Neries str. 5, LT-92227 Klaipeda, Lithuania 5 Vilnius Gediminas Technical University, Sauletekio al. 11, LT-10223 Vilnius, Lithuania
E-mails:1 [email protected] ; [email protected]; [email protected]; [email protected]; [email protected]
Received 30 December 2020; accepted 21 February 2021; published 30 March 2021
Abstract. The article focuses on a relevant scientific and practical problem of the present, i.e., the resilience of organisations in the face of
the COVID-19 pandemic. The aim is, upon analysing the response of organisations to the threats related to the COVID-19-caused
restrictions on economic activity, to identify the predominant behaviour of organisations that predetermines their resilience. The theoretical
part discusses the leadership aspect of the heads of organisations and the ability of organisations to survive in the conditions of uncertainty.
The findings of the research in small and medium-sized enterprises (SMEs) of Klaipėda Region are presented. The research methods
chosen to deal with a scientific problem in the theoretical part include an analysis of literature sources, systematisation, synthesis,
generalisation, and comparison. In the empirical research, quantitative research, i.e., a questionnaire survey and data processing methods,
was applied. Due to the specificity of the region, the majority of the surveyed business entities (71.3%) are from the services sector, while
the rest of the surveyed companies belong to the manufacturing (15%) and trade (13.7%) sectors. The research established that most of the
organisations surveyed benefited from the government support. On assessing the survey data and summarising the response and efforts of
organisations to deal with uncertainties, a conclusion was drawn that SMEs' response to uncertainties was mainly focused on the protection
against threats and avoidance of risk, however, the organisations lacked preparedness and consistency when dealing with unforeseen
circumstances.
Keywords: organisational resilience; small and medium-sized enterprise (SME); COVID 19 pandemic.
Reference to this paper should be made as follows: Župerkienė, E., Šimanskienė, L., Labanauskaitė, D., Melnikova, J., Davidavičienė, V.
2021. The COVID-19 Pandemic and Resilience of SME’s in Lithuania. Entrepreneurship and Sustainability Issues, 8(3), 53-65.
http://doi.org/10.9770/jesi.2021.8.3(4)
JEL Classifications: M12, M21
*The research was conducted in the framework of the research project Assessment of the Effectiveness of COVID-19-Related
Restrictions on Economic Activity and the Impact of State Intervention Measures on Enterprises in the Klaipėda Region (No.
P-COV-20-51), funded by the Research Council of Lithuania (LMTLT). The duration of the project has been 6 months (28 06
20 to 31 12 2020). Grant Agreement Number P-COV-20-51.
ENTREPRENEURSHIP AND SUSTAINABILITY ISSUES
ISSN 2345-0282 (online) http://jssidoi.org/jesi/
2021 Volume 8 Number 3 (March)
http://doi.org/10.9770/jesi.2021.8.3(4)
Make your research more visible, join the Twitter account of ENTREPRENEURSHIP AND SUSTAINABILITY ISSUES:
@Entrepr69728810
54
1. Introduction
Due to the COVID-19 pandemic, after the introduction of the first lockdown in Lithuania (16 March 2020), a
large number of Lithuanian companies faced unprecedented challenges. The Government of Lithuania proposed
state interventions aimed at reducing the negative economic impact on national businesses. The global pandemic
outbreak (COVID-19) continues to pose serious challenges to executives at all levels in different size
organisations. Emergency management at various levels is becoming a regular routine for the leaders of
organisations. They realise the inevitability of changes, and therefore they improve strategies for dealing with
unknown challenges; the behaviour of organisations is to be changed in order to adapt to new situations and
changes. People have to accept change as a part of organisational life, which is a more convenient way for them to
adapt to the situation, however, the challenges of leadership resilience to extreme conditions in organisations
remain a pressing complex issue. Resilience is understood as the ability to regain strength, vitality in recovering
from disasters, failures, and traumas, and recovery to a full-fledged life. Resilience in the context of leadership is
perceived as an essential feature of high-energy leaders able to take responsibility for maintaining the energy of
their team members. Resilience and leadership have so far been more often associated with a team's ability to
restore high levels of energy in the face of conflicts, toxic professional situations, and employment relationships.
In the face of a crisis, resilient leaders are first of all described in terms of who they are and what they do at
different times, given different priorities. The resilience of the employees, described as the ability to continually
adapt and prosper even in the face of challenges, is an individual-level design that also benefits organisations.
Resilient leadership in the face of the pandemic takes on a broader context: adapting and responding to the current
situation, recovering and strengthening, and ensuring continued, sustained, and coherent action. Small and
medium enterprises are so sensitive in environment, that managers should keep strength to continue business in all
circumstances (Bilan, Mishchuk, Roshchyk, Joshi, 2020; Chen, Liu, 2018). The scientific problem can be
formulated by a problematic question: are the organisations under review resilient to emergencies such as the
COVID 19 pandemic?
The aim of the research is, upon analysing the response of organisations to threats related to the COVID-19-
caused restrictions on economic activities, to identify the predominant behaviour of organisations that
predetermine their resilience.
Novelty of the research: assessment of the resilience of small and medium-sized enterprises (SMEs) in Klaipėda
Region (Western Lithuania) in response to the impact of the economic restrictions imposed on SMEs by the
COVID 19 lockdown.
Klaipėda Region in Western Lithuania with the population of 317,199 (11.3% of the Lithuanian population)
includes seven municipalities: those of Klaipėda, Palanga, and Neringa Cities and Klaipėda, Kretinga, Skuodas,
and Šilutė Districts. It is the only region in Lithuania on the seacoast: as many as four municipalities of the region
are located on the Baltic Sea coast, boasting long-established traditions of maritime business and a developed
tourism and recreation sector. Klaipėda Region is the third largest region in Lithuania, covering the area of 5,209
km2 with the average density of population being 61 per km2 (1). It produces 12% of the national GDP (EUR
4.29 bn.), EUR 1.11 bn Federal Direct Investments, and 48% share of exports of Lithuanian origin products.
The methods applied in the research include analysis of literature sources, systematisation, synthesis,
generalisation, and comparison in the theoretical part, and quantitative research, i.e., a questionnaire survey and
data processing methods, in the empirical research.
ENTREPRENEURSHIP AND SUSTAINABILITY ISSUES
ISSN 2345-0282 (online) http://jssidoi.org/jesi/
2021 Volume 8 Number 3 (March)
http://doi.org/10.9770/jesi.2021.8.3(4)
Make your research more visible, join the Twitter account of ENTREPRENEURSHIP AND SUSTAINABILITY ISSUES:
@Entrepr69728810
55
2. Analysis of literature
In general, resilience is understood as the ability to regain strength, vitality in recovering from disasters, failures,
and traumas, and recovery to a full-fledged life. In the context of leadership, resilience is perceived as an essential
feature of high-energy leaders able to take responsibility for maintaining the energy of their team members.
Resilience and leadership have so far been more commonly associated with a team's ability to restore high levels
of energy in the face of conflicts, toxic professional situations, and employment relationships. In the face of a
crisis, resilient leaders are first described in terms of who they are and what they do at different times, given
different priorities. Employee resilience is described as the ability to continually adapt and prosper even in the
face of challenges, i.e., an individual-level design that is also a benefit for organisations. Resilient leadership in
the face of a pandemic takes on a broader context: adapting and responding to the current situation, recovering
and strengthening, and ensuring further sustained and coherent action.
To survive in an uncertain environment and operate successfully in the future, organisations need to be able to
operate in conditions of uncertainty. Companies need to develop resilience capabilities that allow them to respond
appropriately to unexpected events that may threaten the survival of the organisation (Lengnick-Hall et al., 2011;
Walker at al., 2003).
In performing the said function, resilience differs from other resilience-related constructs, such as flexibility,
mobility, or strength. Although flexibility as an ability to adapt quickly to environmental changes (Golden and
Powell, 2000) and mobility as an ability to quickly identify opportunities, change direction, and avoid collisions
share several elements inherent in resilience, some specific accents of these constructs tend to be different
(Duchek 2020). While flexibility and mobility are needed to address day-to-day challenges and change, resilience
is an important success factor in coping with unexpected threats and crises (Lengnick-Hall et al. 2011). In
addition, resilience is associated with adaptation and allows organisations to emerge from the crisis by "jumping"
to a better position, a more advanced stage in the development process than it was before. This quality
distinguishes resilience from strength, which is defined as the ability of a system to maintain its functions despite
disturbances (Capano, Woo, 2016). Resilience is not the final state of being, but rather a process of progressive
development in a risky (uncertain) environment throughout the lifetime (Southwick et al., 2017).
Organisational resilience is defined as the ability of an organisation to effectively master and develop responses to
a specific situation and ultimately engage in transformational activities with the aim of taking advantage of
uncertainties that threaten the survival of the organisation (Lengnick-Hall, Beck, Lengnick-Hall, 2011).
According to Linnenluecke (2017), research in resilience in the area of business and management is fragmented,
broken down into several streams: organisational response to external threats, organisational reliability, employee
strengths, adaptability of business models, and design principles that reduce supply chain vulnerabilities.
The findings of that kind of research resulted in the development of definitions, conceptualisations, and the
measures of resilience. Denyer (2017), who summarised the development of thought on the topic of organisational
resilience, examined it in five directions: (1) preventive control (risk management, removal of physical barriers,
copying of operational systems, standardisation of procedures, etc.); (2) conscious action (detection of threats and
efficient response to unfamiliar or challenging situations); (3) optimisation of productivity (improvement and
extension of existing competencies, upgrading of working methods and technologies used, etc., to serve existing
customers and markets); 4) application of innovation (development, invention, and exploration of unknown
ENTREPRENEURSHIP AND SUSTAINABILITY ISSUES
ISSN 2345-0282 (online) http://jssidoi.org/jesi/
2021 Volume 8 Number 3 (March)
http://doi.org/10.9770/jesi.2021.8.3(4)
Make your research more visible, join the Twitter account of ENTREPRENEURSHIP AND SUSTAINABILITY ISSUES:
@Entrepr69728810
56
markets and new technologies); and (5) paradoxical thinking (combining the first four stages for a more
comprehensive and precise adaptation in line with the character and needs of the specific organisation activity).
Denyer (2017) also identified two main factors of organisational resilience, i.e. protective and progressive, and
two main perspectives for building resilience, i.e. consistency and flexibility; all that was to be integrated into a
holistic system that required integration, balance, and relevance (in accordance with the purpose).
Organistional resilience was defined as a multilevel concept related to an organisation's resources, routine, and
process (Wang et al. 2017). Organisations built resilience through the complex interplay of many factors at the
individual, group, and organisational levels (Xiao, Cao, 2017).
Those differences in attitudes and behaviours led to a lot of disagreement and misunderstandings in organisations,
therefore, not surprisingly, the heads of an organisation who wanted to enhance its resilience received conflicting
instructions. The role of the heads, i.e., controlling tension and balancing the four ways of building resilience,
required paradoxical thinking. The shape of the "stress square" of an organisation's resilience depended on the
nature of the organisation, its activity and its industry, and in particular on the level of uncertainty and the pace of
the industry development (the pace of changes in technology, regulations, and market). Focusing on one specific
aspect could create blind spots that might undermine an organisation's resilience.
When viewing an organisation's resilience from a procedural point of view, three stages of the resilience process
could be identified (Duchek, 2020): (1) anticipation, (2) overcoming, and (3) adaptation; resilient organisations
responded not only to the past (reactive action) or current problems (parallel action), but also to the future (active
action). That temporary structure of the resilience process was associated with the crisis management approaches.
Adaptation could help organisations avoid the negative effects of unexpected events or mitigate them in two
ways: through reflection and learning and through making use of the opportunities for organisational change. On
the one hand, organisations needed to be able to reflect on a crisis and incorporate the knowledge gained into their
existing knowledge base. On the other hand, they had to act on that knowledge and to implement change.
Promoting positive, strong employee relationships helped organisations adapt to change and maintain consistency.
Greater sustainability potential helped organisations to more successfully address unknown problems and deal
with future challenges. Also, entrepreneurs need not to forget about competitiveness and innovations in
organizations (Decyk, 2020).
Researchers around the world had been actively involved in research into the implications of COVID-19. Some of
them placed more emphasis on the importance of medical professionals' general condition (Greenberg, Docherty,
Gnanapragasam, Wessely 2020; Flanagan, Chadwick, Goodrich, Ford, Wickens 2020), on psychosocial societal
issues (Dubey, Biswas, Ghosh, Chatterjee, Dubey, Chatterjee, Lahiri, Lavie 2020; Al-Tammemi, Akour, Alfalah
2020), and the need for clear communication with the public in the event of the pandemic (Vaughan, Tinker 2009,
Brooks, Webster, Smith, Woodland, Wessely, Greenberg, Rubin, 2020), on information and communication
technologies empowerment in remote work (Pretorius, Davidavičienė, 2018; Davidavičienė, Al Majzoub,
Meidute-Kavaliauskiene 2020) while other researchers modelled the scenarios of their countries' development
during and after the pandemic (Rezk, Piccinetti, Radwan, Salem, Sakr, Khasawneh, 2020). Such researchers as
Besenyő and Kármán (2020) examined effects of COVID-19 pandemy on a counry’s health, political and
economic strategy. State intervention in the operation of organisations by suspending their activity or providing
support in the case of crises is not a new phenomenon (Maşca, Văidean, Golgut, 2011), however, it became a
global phenomenon in the context of the global COVID-19 pandemic. Therefore, we will review the impact of
COVID 19 on the organisations in Klaipėda Region.
ENTREPRENEURSHIP AND SUSTAINABILITY ISSUES
ISSN 2345-0282 (online) http://jssidoi.org/jesi/
2021 Volume 8 Number 3 (March)
http://doi.org/10.9770/jesi.2021.8.3(4)
Make your research more visible, join the Twitter account of ENTREPRENEURSHIP AND SUSTAINABILITY ISSUES:
@Entrepr69728810
57
3. Methodology
According to the data of the Department of Statistics of the Republic of Lithuania, in 2020 January 1 there were
10427 business entities operating in Klaipėda region, of which 1041 in the manufacturing sector, 2913 in trade
and 6473 in services. The participant SMEs came from seven municipalities of Klaipėda Region. The research
questionnaire was designed, based on theoretical assumptions and the information on the Government aid
packages to support small and medium-sized business enterprises.
The online questionnaire was submitted by the end of September 2020 and was composed of three parts. The
target groups and economic areas were chosen for the research by SME type: manufacturing, trade, and services.
Stratified sampling was applied (Forthofer, Lee, Hernandez, 2007). By the end of October, 77 questionnnaires
were received, 4 questionnaires were rejected as unsuitable for further data processing, i.e., incomplete, for total
analysis used 73 questionnnaires.
The aim of the research was to find out the views of the respondent organisations on the COVID-19-caused state
restrictions on economic activity and the efficiency of the intervention measures to support SMEs introduced due
to the lockdown. The questionnaire Cronbach α - 0.903 indicated a very high level of internal consistency and
justified its reliability.
In order to assess the impact of COVID-19 on SMEs resilience, the results of the research were analysed through
the prism of organisational resilience, by comparing how the organizations had managed to combine preventive
control, conscious action, performance optimisation, and application of innovation. Conclusions were drawn on
how the SMEs had managed to combine defensive and progressive as well as consistent and flexible behaviour in
their action.
The majority of the respondents (71.3%) worked in the services sector, including almost half of them (46.6%)
providing services that required contact with clients and 24.7% providing services that did not require contact
with clients. The rest of the enterprises under survey belonged to the manufacturing (15.0%) and trade (13.7%)
sectors.
In terms of activity duration, the largest number of the research participants represented business entities
operating for over 10 years (68.8%), 13.7% of them, from 5 to 10 years, 11%, for 2 to 5 years, and 6.8%, for 1 to
2 years; the business entities operating for up to one year accounted for 2.7% of the business entities surveyed.
The largest share of the business entities surveyed (29.2%) had an annual turnover of EUR 100,000 to 300,000;
another larger group of the business entities surveyed, whose annual turnover amounted to EUR 300,000 to one
million, accounted for 20.8% of the survey participants. Other groups of the business entities that participated in
the survey were as follows: 15.3% of them boasted an annual turnover of EUR 30,000 to 100,000, 12%, EUR 2 to
10 million, 8.31%, to 30,000, 8.3%, EUR 10 to 50 million, and 1.48%, over EUR 50 million.
Among the business entities participating in the survey, the majority (50.7%) were subject to the mandatory
restriction on economic activities from 16 March 2020. 27.4% of the respondents stated that their activity was not
suspended, and the work was organised remotely; 16.4% claimed that their activities did not change, and the work
was organised in a routine way; 2.7% marked other than the above named consequences; and 2.7% indicated that
their companies suspended their business activities.
During the Covid-19 lockdown from 16 March 2020, the turnover of 35,6% of the respondent business entities
fell by more than 50%, of 19,2% of them, by between 20 and 50%, and of another 19,2%, by up to 20%. The
turnover did not change in 24.7% of the business entities participating in the survey, while 1.4% of the business
entities reported a 20% increase in turnover. The surveyed businesses performed differently due to COVID-19:
they either 1) operated without major restrictions or had their economic activities 2) restricted or 3) suspended.
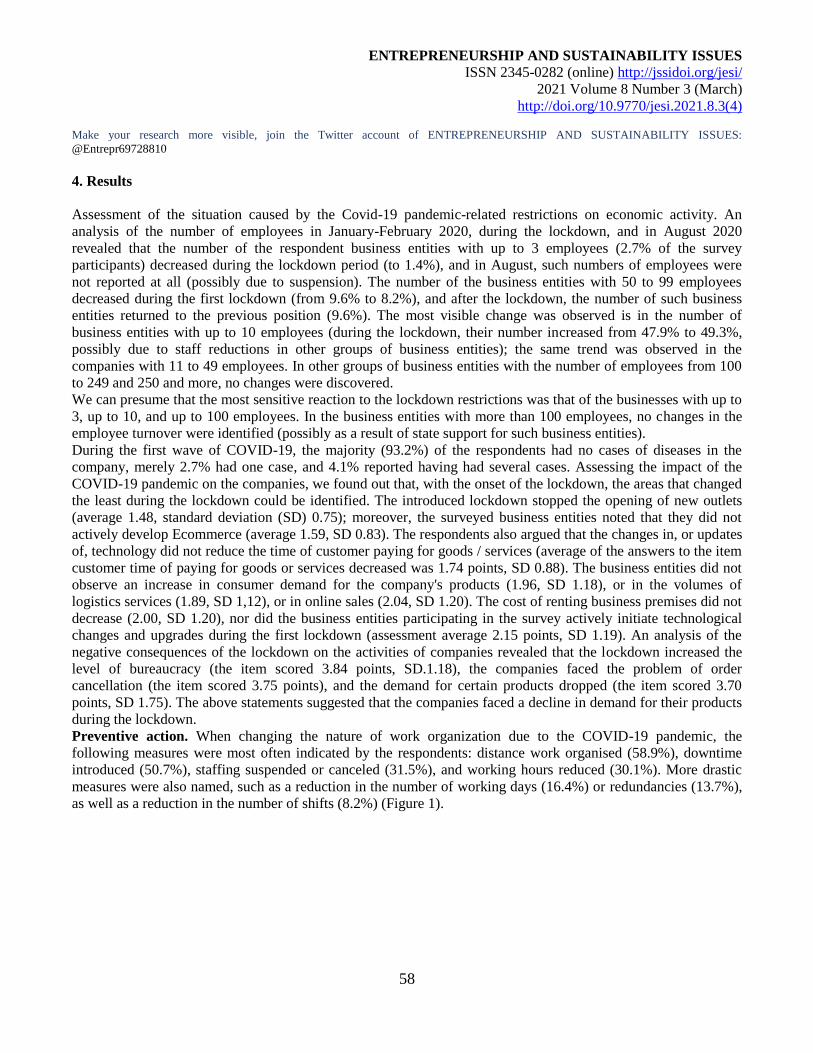
ENTREPRENEURSHIP AND SUSTAINABILITY ISSUES
ISSN 2345-0282 (online) http://jssidoi.org/jesi/
2021 Volume 8 Number 3 (March)
http://doi.org/10.9770/jesi.2021.8.3(4)
Make your research more visible, join the Twitter account of ENTREPRENEURSHIP AND SUSTAINABILITY ISSUES:
@Entrepr69728810
58
4. Results
Assessment of the situation caused by the Covid-19 pandemic-related restrictions on economic activity. An
analysis of the number of employees in January-February 2020, during the lockdown, and in August 2020
revealed that the number of the respondent business entities with up to 3 employees (2.7% of the survey
participants) decreased during the lockdown period (to 1.4%), and in August, such numbers of employees were
not reported at all (possibly due to suspension). The number of the business entities with 50 to 99 employees
decreased during the first lockdown (from 9.6% to 8.2%), and after the lockdown, the number of such business
entities returned to the previous position (9.6%). The most visible change was observed is in the number of
business entities with up to 10 employees (during the lockdown, their number increased from 47.9% to 49.3%,
possibly due to staff reductions in other groups of business entities); the same trend was observed in the
companies with 11 to 49 employees. In other groups of business entities with the number of employees from 100
to 249 and 250 and more, no changes were discovered.
We can presume that the most sensitive reaction to the lockdown restrictions was that of the businesses with up to
3, up to 10, and up to 100 employees. In the business entities with more than 100 employees, no changes in the
employee turnover were identified (possibly as a result of state support for such business entities).
During the first wave of COVID-19, the majority (93.2%) of the respondents had no cases of diseases in the
company, merely 2.7% had one case, and 4.1% reported having had several cases. Assessing the impact of the
COVID-19 pandemic on the companies, we found out that, with the onset of the lockdown, the areas that changed
the least during the lockdown could be identified. The introduced lockdown stopped the opening of new outlets
(average 1.48, standard deviation (SD) 0.75); moreover, the surveyed business entities noted that they did not
actively develop Ecommerce (average 1.59, SD 0.83). The respondents also argued that the changes in, or updates
of, technology did not reduce the time of customer paying for goods / services (average of the answers to the item
customer time of paying for goods or services decreased was 1.74 points, SD 0.88). The business entities did not
observe an increase in consumer demand for the company's products (1.96, SD 1.18), or in the volumes of
logistics services (1.89, SD 1,12), or in online sales (2.04, SD 1.20). The cost of renting business premises did not
decrease (2.00, SD 1.20), nor did the business entities participating in the survey actively initiate technological
changes and upgrades during the first lockdown (assessment average 2.15 points, SD 1.19). An analysis of the
negative consequences of the lockdown on the activities of companies revealed that the lockdown increased the
level of bureaucracy (the item scored 3.84 points, SD.1.18), the companies faced the problem of order
cancellation (the item scored 3.75 points), and the demand for certain products dropped (the item scored 3.70
points, SD 1.75). The above statements suggested that the companies faced a decline in demand for their products
during the lockdown.
Preventive action. When changing the nature of work organization due to the COVID-19 pandemic, the
following measures were most often indicated by the respondents: distance work organised (58.9%), downtime
introduced (50.7%), staffing suspended or canceled (31.5%), and working hours reduced (30.1%). More drastic
measures were also named, such as a reduction in the number of working days (16.4%) or redundancies (13.7%),
as well as a reduction in the number of shifts (8.2%) (Figure 1).
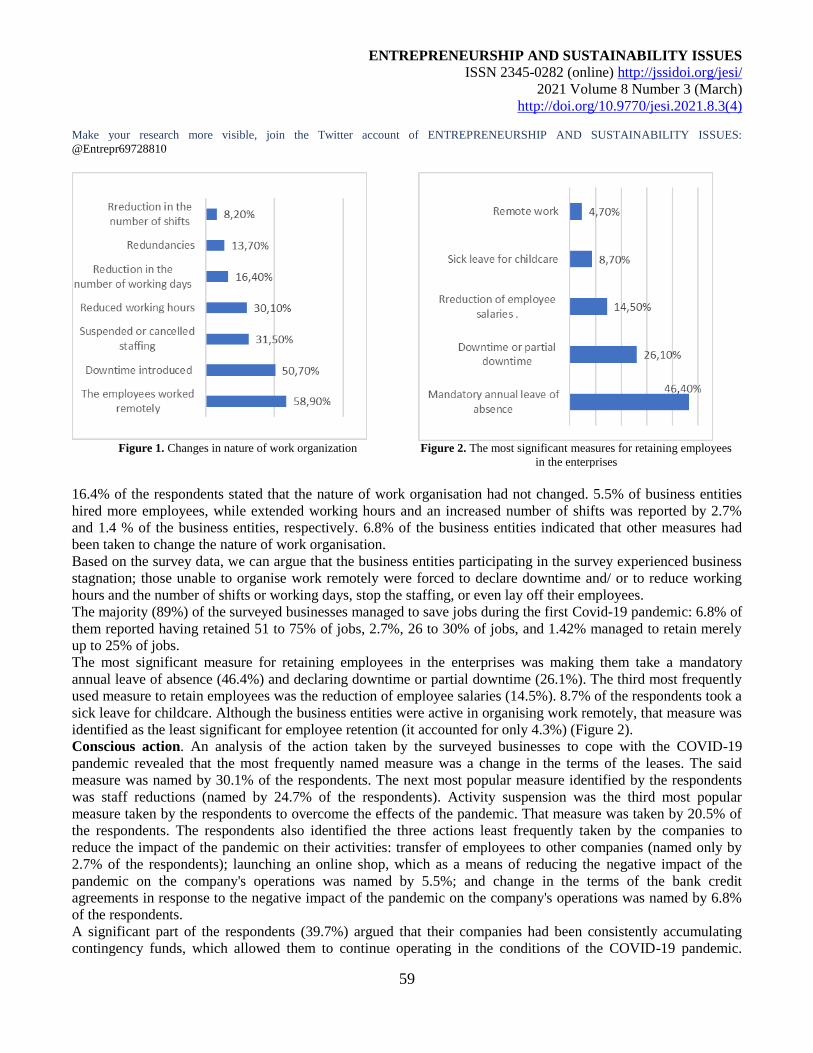
ENTREPRENEURSHIP AND SUSTAINABILITY ISSUES
ISSN 2345-0282 (online) http://jssidoi.org/jesi/
2021 Volume 8 Number 3 (March)
http://doi.org/10.9770/jesi.2021.8.3(4)
Make your research more visible, join the Twitter account of ENTREPRENEURSHIP AND SUSTAINABILITY ISSUES:
@Entrepr69728810
59
Figure 1. Changes in nature of work organization Figure 2. The most significant measures for retaining employees
in the enterprises
16.4% of the respondents stated that the nature of work organisation had not changed. 5.5% of business entities
hired more employees, while extended working hours and an increased number of shifts was reported by 2.7%
and 1.4 % of the business entities, respectively. 6.8% of the business entities indicated that other measures had
been taken to change the nature of work organisation.
Based on the survey data, we can argue that the business entities participating in the survey experienced business
stagnation; those unable to organise work remotely were forced to declare downtime and/ or to reduce working
hours and the number of shifts or working days, stop the staffing, or even lay off their employees.
The majority (89%) of the surveyed businesses managed to save jobs during the first Covid-19 pandemic: 6.8% of
them reported having retained 51 to 75% of jobs, 2.7%, 26 to 30% of jobs, and 1.42% managed to retain merely
up to 25% of jobs.
The most significant measure for retaining employees in the enterprises was making them take a mandatory
annual leave of absence (46.4%) and declaring downtime or partial downtime (26.1%). The third most frequently
used measure to retain employees was the reduction of employee salaries (14.5%). 8.7% of the respondents took a
sick leave for childcare. Although the business entities were active in organising work remotely, that measure was
identified as the least significant for employee retention (it accounted for only 4.3%) (Figure 2).
Conscious action. An analysis of the action taken by the surveyed businesses to cope with the COVID-19
pandemic revealed that the most frequently named measure was a change in the terms of the leases. The said
measure was named by 30.1% of the respondents. The next most popular measure identified by the respondents
was staff reductions (named by 24.7% of the respondents). Activity suspension was the third most popular
measure taken by the respondents to overcome the effects of the pandemic. That measure was taken by 20.5% of
the respondents. The respondents also identified the three actions least frequently taken by the companies to
reduce the impact of the pandemic on their activities: transfer of employees to other companies (named only by
2.7% of the respondents); launching an online shop, which as a means of reducing the negative impact of the
pandemic on the company's operations was named by 5.5%; and change in the terms of the bank credit
agreements in response to the negative impact of the pandemic on the company's operations was named by 6.8%
of the respondents.
A significant part of the respondents (39.7%) argued that their companies had been consistently accumulating
contingency funds, which allowed them to continue operating in the conditions of the COVID-19 pandemic.
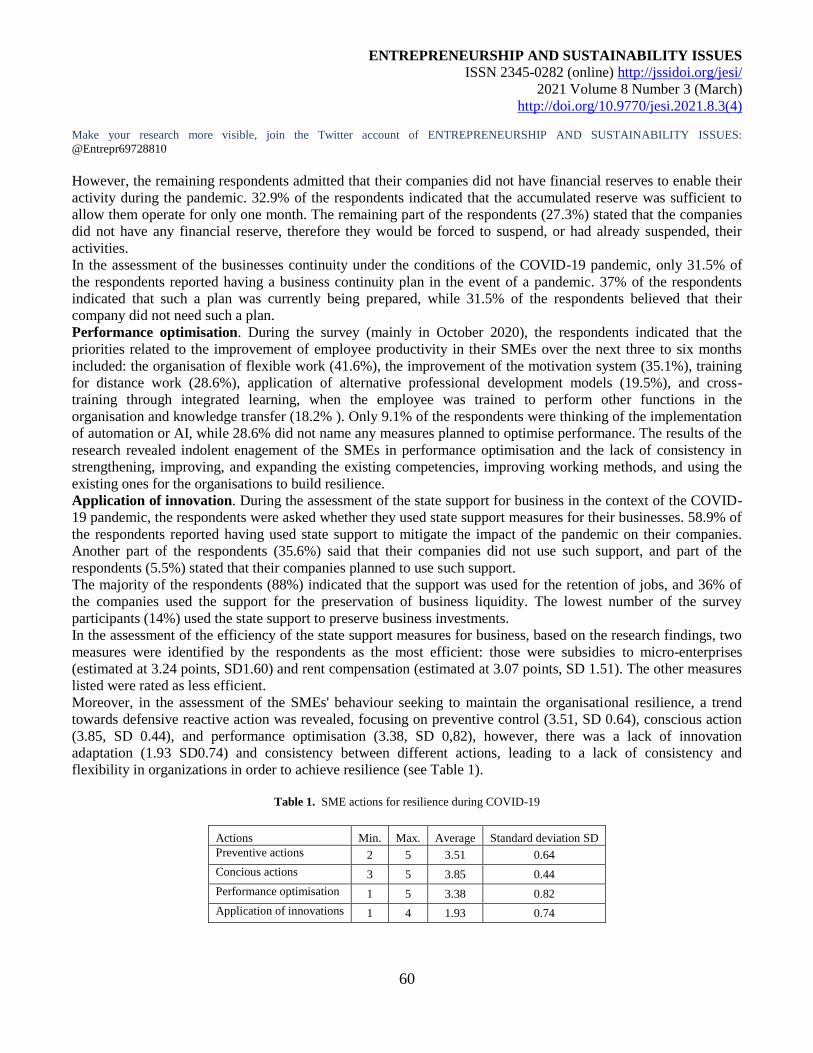
ENTREPRENEURSHIP AND SUSTAINABILITY ISSUES
ISSN 2345-0282 (online) http://jssidoi.org/jesi/
2021 Volume 8 Number 3 (March)
http://doi.org/10.9770/jesi.2021.8.3(4)
Make your research more visible, join the Twitter account of ENTREPRENEURSHIP AND SUSTAINABILITY ISSUES:
@Entrepr69728810
60
However, the remaining respondents admitted that their companies did not have financial reserves to enable their
activity during the pandemic. 32.9% of the respondents indicated that the accumulated reserve was sufficient to
allow them operate for only one month. The remaining part of the respondents (27.3%) stated that the companies
did not have any financial reserve, therefore they would be forced to suspend, or had already suspended, their
activities.
In the assessment of the businesses continuity under the conditions of the COVID-19 pandemic, only 31.5% of
the respondents reported having a business continuity plan in the event of a pandemic. 37% of the respondents
indicated that such a plan was currently being prepared, while 31.5% of the respondents believed that their
company did not need such a plan.
Performance optimisation. During the survey (mainly in October 2020), the respondents indicated that the
priorities related to the improvement of employee productivity in their SMEs over the next three to six months
included: the organisation of flexible work (41.6%), the improvement of the motivation system (35.1%), training
for distance work (28.6%), application of alternative professional development models (19.5%), and cross-
training through integrated learning, when the employee was trained to perform other functions in the
organisation and knowledge transfer (18.2% ). Only 9.1% of the respondents were thinking of the implementation
of automation or AI, while 28.6% did not name any measures planned to optimise performance. The results of the
research revealed indolent enagement of the SMEs in performance optimisation and the lack of consistency in
strengthening, improving, and expanding the existing competencies, improving working methods, and using the
existing ones for the organisations to build resilience.
Application of innovation. During the assessment of the state support for business in the context of the COVID-
19 pandemic, the respondents were asked whether they used state support measures for their businesses. 58.9% of
the respondents reported having used state support to mitigate the impact of the pandemic on their companies.
Another part of the respondents (35.6%) said that their companies did not use such support, and part of the
respondents (5.5%) stated that their companies planned to use such support.
The majority of the respondents (88%) indicated that the support was used for the retention of jobs, and 36% of
the companies used the support for the preservation of business liquidity. The lowest number of the survey
participants (14%) used the state support to preserve business investments.
In the assessment of the efficiency of the state support measures for business, based on the research findings, two
measures were identified by the respondents as the most efficient: those were subsidies to micro-enterprises
(estimated at 3.24 points, SD1.60) and rent compensation (estimated at 3.07 points, SD 1.51). The other measures
listed were rated as less efficient.
Moreover, in the assessment of the SMEs' behaviour seeking to maintain the organisational resilience, a trend
towards defensive reactive action was revealed, focusing on preventive control (3.51, SD 0.64), conscious action
(3.85, SD 0.44), and performance optimisation (3.38, SD 0,82), however, there was a lack of innovation
adaptation (1.93 SD0.74) and consistency between different actions, leading to a lack of consistency and
flexibility in organizations in order to achieve resilience (see Table 1).
Table 1. SME actions for resilience during COVID-19
Actions Min. Max. Average Standard deviation SD
Preventive actions 2 5 3.51 0.64
Concious actions 3 5 3.85 0.44
Performance optimisation 1 5 3.38 0.82
Application of innovations 1 4 1.93 0.74
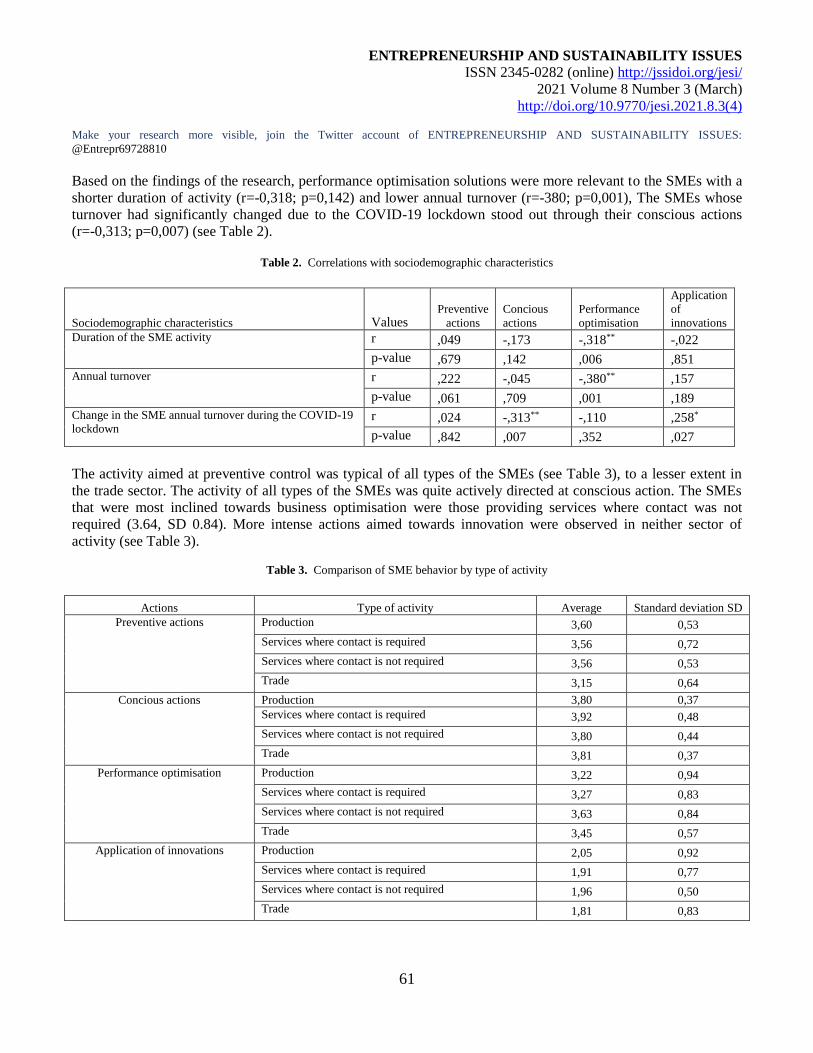
ENTREPRENEURSHIP AND SUSTAINABILITY ISSUES
ISSN 2345-0282 (online) http://jssidoi.org/jesi/
2021 Volume 8 Number 3 (March)
http://doi.org/10.9770/jesi.2021.8.3(4)
Make your research more visible, join the Twitter account of ENTREPRENEURSHIP AND SUSTAINABILITY ISSUES:
@Entrepr69728810
61
Based on the findings of the research, performance optimisation solutions were more relevant to the SMEs with a
shorter duration of activity (r=-0,318; p=0,142) and lower annual turnover (r=-380; p=0,001), The SMEs whose
turnover had significantly changed due to the COVID-19 lockdown stood out through their conscious actions
(r=-0,313; p=0,007) (see Table 2).
Table 2. Correlations with sociodemographic characteristics
Sociodemographic characteristics Values Preventive
actions
Concious
actions Performance
optimisation
Application
of
innovations Duration of the SME activity r ,049 -,173 -,318** -,022
p-value ,679 ,142 ,006 ,851
Annual turnover r ,222 -,045 -,380** ,157
p-value ,061 ,709 ,001 ,189
Change in the SME annual turnover during the COVID-19
lockdown r ,024 -,313** -,110 ,258*
p-value ,842 ,007 ,352 ,027
The activity aimed at preventive control was typical of all types of the SMEs (see Table 3), to a lesser extent in
the trade sector. The activity of all types of the SMEs was quite actively directed at conscious action. The SMEs
that were most inclined towards business optimisation were those providing services where contact was not
required (3.64, SD 0.84). More intense actions aimed towards innovation were observed in neither sector of
activity (see Table 3).
Table 3. Comparison of SME behavior by type of activity
Actions Type of activity Average Standard deviation SD
Preventive actions
Production 3,60 0,53
Services where contact is required 3,56 0,72
Services where contact is not required 3,56 0,53
Trade 3,15 0,64
Concious actions Production 3,80 0,37
Services where contact is required 3,92 0,48
Services where contact is not required 3,80 0,44
Trade 3,81 0,37
Performance optimisation Production 3,22 0,94
Services where contact is required 3,27 0,83
Services where contact is not required 3,63 0,84
Trade 3,45 0,57
Application of innovations Production 2,05 0,92
Services where contact is required 1,91 0,77
Services where contact is not required 1,96 0,50
Trade 1,81 0,83
ENTREPRENEURSHIP AND SUSTAINABILITY ISSUES
ISSN 2345-0282 (online) http://jssidoi.org/jesi/
2021 Volume 8 Number 3 (March)
http://doi.org/10.9770/jesi.2021.8.3(4)
Make your research more visible, join the Twitter account of ENTREPRENEURSHIP AND SUSTAINABILITY ISSUES:
@Entrepr69728810
62
Discussion
In order to properly adapt to the market under difficult conditions, to take advantage of the changed situation, and
to find new opportunities to modify the business, it is important to build organisational resilience and to ensure
sustainable improvement. In the presence of COVID-19, it is important not only to survive at the current
moment, but also to see opportunities for further activities, to adapt on time, and to change.
Despite the unprecedented economic recovery package in Lithuania during the coronavirus pandemic intended
for the retention of jobs and the maintenance of enterprise liquidity and despite the optimistic mood after the first
wave of coronavirus that left Lithuania as one of the countries least affected by the coronavirus, the view of
business people on the situation differed from that of the media. The differences were especially noticeable in the
analysis of the regional situation. The changes in consumer behaviour and habits and the structural changes in
business were believed to affect a significant share of business activity even after the crisis. Small and medium-
sized businesses were particularly sensitive to such changes. As revealed, the leap in the unemployment rate,
associated with the restrictions on economic activities due to the COVID-19 pandemic, hit the hardest the most
vulnerable segment of the workforce; similarly, in the business environment, COVID-19 tended to particularly
hit small and medium-sized enterprises whose activity was based on self-employment. In that way, the group of
the workforce regarded as vulnerable was expanded to include employees of small and medium-sized enterprises.
The EU's approval of the new support package maintains expectations and optimism on the stock exchange.
However, with the drastic acceleration of the second wave of coronovirus in Lithuania, the optimism of business
entities facing restrictions on their activity fades, businesses are suspended, the range of business support
measures is limited, or targeted support does not reach small and medium-sized businesses for various reasons:
complex bureaucratic mechanisms; discriminatory treatment of support for different business entities; the
business itself fears that the support received may adversely affect future trends in the business financing and
development due to the potentially negative assessment of the business potential upon receiving state support; or
hard-to-reach information due to chaotic activities of public bodies in the face of the pandemic.
The prevailing behaviour of the small and medium-sized enterprises under the conditions of uncertainty and the
use of support for mitigation of the COVID-19 effects revealed that, in the current period, the enterprises were
oriented towards survival. That was confirmed by the indolent behaviour of businesses in initiating change at the
onset of the lockdown during the first wave of COVID-19.
On assessing the survey findings and summarising the response of the organisations and their efforts to cope with
uncertainties, we can conclude that the response of the SMEs to the circumstances of uncertainty was mainly
focused on protection against threats and avoidance of risk, while the organisations themselves lacked
preparedness and consistency.
The indolent response of the SMEs to the challenges of the pandemic (e-shops, planning, standardisation of
procedures, etc.) illustrated inconsistency in action, which weakened defense against emerging threats and
reduced the resilience of organisations not only to recover after the economic restrictions but also to prosper in
the future. Due to the concentration on the maintainance of the status quo and economic difficulties, the SMEs
lacked consistent progress-oriented solutions for improving working methods, mastering new technologies, and
developing competencies. Due to the lack of flexibility and progressiveness, the opportunities of adapting new
technologies to enter or create new markets were neither observed nor sought.
Because of the concentration on preventive control, weak response to change (and lack of conscious action:
unaccumulated financial reserves), as well as lack of determination to optimise activities through the expansion
of competencies and the use of technology, no progressiveness was observed in the adaptation of recent
technology, which resulted in the absence of a holistic approach to the balancing of preventive control, conscious
action, efficiency optimisation, and adaptive innovations as well as to managing tensions in order to build
organisational resilience.
ENTREPRENEURSHIP AND SUSTAINABILITY ISSUES
ISSN 2345-0282 (online) http://jssidoi.org/jesi/
2021 Volume 8 Number 3 (March)
http://doi.org/10.9770/jesi.2021.8.3(4)
Make your research more visible, join the Twitter account of ENTREPRENEURSHIP AND SUSTAINABILITY ISSUES:
@Entrepr69728810
63
Conclusions
The resilience of organisations to unforeseen external influences is particularly important. Such resilience was
also important in the past, but the heads of organisations especially need it today, in the face of the global
COVID-19 pandemic. Therefore, it is important for the heads of companies not only to be able to generate that
trait, but also to engage employees so that they do not lose optimism as well as the ability to collaborate; they
have to spread ideas in order to help the organisation focus and find the best solutions together. That, of course,
requires not only the qualities of determination and optimism, but also the planning of financial and human
resources and the modelling of different scenarios under changing conditions. Therefore, the heads of
organisations should rely not only on their innate or developed traits but also on scientist-developed models for
coping with unforeseen conditions.
The results of the research in Klaipėda Region revealed that small and medium-sized businesses suffered
significant losses during the pandemic. Losses also increased due to the specificity of the region. A large part of
the regional small and medium-sized enterprises belonged to the services sector, providing accommodation,
catering, and tourism services. The findings of the research revealed that only some organisations had
contingency funds. It was gratifying to see that some businesses had been able to transform and transfer some of
the services to the virtual space, and employees had been able to continue working remotely. However, to
summarise all the findings of the research, we must conclude that the prevailing behaviour of small and medium-
sized enterprises under the conditions of uncertainty and the ways of using support for mitigating the effects of
COVID-19 revealed that, in the current period, enterprises were oriented towards survival. That was confirmed
by the indolent behaviour of businesses in initiating change at the onset of the lockdown during the first wave of
COVID-19.
References
Al-Tammemi, A.B., Akour, A., Alfalah, L. (2020). Is it Just About Physical Health? An Internet-Based Cross-Sectional Study Exploring
the Psychological Impacts of COVID-19 Pandemic on University Students in Jordan Using Kessler Psychological Distress Scale. Research
Squere. https://doi.org/10.21203/rs.3.rs-29439/v1
Bilan, Y., Mishchuk, H., Roshchyk, I., Joshi, O. (2020). Hiring and Retaining Skilled Employees in SMEs: Problems in Human Resource
Practices and Links with Organizational Success. Verslas: Teorija ir praktika / Business: Theory and Practice. ISSN 1648-0627 / eISSN
1822-4202 2020 21(2), 780–791. https://doi.org/10.3846/btp.2020.12750
Besenyő, J., Kármán, M. (2020). Effects of COVID-19 pandemy on African health, political and economic strategy. Insights into Regional
Development, 2(3), 630-644. https://doi.org/10.9770/IRD.2020.2.3(2)
Brooks, S.K., Webster, R.K. Smith, L.S. Woodland, L., Wessely, S., Greenberg, N., Rubin, G.J. (2020). The psychological impact of
quarantine and how to reduce it: rapid review of the evidence. Lancet 2020; 395: 912–20 Published Online February 26,
https://doi.org/10.1016/S0140-6736(20)30460-8
Capano, G., Woo, J. (2017). Resilience and robustness in policy design: A critical appraisal. Policy Sciences, 50(3), 399-426. https://doi.org/10.1007/s11077-016-9273-x
Chen, W.-H., Liu, Y.-Y. (2018). How does top management team diversity matter in abruptly dynamic environments?. Journal of Business
Economics and Management, 19(3), 521-543. https://doi.org/10.3846/jbem.2018.6579
Davidavičienė, V., Al Majzoub, K., Meidute-Kavaliauskiene, I. (2020). Factors Affecting Knowledge Sharing in Virtual
Teams. Sustainability, 12, 6917. https://doi.org/10.3390/su12176917
ENTREPRENEURSHIP AND SUSTAINABILITY ISSUES
ISSN 2345-0282 (online) http://jssidoi.org/jesi/
2021 Volume 8 Number 3 (March)
http://doi.org/10.9770/jesi.2021.8.3(4)
Make your research more visible, join the Twitter account of ENTREPRENEURSHIP AND SUSTAINABILITY ISSUES:
@Entrepr69728810
64
Decyk, K. 2020. Competitiveness factors in the innovative enterprises in the North-East voivodeships in Poland. Verslas: Teorija ir
praktika / Business: Theory and Practice. ISSN 1648-0627 / eISSN 1822-4202, Volume 21 Issue 2: 503–518
https://doi.org/10.3846/btp.2020.12114
Denyer, D. (2017). Organizational Resilience. A summary of academic evidence, business insights and new thinking. BSI and Cranfield
School of Management. bsigroup.com/organizational-resilience
Dubey, S., Biswas, P., Ghosh, R., Chatterjee, S., Dubey, M.J., Chatterjee, S., Lahiri, D.., Lavie, C.J. (2020). Psychosocial impact of
COVID-19. Diabetes & Metabolic Syndrome: Clinical Research & Reviews, https://doi.org/10.1016/j.dsx.2020.05.035
Duchek, S., Sebastian, R., & Ianina, S. (2020). The role of diversity in organizational resilience: A theoretical framework. Business
Research, 13(2): 387-423. https://doi.org/10.1007/s40685-019-0084-8
Flanagan, E., Chadwick, R., Goodrich, J., Ford, C., Wickens, R. (2020). Reflection for all healthcare staff: a national evaluation of
Schwartz rounds. Journal Interprof Care; 34(1):140-142. https://doi.org/10.1080/13561820.2019.1636008.
Forthofer, R., Lee, E. Hernandez, M. (2007). Biostatistics: A Guide to Design, Analysis and Discovery. Academic Press. https://doi.org/10.1016/C2009-0-03861-6
Golden, W., Powell, P. (2000). Towards a definition of flexibility: In search of the Holy Grail? Omega (Oxford), 28(4): 373-384.
https://doi.org/10.1016/S0305-0483(99)00057-2
Greenberg, N., Docherty, M., Gnanapragasam, S., Wessely, S. (2020). Managing mental health challenges faced by healthcare workers
during covid-19 pandemic. BMJ 2020; 368:m1211 https://doi.org/ 10.1136/bmj.m1211
Lengnick-Hall, C., Beck, Tammy E., Lengnick-Hall, M. (2011). Developing a capacity for organizational resilience through strategic
human resource management. Human Resource Management Review, 21(3): 243-255. https://doi.org/10.1016/j.hrmr.2010.07.001
Linnenluecke, M. (2017). Resilience in Business and Management Research: A Review of Influential Publications and a Research Agenda.
International Journal of Management Reviews, 19(1): 4-30. https://doi.org/10.1111/ijmr.12076
Maşca, S.G., Văidean, V.L., Golgut, A. (2011). Determinants of State Intervention: Evidence For The EU. Transylvanian Review of
Administrative Sciences, 33: 150-169. https://www.researchgate.net/publication/289850307 Pretorius, L., Davidavičienė, V. (2018). Towards technology and entrepreneurship: a perspective with cyclic conditions. 10th International
Scientific Conference “Business and Management 2018”, May 3–4, 2018, Vilnius, Lithuania. 174-182. https://doi.org/10.3846/bm.2018.20
Rezk, M. A., Piccinetti, L., Radwan, A., Salem, N. M., Sakr, M. M., Khasawneh, A. (2020). Egypt beyond COVID 19, the best and the
worst-case scenarios, Entrepreneurship and Sustainability Issues 8(2): 147-162. https://doi.org/10.9770/jesi.2020.8.2(9)
Southwick, S., Martini, B., Charney, D., Southwick, M. (2017). Leadership and Resilience. (Skyrius knygoje J. Marques, S. Dhiman (eds.),
Leadership Today, Springer Texts in Business and Economics, https://doi.org/10.1007/978-3-319-31036-7_18).
Vaughan, E., Tinker, T. (2009). Effective Health Risk Communication About Pandemic Influenza for Vulnerable Populations. American
Journal of Public Health. Supplement 2, Vol. 99, No. S2. https://doi.org/10.2105/AJPH.2009.16253.
Walker, W.E., Harremoës, P., Rotmans, J., van Der Sluijs, J.P., van Asselt, M.B.A., Janssen, P., Krayer Von Krauss, M.P. (2003). Defining
Uncertainty: A Conceptual Basis for Uncertainty Management in Model-Based Decision Support. Integrated Assessment, 4(1): 5-17. https://doi.org/10.1076/iaij.4.1.5.16466
Wang, Zhen, Li, Chaoping, Li, Xupei. (2017). Resilience, Leadership and Work Engagement: The Mediating Role of Positive Affect.
Social Indicators Research, 132(2): 699-708. https://doi.org/10.1007/s11205-016-1306-5
Williams, T., Gruber, D., Sutcliffe, K., Zhao, Shepherd, D., Zhao, E. (2017). Organizational Response to Adversity: Fusing Crisis
Management and Resilience Research Streams. The Academy of Management Annals 11(2). https://doi.org/10.5465/annals.2015.0134
ENTREPRENEURSHIP AND SUSTAINABILITY ISSUES
ISSN 2345-0282 (online) http://jssidoi.org/jesi/
2021 Volume 8 Number 3 (March)
http://doi.org/10.9770/jesi.2021.8.3(4)
Make your research more visible, join the Twitter account of ENTREPRENEURSHIP AND SUSTAINABILITY ISSUES:
@Entrepr69728810
65
Xiao, L., Cao, H. (2017). Organizational Resilience: The Theoretical Model and Research Implication. ITM Web of Conferences, 12, ITM
Web of Conferences, Vol.12. https://doi.org/10.1051/itmconf/20171204021
Acknowledgements
The research was conducted in the framework of the research project Assessment of the Effectiveness of COVID-19-Related
Restrictions on Economic Activity and the Impact of State Intervention Measures on Enterprises in the Klaipėda Region (No.
P-COV-20-51), funded by the Research Council of Lithuania (LMTLT). The duration of the project has been 6 months (28 06
20 to 31 12 2020). Grant Agreement Number P-COV-20-51.
Erika ŽUPERKIENĖ is a Doctor of Social Sciences associate professor at the Management Department of Klaipeda University. She has
18 years of experience in teaching and more than 20 years of practical experience in business as an entrepreneur. Co-author of one
monograph and three other types of books, and over 30 publications have been published in various scientific journals. She provides
training for staff of Lithuanian private and public sector organisations. Research interests: HRM, CSR, leadership, entrepreneurship.
ORCID ID no. https://orcid.org/0000-0002-1505-0962
Ligita ŠIMANSKIENĖ is a Doctor of Social Sciences, professor and head of Management Department, at Social Science and Humanities
Faculty at Klaipeda University, Lithuania. Author (or co-author) of 5 monographs, about 100 research articles published in Lithuania and
abroad. Research interests: organizational culture, sustainability, teamwork, leadership, CSR.
ORCID ID: https://orcid.org/0000-0002-0548-0459
Daiva LABANAUSKAITĖ is a Doctor of Social Sciences, associated professor at Department of Economics, at Faculty of Social
Sciences and Humanities, at Klaipeda University, Lithuania. She is author of over 40 scientific publications, a monograph, among those
many papers are related to the service economy and tourism. Research interests: service economy, sustainable development, green
economic growth. CSR. ORCID ID: https://orcid.org/0000-0002-3538-3991.
Julija MELNIKOVA is a senior researcher at Klaipeda University, Lithuania. She has been responsible for the management and
implementation of national and international research projects such as two projects under Erasmus+ for capacity building and also strategic
partnerships in higher education, as well as Horizon 2020, NordPlus, and Interreg projects. She is an external expert for the National
Agency for Academic Programme Evaluation in Lithuania and regional external expert for the EPALE (European Platform for Adult
Learning) project. CSR. Research interests: leadership in education, quality of education process. ORCID ID: https://orcid.org/0000-0001-
6078-6963
Vida DAVIDAVIČIENĖ is a Doctor of Social Sciences, professor and head of Department of Business Technologies and
Entrepreneurship at Vilnius Gedimintas Technical University, Lithuania. She is an author of more than 100 scientific publications indexed
in Web of Science, Scopus, Ebsco, Emerald, and other databases, published 2 coursebook, 2 textbooks, 7 books/monograph parts. Research
interests: research: ICT development influence on society, business, and economic. ORCID ID: https://orcid.org/0000-0002-0931-0967.
___________________________________________________________________________________________ Copyright © 2021 by author(s) and VsI Entrepreneurship and Sustainability Center
This work is licensed under the Creative Commons Attribution International License (CC BY).
http://creativecommons.org/licenses/by/4.0/
ENTREPRENEURSHIP AND SUSTAINABILITY ISSUES
ISSN 2345-0282 (online) http://jssidoi.org/jesi/
2021 Volume 8 Number 3 (March)
http://doi.org/10.9770/jesi.2021.8.3(5)
Publisher http://jssidoi.org/esc/home
90
INPUT-OUTPUT ANALYSIS OF RECREATIONAL ASSETS WITHIN THE INCLUSIVE
SUSTAINABLE DEVELOPMENT IN UKRAINE*
Hanna Shevchenko 1, Mykola Petrushenko 2, Borys Burkynskyi 3, Nina Khumarova 4, Alina Kodzhebash 5
1,2,3,4,5Institute of Market Problems and Economic-Ecological Research of the National Academy of Sciences of Ukraine,
Odesa, Ukraine
E-mails: [email protected]; 2 [email protected]; [email protected]; 4 [email protected]; [email protected]
Received 10 July 2020; accepted 25 November 2020; published 30 March 2021
Abstract. This paper aims to develop approaches to accounting for recreational assets in the input-output model based on the analysis of
the dynamics of their structure, as well as the structure of intermediate consumption of recreational services, on the example of intersectoral
balance of Ukraine during 2012-2018. Based on forecasting the dynamics of indicators such as gross value added, consumption of fixed
capital, net operated surplus, etc., optimistic and pessimistic scenarios for the development of recreation (arts, sports, entertainment and
leisure) in Ukraine are identified, taking into account the factors of natural asset and the coronavirus pandemic. In particular, the net export
indicator is expected to increase due to the restriction of international tourist arrivals and the formation of the domestic market of
recreational services on the basis of inclusive sustainable development. Herewith, recreational and tourist enterprises have the following
guidelines: security, quality, comfort, effectiveness of asset use. The expediency of state support is seen in the redistribution of the share of
accounted natural assets between agriculture, forestry, fisheries and recreation, as well as in changing the structure of assets and
intermediate consumption by reducing the share of public administration and increasing the share of other sectors, especially healthcare.
The proposed organizational and economic measures complement the Strategy for the development of tourism and resorts for the period up
to 2026 in Ukraine.
Keywords: recreation; assets; input-output analysis; nature; inclusive development; sustainability; Ukraine
Reference to this paper should be made as follows: Shevchenko, H., Petrushenko, M., Burkynskyi, B., Khumarova, N., Kodzhebash, A.
2020. Input-Output analysis of recreational assets within the inclusive sustainable development in Ukraine. Entrepreneurship and
Sustainability Issues, 8(3), 90-109. http://doi.org/10.9770/jesi.2021.8.3(5)
JEL Classifications: C67, L83, Q56
* The article contains the results of research conducted under the National Academy of Science of Ukraine’s grant
“Formation and use of natural-resource assets of the recreational and tourism sphere” (0120U100159).
ENTREPRENEURSHIP AND SUSTAINABILITY ISSUES
ISSN 2345-0282 (online) http://jssidoi.org/jesi/
2021 Volume 8 Number 3 (March)
http://doi.org/10.9770/jesi.2021.8.3(5)
Make your research more visible, join the Twitter account of ENTREPRENEURSHIP AND SUSTAINABILITY ISSUES:
@Entrepr69728810
91
1. Introduction
Activization and expansion of recreational activity is one of the promising areas of sustainable development:
effectively organized recreation and wellness of the population perform economic, social and ecological
functions, as well as contribute to the formation of a healthy nation and thus the well-being of future generations.
The main socio-economic result of the functioning of the recreational sphere is the restoration of labor potential,
which increases the cost of human capital and is a catalyst for other activities in the structure of the national
economy. Herewith the relationship between recreation and the environment has a bilateral nature: on the one
hand, effective recreation is impossible without quality ecosystem services and, on the other hand, ecologically
oriented recreation has minimal impact on the environment compared to other types of socio-economic activities.
The level of development of recreation is one of the indicators of the growth of the country’s economy. Thus, in
the United States, one of the most developed economies in the world, the outdoor recreational product in 2017
was 2.2% of GDP (U.S. Bureau 2019). In the structure of GDP of Ukraine, that is a developing economy,
recreational product for the specified period was 0.4% (State 2018). The structure of recreational services also
differs significantly: such popular recreational activities in the USA as boating, fishing, RVing, camping,
ATVing, hunting and equestrian tourism, are not in great demand in Ukraine. A developed market for recreational
services also helps to support the protection of ecosystems that attract nature tourism (Hjerpe 2018; Singgalen et
al. 2019).
The direct relationship between recreation and tourism, as well as resort treatment allows for the comprehensive
implementation of the Sustainable Development Goals (UNWTO 2015; SDG 2017), namely: Goal 8 – inclusive
growth of opportunities for employment and productivity, in the direction of promotion of sustainable tourism to
create jobs and popularization of local culture, as well as ensure normal conditions for recreation for workers;
Goal 12 – sustainable consumption and production, in the direction of rational use of natural resources in the field
of sustainable tourism and recreation; Goal 14 – conservation of marine resources, in the direction of improving
the safety and quality of recreation and the provision of maritime tourism services. Sustainable recreation (Selin
2017) complements sustainable tourism primarily in the context of inclusive development: in the ecological
context – in providing equal opportunities and increasing access to a clean environment, which also serves as a
tourist magnet, in particular, national nature parks; in the social context – to maintain at the state level social
policy and preventive measures for mass wellness restoration of the population through the implementation of
domestic tourism services; in the economic context – in the rational use of recreational assets to meet the broad
needs of other sectors of the national economy and end consumers in recreation and health.
In conditions of a pandemic crisis, the role of recreation is significantly increased and transformed into a tool for
activating the vital forces of the population to struggle with viral disease. Issues of social and environmental
security increase attention to the conditions and measures of planning and organizing of recreation both within the
green recreational areas and on the territory and in specialized premises of enterprises and institutions throughout
the country. The priority of security is undisputed for the resumption of international tourism (UNWTO 2020).
However, this process requires significant efforts and time, which shifts the orientation of the national tourism
industry, at least until the end of 2020, in the plane of domestic tourism and its recreational function. Given the
further lack of stability in the fight against the pandemic crisis, the shift to the domestic markets of tourism,
recreation and resort business will become a strategic nature.
The relevance of the study of recreational assets of Ukraine is confirmed by current trends in the administration
and development of tourism and recreation sphere in the country (Khumarova 2017) and, along with intra-
ENTREPRENEURSHIP AND SUSTAINABILITY ISSUES
ISSN 2345-0282 (online) http://jssidoi.org/jesi/
2021 Volume 8 Number 3 (March)
http://doi.org/10.9770/jesi.2021.8.3(5)
Make your research more visible, join the Twitter account of ENTREPRENEURSHIP AND SUSTAINABILITY ISSUES:
@Entrepr69728810
92
regional and local strategies, the absence of a national program for the development of recreation as a full-fledged
industry, rather than one of the additional functions of tourism or other areas of socio-economic activity. Thus,
according to the Strategy for the development of tourism and resorts for the period up to 2026 (Strategy 2017),
inter-sectoral, territorial and sectoral coordination of tourism and resorts in Ukraine focuses more on cognitive
than recreational components, especially in combination with environmental factors. Moreover, the development
indicators of tourism and resorts are focused exclusively on the tourist product without explanation of its
recreational component, namely: the number of arrivals, the amount of revenues to local budgets from the
payment of tourist tax, the number of jobs in tourism and etc. Along with this, the previous experience of Ukraine,
namely the Crimea Development Program as a year-round national and international resort-recreational and
tourist center (Crimea 2003) is a positive example of integrated development of recreation, tourism and resorts by
creating a competitive recreational complex where the population in accordance with their needs is provided with
sanatorium-resort and tourism services.
Despite the undeniable social and environmentally relevant importance of the field of organized recreation and
wellness of the population, it is necessary to strengthen its economic justification, namely in the context of active
use of its resources. The purpose of the study is to analyze the assets and economic results of operation of the
recreational sphere in the structure of inter-sectoral relations of the national economy on the example of Ukraine,
for identification of major challenges of accounting, use and distribution of recreational assets and substantiation
of recommendations for solution of those issues at the national level.
2. Literature review
Input-output analysis of the assets of the recreation sphere, first of all, allows to identify its role and place in the
structure of intersectoral linkages of the national economy. Herewith, the following features of the application of
input-output modeling and analysis in relation to recreation, adjacent industries and its sub-sectors and aspects
exist. Thus, the input-output analysis of the tourism sphere from a methodological standpoint (Briassoulis 1991)
has limitations on data accounting, taking into account the impact of tourism on other industries, not only in
economic but also in social and environmental contexts. The use of input-output analysis in the recreational
sphere in the coastal zone (Pomeroy et al. 1988) is associated with the justification of management decisions that
take into account the dynamics of output, income, and employment. In the approximate valuation of
environmental assets the method selected survey was used (Weber et al. 2002), in particular, on the willingness of
respondents to pay for the protection of forests, primarily for their aesthetic value. Herewith, the factors of leisure
were studied in the context of the formation of programs of inclusive recreation (Devine 2004).
Daniels (2004) used input-output model to analyze the socio-economic consequences of sports tourism on the
basis of employment in those industries that have experienced a positive effect from the activation of tourism-
recreational assets. Watson et al. (2008) also has conducted an input-output analysis of sports recreation, namely
golf as an economic area that has a significant positive impact on the development of Colorado. A comprehensive
research of recreational activities types and their impact on the regional economy, in particular, in the field of
taxation, based on input-output analysis (Munn et al. 2010) allows to state that due to the development of fishing
and hunting increase taxes mainly at local and state levels, and from wildlife watching – at the federal level (on
the example of the Southeast US).
Within input-output analysis can be applied multidisciplinary approaches that take into account not only
economic, social and ecological factors (Cherchyk 2008), as well as biological factors (Eiswerth et al. 2005).
Specifically, the impacts of weeds on the economy (biological shock) due to the reduction of the duration of
ENTREPRENEURSHIP AND SUSTAINABILITY ISSUES
ISSN 2345-0282 (online) http://jssidoi.org/jesi/
2021 Volume 8 Number 3 (March)
http://doi.org/10.9770/jesi.2021.8.3(5)
Make your research more visible, join the Twitter account of ENTREPRENEURSHIP AND SUSTAINABILITY ISSUES:
@Entrepr69728810
93
recreational services are considered, namely: direct impacts on spheres that are straightly related to recreation
(retail, service sectors); indirect impacts on the economy as a result of directing additional costs to spheres that are
straightly related to recreation; induced impacts as a result of changes in the structure of consumption due to
direct and indirect effects.
In the recreational sphere, conflicts can arise caused by limitation of space within which the range of services in
leisure and nature sport is provided (Mann & Absher 2008). The resolution of such conflict situations depends on
the potential of natural resources, the set of social and economic interests in its use, as well as the effectiveness of
recreational conflict’s management processes. With a high demand for various types of outdoor activities, and
therefore a significant ecological pressure on the natural recreational territory, it is extremely important to avoid
and prevent additional social burden. Herewith, information about recreation as an economic activity, its structure
and reflection of social, ecological and other data in it, is no less important for management decisions than the
role of people who make them (Obst & Vardon 2014). It is about an integrated information approach that provides
the possibility to account for, plan and forecast the sustainable development processes at the level of the national
economy.
In the study of recreation in the context of inclusive development, it is advisable to assume that it is a relatively
new stage in the evolution of sustainable development. An inclusive approach focuses on the social aspects of
sustainable development. The “socializing” of tourism is to increase the accessibility of tourist and recreational
facilities while maintaining their focus on the diversity of needs and interests of the population (Michopoulou et
al. 2015). The spotlight should remain on the most pressing issues of inclusive tourism development, which are
related to respect for individual independence, ensuring equal opportunities, accessibility in its broadest sense,
and so on. The key to solving these and other problems is the cooperation of all stakeholders in the inclusive
development of tourism and recreation.
Inclusive well-being, which also includes the recreational component, is seen as a criterion of sustainable
development (Polasky et al. 2015): the level of sustainability is directly dependent on the size of all forms of
capital (not only manufactured and financial, but also natural, human and social), which constitute the welfare of
the population. It is important, herewith, not only to measure capital, which is impossible to do exactly at least in
relation to its social and natural forms, but also to monitor the relevant signals that indicate the inclusion of these
forms during the integrated assessment of the level of inclusive sustainable development.
Analysis of equality and fairness in the provision of opportunities for recreation in different regions (Flores et al.
2018) has allowed to identify unused recreational resources and to recommend their direction not only on a
territorial but also on social criteria. Public lands should be used on the principles of social and environmental
justice, which in turn has a positive impact on indicators of economic efficiency in the recreation and tourism
sectors. On the example of national nature parks, which is located on the territory of forest and other recreational
resources, we can see the uneven use of them, on what should be directed the management decisions in the
implementation of state and regional environmental and social policies. Herewith the author (Kattumuri 2018)
takes into account the impact of climate change on the environment and natural resources.
Poudel et al. (2018) carried out an input-output analysis of fishing as an important component of recreational
economic activity. In particular, it was concluded that the economic contribution of recreational fishing depends
on the availability of this activity. Recommendations for the inclusive development of the studied type of
recreation relate to public investment in it. Herewith the government ability to influence can be understated
(Ziegler et al. 2019).
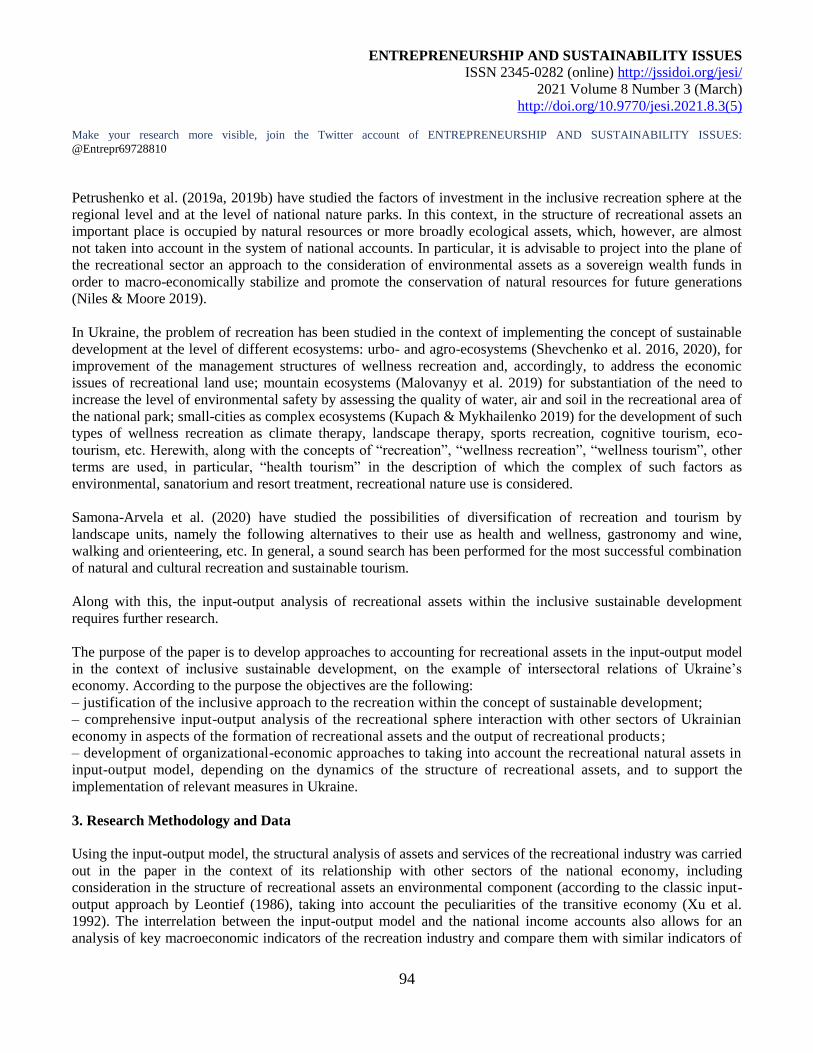
ENTREPRENEURSHIP AND SUSTAINABILITY ISSUES
ISSN 2345-0282 (online) http://jssidoi.org/jesi/
2021 Volume 8 Number 3 (March)
http://doi.org/10.9770/jesi.2021.8.3(5)
Make your research more visible, join the Twitter account of ENTREPRENEURSHIP AND SUSTAINABILITY ISSUES:
@Entrepr69728810
94
Petrushenko et al. (2019a, 2019b) have studied the factors of investment in the inclusive recreation sphere at the
regional level and at the level of national nature parks. In this context, in the structure of recreational assets an
important place is occupied by natural resources or more broadly ecological assets, which, however, are almost
not taken into account in the system of national accounts. In particular, it is advisable to project into the plane of
the recreational sector an approach to the consideration of environmental assets as a sovereign wealth funds in
order to macro-economically stabilize and promote the conservation of natural resources for future generations
(Niles & Moore 2019).
In Ukraine, the problem of recreation has been studied in the context of implementing the concept of sustainable
development at the level of different ecosystems: urbo- and agro-ecosystems (Shevchenko et al. 2016, 2020), for
improvement of the management structures of wellness recreation and, accordingly, to address the economic
issues of recreational land use; mountain ecosystems (Malovanyy et al. 2019) for substantiation of the need to
increase the level of environmental safety by assessing the quality of water, air and soil in the recreational area of
the national park; small-cities as complex ecosystems (Kupach & Mykhailenko 2019) for the development of such
types of wellness recreation as climate therapy, landscape therapy, sports recreation, cognitive tourism, eco-
tourism, etc. Herewith, along with the concepts of “recreation”, “wellness recreation”, “wellness tourism”, other
terms are used, in particular, “health tourism” in the description of which the complex of such factors as
environmental, sanatorium and resort treatment, recreational nature use is considered.
Samona-Arvela et al. (2020) have studied the possibilities of diversification of recreation and tourism by
landscape units, namely the following alternatives to their use as health and wellness, gastronomy and wine,
walking and orienteering, etc. In general, a sound search has been performed for the most successful combination
of natural and cultural recreation and sustainable tourism.
Along with this, the input-output analysis of recreational assets within the inclusive sustainable development
requires further research.
The purpose of the paper is to develop approaches to accounting for recreational assets in the input-output model
in the context of inclusive sustainable development, on the example of intersectoral relations of Ukraine’s
economy. According to the purpose the objectives are the following:
– justification of the inclusive approach to the recreation within the concept of sustainable development;
– comprehensive input-output analysis of the recreational sphere interaction with other sectors of Ukrainian
economy in aspects of the formation of recreational assets and the output of recreational products ;
– development of organizational-economic approaches to taking into account the recreational natural assets in
input-output model, depending on the dynamics of the structure of recreational assets, and to support the
implementation of relevant measures in Ukraine.
3. Research Methodology and Data
Using the input-output model, the structural analysis of assets and services of the recreational industry was carried
out in the paper in the context of its relationship with other sectors of the national economy, including
consideration in the structure of recreational assets an environmental component (according to the classic input-
output approach by Leontief (1986), taking into account the peculiarities of the transitive economy (Xu et al.
1992). The interrelation between the input-output model and the national income accounts also allows for an
analysis of key macroeconomic indicators of the recreation industry and compare them with similar indicators of
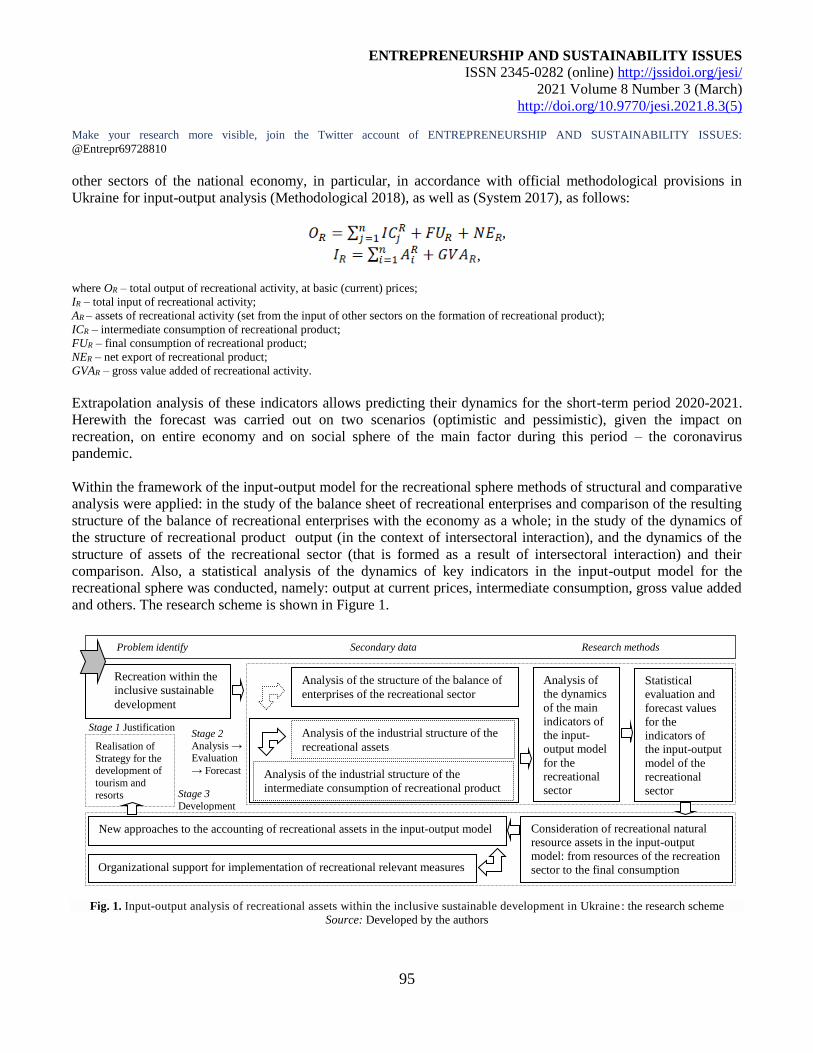
ENTREPRENEURSHIP AND SUSTAINABILITY ISSUES
ISSN 2345-0282 (online) http://jssidoi.org/jesi/
2021 Volume 8 Number 3 (March)
http://doi.org/10.9770/jesi.2021.8.3(5)
Make your research more visible, join the Twitter account of ENTREPRENEURSHIP AND SUSTAINABILITY ISSUES:
@Entrepr69728810
95
other sectors of the national economy, in particular, in accordance with official methodological provisions in
Ukraine for input-output analysis (Methodological 2018), as well as (System 2017), as follows:
,
,
where OR – total output of recreational activity, at basic (current) prices;
IR – total input of recreational activity;
AR – assets of recreational activity (set from the input of other sectors on the formation of recreational product);
ICR – intermediate consumption of recreational product;
FUR – final consumption of recreational product;
NER – net export of recreational product;
GVAR – gross value added of recreational activity.
Extrapolation analysis of these indicators allows predicting their dynamics for the short-term period 2020-2021.
Herewith the forecast was carried out on two scenarios (optimistic and pessimistic), given the impact on
recreation, on entire economy and on social sphere of the main factor during this period – the coronavirus
pandemic.
Within the framework of the input-output model for the recreational sphere methods of structural and comparative
analysis were applied: in the study of the balance sheet of recreational enterprises and comparison of the resulting
structure of the balance of recreational enterprises with the economy as a whole; in the study of the dynamics of
the structure of recreational product output (in the context of intersectoral interaction), and the dynamics of the
structure of assets of the recreational sector (that is formed as a result of intersectoral interaction) and their
comparison. Also, a statistical analysis of the dynamics of key indicators in the input-output model for the
recreational sphere was conducted, namely: output at current prices, intermediate consumption, gross value added
and others. The research scheme is shown in Figure 1.
Fig. 1. Input-output analysis of recreational assets within the inclusive sustainable development in Ukraine : the research scheme
Source: Developed by the authors
Recreation within the
inclusive sustainable
development
Analysis of the structure of the balance of
enterprises of the recreational sector
Analysis of
the dynamics
of the main
indicators of
the input-
output model
for the
recreational
sector
Statistical
evaluation and
forecast values
for the
indicators of
the input-output
model of the
recreational
sector
Consideration of recreational natural
resource assets in the input-output
model: from resources of the recreation
sector to the final consumption
Organizational support for implementation of recreational relevant measures
New approaches to the accounting of recreational assets in the input-output model
Stage 1 Justification
Problem identify Secondary data Research methods
Stage 2
Analysis → Evaluation
→ Forecast
Stage 3
Development
Analysis of the industrial structure of the
recreational assets
Analysis of the industrial structure of the
intermediate consumption of recreational product
Realisation of
Strategy for the development of
tourism and
resorts
ENTREPRENEURSHIP AND SUSTAINABILITY ISSUES
ISSN 2345-0282 (online) http://jssidoi.org/jesi/
2021 Volume 8 Number 3 (March)
http://doi.org/10.9770/jesi.2021.8.3(5)
Make your research more visible, join the Twitter account of ENTREPRENEURSHIP AND SUSTAINABILITY ISSUES:
@Entrepr69728810
96
In the study input-output tables on a case of Ukraine’s economy were used (State 2018, 2020b, 2020c). The focus
of attention in the analysis of the tables was done to that data which describing the flow of assets and services
between recreation and other sectors of the national economy during 2012-2018 years. The data for years previous
to this period were summarized on a fundamentally different methodology and therefore cannot be taken into
account in addition to the period 2012-2018. In the cells of tables that describe the data relevant to recreation, in
the vertical direction assets of the recreational sector are presented, in the horizontal direction – the recreational
services provided to other sectors of the economy and end users. To form a conceptual scheme for taking into
account recreational natural resources in the input-output model, the practical implementation of which will allow
the start of the realization of an optimistic scenario of forecasting the development of recreation in Ukraine in
2021, were used the materials of Crimean Development Program as a resort-recreational and tourist center
(Crimea 2003), Tourism and Resort Development Strategies for the period up to 2026 (Strategy 2017),
Association of Protected Areas of Ukraine (Association 2018) and U.S. Bureau of Economic Analysis (U.S.
Bureau 2019), as well as the Ministry of Ecology and Natural Resources of Ukraine (Ministry 2020).
4. Results
In the context of inclusive sustainable development, the recreational sector has economic, environmental and
social, as prioritized, targeted aspects, that requires further explanation: the needs of the population in health and
recreation, which have increased under the influence of COVID-19, are of paramount importance for the state; the
conceptual connection of recreation with nature components (so-called recreational nature management) is a
prerequisite for increasing the role of environmental and natural-resource factors in the functioning and
development of organized recreation; sustainability and support of recreation and tourism infrastructure is
provided by the economic side of recreation as an important sector of the national economy. By analogy with the
concept of sustainable development, inclusiveness is also multidimensional. In the context of this study, we were
interested in economic inclusion as providing equal opportunities for those sectors of the national economy, the
basis of the functioning and development of which, along with financial investment and human and social capital
were natural resource assets; in particular, it was about recreational sector.
During the period 2019-2021 in the formation of recreational services in Ukraine, producers (recreational and
tourism enterprises and organizations) have the following guidelines: security (especially important during a
pandemic), quality (including the criterion of comfort, which is also actualized in the conditions of isolation under
time of pandemic crisis), effectiveness (the essence of assets is to generate income that exceeds costs). The
inclusive economic result of the recreational sphere and concomitant to it tourism and other sectors of the national
economy is the total output of a recreational product that meets international standards of quality, environmental
management and security. Changes in the structure of assets and liabilities of recreational enterprises (art, sports,
entertainment, recreation) for the period 2012-2018 can be traced in Figure 2: on average, there is a decrease in
the percentage of non-current assets (and, accordingly, an increase in the percentage of current assets), as well as
a decrease in the percentage of long-term liabilities (and, accordingly, an increase in the percentage of current
liabilities); the percentage of equity capital remains stable. Such trends indicate a gradual decline in the real estate
fund in the recreational sector and general economic instability in the market of credit-financial services in
Ukraine.
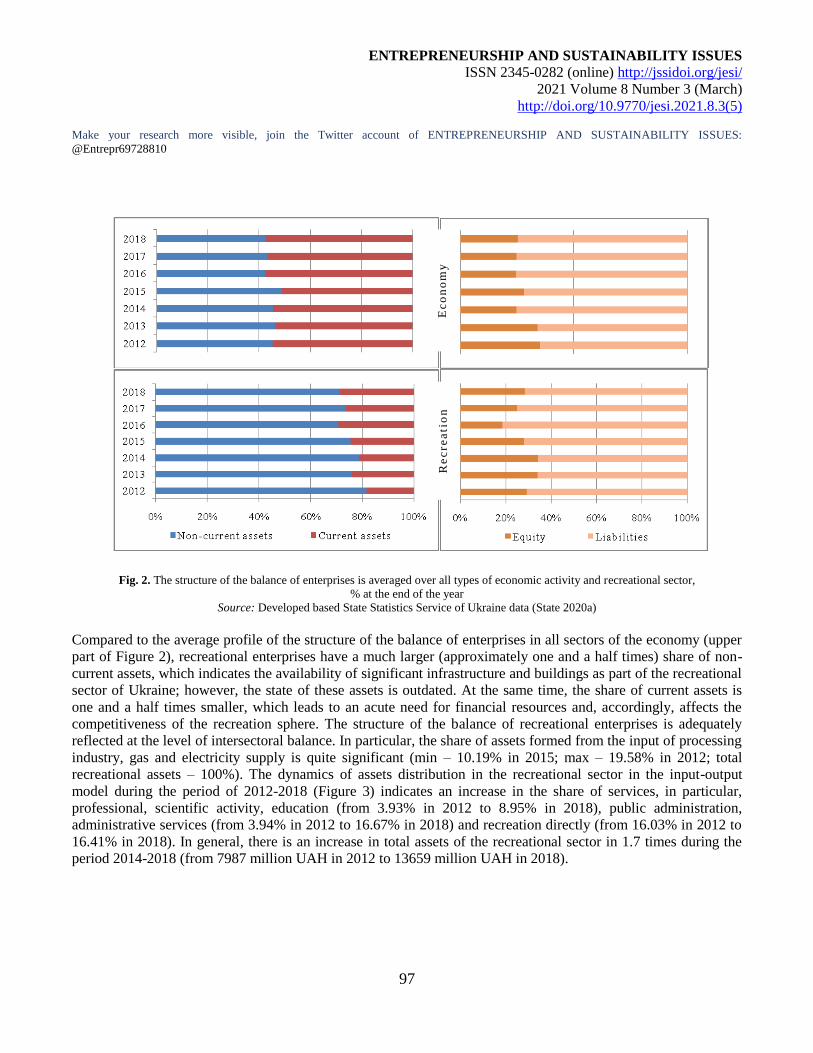
ENTREPRENEURSHIP AND SUSTAINABILITY ISSUES
ISSN 2345-0282 (online) http://jssidoi.org/jesi/
2021 Volume 8 Number 3 (March)
http://doi.org/10.9770/jesi.2021.8.3(5)
Make your research more visible, join the Twitter account of ENTREPRENEURSHIP AND SUSTAINABILITY ISSUES:
@Entrepr69728810
97
Fig. 2. The structure of the balance of enterprises is averaged over all types of economic activity and recreational sector,
% at the end of the year
Source: Developed based State Statistics Service of Ukraine data (State 2020a)
Compared to the average profile of the structure of the balance of enterprises in all sectors of the economy (upper
part of Figure 2), recreational enterprises have a much larger (approximately one and a half times) share of non-
current assets, which indicates the availability of significant infrastructure and buildings as part of the recreational
sector of Ukraine; however, the state of these assets is outdated. At the same time, the share of current assets is
one and a half times smaller, which leads to an acute need for financial resources and, accordingly, affects the
competitiveness of the recreation sphere. The structure of the balance of recreational enterprises is adequately
reflected at the level of intersectoral balance. In particular, the share of assets formed from the input of processing
industry, gas and electricity supply is quite significant (min – 10.19% in 2015; max – 19.58% in 2012; total
recreational assets – 100%). The dynamics of assets distribution in the recreational sector in the input-output
model during the period of 2012-2018 (Figure 3) indicates an increase in the share of services, in particular,
professional, scientific activity, education (from 3.93% in 2012 to 8.95% in 2018), public administration,
administrative services (from 3.94% in 2012 to 16.67% in 2018) and recreation directly (from 16.03% in 2012 to
16.41% in 2018). In general, there is an increase in total assets of the recreational sector in 1.7 times during the
period 2014-2018 (from 7987 million UAH in 2012 to 13659 million UAH in 2018).
Ec
on
om
y
Re
cre
ati
on
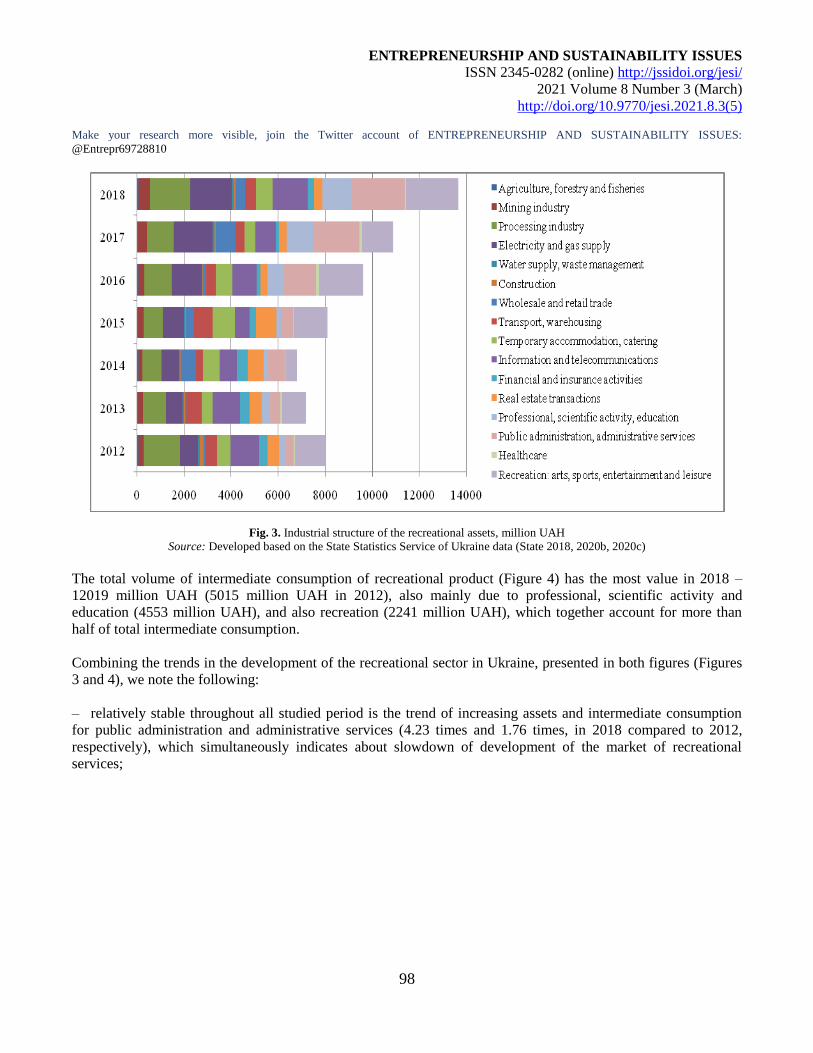
ENTREPRENEURSHIP AND SUSTAINABILITY ISSUES
ISSN 2345-0282 (online) http://jssidoi.org/jesi/
2021 Volume 8 Number 3 (March)
http://doi.org/10.9770/jesi.2021.8.3(5)
Make your research more visible, join the Twitter account of ENTREPRENEURSHIP AND SUSTAINABILITY ISSUES:
@Entrepr69728810
98
Fig. 3. Industrial structure of the recreational assets, million UAH
Source: Developed based on the State Statistics Service of Ukraine data (State 2018, 2020b, 2020c)
The total volume of intermediate consumption of recreational product (Figure 4) has the most value in 2018 –
12019 million UAH (5015 million UAH in 2012), also mainly due to professional, scientific activity and
education (4553 million UAH), and also recreation (2241 million UAH), which together account for more than
half of total intermediate consumption.
Combining the trends in the development of the recreational sector in Ukraine, presented in both figures (Figures
3 and 4), we note the following:
– relatively stable throughout all studied period is the trend of increasing assets and intermediate consumption
for public administration and administrative services (4.23 times and 1.76 times, in 2018 compared to 2012,
respectively), which simultaneously indicates about slowdown of development of the market of recreational
services;
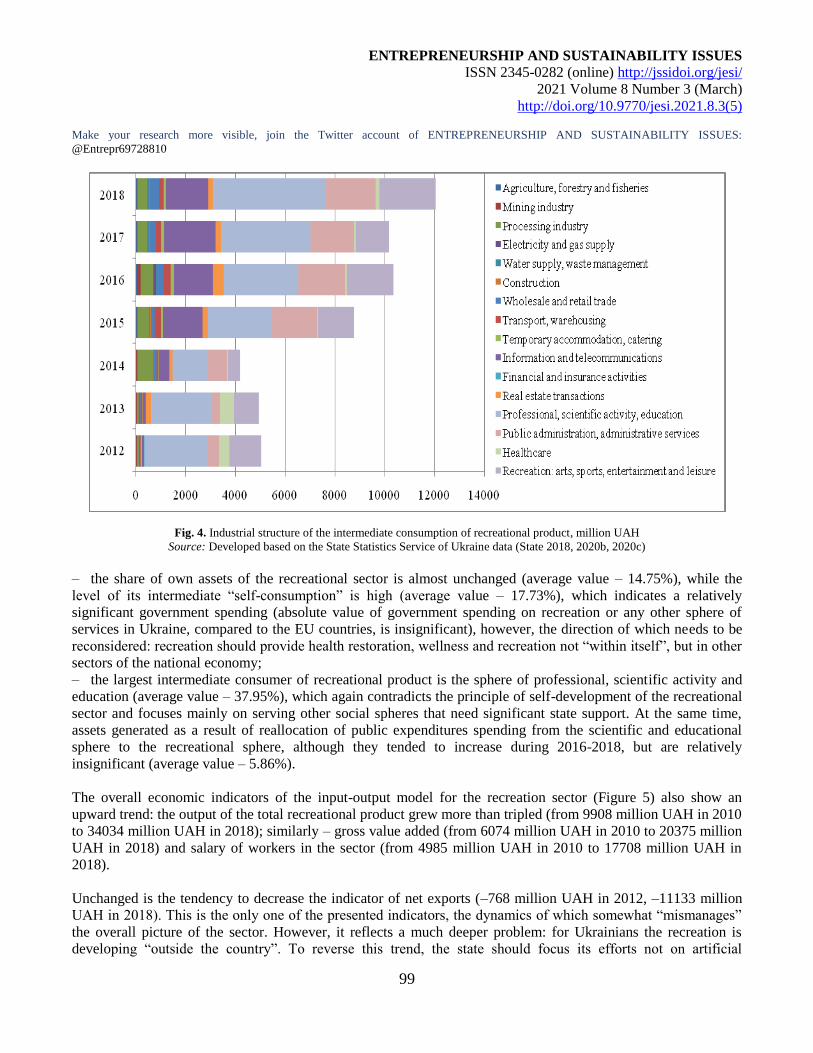
ENTREPRENEURSHIP AND SUSTAINABILITY ISSUES
ISSN 2345-0282 (online) http://jssidoi.org/jesi/
2021 Volume 8 Number 3 (March)
http://doi.org/10.9770/jesi.2021.8.3(5)
Make your research more visible, join the Twitter account of ENTREPRENEURSHIP AND SUSTAINABILITY ISSUES:
@Entrepr69728810
99
Fig. 4. Industrial structure of the intermediate consumption of recreational product, million UAH
Source: Developed based on the State Statistics Service of Ukraine data (State 2018, 2020b, 2020c)
– the share of own assets of the recreational sector is almost unchanged (average value – 14.75%), while the
level of its intermediate “self-consumption” is high (average value – 17.73%), which indicates a relatively
significant government spending (absolute value of government spending on recreation or any other sphere of
services in Ukraine, compared to the EU countries, is insignificant), however, the direction of which needs to be
reconsidered: recreation should provide health restoration, wellness and recreation not “within itself”, but in other
sectors of the national economy;
– the largest intermediate consumer of recreational product is the sphere of professional, scientific activity and
education (average value – 37.95%), which again contradicts the principle of self-development of the recreational
sector and focuses mainly on serving other social spheres that need significant state support. At the same time,
assets generated as a result of reallocation of public expenditures spending from the scientific and educational
sphere to the recreational sphere, although they tended to increase during 2016-2018, but are relatively
insignificant (average value – 5.86%).
The overall economic indicators of the input-output model for the recreation sector (Figure 5) also show an
upward trend: the output of the total recreational product grew more than tripled (from 9908 million UAH in 2010
to 34034 million UAH in 2018); similarly – gross value added (from 6074 million UAH in 2010 to 20375 million
UAH in 2018) and salary of workers in the sector (from 4985 million UAH in 2010 to 17708 million UAH in
2018).
Unchanged is the tendency to decrease the indicator of net exports (–768 million UAH in 2012, –11133 million
UAH in 2018). This is the only one of the presented indicators, the dynamics of which somewhat “mismanages”
the overall picture of the sector. However, it reflects a much deeper problem: for Ukrainians the recreation is
developing “outside the country”. To reverse this trend, the state should focus its efforts not on artificial
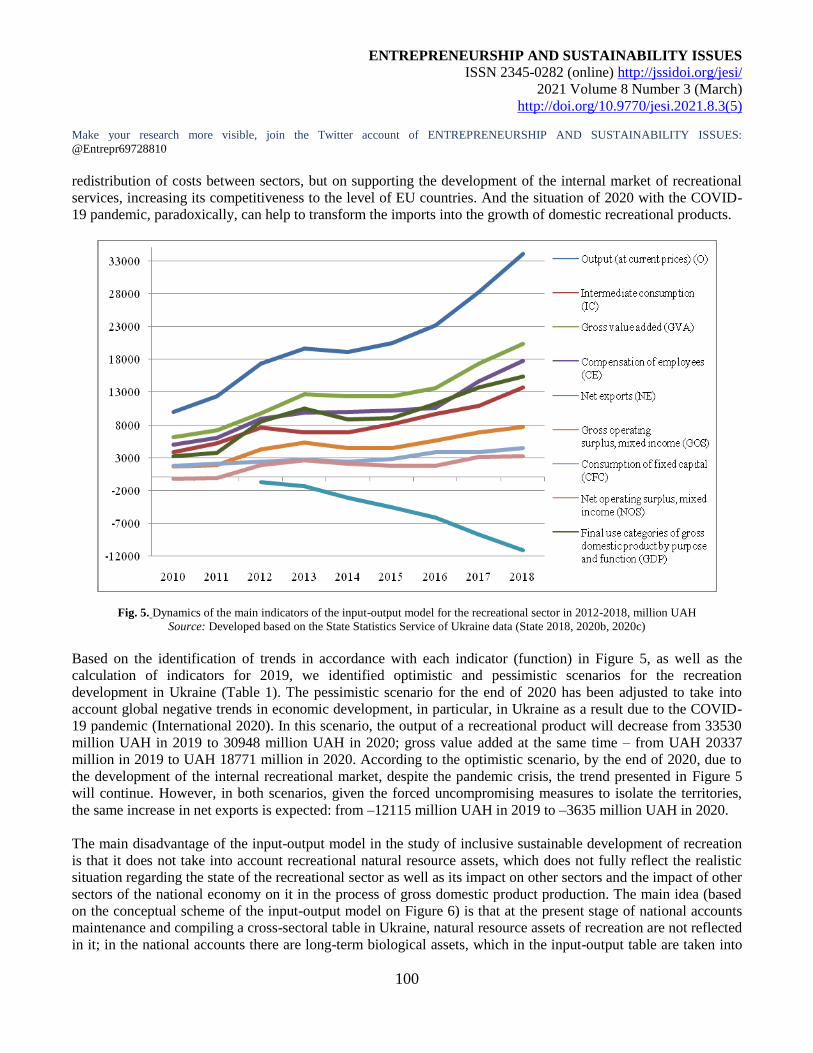
ENTREPRENEURSHIP AND SUSTAINABILITY ISSUES
ISSN 2345-0282 (online) http://jssidoi.org/jesi/
2021 Volume 8 Number 3 (March)
http://doi.org/10.9770/jesi.2021.8.3(5)
Make your research more visible, join the Twitter account of ENTREPRENEURSHIP AND SUSTAINABILITY ISSUES:
@Entrepr69728810
100
redistribution of costs between sectors, but on supporting the development of the internal market of recreational
services, increasing its competitiveness to the level of EU countries. And the situation of 2020 with the COVID-
19 pandemic, paradoxically, can help to transform the imports into the growth of domestic recreational products.
Fig. 5. Dynamics of the main indicators of the input-output model for the recreational sector in 2012-2018, million UAH
Source: Developed based on the State Statistics Service of Ukraine data (State 2018, 2020b, 2020c)
Based on the identification of trends in accordance with each indicator (function) in Figure 5, as well as the
calculation of indicators for 2019, we identified optimistic and pessimistic scenarios for the recreation
development in Ukraine (Table 1). The pessimistic scenario for the end of 2020 has been adjusted to take into
account global negative trends in economic development, in particular, in Ukraine as a result due to the COVID-
19 pandemic (International 2020). In this scenario, the output of a recreational product will decrease from 33530
million UAH in 2019 to 30948 million UAH in 2020; gross value added at the same time – from UAH 20337
million in 2019 to UAH 18771 million in 2020. According to the optimistic scenario, by the end of 2020, due to
the development of the internal recreational market, despite the pandemic crisis, the trend presented in Figure 5
will continue. However, in both scenarios, given the forced uncompromising measures to isolate the territories,
the same increase in net exports is expected: from –12115 million UAH in 2019 to –3635 million UAH in 2020.
The main disadvantage of the input-output model in the study of inclusive sustainable development of recreation
is that it does not take into account recreational natural resource assets, which does not fully reflect the realistic
situation regarding the state of the recreational sector as well as its impact on other sectors and the impact of other
sectors of the national economy on it in the process of gross domestic product production. The main idea (based
on the conceptual scheme of the input-output model on Figure 6) is that at the present stage of national accounts
maintenance and compiling a cross-sectoral table in Ukraine, natural resource assets of recreation are not reflected
in it; in the national accounts there are long-term biological assets, which in the input-output table are taken into
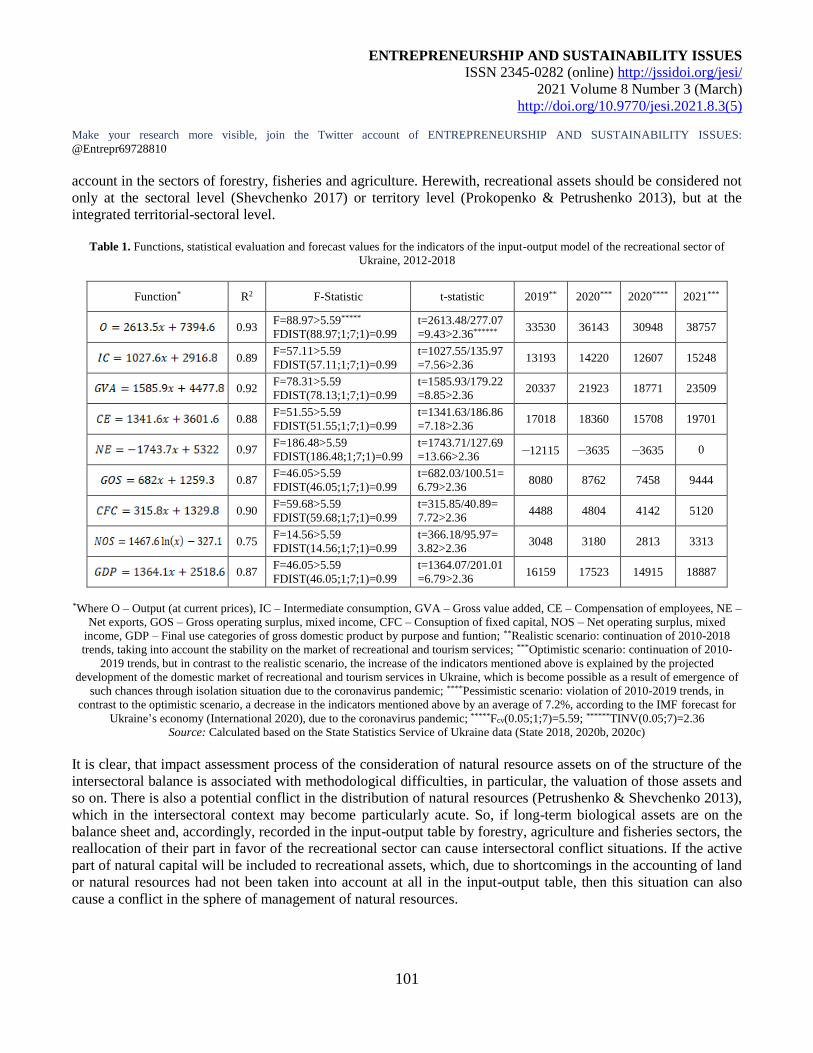
ENTREPRENEURSHIP AND SUSTAINABILITY ISSUES
ISSN 2345-0282 (online) http://jssidoi.org/jesi/
2021 Volume 8 Number 3 (March)
http://doi.org/10.9770/jesi.2021.8.3(5)
Make your research more visible, join the Twitter account of ENTREPRENEURSHIP AND SUSTAINABILITY ISSUES:
@Entrepr69728810
101
account in the sectors of forestry, fisheries and agriculture. Herewith, recreational assets should be considered not
only at the sectoral level (Shevchenko 2017) or territory level (Prokopenko & Petrushenko 2013), but at the
integrated territorial-sectoral level.
Table 1. Functions, statistical evaluation and forecast values for the indicators of the input-output model of the recreational sector of
Ukraine, 2012-2018
Function* R2 F-Statistic t-statistic 2019** 2020*** 2020**** 2021***
0.93 F=88.97>5.59*****
FDIST(88.97;1;7;1)=0.99
t=2613.48/277.07
=9.43>2.36****** 33530 36143 30948 38757
0.89 F=57.11>5.59
FDIST(57.11;1;7;1)=0.99
t=1027.55/135.97
=7.56>2.36 13193 14220 12607 15248
0.92 F=78.31>5.59
FDIST(78.13;1;7;1)=0.99
t=1585.93/179.22
=8.85>2.36 20337 21923 18771 23509
0.88 F=51.55>5.59
FDIST(51.55;1;7;1)=0.99
t=1341.63/186.86
=7.18>2.36 17018 18360 15708 19701
0.97 F=186.48>5.59
FDIST(186.48;1;7;1)=0.99
t=1743.71/127.69
=13.66>2.36 –12115 –3635 –3635 0
0.87 F=46.05>5.59
FDIST(46.05;1;7;1)=0.99
t=682.03/100.51=
6.79>2.36 8080 8762 7458 9444
0.90 F=59.68>5.59
FDIST(59.68;1;7;1)=0.99
t=315.85/40.89=
7.72>2.36 4488 4804 4142 5120
0.75 F=14.56>5.59
FDIST(14.56;1;7;1)=0.99
t=366.18/95.97=
3.82>2.36 3048 3180 2813 3313
0.87 F=46.05>5.59
FDIST(46.05;1;7;1)=0.99
t=1364.07/201.01
=6.79>2.36 16159 17523 14915 18887
*Where O – Output (at current prices), IC – Intermediate consumption, GVA – Gross value added, CE – Compensation of employees, NE –
Net exports, GOS – Gross operating surplus, mixed income, CFC – Consuption of fixed capital, NOS – Net operating surplus, mixed
income, GDP – Final use categories of gross domestic product by purpose and funtion; **Realistic scenario: continuation of 2010-2018
trends, taking into account the stability on the market of recreational and tourism services; ***Optimistic scenario: continuation of 2010-
2019 trends, but in contrast to the realistic scenario, the increase of the indicators mentioned above is explained by the projected
development of the domestic market of recreational and tourism services in Ukraine, which is become possible as a result of emergence of
such chances through isolation situation due to the coronavirus pandemic; ****Pessimistic scenario: violation of 2010-2019 trends, in
contrast to the optimistic scenario, a decrease in the indicators mentioned above by an average of 7.2%, according to the IMF forecast for
Ukraine’s economy (International 2020), due to the coronavirus pandemic; *****Fcv(0.05;1;7)=5.59; ******TINV(0.05;7)=2.36
Source: Calculated based on the State Statistics Service of Ukraine data (State 2018, 2020b, 2020c)
It is clear, that impact assessment process of the consideration of natural resource assets on of the structure of the
intersectoral balance is associated with methodological difficulties, in particular, the valuation of those assets and
so on. There is also a potential conflict in the distribution of natural resources (Petrushenko & Shevchenko 2013),
which in the intersectoral context may become particularly acute. So, if long-term biological assets are on the
balance sheet and, accordingly, recorded in the input-output table by forestry, agriculture and fisheries sectors, the
reallocation of their part in favor of the recreational sector can cause intersectoral conflict situations. If the active
part of natural capital will be included to recreational assets, which, due to shortcomings in the accounting of land
or natural resources had not been taken into account at all in the input-output table, then this situation can also
cause a conflict in the sphere of management of natural resources.
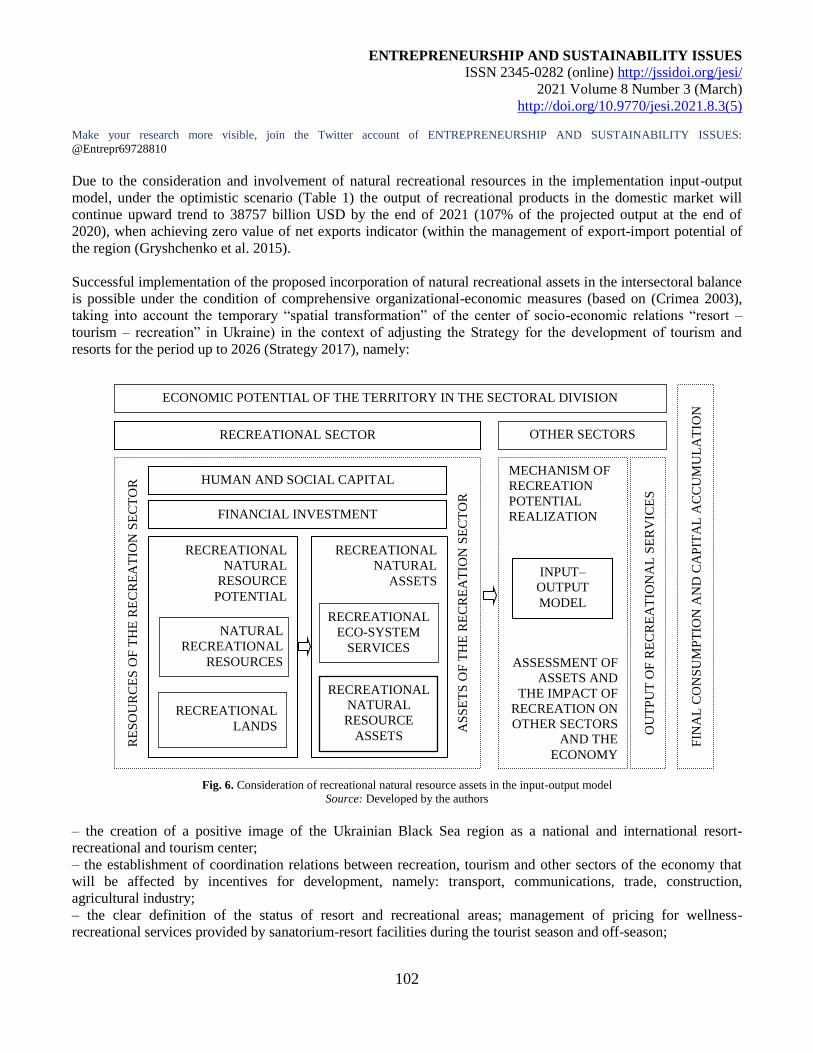
ENTREPRENEURSHIP AND SUSTAINABILITY ISSUES
ISSN 2345-0282 (online) http://jssidoi.org/jesi/
2021 Volume 8 Number 3 (March)
http://doi.org/10.9770/jesi.2021.8.3(5)
Make your research more visible, join the Twitter account of ENTREPRENEURSHIP AND SUSTAINABILITY ISSUES:
@Entrepr69728810
102
Due to the consideration and involvement of natural recreational resources in the implementation input-output
model, under the optimistic scenario (Table 1) the output of recreational products in the domestic market will
continue upward trend to 38757 billion USD by the end of 2021 (107% of the projected output at the end of
2020), when achieving zero value of net exports indicator (within the management of export-import potential of
the region (Gryshchenko et al. 2015).
Successful implementation of the proposed incorporation of natural recreational assets in the intersectoral balance
is possible under the condition of comprehensive organizational-economic measures (based on (Crimea 2003),
taking into account the temporary “spatial transformation” of the center of socio-economic relations “resort –
tourism – recreation” in Ukraine) in the context of adjusting the Strategy for the development of tourism and
resorts for the period up to 2026 (Strategy 2017), namely:
Fig. 6. Consideration of recreational natural resource assets in the input-output model
Source: Developed by the authors
– the creation of a positive image of the Ukrainian Black Sea region as a national and international resort-
recreational and tourism center;
– the establishment of coordination relations between recreation, tourism and other sectors of the economy that
will be affected by incentives for development, namely: transport, communications, trade, construction,
agricultural industry;
– the clear definition of the status of resort and recreational areas; management of pricing for wellness-
recreational services provided by sanatorium-resort facilities during the tourist season and off-season;
RE
SO
UR
CE
S O
F T
HE
RE
CR
EA
TIO
N S
EC
TO
R
AS
SE
TS
OF
TH
E R
EC
RE
AT
ION
SE
CT
OR
RECREATIONAL
NATURAL
RESOURCE
POTENTIAL
NATURAL
RECREATIONAL
RESOURCES
RECREATIONAL
NATURAL
ASSETS
RECREATIONAL
LANDS
RECREATIONAL
NATURAL
RESOURCE
ASSETS
RECREATIONAL
ECO-SYSTEM
SERVICES
FINANCIAL INVESTMENT
HUMAN AND SOCIAL CAPITAL
ECONOMIC POTENTIAL OF THE TERRITORY IN THE SECTORAL DIVISION
RECREATIONAL SECTOR OTHER SECTORS
MECHANISM OF
RECREATION
POTENTIAL
REALIZATION
ASSESSMENT OF
ASSETS AND
THE IMPACT OF
RECREATION ON
OTHER SECTORS
AND THE
ECONOMY
INPUT–
OUTPUT
MODEL
OU
TP
UT
OF
RE
CR
EA
TIO
NA
L S
ER
VIC
ES
FIN
AL
CO
NS
UM
PT
ION
AN
D C
AP
ITA
L A
CC
UM
UL
AT
ION
ENTREPRENEURSHIP AND SUSTAINABILITY ISSUES
ISSN 2345-0282 (online) http://jssidoi.org/jesi/
2021 Volume 8 Number 3 (March)
http://doi.org/10.9770/jesi.2021.8.3(5)
Make your research more visible, join the Twitter account of ENTREPRENEURSHIP AND SUSTAINABILITY ISSUES:
@Entrepr69728810
103
– the creation of tax benefits for organizations of the recreational-tourism sphere, which use the profit for
innovative and environmentally friendly development of material-technical base;
– the optimization of budgeting processes at the local level in order to develop the infrastructure of resorts,
maintenance and arrangement of recreational areas, parks, beaches;
– state support to the arrival of cruise ships in Ukrainian seaports, development of sea and specialized types of
tourism, winter recreation;
– the investment in the use of recreational-tourism potential of estuaries and areas around them, in particular, in
increasing the number of resort-recreational facilities year-round operation (balneal and mud sanatoriums, aqua
parks, swimming pools, fitness centers, etc.);
– the urgent construction of shore protection structures, implementation of anti-landslide and environmental
protection measures, reconstruction of sewage treatment facilities.
Thus, we suggest the following new approaches to the accounting of recreational assets in the input-output model
and organizational support for implementation of relevant measures in Ukraine:
– on taking into account in the structure of recreational assets the natural component (natural resources and eco-
system services) at a level that reflects the necessary socially significant contribution of the recreational sector to
other sectors of the national economy and final consumption of recreational product. This level depends on the
results of the analysis of the dynamics of the recreational assets structure, the intermediate consumption of
recreational services structure, which are reflected in the intersectoral balance of the national economy, as well as
the assessment of real use of natural assets for recreational purposes and their necessary use on the principle of
inclusiveness;
– on the involvement of natural assets in the development of the domestic market of recreational and tourism
services during the coronavirus pandemic, taking into account quality and comfort factors, within the proposed
optimistic scenario (contrary to the pessimistic scenario, when organizational and economic measures fail to
compensate for the negative effects of the pandemic crisis in the short term), according to which the positive
dynamics of the recreational sector from 2010 to 2021 is maintained;
– on state support for the development of the recreational sphere, namely: declaring new rules of the game and
organizational-economic measures in the Strategy for the development of tourism and resorts for the period up to
2026 in Ukraine, promoting engagement and accounting of inactive natural resources and redistribution of
accounted natural assets in favor of the recreational sector, as well as increasing the assets of related sectors of the
national economy, especially health care, to ensure inclusive sustainable development in Ukraine.
5. Discussion
Ukraine has a significant untapped potential of natural recreational resources, which is concentrated primarily in
more than 50 national nature parks: like nature reserves, they are of national importance, serve for nature
protection functions and at the same time perform functions of organized recreational, wellness and tourism
activity and have a high level of attraction in context of expansion of recreational demand for ecological and
aesthetic types of tourism and complex health restoration. The transformation of recreational resources into assets
of national nature parks is impossible without regulating their activities in accordance with the Laws of Ukraine
(Law 2018; Law 2020). However, in practice a nominal activity to be seen or, more precisely, the absence of any
activity on nature protection in national parks and, moreover, on the organization of recreation in them (Open
2020). “Devastating destruction of protected areas” of national parks is taking place: illegal logging, poaching,
havocking due to hostilities in eastern Ukraine, total corruption (UNIAN 2016). Therefore, in order to start
systematic measures to account for the recreational assets of national nature parks, it is necessary to assess the
environmental and economic losses and improve the procedure for the application of appropriate penalties. In
ENTREPRENEURSHIP AND SUSTAINABILITY ISSUES
ISSN 2345-0282 (online) http://jssidoi.org/jesi/
2021 Volume 8 Number 3 (March)
http://doi.org/10.9770/jesi.2021.8.3(5)
Make your research more visible, join the Twitter account of ENTREPRENEURSHIP AND SUSTAINABILITY ISSUES:
@Entrepr69728810
104
other words, making adjustments in the input-output model to take into account natural assets in the recreational
sector will contribute to the stopping of the destruction of natural-recreational areas, especially within national
nature parks, as well as to the reduction of the pollution and recreational loading.
The processes of formation and use of recreational assets of national nature parks must correspond to an inclusive
approach in the social context. It is necessary to provide an equal access to the recreation area and the whole
complex of recreational-tourism services of parks for any recreant, as well as to disseminate information about the
benefits and gains of health recovery and recreation within the country using its best natural potential; naturally,
subject to compliance with the norms of recreational activity, i.e. within the concept of sustainable development.
It is also expedient to start an accounting for natural recreational assets in national parks because there is no such
practice in these objects of the nature-reserve fund of Ukraine. Conditions are favorable for holding preliminary
scientific and applied research, in particular, in the framework of comprehensive organizational-economic
measures for the formation of infrastructure and development of recreational and tourism facilities located on the
territory of national nature parks. Some of them, in particular, Carpathian National Nature Park, Holy Mountains
National Nature Park, Shatsk National Nature Park, etc. (Association 2018) annually receive large flows of
vacationers, due to the following factors: traditions and, consequently, the recognizability and high level of
awareness of potential tourists, the succession of generations; the presence of elements of the experience
economy, first of all, attractions of the “wow-effect” level, which can serve not only as a supplement to outdoor
recreation, but as a major factor in deciding in favor of a trip to a national park.
To make appropriate adjustments to the input-output model, it is necessary to establish work on accounting for
recreational assets in the form of complex satellite accounting, in particular, by example of Outdoor recreation
satellite account by the Bureau of Economic Analysis of the U.S. Department of Commerce (U.S. Bureau 2019).
An experiment can be started within national nature parks, then move to the regional level to take into account the
wide range of recreational and tourism services provided using natural recreational assets, such as fishing,
hunting, mounting, equestrian, rafting, rural tourism and others. In addition to the natural resource component, the
satellite account of the recreation sector should include information in accordance with the industry composition
of economic activity, which is directly related to the provision of recreational services, namely: arts,
entertainment, accommodation, food services; transportation and warehousing; other industries.
Conclusions
Recreation in its combination with the economy of natural resources requires an inclusive approach within the
concept of sustainable development: social inclusion means the formation of recreational services within a
recreational product available to all segments of the population, regardless of individual income; nature-ecological
inclusion implies wide involvement of components of nature in the sphere of organized recreation and
counteraction to various types of pollution of the recreational environment; economic inclusion means providing
equal opportunities for those sectors of the national economy, the basis of the functioning and development of
which, along with financial investment and human and social capital are natural resource assets.
Given the existence of a number of heterogeneous factors that affect the recreational sphere in Ukraine, a
comprehensive input-output analysis of its interaction with other sectors of Ukrainian economy in two main
aspects is needed: the formation of recreational assets and the output of recreational products. The results of the
structure analysis of such interaction, as well as the dynamics of economic indicators of functioning of the
recreational sector of Ukraine allows to state the following: along with financial and human assets, the natural
assets of the sector are practically not taken into account; the sector is mainly subsidized and, accordingly, the
ENTREPRENEURSHIP AND SUSTAINABILITY ISSUES
ISSN 2345-0282 (online) http://jssidoi.org/jesi/
2021 Volume 8 Number 3 (March)
http://doi.org/10.9770/jesi.2021.8.3(5)
Make your research more visible, join the Twitter account of ENTREPRENEURSHIP AND SUSTAINABILITY ISSUES:
@Entrepr69728810
105
market of recreational services is underdeveloped; intermediate consumption processes according to the traditions
of the planned economy make the sector a “hostage” of the rest part of the public services sector, in particular,
professional, scientific and educational activities, public administration and administrative services; during 2010-
2018 there is a quantitative increase in indicators, but the quality of services and development of the sector
compared to the best world experience is low. An inclusive economic approach, which involves the use of natural
assets for the sustainable development of recreation, in the context of input-output analysis means the
transformation of accounting for those assets in favour of the recreational sector, as well as accounting for
previously unaccounted natural assets.
The novelty of the research is the development of organizational-economic approaches to: taking into account the
recreational natural assets in input-output model depending on the dynamics of the structure of recreational assets,
as well as assessing the necessary use of natural assets for recreational purposes on the principle of inclusiveness;
involvement of natural assets in the development of the domestic market of recreational and tourism services
during the coronavirus pandemic within the proposed optimistic scenario, which will maintain the positive
dynamics of the recreational sector until 2021; state support for the development of the recreational sphere by
promoting the involvement and accounting of inactive natural resources and redistribution of the share of
accounted natural assets in favor of the recreational sector to ensure inclusive sustainable development in Ukraine.
The research limiatation is the lack of accurate data to assess the actual use of natural recreational assets, as well
as the impossibility to improve the accuracy of the forecast for the development of the domestic market of
recreational services in Ukraine due to the unpredictability of the scale and duration of the coronavirus pandemic
effects.
The results of the study are of practical importance for decision-making on the development of the recreational
sector in Ukraine, namely on the direction of short- and medium-term investments in the formation and use of
natural recreational assets, both in optimistic and pessimistic scenarios given the consequences of the COVID-19
pandemic.
References
Association of Protected Areas of Ukraine (2018). National natural parks of Ukraine. Retrieved from http://www.zapovidnyk.org/p/blog-
page_4893.html
Briasoulis, H. (1991). Methodological issues: Tourism input-output analysis. Annals of Tourism Research, 18(3), 485-495.
https://doi.org/10.1016/0160-7383(91)90054-F
Cherchyk, L. M. (2008). Evaluation of current state and prospects for recreational nature management development in Ukraine. Actual
Problems of Economics, 6, 180-186. Retrieved from
https://www.researchgate.net/publication/294354209_Evaluation_of_current_state_and_prospects_for_recreational_nature_management_d
evelopment_in_Ukraine
Crimea Development Program as a year-round national and international resort-recreational and tourist center (2003). Resolution of the
Cabinet of Ministers of Ukraine №133, January 29, 2003. Retrieved from https://zakon.rada.gov.ua/laws/show/133-2003-%D0%BF#Text
Daniels, M. J. (2004). Beyond input-output analysis: Using occupation-based modeling to estimate wages generated by a sport tourism
event. Journal of Travel Research, 43(1), 75-82. https://doi.org/10.1177/0047287504265515
Devine, M. A. (2004). Being a “doer” instead of a “viewer”: The role of inclusive leisure contexts in determining social acceptance for
people with disabilities. Journal of Leisure Research, 36(2), 137-159. https://doi.org/10.1080/00222216.2004.11950017
ENTREPRENEURSHIP AND SUSTAINABILITY ISSUES
ISSN 2345-0282 (online) http://jssidoi.org/jesi/
2021 Volume 8 Number 3 (March)
http://doi.org/10.9770/jesi.2021.8.3(5)
Make your research more visible, join the Twitter account of ENTREPRENEURSHIP AND SUSTAINABILITY ISSUES:
@Entrepr69728810
106
Eiswerth, M. E., Darden, T. D., Johnson, W. S., Agapoff, J., & Harris T. R. (2005). Input-output modeling, outdoor recreation, and the
economic impacts of weeds. Weed Science, 53(1), 130-137. https://doi.org/10.1614/WS-04-022R
Flores, D., Falco, G., Roberts, N. S., & Valenzuela, III, F. P. (2018). Recreation equity: Is the forest service serving its diverse publics?
Journal of Forestry, 116(3), 266-272. https://doi.org/10.1093/jofore/fvx016
Gryshchenko, V. F., Dreval, O. Y., & Gryshchenko, I. V. (2015). Regional export-import potential use management within the system of
ecological and economic security. Actual Problems in Economics, (170), 226. Retrieved from
https://www.researchgate.net/publication/298697867_Regional_export-
import_potential_use_management_within_the_system_of_ecological_and_economic_security
Hjerpe, E. E. (2018). Outdoor recreation as a sustainable export industry: A case of the boundary waters wilderness. Ecological Economics,
146, 60-68. https://doi.org/10.1016/j.ecolecon.2017.10.001
International Monetary Fund (2020). Ukraine. Retrieved from https://www.imf.org/en/Countries/UKR#ataglance
Kattumuri, R. (2018). Sustaining natural resources in a changing environment: evidence, policy and impact. Contemporary Social Science,
13(1), 1-16. https://doi.org/10.1080/21582041.2017.1418903
Khumarova, N. I. (2017). Methodological bases of state administration of recreation and tourism resources in Ukraine. Economic
Innovations, 19(2/64), 314-319. https://doi.org/10.31520/ei.2017.19.2(64).314-319
Kupach, T., Mykhailenko, T. (2019). Analysis of the recreational resources of Kaniv in the context of the programme of development of
Ukrainian small-cities. Journal of Geology, Geography and Geoecology, 28(3), 457-474. https://doi.org/10.15421/111942
Law of Ukraine On Resorts. With changes (2020). Resolution of the Verkhovna Rada №554-IX, April 13, 2020. Retrieved from
https://zakon.rada.gov.ua/laws/show/2026-14#Text
Law of Ukraine On Tourism. With changes (2018). Resolution of the Verkhovna Rada №2581-VIII, October 02, 2018. Retrieved from
https://zakon.rada.gov.ua/laws/show/324/95-%D0%B2%D1%80#Text
Leontief, W. (1986). Input-Output Economics. New York: Oxford University Press, 19-40, 241-265.
Malovanyy, M., Masikevych, A., Kolotylo, M., & Yaremchuk, V. (2019). Analysis of environmental safety of recreational territories of
mountain ecosystems and development of technical measures for its stabilization. Eastern-European Journal of Enterprise Technologies,
6(6), 15-24. https://doi.org/10.15587/1729-4061.2019.185850
Mann, C., Absher, J. D. (2008). Recreation conflict potential and management implications in the northern/central Black Forest Nature
Park. Journal of Environmental Planning and Management, 51(3), 363-380. https://doi.org/10.1080/09640560801979527
Methodological provisions on the organization of state statistical observation “input-output “table” (2018). Order of the State Statistics
Service of Ukraine №236, November 01, Kyiv, 2018. Retrieved from http://ukrstat.gov.ua/metod_polog/metod_doc/2018/236/mp_tvv.pdf
Michopoulou, E., Darcy, S., Ambrose, I., & Buhalis, D. (2015). Accessible tourism futures: The world we dream to live in and the
opportunities we hope to have. Journal of Tourism Futures, 1(3), 179-188. https://doi.org/10.1108/JTF-08-2015-0043
Ministry of Ecology and Natural Resources of Ukraine (2020). The list of institutions of natural reserve fund under authority of the
Ministry of Environment. Retrieved from https://menr.gov.ua/en/content/perelik-ustanov-prirodnozapovidnogo-fondu-shcho-nalezhat-do-
sferi-upravlinnya-minprirodi.html
Munn, I., Hussain, A., Spurlock, S., & Henderson, J. (2010). Economic impact of fishing, hunting, and wildlife-associated recreation
expenditures on the southeast U.S. regional economy: An input–output analysis. Human Dimensions of Wildlife, 15, 433-449.
https://doi.org/10.1080/10871209.2010.508193
Niles, K., & Moore, W. (2019). Accounting for environmental assets as sovereign wealth funds. Journal of Sustainable Finance &
Investment, 1-20. https://doi.org/10.1080/20430795.2019.1681618
ENTREPRENEURSHIP AND SUSTAINABILITY ISSUES
ISSN 2345-0282 (online) http://jssidoi.org/jesi/
2021 Volume 8 Number 3 (March)
http://doi.org/10.9770/jesi.2021.8.3(5)
Make your research more visible, join the Twitter account of ENTREPRENEURSHIP AND SUSTAINABILITY ISSUES:
@Entrepr69728810
107
Obst, C., & Vardon, M. (2014). Recording environmental assets in the national accounts. Oxford Review of Economic Policy, 30, 126-144.
https://doi.org/10.1093/oxrep/gru003
Open forest, NGO (2020). Nature reserve myth of Ukraine. Retrieved from https://www.openforest.org.ua/131195/
Petrushenko, M. M., & Shevchenko, H. M. (2013). Management of ecological-economic conflicts in the context of the optimal mechanisms
theory for the resources allocation. Actual Problems of Economics, 3, 186-192. Retrieved from
https://www.researchgate.net/publication/287596604_Management_of_ecological-
economical_conflicts_within_the_framework_of_the_theory_of_optimal_mechanisms_for_resource_distribution
Petrushenko, M. M., Shevchenko, H. M., Vernydub, N. O., Kravchenko, O. V., & Ovcharova, N. V. (2019). The forming of industrial and
national natural parks networks in Ukraine based on the principles for responsible investment. Financial and credit activity: problems of
theory and practice, 4(31), 221-229. https://doi.org/10.18371/fcaptp.v4i31.190880
Petrushenko, M., Shevchenko, H., Burkynskyi, B., & Khumarova, N. (2019). A game-theoretical model for investment in inclusive
recreation and wellness in Ukraine: the regional context. Investment Management and Financial Innovations, 16(4). 382-394.
http://dx.doi.org/10.21511/imfi.16(4).2019.32
Polasky, S., Bryant, B., Hawthorne, P., Johnson, J., Keeler, B., & Pennington, D. (2015). Inclusive wealth as a metric of sustainable
development. Annual Review of Environment and Resources, 40(1), 445-466. https://doi.org/10.1146/annurev-environ-101813-013253
Pomeroy, R. S., Uysal, M., & Lamberte, A. (1988). An input‐output analysis of South Carolina’s economy: With special reference to
coastal tourism and recreation. Leisure Sciences, 10(4), 281-288. https://doi.org/10.1080/01490408809512197
Poudel, J., Munn, I., & Henderson, J. (2018). An input-output analysis of recreational fishing expenditures (2006 & 2011) across the
southern United States. International Journal of Environmental Studies, 75, 652-674. https://doi.org/10.1080/00207233.2017.1412195
Prokopenko, O. V., & Petrushenko, M. M. (2013). Systems-synergetic thinking to the environmental conflicts management at the territorial
level. Marketing and Management of Innovations, 1, 254-266. Retrieved from https://mmi.fem.sumdu.edu.ua/en/journals/2013/1/254-266
Samora-Arvela, A., Ferreira, J., Vaz, E., & Panagopoulos, T. (2020). Modeling nature-based and cultural recreation preferences in
Mediterranean regions as opportunities for smart tourism and diversification. Sustainability, 12, 433. https://doi.org/10.3390/su12010433
Singgalen, Y.A., Sasongko, G., Wiloso, P.G. (2019). Community participation in regional tourism development: a case study in North
Halmahera Regency - Indonesia. Insights into Regional Development, 1(4), 318-332. https://doi.org/10.9770/ird.2019.1.4(3)
SDG Knowledge platform (2017). Sustainable tourism. Retrieved from https://sustainabledevelopment.un.org/topics/sustainabletourism
Selin, S. (2017). Operationalizing sustainable recreation across the National forest system: A qualitative content analysis of six regional
strategies. Journal of Park and Recreation Administration, 35, 35-47. https://doi.org/10.18666/JPRA-2017-V35-I3-8020
Shevchenko, H. M. (2017). Regulatory policy and optimization of investment resource allocation in model of functioning recreation
industry. Baltic Journal of Economic Science, 3(1), 109-115. http://dx.doi.org/10.30525/2256-0742/2017-3-1-109-115
Shevchenko, H. M., Pakhomov, V. M., & Petrushenko, M. M. (2016). Economic and legal issues of rural and recreational land use in
Ukraine. Economic Annals-XXI, 1-2(156), 54-58. https://doi.org/10.21003/ea.V156-0012
Shevchenko, H., Petrushenko, M., Burkynskyi, B., Khumarova, N., & Opanasiuk, Y. (2020). Management of wellness and recreation in
urban agglomerations. Problems and Perspectives in Management, 18(1), 231-241. http://dx.doi.org/10.21511/ppm.18(1).2020.20
State Statistics Service of Ukraine (2018). Statistics / Table input-output of Ukraine at basic prices. Archive 2003-2018. Retrieved from
http://ukrstat.gov.ua/operativ/operativ2006/vvp/vitr_vip/vitr_u/arh_vitr_u.html
State Statistics Service of Ukraine (2020a). Economic statistics / Economic activity / Activity of enterprises. Retrieved from
http://ukrstat.gov.ua/operativ/menu/menu_u/sze.htm
ENTREPRENEURSHIP AND SUSTAINABILITY ISSUES
ISSN 2345-0282 (online) http://jssidoi.org/jesi/
2021 Volume 8 Number 3 (March)
http://doi.org/10.9770/jesi.2021.8.3(5)
Make your research more visible, join the Twitter account of ENTREPRENEURSHIP AND SUSTAINABILITY ISSUES:
@Entrepr69728810
108
State Statistics Service of Ukraine (2020b). Statistical publication / National accounts of Ukraine for 2018. Retrieved from
https://ukrstat.org/en/druk/publicat/kat_u/2020/zb/02/zb_nru2018.pdf
State Statistics Service of Ukraine (2020c). Statistical publication / Table input-output of Ukraine for 2018 at basic prices. Retrieved from
https://ukrstat.org/en/druk/publicat/kat_u/2020/zb/05/zb_tvv_18.pdf
Strategy for the tourism and resorts development for the period up to 2026 (2017). Resolution of the Cabinet of Ministers of Ukraine
№168-р, March 16, 2017. Retrieved from https://zakon.rada.gov.ua/laws/show/168-2017-%D1%80#Text
System of environmental-economic accounting 2012 (2017). United Nations, New York, 45-59. Retrieved from
https://unstats.un.org/unsd/envaccounting/seeaRev/ae_final_en.pdf
UNIAN (2016). National Parks of Ukraine: the destruction of protected areas. Retrieved from https://www.unian.ua/ecology/1250448-
natsionalni-parki-ukrajini-nischivne-ruynuvannya-zapovidnih-zon.html
UNWTO (2015). Tourism in the 2030 AGENDA. Retrieved from https://www.unwto.org/tourism-in-2030-agenda
UNWTO (2020). New data shows impact of COVID-19 on tourism as UNWTO calls for responsible restart of the sector. Retrieved from
https://www.unwto.org/news/new-data-shows-impact-of-covid-19-on-tourism
U.S. Bureau of Economic Analysis (2019). Outdoor recreation satellite account, U.S. and prototype for States, 2017. Retrieved from
https://www.bea.gov/news/2019/outdoor-recreation-satellite-account-us-and-prototype-states-2017
Watson, P., Davies, S., & Thilmany, D. (2008). Determining economic contributions in a recreational industry: An application to
Colorado’s golf industry. Journal of Sports Economics, 9(6), 571-591. https://doi.org/10.1177/1527002508318595
Weber, S., Horak, S., & Marusic, Z. (2002). Valuation of environmental assets: A case of Croatian coastal forests. Tourism Review,
57(1/2), 22-28. https://doi.org/10.1108/eb058375
Xu, D., Deng, S., & Gruver, G. (1992). The application of the Leontief input–output matrix in the transition process. Economic Systems
Research, 4(1), 35-48. https://doi.org/10.1080/09535319200000003
Ziegler, J. P., Jones, S. E., & Solomon, C. T. (2019). Local stakeholders understand recreational fisheries as social-ecological systems but
do not view governance systems as influential for system dynamics. International Journal of the Commons, 13(2), 1035-1048.
https://doi.org/doi.org/10.5334/ijc.945
Acknowledgements
The article contains the results of research conducted under the National Academy of Science of Ukraine’s grant “Formation
and use of natural-resource assets of the recreational and tourism sphere” (0120U100159).
ENTREPRENEURSHIP AND SUSTAINABILITY ISSUES
ISSN 2345-0282 (online) http://jssidoi.org/jesi/
2021 Volume 8 Number 3 (March)
http://doi.org/10.9770/jesi.2021.8.3(5)
Make your research more visible, join the Twitter account of ENTREPRENEURSHIP AND SUSTAINABILITY ISSUES:
@Entrepr69728810
109
Hanna SHEVCHENKO is Doctor of Economics, Associate Professor, Senior Researcher at the Institute of Market Problems and
Economic-Ecological Research of the National Academy of Sciences of Ukraine, Odesa, Ukraine. Research interests: tourism and
recreation, social capital, organizational behavior, national economy.
ORCID ID: 0000-0002-0817-7754
Mykola PETRUSHENKO is Doctor of Economics, Associate Professor, Head of Department at the Institute of Market Problems and
Economic-Ecological Research of the National Academy of Sciences of Ukraine, Odesa, Ukraine. Research interests: game theory,
ecological management, national economy, environmental conflicts.
ORCID ID: 0000-0003-0098-7872
Borys BURKYNSKYI is Doctor of Economics, Professor, Academician of the National Academy of Sciences of Ukraine, Director of the
Institute of Market Problems and Economic-Ecological Research of the National Academy of Sciences of Ukraine, Odesa, Ukraine.
Research interests: market mechanisms and structures, economy and management.
ORCID ID: 0000-0001-9303-0898
Nina KHUMAROVA is Doctor of Economics, Professor, Chief Researcher at the Institute of Market Problems and Economic-Ecological
Research of the National Academy of Sciences of Ukraine, Odesa, Ukraine. Research interests: environmental economics, recreational and
touristic potential, inclusive development.
ORCID ID: 0000-0001-5255-8004
Alina KODZHEBASH is Ph.D.in Economics, Junior Researcher at the Institute of Market Problems and Economic-Ecological Research
of the National Academy of Sciences of Ukraine, Odesa, Ukraine. Research interests: environmental economics, waste management,
transport and logistics.
ORCID ID: 0000-0002-8161-632X
___________________________________________________________________________________________ Copyright © 2021 by author(s) and VsI Entrepreneurship and Sustainability Center
This work is licensed under the Creative Commons Attribution International License (CC BY).
http://creativecommons.org/licenses/by/4.0/
ENTREPRENEURSHIP AND SUSTAINABILITY ISSUES
ISSN 2345-0282 (online) http://jssidoi.org/jesi/
2021 Volume 8 Number 3 (March)
http://doi.org/10.9770/jesi.2021.8.3(6)
Publisher http://jssidoi.org/esc/home
110
MODERN TRENDS IN THE ECONOMIC DIFFERENCES BETWEEN COUNTRIES AND WITHIN
THEM: COMPARISON OF THE WORLD AND THE EUROPEAN UNION
Vera Komarova 1, Natalya Selivanova-Fyodorova 2, Oksana Ruza 3,
Jerzy Kazmierczyk 4, Iluta Arbidane 5
1, 3 Daugavpils University, Parades Str. 1, Daugavpils, LV-5401, Latvia 2 RISEBA University of Applied Sciences, Meza Str. 3, Riga, LV-1048, Latvia
4 Poznan University of Economics and Business, Niepodległosci Avenue 10, Poznan, 61-875, Poland 5Rezekne Academy of Technologies, Atbrivoshanas Avenue 115, Rezekne, LV-4601, Latvia
E-mails: [email protected]; [email protected], [email protected]; [email protected]; [email protected]
Received 11 September 2020; accepted 26 November 2020; published 30 March 2021
Abstract. This article aims to test empirically two popular hypotheses about territorial economic differences in the modern world.
According to the first hypothesis, economic differences between countries in the modern world are not as large as regions’ differences
within countries. According to the second hypothesis, the decline in the degree of economic differences between countries is due to the
relatively faster economic development of capital regions. Investigation of the economic differences on various territorial levels realized
applying the method of comparing the coefficient of variation of the income of the population. The source of the empirical data for this
research is the Sub-national Human Development Index (SHDI) database created by the Netherlands Institute for Management Research of
the Radboud University, which contains such indicator as Income index of SHDI in the inner regions of 161 countries in the world for the
period from 2000 to 2017. A comparison of economic differences at different territorial levels revealed that in the 21st century, neither in
the world as a whole nor in the EU regions’ differences within countries are higher than differences between countries. However, starting
with 2015 the economic differences between inner regions of the EU countries began to outweigh the economic differences between
countries themselves, and this is the specifics of the European Union. In the 21st century, both inter-country and intra-country regional
economic differences in the EU countries are significantly lower than in the world as a whole. The economic importance of non-capital
regions is gradually increasing in the EU, although for the time being the EU (and probably the world as a whole) still characterized by the
economic growth, which is based mainly at the expense of capital regions.
Keywords: economic differences; world; European Union; capital regions; coefficient of variation.
Reference to this paper should be made as follows: Komarova, V., Selivanova-Fyodorova, N., Ruza, O., Kazmierczyk, J., Arbidane, I.
(2021). Modern trends in the economic differences between countries and within them: comparison of the world and the European Union.
Entrepreneurship and Sustainability Issues, 8(3), 110-121. http://doi.org/10.9770/jesi.2020.8.3(6)
JEL Classifications: O47; R11; C33
ENTREPRENEURSHIP AND SUSTAINABILITY ISSUES
ISSN 2345-0282 (online) http://jssidoi.org/jesi/
2021 Volume 8 Number 3 (March)
http://doi.org/10.9770/jesi.2021.8.3(6)
Make your research more visible, join the Twitter account of ENTREPRENEURSHIP AND SUSTAINABILITY ISSUES:
@Entrepr69728810
111
1. Introduction
Almost all the contemporary researchers of territorial economic development peculiarities address the topic of
economic differences in various aspects. The economic differences between territories – countries and regions –
are studied not only by regional economists (Karwat-Wozniak 2011; Boronenko et al. 2014; Tvaronaviciene
2018; Rivza 2018; Prakash, R Garg, 2019; Okuneviciute-Neverauskiene et al. 2020 and many others). This topic –
at least, in Latvia, – is elaborated also by geographers within regional and human geography (Krauklis 2000;
Krisjane, Bauls 2007; Kule at al. 2010; Berzins 2011), that coincides with the common trends worldwide (Hua,
Gu 2001; Kovacs 2004); this happens so because regional economics historically developed from the science of
geography and continues closely interacting with itin the framework of regional science, because investigation of
the spatial correspondences and mutual relatedness of nature and social processes brings out the common interest
field of economic geography and regional economics (Ullman 1958; Isard 1960, 1975; Granberg 1997; Gibbons,
Vignoles 2011; Chatterji 2014).
Regarding the economic differences on various territorial levels, some researchers and international organizations
revealed that economic differences between countries (inter-country level) are often not so large as the economic
differences between regions within these countries (intra-country regional level) (Kim 2008; OECD 2011, 2013,
2016). In many cases the reduction of the degree of economic differences between countries are rather connected
with the development of the capital regions (OECD 2016), as the political and economic life of the whole country
is concentrated in these regions; this is especially characteristic of Central and East Europe (Kuttor 2009).
Within this research, the authors provide the comparative empirical analysis of the modern trends in the degree of
economic differences of the world and EU countries on various territorial levels by comparing coefficients of
variation on the inter-country and intra-country regional level, as well as by comparing coefficients of variation
between EU countries and their capital regions. The empirical analysis is limited to the beginning of the 21st
century (2000-2017). The source of the empirical data for this research is the Sub-national Human Development
Index (SHDI) database created by the Netherlands Institute for Management Research of the Radboud University
(Radboud University 2020). This database is elaborated on the basis of Human Development Index (HDI)
database created by United Nations Development Programme (UNDP) (UNDP 2020). SHDI database contains
not only sub-indexes of HDI but also indicators of population’s income, school education duration, and new-
borns’ life expectancy in the inner regions of 161 countries in the world.
2. Theoretical background
There is quite a lot of research in the scientific literature dedicated to the study and comparison of differences
between countries and inner regions (more often – economic differences) in different spatial areas of the world
and in different time periods (Sala-i-Martin 1995, 1996; Kanbur et al. 2006). According to the authors, systemic
research – from the macro level to the meso level – in this field was carried out by X. Sala-i-Martin. For example,
the analysis of the process of differentiation of economic performance indicators (by GDP per capita) in 110
countries of the world in the period from 1960 to 1990 showed that the degree of economic differences between
these countries increased steadily during the studied period (Sala-i-Martin 1995). In Europe, X. Sala-i-Martin
studied the differences between regions within each country and concluded that “the overall picture shows a
decrease in differences between regions over time in each country” (Sala-i-Martin 1995). Nevertheless, the
authors did not find in these results a comparison between the degree of differences at the inter-country and intra-
country regional level. It means, that the results of abovementioned studies do not suggest precise proof of the
ENTREPRENEURSHIP AND SUSTAINABILITY ISSUES
ISSN 2345-0282 (online) http://jssidoi.org/jesi/
2021 Volume 8 Number 3 (March)
http://doi.org/10.9770/jesi.2021.8.3(6)
Make your research more visible, join the Twitter account of ENTREPRENEURSHIP AND SUSTAINABILITY ISSUES:
@Entrepr69728810
112
thesis mentioned in the introduction to this article: economic differences between countries are often not so large
as the economic differences between regions within these countries (Kim 2008; OECD 2011, 2013, 2016).
The authors believe that the Organization for Economic Co-operation and Development (OECD) in its analytical
reports on regions “OECD Regions at a Glance” emphasizes the comparison of differences at the inter-country
and intra-country regional level. For example, with regard to national and regional differences in educational
attainment, the OECD notes that differences in the availability of high-educated workforce are mostly observed in
different regions of the same country rather than between countries. The largest differences in the availability of
workforce with higher education are in the Czech Republic, France, Spain and the United States. For example, in
2008, 16% of the workforce had completed higher education in West Virginia (United States), compared to 44%
in the District of Columbia (or just Washington) (OECD 2011). Moreover, inequality in household disposable
income between regions of Israel, Spain, Turkey and the United States is much higher than inequality between
countries themselves (OECD 2016).
The analysis of studies of the differences at the inter-country and intra-country regional level described above
shows that it is difficult to compile comparable inequality indicators in many countries and regions, and that there
is no international cross-sectional analysis in the scientific literature on inequality issues (Kim 2008). As a result,
studies of the economic differences between regions predominantly are comparative studies within some
individual countries (Kim 1998; Rodriguez-Pose, Sanchez-Reaza 2005; Kanbur, Zhang 2005; Knight et al. 2006).
There are also attempts in the scientific literature to compare the economic differences at the inter-country and
intra-country regional level in developed and developing countries (Kanbur, Venables 2005; Kim 2008). Due to
the lack of reliable data in developing countries, population statistics is often based on survey data. The data tend
to show a greater degree of regional differences in developing countries, and this could be due to low data quality
or a large disproportion in the economic situation of developing countries. For developed countries, despite quite
large differences in the degree of regional differentiation between countries, the patterns of industrial localization
are quite similar (Kim 2008).
Most importantly, the data on developing countries suggest that the geographical and political factors specific to
each developing country may play a significantly greater role in the process of regional differentiation than in
developed countries. These differences in the process of intra-country regional differentiation create some
difficulties in identifying the causes of territorial inequalities in developing countries. The United Nations
University World Institute’s for Development Economics project “Spatial Disparities in Human Development”,
led by R. Kanbur and A.J. Venables, included data on the degree of intra-country regional differences in more
than 50 developing countries. Although the content of actual data varied considerably from country to country, it
was argued that the degree of regional differences has increased in many developing countries in recent years
(Kanbur, Venables 2005).
Data on the degree of intra-country regional differences in developed countries are much more reliable and valid.
Despite significant differences, the main driver of regional differentiation in developed countries is geographical
differences in industrial concentration. In general, geographical differences in the concentration of industries such
as agriculture and mining increase regional differences, as natural resources are unevenly distributed, while most
service sectors, especially those serving local markets, tend to reduce differences between regions (Kim 2008).
For example, in the United States, traditional low-tech industries, such as textiles, clothing, and tobacco, were
much more localized than medium- and high-tech industries, such as electricity, transportation, and so on. Thus, it
ENTREPRENEURSHIP AND SUSTAINABILITY ISSUES
ISSN 2345-0282 (online) http://jssidoi.org/jesi/
2021 Volume 8 Number 3 (March)
http://doi.org/10.9770/jesi.2021.8.3(6)
Make your research more visible, join the Twitter account of ENTREPRENEURSHIP AND SUSTAINABILITY ISSUES:
@Entrepr69728810
113
can be argued that the gradual shift of production from low-tech to high-tech industries contributed to a greater
dispersion of production over time (Kim 1998) and to decrease in intra-country regional differences.
According to the European Union, Eurostat Regional Yearbook identifies three main features of the process of
regional differentiation in Europe, which are fully in line with the results of the above-analyzed studies on the
economic differences at the inter-country and intra-country regional level in other parts of the world: 1) very high
degree of intra-country regional economic differences by GDP per capita; 2) a geographical profile of the process
of regional differentiation has the form of a “center-periphery” model; 3) the growing economic importance of the
regions in which the capital cities of the EU Member States are located (Eurostat 2018).
3. Research objective and methodology
This article aims to test empirically two popular hypotheses about territorial economic differences in the modern
world. According to the first hypothesis, economic differences between countries in the modern world are not as
great as regions’ differences within countries. According to the second hypothesis, the decline in the degree of
economic differences between countries is due to the relatively faster economic development of capital regions,
which are the centers of politically and economically highly centralized countries, especially in Central and
Eastern Europe (Kuttor 2009).
Further on the authors provide empirical interpretation of the research subject – the economic differences of
territories – in order to specify those indicators whereby the process of the economic differentiation of territories
and its results could be empirically measured and studied. In the scientific literature, there are mainly two
indicators, the differences in which can be considered as economic differences. Firstly, many studies of
economic performance of regions and its differences (Dunford 2008; Stankevics et al. 2014; Boronenko et al.
2014; Kolaríkova et al. 2018) use Gross Domestic Product (GDP) per capita indicator to assess the economic
differences between territories. Secondly, several studies of the economic inequality among regions (Atkinson
1970; Lubrano 2017), as well as studies of the regional aspect of income differentiation (Lavrinovica,
Lavrinenko 2011) use the income of the population for assessment of the economic differences between
territories.
A relatively wide range of instruments can be used to measure the degree of territorial differences, such as the
Tail index, the Atkinson index, the Gini coefficient, the coefficient of variation and the coefficient of asymmetry
(Ruitebeek 1996; Styme, Jackson 2000; Paas, Schlitte 2006; Dunford 2008; Lavrinovich et al. 2012). Following
S. Drobishevskiy and A. Iodchin, the authors will use the coefficient of variation in the further empirical analysis.
Coefficient of variation as the indicator of the state of differentiation of territories is to be used as it does not
depend on the unit of measure of the indicator under analysis (Drobishevskiy et al. 2005; Iodchin 2007).
Thus, in the course of empirical interpretation of the economic differences between territories, the authors
separated the indicators of the economic activity per se (GDP per capita and the income of the population) from
the indicator of the state of economic differentiation of regions (coefficient of variation). Comparing the
coefficients of variation on inter-country and intra-country regional level, the authors will clarify on which
territorial level the degree of economic differences is higher.
The Sub-national Human Development Index (SHDI) database for the period from 2000 to 2017 (Radboud
University 2020) is used as the source of empirical data, as it contains indicators on the income of the population
both in the countries of the world and in their inner regions. It will allow authors to compare the degree of inter-
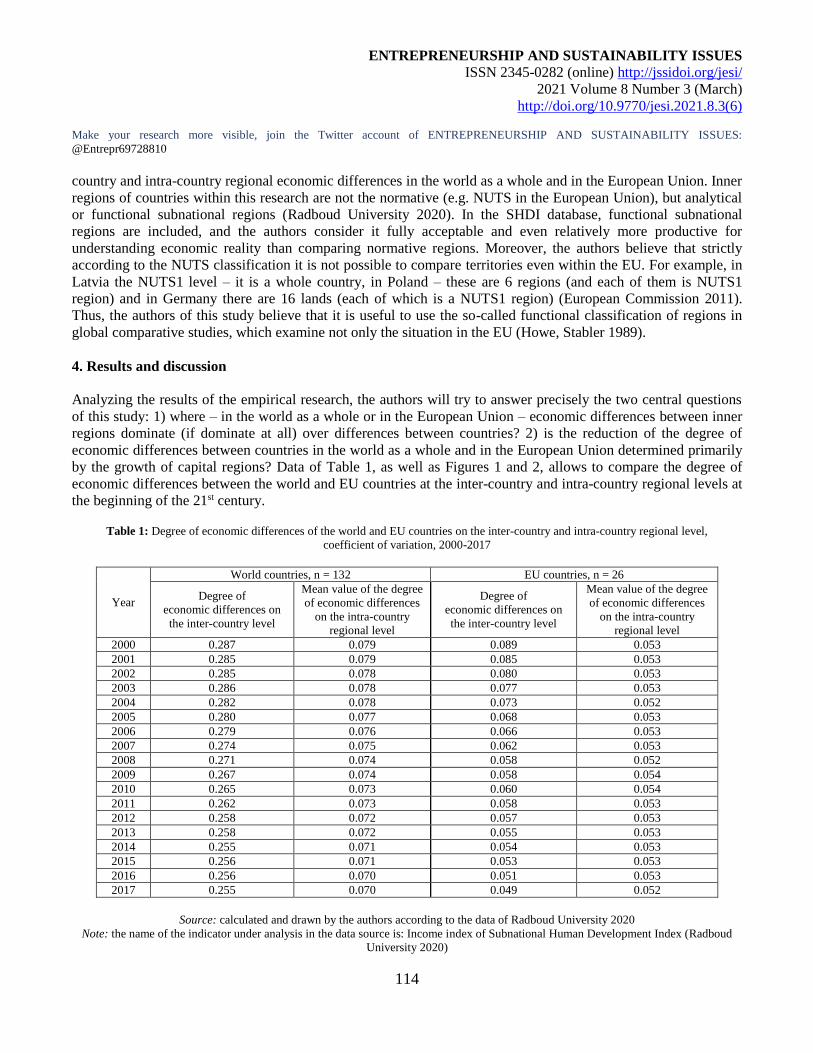
ENTREPRENEURSHIP AND SUSTAINABILITY ISSUES
ISSN 2345-0282 (online) http://jssidoi.org/jesi/
2021 Volume 8 Number 3 (March)
http://doi.org/10.9770/jesi.2021.8.3(6)
Make your research more visible, join the Twitter account of ENTREPRENEURSHIP AND SUSTAINABILITY ISSUES:
@Entrepr69728810
114
country and intra-country regional economic differences in the world as a whole and in the European Union. Inner
regions of countries within this research are not the normative (e.g. NUTS in the European Union), but analytical
or functional subnational regions (Radboud University 2020). In the SHDI database, functional subnational
regions are included, and the authors consider it fully acceptable and even relatively more productive for
understanding economic reality than comparing normative regions. Moreover, the authors believe that strictly
according to the NUTS classification it is not possible to compare territories even within the EU. For example, in
Latvia the NUTS1 level – it is a whole country, in Poland – these are 6 regions (and each of them is NUTS1
region) and in Germany there are 16 lands (each of which is a NUTS1 region) (European Commission 2011).
Thus, the authors of this study believe that it is useful to use the so-called functional classification of regions in
global comparative studies, which examine not only the situation in the EU (Howe, Stabler 1989).
4. Results and discussion
Analyzing the results of the empirical research, the authors will try to answer precisely the two central questions
of this study: 1) where – in the world as a whole or in the European Union – economic differences between inner
regions dominate (if dominate at all) over differences between countries? 2) is the reduction of the degree of
economic differences between countries in the world as a whole and in the European Union determined primarily
by the growth of capital regions? Data of Table 1, as well as Figures 1 and 2, allows to compare the degree of
economic differences between the world and EU countries at the inter-country and intra-country regional levels at
the beginning of the 21st century.
Table 1: Degree of economic differences of the world and EU countries on the inter-country and intra-country regional level,
coefficient of variation, 2000-2017
Year
World countries, n = 132 EU countries, n = 26
Degree of
economic differences on
the inter-country level
Mean value of the degree
of economic differences
on the intra-country
regional level
Degree of
economic differences on
the inter-country level
Mean value of the degree
of economic differences
on the intra-country
regional level
2000 0.287 0.079 0.089 0.053
2001 0.285 0.079 0.085 0.053
2002 0.285 0.078 0.080 0.053
2003 0.286 0.078 0.077 0.053
2004 0.282 0.078 0.073 0.052
2005 0.280 0.077 0.068 0.053
2006 0.279 0.076 0.066 0.053
2007 0.274 0.075 0.062 0.053
2008 0.271 0.074 0.058 0.052
2009 0.267 0.074 0.058 0.054
2010 0.265 0.073 0.060 0.054
2011 0.262 0.073 0.058 0.053
2012 0.258 0.072 0.057 0.053
2013 0.258 0.072 0.055 0.053
2014 0.255 0.071 0.054 0.053
2015 0.256 0.071 0.053 0.053
2016 0.256 0.070 0.051 0.053
2017 0.255 0.070 0.049 0.052
Source: calculated and drawn by the authors according to the data of Radboud University 2020
Note: the name of the indicator under analysis in the data source is: Income index of Subnational Human Development Index (Radboud
University 2020)
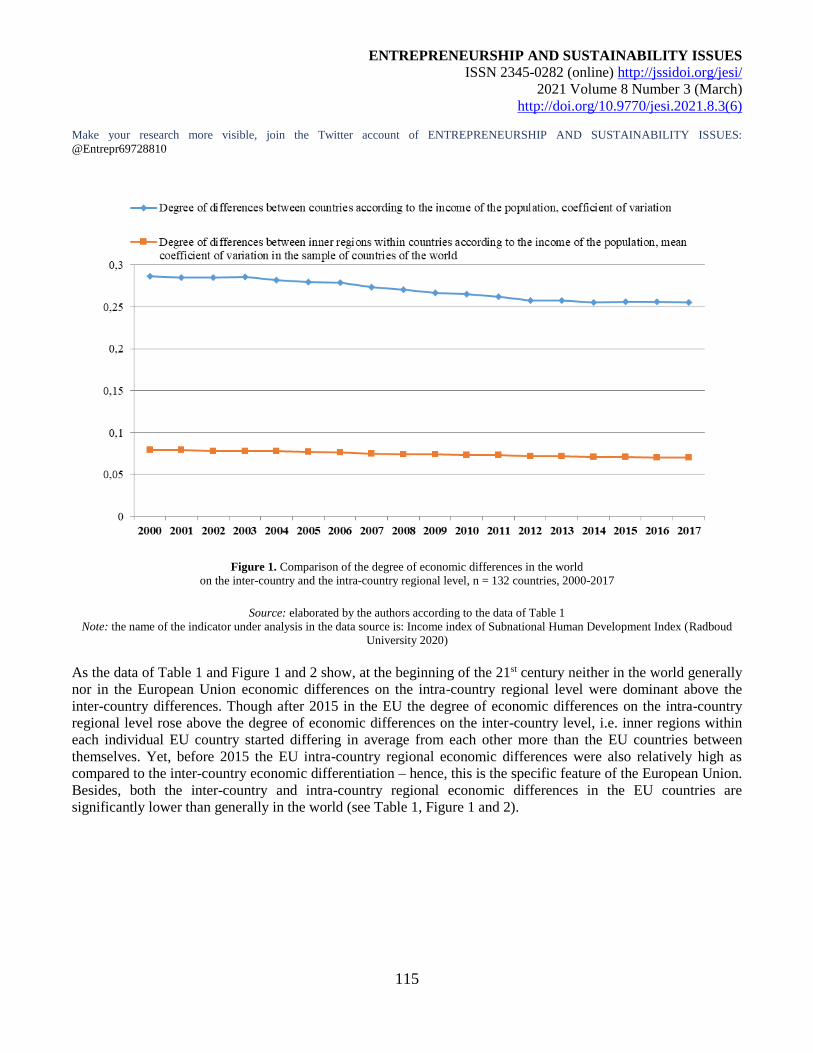
ENTREPRENEURSHIP AND SUSTAINABILITY ISSUES
ISSN 2345-0282 (online) http://jssidoi.org/jesi/
2021 Volume 8 Number 3 (March)
http://doi.org/10.9770/jesi.2021.8.3(6)
Make your research more visible, join the Twitter account of ENTREPRENEURSHIP AND SUSTAINABILITY ISSUES:
@Entrepr69728810
115
Figure 1. Comparison of the degree of economic differences in the world
on the inter-country and the intra-country regional level, n = 132 countries, 2000-2017
Source: elaborated by the authors according to the data of Table 1
Note: the name of the indicator under analysis in the data source is: Income index of Subnational Human Development Index (Radboud
University 2020)
As the data of Table 1 and Figure 1 and 2 show, at the beginning of the 21st century neither in the world generally
nor in the European Union economic differences on the intra-country regional level were dominant above the
inter-country differences. Though after 2015 in the EU the degree of economic differences on the intra-country
regional level rose above the degree of economic differences on the inter-country level, i.e. inner regions within
each individual EU country started differing in average from each other more than the EU countries between
themselves. Yet, before 2015 the EU intra-country regional economic differences were also relatively high as
compared to the inter-country economic differentiation – hence, this is the specific feature of the European Union.
Besides, both the inter-country and intra-country regional economic differences in the EU countries are
significantly lower than generally in the world (see Table 1, Figure 1 and 2).
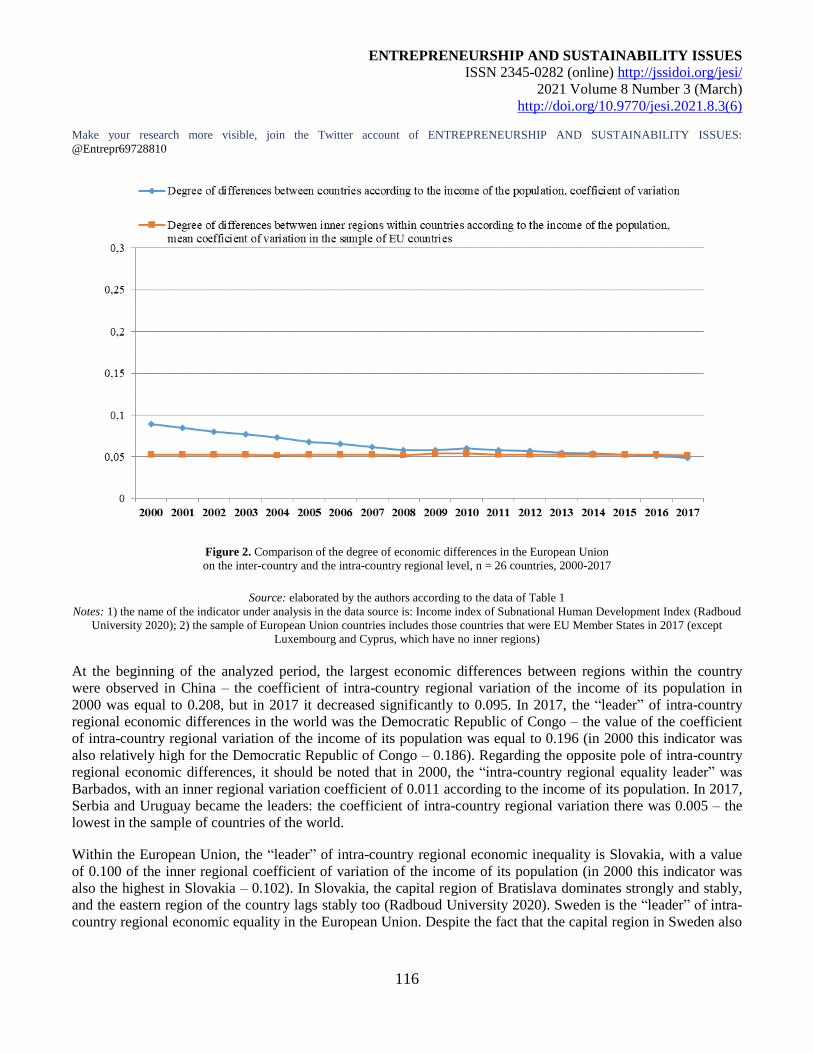
ENTREPRENEURSHIP AND SUSTAINABILITY ISSUES
ISSN 2345-0282 (online) http://jssidoi.org/jesi/
2021 Volume 8 Number 3 (March)
http://doi.org/10.9770/jesi.2021.8.3(6)
Make your research more visible, join the Twitter account of ENTREPRENEURSHIP AND SUSTAINABILITY ISSUES:
@Entrepr69728810
116
Figure 2. Comparison of the degree of economic differences in the European Union
on the inter-country and the intra-country regional level, n = 26 countries, 2000-2017
Source: elaborated by the authors according to the data of Table 1
Notes: 1) the name of the indicator under analysis in the data source is: Income index of Subnational Human Development Index (Radboud
University 2020); 2) the sample of European Union countries includes those countries that were EU Member States in 2017 (except
Luxembourg and Cyprus, which have no inner regions)
At the beginning of the analyzed period, the largest economic differences between regions within the country
were observed in China – the coefficient of intra-country regional variation of the income of its population in
2000 was equal to 0.208, but in 2017 it decreased significantly to 0.095. In 2017, the “leader” of intra-country
regional economic differences in the world was the Democratic Republic of Congo – the value of the coefficient
of intra-country regional variation of the income of its population was equal to 0.196 (in 2000 this indicator was
also relatively high for the Democratic Republic of Congo – 0.186). Regarding the opposite pole of intra-country
regional economic differences, it should be noted that in 2000, the “intra-country regional equality leader” was
Barbados, with an inner regional variation coefficient of 0.011 according to the income of its population. In 2017,
Serbia and Uruguay became the leaders: the coefficient of intra-country regional variation there was 0.005 – the
lowest in the sample of countries of the world.
Within the European Union, the “leader” of intra-country regional economic inequality is Slovakia, with a value
of 0.100 of the inner regional coefficient of variation of the income of its population (in 2000 this indicator was
also the highest in Slovakia – 0.102). In Slovakia, the capital region of Bratislava dominates strongly and stably,
and the eastern region of the country lags stably too (Radboud University 2020). Sweden is the “leader” of intra-
country regional economic equality in the European Union. Despite the fact that the capital region in Sweden also
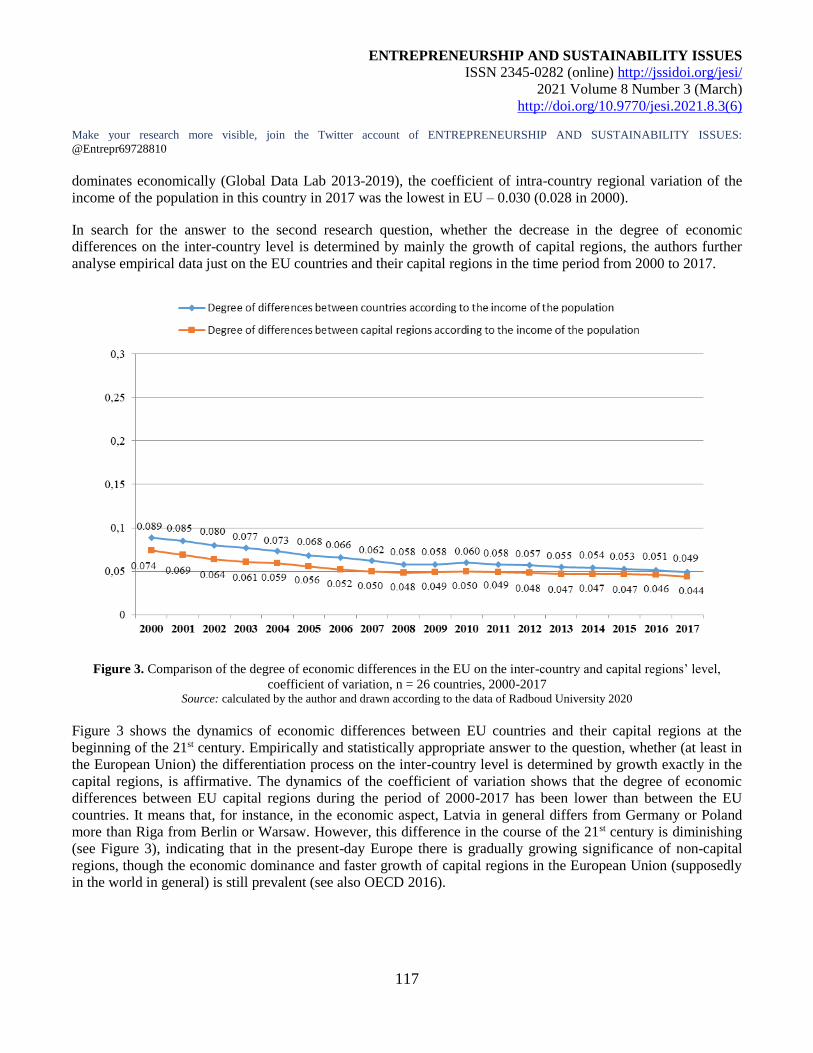
ENTREPRENEURSHIP AND SUSTAINABILITY ISSUES
ISSN 2345-0282 (online) http://jssidoi.org/jesi/
2021 Volume 8 Number 3 (March)
http://doi.org/10.9770/jesi.2021.8.3(6)
Make your research more visible, join the Twitter account of ENTREPRENEURSHIP AND SUSTAINABILITY ISSUES:
@Entrepr69728810
117
dominates economically (Global Data Lab 2013-2019), the coefficient of intra-country regional variation of the
income of the population in this country in 2017 was the lowest in EU – 0.030 (0.028 in 2000).
In search for the answer to the second research question, whether the decrease in the degree of economic
differences on the inter-country level is determined by mainly the growth of capital regions, the authors further
analyse empirical data just on the EU countries and their capital regions in the time period from 2000 to 2017.
Figure 3. Comparison of the degree of economic differences in the EU on the inter-country and capital regions’ level,
coefficient of variation, n = 26 countries, 2000-2017 Source: calculated by the author and drawn according to the data of Radboud University 2020
Figure 3 shows the dynamics of economic differences between EU countries and their capital regions at the
beginning of the 21st century. Empirically and statistically appropriate answer to the question, whether (at least in
the European Union) the differentiation process on the inter-country level is determined by growth exactly in the
capital regions, is affirmative. The dynamics of the coefficient of variation shows that the degree of economic
differences between EU capital regions during the period of 2000-2017 has been lower than between the EU
countries. It means that, for instance, in the economic aspect, Latvia in general differs from Germany or Poland
more than Riga from Berlin or Warsaw. However, this difference in the course of the 21st century is diminishing
(see Figure 3), indicating that in the present-day Europe there is gradually growing significance of non-capital
regions, though the economic dominance and faster growth of capital regions in the European Union (supposedly
in the world in general) is still prevalent (see also OECD 2016).
ENTREPRENEURSHIP AND SUSTAINABILITY ISSUES
ISSN 2345-0282 (online) http://jssidoi.org/jesi/
2021 Volume 8 Number 3 (March)
http://doi.org/10.9770/jesi.2021.8.3(6)
Make your research more visible, join the Twitter account of ENTREPRENEURSHIP AND SUSTAINABILITY ISSUES:
@Entrepr69728810
118
5. Conclusions
A comparison of the inter-country and intra-country regional economic differences in the world and European
Union allowed the authors to conclude, that at the beginning of the 21st century, neither the world nor the EU
economic differences between countries’ inner regions dominated over the inter-country economic differences.
This allows the author to reject the first tested hypothesis, according to which economic differences between
countries are often not so large as the economic differences between regions within these countries. However after
2015, the degree of the economic differences between inner regions of countries in the EU started exceeding inter-
country economic differences, i.e., the inner regions within each individual EU country began to differ on average
more than the EU countries themselves. However, even until 2015, the economic differences of the inner regions
of the EU countries was relatively high in comparison with the economic differences between the whole
countries, which is the specifics of the European Union. At the same time, both tinter-country and intra-country
regional economic differences in EU countries are significantly lower than in the world as a whole.
Empirically justified answer to the question whether the decrease in inter-country economic differences in the
European Union is determined by mostly the growth of capital regions is affirmative. It is supported by the
dynamics of the coefficient of variation in the time period from 2000 to 2017, which shows that the degree of
economic differences between the EU countries’ capital regions is lower than between the EU countries in
general. This difference gradually decreases, indicating that at the beginning of the 21st century in the European
Union there is growth of the economic significance of non-capital regions.
References
Atkinson, A.B. (1970). On the measurement of inequality. Journal of Economic Theory, 2, 244-63. https://doi.org/10.1016/0022-
0531(70)90039-6
Berzins M. (2011). Iekšzemes migrācijas reģionālās dimensijas Latvijā. [Regional dimensions of domestic migration in Latvia]
Proceedings of the Latvian Academy of Sciences, A (3/4), 35-54. Retrieved September 11, 2020 from http://www.lasproceedings.lv/wp-
content/uploads/2020/12/LZA-Vestis-A-dala-2011.-gada-3.-un-4.-numurs.pdf
Boronenko, V., Mensikovs, V., & Lavrinenko, O. (2014). The impact of EU accession on the economic performance of the countries’
internal (NUTS 3) regions. Journal of Economics and Business, 32 (2), 313-341. Retrieved September 11, 2020 from
https://www.efri.uniri.hr/upload/Nastavnici%20i%20istrazivanja/Arhiva%20Zbornika%20radova/04-boronenko_mensikovs_lavrinenko-
2014-2-1420787428.pdf
Chatterji, M. (2014). Walter Isard and the role of Regional Science and Peace Science for the poor countries. International Regional
Science Review, 37 (1), 96-106. https://doi.org/10.1177/0160017613484927
Drobishevkiy, S., Lugovoy, О., Astafyeva, Y., Polevoy, D., Kozlovskaya, А., Trunin, P., & Lederman, L. (2005). Факторы
экономического роста в регионах РФ. [Factors of the Economic Growth in Regions of the RF] Moscow: IEPP.
Dunford, M. (2008). After the three Italies the (internally differentiated) North-South divide: analysing regional and industrial trajectories.
Annales de Géographie, 664 (6). Retrieved September 11, 2020 from
https://www.researchgate.net/publication/228621238_After_the_three_Italies_the_internally_differentiated_North-
South_divide_Analysing_regional_and_industrial_trajectories
European Commission. (2011). Regions in the European Union — Nomenclature of territorial units for statistics NUTS 2010/EU-27.
Luxembourg: Publications Office of the European Union. Retrieved September 11, 2020 from
https://ec.europa.eu/eurostat/documents/3859598/5916917/KS-RA-11-011-EN.PDF
Eurostat. (2018). Eurostat Regional Yearbook 2018. Luxembourg: Publications Office of the European Union.
ENTREPRENEURSHIP AND SUSTAINABILITY ISSUES
ISSN 2345-0282 (online) http://jssidoi.org/jesi/
2021 Volume 8 Number 3 (March)
http://doi.org/10.9770/jesi.2021.8.3(6)
Make your research more visible, join the Twitter account of ENTREPRENEURSHIP AND SUSTAINABILITY ISSUES:
@Entrepr69728810
119
Gibbons, S., & Vignoles, A. (2011) Geography, choice and participation in higher education in England. Regional Science and Urban
Economics, 42 (1-2), 98-113. https://doi.org/10.1016/j.regsciurbeco.2011.07.004
Granberg, A. (1997). Regional science and new regional policy in Russia. In M. Chatterji (Ed.), Regional Science: Perspectives for the
Future (pp. 248–262). London: Macmillan Press. Retrieved September 11, 2020 from https://link.springer.com/chapter/10.1007/978-1-349-
25514-6_17
Howe, E., & Stabler, J. (1989). Canada divided: the optimal division of an economy into regions. ]ournal of Regional Science, 29, 191-211.
https://doi.org/10.1111/j.1467-9787.1989.tb01232.x
Hua, J., & Gu, Ch. (2001). Economic analysis on regional economic difference. Geographical Research, 20 (3), 322-329.
Iodchin, А. (2007). Эконометрическое моделирование межрегиональной конвергенции в России: автореферат диссертации.
[Econometric Modelling of the Regional Convergence in Russia: Resume of the Dissertation] Moscow: Moscow State University.
Retrieved September 11, 2020 from https://www.dissercat.com/content/ekonometricheskoe-modelirovanie-mezhregionalnoi-konvergentsii-
v-rossii
Isard, W. (1960). Methods of Regional Analysis: Introduction to Regional Science. Cambridge, MA: MIT Press and John Wiley.
Isard, W. (1975). Introduction to Regional Science. New York: Prentice Hall.
Kanbur, R., & Venables, A.J. (2005). Spatial inequality and development. In R. Kanbur & A.J. Venables (Eds.), Spatial Inequality and
Development (pp. 115-132). Oxford: Oxford University Press. Retrieved September 11, 2020 from
https://global.oup.com/academic/product/spatial-inequality-and-development-9780199278633?cc=lv&lang=en&
Kanbur, R., Venables, A.J., & Wan, G. (2006). Spatial Disparities in Human Development: Perspectives from Asia. United Nations Press.
Retrieved September 11, 2020 from https://collections.unu.edu/view/UNU:2547
Kanbur, R., & Zhang, X. (2005). Fifty years of regional inequality in China: a journey through central planning, reform and openness.
Review of Development Economics, 9 (1), 87–106. https://doi.org/10.1111/j.1467-9361.2005.00265.x
Karwat-Wozniak, B. (2011). Regional differentiation in the socio-economic development conditions of the agriculture in Poland.
Economics & Sociology, 4 (2), 11-25. Retrieved September 11, 2020 from https://www.economics-sociology.eu/files/E&S_4_2_guest.pdf
Kim, S. (1998). Economic integration and convergence: U.S. regions, 1840–1990. Journal of Economic History, 58, 659–683.
https://doi.org/10.1017/S0022050700021112
Kim, S. (2008). Spatial inequality and economic development: theories, facts and policies. Working Paper No. 16. Washington: The World
Bank. Retrieved September 11, 2020 https://openknowledge.worldbank.org/handle/10986/28050?locale-attribute=es
Knight, J., Shi, L., & Renwei, Zh. (2006). Divergent means and convergent inequality of incomes among the provinces and cities of urban
China. In R. Kanbur, A.J. Venables, & G. Wan (Eds.), Spatial Disparities in Human Development: Perspectives from Asia (pp. 126-144).
United Nations Press. Retrieved September 11, 2020 from https://collections.unu.edu/view/UNU:2547
Kolaríkova, J., Dvoulety, O., & Kolarík, P. (2018). Economic performance of the NUTS III regions in the Czech Republic in the context of
entrepreneurship subsidies from the EU structural funds. Journal of Economics and Business (Proceedings of Rijeka Faculty of
Economics), 36 (1), 129-153. https://doi.org/10.18045/zbefri.2018.1.129
Kovacs, Z. (2004). Socio-economic transition and regional differentiation in Hungary. Geographical Bulletin, LIII (1-2). Retrieved
September 11, 2020 from https://www.researchgate.net/publication/228962218_Socio-
economic_transition_and_regional_differentiation_in_Hungary
Krauklis, A. (2000). Living with diversity in Latvia: people, nature and cultural landscape. Folia Geographica, 8, 1-14. Retrieved
September 11, 2020 from
https://www.geo.lu.lv/fileadmin/user_upload/LU.LV/Apaksvietnes/Fakultates/www.gzzf.lu.lv/Folia_Geographica/Geografiski_raksti_VIII.
ENTREPRENEURSHIP AND SUSTAINABILITY ISSUES
ISSN 2345-0282 (online) http://jssidoi.org/jesi/
2021 Volume 8 Number 3 (March)
http://doi.org/10.9770/jesi.2021.8.3(6)
Make your research more visible, join the Twitter account of ENTREPRENEURSHIP AND SUSTAINABILITY ISSUES:
@Entrepr69728810
120
Krisjane, Z., & Bauls, A. (2007). Migrācijas plūsmu reģionālās iezīmes Latvijā. [Regional features of migration flows in Latvia] Paaudžu
nomaiņa un migrācija Latvijā (Stratēģiskās analīzes komisijas zinātniski pētnieciskie raksti), 4 (15), 130-143.
Kule, L., Krisjane, Z., & Berzins, M. (2010). Rhetoric and reality of pursuing territorial cohesion in Latvia. In N. Adams, G. Cotella, & R.
Nunes (Eds.), Territorial Development, Cohesion and Spatial Planning: Building on EU Enlargement (pp. 586-645). London: Routledge.
Kuttor, D. (2009). Territorial inequalities in Central Europe: spatial analysis of the Visegrad countries. Romanian Review of Regional
Studies, V (1). Retrieved September 11, 2020 from https://core.ac.uk/download/pdf/27060466.pdf
Lavrinovica, I., & Lavrinenko, O. (2011). Iedzīvotāju ienākumu diferenciācija Latvijas reģionos. [Income Differentiation of the Population
in Latvia’s Regions] Daugavpils: Publishing House of Daugavpils University “Saule”. Retrieved September 11, 2020 from
https://www.researchgate.net/publication/299505811_Iedzivotaju_ienakumu_diferenciacija_Latvijas_regionos
Lavrinovich, I., Lavrinenko, O., & Jefimovs, N. (2012). Sustainable development, economic growth and differentiation of incomes of
Latvian population. Journal of Security and Sustainability, 2 (1), 33-39. https://doi.org/10.9770/jssi/2012.2.1(3)
Lubrano, M. (2017). Lorenz curves, the Gini coefficient and parametric distributions. The Econometrics of Inequality and Poverty.
Retrieved September 11, 2020 from http://www.vcharite.univ-mrs.fr/PP/lubrano/cours/Lecture-4.pdf
OECD. (2011). Regional economic disparities. In, OECD Regions at a Glance 2011 (pp. 40-45). Paris: OECDPublishing, Retrieved
September 11, 2020 from https://www.oecd-ilibrary.org/docserver/reg_glance-2011-11-
en.pdf?expires=1613197250&id=id&accname=guest&checksum=EB92DDDDE7D33EDE0B812E175E373390
OECD. (2013). OECD Regions at a Glance 2013. Paris: OECD Publishing. Retrieved September 11, 2020 from https://www.oecd-
ilibrary.org/urban-rural-and-regional-development/oecd-regions-at-a-glance-2013_reg_glance-2013-en
OECD. (2016). OECD Regions at a Glance 2016. Paris: OECD Publishing. Retrieved September 11, 2020 from
http://www.oecd.org/regional/oecd-regions-at-a-glance-19990057.htm
Okuneviciute-Neverauskiene, L., Danileviciene, I. & Tvaronaviciene, M. (2020). Assessment of the factors influencing competitiveness
fostering the country’s sustainability. Economic Research-Ekonomska Istraživanja, 33(1), 1909-1924.
https://doi.org/10.1080/1331677X.2020.1763821
Paas, T., & Schlitte, F. (2006). Regional income inequality and convergence processes in the EU-25. ERSA conference papers, European
Regional Science Association. Retrieved September 11, 2020 from http://www-sre.wu-wien.ac.at/ersa/ersaconfs/ersa06/papers/229.pdf
Prakash, R., Garg, P. (2019). Comparative assessment of HDI with Composite Development Index (CDI). Insights into Regional
Development, 1(1), 58-76. https://doi.org/10.9770/ird.2019.1.1(5)
Rivza, B. (Ed.) (2018) Zināšanu ekonomika Latvijas lauku un reģionu dzīvotspējai. [Knowledge Economy for the Viability of Latvia’s
Countryside and Regions] Jelgava: Publishing House of Jelgava. Retrieved September 11, 2020 from
https://llufb.llu.lv/LLUgramatas/Monografija_Zinasanu_ekonomika_Latvijas_lauku_regionu_dzivotspejai.pdf
Rodriguez-Pose, A., & Sanchez-Reaza, J. (2005). Economic polarization through trade: trade liberalization and regional growth in Mexico.
In R. Kanbur, A.J. Venables (Eds.), Spatial Inequality and Development (pp. 152-179). Oxford: Oxford University Press. Retrieved
September 11, 2020 from https://collections.unu.edu/view/UNU:2547
Ruitebeek, H. (1996). Distribution of ecological entitlements: implications for economic security and population movement. Ecological
Economics, 17, 49-64. https://doi.org/10.1016/0921-8009(95)00103-4
Radboud University. (2020). The Global Data Lab, Sub-national HDI database. Retrieved September 11, 2020 from
https://hdi.globaldatalab.org/areadata/shdi/
Sala-i-Martin, X. (1995). The classical approach to convergence analysis. Economics Working Paper No. 117. Yale: Yale University,
Universitat Pompeu Fabra. Retrieved September 11, 2020 from https://ideas.repec.org/p/upf/upfgen/117.html
ENTREPRENEURSHIP AND SUSTAINABILITY ISSUES
ISSN 2345-0282 (online) http://jssidoi.org/jesi/
2021 Volume 8 Number 3 (March)
http://doi.org/10.9770/jesi.2021.8.3(6)
Make your research more visible, join the Twitter account of ENTREPRENEURSHIP AND SUSTAINABILITY ISSUES:
@Entrepr69728810
121
Sala-i-Martin, X. (1996). Regional cohesion: evidence and theories of regional growth and convergence, European Economic Review,
40(6), 1325-1352. https://doi.org/10.1016/0014-2921(95)00029-1
Stankevics, A., Ignatyeva, S., & Menshikovs, V. (2014). Higher education’s contribution to economic performance and innovativeness in
Latvia: exploratory research. Economic Annals, 202(59), 7-41. https://doi.org/10.2298/EKA1402007S
Styme S., & Jackson T. (2000). Intra-generational equity and sustainable welfare: a time series analyses for the UK and Sweden.
Ecological Economics, 33, 219-236. https://doi.org/10.1016/S0921-8009(99)00144-5
Tvaronaviciene, M. (2018). Towards efficient policy making: Forecasts of vulnerability to external global threats. Journal of Security and
Sustainability Issues, 7 (3). https://doi.org/10.9770/jssi.2018.7.3(18)
Ullman E. (1958) Regional development and the geography of concentration. Papers and Proceedings of the Regional Science Association,
4, 179-198. https://doi.org/10.1111/j.1435-5597.1958.tb01629.x
UNDP. (2020). United Nations Development Programme, Human Development Index (HDI). Retrieved on September 11, 2020, from
http://hdr.undp.org/en/content/human-development-index-hdi
Vera KOMAROVA is Dr. oec., Leading Researcher at the Social Investigations Centre of Institute of Humanities and Social Sciences of
Daugavpils University (Latvia). She has status of the external expert of the COST Association (Brussel). Her research interests: industrial
clusters, regional economics, sustainable territory development.
ORCID ID: 0000-0002-9829-622X
Natalya Selivanova-FYODOROVA is PhD in Economics and Entrepreneurship, Lecturer at the RISEBA University of Applied Sciences
(Latvia). Her research interests: macroeconomics, differentiation of territories, quantitative research methods.
ORCID ID: 0000-0001-8561-4869
Oksana RUZA is Dr. oec., Docent, Researcher at the Social Investigations Centre of Institute of Humanities and Social Sciences of
Daugavpils University (Latvia). Her research interests: regional economics, industrial economics, finances.
ORCID ID: 0000-0002-6194-3841
Jerzy KAZMIERCZYK is PhD, Assistant Professor at the Poznan University of Economics and Business (Poland), Member of the
Presidium of Research Council of Polish Economic Society, and Member of the Regional Labor Market Board at Lubuskie Marshal's
Office. His research interests: labor market, HRM, banking, macroeconomics.
ORCID ID: 0000-0002-5976-0210
Iluta ARBIDANE is Dr, oec., Dean of the Faculty of Economics and Management of Rezekne Academy of Technologies (Latvia). Her
research interests: transport, new technologies, territory development.
ORCID ID: 0000-0002-9762-3874
Copyright © 2021 by author(s) and VsI Entrepreneurship and Sustainability Center
This work is licensed under the Creative Commons Attribution International License (CC BY).
http://creativecommons.org/licenses/by/4.0/
ENTREPRENEURSHIP AND SUSTAINABILITY ISSUES
ISSN 2345-0282 (online) http://jssidoi.org/jesi/
2021 Volume 8 Number 3 (March)
http://doi.org/10.9770/jesi.2021.8.3(7)
Publisher http://jssidoi.org/esc/home
122
SOCIAL DETERMINANTS OF DIGITAL EXCLUSION IN AN AGEING SOCIETY.
THE CASE OF POLAND
Monika Adamczyk 1, Alina Betlej 2
1,2 Institute of Sociological Sciences, The John Paul II Catholic University of Lublin, Al. Racławickie 14, 20-950 Lublin,
Poland
E-mails: [email protected]; [email protected]
Received 20 March 2020; accepted 10 December 2020; published 30 March 2020
Abstract. The aim of the article is to identify and analyze the social determinants of digital exclusion in an ageing society on the example
of Poland. The ageing of societies is nowadays a process recognized as a common trend in the world. Demographic changes cause serious
socio-economic transformations. Contemporary social and economic systems are dependent on new technologies. Full participation in a
technical environment is possible only for individuals with specific technical, social and psychological competences. The ability to use new
information and communication technologies becomes a life necessity. In this context questions about the endogenous and exogenous
determiants of digital exclusion in ageing societies, as well as about the impact of the digital technology on the emergence of new
dimensions of digital exclusion have been raised. The methodological basis of the study are the theories of social and digital exclusion, as
well as science and technology studies. The information bases for the study were the GUS (Central Statistical Office in Poland) reports,
Eurostat data base and several statistic reports of non-government organizations in Poland. The analyzed period includes 2015-2019 years
in cases where the development trends are discusses and 2019 to show the implications of new technologies impact on polish society. The
forecasts reach up to 2060. The theoretical study is based on the analytical and semantic method. It has been shown that the analysis of the
effects of digital exclusion in an ageing society should cover a much wider range of factors causing negative consequences. Exogenous
factors, i.e. barriers preventing Internet use combined with lack of access to new technologies and lack of digital competence should be
treated equally to endogenous factors. Motivation to develop and acquire new skills related to individual life strategies of the elderly plays
an equally important role in the process of social self-exclusion. Authors also identifies the main dimensions of digital exclusion and
presents them as a multi-factor model: Market - trust - economy; Information policy; Marketing - information - knowledge; Electronic
democracy; Quality of life - health. The article provides a theoretical framework for the analysis of new dimensions of digital exclusion in
ageing societies. It situates the assessment of new technologies in the social context of the progressing demographic changes implications.
It points to new categories of social divides in technologically developed societies.
Keywords: ageing society; digital divide; digital exclusion; new technologies; sustainable development
Reference to this paper should be made as follows: Adamczyk, M., Betlej, A. 2021. Social determinants of digital exclusion in an ageing
society. The case of Poland. Entrepreneurship and Sustainability Issues, 8(3), 122-135. http://doi.org/10.9770/jesi.2021.8.3(7)
JEL Classifications: A14, B55
ENTREPRENEURSHIP AND SUSTAINABILITY ISSUES
ISSN 2345-0282 (online) http://jssidoi.org/jesi/
2021 Volume 8 Number 3 (March)
http://doi.org/10.9770/jesi.2021.8.3(7) Make your research more visible, join the Twitter account of ENTREPRENEURSHIP AND SUSTAINABILITY ISSUES: @Entrepr69728810
123
Additional disciplines: sociology
1. Introduction
There is a general consensus among researchers dealing with the problems of an ageing society that modern
demographic processes imply many negative social and economic effects. Transformations of elementary social
structures, which seem to undermine the classical assumptions about the natural rights of social development,
force us to reflect on the challenges faced by societies in the XXI century (Kozubikova, Kotaskova, 2019;
Niemczyk, Trzaska, Borowski, Karolczak, 2019, Korauš, Dobrovič, Polák, Backa, 2019; Borimdesouza, Zanoni,
Janchiba, Borinelli, 2019; Ślusarczyk, Tvaronavičienė, Ul Haque, Oláh, 2020; Tvaronaviciene, Burinskas, 2020).
One of the most serious is the widening scope of digital exclusion of the elderly. The mechanism of social
exclusion is closely connected with structural analysis - the structural configuration influences: the way
knowledge is exchanged, access to material and non-material resources in the society, the possibilities of
expansion of social communities, or the probability of stagnation and decline of certain social entities. The most
stressed dimensions of social exclusion in contemporary concepts are: economic, political and social ones. The
effects of social divides are primarily diverse opportunities for people to participate in social and economic life
(Menshikov, Lavrinenko, Sinica, Simakhova, 2017; Korauš, Dobrovič, Rajnoha, Brezina, 2017; Javaria, Masood,
Garcia, 2020; Androniceanu et al., 2020). Limited participation in consumption, unemployment, reduction of
social contacts, disappearance of elementary social bonds connecting an individual with the social environment,
limited participation in public life, inability to define social and economic reality by means of changing meaning
systems, and finally loss of ability to recognize and understand market game rules are the most frequently
mentioned practical consequences of social stratification.
The set of very well known problems of ageing societies should be accompanied by new issues, such as the
question of threats to the practical implementation of sustainable development principles. Developmental
disparities are becoming apparent in a situation of increasing the percentage of elderly people (aged 60/65 and
over), while reducing the number of young ones. The implications of this situation are the processes that may lead
to a demographic disorder of the system. Sustainability development refers to the case when it meets the needs of
the present without compromising the ability of future societies to meet their own needs. The unbalanced
proportions of society result in the unsustainability of society. From the point of view of the relationship between
the implementation of sustainable development objectives and the processes of ageing, apart from life expectancy
and health, the way of functioning in society, i.e. the degree of social integration is also important (Adamczyk,
2017; Androniceanu, Tvaronavičienė, 2019). Social enterprises have an important role in social integration as
well (Rey-Martí et al. 2020).
The analysis of the notion of old age can refer to many aspects, which results from the very way a person is
perceived from the perspective of different areas of his/her life. The central position in the considerations
conducted on the basis of various theories is the relationship of an individual to the natural world, the social
world, the world of culture, as well as to technological development. The global expansion of new technologies
makes them an indispensable element of everyday life, including the elderly. The development of information and
communication technologies, Internet of Things, artificial intelligence systems can be one of the most serious
factors of social disintegration of the elderly in this context. Many social reports and forecasts also highlight the
positive impact of market developments in new technologies on the top-down stimulated inclusion of excluded
people in society. In the EU debates, the potential of new technologies in eliminating traditional social divisions is
stressed. The works of futurologists and technoenthusiasts have repeatedly referred to the technological theme of
the equality society. It is definitely more frequently confirmed that the fast pace of development of the new
ENTREPRENEURSHIP AND SUSTAINABILITY ISSUES
ISSN 2345-0282 (online) http://jssidoi.org/jesi/
2021 Volume 8 Number 3 (March)
http://doi.org/10.9770/jesi.2021.8.3(7) Make your research more visible, join the Twitter account of ENTREPRENEURSHIP AND SUSTAINABILITY ISSUES: @Entrepr69728810
124
technologies market and the progressing processes of ageing societies will lead to the crystallization of new social
divides, whose scale and scope of impact will be incomparable to the known, sociological categories mentioned
before.
In these considerations context have been raised important questions: What are the endogenous and exogenous
social determiants of digital exclusion in ageing societies? What social challenges are caused by the development
of new technologies in ageing societies?
2. Literature Review
The literature on the subject refers to the concepts of digital divide and digital exclusion. The first term was
promoted by the American journalist Gary Andrew Poole in 1996 (Pool, 1996). In the 1990s, the issue of access
to new technologies was a major interest. Being connected, having a computer or being able to use it at school, in
the workplace, etc., was supposed to determine an individual's position in the structure of chances in the labour,
educational and business markets (Dutton, Reisdorf, 2019; Androniceanu, 2019). In the literature conceptual
divides into information rich and information poor began to appear. The concepts of informational and
telecommunications poverty became popular. Digital exclusion is defined as a result of elimination of an
individual, a social group from the mainstream of social activity, caused by lack of access and/or inability to use
new technologies (Helsper, Van Deursen, 2017). The technological gap between different interactive contexts of
social activity, offline and online is the source of the most difficult to overcome developmental disproportions in
ageing societies. Sources of digital inequalities are sought at many levels of human activity (Kryszczuk, Green,
2015; Haseeb et al., 2019):
-an unequal access to information and communication technologies and the Internet;
-differences in the quality of used information and communication technologies;
-a speed of adaptation to new technologies;
-an amount and quality of time spent on using the network;
-IT skills and abilities of particular categories of users;
-a degree of adaptability to change and the users’ willingness to take risks;
-differences in the knowledge resources needed to skillfully using network resulting directly from the level of
education, income, place of residence, age of users;
-an individual differences in the ability to search and evaluate information on the network, degree of network
control.
Digital competences could be analysed as the abilities to use information and communication technologies (or
more broadly digital). They include skills in operating hardware and software, searching and processing
information in different sources. The term therefore refers to IT, information, communication and relational skills
in the digital environment (Kačerauskas, 2015). However, there are significant differences in the American and
European understanding of this problem. In the United States the phenomenon of digital exclusion is primarily
analysed as digital divide - systematic differences in access to and use of computers and the Internet between
people of different socio-economic status (education, income, occupation) at different stages of life, sex and
different regions. In Europe the term e-inclusion is more popular. The European approach takes into account two
extremely important areas of this phenomenon. The first one is the domain of activities that build digital cohesion
by delivering the benefits of the Internet and other technologies to all groups of society. The second is based on
the recognition that digital exclusion is more than just a digital divide and that it is not only about differences in
access, skills or usage, but about all that lead to social and economic exclusion (Betlej, 2017). E-inclusion refers
to the effective participation of individuals and communities in all dimensions of the knowledge-based society
and economy through access (also understood as removing barriers and facilitating use) and use of information
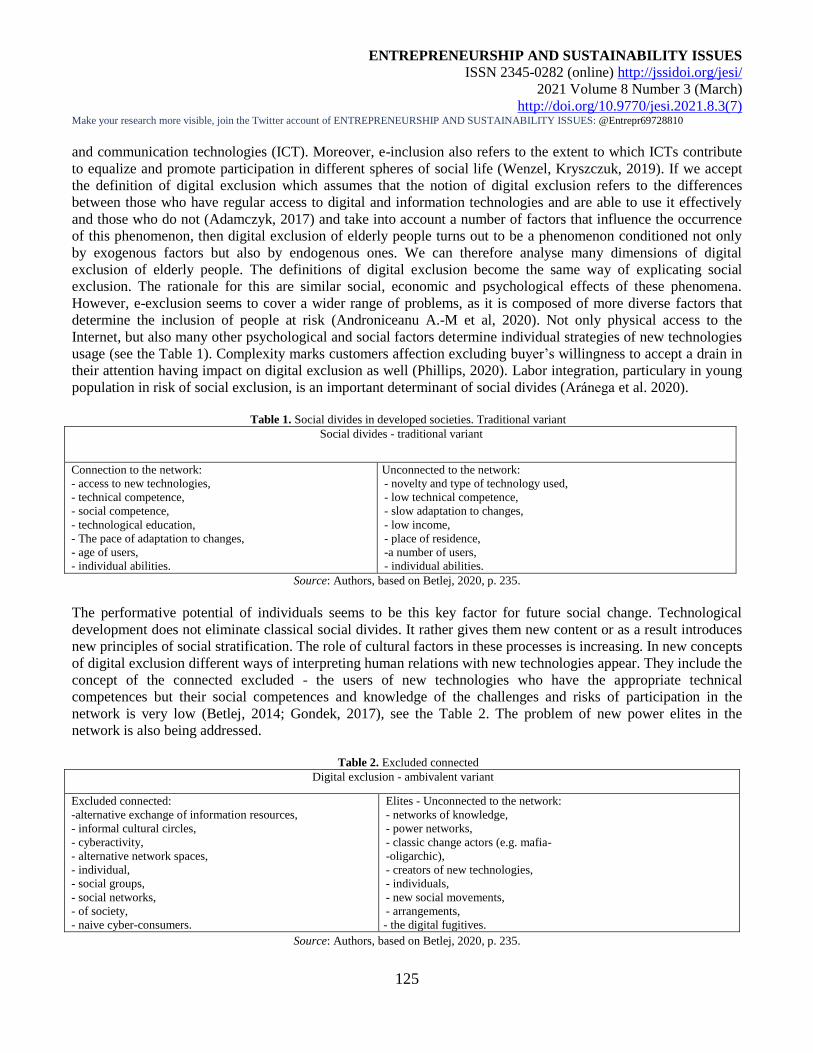
ENTREPRENEURSHIP AND SUSTAINABILITY ISSUES
ISSN 2345-0282 (online) http://jssidoi.org/jesi/
2021 Volume 8 Number 3 (March)
http://doi.org/10.9770/jesi.2021.8.3(7) Make your research more visible, join the Twitter account of ENTREPRENEURSHIP AND SUSTAINABILITY ISSUES: @Entrepr69728810
125
and communication technologies (ICT). Moreover, e-inclusion also refers to the extent to which ICTs contribute
to equalize and promote participation in different spheres of social life (Wenzel, Kryszczuk, 2019). If we accept
the definition of digital exclusion which assumes that the notion of digital exclusion refers to the differences
between those who have regular access to digital and information technologies and are able to use it effectively
and those who do not (Adamczyk, 2017) and take into account a number of factors that influence the occurrence
of this phenomenon, then digital exclusion of elderly people turns out to be a phenomenon conditioned not only
by exogenous factors but also by endogenous ones. We can therefore analyse many dimensions of digital
exclusion of elderly people. The definitions of digital exclusion become the same way of explicating social
exclusion. The rationale for this are similar social, economic and psychological effects of these phenomena.
However, e-exclusion seems to cover a wider range of problems, as it is composed of more diverse factors that
determine the inclusion of people at risk (Androniceanu A.-M et al, 2020). Not only physical access to the
Internet, but also many other psychological and social factors determine individual strategies of new technologies
usage (see the Table 1). Complexity marks customers affection excluding buyer’s willingness to accept a drain in
their attention having impact on digital exclusion as well (Phillips, 2020). Labor integration, particulary in young
population in risk of social exclusion, is an important determinant of social divides (Aránega et al. 2020).
Table 1. Social divides in developed societies. Traditional variant
Social divides - traditional variant
Connection to the network:
- access to new technologies,
- technical competence,
- social competence,
- technological education,
- The pace of adaptation to changes,
- age of users,
- individual abilities.
Unconnected to the network:
- novelty and type of technology used,
- low technical competence,
- slow adaptation to changes,
- low income,
- place of residence,
-a number of users,
- individual abilities.
Source: Authors, based on Betlej, 2020, p. 235.
The performative potential of individuals seems to be this key factor for future social change. Technological
development does not eliminate classical social divides. It rather gives them new content or as a result introduces
new principles of social stratification. The role of cultural factors in these processes is increasing. In new concepts
of digital exclusion different ways of interpreting human relations with new technologies appear. They include the
concept of the connected excluded - the users of new technologies who have the appropriate technical
competences but their social competences and knowledge of the challenges and risks of participation in the
network is very low (Betlej, 2014; Gondek, 2017), see the Table 2. The problem of new power elites in the
network is also being addressed.
Table 2. Excluded connected
Digital exclusion - ambivalent variant
Excluded connected:
-alternative exchange of information resources,
- informal cultural circles,
- cyberactivity,
- alternative network spaces,
- individual,
- social groups,
- social networks,
- of society,
- naive cyber-consumers.
Elites - Unconnected to the network:
- networks of knowledge,
- power networks,
- classic change actors (e.g. mafia-
-oligarchic),
- creators of new technologies,
- individuals,
- new social movements,
- arrangements,
- the digital fugitives.
Source: Authors, based on Betlej, 2020, p. 235.
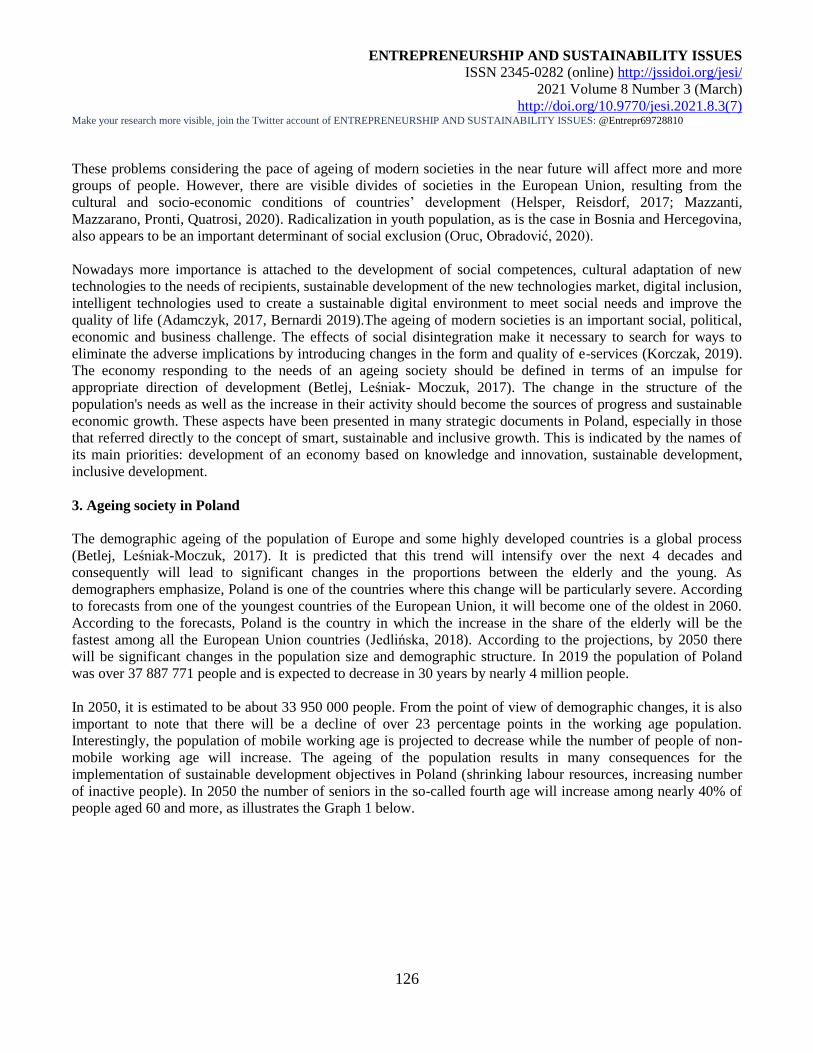
ENTREPRENEURSHIP AND SUSTAINABILITY ISSUES
ISSN 2345-0282 (online) http://jssidoi.org/jesi/
2021 Volume 8 Number 3 (March)
http://doi.org/10.9770/jesi.2021.8.3(7) Make your research more visible, join the Twitter account of ENTREPRENEURSHIP AND SUSTAINABILITY ISSUES: @Entrepr69728810
126
These problems considering the pace of ageing of modern societies in the near future will affect more and more
groups of people. However, there are visible divides of societies in the European Union, resulting from the
cultural and socio-economic conditions of countries’ development (Helsper, Reisdorf, 2017; Mazzanti,
Mazzarano, Pronti, Quatrosi, 2020). Radicalization in youth population, as is the case in Bosnia and Hercegovina,
also appears to be an important determinant of social exclusion (Oruc, Obradović, 2020).
Nowadays more importance is attached to the development of social competences, cultural adaptation of new
technologies to the needs of recipients, sustainable development of the new technologies market, digital inclusion,
intelligent technologies used to create a sustainable digital environment to meet social needs and improve the
quality of life (Adamczyk, 2017, Bernardi 2019).The ageing of modern societies is an important social, political,
economic and business challenge. The effects of social disintegration make it necessary to search for ways to
eliminate the adverse implications by introducing changes in the form and quality of e-services (Korczak, 2019).
The economy responding to the needs of an ageing society should be defined in terms of an impulse for
appropriate direction of development (Betlej, Leśniak- Moczuk, 2017). The change in the structure of the
population's needs as well as the increase in their activity should become the sources of progress and sustainable
economic growth. These aspects have been presented in many strategic documents in Poland, especially in those
that referred directly to the concept of smart, sustainable and inclusive growth. This is indicated by the names of
its main priorities: development of an economy based on knowledge and innovation, sustainable development,
inclusive development.
3. Ageing society in Poland
The demographic ageing of the population of Europe and some highly developed countries is a global process
(Betlej, Leśniak-Moczuk, 2017). It is predicted that this trend will intensify over the next 4 decades and
consequently will lead to significant changes in the proportions between the elderly and the young. As
demographers emphasize, Poland is one of the countries where this change will be particularly severe. According
to forecasts from one of the youngest countries of the European Union, it will become one of the oldest in 2060.
According to the forecasts, Poland is the country in which the increase in the share of the elderly will be the
fastest among all the European Union countries (Jedlińska, 2018). According to the projections, by 2050 there
will be significant changes in the population size and demographic structure. In 2019 the population of Poland
was over 37 887 771 people and is expected to decrease in 30 years by nearly 4 million people.
In 2050, it is estimated to be about 33 950 000 people. From the point of view of demographic changes, it is also
important to note that there will be a decline of over 23 percentage points in the working age population.
Interestingly, the population of mobile working age is projected to decrease while the number of people of non-
mobile working age will increase. The ageing of the population results in many consequences for the
implementation of sustainable development objectives in Poland (shrinking labour resources, increasing number
of inactive people). In 2050 the number of seniors in the so-called fourth age will increase among nearly 40% of
people aged 60 and more, as illustrates the Graph 1 below.
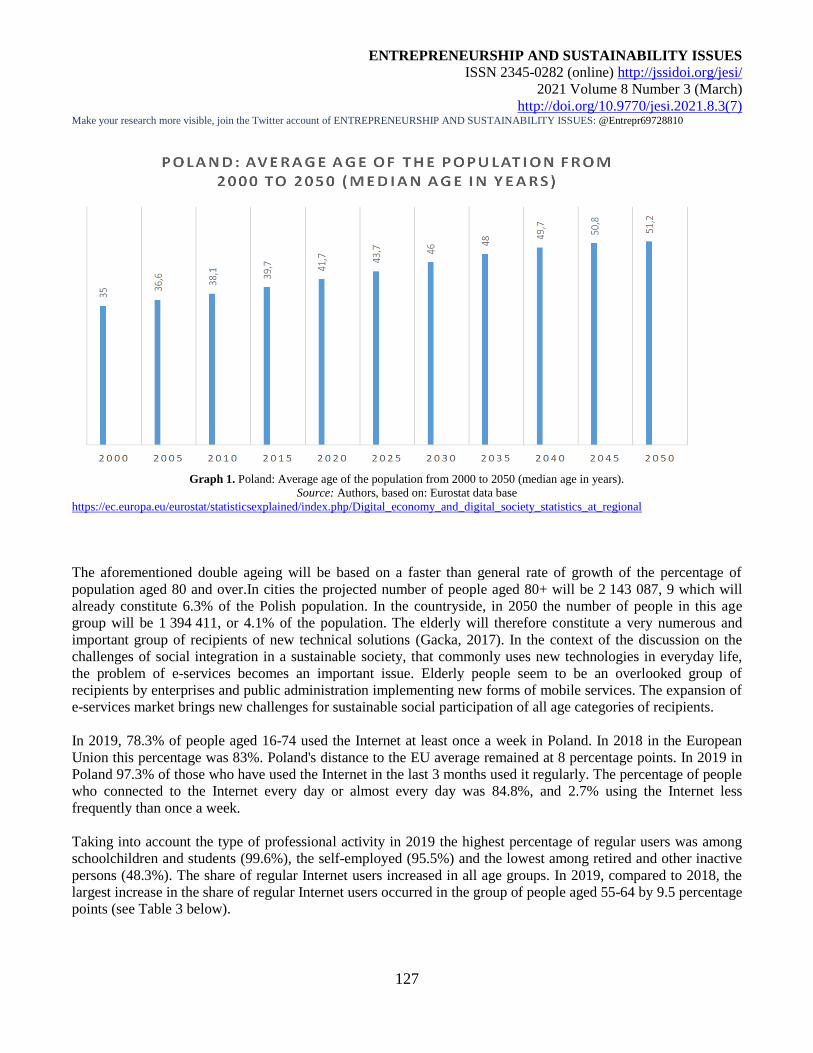
ENTREPRENEURSHIP AND SUSTAINABILITY ISSUES
ISSN 2345-0282 (online) http://jssidoi.org/jesi/
2021 Volume 8 Number 3 (March)
http://doi.org/10.9770/jesi.2021.8.3(7) Make your research more visible, join the Twitter account of ENTREPRENEURSHIP AND SUSTAINABILITY ISSUES: @Entrepr69728810
127
Graph 1. Poland: Average age of the population from 2000 to 2050 (median age in years).
Source: Authors, based on: Eurostat data base
https://ec.europa.eu/eurostat/statisticsexplained/index.php/Digital_economy_and_digital_society_statistics_at_regional
The aforementioned double ageing will be based on a faster than general rate of growth of the percentage of
population aged 80 and over.In cities the projected number of people aged 80+ will be 2 143 087, 9 which will
already constitute 6.3% of the Polish population. In the countryside, in 2050 the number of people in this age
group will be 1 394 411, or 4.1% of the population. The elderly will therefore constitute a very numerous and
important group of recipients of new technical solutions (Gacka, 2017). In the context of the discussion on the
challenges of social integration in a sustainable society, that commonly uses new technologies in everyday life,
the problem of e-services becomes an important issue. Elderly people seem to be an overlooked group of
recipients by enterprises and public administration implementing new forms of mobile services. The expansion of
e-services market brings new challenges for sustainable social participation of all age categories of recipients.
In 2019, 78.3% of people aged 16-74 used the Internet at least once a week in Poland. In 2018 in the European
Union this percentage was 83%. Poland's distance to the EU average remained at 8 percentage points. In 2019 in
Poland 97.3% of those who have used the Internet in the last 3 months used it regularly. The percentage of people
who connected to the Internet every day or almost every day was 84.8%, and 2.7% using the Internet less
frequently than once a week.
Taking into account the type of professional activity in 2019 the highest percentage of regular users was among
schoolchildren and students (99.6%), the self-employed (95.5%) and the lowest among retired and other inactive
persons (48.3%). The share of regular Internet users increased in all age groups. In 2019, compared to 2018, the
largest increase in the share of regular Internet users occurred in the group of people aged 55-64 by 9.5 percentage
points (see Table 3 below).
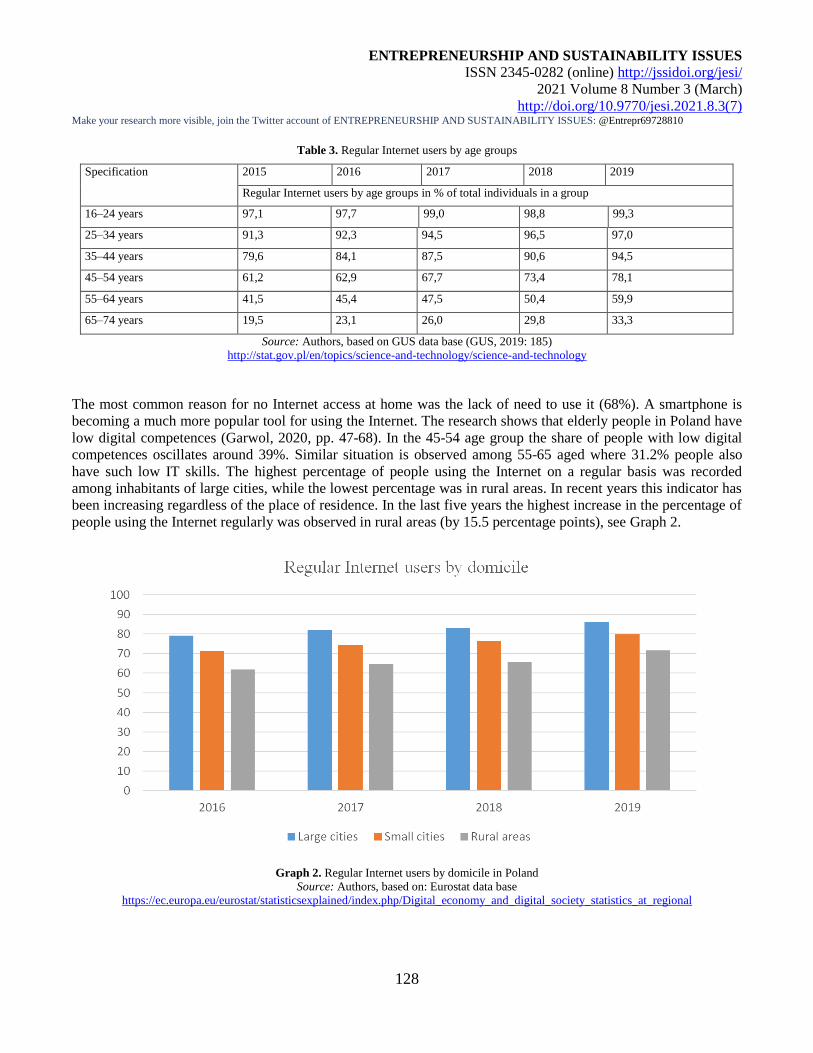
ENTREPRENEURSHIP AND SUSTAINABILITY ISSUES
ISSN 2345-0282 (online) http://jssidoi.org/jesi/
2021 Volume 8 Number 3 (March)
http://doi.org/10.9770/jesi.2021.8.3(7) Make your research more visible, join the Twitter account of ENTREPRENEURSHIP AND SUSTAINABILITY ISSUES: @Entrepr69728810
128
Table 3. Regular Internet users by age groups
Specification
2015 2016 2017 2018 2019
Regular Internet users by age groups in % of total individuals in a group
16–24 years 97,1 97,7 99,0 98,8 99,3
25–34 years 91,3 92,3 94,5 96,5 97,0
35–44 years 79,6 84,1 87,5 90,6 94,5
45–54 years 61,2 62,9 67,7 73,4 78,1
55–64 years 41,5 45,4 47,5 50,4 59,9
65–74 years 19,5 23,1 26,0 29,8 33,3
Source: Authors, based on GUS data base (GUS, 2019: 185)
http://stat.gov.pl/en/topics/science-and-technology/science-and-technology
The most common reason for no Internet access at home was the lack of need to use it (68%). A smartphone is
becoming a much more popular tool for using the Internet. The research shows that elderly people in Poland have
low digital competences (Garwol, 2020, pp. 47-68). In the 45-54 age group the share of people with low digital
competences oscillates around 39%. Similar situation is observed among 55-65 aged where 31.2% people also
have such low IT skills. The highest percentage of people using the Internet on a regular basis was recorded
among inhabitants of large cities, while the lowest percentage was in rural areas. In recent years this indicator has
been increasing regardless of the place of residence. In the last five years the highest increase in the percentage of
people using the Internet regularly was observed in rural areas (by 15.5 percentage points), see Graph 2.
Graph 2. Regular Internet users by domicile in Poland
Source: Authors, based on: Eurostat data base
https://ec.europa.eu/eurostat/statisticsexplained/index.php/Digital_economy_and_digital_society_statistics_at_regional
ENTREPRENEURSHIP AND SUSTAINABILITY ISSUES
ISSN 2345-0282 (online) http://jssidoi.org/jesi/
2021 Volume 8 Number 3 (March)
http://doi.org/10.9770/jesi.2021.8.3(7) Make your research more visible, join the Twitter account of ENTREPRENEURSHIP AND SUSTAINABILITY ISSUES: @Entrepr69728810
129
Among people with higher education there is the highest share of people using the Internet regularly (in 2019 -
97.5%). In the group of people with primary or secondary education, this indicator remains at the lowest level,
despite the fact that over the last five years it has increased by 13.6 percentage points.
Among Poles aged 55-64 there are 40% of Internet users, and only 11% in the group of 65 years and more. Only
16% of pensioners are network users (Garwol, 2020, pp. 47-68). In terms of Internet use by elderly people, Poland
ranks last in the European Union.The spatial diversity of rural and urban municipalities in terms of the number of
Internet users is also visible. The main reasons for this phenomenon can be seen in the differences in access to
ICT infrastructure and the Internet, the wealth of the municipalities, the level of education of the inhabitants
(Adamczyk, 2016, pp.5-13).The size of the place of residence has a large impact on the degree of computer and
Internet use. This indicator also influences the way computers are used. 47% of inhabitants of the largest cities
use computers primarily for work. The smaller the town, the more often the computer is used for entertainment.
In examining the level of e-exclusion in Poland, the Central Statistical Office adopted four basic indicators - total
e-exclusion (persons aged 16 and over who have never personally used a computer); - e-exclusion to a significant
extent (persons aged 16 and over who have personally used a computer but are not Internet users); - e-exclusion to
a moderate degree (persons aged 16 and over who have personally used a computer and the Internet, but the scope
of this use was relatively small); - e-exclusion to a limited extent (persons aged 16 and over who have used the
Internet at work and elsewhere, but not at home). According to the GUS and Eurostat data, the phenomenon of
digital exclusion mainly concerns the elderly, pensioners, disabled people, farmers and residents of rural areas, as
well as poorly educated people. The main dimension of digital exclusion in Poland is age.
4. Discussion
The phenomenon of digital exclusion of elderly people in Poland is very often addressed in public documents as
well as in scientific works. It is confirmed that elderly people do not use the Internet as often as young or very
young people. However, we are dealing here with a cultural phenomenon. When writing about digital exclusion
of elderly people, it should be remembered that this social group is characterized by the high degree of
inhomogeneity (Adamczyk, 2016). A very important factor influencing the attitude to new technologies,
including remote-controlled services, is the fact at what stage of old age the individual is. The process of human
ageing is a sum of changes taking place in three fundamental spheres of human life: biological, psychological
and social. The change within one of these spheres entails changes in the other two, but the process of ageing
does not affect individuals in the same way.
Ageing is not a homogeneous process, there is a fundamental difference in health, intellectual and physical
fitness between people aged 60-75 and the group of people aged 75-85 and the oldest, i.e. over 85 (Gonzales,
Ems, Suri, 2016). For conscious and effective use of modern technologies, the so called third (60-75 years old)
and fourth age (75-85 years old) is important. This results from changes in the human body, the need to provide
care and support especially in old age. It is connected with deepening symptoms of physiological and mental
ageing: gradual reduction of psychophysical fitness and independence, reduction of the possibility of social
adaptation - so-called social ageing, intensification of dependence on others. The age between 60 and 75 (the so-
called third age) is a period characterized by much greater activity, independence and efficiency than the fourth
age (75-85), in which dependency on others and the need for care appear much more often (Adamczyk, 2017). In
the fourth age, the incidence of various somatic and mental illnesses increases significantly. The risk of dementia
with its’ rich and at the same time burdensome symptomatology is growing (Adamczyk, 2017, pp.66-77)).
Therefore, it should be remembered that seniors do not constitute a homogeneous group (Wenzel, Kryszczuk,
2019) and there is a difference of one generation between people aged 60 and 80, although they all fall into the
category of seniors. As a consequence, there is also a significant difference in health and fitness, and thus in the
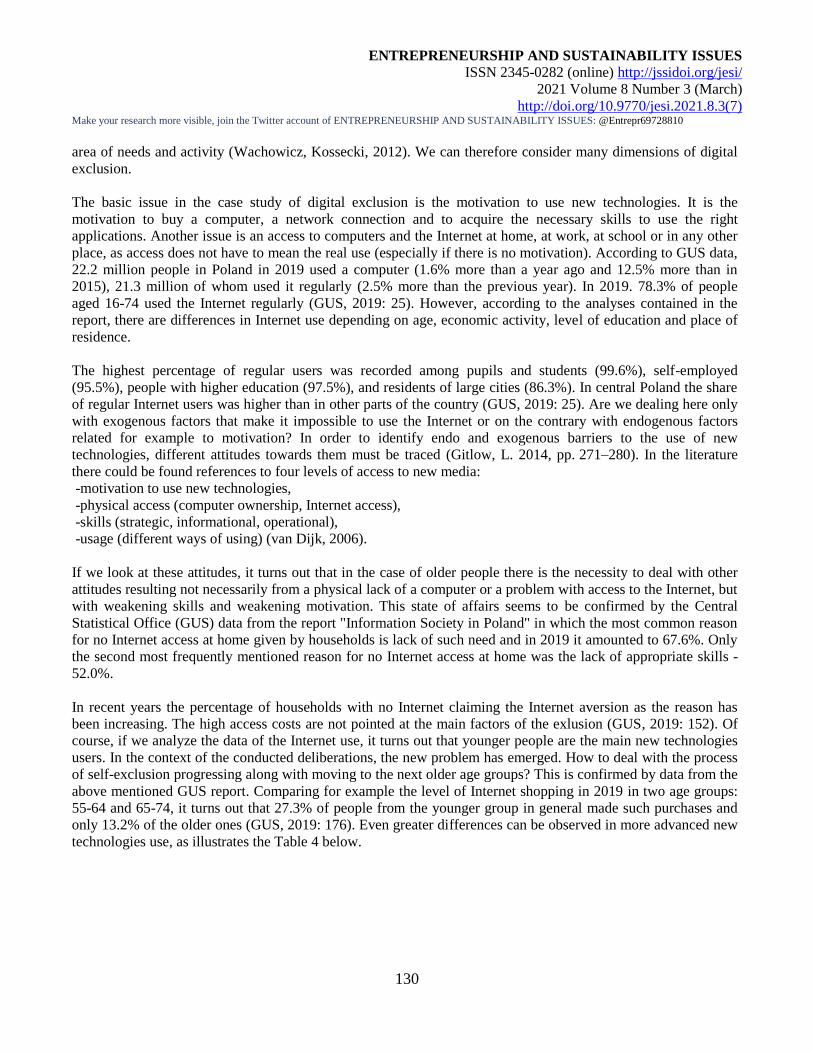
ENTREPRENEURSHIP AND SUSTAINABILITY ISSUES
ISSN 2345-0282 (online) http://jssidoi.org/jesi/
2021 Volume 8 Number 3 (March)
http://doi.org/10.9770/jesi.2021.8.3(7) Make your research more visible, join the Twitter account of ENTREPRENEURSHIP AND SUSTAINABILITY ISSUES: @Entrepr69728810
130
area of needs and activity (Wachowicz, Kossecki, 2012). We can therefore consider many dimensions of digital
exclusion.
The basic issue in the case study of digital exclusion is the motivation to use new technologies. It is the
motivation to buy a computer, a network connection and to acquire the necessary skills to use the right
applications. Another issue is an access to computers and the Internet at home, at work, at school or in any other
place, as access does not have to mean the real use (especially if there is no motivation). According to GUS data,
22.2 million people in Poland in 2019 used a computer (1.6% more than a year ago and 12.5% more than in
2015), 21.3 million of whom used it regularly (2.5% more than the previous year). In 2019. 78.3% of people
aged 16-74 used the Internet regularly (GUS, 2019: 25). However, according to the analyses contained in the
report, there are differences in Internet use depending on age, economic activity, level of education and place of
residence.
The highest percentage of regular users was recorded among pupils and students (99.6%), self-employed
(95.5%), people with higher education (97.5%), and residents of large cities (86.3%). In central Poland the share
of regular Internet users was higher than in other parts of the country (GUS, 2019: 25). Are we dealing here only
with exogenous factors that make it impossible to use the Internet or on the contrary with endogenous factors
related for example to motivation? In order to identify endo and exogenous barriers to the use of new
technologies, different attitudes towards them must be traced (Gitlow, L. 2014, pp. 271–280). In the literature
there could be found references to four levels of access to new media:
-motivation to use new technologies,
-physical access (computer ownership, Internet access),
-skills (strategic, informational, operational),
-usage (different ways of using) (van Dijk, 2006).
If we look at these attitudes, it turns out that in the case of older people there is the necessity to deal with other
attitudes resulting not necessarily from a physical lack of a computer or a problem with access to the Internet, but
with weakening skills and weakening motivation. This state of affairs seems to be confirmed by the Central
Statistical Office (GUS) data from the report "Information Society in Poland" in which the most common reason
for no Internet access at home given by households is lack of such need and in 2019 it amounted to 67.6%. Only
the second most frequently mentioned reason for no Internet access at home was the lack of appropriate skills -
52.0%.
In recent years the percentage of households with no Internet claiming the Internet aversion as the reason has
been increasing. The high access costs are not pointed at the main factors of the exlusion (GUS, 2019: 152). Of
course, if we analyze the data of the Internet use, it turns out that younger people are the main new technologies
users. In the context of the conducted deliberations, the new problem has emerged. How to deal with the process
of self-exclusion progressing along with moving to the next older age groups? This is confirmed by data from the
above mentioned GUS report. Comparing for example the level of Internet shopping in 2019 in two age groups:
55-64 and 65-74, it turns out that 27.3% of people from the younger group in general made such purchases and
only 13.2% of the older ones (GUS, 2019: 176). Even greater differences can be observed in more advanced new
technologies use, as illustrates the Table 4 below.
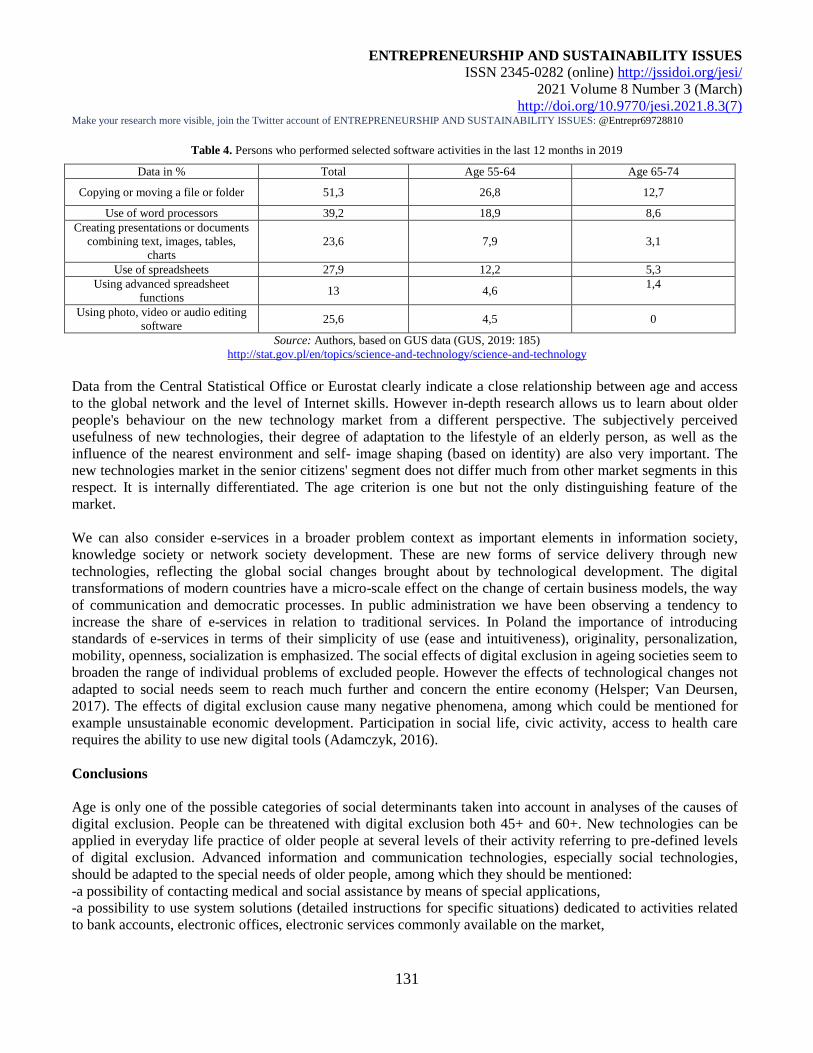
ENTREPRENEURSHIP AND SUSTAINABILITY ISSUES
ISSN 2345-0282 (online) http://jssidoi.org/jesi/
2021 Volume 8 Number 3 (March)
http://doi.org/10.9770/jesi.2021.8.3(7) Make your research more visible, join the Twitter account of ENTREPRENEURSHIP AND SUSTAINABILITY ISSUES: @Entrepr69728810
131
Table 4. Persons who performed selected software activities in the last 12 months in 2019
Data in % Total Age 55-64 Age 65-74
Copying or moving a file or folder 51,3 26,8 12,7
Use of word processors 39,2 18,9 8,6
Creating presentations or documents
combining text, images, tables,
charts
23,6 7,9 3,1
Use of spreadsheets 27,9 12,2 5,3
Using advanced spreadsheet
functions 13 4,6
1,4
Using photo, video or audio editing
software 25,6 4,5 0
Source: Authors, based on GUS data (GUS, 2019: 185)
http://stat.gov.pl/en/topics/science-and-technology/science-and-technology
Data from the Central Statistical Office or Eurostat clearly indicate a close relationship between age and access
to the global network and the level of Internet skills. However in-depth research allows us to learn about older
people's behaviour on the new technology market from a different perspective. The subjectively perceived
usefulness of new technologies, their degree of adaptation to the lifestyle of an elderly person, as well as the
influence of the nearest environment and self- image shaping (based on identity) are also very important. The
new technologies market in the senior citizens' segment does not differ much from other market segments in this
respect. It is internally differentiated. The age criterion is one but not the only distinguishing feature of the
market.
We can also consider e-services in a broader problem context as important elements in information society,
knowledge society or network society development. These are new forms of service delivery through new
technologies, reflecting the global social changes brought about by technological development. The digital
transformations of modern countries have a micro-scale effect on the change of certain business models, the way
of communication and democratic processes. In public administration we have been observing a tendency to
increase the share of e-services in relation to traditional services. In Poland the importance of introducing
standards of e-services in terms of their simplicity of use (ease and intuitiveness), originality, personalization,
mobility, openness, socialization is emphasized. The social effects of digital exclusion in ageing societies seem to
broaden the range of individual problems of excluded people. However the effects of technological changes not
adapted to social needs seem to reach much further and concern the entire economy (Helsper; Van Deursen,
2017). The effects of digital exclusion cause many negative phenomena, among which could be mentioned for
example unsustainable economic development. Participation in social life, civic activity, access to health care
requires the ability to use new digital tools (Adamczyk, 2016).
Conclusions
Age is only one of the possible categories of social determinants taken into account in analyses of the causes of
digital exclusion. People can be threatened with digital exclusion both 45+ and 60+. New technologies can be
applied in everyday life practice of older people at several levels of their activity referring to pre-defined levels
of digital exclusion. Advanced information and communication technologies, especially social technologies,
should be adapted to the special needs of older people, among which they should be mentioned:
-a possibility of contacting medical and social assistance by means of special applications,
-a possibility to use system solutions (detailed instructions for specific situations) dedicated to activities related
to bank accounts, electronic offices, electronic services commonly available on the market,
ENTREPRENEURSHIP AND SUSTAINABILITY ISSUES
ISSN 2345-0282 (online) http://jssidoi.org/jesi/
2021 Volume 8 Number 3 (March)
http://doi.org/10.9770/jesi.2021.8.3(7) Make your research more visible, join the Twitter account of ENTREPRENEURSHIP AND SUSTAINABILITY ISSUES: @Entrepr69728810
132
-a possibility of supporting social activation, maintaining ties with family, friends, other social media user groups
can help eliminate the feeling of alienation, exclusion, lack of contact with other people on a daily basis.
Modern developed societies are constituted by such factors as: universal access to computers, ability to use them
effectively, developed and relatively common knowledge of information and communication technologies. A
very important factor is also the positive assessment of these factors by conscious and not accidental users.
Technology has never before been as human friendly as it is today. Technological novelties such as new phones
and computers are becoming easier to use for the elderly. The tools are more and more adapted to the needs of
the recipients, however, due to the growing reluctance towards technological innovations older people often
exclude themselves from society. What are the reasons for this situation? The answers can be sought by
analyzing the dimensions of digital exclusion of older people:
Market - trust - economy: The digital exclusion of older people is very often due to a lack of trust in new
services such as e-banking. Despite the ability to use technical tools (phone, computer), many people do not want
to adapt to the changing economic environment (Wachowicz; Kossecki, 2012). There are many reasons for this,
including concerns about the lack of privacy and security of online transactions. On a national scale, the losses to
the economy associated with the expansion of this area of exclusion are very high. The financial aspects of
digital exclusion and its importance for the further development of a sustainable economy are less and less
frequently discussed today. This is an extremely important problem area.
Marketing - information - knowledge: Digital exclusion resulting from a lack of knowledge and competence
makes older people a category of people who are particularly exposed to the techniques of marketing
propaganda. The thoughtless treatment of information appearing on the Internet, as well as information
transmitted through new technologies, exposes elderly people to material, psychological and social losses.
Information policy: A separate range of new quality services creates another area of contemporary digital
exclusion of older people - limited access to public services: electronic offices, electronic libraries, e-footprint,
virtual deans.
Electronic Democracy: A consequence of and at the same time an area of digital exclusion are also limited
rights of elderly people to key civic information, as well as a reduced scope of political exercise and civil rights.
Quality of life - health: New technologies, such as cell phones, are becoming tools in the fight for the health and
life of the elderly. Health monitoring applications, fast localization, robotization of medical services, electronic
tools supporting the work of human organs are only selected examples of solutions for improving the quality of
life in the ageing European societies. Lack of willingness to use these solutions by elderly people, despite their
knowledge and technical competence, may constitute another area and factor of digital exclusion.
How to design solutions that can be dedicated to many age categories of people? The key to understanding the
problem is to know the essence of the needs of digitally excluded people. It seems reasonable to say that the
defined new areas of digital exclusion of older people will be a great challenge for social economy entities in the
near future. The most effective programs in the fight against digital divides will be those dedicated to shaping
attitudes and motivation of older people, which will be able to effectively counteract emotional, psychological
and motivational barriers through group education - through experience and interaction. Socio-economic changes
related to the progressive process of ageing of modern societies require a new approach to the use of digital
technologies and innovative actions. Technology assessment should become a key factor of the assistance system
for elderly people. The needs of activation and social integration of the excluded or threatened by digital
exclusion require in-depth research. A quantitative analytical approach prevails in statistical studies. Digital
exclusion is analysed through a global set of similar factors which do not always take cultural differences into
account. This is well illustrated by the example of Poland. Older people are not a homogenous social category.
The analysis of social trends shows that in the future, smart cities will be the main service functions for the
population. The inclusion of rural areas in regional smart networks is also being discussed. New technologies
will therefore be easily accessible. Another issue that needs discussion is the assessment of digital and social
competences. Younger recipients of new technologies also become excluded if one considers new threats, such
ENTREPRENEURSHIP AND SUSTAINABILITY ISSUES
ISSN 2345-0282 (online) http://jssidoi.org/jesi/
2021 Volume 8 Number 3 (March)
http://doi.org/10.9770/jesi.2021.8.3(7) Make your research more visible, join the Twitter account of ENTREPRENEURSHIP AND SUSTAINABILITY ISSUES: @Entrepr69728810
133
as dependence on electronic gadgets, inability to evaluate the e-information, vulnerability to marketing and
propaganda messages and, finally, inability to use increasingly advanced mobile devices. Technological progress
seems to be ahead of social development. Therefore, the assessment of internal determinants of social exclusion
in ageing societies should include an analysis of changes in older people's lifestyles and their expectations of
technological devices. The main problem still seems to be the lack of knowledge about the social potential of
new technologies.
References
Adamczyk, M. 2016. Education in late adulthood as a form of social participation of older people, in: Mensikovs V. (ed. by) Proceedings of
the International Scientific Conferences of Faculty of Social Sciences of Daugavpils University. The materials of the International
Scientific Conference, Daugavpils Universites Akademiskais apgads "Saule", Daugavpils: 5–13.
Adamczyk, M. 2017. Active and Healthy Aging as an Element of Social Integration of Older dults, in: Kinal, J.; Guz, (eds. by) W.
Społeczne aspekty zdrowia: wybrane zagadnienia. (Social aspects of health: selected issues), Rzeszów: Stowarzyszenie Naukowe
Przestrzeń Społeczna i Środowisko: 66–77.
Androniceanu, A.-M., Georgescu, I., Tvaronavičienė, M., Androniceanu 2020. A. Canonical Correlation Analysis and a New Composite
Index on Digitalization and Labor Force in the Context of the Industrial Revolution 4.0., Sustainability 12 (6812).
Androniceanu, A., Tvaronavičienė, M. 2019. Developing a holistic system for social assistance services based on effective and sustainable
partnerships. Administratie si Management Public, 33: 103-118. https://doi.org/10.24818/amp/2019.33-06
Androniceanu, A. 2019. Social responsibility, an essential strategic option for a sustainable development in the field of bio-economy,
Amfiteatru Economic, 21(52): 347-364. In EN: pp.503-519
Androniceanu, A., Kinnunen, J., Georgescu, I. 2020. E-Government clusters in the EU based on the Gaussian Mixture Models.
Administratie si Management Public, 35: 6-20. https://doi.org/10.24818/amp/2020.35-01
Aránega, A.Y., Sánchez, R.C., & Pérez, C.G. (2020). Labour integration of young people at risk of social exclusion through the
development of key competencies. Economic Research-Ekonomska Istraživanja. https://doi.org/10.1080/1331677X.2020.1836991
Bernardi, A. 2019. The capability approach and organizational climate as tools to study occupational health and safety. Insights into
Regional Development, 1(2), 155-169. https://doi.org/10.9770/ird.2019.1.2(6)
Betlej, A. 2020. Społeczeństwo sieciowe- potencjały zmian i ambiwalentne efekty. (Translated by authors: Network society - potential for
change and ambivalent effects), Wydawnictwo KUL. = KUL Publishing House.
Betlej, A. 2014. Non-knowledge, Risk and Technology in Networked World- Towards the Future, Transformacje (Transformations) 3-4
(82-83), 2-17.
Betlej, A. 2017. Peril and Promise of Internet Technology for Future Social Order. In: Zacher, L. W. (ed. by). Technology, Society and
Sustainability. Selected Concepts, Issues and Cases. Springer: 117-128.
Betlej, A.; Leśniak-Moczuk, K. 2017. Technology and an aging population in Network Society. Towards Virtually-based Communities.
Roczniki Nauk Społecznych Vol. 9(45), Issue 2: 61-72.
Borimdesouza, R.; Zanoni, B. L.; Janchiba, J. H.; Borinelli, B. (2019). Organizations and sustainability: a field of knowledge. Management
of Environmental Quality: An International Journal, 31(2), 365-384.
https://www.emerald.com/insight/content/doi/10.1108/MEQ-09-2019-0203/full/html
Dutton, W.H.; Reisdorf, B.C. 2019. Cultural divides and digital inequalities: attitudes shaping Internet and social media divides.
Information, Communication & Society 22(1): 18–38.
Eurostat. https://ec.europa.eu/eurostat/statisticsexplained/index.php/Digital_economy_and_digital_society_statistics_at_regional_level
ENTREPRENEURSHIP AND SUSTAINABILITY ISSUES
ISSN 2345-0282 (online) http://jssidoi.org/jesi/
2021 Volume 8 Number 3 (March)
http://doi.org/10.9770/jesi.2021.8.3(7) Make your research more visible, join the Twitter account of ENTREPRENEURSHIP AND SUSTAINABILITY ISSUES: @Entrepr69728810
134
Gacka, J. 2017. Polscy seniorzy w sieci: wirtualna złota jesień? Korzystanie przez osoby dojrzałe z internetu i nowych technologii.
(Translated by authors: Polish seniors online: a virtual golden autumn? Using the Internet and new technologies by mature people).
Konteksty społeczne, = Social Contexts, 5-1(9): 84-91.
Garwol, K. 2020. Stopień umiejętności korzystania z technologii cyfrowych a wykluczenie społeczne na przykładzie osób
niepełnosprawnych, starszych i ubogich. (Degree of digital literacy and social exclusion, with the example of disabled, elderly and poor
people). Nierówności Społeczne a Wzrost Gospodarczy (Social inequalities and economic growth), 58, 47-68.
Gitlow, L. 2014. Technology use by older adults and barriers to using technology. Physical & Occupational Therapy in Geriatrics
32(3): 271–280.
Gondek, J. 2017. Sign- Technology- Simulation. Reflections on the Project of Jean Baudrillard’s Research Method. Transformacje
(Transformations), Vol. 3-4 (94-95): 87-98.
Gonzales, A.L.; Ems, L.; Suri, V.R. 2016. Cell phone disconnection disrupts access to healthcare and health resources: a technology
maintenance perspective. New Media & Society 18(8): 1422–1438.
GUS, Information society in Poland Results of statistical surveys in the years 2015–2019. http://stat.gov.pl/en/topics/science-and-
technology/science-and-technology
Haseeb, M., Hussai, H. I., Kot, S., Androniceanu, A., Jermsittiparsert, K. 2019. Role of Social and Technological Challenges in Achieving
a Sustainable Competitive Advantage and Sustainable Business Performance. Sustainability, 11(14), Article Number: 3811
Helsper, E.J.; Reisdorf, B.C. 2017. The emergence of a “digital underclass” in Great Britain and Sweden: changing reasons for digital
exclusion. New Media & Society 19(8): 1253–1270.
Helsper, E.J.; Van Deursen, A.J.A.M. 2017. Do the rich get digitally richer? Quantity and quality of support for digital engagement.
Information, Communication & Society, 20(5): 700–714.
Javaria, K.; Masood, O.; Garcia, F. 2020. Strategies to manage the risks faced by consumers in developing e-commerce. Insights into
Regional Development, 2(4): 774-783. http://doi.org/10.9770/IRD.2020.2.4(4 )
Jedlińska, R. 2018. Wykluczenie cyfrowe w Polsce na tle krajów Unii Europejskiej. (Digital exclusion in Poland in comparison with
European Union countries). Ekonomiczne Problemy Usług (Economic Problems of Serrvices), 131(2/2): 225-236.
Kačerauskas, T. 2015. Technologies in creative economy and creative society, Technological and Economic Development of Economy,
21(6): 855-868.
Kozubikova, L.; Kotaskova, A. (2019). The Impact of Technological Factors on the Quality of the Business Environment. Transformations
in Business & Economics, Vol. 18, No 1 (46): 95-108.
Kryszczuk, M., D.; Green, B. E. 2015. Digital Divide in Poland: An Exploration of Some Sociological Impacts of Personal Computer
Possession, Internet Use and PC Proficiency. Central European Management Journal, 23(3): 2-19. https://doi.org/10.7206/mba.ce.2084-
3356.147
Korauš, A.; Dobrovič, J.; Rajnoha, R.; Brezina, I. 2017. The safety risks related to bank cards and cyber attacks, Journal of Security and
Sustainability Issues 6(4): 563-574. https://doi.org/10.9770/jssi.2017.6.4(3)
Korauš, A.; Dobrovič, J.; Polák, J.; Backa, S. 2019. Security aspects: protection of people in connection with the use of personal
identification numbers. Journal of Security and Sustainability Issues, 8(3): 319-330. https://doi.org/10.9770/jssi.2019.8.3(3)
Korczak, K. 2019. Wykluczenie cyfrowe w ochronie zdrowia z perspektywy pacjentów oraz personelu medycznego. (Translated by
authors: Digital exclusion in healthcare from the perspective of patients and health professionals). Polityka Społeczna (Social Polictic), 8
(545): 24-29.
Mazzanti, M.; Mazzarano, M.; Pronti, A.; Quatrosi, M. 2020. Fiscal policies, public investments and wellbeing: mapping the evolution of
the EU. Insights into Regional Development, 2(4): 725-749. http://doi.org/10.9770/IRD.2020.2.4(1)
ENTREPRENEURSHIP AND SUSTAINABILITY ISSUES
ISSN 2345-0282 (online) http://jssidoi.org/jesi/
2021 Volume 8 Number 3 (March)
http://doi.org/10.9770/jesi.2021.8.3(7) Make your research more visible, join the Twitter account of ENTREPRENEURSHIP AND SUSTAINABILITY ISSUES: @Entrepr69728810
135
Menshikov, V.; Lavrinenko, O.; Sinica, L.; Simakhova, A. 2017. Network capital phenomenon and its posibilities under the influence of
development of information and communication technologies. Journal of Security and Sustainability Issues 6(4): 585-604.
https://doi.org/10.9770/jssi.2017.6.4.(5)
Niemczyk, J.; Trzaska, R.; Borowski, K.; Karolczak, P. (2019). Scalability 4.0 as economic rent in Industry 4.0. Transformations in
Business & Economics, 18, No 2B (47B), 824-838.
Oruc, N.; Obradović, N. (2020). Drivers of radicalisation of youth in Bosnia and Herzegovina. Economic Research-Ekonomska
Istraživanja, 33(1): 2559-2573. https://doi.org/10.1080/1331677X.2020.1772094
Phillips, F. (2020). Does complexity belong inside the firm, or out?, Economic Research-Ekonomska Istraživanja, 33(1): 2397-2409,
https://doi.org/10.1080/1331677X.2019.1625796
Poole, G. A. 1996. A new gulf in American education, the digital divide. The New York Times, January 29, 1996.
Rey-Martí, A., Díaz-Foncea, M., & Alguacil-Marí, P. (2020). The determinants of social sustainability in work integration social
enterprises: the effect of entrepreneurship, Economic Research-Ekonomska Istraživanja, https://doi.org/10.1080/1331677X.2020.1805348
Ślusarczyk, B.; Tvaronavičienė, M.; Ul Haque, A.; Oláh, J. 2020. Predictors of Industry 4.0 technologies affecting logistic enterprises’
performance: international perspective from economic lens. Technological and Economic Development of Economy, 26(6): 1263-1283.
https://doi.org/10.3846/tede.2020.13376
Tvaronaviciene, M.; Burinskas, A. 2020. Industry 4.0 significance to competition and the EU competition policy: A literature review.
Economics and Sociology, 13(3), 244-258. https://doi.org/10.14254/2071-789X.2020/13-3/15
Wachowicz, J.; Kossecki, P. 2012. Zaufanie starszych użytkowników Internetu na tle zagrożenia wykluczeniem cyfrowym. (Trust of older
Internet users in the risk of exclusion). Handel Wewnętrzny (Internal Trade), tom 3: 266-276.
Wenzel, M.; Kryszczuk, M. 2019. Od przypadkowości do bezradności. Aktywność poznawcza internautów w sprawach publicznych.
(From randomness to helplessness. Cognitive activity of internet users in public matter). Kultura i Społeczeństwo (Culture and
Society), 63(3): 203-224. https://doi.org/10.35757/KiS.2019.63.3.10
Van Dijk, J. 2006. The network society (2nd edition), Sage Publica‑ tions, London.
Monika ADAMCZYK is an associate professor of Social Sciences in the Field of Sociology. An employee of the Institute of Sociological
Sciences of the John Paul II Catholic University of Lublin (Poland). Author of Books: Social Determination of Successful Ageing and
Active Preparation for Retirement (2019), Discovering the Dynamic Third Age (edit.) (2016), Oldness Between Tradition and Modernity
(edit.) (2016), Actively Towards Retirement (2015), Introduction to Social Capital Theory (2013) and many articles and expert opinions.
ORCID ID: https://orcid.org/0000-0002-1331-6026
Alina BETLEJ is an assistant professor, PhD in the field of sociology. An employee of the Institute of Sociological Sciences of the John
Paul II Catholic University of Lublin (Poland). She is interested in Internet sociology, digital sociology, assessment of new technologies,
economic sociology, sustainable development, forecasting. She is the author of many publications on the social aspects of the Internet and
the implications of the digitisation of the network society (an author of a book: Network society- potentials of change and ambivalence
eefects, Lublin 2019). She is an expert in assessing the social and economic impact of new technologies in many institutions and author of
many experts opinions.
ORCID ID: https://orcid.org/0000-0002-2729-6564
Copyright © 2021 by author(s) and VsI Entrepreneurship and Sustainability Center
This work is licensed under the Creative Commons Attribution International License (CC BY).
http://creativecommons.org/licenses/by/4.0/
ENTREPRENEURSHIP AND SUSTAINABILITY ISSUES
ISSN 2345-0282 (online) http://jssidoi.org/jesi/
2021 Volume 8 Number 3 (March)
http://doi.org/10.9770/jesi.2021.8.3(8)
Publisher http://jssidoi.org/esc/home
136
MAPPING COOPERATIVES IN ITALY*
Andrea Cori ¹, Mattia Granata 2, Keti Lelo 3, Salvatore Monni 4
1,2 Research Institute of the Italian Cooperative Federation “Lega Nazionale delle Cooperative e Mutue - Centro
Studi Legacoop”, Via Antonio Guattani 9, Rome 0164, Italy
3 Department of Economics, Roma Tre University; Via Silvio D’Amico 77, Rome 00145, Italy 4 Department of Business Studies, Roma Tre University; Via Silvio D’Amico 77, Rome 00145, Italy
Received 15 November 2020; accepted 25 January 2021; published 30 March 2021
Abstract. The purpose of this contribution is to photograph and describe, with reasonable accuracy and beginning from the territorial, time
and sectoral distribution, the Italian cooperative universe in all its main economic, size and qualitative variables. In the light of the
economic crisis triggered by the present epidemic, the mapping work also takes on a further importance in outlining a perspective of
analyses on the future impacts of the recession, on the resilience of the cooperative movement and on the role it will be able to play in
counteracting the decline in industry and employment.
Keywords: Cooperatives; Mapping; Italy
Reference to this paper should be made as follows: Cori, A., Granata, M., Lelo, K., Monni, S. 2021. Mapping cooperatives in Italy.
Entrepreneurship and Sustainability Issues, 8(3), 136-163. http://doi.org/10.9770/jesi.2021.8.3(8)
JEL Classifications: J54, P13, Q13
1. Introduction
Since the post-second world war, the academic debate has gradually confined the discussions and research on the
cooperative movement to a residual space in the economic literature and in books on enterprise management
(Kalmi, 2016). Moreover, up to now, the difficulty in gathering data and the fragmentary nature of the local
sources (Bernardi, Treu, Tridico, 2011), as well as the lack of a clear and universally shared definition of a
cooperative, have hindered the creation of a comprehensive global database that would allow for a full-scale
* Financial support from the Italian Ministry of University and Research, Scientific Research Program of National Relevance
(PRIN) 2017, project “Innovation for global challenges in a connected world: the role of local resources and socio-economic
conditions”, is gratefully acknowledged
ENTREPRENEURSHIP AND SUSTAINABILITY ISSUES
ISSN 2345-0282 (online) http://jssidoi.org/jesi/
2021 Volume 8 Number 3 (March)
http://doi.org/10.9770/jesi.2021.8.3(8)
Make your research more visible, join the Twitter account of ENTREPRENEURSHIP AND SUSTAINABILITY ISSUES:
@Entrepr69728810
137
reading of the cooperative movement under its manifold aspects. An internationally recognised definition of a
cooperative enterprise was only reached in 1995 (ICA, 1995), during the International Co-operative Alliance
(ICA) Centennary, after a lengthy consultation involving thousands of co-operatives from around the world.
From then on, over the last decade, some important steps have been made in recognising and taking into
consideration the value of the cooperative world, both at international and national level. The valuable work
carried out in recent years by ICA-Euricse (2012, 2013, 2014, 2015, 2016, 2017, 2018, 2019) has to be seen in
this context. According to ICA data (2019a, 2019b), cooperatives now play a key role in the world’s economic
system. The approximate 2,000 billion dollars in turnover generated by the top 300 cooperative enterprises in the
world out of the 3 million cooperatives registered in 156 countries, in addition to the more than one billion
members and 280 million employees, are important indicators of the scale of this phenomenon.
In Italy, especially starting from the first decade of the century, there is no lack of important contributions in the
work of mapping and measuring the Italian cooperative movement (Borzaga, 2017; Borzaga, C. Carini, C.
Carpita, M., Lori, M., 2016; Borzaga, C. Calzaroni, M., Lori M., 2016; Costa, E., Carini, C., Borzaga, C.,
2013; Euricse 2011, 2013, 2015; ISTAT, 2017; ISTAT-Euricse, 2019; Mazzoli, E., Zamagni, S. 2005; Zamagni
S., Zamagni V. 2011, 2019; Zamagni, V. 2006). In this scenario, the purpose of this contribution is to photograph
and describe, with reasonable accuracy and beginning from the territorial, time and sectoral distribution, the
Italian cooperative universe in all its main economic, size and qualitative variables. In the light of the economic
crisis triggered by the present epidemic, the mapping work also takes on a further importance in outlining a
perspective of analyses on the future impacts of the recession, on the resilience of the cooperative movement
(Berranger, C. Monni S, Realini, A., 2020; Bernardi and Monni, 2016; Bernardi and Monni, 2019; Demartini, P.,
Monni, S. eds., 2017; Zamagni and Zamagni, 2019; Zamagni, V., 2020; Mazzanti, M., Mazzarano, M., Pronti, A.,
Quatrosi, M. 2020) and on the role it will be able to play in counteracting the decline in industry and employment.
The rate of survival and average lifespan of the worker buyouts carried out in Italy under a cooperative model
(Demartini, P., Monni, S., 2017; Monni et al., 2017a; Monni et al., 2017b; Monni et al., 2017c; Area Studi
Legacoop, 2020a; Vieta, 2015, 2016), are the proof of this, showing the economic and social success of this type
of management opportunity as a response to company crises.
In the opening section, the numbers and general aspects of the Italian cooperative system as a whole will be
presented. Subsequently, the territorial distribution of Italian cooperatives will be analysed under the three main
aspects: numbers, production and employment. In the third sub-section, the descriptive analysis will focus on the
size classes of cooperative enterprises. The Italian peculiarity, the distinction between prevailing and non-
prevailing mutuality (better specified in the reference sub-section), will be dealt with in the fourth sub-section. In
the fifth, the new start-up and 100 year old cooperatives, the Italian cooperative enterprises will be classified on
the basis of the years of activity. Finally, the numerical, productive and employment aspects of the Italian
cooperatives will be redistributed on the basis of the sectors of their economic activity.
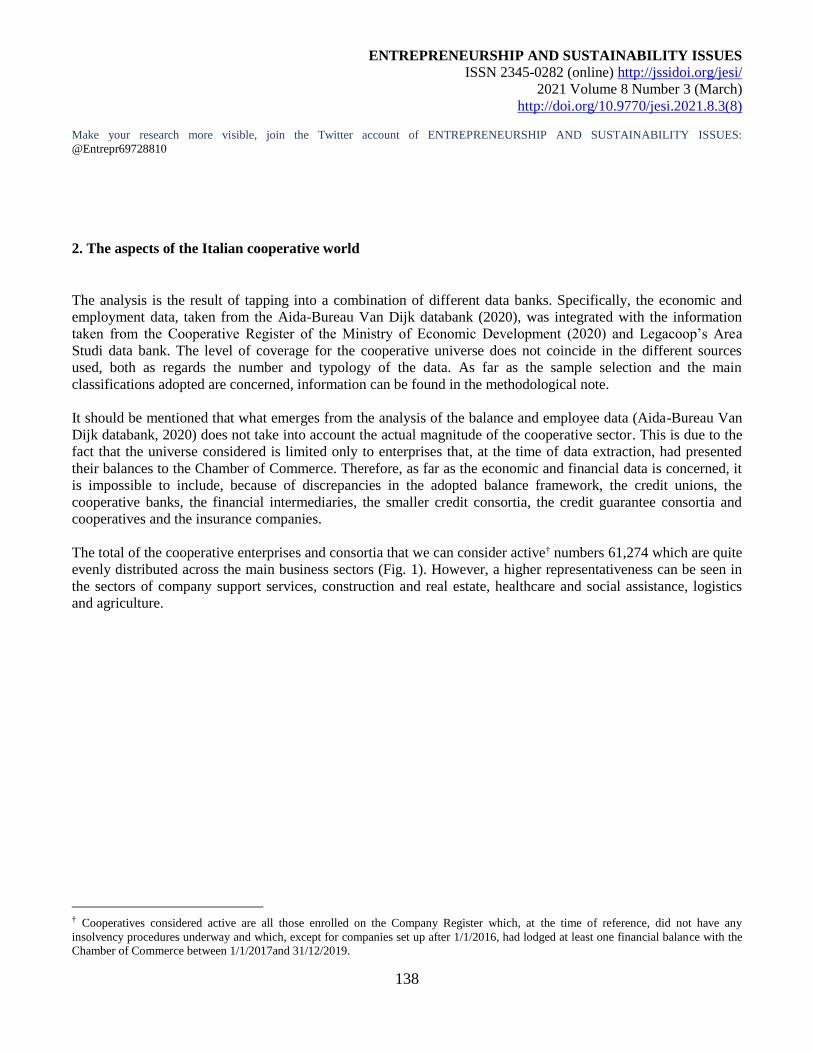
ENTREPRENEURSHIP AND SUSTAINABILITY ISSUES
ISSN 2345-0282 (online) http://jssidoi.org/jesi/
2021 Volume 8 Number 3 (March)
http://doi.org/10.9770/jesi.2021.8.3(8)
Make your research more visible, join the Twitter account of ENTREPRENEURSHIP AND SUSTAINABILITY ISSUES:
@Entrepr69728810
138
2. The aspects of the Italian cooperative world
The analysis is the result of tapping into a combination of different data banks. Specifically, the economic and
employment data, taken from the Aida-Bureau Van Dijk databank (2020), was integrated with the information
taken from the Cooperative Register of the Ministry of Economic Development (2020) and Legacoop’s Area
Studi data bank. The level of coverage for the cooperative universe does not coincide in the different sources
used, both as regards the number and typology of the data. As far as the sample selection and the main
classifications adopted are concerned, information can be found in the methodological note.
It should be mentioned that what emerges from the analysis of the balance and employee data (Aida-Bureau Van
Dijk databank, 2020) does not take into account the actual magnitude of the cooperative sector. This is due to the
fact that the universe considered is limited only to enterprises that, at the time of data extraction, had presented
their balances to the Chamber of Commerce. Therefore, as far as the economic and financial data is concerned, it
is impossible to include, because of discrepancies in the adopted balance framework, the credit unions, the
cooperative banks, the financial intermediaries, the smaller credit consortia, the credit guarantee consortia and
cooperatives and the insurance companies.
The total of the cooperative enterprises and consortia that we can consider active† numbers 61,274 which are quite
evenly distributed across the main business sectors (Fig. 1). However, a higher representativeness can be seen in
the sectors of company support services, construction and real estate, healthcare and social assistance, logistics
and agriculture.
† Cooperatives considered active are all those enrolled on the Company Register which, at the time of reference, did not have any
insolvency procedures underway and which, except for companies set up after 1/1/2016, had lodged at least one financial balance with the
Chamber of Commerce between 1/1/2017and 31/12/2019.
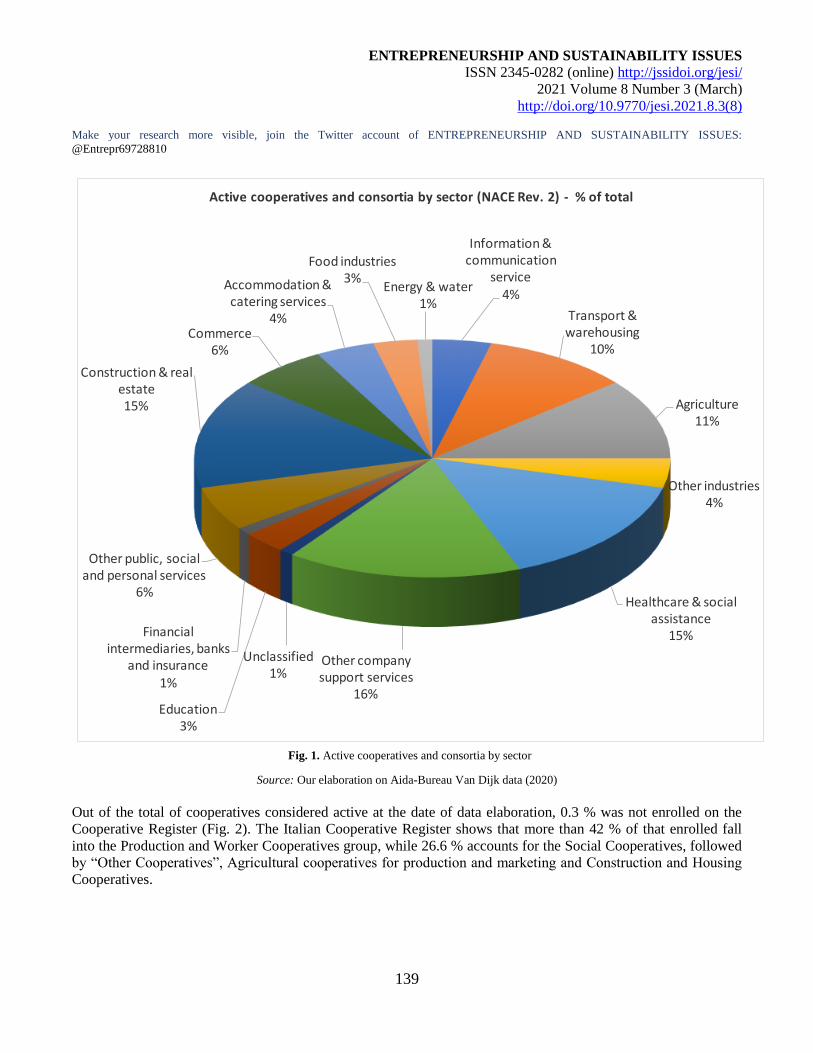
ENTREPRENEURSHIP AND SUSTAINABILITY ISSUES
ISSN 2345-0282 (online) http://jssidoi.org/jesi/
2021 Volume 8 Number 3 (March)
http://doi.org/10.9770/jesi.2021.8.3(8)
Make your research more visible, join the Twitter account of ENTREPRENEURSHIP AND SUSTAINABILITY ISSUES:
@Entrepr69728810
139
Information & communication
service4%
Transport & warehousing
10%
Agriculture11%
Other industries4%
Healthcare & social assistance
15%
Other company support services
16%
Unclassified1%
Education3%
Financial intermediaries, banks
and insurance1%
Other public, social and personal services
6%
Construction & real estate15%
Commerce6%
Accommodation & catering services
4%
Food industries3%
Energy & water1%
Active cooperatives and consortia by sector (NACE Rev. 2) - % of total
Fig. 1. Active cooperatives and consortia by sector
Source: Our elaboration on Aida-Bureau Van Dijk data (2020)
Out of the total of cooperatives considered active at the date of data elaboration, 0.3 % was not enrolled on the
Cooperative Register (Fig. 2). The Italian Cooperative Register shows that more than 42 % of that enrolled fall
into the Production and Worker Cooperatives group, while 26.6 % accounts for the Social Cooperatives, followed
by “Other Cooperatives”, Agricultural cooperatives for production and marketing and Construction and Housing
Cooperatives.
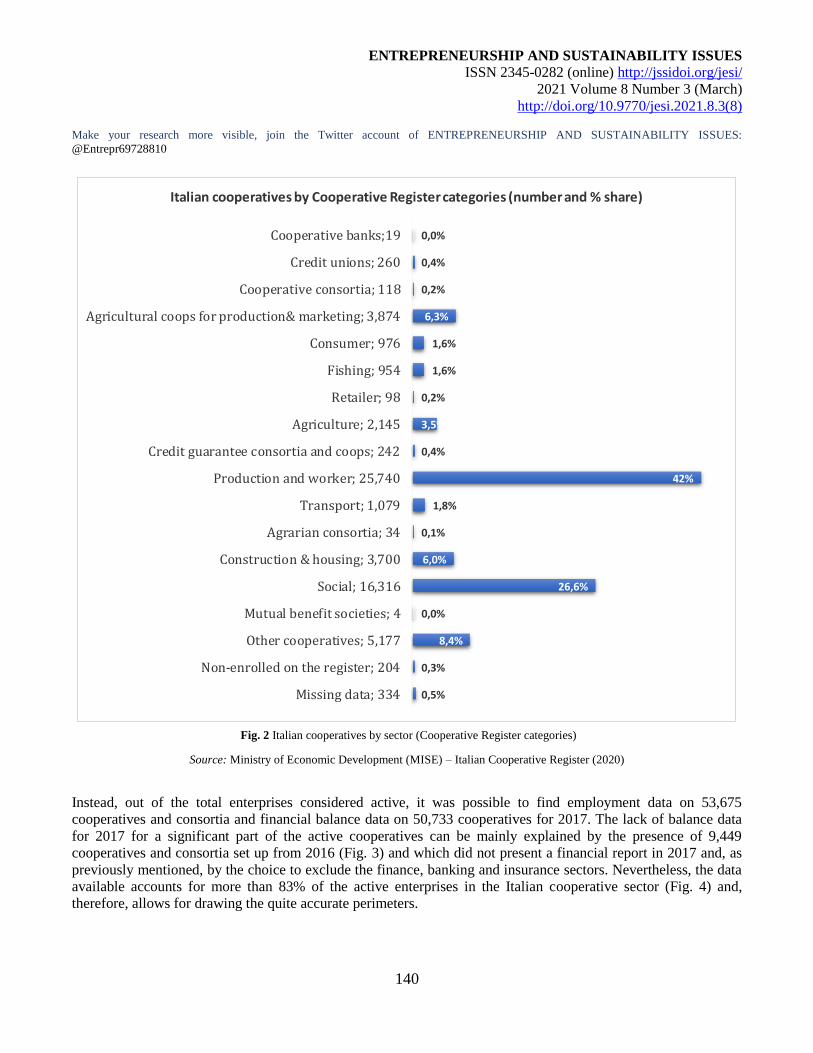
ENTREPRENEURSHIP AND SUSTAINABILITY ISSUES
ISSN 2345-0282 (online) http://jssidoi.org/jesi/
2021 Volume 8 Number 3 (March)
http://doi.org/10.9770/jesi.2021.8.3(8)
Make your research more visible, join the Twitter account of ENTREPRENEURSHIP AND SUSTAINABILITY ISSUES:
@Entrepr69728810
140
0,5%
0,3%
8,4%
0,0%
26,6%
6,0%
0,1%
1,8%
42%
0,4%
3,5%
0,2%
1,6%
1,6%
6,3%
0,2%
0,4%
0,0%
Missing data; 334
Non-enrolled on the register; 204
Other cooperatives; 5,177
Mutual benefit societies; 4
Social; 16,316
Construction & housing; 3,700
Agrarian consortia; 34
Transport; 1,079
Production and worker; 25,740
Credit guarantee consortia and coops; 242
Agriculture; 2,145
Retailer; 98
Fishing; 954
Consumer; 976
Agricultural coops for production& marketing; 3,874
Cooperative consortia; 118
Credit unions; 260
Cooperative banks;19
Italian cooperatives by Cooperative Register categories (number and % share)
Fig. 2 Italian cooperatives by sector (Cooperative Register categories)
Source: Ministry of Economic Development (MISE) – Italian Cooperative Register (2020)
Instead, out of the total enterprises considered active, it was possible to find employment data on 53,675
cooperatives and consortia and financial balance data on 50,733 cooperatives for 2017. The lack of balance data
for 2017 for a significant part of the active cooperatives can be mainly explained by the presence of 9,449
cooperatives and consortia set up from 2016 (Fig. 3) and which did not present a financial report in 2017 and, as
previously mentioned, by the choice to exclude the finance, banking and insurance sectors. Nevertheless, the data
available accounts for more than 83% of the active enterprises in the Italian cooperative sector (Fig. 4) and,
therefore, allows for drawing the quite accurate perimeters.

ENTREPRENEURSHIP AND SUSTAINABILITY ISSUES
ISSN 2345-0282 (online) http://jssidoi.org/jesi/
2021 Volume 8 Number 3 (March)
http://doi.org/10.9770/jesi.2021.8.3(8)
Make your research more visible, join the Twitter account of ENTREPRENEURSHIP AND SUSTAINABILITY ISSUES:
@Entrepr69728810
141
569
3,225
11,301
30,440
6,290 9,449
≥ 100 years
≥ 50 years
≥ 25 years
≥ 5 years
< 5 years
Number of active cooperatives and consortia by years of activity
No. Active companies Start-ups not lodging balances in 2017
Fig. 3. Number of active cooperatives and consortia by years of activity
Source: Our elaboration on Aida-Bureau Van Dijk data (2020)
Active
cooperative
and consortia
total
Sample with
employment
data
Sample with
balance data
Sample size 61,274 53,675 50,733
100%88% 83%
Sample size and coverage
Fig. 4. Sample size and coverage
Source: Our elaboration on Aida-Bureau Van Dijk data (2020)
ENTREPRENEURSHIP AND SUSTAINABILITY ISSUES
ISSN 2345-0282 (online) http://jssidoi.org/jesi/
2021 Volume 8 Number 3 (March)
http://doi.org/10.9770/jesi.2021.8.3(8)
Make your research more visible, join the Twitter account of ENTREPRENEURSHIP AND SUSTAINABILITY ISSUES:
@Entrepr69728810
142
Finally, to establish how many cooperative enterprises operate within the Italian productive and social fabric, two
precise indicators were chosen on a provincial basis‡ - the economic density index (ED) and the number of
workers per 1,000 residents. The ED index expresses, in numerical terms, the percentage of cooperatives in each
territorial unit (province) compared to the national total of active cooperatives, while the latter renders the 1/1,000
share of workers out of the total number of residents per territorial unit.
The average ED value per province, Italy-wide, is 0.93, while the median value is 0.63. From a macro-territorial
viewpoint, the value revealed in the provinces of Southern Italy and the Islands, is on an average higher than those
observed for the Centre-North provinces. In the southern provinces, the share of enterprises set up as cooperatives
is on average 1.2 % compared to the national total, while in the centre-northern provinces, the average ED value is
0.70. The data for the more densely populated provinces – Rome, Milan and Naples – is quite comprehensible,
where the cooperative ED values are well above the average. For example, the Rome province headquarters 8.6%
of Italian cooperative enterprises.
Where employment is concerned, on average, for every 1,000 residents, 18.6 are employed in cooperatives. 30
provinces, involving 107 second level government bodies have been considered, all situated in the Centre-North
of the country and with a population of 21,974,275 inhabitants, with more than 20 employees for every 1,000
residents. From a macro-territorial point of view, the values revealed highlight a picture diametrically opposite to
what emerged from the observation of the median ED values. The median value of the provinces in the Centre-
North is 22.3 (24.7 in the northern provinces) cooperative employees per 1,000 inhabitants, while in the southern
and island provinces the same median coefficient drops to11.9. It can also be noted that in the Bologna and
Reggio Emilia provinces, approximately 9% of inhabitants are employed in cooperatives.
‡ 100 second level government bodies (80 provinces, 14 metropolitan cities, and 6 autonomous municipal consortia in Sicily); 2
autonomous provinces in Trentino-Alto-Adige; 5 cancelled provinces in Friuli-Venezia Giulia and Valle d'Aosta, are considered here for
statistical and information organisation purposes.
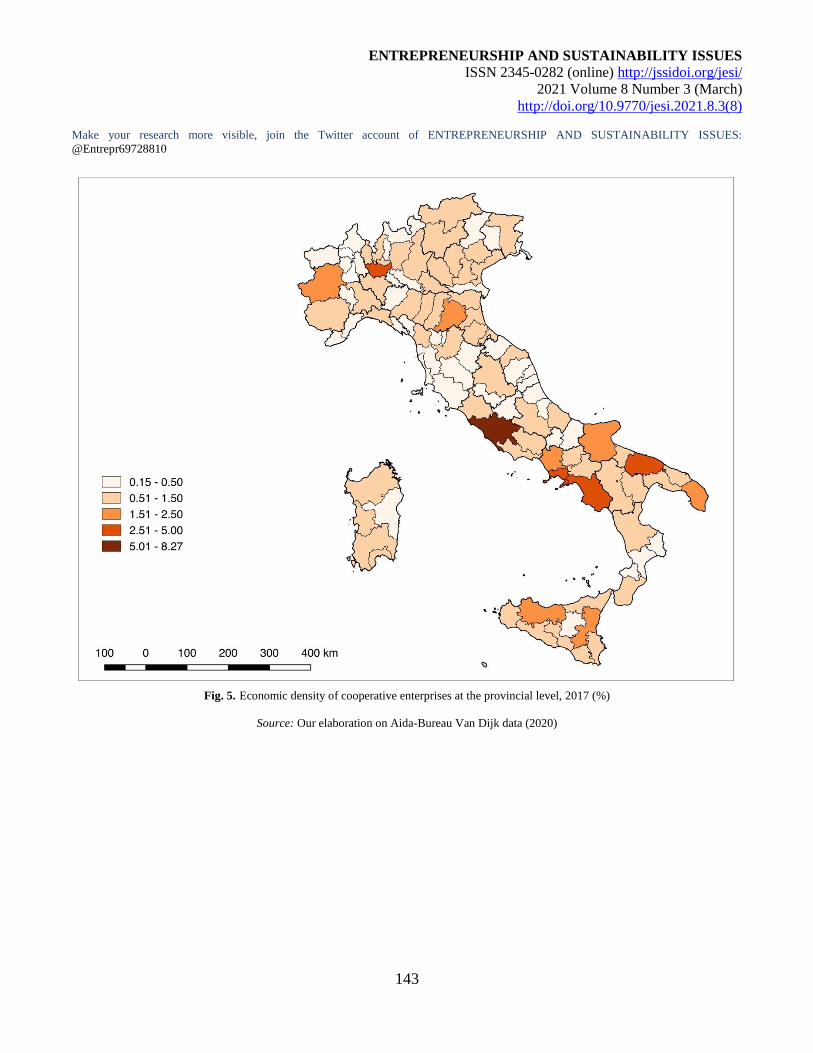
ENTREPRENEURSHIP AND SUSTAINABILITY ISSUES
ISSN 2345-0282 (online) http://jssidoi.org/jesi/
2021 Volume 8 Number 3 (March)
http://doi.org/10.9770/jesi.2021.8.3(8)
Make your research more visible, join the Twitter account of ENTREPRENEURSHIP AND SUSTAINABILITY ISSUES:
@Entrepr69728810
143
Fig. 5. Economic density of cooperative enterprises at the provincial level, 2017 (%)
Source: Our elaboration on Aida-Bureau Van Dijk data (2020)
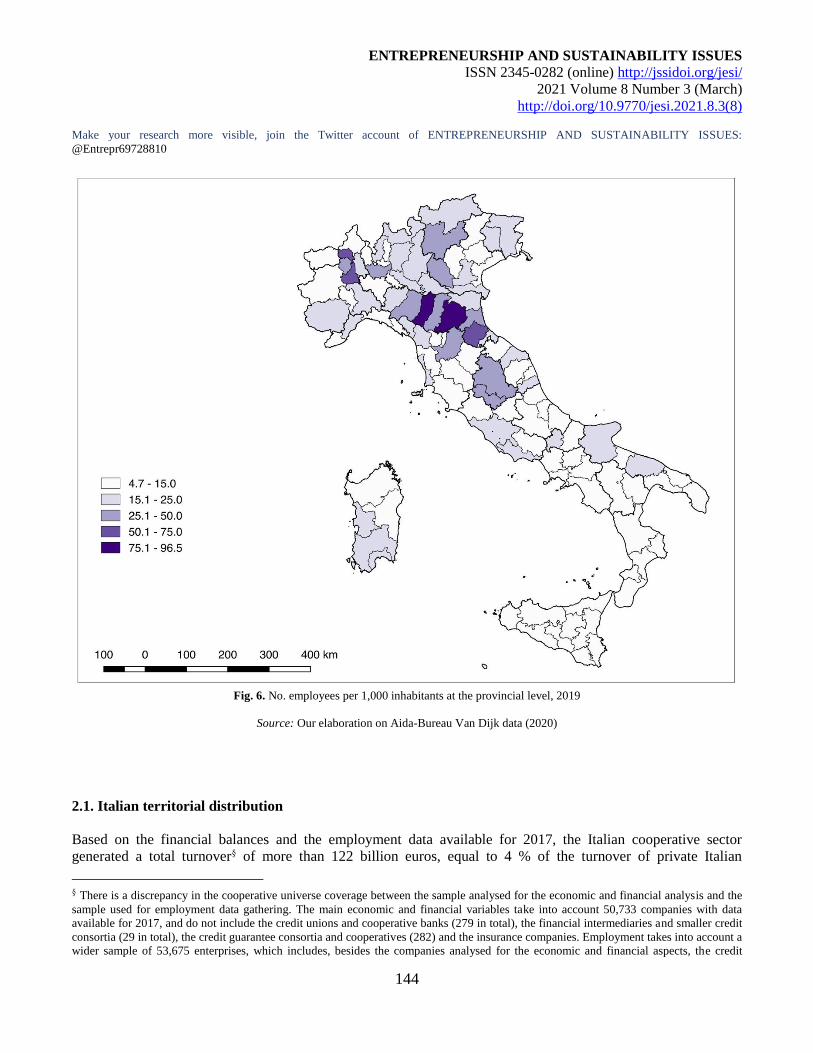
ENTREPRENEURSHIP AND SUSTAINABILITY ISSUES
ISSN 2345-0282 (online) http://jssidoi.org/jesi/
2021 Volume 8 Number 3 (March)
http://doi.org/10.9770/jesi.2021.8.3(8)
Make your research more visible, join the Twitter account of ENTREPRENEURSHIP AND SUSTAINABILITY ISSUES:
@Entrepr69728810
144
Fig. 6. No. employees per 1,000 inhabitants at the provincial level, 2019
Source: Our elaboration on Aida-Bureau Van Dijk data (2020)
2.1. Italian territorial distribution
Based on the financial balances and the employment data available for 2017, the Italian cooperative sector
generated a total turnover§ of more than 122 billion euros, equal to 4 % of the turnover of private Italian
§ There is a discrepancy in the cooperative universe coverage between the sample analysed for the economic and financial analysis and the
sample used for employment data gathering. The main economic and financial variables take into account 50,733 companies with data
available for 2017, and do not include the credit unions and cooperative banks (279 in total), the financial intermediaries and smaller credit
consortia (29 in total), the credit guarantee consortia and cooperatives (282) and the insurance companies. Employment takes into account a
wider sample of 53,675 enterprises, which includes, besides the companies analysed for the economic and financial aspects, the credit
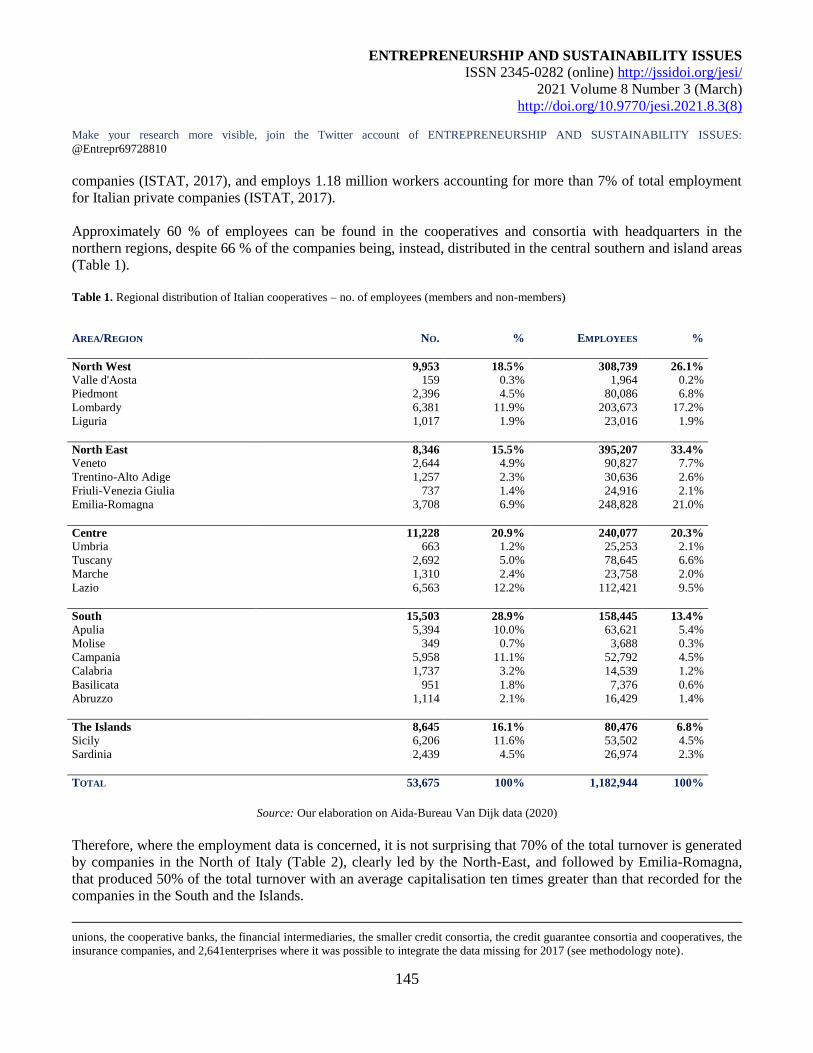
ENTREPRENEURSHIP AND SUSTAINABILITY ISSUES
ISSN 2345-0282 (online) http://jssidoi.org/jesi/
2021 Volume 8 Number 3 (March)
http://doi.org/10.9770/jesi.2021.8.3(8)
Make your research more visible, join the Twitter account of ENTREPRENEURSHIP AND SUSTAINABILITY ISSUES:
@Entrepr69728810
145
companies (ISTAT, 2017), and employs 1.18 million workers accounting for more than 7% of total employment
for Italian private companies (ISTAT, 2017).
Approximately 60 % of employees can be found in the cooperatives and consortia with headquarters in the
northern regions, despite 66 % of the companies being, instead, distributed in the central southern and island areas
(Table 1).
Table 1. Regional distribution of Italian cooperatives – no. of employees (members and non-members)
AREA/REGION NO. %
EMPLOYEES %
North West 9,953 18.5% 308,739 26.1%
Valle d'Aosta 159 0.3% 1,964 0.2%
Piedmont 2,396 4.5% 80,086 6.8%
Lombardy 6,381 11.9% 203,673 17.2%
Liguria 1,017 1.9% 23,016 1.9%
North East 8,346 15.5% 395,207 33.4%
Veneto 2,644 4.9% 90,827 7.7%
Trentino-Alto Adige 1,257 2.3% 30,636 2.6%
Friuli-Venezia Giulia 737 1.4% 24,916 2.1%
Emilia-Romagna 3,708 6.9% 248,828 21.0%
Centre 11,228 20.9% 240,077 20.3%
Umbria 663 1.2% 25,253 2.1%
Tuscany 2,692 5.0% 78,645 6.6%
Marche 1,310 2.4% 23,758 2.0%
Lazio 6,563 12.2% 112,421 9.5%
South 15,503 28.9% 158,445 13.4%
Apulia 5,394 10.0% 63,621 5.4%
Molise 349 0.7% 3,688 0.3%
Campania 5,958 11.1% 52,792 4.5%
Calabria 1,737 3.2% 14,539 1.2%
Basilicata 951 1.8% 7,376 0.6%
Abruzzo 1,114 2.1% 16,429 1.4%
The Islands 8,645 16.1% 80,476 6.8%
Sicily 6,206 11.6% 53,502 4.5%
Sardinia 2,439 4.5% 26,974 2.3%
TOTAL 53,675 100% 1,182,944 100%
Source: Our elaboration on Aida-Bureau Van Dijk data (2020)
Therefore, where the employment data is concerned, it is not surprising that 70% of the total turnover is generated
by companies in the North of Italy (Table 2), clearly led by the North-East, and followed by Emilia-Romagna,
that produced 50% of the total turnover with an average capitalisation ten times greater than that recorded for the
companies in the South and the Islands.
unions, the cooperative banks, the financial intermediaries, the smaller credit consortia, the credit guarantee consortia and cooperatives, the
insurance companies, and 2,641enterprises where it was possible to integrate the data missing for 2017 (see methodology note).
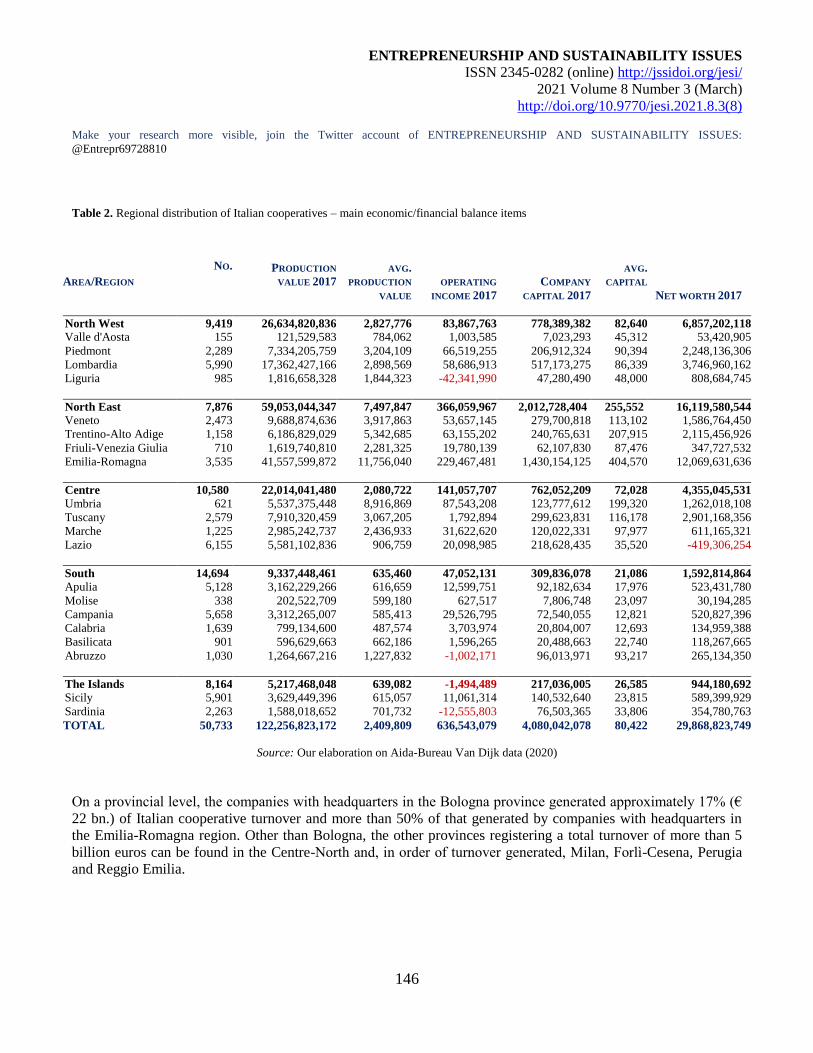
ENTREPRENEURSHIP AND SUSTAINABILITY ISSUES
ISSN 2345-0282 (online) http://jssidoi.org/jesi/
2021 Volume 8 Number 3 (March)
http://doi.org/10.9770/jesi.2021.8.3(8)
Make your research more visible, join the Twitter account of ENTREPRENEURSHIP AND SUSTAINABILITY ISSUES:
@Entrepr69728810
146
Table 2. Regional distribution of Italian cooperatives – main economic/financial balance items
AREA/REGION
NO.
PRODUCTION
VALUE 2017
AVG.
PRODUCTION
VALUE
OPERATING
INCOME 2017
COMPANY
CAPITAL 2017
AVG.
CAPITAL
NET WORTH 2017
North West 9,419 26,634,820,836 2,827,776 83,867,763 778,389,382 82,640 6,857,202,118
Valle d'Aosta 155 121,529,583 784,062 1,003,585 7,023,293 45,312 53,420,905
Piedmont 2,289 7,334,205,759 3,204,109 66,519,255 206,912,324 90,394 2,248,136,306
Lombardia 5,990 17,362,427,166 2,898,569 58,686,913 517,173,275 86,339 3,746,960,162
Liguria 985 1,816,658,328 1,844,323 -42,341,990 47,280,490 48,000 808,684,745
North East 7,876 59,053,044,347 7,497,847 366,059,967 2,012,728,404 255,552 16,119,580,544
Veneto 2,473 9,688,874,636 3,917,863 53,657,145 279,700,818 113,102 1,586,764,450
Trentino-Alto Adige 1,158 6,186,829,029 5,342,685 63,155,202 240,765,631 207,915 2,115,456,926
Friuli-Venezia Giulia 710 1,619,740,810 2,281,325 19,780,139 62,107,830 87,476 347,727,532
Emilia-Romagna 3,535 41,557,599,872 11,756,040 229,467,481 1,430,154,125 404,570 12,069,631,636
Centre 10,580 22,014,041,480 2,080,722 141,057,707 762,052,209 72,028 4,355,045,531
Umbria 621 5,537,375,448 8,916,869 87,543,208 123,777,612 199,320 1,262,018,108
Tuscany 2,579 7,910,320,459 3,067,205 1,792,894 299,623,831 116,178 2,901,168,356
Marche 1,225 2,985,242,737 2,436,933 31,622,620 120,022,331 97,977 611,165,321
Lazio 6,155 5,581,102,836 906,759 20,098,985 218,628,435 35,520 -419,306,254
South 14,694 9,337,448,461 635,460 47,052,131 309,836,078 21,086 1,592,814,864
Apulia 5,128 3,162,229,266 616,659 12,599,751 92,182,634 17,976 523,431,780
Molise 338 202,522,709 599,180 627,517 7,806,748 23,097 30,194,285
Campania 5,658 3,312,265,007 585,413 29,526,795 72,540,055 12,821 520,827,396
Calabria 1,639 799,134,600 487,574 3,703,974 20,804,007 12,693 134,959,388
Basilicata 901 596,629,663 662,186 1,596,265 20,488,663 22,740 118,267,665
Abruzzo 1,030 1,264,667,216 1,227,832 -1,002,171 96,013,971 93,217 265,134,350
The Islands 8,164 5,217,468,048 639,082 -1,494,489 217,036,005 26,585 944,180,692
Sicily 5,901 3,629,449,396 615,057 11,061,314 140,532,640 23,815 589,399,929
Sardinia 2,263 1,588,018,652 701,732 -12,555,803 76,503,365 33,806 354,780,763
TOTAL 50,733 122,256,823,172 2,409,809 636,543,079 4,080,042,078 80,422 29,868,823,749
Source: Our elaboration on Aida-Bureau Van Dijk data (2020)
On a provincial level, the companies with headquarters in the Bologna province generated approximately 17% (€
22 bn.) of Italian cooperative turnover and more than 50% of that generated by companies with headquarters in
the Emilia-Romagna region. Other than Bologna, the other provinces registering a total turnover of more than 5
billion euros can be found in the Centre-North and, in order of turnover generated, Milan, Forlì-Cesena, Perugia
and Reggio Emilia.
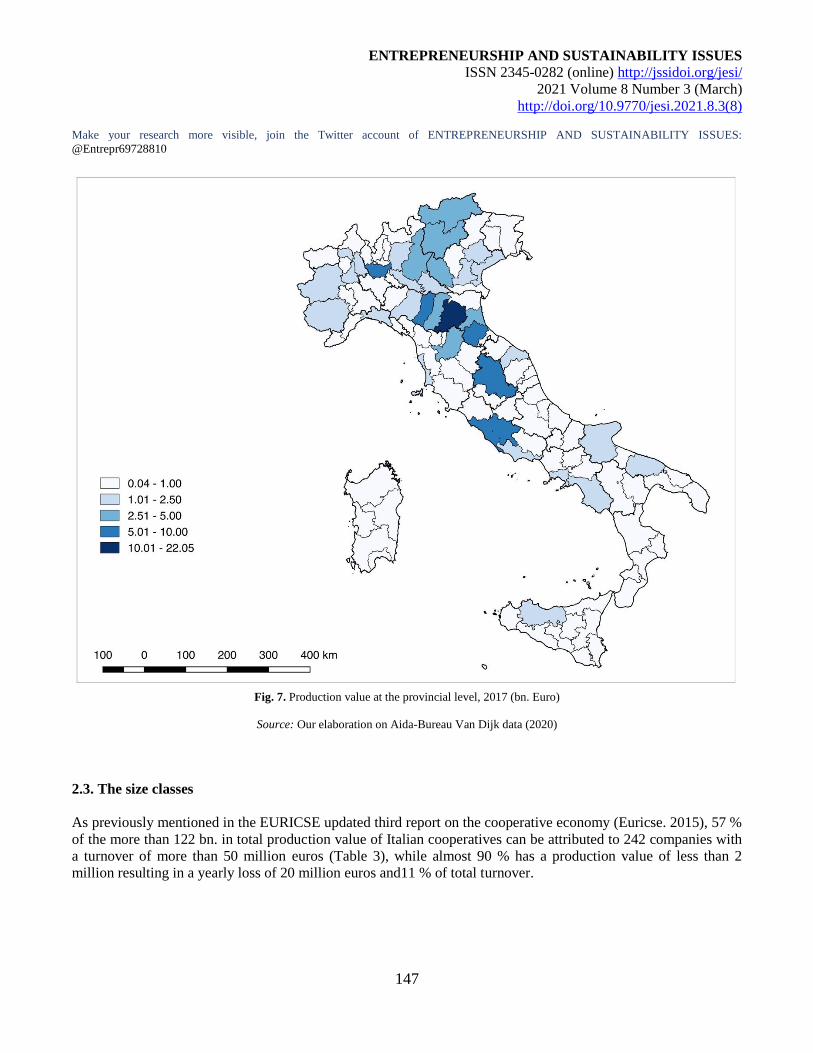
ENTREPRENEURSHIP AND SUSTAINABILITY ISSUES
ISSN 2345-0282 (online) http://jssidoi.org/jesi/
2021 Volume 8 Number 3 (March)
http://doi.org/10.9770/jesi.2021.8.3(8)
Make your research more visible, join the Twitter account of ENTREPRENEURSHIP AND SUSTAINABILITY ISSUES:
@Entrepr69728810
147
Fig. 7. Production value at the provincial level, 2017 (bn. Euro)
Source: Our elaboration on Aida-Bureau Van Dijk data (2020)
2.3. The size classes
As previously mentioned in the EURICSE updated third report on the cooperative economy (Euricse. 2015), 57 %
of the more than 122 bn. in total production value of Italian cooperatives can be attributed to 242 companies with
a turnover of more than 50 million euros (Table 3), while almost 90 % has a production value of less than 2
million resulting in a yearly loss of 20 million euros and11 % of total turnover.
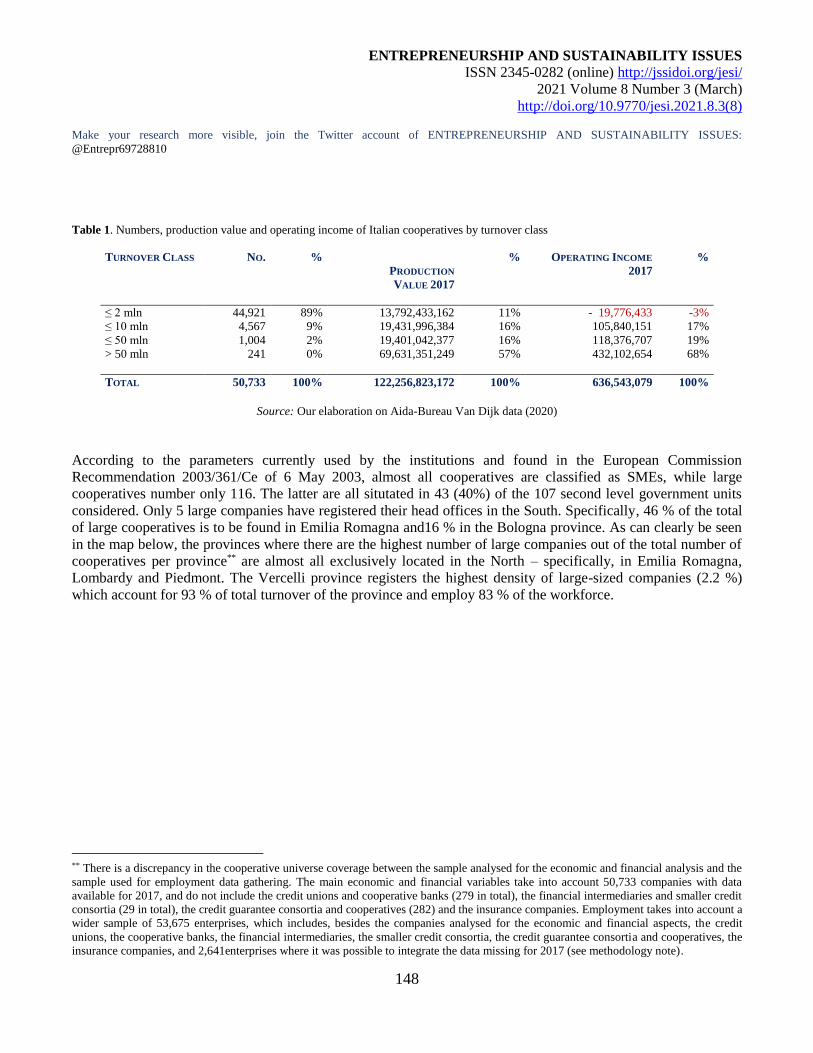
ENTREPRENEURSHIP AND SUSTAINABILITY ISSUES
ISSN 2345-0282 (online) http://jssidoi.org/jesi/
2021 Volume 8 Number 3 (March)
http://doi.org/10.9770/jesi.2021.8.3(8)
Make your research more visible, join the Twitter account of ENTREPRENEURSHIP AND SUSTAINABILITY ISSUES:
@Entrepr69728810
148
Table 1. Numbers, production value and operating income of Italian cooperatives by turnover class
TURNOVER CLASS
NO.
%
PRODUCTION
VALUE 2017
%
OPERATING INCOME
2017
%
≤ 2 mln 44,921 89% 13,792,433,162 11% - 19,776,433 -3%
≤ 10 mln 4,567 9% 19,431,996,384 16% 105,840,151 17%
≤ 50 mln 1,004 2% 19,401,042,377 16% 118,376,707 19%
> 50 mln 241 0% 69,631,351,249 57% 432,102,654 68%
TOTAL 50,733 100% 122,256,823,172 100% 636,543,079 100%
Source: Our elaboration on Aida-Bureau Van Dijk data (2020)
According to the parameters currently used by the institutions and found in the European Commission
Recommendation 2003/361/Ce of 6 May 2003, almost all cooperatives are classified as SMEs, while large
cooperatives number only 116. The latter are all situtated in 43 (40%) of the 107 second level government units
considered. Only 5 large companies have registered their head offices in the South. Specifically, 46 % of the total
of large cooperatives is to be found in Emilia Romagna and16 % in the Bologna province. As can clearly be seen
in the map below, the provinces where there are the highest number of large companies out of the total number of
cooperatives per province** are almost all exclusively located in the North – specifically, in Emilia Romagna,
Lombardy and Piedmont. The Vercelli province registers the highest density of large-sized companies (2.2 %)
which account for 93 % of total turnover of the province and employ 83 % of the workforce.
** There is a discrepancy in the cooperative universe coverage between the sample analysed for the economic and financial analysis and the
sample used for employment data gathering. The main economic and financial variables take into account 50,733 companies with data
available for 2017, and do not include the credit unions and cooperative banks (279 in total), the financial intermediaries and smaller credit
consortia (29 in total), the credit guarantee consortia and cooperatives (282) and the insurance companies. Employment takes into account a
wider sample of 53,675 enterprises, which includes, besides the companies analysed for the economic and financial aspects, the credit
unions, the cooperative banks, the financial intermediaries, the smaller credit consortia, the credit guarantee consortia and cooperatives, the
insurance companies, and 2,641enterprises where it was possible to integrate the data missing for 2017 (see methodology note).
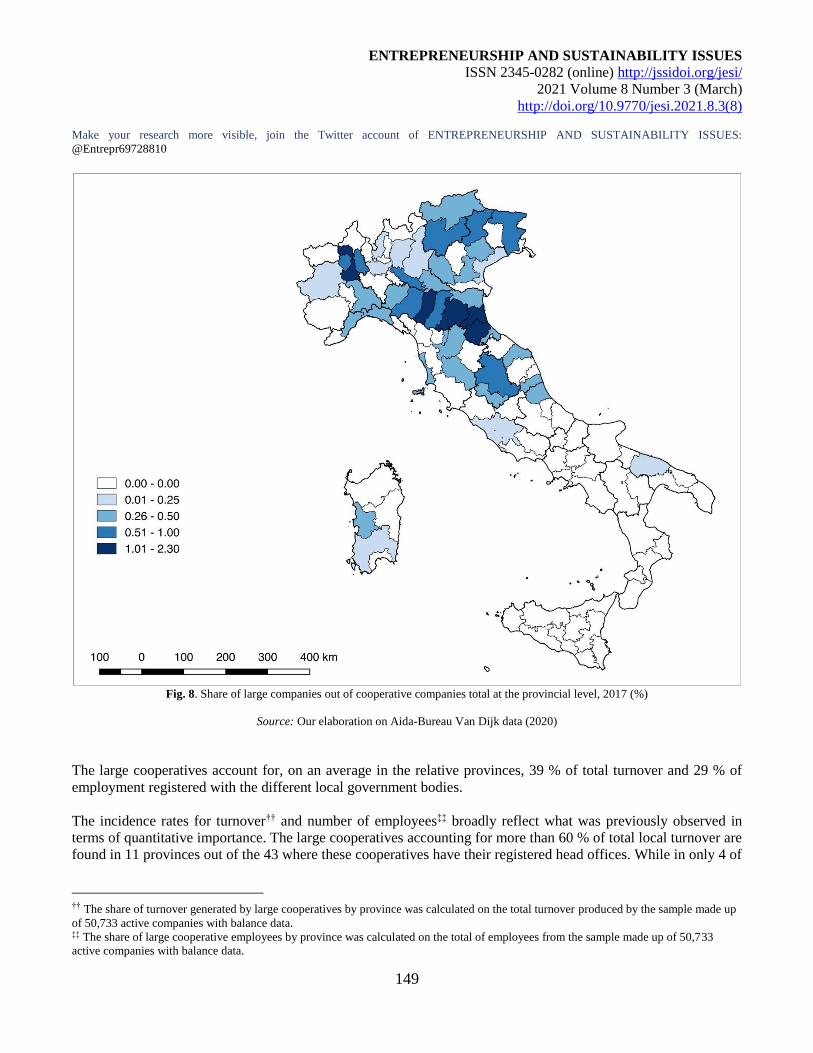
ENTREPRENEURSHIP AND SUSTAINABILITY ISSUES
ISSN 2345-0282 (online) http://jssidoi.org/jesi/
2021 Volume 8 Number 3 (March)
http://doi.org/10.9770/jesi.2021.8.3(8)
Make your research more visible, join the Twitter account of ENTREPRENEURSHIP AND SUSTAINABILITY ISSUES:
@Entrepr69728810
149
Fig. 8. Share of large companies out of cooperative companies total at the provincial level, 2017 (%)
Source: Our elaboration on Aida-Bureau Van Dijk data (2020)
The large cooperatives account for, on an average in the relative provinces, 39 % of total turnover and 29 % of
employment registered with the different local government bodies.
The incidence rates for turnover†† and number of employees‡‡ broadly reflect what was previously observed in
terms of quantitative importance. The large cooperatives accounting for more than 60 % of total local turnover are
found in 11 provinces out of the 43 where these cooperatives have their registered head offices. While in only 4 of
†† The share of turnover generated by large cooperatives by province was calculated on the total turnover produced by the sample made up
of 50,733 active companies with balance data. ‡‡ The share of large cooperative employees by province was calculated on the total of employees from the sample made up of 50,733
active companies with balance data.
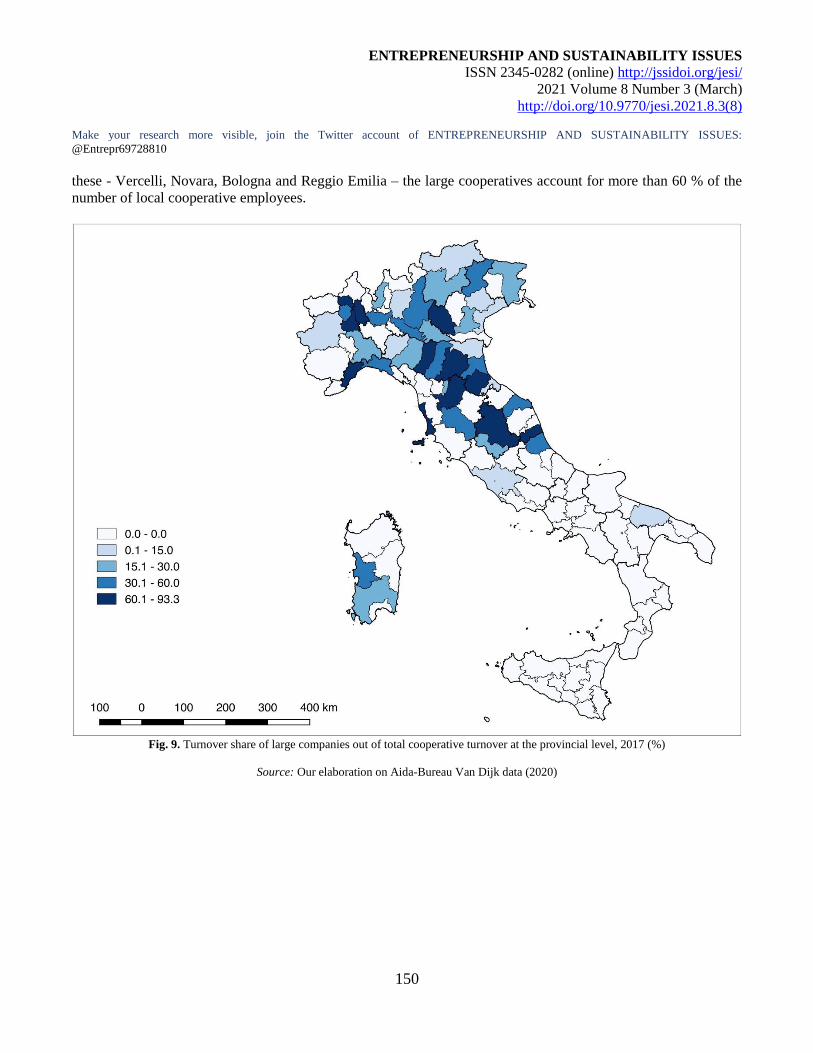
ENTREPRENEURSHIP AND SUSTAINABILITY ISSUES
ISSN 2345-0282 (online) http://jssidoi.org/jesi/
2021 Volume 8 Number 3 (March)
http://doi.org/10.9770/jesi.2021.8.3(8)
Make your research more visible, join the Twitter account of ENTREPRENEURSHIP AND SUSTAINABILITY ISSUES:
@Entrepr69728810
150
these - Vercelli, Novara, Bologna and Reggio Emilia – the large cooperatives account for more than 60 % of the
number of local cooperative employees.
Fig. 9. Turnover share of large companies out of total cooperative turnover at the provincial level, 2017 (%)
Source: Our elaboration on Aida-Bureau Van Dijk data (2020)
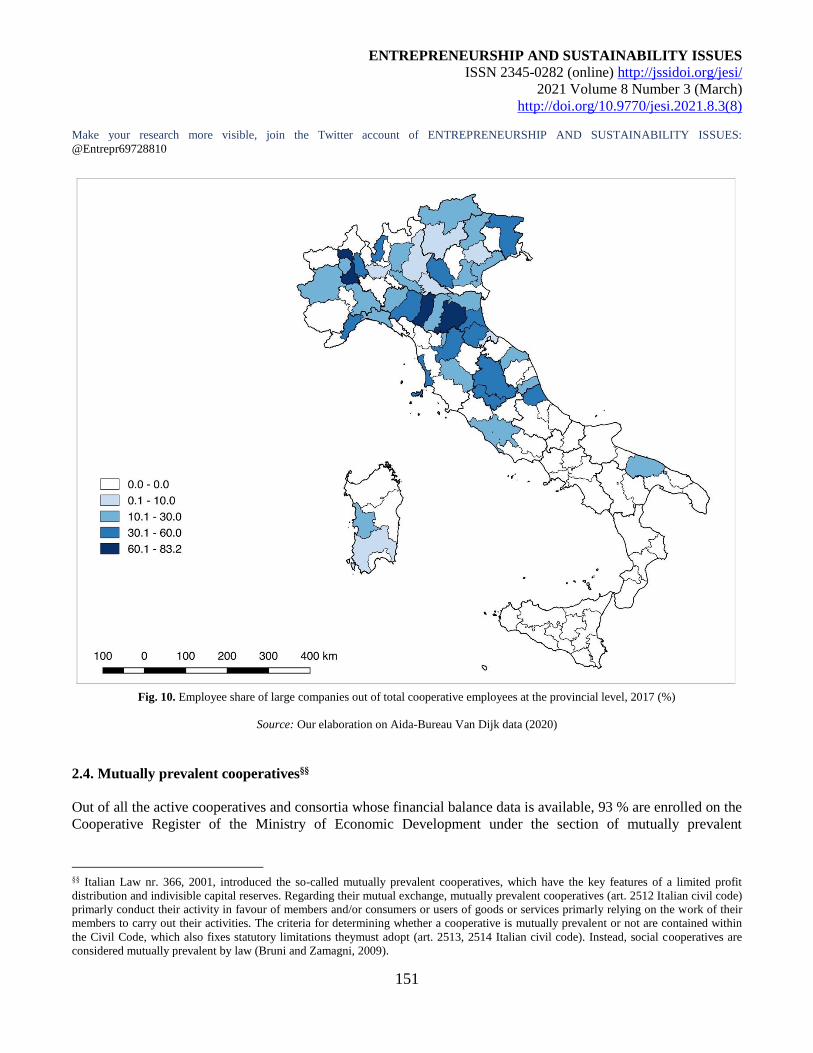
ENTREPRENEURSHIP AND SUSTAINABILITY ISSUES
ISSN 2345-0282 (online) http://jssidoi.org/jesi/
2021 Volume 8 Number 3 (March)
http://doi.org/10.9770/jesi.2021.8.3(8)
Make your research more visible, join the Twitter account of ENTREPRENEURSHIP AND SUSTAINABILITY ISSUES:
@Entrepr69728810
151
Fig. 10. Employee share of large companies out of total cooperative employees at the provincial level, 2017 (%)
Source: Our elaboration on Aida-Bureau Van Dijk data (2020)
2.4. Mutually prevalent cooperatives§§
Out of all the active cooperatives and consortia whose financial balance data is available, 93 % are enrolled on the
Cooperative Register of the Ministry of Economic Development under the section of mutually prevalent
§§ Italian Law nr. 366, 2001, introduced the so-called mutually prevalent cooperatives, which have the key features of a limited profit
distribution and indivisible capital reserves. Regarding their mutual exchange, mutually prevalent cooperatives (art. 2512 Italian civil code)
primarly conduct their activity in favour of members and/or consumers or users of goods or services primarly relying on the work of their
members to carry out their activities. The criteria for determining whether a cooperative is mutually prevalent or not are contained within
the Civil Code, which also fixes statutory limitations theymust adopt (art. 2513, 2514 Italian civil code). Instead, social cooperatives are
considered mutually prevalent by law (Bruni and Zamagni, 2009).
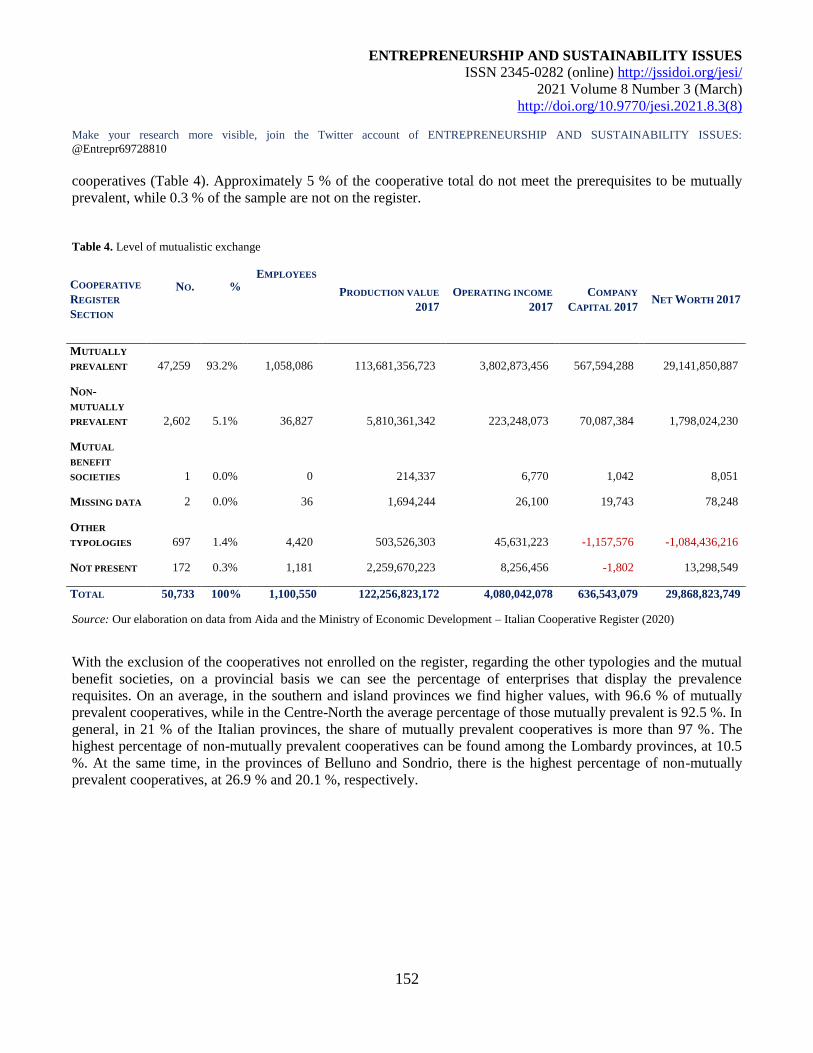
ENTREPRENEURSHIP AND SUSTAINABILITY ISSUES
ISSN 2345-0282 (online) http://jssidoi.org/jesi/
2021 Volume 8 Number 3 (March)
http://doi.org/10.9770/jesi.2021.8.3(8)
Make your research more visible, join the Twitter account of ENTREPRENEURSHIP AND SUSTAINABILITY ISSUES:
@Entrepr69728810
152
cooperatives (Table 4). Approximately 5 % of the cooperative total do not meet the prerequisites to be mutually
prevalent, while 0.3 % of the sample are not on the register.
Table 4. Level of mutualistic exchange
COOPERATIVE
REGISTER
SECTION
NO.
%
EMPLOYEES
PRODUCTION VALUE
2017
OPERATING INCOME
2017
COMPANY
CAPITAL 2017 NET WORTH 2017
MUTUALLY
PREVALENT 47,259 93.2% 1,058,086 113,681,356,723 3,802,873,456 567,594,288 29,141,850,887
NON-
MUTUALLY
PREVALENT 2,602 5.1% 36,827 5,810,361,342 223,248,073 70,087,384 1,798,024,230
MUTUAL
BENEFIT
SOCIETIES 1 0.0% 0 214,337 6,770 1,042 8,051
MISSING DATA 2 0.0% 36 1,694,244 26,100 19,743 78,248
OTHER
TYPOLOGIES 697 1.4% 4,420 503,526,303 45,631,223 -1,157,576 -1,084,436,216
NOT PRESENT 172 0.3% 1,181 2,259,670,223 8,256,456 -1,802 13,298,549
TOTAL 50,733 100% 1,100,550 122,256,823,172 4,080,042,078 636,543,079 29,868,823,749
Source: Our elaboration on data from Aida and the Ministry of Economic Development – Italian Cooperative Register (2020)
With the exclusion of the cooperatives not enrolled on the register, regarding the other typologies and the mutual
benefit societies, on a provincial basis we can see the percentage of enterprises that display the prevalence
requisites. On an average, in the southern and island provinces we find higher values, with 96.6 % of mutually
prevalent cooperatives, while in the Centre-North the average percentage of those mutually prevalent is 92.5 %. In
general, in 21 % of the Italian provinces, the share of mutually prevalent cooperatives is more than 97 %. The
highest percentage of non-mutually prevalent cooperatives can be found among the Lombardy provinces, at 10.5
%. At the same time, in the provinces of Belluno and Sondrio, there is the highest percentage of non-mutually
prevalent cooperatives, at 26.9 % and 20.1 %, respectively.
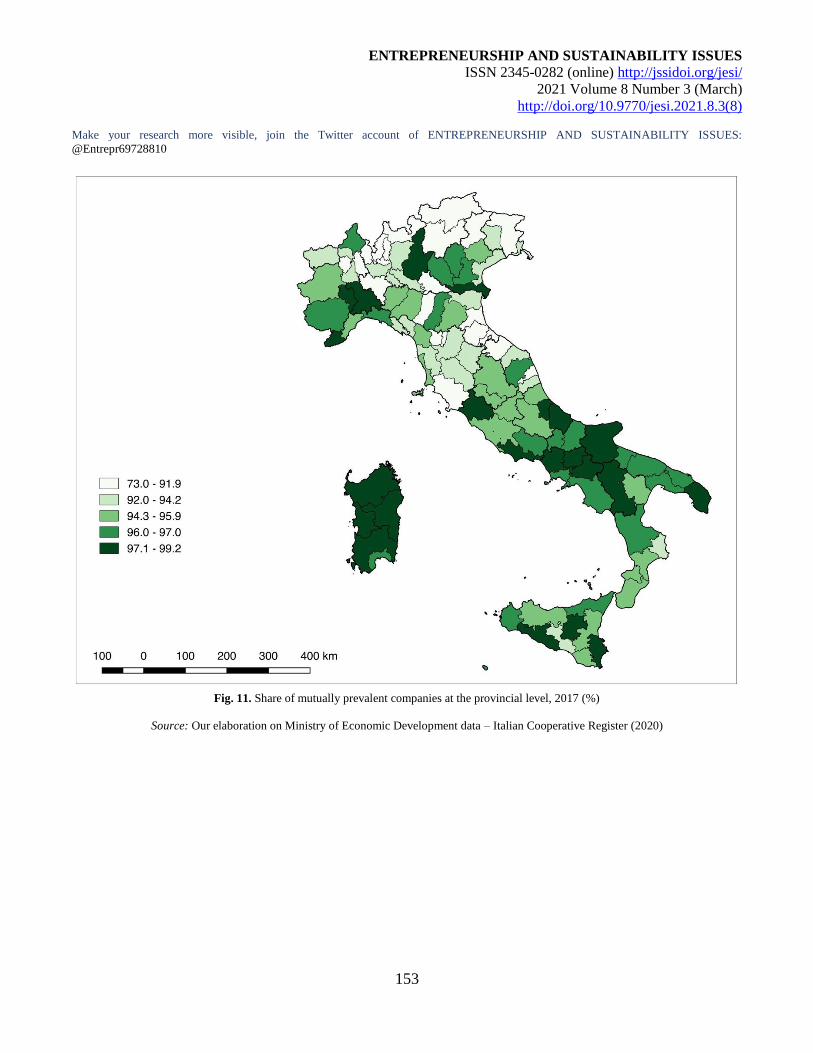
ENTREPRENEURSHIP AND SUSTAINABILITY ISSUES
ISSN 2345-0282 (online) http://jssidoi.org/jesi/
2021 Volume 8 Number 3 (March)
http://doi.org/10.9770/jesi.2021.8.3(8)
Make your research more visible, join the Twitter account of ENTREPRENEURSHIP AND SUSTAINABILITY ISSUES:
@Entrepr69728810
153
Fig. 11. Share of mutually prevalent companies at the provincial level, 2017 (%)
Source: Our elaboration on Ministry of Economic Development data – Italian Cooperative Register (2020)
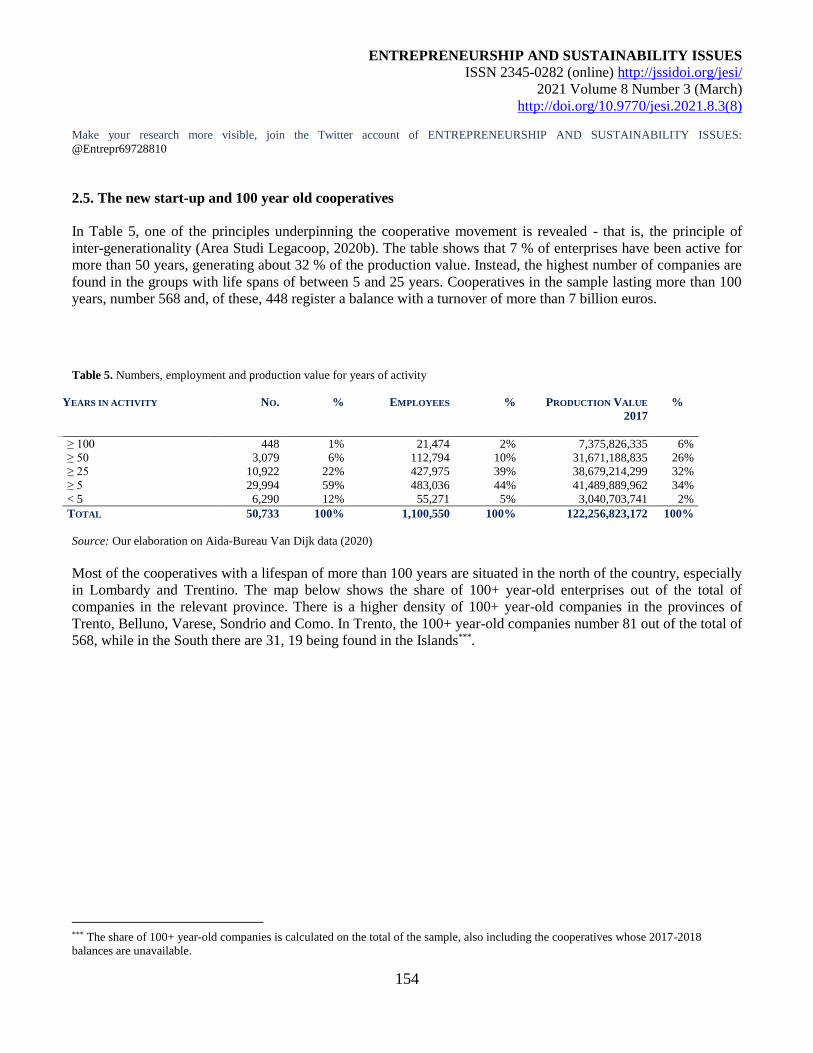
ENTREPRENEURSHIP AND SUSTAINABILITY ISSUES
ISSN 2345-0282 (online) http://jssidoi.org/jesi/
2021 Volume 8 Number 3 (March)
http://doi.org/10.9770/jesi.2021.8.3(8)
Make your research more visible, join the Twitter account of ENTREPRENEURSHIP AND SUSTAINABILITY ISSUES:
@Entrepr69728810
154
2.5. The new start-up and 100 year old cooperatives
In Table 5, one of the principles underpinning the cooperative movement is revealed - that is, the principle of
inter-generationality (Area Studi Legacoop, 2020b). The table shows that 7 % of enterprises have been active for
more than 50 years, generating about 32 % of the production value. Instead, the highest number of companies are
found in the groups with life spans of between 5 and 25 years. Cooperatives in the sample lasting more than 100
years, number 568 and, of these, 448 register a balance with a turnover of more than 7 billion euros.
Table 5. Numbers, employment and production value for years of activity
YEARS IN ACTIVITY
NO. % EMPLOYEES %
PRODUCTION VALUE
2017
%
≥ 100 448 1% 21,474 2% 7,375,826,335 6%
≥ 50 3,079 6% 112,794 10% 31,671,188,835 26%
≥ 25 10,922 22% 427,975 39% 38,679,214,299 32%
≥ 5 29,994 59% 483,036 44% 41,489,889,962 34%
< 5 6,290 12% 55,271 5% 3,040,703,741 2%
TOTAL 50,733 100% 1,100,550 100% 122,256,823,172 100%
Source: Our elaboration on Aida-Bureau Van Dijk data (2020)
Most of the cooperatives with a lifespan of more than 100 years are situated in the north of the country, especially
in Lombardy and Trentino. The map below shows the share of 100+ year-old enterprises out of the total of
companies in the relevant province. There is a higher density of 100+ year-old companies in the provinces of
Trento, Belluno, Varese, Sondrio and Como. In Trento, the 100+ year-old companies number 81 out of the total of
568, while in the South there are 31, 19 being found in the Islands***.
*** The share of 100+ year-old companies is calculated on the total of the sample, also including the cooperatives whose 2017-2018
balances are unavailable.
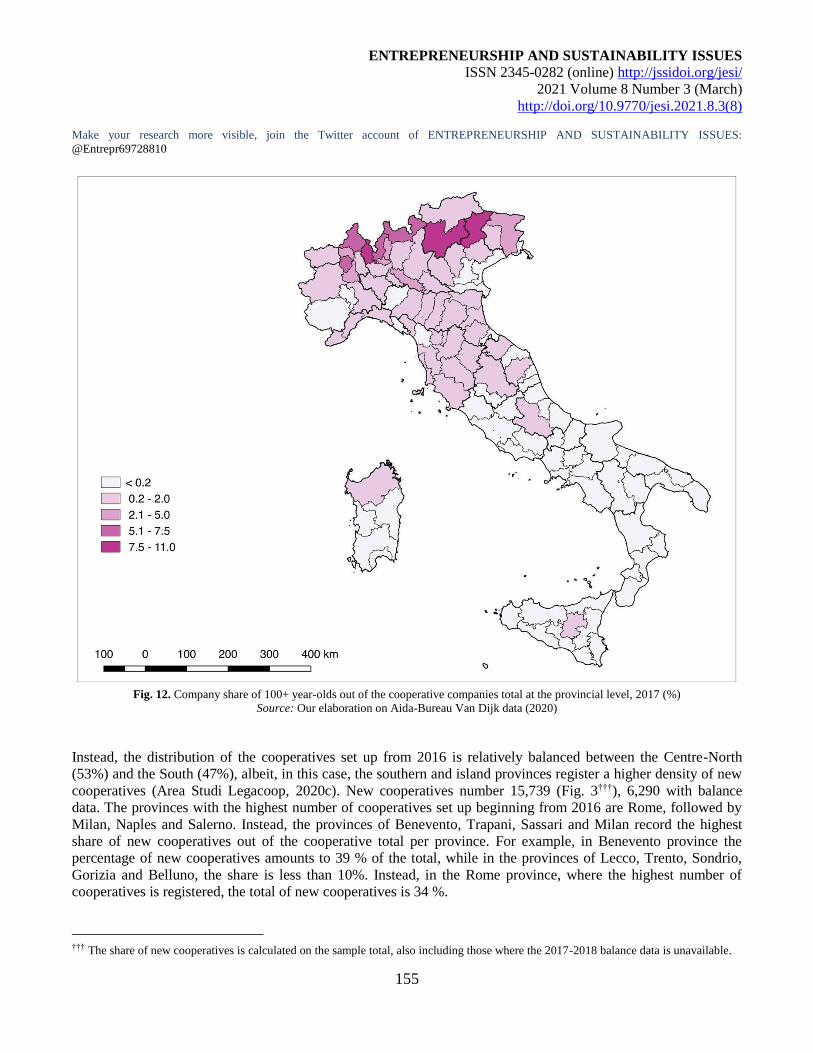
ENTREPRENEURSHIP AND SUSTAINABILITY ISSUES
ISSN 2345-0282 (online) http://jssidoi.org/jesi/
2021 Volume 8 Number 3 (March)
http://doi.org/10.9770/jesi.2021.8.3(8)
Make your research more visible, join the Twitter account of ENTREPRENEURSHIP AND SUSTAINABILITY ISSUES:
@Entrepr69728810
155
Fig. 12. Company share of 100+ year-olds out of the cooperative companies total at the provincial level, 2017 (%)
Source: Our elaboration on Aida-Bureau Van Dijk data (2020)
Instead, the distribution of the cooperatives set up from 2016 is relatively balanced between the Centre-North
(53%) and the South (47%), albeit, in this case, the southern and island provinces register a higher density of new
cooperatives (Area Studi Legacoop, 2020c). New cooperatives number 15,739 (Fig. 3†††), 6,290 with balance
data. The provinces with the highest number of cooperatives set up beginning from 2016 are Rome, followed by
Milan, Naples and Salerno. Instead, the provinces of Benevento, Trapani, Sassari and Milan record the highest
share of new cooperatives out of the cooperative total per province. For example, in Benevento province the
percentage of new cooperatives amounts to 39 % of the total, while in the provinces of Lecco, Trento, Sondrio,
Gorizia and Belluno, the share is less than 10%. Instead, in the Rome province, where the highest number of
cooperatives is registered, the total of new cooperatives is 34 %.
††† The share of new cooperatives is calculated on the sample total, also including those where the 2017-2018 balance data is unavailable.
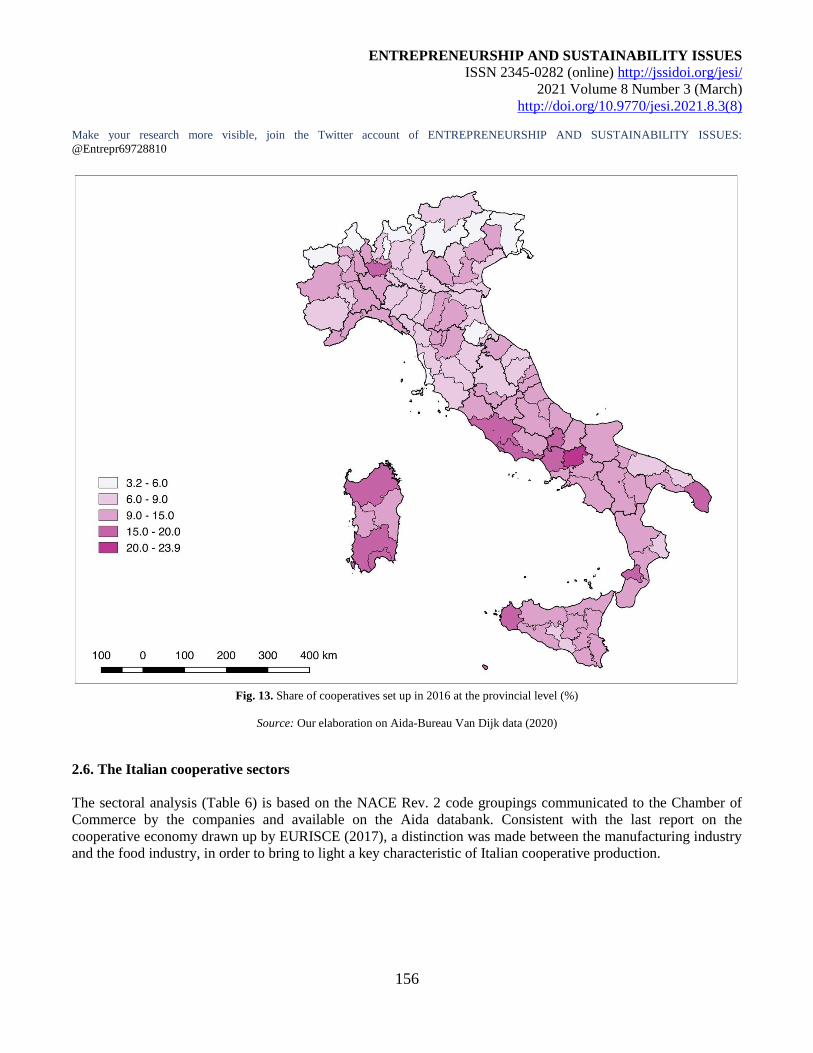
ENTREPRENEURSHIP AND SUSTAINABILITY ISSUES
ISSN 2345-0282 (online) http://jssidoi.org/jesi/
2021 Volume 8 Number 3 (March)
http://doi.org/10.9770/jesi.2021.8.3(8)
Make your research more visible, join the Twitter account of ENTREPRENEURSHIP AND SUSTAINABILITY ISSUES:
@Entrepr69728810
156
Fig. 13. Share of cooperatives set up in 2016 at the provincial level (%)
Source: Our elaboration on Aida-Bureau Van Dijk data (2020)
2.6. The Italian cooperative sectors
The sectoral analysis (Table 6) is based on the NACE Rev. 2 code groupings communicated to the Chamber of
Commerce by the companies and available on the Aida databank. Consistent with the last report on the
cooperative economy drawn up by EURISCE (2017), a distinction was made between the manufacturing industry
and the food industry, in order to bring to light a key characteristic of Italian cooperative production.
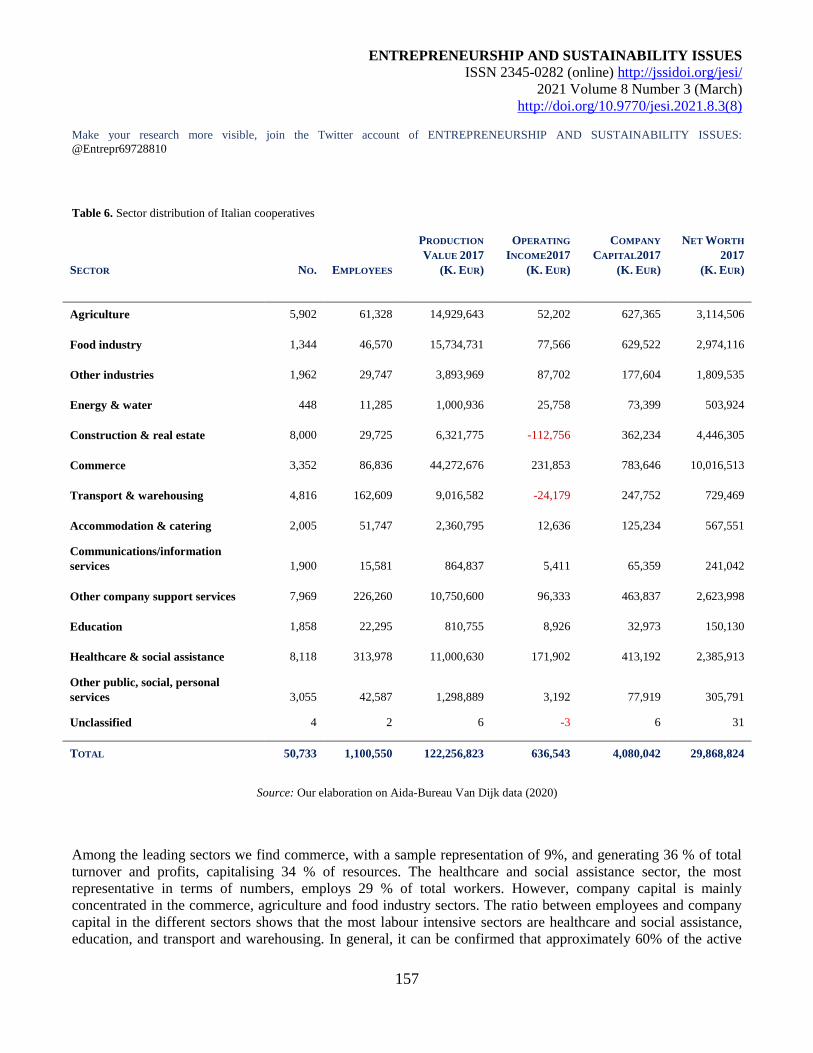
ENTREPRENEURSHIP AND SUSTAINABILITY ISSUES
ISSN 2345-0282 (online) http://jssidoi.org/jesi/
2021 Volume 8 Number 3 (March)
http://doi.org/10.9770/jesi.2021.8.3(8)
Make your research more visible, join the Twitter account of ENTREPRENEURSHIP AND SUSTAINABILITY ISSUES:
@Entrepr69728810
157
Table 6. Sector distribution of Italian cooperatives
SECTOR
NO.
EMPLOYEES
PRODUCTION
VALUE 2017
(K. EUR)
OPERATING
INCOME2017
(K. EUR)
COMPANY
CAPITAL2017
(K. EUR)
NET WORTH
2017
(K. EUR)
Agriculture 5,902 61,328 14,929,643 52,202 627,365 3,114,506
Food industry 1,344 46,570 15,734,731 77,566 629,522 2,974,116
Other industries 1,962 29,747 3,893,969 87,702 177,604 1,809,535
Energy & water 448 11,285 1,000,936 25,758 73,399 503,924
Construction & real estate 8,000 29,725 6,321,775 -112,756 362,234 4,446,305
Commerce 3,352 86,836 44,272,676 231,853 783,646 10,016,513
Transport & warehousing 4,816 162,609 9,016,582 -24,179 247,752 729,469
Accommodation & catering 2,005 51,747 2,360,795 12,636 125,234 567,551
Communications/information
services 1,900 15,581 864,837 5,411 65,359 241,042
Other company support services 7,969 226,260 10,750,600 96,333 463,837 2,623,998
Education 1,858 22,295 810,755 8,926 32,973 150,130
Healthcare & social assistance 8,118 313,978 11,000,630 171,902 413,192 2,385,913
Other public, social, personal
services 3,055 42,587 1,298,889 3,192 77,919 305,791
Unclassified 4 2 6 -3 6 31
TOTAL 50,733 1,100,550 122,256,823 636,543 4,080,042 29,868,824
Source: Our elaboration on Aida-Bureau Van Dijk data (2020)
Among the leading sectors we find commerce, with a sample representation of 9%, and generating 36 % of total
turnover and profits, capitalising 34 % of resources. The healthcare and social assistance sector, the most
representative in terms of numbers, employs 29 % of total workers. However, company capital is mainly
concentrated in the commerce, agriculture and food industry sectors. The ratio between employees and company
capital in the different sectors shows that the most labour intensive sectors are healthcare and social assistance,
education, and transport and warehousing. In general, it can be confirmed that approximately 60% of the active
ENTREPRENEURSHIP AND SUSTAINABILITY ISSUES
ISSN 2345-0282 (online) http://jssidoi.org/jesi/
2021 Volume 8 Number 3 (March)
http://doi.org/10.9770/jesi.2021.8.3(8)
Make your research more visible, join the Twitter account of ENTREPRENEURSHIP AND SUSTAINABILITY ISSUES:
@Entrepr69728810
158
cooperatives, with balance data available, is concentrated in the sectors of construction and real estate, company
support services, healthcare and social assistance and agriculture.
3. Conclusions
This paper which, as mentioned in the introduction, emerged from the objective to outline and analyse the major
aspects of the Italian cooperative movement referring to the most authoritative databanks available, has also taken
on a further meaning in light of the current situation arising from the Covid-19 emergency. The original intent
was to photograph the final situation of what has occurred over the last decade beginning from 2007-2008,
however, with the emergence of this new and still dramatic crisis, it will become the springboard for an analysis
on the future impacts of which, today, we can only vaguely divine the consequences.
In the weeks of the lockdown, the cooperative associations confronted the emergency prioritising job security,
guaranteeing the survival of the cooperatives (liquidity, financial reorganisation support, maintaining services and
product orders, cost-cutting, and so on) and defending jobs. At the same time, it began a constant monitoring of
the immediate repercussions of the legislative measures that froze entire sectors with still unquantifiable
consequences and, as well, of the rapid evolution, at the moment full of uncertainties, of the relevant sector and
market conditions which, in all likelihood, will require a thorough restructuring.
From the very start, an important compass was the certainty, quite widely shared, that the imminent crisis – that
will soon unfold the economic, as well as social and political consequences – must push the economic actors,
among others, to question themselves about the underlying choices and meaning of their actions where the market
is concerned. The cooperative associations along with all the institutional bodies have pointed out the need to
restart, but with the aim to build a different economy, where individuals, the common good, wellbeing, the health
of citizens and the safety of our planet, must always come before individual interests. Otherwise, after this crisis,
we will end up with a fragile and vulnerable world.
Undoubtedly, the different aspects of the Italian cooperative experience outlined here are a force on which future
actions can be hinged. However, it requires a full awareness of the features of the cooperative entrepreneurial
base, as well as appropriate key preparations that take into account the changing context of today.
Italian cooperation emerged from the decade of the crisis seeing some historical strong points consolidated, such
as widespread sector presence, inter-generational solidarity, an instinct for resilience and especially safeguarding
employment, and a capability to adapt and regenerate before social and market changes. On the other hand, the
decade of the great crisis also exacerbated some shadowy areas. These include, for example, a tendency towards
territorial, sectoral and size concentrations in traditional comfort zones; a decrease in numbers that, although
being compensated for by the setting up of new companies, also confirmed some weaknesses in the model, overall
among the micro and small cooperatives; and a difficulty to adapt to the democratic workings of companies in a
context of rapid evolution.
Nevertheless, even throughout the contentious situation of the past decade, while entire sectors were undergoing
restructuring, at times being drastically reduced, the Italian cooperatives also revealed themselves to be
resourceful and energetic in renewing themselves, coming up with new needs, trends, experiences, new market
responses and solutions in an associative, democratic and cooperative form.
ENTREPRENEURSHIP AND SUSTAINABILITY ISSUES
ISSN 2345-0282 (online) http://jssidoi.org/jesi/
2021 Volume 8 Number 3 (March)
http://doi.org/10.9770/jesi.2021.8.3(8)
Make your research more visible, join the Twitter account of ENTREPRENEURSHIP AND SUSTAINABILITY ISSUES:
@Entrepr69728810
159
This is certainly the case for the WBOs where the Italian experience has provided an original contribution to
existing practices at an international level, as well as for the community cooperatives. They provide a new
response for the many different needs that challenge the idea itself of mutualistic exchange and how it has been
shaped and dealt with over decades of cooperative theory and practice, innovatively interpreting the need to
manage public goods, also through a widespread reallocation of ownership rights. The crisis resulted in being a
catalyst for change and, moreover, in recent years has generated productive cross-sectoral collaborations where
the objective of inclusion, often through turning to new technologies to come up with new products or services,
has led to practices in economic, social and cultural innovation whose transformative force we will increasingly
see the results of in the coming years.
Of course, many of these innovations, because they are so widespread, spontaneous and experimental, also
display characteristics of entrepreneurial fragility, albeit in the light of a large-scale added value. One of the
essential aspects of the future cooperative development strategies will be in knowing how to find, recognise,
shape and sustain the sprouting seeds of these innovative practices. After all, accumulating and reproducing
knowledge and entrepreneurial capability, especially if inspired by cooperative values, and linked to local
communities and areas, are per se a “common good” (Berranger, Monni, Realini, 2020; Giovannetti, E: (2001))
to be cultivated and preserved with care.
4. Methodological Note
As of 20/01/2020,146,396 cooperative, cooperative consortia and cooperative consortium company enterprises
were present in the Aida databank. 85,597 of these were active, numbering 84,944 cooperatives and 653 consortia
and cooperative consortium companies.
From the 85,597 active enterprises, all those set up before 11/1/2016 and not lodging a balance with the Chamber
of Commerce from 31/12/2016 were then eliminated. An analysis then followed of the consolidated balances that
brought the total of eliminated companies from the sample to 195. Resulting from the provisions taken in
selecting the sample, the total of cooperative companies and consortia that can be considered active is made up of
61,274 enterprises. Therefore, out of the total of those enterprises considered active, according to what was
previously presented, there are 53,675 cooperatives and consortia for which it was possible to obtain data on
employment. For 3,048 enterprises, the missing data for the number of employees at 31/12/2017 was integrated
with the manual entry of the data from the balance, with the data from cooperative audit minutes in the Area Studi
Legacoop databank or, alternatively, with the corresponding data at 31/12/2018. Instead, as far as the main
economic aspects are concerned, due to the impossibility to compare the balance data, the credit unions and
cooperative banks (279), the financial intermediaries and the smaller credit consortia (29), the credit guarantee
cooperatives and consortia (282) and the insurance companies‡‡‡ (4) were excluded from the sample.
‡‡‡ The credit unions and cooperative banks (279), the financial intermediaries, the smaller credit companies, the credit guarantee
cooperatives and consortia (287) and the insurance companies, were identified based on the information provided by the cooperative
register, the financial intermediary register of the Bank of Italy, and on the balance classification data from the Aida-Bureau Van Dijk
databank (those identified were companies which draw up a balance according to that foreseen in the civil code for banks, financial
intermediaries and insurance companies).
ENTREPRENEURSHIP AND SUSTAINABILITY ISSUES
ISSN 2345-0282 (online) http://jssidoi.org/jesi/
2021 Volume 8 Number 3 (March)
http://doi.org/10.9770/jesi.2021.8.3(8)
Make your research more visible, join the Twitter account of ENTREPRENEURSHIP AND SUSTAINABILITY ISSUES:
@Entrepr69728810
160
References
AREA STUDI LEGACOOP (2020a) Le imprese recuperate in Italia. Retrieved from http://areastudi.legacoop.coop/wp-
content/uploads/2020/03/Nota-8-WBO_Le-imprese-recuperate-in-Italia.pdf.
AREA STUDI LEGACOOP. (2020b). Gli “Highlander” dell’economia italiana: Una panoramica sulla cooperazione ultracentenaria.
Retrieved from http://areastudi.legacoop.coop/wp-content/uploads/2020/02/Gli-Highlander-dell%E2%80%99economia-italiana-1.pdf.
AREA STUDI LEGACOOP (2020c) La natalità delle cooperative nella ripresa del ciclo economico (2014-2019): alcuni dati di
approfondimento. Retrieved from http://areastudi.legacoop.coop/wp-content/uploads/2020/01/La-natalit%C3%A0-delle-cooperative-nella-
ripresa-del-ciclo-economico-alcuni-dati-di-apporfondimento.pdf.
Bernardi, A., Monni S., eds. (2016) The Co-operative firm – Keywords, Rome: Roma Tre-Press. Retrieved from
http://romatrepress.uniroma3.it/libro/the-co-operative-firm-keywords/.
Bernardi, A., Monni, S. eds., (2019). Parole chiave per l’impresa cooperativa del futuro, Bologna: Il Mulino.
Bernardi A, Treu T, Tridico P., (2011), Lavoro e impresa cooperativa in Italia. Diversità, ruolo economico, relazioni industriali, sfide
future, pp.180, Passigli Editori.
Berranger, C. Monni S, Realini, A. eds., (2020) Cooperative Bene comune. Rome: Roma Tre-Press. Retrieved from
http://romatrepress.uniroma3.it/libro/cooperative-bene-comune/.
Borzaga C. (2017) Dimensioni ed evoluzione dell’economia cooperativa italiana nel 2014, Trento: Euricse.
Borzaga, C. Calzaroni, M., Lori M. (2016). L’impresa sociale nei dati censuari. In: G.P. Barbetta, G. Ecchia & N. Zamaro (eds), Le
istituzioni nonprofit in Italia. Dieci anni dopo. Bologna: Il Mulino.
Borzaga, Carini, C., Carpita, C., Lori, M. (2016) Uno sguardo oltre i confini del censimento: dimensioni e caratteristiche dell’economia
sociale. In: G.P. Barbetta, G. Ecchia, N. Zamaro (a cura di), Le istituzioni nonprofit in Italia. Dieci anni dopo. Bologna: Il Mulino.
Costa, E., Carini, C., Borzaga, C. (2103). An assessment of cooperatives in Italy: economic and occupational insights in 2008. Journal of
Co-operative Accounting and Reporting, 2(1), 37-52. https://www.smu.ca/webfiles/v2i1a3.pdf
Bruni, L., Zamagni, S. eds., (2009) Dizionario di economia civile, Roma, Città Nuova.
Demartini, P., Monni, S. eds., (2017) Workers’ buyout Corporate Governance e sistemi di controllo. Rome: Roma TrE-Press. Retrieved
from http://romatrepress.uniroma3.it/libro/workers-buyout-corporate-governance-e-sistemi-di-controllo/.
Euricse (2015) Terzo Rapporto Euricse sulla cooperazione in Italia. Rilevanza, evoluzione e nuove frontiere della cooperazione italiana.
Trento: Euricse, Euricse Edizioni. https://www.alleanzacooperative.it/uffici-studi/wp-content/uploads/2015/10/III°-Rapporto-Euricse-
ECONOMIA-COOPERATIVA.pdf.
Euricse (2013) Secondo rapporto Euricse s sulla cooperazione in Italia. La cooperazione italiana negli anni della crisi. Trento: Euricse.
Retrieved from https://www.euricse.eu/it/publications/la-cooperazione-italiana-negli-anni-della-crisi-2-rapporto-sulla-cooperazione-in-
italia/.
Euricse (2011) Primo Rapporto Euricse sulla Cooperazione in Italia. Trento: Euricse. Retrieved from
https://www.euricse.eu/it/publications/la-cooperazione-in-italia-1-rapporto-euricse-2/.
ENTREPRENEURSHIP AND SUSTAINABILITY ISSUES
ISSN 2345-0282 (online) http://jssidoi.org/jesi/
2021 Volume 8 Number 3 (March)
http://doi.org/10.9770/jesi.2021.8.3(8)
Make your research more visible, join the Twitter account of ENTREPRENEURSHIP AND SUSTAINABILITY ISSUES:
@Entrepr69728810
161
Giovannetti, E. (2001). Le virtù dei commons: imprese cooperative e formazione di beni pubblici di filiera, Economia Pubblica.
http://merlino.unimo.it/campusone/web_dep/materiali_discussione/0384.pdf
ICA (1995) Statement on the co-operative identity. Retrieved from http://www.ica.coop/coop/principles.html.
ICA-Euricse (2019) World Co-operative Monitor. Exploring the Co-operative economy Retrieved from
https://www.ccw.coop/uploads/Publications/World%20Co-op%20Monitor%202019.pdf.
ICA-Euricse (2018) World Co-operative Monitor. Exploring the Co-operative economy Retrieved from
https://monitor.coop/sites/default/files/publication-files/wcm-2018en-1276015391.pdf .
ICA-Euricse (2017) World Co-operative Monitor. Exploring the Co-operative economy Retrieved from https://www.euricse.eu/wp-
content/uploads/2017/11/WCM_2017-web-EN.pdf
ICA-Euricse (2016) World Co-operative Monitor. Exploring the Co-operative economy Retrieved from https://www.euricse.eu/wp-
content/uploads/2017/11/WCM-2016.pdf.
ICA-Euricse (2015) World Co-operative Monitor. Exploring the Co-operative economy Retrieved from
https://monitor.coop/sites/default/files/WCM_2015%20WEB.pdf.
ICA-Euricse (2014) World Co-operative Monitor. Exploring the Co-operative economy Retrieved from
https://www.ica.coop/sites/default/files/WCM2014.pdf.
ICA-Euricse (2013) World Co-operative Monitor. Exploring the Co-operative economy Retrieved from
https://www.euricse.eu/it/publications/world-cooperative-monitor-report-2013/.
ICA-Euricse (2012) World Co-operative Monitor. Exploring the Co-operative economy Retrieved from
https://www.euricse.eu/it/publications/world-cooperative-monitor-2012/.
ICA (2019a) Co-operative facts & figures. Retrieved from http://ica.coop/en/whats-co-op/co-operative-facts-figures.
ICA (2019b) Statistics on cooperatives Retrieved from https://www.ilo.org/global/topics/cooperatives/areas-of-work/WCMS_550541/lang-
-en/index.htm.
ISTAT-Euricse (2019) Struttura, profili economici e prospettive delle cooperative in Italia, Retrieved from
https://www.istat.it/it/files//2019/01/Programma-evento-25-gennaio-2019-2.pdf.
ISTAT (2017) I.Stat database. Retrieved from http://dati.istat.it/Index.aspx?QueryId=29069.
Kalmi, P. (2016). “T: Textbooks” in Bernardi, A., Monni, S. The Co-operative firm – Keywords (2016), Rome: Roma TrE-Press, 143-146.
Mazzanti, M., Mazzarano, M., Pronti, A., Quatrosi, M. 2020. Fiscal policies, public investments and wellbeing: mapping the evolution of
the EU. Insights into Regional Development, 2(4), 725-749. http://doi.org/10.9770/IRD.2020.2.4(1)
Mazzoli, E., Zamagni, S. eds (2005), Verso una nuova teoria economica della cooperazione, Bologna, Il Mulino.
Monni, S., Novelli, G., Pera, L., Realini, A. (2017a). Workers’ buyout: the Italian experience, 1986-2016. Entrepreneurship and
Sustainability Issues, 4(4), 526-539. http://doi.org/10.9770/jesi.2017.4.4(10)
ENTREPRENEURSHIP AND SUSTAINABILITY ISSUES
ISSN 2345-0282 (online) http://jssidoi.org/jesi/
2021 Volume 8 Number 3 (March)
http://doi.org/10.9770/jesi.2021.8.3(8)
Make your research more visible, join the Twitter account of ENTREPRENEURSHIP AND SUSTAINABILITY ISSUES:
@Entrepr69728810
162
Monni, S., Novelli, G., Pera, L., Realini, A. (2017b) “Workers’ buyout: l’esperienza italiana” in Demartini, P., Monni, S. (2017) Workers’
buyout Corporate Governance e sistemi di controllo. Rome: Roma Tre-Press, Rome: 16-29. Retrieved from
http://romatrepress.uniroma3.it/repository/44/pdf/972732c9-9743-44a4-9d67-75ae7c25809a.pdf.
Monni, S., Novelli, G., Pera, L., Realini, A. (2017c) “Workers’ buyout: definizioni e caratteristiche” in Demartini, P., Monni, S. (2017),
Workers’ buyout Corporate Governance e sistemi di controllo. Rome: Roma TrE-Press, Rome: 8-15. Retrieved from
http://romatrepress.uniroma3.it/repository/44/pdf/0a885038-e3dd-4313-9744-3a3e0d9e4131.pdf.
Ministero dello Sviluppo Economico- MISE (2020), Albo delle società cooperative. Retrieved from http://dati.mise.gov.it/index.php/lista-
cooperative.
Van Dijk Bureau (2020) AIDA database. Retrieved from https://aida.bvdinfo.com.
Vieta, M. (2015). The Italian Road to Creating Worker Cooperatives from Worker Buyouts: Italy’s Worker-Recuperated Enterprises and
the Legge Marcora Framework, Euricse Working Papers, 78|15.
Vieta, M. (2016) B: Workers’ Buyout, in Bernardi, A., Monni S., eds., (2016) The Co-operative firm – Keywords, Rome: RomaTrE-Press.
Retrieved from http://romatrepress.uniroma3.it/libro/the-co-operative-firm-keywords/.
Zamagni S., Zamagni V. (2011) Cooperative Enterprise: Facing the Challenge of Globalization. Edward Elgar.
Zamagni S., Zamagni V. (2019) Economia cooperativa, Paese civile. Roma: ECRA.
Zamagni, V. (2006) L’impresa cooperativa italiana: dalla marginalità alla fioritura XIV Congresso internazionale di storia economica
Helsinki 21-25 agosto 2006 Retrieved from https://www.cooperazione.net/fileadmin/coop/uploads/impresa_cooperativa_italiana.pdf.
Zamagni V. (2020) Forme d'impresa. Una prospettiva storico-economica. Il Mulino.
Acknowledgements
Financial support from the Italian Ministry of University and Research, Scientific Research Program of National Relevance
(PRIN) 2017, project “Innovation for global challenges in a connected world: the role of local resources and socio-economic
conditions”, is gratefully acknowledged.
ENTREPRENEURSHIP AND SUSTAINABILITY ISSUES
ISSN 2345-0282 (online) http://jssidoi.org/jesi/
2021 Volume 8 Number 3 (March)
http://doi.org/10.9770/jesi.2021.8.3(8)
Make your research more visible, join the Twitter account of ENTREPRENEURSHIP AND SUSTAINABILITY ISSUES:
@Entrepr69728810
163
Andrea CORI is a researcher for the Research Centre of the Italian Cooperative Federation, –"Legacoop". He graduated
from Università di Roma Tre with a post-graduated diploma in Economics, Law and Management in Co-operative
Companies. Previously, Andrea had done a Masters in Economics and Management from the Università di Roma Tre – along
with a Bachelor in Philosophy from Università degli Studi di Roma “La Sapienza”. His current research and publications are
in the fields of Development Economics, Social Economy and Cooperatives, Latin American Studies and Sustainable Water
Management.
ORCID ID: https://orcid.org/0000-0003-3190-4726
Mattia GRANATA (PhD), an historian by training, is the Head of the Research Centre of the Italian Cooperative Federation
Legacoop, and the Director of the Ivano Barberini Foundation (Bologna). He teaches Labour History at the University of
Milan. He authored a number of books and articles about Italian economic and political history. He published Smart Milan.
Innovation from Expo to Expo (1906-2015) (Springer 2016) and is currently writing a book on the OECD and educational
policies in postwar Europe.
ORCID ID: https://orcid.org/0000-0002-0639-4632
Keti LELO is Assistant Professor in Economic History at Roma Tre University, Department of Business Studies, where she
lectures on Urban and Regional Analysis, Quantitative Methods Lab and Urban History. She is a member of the scientific
committee of the Master’s Programme “Management, promotion, technological innovation for the cultural heritage”, where
she coordinates the module “Knowledge of Heritage”. She is the author of numerous scientific articles in the fields of urban
planning, territorial analysis, geographic information systems and geostatistics.
ORCID ID: https://orcid.org/0000-0002-2009-3772
Salvatore MONNI is Associate Professor of Economic Policy and Director of the Master’s Programme in "The Cooperative
Company: Economics, Law and Management", at Roma Tre University, Department of Economics. His current main
research and publications are in the fields of development economics and policy.
ORCID ID: http://orcid.org/0000-0002-6326-5714
Copyright © 2021 by author(s) and VsI Entrepreneurship and Sustainability Center
This work is licensed under the Creative Commons Attribution International License (CC BY).
http://creativecommons.org/licenses/by/4.0/
ENTREPRENEURSHIP AND SUSTAINABILITY ISSUES
ISSN 2345-0282 (online) http://jssidoi.org/jesi/
2021 Volume 8 Number 3 (March)
http://doi.org/10.9770/jesi.2021.8.3(10)
Publisher http://jssidoi.org/esc/home
179
A STUDY OF ONLINE ENTREPRENEURSHIP EDUCATION UNDER CONDITIONS OF A
PANDEMIC*
Margarita Išoraitė ¹, Gintarė Gulevičiutė ²
Vilniaus kolegija / University of Applied Sciences, Saltoniškių Street 58, Vilnius, Lithuania
E-mails:1 [email protected] ; [email protected]
Received 25 November 2020; accepted 12 January 2021; published 30 March 2021
Abstract. The purpose of this paper is to investigate the methods and measures of online entrepreneurship education of the Lithuanian
population under pandemic conditions. The methodological framework used in the investigation is based on theoretical descriptive,
comparative, and analytical methods. Application of a quantitative method is based on an online survey designed specifically for the
purposes of the study. The paper analyzes scientific literature of entrepreneurship and related topics, then it discusses the possibilities of
online entrepreneurship education under pandemic conditions, the study also determines the expression of respondents' entrepreneurial
qualities and abilities. The quantitative study is the main novelty of the research and it is intended in order to produce recommendations for
improving the entrepreneurship education of the Lithuanian population under the conditions of a pandemic. The conclusions and
recommendations of the research are focused on practical value. Those practical implications could be useful for higher education
institutions in order to improve the entrepreneurship education of the Lithuanian population under the conditions of a pandemic by defining
teaching methods that promote entrepreneurship in higher education and measures that help develop entrepreneurship.
Keywords: entrepreneurship, entrepreneurship education, electronic business.
Reference to this paper should be made as follows: Išoraitė, M., Gulevičiūtė, G. 2021. A Study of Entrepreneurship Education in Internet
Space in Pandemic Conditions, Entrepreneurship and Sustainability Issues, 8(3), 179-192. http://doi.org/10.9770/jesi.2021.8.3(10)
JEL Classifications: M12, M21
Additional disciplines: Management, Educology
1. Introduction
Currently, various countries in the world are counting losses in connection with the spread of the COVID-19
pandemic. The situation encourages entrepreneurs not to stand still but to start online businesses. The intensive
development of youth entrepreneurship, especially its innovativeness, is the key determinant of the modernization
* The research is supported by University of Applied Sciences, Lithuania
ENTREPRENEURSHIP AND SUSTAINABILITY ISSUES
ISSN 2345-0282 (online) http://jssidoi.org/jesi/
2021 Volume 8 Number 3 (March)
http://doi.org/10.9770/jesi.2021.8.3(10)
Make your research more visible, join the Twitter account of ENTREPRENEURSHIP AND SUSTAINABILITY ISSUES:
@Entrepr69728810
180
of the country's economy. New and improved offers, entrepreneurs’ products, or technologies allow entrepreneurs
to develop new markets and create new wealth. This leads to improving the quality of life as well as creating
greater moral and economic freedom; therefore, governments’ interest in entrepreneurial development is entirely
justifiable. However, global practice shows that there are significant differences between different countries,
which include not only the characteristics of the regional mentality, but also numerous other factors that can
promote and hinder development of entrepreneurship.
By assessing the importance of entrepreneurship, this article reveals the possibilities of online entrepreneurship
education under the conditions of a pandemic and explores the ways of developing the entrepreneurial abilities
and skills of the Lithuanian population.
Scientific issue. Pandemic circumstances encourage entrepreneurs not to stand still but to start online businesses;
therefore, there is a need to determine online entrepreneurship education, which would assists entrepreneurs in
moving their businesses online. Thus, the current situation causes a problem because the concept of the
entrepreneuship education under pandemic conditions is not established in scientific literature as well as in
practice, which makes it difficult to determine the opportunities and importance of the entrepreneurship education.
The aim of the research is to investigate the methods and measures of online entrepreneurship education of the
Lithuanian population under pandemic conditions.
Objectives of the study:
1. To substantiate theoretically the possibilities of online entrepreneurship education under pandemic conditions
by analyzing scientific literature related to entrepreneurial education.
2. To determine the expression of respondents' entrepreneurial qualities and abilities.
3. To create recommendations based on the result of the research in order to improve the entrepreneurship
education of the Lithuanian population under the conditions of a pandemic.
Methodology. The paper relies on scientific literature analysis and the quantitative research. Application of a
quantitative method is based on an online survey designed specifically for the purposes of the study. The study
encompasses theoretical literature analysis as well as systematic and comparative analysis of data obtained with
quantitative research.
2. Theoretical background of the entrepreneurship education
Entrepreneurship is the ability to create new products, services, and ideas, realize them and make a profit. Both
foreign and Lithuanian researchers study the topic of entrepreneurship. Turner (2004) relates entrepreneurship to
business skills, whereas Wicham (2006) and Skulskis (2012) connect it with personal skills. Stripeikis (2008)
links entrepreneurship to organizational skills, Čiburienė, Guščinskienė (2009) emphasize its connection to both
personal and business skills, and Žibėnienė (2014) pinpoints that educational and personal skills are closely
related to entrepreneurship. Entrepreneurs are considered as one of the growth factors for countries due to the
latest industrial, organizational, and technical developments from the global environment countries (Gaddam,
2008). Eroğlu, Piçak (2011) argue that entrepreneurs in different countries usually have some universal features as
well as specific ones that are based on their own culture. Schmitt, Husson (2017) define an entrepreneur as a
person capable of managing a large database of information and making decisions. De Sordi et al. (2020) present
a longitudinal study, where entrepreneurs are characterized by development methods that involve little
ENTREPRENEURSHIP AND SUSTAINABILITY ISSUES
ISSN 2345-0282 (online) http://jssidoi.org/jesi/
2021 Volume 8 Number 3 (March)
http://doi.org/10.9770/jesi.2021.8.3(10)
Make your research more visible, join the Twitter account of ENTREPRENEURSHIP AND SUSTAINABILITY ISSUES:
@Entrepr69728810
181
commercial and technological uncertainty, followed by some more complex and unclear initiatives but always
safer innovation.
Chowdhury et al. (2019) suggest that entrepreneurship actively contributes to economic growth. As Bruton et al.
(2018) argue the growing recognition of entrepreneurship around the world has drawn attention to its cultural
ideological foundations. In order to create a business in another country, it is necessary to know in which cultural
environment that business will be developed and to know the culture of the other country. Regional cultural
differences should be taken into account when analysing entrepreneurial failure (Kuckertz et al, 2020). The
discussion emphasizes that entrepreneurship is a multifaceted phenomenon that varies depending on the context,
the level of innovation, and its impact on society. Al Issa (2020) states that entrepreneurship needs to be resilient
enough to face many challenges. In their articles Kowo et al. (2019) and Al-Hawary, Al-Syasneh (2020) mention
that strategic entrepreneurship is the key indicator of economic, technological, and social development.
Shyra et al. (2020) define the need to create secure conditions for the development of entrepreneurship in general.
The current global situation, with the prevalence of the coronavirus COVID-19, provides an opportunity to
develop and build businesses online and adapt their Key Performace Indicators (KPIs) (Girdzijauskaite et al.,
2019).
According to Lascaux, Kolesnikova (2020), entrepreneurial companies need to build trust in their business
projects, especially among customers and employees. Bouncken et al. (2020) argue that areas for cooperation are
important in the development of entrepreneurship. Küttim et al. (2011) mention that entrepreneurship acquire
acceleration of support innovation, creativity and economic growth.
Mahrous et al. (2020) present the characteristics of the organisation's internal environment that support the
development of emerging and growing entrepreneurship: collaborative excellence, a deep focus on planning and
institutional support. Muñoz-Castro (2019) suggests that while government institutions are of significant
importance to multinational entrepreneurs, human capital and motivation are crucial. Raposo et al. (2020) argue
that those countries that implement higher level national entrepreneurship systems perform better in terms of their
sustainability.
The entrepreneurship education has been the key factor in establishing a necessary link between entrepreneurship
and education (Galloway, Kelly, 2009). It is generally defined as a never-ending practice of skill acquisition and
idea generation which helps identify and develop business opportunities that are often overlooked because of
other appropriate insights and self-esteem. Jones and English (2004) describe entrepreneurship in education as the
ability to recognize commercial opportunities and insight, self-esteem, knowledge, and skills to act on them.
Gautam, Singh (2015) claim that the entrepreneurship education is the exploration of the source of opportunities
and the process of discovery in which a person strives for creativity, takes risks, and turns ideas into action.
According to Ayed (2020), entrepreneurial education and innovativeness can evoke entrepreneurial intention.
Miranda et al. (2020) analyze the entrepreneurship education in the context of multidisciplinary collaboration:
sociology, psychology, philosophy, business, and engineering education. Johann et al. (2020) argue that design
thinking is a relatively new methodology in the context of the entrepreneurship education but nonetheless a very
important tool for developing entrepreneurial skills when incorporated into the education system.
According to Karimi et al. (2012), the entrepreneurship education is important because it increases economic
efficiency, brings innovation to the market, creates new jobs, and raises employment rates. Popularity of
entrepreneurship courses has grown significantly among both graduates and undergraduate students. But
ENTREPRENEURSHIP AND SUSTAINABILITY ISSUES
ISSN 2345-0282 (online) http://jssidoi.org/jesi/
2021 Volume 8 Number 3 (March)
http://doi.org/10.9770/jesi.2021.8.3(10)
Make your research more visible, join the Twitter account of ENTREPRENEURSHIP AND SUSTAINABILITY ISSUES:
@Entrepr69728810
182
Griffiths et al. (2012) argue that more experimentation and government support for research is needed to improve
the teaching of innovative entrepreneurship, as there is little evidence of what works and what does not. Kim et al.
(2020) define the special attention to social entrepreneurship education programs, which cultivate social
entrepreneurs’ abilities to enhance connectivity with all relevant entities of the social enterprise ecosystem.
Chien-Chi et al. (2020) analyze entrepreneuship education from social entrepreneurship dimension and suggest
that social–emotional competence and self-efficacy have a positive effect on entrepreneurial intention. A research
based on survey responses from a sample of 740 students of economics, communications, and education, carried
out by Rodriguez-Gutierrez et al. (2020), suggests that personal attitudes and perceived behavioural control are
positively related to students’ entrepreneurial intention. Peña-Ayala,Villegas-Berumen (2020) indicate well-being
of the city wherein the institution is located, students' inner concerns related to entrepreneurship, and formal
entrepreneurial education taught by the institution as important factors in entrepreneurial affairs. Otache et al.
(2020) analyze self-employment intentions as well as paid-employment intentions and define a particularly
positive link between both intensions.
Mani (2015) states that the need for entrepreneurship education has been well established in recent research.
However, there is a debate about how education should be provided, what should be the students’ attitudes
towards the entrepreneurship education. There is an ongoing debate on the role of universities and the
contribution of business schools to entrepreneurship education (Kirby, 2004). Peric et al. (2020) highlights that
not just universities but vocational education should also focus on entrepreneurship background. In the case of
COVID-19, higher education institutions have opportunities to contribute to the change by organizing
entrepreneurial events. In their research Bacq et al. (2020) state the value of the time-compressed virtual idea blitz
in accelerating social entrepreneurial action. Experiential education bridges the gap between theory and practice
(Androniceanu, Tvaronavičienė, 2019; Liguori et al., 2020; Androniceanu, 2020; Androniceanu et al. 2020).
Artificial intelligence can be an important factor in entrepreneurship education, and the need of interdisciplinary
cooperation between computer science, statistics, education, cognition, and robotics can be seen (Yu, 2020).
It should be stated that there is no single definition of entrepreneurship and the entrepreneurships education. There
are, however, several common characteristics amongst different entrepreneurship concepts presented in this
literature review: personal initiative, ability to mobilise resources, management skills, desire for autonomy, and
risk-taking.
Despite the analysis of previous research, the characteristics of the worrying factors of building a business during
a pandemic, teaching methods that promote entrepreneurship in higher education, and the measures that help to
develop entrepreneurship in higher education are not sufficiently detalized. This study aim is to investigate the
methods and measures of online entrepreneurship education of the Lithuanian population under the conditions of
a pandemic. Research questions are formulated based on the aim of the study: how to estimate which teaching
methods and measures help to develop entrepreneurship in higher education under the conditions of a pandemic?
3. Online entrepreneurship education during a pandemic research objective and methodology.
The research employed a quantitative method in a form of an online survey. Questions were based on theoretical
analysis and the aim of the research. The questions sought to distinguish how respondents can define
entrepreneurship (entrepreneurship definition is analysed in the studies of Turner (2004); Wicham (2006);
Skulskis (2012); Stripeikis (2008); Čiburienė, Guščinskienė (2009); Žibėnienė (2014)), which factors are
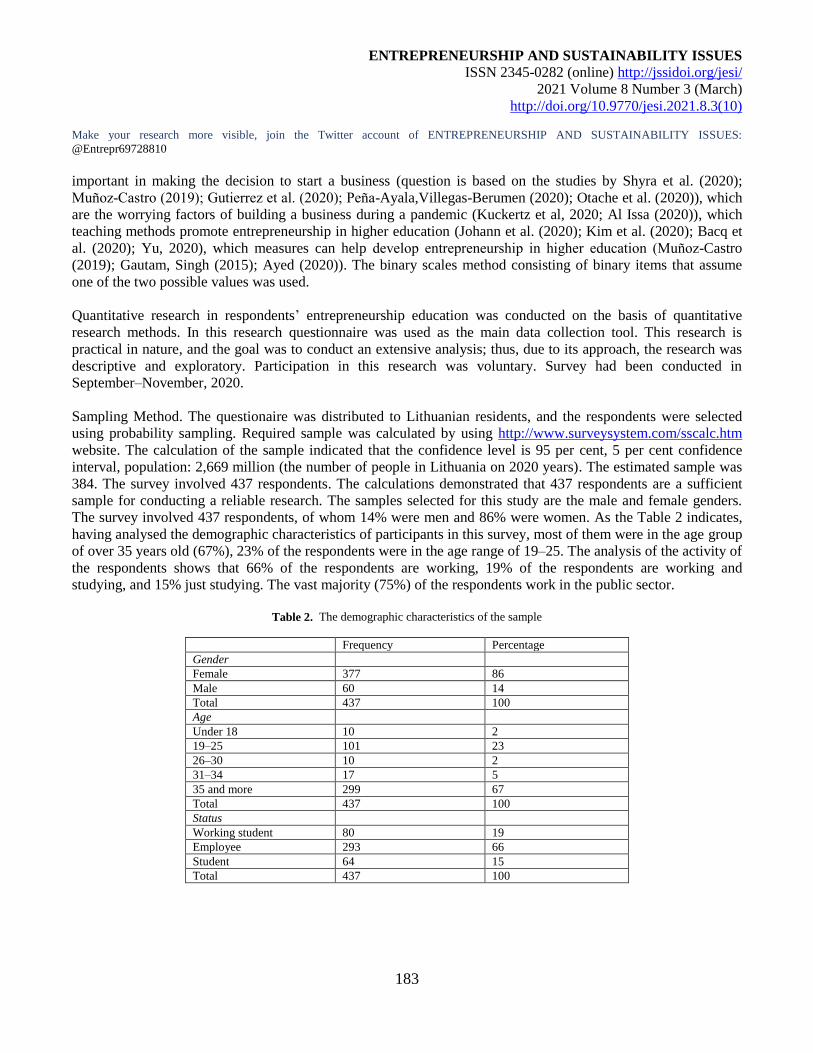
ENTREPRENEURSHIP AND SUSTAINABILITY ISSUES
ISSN 2345-0282 (online) http://jssidoi.org/jesi/
2021 Volume 8 Number 3 (March)
http://doi.org/10.9770/jesi.2021.8.3(10)
Make your research more visible, join the Twitter account of ENTREPRENEURSHIP AND SUSTAINABILITY ISSUES:
@Entrepr69728810
183
important in making the decision to start a business (question is based on the studies by Shyra et al. (2020);
Muñoz-Castro (2019); Gutierrez et al. (2020); Peña-Ayala,Villegas-Berumen (2020); Otache et al. (2020)), which
are the worrying factors of building a business during a pandemic (Kuckertz et al, 2020; Al Issa (2020)), which
teaching methods promote entrepreneurship in higher education (Johann et al. (2020); Kim et al. (2020); Bacq et
al. (2020); Yu, 2020), which measures can help develop entrepreneurship in higher education (Muñoz-Castro
(2019); Gautam, Singh (2015); Ayed (2020)). The binary scales method consisting of binary items that assume
one of the two possible values was used.
Quantitative research in respondents’ entrepreneurship education was conducted on the basis of quantitative
research methods. In this research questionnaire was used as the main data collection tool. This research is
practical in nature, and the goal was to conduct an extensive analysis; thus, due to its approach, the research was
descriptive and exploratory. Participation in this research was voluntary. Survey had been conducted in
September–November, 2020.
Sampling Method. The questionaire was distributed to Lithuanian residents, and the respondents were selected
using probability sampling. Required sample was calculated by using http://www.surveysystem.com/sscalc.htm
website. The calculation of the sample indicated that the confidence level is 95 per cent, 5 per cent confidence
interval, population: 2,669 million (the number of people in Lithuania on 2020 years). The estimated sample was
384. The survey involved 437 respondents. The calculations demonstrated that 437 respondents are a sufficient
sample for conducting a reliable research. The samples selected for this study are the male and female genders.
The survey involved 437 respondents, of whom 14% were men and 86% were women. As the Table 2 indicates,
having analysed the demographic characteristics of participants in this survey, most of them were in the age group
of over 35 years old (67%), 23% of the respondents were in the age range of 19–25. The analysis of the activity of
the respondents shows that 66% of the respondents are working, 19% of the respondents are working and
studying, and 15% just studying. The vast majority (75%) of the respondents work in the public sector.
Table 2. The demographic characteristics of the sample
Frequency Percentage
Gender
Female 377 86
Male 60 14
Total 437 100
Age
Under 18 10 2
19–25 101 23
26–30 10 2
31–34 17 5
35 and more 299 67
Total 437 100
Status
Working student 80 19
Employee 293 66
Student 64 15
Total 437 100
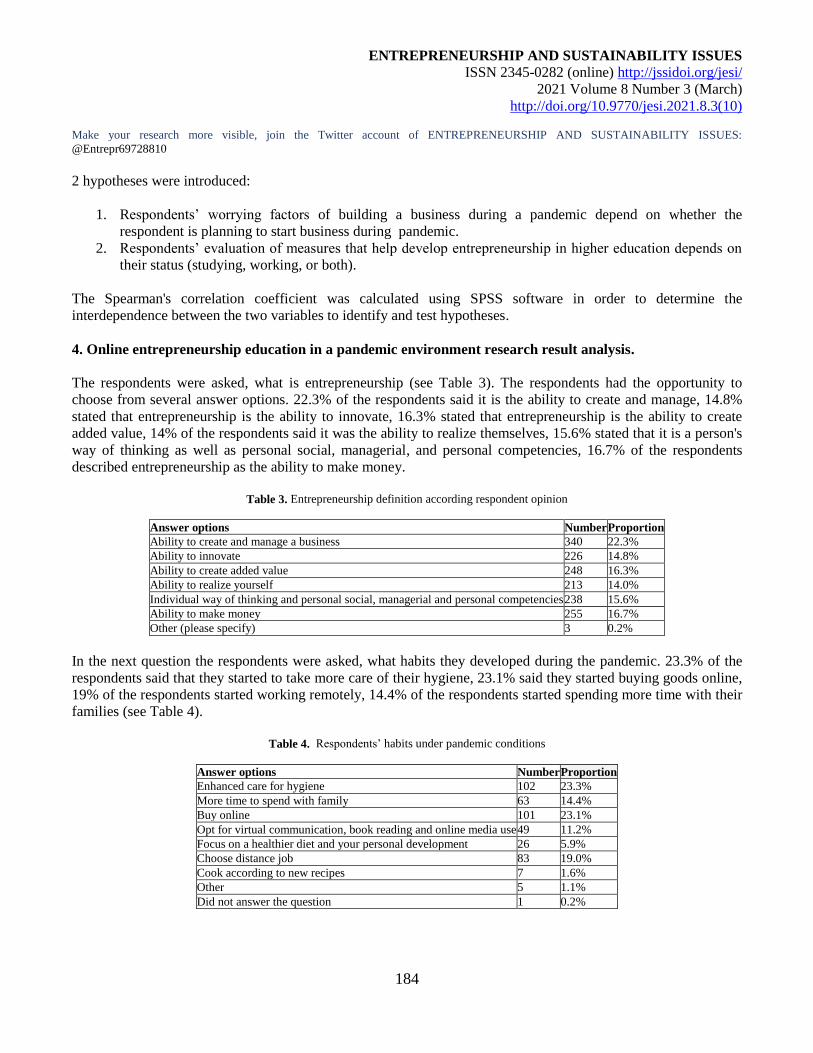
ENTREPRENEURSHIP AND SUSTAINABILITY ISSUES
ISSN 2345-0282 (online) http://jssidoi.org/jesi/
2021 Volume 8 Number 3 (March)
http://doi.org/10.9770/jesi.2021.8.3(10)
Make your research more visible, join the Twitter account of ENTREPRENEURSHIP AND SUSTAINABILITY ISSUES:
@Entrepr69728810
184
2 hypotheses were introduced:
1. Respondents’ worrying factors of building a business during a pandemic depend on whether the
respondent is planning to start business during pandemic.
2. Respondents’ evaluation of measures that help develop entrepreneurship in higher education depends on
their status (studying, working, or both).
The Spearman's correlation coefficient was calculated using SPSS software in order to determine the
interdependence between the two variables to identify and test hypotheses.
4. Online entrepreneurship education in a pandemic environment research result analysis.
The respondents were asked, what is entrepreneurship (see Table 3). The respondents had the opportunity to
choose from several answer options. 22.3% of the respondents said it is the ability to create and manage, 14.8%
stated that entrepreneurship is the ability to innovate, 16.3% stated that entrepreneurship is the ability to create
added value, 14% of the respondents said it was the ability to realize themselves, 15.6% stated that it is a person's
way of thinking as well as personal social, managerial, and personal competencies, 16.7% of the respondents
described entrepreneurship as the ability to make money.
Table 3. Entrepreneurship definition according respondent opinion
Answer options Number Proportion
Ability to create and manage a business 340 22.3%
Ability to innovate 226 14.8%
Ability to create added value 248 16.3%
Ability to realize yourself 213 14.0%
Individual way of thinking and personal social, managerial and personal competencies 238 15.6%
Ability to make money 255 16.7%
Other (please specify) 3 0.2%
In the next question the respondents were asked, what habits they developed during the pandemic. 23.3% of the
respondents said that they started to take more care of their hygiene, 23.1% said they started buying goods online,
19% of the respondents started working remotely, 14.4% of the respondents started spending more time with their
families (see Table 4).
Table 4. Respondents’ habits under pandemic conditions
Answer options Number Proportion
Enhanced care for hygiene 102 23.3%
More time to spend with family 63 14.4%
Buy online 101 23.1%
Opt for virtual communication, book reading and online media use 49 11.2%
Focus on a healthier diet and your personal development 26 5.9%
Choose distance job 83 19.0%
Cook according to new recipes 7 1.6%
Other 5 1.1%
Did not answer the question 1 0.2%
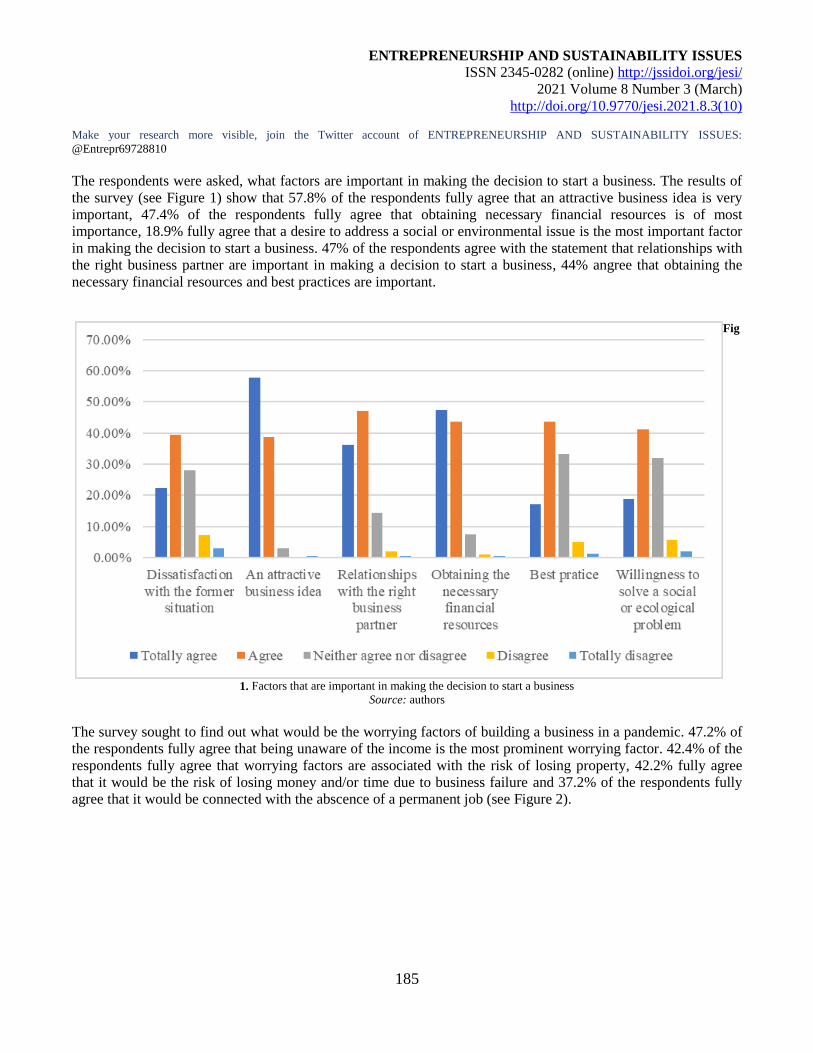
ENTREPRENEURSHIP AND SUSTAINABILITY ISSUES
ISSN 2345-0282 (online) http://jssidoi.org/jesi/
2021 Volume 8 Number 3 (March)
http://doi.org/10.9770/jesi.2021.8.3(10)
Make your research more visible, join the Twitter account of ENTREPRENEURSHIP AND SUSTAINABILITY ISSUES:
@Entrepr69728810
185
The respondents were asked, what factors are important in making the decision to start a business. The results of
the survey (see Figure 1) show that 57.8% of the respondents fully agree that an attractive business idea is very
important, 47.4% of the respondents fully agree that obtaining necessary financial resources is of most
importance, 18.9% fully agree that a desire to address a social or environmental issue is the most important factor
in making the decision to start a business. 47% of the respondents agree with the statement that relationships with
the right business partner are important in making a decision to start a business, 44% angree that obtaining the
necessary financial resources and best practices are important.
Fig
1. Factors that are important in making the decision to start a business
Source: authors
The survey sought to find out what would be the worrying factors of building a business in a pandemic. 47.2% of
the respondents fully agree that being unaware of the income is the most prominent worrying factor. 42.4% of the
respondents fully agree that worrying factors are associated with the risk of losing property, 42.2% fully agree
that it would be the risk of losing money and/or time due to business failure and 37.2% of the respondents fully
agree that it would be connected with the abscence of a permanent job (see Figure 2).
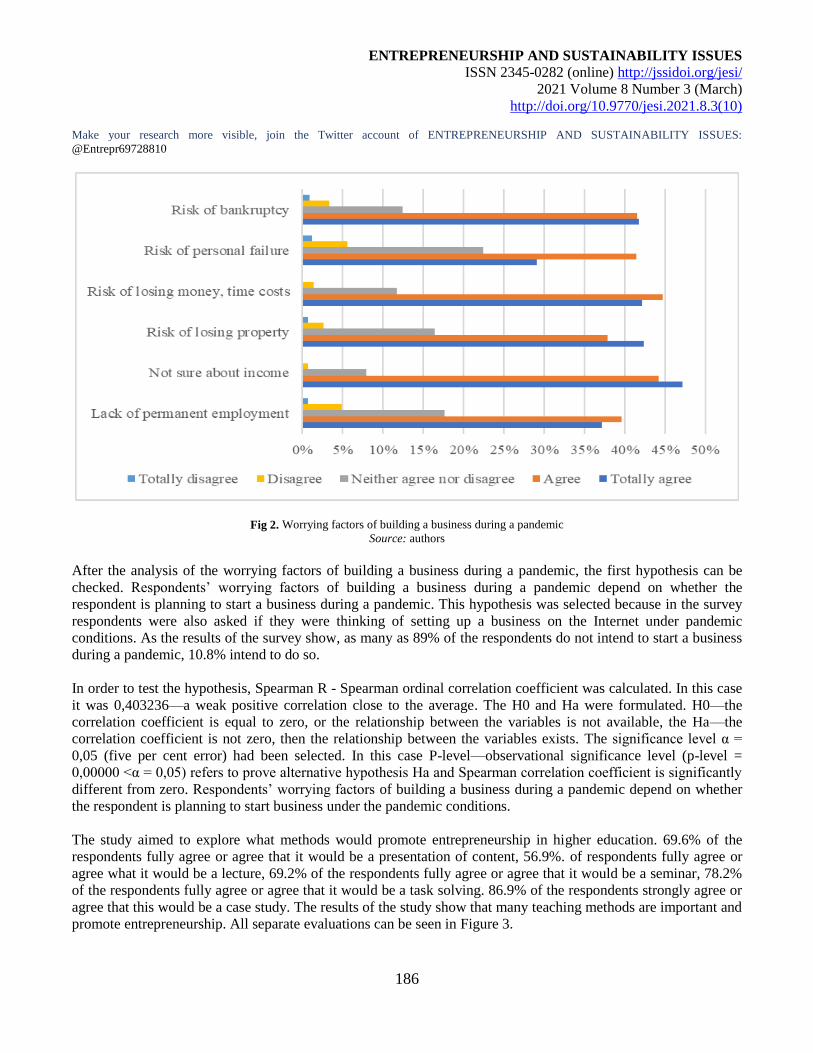
ENTREPRENEURSHIP AND SUSTAINABILITY ISSUES
ISSN 2345-0282 (online) http://jssidoi.org/jesi/
2021 Volume 8 Number 3 (March)
http://doi.org/10.9770/jesi.2021.8.3(10)
Make your research more visible, join the Twitter account of ENTREPRENEURSHIP AND SUSTAINABILITY ISSUES:
@Entrepr69728810
186
Fig 2. Worrying factors of building a business during a pandemic
Source: authors
After the analysis of the worrying factors of building a business during a pandemic, the first hypothesis can be
checked. Respondents’ worrying factors of building a business during a pandemic depend on whether the
respondent is planning to start a business during a pandemic. This hypothesis was selected because in the survey
respondents were also asked if they were thinking of setting up a business on the Internet under pandemic
conditions. As the results of the survey show, as many as 89% of the respondents do not intend to start a business
during a pandemic, 10.8% intend to do so.
In order to test the hypothesis, Spearman R - Spearman ordinal correlation coefficient was calculated. In this case
it was 0,403236—a weak positive correlation close to the average. The H0 and Ha were formulated. H0—the
correlation coefficient is equal to zero, or the relationship between the variables is not available, the Ha—the
correlation coefficient is not zero, then the relationship between the variables exists. The significance level α =
0,05 (five per cent error) had been selected. In this case P-level—observational significance level (p-level =
0,00000 <α = 0,05) refers to prove alternative hypothesis Ha and Spearman correlation coefficient is significantly
different from zero. Respondents’ worrying factors of building a business during a pandemic depend on whether
the respondent is planning to start business under the pandemic conditions.
The study aimed to explore what methods would promote entrepreneurship in higher education. 69.6% of the
respondents fully agree or agree that it would be a presentation of content, 56.9%. of respondents fully agree or
agree what it would be a lecture, 69.2% of the respondents fully agree or agree that it would be a seminar, 78.2%
of the respondents fully agree or agree that it would be a task solving. 86.9% of the respondents strongly agree or
agree that this would be a case study. The results of the study show that many teaching methods are important and
promote entrepreneurship. All separate evaluations can be seen in Figure 3.
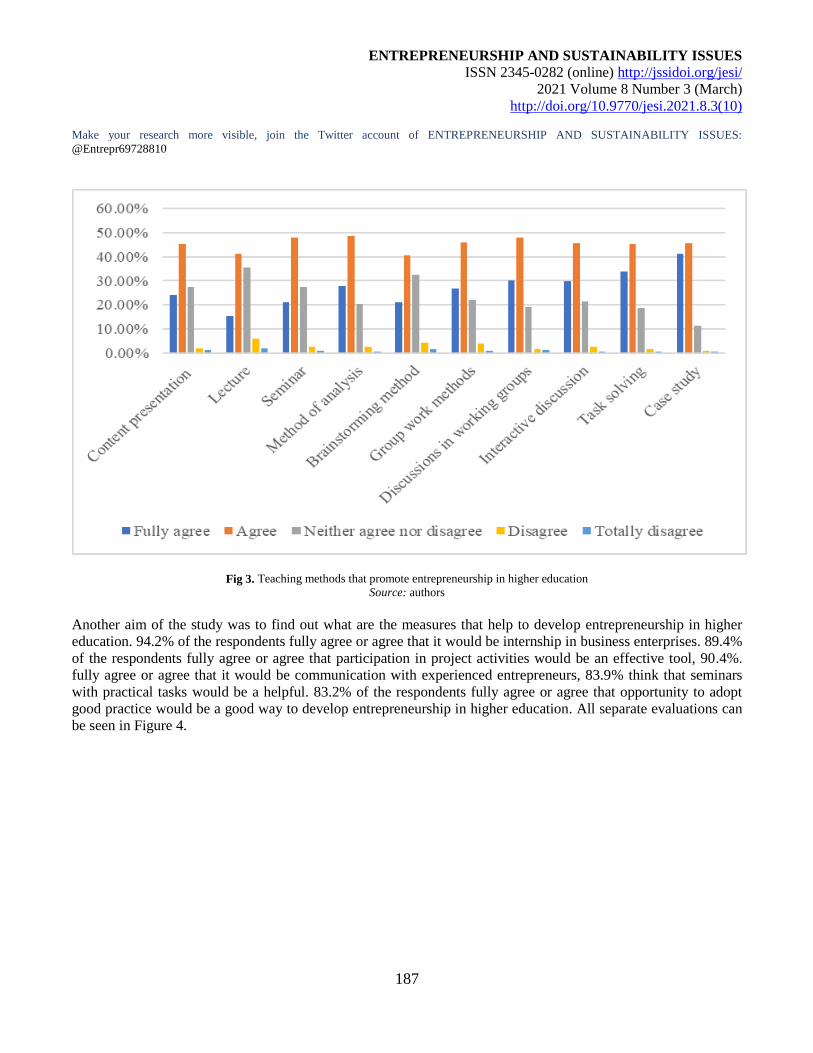
ENTREPRENEURSHIP AND SUSTAINABILITY ISSUES
ISSN 2345-0282 (online) http://jssidoi.org/jesi/
2021 Volume 8 Number 3 (March)
http://doi.org/10.9770/jesi.2021.8.3(10)
Make your research more visible, join the Twitter account of ENTREPRENEURSHIP AND SUSTAINABILITY ISSUES:
@Entrepr69728810
187
Fig 3. Teaching methods that promote entrepreneurship in higher education
Source: authors
Another aim of the study was to find out what are the measures that help to develop entrepreneurship in higher
education. 94.2% of the respondents fully agree or agree that it would be internship in business enterprises. 89.4%
of the respondents fully agree or agree that participation in project activities would be an effective tool, 90.4%.
fully agree or agree that it would be communication with experienced entrepreneurs, 83.9% think that seminars
with practical tasks would be a helpful. 83.2% of the respondents fully agree or agree that opportunity to adopt
good practice would be a good way to develop entrepreneurship in higher education. All separate evaluations can
be seen in Figure 4.
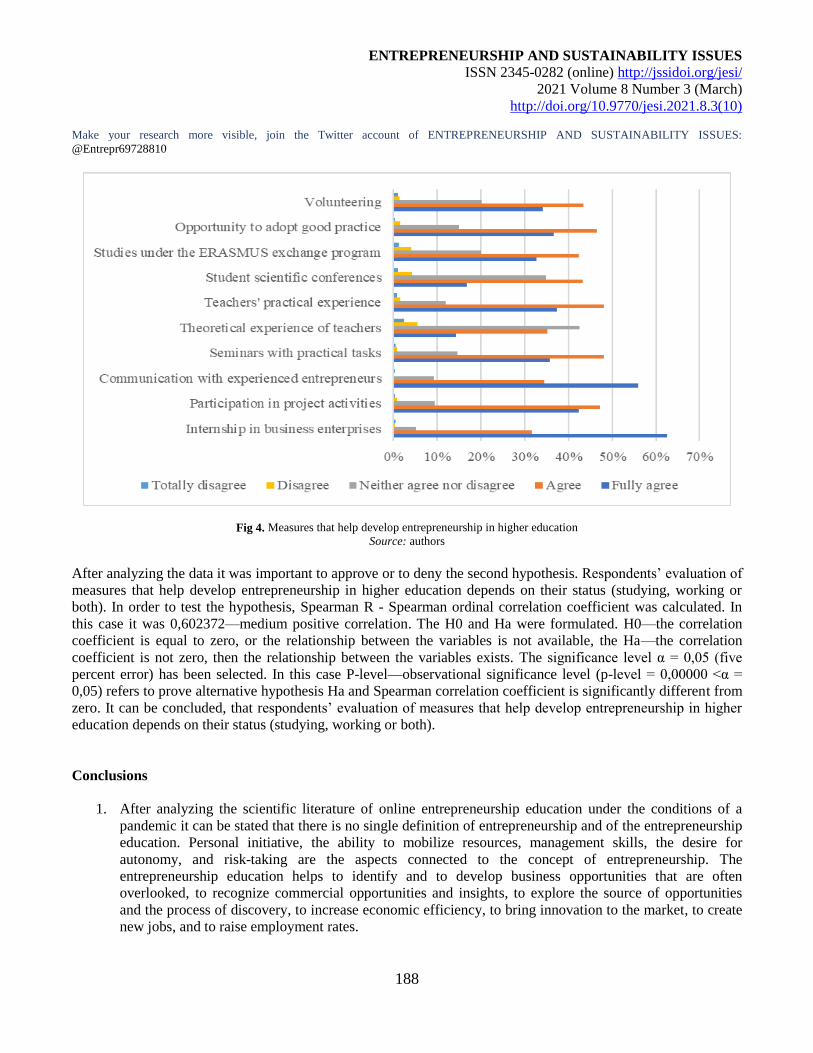
ENTREPRENEURSHIP AND SUSTAINABILITY ISSUES
ISSN 2345-0282 (online) http://jssidoi.org/jesi/
2021 Volume 8 Number 3 (March)
http://doi.org/10.9770/jesi.2021.8.3(10)
Make your research more visible, join the Twitter account of ENTREPRENEURSHIP AND SUSTAINABILITY ISSUES:
@Entrepr69728810
188
Fig 4. Measures that help develop entrepreneurship in higher education
Source: authors
After analyzing the data it was important to approve or to deny the second hypothesis. Respondents’ evaluation of
measures that help develop entrepreneurship in higher education depends on their status (studying, working or
both). In order to test the hypothesis, Spearman R - Spearman ordinal correlation coefficient was calculated. In
this case it was 0,602372—medium positive correlation. The H0 and Ha were formulated. H0—the correlation
coefficient is equal to zero, or the relationship between the variables is not available, the Ha—the correlation
coefficient is not zero, then the relationship between the variables exists. The significance level α = 0,05 (five
percent error) has been selected. In this case P-level—observational significance level (p-level = 0,00000 <α =
0,05) refers to prove alternative hypothesis Ha and Spearman correlation coefficient is significantly different from
zero. It can be concluded, that respondents’ evaluation of measures that help develop entrepreneurship in higher
education depends on their status (studying, working or both).
Conclusions
1. After analyzing the scientific literature of online entrepreneurship education under the conditions of a
pandemic it can be stated that there is no single definition of entrepreneurship and of the entrepreneurship
education. Personal initiative, the ability to mobilize resources, management skills, the desire for
autonomy, and risk-taking are the aspects connected to the concept of entrepreneurship. The
entrepreneurship education helps to identify and to develop business opportunities that are often
overlooked, to recognize commercial opportunities and insights, to explore the source of opportunities
and the process of discovery, to increase economic efficiency, to bring innovation to the market, to create
new jobs, and to raise employment rates.
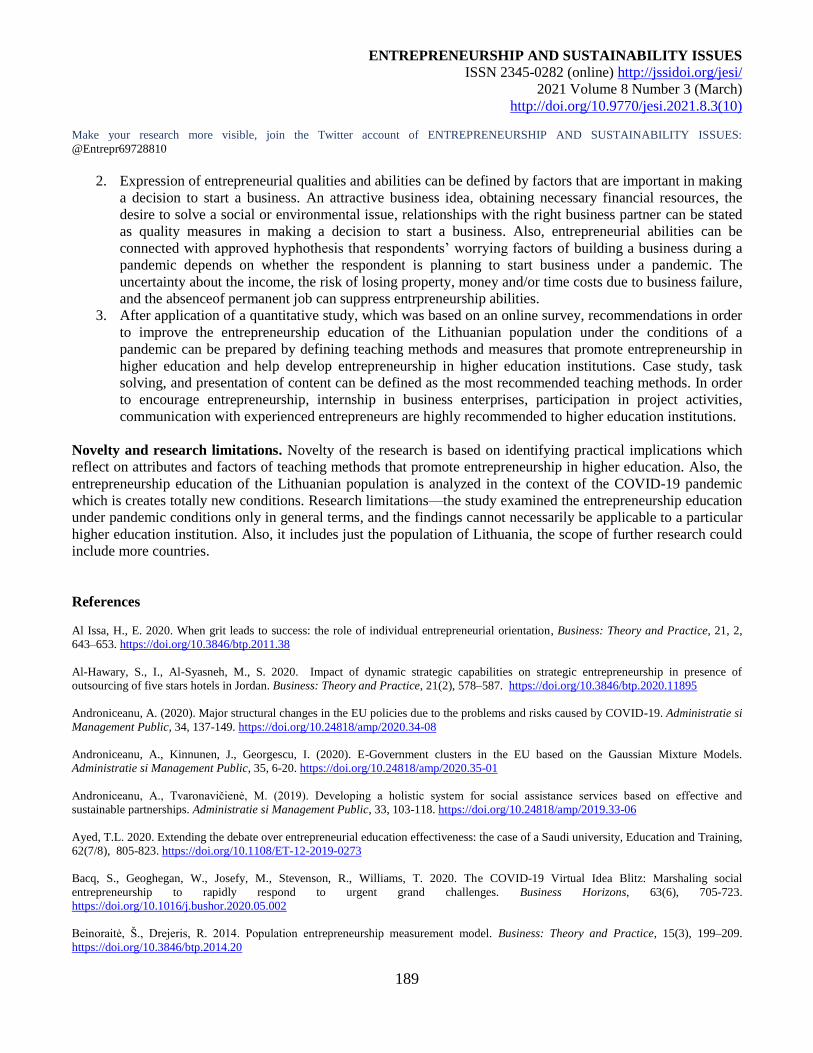
ENTREPRENEURSHIP AND SUSTAINABILITY ISSUES
ISSN 2345-0282 (online) http://jssidoi.org/jesi/
2021 Volume 8 Number 3 (March)
http://doi.org/10.9770/jesi.2021.8.3(10)
Make your research more visible, join the Twitter account of ENTREPRENEURSHIP AND SUSTAINABILITY ISSUES:
@Entrepr69728810
189
2. Expression of entrepreneurial qualities and abilities can be defined by factors that are important in making
a decision to start a business. An attractive business idea, obtaining necessary financial resources, the
desire to solve a social or environmental issue, relationships with the right business partner can be stated
as quality measures in making a decision to start a business. Also, entrepreneurial abilities can be
connected with approved hyphothesis that respondents’ worrying factors of building a business during a
pandemic depends on whether the respondent is planning to start business under a pandemic. The
uncertainty about the income, the risk of losing property, money and/or time costs due to business failure,
and the absenceof permanent job can suppress entrpreneurship abilities.
3. After application of a quantitative study, which was based on an online survey, recommendations in order
to improve the entrepreneurship education of the Lithuanian population under the conditions of a
pandemic can be prepared by defining teaching methods and measures that promote entrepreneurship in
higher education and help develop entrepreneurship in higher education institutions. Case study, task
solving, and presentation of content can be defined as the most recommended teaching methods. In order
to encourage entrepreneurship, internship in business enterprises, participation in project activities,
communication with experienced entrepreneurs are highly recommended to higher education institutions.
Novelty and research limitations. Novelty of the research is based on identifying practical implications which
reflect on attributes and factors of teaching methods that promote entrepreneurship in higher education. Also, the
entrepreneurship education of the Lithuanian population is analyzed in the context of the COVID-19 pandemic
which is creates totally new conditions. Research limitations—the study examined the entrepreneurship education
under pandemic conditions only in general terms, and the findings cannot necessarily be applicable to a particular
higher education institution. Also, it includes just the population of Lithuania, the scope of further research could
include more countries.
References
Al Issa, H., E. 2020. When grit leads to success: the role of individual entrepreneurial orientation, Business: Theory and Practice, 21, 2,
643–653. https://doi.org/10.3846/btp.2011.38
Al-Hawary, S., I., Al-Syasneh, M., S. 2020. Impact of dynamic strategic capabilities on strategic entrepreneurship in presence of
outsourcing of five stars hotels in Jordan. Business: Theory and Practice, 21(2), 578–587. https://doi.org/10.3846/btp.2020.11895
Androniceanu, A. (2020). Major structural changes in the EU policies due to the problems and risks caused by COVID-19. Administratie si
Management Public, 34, 137-149. https://doi.org/10.24818/amp/2020.34-08
Androniceanu, A., Kinnunen, J., Georgescu, I. (2020). E-Government clusters in the EU based on the Gaussian Mixture Models.
Administratie si Management Public, 35, 6-20. https://doi.org/10.24818/amp/2020.35-01
Androniceanu, A., Tvaronavičienė, M. (2019). Developing a holistic system for social assistance services based on effective and
sustainable partnerships. Administratie si Management Public, 33, 103-118. https://doi.org/10.24818/amp/2019.33-06
Ayed, T.L. 2020. Extending the debate over entrepreneurial education effectiveness: the case of a Saudi university, Education and Training,
62(7/8), 805-823. https://doi.org/10.1108/ET-12-2019-0273
Bacq, S., Geoghegan, W., Josefy, M., Stevenson, R., Williams, T. 2020. The COVID-19 Virtual Idea Blitz: Marshaling social
entrepreneurship to rapidly respond to urgent grand challenges. Business Horizons, 63(6), 705-723.
https://doi.org/10.1016/j.bushor.2020.05.002
Beinoraitė, Š., Drejeris, R. 2014. Population entrepreneurship measurement model. Business: Theory and Practice, 15(3), 199–209.
https://doi.org/10.3846/btp.2014.20
ENTREPRENEURSHIP AND SUSTAINABILITY ISSUES
ISSN 2345-0282 (online) http://jssidoi.org/jesi/
2021 Volume 8 Number 3 (March)
http://doi.org/10.9770/jesi.2021.8.3(10)
Make your research more visible, join the Twitter account of ENTREPRENEURSHIP AND SUSTAINABILITY ISSUES:
@Entrepr69728810
190
Bouncken, R.B., Kraus, S., Martínez-Pérez, J.F. 2020. Entrepreneurship of an institutional field: the emergence of coworking spaces for
digital business models. International Entrepreneurship and Management Journal, 16, 1465–1481. https://doi.org/10.1007/s11365-020-
00689-4
Bruton, G., D., Zahra, S., A., Cai, L. 2018. Examining Entrepreneurship through Indigenous Lenses. Entrepreneurship Theory and
Practice, 42(3), 351–361. https://doi.org/10.1177/1042258717741129
Čiburienė, J., Guščinskienė, J. 2009. Youth entrepreneurship: a gender perspective, Economics and Management: Current Issues and
Perspectives, 1(14), 62–69.
Chien-Chi, C., Sun, B., Yang, H., Zheng, M., Li, B. 2020. Emotional Competence, Entrepreneurial Self-Efficacy, and Entrepreneurial
Intention: A Study Based on China College Students’ Social Entrepreneurship Project, Front. Psychol. 11: 547627.
https://doi.org10.3389/fpsyg.2020.547627
Chowdhury, F., Audretsch, D. B., Belitski, M. 2019. Institutions and Entrepreneurship Quality. Entrepreneurship Theory and Practice,
43(1), 51–81. https://doi.org/10.1177/1042258718780431
Eroğlu, O., Piçak, M. 2011. Entrepreneurship, National Culture and Turkey. International Journal of Business and Social Science, 2(16),
146-151.
European Commission/EACEA/Eurydice. 2016. Entrepreneurship Education at School in Europe. Eurydice Report. Luxembourg:
Publications Office of the European Union.
Gaddam, S. 2008. Identifying the relationship between behavioral motives and entrepreneurial intentions: An empirical study based on the
perceptions of business management students. The Icfaian Journal of Management Research, 7(5), 35–55.
Galloway, L., Kelly, S. 2009. Identifying entrepreneurial potential? An investigation of the identifiers and features of entrepreneurship,
International Review of Entrepreneurship, 7(4), 1–24.
Gautam, M., K. Singh, S., K. 2015. Entrepreneurship education: concept, characteristics and implications for teacher education. Shaikshik
Parisamvad (An International Journal of Education) SPIJE, 5(1), 21-35.
Griffiths, M., Kickul, J., Bacq, S., Terjesen, S. 2012. A Dialogue with William J. Baumol: Insights on Entrepreneurship Theory and
Education, Entrepreneurship Theory and Practice, 36(4), 611-625.
Girdzijauskaite, E., Radzeviciene, A., Jakubavicius, A. 2019. Impact of international branch campus KPIs on the university
competitiveness: FARE method. Insights into Regional Development, 1(2), 171-180. https://doi.org/10.9770/ird.2019.1.2(7)
Johann, D., Nunes, A., Santos, G., Silva, D., Bresciani, S., Lopes, L. 2020. Mapping of scientific production on design thinking as a tool
for entrepreneurship education: a bibliometric study of a decade, World Journal of Entrepreneurship, Management and Sustainable
Development, 16(4), 271-285. https://doi.org/10.1108/WJEMSD-05-2019-0028
Jones, C., English, J. 2004. A contemporary approach to entrepreneurship education, Education + Training, 46(8/9), 416-23.
Karimi, S., Biemans, H., Lans, T., Mulder, M., Chizari, M. 2012. The Role of Entrepreneurship Education in Developing Students’
Entrepreneurial Intentions. Proceedings of WICaNeM 2012, The 10th Wageningen International Conference on Chain and Network
Science, Wageningen University, Wageningen, The Netherlands, p. 22.
Kim, M., Lee, J., Roh, T., Son, H. 2020. Social Entrepreneurship Education as an Innovation Hub for Building an Entrepreneurial
Ecosystem: The Case of the KAIST Social Entrepreneurship MBA Program, Sustainability, 12, 9736. https://doi.org/10.3390/su12229736
Kirby, D. 2004. Entrepreneurship education: can business schools meet the challenge? Education Training, 46(8/9), 510-19,
http://dx.doi.org/10.1108/00400910410569632
ENTREPRENEURSHIP AND SUSTAINABILITY ISSUES
ISSN 2345-0282 (online) http://jssidoi.org/jesi/
2021 Volume 8 Number 3 (March)
http://doi.org/10.9770/jesi.2021.8.3(10)
Make your research more visible, join the Twitter account of ENTREPRENEURSHIP AND SUSTAINABILITY ISSUES:
@Entrepr69728810
191
Kowo, S. A., Adenuga, O. A. O., Sabitu, O.O. 2019. The role of SMEs development on poverty alleviation in Nigeria. Insights into
Regional Development, 1(3), 214-226. https://doi.org/10.9770/ird.2019.1.3(3)
Küttim, M., Arvola, K., Venesaar, U. 2011. Development of creative entrepreneurship: opinion of managers from Estonia, Latvia, Finland
and Sweden. Business: Theory and Practice, 12(4), 369–378 http://dx.doi.org/10.3846/btp.2011.38
Kuckertz, A., Berger, E.S.C., Prochotta, A. 2020. Misperception of entrepreneurship and its consequences for the perception of
entrepreneurial failure – the German case, International Journal of Entrepreneurial Behavior & Research, 26(8), 1865-1885.
https://doi.org/10.1108/IJEBR-02-2020-0060
Lascaux, A., Kolesnikova, I. 2020. The emergence and evolution of cognition‐ and affect‐based trust in Russian entrepreneurial ventures.
Strategic entrepreneurship journal https://doi.org/10.1002/sej.1386
Liguori, E., Muldoon, J., Bendickson, J. 2020. Experiential entrepreneurship education via US films: why and how. Journal of Small
Business and Enterprise Development, 27(6), 927-941. https://doi.org/10.1108/JSBED-04-2019-0135
Mahrous, A., Genedy, M.A., Kalliny, M. 2020. The impact of characteristics of intra-organizational environment on entrepreneurial
marketing intensity and performance in Egypt. Journal of Entrepreneurship in Emerging Economies , 12(5), 621-
642. https://doi.org/10.1108/JEEE-08-2019-0115
Mani, M. 2015. Entrepreneurship Education: A Students’ Perspective, International Journal of E-Entrepreneurship and Innovation, 5(1),
1-14.
Miranda, C., Goñi, J., Berhane, B., Carberry, A. 2020. Seven Challenges in Conceptualizing and Assessing Entrepreneurial Skills or
Mindsets in Engineering Entrepreneurship Education, Education Sciences, 10, 0309. https://doi.org/10.3390/educsci10110309
Muñoz-Castro, D.C., Santamaría-Alvarez, S., M., Marín-Zapata, S., I. 2019. Transnational entrepreneurship: a systematic review of the
literature, International Journal of Entrepreneurship and Innovation Management, 23(6), 559-583.
https://doi.org/10.1504/ijeim.2019.102824
Otache, I., Oluwade, D.O. and Idoko, E.-O.J. 2020. Entrepreneurship education and undergraduate students' self-employment intentions: do
paid employment intentions matter?, Education + Training, 62(7/8), 741-757. https://doi.org/10.1108/ET-02-2020-0032
Peña-Ayala, A., Villegas-Berumen, H., G. 2020. Evaluation of the influence that higher education boosts on students’ entrepreneurial
proclivity: Evidence from Mexico and Spain. The International Journal of Management Education, 18(3)
https://doi.org/10.1016/j.ijme.2020.100404
Peric, J., Peterka, O., Getoš, Ž. 2020. The role of vocational education in developing entrepreneurial Competences Of Students. Ekonomski
Pregled, 71 (5), 463-492. https://doi.org/10.32910/ep.71.5.2
Raposo, M., Fernandes, C.I., Veiga, P.M. 2020. National systems of entrepreneurship: goals of sustainability, Journal of Entrepreneurship
and Public Policy, 9(4), 345-364. https://doi.org/10.1108/JEPP-04-2020-0018
Rodriguez-Gutierrez, P., Cabeza-Ramírez, L., Muñoz-Fernández, G. 2020. University Students’ Behaviour towards Entrepreneurial
Intention in Ecuador: Testing for the Influence of Gender, International Journal of Environmental Research and Public Health, 17, 8475.
https://doi.org/10.3390/ijerph17228475
Schmitt, Ch., Husson, J. 2017. Entrepreneurial situations, definition and interests for entrepreneurial research, Int. J. Entrepreneurship and
Small Business, 30(1). https://doi.org/10.1504/IJESB.2017.081037
Shyra, T., Shtyrov, O., Korchynskyy, I., Zerkal, A., Skoryk, H. 2020. Providing the corporate security strategy in the management system
of the enterprise, Business: Theory and Practice, 21(2), 737-745. https://doi.org/10.3846/btp.2020.12975
Skulskis, V. 2012. Eco-farming and sowing, Economics and Management: Current Issues and Perspectives, 3(27), 37–44.
ENTREPRENEURSHIP AND SUSTAINABILITY ISSUES
ISSN 2345-0282 (online) http://jssidoi.org/jesi/
2021 Volume 8 Number 3 (March)
http://doi.org/10.9770/jesi.2021.8.3(10)
Make your research more visible, join the Twitter account of ENTREPRENEURSHIP AND SUSTAINABILITY ISSUES:
@Entrepr69728810
192
Sordi, J., S., Nelson, R., E., Meireles, M., Hashimoto, M., De Freitas Chagas Junior, M. 2020.
A longitudinal study of the creation methods used by entrepreneurs to develop new products and services, International Journal of
Entrepreneurship and Innovation Management (IJEIM), 24(6).
Stripeikis, O. 2008. Formation of entrepreneurship in Lithuanian small and medium business enterprises.
http://vddb.library.lt/fedora/get/LT
Turner, C. 2004. Passion V Pension: Developing Corporate Entrepreneurship (Hardcover), 21st Century Books UK Ltd, p. 272.
Žibėnienė, G. 2014. Improving the qualifications of entrepreneurship teachers: current aspects and trends in Europe. Social Work, 11(2)
Wicham, P., A. 2006. Strategic entrepreneurship. Financial Times/Prentice Hall. 648 p. I.
Yu, Z. 2020. Visualizing Artificial Intelligence Used in Education Over Two Decades, Journal of Information Technology Research
(JITR), 13(4). https://doi.org 10.4018/JITR.2020100103
Acknowledgements
The research is supported by University of Applied Sciences, Lithuania
Margarita IŠORAITĖ. Doctor of social sciences in Vilnius Gediminas Technical University, name of associated professor was given in
Mykolas Romeris University in Lithuania. Associated professor in Vilnius kolegija/ University Applied Sciences. Research interests:
human resource management, strategic marketing, marketing management, advertising, entrepreneurship.
ORCID ID: https://orcid.org/0000-0001-9108-0525
Gintarė GULEVIČIŪTĖ is a lecturer. She received M. Sc. in Electronic Business Management from Mykolas Romeris University. Her
areas of interest are e-business, e-marketing, entrepreneurship, business communication and digital contents.
ORCID ID: https://orcid.org/0000-0003-1974-3982
Register for an ORCID ID:
https://orcid.org/register
Copyright © 2021 by author(s) and VsI Entrepreneurship and Sustainability Center
This work is licensed under the Creative Commons Attribution International License (CC BY).
http://creativecommons.org/licenses/by/4.0/
ENTREPRENEURSHIP AND SUSTAINABILITY ISSUES
ISSN 2345-0282 (online) http://jssidoi.org/jesi/
2021 Volume 8 Number 3 (March)
http://doi.org/10.9770/jesi.2021.8.3(11)
Publisher http://jssidoi.org/esc/home
THE EFFICIENCY EVALUATION OF PUBLIC PROCUREMENT OF MEDICAL EQUIPMENT*
Beata Gavurova¹, Matus Kubak²
1 Tomas Bata University in Zlín, Mostní 5139, 76001 Zlín, Czech Republic 2 Technical University of Kosice, Letná 9, 042 00 Košice, Slovak Republic
E-mails: [email protected]; 2 [email protected]
Received 25 October 2020; accepted 22 December 2020; published 30 March 2021
Abstract. At present, the health systems of many countries face complex challenges even if their priority objectives remain the same - to
provide sustainable health systems at the current and the prognostic demographic changes and requirements in a health system. The quality
and the efficiency of healthcare delivery and their mutual conformity have been brought to public attention. Similarly, the quality and the
efficiency of an entire process depends on the instrumentation and its procurement that represents a significant economic and procedural
issue in the healthcare systems for a long time. Many reports of the public procurement processes and research studies declare this fact. The
primary aim of this study is to evaluate the public procurement efficiency in the health system by means of the valuation approach, or
savings’ estimates that are achieved by the public procurement. The savings were defined as a percentage difference between the estimated
* This research was supported by the Internal Grant Agency of FaME Tomas Bata University in Zlin: RVO/2020: “Economic
quantification of marketing processes that focus on value increase for a patient in a process of system creation to measure
and control efficiency in health facilities in the Czech Republic”.
ENTREPRENEURSHIP AND SUSTAINABILITY ISSUES
ISSN 2345-0282 (online) http://jssidoi.org/jesi/
2021 Volume 8 Number 3 (March)
http://doi.org/10.9770/jesi.2021.8.3(11)
194
and the final contract price. The secondary objective is to examine an influence of selected variables on a creation of savings in the public
procurement process by means of a regression analysis. The researched variables are as follows: time, method, procurement, NUTS level of
procurement, Common Procurement Vocabulary Code, number of offers. The analysis results showed interesting findings. The number of
offers has a significantly positive impact on the savings. It means that if the number of offers increases by one unit, the savings will
increase by 15.6%. Also, time variable (year) has a positive impact on the savings. Consequently, it may be assumed that the public
procurement process is improving from a time perspective. It may be partially caused by the fact that a new public procurement legislative
has been valid since 2015. The NUTS level has also an impact on the savings in relation to the public procurement. The public
procurements which took place at the level of a state were more beneficial as the public procurements at the regional level. Also, the
procurement method was statistically significant parameter of a regression analysis. The competition actions together with a negotiation
process created higher savings in comparison to tenders. In case of the CPV codes, the most significant savings were achieved in the group
of ‘various medicinal products’. The study’s results provide a valuable knowledge for the creators of policies and a realization of the
national strategic plans within the health system. Also, these results support a creation of national and international benchmarks in this area
and a networking of international partnerships in the area of a public procurement that focus on a development of methodologies and
comparative platforms creation.
Keywords: Public Procurement; Public Procurement Efficiency; Medical Equipment; Patients’ Satisfaction; Public Procurement Efficiency
Determinants; Savings
JEL Classifications: D20, H32
Reference to this paper should be made as follows: Gavurova, B., Kubak, M. 2021. The efficiency evaluation of public procurement of
medical equipment. Entrepreneurship and Sustainability Issues, 8(3), 193-209. http://doi.org/10.9770/jesi.2021.8.3(11)
Additional disciplines: political sciences
1. Introduction
In the last decades, the health systems of many countries have solved plenty of complex tasks. The demographic
ageing process that is evident in many countries requires proper setting of various active policies in order to
sustain the health systems. The ageing European population is more susceptible to numerous chronic diseases that
result in an increase of a healthcare demand. Delivering quality health services creates strong fiscal pressures in
the economy (Breandle & Colombier, 2016). Its main reason is a strong technological development and an
implementation of innovations into diagnostic and treatment processes. Many international institutions draw
attention to significant and constant differences in a health among the countries. Similarly, the differences in a
health, that are caused by a different healthcare availability and also various socio-economic factors, systems of
the healthcare financing, deployment of health workers, etc., are identified within the particular countries
(Ucieklak-Jez & Bem, 2020; Megyesiova & Lieskovska, 2018, 2019).
The public sector plays an important role in the processes of the healthcare services’ financing. In the two thirds
of the EU member states, the public sector finances more than 70% of the healthcare costs. Consequently, the
ageing population creates serious concerns of the sustainability of public finances. The public healthcare
expenditures are the largest part, which increases the most when considering the public expenditures. In the
future, it is expected that the public healthcare expenditures rate will increase on the GDP. It is also confirmed by
the population ageing prognoses by 2060. The main factors that cause this increasing process are as follows:
demand for high-quality health services, increasing expectations, and strong technological progress (European
Commission, 2020; Briestenský & Ključnikov, 2019; Kočišová & Sopko, 2019).
In recent years, there have been evident as fiscal issues, so healthcare efficiency issues within the health systems
(Bem et al. 2019). All of the areas of healthcare spending search for the means that would use the resources more
effectively (Ucieklak-Jez et al. 2018). As some of the WHO reports state, almost one-fifth of healthcare spending
does not contribute to any improvement of population’s health, and/or to a minimum extent. Unfortunately, such a
ENTREPRENEURSHIP AND SUSTAINABILITY ISSUES
ISSN 2345-0282 (online) http://jssidoi.org/jesi/
2021 Volume 8 Number 3 (March)
http://doi.org/10.9770/jesi.2021.8.3(11)
195
spending leads to worse health results in some of the cases (European Commission, 2020; Predkiewicz et al.
2019; Stefko et al. 2018).
Therefore, many countries deal with the following issues for a longer period of time – a search for more effective
use of resources, or setting the processes in the health systems in such a way that less resources are spent, while a
performance of the health systems or health results will not worsen (Stefko et al. 2016). In the European
countries, there exist other serious issues of the health systems, such as unequal access to healthcare, fiscal
pressures of different departments, corruption, frequent changes of political priorities, lack of information of
investments’ efficiency into health systems, etc.
One of the key factors of public finance system is an increase of public procurement processes’ efficiency. Many
countries of the European Union intensively work on a reform of public procurement processes. The main aim of
a public procurement is to create an open competition in order to achieve the most effective use of public
resources. The Slovak health system belongs to those systems that declare the long-term financial difficulties. The
Slovak hospitals represent the weakest segment of the healthcare system. Similarly, the public hospitals still suffer
from major losses in spite of the fact that many reforms have been made on cost-effectiveness increase.
The competition rate significantly lags behind the majority of the EU countries even many positive changes have
been recently done in the public procurement of the Slovak health system. In Slovakia, a low efficiency of the
public procurement processes is influenced by other factors, such as an excessive use of the lowest price criterion
in the selection process, a preparation of public procurements without any necessary ex-ante analysis of a
purchase planning efficiency, etc. (Nemec et al. 2020). On the other hand, the public procurement processes in the
Slovak health system may be improved and more efficient by using the diagnostic and the treatment processes in
the health system. Consequently, a higher patient’s value may be created from public resources that would also
provide the sustainability of public finances and the Slovak health system (Huculová, 2018).
The submitted study, whose aim is to verify the public procurement efficiency in the health system by means of
the valuation approach, and/or savings’ estimates which are achieved by public procurement, reflects on these
facts. The savings are defined as a percentage difference between the estimated and the fiscal contract price. The
secondary objective was to examine an influence of selected variables on a creation of savings in the public
procurement process by means of a regression analysis. The variables are as follows: time, method, procurement,
NUTS level of procurement, Common Procurement Vocabulary Code, number of offers. The analysis’s results
provide a space for the creation of national and international benchmarking indicators and also for a realization of
comparative analyses that are required for the processes of efficiency increase (Triantafillou, 2007).
The study is structured as follows: Introduction focuses on the public finances sustainability and the health
systems, which are impacted by the global processes of the demographic ageing. The Research Review
(Background of the Study) pays attention to the research studies that deal with the public procurement efficiency,
and also their determinants, which are declared in the national and international research studies. The research
part of this study is divided into methodological and analytical parts. The methodological part describes the data
base and all of the methodological procedures that were used. The analytical part provides the results visualised in
the form of the graphs and tables. Both, Discussion and Conclusion of this study, are linked to these results.
2. Theoretical background
Many foreign research teams deal with the public procurement efficiency. Their primary aim is to examine the
determinants of the public procurement, and also to search for the possibilities that would make these processes
more effective. Generally, the contents of these research studies are very heterogenous. However, these studies
bring valuable knowledge for the creation of a discussion platform and for the setting of the comparative
ENTREPRENEURSHIP AND SUSTAINABILITY ISSUES
ISSN 2345-0282 (online) http://jssidoi.org/jesi/
2021 Volume 8 Number 3 (March)
http://doi.org/10.9770/jesi.2021.8.3(11)
196
researches. Most of the research studies analyse such factors as corruption, competitiveness and transaction costs
that influence the efficiency of public procurement (e.g. Huculová, 2018; Baldi & Vannoni, 2017; Borowiec,
2017; Ochrana & Maaytová, 2012; Ochrana & Pavel, 2013; Vasconcelos, 2021). Other group of studies analyse
only particular factors, while there are also such studies that more complexly evaluate the public procurement
efficiency. Similarly, such research studies differ from each other depending on the implication type into relevant
policies, and/or they bring suggestions for an improvement of existing data bases, or they open new data registers.
Grega et al. (2019) verify the main factors that have an impact on the public procurement efficiency in Slovakia,
while the authors use the interview method and questionnaires. The questionnaires were created for contracting
authorities/entities and suppliers, while 13571 of suppliers and 4300 of contracting authorities participated in the
research. Both, suppliers and contracting authorities, explicitly confirmed that the most important factors, which
cause non-efficiency in the public procurement are: excessive bureaucracy and corruption or other ethical
shortcomings. The results also show that the insufficient competition and the excessive use of the lowest price
criterion for selecting winning bids add further inefficiencies. The largest savings were achieved between 6 and 8
bidders. In conclusion, the authors state that the e-auctions generally produce larger savings than more traditional
methods, but the Slovak procurement procedures are costly, compared to most other EU states. The study
provides valuable subjects for the policies’ creators that focus on the improvement of the public procurement
processes in order to achieve their higher efficiency.
There are also studies that present new collaborations and partnership networks as the tools for efficient public
procurement processes, and simultaneously, improving efficiency of investment processes that are linked to the
projects of the public procurement. Many studies examine programs of green public procurement. These topics
are related to the global trends of environmental protection that need to be interconnected with the efficiency
processes. In the study of Berezin et al. (2018), the authors state that the implementation of the public-private
partnership (PPP) improves public and municipal property in the EU countries. The study aims at the
classification outline of the countries according to the probability of success in the PPP implementation. The
study presents a significance of a new method that should be based on the indicators’ system by means of which it
should evaluate a quality of the institutional environment, experiences with the project realization, state’s
preparedness, and also institutional sphere on the efficient implementation of the PPP projects. The authors also
suggest that the role of a state plays an important role in the strengthening of the PPP projects’ realization by
means of the financial sphere. It will also support a creation of various mechanisms that would attract private
investments to socially significant public projects. Similarly, Nemec et al. (2020) indicate an insufficient level of
a competitiveness as the primary factor of an insufficient efficiency of the public procurement. In the study, the
authors declare that the level of a competitiveness in Slovakia significantly lags behind the majority of the EU
countries. Low level of a competitiveness has a direct impact on the public procurement efficiency, which is
frequently evaluated by comparing the estimated value to the competitive pricing. The authors analysed data from
2141 public procurements in the period 2014 – 2019. In conclusion, the authors confirm that a higher number of
offers in the Slovak health system generates a lower final price. In average, the number of offers is two, but
almost in one third of the competitions, the health facilities received only one offer. Grega (2018)identifies and
analyses in detail the main factors that determine the public procurement efficiency in Slovakia by performing a
vast primary and secondary research. The author determines bureaucracy as the most important factor of the
efficiency in the public procurement processes on the basis of the research. The second factor is a frequent change
of a legislative, and the third factor is an insufficient ethics and morality on the awarding authorities and/or the
contracting authorities’ sides. Both, corruption and insufficient competitiveness, that are presented by joining a
small number of suppliers into the public procurement, represent the fourth most important factor.
Thematically similar studies were realized in abroad, and their results create an interesting discussion platform for
this team of authors. For instance, Grzyl et al. (2018) performed their research in order to verify to what extent the
Polish contracting authorities use a selection option of many criteria to evaluate the offers. The authors analysed
500 notices on work procedures conducted in open and restricted tenders in Poland and 500 tenders in open and
ENTREPRENEURSHIP AND SUSTAINABILITY ISSUES
ISSN 2345-0282 (online) http://jssidoi.org/jesi/
2021 Volume 8 Number 3 (March)
http://doi.org/10.9770/jesi.2021.8.3(11)
197
restricted proceedings in five selected EU countries. The results of the comparative analysis show many
interesting conclusions. The price, as a decisive criterion in selecting an offer, has both, advantages and
disadvantages. The following may be supported by using the price criteria and others: increase in the efficiency of
public spending, a better definition of the basic characteristics of a product and a better preparation of contract’s
subject description, granting the particular characteristics of a product in the context of innovations, a limited
impact on the environment, etc. However, the authors confront the use of many criteria in the public procurement
with increasing costs of a company, a complex procedure for offers’ evaluation and other risks.
Kozik and Karasińska-Jaśkowiec (2016) focus on the evaluation of the public procurement processes in the
context of environmental protection. The subject of the public procurement is infrastructure in the selected Polish
municipalities. In the analyses, the authors use the following criteria: time of the public procurement realization
(2009-2015) and co-financing of the contract from the EU funds. Similarly, the authors examined the
environmental aspects of planned investments in the contracts by detailed analysis of the environmental criteria,
and also legislative acts adopted in Poland and Europe. In conclusion, the authors declare that the legislative acts
do not represent any obstacle in the awarding process that has an impact on the environment. The authors also
emphasize a consistency of the legislative acts at both, national and international levels.
The study by Fuentes-Bargues et al. (2018) has a sector orientation to education system. As the authors confirm
the universities have a significant role for the public institutions as they make plenty of purchases and financial
procedures on daily basis. The study presents the research results which reflect the analysis of 316 procedures that
were collected and analysed from the calls for tenders made by the Spanish public universities between 2016 and
2017. Also, the environmental criteria, which were analysed according to the sub-sectors, the geographic scope,
and the project’s budget, have an important role. The study’s results clearly declare a low use of environmental
criteria in the contracts that are awarded by the Spanish public universities. The conclusions of the study provide
multiple implications for the policies’ creation, such as the fact that the environmental policies of the universities
should be a part of their institutional policies.
The research study by Grzyl and Siemaszko (2018) is linked to the Europe 2020 strategy, which also emphasizes
an effective use of natural and ecological resources. Both analyses, Life Cycle Assessment and Life Cycle Cost,
should form a basis of the decision-making by awarding entities according to the authors. Thus, the authors
present the advantages of their use. The authors analysed 350 of selected public procurement procedures that were
realized in 2017 in Poland. In the analytical processes, there were examined the types, the average weights and a
frequency of application of non-price criteria for the selection of the best offer in practice. In conclusion, the
authors expressly declare a convenience of using the following analyses, Life Cycle Assessment and Life Cycle
Cost. Both analyses are considered as the tools for determining a real value of the contracts’ subject. However, the
environmental requirements are obligatory in most of the cases of the contracts’ realization. The use of non-price
criteria further remains a difficult task in the public procurement processes and their importance will even
increase in the future.
Grzeszczyk and Czajkowski (2017) draw attention to different specificities of the projects that are co-financed
from the EU funds and commercial projects. The projects that are co-financed from the EU sources are oriented
to the environmental economic and social advantages for a society. Therefore, it is important to research
numerous factors that influence the public procurement processes of the EU projects. Also, the authors use the
European projects observation, comparative study, literature and documentary analysis in order to highlight the
structure and the seriousness of the problems in these types of projects. The project management and the pressures
on the development of methods that would eliminate the risks of the mistakes in these projects are brought to the
attention. However, one serious mistake may lead to the loss of all of the subsidies and subsequently, it may
threaten a realization of an entire project. Consequently, the authors emphasize a necessity of the processes’
improvement for the purchases and the implementation of co-ordinated purchase activities.
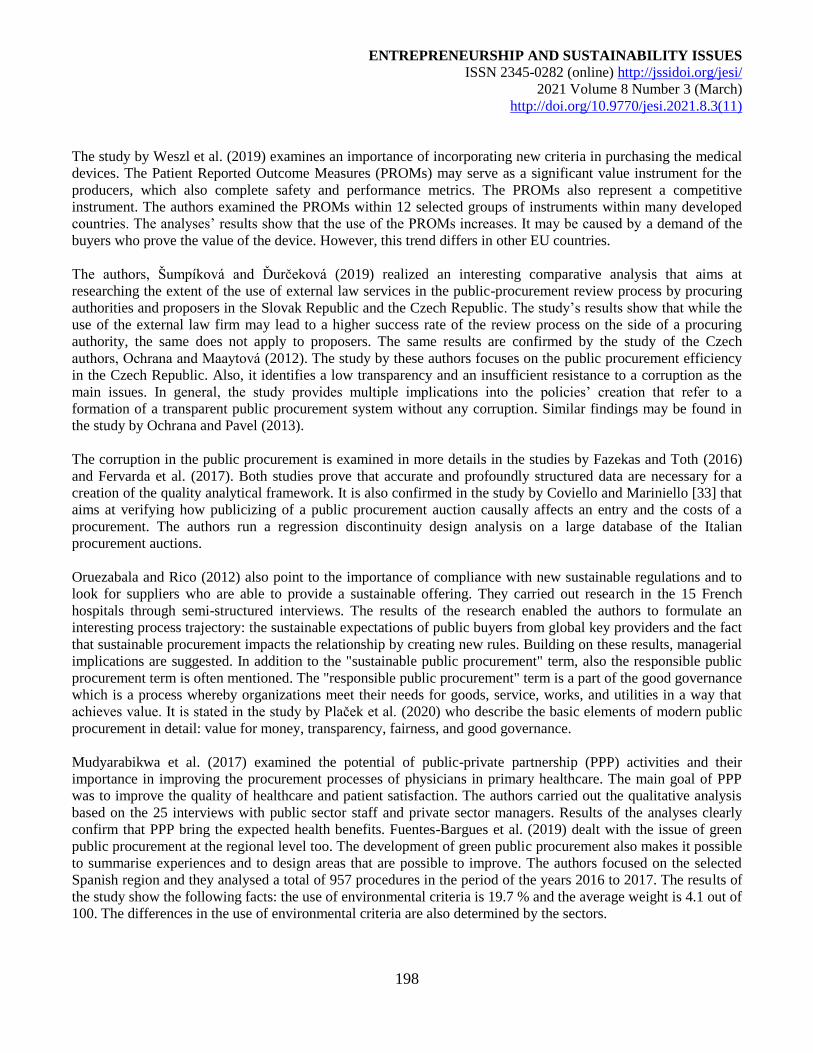
ENTREPRENEURSHIP AND SUSTAINABILITY ISSUES
ISSN 2345-0282 (online) http://jssidoi.org/jesi/
2021 Volume 8 Number 3 (March)
http://doi.org/10.9770/jesi.2021.8.3(11)
198
The study by Weszl et al. (2019) examines an importance of incorporating new criteria in purchasing the medical
devices. The Patient Reported Outcome Measures (PROMs) may serve as a significant value instrument for the
producers, which also complete safety and performance metrics. The PROMs also represent a competitive
instrument. The authors examined the PROMs within 12 selected groups of instruments within many developed
countries. The analyses’ results show that the use of the PROMs increases. It may be caused by a demand of the
buyers who prove the value of the device. However, this trend differs in other EU countries.
The authors, Šumpíková and Ďurčeková (2019) realized an interesting comparative analysis that aims at
researching the extent of the use of external law services in the public-procurement review process by procuring
authorities and proposers in the Slovak Republic and the Czech Republic. The study’s results show that while the
use of the external law firm may lead to a higher success rate of the review process on the side of a procuring
authority, the same does not apply to proposers. The same results are confirmed by the study of the Czech
authors, Ochrana and Maaytová (2012). The study by these authors focuses on the public procurement efficiency
in the Czech Republic. Also, it identifies a low transparency and an insufficient resistance to a corruption as the
main issues. In general, the study provides multiple implications into the policies’ creation that refer to a
formation of a transparent public procurement system without any corruption. Similar findings may be found in
the study by Ochrana and Pavel (2013).
The corruption in the public procurement is examined in more details in the studies by Fazekas and Toth (2016)
and Fervarda et al. (2017). Both studies prove that accurate and profoundly structured data are necessary for a
creation of the quality analytical framework. It is also confirmed in the study by Coviello and Mariniello [33] that
aims at verifying how publicizing of a public procurement auction causally affects an entry and the costs of a
procurement. The authors run a regression discontinuity design analysis on a large database of the Italian
procurement auctions.
Oruezabala and Rico (2012) also point to the importance of compliance with new sustainable regulations and to
look for suppliers who are able to provide a sustainable offering. They carried out research in the 15 French
hospitals through semi-structured interviews. The results of the research enabled the authors to formulate an
interesting process trajectory: the sustainable expectations of public buyers from global key providers and the fact
that sustainable procurement impacts the relationship by creating new rules. Building on these results, managerial
implications are suggested. In addition to the "sustainable public procurement" term, also the responsible public
procurement term is often mentioned. The "responsible public procurement" term is a part of the good governance
which is a process whereby organizations meet their needs for goods, service, works, and utilities in a way that
achieves value. It is stated in the study by Plaček et al. (2020) who describe the basic elements of modern public
procurement in detail: value for money, transparency, fairness, and good governance.
Mudyarabikwa et al. (2017) examined the potential of public-private partnership (PPP) activities and their
importance in improving the procurement processes of physicians in primary healthcare. The main goal of PPP
was to improve the quality of healthcare and patient satisfaction. The authors carried out the qualitative analysis
based on the 25 interviews with public sector staff and private sector managers. Results of the analyses clearly
confirm that PPP bring the expected health benefits. Fuentes-Bargues et al. (2019) dealt with the issue of green
public procurement at the regional level too. The development of green public procurement also makes it possible
to summarise experiences and to design areas that are possible to improve. The authors focused on the selected
Spanish region and they analysed a total of 957 procedures in the period of the years 2016 to 2017. The results of
the study show the following facts: the use of environmental criteria is 19.7 % and the average weight is 4.1 out of
100. The differences in the use of environmental criteria are also determined by the sectors.
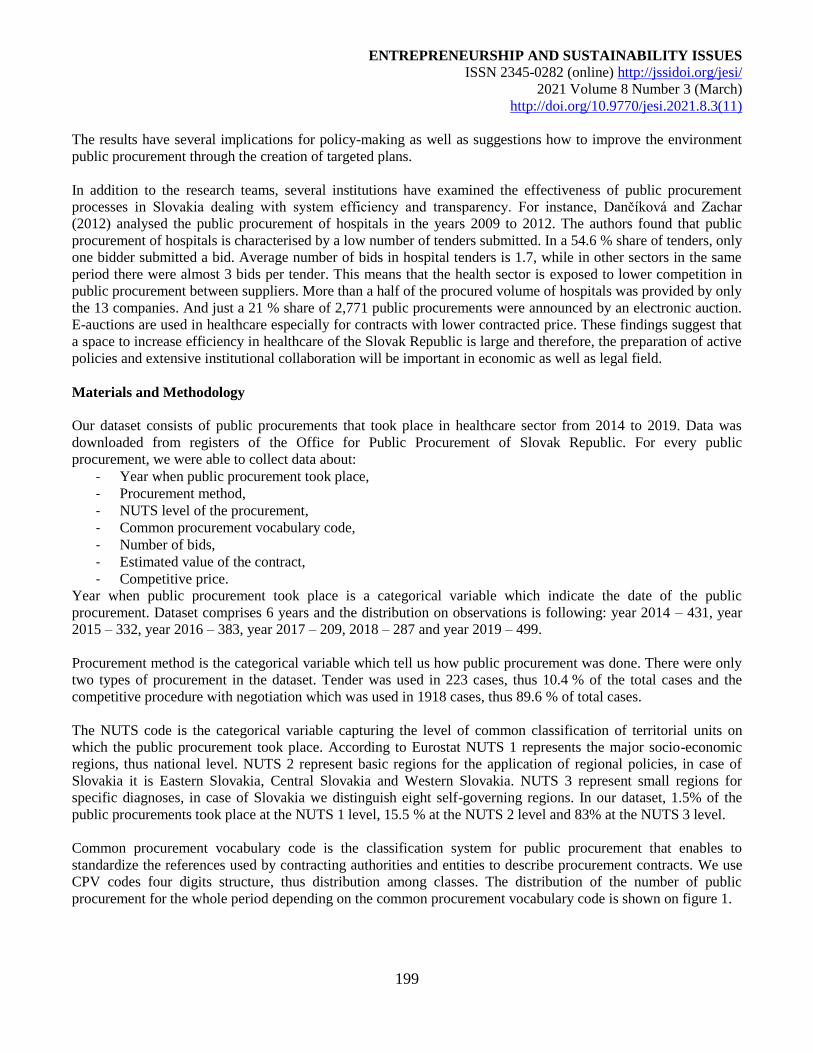
ENTREPRENEURSHIP AND SUSTAINABILITY ISSUES
ISSN 2345-0282 (online) http://jssidoi.org/jesi/
2021 Volume 8 Number 3 (March)
http://doi.org/10.9770/jesi.2021.8.3(11)
199
The results have several implications for policy-making as well as suggestions how to improve the environment
public procurement through the creation of targeted plans.
In addition to the research teams, several institutions have examined the effectiveness of public procurement
processes in Slovakia dealing with system efficiency and transparency. For instance, Dančíková and Zachar
(2012) analysed the public procurement of hospitals in the years 2009 to 2012. The authors found that public
procurement of hospitals is characterised by a low number of tenders submitted. In a 54.6 % share of tenders, only
one bidder submitted a bid. Average number of bids in hospital tenders is 1.7, while in other sectors in the same
period there were almost 3 bids per tender. This means that the health sector is exposed to lower competition in
public procurement between suppliers. More than a half of the procured volume of hospitals was provided by only
the 13 companies. And just a 21 % share of 2,771 public procurements were announced by an electronic auction.
E-auctions are used in healthcare especially for contracts with lower contracted price. These findings suggest that
a space to increase efficiency in healthcare of the Slovak Republic is large and therefore, the preparation of active
policies and extensive institutional collaboration will be important in economic as well as legal field.
Materials and Methodology
Our dataset consists of public procurements that took place in healthcare sector from 2014 to 2019. Data was
downloaded from registers of the Office for Public Procurement of Slovak Republic. For every public
procurement, we were able to collect data about:
- Year when public procurement took place,
- Procurement method,
- NUTS level of the procurement,
- Common procurement vocabulary code,
- Number of bids,
- Estimated value of the contract,
- Competitive price.
Year when public procurement took place is a categorical variable which indicate the date of the public
procurement. Dataset comprises 6 years and the distribution on observations is following: year 2014 – 431, year
2015 – 332, year 2016 – 383, year 2017 – 209, 2018 – 287 and year 2019 – 499.
Procurement method is the categorical variable which tell us how public procurement was done. There were only
two types of procurement in the dataset. Tender was used in 223 cases, thus 10.4 % of the total cases and the
competitive procedure with negotiation which was used in 1918 cases, thus 89.6 % of total cases.
The NUTS code is the categorical variable capturing the level of common classification of territorial units on
which the public procurement took place. According to Eurostat NUTS 1 represents the major socio-economic
regions, thus national level. NUTS 2 represent basic regions for the application of regional policies, in case of
Slovakia it is Eastern Slovakia, Central Slovakia and Western Slovakia. NUTS 3 represent small regions for
specific diagnoses, in case of Slovakia we distinguish eight self-governing regions. In our dataset, 1.5% of the
public procurements took place at the NUTS 1 level, 15.5 % at the NUTS 2 level and 83% at the NUTS 3 level.
Common procurement vocabulary code is the classification system for public procurement that enables to
standardize the references used by contracting authorities and entities to describe procurement contracts. We use
CPV codes four digits structure, thus distribution among classes. The distribution of the number of public
procurement for the whole period depending on the common procurement vocabulary code is shown on figure 1.
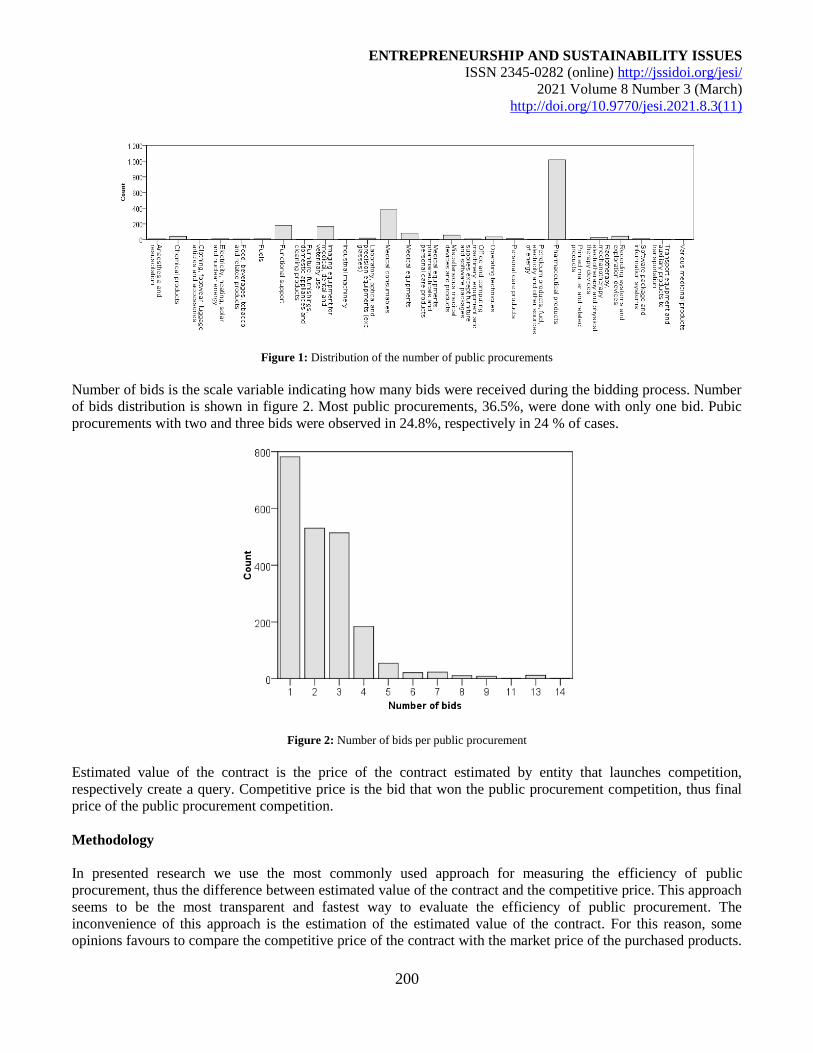
ENTREPRENEURSHIP AND SUSTAINABILITY ISSUES
ISSN 2345-0282 (online) http://jssidoi.org/jesi/
2021 Volume 8 Number 3 (March)
http://doi.org/10.9770/jesi.2021.8.3(11)
200
Figure 1: Distribution of the number of public procurements
Number of bids is the scale variable indicating how many bids were received during the bidding process. Number
of bids distribution is shown in figure 2. Most public procurements, 36.5%, were done with only one bid. Pubic
procurements with two and three bids were observed in 24.8%, respectively in 24 % of cases.
Figure 2: Number of bids per public procurement
Estimated value of the contract is the price of the contract estimated by entity that launches competition,
respectively create a query. Competitive price is the bid that won the public procurement competition, thus final
price of the public procurement competition.
Methodology
In presented research we use the most commonly used approach for measuring the efficiency of public
procurement, thus the difference between estimated value of the contract and the competitive price. This approach
seems to be the most transparent and fastest way to evaluate the efficiency of public procurement. The
inconvenience of this approach is the estimation of the estimated value of the contract. For this reason, some
opinions favours to compare the competitive price of the contract with the market price of the purchased products.
ENTREPRENEURSHIP AND SUSTAINABILITY ISSUES
ISSN 2345-0282 (online) http://jssidoi.org/jesi/
2021 Volume 8 Number 3 (March)
http://doi.org/10.9770/jesi.2021.8.3(11)
201
But use of market price has also its limits. The biggest counterargument the market price use is fact, that market
price not always available and clearly determinable, especially in case of information systems, legal and advisory
services, large construction project and last but not least, services as such. Because of abovementioned facts and
with respect to fact that our dataset includes 2141 observation, we have accepted to use the difference between
estimated value of the contract and competitive price, as this approach is widely used in case of large datasets.
While comparing the estimated value of the contract and its final competitive price, three possible outcomes are
possible. Savings are positive if the estimated value of the contract is higher than the final price of the competitive
price of the purchased goods. Savings are null if the estimated value of the contract is equal to the final price of
the goods being purchased. Savings are negative if the estimated value of the contract is less than the competitive
price of the goods being purchased. All prices were without VAT. Saving expressed in percentage are calculated
as follows:
To determine the main effect of abovementioned variables on achieved savings we run generalized linear model
with following equation:
Saving=β0 + β1 Procurement methodi + β2 NUTSi + β3 CPV codei + β4 Number of offersi + β5 Yeari + εi,
where Saving is the continuous variable indicating the size of the saving/loss achieved by public procurement.
Procurement method is the categorical variable which indicates the method the public procurement was done:
tender or competitive procedure with negotiation. NUTS code is categorical variable indicating the level on which
the public procurement too place – national, or regional. CPV code is categorical variable indicating the class of
common procurement vocabulary that public procurement concerned. Number of offers is scale variable which
indicated how many offers was bidders entered the process of public procurement. Year is variable that indicates
the year in which the public procurement took place.
Analysis
The distribution of saving is shown on the figure 3. We note from the figure 3 that savings are normally
distributed around zero and right skewed.
Figure 3: Distribution of saving
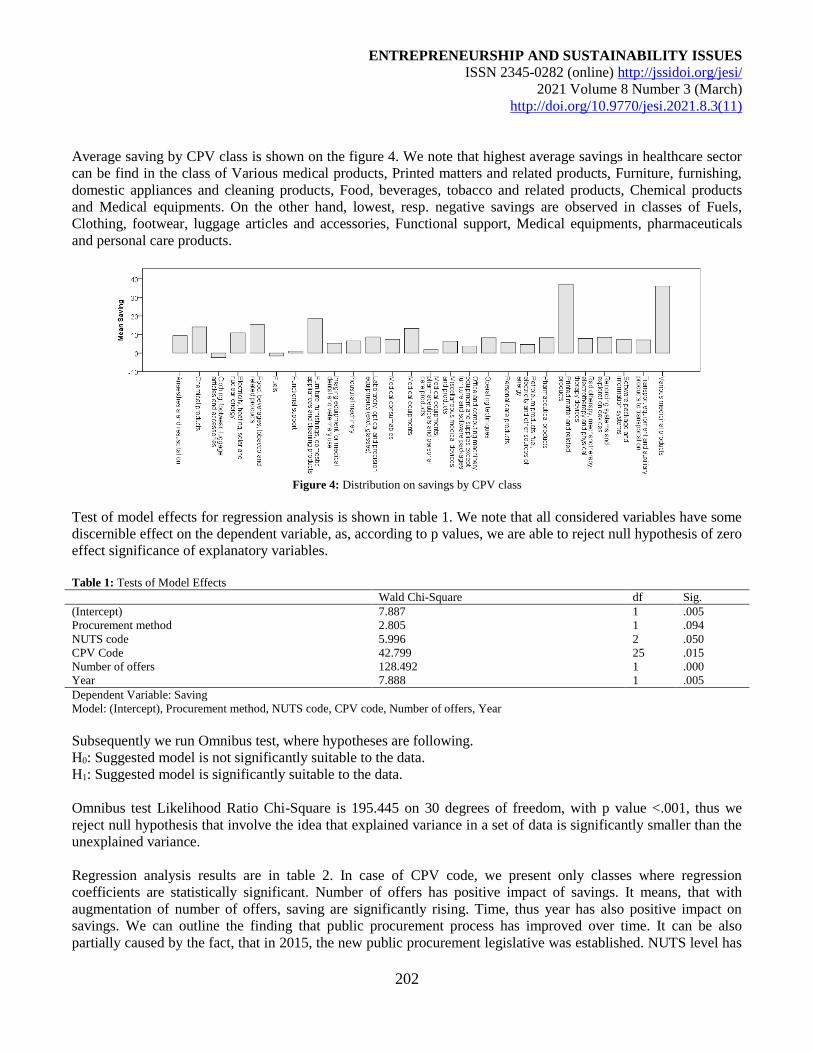
ENTREPRENEURSHIP AND SUSTAINABILITY ISSUES
ISSN 2345-0282 (online) http://jssidoi.org/jesi/
2021 Volume 8 Number 3 (March)
http://doi.org/10.9770/jesi.2021.8.3(11)
202
Average saving by CPV class is shown on the figure 4. We note that highest average savings in healthcare sector
can be find in the class of Various medical products, Printed matters and related products, Furniture, furnishing,
domestic appliances and cleaning products, Food, beverages, tobacco and related products, Chemical products
and Medical equipments. On the other hand, lowest, resp. negative savings are observed in classes of Fuels,
Clothing, footwear, luggage articles and accessories, Functional support, Medical equipments, pharmaceuticals
and personal care products.
Figure 4: Distribution on savings by CPV class
Test of model effects for regression analysis is shown in table 1. We note that all considered variables have some
discernible effect on the dependent variable, as, according to p values, we are able to reject null hypothesis of zero
effect significance of explanatory variables.
Table 1: Tests of Model Effects
Wald Chi-Square df Sig.
(Intercept) 7.887 1 .005
Procurement method 2.805 1 .094
NUTS code 5.996 2 .050
CPV Code 42.799 25 .015
Number of offers 128.492 1 .000
Year 7.888 1 .005
Dependent Variable: Saving
Model: (Intercept), Procurement method, NUTS code, CPV code, Number of offers, Year
Subsequently we run Omnibus test, where hypotheses are following.
H0: Suggested model is not significantly suitable to the data.
H1: Suggested model is significantly suitable to the data.
Omnibus test Likelihood Ratio Chi-Square is 195.445 on 30 degrees of freedom, with p value <.001, thus we
reject null hypothesis that involve the idea that explained variance in a set of data is significantly smaller than the
unexplained variance.
Regression analysis results are in table 2. In case of CPV code, we present only classes where regression
coefficients are statistically significant. Number of offers has positive impact of savings. It means, that with
augmentation of number of offers, saving are significantly rising. Time, thus year has also positive impact on
savings. We can outline the finding that public procurement process has improved over time. It can be also
partially caused by the fact, that in 2015, the new public procurement legislative was established. NUTS level has
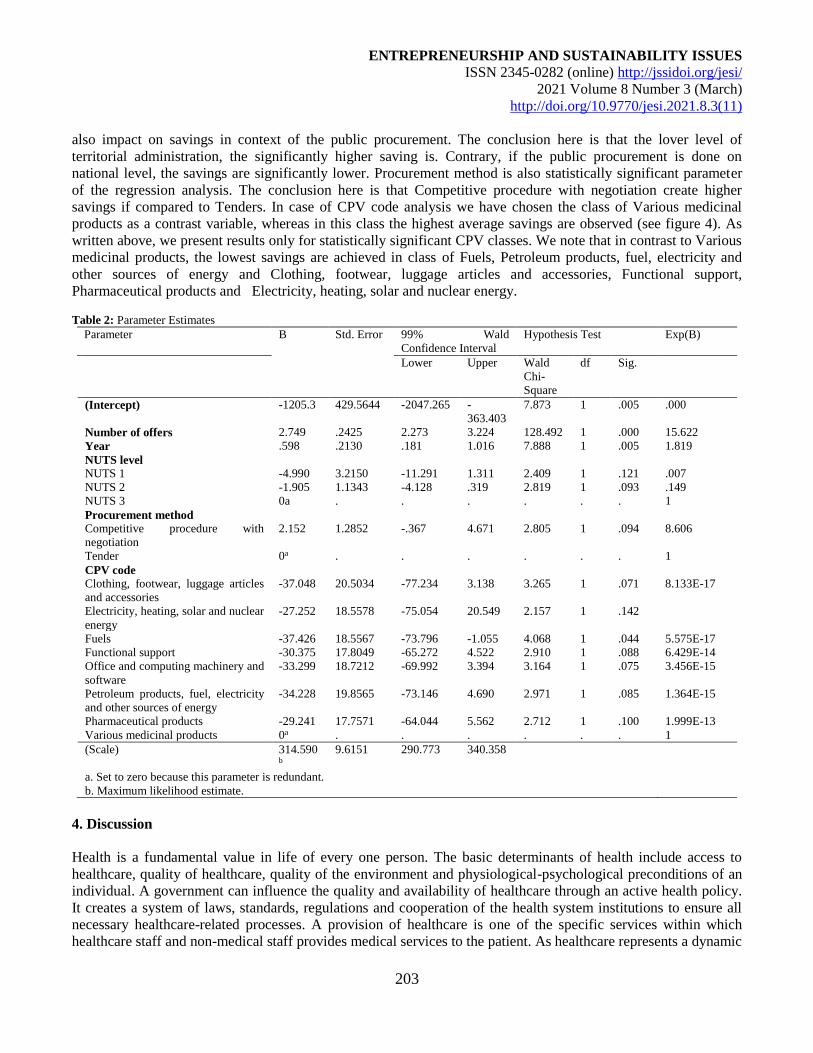
ENTREPRENEURSHIP AND SUSTAINABILITY ISSUES
ISSN 2345-0282 (online) http://jssidoi.org/jesi/
2021 Volume 8 Number 3 (March)
http://doi.org/10.9770/jesi.2021.8.3(11)
203
also impact on savings in context of the public procurement. The conclusion here is that the lover level of
territorial administration, the significantly higher saving is. Contrary, if the public procurement is done on
national level, the savings are significantly lower. Procurement method is also statistically significant parameter
of the regression analysis. The conclusion here is that Competitive procedure with negotiation create higher
savings if compared to Tenders. In case of CPV code analysis we have chosen the class of Various medicinal
products as a contrast variable, whereas in this class the highest average savings are observed (see figure 4). As
written above, we present results only for statistically significant CPV classes. We note that in contrast to Various
medicinal products, the lowest savings are achieved in class of Fuels, Petroleum products, fuel, electricity and
other sources of energy and Clothing, footwear, luggage articles and accessories, Functional support,
Pharmaceutical products and Electricity, heating, solar and nuclear energy.
Table 2: Parameter Estimates
Parameter B Std. Error 99% Wald
Confidence Interval
Hypothesis Test Exp(B)
Lower Upper Wald
Chi-
Square
df Sig.
(Intercept) -1205.3 429.5644 -2047.265 -
363.403
7.873 1 .005 .000
Number of offers 2.749 .2425 2.273 3.224 128.492 1 .000 15.622
Year .598 .2130 .181 1.016 7.888 1 .005 1.819
NUTS level
NUTS 1 -4.990 3.2150 -11.291 1.311 2.409 1 .121 .007
NUTS 2 -1.905 1.1343 -4.128 .319 2.819 1 .093 .149
NUTS 3 0a . . . . . . 1
Procurement method
Competitive procedure with
negotiation
2.152 1.2852 -.367 4.671 2.805 1 .094 8.606
Tender 0a . . . . . . 1
CPV code
Clothing, footwear, luggage articles
and accessories
-37.048 20.5034 -77.234 3.138 3.265 1 .071 8.133E-17
Electricity, heating, solar and nuclear
energy
-27.252 18.5578 -75.054 20.549 2.157 1 .142
Fuels -37.426 18.5567 -73.796 -1.055 4.068 1 .044 5.575E-17
Functional support -30.375 17.8049 -65.272 4.522 2.910 1 .088 6.429E-14
Office and computing machinery and
software
-33.299 18.7212 -69.992 3.394 3.164 1 .075 3.456E-15
Petroleum products, fuel, electricity
and other sources of energy
-34.228 19.8565 -73.146 4.690 2.971 1 .085 1.364E-15
Pharmaceutical products -29.241 17.7571 -64.044 5.562 2.712 1 .100 1.999E-13
Various medicinal products 0a . . . . . . 1
(Scale) 314.590b
9.6151 290.773 340.358
a. Set to zero because this parameter is redundant.
b. Maximum likelihood estimate.
4. Discussion
Health is a fundamental value in life of every one person. The basic determinants of health include access to
healthcare, quality of healthcare, quality of the environment and physiological-psychological preconditions of an
individual. A government can influence the quality and availability of healthcare through an active health policy.
It creates a system of laws, standards, regulations and cooperation of the health system institutions to ensure all
necessary healthcare-related processes. A provision of healthcare is one of the specific services within which
healthcare staff and non-medical staff provides medical services to the patient. As healthcare represents a dynamic
ENTREPRENEURSHIP AND SUSTAINABILITY ISSUES
ISSN 2345-0282 (online) http://jssidoi.org/jesi/
2021 Volume 8 Number 3 (March)
http://doi.org/10.9770/jesi.2021.8.3(11)
204
process which the demands and expectations of patients change in, its management requires ensuring compliance
in several medical, technical and economic dimensions (Predkiewicz et al. 2019; Stefko et al. 2018). The
provision of health care is carried out within the framework of the legislation of each country and the restrictions
caused by the economic capabilities of the healthcare provider. There is often a disproportion between patient
requirements for the service and financial resources that hospitals do not have and they cannot obtain them.
Hence, in the recent years, health systems have been cover a search for opportunities for savings throughout the
healthcare system and transparency of resources spent on service performed (Triantafillou, 2015; Borowiec, 2017;
Grega et al. 2019).
Public procurement plays an important role in this process. It is a strategic tool that every European Union
member state possesses in the system of the economic policy tools. The basis of public procurement is open
competition in order to achieve the most efficient use of public financial resources. Many countries have
implemented several reforms to improve public procurement processes in recent years [38]. Despite the positive
results, there is still a much room for enhancement. Available research studies declare insufficient use of strategic
procurement opportunities. As many as a 55 % share of procurement procedures use the lowest price as the sole
criterion for evaluating tenders (European Commission, 2017).
The most economically advantageous offers are selected on the basis of principles and cost-effectiveness criteria,
which it is also possible to take into account social, environmental and innovative criteria within. Availability
criteria or various qualitative criteria are still not sufficiently applied (Nemec et al. 2020a; Grega et al. 2019;
Nemec et al. 2020b). Procurement processes are often considered to be rather an administrative procedure, which
public authorities purchase the products, works or services necessary for their activities through. Clear and
consolidated data on public procurement are not yet available and there is also no consensus within the European
Union on which data to collect and for what purpose (European Commission, 2017).
The European Commission also criticises the position of some European Union member states that their central
authorities are unable to indicate the exact amount of public procurement expenditure in their country despite the
large financial amounts involved in this process (European Commission, 2017). This puts pressure on
improvement of public revision and the development of effective data-based policies as well as improved
budgetary revision. Innovation is a very important aspect of public procurement processes and thus, it is an
important determinant in improving the quality and efficiency of treatment and diagnostic processes in the
healthcare system. There are also many barriers to innovation as evidenced by several studies (Nemec et al.
2020a; Berezin et al. 2018; Šumpíková & Ďurčeková, 2019).
A creation of innovative partnerships can solve this problem too (Berezin et al. 2018; Mudyarabikwa et al. 2017).
Also, the digital transformation of public procurement, which is currently assessed as slow and insufficient, is
important. Despite the simplification of the European Union rules in the year 2014, many countries criticise the
persistence of overly complex public procurement procedures and excessive administrative burdens. This
consistent fact affects the standardization of procedures and the professionalization of public procurement
(European Commission, 2017).
Many healthcare institutions also have a critical view of the current situation in a field of public procurement in
Slovakia, as for instance SK-MED Association, based on the real practice of the medical institutions and their
suppliers. As stated in their study, public procurement generalizes patients' clinical status and it does not take into
account its specific attributes (SK+MED, 2020).
For patients with a clinical condition, where the use of standard medical devices is not possible, the acquired
devices has to be usable and suitable for specific medical purposes. Providers often tend to use inappropriate
material for the purpose of financial disputes and the elimination of special administrative procedures required by
ENTREPRENEURSHIP AND SUSTAINABILITY ISSUES
ISSN 2345-0282 (online) http://jssidoi.org/jesi/
2021 Volume 8 Number 3 (March)
http://doi.org/10.9770/jesi.2021.8.3(11)
205
the health insurance companies. Therefore, for a certain group of patients, such a healthcare service is more
expensive and hence, it may be unavailable due this fact. Public procurement can also indirectly prevent the use of
innovative methods in the treatment process (SK+MED, 2020).
Patients' needs should not be considered in a standardised way. Public procurement as a process in the current or
proposed legislative form does not allow to assess the price of treatment in terms of total costs, but it only takes
into account the price of the material used. At the present time, the main evaluation criterion in public
procurement is price usually (Grega et al. 2019; Nemec et al. 2020).
Neither the current law nor its proposed amendment defines price as a parameter in more detail. Given the
importance of the quality criterion, which is very closely linked to the price parameter, it is significantly important
that the price in healthcare is assessed as a parameter in terms of total costs in the long term and not as a partial
cost in a single procurement. Only then, it is possible to evaluate the effectiveness of the healthcare provided in
the diagnostic or treatment process. If only the price is applied in public procurement processes in healthcare,
there is a risk that in the end, the total costs may be even higher as they may increase due to various shortcomings
of the procured goods. If the healthcare provider procures medical devices through public procurement that can
only be used in standard treatment, then the treatment of patients will not be in a line with the latest medical
science knowledge in the particular field (SK+MED, 2020).
In order to determine the real state of the efficiency of public procurement processes for medical devices for the
period of the years 2014 to 2019, we performed an analysis of the data obtained from the national registers of the
Public Procurement Office of Slovakia. We focused on the use of so-called value approach through an estimation
of the savings achieved by public procurement. We examined the impact of the selected variables on the creation
of savings in the public procurement process through regression analysis. The variables examined are: time,
procurement method, NUTS level of procurement, common procurement vocabulary code, and number of
tenders. The results of the analyses revealed the interesting findings. The number of offers had a significant
positive impact on savings. This means that with an increase in the number of bids by one unit, the savings are
increased by 15.6 %. The time variable (year) also had a positive effect on the savings. It can be stated that the
public procurement process has been improving in the recent period. This may be partly due to the fact that the
new public procurement legislation was introduced in 2015. The NUTS level also has an impact on the savings in
public procurement. Public procurement at the state level is more advantageous than one at the regional level. The
procurement method is also a statistically significant parameter of the regression analysis. The competitive
negotiated procedures create the significantly higher savings compared to the tenders. In the case of CPV codes,
the most significant savings are achieved for "different drugs". The limitation of our research is caused by an
inaccurate input of public procurements parameters by authorities’ which are in charge of public procurements
information disclosure.
These evaluations represent the valuable findings for policymakers and to ensure a transparent public procurement
system as well as for increasing its efficiency. It is also important to confront these results with many institutions
that cover suppliers of medical devices and equipment and thus, to create innovative partnerships not only in
public procurement processes but also in technological development as manufacturing innovators can provide
valuable information for health technology assessment that should be closely linked to public procurement
processes in the healthcare sector (Huculová, 2018; Kiselova Bilekova et al. 2018; Zavadil et al. 2020; Petruželka
& Barták, 2019).
The absence of this link can result in many negative facts, which will be related to the preferred use of price as the
most important criterion in the entry stages of public procurement in healthcare. If we would like to ensure the
effectiveness of public procurement processes in order to gain more value for the patient and at the same time to
ensure the quality and safety of treatment and a higher quality of life of the patient, individual parameters entering
ENTREPRENEURSHIP AND SUSTAINABILITY ISSUES
ISSN 2345-0282 (online) http://jssidoi.org/jesi/
2021 Volume 8 Number 3 (March)
http://doi.org/10.9770/jesi.2021.8.3(11)
206
public procurement are needed to be evaluated by the specific approaches and methodologies. We will be able to
ensure the sustainability of the healthcare system in the context of demographic aging processes in a line with the
sustainability of public finances only in this way.
5. Conclusions
The processes of demographic aging and the associated changes in the mortality and morbidity structure of the
diagnoses in the individual countries place ever-increasing demands on the healthcare systems. Fulfilling
satisfaction of the health needs of the population is also closely related to the funding processes, an innovative and
technological development as well as the overall setting of the healthcare policies in the individual countries. In
the recent years, the health systems have been looking for savings and transparency of resources spent on the
services performed. Public procurement plays an important role in this process. It is a strategic tool that every
European Union member state possesses in the system of economic policy instruments. The basis of public
procurement is an open competition in order to achieve the most efficient use of the public funds. Public
procurement in the Slovak healthcare system has long been one of the most criticised processes by national as
well as international institutions. In particular, an insufficient coordination between the involved institutions, an
incorrectly set procedures, the inefficient public procurement processes and a poor applicability of the law are
criticised often. The parameter "lowest price" results in the procurement of the products that are often of very low
quality, which in turn causes a low quality of treatment. Successively, the low quality of treatment can also
endanger the patient's health. The aim of our study was to evaluate the efficiency of the public procurement
processes for medical equipment in Slovakia for the period of the years 2014 to 2019. The results of our study
clearly pointed out that the number of offers has positive impact on creation of savings in public procurement
process. We also document the evidence of amelioration of the procurement process over time in the context of
savings generation. According to our results, NUTS level has also impact on savings in context of the public
procurement. We document that public procurements done on the lower level of territorial administration reach
higher savings. Contrary, if the public procurement is done on national level, the savings are significantly lower.
Our study also points out that procurement method used in public procurement process influence the savings.
Competitive procedure with negotiation create higher savings if compared to Tenders. The results of the analyses
represent a valuable platform for the creators of strategic national healthcare plans as well as for the creation of
concepts and methodologies enabling the improvement of public procurement processes in the healthcare system.
The efficient public procurement processes in the healthcare system have to guarantee a higher quality of
healthcare provided. Public procurement in the healthcare system should increase patient value and ensure the
sustainability of the healthcare system as well as public finances from a macroeconomic point of view.
References
Baldi, S.; Vannoni, D. (2017). The impact of centralization on pharmaceutical procurement prices: The role of institutional quality and
corruption. Regional Studies, 51(3), 426–438. https://doi.org/10.1080/00343404.2015.1101517 [Taylor & Francis Online], [Web of
Science ®], [Google Scholar]
Bem, A.; Siedlecki, R.; Predkiewicz, P.; Gazzola, P.; Ryszawska, B.; Ucieklak-Jez, P. (2019). Hospitals' Financial Health in Rural and
Urban Areas in Poland: Does It Ensure Sustainability? Sustainability, 11(7), 1932. https://doi.org/10.3390/su11071932
Berezin, A.; Bruno, S. Sergi; Gorodnova, N. (2018). Efficiency Assessment of Public-Private Partnership (PPP) Projects: The Case of
Russia. Sustainability, 10(10), 3713. https://doi.org/10.3390/su10103713
Borowiec, A. (2017). The impact of public procurement system on the development of competition in the economy in the light of empirical
research. Oeconomia Copernicana, 8(1), 37–50. https://doi.org/10.24136/oc.v8i1.3
ENTREPRENEURSHIP AND SUSTAINABILITY ISSUES
ISSN 2345-0282 (online) http://jssidoi.org/jesi/
2021 Volume 8 Number 3 (March)
http://doi.org/10.9770/jesi.2021.8.3(11)
207
Breandle, T.; Colombier, C. What drives public health care expenditure growth? Evidence from Swiss cantons, 1970–2012. Health Policy
2016, 120(9), 1051–1060. https://doi.org/10.1016/j.healthpol.2016.07.009
Briestenský, R.; Ključnikov, A. (2019). Identification of key factors of success of hospital management in Slovakia. Adiktologie 2019, 4.
Coviello, D.; Mariniello, M. (2014). Publicity requirements in public procurement: Evidence from a regression discontinuity design.
Journal of Public Economics, 109, 76–100. https://doi.org/10.1016/j.jpubeco.2013.10.008
Dančíková, Z., Zachar, D. (2012). Analýza verejného obstarávania nemocníc v rokoch 2009-2012: Intenzita súťaže v tendroch je nízka
(Analysis of public procurement of hospitals in 2009-2012: The intensity of competition in tenders is low). Transparency International
Slovakia/INEKO, 27.
European Commission. (2017). Za fungujúce a prínosné verejné obstarávanie v Európe. Oznámenie komisie Európskemu parlamentu, rade,
európskemu a sociálnemu výboru a výboru regiónov (For functioning and rewarding public procurement in Europe. Communication from
the Commission to the European Parliament, the Council, the European and Social Committee and the Committee of the Regions), 2017.
Available online: https://eur-lex.europa.eu/legal-content/SK/TXT/HTML/?uri=CELEX:52017DC0572&from=EN
European Commission. (2020) Systémy zdravotnej starostlivosti. Available online:
https://ec.europa.eu/info/sites/info/files/file_import/european-semester_thematic-factsheet_health-systems_sk.pdf
Fazekas, M., & Tóth, I. J. (2016). From corruption to state capture: A new analytical framework with empirical applications from Hungary.
Political Research Quarterly, 69(2), 320–334. https://doi.org/10.1177/1065912916639137
Fervarda, J.; Deleanu, J.; Unger, B. (2017). Corruption in public procurement: Finding the right indicators. European Journal of Criminal
Policy Research, 23(2), 245–267. https://doi.org/10.1007/s10610-016-9312-3
Fuentes-Bargues, J. L.; Ferrer-Gisbert, P.S.; González-Cruz, M.C. Analysis of Green Public Procurement of Works by Spanish Public
Universities. Int. J. Environ. Res. Public Health 2018, 15, 1888.
Grega, M. (2018). Možnosti zvýšenia efektívnosti verejného obstarávania v SR (Possibilities of increasing the efficiency of public
procurement in the Slovak Republic). Disertační práce. Banská Bystrica: Ekonomická fakulta UMB 2018.
Grega, M.; Orviska, M.; Nemec, J.; Lawson, C. (2019). Factors Determining the Efficiency of Slovak Public Procurement. The NISPAcee
Journal of Public Administration and Policy, 12(1), 43-68. https://doi.org/10.2478/nispa-2019-0002
Grzeszczyk, T. A.; Czajkowski, B. EU-funded Project Management in the Context of Suppliers and Contractors Selection. Procedia
Engineering volume 2017, 182, 241-246. https://doi.org/10.1016/j.proeng.2017.03.181
Grzyl, B.; Apollo, M.; Miszewska-Urbańska, E.; Kristowski, A. The criteria for evaluation and selection the best tender applied by the
authorities in Poland and selected EU countries. MATEC Web of Conferences 2018, 219, 04006.
https://doi.org/10.1051/matecconf/201821904006
Grzyl, B.; Siemasko, A. The Life Cycle Assessment and Life Cycle Cost in public works contracts. 10th Conference on Interdisciplinary
Problems in Environmental Protection and Engineering EKO-DOK 2018, 44, 00047.
Huculová, E. (2018). Porovnanie vybraných metodologických prístupov HTA na národnej úrovni a na úrovni nemocníc (Comparison of
selected methodological approaches of HTA at the national level and at the hospital level). Exclusive journal: economy and society and
environment, 6(4), 53-59.
Kiselova Bilekova, B.; Gavurova, B.; Rogalewicz, V. (2018). Application of the HTA Core Model for complex evaluation of the
effectiveness and quality of Radium-223 treatment in patients with metastatic castration resistant prostate cancer. Health Econ Rev, 8, 27.
https://doi.org/10.1186/s13561-018-0211-9
Kočišová, K.; Sopko, J. (2019). Key Indicators and Determinants in the Context of the Financial Aspects of Health Systems in Selected
Countries. Adiktologie, 4. doi 10.35198/01-2019-004-0003.
ENTREPRENEURSHIP AND SUSTAINABILITY ISSUES
ISSN 2345-0282 (online) http://jssidoi.org/jesi/
2021 Volume 8 Number 3 (March)
http://doi.org/10.9770/jesi.2021.8.3(11)
208
Kozik, R.; Karasiska-Jakowiec, I. Protecting the Environment Through Public Procurement Law - The Case of Poland. IOP Conference
Series: Earth and Environmental Science 2016, 44(5), 052055.
Megyesiova, S.; Lieskovska, V. (2018). Analysis of the Sustainable Development Indicators in the OECD Countries. Sustainability, 10(12),
4554. https://doi.org/10.3390/su10124554
Megyesiova, S.; Lieskovska, V. (2019). Premature Mortality for Chronic Diseases in the EU Member States. International Journal of
Environmental Research and Public Health, 16(20), 4021. https://doi.org/10.3390/ijerph16204021
Mudyarabikwa, O., Tobi, P., Regmi, K. (2017). Public–private partnerships to improve primary healthcare surgeries: clarifying
assumptions about the role of private provider activities. Primary Health Care Research & Development, 18, 366-375.
https://doi.org/10.1017/S1463423617000147
Nemec, J.; Grega, M.; Horehájová, M.; Kubák, M. (2020). Efficiency of Public Procurement in the Slovak Health care. Český finanční a
účetní časopis, 1, 27-39. https://doi.org/10.18267/j.cfuc.542
Nemec, J.; Grega, M.; Kubak, M. (2020). Vplyv miery konkurencie na výslednú cenu: verejné obstarávanie v slovenskom zdravotníctve
(Influence of the degree of competition on the final price: public procurement in the Slovak healthcare system). Journal of Global Science,
5(2), 1-8.
Ochrana, F.; Maaytová, A. (2012). Starting points for creating a transparent and non-corruption public procurement system. Ekonomický
časopis, 60(7), 732-745.
Ochrana, F.; Pavel, J. (2013). Analysis of the impact of transparency, corruption, openness in competition and tender procedures on public
procurement in the Czech Republic. Central European Journal of Public Policy, 7(2), 114-134.
Oruezabala, G.; Rico, J. C. (2012). The impact of sustainable public procurement on supplier management — The case of French public
hospitals. Industrial Marketing Management, 41(4), 573-580. https://doi.org/10.1016/j.indmarman.2012.04.004
Petruželka, B.; Barták, M. (2019). Potential Indicators for the Analysis of the Association between Public Health and Drug Market Policing
in the Czech Republic: Review of Public Health Indicators. Adiktologie, 19(1–2), 135–143. https://doi.org/doi/10.35198/01-2019-003-0001
Plaček M.; Nemec J.; Ochrana F.; Schmidt M.; Půček M. (2020). Analysis of Factors of Overpricing in Public Procurement: A Study for
Low-Performing EU Countries. In: Farazmand A. (eds) Global Encyclopedia of Public Administration, Public Policy, and Governance.
Springer, Cham. https://doi.org/10.1007/978-3-319-31816-5_3909-1
Predkiewicz, P.; Bem, A.; Ucieklak-Jez, P.; Siedlecki, R. (2019). Public or Private? Which Source of Financing Helps to Achieve Higher
Health System Efficiency? Contemporary Trends and Challenges in Finance. Springer Proceedings in Business and Economics 2019. Ed.
Jajuga, K; LocarekJunge, H; Orlowski, LT; Staehr, K. 2019, 191-199. https://doi.org/10.1007/978-3-030-15581-0_18
SK+MED (2020). Stanovisko k problematike verejného obstarávania medicínskych technológií a zdravotníckych pomôcok (Opinion on the
issue of public procurement of medical technologies and medical devices). Available online: http://www.skmed.sk/files/Tezy_VO.pdf
Stefko, R.; Gavurova, B.; Kocisova, K. (2018). Healthcare efficiency assessment using DEA analysis in the Slovak Republic. Health
Economics Review, 8(1), 6. https://doi.org/10.1186/s13561-018-0191-9
Stefko, R.; Gavurova, B.; Korony, S. (2016). Efficiency Measurement in Healthcare Work Management Using Malmquist Indices. Polish
Journal of Management Studies, 13(1), 168-180. https://doi.org/10.17512/pjms.2016.13.1.16
Šumpíková, M.; Ďurčeková, I. Transaction Costs, Outsourcing, and the Public Procurement Review Process in the Czech Republic and
Slovakia. NISPAcee Journal of Public Administration and Policy 2019, 12(2), 233-250. https://doi.org/10.2478/nispa-2019-0021
Triantafillou, P. (2007). Benchmarking in the public sector: a critical conceptual framework. Public Administration Journal, 85(3), 829–
846. https://doi.org/10.1111/j.1467-9299.2007.00669.x
Ucieklak-Jez, P.; Bem, A. (2020). Does "Rural" Always Mean the Same? Macrosocial Determinants of Rural Populations' Health in
Poland. International Journal of Environmental Research and Public Health, 17(2), 397. https://doi.org/10.3390/ijerph17020397
ENTREPRENEURSHIP AND SUSTAINABILITY ISSUES
ISSN 2345-0282 (online) http://jssidoi.org/jesi/
2021 Volume 8 Number 3 (March)
http://doi.org/10.9770/jesi.2021.8.3(11)
209
Ucieklak-Jez, P.; Bem, A.; Siedlecki, R.; Predkiewicz, P. (2018). Concentration of Hospital Infrastructural Resources as a Source of
Inequalities in Access to Health Care Benefits in Poland. Finance and Sustainability. Ed. Bem, A; Daszynska Zygadlo, K; Hajdikova, T;
Juhasz, P. Springer Proceedings in Business and Economics, 1-10. https://doi.org/10.1007/978-3-319-92228-7_1
Vasconcelos, V.V. (2021). Social justice and sustainable regional development: reflections on discourse and practice in public policies and
public budget. Insights into Regional Development, 3(1), 10-28. https://doi.org/10.9770/IRD.2021.3.1(1)
Weszl, M.; Rencz, F.; Brodszky, V. Is the trend of increasing use of patient-reported outcome measures in medical device studies the sign
of shift towards value-based purchasing in Europe? The European Journal of Health Economics 2019, 20 (Suppl 1): S133–S140.
https://doi.org/10.1007/s10198-019-01070-1
Zavadil, M.; Rogalewicz, V.; Vaclavikova, A.; Gavurova, B.; Bilan, S. (2020). Application on HB-HTA Methods in an Economic
Quantification of Processes Covering Laboratory Technology in Hospitals. Transformations in Business & Economics, 19(1).
Acknowledgements
This research was supported by the Internal Grant Agency of FaME Tomas Bata University in Zlin: RVO/2020: “Economic
quantification of marketing processes that focus on value increase for a patient in a process of system creation to measure
and control efficiency in health facilities in the Czech Republic”.
Beata GAVUROVA
ORCID ID: https://orcid.org/0000-0002-0606-879X
Matus KUBAK
ORCID ID: https://orcid.org/0000-0003-1438-479X
Make your research more visible, join the Twitter account of ENTREPRENEURSHIP AND SUSTAINABILITY ISSUES:
@Entrepr69728810
Copyright © 2021 by author(s) and VsI Entrepreneurship and Sustainability Center
This work is licensed under the Creative Commons Attribution International License (CC BY).
http://creativecommons.org/licenses/by/4.0/
ENTREPRENEURSHIP AND SUSTAINABILITY ISSUES
ISSN 2345-0282 (online) http://jssidoi.org/jesi/
2021 Volume 8 Number 3 (March)
http://doi.org/10.9770/jesi.2021.8.3(12)
Publisher http://jssidoi.org/esc/home
210
CHARACTERISTICS OF DISTANCE WORK ORGANIZATION IN SMES DURING THE COVID-19
LOCKDOWN: CASE OF WESTERN LITHUANIA REGION*
Giedrė Strakšienė ¹, Henrika Ruginė 2, Laura Šaltytė-Vaisiauskė 3
1, 2, 3 Klaipėda University, H. Manto 84, Lithuania
E-mails:1 [email protected] ; 2 [email protected] ; 3 [email protected]
Received 10 December 2020; accepted 28 January 2021; published 30 March 2021
Abstract: The article is based on the findings of the applied research project Assessment of the Effectiveness of COVID-19-Related
Restrictions on Economic Activity and the Impact of State Intervention Measures on Enterprises in the Klaipėda Region (No. P-COV-20-
51). The aim of the research is to reveal the characteristics of distance work in small and medium business enterprises of Klaipėda Region
in the context of COVID-19. The main research question focuses on how the variety of work activities be realized in distance way and to
what extent is it effective? To identify the situation, a mixed research methodology, quantitative (questionnaire) and qualitative (focus
group) research methods were used. 73 business entities participated in the survey, and 7 focus group discussions were organised remotely
in 7 municipalities, with the participation of 61 respondents (on average, 8 in each group). The research findings revealed that the problems
of distance work in SME‘s were generally an under-researched topic, and the definition and concept of distance work varied. Problems
emerged that could be divided into two subgroups: the first related to the IT infrastructure(a shortage of equipment, Internet disruption and
the resulting increased costs), while the second subgroup concerned mainly human factors (the issues of employees' communication skills
and attitudes or emotions when working remotely, lack of methodology for organising distance work, etc.). It is worth adding that, in the
course of the current research, identification of a broader field of problems and discussions of their causes were possible due to the
cooperation of researchers-representatives of various scientific areas.
Keywords: distance work; COVID-19; small and medium enterprise (SME)
Reference to this paper should be made as follows: Strakšienė, G., Ruginė, H., Šaltytė-Vaisiauskė, L. 2021. Characteristics of distance
work organization in smes during the Covid-19 lockdown: case of western Lithuania region. Entrepreneurship and Sustainability Issues,
8(3), 210-225. http://doi.org/10.9770/jesi.2021.8.3(12)
JEL Classifications: O32, O33, O15, O11
* This research was funded by Lithuania Research Council, grant number P-COV-20-5
ENTREPRENEURSHIP AND SUSTAINABILITY ISSUES
ISSN 2345-0282 (online) http://jssidoi.org/jesi/
2021 Volume 8 Number 3 (March)
http://doi.org/10.9770/jesi.2021.8.3(12)
211
1. Introduction
The idea of distance-work (referred to also as e-work; telework, remote work) is closely related to the
development of the knowledge society in Europe. The Lisbon Strategy (2000) highlighted the importance of
creating "to become the most dynamic and competitive knowledge-based economy in the world by 2010 capable
of sustainable economic growth with more and better jobs and greater social cohesion and respect for the
environment". Burbules and Callister (2000) argued that the Internet had been increasingly becoming a working
space where common tasks could be developed and simulation and visualisation-based information could be
designed, able to show interaction in a complicated situation.
In the early 21st century, about 27% of new jobs were created using flexible forms of employment in the United
States (about 18% in the EU), and the role of such forms has been steadily growing (Gruževskis, 2001). Typical
forms of such a type of employment are usually characterised by non-standard working time, specific
employment contracts, or other less common employment and/or labour relations; they appear to be the least
popular in Bulgaria, Estonia, and Latvia (accounting for approximately 13-15%) (Miežienė, Gruževskis, 2016).
According to Nakrošienė and E. Butkevičienė’s (2016) survey performed in 2015, 12,5 % of the respondents tried
to combine distance and face-to-face work, while part of them (9,3%) spent most of the working day either in
their offices or other workplaces that were not at home. The research data proved that, in Lithuania, only 2% of
the respondents worked fully from home. In accordance with Eurostat results, employees that usually worked
from home accounted for approximately 0.9% of all employees in 2015. That type of employment had
insignificantly decreased in Lithuania over the past years. As demonstrated by Eurostat figures, working from
home was much more widespread in other EU countries (in 2015, the EU-28 average was 2.5%). The highest
prevalence of working from home was found in the Netherlands (with 8.4% employees regularly working from
home in 2015), Finland (7.5%), Austria, and Denmark (5.9%), whereas Bulgaria, Romania, and Latvia reported
the lowest prevalence of that type of employment (0.2%, 0.4%, and 0.5%, respectively) (Miežienė, Gruževskis,
2016). The draft LLC (the Lithuanian Labour Code) approved on 21 June 2016 contained, in addition to other
novelties, certain amendments to the types of employment contracts (Miežienė, Gruževskis, 2016).
With the onset of the COVID-19 pandemic and lockdown, the sudden increase in the number of distance workers
in various companies and institutions became a serious test. Research in distance work proved that in Lithuania,
similarly to Europe about 40% of people on average worked remotely during the pandemic. It must be agreed that
the COVID-19 pandemic made it possible to quickly and to a large extent reveal the advantages and
disadvantages of distance work in the Lithuanian labour market. Kwon and Jeon (2020) researched that for
successful implementation of telework programs, leaders, managers, and supervisors should provide consistent
and substantive support for telework programs. For instance, they can develop appropriate legal and policy
guidelines to facilitate tools that encourage cooperation, collaboration, and virtual interactions with and among
teleworkers who may easily feel isolated due to a lack of interaction with coworkers.
One of the main issues of the contemporary distance work is being aware of requirements of constantly changing
life and work, understanding trends of ICT development and managing to apply them for distance work in order
to improve working quality. It is often discussed whether distance work keep up with ICT development and make
opportunities offered by them? Another important question is, can the variety of work activities be realized in
distance way and to what extent is it effective?
The above circumstances make it possible to argue that distance work in SMEs, as the object of research, is
specific. On the one hand, the inadequacy of such research is due to the diversity of the concept of distance work,
still prevalent in social sciences (distance work, e-work; telework, remote work), on the other hand, the research is
encumbered by the fact that the COVID-19 pandemic has not ended and that economic restrictions are still in
ENTREPRENEURSHIP AND SUSTAINABILITY ISSUES
ISSN 2345-0282 (online) http://jssidoi.org/jesi/
2021 Volume 8 Number 3 (March)
http://doi.org/10.9770/jesi.2021.8.3(12)
212
place. Moreover, there is a shortage of specific and tested diagnostic tools (research instruments) to assess the
changes in distance work and the impact on SMEs in the context of the COVID-19 economic constraints.
The aim of the research is to reveal the characteristics of distance work in small and medium business enterprises
of Klaipėda Region in the context of COVID-19.
In order to achieve the goal, the following objectives have been set:
To specify the concept of distance work;
To analyse the changes in the nature of distance work under the COVID -19 circumstances;
To define the specificity of distance work organisation by sector of activity (production, trade,or
services);
To highlight the advantages and disadvantages of distance work and its prospects.
2. Review of phenomenon of distance work
Distance work is a complicated and complex social phemonenon. The practices of recent years as well as research
testified to a slow transition from the traditional to distance work organisation. The transition to distance work
indicates also profound social and cultural changes that fundamentally modify not only the concept of work
organisation but also of work itself. An essential trait of distance work is openness and provision of opportunities
to work from different places and at different times. In order to analyse distance work, first of all, we need to look
into a range of terms that are used to describe working from various other places than office. Telework, as a form
of virtual work, involves working away from the office using computer technology to interact and communicate
with others. Although the duration of teleworking time can vary, it generally involves working from home or
another alternate location for part of a working week, spending the rest of the time in the corporate office. While
telework often entails working from home, it also includes working from other remote locations such as a client
office, airport, telework centre, or hotel (Golden, 2009). A number of various terms are currently in use to
describe e-working, including: e-worker (mostly used in the UK), teleworking or teleworker and telecommuting
(which originated in North America). All of these refer to the ability to work flexibly using remote technology to
communicate with the workplace. Lately, agile working has been added to the terminology (Gillies, 2011).
Telecommuting involves working solely from home instead of commuting to the office place (Golden, 2009). As
defined by Grant at al. (2013), the term remote e-worker is used to describe individuals who use technology to
work remotely from the main group office at any time or place. The terms like virtual teamwork, or telework, are
most commonly operationalised as the dispersion of workers from their coworkers or teammates, including
dispersion across locations, time, and/or organizational boundaries (Gilson, 2015). The term distance work refers
to paid work that is done outside the actual workplace, such as at home or when travelling on the train, and
generally involves use of information technology. By its nature, distance work can also be performed at the
workplace. Sullivan (2003) states that homebased telework refers specifically to telework carried out from home
and is further categorized based on frequency into regular, alternate and occasional.
The opportunity of working from nearly anywhere and at any time was enabled by an increased reliance upon
technology to conduct work activities (Golden, 2009). Arvola at al. (2017) state that on the one hand, telework
suits better to experienced employees as working alone is easier compared to less experienced employees and they
need less help from the colleagues regarding their job-related issues on the other hand, older people have more
challenges with using ICT. Technology has developed to such a degree that a large amount of work can be
completed at any time of day or place, thus the terminology may not be quite as important as the actual working
practices (Grant at al. 2019). Golden (2009) notes that teleworking and telecommuting involve computers with
job-specific software, phones, and other handheld electronic devices as well as and high-speed remote access to
corporate databases. Bathini and Kandathil (2019) argue that although as per the dominant discourse telework
provides flexibility to employees, often, it is not effective in practice. On the contrary, for firms, telework
ENTREPRENEURSHIP AND SUSTAINABILITY ISSUES
ISSN 2345-0282 (online) http://jssidoi.org/jesi/
2021 Volume 8 Number 3 (March)
http://doi.org/10.9770/jesi.2021.8.3(12)
213
provides flexibility in practice; yet, this employer benefit does not figure in the dominant discourse. Distant work
can be kind of a tool to solve general unemployment problems. Hunton at al. (2010) after their research reported a
positive association between organizational commitment and task performance across the treatment conditions
and found that organizational commitment mediates the relationship between the telework arrangements and task
performance. Fleetwood (2007) states that one causal factor that has received attention relates to working women.
The (slight) changes in social attitudes and recent government attempts to “help” women back into work (driven
as much by labour market shortages as a conversion to feminism) have encouraged millions of women to enter
mainly part-time paid work. Both organizational adoption and employee participation in telework have a positive
relationship with job satisfaction, and these results support the social exchange theory (Kwang at al., 2016).
Kwang at al. (2016) also observe that the effects of decoupling of telework on job satisfaction are more significant
for female public employees than for male public employees. Mas-Machuca at al. (2016) research findings
suggest fostering organizational pride to increase job satisfaction and for companies to have the same proportion
of women and men in high levels of responsibility due to problems related with work-life balance.
Remote e-working or distance working is usually associated with the positive effects of improved productivity,
flexible approaches to work, a reduction in work-life conflict, and an increase in job satisfaction, many of these
being mediated by a reduction in commuting aiding a better balance between work and non-working lives (Grant
at all., 2013). Morganson at all. (2010) performed research that showed that main office and home‐based workers
had similar high levels of work-life balance (WLB) support and job satisfaction. Additionally, main office
workers reported the highest levels of workplace inclusion (Morganson at al.,2010). Vitola at al. (2013)
performed research in Latvia and research shows that the majority of working age people in cities as well as in
rural areas is willing to be involved in telework and people in less populated areas are interested in socializing and
networking activities. According to Vitola at al. (2013) smart work remains to be largely urban phenomena.
In Gallancherand and Hossain’s (2020) estimation, 41% of jobs in Canada can be done from home and, when
weighted by wages, the percentage increases to 51%; Dingel and Neiman (2020) estimate the percentage of jobs
that can be done from home in the United States at 37 percent. Vrchota at al. (2019) analyzing telework in Czech
companies found out that telework is more used in foreign companies (not specified whether it is a minority or
majority share), for instance German companies.
3. Research methodology
The methodological paradigm was based on mixed-method research Creswell, John & Plano Clark, Vicki (2011):
Paradigm of quanti tat ive research . Quantitative research is characterised by a large bulk of
statistical data and employment of standardised procedures; numerical values are assigned to the research objects
or their relationships. Quantitative research was applied to verify and confirm the essential features of the research
and to substantiate causal connections of the phenomena statistically.
Paradigm of quali tat ive research. Qualitative research was used with the purpose of describing the
object, obtaining as many as possible diverse data and, based on them, generating ideas and highlighting
problems.
The following methods were chosen to solve the research objectives:
An analysis of scientific literature was performed to reveal the theoretical basis of the research problem;
for the purpose, economic and sociological articles and publications on distance work in international scientific
journals, databases, and the EU and the Republic of Lithuania documents on distance work regulation were
analysed.
A survey in writing (questionnaire) was used to interview representatives of business entities (SMEs
managers and executives) to identify the situation and changes in distance work during the COVID-19 pandemic.
(Authors' note: The total questionnaire was composed of four blocks of questions in order to find out: the
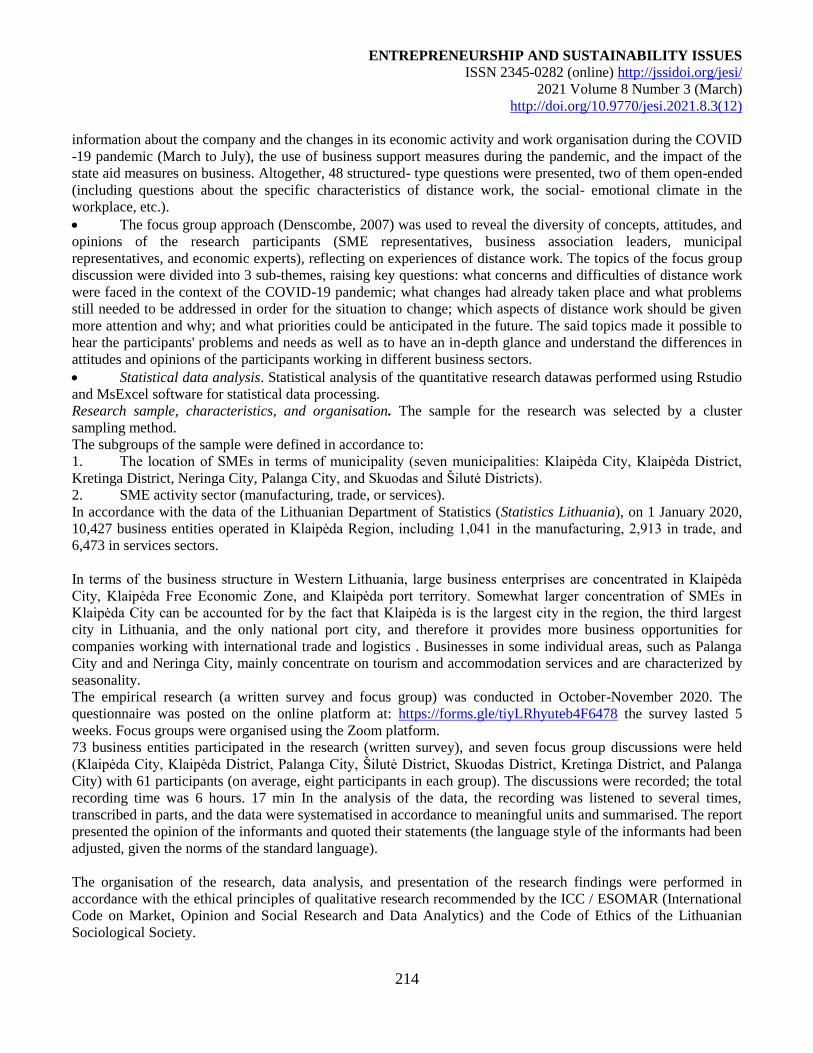
ENTREPRENEURSHIP AND SUSTAINABILITY ISSUES
ISSN 2345-0282 (online) http://jssidoi.org/jesi/
2021 Volume 8 Number 3 (March)
http://doi.org/10.9770/jesi.2021.8.3(12)
214
information about the company and the changes in its economic activity and work organisation during the COVID
-19 pandemic (March to July), the use of business support measures during the pandemic, and the impact of the
state aid measures on business. Altogether, 48 structured- type questions were presented, two of them open-ended
(including questions about the specific characteristics of distance work, the social- emotional climate in the
workplace, etc.).
The focus group approach (Denscombe, 2007) was used to reveal the diversity of concepts, attitudes, and
opinions of the research participants (SME representatives, business association leaders, municipal
representatives, and economic experts), reflecting on experiences of distance work. The topics of the focus group
discussion were divided into 3 sub-themes, raising key questions: what concerns and difficulties of distance work
were faced in the context of the COVID-19 pandemic; what changes had already taken place and what problems
still needed to be addressed in order for the situation to change; which aspects of distance work should be given
more attention and why; and what priorities could be anticipated in the future. The said topics made it possible to
hear the participants' problems and needs as well as to have an in-depth glance and understand the differences in
attitudes and opinions of the participants working in different business sectors.
Statistical data analysis. Statistical analysis of the quantitative research datawas performed using Rstudio
and MsExcel software for statistical data processing.
Research sample, characteristics, and organisation. The sample for the research was selected by a cluster
sampling method.
The subgroups of the sample were defined in accordance to:
1. The location of SMEs in terms of municipality (seven municipalities: Klaipėda City, Klaipėda District,
Kretinga District, Neringa City, Palanga City, and Skuodas and Šilutė Districts).
2. SME activity sector (manufacturing, trade, or services).
In accordance with the data of the Lithuanian Department of Statistics (Statistics Lithuania), on 1 January 2020,
10,427 business entities operated in Klaipėda Region, including 1,041 in the manufacturing, 2,913 in trade, and
6,473 in services sectors.
In terms of the business structure in Western Lithuania, large business enterprises are concentrated in Klaipėda
City, Klaipėda Free Economic Zone, and Klaipėda port territory. Somewhat larger concentration of SMEs in
Klaipėda City can be accounted for by the fact that Klaipėda is is the largest city in the region, the third largest
city in Lithuania, and the only national port city, and therefore it provides more business opportunities for
companies working with international trade and logistics . Businesses in some individual areas, such as Palanga
City and and Neringa City, mainly concentrate on tourism and accommodation services and are characterized by
seasonality.
The empirical research (a written survey and focus group) was conducted in October-November 2020. The
questionnaire was posted on the online platform at: https://forms.gle/tiyLRhyuteb4F6478 the survey lasted 5
weeks. Focus groups were organised using the Zoom platform.
73 business entities participated in the research (written survey), and seven focus group discussions were held
(Klaipėda City, Klaipėda District, Palanga City, Šilutė District, Skuodas District, Kretinga District, and Palanga
City) with 61 participants (on average, eight participants in each group). The discussions were recorded; the total
recording time was 6 hours. 17 min In the analysis of the data, the recording was listened to several times,
transcribed in parts, and the data were systematised in accordance to meaningful units and summarised. The report
presented the opinion of the informants and quoted their statements (the language style of the informants had been
adjusted, given the norms of the standard language).
The organisation of the research, data analysis, and presentation of the research findings were performed in
accordance with the ethical principles of qualitative research recommended by the ICC / ESOMAR (International
Code on Market, Opinion and Social Research and Data Analytics) and the Code of Ethics of the Lithuanian
Sociological Society.
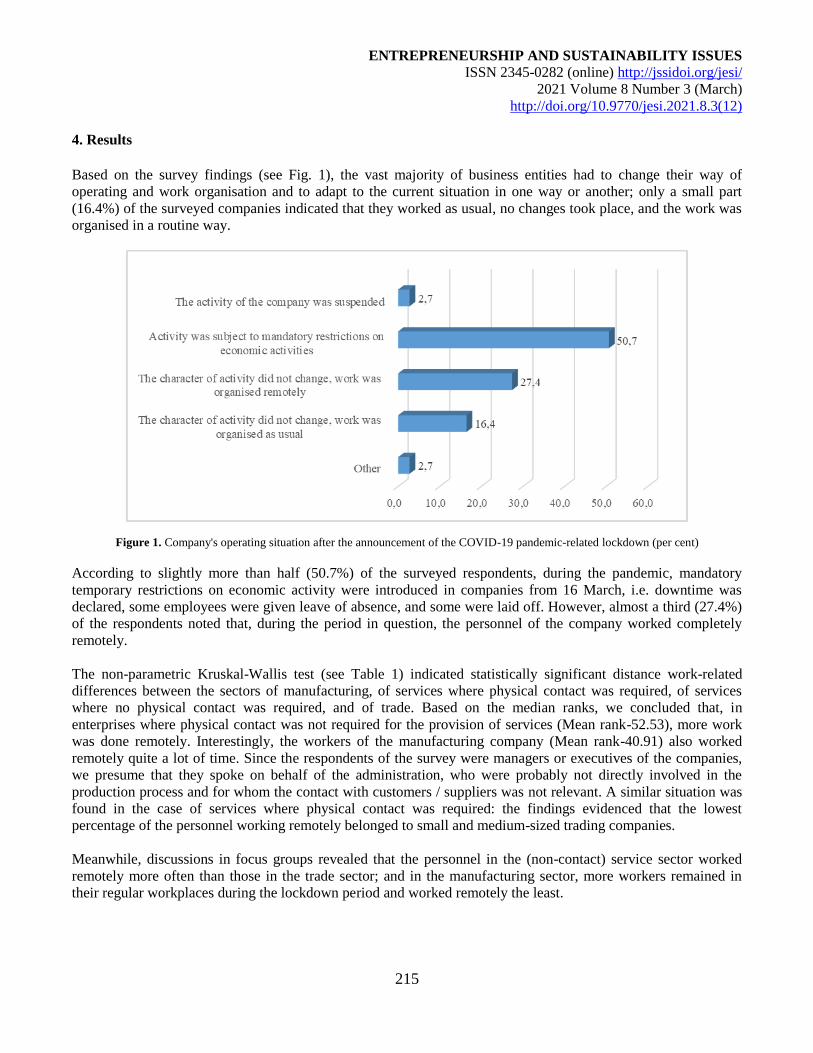
ENTREPRENEURSHIP AND SUSTAINABILITY ISSUES
ISSN 2345-0282 (online) http://jssidoi.org/jesi/
2021 Volume 8 Number 3 (March)
http://doi.org/10.9770/jesi.2021.8.3(12)
215
4. Results
Based on the survey findings (see Fig. 1), the vast majority of business entities had to change their way of
operating and work organisation and to adapt to the current situation in one way or another; only a small part
(16.4%) of the surveyed companies indicated that they worked as usual, no changes took place, and the work was
organised in a routine way.
Figure 1. Company's operating situation after the announcement of the COVID-19 pandemic-related lockdown (per cent)
According to slightly more than half (50.7%) of the surveyed respondents, during the pandemic, mandatory
temporary restrictions on economic activity were introduced in companies from 16 March, i.e. downtime was
declared, some employees were given leave of absence, and some were laid off. However, almost a third (27.4%)
of the respondents noted that, during the period in question, the personnel of the company worked completely
remotely.
The non-parametric Kruskal-Wallis test (see Table 1) indicated statistically significant distance work-related
differences between the sectors of manufacturing, of services where physical contact was required, of services
where no physical contact was required, and of trade. Based on the median ranks, we concluded that, in
enterprises where physical contact was not required for the provision of services (Mean rank-52.53), more work
was done remotely. Interestingly, the workers of the manufacturing company (Mean rank-40.91) also worked
remotely quite a lot of time. Since the respondents of the survey were managers or executives of the companies,
we presume that they spoke on behalf of the administration, who were probably not directly involved in the
production process and for whom the contact with customers / suppliers was not relevant. A similar situation was
found in the case of services where physical contact was required: the findings evidenced that the lowest
percentage of the personnel working remotely belonged to small and medium-sized trading companies.
Meanwhile, discussions in focus groups revealed that the personnel in the (non-contact) service sector worked
remotely more often than those in the trade sector; and in the manufacturing sector, more workers remained in
their regular workplaces during the lockdown period and worked remotely the least.
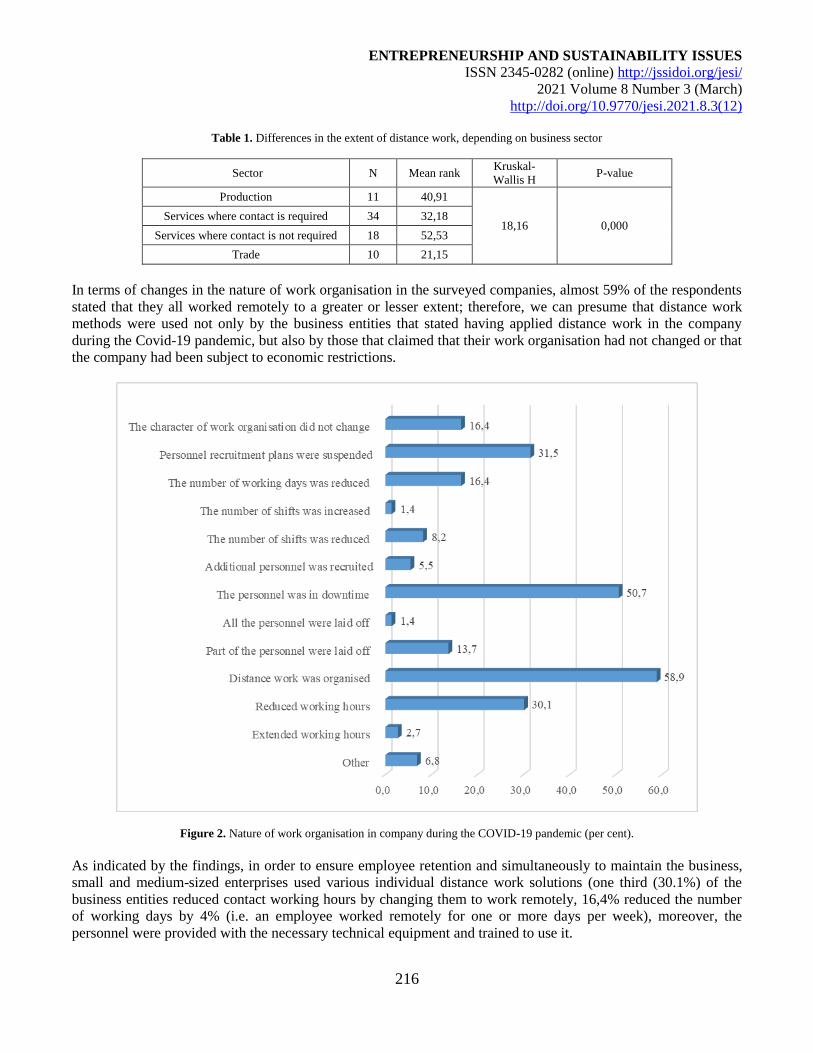
ENTREPRENEURSHIP AND SUSTAINABILITY ISSUES
ISSN 2345-0282 (online) http://jssidoi.org/jesi/
2021 Volume 8 Number 3 (March)
http://doi.org/10.9770/jesi.2021.8.3(12)
216
Table 1. Differences in the extent of distance work, depending on business sector
Sector N Mean rank Kruskal-
Wallis H P-value
Production 11 40,91
18,16 0,000 Services where contact is required 34 32,18
Services where contact is not required 18 52,53
Trade 10 21,15
In terms of changes in the nature of work organisation in the surveyed companies, almost 59% of the respondents
stated that they all worked remotely to a greater or lesser extent; therefore, we can presume that distance work
methods were used not only by the business entities that stated having applied distance work in the company
during the Covid-19 pandemic, but also by those that claimed that their work organisation had not changed or that
the company had been subject to economic restrictions.
Figure 2. Nature of work organisation in company during the COVID-19 pandemic (per cent).
As indicated by the findings, in order to ensure employee retention and simultaneously to maintain the business,
small and medium-sized enterprises used various individual distance work solutions (one third (30.1%) of the
business entities reduced contact working hours by changing them to work remotely, 16,4% reduced the number
of working days by 4% (i.e. an employee worked remotely for one or more days per week), moreover, the
personnel were provided with the necessary technical equipment and trained to use it.
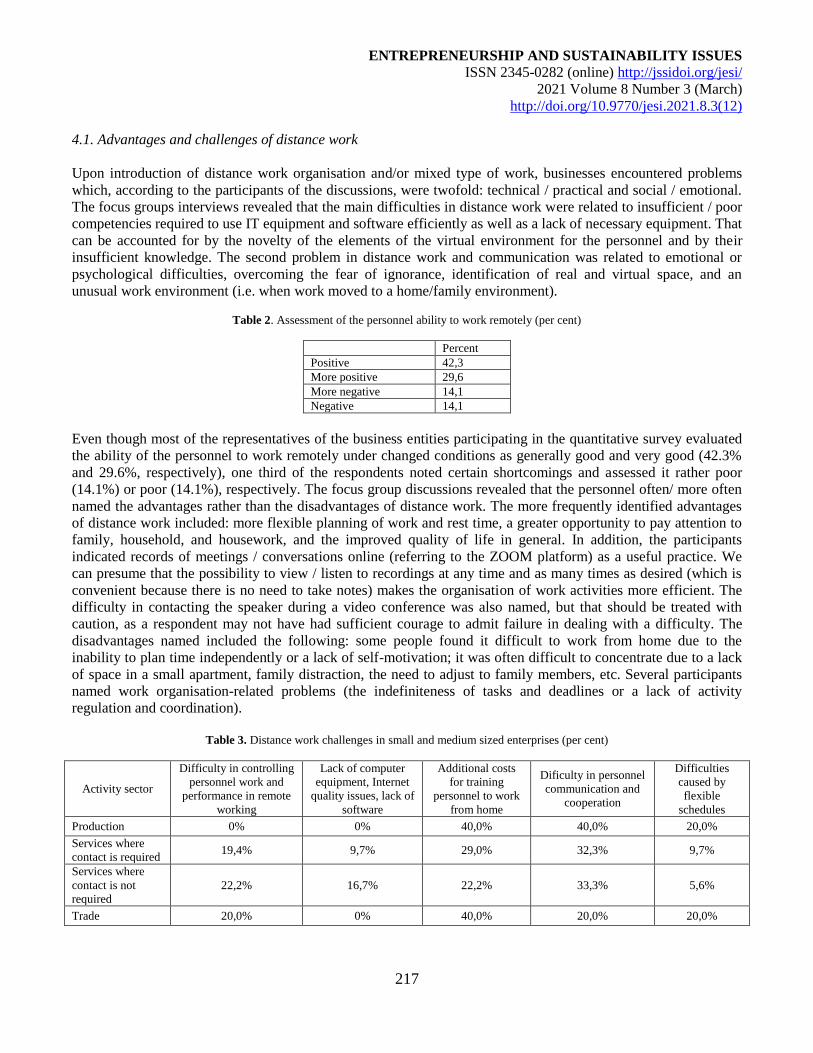
ENTREPRENEURSHIP AND SUSTAINABILITY ISSUES
ISSN 2345-0282 (online) http://jssidoi.org/jesi/
2021 Volume 8 Number 3 (March)
http://doi.org/10.9770/jesi.2021.8.3(12)
217
4.1. Advantages and challenges of distance work
Upon introduction of distance work organisation and/or mixed type of work, businesses encountered problems
which, according to the participants of the discussions, were twofold: technical / practical and social / emotional.
The focus groups interviews revealed that the main difficulties in distance work were related to insufficient / poor
competencies required to use IT equipment and software efficiently as well as a lack of necessary equipment. That
can be accounted for by the novelty of the elements of the virtual environment for the personnel and by their
insufficient knowledge. The second problem in distance work and communication was related to emotional or
psychological difficulties, overcoming the fear of ignorance, identification of real and virtual space, and an
unusual work environment (i.e. when work moved to a home/family environment).
Table 2. Assessment of the personnel ability to work remotely (per cent)
Percent
Positive 42,3
More positive 29,6
More negative 14,1
Negative 14,1
Even though most of the representatives of the business entities participating in the quantitative survey evaluated
the ability of the personnel to work remotely under changed conditions as generally good and very good (42.3%
and 29.6%, respectively), one third of the respondents noted certain shortcomings and assessed it rather poor
(14.1%) or poor (14.1%), respectively. The focus group discussions revealed that the personnel often/ more often
named the advantages rather than the disadvantages of distance work. The more frequently identified advantages
of distance work included: more flexible planning of work and rest time, a greater opportunity to pay attention to
family, household, and housework, and the improved quality of life in general. In addition, the participants
indicated records of meetings / conversations online (referring to the ZOOM platform) as a useful practice. We
can presume that the possibility to view / listen to recordings at any time and as many times as desired (which is
convenient because there is no need to take notes) makes the organisation of work activities more efficient. The
difficulty in contacting the speaker during a video conference was also named, but that should be treated with
caution, as a respondent may not have had sufficient courage to admit failure in dealing with a difficulty. The
disadvantages named included the following: some people found it difficult to work from home due to the
inability to plan time independently or a lack of self-motivation; it was often difficult to concentrate due to a lack
of space in a small apartment, family distraction, the need to adjust to family members, etc. Several participants
named work organisation-related problems (the indefiniteness of tasks and deadlines or a lack of activity
regulation and coordination).
Table 3. Distance work challenges in small and medium sized enterprises (per cent)
Activity sector
Difficulty in controlling
personnel work and
performance in remote
working
Lack of computer
equipment, Internet
quality issues, lack of
software
Additional costs
for training
personnel to work
from home
Dificulty in personnel
communication and
cooperation
Difficulties
caused by
flexible
schedules
Production 0% 0% 40,0% 40,0% 20,0%
Services where
contact is required 19,4% 9,7% 29,0% 32,3% 9,7%
Services where
contact is not
required
22,2% 16,7% 22,2% 33,3% 5,6%
Trade 20,0% 0% 40,0% 20,0% 20,0%
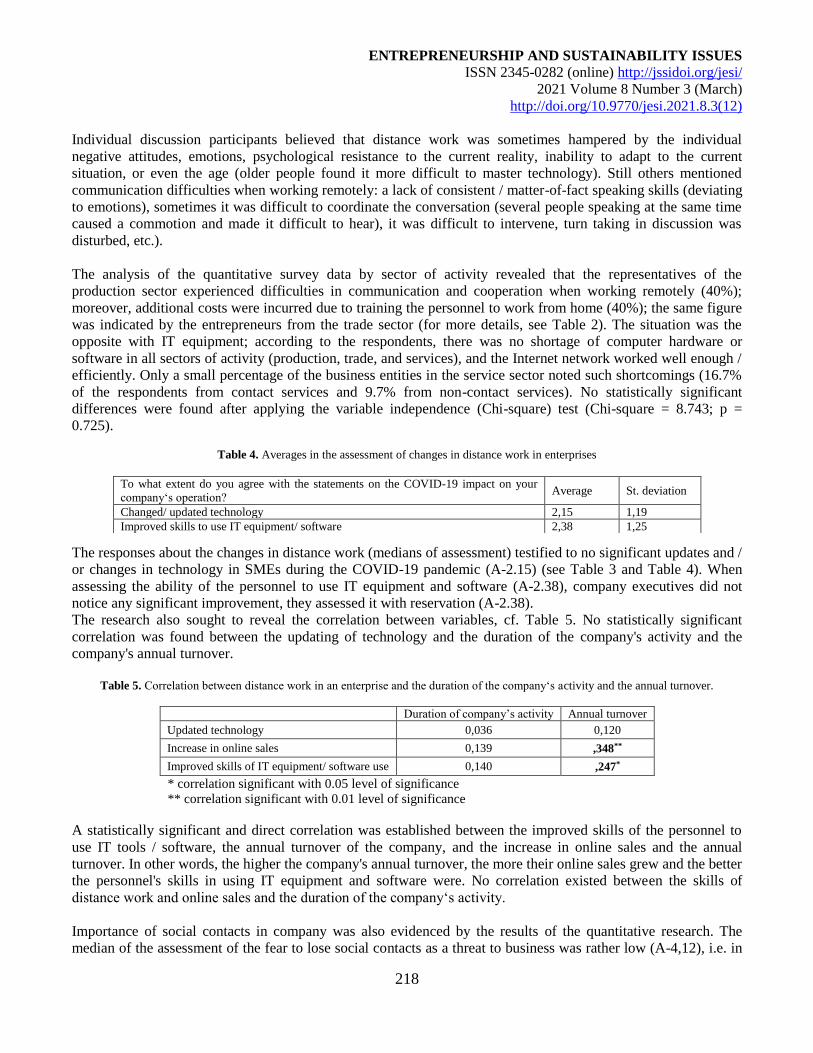
ENTREPRENEURSHIP AND SUSTAINABILITY ISSUES
ISSN 2345-0282 (online) http://jssidoi.org/jesi/
2021 Volume 8 Number 3 (March)
http://doi.org/10.9770/jesi.2021.8.3(12)
218
Individual discussion participants believed that distance work was sometimes hampered by the individual
negative attitudes, emotions, psychological resistance to the current reality, inability to adapt to the current
situation, or even the age (older people found it more difficult to master technology). Still others mentioned
communication difficulties when working remotely: a lack of consistent / matter-of-fact speaking skills (deviating
to emotions), sometimes it was difficult to coordinate the conversation (several people speaking at the same time
caused a commotion and made it difficult to hear), it was difficult to intervene, turn taking in discussion was
disturbed, etc.).
The analysis of the quantitative survey data by sector of activity revealed that the representatives of the
production sector experienced difficulties in communication and cooperation when working remotely (40%);
moreover, additional costs were incurred due to training the personnel to work from home (40%); the same figure
was indicated by the entrepreneurs from the trade sector (for more details, see Table 2). The situation was the
opposite with IT equipment; according to the respondents, there was no shortage of computer hardware or
software in all sectors of activity (production, trade, and services), and the Internet network worked well enough /
efficiently. Only a small percentage of the business entities in the service sector noted such shortcomings (16.7%
of the respondents from contact services and 9.7% from non-contact services). No statistically significant
differences were found after applying the variable independence (Chi-square) test (Chi-square = 8.743; p =
0.725).
Table 4. Averages in the assessment of changes in distance work in enterprises
The responses about the changes in distance work (medians of assessment) testified to no significant updates and /
or changes in technology in SMEs during the COVID-19 pandemic (A-2.15) (see Table 3 and Table 4). When
assessing the ability of the personnel to use IT equipment and software (A-2.38), company executives did not
notice any significant improvement, they assessed it with reservation (A-2.38).
The research also sought to reveal the correlation between variables, cf. Table 5. No statistically significant
correlation was found between the updating of technology and the duration of the company's activity and the
company's annual turnover.
Table 5. Correlation between distance work in an enterprise and the duration of the company‘s activity and the annual turnover.
Duration of company’s activity Annual turnover
Updated technology 0,036 0,120
Increase in online sales 0,139 ,348**
Improved skills of IT equipment/ software use 0,140 ,247*
* correlation significant with 0.05 level of significance
** correlation significant with 0.01 level of significance
A statistically significant and direct correlation was established between the improved skills of the personnel to
use IT tools / software, the annual turnover of the company, and the increase in online sales and the annual
turnover. In other words, the higher the company's annual turnover, the more their online sales grew and the better
the personnel's skills in using IT equipment and software were. No correlation existed between the skills of
distance work and online sales and the duration of the company‘s activity.
Importance of social contacts in company was also evidenced by the results of the quantitative research. The
median of the assessment of the fear to lose social contacts as a threat to business was rather low (A-4,12), i.e. in
To what extent do you agree with the statements on the COVID-19 impact on your
company‘s operation? Average St. deviation
Changed/ updated technology 2,15 1,19
Improved skills to use IT equipment/ software 2,38 1,25
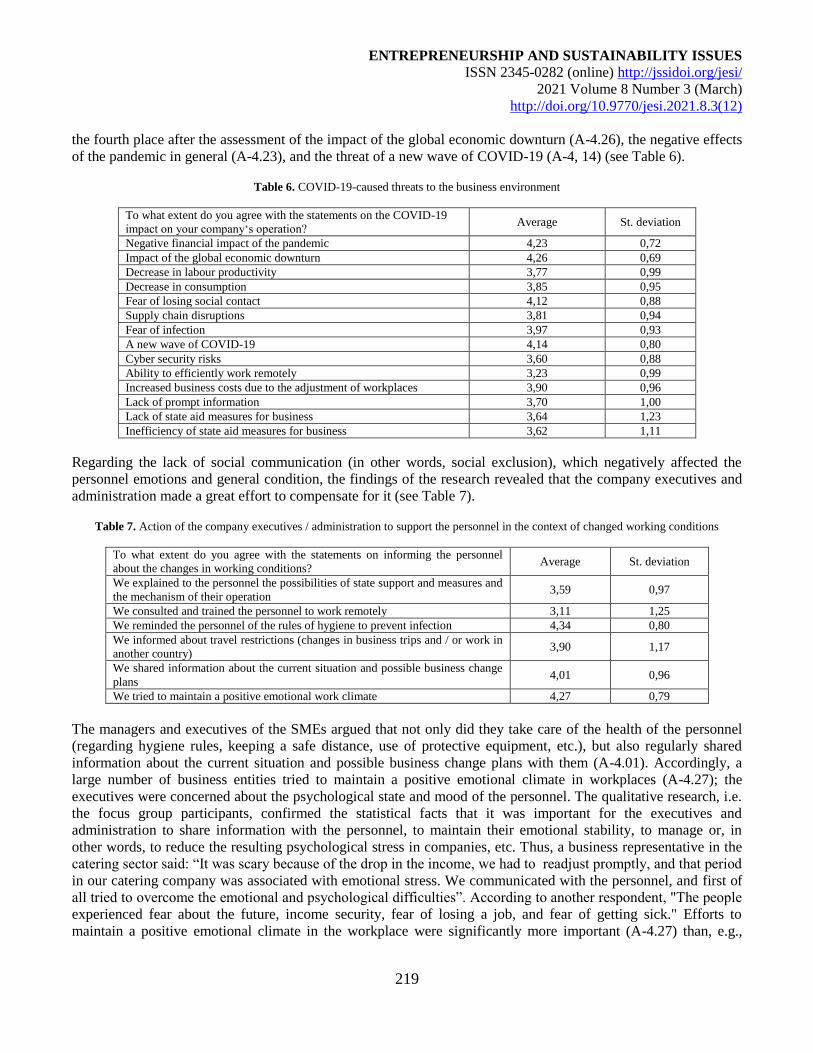
ENTREPRENEURSHIP AND SUSTAINABILITY ISSUES
ISSN 2345-0282 (online) http://jssidoi.org/jesi/
2021 Volume 8 Number 3 (March)
http://doi.org/10.9770/jesi.2021.8.3(12)
219
the fourth place after the assessment of the impact of the global economic downturn (A-4.26), the negative effects
of the pandemic in general (A-4.23), and the threat of a new wave of COVID-19 (A-4, 14) (see Table 6).
Table 6. COVID-19-caused threats to the business environment
To what extent do you agree with the statements on the COVID-19
impact on your company‘s operation? Average St. deviation
Negative financial impact of the pandemic 4,23 0,72
Impact of the global economic downturn 4,26 0,69
Decrease in labour productivity 3,77 0,99
Decrease in consumption 3,85 0,95
Fear of losing social contact 4,12 0,88
Supply chain disruptions 3,81 0,94
Fear of infection 3,97 0,93
A new wave of COVID-19 4,14 0,80
Cyber security risks 3,60 0,88
Ability to efficiently work remotely 3,23 0,99
Increased business costs due to the adjustment of workplaces 3,90 0,96
Lack of prompt information 3,70 1,00
Lack of state aid measures for business 3,64 1,23
Inefficiency of state aid measures for business 3,62 1,11
Regarding the lack of social communication (in other words, social exclusion), which negatively affected the
personnel emotions and general condition, the findings of the research revealed that the company executives and
administration made a great effort to compensate for it (see Table 7).
Table 7. Action of the company executives / administration to support the personnel in the context of changed working conditions
To what extent do you agree with the statements on informing the personnel
about the changes in working conditions? Average St. deviation
We explained to the personnel the possibilities of state support and measures and
the mechanism of their operation 3,59 0,97
We consulted and trained the personnel to work remotely 3,11 1,25
We reminded the personnel of the rules of hygiene to prevent infection 4,34 0,80
We informed about travel restrictions (changes in business trips and / or work in
another country) 3,90 1,17
We shared information about the current situation and possible business change
plans 4,01 0,96
We tried to maintain a positive emotional work climate 4,27 0,79
The managers and executives of the SMEs argued that not only did they take care of the health of the personnel
(regarding hygiene rules, keeping a safe distance, use of protective equipment, etc.), but also regularly shared
information about the current situation and possible business change plans with them (A-4.01). Accordingly, a
large number of business entities tried to maintain a positive emotional climate in workplaces (A-4.27); the
executives were concerned about the psychological state and mood of the personnel. The qualitative research, i.e.
the focus group participants, confirmed the statistical facts that it was important for the executives and
administration to share information with the personnel, to maintain their emotional stability, to manage or, in
other words, to reduce the resulting psychological stress in companies, etc. Thus, a business representative in the
catering sector said: “It was scary because of the drop in the income, we had to readjust promptly, and that period
in our catering company was associated with emotional stress. We communicated with the personnel, and first of
all tried to overcome the emotional and psychological difficulties”. According to another respondent, "The people
experienced fear about the future, income security, fear of losing a job, and fear of getting sick." Efforts to
maintain a positive emotional climate in the workplace were significantly more important (A-4.27) than, e.g.,
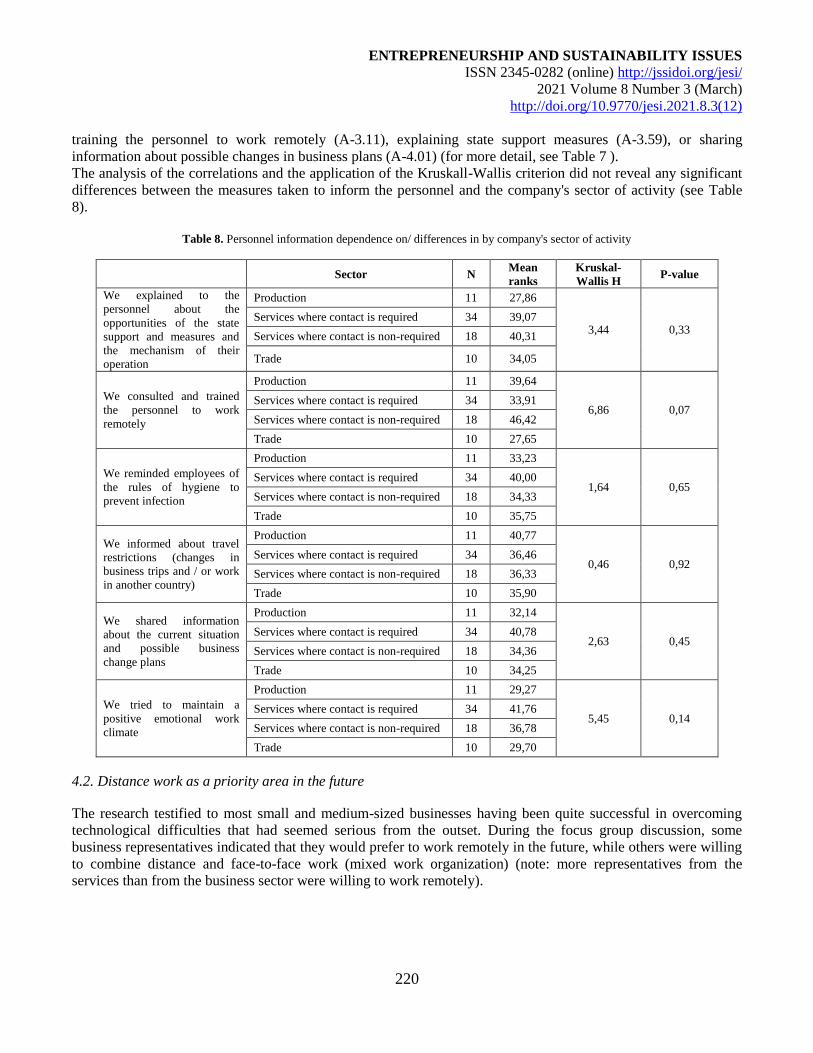
ENTREPRENEURSHIP AND SUSTAINABILITY ISSUES
ISSN 2345-0282 (online) http://jssidoi.org/jesi/
2021 Volume 8 Number 3 (March)
http://doi.org/10.9770/jesi.2021.8.3(12)
220
training the personnel to work remotely (A-3.11), explaining state support measures (A-3.59), or sharing
information about possible changes in business plans (A-4.01) (for more detail, see Table 7 ).
The analysis of the correlations and the application of the Kruskall-Wallis criterion did not reveal any significant
differences between the measures taken to inform the personnel and the company's sector of activity (see Table
8).
Table 8. Personnel information dependence on/ differences in by company's sector of activity
Sector N
Mean
ranks
Kruskal-
Wallis H P-value
We explained to the
personnel about the
opportunities of the state
support and measures and
the mechanism of their
operation
Production 11 27,86
3,44 0,33 Services where contact is required 34 39,07
Services where contact is non-required 18 40,31
Trade 10 34,05
We consulted and trained
the personnel to work
remotely
Production 11 39,64
6,86 0,07 Services where contact is required 34 33,91
Services where contact is non-required 18 46,42
Trade 10 27,65
We reminded employees of
the rules of hygiene to
prevent infection
Production 11 33,23
1,64 0,65 Services where contact is required 34 40,00
Services where contact is non-required 18 34,33
Trade 10 35,75
We informed about travel
restrictions (changes in
business trips and / or work
in another country)
Production 11 40,77
0,46 0,92 Services where contact is required 34 36,46
Services where contact is non-required 18 36,33
Trade 10 35,90
We shared information
about the current situation
and possible business
change plans
Production 11 32,14
2,63 0,45 Services where contact is required 34 40,78
Services where contact is non-required 18 34,36
Trade 10 34,25
We tried to maintain a
positive emotional work
climate
Production 11 29,27
5,45 0,14 Services where contact is required 34 41,76
Services where contact is non-required 18 36,78
Trade 10 29,70
4.2. Distance work as a priority area in the future
The research testified to most small and medium-sized businesses having been quite successful in overcoming
technological difficulties that had seemed serious from the outset. During the focus group discussion, some
business representatives indicated that they would prefer to work remotely in the future, while others were willing
to combine distance and face-to-face work (mixed work organization) (note: more representatives from the
services than from the business sector were willing to work remotely).
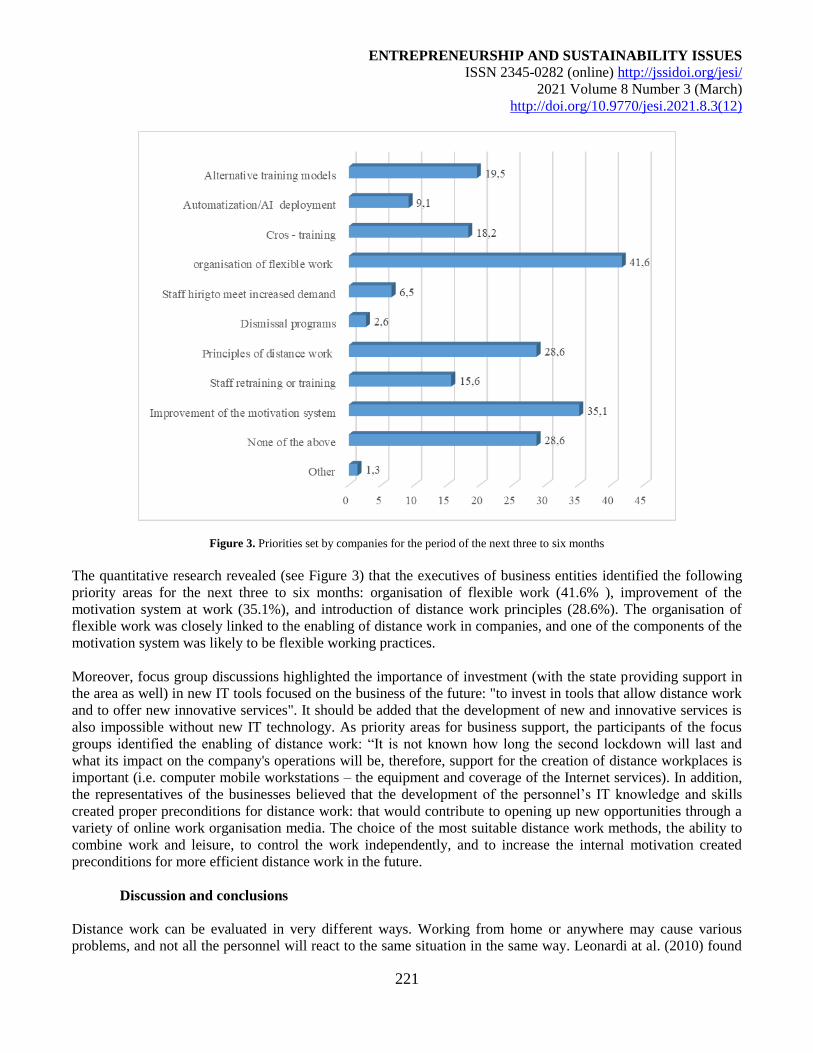
ENTREPRENEURSHIP AND SUSTAINABILITY ISSUES
ISSN 2345-0282 (online) http://jssidoi.org/jesi/
2021 Volume 8 Number 3 (March)
http://doi.org/10.9770/jesi.2021.8.3(12)
221
Figure 3. Priorities set by companies for the period of the next three to six months
The quantitative research revealed (see Figure 3) that the executives of business entities identified the following
priority areas for the next three to six months: organisation of flexible work (41.6% ), improvement of the
motivation system at work (35.1%), and introduction of distance work principles (28.6%). The organisation of
flexible work was closely linked to the enabling of distance work in companies, and one of the components of the
motivation system was likely to be flexible working practices.
Moreover, focus group discussions highlighted the importance of investment (with the state providing support in
the area as well) in new IT tools focused on the business of the future: "to invest in tools that allow distance work
and to offer new innovative services". It should be added that the development of new and innovative services is
also impossible without new IT technology. As priority areas for business support, the participants of the focus
groups identified the enabling of distance work: “It is not known how long the second lockdown will last and
what its impact on the company's operations will be, therefore, support for the creation of distance workplaces is
important (i.e. computer mobile workstations – the equipment and coverage of the Internet services). In addition,
the representatives of the businesses believed that the development of the personnel’s IT knowledge and skills
created proper preconditions for distance work: that would contribute to opening up new opportunities through a
variety of online work organisation media. The choice of the most suitable distance work methods, the ability to
combine work and leisure, to control the work independently, and to increase the internal motivation created
preconditions for more efficient distance work in the future.
Discussion and conclusions
Distance work can be evaluated in very different ways. Working from home or anywhere may cause various
problems, and not all the personnel will react to the same situation in the same way. Leonardi at al. (2010) found
ENTREPRENEURSHIP AND SUSTAINABILITY ISSUES
ISSN 2345-0282 (online) http://jssidoi.org/jesi/
2021 Volume 8 Number 3 (March)
http://doi.org/10.9770/jesi.2021.8.3(12)
222
out that individuals using the same communication tool may experience different degrees of perceived distance.
Eckhardt at al. (2019) in their research established that quite a few companies did not appear to fully appreciate
the consequences of the operation of virtual workers, especially the blurring of the boundaries between their
professional and private lives. Moreover, in other studies, distance work associated with poor general condition,
workplace pressure, and communication overload, all of which might lead to over-working able to subsequently
affect job performance and effectiveness (Barber, Santuzzi, 2015). Suciu (2020) noted that the emergence of
COVID 19 had created new challenges for cybersecurity and information security risk management.
Due to the COVID-19 pandemic, many teams who had enjoyed the benefits of working in the same physical
space became virtual teams overnight. Teams dealing with an unplanned transition to distance work needed help,
especially with accomplishing work that required interdependent, coordinated effort (Bendaly, 2020). Sanjeewa
(2020) argued that team leaders needed to understand how trust and psychological safety were fostered and
maintained in their teams. They needed to take care not to stifle the informal aspects of teamwork. Burrell (2020)
believed that managers needed to keep reminding members of the team of the need to adapt and change roles and
responsibilities. According to Sanjeewa (2020), team leaders had to ensure the possibility for team members to
approach them with proposals or concerns. Teams usually had preferences about how quickly members had to
respond and which modes of communication should be used (Bendaly, 2020).
Dixon and Panteli (2010) observed that teams could actually use technology-mediated communication to bridge
discontinuities (e.g. internal or organisational differences) among team members. Brown at al. (2020) stated that,
unlike prior experimental studies that focused on the detrimental effects of computer-mediated communication,
modern technologies were often used to enable team functioning. The technology used for communication in a
virtual team needed to provide as many types of media as possible to facilitate timely communication and foster
bonds within the team to allow for work to be done effectively and with positive participation (Sanjeewa, 2020).
Bunce, Wright and Scott (2018) indicated that quite a few workplaces had adopted new technological tools
designed to facilitate communication among team members, such as Slack or Microsoft Teams. According to
Laitinen and Valo (2018), those tools, along with other traditional means of communication (e.g. e-mail or instant
message), allowed teams with an equivalent degree of objective dispersion to vary greatly in the ways in which
their members interacted. Thus, two teams performing the same task with members who were equally dispersed
could use a different combination of tools and experience dramatically different levels of virtuality.
The expectations of business executives in Western Lithuania and Klaipėda Region regarding distance work were
basically in line with the traditions of the developed European countries and were justified, especially in the
context of the EU Digital Agenda and the European Green Deal. The personnel who had tried to work remotely
saw more of its advantages than disadvantages. In addition, the advantages of distance work were essential: it
enabled working people to pay more attention to their families and household chores and improved the quality of
life. Meanwhile, most of the negative aspects of distance work were related to the issues of communication,
organisation, and technology and could be easily addressed by providing the personnel with appropriate tools and
paying sufficient attention to communication and the methodology and organisation of distance work.
References
Arvola, R., Tint, P. & Kristjuhan, U. (2017). Employer attitude towards telework in real estate sector, In Economic Science For Rural
Development (pp. 15–22). Jelgava: Latvian University of Life Sciences.
https://llufb.llu.lv/conference/economic_science_rural/2017/Latvia_ESRD_46_2017-15-22.pdf
Barber, K.L., Santuzzi, A.M. (2015). Please respond ASAP: workplace telepressure and employee recovery. Journal of Occupational
Health Psychology, 20(2), 172-189, http://dx.doi.org/0.1037a0038278
ENTREPRENEURSHIP AND SUSTAINABILITY ISSUES
ISSN 2345-0282 (online) http://jssidoi.org/jesi/
2021 Volume 8 Number 3 (March)
http://doi.org/10.9770/jesi.2021.8.3(12)
223
Bathini D. R., Kandathil G. M. (2019). An Orchestrated Negotiated Exchange: Trading Home-Based Telework for Intensified Work. Bus
Ethics (2019) 154:411–423 https://doi.org/10.1007/s10551-017-3449-y
Bendaly, N. (2020). Your Team Is Now Working Remotely 5 Ways to Strengthen Communication and Team Cohesion in the COVID-19
World, Forbes https://www.forbes.com/sites/nicolebendaly/2020/03/20/your-team-is-now-working-remotely5-ways-to-strengthen-
communication-and-team-cohesion-in-the-covid-19-world/?sh=6d681eb85b70
Brown Matt I., Prewett Matthew S., Grossenbacher Michael A. (2020). Distancing Ourselves From Geographic Dispersion: An
Examination of Perceived Virtuality in Teams. Group Dynamics: Theory, Research, and Practice. American Psychological Association,
24(3), 168 –185 ISSN: 1089-2699 http://dx.doi.org/10.1037/gdn0000120
Bunce, M., Wright, K., Scott, M. (2018). Our newsroom in the cloud: Slack, virtual newsrooms and journalistic practice. New Media &
Society, 20, 3381–3399. http://dx.doi.org/10.1177/1461444817748955
Burbules, N. C., Callister, T. A. (2000). Universities in Transition: The promise and the challenge of new technologies. Teachers College
Record, 102(2), 271-293 https://doi.org/10.1111/0161-4681.00056
Burrell D. N. (2020). Understanding The Talent Management Intricacies Of Remote Cybersecurity Teams In Covid-19 Induced Telework
Organizational Ecosystems. Revista Academiei Forţelor Terestre, 3(99) https://doi.org/10.2478/raft-2020-0028
Creswell, J., Plano Clark, Vicki. (2011). Designing and conducting mixed methods research (2nd ed.). Thousand Oaks, CA: Sage.
Denscombe, M. (2007). The good research guide for small-scale social research projects. (3rd ed.). New York: McGraw-Hill.
Dingel J.I. , Neiman B. (2020). How Many Jobs Can Be Done at Home? NBER Working Paper No. 26948. Cambridge, MA: National
Bureau of Economic Research https://www.nber.org/system/files/working_papers/w26948/revisions/w26948.rev0.pdf
Dixon K.R., Panteli, N. (2010). From virtual teams to virtuality in teams. Human Relations, 63, 1177–1197.
http://dx.doi.org/10.1177/0018726709354784
Draft Law No XII-2462 on the Approval, Coming into Force and Implementation of the Labour Code of the Republic of Lithuania. 21 June
2016 https://e-seimas.lrs.lt/portal/legalAct/lt/TAD/da9eea30a61211e8aa33fe8f0fea665f?jfwid=-k3id7tf7e
Eckhardt A., Giordano A., Endter F., Somers P. (2019). Three Stages to a Virtual Workforce. MIS Quarterly Executive, 18(1)
http://docplayer.net/136068266-Three-stages-to-a-virtual-workforce-1.html
Fleetwood S. (2007). Why work–life balance now? The International Journal of Human Resource Management, 18(3), 387–400.
https://doi.org/10.1080/09585190601167441
Gallacherand G., Iqbal H. (2020). Remote Work and Employment Dynamics under COVID-19: Evidence from Canada. Canadian Public
Policy / Analyse de politiques, http://dx.doi.org/10.3138/cpp.2020-026
Gillies, D. (2019). Agile bodies: a new imperative in neoliberal governance. Journal of Education Policy, 26(2), 207-223,
http://dx.doi.org/10.1080/02680939.2010.508177
Gilson, L. L., Maynard, M. T., Young, N. C. J., Vartiainen, M., & Hakonen, M. (2015). Virtual teams research: 10 years, 10 themes, and 10
opportunities. Journal of Management, 41, 1313–1337. http://dx.doi.org/10.1177/0149206314559946
Golden T. D. (2009). Applying technology to work: toward a better understanding of telework. Organization Management Journal, 6, 241–
250 https://doi.org/10.1057/omj.2009.33
Grant Ch.A., Wallace L.M., Spurgeon P.C., Tramontano C., Charalampous M. (2019). Contruction and initial validation of the E-Work
Life Scale to measure remote e-working, Employee Relations, 41(1), 16-33. http://dx.doi.org/10.1108/ER-09-2017-0229
ENTREPRENEURSHIP AND SUSTAINABILITY ISSUES
ISSN 2345-0282 (online) http://jssidoi.org/jesi/
2021 Volume 8 Number 3 (March)
http://doi.org/10.9770/jesi.2021.8.3(12)
224
Grant, C.A., Wallace, L.M. and Spurgeon, P.C. (2019). An exploration of the psychological factors affecting remote e-worker’s job
effectiveness, well-being and work-life balance. Employee Relations, 5(35), 527-546, http://dx.doi.org/10.1108/ER-08-2012-0059
Gruževskis, B. (2001). Užimtumo pokyčiai. Lanksčių užimtumo formų taikymo galimybių įvertinimas (Changes in employment.
Assessment of the possibilities of applying flexible forms of employment). Vilnius: Justitia
https://vb.lstc.lt/object/elaba:25724454/25724454.pdf
Hunton J.E., Norman C.S. (2010). The Impact of Alternative Telework Arrangements on Organizational Commitment: Insights from a
Longitudinal Field Experiment. Journal of Information Systems 24 (1): 67–90. https://doi.org/10.2308/jis.2010.24.1.67
Kwang B.B., Dohyeong K. (2016). The Impact of Decoupling of Telework on Job Satisfaction in U.S. Federal Agencies: Does Gender
Matter? The American Review of Public Administration. Vol.46 issue: 3. https://doi.org/10.1177/0275074016637183
Kwon M., Jeon S.H. (2020). Do Leadership Commitment and Performance-Oriented Culture Matter for Federal Teleworker Satisfaction
With Telework Programs? Review of Public Personnel Administration, Vol. 40(1) 36–55 https://doi.org/10.1177/0734371X18776049
Laitinen, K., Valo, M. (2018). Meanings of communication technology in virtual team settings: Framing technology-related interaction.
International Journal of Human-Computer Studies, 111, 12–22. http://dx.doi.org/10.1016/j.ijhcs.2017.10 .012
Leonardi P. M., Treem J. W., Jackson, M. H. (2010). The connectivity paradox: Using technology to both decrease and increase
perceptions of distance in distributed work. Journal of Applied Communication Research, 38, 85–105.
http://dx.doi.org/10.1080/00909880903483599
Mas-Machuca M., Berbegal-Mirabent J., Alegre I. (2016). Work-life balance and its relationship with organizational pride and job
satisfaction. Journal of Managerial Psychology. https://doi.org/10.1108/JMP-09-2014-0272
Miežienė R., Gruževskis B. (2016). Atypical Forms of Employment in Lithuania: Main Characteristics and Prevalence, Socialiniai tyrimai /
Social Research. 39(1), 27–36 https://doi.org/10.21277/sc.v1i39.76
Morganson, V.J., Major, D.A., Oborn, K.L., Verive, J.M., Heelan, M.P. (2010). Comparing telework locations and traditional work
arrangements: Differences in work‐life balance support, job satisfaction, and inclusion, Journal of Managerial Psychology, 25(6), 578-
95. https://doi.org/10.1108/02683941011056941
Nakrošienė A., Butkevičienė E. (2016). Telework in Lithuania: the concept, benefits and challenges to the employees, Filosofija.
Sociologija, 2027(4), 364–372. https://www.researchgate.net/publication/318273903
Sanjeewa S. (2020). Trust and psychological safety in a virtual healthcare team. World Family Medicine, 18(9), 53-57.
http://dx.doi.org/10.5742MEWFM.2020.93855
Suciu, P. (2020). COVID-19 and Computer Security, Part 2: Shoring Up Systems for Remote Workers. Tech News World
https://www.technewsworld.com/story/86579.html
Sullivan, C. (2003). What’s in a name? Definitions and conceptualisations of teleworking and homeworking. New Technology, Work and
Employment, 18(3), 158–165. https://doi.org/10.1111/1468-005X.00118
Vitola A., Baltina I. (2013). An Evaluation of the Demand for Telework and Smart Work Centres in Rural Areas: A Case Study from
Latvia. European Countryside, Volume 5: Issue 3. https://doi.org/10.2478/euco-2013-0016
Vrchota J., Frantikova Z., Vlčkova M., (2019). Why Some SME’s in the Czech Republic Adopt Telework and Others Not? European
Countryside, 11(4). https://doi.org/10.2478/euco-2019-0033
ENTREPRENEURSHIP AND SUSTAINABILITY ISSUES
ISSN 2345-0282 (online) http://jssidoi.org/jesi/
2021 Volume 8 Number 3 (March)
http://doi.org/10.9770/jesi.2021.8.3(12)
225
Acknowledgements
This research was funded by Lithuania Research Council, grant number P-COV-20-5
Giedrė STRAKŠIENĖ, PhD, is a senior researcher at Klaipeda University, her research interest: communication, development of
communicative competence, information visualization.
ORCID ID: https://orcid.org/0000-0001-8533-0276
Henrika RUGINĖ is a lecturer at Klaipėda university, her research interests: e-work, green economy, labour market
ORCID ID: https://orcid.org/0000-0002-7794-3977
Laura ŠALTYTĖ-VAISIAUSKĖ PhD, is an associate professor at Klaipėda University , her research interests: statistics, econometrics,
big data analytics.
ORCID ID: https://orcid.org/0000-0003-2210-1649
Make your research more visible, join the Twitter account of ENTREPRENEURSHIP AND SUSTAINABILITY ISSUES:
@Entrepr69728810
Copyright © 2021 by author(s) and VsI Entrepreneurship and Sustainability Center
This work is licensed under the Creative Commons Attribution International License (CC BY).
http://creativecommons.org/licenses/by/4.0/
ENTREPRENEURSHIP AND SUSTAINABILITY ISSUES
ISSN 2345-0282 (online) http://jssidoi.org/jesi/
2021 Volume 8 Number 3 (March)
http://doi.org/10.9770/jesi.2021.8.3(13)
Publisher http://jssidoi.org/esc/home
226
THE SUSTAINABLE DEVELOPMENT OF TRANSPORT ENTERPRISES IN THE CONTEXT OF
MACROECONOMIC CONDITIONS. THE CASE OF CENTRAL AND EASTERN EUROPEAN
COUNTRIES
Michał Comporek ¹, Magdalena Kowalska ², Anna Misztal 3
1,2,3 Faculty of Economics and Sociology, University of Lodz, 90-255 Lodz, Poland
E-mails:1 [email protected] ; [email protected] 3 [email protected]
Received 10 November 2020; accepted 15 January 2021; published 30 March 2021
Abstract. The issue of sustainable development is critical in globalization, the rapid growth of the industry, technological progress, and
climate change. Sustainable development is the realization of economic, social, and environmental goals. It requires all actors of socio-
economic life, including enterprises, organizations, institutions, and countries. Sustainable development of an enterprise means improving
the financial and property situation while taking care of employees and local communities' health and development and taking action to
protect the natural environment. This paper aims to assess the impact of macroeconomic conditions on the sustainable development of
transport enterprises in Central and Eastern European Countries (CEECs) in the period from 2008 to 2018. The selection of transport
enterprises for the research sample is related to their high impact on economies in the analyzed countries, their significant negative impact
on the natural environment. Moreover, transport enterprises play a vital role in the development of other economic sectors. The authors
discuss the fundamental theoretical issues related to enterprises' sustainable development and the research result conducted in CEECs. The
study results indicate a statistically significant relationship between the indicator of sustainable development and the hand of the
macroeconomic condition in all analyzed countries. The highest correlation was observed in Romania, Hungary, and Slovenia, while the
lowest in Croatia. The story of socio-economic development in surveyed countries plays a fundamental role in achieving sustainable
development of transport enterprises.
Keywords: macroeconomic conditions; sustainable development; transport enterprises
Reference to this paper should be made as follows: Comporek, M., Kowalska, M., Misztal, A. 2021. The sustainable development of
transport enterprises in the context of macroeconomic conditions. The case of Central and Eastern European countries. Entrepreneurship
and Sustainability Issues, 8(3), 226-247. http://doi.org/10.9770/jesi.2021.8.3(13)
JEL Classifications: D22, E10, Q56
Additional disciplines ecology and environment
ENTREPRENEURSHIP AND SUSTAINABILITY ISSUES
ISSN 2345-0282 (online) http://jssidoi.org/jesi/
2021 Volume 8 Number 3 (March)
http://doi.org/10.9770/jesi.2021.8.3(13)
227
1. Introduction
The concept of sustainable development of enterprises, based on a triad of economic, social, and environmental
objectives - with particular emphasis on a long-term approach to protecting natural resources - seems crucial in all
branches of the modern economy. Also, in the case of the transport industry, which is the fastest-growing sector
from the perspective of the consumption of energy and the production of greenhouse gases (GHGs) in the
European Union, competing enterprises must face the challenge to behave in an environmentally sustainable and
socially responsive manner while creating and increasing shareholder's wealth. The sustainable development of
transport enterprises depends on several factors, external and internal. External factors include macroeconomic
conditions, implemented environmental policy, climate and economic trends, the level of social and ecological
awareness, technical and technological infrastructure. The internal states have the enterprise's financial and
property situation, environmental awareness, implemented environmental policy.
This paper is theoretical and empirical. The theoretical part describes selected problems of sustainable
development of enterprises. The practical piece of this paper contains the results of the research (an econometric
model of the influence of macroeconomic conditions on the sustainable development of enterprises, estimated by
the Least Square Method). This paper aims to assess the impact of macroeconomic conditions on the sustainable
development of transport enterprises in Central and Eastern European Countries (CEECs) in the period from 2008
to 2018.
The authors focus on a sample of transport enterprises from CEECs, which are also members of the European
Union (EU). These countries share a common history, location, and similar level of socio-economic development.
Macroeconomic conditions are associated with a political transformation, integration with the EU, and the
development of the global economic system.
The selection of transport enterprises for the research sample is related to their high impact on economies in the
analyzed countries and significant negative impact on the natural environment. Moreover, transport enterprises
play a vital role in the development of other economic sectors.
2. Sustainable development of enterprise - theoretical background
The term "sustainable development" comes from the concept of "sustained yield" – the seventeenth doctrine that
postulated to hand woodlands undiminished to future generations (Duerr 1975). As noticed Grober (2007), in
1713, Hanns Carl von Carlowitz, head of the Royal Mining Office in the Kingdom of Saxony, introduces the
expression "nachhaltig" to meet the challenge of a predicted shortage of timber, the critical resource of the time.
Afterward, the concept of sustainable development has evolved considerably, expanding its scope to
environmental protection and socio-economic matters.
In 1980, the International Union for the Conservation of Nature, under the UN-General Secretary's patronage,
published the declaration entitled "Living Resource Conservation for Sustainable Development." It was the first
international document on living resource conservation produced with inputs from governments, non-
governmental organizations, and other experts (IUCN 1980). In 1987 the term "sustainable development" gained
prominence in the report "Our Common Future," published by the World Commission on Environment and
Development (that is also commonly known as the Brundtland Report). According to the Brundtland
Commission, sustainable development "meets the needs of the present without compromising future generations'
ability to meet their own needs" (World Commission on Environment and Development 1987). Five years later,
modern optics for mentioned issues entered the global stage during the 1992 "Earth Summit" in Rio de Janeiro,
with the idea of – among other things - saving "blue planet." Another international organization - OECD -
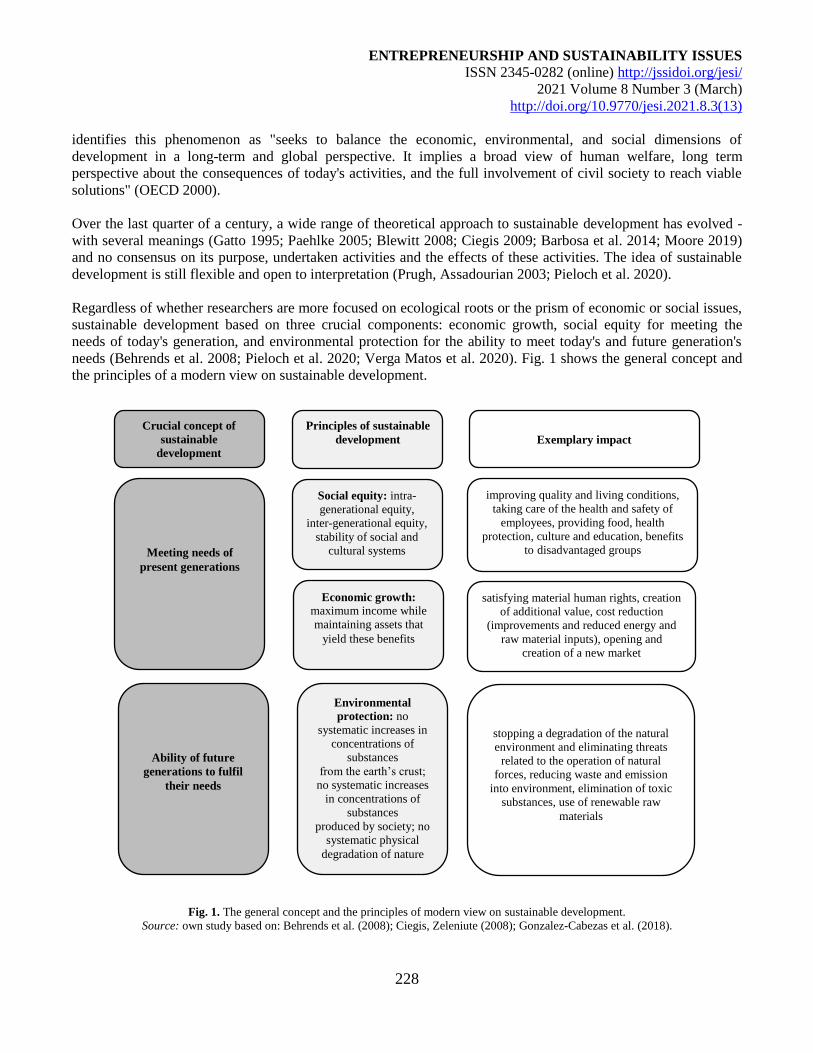
ENTREPRENEURSHIP AND SUSTAINABILITY ISSUES
ISSN 2345-0282 (online) http://jssidoi.org/jesi/
2021 Volume 8 Number 3 (March)
http://doi.org/10.9770/jesi.2021.8.3(13)
228
identifies this phenomenon as "seeks to balance the economic, environmental, and social dimensions of
development in a long-term and global perspective. It implies a broad view of human welfare, long term
perspective about the consequences of today's activities, and the full involvement of civil society to reach viable
solutions" (OECD 2000).
Over the last quarter of a century, a wide range of theoretical approach to sustainable development has evolved -
with several meanings (Gatto 1995; Paehlke 2005; Blewitt 2008; Ciegis 2009; Barbosa et al. 2014; Moore 2019)
and no consensus on its purpose, undertaken activities and the effects of these activities. The idea of sustainable
development is still flexible and open to interpretation (Prugh, Assadourian 2003; Pieloch et al. 2020).
Regardless of whether researchers are more focused on ecological roots or the prism of economic or social issues,
sustainable development based on three crucial components: economic growth, social equity for meeting the
needs of today's generation, and environmental protection for the ability to meet today's and future generation's
needs (Behrends et al. 2008; Pieloch et al. 2020; Verga Matos et al. 2020). Fig. 1 shows the general concept and
the principles of a modern view on sustainable development.
Fig. 1. The general concept and the principles of modern view on sustainable development.
Source: own study based on: Behrends et al. (2008); Ciegis, Zeleniute (2008); Gonzalez-Cabezas et al. (2018).
Crucial concept of
sustainable
development
Exemplary impact
Principles of sustainable
development
Meeting needs of
present generations
Economic growth:
maximum income while
maintaining assets that
yield these benefits
Social equity: intra-
generational equity,
inter-generational equity,
stability of social and
cultural systems
improving quality and living conditions,
taking care of the health and safety of
employees, providing food, health
protection, culture and education, benefits
to disadvantaged groups
satisfying material human rights, creation
of additional value, cost reduction
(improvements and reduced energy and
raw material inputs), opening and
creation of a new market
Ability of future
generations to fulfil
their needs
Environmental
protection: no
systematic increases in
concentrations of
substances
from the earth’s crust;
no systematic increases
in concentrations of
substances
produced by society; no
systematic physical
degradation of nature
stopping a degradation of the natural
environment and eliminating threats
related to the operation of natural
forces, reducing waste and emission
into environment, elimination of toxic
substances, use of renewable raw
materials
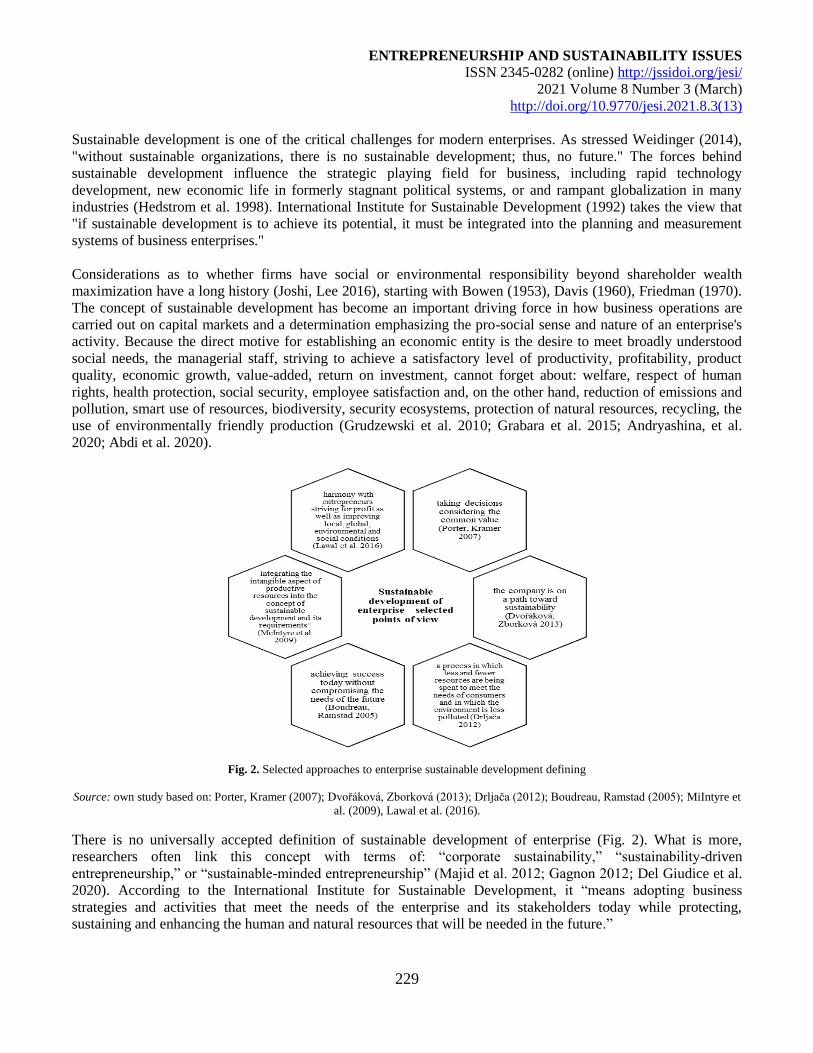
ENTREPRENEURSHIP AND SUSTAINABILITY ISSUES
ISSN 2345-0282 (online) http://jssidoi.org/jesi/
2021 Volume 8 Number 3 (March)
http://doi.org/10.9770/jesi.2021.8.3(13)
229
Sustainable development is one of the critical challenges for modern enterprises. As stressed Weidinger (2014),
"without sustainable organizations, there is no sustainable development; thus, no future." The forces behind
sustainable development influence the strategic playing field for business, including rapid technology
development, new economic life in formerly stagnant political systems, or and rampant globalization in many
industries (Hedstrom et al. 1998). International Institute for Sustainable Development (1992) takes the view that
"if sustainable development is to achieve its potential, it must be integrated into the planning and measurement
systems of business enterprises."
Considerations as to whether firms have social or environmental responsibility beyond shareholder wealth
maximization have a long history (Joshi, Lee 2016), starting with Bowen (1953), Davis (1960), Friedman (1970).
The concept of sustainable development has become an important driving force in how business operations are
carried out on capital markets and a determination emphasizing the pro-social sense and nature of an enterprise's
activity. Because the direct motive for establishing an economic entity is the desire to meet broadly understood
social needs, the managerial staff, striving to achieve a satisfactory level of productivity, profitability, product
quality, economic growth, value-added, return on investment, cannot forget about: welfare, respect of human
rights, health protection, social security, employee satisfaction and, on the other hand, reduction of emissions and
pollution, smart use of resources, biodiversity, security ecosystems, protection of natural resources, recycling, the
use of environmentally friendly production (Grudzewski et al. 2010; Grabara et al. 2015; Andryashina, et al.
2020; Abdi et al. 2020).
Fig. 2. Selected approaches to enterprise sustainable development defining
Source: own study based on: Porter, Kramer (2007); Dvořáková, Zborková (2013); Drljača (2012); Boudreau, Ramstad (2005); MiIntyre et
al. (2009), Lawal et al. (2016).
There is no universally accepted definition of sustainable development of enterprise (Fig. 2). What is more,
researchers often link this concept with terms of: “corporate sustainability,” “sustainability-driven
entrepreneurship,” or “sustainable-minded entrepreneurship” (Majid et al. 2012; Gagnon 2012; Del Giudice et al.
2020). According to the International Institute for Sustainable Development, it “means adopting business
strategies and activities that meet the needs of the enterprise and its stakeholders today while protecting,
sustaining and enhancing the human and natural resources that will be needed in the future.”
ENTREPRENEURSHIP AND SUSTAINABILITY ISSUES
ISSN 2345-0282 (online) http://jssidoi.org/jesi/
2021 Volume 8 Number 3 (March)
http://doi.org/10.9770/jesi.2021.8.3(13)
230
Oželienė (2017) defines this category as “a holistic approach of thinking of business which seeks to integrate
consideration of the three aspects of sustainability – social, environmental and economical.” However, individual
researchers incorporate all sustainability dimensions (social, economic, ecological) into the subject matter with
different emphasis. Crals and Vereeck (2004) underline that a fundamental principle of sustainable
entrepreneurship involves businesses inculcating the consciousness to continually demonstrate ethical behavior
and contribute to economic development while simultaneously ushering an era of improvement in the overall
well-being of employees, their families, and the society at large. On the contrary, Witkowski (2010) points out
that the environmental aspect seems to be the most important, probably because the non-renewable resources are
the most substantial barrier to sustainable development.
The sustainable development of enterprises depends on several factors. Research results indicate the importance
of external and internal conditions (Misztal, Kowalska 2020). External conditions include the level of socio-
economic development, legal, environmental regulations, membership of countries in international organizations
related to environment conservation, financial and institutional support for pro-ecological activities, and
ecological awareness. Internal conditions include financial and property situation of enterprises, profitability,
financial liquidity, productivity, environmental awareness of the management staff, type of business activity,
accumulated human capital, innovation (Lorenc, Sorokina, 2015; Misztal, 2019).
Macroeconomic conditions create opportunities for enterprises and set requirements and restrictions for them. A
higher level of macroeconomic development is associated with greater access to knowledge, a better-educated
society, and a higher awareness of the negative impact of economic activity on the natural environment. It seems
to us that the more economically and socially developed countries are, the more significant pressure on companies
to comply with standards in the care of the social environment and social issues.
3. Sustainable development of transport enterprises – selected problems
Concerning the more empirical studies focused on sustainable development of enterprises conducting activities in
the transport sector, it is noticeable that investigators analyze the mentioned issues from a different context. As
evidenced by Gudmundsson (2004), two major approaches to sustainable development in transport can be
distinguished: the first one, that deal with sustainability (with concerns only for the future generations), and the
second one - which tackle sustainable development (with concerns for both present and future generations). In this
paper, special attention has been focused primarily on the results of research from recent years.
Generally, it is worth emphasizing the lack of broader research on macroeconomic conditions of the sustainable
development of transport enterprises, such as the country's economic development, macroeconomic stability, the
stability of legal regulations, and support for pro-ecological activities, ecological awareness of people. From this
perspective, mainly interest seems to be research carried by Mihai et al. (2019), who test holistically whether the
transport sector is heading away from or towards sustainability in a panel of 35 countries in the reference period
1994-2014. They add to the literature new insights concerning the relationship between gross domestic product
and various aspects of transport sustainability (such as carbon footprint, carbon intensity, or transport safety).
Misztal (2019) devotes her research to the statistical analysis of Polish transport companies' sustainable
development. The study results made it possible to assess that the sustainable development of transport companies
in 2009-2015 takes place, and – what is more – this development is more rapid compared to the average
development of the entire enterprise sector.
One of the biggest problems and the most important things is measuring sustainable development because
indicators are crucial to understanding the complexity of environmental, economic, and social actions undertaken
to achieve development goals (White et al. 2019; Fried 2020; Winter, Stephan 2020). Thus, there are noticeable
numerous empirical studies on transport sustainability indicators (Gudmundsson 2004; Litman 2009; Castillo,
ENTREPRENEURSHIP AND SUSTAINABILITY ISSUES
ISSN 2345-0282 (online) http://jssidoi.org/jesi/
2021 Volume 8 Number 3 (March)
http://doi.org/10.9770/jesi.2021.8.3(13)
231
Pitfield 2010; Andersson, Forslund 2018; Kochov et al. 2020; Nazam et al. 2020). Oberhofer and Fürst (2013),
using their model based on an extensive literature review, gather evidence that although decision-makers' attitudes
have a significant influence on the companies' actual environmental performance, firm size, and sector affiliation
show a more significant contribution. Moreover, they prove that attitude and environmental behavior scored
slightly lower among transport companies than in other industries. Next year, Oberhofer and Dieplinger (2014)
prove that many companies in the transport sector seem to lack environmental measures. They explained it in two
ways: firstly, transport companies seldom face direct end-user contact and are lagging with implement and
communicate sustainable behavior; secondly – many enterprises realize that sustainable performance is not
always a "necessary evil" but can result in an added value in the long run.
Various studies focus their attention on the narrow "sub-areas" of the transport sector. For example, Behrends et
al. (2008) present a definition of sustainable urban freight transport and develop a spectrum of measures detailing
it, consisting of two levels of indicators: impact ratios that describe how the urban freight transport violates the
principles of sustainability and, on the other hand, performance ratios which provide specific different categories
determining the characteristics and performance of the urban transport system. Rai et al. (2018) propose a
comprehensive indicator approach to manage sustainable urban freight transport from a local authority
perspective. The underlined set of factors develop not only the three conventional pillars of sustainable
development (which include: social, environmental, and economic considerations) (Arvidson et al., 2013).
Eventually, Bask et al. (2018) examine the role of environmental sustainability in transport operations in Shipper-
Logistics Service Provider. Their findings indicate that globally-operating transport companies are particularly
interested in environmental issues, and it is caused partly due to the external pressures and partly because they see
the greening of transport as a potential source of competitive advantage. On the other side, on account of the lack
of widely accepted methods for measuring the environmental impact of transports, these enterprises cannot easily
share the costs and benefits of environmental initiatives between supply chain members nor use such initiatives as
marketing arguments to differentiate their offerings.
3. Methodology of the research
The research has been conducted on a sample of transport enterprises from Central and Eastern European
Countries (data come from Eurostat), which are members of the European Union. Considering this, we focus on
the eleven countries, including Bulgaria, Croatia, Czechia, Estonia, Hungary, Latvia, Lithuania, Poland, Romania,
the Slovak Republic, and Slovenia. These countries have a similar geographical location, a shared history, and a
similar socio-economic development level.
The authors focus on transport enterprises for the research sample due to their immense importance for analyzing
countries' enterprise and economic development. Not without significance is the fact that transport companies
harm the environment. Moreover, transport enterprises play a vital role in the development of other economic
sectors.
The research's main aim is to assess the impact of macroeconomic conditions on the sustainable development of
transport enterprises in Central and Eastern European Countries (CEECs) in the period from 2008 to 2018.
In connection with this, the hypothesis is formulated as follows:
"Macroeconomic conditions have a statistically significant impact on the sustainable development of
transport enterprises in Central and Eastern Europe in the period from 2008 to 2018".
Assumption:
macroeconomic condition is one of the critical factors influencing the social and ecological investments
of transport enterprises,
macroeconomic conditions play a vital role in the development of enterprises in developing economies,
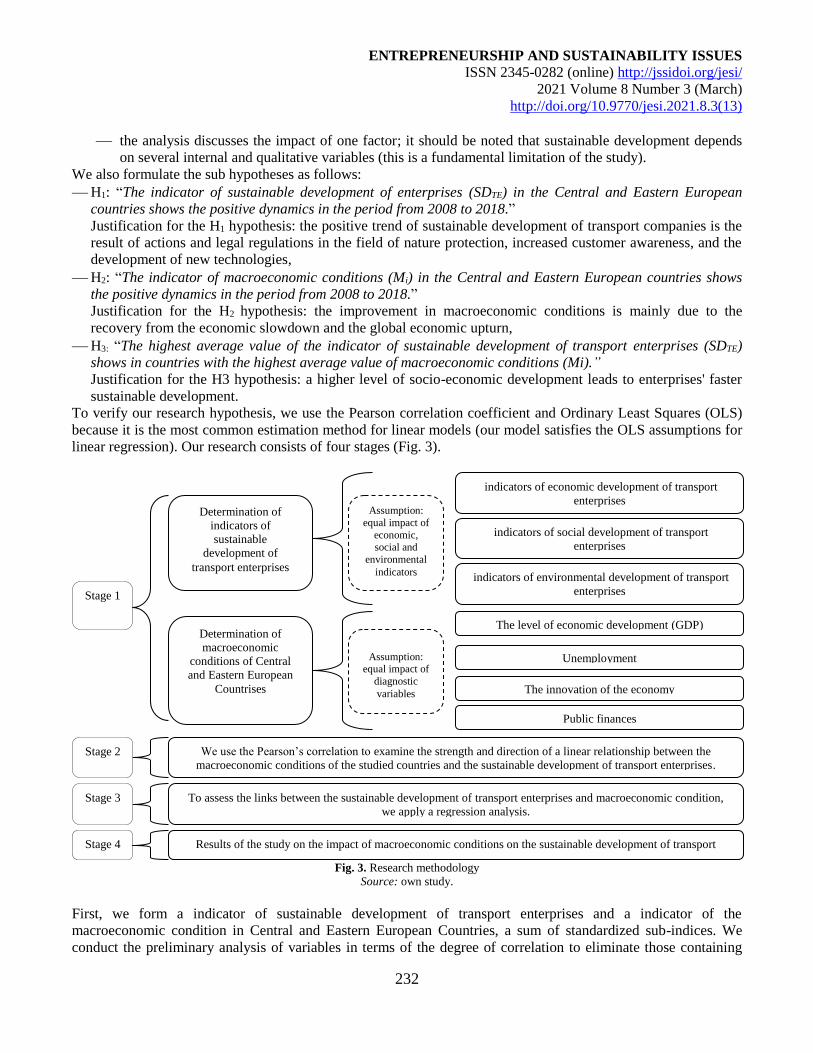
ENTREPRENEURSHIP AND SUSTAINABILITY ISSUES
ISSN 2345-0282 (online) http://jssidoi.org/jesi/
2021 Volume 8 Number 3 (March)
http://doi.org/10.9770/jesi.2021.8.3(13)
232
the analysis discusses the impact of one factor; it should be noted that sustainable development depends
on several internal and qualitative variables (this is a fundamental limitation of the study).
We also formulate the sub hypotheses as follows:
H1: “The indicator of sustainable development of enterprises (SDTE) in the Central and Eastern European
countries shows the positive dynamics in the period from 2008 to 2018.”
Justification for the H1 hypothesis: the positive trend of sustainable development of transport companies is the
result of actions and legal regulations in the field of nature protection, increased customer awareness, and the
development of new technologies,
H2: “The indicator of macroeconomic conditions (Mi) in the Central and Eastern European countries shows
the positive dynamics in the period from 2008 to 2018.”
Justification for the H2 hypothesis: the improvement in macroeconomic conditions is mainly due to the
recovery from the economic slowdown and the global economic upturn,
H3: “The highest average value of the indicator of sustainable development of transport enterprises (SDTE)
shows in countries with the highest average value of macroeconomic conditions (Mi).”
Justification for the H3 hypothesis: a higher level of socio-economic development leads to enterprises' faster
sustainable development.
To verify our research hypothesis, we use the Pearson correlation coefficient and Ordinary Least Squares (OLS)
because it is the most common estimation method for linear models (our model satisfies the OLS assumptions for
linear regression). Our research consists of four stages (Fig. 3).
Fig. 3. Research methodology
Source: own study.
First, we form a indicator of sustainable development of transport enterprises and a indicator of the
macroeconomic condition in Central and Eastern European Countries, a sum of standardized sub-indices. We
conduct the preliminary analysis of variables in terms of the degree of correlation to eliminate those containing
Determination of
indicators of
sustainable
development of
transport enterprises
Stage 1
Assumption:
equal impact of
economic, social and
environmental
indicators
indicators of economic development of transport
enterprises
indicators of social development of transport
enterprises
indicators of environmental development of transport
enterprises
Determination of
macroeconomic
conditions of Central
and Eastern European
Countrises
Assumption: equal impact of
diagnostic
variables
The level of economic development (GDP)
Unemployment
Public finances
The innovation of the economy
We use the Pearson’s correlation to examine the strength and direction of a linear relationship between the
macroeconomic conditions of the studied countries and the sustainable development of transport enterprises.
To assess the links between the sustainable development of transport enterprises and macroeconomic condition,
we apply a regression analysis.
Stage 2
Stage 3
Stage 4 Results of the study on the impact of macroeconomic conditions on the sustainable development of transport
enterprises in Central and Eastern Europe. Discussion and perspective in the future
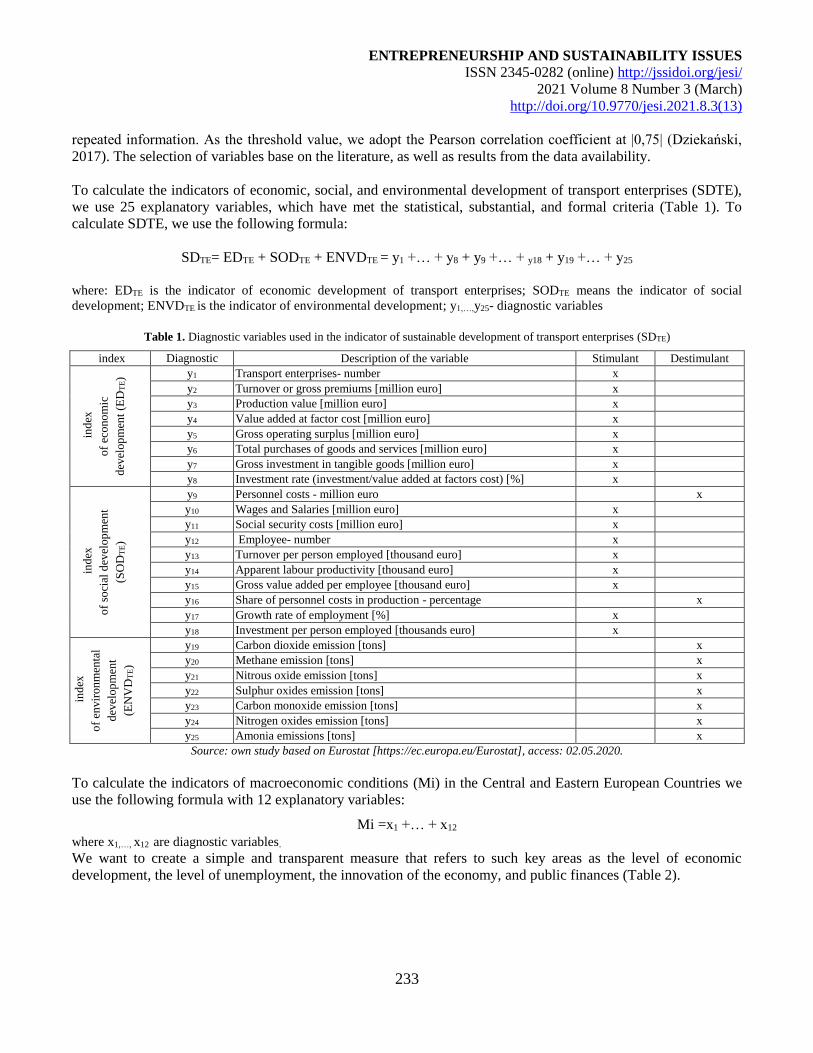
ENTREPRENEURSHIP AND SUSTAINABILITY ISSUES
ISSN 2345-0282 (online) http://jssidoi.org/jesi/
2021 Volume 8 Number 3 (March)
http://doi.org/10.9770/jesi.2021.8.3(13)
233
repeated information. As the threshold value, we adopt the Pearson correlation coefficient at |0,75| (Dziekański,
2017). The selection of variables base on the literature, as well as results from the data availability.
To calculate the indicators of economic, social, and environmental development of transport enterprises (SDTE),
we use 25 explanatory variables, which have met the statistical, substantial, and formal criteria (Table 1). To
calculate SDTE, we use the following formula:
SDTE= EDTE + SODTE + ENVDTE = y1 +… + y8 + y9 +… + y18 + y19 +… + y25
where: EDTE is the indicator of economic development of transport enterprises; SODTE means the indicator of social
development; ENVDTE is the indicator of environmental development; y1,…,y25- diagnostic variables
Table 1. Diagnostic variables used in the indicator of sustainable development of transport enterprises (SDTE)
index Diagnostic
variable
Description of the variable Stimulant Destimulant
in
dex
of
eco
no
mic
dev
elop
men
t (E
DT
E) y1 Transport enterprises- number
x
y2 Turnover or gross premiums [million euro] x
y3 Production value [million euro] x
y4 Value added at factor cost [million euro] x
y5 Gross operating surplus [million euro] x
y6 Total purchases of goods and services [million euro] x
y7 Gross investment in tangible goods [million euro] x
y8 Investment rate (investment/value added at factors cost) [%] x
in
dex
of
soci
al d
evel
op
men
t
(SO
DT
E)
y9 Personnel costs - million euro x
y10 Wages and Salaries [million euro] x
y11 Social security costs [million euro] x
y12 Employee- number x
y13 Turnover per person employed [thousand euro] x
y14 Apparent labour productivity [thousand euro] x
y15 Gross value added per employee [thousand euro] x
y16 Share of personnel costs in production - percentage x
y17 Growth rate of employment [%] x
y18 Investment per person employed [thousands euro] x
in
dex
of
envir
on
men
tal
dev
elop
men
t
(EN
VD
TE)
y19 Carbon dioxide emission [tons] x
y20 Methane emission [tons] x
y21 Nitrous oxide emission [tons] x
y22 Sulphur oxides emission [tons] x
y23 Carbon monoxide emission [tons] x
y24 Nitrogen oxides emission [tons] x
y25 Amonia emissions [tons] x
Source: own study based on Eurostat [https://ec.europa.eu/Eurostat], access: 02.05.2020.
To calculate the indicators of macroeconomic conditions (Mi) in the Central and Eastern European Countries we
use the following formula with 12 explanatory variables:
Mi =x1 +… + x12
where x1,…, x12 are diagnostic variables.
We want to create a simple and transparent measure that refers to such key areas as the level of economic
development, the level of unemployment, the innovation of the economy, and public finances (Table 2).
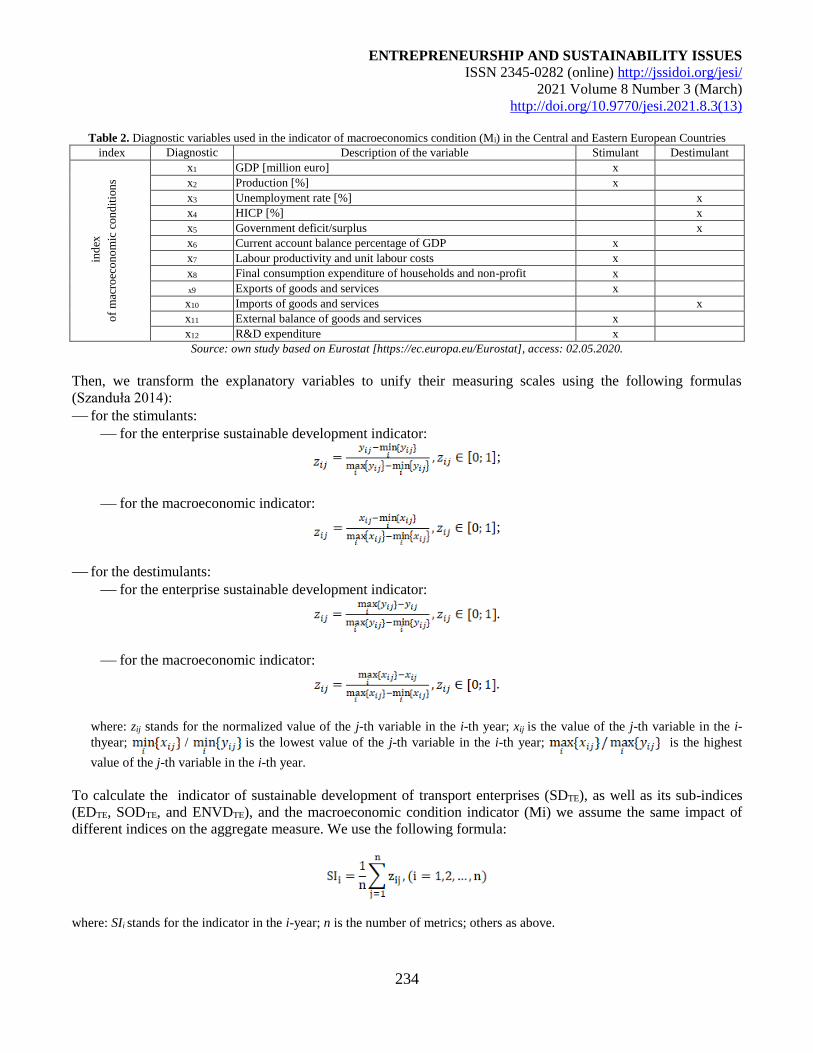
ENTREPRENEURSHIP AND SUSTAINABILITY ISSUES
ISSN 2345-0282 (online) http://jssidoi.org/jesi/
2021 Volume 8 Number 3 (March)
http://doi.org/10.9770/jesi.2021.8.3(13)
234
Table 2. Diagnostic variables used in the indicator of macroeconomics condition (Mi) in the Central and Eastern European Countries
index Diagnostic
variable
Description of the variable Stimulant Destimulant
in
dex
of
mac
roec
on
om
ic c
on
dit
ion
s x1 GDP [million euro] x
x2 Production [%] x
x3 Unemployment rate [%] x
x4 HICP [%] x
x5 Government deficit/surplus x
x6 Current account balance percentage of GDP x
x7 Labour productivity and unit labour costs x
x8 Final consumption expenditure of households and non-profit
institutions serving households
x
x9 Exports of goods and services x
x10 Imports of goods and services x
x11 External balance of goods and services x
x12 R&D expenditure x
Source: own study based on Eurostat [https://ec.europa.eu/Eurostat], access: 02.05.2020.
Then, we transform the explanatory variables to unify their measuring scales using the following formulas
(Szanduła 2014):
for the stimulants:
for the enterprise sustainable development indicator:
;
for the macroeconomic indicator:
;
for the destimulants:
for the enterprise sustainable development indicator:
.
for the macroeconomic indicator:
.
where: zij stands for the normalized value of the j-th variable in the i-th year; xij is the value of the j-th variable in the i-
thyear; / is the lowest value of the j-th variable in the i-th year; is the highest
value of the j-th variable in the i-th year.
To calculate the indicator of sustainable development of transport enterprises (SDTE), as well as its sub-indices
(EDTE, SODTE, and ENVDTE), and the macroeconomic condition indicator (Mi) we assume the same impact of
different indices on the aggregate measure. We use the following formula:
where: SIi stands for the indicator in the i-year; n is the number of metrics; others as above.
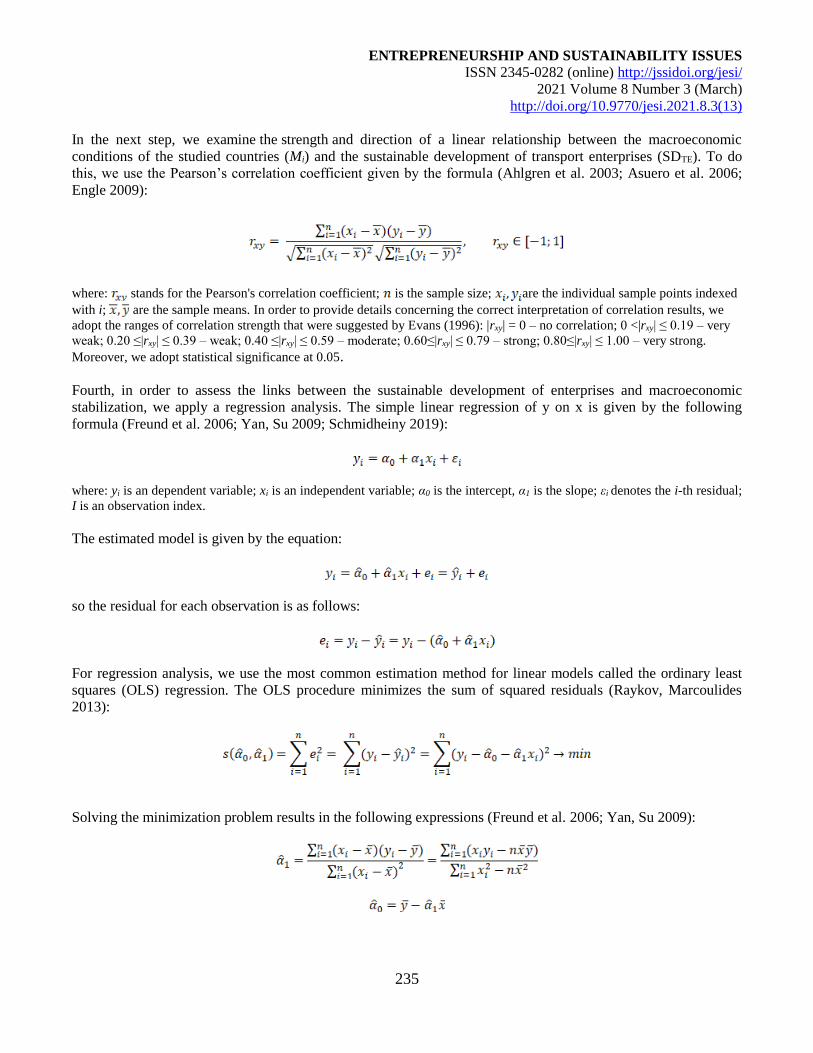
ENTREPRENEURSHIP AND SUSTAINABILITY ISSUES
ISSN 2345-0282 (online) http://jssidoi.org/jesi/
2021 Volume 8 Number 3 (March)
http://doi.org/10.9770/jesi.2021.8.3(13)
235
In the next step, we examine the strength and direction of a linear relationship between the macroeconomic
conditions of the studied countries (Mi) and the sustainable development of transport enterprises (SDTE). To do
this, we use the Pearson’s correlation coefficient given by the formula (Ahlgren et al. 2003; Asuero et al. 2006;
Engle 2009):
where: stands for the Pearson's correlation coefficient; is the sample size; are the individual sample points indexed
with i; are the sample means. In order to provide details concerning the correct interpretation of correlation results, we
adopt the ranges of correlation strength that were suggested by Evans (1996): |rxy| = 0 – no correlation; 0 <|rxy| ≤ 0.19 – very
weak; 0.20 ≤|rxy| ≤ 0.39 – weak; 0.40 ≤|rxy| ≤ 0.59 – moderate; 0.60≤|rxy| ≤ 0.79 – strong; 0.80≤|rxy| ≤ 1.00 – very strong.
Moreover, we adopt statistical significance at 0.05.
Fourth, in order to assess the links between the sustainable development of enterprises and macroeconomic
stabilization, we apply a regression analysis. The simple linear regression of y on x is given by the following
formula (Freund et al. 2006; Yan, Su 2009; Schmidheiny 2019):
where: yi is an dependent variable; xi is an independent variable; α0 is the intercept, α1 is the slope; εi denotes the i-th residual;
I is an observation index.
The estimated model is given by the equation:
so the residual for each observation is as follows:
For regression analysis, we use the most common estimation method for linear models called the ordinary least
squares (OLS) regression. The OLS procedure minimizes the sum of squared residuals (Raykov, Marcoulides
2013):
Solving the minimization problem results in the following expressions (Freund et al. 2006; Yan, Su 2009):
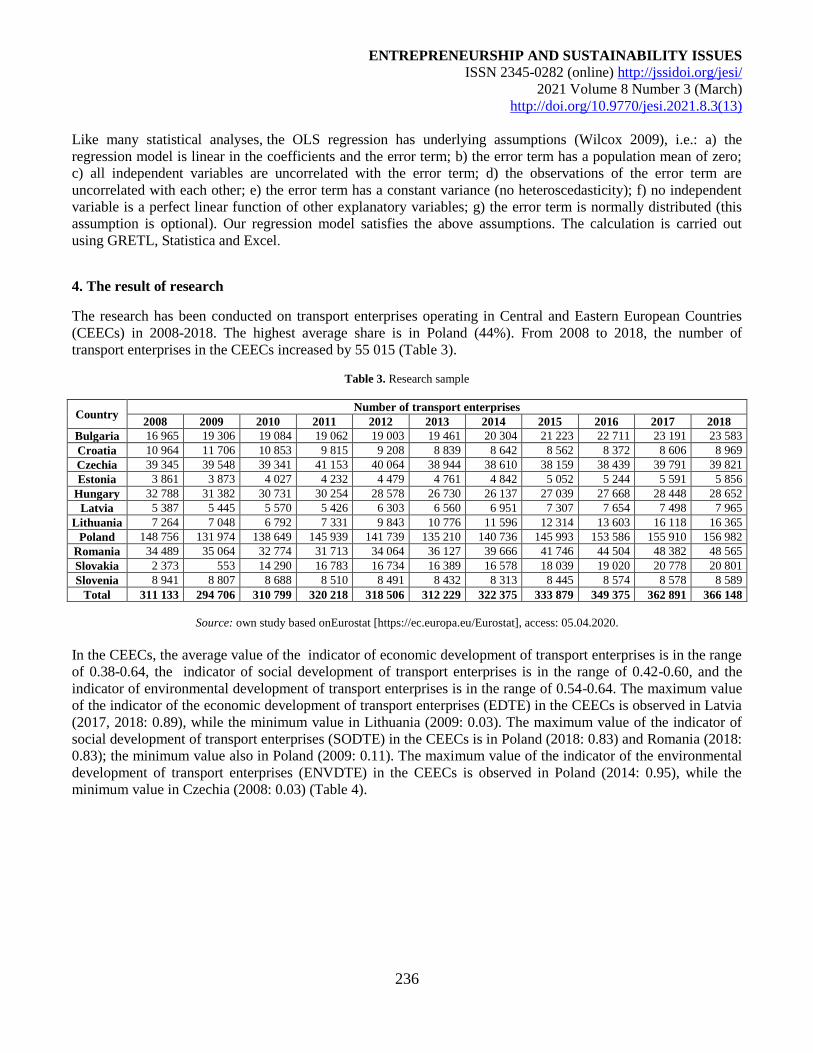
ENTREPRENEURSHIP AND SUSTAINABILITY ISSUES
ISSN 2345-0282 (online) http://jssidoi.org/jesi/
2021 Volume 8 Number 3 (March)
http://doi.org/10.9770/jesi.2021.8.3(13)
236
Like many statistical analyses, the OLS regression has underlying assumptions (Wilcox 2009), i.e.: a) the
regression model is linear in the coefficients and the error term; b) the error term has a population mean of zero;
c) all independent variables are uncorrelated with the error term; d) the observations of the error term are
uncorrelated with each other; e) the error term has a constant variance (no heteroscedasticity); f) no independent
variable is a perfect linear function of other explanatory variables; g) the error term is normally distributed (this
assumption is optional). Our regression model satisfies the above assumptions. The calculation is carried out
using GRETL, Statistica and Excel.
4. The result of research
The research has been conducted on transport enterprises operating in Central and Eastern European Countries
(CEECs) in 2008-2018. The highest average share is in Poland (44%). From 2008 to 2018, the number of
transport enterprises in the CEECs increased by 55 015 (Table 3).
Table 3. Research sample
Country Number of transport enterprises
2008 2009 2010 2011 2012 2013 2014 2015 2016 2017 2018
Bulgaria 16 965 19 306 19 084 19 062 19 003 19 461 20 304 21 223 22 711 23 191 23 583
Croatia 10 964 11 706 10 853 9 815 9 208 8 839 8 642 8 562 8 372 8 606 8 969
Czechia 39 345 39 548 39 341 41 153 40 064 38 944 38 610 38 159 38 439 39 791 39 821
Estonia 3 861 3 873 4 027 4 232 4 479 4 761 4 842 5 052 5 244 5 591 5 856
Hungary 32 788 31 382 30 731 30 254 28 578 26 730 26 137 27 039 27 668 28 448 28 652
Latvia 5 387 5 445 5 570 5 426 6 303 6 560 6 951 7 307 7 654 7 498 7 965
Lithuania 7 264 7 048 6 792 7 331 9 843 10 776 11 596 12 314 13 603 16 118 16 365
Poland 148 756 131 974 138 649 145 939 141 739 135 210 140 736 145 993 153 586 155 910 156 982
Romania 34 489 35 064 32 774 31 713 34 064 36 127 39 666 41 746 44 504 48 382 48 565
Slovakia 2 373 553 14 290 16 783 16 734 16 389 16 578 18 039 19 020 20 778 20 801
Slovenia 8 941 8 807 8 688 8 510 8 491 8 432 8 313 8 445 8 574 8 578 8 589
Total 311 133 294 706 310 799 320 218 318 506 312 229 322 375 333 879 349 375 362 891 366 148
Source: own study based onEurostat [https://ec.europa.eu/Eurostat], access: 05.04.2020.
In the CEECs, the average value of the indicator of economic development of transport enterprises is in the range
of 0.38-0.64, the indicator of social development of transport enterprises is in the range of 0.42-0.60, and the
indicator of environmental development of transport enterprises is in the range of 0.54-0.64. The maximum value
of the indicator of the economic development of transport enterprises (EDTE) in the CEECs is observed in Latvia
(2017, 2018: 0.89), while the minimum value in Lithuania (2009: 0.03). The maximum value of the indicator of
social development of transport enterprises (SODTE) in the CEECs is in Poland (2018: 0.83) and Romania (2018:
0.83); the minimum value also in Poland (2009: 0.11). The maximum value of the indicator of the environmental
development of transport enterprises (ENVDTE) in the CEECs is observed in Poland (2014: 0.95), while the
minimum value in Czechia (2008: 0.03) (Table 4).
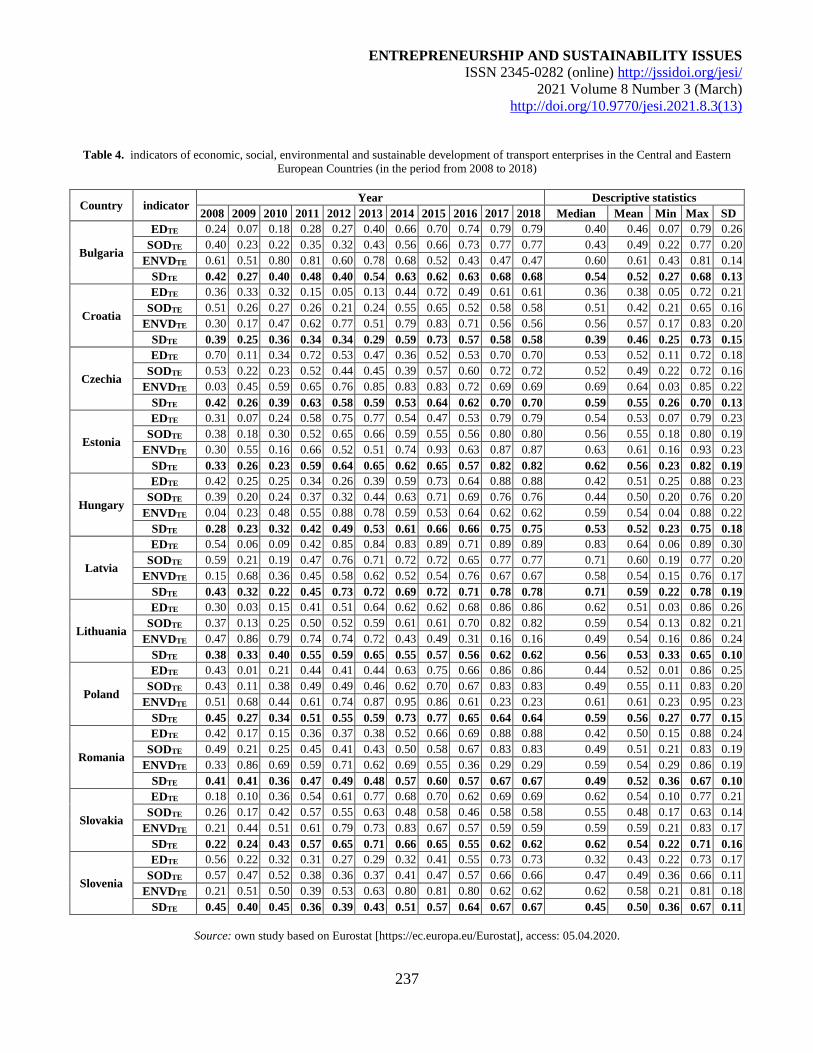
ENTREPRENEURSHIP AND SUSTAINABILITY ISSUES
ISSN 2345-0282 (online) http://jssidoi.org/jesi/
2021 Volume 8 Number 3 (March)
http://doi.org/10.9770/jesi.2021.8.3(13)
237
Table 4. indicators of economic, social, environmental and sustainable development of transport enterprises in the Central and Eastern
European Countries (in the period from 2008 to 2018)
Country indicator Year Descriptive statistics
2008 2009 2010 2011 2012 2013 2014 2015 2016 2017 2018 Median Mean Min Max SD
Bulgaria
EDTE 0.24 0.07 0.18 0.28 0.27 0.40 0.66 0.70 0.74 0.79 0.79 0.40 0.46 0.07 0.79 0.26
SODTE 0.40 0.23 0.22 0.35 0.32 0.43 0.56 0.66 0.73 0.77 0.77 0.43 0.49 0.22 0.77 0.20
ENVDTE 0.61 0.51 0.80 0.81 0.60 0.78 0.68 0.52 0.43 0.47 0.47 0.60 0.61 0.43 0.81 0.14
SDTE 0.42 0.27 0.40 0.48 0.40 0.54 0.63 0.62 0.63 0.68 0.68 0.54 0.52 0.27 0.68 0.13
Croatia
EDTE 0.36 0.33 0.32 0.15 0.05 0.13 0.44 0.72 0.49 0.61 0.61 0.36 0.38 0.05 0.72 0.21
SODTE 0.51 0.26 0.27 0.26 0.21 0.24 0.55 0.65 0.52 0.58 0.58 0.51 0.42 0.21 0.65 0.16
ENVDTE 0.30 0.17 0.47 0.62 0.77 0.51 0.79 0.83 0.71 0.56 0.56 0.56 0.57 0.17 0.83 0.20
SDTE 0.39 0.25 0.36 0.34 0.34 0.29 0.59 0.73 0.57 0.58 0.58 0.39 0.46 0.25 0.73 0.15
Czechia
EDTE 0.70 0.11 0.34 0.72 0.53 0.47 0.36 0.52 0.53 0.70 0.70 0.53 0.52 0.11 0.72 0.18
SODTE 0.53 0.22 0.23 0.52 0.44 0.45 0.39 0.57 0.60 0.72 0.72 0.52 0.49 0.22 0.72 0.16
ENVDTE 0.03 0.45 0.59 0.65 0.76 0.85 0.83 0.83 0.72 0.69 0.69 0.69 0.64 0.03 0.85 0.22
SDTE 0.42 0.26 0.39 0.63 0.58 0.59 0.53 0.64 0.62 0.70 0.70 0.59 0.55 0.26 0.70 0.13
Estonia
EDTE 0.31 0.07 0.24 0.58 0.75 0.77 0.54 0.47 0.53 0.79 0.79 0.54 0.53 0.07 0.79 0.23
SODTE 0.38 0.18 0.30 0.52 0.65 0.66 0.59 0.55 0.56 0.80 0.80 0.56 0.55 0.18 0.80 0.19
ENVDTE 0.30 0.55 0.16 0.66 0.52 0.51 0.74 0.93 0.63 0.87 0.87 0.63 0.61 0.16 0.93 0.23
SDTE 0.33 0.26 0.23 0.59 0.64 0.65 0.62 0.65 0.57 0.82 0.82 0.62 0.56 0.23 0.82 0.19
Hungary
EDTE 0.42 0.25 0.25 0.34 0.26 0.39 0.59 0.73 0.64 0.88 0.88 0.42 0.51 0.25 0.88 0.23
SODTE 0.39 0.20 0.24 0.37 0.32 0.44 0.63 0.71 0.69 0.76 0.76 0.44 0.50 0.20 0.76 0.20
ENVDTE 0.04 0.23 0.48 0.55 0.88 0.78 0.59 0.53 0.64 0.62 0.62 0.59 0.54 0.04 0.88 0.22
SDTE 0.28 0.23 0.32 0.42 0.49 0.53 0.61 0.66 0.66 0.75 0.75 0.53 0.52 0.23 0.75 0.18
Latvia
EDTE 0.54 0.06 0.09 0.42 0.85 0.84 0.83 0.89 0.71 0.89 0.89 0.83 0.64 0.06 0.89 0.30
SODTE 0.59 0.21 0.19 0.47 0.76 0.71 0.72 0.72 0.65 0.77 0.77 0.71 0.60 0.19 0.77 0.20
ENVDTE 0.15 0.68 0.36 0.45 0.58 0.62 0.52 0.54 0.76 0.67 0.67 0.58 0.54 0.15 0.76 0.17
SDTE 0.43 0.32 0.22 0.45 0.73 0.72 0.69 0.72 0.71 0.78 0.78 0.71 0.59 0.22 0.78 0.19
Lithuania
EDTE 0.30 0.03 0.15 0.41 0.51 0.64 0.62 0.62 0.68 0.86 0.86 0.62 0.51 0.03 0.86 0.26
SODTE 0.37 0.13 0.25 0.50 0.52 0.59 0.61 0.61 0.70 0.82 0.82 0.59 0.54 0.13 0.82 0.21
ENVDTE 0.47 0.86 0.79 0.74 0.74 0.72 0.43 0.49 0.31 0.16 0.16 0.49 0.54 0.16 0.86 0.24
SDTE 0.38 0.33 0.40 0.55 0.59 0.65 0.55 0.57 0.56 0.62 0.62 0.56 0.53 0.33 0.65 0.10
Poland
EDTE 0.43 0.01 0.21 0.44 0.41 0.44 0.63 0.75 0.66 0.86 0.86 0.44 0.52 0.01 0.86 0.25
SODTE 0.43 0.11 0.38 0.49 0.49 0.46 0.62 0.70 0.67 0.83 0.83 0.49 0.55 0.11 0.83 0.20
ENVDTE 0.51 0.68 0.44 0.61 0.74 0.87 0.95 0.86 0.61 0.23 0.23 0.61 0.61 0.23 0.95 0.23
SDTE 0.45 0.27 0.34 0.51 0.55 0.59 0.73 0.77 0.65 0.64 0.64 0.59 0.56 0.27 0.77 0.15
Romania
EDTE 0.42 0.17 0.15 0.36 0.37 0.38 0.52 0.66 0.69 0.88 0.88 0.42 0.50 0.15 0.88 0.24
SODTE 0.49 0.21 0.25 0.45 0.41 0.43 0.50 0.58 0.67 0.83 0.83 0.49 0.51 0.21 0.83 0.19
ENVDTE 0.33 0.86 0.69 0.59 0.71 0.62 0.69 0.55 0.36 0.29 0.29 0.59 0.54 0.29 0.86 0.19
SDTE 0.41 0.41 0.36 0.47 0.49 0.48 0.57 0.60 0.57 0.67 0.67 0.49 0.52 0.36 0.67 0.10
Slovakia
EDTE 0.18 0.10 0.36 0.54 0.61 0.77 0.68 0.70 0.62 0.69 0.69 0.62 0.54 0.10 0.77 0.21
SODTE 0.26 0.17 0.42 0.57 0.55 0.63 0.48 0.58 0.46 0.58 0.58 0.55 0.48 0.17 0.63 0.14
ENVDTE 0.21 0.44 0.51 0.61 0.79 0.73 0.83 0.67 0.57 0.59 0.59 0.59 0.59 0.21 0.83 0.17
SDTE 0.22 0.24 0.43 0.57 0.65 0.71 0.66 0.65 0.55 0.62 0.62 0.62 0.54 0.22 0.71 0.16
Slovenia
EDTE 0.56 0.22 0.32 0.31 0.27 0.29 0.32 0.41 0.55 0.73 0.73 0.32 0.43 0.22 0.73 0.17
SODTE 0.57 0.47 0.52 0.38 0.36 0.37 0.41 0.47 0.57 0.66 0.66 0.47 0.49 0.36 0.66 0.11
ENVDTE 0.21 0.51 0.50 0.39 0.53 0.63 0.80 0.81 0.80 0.62 0.62 0.62 0.58 0.21 0.81 0.18
SDTE 0.45 0.40 0.45 0.36 0.39 0.43 0.51 0.57 0.64 0.67 0.67 0.45 0.50 0.36 0.67 0.11
Source: own study based on Eurostat [https://ec.europa.eu/Eurostat], access: 05.04.2020.
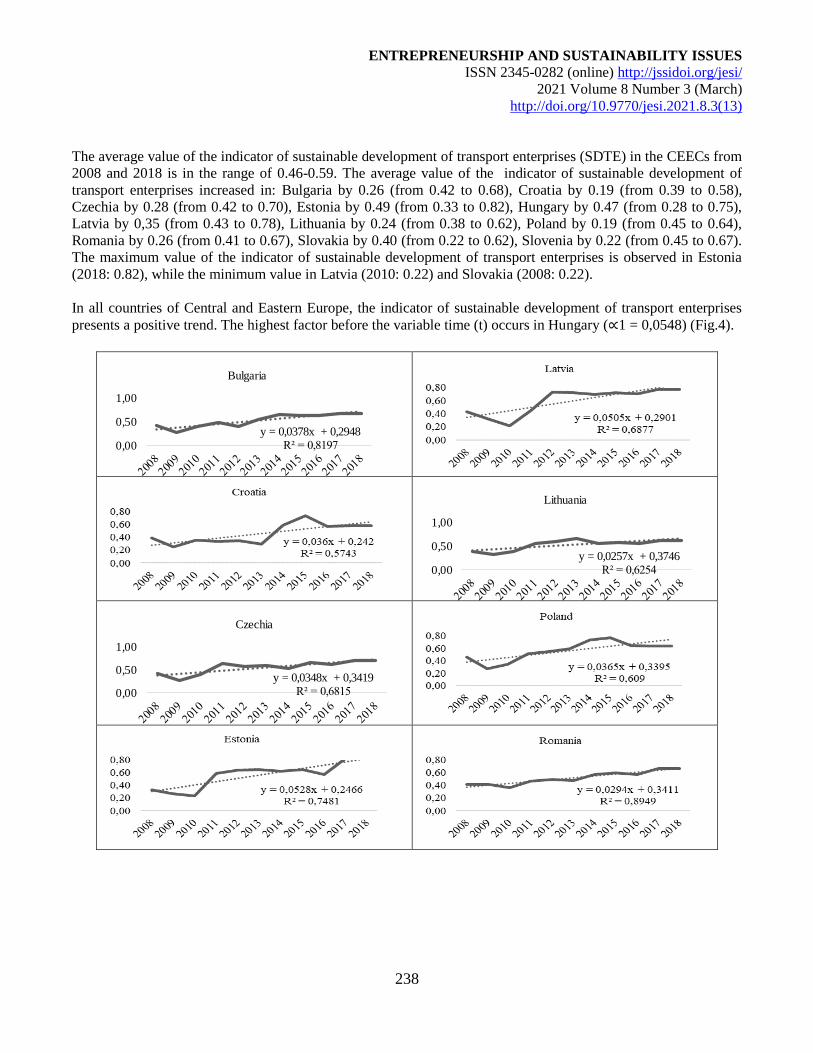
ENTREPRENEURSHIP AND SUSTAINABILITY ISSUES
ISSN 2345-0282 (online) http://jssidoi.org/jesi/
2021 Volume 8 Number 3 (March)
http://doi.org/10.9770/jesi.2021.8.3(13)
238
The average value of the indicator of sustainable development of transport enterprises (SDTE) in the CEECs from
2008 and 2018 is in the range of 0.46-0.59. The average value of the indicator of sustainable development of
transport enterprises increased in: Bulgaria by 0.26 (from 0.42 to 0.68), Croatia by 0.19 (from 0.39 to 0.58),
Czechia by 0.28 (from 0.42 to 0.70), Estonia by 0.49 (from 0.33 to 0.82), Hungary by 0.47 (from 0.28 to 0.75),
Latvia by 0,35 (from 0.43 to 0.78), Lithuania by 0.24 (from 0.38 to 0.62), Poland by 0.19 (from 0.45 to 0.64),
Romania by 0.26 (from 0.41 to 0.67), Slovakia by 0.40 (from 0.22 to 0.62), Slovenia by 0.22 (from 0.45 to 0.67).
The maximum value of the indicator of sustainable development of transport enterprises is observed in Estonia
(2018: 0.82), while the minimum value in Latvia (2010: 0.22) and Slovakia (2008: 0.22).
In all countries of Central and Eastern Europe, the indicator of sustainable development of transport enterprises
presents a positive trend. The highest factor before the variable time (t) occurs in Hungary (∝1 = 0,0548) (Fig.4).
y = 0,0378x + 0,2948R² = 0,81970,00
0,50
1,00
Bulgaria
y = 0,0257x + 0,3746R² = 0,62540,00
0,50
1,00
Lithuania
y = 0,0348x + 0,3419R² = 0,68150,00
0,50
1,00
Czechia
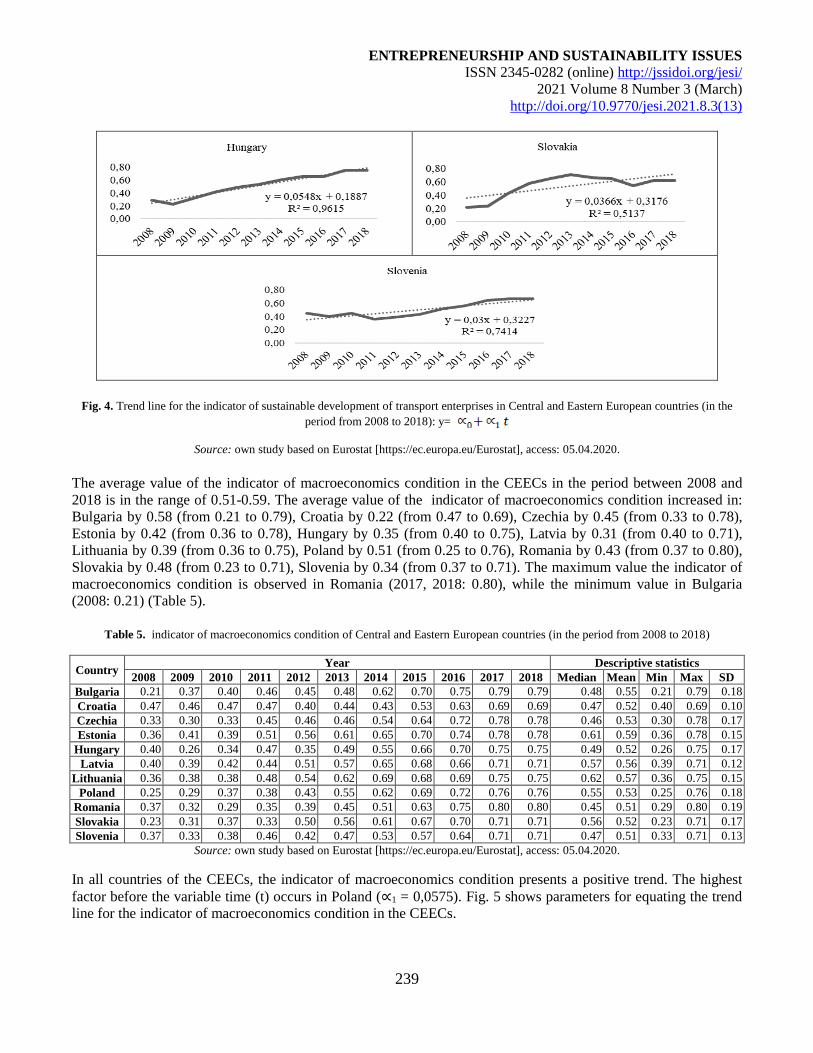
ENTREPRENEURSHIP AND SUSTAINABILITY ISSUES
ISSN 2345-0282 (online) http://jssidoi.org/jesi/
2021 Volume 8 Number 3 (March)
http://doi.org/10.9770/jesi.2021.8.3(13)
239
Fig. 4. Trend line for the indicator of sustainable development of transport enterprises in Central and Eastern European countries (in the
period from 2008 to 2018): y=
Source: own study based on Eurostat [https://ec.europa.eu/Eurostat], access: 05.04.2020.
The average value of the indicator of macroeconomics condition in the CEECs in the period between 2008 and
2018 is in the range of 0.51-0.59. The average value of the indicator of macroeconomics condition increased in:
Bulgaria by 0.58 (from 0.21 to 0.79), Croatia by 0.22 (from 0.47 to 0.69), Czechia by 0.45 (from 0.33 to 0.78),
Estonia by 0.42 (from 0.36 to 0.78), Hungary by 0.35 (from 0.40 to 0.75), Latvia by 0.31 (from 0.40 to 0.71),
Lithuania by 0.39 (from 0.36 to 0.75), Poland by 0.51 (from 0.25 to 0.76), Romania by 0.43 (from 0.37 to 0.80),
Slovakia by 0.48 (from 0.23 to 0.71), Slovenia by 0.34 (from 0.37 to 0.71). The maximum value the indicator of
macroeconomics condition is observed in Romania (2017, 2018: 0.80), while the minimum value in Bulgaria
(2008: 0.21) (Table 5).
Table 5. indicator of macroeconomics condition of Central and Eastern European countries (in the period from 2008 to 2018)
Country Year Descriptive statistics
2008 2009 2010 2011 2012 2013 2014 2015 2016 2017 2018 Median Mean Min Max SD
Bulgaria 0.21 0.37 0.40 0.46 0.45 0.48 0.62 0.70 0.75 0.79 0.79 0.48 0.55 0.21 0.79 0.18
Croatia 0.47 0.46 0.47 0.47 0.40 0.44 0.43 0.53 0.63 0.69 0.69 0.47 0.52 0.40 0.69 0.10
Czechia 0.33 0.30 0.33 0.45 0.46 0.46 0.54 0.64 0.72 0.78 0.78 0.46 0.53 0.30 0.78 0.17
Estonia 0.36 0.41 0.39 0.51 0.56 0.61 0.65 0.70 0.74 0.78 0.78 0.61 0.59 0.36 0.78 0.15
Hungary 0.40 0.26 0.34 0.47 0.35 0.49 0.55 0.66 0.70 0.75 0.75 0.49 0.52 0.26 0.75 0.17
Latvia 0.40 0.39 0.42 0.44 0.51 0.57 0.65 0.68 0.66 0.71 0.71 0.57 0.56 0.39 0.71 0.12
Lithuania 0.36 0.38 0.38 0.48 0.54 0.62 0.69 0.68 0.69 0.75 0.75 0.62 0.57 0.36 0.75 0.15
Poland 0.25 0.29 0.37 0.38 0.43 0.55 0.62 0.69 0.72 0.76 0.76 0.55 0.53 0.25 0.76 0.18
Romania 0.37 0.32 0.29 0.35 0.39 0.45 0.51 0.63 0.75 0.80 0.80 0.45 0.51 0.29 0.80 0.19
Slovakia 0.23 0.31 0.37 0.33 0.50 0.56 0.61 0.67 0.70 0.71 0.71 0.56 0.52 0.23 0.71 0.17
Slovenia 0.37 0.33 0.38 0.46 0.42 0.47 0.53 0.57 0.64 0.71 0.71 0.47 0.51 0.33 0.71 0.13
Source: own study based on Eurostat [https://ec.europa.eu/Eurostat], access: 05.04.2020.
In all countries of the CEECs, the indicator of macroeconomics condition presents a positive trend. The highest
factor before the variable time (t) occurs in Poland (∝1 = 0,0575). Fig. 5 shows parameters for equating the trend
line for the indicator of macroeconomics condition in the CEECs.
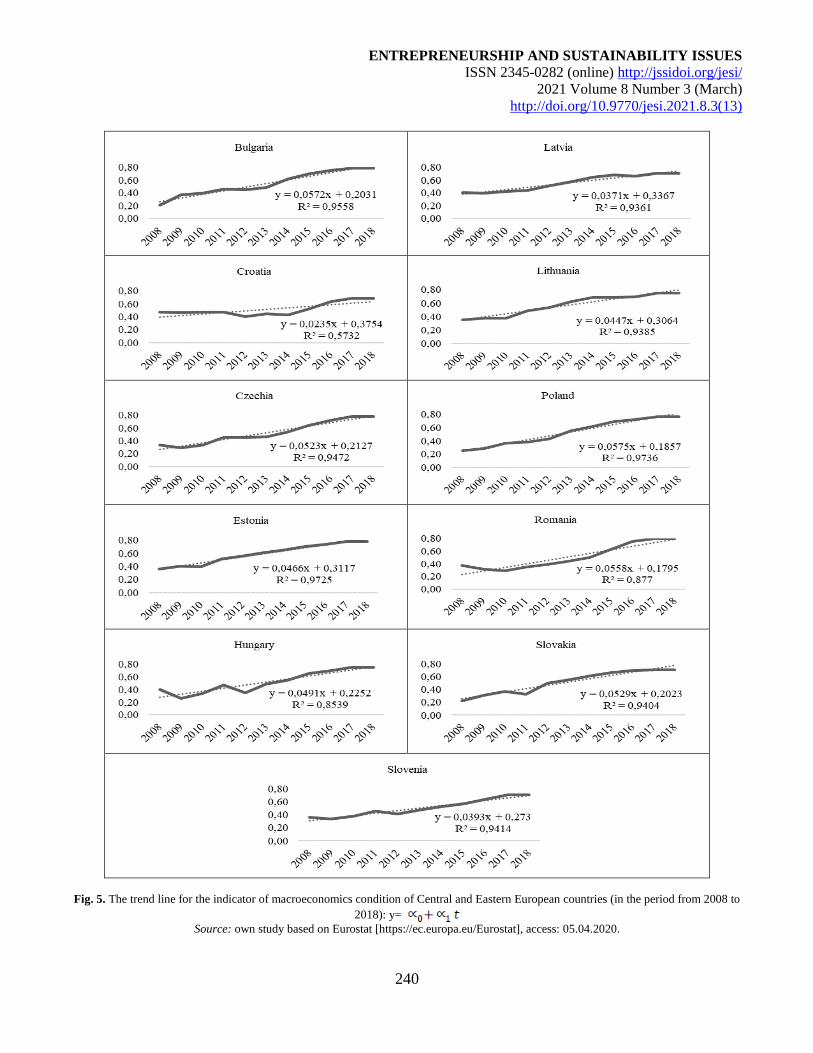
ENTREPRENEURSHIP AND SUSTAINABILITY ISSUES
ISSN 2345-0282 (online) http://jssidoi.org/jesi/
2021 Volume 8 Number 3 (March)
http://doi.org/10.9770/jesi.2021.8.3(13)
240
Fig. 5. The trend line for the indicator of macroeconomics condition of Central and Eastern European countries (in the period from 2008 to
2018): y=
Source: own study based on Eurostat [https://ec.europa.eu/Eurostat], access: 05.04.2020.
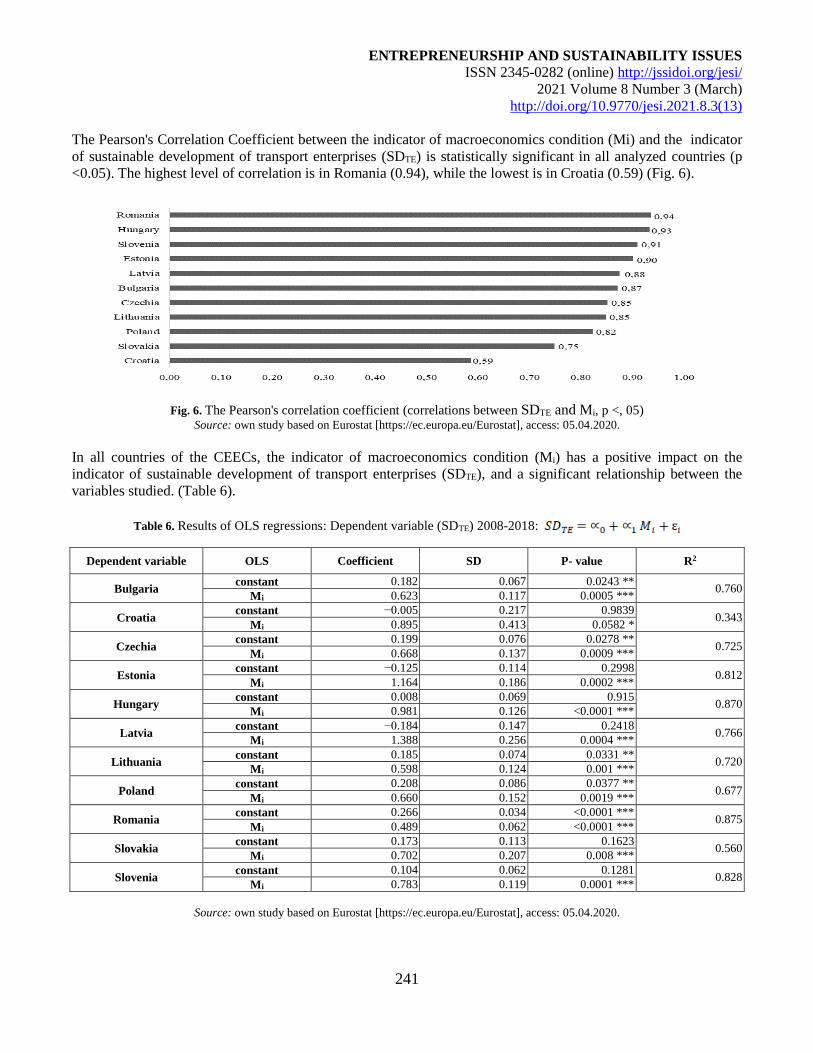
ENTREPRENEURSHIP AND SUSTAINABILITY ISSUES
ISSN 2345-0282 (online) http://jssidoi.org/jesi/
2021 Volume 8 Number 3 (March)
http://doi.org/10.9770/jesi.2021.8.3(13)
241
The Pearson's Correlation Coefficient between the indicator of macroeconomics condition (Mi) and the indicator
of sustainable development of transport enterprises (SDTE) is statistically significant in all analyzed countries (p
<0.05). The highest level of correlation is in Romania (0.94), while the lowest is in Croatia (0.59) (Fig. 6).
Fig. 6. The Pearson's correlation coefficient (correlations between SDTE and Mi, p <, 05) Source: own study based on Eurostat [https://ec.europa.eu/Eurostat], access: 05.04.2020.
In all countries of the CEECs, the indicator of macroeconomics condition (Mi) has a positive impact on the
indicator of sustainable development of transport enterprises (SDTE), and a significant relationship between the
variables studied. (Table 6).
Table 6. Results of OLS regressions: Dependent variable (SDTE) 2008-2018:
Dependent variable OLS Coefficient SD P- value R2
Bulgaria constant 0.182 0.067 0.0243 **
0.760 Mi 0.623 0.117 0.0005 ***
Croatia constant −0.005 0.217 0.9839
0.343 Mi 0.895 0.413 0.0582 *
Czechia constant 0.199 0.076 0.0278 **
0.725 Mi 0.668 0.137 0.0009 ***
Estonia constant −0.125 0.114 0.2998
0.812 Mi 1.164 0.186 0.0002 ***
Hungary constant 0.008 0.069 0.915
0.870 Mi 0.981 0.126 <0.0001 ***
Latvia constant −0.184 0.147 0.2418
0.766 Mi 1.388 0.256 0.0004 ***
Lithuania constant 0.185 0.074 0.0331 **
0.720 Mi 0.598 0.124 0.001 ***
Poland constant 0.208 0.086 0.0377 **
0.677 Mi 0.660 0.152 0.0019 ***
Romania constant 0.266 0.034 <0.0001 ***
0.875 Mi 0.489 0.062 <0.0001 ***
Slovakia constant 0.173 0.113 0.1623
0.560 Mi 0.702 0.207 0.008 ***
Slovenia constant 0.104 0.062 0.1281
0.828 Mi 0.783 0.119 0.0001 ***
Source: own study based on Eurostat [https://ec.europa.eu/Eurostat], access: 05.04.2020.
ENTREPRENEURSHIP AND SUSTAINABILITY ISSUES
ISSN 2345-0282 (online) http://jssidoi.org/jesi/
2021 Volume 8 Number 3 (March)
http://doi.org/10.9770/jesi.2021.8.3(13)
242
The research result allows for adopting the central research hypothesis (H) presented in the introduction because
"Macroeconomic conditions have a statistically significant impact on the sustainable development of transport
enterprises in Central and Eastern Europe in the period from 2008 to 2018". In all countries, this relationship
shows a high level of statistical significance. The indicator of macroeconomics condition's highest impact on the
indicator of sustainable development of transport enterprises is in Latvia (1.388). In contrast, the lowest impact of
the indicator of macroeconomics condition on the indicator of sustainable development of transport enterprises is
in Romania (0.489). The coefficient of determination (R2) is in the range from 0.343 (the relationship between the
indicator of macroeconomics conditions and the indicator of sustainable development of transport enterprises in
Croatia) to 0.875 (the relationship between macroeconomics condition and the indicator of sustainable
development of transport enterprises in Romania).
The high level of the analyzed dependence indicates that the state authorities should undertake actions supporting
the country's socio-economic development. It is important to take initiatives and actions to support
entrepreneurship and environmental protection. Financial and substantive programs of the European Union
focused on innovations, new technologies, and environmental programs should play a key role here.
The first sub-hypothesis (H1) is also true, "the indicator of sustainable development of enterprises (SDTE) in the
Central and Eastern European countries shows the positive dynamics in the period from 2008 to 2018".
Sustainable development of transport enterprises is due to the undertaken actions and ecological initiatives,
financial support programs, increased awareness of society, and consumers' quality and expectations resulting
from economic conditions.
The second sub-hypothesis (H2) is true, “the indicator of macroeconomic conditions (Mi) in the Central and
Eastern European countries shows the positive dynamics in the period from 2008 to 2018”. The macroeconomic
conditions improve due to the recovery from the crisis, the global economic boom, and consumer moods.
The third sub-hypothesis (H3) could not be confirmed, it is not true that “The highest average value of the
indicator of sustainable development of transport enterprises (SDTE) shows in countries with the highest average
value of macroeconomic conditions (Mi)”. Sustainable development is a holistic concept that depends on several
factors omitted in the study, including internal and external conditions, both quantitative and qualitative.
Conclusions
The rapid development of industry has led to environmental degradation and climate change. It has become
necessary to counteract the negative impact of economic activity on the natural environment. Based on socio-
economic changes and the increase of ecological awareness, the concept of sustainable development was born.
The main issues focus on conserving natural resources for present and future generations by achieving economic,
social, and environmental goals.
The effectiveness and efficiency of implementing the concept of sustainable development require the commitment
of all actors of socio-economic life, including enterprises, organizations, institutions, and individual countries.
Sustainable development of the enterprise means improving the financial and property situation, taking care of the
work conditions and the health of employees, and implementing activities to protect the natural environment.
The implementation of sustainable development goals depends significantly on the level of socio-economic
development of countries. In enterprises, apart from macroeconomic conditions, the type, size, scale of operations,
and management awareness are also necessary.
ENTREPRENEURSHIP AND SUSTAINABILITY ISSUES
ISSN 2345-0282 (online) http://jssidoi.org/jesi/
2021 Volume 8 Number 3 (March)
http://doi.org/10.9770/jesi.2021.8.3(13)
243
In this paper, we assume that macroeconomic determinants' impact on the sustainable development of transport
enterprises in Central and Eastern Europe Countries in the period from 2008 to 2018. We analyzed the transport
enterprise sector due to its negative impact on the natural environment and their role in analyzing countries'
economies with a similar geographical location, a shared history, and a similar level of socio-economic
development. The transformation of business conditions after joining the European Union is also crucial. The
research period's definition is associated with the accession of Bulgaria and Romania in 2007 to the EU and the
appearance of symptoms of an economic slowdown.
We adopted the assumption, based on research conducted so far, that socio-economic development is fundamental
for enterprises' sustainable development in developing countries. To verify the research hypothesis
(Macroeconomic conditions have a statistically significant impact on the sustainable development of transport
enterprises in Central and Eastern Europe in the period from 2008 to 2018), we create indicators of sustainable
development of transport enterprises and indicators of macroeconomic conditions and examine the relationships
between them (we use the Pearson Correlation Coefficient and Ordinary Least Squares Method).
The results of the research show that the central hypothesis (H) is correct. In all countries of the CEECs, it is a
positive impact of macroeconomic conditions on the sustainable development of transport enterprises. The highest
degree of Pearson's Correlation Coefficient between macroeconomic conditions and sustainable development of
enterprises occurs in Romania (0.94), Hungary (0.93), and Slovenia (0,91), while the lowest in Croatia (0.59). The
estimation of model parameters using the OLS method also indicates a statistically significant relationship
between variables. The highest impact is in Latvia (1.388), the lowest in Romania (0.489).
The first sub-hypothesis (H1), "the indicator of sustainable development of enterprises (SDTE) in the Central and
Eastern European countries shows the positive dynamics in the period from 2008 to 2018" is correct. It is a
positive phenomenon resulting from the increased environmental awareness of society and the good economic
situation and financial programs supporting the natural environment's protection.
The second sub-hypothesis (H2), "the indicator of macroeconomic conditions (Mi) in the Central and Eastern
European countries shows the positive dynamics in the period from 2008 to 2018" is correct. The main factors
here are the slow recovery from the economic crisis and the good economic situation.
The third sub-hypothesis (H3) it is not true that "The highest average value of the indicator of sustainable
development of transport enterprises (SDTE) shows in countries with the highest average value of
macroeconomic conditions (Mi)". Sustainable development is a holistic concept that depends on several factors
omitted in the study, including internal and external conditions, both quantitative and qualitative.
Determinants of sustainable development of enterprises are exciting and complex research issues. Several factors,
including macroeconomic conditions, determine them. The more economically and socially developed countries
are, the more significant pressure on enterprises to comply with environmental protection and social issues.
Therefore, it seems crucial to create favorable conditions for doing business in harmony with nature. From that
point of view, financial and institutional support from international institutions and social pressure to take
ecological actions are necessary for enterprises' sustainable development, especially in developing countries.
Further research will be conducted to assess the impact of internal and external conditions on enterprises'
sustainable development in the European Union
ENTREPRENEURSHIP AND SUSTAINABILITY ISSUES
ISSN 2345-0282 (online) http://jssidoi.org/jesi/
2021 Volume 8 Number 3 (March)
http://doi.org/10.9770/jesi.2021.8.3(13)
244
References
Abdi, Y.; Li, X.; Càmara-Turull, X. 2020. Impact of Sustainability on Firm Value and Financial Performance in the Air Transport Industry.
Sustainability, 12, 9957. https://doi.org/10.3390/su12239957
Ali, N.; Javid, M. A.; Hussain, S. A.; & Abdullah, M. 2020. Key Performance Indicators for Sustainable Freight Transport and Scenario-
based Impediments in Pakistan Freight Industry. IPTEK Journal of Proceedings Series, (5), 1-8.
Andersson, P.; & Forslund, H. 2018. Developing an indicator framework for measuring sustainable logistics innovation in retail.
Measuring Business Excellence, 22(1): 1-13. https://doi.org/10.1108/MBE-04-2017-0017
Andryashina, N.S., Garina, E.P., Garin, A.P., Seitova, Z.B., Seitov, B.M. 2020. Features of Sustainable Enterprise Development. In:
Popkova E., Sergi B. (eds) Scientific and Technical Revolution: Yesterday, Today and Tomorrow. ISC 2019. Lecture Notes in Networks
and Systems, vol 129. Springer, Cham. https://doi.org/10.1007/978-3-030-47945-9_144.
Arvidsson, N.; Woxenius, J.; & Lammgård, C. 2013. Review of Road Hauliers' Measures for Increasing Transport Efficiency and
Sustainability in Urban Freight Distribution. Transport Reviews, 33(1): 107-127. https://doi.org/10.1080/01441647.2013.763866
Barbosa, G.S.; Drach, P.R.; & Corbella, O.D.A. 2014. Conceptual Review of the Terms Sustainable Development and Sustainability.
International Journal of Social Sciences, 3(2): 1-15.
Bask, A.; Rajahonka, M.; Laari, S.; Solakivi, T.; Töyli, J.; & Ojala, L. 2018. Environmental sustainability in shipper-LSP relationships.
Journal of Cleaner Production, 172: 2986–2998. https://doi.org/10.1016/j.jclepro.2017.11.112
Behrends, S.; Lindholm, M.; & Woxenius, J. 2008. The Impact of Urban Freight Transport: A Definition of Sustainability from an Actor's
Perspective. Transportation Planning and Technology, 31(6): 693-713. https://doi.org/10.1080/03081060802493247
Blewitt, J. 2008. Understanding sustainable development. London: Earthscan.
Boudreau, J.; & Ramstad, P. 2005. Talentship, talent segmentation, and sustainability: A new HR decision science paradigm for a new
strategy definition. Human Resource Management, 44(2): 129–136. https://doi.org/10.1002/hrm.20054
Bowen, H. R. 1953. Social Responsibilities of the Businessman. New York, NY: Harper.
Castillo, H.; & Pitfield, D.E. 2010. ELASTIC–A methodological framework for identifying and selecting sustainable transport indicators.
Transportation Research, PartD, 15: 179-188.
Ciegis, R.; & Zeleniute, R. 2008. Ekonomikos plėtra darnaus vystymosi aspektu (Economic development in terms of sustainable
development). Taikomoji ekonomika: sisteminiai tyrimai, 2(1): 37-54.
Crals, E.; & Vereeck, L. 2004. Sustainable Entrepreneurship in SMEs: Theory and Practice. Conference proceedings in 3rd Global
Conference on Environmental Justice and Global Citizenship, February 12-14, Copenhagen, Denmark.
Davis, K. 1960. Can business afford to ignore social responsibilities? California Management Review, 2(3): 70–76.
https://doi.org/10.2307/41166246
Del Giudice, A.; Rigamonti, S. 2020. Does Audit Improve the Quality of ESG Scores? Evidence from Corporate Misconduct.
Sustainability, 12, 5670. https://doi.org/10.3390/su12145670
Drljača, M. 2012. Koncept održivograzvoja i sustavupravljanja (The concept of sustainable development and governance). Međunarodni
skup Nedeljakvaliteta, Kvalitet i izvrsnost, 1(1-2): 1-15.
Duerr, W. A. 1975. The Role of Faith in Forest Resource Management, in: Rumsey, F., Duerr, W. A. (Eds.), Social Science in Forestry. A
Book of Reading, W. B. Saunders, Philadelphia.
Dvořáková, L.; & Zborková, J. 2014. Integration of Sustainable Development at Enterprise Level. Procedia Engineering, 69: 686-695.
ENTREPRENEURSHIP AND SUSTAINABILITY ISSUES
ISSN 2345-0282 (online) http://jssidoi.org/jesi/
2021 Volume 8 Number 3 (March)
http://doi.org/10.9770/jesi.2021.8.3(13)
245
Dziekański, P. 2014. Diversification Indicator For Evaluating The Financial Capacity Of Local Government. The Case of Polish
Voivodeships. Acta Universitatis Agriculturae Et Silviculturae Mendelianae Brunensis, 65(2): 611-619.
https://pdfs.semanticscholar.org/2df2/a632aa0ec07f2a191b353475e12186da9fcf.pdf
Freund, R.J.; Wilson W.J.; & Sa P. 2006. Regression Analysis. Statistical Modeling of a Response Variable, Burlington, MA: Academic
Press Elsevier Inc.
Fried, T.; Tun, T.H.; Klopp, J.M.; & Welle, B. 2020. Measuring the Sustainable Development Goal (SDG) Transport Target and
Accessibility of Nairobi’s Matatus. Transportation Research Record, 2674(5): 196-207. https://doi.org/10.1177/0361198120914620
Friedman, M. 1970. The social responsibility of business is to increase its profits. The New York Times Magazine, September 13.
Gagnon, M.A. 2012. Sustainable Minded Entrepreneurs: Developing and Testing a Value-based Framework. Journal of Strategic
Innovation and Sustainability, 8(1), 9-25.
Gatto, M. 1995. Sustainability: Is it a Well Defined Concept? Ecological Applications, 5(4), 1181-83.
Gonzalez-Cabezas, D.; Zaror, C.; & Herrera, M. Á. 2018. Comparative assessment of sustainable development in South American
countries based onthe Sustainable Society Index. International Journal of Sustainable Development & World Ecology, 1: 90-98.
Grabara, J.; Bajdro, P.; & Mihaescu, L. 2015. Steps of sustainable development implementation into enterprise activities. Management of
Sustainable Development, 7(1), 45-49.
Grober, U. 2007. Deep roots: A conceptual history of 'sustainable development' (Nachhaltigkeit), Discussion Papers, Presidential
Department, P 2007-002, WZB Berlin Social Science Center.
Grudzewski, W.M.; Hejduk, I.K.; Sankowska, A.; & Wańtuchowicz, M. 2010. Sustainability w biznesie czyli przedsiębiorstwo przyszłości, zmiany
paradygmatów i koncepcji zarządzania (Sustainability in business, i.e. the enterprise of the future, changes in paradigms and management
concepts). Warszawa: Wydawnictwo Poltext.
Gudmundsson, H. 2004. Sustainable transport and performance indicators. Issues in Environmental Science and Technology, 20: 35-63.
Hedstrom, G.; Poltorzycki, S.; & Stroh, P. 1998. Sustainable Development: The Next Generation of Busines Opportunity. Prism, Fourth
Quarter.
International Institute for Sustainable Development (IISD); Deloitte & Touche; & World Business Council for International Union for
Conservation of Nature and Natural Resources. 1992. Business strategy for sustainable development: leadership and accountability for the
'90s. IISD: Winnipeg, MB, Canada.
International Union for Conservation of Nature and Natural Resources (ed.). 1980. World Conservation Strategy: Living Resource
Conservation for Sustainable Development. IUCN–UNEP–WWF.
Joshi, S.; & Li, Y. 2016. What Is Corporate Sustainability and How Do Firms Practice It? A Management Accounting Research Perspective.
Journal of Management Accounting Research, 28(2): 1-11.
Kochov, A., Danev D., & Kostikj A. 2020. Sustainable Transport Indicators in the Context of Introducing of Electric Passenger Cars.
Tehnički glasnik, 14(3): 318-324.
Lawal, F.A.; Worlu, R.E.; & Ayoade, O.E. 2016. Critical Success Factors for Sustainable Entrepreneurship in SMEs: Nigerian Perspective.
Mediterranean Journal of Social Sciences MISER Publishing, 7(3): 338-346.
Litman, T. 2009. Sustainable transportation indicator data quality and availability. Victoria Transport Policy Institute.
Majid, I.A.; Kamaludin, M.H.; Saad, M.S.M.; & Aziz, N.A. 2012. Sustainability-driven Entrepreneurship: The Mediating Effect of
Opportunity based Management Structure on the Relationship between Entrepreneurial Orientation and Environmental Sustainability
Management of SMEs: A Conceptual Framework. European Journal of Business and Management, 4(13): 148-155.
Mihai, E.: Mihai, F.-C.; & Munteanu, A.V. 2019. Sustainability of the transport sector during the last 20 years: evidences from a panel of
35 countries. Conference Proceedings of 19th International Multidisciplinary Scientific GeoConference on Ecology, Economics, Education
and Legislation SGEM, 19(5): 687-694.
ENTREPRENEURSHIP AND SUSTAINABILITY ISSUES
ISSN 2345-0282 (online) http://jssidoi.org/jesi/
2021 Volume 8 Number 3 (March)
http://doi.org/10.9770/jesi.2021.8.3(13)
246
MiIntyre, J.R.; Ivanaj, S.; & Ivanaj, V. 2009. Multinational Enterprises and the Challenge of Sustainable Development, Cheltenham-
Northampton: Edward Elgar Publishing Limited.
Misztal, A. 2019. Sustainable Development of Transport Enterprises in Poland - Statistical Assessment. Logistics and Transport, 42(2): 57-
64.
Misztal, A.; & Kowalska, M. 2020. The impact of globalization on the sustainable development of enterprises – the case of Bulgaria,
Croatia and Romania. Prace Naukowe Uniwersytetu Ekonomicznego we Wrocawiu, 64(3): 42-56.
Moore, N. 2019. Sustainable Development Innovation: Education, Research, and Enterprise Activities at Universities. In: Leal Filho W.
(eds) Encyclopedia of Sustainability in Higher Education. Springer, Cham. https://doi.org/10.1007/978-3-030-11352-0_306
Oberhofer, P.; & Dieplinger, M. 2014. Sustainability in the Transport and Logistics Sector: Lacking Environmental Measures. Business
Strategy and the Environment, 23: 236–253.
Oberhofer, P.; & Fürst, E. 2013. Sustainable Development in the Transport Sector: Influencing Environmental Behaviour and Performance.
Business Strategy and the Environment, 22: 374–389.
Organisation for Economic Co-operation and Development. 2000. Towards Sustainable Development. Indicators to measure progress,
Proceedings of the OECD Rome Conference, 15-17 December.
Oželienė, D. 2017, A review of enterprise sustainable development models: critical appraisal, scientific proceedings, International
Scientific Conference “High technologies. Business. Society”, 2: 257-263.
Paehlke, R. 2005. Sustainability as a Bridging Concept. Conservation Biology, 19(1),\: 36-38.
Pieloch-Babiarz, A.; Misztal, A.; & Kowalska, M. 2020. An impact of macroeconomic stabilization on the sustainable development of
manufacturing enterprises: the case of Central and Eastern European Countries. Environment, Development and Sustainability A
Multidisciplinary Approach to the Theory and Practice of Sustainable Development, 22(7): 1-30.
Porter, M. E.; & Kramer, M. R. 2007. Strategy and Society, The Link between Competitive Advantage and Corporate Social
Responsibility, Harvard Business Review, 84(12): 78-92.
Prugh, T.; & Assadourian, E. 2003. What is sustainability, anyway? World Watch, 16(5): 10-21.
Rai, H.B.; van Lier, T.; Meers, D.; & Macharis, C. 2018. An indicator approach to sustainable urban freight transport. Journal of
Urbanism: International Research on Placemaking and Urban Sustainability, 11(1): 81-102.
Raykov, T., & Marcoulides, G.A. 2013. Basic Statistics: An Introduction with R, Lanham, MD: Rowman & Littlefield Publishers.
Salzmann, O.; Ionescu-Somers, A.; & Steger, U. 2005. The Business Case for Corporate Sustainability: Literature Review and Research
Options. European Management Journa,l 23(1): 27–36.
Schmidheiny, K. (2019). The Multiple Linear Regression Model, Short Guides to Microeconometrics.
https://www.schmidheiny.name/teaching/ols.pdf.
Szanduła, J. 2014. Uwagi do unitaryzacji zmiennych w referencyjnym systemie granicznym. Przegląd Statystyczny, 2: 147-167.
Verga Matos, P.; Barros, V.; Miranda Sarmento, J. 2020. Does ESG Affect the Stability of Dividend Policies in Europe? Sustainability, 12,
8804.
Weidinger, C. 2014. Business Success through Sustainability. Sustainable Entrepreneurship, 287-301.
White, K.; Habib, R.; & Hardisty, D.J. 2019. How to SHIFT Consumer Behaviors to be More Sustainable: A Literature Review and
Guiding Framework. Journal of Marketing, 83(3): 22-49. https://doi.org/10.1177/0022242919825649
Wilcox, R.R. 2009. Basic Statistics: Understanding Conventional Methods and Modern Insights, Oxford: Oxford University Press.
ENTREPRENEURSHIP AND SUSTAINABILITY ISSUES
ISSN 2345-0282 (online) http://jssidoi.org/jesi/
2021 Volume 8 Number 3 (March)
http://doi.org/10.9770/jesi.2021.8.3(13)
247
Winter, S. 2020. Wayfinding and navigation research for sustainable transport. Journal of Spatial Information Science, 20: 103-107.
http://www.josis.org/index.php/josis/article/view/615/267
Witkowski, K. 2010. The aspect of integrated logistics for sustainable development. Proceedings of the Joint International IGIP-SEFI:
Annual Conference 2010, Trnava, Slovakia.
World Commission on Environment and Development. 1987. Report of the World Commission On Environment and Development: our
common feature.
Yan, X.; & Su, X. 2009. Linear Regression Analysis: Theory And Computing, World Scientific Publishing.
Michal COMPOREK PhD, Faculty of Economis and Sociology, University of Lodz. Research interests: shaping the financial result in the
enterprise, measurement of enterprise economic efficiency, enterprise fixed and current assets management, marketing of logistics services,
economic aspects of the tourist and recreational services market, financial standing of sports enterprises.
ORCID ID: https://orcid.org/0000-0002-1402-2505
Magdalena KOWALSKA MA, Faculty of Economis and Sociology, University of Lodz. Research interests: economic and financial
analysis of the enterprise, sustainable development of enterprises, operation and development of companies in the TSL sector, innovations
in logistics.
ORCID ID: https://orcid.org/0000-0002-5821-0305
Anna MISZTAL PhD, Faculty of Economis and Sociology, University of Lodz. Research interests: sustainable development of enterprises
and its determinants, financial and management accounting, corporate finance management, models and strategies for enterprise
development, ICT in business.
ORCID ID: https://orcid.org/0000-0002-7455-5290
Make your research more visible, join the Twitter account of ENTREPRENEURSHIP AND SUSTAINABILITY ISSUES:
@Entrepr69728810
Copyright © 2021 by author(s) and VsI Entrepreneurship and Sustainability Center
This work is licensed under the Creative Commons Attribution International License (CC BY).
http://creativecommons.org/licenses/by/4.0/
ENTREPRENEURSHIP AND SUSTAINABILITY ISSUES
ISSN 2345-0282 (online) http://jssidoi.org/jesi/
2021 Volume 8 Number 3 (March)
http://doi.org/10.9770/jesi.2021.8.3(14)
Publisher http://jssidoi.org/esc/home
248
SUSTAINABILITY AND REGIONAL SECURITY IN THE CONTEXT OF LITHUANIA*
Ieva Meidutė – Kavaliauskienė ¹, Gitana Dudzevičiūtė ², Agnė Šimelytė 3, Nijolė Maknickienė 4
1,2,3General Jonas Zemaitis Military Academy of Lithuania, Silo str. 5A, Vilnius, Lithuania 4Vilnius Gediminas Technical University, Sauletekio al. 11, Vilnius, Lithuania
E-mails:1 [email protected]; [email protected]; [email protected]; [email protected]
Received 18 March 2020; accepted 20 December 2020; published 30 March 2021
Abstract. The article explores the relationship between sustainable development and the regional security complex. Problems of
sustainability are widely analysed since the goals of sustainable development are based on the same principles that are relevant to every
country. Implementation of the sustainable development goals contributes to the understanding that the contemporary lifestyle,
consumption, globalisation and the use of natural resources may have a significant impact on the quality of life of future generations.
Therefore, the state’s responsibility is to ensure economic, social, environmental, cultural and political security for the present and future
generations in all regions. However, the regional security complex has not been analysed sufficiently. The goal of this article is to analyse
the relationship between sustainability and regional security in terms of the situation in Lithuania with regards to its economic, social and
military security. The regional security complex and sustainable development may be determined and analysed by way of observing the
same factors and indicators. Indicators describing economic, social and political security are analysed to reach the objective of the article.
Authors of the article have chosen segmentation and classification methods such as decision making trees to conduct the research. The
results of the analysis demonstrate that the economic and social factors are directly related to the political (military) security in the regions
of Lithuania. Therefore, further research could focus on clarifying the full regional security complex that is relevant to each region in
Lithuania.
Keywords: sustainable development; regional security; migration; economic growth
Reference to this paper should be made as follows: Meidutė – Kavaliauskienė, I., Dudzevičiūtė, G., Šimelytė, A., Maknickienė, N. 2021.
Sustainability and regional security in the context of Lithuania. Entrepreneurship and Sustainability Issues, 8(3), 248-266.
http://doi.org/10.9770/jesi.2021.8.3(14)
JEL Classifications: C45, E24, F50, J10
* This research was partially supported by the Ministry of National Defence of the Republic of Lithuania
ENTREPRENEURSHIP AND SUSTAINABILITY ISSUES
ISSN 2345-0282 (online) http://jssidoi.org/jesi/
2021 Volume 8 Number 3 (March)
http://doi.org/10.9770/jesi.2021.8.3(14)
249
1. Introduction
A great number of scientific articles is dedicated to the problems of sustainability or the implementation of
sustainable development goals (Šimelytė, Antanavičienė 2013; Gilli et al. 2013; Neag et al. 2017; Tsai, 2018;
Feliciano, 2019; Gil, et al. 2019; Savona, & Ciarli, 2019; Kim et al. 2019; Prada, 2020; Vasconcelos, 2021). The
publication of the Brundtland Report by the United Nations in October 1987 prompted the interest in sustainable
development issues to increase. It declared that human poverty reduces opportunities for sustainability and
increases environmental pressures. These findings elicited a demand to balance ecology and economy. In a
broader sense, sustainable development is defined as a compromise between environmental and social societal
goals that creates possibilities to achieve social welfare for the present and future generations while keeping the
environmental impact within the permissible limits (National Sustainable Development Strategy of the Republic
of Lithuania 2011). Neag, Halmaghi & Cucuiet (2017) claim that sustainable development as a strategy involves
all areas that are significant to achieving harmony and continuity as well as benefiting the quality of life.
Furthermore, the implementation of sustainable development goals contributes to the development of every
nation’s long-term strategies in respect of economic, social, environmental, technological and security issues. In
general, it helps to improve the quality of life of present and even future generations. Therefore, the main goal of
sustainable development is to ensure security in all respects for present and future generations. It involves
complicated decision making, especially when a long political process is required. Consequently, political
security has a role in the implementation of sustainable development goals.
However, the scientific literature lacks analysis addressed to the relationship between the implementation of
sustainable development and security issues. The relationship between the regional security complex and
sustainable development is particularly poorly explored.
The goal of the article is to analyse the relationship between sustainability and regional security in terms of the
situation in Lithuania with regards to its economic, social and military security.
For methodological purposes, the article is divided into three parts. The first part analyses the scientific literature
on the concept of security, the regional security complex and the relationship between regional security and
sustainable development goals. The second part is dedicated to data sources and the methodology of the research.
The third part provides findings and discussion of the research related to the economic, social and military
security. The article ends with conclusions and insights about the possibilities of further research.
2. Literature review
Concept of security. Currently, in the scientific context the complex phenomenon of security is understood much
wider than military. For example, Belammy & Hunt (2015) propose that security should include four principal
elements. The first element defines the object of security, the second identifies the threat and the third identifies
the most advantageous means to deal with the threat. Finally, the fourth element determines what actions qualify
to deal with the potential threat. Kafol & Bregar (2017) analyse cyber security and propose a methodology to
guide organisations on how to create sustainable protection systems of the highest level in order to prevent
cyberattacks. Kullenberg (2002) states that security should encompass economic, social and ecological aspects.
Additionally, Ajdari & Asgharpour (2011) exclude physical, spiritual, internal, external, individual, social,
national, humanistic, moral and defensive security. Therefore, it could be stated that security may vary across
different groups based on their social, economic, cultural and political circumstances. Moreover, the security
complex can change with time. In general, traditional understanding of security means being free of any threats or
dangers, being safe and feeling secure and protected against any forced aggression from other individuals.
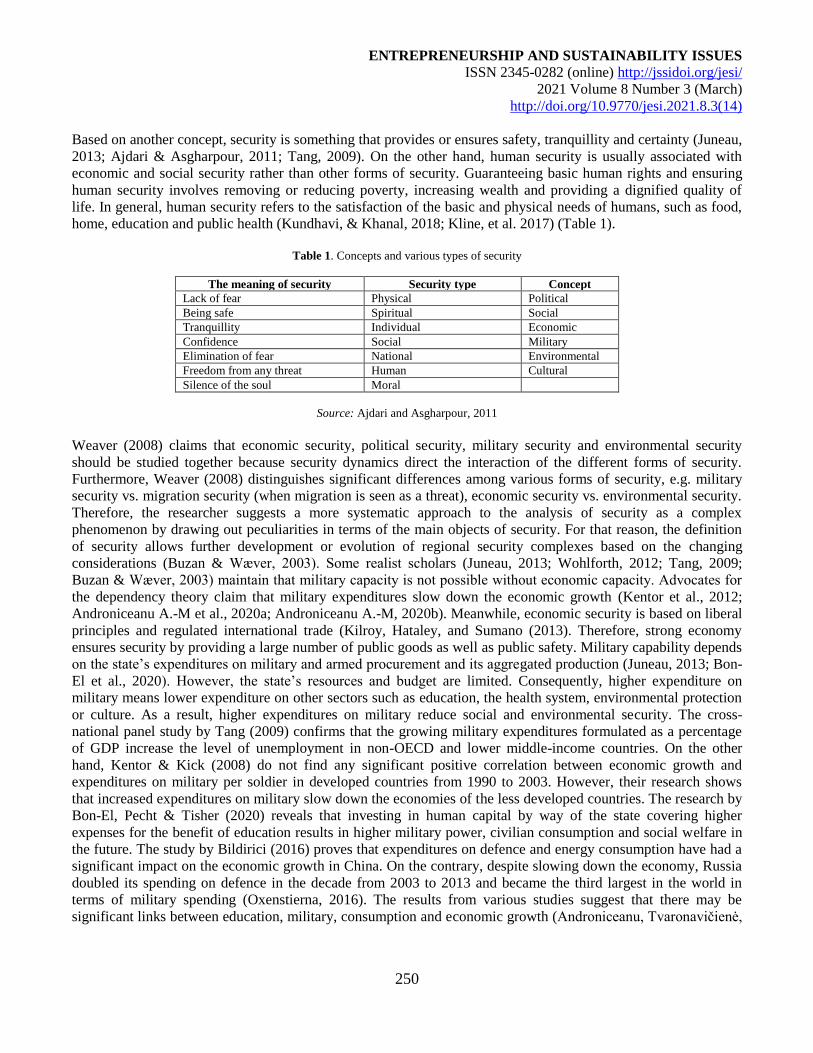
ENTREPRENEURSHIP AND SUSTAINABILITY ISSUES
ISSN 2345-0282 (online) http://jssidoi.org/jesi/
2021 Volume 8 Number 3 (March)
http://doi.org/10.9770/jesi.2021.8.3(14)
250
Based on another concept, security is something that provides or ensures safety, tranquillity and certainty (Juneau,
2013; Ajdari & Asgharpour, 2011; Tang, 2009). On the other hand, human security is usually associated with
economic and social security rather than other forms of security. Guaranteeing basic human rights and ensuring
human security involves removing or reducing poverty, increasing wealth and providing a dignified quality of
life. In general, human security refers to the satisfaction of the basic and physical needs of humans, such as food,
home, education and public health (Kundhavi, & Khanal, 2018; Kline, et al. 2017) (Table 1).
Table 1. Concepts and various types of security
The meaning of security Security type Concept
Lack of fear Physical Political
Being safe Spiritual Social
Tranquillity Individual Economic
Confidence Social Military
Elimination of fear National Environmental
Freedom from any threat Human Cultural
Silence of the soul Moral
Source: Ajdari and Asgharpour, 2011
Weaver (2008) claims that economic security, political security, military security and environmental security
should be studied together because security dynamics direct the interaction of the different forms of security.
Furthermore, Weaver (2008) distinguishes significant differences among various forms of security, e.g. military
security vs. migration security (when migration is seen as a threat), economic security vs. environmental security.
Therefore, the researcher suggests a more systematic approach to the analysis of security as a complex
phenomenon by drawing out peculiarities in terms of the main objects of security. For that reason, the definition
of security allows further development or evolution of regional security complexes based on the changing
considerations (Buzan & Wæver, 2003). Some realist scholars (Juneau, 2013; Wohlforth, 2012; Tang, 2009;
Buzan & Wæver, 2003) maintain that military capacity is not possible without economic capacity. Advocates for
the dependency theory claim that military expenditures slow down the economic growth (Kentor et al., 2012;
Androniceanu A.-M et al., 2020a; Androniceanu A.-M, 2020b). Meanwhile, economic security is based on liberal
principles and regulated international trade (Kilroy, Hataley, and Sumano (2013). Therefore, strong economy
ensures security by providing a large number of public goods as well as public safety. Military capability depends
on the state’s expenditures on military and armed procurement and its aggregated production (Juneau, 2013; Bon-
El et al., 2020). However, the state’s resources and budget are limited. Consequently, higher expenditure on
military means lower expenditure on other sectors such as education, the health system, environmental protection
or culture. As a result, higher expenditures on military reduce social and environmental security. The cross-
national panel study by Tang (2009) confirms that the growing military expenditures formulated as a percentage
of GDP increase the level of unemployment in non-OECD and lower middle-income countries. On the other
hand, Kentor & Kick (2008) do not find any significant positive correlation between economic growth and
expenditures on military per soldier in developed countries from 1990 to 2003. However, their research shows
that increased expenditures on military slow down the economies of the less developed countries. The research by
Bon-El, Pecht & Tisher (2020) reveals that investing in human capital by way of the state covering higher
expenses for the benefit of education results in higher military power, civilian consumption and social welfare in
the future. The study by Bildirici (2016) proves that expenditures on defence and energy consumption have had a
significant impact on the economic growth in China. On the contrary, despite slowing down the economy, Russia
doubled its spending on defence in the decade from 2003 to 2013 and became the third largest in the world in
terms of military spending (Oxenstierna, 2016). The results from various studies suggest that there may be
significant links between education, military, consumption and economic growth (Androniceanu, Tvaronavičienė,
ENTREPRENEURSHIP AND SUSTAINABILITY ISSUES
ISSN 2345-0282 (online) http://jssidoi.org/jesi/
2021 Volume 8 Number 3 (March)
http://doi.org/10.9770/jesi.2021.8.3(14)
251
2019). In addition, Kilroy, Hataley, and Sumano (2013) state that physical or human security may not be separate
from economic security.
Regional trading blocs established since the 1950s, including EEA, EU, NAFTA and OPEC are based on
memberships and international agreements. They have established stronger relationships between their members
by stimulating their interdependence. Despite these regional economic agreements and memberships benefitting
the member states, they can also become a source of insecurity. Trading partners within the region may
experience a threat with the opening of borders resulting in an increased flow of weapons, drugs, criminals, illegal
migrants and even terrorists. This provides a soil for transnational criminal activities.
Trade and movement of labour have increased within the region since 1st May 2004 that saw fifteen new countries
join the European Union. However, this singular, open and free European market has also provided more
possibilities for organised crime. Strong and established EU economies have been faced with higher criminal
activity rates and an increased flow of legal and illegal migrants. These phenomena have caused human security
to decrease in those countries. Furthermore, this insecurity has caused a rise in populist politics across the EU as
well as the vote for Brexit in the United Kingdom. Accordingly, as Kilroy, Hataley, & Sumano (2013) state, the
economic sector is a two-sided coin. On the one hand, regional trade agreements provide institutionalised
arrangements on rules and a framework for solving economic disputes. On the other hand, trade liberalisation
opens the borders of new member states and introduces transnational threats, making the partner countries a
source of insecurity.
On the regional level, the state develops and secures the social sector. According to this concept, regional social
security is based on identity-based policy which impacts security. The measures to ensure social security and to
protect the most vulnerable groups may be applied on the international, regional or state level. As Buzan and
Waever (2009) state, social security threats unfold from the acts of sharing ideas, regional alliances, and violent
and nonviolent cross-border activity. For example, continuing identity-based policy in North America has
influences regional social security. The best-known evidence is found in the state of California in the United
States. Proposition 187 was introduced in 1994 to limit the access of illegal migrants to public services, education
and healthcare (Buzan & Wæver, 2003). As a result, insecure illegal migrants established cooperative
relationships with criminal organisations and even well-known terrorist organisations. Terror attacks threaten
regional social security and negatively impact economic security. For instance, terrorism and wars cause damage
to the economic development by way of losing human lives, destroying property and the natural environment
(Blinc et al., 2007). Since terrorist organisations operate and expand across borders, they tend to recruit members
from the neighbouring states. Accordingly, both the regional social insecurity and the regional economic
insecurity increase.
Regional political security relates to taking actions against threats in order to establish organisational stability. In
other words, external and internal actions may cause threats to the legitimacy and stability of the state. External
threats may arise from transnational corporations, organisations, alliances, cartels or social movements (Buzan &
Wæver, 2009). For instance, new or existing transnational corporations lobby to use their influence on political
decisions and can increase the level of corruption. In this regard, transnational corporations create political
insecurity. Meanwhile, internal threats emerge from ethnic or religious minorities, illegal migrant communities or
groups. Kilroy, Hataley & Sumano (2013) note that the United States, Mexico and Canada are faced with issues
and challenges of political insecurity. In particular, Mexico faces problems resulting from the activity of drug
cartels. In some regions of Mexico, drug cartels replace the government’s role of providing identical public goods.
As a result of the movement of illegal migrants and criminals, the United States and Canada experience the
impact of drug cartels with regards to social costs and increased violence.
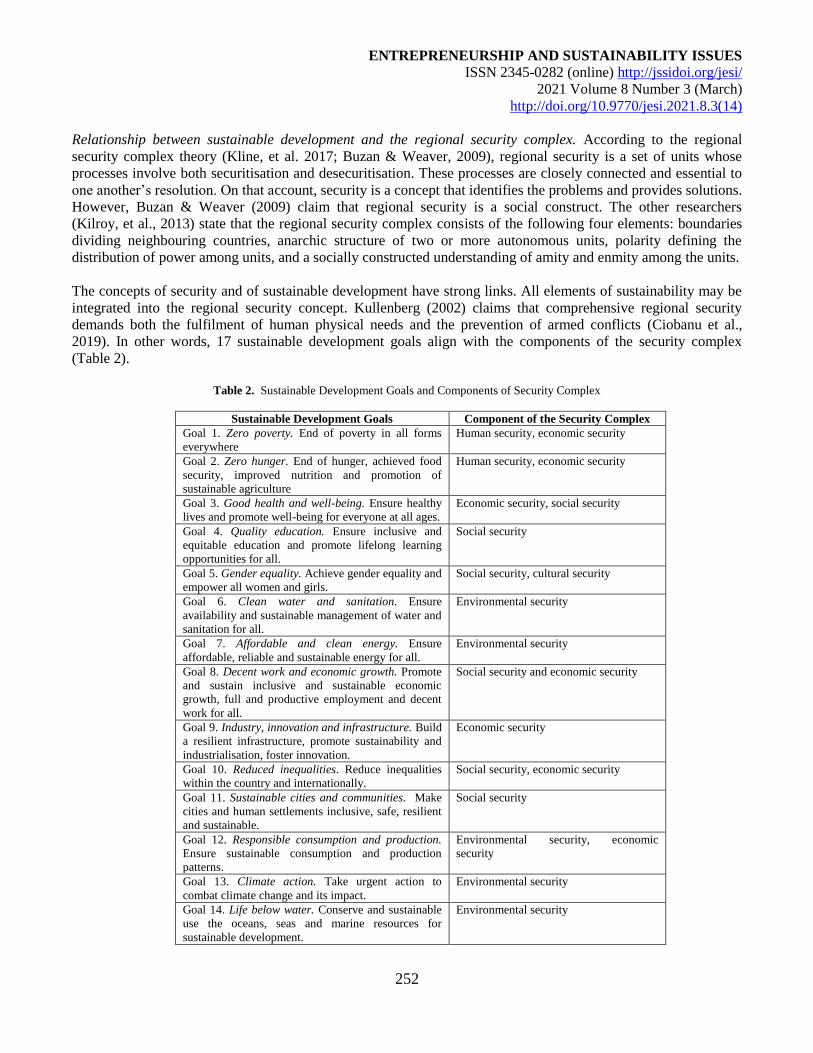
ENTREPRENEURSHIP AND SUSTAINABILITY ISSUES
ISSN 2345-0282 (online) http://jssidoi.org/jesi/
2021 Volume 8 Number 3 (March)
http://doi.org/10.9770/jesi.2021.8.3(14)
252
Relationship between sustainable development and the regional security complex. According to the regional
security complex theory (Kline, et al. 2017; Buzan & Weaver, 2009), regional security is a set of units whose
processes involve both securitisation and desecuritisation. These processes are closely connected and essential to
one another’s resolution. On that account, security is a concept that identifies the problems and provides solutions.
However, Buzan & Weaver (2009) claim that regional security is a social construct. The other researchers
(Kilroy, et al., 2013) state that the regional security complex consists of the following four elements: boundaries
dividing neighbouring countries, anarchic structure of two or more autonomous units, polarity defining the
distribution of power among units, and a socially constructed understanding of amity and enmity among the units.
The concepts of security and of sustainable development have strong links. All elements of sustainability may be
integrated into the regional security concept. Kullenberg (2002) claims that comprehensive regional security
demands both the fulfilment of human physical needs and the prevention of armed conflicts (Ciobanu et al.,
2019). In other words, 17 sustainable development goals align with the components of the security complex
(Table 2).
Table 2. Sustainable Development Goals and Components of Security Complex
Sustainable Development Goals Component of the Security Complex
Goal 1. Zero poverty. End of poverty in all forms
everywhere
Human security, economic security
Goal 2. Zero hunger. End of hunger, achieved food
security, improved nutrition and promotion of
sustainable agriculture
Human security, economic security
Goal 3. Good health and well-being. Ensure healthy
lives and promote well-being for everyone at all ages.
Economic security, social security
Goal 4. Quality education. Ensure inclusive and
equitable education and promote lifelong learning
opportunities for all.
Social security
Goal 5. Gender equality. Achieve gender equality and
empower all women and girls.
Social security, cultural security
Goal 6. Clean water and sanitation. Ensure
availability and sustainable management of water and
sanitation for all.
Environmental security
Goal 7. Affordable and clean energy. Ensure
affordable, reliable and sustainable energy for all.
Environmental security
Goal 8. Decent work and economic growth. Promote
and sustain inclusive and sustainable economic
growth, full and productive employment and decent
work for all.
Social security and economic security
Goal 9. Industry, innovation and infrastructure. Build
a resilient infrastructure, promote sustainability and
industrialisation, foster innovation.
Economic security
Goal 10. Reduced inequalities. Reduce inequalities
within the country and internationally.
Social security, economic security
Goal 11. Sustainable cities and communities. Make
cities and human settlements inclusive, safe, resilient
and sustainable.
Social security
Goal 12. Responsible consumption and production.
Ensure sustainable consumption and production
patterns.
Environmental security, economic
security
Goal 13. Climate action. Take urgent action to
combat climate change and its impact.
Environmental security
Goal 14. Life below water. Conserve and sustainable
use the oceans, seas and marine resources for
sustainable development.
Environmental security
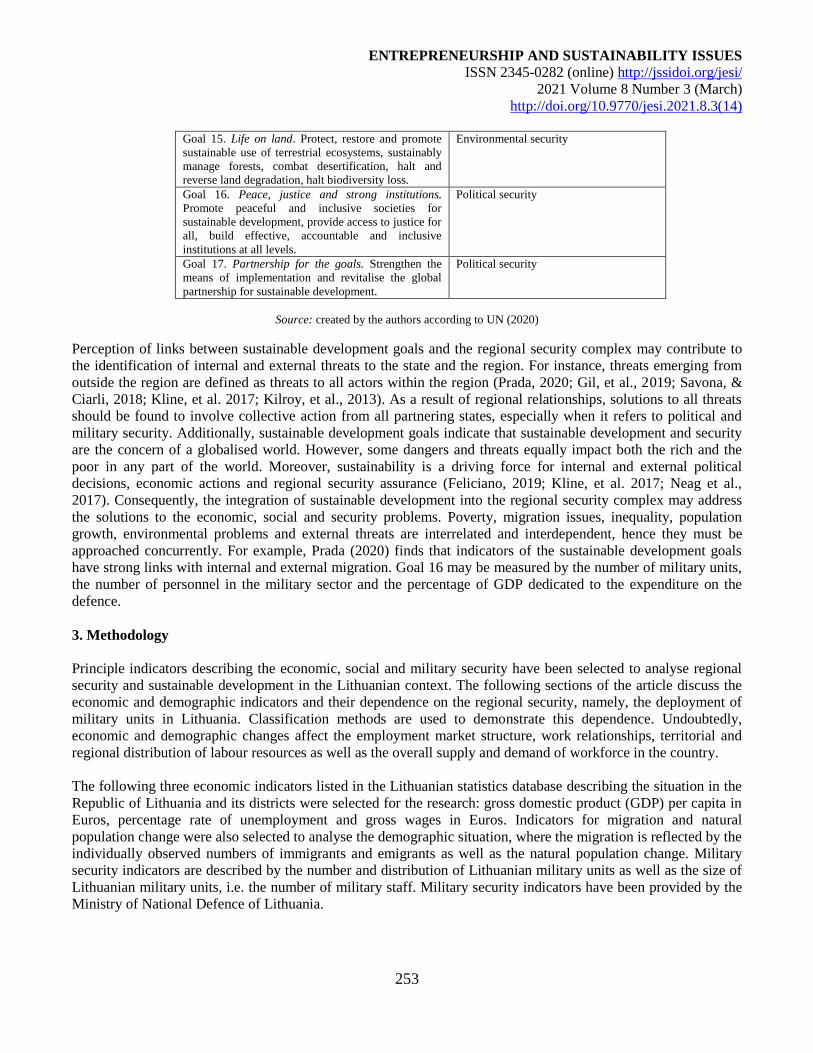
ENTREPRENEURSHIP AND SUSTAINABILITY ISSUES
ISSN 2345-0282 (online) http://jssidoi.org/jesi/
2021 Volume 8 Number 3 (March)
http://doi.org/10.9770/jesi.2021.8.3(14)
253
Goal 15. Life on land. Protect, restore and promote
sustainable use of terrestrial ecosystems, sustainably
manage forests, combat desertification, halt and
reverse land degradation, halt biodiversity loss.
Environmental security
Goal 16. Peace, justice and strong institutions.
Promote peaceful and inclusive societies for
sustainable development, provide access to justice for
all, build effective, accountable and inclusive
institutions at all levels.
Political security
Goal 17. Partnership for the goals. Strengthen the
means of implementation and revitalise the global
partnership for sustainable development.
Political security
Source: created by the authors according to UN (2020)
Perception of links between sustainable development goals and the regional security complex may contribute to
the identification of internal and external threats to the state and the region. For instance, threats emerging from
outside the region are defined as threats to all actors within the region (Prada, 2020; Gil, et al., 2019; Savona, &
Ciarli, 2018; Kline, et al. 2017; Kilroy, et al., 2013). As a result of regional relationships, solutions to all threats
should be found to involve collective action from all partnering states, especially when it refers to political and
military security. Additionally, sustainable development goals indicate that sustainable development and security
are the concern of a globalised world. However, some dangers and threats equally impact both the rich and the
poor in any part of the world. Moreover, sustainability is a driving force for internal and external political
decisions, economic actions and regional security assurance (Feliciano, 2019; Kline, et al. 2017; Neag et al.,
2017). Consequently, the integration of sustainable development into the regional security complex may address
the solutions to the economic, social and security problems. Poverty, migration issues, inequality, population
growth, environmental problems and external threats are interrelated and interdependent, hence they must be
approached concurrently. For example, Prada (2020) finds that indicators of the sustainable development goals
have strong links with internal and external migration. Goal 16 may be measured by the number of military units,
the number of personnel in the military sector and the percentage of GDP dedicated to the expenditure on the
defence.
3. Methodology
Principle indicators describing the economic, social and military security have been selected to analyse regional
security and sustainable development in the Lithuanian context. The following sections of the article discuss the
economic and demographic indicators and their dependence on the regional security, namely, the deployment of
military units in Lithuania. Classification methods are used to demonstrate this dependence. Undoubtedly,
economic and demographic changes affect the employment market structure, work relationships, territorial and
regional distribution of labour resources as well as the overall supply and demand of workforce in the country.
The following three economic indicators listed in the Lithuanian statistics database describing the situation in the
Republic of Lithuania and its districts were selected for the research: gross domestic product (GDP) per capita in
Euros, percentage rate of unemployment and gross wages in Euros. Indicators for migration and natural
population change were also selected to analyse the demographic situation, where the migration is reflected by the
individually observed numbers of immigrants and emigrants as well as the natural population change. Military
security indicators are described by the number and distribution of Lithuanian military units as well as the size of
Lithuanian military units, i.e. the number of military staff. Military security indicators have been provided by the
Ministry of National Defence of Lithuania.
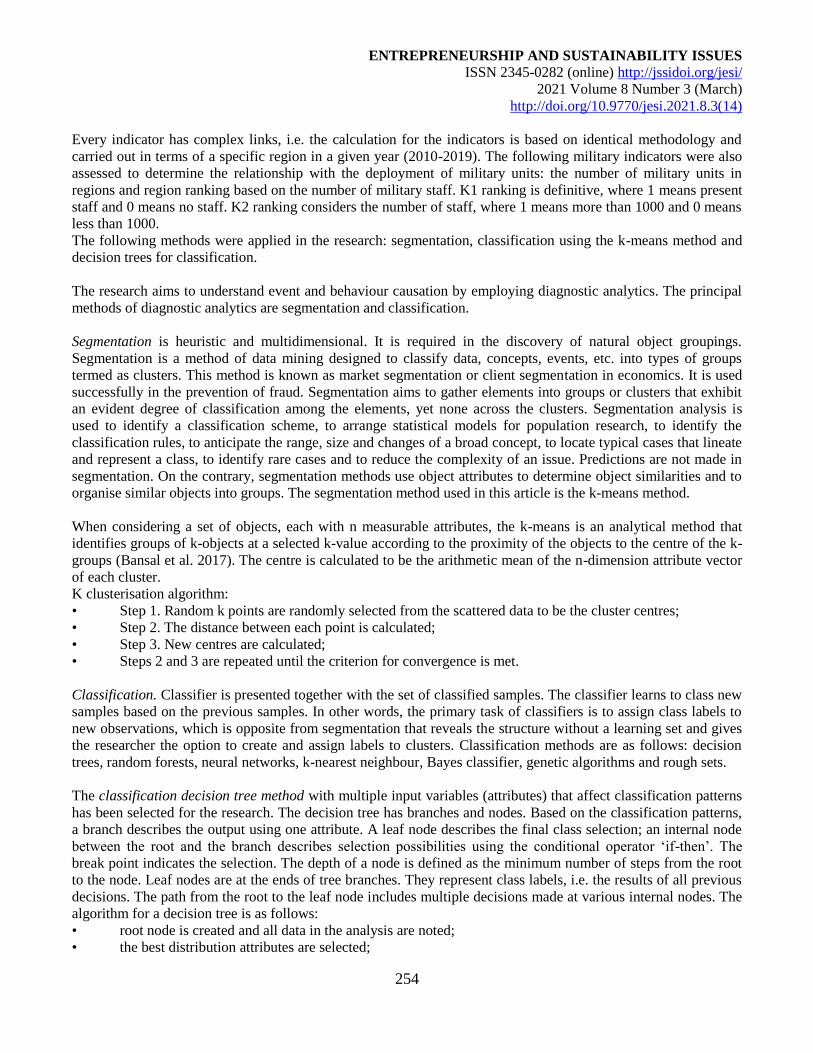
ENTREPRENEURSHIP AND SUSTAINABILITY ISSUES
ISSN 2345-0282 (online) http://jssidoi.org/jesi/
2021 Volume 8 Number 3 (March)
http://doi.org/10.9770/jesi.2021.8.3(14)
254
Every indicator has complex links, i.e. the calculation for the indicators is based on identical methodology and
carried out in terms of a specific region in a given year (2010-2019). The following military indicators were also
assessed to determine the relationship with the deployment of military units: the number of military units in
regions and region ranking based on the number of military staff. K1 ranking is definitive, where 1 means present
staff and 0 means no staff. K2 ranking considers the number of staff, where 1 means more than 1000 and 0 means
less than 1000.
The following methods were applied in the research: segmentation, classification using the k-means method and
decision trees for classification.
The research aims to understand event and behaviour causation by employing diagnostic analytics. The principal
methods of diagnostic analytics are segmentation and classification.
Segmentation is heuristic and multidimensional. It is required in the discovery of natural object groupings.
Segmentation is a method of data mining designed to classify data, concepts, events, etc. into types of groups
termed as clusters. This method is known as market segmentation or client segmentation in economics. It is used
successfully in the prevention of fraud. Segmentation aims to gather elements into groups or clusters that exhibit
an evident degree of classification among the elements, yet none across the clusters. Segmentation analysis is
used to identify a classification scheme, to arrange statistical models for population research, to identify the
classification rules, to anticipate the range, size and changes of a broad concept, to locate typical cases that lineate
and represent a class, to identify rare cases and to reduce the complexity of an issue. Predictions are not made in
segmentation. On the contrary, segmentation methods use object attributes to determine object similarities and to
organise similar objects into groups. The segmentation method used in this article is the k-means method.
When considering a set of objects, each with n measurable attributes, the k-means is an analytical method that
identifies groups of k-objects at a selected k-value according to the proximity of the objects to the centre of the k-
groups (Bansal et al. 2017). The centre is calculated to be the arithmetic mean of the n-dimension attribute vector
of each cluster.
K clusterisation algorithm:
• Step 1. Random k points are randomly selected from the scattered data to be the cluster centres;
• Step 2. The distance between each point is calculated;
• Step 3. New centres are calculated;
• Steps 2 and 3 are repeated until the criterion for convergence is met.
Classification. Classifier is presented together with the set of classified samples. The classifier learns to class new
samples based on the previous samples. In other words, the primary task of classifiers is to assign class labels to
new observations, which is opposite from segmentation that reveals the structure without a learning set and gives
the researcher the option to create and assign labels to clusters. Classification methods are as follows: decision
trees, random forests, neural networks, k-nearest neighbour, Bayes classifier, genetic algorithms and rough sets.
The classification decision tree method with multiple input variables (attributes) that affect classification patterns
has been selected for the research. The decision tree has branches and nodes. Based on the classification patterns,
a branch describes the output using one attribute. A leaf node describes the final class selection; an internal node
between the root and the branch describes selection possibilities using the conditional operator ‘if-then’. The
break point indicates the selection. The depth of a node is defined as the minimum number of steps from the root
to the node. Leaf nodes are at the ends of tree branches. They represent class labels, i.e. the results of all previous
decisions. The path from the root to the leaf node includes multiple decisions made at various internal nodes. The
algorithm for a decision tree is as follows:
• root node is created and all data in the analysis are noted;
• the best distribution attributes are selected;
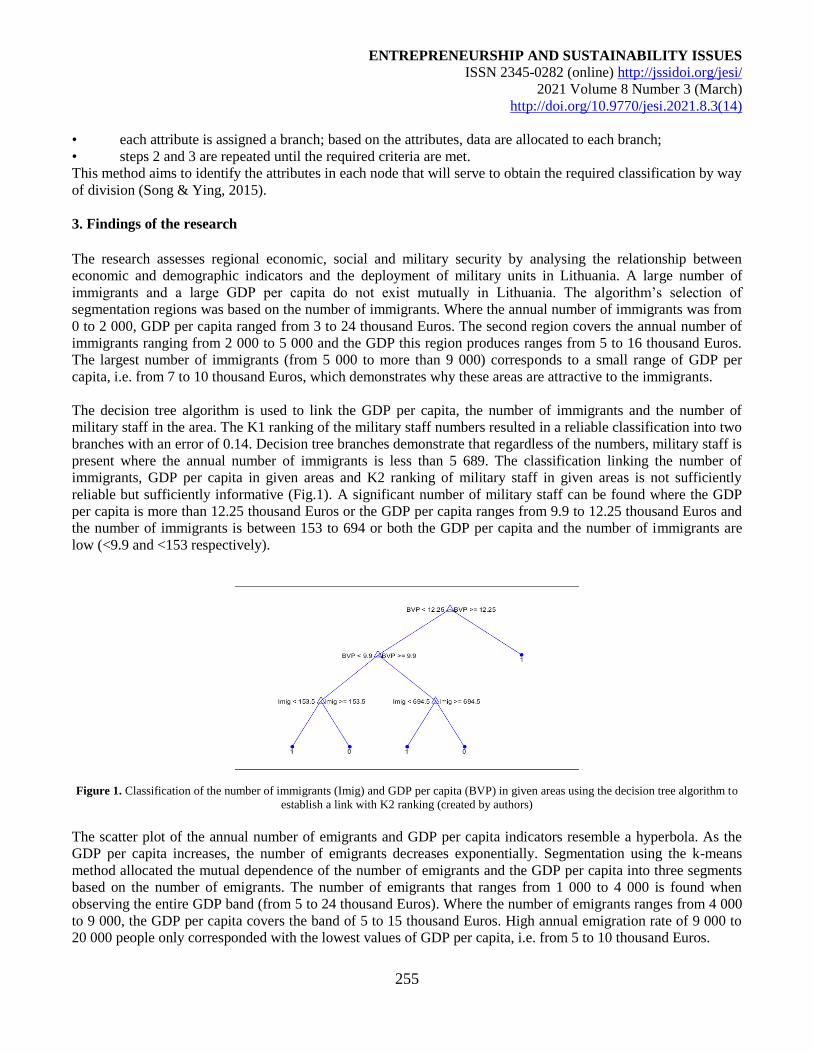
ENTREPRENEURSHIP AND SUSTAINABILITY ISSUES
ISSN 2345-0282 (online) http://jssidoi.org/jesi/
2021 Volume 8 Number 3 (March)
http://doi.org/10.9770/jesi.2021.8.3(14)
255
• each attribute is assigned a branch; based on the attributes, data are allocated to each branch;
• steps 2 and 3 are repeated until the required criteria are met.
This method aims to identify the attributes in each node that will serve to obtain the required classification by way
of division (Song & Ying, 2015).
3. Findings of the research The research assesses regional economic, social and military security by analysing the relationship between
economic and demographic indicators and the deployment of military units in Lithuania. A large number of
immigrants and a large GDP per capita do not exist mutually in Lithuania. The algorithm’s selection of
segmentation regions was based on the number of immigrants. Where the annual number of immigrants was from
0 to 2 000, GDP per capita ranged from 3 to 24 thousand Euros. The second region covers the annual number of
immigrants ranging from 2 000 to 5 000 and the GDP this region produces ranges from 5 to 16 thousand Euros.
The largest number of immigrants (from 5 000 to more than 9 000) corresponds to a small range of GDP per
capita, i.e. from 7 to 10 thousand Euros, which demonstrates why these areas are attractive to the immigrants.
The decision tree algorithm is used to link the GDP per capita, the number of immigrants and the number of
military staff in the area. The K1 ranking of the military staff numbers resulted in a reliable classification into two
branches with an error of 0.14. Decision tree branches demonstrate that regardless of the numbers, military staff is
present where the annual number of immigrants is less than 5 689. The classification linking the number of
immigrants, GDP per capita in given areas and K2 ranking of military staff in given areas is not sufficiently
reliable but sufficiently informative (Fig.1). A significant number of military staff can be found where the GDP
per capita is more than 12.25 thousand Euros or the GDP per capita ranges from 9.9 to 12.25 thousand Euros and
the number of immigrants is between 153 to 694 or both the GDP per capita and the number of immigrants are
low (<9.9 and <153 respectively).
Figure 1. Classification of the number of immigrants (Imig) and GDP per capita (BVP) in given areas using the decision tree algorithm to
establish a link with K2 ranking (created by authors)
The scatter plot of the annual number of emigrants and GDP per capita indicators resemble a hyperbola. As the
GDP per capita increases, the number of emigrants decreases exponentially. Segmentation using the k-means
method allocated the mutual dependence of the number of emigrants and the GDP per capita into three segments
based on the number of emigrants. The number of emigrants that ranges from 1 000 to 4 000 is found when
observing the entire GDP band (from 5 to 24 thousand Euros). Where the number of emigrants ranges from 4 000
to 9 000, the GDP per capita covers the band of 5 to 15 thousand Euros. High annual emigration rate of 9 000 to
20 000 people only corresponded with the lowest values of GDP per capita, i.e. from 5 to 10 thousand Euros.
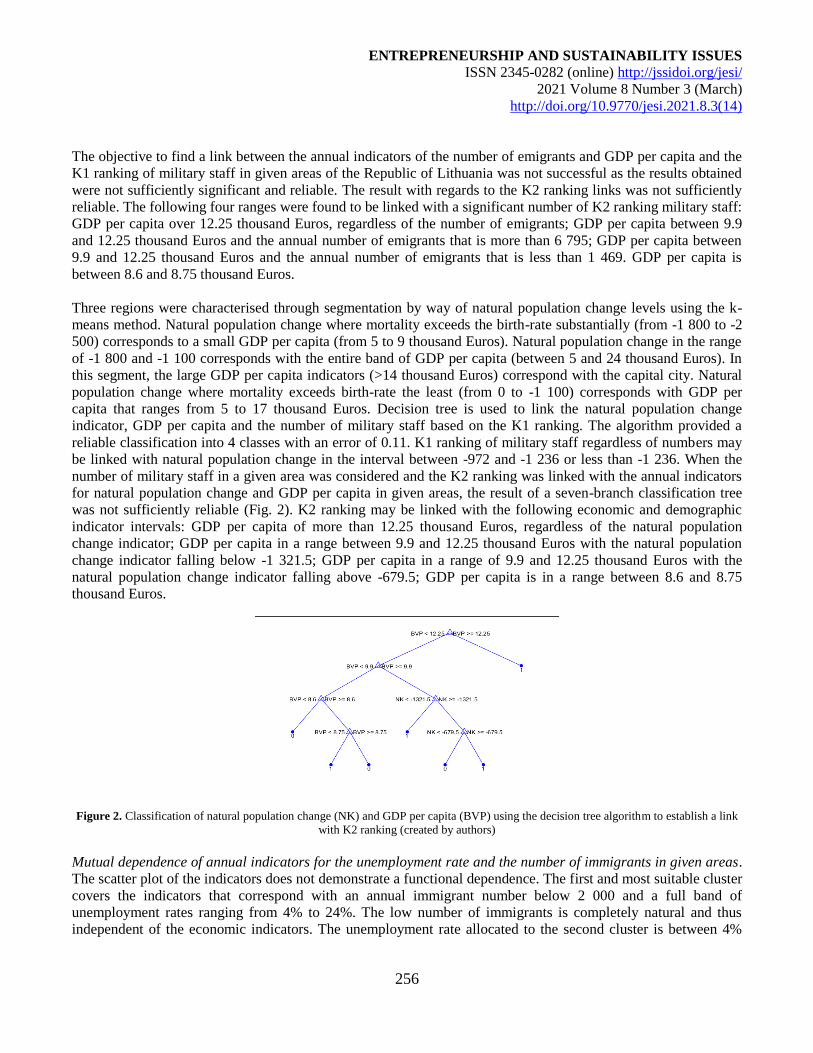
ENTREPRENEURSHIP AND SUSTAINABILITY ISSUES
ISSN 2345-0282 (online) http://jssidoi.org/jesi/
2021 Volume 8 Number 3 (March)
http://doi.org/10.9770/jesi.2021.8.3(14)
256
The objective to find a link between the annual indicators of the number of emigrants and GDP per capita and the
K1 ranking of military staff in given areas of the Republic of Lithuania was not successful as the results obtained
were not sufficiently significant and reliable. The result with regards to the K2 ranking links was not sufficiently
reliable. The following four ranges were found to be linked with a significant number of K2 ranking military staff:
GDP per capita over 12.25 thousand Euros, regardless of the number of emigrants; GDP per capita between 9.9
and 12.25 thousand Euros and the annual number of emigrants that is more than 6 795; GDP per capita between
9.9 and 12.25 thousand Euros and the annual number of emigrants that is less than 1 469. GDP per capita is
between 8.6 and 8.75 thousand Euros.
Three regions were characterised through segmentation by way of natural population change levels using the k-
means method. Natural population change where mortality exceeds the birth-rate substantially (from -1 800 to -2
500) corresponds to a small GDP per capita (from 5 to 9 thousand Euros). Natural population change in the range
of -1 800 and -1 100 corresponds with the entire band of GDP per capita (between 5 and 24 thousand Euros). In
this segment, the large GDP per capita indicators (>14 thousand Euros) correspond with the capital city. Natural
population change where mortality exceeds birth-rate the least (from 0 to -1 100) corresponds with GDP per
capita that ranges from 5 to 17 thousand Euros. Decision tree is used to link the natural population change
indicator, GDP per capita and the number of military staff based on the K1 ranking. The algorithm provided a
reliable classification into 4 classes with an error of 0.11. K1 ranking of military staff regardless of numbers may
be linked with natural population change in the interval between -972 and -1 236 or less than -1 236. When the
number of military staff in a given area was considered and the K2 ranking was linked with the annual indicators
for natural population change and GDP per capita in given areas, the result of a seven-branch classification tree
was not sufficiently reliable (Fig. 2). K2 ranking may be linked with the following economic and demographic
indicator intervals: GDP per capita of more than 12.25 thousand Euros, regardless of the natural population
change indicator; GDP per capita in a range between 9.9 and 12.25 thousand Euros with the natural population
change indicator falling below -1 321.5; GDP per capita in a range of 9.9 and 12.25 thousand Euros with the
natural population change indicator falling above -679.5; GDP per capita is in a range between 8.6 and 8.75
thousand Euros.
Figure 2. Classification of natural population change (NK) and GDP per capita (BVP) using the decision tree algorithm to establish a link
with K2 ranking (created by authors)
Mutual dependence of annual indicators for the unemployment rate and the number of immigrants in given areas.
The scatter plot of the indicators does not demonstrate a functional dependence. The first and most suitable cluster
covers the indicators that correspond with an annual immigrant number below 2 000 and a full band of
unemployment rates ranging from 4% to 24%. The low number of immigrants is completely natural and thus
independent of the economic indicators. The unemployment rate allocated to the second cluster is between 4%
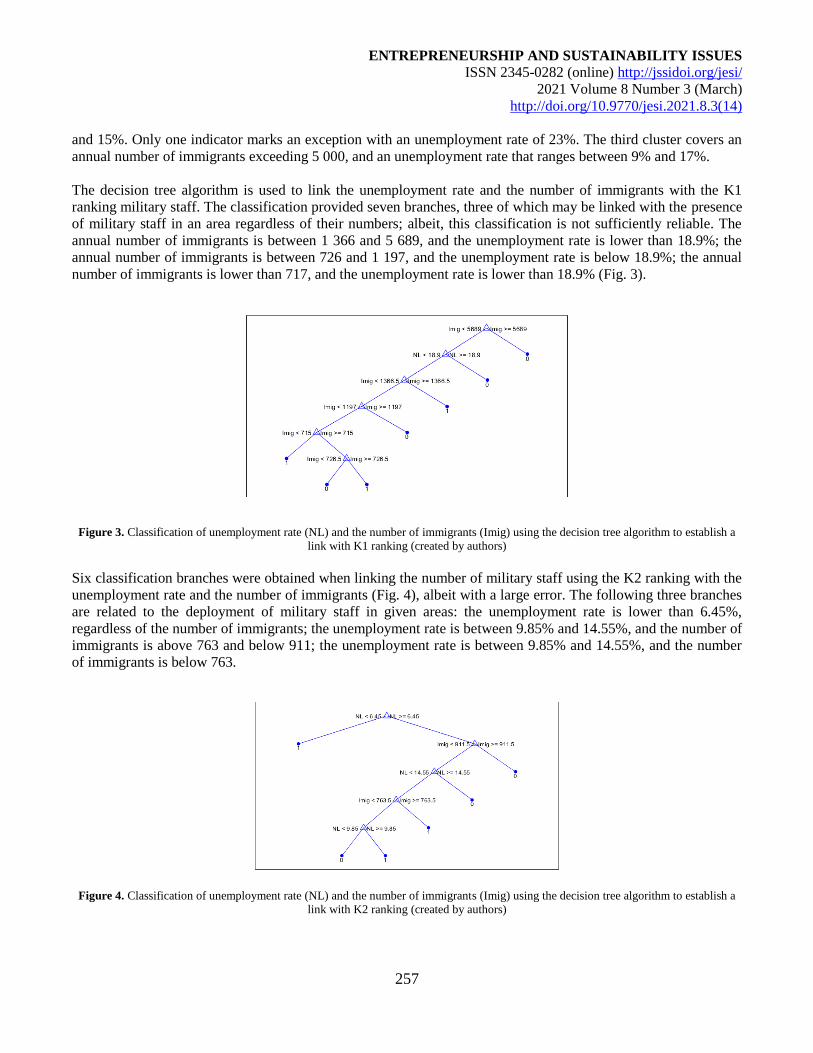
ENTREPRENEURSHIP AND SUSTAINABILITY ISSUES
ISSN 2345-0282 (online) http://jssidoi.org/jesi/
2021 Volume 8 Number 3 (March)
http://doi.org/10.9770/jesi.2021.8.3(14)
257
and 15%. Only one indicator marks an exception with an unemployment rate of 23%. The third cluster covers an
annual number of immigrants exceeding 5 000, and an unemployment rate that ranges between 9% and 17%.
The decision tree algorithm is used to link the unemployment rate and the number of immigrants with the K1
ranking military staff. The classification provided seven branches, three of which may be linked with the presence
of military staff in an area regardless of their numbers; albeit, this classification is not sufficiently reliable. The
annual number of immigrants is between 1 366 and 5 689, and the unemployment rate is lower than 18.9%; the
annual number of immigrants is between 726 and 1 197, and the unemployment rate is below 18.9%; the annual
number of immigrants is lower than 717, and the unemployment rate is lower than 18.9% (Fig. 3).
Figure 3. Classification of unemployment rate (NL) and the number of immigrants (Imig) using the decision tree algorithm to establish a
link with K1 ranking (created by authors)
Six classification branches were obtained when linking the number of military staff using the K2 ranking with the
unemployment rate and the number of immigrants (Fig. 4), albeit with a large error. The following three branches
are related to the deployment of military staff in given areas: the unemployment rate is lower than 6.45%,
regardless of the number of immigrants; the unemployment rate is between 9.85% and 14.55%, and the number of
immigrants is above 763 and below 911; the unemployment rate is between 9.85% and 14.55%, and the number
of immigrants is below 763.
Figure 4. Classification of unemployment rate (NL) and the number of immigrants (Imig) using the decision tree algorithm to establish a
link with K2 ranking (created by authors)

ENTREPRENEURSHIP AND SUSTAINABILITY ISSUES
ISSN 2345-0282 (online) http://jssidoi.org/jesi/
2021 Volume 8 Number 3 (March)
http://doi.org/10.9770/jesi.2021.8.3(14)
258
Segmentation of the dependence between the unemployment rate and the number of emigrants characterises three
regions based on the number of emigrants. A low emigration rate (less than 4 000 emigrants annually) is
characteristic of almost the entire range of the unemployment rate (from 4% to 19%). Many area indicators of the
country are concentrated here, which reflects the natural migration of the population. Emigration rate in the range
of 4 000 and 9 000 annually is characteristic of approximately the same range of the unemployment rate as above,
except that there are fewer indicators here. A high rate of emigration (from 9 000 to 20 000 annually) is linked
with a higher rate of unemployment ranging between 8% and 24%.
The decision tree algorithm provided 4 classes with an error of 0.16 for the link between the unemployment rate
and the number of emigrants and the military staff, regardless of the staff numbers based on the K1 ranking. The
presence of military staff in an area may be linked with the annual number of emigrants in the area that is below 8
977, regardless of the unemployment rate; where the number of emigrants was higher than 8 977, the
unemployment rate was lower than 13.35%. The relationship between the unemployment rate, the number of
emigrants and K2 ranking is described by seven decision tree branches (Fig. 5). A larger concentration of military
staff is related to the following four ranges of economic and demographic indicators: the unemployment rate is
lower than 6.45%, regardless of the number of emigrants; the unemployment rate is between 6.45% and 14.5%,
and the number of emigrants is lower than 1 487; the unemployment rate is between 6.45% and 14.5%, and the
number of emigrants is in the range of 1 846 and 1 887; the number of emigrants is higher than 1 887, and the
unemployment rate is higher than 14,5%.
Figure 5. Classification of unemployment rate (NL) and the number of emigrants (Emig) using the decision tree algorithm to establish a
link with K2 ranking. (created by authors)
Mutual dependence and scattering of the natural population change and unemployment rate indicators are rather
consistent, save for the zones with the highest unemployment rate and the lowest natural population change. A
small difference between the annual number of births and deaths in given areas is related to all possible indicators
of the unemployment rate. The natural population change indicator ranging between 0 and -1 100 is independent
of the unemployment rate. The second segment is defined by the natural population change in the range of -1 800
and -1 100, and the range for the unemployment rate in this case is smaller, i.e. between 4% and 16%. A
particularly negative indicator of the natural population change (from -2 500 to -1 800) is found to be
characteristic of the unemployment rate in the range of 7% and 13%. The presence of military staff in given areas
is related to the unemployment rate below 17.35% and the indicator of natural population change below -1 236 or
the natural population change falling between -1 236 and 893 (Fig. 6).
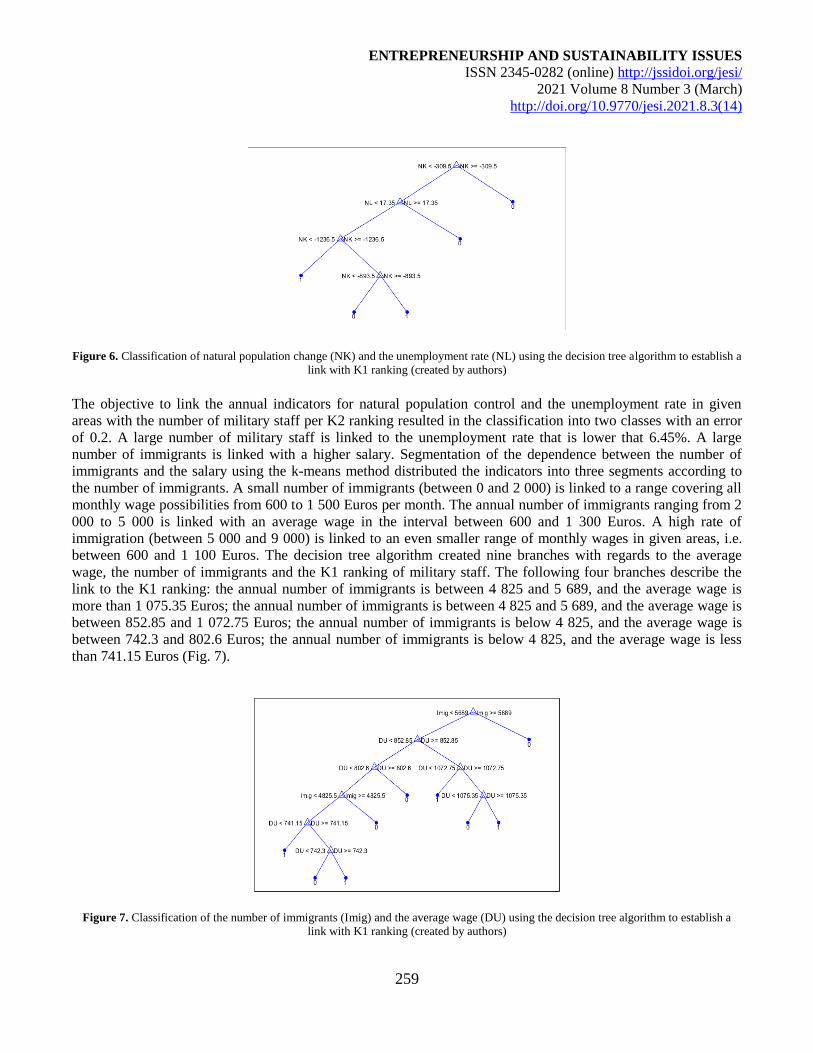
ENTREPRENEURSHIP AND SUSTAINABILITY ISSUES
ISSN 2345-0282 (online) http://jssidoi.org/jesi/
2021 Volume 8 Number 3 (March)
http://doi.org/10.9770/jesi.2021.8.3(14)
259
Figure 6. Classification of natural population change (NK) and the unemployment rate (NL) using the decision tree algorithm to establish a
link with K1 ranking (created by authors)
The objective to link the annual indicators for natural population control and the unemployment rate in given
areas with the number of military staff per K2 ranking resulted in the classification into two classes with an error
of 0.2. A large number of military staff is linked to the unemployment rate that is lower that 6.45%. A large
number of immigrants is linked with a higher salary. Segmentation of the dependence between the number of
immigrants and the salary using the k-means method distributed the indicators into three segments according to
the number of immigrants. A small number of immigrants (between 0 and 2 000) is linked to a range covering all
monthly wage possibilities from 600 to 1 500 Euros per month. The annual number of immigrants ranging from 2
000 to 5 000 is linked with an average wage in the interval between 600 and 1 300 Euros. A high rate of
immigration (between 5 000 and 9 000) is linked to an even smaller range of monthly wages in given areas, i.e.
between 600 and 1 100 Euros. The decision tree algorithm created nine branches with regards to the average
wage, the number of immigrants and the K1 ranking of military staff. The following four branches describe the
link to the K1 ranking: the annual number of immigrants is between 4 825 and 5 689, and the average wage is
more than 1 075.35 Euros; the annual number of immigrants is between 4 825 and 5 689, and the average wage is
between 852.85 and 1 072.75 Euros; the annual number of immigrants is below 4 825, and the average wage is
between 742.3 and 802.6 Euros; the annual number of immigrants is below 4 825, and the average wage is less
than 741.15 Euros (Fig. 7).
Figure 7. Classification of the number of immigrants (Imig) and the average wage (DU) using the decision tree algorithm to establish a
link with K1 ranking (created by authors)
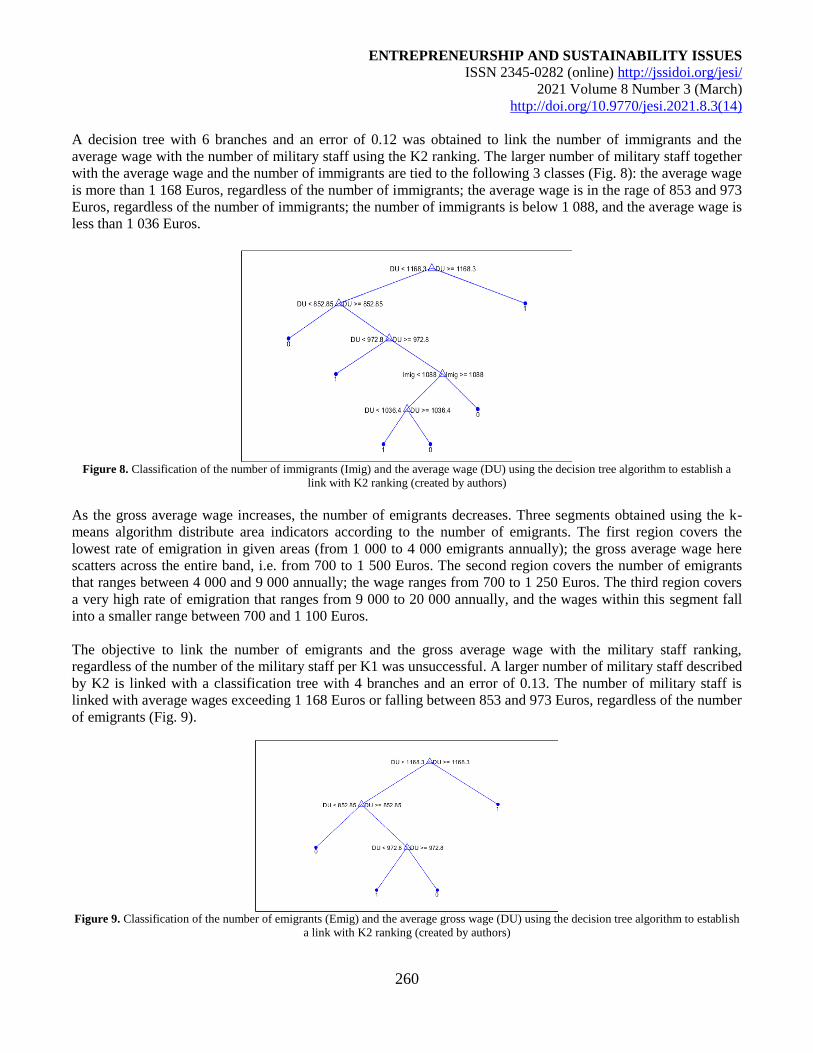
ENTREPRENEURSHIP AND SUSTAINABILITY ISSUES
ISSN 2345-0282 (online) http://jssidoi.org/jesi/
2021 Volume 8 Number 3 (March)
http://doi.org/10.9770/jesi.2021.8.3(14)
260
A decision tree with 6 branches and an error of 0.12 was obtained to link the number of immigrants and the
average wage with the number of military staff using the K2 ranking. The larger number of military staff together
with the average wage and the number of immigrants are tied to the following 3 classes (Fig. 8): the average wage
is more than 1 168 Euros, regardless of the number of immigrants; the average wage is in the rage of 853 and 973
Euros, regardless of the number of immigrants; the number of immigrants is below 1 088, and the average wage is
less than 1 036 Euros.
Figure 8. Classification of the number of immigrants (Imig) and the average wage (DU) using the decision tree algorithm to establish a
link with K2 ranking (created by authors)
As the gross average wage increases, the number of emigrants decreases. Three segments obtained using the k-
means algorithm distribute area indicators according to the number of emigrants. The first region covers the
lowest rate of emigration in given areas (from 1 000 to 4 000 emigrants annually); the gross average wage here
scatters across the entire band, i.e. from 700 to 1 500 Euros. The second region covers the number of emigrants
that ranges between 4 000 and 9 000 annually; the wage ranges from 700 to 1 250 Euros. The third region covers
a very high rate of emigration that ranges from 9 000 to 20 000 annually, and the wages within this segment fall
into a smaller range between 700 and 1 100 Euros.
The objective to link the number of emigrants and the gross average wage with the military staff ranking,
regardless of the number of the military staff per K1 was unsuccessful. A larger number of military staff described
by K2 is linked with a classification tree with 4 branches and an error of 0.13. The number of military staff is
linked with average wages exceeding 1 168 Euros or falling between 853 and 973 Euros, regardless of the number
of emigrants (Fig. 9).
Figure 9. Classification of the number of emigrants (Emig) and the average gross wage (DU) using the decision tree algorithm to establish
a link with K2 ranking (created by authors)
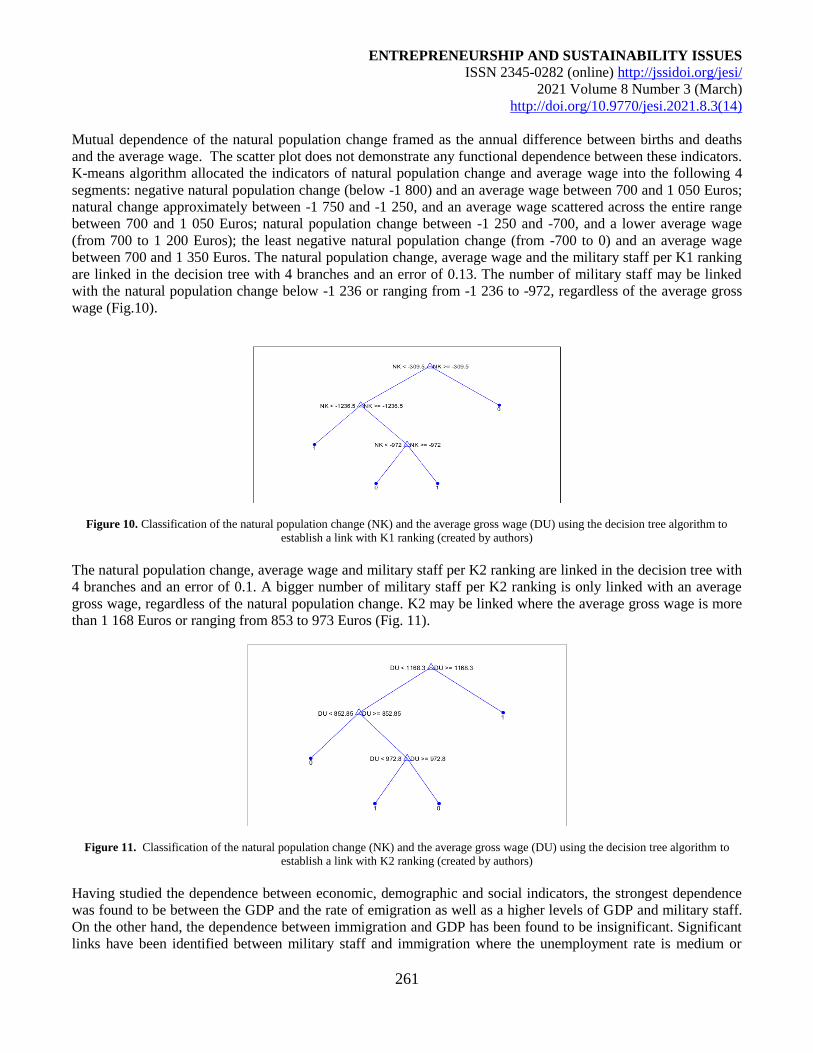
ENTREPRENEURSHIP AND SUSTAINABILITY ISSUES
ISSN 2345-0282 (online) http://jssidoi.org/jesi/
2021 Volume 8 Number 3 (March)
http://doi.org/10.9770/jesi.2021.8.3(14)
261
Mutual dependence of the natural population change framed as the annual difference between births and deaths
and the average wage. The scatter plot does not demonstrate any functional dependence between these indicators.
K-means algorithm allocated the indicators of natural population change and average wage into the following 4
segments: negative natural population change (below -1 800) and an average wage between 700 and 1 050 Euros;
natural change approximately between -1 750 and -1 250, and an average wage scattered across the entire range
between 700 and 1 050 Euros; natural population change between -1 250 and -700, and a lower average wage
(from 700 to 1 200 Euros); the least negative natural population change (from -700 to 0) and an average wage
between 700 and 1 350 Euros. The natural population change, average wage and the military staff per K1 ranking
are linked in the decision tree with 4 branches and an error of 0.13. The number of military staff may be linked
with the natural population change below -1 236 or ranging from -1 236 to -972, regardless of the average gross
wage (Fig.10).
Figure 10. Classification of the natural population change (NK) and the average gross wage (DU) using the decision tree algorithm to
establish a link with K1 ranking (created by authors)
The natural population change, average wage and military staff per K2 ranking are linked in the decision tree with
4 branches and an error of 0.1. A bigger number of military staff per K2 ranking is only linked with an average
gross wage, regardless of the natural population change. K2 may be linked where the average gross wage is more
than 1 168 Euros or ranging from 853 to 973 Euros (Fig. 11).
Figure 11. Classification of the natural population change (NK) and the average gross wage (DU) using the decision tree algorithm to
establish a link with K2 ranking (created by authors)
Having studied the dependence between economic, demographic and social indicators, the strongest dependence
was found to be between the GDP and the rate of emigration as well as a higher levels of GDP and military staff.
On the other hand, the dependence between immigration and GDP has been found to be insignificant. Significant
links have been identified between military staff and immigration where the unemployment rate is medium or
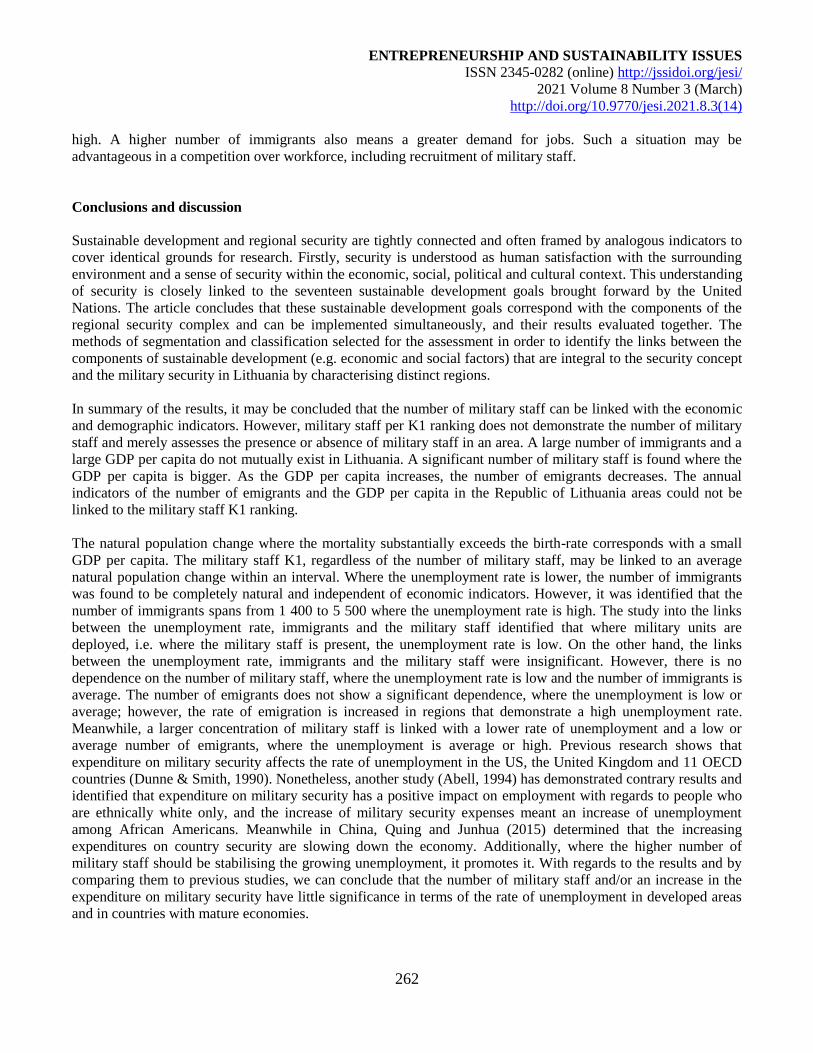
ENTREPRENEURSHIP AND SUSTAINABILITY ISSUES
ISSN 2345-0282 (online) http://jssidoi.org/jesi/
2021 Volume 8 Number 3 (March)
http://doi.org/10.9770/jesi.2021.8.3(14)
262
high. A higher number of immigrants also means a greater demand for jobs. Such a situation may be
advantageous in a competition over workforce, including recruitment of military staff.
Conclusions and discussion
Sustainable development and regional security are tightly connected and often framed by analogous indicators to
cover identical grounds for research. Firstly, security is understood as human satisfaction with the surrounding
environment and a sense of security within the economic, social, political and cultural context. This understanding
of security is closely linked to the seventeen sustainable development goals brought forward by the United
Nations. The article concludes that these sustainable development goals correspond with the components of the
regional security complex and can be implemented simultaneously, and their results evaluated together. The
methods of segmentation and classification selected for the assessment in order to identify the links between the
components of sustainable development (e.g. economic and social factors) that are integral to the security concept
and the military security in Lithuania by characterising distinct regions.
In summary of the results, it may be concluded that the number of military staff can be linked with the economic
and demographic indicators. However, military staff per K1 ranking does not demonstrate the number of military
staff and merely assesses the presence or absence of military staff in an area. A large number of immigrants and a
large GDP per capita do not mutually exist in Lithuania. A significant number of military staff is found where the
GDP per capita is bigger. As the GDP per capita increases, the number of emigrants decreases. The annual
indicators of the number of emigrants and the GDP per capita in the Republic of Lithuania areas could not be
linked to the military staff K1 ranking.
The natural population change where the mortality substantially exceeds the birth-rate corresponds with a small
GDP per capita. The military staff K1, regardless of the number of military staff, may be linked to an average
natural population change within an interval. Where the unemployment rate is lower, the number of immigrants
was found to be completely natural and independent of economic indicators. However, it was identified that the
number of immigrants spans from 1 400 to 5 500 where the unemployment rate is high. The study into the links
between the unemployment rate, immigrants and the military staff identified that where military units are
deployed, i.e. where the military staff is present, the unemployment rate is low. On the other hand, the links
between the unemployment rate, immigrants and the military staff were insignificant. However, there is no
dependence on the number of military staff, where the unemployment rate is low and the number of immigrants is
average. The number of emigrants does not show a significant dependence, where the unemployment is low or
average; however, the rate of emigration is increased in regions that demonstrate a high unemployment rate.
Meanwhile, a larger concentration of military staff is linked with a lower rate of unemployment and a low or
average number of emigrants, where the unemployment is average or high. Previous research shows that
expenditure on military security affects the rate of unemployment in the US, the United Kingdom and 11 OECD
countries (Dunne & Smith, 1990). Nonetheless, another study (Abell, 1994) has demonstrated contrary results and
identified that expenditure on military security has a positive impact on employment with regards to people who
are ethnically white only, and the increase of military security expenses meant an increase of unemployment
among African Americans. Meanwhile in China, Quing and Junhua (2015) determined that the increasing
expenditures on country security are slowing down the economy. Additionally, where the higher number of
military staff should be stabilising the growing unemployment, it promotes it. With regards to the results and by
comparing them to previous studies, we can conclude that the number of military staff and/or an increase in the
expenditure on military security have little significance in terms of the rate of unemployment in developed areas
and in countries with mature economies.
ENTREPRENEURSHIP AND SUSTAINABILITY ISSUES
ISSN 2345-0282 (online) http://jssidoi.org/jesi/
2021 Volume 8 Number 3 (March)
http://doi.org/10.9770/jesi.2021.8.3(14)
263
It was found that a large number of immigrants is linked with higher wages independent of the number of military
staff. On the other hand, the link between the number of military staff and immigrants becomes evident where the
wage is average. A link between military staff, the number of emigrants and the wages was not found. However,
the rate of emigration decreases in areas where the wages increase. Functional dependence also could not be
identified between natural population change and average wages. Meanwhile, the number of military staff can be
linked with an average or high level of natural population change. A high number of military staff per K2 is
linked only with a higher wage, where it does not depend on the natural population change. K2 indicator is linked
with a smaller number of immigrants in given regions and a negative natural population change. Whereas Smith
(2007) identified a higher dependence between deployed military staff and external immigration in the US in
those regions, where migration is considered to be a threat to security. However, the study does not characterise a
dependence on wages or unemployment. On the other hand, another study analysing the US situation
demonstrated that the internal migration has decreased significantly since 1950, albeit this decrease is linked with
a decreasing number of military staff in individual states (Pingle, 2007). Another study conducted in Greece and
spanning from 2011 to 2014 (Hausmann, Nedelkoska, 2018) confirmed a strong relationship between the increase
of wages and unqualified emigrants as well as with a lower unemployment rate.
The results demonstrate that a higher number of military staff, i.e. bigger expenditure on security, has a significant
relationship with a larger GDP. Further research could integrate additional factors to elucidate the Lithuanian
regional security complex.
References
Abell, J. D. (1994). Military spending and income inequality. Journal of Peace Research, 31, 35–43.
https://doi.org.10.1177/0022343394031001004
Ajdari, B., & Asgharpour, S., E. (2011). Human security and development, emphasizing on sustainable development. Procedia Social and
Behavioral Sciences, 19, 41–46. https://doi.org.10.1016/j.sbspro.2011.05.105
Androniceanu, A.-M., Georgescu, I., Tvaronavičiene, M. & Androniceanu, A. (2020a). Canonical Correlation Analysis and a New
Composite Index on Digitalization and Labor Force in the Context of the Industrial Revolution 4.0. Sustainability, 12(17), Article number:
6812 https://doi.org/10.3390/su12176812
Androniceanu, A.-M., Kinnunen, J., Georgescu, I., & Androniceanu, A. (2020b). A Multidimensional Approach to Competitiveness,
Innovation and Well-Being in the EU Using Canonical Correlation Analysis. Journal of Competitiveness, 12(4), 5–
21. https://doi.org/10.7441/joc.2020.04.01
Androniceanu, A. & Tvaronavičienė, M. (2019). Developing a holistic system for social assistance services based on effective and
sustainable partnerships. Administratie si Management Public, 33, 103-118. https://doi.org/10.24818/amp/2019.33-06
Bansal, A., Sharma, M. & Goel, S. 2017. Improved k-mean clustering algorithm for prediction analysis using classification technique in
data mining. International Journal of Computer Applications, 157(6), 0975-8887.
Bellamy, A., & Hunt, Ch. (2015). Twenty‐first century UN peace operations: protection, force and the changing security environment.
International Affairs. Special Issue: the United Nations at 70, 6 (November), 1277-1298. https://doi.org/10.1111/1468-2346.12456
Bildirici, M. (2016). Defense, Economic Growth and Energy Consumption in China. Procedia Economics and Finance, 38, 257–263.
https://doi.org.10.1016/S2212-5671(16)30197-6
Blinc, R., Zidansek, A., & Šlaus, I. (2007). Sustainable development and Global Security. Energy, 32, 883–890.
https://doi.org.10.1016/j.energy.2006.09.017
ENTREPRENEURSHIP AND SUSTAINABILITY ISSUES
ISSN 2345-0282 (online) http://jssidoi.org/jesi/
2021 Volume 8 Number 3 (March)
http://doi.org/10.9770/jesi.2021.8.3(14)
264
Buzan, B., & Waever, O. (2009) Macrosecuritization and security constellations: reconsidering scale in securitization theory. Review of
International Studies, 35, (2), 253–276. https://doi.org.10.1017/S0260210509008511
Buzan, B. & Wæver, O. (2003). Regions and Powers– The Structure of International Security. Cambridge Studies in International
Relations Volume 9. Cambridge: Cambridge University Press.
Ciobanu, A, Androniceanu, A. & Lazaroiu, G. (2019). An integrated psycho-sociological perspective on public employees’ motivation and
performance. Frontiers in Psychology, 10; Article number: 36. https://doi.org/10.3389/fpsyg.2019.00036
Dunne, P., & Smith, R. (1990). Military expenditure and unemployment in the OECD. Defence and Peace Economics, 1(1), 57–73.
https://doi.org/10.1080/10430719008404650
Feliciano, D. (2019). A review on the contribution of crop diversification to Sustainable Development Goal 1 “No poverty” in different
world regions. Sustainable Development, 27, 795–808. https://doi.org.10.1002/sd.1923
Gil, J. D., B., Reidsma, P., Giller, K., Todman, L., Whitmore, A., & van Ittersum, M. (2019). Sustainable development goal 2: Improved
targets and indicators for agriculture and food security. Ambio, 48, 685–698. https://doi.org/10.1007/s13280-018-1101-4
Gilli, M., Mazzantia, M., & Nicollia, F. (2013). Sustainability and competitiveness in evolutionary perspectives: Environmental
innovations, structural change and economic dynamics in the EU. The Journal of Socio-Economics, 45, 204–215.
http://dx.doi.org/10.1016/j.socec.2013.05.008
Hausmann, R., & Nedelkoska, L. (2018). Welcome home in a crisis: Effects of return migration on the non-migrants’ wages and
employment. European Economic Review, 101, 101–132.
Juneau, Th. (2013). Yemen and the Arab Spring: Elite Struggles, State Collapse and Regional Security. Orbis, 57, (3), 408–423.
https://doi.org/10.1016/j.orbis.2013.05.004
Kafol, C. & Bregar, A. (2017). Cyber Security – Building a Sustainable Protection. Chapter 07 in DAAAM International Scientific Book
2017, pp.081-090, B. Katalinic (Ed.), Published by DAAAM International, 87, Vienna, Austria.
https://doi.org.10.2507/daaam.scibook.2017.07
Kentor, J., & Kick, E. (2008). Bringing the military back in: military expenditures and economic growth 1990–2003. Journal of World
Systems Research, 14, 142–172. https://doi.org/10.5195/jwsr.2008.342.
Kentor, J., Jorgenson, A. K., & Kick, E. (2012). The “new” military and income inequality: A cross national analysis. Social Science
Research, 41(3), 514–526. https://doi.org/10.1016/j.ssresearch.2011.12.005.
Kilroy, R. J., Hataley, T. S., & Rodríguez Sumano, A. (2013). North American Regional Security: A Trilateral Framework? Lynne Rienner
Publishers.
Kim, A., Bansal, P., & Haugh, H. (2019). No Time Like the Present: How a Present Time Perspective Can Foster Sustainable
Development. Academy of Management Journal, 62, 2, 607–634. https://doi.org/10.5465/amj.2015.1295
Kline, K. L., Msangi, S., Dale, V. H., Woods, J., Souza, G. M., Osseweijer, P., Clancy, J. S., Hilbert, J. A., Johnson, F., Patrick C.
Mcdonnel, P.C., & Mugera, H. K. (2017). Reconciling food security and bioenergy: priorities for action. GCB Bioenergy, 9, 557–576,
https://doi.org.10.1111/gcbb.12366
Kullenberg, G. (2002). Regional co-development and security: a comprehensive approach. Ocean & Coastal Management, 45, 761–776
Kundhavi, K., & Khanal, P. R. (2018). Rethinking Irrigation for Global Food Security. Irrigation and Drainage, 67(11), 8–11.
https://doi.org.10.1002/ird.2219
National Strategy for Sustainable Development of Lithuania (2011). Vilnius: Ministry of Environment of the Respublic of Lithuania.
Retrieved September, 20, 2020 from URL
https://am.lrv.lt/uploads/am/documents/files/ES_ir_tarptautinis_bendradarbiavimas/Darnaus%20vystymosi%20tikslai/NDVS/NDVS.pdf
Neag, M. M., Halmaghi, E. E., & Cucuiet, P. (2017). Contributions on the Determination of the Relationship among Globalization,
Sustainable Development and Energy Security. Scientific Bulletin, 23 (1), 24–30. https://doi.org.10.1515/bsaft-2017-0004
ENTREPRENEURSHIP AND SUSTAINABILITY ISSUES
ISSN 2345-0282 (online) http://jssidoi.org/jesi/
2021 Volume 8 Number 3 (March)
http://doi.org/10.9770/jesi.2021.8.3(14)
265
Oxenstierna, R. (2016). Russia’s defense spending and the economic decline. Journal of Eureasian Studies, 7, 60–70.
https://doi.org/10.1016/j.euras.2015.06.0011879-3665
Pingle, J. F. (2007). A note on measuring internal migration in the United States. Economics Letters, 94, 38–42.
https://doi.org.10.1016/j.econlet.2006.07.004
Prada, M. (2020). The Relationship between Sustainable Development Goals and Migration. An EU-28 Perspective. Journal of Economics
ans Social Statistics, 9(1), 28–45. https://doi.org.10.2478/jses-2020-0004
Quing, L., & Junhua, H. (2015). Military expenditure and unemployment in China. Procedia Economics and Finance, 30, 498 – 504.
https://doi.org.10.1016/S2212-5671(15)01247-2
Savona, M., & Ciarli, T. (2019). Structural Changes and Sustainability. A Selected Review of the Empirical Evidence. Ecological
Economics, 159, 244–260. https://doi.org/10.1016/j.ecolecon.2019.01.028
Smith, P. (2007). Climate Change, Mass Migration and theMilitary Response. Orbis, 51(4), 617 – 663.
https://doi.org/10.1016/j.orbis.2007.08.006
Song, Y. Y., & Ying, L. U. (2015). Decision tree methods: applications for classification and prediction. Shanghai archives of psychiatry,
27(2), 130–135. https://doi.org.10.11919/j.issn.1002-0829.215044
Šimelytė, A., & Antanavičienė, J. (2013). Foreign Direct Investment Policy as an Instrument for Sustainable Economic Growth: a Case of
Ireland. Journal of Security and Sustainability Issues, 2(4), 25–34. https://doi.org/10.9770/jssi.2013.2.4(3)
Tang, Sh. (2009). The Security Dilemma: A Conceptual Analysis. Security Studies, 18(3), 587-623,
https://doi.org.10.1080/09636410903133050
Tsai, D. H. A. (2018). The effects of dynamic industrial transition on sustainable development. Structural Change and Economic
Dynamics, 44, 46–54. https://doi.org/10.1016/j.strueco.2017.10.002
United Nations. (2020). The 17 Goals. Retrievied October, 3, 2020 from URL https://sdgs.un.org/goals
Vasconcelos, V.V. (2021). Social justice and sustainable regional development: reflections on discourse and practice in public policies and
public budget. Insights into Regional Development, 3(1), 10-28. https://doi.org/10.9770/IRD.2021.3.1(1)
Weaver, O. (2008). The Changing Agenda of Societal Security. In: Brauch H.G. et al. (eds) Globalization and Environmental Challenges.
Hexagon Series on Human and Environmental Security and Peace, vol 3. Springer, Berlin, Heidelberg. https://doi.org/10.1007/978-3-540-
75977-5_44
Wohlforth, W. C. (2012). Realism in Foreign Policy. In: Smith, S. et al. (eds) Foreign Policy– Theories, Actors, Cases. Oxford: Oxford
University Press.
Acknowledgements
This research was partially supported by the Ministry of National Defence of the Republic of Lithuania
ENTREPRENEURSHIP AND SUSTAINABILITY ISSUES
ISSN 2345-0282 (online) http://jssidoi.org/jesi/
2021 Volume 8 Number 3 (March)
http://doi.org/10.9770/jesi.2021.8.3(14)
266
Ieva MEIDUTE-KAVALIAUSKIENE is a Chief Researcher at General Jonas Zemaitis military academy of Lithuania. She holds a PhD
in Technological Sciences (Transport Engineering) from Vilnius Gediminas Technical University. She has approximately 15 years of
experience in lecturing (taught such courses as logistic, transport management, supply chain management, warehouse logistics and
operations management). Her research interests focus on logistics and supply chain management, formation and evaluation of strategic
decisions and decision making. She is an author of more than 50 scientific publications indexed in the Web of Science, Scopus, Ebsco,
Emerald, and other databases. She has also published several monographs and textbooks. The scientific impact of prof. Meidutė-
Kavaliauskienė is as follows: ResearchGate 27, ISI WoS h-Index 10, Scopus h-Index 10. She is a member of the scientific committees of
several scientific journals and international scientific conferences. ORCID ID: orcid.org/0000-0003-0435-7632
Gitana DUDZEVIČIŪTĖ is an associate professor at General Jonas Žemaitis Military Academy of Lithuania. She holds a PhD in
Economics from Vilnius Gediminas Technical University. Her research interests include sustainable development, economic growth and its
determinants and defence economics. She is an author and a co-author of 40 scientific publications indexed on Clarivate Analytics, Scopus,
EBSCO, Emerald and other databases. She is also a co-author of three collective monographs.
ORCID ID: orcid.org/0000-0002-4891-224X
Agnė ŠIMELYTĖ is a senior researcher at General Jonas Zemaitis military academy of Lithuania. She holds a PhD in Social Sciences
from Vilnius Gediminas Technical University. Her research interests include sustainable development, economic growth and defence
economics. She is an author and a co-author of more than 30 scientific publications indexed on Clarivate Analytics, Scopus, EBSCO,
Emerald and other databases. She is also a co-author of two handbooks and two collective monographs.
ORCID ID: orcid.org/0000-0002-9475-9645
Nijolė MAKNICKIENĖ is an associate professor at the Department of Finance Engineering at Vilnius Gediminas Technical University.
She holds a PhD in Social Sciences and Economics. Research interests – economic forecasting, behavioural finance, application of
investment portfolio as an instrument for resource allocation in various areas of the economy, artificial intelligence application to
forecasting and management of economic processes.
ORCID ID: orcid.org/0000-0003-2785-5183
Make your research more visible, join the Twitter account of ENTREPRENEURSHIP AND SUSTAINABILITY ISSUES:
@Entrepr69728810
Copyright © 2021 by author(s) and VsI Entrepreneurship and Sustainability Center
This work is licensed under the Creative Commons Attribution International License (CC BY).
http://creativecommons.org/licenses/by/4.0/
ENTREPRENEURSHIP AND SUSTAINABILITY ISSUES
ISSN 2345-0282 (online) http://jssidoi.org/jesi/ 2021 Volume 8 Number 3 (March)
http://doi.org/10.9770/jesi.2021.8.3(15)
Publisher http://jssidoi.org/esc/home
267
IDENTIFYING CRITICAL SUCCESS FACTORS FOR UNIVERSITY BUSINESS INCUBATORS IN SAUDI ARABIA
Kamran Ahmed Siddiqui 1, Mohammad Emad Al-Shaikh 2, Ishtiaq Ahmed Bajwa 3, Abdulaziz Al-Subaie 4
1,2,3,4 College of Business Administration, Imam Abdulrahman Bin Faisal University, Dammam, Saudi Arabia
E-mails:1 [email protected]; [email protected]; [email protected]; 4 [email protected]
Received 18 July 2020; accepted 15 December 2020; published 15 January 2021
Abstract. Business incubators are a major tool in entrepreneurial eco-system of any country and forms the backbone of economic development initiatives. One of the greatest adaptations of business incubators came through universities especially public sector universities. This is due to the university's understood responsibility of supporting science and society development and ultimately providing all the new businesses' requirements in science and technology. Saudi Arabia has taken robust measures to develop and improve the local entrepreneurial eco-system by establishing and nurturing business incubators, especially university business incubators. In a small frame of time, Saudi business incubators have produced many innovate solutions for the technology, economic and social challenges. Due to multifaceted functionality and lack of standard evaluation criteria the business incubator performance became very important topic in Saudi Arabia. The purpose of this research is to develop critical success criteria for business incubators in Saudi Arabia. Survey methodology was employed to collect the data. Data were analyzed in many ways. Firstly, based on the survey results, list of success criteria for business incubators performance was presented. Secondly, descriptive analysis shows that top three critical factors include (a) coaching and mentoring hours, (b) number of services and supports offered; and (c) access to funds in terms of total attractive investment. While the least important factors considered were (a) affiliation with the university, (b) time limit to tenancy, and (c) numbers of IPOs launched. Thirdly, factor analysis summarizes all the critical success factors for university business incubators and culminates into five big factors, including (a) support services; (b) network support; (c) financial support; (d) economic development;(e) alumni success. Finally, cluster analysis shows there are two major cluster groups in the data: (a) ‘employees’ of the incubators and (b) ‘incubatees’. This research provides guidelines and critical success criteria for business incubators operating in Saudi Arabia or elsewhere. Keywords: Business Incubators; Accelerators; University Business Incubators; Saudi Arabia; Success Factors Reference to this paper should be made as follows: Siddiqui, K.A., Emad Al-Shaikh, M., Bajwa, I.A., Al-Subaie, A. 2021. Identifying critical success factors for university business incubators in Saudi Arabia. Entrepreneurship and Sustainability Issues, 8(3), 267-279. http://doi.org/10.9770/jesi.2021.8.3(15) JEL Classifications: L26 1. Introduction Over the past two decades, Saudi Arabia has been actively engaged in educational expansion and investment. As a result of this direction from the Government, many graduated students from different fields and specializations have graduated. However, it is implausible that the Government will provide the required jobs for all those graduated students. Moreover, the private sector in Saudi Arabia is not developed enough to address this gap
ENTREPRENEURSHIP AND SUSTAINABILITY ISSUES ISSN 2345-0282 (online) http://jssidoi.org/jesi/
2021 Volume 8 Number 3 (March) http://doi.org/10.9770/jesi.2021.8.3(15)
268
between the Government and the huge number of graduated students. As a solution to this problem, the Government has developed a new initiative to establish a business incubator as part of universities throughout the Kingdom. The incubators have been increased very rapidly after launching the 2030 Vision by the Government of Saudi Arabia. There are over 35 business incubators working under the universities as non-profit organizations. Different names are assigned to these incubators, such as ‘business incubators’, ‘accelerators’ ‘accelerated business centers’, and ‘business hub center’. 2. Theoretical background There are many definitions of business incubators (BI) in the literature. The most prominent definition comes from the National Business Incubation Association (NBIA). It defines business incubators as a catalyst tool for either regional or national economic development that has been formulated to enhance the growth rate of the new companies by providing all the required support and services or overcontrol new businesses by managing them through incubation and networking (NBIA, 2021). Other researchers have also provided useful definitions for BI as following. The business incubator is the organization that provides the logistic requirements to the business project in the early stages, such as place and the required recommendations and guidelines; a suitable space and all required assistance in the early stages for the targeted firm; the required support for the firm in the early stages (Mian, 2014). The support may include office service, coaching, and communication (Hansen et al. 2000); governance to the firm in the early stages and provides the required guidance and recommendations (Manan & Yunos 2001); support the new project and link it to the appropriate network, along with the offering of the required advice and recommendation, especially in the first few years of the business start-up (Mian, 1997). Business incubators have evolved over a period of time and can easily be classified into four generations based on the commonalities among services offered. The first generation of the business incubator, which has been stated from 1970 till mid-1990 “traditional incubator.” The main objectives of these incubators were to enhance the national economy by improving entrepreneurship and small firm. The Government normally controls this type of incubator. Additionally, the universities and private sector contribute by providing the space, and the major revenue is by the rent of space. These incubators were based on economies of scale and offer office space and shared resources. Important characteristics were (a) reactive support, (b) landlord-tenant relationships, and inclination towards real estate management (Allahar, & Brathwaite, 2016). The second generation of the incubator which started from 1990 till 2000. This type of incubator is also named as an incubator without walls or a new economy incubator. Technology development is the main target of this incubator without the interest of job creation. The revenue of this incubator is from the equity of companies via IPO. This generation was based on accelerating the learning curve and used to provide coaching and training support in addition to first-generation services. Prominent characteristics of the generation were (a) advisory services and (b) proactive support (Allahar, & Brathwaite, 2016). The third-generation incubators were started in early 2000. These incubators were based on access to external resources, knowledge, and legitimacy and used to offer access to technological, professional, and financial networks (Bruneel et al., 2012). Prominent characteristics of the generation include (a) access to funding; (b) co-venturing; (c) business accelerators; (d) coaching; (e) mentoring; and (f) technology labs/parks (Allahar, & Brathwaite, 2016). The emergence of business accelerators during the third generation of business incubators can be seen as a catalyst for the growth of business incubators. Business accelerators are a series of programs that give developing companies access to mentorship, investors, and other support services that help them become stable, self-sufficient businesses. Start-ups that use the services of business accelerators are typically those having moved beyond the earliest stages of getting established. Typically, business incubators target local start-ups and provide office space to reduce rent, while accelerators offer fixed-term cohort-based programs. Mentoring, education, technical assistance, and seed funding are some of the common characteristics (Ganamotse et al., 2017). The fourth generation of business incubators is still evolving and based on the concept of business incubators accreditations and internationalization (Khalid et al. 2014). Prominent characteristics of the generation include (a) international business incubators; (b) accredited business incubators; and (c)
ENTREPRENEURSHIP AND SUSTAINABILITY ISSUES ISSN 2345-0282 (online) http://jssidoi.org/jesi/
2021 Volume 8 Number 3 (March) http://doi.org/10.9770/jesi.2021.8.3(15)
269
international co-incubation (Allahar, & Brathwaite, 2016). One thing is consistent among all generations and among all definitions of business incubators, i.e., business incubators are companies that help new ideas, novice entrepreneurs, and/or new start-up companies to develop by providing services such as management, training or office space, more precisely they provide support to early-stage start-ups (Bruneel et al., 2012; Khalid et al., 2014). One of the greatest adaptations of business incubators and accelerators came through universities. Although teaching entrepreneurship is not directly linked with business incubators and accelerators as part of their curricula (Siddiqui, & Alaraifi, 2019) but graduates' risk aversion and work effort are positively influenced by the university business incubator and entrepreneurship education programs (Guerrero et al., 2020). Now universities understand their responsibility of supporting science and society development and ultimately providing all the requirements for the new business in science and technology to play their most important roles as university business incubator (Nicholls-Nixon et al., 2020). Literature provide further support to the application and implementation of UBIs throughout the globe i.e., University business incubator (UBI) works as hub to market; university; research and technology (Pellegrini, & Johnson-Sheehan, 2020); UBIs are considered as an effective tool used to compensate the weakness in the traditional business incubators (Grimaldi, & Grandi, 2001); UBIs also provide the required support to university professors, students, alumni to start businesses as entrepreneurs (Gozali et al, 2018); UBI’s role is not only to provide the required support to the accelerate the growth for the new businesses in the market but also provide the required training for the university students and marketing university’s innovation (Nicholls-Nixon et al., 2018); UBIs are considered as the most crucial element of entrepreneurial ecosystem (Nicholls-Nixon et al., 2020); UBI can utilize all available resources and the faculty experiences to support the new firm during the start-up period in the market (Lendner, & Dowling, 2007); UBI establishes effective networks and creates value for the incubatees to survive in the market. It also provides a chance of getting fund and support to incubatees (Cooper et al., 2012); UBI has to consider the differences of cross-border and cross-cultural organizations in order to get acceptance of incubator concept, especially in developing centuries (Dahms, & Kingkaew, 2016); UBI is a tool used to enhance national economic growth. Normally, UBIs are targeting the technology firms in early stages (Somsuk, & Laosirihongthong, 2014); UBI provide the required offices, tools, and the consultation service for the new firm; works as mediator between the university and the industrial market and creates the required link to support the university research (Wonglimpiyarat, 2016); UBI provides varieties of facilities and image to tie with university image and it provide incubatees the ability to survive in the market (Grimaldi, & Grandi, 2001). On the other hand, literature also provide significant critique to the UBIs. For example, UBI’s support activities for entrepreneurs is dependent on UBI’s manager’s experience (Redondo, & Camarero, 2017); UBIs need to consider the organizational and cultural differences in different countries in order to get acceptance of incubator concept, especially for developing centuries (Dahms, & Kingkaew, 2016); UBIs are under great pressures to evaluate the UBI performance and the rationalization of UBI’s fund (Nicholls-Nixon, & Valliere, 2019). Even research on UBIs also came under scrutiny. For example, most of earlier research have ignored to study society funding to the entrepreneur through UBIs (Redondo, & Camarero, 2019); most of the earlier research on UBI activities failed to link the UBI’s activities to the different generations of business incubators and their offerings despite the fact that UBI works as mediator between the university and the industrial market and create the required link to support the university research (Wonglimpiyarat, 2016).
A very thin amount of literature is available on the critical success factors for UBIs. Firstly, a seminal work on UBI’s success factors (Mian, 1994, 1996a, 1996b 1997), reviewed and upgraded success factors (Verma, 2004), and Saudi model for technology incubators (Binsawad et al., 2019); six-factor model including age and quality of facilities, credits and rewards, entry criteria, exit criteria, funding support, good system and infrastructure Gozali et al., 2018); four-factor model including human resources, financial resources, technological resources and organizational resources (Mavi et al. 2019) and most recently used success
ENTREPRENEURSHIP AND SUSTAINABILITY ISSUES ISSN 2345-0282 (online) http://jssidoi.org/jesi/
2021 Volume 8 Number 3 (March) http://doi.org/10.9770/jesi.2021.8.3(15)
270
criteria for the ranking university business incubators (UBI Global, 2020). All models have their merits and demerits. Mian’s model (1994) is very old and belongs to first generation of business incubators but does not link to subsequent generations and needs updating. Verma’s model (2004) is also old and belongs to the second generation of UBI (Verma, 2004). Some of the research on university business incubators and their performance were excluded from this research as they were based on students’ entrepreneurial intentions; not based on actual incubator experience; for example (Yamockul, Pichyangkura, & Chandrachai, 2019) or having methodological issues (Mavi, et al 2019; Gozali et al, 2018). Binsawad et al. (2019) is a Saudi Technology business incubator model is based on personal perspective, not organizational criteria, and cannot be used for UBI performance evaluations and it does not include the attributes of the fourth generation of UBI (Binsawad et al. 2019). UBI Global model (2020) for UBI ranking is more appropriate but lacks features of earlier generations of UBI (UBI Global, 2020). It became the criteria to rank the university incubators in the world. Every year the UBI provides a report started the top business all over the world based on three categories. The first categories are the top changers. The second categories are the recognize the most promising incubator and the last category is the ranking for university incubator over the world. Every year these is around 70 counties involve in the incubator rang with total number of 300 incubators. These samples contain the most important and popular sector in the business. UBI framework to rank the incubator contain of three importins categories, the values of ecosystem, value for client and attractiveness. These three categories spared to seven indictor which use to measure the incubator performance. The seven indictors are economy enhancement, access to funds, incubator offer, talent retention, competence development, post-incubation performance and access to the network (UBI Global, 2020). During the last two decades there has been an increasing effort by the Saudi authorities to improve the entrepreneurial ecosystem in the country establishing the business incubators and accelerators (Al-Mubaraki & Busler, 2010). Saudi vision 2030 has selected entrepreneurship as future roadmap for economic development and employment creation (Saudi Arabia, Vision 2030; www.vision2030.gov.sa/en). In addition, Government has established the Small and Medium Enterprise Authority (SMEA; www.monshaat.gov.sa/en), as part of the Vision 2030 and this authority has helped to establish new business incubators and support and evaluation the performance of existing business incubators. The Kingdom of Saudi Arabia began to support its entrepreneurial ecosystem in the last decade, with different governmental initiatives and the involvement of the private sector. Such initiatives include the Saudi Business Incubator Network initiative (Salem, 2014). Another business incubator that has been established nationally to promote technology and innovation is BADIR technology business incubator (Khorsheed et al., 2014). This indicates that the Saudi government agencies responsible for shaping entrepreneurship policies must acknowledge the need to integrate business incubators into economic policy reforms (Salem, 2014). Table 1 provides a list of national business incubators and accelerators in Saudi Arabia. University business incubators have recently been introduced in Saudi Arabia (Siddiqui, Siddiqui, & Alaraifi, 2018) and almost all universities have launched university business incubators (UBI) as not-for-profit organizations.
Table 1 List of National Business Incubators participated in this study No Business Incubator City No Business Incubator City 1 BADIR - King Abdullah City of Science and Technology (KACST) Riyadh 12 FLAT6LABS Jeddah 2 Misk 500 - MISK Foundation Riyadh 13 InspireU Riyadh 3 9/10th - King Abdullah University of Science and Technology (KAUST) Riyadh 14 Tamakkun BA Riyadh 4 E3qlha - First women's business incubator Riyadh 15 Entertainment BA Riyadh 5 Bab Rizq - Abdullatif Jameel Motors Riyadh 16 I-be Hub Riyadh 6 Jeddah Valley Jeddah 17 Inspire Riyadh 7 Dhahran techno valley Dharan 18 Startups House Riyadh 8 Riyadh Taqnia venture Riyadh 19 Oqal Riyadh 9 Riyadh Valley Riyadh 20 Raz Riyadh
10 Saudi Credit and Savings bank Riyadh 21 Riyada Riyadh 11 Saudi Venture Capital Riyadh
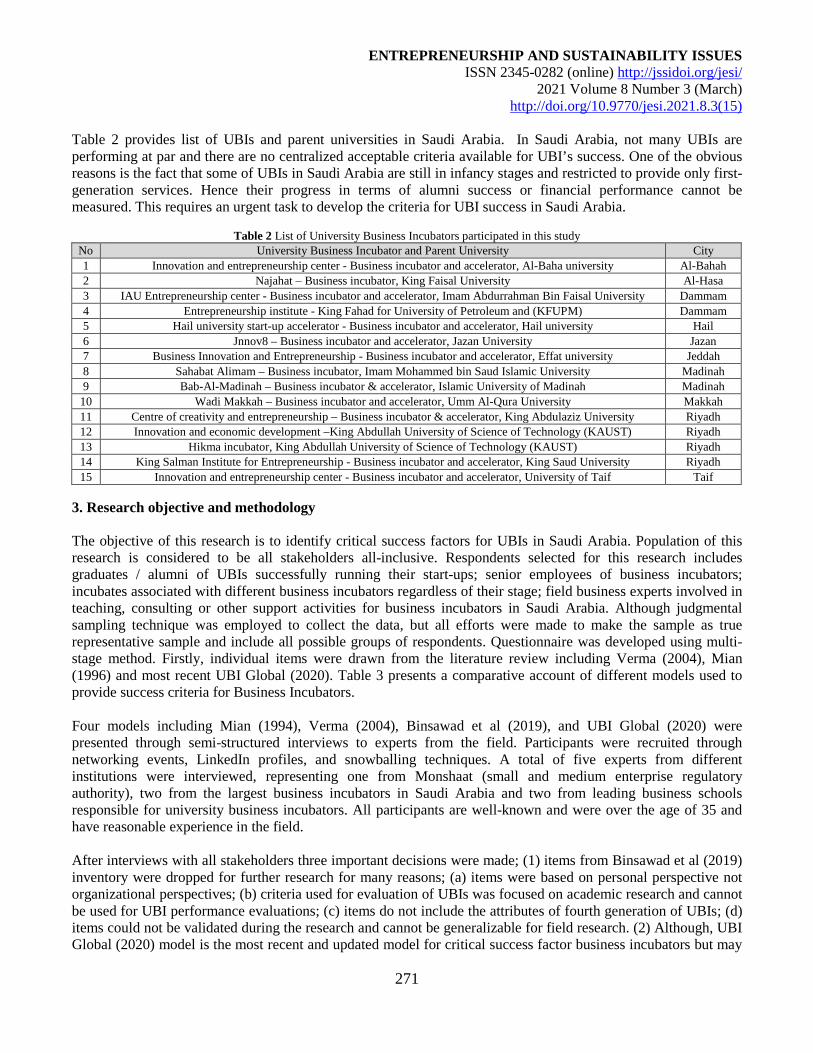
ENTREPRENEURSHIP AND SUSTAINABILITY ISSUES ISSN 2345-0282 (online) http://jssidoi.org/jesi/
2021 Volume 8 Number 3 (March) http://doi.org/10.9770/jesi.2021.8.3(15)
271
Table 2 provides list of UBIs and parent universities in Saudi Arabia. In Saudi Arabia, not many UBIs are performing at par and there are no centralized acceptable criteria available for UBI’s success. One of the obvious reasons is the fact that some of UBIs in Saudi Arabia are still in infancy stages and restricted to provide only first-generation services. Hence their progress in terms of alumni success or financial performance cannot be measured. This requires an urgent task to develop the criteria for UBI success in Saudi Arabia.
Table 2 List of University Business Incubators participated in this study
No University Business Incubator and Parent University City 1 Innovation and entrepreneurship center - Business incubator and accelerator, Al-Baha university Al-Bahah 2 Najahat – Business incubator, King Faisal University Al-Hasa 3 IAU Entrepreneurship center - Business incubator and accelerator, Imam Abdurrahman Bin Faisal University Dammam 4 Entrepreneurship institute - King Fahad for University of Petroleum and (KFUPM) Dammam 5 Hail university start-up accelerator - Business incubator and accelerator, Hail university Hail 6 Jnnov8 – Business incubator and accelerator, Jazan University Jazan 7 Business Innovation and Entrepreneurship - Business incubator and accelerator, Effat university Jeddah 8 Sahabat Alimam – Business incubator, Imam Mohammed bin Saud Islamic University Madinah 9 Bab-Al-Madinah – Business incubator & accelerator, Islamic University of Madinah Madinah
10 Wadi Makkah – Business incubator and accelerator, Umm Al-Qura University Makkah 11 Centre of creativity and entrepreneurship – Business incubator & accelerator, King Abdulaziz University Riyadh 12 Innovation and economic development –King Abdullah University of Science of Technology (KAUST) Riyadh 13 Hikma incubator, King Abdullah University of Science of Technology (KAUST) Riyadh 14 King Salman Institute for Entrepreneurship - Business incubator and accelerator, King Saud University Riyadh 15 Innovation and entrepreneurship center - Business incubator and accelerator, University of Taif Taif
3. Research objective and methodology The objective of this research is to identify critical success factors for UBIs in Saudi Arabia. Population of this research is considered to be all stakeholders all-inclusive. Respondents selected for this research includes graduates / alumni of UBIs successfully running their start-ups; senior employees of business incubators; incubates associated with different business incubators regardless of their stage; field business experts involved in teaching, consulting or other support activities for business incubators in Saudi Arabia. Although judgmental sampling technique was employed to collect the data, but all efforts were made to make the sample as true representative sample and include all possible groups of respondents. Questionnaire was developed using multi-stage method. Firstly, individual items were drawn from the literature review including Verma (2004), Mian (1996) and most recent UBI Global (2020). Table 3 presents a comparative account of different models used to provide success criteria for Business Incubators. Four models including Mian (1994), Verma (2004), Binsawad et al (2019), and UBI Global (2020) were presented through semi-structured interviews to experts from the field. Participants were recruited through networking events, LinkedIn profiles, and snowballing techniques. A total of five experts from different institutions were interviewed, representing one from Monshaat (small and medium enterprise regulatory authority), two from the largest business incubators in Saudi Arabia and two from leading business schools responsible for university business incubators. All participants are well-known and were over the age of 35 and have reasonable experience in the field.
After interviews with all stakeholders three important decisions were made; (1) items from Binsawad et al (2019) inventory were dropped for further research for many reasons; (a) items were based on personal perspective not organizational perspectives; (b) criteria used for evaluation of UBIs was focused on academic research and cannot be used for UBI performance evaluations; (c) items do not include the attributes of fourth generation of UBIs; (d) items could not be validated during the research and cannot be generalizable for field research. (2) Although, UBI Global (2020) model is the most recent and updated model for critical success factor business incubators but may
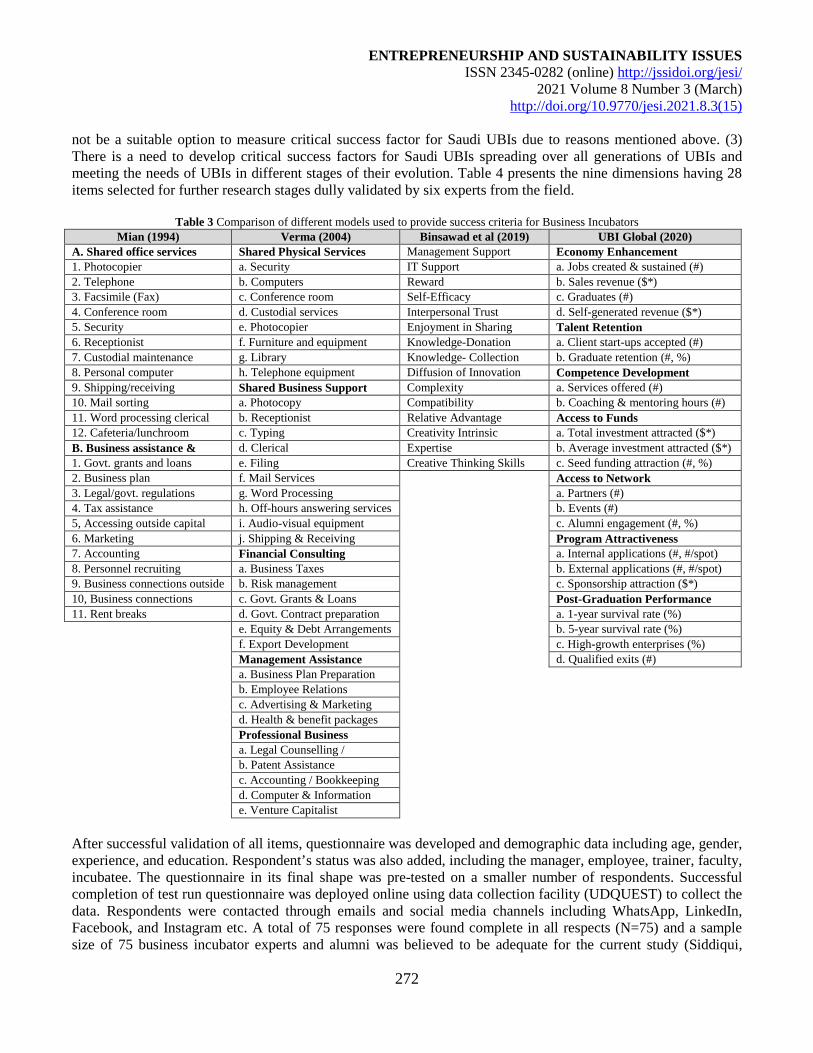
ENTREPRENEURSHIP AND SUSTAINABILITY ISSUES ISSN 2345-0282 (online) http://jssidoi.org/jesi/
2021 Volume 8 Number 3 (March) http://doi.org/10.9770/jesi.2021.8.3(15)
272
not be a suitable option to measure critical success factor for Saudi UBIs due to reasons mentioned above. (3) There is a need to develop critical success factors for Saudi UBIs spreading over all generations of UBIs and meeting the needs of UBIs in different stages of their evolution. Table 4 presents the nine dimensions having 28 items selected for further research stages dully validated by six experts from the field.
Table 3 Comparison of different models used to provide success criteria for Business Incubators
Mian (1994) Verma (2004) Binsawad et al (2019) UBI Global (2020) A. Shared office services Shared Physical Services Management Support Economy Enhancement 1. Photocopier a. Security IT Support a. Jobs created & sustained (#) 2. Telephone b. Computers Reward b. Sales revenue ($*) 3. Facsimile (Fax) c. Conference room Self-Efficacy c. Graduates (#) 4. Conference room d. Custodial services Interpersonal Trust d. Self-generated revenue ($*) 5. Security e. Photocopier Enjoyment in Sharing Talent Retention 6. Receptionist f. Furniture and equipment
Knowledge-Donation a. Client start-ups accepted (#)
7. Custodial maintenance g. Library Knowledge- Collection b. Graduate retention (#, %) 8. Personal computer h. Telephone equipment Diffusion of Innovation Competence Development 9. Shipping/receiving Shared Business Support Complexity a. Services offered (#) 10. Mail sorting a. Photocopy Compatibility b. Coaching & mentoring hours (#) 11. Word processing clerical b. Receptionist Relative Advantage Access to Funds 12. Cafeteria/lunchroom c. Typing Creativity Intrinsic
a. Total investment attracted ($*)
B. Business assistance &
d. Clerical Expertise b. Average investment attracted ($*) 1. Govt. grants and loans e. Filing Creative Thinking Skills c. Seed funding attraction (#, %) 2. Business plan f. Mail Services Access to Network 3. Legal/govt. regulations g. Word Processing a. Partners (#) 4. Tax assistance h. Off-hours answering services b. Events (#) 5, Accessing outside capital i. Audio-visual equipment c. Alumni engagement (#, %) 6. Marketing j. Shipping & Receiving Program Attractiveness 7. Accounting Financial Consulting a. Internal applications (#, #/spot) 8. Personnel recruiting a. Business Taxes b. External applications (#, #/spot) 9. Business connections outside b. Risk management c. Sponsorship attraction ($*) 10, Business connections
c. Govt. Grants & Loans Post-Graduation Performance
11. Rent breaks d. Govt. Contract preparation a. 1-year survival rate (%) e. Equity & Debt Arrangements b. 5-year survival rate (%) f. Export Development
c. High-growth enterprises (%)
Management Assistance d. Qualified exits (#) a. Business Plan Preparation b. Employee Relations c. Advertising & Marketing d. Health & benefit packages Professional Business
a. Legal Counselling /
b. Patent Assistance c. Accounting / Bookkeeping d. Computer & Information
e. Venture Capitalist After successful validation of all items, questionnaire was developed and demographic data including age, gender, experience, and education. Respondent’s status was also added, including the manager, employee, trainer, faculty, incubatee. The questionnaire in its final shape was pre-tested on a smaller number of respondents. Successful completion of test run questionnaire was deployed online using data collection facility (UDQUEST) to collect the data. Respondents were contacted through emails and social media channels including WhatsApp, LinkedIn, Facebook, and Instagram etc. A total of 75 responses were found complete in all respects (N=75) and a sample size of 75 business incubator experts and alumni was believed to be adequate for the current study (Siddiqui,
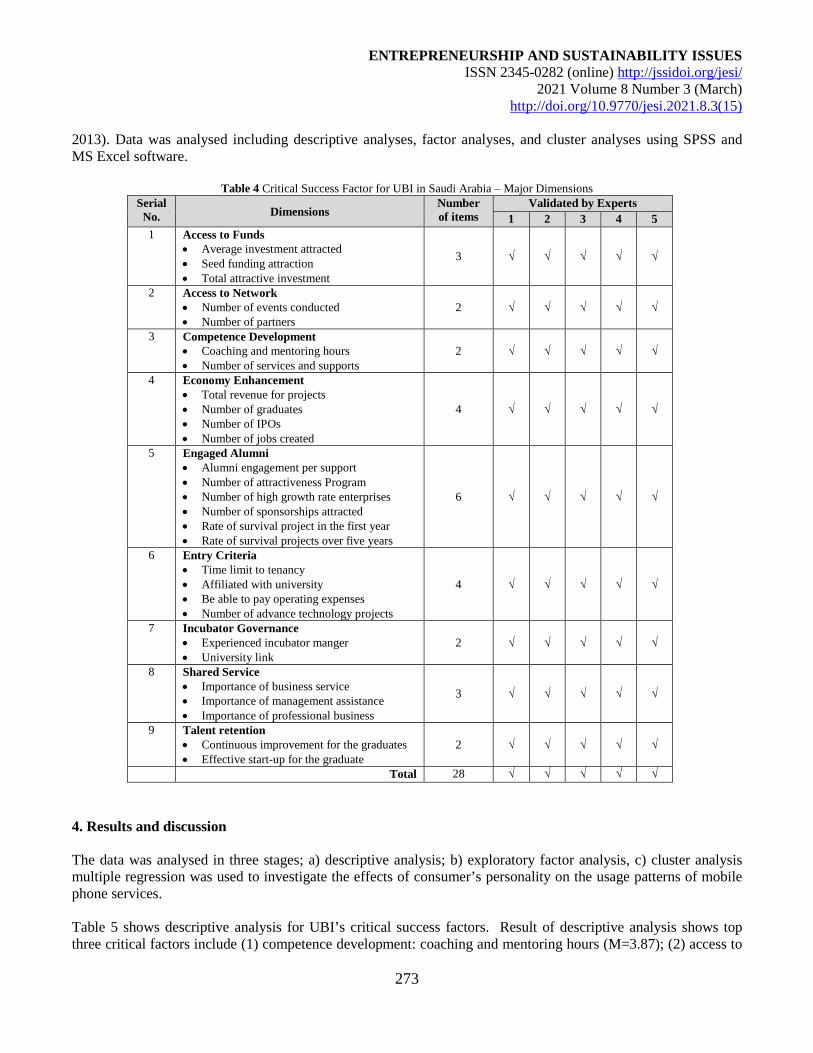
ENTREPRENEURSHIP AND SUSTAINABILITY ISSUES ISSN 2345-0282 (online) http://jssidoi.org/jesi/
2021 Volume 8 Number 3 (March) http://doi.org/10.9770/jesi.2021.8.3(15)
273
2013). Data was analysed including descriptive analyses, factor analyses, and cluster analyses using SPSS and MS Excel software.
Table 4 Critical Success Factor for UBI in Saudi Arabia – Major Dimensions Serial
No. Dimensions Number of items
Validated by Experts 1 2 3 4 5
1 Access to Funds • Average investment attracted • Seed funding attraction • Total attractive investment
3 √ √ √ √ √
2 Access to Network • Number of events conducted • Number of partners
2 √ √ √ √ √
3 Competence Development • Coaching and mentoring hours • Number of services and supports
2 √ √ √ √ √
4 Economy Enhancement • Total revenue for projects • Number of graduates • Number of IPOs • Number of jobs created
4 √ √ √ √ √
5 Engaged Alumni • Alumni engagement per support • Number of attractiveness Program • Number of high growth rate enterprises • Number of sponsorships attracted • Rate of survival project in the first year • Rate of survival projects over five years
6 √ √ √ √ √
6 Entry Criteria • Time limit to tenancy • Affiliated with university • Be able to pay operating expenses • Number of advance technology projects
4 √ √ √ √ √
7 Incubator Governance • Experienced incubator manger • University link
2 √ √ √ √ √
8 Shared Service • Importance of business service • Importance of management assistance • Importance of professional business
3 √ √ √ √ √
9 Talent retention • Continuous improvement for the graduates • Effective start-up for the graduate
2 √ √ √ √ √
Total 28 √ √ √ √ √ 4. Results and discussion The data was analysed in three stages; a) descriptive analysis; b) exploratory factor analysis, c) cluster analysis multiple regression was used to investigate the effects of consumer’s personality on the usage patterns of mobile phone services. Table 5 shows descriptive analysis for UBI’s critical success factors. Result of descriptive analysis shows top three critical factors include (1) competence development: coaching and mentoring hours (M=3.87); (2) access to
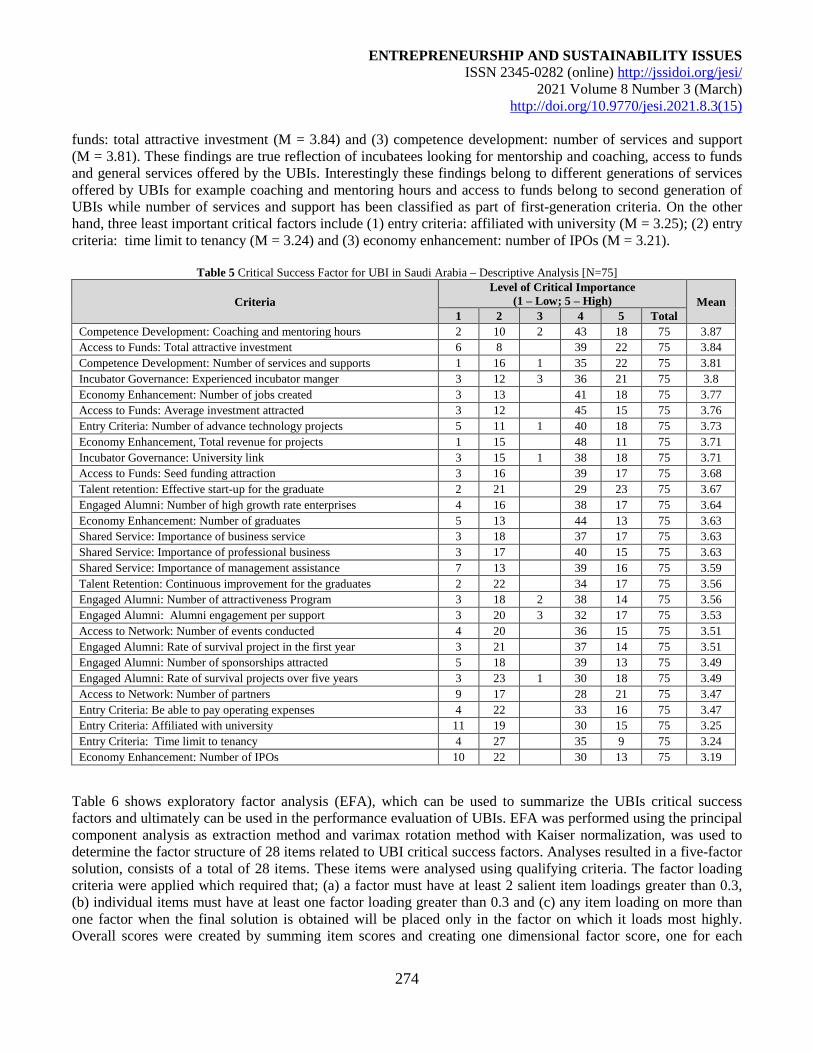
ENTREPRENEURSHIP AND SUSTAINABILITY ISSUES ISSN 2345-0282 (online) http://jssidoi.org/jesi/
2021 Volume 8 Number 3 (March) http://doi.org/10.9770/jesi.2021.8.3(15)
274
funds: total attractive investment (M = 3.84) and (3) competence development: number of services and support (M = 3.81). These findings are true reflection of incubatees looking for mentorship and coaching, access to funds and general services offered by the UBIs. Interestingly these findings belong to different generations of services offered by UBIs for example coaching and mentoring hours and access to funds belong to second generation of UBIs while number of services and support has been classified as part of first-generation criteria. On the other hand, three least important critical factors include (1) entry criteria: affiliated with university (M = 3.25); (2) entry criteria: time limit to tenancy (M = 3.24) and (3) economy enhancement: number of IPOs (M = 3.21).
Table 5 Critical Success Factor for UBI in Saudi Arabia – Descriptive Analysis [N=75]
Criteria Level of Critical Importance
(1 – Low; 5 – High) Mean 1 2 3 4 5 Total
Competence Development: Coaching and mentoring hours 2 10 2 43 18 75 3.87 Access to Funds: Total attractive investment 6 8 39 22 75 3.84 Competence Development: Number of services and supports 1 16 1 35 22 75 3.81 Incubator Governance: Experienced incubator manger 3 12 3 36 21 75 3.8 Economy Enhancement: Number of jobs created 3 13 41 18 75 3.77 Access to Funds: Average investment attracted 3 12 45 15 75 3.76 Entry Criteria: Number of advance technology projects 5 11 1 40 18 75 3.73 Economy Enhancement, Total revenue for projects 1 15 48 11 75 3.71 Incubator Governance: University link 3 15 1 38 18 75 3.71 Access to Funds: Seed funding attraction 3 16 39 17 75 3.68 Talent retention: Effective start-up for the graduate 2 21 29 23 75 3.67 Engaged Alumni: Number of high growth rate enterprises 4 16 38 17 75 3.64 Economy Enhancement: Number of graduates 5 13 44 13 75 3.63 Shared Service: Importance of business service 3 18 37 17 75 3.63 Shared Service: Importance of professional business 3 17 40 15 75 3.63 Shared Service: Importance of management assistance 7 13 39 16 75 3.59 Talent Retention: Continuous improvement for the graduates 2 22 34 17 75 3.56 Engaged Alumni: Number of attractiveness Program 3 18 2 38 14 75 3.56 Engaged Alumni: Alumni engagement per support 3 20 3 32 17 75 3.53 Access to Network: Number of events conducted 4 20 36 15 75 3.51 Engaged Alumni: Rate of survival project in the first year 3 21 37 14 75 3.51 Engaged Alumni: Number of sponsorships attracted 5 18 39 13 75 3.49 Engaged Alumni: Rate of survival projects over five years 3 23 1 30 18 75 3.49 Access to Network: Number of partners 9 17 28 21 75 3.47 Entry Criteria: Be able to pay operating expenses 4 22 33 16 75 3.47 Entry Criteria: Affiliated with university 11 19 30 15 75 3.25 Entry Criteria: Time limit to tenancy 4 27 35 9 75 3.24 Economy Enhancement: Number of IPOs 10 22 30 13 75 3.19
Table 6 shows exploratory factor analysis (EFA), which can be used to summarize the UBIs critical success factors and ultimately can be used in the performance evaluation of UBIs. EFA was performed using the principal component analysis as extraction method and varimax rotation method with Kaiser normalization, was used to determine the factor structure of 28 items related to UBI critical success factors. Analyses resulted in a five-factor solution, consists of a total of 28 items. These items were analysed using qualifying criteria. The factor loading criteria were applied which required that; (a) a factor must have at least 2 salient item loadings greater than 0.3, (b) individual items must have at least one factor loading greater than 0.3 and (c) any item loading on more than one factor when the final solution is obtained will be placed only in the factor on which it loads most highly. Overall scores were created by summing item scores and creating one dimensional factor score, one for each
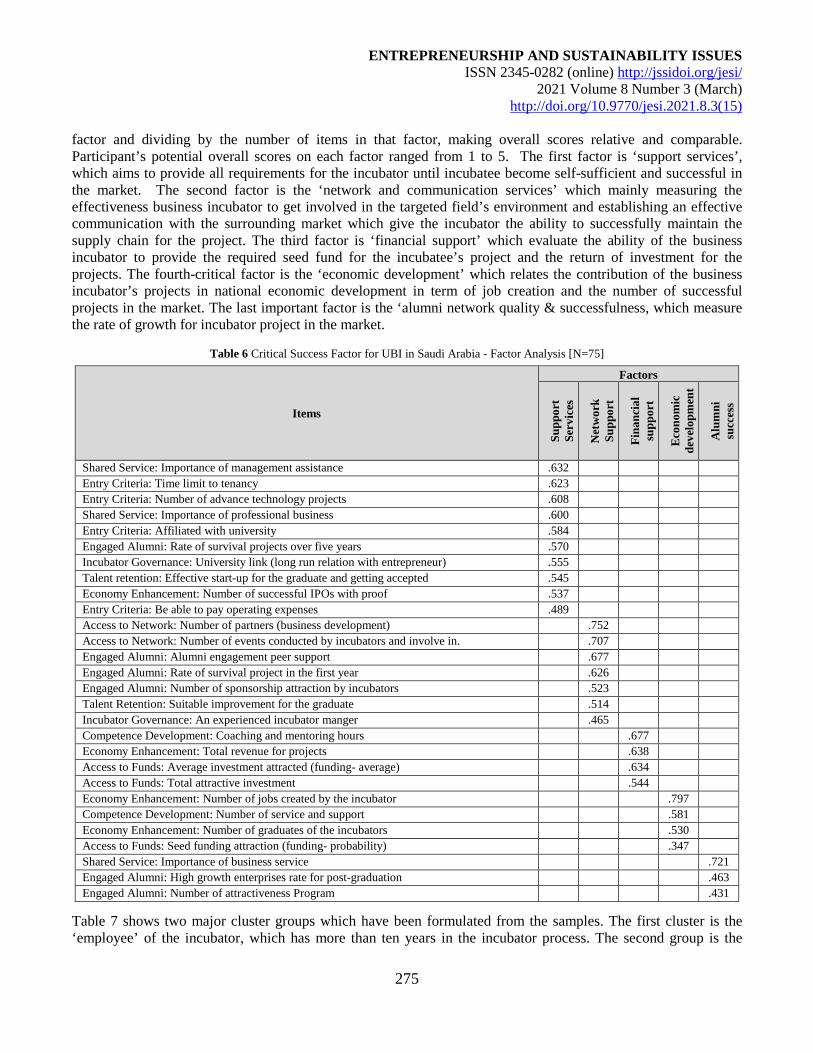
ENTREPRENEURSHIP AND SUSTAINABILITY ISSUES ISSN 2345-0282 (online) http://jssidoi.org/jesi/
2021 Volume 8 Number 3 (March) http://doi.org/10.9770/jesi.2021.8.3(15)
275
factor and dividing by the number of items in that factor, making overall scores relative and comparable. Participant’s potential overall scores on each factor ranged from 1 to 5. The first factor is ‘support services’, which aims to provide all requirements for the incubator until incubatee become self-sufficient and successful in the market. The second factor is the ‘network and communication services’ which mainly measuring the effectiveness business incubator to get involved in the targeted field’s environment and establishing an effective communication with the surrounding market which give the incubator the ability to successfully maintain the supply chain for the project. The third factor is ‘financial support’ which evaluate the ability of the business incubator to provide the required seed fund for the incubatee’s project and the return of investment for the projects. The fourth-critical factor is the ‘economic development’ which relates the contribution of the business incubator’s projects in national economic development in term of job creation and the number of successful projects in the market. The last important factor is the ‘alumni network quality & successfulness, which measure the rate of growth for incubator project in the market.
Table 6 Critical Success Factor for UBI in Saudi Arabia - Factor Analysis [N=75]
Table 7 shows two major cluster groups which have been formulated from the samples. The first cluster is the ‘employee’ of the incubator, which has more than ten years in the incubator process. The second group is the
Items
Factors
Supp
ort
Serv
ices
Net
wor
k Su
ppor
t
Fina
ncia
l su
ppor
t
Eco
nom
ic
deve
lopm
ent
Alu
mni
su
cces
s
Shared Service: Importance of management assistance .632 Entry Criteria: Time limit to tenancy .623 Entry Criteria: Number of advance technology projects .608 Shared Service: Importance of professional business .600 Entry Criteria: Affiliated with university .584 Engaged Alumni: Rate of survival projects over five years .570 Incubator Governance: University link (long run relation with entrepreneur) .555 Talent retention: Effective start-up for the graduate and getting accepted .545 Economy Enhancement: Number of successful IPOs with proof .537 Entry Criteria: Be able to pay operating expenses .489 Access to Network: Number of partners (business development) .752 Access to Network: Number of events conducted by incubators and involve in. .707 Engaged Alumni: Alumni engagement peer support .677 Engaged Alumni: Rate of survival project in the first year .626 Engaged Alumni: Number of sponsorship attraction by incubators .523 Talent Retention: Suitable improvement for the graduate .514 Incubator Governance: An experienced incubator manger .465 Competence Development: Coaching and mentoring hours .677 Economy Enhancement: Total revenue for projects .638 Access to Funds: Average investment attracted (funding- average) .634 Access to Funds: Total attractive investment .544 Economy Enhancement: Number of jobs created by the incubator .797 Competence Development: Number of service and support .581 Economy Enhancement: Number of graduates of the incubators .530 Access to Funds: Seed funding attraction (funding- probability) .347 Shared Service: Importance of business service .721 Engaged Alumni: High growth enterprises rate for post-graduation .463 Engaged Alumni: Number of attractiveness Program .431
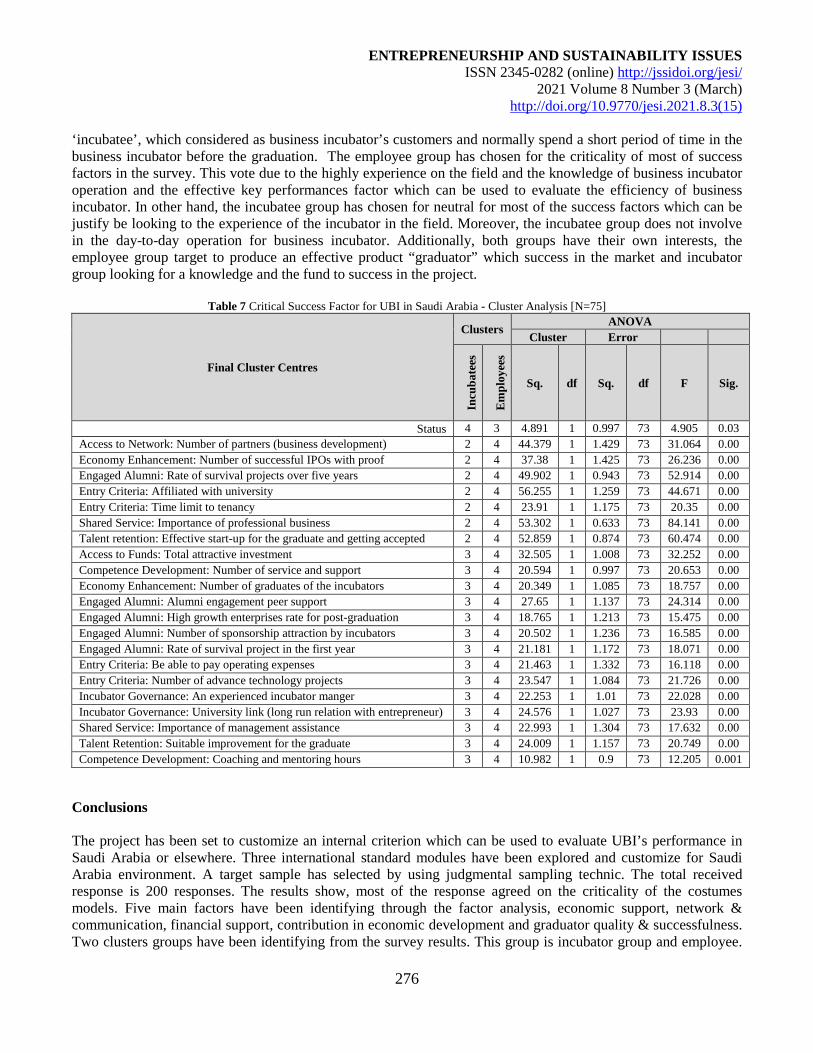
ENTREPRENEURSHIP AND SUSTAINABILITY ISSUES ISSN 2345-0282 (online) http://jssidoi.org/jesi/
2021 Volume 8 Number 3 (March) http://doi.org/10.9770/jesi.2021.8.3(15)
276
‘incubatee’, which considered as business incubator’s customers and normally spend a short period of time in the business incubator before the graduation. The employee group has chosen for the criticality of most of success factors in the survey. This vote due to the highly experience on the field and the knowledge of business incubator operation and the effective key performances factor which can be used to evaluate the efficiency of business incubator. In other hand, the incubatee group has chosen for neutral for most of the success factors which can be justify be looking to the experience of the incubator in the field. Moreover, the incubatee group does not involve in the day-to-day operation for business incubator. Additionally, both groups have their own interests, the employee group target to produce an effective product “graduator” which success in the market and incubator group looking for a knowledge and the fund to success in the project.
Table 7 Critical Success Factor for UBI in Saudi Arabia - Cluster Analysis [N=75]
Final Cluster Centres
Clusters ANOVA Cluster Error
Incu
bate
es
Em
ploy
ees
Sq. df Sq. df F Sig.
Status 4 3 4.891 1 0.997 73 4.905 0.03 Access to Network: Number of partners (business development) 2 4 44.379 1 1.429 73 31.064 0.00 Economy Enhancement: Number of successful IPOs with proof 2 4 37.38 1 1.425 73 26.236 0.00 Engaged Alumni: Rate of survival projects over five years 2 4 49.902 1 0.943 73 52.914 0.00 Entry Criteria: Affiliated with university 2 4 56.255 1 1.259 73 44.671 0.00 Entry Criteria: Time limit to tenancy 2 4 23.91 1 1.175 73 20.35 0.00 Shared Service: Importance of professional business 2 4 53.302 1 0.633 73 84.141 0.00 Talent retention: Effective start-up for the graduate and getting accepted 2 4 52.859 1 0.874 73 60.474 0.00 Access to Funds: Total attractive investment 3 4 32.505 1 1.008 73 32.252 0.00 Competence Development: Number of service and support 3 4 20.594 1 0.997 73 20.653 0.00 Economy Enhancement: Number of graduates of the incubators 3 4 20.349 1 1.085 73 18.757 0.00 Engaged Alumni: Alumni engagement peer support 3 4 27.65 1 1.137 73 24.314 0.00 Engaged Alumni: High growth enterprises rate for post-graduation 3 4 18.765 1 1.213 73 15.475 0.00 Engaged Alumni: Number of sponsorship attraction by incubators 3 4 20.502 1 1.236 73 16.585 0.00 Engaged Alumni: Rate of survival project in the first year 3 4 21.181 1 1.172 73 18.071 0.00 Entry Criteria: Be able to pay operating expenses 3 4 21.463 1 1.332 73 16.118 0.00 Entry Criteria: Number of advance technology projects 3 4 23.547 1 1.084 73 21.726 0.00 Incubator Governance: An experienced incubator manger 3 4 22.253 1 1.01 73 22.028 0.00 Incubator Governance: University link (long run relation with entrepreneur) 3 4 24.576 1 1.027 73 23.93 0.00 Shared Service: Importance of management assistance 3 4 22.993 1 1.304 73 17.632 0.00 Talent Retention: Suitable improvement for the graduate 3 4 24.009 1 1.157 73 20.749 0.00 Competence Development: Coaching and mentoring hours 3 4 10.982 1 0.9 73 12.205 0.001
Conclusions The project has been set to customize an internal criterion which can be used to evaluate UBI’s performance in Saudi Arabia or elsewhere. Three international standard modules have been explored and customize for Saudi Arabia environment. A target sample has selected by using judgmental sampling technic. The total received response is 200 responses. The results show, most of the response agreed on the criticality of the costumes models. Five main factors have been identifying through the factor analysis, economic support, network & communication, financial support, contribution in economic development and graduator quality & successfulness. Two clusters groups have been identifying from the survey results. This group is incubator group and employee.
ENTREPRENEURSHIP AND SUSTAINABILITY ISSUES ISSN 2345-0282 (online) http://jssidoi.org/jesi/
2021 Volume 8 Number 3 (March) http://doi.org/10.9770/jesi.2021.8.3(15)
277
Each opinion reflection the interest of each group in term of how this group is looking to the incubator process. The incubator more looking for fund and knowledge to effectively start their project in the market. In the other hand the incubator employee which more knowledgeable about the incubator process and procedure. Business incubator has been started around ten years back in Saudi Arabia universities. It is recommended to lunch a comprehensive awareness for universities student in order to enhance their knowledge and build up the passion in them to start the bath in the local market. Moreover, most of business incubators are facing a difficulty of getting fund and the government bureaucratic requirements. This research will generate many tangible outputs serving different stakeholders for example, it will provide baseline data and measuring the performance of UBIs in Saudi Arabia. Similarly this exercise will also be used to enhance other business, technology, and bio-technology incubators in Saudi Arabia. It provides output in the form research paper and /or conference paper and augment the existing literature on the subject area. It generates a critical success factor for UBIs, which will help policymakers enhance their UBI policies and rationalize their budgets for different UBIs having different levels of success criteria. Finally, and probably more exciting and rewarding output from this research is in the form of UBI consulting services to enhance the performance of UBIs in Saudi Arabia or elsewhere.
References 9/10th start-up Accelerator Showcase, (December 5, 2020) https://innovation.kaust.edu.sa/event/910ths-startup-accelerator-showcase/ Allahar, H., & Brathwaite, C. (2016). Business incubation as an instrument of innovation: the experience of South America and the
Caribbean. International Journal of Innovation, 4(2), 71-85. http://doi.org/10.5585/iji.v4i2.107 Al‐Mubaraki, H. M., & Busler, M. (2010). Business incubators models of the USA and UK: A SWOT analysis. World Journal of
Entrepreneurship, Management and Sustainable Development. 6(4), 335-347 Binsawad, M., Sohaib, O., & Hawryszkiewycz, I. (2019). Factors impacting technology business incubator performance. International
Journal of Innovation Management, 23(01). http://doi.org/10.1142/S1363919619500075 Bruneel, J., Ratinho, T., Clarysse, B., & Groen, A. (2012). The Evolution of Business Incubators: Comparing demand and supply of
business incubation services across different incubator generations. Technovation, 32(2), 110-121. http://doi.org/10.1016/j.technovation.2011.11.003
Cooper, C. E., Hamel, S. A., & Connaughton, S. L. (2012). Motivations and obstacles to networking in a university business incubator. The Journal of Technology Transfer, 37(4), 433-453. http://doi.org/10.1007/s10961-010-9189-0
Dahms, S., & Kingkaew, S. (2016). University business incubators: An institutional demand side perspective on value adding features. Entrepreneurial Business and Economics Review, 4(3), 41-56. http://doi.org/10.15678/EBER.2016.040304
Flat6labs Jeddah Companies, (December 5, 2020) www.flat6labsjeddah.com/en/ Ganamotse, G. N., Samuelsson, M., Abankwah, R. M., Anthony, T., & Mphela, T. (2017). The emerging properties of business
accelerators: The case of Botswana, Namibia and Uganda global business labs. Journal of Entrepreneurship and Innovation in Emerging Economies, 3(1), 16-40. http://doi.org/10.1177/2393957516684469
Gozali, L., Masrom, M., Zagloel, T. Y. M., Haron, H. N., Dahlan, D., Daywin, F. J., ... & Syamas, E. H. S. (2018). Critical success and moderating factors effect in Indonesian public universities’ business incubators. International Journal of Technology, 9(5), 1049-1060. http://doi.org/10.14716/ijtech.v9i5.1363
Grimaldi, R., & Grandi, A. (2001). The contribution of university business incubators to new knowledge-based ventures: Evidence from Italy. Industry and higher education, 15(4), 239-250. http://doi.org/10.5367/000000001101295731
Guerrero, M., Urbano, D., & Gajón, E. (2020). Entrepreneurial university ecosystems and graduates' career patterns: do entrepreneurship education programmes and university business incubators matter?. Journal of Management Development. 39(5), 753-775 https://doi.org/10.1108/JMD-10-2019-0439
Hansen, M. T. N. Nohria, & J. A. Berger (June 2000). The State of the Incubator Marketplace. Harvard Business School, Boston, MA Indiran, L., Khalifah, Z., Ismail, K., & Ramanathan, S. (2017). Business incubation in Malaysia: An overview of multimedia super
corridor, small and medium enterprises, and incubators in Malaysia. In Handbook of research on small and medium enterprises in developing countries (pp. 322-344). IGI Global.
Khalid, F. A., Gilbert, D., & Huq, A. (2014). The way forward for business incubation process in ICT incubators in Malaysia. International Journal of Business and Society, 15(3), 395.
Khorsheed, M. S., Alhargan, A., & Qasim, S. M. (2012). A Three-Tier service model for national ICT incubator in Saudi Arabia. In Proceedings of IEEE International Conference on Management and Service Science (pp. 1-6).
ENTREPRENEURSHIP AND SUSTAINABILITY ISSUES ISSN 2345-0282 (online) http://jssidoi.org/jesi/
2021 Volume 8 Number 3 (March) http://doi.org/10.9770/jesi.2021.8.3(15)
278
Lendner, C., & Dowling, M. (2007). The organisational structure of university business incubators and their impact on the success of start-ups: an international study. International Journal of Entrepreneurship and Innovation Management, 7(6), 541-555. http://doi.org/10.1504/IJEIM.2007.014596
Malan, J. (2002). Benchmarking of Business Incubators. Centre for Strategy and Evaluation Services, Kent, UK. Manan, A. A. B. A. and M. G. B. M. Yunos (Jan 2001). Technology Business Incubators-A Smart Partnership. International Workshop on
Technology Business Incubators in India, Bangalore, India. 1-20. Mavi, R. K., Gheibdoust, H., Khanfar, A. A., & Mavi, N. K. (2019). Ranking factors influencing strategic management of university
business incubators with ANP. Management Decision, 57(12), 3492-3510. http://doi.org/10.1108/MD-06-2018-0688 Mian, S. A., (2014). Business incubation and incubator mechanisms. In Handbook of Research on Entrepreneurship. Edward Elgar
Publishing. http://doi.org/10.1142/9781783269778_0001 Mian, S. A., (1994). US university-sponsored technology incubators: an overview of management, policies and performance.
Technovation, 14(8), 515–528. http://doi.org/10.1016/0166-4972(94)90151-1 Mian, S. A., (1996a). Assessing value-added contributions of university technology business incubators to tenant firms. Research Policy,
25(3), 325–335. http://doi.org/10.1016/0048-7333(95)00828-4 Mian, S. A., (1996b). The university business incubator: a strategy for developing new research/technology-based firms. The Journal of
High Technology Management Research, 7(2), 191-208. http://doi.org/10.1016/S1047-8310(96)90004-8 Mian, S. A., (1997). Assessing and managing the university technology business incubator: an integrative framework. Journal of Business
Venturing, 12(4), 251–285. http://doi.org/10.1016/S0883-9026(96)00063-8 National Business Incubation Association (2021). Principles and practices of successful business incubators. Retrieved January 15, 2021
from http://www.nbia.org/best_practices.html Nicholls-Nixon, C. L., & Valliere, D. (2019). A Framework for Exploring Heterogeneity in University Business Incubators.
Entrepreneurship Research Journal. 10(3) http://doi.org/10.1515/erj-2018-0190 Nicholls-Nixon, C. L., Valliere, D., Gedeon, S. A., & Wise, S. (2020). Entrepreneurial ecosystems and the lifecycle of university business
incubators: An integrative case study. International Entrepreneurship and Management Journal, 1-29. http://doi.org/10.1007/s11365-019-00622-4
Nicholls-Nixon, C., Valliere, D., & Hassannezhad, Z. (2018). A typology of university business incubators: Implications for research and practice. In International Conference on Innovation and Entrepreneurship (pp. 535-XXII). Academic Conferences International Limited
Pellegrini, M., & Johnson-Sheehan, R. (2020). The Evolution of University Business Incubators: Transnational Hubs for Entrepreneurship. Journal of Business and Technical Communication, 20(10),1-34 https://doi.org/10.1177/1050651920979983
Redondo, M., & Camarero, C. (2017). Dominant logics and the manager’s role in university business incubators. Journal of Business & Industrial Marketing. 32(2), 282-294. http://doi.org/10.1108/JBIM-01-2016-0018
Redondo, M., & Camarero, C. (2019). Social Capital in University Business Incubators: dimensions, antecedents and outcomes. International Entrepreneurship and Management Journal, 15(2), 599-624. http://doi.org/10.1007/s11365-018-0494-7
Salem, M. I. (2014). The role of business incubators in the economic development of Saudi Arabia. International Business & Economics Research Journal (IBER), 13(4), 853-860. http://doi.org/10.19030/iber.v13i4.8694
Saudi Arabia’s Vision 2030. (2020, March 13) retrieved from http://vision2030.gov.sa/en/ntp Saudi National Transformation Program (2018-2020). (December 4, 2018) http://vision2030.gov.sa/sites/default/files/NTP_En.pdf Seam, M. Hakett and David, M. Dilts (2004). A systematic Review of Business Incubation Research, Journal of Technology Transfer.
http://doi.org/10.1023/B:JOTT.0000011181.11952.0F Shalaby, N. (2008). Business and Technology Incubation Initiatives in Saudi Arabia. Chamber of Commerce and Industry Eastern
Province. Siddiqui, K. (2013). Heuristics for sample size determination in multivariate statistical techniques. World Applied Sciences Journal, 27(2),
285-287. http://doi.org/10.5829/idosi.wasj.2013.27.02.889 Siddiqui, K. A., Siddiqui, A., & Alaraifi, A. (2018). Managing University Business Incubators in Saudi Arabia. In ICIE 2018 6th
International Conference on Innovation and Entrepreneurship: ICIE 2018 (p. 418). Academic Conferences and publishing limited. Siddiqui, K., & Alaraifi, A. (2019). What they don’t teach at entrepreneurship institutions? An assessment of 220 entrepreneurship
undergraduate programs. Journal of Entrepreneurship Education, 22(6), 1-16. Somsuk, N., & Laosirihongthong, T. (2014). A fuzzy AHP to prioritize enabling factors for strategic management of university business
incubators: Resource-based view. Technological forecasting and social change, 85, 198-210. http://doi.org/10.1016/j.techfore.2013.08.007
Tavoletti, E. (2013). Business incubators: effective infrastructures or waste of public money? Looking for a theoretical framework, guidelines and criteria. Journal of the Knowledge Economy, 4(4), 423-443. https://doi.org/10.1007/s13132-012-0090-y
UBI Global (2020) https://ubi-global.com/ [Accessed on 16-Oct-2020 at 2:00 pm] Verma, S., (2004). Success Factors for business Incubators: An Empirical Study of Canadian Business Incubator. Dissertation, Sprott
School of Business, Carleton University, Ottawa, Ontario Wonglimpiyarat, J. (2016). The innovation incubator, university business incubator and technology transfer strategy: The case of Thailand.
Technology in Society, 46, 18-27. http://doi.org/10.1016/j.techsoc.2016.04.002 Yamockul, S., Pichyangkura, R., & Chandrachai, A. (2019). University Business Incubators Best Practice: Factors Affecting Thailand UBI
Performance. Academy of Entrepreneurship Journal, 25(1), 1-14.
ENTREPRENEURSHIP AND SUSTAINABILITY ISSUES ISSN 2345-0282 (online) http://jssidoi.org/jesi/
2021 Volume 8 Number 3 (March) http://doi.org/10.9770/jesi.2021.8.3(15)
279
Dr. Kamran SIDDIQUI is an Associate Professor of Marketing and Entrepreneurship at College of Business Administration, Imam Abdulrahman Bin Faisal University, Saudi Arabia. Research interests: entrepreneurship, business incubators and accelerators, entrepreneurial marketing, venture capital. ORCID ID: 0000-0002-5724-0991 Dr. Mohammad EMAD AL-SHAIKH is an Assistant Professor of Entrepreneurship at College of Business Administration, Imam Abdulrahman Bin Faisal University, Saudi Arabia. He is also head of the IAU entrepreneurship unit and business incubator. Research interests: entrepreneurship, business incubators and accelerators, and entrepreneurial marketing ORCID ID: 0000-0003-4545-3938 Dr. Ishtiaq Ahmed BAJWA is an Assistant Professor of Finance at College of Business Administration, Imam Abdulrahman Bin Faisal University, Saudi Arabia. Research interests: entrepreneurial finance, venture capital, and fin-tech. ORCID ID: 0000-0001-5296-0028 Abdulaziz AL-SUBAIE is a graduate student at the College of Business Administration, Imam Abdulrahman Bin Faisal University, Saudi Arabia. ORCID ID: 0000-0002-7938-1189
Make your research more visible, join the Twitter account of ENTREPRENEURSHIP AND SUSTAINABILITY ISSUES: @Entrepr69728810
Copyright © 2021 by author(s) and VsI Entrepreneurship and Sustainability Center This work is licensed under the Creative Commons Attribution International License (CC BY). http://creativecommons.org/licenses/by/4.0/
ENTREPRENEURSHIP AND SUSTAINABILITY ISSUES
ISSN 2345-0282 (online) http://jssidoi.org/jesi/
2021 Volume 8 Number 3 (March)
http://doi.org/10.9770/jesi.2021.8.3(16)
Publisher http://jssidoi.org/esc/home
280
UNIVERSITY-INDUSTRY COLLABORATION: A SCOPING REVIEW OF SUCCESS FACTORS
Vanessa Pertuz1, Luis Francisco Miranda2, Arturo Charris-Fontanilla3, Lorena Pertuz-Peralta4
1Universidad Popular del Cesar, Facultad de Ingenierías y Tecnológicas, Grupo de Investigación SIGAAL 2 University of Barcelona, Barcelona, Spain
3 Universidad del Magdalena, Santa Marta, Colombia 4 Universidad Metropolitana, Barranquilla, Colombia
E-mails:1 [email protected]; 2 [email protected]; 3 [email protected] 4
Received 18 August 2020; accepted 10 December 2020; published 12 January 2021 Abstract. Collaboration processes between universities and companies are increasingly relevant for the generation of new knowledge and for promoting innovation. However, the literature highlights the need to delve into the factors that drive and favour these collaboration dynamics. Thus, the present paper aims to identify the success factors in university-industry collaboration processes. For this purpose, a scoping review was performed. We conducted a search in the Web of Science and Scopus databases, in order to find documents related to the subject until 2019. As a
result of the scoping review, 17 success factors were identified, classified according to the four internal facilitators: structure, strategy, knowledge and relations. Keywords: university-industry collaboration; cooperation; technology transfer; innovation
Reference to this paper should be made as follows: Pertuz, V., Miranda, L.F., Charris-Fontanilla, A., Pertuz-Peralta, L. 2021. University-industry collaboration: a scoping review of success factors. Entrepreneurship and Sustainability Issues, 8(3), 280-290. http://doi.org/10.9770/jesi.2021.8.3(16)
JEL Classifications: D21, O33, O36
1. Introduction
University research has been a key source of specialized knowledge of high value for the economy (Baruch, 1997; Tseng,
Huang, & Chen, 2020) and also the basis for the formulation and execution of public agendas (Debackere & Veugelers,
2005), due to the fundamental role of knowledge to increase the competitiveness of nations (Nava-Rogel & Mercado-
Salgado, 2011). In the last two decades, trends in research and development have privileged collaboration between the
company and universities, under an ecosystem of mutual benefit in the generation and dissemination of knowledge (Fiaz,
Yang, & Abbas, 2014; Santoro & Bierly, 2006).
The university-industry collaboration is considered an important mechanism to leverage innovation, since it
ensures that knowledge is managed and transferred effectively (Mikhailov, Puffal, & Santini, 2020; Weerasinghe &
Dedunu, 2020). Thus, the university knowledge disseminated in that type of relationship is positively associated to firms
innovation performance (Puffal, Ruffoni, & Spricigo, 2020). For instance, research and development between universities
and companies, despite their complexity, lead to higher levels of innovation in the firms (Mikhailov et al., 2020). In that
way, collaboration strengthens the flow of knowledge of the organizations (Bulińska-Stangrecka & Bagieńska, 2020). For
that reason, countries make efforts to create an innovative environment (Danko et al., 2020), from the active involvement
ENTREPRENEURSHIP AND SUSTAINABILITY ISSUES
ISSN 2345-0282 (online) http://jssidoi.org/jesi/
2021 Volume 8 Number 3 (March)
http://doi.org/10.9770/jesi.2021.8.3(16)
281
of universities, research institutes and the main actors of the national innovation systems (Seitzhanov, Kurmanov, Petrova,
Aliyev, & Aidargaliyeva, 2020). The university-industry collaboration facilitates knowledge production that is transferred
and accumulated in social actors (D’Este, Guy, & Iammarino, 2013; Santoro & Bierly, 2006). However, despite the large
amount of literature related to the flow of knowledge created by the interactions between industries and universities, very
little is known about the factors that drive the establishment of research collaborations between these actors (D’Este et al.,
2013). In that vein, the literature highlights the need to identify the factors that contribute to this collaboration dynamic
(Alpaydın, 2019; Fiaz et al., 2014). Previous studies analyse the importance of elements such as the individual
characteristics of researchers (Banal-Estañol, Macho-Stadler, & Pérez-Castrillo, 2018), the organizational structure
(Argueta López & Jiménez Terrazas, 2017; Baruch, 1997), the geographic proximity (D’Este et al., 2013; Tang,
Motohashi, Hu, & Montoro-Sanchez, 2020), levels of trust between participants (Oliver, Montgomery, & Barda, 2020)
and both formal and informal interactions between alliance members (Schaeffer, Öcalan-Özel, & Pénin, 2020).
Likewise, the density and heterogeneity of the network has a positive impact on the transfer of knowledge between
universities and industries (Mao, Yu, Zhou, Harms, & Fang, 2020). Regarding geographic proximity, collaborations with
intraregional universities are associated with incremental innovations, while interaction with transregional universities is
associated with more radical innovations (Tang et al., 2020). Additionally, the literature addresses the motivations of
researchers to transfer knowledge, highlighting the importance of applying knowledge in real situations, in order to
generate innovations and contribute to environmental problems (García Ponce de León, Pérez Mora, & Miranda Zea,
2018). Literature also highlights that a critical understanding of the knowledge collaboration process is decisive for
identifying business growth opportunities (Vauterin & Virkki-Hatakka, 2016) and favour innovation (Johnston &
Huggins, 2017; Mao et al., 2020). Therefore, there is a growing interest in defining the determinants of collaborations
between universities and the industry (Alpaydın, 2019). In that sense, further analysis is needed to analyse the
development process of internal capacities of companies to effectively participate in cooperation agreements with
universities, as a mechanism to produce innovations (Veugelers & Cassiman, 2005) and to improve the organizational
learning process of the firm (Sherwood & Covin, 2008). This paper classifies the success factors for university-industry
collaboration, from the conceptual framework of internal facilitators for innovation proposed by Pellegrini et al. (2019),
which includes the organizational structure, strategy, knowledge and relations. Literature on technology transfer in
interaction processes between the university and industry has focused mainly on the macro level of companies, so it is
necessary to carry out more research on the key aspects for the success of these processes at the micro level (Jones &
Coates, 2020). In that sense, this paper aims to identify the factors that facilitate university-industry collaboration, but
with special emphasis on the perspective of business characteristics, since, up to now, much of the literature has addressed
mainly the characteristics of the universities. For this purpose, the seminal framework proposed by Arksey y O’Malley
(2005) was applied to carry out a scoping review. This review included documents of the Web of Science and Scopus
databases, published between 2002 and 2019. Recent reviews analyse the four central measures of university-industry
collaboration that have been identified previously in the literature: motivations, occupations, barriers and outcomes (Vick
& Robertson, 2018). In contrast, this study delves into the characteristics necessary for companies to develop successful
collaboration strategies with universities.
2. Methodology
This paper uses the seminal framework proposed by Arksey y O’Malley (2005) to carry out an scoping review, which
includes the following stages: (1) identify the research question; (2) identify relevant studies; (3) select studies; (4) data
charting and collation; (5) collating, summarising and reporting the results.
2.1 Identify the research question
According to the methodology proposed by Arksey y O’Malley (2005), the first stage in the literature review is to identify
the research question. This research question was posed as follows: What organizational factors, characteristics or
attributes favour university-industry collaboration?
2.2 Identify relevant studies
In the second stage, the relevant studies are identified. In this case, a search was carried out in the Scopus and Web of
Science databases. The search was carried out according to the equations described in table 1. The descriptors were
selected from the bibliometric analysis carried out by Olvera et al. (2018).
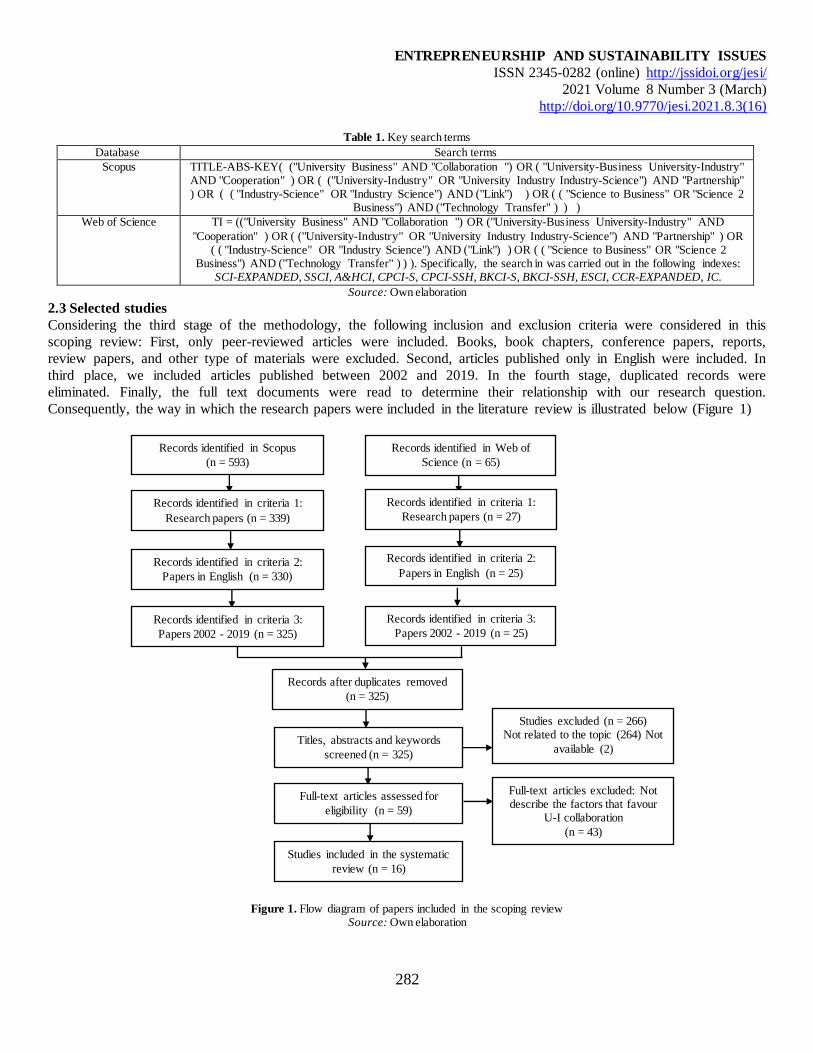
ENTREPRENEURSHIP AND SUSTAINABILITY ISSUES
ISSN 2345-0282 (online) http://jssidoi.org/jesi/
2021 Volume 8 Number 3 (March)
http://doi.org/10.9770/jesi.2021.8.3(16)
282
Table 1. Key search terms
Database Search terms
Scopus TITLE-ABS-KEY( ("University Business" AND "Collaboration ") OR ( "University-Business University-Industry" AND "Cooperation" ) OR ( ("University-Industry" OR "University Industry Industry-Science") AND "Partnership" ) OR ( ( "Industry-Science" OR "Industry Science") AND ("Link") ) OR ( ( "Science to Business" OR "Science 2
Business") AND ("Technology Transfer" ) ) )
Web of Science TI = (("University Business" AND "Collaboration ") OR ("University-Business University-Industry" AND
"Cooperation" ) OR ( ("University-Industry" OR "University Industry Industry-Science") AND "Partnership" ) OR ( ( "Industry-Science" OR "Industry Science") AND ("Link") ) OR ( ( "Science to Business" OR "Science 2
Business") AND ("Technology Transfer" ) ) ). Specifically, the search in was carried out in the following indexes: SCI-EXPANDED, SSCI, A&HCI, CPCI-S, CPCI-SSH, BKCI-S, BKCI-SSH, ESCI, CCR-EXPANDED, IC.
Source: Own elaboration
2.3 Selected studies
Considering the third stage of the methodology, the following inclusion and exclusion criteria were considered in this
scoping review: First, only peer-reviewed articles were included. Books, book chapters, conference papers, reports,
review papers, and other type of materials were excluded. Second, articles published only in English were included. In
third place, we included articles published between 2002 and 2019. In the fourth stage, duplicated records were
eliminated. Finally, the full text documents were read to determine their relationship with our research question.
Consequently, the way in which the research papers were included in the literature review is illustrated below (Figure 1)
Figure 1. Flow diagram of papers included in the scoping review
Source: Own elaboration
Records identified in Scopus (n = 593)
Records identified in Web of
Science (n = 65)
Records identified in criteria 1:
Research papers (n = 339) Records identified in criteria 1:
Research papers (n = 27)
Records identified in criteria 2:
Papers in English (n = 330)
Records identified in criteria 2:
Papers in English (n = 25)
Records identified in criteria 3:
Papers 2002 - 2019 (n = 325) Records identified in criteria 3:
Papers 2002 - 2019 (n = 25)
Records after duplicates removed
(n = 325)
Titles, abstracts and keywords
screened (n = 325)
Full-text articles assessed for
eligibility (n = 59)
Studies included in the systematic
review (n = 16)
Studies excluded (n = 266) Not related to the topic (264) Not
available (2)
Full-text articles excluded: Not
describe the factors that favour U-I collaboration
(n = 43)
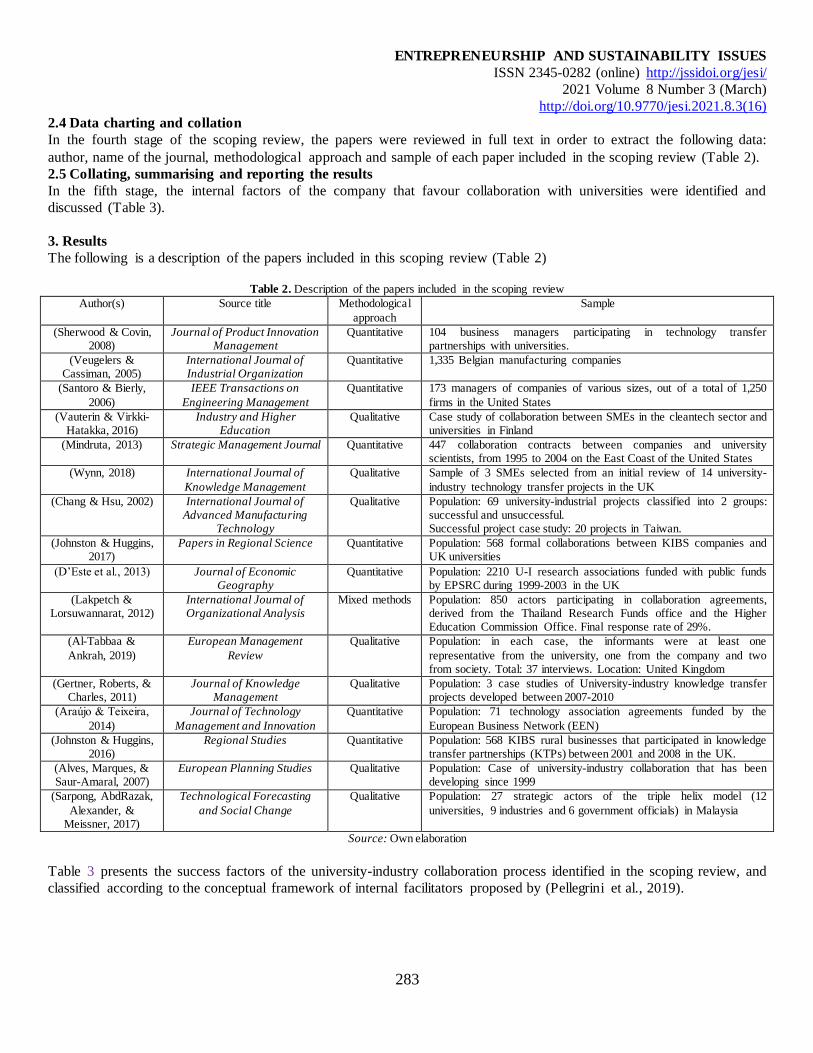
ENTREPRENEURSHIP AND SUSTAINABILITY ISSUES
ISSN 2345-0282 (online) http://jssidoi.org/jesi/
2021 Volume 8 Number 3 (March)
http://doi.org/10.9770/jesi.2021.8.3(16)
283
2.4 Data charting and collation
In the fourth stage of the scoping review, the papers were reviewed in full text in order to extract the following data:
author, name of the journal, methodological approach and sample of each paper included in the scoping review (Table 2).
2.5 Collating, summarising and reporting the results
In the fifth stage, the internal factors of the company that favour collaboration with universities were identified and
discussed (Table 3).
3. Results
The following is a description of the papers included in this scoping review (Table 2)
Table 2. Description of the papers included in the scoping review
Author(s) Source title Methodological
approach
Sample
(Sherwood & Covin, 2008)
Journal of Product Innovation Management
Quantitative 104 business managers participating in technology transfer partnerships with universities.
(Veugelers & Cassiman, 2005)
International Journal of Industrial Organization
Quantitative 1,335 Belgian manufacturing companies
(Santoro & Bierly,
2006)
IEEE Transactions on
Engineering Management
Quantitative 173 managers of companies of various sizes, out of a total of 1,250
firms in the United States
(Vauterin & Virkki-Hatakka, 2016)
Industry and Higher Education
Qualitative Case study of collaboration between SMEs in the cleantech sector and universities in Finland
(Mindruta, 2013) Strategic Management Journal Quantitative 447 collaboration contracts between companies and university scientists, from 1995 to 2004 on the East Coast of the United States
(Wynn, 2018) International Journal of
Knowledge Management
Qualitative Sample of 3 SMEs selected from an initial review of 14 university-
industry technology transfer projects in the UK
(Chang & Hsu, 2002) International Journal of Advanced Manufacturing
Technology
Qualitative Population: 69 university-industrial projects classified into 2 groups: successful and unsuccessful. Successful project case study: 20 projects in Taiwan.
(Johnston & Huggins, 2017)
Papers in Regional Science Quantitative Population: 568 formal collaborations between KIBS companies and UK universities
(D’Este et al., 2013) Journal of Economic Geography
Quantitative Population: 2210 U-I research associations funded with public funds by EPSRC during 1999-2003 in the UK
(Lakpetch & Lorsuwannarat, 2012)
International Journal of Organizational Analysis
Mixed methods Population: 850 actors participating in collaboration agreements, derived from the Thailand Research Funds office and the Higher Education Commission Office. Final response rate of 29%.
(Al-Tabbaa &
Ankrah, 2019)
European Management
Review
Qualitative Population: in each case, the informants were at least one
representative from the university, one from the company and two from society. Total: 37 interviews. Location: United Kingdom
(Gertner, Roberts, & Charles, 2011)
Journal of Knowledge Management
Qualitative Population: 3 case studies of University-industry knowledge transfer projects developed between 2007-2010
(Araújo & Teixeira,
2014)
Journal of Technology
Management and Innovation
Quantitative Population: 71 technology association agreements funded by the
European Business Network (EEN)
(Johnston & Huggins, 2016)
Regional Studies Quantitative Population: 568 KIBS rural businesses that participated in knowledge transfer partnerships (KTPs) between 2001 and 2008 in the UK.
(Alves, Marques, & Saur-Amaral, 2007)
European Planning Studies Qualitative Population: Case of university-industry collaboration that has been developing since 1999
(Sarpong, AbdRazak,
Alexander, & Meissner, 2017)
Technological Forecasting
and Social Change
Qualitative Population: 27 strategic actors of the triple helix model (12
universities, 9 industries and 6 government officials) in Malaysia
Source: Own elaboration
Table 3 presents the success factors of the university-industry collaboration process identified in the scoping review, and
classified according to the conceptual framework of internal facilitators proposed by (Pellegrini et al., 2019).
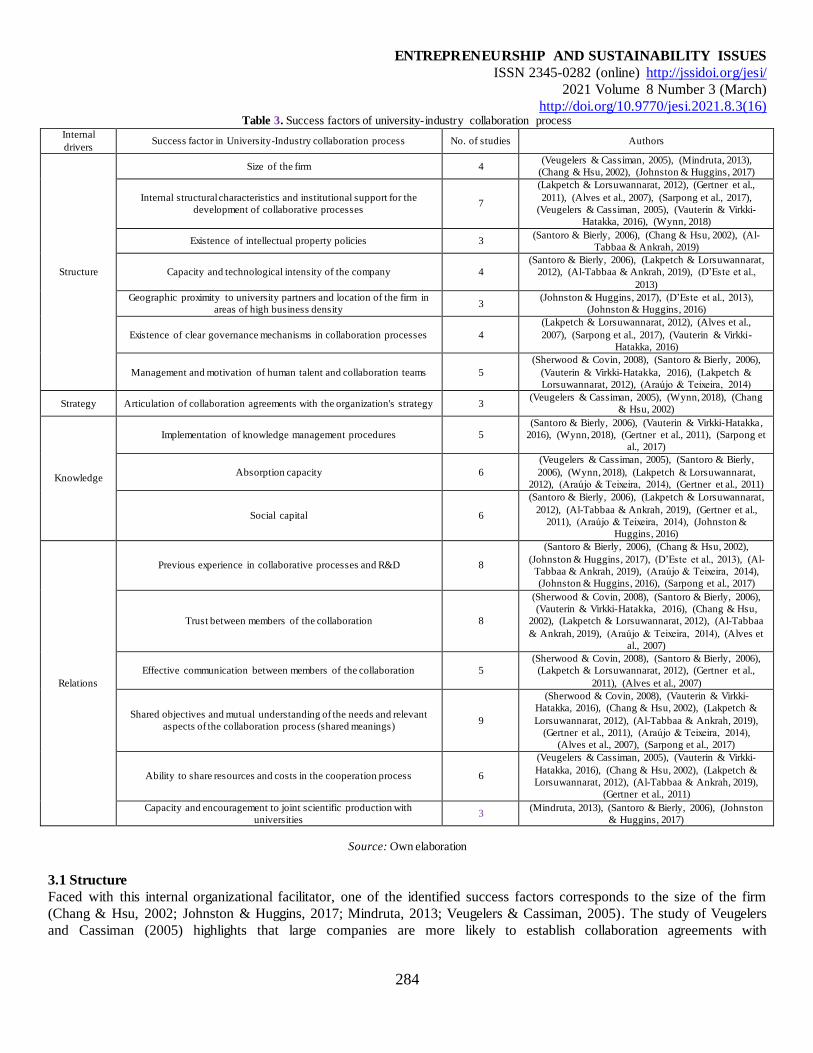
ENTREPRENEURSHIP AND SUSTAINABILITY ISSUES
ISSN 2345-0282 (online) http://jssidoi.org/jesi/
2021 Volume 8 Number 3 (March)
http://doi.org/10.9770/jesi.2021.8.3(16)
284
Table 3. Success factors of university-industry collaboration process Internal
drivers Success factor in University-Industry collaboration process No. of studies Authors
Structure
Size of the firm 4 (Veugelers & Cassiman, 2005), (Mindruta, 2013),
(Chang & Hsu, 2002), (Johnston & Huggins, 2017)
Internal structural characteristics and institutional support for the
development of collaborative processes 7
(Lakpetch & Lorsuwannarat, 2012), (Gertner et al.,
2011), (Alves et al., 2007), (Sarpong et al., 2017),
(Veugelers & Cassiman, 2005), (Vauterin & Virkki-
Hatakka, 2016), (Wynn, 2018)
Existence of intellectual property policies 3 (Santoro & Bierly, 2006), (Chang & Hsu, 2002), (Al-
Tabbaa & Ankrah, 2019)
Capacity and technological intensity of the company 4
(Santoro & Bierly, 2006), (Lakpetch & Lorsuwannarat,
2012), (Al-Tabbaa & Ankrah, 2019), (D’Este et al.,
2013)
Geographic proximity to university partners and location of the firm in
areas of high business density 3
(Johnston & Huggins, 2017), (D’Este et al., 2013),
(Johnston & Huggins, 2016)
Existence of clear governance mechanisms in collaboration processes 4
(Lakpetch & Lorsuwannarat, 2012), (Alves et al.,
2007), (Sarpong et al., 2017), (Vauterin & Virkki-
Hatakka, 2016)
Management and motivation of human talent and collaboration teams 5
(Sherwood & Covin, 2008), (Santoro & Bierly, 2006),
(Vauterin & Virkki-Hatakka, 2016), (Lakpetch &
Lorsuwannarat, 2012), (Araújo & Teixeira, 2014)
Strategy Articulation of collaboration agreements with the organization's strategy 3 (Veugelers & Cassiman, 2005), (Wynn, 2018), (Chang
& Hsu, 2002)
Knowledge
Implementation of knowledge management procedures 5
(Santoro & Bierly, 2006), (Vauterin & Virkki-Hatakka,
2016), (Wynn, 2018), (Gertner et al., 2011), (Sarpong et
al., 2017)
Absorption capacity 6
(Veugelers & Cassiman, 2005), (Santoro & Bierly,
2006), (Wynn, 2018), (Lakpetch & Lorsuwannarat,
2012), (Araújo & Teixeira, 2014), (Gertner et al., 2011)
Social capital 6
(Santoro & Bierly, 2006), (Lakpetch & Lorsuwannarat,
2012), (Al-Tabbaa & Ankrah, 2019), (Gertner et al.,
2011), (Araújo & Teixeira, 2014), (Johnston &
Huggins, 2016)
Relations
Previous experience in collaborative processes and R&D 8
(Santoro & Bierly, 2006), (Chang & Hsu, 2002),
(Johnston & Huggins, 2017), (D’Este et al., 2013), (Al-
Tabbaa & Ankrah, 2019), (Araújo & Teixeira, 2014),
(Johnston & Huggins, 2016), (Sarpong et al., 2017)
Trust between members of the collaboration 8
(Sherwood & Covin, 2008), (Santoro & Bierly, 2006),
(Vauterin & Virkki-Hatakka, 2016), (Chang & Hsu,
2002), (Lakpetch & Lorsuwannarat, 2012), (Al-Tabbaa
& Ankrah, 2019), (Araújo & Teixeira, 2014), (Alves et
al., 2007)
Effective communication between members of the collaboration 5
(Sherwood & Covin, 2008), (Santoro & Bierly, 2006),
(Lakpetch & Lorsuwannarat, 2012), (Gertner et al.,
2011), (Alves et al., 2007)
Shared objectives and mutual understanding of the needs and relevant
aspects of the collaboration process (shared meanings) 9
(Sherwood & Covin, 2008), (Vauterin & Virkki-
Hatakka, 2016), (Chang & Hsu, 2002), (Lakpetch &
Lorsuwannarat, 2012), (Al-Tabbaa & Ankrah, 2019),
(Gertner et al., 2011), (Araújo & Teixeira, 2014),
(Alves et al., 2007), (Sarpong et al., 2017)
Ability to share resources and costs in the cooperation process 6
(Veugelers & Cassiman, 2005), (Vauterin & Virkki-
Hatakka, 2016), (Chang & Hsu, 2002), (Lakpetch &
Lorsuwannarat, 2012), (Al-Tabbaa & Ankrah, 2019),
(Gertner et al., 2011)
Capacity and encouragement to joint scientific production with
universities 3
(Mindruta, 2013), (Santoro & Bierly, 2006), (Johnston
& Huggins, 2017)
Source: Own elaboration
3.1 Structure
Faced with this internal organizational facilitator, one of the identified success factors corresponds to the size of the firm
(Chang & Hsu, 2002; Johnston & Huggins, 2017; Mindruta, 2013; Veugelers & Cassiman, 2005). The study of Veugelers
and Cassiman (2005) highlights that large companies are more likely to establish collaboration agreements with
ENTREPRENEURSHIP AND SUSTAINABILITY ISSUES
ISSN 2345-0282 (online) http://jssidoi.org/jesi/
2021 Volume 8 Number 3 (March)
http://doi.org/10.9770/jesi.2021.8.3(16)
285
universities. Because of this, larger companies are more likely to achieve higher quality in patents and publications made
in conjunction with universities (Mindruta, 2013).
A study by Johnston and Huggins (Johnston & Huggins, 2017) showed that the size of the company is also a
significant determinant in the geographical scope of the links between industries and universities; for example, micro-
companies form links with geographically closer universities, compared to large companies (Johnston & Huggins, 2017).
In contrast, the conclusions of Santoro and Bierly (2006) point out that size is not a significant factor in the collaboration
process with universities, while the sector and the firm's previous experience are significant in this process (Santoro &
Bierly, 2006).
Similarly, the internal structural characteristics and the institutional support for the development of collaboration
processes of the companies correspond to a success factor for the cooperation with university partners (Alves et al., 2007;
Gertner et al., 2011; Lakpetch & Lorsuwannarat, 2012; Sarpong et al., 2017; Vauterin & Virkki-Hatakka, 2016; Veugelers
& Cassiman, 2005). For example, Lakpetch and Lorsuwannarat (2012) highlight the importance of institutional support to
promote cooperative relationships (Lakpetch & Lorsuwannarat, 2012), as well as the allocation of financial resources
required for the development of joint activities (Alves et al., 2007; Lakpetch & Lorsuwannarat, 2012). In addition,
leadership for the development of initiatives (Lakpetch & Lorsuwannarat, 2012; Wynn, 2018) and the ability to manage
projects (Wynn, 2018) they are decisive in the university-industry collaboration processes.
According to the results, effective cooperation between companies and universities requires the existence of
intellectual property policies (Al-Tabbaa & Ankrah, 2019; Chang & Hsu, 2002; Santoro & Bierly, 2006). Intellectual
property policies are positively associated with knowledge transfer between companies and universities (Santoro &
Bierly, 2006). These policies must be constantly evaluated to avoid possible obstacles in the technology transfer process
between companies and universities (Santoro & Bierly, 2006). The above, considering that the intellectual property
mechanisms that are implemented have a significant influence on the sustainability of university-industry collaboration
(Al-Tabbaa & Ankrah, 2019).
The technological capacity of the company was also identified as a relevant factor for cooperation with
universities (Al-Tabbaa & Ankrah, 2019; Lakpetch & Lorsuwannarat, 2012; Santoro & Bierly, 2006). Thus,
communication with technology experts linked to partner organizations allows the company to obtain relevant knowledge
for its processes (Sherwood & Covin, 2008).
Thus, the technological capacity of the company favours the transfer of knowledge with universities, especially
with regard to tacit knowledge (Santoro & Bierly, 2006). Additionally, authors such as (D’Este et al., 2013; Santoro &
Bierly, 2006) identify the technological intensity of the firm as a factor that favours cooperation with universities. In this
regard, the study of Santoro and Bierly (Santoro & Bierly, 2006) validates that high-tech companies have generally
accumulated more knowledge to face the transfer process with universities.
Geographical proximity to university partners, as shown above, and the firm's location in areas of high business
density, also corresponds to a determining factor for cooperating with university partners (D’Este et al., 2013; Johnston &
Huggins, 2016, 2017). For example, the study of D’Este et al. (2013) highlights that geographic proximity increases the
likelihood of establishing research partnerships between university and industry. According to Johnston and Huggins
(2017) the highest levels of industrial clustering promote links with geographically close university partners. In this way,
both geographic and organizational proximity have a significant influence on the selection of partners to develop
knowledge (Johnston & Huggins, 2016).
In addition, the literature highlights that companies must establish governance mechanisms in collaboration with
universities, to guarantee the success of the process (Alves et al., 2007; Lakpetch & Lorsuwannarat, 2012; Sarpong et al.,
2017; Vauterin & Virkki-Hatakka, 2016). Specifically, the procedures required for the development of a collaborative
process are based on the needs of the organization and are driven by a learning agenda established jointly by the members
of the alliance (Vauterin & Virkki-Hatakka, 2016).
In the cooperation process it is necessary to review the governance mechanisms of the alliance, which guarantees
a balance in the contribution of the different partners, and which serves as a meeting point for the different interests that
the two actors may have (Lakpetch & Lorsuwannarat, 2012). Among the mechanisms adopted by companies to favour
collaboration with universities, the participation of managers in strategic meetings is included to facilitate an agile and
flexible articulation between the members of the alliance (Alves et al., 2007).
ENTREPRENEURSHIP AND SUSTAINABILITY ISSUES
ISSN 2345-0282 (online) http://jssidoi.org/jesi/
2021 Volume 8 Number 3 (March)
http://doi.org/10.9770/jesi.2021.8.3(16)
286
Also, the motivation of human talent linked to the alliance and the effective management of the teams designated
to the university-industry collaboration process, correspond to a success factor for the transfer of knowledge between
university and industry actors (Araújo & Teixeira, 2014; Lakpetch & Lorsuwannarat, 2012; Santoro & Bierly, 2006;
Sherwood & Covin, 2008; Vauterin & Virkki-Hatakka, 2016). It is important to establish a system of rewards and
recognitions to increase the motivation and potential of the team to create synergies in the collaboration process (Lakpetch
& Lorsuwannarat, 2012) and promote the training of the company's human talent in knowledge transfer processes (Araújo
& Teixeira, 2014). Sherwood and Covin (2008) validate the importance of formal collaboration teams as an effective
mechanism for the transfer of knowledge between the alliance partners, so it is essential to adjust the internal structures of
the company to the collaboration processes (Sherwood & Covin, 2008).
3.2 Strategy
Another set of success factors for university-industry collaborations is related to strategy. In this aspect, the literature
highlights as a key factor the articulation of collaboration agreements with the organization's strategy (Chang & Hsu,
2002; Veugelers & Cassiman, 2005; Wynn, 2018). The conclusions of Veugelers and Cassiman (2005) highlight that
collaboration agreements with universities are generally part of the company's global innovation strategy.
3.3 Knowledge
In this review, success factors related to knowledge as an internal facilitator in organizations were identified. Specifically,
the effective development of collaboration processes with universities requires the implementation of knowledge
management procedures within firms (Gertner et al., 2011; Santoro & Bierly, 2006; Sarpong et al., 2017; Vauterin &
Virkki-Hatakka, 2016; Wynn, 2018). It is relevant for organizations to establish and implement practices to capture the
knowledge available within the limits of the organization and integrate it into the key competencies of the firm (Santoro &
Bierly, 2006), identifying the responsibilities of the alliance partners and promoting shared knowledge in the technology
transfer process (Sarpong et al., 2017). The foregoing requires identifying the knowledge of each of the members of the
alliance and identifying how this could contribute to the achievement of organizational objectives, through shared
discourse and continuous communication (Gertner et al., 2011).
In addition, a high absorption capacity favours university-industry collaboration (Araújo & Teixeira, 2014;
Gertner et al., 2011; Lakpetch & Lorsuwannarat, 2012; Santoro & Bierly, 2006; Veugelers & Cassiman, 2005; Wynn,
2018). Absorption capacity allows companies, for example, to develop capacities to exploit different competitive
strategies (Veugelers & Cassiman, 2005).
Social capital corresponds to a key determinant for cooperation between universities and companies (Al-Tabbaa
& Ankrah, 2019; Araújo & Teixeira, 2014; Gertner et al., 2011; Johnston & Huggins, 2016; Lakpetch & Lorsuwannarat,
2012; Santoro & Bierly, 2006). The study of Al-Tabbaa and Ankrah (2019) validates the importance of the three
components of social capital (structural, relational and cognitive) in the collaboration processes between universities and
companies.
The social connection (Santoro & Bierly, 2006) and connectivity through networks (Araújo & Teixeira, 2014)
they are positively related to the successful transfer of knowledge between companies and universities. This element is
relevant from the perspective of learning as a social process, influenced by the characteristics and interactions between the
members of the alliance (Santoro & Bierly, 2006). Specifically, the study of Gertner et al. (2011) validates the importance
of personal interactions to facilitate knowledge transfer within the framework of university-industry alliances. Thus,
learning from external sources requires proactive measures on the part of organizations (Santoro & Bierly, 2006).
3.4 Relations
As a result of the review, relations are identified as an important internal facilitator. It stands out, for example, companies
that have experience in collaborative processes tend to be more successful in cooperating with universities (Al-Tabbaa &
Ankrah, 2019; Araújo & Teixeira, 2014; Chang & Hsu, 2002; D’Este et al., 2013; Johnston & Huggins, 2016, 2017;
Santoro & Bierly, 2006; Sarpong et al., 2017). The conclusions of D’Este et al. (2013) establish that experience in R&D
increases the probability of forming partnerships between companies and universities. Thus, companies with experience in
collaboration processes with universities achieve a greater transfer of knowledge through alliances (Chang & Hsu, 2002;
Santoro & Bierly, 2006). These experiences in turn create bonds of familiarity between partners (Al-Tabbaa & Ankrah,
2019; Sherwood & Covin, 2008).
In addition, the results highlight the trust between the collaboration actors as a determinant in the success of the
university-industry collaboration processes (Al-Tabbaa & Ankrah, 2019; Alves et al., 2007; Araújo & Teixeira, 2014;
ENTREPRENEURSHIP AND SUSTAINABILITY ISSUES
ISSN 2345-0282 (online) http://jssidoi.org/jesi/
2021 Volume 8 Number 3 (March)
http://doi.org/10.9770/jesi.2021.8.3(16)
287
Chang & Hsu, 2002; Lakpetch & Lorsuwannarat, 2012; Santoro & Bierly, 2006; Sherwood & Covin, 2008; Vauterin &
Virkki-Hatakka, 2016). Further, trust between partners is essential for organizational learning (Sherwood & Covin, 2008)
and knowledge transfer (Santoro & Bierly, 2006). The effective communication between the partners is a forcefully
highlighted success factor in the literature (Alves et al., 2007; Gertner et al., 2011; Lakpetch & Lorsuwannarat, 2012;
Santoro & Bierly, 2006; Sherwood & Covin, 2008). Effective communication allows the socialization of the interests of
the alliance partners (Alves et al., 2007; Sherwood & Covin, 2008). Trust between members facilitates open
communication between the parties that favours the transfer of knowledge (Santoro & Bierly, 2006).
In the current research, effective alliances between universities and companies imply the establishment of shared
organizational objectives, based on the mutual understanding of the needs of the partners and the relevant aspects of the
collaboration process (Al-Tabbaa & Ankrah, 2019; Alves et al., 2007; Araújo & Teixeira, 2014; Chang & Hsu, 2002;
Gertner et al., 2011; Lakpetch & Lorsuwannarat, 2012; Sarpong et al., 2017; Sherwood & Covin, 2008; Vauterin &
Virkki-Hatakka, 2016). In this process, shared meanings are generated between the actors (Al-Tabbaa & Ankrah, 2019;
Vauterin & Virkki-Hatakka, 2016) and the possibility of co-creating with alliance members is increased (Vauterin &
Virkki-Hatakka, 2016). The personal interactions that are established between the members of the alliance generate a
mutual commitment and a set of shared knowledge in the communities of practice (Gertner et al., 2011). Thus, effective
alliances between universities and industry influence organizational objectives to support companies in creative processes
or knowledge exchange (Alves et al., 2007; Chang & Hsu, 2002). Mutual understanding reduces the mismatch between
the expectations and the results of the university-industry collaboration process (Vauterin & Virkki-Hatakka, 2016). The
ability to share resources and costs is one element of effective collaborative partnerships between industry and universities
(Al-Tabbaa & Ankrah, 2019; Chang & Hsu, 2002; Gertner et al., 2011; Lakpetch & Lorsuwannarat, 2012; Vauterin &
Virkki-Hatakka, 2016; Veugelers & Cassiman, 2005). Specifically, companies linked to successful alliances share
complementary resources between the parties (Chang & Hsu, 2002), establish joint identities or procedures (Gertner et al.,
2011), balance the strengths and weaknesses of partners (Chang & Hsu, 2002) and define a common perspective of the
general R&D objectives (Chang & Hsu, 2002). University-industry collaboration agreements are motivated by the
possibility of sharing costs in the innovation process (Veugelers & Cassiman, 2005). From this perspective, the size of the
company can be related to a greater availability of the resources required to cooperate with universities, depending on the
organizational strategy (Veugelers & Cassiman, 2005). Thus, knowledge collaborations are considered highly effective
and valuable when they allow the creation of joint value and generate strategic value for the knowledge base of
organizations (Vauterin & Virkki-Hatakka, 2016).
Finally, a set of studies analysed in this review (Johnston & Huggins, 2017; Mindruta, 2013; Santoro & Bierly, 2006)
emphasize that scientific production that involves academics and industry personnel favours social connection among
members and facilitates the exchange of highly relevant and pertinent knowledge to face real challenges in society
(Santoro & Bierly, 2006). Further, the high levels of research activity of an institution are important facilitators of
collaborative processes, even with geographically distant partners (Johnston & Huggins, 2017)(Mindruta, 2013).
4. Discussion
Technological development and the consolidation of knowledge-based economies have promoted collaboration between
universities and industries, which is why different industries recognize the importance of university knowledge to
generate competitive advantage (Tseng et al., 2020). From this scenario, partnerships between researchers and
entrepreneurs are becoming more frequent today (Zalewska-Kurek & Harms, 2020). Such collaborations are an important
source of creativity and knowledge generation for partners (Alexander, Martin, Manolchev, & Miller, 2020).
Previous research has analysed different aspects of the collaborative processes between the University-Industry,
for example, the challenges in the technology transfer process (Daniel & Alves, 2020), the barriers (Chryssou, 2020;
Jonbekova, Sparks, Hartley, & Kuchumova, 2020; Tootell et al., 2020), the benefits (Jonbekova et al., 2020), the U-I
collaboration practices implemented by firms (Corsi, Fu, & Külzer-Sacilotto, 2020) and by the universities (Leischnig &
Geigenmüller, 2020). Also, the determinants of the innovative impact in University-Industry collaborations (Messeni
Petruzzelli & Murgia, 2020) and its impact on the productivity of academic research (Garcia, Araújo, Mascarini, Santos,
& Costa, 2020). Additionally, recent systematic reviews (Nsanzumuhire & Groot, 2020) Regarding university-industry
collaboration processes, three topics of interest stand out: interaction channels, mechanisms and barriers that these
collaborations face. Likewise, it is highlighted that there is still a gap in research regarding this issue in developing
countries, compared to developed ones (Nsanzumuhire & Groot, 2020). In contrast, university-industry collaboration is
ENTREPRENEURSHIP AND SUSTAINABILITY ISSUES
ISSN 2345-0282 (online) http://jssidoi.org/jesi/
2021 Volume 8 Number 3 (March)
http://doi.org/10.9770/jesi.2021.8.3(16)
288
increasingly considered a fundamental component of national innovation systems in both developed and developing
countries (Chryssou, 2020).
Considering the above, this scoping review identify the success factors of university-industry collaboration,
specifically from the industry perspective. According to the results of the scoping review (Table 3), the success factors of
the University-Industry cooperation processes most referenced in the literature are: the shared objectives and mutual
understanding of the needs and relevant aspects of the collaboration process (Al-Tabbaa & Ankrah, 2019; Alves et al.,
2007; Araújo & Teixeira, 2014; Chang & Hsu, 2002; Gertner et al., 2011; Lakpetch & Lorsuwannarat, 2012; Sarpong et
al., 2017; Sherwood & Covin, 2008; Vauterin & Virkki-Hatakka, 2016), and the trust between members of the
collaboration (Al-Tabbaa & Ankrah, 2019; Alves et al., 2007; Araújo & Teixeira, 2014; Chang & Hsu, 2002; Lakpetch &
Lorsuwannarat, 2012; Santoro & Bierly, 2006; Sherwood & Covin, 2008; Vauterin & Virkki-Hatakka, 2016). These two
factors are associated with relations, according to the conceptual framework of internal facilitators proposed by Pellegrini
et al. (2019).
Subsequently, the literature highlights the importance of structure of the firm, specifically of the internal structural
characteristics and institutional support for the development of collaborative University-Industry process (Alves et al.,
2007; Gertner et al., 2011; Lakpetch & Lorsuwannarat, 2012; Sarpong et al., 2017; Vauterin & Virkki-Hatakka, 2016;
Veugelers & Cassiman, 2005; Wynn, 2018). Next, the scoping review presents as success factors of the cooperation
process the absorption capacity (Araújo & Teixeira, 2014; Gertner et al., 2011; Lakpetch & Lorsuwannarat, 2012; Santoro
& Bierly, 2006; Veugelers & Cassiman, 2005; Wynn, 2018) and social capital (Al-Tabbaa & Ankrah, 2019; Araújo &
Teixeira, 2014; Gertner et al., 2011; Johnston & Huggins, 2016; Lakpetch & Lorsuwannarat, 2012; Santoro & Bierly,
2006). These two factors are associated with knowledge as an internal facilitator of the company, according to the
framework proposed by Pellegrini et al. (2019).
Finally, the strategy facilitator registers fewer citations when reviewing the success factors of collaboration processes
between universities and industries. Specifically, this scoping revision includes the articulation of collaboration
agreements with the organization's strategy as a facilitator of the collaboration process (Chang & Hsu, 2002; Veugelers &
Cassiman, 2005; Wynn, 2018).
5. Conclusions
Collaboration between companies and universities corresponds to a growing trend in recent years. In that sense, this paper
identifies the success factors in collaboration processes between universities and companies, through a literature review.
The factors included in 16 papers indexed in Scopus and Web of Science, published in 2002 and 2019, are considered, and
which establish companies that participate in collaboration processes with universities as the unit of analysis. As a result
of the review, 17 success factors were identified in the university-industry collaboration processes, classified according to
four internal organizational facilitators: structure, strategy, knowledge, and relations.
In the first place, the success factors related to the structure were identified, namely: the size of the company, the
internal structural characteristics and institutional support for the development of collaborative processes, the existence of
intellectual property policies, the capacity and technological intensity of the company, geographic proximity with
university partners and location of the firm in areas of high business density, the existence of governance mechanisms for
collaboration processes and the management and motivation of human talent and collaboration teams
Second, in terms of innovation strategy, the articulation of collaboration agreements with the organization's
strategy is identified as a success factor in University-Industry collaboration processes. Third, in relation to knowledge as
a facilitator of the innovation process, this review describes the implementation of knowledge management procedures,
absorption capacity and social capital, as success factors in the cooperation processes between companies. companies and
universities.
Finally, regarding organizational relationships, the literature review presents the following success factors:
previous experience in collaborative processes and R&D, trust among the members of the collaboration, effective
communication between the members of the collaboration, shared objectives and mutual understanding of the needs and
relevant aspects of the collaboration process, the ability to share resources and costs in the cooperation process, and the
encouragement of joint scientific production with universities.
In sum, the main contribution of this study, both to the literature on inter-organizational cooperation and to business
management, is that it synthesizes and analyses the factors that could facilitate collaboration between universities and
ENTREPRENEURSHIP AND SUSTAINABILITY ISSUES
ISSN 2345-0282 (online) http://jssidoi.org/jesi/
2021 Volume 8 Number 3 (March)
http://doi.org/10.9770/jesi.2021.8.3(16)
289
industries, but from the perspective of the latter, which had been little attended in the previous literature. We suggest that
future studies empirically explore how and with what intensity the success factors identified in this review could affect
collaboration processes between industry and universities, and how the success or failure of these initiatives can affect the
performance of these organizations.
References Al-Tabbaa, & Ankrah. (2019). ‘Engineered’ University-Industry Collaboration: A Social Capital Perspective. European Management Review, 16(3), 543–565.
https://doi.org/10.1111/emre.12174
Alexander, Martin, Manolchev, & Miller. (2020). University–industry collaboration: using meta-rules to overcome barriers to knowledge transfer. Journal of
Technology Transfer, 45(2), 371–392. https://doi.org/10.1007/s10961-018-9685-1
Alpaydın. (2019). Exploring the spatial reach of co-publication partnerships of multinational enterprises: to what extent does geographical proximity matter? Regional
Studies, Regional Science, 6(1), 281–298. https://doi.org/10.1080/21681376.2019.1583601
Alves, Marques, & Saur-Amaral. (2007). Co-ownership active interfaces between academia and indus try. European Planning Studies, 15(9), 1233–1246.
https://doi.org/10.1080/09654310701529193
Araújo, & Teixeira. (2014). Determinants of international technology transfer: An empirical analysis of the enterprise europe network. Journal of Technology
Management and Innovation, 9(3), 120–134. https://doi.org/10.4067/S0718-27242014000300009
Argueta López, & Jiménez Terrazas. (2017). Gestión del conocimiento en investigadores de la Universidad de Guadalajara (Méxic o). Revista Electrónica de
Investigación Educativa, 19(3), 1. https://doi.org/10.24320/redie.2017.19.3.1151
Arksey, & O’Malley. (2005). Scoping studies: towards a methodological framework. International Journal of Social Research Methodology: Theory and Practice , 8(1),
19–32. https://doi.org/10.1080/1364557032000119616
Banal-Estañol, Macho-Stadler, & Pérez-Castrillo. (2018). Endogenous matching in university-industry collaboration: Theory and empirical evidence from the United
Kingdom. Management Science, 64(4), 1477–1973. https://doi.org/10.1287/mnsc.2016.2680
Baruch. (1997). Industrial-academic collaboration: In search of passion. Interdisciplinary Science Reviews, 22(3), 251–255. https://doi.org/10.1179/isr.1997.22.3.251
Bulińska-Stangrecka, & Bagieńska. (2020). Intangible resources for an organization’s sustainability potential. Entrepreneurship and Sustainability Issues, 8(1), 741–
761. https://doi.org/10.9770/jesi.2020.8.1(50)
Chang, & Hsu. (2002). Improving the innovative capabilities of Taiwan’s manufacturing industries with university -industry research partnerships. International Journal
of Advanced Manufacturing Technology, 19(10), 775–787. https://doi.org/10.1007/s001700200089
Chryssou. (2020). University–industry interactions in the Sultanate of Oman: Challenges and opportunities. Industry and Higher Education.
https://doi.org/10.1177/0950422219896748
Corsi, Fu, & Külzer-Sacilotto. (2020). Boundary spanning roles in cross -border university-industry collaboration: the case of Chinese multinational corporations. R and
D Management. https://doi.org/10.1111/radm.12431
D’Este, Guy, & Iammarino. (2013). Shaping the formation of university -industry research collaborations: What type of proximity does really matter? Journal of
Economic Geography, 13(4), 537–558. https://doi.org/10.1093/jeg/lbs010
Daniel, & Alves. (2020). University-industry technology transfer: the commercialization of university’s patents. Knowledge Management Research and Practice, 18(3),
276–296. https://doi.org/10.1080/14778238.2019.1638741
Danko, Kiselev, Chaykovskaya, Smelov, Sekerin, & Gorokhova. (2020). Marketing positioning of countries in the field of innova tions: questions and answers.
Entrepreneurship and Sustainability Issues, 7(4), 2851–2862. https://doi.org/10.9770/jesi.2020.7.4(19)
Debackere, & Veugelers. (2005). The role of academic technology transfer organizations in improving industry science links. Research Policy, 34(3), 321–342.
https://doi.org/10.1016/j.respol.2004.12.003
Fiaz, Yang, & Abbas. (2014). The dynamics of university-industry alliances: A win-win research and development ecosystem. Information (Japan) , 17(3), 893–903.
Garcia, Araújo, Mascarini, Santos, & Costa. (2020). How long-term university-industry collaboration shapes the academic productivity of research groups. Innovation:
Organization and Management, 22(1), 56–70. https://doi.org/10.1080/14479338.2019.1632711
García Ponce de León, Pérez Mora, & Miranda Zea. (2018). Los profesores -investigadores universitarios y sus motivaciones para transferir conocimiento. Revista
Electronica de Investigacion Educativa , 20(3), 43–55. https://doi.org/10.24320/redie.2018.20.3.1754
Gertner, Roberts, & Charles. (2011). University-industry collaboration: A CoPs approach to KTPs. Journal of Knowledge Management, 15(4), 625–647.
https://doi.org/10.1108/13673271111151992
Johnston, & Huggins. (2016). Drivers of University–Industry links: The case of knowledge-intensive business service firms in rural locations. Regional Studies, 50(8),
1330–1345. https://doi.org/10.1080/00343404.2015.1009028
Johnston, & Huggins. (2017). University-industry links and the determinants of their spatial scope: A study of the knowledge intensive business services sector. Papers
in Regional Science, 96(2), 247–260. https://doi.org/10.1111/pirs.12185
Jonbekova, Sparks, Hartley, & Kuchumova. (2020). Development of university–industry partnerships in Kazakhstan: Innovation under constraint. International Journal
of Educational Development, 79. https://doi.org/10.1016/j.ijedudev.2020.102291
Jones, & Coates. (2020). A micro-level view on knowledge co-creation through university-industry collaboration in a multi-national corporation. Journal of
Management Development, 39(5), 723–738. https://doi.org/10.1108/JMD-08-2019-0365
Lakpetch, & Lorsuwannarat. (2012). Knowledge transfer effectiveness of university-industry alliances. International Journal of Organizational Analysis, 20(2), 128–
186. https://doi.org/10.1108/19348831211227819
Leischnig, & Geigenmüller. (2020). Examining alliance management capabilities in university-industry collaboration. Journal of Technology Transfer, 45(1), 9–30.
https://doi.org/10.1007/s10961-018-9671-7
Mao, Yu, Zhou, Harms, & Fang. (2020). Knowledge growth in university-industry innovation networks – Results from a simulation study. Technological Forecasting
and Social Change, 151. https://doi.org/10.1016/j.techfore.2019.119746
Messeni Petruzzelli, & Murgia. (2020). University–Industry collaborations and international knowledge spillovers: a joint-patent investigation. Journal of Technology
Transfer, 45(4), 958–983. https://doi.org/10.1007/s10961-019-09723-2
Mikhailov, Puffal, & Santini. (2020). University-industry relations and industrial innovation: Evidence from Brazil. Journal of Technology Management and
Innovation, 15(3), 6–16. Retrieved from https://www.scopus.com/inward/record.uri?eid=2-s2.0-
85096237233&partnerID=40&md5=40b9358f6d80f2d4bec375e8159e0d84
Mindruta. (2013). Value creation in university-firm research collaborations: a matching approach. Strategic Management Journal, 34, 644–665.
https://doi.org/10.1002/smj
ENTREPRENEURSHIP AND SUSTAINABILITY ISSUES
ISSN 2345-0282 (online) http://jssidoi.org/jesi/
2021 Volume 8 Number 3 (March)
http://doi.org/10.9770/jesi.2021.8.3(16)
290
Nava-Rogel, & Mercado-Salgado. (2011). Análisis de trayectoria del capital intelectual en una universidad pública mexicana. Revista Electronica de Investigacion
Educativa, 13(2), 166–187.
Nsanzumuhire, & Groot. (2020). Context perspective on University-Industry Collaboration processes: A systematic review of literature. Journal of Cleaner Production,
258. https://doi.org/10.1016/j.jclepro.2020.120861
Oliver, Montgomery, & Barda. (2020). The multi-level process of trust and learning in university–industry innovation collaborations. Journal of Technology Transfer,
45(3), 758–779. https://doi.org/10.1007/s10961-019-09721-4
Olvera, Berbegal-Mirabent, & Merigó. (2018). A bibliometric overview of university-business collaboration between 1980 and 2016. Computacion y Sistemas, 22(4),
1171–1190. https://doi.org/10.13053/CyS-22-4-3101
Pellegrini, Annunziata, Rizzi, & Frey. (2019). The role of networks and sustainable intrapreneurship as interactive d rivers catalyzing the adoption of sustainable
innovation. Corporate Social Responsibility and Environmental Management, 26(5), 1026–1048. https://doi.org/10.1002/csr.1784
Puffal, Ruffoni, & Spricigo. (2020). Empirical Evidence for Brazilian Firms in Terms of University-Industry Interaction, Public Funding and Innovation Outcome.
International Journal of Innovation Management . https://doi.org/10.1142/S1363919621500407
Santoro, & Bierly. (2006). Facilitators of knowledge transfer in university-industry collaborations: A knowledge-based perspective. IEEE Transactions on Engineering
Management, 53(4), 495–507. https://doi.org/10.1109/TEM.2006.883707
Sarpong, AbdRazak, Alexander, & Meissner. (2017). Organizing practices of university, industry and government that facilitate (or impede) the transition to a hybrid
triple helix model of innovation. Technological Forecasting and Social Change, 123, 142–152. https://doi.org/10.1016/j.techfore.2015.11.032
Schaeffer, Öcalan-Özel, & Pénin. (2020). The complementarities between formal and informal channels of university–industry knowledge transfer: a longitudinal
approach. Journal of Technology Transfer, 45(1), 31–55. https://doi.org/10.1007/s10961-018-9674-4
Seitzhanov, Kurmanov, Petrova, Aliyev, & Aidargaliyeva. (2020). Stimulation of entrepreneurs’ innovative activity: Evidence from Kazakhstan. Entrepreneurship and
Sustainability Issues, 7(4), 2615–2629. https://doi.org/10.9770/jesi.2020.7.4(4)
Sherwood, & Covin. (2008). Knowledge acquisition in university industry alliances: An empirical investigation from a learning theory perspective. Journal of Product
Innovation Management, 25(2), 162–179. https://doi.org/10.1111/j.1540-5885.2008.00292.x
Tang, Motohashi, Hu, & Montoro-Sanchez. (2020). University-industry interaction and product innovation performance of Guangdong manufacturing firms: the roles
of regional proximity and research quality of universities. Journal of Technology Transfer, 45(2), 578–618. https://doi.org/10.1007/s10961-019-09715-2
Tootell, Kyriazis, Billsberry, Ambrosini, Garrett-Jones, & Wallace. (2020). Knowledge creation in complex inter-organizational arrangements: understanding the
barriers and enablers of university-industry knowledge creation in science-based cooperation. Journal of Knowledge Management. https://doi.org/10.1108/JKM-
06-2020-0461
Tseng, Huang, & Chen. (2020). Factors of university–industry collaboration affecting university innovation performance. Journal of Technology Transfer, 45(2), 560–
577. https://doi.org/10.1007/s10961-018-9656-6
Vauterin, & Virkki-Hatakka. (2016). A typology of knowledge collaboration: A case study of an initiative to accelerate the internationalization of Finnish cleantech
entrepreneurship. Industry and Higher Education, 30(4), 292–301. https://doi.org/10.1177/0950422216657952
Veugelers, & Cassiman. (2005). R&D cooperation between firms and universities. Some empirical evidence from Belgian manufactu ring. International Journal of
Industrial Organization, 23(5–6), 355–379. https://doi.org/10.1016/j.ijindorg.2005.01.008
Vick, & Robertson. (2018). A systematic literature review of UK university- industry collaboration for knowledge transfer: A future research agenda. Science and
Public Policy, 45(4), 579–590. https://doi.org/10.1093/SCIPOL/SCX086
Weerasinghe, & Dedunu. (2020). Contribution of academics to university–industry knowledge exchange: A study of open innovation in Sri Lankan universities.
Industry and Higher Education. https://doi.org/10.1177/0950422220964363
Wynn. (2018). Technology transfer projects in the UK: An analysis of university - Industry collaboration. International Journal of Knowledge Management , 14(2), 52–
72. https://doi.org/10.4018/IJKM.2018040104
Zalewska-Kurek, & Harms. (2020). Managing autonomy in university–industry research: a case of collaborative Ph.D. projects in the Netherlands. Review of
Managerial Science, 14(2), 393–416. https://doi.org/10.1007/s11846-019-00361-4
Vanessa PERTUZ is professor at the Faculty of Engineering of the Universidad Popular del Cesar. PhD in Management Sciences . Master in Research and
Development Project Management. Industrial engineering from University of Santander, Colombia. She has experience in the deve lopment of research projects of
innovation management, innovation capabilities and organizational learning . She has published in international journals such as Management Review Quarterly, VINE
Journal of Information and Knowledge Management Systems and International Journal of Business Innovation and Research .
ORCID ID: https://orcid.org/0000-0002-1777-6230
Luis Francisco MIRANDA is Business Ph.D. student at the University of Barcelona. His research focuses on the link between open collaboration practic es and
sustainable-oriented innovation. He has supported research projects on innovation measurement, open innovation, climate change in higher education, and impact
evaluation of public policies. Luis has served as peer-review for leading journals such as California Management Review and Economics of Innovation and New
Technology.
ORCID ID: https://orcid.org/0000-0002-5139-4914
Arturo CHARRIS-FONTANILLA is a professor of Organisational Theory and Business Research Methods, at University of Magdalena, Santa Marta, Colombia. His
research is focused on entrepreneurship in higher education, entrepreneurship intention, managerial skills, and competitivene ss.
ORCID ID: https://orcid.org/0000-0003-1160-0485
Lorena PERTUZ-PERALTA is a master's student at the Universidad Metropolitana de Barranquilla, Colombia. Young researcher funded by the Ministry of Science,
Technology and Innovation of Colombia MINCIENCIAS.
ORCID ID: https://orcid.org/0000-0002-9195-5034
Copyright © 2021 by author(s) and VsI Entrepreneurship and Sustainability Center This work is licensed under the Creative Commons Attribution International License (CC BY).
http://creativecommons.org/licenses/by/4.0/
ENTREPRENEURSHIP AND SUSTAINABILITY ISSUES
ISSN 2345-0282 (online) http://jssidoi.org/jesi/
2021 Volume 8 Number 3 (March)
http://doi.org/10.9770/jesi.2021.8.3(17)
Publisher http://jssidoi.org/esc/home
291
VENTURE CAPITAL CHALLENGES IN SAUDI ARABIA
Kamran Ahmed Siddiqui 1, Mohammad Emad Al-Shaikh 2, Ishtiaq Ahmed Bajwa 3 Omar Alenzi 4
1,2,3 & 4 College of Business Administration, Imam Abdulrahman Bin Faisal University, Dammam, Saudi Arabia
E-mails:1 [email protected], [email protected], [email protected], [email protected]
Received 19 September 2020; accepted 10 December 2020; published 12 January 2021
Abstract. The purpose of this exploratory research is to highlight the major Venture Capital (VC) Challenges in Saudi Arabia. A survey
design using a questionnaire has been selected for this study. The respondents include entrepreneurs, investors, employees of VC firms,
investment bankers, and other relevant groups. They answered the questionnaire for their problems, challenges, and prospects about
venture capital in Saudi Arabia. A judgmental sample technique was employed to collect the data (N=122). Descriptive analysis using
mean comparisons show the top three VC challenges, including 'lack of government support for VC'; 'bureaucratic procedures related to
VC' and 'access to angel investors (funding without collateral).' Exploratory Factor Analyses show VC challenges can be grouped into six
broader factors, including ‘entrepreneurial ecosystem,’ ‘entrepreneurial culture’, ‘entrepreneurial attitudes’, ‘entrepreneurial mindset’,
‘entrepreneurial finance’, ‘entrepreneurial planning’. The research provides numerous recommendations to authorities and discusses the
need for further research.
Keywords: Venture capital; Angel investors; Entrepreneurial Finance; Entrepreneurship; Saudi Arabia
Reference to this paper should be made as follows: Siddiqui, K.A., Al-Shaikh, M.E., Ahmed Bajwa, I., Alenzi, O. 2021. Venture capital
challenges in Saudi Arabia. Entrepreneurship and Sustainability Issues, 8(3), 291-302. http://doi.org/10.9770/jesi.2021.8.3(17)
JEL Classifications: L26
1. Introduction Many startups require assistance in various forms to pick up and fit well into the sector where they operate. A
suitable way of helping the different groups entering into the business sector afresh is to offer them funding at
early and seed stages. In this regard, the operations and terms and conditions of venture capital remained quite
successful (Rind, 1981). Venture capital is a form of private equity or financing offered to small companies or
business foundations, usually at the beginning of their operations by larger firms or financial institutions. A
startup qualifying for venture capital must prove-beyond doubt that it can enlarge to become a competitive player
or must have depicted significant growth in areas such as annual revenue, growth, and development of the
workers, marketing, or in all these areas (Scheela & Chua, 2003). The primary reason for the investment by
venture capital firms is to acquire equity or some stake at a new startup (Cornelius, 2005). The venture capital's
overall role in driving innovation in society and contributing to the economy's development is widely identified
and applauded see. (Dossani & Kenney, 2002; Gilson, 2003; Gu & Qian, 2019; Sahlman, 1990). Similarly, its
contribution to promoting the entrepreneurial environment is also well-recognized (Samila & Sorenson, 2011;
Tian, 2012). On the other hand, due to their unique features, the role of close-end venture capital for early-stage
ENTREPRENEURSHIP AND SUSTAINABILITY ISSUES
ISSN 2345-0282 (online) http://jssidoi.org/jesi/
2021 Volume 8 Number 3 (March)
http://doi.org/10.9770/jesi.2021.8.3(17)
292
startup financing and sustainable venture capital importance for the sustainable startup is also emphasized
(Bocken, 2015; Bonini & Capizzi, 2019). Another area that gained attention for researchers and policymakers in
venture capital literature is the operational and other types of challenges faced by venture capitals in various
countries. Nevertheless, venture capital firms' critical importance in the funding ecosystem requires the country's
economic managers to pay attention to VCs' problems and challenges. In this regard, various studies highlighted
numerous issues faced by venture capital firms in different countries. For example, Murray (1992) for UK,
Campani et al. (2016) for Brazil, Jones and Mlambo (2013) for South Africa, Scheela and Van Dinh (2004) for
Vietnam, Dauterive & Fok (2004), Zhang (2017) for the Chinese market, Rossi (2015) for Italy and Aberman
(2009) for the USA. However, no comprehensive research is available examining the role, awareness, and
challenges/problems faced by venture capital firms in KSA. This study aims to bridge this gap and focus on the
venture capital market of Saudi Arabia.
2. Literature Review
The venture capitalists usually take the risk of investing in the new business operation with the belief that the
business they support will record impressive performance. The factors that generally appeal to the venture
capitalists and drive them to invest in the startups are that such companies usually rely on technological and
innovative ways of functioning. Further, these startups also tend to use some modern business models that are
highly likely to yield the best outcome when applied to the appropriate forms (Scheela & Chua, 2003). Venture
capitals are one of the main contributors to innovative entrepreneurship in an economy ultimately effecting the
social development.
Globally, venture capitalists tend to differ in their reasons for providing funding. One of the significant
reasons facilitating venture capitalists' actions is the business condition (Cornelius, 2005). Whereas some VCs
may choose to invest in new ideas or startups, others opt to invest in existing firms that only require some support
to expand and reach global levels. Some venture capitalists may also strictly choose to invest in specific sectors
depending on their interest or specialization. The other funding motivation for VCs at the global level is that some
opt to invest their money in local firms. In contrast, others may choose to invest in companies operating at
international levels (Cornelius, 2005). The U.S. dominates the global venture capital investment. Samuel (2017)
states that the U.S.'s total investment accumulates to $21.5 billion surpassing Asia, which stood second with $12.3
billion. Europe is third in the VC list, with a total investment amounting to $4.7 (Samuel, 2017).
Regarding the difference between venture capital and other similar financing sources, it is critical to
understand that although both venture capital and angel investors are funding methods for new or startup
businesses, still, there are differences between them (Bonnet & Wirtz, 2011). Nevertheless, venture capitalists are
more likely to have more experience and professionalism in evaluating and managing business or money. On the
other hand, angel investors are mostly educated and experienced investors; in addition to that, they typically have
good knowledge in several fields with more general backgrounds or experiences (Bellavitis et al., 2017; Van
Osnabrugge, 2000). Similarly, these days it is also important to differentiate between Crowdfunding and venture
capital financing. According to the Securities and Exchange Commission, USA, "Crowdfunding generally refers
to a financing method in which money is raised through soliciting relatively small individual investments or
contributions from a large number of people. Likewise, in recent times Crowdfunding is one of the financing
types to raise capital for new ventures of small existing ventures, and its role is increasing. (Capizzi & Carluccio,
2016; Marchand, 2016). Furthermore, one of the key differences between VCs and Crowdfunding is the
monitoring process after funding. In venture capital, enterprises' operations and management are well-monitored,
whereas such a requirement does not exist in Crowdfunding. On the other hand, the stability of enterprises in VCs
is relatively better than stability in crowdfunding enterprises. In Crowdfunding, clear objectives or obligations are
not existing, especially in (donation-based type) while, in VCs, the agreement is between founder/entrepreneur
and venture capital for specific goals. (Mamonov Malaga, & Rosenblum, 2017).
The venture capital sector traces its origin in the U.S; the concept of venture capital is long being used for
startup financing in the USA, making them a pioneer. However, it is fast developing in other countries. Although
there are several common grounds between the working of 'Mudarabah,' the Islamic finance instrument, and the
ENTREPRENEURSHIP AND SUSTAINABILITY ISSUES
ISSN 2345-0282 (online) http://jssidoi.org/jesi/
2021 Volume 8 Number 3 (March)
http://doi.org/10.9770/jesi.2021.8.3(17)
293
modern-day venture capital, the current modern form of venture capital appeared in 2011 (Seoudi & Mahmoud,
2016). In recent times the number of non-Americans VCs has been escalating in KSA (Khan & Khan, 2020).
According to experts, venture capital is useful for countries like KSA due to the ongoing changes and heavy
infrastructure investment initiatives. Furthermore, the government's other several initiatives like the promotion of
entrepreneurial activities, incubators, and interest-free loans for startups are important for venture capital growth
in the country (MEVCA, 2013). Moreover, in terms of their performance in Saudi Arabia, venture capital has
served crucial roles as a mechanism for economic empowerment and development. Gradually, venture capital
specializing in SME financing and private equity investments in the Kingdom are becoming prominent. Presently,
Saudi Arabia is the biggest economy in the GCC region with many SMEs, most of which focus on retail and
service provision. The high number of SMEs in Saudi Arabia suggests that establishing Venture Capital would go
a long way in helping the firms fit into the highly competitive market.
The venture capitals in various countries faced many ups and downs. Especially in the previous three
decades, the Asian crises, the IT bubble burst, the 2008 financial crisis, and now recent COVID crises remained
the general reasons for these challenges apart from other country-specific reasons. Various studies have explored
the causes of these challenges faced by venture capitals in different setups. Various authors conducted studies in
the context of multiple countries to highlight these challenges and problems. Murray (1992) pointed out the
problems with the venture capital firms of the UK. According to the author, even after maturity, the industry's
finances remained concentrated in a few portfolio firms, which was the main strategic problem for the venture
capital industry. Jones and Mlambo (2013) conducted a study for the South African market. The authors indicated
that specialized fund managers' unavailability and general low entrepreneurial skills level are the main hindrance
factors for venture capital firms. Scheela and Van Dinh (2004) highlighted the lack of quality investment and
excessive regulations as the main challenges of Venture Capital firms in Vietnam. Dauterive and Fok (2004)
pointed out the leading venture capital challenges in the Chinese market; according to the study, the strict
regulatory environment and capital controls are the main hindrances these VCs face. Similarly, Zhang (2017)
also focused on the institutional framework and organizational structure of venture capital investment trust with
reference to China; the study suggested some key reforms relating to such firms' ownership structure and
independence. There is a number of researches available on the problems and challenges faced by venture capital
firms in China; some other studies that focused on China’s venture capital industry's challenges include Xia et al.
(2001).
Oher studies explore the venture capital issues in other countries like Italy (Rossi, 2015). According to the
author, venture capital in Italy focused more on already developed sectors, whereas their interest in the service
sector and young innovative firms remained relatively low. Similarly, a study conducted in USA (Aberman,
2009). The author noticed that the private venture capital market was shrinking, and VC firms were not generating
a healthy return. It was mainly because some of the newly emerging venture capital managers could not raise
enough capital. On the other hand, a very captivating study by Brush et al. (2018) pointed out an exciting aspect
of venture capital challenges for the US market. According to the analysis of the study, the business firms led by
women were able to attract less funding from venture capital firms compared to the business firms led by men. As
mentioned earlier with regard to Saudi Arabia, this study will bring new insights into the problems and challenges
faced by Saudi Venture capitalists.
3. Data and Methodology
In this study, we used a quantitative approach based on the primary data to examine the problems and challenges
of venture capital firms. For this purpose, we used a questionnaire to collect data from various stakeholders. The
questionnaire highlights venture capital problems and prospects. For this purpose, our target audience was the
venture capitalist managers, entrepreneurs, investors, and bankers to identify the problems and prospects of
venture capital in Saudi Arabia. The questionnaire developed for this study has two parts; the first section with
open-ended questions to measure the un-aided recall and perceptions towards Venture Capital, and the second
section with close-ended questions with a five-point Likert scale. These questions were adapted from earlier
studies (Carmines & Zeller, 1979; Fink & Litwin, 1995). After drafting the questions, various validity checks
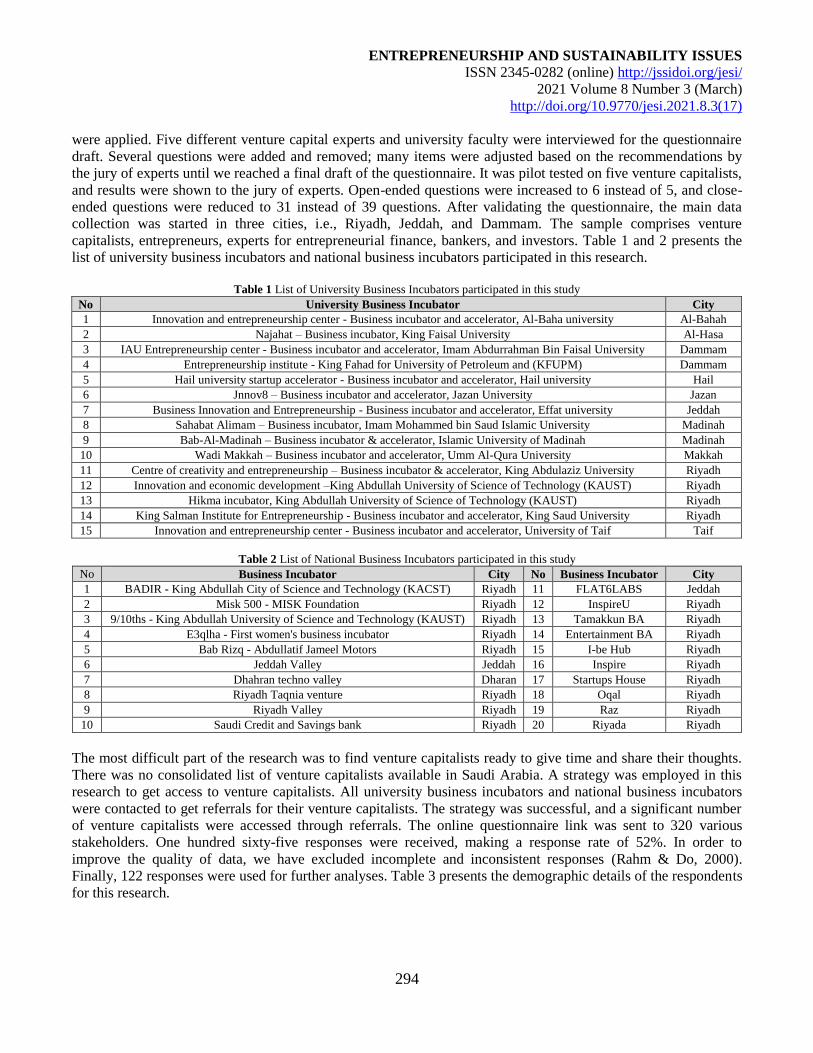
ENTREPRENEURSHIP AND SUSTAINABILITY ISSUES
ISSN 2345-0282 (online) http://jssidoi.org/jesi/
2021 Volume 8 Number 3 (March)
http://doi.org/10.9770/jesi.2021.8.3(17)
294
were applied. Five different venture capital experts and university faculty were interviewed for the questionnaire
draft. Several questions were added and removed; many items were adjusted based on the recommendations by
the jury of experts until we reached a final draft of the questionnaire. It was pilot tested on five venture capitalists,
and results were shown to the jury of experts. Open-ended questions were increased to 6 instead of 5, and close-
ended questions were reduced to 31 instead of 39 questions. After validating the questionnaire, the main data
collection was started in three cities, i.e., Riyadh, Jeddah, and Dammam. The sample comprises venture
capitalists, entrepreneurs, experts for entrepreneurial finance, bankers, and investors. Table 1 and 2 presents the
list of university business incubators and national business incubators participated in this research.
Table 1 List of University Business Incubators participated in this study
No University Business Incubator City
1 Innovation and entrepreneurship center - Business incubator and accelerator, Al-Baha university Al-Bahah
2 Najahat – Business incubator, King Faisal University Al-Hasa
3 IAU Entrepreneurship center - Business incubator and accelerator, Imam Abdurrahman Bin Faisal University Dammam
4 Entrepreneurship institute - King Fahad for University of Petroleum and (KFUPM) Dammam
5 Hail university startup accelerator - Business incubator and accelerator, Hail university Hail
6 Jnnov8 – Business incubator and accelerator, Jazan University Jazan
7 Business Innovation and Entrepreneurship - Business incubator and accelerator, Effat university Jeddah
8 Sahabat Alimam – Business incubator, Imam Mohammed bin Saud Islamic University Madinah
9 Bab-Al-Madinah – Business incubator & accelerator, Islamic University of Madinah Madinah
10 Wadi Makkah – Business incubator and accelerator, Umm Al-Qura University Makkah
11 Centre of creativity and entrepreneurship – Business incubator & accelerator, King Abdulaziz University Riyadh
12 Innovation and economic development –King Abdullah University of Science of Technology (KAUST) Riyadh
13 Hikma incubator, King Abdullah University of Science of Technology (KAUST) Riyadh
14 King Salman Institute for Entrepreneurship - Business incubator and accelerator, King Saud University Riyadh
15 Innovation and entrepreneurship center - Business incubator and accelerator, University of Taif Taif
Table 2 List of National Business Incubators participated in this study
No Business Incubator City No Business Incubator City
1 BADIR - King Abdullah City of Science and Technology (KACST) Riyadh 11 FLAT6LABS Jeddah
2 Misk 500 - MISK Foundation Riyadh 12 InspireU Riyadh
3 9/10ths - King Abdullah University of Science and Technology (KAUST) Riyadh 13 Tamakkun BA Riyadh
4 E3qlha - First women's business incubator Riyadh 14 Entertainment BA Riyadh
5 Bab Rizq - Abdullatif Jameel Motors Riyadh 15 I-be Hub Riyadh
6 Jeddah Valley Jeddah 16 Inspire Riyadh
7 Dhahran techno valley Dharan 17 Startups House Riyadh
8 Riyadh Taqnia venture Riyadh 18 Oqal Riyadh
9 Riyadh Valley Riyadh 19 Raz Riyadh
10 Saudi Credit and Savings bank Riyadh 20 Riyada Riyadh
The most difficult part of the research was to find venture capitalists ready to give time and share their thoughts.
There was no consolidated list of venture capitalists available in Saudi Arabia. A strategy was employed in this
research to get access to venture capitalists. All university business incubators and national business incubators
were contacted to get referrals for their venture capitalists. The strategy was successful, and a significant number
of venture capitalists were accessed through referrals. The online questionnaire link was sent to 320 various
stakeholders. One hundred sixty-five responses were received, making a response rate of 52%. In order to
improve the quality of data, we have excluded incomplete and inconsistent responses (Rahm & Do, 2000).
Finally, 122 responses were used for further analyses. Table 3 presents the demographic details of the respondents
for this research.
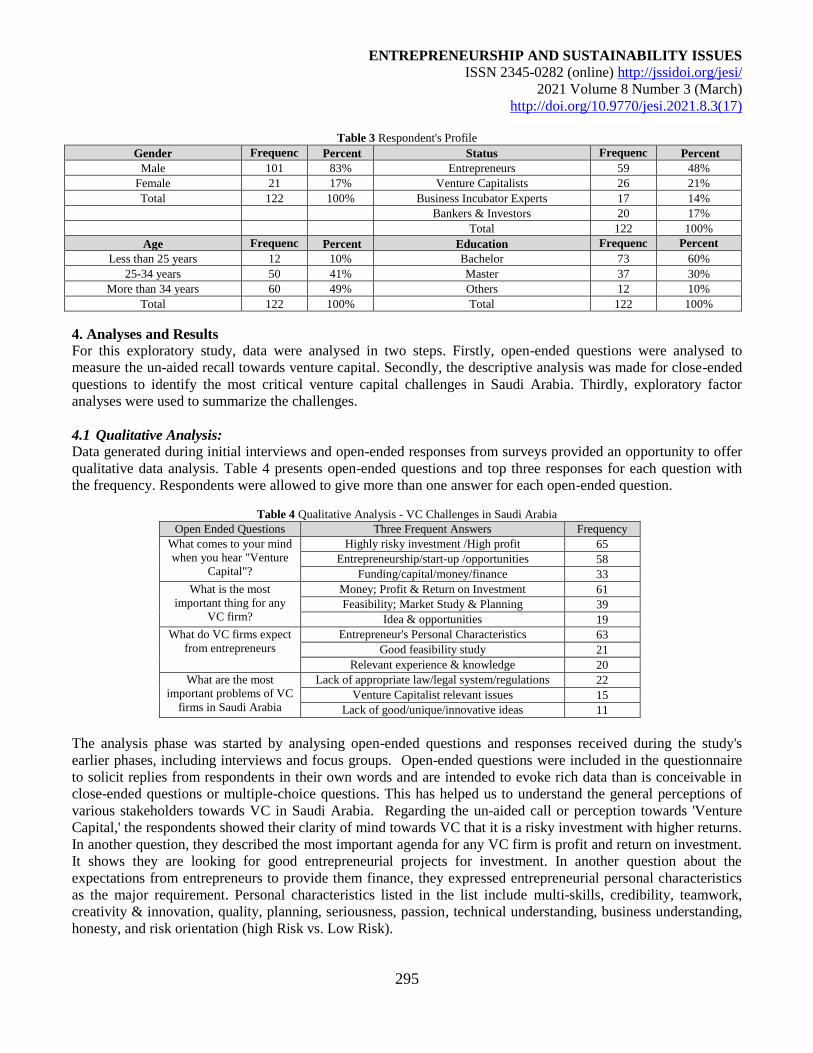
ENTREPRENEURSHIP AND SUSTAINABILITY ISSUES
ISSN 2345-0282 (online) http://jssidoi.org/jesi/
2021 Volume 8 Number 3 (March)
http://doi.org/10.9770/jesi.2021.8.3(17)
295
Table 3 Respondent's Profile
Gender Frequenc
y Percent Status Frequenc
y Percent
Male 101 83% Entrepreneurs 59 48%
Female 21 17% Venture Capitalists 26 21%
Total 122 100% Business Incubator Experts 17 14%
Bankers & Investors 20 17%
Total 122 100%
Age Frequenc
y Percent Education Frequenc
y
Percent
Percent Less than 25 years 12 10% Bachelor 73 60%
25-34 years 50 41% Master 37 30%
More than 34 years 60 49% Others 12 10%
Total 122 100% Total 122 100%
4. Analyses and Results
For this exploratory study, data were analysed in two steps. Firstly, open-ended questions were analysed to
measure the un-aided recall towards venture capital. Secondly, the descriptive analysis was made for close-ended
questions to identify the most critical venture capital challenges in Saudi Arabia. Thirdly, exploratory factor
analyses were used to summarize the challenges.
4.1 Qualitative Analysis: Data generated during initial interviews and open-ended responses from surveys provided an opportunity to offer
qualitative data analysis. Table 4 presents open-ended questions and top three responses for each question with
the frequency. Respondents were allowed to give more than one answer for each open-ended question.
Table 4 Qualitative Analysis - VC Challenges in Saudi Arabia
Open Ended Questions Three Frequent Answers Frequency
What comes to your mind
when you hear "Venture
Capital"?
Highly risky investment /High profit 65
Entrepreneurship/start-up /opportunities 58
Funding/capital/money/finance 33
What is the most
important thing for any
VC firm?
Money; Profit & Return on Investment 61
Feasibility; Market Study & Planning 39
Idea & opportunities 19
What do VC firms expect
from entrepreneurs
Entrepreneur's Personal Characteristics 63
Good feasibility study 21
Relevant experience & knowledge 20
What are the most
important problems of VC
firms in Saudi Arabia
Lack of appropriate law/legal system/regulations 22
Venture Capitalist relevant issues 15
Lack of good/unique/innovative ideas 11
The analysis phase was started by analysing open-ended questions and responses received during the study's
earlier phases, including interviews and focus groups. Open-ended questions were included in the questionnaire
to solicit replies from respondents in their own words and are intended to evoke rich data than is conceivable in
close-ended questions or multiple-choice questions. This has helped us to understand the general perceptions of
various stakeholders towards VC in Saudi Arabia. Regarding the un-aided call or perception towards 'Venture
Capital,' the respondents showed their clarity of mind towards VC that it is a risky investment with higher returns.
In another question, they described the most important agenda for any VC firm is profit and return on investment.
It shows they are looking for good entrepreneurial projects for investment. In another question about the
expectations from entrepreneurs to provide them finance, they expressed entrepreneurial personal characteristics
as the major requirement. Personal characteristics listed in the list include multi-skills, credibility, teamwork,
creativity & innovation, quality, planning, seriousness, passion, technical understanding, business understanding,
honesty, and risk orientation (high Risk vs. Low Risk).
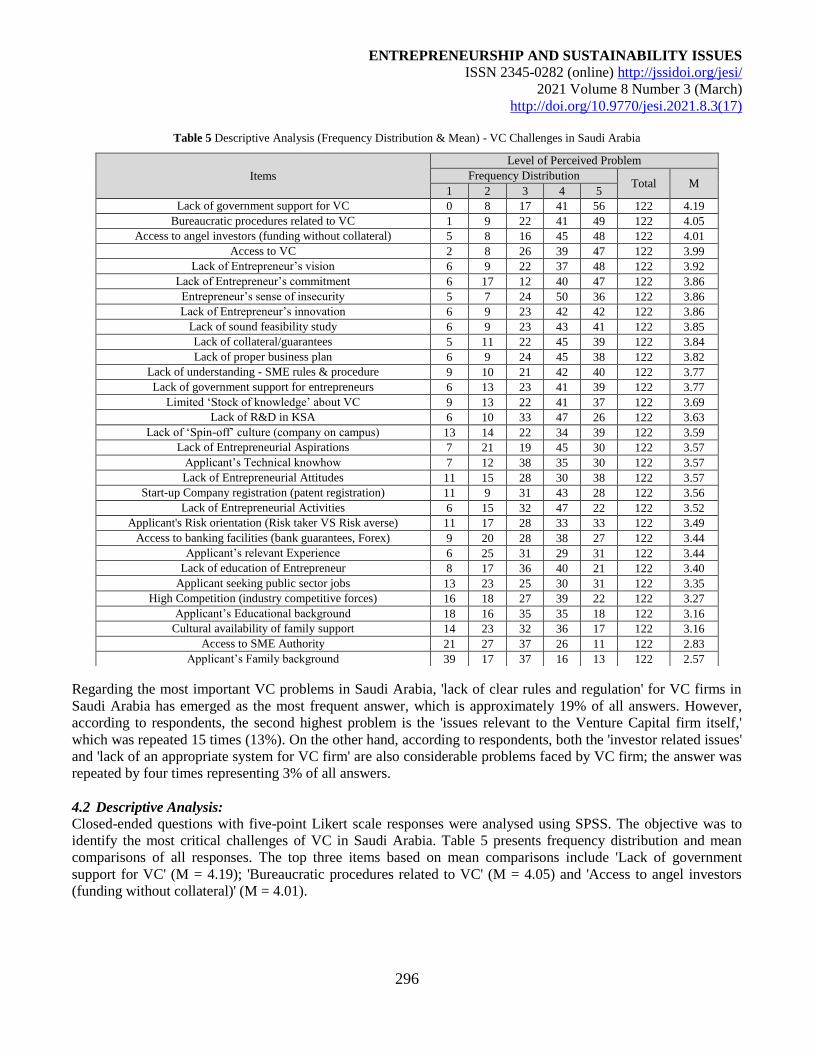
ENTREPRENEURSHIP AND SUSTAINABILITY ISSUES
ISSN 2345-0282 (online) http://jssidoi.org/jesi/
2021 Volume 8 Number 3 (March)
http://doi.org/10.9770/jesi.2021.8.3(17)
296
Table 5 Descriptive Analysis (Frequency Distribution & Mean) - VC Challenges in Saudi Arabia
Regarding the most important VC problems in Saudi Arabia, 'lack of clear rules and regulation' for VC firms in
Saudi Arabia has emerged as the most frequent answer, which is approximately 19% of all answers. However,
according to respondents, the second highest problem is the 'issues relevant to the Venture Capital firm itself,'
which was repeated 15 times (13%). On the other hand, according to respondents, both the 'investor related issues'
and 'lack of an appropriate system for VC firm' are also considerable problems faced by VC firm; the answer was
repeated by four times representing 3% of all answers.
4.2 Descriptive Analysis: Closed-ended questions with five-point Likert scale responses were analysed using SPSS. The objective was to
identify the most critical challenges of VC in Saudi Arabia. Table 5 presents frequency distribution and mean
comparisons of all responses. The top three items based on mean comparisons include 'Lack of government
support for VC' (M = 4.19); 'Bureaucratic procedures related to VC' (M = 4.05) and 'Access to angel investors
(funding without collateral)' (M = 4.01).
Items
Level of Perceived Problem
Frequency Distribution
1 – Minor; 5 -Major Total M
1 2 3 4 5
Lack of government support for VC 0 8 17 41 56 122 4.19
Bureaucratic procedures related to VC 1 9 22 41 49 122 4.05
Access to angel investors (funding without collateral) 5 8 16 45 48 122 4.01
Access to VC 2 8 26 39 47 122 3.99
Lack of Entrepreneur’s vision 6 9 22 37 48 122 3.92
Lack of Entrepreneur’s commitment 6 17 12 40 47 122 3.86
Entrepreneur’s sense of insecurity 5 7 24 50 36 122 3.86
Lack of Entrepreneur’s innovation 6 9 23 42 42 122 3.86
Lack of sound feasibility study 6 9 23 43 41 122 3.85
Lack of collateral/guarantees 5 11 22 45 39 122 3.84
Lack of proper business plan 6 9 24 45 38 122 3.82
Lack of understanding - SME rules & procedure 9 10 21 42 40 122 3.77
Lack of government support for entrepreneurs 6 13 23 41 39 122 3.77
Limited ‘Stock of knowledge’ about VC 9 13 22 41 37 122 3.69
Lack of R&D in KSA 6 10 33 47 26 122 3.63
Lack of ‘Spin-off’ culture (company on campus) 13 14 22 34 39 122 3.59
Lack of Entrepreneurial Aspirations 7 21 19 45 30 122 3.57
Applicant’s Technical knowhow 7 12 38 35 30 122 3.57
Lack of Entrepreneurial Attitudes 11 15 28 30 38 122 3.57
Start-up Company registration (patent registration) 11 9 31 43 28 122 3.56
Lack of Entrepreneurial Activities 6 15 32 47 22 122 3.52
Applicant's Risk orientation (Risk taker VS Risk averse)
11 17 28 33 33 122 3.49
Access to banking facilities (bank guarantees, Forex) 9 20 28 38 27 122 3.44
Applicant’s relevant Experience 6 25 31 29 31 122 3.44
Lack of education of Entrepreneur 8 17 36 40 21 122 3.40
Applicant seeking public sector jobs 13 23 25 30 31 122 3.35
High Competition (industry competitive forces) 16 18 27 39 22 122 3.27
Applicant’s Educational background 18 16 35 35 18 122 3.16
Cultural availability of family support 14 23 32 36 17 122 3.16
Access to SME Authority 21 27 37 26 11 122 2.83
Applicant’s Family background 39 17 37 16 13 122 2.57
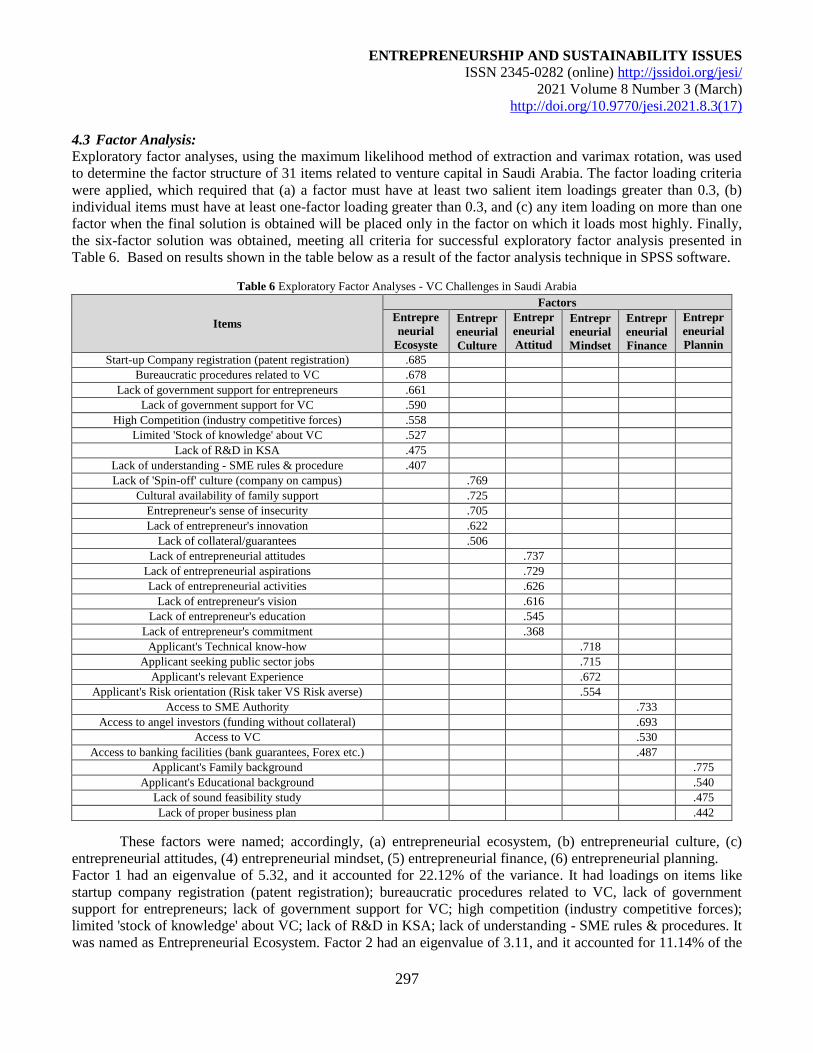
ENTREPRENEURSHIP AND SUSTAINABILITY ISSUES
ISSN 2345-0282 (online) http://jssidoi.org/jesi/
2021 Volume 8 Number 3 (March)
http://doi.org/10.9770/jesi.2021.8.3(17)
297
4.3 Factor Analysis: Exploratory factor analyses, using the maximum likelihood method of extraction and varimax rotation, was used
to determine the factor structure of 31 items related to venture capital in Saudi Arabia. The factor loading criteria
were applied, which required that (a) a factor must have at least two salient item loadings greater than 0.3, (b)
individual items must have at least one-factor loading greater than 0.3, and (c) any item loading on more than one
factor when the final solution is obtained will be placed only in the factor on which it loads most highly. Finally,
the six-factor solution was obtained, meeting all criteria for successful exploratory factor analysis presented in
Table 6. Based on results shown in the table below as a result of the factor analysis technique in SPSS software.
Table 6 Exploratory Factor Analyses - VC Challenges in Saudi Arabia
These factors were named; accordingly, (a) entrepreneurial ecosystem, (b) entrepreneurial culture, (c)
entrepreneurial attitudes, (4) entrepreneurial mindset, (5) entrepreneurial finance, (6) entrepreneurial planning.
Factor 1 had an eigenvalue of 5.32, and it accounted for 22.12% of the variance. It had loadings on items like
startup company registration (patent registration); bureaucratic procedures related to VC, lack of government
support for entrepreneurs; lack of government support for VC; high competition (industry competitive forces);
limited 'stock of knowledge' about VC; lack of R&D in KSA; lack of understanding - SME rules & procedures. It
was named as Entrepreneurial Ecosystem. Factor 2 had an eigenvalue of 3.11, and it accounted for 11.14% of the
Items
Factors
Entrepre
neurial
Ecosyste
m
Entrepr
eneurial
Culture
Entrepr
eneurial
Attitud
es
Entrepr
eneurial
Mindset
Entrepr
eneurial
Finance
Entrepr
eneurial
Plannin
g Start-up Company registration (patent registration) .685
Bureaucratic procedures related to VC .678
Lack of government support for entrepreneurs .661
Lack of government support for VC .590
High Competition (industry competitive forces) .558
Limited 'Stock of knowledge' about VC .527
Lack of R&D in KSA .475
Lack of understanding - SME rules & procedure .407
Lack of 'Spin-off' culture (company on campus) .769
Cultural availability of family support .725
Entrepreneur's sense of insecurity .705
Lack of entrepreneur's innovation .622
Lack of collateral/guarantees .506
Lack of entrepreneurial attitudes .737
Lack of entrepreneurial aspirations .729
Lack of entrepreneurial activities .626
Lack of entrepreneur's vision .616
Lack of entrepreneur's education .545
Lack of entrepreneur's commitment .368
Applicant's Technical know-how .718
Applicant seeking public sector jobs .715
Applicant's relevant Experience .672
Applicant's Risk orientation (Risk taker VS Risk averse)
.554
Access to SME Authority .733
Access to angel investors (funding without collateral) .693
Access to VC .530
Access to banking facilities (bank guarantees, Forex etc.) .487
Applicant's Family background .775
Applicant's Educational background .540
Lack of sound feasibility study .475
Lack of proper business plan .442
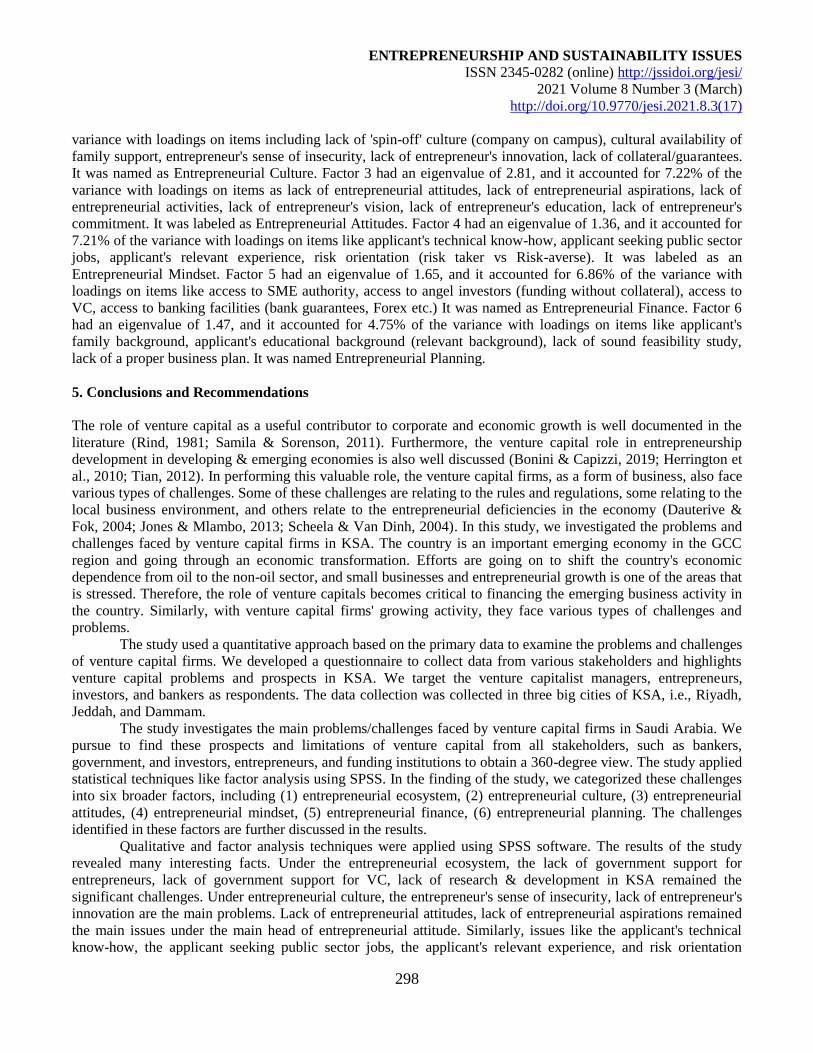
ENTREPRENEURSHIP AND SUSTAINABILITY ISSUES
ISSN 2345-0282 (online) http://jssidoi.org/jesi/
2021 Volume 8 Number 3 (March)
http://doi.org/10.9770/jesi.2021.8.3(17)
298
variance with loadings on items including lack of 'spin-off' culture (company on campus), cultural availability of
family support, entrepreneur's sense of insecurity, lack of entrepreneur's innovation, lack of collateral/guarantees.
It was named as Entrepreneurial Culture. Factor 3 had an eigenvalue of 2.81, and it accounted for 7.22% of the
variance with loadings on items as lack of entrepreneurial attitudes, lack of entrepreneurial aspirations, lack of
entrepreneurial activities, lack of entrepreneur's vision, lack of entrepreneur's education, lack of entrepreneur's
commitment. It was labeled as Entrepreneurial Attitudes. Factor 4 had an eigenvalue of 1.36, and it accounted for
7.21% of the variance with loadings on items like applicant's technical know-how, applicant seeking public sector
jobs, applicant's relevant experience, risk orientation (risk taker vs Risk-averse). It was labeled as an
Entrepreneurial Mindset. Factor 5 had an eigenvalue of 1.65, and it accounted for 6.86% of the variance with
loadings on items like access to SME authority, access to angel investors (funding without collateral), access to
VC, access to banking facilities (bank guarantees, Forex etc.) It was named as Entrepreneurial Finance. Factor 6
had an eigenvalue of 1.47, and it accounted for 4.75% of the variance with loadings on items like applicant's
family background, applicant's educational background (relevant background), lack of sound feasibility study,
lack of a proper business plan. It was named Entrepreneurial Planning.
5. Conclusions and Recommendations
The role of venture capital as a useful contributor to corporate and economic growth is well documented in the
literature (Rind, 1981; Samila & Sorenson, 2011). Furthermore, the venture capital role in entrepreneurship
development in developing & emerging economies is also well discussed (Bonini & Capizzi, 2019; Herrington et
al., 2010; Tian, 2012). In performing this valuable role, the venture capital firms, as a form of business, also face
various types of challenges. Some of these challenges are relating to the rules and regulations, some relating to the
local business environment, and others relate to the entrepreneurial deficiencies in the economy (Dauterive &
Fok, 2004; Jones & Mlambo, 2013; Scheela & Van Dinh, 2004). In this study, we investigated the problems and
challenges faced by venture capital firms in KSA. The country is an important emerging economy in the GCC
region and going through an economic transformation. Efforts are going on to shift the country's economic
dependence from oil to the non-oil sector, and small businesses and entrepreneurial growth is one of the areas that
is stressed. Therefore, the role of venture capitals becomes critical to financing the emerging business activity in
the country. Similarly, with venture capital firms' growing activity, they face various types of challenges and
problems.
The study used a quantitative approach based on the primary data to examine the problems and challenges
of venture capital firms. We developed a questionnaire to collect data from various stakeholders and highlights
venture capital problems and prospects in KSA. We target the venture capitalist managers, entrepreneurs,
investors, and bankers as respondents. The data collection was collected in three big cities of KSA, i.e., Riyadh,
Jeddah, and Dammam.
The study investigates the main problems/challenges faced by venture capital firms in Saudi Arabia. We
pursue to find these prospects and limitations of venture capital from all stakeholders, such as bankers,
government, and investors, entrepreneurs, and funding institutions to obtain a 360-degree view. The study applied
statistical techniques like factor analysis using SPSS. In the finding of the study, we categorized these challenges
into six broader factors, including (1) entrepreneurial ecosystem, (2) entrepreneurial culture, (3) entrepreneurial
attitudes, (4) entrepreneurial mindset, (5) entrepreneurial finance, (6) entrepreneurial planning. The challenges
identified in these factors are further discussed in the results.
Qualitative and factor analysis techniques were applied using SPSS software. The results of the study
revealed many interesting facts. Under the entrepreneurial ecosystem, the lack of government support for
entrepreneurs, lack of government support for VC, lack of research & development in KSA remained the
significant challenges. Under entrepreneurial culture, the entrepreneur's sense of insecurity, lack of entrepreneur's
innovation are the main problems. Lack of entrepreneurial attitudes, lack of entrepreneurial aspirations remained
the main issues under the main head of entrepreneurial attitude. Similarly, issues like the applicant's technical
know-how, the applicant seeking public sector jobs, the applicant's relevant experience, and risk orientation
ENTREPRENEURSHIP AND SUSTAINABILITY ISSUES
ISSN 2345-0282 (online) http://jssidoi.org/jesi/
2021 Volume 8 Number 3 (March)
http://doi.org/10.9770/jesi.2021.8.3(17)
299
appeared under the Entrepreneurial Mindset factor. Moreover, under the Entrepreneurial Finance factor, problems
like access to SME authority, access to banking facilities for bank guarantees, etc., purpose were identified.
Finally, challenges like lack of sound feasibility study, lack of a proper business plan appeared under the
Entrepreneurial Planning factor. Overall, our study results are in line with previous research see (Dauterive &
Fok, 2004; Jones & Mlambo, 2013; Scheela & Van Dinh, 2004).
5.1 Recommendations
The study also presents several recommendations. Firstly, government agencies should understand that venture
capital and angel investors are different from conventional banks, and VC firms should get a separate set of laws
and regulations. Ministries take actions to eliminate important obstacles and develop more flexible rules and
regulations towards VC. Secondly, there is a need to improve the awareness and understanding of VC. All
universities, especially business schools teaching entrepreneurship, should include VC as part of the
entrepreneurship curriculum. Furthermore, the ministry of education should re-organize the entrepreneurship
courses in all universities to be more focused on Venture Capital as an essential pillar for the entrepreneurship
domain. Finally, entrepreneurs should also improve their commitments to get the confidence of finance
institutions and decision-makers. They should show professionalism, seriousness, commitment, and transparency
for funding institutions.
5.2 Limitations
This research is an outcome of overcoming many limitations. These limitations include lack of resource relevant
to venture capital in Saudi Arabia, availability of a limited number of entrepreneurship centers in Saudi Arabia.
Moreover, difficulty to access entrepreneur’s database from other institutions is another limitaion. Furthermore,
there is no government authority to regulate venture capital; no venture capital firms database exists in Saudi
Arabia.
5.3 Need for further research
This exploratory research has been conducted as the first research on Venture Capital and its problems,
challenges, and prospects in KSA. We still feel that there is a lot more to be done in this field. Firstly, there is a
need for indigenous research on rules and regulations needed to support VC in Saudi Arabia. The shortage of this
type of research makes the study more inevitable for many scholars. There are several dimensions for future
research areas such as Venture Capital firm role in Vision 2030, venture capital development agency in Saudi
Arabia.
References
Aberman, J. (2009). The decline of the United States venture capital industry: What the federal government should do about it. Amplifier
Ventures. http://www.innovationamerica.us/images/stories/pdf/abermanvcwhitepaper.pdf
Bellavitis, C., Filatotchev, I., Kamuriwo, D. S., & Vanacker, T. (2017). Entrepreneurial finance: new frontiers of research and practice:
Editorial for the special issue Embracing entrepreneurial funding innovations. In: Taylor & Francis.
https://doi.org/10.1080/13691066.2016.1259733
Bocken, N. M. (2015). Sustainable venture capital–catalyst for sustainable start-up success? Journal of Cleaner Production, 108, 647-658.
Bonini, S., & Capizzi, V. (2019). The role of venture capital in the emerging entrepreneurial finance ecosystem: future threats and
opportunities. Venture Capital, 21(2-3), 137-175. https://doi.org/10.1080/13691066.2019.1608697
Bonnet, C., & Wirtz, P. (2011). Investor type, cognitive governance and performance in young entrepreneurial ventures: A conceptual
framework. https://halshs.archives-ouvertes.fr/halshs-00642737/document
ENTREPRENEURSHIP AND SUSTAINABILITY ISSUES
ISSN 2345-0282 (online) http://jssidoi.org/jesi/
2021 Volume 8 Number 3 (March)
http://doi.org/10.9770/jesi.2021.8.3(17)
300
Brush, C., Greene, P., Balachandra, L., & Davis, A. (2018). The gender gap in venture capital-progress, problems, and perspectives.
Venture Capital, 20(2), 115-136. https://doi.org/10.1080/13691066.2017.1349266
Campani, C. H., Maranho, F. S., Alvarenga, H. D. A., Lima, M. B. A., & Guimaraes, R. S. (2016). Antera: The challenges of private equity
and venture capital management. Administracao-Ensino E Pesquisa, 17(3), 509-535. https://doi.org/10.13058/raep.2016.v17n3.470
Capizzi, V., & Carluccio, E. M. (2016). Competitive Frontiers in Equity Crowdfunding: The Role of Venture Capitalists and Business
Angels in the Early-Stage Financing Industry. In Crowdfunding for SMEs (pp. 117-157): Springer.
Carmines, E. G., & Zeller, R. A. (1979). Reliability and validity assessment (Vol. 17): Sage publications.
Cornelius, B. (2005). The institutionalisation of venture capital. Technovation, 25(6), 599-608.
Dauterive, J., & Fok, W. (2004). Venture capital for China: opportunities and challenges. Managerial Finance, 30(2), 3-15.
https://doi.org/10.1108/03074350410768877
Dossani, R., & Kenney, M. (2002). Creating an environment for venture capital in India. World Development, 30(2), 227-253.
Fink, A., & Litwin, M. S. (1995). How to measure survey reliability and validity (Vol. 7): Sage.
Gilson, R. J. (2003). Engineering a venture capital market: lessons from the American experience. Stanford Law Review, 1067-1103.
Gu, W., & Qian, X. (2019). Does venture capital foster entrepreneurship in an emerging market? Journal of Business Research, 101, 803-
810. https://doi.org/10.1016/j.jbusres.2018.12.011
Herrington, M., Kew, J., Kew, P., & Monitor, G. E. (2010). Tracking entrepreneurship in South Africa: A GEM perspective: Graduate
School of Business, University of Cape Town South Africa.
Jones, M., & Mlambo, C. (2013). Early-stage venture capital in South Africa: Challenges and prospects. South African Journal of Business
Management, 44(4), 1-12. https://doi.org/10.4102/sajbm.v44i4.164
Khan, M. K., & Khan, M. B. (2020). Research, Innovation and Entrepreneurship in Saudi Arabia: Vision 2030: Routledge. ISBN
9781138488533, 192 p.
Mamonov, S., Malaga, R., & Rosenblum, J. (2017). An exploratory analysis of Title II equity crowdfunding success. Venture Capital,
19(3), 239-256.
Marchand, F. I. (2016). Crowdfunding Real Estate: Institutions and Markets. An Institutional Comparison on the Growth-patterns and
Behaviour of Crowdfunding Real Estate Markets in the Netherlands and United States.
https://repository.tudelft.nl/islandora/object/uuid%3A785a36c8-2a5b-4d5f-84a2-b60093491551
MEVCA. (2013). Venture Capital in the Middle East and North Africa Retrieved from
https://www.academia.edu/6760725/Venture_Capital_in_the_Middle_East_and_North_Africa_Report_Table_of_Contents?auto=download
Murray, G. C. (1992). A Challenging Marketplace For Venture Capital. Long Range Planning, 25(6), 79-86. https://doi.org/10.1016/0024-
6301(92)90173-y
Rahm, E., & Do, H. H. (2000). Data cleaning: Problems and current approaches. IEEE Data Eng. Bull., 23(4), 3-13.
Rind, K. W. (1981). The role of venture capital in corporate development. Strategic Management Journal, 2(2), 169-180.
Rossi, M. (2015). The role of venture capital funds in financing innovation in Italy. Constraints and challenges for innovative small firms.
International Journal of Globalisation and Small Business, 7(2), 162-180.
Sahlman, W. A. (1990). The structure and governance of venture-capital organizations. Journal of financial economics, 27(2), 473-521.
Samila, S., & Sorenson, O. (2011). Venture capital, entrepreneurship, and economic growth. The Review of Economics and Statistics,
93(1), 338-349.
ENTREPRENEURSHIP AND SUSTAINABILITY ISSUES
ISSN 2345-0282 (online) http://jssidoi.org/jesi/
2021 Volume 8 Number 3 (March)
http://doi.org/10.9770/jesi.2021.8.3(17)
301
Samuel, J. (2017). Global VC investment remains strong – mega deals lead the way. Retrieved from Retrieved from
https://home.kpmg.com/xx/en/home/media/press-releases/2017/10/global-vc-investment-strong-kpmg-venture-pulse-q3-2017.html
Scheela, W., & Chua, R. (2003). Venture capital in a Developing Country: the Case of the Philippines. Paper presented at the 7th
International Conference on Global Business and Economic Development, January
Scheela, W., & Van Dinh, N. (2004). Venture capital in a transition economy: The case of Vietnam. Venture Capital: An International
Journal of Entrepreneurial Finance, 6(4), 333-350.
Seoudi, I., & Mahmoud, S. (2016). Public Policy for Venture Capital: A Comparative Study of Emirates, Saudi Arabia and Egypt. Review
of Business & Finance Studies, 7(1), 19-42.
Tian, X. (2012). The role of venture capital syndication in value creation for entrepreneurial firms. Review of Finance, 16(1), 245-283.
Van Osnabrugge, M. (2000). A comparison of business angel and venture capitalist investment procedures: an agency theory-based
analysis. Venture Capital: An International Journal of Entrepreneurial Finance, 2(2), 91-109.
Xia, E. J., Liu, L. P., Yan, X. X. (2001). Orient Academic Forum, P., & Orient Academic Forum, P. A study on problems and
countermeasure of Venture Capital of China. https://file.scirp.org/pdf/18-1.8.12.pdf
Zhang, C. (2017). Venture capital investment trusts in China: legal framework, challenges, and reform. Trusts & Trustees, 23(7), 806-822.
https://doi.org/10.1093/tandt/ttx100
ENTREPRENEURSHIP AND SUSTAINABILITY ISSUES
ISSN 2345-0282 (online) http://jssidoi.org/jesi/
2021 Volume 8 Number 3 (March)
http://doi.org/10.9770/jesi.2021.8.3(17)
302
Dr. Kamran SIDDIQUI is an Associate Professor of Marketing and Entrepreneurship at the College of Business Administration, Imam
Abdulrahman Bin Faisal University, Saudi Arabia. Research interests: entrepreneurship, business incubators and accelerators,
entrepreneurial marketing, venture capital.
ORCID ID: 0000-0002-5724-0991
Dr. Mohammad EMAD AL-SHAIKH is an Assistant Professor of Entrepreneurship at College of Business Administration, Imam
Abdulrahman Bin Faisal University, Saudi Arabia. He is also head of the IAU entrepreneurship unit and business incubator. Research
interests: entrepreneurship, business incubators and accelerators, and entrepreneurial marketing
ORCID ID: 0000-0003-4545-3938
Dr. Ishtiaq Ahmed BAJWA is an Assistant Professor of Finance at College of Business Administration, Imam Abdulrahman Bin Faisal
University, Saudi Arabia. Research interests: entrepreneurial finance, venture capital, and fin-tech.
ORCID ID: 0000-0001-5296-0028
Omar ALENZI is a graduate student at the College of Business Administration, Imam Abdulrahman Bin Faisal University, Saudi Arabia.
ORCID ID: 0000-0001-6529-8264
Make your research more visible, join the Twitter account of ENTREPRENEURSHIP AND SUSTAINABILITY ISSUES:
@Entrepr69728810
Copyright © 2021 by author(s) and VsI Entrepreneurship and Sustainability Center
This work is licensed under the Creative Commons Attribution International License (CC BY).
http://creativecommons.org/licenses/by/4.0/
ENTREPRENEURSHIP AND SUSTAINABILITY ISSUES
ISSN 2345-0282 (online) http://jssidoi.org/jesi/
2021 Volume 8 Number 3 (March)
http://doi.org/10.9770/jesi.2021.8.3(18)
Publisher http://jssidoi.org/esc/home
291
ENHANCING RISK MANAGEMENT CULTURE FOR SUSTAINABLE GROWTH OF ASIA
COMMERCIAL BANK - ACB IN VIETNAM UNDER MIXED EFFECTS OF MACRO FACTORS
Le Dinh Hac 1, Dinh Tran Ngoc Huy 2, Nguyen Ngoc Thach 3, Bui Minh Chuyen4,
Pham Thi Hong Nhung 5, Tran Duc Thang 6, Tran Tuan Anh 7
1,3 Banking University HCMC, Ho Chi Minh city, Vietnam (corresponding)
2 MBA, Banking University HCMC, Ho Chi Minh city, Vietnam - International University of Japan, Japan (corresponding) 4 Institute of Financial Training, Vietnam
5 Academy of Finance, Vietnam 6 National Economics University (NEU), Vietnam
7 Thai Nguyen University of Economics and Business Administration (TUEBA), Vietnam
E-mails: 1 [email protected] ; [email protected] ; 3 [email protected] ; [email protected]; ; 5 [email protected] ; [email protected] ; [email protected]
Received 15 May 2020; accepted 11 January 2021; published 30 March 2021
Abstract. For sustainable growth, macro policy makers will need to look at risk management in banking industry and impacts of macro
factors on market risk in order to adjust policies and build risk management culture in banking system. What we need to adjust in trade
balance, risk free rate and other policies? This is one of reasons for us to conduct this study.This paper measures the Beta CAPM in famous
model under impacts of both macro internal and external variables during low inflation time 2015-2020 in the country. The evidence is the
fundamental role of risk management in commercial bank has been increasing with new perspectives in management, corporate governance
and risk management models. We will estimate effects in risk measurement of one of big listed Vietnam commercial bank, Asia
commercial bank (ACB) during the low inflation period 2015-2020 with semiannual data. Through using analysis, synthesis statistics
methods, and dialectical materialism method, combined with econometric model with 9 macro variables, we figure out that CPI has a
positive correlation with Beta CAPM of ACB, while Risk free rate (Rf) and lending rate have negative correlation with Beta CAPM of the
bank. It implies that increase in inflation, together with decrease in Rf and lending rate will increase market risk.Then, one of its major
findings is the suggestion of macro and risk management policies for bank and relevant government agencies. Our recommendation can be
used for reference and expand researches in many other emerging markets.
Keywords: market risk management; risk culture; beta CAPM; low inflation; banking industry; Vietnam, policy
Reference to this paper should be made as follows: Hac, L.D., Huy, D.T.N., Thach, N.N., Chuyen, B.M., Thang, T.D., Nhung, P.T.H.,
Thang, T.D., Anh, T.T. 2021. Enhancing Risk Management Culture for Sustainable Growth of Asia Commercial Bank -ACB in Vietnam
under Mixed Effects of Macro Factors. Entrepreneurship and Sustainability Issues, 10(3), 291-307.
http://doi.org/10.9770/jesi.2021.8.3(18)
JEL Classifications: M1, M21, G30
ENTREPRENEURSHIP AND SUSTAINABILITY ISSUES
ISSN 2345-0282 (online) http://jssidoi.org/jesi/
2021 Volume 8 Number 3 (March)
http://doi.org/10.9770/jesi.2021.8.3(18)
292
1. Introduction
Nowadays, under 4.0 industry and Basel impacts, Vietnam banks pay attention more to risk management,
especially perspectives in governance, management and risk models. This is the 1st reason we conduct this
research paper. Corporate culture can be defined as the set of values and standards of beliefs, behaviors,
perception and thinking methods that are recognized by everyone in the company, thinking and acting as a habit.
Corporate culture is like a person's personality and spiritual life, influencing its lifestyle and behavior. Building a
company culture determines the success, failure and long-term survival of each business. Hence, we can see risk
management culture will include perception and thinking methods relating to risk and risk management within the
firm.
This study will calculate and figure out not only inflation but other macro factors, both internal and external
indicators affecting the market risk level during the low inflation time (2015-2020). Asia Commercial Bank
(ACB) is one of big listed joint stock commercial bank in Vietnam, which achieved significant growth in past
years. Having endured heavy losses in 2012, the bank returned to positive growth on the first stage of the 2014-
2018 development roadmap, with particularly impressive figures in terms of total assets and profits. before tax
reported at the end of 2014. Phase two (2015-2016) focuses on building the bank's capacity when core values and
competencies are maintained and strengthened, in addition, product and service packages are tailored to each
segment. customers, more specifically to improve their competitiveness and better serve the target audience.
During this period, ACB's technology platform was also developed by gradually transforming the core system as
well as by deploying many IT applications into use. Organizational and operational restructuring is also being
implemented. The final phase, which starts in 2017 and will be completed in 2018, focuses on positioning ACB
once again as one of the top banks in Vietnam, especially through key metrics. including: customer satisfaction,
sustainable financial results, risk management, performance and business ethics.
Our research purpose:
We aim to provide recommendations, via an econometric model, for macro and risk management policies and for
building risk management culture at Vietnam commercial banks in order to prevent and control risks better in a
changing world with compounding impacts from Covid 19 and trade war. Our suggestion smight be references fro
other emerging markets.
We will structure the paper with introduction, research issues, literature review, conceptual theories and
methodology. Next is research findings/results. Then we present discussion and conclusion and policy suggestion.
2. Previous studies
2.1. Research questions
We will explore key matters as follow:
Question 1: What are impacts of internal and external macro variables s on market risk measurement of Asia
commercial bank (ACB)?
Question 2: What are risk management culture building plans for ACB to reduce potential risks?
There are hypotheses will be checked:Hypothesis 1: Beta CAPM of listed bank (ACB) will increase if inflation
increase and it will decrease if GDP growth increases.
Hypothesis 2: If exchange rate decreases (VND appreciation), beta CAPM will decrease.
ENTREPRENEURSHIP AND SUSTAINABILITY ISSUES
ISSN 2345-0282 (online) http://jssidoi.org/jesi/
2021 Volume 8 Number 3 (March)
http://doi.org/10.9770/jesi.2021.8.3(18)
293
Hypothesis 3: With the above reasons in Covid 19 and US-China commerce war and low inflation, Beta CAPM of
ACB will impose a high risk value or (>) 1.
2.2. Literature review
First, in 3 factor model, Fama and French (2004) mentioned stock return is affected by value and size. Then,
Anderson et al. (2005) pointed that beta value on stock exchange will change according to macro indicators such
as industrial manufacturing growth index and effects of macro factors large enough to be meaningful. Hojat
(2015) said since the outset of the industrial revolution, the equity market has played an instrumental role in the
progress of economic production. Singh et al (2010) revealed that exchange rate and GDP seem to affect returns
of all portfolios, while inflation rate, exchange rate, and money supply were having negative relationship with
returns for portfolios of big and medium companies. Tahmidi et al (2011) said net lending and net borrowing had
significant negative effect on market risk premium in Canada, whereas in Germany and Sweden the relationship
was not significant.
Next, Ohdner and Zachrison (2016) has presented research results showing that with Beta as risk measurement,
investors will demand higher return when holding higher beta stocks, on the announcement date of monetary
policies. Adhikari (2015) said based on cross-sectional approach it is revealed that size and profitability are
positively associated with the systemic risk, while the dividend payment is negatively related to the risk. The
results thus indicate that financial factors have significant predictive power for the systemic risk of a stock
investment in Nepal.
Then, Ahmad and Ramzan (2016) stated the macroeconomic factors have important concerns with stocks traded
in the stock market and these factors make investors to choose the stock because investors are interested to know
about the factors affecting the working of stock to manage their portfolios. Gay (2016) found no significant
relationship was found between respective exchange rate and oil price on the stock market index prices of either
BRIC country, this may be due to the influence other domestic and international macroeconomic factors on stock
market returns. Nawaz et al. (2017) said the consequences of 29 cement industries showed that there is a huge
relationship between industry size, operating efficiency, and profitability with 181 systematic risk and results
similar to past studies while liquidity and financial leverage have not a significant relationship with beta
(systematic risk). Puspitaningtyas (2017) said the financial information is measured in four accounting variables,
i.e. financial leverage, liquidity, profitability, and firm size.
Moreover, Curran and Velic (2018) took advantage of global data on stock prices and highly value CAPM model
compared to previous models. They show that in the countries with higher level of openness of financial markets,
fluctuation in exchange rate and bigger size of economy receive higher systematic covariance. Also there is
negative correlation between world reserves and systematic risk. Kola et al (2018) used factors affecting bank
profitability such as bank internal factors, industry, and macroeconomic (external) factors. Klimontowiz (2019)
provided direction for banks' decision makers concerning innovativeness' factors that should be taken into account
in the process of building competitive advantage and sustainable market performance. Sadeghzadeh (2018) found
increases of on current ratio, on the ratio of equity capital ratio to tangible assets, on the ratio of own capital to
assets, on accounts receivables turnover rate, net profits, on the ratio of equity, the marketing values of
companies, on the ratio of book value increased share earnings in a short term and increases of on the ratio of debt
to tangible assets and asset turnover decreased share earnings in a short term significantly. Siregar and D. (2019)
showed that there is difference of systematic factors influence to stock return in three observation period.
Increased market risk and economic growth, increase stock returns. Tahir et al. (2020) found higher availability of
private credit in the host country results in lower dividend repatriation. Huy et al. (2020) show that the increase in
GDP growth and lending rate and risk free rate has a significant effect on increasing VCB stock price with the
highest impact coefficient, the second is decreasing the exchange rate, finally is a slight decrease in S&P500.
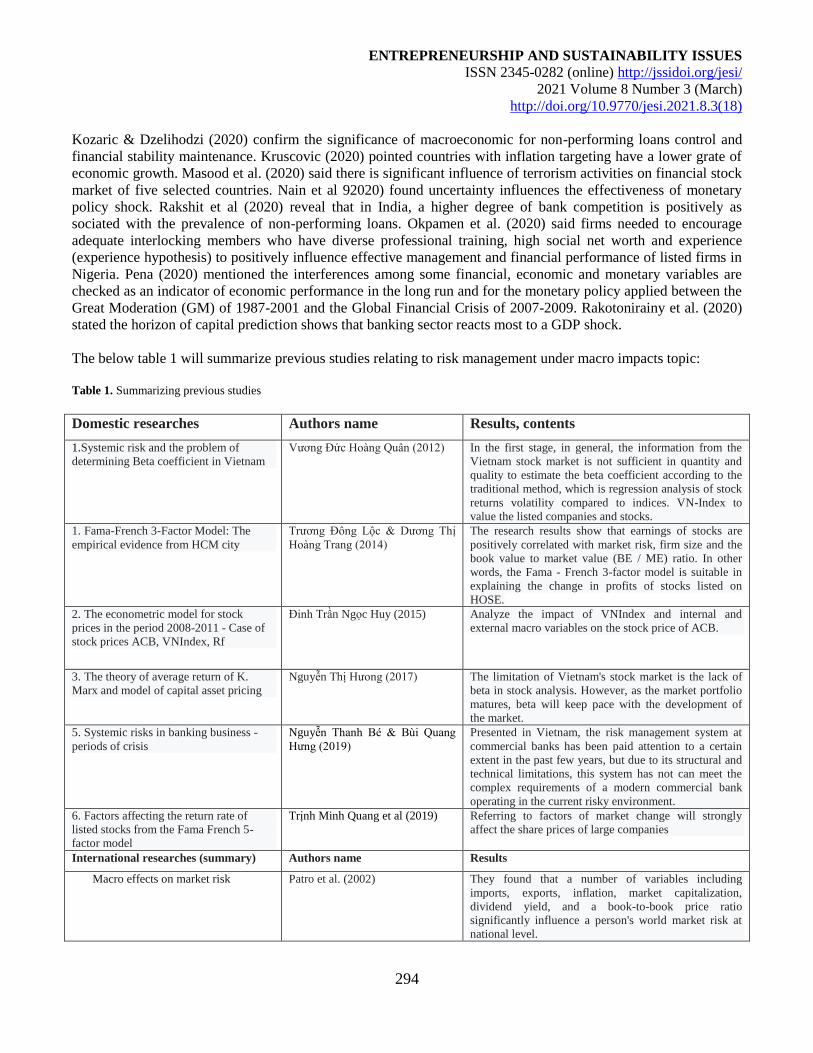
ENTREPRENEURSHIP AND SUSTAINABILITY ISSUES
ISSN 2345-0282 (online) http://jssidoi.org/jesi/
2021 Volume 8 Number 3 (March)
http://doi.org/10.9770/jesi.2021.8.3(18)
294
Kozaric & Dzelihodzi (2020) confirm the significance of macroeconomic for non-performing loans control and
financial stability maintenance. Kruscovic (2020) pointed countries with inflation targeting have a lower grate of
economic growth. Masood et al. (2020) said there is significant influence of terrorism activities on financial stock
market of five selected countries. Nain et al 92020) found uncertainty influences the effectiveness of monetary
policy shock. Rakshit et al (2020) reveal that in India, a higher degree of bank competition is positively as
sociated with the prevalence of non-performing loans. Okpamen et al. (2020) said firms needed to encourage
adequate interlocking members who have diverse professional training, high social net worth and experience
(experience hypothesis) to positively influence effective management and financial performance of listed firms in
Nigeria. Pena (2020) mentioned the interferences among some financial, economic and monetary variables are
checked as an indicator of economic performance in the long run and for the monetary policy applied between the
Great Moderation (GM) of 1987-2001 and the Global Financial Crisis of 2007-2009. Rakotonirainy et al. (2020)
stated the horizon of capital prediction shows that banking sector reacts most to a GDP shock.
The below table 1 will summarize previous studies relating to risk management under macro impacts topic:
Table 1. Summarizing previous studies
Domestic researches Authors name Results, contents
1.Systemic risk and the problem of
determining Beta coefficient in Vietnam
Vương Đức Hoàng Quân (2012) In the first stage, in general, the information from the
Vietnam stock market is not sufficient in quantity and
quality to estimate the beta coefficient according to the
traditional method, which is regression analysis of stock
returns volatility compared to indices. VN-Index to
value the listed companies and stocks.
1. Fama-French 3-Factor Model: The
empirical evidence from HCM city
Trương Đông Lộc & Dương Thị
Hoàng Trang (2014)
The research results show that earnings of stocks are
positively correlated with market risk, firm size and the
book value to market value (BE / ME) ratio. In other
words, the Fama - French 3-factor model is suitable in
explaining the change in profits of stocks listed on
HOSE.
2. The econometric model for stock
prices in the period 2008-2011 - Case of
stock prices ACB, VNIndex, Rf
Đinh Trần Ngọc Huy (2015) Analyze the impact of VNIndex and internal and
external macro variables on the stock price of ACB.
3. The theory of average return of K.
Marx and model of capital asset pricing
Nguyễn Thị Hưong (2017) The limitation of Vietnam's stock market is the lack of
beta in stock analysis. However, as the market portfolio
matures, beta will keep pace with the development of
the market.
5. Systemic risks in banking business -
periods of crisis
Nguyễn Thanh Bé & Bùi Quang
Hưng (2019)
Presented in Vietnam, the risk management system at
commercial banks has been paid attention to a certain
extent in the past few years, but due to its structural and
technical limitations, this system has not can meet the
complex requirements of a modern commercial bank
operating in the current risky environment.
6. Factors affecting the return rate of
listed stocks from the Fama French 5-
factor model
Trịnh Minh Quang et al (2019) Referring to factors of market change will strongly
affect the share prices of large companies
International researches (summary) Authors name Results
1. Macro effects on market risk Patro et al. (2002) They found that a number of variables including
imports, exports, inflation, market capitalization,
dividend yield, and a book-to-book price ratio
significantly influence a person's world market risk at
national level.
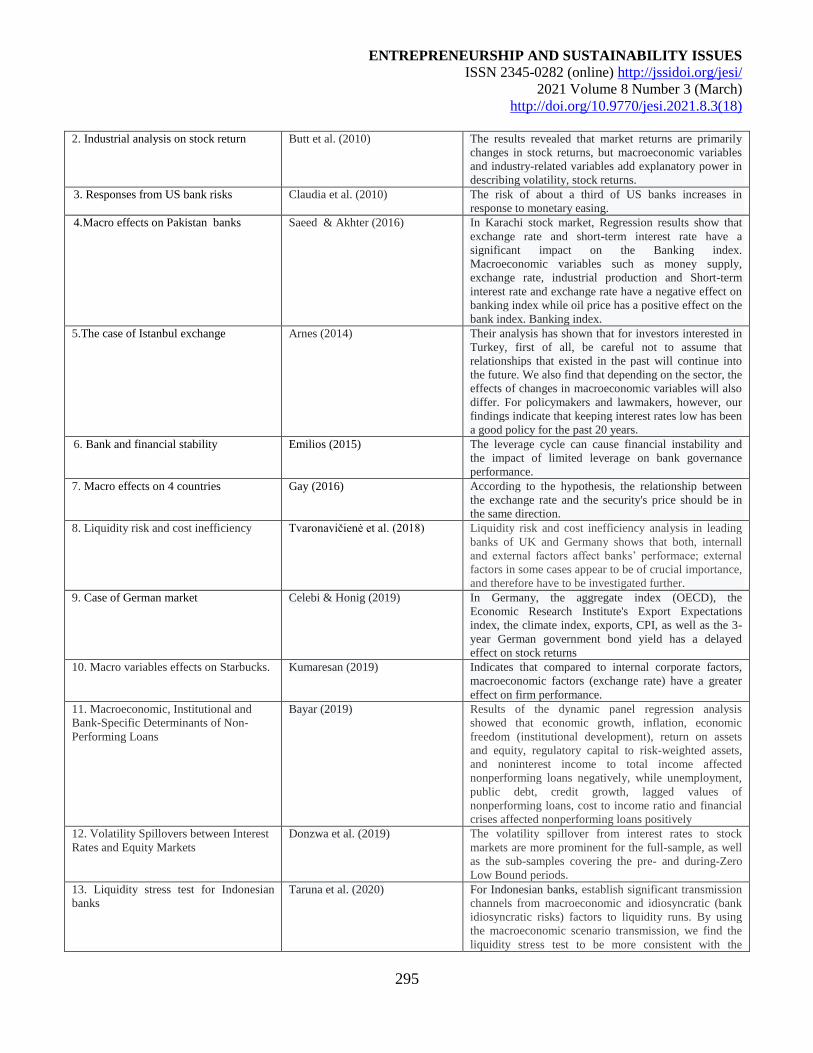
ENTREPRENEURSHIP AND SUSTAINABILITY ISSUES
ISSN 2345-0282 (online) http://jssidoi.org/jesi/
2021 Volume 8 Number 3 (March)
http://doi.org/10.9770/jesi.2021.8.3(18)
295
2. Industrial analysis on stock return Butt et al. (2010) The results revealed that market returns are primarily
changes in stock returns, but macroeconomic variables
and industry-related variables add explanatory power in
describing volatility, stock returns.
3. Responses from US bank risks Claudia et al. (2010) The risk of about a third of US banks increases in
response to monetary easing.
4.Macro effects on Pakistan banks Saeed & Akhter (2016) In Karachi stock market, Regression results show that
exchange rate and short-term interest rate have a
significant impact on the Banking index.
Macroeconomic variables such as money supply,
exchange rate, industrial production and Short-term
interest rate and exchange rate have a negative effect on
banking index while oil price has a positive effect on the
bank index. Banking index.
5.The case of Istanbul exchange Arnes (2014) Their analysis has shown that for investors interested in
Turkey, first of all, be careful not to assume that
relationships that existed in the past will continue into
the future. We also find that depending on the sector, the
effects of changes in macroeconomic variables will also
differ. For policymakers and lawmakers, however, our
findings indicate that keeping interest rates low has been
a good policy for the past 20 years.
6. Bank and financial stability Emilios (2015) The leverage cycle can cause financial instability and
the impact of limited leverage on bank governance
performance.
7. Macro effects on 4 countries Gay (2016) According to the hypothesis, the relationship between
the exchange rate and the security's price should be in
the same direction.
8. Liquidity risk and cost inefficiency Tvaronavičienė et al. (2018) Liquidity risk and cost inefficiency analysis in leading
banks of UK and Germany shows that both, internall
and external factors affect banks’ performace; external
factors in some cases appear to be of crucial importance,
and therefore have to be investigated further.
9. Case of German market Celebi & Honig (2019) In Germany, the aggregate index (OECD), the
Economic Research Institute's Export Expectations
index, the climate index, exports, CPI, as well as the 3-
year German government bond yield has a delayed
effect on stock returns
10. Macro variables effects on Starbucks. Kumaresan (2019) Indicates that compared to internal corporate factors,
macroeconomic factors (exchange rate) have a greater
effect on firm performance.
11. Macroeconomic, Institutional and
Bank-Specific Determinants of Non-
Performing Loans
Bayar (2019) Results of the dynamic panel regression analysis
showed that economic growth, inflation, economic
freedom (institutional development), return on assets
and equity, regulatory capital to risk-weighted assets,
and noninterest income to total income affected
nonperforming loans negatively, while unemployment,
public debt, credit growth, lagged values of
nonperforming loans, cost to income ratio and financial
crises affected nonperforming loans positively
12. Volatility Spillovers between Interest
Rates and Equity Markets
Donzwa et al. (2019) The volatility spillover from interest rates to stock
markets are more prominent for the full-sample, as well
as the sub-samples covering the pre- and during-Zero
Low Bound periods.
13. Liquidity stress test for Indonesian
banks
Taruna et al. (2020) For Indonesian banks, establish significant transmission
channels from macroeconomic and idiosyncratic (bank
idiosyncratic risks) factors to liquidity runs. By using
the macroeconomic scenario transmission, we find the
liquidity stress test to be more consistent with the
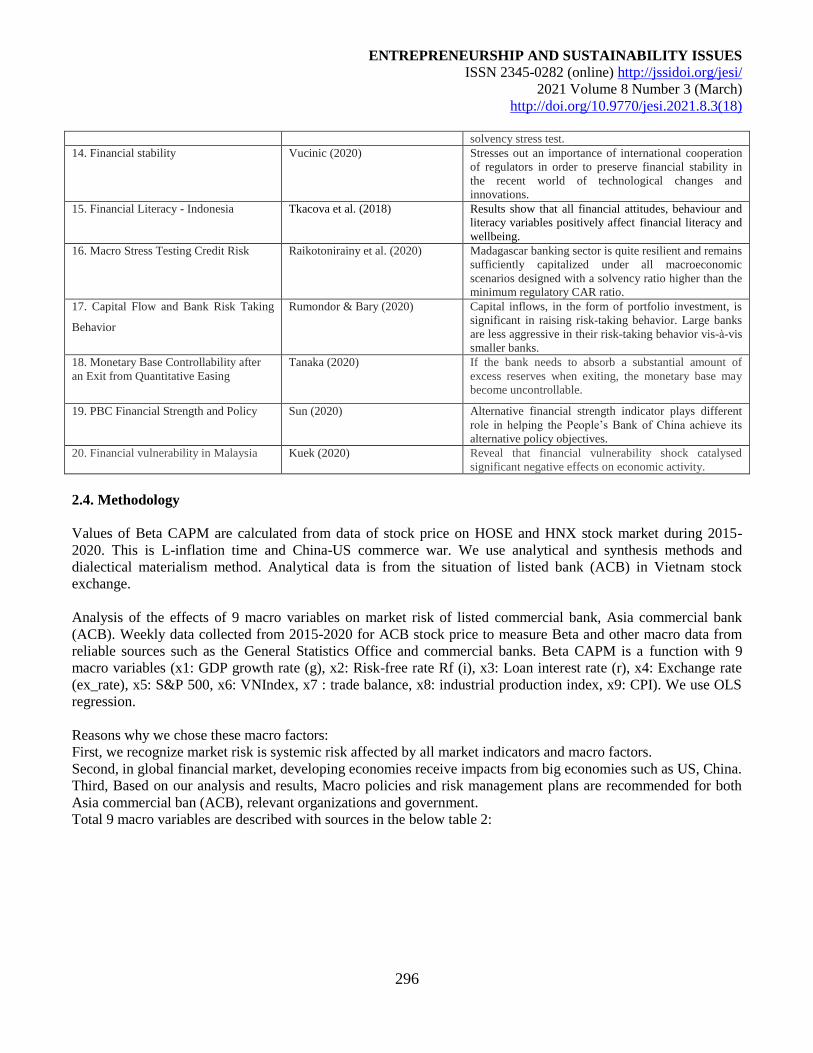
ENTREPRENEURSHIP AND SUSTAINABILITY ISSUES
ISSN 2345-0282 (online) http://jssidoi.org/jesi/
2021 Volume 8 Number 3 (March)
http://doi.org/10.9770/jesi.2021.8.3(18)
296
solvency stress test.
14. Financial stability Vucinic (2020) Stresses out an importance of international cooperation
of regulators in order to preserve financial stability in
the recent world of technological changes and
innovations.
15. Financial Literacy - Indonesia Tkacova et al. (2018) Results show that all financial attitudes, behaviour and
literacy variables positively affect financial literacy and
wellbeing.
16. Macro Stress Testing Credit Risk Raikotonirainy et al. (2020) Madagascar banking sector is quite resilient and remains
sufficiently capitalized under all macroeconomic
scenarios designed with a solvency ratio higher than the
minimum regulatory CAR ratio.
17. Capital Flow and Bank Risk Taking
Behavior
Rumondor & Bary (2020) Capital inflows, in the form of portfolio investment, is
significant in raising risk-taking behavior. Large banks
are less aggressive in their risk-taking behavior vis-à-vis
smaller banks.
18. Monetary Base Controllability after
an Exit from Quantitative Easing
Tanaka (2020) If the bank needs to absorb a substantial amount of
excess reserves when exiting, the monetary base may
become uncontrollable.
19. PBC Financial Strength and Policy Sun (2020) Alternative financial strength indicator plays different
role in helping the People’s Bank of China achieve its
alternative policy objectives.
20. Financial vulnerability in Malaysia Kuek (2020) Reveal that financial vulnerability shock catalysed
significant negative effects on economic activity.
2.4. Methodology
Values of Beta CAPM are calculated from data of stock price on HOSE and HNX stock market during 2015-
2020. This is L-inflation time and China-US commerce war. We use analytical and synthesis methods and
dialectical materialism method. Analytical data is from the situation of listed bank (ACB) in Vietnam stock
exchange.
Analysis of the effects of 9 macro variables on market risk of listed commercial bank, Asia commercial bank
(ACB). Weekly data collected from 2015-2020 for ACB stock price to measure Beta and other macro data from
reliable sources such as the General Statistics Office and commercial banks. Beta CAPM is a function with 9
macro variables (x1: GDP growth rate (g), x2: Risk-free rate Rf (i), x3: Loan interest rate (r), x4: Exchange rate
(ex_rate), x5: S&P 500, x6: VNIndex, x7 : trade balance, x8: industrial production index, x9: CPI). We use OLS
regression.
Reasons why we chose these macro factors:
First, we recognize market risk is systemic risk affected by all market indicators and macro factors.
Second, in global financial market, developing economies receive impacts from big economies such as US, China.
Third, Based on our analysis and results, Macro policies and risk management plans are recommended for both
Asia commercial ban (ACB), relevant organizations and government.
Total 9 macro variables are described with sources in the below table 2:
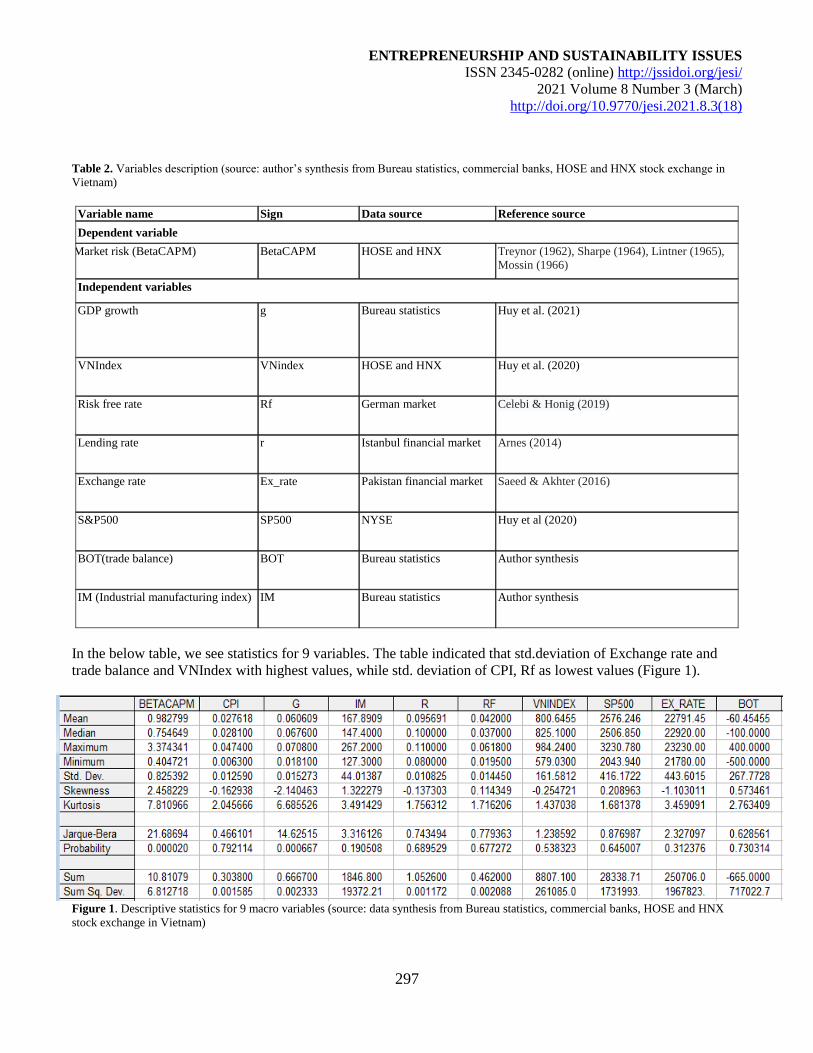
ENTREPRENEURSHIP AND SUSTAINABILITY ISSUES
ISSN 2345-0282 (online) http://jssidoi.org/jesi/
2021 Volume 8 Number 3 (March)
http://doi.org/10.9770/jesi.2021.8.3(18)
297
Table 2. Variables description (source: author’s synthesis from Bureau statistics, commercial banks, HOSE and HNX stock exchange in
Vietnam)
Variable name Sign Data source Reference source
Dependent variable
Market risk (BetaCAPM) BetaCAPM HOSE and HNX Treynor (1962), Sharpe (1964), Lintner (1965),
Mossin (1966)
Independent variables
GDP growth g Bureau statistics Huy et al. (2021)
VNIndex VNindex HOSE and HNX Huy et al. (2020)
Risk free rate Rf German market Celebi & Honig (2019)
Lending rate r Istanbul financial market Arnes (2014)
Exchange rate Ex_rate Pakistan financial market Saeed & Akhter (2016)
S&P500 SP500 NYSE Huy et al (2020)
BOT(trade balance) BOT Bureau statistics Author synthesis
IM (Industrial manufacturing index) IM Bureau statistics Author synthesis
In the below table, we see statistics for 9 variables. The table indicated that std.deviation of Exchange rate and
trade balance and VNIndex with highest values, while std. deviation of CPI, Rf as lowest values (Figure 1).
Figure 1. Descriptive statistics for 9 macro variables (source: data synthesis from Bureau statistics, commercial banks, HOSE and HNX
stock exchange in Vietnam)
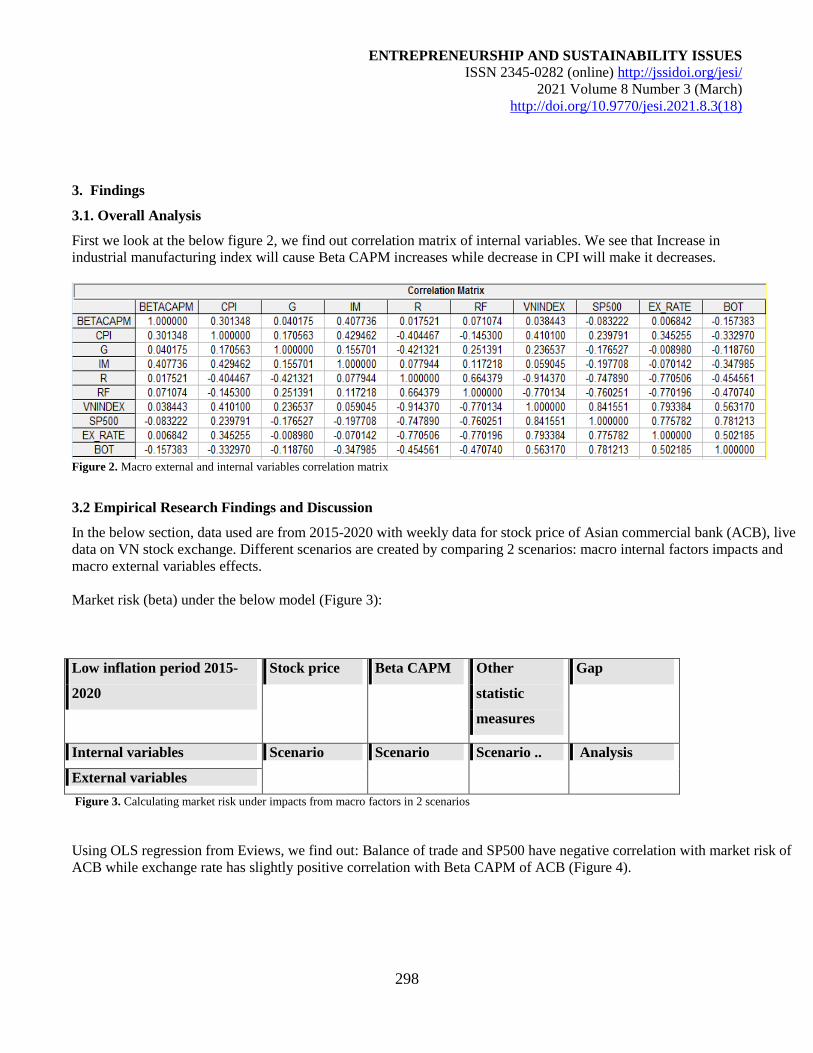
ENTREPRENEURSHIP AND SUSTAINABILITY ISSUES
ISSN 2345-0282 (online) http://jssidoi.org/jesi/
2021 Volume 8 Number 3 (March)
http://doi.org/10.9770/jesi.2021.8.3(18)
298
3. Findings
3.1. Overall Analysis
First we look at the below figure 2, we find out correlation matrix of internal variables. We see that Increase in
industrial manufacturing index will cause Beta CAPM increases while decrease in CPI will make it decreases.
Figure 2. Macro external and internal variables correlation matrix
3.2 Empirical Research Findings and Discussion
In the below section, data used are from 2015-2020 with weekly data for stock price of Asian commercial bank (ACB), live
data on VN stock exchange. Different scenarios are created by comparing 2 scenarios: macro internal factors impacts and
macro external variables effects.
Market risk (beta) under the below model (Figure 3):
Low inflation period 2015-
2020
Stock price Beta CAPM Other
statistic
measures
Gap
Internal variables Scenario Scenario Scenario .. Analysis
External variables
Figure 3. Calculating market risk under impacts from macro factors in 2 scenarios
Using OLS regression from Eviews, we find out: Balance of trade and SP500 have negative correlation with market risk of
ACB while exchange rate has slightly positive correlation with Beta CAPM of ACB (Figure 4).
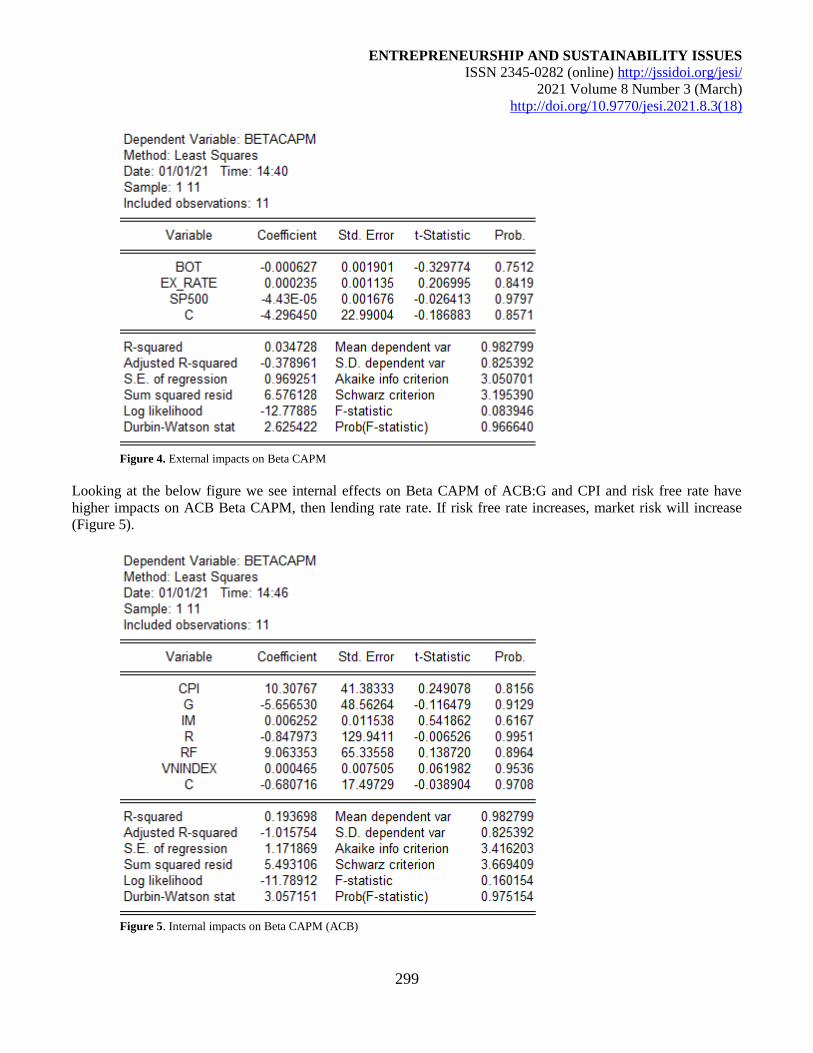
ENTREPRENEURSHIP AND SUSTAINABILITY ISSUES
ISSN 2345-0282 (online) http://jssidoi.org/jesi/
2021 Volume 8 Number 3 (March)
http://doi.org/10.9770/jesi.2021.8.3(18)
299
Figure 4. External impacts on Beta CAPM
Looking at the below figure we see internal effects on Beta CAPM of ACB:G and CPI and risk free rate have
higher impacts on ACB Beta CAPM, then lending rate rate. If risk free rate increases, market risk will increase
(Figure 5).
Figure 5. Internal impacts on Beta CAPM (ACB)
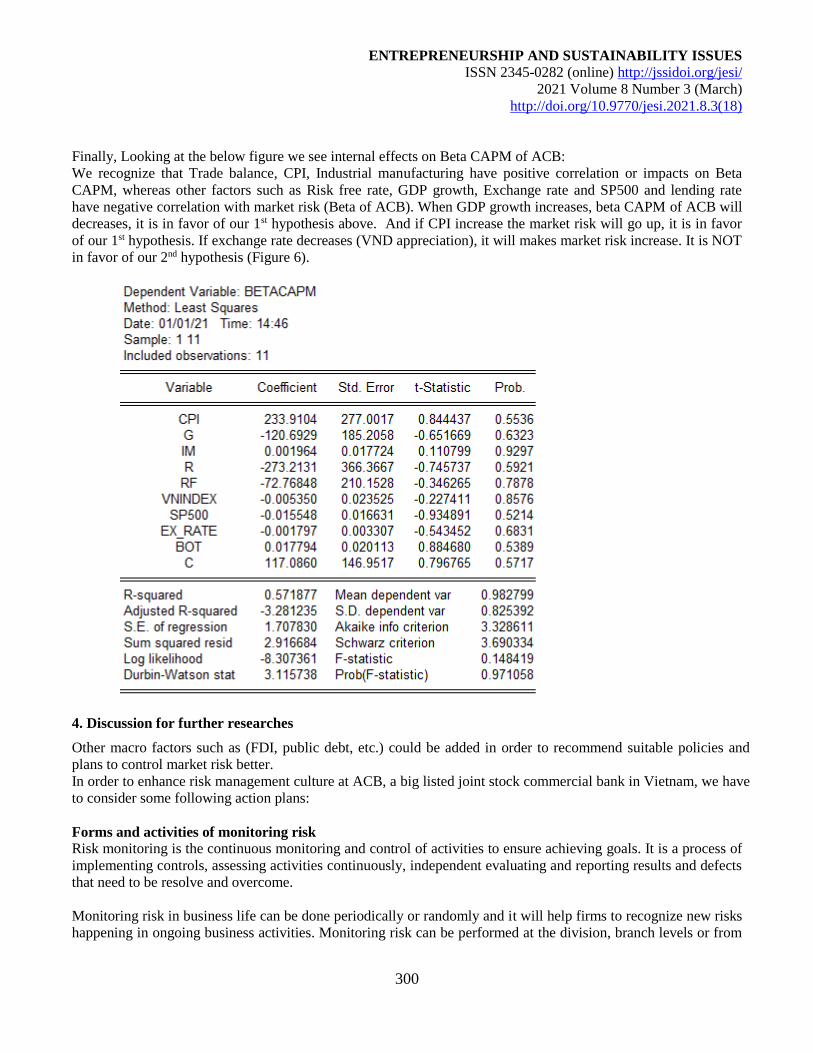
ENTREPRENEURSHIP AND SUSTAINABILITY ISSUES
ISSN 2345-0282 (online) http://jssidoi.org/jesi/
2021 Volume 8 Number 3 (March)
http://doi.org/10.9770/jesi.2021.8.3(18)
300
Finally, Looking at the below figure we see internal effects on Beta CAPM of ACB:
We recognize that Trade balance, CPI, Industrial manufacturing have positive correlation or impacts on Beta
CAPM, whereas other factors such as Risk free rate, GDP growth, Exchange rate and SP500 and lending rate
have negative correlation with market risk (Beta of ACB). When GDP growth increases, beta CAPM of ACB will
decreases, it is in favor of our 1st hypothesis above. And if CPI increase the market risk will go up, it is in favor
of our 1st hypothesis. If exchange rate decreases (VND appreciation), it will makes market risk increase. It is NOT
in favor of our 2nd hypothesis (Figure 6).
4. Discussion for further researches
Other macro factors such as (FDI, public debt, etc.) could be added in order to recommend suitable policies and
plans to control market risk better.
In order to enhance risk management culture at ACB, a big listed joint stock commercial bank in Vietnam, we have
to consider some following action plans:
Forms and activities of monitoring risk
Risk monitoring is the continuous monitoring and control of activities to ensure achieving goals. It is a process of
implementing controls, assessing activities continuously, independent evaluating and reporting results and defects
that need to be resolve and overcome.
Monitoring risk in business life can be done periodically or randomly and it will help firms to recognize new risks
happening in ongoing business activities. Monitoring risk can be performed at the division, branch levels or from
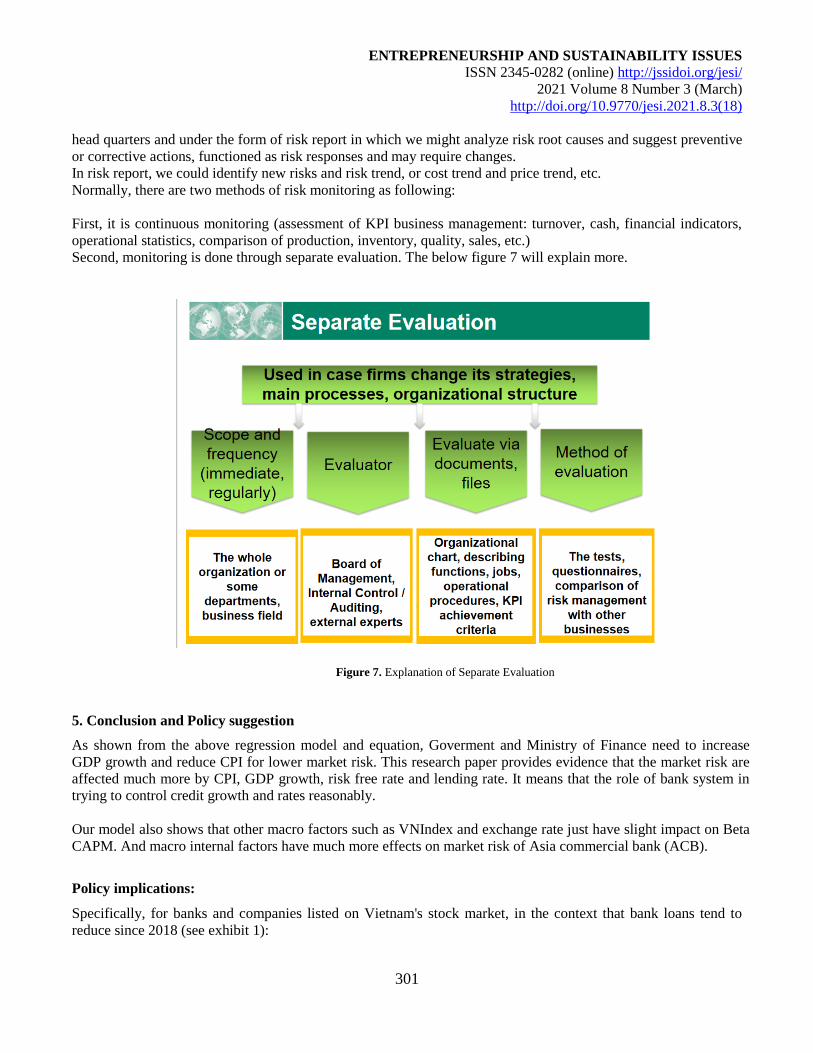
ENTREPRENEURSHIP AND SUSTAINABILITY ISSUES
ISSN 2345-0282 (online) http://jssidoi.org/jesi/
2021 Volume 8 Number 3 (March)
http://doi.org/10.9770/jesi.2021.8.3(18)
301
head quarters and under the form of risk report in which we might analyze risk root causes and suggest preventive
or corrective actions, functioned as risk responses and may require changes.
In risk report, we could identify new risks and risk trend, or cost trend and price trend, etc.
Normally, there are two methods of risk monitoring as following:
First, it is continuous monitoring (assessment of KPI business management: turnover, cash, financial indicators,
operational statistics, comparison of production, inventory, quality, sales, etc.)
Second, monitoring is done through separate evaluation. The below figure 7 will explain more.
Figure 7. Explanation of Separate Evaluation
5. Conclusion and Policy suggestion
As shown from the above regression model and equation, Goverment and Ministry of Finance need to increase
GDP growth and reduce CPI for lower market risk. This research paper provides evidence that the market risk are
affected much more by CPI, GDP growth, risk free rate and lending rate. It means that the role of bank system in
trying to control credit growth and rates reasonably.
Our model also shows that other macro factors such as VNIndex and exchange rate just have slight impact on Beta
CAPM. And macro internal factors have much more effects on market risk of Asia commercial bank (ACB).
Policy implications:
Specifically, for banks and companies listed on Vietnam's stock market, in the context that bank loans tend to
reduce since 2018 (see exhibit 1):
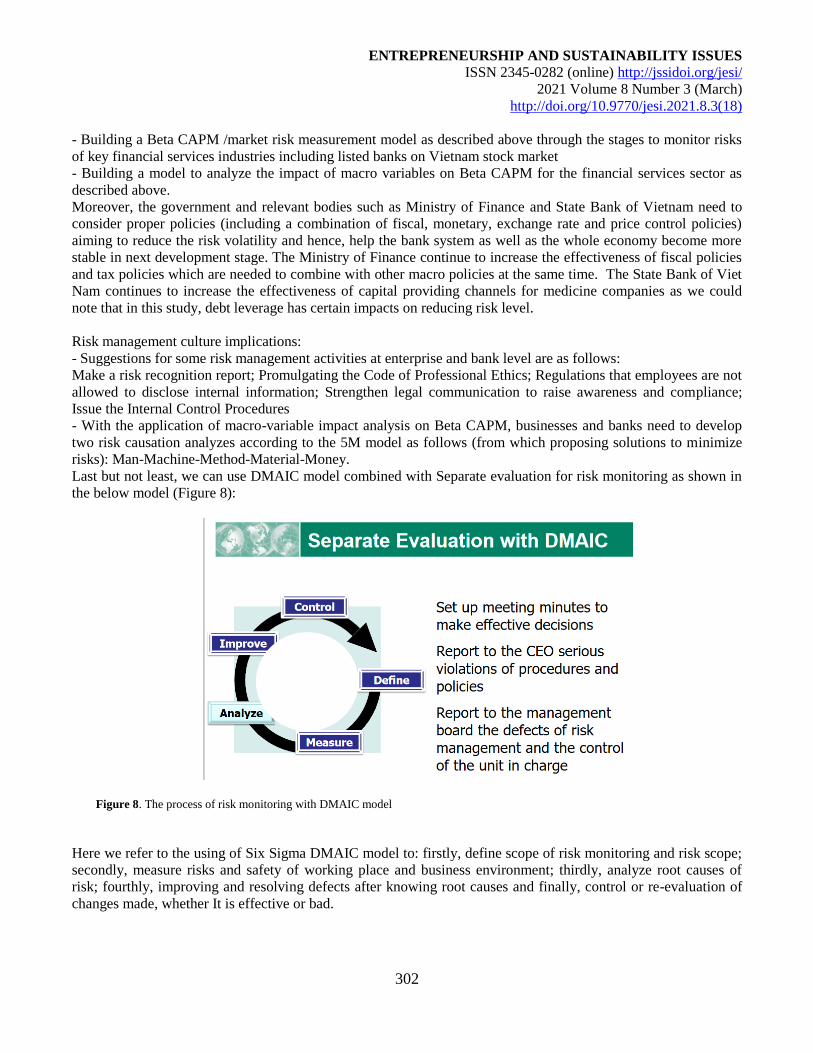
ENTREPRENEURSHIP AND SUSTAINABILITY ISSUES
ISSN 2345-0282 (online) http://jssidoi.org/jesi/
2021 Volume 8 Number 3 (March)
http://doi.org/10.9770/jesi.2021.8.3(18)
302
- Building a Beta CAPM /market risk measurement model as described above through the stages to monitor risks
of key financial services industries including listed banks on Vietnam stock market
- Building a model to analyze the impact of macro variables on Beta CAPM for the financial services sector as
described above.
Moreover, the government and relevant bodies such as Ministry of Finance and State Bank of Vietnam need to
consider proper policies (including a combination of fiscal, monetary, exchange rate and price control policies)
aiming to reduce the risk volatility and hence, help the bank system as well as the whole economy become more
stable in next development stage. The Ministry of Finance continue to increase the effectiveness of fiscal policies
and tax policies which are needed to combine with other macro policies at the same time. The State Bank of Viet
Nam continues to increase the effectiveness of capital providing channels for medicine companies as we could
note that in this study, debt leverage has certain impacts on reducing risk level.
Risk management culture implications:
- Suggestions for some risk management activities at enterprise and bank level are as follows:
Make a risk recognition report; Promulgating the Code of Professional Ethics; Regulations that employees are not
allowed to disclose internal information; Strengthen legal communication to raise awareness and compliance;
Issue the Internal Control Procedures
- With the application of macro-variable impact analysis on Beta CAPM, businesses and banks need to develop
two risk causation analyzes according to the 5M model as follows (from which proposing solutions to minimize
risks): Man-Machine-Method-Material-Money.
Last but not least, we can use DMAIC model combined with Separate evaluation for risk monitoring as shown in
the below model (Figure 8):
Figure 8. The process of risk monitoring with DMAIC model
Here we refer to the using of Six Sigma DMAIC model to: firstly, define scope of risk monitoring and risk scope;
secondly, measure risks and safety of working place and business environment; thirdly, analyze root causes of
risk; fourthly, improving and resolving defects after knowing root causes and finally, control or re-evaluation of
changes made, whether It is effective or bad.
ENTREPRENEURSHIP AND SUSTAINABILITY ISSUES
ISSN 2345-0282 (online) http://jssidoi.org/jesi/
2021 Volume 8 Number 3 (March)
http://doi.org/10.9770/jesi.2021.8.3(18)
303
The role of risk monitoring is presented through risk assessment results sharing, coordination and communication
and from that, we could propose proper risk responses and build trust.
Limitation of the research:
Finally, this study opens some new directions for further researches in risk control policies in medicine system as
well as in the whole economy. We also can add other factors such as public debt into our model for expanding
research. Even we can expand our research model for other Vietnam industries as well as in other emerging
markets and all over the world.
References
Adhikari. N. (2015). Determinants of Systemic Risk for Companies Listed on Nepal Stock Exchange. Global Journal of Management and
Business Research: Finance, 15(5), 75-83.
Ahmad, N., & Ramzan, M. (2016). Stock Market Volatility and Macroeconomic Factor Volatility. International Journal of Research in
Business Studies and Management, 3(7), 37-44.
Andersen, T.G., Bollerslev, T., Diebold, F.X., & Wu, J. (2005). A Framework for Exploring the Macroeconomic Determinants of
Systematic Risk. Financial Economics. Macroeconomics, and Econometrics, 95(2), 398-404.
Anwar, S. (2020). Weighting on Systemic Important Banking (SIB) in Indonesia: The Official Versus PCA Approaches. Journal of Central
Banking Theory and Practice, 9(2), 155-182.
Arnes, S.K. (2014). Impact of Macroeconomic Indicators on Stock Market Performance: The Case of The Istanbul Stock Exchange. Master
Thesis, Copenhagen Business School. Retrieved from: https://research-api.cbs.dk/ws/portalfiles/portal/58450158/sibel_arnes.pdf
Bayar, Y. (2020). Macroeconomic, Institutional and Bank-Specific Determinants of Non-Performing Loans in Emerging Market
Economies: A Dynamic Panel Regression Analysis. Journal of Central Banking Theory and Practice, 9(2), 95-110.
Be, N.T, & Hung, B.Q. (2019). Sytematic risk in banking in stages of crisis, Finance Journal. Retrieved from: http://tapchitaichinh.vn/ngan-
hang/rui-ro-he-thong-trong-hoat-dong-kinh-doanh-ngan-hang-o-cac-giai-doan-khung-hoang-302120.html
Bohachova, O. (2008). The Impact of Macroeconomic Factors on Risks in the Banking Sector: A Cross-Country Empirical Assessment.
IAW Discussion Papers 44, Institut für Angewandte Wirtschaftsforschung (IAW).
Bowman, R.G. (1979). The Theoretical Relationship between Systematic Risk and Financial (Accounting) Variables. The Journal of
Finance, 34(3), 617-630.
Butt, B.Z., & Rehman, K.U. (2010). Do economic factors influence stock returns? A firm and industry level analysis. African Journal of
Business Management, 4(5), 583-593.
Celebi, K., & Honig, M. (2019). The Impact of Macroeconomic Factors on the German Stock Market: Evidence for the Crisis, Pre- and
Post-Crisis Periods. International Journal of Financial Studies, 7(18). https://doi.org/10.3390/ijfs7020018
Claudia, M.P., Sandra, E., & Esteban, P. (2010). Macroeconomic factors and micro-level bank risk. Discussion Paper Series 1: Economic
Studies No 20/2010.
Curran, M., & Velic, A. (2018). The CAPM, National Stock Market Betas, and Macroeconomic Covariates: A Global Analysis'. Trinity
Economics Papers 0618, Trinity College Dublin, Department of Economics.
Donzwa, W., Gupta, R., & Woha, M.E. (2020). Volatility Spillovers between Interest Rates and Equity Markets of Developed Economies.
Journal of Central Banking Theory and Practice, 9(2), 39-50.
Emilios, A. 2015. Bank Leverage Ratios and Financial Stability: A Micro- and Macroprudential Perspective, Working Paper No.849, Levy
Economics Institute.
ENTREPRENEURSHIP AND SUSTAINABILITY ISSUES
ISSN 2345-0282 (online) http://jssidoi.org/jesi/
2021 Volume 8 Number 3 (March)
http://doi.org/10.9770/jesi.2021.8.3(18)
304
Ercegovac, R., Pecaric, M., & Klincac, I. (2020). Bank Risk Profiles and Business Model Characteristics. Journal of Central Banking
Theory and Practice, 9(3), 107-121.
Eugene, F.F, & French, K.R. (2004). The Capital Asset Pricing Model: Theory and Evidence. Journal of Economic Perspectives, 18(3), 25-
46. https://doi.org/10.1257/0895330042162430
Gay, R.D. (2016). Effect Of Macroeconomic Variables On Stock Market Returns For Four Emerging Economies: Brazil, Russia, India,
And China. International Business & Economics Research Journal, 15(3)
Gocer, I., & Ongan, S. (2020). The Relationship between Inflation and Interest Rates in the UK: The Nonlinear ARDL Approach. Journal
of Central Banking Theory and Practice, 9(3), 77-86.
Gizycki, M. (2001). The Effect of Macroeconomic Conditions on Bank Risks and Profitability. Research Discussion Paper 2001-06,
System Stability Department Reserve Bank of Australia. Retrieved from: https://www.rba.gov.au/publications/rdp/2001/pdf/rdp2001-
06.pdf
Hojat, S. (2015). The Impact of Monetary Policy on the Stock Market, Doctoral dissertation, Walden University. Retrieved from:
https://scholarworks.waldenu.edu/cgi/viewcontent.cgi?article=2602&context=dissertations
Hanif, M.N., Iqbal, J., Ali, S.H., & Salam, M.A. (2020). Denoised Inflation: A New Measure of Core Inflation. Journal of Central Banking
Theory and Practice, 9(2), 131-154.
Harjito, D. A., Mohamed, Z., Mohamed, N., & Zainudin, Z. (2020). Bringing various dimensions of credit of ASEAN countries for
scrutiny: implications on sustainable economic growth. Journal of Security and Sustainability Issues, 10(Oct), 338-348.
https://doi.org/10.9770/jssi.2020.10.Oct(27)
Huey-Yeh, L., Nuraeni, H.F., & Meihua, K. (2016). The Impact of Macroeconomic Factors on Credit Risk in Conventional Banks and
Islamic Banks: Evidence from Indonesia. International Journal of Financial Research, 7(4).
Huong, N.T. (2017). Average rate of return theory of K. Marx and CAPM model. Finane Journal http://tapchitaichinh.vn/nghien-cuu-
traodoi/ly-thuyet-ty-suat-loi-nhuan-binh-quan-cua-k-marx-va-mo-hinh-dinh-gia-tai-san-von-132532.html
Huy, D.T.N., Dat, P. M., & Anh, P. T. (2020). Building and econometric model of selected factors’ impact on stock price: a case study.
Journal of Security and Sustainability Issues, 9(M), 77-93. https://doi.org/10.9770/jssi.2020.9.M(7)
Huy, D.T.N., Nhan V.K., Bich N.T.N., Hong N.T.P., Chung N.T., & Huy P.Q. (2021). Impacts of Internal and External Macroeconomic
Factors on Firm Stock Price in an Expansion Econometric model—A Case in Vietnam Real Estate Industry. Data Science for Financial
Econometrics-Studies in Computational Intelligence, 898, Springer. http://doi-org-443.webvpn.fjmu.edu.cn/10.1007/978-3-030-48853-
6_14
Kola, F., Gzipali, A., & Sula, E. (2020). Commercial Bank Performance and Credit Risk in Albania, Journal of Central Banking Theory
and Practice, 9 (2), 161-177.
Kozaric, K., & Dzelihodzic, E.Z. (2020). Effects of Macroeconomic Environment on Non-Performing Loans and Financial Stability: Case
of Bosnia and Herzegovina. Journal of Central Banking Theory and Practice, 9(2), 5-17.
Kruscovic, B. (2020). Exchange Rate Targeting Versus Inflation Targeting: Empirical Analysis of the Impact on Employment and
Economic Growth, Journal of Central Banking Theory and Practice, 9(2), 67-85.
Kuek, T.H., Puah, C.H., & Arip, M.A. (2020). Financial Vulnerability and Economic Dynamics in Malaysia, Journal of Central Banking
Theory and Practice, 9 (s1), 55-73.
Kumaresan, R. (2019). The Effects of Macroeconomics Factors towards the Starbucks Corporation, MPRA Paper No. 97243. Retrieved
from: https://mpra.ub.uni-muenchen.de/97243/1/MPRA_paper_97243.pdf
Kuncoro, H. (2020). Interest Rate Policy and Exchange Rates Volatility Lessons from Indonesia, Journal of Central Banking Theory and
Practice, 9(2), 19-42.
ENTREPRENEURSHIP AND SUSTAINABILITY ISSUES
ISSN 2345-0282 (online) http://jssidoi.org/jesi/
2021 Volume 8 Number 3 (March)
http://doi.org/10.9770/jesi.2021.8.3(18)
305
Lintner, J. (1965). The Valuation of Risk Assets and The Selection of Risky Investments in Stock Portfolios and Capital Budgets. The
Review of Economics and Statistics, 47, 13-37.
Masood, O., Javaria, K., & Petrenko, Y. (2020). Terrorism activities influence on financial stock markets: an empirical evidence from
United Kingdom, India, France. Pakistan, Spain and America. Insights into Regional Development, 2(1), 443-455.
https://doi.org/10.9770/IRD.2020.2.1(4)
Mossin, J. (1966). Equilibrium in A Capital Asset Market. Econometrica, 34(4), 768-783.
Nain, Z., & Kamaiah, B. (2020). Uncertainty and Effectiveness of Monetary Policy: A Bayesian Markov Switching-VAR Analysis. Journal
of Central Banking Theory and Practice, 9 (s1), 237-265.
Nawaz. R., Ahmed, W., Imran, Sabir, S., & Arshad, M. (2017). Financial Variables and Systematic Risk. Chinese Business Review, 16(1),
36-46. https://doi.org/10.17265/1537-1506/2017.01.004
Okpamen, H., & Ogbeide, S.O. (2020). Board director reputation capital and financial performance of listed firms in Nigeria. Insights into
Regional Development, 2(4), 765-773. http://doi.org/10.9770/IRD.2020.2.4(3)
Patro, D.K., Wald, J., & Wu, Y. (2002). The Impact of Macroeconomic and Financial Variables on Market Risk: Evidence from
International Equity Returns, European Financial Management, 8(4), 421 - 447. http://doi.org/10.1111/1468-036X.00198
Pena, G. (2020). Monetary Policy after the Great Moderation, Journal of Central Banking Theory and Practice, 9(3), 5-26.
Puspitaningtyas, Z. (2017). Estimating systematic risk for the best investment decisions on manufacturing company in Indonesia.
Investment Management and Financial Innovations, 14(1), 46-54. https://doi.org/10.21511/imfi.14(1).2017.05
Quang, T.M., Minh, H.C., Linh, L.T.B., Thiem, N.H., & Tuyet, L.T. (2019). Factors affect stock return from perspective of 5 factor Fama-
French model. Finance Journal. Retrieved from: http://tapchitaichinh.vn/kinh-te-vi-mo/yeu-to-tac-dong-den-ty-suat-sinh-loi-cua-co-phieu-
niem-yet-nhin-tu-mo-hinh-5-nhan-to-fama-french-315676.html
Rakotonirainy, M., Rajafindravonona, J., & Rasolomanana, C. (2020). Macro Stress Testing Credit Risk: Case of Madagascar Banking
Sector. Journal of Central Banking Theory and Practice, 9(2), 199-218.
Rakshit, B., & Bardhan, S. (2020). Does Bank Competition Enhance or Hinder Financial Stability? Evidence from Indian Banking. Journal
of Central Banking Theory and Practice, 9(s1), 75-102.
Rumondor, B.Y., & Bary, P. (2020). Capital Flows and Bank Risk-Taking Behavior: Evidence From Indonesia. Journal of Central Banking
Theory and Practice, 9(s1), 33-53.
Sadeghzadeh, K. (2018). The effects of microeconomic factors on the stock market: A panel for the stock exchange in Istanbul ARDL
analysis. Theoretical and Applied Economics Volume XXV, 3(616), 113-134.
Saeed, S., & Akhter, N. (2016). Impact of Macroeconomic Factors on Banking Index in Pakistan. Interdisciplinary Journal of
Contemporary Research in Business, 4(6)
Singh, T., Mehta, S., & Versha, M.S. (2010). Macroeconomic factors and stock returns: Evidence from Taiwan. Journal of Economics and
International Finance, 2(4), 217-227.
Sharpe, W.F. (1964). Capital Asset Prices: A Theory of Market Equilibrium Under Conditions of Risk. The Journal of Finance, 19(3), 425-
442.
Siregar, E. I., & D. (2019). The Impact of Political Risk and Macro Economics on Stock Return at Indonesia Stock Exchange (An
Approach of Arbritage Pricing Theory (APT)) KnE Social Sciences, 3(26), 744–772. https://doi.org/10.18502/kss.v3i26.54
Sun, L. (2020). On the People’s Bank of China’s Financial Strength and Policy Outcomes. Journal of Central Banking Theory and Practice,
9(3), 135-161.
Tahir, M., Ibrahim, H., Zulkafli, A.H., & Mushtaq, M. (2020). Influence of Exchange Rate Fluctuations and Credit Supply on Dividend
Repatriation Policy of U.S. Multinational Corporations. Journal of Central Banking Theory and Practice, 9(s1), 267-290.
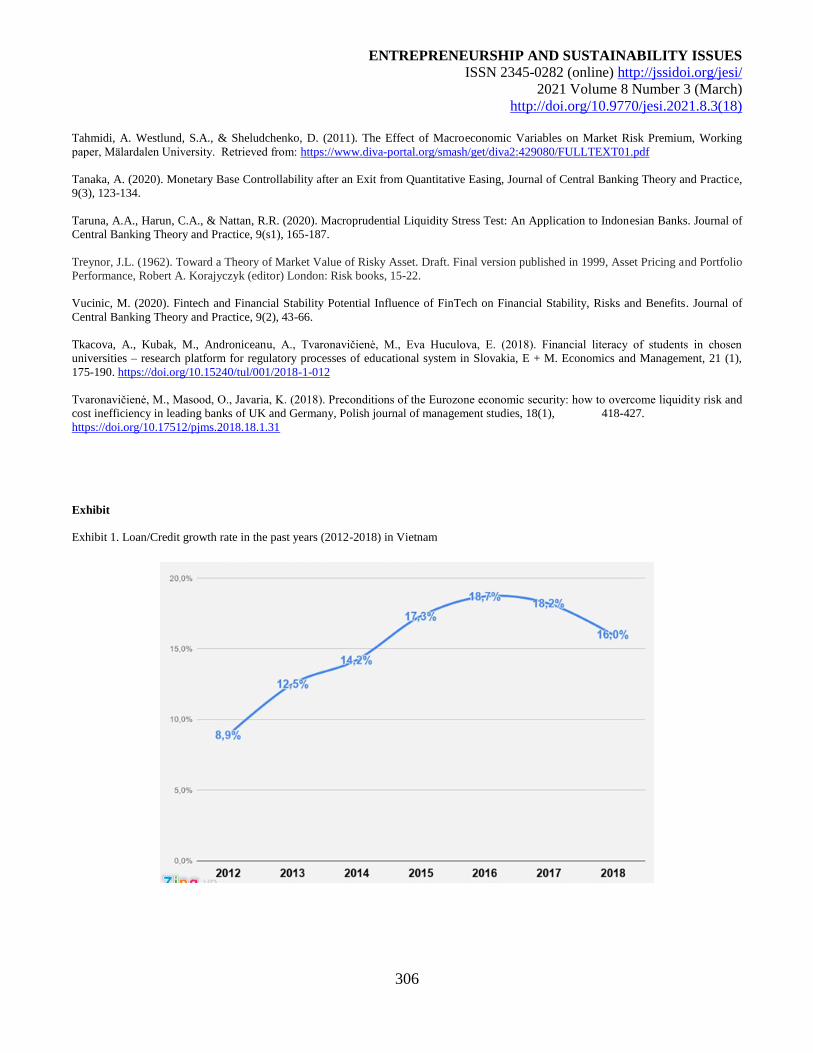
ENTREPRENEURSHIP AND SUSTAINABILITY ISSUES
ISSN 2345-0282 (online) http://jssidoi.org/jesi/
2021 Volume 8 Number 3 (March)
http://doi.org/10.9770/jesi.2021.8.3(18)
306
Tahmidi, A. Westlund, S.A., & Sheludchenko, D. (2011). The Effect of Macroeconomic Variables on Market Risk Premium, Working
paper, Mälardalen University. Retrieved from: https://www.diva-portal.org/smash/get/diva2:429080/FULLTEXT01.pdf
Tanaka, A. (2020). Monetary Base Controllability after an Exit from Quantitative Easing, Journal of Central Banking Theory and Practice,
9(3), 123-134.
Taruna, A.A., Harun, C.A., & Nattan, R.R. (2020). Macroprudential Liquidity Stress Test: An Application to Indonesian Banks. Journal of
Central Banking Theory and Practice, 9(s1), 165-187.
Treynor, J.L. (1962). Toward a Theory of Market Value of Risky Asset. Draft. Final version published in 1999, Asset Pricing and Portfolio
Performance, Robert A. Korajyczyk (editor) London: Risk books, 15-22.
Vucinic, M. (2020). Fintech and Financial Stability Potential Influence of FinTech on Financial Stability, Risks and Benefits. Journal of
Central Banking Theory and Practice, 9(2), 43-66.
Tkacova, A., Kubak, M., Androniceanu, A., Tvaronavičienė, M., Eva Huculova, E. (2018). Financial literacy of students in chosen
universities – research platform for regulatory processes of educational system in Slovakia, E + M. Economics and Management, 21 (1),
175-190. https://doi.org/10.15240/tul/001/2018-1-012
Tvaronavičienė, M., Masood, O., Javaria, K. (2018). Preconditions of the Eurozone economic security: how to overcome liquidity risk and
cost inefficiency in leading banks of UK and Germany, Polish journal of management studies, 18(1), 418-427.
https://doi.org/10.17512/pjms.2018.18.1.31
Exhibit
Exhibit 1. Loan/Credit growth rate in the past years (2012-2018) in Vietnam
ENTREPRENEURSHIP AND SUSTAINABILITY ISSUES
ISSN 2345-0282 (online) http://jssidoi.org/jesi/
2021 Volume 8 Number 3 (March)
http://doi.org/10.9770/jesi.2021.8.3(18)
307
Le Dinh HAC
ORCID: 0000-0003-2961-9088 Dinh Tran Ngoc HUY ORCID: 0000-0002-2358-0699
Nguyen Ngoc THACH ORCID: 0000-0001-8822-2633
Bui Minh CHUYEN ORCID: 0000-0003-1584-5017
Pham Thi Hong NHUNG ORCID: 0000-0002-0441-402X
Tran Duc THANG ORCID: 0000-0002-5148-7723
Tran Tuan ANH ORCID: 0000-0002-0503-888X
Copyright © 2021 by author(s) and VsI Entrepreneurship and Sustainability Center
This work is licensed under the Creative Commons Attribution International License (CC BY).
http://creativecommons.org/licenses/by/4.0/
ENTREPRENEURSHIP AND SUSTAINABILITY ISSUES
ISSN 2345-0282 (online) http://jssidoi.org/jesi/
2021 Volume 8 Number 3 (March)
http://doi.org/10.9770/jesi.2021.8.3(19)
Publisher http://jssidoi.org/esc/home
308
ASSESSMENT OF THE SITUATION CONCERNING PSYCHOLOGICAL SUPPORT TO THE PUBLIC
AND BUSINESS IN THE EXTREME CONDITIONS: CASE OF COVID-19
Tomas Davulis 1, Ligita Gasparėnienė 2, Evaldas Raistenskis 3
1,2, 3 Vilnius University, Law faculty, address: Sauletekio av. 9, Vilnius, Lithuania
E-mails:1 [email protected]; 2 [email protected]; 3 [email protected]
Received 18 September 2020; accepted 20 December 2020; published 30 March 2021
Abstract. Restrictions on personal freedom, work or business loss, increasing financial tensions, limited communication with close people,
friction between the people isolated within the household, uncertainty about the future, especially in the context of conflicting information
coming from authorities, medical representatives and media reports, and other Covid-19 pandemic related factors are likely to substantially
raise the spread of emotional distress and the risk of mental disorders and illnesses. In the context of such unprecedentedly high risks for
society to develop mental disorders, it is purposeful to research the aspects of the provision of psychological support to the public in
extreme conditions. Given the high number of stressors, an extremely high degree of uncertainty and a wide range of vulnerable social
groups (entrepreneurs, pensions, family with children and etc.), the growing tensions in society necessitate the expansion of the scope of
psychological support provided to the public. The main purpose of this research is to assess the situation concerning psychological support
to the public in the extreme conditions at the national level.
Keywords: COVID-19; Corona virus; Psychological support; extreme conditions; business, society
Reference to this paper should be made as follows: Davulis, T., Gasparėnienė, L., Raistenskis, E. 2021. Assessment of the situation
concerning psychological support to the public and business in the extreme conditions: case of Covid-19. Entrepreneurship and
Sustainability Issues, 8(3), 308-323. http://doi.org/10.9770/jesi.2021.8.3(19)
JEL Classifications: I15, I18
1. Introduction
Every crisis has a major impact on entrepreneurs and the businesses they run, regardless of what disaster (natural,
human behaviour or economic) it was caused by. At the end of December 2019, the coronavirus (COVID-19)
outbreak started in Wuhan, China, and spread around the world so quickly that in March 2020 the World Health
Organisation declared COVID-19 the global pandemic. Lithuania was no exception. During the first and second
waves, social life came to a standstill, businesses were forced to close down or move to cyberspace.
Unfortunately, not all entrepreneurs, especially those working under business licences, like massage masters,
small traders, etc., had to temporarily suspend their activities, severely restrict them or become unemployed. The
stressful period people are undergoing can have negative effects on their mental health. For this reason,
ENTREPRENEURSHIP AND SUSTAINABILITY ISSUES
ISSN 2345-0282 (online) http://jssidoi.org/jesi/
2021 Volume 8 Number 3 (March)
http://doi.org/10.9770/jesi.2021.8.3(19)
Make your research more visible, join the Twitter account of ENTREPRENEURSHIP AND SUSTAINABILITY ISSUES:
@Entrepr69728810
309
comprehensive research that would assess population’s psychological well-being at the national level is extremely
relevant.
Restrictions on personal freedom, work or business loss, increasing financial tensions, limited communication
with close people, friction between the people isolated within the household, uncertainty about the future,
especially in the context of conflicting information coming from authorities, medical representatives and media
reports, and other Covid-19 pandemic related factors are likely to substantially raise the spread of emotional
distress and the risk of mental disorders and illnesses.
Some social groups are particularly vulnerable to the adverse effects of the Covid-19 pandemic. This applies to
people infected with coronavirus, families with people with chronic illnesses, the elderly with a weakened
immune system, people with pre-existing medical and/or mental problems, medical staff working in ‘hot spots’,
entrepreneurs, self-employed, etc. Given the high number of stressors, an extremely high degree of uncertainty
and a wide range of vulnerable social groups, the growing tensions in society necessitate the expansion of the
scope of psychological support provided to the public.
In the context of such unprecedentedly high risks for society and business to develop mental disorders, it is
purposeful to research the aspects of the provision of psychological support to the public and business in extreme
conditions. Previous studies mainly focused on the target psychological intervention measures (Orru et al., 2020;
Pfefferbaum and North, 2020; Zhou, 2020; Connolly et al., 2020, Besenyő and Kármán, 2020 etc.), assisting
healthcare professionals (Vizheh et al., 2020; Inchausti et al., 2020; Chen et al., 2020, etc.), profiling support
providing psychotherapists (Humer et al., 2020) and other issues (Koushik 2020; Marazziti et al., 2020)., but
provision of psychological support to the public in extreme conditions has hardly been researched following a
systematic approach.
The main purpose of this research is to assess the situation concerning psychological support to the public in the
extreme conditions at the national level. The defined purpose was detailed into the following objectives: 1) to
review the main components of a system of psychological support to the public in the extreme conditions; 2) to
select and substantiate the methods of the research; 3) based on the results of the empirical research, to provide
assessment of the current situation concerning psychological support to the public in the extreme conditions at the
national level. The research methods include comparative and systematic literature analysis, simple random
survey of professional psychologists.
2. Review of the main components of a system of psychological support to the public in the extreme
conditions
To prevent the psychopathological changes in society’s mental health and to respond rapidly to their increased
risk and predicted evolution in the forms of maladaptive behaviours and a broader range of emotional disorders,
appropriate psychological support measures, in scientific literature also referred to as psychological intervention
measures, must be undertaken. As it was noted by Duan and Zhu (2020), psychological intervention in the current
emergency conditions must be dynamic and flexible so that the measures undertaken can be promptly adjusted to
the rapidly changing environment, requirements and constraints. According to Mohammed et al. (2015), in the
system of psychological support to the public, the professionals of mental health care (clinical psychologists,
psychotherapists and psychological intervention specialists) need to actively cooperate with other medical
professionals and even public information providers. It means not only ensuring that the public has access to
mental health care services and resources, but also raising public awareness of the importance of mental health
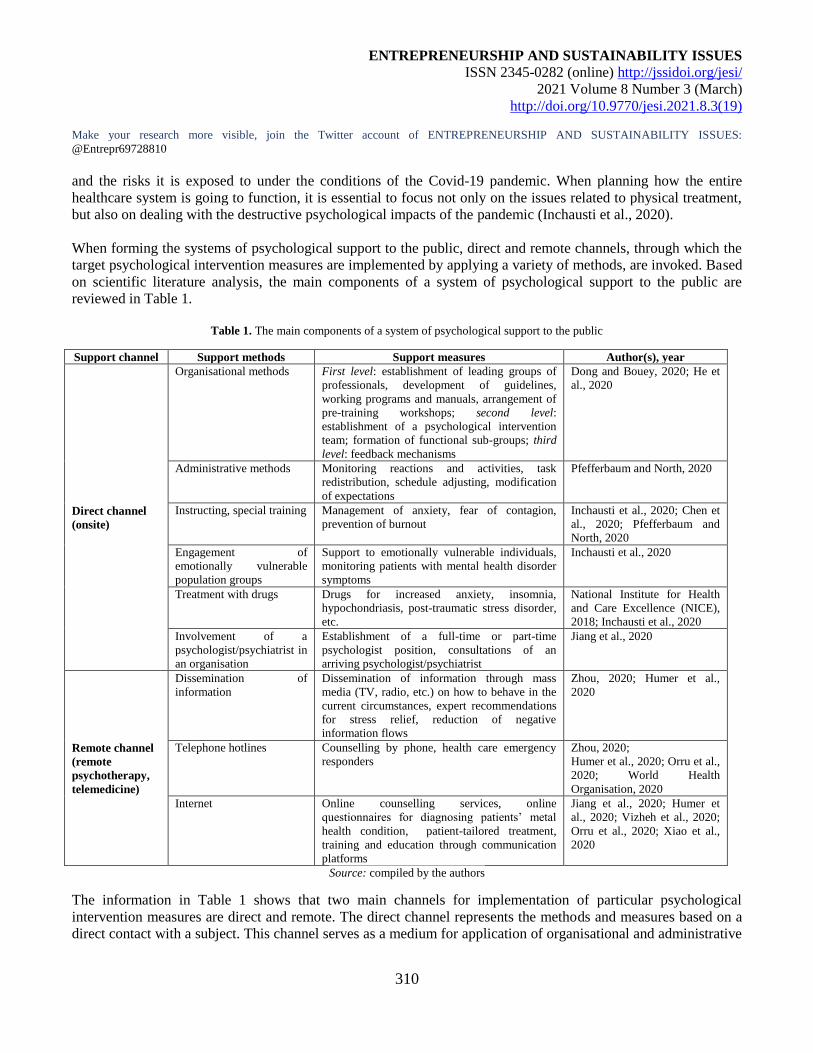
ENTREPRENEURSHIP AND SUSTAINABILITY ISSUES
ISSN 2345-0282 (online) http://jssidoi.org/jesi/
2021 Volume 8 Number 3 (March)
http://doi.org/10.9770/jesi.2021.8.3(19)
Make your research more visible, join the Twitter account of ENTREPRENEURSHIP AND SUSTAINABILITY ISSUES:
@Entrepr69728810
310
and the risks it is exposed to under the conditions of the Covid-19 pandemic. When planning how the entire
healthcare system is going to function, it is essential to focus not only on the issues related to physical treatment,
but also on dealing with the destructive psychological impacts of the pandemic (Inchausti et al., 2020).
When forming the systems of psychological support to the public, direct and remote channels, through which the
target psychological intervention measures are implemented by applying a variety of methods, are invoked. Based
on scientific literature analysis, the main components of a system of psychological support to the public are
reviewed in Table 1.
Table 1. The main components of a system of psychological support to the public
Support channel Support methods Support measures Author(s), year
Direct channel
(onsite)
Organisational methods First level: establishment of leading groups of
professionals, development of guidelines,
working programs and manuals, arrangement of
pre-training workshops; second level:
establishment of a psychological intervention
team; formation of functional sub-groups; third
level: feedback mechanisms
Dong and Bouey, 2020; He et
al., 2020
Administrative methods Monitoring reactions and activities, task
redistribution, schedule adjusting, modification
of expectations
Pfefferbaum and North, 2020
Instructing, special training Management of anxiety, fear of contagion,
prevention of burnout
Inchausti et al., 2020; Chen et
al., 2020; Pfefferbaum and
North, 2020
Engagement of
emotionally vulnerable
population groups
Support to emotionally vulnerable individuals,
monitoring patients with mental health disorder
symptoms
Inchausti et al., 2020
Treatment with drugs Drugs for increased anxiety, insomnia,
hypochondriasis, post-traumatic stress disorder,
etc.
National Institute for Health
and Care Excellence (NICE),
2018; Inchausti et al., 2020
Involvement of a
psychologist/psychiatrist in
an organisation
Establishment of a full-time or part-time
psychologist position, consultations of an
arriving psychologist/psychiatrist
Jiang et al., 2020
Remote channel
(remote
psychotherapy,
telemedicine)
Dissemination of
information
Dissemination of information through mass
media (TV, radio, etc.) on how to behave in the
current circumstances, expert recommendations
for stress relief, reduction of negative
information flows
Zhou, 2020; Humer et al.,
2020
Telephone hotlines Counselling by phone, health care emergency
responders
Zhou, 2020;
Humer et al., 2020; Orru et al.,
2020; World Health
Organisation, 2020
Internet Online counselling services, online
questionnaires for diagnosing patients’ metal
health condition, patient-tailored treatment,
training and education through communication
platforms
Jiang et al., 2020; Humer et
al., 2020; Vizheh et al., 2020;
Orru et al., 2020; Xiao et al.,
2020
Source: compiled by the authors
The information in Table 1 shows that two main channels for implementation of particular psychological
intervention measures are direct and remote. The direct channel represents the methods and measures based on a
direct contact with a subject. This channel serves as a medium for application of organisational and administrative
ENTREPRENEURSHIP AND SUSTAINABILITY ISSUES
ISSN 2345-0282 (online) http://jssidoi.org/jesi/
2021 Volume 8 Number 3 (March)
http://doi.org/10.9770/jesi.2021.8.3(19)
Make your research more visible, join the Twitter account of ENTREPRENEURSHIP AND SUSTAINABILITY ISSUES:
@Entrepr69728810
311
methods, instructing and special training, engagement of emotionally vulnerable population groups, treatment
with drugs and involvement of a psychologist/psychiatrist in an organisation.
By applying organisational methods, first of all, a leading group of competent experts is formed at the level of
the national government. This group manages the intervention and is responsible for the overall planning and
implementation of the intervention measures. For instance, when developing a model of public psychological
resilience to the Covid-19 pandemic in China, the Chinese government issued the order to form a leading panel of
experts at the Chengdu Mental Health Centre; following the “Guideline for the Emergent Psychological Crisis
Intervention during the Novel Coronavirus Pneumonia Pandemic”, approved by the National Health Commission
of China on 25 January 2020, the above-mentioned panel of experts developed working programs for targeted
psychological intervention (He et al., 2020). The working programs were implemented in several steps. First, on
the basis of the working programs, work manuals were developed and pre-training workshops for the staff under
the programs were arranged. Second, a psychological intervention team consisting of mental health professionals
(psychologists, psychotherapists, psychiatrists, psychiatric nurses) was established. The members of the team of
professionals were divided into 4 functional sub-groups: 1) live media group; 2) hotline consultation group; 3)
online video intervention group; 4) on-site intervention group (He et al., 2020). Finally, to ensure that the
psychological intervention measures are applied in a targeted and timely manner, feedback mechanisms were
developed within the organisational system, i.e. the functional sub-groups were required to report regularly to the
leading group. The significance of organisational measures, and in particular the importance of the role of the
national leading group and functional sub-groups, is also supported by Dong and Bouey (2020). According to the
authors, namely organisational mechanisms help to ensure the necessary coordination and financing of the
intervention, while the intervention plan helps to select target measures for the intervention to different social
groups.
Pfefferbaum and North (2020) note that to maintain the psychological health of the public, systemic measures
need to be undertaken to reduce both the stress experienced by individuals and the stress associated with
performing major operations. To accomplish these objectives, the authors propose administrative methods that
can be invoked for application of such stress reduction measures as monitoring reactions and activities, task
redistribution, schedule adjusting and modification of expectations. These measures are mainly proposed at the
level of organisations: organisations should appoint persons to monitor both individual reactions of employees to
emerging stressors and reactions to assigned tasks; when workloads are increasing, work tasks need to be
redistributed and staff work schedules (especially in medical facilities) need to be adjusted. When working in
extreme conditions, minimisation of the expectations previously set for employees can also contribute to stress
reduction.
Inchausti et al. (2020) highlight the significance of instructing and special training methods. Having researched
the issues of assisting frontline health professionals and Covid-19 diagnosed patients, the authors note that the
special training provided to the former can substantially help them learn to manage their emotional reactions to
work situations. When providing special training, frontline health professionals have to be trained to manage
anxiety and fear of contagion, prevent burnout. The opinion that the above-mentioned measures can significantly
contribute to psychological resilience of medical staff is also supported by Chen et al. (2020). What concerns the
assistance to most emotionally vulnerable population groups, Inchausti et al. (2020) recommend the “support to
the individuals undergoing COVID-19 treatment or preventative quarantine” (p. 3). Monitoring patients with
mental health disorder symptoms is also advised.
ENTREPRENEURSHIP AND SUSTAINABILITY ISSUES
ISSN 2345-0282 (online) http://jssidoi.org/jesi/
2021 Volume 8 Number 3 (March)
http://doi.org/10.9770/jesi.2021.8.3(19)
Make your research more visible, join the Twitter account of ENTREPRENEURSHIP AND SUSTAINABILITY ISSUES:
@Entrepr69728810
312
In case patients show such symptoms as increased anxiety, insomnia, hypochondriasis, post-traumatic stress
disorder, etc., the measures of intervention can include drug prescription on condition that the use of drugs is as
minimal as possible (National Institute for Health and Care Excellence (NICE), 2018).
Jiang et al. (2020) emphasise the importance of involvement of a psychologist/psychiatrist in an organisation
(onsite psychotherapy). This is particularly the case for medical institutions, but may also apply to other
organisations or sectors (e.g. sectors and/or businesses that have already lost or are at high risk of losing staff,
companies on the verge of bankruptcy, etc.). According to the authors, onsite services can substantially help
medical staff, patients and other affected people to overcome the psychological difficulties they are facing.
Involvement of a psychologist/psychiatrist can be arranged by establishing a permanent work place or a
professional can regularly arrive to provide onsite counselling.
Since traditional formats of psychotherapeutic care, i.e. the formats based on a direct contact between a patient
and a psychologist/psychiatrist, pose a risk of infection transmission between the persons in contact under the
conditions of the Covid-19 pandemic, one of the most obvious solutions is providing mental health care services
remotely. (Humer et al., 2020).
In this context, the importance of disseminating information to the public is emphasised. Mass media channels
(e.g. television, radio, internet, etc.) can be invoked to disseminate the information on what personal safety and
hygiene practices can help one protect against infection, and thus contribute to reducing the overall level of social
anxiety (Zhou, 2020). Humer et al. (2020) state that information can help to normalize the reaction of different
social groups to stress, if the public information channels provide the information on what people can and/or must
do in the current circumstances so that the situation can be managed. Specialist recommendations for stress relief
(e.g. restructuring individual activities, adherence to normal routines, etc.) may also be provided. On the other
hand, because the news and statistics related to the spread of the Covid-19 infection can raise public anxiety and
panic, the flows of the negative information through public information channels are proposed to be limited. Zhou
(2020) describes the positive effects of the psychological assistance telephone hotlines. 24-hour working free
psychological assistance hotlines in Sichuan province, opened from February 6, enabled citizens to relieve their
negative emotions. Because citizens with non-critical problems are strongly recommended not to visit treatment
facilities during the Covid-19 pandemic outbreak, the psychological assistance hotlines serve as a measure that
significantly contributes to maintaining public mental health. As it was noted by the World Health Organisation
(2020), telephone hotlines help to establish a direct link between at-risk citizens and emergency responders on the
basis of trust. From a broader perspective, hotlines serve not only as a risk communication and community
engagement channel (RCCE) that helps save lives and minimize adverse consequences, but also as a feedback
channel that minimizes the extreme situation related rumours and misunderstandings.
Remote psychotherapy can also be practised through the Internet (online). Xiao et al. (2020) and Orru et al.
(2020) in their studies revealed that universities and institutes operating in different parts of the world activate
provision of online counselling services, for this purpose invoking social media platforms and e-mails. Orru et al.
(2020) mention online questionnaires distributed by Chinese authorities to assess a person’s mental condition.
Questionnaire-based data help to allocate resources and apply patient-tailored treatment. According to Humer et
al. (2020), in a similar way patients can be surveyed when researching the impact of Covid-19 related stressors
(e.g. contacting an infected person, loss of a loved one, physical distance, etc.), secondary stressors (e.g. economic
difficulties), mental factors (depression, sensitivity, domestic violence, etc.). Andersson’s (2016) research
revealed that remote psychotherapy provides good results compared to the methods of the traditional contact
psychotherapy. Shulman et al. (2017), Thomas et al. (2018) and other authors note that patients tend to have
ENTREPRENEURSHIP AND SUSTAINABILITY ISSUES
ISSN 2345-0282 (online) http://jssidoi.org/jesi/
2021 Volume 8 Number 3 (March)
http://doi.org/10.9770/jesi.2021.8.3(19)
Make your research more visible, join the Twitter account of ENTREPRENEURSHIP AND SUSTAINABILITY ISSUES:
@Entrepr69728810
313
positive attitudes towards remote psychotherapy, although doctors express doubts about making an accurate
diagnosis (Berger, 2017; Connolly et al., 2020). In addition, it is noted that application of the methods of remote
psychotherapy can be limited by the lack of legal provisions in this area (Bojdani et al., 2020).
3. Research methodology
The activities of psychologists in Lithuania are insufficiently regulated by law – the Law on the Practical
Activities of Psychologists is still awaiting approval by the Parliament of the Republic of Lithuania. To assess the
situation concerning provision of psychological support to most vulnerable persons under the conditions of the
COVID-19 pandemic, 240 psychologists were interviewed. With reference to the data of the Ministry of
Education and Science (MES), over the 2015-2016 academic year, Lithuanian schools had 753 working
psychologists and 47 psychologist assistants, and 164 psychologists worked in pedagogical-psychological
services. Based on the data of the Ministry of Health (MH), stamp numbers of a health care specialist were issued
to 579 medical psychologists, but in 2015 only 286 psychologists worked in the institutions subordinated to the
MH. At the beginning of 2016, 230 psychologists worked in the institutions subordinated to the Ministry of Social
Security and Labour (MSSL) (Lithuanian Psychological Association, 2020).
When estimating the size of the sample, it was presumed that the number of psychologists in Lithuania amounts to
2059 people. To ensure a 5% error rate, approximately 324 respondents had to be surveyed (Internet survey
system calculator, available at the address http://www.surveysystem.com/sscalc.htm, was engaged). Since 240 of
the respondents were available for the survey, the error rate increased by 5.95 %. The survey was being conducted
during the period of September-October 2020, following the principles of the “snowball” data collection method.
It was established (Duncan, White, & Nicholson, 2003; Vershinina & Rodionova, 2011) that when conducting the
surveys of hidden populations, the basic problems faced by researchers cover accessibility of the target population
and the size of the survey sample.
Respondents. By employing an online survey, the information was obtained from 240 respondents –
psychologists: 229 female and 11 male. Distribution of the respondents by the pre-formed age groups was uneven:
the respondents aged 18–29 accounted for 13.3 percent, the respondents aged 30–49 – for 63.3 percent, and the
respondents aged 55–65 – for 22.5 percent of the total number, and only 2 respondents were older than 65.
Territorial distribution of the respondents is depicted in Table 1 which indicates that basically the whole territory
of Lithuania was covered, although some questionnaires were filled not from Lithuanian cities (apparently by
those staying in other European countries, but having contacts with Lithuania and Lithuanian Psychological
Association through which the questionnaire was distributed). It can be seen that the majority of the respondents
were from Vilnius (41.9 percent of the total sample size). The second largest group of the respondents were from
Kaunas (18.4 percent) and Klaipėda (7.3 percent). The respondents from smaller cities, districts or towns
accounted for 39.7 percent of the total sample size.
Questionnaire. The questionnaire (26 questions in total) was prepared including the subject questions focused on
the psychologists’ activities, opinions and suggestions. Most of the questions were close-ended, four questions –
completely open, and three questions – mixed (several close-ended questions with the last alternative “other”,
where a respondent could add his / her personal insights). Thus, the questionnaire included seven questions where
a respondent was free to express personal views. These answers will be analysed in the further section of this
article. A block of the questions on the potential impact of the pandemic and pandemic-related restrictions on
population’s mental health was presented in the form of seven sub-scales: stress, anxiety, depression, sleep
disorders, persistent tiredness, boredom and anger (aggression). The Cronbach’s alpha (reliability indicator) of the
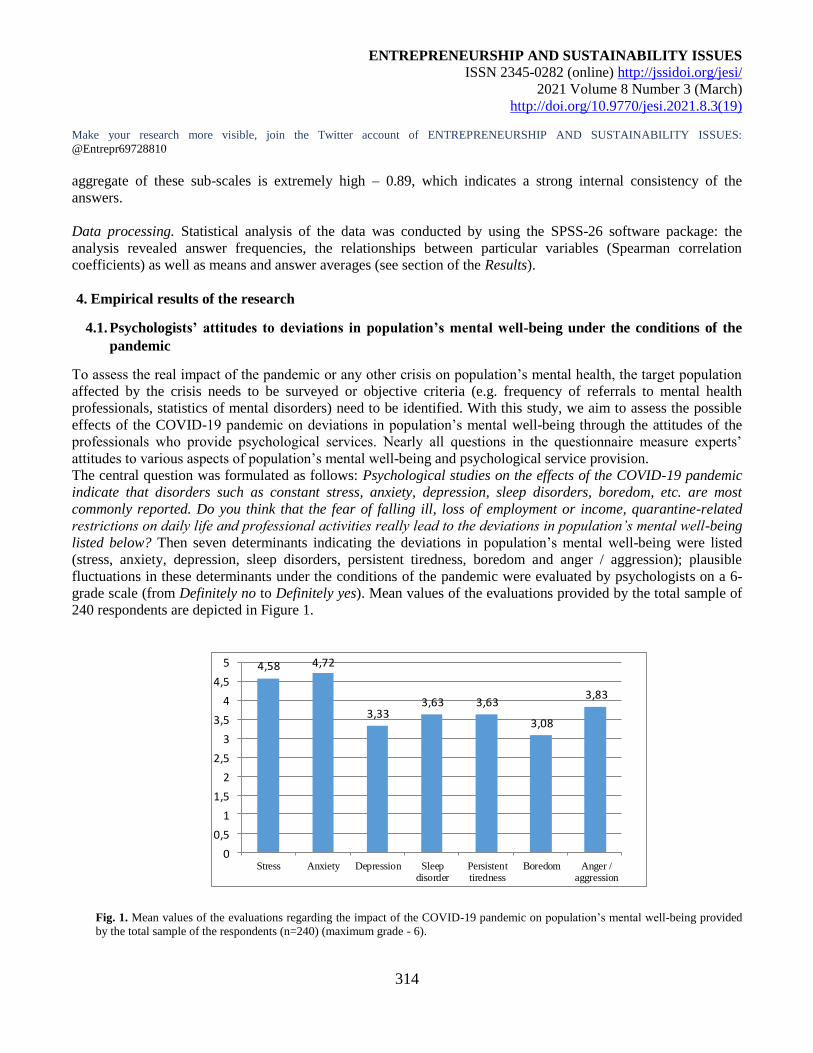
ENTREPRENEURSHIP AND SUSTAINABILITY ISSUES
ISSN 2345-0282 (online) http://jssidoi.org/jesi/
2021 Volume 8 Number 3 (March)
http://doi.org/10.9770/jesi.2021.8.3(19)
Make your research more visible, join the Twitter account of ENTREPRENEURSHIP AND SUSTAINABILITY ISSUES:
@Entrepr69728810
314
aggregate of these sub-scales is extremely high – 0.89, which indicates a strong internal consistency of the
answers.
Data processing. Statistical analysis of the data was conducted by using the SPSS-26 software package: the
analysis revealed answer frequencies, the relationships between particular variables (Spearman correlation
coefficients) as well as means and answer averages (see section of the Results).
4. Empirical results of the research
4.1. Psychologists’ attitudes to deviations in population’s mental well-being under the conditions of the
pandemic
To assess the real impact of the pandemic or any other crisis on population’s mental health, the target population
affected by the crisis needs to be surveyed or objective criteria (e.g. frequency of referrals to mental health
professionals, statistics of mental disorders) need to be identified. With this study, we aim to assess the possible
effects of the COVID-19 pandemic on deviations in population’s mental well-being through the attitudes of the
professionals who provide psychological services. Nearly all questions in the questionnaire measure experts’
attitudes to various aspects of population’s mental well-being and psychological service provision.
The central question was formulated as follows: Psychological studies on the effects of the COVID-19 pandemic
indicate that disorders such as constant stress, anxiety, depression, sleep disorders, boredom, etc. are most
commonly reported. Do you think that the fear of falling ill, loss of employment or income, quarantine-related
restrictions on daily life and professional activities really lead to the deviations in population’s mental well-being
listed below? Then seven determinants indicating the deviations in population’s mental well-being were listed
(stress, anxiety, depression, sleep disorders, persistent tiredness, boredom and anger / aggression); plausible
fluctuations in these determinants under the conditions of the pandemic were evaluated by psychologists on a 6-
grade scale (from Definitely no to Definitely yes). Mean values of the evaluations provided by the total sample of
240 respondents are depicted in Figure 1.
Fig. 1. Mean values of the evaluations regarding the impact of the COVID-19 pandemic on population’s mental well-being provided
by the total sample of the respondents (n=240) (maximum grade - 6).
4,58 4,72
3,333,63 3,63
3,08
3,83
0
0,5
1
1,5
2
2,5
3
3,5
4
4,5
5
Stress Anxiety Depression Sleepdisorder
Persistenttiredness
Boredom Anger /aggression
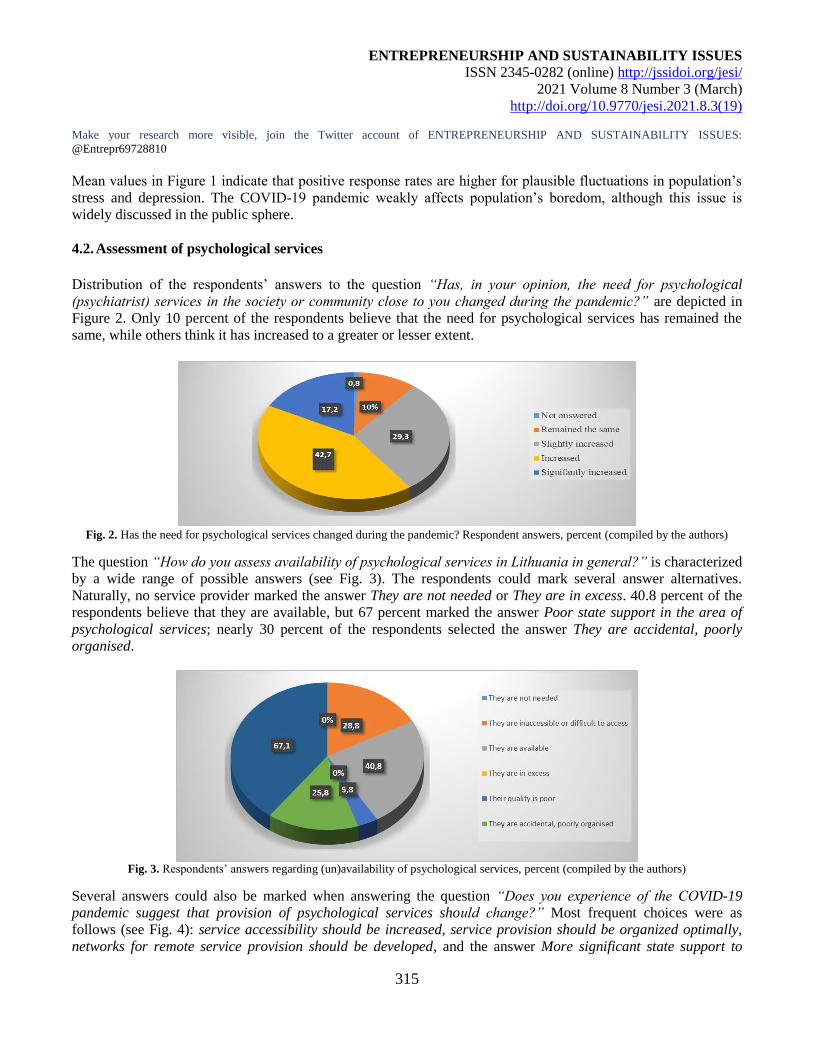
ENTREPRENEURSHIP AND SUSTAINABILITY ISSUES
ISSN 2345-0282 (online) http://jssidoi.org/jesi/
2021 Volume 8 Number 3 (March)
http://doi.org/10.9770/jesi.2021.8.3(19)
Make your research more visible, join the Twitter account of ENTREPRENEURSHIP AND SUSTAINABILITY ISSUES:
@Entrepr69728810
315
Mean values in Figure 1 indicate that positive response rates are higher for plausible fluctuations in population’s
stress and depression. The COVID-19 pandemic weakly affects population’s boredom, although this issue is
widely discussed in the public sphere.
4.2. Assessment of psychological services
Distribution of the respondents’ answers to the question “Has, in your opinion, the need for psychological
(psychiatrist) services in the society or community close to you changed during the pandemic?” are depicted in
Figure 2. Only 10 percent of the respondents believe that the need for psychological services has remained the
same, while others think it has increased to a greater or lesser extent.
Fig. 2. Has the need for psychological services changed during the pandemic? Respondent answers, percent (compiled by the authors)
The question “How do you assess availability of psychological services in Lithuania in general?” is characterized
by a wide range of possible answers (see Fig. 3). The respondents could mark several answer alternatives.
Naturally, no service provider marked the answer They are not needed or They are in excess. 40.8 percent of the
respondents believe that they are available, but 67 percent marked the answer Poor state support in the area of
psychological services; nearly 30 percent of the respondents selected the answer They are accidental, poorly
organised.
Fig. 3. Respondents’ answers regarding (un)availability of psychological services, percent (compiled by the authors)
Several answers could also be marked when answering the question “Does you experience of the COVID-19
pandemic suggest that provision of psychological services should change?” Most frequent choices were as
follows (see Fig. 4): service accessibility should be increased, service provision should be organized optimally,
networks for remote service provision should be developed, and the answer More significant state support to
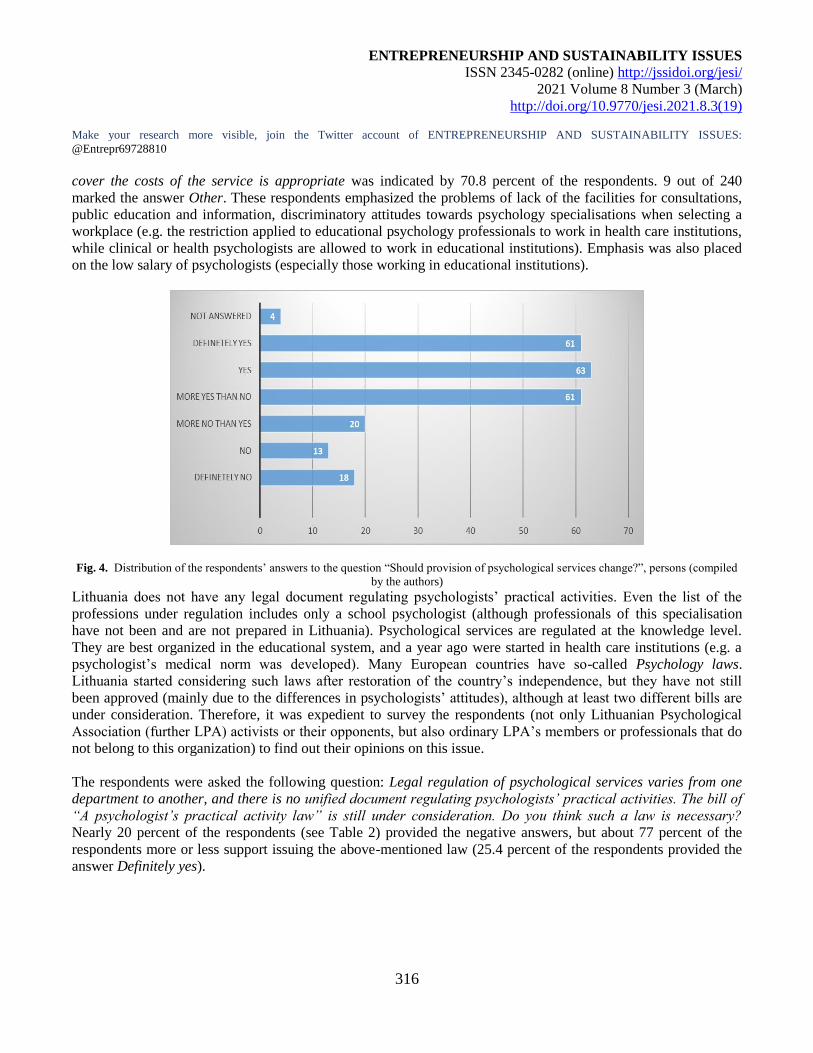
ENTREPRENEURSHIP AND SUSTAINABILITY ISSUES
ISSN 2345-0282 (online) http://jssidoi.org/jesi/
2021 Volume 8 Number 3 (March)
http://doi.org/10.9770/jesi.2021.8.3(19)
Make your research more visible, join the Twitter account of ENTREPRENEURSHIP AND SUSTAINABILITY ISSUES:
@Entrepr69728810
316
cover the costs of the service is appropriate was indicated by 70.8 percent of the respondents. 9 out of 240
marked the answer Other. These respondents emphasized the problems of lack of the facilities for consultations,
public education and information, discriminatory attitudes towards psychology specialisations when selecting a
workplace (e.g. the restriction applied to educational psychology professionals to work in health care institutions,
while clinical or health psychologists are allowed to work in educational institutions). Emphasis was also placed
on the low salary of psychologists (especially those working in educational institutions).
Fig. 4. Distribution of the respondents’ answers to the question “Should provision of psychological services change?”, persons (compiled
by the authors)
Lithuania does not have any legal document regulating psychologists’ practical activities. Even the list of the
professions under regulation includes only a school psychologist (although professionals of this specialisation
have not been and are not prepared in Lithuania). Psychological services are regulated at the knowledge level.
They are best organized in the educational system, and a year ago were started in health care institutions (e.g. a
psychologist’s medical norm was developed). Many European countries have so-called Psychology laws.
Lithuania started considering such laws after restoration of the country’s independence, but they have not still
been approved (mainly due to the differences in psychologists’ attitudes), although at least two different bills are
under consideration. Therefore, it was expedient to survey the respondents (not only Lithuanian Psychological
Association (further LPA) activists or their opponents, but also ordinary LPA’s members or professionals that do
not belong to this organization) to find out their opinions on this issue.
The respondents were asked the following question: Legal regulation of psychological services varies from one
department to another, and there is no unified document regulating psychologists’ practical activities. The bill of
“A psychologist’s practical activity law” is still under consideration. Do you think such a law is necessary?
Nearly 20 percent of the respondents (see Table 2) provided the negative answers, but about 77 percent of the
respondents more or less support issuing the above-mentioned law (25.4 percent of the respondents provided the
answer Definitely yes).
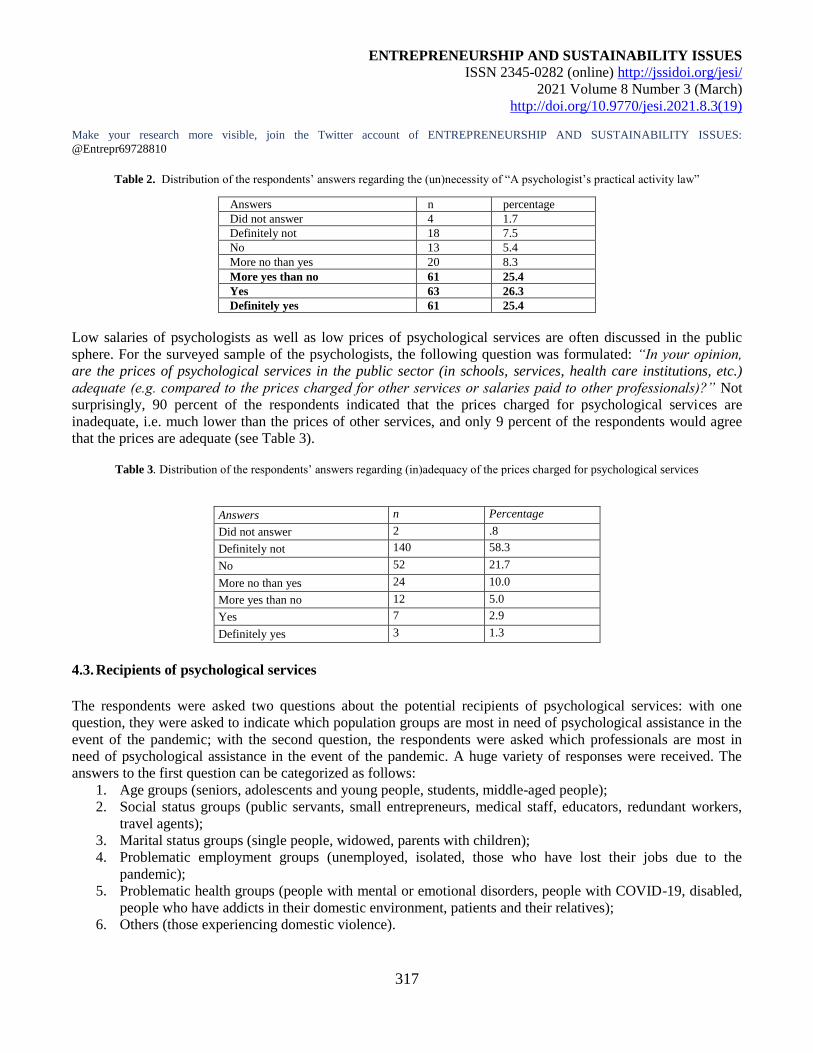
ENTREPRENEURSHIP AND SUSTAINABILITY ISSUES
ISSN 2345-0282 (online) http://jssidoi.org/jesi/
2021 Volume 8 Number 3 (March)
http://doi.org/10.9770/jesi.2021.8.3(19)
Make your research more visible, join the Twitter account of ENTREPRENEURSHIP AND SUSTAINABILITY ISSUES:
@Entrepr69728810
317
Table 2. Distribution of the respondents’ answers regarding the (un)necessity of “A psychologist’s practical activity law”
Answers n percentage
Did not answer 4 1.7
Definitely not 18 7.5
No 13 5.4
More no than yes 20 8.3
More yes than no 61 25.4
Yes 63 26.3
Definitely yes 61 25.4
Low salaries of psychologists as well as low prices of psychological services are often discussed in the public
sphere. For the surveyed sample of the psychologists, the following question was formulated: “In your opinion,
are the prices of psychological services in the public sector (in schools, services, health care institutions, etc.)
adequate (e.g. compared to the prices charged for other services or salaries paid to other professionals)?” Not
surprisingly, 90 percent of the respondents indicated that the prices charged for psychological services are
inadequate, i.e. much lower than the prices of other services, and only 9 percent of the respondents would agree
that the prices are adequate (see Table 3).
Table 3. Distribution of the respondents’ answers regarding (in)adequacy of the prices charged for psychological services
Answers n Percentage
Did not answer 2 .8
Definitely not 140 58.3
No 52 21.7
More no than yes 24 10.0
More yes than no 12 5.0
Yes 7 2.9
Definitely yes 3 1.3
4.3. Recipients of psychological services
The respondents were asked two questions about the potential recipients of psychological services: with one
question, they were asked to indicate which population groups are most in need of psychological assistance in the
event of the pandemic; with the second question, the respondents were asked which professionals are most in
need of psychological assistance in the event of the pandemic. A huge variety of responses were received. The
answers to the first question can be categorized as follows:
1. Age groups (seniors, adolescents and young people, students, middle-aged people);
2. Social status groups (public servants, small entrepreneurs, medical staff, educators, redundant workers,
travel agents);
3. Marital status groups (single people, widowed, parents with children);
4. Problematic employment groups (unemployed, isolated, those who have lost their jobs due to the
pandemic);
5. Problematic health groups (people with mental or emotional disorders, people with COVID-19, disabled,
people who have addicts in their domestic environment, patients and their relatives);
6. Others (those experiencing domestic violence).
ENTREPRENEURSHIP AND SUSTAINABILITY ISSUES
ISSN 2345-0282 (online) http://jssidoi.org/jesi/
2021 Volume 8 Number 3 (March)
http://doi.org/10.9770/jesi.2021.8.3(19)
Make your research more visible, join the Twitter account of ENTREPRENEURSHIP AND SUSTAINABILITY ISSUES:
@Entrepr69728810
318
When answering the second question, many respondents indicated medical staff, followed by educators (school
and kindergarten teachers) and police officers. Other professionals (municipal administration employees,
employment service specialists, salespeople, musicians, sportsmen, psychologists, company managers, private
business employees, artists, waiters, hairdressers, maids, event planners) were less commonly mentioned.
4.4. Determinants of the attitudes to the changes in population’s mental well-being
In this case, the term determinants is not used in full compliance with the strict requirements of the research
methodology. The respondents were grouped depending on their answer selections which are treated as
independent variables. The analysis comprised four variables: respondents’ age, change in the personal
psychological well-being during the pandemic, assessment of the need for psychological services and
specialization (only the means of the two largest specialization groups – clinical and educational psychology –
were compared). Evaluation means representing the changes in population’s mental well-being (stress, anxiety,
etc.) during the pandemic were treated as dependent variables. The professionals in educational psychology are
likely to treat the changes in population’s mental well-being more seriously, but this tendency is statistically
insignificant) Some tendencies to differently assess the effects of the pandemic represented by the independent
variables can also be observed overload the report on the research results with insignificant information, we did
not include any differences in the values of statistical significance. Only a few cases described below were found
to be statistically significant.
First tendency: younger respondents tend to indicate that the pandemic has had stronger effects on population’s
mental well-being, although statistically significant differences were found only for sleep disorder evaluations
(respondents aged 18–29 and 50–65 (p≤0.02), and respondents aged 18–29 and 30–49 (p≤0.05).
Second tendency: the respondents who treated their mental well-being as worse, provided higher evaluations to all
seven aspects representing population’s mental well-being. A substantial number of statistically significant means
were found based on the answers of the respondents who noted that well-being remained the same, and based on
the answers of the respondents who indicated that well-being significantly worsened due to: stress (p≤0.03),
anxiety (p≤0.00), depression (p≤0.01), sleep disorders (p≤0.05), tiredness (p≤0.00). Three statistically significant
differences were found based on the answers on the respondents who noted that well-being slightly worsened or
significantly worsened due to: anxiety (p≤0.05), depression (p≤0.05) and persistent tiredness (p≤0.05).
Third tendency: the respondents who envisage a greater need for psychological services tend to treat plausible
changes in population’s mental well-being as more significant (see Table 11). The statistically significant
differences in the mean values were found when processing the answers remained the same and significantly
increased due to: stress (p≤0.01), sleep disorders (p≤0.02) and tiredness (p≤0.00). Four more statistically
significant differences were found when processing the evaluations of stress and tiredness provided by other
respondent groups. The direction, however, persists the same: a greater need for psychological services is
envisaged, a greater emphasis is placed on plausible changes in population’s mental well-being.
4.5. Correlations between the variables under consideration
Because the values of the variables were not dichotomous, but expressed as evaluation scales (from 4 to 6
evaluations), Pearson correlation coefficient was employed. The tendencies depicted in Tables 1 and 2 are also
confirmed by the correlations between the main variables. Strong correlations were found between the seven
indicators of population’s mental well-being evaluated by the respondents (values r range from 0.45 to nearly
ENTREPRENEURSHIP AND SUSTAINABILITY ISSUES
ISSN 2345-0282 (online) http://jssidoi.org/jesi/
2021 Volume 8 Number 3 (March)
http://doi.org/10.9770/jesi.2021.8.3(19)
Make your research more visible, join the Twitter account of ENTREPRENEURSHIP AND SUSTAINABILITY ISSUES:
@Entrepr69728810
319
0.7). Given that the number of the respondents amounts to 240, the correlations observed between the indicators
are very strong, as evidenced by the high Cronbach’s alpha estimated for the seven scales under consideration,
mentioned in Section 2.1. These correlations reflect a simple respondent evaluation tendency: a respondent, who
provides a higher evaluation to one of the factors representing the changes in population’s mental well-being, is
likely to provide a higher evaluation to any other factor. Relatively strong correlations were found between the
answers to the question Have you undergone the changes in your psychological well-being?, and the answers to
the other questions (9 statistically significant correlations out of 11). Six statistically significant correlations out of
11 were observed between the answers to the question Have you had to provide psychological assistance during
the pandemic? and the answers to the other questions. A substantial number of the statistically significant
correlations were observed between the answers to the question regarding the changes in the need for
psychological services and the other variables.
5. Conclusions and recommendations
Literature analysis and survey results revealed that psychological well-being of Lithuanian population and
entrepreneurs, according to psychologists, shows signs of worsening not only due to uncertainty about how long
the pandemic will last, but also due to deteriorating living conditions (exclusion, business closures, mass
bankruptcies). The state must ensure that the health of its citizens, including mental health, is not harmed. Thus,
based on the research results, it can be stated that to improve the provision of psychological services in transition
economies under the extreme conditions, it is necessary to:
1) balance workloads and professionals’ salaries (raise the number of workplaces in schools; raise the number
of workplaces in medical institutions; raise salaries/reestimate payment coefficients);
2) provide training for psychologists (on how to ensure crisis assistance, arrange remote counselling; remote
training and competence building sessions should also be arranged);
3) inform population about the services available (disseminate the information to the public on where
counselling is available; cover private counselling costs from the state’s budget; ensure that all age groups
are informed about the services provided not only thought the mobile apps and internet websites, but also by
involving doctors and nurses who can provide the guidance on who patients can turn to when they are
seeking assistance; employ a separate telephone line for providing the information about psychological
assistance);
4) eliminate organisational problems (ensure decent work conditions not only in terms of the remote work in the
crisis situation, but also in terms of providing psychologists with offices, equipment, personal protective
measures and rest areas; enhance cooperation among medical institutions, schools and other health care
institutions; build mobile crisis teams (crisis management teams) that could ensure communication with other
professionals and provide comprehensive consultations). Currently, there is a lack of a unified strategy and
specific guidelines on how the services can be provided. The status of psychologists should be equalized with
the status of the professionals working in the mental health system.
References
Andersson, G. (2016). Internet-delivered psychological treatments. Annual Review of Clinical Psychology, 12, 157-179.
https://doi.org/10.1146/annurev-clinpsy-021815-093006
Berger, T. (2017). The therapeutic alliance in internet interventions: a narrative review and suggestions for future research. Psychotherapy
Research, 27, 511–524. https://doi.org/10.1080/10503307.2015.1119908
ENTREPRENEURSHIP AND SUSTAINABILITY ISSUES
ISSN 2345-0282 (online) http://jssidoi.org/jesi/
2021 Volume 8 Number 3 (March)
http://doi.org/10.9770/jesi.2021.8.3(19)
Make your research more visible, join the Twitter account of ENTREPRENEURSHIP AND SUSTAINABILITY ISSUES:
@Entrepr69728810
320
Besenyő, J., Kármán, M. (2020). Effects of COVID-19 pandemy on African health, political and economic strategy. Insights into Regional
Development, 2(3), 630-644. https://doi.org/10.9770/IRD.2020.2.3(2)
Bojdani, E., Rjagopalan, A., Chen, A., Gearin, P., Olcott, W., Shankar, V., Cloutier, A., Solomon, H., Naqvi, N. Z., Batty, N., Festin, F. E.
D., Tahera, D., Chang, G., DeLisi, L. E. (2020). COVID-19 pandemic: impact on psychiatric care in the United States. Psychiatry
Research, 289, 113069. https://doi.org/10.1016/j.psychres.2020.113069
Chen, Q., Liang, M., Li, Y., Guo, J., Fei, D., Wang, L., He, L., Sheng, C., Cai, Y., Li, X., Wang, J., Zhang, Z. (2020). Mental health care
for medical staff in China during the COVID-19 outbreak. Lancet Psychiatry, 7(4), e15–e16. https://doi.org/10.1016/S2215-
0366(20)30078-X
Connolly, S. L., Miller, C. J., Lindsay, J. A., Bauer, M. S. (2020). A systematic review of providers’ attitudes toward telemental health via
videoconferencing. Clinical Psychology Science and Practice, 27(2), e12311. https://doi.org/10.1111/cpsp.12311
Dong, L., Bouey, J. (2020). Public Mental Health Crisis during COVID-19 Pandemic, China. Emerging Infectious Diseases, 26(7), 1616-
1618. https://doi.org/10.3201/eid2607.202407
Duan, L., Zhu, G. (2020). Psychological interventions for people affected by the COVID-19 epidemic. Lancet Psychiatry, 7(4), 300–302.
https://doi.org/10.1016/S2215-0366(20)30073-0
Duncan, D. F., White, J. B. and Nicholson, T. (2003). Using internet based surveys to reach hidden populations: case of non-abusive illicit
drug users. American Journal of Health Behaviour, 27(3), 208-18.
He, Z., Chen, J., Pan, K., Yue, Y., Cheung, T., Yuan, Y., Du, N., Zhao, Y., Feng, Y., Zhou, D., Zhou Y., Lu, F., Chen, Y., He, M., Xiang,
Y. T. (2020). The development of the Covid-19 psychological resilience model and its efficacy during the Covid-19 pandemic in China.
International Journal of Biological Sciences, 16(15), 2828-2834. https://doi.org/10.7150/ijbs.50127
Humer, E., Pieh, C., Kuska, M., Barke, A., Doering, B. K., Gossmann, K., Trnka, R., Meier, Z., Kascakova, N., Tavel, P., Probst, T.
(2020). Provision of Psychotherapy during the COVID-19 Pandemic among Czech, German and Slovak Psychotherapists. International
Journal of Environmental Research and Public Health, 17(13), p. 4811. https://doi.org/10.3390/ijerph17134811
Inchausti, F., MacBeth, A., Hasson-Ohayon, I., Dimaggio, G. (2020). Psychological Intervention and COVID-19: What We Know So Far
and What We Can Do. Journal of Contemporary Psychotherapy, 27, 1–8. https://doi.org/10.1007/s10879-020-09460-w
Jiang, X., Deng, L., Zhu, Y., Ji, H., Tao, L., Liu, L., Yang, D., Ji, W. (2020). Psychological crisis intervention during the outbreak period of
new coronavirus pneumonia from experience in Shanghai. Psychiatry Research, 286. https://doi.org/10.1016/j.psychres.2020.112903
Koushik N. S. (2020). A Population Mental Health Perspective on the Impact of COVID-19. Psychological Trauma: Theory, Research,
Practice, and Policy, 5(12), 529–530. http://dx.doi.org/10.1037/tra0000737
Lithuanian Psychological Association. (2020) Official statistics on psychologists working in Lithuania. Retrieved from:
http://www.psichologusajunga.lt/index.php?p=607&lng=lt
Marazziti, D., Pozza A., Giusepe M., Conversano C. (2020). The Psychosocial Impact of COVID-19 Pandemic in Italy: A Lesson for
Mental Health Prevention in the First Severely hit European Country. Psychological Trauma: Theory, Research, Practice, and Policy,
5(12), 531–533. http://dx.doi.org/10.1037/tra0000687
Mohammed, A., Sheikh, T. L., Poggensee, G., Nguku, P. Olayinka, A., Ohuabunwo, C., Eaton, J. (2015). Mental health in emergency
response: lessons from Ebola. The Lancet, 2(11), p. 955–957. http://dx.doi.org/10.1016/S2215-0366(15)00451-4
National Institute for Health and Care Excellence (NICE). (2018). Posttraumatic stress disorder. Retrieved from:
https://www.nice.org.uk/guidance/ng116
Orru, G., Ciacchini, R., Gemignani, A., Conversano, C. (2020). Psychological intervention measures during the COVID-19 pandemic.
Clinical Neuropsychiatry, 17(2), p. 76-79. http://doi.org/10.36131/CN20200208
ENTREPRENEURSHIP AND SUSTAINABILITY ISSUES
ISSN 2345-0282 (online) http://jssidoi.org/jesi/
2021 Volume 8 Number 3 (March)
http://doi.org/10.9770/jesi.2021.8.3(19)
Make your research more visible, join the Twitter account of ENTREPRENEURSHIP AND SUSTAINABILITY ISSUES:
@Entrepr69728810
321
Pfefferbaum, B., North, C. C. (2020). Mental Health and the Covid-19 Pandemic. The New England Journal of Medicine, 383(6), p. 510-
513. https://www.nejm.org/doi/pdf/10.1056/NEJMp2008017?articleTools=true
Shulman, M., John, M., Kane, J. M. (2017). Home-based outpatient telepsychiatry to improve adherence with treatment appointments: a
pilot study. Psychiatric Services, 68(7), 743–746. http://doi.org/10.1176/appi.ps.201600244
Thomas, J. F., Novins, D. K., Hosokawa, P. W., Olson, C. A., Hunter, D., Brent, A. S., Frunzi, G., Libby, A. M. (2018). The Use of
telepsychiatry to provide cost-efficient care during paediatric mental health emergencies. Psychiatric Services, 69(2), 161–168.
http://doi.org/10.1176/appi.ps.201700140
Vershinina, N., Rodionova, Y. (2011). Methodological issues in studying hidden populations operating in informal economy.
International Journal of Sociology and Social Policy, 31(11/12), 697-716
Vizheh, M., Qorbani, M., Arzaghi, S. M., Muhidin, S., Javanmard, Z., Esmaeili, M. (2020). The mental health of healthcare workers in the
COVID-19 pandemic: a systematic review. Journal of Diabetes and Metabolic Disorders, 26, 1-12. http://doi.org/10.1007/s40200-020-
00643-9
World Health Organisation. (2020). Setup and management of COVID-19 hotlines. Retrieved from:
https://apps.who.int/iris/bitstream/handle/10665/336027/WHO-EURO-2020-1206-40956-55530-eng.pdf
Xiao, H., Zhang, Y., Kong, D., Li, S., Yang, N. (2020). The Effects of Social Support on Sleep Quality of Medical Staff Treating Patients
with Coronavirus Disease 2019 (COVID-19) in January and February 2020 in China. Medical Science Monitor, 26.
http://doi.org/10.12659/MSM.923549
Zhou, X. (2020). Psychological crisis interventions in Sichuan Province during the 2019 novel coronavirus outbreak. Psychiatry Research,
286. http://doi.org/10.1016/j.psychres.2020.112895
Prof. dr. Tomas DAVULIS is a Dean of Law Faculty, Vilnius University, the leader of the national project COVID 19.
Research interests: European Union and International Labour Law, Labour Market, Collective Labour Relationships,
Equality, Social Rights, Social Mode.
ORCID ID: https://orcid.org/0000-0001-5018-140X
Prof. dr. Ligita GASPARĖNIENĖ is a Head of Science and Innovation Department, Vilnius University, the leader of the
national project “Welfare society”. Research interests: shadow economy, digital shadow economy, corruption, money
laundering, investments in gold, monetary policy.
ORCID ID: https://orcid.org/0000-002-5535-6552
Evaldas RAISTENSKIS is a junior researcher at Vilnius University, Faculty of Law, Science and Innovation Department,
Criminal Law General Science Center. I am currently writing a dissertation work for Criminal Liability for Contraband.
Research interests: criminal smuggling, shadow economy, corruption.
ORCID ID: https://orcid.org/0000-0003-3049-2926
Copyright © 2021 by author(s) and VsI Entrepreneurship and Sustainability Center
This work is licensed under the Creative Commons Attribution International License (CC BY).
http://creativecommons.org/licenses/by/4.0/
ENTREPRENEURSHIP AND SUSTAINABILITY ISSUES
ISSN 2345-0282 (online) http://jssidoi.org/jesi/
2021 Volume 8 Number 3 (March)
http://doi.org/10.9770/jesi.2021.8.3(20)
Publisher http://jssidoi.org/esc/home
324
SOCIAL COMPETENCE-BASED PROGNOSTIC POSSIBILITIES OF CREATIVITY
EXPRESSION AMONG STUDENTS OF SOCIAL PROFILE
Kristina Samašonok ¹, Agnė Juškevičienė ²
1,2 Vilniaus kolegija / University of Applied Sciences, Saltoniškių Street 58, Vilnius, Lithuania
E-mails: 1 [email protected] ; 2 [email protected]
Received 20 September 2020; accepted 10 January 2020; published 30 March 2021
Abstract. The article presents a theoretical discussion of peculiarities of creativity and social competence. Creativity expression is analysed
on the basis of social competence. The aim of research: to investigate peculiarities of perceived creativity and social competence of
students of social profile in Lithuanian higher education schools, to disclose their correlations and to foresee prognostic possibilities of
creativity expression on the basis of social competence. The research methodologies: The Questionnaire of Personality Creativity (Petrulis,
1988) was used to investigate the students’ perceived creativity according to the subscales of intuition, phantasy, inclination to creativity,
inclination to innovation, flexibility, originality, criticality, inversion and childishness. The students’ social competence was assessed using
the questionnaire of Ullriche, de Muynck (1994) (cf. Lekavičiene, 2001) according to the subscales of general self-confidence, resistance to
failures and criticism, ability of expressing feelings, ability of asking for a favour, unyielding, ability of demanding and feeling not guilty.
Employing the strategy of quantitative research, the correlations of components of social profile students’ perceived creativity and social
competence were established. It was also identified that social competence acquires a prognostic meaning to expression of students’
creativity. The research results will have a residual value in the scientific discussion about the social competence-based expression of
students’ creativity.
Keywords: social competence; perceived creativity; students of social profile
Reference to this paper should be made as follows: Samašonok, K., Juškevičienė, A. 2021. Social competence-based prognostic
possibilities of creativity expression among students of social profile. Entrepreneurship and Sustainability Issues, 8(3), 324-339.
http://doi.org/10.9770/jesi.2021.8.3(20)
JEL Codes: A2
1. Introduction
Under the influence of requirements imposed by the technological progress and market economy, in the rapidly
changing society, at present novice specialists need more than just competences that are based on exclusively
professional skills. Seeking to adapt to the requirements of labour market and acquire competitive advantages, a
particular emphasis is laid on the person’s critical thinking, his/her ability to generate new ideas and to implement
ENTREPRENEURSHIP AND SUSTAINABILITY ISSUES
ISSN 2345-0282 (online) http://jssidoi.org/jesi/
2021 Volume 8 Number 3 (March)
http://doi.org/10.9770/jesi.2021.8.3(20)
325
them, to boldly face new challenges and adapt to constantly changing conditions (Wang et al., 2006). Moreover,
self-confidence, communication skills, ability to efficiently participate in social interactions, to work in a team and
to foster positive interpersonal relations serve as a factor of social welfare and a driver of innovations (Šinkūnienė,
2011) as well as guarantee success in the social environment and professional activity, help to pursue a career and
to remain competitive in ever-changing situations (Iždonaitė-Medžiūnienė, 2009). Thus, in the context of the rapid
development of technologies, information communication technologies and economy and under conditions of
social, cultural changes in the society, the individual’s creativity and social competence have been acquiring an
exceptional significance.
The peculiarities of social competence and creativity and their expression have been a popular research object
among researchers in the last several decades. The analysis of research works allows noticing that the main focus
is laid on delving into the features of socially competent (Iždonaitė-Medžiūnienė, 2009; Lekavičienė, 2001) and
creative (Grakauskaitė – Karkockienė, 2010; Torrance, 1986; Jaskyte, Taylor, Smariga, 2009; Sternberg, 2006)
personality. The person’s creativity as one of the key features in the labour market is emphasised (Rakauskaitė,
2014; Vaičiūnienė, Mažeikienė, 2014). Other researchers (Hemlin, Allwood and Martin, 2008; Grakauskaitė –
Karkockienė, 2010) allocated more attention to the research on the factors that contribute to manifestations of
person’s creativity, whereas Malinauskas (2003), Šniras (2005) analysed tendencies, possibilities and problems
related to social competence development. Thus, the main focus of researchers is laid on studying features of
socially competent and creative personality and distinguishing the factors that result in their manifestation.
However, the components of individual’s social competence, as some of the factors that influence expression of
creativity, have not been exhaustively investigated and in-depth and empirically grounded research studies are
few. In such a situation, the links between the components of social competence and perceived creativity as well
as their prognostic analysis have been more and more often seen as an important field of scientific research. On
the other hand, more comprehensive scientific research conducted applying the regression analysis, which would
allow foreseeing social competence-based prognostic possibilities of perceived creativity expression according to
separate dimensions in the regression equation, would help to identify if the level of social competence could
influence manifestation of person’s creativity. It would also be possible to establish the components of person’s
creativity which can acquire a prognostic meaning for creativity expression as well as to disclose the possibilities
for promotion of personal creative potential while developing social competences.
Considering the relevance of the topic, the article reveals the peculiarities of perceived creativity and social
competence of social profile students from Lithuanian higher education schools. The correlations of components of
creativity and social competence are identified and prognostic possibilities of creativity expression are foreseen.
The research problem is defined through the following questions: what level of perceived creativity and social
competence is typical of social profile students from Lithuanian higher education schools? How students’
perceived creativity is related to components of social competence? What components of students’ social
competence can significantly forecast the expression of social profile students’ perceived creativity?
The object of research: peculiarities of social competence and perceived creativity of social profile students from
Lithuanian higher education schools, correlations and prognostic possibilities of some (dependent) variables on
the basis of other (independent) variables.
The goal of research: to investigate the peculiarities of social competence and perceived creativity of social
profile students from Lithuanian higher education schools, to reveal their correlations and to foresee social
competence-based prognostic possibilities of creativity expression.
The objectives of research:
1. To conduct the analysis of previous research on the analysed topic theoretically substantiating
manifestation of creativity on the basis of social competence level.
2. To identify peculiarities of perceived creativity and social competence of social profile students
from Lithuanian higher education schools.
ENTREPRENEURSHIP AND SUSTAINABILITY ISSUES
ISSN 2345-0282 (online) http://jssidoi.org/jesi/
2021 Volume 8 Number 3 (March)
http://doi.org/10.9770/jesi.2021.8.3(20)
326
3. To disclose corelations of social competence and perceived creativity.
4. To foresee social competence-based prognostic possibilities of expression of perceived creativity in
the regression equation.
2. Theoretical bacground
Over the last decades the research studies on the analysis of the phenomenon of creative thinking have increased.
Up to now discussions have been held about the qualities that characterise a creative personality and how
expression and development of person’s creativity are encouraged. On the other hand, more often attention is
focused on the fact that person’s abilities and skills that manifest themselves in social situations comprise an
important indicator foreseeing manifestation of individual’s creativity. The researchers allocate their attention to
the importance of social competence stressing out the expression of person’s creativity. Creative thinking is an
important indicator of successful business, which, according to the analysis of scholarly literature, is related to the
aspects of social competence. It is important that creativity encourages creation of innovations and their
introduction in organisations (Cropley, 2015; Newman et al., 2018). Creativity is also linked to the person’s
pursuit of mastery, willingness to take risk, independence and tolerance to various approaches (Beaney, 2019;
Benea-Popuşoi, Duca, 2021; Chen et al., 2018; Demarin, Derke, 2020; Jahanshahi et al., 2019; Huertas,
Pergentino, 2020; Karimi, et al., 2020). The works of others researchers focus on the relationships between
creativity and leadership and, at the same time, between person’s self-confidence and self-respect (Fonseca et al.,
2019; Hughes et al., 2018; Koh et al., 2019; Liu et al., 2020). The research results also show that creativity is
predetermined by the confidence in the power of own efficiency in the society (Haase et al., 2018). Self-
confidence as an important element of social competence was highlighted by Sipahi (2018) as well, who
emphasized that a creative personality is curious, patient, brave enough to accept changes and innovations as well
as to take risk.
Other scholars also recognize that personality self-confidence is an important indicator of predicting a person's
creative achievement, propensity to use a variety of methods and techniques, fear of risk-taking, creative and
original pursuit of results (Pociute, Isiunaite, 2011; Wolfradt, Pretz, 2001). Thus, researchers' research sees trends
in the relationship between self-confidence and creativity: self-confidence as well as the ability to boldly
challenge challenges are significantly correlated with a person's more strongly expressed level of creativity.
It can be assumed that the person’s self-confidence, his/her confidence in own abilities, perseverance with
attaining the set goals disregarding the opinions of others have influence on the expression of person’s creativity
and is an important indicator of creative activities. Thus, the level of person’s social competence is related to the
expression of creativity, when next to peculiarities as strengths attributed to a creative personality, such qualities
as resourcefulness in case of dissatisfaction with possessed information, originality and critical evaluation of own
activities and decisions can be mentioned. Meantime, lack of self-confidence can possibly limit manifestation of
person’s creativity.
Particularly interesting is the concept of ‘dark creativity’. 'Dark creativity' is the use of creative ideas for
malevolent actions (Palmer et al. 2020). It is a combination of cognitive abilities and motivational aspects. This
article is the first to investigate the impact of power on creativity in an immoral occupational task. (Khan et al.
2020) examined the association between the psychological empowerment of project-based employees and the
success of the project. The results concluded that psychological empowerment is directly and indirectly positively
linked to project success. Diković and Gregović (2020) study was carried out on a sample of teachers from three
counties in the Republic of Croatia. Active learning encourages and develops knowledge, skills and attitudes.
Teachers should promote this type of learning from the beginning.
ENTREPRENEURSHIP AND SUSTAINABILITY ISSUES
ISSN 2345-0282 (online) http://jssidoi.org/jesi/
2021 Volume 8 Number 3 (March)
http://doi.org/10.9770/jesi.2021.8.3(20)
327
The researchers acknowledge that a creative personality is characterised with general self-confidence, ability to
critically evaluate situations, bravery and independence in decision-making (Petrulytė, 2001), emotionality,
nonconformism and ability to defend own rights (Grakauskaitė-Karkockienė, 2010). Csikszentmihalyi (1996)
states that a creator, as a mature personality, still possesses certain childish features: sincerity, emotionality,
impulsivity and sensitivity. On the other hand, a creative personality is resourceful, autonomous and open to new
experience, curious, unconstrained and has inclination to originality, more vivid imagination, fluency of thinking
and pursuit of new things. Thus, certain abilities and skills comprise some of the key aspects for creative
achievements of personality (Wang, et al., 2019). In the study (Kelemen et al. 2020) the relationship between
individual and organizational mindfulness is examined. Some authors consider these concepts to be
interconnected, but the exact nature of this connection is still unclear. Research shows that organizational
mindfulness implies mindfulness at the individual level.
The data of other researchers also show similar tendencies: intentions of the individual to continue the chosen
activity having encountered obstacles (Hoyle, 2006), achievement motivation, perseverance in attainment of set
goals and coping with challenges (Judge, Ilies, 2002; Shafi et al., 2020; Tse et al., 2018; Wang, 2020) are linked
to creativity. The results of Huang & Luthans (2015); Song, Yu, Zhang, & Jiang (2015) research also show that
the person’s persistence seeking the established goals and not giving in to obstacles, targeting at high
achievements, generation of new ideas can be of high importance in the process of creative thinking. Therefore, it
can be assumed that the higher level of person’s resistance to failures and obstacles, positive evaluation of own
achievements without experiencing any guilt positively influence manifestation of creativity, ambition to seek
high goals, ability to make plans and expand limits of own possibilities.
The authors (Griffiths, Costi, 2020) do not deny and acknowledge that creativity is related to social competence,
because creativity is more than just mobilizing people when, on the contrary, being together with other personal
clear creative, idea-based goals. Creativity should be addressed to other business processes where it is important
not only to develop financial measurement products but also to delve into human resources in a modern
organization. This allows us to state that various necessary aspects of social communication are the acceptance of
another's opinion, the ability to express oneself clearly, the ability to ask for or give help. Glăveanu (2014) notes
that creative action is characterized by processes of human interaction and communication.
A big number of studies confirm relationships of the person’s ability to act creatively, to establish successful
relations and maintain them. It can be assumed that a higher value of social activity is connected to formation of
person’s more favourable attitude to himself/herself and conducted activities including creative activities. Our
research and the ones conducted by other researchers showed a positive correlation between the ability to
maintain constructive and good relations with others and creativity (Sung, Choi, 2009). This confirms the
statement that people, who possess a higher level of maintaining constructive relations and social openness,
focused on people, able to establish contacts easier and to engage in joint activities and spend more time
communicating with others, are able to create, generate new ideas and to accept challenges and innovations. The
results of our research also confirmed that personal emotional openness, ability to maintain constructive relations
with others is a significant determinant for creativity. The fact that creativity is not a vacuum process decoupled
from social competence is also acknowledged by Glăveanu (2014) and Elisondo (2016), noting that creativity is a
social action and is not performed in solitude. This is because the activities of individuals depend on the opinions
and acceptance of other people. Even an individual creative process is not in itself separate, more and more a
person does it in a socially constructed context, which is determined by language, knowledge, expectations.
Importantly, the scientific literature places significant emphasis on social expectations, as individuals ’perceptions
of the creative expectations that are raised in organizations also enhance the creativity of the latter (Farmer,
Tierney, & Kung-McIntyre, 2003). Communication is one of the essential functions in business, important in
creating, transmitting and interpreting ideas, this suggests that certain aspects of social competence - ability to
ENTREPRENEURSHIP AND SUSTAINABILITY ISSUES
ISSN 2345-0282 (online) http://jssidoi.org/jesi/
2021 Volume 8 Number 3 (March)
http://doi.org/10.9770/jesi.2021.8.3(20)
328
accept criticism, resilience, to express one's position and feelings - are important in business communication.
Businesses also focus on innovative creativity and the development of a creative work environment to create
unique business results. To respond to this goal, according to Sipahi (2018), the ability to compete, to take
initiative decisions is important. Researchers (Farmer, Tierney, & Kung-McIntyre, 2003; Prabhu et al., 2008)
have focused on personality factors: self-knowledge, self-efficacy perceptions that affect employee creativity.
Other researchers note that self-regulatory abilities and even a person’s positive mood can affect a person’s
creativity (Roskes, De Dreu, & Nijstad, 2012). Authors confirm that the stronger the individual’s ability of
expressing feelings, the weaker his/her emotional inhibition, the less constrained the person is in communication
situations, the braver his/her expression of opinion is and the less afraid s/he is to make new acquaintances and
express the feelings in appropriate ways, the more new ideas such a person generates and the easier he is able to
express them. Other researchers (Broekhoven, Cropley, & Seegers, 2020; Camargo, Çelik, & Storme, 2020; Feist,
1998) have identified the existing expression of divergent creative thinking. a statistically significant relationship
between the expression of emotionality and creativity. Research by Sung, Choi (2009) has revealed similar
trends − individuals with stronger emotional sensitivity tend to generate new ideas, as well as curiosity, interest in
the environment around them, the ability to think creatively, act in unconventional ways and accept boldly. The
results of research by Pacevičius (2005), Rantanen et al. (2007) show that more closed and emotionally engaged
individuals, more often experiencing negative emotions, unable to express them in appropriate ways, as well as
more often experiencing tension in communication situations, who likely to limit the opportunities for expression
of creativity. Other researchers has also revealed similar trends, with a person's persistence in pursuing the chosen
activity despite difficulties and obstacles (Hoyle, 2006; Rantanen et al., 2007) and a stronger commitment to
achieving goals are associated with the manifestation of creativity, as it is likely that a person capable of accepting
negative assessments and disagreements from others and respond to failures, and persevere in achieving the set
goals, has a higher level of creativity, is more flexible and original in performing activities.
3. Research objective and methodology
The research participants. The research sample included 176 students of social profile from Lithuanian higher
education schools: 108 (61.4 %) female and 68 (38.6 %) male students. There were 54 (30.7 %) first year, 48
(27.3 %) second year, 44 (25 %) third year and 30 (17 %) fourth year students. The average age of respondents
was 20.8 years. Attempts were made to include students of social profile from various Lithuanian schools of
higher education into the quantitative research. The research sample was convenient. Anonymity was ensured
during the research and the ethical principle of free choice to participate in the survey was followed. The received
results were processes and presented in a generalised manner, confidentiality of data was guaranteed and the
participants were informed about the details of research completion.
The research methods. Analytical descriptive method was used to analyse peculiarities of social competence and
creativity, possibilities for creativity manifestation based on the level of social competence. The quantitative
research. The strategy of quantitative research was applied to investigate expression of creativity, social
competence among students from Lithuanian higher education institutions and their correlations and to foresee
social competence-based prognostic possibilities. The students’ social competence was assessed using the
questionnaire of Ullriche, de Muynck (1994) (cf. Lekavičiene, 2001). The questionnaire consists of 45 statements
with six variants or responses: from 0 (“This is not the case at all, completely untrue”) to 5 (“Completely true”).
The indicators are calculated according to seven scales: 1) general self-confidence (provides information on the
respondent’s self-confidence, perception of own relevance, determination); 2) resistance to failures and criticism
(allows evaluating the participant’s ability to accept negative evaluation and disapproval of surrounding people); 3)
ability of expressing feelings (evaluates the participant’s ability to show own positive and negative feelings, to
discuss them with other people); 4) ability of asking for a favour (helps to evaluate the participant’s ability to
contact with familiar and unfamiliar people); 5) unyielding (allows evaluating the participant’s behaviour regarding
the requirements from other people); 6) ability of demanding (shows the participant’s ability to make complaints
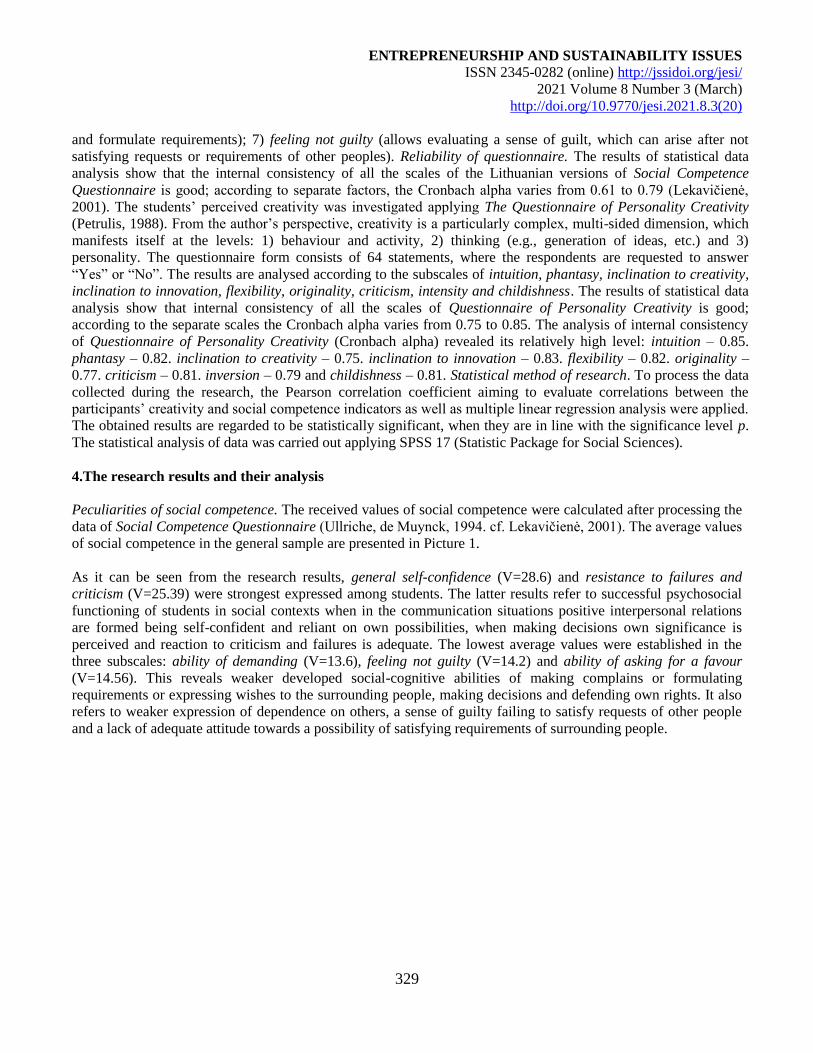
ENTREPRENEURSHIP AND SUSTAINABILITY ISSUES
ISSN 2345-0282 (online) http://jssidoi.org/jesi/
2021 Volume 8 Number 3 (March)
http://doi.org/10.9770/jesi.2021.8.3(20)
329
and formulate requirements); 7) feeling not guilty (allows evaluating a sense of guilt, which can arise after not
satisfying requests or requirements of other peoples). Reliability of questionnaire. The results of statistical data
analysis show that the internal consistency of all the scales of the Lithuanian versions of Social Competence
Questionnaire is good; according to separate factors, the Cronbach alpha varies from 0.61 to 0.79 (Lekavičienė,
2001). The students’ perceived creativity was investigated applying The Questionnaire of Personality Creativity
(Petrulis, 1988). From the author’s perspective, creativity is a particularly complex, multi-sided dimension, which
manifests itself at the levels: 1) behaviour and activity, 2) thinking (e.g., generation of ideas, etc.) and 3)
personality. The questionnaire form consists of 64 statements, where the respondents are requested to answer
“Yes” or “No”. The results are analysed according to the subscales of intuition, phantasy, inclination to creativity,
inclination to innovation, flexibility, originality, criticism, intensity and childishness. The results of statistical data
analysis show that internal consistency of all the scales of Questionnaire of Personality Creativity is good;
according to the separate scales the Cronbach alpha varies from 0.75 to 0.85. The analysis of internal consistency
of Questionnaire of Personality Creativity (Cronbach alpha) revealed its relatively high level: intuition – 0.85.
phantasy – 0.82. inclination to creativity – 0.75. inclination to innovation – 0.83. flexibility – 0.82. originality –
0.77. criticism – 0.81. inversion – 0.79 and childishness – 0.81. Statistical method of research. To process the data
collected during the research, the Pearson correlation coefficient aiming to evaluate correlations between the
participants’ creativity and social competence indicators as well as multiple linear regression analysis were applied.
The obtained results are regarded to be statistically significant, when they are in line with the significance level p.
The statistical analysis of data was carried out applying SPSS 17 (Statistic Package for Social Sciences).
4.The research results and their analysis
Peculiarities of social competence. The received values of social competence were calculated after processing the
data of Social Competence Questionnaire (Ullriche, de Muynck, 1994. cf. Lekavičienė, 2001). The average values
of social competence in the general sample are presented in Picture 1.
As it can be seen from the research results, general self-confidence (V=28.6) and resistance to failures and
criticism (V=25.39) were strongest expressed among students. The latter results refer to successful psychosocial
functioning of students in social contexts when in the communication situations positive interpersonal relations
are formed being self-confident and reliant on own possibilities, when making decisions own significance is
perceived and reaction to criticism and failures is adequate. The lowest average values were established in the
three subscales: ability of demanding (V=13.6), feeling not guilty (V=14.2) and ability of asking for a favour
(V=14.56). This reveals weaker developed social-cognitive abilities of making complains or formulating
requirements or expressing wishes to the surrounding people, making decisions and defending own rights. It also
refers to weaker expression of dependence on others, a sense of guilty failing to satisfy requests of other people
and a lack of adequate attitude towards a possibility of satisfying requirements of surrounding people.
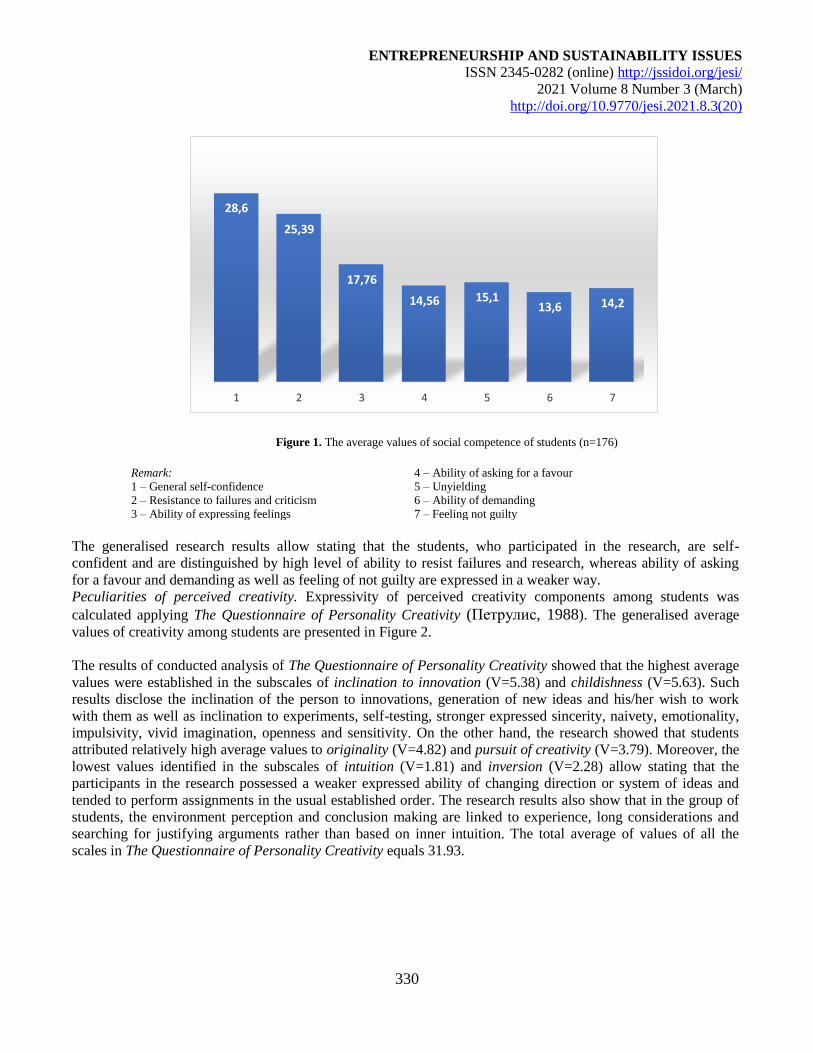
ENTREPRENEURSHIP AND SUSTAINABILITY ISSUES
ISSN 2345-0282 (online) http://jssidoi.org/jesi/
2021 Volume 8 Number 3 (March)
http://doi.org/10.9770/jesi.2021.8.3(20)
330
28,6
25,39
17,76
14,56 15,113,6 14,2
1 2 3 4 5 6 7
Figure 1. The average values of social competence of students (n=176)
Remark: 4 – Ability of asking for a favour
1 – General self-confidence 5 – Unyielding
2 – Resistance to failures and criticism 6 – Ability of demanding
3 – Ability of expressing feelings 7 – Feeling not guilty
The generalised research results allow stating that the students, who participated in the research, are self-
confident and are distinguished by high level of ability to resist failures and research, whereas ability of asking
for a favour and demanding as well as feeling of not guilty are expressed in a weaker way.
Peculiarities of perceived creativity. Expressivity of perceived creativity components among students was
calculated applying The Questionnaire of Personality Creativity (Петрулис, 1988). The generalised average
values of creativity among students are presented in Figure 2.
The results of conducted analysis of The Questionnaire of Personality Creativity showed that the highest average
values were established in the subscales of inclination to innovation (V=5.38) and childishness (V=5.63). Such
results disclose the inclination of the person to innovations, generation of new ideas and his/her wish to work
with them as well as inclination to experiments, self-testing, stronger expressed sincerity, naivety, emotionality,
impulsivity, vivid imagination, openness and sensitivity. On the other hand, the research showed that students
attributed relatively high average values to originality (V=4.82) and pursuit of creativity (V=3.79). Moreover, the
lowest values identified in the subscales of intuition (V=1.81) and inversion (V=2.28) allow stating that the
participants in the research possessed a weaker expressed ability of changing direction or system of ideas and
tended to perform assignments in the usual established order. The research results also show that in the group of
students, the environment perception and conclusion making are linked to experience, long considerations and
searching for justifying arguments rather than based on inner intuition. The total average of values of all the
scales in The Questionnaire of Personality Creativity equals 31.93.
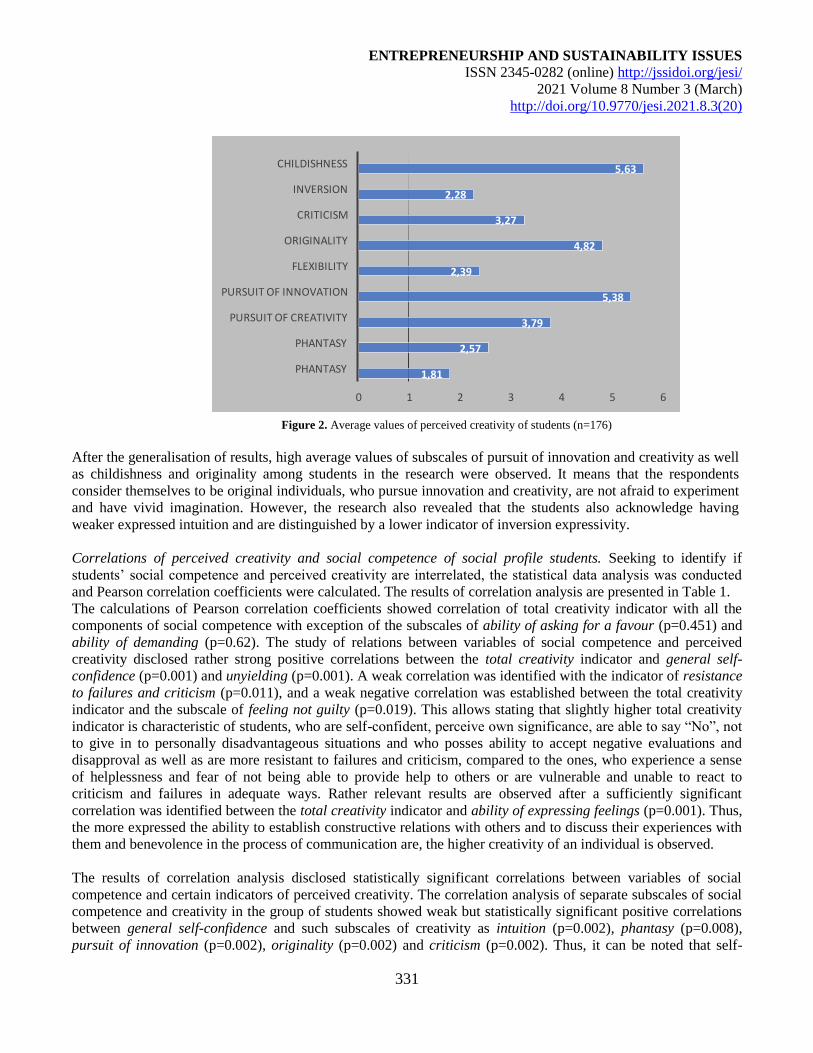
ENTREPRENEURSHIP AND SUSTAINABILITY ISSUES
ISSN 2345-0282 (online) http://jssidoi.org/jesi/
2021 Volume 8 Number 3 (March)
http://doi.org/10.9770/jesi.2021.8.3(20)
331
1,81
2,57
3,79
5,38
2,39
4,82
3,27
2,28
5,63
0 1 2 3 4 5 6
PHANTASY
PHANTASY
PURSUIT OF CREATIVITY
PURSUIT OF INNOVATION
FLEXIBILITY
ORIGINALITY
CRITICISM
INVERSION
CHILDISHNESS
Figure 2. Average values of perceived creativity of students (n=176)
After the generalisation of results, high average values of subscales of pursuit of innovation and creativity as well
as childishness and originality among students in the research were observed. It means that the respondents
consider themselves to be original individuals, who pursue innovation and creativity, are not afraid to experiment
and have vivid imagination. However, the research also revealed that the students also acknowledge having
weaker expressed intuition and are distinguished by a lower indicator of inversion expressivity.
Correlations of perceived creativity and social competence of social profile students. Seeking to identify if
students’ social competence and perceived creativity are interrelated, the statistical data analysis was conducted
and Pearson correlation coefficients were calculated. The results of correlation analysis are presented in Table 1.
The calculations of Pearson correlation coefficients showed correlation of total creativity indicator with all the
components of social competence with exception of the subscales of ability of asking for a favour (p=0.451) and
ability of demanding (p=0.62). The study of relations between variables of social competence and perceived
creativity disclosed rather strong positive correlations between the total creativity indicator and general self-
confidence (p=0.001) and unyielding (p=0.001). A weak correlation was identified with the indicator of resistance
to failures and criticism (p=0.011), and a weak negative correlation was established between the total creativity
indicator and the subscale of feeling not guilty (p=0.019). This allows stating that slightly higher total creativity
indicator is characteristic of students, who are self-confident, perceive own significance, are able to say “No”, not
to give in to personally disadvantageous situations and who posses ability to accept negative evaluations and
disapproval as well as are more resistant to failures and criticism, compared to the ones, who experience a sense
of helplessness and fear of not being able to provide help to others or are vulnerable and unable to react to
criticism and failures in adequate ways. Rather relevant results are observed after a sufficiently significant
correlation was identified between the total creativity indicator and ability of expressing feelings (p=0.001). Thus,
the more expressed the ability to establish constructive relations with others and to discuss their experiences with
them and benevolence in the process of communication are, the higher creativity of an individual is observed.
The results of correlation analysis disclosed statistically significant correlations between variables of social
competence and certain indicators of perceived creativity. The correlation analysis of separate subscales of social
competence and creativity in the group of students showed weak but statistically significant positive correlations
between general self-confidence and such subscales of creativity as intuition (p=0.002), phantasy (p=0.008),
pursuit of innovation (p=0.002), originality (p=0.002) and criticism (p=0.002). Thus, it can be noted that self-
ENTREPRENEURSHIP AND SUSTAINABILITY ISSUES
ISSN 2345-0282 (online) http://jssidoi.org/jesi/
2021 Volume 8 Number 3 (March)
http://doi.org/10.9770/jesi.2021.8.3(20)
332
confident research participants, who perceive their significance and relevance and pursue their set goals in a
determined way see themselves as original individuals, who pursue innovation, possess vivid imagination and are
more critical personalities.
After the calculation of Pearson correlation coefficients, in the group of research participants rather strong
statistically significant positive correlations were found between unyielding and originality (p=0.002), criticism
(p=0.003), phantasy (p=0.003) and flexibility (p=0.001). Slightly weaker but still statistically significant
correlations were identified between pursuit of innovation (p=0.006) and inversion (p=0.007). Thus, the
participants with higher level of ability to respond to requirements from other people in adequate ways and not to
give in to personally disadvantageous situations, with ability to put forward their wishes and to protect own rights,
to say “No” and able not to feel tension in communication situation are distinguished by stronger expressed
phantasy, inversion, originality, flexibility as well as criticism while performing assignments and pursuit of
innovation.
The correlation analysis of subscales of perceived creativity and social competence revealed positive correlations
between the participants’ ability of expressing feelings and the following subscales of creativity: flexibility
(p=0.001), childishness (p=0.002), originality (p=0.003), criticism (p=0.004), pursuit of innovation (p=0.002) and
creativity (p=0.004). The aforesaid allows pointing out that the students, who demonstrate better expressed
confidence in other individuals while establishing contact with them, benevolence while communicating with
others and discussing the feelings they are going through, give higher evaluation to their flexibility, originality,
childlessness and criticism as well as have stronger expressed pursuit of innovation and creativity.
The calculated Pearson correlation coefficients disclosed negative correlations between the subscales of feeling
not guilty and phantasy (p=0.002) as well as childishness (p=0.001); a relatively weak but positive correlation was
identified with the subscale of criticism (p=0.017). This allows stating that social profile students, who possess
weaker responsibility for solving problems of other people and less frequently experience a sense of guilt not
being able to help others, are distinguished by stronger expressed phantasy and childishness, whereas the
participants with stronger expressed adequate attitude to a possibility of satisfying requirements of other people
leads to a higher level of criticism. Important results are observed after establishing strong positive correlations
between the indicator of resistance to failures and criticism and intuition (p=0.001), creativity (p=0.001) and
pursuit of innovation (p=0.001) and weak positive significant correlations with flexibility (p=0.014) and
originality (p=0.017). Following the results of research, it can be noted that the participants’ ability to adequately
react to negative evaluations and disapproval of surrounding people and to accept them precondition stronger
expressed intuition, flexibility, originality, pursuit of innovation and creativity. On the opposite, the stronger
expressed fear of getting at the forefront, an experienced sense of helplessness as well as vulnerability and lack of
ability to react to criticism and failures adequately are linked to weaker expression of flexibility, originality,
intuition as well as pursuit of innovation and creativity among the social-profile students in the research. A weak
but significantly positive correlation found between resistance to failures and criticism and criticism (p=0.008)
shows that stronger expressed criticism is typical of the research participants who are able to react to failures and
criticism in adequate ways and to accept negative evaluations of and disapproval of surrounding people and are
not afraid to get at the forefront. The correlation analysis of perceived creativity and social competence revealed
relatively weak but significantly positive correlations between ability of asking for a favour and pursuit of
creativity (p=0.009), flexibility (p=0.004) and originality (p=0.009). Thus, it can be stated that the respondents,
who are distinguished by a stronger expressed ability of asking for a favour, absence of fear of being rejected or
being a burden to the surrounding people, evaluate higher their own originality and flexibility as well as pursuit of
creativity. The calculations of Pearson correlation coefficients disclosed moderate positive correlations between
the subscales of ability of demanding and criticism (p=0.001) and pursuit of innovation (p=0.009). Also, only
negative correlation with childishness (p=0.003) shows that a stronger expressed ability of students to make
complaints and formulate requirements, to present own wishes and to defend them as well as stronger manifested
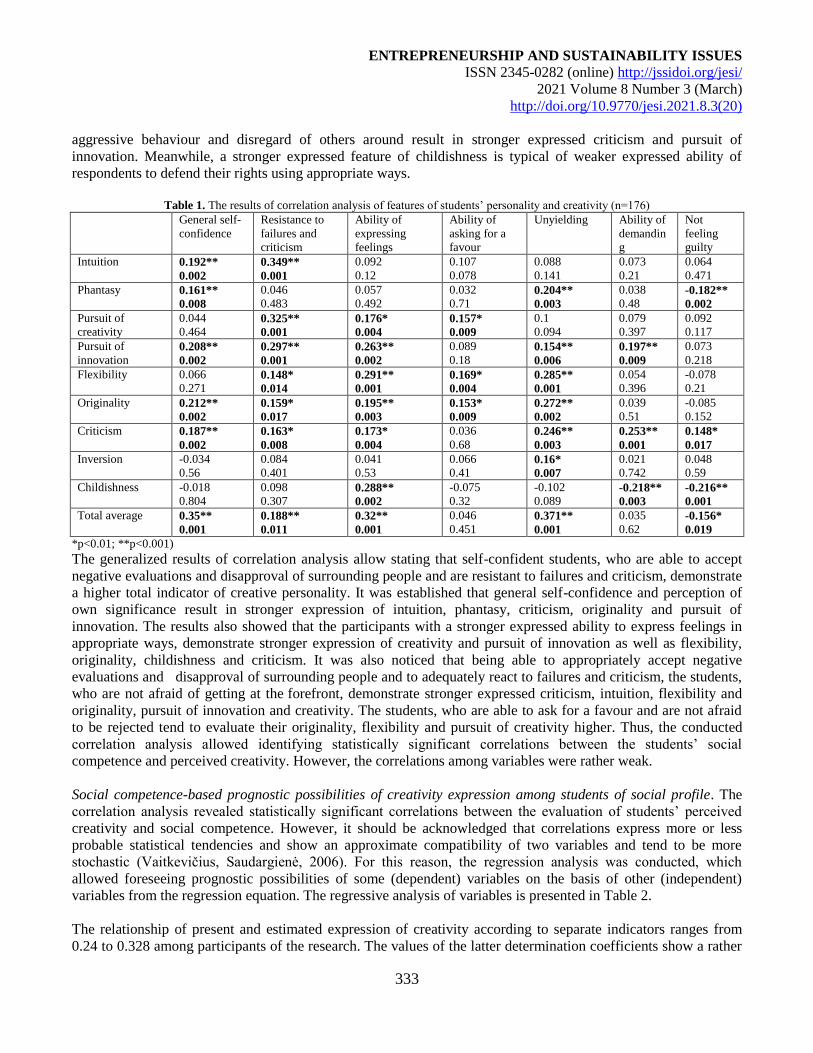
ENTREPRENEURSHIP AND SUSTAINABILITY ISSUES
ISSN 2345-0282 (online) http://jssidoi.org/jesi/
2021 Volume 8 Number 3 (March)
http://doi.org/10.9770/jesi.2021.8.3(20)
333
aggressive behaviour and disregard of others around result in stronger expressed criticism and pursuit of
innovation. Meanwhile, a stronger expressed feature of childishness is typical of weaker expressed ability of
respondents to defend their rights using appropriate ways.
Table 1. The results of correlation analysis of features of students’ personality and creativity (n=176)
General self-
confidence
Resistance to
failures and
criticism
Ability of
expressing
feelings
Ability of
asking for a
favour
Unyielding Ability of
demandin
g
Not
feeling
guilty
Intuition 0.192**
0.002
0.349**
0.001
0.092
0.12
0.107
0.078
0.088
0.141
0.073
0.21
0.064
0.471
Phantasy 0.161**
0.008
0.046
0.483
0.057
0.492
0.032
0.71 0.204**
0.003
0.038
0.48 -0.182**
0.002
Pursuit of
creativity
0.044
0.464 0.325**
0.001
0.176*
0.004
0.157*
0.009
0.1
0.094
0.079
0.397
0.092
0.117
Pursuit of
innovation 0.208**
0.002
0.297**
0.001
0.263**
0.002
0.089
0.18
0.154**
0.006
0.197**
0.009
0.073
0.218
Flexibility 0.066
0.271 0.148*
0.014
0.291**
0.001
0.169*
0.004
0.285**
0.001
0.054
0.396
-0.078
0.21
Originality 0.212**
0.002
0.159*
0.017
0.195**
0.003
0.153*
0.009
0.272**
0.002
0.039
0.51
-0.085
0.152
Criticism 0.187**
0.002
0.163*
0.008
0.173*
0.004
0.036
0.68
0.246**
0.003
0.253**
0.001
0.148*
0.017
Inversion -0.034
0.56
0.084
0.401
0.041
0.53
0.066
0.41
0.16*
0.007
0.021
0.742
0.048
0.59
Childishness -0.018
0.804
0.098
0.307 0.288**
0.002
-0.075
0.32
-0.102
0.089
-0.218**
0.003
-0.216**
0.001
Total average 0.35**
0.001
0.188**
0.011
0.32**
0.001
0.046
0.451 0.371**
0.001
0.035
0.62 -0.156*
0.019
*p<0.01; **p<0.001)
The generalized results of correlation analysis allow stating that self-confident students, who are able to accept
negative evaluations and disapproval of surrounding people and are resistant to failures and criticism, demonstrate
a higher total indicator of creative personality. It was established that general self-confidence and perception of
own significance result in stronger expression of intuition, phantasy, criticism, originality and pursuit of
innovation. The results also showed that the participants with a stronger expressed ability to express feelings in
appropriate ways, demonstrate stronger expression of creativity and pursuit of innovation as well as flexibility,
originality, childishness and criticism. It was also noticed that being able to appropriately accept negative
evaluations and disapproval of surrounding people and to adequately react to failures and criticism, the students,
who are not afraid of getting at the forefront, demonstrate stronger expressed criticism, intuition, flexibility and
originality, pursuit of innovation and creativity. The students, who are able to ask for a favour and are not afraid
to be rejected tend to evaluate their originality, flexibility and pursuit of creativity higher. Thus, the conducted
correlation analysis allowed identifying statistically significant correlations between the students’ social
competence and perceived creativity. However, the correlations among variables were rather weak.
Social competence-based prognostic possibilities of creativity expression among students of social profile. The
correlation analysis revealed statistically significant correlations between the evaluation of students’ perceived
creativity and social competence. However, it should be acknowledged that correlations express more or less
probable statistical tendencies and show an approximate compatibility of two variables and tend to be more
stochastic (Vaitkevičius, Saudargienė, 2006). For this reason, the regression analysis was conducted, which
allowed foreseeing prognostic possibilities of some (dependent) variables on the basis of other (independent)
variables from the regression equation. The regressive analysis of variables is presented in Table 2.
The relationship of present and estimated expression of creativity according to separate indicators ranges from
0.24 to 0.328 among participants of the research. The values of the latter determination coefficients show a rather
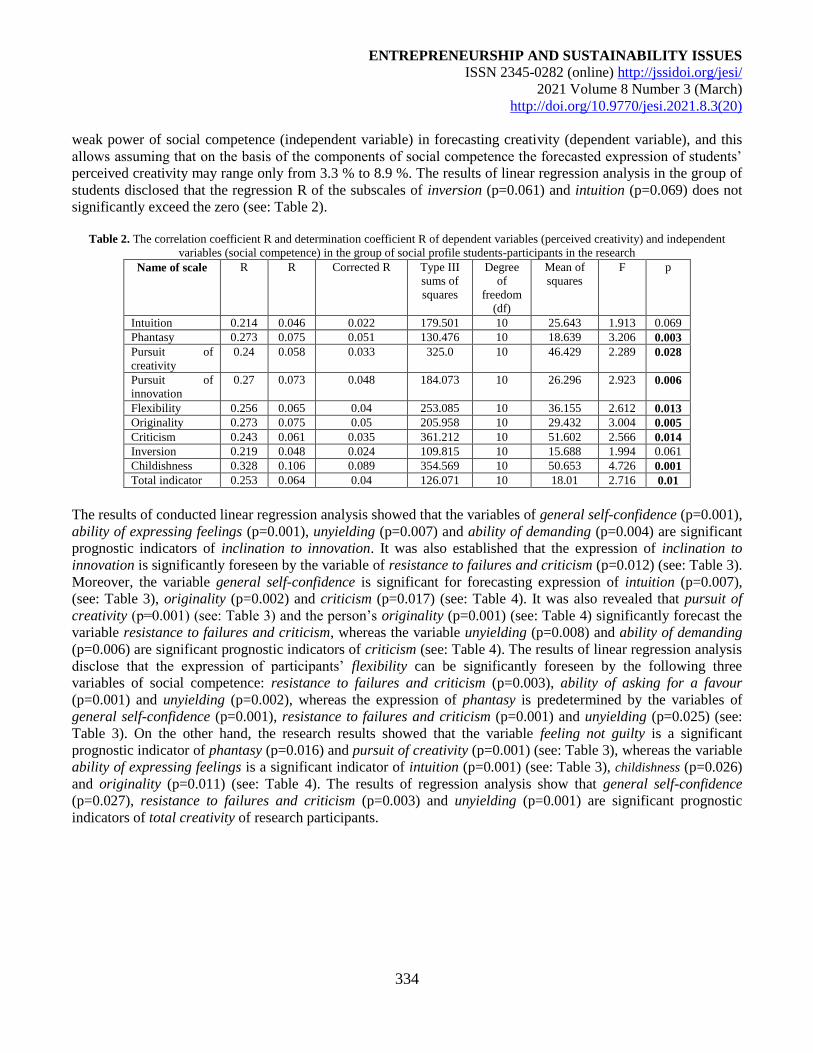
ENTREPRENEURSHIP AND SUSTAINABILITY ISSUES
ISSN 2345-0282 (online) http://jssidoi.org/jesi/
2021 Volume 8 Number 3 (March)
http://doi.org/10.9770/jesi.2021.8.3(20)
334
weak power of social competence (independent variable) in forecasting creativity (dependent variable), and this
allows assuming that on the basis of the components of social competence the forecasted expression of students’
perceived creativity may range only from 3.3 % to 8.9 %. The results of linear regression analysis in the group of
students disclosed that the regression R of the subscales of inversion (p=0.061) and intuition (p=0.069) does not
significantly exceed the zero (see: Table 2).
Table 2. The correlation coefficient R and determination coefficient R of dependent variables (perceived creativity) and independent
variables (social competence) in the group of social profile students-participants in the research
Name of scale R R Corrected R Type III
sums of
squares
Degree
of
freedom
(df)
Mean of
squares
F p
Intuition 0.214 0.046 0.022 179.501 10 25.643 1.913 0.069
Phantasy 0.273 0.075 0.051 130.476 10 18.639 3.206 0.003
Pursuit of
creativity
0.24 0.058 0.033 325.0 10 46.429 2.289 0.028
Pursuit of
innovation
0.27 0.073 0.048 184.073 10 26.296 2.923 0.006
Flexibility 0.256 0.065 0.04 253.085 10 36.155 2.612 0.013
Originality 0.273 0.075 0.05 205.958 10 29.432 3.004 0.005
Criticism 0.243 0.061 0.035 361.212 10 51.602 2.566 0.014
Inversion 0.219 0.048 0.024 109.815 10 15.688 1.994 0.061
Childishness 0.328 0.106 0.089 354.569 10 50.653 4.726 0.001
Total indicator 0.253 0.064 0.04 126.071 10 18.01 2.716 0.01
The results of conducted linear regression analysis showed that the variables of general self-confidence (p=0.001),
ability of expressing feelings (p=0.001), unyielding (p=0.007) and ability of demanding (p=0.004) are significant
prognostic indicators of inclination to innovation. It was also established that the expression of inclination to
innovation is significantly foreseen by the variable of resistance to failures and criticism (p=0.012) (see: Table 3).
Moreover, the variable general self-confidence is significant for forecasting expression of intuition (p=0.007),
(see: Table 3), originality (p=0.002) and criticism (p=0.017) (see: Table 4). It was also revealed that pursuit of
creativity (p=0.001) (see: Table 3) and the person’s originality (p=0.001) (see: Table 4) significantly forecast the
variable resistance to failures and criticism, whereas the variable unyielding (p=0.008) and ability of demanding
(p=0.006) are significant prognostic indicators of criticism (see: Table 4). The results of linear regression analysis
disclose that the expression of participants’ flexibility can be significantly foreseen by the following three
variables of social competence: resistance to failures and criticism (p=0.003), ability of asking for a favour
(p=0.001) and unyielding (p=0.002), whereas the expression of phantasy is predetermined by the variables of
general self-confidence (p=0.001), resistance to failures and criticism (p=0.001) and unyielding (p=0.025) (see:
Table 3). On the other hand, the research results showed that the variable feeling not guilty is a significant
prognostic indicator of phantasy (p=0.016) and pursuit of creativity (p=0.001) (see: Table 3), whereas the variable
ability of expressing feelings is a significant indicator of intuition (p=0.001) (see: Table 3), childishness (p=0.026)
and originality (p=0.011) (see: Table 4). The results of regression analysis show that general self-confidence
(p=0.027), resistance to failures and criticism (p=0.003) and unyielding (p=0.001) are significant prognostic
indicators of total creativity of research participants.
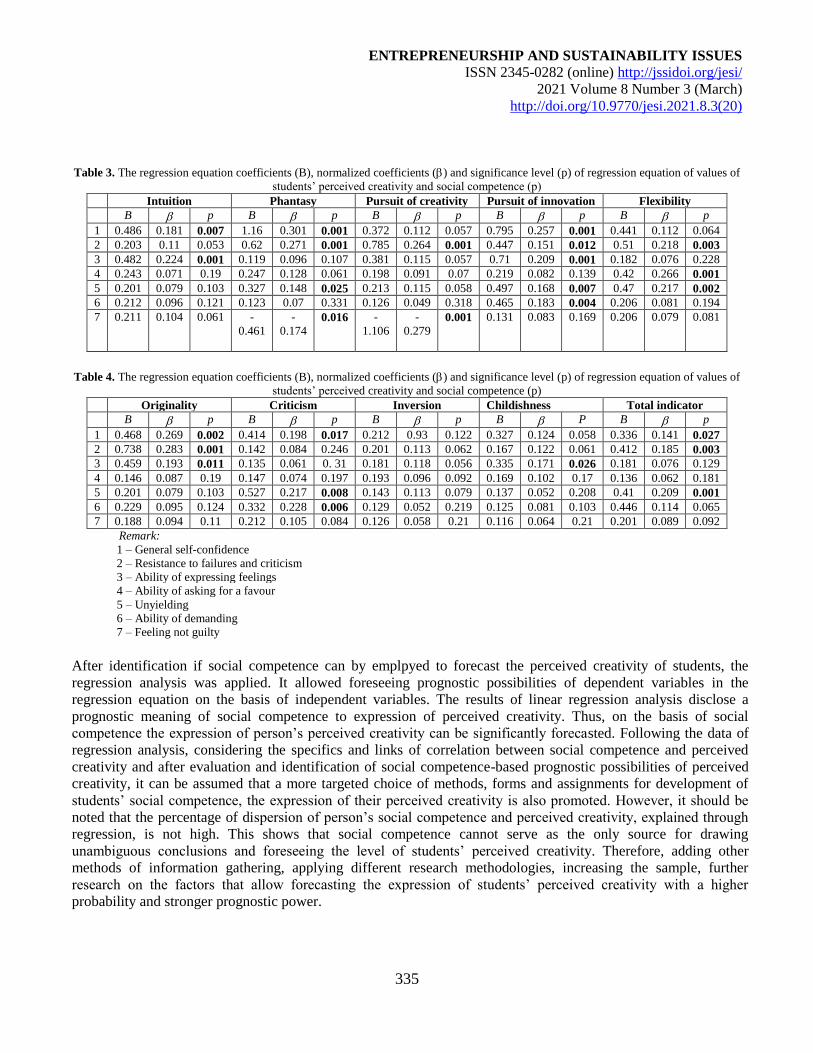
ENTREPRENEURSHIP AND SUSTAINABILITY ISSUES
ISSN 2345-0282 (online) http://jssidoi.org/jesi/
2021 Volume 8 Number 3 (March)
http://doi.org/10.9770/jesi.2021.8.3(20)
335
Table 3. The regression equation coefficients (B), normalized coefficients () and significance level (p) of regression equation of values of
students’ perceived creativity and social competence (p)
Intuition Phantasy Pursuit of creativity Pursuit of innovation Flexibility
B p B p B p B p B p
1 0.486 0.181 0.007 1.16 0.301 0.001 0.372 0.112 0.057 0.795 0.257 0.001 0.441 0.112 0.064
2 0.203 0.11 0.053 0.62 0.271 0.001 0.785 0.264 0.001 0.447 0.151 0.012 0.51 0.218 0.003
3 0.482 0.224 0.001 0.119 0.096 0.107 0.381 0.115 0.057 0.71 0.209 0.001 0.182 0.076 0.228
4 0.243 0.071 0.19 0.247 0.128 0.061 0.198 0.091 0.07 0.219 0.082 0.139 0.42 0.266 0.001
5 0.201 0.079 0.103 0.327 0.148 0.025 0.213 0.115 0.058 0.497 0.168 0.007 0.47 0.217 0.002
6 0.212 0.096 0.121 0.123 0.07 0.331 0.126 0.049 0.318 0.465 0.183 0.004 0.206 0.081 0.194
7 0.211 0.104 0.061 -
0.461
-
0.174
0.016
-
1.106
-
0.279 0.001 0.131 0.083 0.169 0.206 0.079 0.081
Table 4. The regression equation coefficients (B), normalized coefficients () and significance level (p) of regression equation of values of
students’ perceived creativity and social competence (p)
Originality Criticism Inversion Childishness Total indicator
B p B p B p B P B p
1 0.468 0.269 0.002 0.414 0.198 0.017 0.212 0.93 0.122 0.327 0.124 0.058 0.336 0.141 0.027
2 0.738 0.283 0.001 0.142 0.084 0.246 0.201 0.113 0.062 0.167 0.122 0.061 0.412 0.185 0.003
3 0.459 0.193 0.011 0.135 0.061 0. 31 0.181 0.118 0.056 0.335 0.171 0.026 0.181 0.076 0.129
4 0.146 0.087 0.19 0.147 0.074 0.197 0.193 0.096 0.092 0.169 0.102 0.17 0.136 0.062 0.181
5 0.201 0.079 0.103 0.527 0.217 0.008 0.143 0.113 0.079 0.137 0.052 0.208 0.41 0.209 0.001
6 0.229 0.095 0.124 0.332 0.228 0.006 0.129 0.052 0.219 0.125 0.081 0.103 0.446 0.114 0.065
7 0.188 0.094 0.11 0.212 0.105 0.084 0.126 0.058 0.21 0.116 0.064 0.21 0.201 0.089 0.092
Remark:
1 – General self-confidence
2 – Resistance to failures and criticism
3 – Ability of expressing feelings
4 – Ability of asking for a favour
5 – Unyielding
6 – Ability of demanding
7 – Feeling not guilty
After identification if social competence can by emplpyed to forecast the perceived creativity of students, the
regression analysis was applied. It allowed foreseeing prognostic possibilities of dependent variables in the
regression equation on the basis of independent variables. The results of linear regression analysis disclose a
prognostic meaning of social competence to expression of perceived creativity. Thus, on the basis of social
competence the expression of person’s perceived creativity can be significantly forecasted. Following the data of
regression analysis, considering the specifics and links of correlation between social competence and perceived
creativity and after evaluation and identification of social competence-based prognostic possibilities of perceived
creativity, it can be assumed that a more targeted choice of methods, forms and assignments for development of
students’ social competence, the expression of their perceived creativity is also promoted. However, it should be
noted that the percentage of dispersion of person’s social competence and perceived creativity, explained through
regression, is not high. This shows that social competence cannot serve as the only source for drawing
unambiguous conclusions and foreseeing the level of students’ perceived creativity. Therefore, adding other
methods of information gathering, applying different research methodologies, increasing the sample, further
research on the factors that allow forecasting the expression of students’ perceived creativity with a higher
probability and stronger prognostic power.
ENTREPRENEURSHIP AND SUSTAINABILITY ISSUES
ISSN 2345-0282 (online) http://jssidoi.org/jesi/
2021 Volume 8 Number 3 (March)
http://doi.org/10.9770/jesi.2021.8.3(20)
336
Conclusions
1. The research results showed the strongest expression of self-confidence and resistance to failure and
criticism among students. The lowest mean averages were identified in the three subscales: ability to
demand, not feeling guilty and ability to ask for a favour.
2. Analysing the peculiarities of students’ perceived creativity, the highest values were observed within the
scales of pursuit of innovation and creativity, childishness and originality. The research results revealed
that the lowest mean values of expression of perceived creativity were established within the scales of
intuition and inversion.
3. Employing the Pearson correlation analysis, the correlations between the social competence and
perceived creativity were evaluated and identified:
3.1. The identified significant correlations show that social profile students with a higher level of self-
confidence, unyielding, ability to express feeling and resistance to failure and criticism have a higher
level of total creativity indicator. The indicator of the subscale of not feeling guilty negatively
correlates with that of total creativity.
3.2. The correlation analysis discloses that self-confident students also posses a higher level of intuition,
phantasy, pursuit of innovation, originality and criticism, whereas stronger expression of originality,
criticism, phantasy, flexibility, pursuit of innovation and inversion is characteristic of students with
more expressed unyielding.
3.3. The research allowed concluding that the students’ resistance to failures and criticism positively
correlates with the indicators of intuition, creativity, pursuit of creativity and innovation, flexibility,
originality and criticism. The research participants with stronger ability to ask for a favour, tend to
evaluate their originality and flexibility as well as pursuit of creativity higher.
3.4. The correlation analysis of subscales of perceived creativity and social competence disclosed positive
relations between the subscales of the participants’ ability to express feelings and creativity:
flexibility, childishness, originality, criticism, pursuit of innovation and creation.
3.5. The results of correlation analysis revealed that students’ ability to demand negatively correlates with
childishness and positively correlates with criticism and pursuit of innovation. Meanwhile, such
indicators of perceived creativity as phantasy and childishness show negative correlation with not
feeling guilty and the latter positively correlates with the subscale of criticism.
4. The research results show that certain components of social competence acquire a prognostic meaning for
expression of students’ perceived creativity and allow for significant forecasting of students’ perceived
creativity.
References
Cropley, D. H. (2015). Promoting Creativity and Innovation in Engineering Education. Psychology of Aesthetics, Creativity, and the Arts, 9
(2), 161–171. https://doi.org/10.1037/aca0000008
Beaney, M. (2019). First Steps and Conceptual Creativity. Wittgenstein on Philosophy, Objectivity, and Meaning, 15, 119-142.
Benea-Popuşoi, E., & Duca, S. (2021). The Development of Human Creativity as a Way to Compete Globally and Make Knowledge
Economy More Inclusive. Advances in Intelligent Systems and Computing,1191, 676-686.
Broekhoven, K., Cropley, D., & Seegers, P. (2020). Differences in Creativity Across Art and STEM Students: We are more alike than
unalike. Thinking Skills and Creativity, 38 (100707), 1-13.
Camargo, A., Çelik, P., & Storme, M. (2020). Cultural Self-efficacy Increases Creativity in Bicultural Dyads: Evidence From Two Dyadic
Divergent Thinking Tasks. Thinking Skills and Creativity, 38 (100725), 1-10.
ENTREPRENEURSHIP AND SUSTAINABILITY ISSUES
ISSN 2345-0282 (online) http://jssidoi.org/jesi/
2021 Volume 8 Number 3 (March)
http://doi.org/10.9770/jesi.2021.8.3(20)
337
Chen, S., Chandler, J., & Venkatesh, A. (2018). The Influence of Objects on Creativity. Creativity and Innovation Management, 29, 481–
494. https://doi.org/10.1111/caim.12379
Csikszentmihalyi, M. (1996). Creativity. Flow and the Psychology of Discovery and Invention. New York: Harper Perennial.
Demarin, V., Derke, F. (2020). Creativity-the Story Continues: An Overview of Thoughts on Creativity. Mind and Brain: Bridging
Neurology and Psychiatry, 1, 1-20.
Diković, M., & Gergorić , T. (2020). Teachersʼ assessment of active learning in teaching Nature and Society. Economic Research-
Ekonomska Istraživanja, 33(1,) 1265-1279, https://doi.org/10.1080/1331677X.2020.1728563
Elisondo, R. (2016). Creativity is Always a Social Process. Creativity.Theories-Research-Applications, 3 (2), 194-210.
Farmer, S. M., Tierney, P., & Kung-McIntyre, K. (2003). Employee Creativity in Taiwan: An Application of Role Identity Theory.
Academy of Management Journal, 46 (5), 618–630.
Feist, G. J. (1998). A Meta-Analysis of Personality in Scientific and Artistic Creativity. Society for Personality and Social Psychology, 2
(4), p. 290-309. https://doi.org/10.1207/s15327957pspr0204_5
Fonseca, I., Bernate, J., Betancourt, M., Barón, B., & Cobo, J. (2019). Developing Social Responsibility in University Students. ACM
International Conference Proceeding Series, 28, 215-218.
Glăveanu, V. P. (2014). Distributed Creativity: Thinking Outside the Box of the Creative Individual. Springer.
Grakauskaitė-Karkockienė, D. (2010). Training of Creativity: Theoretical and Practical Aspects. Educational Psychology, 21, 66-74.
Griffiths, C., & Costi, M. (2020). The Creativity Thinking Handbook. Your Step-By-Step Guide to Problem Solving in Business. Kogan
Page.
Haase, J., Hoff, E. V., Hanel, P. H. P., & Innes-Ker, Å. (2018). A Meta-Analysis of the Relation between Creative Self-Efficacy and
Different Creativity Measurements. Creativity Research Journal, 30 (1), 1-16, https://doi.org/10.1080/10400419.2018.1411436
Hemlin, S., Allwood, C. M., & Martin, B. R. (2008). Creative Knowledge Environments. Creativity Research Journal, 20 (2), 196–210.
Hoyle, R.H. (2006). Personality and Self-Regulation: Trait and Information-Processing Perspectives. Journal of Personality, 74, 1507–
1526.
Huang, L., & Luthans, F. (2015). Toward Better Understanding of the Learning Goal Orientation–Creativity Relationship: The Role of
Positive Psychological Capital. Applied Psychology, 64 (2), 444–472.
Huertas, M. K. Z., & Pergentino, I. (2020). The Effect of “Co-Creation with Consumers” Claims on Purchase Intention: The Moderating
Role of Product Category Performance Information. Creativity and Innovation Management, 29 (S1), 75–89.
Hughes, D. J., Lee, A., Tian, A. W., Newman, A., & Legood, A. (2018). Leadership, Creativity, and Innovation: A Critical Review and
Practical Recommendations. The Leadership Quarterly, 29 (5), 549–569.
Iždonaitė-Medžiūnienė, I. (2009). Substantiation of Tourism management Students' Social Competence Modeling. Doctoral Thesis.
Šiauliai.
Jahanshahi, A. A., Brem, A., & Hoerauf, D. (2019). Employee Creativity in War Zones: Empirical Evidence from Small Firms in
Afghanistan. Creativity and Innovation Management, 29, 465–480. http://doi.org/10.1111/caim.12396
Jaskyte, K., Taylor, H., & Smariga, R. (2009). Student and Faculty Perceptions of Innovative Teaching. Creativity Research Journal, 21
(1), 111–116.
ENTREPRENEURSHIP AND SUSTAINABILITY ISSUES
ISSN 2345-0282 (online) http://jssidoi.org/jesi/
2021 Volume 8 Number 3 (March)
http://doi.org/10.9770/jesi.2021.8.3(20)
338
Judge, T. A., & Ilies, R. (2002). Relationship of Personality to Performance Motivation: A Metaanalytic Review. Journal of Applied
Psychology, 87, 797–807.
Karimi, P., Rezwana, J., Siddiqui, S., Maher, M. L., & Dehbozorgi, N. (2020). Creative Sketching Partner: An analysis of Human-AI Co-
creativity. International Conference on Intelligent User Interfaces: Proceedings, IUI17, 221-230.
Kelemen, P., Born, E., & Ondráček, T. (2020). Theorizing on the connection between organizational and individual mindfulness. Economic
Research-Ekonomska Istraživanja, 33(1), 1813-1829, https://doi.org/10.1080/1331677X.2020.1761417
Khan, J., Malik, M., & Saleem, S. (2020). The Impact of Psychological Empowerment of Project-Oriented Employees on Project Success:
A Moderated Mediation Model. Economic Research-Ekonomska Istraživanja, 33(1), 1311-1329,
https://doi.org/10.1080/1331677X.2020.1756374
Koh, D., Lee, K., & Joshi, K. (2019). Transformational Leadership and Creativity: A Meta-Analytic Review and Identification of an
Integrated Model. Journal of Organizational Behavior, 40 (6), 625–650.
Lekavičienė, R. (2001). Socialinės kompetencijos psichologiniai kriterijai ir vertinimai. Lietuvos studentų tyrimai [Psychological Criteria
and Assessment of Social Competence: Lithuanian Students' Research: Monograph]. Kaunas: Vytautas Magnus University.
Liu, H., Bracht, E., Zhang, X., Bradley, B., & Rolf van Dick, R. (2020). Creativity in Non-Routine Jobs: The Role of Transformational
Leadership and Organizational Identification. Creativity and Innovation Management, 29 (S1), 1-15. https://doi.org/10.1111/caim.12419
Malinauskas, R. (2003). Influence of social Training on the Social Competence of Sport Pedagogues Pedagogy, 66, 44-50.
Newman, A., Neesham, C., Manville, G., & Tse, H. H. (2018). Examining the Influence of Servant and Entrepreneurial Leadership on the
Work Outcomes of Employees in Social Enterprises. International Journal of Human Resource Management, 29 (20), 2905–2926.
Pacevičius, J. (2005). Emotional Correlates of the Basic Traits of Personality. Psychology, 31, 16-38.
Petrulis, V. (1988). Reflection of Creativity and Creative Productivity Among Scientists. Leningrad.
Pociūtė, B., Isiūnaitė, V. (2011). Problems of Career Choice and Personality Traits. Psychology, 43, 78-91.
Prabhu, V., Sutton, C., & Sauser, W. (2008). Creativity and Certain Personality Traits: Understanding the Mediating Effect of Intrinsic
Motivation. Creativity Research Journal, 20 (1), 53–66. https://doi.org/10.1080/10400410701841955
Rakauskaitė, E. D. (2014). Development of Creativity – an Investment to the Creative Society. Social Technologies, 4 (2), 333–347.
Rantanen, J., Metsapelto, R.L., Feldt, T., Pulkinnen, L., & Kokko, K. (2007). Long-term Stability in the Big Five Personality Traits in
Adulthood. Scandinavian Journal of Psychology, 48 (6), 511–518. https://doi.org/10.1111/j.1467-9450.2007.00609.x
Roskes, M., De Dreu, C. K. W., & Nijstad, B. A. (2012). Necessity is the Mother of Invention: Avoidance Motivation Stimulates Creativity
through Cognitive Effort. Journal of Personality and Social Psychology, 103 (2), 242–256, https://doi.org/10.1037/a0028442
Shafi, M., Lei, Z., Song, X., & Sarker, M. N. I. (2020). The Effects of Transformational Leadership on Employee Creativity: Moderating
Role of Intrinsic Motivation. Asia Pacific Management Review, 25 (3), 166-176. https://doi.org/10.1016/j.apmrv.2019.12.002
Šinkūnienė, J. R. (2011). Aspects of Creativity in Social Work. Social Work, 10 (1), 63 – 70.
Sipahi, E. (2018). Creativity and the Importance of Business Management. International Journal of Scientific & Engineering Research, 8
(8), 428-439.
Šniras, Š. (2005). The Impact of Training Program on Competitive Social Skills of Basketball-Playing Schoolchildren. Education. Physical
Education. Sport, 5 (59), 75-81.
ENTREPRENEURSHIP AND SUSTAINABILITY ISSUES
ISSN 2345-0282 (online) http://jssidoi.org/jesi/
2021 Volume 8 Number 3 (March)
http://doi.org/10.9770/jesi.2021.8.3(20)
339
Song, W., Yu, H., Zhang, Y., & Jiang, W. (2015). Goal Orientation and Employee Creativity: The Mediating Role of Creative Role
Identity. Journal of Management & Organization, 21(1), 82–97.
Sternberg, R. J. (2006). Creating a Vision of Creativity: The First 25 Years. Psychology of Aesthetics, Creativity, and the Arts, S (1), 2–12.
https://doi.org/10.1037/1931-3896.S.1.2
Sung, S. Y., & Choi, J. N. (2009). Do Big Five personality factors affect individual creativity? The Moderating Role of Extrinsic
Motivation. Social Behaviour and Personality: an Interantional Journal, 37 (7), 941-956. https://doi.org/10.2224/sbp.2009.37.7.941
Torrance, E.P. (1986). Teching Creative and Gifted Learners. Handbook of research on teaching In M. C. Witrock (Eds.), 630–647. New
York: Macmillan.
Tse, H. H., To, M. L., & Chiu, W. C. (2018). When and Why does Transformational Leadership Influence Employee Creativity? The Roles
of Personal Control and Creative Personality. Human Resource Management, 57 (1), 145–157. https://doi.org/10.1002/hrm.21855
Vaičiūnienė, V., & Mažeikienė, V. (2014). Creativity, Networked Learning/Teaching and the Development of Deeper Cognitive Skills in
University Studies. Societal Studies, 6 (1), 21–33.
Vaitkevičius, R., & Saudargienė, A. (2006). Statistics with SPSS in Psychological Research: A Textbook. Kaunas: VDU.
Wang, N., Jome, L. M., Haase, R. F., & Bruch, M. A. (2006). The Role of Personality and Career Decision-Making Self-efficacy in the
Career Choice Commitment of College Students. Journal of Career Assessment, 14, 312–332. https://doi.org/10.1177/1069072706286474
Wang, P. (2020). Core Job Characteristic and Uncertainty Avoidance: Into the Black Box of Transformational Leadership Effect on
Creativity. The Journal of Creative Behavior, 54 (2), 311–322. https://doi.org/10.1002/jocb.367
Wang, S., Li, R., Ma, D., & Gao, H. (2019). The Effects of Individual Preparations on Group Creativity. ACM International Conference
Proceeding Series, 28, 219-222.
Wolfradt, U., & Pretz, J. E. (2001). Individual Differences in Creativity: Personality, Story Writing, and Hobbies. European Journal of
Personality, 15, 297–310. https://doi.org/10.1002/per.409
Kristina SAMAŠONOK, Doctor of Social Sciences (Educology), Docent of the Faculty of Business Management of Vilniaus
kolegija/University of Applied Sciences, Didlaukio g., 49, Vilnius, tel. (8-5) 2191640, Faks. (8-5) 2191639, el. p.
administracija[eta]vvf.viko.lt; research interest areas: social exclusion risk for adolescence adaptation, institutional development and
adaptive behaviour modelling, the first year students' adaptation to the study process, motivation factors for choosing studies, developing
students' creative thinking in a higher school.
ORCID ID: https://orcid.org/0000-0002-8985-6942
Agnė JUŠKEVIČIENĖ, Doctor of Social Sciences (Educology), Docent of the Faculty of Business Management of Vilniaus
kolegija/University of Applied Sciences, Didlaukio g., 49, Vilnius, tel. (8-5) 2191640, Faks. (8-5) 2191639, el. p.
administracija[eta]vvf.viko.lt; research interest areas: inclusive, multicultural education in higher and general education school, acquisition
and development of general and subject competencies, formation of identity in adolescence.
ORCID ID: https://orcid.org/0000-0001-9732-8616
Make your research more visible, join the Twitter account of ENTREPRENEURSHIP AND SUSTAINABILITY ISSUES:
@Entrepr69728810
________________________________________________________________________________________________________________
Copyright © 2021 by author(s) and VsI Entrepreneurship and Sustainability Center
This work is licensed under the Creative Commons Attribution International License (CC BY).
http://creativecommons.org/licenses/by/4.0/
ENTREPRENEURSHIP AND SUSTAINABILITY ISSUES
ISSN 2345-0282 (online) http://jssidoi.org/jesi/
2021 Volume 8 Number 3 (March)
http://doi.org/10.9770/jesi.2021.8.3(21)
Publisher http://jssidoi.org/esc/home
340
BUSINESS COUNTERINTELLIGENCE AS A PROTECTION STRATEGY FOR SMES*
Romel Ramón González-Díaz 1, Ángel Eduardo Acevedo-Duque 2, Santos Lucio Guanilo Gómez 3,
Elena Cachicatari Vargas 4
Centro Internacional de Investigación y Desarrollo (CIID) Montería, Colombia
E-mails: [email protected], [email protected], [email protected] , [email protected]
Received 18 September 2020; accepted 22 January 2021; published 30 March 2021
Abstract. The objective of this research was to analyze the processes of business counterintelligence as a strategy to shield the SMEs from
competitive intelligence services. It was framed in the convergence of research approaches given in 2 phases: quantitative phase (Likert
type questionnaire applied to 385 Colombian businessmen), qualitative phase (semi-structured interview to 4 police officers with more than
25 years of experience in police counter-intelligence) and the conclusions are formulated taking into account the convergence of
approaches by dimension/category. The significant findings allude to the existence of a perception on the part of the entrepreneurs about
the counterintelligence systems implemented in the SMEs they manage. However, experts on the subject agree on the lack of knowledge of
risk factors regarding information vulnerability and the lack of strategies to shield SMEs from competitive intelligence services.
Keywords: Business Counterintelligence; Business Intelligence Services; Counterintelligence Strategie; SMEs
Reference to this paper should be made as follows: González-Díaz, R.R., Acevedo-Duque, A.E., Gómez, S.L.G., Cachicatari Vargas, E.
2021. Business counterintelligence as a protection strategy for SMEs. Entrepreneurship and Sustainability Issues, 8(3), 340-352.
http://doi.org/10.9770/jesi.2021.8.3(21)
JEL Classifications: E30, E32
* This research was supported by the project, which has received funding from research and innovation programme of the
Centro Internacional de Investigación y Desarrollo (CIID) Montería, Colombia.
ENTREPRENEURSHIP AND SUSTAINABILITY ISSUES
ISSN 2345-0282 (online) http://jssidoi.org/jesi/
2021 Volume 8 Number 3 (March)
http://doi.org/10.9770/jesi.2021.8.3(21)
Make your research more visible, join the Twitter account of ENTREPRENEURSHIP AND SUSTAINABILITY ISSUES:
@Entrepr69728810
341
1. Introduction
Throughout history, military strategies have been associated with business strategies. This is because they share
similar objectives in terms of achieving competitive advantage over the adversary. The study of strategic
management has its origins in the military, terms such as objectives, mission, strengths and weaknesses were
created to address problems on the battlefield. The academic literature records writings such as the book "The Art
of War" related to military strategy that date back to around 500 BC, The phrase "If you use the enemy to defeat
the enemy, you will be powerful everywhere you go" (Sun, 2016, p. 1) is a commonplace phrase in the literature,
and it is only when you know every detail of the terrain that you can maneuver and fight" (Sun, 2016, p. 1). 78),
alludes to the spying strategies used to destabilize the organization of an army, executing internal sabotage actions
and collecting information on position, logistics and combat strength (Catoira, 2018; Jayaram, 2020; Khristoforov
& Guseva, 2020; Teixeira Júnior & Da Silva, 2020).
The spying activities during the cold war (cases of KGB †communist bloc and CIA‡ capitalist) until today have
multiplied the public cases as: Pentagon Papers (a classified Pentagon report on U.S. decision-making in relation
to the Vietnam War), Watergate (extraction of documents on the harassment of activist groups and political
figures that destroyed Richard Nixon's political career), Wikileaks (publication of documents on the dynamics and
activities of the U.S. government abroad) and the case of Snowden (he warned about the massive programs of
diplomatic surveillance and manipulation, economic espionage and social control by the U.S. government)
(Cadiz, 2016; Crespo-Pazmiño, 2019; Olmedo & Gavilánez, 2018).
Undoubtedly, acts of espionage gain access to privileged information and generate competitive advantage in any
public or private organization. In the business field there are also cases of theft of trade secrets that according to
the consulting firm (PWC, 2018) companies in the world lose an estimated "3 billion euros, equivalent to 5% of
world GDP" (p.65). Most of this crime is associated with the theft of formulas and methods from development
processes and systems as vital to the functioning of the organization. A recent case is the lawsuit filed by TESLA
against RIVIAN for the alleged systematic theft of sensitive data and trade secrets from different projects,
alleging the existence of a pattern of searching for TESLA personnel to consciously manipulate the illegal
appropriation of TESLA trade secrets (Hipertextual, 2020; Pazmiño, 2020).
In Colombia, trade secrets are protected by Decision 486 of the (Andean Community, 2000). However, the
violation of them is constantly evidenced in bidding processes, for example, recent disputes between Claro and
Banco Agrario, where there is an alleged leakage of information in bidding processes to hire a provider of ICT
services and computer security for the headquarters of the agrarian bank for contracts exceeding US$ 40 billion
(Espectador, 2020; González-Díaz & Cruz-Ayala, 2020). In SMEs, the situation regarding theft of trade secrets
has not been addressed. In fact, more than 96% of SMEs do not conduct risk assessments of vulnerability to cyber
attacks, do not follow up on trusted employees and do not strategically plan for the protection of information
assets (Griewatz et al., 2020; PWC, 2018; Riisager-Simonsen et al., 2020; Tejena-Macías, 2018).
† The KGB (Komitet Gosudarstvennoy Bezopasnosti (Комитет Государственной Безопасности)) translated into Spanish as The
Committee for State Security, was the name of the intelligence agency of the Soviet Union from March 13, 1954 to March 13, 1954 1991. ‡ The CIA (Central Intelligence Agency), in Spanish: Central Intelligence Agency is a civilian foreign intelligence service of the United
States federal government in charge of collecting, processing and analyzing national security information from around the world, mainly
through the use of human intelligence.
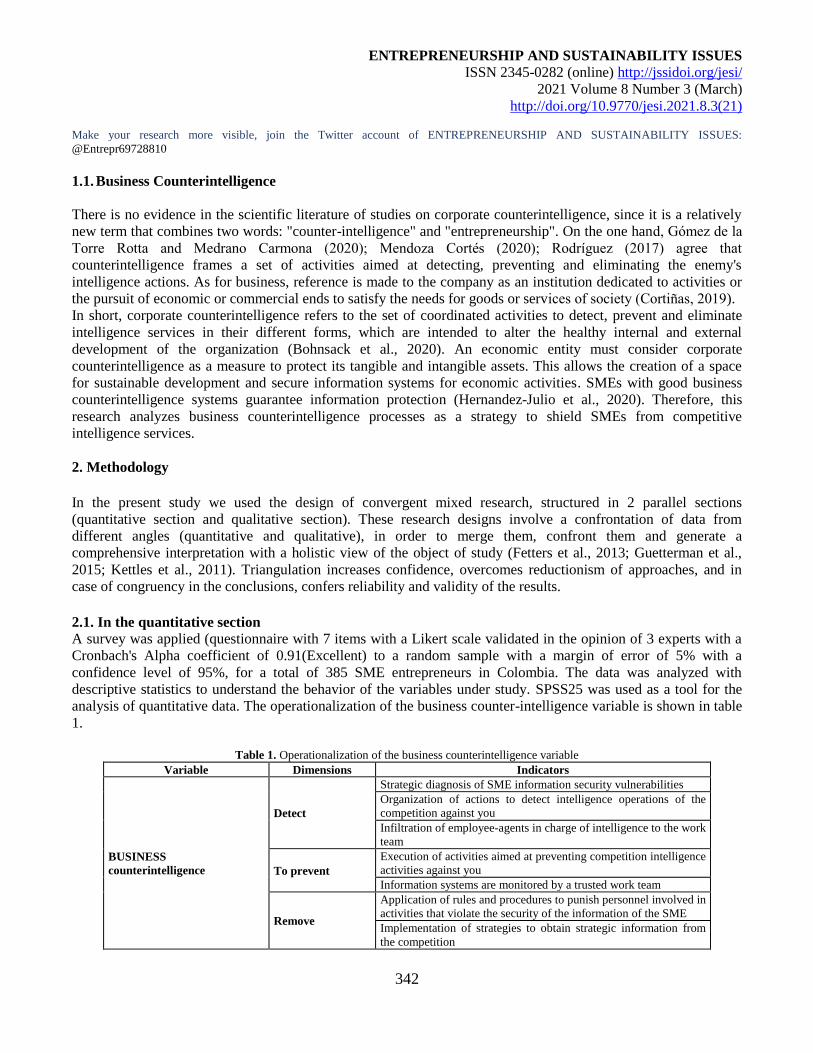
ENTREPRENEURSHIP AND SUSTAINABILITY ISSUES
ISSN 2345-0282 (online) http://jssidoi.org/jesi/
2021 Volume 8 Number 3 (March)
http://doi.org/10.9770/jesi.2021.8.3(21)
Make your research more visible, join the Twitter account of ENTREPRENEURSHIP AND SUSTAINABILITY ISSUES:
@Entrepr69728810
342
1.1. Business Counterintelligence
There is no evidence in the scientific literature of studies on corporate counterintelligence, since it is a relatively
new term that combines two words: "counter-intelligence" and "entrepreneurship". On the one hand, Gómez de la
Torre Rotta and Medrano Carmona (2020); Mendoza Cortés (2020); Rodríguez (2017) agree that
counterintelligence frames a set of activities aimed at detecting, preventing and eliminating the enemy's
intelligence actions. As for business, reference is made to the company as an institution dedicated to activities or
the pursuit of economic or commercial ends to satisfy the needs for goods or services of society (Cortiñas, 2019).
In short, corporate counterintelligence refers to the set of coordinated activities to detect, prevent and eliminate
intelligence services in their different forms, which are intended to alter the healthy internal and external
development of the organization (Bohnsack et al., 2020). An economic entity must consider corporate
counterintelligence as a measure to protect its tangible and intangible assets. This allows the creation of a space
for sustainable development and secure information systems for economic activities. SMEs with good business
counterintelligence systems guarantee information protection (Hernandez-Julio et al., 2020). Therefore, this
research analyzes business counterintelligence processes as a strategy to shield SMEs from competitive
intelligence services.
2. Methodology
In the present study we used the design of convergent mixed research, structured in 2 parallel sections
(quantitative section and qualitative section). These research designs involve a confrontation of data from
different angles (quantitative and qualitative), in order to merge them, confront them and generate a
comprehensive interpretation with a holistic view of the object of study (Fetters et al., 2013; Guetterman et al.,
2015; Kettles et al., 2011). Triangulation increases confidence, overcomes reductionism of approaches, and in
case of congruency in the conclusions, confers reliability and validity of the results.
2.1. In the quantitative section
A survey was applied (questionnaire with 7 items with a Likert scale validated in the opinion of 3 experts with a
Cronbach's Alpha coefficient of 0.91(Excellent) to a random sample with a margin of error of 5% with a
confidence level of 95%, for a total of 385 SME entrepreneurs in Colombia. The data was analyzed with
descriptive statistics to understand the behavior of the variables under study. SPSS25 was used as a tool for the
analysis of quantitative data. The operationalization of the business counter-intelligence variable is shown in table
1.
Table 1. Operationalization of the business counterintelligence variable
Variable Dimensions Indicators
BUSINESS
counterintelligence
Detect
Strategic diagnosis of SME information security vulnerabilities
Organization of actions to detect intelligence operations of the
competition against you
Infiltration of employee-agents in charge of intelligence to the work
team
To prevent
Execution of activities aimed at preventing competition intelligence
activities against you
Information systems are monitored by a trusted work team
Remove
Application of rules and procedures to punish personnel involved in
activities that violate the security of the information of the SME
Implementation of strategies to obtain strategic information from
the competition
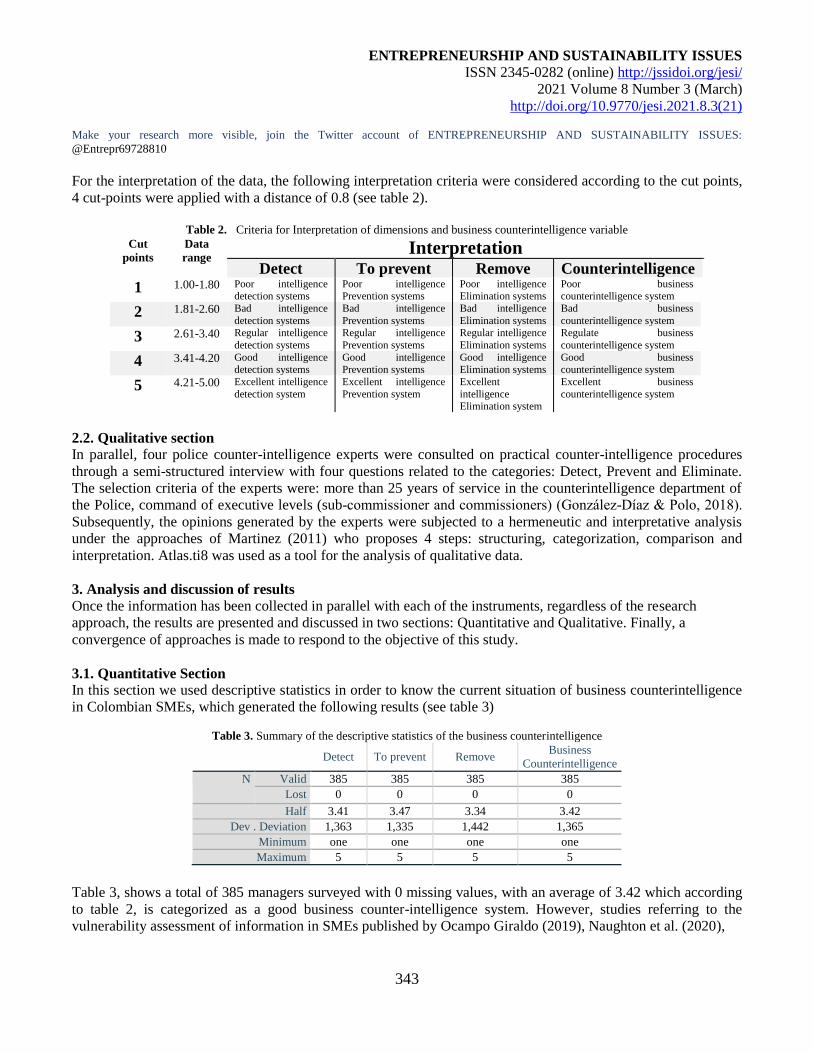
ENTREPRENEURSHIP AND SUSTAINABILITY ISSUES
ISSN 2345-0282 (online) http://jssidoi.org/jesi/
2021 Volume 8 Number 3 (March)
http://doi.org/10.9770/jesi.2021.8.3(21)
Make your research more visible, join the Twitter account of ENTREPRENEURSHIP AND SUSTAINABILITY ISSUES:
@Entrepr69728810
343
For the interpretation of the data, the following interpretation criteria were considered according to the cut points,
4 cut-points were applied with a distance of 0.8 (see table 2).
Table 2. Criteria for Interpretation of dimensions and business counterintelligence variable
Cut
points Data
range Interpretation
Detect To prevent Remove Counterintelligence
1 1.00-1.80 Poor intelligence detection systems
Poor intelligence Prevention systems
Poor intelligence Elimination systems
Poor business counterintelligence system
2 1.81-2.60 Bad intelligence
detection systems Bad intelligence
Prevention systems Bad intelligence
Elimination systems Bad business
counterintelligence system
3 2.61-3.40 Regular intelligence
detection systems Regular intelligence
Prevention systems Regular intelligence
Elimination systems Regulate business
counterintelligence system
4 3.41-4.20 Good intelligence detection systems
Good intelligence Prevention systems
Good intelligence Elimination systems
Good business counterintelligence system
5 4.21-5.00 Excellent intelligence
detection system Excellent intelligence
Prevention system Excellent
intelligence Elimination system
Excellent business
counterintelligence system
2.2. Qualitative section In parallel, four police counter-intelligence experts were consulted on practical counter-intelligence procedures
through a semi-structured interview with four questions related to the categories: Detect, Prevent and Eliminate.
The selection criteria of the experts were: more than 25 years of service in the counterintelligence department of
the Police, command of executive levels (sub-commissioner and commissioners) (González-Díaz & Polo, 2018).
Subsequently, the opinions generated by the experts were subjected to a hermeneutic and interpretative analysis
under the approaches of Martinez (2011) who proposes 4 steps: structuring, categorization, comparison and
interpretation. Atlas.ti8 was used as a tool for the analysis of qualitative data.
3. Analysis and discussion of results Once the information has been collected in parallel with each of the instruments, regardless of the research
approach, the results are presented and discussed in two sections: Quantitative and Qualitative. Finally, a
convergence of approaches is made to respond to the objective of this study.
3.1. Quantitative Section In this section we used descriptive statistics in order to know the current situation of business counterintelligence
in Colombian SMEs, which generated the following results (see table 3)
Table 3. Summary of the descriptive statistics of the business counterintelligence
Detect To prevent Remove Business
Counterintelligence N Valid 385 385 385 385
Lost 0 0 0 0 Half 3.41 3.47 3.34 3.42
Dev . Deviation 1,363 1,335 1,442 1,365 Minimum one one one one Maximum 5 5 5 5
Table 3, shows a total of 385 managers surveyed with 0 missing values, with an average of 3.42 which according
to table 2, is categorized as a good business counter-intelligence system. However, studies referring to the
vulnerability assessment of information in SMEs published by Ocampo Giraldo (2019), Naughton et al. (2020),
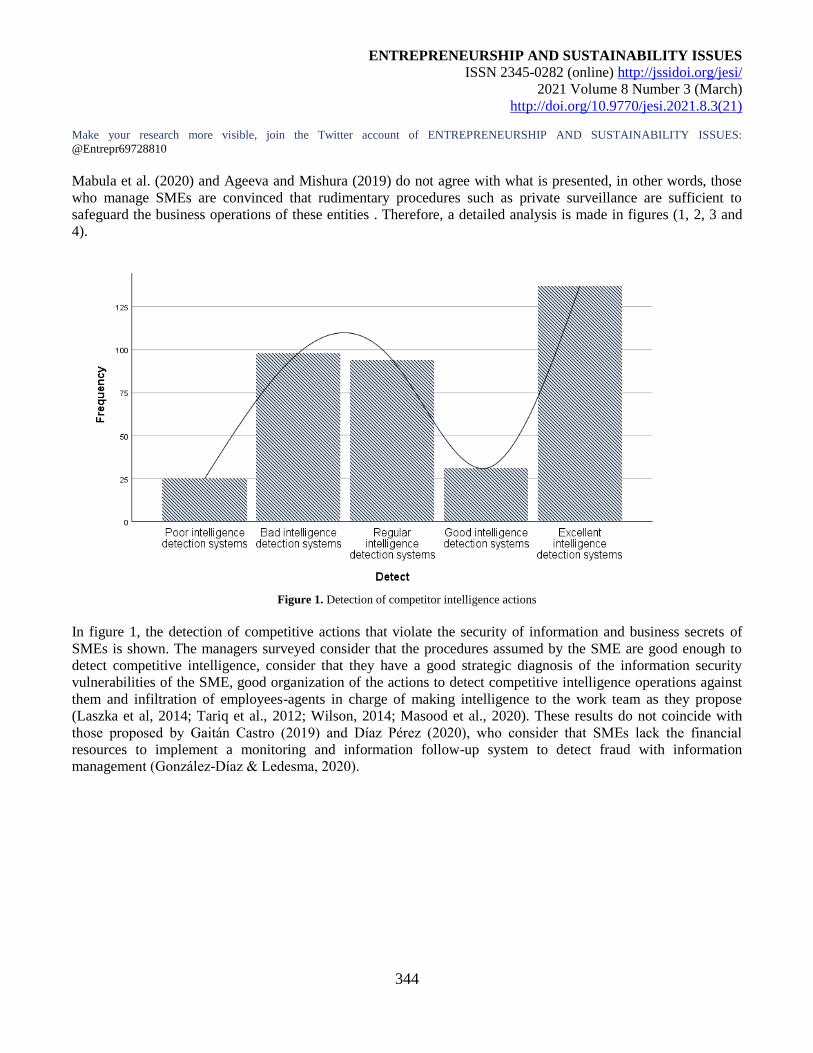
ENTREPRENEURSHIP AND SUSTAINABILITY ISSUES
ISSN 2345-0282 (online) http://jssidoi.org/jesi/
2021 Volume 8 Number 3 (March)
http://doi.org/10.9770/jesi.2021.8.3(21)
Make your research more visible, join the Twitter account of ENTREPRENEURSHIP AND SUSTAINABILITY ISSUES:
@Entrepr69728810
344
Mabula et al. (2020) and Ageeva and Mishura (2019) do not agree with what is presented, in other words, those
who manage SMEs are convinced that rudimentary procedures such as private surveillance are sufficient to
safeguard the business operations of these entities . Therefore, a detailed analysis is made in figures (1, 2, 3 and
4).
Figure 1. Detection of competitor intelligence actions
In figure 1, the detection of competitive actions that violate the security of information and business secrets of
SMEs is shown. The managers surveyed consider that the procedures assumed by the SME are good enough to
detect competitive intelligence, consider that they have a good strategic diagnosis of the information security
vulnerabilities of the SME, good organization of the actions to detect competitive intelligence operations against
them and infiltration of employees-agents in charge of making intelligence to the work team as they propose
(Laszka et al, 2014; Tariq et al., 2012; Wilson, 2014; Masood et al., 2020). These results do not coincide with
those proposed by Gaitán Castro (2019) and Díaz Pérez (2020), who consider that SMEs lack the financial
resources to implement a monitoring and information follow-up system to detect fraud with information
management (González-Díaz & Ledesma, 2020).
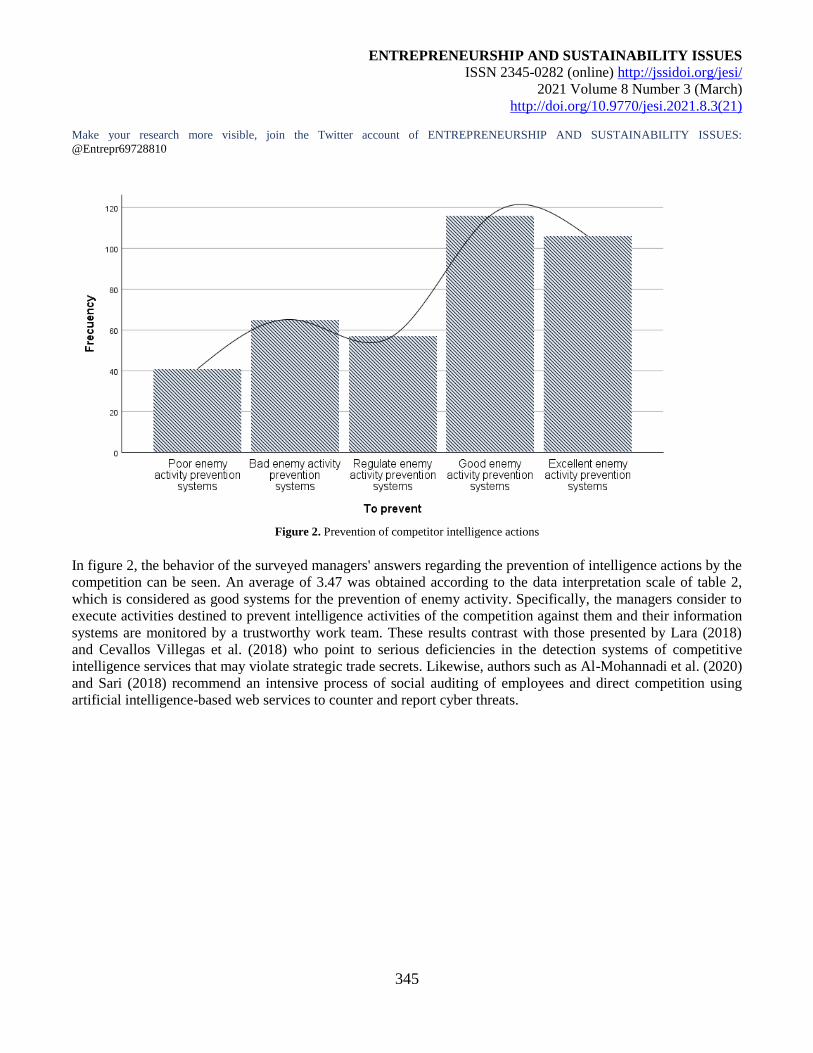
ENTREPRENEURSHIP AND SUSTAINABILITY ISSUES
ISSN 2345-0282 (online) http://jssidoi.org/jesi/
2021 Volume 8 Number 3 (March)
http://doi.org/10.9770/jesi.2021.8.3(21)
Make your research more visible, join the Twitter account of ENTREPRENEURSHIP AND SUSTAINABILITY ISSUES:
@Entrepr69728810
345
Figure 2. Prevention of competitor intelligence actions
In figure 2, the behavior of the surveyed managers' answers regarding the prevention of intelligence actions by the
competition can be seen. An average of 3.47 was obtained according to the data interpretation scale of table 2,
which is considered as good systems for the prevention of enemy activity. Specifically, the managers consider to
execute activities destined to prevent intelligence activities of the competition against them and their information
systems are monitored by a trustworthy work team. These results contrast with those presented by Lara (2018)
and Cevallos Villegas et al. (2018) who point to serious deficiencies in the detection systems of competitive
intelligence services that may violate strategic trade secrets. Likewise, authors such as Al-Mohannadi et al. (2020)
and Sari (2018) recommend an intensive process of social auditing of employees and direct competition using
artificial intelligence-based web services to counter and report cyber threats.
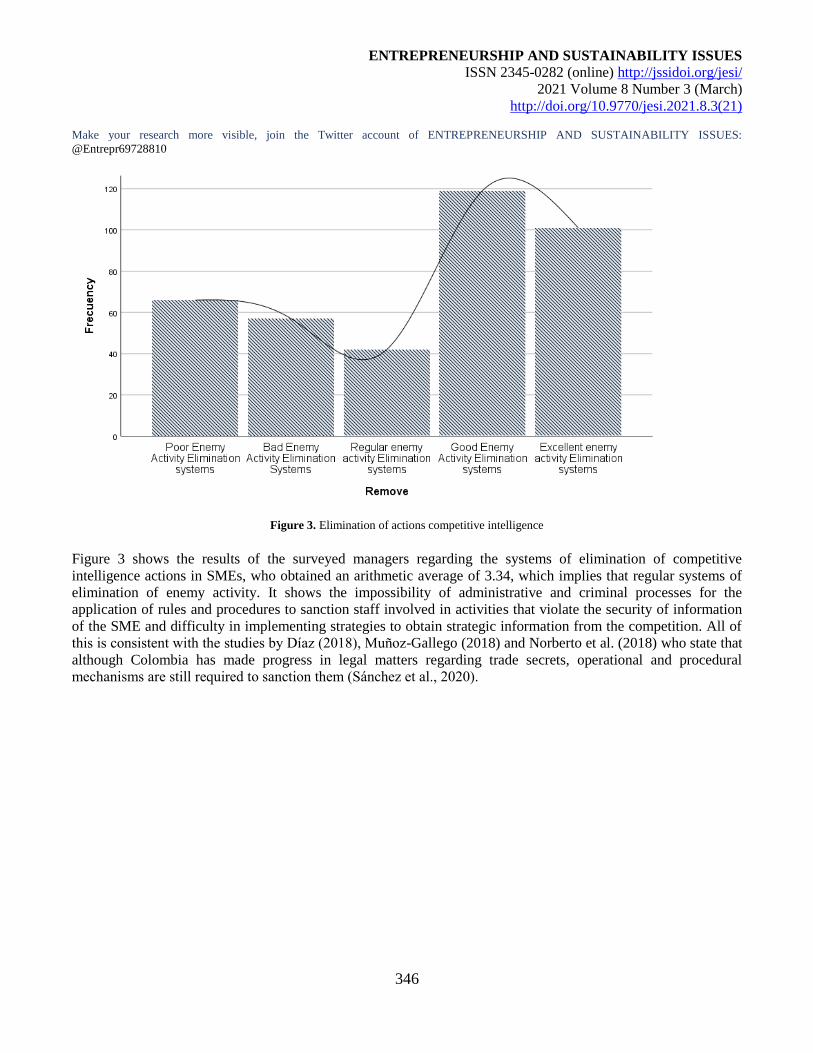
ENTREPRENEURSHIP AND SUSTAINABILITY ISSUES
ISSN 2345-0282 (online) http://jssidoi.org/jesi/
2021 Volume 8 Number 3 (March)
http://doi.org/10.9770/jesi.2021.8.3(21)
Make your research more visible, join the Twitter account of ENTREPRENEURSHIP AND SUSTAINABILITY ISSUES:
@Entrepr69728810
346
Figure 3. Elimination of actions competitive intelligence
Figure 3 shows the results of the surveyed managers regarding the systems of elimination of competitive
intelligence actions in SMEs, who obtained an arithmetic average of 3.34, which implies that regular systems of
elimination of enemy activity. It shows the impossibility of administrative and criminal processes for the
application of rules and procedures to sanction staff involved in activities that violate the security of information
of the SME and difficulty in implementing strategies to obtain strategic information from the competition. All of
this is consistent with the studies by Díaz (2018), Muñoz-Gallego (2018) and Norberto et al. (2018) who state that
although Colombia has made progress in legal matters regarding trade secrets, operational and procedural
mechanisms are still required to sanction them (Sánchez et al., 2020).

ENTREPRENEURSHIP AND SUSTAINABILITY ISSUES
ISSN 2345-0282 (online) http://jssidoi.org/jesi/
2021 Volume 8 Number 3 (March)
http://doi.org/10.9770/jesi.2021.8.3(21)
Make your research more visible, join the Twitter account of ENTREPRENEURSHIP AND SUSTAINABILITY ISSUES:
@Entrepr69728810
347
Figure 4. Business Counterintelligence in SMEs in Colombia
Once the descriptive statistics of each dimension were analyzed, the arithmetic average of the business counter-
intelligence variable was calculated, which obtained an average of 3.42, which represents a good system of
business counter-intelligence in Colombian SMEs in the scale of interpretation of the results described in table 3.
However, these results contradict the cross-cutting approaches of Múnera Pavón (2019), Durst and Zieba (2020),
Jalil and Hassan (2020), Knickmeier (2020), who indirectly believe that businessmen believe that their companies
are protected from the leakage of strategic material by having a closed video camera monitoring system, leaving
aside information traffic as a determining factor in the development of a company. Therefore, a
reconceptualization of the concept of security and protection of assets is required, reflecting on the professional
secrets that give life to the economic entity (Button, 2020; Jung & Jung, 2020; Konopatsch, 2020; Sailio et al.,
2020).
3.2. Cualitative section In this section we used hermeneutic interpretative analysis of key informants' discourses through the following
stages: structuring, categorization, contrasting, and interpretation. To this end, it was used as a tool for the
analysis of qualitative data (Atlas.ti8), which allowed the generation of the following table 4 and the semantic
network (figure 5).
Table 4. Table Analysis keycode-informant
Key Informant 1
Gr = 9
Key Informant 2
Gr = 6
Key Informant 3
Gr = 9
Key Informant 4
Gr = 16 Totals
Absolute Relative
of the
column
Absolute Relative
of the
column
Absolute Relative of
the column
Absolute Relative of
the column
Absolute
Detect
Gr = 22; GS = 10 5 45.45% 4 33.33% 4 30.77%
9 30.00% 22
Remove
Gr = 19; GS = 6 4 36.36% 4 33.33% 4 30.77%
7 23.33% 19
Prevent
Gr = 25; GS = 9 two 18.18% 4 33.33% 5 38.46%
14 46.67% 25
Totals eleven 100.00% 12 100.00% 13 100.00% 30 100.00% 66
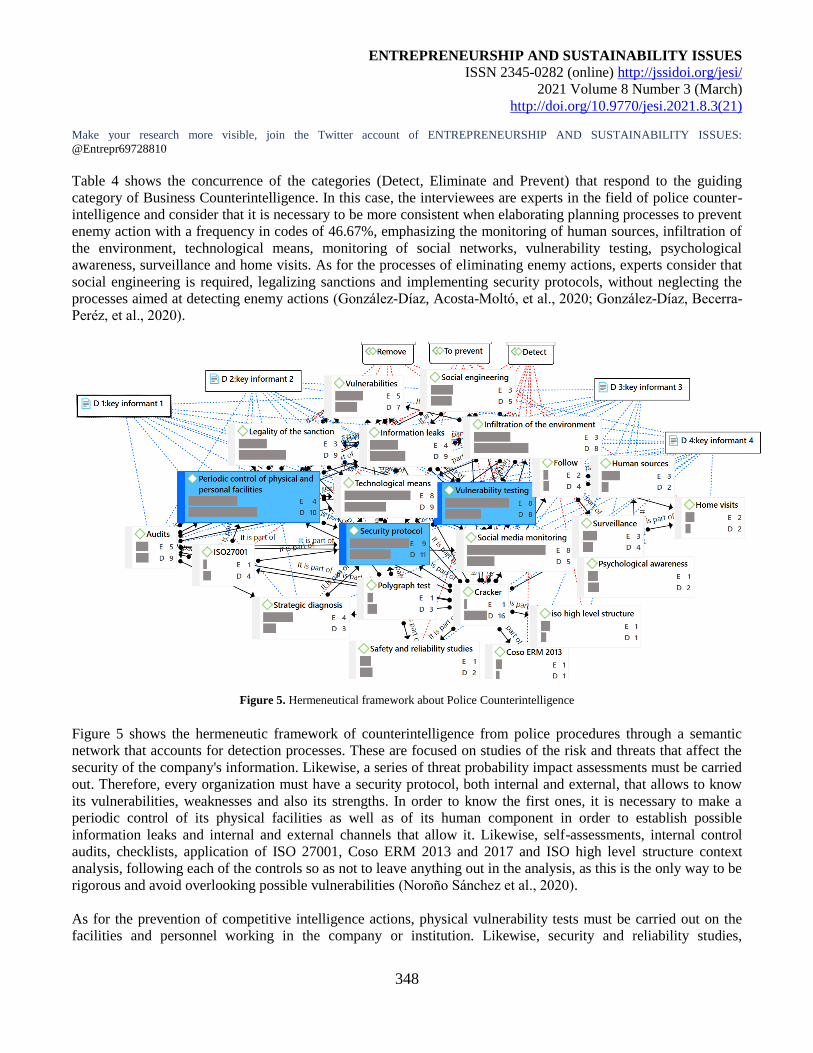
ENTREPRENEURSHIP AND SUSTAINABILITY ISSUES
ISSN 2345-0282 (online) http://jssidoi.org/jesi/
2021 Volume 8 Number 3 (March)
http://doi.org/10.9770/jesi.2021.8.3(21)
Make your research more visible, join the Twitter account of ENTREPRENEURSHIP AND SUSTAINABILITY ISSUES:
@Entrepr69728810
348
Table 4 shows the concurrence of the categories (Detect, Eliminate and Prevent) that respond to the guiding
category of Business Counterintelligence. In this case, the interviewees are experts in the field of police counter-
intelligence and consider that it is necessary to be more consistent when elaborating planning processes to prevent
enemy action with a frequency in codes of 46.67%, emphasizing the monitoring of human sources, infiltration of
the environment, technological means, monitoring of social networks, vulnerability testing, psychological
awareness, surveillance and home visits. As for the processes of eliminating enemy actions, experts consider that
social engineering is required, legalizing sanctions and implementing security protocols, without neglecting the
processes aimed at detecting enemy actions (González-Díaz, Acosta-Moltó, et al., 2020; González-Díaz, Becerra-
Peréz, et al., 2020).
Figure 5. Hermeneutical framework about Police Counterintelligence
Figure 5 shows the hermeneutic framework of counterintelligence from police procedures through a semantic
network that accounts for detection processes. These are focused on studies of the risk and threats that affect the
security of the company's information. Likewise, a series of threat probability impact assessments must be carried
out. Therefore, every organization must have a security protocol, both internal and external, that allows to know
its vulnerabilities, weaknesses and also its strengths. In order to know the first ones, it is necessary to make a
periodic control of its physical facilities as well as of its human component in order to establish possible
information leaks and internal and external channels that allow it. Likewise, self-assessments, internal control
audits, checklists, application of ISO 27001, Coso ERM 2013 and 2017 and ISO high level structure context
analysis, following each of the controls so as not to leave anything out in the analysis, as this is the only way to be
rigorous and avoid overlooking possible vulnerabilities (Noroño Sánchez et al., 2020).
As for the prevention of competitive intelligence actions, physical vulnerability tests must be carried out on the
facilities and personnel working in the company or institution. Likewise, security and reliability studies,
ENTREPRENEURSHIP AND SUSTAINABILITY ISSUES
ISSN 2345-0282 (online) http://jssidoi.org/jesi/
2021 Volume 8 Number 3 (March)
http://doi.org/10.9770/jesi.2021.8.3(21)
Make your research more visible, join the Twitter account of ENTREPRENEURSHIP AND SUSTAINABILITY ISSUES:
@Entrepr69728810
349
polygraph tests, home visits and accompaniment of personnel must be carried out. The continuous monitoring
through surveillance, monitoring, extraction, interception of lines. Similarly, the activities to prevent contrary
actions would be self-inflicted using an external element in order to know the weak part that allows its access, that
is, if you want to know the vulnerabilities at the computer level, you can send a computer virus that can infiltrate
the security system, if you want to know the physical vulnerabilities of the facilities to perform simulation
activities that break with the security protocols and at the level of human component to perform control activities
and monitoring of staff that is considered a threat.
In terms of eliminating the action of intelligence by the competition, you can run a good practice of intensive
awareness at the beginning of the implementation of controls, which can be in 3 phases to ensure that the
organization knows the rules and after this a stage of punishment with the application of exemplary attitudes,
which should be visible to serve as a corrective measure but even more so pedagogical to the rest of people. In
extreme cases, the formal mechanisms established in the Political Constitution of Colombia, Law on Intelligence
and Counterintelligence 1621, Law 734 and 1015, Criminal Code, Law 1581 on Data Protection, may be used.
Any person who violates the security of information has criminal and disciplinary reach.
4. Conclusions
Once both research approaches have been analyzed, a convergence is proposed based on the
dimensions/categories: Detect, Eliminate and Prevent the action of competition. In this sense, the detection of
competitive actions that violate the security of information and business secrets of SMEs is considered good, the
experts recommend to maintain institutional stability by conducting a frequent study of the risks and threats that
affect the security of information of the company or institution, if this is assumed as a frequent procedure,
business sustainability is guaranteed, because organizational weaknesses can be addressed in time. Likewise, it is
necessary to be rigorous in the access of external personnel to the SME. This requires investments in monitoring
and follow-up systems to detect fraud with information management.
As for the processes of prevention of intelligence actions by the competition in SMEs, managers consider having
good prevention systems. However, several studies described above contradict this position, so it is inferred levels
of ignorance as to the scope of prevention of external intelligence attacks. Therefore, experts recommend testing
the physical vulnerability of facilities and personnel working in the company and continuous monitoring through
surveillance and follow-up. The systems of elimination of competitive intelligence actions in SMEs are regular
due to the lack of knowledge about administrative and criminal processes for the application of rules and
procedures to sanction personnel involved in activities that violate the security of the information of the SME.
Therefore, it is recommended to implement awareness programs and reward the culture of information asset
security, all of which will guarantee the sustainability of business counterintelligence.
Finally, the experts suggest implementing strategies to mitigate the processes of intelligence against SMEs,
framed in creating false profiles in social networks, surveillance, monitoring, expansion. It is possible to resort to
the service of hacker or cracker to obtain privileged information, processes of infiltration of their environment,
monitoring of their social networks through social engineering, strategy of collection of human sources
(cooperators, informants, single line of questioning) technical means, infiltration, counter-intelligence.
ENTREPRENEURSHIP AND SUSTAINABILITY ISSUES
ISSN 2345-0282 (online) http://jssidoi.org/jesi/
2021 Volume 8 Number 3 (March)
http://doi.org/10.9770/jesi.2021.8.3(21)
Make your research more visible, join the Twitter account of ENTREPRENEURSHIP AND SUSTAINABILITY ISSUES:
@Entrepr69728810
350
References
Ageeva, S., & Mishura, A. (2019). Spatial aspects of the Russian banking system: Transformation and access to credit for small Russian firms.
In Geofinance between Political and Financial Geographies: A Focus on the Semi-Periphery of the Global Financial System (pp. 120-137).
Edward Elgar Publishing Ltd. https://doi.org/10.4337/9781789903850.00015
Al-Mohannadi, H., Awan, I., & Al Hamar, J. (2020). Analysis of adversary activities using cloud-based web services to enhance cyber threat
intelligence [Article]. Service Oriented Computing and Applications, 14(3), 175-187. https://doi.org/10.1007/s11761-019-00285-7
Bohnsack, R., Kolk, A., Pinkse, J., & Bidmon, C. M. (2020). Driving the electric bandwagon: The dynamics of incumbents' sustainable
innovation [Article]. Business Strategy and the Environment, 29(2), 727-743. https://doi.org/10.1002/bse.2430
Button, M. (2020). Editorial: economic and industrial espionage [Editorial]. Security Journal, 33(1). https://doi.org/10.1057/s41284-019-
00195-5
Cádiz, G. M. P. (2016). Espionaje y contraespionaje en Puerto Rico durante la Segunda Guerra Mundial (Espionage and Counter-espionage in
Puerto Rico during World War II). Cuaderno Internacional de Estudios Humanísticos y Literatura (CIEHL), (23), 20-32.
Catoira, A. A. E. (2018). Inteligencia corporativa y espionaje. http://hdl.handle.net/10469/13208
Cevallos Villegas, D. M., Moreno Rodríguez, C. J., & Chávez Garcés, Á. M. (2018). La auditoría interna como herramienta efectiva para la
prevención de fraudes en las empresas familiares (Internal audit as an effective tool for fraud prevention in family businesses). Revista
Universidad y Sociedad, 10(5), 15-20.
Comunidad-Andina. (2000). Decision 486: régimen común sobre propiedad industrial (Decision 486: common regime on industrial property)
http://www.wipo.nt/wipolex/es/text.jsp
Cortiñas, J. (2019). Definición de empresa. Apuntes Gestión (Definition of company. Management Notes)
https://www.apuntesgestion.com/b/definicion-deempresa/#comments
Crespo-Pazmiño, D. (2019). Ciberseguridad y Derechos Humanos: respuestas estatales e individuales a las revelaciones de espionaje de
Snowden (Cybersecurity and Human Rights: State and Individual Responses to Snowden's Espionage Revelations). Comentario
Internacional. Revista del Centro Andino de Estudios Internacionales (19), 77-98.
Díaz Pérez, J. S. (2020). Esquema Director de Seguridad para Empresas pymes del sector Construcción (Security Director Scheme for SMEs in
the Construction sector). http://rua.ua.es/dspace/handle/10045/102087
Díaz, C. R. F. (2018). El delito de daños y el espionaje empresarial: dos ataques compatibles conta la información como bien inmaterial.
InDret.
Durst, S., & Zieba, M. (2020). Knowledge risks inherent in business sustainability [Article]. Journal of Cleaner Production, 251, Article
119670. https://doi.org/10.1016/j.jclepro.2019.119670
Espectador, E. (2020). Claro rechaza declaraciones del Banco Agrario e insiste en que hubo filtración de datos (Claro rejects statements from
the Agrarian Bank and insists that there was a data leak). https://www.elespectador.com/noticias/economia/claro-rechaza-declaraciones-
del-banco-agrario-e-insiste-en-que-hubo-filtracion-de-datos/
Espionage and Competitiveness: The German Auto Industry in China's Modern Business Game). URVIO Revista Latinoamericana de Estudios
de Seguridad (26), 93-103.
Fetters, M. D., Curry, L. A., & Creswell, J. W. (2013). Achieving integration in mixed methods designs - Principles and practices Health
Services Research, 48(6 PART2), 2134-2156. https://doi.org/10.1111/1475-6773.12117
Gaitán Castro, S. (2019). Riesgos del uso de dispositivos móviles en seguridad de la información de las PYMES (Risks of the use of mobile
devices in information security of SMEs).
http://repository.unipiloto.edu.co/bitstream/handle/20.500.12277/6472/Riesgos%20del%20uso%20de%20dispositivos%20m%C3%B3viles
%20en%20seguridad%20de%20la%20informaci%C3%B3n%20de%20las%20PYMES.pdf?sequence=1&isAllowed=y
Gómez de la Torre Rotta, A., & Medrano Carmona, A. (2020). Orígenes yevolución de lasubversión y la contrainteligencia en el Perú, 1958-
2015 (Origins and evolution of subversion and counterintelligence in Peru, 1958-2015). URVIO Revista Latinoamericana de Estudios de
Seguridad (26), 57-71.
González-Díaz, R. R., & Cruz-Ayala, K. (2020). Contraloría financiera en la contratación pública. Una revisión de los contratos de obras
públicas del estado venezolano (Financial Comptroller in Public Procurement. A review of the public works contracts of the Venezuelan
state). Inquietud Empresarial, 20(1), 43-58.
González-Díaz, R. R., & Ledesma, K. N. F. (2020). Cultura organizacional y Sustentabilidad empresarial en las Pymes durante crisis periodos
de confinamiento social (Organizational culture and business sustainability in SMEs during crisis periods of social confinement). CIID
Journal, 1(1), 28-41.
González-Díaz, R. R., & Polo, E. A. S. (2018). Entrevistas Espontaneas Categoriales (EEC) para la construcción de categorías orientadoras en
la investigación cualitativa (Spontaneous Categorical Interviews (EEC) for the construction of guiding categories in qualitative research).
Journal Latin American Science, 1(2), 1-11.
ENTREPRENEURSHIP AND SUSTAINABILITY ISSUES
ISSN 2345-0282 (online) http://jssidoi.org/jesi/
2021 Volume 8 Number 3 (March)
http://doi.org/10.9770/jesi.2021.8.3(21)
Make your research more visible, join the Twitter account of ENTREPRENEURSHIP AND SUSTAINABILITY ISSUES:
@Entrepr69728810
351
González-Díaz, R. R., Acosta-Moltó, E., Flores-Ledesma, K., Vargas, E. C., & Menacho-Rivera, A. (2020). Marketing experience in non-profit
organizations: A look at experience pro-viders [Article]. RISTI - Revista Iberica de Sistemas e Tecnologias de Informacao, 2020(E36),
186-202.
González-Díaz, R. R., Becerra-Peréz, L. A., & Acevedo-Duque, A. E. (2020). Narco-marketing as a strategy for local tourism development
[Article]. RISTI - Revista Iberica de Sistemas e Tecnologias de Informacao, 2020(E36), 71-85.
https://www.scopus.com/inward/record.uri?eid=2-s2.0-85094645431&partnerID=40&md5=05aa102c97cbe24ef7e6480d83cbb588
Griewatz, J., Yousef, A., Rothdiener, M., Lammerding-Koeppel, M., Fritze, O., Dall'Acqua, A., Geißinger, M., Steffens, S., Steinweg, B.,
Borucki, K., Germanyuk, A., & Koenig, S. (2020). Are we preparing for collaboration, advocacy and leadership? Targeted multi-site
analysis of collaborative intrinsic roles implementation in medical undergraduate curricula [Article]. BMC Medical Education, 20(1),
Article 35. https://doi.org/10.1186/s12909-020-1940-0
Guetterman, T. C., Fetters, M. D., & Creswell, J. W. (2015). Integrating quantitative and qualitative results in health science mixed methods
research through joint displays. Annals of Family Medicine, 13(6), 554-561. https://doi.org/10.1370/afm.1865
Hernández-Julio, Y. F., Meriño-Fuentes, I., González-Díaz, R. R., Guerrero-Avendaño, A., Toledo, L. V. O., & Bernal, W. N. (2020). Fuzzy
knowledge discovery and decision-making through clustering and Dynamic tables: Application in Colombian business Finance. 2020 15th
Iberian Conference on Information Systems and Technologies (CISTI). https://doi.org/10.23919/CISTI49556.2020.9141117
Hipertextual. (2020). Tesla contra Rivian: vuelve la obsesión por el robo de secretos comerciales (Tesla vs.Rivian: Trade Secret Theft
Obsession Returns). https://hipertextual.com/2020/07/tesla-contra-rivian-robo-secretos-comerciales
Jalil, J. A., & Hassan, H. (2020). Protecting trade secret from theft and corporate espionage: Some legal and administrative measures.
International Journal of Business and Society, 21(S1), 205-218. https://www.scopus.com/inward/record.uri?eid=2-s2.0-
85079684581&partnerID=40&md5=fc1e91b41abb8b9e5829bed4f17dcbdc
Jayaram, D. (2020). ‘Climatizing’ military strategy? A case study of the Indian armed forces. International Politics.
https://doi.org/10.1057/s41311-020-00247-3
Jung, S. O., & Jung, C. H. (2020). Classification of industrial espionage cases and countermeasures. 2020 IEEE International Conference on
Big Data and Smart Computing, BigComp 2020,
Kettles, A. M., Creswell, J. W., & Zhang, W. (2011). Mixed methods research in mental health nursing [Article]. Journal of Psychiatric and
Mental Health Nursing, 18(6), 535-542. https://doi.org/10.1111/j.1365-2850.2011.01701.x
Khristoforov, V., & Guseva, Y. (2020). Soviet military strategy in Afghanistan: Errors in planning and public condemnation [Review].
Quaestio Rossica, 8(2), 382-398. https://doi.org/10.15826/qr.2020.2.469
Knickmeier, S. (2020). Spies without borders? The phenomena of economic and industrial espionage and the deterrence strategies of Germany
and other selected European countries [Article]. Security Journal, 33(1), 6-26. https://doi.org/10.1057/s41284-019-00199-1
Konopatsch, C. (2020). Fighting industrial and economic espionage through criminal law: lessons to be learned from Austria and Switzerland.
Security Journal, 33(1), 83-118. https://doi.org/10.1057/s41284-019-00200-x
Lara, J. E. Z. (2018). Médidas De Prevención Del Fraude De Las Empresas. In Médidas De Prevención Del Fraude De Las Empresas. Editorial
Abya-Yala.
Laszka, A., Johnson, B., Schöttle, P., Grossklags, J., & Böhme, R. (2014). Secure team composition to thwart insider threats and cyber-
espionage. ACM Transactions on Internet Technology, 14(2-3), Article 2663499. https://doi.org/10.1145/2663499
Mabula, J. B., Dongping, H., & Mwakapala, L. Y. (2020). SME's use of ICT and financial services on innovation performance: The mediating
role of managers' experience [Article]. Human Systems Management, 39(3), 427-439. https://doi.org/10.3233/HSM-190790
Masood, O., Javaria, K. & Petrenko, Y. (2020). Terrorism activities influence on financial stock markets: an empirical evidence from United
Kingdom, India, France, Pakistan, Spain and America. Insights into Regional Development, 2(1), 443-
455. https://doi.org/10.9770/IRD.2020.2.1(4)
Mendoza Cortés, P. (2020). Inteligencia y contrainteligencia militarfrente a fallos y desafíos. El caso de Culiacán, México (2019). URVIO
Revista Latinoamericana de Estudios de Seguridad (26), 37-56.
Múnera Pavón, L. (2019). El espionaje en Colombia, 1919-1945: una mirada panorámica a través de los diarios El Tiempo (Espionage in
Colombia, 1919-1945: a panoramic view through the newspapers El Tiempo), El Espectador y El Siglo.
Muñoz-Gallego, A. (2018). Retos y estrategias de ciberseguridad en la empresa. negocio Electrónico (Cybersecurity challenges and strategies
in the company. Electronic business) https://riuma.uma.es/xmlui/handle/10630/16527
Naughton, S., Golgeci, I., & Arslan, A. (2020). Supply chain agility as an acclimatisation process to environmental uncertainty and
organisational vulnerabilities: insights from British SMEs [Article]. Production Planning and Control, 31(14), 1164-1177.
https://doi.org/10.1080/09537287.2019.1701130
Norberto, J., Gómez-Aller, J. D., Sánchez, J. A. L., & Martín, A. N. (2018). Derecho penal económico y de la empresa. Dykinson (Economic
and corporate criminal law. Dykinson). file:///C:/Users/271/Downloads/derecho_penal_economico_2018.pdf
Noroño Sánchez, J. G., Nuñez Villavicencio, M., & González Díaz, R. R. (2020). Union ethics as a mechanism driving competitiveness in
small and medium-sized enterprises [Article]. Utopia y Praxis Latinoamericana, 25(Extra3), 154-173.
https://doi.org/10.5281/zenodo.3907063
Ocampo Giraldo, M. (2019). Artículo de revisión de Metodologías de Análisis de Riesgos de la Información, enfocado a Pymes Universidad
Santiago de Cali].
ENTREPRENEURSHIP AND SUSTAINABILITY ISSUES
ISSN 2345-0282 (online) http://jssidoi.org/jesi/
2021 Volume 8 Number 3 (March)
http://doi.org/10.9770/jesi.2021.8.3(21)
Make your research more visible, join the Twitter account of ENTREPRENEURSHIP AND SUSTAINABILITY ISSUES:
@Entrepr69728810
352
Olmedo, J. I., & Gavilánez, F. L. (2018). Análisis de los ciberataques realizados en América Latina (Analysis of cyberattacks carried out in
Latin America). INNOVA Research Journal, 3(9), 172-181.
Pazmiño, D. F. C. (2020). Espionaje y competitividad: la industria automotriz alemana en el juego comercial moderno de China
PWC. (2018). El fraude al descubierto (The fraud exposed). PWC. https://www.pwc.com/co/en/publications/technology/Fraude-al-
descubierto.pdf
Riisager-Simonsen, C., Rendon, O., Galatius, A., Olsen, M. T., & Beaumont, N. (2020). Using ecosystem-services assessments to determine
trade-offs in ecosystem-based management of marine mammals. Conservation Biology. https://doi.org/10.1111/cobi.13512
Rodríguez, J. V. (2017). La contrainteligencia en el sector de la industria (Counterintelligence in the industry sector). Economía industrial
(405), 133-141.
Sailio, M., Latvala, O. M., & Szanto, A. (2020). Cyber threat actors for the factory of the future. Applied Sciences (Switzerland), 10(12),
Article 4334. https://doi.org/10.3390/app10124334
Sánchez, J. G. N., Villavicencio, M. N., & Díaz, R. R. G. (2020). Ética sindical como mecanismo impulsor de competitividad en las pequeñas y
medianas empresas (Trade union ethics as a competitiveness driver in small and medium-sized enterprises). Utopía y praxis
latinoamericana: revista internacional de filosofía iberoamericana y teoría social (3), 154-173.
Sari, A. (2018). Context-aware intelligent systems for fog computing environments for cyber-threat intelligence. In Fog Computing: Concepts,
Frameworks and Technologies (pp. 205-225). Springer International Publishing. https://doi.org/10.1007/978-3-319-94890-4_10
Sun, T. (2016). El arte de la guerra. Aegitas.
Tariq, M. A., Brynielsson, J., & Artman, H. (2012). Framing the attacker in organized cybercrime. 2012 European Intelligence and Security
Informatics Conference, EISIC 2012, Odense.
Teixeira Júnior, A. W. M., & Da Silva, P. F. (2020). China in the contemporary world order: Grand strategy, military modernization, and
balance of power [Article]. Sociedade e Cultura, 23, Article e59618. https://doi.org/10.5216/SEC.V23I.59618
Tejena-Macías, M. A. (2018). Análisis de riesgos en seguridad de la información. Polo del conocimiento, 3(4), 230-244.
Wilson, C. (2014). Cyber threats to critical information infrastructure. In Cyberterrorism: Understanding, Assessment, and Response (Vol.
9781493909629, pp. 123-136). Springer New York. https://doi.org/10.1007/978-1-4939-0962-9_7
Acknowledgements
This research was supported by the project, which has received funding from research and innovation programme of the
Centro Internacional de Investigación y Desarrollo (CIID) Montería, Colombia.
Romel Ramón GONZÁLEZ-DÍAZ is the Professor of Business Enterprise and Innovation and Director of the CIID, Montería Colombia.
ORCID ID: https://orcid.org/0000-0002-7529-8847
Ángel ACEVEDO-DUQUE. Faculty of Business and Administration, Universidad Autónoma de Chile, Providencia - Santiago, Chile.
ORCID ID: https://orcid.org/0000-0002-8774-3282
Santos Lucio GUANILO-GÓMEZ. Professor at the Universidad Nacional Jorge Basadre Grohmann, Tacna, Peru.
ORCID ID: https://orcid.org/0000-0002-7611-937X
Elena CACHICATARI-VARGAS. Professor at the Universidad Nacional Jorge Basadre Grohmann, Tacna, Peru.
ORCID ID: https://orcid.org/0000-0002-9843-432X
Copyright © 2021 by author(s) and VsI Entrepreneurship and Sustainability Center
This work is licensed under the Creative Commons Attribution International License (CC BY).
http://creativecommons.org/licenses/by/4.0/
ENTREPRENEURSHIP AND SUSTAINABILITY ISSUES
ISSN 2345-0282 (online) http://jssidoi.org/jesi/
2021 Volume 8 Number 3 (March)
http://doi.org/10.9770/jesi.2021.8.3(22)
Publisher http://jssidoi.org/esc/home
340
LEGAL REGULATION OF ENTREPRENEURIAL ACTIVITY IN THE NATIONAL SECURITY
SYSTEM
Olha Bezpalova ¹*, Maryna Yunina ², Svitlana Korohod 3, Kristina Rezvorovich 4, Tsahik Ohanisian 5
1* Kharkiv National University of Internal Affairs, Lev Landau Avenue, 27, Kharkiv, 61000, Ukraine 2,3,4,5 Dnipropetrovsk State University of Internal Affairs, Ave. Gagarina, 26, 49005, Dnipro, Ukraine
E-mail: 1* [email protected] (Correponding author)
Received 23 March 2020; accepted 10 January 2021; published 30 March 2021
Abstract. The main directions of the destructive economic impact on business activities in the national security system have been
identified, which allowed to identify possible risks for business activities and to develop a set of preventive measures to reduce the negative
impact of external factors. Given the current conditions of the macroeconomic situation, it is necessary to constantly monitor the processes
that take place in the external environment and have an impact on the state of economic security of business. With the help of international
rating indices, which are an important tool, a significant reference point and an external source of information, Ukraine's place in
international rankings has been tracked in the second section and a comprehensive assessment has been made, as the relevant rankings
places by which world organizations mark Ukraine are indicators of its development. The interrelation and influence of the given indicators
on the economic security of entrepreneurial activity are substantiated. According to the study of Ukraine's position in international
rankings, it is concluded that Ukraine's position is currently unsatisfactory, Ukraine has not yet created safe conditions for business
development: unstable tax legislation, significant corruption pressure and currency restrictions, lack of serious gains in investment
attractiveness and to ensure national competitiveness, state support for business development is insufficient and unfocused; limited
opportunities for financing state programs for business development. Entrepreneurial activity management in Ukraine is a direction of state
policy, a set of measures and forms of economic, legal, and organizational impact on business and entrepreneurs, including through state
support and protection of business entities, as well as state control over compliance requirements of the legislation by subjects of such an
activity.
Keywords: entrepreneurial activity; national security; legal regulation; international rankings; state policy
Reference to this paper should be made as follows: Bezpalova, O., Yunina, M., Korohod, S., Rezvorovich, K., Ohanisian, T. 2021. Legal
regulation of entrepreneurial activity in the national security system. Entrepreneurship and Sustainability Issues, 8(3), 340-355.
http://doi.org/10.9770/jesi.2021.8.3(22)
JEL Classifications: F35, F42
ENTREPRENEURSHIP AND SUSTAINABILITY ISSUES
ISSN 2345-0282 (online) http://jssidoi.org/jesi/
2021 Volume 8 Number 3 (March)
http://doi.org/10.9770/jesi.2021.8.3(22)
Make your research more visible, join the Twitter account of ENTREPRENEURSHIP AND SUSTAINABILITY ISSUES:
@Entrepr69728810
341
1. Introduction
The operation of subjects of entrepreneurial activity takes place in an unstable and chaotic business environment,
which is characterized by an increase in the degree of its uncertainty, complexity, and unpredictability
(Chehabeddine, M., & Tvaronavičienė, M. 2020; Mazzanti, M., 2020; Vasconcelos, V.V. 2021). This requires
subjects of entrepreneurial activity to respond quickly and adequately to changes in the business environment, to
find ways to overcome external threats and to provide the necessary level of economic security. It is economic
security that has a determining role in ensuring the sustainable development and competitiveness of subjects of
entrepreneurial activity.
With the inclusion of Ukraine’s economy in the world economy, in particular, the intensification of European
integration processes, there is an objective need to develop a more effective system of economic security of
entrepreneurial activity when entering new world markets.
Entrepreneurial activity has always been closely linked to the risks posed by the internal and external environment
of businesses. Therefore, ensuring the appropriate level of economic security is an integral prerequisite for
entrepreneurial activity in the face of increasing the complexity of business processes, increasing political,
economic, social, environmental, and other instability.
The issue of economic security becomes especially relevant and requires the creation of an effective mechanism
for managing the system of economic security of entrepreneurial activity. Such a system should be based not only
on neutralizing the negative impact of exogenous and endogenous factors on business but also on preventing
potential or hidden (latent) threats and eliminating actual dangers, which requires the formation of a set of
preventive measures to ensure economic security of entrepreneurial activity.
One of the main tasks to fulfill this is, of course, reforming and improving the entrepreneurial activity
management system. After all, the implementation of any changes in the system of entrepreneurship directly
depends on how this system will be managed, directed, and controlled. In particular, the current management of
business in Ukraine is objectively inefficient and does not meet the requirements of the time.
The purpose of this study is to highlight the basic principles, to reveal key issues, and to prepare specific
proposals for improving the legal regulation of administrative entrepreneurial activity management in Ukraine.
2. Literature Survey
The problems of economic security of entrepreneurial activity are becoming extremely important, because the
factors related to the development of European integration processes, with their impact on the efficiency of
entrepreneurial activity, are gaining in importance.
Theoretical principles of economic security of enterprises are reflected in the works of many scientists: McKenny,
A. F., et. al. (2017), Fagerberg, J. (2017), Kuhlmann, S., & Rip, A. (2018) and others.
Peculiarities of the influence of European integration processes on entrepreneurial activity are considered in the
works of Flanagan, K., & Uyarra, E. (2016), Carayannis, EG, Meissner, D., & Edelkina, A. (2017), Schot, J., &
Steinmueller, WE (2018) and others.
Entrepreneurial activity as one of the most driving forces of economic development of the state requires an
ENTREPRENEURSHIP AND SUSTAINABILITY ISSUES
ISSN 2345-0282 (online) http://jssidoi.org/jesi/
2021 Volume 8 Number 3 (March)
http://doi.org/10.9770/jesi.2021.8.3(22)
Make your research more visible, join the Twitter account of ENTREPRENEURSHIP AND SUSTAINABILITY ISSUES:
@Entrepr69728810
342
orderly management process, through which it will acquire clear features of the appropriate activity, will be a way
of economic legal employment and a means of ensuring the lives of individuals and the general population. In the
modern conditions of state formation in the Ukrainian science of administrative law, there are currently no
comprehensive systematic studies on the methodological foundations of business management, so there is a need
to study and develop the concept, purpose and objectives, methods, and forms of such management.
It should be noted that the issues of improving the entrepreneurial activity management system in Ukraine have
been the subject of active discussions and, accordingly, reflected in the works of scholars on the theory of law,
administrative law, commercial (business) law, and other related branches of law, such as: Díez-Martín, F.,
Blanco-González, A., & Prado-Román, C. (2016), Kacperczyk, A., & Younkin, P. (2017), Kibler, E., Salmivaara,
V., Stenholm, P., & Terjesen, S. (2018), Ingram Bogusz, C., Teigland, R., & Vaast, E. (2019) and others.
The study of theoretical and empirical achievements of these authors makes it possible to say that they have
created a theoretical basis and practical tools to ensure the economic security of business have been proposed. At
the same time, the deepening of European integration processes, in which Ukraine is involved, forms new
requirements for the basic elements of the mechanism of economic security of the entrepreneurial activity
management, in particular, the optimization of internal and external information flows. The need to form
theoretical foundations and practical tools to ensure the economic security of entrepreneurial activity in the
development of European integration processes has led to the choice of topic and direction of research and
structure of work.
Without diminishing the importance of scientific developments of these authors, however, it should be noted that
in view of the above, today requires a comprehensive study of the problems of business management in Ukraine.
It should be emphasized that the issue of entrepreneurial activity management in Ukraine and its improvement
have not yet been the subject of a separate study, which, given the ongoing reform of business management and
its results (including those strategically planned by 2020), is a significant omission from both theoretical and
scientific and practical point of view. Also, the leading practice of business management in economically
powerful countries of the world (in particular, the EU and EU member states, the USA, Japan and the PRC) has
not been systematically considered in order to make recommendations for the application of such practice in
Ukraine. This scientific work is aimed at solving the outlined issues.
3. Methods
The methodological basis of the study is a number of general and special methods of cognition, the choice of
which is determined by the characteristics of its object, subject, purpose, and objectives.
Thus, the historical method was used to determine the characteristics of entrepreneurial activity in the world and
in modern Ukraine, to clarify the essence of entrepreneurial activity as a social and legal phenomenon and its
components: the method of classification, induction, and deduction) was used to provide general legal
characteristics of management activity concerning entrepreneurship in Ukraine - definition of the purpose, tasks,
principles, methods, and forms of management in the specified spheres. The method of systematization in
combination with the system-functional method was used during the development of the system of administrative
entrepreneurial activity management in Ukraine and the delineation of their powers.
Using the logical-semantic method, the basic concepts in the work are defined. The system-structural method, the
method of synthesis, and the method of empirical cognition of observation were used in the study of problems that
ENTREPRENEURSHIP AND SUSTAINABILITY ISSUES
ISSN 2345-0282 (online) http://jssidoi.org/jesi/
2021 Volume 8 Number 3 (March)
http://doi.org/10.9770/jesi.2021.8.3(22)
Make your research more visible, join the Twitter account of ENTREPRENEURSHIP AND SUSTAINABILITY ISSUES:
@Entrepr69728810
343
exist in the field of entrepreneurial activity management, which created opportunities to take into account existing
practice in this area and theoretical developments of leading scholars of administrative law.
Methods of generalization and classification provided opportunities to develop a general system of international
legal level of entrepreneurial activity management. The comparative legal method was used in comparing the
norms and provisions of national legislation on the regulation of entrepreneurial activity management in Ukraine
and the legislation of developed countries. Formal-dogmatic and modeling method allowed to identify
shortcomings in the legal regulation in the research area and to formulate specific proposals for its improvement.
Scientific and theoretical basis for the work includes scientific works of scientists in philosophy, general theory of
state and law, administrative, economic, international and European law, other branches of legal sciences,
including foreign researchers. Provisions and conclusions are based on the norms of the Constitution of Ukraine,
international acts in the field of business regulation, regulations of the Verkhovna Rada of Ukraine, the President
of Ukraine, the Cabinet of Ministers of Ukraine, central executive bodies, as well as current legislation of some
countries with developed market economies and the EU Member States, the US, Japan, and the PRC).
The information and empirical basis of the study were generalizations of the published practice of national
(Chamber of Commerce, National Institute for Strategic Studies and others) and international experts and
specialists (GREGO; World Bank, International Finance Corporation, etc).
This approach allowed the author to substantiate its conclusions and suggestions taking into account the needs of
the practice, international experience, and the need to improve regulations governing the relationship.
4. Results
Entrepreneurial activity management in Ukraine is a direction of state policy, a set of measures and forms of
economic, legal, and organizational influence on entrepreneurial activity and entrepreneurs, including through
state support and protection of the subjects of entrepreneurial activity, as well as state control over compliance
with the law by the subjects of such activities. At the same time, such management is aimed at: ensuring the
economic security of the state and the security of society through rational management; achieving effective legal
regulation of organizational and economic relations in the state in accordance with the requirements of modernity
and the real circumstances of economic reality in the country; achievement of optimally constructed
administrative relations between the authorities on the regulation of economic activity; reduction of state
intervention in the activities of economic entities and elimination of obstacles to the development of legitimate
economic activity.
Today, the development of entrepreneurship in Ukraine has reached a stage where the improvement of the state's
regulatory policy determines its further prospects. Consequently, the issues of state regulation of entrepreneurship
and the means of influence of the state (public administration systems in general) on entrepreneurial activity are
significantly relevant. Secondly, it should be emphasized that the formation of a comprehensive system of means
of state regulation of entrepreneurship has not yet been completed in Ukraine. In this regard, we can see the
chaotic, inconsistent, and fragmentary actions of public authorities in the development and implementation of
modern public policy in the field of entrepreneurship, which would meet the standards and conditions of a market
economy.
It should be noted that the system of bodies carrying out general administrative entrepreneurial activity
management in Ukraine is multifaceted, as such a system includes all state authorities, which are authorized to
ENTREPRENEURSHIP AND SUSTAINABILITY ISSUES
ISSN 2345-0282 (online) http://jssidoi.org/jesi/
2021 Volume 8 Number 3 (March)
http://doi.org/10.9770/jesi.2021.8.3(22)
Make your research more visible, join the Twitter account of ENTREPRENEURSHIP AND SUSTAINABILITY ISSUES:
@Entrepr69728810
344
protect national security. However, the most important part of the study is the analysis of the relevant rights and
responsibilities of bodies carrying out special administrative entrepreneurial activity management in the field of
economic security (On approval of the Procedure for state accreditation of institutions conducting training,
retraining and advanced training of drivers of vehicles, and certification of their specialists (2009), as well as the
safety and well-being of the population, so let's move on to the second group of bodies, namely the system of
bodies that carry out special administrative entrepreneurial activity management in Ukraine.
For example, according to the Law of Ukraine “On the Foundations of National Security of Ukraine” (2003), the
concept of “economic security” is part of a broader concept - “national security of Ukraine”, which is carried out
by conducting a balanced public policy in accordance with duly adopted doctrines, concepts, strategies, and
programs in the political, economic, social, military, environmental, scientific and technological, information, and
other areas.
Entrepreneurial activity plays an important role in a significant part of the economic security of the state: both as a
factor in ensuring and growing the economy, and as a factor in stopping such economic growth and “destroying”
the state's economy as a whole. This is due to the fact that the activities of entrepreneurs in the Ukrainian market
affect the state of growth or decline in prices, as well as in the field of competition, taxes and fees, etc. Therefore,
given that the economic security of Ukraine, as a state with a market economy that is significantly globalized,
directly depends on security and ensuring the security in the field of competition and taxes and fees, in the field of
state customs, pricing and commodity prices, services, etc, the availability and efficient and optimal operation of
bodies carrying out special administrative entrepreneurial activity management in the field of economic security
are difficult to underestimate.
At the same time, a special administrative entrepreneurial activity management in the field of economic security is
carried out by a number of central public authorities and their subordinate authorities within their own powers.
However, given the various sectors and subsectors of the economy and state economic policy of our state and the
relevant bodies, which are responsible for security in the relevant sectors and subsectors of the economy, it is
most appropriate to consider these bodies given the specific subject of their commitment.
Economic security in the field of economic competition is provided in our country by the Antimonopoly
Committee of Ukraine (hereinafter - AMCU), which is a state body under the control of the President of Ukraine
(accountable to the Verkhovna Rada), a body with a special status, the purpose of which, respectively, is to ensure
state protection of competition in entrepreneurial activity and in the field of public procurement.
It is difficult to underestimate the impact of the development of new and improvement of existing regulations, in
particular the impact of bringing Ukrainian tax and customs legislation in line with the acquis Communautaire on
the state and development of entrepreneurial activity in the country. In particular, the current tax legislation can be
described as contradictory, uncertain, unstable, and inadequate to current business conditions; for the functioning
of tax policy, it is necessary to reorient it from purely fiscal goals to stimulate economic growth. At the same
time, the introduction of new tax legislation has led to mass closures of enterprises compared to previous years.
The significant number and frequency of changes and additions to the regulations of tax legislation significantly
complicate the work of regulatory authorities and negatively affects the activities of business entities, as well as
reduces the attractiveness of the national economy for foreign investors.
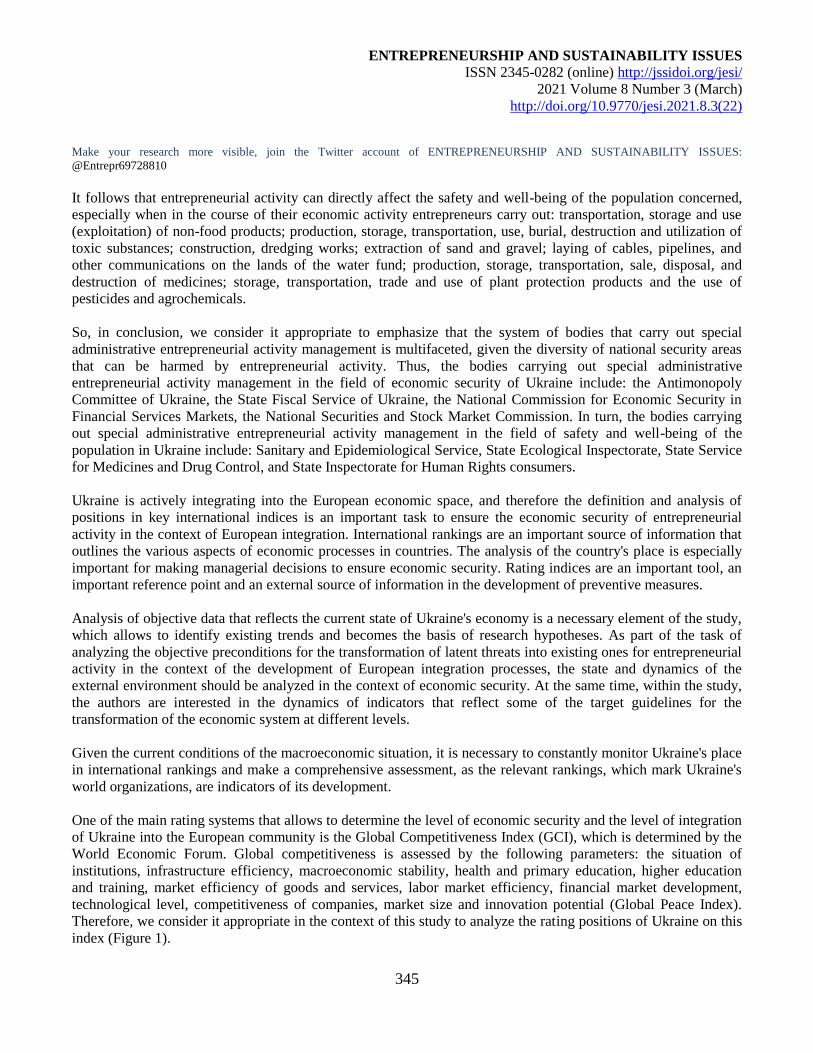
ENTREPRENEURSHIP AND SUSTAINABILITY ISSUES
ISSN 2345-0282 (online) http://jssidoi.org/jesi/
2021 Volume 8 Number 3 (March)
http://doi.org/10.9770/jesi.2021.8.3(22)
Make your research more visible, join the Twitter account of ENTREPRENEURSHIP AND SUSTAINABILITY ISSUES:
@Entrepr69728810
345
It follows that entrepreneurial activity can directly affect the safety and well-being of the population concerned,
especially when in the course of their economic activity entrepreneurs carry out: transportation, storage and use
(exploitation) of non-food products; production, storage, transportation, use, burial, destruction and utilization of
toxic substances; construction, dredging works; extraction of sand and gravel; laying of cables, pipelines, and
other communications on the lands of the water fund; production, storage, transportation, sale, disposal, and
destruction of medicines; storage, transportation, trade and use of plant protection products and the use of
pesticides and agrochemicals.
So, in conclusion, we consider it appropriate to emphasize that the system of bodies that carry out special
administrative entrepreneurial activity management is multifaceted, given the diversity of national security areas
that can be harmed by entrepreneurial activity. Thus, the bodies carrying out special administrative
entrepreneurial activity management in the field of economic security of Ukraine include: the Antimonopoly
Committee of Ukraine, the State Fiscal Service of Ukraine, the National Commission for Economic Security in
Financial Services Markets, the National Securities and Stock Market Commission. In turn, the bodies carrying
out special administrative entrepreneurial activity management in the field of safety and well-being of the
population in Ukraine include: Sanitary and Epidemiological Service, State Ecological Inspectorate, State Service
for Medicines and Drug Control, and State Inspectorate for Human Rights consumers.
Ukraine is actively integrating into the European economic space, and therefore the definition and analysis of
positions in key international indices is an important task to ensure the economic security of entrepreneurial
activity in the context of European integration. International rankings are an important source of information that
outlines the various aspects of economic processes in countries. The analysis of the country's place is especially
important for making managerial decisions to ensure economic security. Rating indices are an important tool, an
important reference point and an external source of information in the development of preventive measures.
Analysis of objective data that reflects the current state of Ukraine's economy is a necessary element of the study,
which allows to identify existing trends and becomes the basis of research hypotheses. As part of the task of
analyzing the objective preconditions for the transformation of latent threats into existing ones for entrepreneurial
activity in the context of the development of European integration processes, the state and dynamics of the
external environment should be analyzed in the context of economic security. At the same time, within the study,
the authors are interested in the dynamics of indicators that reflect some of the target guidelines for the
transformation of the economic system at different levels.
Given the current conditions of the macroeconomic situation, it is necessary to constantly monitor Ukraine's place
in international rankings and make a comprehensive assessment, as the relevant rankings, which mark Ukraine's
world organizations, are indicators of its development.
One of the main rating systems that allows to determine the level of economic security and the level of integration
of Ukraine into the European community is the Global Competitiveness Index (GCI), which is determined by the
World Economic Forum. Global competitiveness is assessed by the following parameters: the situation of
institutions, infrastructure efficiency, macroeconomic stability, health and primary education, higher education
and training, market efficiency of goods and services, labor market efficiency, financial market development,
technological level, competitiveness of companies, market size and innovation potential (Global Peace Index).
Therefore, we consider it appropriate in the context of this study to analyze the rating positions of Ukraine on this
index (Figure 1).
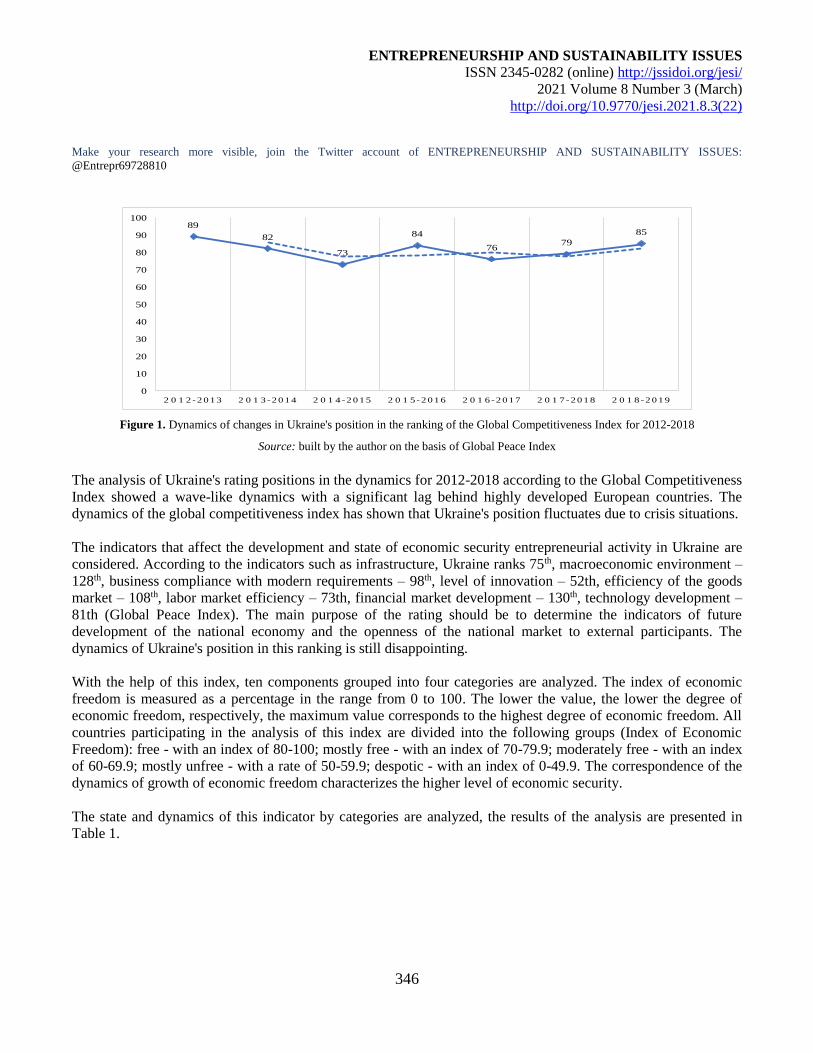
ENTREPRENEURSHIP AND SUSTAINABILITY ISSUES
ISSN 2345-0282 (online) http://jssidoi.org/jesi/
2021 Volume 8 Number 3 (March)
http://doi.org/10.9770/jesi.2021.8.3(22)
Make your research more visible, join the Twitter account of ENTREPRENEURSHIP AND SUSTAINABILITY ISSUES:
@Entrepr69728810
346
89
82
73
84
7679
85
0
10
20
30
40
50
60
70
80
90
100
2 0 1 2 -2013 2 0 1 3 -2014 2 0 1 4 -2015 2 0 1 5 -2016 2 0 1 6 -2017 2 0 1 7 -2018 2 0 1 8 -2019
Figure 1. Dynamics of changes in Ukraine's position in the ranking of the Global Competitiveness Index for 2012-2018
Source: built by the author on the basis of Global Peace Index The analysis of Ukraine's rating positions in the dynamics for 2012-2018 according to the Global Competitiveness
Index showed a wave-like dynamics with a significant lag behind highly developed European countries. The
dynamics of the global competitiveness index has shown that Ukraine's position fluctuates due to crisis situations.
The indicators that affect the development and state of economic security entrepreneurial activity in Ukraine are
considered. According to the indicators such as infrastructure, Ukraine ranks 75th, macroeconomic environment –
128th, business compliance with modern requirements – 98th, level of innovation – 52th, efficiency of the goods
market – 108th, labor market efficiency – 73th, financial market development – 130th, technology development –
81th (Global Peace Index). The main purpose of the rating should be to determine the indicators of future
development of the national economy and the openness of the national market to external participants. The
dynamics of Ukraine's position in this ranking is still disappointing.
With the help of this index, ten components grouped into four categories are analyzed. The index of economic
freedom is measured as a percentage in the range from 0 to 100. The lower the value, the lower the degree of
economic freedom, respectively, the maximum value corresponds to the highest degree of economic freedom. All
countries participating in the analysis of this index are divided into the following groups (Index of Economic
Freedom): free - with an index of 80-100; mostly free - with an index of 70-79.9; moderately free - with an index
of 60-69.9; mostly unfree - with a rate of 50-59.9; despotic - with an index of 0-49.9. The correspondence of the
dynamics of growth of economic freedom characterizes the higher level of economic security.
The state and dynamics of this indicator by categories are analyzed, the results of the analysis are presented in
Table 1.
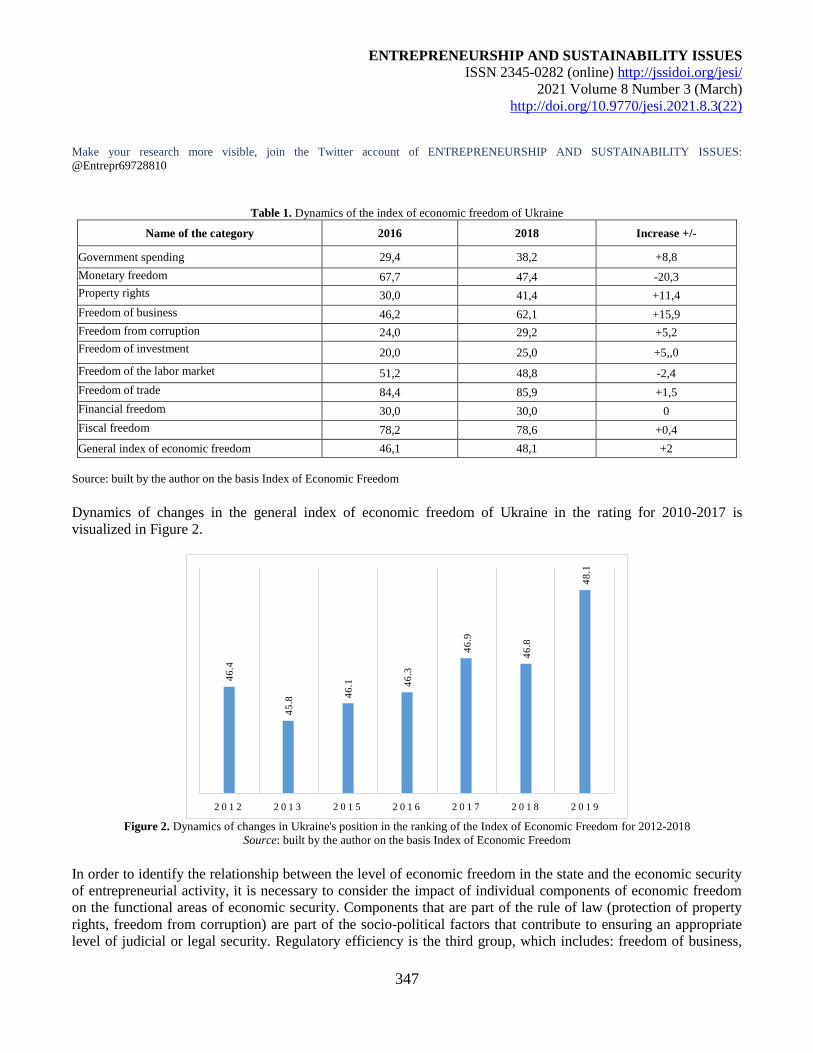
ENTREPRENEURSHIP AND SUSTAINABILITY ISSUES
ISSN 2345-0282 (online) http://jssidoi.org/jesi/
2021 Volume 8 Number 3 (March)
http://doi.org/10.9770/jesi.2021.8.3(22)
Make your research more visible, join the Twitter account of ENTREPRENEURSHIP AND SUSTAINABILITY ISSUES:
@Entrepr69728810
347
Table 1. Dynamics of the index of economic freedom of Ukraine
Name of the category 2016 2018 Increase +/-
Government spending 29,4 38,2 +8,8
Monetary freedom
67,7 47,4 -20,3
Property rights
30,0 41,4 +11,4
Freedom of business
46,2 62,1 +15,9
Freedom from corruption
24,0 29,2 +5,2
Freedom of investment
20,0 25,0 +5,,0
Freedom of the labor market
51,2 48,8 -2,4
Freedom of trade
84,4 85,9 +1,5
Financial freedom
30,0 30,0 0
Fiscal freedom
78,2 78,6 +0,4
General index of economic freedom 46,1 48,1 +2
Source: built by the author on the basis Index of Economic Freedom
Dynamics of changes in the general index of economic freedom of Ukraine in the rating for 2010-2017 is
visualized in Figure 2.
46.4
45.8
46.1 4
6.3
46.9
46.8
48.1
2 0 1 2 2 0 1 3 2 0 1 5 2 0 1 6 2 0 1 7 2 0 1 8 2 0 1 9
Figure 2. Dynamics of changes in Ukraine's position in the ranking of the Index of Economic Freedom for 2012-2018
Source: built by the author on the basis Index of Economic Freedom In order to identify the relationship between the level of economic freedom in the state and the economic security
of entrepreneurial activity, it is necessary to consider the impact of individual components of economic freedom
on the functional areas of economic security. Components that are part of the rule of law (protection of property
rights, freedom from corruption) are part of the socio-political factors that contribute to ensuring an appropriate
level of judicial or legal security. Regulatory efficiency is the third group, which includes: freedom of business,
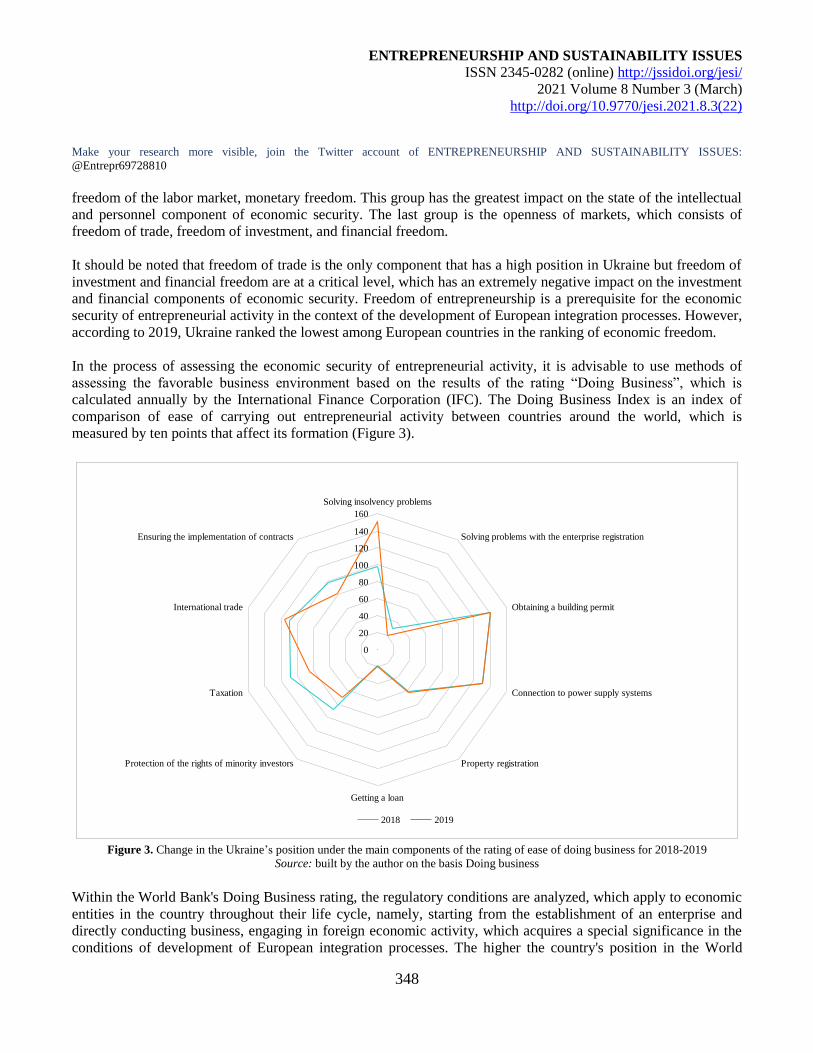
ENTREPRENEURSHIP AND SUSTAINABILITY ISSUES
ISSN 2345-0282 (online) http://jssidoi.org/jesi/
2021 Volume 8 Number 3 (March)
http://doi.org/10.9770/jesi.2021.8.3(22)
Make your research more visible, join the Twitter account of ENTREPRENEURSHIP AND SUSTAINABILITY ISSUES:
@Entrepr69728810
348
freedom of the labor market, monetary freedom. This group has the greatest impact on the state of the intellectual
and personnel component of economic security. The last group is the openness of markets, which consists of
freedom of trade, freedom of investment, and financial freedom.
It should be noted that freedom of trade is the only component that has a high position in Ukraine but freedom of
investment and financial freedom are at a critical level, which has an extremely negative impact on the investment
and financial components of economic security. Freedom of entrepreneurship is a prerequisite for the economic
security of entrepreneurial activity in the context of the development of European integration processes. However,
according to 2019, Ukraine ranked the lowest among European countries in the ranking of economic freedom.
In the process of assessing the economic security of entrepreneurial activity, it is advisable to use methods of
assessing the favorable business environment based on the results of the rating “Doing Business”, which is
calculated annually by the International Finance Corporation (IFC). The Doing Business Index is an index of
comparison of ease of carrying out entrepreneurial activity between countries around the world, which is
measured by ten points that affect its formation (Figure 3).
0
20
40
60
80
100
120
140
160
Solving insolvency problems
Solving problems with the enterprise registration
Obtaining a building permit
Connection to power supply systems
Property registration
Getting a loan
Protection of the rights of minority investors
Taxation
International trade
Ensuring the implementation of contracts
2018 2019
Figure 3. Change in the Ukraine’s position under the main components of the rating of ease of doing business for 2018-2019
Source: built by the author on the basis Doing business Within the World Bank's Doing Business rating, the regulatory conditions are analyzed, which apply to economic
entities in the country throughout their life cycle, namely, starting from the establishment of an enterprise and
directly conducting business, engaging in foreign economic activity, which acquires a special significance in the
conditions of development of European integration processes. The higher the country's position in the World
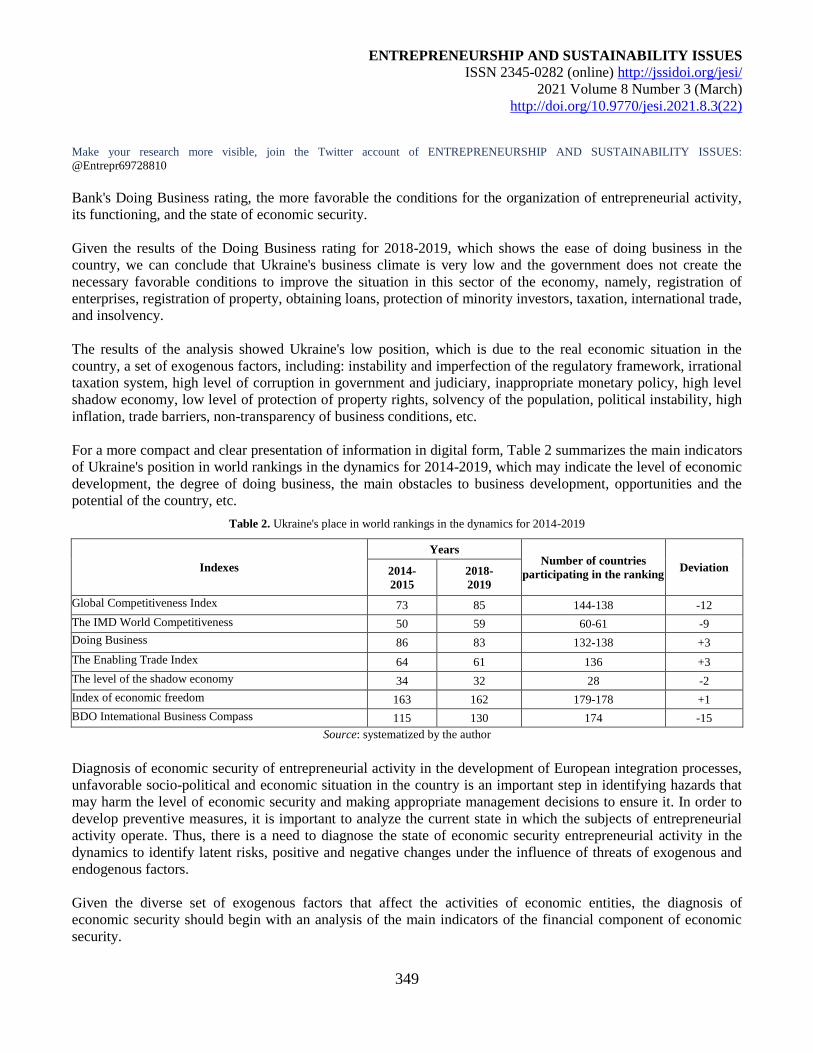
ENTREPRENEURSHIP AND SUSTAINABILITY ISSUES
ISSN 2345-0282 (online) http://jssidoi.org/jesi/
2021 Volume 8 Number 3 (March)
http://doi.org/10.9770/jesi.2021.8.3(22)
Make your research more visible, join the Twitter account of ENTREPRENEURSHIP AND SUSTAINABILITY ISSUES:
@Entrepr69728810
349
Bank's Doing Business rating, the more favorable the conditions for the organization of entrepreneurial activity,
its functioning, and the state of economic security.
Given the results of the Doing Business rating for 2018-2019, which shows the ease of doing business in the
country, we can conclude that Ukraine's business climate is very low and the government does not create the
necessary favorable conditions to improve the situation in this sector of the economy, namely, registration of
enterprises, registration of property, obtaining loans, protection of minority investors, taxation, international trade,
and insolvency.
The results of the analysis showed Ukraine's low position, which is due to the real economic situation in the
country, a set of exogenous factors, including: instability and imperfection of the regulatory framework, irrational
taxation system, high level of corruption in government and judiciary, inappropriate monetary policy, high level
shadow economy, low level of protection of property rights, solvency of the population, political instability, high
inflation, trade barriers, non-transparency of business conditions, etc.
For a more compact and clear presentation of information in digital form, Table 2 summarizes the main indicators
of Ukraine's position in world rankings in the dynamics for 2014-2019, which may indicate the level of economic
development, the degree of doing business, the main obstacles to business development, opportunities and the
potential of the country, etc.
Table 2. Ukraine's place in world rankings in the dynamics for 2014-2019
Indexes
Years Number of countries
participating in the ranking Deviation 2014-
2015
2018-
2019
Global Competitiveness Index 73 85 144-138 -12
The IMD World Competitiveness 50 59 60-61 -9
Doing Business 86 83 132-138 +3
The Enabling Trade Index 64 61 136 +3
The level of the shadow economy 34 32 28 -2
Index of economic freedom 163 162 179-178 +1
BDO Intemational Business Compass 115 130 174 -15
Source: systematized by the author
Diagnosis of economic security of entrepreneurial activity in the development of European integration processes,
unfavorable socio-political and economic situation in the country is an important step in identifying hazards that
may harm the level of economic security and making appropriate management decisions to ensure it. In order to
develop preventive measures, it is important to analyze the current state in which the subjects of entrepreneurial
activity operate. Thus, there is a need to diagnose the state of economic security entrepreneurial activity in the
dynamics to identify latent risks, positive and negative changes under the influence of threats of exogenous and
endogenous factors.
Given the diverse set of exogenous factors that affect the activities of economic entities, the diagnosis of
economic security should begin with an analysis of the main indicators of the financial component of economic
security.
ENTREPRENEURSHIP AND SUSTAINABILITY ISSUES
ISSN 2345-0282 (online) http://jssidoi.org/jesi/
2021 Volume 8 Number 3 (March)
http://doi.org/10.9770/jesi.2021.8.3(22)
Make your research more visible, join the Twitter account of ENTREPRENEURSHIP AND SUSTAINABILITY ISSUES:
@Entrepr69728810
350
In the absence of profit or loss, it cannot be said that the subject of entrepreneurial activity is in economic
security. To ensure economic security of entrepreneurial activity in the conditions of constant intensification of
competition, it is necessary to reliably assess and monitor the dynamics of the financial condition.
The shadowing of the economy is one of the main threats to both the economic security of the state and the
economic security of entrepreneurial activity. The shadow economy is one of the important destabilizing external
factors that affect the state of economic security entrepreneurial activity. The shadow economy is an unregistered
economic activity of an economic entity, which is characterized by minimization of costs for the production of
goods, works and services, tax evasion, fees (mandatory payments), statistical questionnaires and statistical
reporting, the result of which is a violation of statutory norms (the level of the minimum wage, working hours,
working conditions and safety, etc).
In developed countries, the optimal structure of the economy is achieved through a rational combination of large,
medium, and small enterprises. The patterns of the scientific and technological revolution and the problem of
employment of the population reinforce the economic necessity of coexistence and interaction of enterprises of
different sizes. The Western economy relies on large companies that provide it with stability and manageability,
as well as small and medium enterprises, which form a competitive environment that provides flexibility and
dynamism of the economy, individualization of production and services, high employment. Moreover, a
significant proportion of small and medium-sized enterprises exist with and for large companies, and the
sustainability of the situation, income, financial and investment opportunities of small firms directly depend on
their relationship with big business.
The experience of development of Western countries shows that the successful functioning of the market
mechanism requires an appropriate system of property rights, laws and regulations that ensure their transfer, legal
institutions, and decision-making mechanisms. Excessive government intervention leads to deformation of market
processes and falling production efficiency. However, deregulation without economic order, the formation of
effective socio-economic mechanisms, and strict control can turn into economic anarchy. A well-balanced policy
is needed on this issue.
The above-mentioned business management practice in the EU, USA and Japan and PRC indicates the need to
regulate a special set of business management tools in the country. The concept of business management in these
countries is based on the objective idea that entrepreneurial activity is the foundation and guarantor of the state
economy, so management based on state support for entrepreneurship means supporting the economy of the state
itself. However, state aid to entrepreneurship alone is not considered to be a full-fledged business management.
An important stage in the evolution of business management in Ukraine should be the deregulation of business
following the example of developed countries such as the USA and Japan. At the same time, given the fact that
Ukraine pursues the ambitious goal of EU membership, such deregulation should not contradict EU law, to which
Ukrainian legislation is approaching in the process of adaptation.
5. Discussion
Today in Ukraine there is a wide process of business deregulation through the adoption of relevant deregulatory
regulations. At the same time, experts note that despite the government's declaration of reforms to stimulate
business, entrepreneurs are still forced to work under excessive state pressure. Parliament passes laws aimed at
deregulating business but, in practice, these rules either do not change the situation fundamentally or are simply
ENTREPRENEURSHIP AND SUSTAINABILITY ISSUES
ISSN 2345-0282 (online) http://jssidoi.org/jesi/
2021 Volume 8 Number 3 (March)
http://doi.org/10.9770/jesi.2021.8.3(22)
Make your research more visible, join the Twitter account of ENTREPRENEURSHIP AND SUSTAINABILITY ISSUES:
@Entrepr69728810
351
sabotaged by officials. It is necessary to agree with such position as the deregulation which occurs in our state is
not always such as it is registered in the corresponding regulations.
Thus, we believe that enterprises in Ukraine need more freedom, and such freedom should really be the ability of
enterprises to act in accordance with their economic interests and goals, based on the knowledge of objective
business needs. However, of course, such freedom should not be arbitrary and violate legitimate public and state
interests. To balance entrepreneurial freedom and the interests of society and the state, it must be regulated and
put into practice.
Legal economic order. According to Art. 5 of the Commercial Code of Ukraine (CC of Ukraine), such an order in
Ukraine is formed on the basis of optimal combination of market self-regulation of economic relations and
economic regulation of macroeconomic processes, based on the constitutional requirement of state responsibility
for its activities and definition of Ukraine as a sovereign and independent, democratic, social, and legal state.
It should also be noted that we have already emphasized above the fact that in Ukraine an excessive number of
authorized bodies are involved in the entrepreneurial activity management. Therefore, given that the system of
bodies engaged in special administrative entrepreneurial activity management in Ukraine is characterized as
overloaded with a significant number of bodies (this, of course, negatively affects the investment climate of our
country, the attractiveness of doing business for citizens and residents, as well as causes an increase in
corruption), the authors propose to take as a model the US system (there is the principle of the market, in which a
number of issues are not controlled by entrepreneurs but by the customers of this entrepreneur; the number of
special bodies is minimized) or Japan (as in the United States - there are regulatory authorities but in fact there are
several authorities - antitrust, fiscal, securities and stock market authorities, a special authority).
Based on this, the authors consider it appropriate to create a special body (or reorganize, provide the following
functions of the State Regulatory Service of Ukraine) and eliminate (with the subsequent transfer of powers of
such bodies to the special) the following authorities: National Commission for State Regulation of Financial
Services Markets; State Sanitary and Epidemiological Service of Ukraine; State Ecological Inspectorate of
Ukraine; State Service of Ukraine for Medicines and Drug Control; State Veterinary and Phytosanitary Service of
Ukraine; State Inspectorate of Ukraine for Consumer Protection. The functions performed by these bodies (based
on the experience of economically developed countries that have achieved economic success, in part by fighting
bureaucracy) may be performed by one body, to which inspectors on all these special issues will be recruited on
the basis of a public competition on the principle: 2 inspectors on the indicated issues work in the district and the
city (also in the city districts); 8 inspectors - in the region; 1 chief inspector and two deputies - work at the central
level.
Thus, the authors conclude that the legal economic order in our country is sufficiently regulated but it should be
provided with more liberalized instruments and those that will best meet global trends in entrepreneurial activity
management. To do this, our state should borrow the experience of the United States and Japan and introduce
their models to encourage entrepreneurship. The American model is based on a system of comprehensive
encouragement of entrepreneurship, which contributes to the enrichment of the most active part of the population.
An acceptable standard of living for low-income groups and the regulation of other economic issues are ensured
through the redistribution of part of national income and tax functions. The Japanese model is characterized by
the leading influence of the state on the main directions of economic development. Various production
ENTREPRENEURSHIP AND SUSTAINABILITY ISSUES
ISSN 2345-0282 (online) http://jssidoi.org/jesi/
2021 Volume 8 Number 3 (March)
http://doi.org/10.9770/jesi.2021.8.3(22)
Make your research more visible, join the Twitter account of ENTREPRENEURSHIP AND SUSTAINABILITY ISSUES:
@Entrepr69728810
352
corporations and associations take on the solution of social problems. At the same time, the participation of
employees in production management is encouraged.
At the same time, to adopt the experience of Japan, the state authorities of Ukraine should:
a) create conditions for providing easily accessible financial funds for starting a small business;
b) review the system of small business taxation (in general, the main areas of state support that allow to realize the
potential effect of business development include: the formation of a favorable business climate; removal of legal,
administrative, and organizational barriers; expanding access to small and medium enterprises to financial
resources, development of leasing of equipment and technologies, systematic development of infrastructure for
providing small and medium enterprises with integrated financial, material, informational, consulting, and
organizational and methodological assistance);
c) to strengthen the connection between the creation of small and medium enterprises with academic knowledge,
higher education institutions through the establishment of academic incubators and pre-incubators.
d) provide the possibility of continuing education for entrepreneurs (consultations, seminars, trainings, second
education, training courses and retraining).
In addition, we consider it necessary to develop and adopt a legislative act entitled “Fundamentals of
entrepreneurial activity management in Ukraine” in the process of formation of modern administrative and legal
regulation of entrepreneurial activity management in Ukraine.
Within the framework of such a normative legal act, a set of general rules and standards of entrepreneurial activity
management in our state should be regulated, namely: concepts and objects, subjects (their powers) of the
entrepreneurial activity management; basic legal, economic, social, environmental, humanitarian and
organizational and legal principles of entrepreneurial activity management in Ukraine; control over the
performance of functions of entrepreneurial activity management; liability for violation of legislation on
entrepreneurial activity management.
It should also be noted that the regulations on entrepreneurial activity in Ukraine are characterized by the gradual
democratization of the regulation of such activities, which is caused, first of all, by the deeper integration of our
country into the European Union. However, despite the fact that certain norms of Ukrainian legislation are even
more flexible than similar ones in the EU member states, due to many objective and subjective factors, the legal
norms on entrepreneurship in Ukraine cannot yet correspond to European ones in terms of perfection and
efficiency.
The imperfection of the Ukrainian legislation regulating entrepreneurial activity is deepened by a number of
factors: first, the lack of legally defined concepts of “economic capacity”, “economic capacity”, “economic legal
personality”; secondly, the unregulated economic commercial activity of a private enterprise and the very nature
of such an enterprise; thirdly, the lack of normative regulation of entrepreneurial activity of persons belonging to
“free professions”, which indicates the need to develop and adopt a law of Ukraine “On free professions”, which
would regulate, inter alia, the issues of legal status and economic legal personality of individuals that belong to
the category of “free professions”; fourth, limited forms of investment in the Ukrainian economy.
ENTREPRENEURSHIP AND SUSTAINABILITY ISSUES
ISSN 2345-0282 (online) http://jssidoi.org/jesi/
2021 Volume 8 Number 3 (March)
http://doi.org/10.9770/jesi.2021.8.3(22)
Make your research more visible, join the Twitter account of ENTREPRENEURSHIP AND SUSTAINABILITY ISSUES:
@Entrepr69728810
353
Conclusions
Based on the research, it can be concluded that the rapid development of entrepreneurial activity in Ukraine,
increasing business risks and reducing the security of entrepreneurial activity related to Ukraine's European
integration processes requires the formation of scientifically sound approaches to early prevention of latent threats
and timely response to identified dangers of entrepreneurial activity in the context of European integration. The
state and prospects of development and conditions of entrepreneurial activity in Ukraine in terms of European
integration are analyzed in the paper based on a study of Ukraine's position in international rankings and world
statistics, which are compiled by international organizations and institutions and reveal various aspects of
economic processes in the country.
According to the analysis of Ukraine's place in international rankings, it is determined that Ukraine's position is
currently unsatisfactory, and the conditions for entrepreneurial activity in Ukraine are extremely dangerous:
unstable tax legislation, significant corruption pressure and currency restrictions, lack of significant achievements
in ensuring investment attractiveness and ensuring the national competitiveness, the state support for the
development of entrepreneurial activity is insufficient and unfocused; limited opportunities to finance state
programs for entrepreneurial activity development.
In conclusion, the practice of business management in the EU, the USA, Japan, and the PRC indicates the need to
regulate a special set of business management tools in Ukraine. Following the example of these states, the concept
of business management should be developed and implemented in Ukraine, which is based on the objective truth
that entrepreneurial activity is the foundation and guarantor of the state economy, so management based on state
support of entrepreneurship means supporting the state's economy.
In addition, it is objectively appropriate to develop and adopt a new version of the Law of Ukraine “On
Development and State Support of Small and Medium Enterprises in Ukraine” in the form of the Law “On
Encouragement of Small and Medium Enterprises in Ukraine”. In order to standardize and achieve fair
entrepreneurial activity management in Ukraine, it is recommended to develop and create a special legislative act
“Principles of entrepreneurial activity management in Ukraine”.
References
Carayannis, E. G., Meissner, D., & Edelkina, A. (2017). Targeted innovation policy and practice intelligence (TIP2E): concepts and
implications for theory, policy and practice. The Journal of Technology Transfer, 42(3), 460-484. Available at:
https://link.springer.com/article/10.1007/s10961-015-9433-8
Chehabeddine, M., & Tvaronavičienė, M. (2020). Securing regional development. Insights into Regional Development, 2(1), 430-442.
http://doi.org/10.9770/IRD.2020.2.1(3)
Díez-Martín, F., Blanco-González, A., & Prado-Román, C. (2016). Explaining nation-wide differences in entrepreneurial activity: A
legitimacy perspective. International Entrepreneurship and Management Journal, 12(4), 1079-1102. Available at:
https://link.springer.com/article/10.1007/s11365-015-0381-4
Doing business. Available at: http://www.doingbusiness.org/data/exploreeconomies/ukraine
ENTREPRENEURSHIP AND SUSTAINABILITY ISSUES
ISSN 2345-0282 (online) http://jssidoi.org/jesi/
2021 Volume 8 Number 3 (March)
http://doi.org/10.9770/jesi.2021.8.3(22)
Make your research more visible, join the Twitter account of ENTREPRENEURSHIP AND SUSTAINABILITY ISSUES:
@Entrepr69728810
354
Fagerberg, J. (2017). Innovation policy: Rationales, lessons and challenges. Journal of Economic Surveys, 31(2), 497-512. Available at:
https://onlinelibrary.wiley.com/doi/abs/10.1111/joes.12164
Flanagan, K., & Uyarra, E. (2016). Four dangers in innovation policy studies–and how to avoid them. Industry and Innovation, 23(2), 177-
188. Available at: https://www.tandfonline.com/doi/abs/10.1080/13662716.2016.1146126
Global Peace Index. Available at: http://visionofhumanity.org
Index of Economic Freedom. Available at: http://www.heritage.org/index/ranking
Ingram Bogusz, C., Teigland, R., & Vaast, E. (2019). Designed entrepreneurial legitimacy: the case of a Swedish crowdfunding platform.
European Journal of Information Systems, 28(3), 318-335. Available at:
https://orsociety.tandfonline.com/doi/full/10.1080/0960085X.2018.1534039
Kacperczyk, A., & Younkin, P. (2017). The paradox of breadth: The tension between experience and legitimacy in the transition to
entrepreneurship. Administrative Science Quarterly, 62(4), 731-764. Available at:
https://journals.sagepub.com/doi/abs/10.1177/0001839217700352
Kibler, E., Salmivaara, V., Stenholm, P., & Terjesen, S. (2018). The evaluative legitimacy of social entrepreneurship in capitalist welfare
systems. Journal of World Business, 53(6), 944-957. https://doi.org/10.1016/j.jwb.2018.08.002
Kuhlmann, S., & Rip, A. (2018). Next-generation innovation policy and grand challenges. Science and public policy, 45(4), 448-454.
Available at: https://academic.oup.com/spp/article-abstract/45/4/448/4915392
Mazzanti, M., Mazzarano, M., Pronti, A., & Quatrosi, M. (2020). Fiscal policies, public investments and wellbeing: mapping the evolution
of the EU. Insights into Regional Development, 2(4), 725-749. http://doi.org/10.9770/IRD.2020.2.4(1)
McKenny, A. F., Allison, T. H., Ketchen Jr, D. J., Short, J. C., & Ireland, R. D. (2017). How should crowdfunding research evolve? A
survey of the entrepreneurship theory and practice editorial board. Entrepreneurship Theory and Practice, 41(2), 291-304. Available at:
https://journals.sagepub.com/doi/abs/10.1111/etap.12269
On approval of the Procedure for state accreditation of institutions conducting training, retraining and advanced training of drivers of
vehicles, and certification of their specialists (2009). Available at: https://zakon.rada.gov.ua/laws/show/490-2009-п#Text
On the foundations of national security of Ukraine (2003). Available at: https://zakon.rada.gov.ua/laws/show/964-15#Text
Schot, J., & Steinmueller, W. E. (2018). Three frames for innovation policy: R&D, systems of innovation and transformative change.
Research Policy, 47(9), 1554-1567. Available at: https://www.sciencedirect.com/science/article/pii/S0048733318301987
The Commercial Code of Ukraine (2003). Available at: https://zakon.rada.gov.ua/laws/show/436-15?lang=en#Text
Vasconcelos, V.V. (2021). Social justice and sustainable regional development: reflections on discourse and practice in public policies and
public budget. Insights into Regional Development, 3(1), 10-28. https://doi.org/10.9770/IRD.2021.3.1(1)
ENTREPRENEURSHIP AND SUSTAINABILITY ISSUES
ISSN 2345-0282 (online) http://jssidoi.org/jesi/
2021 Volume 8 Number 3 (March)
http://doi.org/10.9770/jesi.2021.8.3(22)
Make your research more visible, join the Twitter account of ENTREPRENEURSHIP AND SUSTAINABILITY ISSUES:
@Entrepr69728810
355
Olha BEZPALOVA, Doctor of Jurisprudence, Professor, Kharkiv National University of Internal Affairs
ORCID ID: orcid.org/0000-0003-2886-695X
Maryna YUNINA, Candidate of Legal Sciences, Associate Professor, Dnipropetrovsk State University of Internal Affairs
ORCID ID: orcid.org/0000-0003-0311-4591
Svitlana KOROHOD, Lecturer, Dnipropetrovsk State University of Internal Affairs
ORCID ID: orcid.org/https://orcid.org/0000-0003-0210-1772
Kristina REZVOROVICH, PhD in Law, Dnipropetrovsk State University of Internal Affairs
ORCID ID: orcid.org/0000-0003-1183-613Х
Tsahik OHANISIAN, Candidate of Law, Dnipropetrovsk State University of Internal Affairs
ORCID ID: orcid.org/0000-0001-9329-5378
Copyright © 2021 by author(s) and VsI Entrepreneurship and Sustainability Center
This work is licensed under the Creative Commons Attribution International License (CC BY).
http://creativecommons.org/licenses/by/4.0/
ENTREPRENEURSHIP AND SUSTAINABILITY ISSUES
ISSN 2345-0282 (online) http://jssidoi.org/jesi/
2021 Volume 8 Number 3 (March)
http://doi.org/10.9770/jesi.2021.8.3(23)
Publisher http://jssidoi.org/esc/home
356
THE EFFECTIVENESS OF FUNDS SPENT ON THE CAMPAIGN WITH REGARD TO THE RESULTS
OF THE ELECTIONS IN THE SLOVAK REPUBLIC*
Marcel Lincényi ¹, Jaroslav Čársky ²
1,2Alexander Dubček university of Trenčin, Študentská 1639/2, 911 01 Trenčín, Slovakia
E-mails: 1 [email protected]; 2 [email protected]
Received 20 February 2020; accepted 10 December 2020; published 30 March 2021
Abstract The research study thematically focuses on the effectiveness of financing selected campaigns of political parties in elections to
the National Council of the Slovak Republic. The authors examined the relationship between the funds spent by selected political entities
on the election campaign with regard to the final ranking in the electionsThe analysis confirmed a new trend of declining financial
resources spent in the election campaign since the parliamentary elections in 2020, which occurred after the validity of legislation that
limits the amount of money spent on the campaign in the Slovak Republic. The research also showed that the leaders and managers of
political parties have not yet begun to focus on the effectiveness of the funds spent on the campaign, as they have to spend twice as much
money on 1% of the election profits as two years ago. The authors recommend for campaign organizers use of the latest marketing methods
and techniques to be able to more effectively convince potential voters in an increasingly challenging election campaign.
Keywords: political party; finance; campaign; economics; Slovak Republic
Reference to this paper should be made as follows: Lincényi, M., Čársky, J. 2021. The effectiveness of funds spent on the campaign with
regard to the results of the elections in the Slovak Republic. Entrepreneurship and Sustainability Issues, 8(3), 356-366.
http://doi.org/10.9770/jesi.2021.8.3(23)
JEL Classifications: F50, F68, Z11
Additional disciplines: General, Policy, Economics of the Arts and Literature
* This research was carried out in the framework of the project KEGA 003TnUAD-4/2018: Innovation of methodological
letters for teachers of civic education from the point of view of prevention of manifestations of extremism and education for
democratic citizenship
ENTREPRENEURSHIP AND SUSTAINABILITY ISSUES
ISSN 2345-0282 (online) http://jssidoi.org/jesi/
2021 Volume 8 Number 3 (March)
http://doi.org/10.9770/jesi.2021.8.3(23)
Make your research more visible, join the Twitter account of ENTREPRENEURSHIP AND SUSTAINABILITY ISSUES:
@Entrepr69728810
357
1. Introduction
“Election campaigns aim to reinforce or change people´s voting behaviour. Pressure groups use campaigns to
alert the public to a particular issue, to influence the public´s opinion on that issue, and to mobilize support and
pressurize those in power to take some desired action. Access to the mass media is often crucial for a pressure
group´s successful campaign" (Watson, J. Hill, A. 2006: 34). The election campaign in Slovakia is specifically
regulated by Act 181/2014 Coll. on the election campaign and the amendment of Act no. 85/2005 Coll. on
political parties and political movements, as amended. This law characterizes an election campaign as any activity
of a political party, political movement, a coalition of political parties and political movements, candidates and
third parties under § 8, for which remuneration is usually paid to promote their activities, goals and program to
obtain the elected office according to a special regulation (Act No. 85/2005 Coll.).
Majority authors agree with the statement that in the current era, full of competition and instability in demand, it
is much more important to use modern strategies. The election campaign has certain rules or criteria, which
follow from the law, regarding the duration of the campaign itself. The election campaign begins on the day of the
publication of the decision to declare elections in the Collection of Laws of the Slovak Republic (hereinafter
referred to as the “declaration of elections”) and ends 48 hours before the day of the elections. (Act No. 85/2005
Coll.) The election campaign has limitations not only in terms of duration but also in terms of funding. This
restriction is also based on Act no. 181/2014 Coll., Specifically from § 3. A political party and a political
movement (hereinafter referred to as a "political party") may spend a maximum of EUR 3,000,000, including
value-added tax, on its election campaign in the elections to the National Council of the Slovak Republic and the
elections to the European Parliament. The limit of the political party's costs under the first sentence shall also
include the difference between the price of the gift or other gratuitous performance specified in the contract and
the usual price and the political party's promotion costs incurred 180 days before the election day. In particular,
however, this Act regulates the conditions for the election of the President of the Slovak Republic, the election of
local authorities or the election of mayors and mayors, or deputies of the city council.
2. Theoretical background
According to Lincényi and Fabuš, the election campaign also influences the public through the media. (Lincényi,
2015). There are many theoretical approaches to defining an election campaign. It is necessary to realize that just
as many phenomena from social life went through development, so the election campaign itself went through
certain stages. The stage of the premodern campaign can be included in the period of the end of the 19th century,
which is associated with the granting of universal suffrage, the development of civil rights and the arrival of mass
political parties. Today, this stage is characteristic of second-category elections such as municipal elections. The
leader is surrounded by a small group of advisers, with the party press or local press playing an important role (in
the case of municipal elections). In the early 1950s, nationwide television broadcasting was created, and so the
premodern campaigns changed to modern campaigns. Modern campaigns have been professionalized and
centralized. An important aspect of the campaign is also the use of marketing. According to Smaliukien and
Monni (2019), social marketing comes to the fore. According to several authors, it is important to follow current
trends in political marketing in order to increase the number of supporters (Brosius et al. 2020) (Geurkink et al.
2020) According to several authors, technology innovation is essential (Ignatavičius et. al. 2015) Of course, this
also applies to election campaigns, where technology is no longer necessary.
ENTREPRENEURSHIP AND SUSTAINABILITY ISSUES
ISSN 2345-0282 (online) http://jssidoi.org/jesi/
2021 Volume 8 Number 3 (March)
http://doi.org/10.9770/jesi.2021.8.3(23)
Make your research more visible, join the Twitter account of ENTREPRENEURSHIP AND SUSTAINABILITY ISSUES:
@Entrepr69728810
358
The period of modern campaigns could also be called the period of media campaigns because they are worked out
exclusively by experts in political communication, survey analysts, marketers and managers. Participation of
ordinary people, volunteers or common party members is disappearing here. During this period, it was very
important that everything the leader says and does looks good on the screens and thus has the greatest possible
effect in terms of gaining public confidence. The last period is the period of the postmodern campaign and dates
back to the early 90s of the 20th century. During this period, politicians are partially returning to the premodern
management of the campaign. It is a kind of mix of two previous periods with the addition of new knowledge.
Politicians are again partially managing the campaign, on the other hand, they are using the services of marketing
experts or communication consultants. A novelty that is crucial for this period is the Internet, or social networks,
which can be understood as the current attractiveness of the global reach. (Rybanská, Košičiarová, Nagyová,
2015). Political communication is shifting to social networks as part of the election campaign. The most popular
social networks for communication about politics include Facebook, Twitter or Instagram, especially social media
are increasingly used for sharing content, ideas, opinions, experiences and are basically an extension of the web
They are important participants who conceive and interpret political events in the world (Bulanda, Vavrečka,
2019). The digital world has caused many changes in the field of marketing communication which affects almost
all areas of our lives, including political (Světlík, Bulanda, 2019). Political leaders are thus closer to their
constituents. They talk to them on a daily basis through statuses or comments. “The Internet and social networks
have made it possible to spread information on an unprecedented scale and faster than ever before. Having a
profile on a social network is a membership in an interconnected globalized society, so we can be in touch with
anyone and have information from anywhere in the world. Also, creating content on social networks and video
sharing portals is becoming easier and more accessible to the masses.” (Laczko, 2020:105) However, current
postmodern political campaigns also have their downsides. Today, it is very easy to involve unclean means such
as misinformation, hoaxes or conspiracies in the campaigns, which are reached especially by populist and
extremist political parties. The vast majority of misinformation is currently concentrated and disseminated by
cyberspace, the Internet and social networks. The reasons are logical. Social networks mean low information
dissemination costs, different target groups, global reach and unprecedented speed of information flow (Laczko,
2019; Lincényi, Laczko, 2020). In connection with the campaign, Fabuš (2015) emphasizes the need for cost-
effectiveness.
3. Research objective and methodology
The main goal of the presented research was to analyze the relationship between the funds spent in the political
campaign and the results of the elections to the National Council of the Slovak Republic.
The secondary goal of the research was to find out whether the amount of money spent affects the result of
political parties in elections.
As part of research planning and design, we preferred the concept of creating research questions to identifying
research problems. We have identified the following 2 research questions (SRQ) and another 2 secondary research
questions (SRQ):
RQ1: What are the development tendencies of the volume of spent financial resources of political parties in
the election campaign in the Slovak Republic?
Explanation RQ1: We assume that in the Slovak Republic since the parliamentary elections in 2020, there has
been a decrease in the volume of financial resources spent by political parties on the election campaign. The
reason is the amendment to Act 181/2014 on the election campaign of 2019, which since 2020 introduced a
ENTREPRENEURSHIP AND SUSTAINABILITY ISSUES
ISSN 2345-0282 (online) http://jssidoi.org/jesi/
2021 Volume 8 Number 3 (March)
http://doi.org/10.9770/jesi.2021.8.3(23)
Make your research more visible, join the Twitter account of ENTREPRENEURSHIP AND SUSTAINABILITY ISSUES:
@Entrepr69728810
359
maximum permitted limit for the election campaign of EUR 3 million per candidate subject or the abolition of
third party support in the political campain.†
SRQ1: How much financial resources did the political parties spend on the election campaign for the selected
parliamentary elections in the Slovak Republic?
Explanation SRQ1: Information on the funds used in the elections will be drawn from the final reports of political
parties, which are published by law on the website of the Ministry of the Interior of the Slovak Republic.
RQ2: What was the relationship between the money spent and the results of the parliamentary elections?
Explanation RQ2: We think that it is possible to observe increased effectiveness of the financial resources spent
in the campaign concerning the results of political parties in the parliamentary elections in the Slovak Republic.
We assume that leaders and managers of political entities are aware that the amount of financial resources spent
by a political party is not equal to electoral success and it is necessary to focus on the effectiveness of financial
resources spent. We believe that campaign organizers will use new marketing methods and techniques to be better
able to convince potential voters in such a challenging battle and competition. In order to confirm this statement,
we need to analyze the relationship between these two variables.
SRQ2: What electoral success did the political parties achieve in the monitored elections to the National Council
of the Slovak Republic?
Explanation SRQ2: To analyze the relationship between the money spent and the election results, we need to
further parse how each political party turned out in the elections. We will draw the election results of individual
political parties from the website of the Statistical Office of the Slovak Republic.
4. Results and discussion
In the research, we analyzed the relationship between the funds spent and the results of the parliamentary
elections. The authors intended to analyze all parliamentary elections since the establishment of the Slovak
Republic in 1993: the elections in 1994, 1998, 2002, 2006, 2010, 2012, 2016 and 2020. It should be noted,
however, that political parties have been obliged to publish the number of resources spent on the campaign only
since the 2012 parliamentary electionsFrom the above, we were forced to limit the research set to 2012, 2016 and
2020 elections.
Analysis of elections to the National Council of the Slovak Republic in 2012
Early elections to the National Council of the Slovak Republic in 2012 took place on March 10, 2012. A total of
26 political entities ran in the elections, which was 8 more than in the previous elections in 2010. Of the 28
political parties running, 6 parties entered parliament. In the parliamentary elections in 2012, the clear winner was
the Smer - SD party with a gain of 44.42%. However, it should be noted here that the Smer-SD party used EUR
3.3 million in the election campaign, thus using the most funds for the election campaign. Immediately behind
her, as far as the funds spent are concerned, was the SDKÚ - DS party. However, we can observe that although
almost 2.2 million euros were spent on the campaign, the party gained only 6.09%. The Slovak National Party
(SNS) invested just over 1.2 million euros in the campaign, yet it failed to overcome the necessary electoral
quorum to enter parliament. The SaS political party spent almost 1.2 million euros on the political campaign, so
† ACT of 29 May 2014 on the election campaign and the amendment of Act no. 85/2005 Coll. on political parties and
political movements, as amended. Amendment: 501/2019 Coll.
ENTREPRENEURSHIP AND SUSTAINABILITY ISSUES
ISSN 2345-0282 (online) http://jssidoi.org/jesi/
2021 Volume 8 Number 3 (March)
http://doi.org/10.9770/jesi.2021.8.3(23)
Make your research more visible, join the Twitter account of ENTREPRENEURSHIP AND SUSTAINABILITY ISSUES:
@Entrepr69728810
360
almost one million euros less than the SDKÚ - DS party, nevertheless had a similar election result. The political
party MOST - HÍD invested 1.1 million euros in the political campaign with an election result of almost 7%. The
last party analyzed is KDH, which invested 1 million euros in the campaign, while the electoral success overtook
the parties that invested more funds in the campaign (more in Table 1).
Table 1. Results of the 2012 parliamentary elections
Order of
success in
elections
Political party The result of the
election (%)
Budget (eur)
1 Smer - SD 44,41 3.309.656,59
2 KDH 8,82 1.054.523
3 OľaNO 8,55 500.399
4 MOST - HÍD 6,89 1.144.588,20
5 SDKÚ - DS 6,09 2.152.913,10
6 SaS 5,88 1.189.287,15
7 SNS 4,55 1.212.971
Source: Own processing based on publicly available data
Analysis of elections to the National Council of the Slovak Republic in 2016
Elections to the National Council of the Slovak Republic in 2016 took place on March 5, 2016. A total of 23
political entities ran in the elections. Of the 23 political parties running, 8 parties entered parliament. Also in
2016, the winner was again the Smer - SD party, which spent almost 3 million euros on the election campaign. In
second place is the two-party coalition OĽaNO - NOVA, which invested 2.4 million euros in the election
campaign with a gain of 11% of the vote. In third place is the MOST-HÍD party, which has spent a similar amount
of money as the OĽANO-NOVA two-party coalition, but with an election result almost half as low. The Sieť
party invested 2.1 million euros in the election campaign. The electoral quorum exceeded by only a few thousand
votes. On the contrary, the KDH movement spent 1.5 million euros on the campaign but failed to reach the
electoral quorum to get into parliament. The Slovak National Party (SNS) won almost 9% of the vote in the
elections, spending 1.3 million euros on the campaign. SMK invested 600,000 euros in the campaign but won
only 4% in the election, so it failed to get into parliament. The opposite example is the SaS party, which invested
only 400,000 euros in the campaign, with an election result of 12%. Sme rodina movement spent similar funds,
with almost half the success of the SaS party. According to the final reports of the political parties, which are
submitted to the Ministry of the Interior of the Slovak Republic, the ĽSNS party spent only 1,000 euros on the
campaign. Despite almost no financial budget, this political party managed to win 8% in the elections (more in
Table 2).
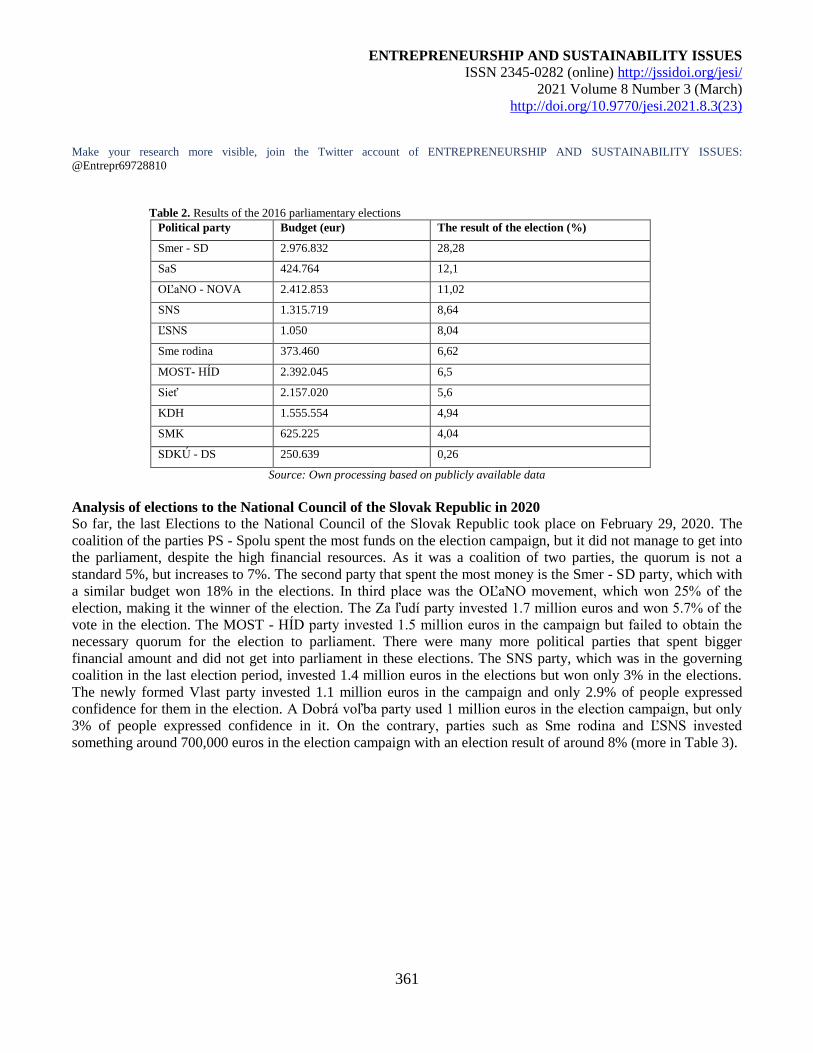
ENTREPRENEURSHIP AND SUSTAINABILITY ISSUES
ISSN 2345-0282 (online) http://jssidoi.org/jesi/
2021 Volume 8 Number 3 (March)
http://doi.org/10.9770/jesi.2021.8.3(23)
Make your research more visible, join the Twitter account of ENTREPRENEURSHIP AND SUSTAINABILITY ISSUES:
@Entrepr69728810
361
Table 2. Results of the 2016 parliamentary elections
Political party Budget (eur) The result of the election (%)
Smer - SD 2.976.832 28,28
SaS 424.764 12,1
OĽaNO - NOVA 2.412.853 11,02
SNS 1.315.719 8,64
ĽSNS 1.050 8,04
Sme rodina 373.460 6,62
MOST- HÍD 2.392.045 6,5
Sieť 2.157.020 5,6
KDH 1.555.554 4,94
SMK 625.225 4,04
SDKÚ - DS 250.639 0,26
Source: Own processing based on publicly available data
Analysis of elections to the National Council of the Slovak Republic in 2020
So far, the last Elections to the National Council of the Slovak Republic took place on February 29, 2020. The
coalition of the parties PS - Spolu spent the most funds on the election campaign, but it did not manage to get into
the parliament, despite the high financial resources. As it was a coalition of two parties, the quorum is not a
standard 5%, but increases to 7%. The second party that spent the most money is the Smer - SD party, which with
a similar budget won 18% in the elections. In third place was the OĽaNO movement, which won 25% of the
election, making it the winner of the election. The Za ľudí party invested 1.7 million euros and won 5.7% of the
vote in the election. The MOST - HÍD party invested 1.5 million euros in the campaign but failed to obtain the
necessary quorum for the election to parliament. There were many more political parties that spent bigger
financial amount and did not get into parliament in these elections. The SNS party, which was in the governing
coalition in the last election period, invested 1.4 million euros in the elections but won only 3% in the elections.
The newly formed Vlast party invested 1.1 million euros in the campaign and only 2.9% of people expressed
confidence for them in the election. A Dobrá voľba party used 1 million euros in the election campaign, but only
3% of people expressed confidence in it. On the contrary, parties such as Sme rodina and ĽSNS invested
something around 700,000 euros in the election campaign with an election result of around 8% (more in Table 3).
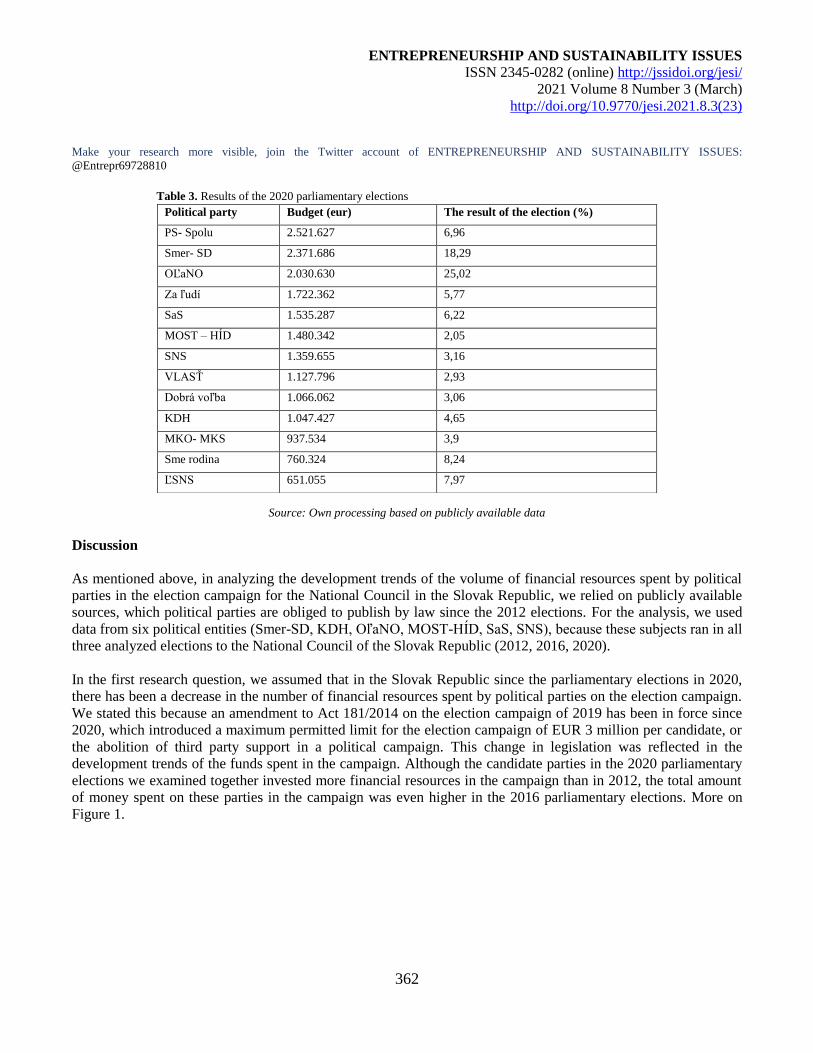
ENTREPRENEURSHIP AND SUSTAINABILITY ISSUES
ISSN 2345-0282 (online) http://jssidoi.org/jesi/
2021 Volume 8 Number 3 (March)
http://doi.org/10.9770/jesi.2021.8.3(23)
Make your research more visible, join the Twitter account of ENTREPRENEURSHIP AND SUSTAINABILITY ISSUES:
@Entrepr69728810
362
Table 3. Results of the 2020 parliamentary elections
Source: Own processing based on publicly available data
Discussion
As mentioned above, in analyzing the development trends of the volume of financial resources spent by political
parties in the election campaign for the National Council in the Slovak Republic, we relied on publicly available
sources, which political parties are obliged to publish by law since the 2012 elections. For the analysis, we used
data from six political entities (Smer-SD, KDH, OľaNO, MOST-HÍD, SaS, SNS), because these subjects ran in all
three analyzed elections to the National Council of the Slovak Republic (2012, 2016, 2020).
In the first research question, we assumed that in the Slovak Republic since the parliamentary elections in 2020,
there has been a decrease in the number of financial resources spent by political parties on the election campaign.
We stated this because an amendment to Act 181/2014 on the election campaign of 2019 has been in force since
2020, which introduced a maximum permitted limit for the election campaign of EUR 3 million per candidate, or
the abolition of third party support in a political campaign. This change in legislation was reflected in the
development trends of the funds spent in the campaign. Although the candidate parties in the 2020 parliamentary
elections we examined together invested more financial resources in the campaign than in 2012, the total amount
of money spent on these parties in the campaign was even higher in the 2016 parliamentary elections. More on
Figure 1.
Political party Budget (eur) The result of the election (%)
PS- Spolu 2.521.627 6,96
Smer- SD 2.371.686 18,29
OĽaNO 2.030.630 25,02
Za ľudí 1.722.362 5,77
SaS 1.535.287 6,22
MOST – HÍD 1.480.342 2,05
SNS 1.359.655 3,16
VLASŤ 1.127.796 2,93
Dobrá voľba 1.066.062 3,06
KDH 1.047.427 4,65
MKO- MKS 937.534 3,9
Sme rodina 760.324 8,24
ĽSNS 651.055 7,97
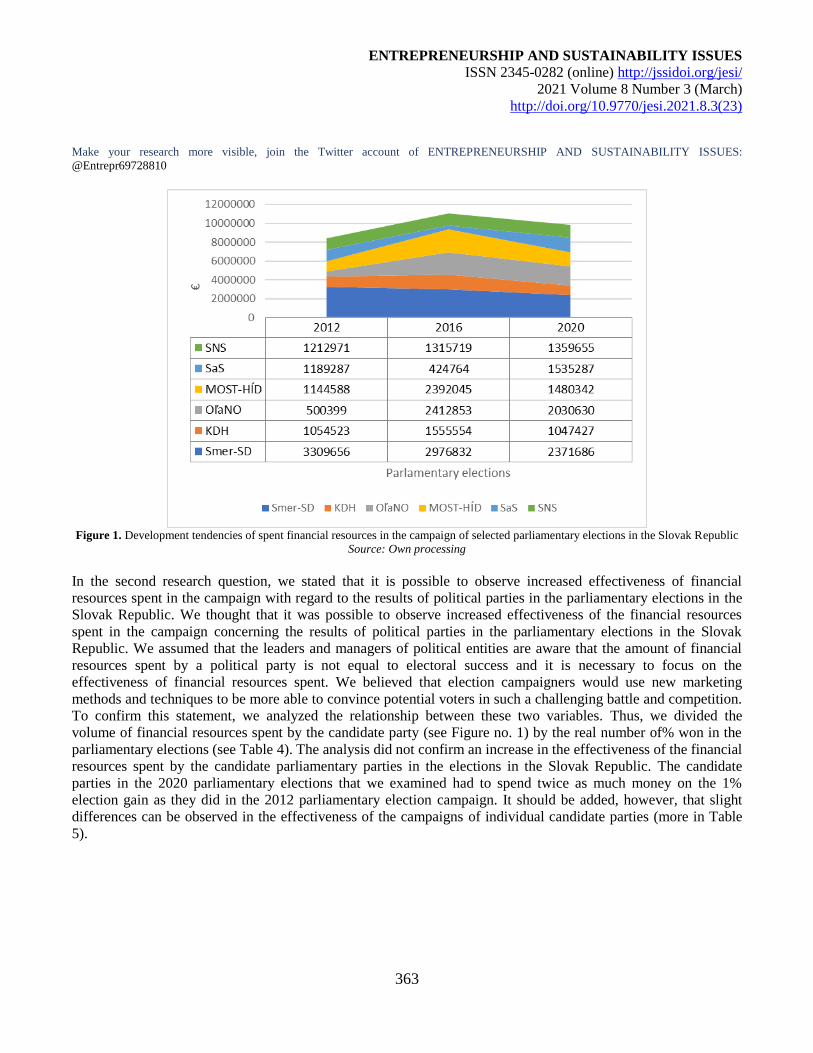
ENTREPRENEURSHIP AND SUSTAINABILITY ISSUES
ISSN 2345-0282 (online) http://jssidoi.org/jesi/
2021 Volume 8 Number 3 (March)
http://doi.org/10.9770/jesi.2021.8.3(23)
Make your research more visible, join the Twitter account of ENTREPRENEURSHIP AND SUSTAINABILITY ISSUES:
@Entrepr69728810
363
Figure 1. Development tendencies of spent financial resources in the campaign of selected parliamentary elections in the Slovak Republic
Source: Own processing
In the second research question, we stated that it is possible to observe increased effectiveness of financial
resources spent in the campaign with regard to the results of political parties in the parliamentary elections in the
Slovak Republic. We thought that it was possible to observe increased effectiveness of the financial resources
spent in the campaign concerning the results of political parties in the parliamentary elections in the Slovak
Republic. We assumed that the leaders and managers of political entities are aware that the amount of financial
resources spent by a political party is not equal to electoral success and it is necessary to focus on the
effectiveness of financial resources spent. We believed that election campaigners would use new marketing
methods and techniques to be more able to convince potential voters in such a challenging battle and competition.
To confirm this statement, we analyzed the relationship between these two variables. Thus, we divided the
volume of financial resources spent by the candidate party (see Figure no. 1) by the real number of% won in the
parliamentary elections (see Table 4). The analysis did not confirm an increase in the effectiveness of the financial
resources spent by the candidate parliamentary parties in the elections in the Slovak Republic. The candidate
parties in the 2020 parliamentary elections that we examined had to spend twice as much money on the 1%
election gain as they did in the 2012 parliamentary election campaign. It should be added, however, that slight
differences can be observed in the effectiveness of the campaigns of individual candidate parties (more in Table
5).
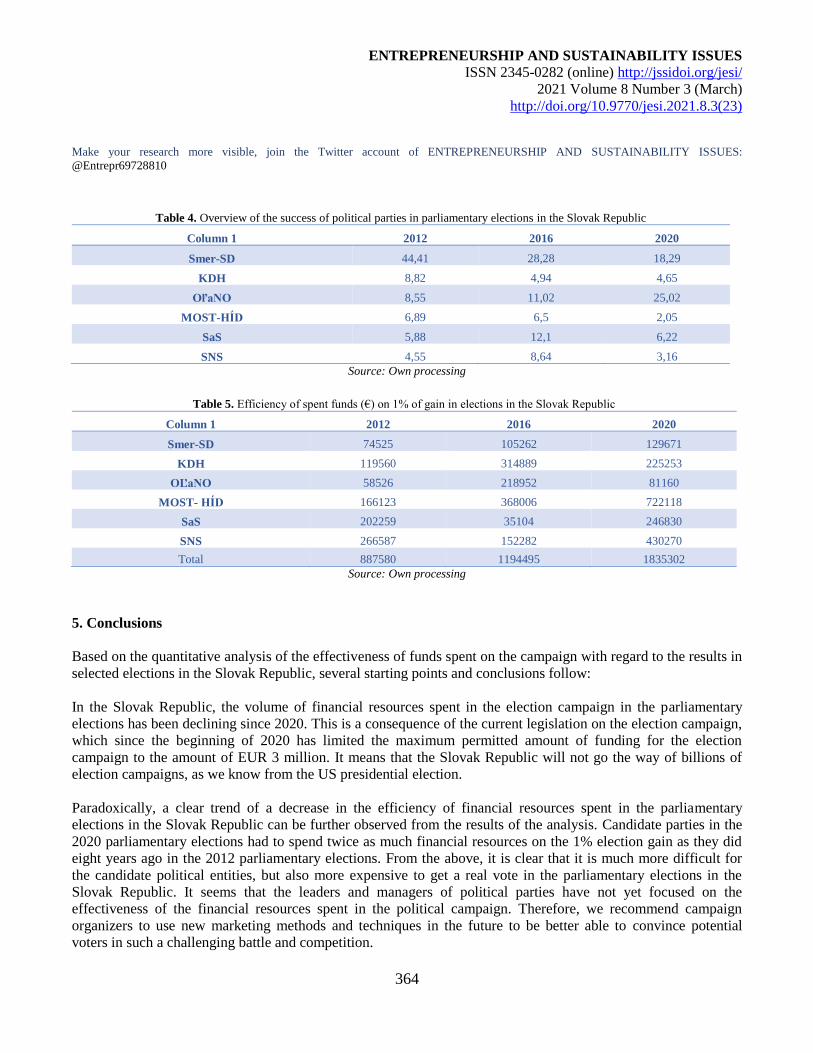
ENTREPRENEURSHIP AND SUSTAINABILITY ISSUES
ISSN 2345-0282 (online) http://jssidoi.org/jesi/
2021 Volume 8 Number 3 (March)
http://doi.org/10.9770/jesi.2021.8.3(23)
Make your research more visible, join the Twitter account of ENTREPRENEURSHIP AND SUSTAINABILITY ISSUES:
@Entrepr69728810
364
Table 4. Overview of the success of political parties in parliamentary elections in the Slovak Republic
Column 1 2012 2016 2020
Smer-SD 44,41 28,28 18,29
KDH 8,82 4,94 4,65
OľaNO 8,55 11,02 25,02
MOST-HÍD 6,89 6,5 2,05
SaS 5,88 12,1 6,22
SNS 4,55 8,64 3,16
Source: Own processing
Table 5. Efficiency of spent funds (€) on 1% of gain in elections in the Slovak Republic
Column 1 2012 2016 2020
Smer-SD 74525 105262 129671
KDH 119560 314889 225253
OĽaNO 58526 218952 81160
MOST- HÍD 166123 368006 722118
SaS 202259 35104 246830
SNS 266587 152282 430270
Total 887580 1194495 1835302
Source: Own processing
5. Conclusions
Based on the quantitative analysis of the effectiveness of funds spent on the campaign with regard to the results in
selected elections in the Slovak Republic, several starting points and conclusions follow:
In the Slovak Republic, the volume of financial resources spent in the election campaign in the parliamentary
elections has been declining since 2020. This is a consequence of the current legislation on the election campaign,
which since the beginning of 2020 has limited the maximum permitted amount of funding for the election
campaign to the amount of EUR 3 million. It means that the Slovak Republic will not go the way of billions of
election campaigns, as we know from the US presidential election.
Paradoxically, a clear trend of a decrease in the efficiency of financial resources spent in the parliamentary
elections in the Slovak Republic can be further observed from the results of the analysis. Candidate parties in the
2020 parliamentary elections had to spend twice as much financial resources on the 1% election gain as they did
eight years ago in the 2012 parliamentary elections. From the above, it is clear that it is much more difficult for
the candidate political entities, but also more expensive to get a real vote in the parliamentary elections in the
Slovak Republic. It seems that the leaders and managers of political parties have not yet focused on the
effectiveness of the financial resources spent in the political campaign. Therefore, we recommend campaign
organizers to use new marketing methods and techniques in the future to be better able to convince potential
voters in such a challenging battle and competition.
ENTREPRENEURSHIP AND SUSTAINABILITY ISSUES
ISSN 2345-0282 (online) http://jssidoi.org/jesi/
2021 Volume 8 Number 3 (March)
http://doi.org/10.9770/jesi.2021.8.3(23)
Make your research more visible, join the Twitter account of ENTREPRENEURSHIP AND SUSTAINABILITY ISSUES:
@Entrepr69728810
365
By carrying out this research study, the authors do not claim a comprehensive view of the analysis of the
effectiveness of the funds spent concerning the results in selected elections in the Slovak Republic. The research
topic offers several other and interesting research subjects for further elaboration. One of them is the research of
the effectiveness of the election campaign with regard to the types and intensity of the use of political marketing
tools. It would be beneficial for science and practice to examine the effectiveness of the funds spent on the
campaign in the future parliamentary and other elections in the Slovak Republic. It would also be interesting to
compare the results from Slovakia with other countries of the Member States of the European Union.
References
ACT of 29 May 2014 on the election campaign and on the amendment of Act no. 85/2005 Coll. on political parties and political
movements, as amended. Amendment: 501/2019 Coll.
Bulanda, I. & Vavrečka, V. (2019). Perception of commercial advertising by generation y in intentions of transaction analysis. In Marketing
Identity - Offline Is the New Online. Conference Proceedings from the International Scientific Conference. Trnava: Faculty of Mass Media
Communication, University of SS. Cyril and Methodius in Trnava, pp. 454-470. ISBN 978-80-572-0038-3
Brosius, A., Elsas, J.E., Vreese, H.C. & Marquart, F. (2020). How political malpractice affects trust in EU institutions. West European
Politics, 43(4), p. 944-968 ISSN: 01402382.
Fabuš, M. (2015). Impact of foreign direct investment on unemployment development in selected regions of Slovak Republic, Economic
Annals-XXI, 155 (11-12), pp. 63-66.
Geurkink, B., Zaslove, A., Sluiter, R. & Jacobs, K. (2020). Populist Attitudes, Political Trust, and External Political Efficacy: Old Wine in
New Bottles? Political Studies. 68(1), 247-267. ISSN: 0032-3217.
Ignatavičius, R., Tvaronavičienė, M., Piccinetti, L. & (2015) Sustainable Development Through Technology Transfer Networks: Case Of
Lithuania. Journal of Security And Sustainability Issues, 4(3) http://dx.doi.org/10.9770/jssi.2015.4.3(6)
Laczko, M. (2019). Dezinformácie, hoaxy ako nástroj pre deštrukciu slobodnej demokratickej spoločnosti (Disinformation, hoaxes as a
tool for the destruction of a free democratic society). In Lincényi, M. (eds.): Výchova a vzdelávanie k demokratickému občianstvu v
Slovenskej republike (Education for democratic citizenship in the Slovak Republic). Trenčín: Department of Political Science, Alexander
Dubček University of Trenčín, p. 140-149.
Lincényi, M. & Laczko, M. (2020). Influence of Brexit on education towards Europeanism. Insights into Regional Development, 2(4), 814-
824. https://doi.org/10.9770/IRD.2020.2.4(7)
Lincényi, M. (2015). Power, media and politics. In: International relations 2015: Current issues of world economy and politics. Available
on: https://publons.com/journal/180091/international-relations-2015-current-issues-of-wor/
Office of the National Council of the Slovac Republic. Annual report KDH for the year 2012, 2016, 2020.
Office of the National Council of the Slovac Republic. Annual report MOST - HÍD for the year 2012, 2016, 2020.
Office of the National Council of the Slovac Republic. Annual report OĽaNO for the year 2012, 2016, 2020.
Office of the National Council of the Slovac Republic. Annual report SaS for the year 2012, 2016, 2020.
Office of the National Council of the Slovac Republic. Annual report Smer - SD for the year 2012, 2016, 2020.
Office of the National Council of the Slovac Republic. Annual report SNS for the year 2012, 2016, 2020.
ENTREPRENEURSHIP AND SUSTAINABILITY ISSUES
ISSN 2345-0282 (online) http://jssidoi.org/jesi/
2021 Volume 8 Number 3 (March)
http://doi.org/10.9770/jesi.2021.8.3(23)
Make your research more visible, join the Twitter account of ENTREPRENEURSHIP AND SUSTAINABILITY ISSUES:
@Entrepr69728810
366
Rybanská, J. & Košičiarová, I. & Nagyová, Ľ. (2015). Negative psychological aspects of consumer behaviour in the digital age. In
MATÚŠ, J., PETRANOVÁ, D. (eds.): Marketing Identity – Digital Life – part II. Trnava: Faculty of Mass Media Communication,
University of SS. Cyril and Methodius in Trnava, 2015, p. 220-232.
Smaliukiene, R. & Monni, S. (2019). A Step-By-Step Approach to Social Marketing in Energy Transition. Insights into Regional
Development, 1(1), 19-32. https://doi.org/10.9770/IRD.2019.1.1(2)
Statistics. (2020). Election results. In: Statistics. Available on: https://volby.statistics.sk/
Světlík, J. & Bulanda, I. (2019). The shift of value types of the Czech population and its influence on the formation of creative advertising
strategy. In Marketing Identity - Offline Is the New Online. Conference Proceedings from the International Scientific Conference. Trnava:
Faculty of Mass Media Communication, University of SS. Cyril and Methodius in Trnava, pp. 323-334. ISBN 978-80-572-0038-3.
Registered in the WOS database
Transparency international Slovensko. (2020). Transparenstný parlament (Transparent parliament). In: transparency.sk. Available on:
https://volby.transparency.sk/parlament2020/
Watson, J. & HILL, A. (2006). Dictionary of media and communication studies. London: Bloomsbury, 8th edition, p. 34, ISBN 978-1-
84966-528-5.
Acknowledgements
This research was carried out in the framework of the project KEGA 003TnUAD-4/2018: Innovation of methodological
letters for teachers of civic education from the point of view of prevention of manifestations of extremism and education for
democratic citizenship
Marcel LINCÉNYI, PhD. in Media studies, obtained at Constantine the Philosopher University in Nitra, currently at Department of
Political Science as associate professor, Trenčín University of Alexander Dubček in Trenčín (TnUAD), Slovakia.
ORCID ID: https://orcid.org/0000-0002-9076-026X
Jaroslav CARSKY, Mgr. is currently internal PhD. student at the Department of Political Science, Alexander Dubček University of
Trenčín in Trenčín
ORCID ID: https://orcid.org/0000-0002-2497-7161
Copyright © 2021 by author(s) and VsI Entrepreneurship and Sustainability Center
This work is licensed under the Creative Commons Attribution International License (CC BY).
http://creativecommons.org/licenses/by/4.0/
ENTREPRENEURSHIP AND SUSTAINABILITY ISSUES
ISSN 2345-0282 (online) http://jssidoi.org/jesi/
2021 Volume 8 Number 3 (March)
http://doi.org/10.9770/jesi.2021.8.3(24)
Publisher http://jssidoi.org/esc/home
367
LAYER AND STRUCTURAL COMPONENTS OF MODERN INVESTMENT SECURITY OF THE
COUNTRY
Lidiia Karpenko¹, Oleksandr Ignatenko², Olena Taranenko3, Iryna Oliinyk4,
Ripsime Khrenova-Shymkina5
1*Odessa Regional Institute for Public Administration of the National Academy for Public Administration under the President of Ukraine,
Genuezka, 22, 65009, Odessa, Ukraine 2,3,4,5 National Academy for Public Administration under the President of Ukraine, 20, Ezhena Pottier st., 03057 Kyiv, Ukraine
E-mail: 1* [email protected]
Received 15 May 2020; accepted 10 January 2021; published 30 March 2021
Abstract. The article considers the structure of components of the country’s investment security as part of ensuring general national
economic safety. It was determined that the Investment component of economic security takes a determining place in the country’s
economic security, while the provision of the economic security and implementation of the national interests should form the investment
policy of the country. The authors identified styles and models of the Investment behavior under the condition of achievement or ignoring
of the proper level of investment security, they formed the directions for adherence and monitoring of the country’s investment security.
They supplemented the classification parameters of types of the country’s investment security. They also built a model of the integrated
investment security provision at different managerial levels of the national economy; they proved the availability of a stable interrelation
and interdependence between the components of the country’s investment security. The country’s investment security was proved to be
considered as the achievement of the investment level, which makes it possible to please current investment needs of the national economy
in terms of volume and structure of investments, with the consideration of efficient use and repayment, the optimal correlation between
volumes of domestic and external investments, foreign investments in the country and domestic ones abroad, the formation of the favorable
national balance of payments.
Keywords: country’s investment security; economic security; direct and portfolio investments; Investment behavior; accumulation of
gross investments
Reference to this paper should be made as follows: Karpenko, L., Ignatenko, O., Taranenko, O., Oliinyk, I., Khrenova-Shymkina, R. 2021.
Layer and structural components of modern investment security of the country. Entrepreneurship and Sustainability Issues, 8(3), 367-383.
http://doi.org/10.9770/jesi.2021.8.3(24)
JEL Classifications: F35, F42
ENTREPRENEURSHIP AND SUSTAINABILITY ISSUES
ISSN 2345-0282 (online) http://jssidoi.org/jesi/
2021 Volume 8 Number 3 (March)
http://doi.org/10.9770/jesi.2021.8.3(24)
Make your research more visible, join the Twitter account of ENTREPRENEURSHIP AND SUSTAINABILITY ISSUES:
@Entrepr69728810
368
1. Introduction
The development of the globalization processes, the domination of international investment relationships between
the world countries, improvement of competition for direct foreign investments, increase in the domestic
investment of the foreground industries of the economic complexes increasingly affect the growth of the national
economies. Nonetheless, as of today, those countries, which are currently developing due to political
transformations, crises occurrence in the sectors of the national economy and the financial system, in particular,
the absence of substantiated economic and financial policies, practical self-removal of state authorities from
regulation and implementation of investment processes, a huge level of public relations corruption, and, hence –
the absence of a proper investment climate are not able to increase their domestic investment and lose the
competitive struggle for foreign investments and corporate interests. Moreover, in the developing countries, there
is still a flight of capital abroad, it is possible to observe the irrational sectoral and regional distribution of
available investment resources, which preserves an imperfect structure of the national economy of raw materials
type and significantly reduces its competitiveness by fixing the technological gap, it increases the dependence of
the domestic producers on the world markets conjuncture, and increases the volumes of financing of foreign
economies. Herewith, a considerable share of savings does not transform into investments, leaving the channels of
inter-industry and inter-regional capital overflow underdeveloped. This all, undoubtedly, requires the fastest and
quality development of the investment processes with the consideration of the proper investment security.
2. Literature Survey
Numerous writings on the problems of the country’s economic security reveal the notion and content of the
investment security category in theoretical and practical aspects. At the same time, there are a lack of publications
on the key components of economic security, namely, the ones dedicated to investment security problems.
Moreover, the content of the notion of investment security requires clarification as well as the mechanisms of the
investment security provision. As of today, the investment and economic security of any country are affected by
internal and external threats. Thus, the main task any country faces is the creation of an effective reactive
mechanism. As noted by (Aitken & Harrison 1999; De Gregorio 2003; Chehabeddine & Tvaronavičienė, 2020),
the threats to economic security are the factors, which complicate self-regulation of the economy and
implementation of the economic interests, lead to the movement of the economic indicator beyond the normative
or border values.
The country’s investment security can be provided under the condition if one provides all conditions, required for
satisfaction of interest and needs in the long term run; generation of innovative shifts in the economy; standing up
to external threats, and use of the national competitive advantages (Xiao & Dickie 2000).
The research papers of (Barro & Sala-I-Marting 2003; Eden 2012) state that the organization of investments
should be the basis for the provision of economic security as the growth of investments should stimulate
economic activity, and growth in demand, which, in its turn, will lead to an increase in employment and national
income, i.e. to the realization of national interests. The researchers (Callanan 2000; Lall 2000) mention that
capital accumulation should be considered as the most important condition for economic growth and surmounting
the crisis. Both the degree of investment activity and tempos of the stock capital recovery will depend on the
dynamics and investment volumes.
In particular, Azam et. al. (2016); Vasconcelos (2021) determine the investment component of economic security
as the totality of legal and regulatory, social, and ecological conditions, which determine the type and dynamics of
ENTREPRENEURSHIP AND SUSTAINABILITY ISSUES
ISSN 2345-0282 (online) http://jssidoi.org/jesi/
2021 Volume 8 Number 3 (March)
http://doi.org/10.9770/jesi.2021.8.3(24)
Make your research more visible, join the Twitter account of ENTREPRENEURSHIP AND SUSTAINABILITY ISSUES:
@Entrepr69728810
369
the reproduction process, provide the reliability of refund, and efficiency of the invested capital. The author
considers investment security as a capability to maintain production accumulations and capital investing at the
level, providing the required tempos of extended reproduction, restructuration, and technological retooling of the
national economy.
As noted by (Gestrin & Novik 2015; Xu 2000), investment security calls for the provision of such investment
quotes, which (in terms of volume and structure) meet the relevant requirements of the economy. Such authors as
(Borensztein et. al. 1998) identify investment security as the one, “providing economically sound reproduction of
the stock capital and intellectual human capital with a focus on the growth of the economic results, the
improvement of production efficiency, quality of produced goods and services, and social standards of living.”
The aim of the study is to determine the principal components of the formation of investment security of the
country in the context of transformations and modern challenges and to develop methodological recommendations
for the development of investment security at various management levels of the national economy. The main
objectives of the study are: a) to investigate the investor's behavior models in the conditions of achieving
investment security; b) to determine the relationship between the investment component of economic security and
investment policy within the national economy; c) identify and methodically justify the leading components of the
country's investment security.
The country’s investment activity is achieved under the condition of adherence to the border norm of investment,
which makes it possible to reproduce the scientific-and-technical and intellectual potential of the nation; carry out
extended reproduction of the stock capital; maintain the competitiveness of the economy; guarantee the GDP
growth at the level of the social-economic growth tasks, and international cooperation; create strategic reserves;
overcome depressive phenomena in the country’s regions; preserve and reproduce natural resources; keep the
ecological parameters at a safe level.
3. Methods
Considering that economy is one of the vital spheres of activity of the society, the country, and personality, the
problem of determining a place of investment security in the system of economic security of the country is
primarily related to the assessment of the economy’s viability, its strength under possible internal and external
threats. From the methodological point of view, we will ground on the following methods and approaches: 1) a
criterion approach. Let us consider the indicators, characterizing the limit value of investment activity, as the
criteria of the country’s investment security, under the excess of which it is impossible to provide stability of the
economy’s development following the objectives of social development and tasks of the country’s national
security provision. Thus, the investment component of economic security is a peculiar subsystem of economic
security, which creates prerequisites for better use of social and economic relationships in the development and
scientific and technical restoration of productive forces of society through active investment activity. 2) The
investment process method. Investments are one of the most moving elements of total expenditure. In view of
this, the investment component is the most mobile system, characterizing investment activity conditions, and
should cover a range of interrelated indicators. The assessment of the investment component of economic security
is of crucial importance; its indicators are the growth of gross investments and the efficiency of their use. The
question of assessing investment security of the real sector of both the country and the region belongs to the least
studied ones. Modern scientific researches refer, primarily, the general economic aspects, leaving the peculiarities
of the investment process without proper attention. Under such conditions, one faces a need for special research of
the questions of guaranteeing investment security of the national economy as well as the development of a system
ENTREPRENEURSHIP AND SUSTAINABILITY ISSUES
ISSN 2345-0282 (online) http://jssidoi.org/jesi/
2021 Volume 8 Number 3 (March)
http://doi.org/10.9770/jesi.2021.8.3(24)
Make your research more visible, join the Twitter account of ENTREPRENEURSHIP AND SUSTAINABILITY ISSUES:
@Entrepr69728810
370
of the corresponding indicators. 3) An indicative method. The most difficult moment in solving these tasks is the
formation of a system of indicators, characterizing investment security. The indicators should reflect the level of
the remoteness of the real sector’s current state of the economy from the border of security. It is worth mentioning
that there is a direct and reverse system of relationship between investments and economic dynamics: the
development of investments into a real economic activity promotes economic growth, and vice versa, the decrease
in investments may lead to the economic slowdown. We can use the notion of a multiplier (K) by determining the
dependence between the growth of economic results, which are assessed by GDP, and the growth of the
investment volume (І), i.e. GDP=KІ. Although this dependence in the real economy is affected by many other
macroeconomic factors (labor, financial, etc.), it can be considered as the theoretical and methodological
foundation for determining investment macroeconomic security.
4. Results
The depth and comprehensiveness of studying investment behavior and safety are largely determined by the
selected cognition methodology. Investment behavior is always associated with limiting. If there were no
limitations, there would not be the need for investment designing, decision making, development of variants for
the objectives achieving within the national economy. The limitations can be of financial, monetary, and credit,
legal, institutional, and informational nature. Thus, the material restrictions may appear due to a lack of
production space, raw materials, energy, etc. The material restrictions also cover the lack of employees of the
required qualification, specialists in certain fields of activity. The financial restraints are expressed by the lack of
monetary capital (sources of financing and crediting). The legal restrictions are reflected in the peculiarities of
performance of specific powers (for example, an investor does not possess all the necessary powers in his sphere
of competence), the existence of state legal conditions of business, the need for legal registration of specific
operations. The institutional limitations occur, on one hand, due to the absence of the organizations of a specific
type, which will be able to speed up and cheapen decision making, lower the risk of investing, on the other hand –
due to the existence of those state system links, which slowdown the investment flow. Apart from those cases, the
institutional restrictions may also appear due to the existence of specific moral conditions of the investor’s
activity in a particular socio-economic system (William 2016). The informational limitations are most important
are of great importance for understanding the nature of investment behavior and investment security. For an
investor, a vital atmosphere is the availability of information about a wide range of phenomena and events,
surrounding him. Depending on the nature of the restrictions, investment behavior can take various forms. Thus,
if the existing restrictions are determined by objective regularities of productive forces functioning, the nature of
the established economic system, the legal order, and the subject cannot overcome them, this weakens the
independence of his actions in the decision-making situations, concerning the objectives and means of investment,
simplifies the function of the choice of the spheres and instruments of the capital formation. Such behavior can be
regarded as the normative-limited as the investor acts within strictly set technical, economical, and legal norms,
where the obedience to norms – fixing the preliminarily permissible target actions and ways or their achievement
– takes an important place. Such investment behavior may be based on a continuing habit or custom. Thus, so
many investors prefer working with the investment instruments, that they have already given a good account of
themselves, and are reluctant to work with the new ones. Of particular importance for this behavioral pattern are
various effects, bearing the name of the behavioral phenomena. Thus, the behavior of the entity may be
conditioned by the behavior of people (the imitation effect), surrounding it. “In his everyday life, a person makes
investment decisions, based on the behavior of other people, which seems to be well-grounded and rational to
him.” (Benmamoun and Lehnert 2013). Phenomena play an important role in such behavior. They see the world
thanks to mass-media information and communication, individual stereotypes, the opinion about friends and
acquaintances. The majority of the financial pyramids and trust societies are built on such behavioral effects.
ENTREPRENEURSHIP AND SUSTAINABILITY ISSUES
ISSN 2345-0282 (online) http://jssidoi.org/jesi/
2021 Volume 8 Number 3 (March)
http://doi.org/10.9770/jesi.2021.8.3(24)
Make your research more visible, join the Twitter account of ENTREPRENEURSHIP AND SUSTAINABILITY ISSUES:
@Entrepr69728810
371
The second type of investment behavior and investment security provision, which can be defined as unlimited,
grounds on the assumption that there is complete accessibility of required resources, and, above all – there are no
transactional costs for data collection and processing, which makes it possible for the investor to consider all
available opportunities. “The expenses, related to decision-making, the possibility of an error, and, often, the
expenses for the acquisition of the information belong in the theories, based on full rationality, to a category of the
homogeneous ones” (Moran 1998). Under such a type of behavior, the optimality and uniqueness of the result
assume the process of decision-making to be made through a simple algorithm of action (the expenses for
decision-making should be minimal). Such a condition is realized if the investor’s capabilities in the area of data
obtaining and processing are compared with the volume of coming information and complexity of the set task.
This type of behavior is rather a theoretical assumption than a practical reality, nevertheless, its existence is quite
acceptable and theoretically justified, as it makes it possible to understand the nature of the investment behavior.
To some extent, the unlimited investment behavior is typical for a monopolist, as its marginal costs on the data
search and collection for him are always lower than the marginal utility of its use.
The limited investment behavior is the main type of investment behavior, under which the investor’s activity is
carried out under various types of restrictions. Such behavior results from the existence of the market uncertainty,
asymmetric distribution of information, and its asynchronous nature. Under such circumstances, the investor
cannot predict all possible situations and calculate the optimal line of behavior and provide the proper level of
investment security. Under the limited type of behavior, the choice procedure is carried out with the consideration
of transactional expenses, playing the role of the selection criteria, while the selection process itself covers the
number of alternatives; the nature of the set tasks (clear and one-dimensional or uncertain and multidimensional);
the degree of their reproduction or repeatability; the availability and accessibility of information; corresponding
motivations and stimuli (Hermes & Lensik 2003).
Thus, investment entities differ upon the possibilities of obtaining and ways of the information use for making
investment decisions and expectations, corresponding to them. Assuming that an investor can get and process all
the necessary information for decision making, then his behavior can be regarded as purposeful rational. Under
such a model, we understand the behavior, based on a thoughtful, cautious, and rational attitude to objective
achievement. Such behavior grounds on the investor’s ability to use calculations, knowledge, and assessment
under the condition of uncertainty, based not only on his personal experience but also on the generalized
experience, bearing the name of the investment security. Otherwise, behavior can be of purposeful rational nature,
under which the objective achievement is carried out under the excessive use of the institutional instruments.
There are peculiar styles and scenarios per each model. The correlation of styles, instruments, and their primary
features upon the selected model is given in Table 1.
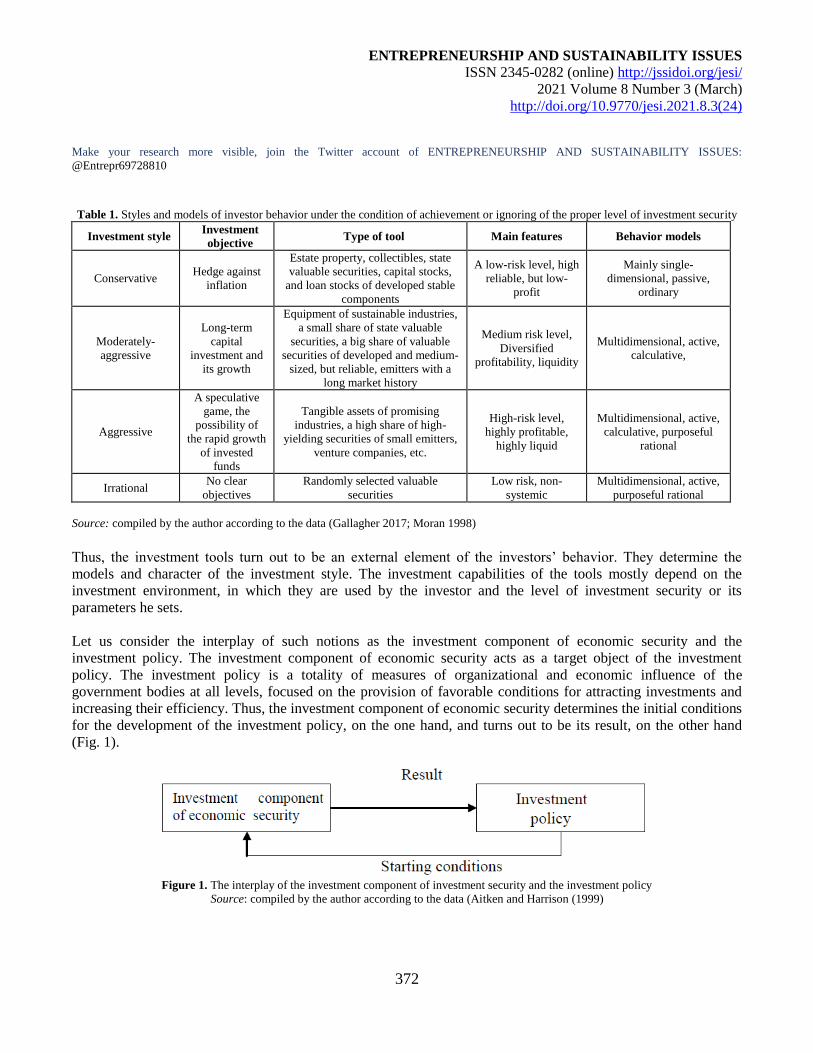
ENTREPRENEURSHIP AND SUSTAINABILITY ISSUES
ISSN 2345-0282 (online) http://jssidoi.org/jesi/
2021 Volume 8 Number 3 (March)
http://doi.org/10.9770/jesi.2021.8.3(24)
Make your research more visible, join the Twitter account of ENTREPRENEURSHIP AND SUSTAINABILITY ISSUES:
@Entrepr69728810
372
Table 1. Styles and models of investor behavior under the condition of achievement or ignoring of the proper level of investment security
Investment style Investment
objective Type of tool Main features Behavior models
Conservative Hedge against
inflation
Estate property, collectibles, state
valuable securities, capital stocks,
and loan stocks of developed stable
components
A low-risk level, high
reliable, but low-
profit
Mainly single-
dimensional, passive,
ordinary
Moderately-
aggressive
Long-term
capital
investment and
its growth
Equipment of sustainable industries,
a small share of state valuable
securities, a big share of valuable
securities of developed and medium-
sized, but reliable, emitters with a
long market history
Medium risk level,
Diversified
profitability, liquidity
Multidimensional, active,
calculative,
Aggressive
A speculative
game, the
possibility of
the rapid growth
of invested
funds
Tangible assets of promising
industries, a high share of high-
yielding securities of small emitters,
venture companies, etc.
High-risk level,
highly profitable,
highly liquid
Multidimensional, active,
calculative, purposeful
rational
Irrational No clear
objectives
Randomly selected valuable
securities
Low risk, non-
systemic
Multidimensional, active,
purposeful rational
Source: compiled by the author according to the data (Gallagher 2017; Moran 1998)
Thus, the investment tools turn out to be an external element of the investors’ behavior. They determine the
models and character of the investment style. The investment capabilities of the tools mostly depend on the
investment environment, in which they are used by the investor and the level of investment security or its
parameters he sets.
Let us consider the interplay of such notions as the investment component of economic security and the
investment policy. The investment component of economic security acts as a target object of the investment
policy. The investment policy is a totality of measures of organizational and economic influence of the
government bodies at all levels, focused on the provision of favorable conditions for attracting investments and
increasing their efficiency. Thus, the investment component of economic security determines the initial conditions
for the development of the investment policy, on the one hand, and turns out to be its result, on the other hand
(Fig. 1).
Figure 1. The interplay of the investment component of investment security and the investment policy
Source: compiled by the author according to the data (Aitken and Harrison (1999)
ENTREPRENEURSHIP AND SUSTAINABILITY ISSUES
ISSN 2345-0282 (online) http://jssidoi.org/jesi/
2021 Volume 8 Number 3 (March)
http://doi.org/10.9770/jesi.2021.8.3(24)
Make your research more visible, join the Twitter account of ENTREPRENEURSHIP AND SUSTAINABILITY ISSUES:
@Entrepr69728810
373
The investment component of economic security provides more favorable conditions for investing under the
influence of the investment policy. The efficiency of the investment policy is determined as a rate of indicator
change of the investment component of economic security for the better. The improvement of the investment
component of economic security, in its turn, positively affects the further improvement of the investment policy.
The share of accumulation of gross investments in GDP is the summarizing, or complex, an indicator of the
investment security. The share of accumulation in GDP, for the developing countries, should constitute for 30-
35% of the GDP volume. Thus, for example, in China, at the top of investment activity from 1990 to 2000, the
share of accumulation in GDP exceeded 30% and reached 33–34% under the tempos of the GDP growth about 8–
10% per annum (World Development Indicators: Structure of service imports 2020).
GCF30 35%
GDP
(1)
where: GCF – Gross capital formation, million US dollars,
GDP – Gross domestic product, US dollars.
The increased attention to investment security is conditioned by the fact that investments are the foundation for
the materialization of economic security, and, hence, the systematicity of tasks of the latter objectively requires
activation of the investment processes to provide expanded reproduction, the formation of the potential for
positive changes under the conditions of aggravation of socio-economic contradictions, threats to development,
and independence of the country. Thus, based on the World Bank and International Finance Corporation experts
estimates, under the increase in private investments in the developing countries by 1% to GDP, under other equal
conditions, one observes the average annual growth ratio of the economy by 0.69%. Moreover, the importance of
providing investment security is determined by the need for keeping to the national interests in this sphere. Thus,
among the national interests in the field of investment security, in particular, the following ones are highlighted
(Alfaro and Chauvin 2016):
1) long-term: formation of the investment, and later – the innovative model of development, provision structural
reorganization of the economy; formation of a favorable investment climate;
2) medium-term: provision of manageability of the process of the capital flow (with the consideration of the
motives and trends of its international movement) to high-tech sectors of the economy, combining of investments
with innovations, speeding up of industry modernization based on modern technologies, provision of qualitative
composition of foreign investments, the development of share market, and the joint investment institutions;
3) short-term: avoiding of the banking system destruction, minimization of losses in the result of the global
financial crisis, provision of the liquidity of enterprises and banks, avoiding exceptional dependence on foreign
capital due to large volumes of external bond debt and attraction of additional international loans, protection of
the economy from the expansion of the foreign TNCs under unacceptable conditions for the country, compliance
with the norms of investment to GDP, and maintenance of the innovative directness of investments.
Nevertheless, from the above-mentioned national interests in the provision of investment security, in our view, it
is legitimate to include only the formation of a favorable investment climate, avoiding of exclusive dependence on
the foreign capital due to large volumes of foreign debt, and attraction of additional international loans, protection
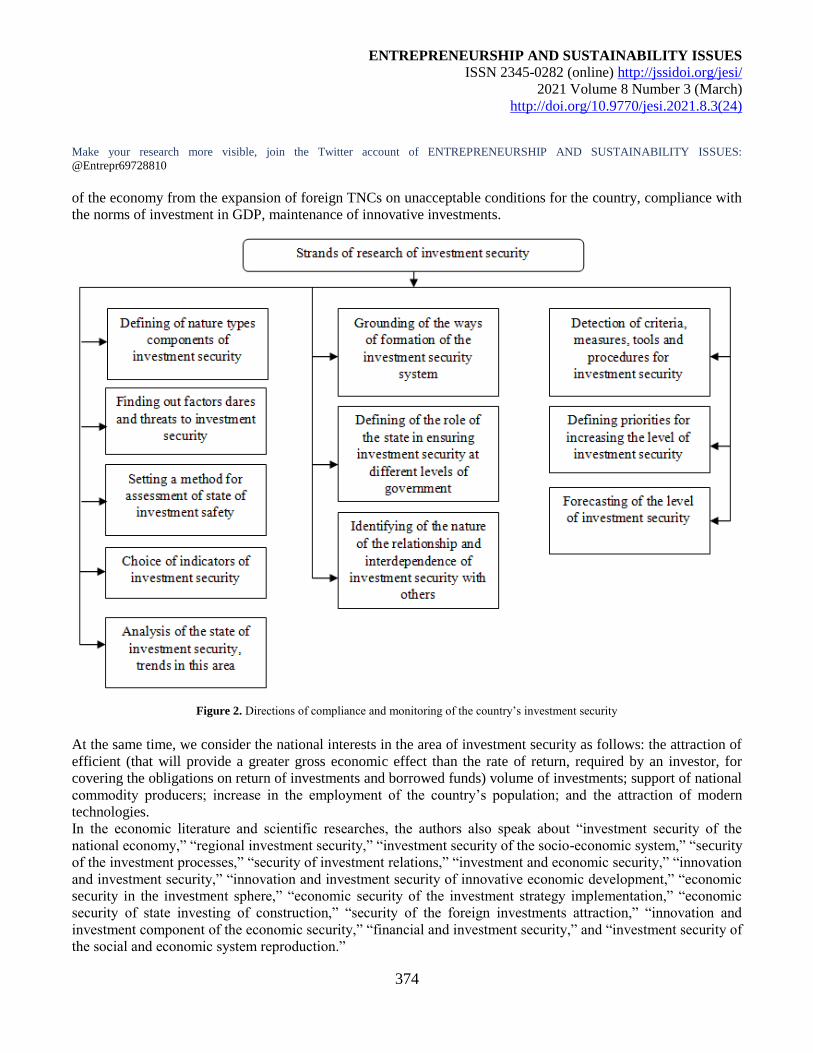
ENTREPRENEURSHIP AND SUSTAINABILITY ISSUES
ISSN 2345-0282 (online) http://jssidoi.org/jesi/
2021 Volume 8 Number 3 (March)
http://doi.org/10.9770/jesi.2021.8.3(24)
Make your research more visible, join the Twitter account of ENTREPRENEURSHIP AND SUSTAINABILITY ISSUES:
@Entrepr69728810
374
of the economy from the expansion of foreign TNCs on unacceptable conditions for the country, compliance with
the norms of investment in GDP, maintenance of innovative investments.
Figure 2. Directions of compliance and monitoring of the country’s investment security
At the same time, we consider the national interests in the area of investment security as follows: the attraction of
efficient (that will provide a greater gross economic effect than the rate of return, required by an investor, for
covering the obligations on return of investments and borrowed funds) volume of investments; support of national
commodity producers; increase in the employment of the country’s population; and the attraction of modern
technologies.
In the economic literature and scientific researches, the authors also speak about “investment security of the
national economy,” “regional investment security,” “investment security of the socio-economic system,” “security
of the investment processes,” “security of investment relations,” “investment and economic security,” “innovation
and investment security,” “innovation and investment security of innovative economic development,” “economic
security in the investment sphere,” “economic security of the investment strategy implementation,” “economic
security of state investing of construction,” “security of the foreign investments attraction,” “innovation and
investment component of the economic security,” “financial and investment security,” and “investment security of
the social and economic system reproduction.”
ENTREPRENEURSHIP AND SUSTAINABILITY ISSUES
ISSN 2345-0282 (online) http://jssidoi.org/jesi/
2021 Volume 8 Number 3 (March)
http://doi.org/10.9770/jesi.2021.8.3(24)
Make your research more visible, join the Twitter account of ENTREPRENEURSHIP AND SUSTAINABILITY ISSUES:
@Entrepr69728810
375
The development of theoretical and methodological fundamentals of investment security should be preceded by
the definition of such principles with respect to investment in general. The held analysis has shown that the vast
majority of scientific schools, theories, and concepts consider investment in the field of safety-related aspect, in
particular: it identifies the connection between them and economic growth, accumulation, and external debt;
determines factors, affecting the achievement of a proper level of investments, the outflow of the national capital
abroad, as well as the risks, stimuli, and cyclicality of investing, demonstrates to the study of its uncertainty, and
investor’s behavior; puts an emphasis on the need for directing investments at innovations and diversification of
the investment portfolio (Blomstrom et al 2000).
We think the study of the investment security should be carried out upon the directions, presented in Figure 2.
They should cover, first of all, the definition of content, types, components of investment security; clarification of
factors, challenges, and threats to investment security; the development of assessment methodology of its state;
the choice of the corresponding indicators; the analysis of the state of investment security and tendencies in this
area. Of no less importance is the justification of approaches to the formation of the investment security system;
the definition of the country’s role in the provision of the latter at different management levels; the identification
of the nature of interrelation and interdependence of investment security with other components of financial
security and types of economic security.
And, finally, the obligatory directions of investment security research should be regarded as follows:
identification of criteria, measures, tools, and procedures on its provision; the determination of its level
advancement priorities; prediction of investment security level. One should mention that nowadays, there is no
straightforward reasoned definition of investment security’s nature. Thus, we think it would be inappropriate to
state that the investment security is a complex indicator that has not been explored to the fullest extent, as,
considering the multidimensionality of this category, there is no single measuring instrument for it.
The investment security has a rather simplifies definition as a state, under which are present: a) conditions of
protection of investment resources, which are directed in the economy; b) the possibilities of the resources
accumulation or capital investments; c) the capability of the national economic system to generate an investment
process, supporting sustainable growth and strategic competitiveness of the country; d) access restrictions for
foreign direct investments in the economic entities, whose activity is related to the realization of national interests;
the condition of the country’s provision with modern high-tech production tools (Morck, 2010).
At the same time, we think, if the positive aspect logically reflects the components of investment security, then it
is at least incorrect to consider the combination of the state of the economy and its changes, guaranteed by the
state as a normative aspect, as the competitiveness of the economy cannot be determined by the normative
regulation alone (the thing the mentioned researcher puts an emphasis on).
We think that considering the multidimensional nature of the category “investment security of a country,” the
study of its content should be carried out with the use of a greater number of different conceptual approaches. We
also think that the notion of the country’s investment security should be considered as follows (Balasubramanyam
et. al., 1996):
1) the achievement of the interests synchronization of subjects of the investment relationship for the provision of
expanded reproduction in the country; restructuration and formation of the innovative model for the development
of the national economy, the optimal distribution of investments upon regions and departments of the economic
complex, reliability, and efficiency of investments;
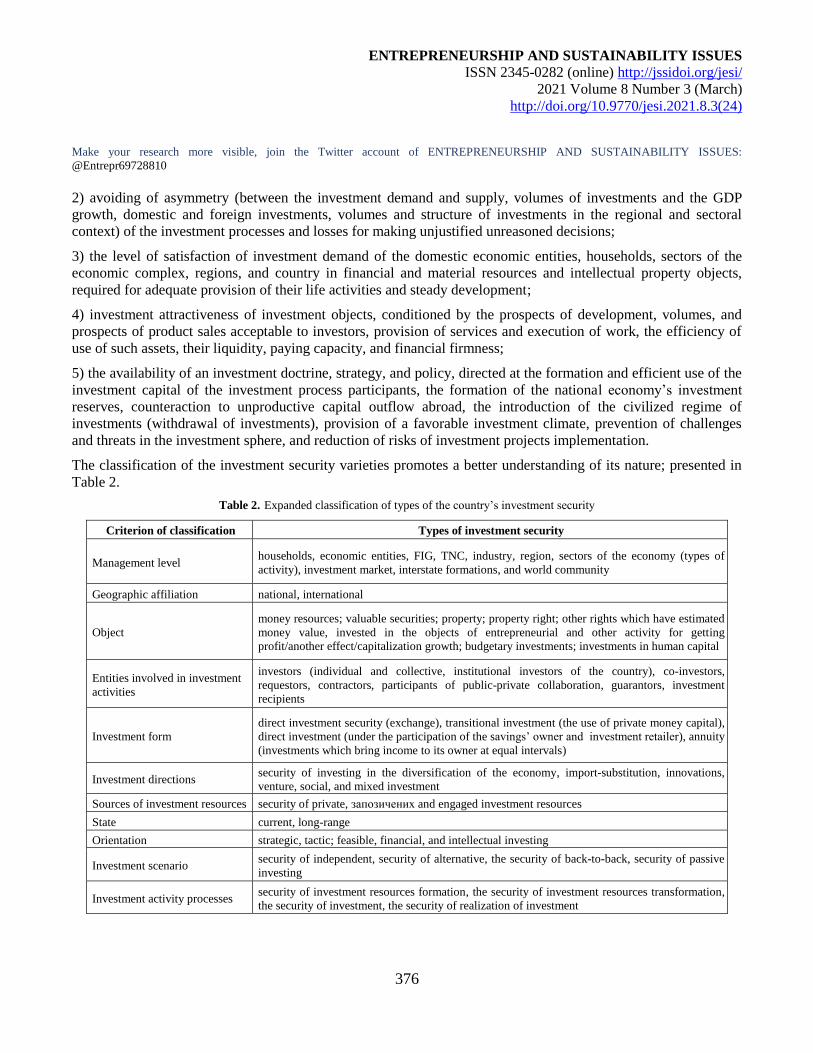
ENTREPRENEURSHIP AND SUSTAINABILITY ISSUES
ISSN 2345-0282 (online) http://jssidoi.org/jesi/
2021 Volume 8 Number 3 (March)
http://doi.org/10.9770/jesi.2021.8.3(24)
Make your research more visible, join the Twitter account of ENTREPRENEURSHIP AND SUSTAINABILITY ISSUES:
@Entrepr69728810
376
2) avoiding of asymmetry (between the investment demand and supply, volumes of investments and the GDP
growth, domestic and foreign investments, volumes and structure of investments in the regional and sectoral
context) of the investment processes and losses for making unjustified unreasoned decisions;
3) the level of satisfaction of investment demand of the domestic economic entities, households, sectors of the
economic complex, regions, and country in financial and material resources and intellectual property objects,
required for adequate provision of their life activities and steady development;
4) investment attractiveness of investment objects, conditioned by the prospects of development, volumes, and
prospects of product sales acceptable to investors, provision of services and execution of work, the efficiency of
use of such assets, their liquidity, paying capacity, and financial firmness;
5) the availability of an investment doctrine, strategy, and policy, directed at the formation and efficient use of the
investment capital of the investment process participants, the formation of the national economy’s investment
reserves, counteraction to unproductive capital outflow abroad, the introduction of the civilized regime of
investments (withdrawal of investments), provision of a favorable investment climate, prevention of challenges
and threats in the investment sphere, and reduction of risks of investment projects implementation.
The classification of the investment security varieties promotes a better understanding of its nature; presented in
Table 2.
Table 2. Expanded classification of types of the country’s investment security
Criterion of classification Types of investment security
Management level households, economic entities, FIG, TNC, industry, region, sectors of the economy (types of
activity), investment market, interstate formations, and world community
Geographic affiliation national, international
Object
money resources; valuable securities; property; property right; other rights which have estimated
money value, invested in the objects of entrepreneurial and other activity for getting
profit/another effect/capitalization growth; budgetary investments; investments in human capital
Entities involved in investment
activities
investors (individual and collective, institutional investors of the country), co-investors,
requestors, contractors, participants of public-private collaboration, guarantors, investment
recipients
Investment form
direct investment security (exchange), transitional investment (the use of private money capital),
direct investment (under the participation of the savings’ owner and investment retailer), annuity
(investments which bring income to its owner at equal intervals)
Investment directions security of investing in the diversification of the economy, import-substitution, innovations,
venture, social, and mixed investment
Sources of investment resources security of private, запозичених and engaged investment resources
State current, long-range
Orientation strategic, tactic; feasible, financial, and intellectual investing
Investment scenario security of independent, security of alternative, the security of back-to-back, security of passive
investing
Investment activity processes security of investment resources formation, the security of investment resources transformation,
the security of investment, the security of realization of investment
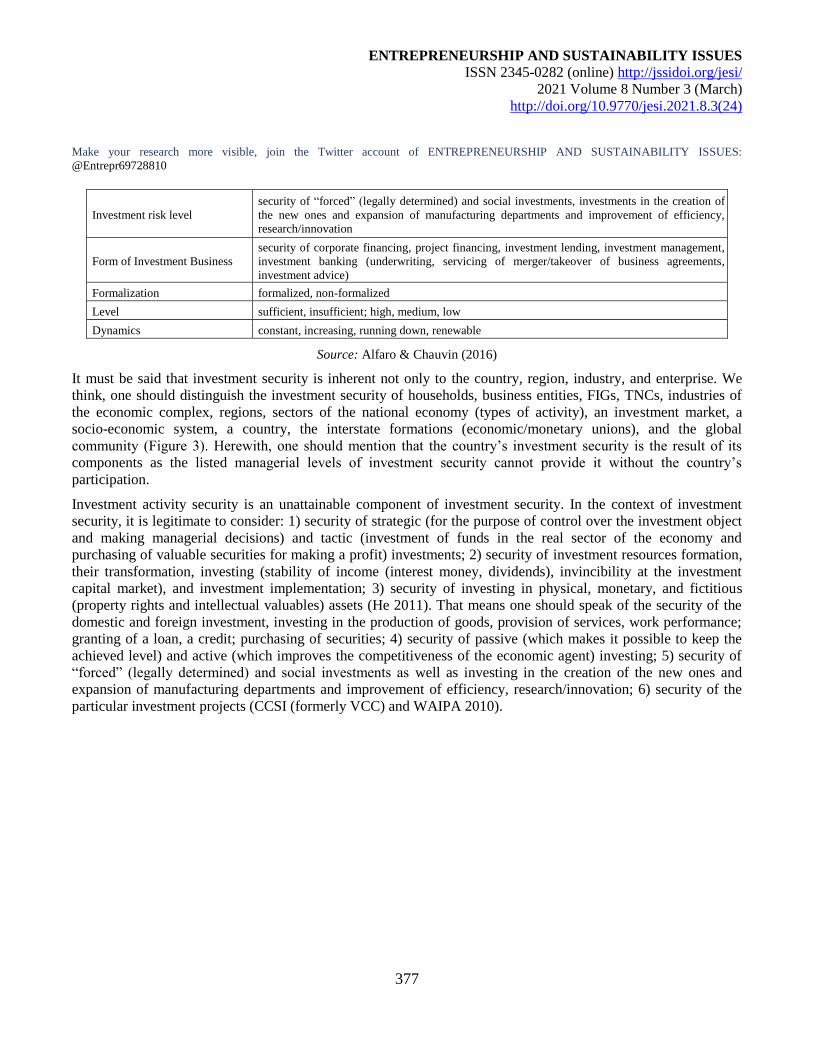
ENTREPRENEURSHIP AND SUSTAINABILITY ISSUES
ISSN 2345-0282 (online) http://jssidoi.org/jesi/
2021 Volume 8 Number 3 (March)
http://doi.org/10.9770/jesi.2021.8.3(24)
Make your research more visible, join the Twitter account of ENTREPRENEURSHIP AND SUSTAINABILITY ISSUES:
@Entrepr69728810
377
Investment risk level
security of “forced” (legally determined) and social investments, investments in the creation of
the new ones and expansion of manufacturing departments and improvement of efficiency,
research/innovation
Form of Investment Business
security of corporate financing, project financing, investment lending, investment management,
investment banking (underwriting, servicing of merger/takeover of business agreements,
investment advice)
Formalization formalized, non-formalized
Level sufficient, insufficient; high, medium, low
Dynamics constant, increasing, running down, renewable
Source: Alfaro & Chauvin (2016)
It must be said that investment security is inherent not only to the country, region, industry, and enterprise. We
think, one should distinguish the investment security of households, business entities, FIGs, TNCs, industries of
the economic complex, regions, sectors of the national economy (types of activity), an investment market, a
socio-economic system, a country, the interstate formations (economic/monetary unions), and the global
community (Figure 3). Herewith, one should mention that the country’s investment security is the result of its
components as the listed managerial levels of investment security cannot provide it without the country’s
participation.
Investment activity security is an unattainable component of investment security. In the context of investment
security, it is legitimate to consider: 1) security of strategic (for the purpose of control over the investment object
and making managerial decisions) and tactic (investment of funds in the real sector of the economy and
purchasing of valuable securities for making a profit) investments; 2) security of investment resources formation,
their transformation, investing (stability of income (interest money, dividends), invincibility at the investment
capital market), and investment implementation; 3) security of investing in physical, monetary, and fictitious
(property rights and intellectual valuables) assets (He 2011). That means one should speak of the security of the
domestic and foreign investment, investing in the production of goods, provision of services, work performance;
granting of a loan, a credit; purchasing of securities; 4) security of passive (which makes it possible to keep the
achieved level) and active (which improves the competitiveness of the economic agent) investing; 5) security of
“forced” (legally determined) and social investments as well as investing in the creation of the new ones and
expansion of manufacturing departments and improvement of efficiency, research/innovation; 6) security of the
particular investment projects (CCSI (formerly VCC) and WAIPA 2010).
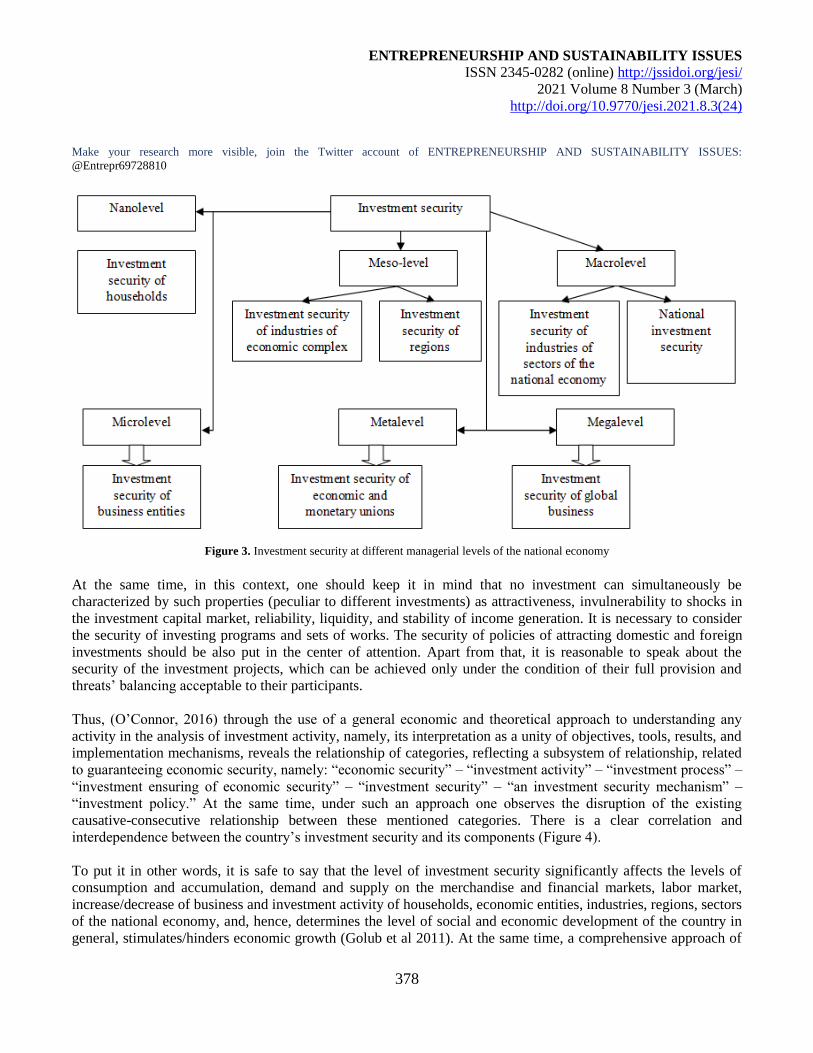
ENTREPRENEURSHIP AND SUSTAINABILITY ISSUES
ISSN 2345-0282 (online) http://jssidoi.org/jesi/
2021 Volume 8 Number 3 (March)
http://doi.org/10.9770/jesi.2021.8.3(24)
Make your research more visible, join the Twitter account of ENTREPRENEURSHIP AND SUSTAINABILITY ISSUES:
@Entrepr69728810
378
Figure 3. Investment security at different managerial levels of the national economy
At the same time, in this context, one should keep it in mind that no investment can simultaneously be
characterized by such properties (peculiar to different investments) as attractiveness, invulnerability to shocks in
the investment capital market, reliability, liquidity, and stability of income generation. It is necessary to consider
the security of investing programs and sets of works. The security of policies of attracting domestic and foreign
investments should be also put in the center of attention. Apart from that, it is reasonable to speak about the
security of the investment projects, which can be achieved only under the condition of their full provision and
threats’ balancing acceptable to their participants.
Thus, (O’Connor, 2016) through the use of a general economic and theoretical approach to understanding any
activity in the analysis of investment activity, namely, its interpretation as a unity of objectives, tools, results, and
implementation mechanisms, reveals the relationship of categories, reflecting a subsystem of relationship, related
to guaranteeing economic security, namely: “economic security” – “investment activity” – “investment process” –
“investment ensuring of economic security” – “investment security” – “an investment security mechanism” –
“investment policy.” At the same time, under such an approach one observes the disruption of the existing
causative-consecutive relationship between these mentioned categories. There is a clear correlation and
interdependence between the country’s investment security and its components (Figure 4).
To put it in other words, it is safe to say that the level of investment security significantly affects the levels of
consumption and accumulation, demand and supply on the merchandise and financial markets, labor market,
increase/decrease of business and investment activity of households, economic entities, industries, regions, sectors
of the national economy, and, hence, determines the level of social and economic development of the country in
general, stimulates/hinders economic growth (Golub et al 2011). At the same time, a comprehensive approach of
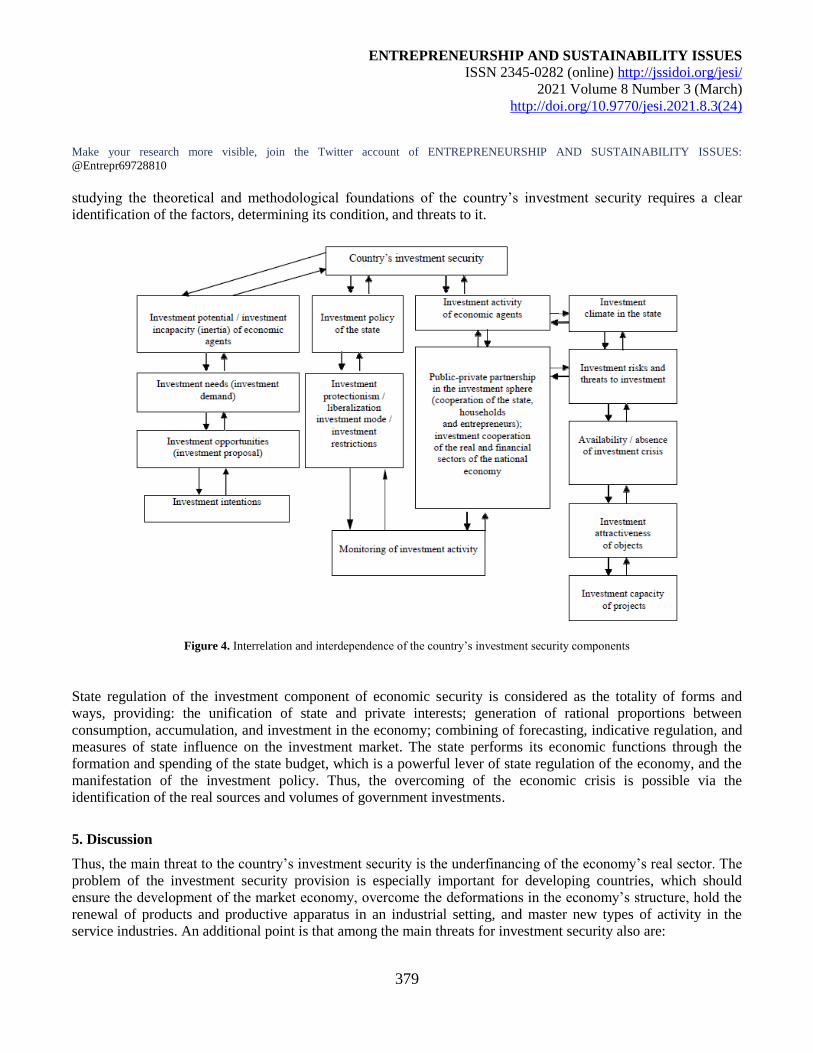
ENTREPRENEURSHIP AND SUSTAINABILITY ISSUES
ISSN 2345-0282 (online) http://jssidoi.org/jesi/
2021 Volume 8 Number 3 (March)
http://doi.org/10.9770/jesi.2021.8.3(24)
Make your research more visible, join the Twitter account of ENTREPRENEURSHIP AND SUSTAINABILITY ISSUES:
@Entrepr69728810
379
studying the theoretical and methodological foundations of the country’s investment security requires a clear
identification of the factors, determining its condition, and threats to it.
Figure 4. Interrelation and interdependence of the country’s investment security components
State regulation of the investment component of economic security is considered as the totality of forms and
ways, providing: the unification of state and private interests; generation of rational proportions between
consumption, accumulation, and investment in the economy; combining of forecasting, indicative regulation, and
measures of state influence on the investment market. The state performs its economic functions through the
formation and spending of the state budget, which is a powerful lever of state regulation of the economy, and the
manifestation of the investment policy. Thus, the overcoming of the economic crisis is possible via the
identification of the real sources and volumes of government investments.
5. Discussion
Thus, the main threat to the country’s investment security is the underfinancing of the economy’s real sector. The
problem of the investment security provision is especially important for developing countries, which should
ensure the development of the market economy, overcome the deformations in the economy’s structure, hold the
renewal of products and productive apparatus in an industrial setting, and master new types of activity in the
service industries. An additional point is that among the main threats for investment security also are:
ENTREPRENEURSHIP AND SUSTAINABILITY ISSUES
ISSN 2345-0282 (online) http://jssidoi.org/jesi/
2021 Volume 8 Number 3 (March)
http://doi.org/10.9770/jesi.2021.8.3(24)
Make your research more visible, join the Twitter account of ENTREPRENEURSHIP AND SUSTAINABILITY ISSUES:
@Entrepr69728810
380
– noncompliance with the norm of investing in relation to GDP;
– a low level of the investment climate upon all its components;
– the imperfection of the state monetary and credit policy, which hinders balancing between savings and
investments;
– a shift in the investment structures (technological, reproductive, sectoral, regional, and by sources of
investment)
– the absence of a strategy concerning direct foreign investments.
Following the orientation on the achievement of investment security as a subsystem of economic security, it is
necessary to implement the following high priority tasks:
– the choice of a promising direction of investment;
– setting market and economic conditions for the investment of reproduction of the main funds and
modernization and innovative accumulation of the stock capital;
– formation of a stable institutional structure, which provides stabilized conditions for performance of
organizational-administrative functions;
– scientific substantiation of a reliable methodological system of complex assessment and analysis of
efficiency of investment activity with the consideration of requirements of economic security;
– transformation of the economic structure for the transition to the production of science-intensive products
with the consideration of an increase in the demand for goods and services in the markets;
– establishment of reliable financial prerequisites and conditions for provision of stable investing of
innovative priorities, including through attraction of new sources of financing and investment process;
– the choice of reliable methods and legal ways of rights protection of private and foreign investors;
– formation of the investment activity insurance system, including shares and other valuable securities (via
hedging of the investment risks and implementation of other methods);
– rationalization of tax payments, stipulated by current legislation, including tax optimization during the
transition to an innovative economy.
The author’s further research is focused on the analysis of the financial market indicators, signalizing the
occurrence of threats for investment security.
Conclusions
The country’s investment security should be considered as the achievement of the investment level, which makes
it possible to please current investment needs of the national economy in terms of volume and structure of
investments, with the consideration of efficient use and repayment of the invested funds, the optimal correlation
between volumes of domestic and external investments, foreign investments in the country and domestic ones
abroad, and support of the favorable national balance of payments.
At the same time, investment security has another component. Thus, the assessment of the market value of
business or assets is needed nowadays not only within the framework of purchase and sale transactions, when
granting loans and determining the object’s collateral value, but also for making strategic and managerial
decisions, and preparation of reports following the requirements of the international investment community. To
ensure the financial security of the country, it is necessary to build the system of investment security with the
consideration of the necessity of keeping to a well-balanced anti-inflationary policy, the achievement of the
budget deficit reduction, and an increase in efficiency of a state borrowings policy. The provision of investment
security should be built with the consideration of a dramatic reduction of the capital export abroad, a high level of
ENTREPRENEURSHIP AND SUSTAINABILITY ISSUES
ISSN 2345-0282 (online) http://jssidoi.org/jesi/
2021 Volume 8 Number 3 (March)
http://doi.org/10.9770/jesi.2021.8.3(24)
Make your research more visible, join the Twitter account of ENTREPRENEURSHIP AND SUSTAINABILITY ISSUES:
@Entrepr69728810
381
the interrelationship of international capitals, the absence of big volumes of foreign capital, intense competition
between the spheres of its investment and countries, which engage foreign capital.
Investment security is determined by the structure and domination at the domestic market of specific investment
motives, diversification level of investment sources; the volume of capital outflow; the level of return on invested
funds; presence/absence of investment risk insurance; due diligence/dishonesty of investors’ behavior; the level of
coordination of managers’ interests, majority, and minority owners; by the level of investors’ awareness; the form
of receiving investment income; the currency exchange rate regime and interest policy that were established in the
country; the character of the depreciation policy; the time frames for making decisions on investment; and a clear
investment policy, developed for the long term.
The level of investment security of the developing countries is still regarded as low. The investment climate,
which forms in the country, may not stimulate the attraction of direct and portfolio investments. Successful
investment attraction requires quality “goods,” i.e. the investment-attractive business entities with a well-
developed mechanism of investment consumption, with a modern management structure, without debts, etc. A lot
of national companies today do not meet these requirements and, therefore, cannot become a real investment
object. Thus, the country should implement the entire complex of practical measures on increasing the level of
investment security within the lines of the national economy. The improvement of the investment climate, the
increase of the investment activity, and, hence, the level of investment security are possible under the condition of
establishing the corresponding financial and economic, normative and legal, and methodological bases, and
concentration of resources for the implementation of a perfect investment policy.
References
Aitken, B.J. & Harrison, A.E. (1999). Do Domestic Firms Benefit from Direct Foreign Investment? Evidence from Venezuela, American
Economic Review, 89, 605-618.
Alfaro, L. & Chauvin, J. (2016). Foreign Direct Investment, Finance, and Economic Development, URL:
http://www.hbs.edu/faculty/Publication%20Files/FDICapital_092116_FV_dc85d0a4-4964-4c2f-8d8b-2bc3b2b79e0d.pdf
Azam, M. et al. (2016). External Sources and Economic Growth – The Role of Foreign Remittances: Evidence from Europe and Central
Asia. The Journal of Development, 50(2), 367-387.
Balasubramanyam, V.N., Salisu, M. & Sapsford, D. (1996). Foreign Direct Investment and Growth in EP and IS Countries. Economic
Journal, 106, 92-105.
Barro, R. J., & Sala-I-Marting, X. (2003). Economic Growth. Cambridge MA: McGraw-Hill.
Benmamoun, M. & Lehnert, K. (2013). Financing Growth: Comparing the Effects of FDI, ODA and International Remittances. Journal of
Economic Development, 38(2), 43-65.
Blomstrom, M., Globerman, S. & Kokko, A. (2000). The Determinants of Host Country Spillovers from Foreign Direct Investment CEPR
discussion paper 2350.
Borensztein, E., & De Gregorio, J., & Lee, J. W. (1998). How does foreign direct investment affect economic growth? Journal of
International Economics, Vol. 45, 35-115.
ENTREPRENEURSHIP AND SUSTAINABILITY ISSUES
ISSN 2345-0282 (online) http://jssidoi.org/jesi/
2021 Volume 8 Number 3 (March)
http://doi.org/10.9770/jesi.2021.8.3(24)
Make your research more visible, join the Twitter account of ENTREPRENEURSHIP AND SUSTAINABILITY ISSUES:
@Entrepr69728810
382
Callanan, B. (2000). Ireland’s Shannon Story, Irish Academic Press, Dublin.
CCSI (formerly VCC) and WAIPA (2010). Investment Promotion Agencies and Sustainable FDI: Moving Toward the Fourth Generation
of Investment Policies.
Chehabeddine, M., & Tvaronavičienė, M. (2020). Securing regional development. Insights into Regional Development, 2(1), 430-442.
http://doi.org/10.9770/IRD.2020.2.1(3)
De Gregorio, Jose. (2003). The Role of Foreign Direct Investment and Natural Resources in Economic Development. Working Paper, No.
196. Central Bank of Chile, Santiago.
Eden, Lorraine (2012). Transfer price manipulation and developing countries. In Peter Reuter (editor). Draining Development? The
Sources, Consequences and Control of Illicit Funds from Developing Countries. Washington, DC: The World Bank.
Gallagher, K.P. (2017). Global Energy Finance: A New Database (GEGI Policy Brief 002 – 03/2017).
Gestrin, Michael and Ana Novik (2015). Multinational enterprises and the Shifting Global Business Landscape. The E15 Initiative: Second
Task Force Workshop on Investment Policy, June 9-10.
Golub, S.S., Kauffmann, C., & Yeres, P. (2011). Defining and Measuring Green FDI, OECD Working Papers on International Investment,
URL: http://www.oecd-ilibrary.org/content/workingpaper/5kg58j1cvcvk-en
He, Xiaoming (2011). State Multinationals: The impact of state ownership on international diversification and firm performance.
Unpublished PhD dissertation. Texas A&M University, Department of Management.
Hermes, N., & Lensik, R. (2003). Foreign direct investment, financial development and economic growth. Journal of Development Studies,
Vol. 38, 142-163.
Lall, S. (2000). FDI and development: research issues in the emerging context. Policy Discussion Paper 20, Centre for International
Economic Studies, University of Adelaide.
Mazzanti, M., Mazzarano, M., Pronti, A., Quatrosi, M. (2020). Fiscal policies, public investments and wellbeing: mapping the evolution of
the EU. Insights into Regional Development, 2(4), 725-749. http://doi.org/10.9770/IRD.2020.2.4(1)
Moran, T.H. (1998). Foreign Direct Investment and Development. Institute for International Economics, Washington, DC.
Morck, Randall (2010). The riddle of the great pyramid. In Eds. Colpan AM, T. Hikino, and J.R. Lincoln. The Oxford Handbook of
Business Groups. Oxford University Press: New York, NY, 602– 628.
O’Connor, S. (2016). Measuring the Value of “Green” Foreign Direct Investment in the United Kingdom (UK Office for National
Statistics), URL:
https://www.ons.gov.uk/economy/nationalaccounts/balanceofpayments/adhocs/005648greenforeigndirectinvestmentexperimentalestimates
Vasconcelos, V.V. (2021). Social justice and sustainable regional development: reflections on discourse and practice in public policies and
public budget. Insights into Regional Development, 3(1), 10-28. https://doi.org/10.9770/IRD.2021.3.1(1)
Williams, K. (2016). Remittances and Financial Development: Evidence from Sub-Saharan Africa, African Development Review, 28.3,
357-367.
World Development Indicators: Structure of service imports (2020). URL: http://wdi.worldbank.org/table/4.7
ENTREPRENEURSHIP AND SUSTAINABILITY ISSUES
ISSN 2345-0282 (online) http://jssidoi.org/jesi/
2021 Volume 8 Number 3 (March)
http://doi.org/10.9770/jesi.2021.8.3(24)
Make your research more visible, join the Twitter account of ENTREPRENEURSHIP AND SUSTAINABILITY ISSUES:
@Entrepr69728810
383
Xiao, Qin Fan & Paul, M. Dickie (2000). The Contribution of Foreign Direct Investment to Growth and Stability. ASEAN Economic
Bulletin, 17(3), 312-23.
Xu, B. (2000). Multinational enterprises, technology diffusion, and host country productivity. Journal of Development Economics, 62, 477-
493.
Lidiia KARPENKO, Doctor in Economics, Professor, Odessa Regional Institute for Public Administration of the National Academy for
Public Administration under the President of Ukraine
ORCID ID: orcid.org/0000-0002-2888-2477
Oleksandr IGNATENKO, Doctor of Science in Public Administration, Professor, National Academy of Public Administration under the
President of Ukraine,
ORCID ID: orcid.org/0000-0001-9088-5794
Olena TARANENKO, PhD (Public Administration), National Academy of Public Administration under the President of Ukraine
ORCID ID: orcid.org/0000-0002-1596-9493
Iryna OLIINYK, Post-graduate student of the National Academy of Public Administration under the President of Ukraine
ORCID ID: orcid.org/0000-0002-4263-1324
Ripsime KHRENOVA-SHYMKINA, Post-graduate student of the National Academy of Public Administration under the President of
Ukraine
ORCID ID: orcid.org/0000-0003-2566-9782
Copyright © 2021 by author(s) and VsI Entrepreneurship and Sustainability Center
This work is licensed under the Creative Commons Attribution International License (CC BY).
http://creativecommons.org/licenses/by/4.0/
ENTREPRENEURSHIP AND SUSTAINABILITY ISSUES
ISSN 2345-0282 (online) http://jssidoi.org/jesi/
2021 Volume 8 Number 3 (March)
http://doi.org/10.9770/jesi.2021.8.3(25)
Publisher http://jssidoi.org/esc/home
384
SMUGGLING AS A THREAT TO ECONOMIC SECURITY OF THE STATE
Anatolii Kulish ¹, Oleksandr Yunin ², Olha Us 3, Iryna Shapovalova 4, Ivan Yaromii 5
1*Sumy State University, 2 Rimsky-Korsakova Street, Sumy, 40000, Ukraine 2,5 Dnipropetrovsk State University of Internal Affairs, Ave. Gagarina, 26, 49005, Dnipro, Ukraine
3 Yaroslav Mudryi National Law University, 77 Pushkinskaya Street, Kharkiv, 61024, Ukraine 4 National Academy of Management, Ushynskoho str., 15, Kyiv, 03151, Ukraine
E-mail: 1* [email protected]
Received 15 June 2020; accepted 10 January 2021; published 30 March 2021
Abstract. Smuggling has been proven to be a global threat to the economic security of each country. The authors have assessed the
macroeconomic impact of smuggling on the current scale: GDP and work places. They discovered that the mechanism of administrative
and legal prevention and counteraction to violations of customs rules, which is realized through the institution of administrative
responsibility, appears to be independently-individual, along with other means of its legal protection. Herewith, it is worth to mention that
administrative responsibility for violation of customs rules is the responsibility of a special authorized official or citizen, a regulated by the
customs law norms, which resides in the awareness of guilt, illegality of actions in the area of customs legal order and, in case of sufficient
grounds, ability to bear responsibility in the form of an administrative penalty, which is imposed by the customs authority or court. This
shows that the object of administrative and legal prevention and counteraction to violation of the customs rules is specific and
individualized. It sits in the area of social and economic relations. Administrative responsibility is an efficient means of offence prevention,
including the ones, aimed at violation of the customs rules. It focuses on the prevention of any illegal behaviour. The measures of
administrative prevention of the customs rules violation are characterized as the actions, applied by customs authorities, based on the
provisions defined by customs legislation under the absence of customs law violations for their prevention and detection as well. They are
one of the components of a complex mechanism used by the customs authorities to combat violation of the customs rules. They precede
greater legal restrictions on the material and personal sphere of the offender’s personality, measures of administrative termination and
responsibility.
Keywords: economic security; multiplier; smuggling schemes; administrative responsibility; customs rules
Reference to this paper should be made as follows: Kulish, A., Yunin, O., Us, O., Shapovalova, I., Yaromii, I. 2021. Smuggling as a threat
to economic security of the state. Entrepreneurship and Sustainability Issues, 8(3), 384-399. http://doi.org/10.9770/jesi.2021.8.3(25)
JEL Classifications: F35, F42
ENTREPRENEURSHIP AND SUSTAINABILITY ISSUES
ISSN 2345-0282 (online) http://jssidoi.org/jesi/
2021 Volume 8 Number 3 (March)
http://doi.org/10.9770/jesi.2021.8.3(25)
Make your research more visible, join the Twitter account of ENTREPRENEURSHIP AND SUSTAINABILITY ISSUES:
@Entrepr69728810
385
1. Introduction
Economic security of a country is determined by a wide array of factors (e.g. Masood et al. 2020; Chehabeddine,
Tvaronavičienė, 2020).
The problem of smuggling is one of the country’s major priorities in protecting its economic security. A
significant part of the export-import trade flows in Ukraine are characterized as smuggled for more than two last
decades. Special hazard for the state resides in the fact that smuggling operations usually involve acts of
corruption, carried out by state and local authority officers. As a result, the interests of the domestic commodity
producers experience significant losses.
Illegal entry of foreign goods reduces the demand for Ukrainian products, leads to liquidation of manufacturing
facilities, decrease in the competitiveness of the Ukrainian enterprises in the domestic market, and their shift
abroad. All those issues contribute to the reduction of personnel and wages funds.
Furthermore, the results of such criminal activity negatively affect public relations in the field of protection of life
and health of citizens in case of smuggling of arms and ammunition, nuclear materials and substances, deprive the
citizens of the right to use cultural values and historical heritage of Ukraine.
Smuggling should be considered to be one of the biggest threats to the national security of Ukraine. The
mentioned threat reinforces itself through the policy of transnational corporations and criminal organizations,
aimed at taking advantage of the criminal schemes in international economic activity, due to which the majority
of financial flows remain untaxed and contribute to a significant expansion of the shadow economy.
In 2018, the legal foreign trade turnover of Ukraine amounted to $104.5 billion, which is equivalent to 80% of the
GDP of Ukraine, while shade import traditionally falls in the range of 10% from the GDP. The budget income
from international commerce is generated not only by the customs fees (UAH 27.1 billion or 3% of state budget
revenues in 2018) but by the import VAT, generating significant income to the budget of Ukraine (Official site of
the State Fiscal Service of Ukraine). In 2018, UAH 295.4 billion, or 79%, out of UAH 374 billion of income from
the value-added taxes, was generated thanks to import VAT. Along with customs fees and import taxes, it is
40.2%, or almost a half, of state budget income.
2. Literature Survey
Modern juridical science offers us with a range of different grounds for classification of offences, but when it
comes to characteristics of the customs offences, it seems to be appropriate to consider the classification,
depending on the branch of law, the rules of which are violated in the process of the offence commitment. In this
context, based on this classification basis, it is possible to identify customs offences as the ones, which trespass on
a specific group of social relations, appearing in the area of state customs policy and customs affairs of Ukraine.
Upon the general rule, an offence has the following characteristics:
1) it has lawless and legally inappropriate nature, i.e. contradicts the rules of law, manifests itself as the
violation of prohibitions, determined in the laws and sub-decrees, abuse of subjective law, and excess of
competence (Avdeev et. al. (2019));
2) it has a socially harmful or socially dangerous nature (Danijela (2016)). The given feature is characterized by
undesirability for a society, a state or an individual; it includes the appearance of the negative consequences that
may occur both at the time and in the future; the degree of its danger or harm for the public may vary, and it finds
its reflection in the negative reaction from the state and in accordance with the requirements of the legal norm.
ENTREPRENEURSHIP AND SUSTAINABILITY ISSUES
ISSN 2345-0282 (online) http://jssidoi.org/jesi/
2021 Volume 8 Number 3 (March)
http://doi.org/10.9770/jesi.2021.8.3(25)
Make your research more visible, join the Twitter account of ENTREPRENEURSHIP AND SUSTAINABILITY ISSUES:
@Entrepr69728810
386
A range of authors distinguish two aspects of public danger: first of all, it is the nature of public danger as a
qualitative estimate of the harmful nature of an act, grounding on the object of the offence (Grotteli, M. (2015));
secondly, it is the degree of social danger, i.e. the size of damage caused by the offence (Kiyanchuk, I. (2017)).
The scientists consider that all offences are harmful to a society, but only a part of them are socially dangerous;
1) expressed as behaviour in the form of action (theft, robbery) or inaction (leaving a person in a helpless state).
The current legislation does not consider thoughts, intentions, and beliefs to be illegal if they were not
implemented (van Engelenburg, S., Janssen, M., & Klievink, B. (2019));
2) having volitional nature, i.e. the ones, which depend on the will and consciousness of the participants at the
time of execution; they are carried out voluntarily by people (Nguyen, T. C. N., Kettle, M., & Doherty, C.
(2019));
3) regarded as guilt-inducing action. Guilt is a person’s mental attitude to his action and its consequences
(Kormych, B. (2018));
4) has a causal connection between the action and caused consequences (Rogers, T. W., Jaccard, N., Morton, E.
J., & Griffin, L. D. (2017));
5) causes the application of legal responsibility measures to the law-breaker (Nowak, T., Sowiński, C., &
Czyźowicz, W. (2015)).
Previously, the legal literature had already formulated a position, the supporters of which stated that the range of
customs offences included such tortious acts as customs offences, violation of customs rules and violations,
interfering with the performance of the powers, assigned to officers of revenue and tallage bodies (Świerczyńska,
J. (2016)).
Nonetheless, they provided no sufficiently strong argumentation. At the time when there are no questions to the
identification of crimes, the identification of two separate groups of offences appears to be not so clear. In this
context, it is logical to consider the relationship between violation of customs rules and violations, which prevent
the implementation of powers, assigned to the officials of the revenue and tallage bodies with such a
misdemeanour as an administrative offence.
In the course of further investigation, we think it necessary to carry out the division of the customs offence into
specific groups. Based on general offence classification upon the degree of social danger and caused damage, they
fall into the following categories:
- offences, illegal, guilt-inducing (intentional or unintended) action or inactivity, infringing on civil order,
property, rights and freedoms of citizens, established administrative order, for which the law prescribes
responsibility for the offence (Lay, C., & Astrina, A. R. (2020));
- socially dangerous, guilt-inducing, illegal and criminally liable accts (action or inactivity), committed by the
subject of crime (Komarov, O. (2016)).
According to the current legislation, the crimes, committed in the lines of customs, include the following criminal
offences: smuggling, transfer of big quantities of goods, and cultural and historical valuables, poisonous and
superpotent substances, radioactive materials, explosives, as well as arms and ammunition, special technical
means of non-public information acquisition across the customs border of Ukraine, outside the customs control or
with concealment from the customs control, stipulated in (Article 201 of The Criminal Code of Ukraine), and
smuggling of narcotic drugs, psychotropic substances, their analogsта or precursors or counterfeited
ENTREPRENEURSHIP AND SUSTAINABILITY ISSUES
ISSN 2345-0282 (online) http://jssidoi.org/jesi/
2021 Volume 8 Number 3 (March)
http://doi.org/10.9770/jesi.2021.8.3(25)
Make your research more visible, join the Twitter account of ENTREPRENEURSHIP AND SUSTAINABILITY ISSUES:
@Entrepr69728810
387
pharmaceutical products (Article 305 of the Criminal Code of Ukraine).
3. Methods
The methodological basis of the study covers a set of methods, means and ways of scientific knowledge of the
nature and content of the legal phenomena. The study included the use of both general scientific methods
(observation, comparison, description, classification) to identify the regularities, which characterize the principle
of legality; and special methods, more specifically: historical and legal – to study the genesis of legislation,
concerning the regulation of the principle of legality and disclose the views of scientists of different times on the
problems, related to the subject under the study; systemic and structural – for conceptual analysis of the principle
of legality, its nature and place in the system of principles of criminal proceedings; a dogmatic method and a
method of definitions analysis – for clarification and in-depth understanding of the conceptual and categorical
apparatus, related to the subject of the study; analysis, synthesis, classification, and grouping – used for
determining the subjects of observance and implementation of the principle of legality; comparative analysis –
when making a generalization of different approaches to implementation of the principle of legality during the
pre-trial investigation; the logical and regulatory method and modelling – to formulate and justify the
amendments to the criminal procedural legislation; sociological – to learn the opinions of the prosecution
authority officers, regarding the problem of the study; statistical – to generalize the survey findings, study the
criminal case files, law enforcement and court practice materials.
The normative-legal and information basis of the study included the Constitution of Ukraine, international
agreements, considered indispensable by Verkhovna Rada of Ukraine, the judgments of the European Court of
Human Rights, laws and by-laws of Ukraine, court practice.
The theoretical foundation of the research covered scientific papers in the area of legal theory, constitutional and
international law, and the criminal procedure.
4. Results
Nonetheless, the analysis of the available information shows that the situation in the area of counteraction to
smuggling has not changed significantly in recent years. It continues to be difficult. According to statistical data
of the Security Service of Ukraine (SSU) for the first half of 2019, one detected 37 crimes under Article 201 of
the Criminal Code of Ukraine and 4 crimes under Article 333 of the Criminal Code. People, suspected of
committing, were reported on suspicion, while the items of offence were seized; 27 people were convicted; the
customs officers seized objects of smuggling and detected violations of the customs rules for over UAH 18.6
million; they confiscated the items of smuggling and detected violations of the customs rules by court order for
UAH 536.000. Due to its high profitability, the most common type of shadow business is the illegal transfer of
excise goods across the customs border (tobacco products – to EU countries, alcohol and fuel – lubricating oils –
in Ukraine). Such movement has a pronounced regional localization. It results in committing official crimes
(corruption) and economic crimes (creation of clandestine manufacturing facilities).
In the current year, according to the data by Security Service of Ukraine (SBU), it is reported that 18 criminal
proceedings have been initiated against customs officials (13 of which – under the Article 368 of the Criminal
Code of Ukraine), 13 – against members of the State Border Guard Service of Ukraine (STS of Ukraine), 2 –
against employees of regulatory authorities at the customs border. One convicted 7 officers of the State Tax
Service of Ukraine, 3 – customs officers, and 1 officer of the controlling bodies at the customs border. One also
fired 5 officials of the customs bodies, 8 servicemen of the State Tax Service of Ukraine, and 2 officers of
controlling bodies on the customs border. In particular, it was reported that a number of heads of city and regional
ENTREPRENEURSHIP AND SUSTAINABILITY ISSUES
ISSN 2345-0282 (online) http://jssidoi.org/jesi/
2021 Volume 8 Number 3 (March)
http://doi.org/10.9770/jesi.2021.8.3(25)
Make your research more visible, join the Twitter account of ENTREPRENEURSHIP AND SUSTAINABILITY ISSUES:
@Entrepr69728810
388
customs received suspicions of wrongdoings. The State Bureau of Investigation carried out a pre-trial
investigation into the possible complicity of customs officers of the Yagodin Volyn Customs of the State Fiscal
Service of Ukraine (SFU of Ukraine) in the illegal transportation of goods with an approximate value of $550.000
with the preliminary qualification of the crime as an abuse of power or official position, which entailed serious
consequences (part 2 of the Article 364 of the Criminal Code of Ukraine).
The insufficient density of the Ukrainian border protection system has made it a transit point for drugs. Ukraine
now has 409 km of uncontrolled border with the Russian Federation, the rest 1.300 km of the section, controlled
to the junction of the border with Belarus. The main countries of supply of smuggled drugs today are Iran,
Colombia, Moldova, Netherlands, Panama, Poland, Russia, Hungary, etc. For example, Poland is now one of the
world’s leaders in the production of synthetic drugs. It has quite developed economic ties with Ukraine as well as
a fairly long border. Considering the geopolitical position of Ukraine, we can speak about the expansion of
spheres of influence of the international drug mafia, using the territory of our state as a transport corridor for the
transportation of drugs, as well as a new market for their sales.
The Internet and the global growth of technological advances such as mobile communications and the
international banking system have made national borders more vulnerable. Information technologies are widely
used by organized criminal groups as a means of preparation and implementation of smuggling. The latest
information technologies provide the members of a transnational criminal organization with an opportunity to
ensure their anonymity in a low-risk environment, as well as attract more people into criminal activities, hiding
their personalities.
Among the main factors, providing favourable conditions for smuggling are insufficient coordination of law
enforcement and regulatory authorities of Ukraine with the corresponding authorities of the neighbouring
countries for information exchange on countermeasures to the movement of goods beyond the customs control or
with hiding from customs control. As a rule, the reason behind this is the absence of a unified database of the
customs authorities of Ukraine with the customs authorities of foreign countries; assistance of the officials of the
state authorities, in particular, law enforcement and controlling ones to legal entities or individuals in the
movement of the specified type of goods across the customs border of Ukraine (corruption component); imperfect
and contradictory legislative regulation of the activity concerning counteraction to smuggling and violation of the
customs rules; the availability of a significant difference between the prices for the specific group of goods in the
domestic and international markets; unemployment of residents of the border areas.
Here are the determining factors, affecting the formation and development of the smuggling environment:
- incompleteness of the demarcation process with Russia, Belarus, and Moldova, location of settlements, private
houses, territories of private property, and the land shares close to the state border line;
- insufficiency of engineering and technical arrangements of the state border line, the availability of uncontrolled
roads and water crossings, significant distances between individual Ukrainian and adjacent border crossing points;
- the loss of control over the specific area of a state border on the temporarily occupied territories of Ukraine,
which can be used for the illegal transfer of items of crime;
- problems of personnel and logistics support of the State Tax Service of Ukraine, the customs offices of the
Ukrainian Federal Customs Service, and other state bodies, performing control functions at the state border;
- corruption of the customs and border guards officers, the law enforcement officials who provide the pre-trial
investigation of the criminal smuggling proceedings, as well as the corruption of the judges in sentencing
smugglers;
- the insufficient level of the customs control over the international parcels due to their significant quantity;
ENTREPRENEURSHIP AND SUSTAINABILITY ISSUES
ISSN 2345-0282 (online) http://jssidoi.org/jesi/
2021 Volume 8 Number 3 (March)
http://doi.org/10.9770/jesi.2021.8.3(25)
Make your research more visible, join the Twitter account of ENTREPRENEURSHIP AND SUSTAINABILITY ISSUES:
@Entrepr69728810
389
- the possibility of selling smuggling goods anonymously through the Internet shops and auctions;
- gradual restriction of the powers of the law enforcement agencies in the area of counteraction to smuggling and
offences of the foreign economic entities and foreign business entities;
- the absence of a clear definition of a concept and a full list of potent and toxic substances in current legislation,
and the inability to conduct laboratory tests for determining a substance as poisonous or strongly active, which
makes it difficult to document their smuggling.
As of today, the most common schemes for smuggling of goods include: import of goods without customs
documents, payment of fees and taxes, fixation in the accounts of the corresponding services; transfer of goods by
substitution or fabrication of the shipping documents, concealment of goods as other products, manipulations with
the name and coding of goods, their quantity and weight; addressing of import goods to the non-existent
companies; transfer of cargo beyond the checkpoints in the “green” section of the border; registration of vehicles
with goods as such, which run as “empty;” “interrupted” transit (goods are declared as “transit” when imported
into Ukraine with their subsequent unloading on the territory of Ukraine and formal closure of the “transit”);
substitution of goods after their import into the customs territory of Ukraine on the way to the internal customs of
destination; disappearance of goods that are not released into free circulation and are under customs control, from
the places of their storage (warehouses and temporary storage places, territories of ports and airports).
This range also includes the abuse of the benefits, provided by legislation for the import of goods by citizens
(products worth 500 euros – by road transport, 1000 euros – by air): division of big amounts of goods, formation
of brigades of individual citizens (the so-called “ants”), which, within the norm “up to 500 euros, up to 50 kg” can
move goods without taxation; “postal smuggling” – a separate direction of schemes with the norms of tax-free
import (goods for the amount of no more than 150 euros in one parcel): redesign of commercial batches so that
they look as small parcels, their division upon the norm of up to 150 euros and subsequent import to
counterfeiters; misleading declaration: undervaluation of weight; artificial undervaluation of the customs value to
border indicatives; indication of the wrong commodity code, belonging to other product; the use of goods of the
“cover” group (high-cost goods are declared as low-cost, complete replacement of the names; hiding the
quantitative and qualitative characteristics of goods, trademarks, and manufacturers of goods, and creation of
importing firms that receive “special conditions” from the customs). (tariffs, “play” with weight and codes, etc.)
for large-scale import of highly liquid imported goods, which puts the legal business in an uncompetitive
environment.
After discussion of the legal aspects of the smuggling consequences as a threat to Ukrainian national security, let
us consider the macroeconomic consequences of the existence of smuggling in the current scale: GDP and work
places.
Figure 1 displays the methodology, compiled by the author, for assessment of the macroeconomic consequences
of smuggling existence in the current scale: GDP and work places.
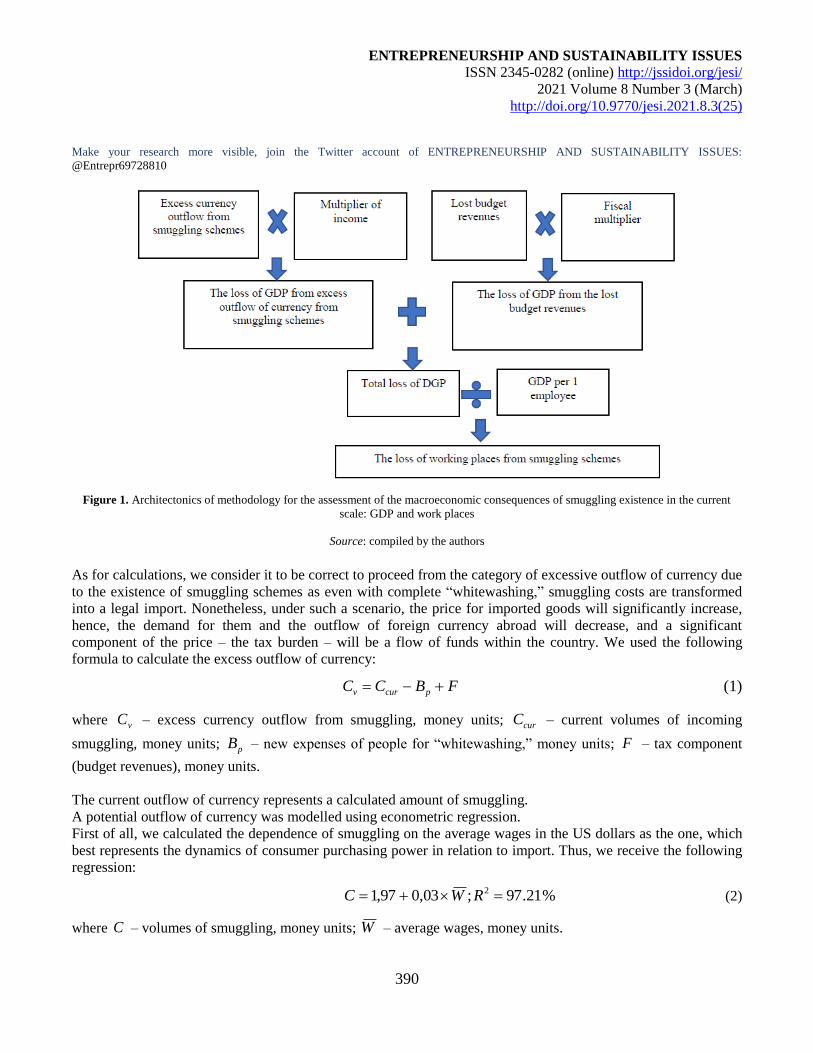
ENTREPRENEURSHIP AND SUSTAINABILITY ISSUES
ISSN 2345-0282 (online) http://jssidoi.org/jesi/
2021 Volume 8 Number 3 (March)
http://doi.org/10.9770/jesi.2021.8.3(25)
Make your research more visible, join the Twitter account of ENTREPRENEURSHIP AND SUSTAINABILITY ISSUES:
@Entrepr69728810
390
Figure 1. Architectonics of methodology for the assessment of the macroeconomic consequences of smuggling existence in the current
scale: GDP and work places
Source: compiled by the authors
As for calculations, we consider it to be correct to proceed from the category of excessive outflow of currency due
to the existence of smuggling schemes as even with complete “whitewashing,” smuggling costs are transformed
into a legal import. Nonetheless, under such a scenario, the price for imported goods will significantly increase,
hence, the demand for them and the outflow of foreign currency abroad will decrease, and a significant
component of the price – the tax burden – will be a flow of funds within the country. We used the following
formula to calculate the excess outflow of currency:
FBCC pcurv (1)
where vC – excess currency outflow from smuggling, money units; curC – current volumes of incoming
smuggling, money units; pB – new expenses of people for “whitewashing,” money units; F – tax component
(budget revenues), money units.
The current outflow of currency represents a calculated amount of smuggling.
A potential outflow of currency was modelled using econometric regression.
First of all, we calculated the dependence of smuggling on the average wages in the US dollars as the one, which
best represents the dynamics of consumer purchasing power in relation to import. Thus, we receive the following
regression:
%21.97;03,097,1 2 RWC (2)
where C – volumes of smuggling, money units; W – average wages, money units.
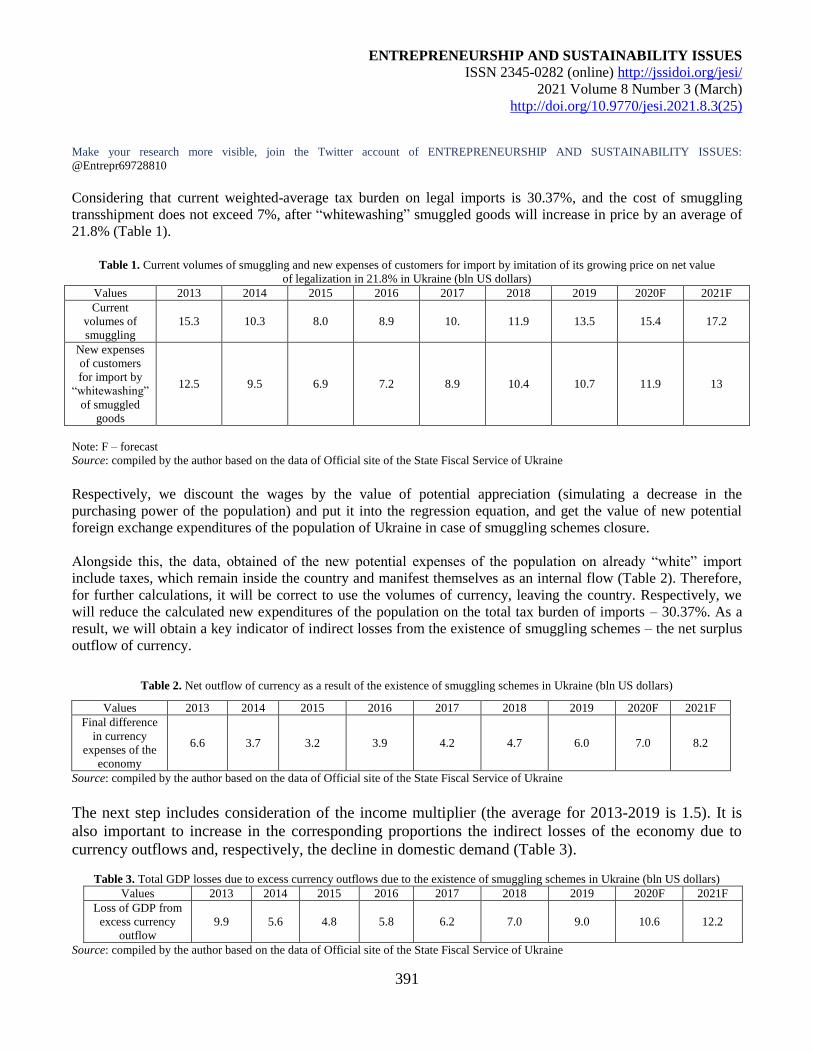
ENTREPRENEURSHIP AND SUSTAINABILITY ISSUES
ISSN 2345-0282 (online) http://jssidoi.org/jesi/
2021 Volume 8 Number 3 (March)
http://doi.org/10.9770/jesi.2021.8.3(25)
Make your research more visible, join the Twitter account of ENTREPRENEURSHIP AND SUSTAINABILITY ISSUES:
@Entrepr69728810
391
Considering that current weighted-average tax burden on legal imports is 30.37%, and the cost of smuggling
transshipment does not exceed 7%, after “whitewashing” smuggled goods will increase in price by an average of
21.8% (Table 1).
Table 1. Current volumes of smuggling and new expenses of customers for import by imitation of its growing price on net value
of legalization in 21.8% in Ukraine (bln US dollars)
Values 2013 2014 2015 2016 2017 2018 2019 2020F 2021F
Current
volumes of
smuggling
15.3 10.3 8.0 8.9 10. 11.9 13.5 15.4 17.2
New expenses
of customers
for import by
“whitewashing”
of smuggled
goods
12.5 9.5 6.9 7.2 8.9 10.4 10.7 11.9 13
Note: F – forecast
Source: compiled by the author based on the data of Official site of the State Fiscal Service of Ukraine
Respectively, we discount the wages by the value of potential appreciation (simulating a decrease in the
purchasing power of the population) and put it into the regression equation, and get the value of new potential
foreign exchange expenditures of the population of Ukraine in case of smuggling schemes closure.
Alongside this, the data, obtained of the new potential expenses of the population on already “white” import
include taxes, which remain inside the country and manifest themselves as an internal flow (Table 2). Therefore,
for further calculations, it will be correct to use the volumes of currency, leaving the country. Respectively, we
will reduce the calculated new expenditures of the population on the total tax burden of imports – 30.37%. As a
result, we will obtain a key indicator of indirect losses from the existence of smuggling schemes – the net surplus
outflow of currency.
Table 2. Net outflow of currency as a result of the existence of smuggling schemes in Ukraine (bln US dollars)
Values 2013 2014 2015 2016 2017 2018 2019 2020F 2021F
Final difference
in currency
expenses of the
economy
6.6 3.7 3.2 3.9 4.2 4.7 6.0 7.0 8.2
Source: compiled by the author based on the data of Official site of the State Fiscal Service of Ukraine
The next step includes consideration of the income multiplier (the average for 2013-2019 is 1.5). It is
also important to increase in the corresponding proportions the indirect losses of the economy due to
currency outflows and, respectively, the decline in domestic demand (Table 3).
Table 3. Total GDP losses due to excess currency outflows due to the existence of smuggling schemes in Ukraine (bln US dollars)
Values 2013 2014 2015 2016 2017 2018 2019 2020F 2021F
Loss of GDP from
excess currency
outflow
9.9 5.6 4.8 5.8 6.2 7.0 9.0 10.6 12.2
Source: compiled by the author based on the data of Official site of the State Fiscal Service of Ukraine
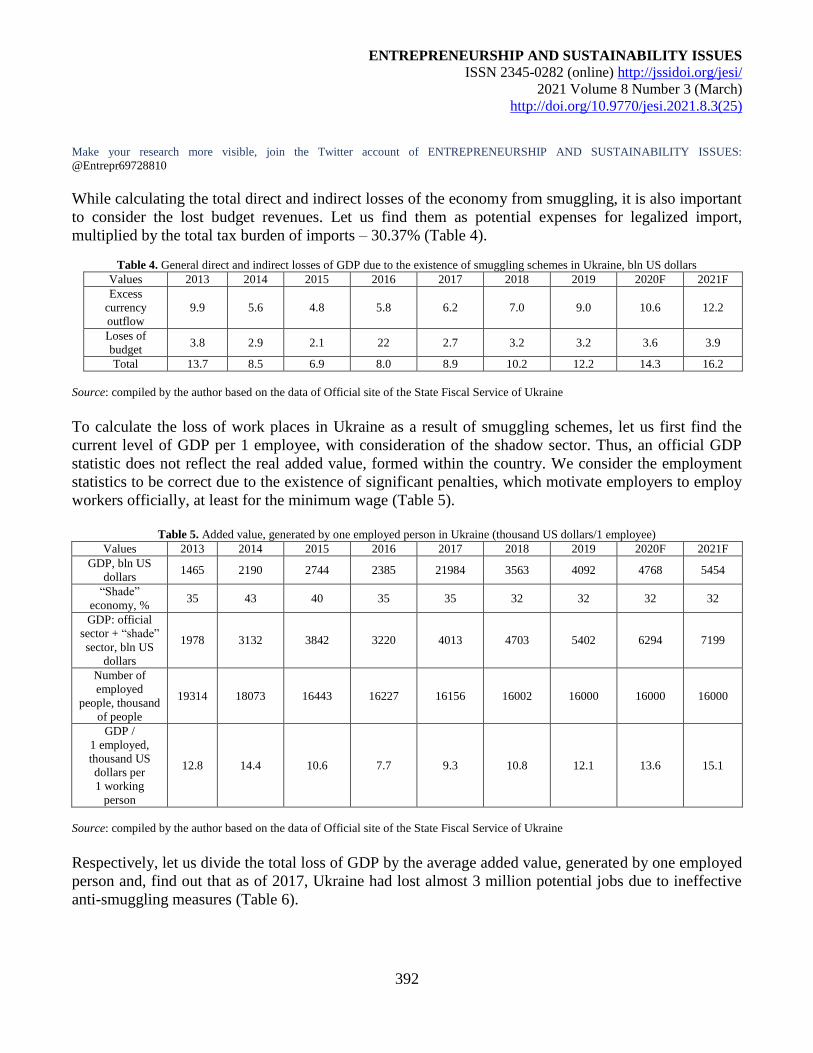
ENTREPRENEURSHIP AND SUSTAINABILITY ISSUES
ISSN 2345-0282 (online) http://jssidoi.org/jesi/
2021 Volume 8 Number 3 (March)
http://doi.org/10.9770/jesi.2021.8.3(25)
Make your research more visible, join the Twitter account of ENTREPRENEURSHIP AND SUSTAINABILITY ISSUES:
@Entrepr69728810
392
While calculating the total direct and indirect losses of the economy from smuggling, it is also important
to consider the lost budget revenues. Let us find them as potential expenses for legalized import,
multiplied by the total tax burden of imports – 30.37% (Table 4).
Table 4. General direct and indirect losses of GDP due to the existence of smuggling schemes in Ukraine, bln US dollars
Values 2013 2014 2015 2016 2017 2018 2019 2020F 2021F
Excess
currency
outflow
9.9 5.6 4.8 5.8 6.2 7.0 9.0 10.6 12.2
Loses of
budget 3.8 2.9 2.1 22 2.7 3.2 3.2 3.6 3.9
Total 13.7 8.5 6.9 8.0 8.9 10.2 12.2 14.3 16.2
Source: compiled by the author based on the data of Official site of the State Fiscal Service of Ukraine
To calculate the loss of work places in Ukraine as a result of smuggling schemes, let us first find the
current level of GDP per 1 employee, with consideration of the shadow sector. Thus, an official GDP
statistic does not reflect the real added value, formed within the country. We consider the employment
statistics to be correct due to the existence of significant penalties, which motivate employers to employ
workers officially, at least for the minimum wage (Table 5).
Table 5. Added value, generated by one employed person in Ukraine (thousand US dollars/1 employee)
Values 2013 2014 2015 2016 2017 2018 2019 2020F 2021F
GDP, bln US
dollars 1465 2190 2744 2385 21984 3563 4092 4768 5454
“Shade”
economy, % 35 43 40 35 35 32 32 32 32
GDP: official
sector + “shade”
sector, bln US
dollars
1978 3132 3842 3220 4013 4703 5402 6294 7199
Number of
employed
people, thousand
of people
19314 18073 16443 16227 16156 16002 16000 16000 16000
GDP /
1 employed,
thousand US
dollars per
1 working
person
12.8 14.4 10.6 7.7 9.3 10.8 12.1 13.6 15.1
Source: compiled by the author based on the data of Official site of the State Fiscal Service of Ukraine
Respectively, let us divide the total loss of GDP by the average added value, generated by one employed
person and, find out that as of 2017, Ukraine had lost almost 3 million potential jobs due to ineffective
anti-smuggling measures (Table 6).
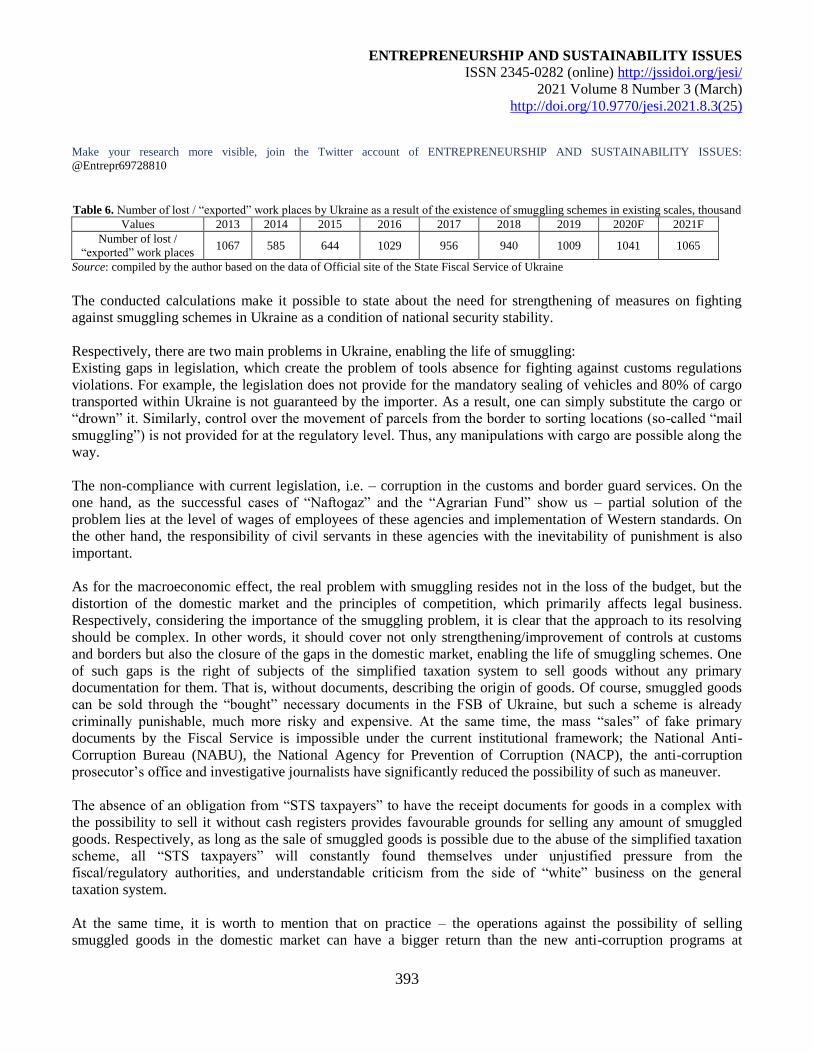
ENTREPRENEURSHIP AND SUSTAINABILITY ISSUES
ISSN 2345-0282 (online) http://jssidoi.org/jesi/
2021 Volume 8 Number 3 (March)
http://doi.org/10.9770/jesi.2021.8.3(25)
Make your research more visible, join the Twitter account of ENTREPRENEURSHIP AND SUSTAINABILITY ISSUES:
@Entrepr69728810
393
Table 6. Number of lost / “exported” work places by Ukraine as a result of the existence of smuggling schemes in existing scales, thousand
Values 2013 2014 2015 2016 2017 2018 2019 2020F 2021F
Number of lost /
“exported” work places 1067 585 644 1029 956 940 1009 1041 1065
Source: compiled by the author based on the data of Official site of the State Fiscal Service of Ukraine
The conducted calculations make it possible to state about the need for strengthening of measures on fighting
against smuggling schemes in Ukraine as a condition of national security stability.
Respectively, there are two main problems in Ukraine, enabling the life of smuggling:
Existing gaps in legislation, which create the problem of tools absence for fighting against customs regulations
violations. For example, the legislation does not provide for the mandatory sealing of vehicles and 80% of cargo
transported within Ukraine is not guaranteed by the importer. As a result, one can simply substitute the cargo or
“drown” it. Similarly, control over the movement of parcels from the border to sorting locations (so-called “mail
smuggling”) is not provided for at the regulatory level. Thus, any manipulations with cargo are possible along the
way.
The non-compliance with current legislation, i.e. – corruption in the customs and border guard services. On the
one hand, as the successful cases of “Naftogaz” and the “Agrarian Fund” show us – partial solution of the
problem lies at the level of wages of employees of these agencies and implementation of Western standards. On
the other hand, the responsibility of civil servants in these agencies with the inevitability of punishment is also
important.
As for the macroeconomic effect, the real problem with smuggling resides not in the loss of the budget, but the
distortion of the domestic market and the principles of competition, which primarily affects legal business.
Respectively, considering the importance of the smuggling problem, it is clear that the approach to its resolving
should be complex. In other words, it should cover not only strengthening/improvement of controls at customs
and borders but also the closure of the gaps in the domestic market, enabling the life of smuggling schemes. One
of such gaps is the right of subjects of the simplified taxation system to sell goods without any primary
documentation for them. That is, without documents, describing the origin of goods. Of course, smuggled goods
can be sold through the “bought” necessary documents in the FSB of Ukraine, but such a scheme is already
criminally punishable, much more risky and expensive. At the same time, the mass “sales” of fake primary
documents by the Fiscal Service is impossible under the current institutional framework; the National Anti-
Corruption Bureau (NABU), the National Agency for Prevention of Corruption (NACP), the anti-corruption
prosecutor’s office and investigative journalists have significantly reduced the possibility of such as maneuver.
The absence of an obligation from “STS taxpayers” to have the receipt documents for goods in a complex with
the possibility to sell it without cash registers provides favourable grounds for selling any amount of smuggled
goods. Respectively, as long as the sale of smuggled goods is possible due to the abuse of the simplified taxation
scheme, all “STS taxpayers” will constantly found themselves under unjustified pressure from the
fiscal/regulatory authorities, and understandable criticism from the side of “white” business on the general
taxation system.
At the same time, it is worth to mention that on practice – the operations against the possibility of selling
smuggled goods in the domestic market can have a bigger return than the new anti-corruption programs at
ENTREPRENEURSHIP AND SUSTAINABILITY ISSUES
ISSN 2345-0282 (online) http://jssidoi.org/jesi/
2021 Volume 8 Number 3 (March)
http://doi.org/10.9770/jesi.2021.8.3(25)
Make your research more visible, join the Twitter account of ENTREPRENEURSHIP AND SUSTAINABILITY ISSUES:
@Entrepr69728810
394
customs/border guard service. Considering that the current scale of abuse of official positions is impossible
without the support of political parties, which “got” the customs in the course of inter-fractional agreements.
Respectively, the measures of the government of Ukraine on real counteraction to smuggling – will face the
corresponding critics of the smuggling beneficiaries, media-attacks, and blocking of decisions through the judicial
system, as it currently can be observed with a competition for the position of the head of the customs service. At
the same time, the transition to obligatory storage of primary documents, describing the origin of goods, will
neither bring harm to honest market participants nor contribute the main beneficiaries of smuggling, as a direct
threat to “business.”
Special prevention of customs regulations violations includes measures that directly address the causes and
conditions of customs regulations violations. Special preventive measures are divided into general and individual
measures. General prevention of customs regulations violations concerns a non-personified group. The general
measures of special prevention of customs rules violation should include the following ones: the actions, related
to the development and introduction into practice of technical means of the customs control, introduction of the
newest technologies and achievements of science and technology in the field of computerization; the actions,
related to the improvement of the activity of all subjects of prevention of customs rules violation; measures,
aimed at improvement of professional training, legal and general culture of the customs employees, improvement
of their social and financial support; proper legal support of preventive activity of the subjects, etc. Individual
prevention of crime is characterized as systematic measures of purposeful action on the legal consciousness and
actions of a specific person to prevent its illegal behaviour in the future. This type of the customs rules violations
prevention resides in timely identification of people, who can potentially commit a violation of customs rules; in
conduction of educational impact on such individuals and their micro and macro environment, and consideration
of other measures.
All this allows us to come to a conclusion that it makes sense to consider the mechanism of administrative and
legal prevention and counteraction to customs rules violations through a theoretical analysis of the mechanism of
administrative and legal regulation and as its integral part.
In general, the mechanism of administrative and legal prevention and counteraction to violations of the customs
rules is characterized by the following peculiarities and features: it is a specific set of means (administrative and
legal), the application of which is aimed at regulation of public relations in the area of prevention and
counteraction to the customs rules violations; prevention of the customs rules violations is a set of measures,
which are carried out by specially authorized subjects to prevent causes and conditions, promoting the breach of
the customs rules and prevention of their occurrence in the future.
The administrative and legal mechanism for prevention and counteraction to violations of the customs rules
includes the following elements: the norms of the administrative law; administrative-legal relations;
administrative-legal methods; the procedures for the norms of administrative law implementation.
All this allows us to come to the conclusion that the administrative and legal mechanism on prevention and
counteraction against customs rules violations is a dynamic set of interrelated and interacting administrative and
legal measures, and the means, using which the subjects’ behaviour is set according to the requirements and
permits of legal norms, including three stages: the publication of legal norms, the appearance of specific rights
and responsibilities, and realization of the rights and obligations by the subjects of these relations.
ENTREPRENEURSHIP AND SUSTAINABILITY ISSUES
ISSN 2345-0282 (online) http://jssidoi.org/jesi/
2021 Volume 8 Number 3 (March)
http://doi.org/10.9770/jesi.2021.8.3(25)
Make your research more visible, join the Twitter account of ENTREPRENEURSHIP AND SUSTAINABILITY ISSUES:
@Entrepr69728810
395
It is a complex process, covering a set of operations, aimed at organization of actions, the impact of administrative
law on freedom and the behaviour of the subjects of relations on prevention of offences contributing to the
appearance of legal relations. Considering this, it is possible to distinguish the following elements of the
administrative and legal mechanism on prevention of customs rules violations, namely: the legal norms,
established by laws and by-laws, legal relations, appearing in this area and regulated by the norms of law, as well
as the actions of subjects concerning the implementation of the rights and obligations, specified by the norms of
law. Thus, considering public importance of the above-highlighted problems, these days, there is a need for
regulation of the forms, methods, and types of preventive activity on prevention and counteraction to customs
rules violation as well as the procedure for the implementation of the preventive measures by revenue and tallage
authorities at the regulatory level.
All this allows us to make a conclusion, concerning the formation of the operational priorities for prevention and
counteraction to violations of the customs rules. Thus, we consider it expedient, first of all, to develop and adopt
the “Regulation on the Prevention of the Customs Rules Violations.” This regulation should define the legal and
regulatory framework, main tasks, types, forms and mechanism of application of the main measures to prevent
violations of customs rules. This regulation should clearly determine the legal and regulatory frameworks, main
tasks, forms, and mechanisms of application of the main measures on the customs rules violation prevention.
While developing this regulation, it is advisable to give a detailed description of the main forms, methods, and
objects of individual preventive measures; determine the status and powers of subjects, authorized to implement
individual preventive measures; highlight the main directions for the implementation of the preventive activity,
concerning prevention and counteraction to customs rules violations and fix the main preventive measures in the
Plan of Action of the State Fiscal Service.
5. Discussion
One of the efficient ways to strengthen the fight against the illegal import of goods into the customs territory of
Ukraine is the renewal of criminal responsibility for the smuggling of goods. Since the entry into force of the Law
“On Amendments to Certain Legislative Acts of Ukraine Regarding Humanization of Liability for Offences in the
Sphere of Economic Activity” in the part, considering the terms of removing criminal liability for the smuggling
of goods, the number of such offences has significantly increased.
The strategy, approved by Cabinet of Ministers of Ukraine (CMU), Strategy in the field of combating illicit
production and circulation of tobacco products until 2021 (2017), determines illegal tobacco trade as a threat to
national security, hindering the economic development of the state, and the one, having a negative impact on
Ukraine’s image in the international arena. One of the main directions of this strategy is the introduction of
criminal responsibility for the illegal transfer of tobacco products across the customs border of Ukraine. The
proposal of setting criminal responsibility for “commodity smuggling” was supported in June 2019 by the
interagency working group on coordination of integrated border management (established by the Decree of the
Government of Ukraine of 30.01.2019 № 83) during the consideration of the project a National Integrated Border
Management Strategy for the period up to 2025.
Under such conditions, to increase the efficiency of measures on fighting against smuggling, encouraging of
participants of foreign economic activity to faithful payment of the customs fees, unconditional direction to the
state income of smuggled excisable and other goods; there is the need for establishing criminal liability for
smuggling of excisable and counterfeit goods (products) in large amounts through the addition of the
corresponding group of goods to the objects of crime, specified by the Article 201 of the Criminal Code of
Ukraine.
ENTREPRENEURSHIP AND SUSTAINABILITY ISSUES
ISSN 2345-0282 (online) http://jssidoi.org/jesi/
2021 Volume 8 Number 3 (March)
http://doi.org/10.9770/jesi.2021.8.3(25)
Make your research more visible, join the Twitter account of ENTREPRENEURSHIP AND SUSTAINABILITY ISSUES:
@Entrepr69728810
396
Here, one should also add the need for establishing criminal liability for illegal creation and use of engineering
structures and vehicles for illegal transfer of goods across the state border of Ukraine. In addition, it is advisable
to initiate amendments and additions to other regulations, in particular: to define the concept and list of poisonous
and potent substances; implement the provisions of the Concept of creation and implementation of the automated
system of control over the circulation of excisable goods (alcoholic beverages and tobacco products) “Electronic
excise stamp,” approved by the resolution of the Cabinet of Ministers of Ukraine of 06.07.2016 № 497р.
Organizational plan proposals:
1. The approach to solving the smuggling problem should be multidimensional – cover not only strengthening of
customs and border controls but also include the elimination of the gaps in the internal market, which make it
possible for the smuggling schemes to exist.
2. In real-world terms, the operations against the possibility of selling smuggled goods in the domestic market
through the Special Operations Service has a bigger return than the new anti-corruption programs at customs and
border guards.
3. The situation requires provision of full information exchange between the databases of the customs and border
guard services, as well as compliance with the requirements of the law on the right of duty-free importation of
goods while being abroad for more than 24 hours and entry for no more than once every 72 hours.
4. The anti-smuggling operations on detection of smuggling sources should consider a social aspect, performing
law enforcement and economic functions, more precisely – promote overcoming of unemployment in the border
areas.
5. The system of provision of the customs security of Ukraine should be formed with consideration of the
international experience of the world’s major economies. In this regard, it is necessary to reform the subjects of
customs security provision in Ukraine.
6. It is necessary to broaden the powers, regarding the implementation of law enforcement intelligence-gathering
activities by the customs authorities, and to unify the customs and criminal procedural legislation of Ukraine in
the part, related to the provision of the efficient mechanisms for implementation law enforcement intelligence-
gathering activities by the customs authorities, connected to the crimes, the characteristics of which can be
detected during customs control.
Conclusions
Upon the research results, it is possible to draw the following conclusions.
1. Smuggling in Ukraine has been widespread throughout all period of its independence. The results of the
criminal activity of smugglers found their reflection in all spheres of economic activity of the state.
2. The highest forms of smuggling in Ukraine are one of the components of transnational organized crime
activity.
3. The crimes, which are related to an illegal transfer of cargo across the border of Ukraine, are implemented
through the use of the corruption schemes, including engagement of the officials of the State Fiscal Service of
Ukraine and the State Border Guard Service of Ukraine, and other state bodies as well.
4. Judges in Ukraine often consciously help the criminals to avoid just punishment for crimes, related to
smuggling, which can be qualified as a corruption crime.
5. One of the gaps on the internal market that contributes to smuggling is the right of entities of the simplified
taxation system to sell goods without any primary documentation for them, which would describe the origin of the
products.
ENTREPRENEURSHIP AND SUSTAINABILITY ISSUES
ISSN 2345-0282 (online) http://jssidoi.org/jesi/
2021 Volume 8 Number 3 (March)
http://doi.org/10.9770/jesi.2021.8.3(25)
Make your research more visible, join the Twitter account of ENTREPRENEURSHIP AND SUSTAINABILITY ISSUES:
@Entrepr69728810
397
6. The absence of an obligation from “STS taxpayers” to have the receipt documents for goods in a complex with
the possibility to sell it without cash registers provides favourable grounds for selling any amount of smuggled
goods.
7. The current scale of abuse of official positions would not have been possible without the support of political
parties, which “got” the customs in the course of inter-fractional agreements.
8. The government measures on counteraction to smuggling face the corresponding critics of the smuggling
beneficiaries, media-attacks, and blocking of decisions through the judicial system.
9. Smuggling also flourishes thanks to a longstanding practice of getting additional untaxed income among the
residents in the border areas – smuggling acts as a “living” alternative to employment or legal entrepreneurship.
10. Rough breach of the law in the customs and State Border Guard Service of Ukraine are possible only under
the condition of availability of the corresponding corruption, grounding on the breaches in the information flows
with those states, which are regarded as trade partners of Ukraine.
References
Avdeev, V. A., Rozenko, S. V., Bulygin, A. V., & Byzova, I. G. (2019). Mechanism of Customs-Legal Regulation and Ensuring Economic
Security Taking into Account the Features of the Northern Region. International Journal of Civil Engineering and Technology, 10(2),
1777-1783. Available at: http://www.academia.edu/download/58606192/IJCIET1002173.pdf
Chehabeddine, M., Tvaronavičienė, M. (2020). Securing regional development. Insights into Regional Development, 2(1), 430-442.
http://doi.org/10.9770/IRD.2020.2.1(3)
Danijela, M. (2016). Security roll of the Macedonian customs. European journal of law and political sciences, (4).
Grotteli, M. (2015). The safety and security of international trade as a determinant of the business strategy of the Polish Customs Service.
European Integration Studies, 9(1), 139-154. Available at: https://www.ceeol.com/search/article-detail?id=478127
Kiyanchuk, I. (2017). Influence of customs payments on the economic security of the country, problems and ways of overcoming. Baltic
Journal of Economic Studies, 3(3).
Komarov, O. (2016). Customs control and risk management system on the example of the Ukrainian customs. Customs Scientific Journal
CUSTOMS, 6(2), 85-97.
Kormych, B. (2018). The Modern Trends of Foreign Trade Policy Implementation: Implications for Customs Regulations. Lex Portus, 13,
27. Available at: https://heinonline.org/HOL/LandingPage?handle=hein.journals/lxportus13&div=5&id=&page=
Lay, C., & Astrina, A. R. (2020). The Limits of the Multiple Institutionalization of Border Control: A Case Study of Immigration, Customs,
and the Indonesian Maritime Security Agency in Batam, Indonesia. Pacific Affairs, 93(1), 113-134. Available at:
https://www.ingentaconnect.com/content/paaf/paaf/2020/00000093/00000001/art00006
Masood, O., Javaria, K., Petrenko, Y. (2020). Terrorism activities influence on financial stock markets: an empirical evidence from United
Kingdom, India, France, Pakistan, Spain and America. Insights into Regional Development, 2(1), 443-455.
https://doi.org/10.9770/IRD.2020.2.1(4)
Nguyen, T. C. N., Kettle, M., & Doherty, C. (2019). From form to function: Mobile language resources in the Vietnamese customs setting.
Journal of International and Intercultural Communication, 12(4), 344-363. Available at:
https://www.tandfonline.com/doi/abs/10.1080/17513057.2019.1572208
ENTREPRENEURSHIP AND SUSTAINABILITY ISSUES
ISSN 2345-0282 (online) http://jssidoi.org/jesi/
2021 Volume 8 Number 3 (March)
http://doi.org/10.9770/jesi.2021.8.3(25)
Make your research more visible, join the Twitter account of ENTREPRENEURSHIP AND SUSTAINABILITY ISSUES:
@Entrepr69728810
398
Nowak, T., Sowiński, C., & Czyźowicz, W. (2015). Customs protection of cultural property as part of the security policy of the European
Union. Customs Scientific Journal CUSTOMS, 5(2), 7-16. Available at: https://www.ccjournals.eu/ojs/index.php/customs/article/view/468
Official site of the State Fiscal Service of Ukraine. Available at: http://sfs.gov.ua/diyalnist-/borotba-z-ekonomichnoyu-zlochinnisty%20u-
ta/informatsiya-pro-vjittya-zahodiv-schodo-bo/223549.html
On approval of the Concept of creation and implementation of the automated system of control over the circulation of excisable goods
(alcoholic beverages and tobacco products) “Electronic excise stamp” (2016). Available at: https://zakon.rada.gov.ua/laws/show/497-2016-
р?lang=en#Text
On approval of the Strategy in the field of combating illicit production and circulation of tobacco products until 2021 (2017). Available at:
https://zakon.rada.gov.ua/laws/show/570-2017-р?lang=en#Text
Rogers, T. W., Jaccard, N., Morton, E. J., & Griffin, L. D. (2017). Automated x-ray image analysis for cargo security: Critical review and
future promise. Journal of X-ray science and technology, 25(1), 33-56. Available at: https://content.iospress.com/articles/journal-of-x-ray-
science-and-technology/xst606
Security Service of Ukraine. Available at: https://ssu.gov.ua/
Świerczyńska, J. (2016). The reduction of barriers in customs as one of the measures taken by the customs service in the proces of ensuring
security and safety of trade. Studia Ekonomiczne, 266, 212-222. Available at:
http://yadda.icm.edu.pl/yadda/element/bwmeta1.element.cejsh-6c221efb-5988-47aa-81e1-60f3f6d5d266
The Criminal Code of Ukraine. Available at: https://zakon.rada.gov.ua/laws/show/2341-14?lang=en#Text
van Engelenburg, S., Janssen, M., & Klievink, B. (2019). Design of a software architecture supporting business-to-government information
sharing to improve public safety and security. Journal of Intelligent information systems, 1-24. Available at:
https://link.springer.com/article/10.1007/s10844-017-0478-z
ENTREPRENEURSHIP AND SUSTAINABILITY ISSUES
ISSN 2345-0282 (online) http://jssidoi.org/jesi/
2021 Volume 8 Number 3 (March)
http://doi.org/10.9770/jesi.2021.8.3(25)
Make your research more visible, join the Twitter account of ENTREPRENEURSHIP AND SUSTAINABILITY ISSUES:
@Entrepr69728810
399
Anatolii KULISH, Doctor of Science of Law, Professor, Sumy State University
ORCID ID: orcid.org/0000-0003-2700-483X
Oleksandr YUNIN, Doctor of Legal Sciences, Professor, Dnipropetrovsk State University of Internal Affairs
ORCID ID: orcid.org/0000-0003-4846-2573
Olha US, Yaroslav Mudryi National Law University
ORCID ID: orcid.org/0000-0002-9035-822Х
Iryna SHAPOVALOVA, Candidate of Law, Professor, National Academy of Management
ORCID ID: orcid.org/0000-0002-9145-8994
Ivan YAROMII, PhD in Law, Dnipropetrovsk State University of Internal Affairs
ORCID ID: orcid.org/0000-0002-0879-500X
Copyright © 2021 by author(s) and VsI Entrepreneurship and Sustainability Center
This work is licensed under the Creative Commons Attribution International License (CC BY).
http://creativecommons.org/licenses/by/4.0/
ENTREPRENEURSHIP AND SUSTAINABILITY ISSUES
ISSN 2345-0282 (online) http://jssidoi.org/jesi/
2021 Volume 8 Number 3 (March)
http://doi.org/10.9770/jesi.2021.8.3(26)
Publisher http://jssidoi.org/esc/home
402
MECHANISM OF FORMATION OF INNOVATION SECURITY AND ACTIVATION OF
INNOVATION ACTIVITY OF CORPORATIONS
Kostiantyn Buhaichuk ¹*, Nataliia Varenia ², Vitalii Khodanovych 3, Maryna Kriepakova 4,
Valentyn Seredynskyi 5
1*,4 Kharkiv National University of Internal Affairs, Lieutenant Colonel of Police, Lev Landau Avenue, 27, Kharkiv, 61000, Ukraine 2,3 National Academy of Security Service of Ukraine, 22, Maksymovycha str., Kyiv, 03022, Ukraine
5 Investigative Department of the DVP GUNP in Dnipropetrovsk region, Troitskaya square, 2a, Dnipro, 49000, Ukraine
E-mail: 1* buhaichuk @i.ua (Corresponding author)
Received 15 March 2020; accepted 8 January 2021; published 30 March 2021
Abstract. It has been proven that international migration is a global challenge to the national security of each country. The statistical
analysis of migration processes in Ukraine has been carried out. Special features of legal regulation of migration flows in Ukraine have
been considered. Migration control concerning transit migration in Ukraine is mainly related to the system of restrictions and measures of
responsibility for non-compliance with established norms, and at the same time it is more important to ensure the legal stay of foreign
citizens in the country, proper legal regulation of their accounting. Instead, Ukrainian case law and judgments of the European Court of
Human Rights concerning Ukraine indicate existing violations in the procedure of state protection of the rights and freedoms of foreigners
and stateless persons, which they are endowed with in accordance with international standards and national legislation while in Ukraine.
One of the problems of migration control in Ukraine is the imperfection of the procedure for registration of citizens at the place of
residence, which does not meet the state need to control the processes of population movement and migration within the country. Currently,
the basis for registration is not the fact of living in a dwelling, but rather the right to reside in it, as the registration procedure involves the
submission of supporting documents for such right. Moreover, living of citizens without registration of residence is an offense and entails
the occurrence of administrative liability, while living outside the place of registration is legal.
Keywords: national security; migration flows; migration control; administrative responsibility; transit migration
Reference to this paper should be made as follows: Buhaichuk, K., Varenia, N., Khodanovych, V., Kriepakova, M., Seredynskyi, V. 2021.
Smuggling as a threat to economic security of the state. Entrepreneurship and Sustainability Issues, 8(3), 402-419.
http://doi.org/10.9770/jesi.2021.8.3(26)
JEL Classifications: F35, F42
ENTREPRENEURSHIP AND SUSTAINABILITY ISSUES
ISSN 2345-0282 (online) http://jssidoi.org/jesi/
2021 Volume 8 Number 3 (March)
http://doi.org/10.9770/jesi.2021.8.3(26)
Make your research more visible, join the Twitter account of ENTREPRENEURSHIP AND SUSTAINABILITY ISSUES:
@Entrepr69728810
403
1. Introduction
Modern migration policy is mainly focused on eliminating threats related to security, primarily national, as well
as personal security (citizens and newly arrived members of the immigration society), especially when it comes to
such a subdivision of migration policy as the policy of adaptation of immigrants, which, albeit at a slow pace, but
still developing in modern recipient countries of migrants. However, with successful cooperation in the regulation
of migration processes, both with traditional and preventive measures, we can talk about combating the threats
posed by the intensification of uncontrolled processes of international migration for security at the international
(global) level.
The unparalleled importance of the issue under study is also confirmed by the content of the Association
Agreement between Ukraine, on the one hand, and the European Union, the European Atomic Energy
Community and their member states, on the other, which stipulates the importance of joint management of
migration flows between territories and and a comprehensive dialogue on all issues in the field of migration,
including illegal migration, legal migration, smuggling and trafficking in human beings, as well as the inclusion
of problematic issues in national strategies for the economic and social development of migrant regions.
The special importance of migration control problems is also reflected in the national legislation by the fact that in
accordance with the provisions of the Constitution of Ukraine only the laws of Ukraine determine the principles
of regulation of demographic and migration processes, as well as the formation and operation of free and other
special zones that have an economic or migration regime different from the general one. In our opinion, it is with
this that the need for scientific studies in the relevant field, the development of scientific tools, clear legal
categories, the conceptual framework of the relevant processes is related.
The purpose of the paper is a theoretical justification, development of scientific and methodological principles
and practical solutions focused on improving the system of regulation of international migration in the context of
globalization.
2. Literature Survey
As an economic category, international migration is a direct manifestation of the existence of the international
(world) labor market, which is developing due to the uneven distribution of labor resources between countries.
Personel is recruited in countries where the demand for labor of the appropriate level of education and with the
necessary skills and professional competencies exceeds its supply. In the event that an employee is unable to
realize his or her potential, he or she seeks to move to a country where there is a vacancy commensurate with his
or her level of professional competence. If a country is unable to provide adequate jobs for workers in the national
labor market, there is a phenomenon of outflow of personnel.
The intensification of migration processes in the world economy is due to several reasons:
1) the tendency to increased contrast in the levels of economic and social development of exporting and importing
countries of labor and population (Tymchyk (2014));
2) the growth of international capital movement and the functioning of transnational corporations that promote the
union of labor and capital (Turetska (2018));
3) demographic crisis in developed countries, which is manifested in a reduction in the number of able-bodied
ENTREPRENEURSHIP AND SUSTAINABILITY ISSUES
ISSN 2345-0282 (online) http://jssidoi.org/jesi/
2021 Volume 8 Number 3 (March)
http://doi.org/10.9770/jesi.2021.8.3(26)
Make your research more visible, join the Twitter account of ENTREPRENEURSHIP AND SUSTAINABILITY ISSUES:
@Entrepr69728810
404
people and an increase in the elderly (Vasylchenko (2014));
4) the presence of a large number of low-prestige jobs in services, health care, construction, agriculture, etc.
where the natives are reluctant to work (Levenets (2017))
5) the presence and intensity of information communications between countries or their absence (Reznik, et. al.
(2020); Chehabeddine &Tvaronavičienė (2020));
6) interethnic, religious, political problems, etc. (Hrabylnikov (2015); Lincényi, & Laczko (2020)).
In scientific papers, regulations, you can find different interpretations of the concept of labor migration (Hula,
(2018)). In the most general sense, labor migration is considered as the movement of population outside certain
territories within the country or abroad due to changes in employment and residence.
As a social phenomenon, migration includes three parameters: change of coordinates of his or her location by a
person (mobility factor), intentions of a person to improve his or her material and social condition (need factor)
and attempts of a person to settle in a new place and consider it his or her "second home" (stability factor).
In the scientific literature, in the study of the migration regime of stay of foreign citizens and stateless persons in
Ukraine the promising components are the following (Belevtseva, 2019):
- legal regime of "transnational corridors" and transit of foreign citizens through the territory of Ukraine;
- legal standing of compatriots who voluntarily relocate from abroad and other foreign citizens temporarily
residing in Ukraine;
- legal regime of border areas.
In this study, the issues of migration control are subject to analysis, namely, by keeping records of foreign citizens
and stateless persons. Therefore, our study will not relate to the regime of border areas.
Based on the study and analysis of the literature on the subject of the publication, it can be argued that the
relationship between international migration and security issues remain poorly studied today, in contrast to the
issues of migration processes themselves and security issues, which have long been considered mainly in the
military dimension.
3. Methods
The theoretical-methodological basis of the paper are the basic factors of economics. Various study methods were
used to solve the set tasks, in particular, system analysis (for theoretical-methodological substantiation of factors
and consequences of migration); graphic analysis (to assess the dynamics of international labor migration);
statistical analysis (to calculate the balance of migration, gross migration, coefficients of departure, arrival and
migration turnover); grouping.
The accuracy of the study results is provided by a comprehensive use of general and special scientific methods of
cognition. The methodological basis is a dialectical general scientific method of cognition, which was used in the
study of the development of doctrine of control activities in the area of migration. The method of semantic
analysis was used to clarify the content of such concepts as "migration", "control", "migration control",
"registration", "accounting", "verification", "passport", "form of control", "method of control" , etc., and the
formal-logical method was used in distinguishing similar concepts. Modeling and forecasting method was used
when developing provisions for reforming the procedure for registration of citizens at the place of residence or
stay. Methods of analysis and synthesis were used in the development of proposals to improve the legislation. The
above methods were used in the study with the purpose of ensuring its comprehensiveness.
ENTREPRENEURSHIP AND SUSTAINABILITY ISSUES
ISSN 2345-0282 (online) http://jssidoi.org/jesi/
2021 Volume 8 Number 3 (March)
http://doi.org/10.9770/jesi.2021.8.3(26)
Make your research more visible, join the Twitter account of ENTREPRENEURSHIP AND SUSTAINABILITY ISSUES:
@Entrepr69728810
405
The theoretical foundations of the study were laid down by the fundamental achievements of scientists in the field
of general theory of state and law, management theory, constitutional, administrative law and process (justice)
and other branches of law formulated in the works of specialists, as well as encyclopedic legal literature.
The normative basis of the work is the Constitution of Ukraine, Laws of Ukraine, acts of the President of Ukraine,
the Cabinet of Ministers of Ukraine, central executive bodies, international normative legal acts, the binding
nature of which has been approved by the Verkhovna Rada of Ukraine.
The empirical basis of the study consists of law enforcement acts of government entities, court decisions,
reference and statistical materials, etc.
4. Results
While analyzing the so-called transit migration, it should be noted that in Ukraine control measures are mainly
related to the system of restrictions and liability for non-compliance with established norms. At the same time, in
our opinion, it is more important to ensure the legal stay of foreign citizens on the territory of the state, so the
issue of their registration, ensuring their rights and freedoms, which they are entitled to in accordance with
international standards and national legislation when in Ukraine is more significant. Here it is also necessary to
refer to the definition of "legal migration".
The legislation does not define this, but gives the definition of "illegal migrant", i.e., a foreigner or a stateless
person who have crossed the state border outside checkpoints or at checkpoints, but with the avoidance of border
control and did not immediately apply for refugee status or asylum in Ukraine, as well as a foreigner or a stateless
person who legally arrived in Ukraine, but after the expiration of the period of their stay lost the grounds for
further stay and evade leaving Ukraine (Law of Ukraine ‘On the Legal Status of Foreigners and Stateless Persons’
(2011)).
Accordingly, a foreigner, if he or she lives in Ukraine and does not meet the standard criteria, is a legal migrant.
In general, the administrative and legal status of foreign citizens and stateless persons is established by the Law of
Ukraine "On the Legal Status of Foreigners and Stateless Persons", the Convention on the Status of Refugees, the
Convention on the Status of Stateless Persons, the Declaration of the Human Rights as regards the persons who
are not the citizens of the country, in which they reside, and other laws and regulations.
The law defines a number of grounds for the stay of foreigners and stateless persons on the territory of Ukraine
(Law of Ukraine ‘On the Legal Status of Foreigners and Stateless Persons’ (2011)).
Firstly, foreigners and stateless persons may, in accordance with the Law of Ukraine ‘On Immigration’ (2001),
immigrate to Ukraine for permanent residence. The above law determines immigration as arrival in Ukraine or
stay in Ukraine of foreigners and stateless persons for permanent residence in accordance with the order
established by the law (Article 1 of the Law "On Immigration").
Secondly, foreigners and stateless persons may be recognized as refugees or granted asylum in Ukraine, in which
case they are considered to be permanent residents of Ukraine, as evidenced by a refugee certificate.
Thirdly, there are foreigners and stateless persons who came to Ukraine to participate in the implementation of
international technical assistance projects, in order to preach religious beliefs, to participate in the activities of
branches, offices, representative offices and other structural units of public (non-governmental) organizations of
ENTREPRENEURSHIP AND SUSTAINABILITY ISSUES
ISSN 2345-0282 (online) http://jssidoi.org/jesi/
2021 Volume 8 Number 3 (March)
http://doi.org/10.9770/jesi.2021.8.3(26)
Make your research more visible, join the Twitter account of ENTREPRENEURSHIP AND SUSTAINABILITY ISSUES:
@Entrepr69728810
406
foreign countries, for carrying out cultural, scientific, educational activity on the grounds and in the order
established by the international agreements of Ukraine or special programs, for the purpose of education or
employment, for work as the correspondent or the representative of foreign mass media. Such persons receive a
temporary residence permit and are considered to be legally present on the territory of Ukraine for the period of
validity of the circumstances that caused the stay.
Fourthly, foreigners and stateless persons who arrived in Ukraine for the purpose of family reunification with
persons who are citizens of Ukraine, or who while staying legally on the territory of Ukraine married Ukrainian
citizens and received temporary residence permit are considered to be legally present on the territory of Ukraine
for the period prior to obtaining an immigration permit (Article 4 of the Law "On the Legal Status of Foreigners
and Stateless Persons").
Thus, foreigners and stateless persons can stay in our country for different periods (both permanently and
temporarily) and for different purposes, the legal regulation of their status allows to distinguish three groups of
persons:
1) persons permanently residing on the territory of Ukraine;
2) persons temporarily residing on the territory of Ukraine;
3) refugees and asylum seekers.
Consequently, it is just in this order that the legal regulation of their registration by the national law will be
studied. However, due to the fact that the mechanisms of registration and control of persons permanently residing
in Ukraine coincide with those applied to persons temporarily staying in Ukraine, their analysis will be conducted
simultaneously.
Permanent residence of foreigners in Ukraine is related to such concept as "immigration" and is regulated by the
Law of Ukraine "On Immigration" (2001). Immigration permit is issued within the immigration quota set by the
Cabinet of Ministers of Ukraine for the following categories of immigrants:
1) workers of science and culture, whose immigration meets the interests of Ukraine;
2) highly qualified specialists and workers, the urgent need for which is considerable for the economy of Ukraine;
3) persons who have made a foreign investment in the economy of Ukraine in a foreign convertible currency in
the amount of not less than 100 (one hundred) thousand US dollars;
4) persons who are full brothers or sisters, grandparents, grandson or granddaughter of citizens of Ukraine;
5) persons who were previously citizens of Ukraine;
6) parents, husband (wife) of an immigrant and his minor children;
7) persons who have continuously resided on the territory of Ukraine for three years from the date of establishing
their status as a victim of human trafficking;
8) persons who have served in the Armed Forces of Ukraine for three or more years.
So, for example, for 2019 the government established the following quotas of immigration to Ukraine by
categories of immigrants (region-wise): workers of science and culture — 280; highly qualified specialists and
workers — 4; persons who have made a foreign investment in the economy of Ukraine — without restrictions;
persons who are full brothers or sisters, grandparents, grandson or granddaughter of citizens of Ukraine — 875;
persons who were previously citizens of Ukraine — 498; parents, husband (wife) of an immigrant and his minor
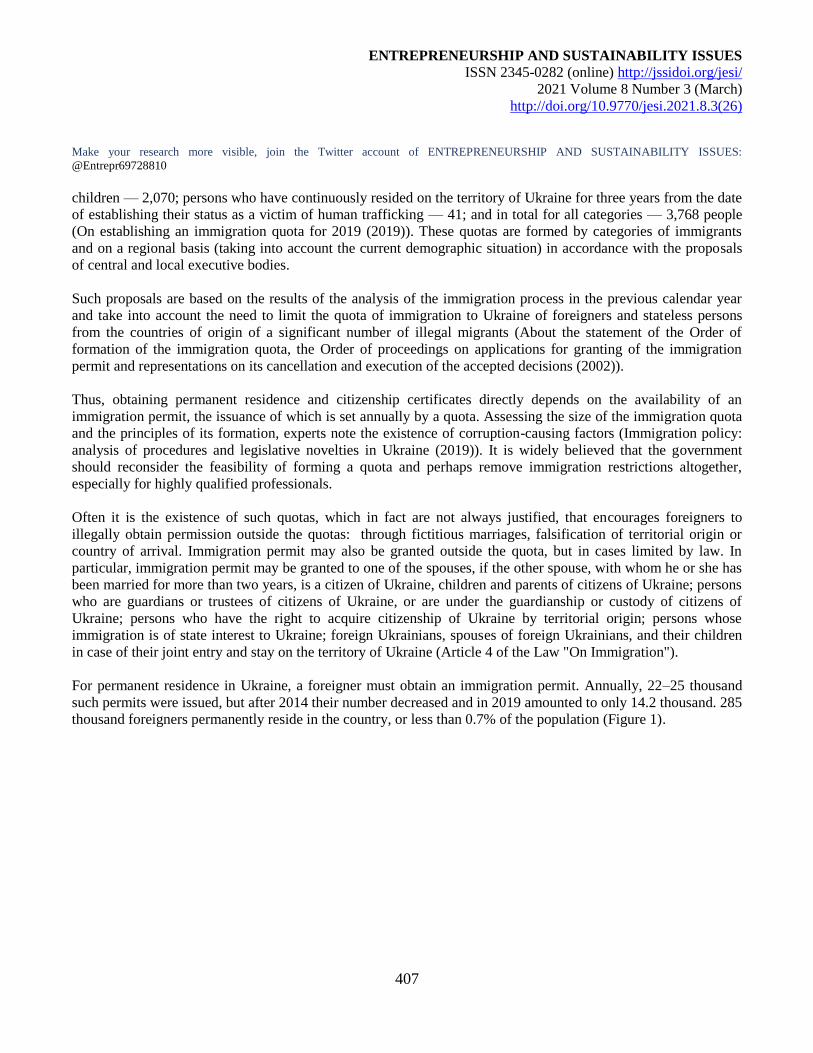
ENTREPRENEURSHIP AND SUSTAINABILITY ISSUES
ISSN 2345-0282 (online) http://jssidoi.org/jesi/
2021 Volume 8 Number 3 (March)
http://doi.org/10.9770/jesi.2021.8.3(26)
Make your research more visible, join the Twitter account of ENTREPRENEURSHIP AND SUSTAINABILITY ISSUES:
@Entrepr69728810
407
children — 2,070; persons who have continuously resided on the territory of Ukraine for three years from the date
of establishing their status as a victim of human trafficking — 41; and in total for all categories — 3,768 people
(On establishing an immigration quota for 2019 (2019)). These quotas are formed by categories of immigrants
and on a regional basis (taking into account the current demographic situation) in accordance with the proposals
of central and local executive bodies.
Such proposals are based on the results of the analysis of the immigration process in the previous calendar year
and take into account the need to limit the quota of immigration to Ukraine of foreigners and stateless persons
from the countries of origin of a significant number of illegal migrants (About the statement of the Order of
formation of the immigration quota, the Order of proceedings on applications for granting of the immigration
permit and representations on its cancellation and execution of the accepted decisions (2002)).
Thus, obtaining permanent residence and citizenship certificates directly depends on the availability of an
immigration permit, the issuance of which is set annually by a quota. Assessing the size of the immigration quota
and the principles of its formation, experts note the existence of corruption-causing factors (Immigration policy:
analysis of procedures and legislative novelties in Ukraine (2019)). It is widely believed that the government
should reconsider the feasibility of forming a quota and perhaps remove immigration restrictions altogether,
especially for highly qualified professionals.
Often it is the existence of such quotas, which in fact are not always justified, that encourages foreigners to
illegally obtain permission outside the quotas: through fictitious marriages, falsification of territorial origin or
country of arrival. Immigration permit may also be granted outside the quota, but in cases limited by law. In
particular, immigration permit may be granted to one of the spouses, if the other spouse, with whom he or she has
been married for more than two years, is a citizen of Ukraine, children and parents of citizens of Ukraine; persons
who are guardians or trustees of citizens of Ukraine, or are under the guardianship or custody of citizens of
Ukraine; persons who have the right to acquire citizenship of Ukraine by territorial origin; persons whose
immigration is of state interest to Ukraine; foreign Ukrainians, spouses of foreign Ukrainians, and their children
in case of their joint entry and stay on the territory of Ukraine (Article 4 of the Law "On Immigration").
For permanent residence in Ukraine, a foreigner must obtain an immigration permit. Annually, 22–25 thousand
such permits were issued, but after 2014 their number decreased and in 2019 amounted to only 14.2 thousand. 285
thousand foreigners permanently reside in the country, or less than 0.7% of the population (Figure 1).
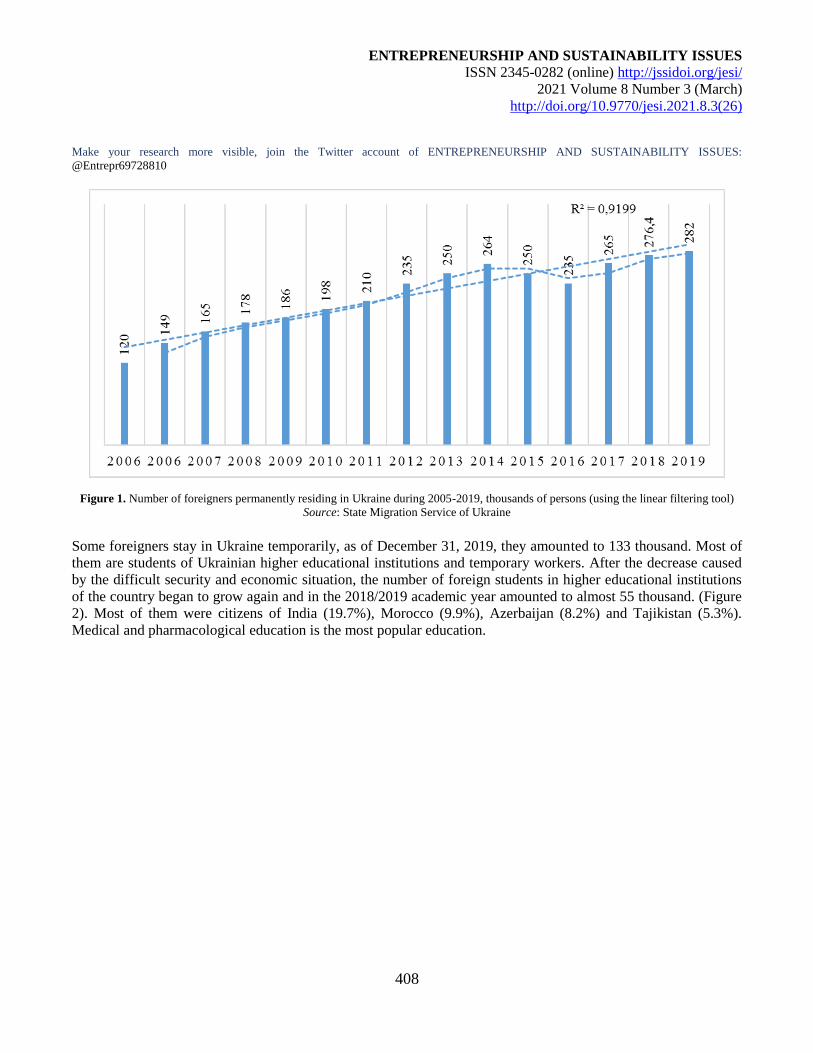
ENTREPRENEURSHIP AND SUSTAINABILITY ISSUES
ISSN 2345-0282 (online) http://jssidoi.org/jesi/
2021 Volume 8 Number 3 (March)
http://doi.org/10.9770/jesi.2021.8.3(26)
Make your research more visible, join the Twitter account of ENTREPRENEURSHIP AND SUSTAINABILITY ISSUES:
@Entrepr69728810
408
Figure 1. Number of foreigners permanently residing in Ukraine during 2005-2019, thousands of persons (using the linear filtering tool)
Source: State Migration Service of Ukraine
Some foreigners stay in Ukraine temporarily, as of December 31, 2019, they amounted to 133 thousand. Most of
them are students of Ukrainian higher educational institutions and temporary workers. After the decrease caused
by the difficult security and economic situation, the number of foreign students in higher educational institutions
of the country began to grow again and in the 2018/2019 academic year amounted to almost 55 thousand. (Figure
2). Most of them were citizens of India (19.7%), Morocco (9.9%), Azerbaijan (8.2%) and Tajikistan (5.3%).
Medical and pharmacological education is the most popular education.
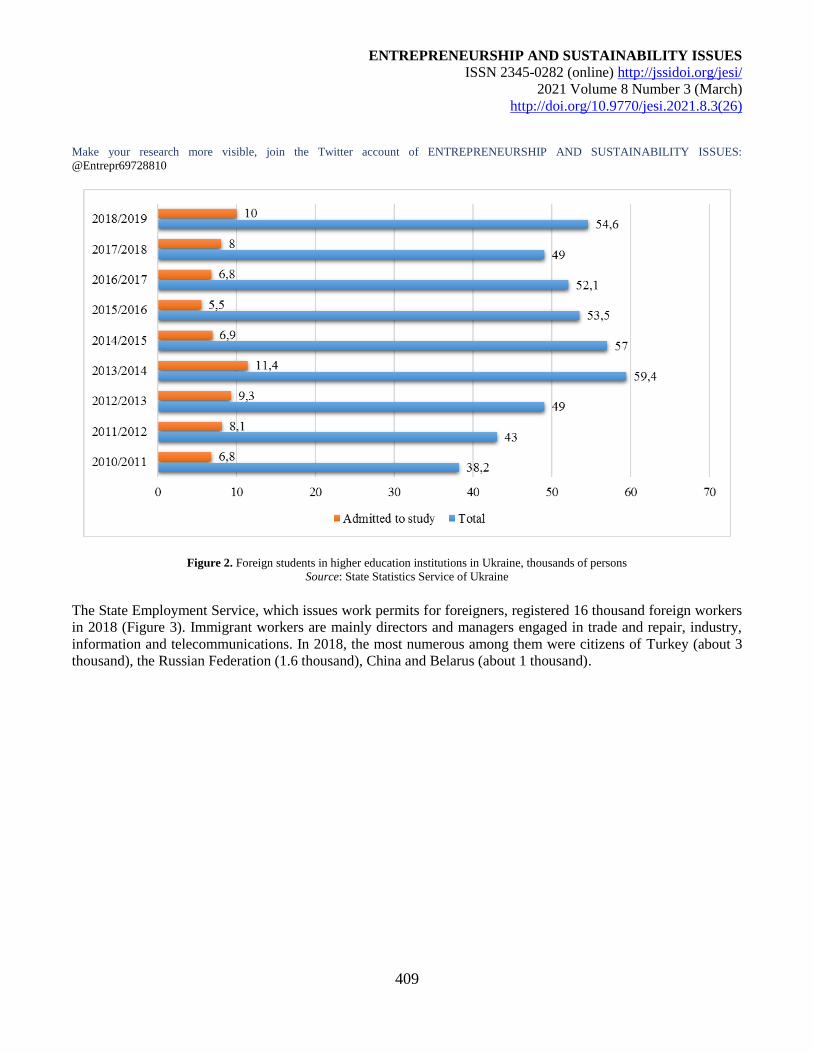
ENTREPRENEURSHIP AND SUSTAINABILITY ISSUES
ISSN 2345-0282 (online) http://jssidoi.org/jesi/
2021 Volume 8 Number 3 (March)
http://doi.org/10.9770/jesi.2021.8.3(26)
Make your research more visible, join the Twitter account of ENTREPRENEURSHIP AND SUSTAINABILITY ISSUES:
@Entrepr69728810
409
Figure 2. Foreign students in higher education institutions in Ukraine, thousands of persons
Source: State Statistics Service of Ukraine
The State Employment Service, which issues work permits for foreigners, registered 16 thousand foreign workers
in 2018 (Figure 3). Immigrant workers are mainly directors and managers engaged in trade and repair, industry,
information and telecommunications. In 2018, the most numerous among them were citizens of Turkey (about 3
thousand), the Russian Federation (1.6 thousand), China and Belarus (about 1 thousand).
ENTREPRENEURSHIP AND SUSTAINABILITY ISSUES
ISSN 2345-0282 (online) http://jssidoi.org/jesi/
2021 Volume 8 Number 3 (March)
http://doi.org/10.9770/jesi.2021.8.3(26)
Make your research more visible, join the Twitter account of ENTREPRENEURSHIP AND SUSTAINABILITY ISSUES:
@Entrepr69728810
410
Figure 3. Number of foreigners who temporarily worked in Ukraine with an employment permit at the end of the year, thousands of
persons
Source: Ministry of Social Policy of Ukraine
Another group of foreigners in Ukraine are refugees and persons who have been granted subsidiary protection. As
of December 2019, 2,096 foreigners with the appropriate status resided in the country. Most of them are from
Afghanistan (985 people) and Syria (446 people), as well as from some CIS countries, including Armenia (188
people) and the Russian Federation (135 people).
During 2019, 1,443 applications for international protection were filed, and 93 decisions on granting refugee
status or subsidiary protection were made (Figure 4).
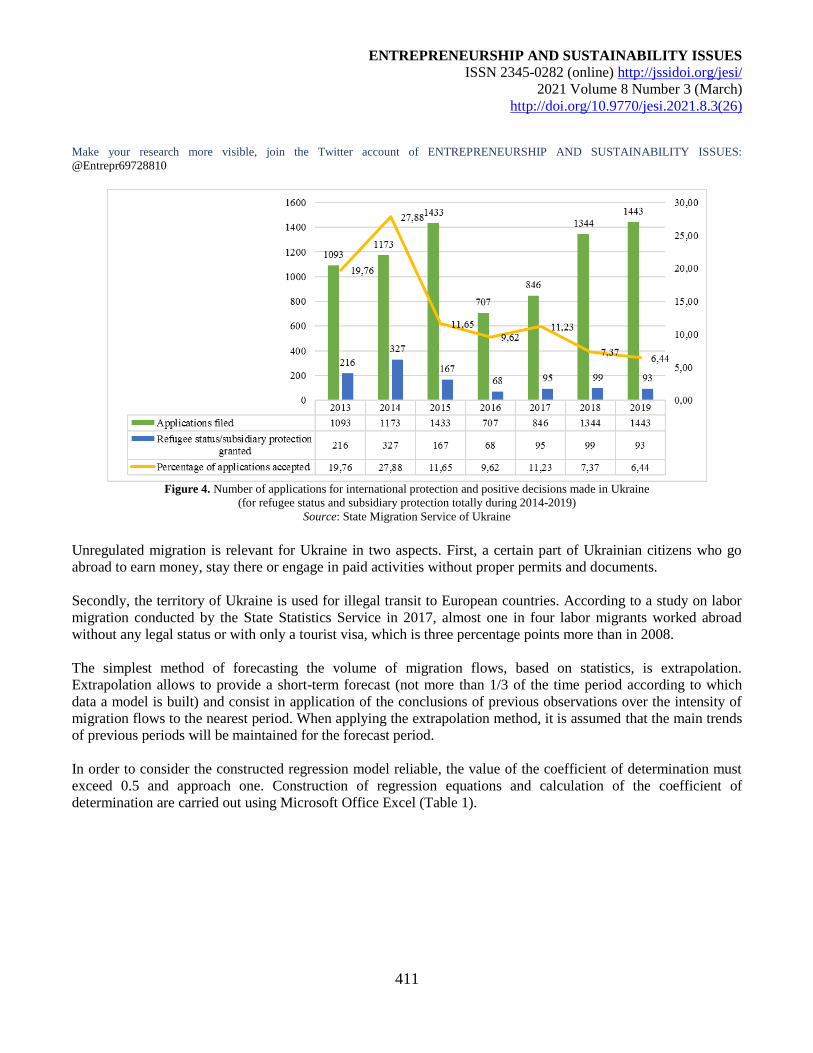
ENTREPRENEURSHIP AND SUSTAINABILITY ISSUES
ISSN 2345-0282 (online) http://jssidoi.org/jesi/
2021 Volume 8 Number 3 (March)
http://doi.org/10.9770/jesi.2021.8.3(26)
Make your research more visible, join the Twitter account of ENTREPRENEURSHIP AND SUSTAINABILITY ISSUES:
@Entrepr69728810
411
Figure 4. Number of applications for international protection and positive decisions made in Ukraine
(for refugee status and subsidiary protection totally during 2014-2019)
Source: State Migration Service of Ukraine
Unregulated migration is relevant for Ukraine in two aspects. First, a certain part of Ukrainian citizens who go
abroad to earn money, stay there or engage in paid activities without proper permits and documents.
Secondly, the territory of Ukraine is used for illegal transit to European countries. According to a study on labor
migration conducted by the State Statistics Service in 2017, almost one in four labor migrants worked abroad
without any legal status or with only a tourist visa, which is three percentage points more than in 2008.
The simplest method of forecasting the volume of migration flows, based on statistics, is extrapolation.
Extrapolation allows to provide a short-term forecast (not more than 1/3 of the time period according to which
data a model is built) and consist in application of the conclusions of previous observations over the intensity of
migration flows to the nearest period. When applying the extrapolation method, it is assumed that the main trends
of previous periods will be maintained for the forecast period.
In order to consider the constructed regression model reliable, the value of the coefficient of determination must
exceed 0.5 and approach one. Construction of regression equations and calculation of the coefficient of
determination are carried out using Microsoft Office Excel (Table 1).
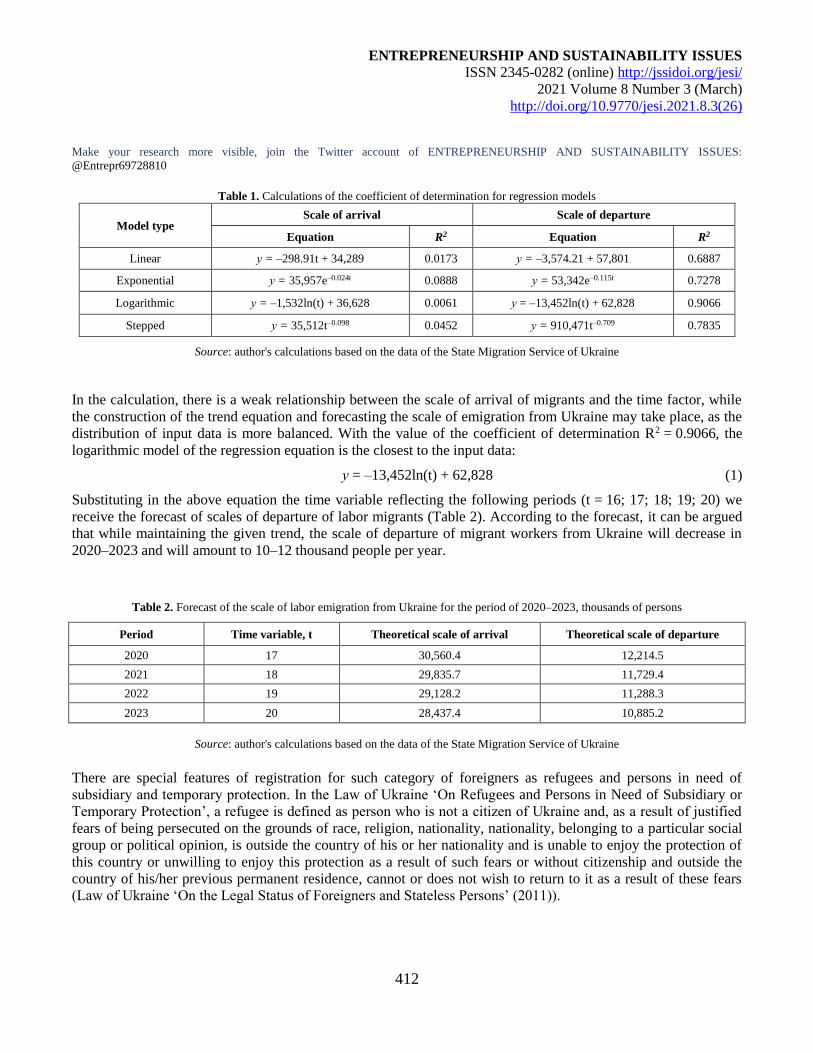
ENTREPRENEURSHIP AND SUSTAINABILITY ISSUES
ISSN 2345-0282 (online) http://jssidoi.org/jesi/
2021 Volume 8 Number 3 (March)
http://doi.org/10.9770/jesi.2021.8.3(26)
Make your research more visible, join the Twitter account of ENTREPRENEURSHIP AND SUSTAINABILITY ISSUES:
@Entrepr69728810
412
Table 1. Calculations of the coefficient of determination for regression models
Model type Scale of arrival Scale of departure
Equation R2 Equation R2
Linear у = –298.91t + 34,289 0.0173 у = –3,574.21 + 57,801 0.6887
Exponential у = 35,957e–0.024t 0.0888 у = 53,342e–0.115t 0.7278
Logarithmic у = –1,532ln(t) + 36,628 0.0061 у = –13,452ln(t) + 62,828 0.9066
Stepped у = 35,512t–0.098 0.0452 у = 910,471t–0.709 0.7835
Source: author's calculations based on the data of the State Migration Service of Ukraine
In the calculation, there is a weak relationship between the scale of arrival of migrants and the time factor, while
the construction of the trend equation and forecasting the scale of emigration from Ukraine may take place, as the
distribution of input data is more balanced. With the value of the coefficient of determination R2 = 0.9066, the
logarithmic model of the regression equation is the closest to the input data:
у = –13,452ln(t) + 62,828 (1)
Substituting in the above equation the time variable reflecting the following periods (t = 16; 17; 18; 19; 20) we
receive the forecast of scales of departure of labor migrants (Table 2). According to the forecast, it can be argued
that while maintaining the given trend, the scale of departure of migrant workers from Ukraine will decrease in
2020–2023 and will amount to 10–12 thousand people per year.
Table 2. Forecast of the scale of labor emigration from Ukraine for the period of 2020–2023, thousands of persons
Period Time variable, t Theoretical scale of arrival Theoretical scale of departure
2020 17 30,560.4 12,214.5
2021 18 29,835.7 11,729.4
2022 19 29,128.2 11,288.3
2023 20 28,437.4 10,885.2
Source: author's calculations based on the data of the State Migration Service of Ukraine
There are special features of registration for such category of foreigners as refugees and persons in need of
subsidiary and temporary protection. In the Law of Ukraine ‘On Refugees and Persons in Need of Subsidiary or
Temporary Protection’, a refugee is defined as person who is not a citizen of Ukraine and, as a result of justified
fears of being persecuted on the grounds of race, religion, nationality, nationality, belonging to a particular social
group or political opinion, is outside the country of his or her nationality and is unable to enjoy the protection of
this country or unwilling to enjoy this protection as a result of such fears or without citizenship and outside the
country of his/her previous permanent residence, cannot or does not wish to return to it as a result of these fears
(Law of Ukraine ‘On the Legal Status of Foreigners and Stateless Persons’ (2011)).
ENTREPRENEURSHIP AND SUSTAINABILITY ISSUES
ISSN 2345-0282 (online) http://jssidoi.org/jesi/
2021 Volume 8 Number 3 (March)
http://doi.org/10.9770/jesi.2021.8.3(26)
Make your research more visible, join the Twitter account of ENTREPRENEURSHIP AND SUSTAINABILITY ISSUES:
@Entrepr69728810
413
Separately, it should be noted that the legislator identified just a justified fear of becoming a victim of persecution
as a key criterion for characterizing a refugee. This criterion is detailed in the national judicial practice (On the
Judicial Practice of Considering Disputes Concerning Refugee Status and a Person in Need of Additional or
Temporary Protection, Forced Return and Compulsory Expulsion of a Foreigner or a Stateless Person from
Ukraine and Disputes Related to the Stay of a Foreigner and a Stateless Person in Ukraine (2009)) and consists of
subjective and objective sides. The subjective side lies in the fact that a person has this fear. Fear is an evaluative
judgment that indicates psychological assessment of the surrounding situation by a person. Influenced by this
subjective assessment, a person decided to leave the country and became a refugee. Subjective assessment
depends on a person, and what is the norm for one person may be intolerable for another. Fear is based not only
on the fact that a person has personally suffered from actions that forced him or her to leave the country, i.e., this
fear may arise not from the own experience of refugee, but from the experience of others (relatives, friends and
other members of the same racial or social group, etc.).
The objective side is related to the existence of a justified fears of persecution and means that there is factual
evidence that these fears are real. When recognizing the status of refugee, the situation in the country of origin is
an evidence of the fact that subjective fears of being persecuted are justified, i.e., supported by an objective
situation in the country and a history that has taken place personally with an applicant.
A person in need of subsidiary protection is recognized as not being a refugee under the Convention relating to
the Status of Refugees (1951) and the Protocol relating to the Status of Refugees (1967) and national legislation,
but in need of protection because the person was forced to come to Ukraine or stay in Ukraine as a result of
threats to life, security or liberty in the country of origin for fear of the death penalty or torture, inhuman or
degrading treatment or punishment or widespread violence in situations of international or internal armed conflict
or systematic violation of human rights and is unable or unwilling to return to such country as result of these
fears. Persons in need of temporary protection include foreigners and stateless persons who are massively forced
to seek protection in Ukraine as a result of external aggression, foreign occupation, civil war, ethnic clashes,
natural or man-made disasters or other events that disturb public order in a particular area or on all territory of the
country of origin (Law of Ukraine ‘On the Legal Status of Foreigners and Stateless Persons’ (2011)).
The issue of subsidiary and temporary protection has arisen and has been addressed in national legislation, as
noted in certain scientific studies, due to the lack of clear and understandable criteria for granting the status of
refugees to third-country nationals (Mushak (2015)). However, it is difficult to agree with this, as among the
sources of legal regulation there are not only national legal acts, but also international acts and sources of soft law,
which are widely used in the justification of decisions of national courts.
Thus, the definition of concepts and their characteristics is contained in Council Directive 2004/83/EC of 29 April
2004 on minimum standards for the qualification and status of third-country nationals and stateless persons as
refugees or otherwise in need of international protection, as well as the essence of guaranteed protection. This act
stipulates that applications for the relevant status are justified if the following conditions are met: the applicant
made a real attempt to substantiate his or her application; all the important facts at his disposal were provided and
there was a satisfactory explanation as to any absence of other important facts; the allegations of the applicant are
clear and plausible and do not contradict the specific and general information in his case; the applicant has filed
his application for international protection as soon as possible if the applicant cannot prove the absence of a valid
reason for filing such application; it is established that, in general, the applicant is credible (Council Directive
2004/83/EC of 29 April 2004 on minimum standards for the qualifications and status of third country nationals or
ENTREPRENEURSHIP AND SUSTAINABILITY ISSUES
ISSN 2345-0282 (online) http://jssidoi.org/jesi/
2021 Volume 8 Number 3 (March)
http://doi.org/10.9770/jesi.2021.8.3(26)
Make your research more visible, join the Twitter account of ENTREPRENEURSHIP AND SUSTAINABILITY ISSUES:
@Entrepr69728810
414
stateless persons as refuges or as persons who otherwise need international protection and the content of the
protection granted).
Another important soft law instrument is the Directive of the European Parliament and of the Council «On
common procedures for granting and withdrawing international protection», which aims to establish common
procedures for granting and withdrawing international protection, which member states must follow or introduce
more favorable procedures, which are comparable to those defined by the relevant directive (Directive
2013/32/EU of the European Parliament and of the Council of 26 June 2013 on common procedures for granting
and withdrawing international protection.). A separate directive defines common standards and procedures
applicable to the return of persons illegally staying on the territory of third countries (Law of Ukraine ‘On the
Single State Demographic Register and the Documents that Confirm the Citizenship of Ukraine, Identify a Person
or its Special Status’ (2013)).
The peculiarity of their registration is that not only persons who have been granted the status, but all those who
have applied for recognition as a refugee or a person in need of subsidiary protection are subject to centralized
registration and entering information into the relevant centralized information system. Therefore, it is worth
examining the whole procedure of recognition as a refugee or a person in need of subsidiary protection.
The existing violations in the procedure of acquiring special legal status are evidenced by the case law and
decisions of the European Court of Human Rights concerning our state. Thus, in the decision in the case of Kebe
and Others v. Ukraine (Case of Kebe and Others v. Ukraine: Judgment of the European Court of Human Rights of
1 December 2017. 2552/12.), it was established that border guards did not provide an opportunity for foreigners to
apply for refugee status while on board the ship, they were not provided with information on the asylum
procedure in Ukraine, no duly considered their need for international protection and did not accept their
applications. In addition, the decision to refuse to cross the state border to the applicants took effect immediately,
which made it possible to expel or forcibly return the applicants outside Ukraine at any time, without proper
consideration by the authorities of the application for a potential threat to the applicants.
As for fingerprinting of applicants for acquiring the relevant special status, it is not a fabrication of a domestic
legislator. In Germany obtaining political asylum also requires that asylum seekers be photographed and
fingerprinted in order to identify them (Svoboda, 2010).
There is also an opinion in the literature that migrants, stateless persons and persons seeking political asylum in
Ukraine should also be subject to mandatory dactyloscopic registration, and the relevant international norms
should be taken into account when determining the procedure for their registration (Svoboda, 2010).
In this regard, it should be noted that such remarks were relevant until 2011, when the current laws "On the legal
status of foreigners and stateless persons", "On refugees and persons in need of subsidiary or temporary
protection" were adopted. Currently, the concept of "asylum" is contained in the Constitution of Ukraine, where
Article 26 stipulates that foreigners and stateless persons may be granted asylum in the order established by law,
and Article 106 stipulates that the authority to make decisions on asylum in Ukraine are referred to the
competence of the President. The Law of Ukraine "On the Legal Status of Foreigners and Stateless Persons"
stipulates that asylum may be granted to foreigners and stateless persons in accordance with the procedure
established by law (Article 7 of the Law). That is, a separate asylum law is envisaged, which we do not have.
Today in Ukraine it is possible to recognize a person as a refugee, a person in need of subsidiary or temporary
ENTREPRENEURSHIP AND SUSTAINABILITY ISSUES
ISSN 2345-0282 (online) http://jssidoi.org/jesi/
2021 Volume 8 Number 3 (March)
http://doi.org/10.9770/jesi.2021.8.3(26)
Make your research more visible, join the Twitter account of ENTREPRENEURSHIP AND SUSTAINABILITY ISSUES:
@Entrepr69728810
415
protection, for such persons a separate special legal status is established. Therefore, when publicistic and political
sources refer to political asylum, they most likely mean the status of refugees, a person in need of subsidiary or
temporary protection.
At the same time, the case law indicates that legislative provisions are not always literally implemented in law
enforcement activities. Thus, the decision of the Administrative Court of Cassation of the Supreme Court in case
№815/476/17 cites the provisions of the above law on the grounds for loss of refugee status. It is noted that a
similar norm is enshrined in the Convention relating to the Status of Refugees (1951), according to which the
provisions of this Convention do not apply to persons who have voluntarily re-used the protection of the country
of citizenship (nationality).
The court also cited paragraphs 118, 119 of the Guidelines on Procedures and Criteria for Determining Refugee
Status of the Office of the High Commissioner for Refugees (UN): "voluntary resumption of the protection of the
country of one's nationality" means that a refugee who has voluntarily re-used the protection of the country of his
or her citizenship does not need international protection. In this case, the above provision on termination of status
must meet three conditions: 1) voluntariness: a refugee must act voluntarily; 2) intention: a refugee must intend to
take action to re-use the protection of the country of his or her citizenship; 3) renewal: a refugee must really
obtain such protection (Case №815/476/17: Decision of the Administrative Court of Cassation of the Supreme
Court of 17.10. 2018).
However, in support of its decision, the court states that in determining whether refugee status has been lost in
such circumstances, it is necessary to distinguish between the actual use of the protection of the country of
citizenship and accidental, insignificant contacts with the authorities of this country. If a refugee has applied for,
receives or renews a national passport, this will indicate, in the absence of evidence to the contrary, that he or she
intends to use the protection of the country of his or her citizenship. On the other hand, obtaining certain
documents from the authorities of a country, which should also be sought by persons of another citizenship, for
example, birth or marriage certificates, or other similar services, cannot be considered as a renewal of the
protection of that country. A refugee seeking protection from the authorities of the country of his or her
citizenship may be considered to have resumed the use of protection only if such protection has actually been
granted to him or her (Case № 815/476/17: Decision of the Administrative Court of Cassation of the Supreme
Court of 17.10. 2018).
5. Discussion
Ukraine has a well-developed system for collecting information on migration. Its main sources are current
migration records, censuses, household surveys, and administrative data.
A number of state registers have been created, covering certain groups of the population and containing data that
could potentially be used to supplement knowledge about migration. However, the disadvantages of migration
data are their lack of comparability not only with international data, but also with administrative data of various
agencies, under-registration or double-entry of migrants.
In order to provide the sound statistical and factual basis needed to make appropriate migration policy decisions,
it is necessary to:
to provide a block of questions related to migration (permanent, labor, circular) in the 2020 census;
ENTREPRENEURSHIP AND SUSTAINABILITY ISSUES
ISSN 2345-0282 (online) http://jssidoi.org/jesi/
2021 Volume 8 Number 3 (March)
http://doi.org/10.9770/jesi.2021.8.3(26)
Make your research more visible, join the Twitter account of ENTREPRENEURSHIP AND SUSTAINABILITY ISSUES:
@Entrepr69728810
416
add standardized modules on migration to household and labor force surveys to collect information on labor
migration abroad, reintegration of returnees, level of integration of immigrants;
ensure compliance of migration data collected and published in Ukraine with UN recommendations on migration
statistics and indicators used by Eurostat;
identify opportunities to use new sources of statistical information, such as state registers containing population
data, big data;
to strengthen the level of interaction between agencies in order to achieve comparability of administrative data;
to strengthen the role of the State Statistics Service of Ukraine in coordinating and methodological support for the
work of departments of executive bodies responsible for administrative data in the area of migration;
in order to achieve these goals, develop and implement an integrated strategy to improve migration data.
Conclusions
One of the problems of migration control in Ukraine is the imperfection of the procedure for registration of
citizens at the place of residence, which does not meet the state need to control the processes of population
movement and migration within the country. Currently, the basis for registration is not the fact of living in a
dwelling, but rather the right to reside in it, as the registration procedure involves the submission of supporting
documents for such right.
Moreover, living of citizens without registration of residence is an offense and entails the occurrence of
administrative liability, while living outside the place of registration is legal. All this condition a situation where
individuals are forced to register not where they actually live, but where they can document the right to residence,
which leads to the accumulation in the registers of local communities of information about the place of residence,
which is not true. The solution to this problem is seen through the change of the very principle of registration
from the permit to the notification, when the citizen only notifies the relevant authorities about his place of
residence.
The only case in law where registration of residence is carried out by notification is acquiring the status of a
forcibly displaced person, when the applicant declares a new address, which is his place of residence, without the
need to provide any evidence or obtain residence permits.
Another practical problem that needs to be solved by law is to regulate the registration of residence of persons
registered in the temporarily occupied territories of Donetsk or Luhansk regions, as well as Crimea, who are
internally displaced persons, as well as internal migrants who migrated before 2014, but did no change the place
of registration, as well as students who studied in higher educational institutions of Ukraine and were registered
for the period of study. All of the above categories of persons have problems with registration and access to all
administrative services provided at the place of registered residence.
The normative solution to this problem may consist in establishing a body and regulating the mechanism of
registration of residence of a person in the temporarily occupied territory, as well as entering information about
the place of residence of such persons in the register of territorial communities by unifying the procedures of
registration of internally displaced persons and registration at the place of residence. However, currently a kind of
solution to this problem of registration at the place of residence is the activity of law enforcement agencies, which
are the bodies of the migration service, which do not record the place of registration of an individual when
ENTREPRENEURSHIP AND SUSTAINABILITY ISSUES
ISSN 2345-0282 (online) http://jssidoi.org/jesi/
2021 Volume 8 Number 3 (March)
http://doi.org/10.9770/jesi.2021.8.3(26)
Make your research more visible, join the Twitter account of ENTREPRENEURSHIP AND SUSTAINABILITY ISSUES:
@Entrepr69728810
417
exchanging a passport due to unfitness for further use, or obtaining the first passport upon reaching 16 years of
age in the form ID-cards.
Migration control concerning the so-called transit migration in Ukraine is mainly related to the system of
restrictions and measures of responsibility for non-compliance with established norms, and at the same time it is
more important to ensure the legal stay of foreign citizens in the country, proper legal regulation of their
accounting. Instead, the national case law and judgments of the European Court of Human Rights concerning our
country indicate existing violations in the procedure of state protection of the rights and freedoms of foreigners
and stateless persons, which they are entitled to in accordance with international standards and national legislation
while staying on the territory of Ukraine.
References
About the statement of the Order of formation of the immigration quota, the Order of proceedings on applications for granting of the
immigration permit and representations on its cancellation and execution of the accepted decisions (2002). Available at:
https://zakon.rada.gov.ua/laws/show/1983-2002-п?lang=en#Text
Belevtseva, V.V. (2019). Migration regime of stay of foreign citizens and stateless persons on the territory of Ukraine: state and prospects.
Information and law, 2(29), 167-171.
Case №815 / 476/17: Decision of the Administrative Court of Cassation of the Supreme Court of 17.10. 2018. Available at:
http://reyestr.court.gov.ua/Review/77197810
Case of Kebe and Others v. Ukraine: Judgment of the European Court of Human Rights of 1 December 2017. 2552/12. Government
courier. № 109 dated 2017-06-15. P.12
Chehabeddine, M., Tvaronavičienė, M. 2020. Securing regional development. Insights into Regional Development, 2(1), 430-442.
http://doi.org/10.9770/IRD.2020.2.1(3)
Council Directive 2004/83/EC of 29 April 2004 on minimum standards for the qualifications and status of third country nationals or
stateless persons as refuges or as persons who otherwise need international protection and the content of the protection granted. Available
at: https://eur-lex.europa.eu/legal-content/EN/TXT/?uri=celex%3A32004L0083
Directive 2013/32/EU of the European Parliament and of the Council of 26 June 2013 on common procedures for granting and
withdrawing international protection. Available at: https://eur-lex.europa.eu/legal-content/en/ALL/?uri=celex%3A32013L0032
Hrabylnikov, A.V. (2015). Constitutional legal status and legal regime of foreigners and stateless persons in Ukraine: correlation of
concepts. Aktualni problemy vitchyznianoi yurysprudentsii, 6, 59-66.
Hula I.L. (2018). Personal expression from Ukraine of foreigners and universal membersas a west of administrative approach. Porivnialno-
analitychne pravo, 4, 252-255.
Immigration policy: analysis of procedures and legislative novelties in Ukraine (2019). Available at:
https://www.slideshare.net/EWBUkraine/ss-147973898
Law of Ukraine ‘On Immigration’ (2001). Available at: https://zakon.rada.gov.ua/laws/show/2491-14?lang=en#Text
Law of Ukraine ‘On the Legal Status of Foreigners and Stateless Persons’ (2011). Available at: https://zakon.rada.gov.ua/laws/show/3773-
17?lang=en#Text
ENTREPRENEURSHIP AND SUSTAINABILITY ISSUES
ISSN 2345-0282 (online) http://jssidoi.org/jesi/
2021 Volume 8 Number 3 (March)
http://doi.org/10.9770/jesi.2021.8.3(26)
Make your research more visible, join the Twitter account of ENTREPRENEURSHIP AND SUSTAINABILITY ISSUES:
@Entrepr69728810
418
Law of Ukraine ‘On the Single State Demographic Register and the Documents that Confirm the Citizenship of Ukraine, Identify a Person
or its Special Status’ (2013). Available at: https://zakon.rada.gov.ua/laws/show/5492-17?lang=en#Text
Levenets, A.V. (2017). Municipal legal status of foreigners in Ukraine. The thesis for the degree of candidate of legal sciences, specialty
12.00.02. Karazin Kharkiv National University, Kharkiv. Available at: http://dspace.univer.kharkov.ua/bitstream/123456789/12602/6/diss-
Levenec.pdf
Lincényi, M., & Laczko, M. 2020. Influence of Brexit on Education towards Europeanism. Insights into Regional Development, 2(4), 814-
824. http://doi.org/10.9770/IRD.2020.2.4(7)
Ministry of Social Policy of Ukraine. Available at: https://www.msp.gov.ua/
Mushak, N.B. (2015). Common policy of the European Union to provide protection to third-country nationals. Journal of Kyiv University
of Law, 3, 346-249.
On establishing an immigration quota for 2019 (2019). Available at: https://zakon.rada.gov.ua/laws/show/114-2019-р?lang=en#Text
On the Judicial Practice of Considering Disputes Concerning Refugee Status and a Person in Need of Additional or Temporary Protection,
Forced Return and Compulsory Expulsion of a Foreigner or a Stateless Person from Ukraine and Disputes Related to the Stay of a
Foreigner and a Stateless Person in Ukraine (2009). Available at: https://ips.ligazakon.net/document/AS090107
Reznik, O., Muzychuk, O., Andriichenko, N., Yakushchenko, Y., & Korzh, S. (2020). Fight Against Doping: Experience of Ukraine and
European States. Amazonia Investiga, 9(27), 34-41. https://doi.org/10.34069/AI/2020.27.03.4
State Migration Service of Ukraine. Available at: https://dmsu.qov.ua/divalnist/statistichni-dani/statistika-z-osnovnoi-diyalnosti.html
State Statistics Service of Ukraine. Available at: http://www.ukrstat.gov.ua
Svoboda, E.Yu. (2010). Some aspects of legal regulation of dactyloscopic registration. Bulletin of the Academy of Advocacy of Ukraine, 3
(19), 148-153.
Turetska, Y. (2018). Theoretical and practical aspects of the constitutional and legal status of refugees in Ukraine. Visegrad Journal on
Human Rights, 2, 126-131.
Tymchyk, G.S. (2014). Administrative and legal status of foreigners and refugees in Ukraine: a comparative legalanalysis. Legal scientific
electronic journal, 2, 82-84.
Vasylchenko, O.P. (2014). Features of the l egal status of foreigners and stateless persons while ensuring the principle of equality of rights
and freedoms in Ukraine. European perspectives, 10, 23-28.

ENTREPRENEURSHIP AND SUSTAINABILITY ISSUES
ISSN 2345-0282 (online) http://jssidoi.org/jesi/
2021 Volume 8 Number 3 (March)
http://doi.org/10.9770/jesi.2021.8.3(26)
Make your research more visible, join the Twitter account of ENTREPRENEURSHIP AND SUSTAINABILITY ISSUES:
@Entrepr69728810
419
Kostiantyn BUHAICHUK, Doctor of Legal Sciences, Associate Professor, Kharkiv National University of Internal Affairs, Ukraine
ORCID ID: orcid.org/0000-0003-2429-5010
Nataliia VARENIA, PhD, National Academy of Security Service of Ukraine, Ukraine
ORCID ID: orcid.org/0000-0002-2797-197Х
Vitalii KHODANOVYCH, PhD in Law, Leading Research Associate, National Academy of the Security Service of Ukraine
ORCID ID: orcid.org/0000-0002-0383-1788
Maryna KRIEPAKOVA, PhD in Law, Kharkiv National University of Internal Affairs, Ukraine
ORCID ID: orcid.org/0000-0001-5705-5027
Valentyn SEREDYNSKYI, Investigator of the Department of Investigation of Crimes in the Sphere of Transport of the Investigative
Department of the DVP GUNP in Dnipropetrovsk region, Ukraine
ORCID ID: orcid.org/0000-0003-5318-2548
Copyright © 2021 by author(s) and VsI Entrepreneurship and Sustainability Center
This work is licensed under the Creative Commons Attribution International License (CC BY).
http://creativecommons.org/licenses/by/4.0/
ENTREPRENEURSHIP AND SUSTAINABILITY ISSUES
ISSN 2345-0282 (online) http://jssidoi.org/jesi/
2021 Volume 8 Number 3 (March)
http://doi.org/10.9770/jesi.2021.8.3(27)
Publisher http://jssidoi.org/esc/home
420
INFLUENCE OF SHADOW ECONOMY LEGALIZATION ON NATIONAL SECURITY OF UKRAINE
Tetiana Kolomoiets ¹*, Nelli Tsybulnyk ², Oleksandr Moroz 3, Vitaliy Prymachenko 4, Vadym Khashev 5
1* Zaporizhzhia National University, street Zhukovsky, 66, Zaporozhye, 69600, Ukraine 2 Kharkiv National University of Internal Affairs, Lviv Landau avenue, 27, Kharkiv, 61000, Ukraine
3 Sumy National Agrarian University, Gerasim Kondratiev Street, 160, Sumy, 40000, Ukraine 4,5 Dnipropetrovsk State University of Internal Affairs, Ave. Gagarina, 26, 49005, Dnipro, Ukraine
E-mail: 1* t_kolomoiets @ukr.net (Corresponding author)
Received 18 March 2020; accepted 14 January 2021; published 30 March 2021
Abstract. The held analysis indicates about the availability of a wide spectrum of schemes and instruments of tax evasion, complex
application of which, apart from reduction of the fiscal flows, causes deterioration of the economic environment and appearance of the
negative macroeconomic consequences: distortion of the payment balance, capital outflow from the country, formation of additional
pressure on the exchange rate, destructive influence on the formation of differently vectored priorities of the customs and tax policy of the
country, and deepening of corruption schemes. In general, these losses are reflected in significant volumes of shortfalls in budget revenues
and the ability of public authorities to perform functions and powers assigned to them. Under the condition of accelerated development of
the European integration processes, entry to the new markets for sales of goods and services, the analysis and identification of all possible
schemes of tax evasion and illegal financial flows formation take an important place in the general state strategy on the country’s
development. The availability of a considerable variety of types and forms of the shadow financial transactions implementation requires the
implementation of a measures complex, aimed at timely identification and prevention, development of methodological instruments for
assessment of the effects from the existence of the shadow sector in the national economy. This situation makes it necessary to develop an
efficient instrumentarium on counteraction to tax evasion, making it possible to timely detect illegal actions of the economic entities at all
stages of their appearance. The development of these measures will contribute to financial security level improvement and strengthening of
competitiveness of the economy of Ukraine.
Keywords: shadow economy; legalization; national security; financial security; taxation
Reference to this paper should be made as follows: Kolomoiets, T., Tsybulnyk, N., Moroz, O., Prymachenko, V., Khashev, V. 2021.
Influence of shadow economy legalization on national security of Ukraine. Entrepreneurship and Sustainability Issues, 8(3), 420-437.
http://doi.org/10.9770/jesi.2021.8.3(27)
JEL Classifications: F35, F42
ENTREPRENEURSHIP AND SUSTAINABILITY ISSUES
ISSN 2345-0282 (online) http://jssidoi.org/jesi/
2021 Volume 8 Number 3 (March)
http://doi.org/10.9770/jesi.2021.8.3(27)
Make your research more visible, join the Twitter account of ENTREPRENEURSHIP AND SUSTAINABILITY ISSUES:
@Entrepr69728810
421
1. Introduction
The current economic development trends in Ukraine are characterized by the instability of the activity figures,
budget deficits, low efficiency of the economic, political, and social reforms, rise in the level of the unprofitability
of the enterprises, a high level of corruption, etc. The transformational transfigurations, which are observed in
these days in Ukraine, take place under the influence of factors of exogenous and endogenous nature, which, on
the one hand, are the stimulators of these processes and, on the other hand, deepen economic misbalances in the
country and lead to threats to national security (Kozlovskyi, S., Grynyuk, R., Baidala, V., Burdiak, V. & Bakun,
Y. (2019)).
Shadowing of the economy is one of the most powerful destabilizing factors nowadays (Osipov, G.V., Glotov,
V.I., Karepova, S.G. (2018): Vigliarolo, F. (2020); Draskovic, V., Jovovic, R., Streimikiene, D. & Bilan, S V.
(2020); Mazzanti, M., Mazzarano, M., Pronti, A., Quatrosi, M. (2020); Chehabeddine, M., Tvaronavičienė, M.
(2020); Dorogov, N.I., Kapitonov, I.A., & Batyrova, N.T. (2020)).
Financial flows often become an object of manipulation during the preparation of statistical, accounting, and tax
reporting, determination of the economic subjects’ activity results, and, as a result, significantly hinder investment
processes in the country, limit the temps of the economic development, and significantly level down the
effectiveness of the introduced reforms.
The reinforcement of the globalization processes, openness of the economic and financial systems, an increase in
the scale of the export-import operations, and other factors, create preconditions for the expansion of the
shadowing volumes of the national economy (NE). According to the estimates of the International Monetary
Fund, in 2018, the average global level of the national economy shadowing amounted 25% of the global GDP,
and in Ukraine, it reached even higher level – 30% of GDP (Ministry of Economic Development, Trade and
Agriculture of Ukraine).
According to the estimated of the Basel Institute on Governance, Ukraine lags significantly behind the leading
countries in terms of the quality of the anti-money laundering and counter-terrorist financing policies (in 2017 –
52nd position, in 2019 – 37th place out of 125 possible positions). One of the most common ways of shadowing
of NE is the avoidance of tax obligations by the economic agents, which leads to the formation of tax gaps (TG)
in the NE. The total average volume of TG in the EU countries upon all taxes amounts approximately 20 % (825
billion euro) of the volume of tax revenues, while in Ukraine – it is about 25 %. Therefore, the TG management
should be considered as an important direction of implementation of the state policy on unshadowing of the NE,
which necessitates an objective need for harmonization of its methodological, organizational, institutional, and
regulatory subsystems.
The shadowing of the economy (Nguyen, T.A.N., Luong, T.T.H. (2020 is an expected result of the economic
processes, which reside in the growth of the global economic crisis and the European integration and globalization
processes in the country. As of today, the operations on income shadowing are actively used in all spheres of
public life and at all its levels. The high level of corruption inside the state, a significant level of bureaucracy,
difficulty in starting and further business development contribute to the diversification of channels of the capital
transfer and increase in the scale of their use.
The contemporary challenges of the economic development, appearing on the way of economic entities in
Ukraine, encourage them to use diverse ways for optimization and reduction of possible expenditures of the
ENTREPRENEURSHIP AND SUSTAINABILITY ISSUES
ISSN 2345-0282 (online) http://jssidoi.org/jesi/
2021 Volume 8 Number 3 (March)
http://doi.org/10.9770/jesi.2021.8.3(27)
Make your research more visible, join the Twitter account of ENTREPRENEURSHIP AND SUSTAINABILITY ISSUES:
@Entrepr69728810
422
production cycle. While trying to hide their income, commercial entities implement various schemes of shadow
funds withdrawal abroad and their subsequent legalization.
As a result, one observes an increase in the need for identification of the legal and illegal shadowing schemes as
an opportunity to reduce tax pressure, accumulate additional income, etc.
2. Literature Survey
There is a great number of approaches to the determination of the main ways to transfer capital abroad in
economic literature. Putniņš, T. J., & Sauka, A. (2015) distinguish two forms of the capital flow: an investment
channel – withdrawal (input) of the entrepreneur’s capital or foreign investments, and financial and credit channel
– withdrawal (input) of the loan capital or capital transfer (loans, credits, bank deposits, payments upon the
transactions with foreign partners).
Based on the held analysis, it is possible to identify the following channels of assets concealment out of country:
1) external-economic – non-repayment of foreign exchange assets, which is related to the use of external-
economic transactions (Κάτσιος, Σ. (2015));
2) investment – the use of schemes on the return of pseudo-investments or payments of dividends to non-
residents, which significantly exceed the actually invested foreign capital (Schneider, F., Raczkowski, K., &
Mróz, B. (2015));
3) foreign exchange – implementation of transactions with valuable securities, primarily through repurchasing of
domestic securities (González-Fernández, M., & González-Velasco, C. (2015));
4) insurance – implementation of fictitious transactions in the field of insurance and reinsurance (Dell’Anno, R.
(2016)).
Other authors also distinguish the following schemes of the money withdrawal abroad:
1) foreign economic – transfer of foreign currency abroad, disguised as a foreign economic activity through such
transactions (Salahodjaev, R. (2015)):
- understatement of export and overcharge of import contract prices to make a foreign partner receive a reward,
part of which is transferred to the foreign accounts of the Ukrainian residents;
- non-repayment of export earnings or implementation or goods, imported without their actual import into the
country, in particular, through the mechanism of making advance payments, disguised as fictitious import ones;
- contracts;
- transfer or non-repayment of currency from abroad in the form of contributions to the statutory funds of the joint
ventures;
- lodging of a security deposit in a foreign bank for obtaining a loan, which is actually not disbursed;
- artificial application of penalties by a non-resident;
2) investment – the use of schemes on the return of pseudo-investments or payment of dividends to non-residents,
which significantly exceed the actually invested foreign capital (Feige, E. L. (2016));
3) stock – conduction of repurchase transactions of previously emitted domestic securities (Goel, R. K., & Nelson,
M. A. (2016));
4) insurance – conduction of fictitious insurance and reinsurance transactions (Kirchgässner, G. (2017)).
Despite the existing scientific potential, there are many theoretical and applied problems, which still require a
final decision and regard, in particular, the definition of catalysts of shadowing of the national economy, the
assessment of efficiency of the state policy on unshadowing, considering socio-economic determinants of national
economic development. The logical non-completion of the holistic view formation about the governance in the
ENTREPRENEURSHIP AND SUSTAINABILITY ISSUES
ISSN 2345-0282 (online) http://jssidoi.org/jesi/
2021 Volume 8 Number 3 (March)
http://doi.org/10.9770/jesi.2021.8.3(27)
Make your research more visible, join the Twitter account of ENTREPRENEURSHIP AND SUSTAINABILITY ISSUES:
@Entrepr69728810
423
context of the implementation of the state policy on unshadowing of the national economy has determined the
relevance of the research, its objective, tasks, and content.
3. Methods
The methodological basis of the work included the fundamental statements of the economic theory, the theory of
money, finance and credit, macroeconomics, management theory, state regulation of the economy, economic and
mathematical modelling, and research papers on the TG management and the unshadowing of the national
economy.
The research includes the use of such research methods as the methods of logical generalization and scientific
abstraction, induction and deduction – during the clarification of the conceptual and categorical framework; a
system-structural analysis – while assessing the efficiency of the state policy on unshadowing of the NE.
The information and factual basis of the research covered: the laws of Ukraine, decrees of the President of
Ukraine, the normative acts of the Cabinet of Ministers of Ukraine, international legal and regulatory and
recommendation documents on financial monitoring, analytical and reporting data of the Ministry of Finance of
Ukraine, the Ministry of Economic Development, Trade and Agriculture of Ukraine, State Statistics Service of
Ukraine, data of the World Bank, and Organization for Economic Cooperation and Development, the analytical
reviews of the international agency Bloomberg, the Financial Action Task Force (FATF), the research results on
the TG management problematics, and counteraction to shadowing of the NE.
4. Results
The annual increase in the shadowing volumes of the economy leads to the formation of the institutional and
regulatory policy on the economy shadowing countermeasures both at national and international levels. As of
today, the existence of the shadow sector of the economy is typical for the majority of the world countries, each of
which has already developed a variety of countermeasures that are different in terms of specificity structure of
their budget, tax, finance, investment, and other policies.
The modern system of counteraction against income shadowing of each country consists of two components: a
national component and a supranational component. The structure and functioning peculiarities of the national
component are determined by the level of development of a particular country and the powers of the authorities,
involved in this process. To date, the international community has developed a significant variety of tools on
counteraction against economy shadowing, which can be divided into restricting and controlling ones (Table 1).
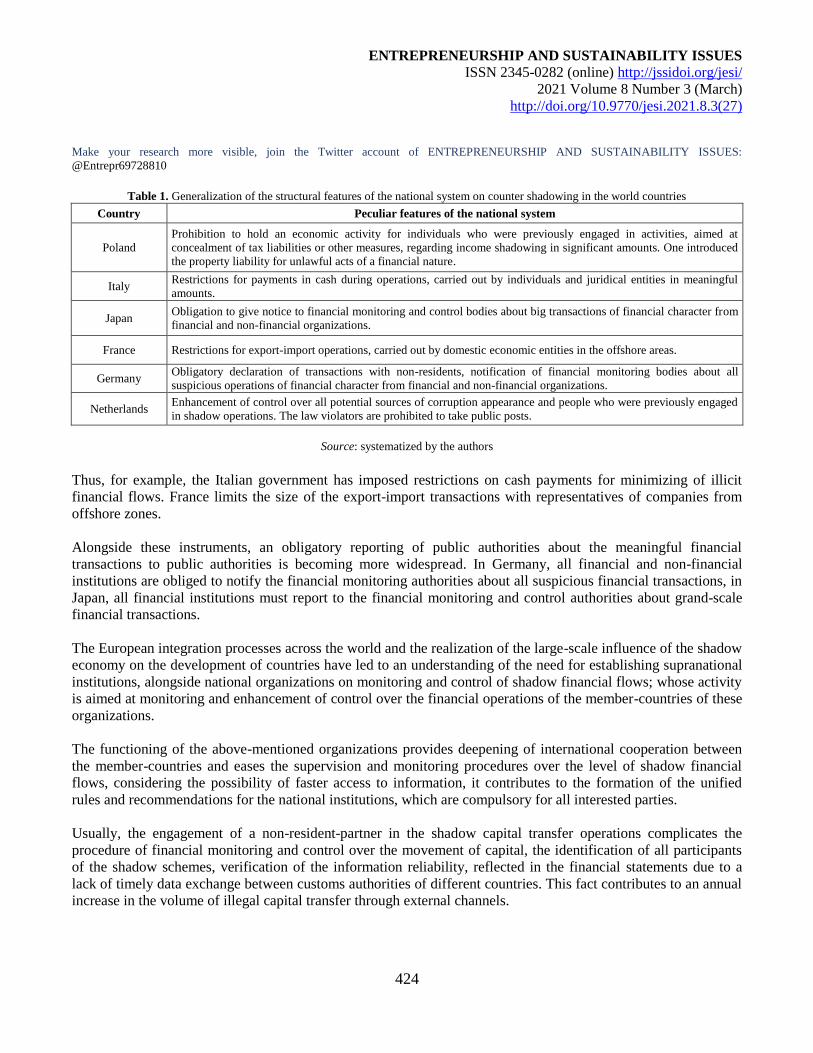
ENTREPRENEURSHIP AND SUSTAINABILITY ISSUES
ISSN 2345-0282 (online) http://jssidoi.org/jesi/
2021 Volume 8 Number 3 (March)
http://doi.org/10.9770/jesi.2021.8.3(27)
Make your research more visible, join the Twitter account of ENTREPRENEURSHIP AND SUSTAINABILITY ISSUES:
@Entrepr69728810
424
Table 1. Generalization of the structural features of the national system on counter shadowing in the world countries
Country Peculiar features of the national system
Poland
Prohibition to hold an economic activity for individuals who were previously engaged in activities, aimed at
concealment of tax liabilities or other measures, regarding income shadowing in significant amounts. One introduced
the property liability for unlawful acts of a financial nature.
Italy Restrictions for payments in cash during operations, carried out by individuals and juridical entities in meaningful
amounts.
Japan Obligation to give notice to financial monitoring and control bodies about big transactions of financial character from
financial and non-financial organizations.
France Restrictions for export-import operations, carried out by domestic economic entities in the offshore areas.
Germany Obligatory declaration of transactions with non-residents, notification of financial monitoring bodies about all
suspicious operations of financial character from financial and non-financial organizations.
Netherlands Enhancement of control over all potential sources of corruption appearance and people who were previously engaged
in shadow operations. The law violators are prohibited to take public posts.
Source: systematized by the authors
Thus, for example, the Italian government has imposed restrictions on cash payments for minimizing of illicit
financial flows. France limits the size of the export-import transactions with representatives of companies from
offshore zones.
Alongside these instruments, an obligatory reporting of public authorities about the meaningful financial
transactions to public authorities is becoming more widespread. In Germany, all financial and non-financial
institutions are obliged to notify the financial monitoring authorities about all suspicious financial transactions, in
Japan, all financial institutions must report to the financial monitoring and control authorities about grand-scale
financial transactions.
The European integration processes across the world and the realization of the large-scale influence of the shadow
economy on the development of countries have led to an understanding of the need for establishing supranational
institutions, alongside national organizations on monitoring and control of shadow financial flows; whose activity
is aimed at monitoring and enhancement of control over the financial operations of the member-countries of these
organizations.
The functioning of the above-mentioned organizations provides deepening of international cooperation between
the member-countries and eases the supervision and monitoring procedures over the level of shadow financial
flows, considering the possibility of faster access to information, it contributes to the formation of the unified
rules and recommendations for the national institutions, which are compulsory for all interested parties.
Usually, the engagement of a non-resident-partner in the shadow capital transfer operations complicates the
procedure of financial monitoring and control over the movement of capital, the identification of all participants
of the shadow schemes, verification of the information reliability, reflected in the financial statements due to a
lack of timely data exchange between customs authorities of different countries. This fact contributes to an annual
increase in the volume of illegal capital transfer through external channels.
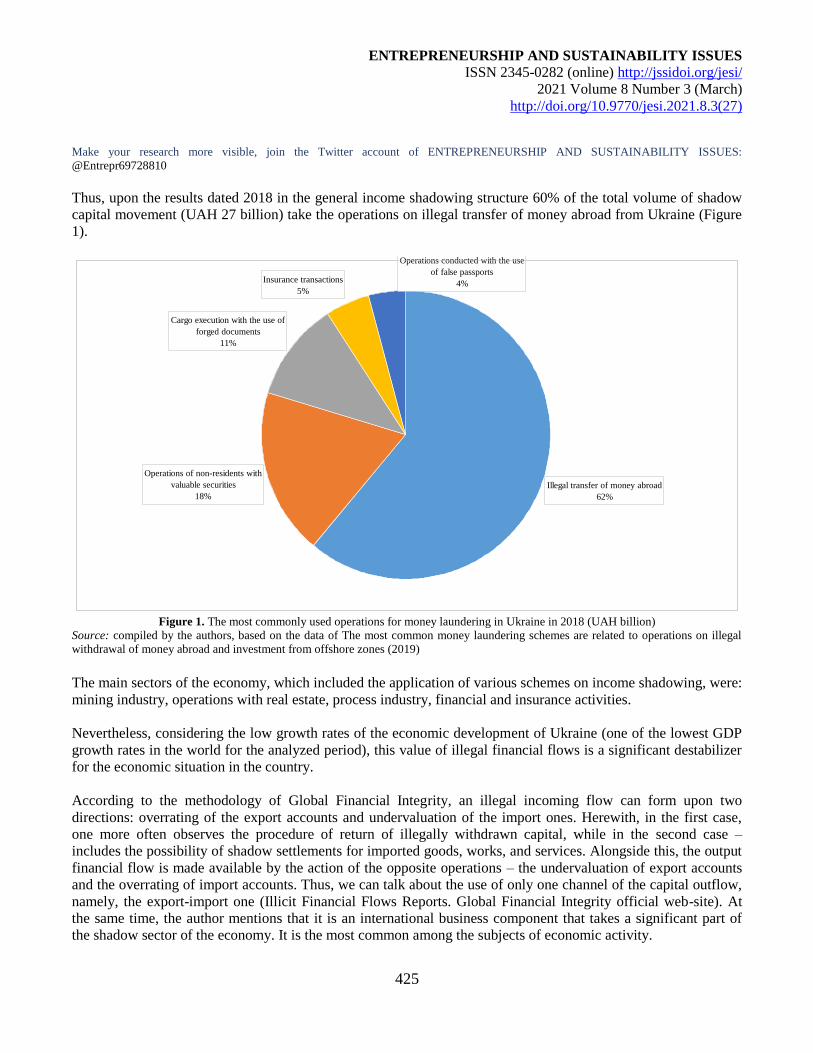
ENTREPRENEURSHIP AND SUSTAINABILITY ISSUES
ISSN 2345-0282 (online) http://jssidoi.org/jesi/
2021 Volume 8 Number 3 (March)
http://doi.org/10.9770/jesi.2021.8.3(27)
Make your research more visible, join the Twitter account of ENTREPRENEURSHIP AND SUSTAINABILITY ISSUES:
@Entrepr69728810
425
Thus, upon the results dated 2018 in the general income shadowing structure 60% of the total volume of shadow
capital movement (UAH 27 billion) take the operations on illegal transfer of money abroad from Ukraine (Figure
1).
Illegal transfer of money abroad
62%
Operations of non-residents with
valuable securities
18%
Cargo execution with the use of
forged documents
11%
Insurance transactions
5%
Operations conducted with the use
of false passports
4%
Figure 1. The most commonly used operations for money laundering in Ukraine in 2018 (UAH billion)
Source: compiled by the authors, based on the data of The most common money laundering schemes are related to operations on illegal
withdrawal of money abroad and investment from offshore zones (2019)
The main sectors of the economy, which included the application of various schemes on income shadowing, were:
mining industry, operations with real estate, process industry, financial and insurance activities.
Nevertheless, considering the low growth rates of the economic development of Ukraine (one of the lowest GDP
growth rates in the world for the analyzed period), this value of illegal financial flows is a significant destabilizer
for the economic situation in the country.
According to the methodology of Global Financial Integrity, an illegal incoming flow can form upon two
directions: overrating of the export accounts and undervaluation of the import ones. Herewith, in the first case,
one more often observes the procedure of return of illegally withdrawn capital, while in the second case –
includes the possibility of shadow settlements for imported goods, works, and services. Alongside this, the output
financial flow is made available by the action of the opposite operations – the undervaluation of export accounts
and the overrating of import accounts. Thus, we can talk about the use of only one channel of the capital outflow,
namely, the export-import one (Illicit Financial Flows Reports. Global Financial Integrity official web-site). At
the same time, the author mentions that it is an international business component that takes a significant part of
the shadow sector of the economy. It is the most common among the subjects of economic activity.
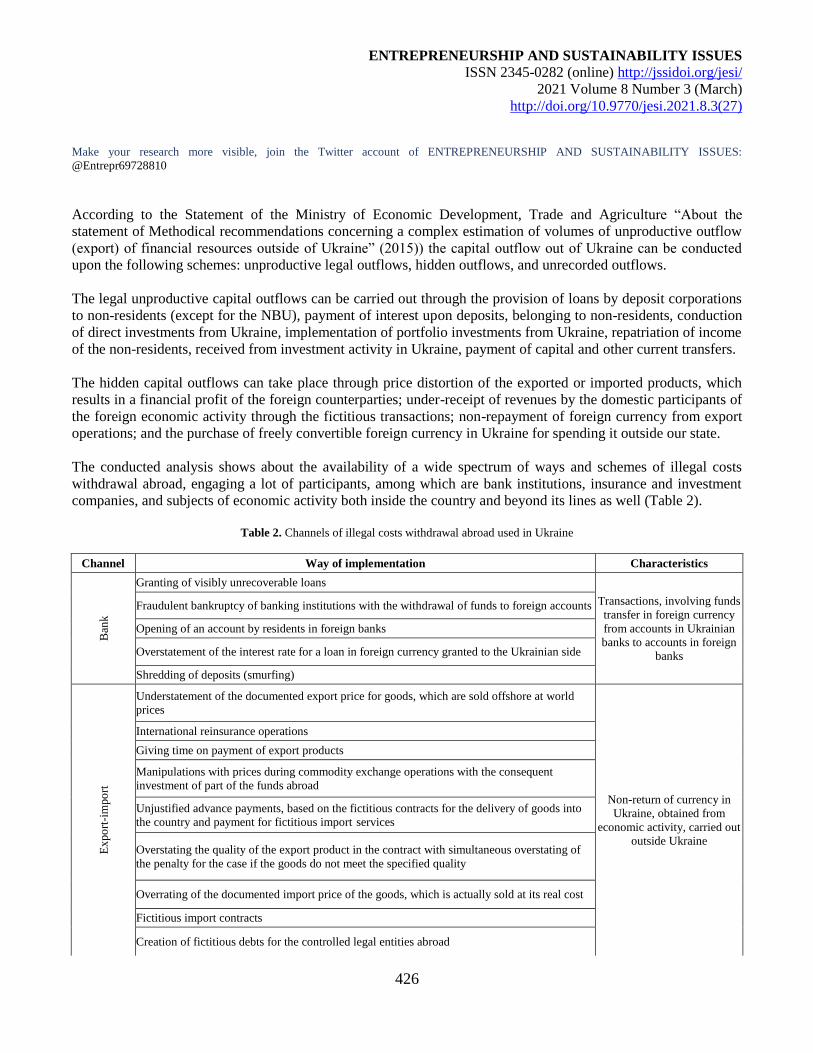
ENTREPRENEURSHIP AND SUSTAINABILITY ISSUES
ISSN 2345-0282 (online) http://jssidoi.org/jesi/
2021 Volume 8 Number 3 (March)
http://doi.org/10.9770/jesi.2021.8.3(27)
Make your research more visible, join the Twitter account of ENTREPRENEURSHIP AND SUSTAINABILITY ISSUES:
@Entrepr69728810
426
According to the Statement of the Ministry of Economic Development, Trade and Agriculture “About the
statement of Methodical recommendations concerning a complex estimation of volumes of unproductive outflow
(export) of financial resources outside of Ukraine” (2015)) the capital outflow out of Ukraine can be conducted
upon the following schemes: unproductive legal outflows, hidden outflows, and unrecorded outflows.
The legal unproductive capital outflows can be carried out through the provision of loans by deposit corporations
to non-residents (except for the NBU), payment of interest upon deposits, belonging to non-residents, conduction
of direct investments from Ukraine, implementation of portfolio investments from Ukraine, repatriation of income
of the non-residents, received from investment activity in Ukraine, payment of capital and other current transfers.
The hidden capital outflows can take place through price distortion of the exported or imported products, which
results in a financial profit of the foreign counterparties; under-receipt of revenues by the domestic participants of
the foreign economic activity through the fictitious transactions; non-repayment of foreign currency from export
operations; and the purchase of freely convertible foreign currency in Ukraine for spending it outside our state.
The conducted analysis shows about the availability of a wide spectrum of ways and schemes of illegal costs
withdrawal abroad, engaging a lot of participants, among which are bank institutions, insurance and investment
companies, and subjects of economic activity both inside the country and beyond its lines as well (Table 2).
Table 2. Channels of illegal costs withdrawal abroad used in Ukraine
Channel Way of implementation Characteristics
Ban
k
Granting of visibly unrecoverable loans
Transactions, involving funds
transfer in foreign currency
from accounts in Ukrainian
banks to accounts in foreign
banks
Fraudulent bankruptcy of banking institutions with the withdrawal of funds to foreign accounts
Opening of an account by residents in foreign banks
Overstatement of the interest rate for a loan in foreign currency granted to the Ukrainian side
Shredding of deposits (smurfing)
Ex
po
rt-i
mpo
rt
Understatement of the documented export price for goods, which are sold offshore at world
prices
Non-return of currency in
Ukraine, obtained from
economic activity, carried out
outside Ukraine
International reinsurance operations
Giving time on payment of export products
Manipulations with prices during commodity exchange operations with the consequent
investment of part of the funds abroad
Unjustified advance payments, based on the fictitious contracts for the delivery of goods into
the country and payment for fictitious import services
Overstating the quality of the export product in the contract with simultaneous overstating of
the penalty for the case if the goods do not meet the specified quality
Overrating of the documented import price of the goods, which is actually sold at its real cost
Fictitious import contracts
Creation of fictitious debts for the controlled legal entities abroad
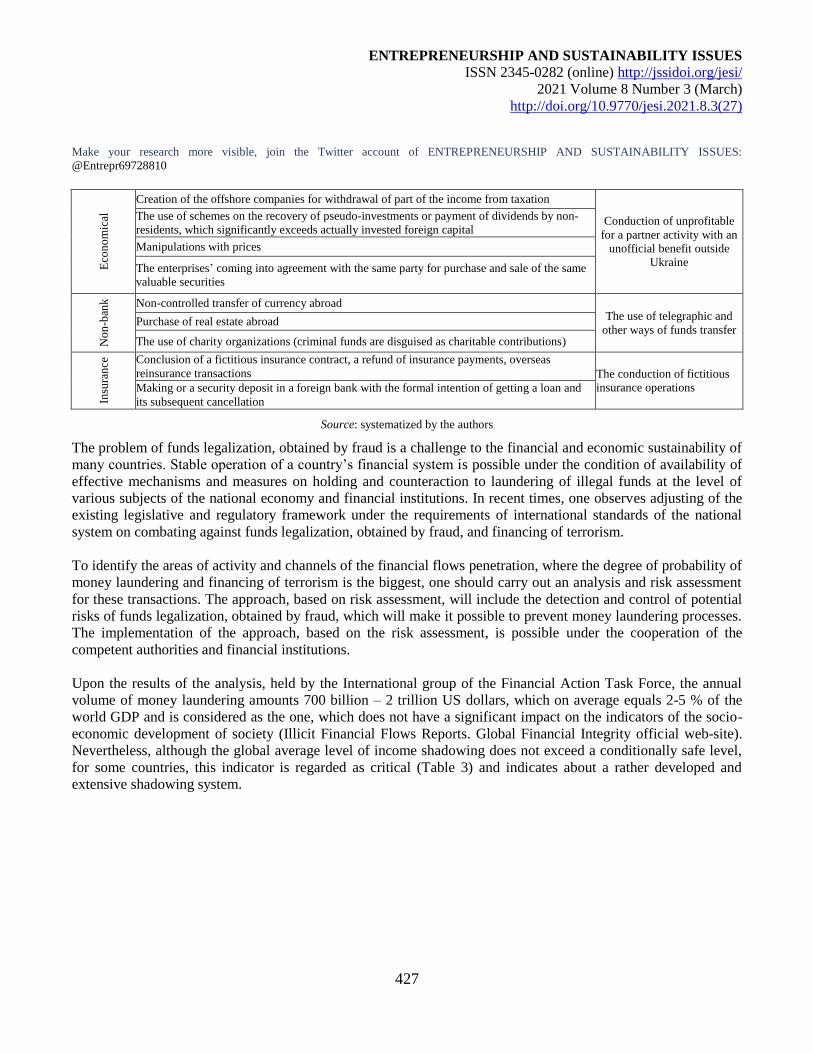
ENTREPRENEURSHIP AND SUSTAINABILITY ISSUES
ISSN 2345-0282 (online) http://jssidoi.org/jesi/
2021 Volume 8 Number 3 (March)
http://doi.org/10.9770/jesi.2021.8.3(27)
Make your research more visible, join the Twitter account of ENTREPRENEURSHIP AND SUSTAINABILITY ISSUES:
@Entrepr69728810
427
Eco
no
mic
al
Creation of the offshore companies for withdrawal of part of the income from taxation
Conduction of unprofitable
for a partner activity with an
unofficial benefit outside
Ukraine
The use of schemes on the recovery of pseudo-investments or payment of dividends by non-
residents, which significantly exceeds actually invested foreign capital
Manipulations with prices
The enterprises’ coming into agreement with the same party for purchase and sale of the same
valuable securities
No
n-b
ank
Non-controlled transfer of currency abroad The use of telegraphic and
other ways of funds transfer Purchase of real estate abroad
The use of charity organizations (criminal funds are disguised as charitable contributions)
Insu
ran
ce
Conclusion of a fictitious insurance contract, a refund of insurance payments, overseas
reinsurance transactions The conduction of fictitious
insurance operations Making or a security deposit in a foreign bank with the formal intention of getting a loan and
its subsequent cancellation
Source: systematized by the authors
The problem of funds legalization, obtained by fraud is a challenge to the financial and economic sustainability of
many countries. Stable operation of a country’s financial system is possible under the condition of availability of
effective mechanisms and measures on holding and counteraction to laundering of illegal funds at the level of
various subjects of the national economy and financial institutions. In recent times, one observes adjusting of the
existing legislative and regulatory framework under the requirements of international standards of the national
system on combating against funds legalization, obtained by fraud, and financing of terrorism.
To identify the areas of activity and channels of the financial flows penetration, where the degree of probability of
money laundering and financing of terrorism is the biggest, one should carry out an analysis and risk assessment
for these transactions. The approach, based on risk assessment, will include the detection and control of potential
risks of funds legalization, obtained by fraud, which will make it possible to prevent money laundering processes.
The implementation of the approach, based on the risk assessment, is possible under the cooperation of the
competent authorities and financial institutions.
Upon the results of the analysis, held by the International group of the Financial Action Task Force, the annual
volume of money laundering amounts 700 billion – 2 trillion US dollars, which on average equals 2-5 % of the
world GDP and is considered as the one, which does not have a significant impact on the indicators of the socio-
economic development of society (Illicit Financial Flows Reports. Global Financial Integrity official web-site).
Nevertheless, although the global average level of income shadowing does not exceed a conditionally safe level,
for some countries, this indicator is regarded as critical (Table 3) and indicates about a rather developed and
extensive shadowing system.
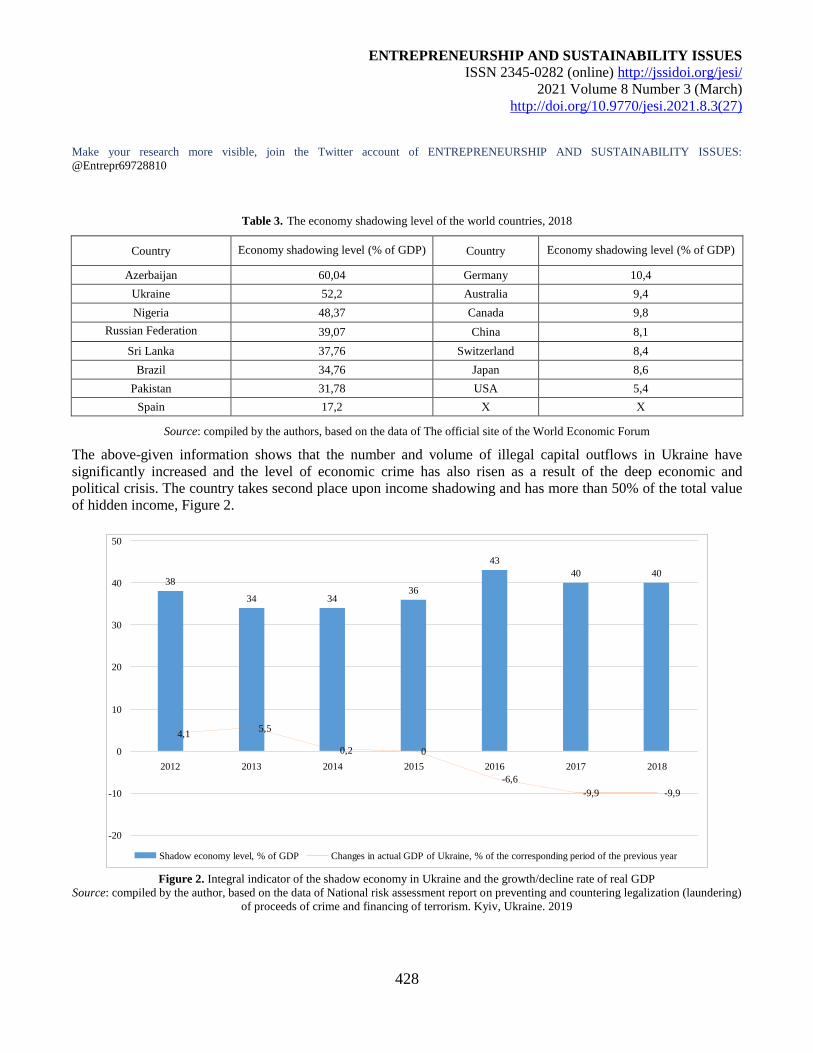
ENTREPRENEURSHIP AND SUSTAINABILITY ISSUES
ISSN 2345-0282 (online) http://jssidoi.org/jesi/
2021 Volume 8 Number 3 (March)
http://doi.org/10.9770/jesi.2021.8.3(27)
Make your research more visible, join the Twitter account of ENTREPRENEURSHIP AND SUSTAINABILITY ISSUES:
@Entrepr69728810
428
Table 3. The economy shadowing level of the world countries, 2018
Country Economy shadowing level (% of GDP) Country Economy shadowing level (% of GDP)
Azerbaijan 60,04 Germany 10,4
Ukraine 52,2 Australia 9,4
Nigeria 48,37 Canada 9,8
Russian Federation 39,07 China 8,1
Sri Lanka 37,76 Switzerland 8,4
Brazil 34,76 Japan 8,6
Pakistan 31,78 USA 5,4
Spain 17,2 Х Х
Source: compiled by the authors, based on the data of The official site of the World Economic Forum
The above-given information shows that the number and volume of illegal capital outflows in Ukraine have
significantly increased and the level of economic crime has also risen as a result of the deep economic and
political crisis. The country takes second place upon income shadowing and has more than 50% of the total value
of hidden income, Figure 2.
38
34 3436
43
40 40
4,15,5
0,2 0
-6,6
-9,9 -9,9
-20
-10
0
10
20
30
40
50
2012 2013 2014 2015 2016 2017 2018
Shadow economy level, % of GDP Changes in actual GDP of Ukraine, % of the corresponding period of the previous year
Figure 2. Integral indicator of the shadow economy in Ukraine and the growth/decline rate of real GDP
Source: compiled by the author, based on the data of National risk assessment report on preventing and countering legalization (laundering)
of proceeds of crime and financing of terrorism. Kyiv, Ukraine. 2019
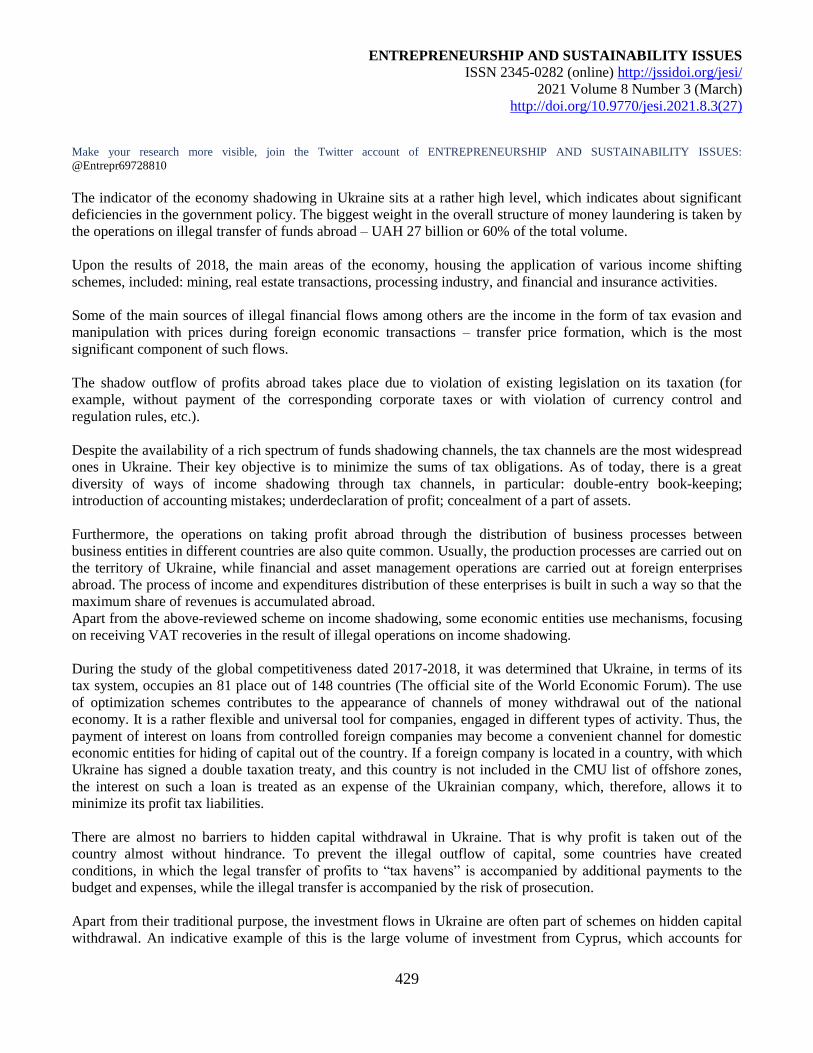
ENTREPRENEURSHIP AND SUSTAINABILITY ISSUES
ISSN 2345-0282 (online) http://jssidoi.org/jesi/
2021 Volume 8 Number 3 (March)
http://doi.org/10.9770/jesi.2021.8.3(27)
Make your research more visible, join the Twitter account of ENTREPRENEURSHIP AND SUSTAINABILITY ISSUES:
@Entrepr69728810
429
The indicator of the economy shadowing in Ukraine sits at a rather high level, which indicates about significant
deficiencies in the government policy. The biggest weight in the overall structure of money laundering is taken by
the operations on illegal transfer of funds abroad – UAH 27 billion or 60% of the total volume.
Upon the results of 2018, the main areas of the economy, housing the application of various income shifting
schemes, included: mining, real estate transactions, processing industry, and financial and insurance activities.
Some of the main sources of illegal financial flows among others are the income in the form of tax evasion and
manipulation with prices during foreign economic transactions – transfer price formation, which is the most
significant component of such flows.
The shadow outflow of profits abroad takes place due to violation of existing legislation on its taxation (for
example, without payment of the corresponding corporate taxes or with violation of currency control and
regulation rules, etc.).
Despite the availability of a rich spectrum of funds shadowing channels, the tax channels are the most widespread
ones in Ukraine. Their key objective is to minimize the sums of tax obligations. As of today, there is a great
diversity of ways of income shadowing through tax channels, in particular: double-entry book-keeping;
introduction of accounting mistakes; underdeclaration of profit; concealment of a part of assets.
Furthermore, the operations on taking profit abroad through the distribution of business processes between
business entities in different countries are also quite common. Usually, the production processes are carried out on
the territory of Ukraine, while financial and asset management operations are carried out at foreign enterprises
abroad. The process of income and expenditures distribution of these enterprises is built in such a way so that the
maximum share of revenues is accumulated abroad.
Apart from the above-reviewed scheme on income shadowing, some economic entities use mechanisms, focusing
on receiving VAT recoveries in the result of illegal operations on income shadowing.
During the study of the global competitiveness dated 2017-2018, it was determined that Ukraine, in terms of its
tax system, occupies an 81 place out of 148 countries (The official site of the World Economic Forum). The use
of optimization schemes contributes to the appearance of channels of money withdrawal out of the national
economy. It is a rather flexible and universal tool for companies, engaged in different types of activity. Thus, the
payment of interest on loans from controlled foreign companies may become a convenient channel for domestic
economic entities for hiding of capital out of the country. If a foreign company is located in a country, with which
Ukraine has signed a double taxation treaty, and this country is not included in the CMU list of offshore zones,
the interest on such a loan is treated as an expense of the Ukrainian company, which, therefore, allows it to
minimize its profit tax liabilities.
There are almost no barriers to hidden capital withdrawal in Ukraine. That is why profit is taken out of the
country almost without hindrance. To prevent the illegal outflow of capital, some countries have created
conditions, in which the legal transfer of profits to “tax havens” is accompanied by additional payments to the
budget and expenses, while the illegal transfer is accompanied by the risk of prosecution.
Apart from their traditional purpose, the investment flows in Ukraine are often part of schemes on hidden capital
withdrawal. An indicative example of this is the large volume of investment from Cyprus, which accounts for
ENTREPRENEURSHIP AND SUSTAINABILITY ISSUES
ISSN 2345-0282 (online) http://jssidoi.org/jesi/
2021 Volume 8 Number 3 (March)
http://doi.org/10.9770/jesi.2021.8.3(27)
Make your research more visible, join the Twitter account of ENTREPRENEURSHIP AND SUSTAINABILITY ISSUES:
@Entrepr69728810
430
more than 32% of total domestic foreign direct investment. According to the data of the State Statistics Service,
Cyprus accounts for the largest share with 19 billion US dollars out of 58.2 billion US dollars of foreign direct
investment, attracted during all years of independence of Ukraine since 1991. Only in 2013, the investors
registered in Cyprus invested 1.8 billion from 3.7 billion US dollars of direct foreign investments (in 2012 – 3.9
billion US dollars from 4.1 billion US dollars).
The estimates of the Tax Justice Network experts indicate that for the ten jurisdictions, which have the highest
financial secrecy score upon the “Financial Secrecy Index” account for around 80% of global financial services
trade in the global market. Over 50 % of bank assets pass through jurisdiction, which has a high level of secrecy.
According to the data of the Stoles Asset Recovery Initiative, almost all large transnational companies use
jurisdictions with high levels of secrecy for minimizing tax assessment base upon the corporate taxes (The official
site of The Stolen Asset Recovery Initiative (StAR)).
The financial systems of developing countries are more prone to the accumulation and realization of systemic
risks, despite the small size and sophistication level of their financial systems, compared to developed countries.
The level of financial stability risk in a country depends on the behaviour of many participants in the financial
system.
Considering constant systemic interaction of the economic agents in the domestic and foreign markets for
resources, goods, and services and financial markets, and the consequences of these interactions in the form of
synergistic explicit and latent effects, we have identified the drivers and methods for economy shadowing.
The main components of the process of illegal funds withdrawal abroad are given in Figure 3.
ENTREPRENEURSHIP AND SUSTAINABILITY ISSUES
ISSN 2345-0282 (online) http://jssidoi.org/jesi/
2021 Volume 8 Number 3 (March)
http://doi.org/10.9770/jesi.2021.8.3(27)
Make your research more visible, join the Twitter account of ENTREPRENEURSHIP AND SUSTAINABILITY ISSUES:
@Entrepr69728810
431
10
11
27
4
2
4
4
2
2
1
1
41
37
20
26
26
19
19
18
13
10
9
29
28
8
28
31
20
20
30
27
23
26
13
15
7
23
36
21
21
41
42
53
45
7
9
38
19
5
36
36
9
16
13
19
0 20 40 60 80 100 120
Institutes in the field of higher education
Preschool education
Police
Army
Higher education authorities
Natioal bank
Health care
Local government authorities
Tax administration authorities
Prosecution authorities
Customs
Absolute level of corruption Very high level High level Impossible to carry out any operations without a bribe Difficult to identify
Figure 3. Corruption level in different institutions in Ukraine in 2018
Source: compiled by the authors, based on the data of National risk assessment report on preventing and countering legalization
(laundering) of proceeds of crime and financing of terrorism. Kyiv, Ukraine. 2019
Let us conduct practical testing of the proposed approach to assessing the risk of income shadowing, using the
example of investment channels for the withdrawal of funds. According to the State Statistics Service of Ukraine
for the period 2012-2018, the volume of foreign direct investment from Ukraine amounted to USD 39 billion.
Cyprus and the United Kingdom were the main investors.
The share of countries upon the volumes of direct investments from Ukraine is given in Figure 4. Considering the
details mentioned above, the practical testing of the proposed approach for determination of the probability of
funds legalization transactions for Ukraine will be carried out using the example of Cyprus and the Virgin Islands
as the countries with the largest volume of investments from Ukraine.
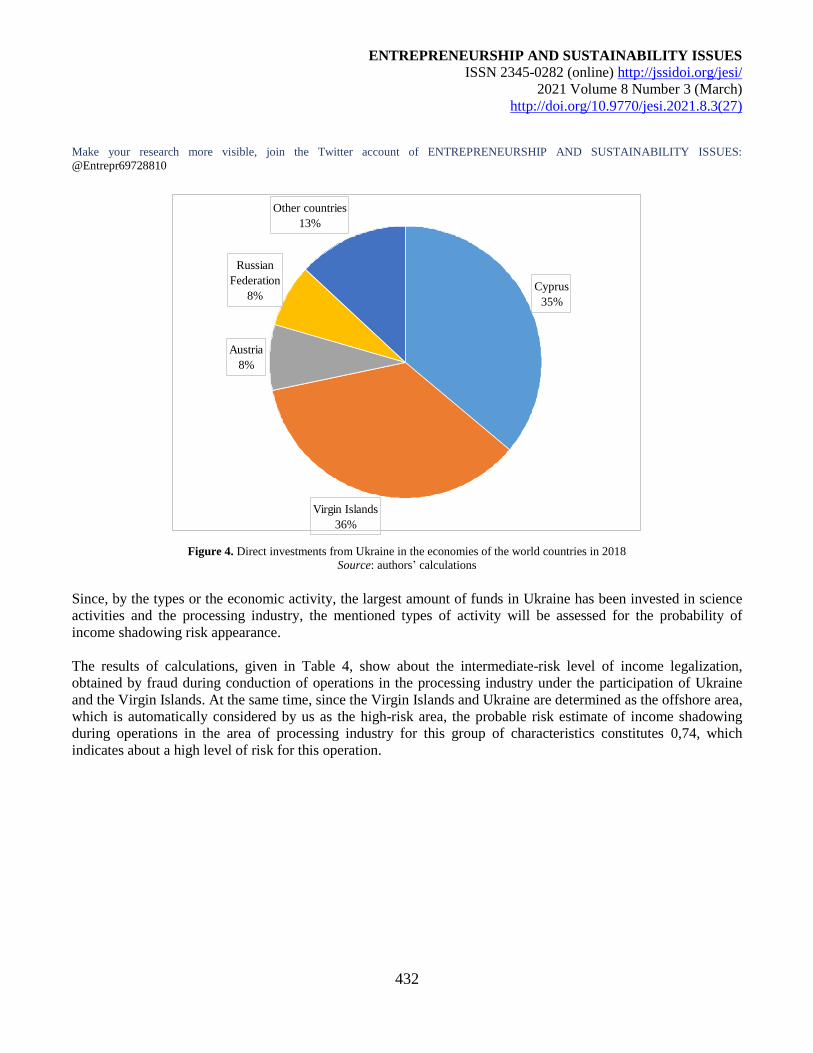
ENTREPRENEURSHIP AND SUSTAINABILITY ISSUES
ISSN 2345-0282 (online) http://jssidoi.org/jesi/
2021 Volume 8 Number 3 (March)
http://doi.org/10.9770/jesi.2021.8.3(27)
Make your research more visible, join the Twitter account of ENTREPRENEURSHIP AND SUSTAINABILITY ISSUES:
@Entrepr69728810
432
Cyprus
35%
Virgin Islands
36%
Austria
8%
Russian
Federation
8%
Other countries
13%
Figure 4. Direct investments from Ukraine in the economies of the world countries in 2018
Source: authors’ calculations
Since, by the types or the economic activity, the largest amount of funds in Ukraine has been invested in science
activities and the processing industry, the mentioned types of activity will be assessed for the probability of
income shadowing risk appearance.
The results of calculations, given in Table 4, show about the intermediate-risk level of income legalization,
obtained by fraud during conduction of operations in the processing industry under the participation of Ukraine
and the Virgin Islands. At the same time, since the Virgin Islands and Ukraine are determined as the offshore area,
which is automatically considered by us as the high-risk area, the probable risk estimate of income shadowing
during operations in the area of processing industry for this group of characteristics constitutes 0,74, which
indicates about a high level of risk for this operation.
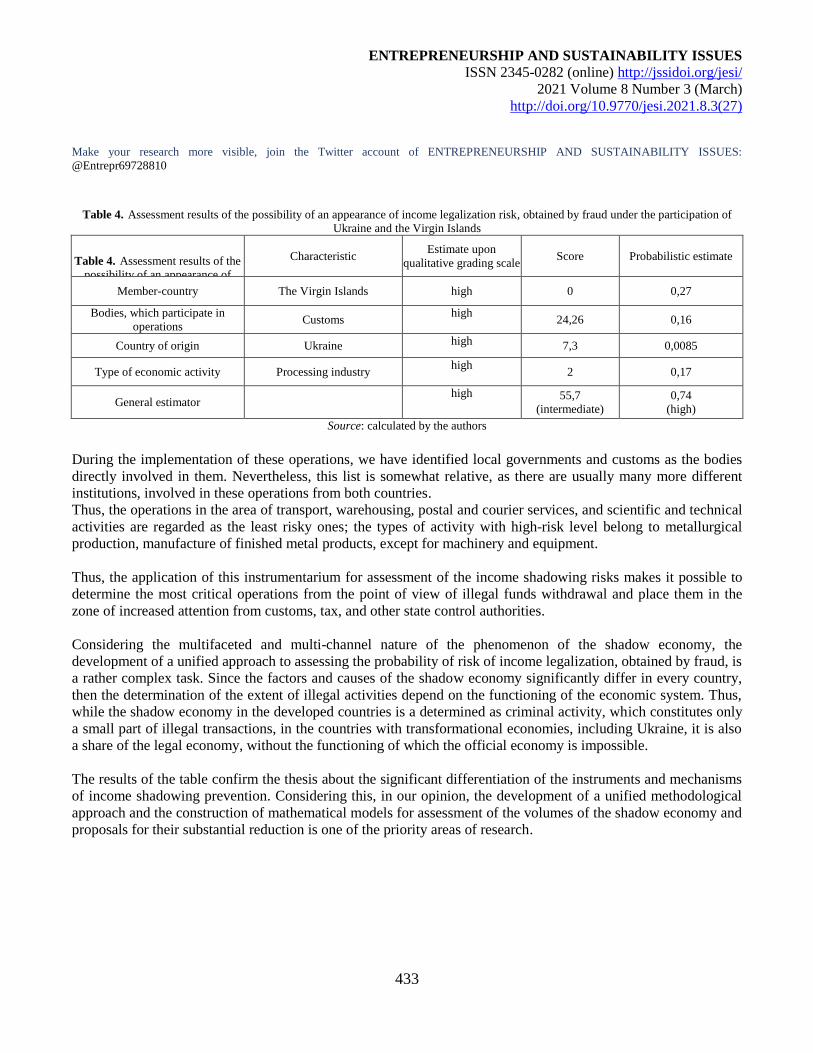
ENTREPRENEURSHIP AND SUSTAINABILITY ISSUES
ISSN 2345-0282 (online) http://jssidoi.org/jesi/
2021 Volume 8 Number 3 (March)
http://doi.org/10.9770/jesi.2021.8.3(27)
Make your research more visible, join the Twitter account of ENTREPRENEURSHIP AND SUSTAINABILITY ISSUES:
@Entrepr69728810
433
Table 4. Assessment results of the possibility of an appearance of income legalization risk, obtained by fraud under the participation of
Ukraine and the Virgin Islands
Table 4. Assessment results of the
possibility of an appearance of
income legalization risk, obtained
by fraud under the participation of
Ukraine and the Virgin Islands
Indicator
Characteristic Estimate upon
qualitative grading scale Score Probabilistic estimate
Member-country The Virgin Islands high 0 0,27
Bodies, which participate in
operations Customs
high 24,26 0,16
Country of origin Ukraine high 7,3 0,0085
Type of economic activity Processing industry high
2 0,17
General estimator high 55,7
(intermediate)
0,74
(high)
Source: calculated by the authors
During the implementation of these operations, we have identified local governments and customs as the bodies
directly involved in them. Nevertheless, this list is somewhat relative, as there are usually many more different
institutions, involved in these operations from both countries.
Thus, the operations in the area of transport, warehousing, postal and courier services, and scientific and technical
activities are regarded as the least risky ones; the types of activity with high-risk level belong to metallurgical
production, manufacture of finished metal products, except for machinery and equipment.
Thus, the application of this instrumentarium for assessment of the income shadowing risks makes it possible to
determine the most critical operations from the point of view of illegal funds withdrawal and place them in the
zone of increased attention from customs, tax, and other state control authorities.
Considering the multifaceted and multi-channel nature of the phenomenon of the shadow economy, the
development of a unified approach to assessing the probability of risk of income legalization, obtained by fraud, is
a rather complex task. Since the factors and causes of the shadow economy significantly differ in every country,
then the determination of the extent of illegal activities depend on the functioning of the economic system. Thus,
while the shadow economy in the developed countries is a determined as criminal activity, which constitutes only
a small part of illegal transactions, in the countries with transformational economies, including Ukraine, it is also
a share of the legal economy, without the functioning of which the official economy is impossible.
The results of the table confirm the thesis about the significant differentiation of the instruments and mechanisms
of income shadowing prevention. Considering this, in our opinion, the development of a unified methodological
approach and the construction of mathematical models for assessment of the volumes of the shadow economy and
proposals for their substantial reduction is one of the priority areas of research.
ENTREPRENEURSHIP AND SUSTAINABILITY ISSUES
ISSN 2345-0282 (online) http://jssidoi.org/jesi/
2021 Volume 8 Number 3 (March)
http://doi.org/10.9770/jesi.2021.8.3(27)
Make your research more visible, join the Twitter account of ENTREPRENEURSHIP AND SUSTAINABILITY ISSUES:
@Entrepr69728810
434
5. Discussion
The variety of instruments indicates about the use of an individual approach by the countries in the course of
development of the economy unshadowing policy. The executive and legislative authorities should determine the
reasonability for application of a particular instrument and form the respective regulatory framework of their use,
depending on the level of the country’s economic development, the level of income shadowing risk, and the most
powerful shadowing inhibitors, typical to a particular country. One of the most important and, at the same time,
most difficult elements in terms of implementation in the management system of the shadow economy is the
performance evaluation of the existing shadowing tools.
In this context, the introduction of a results-oriented approach in the executive authorities during the
determination of the priorities of their activity becomes particularly important. Quite often, the actual activity of
public authorities in the field of the economy unshadowing does not correlate with the tasks that are declared in
the legal acts of the respective direction. Nevertheless, the experience of the leading world countries shows that
the inconsistency of the strategy and tactics can act as a barrier for the determined tasks.
We think that the analysis of the effectiveness of the economy unshadowing policy should consider the fact that
the stage of determining the key principles of their implementation (including objectives, indices and the time
horizon for their achievement) is an important step towards building the state policy. The further successful
achievement of these objectives is ensured through effective governance, which can be considered as a process of
making decisions by businesses, institutions, organizations, and individuals, concerning compliance or non-
compliance with the determined objectives.
Thus, the assessment of the instruments’ conformity to the declared objectives is one of the key phases of
determination of the efficiency of the economy unshadowing policy. The introduction of the collaborative control
regime, grounding on the involvement of all interested parties to the process of development and implementation
of the state policy on the economy unshadowing will promote, on one hand, the improvement of understanding of
the importance and rightness of the decisions, which are made as part of the implementation of the tax system in
the country, and, on the other hand, will create an opportunity for reconciling of the interests of the state and
society during strategic decision-making.
Conclusions
Summing up, one should mention that the availability of effective instruments for assessment of the income
shadowing volumes creates favourable conditions for an increase in the country’s investment attractiveness and
the level of its financial potential. A prerequisite for achieving these objectives is the Timely forecasting of the
potential illegal funds withdrawal abroad and the introduction of the preventive measures is an important
condition for achievement of the mentioned objectives.
The offered approach makes it possible to assess the possibility of occurrence of the risk of income legalization,
which was obtained illegally, both upon individual components (a type of economic activity, authorities, involved
in transactions, country of origin, etc.) and the transaction as a whole. The foundation for the development of this
approach included the assumption that the use of the corrupt schemes of funds withdrawal abroad takes place at
every level of the economic system, and, therefore, one should assess its effects on the overall extent of risk of the
operation.
ENTREPRENEURSHIP AND SUSTAINABILITY ISSUES
ISSN 2345-0282 (online) http://jssidoi.org/jesi/
2021 Volume 8 Number 3 (March)
http://doi.org/10.9770/jesi.2021.8.3(27)
Make your research more visible, join the Twitter account of ENTREPRENEURSHIP AND SUSTAINABILITY ISSUES:
@Entrepr69728810
435
The control measures for managing tax gaps should be diversified, depending on the risk level of the business
operation shadowing, which is determined based on: 1) the risk of exposure of the involved public authorities to
the facilitation of shadow financial and economic relations (in Ukraine, it is the highest for the law enforcement
authorities (0,55), customs (0,82), police (0,49)); 2) risk of the national economy shadowing of the countries,
performance of activity of counteragents (can be identified as high for 36 offshore areas as well as 35 other
countries, for example, Bulgaria (0,87), Turkey (0,75), Uzbekistan (0,65), Azerbaijan (0,84), Kazakhstan (0,71),
Tadzhikistan (0,73), etc.); as low – for 23 countries, for example, Germany (0,32), Sweden (0,44), Denmark
(0,39), etc.); 3) risk of shadowing of the corresponding the type of the economic activity (17 types of economic
activity were identified as the riskiest in terms of shadowing the national economy, for example, financial leasing
operations (0,98), crediting (0,98), insurance (0,98), etc., the least risky – 16 types, for example, textile production
(0,14), metallurgy (0,11), processing industry (0,21), etc.).
This approach can be used as a tool for assessing the efficiency of the state anti-corruption policy, especially in
the area of shadow flows minimization both at micro- and macrolevel. Apart from that, the offered approach can
be used for identification of the main stabilizing and destabilizing factors on the income shadowing level for their
more profound research and transformation into controlled in a short- and long-term perspective.
References
About the statement of Methodical recommendations concerning a complex estimation of volumes of unproductive outflow (export) of
financial resources outside of Ukraine (2015). Available at: http://www.me.gov.ua/Ascod/List?lang=uk-
UA&id=d6a26174d0fd406b9c307a4043f04eb5&tag=SistemaQblikuPublichnoiInformatsii&pageNumber=86&fCtx=inName&fSort=date&
fSdir=asc
Chehabeddine, M., Tvaronavičienė, M. (2020). Securing regional development. Insights into Regional Development, 2(1), 430-442.
http://doi.org/10.9770/IRD.2020.2.1(3)
Dell’Anno, R. (2016). Analyzing the determinants of the shadow economy with a “separate approach”. An application of the relationship
between inequality and the shadow economy. World Development, 84, 342-356. Available at:
https://www.sciencedirect.com/science/article/abs/pii/S0305750X15002077
Dorogov, N.I., Kapitonov, I.A., & Batyrova, N.T. (2020). The role of national plans in developing the competitiveness of the state
economy. Entrepreneurship and Sustainability Issues, 8(1), 672-686. http://doi.org/10.9770/jesi.2020.8.1(46)
Draskovic, V., Jovovic, R., Streimikiene, D. & Bilan, S. (2020). Formal and Informal vs. Alternative Institutions. Montenegrin Journal of
Economics, 16(2). 193-201.
Feige, E. L. (2016). Reflections on the Meaning and Measurement of Unobserved Economies: What Do We Really Know About
the'Shadow Economy'. Journal of Tax Administration, 2. Available at: https://papers.ssrn.com/sol3/papers.cfm?abstract_id=2728060
Goel, R. K., & Nelson, M. A. (2016). Shining a light on the shadows: Identifying robust determinants of the shadow economy. Economic
Modelling, 58, 351-364. Available at: https://www.sciencedirect.com/science/article/abs/pii/S0264999316301729
González-Fernández, M., & González-Velasco, C. (2015). Analysis of the shadow economy in the Spanish regions. Journal of Policy
Modeling, 37(6), 1049-1064. Available at: https://www.sciencedirect.com/science/article/abs/pii/S016189381500099X
Illicit Financial Flows Reports. Global Financial Integrity official web-site. Available at: http://www.gfintegrity.org/reports/
Kirchgässner, G. (2017). On estimating the size of the shadow economy. German Economic Review, 18(1), 99-111. Available at:
https://onlinelibrary.wiley.com/doi/abs/10.1111/geer.12094
ENTREPRENEURSHIP AND SUSTAINABILITY ISSUES
ISSN 2345-0282 (online) http://jssidoi.org/jesi/
2021 Volume 8 Number 3 (March)
http://doi.org/10.9770/jesi.2021.8.3(27)
Make your research more visible, join the Twitter account of ENTREPRENEURSHIP AND SUSTAINABILITY ISSUES:
@Entrepr69728810
436
Kozlovskyi, S., Grynyuk, R., Baidala, V., Burdiak, V. & Bakun, Y. (2019). Economic Security Management of Ukraine in Conditions of
European Integration. Montenegrin Journal of Economics, 15(3), 137-153.
Mazzanti, M., Mazzarano, M., Pronti, A., & Quatrosi, M. (2020). Fiscal policies, public investments and wellbeing: mapping the evolution
of the EU. Insights into Regional Development, 2(4), 725-749. http://doi.org/10.9770/IRD.2020.2.4(1)
Ministry of Economic Development, Trade and Agriculture of Ukraine. Available at: https://www.me.gov.ua/Documents/List?lang=uk-
UA&id=2c90ad86-f47a-4c19-bf95-13345b83c279&tag=PravoviZasadiDiialnosti
National risk assessment report on preventing and countering legalization (laundering) of proceeds of crime and financing of terrorism.
Kyiv, Ukraine. 2018. Available at: http://www.sdfm.gov.ua/content/file/Site docs/2019/20170113/nra.pdf
Nguyen, T.A.N., Luong, T.T.H. (2020). Corruption, Shadow Economy and Economic Growth: Evidence from Emerging and Developing
Asian Economies. Montenegrin Journal of Economics, 16(4), 85-94.
Putniņš, T. J., & Sauka, A. (2015). Measuring the shadow economy using company managers. Journal of Comparative Economics, 43(2),
471-490. Available at: https://www.sciencedirect.com/science/article/pii/S0147596714000262
Salahodjaev, R. (2015). Intelligence and shadow economy: A cross-country empirical assessment. Intelligence, 49, 129-133. Available at:
https://www.sciencedirect.com/science/article/abs/pii/S016028961500015X
Schneider, F., Raczkowski, K., & Mróz, B. (2015). Shadow economy and tax evasion in the EU. Journal of Money Laundering Control.
Available at: https://www.emerald.com/insight/content/doi/10.1108/JMLC-09-2014-0027/full/html?journalCode=jmlc
The most common money laundering schemes are related to operations on illegal withdrawal of money abroad and investment from
offshore zones (2019). Available at: http://tsn.ua/groshi/skladeno-revting-navpopulvarnishih-sposobiv-vidmivannva- groshev-v-
ukrayini.html
The official site of The Stolen Asset Recovery Initiative (StAR). Available at: https://star.worldbank.org/star/
The official site of the World Economic Forum. Available at: https://www.weforum.org/
Κάτσιος, Σ. (2015). The shadow economy and corruption in Greece. South-Eastern Europe Journal of Economics, 4(1). Available at:
https://ojs.lib.uom.gr/index.php/seeje/article/view/5557
Osipov, G.V., Glotov, V.I., & Karepova, S.G. (2018). Population in the shadow market: petty corruption and unpaid taxes,
Entrepreneurship and Sustainability Issues, 6(2), 692-710. http://doi.org/10.9770/jesi.2018.6.2(16)
Vigliarolo, F. (2020). Towards an ontological reason law in economics: principles and foundations. Insights into Regional Development,
2(4), 784-801. http://doi.org/10.9770/IRD.2020.2.4(5)
ENTREPRENEURSHIP AND SUSTAINABILITY ISSUES
ISSN 2345-0282 (online) http://jssidoi.org/jesi/
2021 Volume 8 Number 3 (March)
http://doi.org/10.9770/jesi.2021.8.3(27)
Make your research more visible, join the Twitter account of ENTREPRENEURSHIP AND SUSTAINABILITY ISSUES:
@Entrepr69728810
437
Tetiana KOLOMOIETS, Doctor of Jurisprudence, Professor, Zaporizhzhia National University
ORCID ID: orcid.org/0000-0003-1101-8073
Nelli TSYBULNYK, PhD in Law, Lecturer Kharkiv National University of Internal Affairs
ORCID ID: orcid.org/0000-0002-5128-0511
Oleksandr MOROZ, Post-graduate student of Law Faculty of Sumy National Agrarian University
ORCID ID: orcid.org/0000-0003-1621-8859
Vitaliy PRYMACHENKO, Candidate of Juridical Sciences, Associate Professor, Dnipropetrovsk State University of Internal Affairs
ORCID ID: orcid.org/0000-0002-9907-0820
Vadym KHASHEV, Law Sciences, Associate Professor, Dnipropetrovsk State University of Internal Affairs
ORCID ID: orcid.org/0000-0002-2240-0713
Copyright © 2021 by author(s) and VsI Entrepreneurship and Sustainability Center
This work is licensed under the Creative Commons Attribution International License (CC BY).
http://creativecommons.org/licenses/by/4.0/
ENTREPRENEURSHIP AND SUSTAINABILITY ISSUES
ISSN 2345-0282 (online) http://jssidoi.org/jesi/
2021 Volume 8 Number 3 (March)
http://doi.org/10.9770/jesi.2021.8.3(28)
Publisher http://jssidoi.org/esc/home
438
THE ROLE OF A DEFENCE INDUSTRY IN THE SYSTEM OF NATIONAL SECURITY: A CASE
STUDY
Oleksandr Ilchenko ¹, Oksana Brusakova ², Yuliia Burchenko 3, Artem Yaroshenko 4, Yaroslav Bagan 5
1*Sumy State University, 2 Rimsky-Korsakova Street, Sumy, 40000, Ukraine 2 Kharkiv National University of Internal Affairs, Lev Landau Avenue, 27, Kharkiv, 61000, Ukraine
3 National University of Water Management and Nature Management, Soborna Street, 11, Rivne, 33000, Ukraine 4 Dnipropetrovsk State University of Internal Affairs, Ave. Gagarina, 26, 49005, Dnipro, Ukraine
5 Law firm "Ex Jure", Sh. Rustaveli str., 18, Lviv, 79005, Ukraine
E-mail: 1* [email protected]
Received 15 March 2020 ; accepted 10 December 2020; published 30 March 2021
Abstract. It was determined that the existing scientific and methodological approaches to the assessment of the state of financial security
of defence industry enterprises due to the specific peculiarities of this industry and the rapid changes in their external environment,
currently taking place, need both the advancement in the direction of improving the level of timeliness of such assessment and expansion of
the indicators list for its implementation. In the light of modern conditions, characterized by globalization and increased competition in the
domestic and foreign arms markets, the defence enterprises can be competitive if they can adapt their activity effectively to the changes in
the external environment, take timely preventive measures against the impact of negative environmental factors and make timely use of the
opportunities, provided by the environment for strengthening of their financial security. In the research, the authors have improved
scientific and methodological approaches to the complex assessment of financial security of defence enterprises – conduction of the
analysis upon 3 blocks: definition of the indicators system (including the one upon the criterion of the enterprise’s relations state with the
subjects of the external environment; express diagnostics of the enterprise’s financial security; a full-blown assessment of the financial
security of the enterprise, which makes it possible to provide operational efficiency during substantiation of the administrative decisions,
concerning the provision of financial security of the enterprises and consider the change of conditions of their interaction with subjects of
the external environment. The development of the integration processes in the global economy, in particular defence industries, and the
steady increase in competition on the global arms market, provides importers of arms and military equipment (AME) with a diverse choice
of means of pressure on the exporters, directly encourage the application of the offset practices in this area. The research determines the
ways and priorities of application of the offset activity by defence enterprises of Ukraine in the context of consideration of this
phenomenon as a tool for strengthening their financial security thanks to the optimization of expenditures for implementation of the export-
import operations and research, development, and engineering activity (RD&T).
Keywords: national security; financial security; defence industry; offset activity; express diagnostics; Ukraine
Reference to this paper should be made as follows: Ilchenko, O., Brusakova, O., Burchenko, Y., Yaroshenko, A., Bagan, Y. 2021. The role
of a defence industry in the system of national security: a case study. Entrepreneurship and Sustainability Issues, 8(3), 438-454.
http://doi.org/10.9770/jesi.2021.8.3(28)
JEL Classifications: F35, F42
ENTREPRENEURSHIP AND SUSTAINABILITY ISSUES
ISSN 2345-0282 (online) http://jssidoi.org/jesi/
2021 Volume 8 Number 3 (March)
http://doi.org/10.9770/jesi.2021.8.3(28)
Make your research more visible, join the Twitter account of ENTREPRENEURSHIP AND SUSTAINABILITY ISSUES:
@Entrepr69728810
439
1. Introduction
The world market experience shows that the dynamic growth of the sovereign country, which can guarantee
security to its residents, is not possible without functioning of the defence industry. It is impossible to provide
state security without the Armed Forces and the defence industry, catering to its needs, in the light of instability of
the international environment. The existence of strong defence industry is also the key success factor to the
reinforcement of the international cooperation of any country: provision of conditions for its full participation in
the collective security systems and systems of control over the supply of defence and dual-purpose products and
technologies.
The manufacturing sector of the defence economy plays a decisive role in the production and supply of the
military products to the Armed Forces and other military formations. It is a special part of the state’s economy,
catering to its specific military and economic needs for national security provision. Among such needs are
arming, ammunition supplies, military machinery, other military property, spare parts and materials, the
performance of activities and provision of services, as well as export-import delivery in the area of the military
and technical cooperation of Ukraine with foreign countries.
The fundamental principles of satisfying the military and technical needs of the Armed Forces include the
achievement of compliance of the level of their technical equipment with the national security needs of the state;
consideration of scientific, technical, and economic capabilities of the state; maintenance of the armaments,
military, special equipment and other property in readiness condition.
The Military-Industrial Complex/Defence industry is the key element in the production sector of the defence
economy of the developed countries. In Ukraine, it is the defence industrial complex (hereinafter referred to as the
“DIC”) as an integral economic system of industries, enterprises, scientific organizations, design bureaus and
service facilities of the infrastructure of this system, focusing on research, development, production, and supply of
weapons, military and special equipment and property for satisfaction of the national military-economic needs.
The defence industry is critical to both the development of the national economy and the protection of public
interests. Successful functioning of this strategic state industry requires specific grounded economic policy
(Rajnoha, R. et al., 2019; Liao, H. et al., 2019; Lincényi, M. & Čársky, J. 2020). It is an area that nowadays
operates mainly within the industry 4.0; what triggers respective specific threats, which have to be addressed at
national and international level (Tvaronavičienė, M. et al., 2020; Plėta et al., 2020).
The regulation of the defence-industrial complex development, which can adapt to functioning in crises situations
and threats to national security, ensure the transition to the fifth technological mode and strengthen the state’s
ability within the framework of achieving military and political independence by Ukraine, meets the national
interests of Ukraine.
2. Literature Survey
The international practices of the world’s leading countries, including Central and Eastern European countries,
also indicate about the use of the diverse mechanisms for the attraction of financial resources to the defence
industry, namely:
- arrangement of favourable investment conditions by granting allowances and preferences to the defence
enterprises through the adoption of the consistent normative legal acts (Qureshi, F.A. (2018));
ENTREPRENEURSHIP AND SUSTAINABILITY ISSUES
ISSN 2345-0282 (online) http://jssidoi.org/jesi/
2021 Volume 8 Number 3 (March)
http://doi.org/10.9770/jesi.2021.8.3(28)
Make your research more visible, join the Twitter account of ENTREPRENEURSHIP AND SUSTAINABILITY ISSUES:
@Entrepr69728810
440
- maintenance of cooperation with foreign enterprises, including the one, conducted through the establishment of
joint ventures, without sacrificing state control over strategic enterprises (sales of no more than 25-49% of shares)
(Behma, V.M., & Sverhunov, O.O. (2019));
- vigorous activity in stock markets. The analysis of the activity of the world-leading arms producers shows that a
stock market is one of the most significant sources for the attraction of the investments, while the growth of
capitalization of these enterprises is one of the fundamental criteria of their economic success (Lonsdale, D.J.
(2019));
- the last few years have been marked by new tendencies in the offset policy. The main tendencies of the modern
world in the area of offset can be regarded as follows (Nzeribe, S., & Imam, M. (2018); Kravchenko, V. (2019);
Usachenko, O. (2019)): an increase in the number of countries that apply offset when purchasing the military
purpose products; the growing importance of the offset programs in the tender holding; the increase in the role
and share of the projects on direct offset in the development of the offset programs; the increase in the volume of
the offset obligations to 100% and more from the contract cost for delivery of the defence and military goods
(DMG); the importers’ insisting, in the framework of indirect offset, first of all, on transference to them the
knowledge-intensive technologies, developments, and “know-how” of the military, dual- and civilian purpose, on
conduction of joint scientific research and training of the qualified scientific staff; the reduction in the size of
multipliers (multiplying coefficient) in the determination of the offset value of the projects; the attempts to limit
the transfer of critical technologies on arms production.
The main principles of government export regulation of military technologies should be as follows:
- provision of the correspondence of the state regulatory methods to the national security needs (Avanesova, N.E.,
Kolodyazhna, T.V., & Semenova, J.I. (2018));
- the use of scientific methods for determination of the economic practicality of the military technologies export
(Momot, T.V., Avanesova, N.E., & Vinnik, I.U. (2015));
- optimal combination of instruments for limiting and encouraging of the military technologies export
(Potomkina, M. (2018));
- implementation of measures or state regulation of military technologies export, based on the creation of an
appropriate regulatory framework and strict control over compliance with such a foundation (Kamianetska, O.
(2015));
- encouragement of the establishment and use of an individual system of intra-company export control by the
corporate exporters (Reznik O., Mazievich T., Shebanits D., Puzanova G., Pyrih I. (2020));
- establishment of a high level of responsibility (including criminal liability) for non-compliance with the
statutory requirements of the system of state regulation over the military technologies export (Weber, R.N.
(2020)).
In paying tribute to the scientific and practical significance of the works of these authors, it should be noted that
some questions of a theoretical and methodological nature have not been sufficiently studied, namely:
interdependence between the state of financial security of defence enterprises and the degree of realization of
national interests, influence on the development of risks and threats to the economic security of the state;
identification of opportunities and problems in the provision of the financial security of the enterprises in their
interaction with the external environment; the existing approaches to assessing the level of defence enterprises’
financial security do not sufficiently consider the dynamics and the interrelation of factors, predetermining it;
insufficient consideration of specific peculiarities of the subjects of the external environment of the defence
enterprises.
ENTREPRENEURSHIP AND SUSTAINABILITY ISSUES
ISSN 2345-0282 (online) http://jssidoi.org/jesi/
2021 Volume 8 Number 3 (March)
http://doi.org/10.9770/jesi.2021.8.3(28)
Make your research more visible, join the Twitter account of ENTREPRENEURSHIP AND SUSTAINABILITY ISSUES:
@Entrepr69728810
441
3. Methods
The research included the following methods of scientific cognition: observation, analysis of empirical science,
logical generalization – for determining the place and role of the defence industry in the realization of the national
interests; analysis and synthesis, comparison, structural-logical and semantic analysis – during the study of the
content and peculiarities of the financial security of the highlighted companies, as well as its impact on the
components of the economic security of the state; systemic and subject-oriented approach – during substantiation
of theoretical formation foundations of a mechanism and tools for provision of financial security of the defence
industry enterprises in interaction with the subjects of the external environment; comparative analysis – during the
process of researching the international experience on the development of the defence industry in the context of
its implementation in Ukraine; multi-criteria (vector) optimization, economics and mathematics (analysis and
simulation) modelling – when substantiating the scientific-methodological approach to modeling and multi-
criteria optimization of financial and material flows at the defence industry enterprises.
4. Results
The results of the analysis show that during the period from 2014 to 2018, the number of the enterprises and DIC
organizations in Ukraine fell five-fold, while the number of employees – decreased by a factor of 7 times (in
particular, the employees of the 35-45 age group) (State Statistics Service of Ukraine). The average age of
qualified specialists is 40-65.
The analysis of the existing approaches towards the assessment of different aspects of financial safety of the
defensive industry enterprises has confirmed that there is an urgent need for advancement and introduction of the
integrated rating approaches to financial safety condition assessment of the highlighted enterprises, which levels
lack existing approaches and will raise their adequacy to modern market conditions, including, first of all,
expansion of the enterprises’ spectrum of interaction with the external environment.
The results of the author’s express diagnostics of financial security condition of 12 Ukrainian defence enterprises
(3 non-governmental enterprises (private), 9 – state enterprises), held based on their statistical data (upon the data
available as of 01.01.2019) with consideration of analysis, are given in Table 1.
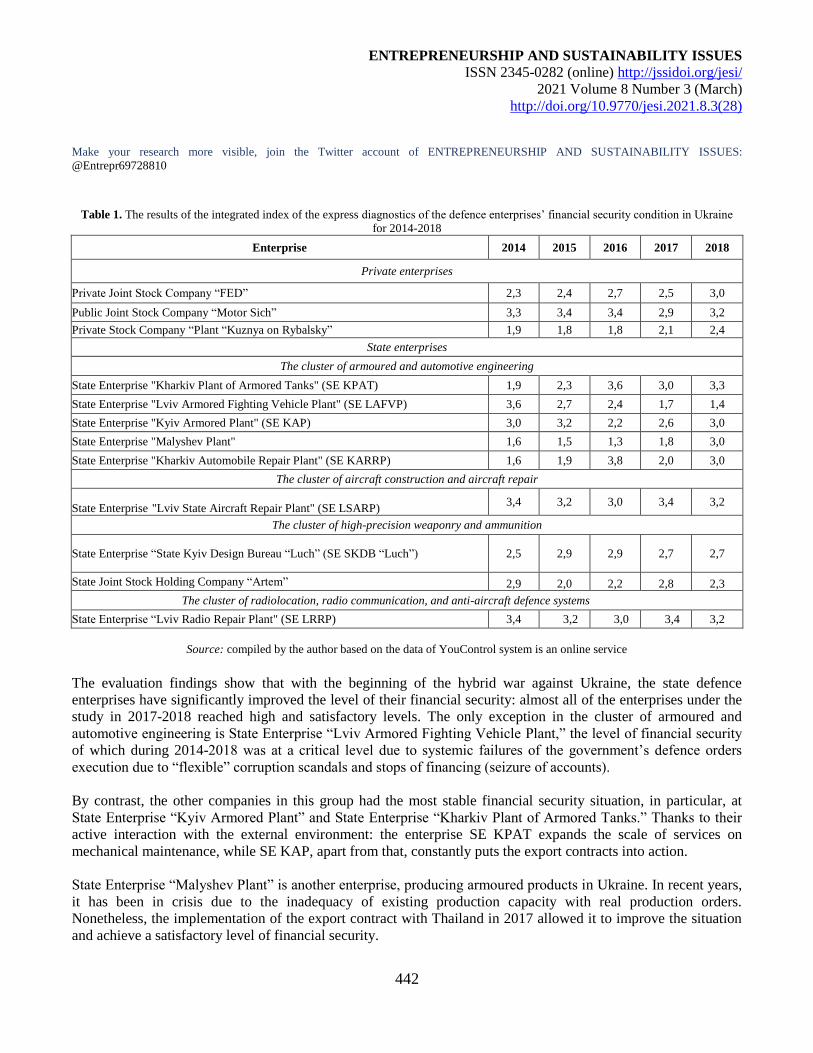
ENTREPRENEURSHIP AND SUSTAINABILITY ISSUES
ISSN 2345-0282 (online) http://jssidoi.org/jesi/
2021 Volume 8 Number 3 (March)
http://doi.org/10.9770/jesi.2021.8.3(28)
Make your research more visible, join the Twitter account of ENTREPRENEURSHIP AND SUSTAINABILITY ISSUES:
@Entrepr69728810
442
Table 1. The results of the integrated index of the express diagnostics of the defence enterprises’ financial security condition in Ukraine
for 2014-2018
Enterprise 2014 2015 2016 2017 2018
Private enterprises
Private Joint Stock Company “FED” 2,3 2,4 2,7 2,5 3,0
Public Joint Stock Company “Motor Sich” 3,3 3,4 3,4 2,9 3,2
Private Stock Company “Plant “Kuznya on Rybalsky” 1,9 1,8 1,8 2,1 2,4
State enterprises
The cluster of armoured and automotive engineering
State Enterprise "Kharkiv Plant of Armored Tanks" (SE KPAT) 1,9 2,3 3,6 3,0 3,3
State Enterprise "Lviv Armored Fighting Vehicle Plant" (SE LAFVP) 3,6 2,7 2,4 1,7 1,4
State Enterprise "Kyiv Armored Plant" (SE KAP) 3,0 3,2 2,2 2,6 3,0
State Enterprise "Malyshev Plant" 1,6 1,5 1,3 1,8 3,0
State Enterprise "Kharkiv Automobile Repair Plant" (SE KARRP) 1,6 1,9 3,8 2,0 3,0
The cluster of aircraft construction and aircraft repair
State Enterprise "Lviv State Aircraft Repair Plant" (SE LSARP) 3,4 3,2 3,0 3,4 3,2
The cluster of high-precision weaponry and ammunition
State Enterprise “State Kyiv Design Bureau “Luch” (SE SKDB “Luch”) 2,5 2,9 2,9 2,7 2,7
State Joint Stock Holding Company “Artem” 2,9 2,0 2,2 2,8 2,3
The cluster of radiolocation, radio communication, and anti-aircraft defence systems
State Enterprise “Lviv Radio Repair Plant" (SE LRRP) 3,4 3,2 3,0 3,4 3,2
Source: compiled by the author based on the data of YouControl system is an online service
The evaluation findings show that with the beginning of the hybrid war against Ukraine, the state defence
enterprises have significantly improved the level of their financial security: almost all of the enterprises under the
study in 2017-2018 reached high and satisfactory levels. The only exception in the cluster of armoured and
automotive engineering is State Enterprise “Lviv Armored Fighting Vehicle Plant,” the level of financial security
of which during 2014-2018 was at a critical level due to systemic failures of the government’s defence orders
execution due to “flexible” corruption scandals and stops of financing (seizure of accounts).
By contrast, the other companies in this group had the most stable financial security situation, in particular, at
State Enterprise “Kyiv Armored Plant” and State Enterprise “Kharkiv Plant of Armored Tanks.” Thanks to their
active interaction with the external environment: the enterprise SE KPAT expands the scale of services on
mechanical maintenance, while SE KAP, apart from that, constantly puts the export contracts into action.
State Enterprise “Malyshev Plant” is another enterprise, producing armoured products in Ukraine. In recent years,
it has been in crisis due to the inadequacy of existing production capacity with real production orders.
Nonetheless, the implementation of the export contract with Thailand in 2017 allowed it to improve the situation
and achieve a satisfactory level of financial security.
ENTREPRENEURSHIP AND SUSTAINABILITY ISSUES
ISSN 2345-0282 (online) http://jssidoi.org/jesi/
2021 Volume 8 Number 3 (March)
http://doi.org/10.9770/jesi.2021.8.3(28)
Make your research more visible, join the Twitter account of ENTREPRENEURSHIP AND SUSTAINABILITY ISSUES:
@Entrepr69728810
443
State Enterprise “Kharkiv Automobile Repair Plant” takes a separate position in the range of enterprises under the
study. In recent years, the level of its financial security has fluctuated from critical to high because this enterprise
practically does not receive any state orders for repair of the military equipment. Moreover, it has no access to
foreign markets. Thus, it is forced to work in competitive conditions with private companies in the domestic car
repair market.
The next group of traditionally stable state defence enterprises in recent years includes State Enterprise “Lviv
Radio Repair Plant” (a cluster of radiolocation, radio communication and anti-aircraft defence systems) and State
Enterprise “Lviv State Aircraft Repair Plant” (a cluster of aircraft construction and aircraft repair). The level of
financial security of these enterprises ranges from satisfactory to high due to their practically monopolistic
position on the domestic arms market and active position on the foreign market.
To this group of stable enterprises, in terms of financial security, one can also include the enterprise of the high-
precision weaponry and ammunition cluster: State Enterprise “State Kiev Design Bureau “Luch” (its level of
financial security over the last 5 years is regarded as satisfactory). It can be listed in this group as a result of the
additional organization of independent production of defence products of its own design at a traditionally
scientific and design enterprise. The majority of the mentioned products should be produced at the production
capacities of State Joint Stock Holding Company “Artem,” as it specializes in the production of high-technology
defence products; with which SE SKDB “Luch” is in partnership. This, alongside more vigorous activity on
foreign markets and solution of problems with import substitution of components, would allow SJSHC “Artem”
to improve the level of financial security to a satisfactory one (as of today, this company sits at the non-
satisfactory level of financial security).
In general, in the group of state enterprises of the defence industry, one traces the influence of the extent of
application of active cooperation by the enterprises with the external environment (export and import contracts,
partnerships with suppliers and consumers, lobbying in relations with the state, etc.) on the level of their financial
security. Different levels of financial security at the enterprises under consideration result from their industry
specificity, which ha differences in the legal regulation of the industry, existing business practices, organizational
peculiarities of the enterprises, technological peculiarities of production (in particular, the availability and
complexity of cooperative relationships), market demand, and modern needs of the Armed Forces of Ukraine, the
degree of state regulation of activity, etc.
In the group of considered private companies of the defence industry of Ukraine, there is a stable high level of
financial security of large enterprises: Public Joint Stock Company “Motor Sich” and Private Joint Stock
Company “FED.” PJSC “Motor Sich” is the undisputed leader among them. The level of its financial security was
at a high level during 4 of 5 years due to its better adaptation to market conditions, compared to the state
enterprises. The previously-mentioned enterprise actively interacts with the external environment (in particular, it
exports to over 100 countries and has complex cooperation links, including the EU enterprises).
PJSC “FED” has also been at a satisfactory level of financial security in recent years, primarily, due to the use of
extensive cooperative ties during the sale of products and performance of the export activity with competitive
products of its own production. Private Stock Company “Plant “Kuznya on Rybalsky” in 2013-2014 was in a state
of crisis due to passive adaptation to market conditions (the enterprise offered a limited range of services). At the
same time, over the last 2 years, this enterprise has actively joined the state defence order on the production of
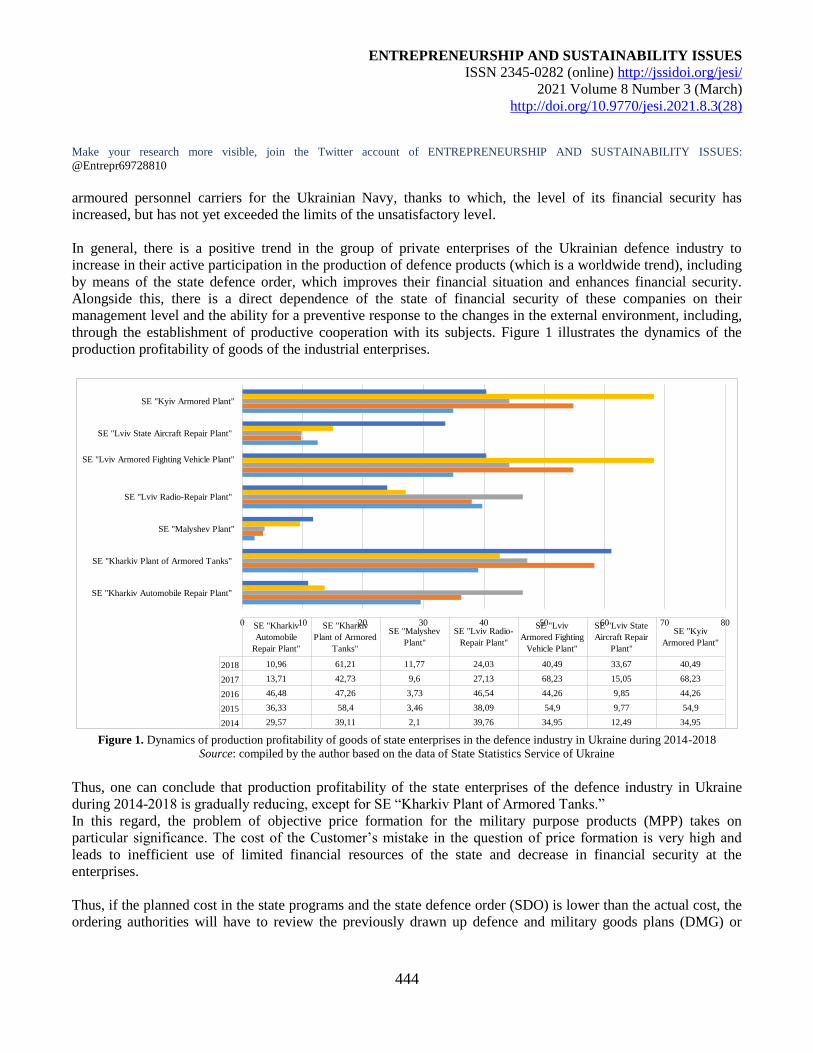
ENTREPRENEURSHIP AND SUSTAINABILITY ISSUES
ISSN 2345-0282 (online) http://jssidoi.org/jesi/
2021 Volume 8 Number 3 (March)
http://doi.org/10.9770/jesi.2021.8.3(28)
Make your research more visible, join the Twitter account of ENTREPRENEURSHIP AND SUSTAINABILITY ISSUES:
@Entrepr69728810
444
armoured personnel carriers for the Ukrainian Navy, thanks to which, the level of its financial security has
increased, but has not yet exceeded the limits of the unsatisfactory level.
In general, there is a positive trend in the group of private enterprises of the Ukrainian defence industry to
increase in their active participation in the production of defence products (which is a worldwide trend), including
by means of the state defence order, which improves their financial situation and enhances financial security.
Alongside this, there is a direct dependence of the state of financial security of these companies on their
management level and the ability for a preventive response to the changes in the external environment, including,
through the establishment of productive cooperation with its subjects. Figure 1 illustrates the dynamics of the
production profitability of goods of the industrial enterprises.
0 10 20 30 40 50 60 70 80
SE "Kharkiv Automobile Repair Plant"
SE "Kharkiv Plant of Armored Tanks"
SE "Malyshev Plant"
SE "Lviv Radio-Repair Plant"
SE "Lviv Armored Fighting Vehicle Plant"
SE "Lviv State Aircraft Repair Plant"
SE "Kyiv Armored Plant"
2018 10,96 61,21 11,77 24,03 40,49 33,67 40,49
2017 13,71 42,73 9,6 27,13 68,23 15,05 68,23
2016 46,48 47,26 3,73 46,54 44,26 9,85 44,26
2015 36,33 58,4 3,46 38,09 54,9 9,77 54,9
2014 29,57 39,11 2,1 39,76 34,95 12,49 34,95
SE "Kharkiv
Automobile
Repair Plant"
SE "Kharkiv
Plant of Armored
Tanks"
SE "Malyshev
Plant"
SE "Lviv Radio-
Repair Plant"
SE "Lviv
Armored Fighting
Vehicle Plant"
SE "Lviv State
Aircraft Repair
Plant"
SE "Kyiv
Armored Plant"
Figure 1. Dynamics of production profitability of goods of state enterprises in the defence industry in Ukraine during 2014-2018
Source: compiled by the author based on the data of State Statistics Service of Ukraine Thus, one can conclude that production profitability of the state enterprises of the defence industry in Ukraine
during 2014-2018 is gradually reducing, except for SE “Kharkiv Plant of Armored Tanks.”
In this regard, the problem of objective price formation for the military purpose products (MPP) takes on
particular significance. The cost of the Customer’s mistake in the question of price formation is very high and
leads to inefficient use of limited financial resources of the state and decrease in financial security at the
enterprises.
Thus, if the planned cost in the state programs and the state defence order (SDO) is lower than the actual cost, the
ordering authorities will have to review the previously drawn up defence and military goods plans (DMG) or
ENTREPRENEURSHIP AND SUSTAINABILITY ISSUES
ISSN 2345-0282 (online) http://jssidoi.org/jesi/
2021 Volume 8 Number 3 (March)
http://doi.org/10.9770/jesi.2021.8.3(28)
Make your research more visible, join the Twitter account of ENTREPRENEURSHIP AND SUSTAINABILITY ISSUES:
@Entrepr69728810
445
refuse to purchase DMG, which will destabilize the DMG development plans and have negatively affected the
combat readiness of the armed forces, the state of DIC enterprises, and, consequently, on national security.
Hence, the quality of development of the conceptual framework and the regulatory and methodological apparatus,
concerning the DMG price justification is a necessary condition for achievement of the goals on the provision of
the financial security of the DIC enterprises and the state.
The actual order of formation of the price for the production, works, services of defence appointment in Ukraine
(in case selection of executors on supply (purchase) of such production, works, services is carried out without
application of competitive procedures) was introduced by the Decree of the Cabinet of Ministers of Ukraine dated
August 8, 2016, No. 517. (About the statement of the Order of formation of the price for production, works,
services of defence appointment in case selection of executors on supply (purchase) of such production, works,
services is carried out without application of competitive procedures (2016)).
According to it, the profit or the enterprise as a part of the price should not exceed 5% of its expenditures on the
purchase of components (semi-finished products) and works (services) from other business entities, as well as
30% of other expenses in the production cost of products (works, services) of own production.
In reality, the percentage of purchased components (semifinished piece) in the latest DMG samples amounts, on
average, 70% of the total number, while the rest number (own production) amounts only 30%, which affects the
level of profit. Currently, the defence industry enterprises have an estimated profit level of 10%, while the real
profit level is even lower, considering the inflation temps.
The established profit level significantly limits opportunities for the development of the military purpose products
producers. Despite this, to save financial resources, allocated for the purchase of weapons and military machinery,
the Ministry of Defence of Ukraine approved “Methodological recommendations, for unified approaches during
application of certain provisions, determined by the decision of the Cabinet of Ministers of Ukraine №517 dated
08.08.2016” (upon the registered number 2591/u/2 of 18.10.2016), where the determined profit levels (5% and
30%) were reduced (About the statement of the Order of formation of the price for production, works, services of
defence appointment in case selection of executors on supply (purchase) of such production, works, services is
carried out without application of competitive procedures (2016)).
Thus, the Methodological recommendations reduced the acceptable level of profit, amounted to expenses from the
purchase of components (semifinished products), works (services) from other business entities fivefold – from 5%
to 1%, while the profit level for the rest of expenses – was reduced from 30% to 20%.
Thus, according to the standards, specified by the Methodological recommendations, the estimated profitability
level of the executor of the State defence order was reduced for almost two times – to 5.4-8% (which is less than
even the planned inflation rate in Ukraine) (About the statement of the Order of formation of the price for
production, works, services of defence appointment in case selection of executors on supply (purchase) of such
production, works, services is carried out without application of competitive procedures (2016)).
When studying the international experience on price formation, one gets an opportunity to identify its regularities
and trends, and the use of the received knowledge during the formation and regulation of prices for MPP.
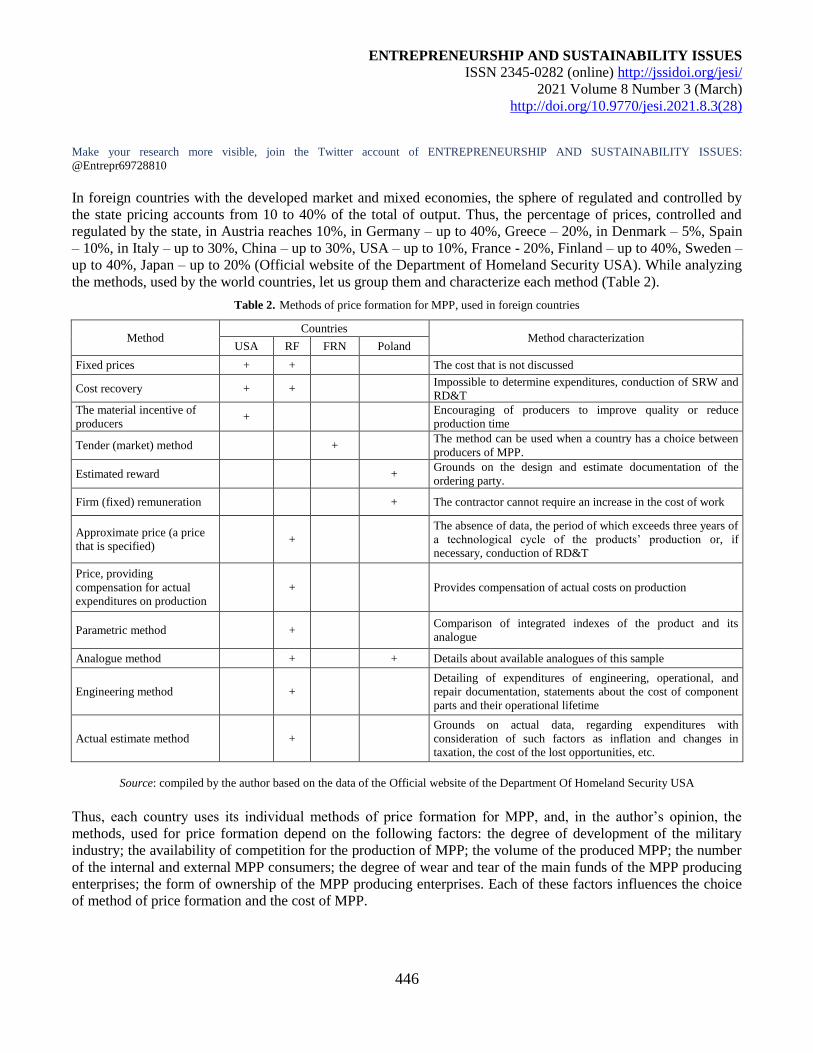
ENTREPRENEURSHIP AND SUSTAINABILITY ISSUES
ISSN 2345-0282 (online) http://jssidoi.org/jesi/
2021 Volume 8 Number 3 (March)
http://doi.org/10.9770/jesi.2021.8.3(28)
Make your research more visible, join the Twitter account of ENTREPRENEURSHIP AND SUSTAINABILITY ISSUES:
@Entrepr69728810
446
In foreign countries with the developed market and mixed economies, the sphere of regulated and controlled by
the state pricing accounts from 10 to 40% of the total of output. Thus, the percentage of prices, controlled and
regulated by the state, in Austria reaches 10%, in Germany – up to 40%, Greece – 20%, in Denmark – 5%, Spain
– 10%, in Italy – up to 30%, China – up to 30%, USA – up to 10%, France - 20%, Finland – up to 40%, Sweden –
up to 40%, Japan – up to 20% (Official website of the Department of Homeland Security USA). While analyzing
the methods, used by the world countries, let us group them and characterize each method (Table 2).
Table 2. Methods of price formation for MPP, used in foreign countries
Method Countries
Method characterization USA RF FRN Poland
Fixed prices + + The cost that is not discussed
Cost recovery + + Impossible to determine expenditures, conduction of SRW and
RD&T
The material incentive of
producers +
Encouraging of producers to improve quality or reduce
production time
Tender (market) method + The method can be used when a country has a choice between
producers of MPP.
Estimated reward + Grounds on the design and estimate documentation of the
ordering party.
Firm (fixed) remuneration + The contractor cannot require an increase in the cost of work
Approximate price (a price
that is specified) +
The absence of data, the period of which exceeds three years of
a technological cycle of the products’ production or, if
necessary, conduction of RD&T
Price, providing
compensation for actual
expenditures on production + Provides compensation of actual costs on production
Parametric method + Comparison of integrated indexes of the product and its
analogue
Analogue method + + Details about available analogues of this sample
Engineering method + Detailing of expenditures of engineering, operational, and
repair documentation, statements about the cost of component
parts and their operational lifetime
Actual estimate method +
Grounds on actual data, regarding expenditures with
consideration of such factors as inflation and changes in
taxation, the cost of the lost opportunities, etc.
Source: compiled by the author based on the data of the Official website of the Department Of Homeland Security USA Thus, each country uses its individual methods of price formation for MPP, and, in the author’s opinion, the
methods, used for price formation depend on the following factors: the degree of development of the military
industry; the availability of competition for the production of MPP; the volume of the produced MPP; the number
of the internal and external MPP consumers; the degree of wear and tear of the main funds of the MPP producing
enterprises; the form of ownership of the MPP producing enterprises. Each of these factors influences the choice
of method of price formation and the cost of MPP.
ENTREPRENEURSHIP AND SUSTAINABILITY ISSUES
ISSN 2345-0282 (online) http://jssidoi.org/jesi/
2021 Volume 8 Number 3 (March)
http://doi.org/10.9770/jesi.2021.8.3(28)
Make your research more visible, join the Twitter account of ENTREPRENEURSHIP AND SUSTAINABILITY ISSUES:
@Entrepr69728810
447
As we can see from Table 2, there are countries (the USA, Germany, and Poland), which use a full set of the MPP
cost assessment models.
In general, their approached ground on consideration of interests and risks of the ordering party and conductor,
providing efficiency of use of the budget costs at all stages of design, production, and sales of MPP.
The United States Department of Defence uses contracts of different forms and purpose, including the contracts
with fixed prices, remuneration of the production expenditures, and the material incentives of producers.
Germany gives its preference to tender (market) method of the DMG price formation. Poland uses the methods of
estimated or firm (fixed) remuneration or both methods simultaneously.
The UK and other developed countries have a fairly strict system of government regulation in the area of DMG
production in the interests of military-technical cooperation (MTC). The non-economic factors put some pressure
on the price of DMG export supplies. Among them are primarily political factors, which affect not only the price
itself but also the model of calculations for the products supplied. These factors play an important role and are
used by all players in the DMG market.
The principle of export prices formation in the USA for new military products, the base of which is the cost of
DMG delivery for the national armed forces. The law in the USA prohibits the export of DMG at prices lower
than the domestic prices. Given the fact that the production of weapons in the US is many times higher than that
of all other manufacturers, this requirement is understandable.
A large number of factors are taken into account when determining the contractual price of goods by a particular
business. Depending on the chosen price formation strategy, the enterprise accepts the prices of the competitor
firms to a greater or lesser extent.
Under the condition, when the amount of profit of the enterprise depends on the level of expenses, it is possible to
get the contractor interested only when he makes a profit, no less than it was before expenditures reduction.
The expenditures reduction is advantageous for both the enterprise and the state. First of all, it increases the
competitiveness of the state in the foreign markets; secondly, it provides an opportunity to transform a part of
economic expenditures into profit, provides the enterprise with free financial resources for modernization of the
main funds, innovation and social activity, which positively affects the quality of products, and will help to hold
down the price for orders in the future.
The concise comparative characteristic of the expenditure and value-based concept of price formation is given in
Table 3.
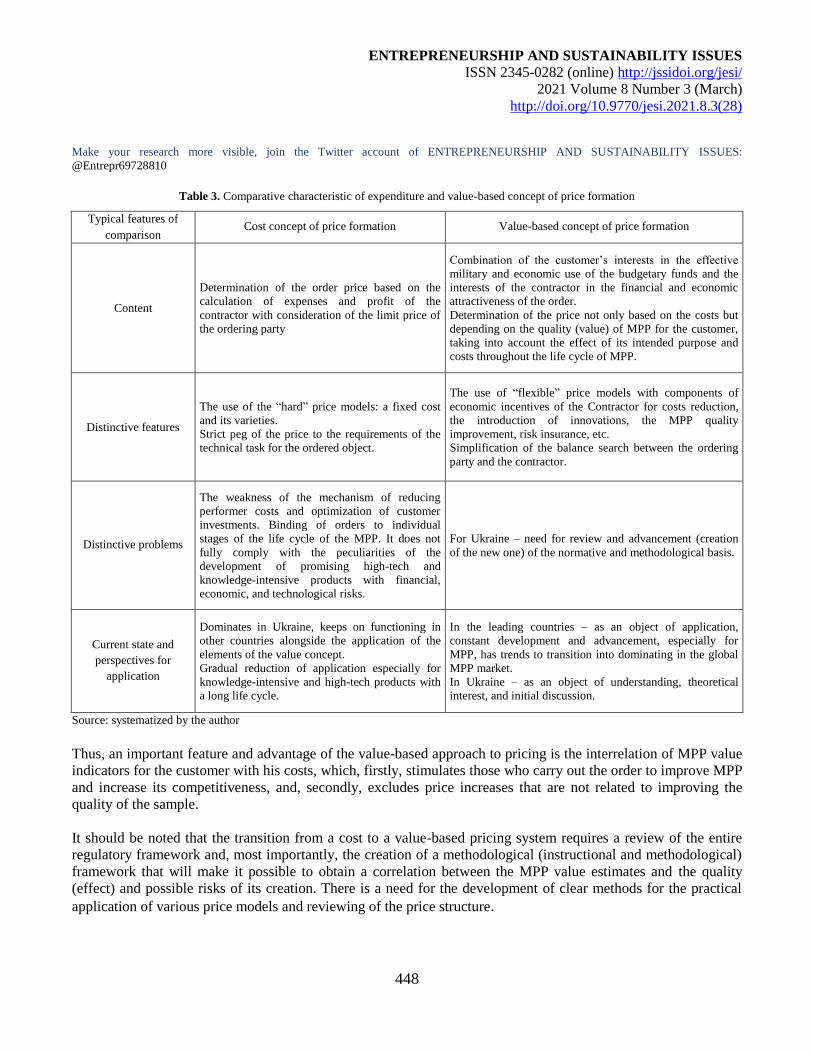
ENTREPRENEURSHIP AND SUSTAINABILITY ISSUES
ISSN 2345-0282 (online) http://jssidoi.org/jesi/
2021 Volume 8 Number 3 (March)
http://doi.org/10.9770/jesi.2021.8.3(28)
Make your research more visible, join the Twitter account of ENTREPRENEURSHIP AND SUSTAINABILITY ISSUES:
@Entrepr69728810
448
Table 3. Comparative characteristic of expenditure and value-based concept of price formation
Typical features of
comparison Cost concept of price formation Value-based concept of price formation
Content
Determination of the order price based on the
calculation of expenses and profit of the
contractor with consideration of the limit price of
the ordering party
Combination of the customer’s interests in the effective
military and economic use of the budgetary funds and the
interests of the contractor in the financial and economic
attractiveness of the order.
Determination of the price not only based on the costs but
depending on the quality (value) of MPP for the customer,
taking into account the effect of its intended purpose and
costs throughout the life cycle of MPP.
Distinctive features
The use of the “hard” price models: a fixed cost
and its varieties.
Strict peg of the price to the requirements of the
technical task for the ordered object.
The use of “flexible” price models with components of
economic incentives of the Contractor for costs reduction,
the introduction of innovations, the MPP quality
improvement, risk insurance, etc.
Simplification of the balance search between the ordering
party and the contractor.
Distinctive problems
The weakness of the mechanism of reducing
performer costs and optimization of customer
investments. Binding of orders to individual
stages of the life cycle of the MPP. It does not
fully comply with the peculiarities of the
development of promising high-tech and
knowledge-intensive products with financial,
economic, and technological risks.
For Ukraine – need for review and advancement (creation
of the new one) of the normative and methodological basis.
Current state and
perspectives for
application
Dominates in Ukraine, keeps on functioning in
other countries alongside the application of the
elements of the value concept.
Gradual reduction of application especially for
knowledge-intensive and high-tech products with
a long life cycle.
In the leading countries – as an object of application,
constant development and advancement, especially for
MPP, has trends to transition into dominating in the global
MPP market.
In Ukraine – as an object of understanding, theoretical
interest, and initial discussion.
Source: systematized by the author Thus, an important feature and advantage of the value-based approach to pricing is the interrelation of MPP value
indicators for the customer with his costs, which, firstly, stimulates those who carry out the order to improve MPP
and increase its competitiveness, and, secondly, excludes price increases that are not related to improving the
quality of the sample.
It should be noted that the transition from a cost to a value-based pricing system requires a review of the entire
regulatory framework and, most importantly, the creation of a methodological (instructional and methodological)
framework that will make it possible to obtain a correlation between the MPP value estimates and the quality
(effect) and possible risks of its creation. There is a need for the development of clear methods for the practical
application of various price models and reviewing of the price structure.
ENTREPRENEURSHIP AND SUSTAINABILITY ISSUES
ISSN 2345-0282 (online) http://jssidoi.org/jesi/
2021 Volume 8 Number 3 (March)
http://doi.org/10.9770/jesi.2021.8.3(28)
Make your research more visible, join the Twitter account of ENTREPRENEURSHIP AND SUSTAINABILITY ISSUES:
@Entrepr69728810
449
The implementation of the new pricing concept is comprehensive, not only in terms of the aspects of pricing
taking into account the interests of the state but also in terms of realizing the interests of business entities. The
transition to the new pricing concept will make it possible to significantly improve the quality of the plan
documents, which are developed, the efficiency of budget allocations, and the financial stability of enterprises.
5. Discussion
The real-world effects in the area of international trade of DMG create certain conditions for suppliers and
consumers: on the one hand, each country tries to arm its own army with modern DMG, including the one of
foreign production, and, on the other hand, find and allocate funds for the development of its own defence
industry.
When compared to the leading countries in the region, Ukraine is characterized by a range of differences in the
defence industry, in particular:
- total lag of Ukraine in the defence industry (problems of the Armed Forces (AF) reformation, re-equipment,
restructuration of the national DIC, etc.);
- a chronic lack of financing in the defence sphere and a disbalance of the defence budget towards “maintenance
and capital decumulation.”
Thus, the Ukrainian Armed Forces have such conditions, when the Ukrainian DIC is unable to produce modern
DMG systems and will have to buy them abroad. The world experience shows that the most effective economic
tool under such conditions is the use of the offset schemes during import of DMG for the development of DIC.
The offsets, under which the weapons salesman is obliged not only to deliver the goods but also takes additional
responsibilities on the compensation of a share of his costs to a buyer, are widely used in international military-
technical cooperation. These are the directions for the development of the international military and technical
cooperation today. The offset opens up significant prospects under the limited financial capabilities for purchasing
modern equipment and new technologies, improvement of its own military-industrial complex and attraction of
foreign investments into the domestic market for the development of industries, which are not related to the
defence industry.
More than 90 countries apply offset in various forms in the defence industry. Initially, the level of offset
obligations amounted 10-20% of the volume of the main export/import contract for the supply of DMG.
Nonetheless, over time, as the global arms market began to shrink and supply started to exceed the demand, the
requirements of the importers to volumes of compensation significantly increased.
The external factors, encouraging offset practice, include:
- the absence of the closed cycles of military machinery production;
- exhaustiveness of the design, technological, and technical developments, created in the DIC during the previous
years against the background of almost no financing of the national innovative scientific and technical projects
both military and civil ones;
- uncertainty of mechanisms and imperfection of the regulatory and legal framework for crediting the
development of high technologies, provision of the intellectual property rights use;
- steady rise in the competition level in the global arms market, which provides the DMG importers with a diverse
choice of means for putting pressure on the DMG exporters;
- the development of integration processes in the world economy, especially military-industrial sectors.
ENTREPRENEURSHIP AND SUSTAINABILITY ISSUES
ISSN 2345-0282 (online) http://jssidoi.org/jesi/
2021 Volume 8 Number 3 (March)
http://doi.org/10.9770/jesi.2021.8.3(28)
Make your research more visible, join the Twitter account of ENTREPRENEURSHIP AND SUSTAINABILITY ISSUES:
@Entrepr69728810
450
One keeps on performing the offset transactions in the context of the military-technical cooperation between the
states, and the requirements for such agreements are becoming more responsible and detailed. The weapon-
importing countries improve their legal framework on the conclusion and implementation of the offsets
agreements. There is a global trend when the main contracts on the import of weapons and offset agreements join
together. Herewith, the importing countries are trying to establish joint production on their own territory.
Offset is a modern practice in the international weapons and military equipment trade. It allows importers to
partially compensate (in various forms) their own purchasing costs. In other words, offset is understood as a
special agreement, under which the exporter takes an obligation to compensate the importer, in a way agreed with
it, a part of the costs, related with purchasing military products. That is why such contracts are often regarded as
compensation contracts.
The projects upon the following directions can turn into real offset programs in Ukraine:
- the establishment of service centres on collection and production, service and repair of the military purpose
products, which are imported, in the home territories;
- the establishment of the production facilities on the modernization of the existing DMG, which is currently on
service in the Armed Forces, as well as the production of specific types of spare parts and components for the
military products, which are imported and modernized;
- acquisition and introduction of military technologies, developments, and “know-how”;
- conduction of joint scientific research, research and design, production and technological, and other works;
- implementation of training and retraining programs for specialists of different fields of activity for the importing
countries;
- investments in scientific organizations and production enterprises of the Ukrainian DIC and civil industries,
which are of particular significance for the national security.
The priorities for military and technical cooperation in Ukraine should be as follows:
- the development of scientific and technical and production cooperation of defence enterprises with foreign
companies;
- introduction of offset and leasing into the practice of export/import of defence products;
- joint use of existing military objects and construction of the new ones;
- lobbying of measures of the military and technical partnership of Ukraine with foreign countries at the state
level, the advancement of information support and exhibition activities.
Ukraine has already started to create a legislative basis for work in the direction of implementation of the offset
schemes during import of DMG. One has already approved the amendments to the Law of Ukraine “On State
Defence Order,” which introduce new notions of the compensation (offset) contract and terms of its application to
the legislation of Ukraine, as well as the peculiarities of purchasing products, works, and services of defence
purposes upon import.
According to this Law, the receiving of compensation is carried out through conclusion of a compensation (offset)
agreement between the central executive body, authorized by the Cabinet of Ministers of Ukraine, and a foreign
economic entity of a compensation (offset) agreement, which is a foreign economic agreement (contract). The
implementation of the agreement is carried out following the terms of the state contract for supply and purchase
of products, works, and services.
ENTREPRENEURSHIP AND SUSTAINABILITY ISSUES
ISSN 2345-0282 (online) http://jssidoi.org/jesi/
2021 Volume 8 Number 3 (March)
http://doi.org/10.9770/jesi.2021.8.3(28)
Make your research more visible, join the Twitter account of ENTREPRENEURSHIP AND SUSTAINABILITY ISSUES:
@Entrepr69728810
451
Conclusions
The results of the author’s express diagnostics of financial security condition of 12 Ukrainian defence enterprises
(3 non-governmental enterprises (private), 9 – state enterprises), held based on their statistical data (upon the data
available as of 01.01.2019) show that with the beginning of the hybrid war against Ukraine, the state defence
enterprises have significantly improved the level of their financial security due to growth of state financing of the
production/repair of weapons and military machinery: almost all of the enterprises under the study in 2016-2017
reached high and satisfactory levels.
In general, in the group of state enterprises of the defence industry, one traces the influence of the extent of
application of active cooperation by the enterprises with the external environment (increase in the number of the
export and import contracts with order parties, the establishment of partnerships with suppliers and consumers,
lobbying in relations with the state, etc.) on the level of their financial security. Different levels of financial
security at the enterprises under consideration result from their industry specificity, which ha differences in the
legal regulation of the industry, existing business practices, organizational peculiarities of the enterprises,
technological peculiarities of production (in particular, the availability and complexity of cooperative
relationships), market demand, and modern needs of the Armed Forces of Ukraine, the degree of state regulation
of activity, etc.
In general, there is a positive trend in the group of private enterprises of the Ukrainian defence industry to
increase in their active participation in the production of defence products (which is a worldwide trend), including
using the state defence order, which improves their financial situation and enhances financial security. Alongside
this, there is a direct dependence of the state of financial security of these companies on their management level
and the ability for a preventive response to the changes in the external environment, including, through the
establishment of productive cooperation with its subjects.
Thus, the interrelation of the DMG value indicators for the client with his expenditures is an important peculiarity
and advantage of the value-based approach to the price formation. This, first of all, stimulates executors to
advance DMG and improve its competitiveness; secondly, the cost increases, related to the sample’s quality
improvement, are excluded.
The real-world effects in the area of international trade of DMG create certain conditions for suppliers and
consumers: on the one hand, each country tries to arm its own army with modern DMG (including the one of
foreign production), and, on the other hand, find and allocate funds for the development of its own defence
industry. The Ukrainian Armed Forces have such conditions when the Ukrainian DIC is unable to produce the
necessary DMG systems and will have to buy them abroad. The most effective economic tool under such
conditions is the use of the offset schemes during import of DMG for the development of DIC and strengthening
of financial security of defence industry enterprises.
The offsets, under which the weapons salesman is obliged not only to deliver the goods but also takes additional
responsibilities on the compensation of a share of his costs to a buyer, are widely used in international military-
technical cooperation. The offset opens up significant prospects under the limited financial capabilities for
purchasing modern equipment and new technologies, improvement of its own military-industrial complex and
attraction of foreign investments into the domestic market for the development of the industry.
Ukraine does not yet have a state body, which carries out coordination and expert functions in the course of
development of the offset query packages, as well as organizational and administrative and control functions
ENTREPRENEURSHIP AND SUSTAINABILITY ISSUES
ISSN 2345-0282 (online) http://jssidoi.org/jesi/
2021 Volume 8 Number 3 (March)
http://doi.org/10.9770/jesi.2021.8.3(28)
Make your research more visible, join the Twitter account of ENTREPRENEURSHIP AND SUSTAINABILITY ISSUES:
@Entrepr69728810
452
during the implementation of the offset programs (the Offset Commission, established under the Ministry of
Economic Development, Trade and Agriculture of Ukraine cannot cover the entire scope of works on this
question).
It was determined that the main efforts of the state, regarding the provision of favourable conditions for the
implementation of the offset projects in the defence sector of Ukraine, should focus on:
- the development and implementation of the offset programs, which contribute to the development of the
scientific and technological and production and technological potential of the country, transfer of modern
technologies and know-how, an increase in labour productivity, a decrease in the resource and material
consumption of the domestic products, and an improvement of their quality;
- acceleration of organizational changes in the national economy, directed at the creation of powerful integrated
research and production structures, capable of developing and producing competitive MPP independently or in
cooperation with foreign companies, in particular, EU countries;
- the development of international cooperation, including active participation in the activity of transnational
corporations, conquering own segments of the world market during the international division of labour,
cooperation in research and development works on creation of modern pieces of armament and military
equipment;
- provision of the investment attractiveness of the defence enterprises;
- the development of the export-import activity of the enterprises of the national DIC and development and
implementation of the effective organizational and economic mechanisms on the realization of foreign economic
activity, the development of cooperation with foreign corporations for joint promotion products into the world
markets;
- active introduction and use of modern information technologies in marketing and creation of the military and
civilian purpose products.
References
About the statement of the Order of formation of the price for production, works, services of defense appointment in case selection of
executors on supply (purchase) of such production, works, services is carried out without application of competitive procedures (2016).
Available at: https://zakon.rada.gov.Ua/laws/show/517-2016-%D0%BF
About the statement of the Order of formation of the price for production, works, services of defense appointment in case selection of
executors on supply (purchase) of such production, works, services is carried out without application of competitive procedures (2016).
Available at: https://zakon.rada.gov.ua/laws/show/517-2016-п?lang=en#Text
Avanesova, N.E., Kolodyazhna, T.V., & Semenova, J.I. (2018). Strategic platform for economic developmentof enterprises of the military-
industrial complex of Ukraine. Naukovyi visnyk Uzhhorodskoho natsionalnoho universytetu, 20(1), 6-9. Available at: http://www.visnyk-
econom.uzhnu.uz.ua/archive/20_1_2018ua/3.pdf
Behma, V.M., & Sverhunov, O.O. (2019). Conceptual bases of the strategies of investment-innovative development of the defense-
industrial complexes of the states. Experience for Ukraine. Kyiv: NISD, 64р. Available at: https://niss.gov.ua/sites/default/files/2019-
07/Dopovid_Begma__druk.pdf
Kamianetska, O. (2015). Status and prospects of development of the military-industrial complex of Ukraine in the formation of national
sovereignty. Visnyk Donetskoho natsionalnoho universytetu. Seriia V. Ekonomika i pravo, 1, 143-146. Available at: http://jvestnik-
c.donnu.edu.ua/article/view/291/302
ENTREPRENEURSHIP AND SUSTAINABILITY ISSUES
ISSN 2345-0282 (online) http://jssidoi.org/jesi/
2021 Volume 8 Number 3 (March)
http://doi.org/10.9770/jesi.2021.8.3(28)
Make your research more visible, join the Twitter account of ENTREPRENEURSHIP AND SUSTAINABILITY ISSUES:
@Entrepr69728810
453
Kravchenko, V. (2019). Military economics and military finance: new challenges in the first half of XXI century. Ekonomika ta derzhava,
9, 4-11. Available at: https://doi.org/10.32702/2306-6806.2019.9.4
Liao, H., Long, Y., Ming, T., Mardani, A., Xu, J. 2019. Low Carbon Supplier Selection Using a Hesitant Fuzzy Linguistic SPAN Method
Integrating the Analytic Network Process. Transformations In Business & Economics, Vol. 18, No 2 (47), pp.67-87.
Lincényi, M., Čársky, J. 2020. Policy trusts in public policy in the Slovak Republic. Insights into Regional Development, 2(1), 456-468.
http://doi.org/10.9770/IRD.2020.2.1(5)
Lonsdale, D.J. (2019). The 2018 Nuclear Posture Review: A return to nuclear warfighting? Comparative Strategy, 38, 98-117. Available at:
https://doi.org/10.1080/01495933.2019.1573074
Momot, T.V., Avanesova, N.E., & Vinnik, I.U. (2015). The defense industry of Ukraine: priority directions of reform in the conditions of
Eurointegration. Ekonomika i rehion, 5(54), 27-33.
Nzeribe, S., & Imam, M. (2018). The military industrial complex: a catalyst for conflicts and wars (USA). Journal of Social Development,
7 (1), 73-81. Available at: https://doi.org/10.12816/0046772
Official website of the Department Of Homeland Security USA. URL: https://www.dhs.gov/cisa/defense-industrial-base-sector
Plėta, T., Tvaronavičienė, M., Della Casa, S., Agafonov, K. 2020. Cyber-attacks to critical energy infrastructure and management issues:
overview of selected cases. Insights into Regional Development, 2(3), 703-715. https://doi.org/10.9770/IRD.2020.2.3(7)
Potomkina, M. (2018). Theoretical and legal foundations of economic legal relations in the defense industry of Ukraine. Part One.
Pidpryiemnytstvo, hospodarstvo i pravo, 2, 58-62. Available at: http://pgp-journal.kiev.ua/archive/2018/2/12.pdf
Qureshi, F.A. (2018). The Military Industrial Complex and its typology in the context of its political framework. International Journal of
Political Science and Development, 6(5), 123-130. Available at: https://doi.org/10.14662/IJPSD2018.035
Rajnoha, R., Lesnikova, P., Stefko, R., Schmidtova, J., Formanek, I. 2019. Transformations in Strategic Business Planning in the Context
of Sustainability and Business Goals Setting. Transformations In Business & Economics, Vol. 18, No 2(47), 44-66.
Reznik O., Mazievich T., Shebanits D., Puzanova G., Pyrih I. (2020). Peculiarities of Ecological Taxation in Ukraine and the World.
Journal of Legal, Ethical and Regulatory Issues 23(1), с. 1-6. Available at: https://www.abacademies.org/articles/peculiarities-of-
ecological-taxation-in-ukraine-and-the-world-9016.html
State Statistics Service of Ukraine. Available at: http://www.ukrstat.gov.ua/
Tvaronavičienė, M., Plėta, T., Della Casa, S., Latvys, J. 2020. Cyber security management of critical energy infrastructure in national
cybersecurity strategies: cases of USA, UK, France, Estonia and Lithuania. Insights into Regional Development, 2(4), 802-813.
http://doi.org/10.9770/IRD.2020.2.4(6)
Usachenko, O. (2019). Experience of state regulation of the reform of the US and EU defense industrial complex. Derzhavne upravlinnia:
udoskonalennia ta rozvytok, 7. Available at: https://doi.org/10.32702/2307-2156-2019.7.24
Weber, R.N. (2020). Military-industrial complex. Encyclopedia Britannica. Available at: https://www.britannica.com/topic/private-
military-firm
YouControl system is an online service. Available at: https://youcontrol.com.ua/en/
ENTREPRENEURSHIP AND SUSTAINABILITY ISSUES
ISSN 2345-0282 (online) http://jssidoi.org/jesi/
2021 Volume 8 Number 3 (March)
http://doi.org/10.9770/jesi.2021.8.3(28)
Make your research more visible, join the Twitter account of ENTREPRENEURSHIP AND SUSTAINABILITY ISSUES:
@Entrepr69728810
454
Oleksandr ILCHENKO, Candidate of Juridical Sciences, Associate Professor, Sumy State University
ORCID ID: orcid.org/0000-0003-4885-2205
Oksana BRUSAKOVA, Candidate of Philosophy, Associate Professor, Kharkiv National University of Internal Affairs
ORCID ID: orcid.org/0000-0001-6522-8020
Yuliia BURCHENKO, PhD student National University of Water Management and Nature Management
ORCID ID: orcid.org/0000-0002-9426-8280
Artem YAROSHENKO, PhD, Associate Professor, Dnipropetrovsk State University of Internal Affairs
ORCID ID: orcid.org/0000-0001-7072-0589
Yaroslav BAGAN, Lawyer, Law firm "Ex Jure"
ORCID ID: orcid.org/0000-0001-9509-6444
Copyright © 2021 by author(s) and VsI Entrepreneurship and Sustainability Center
This work is licensed under the Creative Commons Attribution International License (CC BY).
http://creativecommons.org/licenses/by/4.0/
ENTREPRENEURSHIP AND SUSTAINABILITY ISSUES
ISSN 2345-0282 (online) http://jssidoi.org/jesi/
2021 Volume 8 Number 3 (March)
http://doi.org/10.9770/jesi.2021.8.3(29)
Publisher http://jssidoi.org/esc/home
455
LEGAL MECHANISM TO ENSURE NATIONAL SECURITY IN THE FIELD OF USE OF NATURAL
RESOURCES
Oleksii Shumilo ¹, Ivan Lytvyn ², Volodymyr Shablystyi 3, Tetiana Kornyakova 4, Irina Popovich 5
1* Kharkiv National University of Internal Affairs, Lev Landau Avenue, 27, Kharkiv, 61000, Ukraine 2 Kropyvnytskyi Institute of State and Municipal Administration, 73 vul. Nicholas Levitsky, Kropyvnytskyi, 25026, Ukraine
3 Dnipropetrovsk State University of Internal Affairs, Ave. Gagarina, 26, 49005, Dnipro, Ukraine 4 Oles Honchar Dnipro National University, Gagarin Avenue, 72, Dnipro, Ukraine
5 National Scientific Center "Institute of Forensic Examinations named after Hon. Prof. M.S. Bokarius", Zolochevskaya street, 8a,
Kharkov, 61004, Ukraine
E-mail: 1* [email protected]
Received 18 June 2020; accepted 6 January 2021; published 30 March 2021
Abstract. The legal basis for the national security of Ukraine is the Constitution of Ukraine, according to which laws, doctrines, concepts,
strategies, and programs are developed, which determine the targets and guidelines for the national security policy of the Ukrainian state in
order to timely identify, prevent, and neutralize real and potential threats to the national interests of Ukraine. Ukraine is one of the countries
with a deficit of its own natural hydrocarbon resources. Lack of necessary reserves, dependence on energy imports pose a threat to the
country's energy security. The transformation of the oil and gas sector of Ukraine and the creation of an effective organizational model
should provide sufficient control over the areas of activity to ensure effective resource consumption in the oil and gas sector of the
economy, grouped into appropriate blocks. Blocks should include directions of action to achieve the effect and further development of the
industry, as well as to ensure effective control. Conclusions on the development of the oil and gas sector in Ukraine are made, ways to
improve using the SWOT analysis technique are suggested. That is, the author has analyzed the oil and gas sector from the point of view of
existing and potential opportunities, threats, advantages, and disadvantages. At the same time, the requirements of the Third Energy
Package for the separation of the transport function from the gas production and supply business are provided, and it is also taken into
account that the operator is removed from the structure of a vertically integrated company and is not associated with it by legal, financial,
and managerial ties. The success of modernization should become an important driver of reform of the entire state oil and gas sector of the
Ukrainian economy and have a long-term impact on the entire society, the lives of citizens, and business.
Keywords: natural resources; national security; energy security; legal regulation; potential threat
Reference to this paper should be made as follows: Shumilo, O., Lytvyn, I., Shablystyi, V., Kornyakova, T., Popovich, I. 2021. Legal
mechanism to ensure national security in the field of use of natural resources. Entrepreneurship and Sustainability Issues, 8(3), 455-470.
http://doi.org/10.9770/jesi.2021.8.3(29)
JEL Classifications: F35, F42
ENTREPRENEURSHIP AND SUSTAINABILITY ISSUES
ISSN 2345-0282 (online) http://jssidoi.org/jesi/
2021 Volume 8 Number 3 (March)
http://doi.org/10.9770/jesi.2021.8.3(29)
Make your research more visible, join the Twitter account of ENTREPRENEURSHIP AND SUSTAINABILITY ISSUES:
@Entrepr69728810
456
1. Introduction
The emergence and establishment of Ukraine as a democratic, independent, and sovereign state is primarily
related to ensuring its national security. Modern challenges and threats have led to a radical transformation of the
world economic and social order, which are accompanied by a change in political configurations. The global
financial and economic crisis has become another challenge to world civilization, caused uncertainty in the
prospects of global and national economies, and intensified the search for ways to modernize social systems.
Against the background of increasing modern threats and growing instability in the world, there are new
challenges to international security in the raw materials, energy, financial, information, environmental and food
spheres.
Threats such as the proliferation of mass destruction weapons, international terrorism, transnational organized
crime, illegal migration, piracy, and the escalation of interstate and civil conflicts are becoming more intense,
encompassing new geopolitical regions and states.
The availability of natural resources is one of the factors in ensuring the national security of each country.
Therefore, it is essential to explore the features of the legal mechanism for national security in the use of natural
resources. This applies to Ukraine, a country on the path to European integration. Since the proclamation of
Ukraine's independence, the issue of ensuring its security has always played an important role in the activities of
all state bodies. The focus on the protection and preservation of Ukrainian statehood was defined by the
Declaration of State Sovereignty of July 16, 1990. Subsequently, these provisions were developed in the
Constitution of Ukraine. In particular, it concerns the attribution of the protection of the sovereignty and territorial
integrity of Ukraine, ensuring national security to the most important functions of the state. The concept of
national security, which was initially considered a political doctrine in Ukraine, was later implemented as a result
of determining the relevant area of state activity.
Further development of special legislation in this area took place mainly through the legal and organizational
regulation of the relevant state bodies. The system of national security was formed with the adoption of the Law
of Ukraine "On Fundamentals of National Security of Ukraine" of June 19, 2003.
Subsequently, Ukraine has undergone quite frequent changes in foreign policy guidelines in the context of
integration into European and Euro-Atlantic structures. In general, this negatively affected the organization of
Ukraine's national security system and its ability to effectively counter threats. Numerous shortcomings in the
legislation led to the extraordinary nature of the response, which caused complex legislative constructions, some
of which, for a number of reasons, immediately revealed their own unsustainability, while others significantly
complicated the legal regulation of public relations.
The proclamation and constitutional consolidation in 2019 of the country's strategic course towards European and
Euro-Atlantic integration necessitated the adaptation of Ukrainian legislation to legal systems and standards in the
field of security and defense of EU and NATO member states.
ENTREPRENEURSHIP AND SUSTAINABILITY ISSUES
ISSN 2345-0282 (online) http://jssidoi.org/jesi/
2021 Volume 8 Number 3 (March)
http://doi.org/10.9770/jesi.2021.8.3(29)
Make your research more visible, join the Twitter account of ENTREPRENEURSHIP AND SUSTAINABILITY ISSUES:
@Entrepr69728810
457
2. Literature Survey
Analysis of the legal framework shows its specificity. This is a property of legislative acts, which in essence
sometimes establish a new legal order. One example is "sanctions legislation" - that is, the introduction of
restrictive measures outside the legal responsibility in the interests of national security, which has recently been
embodied in Ukrainian law.
In addition, it is about a certain circle for legal regulation, which includes public relations in a particular area.
These public relations relate to the following areas of activity:
1) state strategic planning in the field of national security, which is perceived in practice through the prism of the
needs and features of public administration for unresolved organizational and legal issues (general subjectivity of
planning, grounds and relevant procedures, competence of state bodies and officials, boundaries and control
procedure) (Akimova, L.N. (2018));
2) defense of the state and economic support of defense measures (features of conducting and implementing state
policy in the field of defense, competence and procedures of subjects, standardization of special subjects that have
competence only in cases of application of certain administrative and legal regimes, state regulation economic
sphere for the needs of defense, the volume of public administration and public-civil partnership) (Bondar, O.
(2018));
3) obtaining particularly important information in the interests of the state, conducting external measures of
influence, counteracting subversive activities of foreign states and organizations using non-military or "hybrid"
methods of achieving goals (which will be carried out in the form of legal regulation in Ukraine of intelligence,
counterintelligence, and other state activities carried out by specially authorized state bodies), forms and methods
of these activities (Romaniuk, M., & Smutchak, Z. (2016));
4) carrying out measures of influence on the state policy of other states concerning Ukraine during carrying out of
measures of strategic communication, and also other similar activity (information influence, propaganda and
counterpropaganda, state diplomacy and non-state cooperation in the interests of Ukraine, cultural influence,
maintenance of contacts with compatriots abroad, etc) (Kovalova, O.V., Korniienko, M.V., & Pavliutin, Y.V.
(2020));
5) carrying out temporary (special, emergency) restrictive measures in situations that threaten the security of the
state (Kulish, A., Petrushenko, M., Reznik, O., & Kiselyova, E. (2018));
6) countering terrorism, separatism and political extremism (Bogutska, O. (2018));
7) state policy of protection of the state border of Ukraine (Blakyta, G., & Ganushchak, T. (2018));
8) certain components of the legal regime of military security (Kizian, R. (2019));
9) legal problems of temporary occupation of the territory of Ukraine, maintaining ties with citizens of Ukraine in
the occupied territory, deoccupation and integration of territories (Serafimov, V. (2017), Serbyn, R. et. al. (2020)).
This list only outlines the range of problematic areas of relevant social relations that already exist, and therefore it
can be clarified in further research. Under such conditions, a thorough study of the issue of national security and
defense law on the basis of Ukrainian legislation is an important task of legal science in general.
3. Methods
The theoretical and methodological basis of the work were the provisions of economic theory, which are set out in
the works of leading economists. General and special methods of scientific cognition are used: historical-logical
method; method of systematization and classification of economic processes and phenomena; institutional
analysis; system approach and system analysis; analysis and synthesis; statistical and graphical methods - for
processing and generalization of statistical data and their display in Tables.
ENTREPRENEURSHIP AND SUSTAINABILITY ISSUES
ISSN 2345-0282 (online) http://jssidoi.org/jesi/
2021 Volume 8 Number 3 (March)
http://doi.org/10.9770/jesi.2021.8.3(29)
Make your research more visible, join the Twitter account of ENTREPRENEURSHIP AND SUSTAINABILITY ISSUES:
@Entrepr69728810
458
The information base of the study was the laws of Ukraine, decrees of the President of Ukraine, resolutions of the
Cabinet of Ministers of Ukraine, information of the State Statistics Service of Ukraine and the Ministry of
Finance of Ukraine, Ukrainian and international regulations, materials published in scientific journals,
information bulletins, statistical collections, monographic studies of economists, and information from the
Internet.
4. Results
For Ukraine, the problem of protecting vital national interests remains extremely complex and relevant.
Unfortunately, for more than a quarter of a century, the Ukrainian government has failed to make significant
progress in formulating and implementing an effective national security policy. Crisis phenomena, which are
inherent in almost all spheres of public life of the country and foreign relations, objectively demonstrate the lack
of a clear, long-term strategy for further development and protection of the most important achievements of
Ukraine.
Thus, despite the obvious importance of ensuring the state's defense capabilities, the current state of the Armed
Forces of Ukraine against the background of the current Russian-Ukrainian military conflict is very critical. The
actual failure of the main programs of reforming and rearming the Ukrainian army, the systematic underfunding
of the needs for the maintenance and training of the Armed Forces threatens the ability of them to fulfill the main
tasks of protecting the territorial integrity and inviolability of the Ukrainian state.
Currently, the processes of development of the Ukrainian state and the formation of civil society are taking place
in the context of ongoing global transformations in the world, active "reformatting" of leading world players,
formation of a new architecture of global and regional security, intensive search by the world community for
ways out of the financial and economic crisis, and the formation of a new world economic order. It is in such
periods of world history that the foundations of new world order, the place and the role of the country in
international schedules are laid for the long term.
Further development and protection of Ukraine's most important achievements require a clear definition of the
state in strategic priorities that must meet the challenges and threats of the XXI century, its interaction with
modern systems of international and regional security.
It is the choice and success of Ukraine's foreign policy implementation that depends not only on the state of its
national security but also to a large extent on the state of security and stability in the European region. Further
factual uncertainty of Ukraine in the global and regional security system threatens to turn our country into a buffer
zone between powerful international players who will try to use its territory to reduce their own risks and threats.
The legal basis of national security is the Constitution and other regulations that enshrine and guarantee the
protection of fundamental human and civil rights, the organization of state power, and the establishment of
universal values on which any society is based.
Examining the regulations in the field of national security, it should be noted that they form a complex both in
structure and content dynamic system, which is a set of laws and regulations that create legal support for the
functioning of the national security system of the Ukrainian state.
ENTREPRENEURSHIP AND SUSTAINABILITY ISSUES
ISSN 2345-0282 (online) http://jssidoi.org/jesi/
2021 Volume 8 Number 3 (March)
http://doi.org/10.9770/jesi.2021.8.3(29)
Make your research more visible, join the Twitter account of ENTREPRENEURSHIP AND SUSTAINABILITY ISSUES:
@Entrepr69728810
459
Considering the current regulations in the field of Ukrainian legislation on national security, it is necessary to note
the following. According to the criterion of the nature of the expression of will, regulations in the field of national
security, on the one hand, can act as a direct expression of the will of the entire Ukrainian people, and on the other
- be created and adopted by the state or authorized state authorities.
In the first case, they are primary because they express the will of the Ukrainian people as the bearer of
sovereignty and the only source of power. Such primary regulations in the field of national security include the
Declaration of State Sovereignty of Ukraine, adopted by the Verkhovna Rada on July 16, 1990, the Resolution of
the Verkhovna Rada “On the Declaration of Independence of Ukraine” dated August 24, 1991, the Act of
Independence of Ukraine, adopted on August 24, 1991, which received support in the All-Ukrainian referendum
on December 1, 1991. These regulations became the first legal basis, the legal basis for regulating public relations
of the independent, sovereign Ukrainian state and its national security.
In particular, it should be noted that the Declaration of State Sovereignty of Ukraine in Chapter IX “External and
Internal Security” laid down the basic principles of external and internal security of the Ukrainian state: Ukraine
has the right to its own Armed Forces; has its own internal troops and state security bodies subordinate to the
Verkhovna Rada. Ukraine determines the procedure for military service by its citizens. Citizens perform active
military service, as a rule, on its territory and may not be used for military purposes outside it without the consent
of the Verkhovna Rada of the Ukrainian SSR; the Ukrainian SSR solemnly declares its intention to become a
permanently neutral state in the future, which does not participate in military blocs and adheres to the three non-
nuclear principles (not to accept, produce or acquire nuclear weapons).
In the second case, a number of normative acts in the field of national security legislation are derivatives of
constitutional law, as they express the political will of the Ukrainian state. These are the regulations in the field of
national security that are created, adopted or sanctioned by the state and authorized public authorities.
The legal basis for the national security of the Ukrainian state is the Constitution of Ukraine, where its supremacy
in the system of other normative legal acts of Ukraine is defined as follows:
a) The Constitution of Ukraine, consolidating the authority of the people, regulates the core of social relations that
arise directly in the process of protecting national interests and guaranteeing in Ukraine the security of the
individual, society, and state from external and internal threats in all spheres of life. Protection of the sovereignty
and territorial integrity of Ukraine, ensuring its economic and information security, are referred by the
Constitution to the most important functions of the state, moreover, it is a matter of the entire Ukrainian people;
b) The Constitution of Ukraine defines and enshrines the basic guidelines, principles, and norms of national
security, fills in the content of current laws and regulations, by which the security of the individual, society, and
the state is ensured in a systematic way. In particular, fundamental concepts such as environmental security
(Article 16), economic and information, state security (Article 17), interests of national security (Articles 32, 34,
36, 39), ensuring national security (Article 44), basics of national security (Article 92), national security, spheres
of national security, danger (Article 106), personal security (Article 126), public security (Article 138), and
human security (Article 3) have been enshrined in the Constitution of Ukraine.
c) The Constitution of Ukraine defines the most important national interests and establishes the basic legal
guidelines for the activities of national security actors. The Constitution of Ukraine takes a differentiated approach
to the problems of legislative consolidation, and then the organization and activities of national security actors.
The general issues of legislative consolidation, organization and activity of the subjects of national security are
reflected both in the general principles (Articles 3, 16, 17, 18) and in separate sections of the Constitution
ENTREPRENEURSHIP AND SUSTAINABILITY ISSUES
ISSN 2345-0282 (online) http://jssidoi.org/jesi/
2021 Volume 8 Number 3 (March)
http://doi.org/10.9770/jesi.2021.8.3(29)
Make your research more visible, join the Twitter account of ENTREPRENEURSHIP AND SUSTAINABILITY ISSUES:
@Entrepr69728810
460
(paragraph 1 of Article 32; Article 37; 2 Article 39, paragraph 2 of Article 44, paragraph 2 of Article 64,
paragraph 9 of Article 85, Articles 22, 23, 31, paragraph 17 of Article 92, paragraphs 1, 17, 18, 19, 20 of Article
106; Article 107; paragraph 7 of Article 116).
Article 13 of the Constitution of Ukraine stipulates that the land, its subsoil, atmospheric air, water and other
natural resources located within the territory of Ukraine, the natural resources of its continental shelf, and the
exclusive (sea) economic zone are the objects of property rights of the Ukrainian people, and at the same time in
the Code of Ukraine on Subsoil, in Article 13 it is determined that natural persons, citizens of Ukraine, as well as
foreigners and stateless persons, when it is necessary to register it in the manner prescribed by law, in order to
carry out such economic activity, can be users of subsoil. In addition, owners of land plots can obtain a permit for
the extraction of minerals, and, in the conditions of a geological study of a subsoil plot for their own funds, obtain
a permit without an auction.
In the same vein, the Resolution of the Cabinet of Ministers of Ukraine provides for the procedure for granting
special permits for the use of subsoil by issuing a permit without holding an auction.
Only how is it possible to combine equal rights of citizens to the subsoil when distributing land plots where there
is no subsoil?
Then for whom and why were these corruption norms prescribed. Probably, so that the persons in power would
receive plots of mineral resources, and the state would redeem in them, so that such landowners would oppose the
development of oil and gas and other minerals.
Thus, the availability of natural gas and oil (natural resources) is a component of the country's energy security.
One component and a guarantee of energy security and independence of Ukraine is an efficiently operating gas
industry, on the state of which the development of the economy as a whole, industry, agriculture, services,
utilities, and the like depends. The structural rebuilding of the industry and the attraction of investments are the
basis of the activity, which is entrusted with an important role to meet the needs of residential and industrial
consumers in fuel and energy resources.
The subjects of the gas market in Ukraine are the operator of the gas transportation system (GTS), the operator of
the gas distribution system (GDS), the operator of the gas storage facilities, the operator of the LNG plant, the
customer, the wholesaler, the wholesale buyer, the supplier, and the consumer. The transportation of natural gas
through the territory of Ukraine is carried out by the GTS operator, and the storage of natural gas in underground
gas storage is carried out by the gas storage operator. The dynamics of the gas sector development are shown
(Table 1).
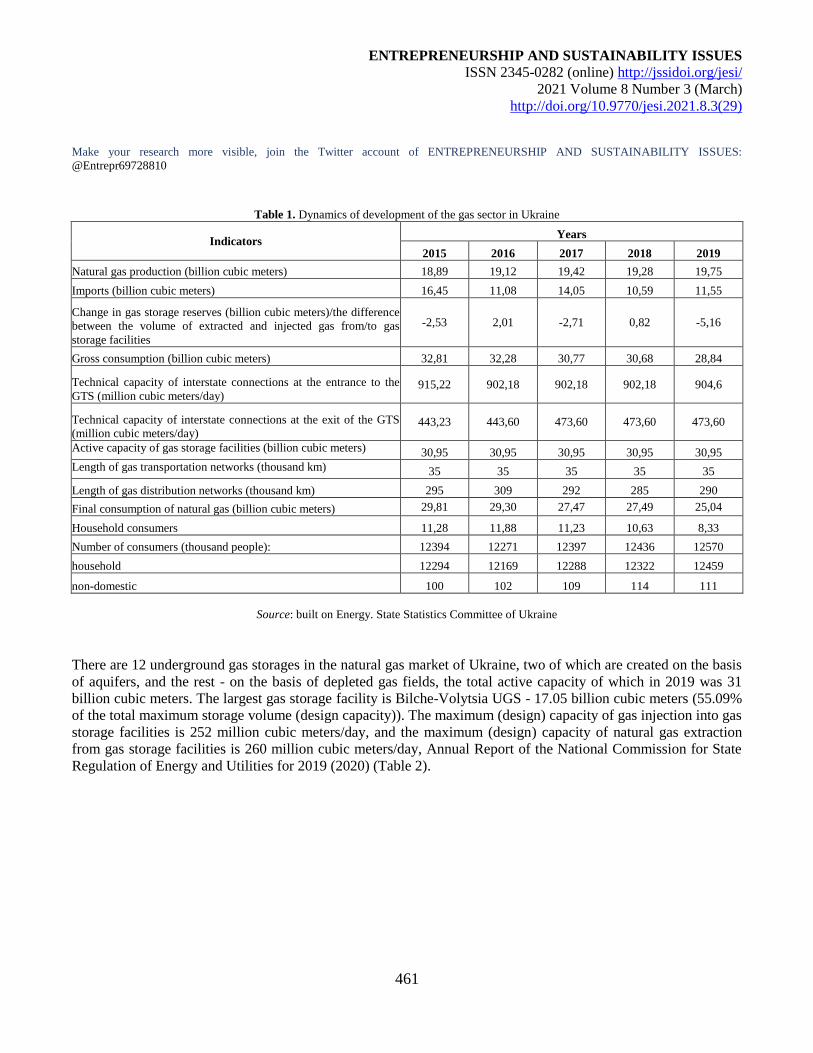
ENTREPRENEURSHIP AND SUSTAINABILITY ISSUES
ISSN 2345-0282 (online) http://jssidoi.org/jesi/
2021 Volume 8 Number 3 (March)
http://doi.org/10.9770/jesi.2021.8.3(29)
Make your research more visible, join the Twitter account of ENTREPRENEURSHIP AND SUSTAINABILITY ISSUES:
@Entrepr69728810
461
Table 1. Dynamics of development of the gas sector in Ukraine
Indicators Years
2015 2016 2017 2018 2019
Natural gas production (billion cubic meters) 18,89 19,12 19,42 19,28 19,75
Imports (billion cubic meters) 16,45 11,08 14,05 10,59 11,55
Change in gas storage reserves (billion cubic meters)/the difference
between the volume of extracted and injected gas from/to gas
storage facilities
-2,53 2,01 -2,71 0,82 -5,16
Gross consumption (billion cubic meters) 32,81 32,28 30,77 30,68 28,84
Technical capacity of interstate connections at the entrance to the
GTS (million cubic meters/day) 915,22 902,18 902,18 902,18 904,6
Technical capacity of interstate connections at the exit of the GTS
(million cubic meters/day) 443,23 443,60 473,60 473,60 473,60
Active capacity of gas storage facilities (billion cubic meters)
30,95 30,95 30,95 30,95 30,95
Length of gas transportation networks (thousand km)
35 35 35 35 35
Length of gas distribution networks (thousand km) 295 309 292 285 290
Final consumption of natural gas (billion cubic meters) 29,81 29,30 27,47 27,49 25,04
Household consumers 11,28 11,88 11,23 10,63 8,33
Number of consumers (thousand people): 12394 12271 12397 12436 12570
household 12294 12169 12288 12322 12459
non-domestic 100 102 109 114 111
Source: built on Energy. State Statistics Committee of Ukraine
There are 12 underground gas storages in the natural gas market of Ukraine, two of which are created on the basis
of aquifers, and the rest - on the basis of depleted gas fields, the total active capacity of which in 2019 was 31
billion cubic meters. The largest gas storage facility is Bilche-Volytsia UGS - 17.05 billion cubic meters (55.09%
of the total maximum storage volume (design capacity)). The maximum (design) capacity of gas injection into gas
storage facilities is 252 million cubic meters/day, and the maximum (design) capacity of natural gas extraction
from gas storage facilities is 260 million cubic meters/day, Annual Report of the National Commission for State
Regulation of Energy and Utilities for 2019 (2020) (Table 2).
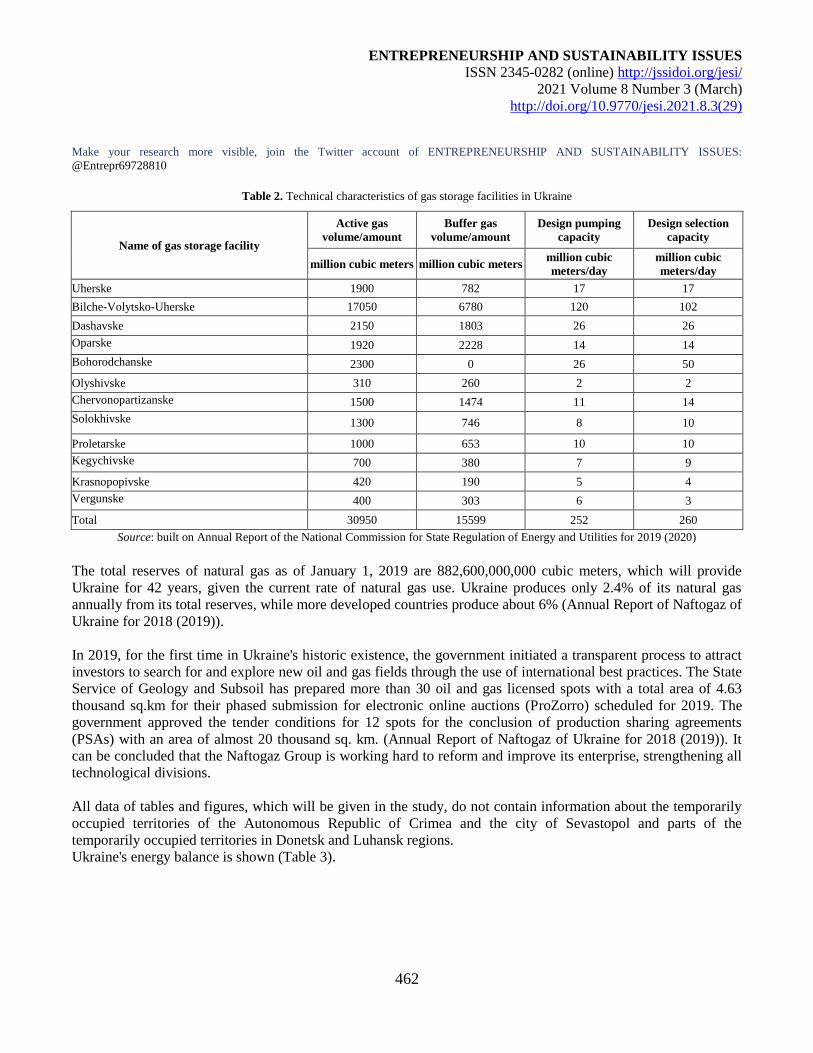
ENTREPRENEURSHIP AND SUSTAINABILITY ISSUES
ISSN 2345-0282 (online) http://jssidoi.org/jesi/
2021 Volume 8 Number 3 (March)
http://doi.org/10.9770/jesi.2021.8.3(29)
Make your research more visible, join the Twitter account of ENTREPRENEURSHIP AND SUSTAINABILITY ISSUES:
@Entrepr69728810
462
Table 2. Technical characteristics of gas storage facilities in Ukraine
Name of gas storage facility
Active gas
volume/amount
Buffer gas
volume/amount
Design pumping
capacity
Design selection
capacity
million cubic meters million cubic meters million cubic
meters/day
million cubic
meters/day
Uherske 1900 782 17 17
Bilche-Volytsko-Uherske 17050 6780 120 102
Dashavske 2150 1803 26 26
Oparske
1920 2228 14 14
Bohorodchanske
2300 0 26 50
Olyshivske 310 260 2 2
Chervonopartizanske
1500 1474 11 14
Solokhivske
1300 746 8 10
Proletarske 1000 653 10 10
Kegychivske
700 380 7 9
Krasnopopivske 420 190 5 4
Vergunske
400 303 6 3
Total 30950 15599 252 260
Source: built on Annual Report of the National Commission for State Regulation of Energy and Utilities for 2019 (2020)
The total reserves of natural gas as of January 1, 2019 are 882,600,000,000 cubic meters, which will provide
Ukraine for 42 years, given the current rate of natural gas use. Ukraine produces only 2.4% of its natural gas
annually from its total reserves, while more developed countries produce about 6% (Annual Report of Naftogaz of
Ukraine for 2018 (2019)).
In 2019, for the first time in Ukraine's historic existence, the government initiated a transparent process to attract
investors to search for and explore new oil and gas fields through the use of international best practices. The State
Service of Geology and Subsoil has prepared more than 30 oil and gas licensed spots with a total area of 4.63
thousand sq.km for their phased submission for electronic online auctions (ProZorro) scheduled for 2019. The
government approved the tender conditions for 12 spots for the conclusion of production sharing agreements
(PSAs) with an area of almost 20 thousand sq. km. (Annual Report of Naftogaz of Ukraine for 2018 (2019)). It
can be concluded that the Naftogaz Group is working hard to reform and improve its enterprise, strengthening all
technological divisions.
All data of tables and figures, which will be given in the study, do not contain information about the temporarily
occupied territories of the Autonomous Republic of Crimea and the city of Sevastopol and parts of the
temporarily occupied territories in Donetsk and Luhansk regions.
Ukraine's energy balance is shown (Table 3).
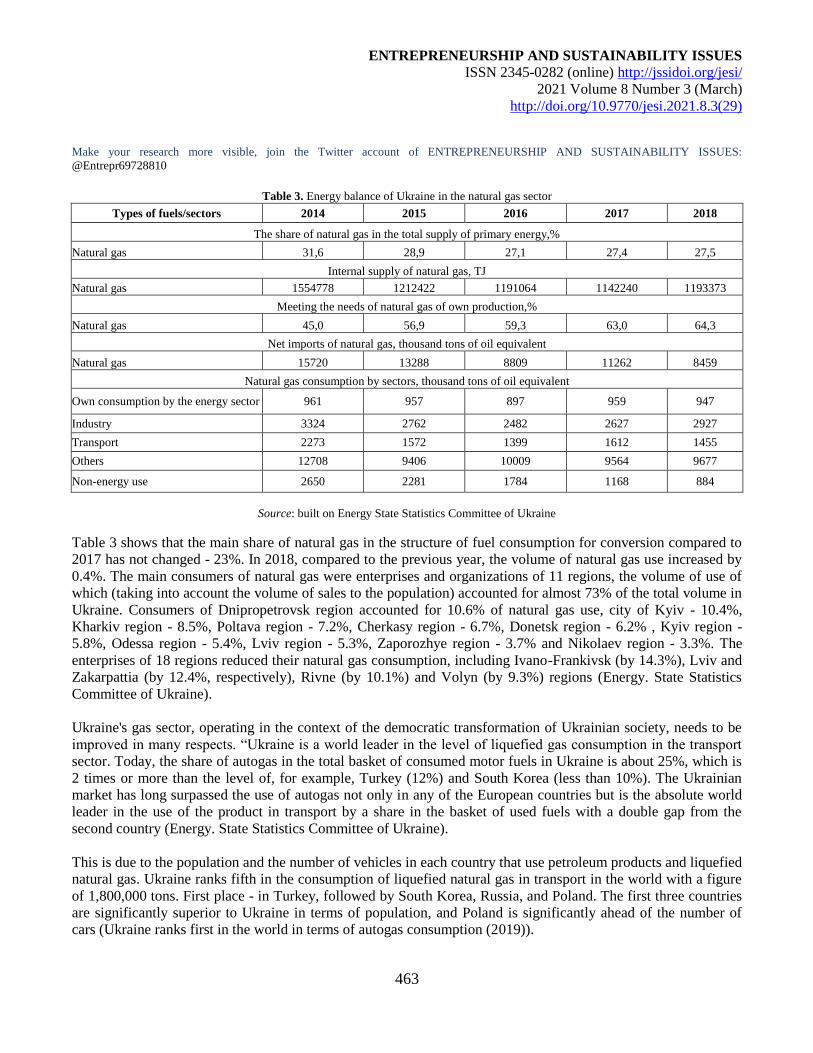
ENTREPRENEURSHIP AND SUSTAINABILITY ISSUES
ISSN 2345-0282 (online) http://jssidoi.org/jesi/
2021 Volume 8 Number 3 (March)
http://doi.org/10.9770/jesi.2021.8.3(29)
Make your research more visible, join the Twitter account of ENTREPRENEURSHIP AND SUSTAINABILITY ISSUES:
@Entrepr69728810
463
Table 3. Energy balance of Ukraine in the natural gas sector
Types of fuels/sectors 2014 2015 2016 2017 2018
The share of natural gas in the total supply of primary energy,%
Natural gas 31,6 28,9 27,1 27,4 27,5
Internal supply of natural gas, TJ
Natural gas 1554778 1212422 1191064 1142240 1193373
Meeting the needs of natural gas of own production,%
Natural gas 45,0 56,9 59,3 63,0 64,3
Net imports of natural gas, thousand tons of oil equivalent
Natural gas 15720 13288 8809 11262 8459
Natural gas consumption by sectors, thousand tons of oil equivalent
Own consumption by the energy sector 961 957 897 959 947
Industry 3324 2762 2482 2627 2927
Transport 2273 1572 1399 1612 1455
Others 12708 9406 10009 9564 9677
Non-energy use 2650 2281 1784 1168 884
Source: built on Energy State Statistics Committee of Ukraine
Table 3 shows that the main share of natural gas in the structure of fuel consumption for conversion compared to
2017 has not changed - 23%. In 2018, compared to the previous year, the volume of natural gas use increased by
0.4%. The main consumers of natural gas were enterprises and organizations of 11 regions, the volume of use of
which (taking into account the volume of sales to the population) accounted for almost 73% of the total volume in
Ukraine. Consumers of Dnipropetrovsk region accounted for 10.6% of natural gas use, city of Kyiv - 10.4%,
Kharkiv region - 8.5%, Poltava region - 7.2%, Cherkasy region - 6.7%, Donetsk region - 6.2% , Kyiv region -
5.8%, Odessa region - 5.4%, Lviv region - 5.3%, Zaporozhye region - 3.7% and Nikolaev region - 3.3%. The
enterprises of 18 regions reduced their natural gas consumption, including Ivano-Frankivsk (by 14.3%), Lviv and
Zakarpattia (by 12.4%, respectively), Rivne (by 10.1%) and Volyn (by 9.3%) regions (Energy. State Statistics
Committee of Ukraine).
Ukraine's gas sector, operating in the context of the democratic transformation of Ukrainian society, needs to be
improved in many respects. “Ukraine is a world leader in the level of liquefied gas consumption in the transport
sector. Today, the share of autogas in the total basket of consumed motor fuels in Ukraine is about 25%, which is
2 times or more than the level of, for example, Turkey (12%) and South Korea (less than 10%). The Ukrainian
market has long surpassed the use of autogas not only in any of the European countries but is the absolute world
leader in the use of the product in transport by a share in the basket of used fuels with a double gap from the
second country (Energy. State Statistics Committee of Ukraine).
This is due to the population and the number of vehicles in each country that use petroleum products and liquefied
natural gas. Ukraine ranks fifth in the consumption of liquefied natural gas in transport in the world with a figure
of 1,800,000 tons. First place - in Turkey, followed by South Korea, Russia, and Poland. The first three countries
are significantly superior to Ukraine in terms of population, and Poland is significantly ahead of the number of
cars (Ukraine ranks first in the world in terms of autogas consumption (2019)).
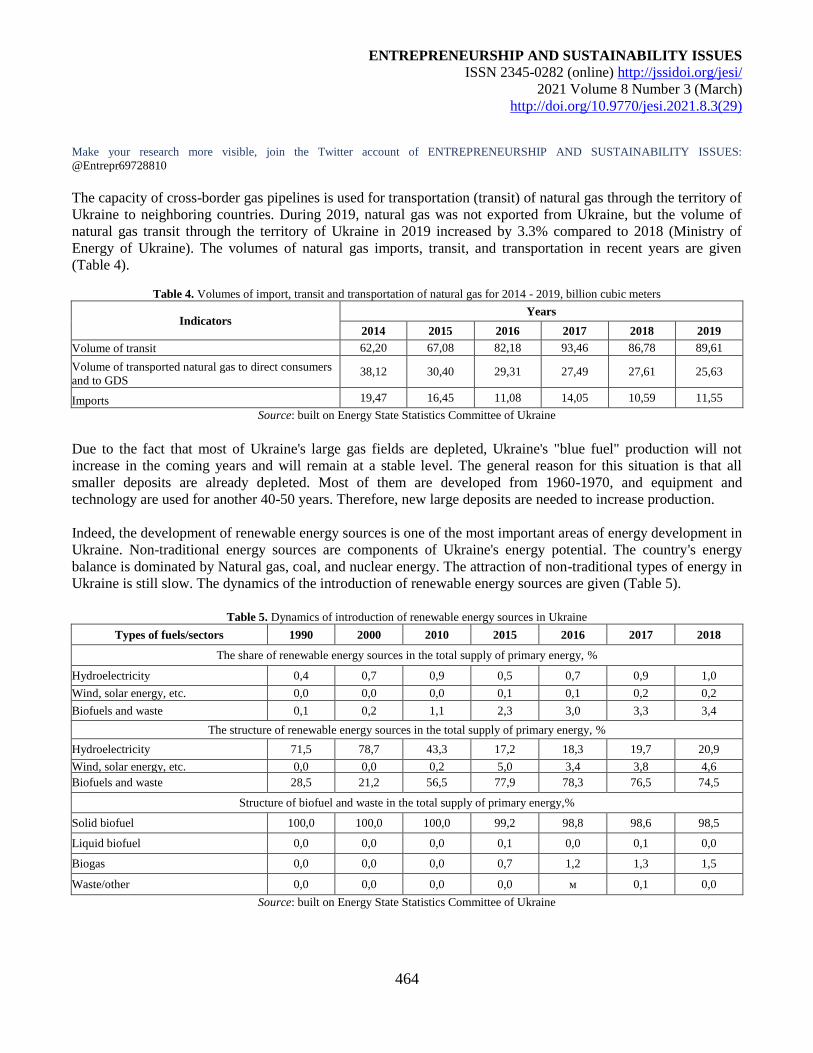
ENTREPRENEURSHIP AND SUSTAINABILITY ISSUES
ISSN 2345-0282 (online) http://jssidoi.org/jesi/
2021 Volume 8 Number 3 (March)
http://doi.org/10.9770/jesi.2021.8.3(29)
Make your research more visible, join the Twitter account of ENTREPRENEURSHIP AND SUSTAINABILITY ISSUES:
@Entrepr69728810
464
The capacity of cross-border gas pipelines is used for transportation (transit) of natural gas through the territory of
Ukraine to neighboring countries. During 2019, natural gas was not exported from Ukraine, but the volume of
natural gas transit through the territory of Ukraine in 2019 increased by 3.3% compared to 2018 (Ministry of
Energy of Ukraine). The volumes of natural gas imports, transit, and transportation in recent years are given
(Table 4).
Table 4. Volumes of import, transit and transportation of natural gas for 2014 - 2019, billion cubic meters
Indicators Years
2014 2015 2016 2017 2018 2019
Volume of transit 62,20 67,08 82,18 93,46 86,78 89,61
Volume of transported natural gas to direct consumers
and to GDS 38,12 30,40 29,31 27,49 27,61 25,63
Imports 19,47 16,45 11,08 14,05 10,59 11,55
Source: built on Energy State Statistics Committee of Ukraine
Due to the fact that most of Ukraine's large gas fields are depleted, Ukraine's "blue fuel" production will not
increase in the coming years and will remain at a stable level. The general reason for this situation is that all
smaller deposits are already depleted. Most of them are developed from 1960-1970, and equipment and
technology are used for another 40-50 years. Therefore, new large deposits are needed to increase production.
Indeed, the development of renewable energy sources is one of the most important areas of energy development in
Ukraine. Non-traditional energy sources are components of Ukraine's energy potential. The country's energy
balance is dominated by Natural gas, coal, and nuclear energy. The attraction of non-traditional types of energy in
Ukraine is still slow. The dynamics of the introduction of renewable energy sources are given (Table 5).
Table 5. Dynamics of introduction of renewable energy sources in Ukraine
Types of fuels/sectors 1990 2000 2010 2015 2016 2017 2018
The share of renewable energy sources in the total supply of primary energy, %
Hydroelectricity 0,4 0,7 0,9 0,5 0,7 0,9 1,0
Wind, solar energy, etc. 0,0 0,0 0,0 0,1 0,1 0,2 0,2
Biofuels and waste 0,1 0,2 1,1 2,3 3,0 3,3 3,4
The structure of renewable energy sources in the total supply of primary energy, %
Hydroelectricity 71,5 78,7 43,3 17,2 18,3 19,7 20,9
Wind, solar energy, etc. 0,0 0,0 0,2 5,0 3,4 3,8 4,6
Biofuels and waste 28,5 21,2 56,5 77,9 78,3 76,5 74,5
Structure of biofuel and waste in the total supply of primary energy,%
Solid biofuel 100,0 100,0 100,0 99,2 98,8 98,6 98,5
Liquid biofuel 0,0 0,0 0,0 0,1 0,0 0,1 0,0
Biogas 0,0 0,0 0,0 0,7 1,2 1,3 1,5
Waste/other 0,0 0,0 0,0 0,0 м 0,1 0,0
Source: built on Energy State Statistics Committee of Ukraine
ENTREPRENEURSHIP AND SUSTAINABILITY ISSUES
ISSN 2345-0282 (online) http://jssidoi.org/jesi/
2021 Volume 8 Number 3 (March)
http://doi.org/10.9770/jesi.2021.8.3(29)
Make your research more visible, join the Twitter account of ENTREPRENEURSHIP AND SUSTAINABILITY ISSUES:
@Entrepr69728810
465
The growth in the supply and consumption of energy from renewable sources indicates that the implementation of
state policy in the areas of efficient use of fuel and energy resources, energy conservation, renewable energy
sources and alternative fuels is gradually being ensured, albeit at a very slow pace. Due to the availability of land
resources that can be allotted for the production of biofuels in Ukraine without much harm to food production and
the provision of livestock feed, Ukraine can potentially be an important player in the European biofuel market.
From the foregoing, the following conclusions can be drawn: the gas sector of the Ukrainian energy sector is the
most problematic for the economy due to the high gas intensity of GDP, which, in turn, gives rise to even greater
gas import dependence and contributes to the spread of corruption. The main problems of the sector include the
monopoly position of the National joint stock company Naftogaz of Ukraine, the need for a large-scale
modernization of the GTS in the absence of funds in the National joint stock company Naftogaz of Ukraine,
absence of the “liberalized” and organizationally formalized natural gas market, the lack of membership of the
system operator of supplies in ENTSO-G, lack of economically justified tariffs, economically justified rates of
payment for the use of subsoil, unsatisfactory pace of reorganization of enterprises, separation of enterprises for
the distribution and supply of gas, and unsatisfactory conditions for attracting investors.
Also, the main problems of the oil and gas sector are imperfect legislation, corruption, shadow business,
overregulation of the licensing system, unstable rental, and tax rules. To ensure economic security and overcome
security threats in the energy sector, the state should develop effective mechanisms and tools to develop and
improve the efficiency of the industry. The priority tasks should include optimization of production,
diversification of supplies and production, modernization of existing facilities, formation of a unified legal
framework, taking into account international standards, implementation of an effective system of state regulation
and control, activation and stimulation of innovation and investment activities, implementation of Euro
environmental norms and international standards, etc. A special attention has to be paid to security of critical
infrastructure (Plėta, T., Tvaronavičienė, M., & Della Casa, S. 2020; Plėta, T., Tvaronavičienė, M., Della Casa,
S., & Agafonov, K. 2020; Tvaronavičienė, M., Plėta, T., Della Casa, S., & Latvys, J. 2020).
It is possible to draw conclusions on the development of the oil and gas sector in Ukraine in more detail and in a
qualified manner and propose ways to improve it using the SWOT analysis technique. That is, we will analyze
this sector in terms of existing and potential opportunities, threats, advantages, and disadvantages. At the same
time, we assume the requirements of the Third Energy Package to separate the transport function from the gas
production and supply business and also assume that the operator is removed from the structure of a vertically
integrated company and is not associated with it by legal, financial and managerial ties, in accordance with the
Directive (Table 6).
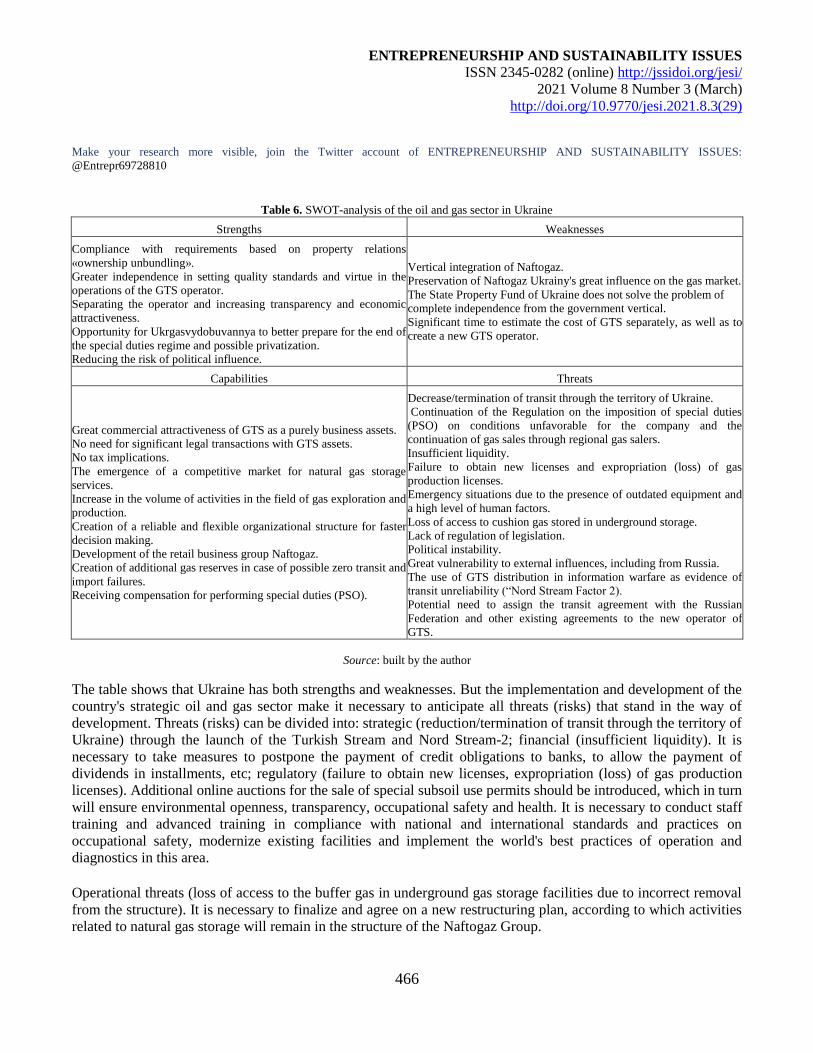
ENTREPRENEURSHIP AND SUSTAINABILITY ISSUES
ISSN 2345-0282 (online) http://jssidoi.org/jesi/
2021 Volume 8 Number 3 (March)
http://doi.org/10.9770/jesi.2021.8.3(29)
Make your research more visible, join the Twitter account of ENTREPRENEURSHIP AND SUSTAINABILITY ISSUES:
@Entrepr69728810
466
Table 6. SWOT-analysis of the oil and gas sector in Ukraine
Strengths Weaknesses
Compliance with requirements based on property relations
«ownership unbundling».
Greater independence in setting quality standards and virtue in the
operations of the GTS operator.
Separating the operator and increasing transparency and economic
attractiveness.
Opportunity for Ukrgasvydobuvannya to better prepare for the end of
the special duties regime and possible privatization.
Reducing the risk of political influence.
Vertical integration of Naftogaz.
Preservation of Naftogaz Ukrainy's great influence on the gas market.
The State Property Fund of Ukraine does not solve the problem of
complete independence from the government vertical.
Significant time to estimate the cost of GTS separately, as well as to
create a new GTS operator.
Capabilities Threats
Great commercial attractiveness of GTS as a purely business assets.
No need for significant legal transactions with GTS assets.
No tax implications.
The emergence of a competitive market for natural gas storage
services.
Increase in the volume of activities in the field of gas exploration and
production.
Creation of a reliable and flexible organizational structure for faster
decision making.
Development of the retail business group Naftogaz.
Creation of additional gas reserves in case of possible zero transit and
import failures.
Receiving compensation for performing special duties (PSO).
Decrease/termination of transit through the territory of Ukraine.
Continuation of the Regulation on the imposition of special duties
(PSO) on conditions unfavorable for the company and the
continuation of gas sales through regional gas salers.
Insufficient liquidity.
Failure to obtain new licenses and expropriation (loss) of gas
production licenses.
Emergency situations due to the presence of outdated equipment and
a high level of human factors.
Loss of access to cushion gas stored in underground storage.
Lack of regulation of legislation.
Political instability.
Great vulnerability to external influences, including from Russia.
The use of GTS distribution in information warfare as evidence of
transit unreliability (“Nord Stream Factor 2).
Potential need to assign the transit agreement with the Russian
Federation and other existing agreements to the new operator of
GTS.
Source: built by the author
The table shows that Ukraine has both strengths and weaknesses. But the implementation and development of the
country's strategic oil and gas sector make it necessary to anticipate all threats (risks) that stand in the way of
development. Threats (risks) can be divided into: strategic (reduction/termination of transit through the territory of
Ukraine) through the launch of the Turkish Stream and Nord Stream-2; financial (insufficient liquidity). It is
necessary to take measures to postpone the payment of credit obligations to banks, to allow the payment of
dividends in installments, etc; regulatory (failure to obtain new licenses, expropriation (loss) of gas production
licenses). Additional online auctions for the sale of special subsoil use permits should be introduced, which in turn
will ensure environmental openness, transparency, occupational safety and health. It is necessary to conduct staff
training and advanced training in compliance with national and international standards and practices on
occupational safety, modernize existing facilities and implement the world's best practices of operation and
diagnostics in this area.
Operational threats (loss of access to the buffer gas in underground gas storage facilities due to incorrect removal
from the structure). It is necessary to finalize and agree on a new restructuring plan, according to which activities
related to natural gas storage will remain in the structure of the Naftogaz Group.
ENTREPRENEURSHIP AND SUSTAINABILITY ISSUES
ISSN 2345-0282 (online) http://jssidoi.org/jesi/
2021 Volume 8 Number 3 (March)
http://doi.org/10.9770/jesi.2021.8.3(29)
Make your research more visible, join the Twitter account of ENTREPRENEURSHIP AND SUSTAINABILITY ISSUES:
@Entrepr69728810
467
Therefore, the transformation of the oil and gas sector of Ukraine and the creation of an effective organizational
model should provide sufficient control over the areas of activity grouped into appropriate blocks, with
appropriate tasks and objectives. Blocks should also include areas for action to achieve effect (individual
responsibility for results, identification of key positions and strengthening of responsibilities, ensuring national
interests, proper consideration of operating costs, etc) and further development of the industry, as well as to
ensure effective control.
5. Discussion
In general, Ukraine has sufficient natural, scientific, technical, technological, and human resources to provide
natural gas for its own production. The increase in gas production in Ukraine is possible due to two main
directions, firstly - the use of modern technologies, and secondly - the expansion of the resource base by finding
new deposits and drilling a large number of wells. It is necessary to conduct an inventory, re-certification, and
illustration of the operational fund of wells and deposits. It is also essential to provide for effective and efficient
mechanisms for regulating the exploration and production of hydrocarbons, namely: transparent competitive
licensing procedures; to settle the issue of a single fee for subsoil use; to determine clear and comprehensive
grounds for granting a license outside the auction and revoking the license, etc. That is, it is necessary to mobilize
the available scientific, technical, financial, and administrative resources in the country, to improve the legislation
on subsoil use.
The main problems of resource security of the gas sector of Ukraine include imperfect legislation, corruption,
shadow business, over-regulation of the permitting system, unstable rent and tax rules.
To ensure economic security and overcome security threats in the energy sector, the state must develop effective
mechanisms and tools to develop and improve the efficiency of the industry.
Regarding the market of oil and oil products, the filling of the domestic oil market, in recent years, was carried
out both at the expense of domestic production resources and through oil imports. For the first time in 12 years,
the negative trend of oil and condensate production was reversed. At the same time, despite the improvement of
Ukrnafta's indicators, the general trend of oil production remains negative due to the problem of accumulated tax
debt, which, in turn, makes it impossible to invest in the development of the company's reserves.
Conclusions
The study of the constitutional and legal foundations of national security of Ukraine provided an opportunity to
make a number of conclusions, generalizations and develop appropriate proposals that, hopefully, will not only
significantly improve the field of conceptual analysis of theoretical and methodological problems of national
security but also a unified methodological approach to its components, as well as analysis, evaluation and
forecasting, making management decisions to ensure the national security of our state. The obtained results can be
the basis for the creation of a holistic theory of national security and will provide scientific support for the
realization of national interests of Ukraine in the modern geopolitical dimension.
Summarizing the above, we can conclude that it is necessary to create minimum reserves of oil and oil products in
Ukraine, which is due to: insufficient production of its own hydrocarbons, dependence on imports, limited
opportunities for increasing volumes, the existing threat of crisis in the oil and oil products market, and the like.
ENTREPRENEURSHIP AND SUSTAINABILITY ISSUES
ISSN 2345-0282 (online) http://jssidoi.org/jesi/
2021 Volume 8 Number 3 (March)
http://doi.org/10.9770/jesi.2021.8.3(29)
Make your research more visible, join the Twitter account of ENTREPRENEURSHIP AND SUSTAINABILITY ISSUES:
@Entrepr69728810
468
The authors have analyzed and concluded that the oil and gas complex of Ukraine occupies a leading place among
the basic industries of the fuel and energy complex (FEC), and the lack of its own energy resources, their supply
from outside destabilizes the political and economic situation. One component and a guarantee of energy security
and independence of Ukraine is an efficiently operating gas industry.
One of the key events of recent years is the very low volumes of Russian gas supplies to Europe. Unlike the
Ukrainian transit route, other routes for the transit of Russian gas to European countries were operating at
maximum rates. However, since the only transport corridor that has sufficient capacity and flexibility is the
Ukrainian transit corridor, the transportation volumes of the Ukrainian GTS began to gradually grow and at the
end of March 2018 amounted to 155 million cubic meters/day at the Uzhgorod/Velke Kapushany point, which in
turn was almost three times higher than at the beginning of February. In addition, there were also difficulties with
resource provision. That is, Naftogaz, pursuant to the decision of the Stockholm Arbitration, made an advance
payment in favor of Gazprom for the volumes of gas stipulated in the contract but Gazprom did not supply the
prepaid gas to Naftogaz, for which there was a critical situation with the supply of gas to consumers in Ukraine
and Naftogaz. This problem was eliminated only due to the urgent purchase of gas in Europe, an increase in gas
withdrawal from UGS facilities and due to the "flexibility" of the pipeline system in Ukraine.
The total reserves of natural gas as of January 1, 2019 are 882.6 billion cubic meters, which will provide Ukraine
for 42 years under the current rate of natural gas use. Ukraine annually produces only 2.4% of the total natural gas
reserves, while more developed countries produce about 6%. In general, the gas sector of Ukraine, which
functions in the conditions of democratic transformation of Ukrainian society, requires improvement in many
aspects.
To ensure economic security and overcome security threats in the energy sector, the state should develop effective
mechanisms and tools to improve the efficiency of the industry in the context of globalization, taking into account
world development trends. The priority tasks should be: optimization of own production and development and
production of oil from new fields both in Ukraine and abroad, reducing the level of dependence on imports
through diversifying sources of external oil supplies, modernizing and increasing the competitiveness of the oil
refining industry, consolidating a positive image of Ukraine in the international system, the formation of a single
legal framework, taking into account international standards, the introduction of an effective system of state
regulation and control to ensure fair competition, the activation of the scientific potential of the industry and the
implementation of state policy to stimulate innovation and investment in the oil industry, the modernization of
existing capacities of oil refineries and construction of new facilities to increase the production of high-quality
petroleum products, review and improvement of the technical specifications for compliance with EU standards,
implementation of Euro environmental standards in Ukraine, creation of the strategic reserve of oil and oil
products, viewing and setting competitive tariffs for transportation and oil transshipment services, attracting
analysts and scientists to the coverage of topical and problematic issues of the industry, and the like.
ENTREPRENEURSHIP AND SUSTAINABILITY ISSUES
ISSN 2345-0282 (online) http://jssidoi.org/jesi/
2021 Volume 8 Number 3 (March)
http://doi.org/10.9770/jesi.2021.8.3(29)
Make your research more visible, join the Twitter account of ENTREPRENEURSHIP AND SUSTAINABILITY ISSUES:
@Entrepr69728810
469
References
Akimova, L. N. (2018). Role and place of economic security in the system of state regulation providing for national security of Ukraine.
Public manаgement, (2), 15-28.
Annual Report of Naftogaz of Ukraine for 2018 (2019). Available at: https://www.slideshare.net/tsnua/2018-152295656
Annual Report of the National Commission for State Regulation of Energy and Utilities for 2019 (2020). Available at:
https://www.nerc.gov.ua/data/filearch/Catalog3/Richnyi_zvit_NKREKP_2019.pdf
Blakyta, G., & Ganushchak, T. (2018). Enterprise financial security as a component of the economic security of the state. Investment
management and financial innovations, 15(2), 248-256. Available at: https://www.ceeol.com/search/article-detail?id=741534
Bogutska, O. (2018). Financial and economic mechanism of ensuring investment activity of enterprises within institutional models of
financing the real sector of economics. Innovative technologies and scientific solutions for industries, (3 (5)), 79-86. Available at:
http://journals.uran.ua/itssi/article/view/2522-9818.2018.5.079
Bondar, O. (2018). Public administration in the field of land use and protection and state land policy in Ukraine: problems of correlation.
Baltic Journal of Economic Studies, 4(3), 22-27. Available at: http://baltijapublishing.lv/index.php/issue/article/view/419
Energy. State Statistics Committee of Ukraine. Available at: https://ukrstat.org/uk/operativ/menu/menu_u/energ.htm
Kizian, R. (2019). Justification of the legal mechanism of the government control of antiterrorist security system of Ukraine. East journal of
security studies, 4(1), 117-126. Available at: https://ejss.nuczu.edu.ua/index.php/ejss/article/view/14
Kovalova, O. V., Korniienko, M. V., & Pavliutin, Y. V. (2020). The Role of Public Organizations in Ensuring National Security of
Ukraine. Cuestiones Políticas, 37(65).
Kulish, A., Petrushenko, M., Reznik, O., & Kiselyova, E. (2018). The relations unshadowing in business activities: The economic and legal
factors of security at the macroeconomic level. Problems and Perspectives in Management, 16(1), 428-436. Available at:
https://www.ceeol.com/search/article-detail?id=648327
Ministry of Energy of Ukraine. Available at: http://mpe.kmu.gov.ua/minugol/control/uk/publish/officialcategory?cat_id=35016
Plėta, T., Tvaronavičienė, M., & Della Casa, S. (2020). Cyber effect and security management aspects in critical energy infrastructures.
Insights into Regional Development, 2(2), 538-548. https://doi.org/10.9770/IRD.2020.2.2(3)
Plėta, T., Tvaronavičienė, M., Della Casa, S., & Agafonov, K. (2020). Cyber-attacks to critical energy infrastructure and management
issues: overview of selected cases. Insights into Regional Development, 2(3), 703-715. https://doi.org/10.9770/IRD.2020.2.3(7)
Romaniuk, M., & Smutchak, Z. (2016). Migratory threats to national security of Ukraine: current challenges and ways of regulation. Baltic
Journal of Economic Studies, 2(3). Available at: https://cyberleninka.ru/article/n/migratory-threats-to-national-security-of-ukraine-current-
challenges-and-ways-of-regulation
Serafimov, V. (2017). The Organizational and Legal Mechanism of Ensuring the Safety of the Ukrainian Seaport. Lex Portus, 5, 100.
Available at: https://heinonline.org/HOL/LandingPage?handle=hein.journals/lxportus5&div=12&id=&page=
Serbyn, R., Zelenko, I., Kiselyova, E., Voloshyna, M., & Mykhaylovs' ka, Y. (2020). Administrative and Legal Mechanism for Ensuring
the Rights of Civil Servants in Ukraine and the Developed Countries of the World. Cuestiones Políticas, 37(65).
ENTREPRENEURSHIP AND SUSTAINABILITY ISSUES
ISSN 2345-0282 (online) http://jssidoi.org/jesi/
2021 Volume 8 Number 3 (March)
http://doi.org/10.9770/jesi.2021.8.3(29)
Make your research more visible, join the Twitter account of ENTREPRENEURSHIP AND SUSTAINABILITY ISSUES:
@Entrepr69728810
470
Tvaronavičienė, M., Plėta, T., Della Casa, S., & Latvys, J. (2020). Cyber security management of critical energy infrastructure in national
cybersecurity strategies: cases of USA, UK, France, Estonia and Lithuania. Insights into Regional Development, 2(4), 802-813.
http://doi.org/10.9770/IRD.2020.2.4(6)
Ukraine ranks first in the world in terms of autogas consumption (2019). Available at: https://nv.ua/ukr/biz/markets/avtogaz-ukrajina-stala-
svitovim-liderom-za-rivnem-spozhivannya-avtogazu-novini-ukrajini-50061160.html
Oleksii SHUMILO, Candidate of Law Sciences, Associate Professor, Kharkiv National University of Internal Affairs
ORCID ID: orcid.org/0000-0002-0506-4631
Ivan LYTVYN, Doctor of Laws, Associate Professor, Director of the Kropyvnytskyi Institute of State and Municipal Administration
ORCID ID: orcid.org/0000-0002-4180-7500
Volodymyr SHABLYSTYI, Doctor of Law, Associate Professor, Dnipropetrovsk State University of Internal Affairs
ORCID ID: orcid.org/https://orcid.org/0000-0003-0210-1772
Tetiana KORNYAKOVA, Doctor of Law Sciences, Associate Professor, Oles Honchar Dnipro National University
ORCID ID: orcid.org/0000-0001-5993-0745
Irina POPOVICH, PhD in Law, Researcher at the National Scientific Center "Institute of Forensic Examinations named after Hon. Prof.
M.S. Bokarius"
ORCID ID: orcid.org/0000-0001-9329-5378
Copyright © 2021 by author(s) and VsI Entrepreneurship and Sustainability Center
This work is licensed under the Creative Commons Attribution International License (CC BY).
http://creativecommons.org/licenses/by/4.0/
ENTREPRENEURSHIP AND SUSTAINABILITY ISSUES
ISSN 2345-0282 (online) http://jssidoi.org/jesi/
2021 Volume 8 Number 3 (March)
http://doi.org/10.9770/jesi.2021.8.3(30)
Publisher http://jssidoi.org/esc/home
471
PROBLEMS OF INTELLECTUAL PROPERTY IN THE NATIONAL SECURITY SYSTEM OF THE
COUNTRY
Oleksandr Bryhinets ¹, Roman Shapoval ², Alona Bakhaieva 3, Vitalii Pchelin 4, Andrii Fomenko 5
1*Khmelnytsky University of Management and Law named after Leonid Yuzkov, Heroes of the Maidan str.,8, Khmelnytsky, 29000, Ukraine 2 Yaroslav Mudryi National Law University, 77 Pushkinskaya Street, Kharkiv, 61024, Ukraine
3,4Kharkiv National University of Internal Affairs, Lviv Landau avenue, 27, Kharkiv, 61024, Ukraine 5 Dnipropetrovsk State University of Internal Affairs, Ave. Gagarina, 26, 49005, Dnipro, Ukraine
E-mail: 1* [email protected]
Received 25 March 2020; accepted 6 January 2021; published 30 March 2021
Abstract. The problems of intellectual property as a component of intellectual security in the national security system of the country have
been considered. A statistical analysis of the registration of intellectual property in Ukraine for 2015-2019 has been carried out. The
assessment of the level of intellectual security of Ukraine has been carried out on the basis of the calculation of the integrated index of
intellectual security of Ukraine, which is based on the methodology of integrated assessment, the theory of factor analysis. The results
confirmed that the level of intellectual security of Ukraine is low. The integrated index is in the range of the lower limit, which indicates
that the state underestimates the importance of preserving, developing and increasing intellectual potential. The low level of intellectual
security of Ukraine is largely due to the destructive influence of inhibitory factors, which over time can take the form of real threats. Given
the diverse nature, sources and forms of manifestation, the threats of regulatory, institutional, organizational and managerial, economic,
subjective, social, global and related nature, which have a destabilizing effect on the state of intellectual security of the state have been
distinguished. Special attention was focused on structuring threats to intellectual potential as a strategic resource for strengthening the
economic security of Ukraine. In order to achieve the strategic goals of innovation development of the state, the Strategy of development
and rational use of intellectual potential to strengthen economic security of the state has been proposed. The main purpose of this strategy
consists in strengthening the economic security of Ukraine on the basis of development and rational use of intellectual potential
harmonized with intellectual security threats in the economic security system of the state.
Keywords: intellectual property; national security; intellectual security; regulatory support; intellectual potential
Reference to this paper should be made as follows: Bryhinets, O., Shapoval, R., Bakhaieva, A., Pchelin, V., Fomenko, A. 2021. Problems
of intellectual property in the national security system of the country. Entrepreneurship and Sustainability Issues, 8(3), 471-486.
http://doi.org/10.9770/jesi.2021.8.3(30)
JEL Classifications: F35, F42
ENTREPRENEURSHIP AND SUSTAINABILITY ISSUES
ISSN 2345-0282 (online) http://jssidoi.org/jesi/
2021 Volume 8 Number 3 (March)
http://doi.org/10.9770/jesi.2021.8.3(30)
Make your research more visible, join the Twitter account of ENTREPRENEURSHIP AND SUSTAINABILITY ISSUES:
@Entrepr69728810
472
1. Introduction
The problem of national security in a transitional economy becomes particularly acute, as the latter is
characterized by numerous negative consequences of reform, manifested in the disintegration of production
structures, rupture of economic ties, imbalance between extractive and processing industries, domestic market
reduction, regional development imbalances, significant reduction of expenses on research and innovation
activities and, as a consequence lowering the level of inventive, patent, licensing and innovation activity, loss of
competitiveness of domestic producers, increasing the level of counterfeiting and piracy, etc.
The problem of economic security of Ukraine is decisive in the context of the existence and development of
Ukraine as a sovereign state. Economic security is a multifactorial phenomenon that can be considered as a
system consisting of such functional components as: financial, social, information, intellectual, technological,
military security, environmental security, etc.
Intellectual property is a key aspect of intellectual security in the national security system of each country.
Ukraine should continue to create effective mechanisms for the protection and enforcement of intellectual
property rights.
At the present stage of formation of the innovation model of economic development of Ukraine, the main driver
of economic growth is the intellectual potential as a strategic resource and economic power of the state. Economic
stability of highly developed countries is ensured by the introduction of scientific and technological developments
and high breakthrough technologies. This objectively puts before Ukraine the task of strengthening scientific,
educational and innovation competitiveness, more effective use of intellectual potential as a precondition for
economic security of the state.
Elimination of Ukraine's technological lag behind advanced countries is actualized by the influence of destructive
factors that take the form of potential and real threats. These include, first of all, the processes of devaluation of
moral and spiritual values in society, the real decline in purchasing power and deterioration of the quality of life
of the population, extremely slow reform of Ukrainian science and education, the delay in creating a national
innovation system.
One of the preconditions for intensifying the development of the national economy is the development and
implementation of state policy of development and use of intellectual potential to ensure economic security of the
state as a set of software to counter security threats to the cultural, spiritual and scientific-educational base of the
national economy. At the state level, a national strategy for the development of science has not yet been
developed.
The scientific sphere is characterized by low innovation activity and slow integration of modern organizational
forms and methods. When reforming higher education, it is necessary to take into account global trends:
intensification of competition between universities for leadership in the global market of educational services,
revival of international scientific cooperation, diversification of funding mechanisms for education and research
with the state, development of new technologies to improve educational services These factors determine the
relevance of the development and implementation of state policy for the development and use of intellectual
potential using a functionally integrated set of tools to counter potential and real threats and outline strategic
priorities for strengthening the economic security of the state.
ENTREPRENEURSHIP AND SUSTAINABILITY ISSUES
ISSN 2345-0282 (online) http://jssidoi.org/jesi/
2021 Volume 8 Number 3 (March)
http://doi.org/10.9770/jesi.2021.8.3(30)
Make your research more visible, join the Twitter account of ENTREPRENEURSHIP AND SUSTAINABILITY ISSUES:
@Entrepr69728810
473
The purpose of the paper is the formation of methodological foundations, theoretical and methodological
approaches and scientific and practical areas to substantiate the strategic priorities and means of development and
use of intellectual property and intellectual potential and strengthening the economic security of Ukraine.
2. Literature Survey
There has been made a significant contribution to the theoretical substantiation of the economic nature of human
labor and intelligence, scientific thought, business cycles and innovations.
Theoretical and methodological principles of the development of intellectual potential as the main productive
force of society are substantiated in the works of Agostini, L., et.al. (2017), Holgersson, M., & Aaboen, L. (2019),
Miyashita, S., Katoh, S., Anzai, T., & Sengoku, S. (2020), Laužikas, M., Miliūtė, A., & Khalili, M. (2021) etc.
Economic, philosophical and social aspects of intellectual and human capital are covered in the works of Kim, S.
Y., & Kim, E. (2018), Torre, R. D. L., Alcaide-Muñoz, C., & Ollo-López, A. (2019), Tekic, A., & Willoughby, K.
W. (2020), Laužikas, M., & Miliūtė, A. (2020) etc.
The studies of theoretical and methodological points and practical problems of economic security of the state in
the strategic aspect, including scientific and technological, investment and innovation components are presented
in the works of Peng, M. W., Ahlstrom, D., Carraher, S. M., & Shi, W. S. (2017), Efendioglu, N., & Woitsch, R.
(2017), Baran, A., & Zhumabaeva, A. (2018).
Given the significant scientific achievements of scientists, today research into the role and place of intellectual
potential in the system of economic security of the state, quality development and rational use of intellectual
potential, determining the impact of intellectual potential on the level of economic security of the state taking into
account its dualistic nature is gaining relevance. Also, there become urgent the issues of substantiation of the
conceptual foundations of the study of intellectual security in the economic security system of the state, the
development of a set of social and motivational programs for young scientists, borrowing positive world
experience in strengthening the economic security of the state. All this conditioned the choice of the subject of the
paper, determined its purpose and objectives, as well as the logic of the presentation of the material.
3. Methods
In the process of research there was used the theory of systems, and there was constructed the hierarchical concept
of research including the following: the methods of scientific abstraction, induction and deduction, analysis and
synthesis, and historical and logical methods (for the generalization of scientific theses and the development of
the terminological framework of the theory of security science); comparative analysis (for the comparison of the
scientific foundations for the interpretation of the concepts of "intellectual property", "intellectual potential",
"intellectual security of the state"); structural and axiological analysis (for outlining the architecture of intellectual
potential and the relationship between system components); systematization, theoretical generalization and
aggregation (in substantiation of theoretical and methodological approaches and principles to assess the level and
threats to the development of intellectual potential of Ukraine); economic and mathematical, analytical and
forecasting calculations, in particular, the methods of the theory of sets and mathematical logic, mathematical
programming (for calculations of the level of intellectual potential of Ukraine and identification of the dominant
trends in its development); data envelopment analysis (in determining the effectiveness of the use of intellectual
ENTREPRENEURSHIP AND SUSTAINABILITY ISSUES
ISSN 2345-0282 (online) http://jssidoi.org/jesi/
2021 Volume 8 Number 3 (March)
http://doi.org/10.9770/jesi.2021.8.3(30)
Make your research more visible, join the Twitter account of ENTREPRENEURSHIP AND SUSTAINABILITY ISSUES:
@Entrepr69728810
474
potential in the process of strengthening the economic security of Ukraine); system dynamics modeling (for the
identification of causal relationships between motives and factors of effective use of intellectual potential);
integrated assessment (for the calculation of the integrated index of intellectual security of Ukraine); fuzzy logic
(for the identification of the impact of systemic threats on the level of economic security of the state); system
analysis (for the identification of the key trends and achievements in the educational, scientific, cultural and
spiritual spheres of developed countries and Ukraine; graphic method (for the visualization of the results of
assessment of the development and use of intellectual potential and the level of intellectual security of Ukraine).
The information base of the study is the laws of Ukraine, decrees of the President of Ukraine, resolutions of the
Cabinet of Ministers of Ukraine, materials of the State Statistics Service of Ukraine, official publications of
international economic organizations (UN, IMF, World Bank, OECP, World Economic Forum), strategic and
program documents on the issues of development of national education and science, reform of the national
economy, scientific literature, official statistical and analytical-forecast materials, online publications, individual
studies and results of the author.
4. Results
The main results of the study. The analysis of the intellectual property market requires a systematic approach
taking into account the environment of use of the intellectual potential of the population:
- Analysis level І: analysis of the level of innovation development of the country and its regions aiming to define
the structure of the economy based on technological modes, the importance of science-intensive products in GDP,
the competitiveness of the economy in the world, etc.; analysis of the intellectual potential of the population, the
number of people employed in knowledge-intensive areas of economy, trends of intellectual migration in different
spatial scales (global competition for "brains");
- Analysis level ІІ: analysis of the intellectual property market itself, in particular its entities (of business and
research, including educational, environment that can be producers and consumers), and objects (results of
intellectual activity and their juridical security);
- Analysis level ІІІ: analysis of the management environment of the intellectual property market, in particular the
participation of the state in the protection and promotion of intellectual activity;
- Analysis level IV: analysis of commercialization of intellectual property items and reflection of this process at
the level of innovation development of the country (thus a closed cycle of analysis with level I is formed).
Analysis level І is necessary in the conditions of formation of the world economic space. A wide range of
international indices, including the Global Innovation Index, the Global Competitiveness Index, the Global Index
of Intellectual Property Protection and others allows determining the level of innovation development of a country
on a global scale.
According to the Global Innovation Index, there is a positive dynamics for Ukraine in the rating. Information in
this regard is widespread in the Ukrainian media. However, if we take the Global Index of Protection of
Intellectual Property Rights, the situation for Ukraine is quite problematic. Among the 125 countries analyzed,
Ukraine occupies a very backward position (100th position in 2018). To understand the reasons for this situation,
it is necessary to analyze the indicators that form this index in more detail.
The ratings of the Global Index of Intellectual Property Protection have been published annually since 2007 by
the International Property Rights Alliance. The index includes indicators of protection of physical and intellectual
property rights; in the context of the latter, three factors are the measures of quality and perfection of the
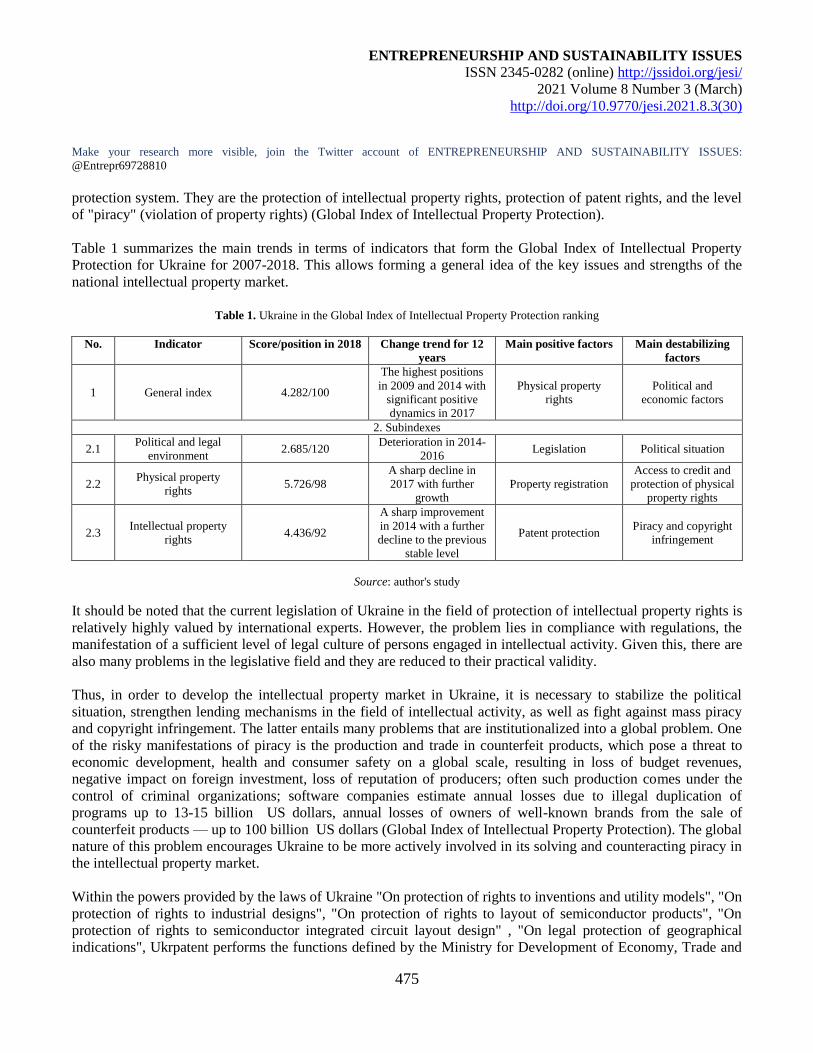
ENTREPRENEURSHIP AND SUSTAINABILITY ISSUES
ISSN 2345-0282 (online) http://jssidoi.org/jesi/
2021 Volume 8 Number 3 (March)
http://doi.org/10.9770/jesi.2021.8.3(30)
Make your research more visible, join the Twitter account of ENTREPRENEURSHIP AND SUSTAINABILITY ISSUES:
@Entrepr69728810
475
protection system. They are the protection of intellectual property rights, protection of patent rights, and the level
of "piracy" (violation of property rights) (Global Index of Intellectual Property Protection).
Table 1 summarizes the main trends in terms of indicators that form the Global Index of Intellectual Property
Protection for Ukraine for 2007-2018. This allows forming a general idea of the key issues and strengths of the
national intellectual property market.
Table 1. Ukraine in the Global Index of Intellectual Property Protection ranking
No. Indicator Score/position in 2018 Change trend for 12
years
Main positive factors Main destabilizing
factors
1 General index 4.282/100
The highest positions
in 2009 and 2014 with
significant positive
dynamics in 2017
Physical property
rights
Political and
economic factors
2. Subindexes
2.1 Political and legal
environment 2.685/120
Deterioration in 2014-
2016 Legislation Political situation
2.2 Physical property
rights 5.726/98
A sharp decline in
2017 with further
growth
Property registration
Access to credit and
protection of physical
property rights
2.3 Intellectual property
rights 4.436/92
A sharp improvement
in 2014 with a further
decline to the previous
stable level
Patent protection Piracy and copyright
infringement
Source: author's study
It should be noted that the current legislation of Ukraine in the field of protection of intellectual property rights is
relatively highly valued by international experts. However, the problem lies in compliance with regulations, the
manifestation of a sufficient level of legal culture of persons engaged in intellectual activity. Given this, there are
also many problems in the legislative field and they are reduced to their practical validity.
Thus, in order to develop the intellectual property market in Ukraine, it is necessary to stabilize the political
situation, strengthen lending mechanisms in the field of intellectual activity, as well as fight against mass piracy
and copyright infringement. The latter entails many problems that are institutionalized into a global problem. One
of the risky manifestations of piracy is the production and trade in counterfeit products, which pose a threat to
economic development, health and consumer safety on a global scale, resulting in loss of budget revenues,
negative impact on foreign investment, loss of reputation of producers; often such production comes under the
control of criminal organizations; software companies estimate annual losses due to illegal duplication of
programs up to 13-15 billion US dollars, annual losses of owners of well-known brands from the sale of
counterfeit products — up to 100 billion US dollars (Global Index of Intellectual Property Protection). The global
nature of this problem encourages Ukraine to be more actively involved in its solving and counteracting piracy in
the intellectual property market.
Within the powers provided by the laws of Ukraine "On protection of rights to inventions and utility models", "On
protection of rights to industrial designs", "On protection of rights to layout of semiconductor products", "On
protection of rights to semiconductor integrated circuit layout design" , "On legal protection of geographical
indications", Ukrpatent performs the functions defined by the Ministry for Development of Economy, Trade and
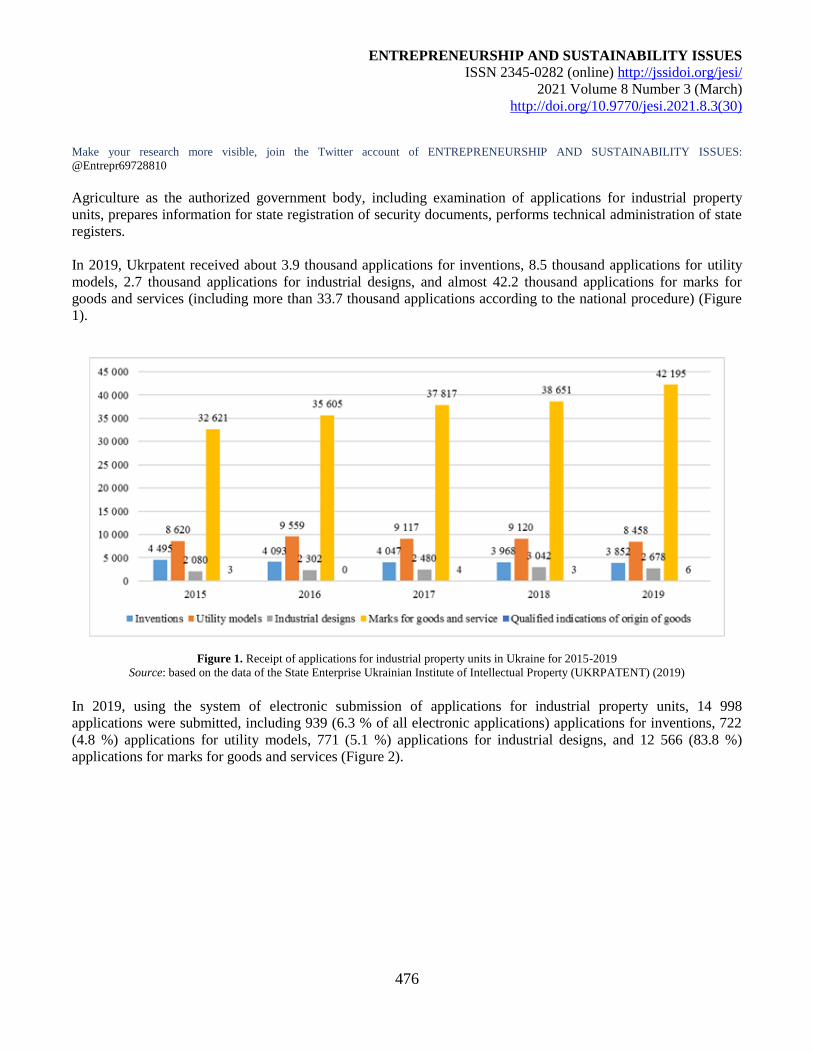
ENTREPRENEURSHIP AND SUSTAINABILITY ISSUES
ISSN 2345-0282 (online) http://jssidoi.org/jesi/
2021 Volume 8 Number 3 (March)
http://doi.org/10.9770/jesi.2021.8.3(30)
Make your research more visible, join the Twitter account of ENTREPRENEURSHIP AND SUSTAINABILITY ISSUES:
@Entrepr69728810
476
Agriculture as the authorized government body, including examination of applications for industrial property
units, prepares information for state registration of security documents, performs technical administration of state
registers.
In 2019, Ukrpatent received about 3.9 thousand applications for inventions, 8.5 thousand applications for utility
models, 2.7 thousand applications for industrial designs, and almost 42.2 thousand applications for marks for
goods and services (including more than 33.7 thousand applications according to the national procedure) (Figure
1).
Figure 1. Receipt of applications for industrial property units in Ukraine for 2015-2019
Source: based on the data of the State Enterprise Ukrainian Institute of Intellectual Property (UKRPATENT) (2019)
In 2019, using the system of electronic submission of applications for industrial property units, 14 998
applications were submitted, including 939 (6.3 % of all electronic applications) applications for inventions, 722
(4.8 %) applications for utility models, 771 (5.1 %) applications for industrial designs, and 12 566 (83.8 %)
applications for marks for goods and services (Figure 2).
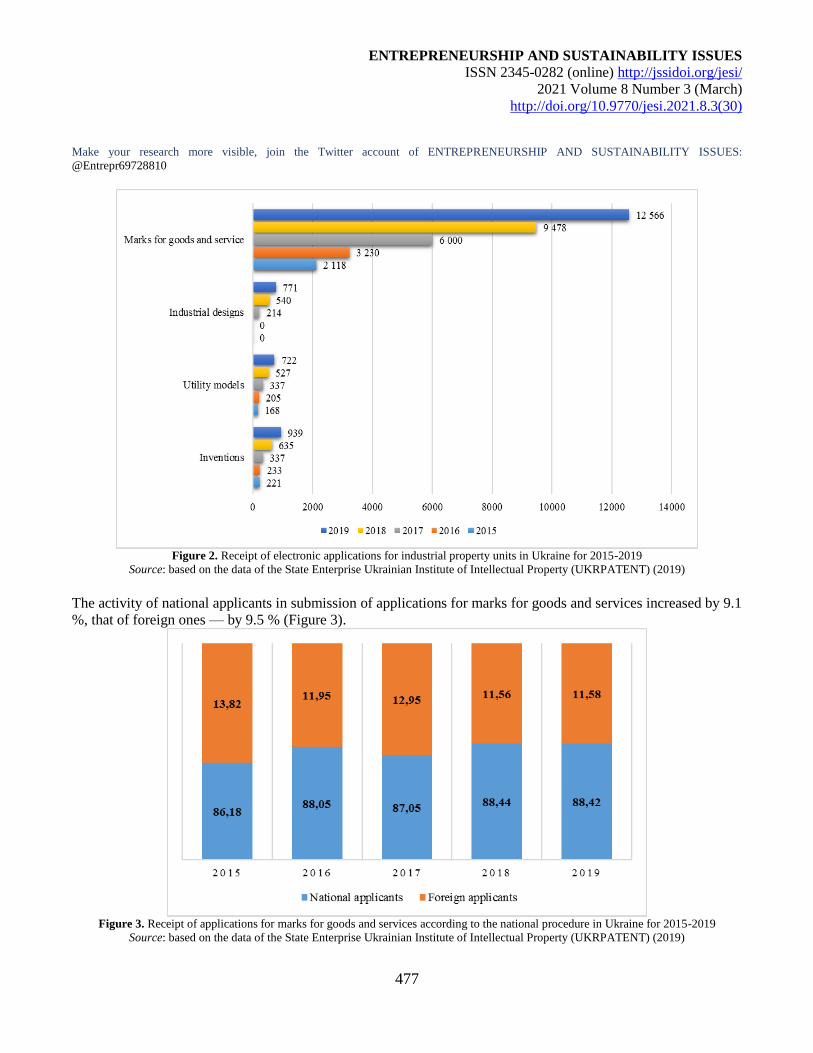
ENTREPRENEURSHIP AND SUSTAINABILITY ISSUES
ISSN 2345-0282 (online) http://jssidoi.org/jesi/
2021 Volume 8 Number 3 (March)
http://doi.org/10.9770/jesi.2021.8.3(30)
Make your research more visible, join the Twitter account of ENTREPRENEURSHIP AND SUSTAINABILITY ISSUES:
@Entrepr69728810
477
Figure 2. Receipt of electronic applications for industrial property units in Ukraine for 2015-2019
Source: based on the data of the State Enterprise Ukrainian Institute of Intellectual Property (UKRPATENT) (2019)
The activity of national applicants in submission of applications for marks for goods and services increased by 9.1
%, that of foreign ones — by 9.5 % (Figure 3).
Figure 3. Receipt of applications for marks for goods and services according to the national procedure in Ukraine for 2015-2019
Source: based on the data of the State Enterprise Ukrainian Institute of Intellectual Property (UKRPATENT) (2019)
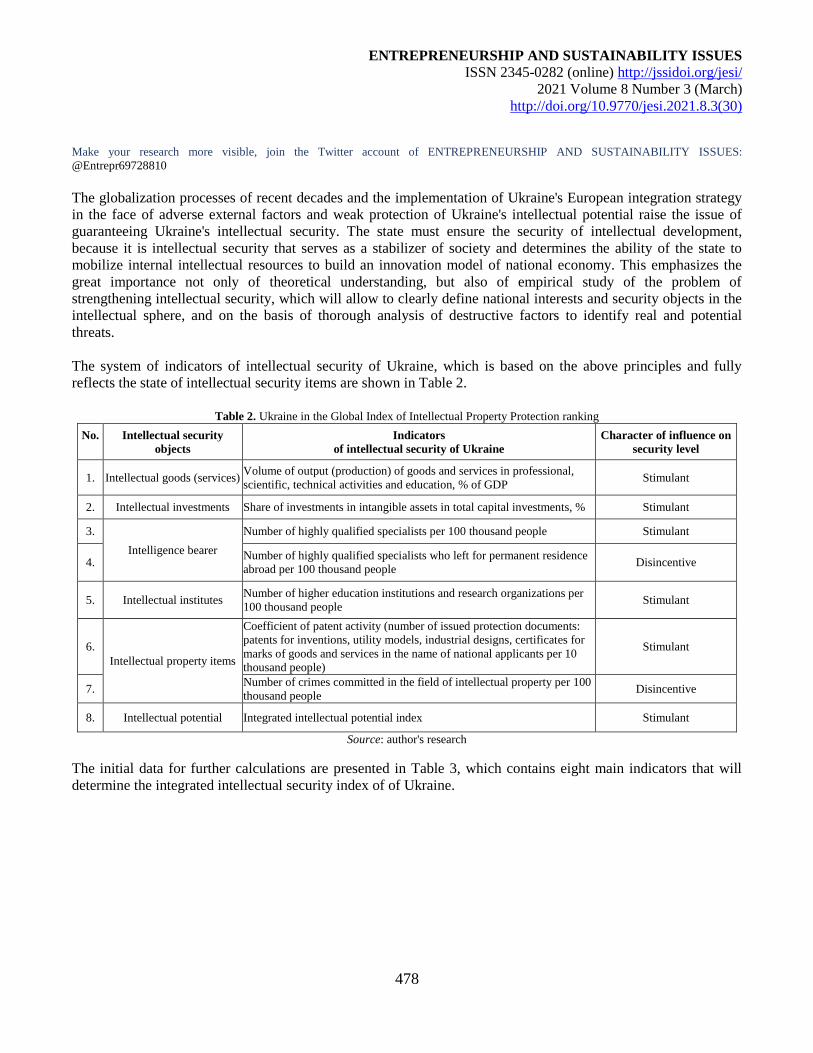
ENTREPRENEURSHIP AND SUSTAINABILITY ISSUES
ISSN 2345-0282 (online) http://jssidoi.org/jesi/
2021 Volume 8 Number 3 (March)
http://doi.org/10.9770/jesi.2021.8.3(30)
Make your research more visible, join the Twitter account of ENTREPRENEURSHIP AND SUSTAINABILITY ISSUES:
@Entrepr69728810
478
The globalization processes of recent decades and the implementation of Ukraine's European integration strategy
in the face of adverse external factors and weak protection of Ukraine's intellectual potential raise the issue of
guaranteeing Ukraine's intellectual security. The state must ensure the security of intellectual development,
because it is intellectual security that serves as a stabilizer of society and determines the ability of the state to
mobilize internal intellectual resources to build an innovation model of national economy. This emphasizes the
great importance not only of theoretical understanding, but also of empirical study of the problem of
strengthening intellectual security, which will allow to clearly define national interests and security objects in the
intellectual sphere, and on the basis of thorough analysis of destructive factors to identify real and potential
threats.
The system of indicators of intellectual security of Ukraine, which is based on the above principles and fully
reflects the state of intellectual security items are shown in Table 2.
Table 2. Ukraine in the Global Index of Intellectual Property Protection ranking
No.
Intellectual security
objects
Indicators
of intellectual security of Ukraine
Character of influence on
security level
1. Intellectual goods (services) Volume of output (production) of goods and services in professional,
scientific, technical activities and education, % of GDP Stimulant
2. Intellectual investments Share of investments in intangible assets in total capital investments, % Stimulant
3.
Intelligence bearer
Number of highly qualified specialists per 100 thousand people Stimulant
4. Number of highly qualified specialists who left for permanent residence
abroad per 100 thousand people Disincentive
5. Intellectual institutes Number of higher education institutions and research organizations per
100 thousand people Stimulant
6.
Intellectual property items
Coefficient of patent activity (number of issued protection documents:
patents for inventions, utility models, industrial designs, certificates for
marks of goods and services in the name of national applicants per 10
thousand people)
Stimulant
7. Number of crimes committed in the field of intellectual property per 100
thousand people Disincentive
8. Intellectual potential Integrated intellectual potential index Stimulant
Source: author's research
The initial data for further calculations are presented in Table 3, which contains eight main indicators that will
determine the integrated intellectual security index of of Ukraine.
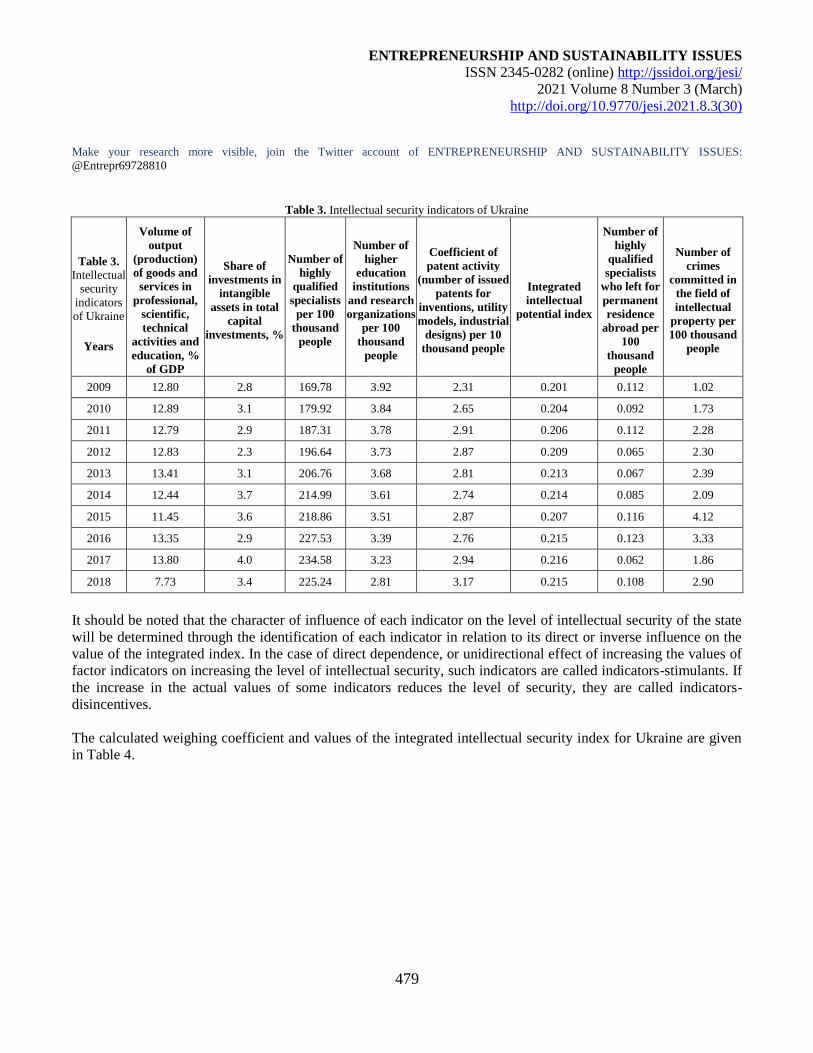
ENTREPRENEURSHIP AND SUSTAINABILITY ISSUES
ISSN 2345-0282 (online) http://jssidoi.org/jesi/
2021 Volume 8 Number 3 (March)
http://doi.org/10.9770/jesi.2021.8.3(30)
Make your research more visible, join the Twitter account of ENTREPRENEURSHIP AND SUSTAINABILITY ISSUES:
@Entrepr69728810
479
Table 3. Intellectual security indicators of Ukraine
Table 3. Intellectual
security
indicators
of Ukraine
Years
Volume of
output
(production)
of goods and
services in
professional,
scientific,
technical
activities and
education, %
of GDP
Share of
investments in
intangible
assets in total
capital
investments, %
Number of
highly
qualified
specialists
per 100
thousand
people
Number of
higher
education
institutions
and research
organizations
per 100
thousand
people
Coefficient of
patent activity
(number of issued
patents for
inventions, utility
models, industrial
designs) per 10
thousand people
Integrated
intellectual
potential index
Number of
highly
qualified
specialists
who left for
permanent
residence
abroad per
100
thousand
people
Number of
crimes
committed in
the field of
intellectual
property per
100 thousand
people
2009 12.80 2.8 169.78 3.92 2.31 0.201 0.112 1.02
2010 12.89 3.1 179.92 3.84 2.65 0.204 0.092 1.73
2011 12.79 2.9 187.31 3.78 2.91 0.206 0.112 2.28
2012 12.83 2.3 196.64 3.73 2.87 0.209 0.065 2.30
2013 13.41 3.1 206.76 3.68 2.81 0.213 0.067 2.39
2014 12.44 3.7 214.99 3.61 2.74 0.214 0.085 2.09
2015 11.45 3.6 218.86 3.51 2.87 0.207 0.116 4.12
2016 13.35 2.9 227.53 3.39 2.76 0.215 0.123 3.33
2017 13.80 4.0 234.58 3.23 2.94 0.216 0.062 1.86
2018 7.73 3.4 225.24 2.81 3.17 0.215 0.108 2.90
It should be noted that the character of influence of each indicator on the level of intellectual security of the state
will be determined through the identification of each indicator in relation to its direct or inverse influence on the
value of the integrated index. In the case of direct dependence, or unidirectional effect of increasing the values of
factor indicators on increasing the level of intellectual security, such indicators are called indicators-stimulants. If
the increase in the actual values of some indicators reduces the level of security, they are called indicators-
disincentives.
The calculated weighing coefficient and values of the integrated intellectual security index for Ukraine are given
in Table 4.
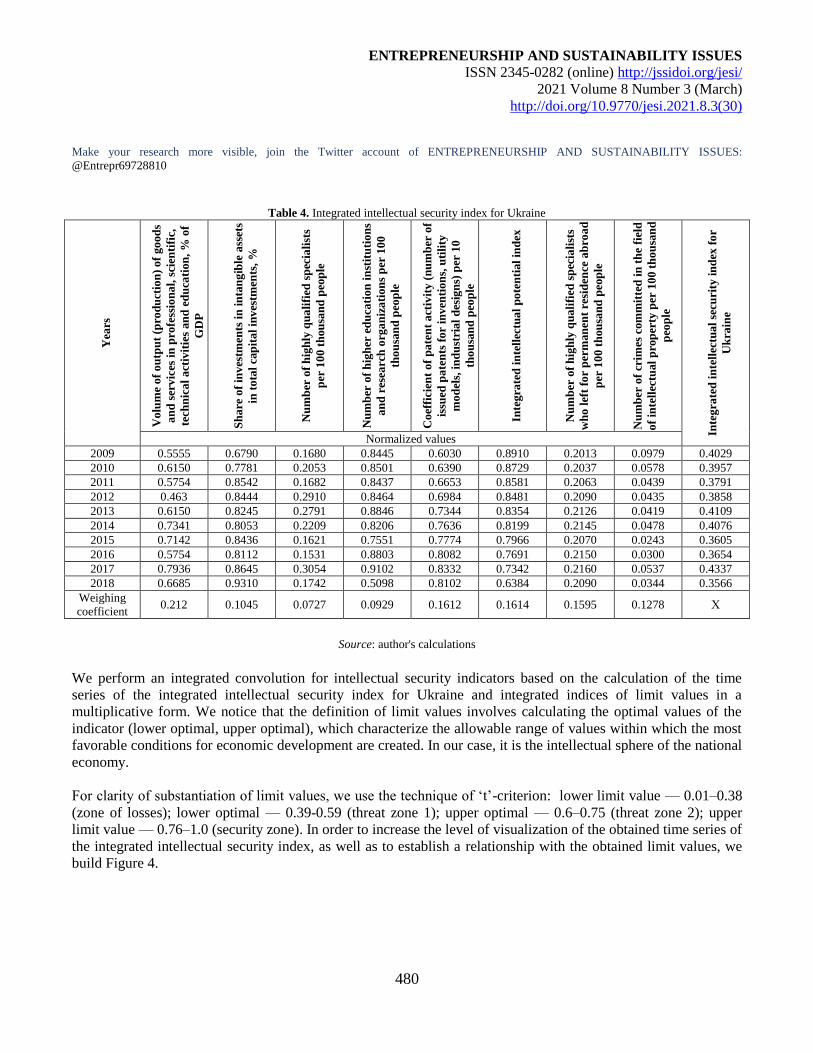
ENTREPRENEURSHIP AND SUSTAINABILITY ISSUES
ISSN 2345-0282 (online) http://jssidoi.org/jesi/
2021 Volume 8 Number 3 (March)
http://doi.org/10.9770/jesi.2021.8.3(30)
Make your research more visible, join the Twitter account of ENTREPRENEURSHIP AND SUSTAINABILITY ISSUES:
@Entrepr69728810
480
Table 4. Integrated intellectual security index for Ukraine
Yea
rs
Vo
lum
e o
f o
utp
ut
(pro
du
ctio
n)
of
go
od
s
an
d s
erv
ices
in
pro
fess
ion
al,
sci
enti
fic,
tech
nic
al
act
ivit
ies
an
d e
du
cati
on
, %
of
GD
P
Sh
are
of
inv
estm
ents
in
in
tan
gib
le a
sset
s
in t
ota
l ca
pit
al
inv
estm
ents
, %
Nu
mb
er o
f h
igh
ly q
ua
lifi
ed s
pec
iali
sts
per
10
0 t
hou
san
d p
eop
le
Nu
mb
er o
f h
igh
er e
du
cati
on
in
stit
uti
on
s
an
d r
esea
rch
org
an
iza
tion
s p
er 1
00
tho
usa
nd
peo
ple
Co
effi
cien
t o
f p
ate
nt
act
ivit
y (
nu
mb
er o
f
issu
ed p
ate
nts
fo
r in
ven
tion
s, u
tili
ty
mo
del
s, i
nd
ust
ria
l d
esig
ns)
per
10
tho
usa
nd
peo
ple
Inte
gra
ted
in
tell
ectu
al
po
ten
tial
ind
ex
Nu
mb
er o
f h
igh
ly q
ua
lifi
ed s
pec
iali
sts
wh
o l
eft
for
per
man
ent
resi
den
ce a
bro
ad
per
10
0 t
hou
san
d p
eop
le
Nu
mb
er o
f cr
imes
com
mit
ted
in
th
e fi
eld
of
inte
llec
tual
pro
per
ty p
er 1
00 t
ho
usa
nd
peo
ple
Inte
gra
ted
in
tell
ectu
al
secu
rity
in
dex
fo
r
Uk
rain
e
Normalized values
2009 0.5555 0.6790 0.1680 0.8445 0.6030 0.8910 0.2013 0.0979 0.4029
2010 0.6150 0.7781 0.2053 0.8501 0.6390 0.8729 0.2037 0.0578 0.3957
2011 0.5754 0.8542 0.1682 0.8437 0.6653 0.8581 0.2063 0.0439 0.3791
2012 0.463 0.8444 0.2910 0.8464 0.6984 0.8481 0.2090 0.0435 0.3858
2013 0.6150 0.8245 0.2791 0.8846 0.7344 0.8354 0.2126 0.0419 0.4109
2014 0.7341 0.8053 0.2209 0.8206 0.7636 0.8199 0.2145 0.0478 0.4076
2015 0.7142 0.8436 0.1621 0.7551 0.7774 0.7966 0.2070 0.0243 0.3605
2016 0.5754 0.8112 0.1531 0.8803 0.8082 0.7691 0.2150 0.0300 0.3654
2017 0.7936 0.8645 0.3054 0.9102 0.8332 0.7342 0.2160 0.0537 0.4337
2018 0.6685 0.9310 0.1742 0.5098 0.8102 0.6384 0.2090 0.0344 0.3566
Weighing
coefficient 0.212 0.1045 0.0727 0.0929 0.1612 0.1614 0.1595 0.1278 Х
Source: author's calculations
We perform an integrated convolution for intellectual security indicators based on the calculation of the time
series of the integrated intellectual security index for Ukraine and integrated indices of limit values in a
multiplicative form. We notice that the definition of limit values involves calculating the optimal values of the
indicator (lower optimal, upper optimal), which characterize the allowable range of values within which the most
favorable conditions for economic development are created. In our case, it is the intellectual sphere of the national
economy.
For clarity of substantiation of limit values, we use the technique of ‘t’-criterion: lower limit value — 0.01–0.38
(zone of losses); lower optimal — 0.39-0.59 (threat zone 1); upper optimal — 0.6–0.75 (threat zone 2); upper
limit value — 0.76–1.0 (security zone). In order to increase the level of visualization of the obtained time series of
the integrated intellectual security index, as well as to establish a relationship with the obtained limit values, we
build Figure 4.
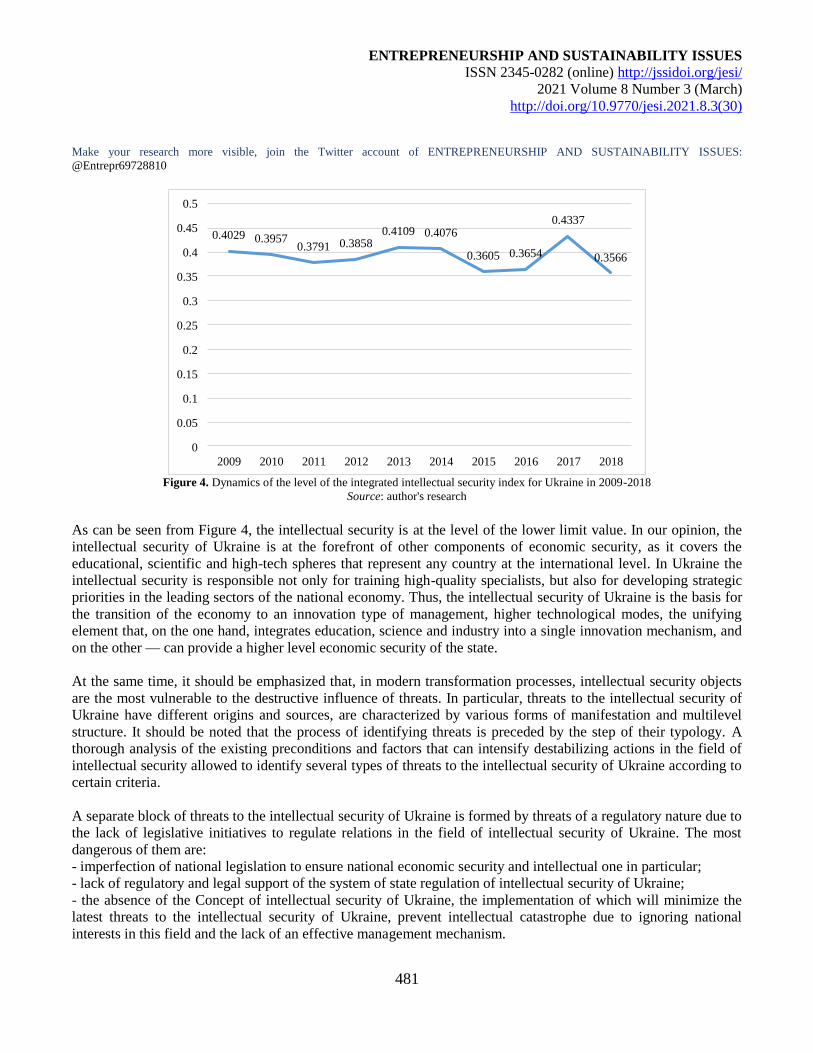
ENTREPRENEURSHIP AND SUSTAINABILITY ISSUES
ISSN 2345-0282 (online) http://jssidoi.org/jesi/
2021 Volume 8 Number 3 (March)
http://doi.org/10.9770/jesi.2021.8.3(30)
Make your research more visible, join the Twitter account of ENTREPRENEURSHIP AND SUSTAINABILITY ISSUES:
@Entrepr69728810
481
0.4029 0.39570.3791 0.3858
0.4109 0.4076
0.3605 0.3654
0.4337
0.3566
0
0.05
0.1
0.15
0.2
0.25
0.3
0.35
0.4
0.45
0.5
2009 2010 2011 2012 2013 2014 2015 2016 2017 2018
Figure 4. Dynamics of the level of the integrated intellectual security index for Ukraine in 2009-2018
Source: author's research
As can be seen from Figure 4, the intellectual security is at the level of the lower limit value. In our opinion, the
intellectual security of Ukraine is at the forefront of other components of economic security, as it covers the
educational, scientific and high-tech spheres that represent any country at the international level. In Ukraine the
intellectual security is responsible not only for training high-quality specialists, but also for developing strategic
priorities in the leading sectors of the national economy. Thus, the intellectual security of Ukraine is the basis for
the transition of the economy to an innovation type of management, higher technological modes, the unifying
element that, on the one hand, integrates education, science and industry into a single innovation mechanism, and
on the other — can provide a higher level economic security of the state.
At the same time, it should be emphasized that, in modern transformation processes, intellectual security objects
are the most vulnerable to the destructive influence of threats. In particular, threats to the intellectual security of
Ukraine have different origins and sources, are characterized by various forms of manifestation and multilevel
structure. It should be noted that the process of identifying threats is preceded by the step of their typology. A
thorough analysis of the existing preconditions and factors that can intensify destabilizing actions in the field of
intellectual security allowed to identify several types of threats to the intellectual security of Ukraine according to
certain criteria.
A separate block of threats to the intellectual security of Ukraine is formed by threats of a regulatory nature due to
the lack of legislative initiatives to regulate relations in the field of intellectual security of Ukraine. The most
dangerous of them are:
- imperfection of national legislation to ensure national economic security and intellectual one in particular;
- lack of regulatory and legal support of the system of state regulation of intellectual security of Ukraine;
- the absence of the Concept of intellectual security of Ukraine, the implementation of which will minimize the
latest threats to the intellectual security of Ukraine, prevent intellectual catastrophe due to ignoring national
interests in this field and the lack of an effective management mechanism.
ENTREPRENEURSHIP AND SUSTAINABILITY ISSUES
ISSN 2345-0282 (online) http://jssidoi.org/jesi/
2021 Volume 8 Number 3 (March)
http://doi.org/10.9770/jesi.2021.8.3(30)
Make your research more visible, join the Twitter account of ENTREPRENEURSHIP AND SUSTAINABILITY ISSUES:
@Entrepr69728810
482
Significant destabilizing influence on the state of intellectual security of Ukraine is posed by threats of an
institutional nature, including:
- the absence of a state institute or a network of institutes that would study the development and implementation
of the Strategy of the intellectual momentas of Ukraine in the XXI century;
- insufficient development of the national innovation system with weak relationships of education, science and
business. The main lever of the transition of the economy to the intensive growth of social production is the
acceleration of innovation processes. The function of generating new ideas and their further commercialization
should be performed by an innovation system with a branched organizational and functional structure.
Unfortunately, the processes of building a national innovation system are still at an early stage;
- imbalance of powers between state authorities and local self-government, inconsistency of inter-budgetary
relations regarding the establishment and delimitation of budgetary powers, financial resources, rights, duties and
responsibilities during the budget process;
- corruption loyalty, which becomes the basis of systemic corruption in all branches of government;
- lack of interest of government institutions in establishing "transparent" rules for market participants in the
process of regulation of economic relations between state institutions, firms and households, bureaucratic delays
in registration of property rights to intellectual and industrial property. The lack of an appropriate institutional
environment based on the principles of general moral consciousness of market participants and formal rules of
conduct leads to an increase in transaction costs in carrying out economic activities.
A number of threats to the intellectual security of Ukraine are associated with the insufficient level of
organizational and managerial decision-making due to:
- low efficiency of state administration, incompetence of state authorities, transformation of corruption into a
basic social mechanism for solving public affairs, performance of functions of external influence agents by many
government officials and politicians resulting in mass distrust of existing state institutions;
- low intellectual level of state decision-making; insufficient level of qualification of decision-makers in the field
of state powers; high degree of influence of lobby groups on government decision-making;
- lack of an effective system of reproduction and thus enrichment and development of the intellectual potential of
the state aimed at strengthening the economic security of the state;
- lack of effective organizational and managerial mechanisms to stimulate intellectual activity at the micro and
macro levels;
- inefficiency of the system of control over the spending of budget funds, in particular for scientific purposes,
financing of scientific and technical projects.
Of particular concern are domestic threats of an economic nature resulting from ineffective macroeconomic
policies. Negative trends are strengthened by such destructive factors as:
- growth of economic crimes of intellectual content, shadowing of the national economy in terms of unauthorized
access to information sources, pirate copying and distribution of items copyright and related rights;
- lack of state policy on the use of intellectual resources, deintellectualization of society and government in
general;
- lack of investment resources and, as a consequence, limited innovation development as a guarantee of
strengthening the intellectual security of Ukraine;
- uncontrolled and illegal outflow of intellectual and human capital outside Ukraine, a decrease in the level of
"intellectualization" of exports accompanied by an increase in the import dependence on high-tech goods of the
country;
ENTREPRENEURSHIP AND SUSTAINABILITY ISSUES
ISSN 2345-0282 (online) http://jssidoi.org/jesi/
2021 Volume 8 Number 3 (March)
http://doi.org/10.9770/jesi.2021.8.3(30)
Make your research more visible, join the Twitter account of ENTREPRENEURSHIP AND SUSTAINABILITY ISSUES:
@Entrepr69728810
483
- lack of intellectual security policy.
5. Discussion
In modern conditions, the intensification of the processes of accumulation of intellectual potential of Ukraine
requires the development of scientifically sound state policy, the adoption of effective measures to combat threats
to its development. Active participation of the state in the regulation of processes related to preventing the process
of degradation and destruction of intellectual potential involves the development of adequate mechanisms to
combat numerous threats. In our opinion, the state policy of development and use of intellectual potential of
Ukraine should be implemented in the context of the state policy of protection of national interests and strategy of
national security.
The current legal framework partially defines national priorities and strategic directions of state policy in the
system of protection of national interests, however, such important issues as preservation and development of
intellectual potential of Ukraine, minimization of threats in the intellectual sphere, taking measures to intensify
innovation processes, etc. remain unaddressed. The recently adopted National Security Strategy of Ukraine
envisages the main directions of the state policy of national security of Ukraine. In our opinion, the most
important of them are the following: minimization of threats to state sovereignty and creation of conditions for
restoration of territorial integrity of Ukraine within the internationally recognized state border of Ukraine,
guarantee of peaceful future of Ukraine as sovereign and independent, democratic, social, legal state; affirmation
of human and civil rights and freedoms, ensuring a new quality of economic, social and humanitarian
development, ensuring the integration of Ukraine into the European Union and creating conditions for joining
NATO (National Security Strategy of Ukraine (2015)).
According to Art. 6 of the Law of Ukraine "On Fundamentals of National Security of Ukraine" the priorities of
national interests include: preservation and strengthening of scientific and technological potential, approval of an
innovation model of development; development of spirituality, moral principles, intellectual potential of the
Ukrainian people, strengthening of physical health of the nation, creation of conditions for the expanded
reproduction of the population. At the same time, Art. 7 presents a number of threats to national interests in the
intellectual sphere (On Fundamentals of National Security of Ukraine (2003)), which, of course, highlights the
need for formation of state policy of development and use of intellectual potential of Ukraine.
The decisive role in intensifying innovation processes on the basis of effective use of existing intellectual
potential belongs to the state, which must reasonably shape macroeconomic policy taking into account the
specifics of the national economy. In our opinion, the state policy of development and use of intellectual potential
of Ukraine as a component of the national policy, which is carried out according to the declared purposes and
objectives, is based on general scientific and organizational-administrative principles and is implemented by
means of the mechanism of combating the threats to development of intellectual potential of Ukraine.
We emphasize that the key idea of the state policy of development and use of intellectual potential of Ukraine is
conditioned by the inward nature of potential and real threats, the nature of their occurrence and the form of
manifestation. It should be implemented with the help of appropriate tools and conditioned by certain functional
tasks.
1. Monitoring and identification of potential threats through a set of observations on the condition of a security
object, development of threat profiles.
ENTREPRENEURSHIP AND SUSTAINABILITY ISSUES
ISSN 2345-0282 (online) http://jssidoi.org/jesi/
2021 Volume 8 Number 3 (March)
http://doi.org/10.9770/jesi.2021.8.3(30)
Make your research more visible, join the Twitter account of ENTREPRENEURSHIP AND SUSTAINABILITY ISSUES:
@Entrepr69728810
484
2. Application of effective preventive methods of combating threats with the use of modern information
technologies, means of communication, etc.
3. Localization of realized threats to the development of the intellectual potential of the state with the purpose of
preventing their deepening and causing serious damages and losses.
4. Preventing further decline of intellectual potential and deepening of the intellectual crisis in society by adopting
appropriate legal documents, reviving the investment and innovation climate, improving the social protection of
intellectual workers, etc.
The above tasks of the state policy of development and use of intellectual potential of Ukraine are intended to
promote the earliest possible decision-making on prevention and/or neutralization of threats and to create a
positive environment for fast restoration of national intellectual potential and transition to the stage of its
enrichment.
The implementation of the above directions of accumulation of intellectual potential of Ukraine will be enhanced
by the action of such factors: recognition as a priority area ofintellectual development through the adoption of an
appropriate strategy or program; increasing the public assessment of knowledge and prestige of creative work and
intellectual activity in general through the encouragement of invention, the award of scientific scholarships,
assistance in obtaining Ukrainian and international grants for research; creation of favorable conditions for active
implementation of technology transfer, Ukrainian and foreign investment in priority knowledge-intensive
industries (status of free economic zones, tax benefits, tax credits, government orders, state guarantees of
copyright protection, assistance in patent activities, guaranteed return on investment, etc.); state support of
knowledge-intensive and high-tech industries and priority sectors of the national economy; creation of favorable
conditions for growth of competitiveness of national economy; rational use of available intellectual resources,
creation of conditions for commercialization of scientific knowledge, stimulation of investments in intangible
assets; support for social partnership institutions that provide sustainable, effective relationships with employers,
educational institutions and the population.
Conclusions
Intellectual security, as an integral part of the system of economic security of the state reflecting the degree of
development and use of intellectual potential, tactically characterizes the state of the intellectual environment of
society and strategically has a positive impact on macroeconomic indicators. Substantiation of the collocation
relationship of intellectual potential with the system of economic security proves that intellectual security serves
as a basis for the formation of national competitiveness on the basis of innovation development of education and
science, institutional infrastructure, entrepreneurship.
According to the object-subject approach, the intellectual security of the state is structured into objects and
subjects, which are influenced by destructive factors and threats, and on this basis an integrated set of indicators
for assessing the level of intellectual security of the state is formed and methodological points for determining the
integrated intellectual security index of the state is substantiated. The obtained results demonstrated that the
calculated index values are between the lower limit and the lower optimal values, which reflects the
ineffectiveness of state education and research and innovation policy and underestimation by state authorities of
their role in strengthening economic security in the global environment, which is the main reason for the low level
of intellectual security (36% in 2018 against 40% in 2009) as confirmed in the paper.
In order to achieve the strategic goals of innovation development of the state, the Strategy of development and
rational use of intellectual potential to strengthen the economic security of the state is proposed, the main purpose
ENTREPRENEURSHIP AND SUSTAINABILITY ISSUES
ISSN 2345-0282 (online) http://jssidoi.org/jesi/
2021 Volume 8 Number 3 (March)
http://doi.org/10.9770/jesi.2021.8.3(30)
Make your research more visible, join the Twitter account of ENTREPRENEURSHIP AND SUSTAINABILITY ISSUES:
@Entrepr69728810
485
of which is to strengthen the economic security of Ukraine on the basis of the development and rational use of
intellectual potential harmonized with the means of combating threats to intellectual security in the system of
economic security of the state. The priority directions for the implementation of the Strategy include:
modernization of the system of training of specialists for the high-tech industries; reform of the scientific sphere
of Ukraine with the purpose of integration into the global scientific space; raising the cultural and spiritual level
of the nation to harmonize social relations; development of high-tech industries as a basis for building a
competitive innovation economy.
References
Agostini, L., Nosella, A., Lazzarotti, V., Manzini, R., & Pellegrini, L. (2017). Introduction to the Special Issue on Intellectual Property
Management: an internal and external perspective. Management decision. Available at:
https://www.emerald.com/insight/content/doi/10.1108/MD-05-2017-0501/full/html
Baran, A., & Zhumabaeva, A. (2018). Intellectual property management in startups—problematic issues. Engineering Management in
Production and Services, 10(2), 66-74. Available at: https://content.sciendo.com/view/journals/emj/10/2/article-p66.xml
Efendioglu, N., & Woitsch, R. (2017). A modelling method for digital service design and intellectual property management towards
Industry 4.0: CAxMan case. In International Conference on Serviceology (pp. 153-163). Springer, Cham. Available at:
https://link.springer.com/chapter/10.1007/978-3-319-61240-9_15
Global Index of Intellectual Property Protection. Available at:
https://tcdata360.worldbank.org/indicators/h87dfd1b6?country=BRA&indicator=557&viz=line_chart&years=2007
Holgersson, M., & Aaboen, L. (2019). A literature review of intellectual property management in technology transfer offices: From
appropriation to utilization. Technology in Society, 59, 101132. Available at:
https://www.sciencedirect.com/science/article/pii/S0160791X18301593
Kim, S. Y., & Kim, E. (2018). How Intellectual Property Management Capability and Network Strategy Affect Open Technological
Innovation in the Korean New Information Communications Technology Industry. Sustainability, 10(8), 2600. Available at:
https://www.mdpi.com/2071-1050/10/8/2600
Laužikas, M., & Miliūtė, A. 2020. Human resource management effects on sustainability of high-tech companies: what Lithuania and
South Korea can learn from each other. Insights into Regional Development, 2(2), 562-579. https://doi.org/10.9770/IRD.2020.2.2(5)
Laužikas, M., Miliūtė, A., & Khalili, M. 2021. Internationalization impacts on team innovation in Lithuanian high-tech firms. Insights into
Regional Development, 3(1), 41-64. https://doi.org/10.9770/IRD.2021.3.1(3)
Miyashita, S., Katoh, S., Anzai, T., & Sengoku, S. (2020). Intellectual Property Management in Publicly Funded R&D Program and
Projects: Optimizing Principal–Agent Relationship through Transdisciplinary Approach. Sustainability, 12(23), 9923. Available at:
https://www.mdpi.com/2071-1050/12/23/9923
National Security Strategy of Ukraine (2015). Available at: http://zakon2.rada.gov.ua/laws/show/287/2015
On the foundations of national security of Ukraine (2003). Available at: http://zakon4.rada.gov.ua/laws/show/964-15
Peng, M. W., Ahlstrom, D., Carraher, S. M., & Shi, W. S. (2017). History and the debate over intellectual property. Management and
Organization Review, 13(1), 15-38. Available at: https://www.cambridge.org/core/journals/management-and-organization-
review/article/history-and-the-debate-over-intellectual-property/D11C95A6199EC9EF753BAE7A3F121C2B
State Enterprise Ukrainian Institute of Intellectual Property (UKRPATENT) (2019). Available at: https://ukrpatent.org/atachs/zvit-ukr-
2019.pdf
ENTREPRENEURSHIP AND SUSTAINABILITY ISSUES
ISSN 2345-0282 (online) http://jssidoi.org/jesi/
2021 Volume 8 Number 3 (March)
http://doi.org/10.9770/jesi.2021.8.3(30)
Make your research more visible, join the Twitter account of ENTREPRENEURSHIP AND SUSTAINABILITY ISSUES:
@Entrepr69728810
486
State Statistics Service of Ukraine. Available at: http://www.ukrstat.gov.ua/
Tekic, A., & Willoughby, K. W. (2020). Configuring intellectual property management strategies in co-creation: a contextual perspective.
Innovation, 22(2), 128-159. Available at: https://www.tandfonline.com/doi/abs/10.1080/14479338.2019.1585189
Torre, R. D. L., Alcaide-Muñoz, C., & Ollo-López, A. (2019). A review of intellectual property management practices using qualitative
comparative analysis. International Journal of Intellectual Property Management, 9(3-4), 264-286. Available at:
https://www.inderscienceonline.com/doi/abs/10.1504/IJIPM.2019.103030
Oleksandr BRYHINETS, Doctor of Juridical Sciences, Associate Professor Khmelnytsky University of Management and Law named
after Leonid Yuzkov
ORCID ID: orcid.org/0000-0003-4058-7566
Roman SHAPOVAL, Doctor of Law, Professor, Yaroslav Mudryi National Law University
ORCID ID: orcid.org/0000-0002-5716-9291
Alona BAKHAIEVA, Candidate of Jurisprudence, Lecturer, Kharkiv National University of Internal Affairs
ORCID ID: orcid.org/0000-0002-6498-2213
Vitalii PCHELIN, Doctor of Jurisprudence, Associate Professor, Kharkiv National University of Internal Affairs
ORCID ID: orcid.org/0000-0001-9540-9084
Andrii FOMENKO, Candidate of Legal Sciences, Rector of Dnipropetrovsk State University of Internal Affairs
ORCID ID: orcid.org/0000-0003-3755-4130
Copyright © 2021 by author(s) and VsI Entrepreneurship and Sustainability Center
This work is licensed under the Creative Commons Attribution International License (CC BY).
http://creativecommons.org/licenses/by/4.0/
ENTREPRENEURSHIP AND SUSTAINABILITY ISSUES
ISSN 2345-0282 (online) http://jssidoi.org/jesi/
2021 Volume 8 Number 3 (March)
http://doi.org/10.9770/jesi.2021.8.3(31)
Publisher http://jssidoi.org/esc/home
487
MEASURING EFFICIENCY BY USING SELECTED DETERMINANTS IN REGIONAL SMEs*
Ladislav Mura ¹*, Zuzana Hajduová ²
1Pan-European University, Faculty of Economics and Business, Tematínska 10, 851 05 Bratislava, Slovakia 2 University of Economics, Faculty of Business Management, Dolnozemská cesta 1/b, 852 35 Bratislava, Slovakia
E-mails:*1 [email protected] (corresponding author); [email protected]
Received 15 August 2020; accepted 28 January 2021; published 30 March 2021
Abstract. In comparison to other EU countries, Slovakia is characterized by increased business activity and the highest representation of
micro-enterprises in the business sector. In the years 2017/2018 -, up to 75% of companies in the SME segment conducted business activity
in the field of industry, accommodation, trade, transport and construction. The collected data clearly indicates a growing trend in providing
accommodation services, business and information services, business and brokerage services. The main objective of the study is to assess
the sectorial structure of SMEs and managerial determinants of their efficiency. The research sample of the enterprises has shown that even
these methods can better warn against bankruptcy by predicting whether business will or will not be sustainable. In comparison to EU-28,
Slovakia has a significantly higher representation of industry and civil engineering in the sectoral structure of SMEs, while the service
sector is under-represented. We conducted a research focusing on our defined area of business in the SME segment. The evaluation of
efficiency is most often performed by ratios, which are based on current financial statements of companies. The disadvantage of these
measurements is the focus on a certain quantified range of parameters that do not significantly affect the overall efficiency of the unit.
Based on the DEA methodology, a selected segment of services in individual regions of Slovakia was analysed in details. The SME sector
in individual regions of Slovakia is showing differences. This work presents the results of the clearly defined efficiency of business entities.
The main part of this work is about the exact determination of factors that need to be changed in order the specified entity shows signs of
efficient management
Keywords: small and medium enterprises; regions; DEA; models; correlation
Reference to this paper should be made as follows: Mura, L., Hajduová, Z. 2021. Measuring efficiency by using selected determinants in
regional SMEs. Entrepreneurship and Sustainability Issues, 8(3), 487-503. http://doi.org/10.9770/jesi.2021.8.3(31)
JEL Classifications: C14, C44, C61, L21
* This research was supported by the project VEGA 1/0813/19 Managing the development of innovative and start-up forms of
businesses in international environment and verification of INMARK concept, which has received funding from Ministry of
Education, Science, Research and Sport of the Slovak Republic and project GAAA 5-5/2020 Development of family
businesses in Slovak regions, which has received funding from Grant Agency Academia aurea.
ENTREPRENEURSHIP AND SUSTAINABILITY ISSUES
ISSN 2345-0282 (online) http://jssidoi.org/jesi/
2021 Volume 8 Number 3 (March)
http://doi.org/10.9770/jesi.2021.8.3(31)
Make your research more visible, join the Twitter account of ENTREPRENEURSHIP AND SUSTAINABILITY ISSUES:
@Entrepr69728810
488
1. Introduction
One of the most important discussions of scientific literature is related to the factors that determine the efficiency
SMEs, analyzing different specific factors and selected determinants SMEs. Only the precisely processed and
evaluated data are helpful to address the issue of business development in the SME sector. Identifying the factors
that cause this segment to have a competitive advantage is a high research priority. Differences need to be
identified and the determinants of low economic performance in all regions of our country has to be removed
(Dellis et al. 2016; Lambert 2017; Selivanova-Fyodorova et al., 2019; Chehabeddine & Tvaronavičienė, 2020).
There are several studies available in the scientific literature that are addressing the issue of SMEs. There are
different approaches about the definition and characteristics of SMEs. There are also numerous criteria either
qualitative or quantitative to decide what form of enterprise we talk about. Undoubtedly, we can say that these
forms of businesses are an important element of the market that cannot be replaced by large companies due to
their robustness (Anyakoha, 2019; Chunling, 2019; Hudáková & Masár, 2018). SMEs form the basis of a market
economy, employment, added value or international trade, and are a prerequisite for stable growth of the global
economy (Zauskova, Reznickova, 2020; Cooper, 2017; Peracek, et al., 2017; Chrenekova et al., 2016; Csikosova,
Culkova, 2012). They are a strategic source of jobs that create entrepreneurship, especially at regional level and
contribute to innovation in the EU, therefore the most important entities promoting competitiveness, employment
and business efficiency (Harabi, 2005; Kordos, 2018; Poór et al., 2020; Dvorský et al., 2020).
Considering further scientific studies and literature, our ambition is to focus on firm-specific factors potentially
influencing efficiency. The aim of our study is to identify the influence of the selected efficiency factors in the
SME sector. The choice of specific sector orientation is motivated by the effort to capture individual effects on
efficiency. The paper is organized as follows: presents literature review on the topic connected with measuring
efficiency determinants of firms: introduce data and methodology: assess empirical results and their discussion
within conclusions.
2. Theoretical background
Several research studies emphasize the importance of measuring the effectiveness and evaluating the degree of
innovation performance of SMEs (Brocki, 2019; Meyer, Kot, 2019). The influence of institutional factors on
ensuring the innovative performance of SMEs deserves attention. SMEs have become an important field of
research in the last years of our century (European Commission, 2016 a, b). The aim of this research is to reveal
the influence of orientation on the interaction of individual inputs and the effective operation of companies in the
service sector (European Commission, 2017). Business development is very important in terms of macroeconomic
development of the state (Janoskova, Culkova, Csikosova, 2018). This has an impact on GDP and reducing the
number of unemployed in regions showing weak economic performance (Cepel, 2020, Remeikiene et al., 2020;
Haviernikova et al., 2019; Cera, 2019). We define the performance of SMEs primarily in quantitative terms.
Factors with a direct impact affect the results in the field of finance, quality of production, revenue increase,
reduction of costs, increase in profits, company liquidity and stock levels (Huggins,2015; Raisová, Regásková, &
Lazányi, 2020; Zavadska, Zavadsky, 2020). The previous factors focus on quantitative assessment of companies,
but the qualitative aspect is also important, such as setting and meeting the company's strategic goal, potential
customer satisfaction, innovation, but also product and service promotion and marketing development (Pisar,
2019; Lakner, 2018).
ENTREPRENEURSHIP AND SUSTAINABILITY ISSUES
ISSN 2345-0282 (online) http://jssidoi.org/jesi/
2021 Volume 8 Number 3 (March)
http://doi.org/10.9770/jesi.2021.8.3(31)
Make your research more visible, join the Twitter account of ENTREPRENEURSHIP AND SUSTAINABILITY ISSUES:
@Entrepr69728810
489
The scientific literature mentions a wide range of environmental factors potentially influencing the performance
of SMEs. An increased attention is paid to a stable size of the business (Vekic, 2020; Belas et al., 2020; Gupta,
2016; Virglerová et al., 2017; Kotaskova, Rozsa, 2018; Dyduch, 2019), business staff and human resources
practices, sales networks, products, processes, marketing innovations, as well as the sustainable management
(Kotulic et al., 2017; Lazikova et al., 2018; Tingvall, 2018; Durda & Kljucnikov, 2019). Exports, market
orientation and planning flexibility have been identified as priorities in SME studies in terms of transformation
into efficient economic units (Sheehan, 2013; Bencikova, Mala, Minarova, 2013; Wallsten, 2000; Jašková, 2019;
Dvorský, et al. 2019). Sustainable development in the field of services is closely related to the level of business
development in the country (Kozubíková & Kotásková, 2019). Our government targeted to develop this segment
(Horvath and Machyniak, 2016; Cibik, and Melus, 2019). It is backed by the existence of a relatively wide range
of institutions, which focus exclusively or at least to some extent on supporting policies to create a favorable
business environment for small businesses (Altuntas, 2018; Tamulevičiene, 2020).
Sustainability entrepreneurship is directly related to the financial situation of the enterprise (Cvetanovič et al.,
2014). The importance of factors enhancing the firm´s efficiency was initially discussed in the work of
Wernerfelt (1984) and later significantly developed by Barney (1991). The size of SME proved to have no impact
on the efficiency. Most works have proved that larger businesses generate higher profits and thus showed
positive relation between the size and business performance (Pratheepan, 2014). On the other hand, some studies
found evidence of a negative size-profitability relationship. In order to maintain the market position and
competitiveness, companies must constantly adapt to market changes, whether it is a change in consumer
preferences or in the behavior of competitors. Thus, the competitiveness of enterprises is affected by a numerous
of factors, which affect the efficiency of business.
The evaluation of efficiency is most often performed using financial indicators, which are based on parameters
from financial and annual reports on the management of the company (Mikhaylova, 2019). The disadvantage of
these measurements is the focus on a certain number of financial factors that assess the overall effectiveness of
the examined business units insufficiently. We used the quantitative DEA method for this assessment (Fernandes,
2018; Wei, 2012).
3. Research objective and methodology
DEA methodology is the selection of the investigated units from the aspect of their efficiency. The unit is
efficient when it consumes a small number of inputs, while generating a large number of outputs. Data wrapping
method is an optimization method classified as a method of multicriteria decision-making. In comparison to
statistical models, comparing units with respect to average efficiency, DEA is based on the theory of linear
programming. When evaluating the effectiveness of units, it is necessary to introduce a hypothetical (virtual) unit,
which is characterized as a weighted average of effective units. A hypothetical unit becomes the basis for
evaluating real units. A real unit will be inefficient if it produces fewer outputs or consumes more inputs than the
hypothetical unit. Sometimes it is difficult to identify common units, which involve various inputs and outputs.
The DEA method generalizes the calculation of the relative efficiency rate and allows different weights of input
determinants and output determined key factors for individual units of the model. These weight values are not
connected to price but to item technology, and the term of relative technical efficiency is used. The DEA model is
considered an important management tool for determining efficiency. The basic task is to compare organizational
units within a certain specified reference group.
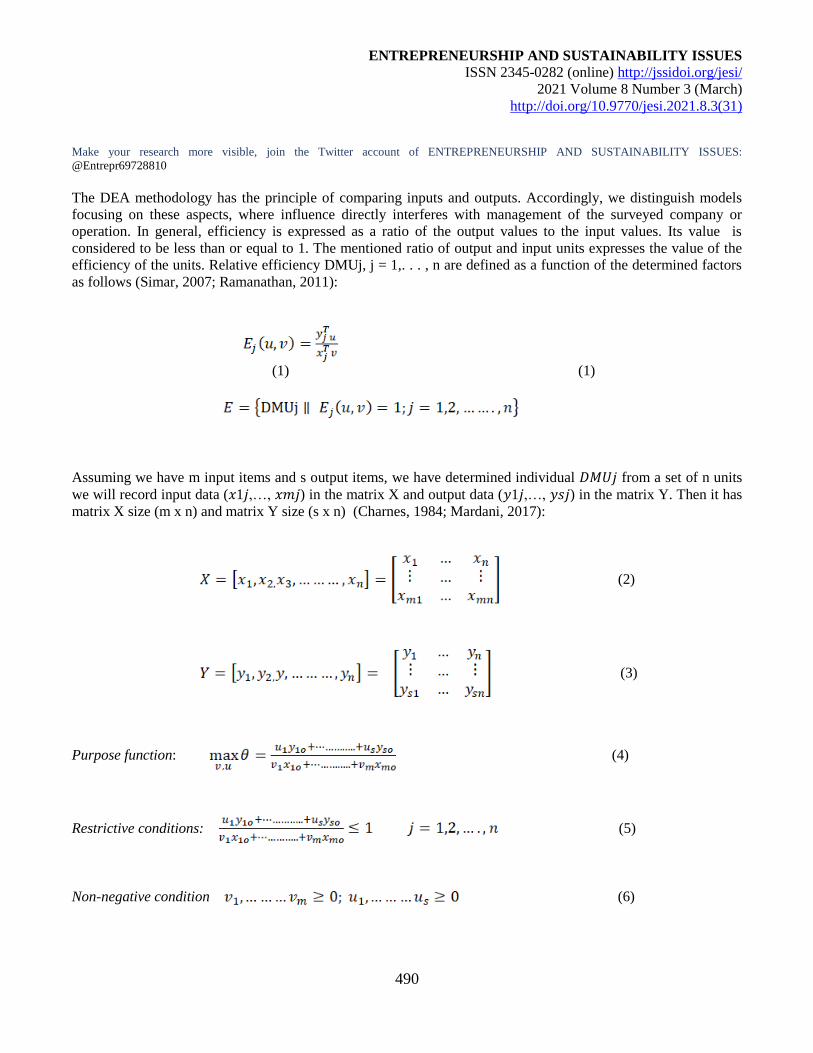
ENTREPRENEURSHIP AND SUSTAINABILITY ISSUES
ISSN 2345-0282 (online) http://jssidoi.org/jesi/
2021 Volume 8 Number 3 (March)
http://doi.org/10.9770/jesi.2021.8.3(31)
Make your research more visible, join the Twitter account of ENTREPRENEURSHIP AND SUSTAINABILITY ISSUES:
@Entrepr69728810
490
The DEA methodology has the principle of comparing inputs and outputs. Accordingly, we distinguish models
focusing on these aspects, where influence directly interferes with management of the surveyed company or
operation. In general, efficiency is expressed as a ratio of the output values to the input values. Its value is
considered to be less than or equal to 1. The mentioned ratio of output and input units expresses the value of the
efficiency of the units. Relative efficiency DMUj, j = 1,. . . , n are defined as a function of the determined factors
as follows (Simar, 2007; Ramanathan, 2011):
(1) (1)
Assuming we have m input items and s output items, we have determined individual 𝐷𝑀𝑈𝑗 from a set of n units
we will record input data (𝑥1𝑗,…, 𝑥𝑚𝑗) in the matrix X and output data (𝑦1𝑗,…, 𝑦𝑠𝑗) in the matrix Y. Then it has
matrix X size (m x n) and matrix Y size (s x n) (Charnes, 1984; Mardani, 2017):
(2)
(3)
Purpose function: (4)
Restrictive conditions: (5)
Non-negative condition (6)
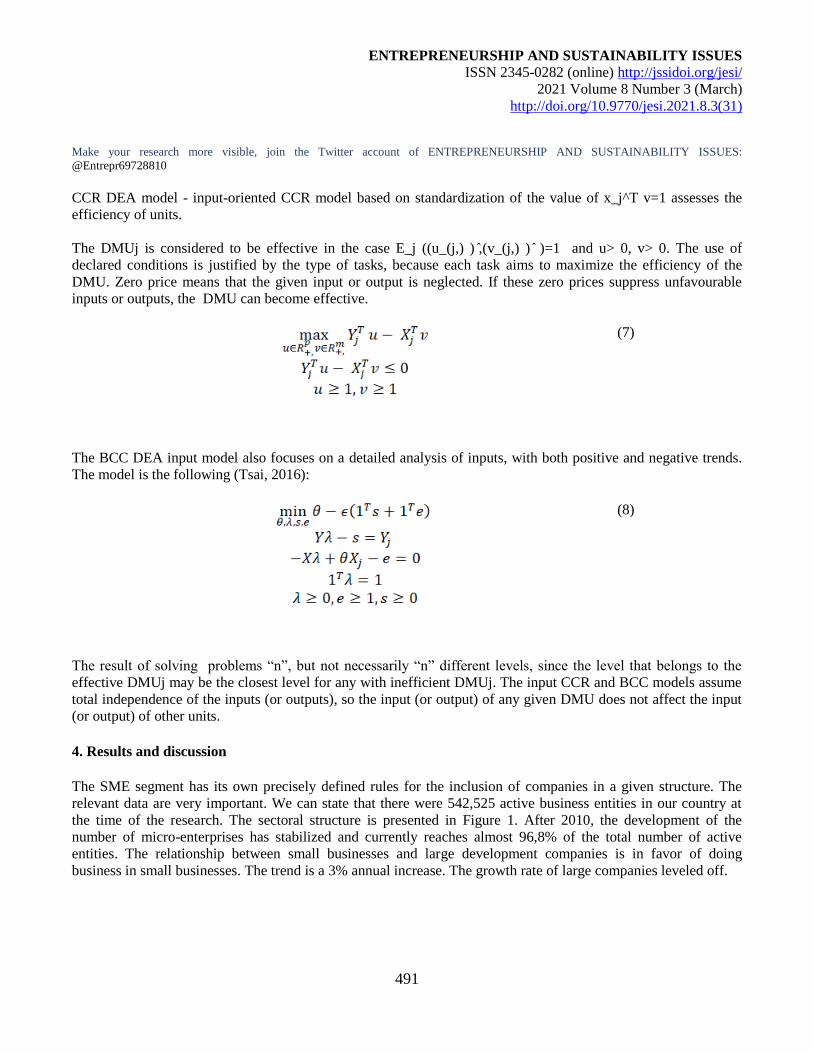
ENTREPRENEURSHIP AND SUSTAINABILITY ISSUES
ISSN 2345-0282 (online) http://jssidoi.org/jesi/
2021 Volume 8 Number 3 (March)
http://doi.org/10.9770/jesi.2021.8.3(31)
Make your research more visible, join the Twitter account of ENTREPRENEURSHIP AND SUSTAINABILITY ISSUES:
@Entrepr69728810
491
CCR DEA model - input-oriented CCR model based on standardization of the value of x_j^T v=1 assesses the
efficiency of units.
The DMUj is considered to be effective in the case E_j ((u_(j,) ) ̂,(v_(j,) ) ̂ )=1 and u> 0, v> 0. The use of
declared conditions is justified by the type of tasks, because each task aims to maximize the efficiency of the
DMU. Zero price means that the given input or output is neglected. If these zero prices suppress unfavourable
inputs or outputs, the DMU can become effective.
(7)
The BCC DEA input model also focuses on a detailed analysis of inputs, with both positive and negative trends.
The model is the following (Tsai, 2016):
(8)
The result of solving problems “n”, but not necessarily “n” different levels, since the level that belongs to the
effective DMUj may be the closest level for any with inefficient DMUj. The input CCR and BCC models assume
total independence of the inputs (or outputs), so the input (or output) of any given DMU does not affect the input
(or output) of other units.
4. Results and discussion
The SME segment has its own precisely defined rules for the inclusion of companies in a given structure. The
relevant data are very important. We can state that there were 542,525 active business entities in our country at
the time of the research. The sectoral structure is presented in Figure 1. After 2010, the development of the
number of micro-enterprises has stabilized and currently reaches almost 96,8% of the total number of active
entities. The relationship between small businesses and large development companies is in favor of doing
business in small businesses. The trend is a 3% annual increase. The growth rate of large companies leveled off.
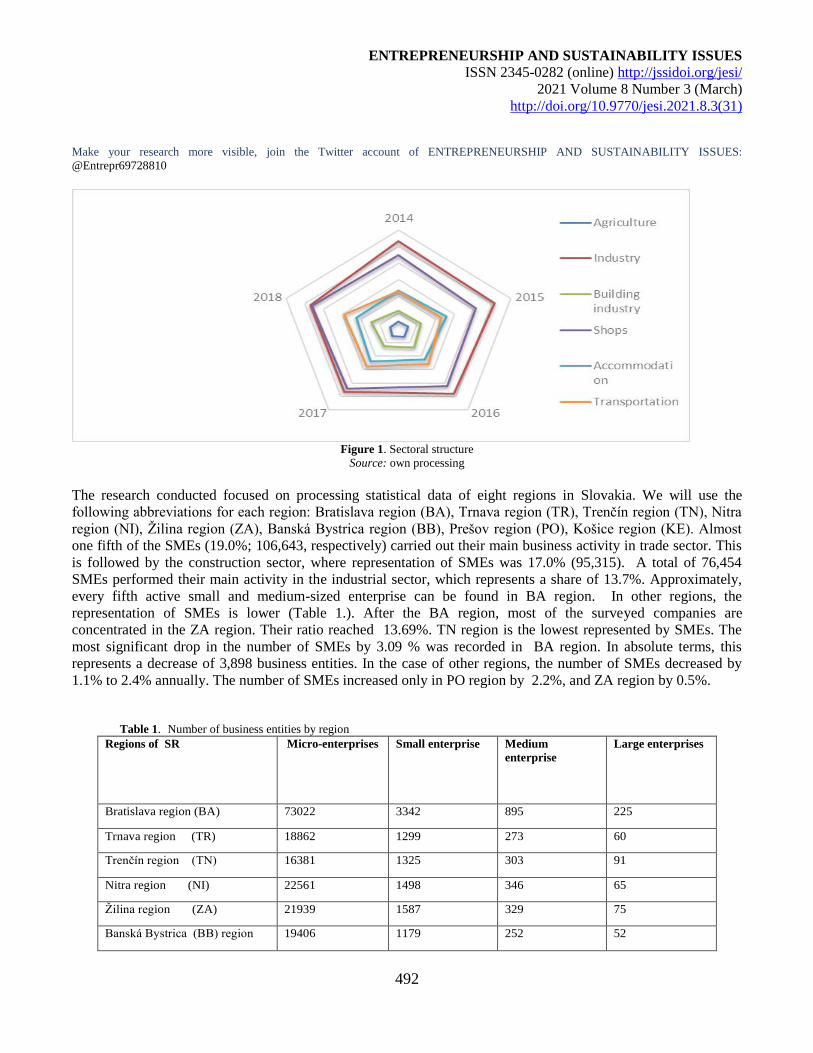
ENTREPRENEURSHIP AND SUSTAINABILITY ISSUES
ISSN 2345-0282 (online) http://jssidoi.org/jesi/
2021 Volume 8 Number 3 (March)
http://doi.org/10.9770/jesi.2021.8.3(31)
Make your research more visible, join the Twitter account of ENTREPRENEURSHIP AND SUSTAINABILITY ISSUES:
@Entrepr69728810
492
Figure 1. Sectoral structure
Source: own processing
The research conducted focused on processing statistical data of eight regions in Slovakia. We will use the
following abbreviations for each region: Bratislava region (BA), Trnava region (TR), Trenčín region (TN), Nitra
region (NI), Žilina region (ZA), Banská Bystrica region (BB), Prešov region (PO), Košice region (KE). Almost
one fifth of the SMEs (19.0%; 106,643, respectively) carried out their main business activity in trade sector. This
is followed by the construction sector, where representation of SMEs was 17.0% (95,315). A total of 76,454
SMEs performed their main activity in the industrial sector, which represents a share of 13.7%. Approximately,
every fifth active small and medium-sized enterprise can be found in BA region. In other regions, the
representation of SMEs is lower (Table 1.). After the BA region, most of the surveyed companies are
concentrated in the ZA region. Their ratio reached 13.69%. TN region is the lowest represented by SMEs. The
most significant drop in the number of SMEs by 3.09 % was recorded in BA region. In absolute terms, this
represents a decrease of 3,898 business entities. In the case of other regions, the number of SMEs decreased by
1.1% to 2.4% annually. The number of SMEs increased only in PO region by 2.2%, and ZA region by 0.5%.
Table 1. Number of business entities by region
Regions of SR Micro-enterprises Small enterprise Medium
enterprise
Large enterprises
Bratislava region (BA) 73022 3342 895 225
Trnava region (TR) 18862 1299 273 60
Trenčín region (TN) 16381 1325 303 91
Nitra region (NI) 22561 1498 346 65
Žilina region (ZA) 21939 1587 329 75
Banská Bystrica (BB) region 19406 1179 252 52
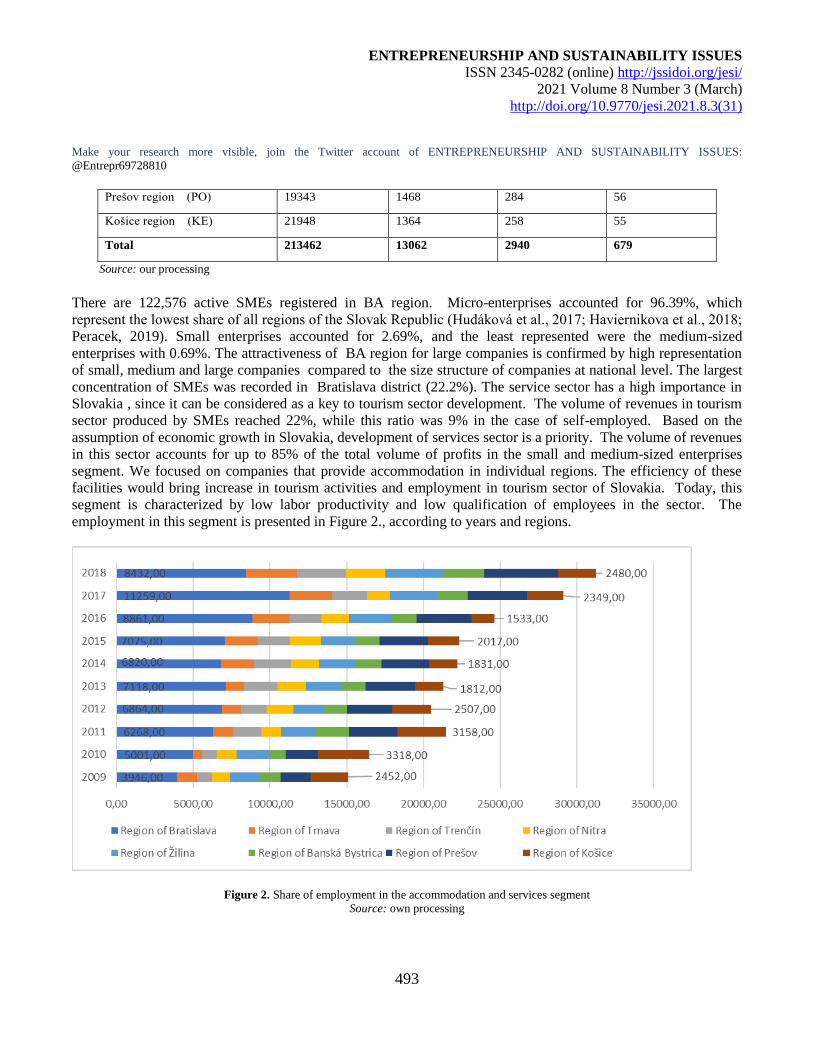
ENTREPRENEURSHIP AND SUSTAINABILITY ISSUES
ISSN 2345-0282 (online) http://jssidoi.org/jesi/
2021 Volume 8 Number 3 (March)
http://doi.org/10.9770/jesi.2021.8.3(31)
Make your research more visible, join the Twitter account of ENTREPRENEURSHIP AND SUSTAINABILITY ISSUES:
@Entrepr69728810
493
Prešov region (PO) 19343 1468 284 56
Košice region (KE) 21948 1364 258 55
Total 213462 13062 2940 679
Source: our processing
There are 122,576 active SMEs registered in BA region. Micro-enterprises accounted for 96.39%, which
represent the lowest share of all regions of the Slovak Republic (Hudáková et al., 2017; Haviernikova et al., 2018;
Peracek, 2019). Small enterprises accounted for 2.69%, and the least represented were the medium-sized
enterprises with 0.69%. The attractiveness of BA region for large companies is confirmed by high representation
of small, medium and large companies compared to the size structure of companies at national level. The largest
concentration of SMEs was recorded in Bratislava district (22.2%). The service sector has a high importance in
Slovakia , since it can be considered as a key to tourism sector development. The volume of revenues in tourism
sector produced by SMEs reached 22%, while this ratio was 9% in the case of self-employed. Based on the
assumption of economic growth in Slovakia, development of services sector is a priority. The volume of revenues
in this sector accounts for up to 85% of the total volume of profits in the small and medium-sized enterprises
segment. We focused on companies that provide accommodation in individual regions. The efficiency of these
facilities would bring increase in tourism activities and employment in tourism sector of Slovakia. Today, this
segment is characterized by low labor productivity and low qualification of employees in the sector. The
employment in this segment is presented in Figure 2., according to years and regions.
Figure 2. Share of employment in the accommodation and services segment
Source: own processing
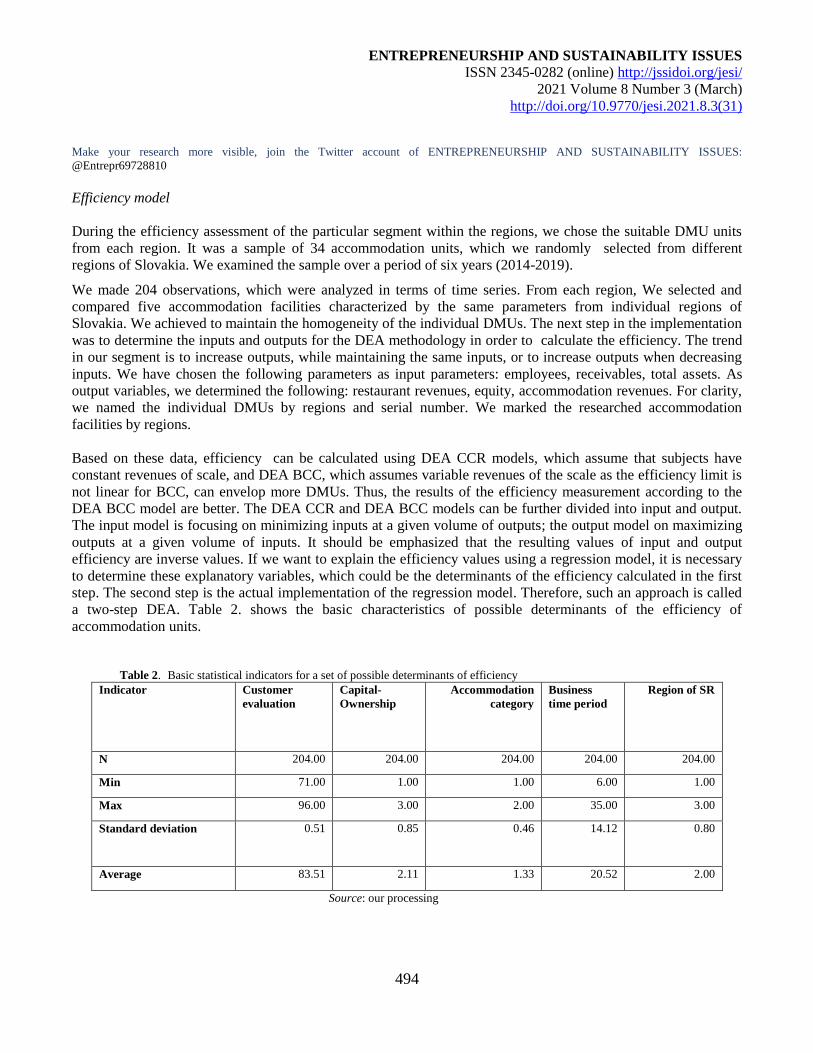
ENTREPRENEURSHIP AND SUSTAINABILITY ISSUES
ISSN 2345-0282 (online) http://jssidoi.org/jesi/
2021 Volume 8 Number 3 (March)
http://doi.org/10.9770/jesi.2021.8.3(31)
Make your research more visible, join the Twitter account of ENTREPRENEURSHIP AND SUSTAINABILITY ISSUES:
@Entrepr69728810
494
Efficiency model
During the efficiency assessment of the particular segment within the regions, we chose the suitable DMU units
from each region. It was a sample of 34 accommodation units, which we randomly selected from different
regions of Slovakia. We examined the sample over a period of six years (2014-2019).
We made 204 observations, which were analyzed in terms of time series. From each region, We selected and
compared five accommodation facilities characterized by the same parameters from individual regions of
Slovakia. We achieved to maintain the homogeneity of the individual DMUs. The next step in the implementation
was to determine the inputs and outputs for the DEA methodology in order to calculate the efficiency. The trend
in our segment is to increase outputs, while maintaining the same inputs, or to increase outputs when decreasing
inputs. We have chosen the following parameters as input parameters: employees, receivables, total assets. As
output variables, we determined the following: restaurant revenues, equity, accommodation revenues. For clarity,
we named the individual DMUs by regions and serial number. We marked the researched accommodation
facilities by regions.
Based on these data, efficiency can be calculated using DEA CCR models, which assume that subjects have
constant revenues of scale, and DEA BCC, which assumes variable revenues of the scale as the efficiency limit is
not linear for BCC, can envelop more DMUs. Thus, the results of the efficiency measurement according to the
DEA BCC model are better. The DEA CCR and DEA BCC models can be further divided into input and output.
The input model is focusing on minimizing inputs at a given volume of outputs; the output model on maximizing
outputs at a given volume of inputs. It should be emphasized that the resulting values of input and output
efficiency are inverse values. If we want to explain the efficiency values using a regression model, it is necessary
to determine these explanatory variables, which could be the determinants of the efficiency calculated in the first
step. The second step is the actual implementation of the regression model. Therefore, such an approach is called
a two-step DEA. Table 2. shows the basic characteristics of possible determinants of the efficiency of
accommodation units.
Table 2. Basic statistical indicators for a set of possible determinants of efficiency
Indicator Customer
evaluation
Capital-
Ownership
Accommodation
category
Business
time period
Region of SR
N 204.00 204.00 204.00 204.00 204.00
Min 71.00 1.00 1.00 6.00 1.00
Max 96.00 3.00 2.00 35.00 3.00
Standard deviation 0.51 0.85 0.46 14.12 0.80
Average 83.51 2.11 1.33 20.52 2.00
Source: our processing
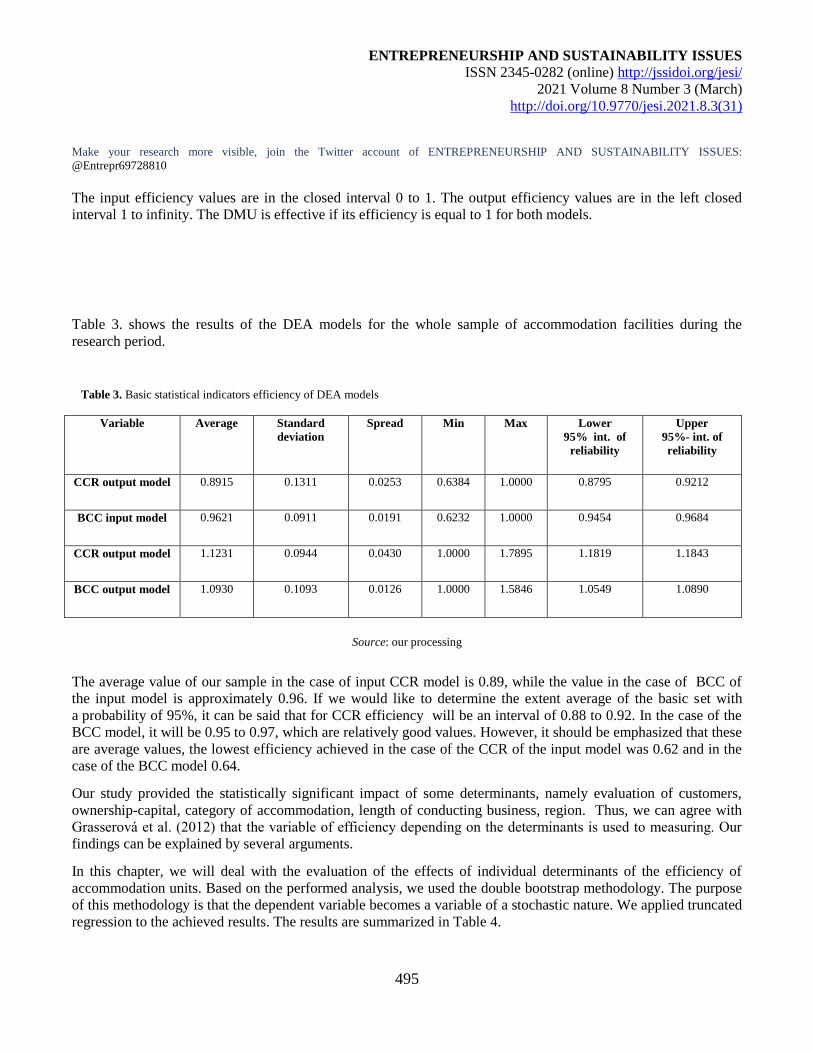
ENTREPRENEURSHIP AND SUSTAINABILITY ISSUES
ISSN 2345-0282 (online) http://jssidoi.org/jesi/
2021 Volume 8 Number 3 (March)
http://doi.org/10.9770/jesi.2021.8.3(31)
Make your research more visible, join the Twitter account of ENTREPRENEURSHIP AND SUSTAINABILITY ISSUES:
@Entrepr69728810
495
The input efficiency values are in the closed interval 0 to 1. The output efficiency values are in the left closed
interval 1 to infinity. The DMU is effective if its efficiency is equal to 1 for both models.
Table 3. shows the results of the DEA models for the whole sample of accommodation facilities during the
research period.
Table 3. Basic statistical indicators efficiency of DEA models
Variable Average Standard
deviation
Spread Min Max Lower
95% int. of
reliability
Upper
95%- int. of
reliability
CCR output model 0.8915 0.1311 0.0253 0.6384 1.0000 0.8795 0.9212
BCC input model 0.9621 0.0911 0.0191 0.6232 1.0000 0.9454 0.9684
CCR output model 1.1231 0.0944 0.0430 1.0000 1.7895 1.1819 1.1843
BCC output model 1.0930 0.1093 0.0126 1.0000 1.5846 1.0549 1.0890
Source: our processing
The average value of our sample in the case of input CCR model is 0.89, while the value in the case of BCC of
the input model is approximately 0.96. If we would like to determine the extent average of the basic set with
a probability of 95%, it can be said that for CCR efficiency will be an interval of 0.88 to 0.92. In the case of the
BCC model, it will be 0.95 to 0.97, which are relatively good values. However, it should be emphasized that these
are average values, the lowest efficiency achieved in the case of the CCR of the input model was 0.62 and in the
case of the BCC model 0.64.
Our study provided the statistically significant impact of some determinants, namely evaluation of customers,
ownership-capital, category of accommodation, length of conducting business, region. Thus, we can agree with
Grasserová et al. (2012) that the variable of efficiency depending on the determinants is used to measuring. Our
findings can be explained by several arguments.
In this chapter, we will deal with the evaluation of the effects of individual determinants of the efficiency of
accommodation units. Based on the performed analysis, we used the double bootstrap methodology. The purpose
of this methodology is that the dependent variable becomes a variable of a stochastic nature. We applied truncated
regression to the achieved results. The results are summarized in Table 4.
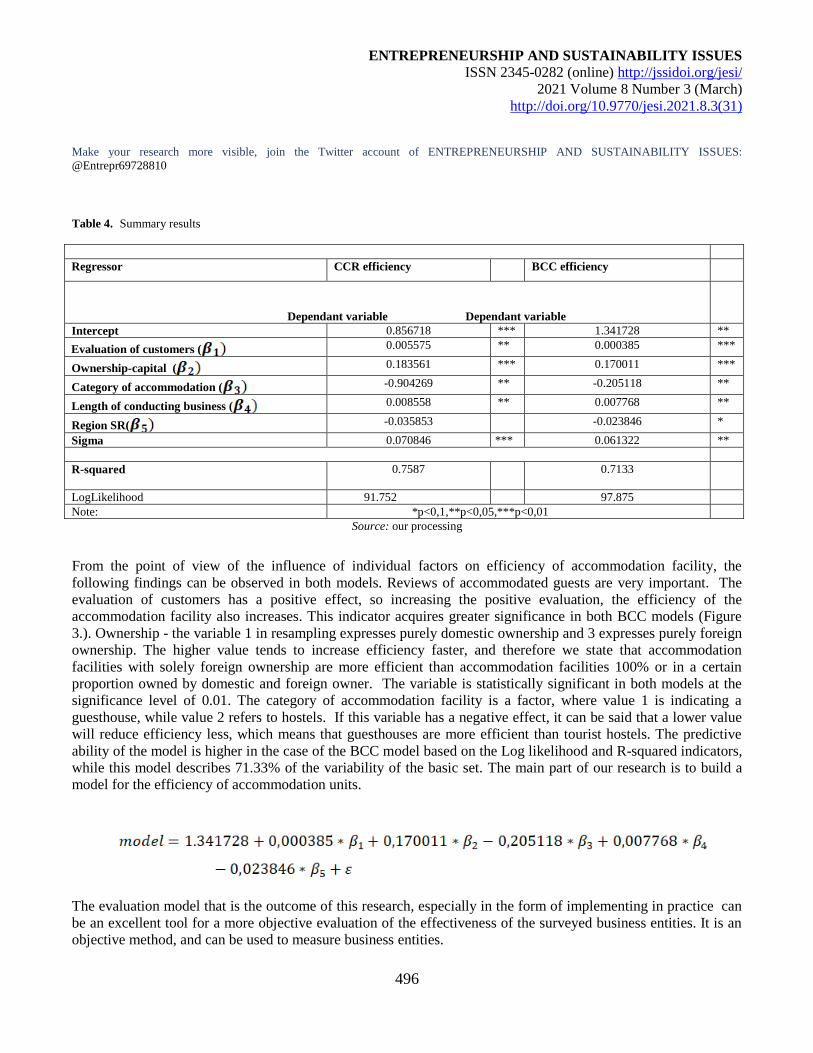
ENTREPRENEURSHIP AND SUSTAINABILITY ISSUES
ISSN 2345-0282 (online) http://jssidoi.org/jesi/
2021 Volume 8 Number 3 (March)
http://doi.org/10.9770/jesi.2021.8.3(31)
Make your research more visible, join the Twitter account of ENTREPRENEURSHIP AND SUSTAINABILITY ISSUES:
@Entrepr69728810
496
Table 4. Summary results
Regressor CCR efficiency BCC efficiency
Dependant variable Dependant variable
Intercept 0.856718 *** 1.341728 **
Evaluation of customers ( 0.005575 ** 0.000385 ***
Ownership-capital ( 0.183561 *** 0.170011 ***
Category of accommodation ( -0.904269 ** -0.205118 **
Length of conducting business ( 0.008558 ** 0.007768 **
Region SR( -0.035853 -0.023846 *
Sigma 0.070846 *** 0.061322 **
R-squared 0.7587
0.7133
LogLikelihood 91.752 97.875
Note: *p<0,1,**p<0,05,***p<0,01
Source: our processing
From the point of view of the influence of individual factors on efficiency of accommodation facility, the
following findings can be observed in both models. Reviews of accommodated guests are very important. The
evaluation of customers has a positive effect, so increasing the positive evaluation, the efficiency of the
accommodation facility also increases. This indicator acquires greater significance in both BCC models (Figure
3.). Ownership - the variable 1 in resampling expresses purely domestic ownership and 3 expresses purely foreign
ownership. The higher value tends to increase efficiency faster, and therefore we state that accommodation
facilities with solely foreign ownership are more efficient than accommodation facilities 100% or in a certain
proportion owned by domestic and foreign owner. The variable is statistically significant in both models at the
significance level of 0.01. The category of accommodation facility is a factor, where value 1 is indicating a
guesthouse, while value 2 refers to hostels. If this variable has a negative effect, it can be said that a lower value
will reduce efficiency less, which means that guesthouses are more efficient than tourist hostels. The predictive
ability of the model is higher in the case of the BCC model based on the Log likelihood and R-squared indicators,
while this model describes 71.33% of the variability of the basic set. The main part of our research is to build a
model for the efficiency of accommodation units.
The evaluation model that is the outcome of this research, especially in the form of implementing in practice can
be an excellent tool for a more objective evaluation of the effectiveness of the surveyed business entities. It is an
objective method, and can be used to measure business entities.
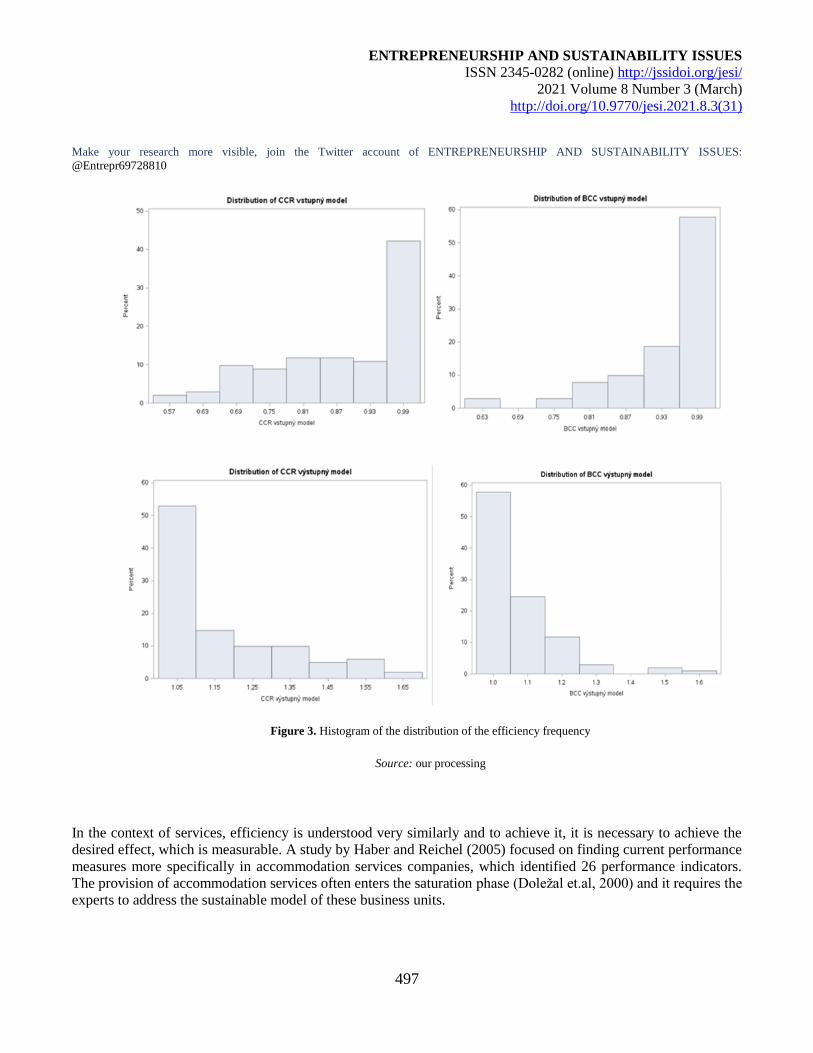
ENTREPRENEURSHIP AND SUSTAINABILITY ISSUES
ISSN 2345-0282 (online) http://jssidoi.org/jesi/
2021 Volume 8 Number 3 (March)
http://doi.org/10.9770/jesi.2021.8.3(31)
Make your research more visible, join the Twitter account of ENTREPRENEURSHIP AND SUSTAINABILITY ISSUES:
@Entrepr69728810
497
Figure 3. Histogram of the distribution of the efficiency frequency
Source: our processing
In the context of services, efficiency is understood very similarly and to achieve it, it is necessary to achieve the
desired effect, which is measurable. A study by Haber and Reichel (2005) focused on finding current performance
measures more specifically in accommodation services companies, which identified 26 performance indicators.
The provision of accommodation services often enters the saturation phase (Doležal et.al, 2000) and it requires the
experts to address the sustainable model of these business units.
ENTREPRENEURSHIP AND SUSTAINABILITY ISSUES
ISSN 2345-0282 (online) http://jssidoi.org/jesi/
2021 Volume 8 Number 3 (March)
http://doi.org/10.9770/jesi.2021.8.3(31)
Make your research more visible, join the Twitter account of ENTREPRENEURSHIP AND SUSTAINABILITY ISSUES:
@Entrepr69728810
498
Conclusions
In the current era of globalization it is very important to look at the discussed issue in terms of economic growth.
In order to fulfil the main aim of the study, analysis with fixed effects models was applied on a sample of 34
accommodation units, covering the period from 2014 to 2019. The results of the conducted analysis supported
the hypothesis that a country like Slovakia must set itself the primary goal of revealing hidden reserves in the
segment of services provided. In the last six years, up to about 83% of new jobs have been created in this
segment. This research focused on the area of services on regional scale in Slovakia. Using the implementation
of the DEA method, and individual models focusing on inputs, we were able to identify the inefficient units in
the field. As an output of our research, we want to emphasize that each inefficient unit, we were able to
accurately quantify need to be changed with respect to the efficiency of the processes that take place in it.
Knowing the degree of efficiency or inefficiency will help to identify the weaknesses of the production unit and
at the same time will help to identify the shortcomings that affect the economic result of the company.
The results of our study provide guidelines for managers of Slovak companies to understand how to run their
small businesses in the SME segment effectively. Our model points to the factors that affect the efficiency of
business as much as possible.
References
Ajaz Khan, K., Çera, G., & Nétek, V. (2019). Perception of the Selected Business Environment Aspects by Service Firms. Journal of
Tourism and Services, 10(19), 111-127. https://doi.org/10.29036/jots.v10i19.115
Altuntas, S., Cinar, O., & Kaynak, S. (2018). Relationships among advanced manufacturing technology, innovation, export, and firm
performance: Empirical evidence from Turkish manufacturing companies. Kybernetes, 47(9), 1836. https://doi.org/10.1108/K-10-2017-
0380
Anyakoha, C. (2019). Job analysis as a tool for improved organizational performance of SMEs in Lagos, Nigeria. Central European
Journal of Labour Law and Personnel Management, 2 (1), 7-16. https://doi.org/10.33382/cejllpm.2019.02.0
Barney, J.B. (1991). Firm resources and sustained and sustained competitive advantage. Journal of Management, 17(1), 99-120.
Belas, J., Gavurova, B., Kubalek, J., & Kubak, M. (2020). Discrepancies in perception and evaluation of macroenvironment - sectoral
analysis. Journal of Business Economics and Management, 21(4), 1072-1092. https://doi.org/10.3846/jbem.2020.12274
Bencikova, D., Mala, D., & Minarova, M. (2013). How culturally intelligent are Slovak small and medium business? 7th International
Days of Statistics and Economics, 109-121
Borocki, J., Radisic, M., Sroka, W., Greblikaite, J., & Androniceanu, A. (2019). Methodology for strategic posture determination of SMEs
- the case from a developing country. Inžinerinė Ekonomika-Engineering Economics, 30(3), 265-277.
Chrenekova, M., Melichova, K., Marisova, E., & Moroz, S. (2016). Informal employment and quality of life in rural areas of Ukraine.
European countryside, 8(2), 135-146, SI. https://doi.org/10.1515/euco-2016-0011
Çera, G. Meço, M., Çera, E., & Maloku, S. (2019). The effect of institutional constraints and business network on trust in government: an
institutional perspective. Administratie si Management Public, 33, 6-19, https://doi.org/10.24818/amp/2019.33-01
Cibik, L., & Melus, M. (2019). Fiscal Decentralization in the Slovak Republic: Revenues and Expenditures. Lex localis-Journal of local
self-government, 17 (3), 697-720. https://doi.org/10.4335/17.3.697-720(2019)
ENTREPRENEURSHIP AND SUSTAINABILITY ISSUES
ISSN 2345-0282 (online) http://jssidoi.org/jesi/
2021 Volume 8 Number 3 (March)
http://doi.org/10.9770/jesi.2021.8.3(31)
Make your research more visible, join the Twitter account of ENTREPRENEURSHIP AND SUSTAINABILITY ISSUES:
@Entrepr69728810
499
Cooper, D. J., Ezzamel, M., & Qu, S. Q. (2017). Popularizing a management accounting idea: The case of the balanced scorecard.
Contemporary Accounting Research, 34(2), 991-1025. https://doi.org/10.1111/1911-3846.12299
Cepel, M., Dvorsky, J., Gregova, E., & Vrbka, J. (2020). Business environment quality model in the SME segment. Transformations in
Business & Economics, 19(1), 262-283.
Csikosova, A., & Culkova, K. (2012). Industrial marketing as review of opinion and realization problems. Acta Montanistica Slovaca, 17
(3), 167-173.
Cvetanovič, D. Despotovič. (2014). Knowledge as the component of human capital in economic growth models. Škola biznisa, 1, 1-17.
Doležal, T. et al., (2000). Integration of sustainability development principles into tourism. Praha: Charles University, Faculty of Physical
Education and Sport
Dvorský, J., Petráková, Z., & Polách, J. (2019). Assessing the Market, Financial, and Economic Risk Sources by Czech and Slovak SMEs.
International Journal of Entrepreneurial Knowledge, 7(2), 30-40. https://doi.org/10.12345-000
Dvorský, J., Petráková, Z., Ajaz Khan, K., Formánek, I., & Mikoláš, Z. (2020). Selected Aspects of Strategic Management in the Service
Sector. Journal of Tourism and Services, 20(11), 109–123. https://doi.org/10.29036/jots.v11i20.146
Durda, L., & Kljucnikov, A. (2019). Social networks in entrepreneurial startups development. Economics & Sociology, 12(3), 192-208.
https://doi.org/10.14254/2071-789X.2019/12-3/13
Dyduch, W. (2019). Entrepreneurial Strategy Stimulating Value Creation: Conceptual Findings and Some Empirical Tests. Entrepreneurial
Business and Economics Review, 7(3), 65-82. https://doi.org/10.15678/EBER.2019.070304
European Commission. (2016a). Annual report on European SMEs 2015/2016. Retrieved from http://ec.europa.eu/growth/smes/business-
friendly-environment/performance-review-2016_ro
European Commission. (2016b). Funds absorption rate. Retrieved from https://cohesiondata.ec.europa.eu/dataset/2007-2013-Funds-
Absoption-Rate/kk86-ceun
European Commission. (2017). Value added at factor costs (% of total value added by enterprises). Retrieved from
https://ec.europa.eu/growth/smes/business-friendly-environment/performance-review-2016_ro
Fernandes, F. D. S., Stasinakis, C., & Bardarova, V. (2018). Two-stage DEA-Truncated Regression: Application in banking efficiency and
financial development. Expert Systems with Applications, 96, 284–301, https://doi.org/10.1016/j.eswa.2017.12.010
Grasseová, M., Dubec, R., & Řehák, D. (2012). Analýza podniku v rukou manažera. 33 nejpoužívanějších metod strategického řízení
(Business analysis in the hands of a manager. 33 most used methods of strategic management). 2. vydání. Brno: BizBooks, 2012. 325 s.
ISBN 978-80-265-0032-2
Gupta, V. K., & Batra, S. (2016). Entrepreneurial orientation and firm performance in Indian SMEs: Universal and contingency
perspectives. International Small Business Journal: Researching Entrepreneurship, 34(5), 660–682.
https://doi.org/10.1177/0266242615577708
Haber, S., Reichel, A. (2005). Identifying Performance Measures of Small Ventures—The Case of the Tourism Industry. Journal of Small
Business Management, 43(30), 257-286. https://doi.org/10.1111/j.1540-627X.2005.00137.x
Harabi, N. (2005). Determinants of Firm Growth: An Empirical Analysis from Morocco. MPRA Paper, Switzerland: University of Applied
Sciences, https://mpra.ub.uni-muenchen.de/4394/1/MPRA_paper_4394.pdf
Haviernikova, K., Kordos, M. & Navickas, V. (2018). The motivation of Slovak small and medium entrepreneurs towards cluster
cooperation. Transformations in Business & Economics, 17(3), 91-101
ENTREPRENEURSHIP AND SUSTAINABILITY ISSUES
ISSN 2345-0282 (online) http://jssidoi.org/jesi/
2021 Volume 8 Number 3 (March)
http://doi.org/10.9770/jesi.2021.8.3(31)
Make your research more visible, join the Twitter account of ENTREPRENEURSHIP AND SUSTAINABILITY ISSUES:
@Entrepr69728810
500
Haviernikova, K., Snieska, V., Navickas, V., & Burksaitiene, D. (2019). The attitudes of small and medium entrepreneurs toward cluster
cooperation: the expectations and reality. Transformations in Business & Economics, 18 (3), 191-205.
Horvath, P., & Machyniak, J. (2016). Media impact on public policy making. Marketing identity: brands we love, PT I. International
Scientific Conference on Marketing Identity 2016: Brands We Love, 316-325
Hudáková, J. Fiľa, M., & Maroš, M. (2017). Innovation potential of the regions in the Slovak republic. Acta Oeconomica Universitatis
Selye 6 (2), 81 – 88.
Hudáková, M., & Masár, M. (2018). Assessment of the Key Business Risks of the SMEs in Slovakia and Their Comparison with other EU
Countries. Entrepreneurial Business and Economics Review, 6(4), 145-160. https://doi.org/10.15678/EBER.2018.060408
Huggins, R., & Thompson, P., (2015). Entrepreneurship, innovation and regional growth: a network theory. Small Business Economics,
45(1), 103–128.
Charnes, A., Clark, C. T., Cooper, W. W., & Golany, B. A (1984). Developmental study of data envelopment analysis in measuring the
efficiency of maintenance units in the U.S. air forces. Annals of Operations Research, 2, 95–112, https://doi.org/10.1007/BF01874734
Chehabeddine, M., & Tvaronavičienė, M. (2020). Securing regional development. Insights into Regional Development, 2(1), 430-442.
https://doi.org/10.9770/IRD.2020.2.1(3)
Chunling Li, Khansa Pervaiz, Muhammad Asif Khan, Faheem Ur Rehman, & Oláh, J. (2019). On the Asymmetries of Sovereign Credit
Rating Announcements and Financial Market Development in the European Region. Sustainability, 11(23), 6636, 1-14.
https://doi.org/10.3390/su11236636
Dellis, K., Karkalakos, S., & Kottaridi, C. (2016). Entrepreneurship Targeting Policies, Technological Growth, and Unemployment.
Journal of Eurasian Economic Dialogue, 1(6), 19–39.
Janoskova, M., Culkova, K., & Csikosova, A. (2018). Position and development of small and medium enterprises in european countries.
Proceedings of the 8th Business & Management Conference. Proceedings of the Business & Management Conferences, 91-103.
https://doi.org/10.20472/BMC.2018.008.007
Jašková, D. (2019). Assessment of social development in Slovakia in the context of human resources. Central European Journal of Labour
Law and Personnel Management, 2 (2), 21-32. https://doi.org/10.33382/cejllpm.2019.03.02
Kordos, M. (2018). Risk aspect of cluster innovation potential in SR and EU. International relations 2018: Current issues of world economy
and politics. 19th International Scientific Conference on International Relations - Current Issues of World Economy and Politics, 345-358
Kotaskova, A., & Rozsa, Z. (2018). The impact of selected factors on the quality of business environment assessment in the Czech
Republic and the Slovak Republic. International Journal of Entrepreneurial Knowledge, 6(2), 71-80. https://doi.org/10.2478/IJEK-2018-
0015
Kotulic, R., Adamisin, P., Vozarova, I.K., & Vavrek, R. (2017). Targeted regionalization of Slovakia to ensure economic efficiency and
sustainability of agriculture. 20th International Colloquium on Regional Sciences, 185-192. https://doi.org/10.5817/CZ.MUNI.P210-8587-
2017-23
Kozubíková, L., & Kotásková, A. (2019). The impact of technological factors on the quality of the business environment. Transformations
in Business & Economics, 18(1), 95-108.
Lakner, Z., Kiss, A., Merlet, I., Oláh, J., Máté, D., Grabara, J., & Popp, J. (2018). Building Coalitions for a Diversified and Sustainable
Tourism: Two Case Studies from Hungary. Sustainability, 10, 1090.
Lazikova, J., Bandlerova, A., Rohacikova, O., Schwarcz, P., & Rumanovska, L. (2018). Regional Disparities of Small and Medium
Enterprises in Slovakia. Acta Polytechnica Hungarica, 15 (8), 227-246. https://doi.org/10.12700/APH.15.8.2018.8.12
ENTREPRENEURSHIP AND SUSTAINABILITY ISSUES
ISSN 2345-0282 (online) http://jssidoi.org/jesi/
2021 Volume 8 Number 3 (March)
http://doi.org/10.9770/jesi.2021.8.3(31)
Make your research more visible, join the Twitter account of ENTREPRENEURSHIP AND SUSTAINABILITY ISSUES:
@Entrepr69728810
501
Mardani, A.; Zavadskas, E. K.; Streimikiene, D.; Jusoh, A.; & Khoshnoudi, M. (2017). A comprehensive review of data envelopment
analysis (DEA) approach in energy efficiency. Renew. Sustain. Energy Rev. 70, 1298–1322, https://doi.org/10.1016/j.rser.2016.12.030
Meyer, N., & Kot, S. (2019). Entrepreneurial motivation: a cross country comparison between Polish and South african students.
Transformations in Business & Economics, 18(3), 155-167.
Mikhaylova, A. A., Mikhaylov, A. S., Savchina, O. V., & Plotnikova, A. P. (2019). Innovation landscape of the Baltic region.
Administratie si Management Public, 33, 165-180, https://doi.org/10.24818/amp/2019.33-10
Peracek, T. (2019). Family Business and Its Anchoring In the Legal Order of the Slovak Republic and the Czech Republic. 33rd
International-Business-Information-Management-Association (IBIMA) Conference. Education excellence and innovation management
through Vision 2020, 7290-7298
Peracek, T., Noskova, M., & Mucha, B. (2017). Special characters of family businesses in the Slovak republic. International Scientific
Conference on Economic and Social Development. Economic and social development (esd): managerial issues in modern business, 260-
266.
Pisar, P., & Bilkova, D. (2019). Controlling as a tool for SME management with an emphasis on innovations in the context of Industry 4.0.
Equilibrium. Quarterly Journal of Economics and Economic Policy, 14(4), 763-785. https://doi.org/10.24136/eq.2019.035
Poór, J., Engle, A.D., Kovács, Á., Albrychiewicz-Slocinska, A., Caha, Z., Kumpikaite-Valiuniene, V., & Horbulák, Zs. (2020). Initial
findings for labour markets in the Czech Republic, Hungary, Poland and Slovakia. Central European Journal of Labour Law and
Personnel Management, 3(1), 46-59. https://doi.org/10.33382/cejllpm.2020.04.04
Pratheepan, T. 2014. A panel data analysis of profitability determinants: Empirical results from Sri Lankan manufacturing companies.
International Journal of Economics, Commerce and Management, 2(12), 1-9.
Raisová, M., Regásková, M., & Lazányi, K. (2020). The financial transaction tax: an ANOVA assessment of selected EU countries.
Equilibrium. Quarterly Journal of Economics and Economic Policy, 15(1), 29-48. https://doi.org/10.24136/eq.2020.002
Ramanathan, R., & Ramanathan, U. (2011). A performance measurement framework combining DEA and balanced scorecard for the UK
health sector. International Journal of Operational Research, 12(3), 257-278.
Remeikiene, R., Belas, J., Kliestik, T., & Smrcka, L. (2020). Quantitative assessment of dynamics of economic development in the
countries of the European Union. Technological and Economic Development of Economy, 26(4), 933-946.
https://doi.org/10.3846/tede.2020.12892
Selivanova-Fyodorova, N., Komarova, V, Lonska, J., & Mietule, I. (2019). Differentiation of internal regions in the EU countries. Insights
into Regional Development, 1(4), 370-384. https://doi.org/10.9770/ird.2019.1.4(7)
Sheehan, M. (2013). Human resource management and performance: Evidence from small and medium-sized firms. International Small
Business Journal: Researching Entrepreneurship, 32(5), 545–570. https://doi.org/10.1177/0266242612465454
Simar, L., & Wilson, P. W.(2007). Estimation and inference in two-stage, semi-parametric models of production processes. Journal of
Economics, 136, 31–64, https://doi.org/10.1016/j.jeconom.2005.07.009
Tamulevičienė, D., & Androniceanu, A. (2020). Selection of the indicators to measure an enterprise’s value and its changes in the
controlling system for medium-sized enterprises. Entrepreneurship and Sustainability Issues, 7(3), 1440-1458.
https://doi.org/10.9770/jesi.2020.7.3(1)
Tingvall, P. G., & Videnord, J. (2018). Regional differences in effects of publicly sponsored R&D grants on SME performance. Small
Business Economics, 54, 951–969. https://doi.org/10.1007/s11187018-0085-6
ENTREPRENEURSHIP AND SUSTAINABILITY ISSUES
ISSN 2345-0282 (online) http://jssidoi.org/jesi/
2021 Volume 8 Number 3 (March)
http://doi.org/10.9770/jesi.2021.8.3(31)
Make your research more visible, join the Twitter account of ENTREPRENEURSHIP AND SUSTAINABILITY ISSUES:
@Entrepr69728810
502
Tsai, W.H.; Lee, H.L.; Yang, C.-H.; & Huang, C.-C. (2016). Input-Output Analysis for Sustainability by Using DEA Method: A
Comparison Study between European and Asian Countries. Sustainability 8, 1230, https://doi.org/10.3390/su8121230
Vekic, A., Djakovic, V., Borocki, J., Sroka, W., Popp, J., & Olàh, J. (2020). The Importance of Academic New Ventures for Sustainable
Regional Development. Amfiteatru Economic, 22(54), 533-550.
Virglerová, Z., Homolka, L., Smrcka, L., Lazányi, K., & Klieštik, T. (2017). Key determinants of the quality of business environment of
SMEs in the Czech Republic. E & M Ekonomie a Management, 20 (2), 87-101. https://doi.org/10.15240/tul/001/2017-2-007
Wallsten, S. J. (2000). The Effects of Government-Industry R&D Programs on Private R&D: The Case of the Small Business Innovation
Research Program. The Rand Journal of Economics, 31(1), 82–100.
Wei, C.-K., Chen, L.-C., Li, R.-K., Tsai, C.-H., & Huang, H.-L. (2012). A study of optimal weights of Data Envelopment Analysis -
Development of a context-dependent DEA-R model. Expert Systems with Applications. 39 (4), 4599-4608.
Wernerfelt, B. 1984. A resource-based view of the firm. In: Strategic Management Journal, roč. 5, č. 2, s. 171-180. ISSN 1097-0266.
Zavadska, Z., & Zavadsky, J. (2020). Quality managers and their future technological expectations related to Industry 4.0. Total Quality
Management & Business Excellence, 31 (7-8), 717-741. https://doi.org/10.1080/14783363.2018.1444474
Zauskova, A., & Reznickova, M. (2020). SoLoMo marketing as a global tool for enhancing awareness of eco-innovations in Slovak
business environment. Equilibrium. Quarterly Journal of Economics and Economic Policy, 15(1), 133-150.
https://doi.org/10.24136/eq.2020.007
Acknowledgements
This research was supported by the project VEGA 1/0813/19 Managing the development of innovative and start-up forms of
businesses in international environment and verification of INMARK concept, which has received funding from Ministry of
Education, Science, Research and Sport of the Slovak Republic and project GAAA 5-5/2020 Development of family
businesses in Slovak regions, which has received funding from Grant Agency Academia aurea, VEGA 1/0240/20.
ENTREPRENEURSHIP AND SUSTAINABILITY ISSUES
ISSN 2345-0282 (online) http://jssidoi.org/jesi/
2021 Volume 8 Number 3 (March)
http://doi.org/10.9770/jesi.2021.8.3(31)
Make your research more visible, join the Twitter account of ENTREPRENEURSHIP AND SUSTAINABILITY ISSUES:
@Entrepr69728810
503
Ladislav MURA is an Associate Professor, a Slovak expert on small and medium business, international business, and the human resource
of management. He is the author of 3 domestic scientific monographs on the internationalization of business, small and medium
enterprises, human resource management, co-author of foreign scientific monographs. He has published a lot of articles in various scientific
journals.
ORCID ID: https://orcid.org/0000-0002-2453-8740
Zuzana HAJDUOVÁ is an expert in assessing performance and efficiency in service enterprises specialized in business informatics and
linear programming. In addition, she is devoted to the application of the DEA method to measure the effectiveness of small and medium
business, as confirmed by her scientific outputs registered in the WoS and Scopus databases.
ORCID: https://orcid.org/0000-0002-9381-776X
Copyright © 2021 by author(s) and VsI Entrepreneurship and Sustainability Center
This work is licensed under the Creative Commons Attribution International License (CC BY).
http://creativecommons.org/licenses/by/4.0/
ENTREPRENEURSHIP AND SUSTAINABILITY ISSUES
ISSN 2345-0282 (online) http://jssidoi.org/jesi/
2021 Volume 8 Number 3 (March)
http://doi.org/10.9770/jesi.2021.8.3(32)
Publisher http://jssidoi.org/esc/home
504
MANAGING THE INSTITUTIONAL ENVIRONMENT AND IMPACT ON THE COMPETITIVENESS
OF TRANSITIONAL ECONOMIES
Marinko Škare ¹, Sanja Radolović ², Manuela Tvaronavičienė 3,4
1 ,2 Juraj Dobrila University of Pula, Zagrebačka 30, 52100 Pula, Croatia 3Vilnius Gediminas Technical University (Vilnius Tech), Saulėtekio 11, LT-10223, Vilnius, Lithuania
4General Jonas Zemaitis Military Academy of Lithuania, Silo 5 A, LT-10322, Vilnius, Lithuania
E-mails:1 [email protected] ; 2 [email protected]
Received 18 September 2020; accepted 28 January 2020; published 30 March 2021
Abstract. The main unsolved issue in the qualitative research of the "new" institutional economics in the area of the institutional impact on
economic growth is how productive institutions occur, i.e., which variables explicitly "stand" behind the institutional "infrastructure"
impact on economic growth. The research presents the postulates of the "new" institutional economics, claiming a connection between the
institutional structure and the movement of economic growth. Furthermore, the impact of institutional quality on economic growth was
analyzed on examples of individual national economies. The comparative method of the assessment based on six criteria: voice and
accountability, political stability, government effectiveness, regulatory quality, the rule of law and control of corruption, and the
comparison of the GDP per capita of the same as one of the most significant economic indicators, tested the primary hypothesis (H1) in this
work: institutions are the fundamental determinant of the long-term success in economy, and the importance of government effectiveness is
seen through economic growth, especially long-term growth. The conducted research showed a high level of correlation between
institutions' success and the gross domestic product with indications of equal returns per ratio and the fact that the advancement of
institutional quality, indirectly through GDP, can lead to the growth of the relative significance of economies.
Keywords: institutional economics; quality of institutions; GDP per capita; economic growth
Reference to this paper should be made as follows: Škare, M., Radolović, S., Tvaronavičienė, M. 2021. Managing the institutional
environment and impact on the competitiveness of transitional economies. Entrepreneurship and Sustainability Issues, 8(3), 504-526.
http://doi.org/10.9770/jesi.2021.8.3(32)
JEL Classifications: C33, DO2, O13, O43
1. Introduction
The effect of institutions, their “quality” and capacity on the level of economic growth is the research object of
institutional economics, and in the last twenty years of the “new” institutional economics as well, and the
theoretical postulates and cognitions which rose from the theoretical and empirical research of the same will be
ENTREPRENEURSHIP AND SUSTAINABILITY ISSUES
ISSN 2345-0282 (online) http://jssidoi.org/jesi/
2021 Volume 8 Number 3 (March)
http://doi.org/10.9770/jesi.2021.8.3(32)
505
presented and analyzed. According to institutional economics, institutions have an essential role in increasing
society's functionality, especially economic effectiveness (Vasconcelos, 2021; Lincényi & Čársky, 2021). They
are the constituent part of the social capital as the critical factor of economic growth and economic success
(Trofimov, 2017; Iacobuta et al., 2019; Mazzanti et al., 2020).
The core of the “new” institutional economics research is the emergence of institutions and their comparative
effectiveness and impact on economic growth, economic behavior, success, and division problems. The
theoretical and empirical research of the NIE affected the regulatory, macroeconomic, and other public policies.
Central and Eastern European transition countries are one more example of the influence of the institutional
development on economic growth, and the question of why certain transition countries had developed faster than
others when all went through a similar process of reforms (stabilization of the economy, market liberalization, and
privatization) comes as reasonable.
This paper will present the postulates of the "new" institutional economics and the qualitative and empirical
research inside it, claiming a link between the institutional structure and the economic growth movement.
Furthermore, examples of individual national economies, emphasizing transition countries show the impact of
institutional infrastructure on economic growth analysis. The comparative method of the assessment of
government effectiveness based on six criteria: voice and accountability, political stability, government
effectiveness, regulatory quality, the rule of law and control of corruption, and the comparison of the GDP per
capita of the same as one of the most significant economic indicators, tested the primary hypothesis (H1) in this
work: institutions are the fundamental determinant of the long-term success in economy, and the importance of
government effectiveness is seen through economic growth, especially long-term growth.
Literature in the field of institutional economics is vast but there is a gap concerning the institutions’ role in
economic growth for transitional economies. Institutional transition process in former planned economies largerly
differs across ex-socialist countries. The nature of the transitional process, specifically, institutional transitional
process dynamics, nature and its impact on competitiveness and growth is missing in the literature. This paper
addresses the gap by studying the transition process of the institutional environment for selected transitional
economies. Empirical results obtained from the panel vector autoregression estimation later compares to the
institutional environment change in advanced economies. This study addresses the issue of institutional
environment efficiency impact on economy competitiveness and economic growth in the long run. Empirical
results support the thesis that the institutional environment is a significant driver of a country's competitiveness
and growth.
Study results prove that government effectiveness' is a key competitiveness factor in an economy. GDP dynamics
is not essential for building institutional efficiency (no Granger causality). Voice and accountability as an
institutional factor have a limited impact on the country's competitiveness. Freedom of thought and government
accountability is vital for a level of competitiveness but not essential. Political stability is significant for the level
of competitiveness. Regulatory quality is essential as an institutional factor for competitiveness but not that
determinant as government effectiveness and political stability. The rule of law is also crucial for the country's
competitiveness, but we find the same long-run relationship as for the regulatory quality. Thus, the rule of law is
necessary but not a sufficient condition for competitiveness. Corruption control is a pre-requisite to achieve and
increase the level of competitiveness. We can see that after government effectiveness and political stability,
corruption control is at the top level of competitiveness determinants. The dummy variable as a proxy for the
financial crisis of 2008, as we expected, had a significant impact on the competitiveness across the panel. We can
see financial crisis (and financial cycles) significantly negatively impact a country's level of competitiveness.
ENTREPRENEURSHIP AND SUSTAINABILITY ISSUES
ISSN 2345-0282 (online) http://jssidoi.org/jesi/
2021 Volume 8 Number 3 (March)
http://doi.org/10.9770/jesi.2021.8.3(32)
506
2. Literature review
In the last twenty years, the scientific and professional literature has been dealing with the incorporation of the
institutional impact and institutional structure in economic growth theories, and economic policies and the
adaptation to economic movements are strongly dependent on institutional construction (North, 1990; 2003;
Myhrman & Weingast, 1994; Coase, 1998; Torsten Persson, 2001; Powell, 2003; Acemoglu, 2004).
In the broader sense, institutions are formal and informal rules that determine human interrelations (North, 1990).
In a narrower sense, institutions are organizational units, procedures, and the regulatory framework (Williamson,
2000). The primary division differentiates exogenous institutions (external, given) and endogenous institutions
(internal) to the economic system (Williamson, 2000; Jutting, 2003).
North (1994) divides institutions according to the level of formality to "informal" and "formal" and divides the
"formal" ones further on into constitution, statutes, common law, regulative and other state decisions and
regulations, political system: structure of power, civil rights, economic structure: inheritance rights, contracts, the
coercion system: legislation, police; the author divides informal institutions to traditions, customs, moral values,
religious beliefs and other behavioral norms acquired during a time, the prevailing fears and attitudes of the
community toward the world, the knowledge collected from the past and the prevailing number of values, the
common inheritance (culture) and the informal coercion system: being expelled from the community, criticism,
loss of respect.
Moreover, North claims that both types of institutions are present in all countries, but the informal ones are more
prominent in "poorer" countries because formal institutions are weekly developed or do not exist. He emphasizes
that institutions determine "the rules of the game" in economic, political, and social interactions, as well as "social
"organizations (2003). The influence of institutions on transnational multinational firms’ strategies has increased
enormously. The wide range of studies on the impact of institutions on international policy were covered in the
review. In recent international strategy research, it has achieved a much better overall understanding of
multinational firms’ activities (Xu et al., 2021). The results of (Wu et al., 2019) suggest while it is important for
emerging-market governments to develop preferred strategies that encourage their domestic companies to
participate actively in global competition, it is also crucial for them to significantly improve the quality of policies
that can provide institutional support for these companies to internationalize in various foreign markets and
provide innovation advantages.
According to Kasper and Streit (1998), institutions create stimulating structures for individuals and organizations'
behaviors and coordinate their activities. Although institutions have to provide predictable and coherent rules,
what is also necessary are institutional changes and adaptations to social preferences, technologies, political and
socio-economic structures, and external factors. It is also essential to differentiate the institutional environment, a
set of fundamental political, social, and legal rules from the institutional organization (agreement among
economic units about collaboration and competition). Innovations have an essential role in determining the
country's competitiveness in international markets (Awang et al., 2019). Del Olmo-García et al., (2020) indicate a
negative relationship between the quality of formal institutions, the entrepreneurial culture, social norms, and
efficiency in the markets for goods and services to entrepreneurship failure rate. A positive relationship is shown
with respect to high status assigned to successful entrepreneurs.
Institutional economics developed at the turn of the 19th to the 20th century. There are the “old” institutional
economics and the “new” institutional economics (Hodgson, 2003). The new institutional economics (NIE),
whose leading representatives are North and Williamson, developed around the middle seventies of the 20th
ENTREPRENEURSHIP AND SUSTAINABILITY ISSUES
ISSN 2345-0282 (online) http://jssidoi.org/jesi/
2021 Volume 8 Number 3 (March)
http://doi.org/10.9770/jesi.2021.8.3(32)
507
century to answer the prevailing, neoclassical, and liberal economic thought. Nadeem et al., (2020) study indicate
that participation in gross value chains positively affects GDP per capita, and this effect is greater when
participation is facilitated by an institution. This data suggests that the inclusion of domestic institutions in strong
gross value chains can greatly enhance a country's economic growth.
At the beginning of the 1970s, Douglas Cecil North (1971) developed institutions' theory to modify the
neoclassical theoretical model. However, North distanced himself more and more from the neoclassical economic
theory and significantly modified the whole approach in the research of the long-term economic growth in the
USA and Europe and the analysis of the role and significance of institutions. In that way, he became the founder
of NIE. There is a consensus among researchers that poor institutions greatly hinder progress; however, it is
widely recognized that this idea is of little use without explanations on how they can be improved and made to
self-sustain a "good equilibrium" (Blažys, 2020).
NIE theoreticians consider neoclassical theory as an inadequate tool for the analysis and determination of policies
that would stimulate the growth and development since in the neoclassical analysis, it is usually assumed that
transactions cost nothing, that information is at free disposal, and that countries are benevolent. NIE thus relies
upon the contribution given by Ronald Coase (1937, 1960), who showed that market use has its actors for a price,
and "when transactions cost, institutions are important" (North, 1990). Sun et al., (2020) examine how social
legitimacy and economic efficiency are associated with corporate philanthropy (CPG). (CPG) is viewed as a cost
factor necessary to gain power, and as a resource to achieve efficiency. The paper suggests that state ownership
increases the positive effect of infrastructure investment on (CPG) but decreases the positive effect of human
capital on (CPG).
NIE's core belief is that institutions are also crucial for economic success and are, therefore, susceptible to
economic analysis. In contrast, economic history and development's central task is to consider the evolution of
political and economic institutions that form the economic environment stimulating increased productivity (North,
1991). Godlewska and Morawska (2018) found that the size of the territory or the level of debt did not affect the
behaviour of local and regional formal institutions (LGU) in their support for the development of
entrepreneurship, while the geographical location of the LGU had no influence. The value of supporting
entrepreneurship was the way the company was run, the type of company and the number of companies in the
area to which the LGU is subject.
According to North (1999), there are three characteristic weaknesses of neoclassicism: first, there are no
institutions; second, the assumptions about the acting parties' behavior are inadequate; third, there is no
consideration of time. Moreover, North claims, "institutions and technology interact. One without the other cannot
lead to economic growth."
Field states that while in the standard neoclassical theory exogenous variables encompass preferences, stocks of
factors, technologies, and institutions, NIE attempts to make the latter endogenous to the first three (Field, 1981).
Institutions, as North claims (1997), fundamentally determine how society and economy work. Institutions are the
social rules of the game – limitations created by people that shape their interactions. They give a structure to
stimuli in exchange, whether political, social, or economic. Institutions responsible for banking regulation and
supervision must focus their attention on promoting good corporate governance practices in banking institutions
and on providing an appropriate legal and institutional framework to give stability and confidence to the banking
system, which is crucial for the proper functioning of the economy as a whole (Arias et al., 2020).
The essence of NIE is the attempt to incorporate the theory of institutions into economics. What is left behind is
instrumental rationality – the assumption of neoclassical economics, which made it a theory without institutions.
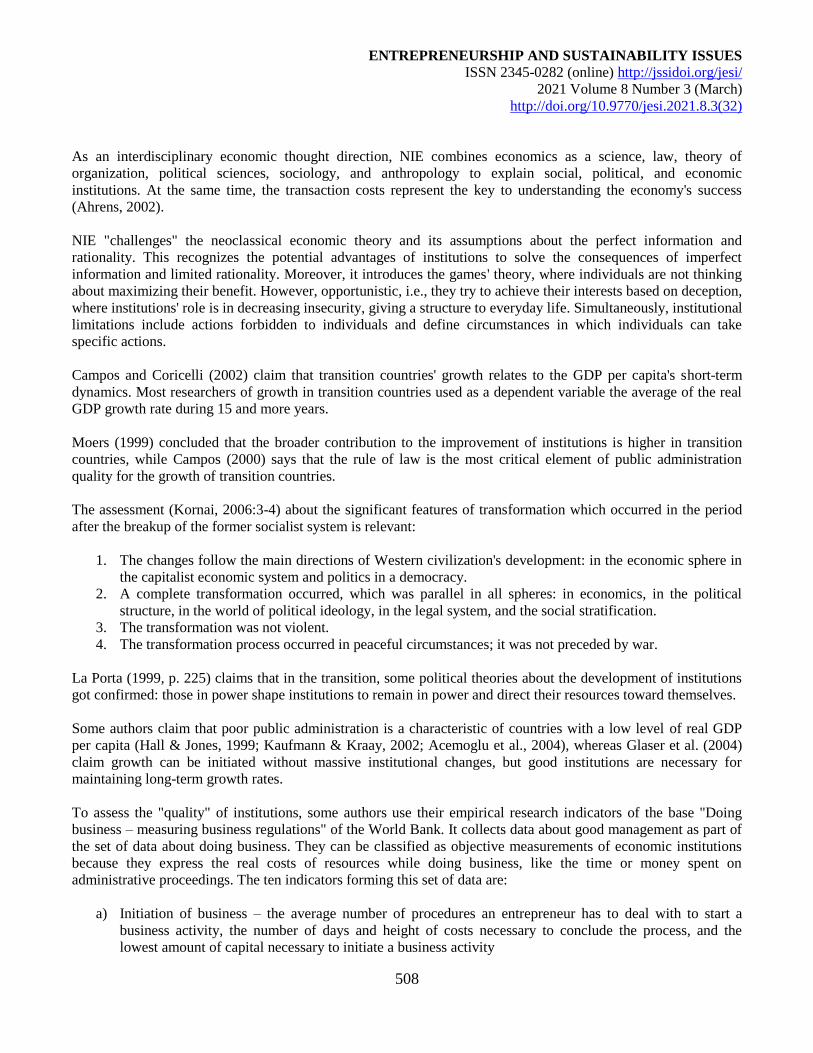
ENTREPRENEURSHIP AND SUSTAINABILITY ISSUES
ISSN 2345-0282 (online) http://jssidoi.org/jesi/
2021 Volume 8 Number 3 (March)
http://doi.org/10.9770/jesi.2021.8.3(32)
508
As an interdisciplinary economic thought direction, NIE combines economics as a science, law, theory of
organization, political sciences, sociology, and anthropology to explain social, political, and economic
institutions. At the same time, the transaction costs represent the key to understanding the economy's success
(Ahrens, 2002).
NIE "challenges" the neoclassical economic theory and its assumptions about the perfect information and
rationality. This recognizes the potential advantages of institutions to solve the consequences of imperfect
information and limited rationality. Moreover, it introduces the games' theory, where individuals are not thinking
about maximizing their benefit. However, opportunistic, i.e., they try to achieve their interests based on deception,
where institutions' role is in decreasing insecurity, giving a structure to everyday life. Simultaneously, institutional
limitations include actions forbidden to individuals and define circumstances in which individuals can take
specific actions.
Campos and Coricelli (2002) claim that transition countries' growth relates to the GDP per capita's short-term
dynamics. Most researchers of growth in transition countries used as a dependent variable the average of the real
GDP growth rate during 15 and more years.
Moers (1999) concluded that the broader contribution to the improvement of institutions is higher in transition
countries, while Campos (2000) says that the rule of law is the most critical element of public administration
quality for the growth of transition countries.
The assessment (Kornai, 2006:3-4) about the significant features of transformation which occurred in the period
after the breakup of the former socialist system is relevant:
1. The changes follow the main directions of Western civilization's development: in the economic sphere in
the capitalist economic system and politics in a democracy.
2. A complete transformation occurred, which was parallel in all spheres: in economics, in the political
structure, in the world of political ideology, in the legal system, and the social stratification.
3. The transformation was not violent.
4. The transformation process occurred in peaceful circumstances; it was not preceded by war.
La Porta (1999, p. 225) claims that in the transition, some political theories about the development of institutions
got confirmed: those in power shape institutions to remain in power and direct their resources toward themselves.
Some authors claim that poor public administration is a characteristic of countries with a low level of real GDP
per capita (Hall & Jones, 1999; Kaufmann & Kraay, 2002; Acemoglu et al., 2004), whereas Glaser et al. (2004)
claim growth can be initiated without massive institutional changes, but good institutions are necessary for
maintaining long-term growth rates.
To assess the "quality" of institutions, some authors use their empirical research indicators of the base "Doing
business – measuring business regulations" of the World Bank. It collects data about good management as part of
the set of data about doing business. They can be classified as objective measurements of economic institutions
because they express the real costs of resources while doing business, like the time or money spent on
administrative proceedings. The ten indicators forming this set of data are:
a) Initiation of business – the average number of procedures an entrepreneur has to deal with to start a
business activity, the number of days and height of costs necessary to conclude the process, and the
lowest amount of capital necessary to initiate a business activity
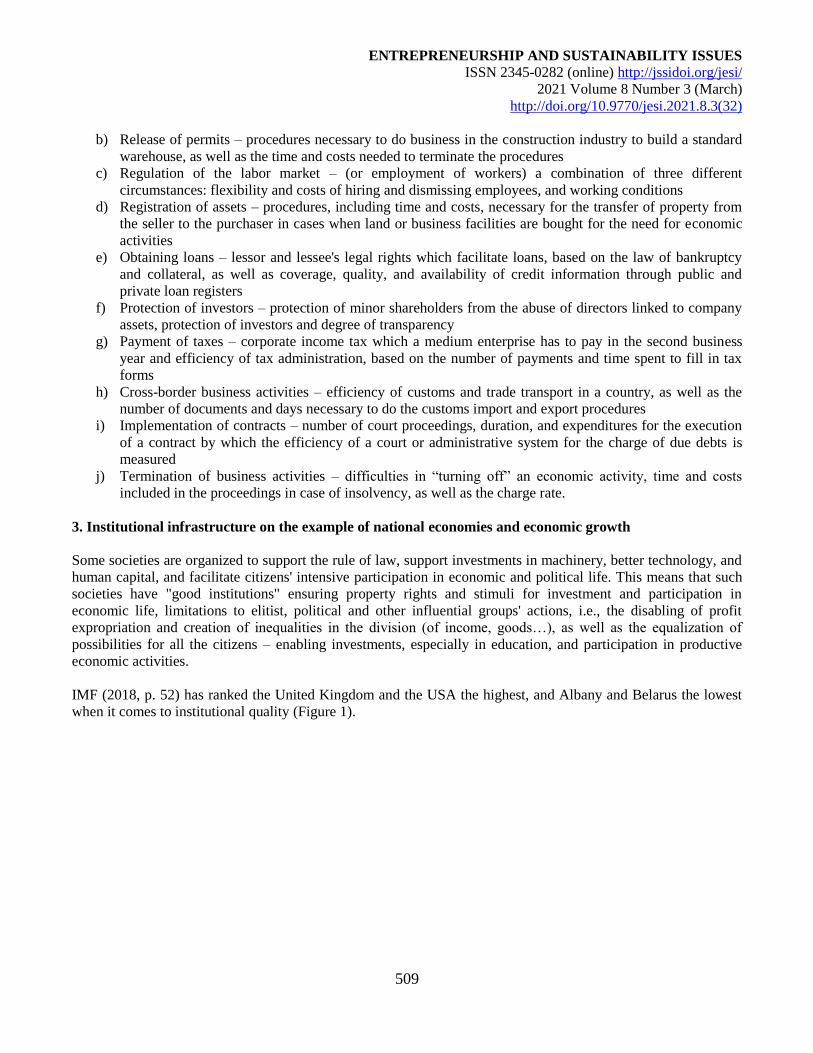
ENTREPRENEURSHIP AND SUSTAINABILITY ISSUES
ISSN 2345-0282 (online) http://jssidoi.org/jesi/
2021 Volume 8 Number 3 (March)
http://doi.org/10.9770/jesi.2021.8.3(32)
509
b) Release of permits – procedures necessary to do business in the construction industry to build a standard
warehouse, as well as the time and costs needed to terminate the procedures
c) Regulation of the labor market – (or employment of workers) a combination of three different
circumstances: flexibility and costs of hiring and dismissing employees, and working conditions
d) Registration of assets – procedures, including time and costs, necessary for the transfer of property from
the seller to the purchaser in cases when land or business facilities are bought for the need for economic
activities
e) Obtaining loans – lessor and lessee's legal rights which facilitate loans, based on the law of bankruptcy
and collateral, as well as coverage, quality, and availability of credit information through public and
private loan registers
f) Protection of investors – protection of minor shareholders from the abuse of directors linked to company
assets, protection of investors and degree of transparency
g) Payment of taxes – corporate income tax which a medium enterprise has to pay in the second business
year and efficiency of tax administration, based on the number of payments and time spent to fill in tax
forms
h) Cross-border business activities – efficiency of customs and trade transport in a country, as well as the
number of documents and days necessary to do the customs import and export procedures
i) Implementation of contracts – number of court proceedings, duration, and expenditures for the execution
of a contract by which the efficiency of a court or administrative system for the charge of due debts is
measured
j) Termination of business activities – difficulties in “turning off” an economic activity, time and costs
included in the proceedings in case of insolvency, as well as the charge rate.
3. Institutional infrastructure on the example of national economies and economic growth
Some societies are organized to support the rule of law, support investments in machinery, better technology, and
human capital, and facilitate citizens' intensive participation in economic and political life. This means that such
societies have "good institutions" ensuring property rights and stimuli for investment and participation in
economic life, limitations to elitist, political and other influential groups' actions, i.e., the disabling of profit
expropriation and creation of inequalities in the division (of income, goods…), as well as the equalization of
possibilities for all the citizens – enabling investments, especially in education, and participation in productive
economic activities.
IMF (2018, p. 52) has ranked the United Kingdom and the USA the highest, and Albany and Belarus the lowest
when it comes to institutional quality (Figure 1).
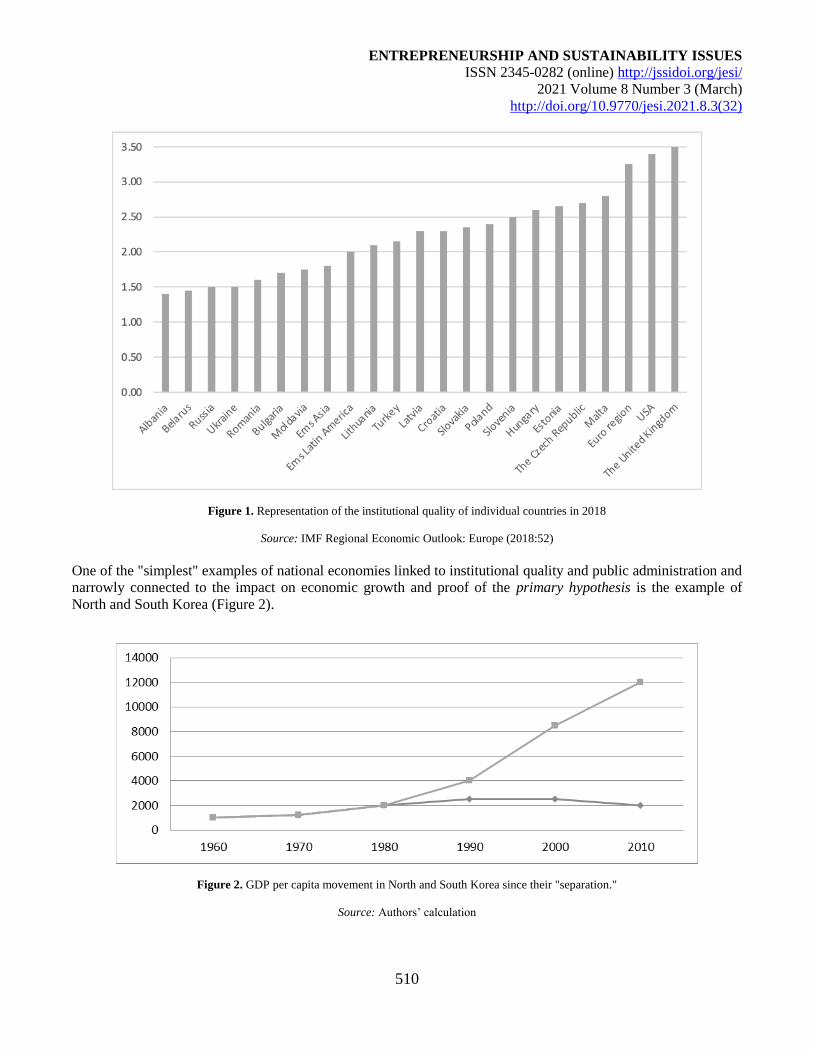
ENTREPRENEURSHIP AND SUSTAINABILITY ISSUES
ISSN 2345-0282 (online) http://jssidoi.org/jesi/
2021 Volume 8 Number 3 (March)
http://doi.org/10.9770/jesi.2021.8.3(32)
510
Figure 1. Representation of the institutional quality of individual countries in 2018
Source: IMF Regional Economic Outlook: Europe (2018:52)
One of the "simplest" examples of national economies linked to institutional quality and public administration and
narrowly connected to the impact on economic growth and proof of the primary hypothesis is the example of
North and South Korea (Figure 2).
Figure 2. GDP per capita movement in North and South Korea since their "separation."
Source: Authors’ calculation
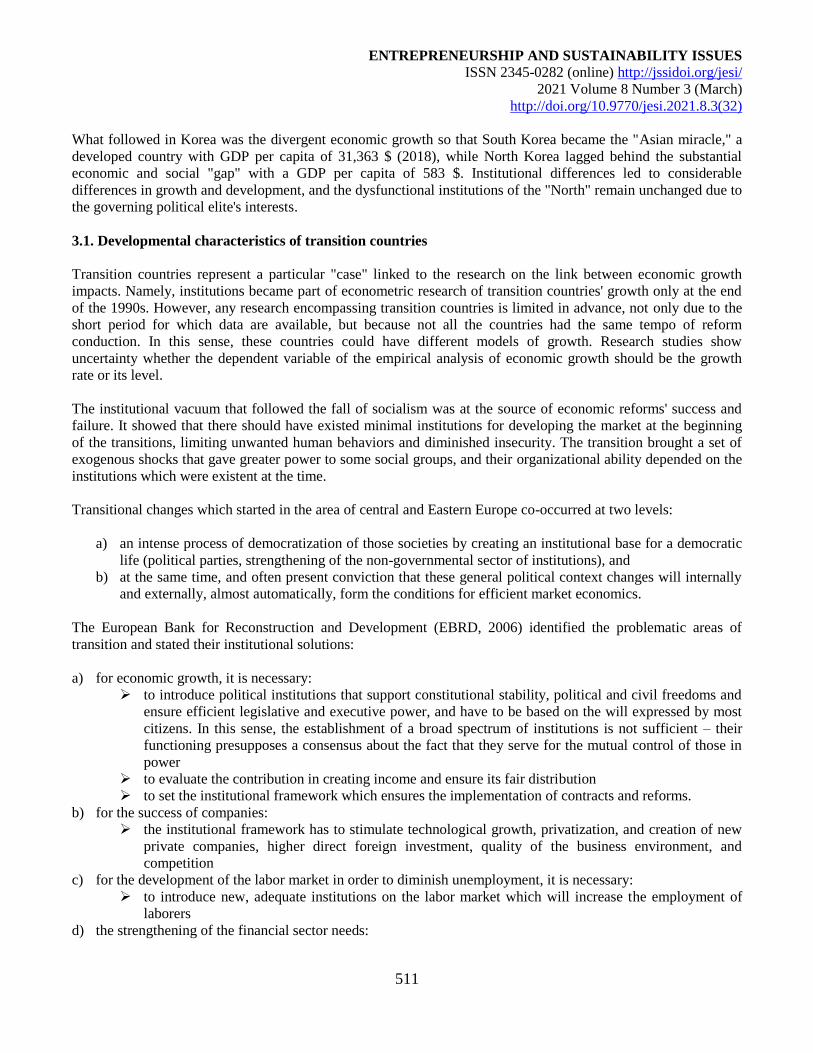
ENTREPRENEURSHIP AND SUSTAINABILITY ISSUES
ISSN 2345-0282 (online) http://jssidoi.org/jesi/
2021 Volume 8 Number 3 (March)
http://doi.org/10.9770/jesi.2021.8.3(32)
511
What followed in Korea was the divergent economic growth so that South Korea became the "Asian miracle," a
developed country with GDP per capita of 31,363 $ (2018), while North Korea lagged behind the substantial
economic and social "gap" with a GDP per capita of 583 $. Institutional differences led to considerable
differences in growth and development, and the dysfunctional institutions of the "North" remain unchanged due to
the governing political elite's interests.
3.1. Developmental characteristics of transition countries
Transition countries represent a particular "case" linked to the research on the link between economic growth
impacts. Namely, institutions became part of econometric research of transition countries' growth only at the end
of the 1990s. However, any research encompassing transition countries is limited in advance, not only due to the
short period for which data are available, but because not all the countries had the same tempo of reform
conduction. In this sense, these countries could have different models of growth. Research studies show
uncertainty whether the dependent variable of the empirical analysis of economic growth should be the growth
rate or its level.
The institutional vacuum that followed the fall of socialism was at the source of economic reforms' success and
failure. It showed that there should have existed minimal institutions for developing the market at the beginning
of the transitions, limiting unwanted human behaviors and diminished insecurity. The transition brought a set of
exogenous shocks that gave greater power to some social groups, and their organizational ability depended on the
institutions which were existent at the time.
Transitional changes which started in the area of central and Eastern Europe co-occurred at two levels:
a) an intense process of democratization of those societies by creating an institutional base for a democratic
life (political parties, strengthening of the non-governmental sector of institutions), and
b) at the same time, and often present conviction that these general political context changes will internally
and externally, almost automatically, form the conditions for efficient market economics.
The European Bank for Reconstruction and Development (EBRD, 2006) identified the problematic areas of
transition and stated their institutional solutions:
a) for economic growth, it is necessary:
to introduce political institutions that support constitutional stability, political and civil freedoms and
ensure efficient legislative and executive power, and have to be based on the will expressed by most
citizens. In this sense, the establishment of a broad spectrum of institutions is not sufficient – their
functioning presupposes a consensus about the fact that they serve for the mutual control of those in
power
to evaluate the contribution in creating income and ensure its fair distribution
to set the institutional framework which ensures the implementation of contracts and reforms.
b) for the success of companies:
the institutional framework has to stimulate technological growth, privatization, and creation of new
private companies, higher direct foreign investment, quality of the business environment, and
competition
c) for the development of the labor market in order to diminish unemployment, it is necessary:
to introduce new, adequate institutions on the labor market which will increase the employment of
laborers
d) the strengthening of the financial sector needs:
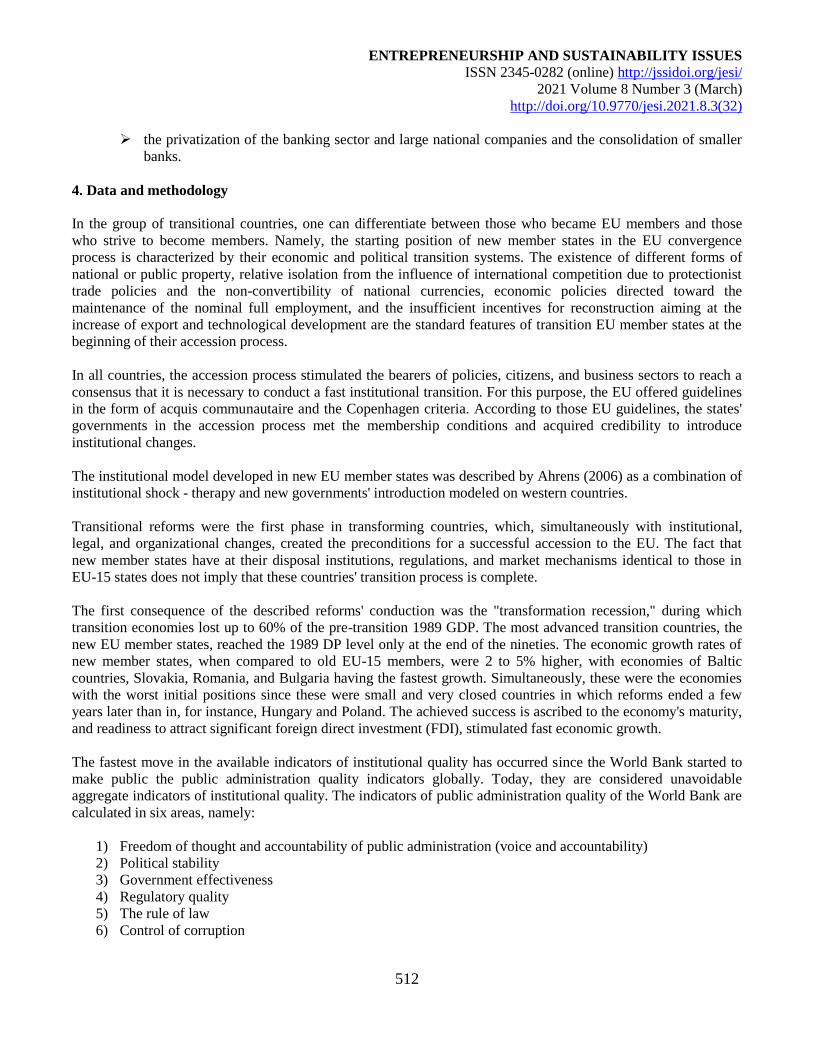
ENTREPRENEURSHIP AND SUSTAINABILITY ISSUES
ISSN 2345-0282 (online) http://jssidoi.org/jesi/
2021 Volume 8 Number 3 (March)
http://doi.org/10.9770/jesi.2021.8.3(32)
512
the privatization of the banking sector and large national companies and the consolidation of smaller
banks.
4. Data and methodology
In the group of transitional countries, one can differentiate between those who became EU members and those
who strive to become members. Namely, the starting position of new member states in the EU convergence
process is characterized by their economic and political transition systems. The existence of different forms of
national or public property, relative isolation from the influence of international competition due to protectionist
trade policies and the non-convertibility of national currencies, economic policies directed toward the
maintenance of the nominal full employment, and the insufficient incentives for reconstruction aiming at the
increase of export and technological development are the standard features of transition EU member states at the
beginning of their accession process.
In all countries, the accession process stimulated the bearers of policies, citizens, and business sectors to reach a
consensus that it is necessary to conduct a fast institutional transition. For this purpose, the EU offered guidelines
in the form of acquis communautaire and the Copenhagen criteria. According to those EU guidelines, the states'
governments in the accession process met the membership conditions and acquired credibility to introduce
institutional changes.
The institutional model developed in new EU member states was described by Ahrens (2006) as a combination of
institutional shock - therapy and new governments' introduction modeled on western countries.
Transitional reforms were the first phase in transforming countries, which, simultaneously with institutional,
legal, and organizational changes, created the preconditions for a successful accession to the EU. The fact that
new member states have at their disposal institutions, regulations, and market mechanisms identical to those in
EU-15 states does not imply that these countries' transition process is complete.
The first consequence of the described reforms' conduction was the "transformation recession," during which
transition economies lost up to 60% of the pre-transition 1989 GDP. The most advanced transition countries, the
new EU member states, reached the 1989 DP level only at the end of the nineties. The economic growth rates of
new member states, when compared to old EU-15 members, were 2 to 5% higher, with economies of Baltic
countries, Slovakia, Romania, and Bulgaria having the fastest growth. Simultaneously, these were the economies
with the worst initial positions since these were small and very closed countries in which reforms ended a few
years later than in, for instance, Hungary and Poland. The achieved success is ascribed to the economy's maturity,
and readiness to attract significant foreign direct investment (FDI), stimulated fast economic growth.
The fastest move in the available indicators of institutional quality has occurred since the World Bank started to
make public the public administration quality indicators globally. Today, they are considered unavoidable
aggregate indicators of institutional quality. The indicators of public administration quality of the World Bank are
calculated in six areas, namely:
1) Freedom of thought and accountability of public administration (voice and accountability)
2) Political stability
3) Government effectiveness
4) Regulatory quality
5) The rule of law
6) Control of corruption
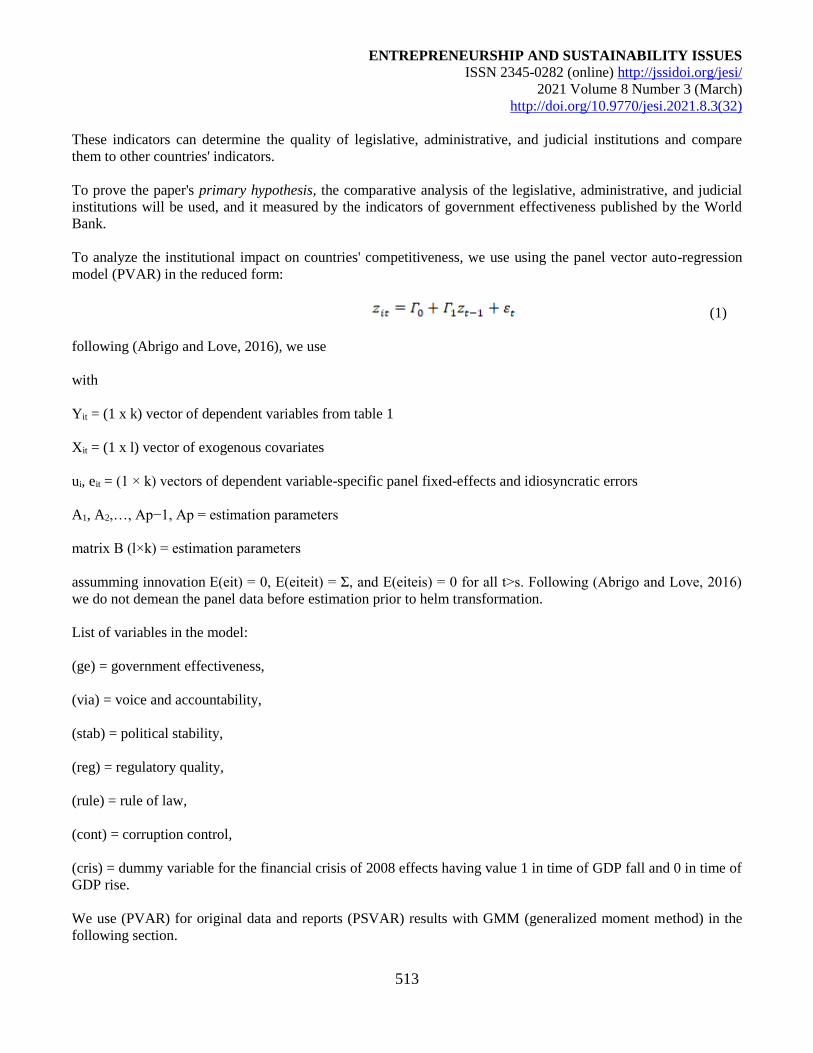
ENTREPRENEURSHIP AND SUSTAINABILITY ISSUES
ISSN 2345-0282 (online) http://jssidoi.org/jesi/
2021 Volume 8 Number 3 (March)
http://doi.org/10.9770/jesi.2021.8.3(32)
513
These indicators can determine the quality of legislative, administrative, and judicial institutions and compare
them to other countries' indicators.
To prove the paper's primary hypothesis, the comparative analysis of the legislative, administrative, and judicial
institutions will be used, and it measured by the indicators of government effectiveness published by the World
Bank.
To analyze the institutional impact on countries' competitiveness, we use using the panel vector auto-regression
model (PVAR) in the reduced form:
(1)
following (Abrigo and Love, 2016), we use
with
Yit = (1 x k) vector of dependent variables from table 1
Xit = (1 x l) vector of exogenous covariates
ui, eit = (1 × k) vectors of dependent variable-specific panel fixed-effects and idiosyncratic errors
A1, A2,…, Ap−1, Ap = estimation parameters
matrix B (l×k) = estimation parameters
assumming innovation E(eit) = 0, E(eiteit) = Σ, and E(eiteis) = 0 for all t>s. Following (Abrigo and Love, 2016)
we do not demean the panel data before estimation prior to helm transformation.
List of variables in the model:
(ge) = government effectiveness,
(via) = voice and accountability,
(stab) = political stability,
(reg) = regulatory quality,
(rule) = rule of law,
(cont) = corruption control,
(cris) = dummy variable for the financial crisis of 2008 effects having value 1 in time of GDP fall and 0 in time of
GDP rise.
We use (PVAR) for original data and reports (PSVAR) results with GMM (generalized moment method) in the
following section.
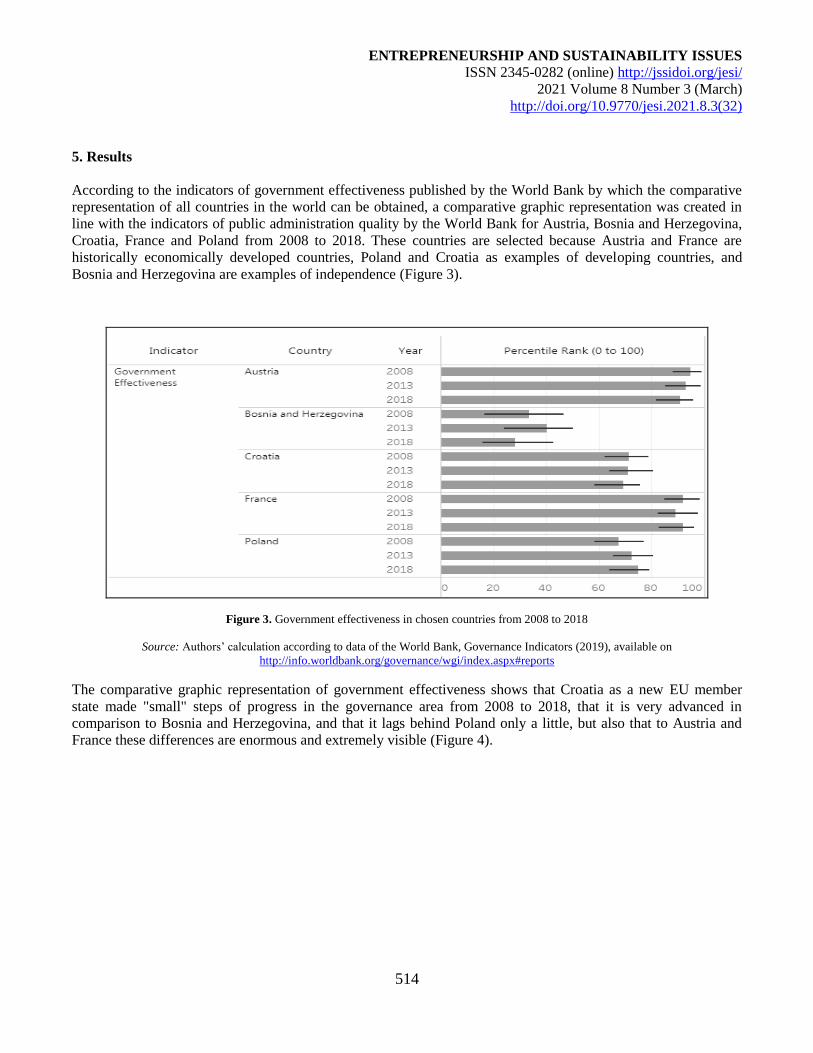
ENTREPRENEURSHIP AND SUSTAINABILITY ISSUES
ISSN 2345-0282 (online) http://jssidoi.org/jesi/
2021 Volume 8 Number 3 (March)
http://doi.org/10.9770/jesi.2021.8.3(32)
514
5. Results
According to the indicators of government effectiveness published by the World Bank by which the comparative
representation of all countries in the world can be obtained, a comparative graphic representation was created in
line with the indicators of public administration quality by the World Bank for Austria, Bosnia and Herzegovina,
Croatia, France and Poland from 2008 to 2018. These countries are selected because Austria and France are
historically economically developed countries, Poland and Croatia as examples of developing countries, and
Bosnia and Herzegovina are examples of independence (Figure 3).
Figure 3. Government effectiveness in chosen countries from 2008 to 2018
Source: Authors’ calculation according to data of the World Bank, Governance Indicators (2019), available on
http://info.worldbank.org/governance/wgi/index.aspx#reports
The comparative graphic representation of government effectiveness shows that Croatia as a new EU member
state made "small" steps of progress in the governance area from 2008 to 2018, that it is very advanced in
comparison to Bosnia and Herzegovina, and that it lags behind Poland only a little, but also that to Austria and
France these differences are enormous and extremely visible (Figure 4).
ENTREPRENEURSHIP AND SUSTAINABILITY ISSUES
ISSN 2345-0282 (online) http://jssidoi.org/jesi/
2021 Volume 8 Number 3 (March)
http://doi.org/10.9770/jesi.2021.8.3(32)
515
Figure 4. Voice and accountability of the chosen countries
Source: Authors’ calculation according to data of the World Bank, Governance Indicators (2019), available on
http://info.worldbank.org/governance/wgi/index.aspx#reports
Figure 4 shows that freedom of thought and government accountability in Austria and France are high. Croatia
records minor growth or stagnation in the freedom of thought from 2008 to 2018, but the differences are still
expressed. It lags behind Austria, France, and to a lower extent Poland, and is better than Bosnia and Herzegovina
only (Figure 5).
Figure 5. The political stability of chosen countries from 2008 to 2018
Source: Authors’ calculation according to data of the World Bank, Governance Indicators (2019), available on
http://info.worldbank.org/governance/wgi/index.aspx#reports
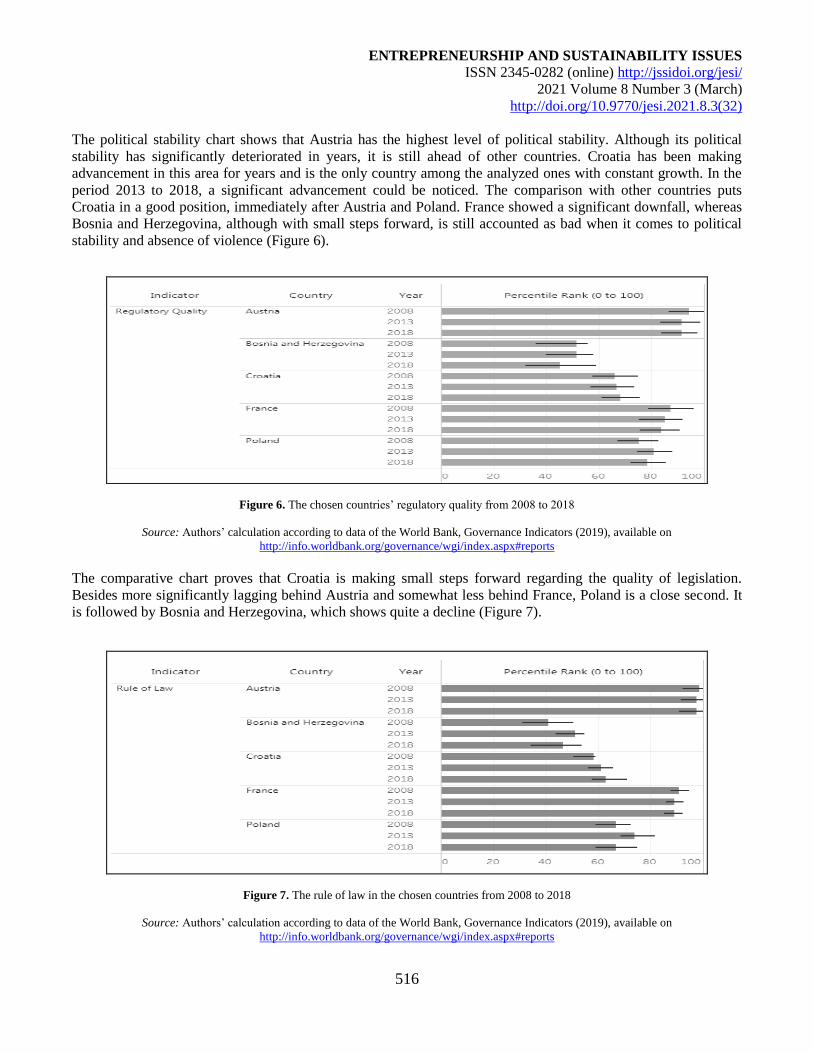
ENTREPRENEURSHIP AND SUSTAINABILITY ISSUES
ISSN 2345-0282 (online) http://jssidoi.org/jesi/
2021 Volume 8 Number 3 (March)
http://doi.org/10.9770/jesi.2021.8.3(32)
516
The political stability chart shows that Austria has the highest level of political stability. Although its political
stability has significantly deteriorated in years, it is still ahead of other countries. Croatia has been making
advancement in this area for years and is the only country among the analyzed ones with constant growth. In the
period 2013 to 2018, a significant advancement could be noticed. The comparison with other countries puts
Croatia in a good position, immediately after Austria and Poland. France showed a significant downfall, whereas
Bosnia and Herzegovina, although with small steps forward, is still accounted as bad when it comes to political
stability and absence of violence (Figure 6).
Figure 6. The chosen countries’ regulatory quality from 2008 to 2018
Source: Authors’ calculation according to data of the World Bank, Governance Indicators (2019), available on
http://info.worldbank.org/governance/wgi/index.aspx#reports
The comparative chart proves that Croatia is making small steps forward regarding the quality of legislation.
Besides more significantly lagging behind Austria and somewhat less behind France, Poland is a close second. It
is followed by Bosnia and Herzegovina, which shows quite a decline (Figure 7).
Figure 7. The rule of law in the chosen countries from 2008 to 2018
Source: Authors’ calculation according to data of the World Bank, Governance Indicators (2019), available on
http://info.worldbank.org/governance/wgi/index.aspx#reports
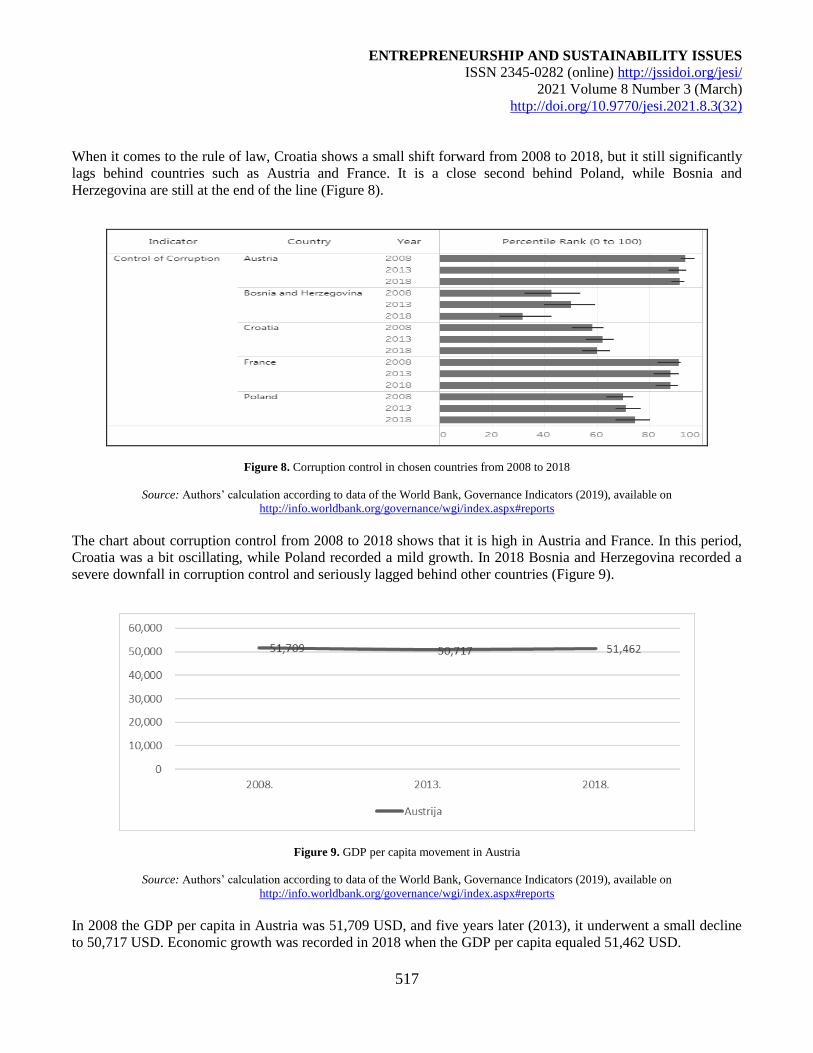
ENTREPRENEURSHIP AND SUSTAINABILITY ISSUES
ISSN 2345-0282 (online) http://jssidoi.org/jesi/
2021 Volume 8 Number 3 (March)
http://doi.org/10.9770/jesi.2021.8.3(32)
517
When it comes to the rule of law, Croatia shows a small shift forward from 2008 to 2018, but it still significantly
lags behind countries such as Austria and France. It is a close second behind Poland, while Bosnia and
Herzegovina are still at the end of the line (Figure 8).
Figure 8. Corruption control in chosen countries from 2008 to 2018
Source: Authors’ calculation according to data of the World Bank, Governance Indicators (2019), available on
http://info.worldbank.org/governance/wgi/index.aspx#reports
The chart about corruption control from 2008 to 2018 shows that it is high in Austria and France. In this period,
Croatia was a bit oscillating, while Poland recorded a mild growth. In 2018 Bosnia and Herzegovina recorded a
severe downfall in corruption control and seriously lagged behind other countries (Figure 9).
Figure 9. GDP per capita movement in Austria
Source: Authors’ calculation according to data of the World Bank, Governance Indicators (2019), available on
http://info.worldbank.org/governance/wgi/index.aspx#reports
In 2008 the GDP per capita in Austria was 51,709 USD, and five years later (2013), it underwent a small decline
to 50,717 USD. Economic growth was recorded in 2018 when the GDP per capita equaled 51,462 USD.
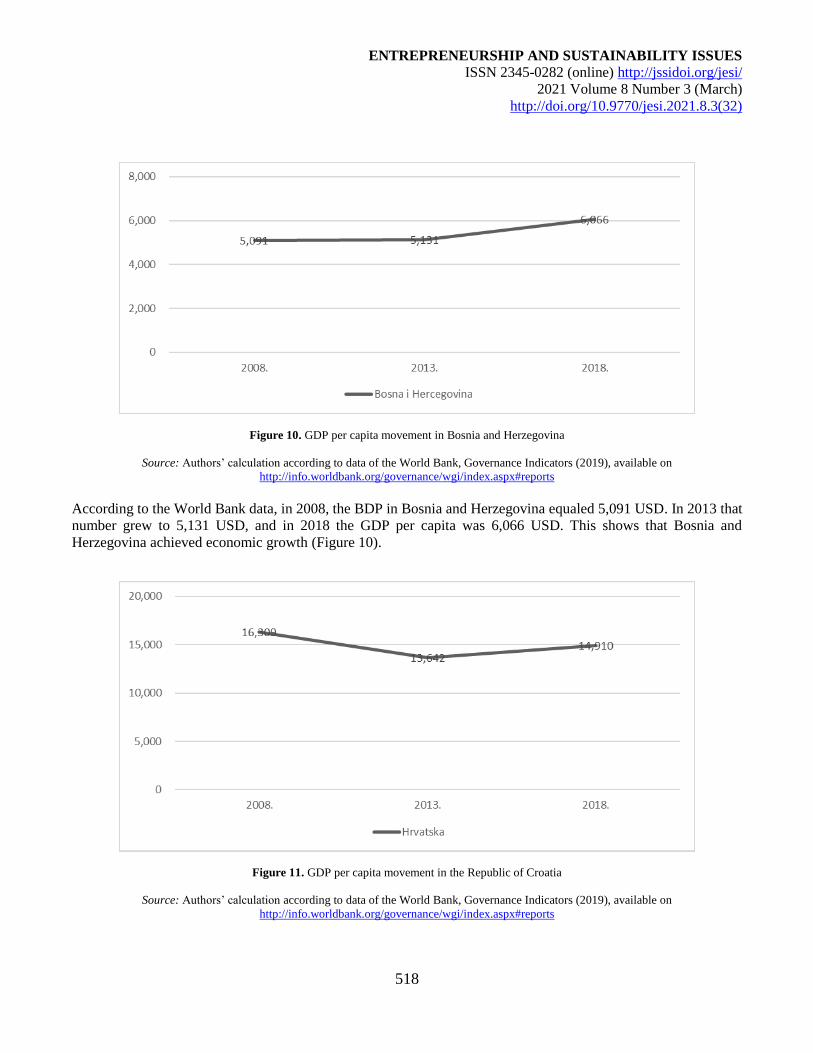
ENTREPRENEURSHIP AND SUSTAINABILITY ISSUES
ISSN 2345-0282 (online) http://jssidoi.org/jesi/
2021 Volume 8 Number 3 (March)
http://doi.org/10.9770/jesi.2021.8.3(32)
518
Figure 10. GDP per capita movement in Bosnia and Herzegovina
Source: Authors’ calculation according to data of the World Bank, Governance Indicators (2019), available on
http://info.worldbank.org/governance/wgi/index.aspx#reports
According to the World Bank data, in 2008, the BDP in Bosnia and Herzegovina equaled 5,091 USD. In 2013 that
number grew to 5,131 USD, and in 2018 the GDP per capita was 6,066 USD. This shows that Bosnia and
Herzegovina achieved economic growth (Figure 10).
Figure 11. GDP per capita movement in the Republic of Croatia
Source: Authors’ calculation according to data of the World Bank, Governance Indicators (2019), available on
http://info.worldbank.org/governance/wgi/index.aspx#reports
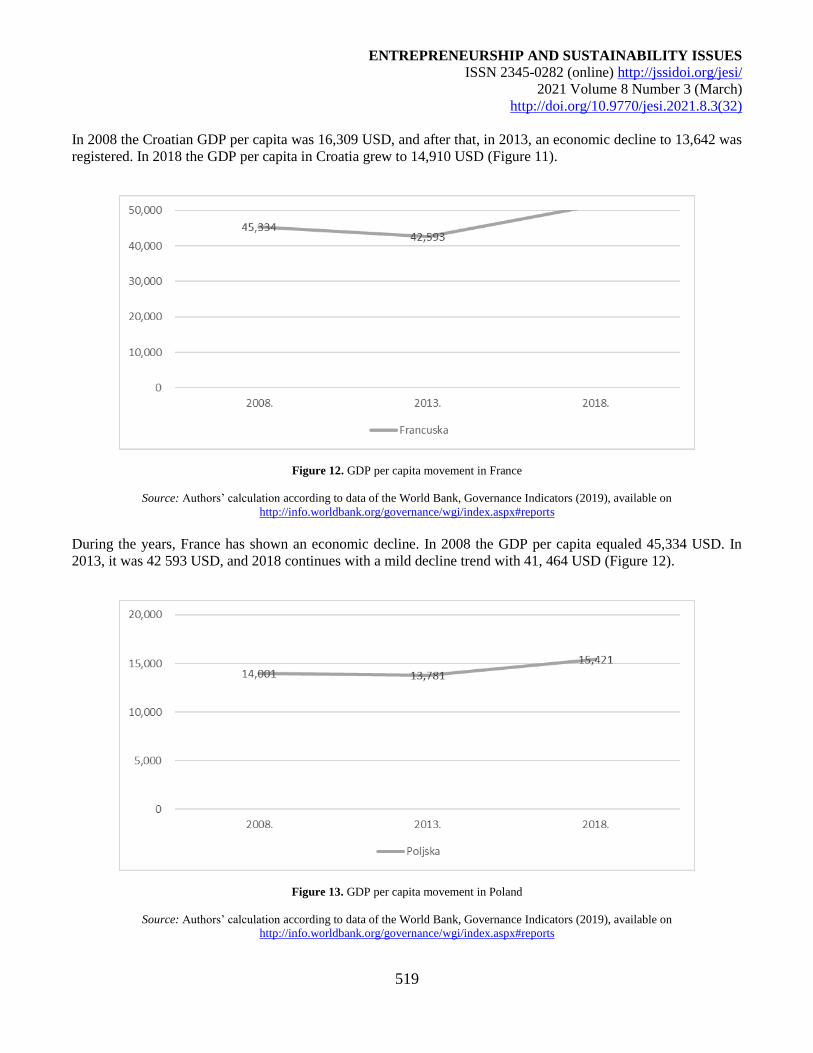
ENTREPRENEURSHIP AND SUSTAINABILITY ISSUES
ISSN 2345-0282 (online) http://jssidoi.org/jesi/
2021 Volume 8 Number 3 (March)
http://doi.org/10.9770/jesi.2021.8.3(32)
519
In 2008 the Croatian GDP per capita was 16,309 USD, and after that, in 2013, an economic decline to 13,642 was
registered. In 2018 the GDP per capita in Croatia grew to 14,910 USD (Figure 11).
Figure 12. GDP per capita movement in France
Source: Authors’ calculation according to data of the World Bank, Governance Indicators (2019), available on
http://info.worldbank.org/governance/wgi/index.aspx#reports
During the years, France has shown an economic decline. In 2008 the GDP per capita equaled 45,334 USD. In
2013, it was 42 593 USD, and 2018 continues with a mild decline trend with 41, 464 USD (Figure 12).
Figure 13. GDP per capita movement in Poland
Source: Authors’ calculation according to data of the World Bank, Governance Indicators (2019), available on
http://info.worldbank.org/governance/wgi/index.aspx#reports
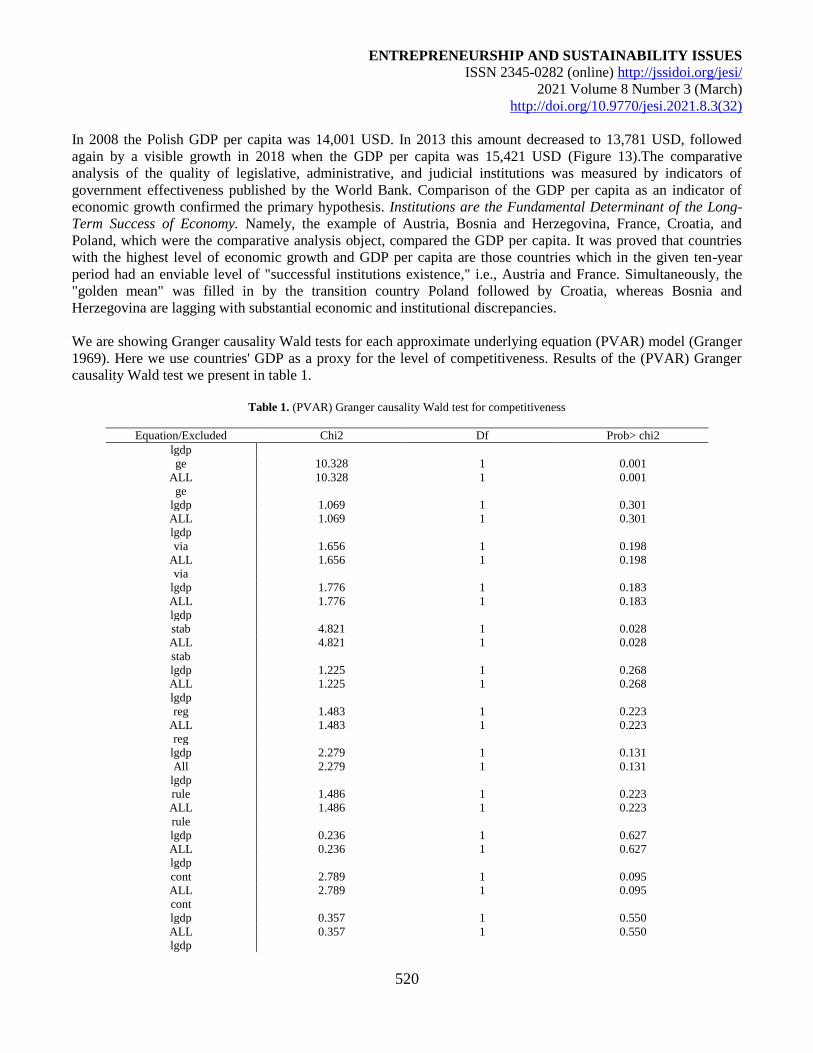
ENTREPRENEURSHIP AND SUSTAINABILITY ISSUES
ISSN 2345-0282 (online) http://jssidoi.org/jesi/
2021 Volume 8 Number 3 (March)
http://doi.org/10.9770/jesi.2021.8.3(32)
520
In 2008 the Polish GDP per capita was 14,001 USD. In 2013 this amount decreased to 13,781 USD, followed
again by a visible growth in 2018 when the GDP per capita was 15,421 USD (Figure 13).The comparative
analysis of the quality of legislative, administrative, and judicial institutions was measured by indicators of
government effectiveness published by the World Bank. Comparison of the GDP per capita as an indicator of
economic growth confirmed the primary hypothesis. Institutions are the Fundamental Determinant of the Long-
Term Success of Economy. Namely, the example of Austria, Bosnia and Herzegovina, France, Croatia, and
Poland, which were the comparative analysis object, compared the GDP per capita. It was proved that countries
with the highest level of economic growth and GDP per capita are those countries which in the given ten-year
period had an enviable level of "successful institutions existence," i.e., Austria and France. Simultaneously, the
"golden mean" was filled in by the transition country Poland followed by Croatia, whereas Bosnia and
Herzegovina are lagging with substantial economic and institutional discrepancies.
We are showing Granger causality Wald tests for each approximate underlying equation (PVAR) model (Granger
1969). Here we use countries' GDP as a proxy for the level of competitiveness. Results of the (PVAR) Granger
causality Wald test we present in table 1.
Table 1. (PVAR) Granger causality Wald test for competitiveness
Equation/Excluded Chi2 Df Prob> chi2
lgdp
ge 10.328 1 0.001
ALL 10.328 1 0.001
ge
lgdp 1.069 1 0.301
ALL 1.069 1 0.301
lgdp
via 1.656 1 0.198
ALL 1.656 1 0.198
via
lgdp 1.776 1 0.183
ALL 1.776 1 0.183
lgdp
stab 4.821 1 0.028
ALL 4.821 1 0.028
stab
lgdp 1.225 1 0.268
ALL 1.225 1 0.268
lgdp
reg 1.483 1 0.223
ALL 1.483 1 0.223
reg
lgdp 2.279 1 0.131
All 2.279 1 0.131
lgdp
rule 1.486 1 0.223
ALL 1.486 1 0.223
rule
lgdp 0.236 1 0.627
ALL 0.236 1 0.627
lgdp
cont 2.789 1 0.095
ALL 2.789 1 0.095
cont
lgdp 0.357 1 0.550
ALL 0.357 1 0.550
lgdp
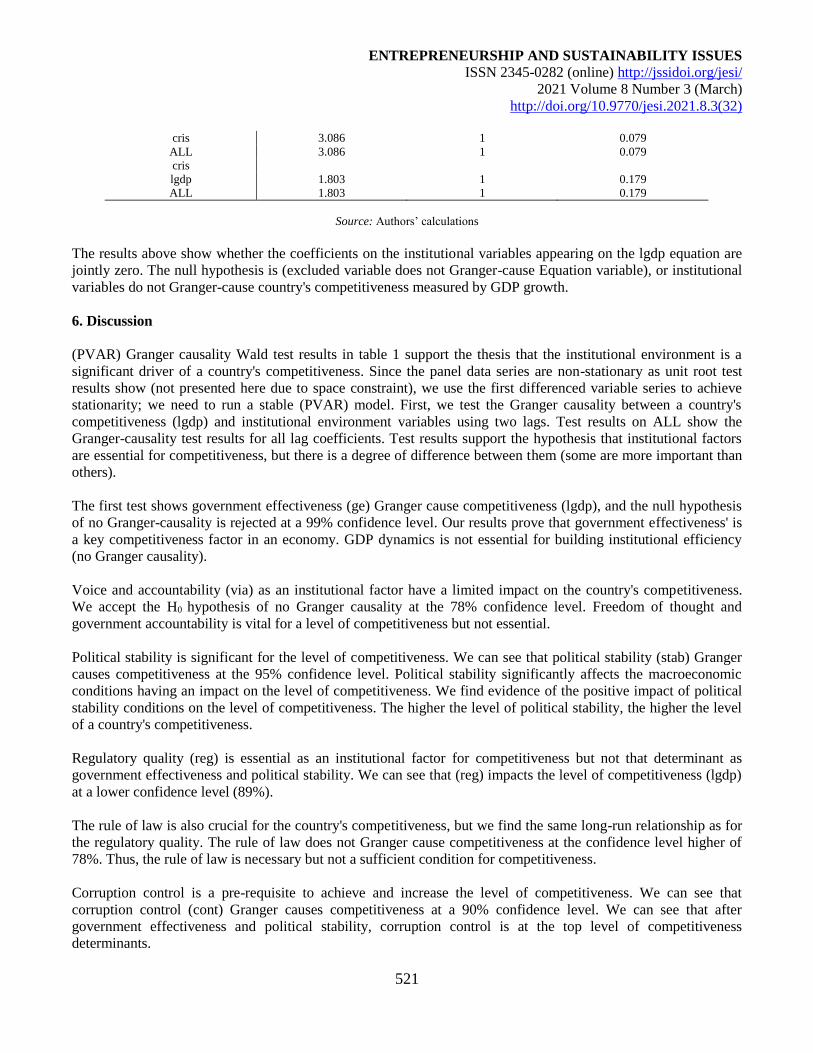
ENTREPRENEURSHIP AND SUSTAINABILITY ISSUES
ISSN 2345-0282 (online) http://jssidoi.org/jesi/
2021 Volume 8 Number 3 (March)
http://doi.org/10.9770/jesi.2021.8.3(32)
521
cris 3.086 1 0.079
ALL 3.086 1 0.079
cris
lgdp 1.803 1 0.179
ALL 1.803 1 0.179
Source: Authors’ calculations
The results above show whether the coefficients on the institutional variables appearing on the lgdp equation are
jointly zero. The null hypothesis is (excluded variable does not Granger-cause Equation variable), or institutional
variables do not Granger-cause country's competitiveness measured by GDP growth.
6. Discussion
(PVAR) Granger causality Wald test results in table 1 support the thesis that the institutional environment is a
significant driver of a country's competitiveness. Since the panel data series are non-stationary as unit root test
results show (not presented here due to space constraint), we use the first differenced variable series to achieve
stationarity; we need to run a stable (PVAR) model. First, we test the Granger causality between a country's
competitiveness (lgdp) and institutional environment variables using two lags. Test results on ALL show the
Granger-causality test results for all lag coefficients. Test results support the hypothesis that institutional factors
are essential for competitiveness, but there is a degree of difference between them (some are more important than
others).
The first test shows government effectiveness (ge) Granger cause competitiveness (lgdp), and the null hypothesis
of no Granger-causality is rejected at a 99% confidence level. Our results prove that government effectiveness' is
a key competitiveness factor in an economy. GDP dynamics is not essential for building institutional efficiency
(no Granger causality).
Voice and accountability (via) as an institutional factor have a limited impact on the country's competitiveness.
We accept the H0 hypothesis of no Granger causality at the 78% confidence level. Freedom of thought and
government accountability is vital for a level of competitiveness but not essential.
Political stability is significant for the level of competitiveness. We can see that political stability (stab) Granger
causes competitiveness at the 95% confidence level. Political stability significantly affects the macroeconomic
conditions having an impact on the level of competitiveness. We find evidence of the positive impact of political
stability conditions on the level of competitiveness. The higher the level of political stability, the higher the level
of a country's competitiveness.
Regulatory quality (reg) is essential as an institutional factor for competitiveness but not that determinant as
government effectiveness and political stability. We can see that (reg) impacts the level of competitiveness (lgdp)
at a lower confidence level (89%).
The rule of law is also crucial for the country's competitiveness, but we find the same long-run relationship as for
the regulatory quality. The rule of law does not Granger cause competitiveness at the confidence level higher of
78%. Thus, the rule of law is necessary but not a sufficient condition for competitiveness.
Corruption control is a pre-requisite to achieve and increase the level of competitiveness. We can see that
corruption control (cont) Granger causes competitiveness at a 90% confidence level. We can see that after
government effectiveness and political stability, corruption control is at the top level of competitiveness
determinants.
ENTREPRENEURSHIP AND SUSTAINABILITY ISSUES
ISSN 2345-0282 (online) http://jssidoi.org/jesi/
2021 Volume 8 Number 3 (March)
http://doi.org/10.9770/jesi.2021.8.3(32)
522
The dummy variable (cris) as a proxy for the financial crisis of 2008, as we expected, had a significant impact on
the competitiveness across the panel. We can see that (cris) Granger causes competitiveness at a 93% confidence
level supporting the thesis that financial crisis (and financial cycles) significantly negatively impact a country's
level of competitiveness.
Our results support the study results from Rusu and Roman (2018), Djeri et al. (2018), and Radulescu et al.
(2019).
7. Conclusion
The mentioned empirical research and literature review concluded that the overall results are that "institutions
make the difference." However, it remains unsolved whether the given institutions are the source of economic
growth or has growth incited by an adequate economic policy led to the formation of new institutions.
By the conducted research of correlation of institutional quality and economic growth, it can be concluded that
economic institutions can contribute to a better understanding of the good and bad sides of an economic quality
which aims at improving economic success and that institutions can be significant for the global position of an
economy.
The research showed a high level of correlation between institutions' success and gross domestic product with
indications of equal returns per ratio. The advancement of institutional quality, indirectly through GDP, can lead
to the relative significance of economies.
The research limitations are that the indicators of government effectiveness of the World Bank do not reflect
certain permanent institutional features. However, the results of a particular country's policies in the former period
and specific governance dimensions are measured very widely.
Moreover, it is evident in the research that institutional quality is vital for growth. However, the cognitions about
the relative significance of institutions compared to other determinants of growth and development, such as the
historical heritage or trade, i.e., the foreign trade exchange, is unclear, representing a recommendation for future
research.
References
Acemoglu, D., Johnson, S. & Robinson, J. A. (2006). Institutions as a Fundamental Cause of Long-Run Growth. In Aghion, P. and
Stephen, D. (eds). Handbook of Economic Growth, North Holland, Amsterdam.
Ahrens, J. & Meurers, M. (2000). Institutions, Governance, and Economic Performance in Post-Socialist Countries: A Conceptual and
Empirical Approach. 4th International Conference “Institutions in Transition," 23 – 24 June, Portorož, Slovenia, pp. 314-317.
Arias, J., Maquieira, C., & Jara, M. (2020). Do legal and institutional environments matter for banking system performance?, Economic
Research-Ekonomska Istraživanja, 33(1), 2203-2228, https://doi.org/10.1080/1331677X.2019.1666023
Austria Wirtschaftsservice: www.awsg.at
Beck, T. & Laeven, L. (2005). Institution Building and Growth in Transition Economies. World Bank Policy Research Working Paper, No.
3657.
Blažys, E. (2020). Governance spending fixation as a tool for reform to improve institutions, Economic Research-Ekonomska Istraživanja,
33(1), 934-956, https://doi.org/10.1080/1331677X.2019.1676282

ENTREPRENEURSHIP AND SUSTAINABILITY ISSUES
ISSN 2345-0282 (online) http://jssidoi.org/jesi/
2021 Volume 8 Number 3 (March)
http://doi.org/10.9770/jesi.2021.8.3(32)
523
Campos, N. F. & Coricelli, F. (2002). Growth in Transition: What We Know, What We Don't, and What We Should. William Davidson
Institute Working Paper, No. 470.
Campos, N. F. (2000). Context is Everything: Measuring Institutional Change in Transition Economies. World Bank Working Paper, No.
2269.
Chambre de commerce et d’industrie: www.cci.fr (French Chambers of Commerce and Industry)
Croatian Bureau of Statistics, www.dzs.hr
del Olmo-García, F., Crecente, F., & Sarabia, M. (2020). Macroeconomic and institutional drivers of early failure among self-employed
entrepreneurs: an analysis of the euro zone, Economic Research-Ekonomska Istraživanja, 33(1), 1830-1848,
https://doi.org/10.1080/1331677X.2020.1754268
Duke Economics. (October 19, 2010). Timur Kuran: Institutions and Economic Performance, YouTube.
https://www.youtube.com/watch?v=IbAL7s2QgNk
Edison, H. (2003). Testing the Links: How Strong are the Links Between Institutional Quality and Economic Performance?. Finance and
Development, (40), 2, 35-37.
Federal Ministry of Finance of Bosnia and Herzegovina, http://www.fmf.gov.ba/
French Ministry for the Economy and Finance: www.economie.gouv.fr
Grossman, G. M. & Helpman, E. (1991). Innovation and Growth in the Global Economy. Cambridge, Mass. The MIT Press.
Hair Jr., J. F., Black, W. C., Babin, B. J., Anderson, R. E. (2009). Multivariate Data Analysis (7th Edition), Prentice Hall.
Hammermann, F., Schweickert, R. (2005). EU Enlargement and Institutional Development: How Far Away Are the EU’s Balkan and Black
Sea Neighbors?. Kiel Working Paper No. 1261, Kiel Institute for World Economics, November 2005.
Iacobuta, A-O., Mursa, G.C., Mihai, C., Cautisanu, C., & Cismas, L.M. (2019). Institutions and Sustainable Development: A Cross-
Country Analysis. Transformations in Business & Economics, Vol. 18, No 2A (47A), 628-646.
Kasper, W. & Streit, M. E. (1998). Institutional Economics. Cheltenham: Edward Elgar.
Kaufmann, D. & Kraay, A., (2002). Growth Without Governance. World Bank Working Paper, No. 2928.
Knack, S. & Keefer P. (1995). Institutions and Economic Performance: CrossCountry Tests Using Alternative Institutional Measures.
Economics and Politics, 7 (3), 207-227.
Knack, S. (2003). Democracy, Governance and Growth, The University of Michigan Press: Ann Arbor.
Kornai, J. (2006). The Great Transformation of Central Eastern Europe: Success and Disappointment. Croatian Journal of Social Policy,
Year 13, No. 3-4, Zagreb, July – December 2006.
La Porta, R. et al. (1999). The Quality of Government. Journal of Law, Economics and Organization, 15 (1), pp. 222-279.
https://doi.org/10.1093/jleo/15.1.222
Lincényi, M., Čársky, J. (2021). Research of citizens' behavior in a political campaign in searching for and monitoring political advertising
in The Slovak Republic. Insights into Regional Development, 3(1), 29-40. https://doi.org/10.9770/IRD.2021.3.1(2)
Mazzanti, M., Mazzarano, M., Pronti, A., Quatrosi, M. (2020). Fiscal policies, public investments and wellbeing: mapping the evolution of
the EU. Insights into Regional Development, 2(4), 725-749. http://doi.org/10.9770/IRD.2020.2.4(1)
Ministry of Finance od the Republic of Poland, http://www.mf.gov.pl/ministerstwo-finansow
Ministry of State Treasury of the Republic of Poland, http://www.msp.gov.pl/portal/en/43/Announcements.html
ENTREPRENEURSHIP AND SUSTAINABILITY ISSUES
ISSN 2345-0282 (online) http://jssidoi.org/jesi/
2021 Volume 8 Number 3 (March)
http://doi.org/10.9770/jesi.2021.8.3(32)
524
Moers, L. (1999). Growth Empirics with Institutional Measures and Its Application to Transition Countries: A Survey. Tinbergen Institute
Discussion Papers, No. 98-126/2.
Nadeem, M., Momna Niazi Y.J., Tian, Y., & Subhan, S. (2020). Paths of economic development: a global evidence for the mediating role
of institutions for participation in global value chains, Economic Research-Ekonomska Istraživanja,
https://doi.org/10.1080/1331677X.2020.1804426
North, D. C. (1971). Institutional change and Economic Growth, Journal of Economic History, 31, 118 – 125.
North, D. C. (1991). Institutions. Journal of Economic Perspectives, Winter, 5(1), 97 – 112. https://doi.org/10.1257/jep.5.1.97
North, D. C. (1997a). Cliometrics – 40 Years Latter. American Economic Review, Papers and Proceedings, May, 87(2),
12 – 14.
North, D. C. (1997b). The Contribution of the New Institutional Economics to an Understanding of the Transition Problem. UNU/WIDER
Annual Lecture.
North, D. C. (1999a). Response to Geddes and Keohane. In Alt, J., Levi, M., & Ostrom, E. (1999). Competition and
Cooperation: Conversations with Nobelists about Economics and Political Science. New York: Russell Sage Foundation, pp. 247 – 252.
North, D. C. (1999b). In Anticipation of the Marriage of Political and Economic Theory. In Alt, J., Levi, M., & Ostrom, E.
(1999). Competition and Cooperation: Conversations with Nobelists about Economics and Political Science. New York: Russell Sage
Foundation, pp. 314-317
North, D. C. (2003). Institutions, Institutional Change and Economic Performance, Masmedia, Zagreb.
North, DC (1990). Institutions, Institutional Change and Economic Performance, 18th edition, Cambridge University Press, SAD.
North, DC (1994). Institutions and Economic Theory. The American Economist, 36 (1),
3-6.
Ott, K. (2004). Croatian accession to the European union: Institutional challenges. Zagreb, Institut za javne financije: Zaklada Friedrich
Ebert.
Pieper, U. (2000). Deindustrialization and the Social and Economic Sustainability Nexus in Developing Countries: Cross-Country
Evidence on Productivity and Employment. Journal of Development Studies, Taylor & Francis Journals, 36(4), 66-99.
https://doi.org/10.1080/00220380008422638
Rodrik, D. (1997). TFPG Controversies, Institutions, and Economic Performance in East Asia. National Bureau of Economic Research
Working Paper, No. 5914.
Rodrik, D. (2010). One Economics, Many Recipes: Globalization, Institutions and Economic Growth, Princeton: UP Princeton.
Rodrik, D., Subramanian, A. & Trebbi, F. (2002). Institutions Rule: the primacy of institutions over integration and geography in economic
development. IMF Working Paper, No. 02/189
Shleifer, A. (1997). Government in transition. European Economic Review, 41, 385-410.
Start-up Service Austria, www.gruenderservice.at
Statistik Austria: http://www.statistik.at/web_en/statistics/------/hows_austria/index.html, pp. 23
Sun, J., Ji, Z., Chen, W., & Wang, X. (2020). State ownership, institutional development, and corporate philanthropic giving: an integrated
view of legitimacy–efficiency trade-offs, Economic Research-Ekonomska Istraživanja, https://doi.org/10.1080/1331677X.2020.1802322
The Austrian Federal Economic Chamber, http://wko.at
The Central Bank of Bosnia and Herzegovina: www.cbbh.ba
The Central Registration and Information on Economic Activity of the Republic of Poland, https://prod.ceidg.gov.pl
ENTREPRENEURSHIP AND SUSTAINABILITY ISSUES
ISSN 2345-0282 (online) http://jssidoi.org/jesi/
2021 Volume 8 Number 3 (March)
http://doi.org/10.9770/jesi.2021.8.3(32)
525
The Croatian National Tourist Board, http://business.croatia.hr/hr-HR/Hrvatska-turisticka-zajednica
The Foreign Investments Promotion Agency of BiH – FIPA,
http://www.fipa.gov.ba/publikacije_materijali/zakoni/default.aspx?id=317&langTag=bs-BA
The Growth Report: Strategies for Sustained Growth and Inclusive Development (2018), The International Bank for Reconstruction and
Development / The World Bank, The Commission on Growth and Development.
The Statistics Agency of Bosnia and Herzegovina, The Central Bank of Bosnia and Herzegovina http://www.bhas.ba/Home/
The Ministry of Finance of the Republic of Croatia, https://mfin.gov.hr/
Trofimov, I. D. (2017). Entrepreneurship and Policy Dynamics: a Theoretical Framework. Journal of Eurasian Economic Dialogue, 2(3),
13–29.
Vasconcelos, V.V. (2021). Social justice and sustainable regional development: reflections on discourse and practice in public policies and
public budget. Insights into Regional Development, 3(1), 10-28. https://doi.org/10.9770/IRD.2021.3.1(1)
Why Institutions Matter Dr. Douglass C. North (1993). Nobel Memorial Prize in Economics, https://www.youtube.com/watch?v=8d-
O7T0p3zE&list=PLDFB3E6119CF6D491&index=2
Wu, J., Ma, Z., Liu, Z., & Lei, C. K. (2019). A contingent view of institutional environment, firm capability, and innovation performance
of emerging multinational enterprises. Industrial Marketing Management, 82, 148-157, https://doi.org/10.1016/j.indmarman.2019.01.018
Xu, K., Hitt, M.A., Brock, D., Pisano, V., Huang, L.S.R. (2021). Country institutional environments and international strategy: A review
and analysis of the research, Journal of International Management, 27(1).
Yongjian, L., Ning, Y., Xiaofang, D. (2005). A Study on the Relationship between Institutions and Economic Growth – The Case of Ningbo
Hi-Tech Park. Master Dissertations. Kristianstad University.
ENTREPRENEURSHIP AND SUSTAINABILITY ISSUES
ISSN 2345-0282 (online) http://jssidoi.org/jesi/
2021 Volume 8 Number 3 (March)
http://doi.org/10.9770/jesi.2021.8.3(32)
526
Marinko ŠKARE is a Full Professor in economics and Editor in Chief of Taylor & Francis Group (Routledge) journal Economic Research
- Ekonomska istraživanja at the Faculty of Economics and Tourism "Dr. Mijo Mirković", Juraj Dobrila University of Pula, where he is also
the Vice-Rector for Research and Arts. His scientific interests include poverty, growth, golden triangle, chaos economics, economic
philosophy, general economics, economic history.
ORCID ID: 0000-0001-6426-3692
Sanja RADOLOVIĆ holds a Ph.D. in Economics and has an MBA degree. She gives lectures on Human resources management and the
Basics of entrepreneurship. As the Head of Research and Project Office at the Juraj Dobrila University of Pula, her expertise includes
project management, strategic planning, and institutional development.
ORCID ID: 0000-0001-5867-1083
Manuela TVARONAVIČIENĖ is Full Professor at Vilnius Gediminas Technical University (Vilnius Tech) and General Jonas Zemaitis
Military Academy of Lithuania. She expert of European Comission and national head of international projects, financed by European
Union and Norway (Framework 7, Horizon 2020, Baltic Research Programm),
ORCID ID: orcid.org/0000-0002-9667-3730
Make your research more visible, join the Twitter account of ENTREPRENEURSHIP AND SUSTAINABILITY ISSUES:
@Entrepr69728810
Copyright © 2021 by author(s) and VsI Entrepreneurship and Sustainability Center
This work is licensed under the Creative Commons Attribution International License (CC BY).
http://creativecommons.org/licenses/by/4.0/
ENTREPRENEURSHIP AND SUSTAINABILITY ISSUES
ISSN 2345-0282 (online) http://jssidoi.org/jesi/
2021 Volume 8 Number 3 (March)
http://doi.org/10.9770/jesi.2021.8.3(33)
Publisher http://jssidoi.org/esc/home
527
TOWARDS SUSTAINABLE DEVELOPMENT: RISK MANAGEMET FOR ORGANIZATIONAL
SECURITY*
Aneta Wysokińska-Senkus 1, Justyna Górna 2
1 War Studies University, Al. gen. Antoniego Chruściela "Montera" 103, 00-910 Warsaw, Poland 2Poznań University of Economics and Business, Al. Niepodległości 10, 61-875 Poznań, Poland
E-mails: [email protected] ; [email protected]
Received 15 August 2020; accepted 25 January 2021; published 30 March 2021
Abstract. Controlling risk and skilful planning of the continuity of the organization’s operation positively influences the value of the
organization, its image and the ability to achieve the planned goals in the economic, social and environmental dimensions. This article
presents risk management as a determinant of the implementation of sustainable development assumptions in an organization. The process
consisting of: identification and analysis of stakeholders, setting partial goals and relations between the key perspectives of the
organization’s functioning (legal, economic, social and environmental), risk identification, its measurement, regulation, monitoring and
control contributes to the improvement of the organization’s safety. Thanks to the focus on the concept of sustainability, organizations
manage risk in a systematic manner. One of the basic assumptions of the “triple bottom line” concept is the organization’s focus on
economic goals, i.e. profit maximization. The second foundation is focusing on the human aspect in the organization and achieving goals
under the assumption of corporate social responsibility. The third is to focus on environmental goals and eco-efficiency. The aim of the
research was to identify critical variables for improving risk management in the organization in the context of the implementation of the
concept of sustainable development, and to indicate the approach applied to risk management by organizations that manage many aspects
in a systemic manner. The research was carried out in 150 organizations in Poland that have at least one certified management system, e.g.
ISO 9001, ISO 14001. It was determined that such a number of surveyed organizations is representative, taking into account the fact that
the ISO 9001 certificate in Poland can be found in almost 15,000 organizations.
Keywords: management; risk; risk management; sustainable development
Reference to this paper should be made as follows: Wysokińska-Senkus, A., Górna, J. 2021. Towards sustainable development: risk
managemet for organizational security. Entrepreneurship and Sustainability Issues, 8(3), 527-544. http://doi.org/10.9770/jesi.2021.8.3(33)
JEL Classifications: M10, M14, M20
Additional disciplines: ecology and environment, security
* The research was supported by Academy Of War Art, Poland
ENTREPRENEURSHIP AND SUSTAINABILITY ISSUES
ISSN 2345-0282 (online) http://jssidoi.org/jesi/
2021 Volume 8 Number 3 (March)
http://doi.org/10.9770/jesi.2021.8.3(33)
528
1. Introduction
“We have changed our environment so radically that we have no choice but to change ourselves and adapt to this
changing environment” (Wiener, 1989).
The complexity of the organization’s environment, the need to flexibly respond to changes occurring in it,
determine a new approach to management. The new quality of management is strongly associated with
innovation, creativity, the ability to analyse the organization’s environment and a quick response to emerging
opportunities and threats. One of the key tasks of the organization is to cope with uncertainty and volatility and
continuous improvement of functioning, which is possible thanks to a strategic approach to risk management.
“The effect of improving the organization is to make the organization resistant to disruptions, increase efficiency
and develop the ability to achieve system goals and objectives of individual participants” (Masłyk – Musiał,
2002).
Risk management is a key process that contributes to the improvement of efficiency and the achievement of the
organization’s goals. Systematic application of management procedures and practices to activities in the area of
identifying, analysing, evaluating, dealing with risk, monitoring and reviewing risk leads to the improvement of
the process of establishing the organization’s strategy, increasing the probability of achieving economic, social
and environmental goals and improving the decision-making process.
Risk management is a determinant of the implementation of the assumptions of sustainable development in the
organization, and thus the improvement of economic, social and environmental security.
2. The essence of risk management in standardized management systems
Risk management can be considered a phenomenon of the future. It is an important element of an effective and
comprehensive corporate governance system. Organizations, more than ever, should recognize, assess and
respond to all forms of risk they face. Organizations and corporate leaders must learn from failures by developing
risk management practices. Effective risk management can be considered a leading competitive advantage that
determines the survival and success of enterprises in an uncertain global environment (Miloš, 2014).
In order to effectively manage risk, an organization should develop a risk model, the design of which must go
through several stages, i.e. identification of measures, risk development, model and assessment of the risk model
(Ibnugraha, Nugroho, Santosa 2020).
The assessment of operational risk management becomes important due to organizational and infrastructural
changes, as well as the business and technological environment. Risk management is a management process that
covers all techniques and methods of risk assessment and analysis. It is represented by various processes, such as
measurement, control, reporting or selection of decisions that lead to the reduction of all risks (Prasad, Sekhar,
2019).
Effective company management may be based on the requirements contained in standardized management
systems regarding the following aspects: quality, environment, health and safety at work, but also on finding
solutions to improve the effectiveness and efficiency of quality control in the risk management process, when the
results achieved are not consistent with the goals set. Risk, as a result of uncertainty, affects the goals of almost all
human activities, thus implying the risk of loss. Risk is present in every aspect of our lives; therefore, risk
management is universal, but is fully based on estimates and predictions made with inherent uncertainty that takes
into account the extent of the probability that a given condition may or may not exist (Bowers, 2016).
ENTREPRENEURSHIP AND SUSTAINABILITY ISSUES
ISSN 2345-0282 (online) http://jssidoi.org/jesi/
2021 Volume 8 Number 3 (March)
http://doi.org/10.9770/jesi.2021.8.3(33)
529
The PN-EN ISO 9001:2015 Quality management systems standard. Requirements, introduces a key concept in
this regard, which is risk-based thinking.
According to the dictionary of the Polish language, risk is defined as “the possibility, the probability that
something will fail, a venture which outcome is unknown, uncertain, problematic” (Szymczak, 1989).
According to ISO 9001, risk is the effect of uncertainty that causes a positive or negative deviation from
expectations. Uncertainty is the state of lack of information related to understanding or knowledge about an event,
its consequences or probability (PN - EN ISO 9001, 2016).
The ISO 31000 standard defines risk as: “the effect of uncertainty on objectives”. According to the indicated
standard: uncertainty causes a positive or negative deviation from expectations, goals may relate to various
aspects and be implemented at various levels, risk is determined in relation to potential events and consequences
or their combination, and uncertainty is the lack of information about an event, its consequences or probabilities.
The ISO 31000 standard defines risk as: “coordinated activities related to the management and supervision of an
organization in relation to risk”. According to the requirements of the ISO 31000 standard, risk management
should be an integral part of all processes in the organization, it should contribute to the achievement of goals and
continuous improvement, it should be systematic and timely, it should be adapted to the context of the
organization, the risk analysis should be constantly updated and react to changes (PN- ISO 31000, 2012).
By implementing the risk-based approach, the organization should plan and implement activities that take into
account risks and opportunities, which leads to an increase in the effectiveness of the quality management system
and improvement of the organization’s performance.
At the stage of planning the quality management system, the organization should take into account external
factors influencing the functioning of the organization. A strategic analysis of the organization should be carried
out. Strategic analysis is a stage of strategic management involving the use of appropriate methods to identify
factors influencing the organization’s future operations. The analysis of the environment consists in identifying
the processes and events in the environment as well as the activities of other organizations, which may create
opportunities or pose a threat to it (Gierszewska, Olszewska, Skonieczny, 2013).
Canton (2007) believes that strategic planning is the cornerstone of a crisis management program – and binds the
various elements of the program together and ensures that the resulting actions are properly aligned with the
shared vision of the organization’s stakeholders (Canton, 2007). Strategic planning is an adaptable set of
concepts, procedures, tools and practices designed to help people and organizations decide what to do, how and
why (Manning, 2020).
It is very important to analyse the legal, technological, competitive, market, cultural, social, economic, as well as
international, national, regional or local environment. It is also necessary to analyse internal factors regarding
issues related to the organization’s potential, values, culture, knowledge, processes taking place in the
organization, those factors that are important for the purpose and strategic direction of its operation, and to
identify the needs and expectations of its stakeholders.
The organization is responsible for the application of the risk-based approach and for the actions it takes to
address the risk, as well as for the management of the necessary documentation in this regard. Top management
plays a key role in risk management, and should demonstrate leadership and commitment to promoting a process-
based and risk-based approach within the organization.
ENTREPRENEURSHIP AND SUSTAINABILITY ISSUES
ISSN 2345-0282 (online) http://jssidoi.org/jesi/
2021 Volume 8 Number 3 (March)
http://doi.org/10.9770/jesi.2021.8.3(33)
530
The organization shall plan actions to address risks and opportunities, how to integrate and implement these
actions into the processes of the functioning quality management system, and how to evaluate the effectiveness of
these actions.
It is very important that top management takes action to ensure that risks and opportunities that affect product and
service compliance and the ability to increase customer satisfaction are identified and addressed (ISO 9001,
2015).
The ISO 31000 standard helps organizations to develop a risk management strategy to effectively identify and
reduce risk, and thus increase the degree of achievement of the assumed goals and ensure the safety of the
organization in the economic, social and environmental area.
The implementation of ISO 31000 also helps organizations to see both the positive opportunities and the negative
consequences associated with risk and allows for more informed and thus more effective decision making,
especially when allocating resources. Moreover, it can be an active element in improving the organization’s
management and ultimately its performance (Wisianto, 2020).
The following risk management principles according to ISO 31000: 2018 can be indicated:
Integrated – Risk management is an integral part of all organizational activities.
Structured and comprehensive – A structured and comprehensive approach to risk management
contributes to consistent and comparable results.
Adapted – The risk management framework and process are aligned and proportionate to the
organization’s goals.
Inclusive – Inclusive adequate and timely stakeholder involvement enables the inclusion of their
knowledge, views and insights.
Dynamic – Risks can appear, change or disappear as the external and internal context of the organization
changes.
Best available information – The risk management inputs are based on historical and current information
as well as future expectations.
Human and cultural factors – Human behaviour and culture significantly influence all aspects of risk
management at every level and stage.
Continuous improvement – Risk management is continuously improved through learning and experience
(Wilbanks, Byrd, 2020).
3. Risk management and business continuity management
In order for the organization to comprehensively implement the risk management approach, it should identify the
key processes and resources that will become necessary to ensure business continuity and fulfilment of its
obligations towards stakeholders in the event of a risk.
Ensuring the organization’s consistent operation in the event of disruptions in any part of it is possible thanks to
the implementation of the Business Continuity Management (BCM).
Business Continuity Management complements the risk management framework. BCM is a broader concept than
risk management. In addition to identifying the products, services and processes that determine the survival of the
organization and performing risk assessment and related activities, in line with the BCM idea, it is also important
to identify what the organization needs to continue to fulfil its obligations in the event of a risk. Maintaining
ENTREPRENEURSHIP AND SUSTAINABILITY ISSUES
ISSN 2345-0282 (online) http://jssidoi.org/jesi/
2021 Volume 8 Number 3 (March)
http://doi.org/10.9770/jesi.2021.8.3(33)
531
business continuity is a much broader issue than risk management. The activities performed in the scope of risk
management constitute the basis of the business continuity management system.
Business Continuity Institute defines business continuity management as a holistic management process that aims
to identify the potential impact of disruptions on the organization and create conditions for building resilience to
them and the ability to respond effectively in the protection of key interests of owners, reputation and brand of the
organization, as well as the values achieved in its activities to date (Standard BS 2599).
Thanks to BCM, the organization is thus able to recognize what needs to be done before a possible event occurs to
protect its employees, site, technology, information, supply chain, stakeholders and reputation.
Currently, the approach to risk management is evolving towards ensuring business continuity. Business continuity
is understood as an organizational procedure that creates the organization’s ability to respond effectively in the
event of a disruption as a result of a specific interaction of threats with the vulnerability of the organization’s
internal infrastructure or resources. In this sense, ensuring business continuity is the subject of operational
management and is the last link in operational risk management (Rot, Pękala, 2016).
Business Continuity Management (BCM) ensures that processes and resources are available after a business
disruption to ensure that you continuously meet your critical goals. Business Continuity (BC), by definition, aims
to maintain critical business continuity. Business Continuity Management (BCM) ensures the availability of
processes and resources after a business interruption to ensure the continual achievement of critical goals (Hiles,
Andrew, Noakes-Fry, 2014).
ISO 22301 is the world’s first international standard for business continuity management. ISO22301 is a standard
for the implementation of the BC management system and the continual improvement of the BC capability based
on management priorities and feedback. The purpose and intention of the standard is to plan, establish,
implement, operate, monitor, review, maintain and continuously improve the documented management system in
order to protect against any disruptions that may arise, reduce the likelihood of occurrence, prepare for, respond to
an incident causing disruptions and repair it. The standard contains auditable requirements, such as certification
that shows that an appropriate BCMS exists. Organizations that have obtained ISO 22301 certification
demonstrate BC compliance and commitment to customers and other stakeholders.
The following international standards apply to business continuity management:
ISO 22301:2019 Security and resilience – Business continuity management systems. Requirements. This
document specifies the requirements for the implementation, maintenance and improvement of the
management system in order to prevent, reduce the probability of disruptions, prepare for them, respond
to them and repair them after their occurrence (ISO 22301, 2019).
ISO 22313:2020 Security and resilience – Business continuity management systems. Guidance on the use
of ISO 22301. The document contains recommendations for the application of the requirements of the
Business Continuity Management System (BCMS) contained in ISO 22301. The guidelines and
recommendations are based on good international practice (ISO 22313, 2020).
ISO 22300:2018 Security and resilience. Vocabulary. The standard defines the terms used in Business
continuity management systems (ISO 22300, 2018).
Requirements of ISO 22301:
• Clause 4: Context of the Organization
• Clause 5: Leadership
ENTREPRENEURSHIP AND SUSTAINABILITY ISSUES
ISSN 2345-0282 (online) http://jssidoi.org/jesi/
2021 Volume 8 Number 3 (March)
http://doi.org/10.9770/jesi.2021.8.3(33)
532
• Clause 6: Planning
• Clause 7: Support
• Clause 8: Operations
• Clause 9: Performance Evaluation
• Clause 10: Improvement.
BCMS (Business Continuity Management Systems Standard) can help an organization build its management
system in a clear and specific way through the creation, implementation and training of management system
requirements and procedures (Roskoski, 2020).
The following principles of business continuity management can be identified: long-range Focus, leadership,
governance, good business practice, multidisciplinary function, communication, value preservation, adaptation
(Wong, Shi, 2015).
The ISO 22301:2019 Security and resilience standard — Business continuity management systems —
Requirements contains a framework for identifying key risk factors affecting the organization and for maintaining
its operations in the most difficult conditions – thus it concerns the business continuity management system
(BCM). (ISO 220301, 2019). ISO 22301 can be a valuable tool that will help an organization achieve stability and
management efficiency by creating a business continuity program (Roskoski, Maureen, 2020).
ISO 22301 combines international best practices to help organizations effectively respond to and recover from
disruptions. This means lower costs and less impact on business results in the event of disruptions. Additionally,
for organizations with multiple locations or divisions, it provides a consistent management approach across the
organization.
By implementing the requirements of the ISO 22301 standard, the organization achieves the following benefits:
gains the ability to reassure customers, suppliers, regulators and other stakeholders that they have robust
systems and processes to ensure business continuity,
achieves better business results and increases its organizational resilience,
by analysing critical problems and sensitive areas, it is easier to manage the organization.
It can be concluded that business continuity management is a holistic management process aimed at determining
the potential impact on the organization and creating conditions for building resistance to them and the ability to
respond effectively in the protection of the key interests of the owners, reputation and brand of the organization,
as well as the values achieved in the current activities (Wołowski, Zawiła-Niedźwiecki, 2012).
At the end of 2019, 6231 business continuity management system certificates in accordance with the ISO
22301:2012 Societal security standard - Business continuity management systems – Requirements were awarded.
In Poland, this number is 101 certificates. The leader in terms of the number of ISO 22301 certificates granted is
India with 1966, United Kingdom of Great Britain and Northern Ireland – 609, United States of America – 406,
Japan – 301, Singapore – 300, China – 291 (ISO, 2020).
ISO 22301 provides a comprehensive approach to protecting business continuity and employee safety, and
presents good practices and guidelines for:
identification of threats,
assessment of the potential effects of their occurrence,
development and testing of emergency plans,
management support, communication, resources.
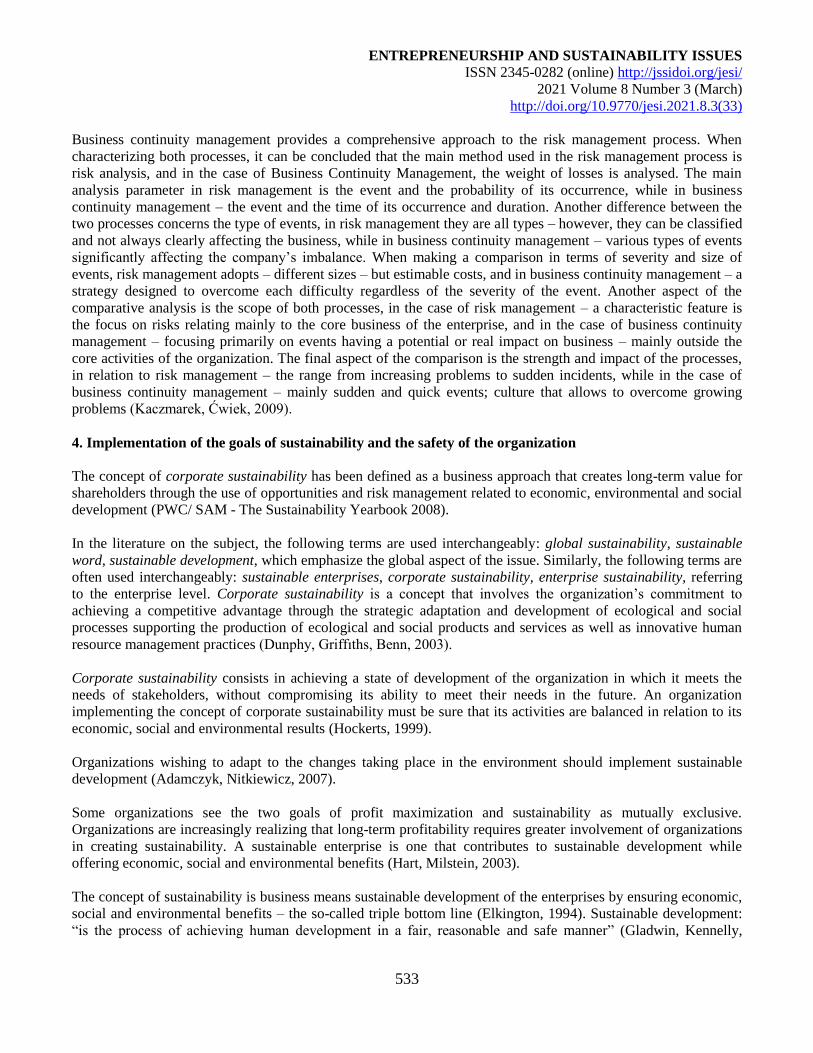
ENTREPRENEURSHIP AND SUSTAINABILITY ISSUES
ISSN 2345-0282 (online) http://jssidoi.org/jesi/
2021 Volume 8 Number 3 (March)
http://doi.org/10.9770/jesi.2021.8.3(33)
533
Business continuity management provides a comprehensive approach to the risk management process. When
characterizing both processes, it can be concluded that the main method used in the risk management process is
risk analysis, and in the case of Business Continuity Management, the weight of losses is analysed. The main
analysis parameter in risk management is the event and the probability of its occurrence, while in business
continuity management – the event and the time of its occurrence and duration. Another difference between the
two processes concerns the type of events, in risk management they are all types – however, they can be classified
and not always clearly affecting the business, while in business continuity management – various types of events
significantly affecting the company’s imbalance. When making a comparison in terms of severity and size of
events, risk management adopts – different sizes – but estimable costs, and in business continuity management – a
strategy designed to overcome each difficulty regardless of the severity of the event. Another aspect of the
comparative analysis is the scope of both processes, in the case of risk management – a characteristic feature is
the focus on risks relating mainly to the core business of the enterprise, and in the case of business continuity
management – focusing primarily on events having a potential or real impact on business – mainly outside the
core activities of the organization. The final aspect of the comparison is the strength and impact of the processes,
in relation to risk management – the range from increasing problems to sudden incidents, while in the case of
business continuity management – mainly sudden and quick events; culture that allows to overcome growing
problems (Kaczmarek, Ćwiek, 2009).
4. Implementation of the goals of sustainability and the safety of the organization
The concept of corporate sustainability has been defined as a business approach that creates long-term value for
shareholders through the use of opportunities and risk management related to economic, environmental and social
development (PWC/ SAM - The Sustainability Yearbook 2008).
In the literature on the subject, the following terms are used interchangeably: global sustainability, sustainable
word, sustainable development, which emphasize the global aspect of the issue. Similarly, the following terms are
often used interchangeably: sustainable enterprises, corporate sustainability, enterprise sustainability, referring
to the enterprise level. Corporate sustainability is a concept that involves the organization’s commitment to
achieving a competitive advantage through the strategic adaptation and development of ecological and social
processes supporting the production of ecological and social products and services as well as innovative human
resource management practices (Dunphy, Griffıths, Benn, 2003).
Corporate sustainability consists in achieving a state of development of the organization in which it meets the
needs of stakeholders, without compromising its ability to meet their needs in the future. An organization
implementing the concept of corporate sustainability must be sure that its activities are balanced in relation to its
economic, social and environmental results (Hockerts, 1999).
Organizations wishing to adapt to the changes taking place in the environment should implement sustainable
development (Adamczyk, Nitkiewicz, 2007).
Some organizations see the two goals of profit maximization and sustainability as mutually exclusive.
Organizations are increasingly realizing that long-term profitability requires greater involvement of organizations
in creating sustainability. A sustainable enterprise is one that contributes to sustainable development while
offering economic, social and environmental benefits (Hart, Milstein, 2003).
The concept of sustainability is business means sustainable development of the enterprises by ensuring economic,
social and environmental benefits – the so-called triple bottom line (Elkington, 1994). Sustainable development:
“is the process of achieving human development in a fair, reasonable and safe manner” (Gladwin, Kennelly,
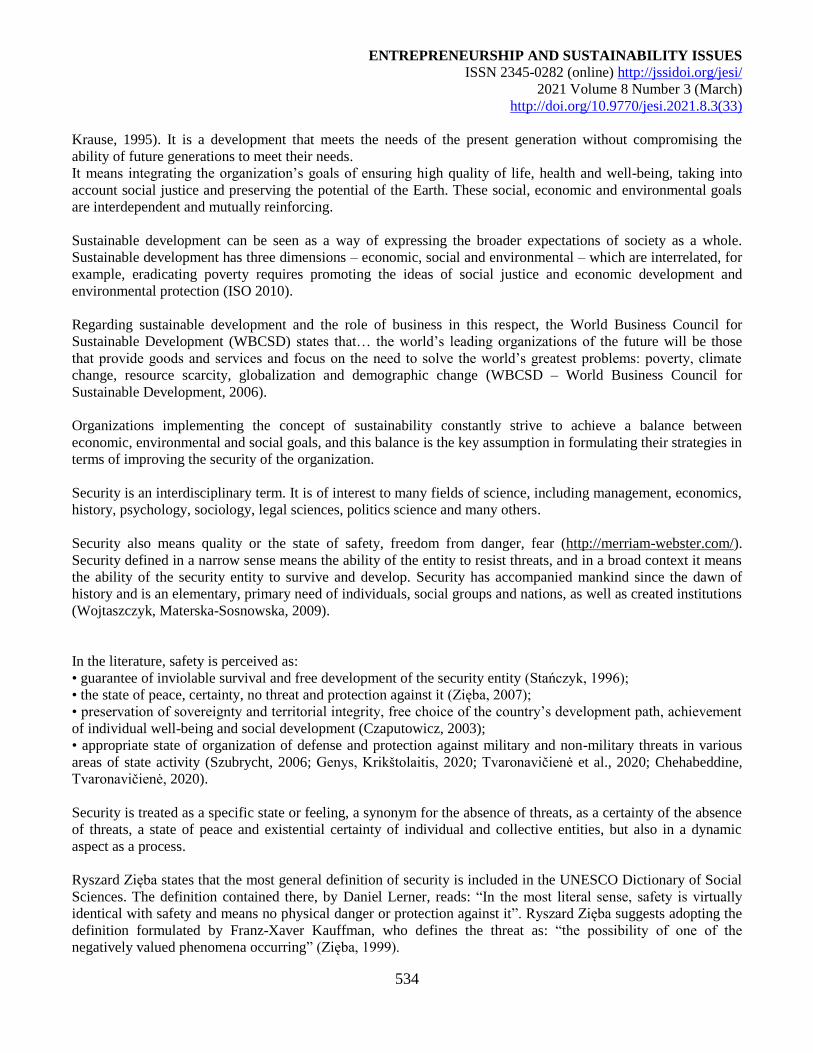
ENTREPRENEURSHIP AND SUSTAINABILITY ISSUES
ISSN 2345-0282 (online) http://jssidoi.org/jesi/
2021 Volume 8 Number 3 (March)
http://doi.org/10.9770/jesi.2021.8.3(33)
534
Krause, 1995). It is a development that meets the needs of the present generation without compromising the
ability of future generations to meet their needs.
It means integrating the organization’s goals of ensuring high quality of life, health and well-being, taking into
account social justice and preserving the potential of the Earth. These social, economic and environmental goals
are interdependent and mutually reinforcing.
Sustainable development can be seen as a way of expressing the broader expectations of society as a whole.
Sustainable development has three dimensions – economic, social and environmental – which are interrelated, for
example, eradicating poverty requires promoting the ideas of social justice and economic development and
environmental protection (ISO 2010).
Regarding sustainable development and the role of business in this respect, the World Business Council for
Sustainable Development (WBCSD) states that… the world’s leading organizations of the future will be those
that provide goods and services and focus on the need to solve the world’s greatest problems: poverty, climate
change, resource scarcity, globalization and demographic change (WBCSD – World Business Council for
Sustainable Development, 2006).
Organizations implementing the concept of sustainability constantly strive to achieve a balance between
economic, environmental and social goals, and this balance is the key assumption in formulating their strategies in
terms of improving the security of the organization.
Security is an interdisciplinary term. It is of interest to many fields of science, including management, economics,
history, psychology, sociology, legal sciences, politics science and many others.
Security also means quality or the state of safety, freedom from danger, fear (http://merriam-webster.com/).
Security defined in a narrow sense means the ability of the entity to resist threats, and in a broad context it means
the ability of the security entity to survive and develop. Security has accompanied mankind since the dawn of
history and is an elementary, primary need of individuals, social groups and nations, as well as created institutions
(Wojtaszczyk, Materska-Sosnowska, 2009).
In the literature, safety is perceived as:
• guarantee of inviolable survival and free development of the security entity (Stańczyk, 1996);
• the state of peace, certainty, no threat and protection against it (Zięba, 2007);
• preservation of sovereignty and territorial integrity, free choice of the country’s development path, achievement
of individual well-being and social development (Czaputowicz, 2003);
• appropriate state of organization of defense and protection against military and non-military threats in various
areas of state activity (Szubrycht, 2006; Genys, Krikštolaitis, 2020; Tvaronavičienė et al., 2020; Chehabeddine,
Tvaronavičienė, 2020).
Security is treated as a specific state or feeling, a synonym for the absence of threats, as a certainty of the absence
of threats, a state of peace and existential certainty of individual and collective entities, but also in a dynamic
aspect as a process.
Ryszard Zięba states that the most general definition of security is included in the UNESCO Dictionary of Social
Sciences. The definition contained there, by Daniel Lerner, reads: “In the most literal sense, safety is virtually
identical with safety and means no physical danger or protection against it”. Ryszard Zięba suggests adopting the
definition formulated by Franz-Xaver Kauffman, who defines the threat as: “the possibility of one of the
negatively valued phenomena occurring” (Zięba, 1999).
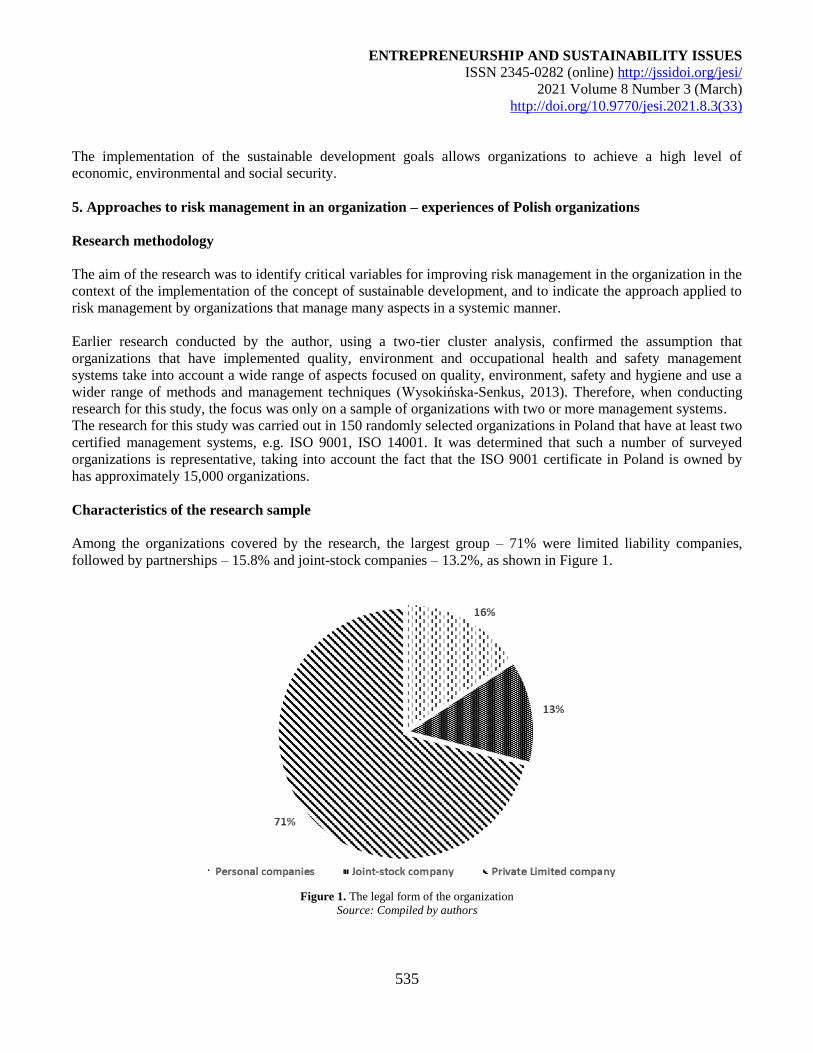
ENTREPRENEURSHIP AND SUSTAINABILITY ISSUES
ISSN 2345-0282 (online) http://jssidoi.org/jesi/
2021 Volume 8 Number 3 (March)
http://doi.org/10.9770/jesi.2021.8.3(33)
535
The implementation of the sustainable development goals allows organizations to achieve a high level of
economic, environmental and social security.
5. Approaches to risk management in an organization – experiences of Polish organizations
Research methodology
The aim of the research was to identify critical variables for improving risk management in the organization in the
context of the implementation of the concept of sustainable development, and to indicate the approach applied to
risk management by organizations that manage many aspects in a systemic manner.
Earlier research conducted by the author, using a two-tier cluster analysis, confirmed the assumption that
organizations that have implemented quality, environment and occupational health and safety management
systems take into account a wide range of aspects focused on quality, environment, safety and hygiene and use a
wider range of methods and management techniques (Wysokińska-Senkus, 2013). Therefore, when conducting
research for this study, the focus was only on a sample of organizations with two or more management systems.
The research for this study was carried out in 150 randomly selected organizations in Poland that have at least two
certified management systems, e.g. ISO 9001, ISO 14001. It was determined that such a number of surveyed
organizations is representative, taking into account the fact that the ISO 9001 certificate in Poland is owned by
has approximately 15,000 organizations.
Characteristics of the research sample
Among the organizations covered by the research, the largest group – 71% were limited liability companies,
followed by partnerships – 15.8% and joint-stock companies – 13.2%, as shown in Figure 1.
Figure 1. The legal form of the organization
Source: Compiled by authors
ENTREPRENEURSHIP AND SUSTAINABILITY ISSUES
ISSN 2345-0282 (online) http://jssidoi.org/jesi/
2021 Volume 8 Number 3 (March)
http://doi.org/10.9770/jesi.2021.8.3(33)
536
As for the size of the organizations, the largest group were medium-sized organizations – 52%, followed by small
– 27%, large – 15.8 and micro-enterprises – 5.3 (Figure 2).
Figure 2. Organization size
Source: Compiled by authors
Figure 3 presents the characteristics of the research sample according to the criterion of the dominant sectors of
activity. The most numerous were production enterprises – 38%, service – 11%, construction – 10%, representing
the following sectors: logistics and warehousing – 6%, banking services – 5%.
Figure 3. Dominant sectors of activity
Source: Compiled by authors
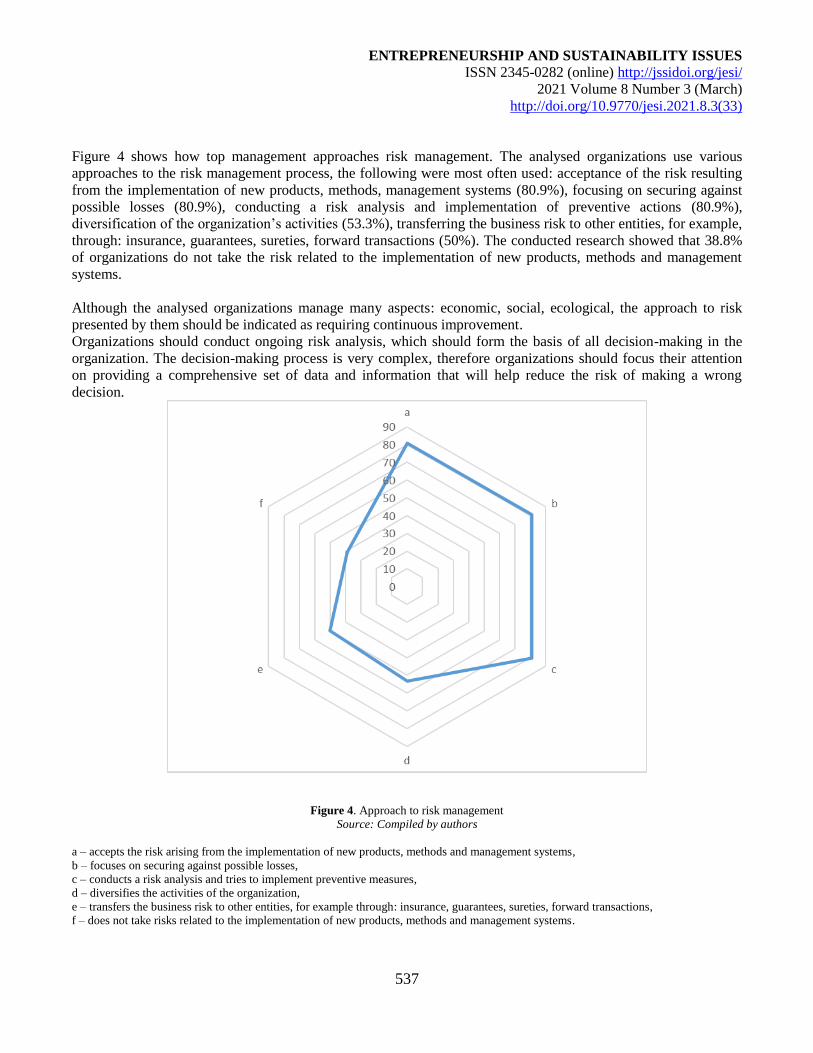
ENTREPRENEURSHIP AND SUSTAINABILITY ISSUES
ISSN 2345-0282 (online) http://jssidoi.org/jesi/
2021 Volume 8 Number 3 (March)
http://doi.org/10.9770/jesi.2021.8.3(33)
537
Figure 4 shows how top management approaches risk management. The analysed organizations use various
approaches to the risk management process, the following were most often used: acceptance of the risk resulting
from the implementation of new products, methods, management systems (80.9%), focusing on securing against
possible losses (80.9%), conducting a risk analysis and implementation of preventive actions (80.9%),
diversification of the organization’s activities (53.3%), transferring the business risk to other entities, for example,
through: insurance, guarantees, sureties, forward transactions (50%). The conducted research showed that 38.8%
of organizations do not take the risk related to the implementation of new products, methods and management
systems.
Although the analysed organizations manage many aspects: economic, social, ecological, the approach to risk
presented by them should be indicated as requiring continuous improvement.
Organizations should conduct ongoing risk analysis, which should form the basis of all decision-making in the
organization. The decision-making process is very complex, therefore organizations should focus their attention
on providing a comprehensive set of data and information that will help reduce the risk of making a wrong
decision.
Figure 4. Approach to risk management
Source: Compiled by authors
a – accepts the risk arising from the implementation of new products, methods and management systems,
b – focuses on securing against possible losses,
c – conducts a risk analysis and tries to implement preventive measures,
d – diversifies the activities of the organization,
e – transfers the business risk to other entities, for example through: insurance, guarantees, sureties, forward transactions,
f – does not take risks related to the implementation of new products, methods and management systems.
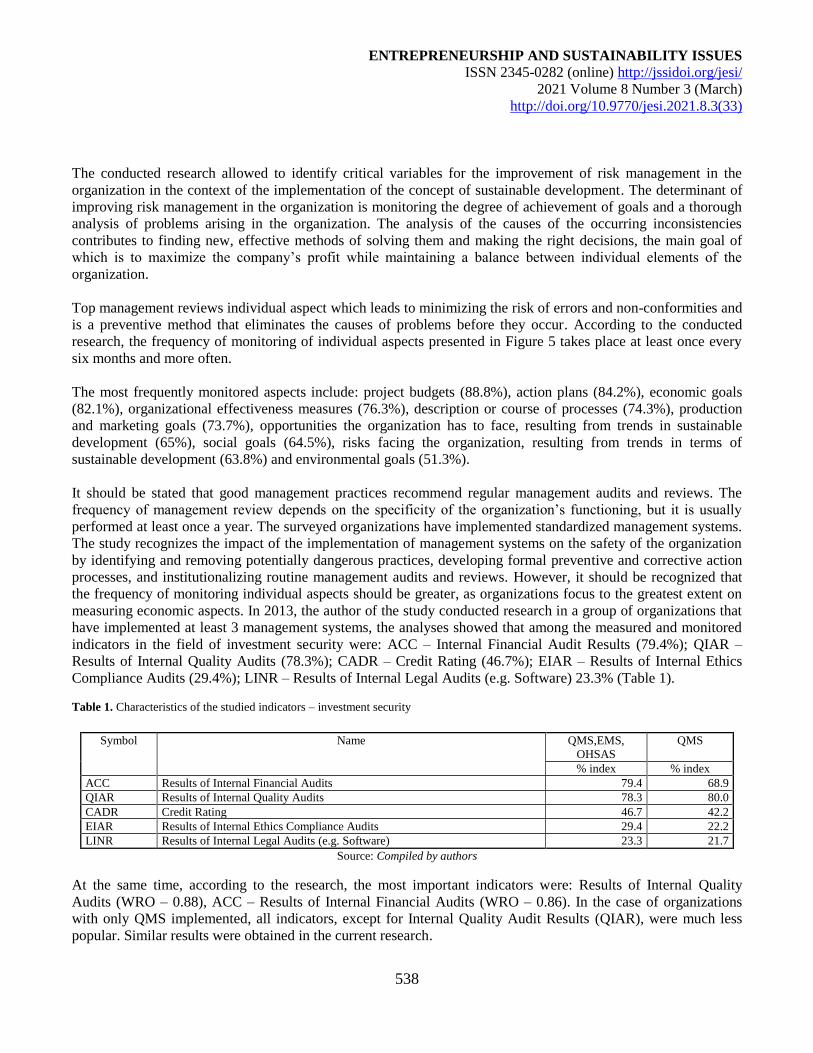
ENTREPRENEURSHIP AND SUSTAINABILITY ISSUES
ISSN 2345-0282 (online) http://jssidoi.org/jesi/
2021 Volume 8 Number 3 (March)
http://doi.org/10.9770/jesi.2021.8.3(33)
538
The conducted research allowed to identify critical variables for the improvement of risk management in the
organization in the context of the implementation of the concept of sustainable development. The determinant of
improving risk management in the organization is monitoring the degree of achievement of goals and a thorough
analysis of problems arising in the organization. The analysis of the causes of the occurring inconsistencies
contributes to finding new, effective methods of solving them and making the right decisions, the main goal of
which is to maximize the company’s profit while maintaining a balance between individual elements of the
organization.
Top management reviews individual aspect which leads to minimizing the risk of errors and non-conformities and
is a preventive method that eliminates the causes of problems before they occur. According to the conducted
research, the frequency of monitoring of individual aspects presented in Figure 5 takes place at least once every
six months and more often.
The most frequently monitored aspects include: project budgets (88.8%), action plans (84.2%), economic goals
(82.1%), organizational effectiveness measures (76.3%), description or course of processes (74.3%), production
and marketing goals (73.7%), opportunities the organization has to face, resulting from trends in sustainable
development (65%), social goals (64.5%), risks facing the organization, resulting from trends in terms of
sustainable development (63.8%) and environmental goals (51.3%).
It should be stated that good management practices recommend regular management audits and reviews. The
frequency of management review depends on the specificity of the organization’s functioning, but it is usually
performed at least once a year. The surveyed organizations have implemented standardized management systems.
The study recognizes the impact of the implementation of management systems on the safety of the organization
by identifying and removing potentially dangerous practices, developing formal preventive and corrective action
processes, and institutionalizing routine management audits and reviews. However, it should be recognized that
the frequency of monitoring individual aspects should be greater, as organizations focus to the greatest extent on
measuring economic aspects. In 2013, the author of the study conducted research in a group of organizations that
have implemented at least 3 management systems, the analyses showed that among the measured and monitored
indicators in the field of investment security were: ACC – Internal Financial Audit Results (79.4%); QIAR –
Results of Internal Quality Audits (78.3%); CADR – Credit Rating (46.7%); EIAR – Results of Internal Ethics
Compliance Audits (29.4%); LINR – Results of Internal Legal Audits (e.g. Software) 23.3% (Table 1).
Table 1. Characteristics of the studied indicators – investment security
Symbol Name QMS,EMS,
OHSAS
QMS
% index % index
ACC Results of Internal Financial Audits 79.4 68.9
QIAR Results of Internal Quality Audits 78.3 80.0
CADR Credit Rating 46.7 42.2
EIAR Results of Internal Ethics Compliance Audits 29.4 22.2
LINR Results of Internal Legal Audits (e.g. Software) 23.3 21.7
Source: Compiled by authors
At the same time, according to the research, the most important indicators were: Results of Internal Quality
Audits (WRO – 0.88), ACC – Results of Internal Financial Audits (WRO – 0.86). In the case of organizations
with only QMS implemented, all indicators, except for Internal Quality Audit Results (QIAR), were much less
popular. Similar results were obtained in the current research.
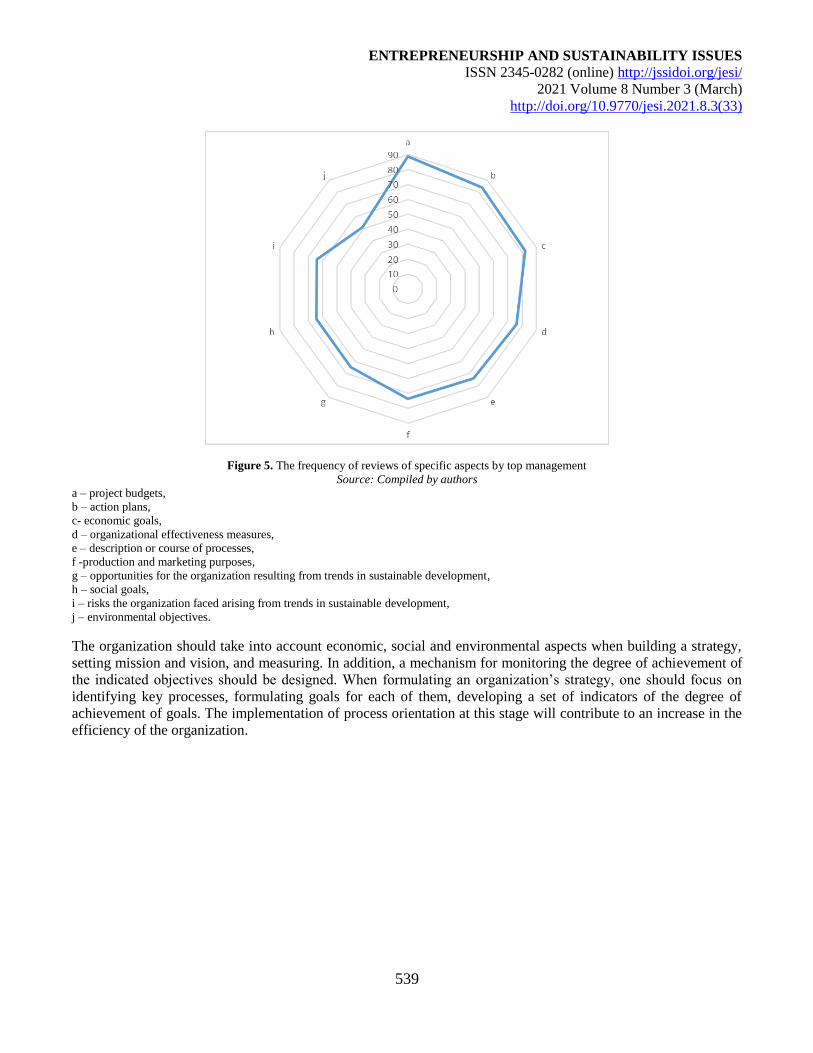
ENTREPRENEURSHIP AND SUSTAINABILITY ISSUES
ISSN 2345-0282 (online) http://jssidoi.org/jesi/
2021 Volume 8 Number 3 (March)
http://doi.org/10.9770/jesi.2021.8.3(33)
539
Figure 5. The frequency of reviews of specific aspects by top management
Source: Compiled by authors
a – project budgets,
b – action plans,
c- economic goals,
d – organizational effectiveness measures,
e – description or course of processes,
f -production and marketing purposes,
g – opportunities for the organization resulting from trends in sustainable development,
h – social goals,
i – risks the organization faced arising from trends in sustainable development,
j – environmental objectives.
The organization should take into account economic, social and environmental aspects when building a strategy,
setting mission and vision, and measuring. In addition, a mechanism for monitoring the degree of achievement of
the indicated objectives should be designed. When formulating an organization’s strategy, one should focus on
identifying key processes, formulating goals for each of them, developing a set of indicators of the degree of
achievement of goals. The implementation of process orientation at this stage will contribute to an increase in the
efficiency of the organization.
ENTREPRENEURSHIP AND SUSTAINABILITY ISSUES
ISSN 2345-0282 (online) http://jssidoi.org/jesi/
2021 Volume 8 Number 3 (March)
http://doi.org/10.9770/jesi.2021.8.3(33)
540
Figure 6. Key determinants of building an organization’s strategy (number of organizations that rated the significance of the indicated
aspects as high and very high in %)
Source: Compiled by author
A very important factor that organizations should take into account when designing a strategy is risk analysis in
relation to economic, social and environmental aspects. Figure 6 shows the extent to which the surveyed
organizations take into account economic, environmental and social aspects when building their strategies.
Economic/market aspects were identified as the most important – 92.1% of organizations assessed this aspect as
important and very important, then environmental – 67.8% followed by social – 65.8%.
According to research carried out in 2013 in a group of organizations that have at least 3 management systems
implemented, all aspects are also very important when building the organization’s strategy: economic, ecological
and social, but the most important were economic/market aspects with the number of indications 96.7% (WRO –
0.88), followed by environmental – 96.1% (WRO – 0.78), and then social – 88.9% (WRO – 0.74). In this case, the
number of responses completely coincided with the hierarchy of the relative assessment indicator (Wysokińska-
Senkus, 2013).
Organizations should focus to a greater extent on the implementation of social and environmental goals, as a
strategic approach to these goals can be an effective tool for managing the risk of their business (in relation to
threats related to the impact on particular groups of stakeholders) and the implementation of the principles of
sustainable development.
Conclusions
Risk management is a key process that contributes to the improvement of efficiency and the achievement of the
organization’s goals. Risk management is a determinant of the implementation of the assumptions of sustainable
development in the organization, and thus the improvement of economic, social and environmental security.
Currently, the approach to risk management is evolving towards ensuring business continuity. Business
continuity management is a holistic management process that aims to identify potential impacts on an
ENTREPRENEURSHIP AND SUSTAINABILITY ISSUES
ISSN 2345-0282 (online) http://jssidoi.org/jesi/
2021 Volume 8 Number 3 (March)
http://doi.org/10.9770/jesi.2021.8.3(33)
541
organization and create conditions for building resilience to them. The implementation of the sustainable
development goals allows organizations to achieve a high level of economic, environmental and social security.
Organizations that have implemented quality, environmental and occupational health and safety management
systems take into account a wide spectrum of aspects focused on quality, environment, safety and hygiene and
use a wider range of management methods and techniques.
The conducted research has shown that organizations use different approaches to the risk management processes,
as many as 38.8% of the analysed enterprises do not take the risk related to the implementation of new products,
methods and management systems, and about 20% do not have an opinion on this subject. Therefore, it is
recommended to be more actively involved in risk management and to develop a comprehensive management
approach in this aspect. The surveyed organizations take into account economic, environmental and social
aspects when building their strategies, the most important were economic/market aspects – 92.1% of
organizations assessed this aspect as important and very important, then environmental – 67.8%, and then social
– 65.8%.
According to the conducted research, the most frequently monitored aspects include: project budgets, action
plans, economic goals, measures of organizational effectiveness. It should be recognized that the frequency of
monitoring individual aspects should be greater, as organizations focus to the greatest extent on measuring
economic aspects. The review of individual aspects by the top management minimizes the risk of errors and non-
compliance, and thus determines the improvement of the risk management process. Management reviews give
senior management the opportunity to assess the effectiveness of the organization and make any changes that
could improve economic, social and environmental security.
Summing up, it should be mentioned that the analyzed organizations did not sufficiently analyze and monitor the
risk. There was no comprehensive approach to risk management and the perception of a given risk as an
opportunity or a threat. The limitation in risk management was the complexity of the organization's environment,
the dynamics of changes taking place in it, and the lack of appropriate methods in this area. The solutions that is
proposed in the study, indicated in the ISO 22301 standard for business continuity management, enables
organizations to adopt a modern, comprehensive approach to risk management.
Moreover, the solution for the organization may be integrated with other available risk management standards,
among which the following can be distinguished, developed by: Federation of European Risk Management
Associations (FERMA), Committee of Sponsoring Organizations of the Treadway Commission (COSO II).
The use of these standards by the organization allows the organization to accept the existing risk and take
appropriate action if it occurs.
References
Adamczyk, J., Nitkiewicz, T. (2007). Programowanie zrównoważonego rozwoju przedsiębiorstw (Programming the sustainable
development of enterprises), Scientific Publisher PWE, Warsaw, 50-54.
Bowers, D. (2016). Risk Management: Past, Present and Future Directions, Hauppauge, New York: Nova Science Publishers.
Canton, L. (2007). Emergency Management: Concepts and Strategies for Effective Programs. Hoboken, NJ: John Wiley & Sons, Inc.
Chehabeddine, M., Tvaronavičienė, M. (2020). Securing regional development. Insights into Regional Development, 2(1), 430-442.
http://doi.org/10.9770/IRD.2020.2.1(3)
Czaputowicz, J. (2003). Kryteria bezpieczeństwa międzynarodowego – aspekty teoretyczne (Criteria of international security - theoretical
aspects) [w:] Kryteria bezpieczeństwa międzynarodowego państwa (Criteria of the international security of the state), S. Dębski, B.
Górska-Winter (red.), PISM, Warsaw.
ENTREPRENEURSHIP AND SUSTAINABILITY ISSUES
ISSN 2345-0282 (online) http://jssidoi.org/jesi/
2021 Volume 8 Number 3 (March)
http://doi.org/10.9770/jesi.2021.8.3(33)
542
Dunphy, D., Griffıths, A., Benn, S. (2003). Organizational Change For Corporate Sustainability: a Guide For Leaders and Change Agents
of The Future, Routledge, London.
Elkington, J. (1994). Towards the sustainable corporation: Win-win-win business strategies for sustainable development. California
Management Review, 36(3), 90 – 100.
Genys, D., Krikštolaitis, R. 2020. Clusterization of public perception of nuclear energy in relation to changing political priorities. Insights
into Regional Development, 2(4), 750-764. http://doi.org/10.9770/IRD.2020.2.4(2)
Gierszewska, G., Olszewska, B., Skonieczny, J. (2013). Zarządzanie strategiczne dla inżynierów (Strategic management for engineers),
Scientific Publisher PWE, Warsaw 2013, 43.
Gladwin, T., Kennelly, J., Krause, T. (1995). Shifting paradigms for sustainable development: Implications for management theory and
research. Academy of Management Review, 20(4), 878-907.
Hart, S.L., Milstein, M.B. (2003). Creating sustainable value, Academy of Management Executive, 17(2).
Hiles, Andrew, and Kristen Noakes-Fry (2014). Business Continuity Management : Global Best Practices. Vol. 4th ed, Rothstein
Publishing, 75-80.
Hockerts, K. (1999). The sustainability radar: a tool for the innovation of sustainable products and services, Greener Management
International, Spring, p. 29-49.
Ibnugraha, P. D., Nugroho, L. E., Santosa, P. I. (2020). Reliability Analysis of Risk Model Metrics Based on Business Approach in
Information Security. Ingénierie des Systèmes d’Information, 25(4), 475–480. https://doi.org/10.18280/isi.250410
ISO 22300:2018 Security and resilience. Vocabulary.
ISO 22301:2019 Security and resilience – Business continuity management systems. Requirements.
ISO 22313:2020 Security and resilience – Business continuity management systems. Guidance on the use of ISO 22301.
ISO 31000:2018 Risk Management — Guidelines.
ISO 9001:2015 Quality Management Systems — requirements.
ISO/FDIS 26000 Guidance on social responsibility, ISO 2010.
Kaczmarek, T.T., Ćwiek, G. (2009). Ryzyko kryzysu a ciągłość działania (Crisis risk and business continuity), Scientific Publisher Difin,
Warsaw.
Manning, S. (2020). Strategic Planning in Emergency Management: Evaluating the Impacts on Local Program Quality. Journal of
Homeland Security & Emergency Management, 17(3), 3-55. https://doi.org/10.1515/jhsem-2019-0051
Masłyk – Musiał, E. (2002). Zarządzanie zmianami (Change management), Scientific Publisher PWE, Warsaw.
Miloš Sprčić, D. (2014). Risk Management: Strategies for Economic Development and Challenges in the Financial System. New York:
Nova Science Publishers, Inc. ISBN 9781633214965,15.
Prasad MSV, Sekhar GVS. Currency Risk Management: Selected Research Papers. Vernon Press; 2019. Accessed October 14, 2020, 92.
PWC/ SAM - The Sustainability Yearbook 2008.
Roskoski, M. (2020). ISO 22301 Business Continuity Management Systems Standard. Facility Management Journal / FMJ, [s. l.], v. 30, n.
2, p. 014–016.
ENTREPRENEURSHIP AND SUSTAINABILITY ISSUES
ISSN 2345-0282 (online) http://jssidoi.org/jesi/
2021 Volume 8 Number 3 (March)
http://doi.org/10.9770/jesi.2021.8.3(33)
543
Roskoski, M. (2020). ISO 22301 Business Continuity Management Systems Standard. Facility Management Journal / FMJ. Mar/Apr2020,
30(2), 014-016.
Rot, A. Pękala, M. (2016). Backup and data recovery as an element of business continuity management system in the organisation.
Business Informatics, 2(40), 95-107.
Standard BS 2599
Stańczyk, J. (ed.) (1996). Współczesne pojmowanie bezpieczeństwa (Contemporary understanding of security), Scientific Publisher ISP
PAN, Warsaw, 17–20.
Szubrycht, T. (2006). Współczesne aspekty bezpieczeństwa państwa (Contemporary aspects of state security), ZN AMW, 4, 89.
Szymczak, M. (1989). Słownik języka polskiego (Polish dictionary), t. 3, Wyd. 5, Scientific Publisher PWN, Warsaw.
The ISO Survey of Management System Standard Certifications, 2019.
Tvaronavičienė, M., Plėta, T., Della Casa, S., Latvys, J. 2020. Cyber security management of critical energy infrastructure in national
cybersecurity strategies: cases of USA, UK, France, Estonia and Lithuania. Insights into Regional Development, 2(4), 802-813.
http://doi.org/10.9770/IRD.2020.2.4(6)
Wiener, N. (1989). The Human Use of Human Beings”. Free Association Books. London.
Wilbanks. D.W., Byrd, T. (2020). The Relevance & Benefit of ISO 31000 to OSH Practice. Professional Safety, 65(10), 32-38.
Wisianto A. (2020). Managing Risk of Refinery Megaproject Based on ISO 31000 and Pmbok. Project Management Development -
Practice & Perspectives. January 2019, 7-14.
Wojtaszczyk, K.A. , Materska-Sosnowska, A. (ed.) (2009). Bezpieczeństwo państwa (State security), Scientific Publisher ASPRA-JR,
Warsaw, 17.
Wong, W. N. Z.; ShI, J. Business Continuity Management System: A Complete Guide to Implementing ISO 22301. London: Kogan Page,
2015. ISBN 9780749469115,l.
Wysokińska-Senkus, A. (2013). Doskonalenie systemowego zarządzania w kontekście sustainability (Improving systemic management in
the context of sustainability), Difin, Warsaw.
Zięba R. (1999). Instytucjonalizacja bezpieczeństwa europejskiego: koncepcje – struktury – funkcjonowanie (Institutionalization of
European security: concepts - structures – functioning). Warsaw, „Scholar”, 27.
Zięba, R. (2007). Instytucjonalizacja bezpieczeństwa europejskiego (Institutionalization of European security). Scientific Publisher
Scholar, Warsaw, 27.
Acknowledgements
The research was supported by Academy Of War Art, Poland
ENTREPRENEURSHIP AND SUSTAINABILITY ISSUES
ISSN 2345-0282 (online) http://jssidoi.org/jesi/
2021 Volume 8 Number 3 (March)
http://doi.org/10.9770/jesi.2021.8.3(33)
544
Aneta WYSOKIŃSKA-SENKUS
ORCHID ID: 0000-0001-9021-6355
Justyna GÓRNA ORCHID ID: 0000-0002-2763-5810
Make your research more visible, join the Twitter account of ENTREPRENEURSHIP AND SUSTAINABILITY ISSUES:
@Entrepr69728810
Copyright © 2021 by author(s) and VsI Entrepreneurship and Sustainability Center
This work is licensed under the Creative Commons Attribution International License (CC BY).
http://creativecommons.org/licenses/by/4.0/
ENTREPRENEURSHIP AND SUSTAINABILITY ISSUES
ISSN 2345-0282 (online) http://jssidoi.org/jesi/
2021 Volume 8 Number 3 (March)
http://doi.org/10.9770/jesi.2021.8.3(34)
Publisher http://jssidoi.org/esc/home
545
DIRECT SUBSIDIES AND COMPENSATION FUNDS IN FINANCING OF UNIVERSAL POSTAL
SERVICES
Leszek Borowiec
University of Economics and Human Sciences in Warsaw, Okopowa 59, 01-043 Warsaw, Poland
E-mails: [email protected]
Received 9 April 2020; accepted 31 January 2021; published 30 March 2021
Abstract Member States of the European Union are obliged to ensure access to universal postal services for all citizens. The aim of the
study is to assess the effectiveness of direct subsidies and compensation funds as basic methods of financing universal postal services in the scope of incurred net cost on the example of selected postal operators in Europe and to indicate the results of application of such solutions. The scope of the study includes an evaluation of the direct subsidy mechanism applicable in Europe on the example of Belgium. A characterization of the legal framework of operation of the compensation fund and an analysis of the impact of the adopted financing
mechanisms on the achieved level of profitability of the entity obliged to provide universal postal services in Poland were made. The thesis of the current study is that the mechanism of compensation for provision of universal postal services by means of a compensation fund on the Polish example is defective and ineffective from the point of view of market regulation and the designated postal operator. The study concludes by stating that the preferred form of net cost financing should be a full budget subsidy and that it is unjustified to charge the full
value of the net cost as additional commitment to the operator. The research methods used include analysis of scientific lite rature, collection, comparison, classification and generalization of data and expert evaluation.
Keywords: postal sector; net cost of universal service; loss on universal service; direct subsidies; compensation fund; unfair financia l
burden
Reference to this paper should be made as follows: Borowi8ec, L. 2021. Direct subsidies and compensation funds in financing of universal postal services. Entrepreneurship and Sustainability Issues, 8(3), 545-564. http://doi.org/10.9770/jesi.2021.8.3(34)
JEL Classifications: G38, D43, L51
1. Introduction
Universal postal services are considered services of general economic*interest (SGEI), that is, their provision is in
the public interest (they implement public service mission). They are entities which would not be provided
otherwise (or would be provided under less favorable conditions) on the market without public intervention
* According to point 12 of the 2012 SGEI framework agreements, subsidies may be granted for an actual and correctly defined service of general economic interest (EU Treaty 2002, art. 106).
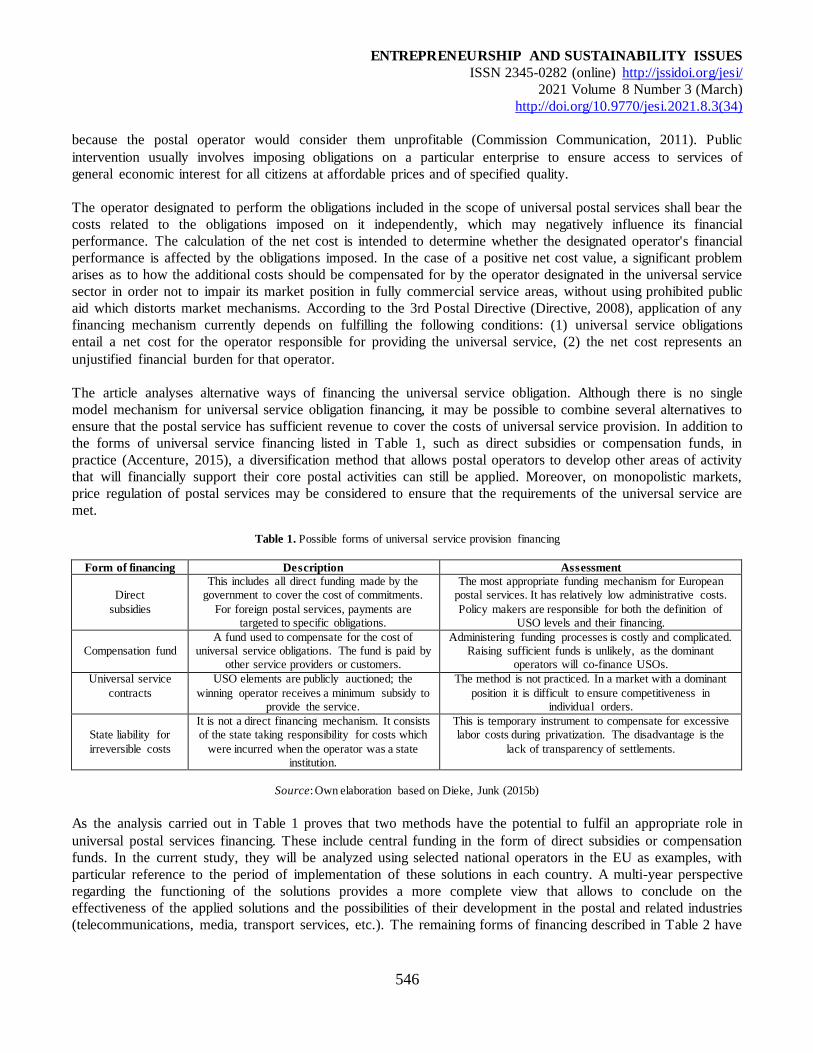
ENTREPRENEURSHIP AND SUSTAINABILITY ISSUES
ISSN 2345-0282 (online) http://jssidoi.org/jesi/
2021 Volume 8 Number 3 (March)
http://doi.org/10.9770/jesi.2021.8.3(34)
546
because the postal operator would consider them unprofitable (Commission Communication, 2011). Public
intervention usually involves imposing obligations on a particular enterprise to ensure access to services of
general economic interest for all citizens at affordable prices and of specified quality.
The operator designated to perform the obligations included in the scope of universal postal services shall bear the
costs related to the obligations imposed on it independently, which may negatively influence its financial
performance. The calculation of the net cost is intended to determine whether the designated operator's financial
performance is affected by the obligations imposed. In the case of a positive net cost value, a significant problem
arises as to how the additional costs should be compensated for by the operator designated in the universal service
sector in order not to impair its market position in fully commercial service areas, without using prohibited public
aid which distorts market mechanisms. According to the 3rd Postal Directive (Directive, 2008), application of any
financing mechanism currently depends on fulfilling the following conditions: (1) universal service obligations
entail a net cost for the operator responsible for providing the universal service, (2) the net cost represents an
unjustified financial burden for that operator.
The article analyses alternative ways of financing the universal service obligation. Although there is no single
model mechanism for universal service obligation financing, it may be possible to combine several alternatives to
ensure that the postal service has sufficient revenue to cover the costs of universal service provision. In addition to
the forms of universal service financing listed in Table 1, such as direct subsidies or compensation funds, in
practice (Accenture, 2015), a diversification method that allows postal operators to develop other areas of activity
that will financially support their core postal activities can still be applied. Moreover, on monopolistic markets,
price regulation of postal services may be considered to ensure that the requirements of the universal service are
met.
Table 1. Possible forms of universal service provision financing
Form of financing Description Assessment
Direct
subsidies
This includes all direct funding made by the
government to cover the cost of commitments.
For foreign postal services, payments are targeted to specific obligations.
The most appropriate funding mechanism for European
postal services. It has relatively low administrative costs.
Policy makers are responsible for both the definition of USO levels and their financing.
Compensation fund
A fund used to compensate for the cost of universal service obligations. The fund is paid by
other service providers or customers.
Administering funding processes is costly and complicated. Raising sufficient funds is unlikely, as the dominant
operators will co-finance USOs.
Universal service
contracts
USO elements are publicly auctioned; the
winning operator receives a minimum subsidy to provide the service.
The method is not practiced. In a market with a dominant
position it is difficult to ensure competitiveness in individual orders.
State liability for
irreversible costs
It is not a direct financing mechanism. It consists of the state taking responsibility for costs which
were incurred when the operator was a state
institution.
This is temporary instrument to compensate for excessive labor costs during privatization. The disadvantage is the
lack of transparency of settlements.
Source: Own elaboration based on Dieke, Junk (2015b)
As the analysis carried out in Table 1 proves that two methods have the potential to fulfil an appropriate role in
universal postal services financing. These include central funding in the form of direct subsidies or compensation
funds. In the current study, they will be analyzed using selected national operators in the EU as examples, with
particular reference to the period of implementation of these solutions in each country. A multi-year perspective
regarding the functioning of the solutions provides a more complete view that allows to conclude on the
effectiveness of the applied solutions and the possibilities of their development in the postal and related industries
(telecommunications, media, transport services, etc.). The remaining forms of financing described in Table 2 have
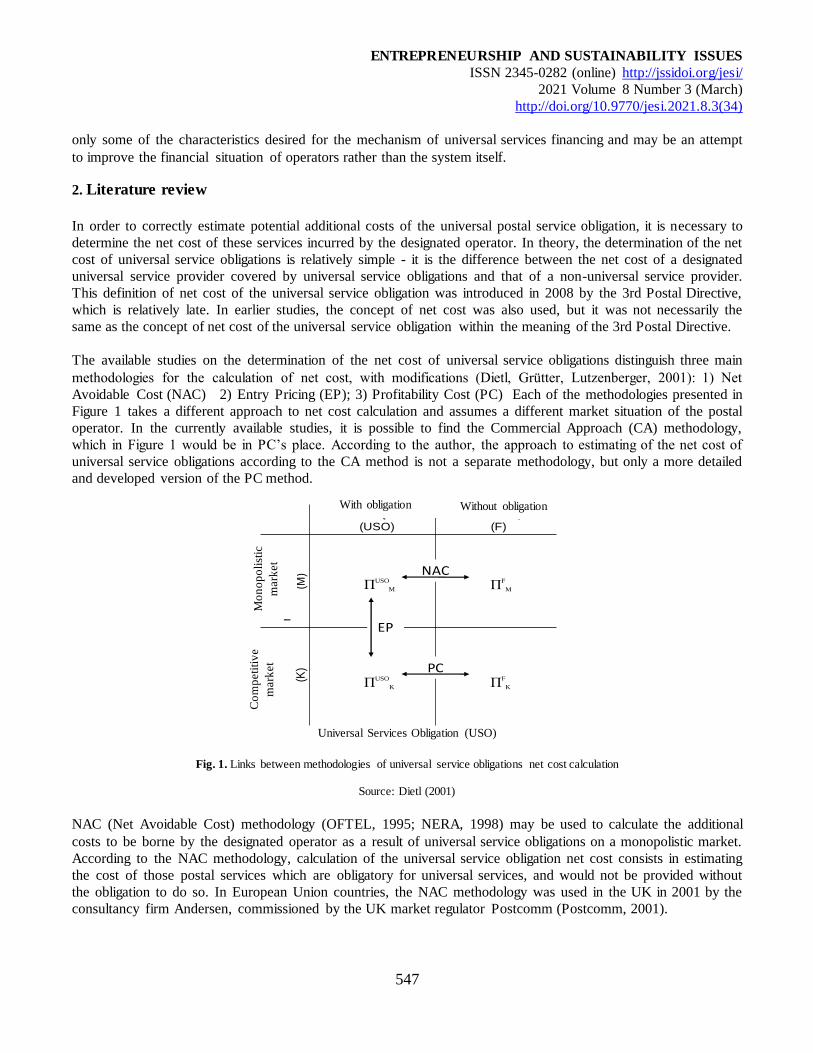
ENTREPRENEURSHIP AND SUSTAINABILITY ISSUES
ISSN 2345-0282 (online) http://jssidoi.org/jesi/
2021 Volume 8 Number 3 (March)
http://doi.org/10.9770/jesi.2021.8.3(34)
547
only some of the characteristics desired for the mechanism of universal services financing and may be an attempt
to improve the financial situation of operators rather than the system itself.
2. Literature review
In order to correctly estimate potential additional costs of the universal postal service obligation, it is necessary to
determine the net cost of these services incurred by the designated operator. In theory, the determination of the net
cost of universal service obligations is relatively simple - it is the difference between the net cost of a designated
universal service provider covered by universal service obligations and that of a non-universal service provider.
This definition of net cost of the universal service obligation was introduced in 2008 by the 3rd Postal Directive,
which is relatively late. In earlier studies, the concept of net cost was also used, but it was not necessarily the
same as the concept of net cost of the universal service obligation within the meaning of the 3rd Postal Directive.
The available studies on the determination of the net cost of universal service obligations distinguish three main
methodologies for the calculation of net cost, with modifications (Dietl, Grütter, Lutzenberger, 2001): 1) Net
Avoidable Cost (NAC) 2) Entry Pricing (EP); 3) Profitability Cost (PC) Each of the methodologies presented in
Figure 1 takes a different approach to net cost calculation and assumes a different market situation of the postal
operator. In the currently available studies, it is possible to find the Commercial Approach (CA) methodology,
which in Figure 1 would be in PC’s place. According to the author, the approach to estimating of the net cost of
universal service obligations according to the CA method is not a separate methodology, but only a more detailed
and developed version of the PC method.
Bez obowiązku
(F)
Z obowiązkiem
(USO)
Ryn
ek
mo
no
pol
isty
czny
(M
)
Ryn
ek
kon
kure
ncyj
ny
(K)
ΠUSO
M ΠF
M
ΠUSO
K ΠF
K
NAC
PC
EP
Universal Services Obligation (USO)
Fig. 1. Links between methodologies of universal service obligations net cost calculation
Source: Dietl (2001)
NAC (Net Avoidable Cost) methodology (OFTEL, 1995; NERA, 1998) may be used to calculate the additional
costs to be borne by the designated operator as a result of universal service obligations on a monopolistic market.
According to the NAC methodology, calculation of the universal service obligation net cost consists in estimating
the cost of those postal services which are obligatory for universal services, and would not be provided without
the obligation to do so. In European Union countries, the NAC methodology was used in the UK in 2001 by the
consultancy firm Andersen, commissioned by the UK market regulator Postcomm (Postcomm, 2001).
With obligation Without obligation
Mo
no
po
list
ic
mark
et
Co
mp
eti
tiv
e
mark
et
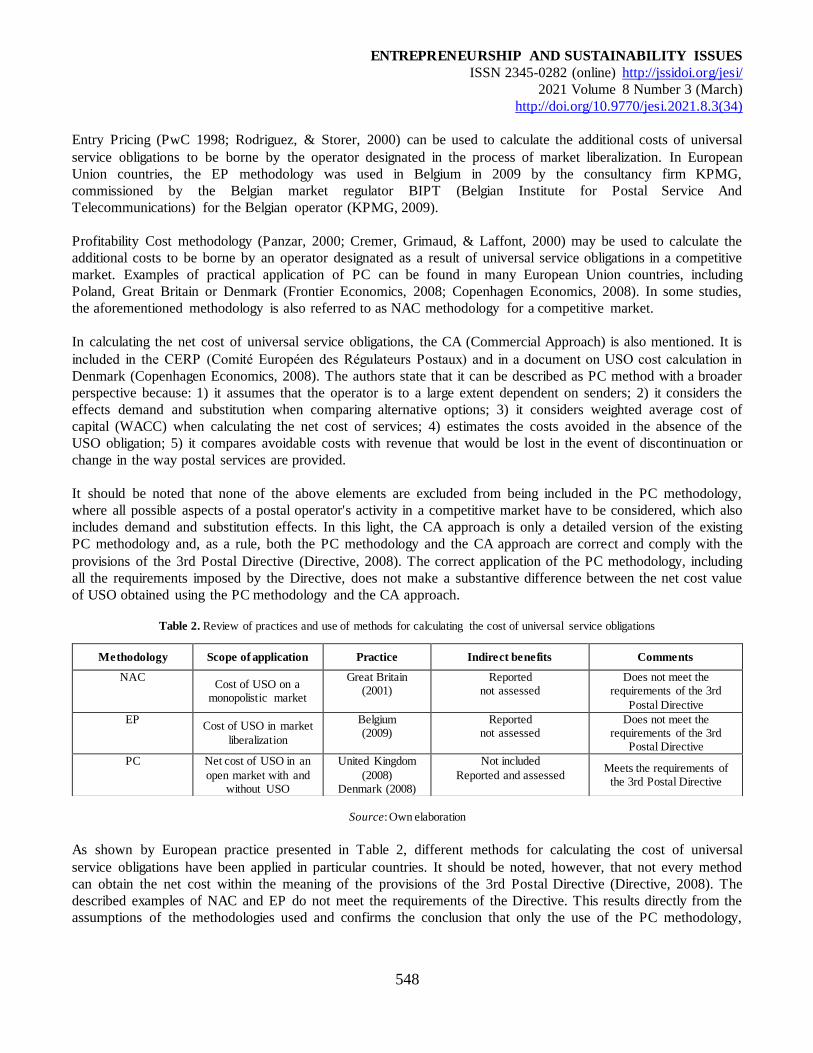
ENTREPRENEURSHIP AND SUSTAINABILITY ISSUES
ISSN 2345-0282 (online) http://jssidoi.org/jesi/
2021 Volume 8 Number 3 (March)
http://doi.org/10.9770/jesi.2021.8.3(34)
548
Entry Pricing (PwC 1998; Rodriguez, & Storer, 2000) can be used to calculate the additional costs of universal
service obligations to be borne by the operator designated in the process of market liberalization. In European
Union countries, the EP methodology was used in Belgium in 2009 by the consultancy firm KPMG,
commissioned by the Belgian market regulator BIPT (Belgian Institute for Postal Service And
Telecommunications) for the Belgian operator (KPMG, 2009).
Profitability Cost methodology (Panzar, 2000; Cremer, Grimaud, & Laffont, 2000) may be used to calculate the
additional costs to be borne by an operator designated as a result of universal service obligations in a competitive
market. Examples of practical application of PC can be found in many European Union countries, including
Poland, Great Britain or Denmark (Frontier Economics, 2008; Copenhagen Economics, 2008). In some studies,
the aforementioned methodology is also referred to as NAC methodology for a competitive market.
In calculating the net cost of universal service obligations, the CA (Commercial Approach) is also mentioned. It is
included in the CERP (Comité Européen des Régulateurs Postaux) and in a document on USO cost calculation in
Denmark (Copenhagen Economics, 2008). The authors state that it can be described as PC method with a broader
perspective because: 1) it assumes that the operator is to a large extent dependent on senders; 2) it considers the
effects demand and substitution when comparing alternative options; 3) it considers weighted average cost of
capital (WACC) when calculating the net cost of services; 4) estimates the costs avoided in the absence of the
USO obligation; 5) it compares avoidable costs with revenue that would be lost in the event of discontinuation or
change in the way postal services are provided.
It should be noted that none of the above elements are excluded from being included in the PC methodology,
where all possible aspects of a postal operator's activity in a competitive market have to be considered, which also
includes demand and substitution effects. In this light, the CA approach is only a detailed version of the existing
PC methodology and, as a rule, both the PC methodology and the CA approach are correct and comply with the
provisions of the 3rd Postal Directive (Directive, 2008). The correct application of the PC methodology, including
all the requirements imposed by the Directive, does not make a substantive difference between the net cost value
of USO obtained using the PC methodology and the CA approach.
Table 2. Review of practices and use of methods for calculating the cost of universal service obligations
Source: Own elaboration
As shown by European practice presented in Table 2, different methods for calculating the cost of universal
service obligations have been applied in particular countries. It should be noted, however, that not every method
can obtain the net cost within the meaning of the provisions of the 3rd Postal Directive (Directive, 2008). The
described examples of NAC and EP do not meet the requirements of the Directive. This results directly from the
assumptions of the methodologies used and confirms the conclusion that only the use of the PC methodology,
Methodology Scope of application Practice Indirect benefits Comments
NAC
Cost of USO on a monopolistic market
Great Britain (2001)
Reported not assessed
Does not meet the requirements of the 3rd
Postal Directive
EP
Cost of USO in market
liberalization
Belgium (2009)
Reported not assessed
Does not meet the requirements of the 3rd
Postal Directive
PC
Net cost of USO in an
open market with and without USO
United Kingdom
(2008) Denmark (2008)
Not included
Reported and assessed Meets the requirements of
the 3rd Postal Directive
ENTREPRENEURSHIP AND SUSTAINABILITY ISSUES
ISSN 2345-0282 (online) http://jssidoi.org/jesi/
2021 Volume 8 Number 3 (March)
http://doi.org/10.9770/jesi.2021.8.3(34)
549
which covers all effects on both the cost and revenue side, results in an estimate consistent with the definition of
the net cost of universal service obligations.
For the financing mechanism to trigger, the following need to occur: the net cost of the universal service and an
unjustified financial burden on the operator. As it was mentioned, the definition of net cost is included in the 3rd
Postal Directive and the methodology is described precisely in the literature (e.g. Frontier Economics, 2008; Jaag,
Koller, & Trinkner, 2009; Jaag, 2011a). Most models of the universal postal service are exogenous, and scientific
studies boil down to the analysis of their implementation in individual countries (see e.g.: Cohen, Mc Bride, &
Panzar, 2010; Bergum, 2008; Anton, VanderWeide, & Vettas, 2002; Bourguignon, & Ferrando, 2007; Calzada,
2009; Choné, Flochel, & Perrot, 2002; Foros, & Kind, 2003; Gautier, & Mizuno, 2011; Gautier, & Paolini, 2011;
Gautier, & Wauthy, 2010; Jaag, 2011; Borowiec 2012; Borowiec 2013; Rozbiecki, & Rosiak, 2014; KPMG,
2010). However, the 3rd Postal Directive does not explain what the term "unjustified financial burden" entails
(Borowiec, 2011). The literature (Boldron et al., 2009) often refers to situations where the burden exceeds a
certain percentage of the designated operator's profits, prevents a 'reasonable profit' (Frontier Economics, 2012) or
suggests to consider its financial situation (ERGP, 2012).
Issues related to the need to finance universal servic obligations are the subject of numerous studies as well
(Boldron, Borsenberger, Joram et al., 2010; Borsenberger, Cremer, De Donder et al., 2010; Panzar 2008; Mirabel,
Poudou, & Roland, 2009; Chone, Flochel, & Perrot, 2002). However, they serve classification and review
purposes. They refer to the potential possibilities of introducing different financing instruments. There is no
practical verification of the effectiveness of implemented mechanisms with the use of empirical data from
individual markets in which universal postal service is provided, designated operators bear an unjustified burden
and there is an implemented (operating) compensation mechanism for this. There is a lot of research into the
impact of pricing policies in the market where universal service operator is present (Pardou, & Roland, 2014; De
Villemeur, Cremer, Roy, et al., 2003). Research often addresses theoretical issues in pricing and competition
behavior mechanisms in imperfectly competitive markets (Anderson, De Palma, & Kreider, 2001; Hoering, 2006;
Armstrong, Doyle, & Vickers, 1996; Bloch, & Gautier, 2008; De Donder, 2006).
The latest research on operations of the postal services market, where universal services are provided, are focused
on an attempt to redefine the scope. Analyzes are mainly undertaken in order to limit the most important
components of the net cost, which directly affects the amount of unjustified burden on the operator, and therefore
the amount of necessary compensation. This applies primarily to research on the availability of the postal network
for customers and its impact on the quality of services provided (Mercier, Souche ‐ Le Corvec, & Ovtracht, 2020;
Mostarac, Kavran, & Rakic, 2019; Hostakova, 2018; Sarac, Unterberger, Jovanovic et al., 2017). There are also
studies in which the postal network is examined from the point of view of the postal operator, in the framework of
not necessarily an access for the customer, but of its profitability assessment and reorganization in order to
increase its effectiveness (Blagojevic, Ralevic, & Sarac, 2020; Milutinovic, Markovic, Stanivukovic, et al., 2020;
Sarac, Kopic, Mostarac et al., 2016).
At the same time, it should be noted that new means of electronic communication and consumer needs undermine
the economic justification and traditional scope of the postal universal service obligation (Lewandowski,
Mlodkowski, & Wrobel, 2019). In the future, individual countries will adapt their postal universal services to take
into account the availability of electronic substitutes, changes in customer behavior and declining number of
postal items, similar to the telecommunications market. Other areas of current research focus on comparing the
efficiency of postal operators in EU countries (Ralević, Dobrodolac, & Švadlenka, 2020), or in individual
countries such as Ireland (Cahill, Palcic, Reeves et al., 2018) or Serbia (Dobrodolac, Blagojevic & Draskovic,
2016; Dobrodolac, Ralević, Švadlenka, et al., 2018). Other areas of current research focus on comparing
efficiency of postal operators in EU countries (Ralević, Dobrodolac, & Švadlenka, 2020), or in individual
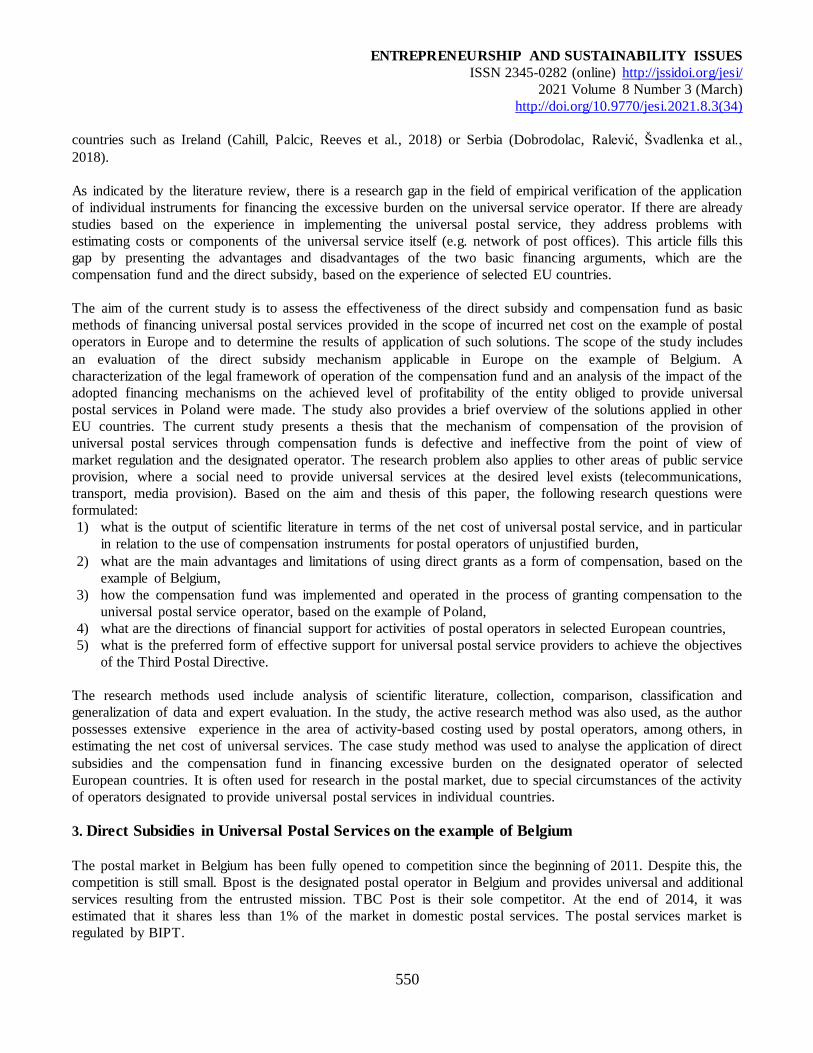
ENTREPRENEURSHIP AND SUSTAINABILITY ISSUES
ISSN 2345-0282 (online) http://jssidoi.org/jesi/
2021 Volume 8 Number 3 (March)
http://doi.org/10.9770/jesi.2021.8.3(34)
550
countries such as Ireland (Cahill, Palcic, Reeves et al., 2018) or Serbia (Dobrodolac, Ralević, Švadlenka et al.,
2018).
As indicated by the literature review, there is a research gap in the field of empirical verification of the application
of individual instruments for financing the excessive burden on the universal service operator. If there are already
studies based on the experience in implementing the universal postal service, they address problems with
estimating costs or components of the universal service itself (e.g. network of post offices). This article fills this
gap by presenting the advantages and disadvantages of the two basic financing arguments, which are the
compensation fund and the direct subsidy, based on the experience of selected EU countries.
The aim of the current study is to assess the effectiveness of the direct subsidy and compensation fund as basic
methods of financing universal postal services provided in the scope of incurred net cost on the example of postal
operators in Europe and to determine the results of application of such solutions. The scope of the study includes
an evaluation of the direct subsidy mechanism applicable in Europe on the example of Belgium. A
characterization of the legal framework of operation of the compensation fund and an analysis of the impact of the
adopted financing mechanisms on the achieved level of profitability of the entity obliged to provide universal
postal services in Poland were made. The study also provides a brief overview of the solutions applied in other
EU countries. The current study presents a thesis that the mechanism of compensation of the provision of
universal postal services through compensation funds is defective and ineffective from the point of view of
market regulation and the designated operator. The research problem also applies to other areas of public service
provision, where a social need to provide universal services at the desired level exists (telecommunications,
transport, media provision). Based on the aim and thesis of this paper, the following research questions were
formulated:
1) what is the output of scientific literature in terms of the net cost of universal postal service, and in particular
in relation to the use of compensation instruments for postal operators of unjustified burden,
2) what are the main advantages and limitations of using direct grants as a form of compensation, based on the
example of Belgium,
3) how the compensation fund was implemented and operated in the process of granting compensation to the
universal postal service operator, based on the example of Poland,
4) what are the directions of financial support for activities of postal operators in selected European countries,
5) what is the preferred form of effective support for universal postal service providers to achieve the objectives
of the Third Postal Directive.
The research methods used include analysis of scientific literature, collection, comparison, classification and
generalization of data and expert evaluation. In the study, the active research method was also used, as the author
possesses extensive experience in the area of activity-based costing used by postal operators, among others, in
estimating the net cost of universal services. The case study method was used to analyse the application of direct
subsidies and the compensation fund in financing excessive burden on the designated operator of selected
European countries. It is often used for research in the postal market, due to special circumstances of the activity
of operators designated to provide universal postal services in individual countries.
3. Direct Subsidies in Universal Postal Services on the example of Belgium
The postal market in Belgium has been fully opened to competition since the beginning of 2011. Despite this, the
competition is still small. Bpost is the designated postal operator in Belgium and provides universal and additional
services resulting from the entrusted mission. TBC Post is their sole competitor. At the end of 2014, it was
estimated that it shares less than 1% of the market in domestic postal services. The postal services market is
regulated by BIPT.
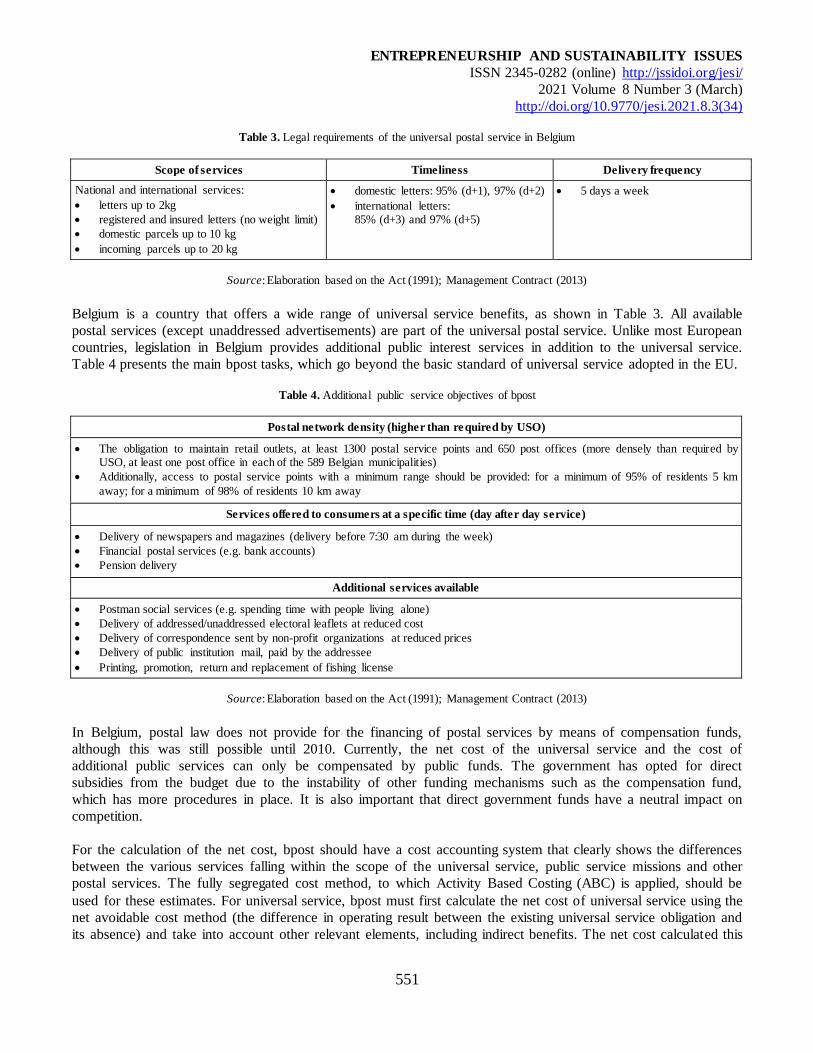
ENTREPRENEURSHIP AND SUSTAINABILITY ISSUES
ISSN 2345-0282 (online) http://jssidoi.org/jesi/
2021 Volume 8 Number 3 (March)
http://doi.org/10.9770/jesi.2021.8.3(34)
551
Table 3. Legal requirements of the universal postal service in Belgium
Scope of services Timeliness Delivery frequency
National and international services:
letters up to 2kg
registered and insured letters (no weight limit)
domestic parcels up to 10 kg
incoming parcels up to 20 kg
domestic letters: 95% (d+1), 97% (d+2)
international letters: 85% (d+3) and 97% (d+5)
5 days a week
Source: Elaboration based on the Act (1991); Management Contract (2013)
Belgium is a country that offers a wide range of universal service benefits, as shown in Table 3. All available
postal services (except unaddressed advertisements) are part of the universal postal service. Unlike most European
countries, legislation in Belgium provides additional public interest services in addition to the universal service.
Table 4 presents the main bpost tasks, which go beyond the basic standard of universal service adopted in the EU.
Table 4. Additional public service objectives of bpost
Postal network density (higher than required by USO)
The obligation to maintain retail outlets, at least 1300 postal service points and 650 post offices (more densely than required by
USO, at least one post office in each of the 589 Belgian municipalities)
Additionally, access to postal service points with a minimum range should be provided: for a minimum of 95% of residents 5 km
away; for a minimum of 98% of residents 10 km away
Services offered to consumers at a specific time (day after day service)
Delivery of newspapers and magazines (delivery before 7:30 am during the week)
Financial postal services (e.g. bank accounts)
Pension delivery
Additional services available
Postman social services (e.g. spending time with people living alone)
Delivery of addressed/unaddressed electoral leaflets at reduced cost
Delivery of correspondence sent by non-profit organizations at reduced prices
Delivery of public institution mail, paid by the addressee
Printing, promotion, return and replacement of fishing license
Source: Elaboration based on the Act (1991); Management Contract (2013)
In Belgium, postal law does not provide for the financing of postal services by means of compensation funds,
although this was still possible until 2010. Currently, the net cost of the universal service and the cost of
additional public services can only be compensated by public funds. The government has opted for direct
subsidies from the budget due to the instability of other funding mechanisms such as the compensation fund,
which has more procedures in place. It is also important that direct government funds have a neutral impact on
competition.
For the calculation of the net cost, bpost should have a cost accounting system that clearly shows the differences
between the various services falling within the scope of the universal service, public service missions and other
postal services. The fully segregated cost method, to which Activity Based Costing (ABC) is applied, should be
used for these estimates. For universal service, bpost must first calculate the net cost of universal service using the
net avoidable cost method (the difference in operating result between the existing universal service obligation and
its absence) and take into account other relevant elements, including indirect benefits. The net cost calculated this
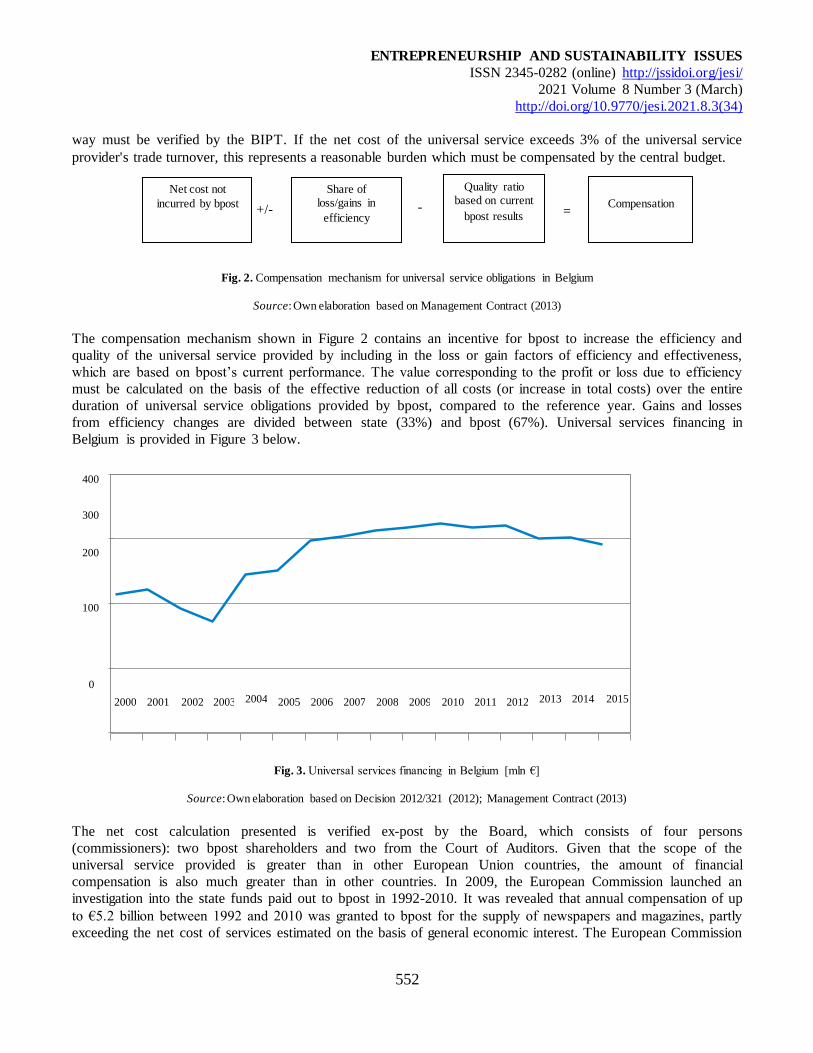
ENTREPRENEURSHIP AND SUSTAINABILITY ISSUES
ISSN 2345-0282 (online) http://jssidoi.org/jesi/
2021 Volume 8 Number 3 (March)
http://doi.org/10.9770/jesi.2021.8.3(34)
552
0
400
way must be verified by the BIPT. If the net cost of the universal service exceeds 3% of the universal service
provider's trade turnover, this represents a reasonable burden which must be compensated by the central budget.
Fig. 2. Compensation mechanism for universal service obligations in Belgium
Source: Own elaboration based on Management Contract (2013)
The compensation mechanism shown in Figure 2 contains an incentive for bpost to increase the efficiency and
quality of the universal service provided by including in the loss or gain factors of efficiency and effectiveness,
which are based on bpost’s current performance. The value corresponding to the profit or loss due to efficiency
must be calculated on the basis of the effective reduction of all costs (or increase in total costs) over the entire
duration of universal service obligations provided by bpost, compared to the reference year. Gains and losses
from efficiency changes are divided between state (33%) and bpost (67%). Universal services financing in
Belgium is provided in Figure 3 below.
Fig. 3. Universal services financing in Belgium [mln €]
Source: Own elaboration based on Decision 2012/321 (2012); Management Contract (2013)
The net cost calculation presented is verified ex-post by the Board, which consists of four persons
(commissioners): two bpost shareholders and two from the Court of Auditors. Given that the scope of the
universal service provided is greater than in other European Union countries, the amount of financial
compensation is also much greater than in other countries. In 2009, the European Commission launched an
investigation into the state funds paid out to bpost in 1992-2010. It was revealed that annual compensation of up
to €5.2 billion between 1992 and 2010 was granted to bpost for the supply of newspapers and magazines, partly
exceeding the net cost of services estimated on the basis of general economic interest. The European Commission
= - +/-
Net cost not
incurred by bpost
Share of
loss/gains in
efficiency
Quality ratio based on current
bpost results
Compensation
2000 2001 2002 2003 2004 2005 2006 2007 2008 2009 2011 2010 2012 2013 2014 2015
200
300
100
ENTREPRENEURSHIP AND SUSTAINABILITY ISSUES
ISSN 2345-0282 (online) http://jssidoi.org/jesi/
2021 Volume 8 Number 3 (March)
http://doi.org/10.9770/jesi.2021.8.3(34)
553
ordered the reimbursement of €417 million in 2012 for unjustified support. This decision was challenged by bpost
and Post Invest Europe. In 2013, the court found both motions to be unfounded.
In March 2013, Belgium informed the Commission of a planned annual grant of €300 million to finance the
services of general interest entrusted to bpost under the 5th Management Contract for the period 2013-2015. The
European Commission has positively assessed the method used to estimate the net cost of universal services. It
has determined that the compensation did not exceed the costs of the services and can therefore be transferred
within the framework of the permitted public aid.
After the bpost subsidies increased significantly after 2003, they started to decrease slightly from 2012 as a result
of the operator's productivity increase. Their value fluctuates around 12% of annual bpost turnover. In practice,
the operator receives more compensation for the provision of the public service mission entrusted to it than for the
provision of the standard universal service.
The possibility of introducing a compensation fund to finance the net cost of universal services was eliminated by
the postal law. The BIPT identified the advantages and disadvantages of public subsidies and the universal service
fund. The Belgian Government chose public funding because of the uncertainty in other funding mechanisms, as
is the case with compensation funds (for example, more complex procedures). In addition, their neutral impact on
competition is important. However, through high compensation payments (12% of turnover), bpost is currently
the most profitable postal operator in Europe. This raises doubts whether budget subsidies are needed at all.
4. Compensation Fund in Poland
In the case of the Polish postal market, the obligation to provide services of general economic interest in 2013-
2015 was imposed on Polish Post (Poczta Polska) in the form of statutory provisions, (Act of 2012, art. 178, sec.
1) to provide universal postal services. Since 2016, the Polish Post (Poczta Polska) has also won the competition
for the designated operator for the next 10 years. No universal service which has quality parameters above the
standard regulated at European level occur, contrary to Belgium’s case. In Poland, financing of the net cost of the
designated operator is possible only if the provision of universal services is carried out at an accounting loss. It
must be concluded that such an assessment of the unjustified financial burden is in line with the principles
underlying the 3rd Postal Directive as it is objective, transparent and accurate, for its appropriate allocation of
revenues and costs necessary for the calculation of the loss is guaranteed by the regulatory accounting obligation
imposed on the designated operator (Commission Communication, 2016).
In order to possibly compensate the net cost incurred by Polish Post (Poczta Polska), the Polish authorities
established a compensation fund mechanism, which was notified to the European Commission. It allows for
compensating the costs of Polish Post (Poczta Polska) through contributions from postal service providers
(including Polish Post) operating on the universal postal service market and those services which are
interchangeable.†If necessary, these contributions may be supplemented by subsidies from state budget.
The designated operator shall estimate the projected net cost of the universal service obligation and the accounting
loss it expects to incur in connection with the performance of the universal service obligation in a given financial
year. The operator is also obliged to submit, by 31 March of the reference year, a corrective action plan to avoid
the occurrence of the forecasted loss (if any) in the provision of universal service (at least to minimize it). The
recovery plan includes various initiatives to increase business efficiency.
†The Postal Law Act art. 3 point 30 contains the definition of "services within the scope of universal services" called "exchangeable services".
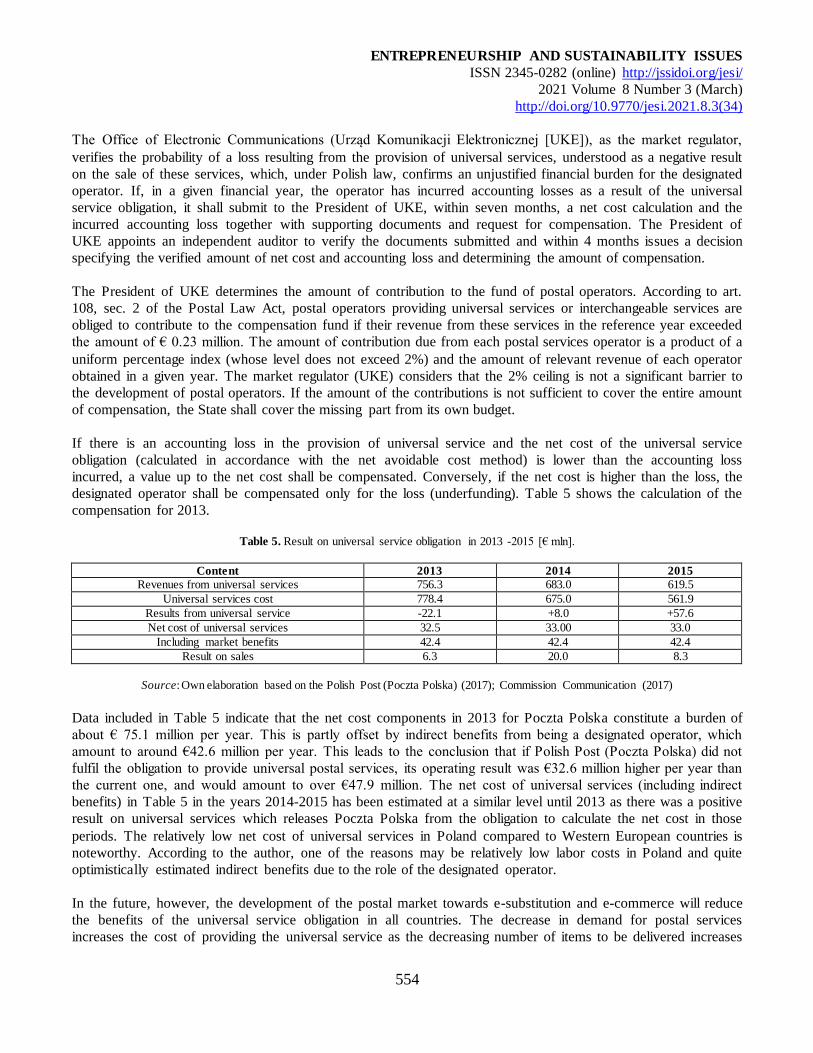
ENTREPRENEURSHIP AND SUSTAINABILITY ISSUES
ISSN 2345-0282 (online) http://jssidoi.org/jesi/
2021 Volume 8 Number 3 (March)
http://doi.org/10.9770/jesi.2021.8.3(34)
554
The Office of Electronic Communications (Urząd Komunikacji Elektronicznej [UKE]), as the market regulator,
verifies the probability of a loss resulting from the provision of universal services, understood as a negative result
on the sale of these services, which, under Polish law, confirms an unjustified financial burden for the designated
operator. If, in a given financial year, the operator has incurred accounting losses as a result of the universal
service obligation, it shall submit to the President of UKE, within seven months, a net cost calculation and the
incurred accounting loss together with supporting documents and request for compensation. The President of
UKE appoints an independent auditor to verify the documents submitted and within 4 months issues a decision
specifying the verified amount of net cost and accounting loss and determining the amount of compensation.
The President of UKE determines the amount of contribution to the fund of postal operators. According to art.
108, sec. 2 of the Postal Law Act, postal operators providing universal services or interchangeable services are
obliged to contribute to the compensation fund if their revenue from these services in the reference year exceeded
the amount of € 0.23 million. The amount of contribution due from each postal services operator is a product of a
uniform percentage index (whose level does not exceed 2%) and the amount of relevant revenue of each operator
obtained in a given year. The market regulator (UKE) considers that the 2% ceiling is not a significant barrier to
the development of postal operators. If the amount of the contributions is not sufficient to cover the entire amount
of compensation, the State shall cover the missing part from its own budget.
If there is an accounting loss in the provision of universal service and the net cost of the universal service
obligation (calculated in accordance with the net avoidable cost method) is lower than the accounting loss
incurred, a value up to the net cost shall be compensated. Conversely, if the net cost is higher than the loss, the
designated operator shall be compensated only for the loss (underfunding). Table 5 shows the calculation of the
compensation for 2013.
Table 5. Result on universal service obligation in 2013 -2015 [€ mln].
Content 2013 2014 2015
Revenues from universal services 756.3 683.0 619.5
Universal services cost 778.4 675.0 561.9
Results from universal service -22.1 +8.0 +57.6
Net cost of universal services 32.5 33.00 33.0
Including market benefits 42.4 42.4 42.4
Result on sales 6.3 20.0 8.3
Source: Own elaboration based on the Polish Post (Poczta Polska) (2017); Commission Communication (2017)
Data included in Table 5 indicate that the net cost components in 2013 for Poczta Polska constitute a burden of
about € 75.1 million per year. This is partly offset by indirect benefits from being a designated operator, which
amount to around €42.6 million per year. This leads to the conclusion that if Polish Post (Poczta Polska) did not
fulfil the obligation to provide universal postal services, its operating result was €32.6 million higher per year than
the current one, and would amount to over €47.9 million. The net cost of universal services (including indirect
benefits) in Table 5 in the years 2014-2015 has been estimated at a similar level until 2013 as there was a positive
result on universal services which releases Poczta Polska from the obligation to calculate the net cost in those
periods. The relatively low net cost of universal services in Poland compared to Western European countries is
noteworthy. According to the author, one of the reasons may be relatively low labor costs in Poland and quite
optimistically estimated indirect benefits due to the role of the designated operator.
In the future, however, the development of the postal market towards e-substitution and e-commerce will reduce
the benefits of the universal service obligation in all countries. The decrease in demand for postal services
increases the cost of providing the universal service as the decreasing number of items to be delivered increases
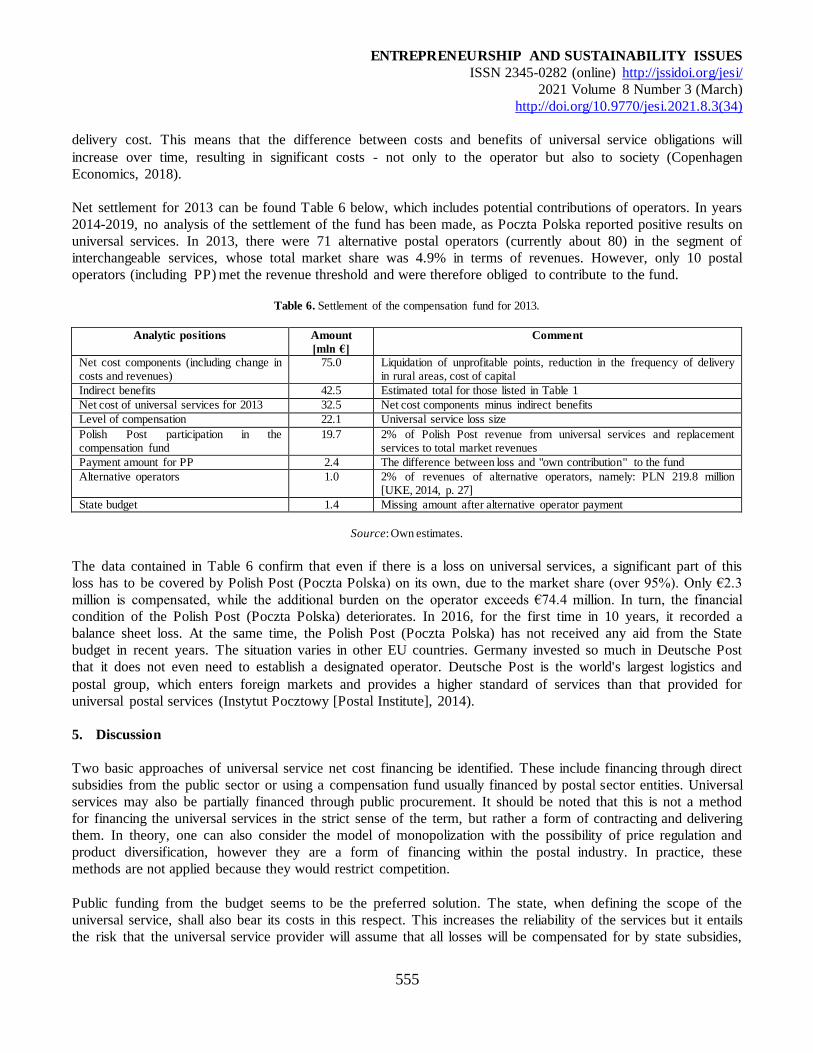
ENTREPRENEURSHIP AND SUSTAINABILITY ISSUES
ISSN 2345-0282 (online) http://jssidoi.org/jesi/
2021 Volume 8 Number 3 (March)
http://doi.org/10.9770/jesi.2021.8.3(34)
555
delivery cost. This means that the difference between costs and benefits of universal service obligations will
increase over time, resulting in significant costs - not only to the operator but also to society (Copenhagen
Economics, 2018).
Net settlement for 2013 can be found Table 6 below, which includes potential contributions of operators. In years
2014-2019, no analysis of the settlement of the fund has been made, as Poczta Polska reported positive results on
universal services. In 2013, there were 71 alternative postal operators (currently about 80) in the segment of
interchangeable services, whose total market share was 4.9% in terms of revenues. However, only 10 postal
operators (including PP) met the revenue threshold and were therefore obliged to contribute to the fund.
Table 6. Settlement of the compensation fund for 2013.
Analytic positions Amount
[mln €]
Comment
Net cost components (including change in
costs and revenues)
75.0 Liquidation of unprofitable points, reduction in the frequency of delivery
in rural areas, cost of capital
Indirect benefits 42.5 Estimated total for those listed in Table 1
Net cost of universal services for 2013 32.5 Net cost components minus indirect benefits
Level of compensation 22.1 Universal service loss size
Polish Post participation in the compensation fund
19.7 2% of Polish Post revenue from universal services and replacement services to total market revenues
Payment amount for PP 2.4 The difference between loss and "own contribution" to the fund
Alternative operators 1.0 2% of revenues of alternative operators, namely: PLN 219.8 million [UKE, 2014, p. 27]
State budget 1.4 Missing amount after alternative operator payment
Source: Own estimates.
The data contained in Table 6 confirm that even if there is a loss on universal services, a significant part of this
loss has to be covered by Polish Post (Poczta Polska) on its own, due to the market share (over 95%). Only €2.3
million is compensated, while the additional burden on the operator exceeds €74.4 million. In turn, the financial
condition of the Polish Post (Poczta Polska) deteriorates. In 2016, for the first time in 10 years, it recorded a
balance sheet loss. At the same time, the Polish Post (Poczta Polska) has not received any aid from the State
budget in recent years. The situation varies in other EU countries. Germany invested so much in Deutsche Post
that it does not even need to establish a designated operator. Deutsche Post is the world's largest logistics and
postal group, which enters foreign markets and provides a higher standard of services than that provided for
universal postal services (Instytut Pocztowy [Postal Institute], 2014).
5. Discussion
Two basic approaches of universal service net cost financing be identified. These include financing through direct
subsidies from the public sector or using a compensation fund usually financed by postal sector entities. Universal
services may also be partially financed through public procurement. It should be noted that this is not a method
for financing the universal services in the strict sense of the term, but rather a form of contracting and delivering
them. In theory, one can also consider the model of monopolization with the possibility of price regulation and
product diversification, however they are a form of financing within the postal industry. In practice, these
methods are not applied because they would restrict competition.
Public funding from the budget seems to be the preferred solution. The state, when defining the scope of the
universal service, shall also bear its costs in this respect. This increases the reliability of the services but it entails
the risk that the universal service provider will assume that all losses will be compensated for by state subsidies,
ENTREPRENEURSHIP AND SUSTAINABILITY ISSUES
ISSN 2345-0282 (online) http://jssidoi.org/jesi/
2021 Volume 8 Number 3 (March)
http://doi.org/10.9770/jesi.2021.8.3(34)
556
which will not provide an incentive to reduce costs. However, as indicated by the research, the creation of
compensation funds leads to the conclusion that without a significant participation in the proceeds of public funds,
it is not possible to effectively finance the costs of the implementation of universal postal services in the amounts
constituting an unjustified burden on the designated operator.
Financing of the universal services by the state is particularly justified for countries where the burden of the net
cost of postal services is high in comparison with the funds that can be obtained from charges from operators or
their customers. Undoubtedly, direct subsidies that reimburse additional costs incurred are effective and do not
significantly affect market competition. By financing the universal service by means of budget contributions, the
costs of the universal service are shared by society as a whole, not just market participants. In addition, if
government subsidies are financed by progressive taxes, the mechanism may be more socially fair. There are
obviously risks and temptations of overcompensation, which will have a negative impact on competition in which
the operator functions. Where the government plays the dual role of investor and supervisor, budgetary financing
must be transparent with regards to the estimation of the net cost and implementation of subsidies.‡
In Italy, a compensation fund method is used. Payments from postal operators collected through the fund between
2000 and 2010 amounted to 0.01% of universal postal service net costs (Fratini, 2016). For example, the
contribution to the compensation fund of other service providers was only € 111,000 in 2005 (representing 0.04%
of the net cost of universal service). Contributions paid to the compensation fund proved to be insufficient to
cover the costs of the universal postal service. As a result of state intervention, budget subsidies of approximately
370 million per year for the provision of the universal postal service were transferred to Poste Italiane. The
European Commission verified the compensation for Poste Italiane in the years 2000-2011 (European
Commission Decision, 11.2012) and ruled that the payments were in line with the internal market, as the net cost
of the provided universal services significantly exceeded the value of the subsidy (e.g. in 2010, the net cost of the
universal services was € 689 million and the compensation was € 364.5 million).
A formal verification of the net cost of the universal postal service of the Italian market regulator (AGCom),
performed for the first time in 2014 for the years 2011 and 2012 using the net unpaid method, indicated that it
amounted to € 709 million and € 704 million respectively. This means that the compensation of € 380.6 million
for 2011 and € 327.3 million for 2012 covered only half of the net costs of the universal postal service. For the
period 2015-2019, government subsidies for the provision of the universal postal service have been set at €262.4
million per year regardless of the net cost estimates of the universal service.
In Germany, a universal service compensation fund was not set up as no universal service deficiencies were
observed. The universal postal service is financed by revenues generated by Deutsche Post DHL. In addition,
Deutsche Post receives substantial subsidies for its pension costs, which have been the subject of an in-depth
investigation by the European Commission. Pension subsidies increased from € 151 million in 1995 to € 3.2
billion in 2010, which means that they amounted to around € 37 billion over the period 1995-2010 (Commission
Decision 2012/636). Deutsche Post voluntarily deals with the provision of universal services and their financing,
mainly by building a positive image. It is estimated that the image loss, defined as indirect benefits, could be
greater than the expected savings after the abandonment of universal service. In addition, Deutsche Post would
probably lose its VAT exemption.
Postal services market in France were fully opened up to competition in early 2011. La Poste receives two types
of public subsidies: compensation for the reduced rate for the press and subsidies for maintaining a dense postal
network. La Poste received compensation for the reduced press rate of €242 million a year in the period 2005-
2011. Later, the French government reduced compensation by 50 million € in 2014 and 2015. The compensation
‡ In order to meet the legal requirements, the funding must meet the four criteria set out in Altmark (2003).
ENTREPRENEURSHIP AND SUSTAINABILITY ISSUES
ISSN 2345-0282 (online) http://jssidoi.org/jesi/
2021 Volume 8 Number 3 (March)
http://doi.org/10.9770/jesi.2021.8.3(34)
557
for maintaining adequate network density is approximately € 150 million. The net cost to La Poste of maintaining
a dense postal network is set at €269 million for 2010 and €277 million for 2011. Unlike the compensation
payments for lower press costs, the subsidy to provide a dense postal network increases. The European
Commission has accepted the subsidy given to La Poste to maintain a dense network of postal services for the
period 2008-2012, since it represented only a part of the net cost of the relevant public service tasks (Commission
Decision, January 2012).
Great Britain was one of the first countries in Europe to introduce competition on the postal services market in
2006. The Postal Services Act of 2011 provides that the UK Government is taking over part of Royal Mail's
(RMPP) commitments. A pension system has been established which is a burden on the UK Government. As of
31 March 2012, Royal Mail is only obliged to pay pension contributions to employees who still work for Royal
Mail. As a result, it is only responsible for new pension rights acquired after March 2012 (Commission Decision
03.2015).
Royal Mail and Post Office Ltd. (POL), which also deals with retail sales, receives financial support for
maintaining the rural network, subsidies for transforming the network of post offices and exemption from pension
costs. POL has received annual compensation for the maintenance of the network in rural areas which amounted
to up to £ 150 million by 2010. The compensation increased to £280 million between 2015 and 2016. The
Government has granted Royal Mail a debt reduction of £ 1.089 billion over the period 2010-2015, and £184
million for the costs of closing down post offices on the basis of restructuring plans. The European Commission
has reviewed both programmes, declaring them legal (Commission Decision 03.2012; Commission Decision
11.2007). The European Commission has also adopted a £32.2 billion scheme to relieve Royal Mail of pension
costs.
The postal market in Spain was liberalized in 2011. Correos is obliged to provide universal postal services by the
end of 2026 (Postal Law, 2010). In 2011, a compensation fund for universal services was established. Although
has not been implemented yet, the methodology has already been defined. The fund shall be paid for from various
sources. Government subsidies, postal operators' fees, license fees and interest on the collected funds will be the
basic source of funds. Correos will be the only exempt operator. Once the net cost and unjustified burden for a
given year have been determined, the designated operator shall receive their value. In the event that the
components of the fund are not sufficient to compensate for the costs of providing universal service, the
difference will be paid by the central budget. In addition, since 2008, Correos has been receiving capital subsidies
(€ 5-20 million per year) and subsidies for employee training. The total amount transferred decreased from € 627
million in 2008 to € 171 million in 2014 (Annual Reports, 2008-2014).
Correos receives compensation payments for the provision of universal services in advance on the basis of net
cost calculations from previous years. After the end of a given year, the actual net cost of providing the universal
service shall be estimated and a final settlement shall take place. For example, in 2013 Correos received
outstanding payments for 2009 (€ 148 million) and 2010 (€ 121 million). For the 3-year period 2011-2013, a
payment of € 518 million was transferred in 2014. The value of compensations paid out has been increasing in
recent years, from € 40 million in 2011-2012 to € 337 million in 2014.
When considering the methods of universal postal service financing, direct subsidy is proving to be the most
effective source of financing on European markets. The advantage of this alternative is the clear responsibility of
the central budget for ensuring an adequate level of universal service and its financing. A direct subsidy provides
full financing of the universal service based on the estimated cost of the obligation, but is often difficult to
determine reliably. These difficulties can be eliminated by linking subsidies to additional activities of postal
operators, as is the case on European markets. In the UK, the Government provides a subsidy to enable Royal
Mail to maintain post offices in rural areas. By limiting the subsidy to dedicated activities, it facilitates the linking
ENTREPRENEURSHIP AND SUSTAINABILITY ISSUES
ISSN 2345-0282 (online) http://jssidoi.org/jesi/
2021 Volume 8 Number 3 (March)
http://doi.org/10.9770/jesi.2021.8.3(34)
558
of the subsidy to specific costs. The French government is compensating the national operator La Poste for the
reduction in payments for press. In Belgium, the subsidies mainly concern non-standard public service mission.
All these solutions lead to strong support of national postal operators. In this context, the situation of Polish Post
(Poczta Polska) is different because in practice, through the application of the compensation fund, it does not
receive any financial support for the provision of universal services. This deteriorates its financial situation and
competitiveness, especially on international markets in the area of e-commerce.
The ineffectiveness of financing through the compensation fund is also confirmed by the fact that, the Polish Post
(Poczta Polska) has not yet received any amounts to cover the net cost due to the settlement of the compensation
fund for 2013, despite the positive opinion of the European Commission on the justification of granting such aid.
Adoption of a compensation fund model through subsidies of postal operators as the preferred solution for
financing the net cost leads to a situation in which the designated operator is obliged, almost independently, to
finance the burden resulting from the net cost. Consequently, the designated operator is destined to operate in a
much less friendly regulatory environment than other entities, which should be considered a significant
shortcoming of the postal market liberalization process in Poland. Moreover, as indicated by other studies
(Borowiec, 2018), postal operators which function simultaneously on regulated universal services and fully
competitive markets, by using a single cost calculation model (e.g. ABC) may have distorted information about
the result on universal services. The author proves the existence of the so-called universal services result
paradox, which causes an improvement in operating result with decreasing volumes of services and constant
regulatory requirements. On the basis of this evidence, further consideration was given to the need to modify the
ABC model together with a proposal for a methodological basis determined using the net cost of universal
service. The consequence of which is an overstatement of the result on universal services, which results in
limiting the potential amount of co-financing, either from a direct subsidy or a compensation fund.
Conclusions
In the case of the postal market, the regulations at EU level provide for the possibility to finance the activities of
the operator within the framework of the imposed obligation, but without any absolute obligation on the part of
public authorities to finance those services. For the universal service net cost financing, a distinction can be made
between financing through direct subsidies or compensation funds usually financed by postal operators.
In almost all Western European countries (e.g. Belgium, France, Italy, Spain and the UK), the designated
operator receives direct or indirect payments from the public sector. Subsidies can directly finance the cost of the
universal service (Spain, Italy), maintain the postal network (UK, France and Belgium) or support selected
processes, for example press delivery (France and Belgium). A positive aspect of financing the postal service by
the public sector is responsibility or greater availability of funds. This method ensures secure funding, which
increases the reliability of compensation paid to the operator (this was the reason why the fund was abandoned in
Belgium). It is also characterized by relatively low administrative costs. However, it does not provide an
incentive to reduce the costs of universal service, as it is financed by the government. Excessive compensation
may have a negative impact on competition as it may be open to abuse by the service provider. Through public
funding, the cost of service provision is shared by society on a larger scale. The risk of public financing lies in a
potential allegation by the European Commission of unjustified financing of the postal operator, although in the
case of the compensation fund there is also a necessity to notify the EC of the potential financial aid.
The compensation fund shall be financed by contributions imposed on postal service providers or their users.
Almost all countries (Poland, France, Germany, Italy, Spain and the United Kingdom) have the legal basis to
establish a compensation fund. Contributions to the fund are usually limited, as they represent several percent of
the universal service provision net cost (e.g. in Poland, Italy). As the study demonstrates, there are difficulties in
collecting contributions from operators. In practice, the compensation fund is not sufficient and must be
ENTREPRENEURSHIP AND SUSTAINABILITY ISSUES
ISSN 2345-0282 (online) http://jssidoi.org/jesi/
2021 Volume 8 Number 3 (March)
http://doi.org/10.9770/jesi.2021.8.3(34)
559
supported by public funds. The disadvantage of the compensation fund is that the net cost has to be compensated
by market participants, which may lead to a situation where the beneficiary will have to finance itself to a large
extent. Moreover, it sets high requirements for all postal operators due to the requirement to keep separate
accounting and the obligation to submit annual reports. The compensation fund is administratively expensive
(examination of financial data of all operators, calculation of base contribution, fund management). The pros
compensation funds lie in the fact that universal services are financed by the industry, without burdening public
finances. The results of the research carried out in this study and European experience suggest that compensation
funds are not an appropriate mechanism for financing the net costs of postal services.
The study has shown that the preferred form net cost financing should be fully paid from state budget.
Additionally, it should be considered unjustified to charge the full value of the net cost to the operator as the
actual burden and not only the amount of the loss on universal service. It should be stressed that the mechanism
for subsidizing services of general economic interest (SGEIs) implemented directly from budget resources is
already in place (in the rail, postal and telecommunications sectors). A similar financing mechanism should apply
to services of general economic interest (SGEIs) in the entire postal market, namely, for universal service net
cost financing.
References 5th Management Contract, 2013. Art. 5-6, 12, 22. https://www.bpost.be/en/pdf/RD_May_29_2013_5th_Management_Agreement.pdf
Accenture, (2015). Achieving High Performance in the Post and Parcel Industry, Accenture Research and Insights, p. 7. https://www.accenture.com/us-en/insight-achieving-high-performance-post-and-parcel-industry
Altmark, 2003. Sprawa c-280/0 Altmark Trans GmbH i Regierungspräsidium Magdeburg v Nahverkehrsgesellschaft Altmark GmbH. https://www.studocu.com/fr-ca/document/libera-universita-internazionale-degli-studi-sociali-guido-carli/diritto-europeo/notes-de-cours/altmark-diritto-europeo/4547336/view
Anderson, S.P., De Palma, A., & Kreider, B. (2001). The efficiency of indirect taxes under imperfect competition. Journal of Public Economics, 81(2), 231-251. https://doi.org/10.1016/S0047-2727(00)00085-2
Anton, J., VanderWeide, J. H., & Vettas, N. (2002). Entry Auctions and Strategic Behaviour under Cross-Market Price Constraints.
International Journal of Industrial Organization , 20, 611-629. https://doi.org/10.1016/S0167-7187(01)00055-8 Armstrong, M., Doyle, C., & Vickers, J. (1996). The access pricing problem: A synthesis. Journal of Industrial Economics, 44(2), 131-150.
https://doi.org/10.2307/2950642 http://www.ingenta.com/journals/browse/bpl/joie
Bergum, K. (2008). Calculating the net cost of the USO: A practical example from Norway, Handbook of Worldwide Postal Reform, 110-119. https://www.elgaronline.com/view/9781847209573.xml, https://doi.org/10.4337/9781848444904.00013
Blagojevic, M., Ralevic, P., & Sarac, D. (2020). An integrated approach to analysing the cost efficiency of postal networks. Utilities Policy, Vol. 62, Number 101002. https://doi.org/10.1016/j.jup.2019.101002
Bloch, F., & Gautier, A. (2008). Access pricing and entry in the postal sector. The Review of Network Economics, 7(2), 207–230.
http://www2.ulg.ac.be/crepp/papers/crepp-wp200606.pdf Boldron, F., Borsenberger, C., Joram, D., Lécou, S., & Roy, B. (2009). A dynamic and endogenous approach to financing the USO in a
liberalized environment, in Crew, M.A.; Kleindorfer P. R. (Ed.) Progress in the Competitive Agenda in the Postal and Delivery Sector, Edward Elgar, Cheltenham, UK, Northampton, MA 67–82. http://www.e-elgar.com/bookentry_main.lasso?id=13248
https://doi.org/10.4337 / 9781848447288.00011
Borowiec, L. (2011). Metoda weryfikacji kosztu netto usług powszechnych jako nieuzasadnionego obciążenia operatora wyznaczonego
[Method of verifying the universal service net cost as an unjustified burden on the designated operator], in Nowak E.; Nieplowicz
ENTREPRENEURSHIP AND SUSTAINABILITY ISSUES
ISSN 2345-0282 (online) http://jssidoi.org/jesi/
2021 Volume 8 Number 3 (March)
http://doi.org/10.9770/jesi.2021.8.3(34)
560
M. (Ed.) Prace Naukowe Uniwersytetu Ekonomicznego we Wrocławiu nr 181 Rachunkowość a controlling, Wrocław, 44-54.
http://yadda.icm.edu.pl/yadda/element/bwmeta1.element.ekon-element-000171375129 Borowiec, L. (2012). Koncepcja kosztu netto usług komunalnych w Polsce [The concept of net cost of utilities in Poland], in Nowak, E.;
Nieplowicz, M. (Ed.) Prace Naukowe Uniwersytetu Ekonomicznego we Wrocławiu nr 252, Instrumenty zarządzania kosztami i
dokonaniami, Wrocław, 42-53. http://yadda.icm.edu.pl/yadda//element/bwmeta1.element.ekon-element-000171229441?printView=true
Borowiec, L. (2013). Szacowanie kosztu netto usługi powszechnej na wybranym przykładzie [Estimating the net cost of universal service
on the chosen example], in Nowak E.; Nieplowicz, M. (Ed.) Prace Naukowe Uniwersytetu Ekonomicznego we Wrocławiu nr 289, Systemy rachunku kosztów i kontroli zarządczej , Wrocław, 91-101. http://yadda.icm.edu.pl/yadda/element/bwmeta1.element.ekon-element-000171258159
Borowiec, L. (2018). Rachunek kosztów działań a potrzeby informacyjne podmiotów świadczących powszechne usługi pocztowe [Activity
costing and information needs of universal postal service providers]. Aspekty regulacyjne i zarządcze, Wydawnictwo AEH, Warszawa.
Borsenberger, C., Cremer, H., De Donder, P., Joram, D., & Roy, B. (2010). Funding the cost of universal service in a liberalized postal sector, Heightening Competition in the Postal and Delivery Sector, 220-234. 10.1007/978-1-4615-4481-4_3, http://www.e-lgar.com/bookentry_main.lasso?id=13672
Bourguignon, H., & Ferrando, J. A. (2007). Skimming the Others. Cream: Competitive Efects of an Asymmetric Universal Service Obligation. International Journal of Industrial Organization, 25, 761-790.
Cahill, C., Palcic, D., & Reeves, E. (2018). Striving to deliver: commercialization and performance in Ireland's postal sector. Annals of
Public and Cooperative Economics, 89(3), 527-541. https://doi.org/10.1111/apce.12178
Calzada, J. (2009). Universal service obligations in the postal sector: The relationship between quality and coverage, Original research article. Information Economics and Policy, 21(1), 10-20. https://doi.org/10.1016/j.infoecopol.2008.07.002
Choné, P., Flochel, L., & Perrot, A. (2002). Allocating and Funding Universal Service Obligations in a Competitive Market. International Journal of Industrial Organization, 20, 1247-1276. https://doi.org/10.1016/S0167-7187(01)00077-7
Cohen, R., McBride, C., & Panzar, J.C. (2010). The cost of the USO in the United States, Heightening Competition In The Posta l And Delivery Sector, Book Series: Advances in Regulatory Economics, 253-262, http://www.e-elgar.com/bookentry_main.lasso?id=13672
Copenhagen Economics, (2008). What is the cost of Post Denmark’s Universal service obligation? Copenhagen. Copenhagen Economics, (2018). Report on USO net costs in Iceland.
https://www.copenhageneconomics.com/publications/publication/report-on-uso-net-costs-in-iceland
Cremer, H., Grimaud, A., Laffont, J.J. (2000). The Cost of Universal Service in the Postal Sector in Crew, M.; Kleindorfer, P. (Ed.).
Current Directions in Postal Reform, Kluwer Academic Press, Boston (MA).
De Donder, P. (2006). Access pricing in the postal sector: Theory and simulations. Review of Industrial Organisation, 28(3), 307-326. https://doi.org/10.1007/s11151-006-0017-5
De Villemeur, E.B., Cremer, H., Roy, B., & Toledano, J. (2003). Optimal Pricing and Price-Cap Regulation in the Postal Sector. Journal of
Regulatory Economics, 24 (1), 49-62. https://doi.org/10.1023/A:1023948014513 Decision 2012/321 of the Commission of 25 January 2012.
https://ec.europa.eu/competition/state_aid/cases/232315/232315_1314149_177_2.pdf
Decyzja Komisji 2012/636 z 25 stycznia 2012. Complaint against Germany for unlawful state aid to Deutsche Post, OJ L289.
https://ec.europa.eu/competition/state_aid/cases/221961/221961_1314187_452_2.pdf
Decyzja Komisji z 19 marca 2015. Sprawa SA 38788. [Commission decision of 19 March 2015. Case SA 38788.]
ENTREPRENEURSHIP AND SUSTAINABILITY ISSUES
ISSN 2345-0282 (online) http://jssidoi.org/jesi/
2021 Volume 8 Number 3 (March)
http://doi.org/10.9770/jesi.2021.8.3(34)
561
Decyzja Komisji z 21 marca 2012. Sprawa SA 31479 [Commission decision of 21 March 2012. Case SA 31479], UK - Royal Mail, OJ
L279. file:///C:/Users/cciadmin/Downloads/2012_l_279_l_27920121012pl00400068.pdf Decyzja Komisji z 28 listopada 2007. Pomoc państwa N 388/2007 - Zjednoczone Królestwo [Commission decision of 28 November 2007.
State aid N 388/2007 - United Kingdom,], Post Office Limited (POL) transformation programme (Dz. U. C 14 z 19.1.2008, s.
19). Decyzja Komisji z dnia 25 stycznia 2012. Sprawa SA 34 027 [Commission decision of 25 January 2012. Case SA 34 027] (Abattement
fiscale en faveur de La Poste pour le financement de la presence territorial).
Decyzje Komisji Europejskiej C(2006) 4206 ostateczna 26.9.2006, C(2008) 1606 ostateczna z dnia. 30.4.2008, oraz C(2012) 8230 wersja
ostateczna z dnia 20.11.2012 [Decisions of the European Commission C(2006) 4206 final 26.9.2006, C(2008) 1606 final of the European Parliament and of the Council of 26.9.2006. 30.4.2008, and C(2012) 8230 final of 20.11.2012].
Dieke, A., & Junk, P. (2015a). Alternative Funding Models for the Universal Service Obligation: The European Experience. WIK Report, Bad Honnef.
Dieke, A., & Junk, P. (2015b). Funding the Universal Service Obligation, RARC Report RARC-WP-16-005. WIK Report, Bad Honnef 2015. https://www.uspsoig.gov/sites/default/files/document-library-files/2016/RARC-WP-16-005.pdf
Dietl, H., Jaag, C., Lang, M., Lutzenberger, M., & Trinkner, U. (2011). Impact of VAT exemptions in the postal sector on competition and
welfare. In Crew, M. & Kleindorfer, P. (Ed.) Reinventing the Postal Sector in an Electronic Age. Edward Elgar, Cheltenham, 267– 280. https://doi.org/10.4337/9781849805964.00024
Dietl, H.M., Grütter, A., & Lutzenberger, M. (2001). Methods of Estimating the Cost of the Universa l Service Obligation, First
Conference of the Global Postal Research and Educational Network, University of Zurich, Dimensions of services switching costs and managing their differential strategic outcomes. Journal of Business Research: 441-450.
Dobrodolac, M., Blagojevic, M., Draskovic, D., & Svadlenka, L. (2018). Development trends in the structure of services of the public
postal operator in Serbia. International Conference on traffic and transport engineering (ICTTE), (Ed.) Cokorilo, O., 534-539.
Dobrodolac, M., Ralević, P., Švadlenka, L., & Radojičić, V. (2016). Impact of a new concept of universal service obligations on revenue
increase in the post of Serbia. Promet - Traffic&Transportation, 28(3), 235-244. https://hrcak.srce.hr/165522
Dyrektywa Parlamentu Europejskiego i Rady 2008/6/WE z dnia 20 lutego 2008 r. zmieniająca dyrektywę 97/67/WE w odniesieniu do
pełnego urzeczywistnienia rynku wewnętrznego usług pocztowych Wspólnoty [Directive 2008/6/EC of the European Parliament and of the Council of 20 February 2008 amending Directive 97/67/EC with regard to the full accomplishment of the internal
market of Community postal services]. http://data.europa.eu/eli/dir/2008/6/oj ERGP, (2012). Net Cost Calculation and Evaluation of a Reference Scenario. file:///C:/Users/cciadmin/Downloads/ergp-11-17-rev-
1_en%20(1).pdf
Foros, O., Kind, H. J. (2003). The Broadband Access Market: Competition, Uniform Pricing and Geographical Coverage. Journal of
Regulatory Economics, 23, 215-235. https://ideas.repec.org/a/kap/regeco/v23y2003i3p215-35.html
Fratini, A. (2016). Compensation Fund Under EU Law: A Suitable Solution for the Postal Market?, in Crew, M.; Brennan, T.J. (Ed.). The Future of the Postal Sector in a Digital World, Springer International Publishing, New York. https://www.springer.com/gp/book/9783319244525#aboutAuthors
Frontier Economics, (2008). Net costs of elements of the Universal service, London. Frontier Economics, (2012). Report: Study on the principles used to calculate the net costs of the postal USO: 126-127 i 129.
(http://ec.europa.eu/internal_market/post/doc/studies/2012-net-costs-uso-postal_en.pdf).
Gautier, A., & Mizuno, K. (2011). Gradual Network Expansion and Universal Service Obligations. Annals of Public and Cooperative
Economics, 82, 97-113. https://onlinelibrary.wiley.com/doi/abs/10.1111/j.1467-8292.2011.00432.x
Gautier, A., & Paolini, D. (2011). Universal Service Financing in Competitive Postal Markets: One Size Does Not Fit All. Review of Network Economics, 10, 1-28. https://doi.org/10.2202/1446-9022.1227
ENTREPRENEURSHIP AND SUSTAINABILITY ISSUES
ISSN 2345-0282 (online) http://jssidoi.org/jesi/
2021 Volume 8 Number 3 (March)
http://doi.org/10.9770/jesi.2021.8.3(34)
562
Gautier, A., & Wauthy, X. (2010). Price Competition under Universal Service Obligations. International Journal of Economic Theory, 6,
311-326. https://doi.org/10.1111/j.1742-7363.2010.00137.x Hoernig, S.H. (2006). Should uniform pricing constraints be imposed on entrants? Journal of Regulatory Economics, 30(2), 199-216.
https://doi.org/10.1007/s11149-006-0013-6
Hostakova, D. (2018). Identification of the requirements of customers of the postal company on the spatial availability of access and
contact points of the public postal network, CBU International Conference proceedings 2018: Innovations in Science and
Education, (Ed.) Hajek P.; Vit O., Proceedings of CBU, 6, 187-192. https://doi.org/10.12955/cbup.v6.1154
Instytut Pocztowy, (2014). Instytucja pocztowego operatora wyznaczonego w Unii Europejskiej. Przegląd rozwiązań krajowych w zakresie
świadczenia pocztowych usług publicznych w 27 państwach Unii Europejskiej [Institution of the postal operator designated in the European Union. Review of national solutions for provision of public postal services in the 27 countries of the European
Union], Warsaw, p: 8.
Jaag, C. (2011a). Entry Deterrence and the Calculation of the Net Cost of Universal Service Obligations. Review of Network Economics,
10(1), Article 4. https://doi.org/10.2202/1446-9022.1189
Jaag, C. (2011b). What is an Unfair Burden? Compensating the Net Cost of Universal Service Provision. Review of Network Economics,
10(3), Article 7. https://doi.org/10.2202/1446-9022.1225
Jaag, C., & Trinkner, U. (2011). The interaction between universal service costing and financing in the postal sector: A calibrated approach. Journal of Regulatory Economics, 39(1), 89–110. https://doi.org/10.1007/s11149-010-9138-8
Jaag, C., Koller, M., & Trinkner, U. (2009). Calculating the cost of the universal service obligation: the need for a global approach,
Progress in the Competitive Agenda in the Postal and Delivery Sector, Publisher: Edward Elgar, Cheltenham. https://doi.org/10.5167/uzh-20559
Komunikat Komisji do Parlamentu Europejskiego, Rady Europejskiego Komitetu Ekonomiczno-Społecznego i Komitetu Regionów, Ramy
jakości dotyczące usług świadczonych w interesie ogólnym [Commission communication to the European Parliament, the
Council of the European Economic and Social Committee and the Committee of the Regions, Quality framework for services of general interest], Brussels, 20.12.2011, COM(2011) 900. https://ec.europa.eu/transparency/regdoc/rep/1/2011/PL/1-2011-900-PL-F1-1.Pdf
Komunikat Komisji Europejskiej [European Comission Communication], 2015. State aid: Commission approves financing of Polish Post's
universal service obligation via a compensation fund, Brussels, http://europa.eu/rapid/press-release_IP-15-6176_en.htm
KPMG, (2009). Analyse de la méthode de calcul des coûts du service universel, Paris. https://www.ibpt.be/public/files/fr/1427/3049_fr_management_rapportversionfinale-fr.pdf
KPMG, (2010). Poczta Polska. Koszt netto usług powszechnych. Wybór metodologii [Net cost of universal services. Choice of
methodology], Warszawa. Lewandowski, M., Mlodkowski, P., & Wrobel, M. (2019). Digital Platforms for Postal Services in EU and Japan. European Integration
Studies, 13, 117-130. 10.5755/j01.eis.0.13.22897
Mercier, A., Souche‐Le Corvec, S., & Ovtracht, N. (2020). Measure of accessibility to postal services in France: A potential spatial accessibility approach applied in an urban region. Papers in Regional Science. https://doi.org/10.1111/pirs.12564
Milutinovic, J., Markovic, D., Stanivukovic, B., Svadlenka, L., & Dobrodolac, M. (2020). A Model For Public Postal Network Reorganization Based On Dea And Fuzzy Approach. Transport, 35(4), 401-418. https://doi.org/10.3846/transport.2020.13741
Mirabel, F., Poudou, J.-C., Roland, M. (2009). Universal service obligations: The role of subsidization schemes. Information Economics
and Policy, 21(1), 1-9. https://doi.org/10.1016/j.infoecopol.2008.07.003
Mostarac, K., Kavran, Z., & Rakic, E. (2019). Accessibility of Universal Postal Service According to Access Points Density Criteria: Case
Study of Bjelovar-Bilogora County, Croatia. Promet-Traffic & Transportation, 31(2), 173-183. https://doi.org/10.7307/ptt.v31i2.3019
NERA. (1998). Costing and Financing of Universal Services in the Postal Sector in the European Union, A report to DGXIII, London.
ENTREPRENEURSHIP AND SUSTAINABILITY ISSUES
ISSN 2345-0282 (online) http://jssidoi.org/jesi/
2021 Volume 8 Number 3 (March)
http://doi.org/10.9770/jesi.2021.8.3(34)
563
OFTEL. (1995). Universal Telecommunications Services: Consultative Document on Universal Services in the UK from 1997. Oxera. (2007). Funding universal service obligations in the postal sector. Report prepared for La Poste, De Post-La Poste, Hellenic Post,
Poste Italiane, P&T Luxembourg, Correos, Magyar Posta, Cyprus Post, Poczta Polska. https://www.oxera.com/wp-
content/uploads/2018/03/Funding-the-USO-in-the-postal-sector.pdf Panzar, J. (2000). A Methodology for Measuring the Costs of Universal Service Obligations. Information Economics and Policy, 12(3),
211-220. http://www.sciencedirect.com/science/article/pii/S0167-6245(00)00013-5
Panzar, J.C. (2008). Funding Universal Service Obligations. Handbook of Worldwide Postal Reform, 98–109.
https://www.elgaronline.com/view/9781847209573.xml https://doi.org/10.4337 /9781848444904.00012
Poczta Polska, (2017). Sprawozdanie z prowadzonej rachunkowości regulacyjnej za rok obrotowy zakończony 31 grudnia 2015 roku
[Report on the regulatory accounting for the financial year concluded on 31 December 2015], https://www.uke.gov.pl/sprawozdanie-poczty-polskiej-z-rachunkowosci-regulacyjnej-za-rok-2015-20422
Postcomm. (2001). An assessment of the costs and benefits of Consignia’s current Universal Service Provision, London. Poudou, J.C., & Roland M. (2014). Efficiency of uniform pricing in universal service obligations. International Journal of Industrial
Organization, 37, 141-152, https://doi.org/10.1016/j.ijindorg.2014.08.006
Prawo pocztowe z 30 grudnia 2010 [Postal law of 30 December 2010]. (Ley 43/2010), Hiszpania.
https://www.boe.es/eli/es/l/2010/12/30/43
PricewaterhouseCoopers (PwC), (1988). The Impact of Liberalization of Cross-Border Mail.
Ralević, P., Dobrodolac, M., Švadlenka, L., Šarac, D., & Đurić, D. (2020). Efficiency and productivity analysis of universal service obligation: a case of 29 designated operators in the European countries. Technological and Economic Development of
Economy, 26 (4), 785-807. https://doi.org/10.3846/tede.2020.12062
Raporty roczne [Annual reports] 2008-2014. Correos, https://www.correos.es/COREstaticos/
Rodriguez, F., & Storer, D. (2000). Alternative Approaches to Estimating the Cost of the USO in Posts, Information Economics and Policy, 12(3), 285-299. https://doi.org/10.1016/S0167-6245(00)00010-X
Rozbiecki, M., Rosiak, W. (2014). Koszt netto pocztowej usługi powszechnej i jego finansowanie [Net cost of universal postal services and
its financing], Internetowy Kwartalnik Antymonopolowy i Regulacyjny, 2(3). https://ikar.wz.uw.edu.pl/numery/16/pdf/23.pdf Sarac, D., Kopic, M., Mostarac, K., Kujacic, M., & Jovanovic, B. (2016). Application of set covering location problem for organizing the
public postal network. Promet-Traffic & Transportation, 28(4), 403-413. doi: 10.7307/ptt.v28i4.1962
Sarac, D., Unterberger, M., Jovanovic, B., Kujacic, M., Trubint, N., & Ozegovic, S. (2017). Postal network access and service quality:
Expectation and experience in Serbia. Utilities Policy, 48, 69-75, https://doi.org/10.1016/j.jup.2017.09.004
Traktat o Unii Europejskiej i Traktatu o funkcjonowaniu Unii Europejskiej opublikowanego w Dz. Urz. UE 2016 C 202. [Treaty on European Union and the Treaty on the Functioning of the European Union published in OJ EU 2016 C 202]
Urząd Komunikacji Elektronicznej, 2018. Raportu o stanie rynku pocztowego za rok 2017 [Office of Electronic Communications, 2018.
Report on the state of the postal market for 2017], Warsaw. https://eur-lex.europa.eu/legal-content/PL/TXT/?uri=OJ%3AC%3A2016%3A202%3ATOC
Ustawa z 21 marca 1991. Art. 142. par. 1-2 Art. 141 oraz 144 [Act of 21 March 1991. Art. 142 sec. 1-2, art. 141 and 144] (Loi portant
rÈforme de certaines entreprises publiques Èconomique).
Ustawa z dnia 23 listopada 2012 r. Prawo pocztowe, [Act of 23 November 2012, Postal law], (Dz. U. z 29.12.2012, poz. 1529). http://prawo.sejm.gov.pl/isap.nsf/download.xsp/WDU20120001529/T/D20121529L.pdf
ENTREPRENEURSHIP AND SUSTAINABILITY ISSUES
ISSN 2345-0282 (online) http://jssidoi.org/jesi/
2021 Volume 8 Number 3 (March)
http://doi.org/10.9770/jesi.2021.8.3(34)
564
Dr. Leszek BOROWIEC is a doctor of economics at the Faculty of Management and Finance of the Academy of Economics and Human Sciencees in Warsaw. Scientific interests: controlling, management accounting, modern cost accounting systems, financial management.
He specializes in controlling and cost management in public services. ORCID ID: orcid.org/0000-0002-6113-9191
Make your research more visible, join the Twitter account of ENTREPRENEURSHIP AND SUSTAINABILITY ISSUES: @Entrepr69728810
Copyright © 2021 by author(s) and VsI Entrepreneurship and Sustainability Center This work is licensed under the Creative Commons Attribution International License (CC BY). http://creativecommons.org/licenses/by/4.0/
ENTREPRENEURSHIP AND SUSTAINABILITY ISSUES
ISSN 2345-0282 (online) http://jssidoi.org/jesi/
2021 Volume 8 Number 3 (March)
http://doi.org/10.9770/jesi.2021.8.3(35)
Publisher http://jssidoi.org/esc/home
DEVELOPMENT OF DIGITAL AND ENTREPRENEURIAL COMPETENCES FOR THE FUTURE
LABOUR MARKET NEEDS *
Daiva Labanauskaitė ¹, Erika Župerkienė ², Alexander Kumpf 3, Ligita Šimanskienė 4,
Sophie – Marie Koller 5
1,2,4 Klaipeda University, S. Neries str. 5, LT-92227 Klaipeda, Lithuania 3,5 Hochschule Landshut, Am Lurzenhof 1, D-84036 Landshut, Germany
E-mails: [email protected] , [email protected] , [email protected] , [email protected] , [email protected]
Received 5 January 2020; accepted 25 February 2021; published 30 March 2021
Abstract. This article aims to identify what digital and entrepreneurial competences are required in a concept of New Work orientated
labor market. To achieve this, the research takes a two-folded approach by breaking down how digitalisation changes the role of employees
in a digital and automated world, which competences and organisational structures are required for a successful adaption of digitalisation in
the company and what the digital awareness and the current transformation status in small and medium-sized companies in Bavaria
(Germany) and Lithuania looks like. The research methods chosen to deal with a scientific problem in the theoretical part include an
analysis of literature sources, systematisation, synthesis, generalisation, and comparison. The status of the research findings shows that
digitalisation has arrived in companies, but especially small and medium-sized companies have to overcome various barriers. The focus on
employees as stakeholders is crucial to these adaptation processes. Primary research has shown that the employer´s and employee´s sides
have recognized the importance of implementation. Nevertheless, there is room for adjustments. Both sides also need to find their own path
to adapt requirements and expectations, to start a successful cooperation. It could help adapt to rapidly changing market trends and link
stakeholders via user-friendly technology, just because this technology is created through strategic collaboration activities (Laužikas,
Miliūtė, 2020).
*The research was conducted in the framework of the project Development of digital and entrepreneurial competences for the
future labour market need. This project of the Baltic-German University Liaison Office is supported by the German
Academic Exchange Service (DAAD) with funds from the Foreign Office of the Federal Republic Germany.
ENTREPRENEURSHIP AND SUSTAINABILITY ISSUES
ISSN 2345-0282 (online) http://jssidoi.org/jesi/
2021 Volume 8 Number 3 (March)
http://doi.org/10.9770/jesi.2021.8.3(35)
Make your research more visible, join the Twitter account of ENTREPRENEURSHIP AND SUSTAINABILITY ISSUES:
@Entrepr69728810
566
Keywords: digital competences; entrepreneurial competencees; labor market
Reference to this paper should be made as follows: Labanauskaitė, D., Župerkienė, E., Kumpf, A., Šimanskienė, L., Koller, S.-M. (2021).
Development of digital and entrepreneurial competences for the future labour market need. Entrepreneurship and Sustainability Issues, 8(3), 565-581. http://doi.org/10.9770/jesi.2021.8.3(35)
JEL Classifications: J2, J5
1. Introduction
The global megatrend of emerging technologies is colliding to disrupt both - business and society. This revolution
increases productivity, shifts economics, foster industrial growth, and especially modifies the profile of the
workforce. This paper analyzes digital and entrepreneurial competences needed to create and manage a business
emerging from the technological transformation.
The megatrend digitalization is a booming worldwide phenomenon, one we must be involved in shaping
(Degryse, 2016). To face challenges such as increasing uncertainty and volatility, agility and digitalization can be
implemented (Hulla, Ramsauer, 2020). “Digitalization” means using digital technologies to change a company’s
business model (Westerlund, 2020), changing the way of communication and nature of professional and personal
relationships in the company (Ritter, Pedersen, 2020). Digitalization implicates changes in job roles and new
processes, work and employment conditions, and industrial relations (Cijan, Jenič, Lamovšek, Stemberger, 2019).
Digitalization requires a new type of business operation and organization, understanding the urgent need of
rethinking work systems and the role of workforces in the context of digital transformation (Ruohomaa,
Salminen, 2019; Feller, Amann, Müller at all, 2016), the impact on nature of work and the skills required (OECD,
2019) is gaining importance and is broadly discussed these days. According to Ware (2003) the very nature of
work has changed and continues to evolve; the ‘Information Revolution’ is real, and industrial-age management
practices are no longer adequate or appropriate for knowledge-based work and workers. Understanding the urgent
need of rethinking work systems and the role of workforces in the context of digital transformation, the authors of
the article describe the change of work nature by the term New Work.
Although digitalization and the changed nature of work and skills are fundamentally and rapidly changing
existing businesses and organisations, the combined field of both, however, still remains scarce; especially with
regards to small and medium-sized companies. Small and medium-sized companies are not very represented when
it comes to digital transformation and new working systems, even though they should. SMEs generate 54.4% of
overall value-added and 63.7% of overall employment in the German ‘non-financial business economy’ (SBA
Fact Sheet – Germany, 2019). SMEs play an important role in Lithuania’s non-financial business economy; in
2018, they generated 69.4% of value-added and 75.9% of employment, exceeding the EU averages of 56.4% and
66.6% (SBA Fact Sheet – Lithuania, 2019). 3 out of 4 jobs in Lithuania were created by small and medium-sized
enterprises, which is as much as 10 percent, more than the EU average (Activity Report of the Ministry of
Economy of the Republic of Lithuania for 2019, 2020). At the same time, small and medium-sized companies
face the problem of a very tentative adaption to digital innovations and New Work. Typically, they have a lack of
financial resources and specialised experts, and they can´t easily afford mistakes and failure. However, the
readiness of SMEs to keep pace with technological progress and innovation is crucial for sustainable economic
growth.
Another important precondition for sustainable economic growth is the successful inclusion of intergenerational
workers in the lifelong learning process, ensuring a balanced strengthening of their entrepreneurship and digital
competences. The baby boomers, the largest age group, will retire in the next two decades. This will consequently
lead to an increased shortage of skilled workers and a large number of older employees (Immerschitt, 2019).
Consequently, the inevitable demographic change no longer allows to deny the necessity of changes and
ENTREPRENEURSHIP AND SUSTAINABILITY ISSUES
ISSN 2345-0282 (online) http://jssidoi.org/jesi/
2021 Volume 8 Number 3 (March)
http://doi.org/10.9770/jesi.2021.8.3(35)
Make your research more visible, join the Twitter account of ENTREPRENEURSHIP AND SUSTAINABILITY ISSUES:
@Entrepr69728810
567
adaptions. It is not enough for high digital and entrepreneurial competences to be demonstrated by workers
representing the Millennials who have grown up with modern technology. The integration of the silver agers, their
needs, and the demands on them should be taken into consideration when planning the social sustainability of
business under conditions of the digital economy. By doing this, it is essential to always have in mind the
continuously influencing megatrends, which affect the corporate world significantly.
The scientific problem can be formulated by a question: how is the labor market need for digital and
entrepreneurial competences changing in the context of technological advances in business and demographic
changes in the labor market?
The aim of the research is to identify what digital and entrepreneurial competences are required to a concept of
New Work orientated labour market. Referring to this perception, this research aims to understand how
digitalisation changes the role of employees in a digital and automated world. Secondly, it will focus on
answering the question of which competences and organisational structures are required for a successful adaption
of digitalisation in the company. And finally, the study will figure out the digital awareness and the current
transformation status in small and medium-sized companies in Germany/Bavaria and Lithuania.
The novelty of the research: the study not only helped to determine how SMEs perceive digitization processes in
business but also enabled the comparison of employers 'and employees' attitudes in assessing the need for
digitization and entrepreneurial competences in the German (Bavarian) and Lithuanian labor markets.
The methods applied in the research include analysis of literature sources, systematization, synthesis,
generalization, and comparison in the theoretical part, and quantitative research, i.e., a questionnaire survey and
data processing methods, in the empirical research.
2. Analysis of literature
Megatrends describe trends that influence and affect the entire society and economy globally and sustainably in
the long term. The megatrends have long influenced the corporate world and will continue to do so, resulting in an
increasingly dynamic environment. That is why general conditions such as leadership styles and other
organisational structures will continue to have to be constantly adjusted (Enste, 2013). Organizational culture
could help adapt to rapidly changing market trends and link stakeholders via user-friendly technology, just
because this technology is created through strategic collaboration activities (Laužikas, Miliūtė, 2020).
A topic of big interest is how digitalisation is changing the economy and especially the labour market. In the
context of global digitalization, various changes take place in organisational management structures and processes
(Davidavičienė, Raudeliūnienė, Kaušinis, 2019). Digital innovations can increasingly replace humans and their
workload at various levels; therefore, digitalisation raises questions about the cooperation between machines and
humans. It is often alleged and feared that the technical transformation, especially when it comes to Artificial
Intelligence, will destroy jobs (Clauberg, 2020). The term Substitutional Potential describes exactly this scenario.
It stands for the proportional activities of a job which can be replaced by computers or computer-controlled
machines by today. This term only relates to technical feasibility which does not necessarily mean that it will be
realised in practice (Dengler, Matthes, 2018). The three megatrends (AI Everywhere, Transparently Immersive
Experiences, and Digital platforms) show that the more companies are able to make technology an integral part of
employees', partners', and customers' experiences, the more they will be able to connect in new and dynamic ways
to employees', partners', customers' ecosystems, and platforms (Jari, Lauraeus, 2019). Digitalization is
transforming the locus of entrepreneurial opportunities and entrepreneurial practices (Autio, 2018). Due to the
increasing use of digital technologies, there were built new forms of socio-technological working systems which
lead to massive changes in working organisations and working forms. The increasing autonomy and intelligence
of technical systems are changing the requirements for human-technology interactions. Today there is broad
agreement that business potential can only be fully exploited through a successful partnership between humans
ENTREPRENEURSHIP AND SUSTAINABILITY ISSUES
ISSN 2345-0282 (online) http://jssidoi.org/jesi/
2021 Volume 8 Number 3 (March)
http://doi.org/10.9770/jesi.2021.8.3(35)
Make your research more visible, join the Twitter account of ENTREPRENEURSHIP AND SUSTAINABILITY ISSUES:
@Entrepr69728810
568
and technology. Human-technology interfaces will be of central importance in the future. The future of work lies
in the intelligent and creative linking of human potential with the growing technical possibilities These must
enable close cooperation between people and technologies so that the strengths of technologies - such as
repeatability, accuracy, and endurance - and the special human skills - such as creativity and flexibility -
complement each other optimally. For autonomous and self-learning systems, in particular, there is hardly any
certainty about how human-technology interactions can be designed to create human-friendly working conditions
that promote satisfaction and personal growth (Bauer et al., 2018)
The term New Work is often mentioned in the literature in connection with digitalisation and modern working
models. The more complex the digital world and the companies get, the less suitable seem to be the traditional
hierarchies and working structures. For that, the organisation needs to be reinvented. Digitalisation, on the one
hand, is seen as a driver of the New Work movement and enables a rethinking of old structures. On the other
hand, New Work can be seen as necessary to adapt to the changing working world; this might can be seen as an
interrelation between both developments (Stuck, 2020; Breidenbach, Rollow, 2019). Digitalisation, for example,
enables flexibility in terms of time and space: home office, remote work, flextime, and co-working spaces are
slowly becoming the norm and enable new forms of collaboration on the regional, national or international level.
The association between network-level collaboration patterns and innovation may be sensitive to the geographic
area set for analysis (Galaso, Kovářı́k, 2018). But also, executives have to adapt to changes: they have to
internalize transparency, trust work, and agility, and they must actively involve the employees. Employees need
more autonomy. In the frenzied competition, it is not possible to control complex companies with instructions
from above. This works better with autonomous teams that have the means and the freedom of making decisions
and trying things out. The desire for independence and freedom is growing. Instead of rigid hierarchies, team
spirit, community spirit, and the will to work together are paramount.
Development in information and communication technology have been among the key drivers of change in
working life over the past two decades. However, the ability to work anywhere and at any time can lead to greater
work intensification, competition, and work-on-demand. Changes in the profile of competences that are in
demand in the labor market will lead to significant changes in the structure of employment, as well as to the
formation of portfolios of competences based on the assessment of the expected demand of companies
(Romanova et al., 2017). But because of the constant availability, the boundaries between work and private life
are slowly blurring. Therefore, there is also a desire for a better work-life balance (Vargas, Weber, 2020).
The productivity of employees is essential for every company and it is a common prejudice that decreases with
age. With suitable educational training and similar measures supported by the company, productivity can be
increased, also for senior employees (Walla, 2006). Strategic leadership and the development of innovation
capability is of critical importance for product design and manufacturing as emerging digital technologies
increasingly challenge conventional practice (Walden et al., 2020). As the stereotype of losing skills and abilities
with age is even more widely spread, workers over 50 are often not offered enough training. However, there is
scientific evidence that skills change with age but do not get lost. The development depends on the individual, his
or her intrinsic motivation, and external influences. It is therefore not possible to generalise the assessment of the
productivity of senior employees and it is not a loss of effort to invest in training measures. If a company wants to
be successful in the future, it has to create an environment in which employees can grow, in which they are
perceived as a human being and not as a humane resource. The movement work 4.0, in particular, has given more
importance to intellectual, knowledge based and communicative activities. Knowledge preservation is becoming
more and more essential, but the type of knowledge demanded is also changing faster and faster. Hence, new
professional and social skills will be required of employees in the future.
ENTREPRENEURSHIP AND SUSTAINABILITY ISSUES
ISSN 2345-0282 (online) http://jssidoi.org/jesi/
2021 Volume 8 Number 3 (March)
http://doi.org/10.9770/jesi.2021.8.3(35)
Make your research more visible, join the Twitter account of ENTREPRENEURSHIP AND SUSTAINABILITY ISSUES:
@Entrepr69728810
569
3. Methodology
To determine what digital and entrepreneurial competences are required to a concept of New Work oriented labor
market was conducted. Qualitative research is undertaken to attain a greater understanding of a relatively
unknown phenomenon (Murshed, Zhang, 2016). During the evaluation, in-depth or qualitative interviews reveal
different perspectives, detailed assessments, attitudes, motivation.
The design of the study follows a systematic approach to the study of social problems, which is based on the
premise that the study of the efficiency and quality of the phenomenon/process requires a variety of research
methods, both quantitative and qualitative, that complement each other at different stages of research.
Organization of research. In the first stage of the research conducted qualitative interviews, to understand how
the company´s representatives perceive the digital status of transformation, the adaption of the employees to the
new digital environment, and the status of New Work models in their own company.
Using the elements of target sampling, informants belonging to the territorial units of the survey geography were
interviewed, no statistical generalization was sought because in qualitative surveys it is sometimes difficult to
reach the respondents. The general population of the qualitative research is the managers of SMEs in Bavaria and
Lithuania.
The qualitative research was conducted in form of personal interviews (face-to-face or via the phone). During the
period from the 9th of January to the 14th of February 2020. 14 interviews were conducted with companies from
various sectors from the SME-environment in Bavaria and 14 interviews were conducted from the SME-
environment in Lithuania.
The interviews aimed to clarify how the representatives weigh the trend digitalisation and digital adoption in
general and relating to their companies. Furthermore, the experts were asked to draw a picture of the current
digital status with technological systems within the company. On the one hand, these questions concentrated on
the steps that were already taken in the past and on the other hand, the steps that were planned for the future; with
the focus on technical adjustments in the administrative area and the offices. The subsequent questions then
focused on the positive and negative effects of the digital transformation on the leadership of the employees and
the organisational structure that was perceived in the own firm.
Afterwards, the questions aimed to gain an understanding of the changing role of the leaders and managers as well
as the employees and their competences that are increasingly required due to times of transformation.
In the second stage of the empirical research, a qualitative study was implemented, the aim of which is to
understand how employees perceived the status of digital transformation in their daily work life and their
company. The research questions that were set before, built a guideline for the survey and its content. The
questionnaire was developed in collaboration with the project team members.
The expected result should therefore clarify how the employees saw the current digital status and its influence on
their working structure. Additionally, it should give a closer look at the perception of new working models and
modern organisational structures of leadership. The comparison of the actual status and the intrinsic wishes and
expectations intends to indicate what companies can improve for themselves.
Leading questions of the research:
1) How does digitalisation change the role of employees and employers in a digital world?
2) Which competences and organisational structures are required for a successful adaption of the digital
transformation?
3) What is the digital awareness and the current transformation status in small and medium-sized companies?
The general population of Quantitative research: SME employees in Bavaria and Lithuania. In total 192 attended
employees in Germany (Bavaria) and 184 employees in Lithuania were asked to their opinions and perceptions.
ENTREPRENEURSHIP AND SUSTAINABILITY ISSUES
ISSN 2345-0282 (online) http://jssidoi.org/jesi/
2021 Volume 8 Number 3 (March)
http://doi.org/10.9770/jesi.2021.8.3(35)
Make your research more visible, join the Twitter account of ENTREPRENEURSHIP AND SUSTAINABILITY ISSUES:
@Entrepr69728810
570
The quantitative study was conducted in form of an anonymous online survey with the technical program EvaSys.
The link was published on the economic social media platforms Xing and LinkedIn was distributed by the IHK
Niederbayern and by Klaipeda University. The survey period took place from the 16th of December 2019 to the
17th of February 2020. The evaluation of the survey was done via EvaSys and SPSS.303.
Research ethics. The study followed the basic ethical principles of scientific research.
The principle of goodwill. Respondents are assured that they are not exposed to any risk associated with the
research process or results that participation in the research will not lead to greater anxiety or fear.
The principle of respect for the dignity of the person. All study participants participated in the study voluntarily,
and each participant’s consent to use a dictaphone to record the conversation was obtained. It is stated that the
data will be used in aggregate, for research purposes. Before the research, the essence of the research was
presented, the purposes for which the answers would be used were explained, and the course of the interviews
were explained (how they could behave, how long the interview would take, etc.).
Principle of justice. It was explained to all study participants that the confidentiality and confidentiality of the data
of each study participant would be ensured. The research procedures are explained using everyday language
terminology. The analysis of the results contains only depersonalized information, statements that would at least
theoretically allow the identification of the study participant are excluded, and the transcription text is not
provided.
Analysis of research data. The results represent an evaluation in form of qualitative content analysis. The
evaluation methods (by Mayring, Frenzl, 2019) that were used are processes texts that are produced in the context
of social science research projects like transcripts.
The research has several limitations. The nonprobability sampling has been used as it was not possible to acquire
the sampling frame and ensure that all representers of the target group had a reasonable opportunity to be invited
to participate in the study. Although relevant references are included, some research data interpretation aspects are
mainly driven by the opinions of the authors. The scope of the research is limited to digital and entrepreneurship
competences, other competences are not included as a part of New Work and entrepreneurial ecosystem.
4. Results
A change in values within the society leads to new needs on the part of companies and employees. Furthermore,
the rising influence of individualisation should not be neglected when developing an optimal business
environment. An increase in opportunities and the desire for self-realisation, also at a professional level, is
present. Therefore, it is increasingly important for companies to remain attractive to employees and to offer
diversity and the opportunity for self-realisation within the company itself. More individuality, also in form of
autonomous, independent work and personal responsibility is desired and demanded. For the employee, this might
be fulfilled with the possibility of freely organising work. The company should implement a goal-oriented
concept in which there are still defined responsibilities to have a minimum of structure.
Despite everything, interdepartmental cooperation should be strengthened and a "we" culture should be created. A
mutual understanding towards young and old as well as employees and managers will be essential. This will
probably be the biggest challenge, because up to now senior employees have been used to hierarchies and a clear
division of tasks. Better cooperation in general and especially between young and old should be promoted that
valuable knowledge is passed on more easily and automatically. This is highly relevant since valuable expertise
could be lost with the retirement of the baby boomers. Further, it is even more important, when imagine they are
to be employed after retirement and the skills of the younger generations are to be passed on to them. A respectful
intergenerational relationship should be created and be seen as normal.
New training measures, such as (reverse) mentoring, coaching and tutoring programmes to support everyday
learning might be helpful. Senior employees would suit well for such advisory tasks. To achieve the desired
ENTREPRENEURSHIP AND SUSTAINABILITY ISSUES
ISSN 2345-0282 (online) http://jssidoi.org/jesi/
2021 Volume 8 Number 3 (March)
http://doi.org/10.9770/jesi.2021.8.3(35)
Make your research more visible, join the Twitter account of ENTREPRENEURSHIP AND SUSTAINABILITY ISSUES:
@Entrepr69728810
571
competences, open departments and mixed teams might be the solution. Through the cooperation of mixed
generations, the strengths of the individual generations become visible again and again to the others and could be
adopted. Furthermore, the competences of the different generations could be mutually dependent and
complementary and therefore profitable. Also, the general conditions, such as contract constructs, working time
regulations, workplace design, and other special agreements should be more tailored to the individual in the
future. A rethinking has to take place in which employees are again seen more as value-adding creators and, in
times of a shortage of skilled workers, senior employees in particular. Especially for SMEs, it is important to offer
an attractive environment to their employees because they are more affected by the effects of demographic change
and the lack of skilled workers. However, it is easier for them to introduce new approaches than for large
companies.
Assessing how does digitalization change the role of employees and employers in a digital world, the employees
mainly wished and expected the leadership to support flexible working systems; but also, a personal feedback
culture, lifelong learning opportunities and agile organisational structures. There was mainly a similar rating for
the importance and the occurrence of the competences. Looking at the answers of the company´s leaders or
managers, it became clear that there were important and generally expected competences and that the opinions
about them were similar. But on the other hand, the satisfaction with their presence in the working world was not
equally high. It can therefore be assumed that there is a need to catch up here, regarding the development of the
competences.
Summary of companies’ leaders’ insights:
Cloud solutions were not considered as trustworthy. The selection of suitable systems seemed to be a
challenge. Problems were also seen in an ineffective system landscape and in the dependency of others
(company´s partners; legal regulations).
Companies were mainly satisfied with their current digital status (some still saw room for improvement)
Some companies already introduced a digital responsible position or department. Reasons for adaption
mainly were customers/business partners (first adaptions in the interface areas); for this the priority was
mostly on the expansion of the interface technologies (to customers and partners). Automatisational
supporting systems and communication platforms for employees were often already implemented.
Suspected threats for the employees such as fear of job loss could not be confirmed by the
companies´leaders.
SMEs seemed to have an easier digital integration start than the others (because of independency and
smaller organisational structures). Companies often stressed the importance of the communication skills
and of personal relationships/feedback.
Managers and leaders must give up responsibility, build up trust and rely more on the employees and their
freedom of opinion, autonomy and responsibility as well as expand the personal feed-back-culture and the
error culture for increasing the innovation.
An open and convinced attitude, “lifelong learning", mobility, sensitivity and empathy/humanity,
empowering nature were listed as important for a manager´s character and leadership style.
It seemed like the bigger companies had better current conditions facing the flexible working structures.
Many companies seemed to have bigger struggles with the flexibility of work than with agility. This was
often justified by the fact that implementation would be difficult in terms of positions and company
orientation and that the human contact between the employees would suffer.
It was striking that the entrepreneurs mentioned autonomy and error culture often together (a closer
relationship can be suspected). For the areas of autonomy and error culture, no extraordinarily strong
assignments to the companies sizes could be observed.
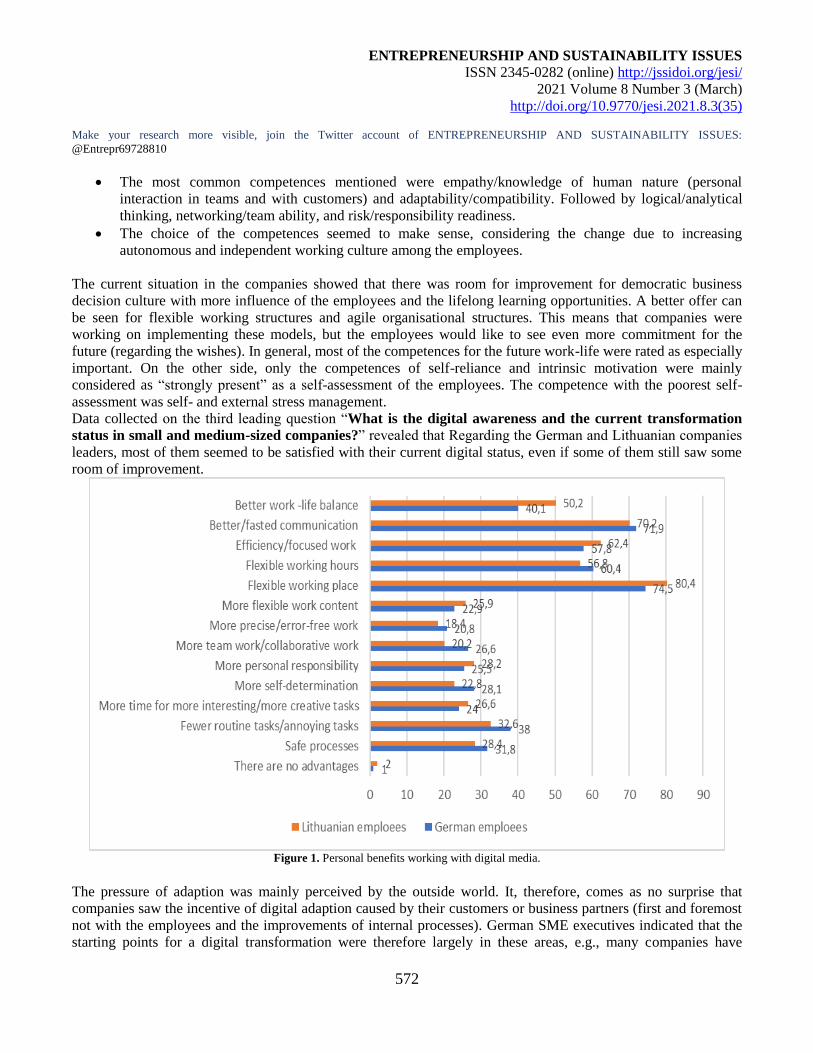
ENTREPRENEURSHIP AND SUSTAINABILITY ISSUES
ISSN 2345-0282 (online) http://jssidoi.org/jesi/
2021 Volume 8 Number 3 (March)
http://doi.org/10.9770/jesi.2021.8.3(35)
Make your research more visible, join the Twitter account of ENTREPRENEURSHIP AND SUSTAINABILITY ISSUES:
@Entrepr69728810
572
The most common competences mentioned were empathy/knowledge of human nature (personal
interaction in teams and with customers) and adaptability/compatibility. Followed by logical/analytical
thinking, networking/team ability, and risk/responsibility readiness.
The choice of the competences seemed to make sense, considering the change due to increasing
autonomous and independent working culture among the employees.
The current situation in the companies showed that there was room for improvement for democratic business
decision culture with more influence of the employees and the lifelong learning opportunities. A better offer can
be seen for flexible working structures and agile organisational structures. This means that companies were
working on implementing these models, but the employees would like to see even more commitment for the
future (regarding the wishes). In general, most of the competences for the future work-life were rated as especially
important. On the other side, only the competences of self-reliance and intrinsic motivation were mainly
considered as “strongly present” as a self-assessment of the employees. The competence with the poorest self-
assessment was self- and external stress management.
Data collected on the third leading question “What is the digital awareness and the current transformation
status in small and medium-sized companies?” revealed that Regarding the German and Lithuanian companies
leaders, most of them seemed to be satisfied with their current digital status, even if some of them still saw some
room of improvement.
Figure 1. Personal benefits working with digital media.
The pressure of adaption was mainly perceived by the outside world. It, therefore, comes as no surprise that
companies saw the incentive of digital adaption caused by their customers or business partners (first and foremost
not with the employees and the improvements of internal processes). German SME executives indicated that the
starting points for a digital transformation were therefore largely in these areas, e.g., many companies have
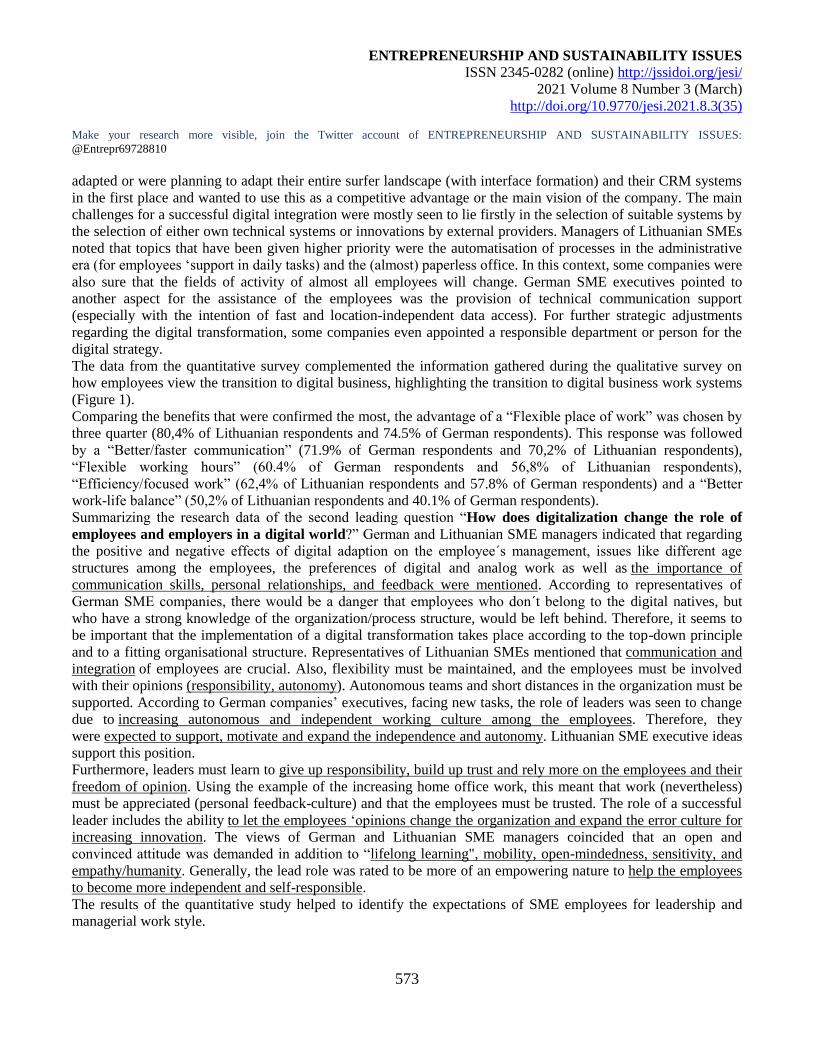
ENTREPRENEURSHIP AND SUSTAINABILITY ISSUES
ISSN 2345-0282 (online) http://jssidoi.org/jesi/
2021 Volume 8 Number 3 (March)
http://doi.org/10.9770/jesi.2021.8.3(35)
Make your research more visible, join the Twitter account of ENTREPRENEURSHIP AND SUSTAINABILITY ISSUES:
@Entrepr69728810
573
adapted or were planning to adapt their entire surfer landscape (with interface formation) and their CRM systems
in the first place and wanted to use this as a competitive advantage or the main vision of the company. The main
challenges for a successful digital integration were mostly seen to lie firstly in the selection of suitable systems by
the selection of either own technical systems or innovations by external providers. Managers of Lithuanian SMEs
noted that topics that have been given higher priority were the automatisation of processes in the administrative
era (for employees ‘support in daily tasks) and the (almost) paperless office. In this context, some companies were
also sure that the fields of activity of almost all employees will change. German SME executives pointed to
another aspect for the assistance of the employees was the provision of technical communication support
(especially with the intention of fast and location-independent data access). For further strategic adjustments
regarding the digital transformation, some companies even appointed a responsible department or person for the
digital strategy.
The data from the quantitative survey complemented the information gathered during the qualitative survey on
how employees view the transition to digital business, highlighting the transition to digital business work systems
(Figure 1).
Comparing the benefits that were confirmed the most, the advantage of a “Flexible place of work” was chosen by
three quarter (80,4% of Lithuanian respondents and 74.5% of German respondents). This response was followed
by a “Better/faster communication” (71.9% of German respondents and 70,2% of Lithuanian respondents),
“Flexible working hours” (60.4% of German respondents and 56,8% of Lithuanian respondents),
“Efficiency/focused work” (62,4% of Lithuanian respondents and 57.8% of German respondents) and a “Better
work-life balance” (50,2% of Lithuanian respondents and 40.1% of German respondents).
Summarizing the research data of the second leading question “How does digitalization change the role of
employees and employers in a digital world?” German and Lithuanian SME managers indicated that regarding
the positive and negative effects of digital adaption on the employee´s management, issues like different age
structures among the employees, the preferences of digital and analog work as well as the importance of
communication skills, personal relationships, and feedback were mentioned. According to representatives of
German SME companies, there would be a danger that employees who don´t belong to the digital natives, but
who have a strong knowledge of the organization/process structure, would be left behind. Therefore, it seems to
be important that the implementation of a digital transformation takes place according to the top-down principle
and to a fitting organisational structure. Representatives of Lithuanian SMEs mentioned that communication and
integration of employees are crucial. Also, flexibility must be maintained, and the employees must be involved
with their opinions (responsibility, autonomy). Autonomous teams and short distances in the organization must be
supported. According to German companies’ executives, facing new tasks, the role of leaders was seen to change
due to increasing autonomous and independent working culture among the employees. Therefore, they
were expected to support, motivate and expand the independence and autonomy. Lithuanian SME executive ideas
support this position.
Furthermore, leaders must learn to give up responsibility, build up trust and rely more on the employees and their
freedom of opinion. Using the example of the increasing home office work, this meant that work (nevertheless)
must be appreciated (personal feedback-culture) and that the employees must be trusted. The role of a successful
leader includes the ability to let the employees ‘opinions change the organization and expand the error culture for
increasing innovation. The views of German and Lithuanian SME managers coincided that an open and
convinced attitude was demanded in addition to “lifelong learning", mobility, open-mindedness, sensitivity, and
empathy/humanity. Generally, the lead role was rated to be more of an empowering nature to help the employees
to become more independent and self-responsible.
The results of the quantitative study helped to identify the expectations of SME employees for leadership and
managerial work style.
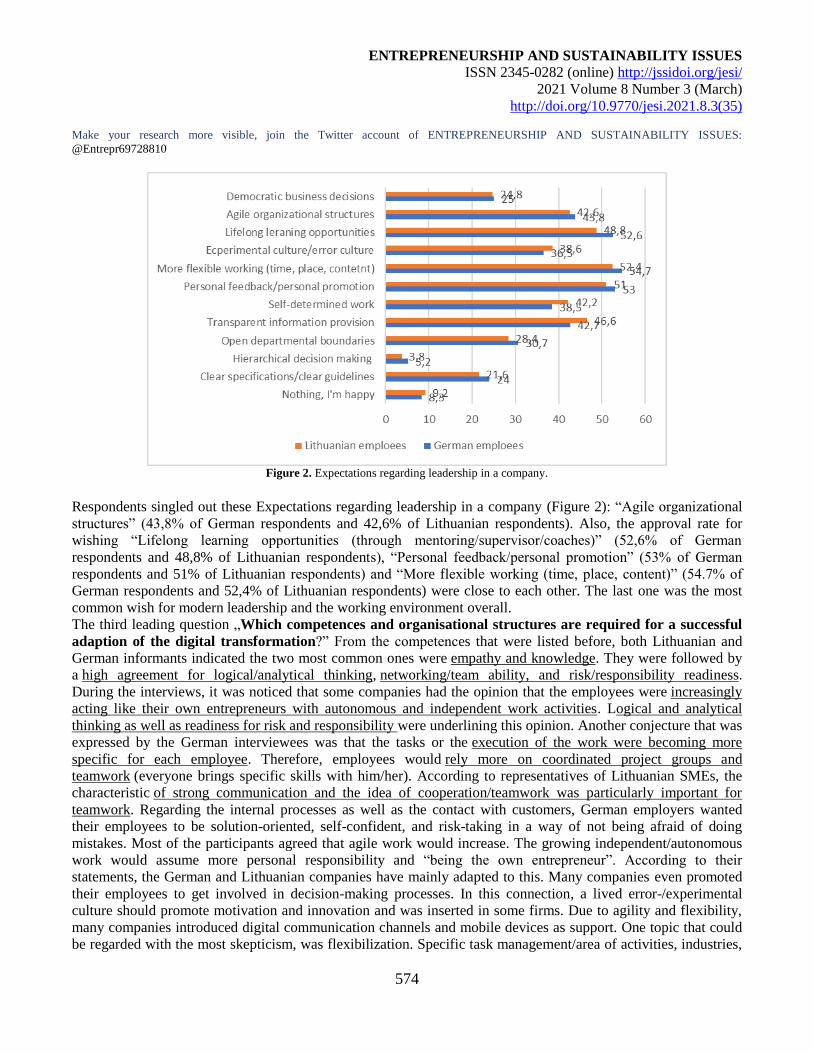
ENTREPRENEURSHIP AND SUSTAINABILITY ISSUES
ISSN 2345-0282 (online) http://jssidoi.org/jesi/
2021 Volume 8 Number 3 (March)
http://doi.org/10.9770/jesi.2021.8.3(35)
Make your research more visible, join the Twitter account of ENTREPRENEURSHIP AND SUSTAINABILITY ISSUES:
@Entrepr69728810
574
Figure 2. Expectations regarding leadership in a company.
Respondents singled out these Expectations regarding leadership in a company (Figure 2): “Agile organizational
structures” (43,8% of German respondents and 42,6% of Lithuanian respondents). Also, the approval rate for
wishing “Lifelong learning opportunities (through mentoring/supervisor/coaches)” (52,6% of German
respondents and 48,8% of Lithuanian respondents), “Personal feedback/personal promotion” (53% of German
respondents and 51% of Lithuanian respondents) and “More flexible working (time, place, content)” (54.7% of
German respondents and 52,4% of Lithuanian respondents) were close to each other. The last one was the most
common wish for modern leadership and the working environment overall.
The third leading question „Which competences and organisational structures are required for a successful
adaption of the digital transformation?” From the competences that were listed before, both Lithuanian and
German informants indicated the two most common ones were empathy and knowledge. They were followed by
a high agreement for logical/analytical thinking, networking/team ability, and risk/responsibility readiness.
During the interviews, it was noticed that some companies had the opinion that the employees were increasingly
acting like their own entrepreneurs with autonomous and independent work activities. Logical and analytical
thinking as well as readiness for risk and responsibility were underlining this opinion. Another conjecture that was
expressed by the German interviewees was that the tasks or the execution of the work were becoming more
specific for each employee. Therefore, employees would rely more on coordinated project groups and
teamwork (everyone brings specific skills with him/her). According to representatives of Lithuanian SMEs, the
characteristic of strong communication and the idea of cooperation/teamwork was particularly important for
teamwork. Regarding the internal processes as well as the contact with customers, German employers wanted
their employees to be solution-oriented, self-confident, and risk-taking in a way of not being afraid of doing
mistakes. Most of the participants agreed that agile work would increase. The growing independent/autonomous
work would assume more personal responsibility and “being the own entrepreneur”. According to their
statements, the German and Lithuanian companies have mainly adapted to this. Many companies even promoted
their employees to get involved in decision-making processes. In this connection, a lived error-/experimental
culture should promote motivation and innovation and was inserted in some firms. Due to agility and flexibility,
many companies introduced digital communication channels and mobile devices as support. One topic that could
be regarded with the most skepticism, was flexibilization. Specific task management/area of activities, industries,
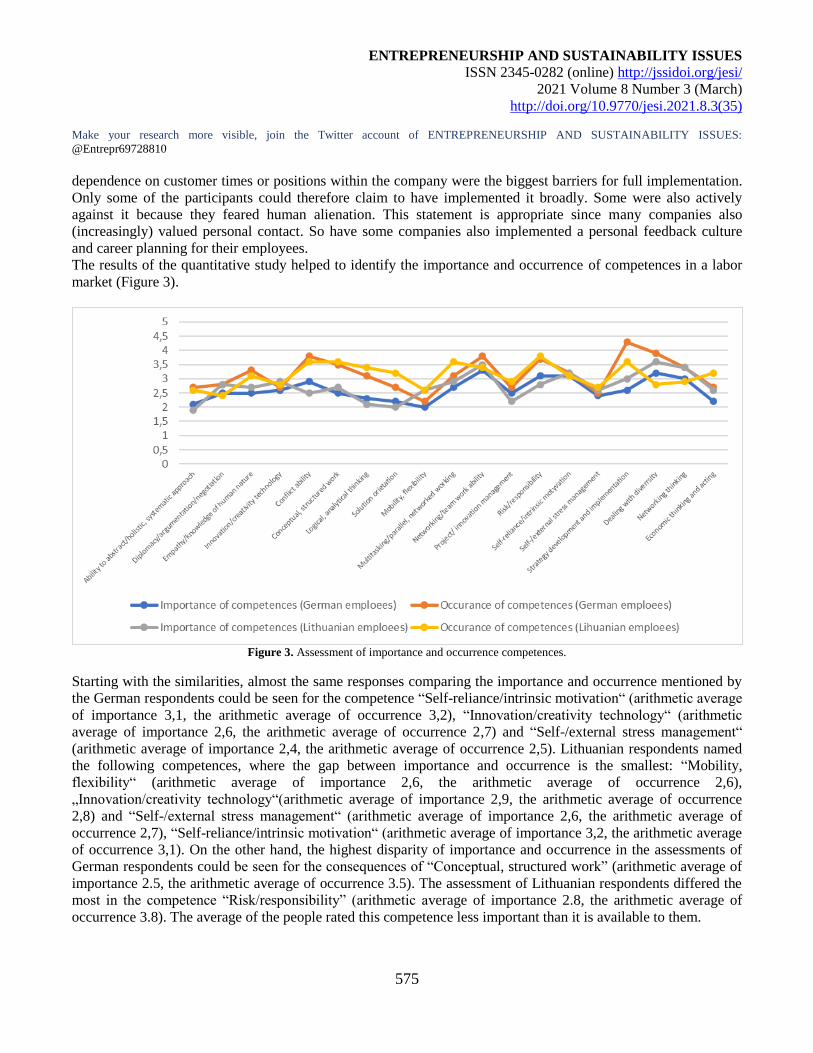
ENTREPRENEURSHIP AND SUSTAINABILITY ISSUES
ISSN 2345-0282 (online) http://jssidoi.org/jesi/
2021 Volume 8 Number 3 (March)
http://doi.org/10.9770/jesi.2021.8.3(35)
Make your research more visible, join the Twitter account of ENTREPRENEURSHIP AND SUSTAINABILITY ISSUES:
@Entrepr69728810
575
dependence on customer times or positions within the company were the biggest barriers for full implementation.
Only some of the participants could therefore claim to have implemented it broadly. Some were also actively
against it because they feared human alienation. This statement is appropriate since many companies also
(increasingly) valued personal contact. So have some companies also implemented a personal feedback culture
and career planning for their employees.
The results of the quantitative study helped to identify the importance and occurrence of competences in a labor
market (Figure 3).
Figure 3. Assessment of importance and occurrence competences.
Starting with the similarities, almost the same responses comparing the importance and occurrence mentioned by
the German respondents could be seen for the competence “Self-reliance/intrinsic motivation“ (arithmetic average
of importance 3,1, the arithmetic average of occurrence 3,2), “Innovation/creativity technology“ (arithmetic
average of importance 2,6, the arithmetic average of occurrence 2,7) and “Self-/external stress management“
(arithmetic average of importance 2,4, the arithmetic average of occurrence 2,5). Lithuanian respondents named
the following competences, where the gap between importance and occurrence is the smallest: “Mobility,
flexibility“ (arithmetic average of importance 2,6, the arithmetic average of occurrence 2,6),
„Innovation/creativity technology“(arithmetic average of importance 2,9, the arithmetic average of occurrence
2,8) and “Self-/external stress management“ (arithmetic average of importance 2,6, the arithmetic average of
occurrence 2,7), “Self-reliance/intrinsic motivation“ (arithmetic average of importance 3,2, the arithmetic average
of occurrence 3,1). On the other hand, the highest disparity of importance and occurrence in the assessments of
German respondents could be seen for the consequences of “Conceptual, structured work” (arithmetic average of
importance 2.5, the arithmetic average of occurrence 3.5). The assessment of Lithuanian respondents differed the
most in the competence “Risk/responsibility” (arithmetic average of importance 2.8, the arithmetic average of
occurrence 3.8). The average of the people rated this competence less important than it is available to them.
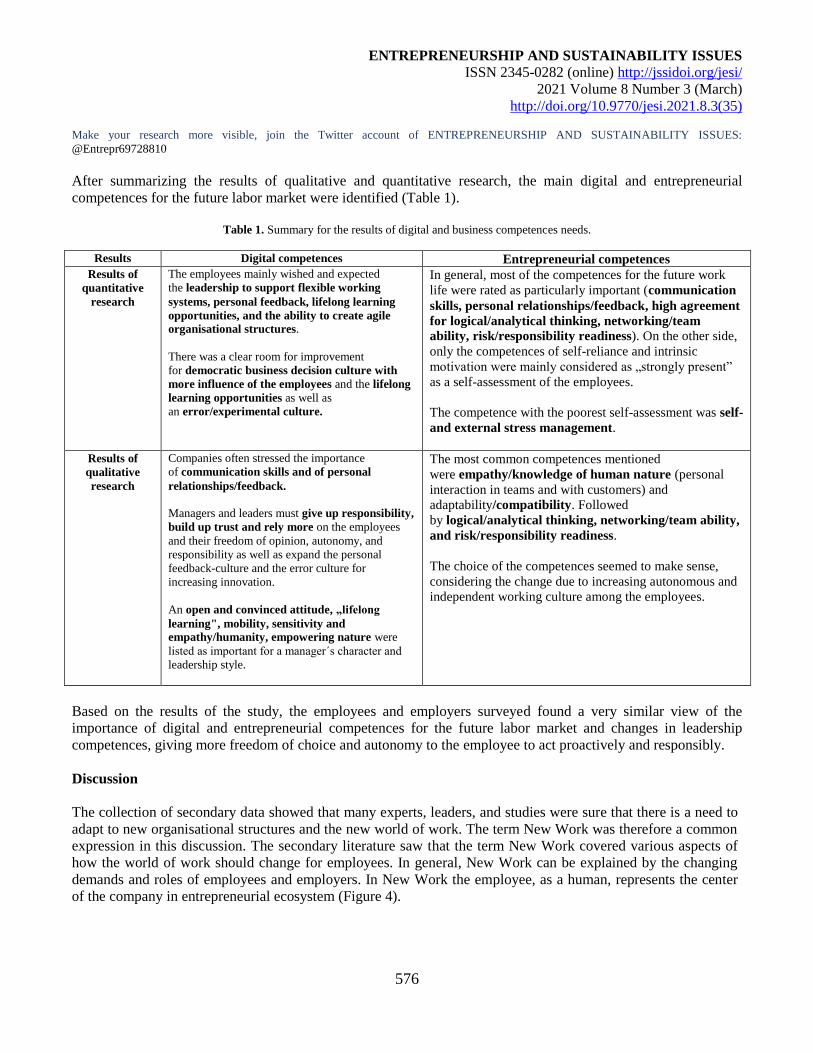
ENTREPRENEURSHIP AND SUSTAINABILITY ISSUES
ISSN 2345-0282 (online) http://jssidoi.org/jesi/
2021 Volume 8 Number 3 (March)
http://doi.org/10.9770/jesi.2021.8.3(35)
Make your research more visible, join the Twitter account of ENTREPRENEURSHIP AND SUSTAINABILITY ISSUES:
@Entrepr69728810
576
After summarizing the results of qualitative and quantitative research, the main digital and entrepreneurial
competences for the future labor market were identified (Table 1).
Table 1. Summary for the results of digital and business competences needs.
Results Digital competences Entrepreneurial competences Results of
quantitative
research
The employees mainly wished and expected
the leadership to support flexible working
systems, personal feedback, lifelong learning
opportunities, and the ability to create agile
organisational structures.
There was a clear room for improvement
for democratic business decision culture with
more influence of the employees and the lifelong
learning opportunities as well as
an error/experimental culture.
In general, most of the competences for the future work
life were rated as particularly important (communication
skills, personal relationships/feedback, high agreement
for logical/analytical thinking, networking/team
ability, risk/responsibility readiness). On the other side,
only the competences of self-reliance and intrinsic
motivation were mainly considered as „strongly present”
as a self-assessment of the employees.
The competence with the poorest self-assessment was self-
and external stress management.
Results of
qualitative
research
Companies often stressed the importance
of communication skills and of personal
relationships/feedback.
Managers and leaders must give up responsibility,
build up trust and rely more on the employees
and their freedom of opinion, autonomy, and
responsibility as well as expand the personal
feedback-culture and the error culture for
increasing innovation.
An open and convinced attitude, „lifelong
learning", mobility, sensitivity and
empathy/humanity, empowering nature were
listed as important for a manager´s character and
leadership style.
The most common competences mentioned
were empathy/knowledge of human nature (personal
interaction in teams and with customers) and
adaptability/compatibility. Followed
by logical/analytical thinking, networking/team ability,
and risk/responsibility readiness.
The choice of the competences seemed to make sense,
considering the change due to increasing autonomous and
independent working culture among the employees.
Based on the results of the study, the employees and employers surveyed found a very similar view of the
importance of digital and entrepreneurial competences for the future labor market and changes in leadership
competences, giving more freedom of choice and autonomy to the employee to act proactively and responsibly.
Discussion
The collection of secondary data showed that many experts, leaders, and studies were sure that there is a need to
adapt to new organisational structures and the new world of work. The term New Work was therefore a common
expression in this discussion. The secondary literature saw that the term New Work covered various aspects of
how the world of work should change for employees. In general, New Work can be explained by the changing
demands and roles of employees and employers. In New Work the employee, as a human, represents the center
of the company in entrepreneurial ecosystem (Figure 4).
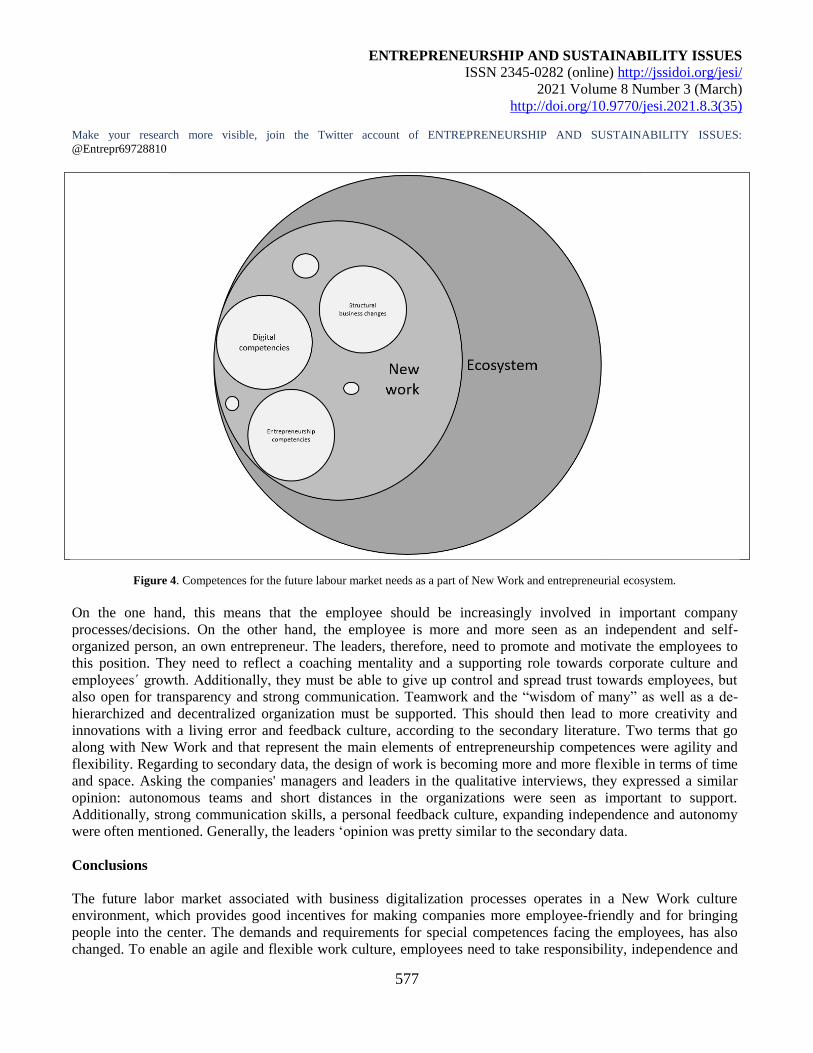
ENTREPRENEURSHIP AND SUSTAINABILITY ISSUES
ISSN 2345-0282 (online) http://jssidoi.org/jesi/
2021 Volume 8 Number 3 (March)
http://doi.org/10.9770/jesi.2021.8.3(35)
Make your research more visible, join the Twitter account of ENTREPRENEURSHIP AND SUSTAINABILITY ISSUES:
@Entrepr69728810
577
Figure 4. Competences for the future labour market needs as a part of New Work and entrepreneurial ecosystem.
On the one hand, this means that the employee should be increasingly involved in important company
processes/decisions. On the other hand, the employee is more and more seen as an independent and self-
organized person, an own entrepreneur. The leaders, therefore, need to promote and motivate the employees to
this position. They need to reflect a coaching mentality and a supporting role towards corporate culture and
employees´ growth. Additionally, they must be able to give up control and spread trust towards employees, but
also open for transparency and strong communication. Teamwork and the “wisdom of many” as well as a de-
hierarchized and decentralized organization must be supported. This should then lead to more creativity and
innovations with a living error and feedback culture, according to the secondary literature. Two terms that go
along with New Work and that represent the main elements of entrepreneurship competences were agility and
flexibility. Regarding to secondary data, the design of work is becoming more and more flexible in terms of time
and space. Asking the companies' managers and leaders in the qualitative interviews, they expressed a similar
opinion: autonomous teams and short distances in the organizations were seen as important to support.
Additionally, strong communication skills, a personal feedback culture, expanding independence and autonomy
were often mentioned. Generally, the leaders ‘opinion was pretty similar to the secondary data.
Conclusions
The future labor market associated with business digitalization processes operates in a New Work culture
environment, which provides good incentives for making companies more employee-friendly and for bringing
people into the center. The demands and requirements for special competences facing the employees, has also
changed. To enable an agile and flexible work culture, employees need to take responsibility, independence and
ENTREPRENEURSHIP AND SUSTAINABILITY ISSUES
ISSN 2345-0282 (online) http://jssidoi.org/jesi/
2021 Volume 8 Number 3 (March)
http://doi.org/10.9770/jesi.2021.8.3(35)
Make your research more visible, join the Twitter account of ENTREPRENEURSHIP AND SUSTAINABILITY ISSUES:
@Entrepr69728810
578
act like entrepreneurs. At the same time, it is becoming more and more important to be cooperative and highly
communicative when working in an agile, networked company. The “wisdom of all” stands in the center of
innovative work and must therefore be used by everyone. As a result, it can be said that German and Lithuanian
companies and employees are in general open to digital changes under conditions of a New Work model. It can
also be detected that companies have already initiated changes in both areas, but the full potential has not yet
been realized. Even if SMEs face challenges of internal adaptation, the time of rapid change and the increasing
focus on the human side can be seen as an advantage over the big players. Short organisational ways, clear
structures, and a family- and people-oriented corporate atmosphere can reflect decisive advantages for small and
medium-sized companies. This should be exploited even more in times of digital change and newly developing
employees´ models.
Assessing how does digitalization changes the role of employees and employers in a digital world and their
expectations for digital and entrepreneurial competences, the employees mainly wished and expected the
leadership to support flexible working systems; but also, a personal feedback culture, lifelong learning
opportunities, and agile organisational structures. There was mainly a similar rating for the importance and the
occurrence of the competences in the evaluations of employers and employees representing the Lithuanian and
German labor markets Looking at the answers of the company´s leaders or managers, it became clear that there
were important and generally expected competences and that the opinions about them were similar. But on the
other hand, the satisfaction with their presence in the working world was not equally high. It can therefore be
assumed that there is a need to catch up here, regarding the development of the competences.
References
Autio, E., Nambisan, S., Thomas, L., Wright, M. (2018). Digital affordances, spatial affordances, and the genesis of entrepreneurial
ecosystems. Strategic Entrepreneurship Journal, 12(1), 72-95. https://doi.org/10.1002/sej.1266
Bauer W., Hämmerle M., Bauernhansl T., Zimmermann T. (2018) Future Work Lab. In: Neugebauer R. (eds) Digitalisierung. Springer
Vieweg, Berlin, Heidelberg. https://doi.org/10.1007/978-3-662-55890-4_11
Breidenbach, J., Rollow, B., (2019). New Work needs Inner Work. Ein Handbuch für Unternehmen auf dem Weg zur Selbstorganisation.
München: Franz Vahlen München.
Cijan, A., Jenič, L., Lamovšek, A., Stemberger, J. (2019). How Digitalization Changes the Workplace. Dynamic Relationships
Management Journal, 8(1), 3-12. http://dx.doi.org/ 10.17708/DRMJ.2019.v08n01a01
Clauberg, R. (2020). Challenges of digitalization and artificial intelligence for modern economies, societies and management. RUDN
Journal of Economics, 28(3), 556-567. https://doi.org/10.22363/2313-2329-2020-28-3-556-567
Davidavičienė, V., Raudeliūnienė, J., Tvaronavičienė, M., Kaušinis, J. (2019). The importance of security aspects in consumer preferences
in electronic environment. Journal of Security and Sustainability Issues, 8(3), 399-411. http://doi.org/10.9770/jssi.2019.8.3(9)
Degryse, Ch. (2016). Digitalisation of the Economy and its Impact on Labour Markets. ETUI Research Paper.
http://dx.doi.org/10.2139/ssrn.2730550
Dengler, K., Matthes, B. (2018). The impacts of digital transformation on the labour market: Substitution potentials of occupations in
Germany. Technological Forecasting & Social Change, 137, 304-316. http://doi.org/10.1016/j.techfore.2018.09.024
Enste, D. H. et. al., (2013). Führung im Wandel. Führungsstile und gesellschaftliche Megatrends im 21. Jahrhundert (Change in
leadership. Leadership styles and social megatrends in the 21st century), Nr. 22, München: Roman Herzog Institut e.V.
ENTREPRENEURSHIP AND SUSTAINABILITY ISSUES
ISSN 2345-0282 (online) http://jssidoi.org/jesi/
2021 Volume 8 Number 3 (March)
http://doi.org/10.9770/jesi.2021.8.3(35)
Make your research more visible, join the Twitter account of ENTREPRENEURSHIP AND SUSTAINABILITY ISSUES:
@Entrepr69728810
579
Feller, N., Amann, A., Müller, U., Schiffmann, M., Kurscheid, O., Gorzellik, M. (2017) Application of a Simulation-Based Software Tool
for the Prospective Design of IT Work Places. In: Hale K., Stanney K. (eds) Advances in Neuroergonomics and Cognitive Engineering.
Advances in Intelligent Systems and Computing, vol 488. Springer, Cham. https://doi.org/10.1007/978-3-319-41691-5_8
Galaso, P., Kovářı́k, J. (2018). Collaboration Networks and Innovation: How to Define Network Boundaries. Journal of Eurasian
Economic Dialogue, 3(2), 1–17.
Hulla, M., Ramsauer, Ch. (2020). Competences of Production in SMEs in Assembly Industries in a Digital, Volatile Business
Environment. Tehnički Glasnik, 14(3), 388-395. https://doi.org/10.31803/tg-20200720145117
Immerschitt, W., Stumpf, M. (2018). Employer Branding für KMU. Der Mittelstand als attraktiver Arbeitgeber, 2nd edition, Springer
Verlag, Wiesbaden 2018. https://doi.org/10.1007/978-3-658-01204-5
Jari, K., Lauraeus, T. (2019). Analysis of 2017 Gartner’s Three Megatrends to Thrive the Disruptive Business, Technology Trends 2008-
2016, Dynamic Capabilities of VUCA and Foresight Leadership Tools. Advances in Technology Innovation, 4(2), 105-115.
http://ojs.imeti.org/index.php/AITI/article/view/2521/783
Laužikas, M., Miliūtė, A. 2020. Liaisons between culture and innovation: comparative analysis of South Korean and Lithuanian IT
companies. Insights into Regional Development, 2(2), 523-537. https://doi.org/10.9770/IRD.2020.2.2(2)
Lietuvos Respublikos ūkio ministerijos 2019 metų veiklos ataskaita (2020) [Activity Report of the Ministry of Economy of the Republic of
Lithuania for 2019 (2020)]. Vilnius: 45.
https://eimin.lrv.lt/uploads/eimin/documents/files/Planavimo%20dokumentai/SVP/2019%20m_%20EIMIN%20ataskaita%20.pdf
Mayring, P., Fenzl, T., (2019). Handbuch Methoden der empirischen Sozialforschung. (Manual methods of empirical social research)
Wiesbaden: Springer Fachmedien Wiesbaden GmbH. p. 633.
Murshed, F., Zhang, Y. (2016). Thinking orientation and preference for research methodology. Journal of Consumer Marketing, 33(6),
437-446. https://doi.org/10.1108/JCM-01-2016-1694
OECD (2019). Preparing for the changing nature of work in the digital era. OECD Going Digital Policy Note, OECD, Paris,
www.oecd.org/going-digital/changing-nature-of-work-in-the-digital-era.pdf.
Ritter, T., Pedersen, C. (2020). Digitization capability and the digitalization of business models in business-to-business firms: Past, present,
and future. Industrial Marketing Management, 86, 180-190. http://doi.org/10.1016/j.indmarman.2019.11.019
Romanova, O. A., Korovin, G. B., Kuzmin, E. A. (2017). Analysis of the development prospects for the high-tech sector of the economy in
the context of new industrialization. Espacios, 38(59). https://www.revistaespacios.com/a17v38n59/a17v38n59p25.pdf
Ruohomaa, H., Salminen, V. (2019). Ecosystem-Based Development on Managing Digital Transformation. Advances in Human
Factors,Business Management and Leadership, Proceedings of the AHFE 2019 International Conference on Human Factors, Business
Management and Society, and the AHFE International Conference on Human Factors in Management and Leadership, held on July 24–28,
2019, in Washington D.C., USA. https://doi.org/10.1007/978-3-030-20154-8.
SBA Fact Sheet – Germany (2019). European Comission https://ec.europa.eu/growth/smes/sme-strategy/performance-review_en#annual-
report
SBA Fact Sheet – Lithuania (2019). European Comission. https://eimin.lrv.lt/uploads/eimin/documents/files/Lithuania%20-
%20SBA%20Fact%20Sheet%202019.pdf
Stuck, S. (2020). Führung und Macht: Auf der Suche nach einem neuen Gleichgewicht. Zeitschrift Führung Und Organisation, (Leadership
and Power: In Search of a New Balance. Journal of Leadership and Organization), (3), 140-146.
ENTREPRENEURSHIP AND SUSTAINABILITY ISSUES
ISSN 2345-0282 (online) http://jssidoi.org/jesi/
2021 Volume 8 Number 3 (March)
http://doi.org/10.9770/jesi.2021.8.3(35)
Make your research more visible, join the Twitter account of ENTREPRENEURSHIP AND SUSTAINABILITY ISSUES:
@Entrepr69728810
580
Vargas, L., Weber, T. (2020). Regulations to address work-life balance in digital flexible working arrangements (Industrial relations).
Luxembourg: Publications Office. http://doi.org/10.2806/03528
Walden, R., Lie, S., Pandolfo, B., Nemme, A. (2020). Developing Strategic Leadership and Innovation Capability for Manufacturing SMEs
Transitioning to Digital Manufacturing Technology. Leadership Styles, Innovation, and Social Entrepreneurship in the Era of
Digitalization, p. 164-189. http://doi.org/10.4018/978-1-7998-1108-4.ch007
Walla, W., Bernd, E., Lipinski, H. (2006). Der demographische Wandel. Herausforderungen für Politik und Wirtschaft (The demographic
change. Challenges for politics and business). Kohlhammer, Stuttgart 2006, ISBN: 978-3-17- 019023-8.
Ware, J., Grantham, C. (2003). The future of work: Changing patterns of workforce management and their impact on the workplace.
Journal of Facilities Management, 2(2), 142-159. http://doi.org/10.1108/14725960410808177
Westerlund, M. (2020). Digitalization, internationalization and scaling of online SMEs. Technology Innovation Management Review,
10(4), 48-57. Retrieved from https://ezproxy.biblioteka.ku.lt:4751/scholarly-journals/digitalization-internationalization-
scaling/docview/2404086313/se-2?accountid=16371
Acknowledgements The research was conducted in the framework of the project Development of digital and entrepreneurial competences for the
future labour market need. This project of the Baltic-German University Liaison Office is supported by the German
Academic Exchange Service (DAAD) with funds from the Foreign Office of the Federal Republic Germany.
Daiva LABANAUSKAITĖ is a Doctor of Social Sciences, associated professor at Department of Economics, at Faculty of Social
Sciences and Humanities, at Klaipeda University, Lithuania. She is author of over 40 scientific publications, a monograph, among those
many papers are related to the service economy and tourism. Research interests: service economy, sustainable development, green
economic growth. CSR. ORCID ID: https://orcid.org/0000-0002-3538-3991.
Erika ŽUPERKIENĖ is a Doctor of Social Sciences, associate professor at the Management Department of Klaipeda University. She has
18 years of experience in teaching and more than 20 years of practical experience in business as an entrepreneur. Co-author of one
monograph and three other types of books, and over 30 publications have been published in various scientific journals. She provides
training for staff of Lithuanian private and public sector organisations. Research interests: HRM, CSR, leadership, entrepreneurship.
ORCID ID: https://orcid.org/0000-0002-1505-0962
Alexander KUMPF is a Doctor of Engineering (graduated from the Technical University of Munich), had several years working
experiences indifferent positions in leading companies worldwide (e.g., BMW, MAHLE) and is currently Professor for Purchasing and
Logistics at the University of Applied Sciences Landshut/Germany. Author (or co-author) of several monographs and scientific papers
published mainly in Germany. Auditor for program and system accreditation of Universities working for international agencies. Research
interests: Digital Transitions in Operations (Manufacturing, Logistics and Supply Chain), International Operations Network, Inventory
Management, Lean Management in Operations and Change Management.
ORCID ID: https://orcid.org/0000-0002-7198-6546.
Ligita ŠIMANSKIENĖ is a Doctor of Social Sciences, professor and head of Management Department, at Social Science and Humanities
Faculty at Klaipeda University, Lithuania. Author (or co-author) of 5 monographs, about 100 research articles published in Lithuania and
abroad. Research interests: organizational culture, sustainability, teamwork, leadership, CSR.
ORCID ID: https://orcid.org/0000-0002-0548-0459
ENTREPRENEURSHIP AND SUSTAINABILITY ISSUES
ISSN 2345-0282 (online) http://jssidoi.org/jesi/
2021 Volume 8 Number 3 (March)
http://doi.org/10.9770/jesi.2021.8.3(35)
Make your research more visible, join the Twitter account of ENTREPRENEURSHIP AND SUSTAINABILITY ISSUES:
@Entrepr69728810
581
Sophie Marie KOLLER is s a master’s graduate in International Business at the University of Landshut. For her master’s thesis "the
impact of the economical megatrend digitalization on modern work systems and organizational excellence" she accomplished a practical
research for companies in Bavaria in 2020. The subject of investigation was the digitization and New Work developments within 14
companies.
ORCID ID: https://orcid.org/0000-0003-0913-7444
Copyright © 2021 by author(s) and VsI Entrepreneurship and Sustainability Center
This work is licensed under the Creative Commons Attribution International License (CC BY).
http://creativecommons.org/licenses/by/4.0/
ENTREPRENEURSHIP AND SUSTAINABILITY ISSUES
ISSN 2345-0282 (online) http://jssidoi.org/jesi/
2021 Volume 8 Number 3 (March)
http://doi.org/10.9770/jesi.2021.8.3(36)
Publisher http://jssidoi.org/esc/home
582
Gábor Kincses 1, Mihály Ormos 2, Zsolt Bartha 3
1,3Budapest University of Technology and Economics Centre of Physical Education, Budapest, 1111 Budapest, 1111
Budapest, Bertalan Lajos st. 4-6. Hungary 1University of Physical Education, Budapest, 1123 Budapest, Alkotás st. 44. Hungary
2Eotvos Lorand University Department of Finance and Accounting, Budapest, 1088 Budapest, Rakoczi st. 7. Hungary 2J. Selye University, Department of Economics, Bratislavská cesta 3322, 945 01, Komarno, Slovakia
3University of Pecs Faculty of Health Science,7621 Pecs, Vörösmarty st. 4. Hungary
E-mails: [email protected] ; [email protected] ; [email protected]
Received 10 September 2020; accepted 07 February 2021; published 30 March 2021
Abstract. Tennis as a sport has undergone significant improvement in the past few decades in the former socialist countries. The study is
going to introduce the historical background, where exactly East-European Women Tennis Players in large numbers, belonging to the
world elite originated from. The article reviews the motivational theories valid in sports and focusing on female players defines the
doctrine. The study based on an empirical research which was targeted to reveal the factors behind the motivation of women tennis players.
The research was implemented among (n=31) elite women tennis player. Data collection was implemented both by questionnaires and half
structured interviews. The outcome of the research will be introduced through 5 dimensions. Satisfaction of East-European elite women
tennis players with their (a) career, (b) the amount won at prize money tournaments (c) the relationship between the invested time, money
and energy during their sport career and their results, (d) the opinion on the possible restart of their career, (e) the after retirement plans of
tennis women players. One of the major consequences of the study is that women tennis players of the world elite have different approach
concerning the successfulness of their career, a large percentage of them agree, their prize money won in tournaments they can create
material goods for themselves will establishes for their further lives. Tennis today not only provides them with a sporting opportunity, it is
also a career model. Their passion for the sport makes many of them work around tennis, even after the end of their players lifeway.
Keywords: tennis; history; post socialist elite players; motivation
Reference to this paper should be made as follows: Kincses, G., Ormos, M., Bartha, Z. 2021. Motivational peculiarities of elite women
tennis players from the post-socialist countries. Entrepreneurship and Sustainability Issues, 8(3), 582-591.
http://doi.org/10.9770/jesi.2021.8.3(36)
JEL Classifications: I10, H30, O15
ENTREPRENEURSHIP AND SUSTAINABILITY ISSUES
ISSN 2345-0282 (online) http://jssidoi.org/jesi/
2021 Volume 8 Number 3 (March)
http://doi.org/10.9770/jesi.2021.8.3(36)
Make your research more visible, join the Twitter account of ENTREPRENEURSHIP AND SUSTAINABILITY ISSUES:
@Entrepr69728810
583
1. Introduction
Tennis the ball game of Anglo-Saxon origin was introduced to a company by a British aristocrat in 1873. Right
after setting up the licence document, the first code has been issued on the rules of the game called ’lawn tennis’.
Tennis became soon popular among women as well in aristocratic circles. They gathered in clubs and became
addicted to this kind of leisure activity. The Wimbledon tournament was organised in 1877 for the first time
(Gáspár, 2012). Athens, the first location of modern Olympic games, had only men both in the single and double
games. Women only grab the racket for the first time at the London Olympics in 1908. After the end of World
War I. in Antwerp in 1920, later in Paris in 1924 tennis was a part of the Olympic games. In all sports the
champions were West-European or players from the oversees (Kahlich et al. 1972). Next occasion when tennis
moved back to the program of Olympic games was in 1988 in Seoul. In tennis it was never the Olympic games
that counted the most. Grand Slam tournaments, the winning of one of the four major tournaments meant the real
appreciation. These major tournaments are Australian Open, Roland Garros, Wimbledon and US Open. Those
who managed to meet the criteria of these four tournaments and won, were completing the classic Grand Slam.
Among women players there have been only three who accomplished this winning serial: Maureen Conolly
(1953), Margaret Court (1970) and Steffi Graf (1988). (Record and Record Keepers in the White Sport History,
2013). Professional tennis was established at the introduction of the „open era” in 1968, where professional
players were also allowed to participate at tournaments. Tennis has been switched step by step from amateur to
professional sport. From this point we consider tennis as a modern sport, and we register world rankings, statistics
and other records since then. The Association of professional women tennis players WTA (Women’s Tennis
Association) was founded in 1973 (WTA Media Guide, 2020). There are nearly 1300 players listed on the adult
women world rank list. Sponsors select among them based on various aspects, whom to support and why during
their career. A tennis fan, that follows tournaments through the tv screen may not notice much difference between
these players. Apart from the physical parameters he may prefer one player to the other based on certain aspects.
Not taking into account the objective fact of being successful, he/she might have no clue of the reason of the place
on the ranking list. For a fan like this, the world rankings could be upside down, as there may not be sensed major
differences concerning the skills of the players. Ladies hit the ball strongly, their serves are excellent, they are
quick and fight with heart and hand on the court. The only difference can be noted in playing the significant
scores, however, some minor momentum favours only one of them. The player with more routine with more
experience in this case is more confident and relaxed than the opponent.
In the research we used our experience collected during the past decades. Our basic goal was to verify by empiric
tests that in the background of the success of post socialistic elite women players there are various motivational
factors. Hereby we would refer to our former studies performed in the subject. One of them was examining the
successfulness of the already retired (n=25) and still active (n=22) Hungarian elit women tennis players in the
light of tennis becoming a business. The findings of the above study are currently under printing. In the following
parts hereby, we wish to introduce a part of the overall and wholescale research in the subject.
This study monitors the satisfaction of the players by five dimensions, and the role of prize money won during
their career. Our research questions seek answers to, whether the elite tennis ladies throughtout their careers, what
sums they aim to win? Through this prize money do they consider, it possible to continue work around tennis
after the end of their sports career and realize it as a lifeway? In the first chapter we are review the most
commonly known motivational models in sport. In the second chapter we took those female world class tennis
players who managed to reach the top due to their excellent talent from those socialistic countries that were not
supporting tennis at all.
ENTREPRENEURSHIP AND SUSTAINABILITY ISSUES
ISSN 2345-0282 (online) http://jssidoi.org/jesi/
2021 Volume 8 Number 3 (March)
http://doi.org/10.9770/jesi.2021.8.3(36)
Make your research more visible, join the Twitter account of ENTREPRENEURSHIP AND SUSTAINABILITY ISSUES:
@Entrepr69728810
584
2. Motivational peculiarities
In most societies young girls and women show a high proportion in participation in sports, although comparing
their number to boys and men this number is much lower. This difference is sexes came about during evolution,
women have always shown less interest in sport. The motivation of sportsmen and sportswomen usually differs in
competitiveness and risk taking. Women are seemingly interested in sport, but only in participation (Deaner et al.
2016).
Examining young female and male team players it was established that the ice-hockey, football, water-polo and
volleyball players’ motivation skills show a great difference regarding the two sexes. The trainers of young teams
should pay special attention to organising their education mostly to processes that team members perform
together. According to results, male athletes are able to perform better under pressure, in circumstances that focus
on the aim and the task. They are mentally more prepared, more self-confident and have a higher level of
concentration then their female peers (Geczi et al. 2009). The study concerning the Bulgarian elite athletes
demonstrated that the sport motivation scale (SMS) filled by figure skaters, skiers and boxers show differences in
the motivation affecting performance (Chantal et al. 1996). However, the research dealing with fantasy sport
showed that women are as motivated in participation as men. Female sports fans enjoy the content of sports
media. This world is rather called “boys-club”, still millions of women enjoy the entertainment offered by these
games. Fantasy sport fulfils women consumers’ special demands (Ruihley et al. 2013). Examining Palestine
women’s habits, taking social hindrance into consideration, it was clear that they possess a high level of inner
motivation and are dedicated to sport. The research referring to basketball, volleyball, table-tennis players and
track and field athletes showed that their coaches can provide such atmosphere that they are happy to participate,
enjoy sport movements and also themselves (Younes et al. 2013). The results of questionnaires filled by female
teenage softball players reflect that precise aims are to be set at an early age. In this motivating atmosphere both
the parents and the coach help the kids’ goal orientation more developed and sophisticated during the
socialization process. They always recommend new goal elements to reach (Waldron, Krane. 2005). Sarrazin and
his colleagues observed and tested French volleyball players during their research. They recommend the
acceptance of the three elements of inner motivation. The knowledge the player has ensures satisfaction and
pleasure gained with playing sport. With practice and a lot of training, the newly established goals become
achievable, accomplishment is reached for the player’s happiness. The player experiences the stimulating feeling
which provides entertainment, esthetical experience, and sensory pleasure (Sarrazin et al. 2002). Sweden is
known about its imposing, results connected with equality between the sexes. However, girls and women are
more sensitive than men. Based on research regarding junior players, competitive tennis is less attractive for girls
because there is fight in the rallies on the court. Mental struggle. Women’s characters are different, they are not
aggressors, thus this sport is not really suitable for them. They rather enjoy trainings, practicing together, team
events to competitions. To become first-rate, one must have a strong personality (Bykanova-Yudanov, 2018). An
Australian study tested the role of parents among professional tennis players on the WTA rankings. Inductive
content analysis proved that caring and respectful environment at home meant serious support for the
development of the talent, for pursuing a career in tennis (Young, Pearce, 2011). Tennis requires different types
of psychological characteristics. From these the most important is the motivation affecting the results. Players are
continually adjusting to circumstances during matches; to the opponent’s tactics, to the surface of the court, to the
wind and sun. The concepts connected to motivation are getting stronger, like the wish to win, sustaining
competitiveness, the will to participate, the passion and enjoying the game. In modern approach, to understand
motivation in tennis, the aim perspective theory plays the leading role. The player determines her personal
competencies on her own personal references. These are the aspirations for effort, the continuity of learning, the
ENTREPRENEURSHIP AND SUSTAINABILITY ISSUES
ISSN 2345-0282 (online) http://jssidoi.org/jesi/
2021 Volume 8 Number 3 (March)
http://doi.org/10.9770/jesi.2021.8.3(36)
Make your research more visible, join the Twitter account of ENTREPRENEURSHIP AND SUSTAINABILITY ISSUES:
@Entrepr69728810
585
developing of skills. They adjust their trainings to the goals to be achieved. The studies revealed that the task
oriented motivational environment has a positive effect on self-confidence, boosts the feeling of satisfaction,
forms the real sports personality. To achieve and sustain all the above, coaches and parents play an undeniable
role (Crespo, Reid, 2007).
3. Post-socialist countries and female superstars
Sport managers of the post socialistic countries have been focusing on the Olympic sports for long decades. They
have been thinking in 4-year cycles and measured their national proudness and prestige in golden medals won.
Elite sport policy has always preferred pure domestic aspects while the international trends count on success
achieved both at home and in the world (Haut et al. 2019).
Between 1950 and 1988 on the summarized charts of the Olympic medals there were numerous East-European
countries among the best 10 nations. The State paid all costs related to the sport. Perfect conditions were created
in well-equipped institutions in order to achieve worldwide quality sport results. Leading athletes enjoyed
financial benefits, bonuses and special attention. They travelled through sports, they saw the wourld. In the
beginning of the 1990s, due to the economic changes, organisations responsible for sport sponsorship had to be
reformed. New legislation was established by considering the changes all over the world. Top-class sportsmen
were leaving their countries in masses for the sake of a better living. In their countries full time sport activity was
not a well-paid job any longer (Poupaux, 2005).
At the Seoul Olympics at 1988 the Soviet Union was represented with the most sportsmen right after the USA.
They reached the first place on the medal table, and won the most medals in athletics, gymnastics, wrestling and
weightlifting. Two women tennis player nominated in singles, but both have lost in the second round.
Women tennis delivers good players continuously, and the new generation have their icons to respect. In the past
40 years there have been numerous talents appeared. In the end of the 1970’s and in the beginning of the 1980’s
the United States of America has become a dominant tennis power. Europeans were dropped behind. Among the
best 100 female players of the world ranking list 59 were Americans. We have not noticed such proportion since
then. Between 1980 and 1986 they won 23 Grand Slam victory in women singles.
In 1980 none of the women tennis players in Russia were among the best 100 players in the world rank list. In
1990 there were 5, later in 2000 already 7, while in 2010 there were already 16 players listed among the bests.
Apart from the Russian ones, there were significant players from Kazakhstan, Uzbekistan, Latvia, Lithuania and
Estonia. Anna Kournikova was the first Russian woman player noticed and known all over the world. She
struggled herself among in the first 10 in the beginning of the 1990’s (Marshall, 2011).
Kournikova was a real phenomenon on court. She was likeable both in appearance and behaviour. She was from
a post socialist country where tennis as a sport was not admitted at all. She was very successful on the tennis
court: played tight matches with the best players and they got really squeezed. Some of them were even beaten in
enormous matches. Despite all, she did not win a real tournament – Grand Slam trophy in single – ever. Never has
she headed the women tennis world rank list. However subsidizing companies saw potential in her, assessed her
promising in respect of added value. During several years she was granted with the best sponsorship contracts.
Companies took bigger risk for the sake of higher profit. Kournikova has not always won at her tournaments, but
organisers kept on putting her to the central court, where she could play in front of crowded audience. Her
matches were broadcasted live by TV channels, and these were sometimes played for more than two hours in
front of millions of spectators. Sponsors not always go after the best results from sport aspect, but they have
marketability approach, they consider the ‘object’ saleability. Anna Kournikova highly met these criteria in her
career.
ENTREPRENEURSHIP AND SUSTAINABILITY ISSUES
ISSN 2345-0282 (online) http://jssidoi.org/jesi/
2021 Volume 8 Number 3 (March)
http://doi.org/10.9770/jesi.2021.8.3(36)
Make your research more visible, join the Twitter account of ENTREPRENEURSHIP AND SUSTAINABILITY ISSUES:
@Entrepr69728810
586
Most former socialistic countries could not manage to uphold the pre-world war status of tennis. The only
possible exemption was Czechoslovakia, where they managed to keep up and maintain the tradition. The National
Association established 6 tennis centres, they employed full-time coaches who trained excellent players with the
most up to date coaching techniques. From the late 1970’s talented players showed up one after another. The
greatest Czechoslovakian woman tennis star was Martina Navratilova. She started to play tennis for family
impulse, her stepfather was her first coach. As early as at her 13s she played against foreign opponents, and not
much later managed to win amateur Europe Cup in Vienna. After the tournament she defected - left the country,
as we used to say at that time - and settled in the USA. The professional environment diverted her career in the
right direction. (Oltványi, 1986). Her first world famous success was in 1978, when she won Wimbledon woman
single. Other victories were followed up, she collected altogether 18 Grand Slam trophies in single, 31 in women
double, and 10 in mixed double. She won the most in Wimbledon, where she managed to get into the finale 12
times in single and won 9 times as a champion. She retired in 1994 from single games and continued in doubles.
She even won a mixed double in Wimbledon when she was 47-year-old. 3 years later, at her 50, she won through
over the US Open. In 2008 she announced to open a tennis academy in her motherland, then already called Czech
Republic. (Martina Navratilova Biography, 2019). Martina Navratilova headed the world rank list in July 10th,
1978. for the first time and remained there for 27 weeks. During her career she headed the WTA women ranking
lists for 332 weeks through, 156 times without a break. (WTA The History of Tennis Rankings, 2019). In her
whole career she hit almost 22 million USD altogether, and with this amount of prize money, she is on the 15th
place on the world ranking list. This is taken a prominent place, since the prize money consumed her time, were
far away from the one, we have today (Career Prize Money Leaders, 2020).
Monica Seles was born in 1973, in the former Yugoslavia, in Újvidék-Novi Sad. Her father started to teach her
tennis in a parking lot, above an extended rope. She was 13 when the whole family emigrated to the USA. At that
time, she was considered the best junior tennis player in the world. At her 16 she won the Roland Garros women
singles as the youngest player, and at her 17 she was heading the world ranking list. In her best years she seemed
to be almost unbeatable. Between 1991 and 1993 she won 33 out of the 34 tournaments she played at, the 6 Grand
Slam trophy was one of them. Altogether she won at 9 Grand Slam championship, with 53 times victory in
singles. (Monica Seles Biography, 2019). Monica Seles got to the top of the world ranking list in March 11, 1991.
and remained there for a further 21 weeks. During her career she was heading the WTA women ranking lists for
178 weeks, 91 times without a break. (WTA The History of Tennis Rankings, 2019). She won during her tennis
career almost 15 million dollars and took the 28th place on the world ranking list. Though she joined the circle 15
years later than Navratilova, it is still an extraordinary feat to take such a place on the ranking list together with
the prizes earned (Career Prize Money Leaders, 2020).
The three genius world stars are all originated from less prosperous families, from those socialistic countries
where tennis as a sport was hardly supported at all. Nevertheless, these girls managed to struggle themselves
among the bests. Their families sensed certain signs early enough that was worth to build on. From the promising
talent, they became devoted to reach their goals by utilizing their specific skills. An extraordinary creativity was
also necessary to implement their tasks. With the circumstances given, they kept on practicing hardly and utilised
the chances granted by their life. Also due to good fortune they could obtain appreciation for themselves and for
their surroundings. They were at good time at the right place to be influenced positively and become real sport
talents (Hódi, 2009).
The player with extraordinary talent is able to sell his/her skills as a service at a higher price due to his/her inner
abilities since the price and quantity together with the higher quality will show that talent has a great impact on
ENTREPRENEURSHIP AND SUSTAINABILITY ISSUES
ISSN 2345-0282 (online) http://jssidoi.org/jesi/
2021 Volume 8 Number 3 (March)
http://doi.org/10.9770/jesi.2021.8.3(36)
Make your research more visible, join the Twitter account of ENTREPRENEURSHIP AND SUSTAINABILITY ISSUES:
@Entrepr69728810
587
the award. (Rosen, 1981). All three players rose from the mass and became successful sport personalities. They
always foregone things and were able to control them. They were purposeful to plan their future and deployed
their inner skills that is why they became successful sport personalities. (Takács, 2017). The Superstar feature is
an explanation for the outstanding performance which is only given to the biggest talents. The Star makes the
same effort irrespectively of playing in front of 100 people or of 10 thousand. And those people are willing to pay
more and more for the gorgeous service (Rosen, 1981).
4. Research methods
The population examined consists of one part. The active tennis players from the former socialistic countries. We
monitored the entire population. We intended to include those tennis players in our research, who were among the
best 700 of the adult women on the world ranking list. We used the September 30, 2019 database and register by
the Women’s Tennis Association. The total of the population of the women from the former socialist countries
was 209 persons. We managed to find 127 out of the 209 women tennis players by the tools of the social media
and the contact provided in it.
Data collection was performed in the examined population by questionnaires. The questionnaires were set up and
finalised based on test questions. Ladies on the world rank list received the questionnaire through means of social
media and contacts provided by them. From the 127 pieces we sent out, 31 was received back (n1=31). Altogether
we received 31 answered questionnaires (N=31). Answering the questionnaire were performed by self-fill-up
method in the population. Apart from the questionnaire there were two half structured personal interviews
performed as well (n2=2). The main structure of the interview was the assessment of success during the whole of
the career. In the further parts of the research we will need more interviews for the interpretation of the results
received, and also for obtaining new pieces of information.
In this study the processing of relevant questionnaire parts was implemented by SPSS program. Taking into
aspect the element number of the examined population and assuming that the data are fully reliable, it seems, that
the results show a tendency character. On the other hand, since the research was implemented in the full basic
population they fully represent the judgement and opinion by the post socialistic elite women tennis players.
Based on the research questions formulated earlier, the study makes the following hypotheses.
H1: Women tennis players aim to win that kind of prize money during tennis years, that will lay the foundation
for their post-career lives.
H2: We assume that at the end of their player’s career, many of them will stay close to the sport and see tennis as
their lifeway.
ENTREPRENEURSHIP AND SUSTAINABILITY ISSUES
ISSN 2345-0282 (online) http://jssidoi.org/jesi/
2021 Volume 8 Number 3 (March)
http://doi.org/10.9770/jesi.2021.8.3(36)
Make your research more visible, join the Twitter account of ENTREPRENEURSHIP AND SUSTAINABILITY ISSUES:
@Entrepr69728810
588
5. Results
61.3% of the elite women tennis players out of 31 post-socialistic countries hope that by the end of their career the
sum of their prize money will be above 5 million USD (see Figure 1). A smaller percentage would be happy with
1-5 million USD earnings, while 16.1% of them are in the lowest category. Prize money granted at tournaments
have been continuously increased in the past decades. Ladies today can earn much more even though they do not
belong to the top players. Therefore the post-socialistic players today might have much more promising
perspectives than their predecessors.
Fig. 1. Prize money expectations of ladies, in USD
Source: authors
The answers by the 31 active women tennis players from the former socialistic countries reveal, that 18 of them
are still happy with their careers, and only 8 of them had a negative answer. 5 of the players have doubts
concerning their results achieved, they had higher expectations before, but it seems that they still have promising
goals. Therefore, they provided us with a “so-so” answer. 26 of the players voted with a “yes” saying that the
invested energy, training time, travels, and money all was worth for the incredible efforts. 3 of them do not agree
with this statement, in their opinion perhaps they had had to deal with something else instead of tennis. In a very
high percentage, namely 27 would have started their tennis carrier again, if they had been children again.
Fig. 2. The planned after career activity by post-socialistic ladies
Source: authors
ENTREPRENEURSHIP AND SUSTAINABILITY ISSUES
ISSN 2345-0282 (online) http://jssidoi.org/jesi/
2021 Volume 8 Number 3 (March)
http://doi.org/10.9770/jesi.2021.8.3(36)
Make your research more visible, join the Twitter account of ENTREPRENEURSHIP AND SUSTAINABILITY ISSUES:
@Entrepr69728810
589
Elite women players of the former socialistic countries have different views on the finish of their tennis career
(see Figure 2). 6 of them would choose a coach career, another 6 of them would direct a sport club or sport
centre. 7 of the ladies would prefer to assist their own child to transfer her own experiences as tennis mothers. 4 of
them think, that they would successfully harmonise both coaching and manager roles in their lives. 2 of them are
the bravest ones, who think, they could be successful in all three roles in their future civil lives. The tennis ladies
being happy with their career from childhood to these days is quite clear in their subjective opinion.
Conclusions
In the study we examined the motivational peculiarities of the post socialistic women tennis players. The findings
of the study suggest that the players today by also respecting their domestic superstars, they prove the changed
status of tennis on their homeland. The generation gaps and differences certify the enormous spreading of tennis
sport in the former socialist countries. This transformation was even double, since the major changes in society
also enabled the international follow up with the sport. By the split of the former Soviet Union, Yugoslavia and
Czechoslovakia the former opponents now must fight against players from 24 countries instead of the former 3.
From the answers of the questionnaire (namely the one that asks which club they started to play at), it turns out,
that they were elite woman players from 10 different post-socialist countries participating at the research. 8 of
them targeted to be the best of the world, 7 of them wanted to be among the best 10 and wanted to go on with
their career up to their 30s. We accept our first hypotheses, because more than two-third of elite women players
aim to win over 5 million USD, acquire such material possessions, that would be enough for the foundation of
their future civil life.
The global development of the sport, the continuous increase of prize money provide opportunity for the players
today to build up a career. The financial benefits available today are much more for them than for their
predecessors. Our research has proven, that in addition to the external and internal motivational factors found in
tennis, the persistent training work and efforts for 10-15 years pay off in tennis of prizes that can be won. The
post-socialist women tennis players, with their professional activities, can also establish their lives after the end of
their careers. Therefore, we also accept our second hypotheses, because most players view tennis as a lifeway and
staying close to the sport intends to pass on its knowledge to future generations.
By considering the rest of the results of our overall study, it is likely that choosing professional tennis player
career as a model, not only as a sport, can be evaluated as a determined profession. The findings of this latter
research will be introduced at a following article.
References
Bykanova-Yudanov, N. (2018). Motivation in competitive tennis: Is it different for girls and boys? ITF Coaching and Sport Science
Review, 76 (26), 20 – 22.
Career Prize Money Leaders (2020). Retrieved February 14, 2020, from
http://wtafiles.wtatennis.com/pdf/rankings/All_Career_Prize_Money.pdf
Chantal, Y.; Guay, F.; Dobreva-Martinova, T.; Vallerand, RJ. (1996). Motivation and elite performance: An
exploratory investigation with Bulgarian athletes. International Journal of Sport Psychology, 27 (2), 173-182.
Crespo, M.; Reid, MM. (2007). Motivation in tennis. British Journal of Sports Medicine, 41 (11), 769–772.
doi: 10.1136/bjsm.2007.036285
ENTREPRENEURSHIP AND SUSTAINABILITY ISSUES
ISSN 2345-0282 (online) http://jssidoi.org/jesi/
2021 Volume 8 Number 3 (March)
http://doi.org/10.9770/jesi.2021.8.3(36)
Make your research more visible, join the Twitter account of ENTREPRENEURSHIP AND SUSTAINABILITY ISSUES:
@Entrepr69728810
590
Deaner, R.O.; Balish, S.M.; Lombardo, M.P. (2016). Sex Differences in Sports Interest and Motivation: An Evolutionary Perspective.
Evolutionary Behavioral Sciences, 10 (2), 73–97. https://doi.org/10.1037/ebs0000049
Gáspár, P. (2012). Grand Slam Tennis Tournaments Comparison, Organisation and Implementation. Veszprém: Univesity.
Géczi, G.; Vincze, G.; Koltai, M.; Bognár, J. (2009). Elite Young Team Players’ Coping, Motivation and Perceived Climate Measures.
Physical Culture and Sport Studies and Research, XLVI, 229-242. DOI: 10.2478/v10141-009-0020-2
Haut, J.; Gassmann, F.; Emrich, E.; Meyer, T.; Pierdzioch, P. (2019). Heroes at Home, Suspects Abroad? National and International
Perceptions of Elite- Sports Success. Sociology of Sport Journal, 37 (2), 133-142. https://doi.org/ 10.1123/ssj.2018-0157
Hódi, S. (2009). Questionmarks of Talent. Retrieved February 14, 2020, from
http://adattar.vmmi.org/konyvek/30/hodi_sandor_a_tehetseg_kerdojelei.pdf
Kahlich, E.; Papp, L.; Subert, Z. (1972). Olympic Games 1896-1972. Budapest: Sport.
Marshall, A. (2011). Tennis' Global Evolution is Bringing the Sport To New Markets: An Analysis. Retrieved February 14, 2020, from
http://www.internationaled.org/tennis/tennis-global-evolution-is-bringing-the-sport-to-new-markets-an-analysis/
Navratilova, M. Biography, (2019). Retrieved February, 14, 2020, from https://www.biography.com/athlete/martina-navratilova
Oltványi, T. (1986). Game of Million Worth. Budapest: Lapkiadó.
Pompaux, S. (2005). Soviet and post-soviet sport. In Andreff, W.–Szymanszki, S. (Eds.), Handbook on the Economics of Sport 2006
(pp.316-323). Northamton (UK): Edward Elgar.
Records and Record Keepers in the White Sport History, (2013). Retrieved February, 14 2020, from
https://www.ksh.hu/szamlap/olimpia.html
Rosen, S. (1981). Economics of Superstars. American Economic Review, 71 (5), 845-858. Retrieved February 14, 2020, from
http://links.jstor.org/sici?sici=0002-8282%28198112%2971%3A5%3C845%3ATEOS%3E2.0.CO%3B2-R
Ruihley, B.J.; Brody J. (2013). Infiltrating the boys’ club: Motivations for women’s fantasy sport participation. International Review for the
Sociology of Sport, 48 (4), 435–452. DOI: 10.1177/1012690212443440
Sarrazin, P.; Vallerand, R.; Guillet, E.; Pelletier, L.; Cury, F. (2002). Motivation and dropout in female handballers: a 21-month
prospective study. European Journal of Social Psychology, 32, 395–418.
Seles, Monica. Biography, (2019). Retrieved February 14, 2020, from https://www.biography.com/athlete/monica-seles
Takács, D. (2017). Sport-Coaching Business Success. Retrieved February, 14 2020, from http://dolgozattar.repozitorium.bgf.hu/9875/
Waldron, J.J.; Krane, V. (2005). Motivational climate and goal orientation in adolescent female softball players. Journal of Sport
Behavior, 28 (4), 378-391.
WTA Media Guide, (2020). Retrieved February, 14, 2020, from http://wtafiles.wtatennis.com/pdf/publications/2020WTA-
MG_GeneralInformation.pdf
WTA The history of Tennis Rankings, (2019). Retrieved February, 14, 2020, from https://www.tennis-x.com/stats/wtarankhist.shtml
Younes, S.; Ciccomascolo, L.; Shim, M. (2013). Climate and motivation for women athletes in Palestine. ICHPER-SD Journal of
Research, 8 (1), 12-19.
Young, J.A.; Pearce, A.J. (2011). The influence of parents in identifying and developing Australian female tennis talent. Journal of
medicine and science in tennis, 17 (1), 22-27.
ENTREPRENEURSHIP AND SUSTAINABILITY ISSUES
ISSN 2345-0282 (online) http://jssidoi.org/jesi/
2021 Volume 8 Number 3 (March)
http://doi.org/10.9770/jesi.2021.8.3(36)
Make your research more visible, join the Twitter account of ENTREPRENEURSHIP AND SUSTAINABILITY ISSUES:
@Entrepr69728810
591
Gábor KINCSES is a teacher of physical education, professional tennis coach and economist. He is a director of the Physical Education
Center of Budapest University Technology and Economics. He is a 3rd year PhD student of University of Physical Education Budapest. He
is main area of research is sport, tennis, education, management and business. Mr. Kincses published his research results in Hungary. ORCID ID: orcid.org/0000-0003-4176-6718
Mihály ORMOS is a Professor of Finance at the Department of Finance and Accounting, Institute of Business Economics and Eotvos
Lorand University, Budapest and at the Department of Economics at J. Selye University. His area of research is financial economics
especially asset pricing, risk measures, risk perception and behavioral finance. He serves as one of the contributing editors at Eastern
European Economics published by Taylor and Francis. His teaching activities concentrate on financial economics, investments and
accounting. Prof. Ormos published his research results in Journal of Banking and Finance, Quantitative Finance, Finance Research Letters,
Economic Modelling, Empirica, Eastern European Economics, Baltic Journal of Economics, PLoS One, Acta Oeconomica and Economic
Systems amongst others.
ORCID ID: orcid.org/0000-0002-3224-7636
Zsolt BARTHA is a teacher of physical education and handball coach. He is a deputy director of The Physical Education Center of
Budapest University of Technology and Economics. He is the President of the Budapest University College Sports Assiciation. He is a 3rd
year PhD student of University of Pecs. He is main area of research is sport, management and economics.
ORCID ID: orcid.org/0000-0002-9539-0923
Copyright © 2021 by author(s) and VsI Entrepreneurship and Sustainability Center
This work is licensed under the Creative Commons Attribution International License (CC BY).
http://creativecommons.org/licenses/by/4.0/
ENTREPRENEURSHIP AND SUSTAINABILITY ISSUES
ISSN 2345-0282 (online) http://jssidoi.org/jesi/
2021 Volume 8 Number 3 (March)
http://doi.org/10.9770/jesi.2021.8.3(37)
Publisher http://jssidoi.org/esc/home
592
DETERMINATION OF OBJECTIVES AND RESPONSIBILITIES OF PUBLIC ADMINISTRATION
BODIES IN CORRELATION WITH LEGAL AND MANAGERIAL ASPECTS: CASE STUDY OF THE
SLOVAK REPUBLIC*
Mykola Sidak 1, Edita Hajnišová 2, Michal Fabus 3
1,3 University of Economics and Management in Public Administration in Bratislava, Furdekova 16, 851 04 Bratislava,
Slovak Republic 2 Comenius University in Bratislava, Faculty of Law, Šafárikovo námestie 6, 814 99 Bratislava, Slovak Republic
E-mails: 1 [email protected]; 2 [email protected] , 3 [email protected]
Received 10 May 2020; accepted 10 February 2021; published 30 March 2021
Abstract. The sustainable growth of the Slovak Republic can only be ensured by a properly and effectively functioning public
administration. In the current challenging extraordinary conditions (in the context of epidemiological, economic, financial, and sociological considerations), public power must be more efficient than ever and the management of public finances - economical, efficient, effective, and effective. Therefore, the aim of this scientific article was to carry out scientific research on the terminus technicus "public administration", to analyze the position of the most important institutions (their goals, tasks, functions, and responsibilities). The authors
researched the following partial areas: mainly the pillars of efficient and proper functioning of public administration in the Slovak Republic
to ensure sustainable growth; managerial foundations for the effective functioning of public administration; the legal status of public administration entities (and their responsibilities); primary goals, tasks, and tools of state administration bodies in the Slovak Republic and control in public administration. Base on research, the authors proposed de lege ferenda for more effective legislation in public
administration for sustainable growth of Slovak Republic.
Keywords: public administration; public authorities; sustainability; goal and responsibility; Slovak Republic; UN; EU
Reference to this paper should be made as follows: Sidak, M., Hajnišová, E., Fabuš, M. 2021. Determination of objectives and responsibilities of public administration bodies in correlation with legal and managerial aspects: case study of the Slovak Republic. Entrepreneurship and Sustainability Issues, 8(3), 592-603. http://doi.org/10.9770/jesi.2021.8.3(37)
JEL Classifications: K20, K30, K33, O20
Additional disciplines: public administration, law, economics, management
* The paper is the output of a scientific project IGA no. 3/2020 - M „Innovations of Public Administration in the SR: Determination of Economic and Legal Aspects, with Reflecting European Countries Novelty Factors”. (Funder: VSEMvs IGA VSEMvs, i.e. University of Economics and Management in Public Administration).
ENTREPRENEURSHIP AND SUSTAINABILITY ISSUES
ISSN 2345-0282 (online) http://jssidoi.org/jesi/
2021 Volume 8 Number 3 (March)
http://doi.org/10.9770/jesi.2021.8.3(37)
593
1. Introduction
Sustainable growth of the Slovak Republic can be ensured only by a properly and effectively functioning public
(state) administration. In the current challenging extraordinary conditions (in the context of epidemiological,
economic, financial, and sociological considerations), the state administration must be more efficient than ever
and the management of public finances - economical, efficient, effective, and effective. A small mistake in the
management of the state will result - a crisis. The current system of public administration in the Slovak Republic
builds on previous historical experience and contains new elements that have been implemented not only as a
result of modernization efforts, but also as part of Slovakia's commitment as a member of the European Union and
the UN. If we talk about public administration as an object of scientific research or as a real social phenomenon,
we understand: the sphere of society, the sphere of certain public activities, the sphere of organizations and the
sphere of employees (Klimovský 2014; Cheng 2020).
The term "public administration" can be understood at the political, economic, sociological, legal, managerial, and
other levels. Given the diversity of approaches to the institute of public administration, we can state (not define)
that it is a social phenomenon that: a) is an integral and obligatory part of any state (as part of public power),
b) ensures the administration of public affairs (state operation) - in the public interest and on public account and
public accountability; c) is a system of organizations (state administration bodies, self-government bodies and
other subjects of public administration), d) activities and activities of public administration is a manifestation of
executive power, which is explicitly and obligatorily defined by legislation, e) is an area of social relations
between various entities (where on the one hand, there will always be a public entity), f) it is personally,
materially, organizationally and functionally influenced by political events (Klimovský 2014). Under the terminus
technicus of "public administration" (the authors of "Britannica") understand - the implementation of public
policy. Today public administration is often regarded as also including some responsibility for determining the
policies and programs of governments. Specifically, it is the planning, organizing, directing, coordinating, and
controlling of government operations.
The aim of this paper is to conduct scientific research of terminus technicus "public administration", its most
important institutes and bodies, their goals, tasks, functions and responsibilities, and based on the analysis of
scientific knowledge on current legislation de lege lata to offer authors' conclusions and prepare proposals de lege
ferenda. Based on the main goal, the authors set partial tasks: 1) to determine the main pillars of effective and
proper functioning of public (state) administration in the Slovak Republic to ensure continuous growth, 2) to set
the managerial foundations of effective functioning of public administration in Slovakia, 3) to analyze the legal
status of entities state administration and their responsibilities, 4) determination of primary goals, tasks and tools
of state administration bodies in the Slovak Republic, 5) determine the main state institutions that are obliged to
exercise control over the effective activities of state administration and economic, efficient, effective and effective
use of public finances, 6) to prepare proposals (starting points, de lege ferenda) for improving the functioning of
state administration in Slovakia.
2. Research methods
For scientific research of the subject of the article, we had used the following scientific methods: observation,
analysis, synthesis, comparison, abstractions, generalizations, induction, and deduction. Observation method
helped us to systematization of existing knowledge within the current state of the problem. It represented the
theoretical and methodological basis on which this scientific article had based. Scientific method of analysis we
had used for the process of thought division of the researched problem – the public administration, into individual
parts, elements, features, contradictions and their research in order to reveal their essence; the task of the analysis
was excluding from the whole mass of facts and contexts the main, essential, necessary ones that can shed light on
ENTREPRENEURSHIP AND SUSTAINABILITY ISSUES
ISSN 2345-0282 (online) http://jssidoi.org/jesi/
2021 Volume 8 Number 3 (March)
http://doi.org/10.9770/jesi.2021.8.3(37)
594
the causes of the occurrence and course of the investigated event, its essence. Synthesis – we had used it as a
process of finding out the connections between the allocated elements, features, opposites, their connection, and
subsequent reproduction of the investigated event with their essential features and relationships. The synthesis
makes it possible to monitor the relationships between facts, the nature of the interrelationships between them, to
reveal the causes, functional dependence, the sequence of stages or the tendency of the development of the
financial system.
We had used method of comparison for the process of great importance in clarifying the processes of change,
development, the examined relationship, revealing the tendencies and patterns of its development. In terms of the
complexity and systematic nature of the research, we had used a vertical comparative analysis of aspects of the
organization and functioning of the public administration in the EU and Slovak republic. Evaluation and
comparison of the effectiveness of concepts and models of public administration based on managemant and legal
analysis, confrontation of results with current innovations in the field of modern public administration.
Abstractions method – when researching a specific phenomenon, it is necessary to study it step by step, one page
after another and temporarily leave the other pages aside, abstract from them: identifying desirable and
undesirable elements in the financial system. Generalizations method helped us to analyze the general connection
of real objects and phenomena, the relationship of unique and common in all real existing events.
The induction had used to draw general scientific conclusions, based on the evaluation of basic scientific data.
Deduction - helped for us to start from general assumptions and applies them to individual general or partial
conclusions, and other scientific methods.
3. Literature review
The above-mentioned problems were analysed by many authors (Peters, Pierre, Holzer, Shafritz, Klimovský, and
others). The Handbook of Public Administration is a landmark publication, the first to provide a comprehensive
and authoritative survey of the discipline. The Handbook provide a complete review and guide to past and present
knowledge in this essential field of inquiry. Assembling an outstanding team of scholars from around the world
explores the current state-of-the-art in academic thinking and the current structures and processes for the
administration of public policy: identifying the Antecedents in Public Performance, Bureaucratic Politics,
Strategy Structure and Policy Dynamics, Comparative Administrative Reform, Administrative Ethics,
Accountability through Market and Social Instruments, Federalism, and Intergovernmental coordination. A
dominant theme throughout the handbook is a critical reflection on the utility of scholarly theory and the extent to
which government practices inform the development of this theory (Peters & Pierre 2014).
In the book “Fundamentals of Public Administration” Klimovský (2014) analyzes: the significance of the
terminus technicus “public administration”, the development of knowledge and approaches in public
administration (from antiquity to the present), the dichotomy of public and private interest, public and private law,
the state and society. The author pays great attention in his work to the normative, managerial, organizational,
economic, and ethical dimensions of public administration, as well as to the current development of the system of
public administration in the Slovak Republic.
Marc Holzer and Richard Schwester (2011) have written a highly engaging textbook. Their coverage is both
comprehensive and cutting edge, not just including all the basic topics (OT, budgeting, HRM), but also reflecting
new realities in public administration: Innovations in e-government, the importance of new technology, changes
in intergovernmental relations, especially the emphasis on inter-local and shared regional resources and public
performance.
ENTREPRENEURSHIP AND SUSTAINABILITY ISSUES
ISSN 2345-0282 (online) http://jssidoi.org/jesi/
2021 Volume 8 Number 3 (March)
http://doi.org/10.9770/jesi.2021.8.3(37)
595
The book "The Next Public Administration" explores public administration in the past, present and future,
critically reviewing the modernization of public management reform. It reasserts public administration as an
integral component of democratic governance and fostering a state-citizen relationship – consider issues
associated with management, governance, and democracy, covers core public administration concepts and their
evolution through time, etc. (Peters & Pierre 2017).
The Introducing Public Administration (9th edition) provides with the conceptual foundation - the most important
issues in the field of public administration using examples from various disciplines and modern culture. This
unique approach captivates and encourages to think critically about the nature of public administration today: an
examination of the effect of the Barack Obama administration on the discipline, especially economic and financial
management and budgetary policy, allowing to apply the theories and concepts in the text to recent US
government practice; new sections on careers in public service, whistleblowing and public employee dissent,
networks and collaboration across organizations, social innovation, managerialism and productivity improvement,
Big Data and cloud computing, collaboration and civic engagement, and evidence-based policy and management
(Shafritz et. al. 2016).
“Public Administration: Research Strategies, Concepts, and Methods” explores how scholars of public
administration and institutional politics can improve their analysis by focusing on the contextual particularities of
their research problems and considering the use of multiple theories and methods. The book functions as an
introduction to central themes of public administration and related traditions of research, but also proposes a new
pluralist approach for studying public institutions (Peters 2015).
The book "Public Administration: Concepts and Cases" offers a unique and highly regarded framework in which
conceptual readings are paired with contemporary case studies that reflect real-world examples of administrative
work, as well as new thinking and developments in the field. Case studies and examples cover topics such as the
shootings at Columbine High School, the AIDS epidemic, and the war in Iraq, etc. (Stillman 2009).
Through contemporary case studies of strategic management at work in the US and Europe, this collection
„Developments in Strategic and Public Management: Studies in the US and Europe“ shows that it can no longer
be seen as a discipline for long term decisions but has become a central feature of the public sector. Individual
chapters offer insights into strategic management capabilities at the national and sub-national level (Joyce et. al
2014).
Marc Holzer and Richard W. Schwester (2019) have written a textbook that is distinct from the dozens of public
administration books. Their vision is a unique blend of substance and style-a text that is both informative and
enlivening, capturing the evolving nature of the field. The book "Public Administration: An Introduction"
explores the traditional, essential elements of public administration such as organizational theory, human resource
management, leadership, program evaluation and policy analysis, budgeting, and the politics of public
administration. This edition are three sections that provide a natural flow and progression of the material: section I
provides the theoretical construct of public administration, section II provides actionable material for public
administrators, while section III deals with the future of public organizations through the lens of performance
improvement and the techniques available to achieve such improvement.
Other authors analyze some aspects of public administration in European countries, the legal status of public
authorities, the activities of public institutions, the impact of public administration on sustainable development,
economic growth, and legal responsibility in the public sphere (Oakland & Porter 1994; Scholl 2002; Vačok
2018; Potásch 2019; Akerlof et. al. 2021; Braun et. al. 2020; Cheng 2020; Deslatte & Stokan 2020; Döhler 2020;
Siller & Cibák 2016; Špaček 2019; Vicen & Haviarová 2013; Lankauskienė & Tvaronavičienė 2012; Vozáryová
& Burdová 2018; Mamojka 2016; Lysiná et al. 2016; Gorina & Hoang 2020; Hajnal 2021; Hillebrandt & Leino-
ENTREPRENEURSHIP AND SUSTAINABILITY ISSUES
ISSN 2345-0282 (online) http://jssidoi.org/jesi/
2021 Volume 8 Number 3 (March)
http://doi.org/10.9770/jesi.2021.8.3(37)
596
Sandberg 2021; Cepek 2018; Philipsen et.al. 2021; Šabiková & Vicen 2018; Vojtech, F. et. al. 2019; Masood &
Nisar 2021; Kurilovská & Kordík 2017; Uramová et. al. 2016.; Mazzanti et al. 2020; Wanzenböck et. al. 2021).
4. Managerial bases of public administration in Slovakia
In correlation with the aim of the given analysis, we can clearly state that the organization and functioning of
public power is precisely defined by law and formally (Brostl et. al. 2020; Akerlof et. al. 2021).
Therefore, it should be noted at the management level (in the context of theories: traditional public administration,
public management, new public management, progressive public administration, new public service (Peters &
Pierre 2014)) that: a) public administration should be politically neutral (Woodrow Wilson), b) from an
organizational point of view, public administration should take the form of a centralized formal organization and
from a functional point of view - a bureaucratic organization (Max Weber), c) government policy should be
implemented by public administration on a top-down method, d) officials, resp. officials must be strictly limited
by procedural rules and competencies (Klimovský 2014).
If public administration is to be effective, public administration bodies (their statutes) must follow the following
meetings (Shafritz et. Al. 2016; Braun et. al. 2020): a) each body must have clearly and precisely defined tasks
and associated measurable goals, b) public policies they must have clear and effective strategic and support plans,
c) every organizational process in public administration must be planned with identifiable factors (which affect its
success), in order to choose the right tools to achieve goals (or prevent failure) - each process must be
implemented in the form of a "PDCA" (plan-do-check-act) cycle, d) the organizational and management structure
of the body must have appropriate objectives, tasks, functions and competencies, e) identification of competent
staff and their involvement in policy implementation (Oakland & Porter 1994 ).
In the current conditions of society development - strengthening civic participation in the creation and control
over the application of public policies (Peters & Pierre 2017), and also in the modern information world
(introduction of information and communication technologies into public administration) is creating a model of
electronic government - eGovernment, which is electronic performance of public administration and should
ensure not only the use of information and communication technologies in the provision of public services and
aims to improve, improve, modernize, simplify, streamline and ensure accessibility (Klimovský 2014; Deslatte &
Stokan 2020).
At the local level, eGovernment has transformed into a digital city model and a smart city model, with the latter
model aiming to ensure sustainable economic development through a more prudent management of trust with the
inclusion of others (Scholl 2002). In this context, we note that to ensure the effective and sustainable development
of the city of the Slovak Republic, they are trying to apply the "smart city" model.
5. Analysis de lege lata status of state administration entities
The legal foundations of the organization and activities of state administration bodies as well as the legal status of
central state administration bodies are enshrined in Constitutional Act no. 460/1992 Coll. The Constitution of the
Slovak Republic and Act no. 757/2001 Coll. on the organization of government activities and the organization of
the central state administration (Vačok 2018; Potásch 2019; Vrabko 2012).
The Slovak legislator correctly enshrined the legal status of state administration entities in the system of public
authorities, also precisely defined their rights and obligations, their competencies, and powers, in some cases also
functions and tasks (for example § 7 Act No. 757/2001 Coll. On the organization of government activities and the
organization of the central state administration) (Vačok 2018).
ENTREPRENEURSHIP AND SUSTAINABILITY ISSUES
ISSN 2345-0282 (online) http://jssidoi.org/jesi/
2021 Volume 8 Number 3 (March)
http://doi.org/10.9770/jesi.2021.8.3(37)
597
De lege lata SR has established that each state body is a budgetary organization (legal entity), which is
established by law, acts in the name, on behalf and for the responsibility of the state. The statutory body
responsible for its activities acts on behalf of the state body.
But we must state that the Slovak legislator did not legislate measurable and precise explicitly defined main and
related sub-objectives (policy objectives), tasks, functions, tools, indicators, competencies, and responsibilities of
central public administration bodies in the Slovak Republic (neither in laws nor by-laws, nor in the statutes of
state administration bodies (in which, according to § 39 of Act No. 757/2001 Coll., there should be de jure tasks
and principles)). In some statutes of central state administration bodies, the Government of the Slovak Republic
has vaguely adjusted the tasks and principles, in some cases - these are de facto functions and competencies of
public administration bodies.
In the theory of law, we encounter the scientific definition of the tasks of the government and central bodies of
state administration - to perform state administration and ensure its performance throughout the country. The
Government of the Slovak Republic, as the supreme executive body of power with central state administration
bodies, ensures the international, defense, political, economic, and other interests of the state (Vačok 2018;
Vrabko 2012).
At the same time, we must note that in the context of European integration and in correlation with primary EU
law, the only public entity in the Slovak Republic for which the Slovak legislator precisely defined a measurable
main objective (ensuring price stability) is the Central Bank of the Slovak Republic. 566/1992 Coll. on the
National Bank of Slovakia (Vicen & Haviarová 2013).
6. Setting the primary goals of state administration bodies in the Slovak Republic
First Commission Vice-President Frans Timmermans, responsible for better regulation, interinstitutional relations,
the rule of law and the Charter of Fundamental Rights, said: "Sustainability is a European brand and sustainable
development is at the heart of the European Commission's agenda" (Uramová et. al. 2016).
Therefore, in order to streamline the activities of public authorities, according to the authors, setting the main
goals, tasks, developing strategies, policies, selection of tools and indicators for the Slovak Republic, we must
build on the milestone: the main goals of the UN (UN 2030 Agenda for Sustainable Development) and EU
objectives (Starling 2019; Gorina & Hoang 2020). Agenda 2030 and EU law are a global beacon of basic goals
and values for the Slovak Republic. The goals of sustainable growth are based on the principles of the social
market economy (with environmental sustainability) (Vozáryová & Burdová 2018).
The UN's 17 main objectives (which have 169 related sub-objectives) are: 1. to end poverty in all its forms
(Hajnal 2021; Vasconcelos 2021), 2. to end hunger, achieve food security and better nutrition and promote
sustainable agriculture, 3. to ensure healthy living and promote well-being for all in 4. ensure inclusive and
equitable quality education and promote lifelong learning opportunities for all (Masood & Nisar 2021), 5. achieve
gender equality and empower all women and girls, 6. ensure accessibility and sustainable water management and
sanitation for all, 7. ensure access to to affordable, reliable, sustainable and modern energy for all, 8. to support
sustainable, inclusive and sustainable economic growth, full and productive employment and decent work for all,
9. to build a resilient infrastructure, to support inclusive and sustainable industrialization and foster innovation
(Wanzenböck et. al. 2021); 10. reduce inequalities within countries i between them, 11. make cities and human
settlements inclusive, safe, resilient and sustainable (Philipsen et. al. 2021), 12. ensure sustainable consumption
and production patterns, 13. take urgent action to combat climate change and its impact, 14. conserve and
sustainably use the oceans, seas, 15. protecting, restoring and promoting the sustainable use of terrestrial
ENTREPRENEURSHIP AND SUSTAINABILITY ISSUES
ISSN 2345-0282 (online) http://jssidoi.org/jesi/
2021 Volume 8 Number 3 (March)
http://doi.org/10.9770/jesi.2021.8.3(37)
598
ecosystems, sustainable forest management, halting and reversing soil degradation and halting the loss of
biodiversity (Vojtech, et. al. 2019), 16. promoting peaceful and inclusive societies for sustainable development,
ensuring access to justice for all and to build effective, accountable and inclusive institutions at all levels (Döhler
2020), 17. strengthen the means of implementation and revitalize the global partnership for sustainable
development (Mamojka 2016; Lysina et al. 2016).
And each of the UN's main objectives has its sub-objectives, such as objective 8. "To promote sustainable,
inclusive and sustainable economic growth, full and productive employment and decent work for all":
8.1 Maintain economic growth per capita depending on country conditions, in particular at least 7% annual GDP
growth in the least developed countries. 8.2 Achieve higher levels of economic productivity through
diversification, technological development, and innovation, inter alia by focusing on sectors with high added
value and a high share of human labor. 8.3 Promote development-oriented policies that support productive
activities, decent job creation, entrepreneurship, creativity, and innovation, and support the creation and growth of
micro, small and medium-sized enterprises, inter alia through access to financial services. 8.4 Gradually, by 2030,
improve the efficient use of global resources in consumption and production and do everything necessary to
ensure that economic growth is not linked to environmental damage, in line with the 10-year Framework Program
for Sustainable Consumption and Production, headed by developed countries. 8.5 By 2030, achieve full and
productive employment and ensure decent work for all women and men, including young people and people with
disabilities, and ensure equal pay for equal work. 8.6 Significantly reduce the proportion of young people not in
work or education by 2020. 8.7 Take immediate and effective measures to eliminate forced labor, end modern
forms of slavery and trafficking in human beings, and ban and eliminate the worst forms of child labor, including
the recruitment and use of child soldiers, and eliminate child labor in all its forms by 2025. 8.8 Protecting rights
and promoting safe and stable working conditions for all workers, including migrant workers - especially women
and people with dangerous occupations. 8.9 By 2030, design and implement policies to promote sustainable
tourism that creates jobs and promotes local culture and products. 8.10 Strengthen the capacity of domestic
financial institutions to promote and expand access to banking, insurance, and financial services for all.
Achieving this goal (sustainable and inclusive economic growth) will ensure that the economic benefits are shared
by the whole population and generations (Peters 2015). To meet the 8th objective, indicators of GDP per capita,
the employment rate aged 20-64, the youth unemployment rate aged 15-24, the long-term unemployment rate and
the economic activity rate aged 15-64 were selected as national indicators. Slovakia ranks among the 15 countries
with a higher unemployment rate of young people aged 15-24 than the EU average. The Slovak Republic has long
been one of the countries with a high rate of long-term unemployment. Slovakia is one of two thirds of countries
where the rate of economic activity in the 15-64 age group has exceeded 70%.
The main objectives of the European Union include (Holzer & Schwester 2011; Kurilovská & Kordík 2017):
1) promoting peace, values and the well-being of its citizens, 2) ensuring freedom, security and justice without
internal borders, 3) sustainable development based on balanced economic growth and price stability, 4 ) a highly
competitive market economy characterized by full employment and social progress and environmental protection,
5) the fight against social exclusion and discrimination, 6) the promotion of scientific and technological progress,
7) the improvement of economic, social and territorial cohesion and solidarity between Member States,
8) protection of rich cultural and linguistic diversity, 9) creation of an economic and monetary union whose
currency is the euro. EU values are common to member countries in a society in which government includes
inclusion, tolerance, justice, solidarity, and non-discrimination (Novotný 2018). And freedom, democracy,
equality, the rule of law, human rights are an integral part of the European way of life (Lankauskienė &
Tvaronavičienė 2012).
Each Agenda 2030 objective is associated with 241 global indicators (developed by IEAG-SDGs to measure
progress towards the objectives), which correspond to the global objectives and are also available in official
ENTREPRENEURSHIP AND SUSTAINABILITY ISSUES
ISSN 2345-0282 (online) http://jssidoi.org/jesi/
2021 Volume 8 Number 3 (March)
http://doi.org/10.9770/jesi.2021.8.3(37)
599
databases. Their selection considered the relevance from the perspective of the Slovak Republic and the European
Union, in particular the Strategy for Sustainable Development (EU SDS) and the Strategy for Smart, Sustainable
and Inclusive Growth.
Based on the stated goals of the EU and the UN, the Slovak Republic must set its own goals, prepare strategies,
policies, tasks, indicators, competencies and especially the tools that will be needed to achieve the goals of
sustainable growth (Stillman 2009). We must always keep in mind: "What you cannot measure, you cannot do."
(Hillebrandt & Leino-Sandberg 2021).
In conclusion, we will only state that the responsibility for Agenda 2030 in Slovakia is divided between the
Ministry of Investment, Regional Development and Informatization of the Slovak Republic and the Ministry of
Foreign Affairs and European Affairs of the Slovak Republic.
7. Responsibility of public administration bodies in the Slovak Republic
Legal liability is one of the basic legal institutes of the state legal system (Holzer & Schwester 2019). Liability is
the obligation to bear the consequences of conduct contrary to normative rules, as well as the removal of the
consequences of conduct contra legem. In general, the institute of liability is subject to the regulation of several
branches of law, whether administrative or criminal law, but also civil, labor, financial and commercial law. This
follows from the assumption that in every legal branch, a legal entity must bear the consequences for its unlawful
conduct or inaction, i.e., it must be the holder of legal liability (Siller & Cibák 2016). At this level, the
responsibility can be classified into (Vrabko 2012):
1) private: liability for damage (according to civil, commercial, and labor law), liability for unjust enrichment
(according to civil, commercial, and labor law), liability for defects (according to civil and commercial law),
liability for interference with intangible assets (honor, dignity), liability for damage in the exercise of public
power by an illegal decision or maladministration,
2) public: constitutional liability (mixed, political-legal character), criminal liability (according to criminal law),
administrative liability for administrative offenses (according to administrative law), disciplinary liability for
breach of discipline in internal relations in public institutions (according to labor law).
On this basis, we can also exclude the types of compensation for damage or other harm in public administration
(Vrabko 2012): liability for damage caused by an illegal decision or incorrect official procedure, liability for
damage under special regulations, liability for breach of personal data protection obligations, compensation or
other damage caused by the legal procedure of public administration (restriction of property rights, compensation
for expropriation, material assistance, compensation in connection with the implementation of measures proven in
emergencies, etc.), compensation for damage caused to citizens in the performance of public office, personal
assistance and fulfillment of personal duty according to the law, responsibility for unjust enrichment in public
administration.
Liability for damage caused in the exercise of public power is one of the fundamental attributes of democracy and
contributes to strengthening the role of the rule of law and the efficient and proper functioning of public
administration. In Slovakia, the legally regulated legal institute "responsibility for the performance of state
(public) administration", which means - legal responsibility for the administrative and legal performance of public
administration (Cepek 2018): for damage caused by illegal decisions, wrongful practices, illegal arrests,
detentions or other deprivation of personal liberty, or a decision on punishment, a protective measure, or a
decision on detention) by employees in the state administration. Responsible subjects for compensation of damage
to the injured party are public authorities in the exercise of public power and territorial self-government bodies
ENTREPRENEURSHIP AND SUSTAINABILITY ISSUES
ISSN 2345-0282 (online) http://jssidoi.org/jesi/
2021 Volume 8 Number 3 (March)
http://doi.org/10.9770/jesi.2021.8.3(37)
600
with the right of recourse compensation against the pest in the exercise of self-government. We emphasize that the
state - the Slovak Republic (Potásch 2019) is responsible for the damage caused by state authorities (in the
exercise of public power).
Also, for effective control of public administration in Slovakia there are also institutes of “legal guarantee in
public administration” (Cepek 2018): 1) the right to free access to information, 2) petitions, 3) complaints,
4) complaints, 4) protection against illegal inaction, 5) against illegal legislation, 6) criminal liability of officials
and officials.
But we must note that there are no institutes of political or labor responsibility for failing to achieve legally
regulated goals or failing to fulfill tasks (linked to goals). Of course, we must state that this is due to the fact that
the legislator did not enshrine the goals and tasks of central public administration bodies, which contradicts
theories of management as a scientific field: new public management, progressive public administration, new
public service or good administration. We are convinced that the public administration entity will not function
effectively without explicitly regulated measurable goals, tasks, deadlines, indicators, strategies, policies, tools,
functions, and competencies.
In this context, we must state that it is not enough to enshrine in the constitution of the state, that we are a
sovereign, democratic and rule of law, and that the rule of law is reflected in legal norms, but that public power
must function in such a way that natural and legal persons can their rights and legally protected interests. Subjects
of social relations rightly expect the rule of law that public authorities will deal promptly, managerially, and
properly (Joyce et al. 2014): both public affairs, but also rights (freedoms) and the legitimate interests of private
entities. We ask ourselves the question: “can we expect the efficiency of state management and the functioning of
public power without the control bodies monitoring and controlling the indicators of achieving the goals of state
bodies and self-governing bodies? According to the authors, no, that is not possible.
Take, for example, the Institute of "Law Enforcement", the Institute of "Access to Justice for All" and the Institute
of "Protection of Human Rights", which are the main indicators of the real rule of law, and ask ourselves: "Are we
measuring these indicators of achieving these goals?" Is the statute of a public authority responsible for achieving
these goals?” We are convinced that such a sui generis approach does not exist in public administration in
Slovakia.
We believe that in order to implement Agenda (UN) 2030, the Slovak Republic will have to develop National
Priorities for the implementation of Agenda 2030 (which, according to LP / 2020/142 Reports on the results
achieved in the national priorities for the implementation of Agenda 2030, should be developed by 31 December,
2020) and the main objectives, related sub-objectives, deadlines, tools, strategies, policies and measurable
indicators of achievement of the objectives will be legislated. Then, on this basis, the control bodies will have the
opportunity to infer the personal responsibility of the statutes of the state bodies for not achieving the set goals
(Šabiková & Vicen 2014; Špaček 2019.).
At this point, it is necessary to state that the system of control in public administration in Slovakia is adjusted to a
sufficient level. As an example, external control of public administration is exercised by the legislature
(parliamentary control), the Supreme Audit Office, the courts, the prosecutor's office, the ombudsman, and other
institutions. Striking indicators of sufficient parliamentary competence in the area of control are the institute of
interpellation (Article 80 of the Constitution of the Slovak Republic), the institute of expressing confidence in the
government or its members (Article 86 of the Constitution of the Slovak Republic) and others (Cepek 2018).
ENTREPRENEURSHIP AND SUSTAINABILITY ISSUES
ISSN 2345-0282 (online) http://jssidoi.org/jesi/
2021 Volume 8 Number 3 (March)
http://doi.org/10.9770/jesi.2021.8.3(37)
601
Conclusion
Based on the theory of management, theories of public administration management of democratic countries and
de lege lata analysis, we can state that: 1) public administration will function effectively when precisely defined
and legislatively enshrined goals, tasks, functions, principles, tools, strategies, policies, indicators, competencies
and responsibilities of a public administration body, 2) the setting of goals and tasks cannot be vague (as we
currently have) and must be precisely explicitly defined by legislation in constitutional or administrative norms,
3) the goal and tasks of state administration bodies must be measurable), 4) the obligation of the Government of
the Slovak Republic and the National Council of the Slovak Republic to evaluate the achieved primary and
secondary goals and tasks of each central state administration body must be enshrined every year and, if
necessary, hold the state administration body accountable (for failure to achieve set goals and failure to fulfill
tasks). Only in this case can we ensure proper, efficient, economical, efficient, and effective operation of state
administration bodies.
Therefore, we propose de lege ferenda to streamline the functioning of state administration in the Slovak
Republic: 1) to enshrine in the Act no. 575/2001 Coll. on the organization of government activities and the
organization of the central state administration, especially the goals and tasks of central state administration
bodies (implement the goals and tasks enshrined in the EU Agenda 2030), 2) enshrine the responsibility of the
statutory state administration body for failure to achieve medium term).
References:
Akerlof, K., Allegra, A., Webler, T., Heath, E., & Cloyd, E.T. (2021). New Methods, 47(4, August 2020), 536–547. https://doi.org/10.1093/scipol/scaa033
Braun, D., Gross, M. & Rittberger, B. (2020). Political Behavior in the EU Multi-Level System. Politics and Governance, 8(1) (2020).
http://dx.doi.org/10.17645/pag.v8i1.2706
Cepek, B. et al. (2018). Substantive administrative law: general part / Cepek, Branislav; Hašanová, Janka; Horvat, Matej; Kaššák, Rastislav; Skorková, Veronika; Vallová, Jana; Zemková, Jana. – 1. vyd. – Bratislava (Slovensko): Wolters Kluwer. Wolters Kluwer SR,
2018. – ISBN 978-80-8168-785-3 Cheng, Y. (2020). Contingent organization-public relationship (COPR) matters: reconciling the contingency theory of accommodation into the relationship management paradigm. Journal of Public Relations Research, 32(3-4), 140-154.
http://dx.doi.org/10.1080/1062726X.2020.1830405 Deslatte, A., & Stokan E. (2020). Sustainability Synergies or Silos? The Opportunity Costs of Local Government Organizational Capabilities. Public administration Review, 80(6), 1024-1034. https://doi.org/10.1111/puar.13237
Döhler, M. (2020). The architecture of organizations as missed opportunity in political research. Public Administration, 98(4), 891-904.
https://doi.org/10.1111/padm.12669
Gorina, E., & Hoang, T. (2020). Pension Reforms and Public Sector Turnover. Journal of Public Administration Research and Theory, 30(1), 96–112. https://doi.org/10.1093/jopart/muz009 Hajnal, G. (2021). Illiberal challenges to mainstream public management research: Hungary as an exemplary case. Public Management
Review, 23(3), 317-325. https://doi.org/10.1080/14719037.2020.1752038 Hillebrandt, M. & Leino-Sandberg, P. (2021). Administrative and judicial oversight of trilogies. Journal of European Public Policy, 28(1), 53-71. https://doi.org/10.1080/13501763.2020.1859598
Holzer, M., Schwester R. W. (2011). Public Administration: An Introduction. / by Marc Holzer and Richard W. Schwester. Routledge. 490 p. ISBN: 0765621207
ENTREPRENEURSHIP AND SUSTAINABILITY ISSUES
ISSN 2345-0282 (online) http://jssidoi.org/jesi/
2021 Volume 8 Number 3 (March)
http://doi.org/10.9770/jesi.2021.8.3(37)
602
Holzer M. & Schwester R. W. (2019). Public Administration: An Introduction (3rd edition). Routledge. 452 p. ISBN: 1138579645
Joyce P. et. al (2014). Developments in Strategic and Public Management: Studies in the US and Europe. / Paul Joyce, J. Bryson (Editor), Marc Holzer. Palgrave MacMillan. 300 p. ISBN: 1349463647
Klimovský, D. (2014). Základy verejnej správy. Wolters Kluwer. - 454 s. ISBN 978-80-8168-022-1 Kurilovská, L., Kordík, M. (2017). National anti-money laundering/counter-terrorist financing risk assessment as a partial tool for creditor's
protection. Internal Security. Journal of Security and Sustainability Issues 9(1), 47-57. ISSN 2345-0282 (online)
Lankauskienė, T. & Tvaronavičienė M. (2012). Security and sustainable development: approaches and dimensions in the globalization context. Journal of Security and Sustainability Issues 2(1), 287-297.
Mamojka M. (2016). Limited Liability Company: § 105-153. Business Code, Vol. 1: large commentary. - Žilina: Eurokódex, p. 419-590.
Masood, A., Nisar, M.A. (2021). Administrative Capital and Citizens’ Responses to Administrative Burden. Journal of Public Administration Research and Theory, 31(1), 56–72. https://doi.org/10.1093/jopart/muaa031
Mazzanti, M., Mazzarano, M., Pronti, A., Quatrosi, M. (2020). Fiscal policies, public investments and wellbeing: mapping the evolution of the EU. Insights into Regional Development, 2(4), 725-749. http://doi.org/10.9770/IRD.2020.2.4(1)
Peters, B. G., Pierre J. (2014). Handbook of Public Administration. SAGE Publications Ltd. - 816 p. ISBN 144629580X Peters, B. G., Pierre J. (2017). Next Public Administration: Debates and Dilemmas. SAGE Publications Ltd. – 192 p. ISBN 9781446252895
Peters, B. G. (2015). Public Administration: Research Strategies, Concepts, and Methods. 1st edition. Routledge. - 224 p. ISBN
9781612051635
Philipsen, S., Stamhuis, E.F. & de Jong, M. (2021). Legal enclaves as a test environment for innovative products: Toward legally resilient
experimentation policies. Regulation & Governance, 15(1), 1-16. https://doi.org/10.1111/rego.12375 Potásch, P. (2019). The 3Ps of administrative law in Slovakia and in selected countries: (precedents, public interest, proper reasoning). 1.
vyd. – Bratislava (Slovensko): Paneurópska vysoká škola, 174 p. ISBN 978-80-89453-60-3 Oakland, J. S., Porter, L.J. (1994). Case s in Total Qualitz Management. London: Butterworth-Heinemann, 1994.
Šabiková, I. & Vicen V. (2018). ECB Policy in the Time of Vague Rhetoric of Central Bank. Európska veda. p. 21-26. ISSN 2585-7738 Shafritz, J. M. et. al. (2016). Introducing Public Administration 9th Edition. /Jay M. Shafritz, E. W. Russell, Christopher P. Borick, Albert C. Hyde. Taylor & Francis Ltd. - 612 p. ISBN-13: 978-1138666344
Scholl, H.J. (2002). Applzing Stakeholder Theory to E-government. In: Schimd, B., Stanoevska-Slabeva, K., et. al.: Towards the E-Society: E-Commerce. E-Business, and E-Government. IFIP Volume 74. Boston: Springer, - p. 735-747.
Siller H. & Cibák L. (2016). Korruption und ihre gesamtwirtschaftliche Bedeutung (Corruption and its macroeconomic significance). Kriminalistik, 70(1), 50-55. ISSN 0023-4699 Špaček, M. (2019). Common international law: still relevant in the digital age? In: Proceedings: International Customs Law: Still Relevant
in the Digital Age? [14.10.2016-15.10.2016, Nimnica, Slovakia]. - Bratislava (Slovakia): Slovak Academy of Science. Slovak Society for International Law, 2019. – 94 s. ISBN 978-80-89640-05-8 Špaček, M. (2019). Recent Slovak practice in the field of international law / Špaček, Metod; Kičurová, Karina; Sýkorová, Michaela. In:
Slovak yearbook of international law. – 1st edition. – Vol. 8. – Bratislava (Slovensko): Slovak Academy of Science. Slovak Society for International Law, ISBN 978-80-89640-08-9
Stillman, II, R. J. (2009). Public Administration: Concepts and Cases. 7th Edition. Strayer University. 500 p. ISBN-13: 978-0618993017
Vačok, J. (2018). Making information available on request. In: Administrative procedural law: special part. – 2. aktual. vyd. – Šamorín: Heuréka, 2018. ISBN 978-80-8173-049-8, s. 275-287
ENTREPRENEURSHIP AND SUSTAINABILITY ISSUES
ISSN 2345-0282 (online) http://jssidoi.org/jesi/
2021 Volume 8 Number 3 (March)
http://doi.org/10.9770/jesi.2021.8.3(37)
603
Vasconcelos, V.V. (2021). Social justice and sustainable regional development: reflections on discourse and practice in public policies and public budget. Insights into Regional Development, 3(1), 10-28. https://doi.org/10.9770/IRD.2021.3.1(1)
Vicen V. & Haviarová (2013). Equality as a legal requirement (analytical considerations). In: Economic and Social Development of Slovakia: Proceedings of the International Scientific Conference, Bratislava 7 Novembra Bratislava: University of economics and manazement of public administration in Bratislava, p. 475-483. ISBN 978-80-89654-02-4
Vozáryová, M., Burdová, K. (2018). Brussels Ia Regulation and Arbitration In: Current Issues of European Private Internationa l Law: Justice Academy of the Slovak Republic; Bratislava: Slovak Association of European Law, 2018. ISBN 978-80-973158-0-1, s. 27-38 Vojtech, F. Levický, M. & Filip, S. (2019). Economic Policy for Sustainable Regional Development: A Case Study of Slovak Republic.
Journal of Security and Sustainability Issues. ISSN 2029-7017, 8(4), 597-608.
Uramová, M., Majkut, Y., Turošík, M. (2016). Economic and legal issues and challenges of the labour market and individual well-being. In: Banská Bystrica : Matej Bel University Publishing House - Belianum , 2016.
Wanzenböck, I., Wesseling, J.H., Frenken, K., Hekkert, M.P. & Weber, K.M. (2021). A framework for mission-oriented innovation policy: Alternative pathways through the problem–solution space. Science and Public Policy, 47(4), 474–489,
https://doi.org/10.1093/scipol/scaa027
Acknowledgements
The paper is the output of a scientific project IGA no. 3/2020 - M „Innovations of Public Administration in the SR:
Determination of Economic and Legal Aspects, with Reflecting European Countries Novelty Factors ”. (Funder: VSEMvs IGA VSEMvs, i.e. School of Economics and Management in Public Administration). prof. Mykola SIDAK, DrSc. is head of Institute of Public Administration of the University of Economics and Management
in Public Administration in Bratislava (Slovak Republic). Scientific field: Public Administration, Administrative Law, Financial Law and EU Law. ORCID ID: https://orcid.org/0000-0001-7173-3197
JUDr. Edita HAJNISOVA, PhD, is an assistant professor at the Department of Commercial and Economic Law, Faculty of Law, Comenius University in Bratislava (Slovak Republic). Research focused on investment protection and commercial law.
ORCID ID: https://orcid.org/0000-0002-4895-8037 Ing. Michal FABUŠ PhD. in International Economics Relations, obtained at University of Economics in Bratislava, Vice -rector for Foreign Affairs, Head of Department of Economics and Finance, University of Economics and Management in Public Administration in Bratislava (Slovak Republic). ORCID ID: https://orcid.org/0000-0002-3792-179X
Copyright © 2021 by author(s) and VsI Entrepreneurship and Sustainability Center This work is licensed under the Creative Commons Attribution International License (CC BY). http://creativecommons.org/licenses/by/4.0/
ENTREPRENEURSHIP AND SUSTAINABILITY ISSUES
ISSN 2345-0282 (online) http://jssidoi.org/jesi/
2021 Volume 8 Number 3 (March)
http://doi.org/10.9770/jesi.2021.8.3(38)
Publisher http://jssidoi.org/esc/home
604
THE EFFECT OF REGULATORY PERFORMANCE ON ECONOMIC GROWTH*
Nur Hayati Abd Rahman ¹, Shafinar Ismail ², Eeng Ahman 3, Aas Nurasyiah 4, Neni Sri Wulandari 5
1,2 Universiti Teknologi MARA, Melaka, Malaysia 3,4,5 Universitas Pendidikan Indonesia, Bandung, Indonesia
E-mails: 1 [email protected] ; 2 [email protected] ; 3 [email protected] ; 4 [email protected] ; 5 [email protected]
Received 18 September 2020; accepted 8 February 2021; published 30 March 2021
Abstract. The tendency to fall into a middle-income trap position due to weak regulatory performance remains a longstanding issue faced
by the majority of upper-middle-income economies (UMIE). Although regulatory performance is considered as one of the most vital
factors that determine the financial progression and stability of a nation, this variable is often overlooked in previous economic growth
literature. Hence, this study aims to examine the important role of regulatory performance in accelerating the economic growth of 30 upper-
middle-income economies countries within the timeframe of 2000 to 2018. Using the two-step system Generalised Method of Moments
(GMM), the findings reported that regulatory performance is indeed essential in stimulating economic growth. The results also indicated
that lengthy procedures and waiting period involved in opening and registering new businesses are a common predicament for start-up
firms. This proves to be a demotivating factor for new investors, indirectly slowing down the economic performance of the UMIE. As this
study leads to various policy implications, future studies can consider advancing research in this area by further examining the link between
regulatory performances and economic growth for individual countries based on a time series analysis.
Keywords: middle-income trap; upper-middle-income economies; regulatory performance; economic growth; system GMM
Reference to this paper should be made as follows: Abd Rahman, N.H., Ismail, S., Ahman, E., Nurasyiah, A., Wulandari, N.S. 2021. The
effect of regulatory performance on economic growth. Entrepreneurship and Sustainability Issues, 8(3), 604-617.
http://doi.org/10.9770/jesi.2021.8.3(38)
JEL Classifications: K20, K22, O43, O47
* This research was supported in part by Universiti Teknologi MARA Melaka and Universitas Pendidikan Indonesia, under
2020 Teja’s International Matching Grant Scheme (Grant no: GSAT2020–13).
ENTREPRENEURSHIP AND SUSTAINABILITY ISSUES
ISSN 2345-0282 (online) http://jssidoi.org/jesi/
2021 Volume 8 Number 3 (March)
http://doi.org/10.9770/jesi.2021.8.3(38)
Make your research more visible, join the Twitter account of ENTREPRENEURSHIP AND SUSTAINABILITY ISSUES:
@Entrepr69728810
605
1. Introduction
The World Bank Group (2018a) announced that the upper-middle-income economies (UMIE) tend to fall into a
middle-income trap position for a long period. This usually happens when countries are not progressing
economically at a promising rate and are unable to catch up with the developmental pace of high-income
economies (HIE). One of the main contributing factors to this situation is the weak regulatory performance of
these countries. Generally, the regulatory performance is measured using the ease of starting business (EOSB)
score. The score captures the gap of the individual economy of countries that are known for their best regulatory
performance achievement (The World Bank Group, 2019). The value of the score varies from 0 (the worst
regulatory performance) to 100 (the best regulatory performance). The calculation of this score is based on a
simple average of four business indicators components in setting up a business, namely the number of procedures
involved, the number of days involved, costs involved as well as paid-up minimum capital required to set up a
business (The World Bank Group, 2019). A higher score indicates that the country’s regulatory performance is at
a good stage and is capable of attracting new firms to set up businesses in the country.
Reviewing the statistics on countries’ classification tabulated by the World Bank Group (2019), on average,
business operations are easier to handle in HIE (average score of 89.28 in 2018) due to their favourable regulatory
performance. In 2018, the average score obtained by UMIE was 81.28. Although the average score for UMIE
then was more than 80, nineteen countries within the UMIE received a score of less than 80. This imDiplies the
issues underpinning business operations in these countries. Among the countries that fell into this category were
Venezuela (25), Bosnia and Herzegovina (59), Suriname (60) and Brazil (64). Since the regulatory environment in
these countries were far from conducive, businesses were reluctant to start up or even operate there.
Attracting new investors to invest in the UMIE is a daunting task which requires the macroeconomic foundation
of a country to be stable and resilient enough in confronting unexpected downturns. Both public and private
sectors should assume the role as the engine of growth in transforming the nation’s economy by attracting a
higher level of investments into the country. This must be done to avoid UMIE from experiencing economic
stagnation where they are trapped in the middle-income economy level for an extended time. When this happens,
UMIE will find it even more difficult to move up from their current economic level as most investors would
already be disinterested to invest in a country whose economy is stagnated.
The lower inflow of investments is bound to affect the economy of a country in various manners. Generally, the
country’s economy, on the whole, may experience slower technological progress as a result of a reduction in
capital and investment meant for scientific research and innovation. The reliance on the public sector to inject
more capital into the economy will naturally be higher (Hanif, Rakhman, Nurkholis, Pirzada, 2019). However,
governments would need to prioritise the welfare of citizen over larger financial matters. The lack of progress in
all areas including research innovations and infrastructure development may lead to a reduction of job
opportunities for the public. Consequently, fresh graduates may be unable to secure better jobs despite having
established academic background. This situation prompts migration to other countries that provide better
opportunities especially for those with financial means, knowledge, skills and talent. This issue, known as “brain
drain”, exacerbates further the current economic crisis with the loss of local talents to lead and drive the economy.
Subsequently, the income inequality between nations continues to widen, rendering it more difficult for the
economies to maintain the status of UMIE when such conditions persist for an extended time. If the situation
ceases to be monitored, most UMIE may not be able to accomplish the Industrial Revolution 4.0 (IR4.0) as the
IR4.0 necessitates countries to equip themselves with sufficient investments in capital, technological advancement
as well as human capital (Lee, Wong, Intarakumnerd, 2019).
ENTREPRENEURSHIP AND SUSTAINABILITY ISSUES
ISSN 2345-0282 (online) http://jssidoi.org/jesi/
2021 Volume 8 Number 3 (March)
http://doi.org/10.9770/jesi.2021.8.3(38)
Make your research more visible, join the Twitter account of ENTREPRENEURSHIP AND SUSTAINABILITY ISSUES:
@Entrepr69728810
606
Therefore, this study intends to examine the importance of regulatory performance in enhancing the economic
growth of the UMIE. This study is highly significant as it is closely related to the accomplishment of the fourth
industrial revolution. The findings of the study can be used by policymakers to re-design the business regulatory
environment to enhance the roles of the private sector, both domestic and foreign investors, as the engine of
economic growth (Yacoub, Lestari, 2019).
This study contributes to the existing literature in several ways. The existing literature on growth encompasses
emerging economies (Kharusi & Mbah, 2018), middle-income countries (Benali et al., 2018), lower-middle-
income economics (Akhanolu et al., 2018), low-middle-income economies (Moore & Thomas, 2010), developed
economies (Mencinger et al., 2015), developing economies (Karadam, 2018), industrial economies (Karadam,
2018) and mixed economies (Intartaglia et al., 2018). This study contributes to the existing literature by focusing
on UMIE, which is rarely focused upon by previous researchers. Previous studies often categorise LMIE and
UMIE as middle-income economies (Akhanolu et al., 2018; Benali et al., 2018).
Furthermore, the notion of EOSB was not fully utilised in the elucidation of its direct relationship with economic
growth (S. Asongu & Odhiambo, 2018; Bonga & Mahuni, 2018; Ncube et al., 2019). This variable is often
viewed as a less important variable in the growth literature where its direct relationship on economic growth is yet
to receive significant attention (Krammer, 2015). The establishment of its link to economic growth due provides
an insight into the understanding of different factors affecting the financial status and development of a country.
2. Literature review
Globally, some countries with an abundance of natural and physical resources such as Sub-Saharan Africa are still
unable to achieve high economic growth (The World Bank Group, 2018b). In contrast, countries with limited
resources such as Japan and Singapore charted significant rapid growth, overtaking the lead from resource-
abundant countries. This implies that the abundance of physical and natural resources does not guarantee the
economic growth and stability of a country. Based on this proposition, Hibbs (2001) developed the politicisation
of growth theory to improve existing growth models by adding the element of the institutional quality. Since
regulatory performance is an element in the institutional quality, this theory is adopted in this study to elucidate
the relationship between regulatory performance and economic growth.
2.1 The politicization of growth theory
This theory is developed by Hibbs (2001) to emphasise the importance of institutions as part of economic growth.
The idea was initially postulated by Adam Smith, the father of economics, in his popular book of the Wealth of
Nations. He stressed the importance of property rights and institutions in accelerating economic growth. Adam
Smith's idea was then explored by Hibbs (2001) to include politics, institutional quality and policy as additional
factors in creating a conducive economic environment for businesses and investors. These variables were included
because the traditional factors were identified to be insufficient in ensuring economic development.
One of the variables which demonstrate institutional quality is the regulatory performance (The World Bank
Group, 2019). In measuring regulatory performance, the World Bank Group was able to initiate an index to
determine the ease of business start-up partly by using the elements in Hibbs (2001). The index is used to rank
countries based on their regulatory performance besides highlighting the institutional quality elements of a
country. Institutional quality is defined as the quality of the public sector in running the nation’s economy. The
ENTREPRENEURSHIP AND SUSTAINABILITY ISSUES
ISSN 2345-0282 (online) http://jssidoi.org/jesi/
2021 Volume 8 Number 3 (March)
http://doi.org/10.9770/jesi.2021.8.3(38)
Make your research more visible, join the Twitter account of ENTREPRENEURSHIP AND SUSTAINABILITY ISSUES:
@Entrepr69728810
607
quality of public institutions is imposed by formal and informal constraints (Snowdon & Vane, 2005). The formal
constraints can be in the form of laws and contract enforcement while the informal constraints involve customs,
conventions and self-imposed conduct. Naturally, both constraints should complement each other. Certain
institutions with specific constraints allow individuals and firms to conduct activities in a country by using the
same repetitive procedures (Hibbs, 2001). These procedures are tedious and may hinder economic growth by
distorting a country’s reputation.
Countries with a good reputation will inevitably attract more business start-ups, thus leading to higher
employment opportunities, national productivity and economic prosperity. On the contrary, business owners who
had to succumbed to slow and tedious procedures will be affected by this bad impression and may choose to cease
business ties in the country. This indirectly tarnishes the country's reputation. As a result, other potential business
investors may also be reluctant to invest in the country so as to avoid the bureaucracy and tedious procedures
imposed by the government (Husaini, Pirzada, Saiful, 2020). Consequently, private sectors are forced to
contribute lesser to economic development due to the lack of participation from firms and investors. Undoubtedly,
the ease of starting a business is one of the most important elements under institutional qualities.
2.2 Empirical review
The role of the private sector in boosting economic growth is undeniable. Increased participation of firms means
more job opportunities, improved standard of living as well as an increased national income via exports,
investments and private consumptions. Nevertheless, attracting more participation from firms in doing business is
not an easy task and requires full supports from the public sector, especially in easing the regulatory performance
such as reducing costs, time and procedures involved in starting up a business. As mentioned earlier, in measuring
the ease of starting a business, The World Bank has calculated a score for each country. The best countries to
start-up business are those that have the highest score value. This score indicates less complexity in conduct
business, strong legal institutions as well as lower costs of regulatory processes. These costs involve both time
and money in handling bureaucracy and administrative procedures.
The ease of doing business is a measure of the regulatory performance and is normally used as an independent
variable to directly explain entrepreneurial well-being (Abreu et al., 2018), entrepreneurial intention (Griffiths et
al., 2009), foreign direct investment (Asongu, 2013; Aziz, 2018; Bournakis et al., 2018; Corcoran & Gillanders,
2015), domestic investment (Asongu, 2013, 2015), exports (Wang & Le, 2018), business creation (Canare, 2018)
as well as the growth of both small and medium enterprises (Obadić, 2015). However, within the growth
literature, the ease of doing business and its direct relationship with economic growth remains underexplored
(Asongu & Odhiambo, 2018; Bonga & Mahuni, 2018; Ncube et al., 2019). Investigating the relationship between
these two variables is deemed vital as it involves the formation of new businesses and the role of new investors in
developing the economy of a country.
The direct effect of the ease of doing business on economic growth has been investigated in the cases of the
Western European and transitional countries from 1990 to 2009 (Krammer, 2015), in Russia (Matveev et al.,
2018) as well as in African countries (Bonga & Mahuni, 2018; Ncube et al., 2019). Finding shows that Western
countries that are more have a higher level of economic growth as compared to transitional economies as business
operations tend to be easier to conduct (Krammer, 2015). Investors are happy to conduct businesses in Western
countries since the business regulatory environment is uncomplicated. The conducive environment creates a
positive ripple effect as new firms are attracted to join the market due to lower regulatory costs (Canare, 2018). A
higher number of firms in the market will create more employment opportunities for the citizens which is a
ENTREPRENEURSHIP AND SUSTAINABILITY ISSUES
ISSN 2345-0282 (online) http://jssidoi.org/jesi/
2021 Volume 8 Number 3 (March)
http://doi.org/10.9770/jesi.2021.8.3(38)
Make your research more visible, join the Twitter account of ENTREPRENEURSHIP AND SUSTAINABILITY ISSUES:
@Entrepr69728810
608
stepping stone to economic vitality (Asongu & Odhiambo, 2018). Although the ease of doing business is rarely
used in growth models (Coe et al., 2009), its impact on the economy is large and significant. A previous study
reported that the magnitude for the ease of doing business variable is even larger than other common control
variables in growth models such as inflation and secondary level education (Djankov et al., 2006). This may be
attributed to the fact that the ease of doing business contributes to the economy via private consumptions and
private investments (Asongu & Odhiambo, 2018). Doing business in an uncomplicated and comfortable
environment aid investors and entrepreneurs in focusing on inventing and innovating products based on
customers’ demands. With the increase in demands, higher profits can be obtained by firms, thus, allowing new
employment or distribution of profits to existing employees. This, in turn, will contribute to an improved standard
of living besides encouraging private consumptions. In the long run, this practice may also encourage knowledge
and skills transfer between local firms and new investors, prompting a more efficient and larger production of
goods and services.
3. Research methodology
The model derived in this study is based on the grand theory of the economic growth, known as the endogenous
growth model (Lucas, 1988; Romer, 1986) which stressed the importance of labour, capital and human capital in
accelerating the economic growth (Pirzada, 2016). Therefore, the specifications and standards developed in this
study were based on this common model.
3.1 Model specification and sources of data
Based on Barro (2003), Barro and Sala-I-Martin (1992), as well as Ibrahim and Law (2016), the baseline
regression for the growth model using panel data specification, is as follows:
ln𝑦𝑖𝑡 =∝ + 𝜌ln𝑦𝑖𝑡−1 + 𝛽ln𝑥𝑖𝑡 + 𝜇𝑖 + 𝜀𝑖 (1)
where ln𝑦𝑖𝑡 is the real GDP growth per capita (in logarithm form), α is a constant term, lnyit-1 is the initial real
GDP per capita (in logarithm form), ln𝑥𝑖𝑡 is a vector of explanatory variables (in logarithm form), 𝜇𝑖 is the
individual-specific effects, 𝜀𝑖𝑡 is the error term while i and t represent country and time, respectively. Meanwhile,
β is a coefficient that measures the change in the real GDP growth per capita due to a unit change in the control
variables, ρ measures how the countries converge to its steady-state level. In line with the convergence hypothesis
(Robert Joseph Barro, 1991; Robert Joseph Barro & Sala-i-Martin, 2004), the ρ is expected to be negative. Lower-
income countries with lower initial levels of technology and capital tend to chart rapid growth as compared to
advanced economies. This is due to product imitation and diffusion of technology in advanced countries. This
inclusion of this effect is essential as it evaluates the ability of the economy to reach its equilibrium state and
develop in the long run.
In ensuring the validity of the estimation, the xit as the vector of explanatory variables includes both, the variable
of interest and the control variables. The variable of interest is the ease of starting business score (EOSB) which
also acts as a measure of the regulatory performance. Meanwhile, the control variables included in the estimation
models are parallel to the grand theory of the endogenous growth model and previous literature. The baseline
growth model in equation (1) is expanded into the following model specification.
ln𝑦𝑖𝑡 =∝ + 𝜌ln𝑦𝑖𝑡−1 + 𝛽1𝐸OSB𝑖𝑡 + 𝛽2lnPOPG𝑖𝑡 + 𝛽3lnINV𝑖𝑡 + 𝛽4lnHC𝑖𝑡 + 𝛽5lnTO𝑖𝑡 + 𝛽6lnINF𝑖𝑡 +
𝛽7EDEBT𝑖𝑡 + 𝜇𝑖 +𝜀it (2)
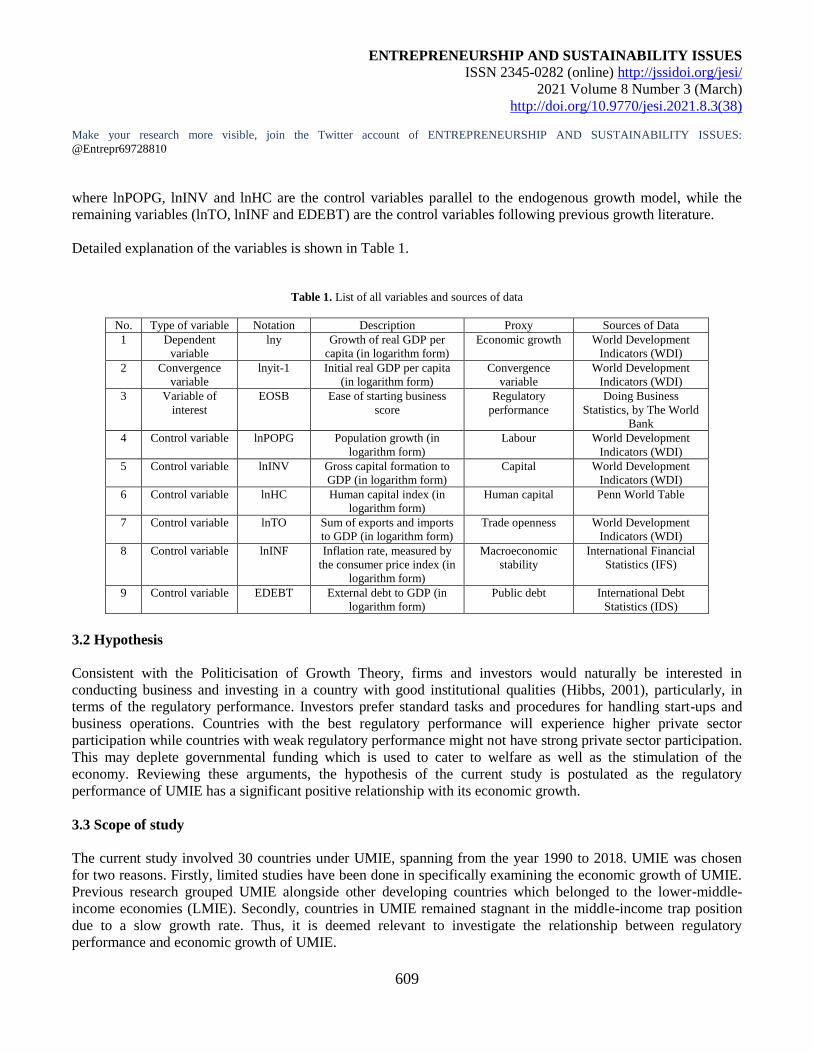
ENTREPRENEURSHIP AND SUSTAINABILITY ISSUES
ISSN 2345-0282 (online) http://jssidoi.org/jesi/
2021 Volume 8 Number 3 (March)
http://doi.org/10.9770/jesi.2021.8.3(38)
Make your research more visible, join the Twitter account of ENTREPRENEURSHIP AND SUSTAINABILITY ISSUES:
@Entrepr69728810
609
where lnPOPG, lnINV and lnHC are the control variables parallel to the endogenous growth model, while the
remaining variables (lnTO, lnINF and EDEBT) are the control variables following previous growth literature.
Detailed explanation of the variables is shown in Table 1.
Table 1. List of all variables and sources of data
No. Type of variable Notation Description Proxy Sources of Data
1 Dependent
variable
lny Growth of real GDP per
capita (in logarithm form)
Economic growth World Development
Indicators (WDI)
2 Convergence
variable
lnyit-1 Initial real GDP per capita
(in logarithm form)
Convergence
variable
World Development
Indicators (WDI)
3 Variable of
interest
EOSB Ease of starting business
score
Regulatory
performance
Doing Business
Statistics, by The World
Bank
4 Control variable lnPOPG Population growth (in
logarithm form)
Labour World Development
Indicators (WDI)
5 Control variable lnINV Gross capital formation to
GDP (in logarithm form)
Capital World Development
Indicators (WDI)
6 Control variable lnHC Human capital index (in
logarithm form)
Human capital Penn World Table
7 Control variable lnTO Sum of exports and imports
to GDP (in logarithm form)
Trade openness World Development
Indicators (WDI)
8 Control variable lnINF Inflation rate, measured by
the consumer price index (in
logarithm form)
Macroeconomic
stability
International Financial
Statistics (IFS)
9 Control variable EDEBT External debt to GDP (in
logarithm form)
Public debt International Debt
Statistics (IDS)
3.2 Hypothesis
Consistent with the Politicisation of Growth Theory, firms and investors would naturally be interested in
conducting business and investing in a country with good institutional qualities (Hibbs, 2001), particularly, in
terms of the regulatory performance. Investors prefer standard tasks and procedures for handling start-ups and
business operations. Countries with the best regulatory performance will experience higher private sector
participation while countries with weak regulatory performance might not have strong private sector participation.
This may deplete governmental funding which is used to cater to welfare as well as the stimulation of the
economy. Reviewing these arguments, the hypothesis of the current study is postulated as the regulatory
performance of UMIE has a significant positive relationship with its economic growth.
3.3 Scope of study
The current study involved 30 countries under UMIE, spanning from the year 1990 to 2018. UMIE was chosen
for two reasons. Firstly, limited studies have been done in specifically examining the economic growth of UMIE.
Previous research grouped UMIE alongside other developing countries which belonged to the lower-middle-
income economies (LMIE). Secondly, countries in UMIE remained stagnant in the middle-income trap position
due to a slow growth rate. Thus, it is deemed relevant to investigate the relationship between regulatory
performance and economic growth of UMIE.
ENTREPRENEURSHIP AND SUSTAINABILITY ISSUES
ISSN 2345-0282 (online) http://jssidoi.org/jesi/
2021 Volume 8 Number 3 (March)
http://doi.org/10.9770/jesi.2021.8.3(38)
Make your research more visible, join the Twitter account of ENTREPRENEURSHIP AND SUSTAINABILITY ISSUES:
@Entrepr69728810
610
In order to avoid any structural break in the data, a non-overlapping five-year data averaging for all data points
following the procedures by Ahlborn and Schweickert (2018), Ewaida (2017) and Islam (1995) was conducted.
Considering the period of estimation between 2000 to 2018 and five-year data averaging, the four data (time)
points of each country are (1) 2000 to 2004, (2) 2005 to 2009, (3) 2010 to 2014 and (4) 2015 to 2018.
By referring to the variables used throughout the estimation models, the subscript notation of t refers to the four-
time points as stated before, while the subscript of t-1 in the convergence variable refers to the initial value of the
per capita income. For instance, if t = 1 refers to 2000 to 2004, t-1 is the initial value of per capita income in 2000.
This is in line with the procedure by Barro (2003).
3.4 Estimation method
Since this study utilises panel data that consists of a large number of cross-sections (30) with limited points for
time (4), the best viable method in tackling this data type is the Generalised Method of Moments (GMM)
(Arellano & Bond, 1991). GMM also allows potential heterogeneity across countries by including the specific
individual effect (𝜇𝑖) in the model specification (Ibrahim & Law, 2016). Adding 𝜇𝑖 addresses the omitted variable
bias which may arise from the unobserved characteristics of countries under investigation.
In addition, GMM permits the model to be dynamic. The dynamic model is when the lag dependent variable (yit-
1) is added to the regression model as one of the independent variables. In the growth model, the inclusion of the
lag dependent variable is consistent with the convergence hypothesis (Barro, 1991; Barro & Sala-i-Martin, 2004).
Other traditional panel models, such as POLS and least-square dummy variable (LSDV) are biased when the
dynamic term is present in the estimation model (Ibrahim & Law, 2016; Nickell, 1981).
There are two variants of the GMM system namely, one-step and two-step system GMM. The difference between
these two variants is on the use of weighting matrices. The one-step estimator uses weighting matrices that are
independent of the estimated parameters, while the two-step estimator uses optimal matrices, in which the
moment conditions are weighted by a consistent estimate of the covariance matrix. In this study, the two-step
variant was employed as the results are projected to be more consistent compared to the one-step variant.
The use of the GMM system requires careful selection of instruments. By default, the instruments are selected by
using all available lags. Too many lags will lead to a high number of instruments and may cause estimation bias
(Roodman, 2009). To avoid this situation, the number of instruments should be lower than the number of cross-
sections (Roodman, 2009). Alternatively, the number of lags can be reduced by restricting the lags or by
collapsing the instruments.
In ensuring the validity of the instruments, the Hansen J test is used to confirm whether the instruments appear to
be exogenous or not (Hansen, 1982). The test is to ensure that the null hypothesis is not rejected (overidentifying
restrictions are valid). If this is the case, then the overidentifying conditions need to be correctly specified to
ensure the instruments are valid.
Moreover, the GMM estimator only allows for the first-order serial correlation if the error terms are serially
independent (Arellano & Bond, 1991). This is allowed as the model is a combination of both level and first
difference variables. A higher order of serial correlation illustrates the specification error in the model. Therefore,
to test for the second-order serial correlation, Arellano-Bond test is conducted using a null hypothesis of no
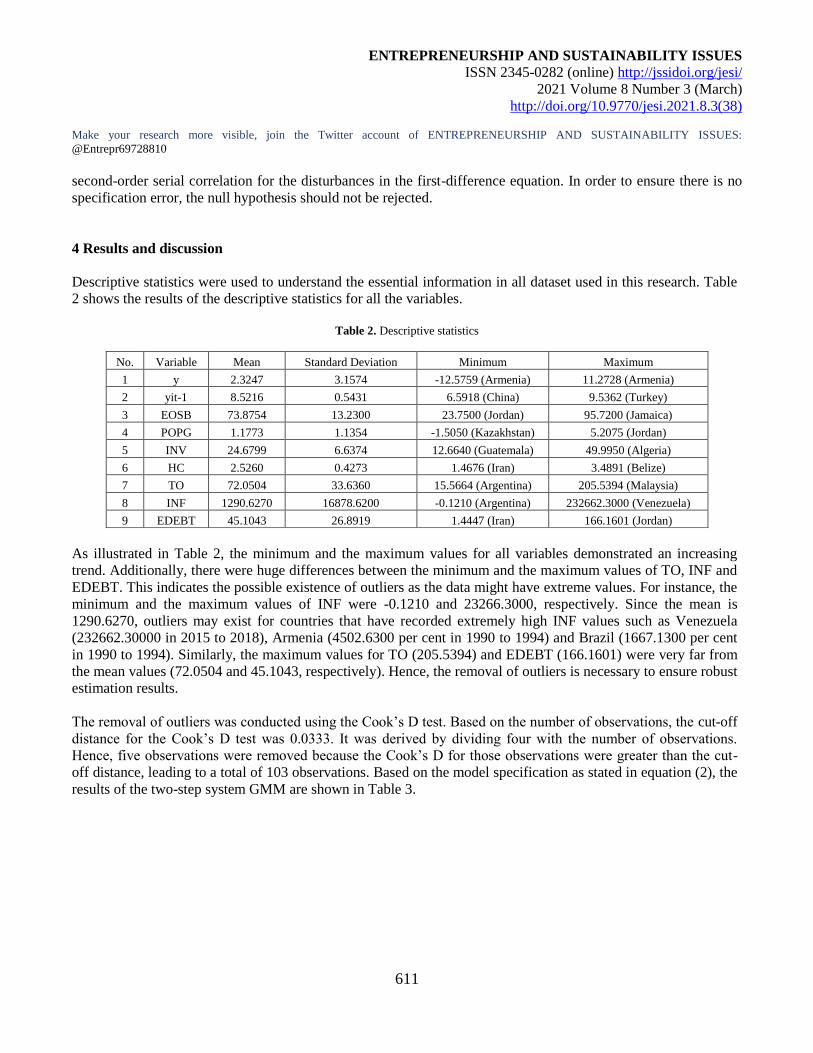
ENTREPRENEURSHIP AND SUSTAINABILITY ISSUES
ISSN 2345-0282 (online) http://jssidoi.org/jesi/
2021 Volume 8 Number 3 (March)
http://doi.org/10.9770/jesi.2021.8.3(38)
Make your research more visible, join the Twitter account of ENTREPRENEURSHIP AND SUSTAINABILITY ISSUES:
@Entrepr69728810
611
second-order serial correlation for the disturbances in the first-difference equation. In order to ensure there is no
specification error, the null hypothesis should not be rejected.
4 Results and discussion
Descriptive statistics were used to understand the essential information in all dataset used in this research. Table
2 shows the results of the descriptive statistics for all the variables.
Table 2. Descriptive statistics
No. Variable Mean Standard Deviation Minimum Maximum
1 y 2.3247 3.1574 -12.5759 (Armenia) 11.2728 (Armenia)
2 yit-1 8.5216 0.5431 6.5918 (China) 9.5362 (Turkey)
3 EOSB 73.8754 13.2300 23.7500 (Jordan) 95.7200 (Jamaica)
4 POPG 1.1773 1.1354 -1.5050 (Kazakhstan) 5.2075 (Jordan)
5 INV 24.6799 6.6374 12.6640 (Guatemala) 49.9950 (Algeria)
6 HC 2.5260 0.4273 1.4676 (Iran) 3.4891 (Belize)
7 TO 72.0504 33.6360 15.5664 (Argentina) 205.5394 (Malaysia)
8 INF 1290.6270 16878.6200 -0.1210 (Argentina) 232662.3000 (Venezuela)
9 EDEBT 45.1043 26.8919 1.4447 (Iran) 166.1601 (Jordan)
As illustrated in Table 2, the minimum and the maximum values for all variables demonstrated an increasing
trend. Additionally, there were huge differences between the minimum and the maximum values of TO, INF and
EDEBT. This indicates the possible existence of outliers as the data might have extreme values. For instance, the
minimum and the maximum values of INF were -0.1210 and 23266.3000, respectively. Since the mean is
1290.6270, outliers may exist for countries that have recorded extremely high INF values such as Venezuela
(232662.30000 in 2015 to 2018), Armenia (4502.6300 per cent in 1990 to 1994) and Brazil (1667.1300 per cent
in 1990 to 1994). Similarly, the maximum values for TO (205.5394) and EDEBT (166.1601) were very far from
the mean values (72.0504 and 45.1043, respectively). Hence, the removal of outliers is necessary to ensure robust
estimation results.
The removal of outliers was conducted using the Cook’s D test. Based on the number of observations, the cut-off
distance for the Cook’s D test was 0.0333. It was derived by dividing four with the number of observations.
Hence, five observations were removed because the Cook’s D for those observations were greater than the cut-
off distance, leading to a total of 103 observations. Based on the model specification as stated in equation (2), the
results of the two-step system GMM are shown in Table 3.
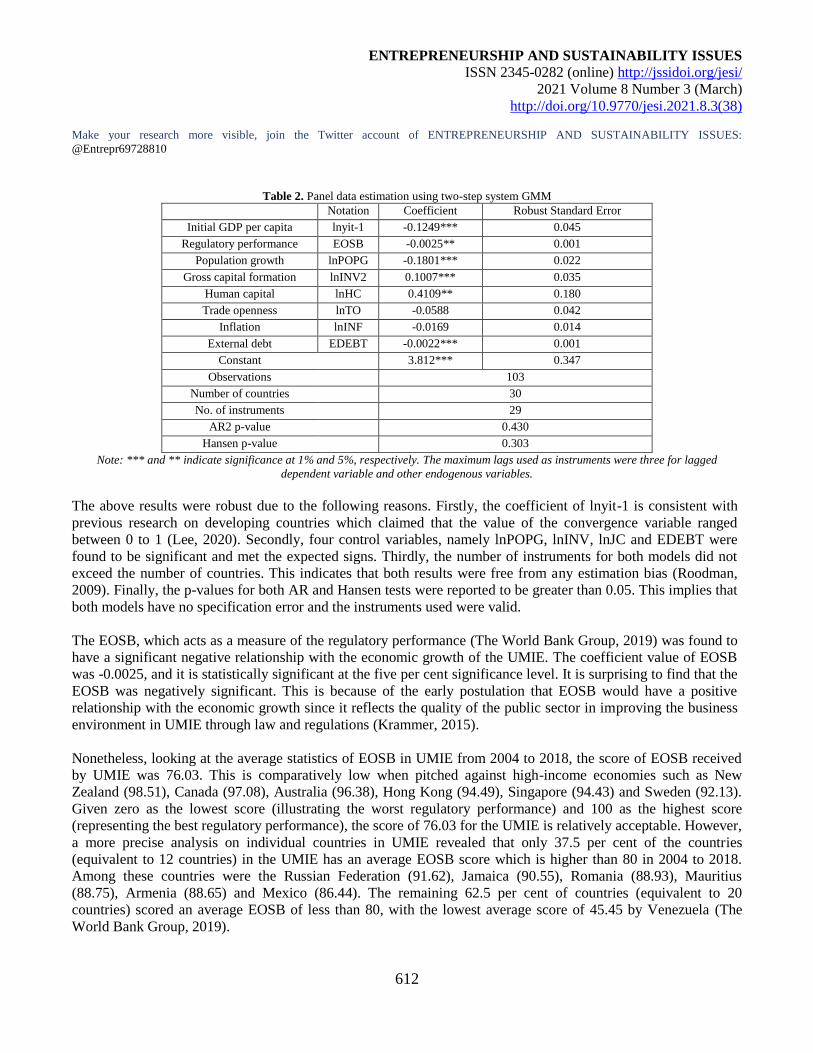
ENTREPRENEURSHIP AND SUSTAINABILITY ISSUES
ISSN 2345-0282 (online) http://jssidoi.org/jesi/
2021 Volume 8 Number 3 (March)
http://doi.org/10.9770/jesi.2021.8.3(38)
Make your research more visible, join the Twitter account of ENTREPRENEURSHIP AND SUSTAINABILITY ISSUES:
@Entrepr69728810
612
Table 2. Panel data estimation using two-step system GMM
Notation Coefficient Robust Standard Error
Initial GDP per capita lnyit-1 -0.1249*** 0.045
Regulatory performance EOSB -0.0025** 0.001
Population growth lnPOPG -0.1801*** 0.022
Gross capital formation lnINV2 0.1007*** 0.035
Human capital lnHC 0.4109** 0.180
Trade openness lnTO -0.0588 0.042
Inflation lnINF -0.0169 0.014
External debt EDEBT -0.0022*** 0.001
Constant 3.812*** 0.347
Observations 103
Number of countries 30
No. of instruments 29
AR2 p-value 0.430
Hansen p-value 0.303
Note: *** and ** indicate significance at 1% and 5%, respectively. The maximum lags used as instruments were three for lagged
dependent variable and other endogenous variables.
The above results were robust due to the following reasons. Firstly, the coefficient of lnyit-1 is consistent with
previous research on developing countries which claimed that the value of the convergence variable ranged
between 0 to 1 (Lee, 2020). Secondly, four control variables, namely lnPOPG, lnINV, lnJC and EDEBT were
found to be significant and met the expected signs. Thirdly, the number of instruments for both models did not
exceed the number of countries. This indicates that both results were free from any estimation bias (Roodman,
2009). Finally, the p-values for both AR and Hansen tests were reported to be greater than 0.05. This implies that
both models have no specification error and the instruments used were valid.
The EOSB, which acts as a measure of the regulatory performance (The World Bank Group, 2019) was found to
have a significant negative relationship with the economic growth of the UMIE. The coefficient value of EOSB
was -0.0025, and it is statistically significant at the five per cent significance level. It is surprising to find that the
EOSB was negatively significant. This is because of the early postulation that EOSB would have a positive
relationship with the economic growth since it reflects the quality of the public sector in improving the business
environment in UMIE through law and regulations (Krammer, 2015).
Nonetheless, looking at the average statistics of EOSB in UMIE from 2004 to 2018, the score of EOSB received
by UMIE was 76.03. This is comparatively low when pitched against high-income economies such as New
Zealand (98.51), Canada (97.08), Australia (96.38), Hong Kong (94.49), Singapore (94.43) and Sweden (92.13).
Given zero as the lowest score (illustrating the worst regulatory performance) and 100 as the highest score
(representing the best regulatory performance), the score of 76.03 for the UMIE is relatively acceptable. However,
a more precise analysis on individual countries in UMIE revealed that only 37.5 per cent of the countries
(equivalent to 12 countries) in the UMIE has an average EOSB score which is higher than 80 in 2004 to 2018.
Among these countries were the Russian Federation (91.62), Jamaica (90.55), Romania (88.93), Mauritius
(88.75), Armenia (88.65) and Mexico (86.44). The remaining 62.5 per cent of countries (equivalent to 20
countries) scored an average EOSB of less than 80, with the lowest average score of 45.45 by Venezuela (The
World Bank Group, 2019).
ENTREPRENEURSHIP AND SUSTAINABILITY ISSUES
ISSN 2345-0282 (online) http://jssidoi.org/jesi/
2021 Volume 8 Number 3 (March)
http://doi.org/10.9770/jesi.2021.8.3(38)
Make your research more visible, join the Twitter account of ENTREPRENEURSHIP AND SUSTAINABILITY ISSUES:
@Entrepr69728810
613
The reason for the negative relationship between EOSB and the economic growth of UMIE perhaps lie in the
difficulties in of starting businesses. The justification is supported by the claim put forth in the previous paragraph
where the average EOSB for UMIE from 2014 to 2018 was less than 80. This implies that firms in the UMIE
were having difficulties in starting up their new ventures. Furthermore, the sub-components of the EOSB reported
that twenty countries in the UMIE had low scores in the EOSB (less than 80) due to weak regulatory
performance. Most public sector in UMIE requires new firms to undergo multiple procedures in setting up
businesses. These procedures are time and effort consuming. This further supported by the data in Table 4 which
illustrates the weakness of regulatory performance in the UMIE based on its sub-components. There was a total of
twenty-three countries in the UMIE which adopted lengthy procedures.
Therefore, consistent with the Politicisation Of Growth Theory (Hibbs, 2001), it can be concluded that tedious
and lengthy procedures will hinder economic progression. New firms are less likely to be attracted to begin their
business venture in UMIE with such hassles. This signifies a lost opportunity for UMIE as they lose out on new
business prospects which enables the creation of job opportunities, contribution of higher tax revenues and
funding for economic growth and development.
5 Conclusion and policy implications
Weak regulatory performance in the UMIE may be one of the possible reasons why UMIE experience slow
economic growth and remain trap in the middle-income position. The weak regulatory performance is identified
as the lengthy procedures required for new business ventures. Overcoming this issue is necessary if UMIE desires
to keep its global competitive advantage. Investors would most likely choose not to invest in UMIE if it continues
recording a stagnant growth rate. This will further hinder UMIE governments in implementing appropriate
economic transformation plans which are aligned with the fourth industrial revolution for future progression.
The findings of this research have various policy implications. Governments should consider reducing
bureaucracy and documentation to improve the regulatory performance of UMIE. Policies should be implemented
where new firms are allowed to operate their businesses within a short period without the hassle of tedious
paperwork and procedures. When the regulatory performance is improved and in place, both policymakers and the
Central Bank need to closely monitor the inflationary condition as the improvement in the regulatory performance
might lead to this issue. Should this occur, direct measures need to be imposed to minimise the effects of the
private sector's contribution to economic growth. These measures can include the imposition of the price control
and subsidies to control price hike. The imposition of the fiscal and monetary policy instruments should only be
enforced when the inflationary condition is beyond control. This is because indirect measures as such promote
adverse effects to the private sector participation in the long run.
Limitations of the study
This study is not without its limitations. Firstly, the scope of this study is limited to only 30 countries in the
UMIE. It does not include all 62 countries under the UMIE due to limited data availability. Secondly, this
research also did not manage to provide a comparison based on group of countries or group of economies.
Thirdly, this study also used regulatory performance as an institutional variable which can influence economic
growth. It does not include other institutional variables since there is only one variable which can represent the
business regulatory performance (The World Bank Group, 2019), namely the ease of starting a business. The rest
of the institutional variables were also not included as part of the study. Finally, the findings of this research were
ENTREPRENEURSHIP AND SUSTAINABILITY ISSUES
ISSN 2345-0282 (online) http://jssidoi.org/jesi/
2021 Volume 8 Number 3 (March)
http://doi.org/10.9770/jesi.2021.8.3(38)
Make your research more visible, join the Twitter account of ENTREPRENEURSHIP AND SUSTAINABILITY ISSUES:
@Entrepr69728810
614
generalised for all 30 countries under this investigation. Since this study is using a panel data analysis, the
researcher is unable to derive the findings for 30 individual countries separately. Therefore, it is suggested that
future research extend this study by focusing on overcoming these limitations.
References
Abreu, M., Oner, O., Brouwer, A., & Leeuwen, E. Van. (2018). Well-being effects of self-employment: A spatial inquiry. Journal of
Business Venturing, November, 1–19. https://doi.org/10.1016/j.jbusvent.2018.11.001
Ahlborn, M., & Schweickert, R. (2018). Public debt and economic growth – economic systems matter. International Economics and
Economic Policy, 15(2), 373–403.
Akhanolu, I. A., Babajide, A. A., Victoria, A., Tolulope, O., & Godswill, O. (2018). The effect of public debt on economic growth in
Nigeria: An empirical investigation. International Business Management, 12(6), 436–441.
https://doi.org/10.18488/journal.aefr/2016.6.11/102.11.692.705
Arellano, M., & Bond, S. (1991). Some tests of specification for panel data: Monte Carlo evidence and an application to employment
equations. Review of Economic Studies, 58(2), 277–297. https://doi.org/10.2307/2297968
Asongu, S. A. (2013). How would population growth affect investment in the future? Asymmetric panel causality evidence for Africa.
African Development Review, 25(1), 14–29. https://doi.org/10.1111/j.1467-8268.2013.12010.x
Asongu, S. A. (2015). Long-term effects of population growth on aggregate investment dynamics: Selected country evidence for Africa.
African Journal of Economic and Management Studies, 6(3), 225–250. https://doi.org/10.1108/AJEMS-12-2012-0083
Asongu, S., & Odhiambo, N. M. (2018). Challenges of doing business in Africa: A systematic review. In AGDI Working Paper
(WP/18/057).
Aziz, O. G. (2018). Institutional quality and FDI inflows in Arab economies. Finance Research Letters, 25(October 2017), 111–123.
https://doi.org/10.1016/j.frl.2017.10.026
Barro, R. J., & Sala-I-Martin, X. (1992). Convergence. Journal of Political Economy, 100(2), 223–251. https://doi.org/10.1086/261816
Barro, R. J. (1991). Economic growth in a cross section of countries. Quarterly Journal of Economics.106(2), 407-443.
https://doi.org/10.2307/2937943
Barro, R. J. (2003). Determinants of economic growth in a panel of countries. Annals of Economics and Finance, 4(2), 231–274.
Barro, R. J., & Sala-i-Martin, X. (2004). Economic Growth. In The MIT Press (2nd edition). The MIT Press. https://doi.org/10.1016/0025-
5408(96)80018-3
Benali, N., Abdelkafi, I., & Feki, R. (2018). Natural-disaster shocks and government’s behavior: Evidence from middle-income countries.
International Journal of Disaster Risk Reduction, 27(December 2016), 1–6. https://doi.org/10.1016/j.ijdrr.2016.12.014
Bonga, W. G., & Mahuni, K. (2018). Assessing the impact of ease of doing business and corruption on economic growth for Africa Free
Trade Zone (AFTZ) member states. In MPRA Paper 88932 (Issue 88932).
Bournakis, I., Christopoulos, D., & Mallick, S. (2018). Knowledge spillovers and output per worker: An industry-level analysis for OECD
countries. Economic Inquiry, 56(2), 1028–1046. https://doi.org/10.1111/ecin.12458
Canare, T. (2018). The effect of ease of doing business on firm creation. Annals of Economics and Finance, 19(2), 555–584.
Coe, D. T., Helpman, E., & Hoffmaister, A. W. (2009). International R & D spillovers and institutions. European Economic Review, 53(7),
723–741. https://doi.org/10.1016/j.euroecorev.2009.02.005
ENTREPRENEURSHIP AND SUSTAINABILITY ISSUES
ISSN 2345-0282 (online) http://jssidoi.org/jesi/
2021 Volume 8 Number 3 (March)
http://doi.org/10.9770/jesi.2021.8.3(38)
Make your research more visible, join the Twitter account of ENTREPRENEURSHIP AND SUSTAINABILITY ISSUES:
@Entrepr69728810
615
Corcoran, A., & Gillanders, R. (2015). Foreign direct investment and the ease of doing business. Review of World Economics, 151(1), 103–
126. https://doi.org/10.1007/s10290-014-0194-5
Djankov, S., McLiesh, C., & Ramalho, R. M. (2006). Regulation and growth. Economics Letters, 92(3), 395–401.
Ewaida, H. Y. M. (2017). The impact of sovereign debt on growth: An empirical study on GIIPS versus JUUSD countries. European
Research Studies Journal, 20(2), 607–633.
Griffiths, M. D., Kickul, J., & Carsrud, A. L. (2009). Government bureaucracy, transactional impediments and entrepreneurial intentions.
International Small Business Journal, 27(5), 626–645. https://doi.org/10.1177/0266242609338752
Hanif, H., Rakhman, A., Nurkholis, M., & Pirzada, K. (2019). Intellectual capital: extended VAIC model and building of a new HCE
concept: the case of Padang Restaurant Indonesia. African Journal of Hospitality, Tourism and Leisure, 8 (S), pp.1-15.
https://www.ajhtl.com/2019.html
Husaini, Pirzada, K., Saiful, (2020). Risk Management, Sustainable Governance Impact on Corporate Performance. Journal of Security and
Sustainability Issues, 9(3), 993-1004. https://doi.org/10.9770/jssi.2020.9.3(23)
Hansen, L. (1982). Large sample properties of generalized method of moments estimators. Econometrica, 50, 1029–1054.
Hibbs, D. A. (2001). The politicisation of growth theory. Kyklos.
Ibrahim, M. H., & Law, S. H. (2016). Institutional quality and CO2 emission–trade relations: Evidence from Sub-Saharan Africa. South
African Journal of Economics, 84(2), 323–340. https://doi.org/10.1111/saje.12095
Intartaglia, M., Antoniades, A., & Bhattacharyya, S. (2018). Unbundled debt and economic growth in developed and developing
economies: An empirical analysis. World Economy, 41(12), 3345–3358. https://doi.org/10.1111/twec.12626
Islam, N. (1995). Growth empirics: A panel data approach. Quarterly Journal of Economics, 110(4), 1127–1170.
https://doi.org/10.2307/2946651
Karadam, D. Y. (2018). An investigation of nonlinear effects of debt on growth. Journal of Economic Asymmetries, 18, 1–13.
https://doi.org/10.1016/j.jeca.2018.e00097
Kharusi, S. Al, & Mbah, A. S. (2018). External debt and economic growth : The case of emerging economy. Journal of Economic
Integration, 33(1), 1141–1157. https://doi.org/10.11130/jei.2018.33.1.1141
Krammer, S. M. S. (2015). Do good institutions enhance the effect of technological spillovers on productivity? Comparative evidence from
developed and transition economies. Technological Forecasting and Social Change, 94, 133–154.
https://doi.org/10.1016/j.techfore.2014.09.002
Lee, J. W. (2020). Convergence success and the middle-income trap. Developing Economies, 58(1), 30–62.
https://doi.org/10.1111/deve.12214
Lucas, R. E. (1988). On the mechanics of economic development. Journal of Monetary Economics, 22(1), 3–42. https://doi.org/10.1016/0304-3932(88)90168-7
Matveev, Y. V., Trubetskaya, O. V., Lunin, I. A., & Matveev, K. Y. (2018). Institutional aspect of the Russian economy regional
development. Problems and Perspectives in Management, 16(1), 381–391. https://doi.org/10.21511/ppm.16(1).2018.36
Mencinger, J., Verbic, M., & Aristovnik, A. (2015). Revisiting the role of public debt in economic growth: The case of OECD countries.
Engineering Economics, 26(1), 61–66. https://doi.org/10.5755/j01.ee.26.1.4551
Moore, W., & Thomas, C. (2010). A meta-analysis of the relationship between debt and growth. International Journal of Development
Issues, 9(3), 214–225. https://doi.org/10.1108/14468951011073307
ENTREPRENEURSHIP AND SUSTAINABILITY ISSUES
ISSN 2345-0282 (online) http://jssidoi.org/jesi/
2021 Volume 8 Number 3 (March)
http://doi.org/10.9770/jesi.2021.8.3(38)
Make your research more visible, join the Twitter account of ENTREPRENEURSHIP AND SUSTAINABILITY ISSUES:
@Entrepr69728810
616
Ncube, M., Soonawalla, K., & Hausken, K. (2019). The Links between business environment, economic growth and social equity: A Study
of African countries. Journal of African Business, 1–24. https://doi.org/10.1080/15228916.2019.1695184
Nickell, S. (1981). Biases in dynamic models with fixed effects. Econometrica, 49(6), 1419–1426. https://doi.org/10.2307/1911408
Obadić, A. A. (2015). The impact and efficiency of public administration excellence on fostering SMEs in EU countries. Amfiteatru
Economic, 17(39), 761–774.
Pirzada, K. (2016). Providers and users’ perception of voluntary need of human resource disclosure: A content analysis. Polish Journal of
Management Studies, 14(2) 232-242. http://doi.org/10.17512/pjms.2016.14.2.22
Romer, P. M. (1986). Increasing returns and long-run growth. Journal of Political Economy, 94(5), 1002–1037.
http://dx.doi.org/10.1086/261420
Roodman, D. (2009). A note on the theme of too many instruments. Oxford Bulletin of Economics and Statistics, 71(1).
https://doi.org/10.1111/j.1468-0084.2008.00542.x
Snowdon, B., & Vane, H. R. (2005). Modern macroeconomics. Edward Elgar Publishing Limited.
The World Bank Group. (2018a). World Bank analytical classifications. https://blogs.worldbank.org/opendata/new-country-classifications-
income-level-2019-2020
The World Bank Group. (2018b). Data catalog: World development indicators. https://datacatalog.worldbank.org/dataset/world-
development-indicators
The World Bank Group. (2019). Doing busines. http://www.doingbusiness.org
Wang, C. N., & Le, A. P. (2018). Application in international market selection for the export of goods: A case study in Vietnam.
Sustainability, 10(4621), 1–24. https://doi.org/10.3390/su10124621
Yacoub, Y., Lestari, N. (2019). Causality of Economic Growth and Openness in ASEAN-5, J. Bus. Econ. Review, 4(1) 01 – 09
https://doi.org/10.35609/jber.2019.4.1(1)
Acknowledgements
This research was supported in part by Universiti Teknologi MARA Melaka and Universitas Pendidikan Indonesia, under
2020 Teja’s International Matching Grant Scheme (Grant no: GSAT2020–13).
ENTREPRENEURSHIP AND SUSTAINABILITY ISSUES
ISSN 2345-0282 (online) http://jssidoi.org/jesi/
2021 Volume 8 Number 3 (March)
http://doi.org/10.9770/jesi.2021.8.3(38)
Make your research more visible, join the Twitter account of ENTREPRENEURSHIP AND SUSTAINABILITY ISSUES:
@Entrepr69728810
617
Nur Hayati ABD RAHMAN is a senior lecturer at the Faculty of Business and Management, Universiti Teknologi MARA Melaka,
Malaysia. Research interests: public finance; economic development; international economics; econometrics.
ORCID ID: orcid.org/0000-0002-1086-9792
Shafinar ISMAIL is the Professor of Finance at the Faculty of Business and Management, Universiti Teknologi MARA Melaka,
Malaysia. Research interests: personal finance; waqf.
ORCID ID: orcid.org/0000-0002-0339-0003
Eeng AHMAN is the Professor at the Faculty of Economics and Business Education, Universitas Pendidikan Indonesia, Bandung,
Indonesia. Research interests: economics; management.
ORCID ID: orcid.org/0000-0002-2606-5449
Aas NURASYIAH is a lecturer at the Faculty of Economics and Business Education, Universitas Pendidikan Indonesia, Bandung,
Indonesia. Research interests: Islamic finance, Islamic microfinance, economics.
ORCID ID: orcid.org/0000-0001-5746-3856
Neni Sri WULANDARI is a lecturer at the Faculty of Economics and Business Education, Universitas Pendidikan Indonesia, Bandung,
Indonesia. Research interests: Islamic finance, economics.
ORCID ID: orcid.org/0000-0003-3456-8342
Copyright © 2021 by author(s) and VsI Entrepreneurship and Sustainability Center
This work is licensed under the Creative Commons Attribution International License (CC BY).
http://creativecommons.org/licenses/by/4.0/
ENTREPRENEURSHIP AND SUSTAINABILITY ISSUES
ISSN 2345-0282 (online) http://jssidoi.org/jesi/
2021 Volume 8 Number 3 (March)
http://doi.org/10.9770/jesi.2021.8.3(39)
Publisher http://jssidoi.org/esc/home
618
FISCAL SUSTAINABILITY AND FISCAL RISK IN THE EU: FORECASTS AND CHALLENGES IN
TERMS OF COVID-19
Andrey Zahariev ¹, Anelia Radulova 2, Aleksandrina Aleksandrova3,
Mariana Petrova 4
1,2,3 D. A. Tsenov Academy of Economics, Em. Chakarov 2 Str., 5250 Svishtov, Bulgaria 4 St. Cyril and St. Methodius University of Veliko Tarnovo, T.Tarnovski 2 Str, 5000 Veliko Tarnovo, Bulgaria
E-mails: [email protected], [email protected], [email protected], 4* [email protected] (Corresponding author)
Received 20 September 2020; accepted 10 February 2021; published 30 March 2021
Abstract. This study focuses on examining the relationship between fiscal and debt sustainability indicators in EU Member States, based
on the multidimensional approach to estimating and forecasting different time horizons applied by the European Commission. The
relationship between fiscal sustainability and the numerical fiscal rules applied at national and supranational level in the context of the
Stability and Growth Pact has been established. The dynamics of medium-term risks in the Member States of the European Union for the
period 2015 - 2019 is traced. The main challenges to fiscal sustainability in the European space in the context of the COVID-19 pandemic
are outlined.
Keywords: fiscal policy; fiscal rules; debt; fiscal sustainability; fiscal risk; COVID-19
Reference to this paper should be made as follows: Zahariev, A., Radulova, A., Aleksandrova, A., Petrova, M. 2021. Fiscal sustainability
and fiscal risk in the EU: forecasts and challenges in terms of COVID-19. Entrepreneurship and Sustainability Issues, 8(3), 618-632.
http://doi.org/10.9770/jesi.2021.8.3(39)
JEL Classifications: E62, E63, G28, H62
ENTREPRENEURSHIP AND SUSTAINABILITY ISSUES
ISSN 2345-0282 (online) http://jssidoi.org/jesi/
2021 Volume 8 Number 3 (March)
http://doi.org/10.9770/jesi.2021.8.3(39) Make your research more visible, join the Twitter account of ENTREPRENEURSHIP AND SUSTAINABILITY ISSUES: @Entrepr6972881
619
1. Introduction
Fiscal sustainability as the ability of governments to sustain their current fiscal policies in the long run is largely
linked to the concept of fiscal risks. To the extent that the sustainability of public finances affects
intergenerational fairness and embodies principles that apply at all times and to all governments, regardless of
their current indebtedness, EU Member States need to adjust to unforeseen circumstances beyond the control of
the government, such as major changes in the business cycle or economic crises. The need to keep government
debt under control and to maintain the ability to issue debt when needed is also essential for the smooth
functioning of the economy.
Prior to the recent financial crisis, the indicators used to "measure" fiscal sustainability of EU Member States
provided an opportunity to assess long-term risk. Yet, subsequent events have shown that this is not enough.
Thus, there is a need to apply an approach that integrates the assessment of long-term sustainability with the
assessment of more immediate issues and risks by involvement of additional indicators for measuring medium-
term and short-term risk. In this line, to ensure a more efficient and coordinated fiscal policy within the European
Union, common fiscal sustainability standards were introduced for all Member States.
The purpose of this research is, based on an assessment of the nature of the fiscal policy and the fiscal rules
applied in the EU for its stabilization, to trace the dynamics of risk levels based on the multidimensional
approach applied by the EC which brings together in a synthetic way results on debt sustainability analysis
(DSA) and fiscal sustainability indicators. The last two paragraphs analyse the forecasts for fiscal sustainability
and level of fiscal risk in EU Member States in the COVID-19 pandemic situation and outline the trends in the
medium term.
2. Fiscal sustainability and fiscal rules in the EU
According to the OECD definition, fiscal sustainability is the ability of a government to maintain public finances
at a credible and serviceable position in the long run (Gov. at Glance, 2014). Ensuring long-term fiscal
sustainability requires accurate and continuous planning and correct forecasting of future values of public
revenues and liabilities, taking into account the economic situation, the factors influencing economic
development, etc. The unforeseen situation the governments of the EU Member States have faced since the
outbreak of the COVID-19 pandemic has created preconditions for deterioration in fiscal positions of the
countries, "a snow ball effect" in terms of the constantly growing debt levels and reduction of the potential for
economic growth. The spending of the EU Member States in the form of recovery measures, as well as the
unprecedented decline in economic activity in 2020, have posed a big challenge for governments to maintain
fiscal sustainability. Ensuring fiscal sustainability and overcoming this challenge are directly related.
Fiscal sustainability largely depends on the level of debt (Prodanov & Naydenov, 2020; Vasconcelos, 2021). The
question related to determining the maximum levels of government debt ratios is of interest for many economists
and policy makers. The European Union follows strict rules on optimal debt and deficit levels. The Maastricht
Treaty, concluded in 1992, set the requirements for keeping low levels of public debt and deficit while respecting
budgetary discipline as a guarantee for ensuring fiscal sustainability (Lilova et al., 2017; Mazzanti et al., 2020).
The next step towards compliance with fiscal discipline, supplementing and elaborating the provisions of the
Maastricht Treaty, the European Commission took in 1997 with the adoption of the Stability and Growth Pact.
Given the specifics of the fiscal systems of each Member State and the need to supplement existing treaties, the
ENTREPRENEURSHIP AND SUSTAINABILITY ISSUES
ISSN 2345-0282 (online) http://jssidoi.org/jesi/
2021 Volume 8 Number 3 (March)
http://doi.org/10.9770/jesi.2021.8.3(39) Make your research more visible, join the Twitter account of ENTREPRENEURSHIP AND SUSTAINABILITY ISSUES: @Entrepr6972881
620
so-called "Two-pack " and "Six-pack" - Revision of the Stability and Growth Pact in 2005, Treaty on Stability,
Coordination and Governance within the Economic and Monetary Union-European Fiscal Pact (2013) were
ratified. The introduction of increasingly restrictive measures and specific fiscal rules aims to achieve fiscal
sustainability and balance the needs for additional funding and public sector stability in the Member States.
Anderson, B. and Minarik, J. claim that the establishment of new fiscal rules must take into account not only the
levels of government debt and deficit, but also the measures applied in crisis situations for economic recovery and
growth and public credibility. Authors such as Aerts J. and Bizarro P. (Aerts & Bizarro, 2020), Onofrei M.
(Onofrei et al., 2020) and others call for the application of a new analytical approach to the framework for fiscal
governance and fiscal sustainability with a focus on government debt levels and the ability of governments to
service it. The COVID-19 economic shock in all Member States and the Spring 2020 European Economic
Forecast published in May 2020, which forecasts a new average European debt level of 103% for 2020, clearly
prove the need for a new approach to the fiscal frameworks of the countries and the fiscal instruments used.
The fiscal discipline in the EU is mainly the subject of empirical research and, to a lesser extent, of fundamental
theoretical formulations. A number of authors such as von Hagen (1991), Bayoumi and Eichengreen (1994),
Alesina and Bayoumi (1996), Bohn and Inman (1996), von Hagen and Eichengreen, (1996) in the mid-1990s
investigated the effectiveness of the fiscal rules used in the United States with the idea to "adapt" them to the
specifics of the euro area.
The efforts to ensure stability of the Economic and Monetary Union also requires the introduction of fiscal rules
in the EU Member States (Zahariev, 2012), which shifts the focus of research to Europe. The findings of the
empirical research in the last two decades have proved the need to establish fiscal rules with fixed numerical
values to provide for a balanced level of public finances in the long run. Today it is rarely disputable that the
effectiveness of fiscal results depends firstly on the type of rule and secondly on the mechanisms of influence in
case of "deviation" from the fixed numerical value.
The concept ‘fiscal rules’ is defined with precision by Kopits and Symansky (1998) as a permanent constraint on
fiscal policy, expressed in terms of a summary indicator of fiscal performance such as the government budget
deficit, borrowing, debt and others.
The European Commission has formulated four major categories of fiscal rules in force in EU Member States:
constraints to balance the government budget, the level of public debt, public expenditure and public revenue.
As envisaged in the European Commission regulations, the strengths of a fiscal constraint in Member States are
assessed according to the following criteria: legal basis for establishing the rule; the type of institution that
applies the rule; the presence of corrective mechanisms and sanctions for violations; media coverage of the rules
and their observance or non-compliance; a body responsible for establishing a deviation from the target.
Logically, most empirical research on fiscal discipline focuses on identifying the level of debt and the risk of
fiscal sustainability imbalances (Ayuso-i-Casals et al. 2009). Fewer are the rules on public expenditure and
revenue: 55% (of the 113 rules currently in force) aim at balancing government budgets and 25.44% at reducing
debt (Figure 1.). The expenditure rules introduced in the EU Member States constitute 16.67% of the total number
and revenue rules - 2.63%.
The supranational fiscal rules, which account for 61.6% (Figure 2), are based on the preventive and corrective
clauses in the Stability and Growth Pact, the effectiveness of which is directly dependent on the envisaged non-
compliance sanctions (Ayuso-i-Casals, Gonzalez Hernandez, Moulin and Turrini, 2009). The fiscal rules in force
at national level are largely in line with the provisions of Treaty on Stability, Coordination and Governance in the
Economic and Monetary Union (Comisión Europea, 2011), concluded in 2013. The main requirement is the
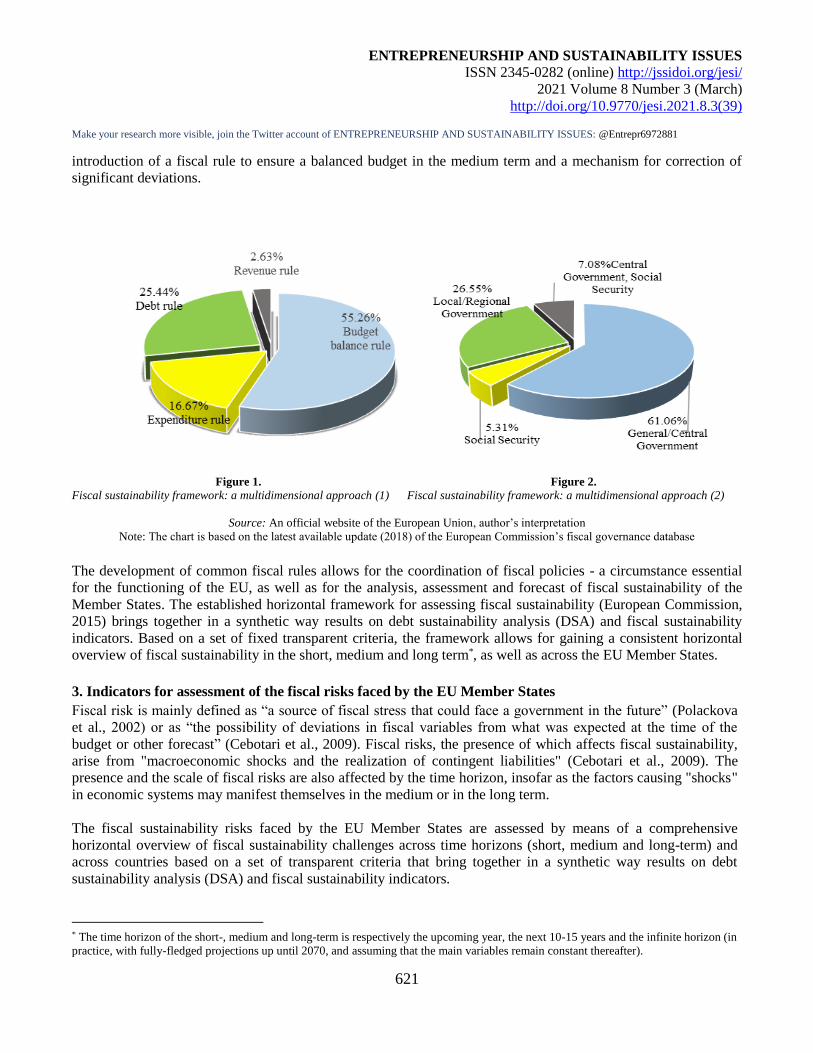
ENTREPRENEURSHIP AND SUSTAINABILITY ISSUES
ISSN 2345-0282 (online) http://jssidoi.org/jesi/
2021 Volume 8 Number 3 (March)
http://doi.org/10.9770/jesi.2021.8.3(39) Make your research more visible, join the Twitter account of ENTREPRENEURSHIP AND SUSTAINABILITY ISSUES: @Entrepr6972881
621
introduction of a fiscal rule to ensure a balanced budget in the medium term and a mechanism for correction of
significant deviations.
Figure 1. Figure 2.
Fiscal sustainability framework: a multidimensional approach (1) Fiscal sustainability framework: a multidimensional approach (2)
Source: An official website of the European Union, author’s interpretation
Note: The chart is based on the latest available update (2018) of the European Commission’s fiscal governance database
The development of common fiscal rules allows for the coordination of fiscal policies - a circumstance essential
for the functioning of the EU, as well as for the analysis, assessment and forecast of fiscal sustainability of the
Member States. The established horizontal framework for assessing fiscal sustainability (European Commission,
2015) brings together in a synthetic way results on debt sustainability analysis (DSA) and fiscal sustainability
indicators. Based on a set of fixed transparent criteria, the framework allows for gaining a consistent horizontal
overview of fiscal sustainability in the short, medium and long term*, as well as across the EU Member States.
3. Indicators for assessment of the fiscal risks faced by the EU Member States
Fiscal risk is mainly defined as “a source of fiscal stress that could face a government in the future” (Polackova
et al., 2002) or as “the possibility of deviations in fiscal variables from what was expected at the time of the
budget or other forecast” (Cebotari et al., 2009). Fiscal risks, the presence of which affects fiscal sustainability,
arise from "macroeconomic shocks and the realization of contingent liabilities" (Cebotari et al., 2009). The
presence and the scale of fiscal risks are also affected by the time horizon, insofar as the factors causing "shocks"
in economic systems may manifest themselves in the medium or in the long term.
The fiscal sustainability risks faced by the EU Member States are assessed by means of a comprehensive
horizontal overview of fiscal sustainability challenges across time horizons (short, medium and long-term) and
across countries based on a set of transparent criteria that bring together in a synthetic way results on debt
sustainability analysis (DSA) and fiscal sustainability indicators.
* The time horizon of the short-, medium and long-term is respectively the upcoming year, the next 10-15 years and the infinite horizon (in
practice, with fully-fledged projections up until 2070, and assuming that the main variables remain constant thereafter).
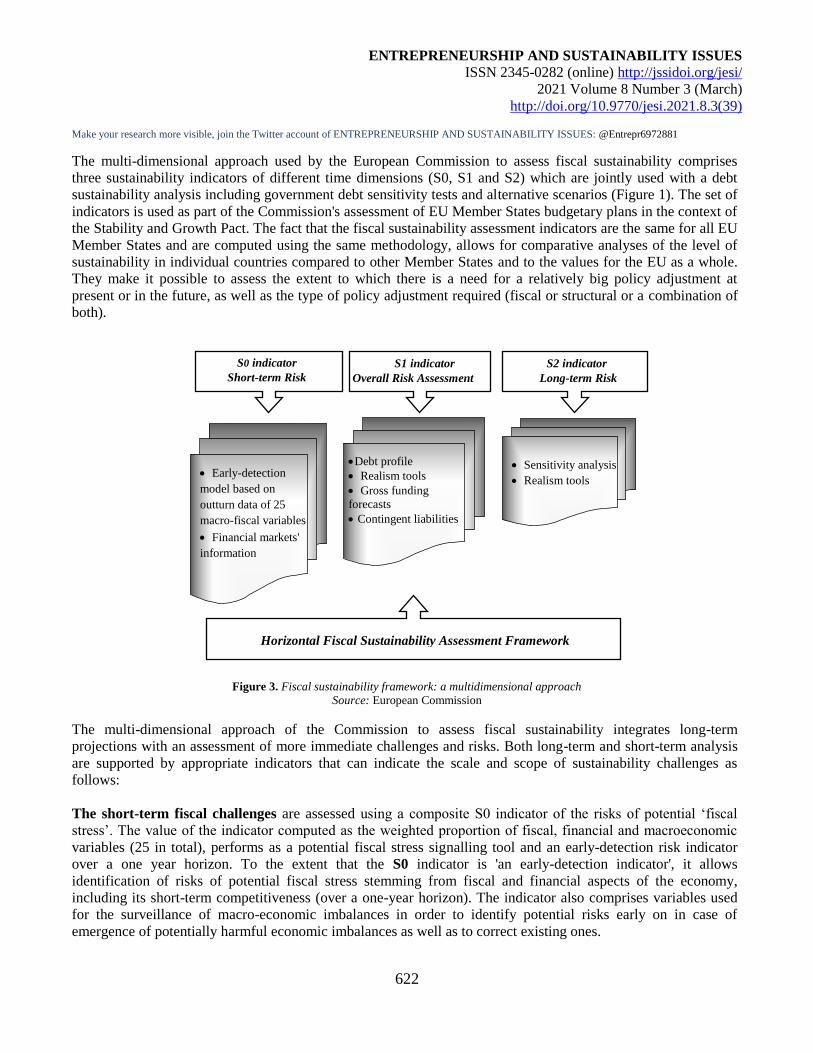
ENTREPRENEURSHIP AND SUSTAINABILITY ISSUES
ISSN 2345-0282 (online) http://jssidoi.org/jesi/
2021 Volume 8 Number 3 (March)
http://doi.org/10.9770/jesi.2021.8.3(39) Make your research more visible, join the Twitter account of ENTREPRENEURSHIP AND SUSTAINABILITY ISSUES: @Entrepr6972881
622
Sensitivity analysis
Realism tools
Debt profile
Realism tools
Gross funding
forecasts
Contingent liabilities
S0 indicator
Short-term Risk
Early-detection
model based on
outturn data of 25
macro-fiscal variables
Financial markets'
information
S2 indicator
Long-term Risk
S1 indicator
Overall Risk Assessment
Horizontal Fiscal Sustainability Assessment Framework
The multi-dimensional approach used by the European Commission to assess fiscal sustainability comprises
three sustainability indicators of different time dimensions (S0, S1 and S2) which are jointly used with a debt
sustainability analysis including government debt sensitivity tests and alternative scenarios (Figure 1). The set of
indicators is used as part of the Commission's assessment of EU Member States budgetary plans in the context of
the Stability and Growth Pact. The fact that the fiscal sustainability assessment indicators are the same for all EU
Member States and are computed using the same methodology, allows for comparative analyses of the level of
sustainability in individual countries compared to other Member States and to the values for the EU as a whole.
They make it possible to assess the extent to which there is a need for a relatively big policy adjustment at
present or in the future, as well as the type of policy adjustment required (fiscal or structural or a combination of
both).
Figure 3. Fiscal sustainability framework: a multidimensional approach
Source: European Commission
The multi-dimensional approach of the Commission to assess fiscal sustainability integrates long-term
projections with an assessment of more immediate challenges and risks. Both long-term and short-term analysis
are supported by appropriate indicators that can indicate the scale and scope of sustainability challenges as
follows:
The short-term fiscal challenges are assessed using a composite S0 indicator of the risks of potential ‘fiscal
stress’. The value of the indicator computed as the weighted proportion of fiscal, financial and macroeconomic
variables (25 in total), performs as a potential fiscal stress signalling tool and an early-detection risk indicator
over a one year horizon. To the extent that the S0 indicator is 'an early-detection indicator', it allows
identification of risks of potential fiscal stress stemming from fiscal and financial aspects of the economy,
including its short-term competitiveness (over a one-year horizon). The indicator also comprises variables used
for the surveillance of macro-economic imbalances in order to identify potential risks early on in case of
emergence of potentially harmful economic imbalances as well as to correct existing ones.
ENTREPRENEURSHIP AND SUSTAINABILITY ISSUES
ISSN 2345-0282 (online) http://jssidoi.org/jesi/
2021 Volume 8 Number 3 (March)
http://doi.org/10.9770/jesi.2021.8.3(39) Make your research more visible, join the Twitter account of ENTREPRENEURSHIP AND SUSTAINABILITY ISSUES: @Entrepr6972881
623
The medium-term fiscal challenges are assessed using a modified S1 indicator (fiscal gap), which
measures the fiscal adjustment required to bring debt ratios to 60% of GDP in 15 years, including future costs of
ageing.
The long-term fiscal challenges are assessed based on the use of the S2 indicator, which measures the
‘gap’ in the long-term sustainability. The values of the indicator determine the fiscal adjustment of the structural
primary balance required to meet the debt ratio constraint over an infinite period, including ageing costs
projections. Unlike the S1 indicator, the S2 indicator by definition does not provide for a debt upper
limitation as it is computed over an infinite horizon. Thus, the S2 indicator does not take into account the
adjustment required to reduce debt below 60% of GDP in accordance with the provisions of the Stability and
Growth Pact for countries with a high debt burden. The higher the values of the S2 sustainability indicator, the
more fiscal adjustments and adjustment of the risk of fiscal instability are required.
The multi-dimensional analysis of fiscal risks the EU Member States face aims: first, to identify the type and the
intensity of the challenges to fiscal sustainability and, second, comparing the relative present and future deficit
and debt values and future ageing costs to pursue appropriate corrective policies.
4. Medium-term assessment of the fiscal risk of the EU Member States for the period 2015-2019.
The increase in the level of government debt in the public and private sectors of a number of EU countries,
especially following the 2008 global economic and financial crisis, is one of the main risks to the fiscal
sustainability of the EU Member States. In the macro-economic context, serious challenges to easing government
debt burden in the EU pose the very low inflation and the not very high GDP growth, which only contributes to a
reduction in the relative debt-to-GDP ratio, but not to a real reduction in the size of the debt (Zahariev, et al.,
2020a). The only positive effect on government debt management is the fact that the cost of government debt
financing remains low, reflecting the historically low interest rate.
The problem of the sustainability of public finances in the EA and in the EU as a whole was brought to the fore
by the significant increase in the level of debt due to the economic and financial crisis. Compared to 2007, it was
28.9% up in 2014 (for the EU-28 countries) and only in 2015 began to decline gradually, reaching a level of
80.4% in 2018. In line with the main provisions of the Stability and Growth Pact, the European Commission
makes regular assessments (twice a year) of the degree of fiscal risk in the short, medium and long term. The
findings of the Commission, presented in five annual reports (2016-2020) on the fiscal sustainability risks in the
short run (the forthcoming year) – S0 indicator, confirm that none of the EU Member States has been exposed to
high risk after 2015, the risks of short-term fiscal stress being significantly lower compared to the situation in
2009 (the first crisis year). The assessment of the medium-term challenges to sustainability, based on DSA and
S1 indicator analysis and both deterministic and stochastic debt projections over a 10-year horizon in five
consecutive years (2015 – 2019), allows for outlining the trends in the situation and the expectations on the fiscal
sustainability of the EU Member States (Table 1).
For nine of the Member States: Bulgaria, Czech Republic, Denmark, Germany, Estonia, Latvia, Luxembourg,
Malta and Sweden, the levels of fiscal risk on both indicators (DSA and S1) are low for the entire analysed
period. The risk for Ireland, Croatia, Hungary, Cyprus, Latvia, the Netherlands, Austria, Poland and Slovenia
(countries that "started" with relatively high debt-to-GDP ratios in 2014) is reported as low medium for 2019
(104.4% for Ireland, 109.2% for Latvia, 83.3% for Slovenia). With the exception of Poland and the Netherlands,
states that managed to "lower" the debt level below 60% (the EU Treaty reference value) at the end of the
analysed period, the other countries maintained levels higher than the reference values, with markedly declining
trend over a horizon by 2030, including future aging costs. Countries are deemed to face high medium-term
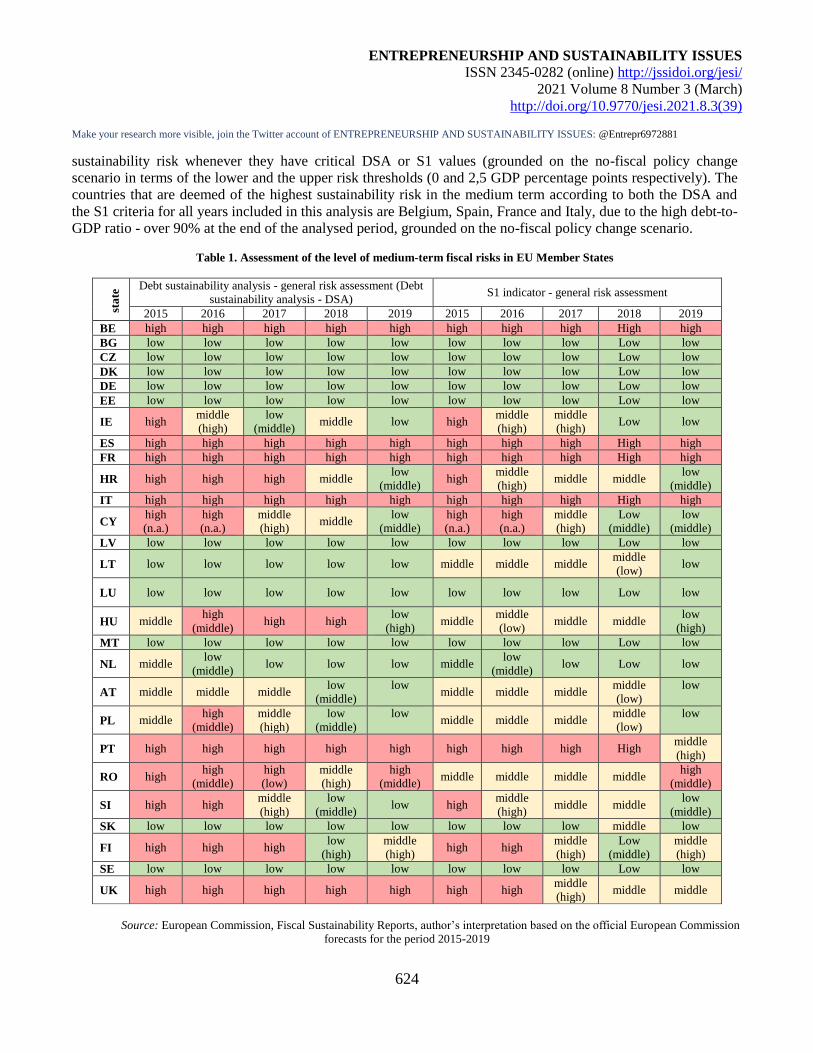
ENTREPRENEURSHIP AND SUSTAINABILITY ISSUES
ISSN 2345-0282 (online) http://jssidoi.org/jesi/
2021 Volume 8 Number 3 (March)
http://doi.org/10.9770/jesi.2021.8.3(39) Make your research more visible, join the Twitter account of ENTREPRENEURSHIP AND SUSTAINABILITY ISSUES: @Entrepr6972881
624
sustainability risk whenever they have critical DSA or S1 values (grounded on the no-fiscal policy change
scenario in terms of the lower and the upper risk thresholds (0 and 2,5 GDP percentage points respectively). The
countries that are deemed of the highest sustainability risk in the medium term according to both the DSA and
the S1 criteria for all years included in this analysis are Belgium, Spain, France and Italy, due to the high debt-to-
GDP ratio - over 90% at the end of the analysed period, grounded on the no-fiscal policy change scenario.
Table 1. Assessment of the level of medium-term fiscal risks in EU Member States
sta
te Debt sustainability analysis - general risk assessment (Debt
sustainability analysis - DSA) S1 indicator - general risk assessment
2015 2016 2017 2018 2019 2015 2016 2017 2018 2019
BE high high high high high high high high High high
BG low low low low low low low low Low low
CZ low low low low low low low low Low low
DK low low low low low low low low Low low
DE low low low low low low low low Low low
EE low low low low low low low low Low low
IE high middle
(high)
low
(middle) middle low high
middle
(high)
middle
(high) Low low
ES high high high high high high high high High high
FR high high high high high high high high High high
HR high high high middle low
(middle) high
middle
(high) middle middle
low
(middle)
IT high high high high high high high high High high
CY high
(n.a.)
high
(n.a.)
middle
(high) middle
low
(middle)
high
(n.a.)
high
(n.a.)
middle
(high)
Low
(middle)
low
(middle)
LV low low low low low low low low Low low
LT low low low low low middle middle middle middle
(low) low
LU low low low low low low low low Low low
HU middle high
(middle) high high
low
(high) middle
middle
(low) middle middle
low
(high)
MT low low low low low low low low Low low
NL middle low
(middle) low low low middle
low
(middle) low Low low
AT middle middle middle low
(middle)
low
middle middle middle
middle
(low)
low
PL middle high
(middle)
middle
(high)
low
(middle)
low
middle middle middle
middle
(low)
low
PT high high high high high high high high High middle
(high)
RO high high
(middle)
high
(low)
middle
(high)
high
(middle) middle middle middle middle
high
(middle)
SI high high middle
(high)
low
(middle) low high
middle
(high) middle middle
low
(middle)
SK low low low low low low low low middle low
FI high high high low
(high)
middle
(high) high high
middle
(high)
Low
(middle)
middle
(high)
SE low low low low low low low low Low low
UK high high high high high high high middle
(high) middle middle
Source: European Commission, Fiscal Sustainability Reports, author’s interpretation based on the official European Commission
forecasts for the period 2015-2019
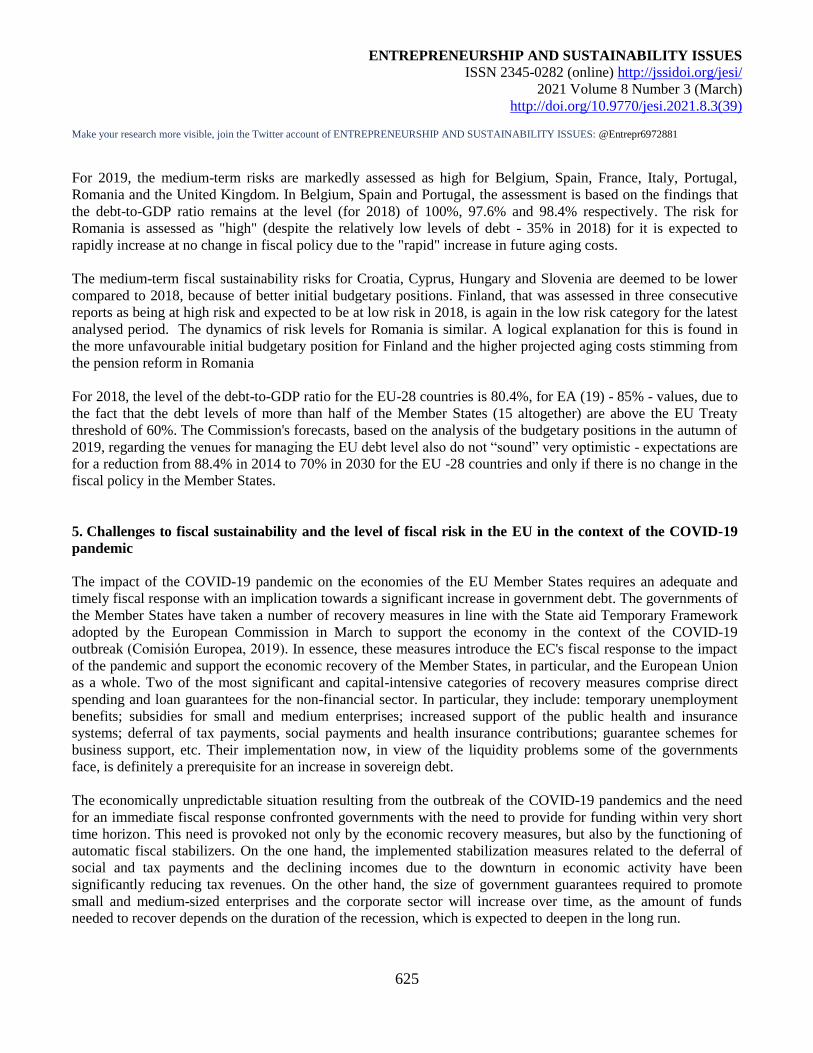
ENTREPRENEURSHIP AND SUSTAINABILITY ISSUES
ISSN 2345-0282 (online) http://jssidoi.org/jesi/
2021 Volume 8 Number 3 (March)
http://doi.org/10.9770/jesi.2021.8.3(39) Make your research more visible, join the Twitter account of ENTREPRENEURSHIP AND SUSTAINABILITY ISSUES: @Entrepr6972881
625
For 2019, the medium-term risks are markedly assessed as high for Belgium, Spain, France, Italy, Portugal,
Romania and the United Kingdom. In Belgium, Spain and Portugal, the assessment is based on the findings that
the debt-to-GDP ratio remains at the level (for 2018) of 100%, 97.6% and 98.4% respectively. The risk for
Romania is assessed as "high" (despite the relatively low levels of debt - 35% in 2018) for it is expected to
rapidly increase at no change in fiscal policy due to the "rapid" increase in future aging costs.
The medium-term fiscal sustainability risks for Croatia, Cyprus, Hungary and Slovenia are deemed to be lower
compared to 2018, because of better initial budgetary positions. Finland, that was assessed in three consecutive
reports as being at high risk and expected to be at low risk in 2018, is again in the low risk category for the latest
analysed period. The dynamics of risk levels for Romania is similar. A logical explanation for this is found in
the more unfavourable initial budgetary position for Finland and the higher projected aging costs stimming from
the pension reform in Romania
For 2018, the level of the debt-to-GDP ratio for the EU-28 countries is 80.4%, for EA (19) - 85% - values, due to
the fact that the debt levels of more than half of the Member States (15 altogether) are above the EU Treaty
threshold of 60%. The Commission's forecasts, based on the analysis of the budgetary positions in the autumn of
2019, regarding the venues for managing the EU debt level also do not “sound” very optimistic - expectations are
for a reduction from 88.4% in 2014 to 70% in 2030 for the EU -28 countries and only if there is no change in the
fiscal policy in the Member States.
5. Challenges to fiscal sustainability and the level of fiscal risk in the EU in the context of the COVID-19
pandemic
The impact of the COVID-19 pandemic on the economies of the EU Member States requires an adequate and
timely fiscal response with an implication towards a significant increase in government debt. The governments of
the Member States have taken a number of recovery measures in line with the State aid Temporary Framework
adopted by the European Commission in March to support the economy in the context of the COVID-19
outbreak (Comisión Europea, 2019). In essence, these measures introduce the EC's fiscal response to the impact
of the pandemic and support the economic recovery of the Member States, in particular, and the European Union
as a whole. Two of the most significant and capital-intensive categories of recovery measures comprise direct
spending and loan guarantees for the non-financial sector. In particular, they include: temporary unemployment
benefits; subsidies for small and medium enterprises; increased support of the public health and insurance
systems; deferral of tax payments, social payments and health insurance contributions; guarantee schemes for
business support, etc. Their implementation now, in view of the liquidity problems some of the governments
face, is definitely a prerequisite for an increase in sovereign debt.
The economically unpredictable situation resulting from the outbreak of the COVID-19 pandemics and the need
for an immediate fiscal response confronted governments with the need to provide for funding within very short
time horizon. This need is provoked not only by the economic recovery measures, but also by the functioning of
automatic fiscal stabilizers. On the one hand, the implemented stabilization measures related to the deferral of
social and tax payments and the declining incomes due to the downturn in economic activity have been
significantly reducing tax revenues. On the other hand, the size of government guarantees required to promote
small and medium-sized enterprises and the corporate sector will increase over time, as the amount of funds
needed to recover depends on the duration of the recession, which is expected to deepen in the long run.
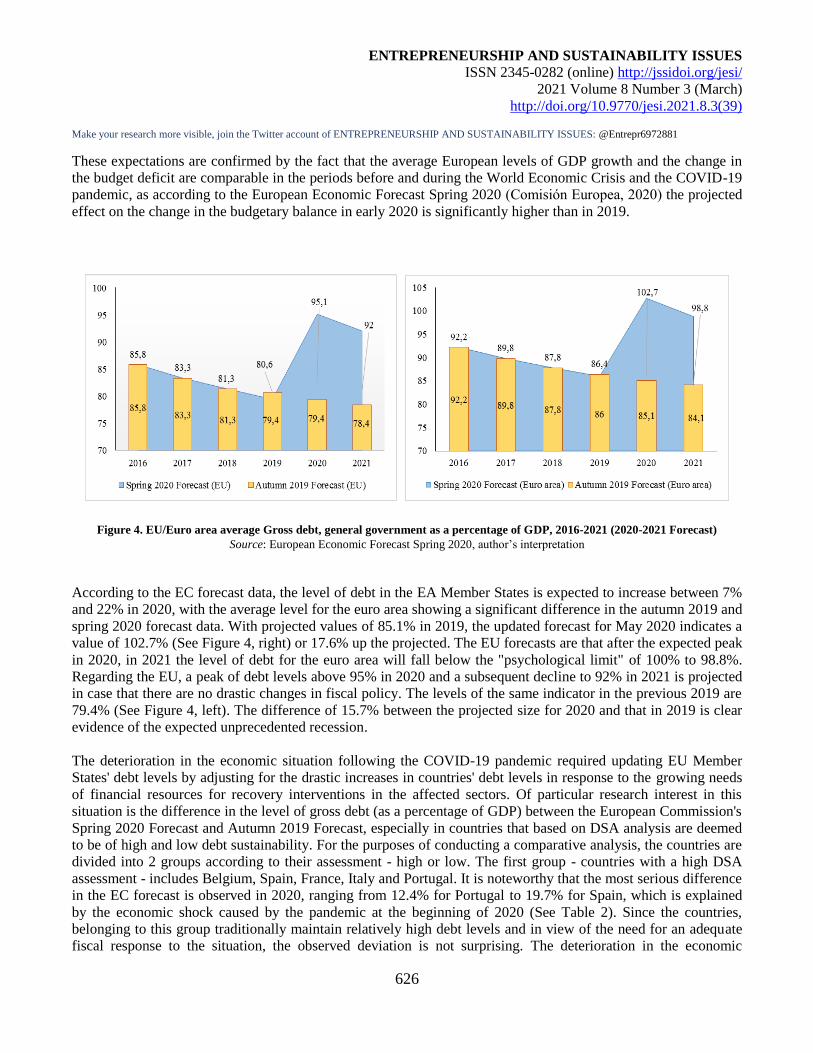
ENTREPRENEURSHIP AND SUSTAINABILITY ISSUES
ISSN 2345-0282 (online) http://jssidoi.org/jesi/
2021 Volume 8 Number 3 (March)
http://doi.org/10.9770/jesi.2021.8.3(39) Make your research more visible, join the Twitter account of ENTREPRENEURSHIP AND SUSTAINABILITY ISSUES: @Entrepr6972881
626
These expectations are confirmed by the fact that the average European levels of GDP growth and the change in
the budget deficit are comparable in the periods before and during the World Economic Crisis and the COVID-19
pandemic, as according to the European Economic Forecast Spring 2020 (Comisión Europea, 2020) the projected
effect on the change in the budgetary balance in early 2020 is significantly higher than in 2019.
Figure 4. EU/Euro area average Gross debt, general government as a percentage of GDP, 2016-2021 (2020-2021 Forecast)
Source: European Economic Forecast Spring 2020, author’s interpretation
According to the EC forecast data, the level of debt in the EA Member States is expected to increase between 7%
and 22% in 2020, with the average level for the euro area showing a significant difference in the autumn 2019 and
spring 2020 forecast data. With projected values of 85.1% in 2019, the updated forecast for May 2020 indicates a
value of 102.7% (See Figure 4, right) or 17.6% up the projected. The EU forecasts are that after the expected peak
in 2020, in 2021 the level of debt for the euro area will fall below the "psychological limit" of 100% to 98.8%.
Regarding the EU, a peak of debt levels above 95% in 2020 and a subsequent decline to 92% in 2021 is projected
in case that there are no drastic changes in fiscal policy. The levels of the same indicator in the previous 2019 are
79.4% (See Figure 4, left). The difference of 15.7% between the projected size for 2020 and that in 2019 is clear
evidence of the expected unprecedented recession.
The deterioration in the economic situation following the COVID-19 pandemic required updating EU Member
States' debt levels by adjusting for the drastic increases in countries' debt levels in response to the growing needs
of financial resources for recovery interventions in the affected sectors. Of particular research interest in this
situation is the difference in the level of gross debt (as a percentage of GDP) between the European Commission's
Spring 2020 Forecast and Autumn 2019 Forecast, especially in countries that based on DSA analysis are deemed
to be of high and low debt sustainability. For the purposes of conducting a comparative analysis, the countries are
divided into 2 groups according to their assessment - high or low. The first group - countries with a high DSA
assessment - includes Belgium, Spain, France, Italy and Portugal. It is noteworthy that the most serious difference
in the EC forecast is observed in 2020, ranging from 12.4% for Portugal to 19.7% for Spain, which is explained
by the economic shock caused by the pandemic at the beginning of 2020 (See Table 2). Since the countries,
belonging to this group traditionally maintain relatively high debt levels and in view of the need for an adequate
fiscal response to the situation, the observed deviation is not surprising. The deterioration in the economic
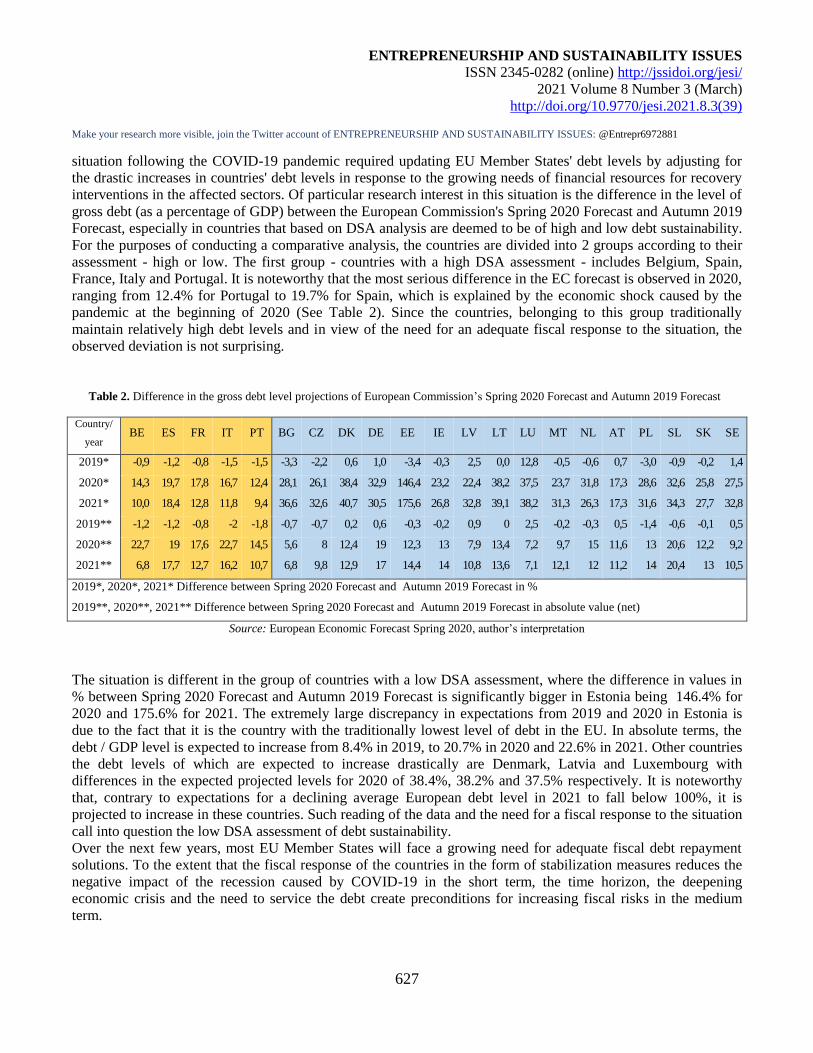
ENTREPRENEURSHIP AND SUSTAINABILITY ISSUES
ISSN 2345-0282 (online) http://jssidoi.org/jesi/
2021 Volume 8 Number 3 (March)
http://doi.org/10.9770/jesi.2021.8.3(39) Make your research more visible, join the Twitter account of ENTREPRENEURSHIP AND SUSTAINABILITY ISSUES: @Entrepr6972881
627
situation following the COVID-19 pandemic required updating EU Member States' debt levels by adjusting for
the drastic increases in countries' debt levels in response to the growing needs of financial resources for recovery
interventions in the affected sectors. Of particular research interest in this situation is the difference in the level of
gross debt (as a percentage of GDP) between the European Commission's Spring 2020 Forecast and Autumn 2019
Forecast, especially in countries that based on DSA analysis are deemed to be of high and low debt sustainability.
For the purposes of conducting a comparative analysis, the countries are divided into 2 groups according to their
assessment - high or low. The first group - countries with a high DSA assessment - includes Belgium, Spain,
France, Italy and Portugal. It is noteworthy that the most serious difference in the EC forecast is observed in 2020,
ranging from 12.4% for Portugal to 19.7% for Spain, which is explained by the economic shock caused by the
pandemic at the beginning of 2020 (See Table 2). Since the countries, belonging to this group traditionally
maintain relatively high debt levels and in view of the need for an adequate fiscal response to the situation, the
observed deviation is not surprising.
Table 2. Difference in the gross debt level projections of European Commission’s Spring 2020 Forecast and Autumn 2019 Forecast
Country/
year BE ES FR IT PT BG CZ DK DE EE IE LV LT LU MT NL AT PL SL SK SE
2019* -0,9 -1,2 -0,8 -1,5 -1,5 -3,3 -2,2 0,6 1,0 -3,4 -0,3 2,5 0,0 12,8 -0,5 -0,6 0,7 -3,0 -0,9 -0,2 1,4
2020* 14,3 19,7 17,8 16,7 12,4 28,1 26,1 38,4 32,9 146,4 23,2 22,4 38,2 37,5 23,7 31,8 17,3 28,6 32,6 25,8 27,5
2021* 10,0 18,4 12,8 11,8 9,4 36,6 32,6 40,7 30,5 175,6 26,8 32,8 39,1 38,2 31,3 26,3 17,3 31,6 34,3 27,7 32,8
2019** -1,2 -1,2 -0,8 -2 -1,8 -0,7 -0,7 0,2 0,6 -0,3 -0,2 0,9 0 2,5 -0,2 -0,3 0,5 -1,4 -0,6 -0,1 0,5
2020** 22,7 19 17,6 22,7 14,5 5,6 8 12,4 19 12,3 13 7,9 13,4 7,2 9,7 15 11,6 13 20,6 12,2 9,2
2021** 6,8 17,7 12,7 16,2 10,7 6,8 9,8 12,9 17 14,4 14 10,8 13,6 7,1 12,1 12 11,2 14 20,4 13 10,5
2019*, 2020*, 2021* Difference between Spring 2020 Forecast and Autumn 2019 Forecast in %
2019**, 2020**, 2021** Difference between Spring 2020 Forecast and Autumn 2019 Forecast in absolute value (net)
Source: European Economic Forecast Spring 2020, author’s interpretation
The situation is different in the group of countries with a low DSA assessment, where the difference in values in
% between Spring 2020 Forecast and Autumn 2019 Forecast is significantly bigger in Estonia being 146.4% for
2020 and 175.6% for 2021. The extremely large discrepancy in expectations from 2019 and 2020 in Estonia is
due to the fact that it is the country with the traditionally lowest level of debt in the EU. In absolute terms, the
debt / GDP level is expected to increase from 8.4% in 2019, to 20.7% in 2020 and 22.6% in 2021. Other countries
the debt levels of which are expected to increase drastically are Denmark, Latvia and Luxembourg with
differences in the expected projected levels for 2020 of 38.4%, 38.2% and 37.5% respectively. It is noteworthy
that, contrary to expectations for a declining average European debt level in 2021 to fall below 100%, it is
projected to increase in these countries. Such reading of the data and the need for a fiscal response to the situation
call into question the low DSA assessment of debt sustainability.
Over the next few years, most EU Member States will face a growing need for adequate fiscal debt repayment
solutions. To the extent that the fiscal response of the countries in the form of stabilization measures reduces the
negative impact of the recession caused by COVID-19 in the short term, the time horizon, the deepening
economic crisis and the need to service the debt create preconditions for increasing fiscal risks in the medium
term.
ENTREPRENEURSHIP AND SUSTAINABILITY ISSUES
ISSN 2345-0282 (online) http://jssidoi.org/jesi/
2021 Volume 8 Number 3 (March)
http://doi.org/10.9770/jesi.2021.8.3(39) Make your research more visible, join the Twitter account of ENTREPRENEURSHIP AND SUSTAINABILITY ISSUES: @Entrepr6972881
628
6. The “new normality” of deficit financing for governmental support to the business under COVID-19
framework
The current COVID-19 crisis has characteristics never seen before because many sectors of the economy have
responded to it by restructuring and changing the way they operate and the goals they pursue (Terziev, 2019). The
global interaction of producers and traders in supply chains (Laktionova, Dobrovolskyi, Karpova, & Zahariev,
2019) will have a cascading effect on the financial performance of all businesses in the supply chain. Moreover,
the COVID-19 crisis has brought to the fore the demand for quality medical services. Thus, companies related to
the pharmaceutical and healthcare sectors are subject to increased interest from the capital market. The limiting
factor for such businesses as well as for the healthcare sector in general seems to be the scarcity of skilled
healthcare specialists (Adamov, et al., 2010) rather than the shortage of drugs or hospital beds.
The changing conditions led to new risks, including all related to the traditional risk-free investment instruments
issued by governments of the EU Member States (Zahariev, et al., 2020a) and devaluation of assets (Prodanov &
Pavlov, 2016), currencies (Kostov, 2016) and oil as well (Zahariev & Kostov, 2016). These changes are not
likely to be transient but to remain in effect even after the crisis is over. This situation is often referred to as "new
normality." It can therefore be argued that benchmarking based on government securities will be even more non-
applicable in relation to economic recovery due to fiscal policy of EU and Member States to support the business
with deficit financing instruments. The entire markets have been able to adapt to this "new normality", but all
traditional valuation and business models, based on risk-free rate of return (T-Bills related), will be more difficult
to apply due to their many assumptions, expected parameters and obvious covariance of business ingoing cash
flow from governmental COVID-19 programs and deficit financing of those programs. The “new normality”
requires management goals (Terziev, 2020). In such situations, many public companies and banking institutions
face the risk of persistent negative performance and, eventually, bankruptcy (Zahariev, et al., 2020b). On April 9,
2020 the Bulgarian National Bank Governing Council approved the submitted by the Association of Banks in
Bulgaria draft Procedure for Deferral and Settlement of Liabilities Payable to Banks and their Subsidiaries -
Financial Institutions in relation to the state of emergency enforced by the National Assembly on 13 March 2020.
Once approved, the document constitutes a private moratoria within the meaning of the European Banking
Authority (EBA) Guidelines on treatment of public and private moratoria in light of COVID-19 (EBA / GL /
2020/02). As of June 30, 2020, a total of 118,584 claims for liabilities with a gross carrying value of EUR 5
billion were submitted under the Procedure for deferral and settlement of liabilities payable to banks and their
subsidiaries - financial institutions (Zahariev, et al., 2020b). Of these, 98,499 were approved for EUR 4.15 billion.
According to the first published data, the profit of the banking system of Bulgaria for 1H2020 is EUR 263.32
million, against EUR 469.4 million for the first six months of 2019 (BNB, 2020).
Above data suggests that the business failure scenario is very possible even if business entities have insured their
profits with sound insurance intermediaries (Zahariev, et al., 2020c). The findings are considered valid not only
for the EU Member States, but also for a country with advancement in the research on the development of a
COVID-19 vaccine as Russia, where the public deficit on national and regional budget level is part of the “new
normality” (Sabitova, Shavaleyeva, Lizunova, Khairullova, & Zahariev, 2020).
Conclusion
The European Commission's multidimensional approach to conducting a systematic and harmonised analysis of
the sustainability of public debt for EU Member States and assessing fiscal risk levels in the short, medium and
long term provides key information for regular budgetary surveillance under the Stability and Growth Pact, the
ENTREPRENEURSHIP AND SUSTAINABILITY ISSUES
ISSN 2345-0282 (online) http://jssidoi.org/jesi/
2021 Volume 8 Number 3 (March)
http://doi.org/10.9770/jesi.2021.8.3(39) Make your research more visible, join the Twitter account of ENTREPRENEURSHIP AND SUSTAINABILITY ISSUES: @Entrepr6972881
629
European Semester and the Europe 2020 strategy. The assessment criteria applied in the methodology make it
possible to identify "vulnerable" countries in terms of public debt sustainability. All this by no means exhausts
the obligations of the EU Member States to interpret the quantitative data and the related risk assessments for
their "use" in the conduct of fiscal policy in the context of the individual country specifics. Providing for
sufficient fiscal space to "deal" with adverse macroeconomic situations within the economic cycle remains one of
the most serious challenges that the fiscal policy of a Member State and of the EU as a whole face.
In recent years, it has become increasingly supported that „countries can sustainably serve different levels of
debt“ (Constâncio, 2020) and this largely depends on their fiscal space. According to authors such as Perote
(Briceño & Perote, 2020), H., Navarro Ortiz, J. (Navarro-Ortiz & Sapena, 2020) respecting fiscal responsibility
and avoiding excessive deficits is an important "first step" in ensuring fiscal sustainability, but substantial reform
is needed in the fiscal rules implemented at European Union level. This claim is substantiated by the fact that in
recent decades’ fiscal policy within the EU has been limited to a rather passive manifestation, namely to the
establishment of fiscal sustainability through compliance with deficit and debt limits, which resulted in the
impossibility of adequate fiscal response to the debt crisis in the period 2008-2010. The discussion on the
necessary reforms in the fiscal framework for the governance of the union is even more relevant and urgent at
present, having in mind the unprecedented economic crisis the European economy is in since the outbreak of the
COVID-19 pandemic.
Acknowledgement
This research was supported by the project, which has received funding from the The National Science Fund at
the Bulgarian Ministry of Education and Science, Funding Competition for financial support for projects of
junior basic researchers and postdocs – 2019, No. КП-06 М35/5 from 18/12/2019, “Fiscal discipline and/or
growing the fiscal capacity of the Republic of Bulgaria?”, Project coordinator: Aleksandrina Aleksandrova,
Researcher, PhD
References
Adamov, V. et al., 2010. Human resources of the health system in Republic of Bulgaria. Cahiers de sociologie et de démographie
médicales, 50 (1), 6-120, PMID: 20345082
Aerts, J., & Bizarro, P. (2020). The reform of the European Stability Mechanism. Capital Markets Law Journal, 15(2), 159–174.
https://doi.org/10.1093/cmlj/kmaa001
Anderson, B. and J. Minarik (2006), "Design Choices for Fiscal Policy Rules", OECD Journal on Budgeting, vol. 5/4,
https://doi.org/10.1787/budget-v5-art25-en.
Audretsch, D.B., & Feldman, M. (1996). Innovative Clusters and the Industry Life Cycle. Review of Industrial Organization, 11(2), 253–
273. http://dx.doi.org/10.1007/BF00157670
Ayuso-i-Casals J., Hernandez D.G., Moulin L., Turrini A. (2009) Beyond the SGP: Features and Effects of EU National-Level Fiscal
Rules. In: Ayuso-i-Casals J., Deroose S., Flores E., Moulin L. (eds) Policy Instruments for Sound Fiscal Policies. Finance and Capital
Markets Series. Palgrave Macmillan, London. https://doi.org/10.1057/9780230271791_10
BNB, 2020. BNB statistics, s.l.: s.n.
ENTREPRENEURSHIP AND SUSTAINABILITY ISSUES
ISSN 2345-0282 (online) http://jssidoi.org/jesi/
2021 Volume 8 Number 3 (March)
http://doi.org/10.9770/jesi.2021.8.3(39) Make your research more visible, join the Twitter account of ENTREPRENEURSHIP AND SUSTAINABILITY ISSUES: @Entrepr6972881
630
Briceño, H. R., & Perote, J. (2020). Determinants of the public debt in the Eurozone and its sustainability amid the COVID-19 pandemic.
Sustainability (Switzerland), 12(16). https://doi.org/10.3390/su12166456
Cebotari Aliona, (2008): Fiscal risks: sources, disclosure, and management/Fiscal Affairs Dept.; editors—Washington, DC: International
Monetary Fund, 2008. https://www.imf.org/external/pubs/ft/dp/2009/dp0901.pdf
Cebotari, Aliona, (2009): Fiscal Risks: Sources, Disclosure, and Management; Departmental paper 09/01; IMF Fiscal Affairs Department;
2009. https://www.imf.org/en/Publications/Departmental-Papers-Policy-Papers/Issues
Comisión Europea. (2011). TREATY ON STABILITY, COORDINATION AND GOVERNANCE IN THE ECONOMIC AND MONETARY
UNION. https://eur-lex.europa.eu/legal-content/EN/TXT/PDF/?uri=CELEX:42012A0302(01)&from=BG
Comisión Europea. (2019). Temporary Framework for State aid measures to support the economy in the current COVID-19 outbreak.
https://ec.europa.eu/competition/state_aid/what_is_new/sa_covid19_temporary-framework.pdf
Comisión Europea. (2020). Spring 2020 European Economic Forecast EUROPEAN ECONOMY (Vol. 8014, Issue May).
https://doi.org/10.2765/788367
Constâncio, V. (2020). The Return of Fiscal Policy and the Euro Area Fiscal Rule. Comparative Economic Studies, 62(3), 358–372.
https://doi.org/10.1057/s41294-020-00122-3
European Commission. (2015). Fiscal Sustainability Report 2015 (Vol. 8014, Issue January). https://doi.org/10.2765/7398
European Communities. (2006). Nová definice malých a středních podniků. Brussels: European Communities. Retrieved October 9, 2014,
from http://ec.europa.eu/enterprise/policies/sme/files/sme_definition/sme_user_guide_cs.pdf
Government at a Glance. (2014). In Government at a Glance. https://doi.org/10.1787/9789264209480-en
Kostov, D., 2016. A new yuan or a new monetary system. Economic Archive, LXIX(2), pp. 68-90. https://www2.uni-
svishtov.bg/NSArhiv/title.asp?lang=en&title=559
Kopits, G. & A. Symansky, S.A (1998). Fiscal Policy Rules. IMF. https://www.imf.org/en/Publications/Occasional-
Papers/Issues/2016/12/30/Fiscal-Policy-Rules-2608
Laktionova, O., Dobrovolskyi, O., Karpova, T. S. & Zahariev, A., 2019. Cost Efficiency of Applying Trade Finance for Agricultural
Supply Chains. Management Theory and Studies for Rural Business and Infrastructure Development, 41(1), pp. 62-73.
https://doi.org/10.15544/mts.2019.06
Lilova, R., Radulova, A., & Alexandrova, A. (2017). Fiscal responsibility - necessity vs. obligation. The EU case. Espacios, 38(51).
https://www.revistaespacios.com/a17v38n51/17385131.html
Mazzanti, M., Mazzarano, M., Pronti, A. & Quatrosi, M. (2020). Fiscal policies, public investments and wellbeing: mapping the evolution
of the EU. Insights into Regional Development, 2(4), 725-749. http://doi.org/10.9770/IRD.2020.2.4(1)
Navarro-Ortiz, J., & Sapena, J. (2020). Is external debt sustainable? A probabilistic approach. Economic Modelling, 93(July 2019), 142–
153. https://doi.org/10.1016/j.econmod.2020.07.014
Onofrei, M., Vatamanu, A. G., Bostan, I., Oprea, F., Paraschiv, G., & Lazar, C. M. (2020). The implication of fiscal principles and rules on
promoting sustainable public finances in the EU countries. Sustainability (Switzerland), 12(7). https://doi.org/10.3390/su12072772
Pavelkova, D., Jircikova, E., Knapkova, A., Bialic-Davendra, M., & Saha, N. (2011). Empirical Evidence of Development of Plastic
Clusters. In B. Katalinic (Ed.), DAAAM International Scientific Book 2011 (pp. 619 – 637). Vienna (Austria): DAAAM International.
DOI: https://doi.org/10.2507/daaam.scibook.2011.50
ENTREPRENEURSHIP AND SUSTAINABILITY ISSUES
ISSN 2345-0282 (online) http://jssidoi.org/jesi/
2021 Volume 8 Number 3 (March)
http://doi.org/10.9770/jesi.2021.8.3(39) Make your research more visible, join the Twitter account of ENTREPRENEURSHIP AND SUSTAINABILITY ISSUES: @Entrepr6972881
631
Polackova Brixi, H. and A. Schick, E. (2002). Government at Risk: Contingent Liabilities and Fiscal Risk (Issue April).
http://documents1.worldbank.org/curated/en/284531468771891611/pdf/multi0page.pdf
Prodanov, S., Naydenov L., 2020. Theoretical, Qualitative and Quantitative Aspects of Municipal Fiscal Autonomy in Bulgaria. Economic
Studies journal, Bulgarian Academy of Sciences - Economic Research Institute, issue 2, pp. 126-150.
https://ideas.repec.org/a/bas/econst/y2020i2p126-150.html
Prodanov, S. & Pavlov, T., 2016. Comparative Analysis of the Leading Consumption-Based Asset Pricing Models. Economic Archive,
LXIX(1), pp. 20-46. https://www2.uni-svishtov.bg/NSArhiv/title.asp?lang=en&title=531
Sabitova, N. M. et al., 2020. Tax Capacity of the Russian Federation Constituent Entities: Problems of Assessment and Unequal
Distribution. In: Regional Economic Developments in Russia. s.l.: Springer, pp. 79-86. https://doi.org/10.1007/978-3-030-39859-0_7
Terziev, V., 2019. The role of business in society. Istanbul, Turkey, International Organization Center of Academic Research, pp. 324-330.
ISBN: 978-605-82433-6-1
Terziev, V., 2020. Programming as mechanism of managing, oriented towards results. Chelyabinsk, Economic and Social Development,
pp. 92-98.
Vasconcelos, V.V. (2021). Social justice and sustainable regional development: reflections on discourse and practice in public policies and
public budget. Insights into Regional Development, 3(1), 10-28. https://doi.org/10.9770/IRD.2021.3.1(1)
Zahariev, A. (2012). Debt Management, ABAGAR Publishing House Veliko Tarnovo, 287 pages, ISBN 978-954-427-981-3. Available at
SSRN: https://ssrn.com/abstract=2918699 DOI: http://dx.doi.org/10.13140/RG.2.1.4872.3607
Zahariev, A., & Kostov, D. (2016). The price of crude oil as a factor for USD volatility. Ekonomika I Orhanizatsiia Upravlinnia, 21(1), 15-
23. http://dx.doi.org/10.2139/ssrn.2915435 Zahariev, A. et al. (2020a). Debt management evaluation through support vector machines: on the example of Italy and Greece.
Entrepreneurship and Sustainability Issues, 7(3), 2382-2393. doi: https://doi.org/10.9770/jesi.2020.7.3(61)
Zahariev, A. et al., 2020b. The Bank Insolvency: from Lehman Brothers to COVID-19 (International Remarks and National Peculiarities).
Economic and Social Developments, 04-05 September, Issue 58, pp. 44-59. www.bit.ly/30CGFLz, Available at SSRN:
https://ssrn.com/abstract=3688961or http://dx.doi.org/10.2139/ssrn.3688961
Zahariev, A. et al., 2020c. Тhe Brokerage Insurance Companies under COVID-19 Framework (the Bulgarian experience). Economic and
Social Development, 04-05 September, Issue 58, pp. 369-383. www.bit.ly/30CGFLz, Available at SSRN:
https://ssrn.com/abstract=3688949 or http://dx.doi.org/10.2139/ssrn.3688949.
Andrey ZAHARIEV, Professor of Finance and Dean of the Faculty of Finance at D. A. Tsenov Academy of Economics, Svishtov,
Bulgaria. He is with a PhD degree in the field of the financial management of human resources and habilitation work in the field of public
deficit and public debt (for assoc. professor position) and fiscal decentralization and financial management of municipalities (for professor
position). He is currently Editor-in-Chief of Economic Archive, leading Bulgarian scientific journal in the field of social science. Research
interests: debt management; public finance; human capital investment; international finance; financial analysis; financial management,
fiscal decentralization.
ORCID ID: https://orcid.org/0000-0001-7362-6133
ENTREPRENEURSHIP AND SUSTAINABILITY ISSUES
ISSN 2345-0282 (online) http://jssidoi.org/jesi/
2021 Volume 8 Number 3 (March)
http://doi.org/10.9770/jesi.2021.8.3(39) Make your research more visible, join the Twitter account of ENTREPRENEURSHIP AND SUSTAINABILITY ISSUES: @Entrepr6972881
632
Anelia RADULOVA, Assoc. professor in the Department of Finance and Credit at D. A. Tsenov Academy of Economics, Svishtov,
Bulgaria. She helds a PhD degree in the field of the financial analysis and habilitation work in the field of investments. She is currently
Editor-in-Chief of Economic Archive, leading Bulgarian scientific journal in the field of social science. Research interests: fiscal policy,
fiscal policy of the EU, debt management; public finance; investments; financial analysis; fiscal sustainability.
ORCID ID: https://orcid.org/0000-0002-5943-0393
Aleksandrina ALEKSANDROVA, Researcher at the Scientific Research Institute, Assist. prof., PhD (part-time) in the Department of
Finance and Credit at D. A. Tsenov Academy of Economics, Svishtov, Bulgaria. She helds a PhD degree in the field of the public finance
(taxation). She is currently a Project coordinator of a Research project “Fiscal discipline and/or growing the fiscal capacity of the Republic
of Bulgaria?” No. КП-06 М35/5 from 18/12/2019, supported by The National science fund at the Ministry of Education and Science.
Research interests: public finance; debt management; fiscal policy of the European Union; taxation; international finance; financial
analysis; corporate capital management.
ORCID ID: https://orcid.org/0000-0001-9533-1563
Mariana PETROVA, Professor, D.Sc in Physics and Mathematics, assoc.prof. St. Cyril and St. Methodius University of Veliko Tarnovo,
Bulgaria; Professor Economics and Management in Department of Management, ISMA University, Riga, Latvia. Research interests:
management of IT processes, project and services, business administration, modern information systems and innovations, knowledge
economy, sustainable development.
ORCID ID: https://orcid.org/0000-0003-1531-4312
Register for an ORCID ID:
https://orcid.org/register
Copyright © 2020 by author(s) and VsI Entrepreneurship and Sustainability Center
This work is licensed under the Creative Commons Attribution International License (CC BY).
http://creativecommons.org/licenses/by/4.0/
ENTREPRENEURSHIP AND SUSTAINABILITY ISSUES
ISSN 2345-0282 (online) http://jssidoi.org/jesi/
2021 Volume 8 Number 3 (March)
http://doi.org/10.9770/jesi.2021.8.3(40)
Publisher http://jssidoi.org/esc/home
633
TOWARDS MORE SUSTAINABLE DISPUTE RESOLUTION IN COURTS: EMPIRICAL STUDY ON
CHALLENGES OF THE COURT-CONNECTED MEDIATION IN LITHUANIA
Agnė Tvaronavičienė 1, Natalija Kaminskienė 2, Irena Žemaitaitytė3, Maria Cudowska4
1,2,3 Mykolas Romeris University, Ateities st. 20, LT-08303, Vilnius, Lithuania 4 University of Bialystok, Swierkowa str. 20 B, PL-15-328, Bialystok, Poland
E-mails:1 [email protected]; [email protected]; 3 [email protected]; 4 [email protected];
Received 29 January 2021; accepted 27 February 2021; published 30 March 2021
Abstract. Court-connected mediation designed to foster more sustainable dispute resolution practices in Lithuania was launched in 2005.
The article is an elaboration on Lithuania’s experiences relating to court-connected mediation in the realm of civil justice. It investigates
the problem of the so called “plateau”, when the number of mediated cases stops to grow, thus raising the question of what is the future of
court-connected mediation in general. Authors present the main features of the Lithuanian court-connected mediation model and stages of
its formation. The autors strive to provide a better understanding of the possible causes for the problem under consideration, as well as
underlying assumptions associated with sustainable dispute resolution practices in courts. Next, the results of the original quantitative and
qualitative empirical survey dedicated to the analyzed problem and performed by the authors in the beginning of 2021 are presented. The
research is supplemented by data from Poland, which presents a fracture of the problems related to court-connected mediation in Eastern
Europe. Poland’s perspective provides a glance into another legal system, which chose a different model of court-connected mediation
without the direct involvement of judges as mediators. Still, the data from Poland shows the tendency of a steady influx of mediated cases.
The article ends with a discussion, conclussions and recommendations on the causes and consequences of mediation stagnation in the
process of developing a court-mediation and, possibly, mediation in general. The paper is dedicated to dispute resolution experts, both
practitioners and scientists, who are interested in Eastern European experiences and problems associated with the development of
mediatiaton.
Keywords: court-connected mediation; judge as a mediator; dispute resolution; mediation “plateau”; stagnation; empirical research
Reference to this paper should be made as follows: Tvaronavičienė, A., Kaminskienė, N., Žemaitaitytė, I., Cudowska, M. 2021. Towards
more sustainable dispute resolution in courts: empirical study on challenges of the court-connected mediation in Lithuania.
Entrepreneurship and Sustainability Issues, 8(3), 633-653. http://doi.org/10.9770/jesi.2021.8.3(40)
JEL Classifications: K15, K41, Q01
1. Introduction
The court-connected mediation was a starting form of mediation development in Lithuania, which, compared to
out-of-court mediation, in the last 15 years showed incredible results by high numbers of enthusiasts who decided
ENTREPRENEURSHIP AND SUSTAINABILITY ISSUES
ISSN 2345-0282 (online) http://jssidoi.org/jesi/
2021 Volume 8 Number 3 (March)
http://doi.org/10.9770/jesi.2021.8.3(40)
634
to join the list of court mediators and exponentially growing numbers of mediations conducted in the court. The
main intention of launching court-connected mediation went in line with a need to promote social dialog and
foster settlements, as adversial litigation could not be treated as dispute resolution process bringing to
sustainability (Kaminskiene et al. 2014). However, the days of glory for the court-connected mediation seem to
have passed. As it is proven further, court-connected mediation in Lithuania does not appear to be popular as a
preferred way of settling a dispute. In fact, during the last four years the number of the court-connected mediation
cases is stable, but has shown no significant change. Currently such situation can be described as a “plateau” and
requires to answer the question of what can be done to prevent such situation and even broader question of what
the future holds for a court-connected mediation not only in Lithuania, but also in the countries that face the same
problems of mediation stagnation.
The scientific discussion requires a glance from aside from the position of the development of court-connected
mediation in another country. Thus, the article presents a short overview of Polish court-connected mediation
model (without involvement of judges as mediators), which arguably shows a tendency of a stable mediation
growth.
The objective of this article is to analyze the reasons for the problem of stagnation of court-connected mediation,
suggest the ways for overcoming it and possible further directions for the development of court-connected
mediation.
Previous research on the subject. The topic of court-connected mediation usually forms a natural part of general
scientific studies on mediation, as long as the court-connected mediation is rather popular form of mediation.
Nevertheless, some authors tend to debate if court-connected mediation is a part of reinvigoration or further
erosion of a democratic justice system (Welsh 2004, 117). However, the works where court-connected mediation
models or programs are analyzed empirically from the point of view of their problematics and effectiveness,
dominate mostly in the works of American scientists, but are not so common for Europe. The works of Roselle L.
Wissler (2004) presented the results of empirical researches on court-connected general civil case mediation and
gave answers to the question of general effectiveness of court-connected mediation program used in the US. The
lessons that are emerging from the available empirical data regarding best practices for court-connected mediation
programs that mediate non-family civil matters are discussed in the article of Barbara McAdoo, Nancy Welsh and
Roselle Wissler (2003). John Lande (2004) analyzed why some mediation programs produced the desired results
while others did not outperform traditional litigation. Worldwide perspective is given in the works of Shahla F.Ali
(2018), who explored the attitudes and perceptions of practitioners implementing court mediation programs in
five regions (including Europe) of the world in order to understand the dynamics, challenges, and lessons learned
from the perspective of those directly engaged in the work of administering, representing, and mediating civil
claims.
In Lithuania the topic of court-connected mediation was previously analyzed by Natalija Kaminskienė (2010) (the
article assesses the results of the pilot court-connected mediation project, attempts to identify problems
encountered and propose possible solutions), Ieva Saudargaitė (2015) (the research object is the legal regulation
of judicial mediation in civil disputes in Lithuania), Agnė Tvaronavičienė and Natalija Kaminskienė (2019) (the
article analyzes the application of court-connected mediation in administrative law and proposes possible
improvements in the legal framework in this area). Authors Sandra Molė and Jolanta Sondaitė (2014; 2019)
analyzed attitudes of court mediators toward the practice of court-connected mediation from psychological point
of view. Opportunities of court-connected and private family disputes mediation were described in the work of
Salomėja Zaksaitė and Zigmas Garalevičius (2009). However, most of these works were published during the
period when court-connected mediation “prospered” and was growing in numbers. No research was made on the
ENTREPRENEURSHIP AND SUSTAINABILITY ISSUES
ISSN 2345-0282 (online) http://jssidoi.org/jesi/
2021 Volume 8 Number 3 (March)
http://doi.org/10.9770/jesi.2021.8.3(40)
635
current stagnation of the court-connected mediation in Lithuania. This study is a first attempt to perform a
quantitative and qualitative empirical research dedicated to the current problems of court-connected mediation in
practice.
Methodology. Research was carried out using the methods of scientific literature review, document and
comparative analyses, quantitative and qualitative empirical methods.
2. Theoretical background
Mediation was introduced for the first time in the Lithuanian legal system in 2005 through a court-connected
mediation pilot project. The project was inspired by the embedment of court conciliation, a novelty in Lithuanian
civil procedure introduced in 2003 under the new Code of Civil Procedure (hereinafter referred as – CCP). The
pilot project was conducted by several judges and academicians familiar with the notion of mediation, who
strongly supported the model adopted by the province of Quebec in Canada and its introduction in the Lithuanian
courts (Kaminskiene 2010).
Initially only one court in capital of Lithuania – Vilnius, was applying the procedure of mediation. In 2006,
already several district courts were using it, and after yielding positive results, later in 2007, following the Decree
of Judicial Council No. 13P-15, it was extended to all Lithuanian courts. Within just a few years the pilot became
the permanent court-connected mediation program in civil cases throughout the country.
The choice of starting mediation from the courts was mostly influenced by understanding that people of Lithuania
recognize the authority of the court and trust judges. That is why it was decided that the best person, who could
reliably offer mediation to the parties without discrediting himself, should be a judge.
Thus, successful experience in the Canadian province of Quebec has been applied in the development of the
court-connected mediation project in Lithuania. Even nowadays the Lithuanian and Quebec models of court-
connected mediation have much in common. For example, it similarly provides for the possibility of private
meetings between the parties to the dispute and the mediator, the persons involved in court-connected mediation,
the principle of confidentiality etc. However, as the time has passed, some new features were adopted to allow
court-connected mediation operating more effectively.
Since the start of the pilot project court-connected mediation in Lithuania was completely voluntary. However,
from 2019 in separate cases following the discretion of the judge, parties to a dispute may be referred to
mandatory court mediation (CCP Art. 2311(1)).
Initially, court-connected mediation was performed by a court-appointed mediator included in the list of court
mediators administered by the National courts administration. Court mediators were listed since the very
beginning of this institute. By the end of 2018 there were more than 450 mediators in the list of court mediators
and this number was still growing. 81 per cent of all listed court-mediators were not judges – advocates, lawyers,
psychologists, social workers, etc. Interestingly, although only 19 per cent of court mediators were judges, most
of court mediations were mediated by court mediators-judges. Namely, 87 per cent of civil cases in 2018 were
mediated by judges-mediators and only 13 per cent by non-judges (Annual Report of Lithuanian Courts 2018).
However, since 2019 only judges are allowed to be called “court-mediators” and be included into the list of court
mediators (Law on Mediation, Art. 23, part 2). Currently there are 105 court mediators-judges in the list (The list
of Court Mediators 2021). Trained judges serve as court mediators, whilst other mediators may be appointed from
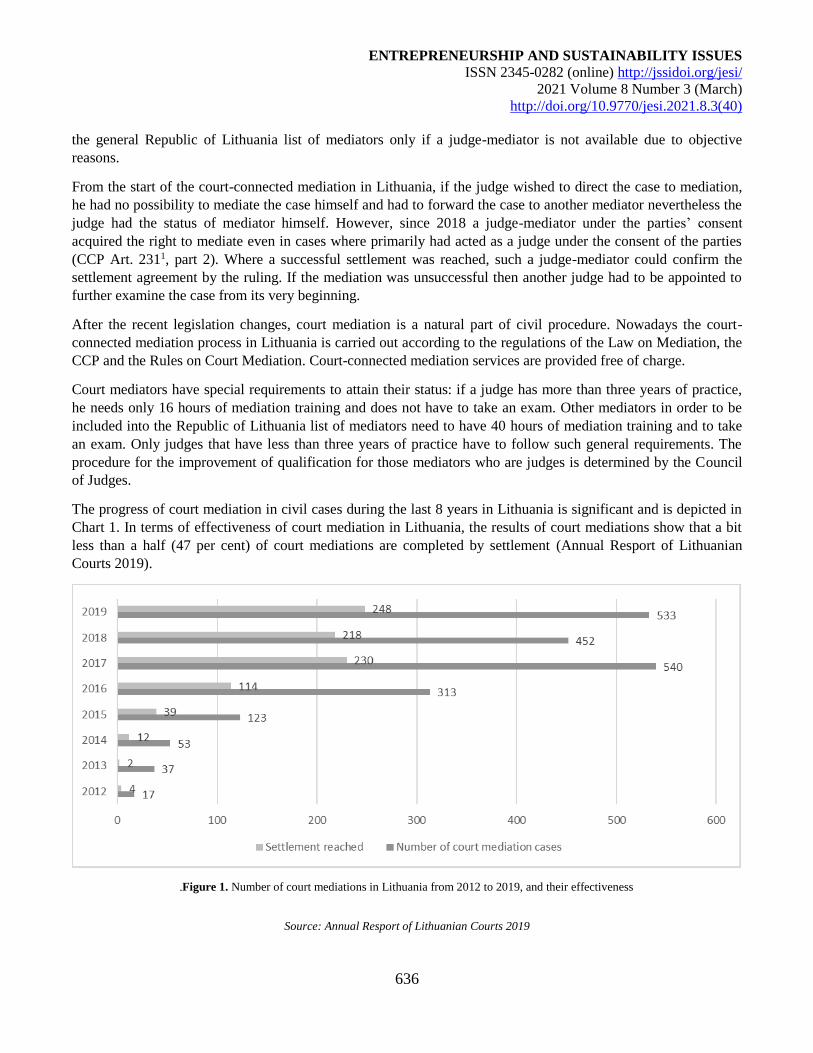
ENTREPRENEURSHIP AND SUSTAINABILITY ISSUES
ISSN 2345-0282 (online) http://jssidoi.org/jesi/
2021 Volume 8 Number 3 (March)
http://doi.org/10.9770/jesi.2021.8.3(40)
636
the general Republic of Lithuania list of mediators only if a judge-mediator is not available due to objective
reasons.
From the start of the court-connected mediation in Lithuania, if the judge wished to direct the case to mediation,
he had no possibility to mediate the case himself and had to forward the case to another mediator nevertheless the
judge had the status of mediator himself. However, since 2018 a judge-mediator under the parties’ consent
acquired the right to mediate even in cases where primarily had acted as a judge under the consent of the parties
(CCP Art. 2311, part 2). Where a successful settlement was reached, such a judge-mediator could confirm the
settlement agreement by the ruling. If the mediation was unsuccessful then another judge had to be appointed to
further examine the case from its very beginning.
After the recent legislation changes, court mediation is a natural part of civil procedure. Nowadays the court-
connected mediation process in Lithuania is carried out according to the regulations of the Law on Mediation, the
CCP and the Rules on Court Mediation. Court-connected mediation services are provided free of charge.
Court mediators have special requirements to attain their status: if a judge has more than three years of practice,
he needs only 16 hours of mediation training and does not have to take an exam. Other mediators in order to be
included into the Republic of Lithuania list of mediators need to have 40 hours of mediation training and to take
an exam. Only judges that have less than three years of practice have to follow such general requirements. The
procedure for the improvement of qualification for those mediators who are judges is determined by the Council
of Judges.
The progress of court mediation in civil cases during the last 8 years in Lithuania is significant and is depicted in
Chart 1. In terms of effectiveness of court mediation in Lithuania, the results of court mediations show that a bit
less than a half (47 per cent) of court mediations are completed by settlement (Annual Resport of Lithuanian
Courts 2019).
0102030
40506070
8090
1-asketvirtis 3-iasketvirtis
RytaiVakaraiŠiaurėFigure 1. Number of court mediations in Lithuania from 2012 to 2019, and their effectiveness
Source: Annual Resport of Lithuanian Courts 2019
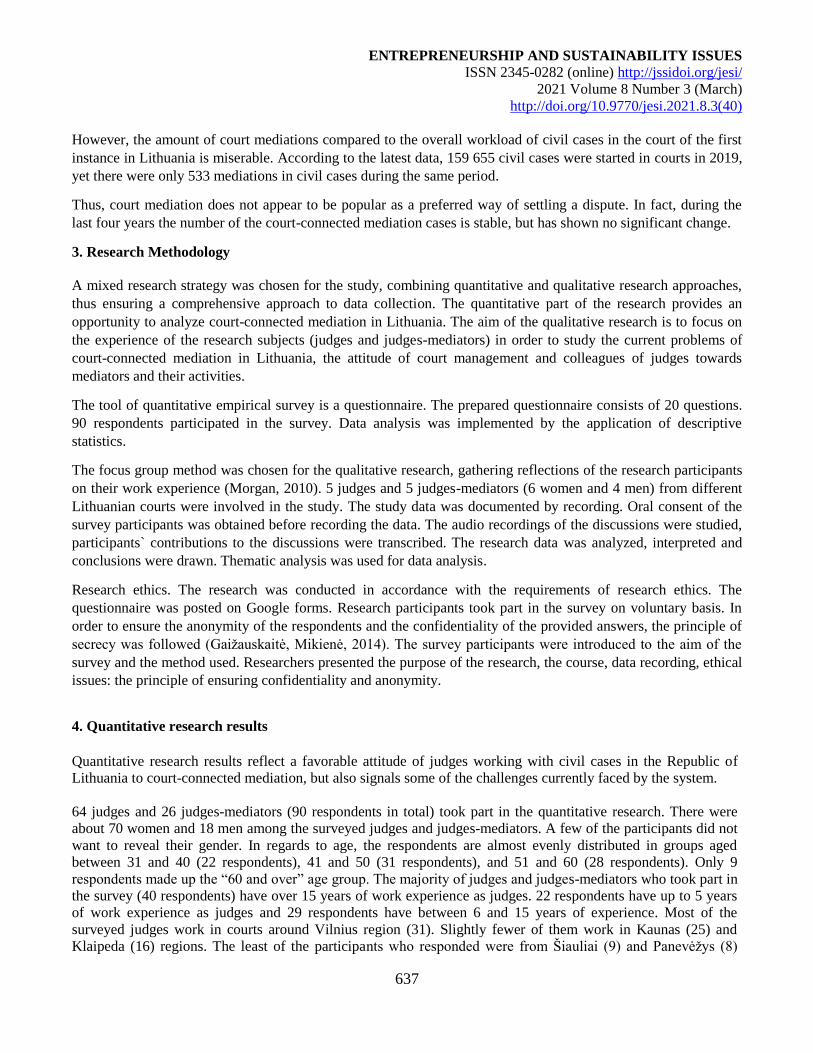
ENTREPRENEURSHIP AND SUSTAINABILITY ISSUES
ISSN 2345-0282 (online) http://jssidoi.org/jesi/
2021 Volume 8 Number 3 (March)
http://doi.org/10.9770/jesi.2021.8.3(40)
637
However, the amount of court mediations compared to the overall workload of civil cases in the court of the first
instance in Lithuania is miserable. According to the latest data, 159 655 civil cases were started in courts in 2019,
yet there were only 533 mediations in civil cases during the same period.
Thus, court mediation does not appear to be popular as a preferred way of settling a dispute. In fact, during the
last four years the number of the court-connected mediation cases is stable, but has shown no significant change.
3. Research Methodology
A mixed research strategy was chosen for the study, combining quantitative and qualitative research approaches,
thus ensuring a comprehensive approach to data collection. The quantitative part of the research provides an
opportunity to analyze court-connected mediation in Lithuania. The aim of the qualitative research is to focus on
the experience of the research subjects (judges and judges-mediators) in order to study the current problems of
court-connected mediation in Lithuania, the attitude of court management and colleagues of judges towards
mediators and their activities.
The tool of quantitative empirical survey is a questionnaire. The prepared questionnaire consists of 20 questions.
90 respondents participated in the survey. Data analysis was implemented by the application of descriptive
statistics.
The focus group method was chosen for the qualitative research, gathering reflections of the research participants
on their work experience (Morgan, 2010). 5 judges and 5 judges-mediators (6 women and 4 men) from different
Lithuanian courts were involved in the study. The study data was documented by recording. Oral consent of the
survey participants was obtained before recording the data. The audio recordings of the discussions were studied,
participants` contributions to the discussions were transcribed. The research data was analyzed, interpreted and
conclusions were drawn. Thematic analysis was used for data analysis.
Research ethics. The research was conducted in accordance with the requirements of research ethics. The
questionnaire was posted on Google forms. Research participants took part in the survey on voluntary basis. In
order to ensure the anonymity of the respondents and the confidentiality of the provided answers, the principle of
secrecy was followed (Gaižauskaitė, Mikienė, 2014). The survey participants were introduced to the aim of the
survey and the method used. Researchers presented the purpose of the research, the course, data recording, ethical
issues: the principle of ensuring confidentiality and anonymity.
4. Quantitative research results
Quantitative research results reflect a favorable attitude of judges working with civil cases in the Republic of
Lithuania to court-connected mediation, but also signals some of the challenges currently faced by the system.
64 judges and 26 judges-mediators (90 respondents in total) took part in the quantitative research. There were
about 70 women and 18 men among the surveyed judges and judges-mediators. A few of the participants did not
want to reveal their gender. In regards to age, the respondents are almost evenly distributed in groups aged
between 31 and 40 (22 respondents), 41 and 50 (31 respondents), and 51 and 60 (28 respondents). Only 9
respondents made up the “60 and over” age group. The majority of judges and judges-mediators who took part in
the survey (40 respondents) have over 15 years of work experience as judges. 22 respondents have up to 5 years
of work experience as judges and 29 respondents have between 6 and 15 years of experience. Most of the
surveyed judges work in courts around Vilnius region (31). Slightly fewer of them work in Kaunas (25) and
Klaipeda (16) regions. The least of the participants who responded were from Šiauliai (9) and Panevėžys (8)
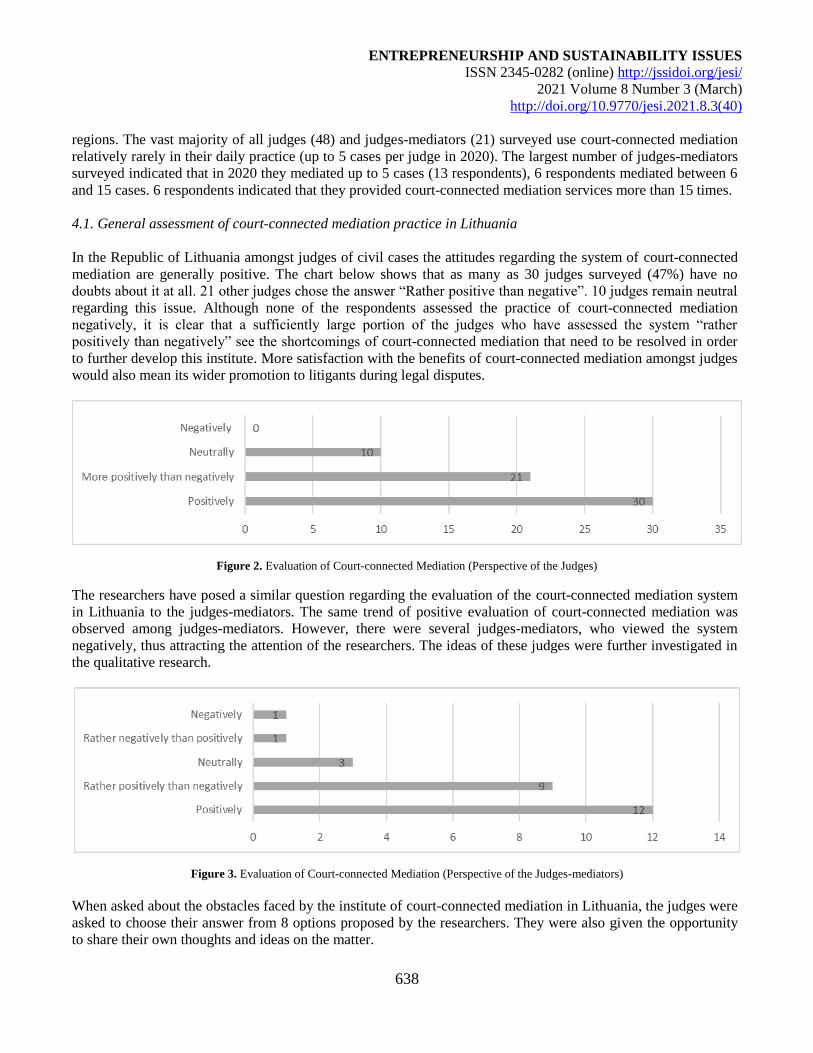
ENTREPRENEURSHIP AND SUSTAINABILITY ISSUES
ISSN 2345-0282 (online) http://jssidoi.org/jesi/
2021 Volume 8 Number 3 (March)
http://doi.org/10.9770/jesi.2021.8.3(40)
638
regions. The vast majority of all judges (48) and judges-mediators (21) surveyed use court-connected mediation
relatively rarely in their daily practice (up to 5 cases per judge in 2020). The largest number of judges-mediators
surveyed indicated that in 2020 they mediated up to 5 cases (13 respondents), 6 respondents mediated between 6
and 15 cases. 6 respondents indicated that they provided court-connected mediation services more than 15 times.
4.1. General assessment of court-connected mediation practice in Lithuania
In the Republic of Lithuania amongst judges of civil cases the attitudes regarding the system of court-connected
mediation are generally positive. The chart below shows that as many as 30 judges surveyed (47%) have no
doubts about it at all. 21 other judges chose the answer “Rather positive than negative”. 10 judges remain neutral
regarding this issue. Although none of the respondents assessed the practice of court-connected mediation
negatively, it is clear that a sufficiently large portion of the judges who have assessed the system “rather
positively than negatively” see the shortcomings of court-connected mediation that need to be resolved in order
to further develop this institute. More satisfaction with the benefits of court-connected mediation amongst judges
would also mean its wider promotion to litigants during legal disputes.
Figure 2. Evaluation of Court-connected Mediation (Perspective of the Judges)
The researchers have posed a similar question regarding the evaluation of the court-connected mediation system
in Lithuania to the judges-mediators. The same trend of positive evaluation of court-connected mediation was
observed among judges-mediators. However, there were several judges-mediators, who viewed the system
negatively, thus attracting the attention of the researchers. The ideas of these judges were further investigated in
the qualitative research.
Figure 3. Evaluation of Court-connected Mediation (Perspective of the Judges-mediators)
When asked about the obstacles faced by the institute of court-connected mediation in Lithuania, the judges were
asked to choose their answer from 8 options proposed by the researchers. They were also given the opportunity
to share their own thoughts and ideas on the matter.
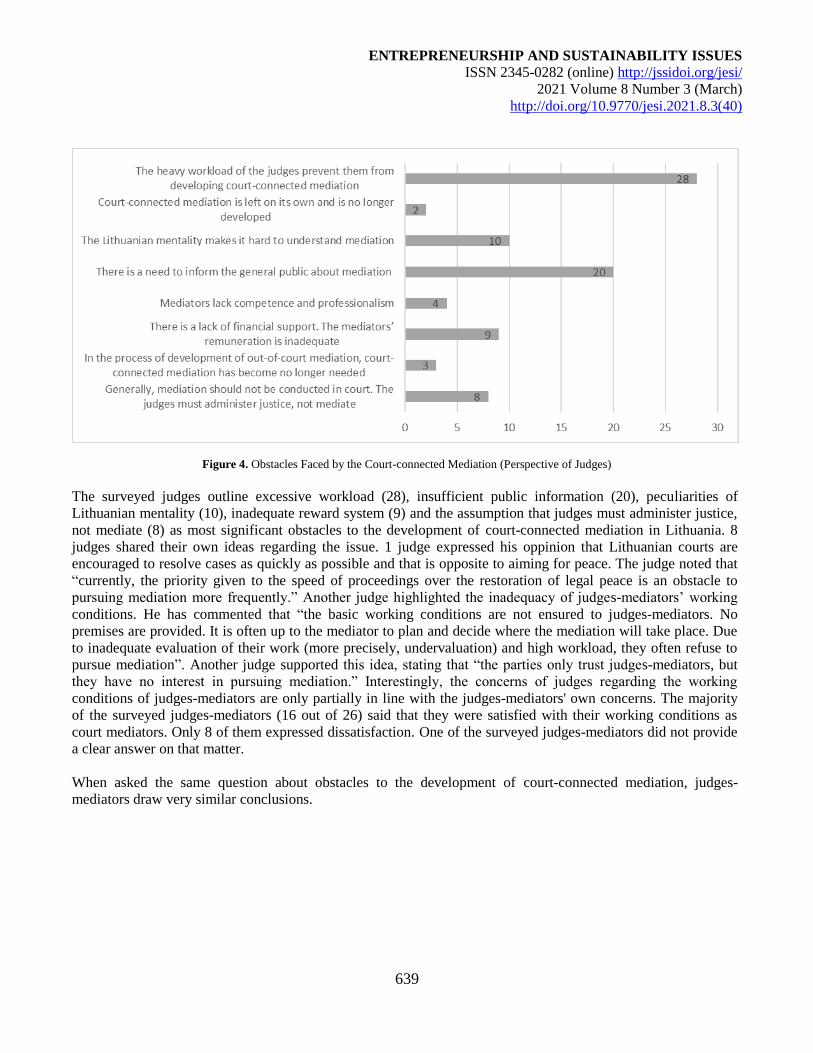
ENTREPRENEURSHIP AND SUSTAINABILITY ISSUES
ISSN 2345-0282 (online) http://jssidoi.org/jesi/
2021 Volume 8 Number 3 (March)
http://doi.org/10.9770/jesi.2021.8.3(40)
639
Figure 4. Obstacles Faced by the Court-connected Mediation (Perspective of Judges)
The surveyed judges outline excessive workload (28), insufficient public information (20), peculiarities of
Lithuanian mentality (10), inadequate reward system (9) and the assumption that judges must administer justice,
not mediate (8) as most significant obstacles to the development of court-connected mediation in Lithuania. 8
judges shared their own ideas regarding the issue. 1 judge expressed his oppinion that Lithuanian courts are
encouraged to resolve cases as quickly as possible and that is opposite to aiming for peace. The judge noted that
“currently, the priority given to the speed of proceedings over the restoration of legal peace is an obstacle to
pursuing mediation more frequently.” Another judge highlighted the inadequacy of judges-mediators’ working
conditions. He has commented that “the basic working conditions are not ensured to judges-mediators. No
premises are provided. It is often up to the mediator to plan and decide where the mediation will take place. Due
to inadequate evaluation of their work (more precisely, undervaluation) and high workload, they often refuse to
pursue mediation”. Another judge supported this idea, stating that “the parties only trust judges-mediators, but
they have no interest in pursuing mediation.” Interestingly, the concerns of judges regarding the working
conditions of judges-mediators are only partially in line with the judges-mediators' own concerns. The majority
of the surveyed judges-mediators (16 out of 26) said that they were satisfied with their working conditions as
court mediators. Only 8 of them expressed dissatisfaction. One of the surveyed judges-mediators did not provide
a clear answer on that matter.
When asked the same question about obstacles to the development of court-connected mediation, judges-
mediators draw very similar conclusions.
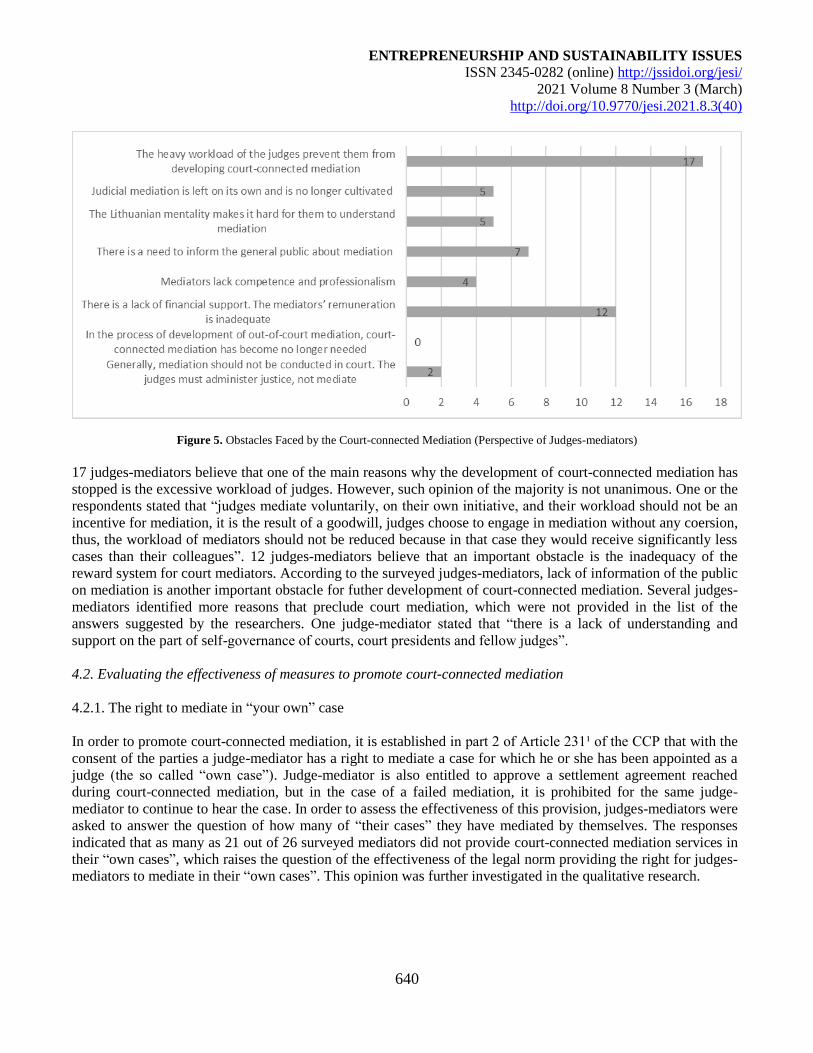
ENTREPRENEURSHIP AND SUSTAINABILITY ISSUES
ISSN 2345-0282 (online) http://jssidoi.org/jesi/
2021 Volume 8 Number 3 (March)
http://doi.org/10.9770/jesi.2021.8.3(40)
640
Figure 5. Obstacles Faced by the Court-connected Mediation (Perspective of Judges-mediators)
17 judges-mediators believe that one of the main reasons why the development of court-connected mediation has
stopped is the excessive workload of judges. However, such opinion of the majority is not unanimous. One or the
respondents stated that “judges mediate voluntarily, on their own initiative, and their workload should not be an
incentive for mediation, it is the result of a goodwill, judges choose to engage in mediation without any coersion,
thus, the workload of mediators should not be reduced because in that case they would receive significantly less
cases than their colleagues”. 12 judges-mediators believe that an important obstacle is the inadequacy of the
reward system for court mediators. According to the surveyed judges-mediators, lack of information of the public
on mediation is another important obstacle for futher development of court-connected mediation. Several judges-
mediators identified more reasons that preclude court mediation, which were not provided in the list of the
answers suggested by the researchers. One judge-mediator stated that “there is a lack of understanding and
support on the part of self-governance of courts, court presidents and fellow judges”.
4.2. Evaluating the effectiveness of measures to promote court-connected mediation
4.2.1. The right to mediate in “your own” case
In order to promote court-connected mediation, it is established in part 2 of Article 231¹ of the CCP that with the
consent of the parties a judge-mediator has a right to mediate a case for which he or she has been appointed as a
judge (the so called “own case”). Judge-mediator is also entitled to approve a settlement agreement reached
during court-connected mediation, but in the case of a failed mediation, it is prohibited for the same judge-
mediator to continue to hear the case. In order to assess the effectiveness of this provision, judges-mediators were
asked to answer the question of how many of “their cases” they have mediated by themselves. The responses
indicated that as many as 21 out of 26 surveyed mediators did not provide court-connected mediation services in
their “own cases”, which raises the question of the effectiveness of the legal norm providing the right for judges-
mediators to mediate in their “own cases”. This opinion was further investigated in the qualitative research.
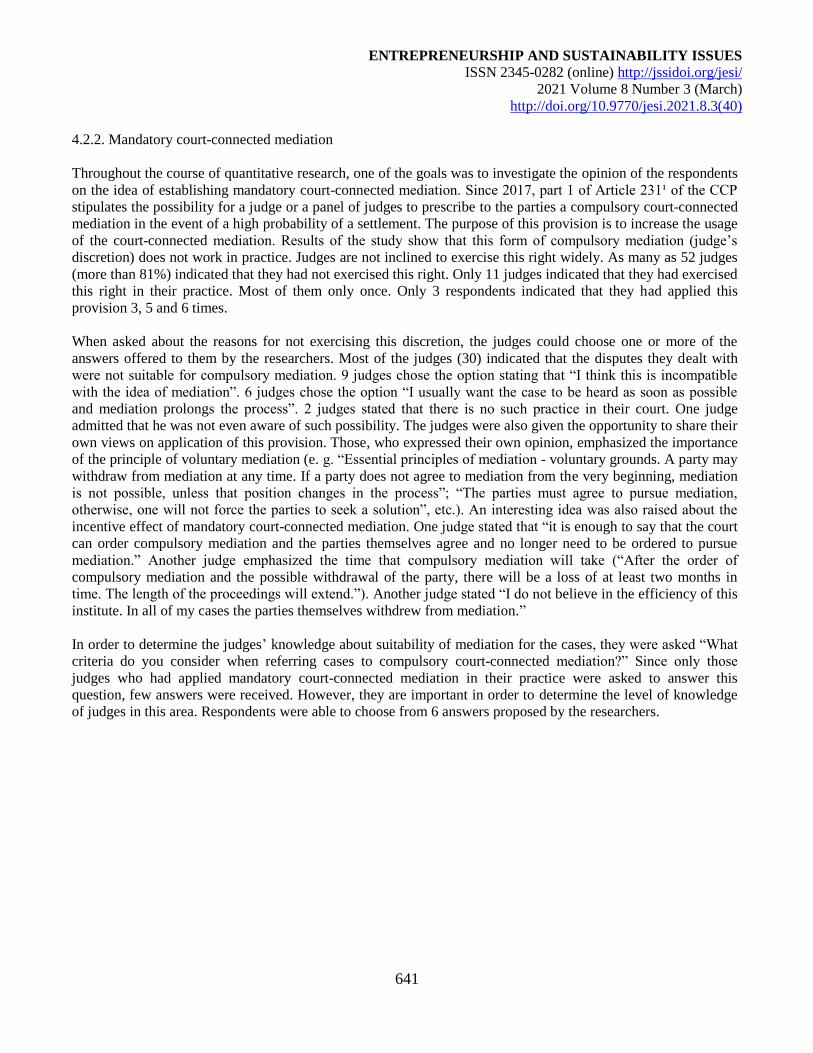
ENTREPRENEURSHIP AND SUSTAINABILITY ISSUES
ISSN 2345-0282 (online) http://jssidoi.org/jesi/
2021 Volume 8 Number 3 (March)
http://doi.org/10.9770/jesi.2021.8.3(40)
641
4.2.2. Mandatory court-connected mediation
Throughout the course of quantitative research, one of the goals was to investigate the opinion of the respondents
on the idea of establishing mandatory court-connected mediation. Since 2017, part 1 of Article 231¹ of the CCP
stipulates the possibility for a judge or a panel of judges to prescribe to the parties a compulsory court-connected
mediation in the event of a high probability of a settlement. The purpose of this provision is to increase the usage
of the court-connected mediation. Results of the study show that this form of compulsory mediation (judge’s
discretion) does not work in practice. Judges are not inclined to exercise this right widely. As many as 52 judges
(more than 81%) indicated that they had not exercised this right. Only 11 judges indicated that they had exercised
this right in their practice. Most of them only once. Only 3 respondents indicated that they had applied this
provision 3, 5 and 6 times.
When asked about the reasons for not exercising this discretion, the judges could choose one or more of the
answers offered to them by the researchers. Most of the judges (30) indicated that the disputes they dealt with
were not suitable for compulsory mediation. 9 judges chose the option stating that “I think this is incompatible
with the idea of mediation”. 6 judges chose the option “I usually want the case to be heard as soon as possible
and mediation prolongs the process”. 2 judges stated that there is no such practice in their court. One judge
admitted that he was not even aware of such possibility. The judges were also given the opportunity to share their
own views on application of this provision. Those, who expressed their own opinion, emphasized the importance
of the principle of voluntary mediation (e. g. “Essential principles of mediation - voluntary grounds. A party may
withdraw from mediation at any time. If a party does not agree to mediation from the very beginning, mediation
is not possible, unless that position changes in the process”; “The parties must agree to pursue mediation,
otherwise, one will not force the parties to seek a solution”, etc.). An interesting idea was also raised about the
incentive effect of mandatory court-connected mediation. One judge stated that “it is enough to say that the court
can order compulsory mediation and the parties themselves agree and no longer need to be ordered to pursue
mediation.” Another judge emphasized the time that compulsory mediation will take (“After the order of
compulsory mediation and the possible withdrawal of the party, there will be a loss of at least two months in
time. The length of the proceedings will extend.”). Another judge stated “I do not believe in the efficiency of this
institute. In all of my cases the parties themselves withdrew from mediation.”
In order to determine the judges’ knowledge about suitability of mediation for the cases, they were asked “What
criteria do you consider when referring cases to compulsory court-connected mediation?” Since only those
judges who had applied mandatory court-connected mediation in their practice were asked to answer this
question, few answers were received. However, they are important in order to determine the level of knowledge
of judges in this area. Respondents were able to choose from 6 answers proposed by the researchers.
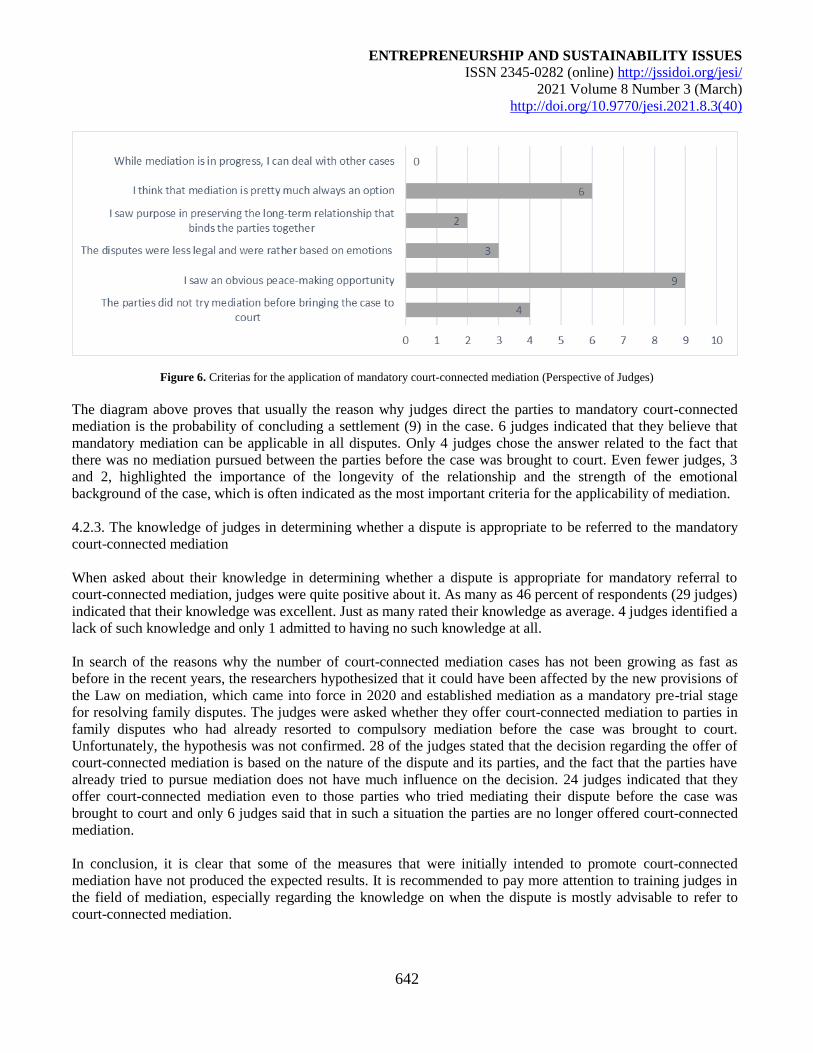
ENTREPRENEURSHIP AND SUSTAINABILITY ISSUES
ISSN 2345-0282 (online) http://jssidoi.org/jesi/
2021 Volume 8 Number 3 (March)
http://doi.org/10.9770/jesi.2021.8.3(40)
642
Figure 6. Criterias for the application of mandatory court-connected mediation (Perspective of Judges)
The diagram above proves that usually the reason why judges direct the parties to mandatory court-connected
mediation is the probability of concluding a settlement (9) in the case. 6 judges indicated that they believe that
mandatory mediation can be applicable in all disputes. Only 4 judges chose the answer related to the fact that
there was no mediation pursued between the parties before the case was brought to court. Even fewer judges, 3
and 2, highlighted the importance of the longevity of the relationship and the strength of the emotional
background of the case, which is often indicated as the most important criteria for the applicability of mediation.
4.2.3. The knowledge of judges in determining whether a dispute is appropriate to be referred to the mandatory
court-connected mediation
When asked about their knowledge in determining whether a dispute is appropriate for mandatory referral to
court-connected mediation, judges were quite positive about it. As many as 46 percent of respondents (29 judges)
indicated that their knowledge was excellent. Just as many rated their knowledge as average. 4 judges identified a
lack of such knowledge and only 1 admitted to having no such knowledge at all.
In search of the reasons why the number of court-connected mediation cases has not been growing as fast as
before in the recent years, the researchers hypothesized that it could have been affected by the new provisions of
the Law on mediation, which came into force in 2020 and established mediation as a mandatory pre-trial stage
for resolving family disputes. The judges were asked whether they offer court-connected mediation to parties in
family disputes who had already resorted to compulsory mediation before the case was brought to court.
Unfortunately, the hypothesis was not confirmed. 28 of the judges stated that the decision regarding the offer of
court-connected mediation is based on the nature of the dispute and its parties, and the fact that the parties have
already tried to pursue mediation does not have much influence on the decision. 24 judges indicated that they
offer court-connected mediation even to those parties who tried mediating their dispute before the case was
brought to court and only 6 judges said that in such a situation the parties are no longer offered court-connected
mediation.
In conclusion, it is clear that some of the measures that were initially intended to promote court-connected
mediation have not produced the expected results. It is recommended to pay more attention to training judges in
the field of mediation, especially regarding the knowledge on when the dispute is mostly advisable to refer to
court-connected mediation.
ENTREPRENEURSHIP AND SUSTAINABILITY ISSUES
ISSN 2345-0282 (online) http://jssidoi.org/jesi/
2021 Volume 8 Number 3 (March)
http://doi.org/10.9770/jesi.2021.8.3(40)
643
5. Qualitative research results
5.1. General assessment of the court-connected mediation practice in Lithuania
Qualitative research data analysis revealed that both judges (J) and judges-mediators (JM) assessed court-
connected mediation positively. Court-connected mediation is an opportunity to find a solution acceptable to
both dispute parties and to resolve the dispute peacefully. “Social peace is the settlement of a dispute when both
parties reach an agreement, which is a great good, at a state level, at a society level, at family, business or partner
levels” (J3); “it is only good, <...> in any case, any level of peace, is far better than a hostile, long war between
the parties. They themselves agree on the terms, <...> both parties leave the court as winners ... and both parties
are satisfied” (J4).
Both judges and judges-mediators agree that a considerable amount of attention is paid to court-connected
mediation. Judges who deal with civil cases always inform the parties to the dispute about mediation, they ask
the parties whether substantial efforts have been made to resolve the dispute peacefully. According to the
respondents: “In each case we suggest that the parties try to negotiate and to find a peaceful solution by
themselves, if that is possible” (J4); “In practice, it is likely that when dealing with cases all judges will suggest
to seek peaceful dispute resolution” (J2). However, as noted by the participants of the study, it is important that
parties themselves want to resolve the disputes peacefully.
All participants of the research agreed that mediation is currently widely known. The judges mentioned that there
are cases where the parties themselves request mediation and even indicate a preferred mediator. In some cases,
even those parties that do not have lawyers, who would ensure that they are made aware of mediation as a
possibility, have heard of mediation before. Perhaps they have heard about successful cases of mediation. The
judges say that “when we accept lawsuits, along with the documents we send to the parties information about
court-connected mediation, and we actually suggest it during the hearing. <...> we often manage to persuade the
parties <...> they decide to try out the suggested path. We stress that it does not necessarily mean that you will
reach an agreement in the end, but it is very important for you to talk, it might make it easier for you in the
future” (J1). According to judges-mediators, court-connected mediation received more attention a few years ago.
It used to be more publicized and was discussed in the legal community more frequently. One of the participants
of the research pointed out the recent lack of information about court-connected mediation and the suppressed
publicity process, but she noted that the “work has already been done” (JM2) and the mediation institute simply
no longer needs to be repeatedly introduced to the public. “It is likely that mediation does not need that much
advertising, that much attention, that much publicizing, because one can already see that the process is smooth
and it is in force at full speed” (JM5).
However, the respondents acknowledged the fact that some of their fellow judges’ views are quite formal when it
comes to the promotion of the court-connected mediation. They simply inform the parties to the dispute that they
have a right to pursue mediation, but do not actively encourage or persuade them to exercise the right. On the
other hand, there are judges who are not judges-mediators themselves, yet they make extensive work to offer the
court-connected mediation in their cases giving the dispute parties every opportunity to seek peaceful settlement.
“I am convinced that there are judges who carry out mediation in their “own cases” by actively suggesting ways
to reach a peaceful settlement, perhaps even some specific solutions, doing that [more actively] than the judges
who are dealing with those cases” (J5).
The respondents noted that to this day court mediators still lack attention. According to them, both the court
administrators and the National Courts Administration should pay more attention to judges-mediators.
Participants of the research stated that “everyone here has an interest in publicizing this process, which is indeed
extremely necessary and important” (JM1); “Mediators really lack attention, but not in the literal sense -
ENTREPRENEURSHIP AND SUSTAINABILITY ISSUES
ISSN 2345-0282 (online) http://jssidoi.org/jesi/
2021 Volume 8 Number 3 (March)
http://doi.org/10.9770/jesi.2021.8.3(40)
644
mediators may lack help” (JM3). Judges-mediators reminisced that they decided to engage in mediation because
it was something new and interesting. When they started carrying out court-connected mediation, they saw great
meaning and purpose in promoting such a peace-building-oriented procedure in court. “It was something new,
and answering the question “why am I still engaged in mediation?”, it seems that most of us who have tried it out
and have seen positive results are encouraged by them and still think we can do the job and take on those
additional responsibilities” (JM3). Yet at the same time, it was mentioned that besides building and extending the
community of court mediators, it is also important to maintain the motivation of existing mediators, who,
unfortunately, often drop out due to overwork or lack of knowledge and skills. “To a certain point, you can take
the ideological path, the motivation is somewhat driven on an ideological basis. But then those human
psychological effects make you stop and you begin to lack motivation” (JM5); “On the other hand, when you
engage in an extracurricular activity, you take extra interest in it. It is only natural that your horizon expands and
you see that there is room for improvement, that there is something to learn and more knowledge is required”
(JM3). The respondents noted that “a great deal of training is directed at a circle of individuals who are only to be
provided that mediator qualification. But for existing mediators, improving those skills, not forgetting and
remembering both the legal regulations and other skills - I personally lack such training” (JM4).
5.2. Obstacles to the development of court-connected mediation in Lithuania
When asked to share their insights about why they think the number of court mediations has stalled, the members
of the focus group identified a number of reasons: a) there is a certain distrust in colleagues (“If I will pass on the
case to my colleague, he will mediate it, he might succeed, but he might also fail, he might give it back, then I
will still have to deal with the case and I might even get another one because his schedule will be full and the
courts are small”) (J5), b) the ability of people to negotiate peacefully is not sufficiently developed (“We must
cultivate our cultural aspect. That understanding, the trust in both the institute of mediators, and any other
common ability to negotiate peacefully. Because everyone here in Lithuania tends to curse at the courts anyway,
but judging from the number of cases it is clear that they still want to go to those courts rather than to solve their
disputes by themselves”) (J5). As for the reason why the number of court mediations is no longer increasing, one
participant noted that c) the number of civil cases in Lithuania has been decreasing throughout the last few years.
Besides, litigation cases at first instance, especially in large cities, often consist of cases that are settled in
absentia without the presence of litigants, so there is no possibility to offer mediation (“The big Lithuanian courts
<...> make such decisions very frequently, which means that the defendant is very passive, he does not
participate, so there is no point in talking about mediation in this case at all. It is now a question of whether it is
possible to increase the frequency [of mediations], it should be possible. If things were more active, people
would be educated, fellow lawyers would look at mediation more favorably and encourage their clients to pursue
it, then I think we could have that kind of growth”) (J1). Another reason why the number of court-connected
mediations stopped growing, according to the focus group, is d) the duration of ongoing cases. The courts, just
like the parties to the disputes, have an interest in resolving cases in the shortest possible time, and referring the
parties to court-connected mediation will undoubtedly prolong the duration of the proceedings. Moreover, there
is no guarantee that mediation will succeed. In the absence of a peaceful settlement, the dispute is returned back
to the court for further hearing, which statistically means that the duration of the case hearing will be longer than
average. “We have a very clear orientation towards a short trial. This becomes one of the criteria - that we have
to deal with cases in the shortest possible time. Mediation is immediately perceived as some additional pause in
the proceedings. Therefore, we are more likely to suggest for the parties to attempt to reach a peaceful agreement
independently, we give them a couple of weeks before the next hearing to try and such a model is preferred over
sending the case to mediation.” (J5). “Let’s say that some judges may be hesitant to refer the case to court-
connected mediation, because if mediation fails, the overall time limit for hearing the case will be prolonged.
And, of course, mediation usually takes a few months, it can take a long time and in case of failure, statistically
for the judge it will take longer to process the case. I myself was surprised by such arguments and I think maybe
we could think of some leverage points here, to deduct the amount of time that the mediation takes from the
ENTREPRENEURSHIP AND SUSTAINABILITY ISSUES
ISSN 2345-0282 (online) http://jssidoi.org/jesi/
2021 Volume 8 Number 3 (March)
http://doi.org/10.9770/jesi.2021.8.3(40)
645
length of the case or something like that because I myself have not even thought that there may be such fears”
(JM4).
During the investigation both the judges and the judges-mediators touched upon the subject of a workload
relevant to both of the groups as the number of new cases for judges-mediators conducting court-connected
mediation is reduced to some extent. “If mediation is ordered, some of our cases are taken away” (JM5).
Although there is currently no clear regulation on reducing the number of cases for judges conducting court-
connected mediation, this issue is causing some dissatisfaction and tension among other judges in courts. “<...>
we are saying that the workload is heavy and we have some judges who, for example, count their workload
including [out-of-court mediations] and thus deal with fewer cases” (J5). Judges lack clearer information from
the National Courts Administration. “At the moment, we cannot see how much of our workload is made up of
mediation cases, it is impossible ... we have not yet done so. We have also contacted the National Courts
Administration asking them to explain to us the weight of a mediation case and what it affects” (J4). However,
judges themselves agree that when talking to fellow judges-mediators, they say they do not feel any significant
reduction in workload and they often refuse to take mediation themselves because it is not worth it for them to
mediate in terms of a workload. They prefer choosing to hear the ordinary case and to then have a clear sense of
their workload. “They are formally court mediators, they are on the list, but they don’t take a single case. They
say, they would rather take the case assigned to them, then at least their work will be formally considered a part
of their workload” (J1).
5.3. Measures to promote court-connected mediation
Referring to part 1 of Article 2311 of the CCP that grants the judges the right to refer the parties to mandatory
court-connected mediation, the judges indicated that this legal norm is useful in promoting mediation. Some
respondents mentioned that they make little use of it, but the fact that such a statutory provision exists in general
is perceived positively. However, it was emphasized that court-connected mediation is used to end the dispute on
peaceful terms. The parties to the dispute can only participate in this process voluntarily and they themselves
must be determined to resolve the dispute peacefully. “If it is a settlement, it is the will of both parties, the
goodwill of both parties. And if the parties do not see the possibility for this peaceful settlement to eventually be
reached, then it is obviously possible to encourage it or to somewhat persuade them, but the peace treaty still is
<...> a reciprocal element of voluntary goodwill and concessions of both sides” (J4). “For example, I have a hard
time imagining a judge, at least myself, forcing a party into mediation, because to me mediation seems to be
based on voluntary principles, and if you can not convince the parties, you can not be good by force” (J1).
Several other judges agreed with the provisions of part 1 of Article 2311 of the CCP on the appointment of
mandatory court-connected mediation, but they also expressed doubts about the application of this norm. “I
would like to mention that in any case, during the court hearing the judge can speak quite reservedly about both
the possibilities or consequences of the settlement agreement and the referral of the case to mediation. Perhaps
the judge is trying to avoid being accused of bias and so although he sees a high probability of resolving the
dispute in peace, he cannot directly express that to the litigants at the court hearing” (J2). “If we say that this is a
mediation process and it is not an integral part of the trial, then I think I have the right and reason to expect to be
entitled to a legal protection instead of some alternative means of dispute resolution when I go to court” (J3).
Thus, the respondents are cautious about making the appointment of court-connected mediation mandatory, as
they believe that court-connected mediation is effective only when it is voluntary and when the parties are
motivated to seek peace.
Judges-mediators expressed doubts about part 2 of Article 2311 of the CCP. “With the consent of the parties,
judges dealing with civil cases may decide to conduct mediation themselves if they are mediators.” One judge-
mediator shared his experience: “At the very beginning, the institute took time to establish itself and I have even
had to go to such extreme situations, <...> that I had to mediate in my “own cases” (JM5). But now it can be
ENTREPRENEURSHIP AND SUSTAINABILITY ISSUES
ISSN 2345-0282 (online) http://jssidoi.org/jesi/
2021 Volume 8 Number 3 (March)
http://doi.org/10.9770/jesi.2021.8.3(40)
646
concluded that it seems that the judges-mediators have a mutual agreement not to mediate their “own cases”.
Since in the absence of a peace agreement, the judge would have to step down and transfer the case to another
judge, which would again be related to the judges’ workload, the mediating judges inform the dispute parties
about the possibility of mediation and, with their consent, refer the case to another mediator. “When mediators
with complex cases agree to mediate them, in case of a failure, they have to withdraw from the case as judges”
(JM3); “Everytime I encourage the parties to use mediation, I don’t even raise the question of my candidacy, I
suggest considering another mediator aside from the judge and the opportunity to go to another court” (JM4).
In civil cases court-connected mediation can legally be performed by all mediators from the List of Mediators of
the Republic of Lithuania who have signed agreements with the state-guaranteed legal aid office. However, the
analysis of the research data revealed that both the judges and judges-mediators believe that the people involved
in the court process often want the judges to perform mediation. Not only do they associate this with the judges’
extensive knowledge of legal issues, but also with their authority placing great confidence in them. One of the
respondents stated that “Whenever court mediation is required and the parties come to choose mediators, judges-
mediators are prioritised. This is precisely what is shown by the fact that judges are probably trusted more than
other specialists who may be more qualified when it comes to settling real disputes” (J2). However, a part of the
judges who participated in the research are still in favor of court-connected mediation being carried out by
specialists who are not necessarily judges. In their view, a mediator should be a separate profession, especially
considering the fact that professionals in this field are already being trained. “I am categorically against the
participation of judges in the mediation process, categorically. When we talk about lawyers, notaries,
prosecutors, we always say it is a job. When we talk about mediators, we also say that it is a job. I understand
that judges have authority, I understand that they have legal knowledge, I understand that if they have worked,
then [they also] have knowledge about communication and psychology, and so they can mediate. But if
professional mediators were to be trained, they would do no worse” (J3). “If the system really succeeded in
producing professional mediators who would have a genuine interest in resolving those disputes peacefully, I
think that judges could really relinquish that function” (J1). According to an opinion of the majority of the
respondents, judges should focus on the performance of their direct functions. Their functions – the
administration of justice – cannot be performed by anyone else, thus, this must be the basis of their activities.
Since the enforcement of court-connected mediation is not a function exclusive to the courts, judges should only
refer the parties to the dispute to court-connected mediation, but not to perform mediation themselves. The
respondents, who emphasized this idea, pointed out that: “I would rather have judges abstain from being court
mediators all together. That is the position I take, since after all court mediation is not a court-connected
function” (J2); “I would agree <....> it is not entirely a court-connected function. We are currently carrying it out,
because we are generally trying to promote this institute. More often people themselves choose judges-mediators,
this is probably just how the system is at the moment” (J1); “I think that the judge’s contribution to court-
connected mediation should be limited to explaining to the parties [the possibility of pursuing mediation] and
directing them to court-connected mediation, but not carrying it out” (J2).
In the opinion of both the judges and the judges-mediators, judges were very important in the initial stages of
publicizing court-connected mediation. “Once it [court-connected mediation] has been introduced to the public, it
is questionable whether we [judges] are very necessary” (JM5); “As far as I know, according to the established
regulations, judges in Latvia and Estonia cannot be mediators. In that case, if our mission was to start this
process, then I agree that we may have already achieved that” (JM3).
While sharing their visions of the future of court-connected mediation, members of the focus groups
acknowledged that only a small part of all court disputes are resolved through mediation at the moment,
therefore, there is room for growth. The respondents noted that court-connected mediation is especially effective
when solving disputes of a complex nature. “I order about two or three complicated cases to be mediated a year.
And as a rule of thumb, they were all resolved peacefully. The mediator would work for a long time, for as long
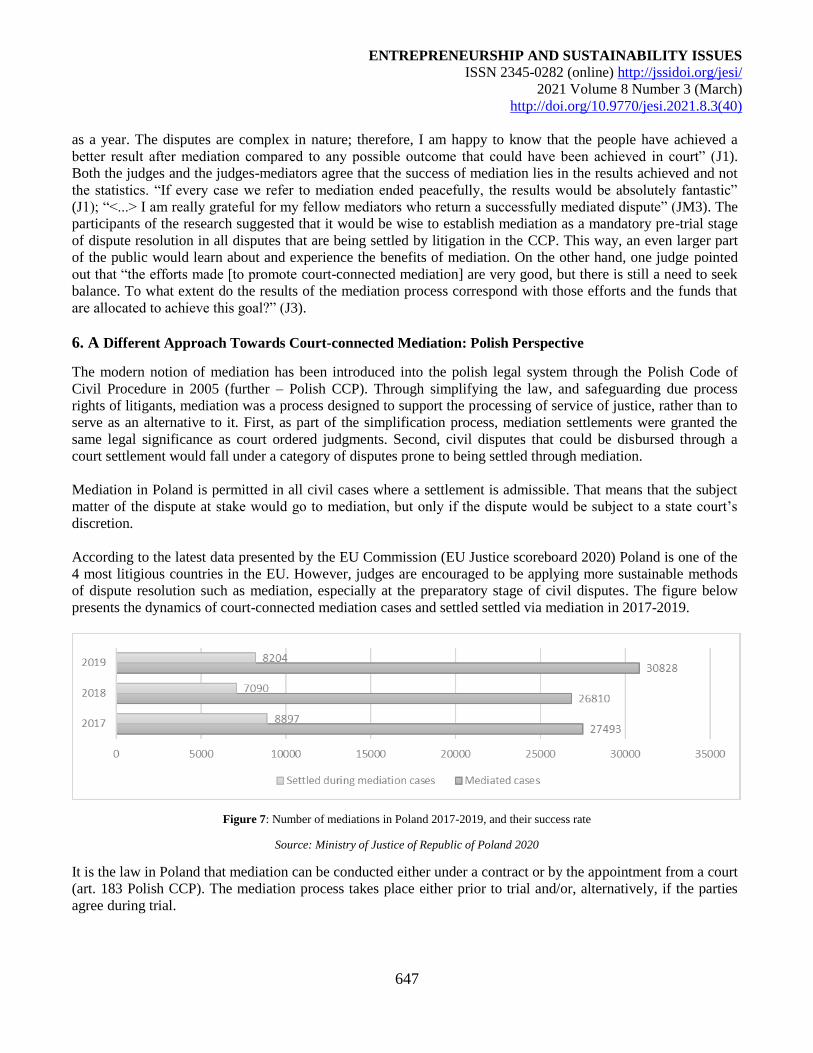
ENTREPRENEURSHIP AND SUSTAINABILITY ISSUES
ISSN 2345-0282 (online) http://jssidoi.org/jesi/
2021 Volume 8 Number 3 (March)
http://doi.org/10.9770/jesi.2021.8.3(40)
647
as a year. The disputes are complex in nature; therefore, I am happy to know that the people have achieved a
better result after mediation compared to any possible outcome that could have been achieved in court” (J1).
Both the judges and the judges-mediators agree that the success of mediation lies in the results achieved and not
the statistics. “If every case we refer to mediation ended peacefully, the results would be absolutely fantastic”
(J1); “<...> I am really grateful for my fellow mediators who return a successfully mediated dispute” (JM3). The
participants of the research suggested that it would be wise to establish mediation as a mandatory pre-trial stage
of dispute resolution in all disputes that are being settled by litigation in the CCP. This way, an even larger part
of the public would learn about and experience the benefits of mediation. On the other hand, one judge pointed
out that “the efforts made [to promote court-connected mediation] are very good, but there is still a need to seek
balance. To what extent do the results of the mediation process correspond with those efforts and the funds that
are allocated to achieve this goal?” (J3).
6. A Different Approach Towards Court-connected Mediation: Polish Perspective
The modern notion of mediation has been introduced into the polish legal system through the Polish Code of
Civil Procedure in 2005 (further – Polish CCP). Through simplifying the law, and safeguarding due process
rights of litigants, mediation was a process designed to support the processing of service of justice, rather than to
serve as an alternative to it. First, as part of the simplification process, mediation settlements were granted the
same legal significance as court ordered judgments. Second, civil disputes that could be disbursed through a
court settlement would fall under a category of disputes prone to being settled through mediation.
Mediation in Poland is permitted in all civil cases where a settlement is admissible. That means that the subject
matter of the dispute at stake would go to mediation, but only if the dispute would be subject to a state court’s
discretion.
According to the latest data presented by the EU Commission (EU Justice scoreboard 2020) Poland is one of the
4 most litigious countries in the EU. However, judges are encouraged to be applying more sustainable methods
of dispute resolution such as mediation, especially at the preparatory stage of civil disputes. The figure below
presents the dynamics of court-connected mediation cases and settled settled via mediation in 2017-2019.
Figure 7: Number of mediations in Poland 2017-2019, and their success rate
Source: Ministry of Justice of Republic of Poland 2020
It is the law in Poland that mediation can be conducted either under a contract or by the appointment from a court
(art. 183 Polish CCP). The mediation process takes place either prior to trial and/or, alternatively, if the parties
agree during trial.
ENTREPRENEURSHIP AND SUSTAINABILITY ISSUES
ISSN 2345-0282 (online) http://jssidoi.org/jesi/
2021 Volume 8 Number 3 (March)
http://doi.org/10.9770/jesi.2021.8.3(40)
648
Court appointed mediation is possible even if the parties have not previously been bound by a mediation
provision in a contract or a specific mediation-contract. Such mediation can go forward if certain conditions are
satisfied. First, the parties should agree to mediate and, second, it may take place only during the preliminary
stage of litigation (until the first hearing). The notion of mandatory court-bound mediation does not exist in the
polish legal system.
Parties to a dispute are encouraged to engage in mediation by judges. At the preparatory hearing, together with
the parties, the chair judge shall determine the subject matter of the dispute and encourage the parties to
reconcile, especially through mediation. Judges can act as conciliators on their own or advise to find a neutral
mediator to deal with the case. There is, however, an assumption that the judge will assume an active role in
negotiations between the parties. Although moderating the discussion between the parties is not anything new,
the judge’s “settlement” authority is quite broad. Therefore, a court settlement, a settlement reached/concluded in
front of a mediator, as well as negotiations in front of a judge are all forms of amicable settlement made available
to the parties in due process of the preparatory hearing (Flaga-Gieruszynska & Zielinski 2019).
Notwithstanding all of the potential benefits of the preparatory hearing, there are several controversies that relate
to the judges’ direct participation in the negotiations between the parties. Scholars and practitioners argue that
such an arrangement by a judge may be dangerous for three main reasons. First, during the preliminary hearing, a
party does not have to be represented by counsel. Second, the principles of equality and neutrality may be
compromised. Finally, early intervention into the process can result in major setbacks and ultimately can infringe
upon the parties’ substantial procedural rights (Marszałkowska-Krzes 2021). Poland’s mediation laws have been
criticized for not being clear enough in regard to the actual actions that will have to be undertaken by the judges
during the preparatory stage. In spite of the fact that there are not any real incentives or repercussions for the
judges, the forecast is that the judge’s engagement will be limited (Mucha 2020).
Additionally, as evidenced by empirical research, judges may also be obstacles to effective mediation
proceedings in Poland. One of the most comprehensive studies conducted in Poland has revealed major
challenges to institutionalized mediation (Rudolf et al. 2014). Judges being convinced of their own conciliatory
skills, their lack of specific mediation knowledge, and also low quality of mediation settlements are all elements
having an overall impact on the way mediation is perceived and utilized in Poland.
A universal rule, in a scenario where parties do proceed to mediation through the appointment of the court (court-
connected mediation), they bear the costs of the proceeding (art. 1838 Polish CCP). In short, the mediator’s salary
can be determined through three different avenues depending on the type of mediation – it can be determined
upon the basis of the Decree of the Ministry of Justice if it is a court-appointed mediation; on the basis of a
mediation regulation in accordance with the payment tariff of the mediation center that the mediator acts on
behalf of, or an individual agreement with the mediator if it is a contractual mediation.
In general, Polish civil procedure does not specifically distinguish requirements that ought to be met by
mediators acting in court-connected mediation as opposed to contractual mediations. According to art. 1832 §2 of
the Polish Civil Code, in order to become a mediator, one has to be a natural person with full legal capacity, who
is also exercising their innate rights. Thus, the law does not specify any formal requirements that have to be met
by a mediator. However, there are exceptions. In divorce and separation cases (art. 436 §4, Polish CCP), if the
parties have not decided on the mediator, the court will refer them to a permanent mediator who has theoretical
knowledge on matters which could be relevant to such disputes. Under the law there are two kinds of mediators
in Poland: permanent and ad hoc.
Article 1832 § 3 specifies that nongovernmental organizations, public institutions (such as Universities) maintain
lists of permanent mediators and create mediation centers. The lists of permanent mediators are forwarded to the
ENTREPRENEURSHIP AND SUSTAINABILITY ISSUES
ISSN 2345-0282 (online) http://jssidoi.org/jesi/
2021 Volume 8 Number 3 (March)
http://doi.org/10.9770/jesi.2021.8.3(40)
649
president of the circuit court. Art 1832 §3 1 specifies that henceforth when the Act mentions a “mediator,” it is a
permanent mediator, unless the Code explicitly states otherwise. In consequence, the ad hoc mediator can be
distinguished from the permanent mediator in the Polish system under the Polish CCP. A practical consequence
of said differentiation is that institutions that ultimately maintain lists of permanent mediators may include
additional criteria for a mediator to be enlisted. Such criteria may include specific training, knowledge,
educational background, etc. Presidents of circuit courts maintain lists of permanent mediators. The requirements
set forth by the Decree establishing the lists of permanent mediators are not extensive.
As of now the Ministry of Justice is introducing a novel mediator’s registry called the National Mediator’s
Registry (Krajowy Rejestr Mediatorów), which would come into force during 2023. The NMR is designed to be
a public registry of mediators conducting court and out-of-court mediations. Sparking much debate, The National
Mediator’s registry is an attempt to unify the profession and provide clear-cut requirements on skills and training.
What is most important is that an existing registry, namely the Integrated Qualification System (Zintegrowany
System Kwalifikacji), already enlists qualifications that have to be met by a mediator in civil and commercial
cases. Therefore, it seems that in the coming years the profession will undergo further scrutiny relating to
training, skills and expertise.
A permanent mediator can refuse to conduct mediation for valid reasons only. A mediator is under an obligation
to inform the parties immediately of said refusal, and if the parties were appointed in a due process of trial,
inform the court as well (art. 1832 §4, Polish CCP).
What is important is that the Polish CCP introduces limitations on the appointment of judges as mediators. The
Act specifies that although active judges cannot be mediators, the act does make an exception for judge emeriti.
Under article 68 on the Common Court System, the general rule is that a judge retires at the age of 65.
In Poland, mediation is advertised as a concept and an out-of-court dispute settlement procedure. For that reason,
there are limited unified national measures undertaken to promote court-connected mediations. However, it must
be appreciated that state courts do promote mediation through various information and social campaigns.
7. Discussion, Conclusions and Recommendations
Court-connected mediation in Lithuania was first introduced by adopting appropriate legal regulation and only
later was applied in practice. Lithuanian researchers studied the legal regulation of mediation, its development,
the peculiarities of its implementation and the possibility of applying mediation in different disputes. However,
there is very little research done on the attitudes and experiences of judges and judges-mediators regarding court-
connected mediation.
The results of the completed quantitative and qualitative research revealed that both judges who deal with civil
cases and judges-mediators of the Republic of Lithuania are generally positive about the system of court-
connected mediation. Both of the mentioned groups believe considerable attention is paid to court-connected
mediation. The dispute parties are offered to resolve the dispute peacefully and to make use of the court-
connected mediation possibilities. Although the number of civil cases referred to court-connected mediation has
been increasing over the past few years, this growth has recently stalled. While the results of the quantitative
research revealed that judges see the lack of public awareness as one of the greatest obstacles to the development
of the court-connected mediation, members of the focus groups expressed a bit different opinion. They
mentioned the heavy workload, the incomplete accounting system for judges-mediators’ workload and a decrease
in the total number of civil cases as the main reasons hindering the development of the court-connected
mediation in Lithuania.
ENTREPRENEURSHIP AND SUSTAINABILITY ISSUES
ISSN 2345-0282 (online) http://jssidoi.org/jesi/
2021 Volume 8 Number 3 (March)
http://doi.org/10.9770/jesi.2021.8.3(40)
650
A study conducted by J. Sondaitė and S. Molė (2019) titled “Attitudes of court mediators towards judicial
mediation practice” revealed that after being offered court-connected mediation, the dispute parties tend to
choose a judge as their mediator. Researchers refer to this as a kind of stereotype, linking these attitudes to the
general assumption that the judge is a professional who is more knowledgeable in terms of the legal aspects of
disputes. A study by S. B. Goldberg, M. L. Shaw, and J. M. Brett (2009) indicates the importance of the legal
experience of judges-mediators when it comes to acquiring the dispute parties’s trust. The authority and the legal
knowledge of the judge-mediator encourages the dispute parties to get involved in mediation more actively in
order to achieve a peaceful settlement. The conducted research confirms this idea. According to the judges and
the judges-mediators, in most cases, dispute parties who are involved in the court mediation process want the
mediator to be a judge. Not only is this due to their good knowledge of legal issues, but it is also because of their
authority and the society’s high confidence in them. The research also revealed the judges’ positive attitude
towards mediation, even if it does not end with a settlement. In their opinion, when the case returns to court from
mediation, the emotional motives are already discussed, and so it is only the legal arrangements that remain to be
made. This was also observed in a study conducted by J. Sondaitė and S. Molė (2019, 203), where the court
mediators mentioned that “even if a peace treaty is not signed after mediation, the dialogue still has its effects,
the parties gain more clarity and the conflict becomes less intense in any case”.
To summarize the results of the study, the need to explain the reasons for the dissatisfaction of judges with the
court-connected mediation system in more detail is identified. There are several directions for the improvement
of the institute of the court-connected mediation. First of all, both judges and judges-mediators see excessive
workload of judges as the main obstacle for the development of the court-connected mediation. Given that there
are judges who believe that court-connected mediation should not be conducted by judge-mediators at all, there
is a need to discuss the possibility of more extensive involving of non-judges mediators in the process of court-
connected mediation. Secondly, according to judges and judges-mediators, court-connected mediation still lacks
wider public awareness. Due to the fact that a large part of the public takes part in court disputes relatively
infrequently and that the option of court-connected mediation is relevant only to those who are currently involved
in litigation, one-time information distribution is not sufficient - consistent long-term publicity is needed. It
should also be noted that some respondents mentioned the low competence and professionalism of mediators. It
is necessary to ensure continuous professional development of judges-mediators, increase their motivation to stay
active in mediation.
Taking a glace at the Polish model of court-connected mediation which does not involve judges as mediators at
all, it is obvious that this approach may be seen as an alternative to the Lithuanian model. However, it should be
noted that the success rate of court-connected mediation in Lithuania (47 per cent in 2019) is higher than in
Poland (27 per cent in 2019). Such a difference may be caused by issues concerning mediators’ qualification. In
Poland the problem of mediator’s qualification is related primarily to a fragmentary qualification and training
system with little or no control as well as no unified measures applied. Fostering more sustainable measures
designed to improvee the system of resolving civil disputes requires not only legal background, incentive
measures but also a pool of professional mediators, who are ready to serve both in contract-based mediation and
court-connected mediation. The existsing certification system of out-of-court mediatiors’ in Lithuania and more
than 500 mediators on the Lithuanian list of mediators is a strong argument for a comprehensive reform of the
institutional model of the court-connected mediation in Lithuania.
ENTREPRENEURSHIP AND SUSTAINABILITY ISSUES
ISSN 2345-0282 (online) http://jssidoi.org/jesi/
2021 Volume 8 Number 3 (March)
http://doi.org/10.9770/jesi.2021.8.3(40)
651
References
Ali, S. F. (2018). Court mediation reform: Efficiency, confidence and perceptions of Justice. Edward Elgar Publishing, 351 p.
Ali, S. F. (2018). Practitioners' Perception of Court-Connected Mediated in Five Regions: An Empirical Study. Vanderbilt Journal of
Transnational Law, 51, no. 4 (October 2018): 997-1026. cdn.vanderbilt.edu
Annual Report of Lithuanian Courts. (2018). Constitutional Court of the Republic of Lithuania. available at
https://www.lrkt.lt/data/public/uploads/2020/06/annual-report-2019-web_.pdf
Annual Report of Lithuanian Courts. (2019). Constitutional Court of the Republic of Lithuania. available at
https://www.teismai.lt/data/public/uploads/2020/03/teismai2020.pdf
Art. 13, Rules on Court mediation, approved by the Council of Judges (19675 TAR 2018), available at https://www.e-
tar.lt/portal/lt/legalAct/70208500f79411e880d0fe0db08fac89
Art. 6, part 2. Law on Mediation of the Republic of Lithuania (Valstybės žinios, 2008-07-31, Nr. 87-3462,. available at https://e-
seimas.lrs.lt/portal/legalAct/lt/TAD/TAIS.325294/asr
Code of Civil procedure of the Republic of Lithuania (36-1340, Valstybės žinios, 2002), available at https://www.e-
tar.lt/portal/lt/legalAct/TAR.2E7C18F61454/asr
EU Justice Scoreboard 2020, available at: https://ec.europa.eu/info/policies/justice-and-fundamental-rights/upholding-rule-law/eu-justice-
scoreboard_en
Flaga-Gieruszyńska, K., Zieliński, A. (2019). Kodeks postępowania cywilnego (Code of Civil Procedure). Komentarz. Wyd. 10.
Gaižauskaitė, I. & Mikėnė, S. (2014). Socialinių tyrimų metodai: apklausa (Social research methods: survey). Vilnius: Mykolo Romerio
universitetas, 215p.
Goldberg, S. B., Shaw, M. L., Brett, J. M. (2009). What Difference Does a Robe Make? Comparing Mediators with and without Prior
Judicial Experience. Negotiation Journal, 25, 277-305. https://doi.org/10.1111/j.1571-9979.2009.00227.x
Kaminskiene, N., Tvaronaviciene, A. & Zaleniene, I. (2014). Bringing sustainability into dispute resolution processes. Journal of Security
and Sustainability Issues, 4(1), 69-77. https://doi.org/10.9770/jssi.2014.4.1(6)
Kaminskienė, N. (2010). Teisminė mediacija Lietuvoje. Quo vadis? Socialinis darbas, 9(1), 54-63.
Lande, J. (2004). Commentary: Focusing on program design issues in future research on court-connected mediation. Conflict Resolution,
Quarterly 22(1), 89-100. https://doi.org/10.1002/crq.93
McAdoo, B., Welsh, N. & Wissler, R. (2003). Institutionalization: What do empirical studies tell us about court mediation? Dispute
Resolution Magazine, 9(2), 8-10. https://scholarship.law.tamu.edu/facscholar/990
Ministry of Justice of Poland, information on National Mediator’s registry (2020), available at
https://www.gov.pl/web/sprawiedliwosc/nowy-projekt-dla-mediacji--powstanie-krajowy-rejestr-mediatorow.
Molė, S. & Sondaitė, J. (2019). Teismo mediatorių požiūris į teisminės mediacijos praktiką. Socialinis darbas, 17 (2), 191-208;
https://doi.org/10.13165/SD-19-17-2-05
Morgan, D. L. (2010). Reconsidering the Role of Interaction in Analyzing and Reporting Focus Groups. Qualitative Health Research. 20
(5), 718 –722. https://doi.org/10.1177/1049732310364627
Mucha, J. [in:], Flaga-Gieruszyńska, K, Flejszar R, Malczyk M. (2020), Nowelizacja Kodeksu postępowania cywilnego (Amendment of
the Code of Civil Procedure) z 4.7.2019 r. w praktyce.
Polish Civil Code, Journal of Laws 1964, No 16, item 93), available at
http://isap.sejm.gov.pl/isap.nsf/download.xsp/WDU19640160093/U/D19640093Lj.pdf
ENTREPRENEURSHIP AND SUSTAINABILITY ISSUES
ISSN 2345-0282 (online) http://jssidoi.org/jesi/
2021 Volume 8 Number 3 (March)
http://doi.org/10.9770/jesi.2021.8.3(40)
652
Rudolf, A. at al. (2014) Diagnoza stanu stosowania mediacji oraz przyczyny zbyt niskiej w stosunku do oczekiwanej popularności
mediacji, Raport końcowy. Projekt: „Propagowanie alternatywnych metod rozwiązywania sporów” (Program operacyjny „Budowanie
potencjału instytucjonalnego i współpraca w obszarze wymiary sprawiedliwości/Poprawa skuteczności wymiaru sprawiedliwości”
realizowany w ramach Norweskiego Mechanizmu Finansowego 2009 – 2014). (Diagnosis of the application of mediation and the reason
for its low popularity in relation to the expected popularity of mediation, Final report. Project: "Promoting alternative dispute resolution"
(Operational program "Building institutional capacity and cooperation in the area of justice / Improving the efficiency of the justice
system" implemented under the Norwegian Financial Mechanism 2009-2014).
Postępowanie Mediacyjne w świetle danych statystycznych, Sądy Rejonowe i Okręgowe w latach 2006 – 2019 (Mediation proceedings in
the light of statistical data, District and District Courts in the years 2006 – 2019), available at: https://isws.ms.gov.pl/pl/baza-
statystyczna/publikacje/download,2779,6.html
Rules on Court mediation, approved by the Council of Judges (19675 TAR 2018), available at https://www.e-
tar.lt/portal/lt/legalAct/70208500f79411e880d0fe0db08fac89.
Saudargaitė, I. (2015). Judicial mediation in civil disputes in Lithuania. Dissertation. Vilnius, Mykolo Romerio universitetas.
The Act of July 27 2001 on the Common Court System, (Journal of Laws, No 98, item 1070 (Poland)), available at:
http://isap.sejm.gov.pl/isap.nsf/download.xsp/WDU20010981070/U/D20011070Lj.pdf
The Act of 28.07.2005 amending the Code of Civil Procedure and other Acts, (Journal of Laws of 1964, Nr 43, item 269, with further
amendments (Poland)), available at http://isap.sejm.gov.pl/isap.nsf/download.xsp/WDU20051721438/O/D20051438.pdf.
The Decree of the Minister of Justice of Poland of 20 January 2016 on maintaining lists of permanent mediators, (Journal of Laws of 2016,
item 122), available at http://isap.sejm.gov.pl/isap.nsf/download.xsp/WDU20160000921/O/D20160921.pdf
The Decree of the Minister of Justice of Poland of 20 June, 2016 on mediator’s salary and recovarable costs in civil litigation, (Journal of
Laws 2016, item 921), available at http://isap.sejm.gov.pl/isap.nsf/download.xsp/WDU20160000921/O/D20160921.pdf
The Decree No. 13P-15 of Judicial Council of January 26, 2007 on the continuation of court mediation pilot project (Lithuania).
The Integrated Qualification System, qualifications of a mediator qualified in civil and commercial disputes (2021), available at:
https://rejestr.kwalifikacje.gov.pl/frontend/index.php?r=kwalifikacja%2Fview&id=12632.
The list of court mediators, available at https://e.teismas.lt/lt/public/teismin%C4%97-mediacija/ (2021-01-12).
Tvaronavičienė, A. & Kaminskienė, N. (2019). Teisminės mediacijos taikymas administracinėje justicijoje (Application of judicial
mediation in administrative justice). Lithuanian Law. Essential changes, 29-33. https://repository.mruni.eu/handle/007/16248
Welsh. N. A. (2004). The Place of Court-Connected Mediation in a Democratic Justice System. Cardozo Journal of Conflict Resolution, 5,
117-144. https://scholarship.law.tamu.edu/facscholar/948
Wissler, R. L. (2002). Court-Connected Mediation in General Civil Cases: What We Know from Empirical Research. Ohio State Journal
on Dispute Resolution, 17(3), 641-704. http://hdl.handle.net/1811/87141
Wissler, R. L. (2002). The effectiveness of court-connected dispute resolution in civil cases. Conflict Resolution. Quarterly, 22(1), 55-88.
https://doi.org/10.1002/crq.92
Zaksaitė, S. & Garalevičius, Z. (2009). Teisminės ir neteisminės šeimos ginčų mediacijos galimybės (Judicial and out-of-court mediation
options for family disputes). Teisės problemos, 4(66), 70-108.
ENTREPRENEURSHIP AND SUSTAINABILITY ISSUES
ISSN 2345-0282 (online) http://jssidoi.org/jesi/
2021 Volume 8 Number 3 (March)
http://doi.org/10.9770/jesi.2021.8.3(40)
653
Agnė TVARONAVIČIENĖ is a Professor at the Law School of Mykolas Romeris University. Research interests: alternative dispute
resolution, mediation, public procurement, social technologies.
ORCID ID: orcid.org/0000-0002-5489-5570
Natalija KAMINSKIENĖ is an Associate Professor at the Law School of Mykolas Romeris University. Research interests: civil
procedure, alternative dispute resolution, mediation, legal negotiations.
ORCID ID: orcid.org/0000-0002-0198-8271
Irena ŽEMAITAITYTĖ is a Professor at the Faculty of Human and Social Studies of Mykolas Romeris University. Research interests:
adult education, formal and informal education, mediation. ORCID ID: orcid.org/0000-0002-7773-9263
Maria CUDOWSKA is a junior lecturer at the Faculty of Law, University of Bialystok. Research interests: civil law, commercial law,
alternative dispute resolution.
ORCID ID: orcid.org/0000-0002-8907-4211
Make your research more visible, join the Twitter account of ENTREPRENEURSHIP AND SUSTAINABILITY ISSUES: @Entrepr6972881
__________________________________________________________________________________________ Copyright © 2021 by author(s) and VsI Entrepreneurship and Sustainability Center
This work is licensed under the Creative Commons Attribution International License (CC BY).
http://creativecommons.org/licenses/by/4.0/
ENTREPRENEURSHIP AND SUSTAINABILITY ISSUES
ISSN 2345-0282 (online) http://jssidoi.org/jesi/
2021 Volume 8 Number 3 (March)
http://doi.org/10.9770/jesi.2021.8.3(41)
Publisher http://jssidoi.org/esc/home
ENTREPRENEURIAL ORIENTATION AND CSR: A DYNAMIC CAPABILITY IN THE CORPORATE
PERFORMANCE OF MEXICAN SMES*
Luis Enrique Valdez-Juárez ¹, Dolores Gallardo-Vázquez 2, Elva Alicia Ramos-Escobar 3
1 Faculty of Economics and Business, Technological Institute of Sonora, Guaymas, Sonora 85400, Mexico 2 Department of Financial Economics and Accounting, Faculty of Economics and Business, University of Extremadura,
06006 Badajoz, Spain 3Faculty of Economics and Business, Technological Institute of Sonora, Guaymas, Sonora 85400, Mexico
E-mails:1 [email protected]; 2 [email protected]; 3 [email protected]
Received 10 October 2020; accepted 14 February 2020; published 30 March 2021
Abstract. In the current business context, SMEs play a determining role for most regions. For this reason, more and more companies are
adopting business strategies that lead them to maintain and increase their competitiveness. Two of these strategies are Entrepreneurial
Orientation (EO) and Corporate Social Responsibility (CSR). The purpose of the study is to observe the effects that the EO has on the CSR
and on the Corporate Performance (CPERF). In addition, it seeks to determine if the CSR has significant effects on the Corporate
Performance, and it has also been proposed to examine the mediating effect that the CSR has between the variable EO and Corporate
Performance. The study analyzes a sample of 488 trade and service SMEs from the Northwest region in Mexico. The information was
collected through a self-directed survey of the manager of each SME from May to September 2018. For the analysis of the data, the
statistical technique PLS-SEM was used (partial least squares structural equation modeling). The results report that EO has a strong
significant effect on CSR and also on the Corporate Performance of SMEs. Furthermore, the results have corroborated that CSR is a
mediating variable between EO and Corporate Performance. The study contributes to the development of the theory of Dynamic
Capabilities and of Stakeholders, corroborating that SMEs that adopt EO and CSR can lead them to the permanent adoption of sustainable
entrepreneurship and the improvement of their corporate performance results.
* This research has been funded with support from the Government of Mexico through the program of the Ministry of Public
Education for the Strengthening of Educational Quality (PFCE 2019, 2020)
https://www.dgespe.sep.gob.mx/pfce/reglas_operacion and with resources from the Technological Institute of Sonora
(ITSON), during the year 2020. European Regional Development Fund and Junta of Extremadura (Business Research
[INVE] Research Group [SEJ022 code]) and by the VI Action Plan 2018–2020 under grant number GR18058.
ENTREPRENEURSHIP AND SUSTAINABILITY ISSUES
ISSN 2345-0282 (online) http://jssidoi.org/jesi/
2021 Volume 8 Number 3 (March)
http://doi.org/10.9770/jesi.2021.8.3(41) Make your research more visible, join the Twitter account of ENTREPRENEURSHIP AND SUSTAINABILITY ISSUES: @Entrepr69728810
655
Keywords: Entrepreneurial Orientation; Corporate Social Responsibility (CSR); Corporate Performance; Small and Medium Enterprises
(SMEs)
Reference to this paper should be made as follows: Valdez-Juárez, L.E., Gallardo-Vázquez, D., Ramos-Escobar, E.A. 2021.
Entrepreneurial orientation and CSR: a dynamic capability in the corporate performance of Mexican SMEs. Entrepreneurship and
Sustainability Issues, 8(3), 654-680. http://doi.org/10.9770/jesi.2021.8.3(41)
JEL Classifications: L21, L26
1. Introduction
In past and recent times organizations have been in search of competitiveness and permanence in global markets.
For this, it has been necessary to adopt strategies that are difficult to match and with a high degree of innovation.
For this purpose, the managers of these companies require resources and capacities to achieve these goals
(Andreeva & Ritala, 2016). Among these requirements are entrepreneurship-oriented capacity and creativity to
develop high-impact business ideas for stakeholders. Entrepreneurship is associated with the level of creativity,
with the capacity for innovation, with taking risks and with the degree of proactivity of individuals (Drucker
2014; Zahra, & Wright 2016). Generally, experts on the subject have analyzed the behavior of this variable as a
multidimensional construct, which considers the capacity for innovation, the ability to take risks, the ability to be
proactive, aggressiveness and autonomy in the management of companies (Covin & Slevin, 1991; Wales, 2016).
However, the variables that are most frequently studied in the field of business sciences are: innovation,
proactivity and risk taking (Wales, 2016). In this same direction, various specialists in the business area and
theoretical experts in business sustainability have expressed and confirmed that the Entrepreneurial Orientation
(EO) provides an important number of benefits for companies (Mishra & Zachary, 2014; Nasra & Dacin, 2010;
Zahra, 2007). These can be financial, organizational, and market specialists in the development of the Theory of
Dynamic Capabilities (TDC) have explained that EO has become a crucial business strategy to maintain a
competitive advantage, therefore, it is necessary to take advantage of opportunities, know the changes in the
environment and reduce threats to through the exploration of innovation capacity (adopting new technologies) and
the exploitation of intangible resources (organizational management capacity) with which an organization has
available (Aagaard, 2016; Teece, 2007, 2016). Another key dynamic capability that is linked to business strategy
is the case of Corporate Social Responsibility (CSR), which has been one of the most recurring sustainability
strategies in the last two decades by company managers.
However, in order to achieve these benefits within and outside the company and more so for small and medium-
sized enterprises (SMEs), it is necessary to bring down some obstacles such as: 1) the poor strategic vision of
managers or investors, 2) little importance in creativity, innovation and orientation towards entrepreneurship, 3)
high CSR regulations, 4) high costs of implementation in certifications, 5) little social and environmental
commitment of employees, and 6) high competition with multinational companies (Gibb, 2007; Hernández et al.,
2010; Terán-Yépez et al., 2020; Tiba et al., 2020; Zahra et al., 2006). All this has led to the arrival of new
business models focused on corporate sustainability and are gradually leaving benefits focused only on traditional
models that benefit shareholders (Carroll, 1991; Friedman, 2007). Therefore, sustainable business models
incorporate a triple bottom line approach and consider multiple benefits for stakeholders, where they generally
include ethical, environmental and social aspects (Cavaleri & Shabana, 2018; McWilliams et al., 2016; Seaborn et
al., 2020). The conceptualization of CSR has been in constant evolution, the stakeholders theory being the most
predominant in research, as it contemplates the voluntary actions and behaviors that companies undertake towards
their internal and external clients, in ethical and legal terms, social, economic and environmental (Freeman et al.,
2010; Hsueh, 2015; Spence, 2016). The literature on sustainable entrepreneurship has exposed an important
variety of business models, from which SMEs can adopt to improve their corporate performance, among which
ENTREPRENEURSHIP AND SUSTAINABILITY ISSUES
ISSN 2345-0282 (online) http://jssidoi.org/jesi/
2021 Volume 8 Number 3 (March)
http://doi.org/10.9770/jesi.2021.8.3(41) Make your research more visible, join the Twitter account of ENTREPRENEURSHIP AND SUSTAINABILITY ISSUES: @Entrepr69728810
656
are: 1) circular business model, which is characterized in that in most cases they are closing, slowing down,
intensifying, dematerializing or narrowing resource loops, these models have given rise to the business model
based on the circular economy (Carayannis et al., 2018; Kalmykova et al., 2018), 2) social enterprises: business
models that aim at social impact by generating profitability derived from economic activity or by completely
reinvesting them (Nosratabadi et al., 2019), and 3) product and service system: these are business models that
integrate the offer of functional products and services with substantial benefits and results for customers
(Carayannis et al., 2012; Geissdoerfer et al., 2017, 2018), these approaches and/or models have been adapted to
different contexts and productive sectors that have contributed to the sustainable development of various regions
of the world (Abdelkafi & Täuscher, 2016; Nosratabadi et al., 2019).
Commonly, for SMEs in the commerce and service sector, the EO is not applied in its entirety, due to internal and
external barriers that prevent the adoption of innovative actions, it is also common for these companies to have
limited financial resources, little commitment from all stakeholders employees for the development of creativity,
taking high risks in projects is not the priority and sustainable actions aimed at offering socially responsible goods
and services have been a difficult task to adopt (Eggers, 2020). However, it has been shown that to be more
competitive and face global economic crises it is advisable and important to focus on entrepreneurial-oriented
strategies (Eggers, 2020) . In the current context, the most active entrepreneurial activity is centered in the United
States of America, Europe and Asia (Feng et al., 2020; Yang et al., 2020), the latter being the one that has stood
out with the presence of emerging companies with innovative products in different parts of the world (Brink,
2018; Donbesuur et al., 2020). In this sense, the literature on entrepreneurship orientation states that companies
must act proactively, innovatively and with tolerance to risk to respond to the demands of society and markets in a
socially responsible way, with ethical behaviors that integrate the social, environmental and economic interests of
stakeholders (Covin & Lumpkin, 2011; Donbesuur et al., 2020). In short, it is clear that companies that adopt
ethical and legal practices lead them to reduce risks and errors in decision-making, however the level of
proactivity and innovation can be seriously affected (Tuan, 2015). On the other hand, companies oriented to
sustainability and ecological practices tend to be more innovative and proactive, but they are betting on a return
on investment and long-term corporate performance and with greater risk (Carroll, 2018; McWilliams et al.,
2016). These risks are more acute in SMEs, because when trying to voluntarily change towards sustainable
entrepreneurship, their resources and management capacities are more limited (Terán-Yépez et al., 2020; Tiba et
al., 2020). In the theoretical and empirical review, it has been detected that there are few studies focused on the
analysis of business models oriented towards the influence of the EO on CSR and CPERF in SMEs (Stewart &
Roth, 2007; Zahra, 2008). In most of the works analyzed, they focus on studying large corporations from different
regions where countries have highly developed economic, political and social levels (Cooren, 2020; Kaplan &
Kinderman, 2020; Perrini, 2006; Winkler et al., 2020). Due to the recent incursion of sustainable entrepreneurship
(innovative actions based on social, economic and environmental practices) in organizations at a global level and
more in the business practices of SMEs, but in addition to the lack of consistency in the literature and in the effect
significant in financial performance, the study contributes to the development of the theory of dynamic
capabilities (Jiang et al., 2018; Terán-Yépez et al., 2020).
In the Mexican context, SMEs represent 99% of the total companies registered in the country (about 6 million
businesses), of which 60% are focused on the commerce sector, 30% on the services sector and 10% belongs to
the industrial sector (manufacturing) (INEGI, 2019). On the other hand, Mexican companies (microenterprises)
are characterized by being within the informal economy, these data represent 60% of the total generation of the
economy in the country, although it is below the global average it is still a figure alarming (ILO, 2016). Despite
the fact that in Mexico there are strong technological limitations (lack of internet connectivity coverage) and the
promotion of innovation for social, political and economic development, the country is among those highlighted
by the development of new enterprises (GEM, 2018; OECD, 2018). According to GEM (2020), Mexico has
ENTREPRENEURSHIP AND SUSTAINABILITY ISSUES
ISSN 2345-0282 (online) http://jssidoi.org/jesi/
2021 Volume 8 Number 3 (March)
http://doi.org/10.9770/jesi.2021.8.3(41) Make your research more visible, join the Twitter account of ENTREPRENEURSHIP AND SUSTAINABILITY ISSUES: @Entrepr69728810
657
important challenges to develop the entrepreneurial spirit and the culture of entrepreneurship, among which the
following stand out: 1) the few government programs to promote entrepreneurship, 2) financing with high interest
rates, 3) lack of entrepreneurial education during training school, 4) high internal market regulations, and 5) little
investment in research and development for innovation. On the other hand, the lack of government initiatives to
promote business sustainability has been rare and a barrier to the development of sustainable entrepreneurship. In
Mexico, companies are not required to go through certification processes related to sustainability or corporate
social responsibility, only large companies are the ones that are voluntarily pushing these initiatives with force
(UNO, 2019).
From the previous context, the study focuses on the contribution to the development of literature from two
perspectives: 1) It contributes to the development of the EO literature as a strategy of dynamic capability of
SMEs, and 2) It contributes to the development of Stakeholder theory through CSR analysis in SMEs with an
economy in a developing country. The research work has the following objectives: 1. Analyze the effects that EO
has on CSR and Corporate Performance, 2. Determine if CSR has significant effects on Corporate Performance,
and 3. Examine the mediating effect that has the CSR between the variable EO and the Corporate Performance
that is generated in the SMEs of the Northwest region of Mexico. In addition, the study answers the research
questions: 1) The EO can be a dynamic capability that raises the CSR level and that improves the Corporate
Performance in the SMEs trade and service of the Northwest of Mexico? 2) What are the strategic actions of EO
that are most applied by SMEs trade and service in Northwestern Mexico, and 3) What are the CSR practices that
are most developed by SMEs in Northwest Mexico? The document includes a review of the literature, the
justification of the hypotheses, the method used, the measurement of the variables, the main findings, discussions
and conclusions.
2. Review and Theoretical-Empirical Justification of the Hypotheses
2.1. Entrepreneurial Orientation, its Relationship with CSR and Corporate Performance
Entrepreneurial Orientation, in recent years, has been viewed as a dynamic capability and a superior value
strategy for organizations (Teece, 2009; Zahra et al., 2006). Its conceptual origins derive from the literature of
entrepreneurship, therefore, EO encompasses the configuration of practices, the adoption and application of
policies in the processes that allow the creation of rational actions and decisions within the company (Lumpkin &
Dess, 2015). Main researchers in the contextualization and measurement of EO have been Miller (1983) and
Covin and Slevin (1991), who, in addition to determining that it is a multidimensional construct, have concluded
that it is defined as a business strategy that is made up of actions, intentions and abilities, both individual and
collective: 1) the capacity for innovation (leadership in innovation requires a strong investment in research and
development for the generation of new products, changes in existing products, generation of new working
techniques and adoption of new technologies in the processes) (Teece, 2010; Weerawardena & Mavondo, 2011),
2) proactivity: -human capacity to face the risks of the external environment- (must show a competitive posture,
be the first to introduce new products, make bold decisions before competitors, show environmental boldness,
make rational decisions, etc., (Wales, 2016; Zhao & Smallbone, 2019) and, 3) take risks (ease of propensity to
take risks in projects with high risk and high return, value the cost-benefit) that assumes a business (Donbesuur et
al., 2020; Lisboa et al., 2011). All this mix of capabilities leads companies to explore and take advantage of new
opportunities, improve their performance in highly competitive markets and generate sustainable competitive
advantages (Drucker, 2014; Lumpkin & Dess, 1996).
However, these classic trends have explained very little the relationship between entrepreneurial orientation or
(intra-entrepreneurship) with the Theory of Stakeholders and the strategy of Corporate Social Responsibility,
therefore, authors such as Teece (2007) and Newey and Zahra (2009), through their postulates and models have
ENTREPRENEURSHIP AND SUSTAINABILITY ISSUES
ISSN 2345-0282 (online) http://jssidoi.org/jesi/
2021 Volume 8 Number 3 (March)
http://doi.org/10.9770/jesi.2021.8.3(41) Make your research more visible, join the Twitter account of ENTREPRENEURSHIP AND SUSTAINABILITY ISSUES: @Entrepr69728810
658
developed the theory of Dynamic Capabilities. They have given great importance to the incursion of business
strategies oriented towards entrepreneurship, innovation, technology, knowledge management, sustained financial
profitability, but they have also studied and incorporated into their models’ sustainable practices such as corporate
social responsibility in organizations of different dimensions. From an empirical perspective, recent studies have
concluded that there is a strong relationship between EO and CSR in SMEs. We highlight the research of Isaak &
Logic (1999) and Wagner (2010) who have linked green and social entrepreneurship to sustainable
entrepreneurship, as three categories that share the common objective of positive environmental impact. Adomako
& Nguyen(2020), also in a context of SMEs, observe EO as a key capability, able to create sustained competitive
advantage for companies. Under the view of dynamic capabilities theory, greater levels of EO provide the
company with available resources and the possibility to undertake CSR activities (Adomako & Nguyen, 2020).
This way, EO facilitates the implementation of CSR activities, making its skills available to the company, so that
it uses its internal resources and applies them in the CSR strategy. Iqbal & Malik (2019), analyzed the effects of
EO through the engagement of SMEs in CSR practices. The results revealed that EO is positively associated with
the engagement on sustainable practices, particulary regarding the environment, human resource management,
and community and local development.
In addition, there are other results that have informed that SMEs, managers and entrepreneurs who take risks and
who focus on innovation and technological development have managed to generate co-creation of value through
the adoption of sustainable actions, the same as the leads to penetrate new market niches riddled with customers
with greater awareness and ecological and environmental demands (Broadstock et al., 2019; Multaharju et al.,
2017), however, the issue of sustainability has become a critical strategy for managers of SMEs (Liu, C. H. S., &
Huang, 2020). From another perspective, some researchers have revealed that there is evidence that in some cases
these practices lead companies to adopt certifications and drive them towards internationalization, positively
impacting interest groups (Ayuso & Navarrete-Báez, 2018; Calic & Mosakowski, 2016; Moratis & Cochius,
2017; Schaltegger & Wagner, 2017). On the other hand, in the context of corporate performance, this variable is
significantly affected by EO. Various authors have agreed that SMEs, oriented towards creativity, innovation and
risk-taking, are more likely to increase their sales, improve their profits and achieve a greater competitive
advantage (Linton et al., 2007; Martin & Javalgi, 2016). In addition, entrepreneurship-oriented SME managers
have a strong propensity for new product innovation, improved business strategies that drive value creation, and
drives toward higher levels of corporate performance for business stakeholders (Eshima & Anderson, 2017; Wang
et al., 2020), besides, the EO focused on sustainability practices becomes more difficult to fulfill when global
economic conditions are more turbulent for most SMEs in different regions (Ayuso & Navarrete-Báez, 2018;
Laskovaia et al., 2019). The previous information justifies that EO is a predictor of the success of corporations
(Kraus et al., 2012) and has a significant influence on corporate performance and value creation (Covin & Slevin,
1989). At the same time, Chege, Wang, and Leparan Suntu (2020) examines the link between EO and firm
performance in Kenya obtaining positive results and recommending entrepreneurial actions of all type in the
organization to achieve greater corporate performance. Similarly, Shafique and Saeed (2020) examine the impact
of EO on corporate performance by considering environmental dynamism as a potential moderator.
Other important studies in this context of business strategy that have been developed in different economies such
as Mexico, Spain and China, have shown that the EO is due to the level of innovation capacity, proactivity and
risk-taking of companies to be able to raise corporate performance (Basco, Hernández-Perlines, & Rodríguez-
García 2020). This behavior is manifested in recently created companies and in small businesses. Therefore, from
a strategic vision, companies with EO and the capacity for innovation, which create and develop new products
and with greater risk assessment in highly competitive markets are viewed as strategies that become dynamic
capacities to achieve exponential and sustained results in organizational and financial terms (Lisboa et al., 2011;
Monteiro et al., 2019). The following hypotheses arise from the previous context:
ENTREPRENEURSHIP AND SUSTAINABILITY ISSUES
ISSN 2345-0282 (online) http://jssidoi.org/jesi/
2021 Volume 8 Number 3 (March)
http://doi.org/10.9770/jesi.2021.8.3(41) Make your research more visible, join the Twitter account of ENTREPRENEURSHIP AND SUSTAINABILITY ISSUES: @Entrepr69728810
659
Hypothesis 1 (H1). The more entrepreneurial orientation, the higher the level of practices of Corporate Social
Responsibility in SMEs.
Hypothesis 2 (H2). The more entrepreneurial orientation, the higher level of corporate performance (SMEs).
2.2. The Relationship of CSR and Corporate Performance
The literature has exposed that CSR practices are decisive for business sustainability. Furthermore, CSR is a
concept that is made up of economic, social and environmental aspects (McWilliams et al., 2016; Schaltegger et
al., 2016; Tasdemir et al., 2018). Starting from the Stakeholder theory, CSR can be defended as those companies
that adopt voluntary practices focused on ethical, legal, social, economic and environmental actions to benefit
employees, shareholders, suppliers, customers, society and other organizations (Carroll, 2018; Freeman et al.,
2010). In the literature, the positive effect that CSR has on corporate performance has been largely discussed, it is
common to find in literature that CSR produces greater social innovation, greater image, greater reputation and,
consequently, better performance organizational economic and financial business (Hadj, 2020; McWilliams et al.,
2006). However, for SMEs, the road is long to achieve all these benefits, this mainly depends on the size,
resources and entrepreneurial capabilities (Ortiz-Avram et al., 2018a), in addition, SMEs tend to focus on a
narrow niche of interest groups, all this contrasts with what is practiced in large companies (Magrizos et al.,
2020).
However, the relationship between CSR and company performance is not yet fully defined and may vary
according to operational conditions and the nature of each company (Carroll, 2016; Friedman, 2007). Research on
endogeneity in the CSR area has explained that there is a divergence in the effect that CSR has on Corporate
Performance. Empirical studies have shown that there can be a unidirectional and bidirectional relationship,
however, it has been observed that there is a direct correlation between both constructs (CSR-Corporate
Performance), but in addition, there are other variables that can act as mediators to obtain a direct positive effect
and indirect on financial performance (Liu et al., 2020). Intangible variables such as knowledge, entrepreneurial
orientation (innovation, proactivity and risk taking) and company size can help improve this correlation
(Martínez-Campillo et al., 2013). Researchers on the subject have expressed that companies that focus on
sustainable ventures have managed to generate trust and loyalty towards their clients, generate higher sales, raise
their image, improve the reputation level and, consequently, manage to increase their financial profits (Martinez-
Conesa et al., 2017; Naseem et al., 2020; Pérez-Cornejo et al., 2020; Tang & Tang, 2012). In this same context of
SMEs, these organizations have been adopting business models based on innovation and sustainability, and with a
greater concern and focus on customers and society, actions positively affect performance financial (Broadstock
et al., 2019; Veronica et al., 2019). In this same direction, recent studies have expressed that the CSR is a business
strategy that drives financial results, increases business reputation, improves customer satisfaction and is a
measuring strategy to achieve competitive advantage (Cantele & Zardini, 2018; Gupta & Gupta, 2020).
There are numerous researches that link CSR with corporate performance. Literature indicates that firms which
are carrying out CSR actions finally perform better. We can find empirical evidence about this relationship
(Orlitzky, 2011; Pivato et al., 2007). Some authors provide evidence about how CSR practices in African
companies generate performance improvement (Lindgreen et al., 2009). On the other hand, a study in China
evidences that environmental CSR results on a corporate performance, higher in polluting industries with lower
state ownership (Hu et al., 2018). More studies confirm this relationship with economic and social dimensions
(Halme et al., 2020; Lindgreen et al., 2009; Reverte et al., 2016; Valdez-Juárez, 2017). Also, the developed by
Gallardo-Vázquez, Valdez-Juárez, and Castuera-Díaz (2019) expresses this relationship in Spanish SMEs, while
expressing a very complete link between the variables under study with others, such as innovation, reputation and
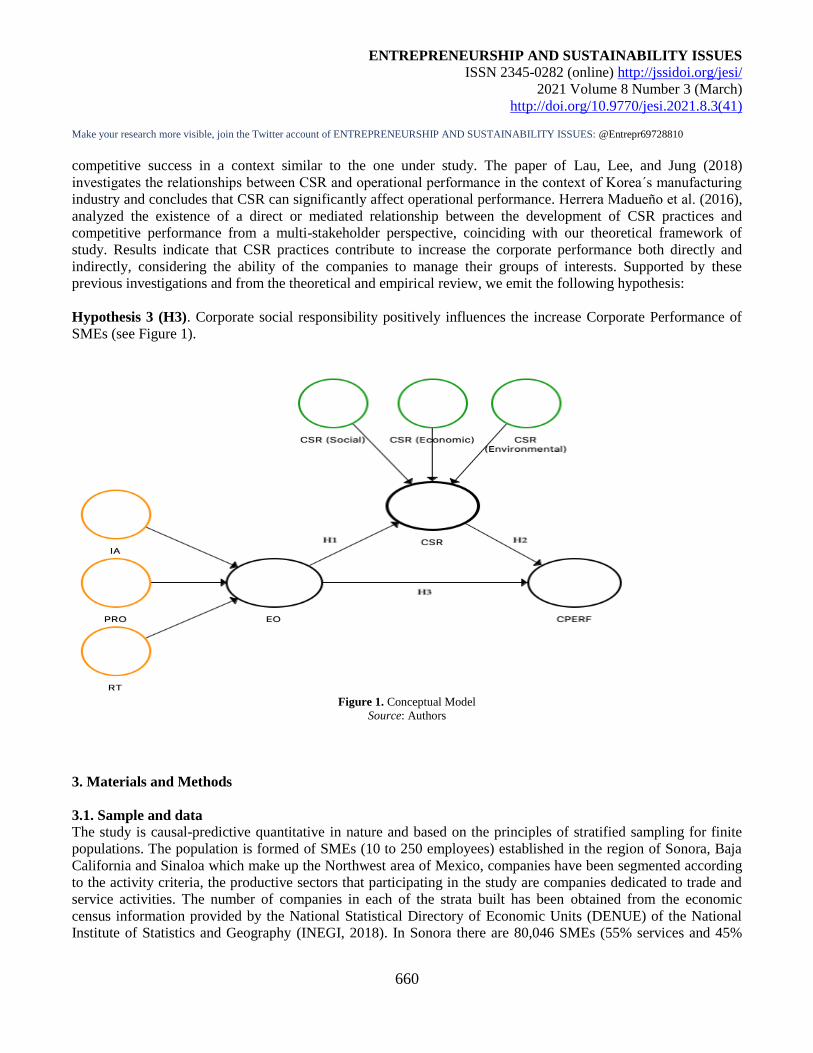
ENTREPRENEURSHIP AND SUSTAINABILITY ISSUES
ISSN 2345-0282 (online) http://jssidoi.org/jesi/
2021 Volume 8 Number 3 (March)
http://doi.org/10.9770/jesi.2021.8.3(41) Make your research more visible, join the Twitter account of ENTREPRENEURSHIP AND SUSTAINABILITY ISSUES: @Entrepr69728810
660
competitive success in a context similar to the one under study. The paper of Lau, Lee, and Jung (2018)
investigates the relationships between CSR and operational performance in the context of Korea´s manufacturing
industry and concludes that CSR can significantly affect operational performance. Herrera Madueño et al. (2016),
analyzed the existence of a direct or mediated relationship between the development of CSR practices and
competitive performance from a multi-stakeholder perspective, coinciding with our theoretical framework of
study. Results indicate that CSR practices contribute to increase the corporate performance both directly and
indirectly, considering the ability of the companies to manage their groups of interests. Supported by these
previous investigations and from the theoretical and empirical review, we emit the following hypothesis:
Hypothesis 3 (H3). Corporate social responsibility positively influences the increase Corporate Performance of
SMEs (see Figure 1).
Figure 1. Conceptual Model
Source: Authors
3. Materials and Methods
3.1. Sample and data
The study is causal-predictive quantitative in nature and based on the principles of stratified sampling for finite
populations. The population is formed of SMEs (10 to 250 employees) established in the region of Sonora, Baja
California and Sinaloa which make up the Northwest area of Mexico, companies have been segmented according
to the activity criteria, the productive sectors that participating in the study are companies dedicated to trade and
service activities. The number of companies in each of the strata built has been obtained from the economic
census information provided by the National Statistical Directory of Economic Units (DENUE) of the National
Institute of Statistics and Geography (INEGI, 2018). In Sonora there are 80,046 SMEs (55% services and 45%
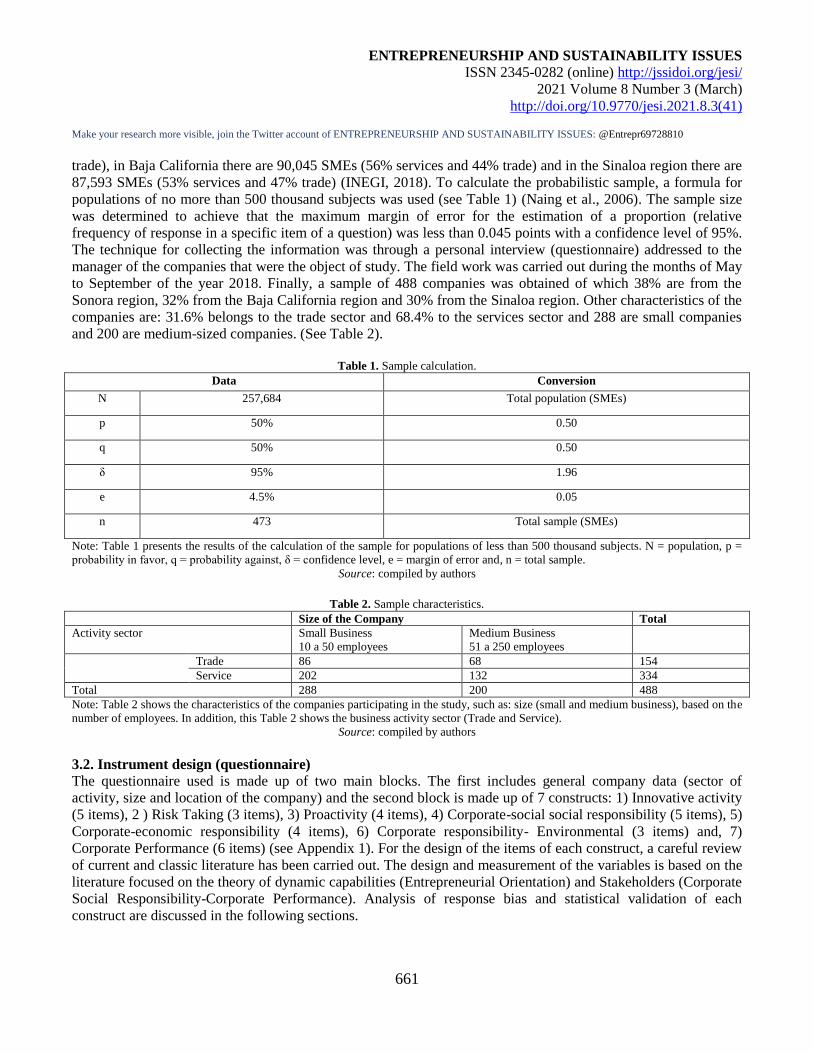
ENTREPRENEURSHIP AND SUSTAINABILITY ISSUES
ISSN 2345-0282 (online) http://jssidoi.org/jesi/
2021 Volume 8 Number 3 (March)
http://doi.org/10.9770/jesi.2021.8.3(41) Make your research more visible, join the Twitter account of ENTREPRENEURSHIP AND SUSTAINABILITY ISSUES: @Entrepr69728810
661
trade), in Baja California there are 90,045 SMEs (56% services and 44% trade) and in the Sinaloa region there are
87,593 SMEs (53% services and 47% trade) (INEGI, 2018). To calculate the probabilistic sample, a formula for
populations of no more than 500 thousand subjects was used (see Table 1) (Naing et al., 2006). The sample size
was determined to achieve that the maximum margin of error for the estimation of a proportion (relative
frequency of response in a specific item of a question) was less than 0.045 points with a confidence level of 95%.
The technique for collecting the information was through a personal interview (questionnaire) addressed to the
manager of the companies that were the object of study. The field work was carried out during the months of May
to September of the year 2018. Finally, a sample of 488 companies was obtained of which 38% are from the
Sonora region, 32% from the Baja California region and 30% from the Sinaloa region. Other characteristics of the
companies are: 31.6% belongs to the trade sector and 68.4% to the services sector and 288 are small companies
and 200 are medium-sized companies. (See Table 2).
Table 1. Sample calculation.
Data Conversion
N 257,684 Total population (SMEs)
p 50% 0.50
q 50% 0.50
δ 95% 1.96
e 4.5% 0.05
n 473 Total sample (SMEs)
Note: Table 1 presents the results of the calculation of the sample for populations of less than 500 thousand subjects. N = population, p =
probability in favor, q = probability against, δ = confidence level, e = margin of error and, n = total sample.
Source: compiled by authors
Table 2. Sample characteristics.
Size of the Company Total
Activity sector Small Business
10 a 50 employees
Medium Business
51 a 250 employees
Trade 86 68 154
Service 202 132 334
Total 288 200 488
Note: Table 2 shows the characteristics of the companies participating in the study, such as: size (small and medium business), based on the
number of employees. In addition, this Table 2 shows the business activity sector (Trade and Service).
Source: compiled by authors
3.2. Instrument design (questionnaire)
The questionnaire used is made up of two main blocks. The first includes general company data (sector of
activity, size and location of the company) and the second block is made up of 7 constructs: 1) Innovative activity
(5 items), 2 ) Risk Taking (3 items), 3) Proactivity (4 items), 4) Corporate-social social responsibility (5 items), 5)
Corporate-economic responsibility (4 items), 6) Corporate responsibility- Environmental (3 items) and, 7)
Corporate Performance (6 items) (see Appendix 1). For the design of the items of each construct, a careful review
of current and classic literature has been carried out. The design and measurement of the variables is based on the
literature focused on the theory of dynamic capabilities (Entrepreneurial Orientation) and Stakeholders (Corporate
Social Responsibility-Corporate Performance). Analysis of response bias and statistical validation of each
construct are discussed in the following sections.
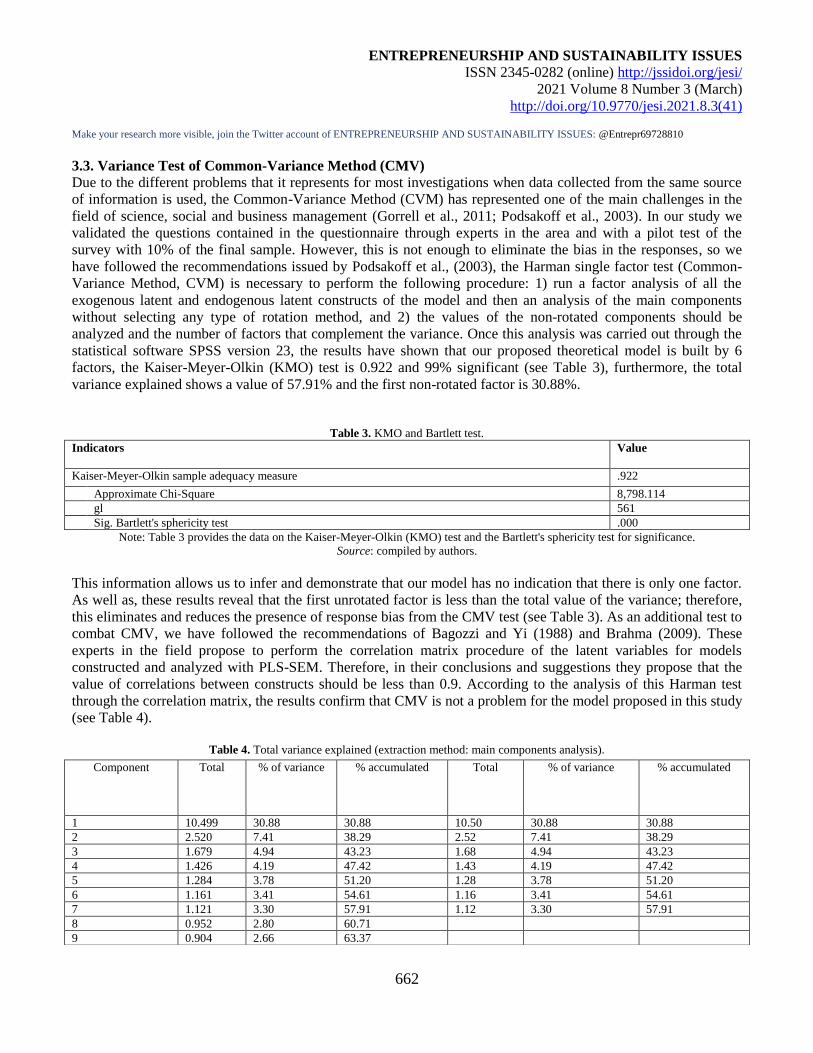
ENTREPRENEURSHIP AND SUSTAINABILITY ISSUES
ISSN 2345-0282 (online) http://jssidoi.org/jesi/
2021 Volume 8 Number 3 (March)
http://doi.org/10.9770/jesi.2021.8.3(41) Make your research more visible, join the Twitter account of ENTREPRENEURSHIP AND SUSTAINABILITY ISSUES: @Entrepr69728810
662
3.3. Variance Test of Common-Variance Method (CMV)
Due to the different problems that it represents for most investigations when data collected from the same source
of information is used, the Common-Variance Method (CVM) has represented one of the main challenges in the
field of science, social and business management (Gorrell et al., 2011; Podsakoff et al., 2003). In our study we
validated the questions contained in the questionnaire through experts in the area and with a pilot test of the
survey with 10% of the final sample. However, this is not enough to eliminate the bias in the responses, so we
have followed the recommendations issued by Podsakoff et al., (2003), the Harman single factor test (Common-
Variance Method, CVM) is necessary to perform the following procedure: 1) run a factor analysis of all the
exogenous latent and endogenous latent constructs of the model and then an analysis of the main components
without selecting any type of rotation method, and 2) the values of the non-rotated components should be
analyzed and the number of factors that complement the variance. Once this analysis was carried out through the
statistical software SPSS version 23, the results have shown that our proposed theoretical model is built by 6
factors, the Kaiser-Meyer-Olkin (KMO) test is 0.922 and 99% significant (see Table 3), furthermore, the total
variance explained shows a value of 57.91% and the first non-rotated factor is 30.88%.
Table 3. KMO and Bartlett test.
Indicators Value
Kaiser-Meyer-Olkin sample adequacy measure .922
Approximate Chi-Square 8,798.114
gl 561
Sig. Bartlett's sphericity test .000
Note: Table 3 provides the data on the Kaiser-Meyer-Olkin (KMO) test and the Bartlett's sphericity test for significance.
Source: compiled by authors.
This information allows us to infer and demonstrate that our model has no indication that there is only one factor.
As well as, these results reveal that the first unrotated factor is less than the total value of the variance; therefore,
this eliminates and reduces the presence of response bias from the CMV test (see Table 3). As an additional test to
combat CMV, we have followed the recommendations of Bagozzi and Yi (1988) and Brahma (2009). These
experts in the field propose to perform the correlation matrix procedure of the latent variables for models
constructed and analyzed with PLS-SEM. Therefore, in their conclusions and suggestions they propose that the
value of correlations between constructs should be less than 0.9. According to the analysis of this Harman test
through the correlation matrix, the results confirm that CMV is not a problem for the model proposed in this study
(see Table 4).
Table 4. Total variance explained (extraction method: main components analysis).
Component Total % of variance % accumulated Total % of variance % accumulated
1 10.499 30.88 30.88 10.50 30.88 30.88
2 2.520 7.41 38.29 2.52 7.41 38.29
3 1.679 4.94 43.23 1.68 4.94 43.23
4 1.426 4.19 47.42 1.43 4.19 47.42
5 1.284 3.78 51.20 1.28 3.78 51.20
6 1.161 3.41 54.61 1.16 3.41 54.61
7 1.121 3.30 57.91 1.12 3.30 57.91
8 0.952 2.80 60.71
9 0.904 2.66 63.37
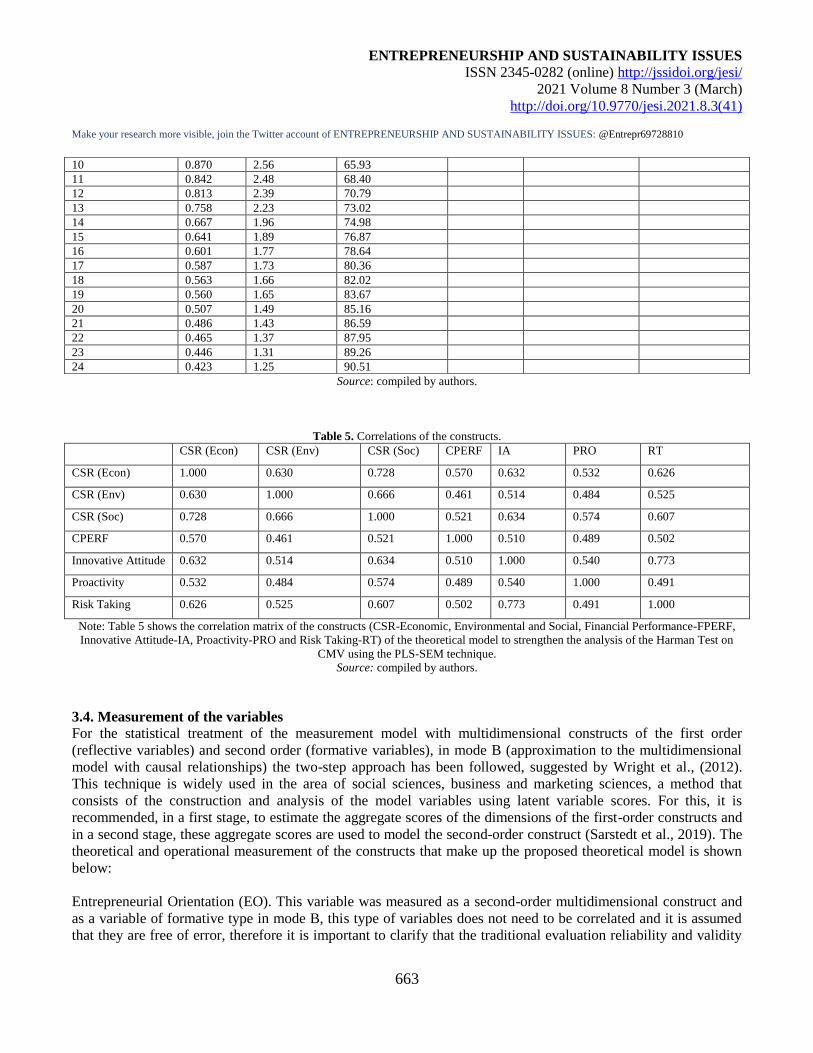
ENTREPRENEURSHIP AND SUSTAINABILITY ISSUES
ISSN 2345-0282 (online) http://jssidoi.org/jesi/
2021 Volume 8 Number 3 (March)
http://doi.org/10.9770/jesi.2021.8.3(41) Make your research more visible, join the Twitter account of ENTREPRENEURSHIP AND SUSTAINABILITY ISSUES: @Entrepr69728810
663
Source: compiled by authors.
Table 5. Correlations of the constructs.
CSR (Econ) CSR (Env) CSR (Soc) CPERF IA PRO RT
CSR (Econ) 1.000 0.630 0.728 0.570 0.632 0.532 0.626
CSR (Env) 0.630 1.000 0.666 0.461 0.514 0.484 0.525
CSR (Soc) 0.728 0.666 1.000 0.521 0.634 0.574 0.607
CPERF 0.570 0.461 0.521 1.000 0.510 0.489 0.502
Innovative Attitude 0.632 0.514 0.634 0.510 1.000 0.540 0.773
Proactivity 0.532 0.484 0.574 0.489 0.540 1.000 0.491
Risk Taking 0.626 0.525 0.607 0.502 0.773 0.491 1.000
Note: Table 5 shows the correlation matrix of the constructs (CSR-Economic, Environmental and Social, Financial Performance-FPERF,
Innovative Attitude-IA, Proactivity-PRO and Risk Taking-RT) of the theoretical model to strengthen the analysis of the Harman Test on
CMV using the PLS-SEM technique.
Source: compiled by authors.
3.4. Measurement of the variables
For the statistical treatment of the measurement model with multidimensional constructs of the first order
(reflective variables) and second order (formative variables), in mode B (approximation to the multidimensional
model with causal relationships) the two-step approach has been followed, suggested by Wright et al., (2012).
This technique is widely used in the area of social sciences, business and marketing sciences, a method that
consists of the construction and analysis of the model variables using latent variable scores. For this, it is
recommended, in a first stage, to estimate the aggregate scores of the dimensions of the first-order constructs and
in a second stage, these aggregate scores are used to model the second-order construct (Sarstedt et al., 2019). The
theoretical and operational measurement of the constructs that make up the proposed theoretical model is shown
below:
Entrepreneurial Orientation (EO). This variable was measured as a second-order multidimensional construct and
as a variable of formative type in mode B, this type of variables does not need to be correlated and it is assumed
that they are free of error, therefore it is important to clarify that the traditional evaluation reliability and validity
10 0.870 2.56 65.93
11 0.842 2.48 68.40
12 0.813 2.39 70.79
13 0.758 2.23 73.02
14 0.667 1.96 74.98
15 0.641 1.89 76.87
16 0.601 1.77 78.64
17 0.587 1.73 80.36
18 0.563 1.66 82.02
19 0.560 1.65 83.67
20 0.507 1.49 85.16
21 0.486 1.43 86.59
22 0.465 1.37 87.95
23 0.446 1.31 89.26
24 0.423 1.25 90.51
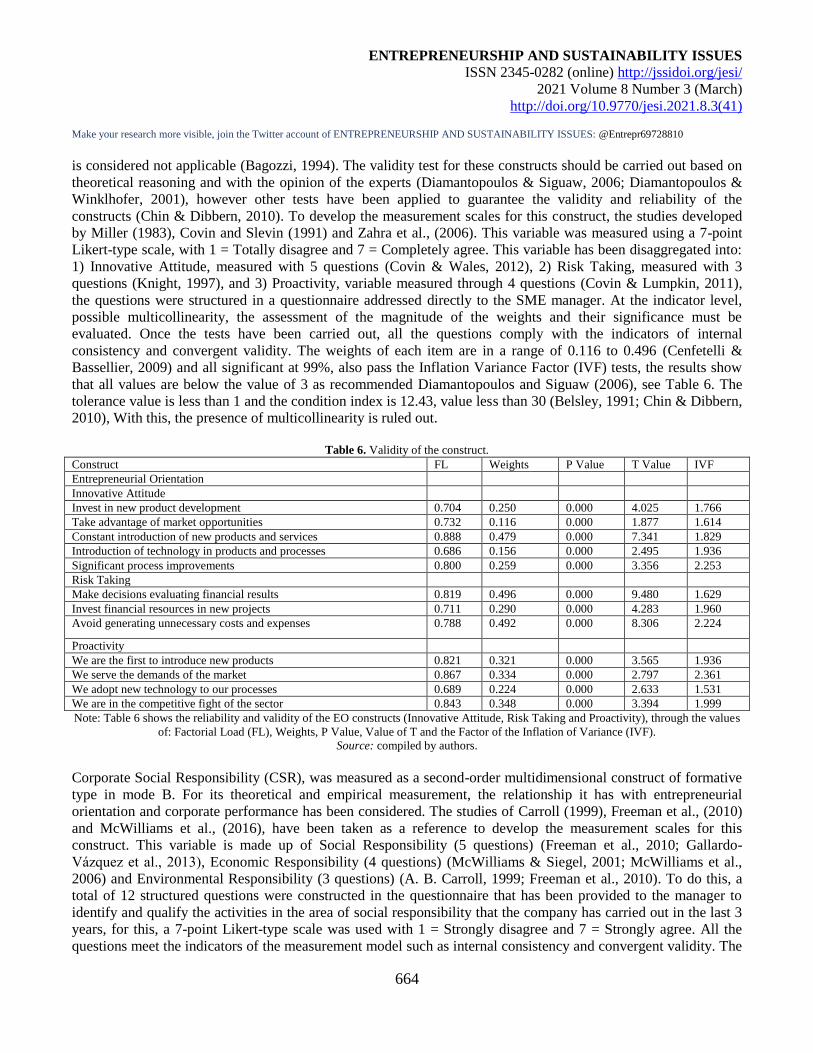
ENTREPRENEURSHIP AND SUSTAINABILITY ISSUES
ISSN 2345-0282 (online) http://jssidoi.org/jesi/
2021 Volume 8 Number 3 (March)
http://doi.org/10.9770/jesi.2021.8.3(41) Make your research more visible, join the Twitter account of ENTREPRENEURSHIP AND SUSTAINABILITY ISSUES: @Entrepr69728810
664
is considered not applicable (Bagozzi, 1994). The validity test for these constructs should be carried out based on
theoretical reasoning and with the opinion of the experts (Diamantopoulos & Siguaw, 2006; Diamantopoulos &
Winklhofer, 2001), however other tests have been applied to guarantee the validity and reliability of the
constructs (Chin & Dibbern, 2010). To develop the measurement scales for this construct, the studies developed
by Miller (1983), Covin and Slevin (1991) and Zahra et al., (2006). This variable was measured using a 7-point
Likert-type scale, with 1 = Totally disagree and 7 = Completely agree. This variable has been disaggregated into:
1) Innovative Attitude, measured with 5 questions (Covin & Wales, 2012), 2) Risk Taking, measured with 3
questions (Knight, 1997), and 3) Proactivity, variable measured through 4 questions (Covin & Lumpkin, 2011),
the questions were structured in a questionnaire addressed directly to the SME manager. At the indicator level,
possible multicollinearity, the assessment of the magnitude of the weights and their significance must be
evaluated. Once the tests have been carried out, all the questions comply with the indicators of internal
consistency and convergent validity. The weights of each item are in a range of 0.116 to 0.496 (Cenfetelli &
Bassellier, 2009) and all significant at 99%, also pass the Inflation Variance Factor (IVF) tests, the results show
that all values are below the value of 3 as recommended Diamantopoulos and Siguaw (2006), see Table 6. The
tolerance value is less than 1 and the condition index is 12.43, value less than 30 (Belsley, 1991; Chin & Dibbern,
2010), With this, the presence of multicollinearity is ruled out.
Table 6. Validity of the construct.
Construct FL Weights P Value T Value IVF
Entrepreneurial Orientation
Innovative Attitude
Invest in new product development 0.704 0.250 0.000 4.025 1.766
Take advantage of market opportunities 0.732 0.116 0.000 1.877 1.614
Constant introduction of new products and services 0.888 0.479 0.000 7.341 1.829
Introduction of technology in products and processes 0.686 0.156 0.000 2.495 1.936
Significant process improvements 0.800 0.259 0.000 3.356 2.253
Risk Taking
Make decisions evaluating financial results 0.819 0.496 0.000 9.480 1.629
Invest financial resources in new projects 0.711 0.290 0.000 4.283 1.960
Avoid generating unnecessary costs and expenses 0.788 0.492 0.000 8.306 2.224
Proactivity
We are the first to introduce new products 0.821 0.321 0.000 3.565 1.936
We serve the demands of the market 0.867 0.334 0.000 2.797 2.361
We adopt new technology to our processes 0.689 0.224 0.000 2.633 1.531
We are in the competitive fight of the sector 0.843 0.348 0.000 3.394 1.999
Note: Table 6 shows the reliability and validity of the EO constructs (Innovative Attitude, Risk Taking and Proactivity), through the values
of: Factorial Load (FL), Weights, P Value, Value of T and the Factor of the Inflation of Variance (IVF).
Source: compiled by authors.
Corporate Social Responsibility (CSR), was measured as a second-order multidimensional construct of formative
type in mode B. For its theoretical and empirical measurement, the relationship it has with entrepreneurial
orientation and corporate performance has been considered. The studies of Carroll (1999), Freeman et al., (2010)
and McWilliams et al., (2016), have been taken as a reference to develop the measurement scales for this
construct. This variable is made up of Social Responsibility (5 questions) (Freeman et al., 2010; Gallardo-
Vázquez et al., 2013), Economic Responsibility (4 questions) (McWilliams & Siegel, 2001; McWilliams et al.,
2006) and Environmental Responsibility (3 questions) (A. B. Carroll, 1999; Freeman et al., 2010). To do this, a
total of 12 structured questions were constructed in the questionnaire that has been provided to the manager to
identify and qualify the activities in the area of social responsibility that the company has carried out in the last 3
years, for this, a 7-point Likert-type scale was used with 1 = Strongly disagree and 7 = Strongly agree. All the
questions meet the indicators of the measurement model such as internal consistency and convergent validity. The
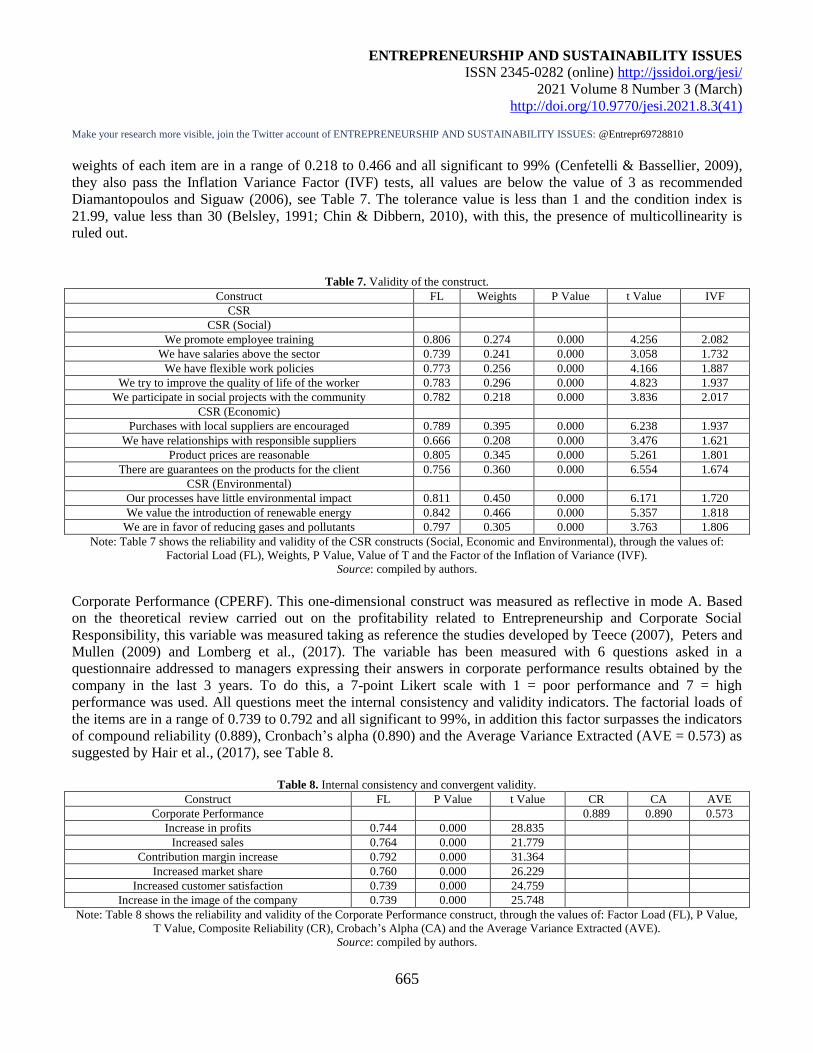
ENTREPRENEURSHIP AND SUSTAINABILITY ISSUES
ISSN 2345-0282 (online) http://jssidoi.org/jesi/
2021 Volume 8 Number 3 (March)
http://doi.org/10.9770/jesi.2021.8.3(41) Make your research more visible, join the Twitter account of ENTREPRENEURSHIP AND SUSTAINABILITY ISSUES: @Entrepr69728810
665
weights of each item are in a range of 0.218 to 0.466 and all significant to 99% (Cenfetelli & Bassellier, 2009),
they also pass the Inflation Variance Factor (IVF) tests, all values are below the value of 3 as recommended
Diamantopoulos and Siguaw (2006), see Table 7. The tolerance value is less than 1 and the condition index is
21.99, value less than 30 (Belsley, 1991; Chin & Dibbern, 2010), with this, the presence of multicollinearity is
ruled out.
Table 7. Validity of the construct.
Construct FL Weights P Value t Value IVF
CSR
CSR (Social)
We promote employee training 0.806 0.274 0.000 4.256 2.082
We have salaries above the sector 0.739 0.241 0.000 3.058 1.732
We have flexible work policies 0.773 0.256 0.000 4.166 1.887
We try to improve the quality of life of the worker 0.783 0.296 0.000 4.823 1.937
We participate in social projects with the community 0.782 0.218 0.000 3.836 2.017
CSR (Economic)
Purchases with local suppliers are encouraged 0.789 0.395 0.000 6.238 1.937
We have relationships with responsible suppliers 0.666 0.208 0.000 3.476 1.621
Product prices are reasonable 0.805 0.345 0.000 5.261 1.801
There are guarantees on the products for the client 0.756 0.360 0.000 6.554 1.674
CSR (Environmental)
Our processes have little environmental impact 0.811 0.450 0.000 6.171 1.720
We value the introduction of renewable energy 0.842 0.466 0.000 5.357 1.818
We are in favor of reducing gases and pollutants 0.797 0.305 0.000 3.763 1.806
Note: Table 7 shows the reliability and validity of the CSR constructs (Social, Economic and Environmental), through the values of:
Factorial Load (FL), Weights, P Value, Value of T and the Factor of the Inflation of Variance (IVF).
Source: compiled by authors.
Corporate Performance (CPERF). This one-dimensional construct was measured as reflective in mode A. Based
on the theoretical review carried out on the profitability related to Entrepreneurship and Corporate Social
Responsibility, this variable was measured taking as reference the studies developed by Teece (2007), Peters and
Mullen (2009) and Lomberg et al., (2017). The variable has been measured with 6 questions asked in a
questionnaire addressed to managers expressing their answers in corporate performance results obtained by the
company in the last 3 years. To do this, a 7-point Likert scale with 1 = poor performance and 7 = high
performance was used. All questions meet the internal consistency and validity indicators. The factorial loads of
the items are in a range of 0.739 to 0.792 and all significant to 99%, in addition this factor surpasses the indicators
of compound reliability (0.889), Cronbach’s alpha (0.890) and the Average Variance Extracted (AVE = 0.573) as
suggested by Hair et al., (2017), see Table 8.
Table 8. Internal consistency and convergent validity.
Construct FL P Value t Value CR CA AVE
Corporate Performance 0.889 0.890 0.573
Increase in profits 0.744 0.000 28.835
Increased sales 0.764 0.000 21.779
Contribution margin increase 0.792 0.000 31.364
Increased market share 0.760 0.000 26.229
Increased customer satisfaction 0.739 0.000 24.759
Increase in the image of the company 0.739 0.000 25.748
Note: Table 8 shows the reliability and validity of the Corporate Performance construct, through the values of: Factor Load (FL), P Value,
T Value, Composite Reliability (CR), Crobach’s Alpha (CA) and the Average Variance Extracted (AVE).
Source: compiled by authors.
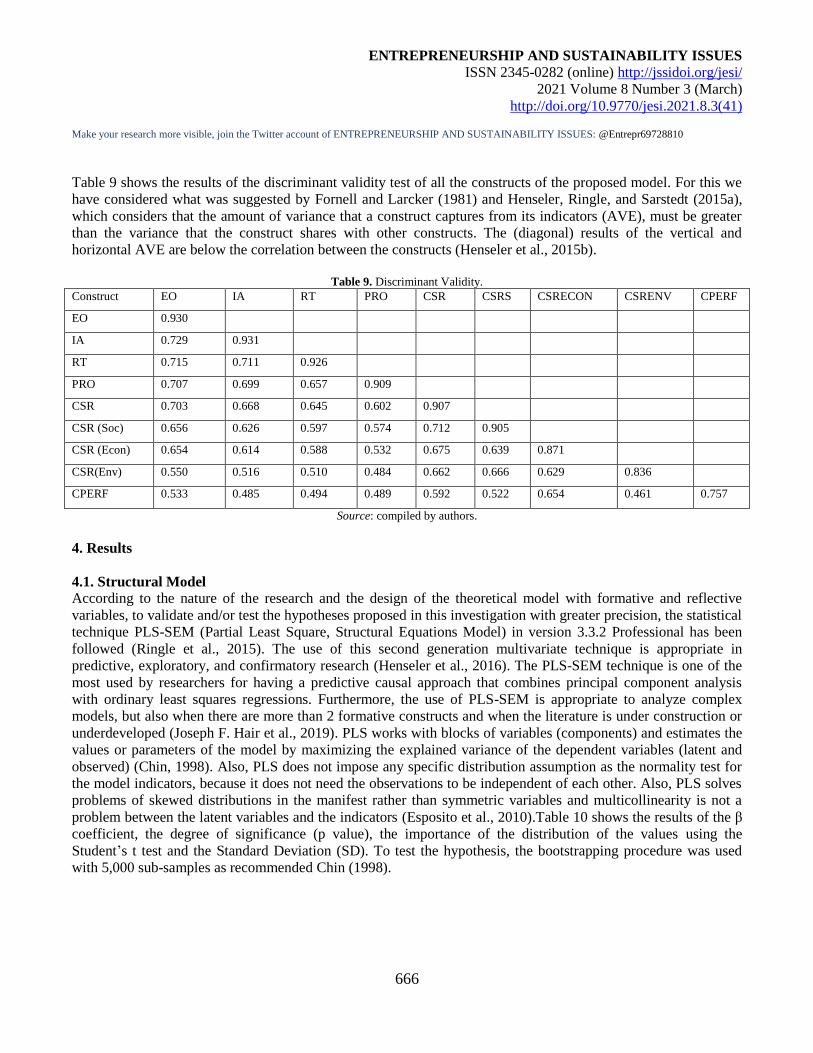
ENTREPRENEURSHIP AND SUSTAINABILITY ISSUES
ISSN 2345-0282 (online) http://jssidoi.org/jesi/
2021 Volume 8 Number 3 (March)
http://doi.org/10.9770/jesi.2021.8.3(41) Make your research more visible, join the Twitter account of ENTREPRENEURSHIP AND SUSTAINABILITY ISSUES: @Entrepr69728810
666
Table 9 shows the results of the discriminant validity test of all the constructs of the proposed model. For this we
have considered what was suggested by Fornell and Larcker (1981) and Henseler, Ringle, and Sarstedt (2015a),
which considers that the amount of variance that a construct captures from its indicators (AVE), must be greater
than the variance that the construct shares with other constructs. The (diagonal) results of the vertical and
horizontal AVE are below the correlation between the constructs (Henseler et al., 2015b).
Table 9. Discriminant Validity.
Construct EO IA RT PRO CSR CSRS CSRECON CSRENV CPERF
EO 0.930
IA 0.729 0.931
RT 0.715 0.711 0.926
PRO 0.707 0.699 0.657 0.909
CSR 0.703 0.668 0.645 0.602 0.907
CSR (Soc) 0.656 0.626 0.597 0.574 0.712 0.905
CSR (Econ) 0.654 0.614 0.588 0.532 0.675 0.639 0.871
CSR(Env) 0.550 0.516 0.510 0.484 0.662 0.666 0.629 0.836
CPERF 0.533 0.485 0.494 0.489 0.592 0.522 0.654 0.461 0.757
Source: compiled by authors.
4. Results
4.1. Structural Model
According to the nature of the research and the design of the theoretical model with formative and reflective
variables, to validate and/or test the hypotheses proposed in this investigation with greater precision, the statistical
technique PLS-SEM (Partial Least Square, Structural Equations Model) in version 3.3.2 Professional has been
followed (Ringle et al., 2015). The use of this second generation multivariate technique is appropriate in
predictive, exploratory, and confirmatory research (Henseler et al., 2016). The PLS-SEM technique is one of the
most used by researchers for having a predictive causal approach that combines principal component analysis
with ordinary least squares regressions. Furthermore, the use of PLS-SEM is appropriate to analyze complex
models, but also when there are more than 2 formative constructs and when the literature is under construction or
underdeveloped (Joseph F. Hair et al., 2019). PLS works with blocks of variables (components) and estimates the
values or parameters of the model by maximizing the explained variance of the dependent variables (latent and
observed) (Chin, 1998). Also, PLS does not impose any specific distribution assumption as the normality test for
the model indicators, because it does not need the observations to be independent of each other. Also, PLS solves
problems of skewed distributions in the manifest rather than symmetric variables and multicollinearity is not a
problem between the latent variables and the indicators (Esposito et al., 2010).Table 10 shows the results of the β
coefficient, the degree of significance (p value), the importance of the distribution of the values using the
Student’s t test and the Standard Deviation (SD). To test the hypothesis, the bootstrapping procedure was used
with 5,000 sub-samples as recommended Chin (1998).
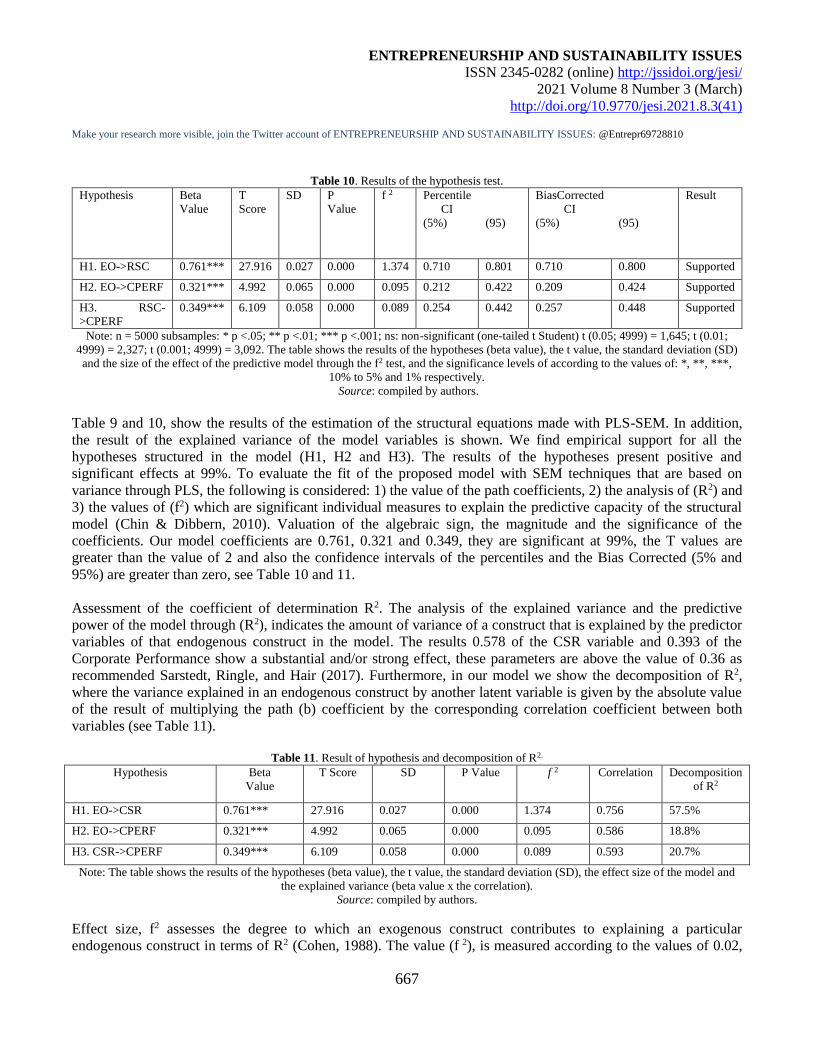
ENTREPRENEURSHIP AND SUSTAINABILITY ISSUES
ISSN 2345-0282 (online) http://jssidoi.org/jesi/
2021 Volume 8 Number 3 (March)
http://doi.org/10.9770/jesi.2021.8.3(41) Make your research more visible, join the Twitter account of ENTREPRENEURSHIP AND SUSTAINABILITY ISSUES: @Entrepr69728810
667
Table 10. Results of the hypothesis test.
Hypothesis Beta
Value
T
Score
SD P
Value
f 2 Percentile
CI
(5%)
(95)
BiasCorrected
CI
(5%)
(95)
Result
H1. EO->RSC 0.761*** 27.916 0.027 0.000 1.374 0.710 0.801 0.710 0.800 Supported
H2. EO->CPERF 0.321*** 4.992 0.065 0.000 0.095 0.212 0.422 0.209 0.424 Supported
H3. RSC-
>CPERF
0.349*** 6.109 0.058 0.000 0.089 0.254 0.442 0.257 0.448 Supported
Note: n = 5000 subsamples: * p <.05; ** p <.01; *** p <.001; ns: non-significant (one-tailed t Student) t (0.05; 4999) = 1,645; t (0.01;
4999) = 2,327; t (0.001; 4999) = 3,092. The table shows the results of the hypotheses (beta value), the t value, the standard deviation (SD)
and the size of the effect of the predictive model through the f2 test, and the significance levels of according to the values of: *, **, ***,
10% to 5% and 1% respectively.
Source: compiled by authors.
Table 9 and 10, show the results of the estimation of the structural equations made with PLS-SEM. In addition,
the result of the explained variance of the model variables is shown. We find empirical support for all the
hypotheses structured in the model (H1, H2 and H3). The results of the hypotheses present positive and
significant effects at 99%. To evaluate the fit of the proposed model with SEM techniques that are based on
variance through PLS, the following is considered: 1) the value of the path coefficients, 2) the analysis of (R2) and
3) the values of (f2) which are significant individual measures to explain the predictive capacity of the structural
model (Chin & Dibbern, 2010). Valuation of the algebraic sign, the magnitude and the significance of the
coefficients. Our model coefficients are 0.761, 0.321 and 0.349, they are significant at 99%, the T values are
greater than the value of 2 and also the confidence intervals of the percentiles and the Bias Corrected (5% and
95%) are greater than zero, see Table 10 and 11.
Assessment of the coefficient of determination R2. The analysis of the explained variance and the predictive
power of the model through (R2), indicates the amount of variance of a construct that is explained by the predictor
variables of that endogenous construct in the model. The results 0.578 of the CSR variable and 0.393 of the
Corporate Performance show a substantial and/or strong effect, these parameters are above the value of 0.36 as
recommended Sarstedt, Ringle, and Hair (2017). Furthermore, in our model we show the decomposition of R2,
where the variance explained in an endogenous construct by another latent variable is given by the absolute value
of the result of multiplying the path (b) coefficient by the corresponding correlation coefficient between both
variables (see Table 11).
Table 11. Result of hypothesis and decomposition of R2.
Hypothesis Beta
Value
T Score SD P Value f 2 Correlation Decomposition
of R2
H1. EO->CSR 0.761*** 27.916 0.027 0.000 1.374 0.756 57.5%
H2. EO->CPERF 0.321*** 4.992 0.065 0.000 0.095 0.586 18.8%
H3. CSR->CPERF 0.349*** 6.109 0.058 0.000 0.089 0.593 20.7%
Note: The table shows the results of the hypotheses (beta value), the t value, the standard deviation (SD), the effect size of the model and
the explained variance (beta value x the correlation).
Source: compiled by authors.
Effect size, f2 assesses the degree to which an exogenous construct contributes to explaining a particular
endogenous construct in terms of R2 (Cohen, 1988). The value (f 2), is measured according to the values of 0.02,
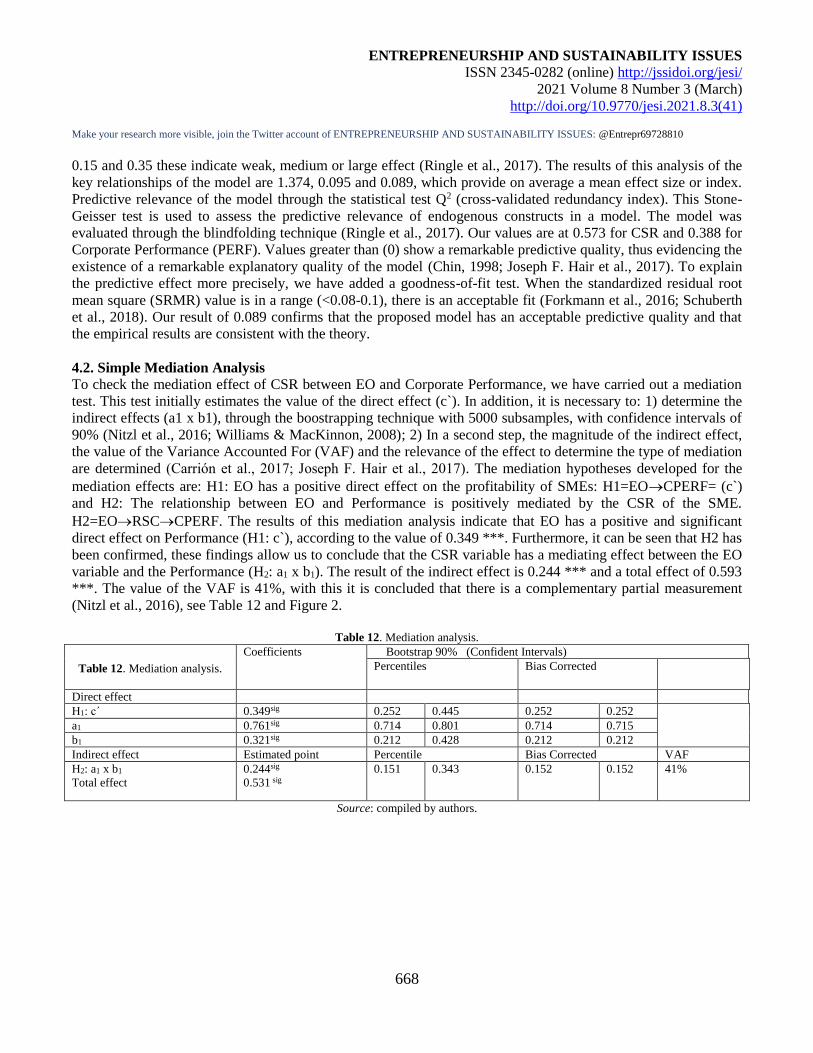
ENTREPRENEURSHIP AND SUSTAINABILITY ISSUES
ISSN 2345-0282 (online) http://jssidoi.org/jesi/
2021 Volume 8 Number 3 (March)
http://doi.org/10.9770/jesi.2021.8.3(41) Make your research more visible, join the Twitter account of ENTREPRENEURSHIP AND SUSTAINABILITY ISSUES: @Entrepr69728810
668
0.15 and 0.35 these indicate weak, medium or large effect (Ringle et al., 2017). The results of this analysis of the
key relationships of the model are 1.374, 0.095 and 0.089, which provide on average a mean effect size or index.
Predictive relevance of the model through the statistical test Q2 (cross-validated redundancy index). This Stone-
Geisser test is used to assess the predictive relevance of endogenous constructs in a model. The model was
evaluated through the blindfolding technique (Ringle et al., 2017). Our values are at 0.573 for CSR and 0.388 for
Corporate Performance (PERF). Values greater than (0) show a remarkable predictive quality, thus evidencing the
existence of a remarkable explanatory quality of the model (Chin, 1998; Joseph F. Hair et al., 2017). To explain
the predictive effect more precisely, we have added a goodness-of-fit test. When the standardized residual root
mean square (SRMR) value is in a range (<0.08-0.1), there is an acceptable fit (Forkmann et al., 2016; Schuberth
et al., 2018). Our result of 0.089 confirms that the proposed model has an acceptable predictive quality and that
the empirical results are consistent with the theory.
4.2. Simple Mediation Analysis
To check the mediation effect of CSR between EO and Corporate Performance, we have carried out a mediation
test. This test initially estimates the value of the direct effect (c`). In addition, it is necessary to: 1) determine the
indirect effects (a1 x b1), through the boostrapping technique with 5000 subsamples, with confidence intervals of
90% (Nitzl et al., 2016; Williams & MacKinnon, 2008); 2) In a second step, the magnitude of the indirect effect,
the value of the Variance Accounted For (VAF) and the relevance of the effect to determine the type of mediation
are determined (Carrión et al., 2017; Joseph F. Hair et al., 2017). The mediation hypotheses developed for the
mediation effects are: H1: EO has a positive direct effect on the profitability of SMEs: H1=EOCPERF= (c`)
and H2: The relationship between EO and Performance is positively mediated by the CSR of the SME.
H2=EORSCCPERF. The results of this mediation analysis indicate that EO has a positive and significant
direct effect on Performance (H1: c`), according to the value of 0.349 ***. Furthermore, it can be seen that H2 has
been confirmed, these findings allow us to conclude that the CSR variable has a mediating effect between the EO
variable and the Performance (H2: a1 x b1). The result of the indirect effect is 0.244 *** and a total effect of 0.593
***. The value of the VAF is 41%, with this it is concluded that there is a complementary partial measurement
(Nitzl et al., 2016), see Table 12 and Figure 2.
Table 12. Mediation analysis.
Table 12. Mediation analysis.
Coefficients Bootstrap 90% (Confident Intervals)
Percentiles Bias Corrected
Direct effect
H1: c´ 0.349sig 0.252 0.445 0.252 0.252
a1 0.761sig 0.714 0.801 0.714 0.715
b1 0.321sig 0.212 0.428 0.212 0.212
Indirect effect Estimated point Percentile Bias Corrected VAF
H2: a1 x b1
Total effect
0.244sig
0.531 sig
0.151
0.343 0.152
0.152
41%
Source: compiled by authors.
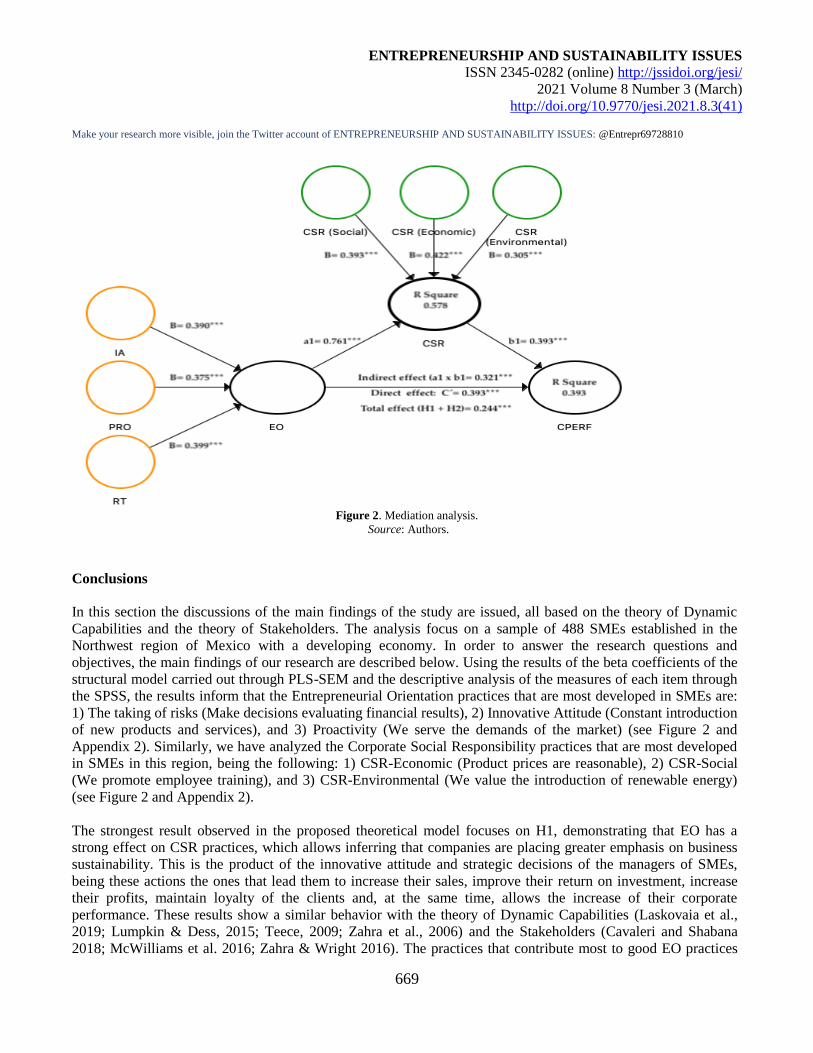
ENTREPRENEURSHIP AND SUSTAINABILITY ISSUES
ISSN 2345-0282 (online) http://jssidoi.org/jesi/
2021 Volume 8 Number 3 (March)
http://doi.org/10.9770/jesi.2021.8.3(41) Make your research more visible, join the Twitter account of ENTREPRENEURSHIP AND SUSTAINABILITY ISSUES: @Entrepr69728810
669
Figure 2. Mediation analysis.
Source: Authors.
Conclusions
In this section the discussions of the main findings of the study are issued, all based on the theory of Dynamic
Capabilities and the theory of Stakeholders. The analysis focus on a sample of 488 SMEs established in the
Northwest region of Mexico with a developing economy. In order to answer the research questions and
objectives, the main findings of our research are described below. Using the results of the beta coefficients of the
structural model carried out through PLS-SEM and the descriptive analysis of the measures of each item through
the SPSS, the results inform that the Entrepreneurial Orientation practices that are most developed in SMEs are:
1) The taking of risks (Make decisions evaluating financial results), 2) Innovative Attitude (Constant introduction
of new products and services), and 3) Proactivity (We serve the demands of the market) (see Figure 2 and
Appendix 2). Similarly, we have analyzed the Corporate Social Responsibility practices that are most developed
in SMEs in this region, being the following: 1) CSR-Economic (Product prices are reasonable), 2) CSR-Social
(We promote employee training), and 3) CSR-Environmental (We value the introduction of renewable energy)
(see Figure 2 and Appendix 2).
The strongest result observed in the proposed theoretical model focuses on H1, demonstrating that EO has a
strong effect on CSR practices, which allows inferring that companies are placing greater emphasis on business
sustainability. This is the product of the innovative attitude and strategic decisions of the managers of SMEs,
being these actions the ones that lead them to increase their sales, improve their return on investment, increase
their profits, maintain loyalty of the clients and, at the same time, allows the increase of their corporate
performance. These results show a similar behavior with the theory of Dynamic Capabilities (Laskovaia et al.,
2019; Lumpkin & Dess, 2015; Teece, 2009; Zahra et al., 2006) and the Stakeholders (Cavaleri and Shabana
2018; McWilliams et al. 2016; Zahra & Wright 2016). The practices that contribute most to good EO practices
ENTREPRENEURSHIP AND SUSTAINABILITY ISSUES
ISSN 2345-0282 (online) http://jssidoi.org/jesi/
2021 Volume 8 Number 3 (March)
http://doi.org/10.9770/jesi.2021.8.3(41) Make your research more visible, join the Twitter account of ENTREPRENEURSHIP AND SUSTAINABILITY ISSUES: @Entrepr69728810
670
are the risk taking (decision-making focused on sustainable financial results) of the businessmen, the innovative
attitude (detection of market opportunities for the introduction of new products and services) and proactivity
(facing the competitive fight, adapting to new technologies and satisfying the demands of the markets and
customers) (see Figure 2). In this same direction, but with less force, H2 shows that the higher the EO in the
SME, the Corporate Performance increases. These findings allow us to state that innovative organizations that
take planned risks have a greater propensity to achieve the increase in more significant financial results (Basco,
Hernández-Perlines, & Rodríguez-García 2020; Drucker 2014; Gibb 2007; Zahra & Wright 2016). These
findings are aligned with the theory of Dynamic Capabilities and with most empirical studies (Brink, 2018;
Teece, 2016; Zahra et al., 2014). Another of our important findings and that maintains considerable strength is
the H3, this relationship analyzes the effect that CSR exerts on Corporate Performance. This discovery indicates
that SMEs that are adopting new business models based on sustainability, such as ecological processes and other
actions aimed at protecting their resources, the environment and the benefit of their stakeholders (Aagaard, 2016;
Freeman et al., 2010; Teece, 2007), are achieving greater organizational and financial benefits (Hsueh, 2015;
Spence, 2016). Results that are in agreement with various empirical studies (Flammer, 2015; Tang & Tang, 2012;
Vitolla et al., 2017; Zhao et al., 2019) and mainly with the Stakeholder theory (Brown & Forster, 2013; Abagail
McWilliams et al., 2016; Spence, 2016). In addition, the study has shown that the practices that have the greatest
impact on CSR are Economic actions (buying from local suppliers and selling products at reasonable prices),
followed by Social ones (training of employees and participation in social projects) and Environmental projects
(processes with a positive impact on the environment and the use of renewable energy) (see Figure 2).
These findings allow us to draw a series of conclusions for the administration and management of SMEs. First of
all, research has shown that traditional sustainability models are efficient and profitable for stakeholders,
however, the literature has exposed that the majority of SMEs do not support CSR practices or achieve sustained
financial returns due to the lack of a strategic plan and their weak financial and organizational capacity
(Martinez-Conesa et al., 2017; Spence, 2016). Secondly, our study sheds light on an important finding informing
that the combination and incorporation of Entrepreneurial Orientation is an important piece that strengthens a
successful business sustainability model (CSR and Financial Performance), in general, the organizational and
financial results are more significant, this has been proven through our mediation analysis and also by what is
exposed by the literature focused on the theory of dynamic capacities, affirming that SMEs with sustainable
models are the ones with a greater orientation to entrepreneurship and innovation capacity (Ayuso & Navarrete-
Báez, 2018; Teece, 2007, 2016; Wales, 2016). The main novel contribution in this field of business sciences is
that the study has shown that the combination between an efficient entrepreneurial orientation and a correct
application of corporate social responsibility practices are determining drivers to achieve greater growth,
development and financial profitability for SMEs in developing regions such as Mexico. The link between
companies, universities, government and society is the key to achieving increased entrepreneurship, innovation
and regional development to increase the competitiveness of Mexican SMEs (Carayannis et al., 2012).
The study has generated a series of implications, from a theoretical context the study allows: 1) contribute to the
development of Dynamic Capabilities (concluding that SMEs innovative and entrepreneurship-oriented can raise
their competitiveness and Corporate Performance to a higher level and to the Stakeholder theory (proving that
SMEs are a key piece for the survival and economic, social and environmental development of most regions, 2)
design and improve business models focused on business sustainability, and 3) provide literature on sustainable
business for discussion among experts, researchers and the university community. From an empirical perspective,
the study has found that: SMEs in this region are: 1) developing entrepreneurial-oriented strategies, mostly
focused on making risky decisions but with safer financial results, on improving their capacity for innovation to
generate new and better products for their customers and are also focusing in its proactivity through the constant
fight for competitiveness in the sector (Laskovaia et al., 2019; Wales, 2016), 2. In addition, these SMEs are on
ENTREPRENEURSHIP AND SUSTAINABILITY ISSUES
ISSN 2345-0282 (online) http://jssidoi.org/jesi/
2021 Volume 8 Number 3 (March)
http://doi.org/10.9770/jesi.2021.8.3(41) Make your research more visible, join the Twitter account of ENTREPRENEURSHIP AND SUSTAINABILITY ISSUES: @Entrepr69728810
671
the right path towards sustainable entrepreneurship through the voluntary implementation and in some cases
blindly (without full knowledge) of corporate social responsibility (Magrizos et al., 2020; McWilliams et al.,
2006). 2) These companies are aware that greater investment in social, economic and environmental actions can
lead them to generate greater corporate performance, to achieve greater prestige and to attract and greater market
coverage (Ortiz-Avram et al., 2018b; Tuan, 2015; Wales, 2016). However, the findings also inform that
environmental actions are the least developed or practiced in these organizations, this because there is always the
fear that this investment can become a significant expense for the finances of the business (Friedman, 2007;
Magrizos et al., 2020). 3) Therefore, our study is extremely important for business sciences, because the
combination of two dynamic capacities such as entrepreneurial orientation and corporate social responsibility,
can be the right way for SMEs to become business-oriented sustainable entrepreneurship, in highly competitive
companies within their sector and, in companies that manage to improve their more sustained financial returns
over time (Wales, 2016; Zahra et al., 2006). All of this can be achieved through the correct deployment of their
resources and capabilities, but also with good management of the business leaders through the individual and
collective involvement of the members of the organization. Therefore, it is important that the leaders of this type
of organization transmit to their collaborators (managers, supervisors and employees) the good practices they are
developing and that they also adopt other business practices from abroad (Benchmarking). Therefore, it is
important that these types of companies: 1) continue to adopt sustainable and innovative business models (Müller
et al., 2018; Teece, 2010), 2) grow in a sustained and responsible way through a strategic plan (Dixit & Nanda,
2011; Stefan Schaltegger et al., 2016), 3) make strategic decisions with the least possible risk (agile
entrepreneurship methodologies and discovery of new markets) (Cavaleri & Shabana, 2018; Hart & Milstein,
2003), 4) continue with the practices of innovation in products and processes, and gradually incorporate radical
innovation (Andreeva & Ritala, 2016; Carlo et al., 2012; West et al., 2014), 5) establish ties and collaboration
abroad with other companies and with other institutions, such as universities, research centers and training
centers (Carayannis et al., 2012, 2018), 6) establish and strengthen ties with their employees, customers and
suppliers (McWilliams et al., 2016; Veronica et al., 2019), 7) strengthen their current markets, in order to obtain
sustained financial results (Multaharju et al., 2017; Zhao et al., 2019) and 8) adopt certified processes at the
regional and global levels in order to compete with other companies (adoption of a model with a focus on the
circular economy) (Moratis & Cochius, 2017; Nosratabadi et al., 2019).
The research exposes some limitations and on the other hand opens windows for the development of future lines
of research. One of the first limitations contemplated in the work focuses on the use of a single source of
information. This, because the data was collected from subjective perceptions expressed by the owners and/or
managers of SMEs, which may in some cases cause bias in the results. Secondly, the sample has only been
focused on companies in the trade and services sector, in the future the sample may cover other productive
sectors and with a greater degree of specialization. As well as the sample has focused on specific regions and/or
cities in Northwest Mexico. In later times, other regions of the country or other countries can be considered to
analyze and compare the results through multigroup and/or cross-cultural analysis. The last limitation considered
in this work refers to the measurement scales used in our model, since validated scales and questions were
considered in contexts of regions with characteristics different from the area in which this study was carried out.
In addition, in the future, the use of statistical analyzes that focus on examining the behavior of covariance may
be considered. Therefore, in the short and medium term, in order to face the limitations, it is convenient to
improve and refine the conceptual model through this type of research, by including new constructs that
contribute to the analysis of sustainable, entrepreneurial and innovative behavior of the SME. Finally, given the
importance of EO and CSR in small and large companies, for being factors that generate social, economic and
financial stability at a global level, is convenient to continue with the development of this type of studies that
consider complementary variables such as: creativity, the circular economy, open innovation and corporate
image.
ENTREPRENEURSHIP AND SUSTAINABILITY ISSUES
ISSN 2345-0282 (online) http://jssidoi.org/jesi/
2021 Volume 8 Number 3 (March)
http://doi.org/10.9770/jesi.2021.8.3(41) Make your research more visible, join the Twitter account of ENTREPRENEURSHIP AND SUSTAINABILITY ISSUES: @Entrepr69728810
672
References
Aagaard, A. (2016). Sustainable Business: River Publishers. https://books.google.com.mx/books?id=ExvkDAAAQBAJ
Abdelkafi, N., & Täuscher, K. (2016). Business Models for Sustainability From a System Dynamics Perspective. Organization and
Environment, 29(1), 74–96. https://doi.org/10.1177/1086026615592930
Adomako, S., & Nguyen, N. P. (2020). Interfirm collaboration and corporate social responsibility expenditure in turbulent environments:
The moderating role of entrepreneurial orientation. Corporate Social Responsibility and Environmental Management.
https://doi.org/10.1002/csr.1991
Andreeva, T., & Ritala, P. (2016). What are the sources of capability dynamism? Reconceptualizing dynamic capabilities from the
perspective of organizational change. Baltic Journal of Management, 11(3), 238–259. https://doi.org/10.1108/BJM-02-2015-0049
Ayuso, S., & Navarrete-Báez, F. E. (2018). How Does Entrepreneurial and International Orientation Influence SMEs’ Commitment to
Sustainable Development? Empirical Evidence from Spain and Mexico. Corporate Social Responsibility and Environmental
Management, 25(1), 80–94. https://doi.org/10.1002/csr.1441
Bagozzi, R. P. (1994). Structural equation models in marketing research: Basic principles. Principles of Marketing Research, 3(1), 7–385.
Bagozzi, R. P., & Yi, Y. (1988). On the evaluation of structural equation models. Journal of the Academy of Marketing Science, 16(1), 74–
94. https://doi.org/10.1007/BF02723327
Basco, R., Hernández-Perlines, F., & Rodríguez-García, M. (2020). El efecto de la orientación empresarial en el desempeño de la empresa:
un análisis multigrupo que compara China, México y España. Journal of Business ...
https://www.sciencedirect.com/science/article/pii/S0148296319305454
Belsley, D. A. (1991). A guide to using the collinearity diagnostics. Computer Science in Economics and Management, 4(1), 33–50.
Brahma, S. (2009). Assessment of construct validity in management research: A structured guideline. Journal of Management Research, 2,
59–71. http://www.indianjournals.com/ijor.aspx?target=ijor:jmr&volume=9&issue=2&article=001
Brink, T. (2018). Organising of dynamic proximities enables robustness, innovation and growth: The longitudinal case of small and
medium-sized enterprises (SMEs) in food producing firm networks. Industrial Marketing Management.
https://doi.org/10.1016/J.INDMARMAN.2018.04.005
Broadstock, D. C., Matousek, R., Meyer, M., & Tzeremes, N. G. (2019). Does corporate social responsibility impact firms’ innovation
capacity? The indirect link between environmental & social governance implementation and innovation performance. Journal of
Business Research. https://doi.org/10.1016/j.jbusres.2019.07.014
Brown, J. A., & Forster, W. R. (2013). CSR and Stakeholder Theory: A Tale of Adam Smith. Journal of Business Ethics, 112(2), 301–312.
https://doi.org/10.1007/s10551-012-1251-4
Calic, G., & Mosakowski, E. (2016). Kicking Off Social Entrepreneurship: How A Sustainability Orientation Influences Crowdfunding
Success. Journal of Management Studies, 53(5), 738–767. https://doi.org/10.1111/joms.12201
Cantele, S., & Zardini, A. (2018). Is sustainability a competitive advantage for small businesses? An empirical analysis of possible
mediators in the sustainability–financial performance relationship. Journal of Cleaner Production, 182, 166–176.
https://doi.org/10.1016/J.JCLEPRO.2018.02.016
Carayannis, E. G., Barth, T. D., & Campbell, D. F. (2012). The Quintuple Helix innovation model: global warming as a challenge and
driver for innovation. Journal of Innovation and Entrepreneurship, 1(1), 2. https://doi.org/10.1186/2192-5372-1-2
Carayannis, E. G., Grigoroudis, E., Campbell, D. F. J., Meissner, D., & Stamati, D. (2018). The ecosystem as helix: an exploratory theory-
building study of regional co-opetitive entrepreneurial ecosystems as Quadruple/Quintuple Helix Innovation Models. R&D
Management, 48(1), 148–162. https://doi.org/10.1111/radm.12300
Carlo, J. L., Lyytinen, K., & Rose, G. M. (2012). a Knowledge-Based Model of Radical Innovation in Small Software Firms. MIS
Quarterly, 36(3), 865-A10. http://search.ebscohost.com/login.aspx?direct=true&db=aph&AN=78164851&lang=pt-br&site=ehost-
live
Carrión, G. C., Nitzl, C., & Roldán, J. L. (2017). Mediation Analyses in Partial Least Squares Structural Equation Modeling: Guidelines
and Empirical Examples. In Partial Least Squares Path Modeling (pp. 173–195). Springer International Publishing.
https://doi.org/10.1007/978-3-319-64069-3_8
Carroll, A. (2018). Corporate social responsibility: A review of current concepts, research, and issues. Emeraldinsight.Com, 2(360), 39–69.
https://www.emeraldinsight.com/doi/abs/10.1108/S2514-175920180000002002
Carroll, A. B. (1991). The pyramid of corporate social responsibility: Toward the moral management of organizational stakeholders.
Business Horizons, 34(4), 39–48. https://doi.org/10.1016/0007-6813(91)90005-G
Carroll, A. B. (1999). Corporate Social Responsibility. Business & Society, 38(3), 268–295. https://doi.org/10.1177/000765039903800303
Carroll, A. B. (2016). Carroll’s pyramid of CSR: taking another look. International Journal of Corporate Social Responsibility, 1(1), 3.
https://doi.org/10.1186/s40991-016-0004-6
Cavaleri, S., & Shabana, K. (2018). Rethinking sustainability strategies. Journal of Strategy and Management, 11(1), 2–17.
https://doi.org/10.1108/JSMA-08-2016-0050
ENTREPRENEURSHIP AND SUSTAINABILITY ISSUES
ISSN 2345-0282 (online) http://jssidoi.org/jesi/
2021 Volume 8 Number 3 (March)
http://doi.org/10.9770/jesi.2021.8.3(41) Make your research more visible, join the Twitter account of ENTREPRENEURSHIP AND SUSTAINABILITY ISSUES: @Entrepr69728810
673
Cenfetelli, R. T., & Bassellier, G. (2009). Interpretation of formative measurement in information systems research. MIS Quarterly, 689–
707.
Chin, W. W. (1998). Issues and Opinion on Structural Equation Modeling. MIS Quarterly, 22(1), 1. https://doi.org/Editorial
Chin, W. W., & Dibbern, J. (2010). Handbook of Partial Least Squares. In Handbook of Partial Least Squares (Issue September).
https://doi.org/10.1007/978-3-540-32827-8
Cohen, J. (1988). Set Correlation and Contingency Tables. Applied Psychological Measurement, 12(4), 425–434.
https://doi.org/10.1177/014662168801200410
Cooren, F. (2020). A Communicative Constitutive Perspective on Corporate Social Responsibility: Ventriloquism, Undecidability, and
Surprisability. Business & Society, 59(1), 175–197. https://doi.org/10.1177/0007650318791780
Covin, J. G., & Lumpkin, G. T. (2011). Entrepreneurial Orientation Theory and Research: Reflections on a Needed Construct.
Entrepreneurship Theory and Practice, 35(5), 855–872. https://doi.org/10.1111/j.1540-6520.2011.00482.x
Covin, J. G., & Slevin, D. P. (1989). Strategic management of small firms in hostile and benign environments. Strategic Management
Journal, 10(1), 75–87. https://doi.org/10.1002/smj.4250100107
Covin, J. G., & Slevin, D. P. (1991). A Conceptual Model of Entrepreneurship as Firm Behavior. Entrepreneurship Theory and Practice,
16(1), 7–26. https://doi.org/10.1177/104225879101600102
Covin, J. G., & Wales, W. J. (2012). The Measurement of Entrepreneurial Orientation. Entrepreneurship: Theory and Practice, 36(4), 677–
702. https://doi.org/10.1111/j.1540-6520.2010.00432.x
Diamantopoulos, A., & Siguaw, J. A. (2006). Formative versus reflective indicators in organizational measure development: A comparison
and empirical illustration. British Journal of Management, 17(4), 263–282. https://doi.org/10.1111/j.1467-8551.2006.00500.x
Diamantopoulos, A., & Winklhofer, H. M. (2001). Index construction with formative indicators: An alternative to scale development.
Journal of Marketing Research, 38(2), 269–277.
Dixit, G. K., & Nanda, T. (2011). Strategic Alignment of Organizational Culture and Climate for Stimulating Innovation in SMEs.
International Journal of Innovation, Management and Technology, 2(1), 77–85.
https://doi.org/http://dx.doi.org/10.7763/IJIMT.2011.V2.109
Donbesuur, F., Boso, N., & Hultman, M. (2020). The effect of entrepreneurial orientation on new venture performance: Contingency roles
of entrepreneurial actions. Journal of Business Research, 118, 150–161. https://doi.org/10.1016/j.jbusres.2020.06.042
Drucker, P. (2014). Innovation and entrepreneurship : practice and principles.
https://books.google.com.mx/books?id=NyqDBAAAQBAJ&dq=entrepreneur+concepts,+Drucker+&lr=&hl=es&source=gbs_navlin
ks_s
Eggers, F. (2020). Masters of disasters? Challenges and opportunities for SMEs in times of crisis. Journal of Business Research, 116, 199–
208. https://doi.org/10.1016/j.jbusres.2020.05.025
Eshima, Y., & Anderson, B. S. (2017). Firm growth, adaptive capability, and entrepreneurial orientation. Strategic Management Journal,
38(3), 770–779. https://doi.org/10.1002/smj.2532
Esposito, V., Chin, W., Henseler, J., & Wang, H. (2010). Handbook of partial least squares: Concepts, methods and applications.
Feng, C., Patel, P. C., & Xiang, K. (2020). The well-trodden path: Complementing market and entrepreneurial orientation with a strategic
emphasis to influence IPO survival in the United States. Journal of Business Research, 110, 370–385.
https://doi.org/10.1016/j.jbusres.2020.01.065
Flammer, C. (2015). Does Corporate Social Responsibility Lead to Superior Financial Performance? A Regression Discontinuity
Approach. Management Science, 61(11), 2549–2568. https://doi.org/10.1287/mnsc.2014.2038
Forkmann, S., Henneberg, S. C., Naudé, P., & Mitrega, M. (2016). Supplier relationship management capability: a qualification and
extension. Industrial Marketing Management, 57, 185–200. https://doi.org/10.1016/J.INDMARMAN.2016.02.003
Fornell, C., & Larcker, D. F. (1981). Evaluating Structural Equation Models with Unobservable Variables and Measurement Error. Journal
of Marketing Research (JMR). Feb1981, 18(1), 39-50. 12p. 1 Diagram. https://doi.org/10.2307/3151312
Freeman, R. E., Harrison, J. S., Wicks, A. C., Parmar, B. L., & de Colle, S. (2010). Stakeholder Theory: The State of the Art. Cambridge
University Press. https://books.google.com.mx/books?id=xF8-WN1QlIMC
Friedman, M. (2007). The Social Responsibility of Business Is to Increase Its Profits. In W. C. Zimmerli, M. Holzinger, & K. Richter
(Eds.), Corporate Ethics and Corporate Governance (pp. 173–178). Springer Berlin Heidelberg. https://doi.org/10.1007/978-3-540-
70818-6_14
Gallardo-Vázquez, D., Enrique Valdez-Juárez, L., & Castuera-Díaz, Á. M. (2019). Corporate Social Responsibility as an Antecedent of
Innovation, Reputation, Performance, and Competitive Success: A Multiple Mediation Analysis. Mdpi.Com, 11(5614), 2–28.
https://doi.org/10.3390/su11205614
Gallardo-Vázquez, D., Sánchez-Hernández, M. I., & Corchuelo-Martínez-Azúa, M. B. (2013). Validation of a measurement scale for the
relationship between the orientation to corporate social responsibility and other business strategic variables. Revista de Contabilidad-
Spanish Accounting Review, 16(1), 11–23. https://doi.org/10.1016/S1138-4891(13)70002-5
Geissdoerfer, M., Savaget, P., Bocken, N. M. P., & Hultink, E. J. (2017). The Circular Economy – A new sustainability paradigm? In
Journal of Cleaner Production (Vol. 143, pp. 757–768). Elsevier Ltd. https://doi.org/10.1016/j.jclepro.2016.12.048
Geissdoerfer, M., Vladimirova, D., & Evans, S. (2018). Sustainable business model innovation: A review. In Journal of Cleaner
Production (Vol. 198, pp. 401–416). Elsevier Ltd. https://doi.org/10.1016/j.jclepro.2018.06.240
ENTREPRENEURSHIP AND SUSTAINABILITY ISSUES
ISSN 2345-0282 (online) http://jssidoi.org/jesi/
2021 Volume 8 Number 3 (March)
http://doi.org/10.9770/jesi.2021.8.3(41) Make your research more visible, join the Twitter account of ENTREPRENEURSHIP AND SUSTAINABILITY ISSUES: @Entrepr69728810
674
GEM. (2018). Global Entrepreneurship Monitor. Global Report, Entreprenuer and Innovation 2017-2018.
https://www.gemconsortium.org/report
GEM. (2020). Global Entrepreneurship Monitor 2019/2020 Global Report. In GEM (Vol. 8, Issue 2).
Gibb, A. (2007). Enterprise in Education. Educating Tomorrow’s Entrepreneurs. Pentti Mankinen, 1–17.
https://doi.org/10.1145/237218.237249
Gorrell, G., Ford, N., Madden, A., Holdridge, P., & Eaglestone, B. (2011). Countering method bias in questionnaire‐based user studies.
Journal of Documentation, 67(3), 507–524. https://doi.org/10.1108/00220411111124569
Gupta, A. K., & Gupta, N. (2020). Effect of corporate environmental sustainability on dimensions of firm performance – Towards
sustainable development: Evidence from India. Journal of Cleaner Production, 253. https://doi.org/10.1016/j.jclepro.2019.119948
Hadj, T. B. (2020). Effects of corporate social responsibility towards stakeholders and environmental management on responsible
innovation and competitiveness. Journal of Cleaner Production, 250, 119490. https://doi.org/10.1016/j.jclepro.2019.119490
Hair, J. F., Black, W. C., Babin, B. J., & Anderson, R. (2017). Multivariate Data Analysis. Pearson.
Hair, Joseph F., Hult, G. T. M., Ringle, C. M., Sarstedt, M., & Thiele, K. O. (2017). Mirror, mirror on the wall: a comparative evaluation of
composite-based structural equation modeling methods. Journal of the Academy of Marketing Science, 45(5), 616–632.
https://doi.org/10.1007/s11747-017-0517-x
Hair, Joseph F., Risher, J. J., Sarstedt, M., & Ringle, C. M. (2019). When to use and how to report the results of PLS-SEM. In European
Business Review (Vol. 31, Issue 1, pp. 2–24). Emerald Group Publishing Ltd. https://doi.org/10.1108/EBR-11-2018-0203
Halme, M., Rintamäki, J., Knudsen, J. S., Lankoski, L., & Kuisma, M. (2020). When Is There a Sustainability Case for CSR? Pathways to
Environmental and Social Performance Improvements. Business & Society, 59(6), 1181–1227.
https://doi.org/10.1177/0007650318755648
Hart, S. L., & Milstein, M. B. (2003). Creating sustainable value. Academy of Management Perspectives, 17(2), 56–67.
https://doi.org/10.5465/ame.2003.10025194
Henseler, J., Hubona, G., & Ray, P. A. (2016). Using PLS path modeling in new technology research: updated guidelines. Industrial
Management & Data Systems, 116(1), 2–20. https://doi.org/10.1108/IMDS-09-2015-0382
Henseler, J., Ringle, C. M., & Sarstedt, M. (2015a). A new criterion for assessing discriminant validity in variance-based structural
equation modeling. Journal of the Academy of Marketing Science, 43(1), 115–135. https://doi.org/10.1007/s11747-014-0403-8
Henseler, J., Ringle, C. M., & Sarstedt, M. (2015b). A new criterion for assessing discriminant validity in variance-based structural
equation modeling. Journal of the Academy of Marketing Science, 43(1), 115–135. https://doi.org/10.1007/s11747-014-0403-8
Hernández, Ó. S., Martín-Brufau, R., Carrillo, F. X. M., Berna, F. J. C., & Gras, R. M. L. (2010). Relación entre optimismo, creatividad y
síntomas psicopatológicos, en estudiantes universitarios. Electronic Journal of Research in Educational Psychology, 8(3), 1151–
1178.
Herrera Madueño, J., Larrán Jorge, M., Martínez Conesa, I., & Martínez-Martínez, D. (2016). Relationship between corporate social
responsibility and competitive performance in Spanish SMEs: Empirical evidence from a stakeholders’ perspective. BRQ Business
Research Quarterly, 19(1), 55–72. https://doi.org/10.1016/j.brq.2015.06.002
Hsueh, C.-F. (2015). A bilevel programming model for corporate social responsibility collaboration in sustainable supply chain
management. Transportation Research Part E: Logistics and Transportation Review, 73, 84–95.
https://doi.org/10.1016/J.TRE.2014.11.006
Hu, J., Wang, S., & Xie, F. (2018). Environmental responsibility, market valuation, and firm characteristics: Evidence from China.
Corporate Social Responsibility and Environmental Management, 25(6), 1376–1387. https://doi.org/10.1002/csr.1646
ILO. (2016). International Labor Organization. Economía informal nformal economy (Platform for decent work resources for sustainable
development). https://www.ilo.org/global/topics/dw4sd/themes/informal-economy/lang--es/index.htm
INEGI. (2018). Economic Census, summary of the final results.
http://internet.contenidos.inegi.org.mx/contenidos/productos/prod_serv/contenidos/espanol/bvinegi/productos/nueva_estruc/promo/fr
rdf_ce2014.pdf
INEGI. (2019). Instituto Nacional de Geografía, Estadística e Informática. Censos Económicos 2019.
https://www.inegi.org.mx/programas/ce/2019/#Informacion_general
Iqbal, Z., & Malik, M. (2019). Entrepreneurial orientation and engagement of Pakistani small and medium enterprises in sustainable
development practices: Mediating role of knowledge management. Business Strategy and Development, 2(3), 192–203.
https://doi.org/10.1002/bsd2.53
Isaak, R., & Logic, G. (1999). Ecopreneurship, Theory and Ethics.
Jiang, W., Chai, H., Shao, J., & Feng, T. (2018). Green entrepreneurial orientation for enhancing firm performance: A dynamic capability
perspective. Journal of Cleaner Production, 198, 1311–1323. https://doi.org/10.1016/j.jclepro.2018.07.104
Kalmykova, Y., Sadagopan, M., & Rosado, L. (2018). Circular economy - From review of theories and practices to development of
implementation tools. Resources, Conservation and Recycling, 135, 190–201. https://doi.org/10.1016/j.resconrec.2017.10.034
Kaplan, R., & Kinderman, D. (2020). The Business-Led Globalization of CSR: Channels of Diffusion From the United States Into
Venezuela and Britain, 1962-1981. Business & Society, 59(3), 439–488. https://doi.org/10.1177/0007650317717958
Knight, G. A. (1997). Cross-cultural reliability and validity of a scale to measure firm entrepreneurial orientation. Journal of Business
Venturing, 12(3), 213–225. https://doi.org/10.1016/S0883-9026(96)00065-1
ENTREPRENEURSHIP AND SUSTAINABILITY ISSUES
ISSN 2345-0282 (online) http://jssidoi.org/jesi/
2021 Volume 8 Number 3 (March)
http://doi.org/10.9770/jesi.2021.8.3(41) Make your research more visible, join the Twitter account of ENTREPRENEURSHIP AND SUSTAINABILITY ISSUES: @Entrepr69728810
675
Kraus, S., Rigtering, J. P. C., Hughes, M., & Hosman, V. (2012). Entrepreneurial orientation and the business performance of SMEs: A
quantitative study from the Netherlands. Review of Managerial Science, 6(2), 161–182. https://doi.org/10.1007/s11846-011-0062-9
Laskovaia, A., Marino, L., Shirokova, G., & Wales, W. (2019). Expect the unexpected: examining the shaping role of entrepreneurial
orientation on causal and effectual decision-making logic during economic crisis. Entrepreneurship and Regional Development,
31(5–6), 456–475. https://doi.org/10.1080/08985626.2018.1541593
Lau, A., Lee, S., & Jung, S. (2018). The Role of the Institutional Environment in the Relationship between CSR and Operational
Performance: An Empirical Study in Korean Manufacturing Industries. Sustainability, 10(3), 834.
https://doi.org/10.3390/su10030834
Lindgreen, A., Swaen, V., & Campbell, T. T. (2009). Corporate Social Responsibility Practices in Developing and Transitional Countries:
Botswana and Malawi. Springer, 90(SUPPL 3), 429–440. https://doi.org/10.1007/s10551-010-0415-3
Linton, J., Klassen, R., & Jayaraman, V. (2007). Sustainable supply chains: An introduction. Journal of Operations Management, 25(6),
1075–1082. https://doi.org/10.1016/J.JOM.2007.01.012
Lisboa, A., Skarmeas, D., & Lages, C. (2011). Entrepreneurial orientation, exploitative and explorative capabilities, and performance
outcomes in export markets: A resource-based approach. Industrial Marketing Management, 40(8), 1274–1284.
https://doi.org/10.1016/j.indmarman.2011.10.013
Liu, C. H. S., & Huang, C. E. (2020). Discovering differences in the relationship among social entrepreneurial orientation, extensions to
market orientation and value co-creation–The moderating role of. Journal of Hospitality and Tourism, 42, 97–106.
https://www.sciencedirect.com/science/article/pii/S1447677019302657
Liu, W., Shao, X., De Sisto, M., & Li, W. H. (2020). A new approach for addressing endogeneity issues in the relationship between
corporate social responsibility and corporate financial performance. Finance Research Letters, 101623.
https://doi.org/10.1016/j.frl.2020.101623
Lomberg, C., Urbig, D., Stöckmann, C., Marino, L. D., & Dickson, P. H. (2017). Entrepreneurial Orientation: The Dimensions’ Shared
Effects in Explaining Firm Performance. Entrepreneurship Theory and Practice, 41(6), 973–998. https://doi.org/10.1111/etap.12237
Lumpkin, G. T., & Dess, G. G. (1996). Clarifying the entrepreneurial orientation construct and linking it to performance. Academy of
Management Review, 21(1), 135–172. https://doi.org/10.5465/AMR.1996.9602161568
Lumpkin, George Thomas, & Dess, G. G. (2015). Entrepreneurial Orientation. In Wiley Encyclopedia of Management (pp. 1–4). John
Wiley & Sons, Ltd. https://doi.org/10.1002/9781118785317.weom030030
Macharia Chege, S., Wang, D., & Leparan Suntu, S. (2020). Information Technology for Development Impact of information technology
innovation on firm performance in Kenya Impact of information technology innovation on firm performance in Kenya. Taylor &
Francis, 26(2), 316–345. https://doi.org/10.1080/02681102.2019.1573717
Magrizos, S., Apospori, E., Carrigan, M., & Jones, R. (2020). Is CSR the panacea for SMEs? A study of socially responsible SMEs during
economic crisis. European Management Journal. https://doi.org/10.1016/j.emj.2020.06.002
Martin, S. L., & Javalgi, R. (Raj) G. (2016). Entrepreneurial orientation, marketing capabilities and performance: The Moderating role of
Competitive Intensity on Latin American International New Ventures. Journal of Business Research, 69(6), 2040–2051.
https://doi.org/10.1016/j.jbusres.2015.10.149
Martínez-Campillo, A., Cabeza-García, L., & Marbella-Sánchez, F. (2013). Responsabilidad social corporativa y resultado financiero:
Evidencia sobre la doble dirección de la causalidad en el sector de las Cajas de Ahorros. Cuadernos de Economia y Direccion de La
Empresa, 16(1), 54–68. https://doi.org/10.1016/j.cede.2012.04.005
Martinez-Conesa, I., Soto-Acosta, P., & Palacios-Manzano, M. (2017). Corporate social responsibility and its effect on innovation and firm
performance: An empirical research in SMEs. Journal of Cleaner Production, 142, 2374–2383.
https://doi.org/10.1016/J.JCLEPRO.2016.11.038
McWilliams, A., & Siegel, D. (2001). Corporate Social Responsibility: A Theory of The Firm Perspective. Academy of Management
Review, 26(1), 117–127. https://doi.org/10.5465/AMR.2001.4011987
McWilliams, Abagail, Parhankangas, A., Coupet, J., Welch, E., & Barnum, D. T. (2016). Strategic Decision Making for the Triple Bottom
Line. Business Strategy and the Environment, 25(3), 193–204. https://doi.org/10.1002/bse.1867
McWilliams, Abagail, Siegel, D. S., & Wright, P. M. (2006). Corporate social responsibility: Strategic implications. Journal of
Management Studies, 43(1), 1–18. https://doi.org/10.1111/j.1467-6486.2006.00580.x
Miller, D. (1983). The Correlates of Entrepreneurship in Three Types of Firms. Management Science, 29(7), 770–791.
https://doi.org/10.1287/mnsc.29.7.770
Mishra, C. S., & Zachary, R. K. (2014). The theory of entrepreneurship : creating and sustaining entrepreneurial value. Springer
International Publishing.
Monteiro, A. P., Soares, A. M., & Rua, O. L. (2019). Linking intangible resources and entrepreneurial orientation to export performance:
The mediating effect of dynamic capabilities. Journal of Innovation and Knowledge, 4(3), 179–187.
https://doi.org/10.1016/j.jik.2019.04.001
Moratis, L., & Cochius, T. (2017). ISO 26000: The Business Guide to the New Standard on Social Responsibility. Taylor & Francis.
https://books.google.com.mx/books?id=2qk0DwAAQBAJ
Müller, J. M., Buliga, O., & Voigt, K.-I. (2018). Fortune favors the prepared: How SMEs approach business model innovations in Industry
4.0. Technological Forecasting and Social Change, 132, 2–17. https://doi.org/10.1016/J.TECHFORE.2017.12.019
ENTREPRENEURSHIP AND SUSTAINABILITY ISSUES
ISSN 2345-0282 (online) http://jssidoi.org/jesi/
2021 Volume 8 Number 3 (March)
http://doi.org/10.9770/jesi.2021.8.3(41) Make your research more visible, join the Twitter account of ENTREPRENEURSHIP AND SUSTAINABILITY ISSUES: @Entrepr69728810
676
Multaharju, S., Lintukangas, K., Hallikas, J., & Kähkönen, A.-K. (2017). Sustainability-related risk management in buying logistics
services. The International Journal of Logistics Management, 28(4), 1351–1367. https://doi.org/10.1108/IJLM-05-2016-0134
Naing, L., Winn, T., & Rusli, B. N. (2006). Practical Issues in Calculating the Sample Size for Prevalence Studies. In Archives of Orofacial
Sciences (Vol. 1). http://www.dental.usm.my/aos/docs/Vol_1/09_14_ayub.pdf
Naseem, T., Shahzad, F., Asim, G. A., Rehman, I. U., & Nawaz, F. (2020). Corporate social responsibility engagement and firm
performance in Asia Pacific: The role of enterprise risk management. Corporate Social Responsibility and Environmental
Management, 27(2), 501–513. https://doi.org/10.1002/csr.1815
Nasra, R., & Dacin, M. T. (2010). Institutional Arrangements and International Entrepreneurship: The State as Institutional Entrepreneur.
Entrepreneurship Theory and Practice, 34(3), 583–609. https://doi.org/10.1111/j.1540-6520.2009.00354.x
Newey, L. R., & Zahra, S. A. (2009). The Evolving Firm: How Dynamic and Operating Capabilities Interact to Enable Entrepreneurship.
British Journal of Management, 20(s1), S81–S100. https://doi.org/10.1111/j.1467-8551.2008.00614.x
Nitzl, C., Roldan, J. L., & Cepeda, G. (2016). Mediation analysis in partial least squares path modeling. Industrial Management & Data
Systems, 116(9), 1849–1864. https://doi.org/10.1108/IMDS-07-2015-0302
Nosratabadi, S., Mosavi, A., Shamshirband, S., Kazimieras Zavadskas, E., Rakotonirainy, A., & Chau, K. W. (2019). Sustainable Business
Models: A Review. Sustainability, 11(6), 1663. https://doi.org/10.3390/su11061663
OECD. (2018). Organization for Economic Cooperation and Development. Employment Outlook 2018 (Mexico). In Employment Outlook
2018 (p. 3). https://doi.org/10.1787/empl_outlook-2018-en
Orlitzky, M. (2011). Institutional logics in the study of organizations: The social construction of the relationship between corporate social
and financial performance. Business Ethics Quarterly, 21(3), 409–444. https://www.jstor.org/stable/41304439
Ortiz-Avram, D., Domnanovich, J., Kronenberg, C., & Scholz, M. (2018a). Exploring the integration of corporate social responsibility into
the strategies of small- and medium-sized enterprises: A systematic literature review. Journal of Cleaner Production, 201, 254–271.
https://doi.org/10.1016/j.jclepro.2018.08.011
Ortiz-Avram, D., Domnanovich, J., Kronenberg, C., & Scholz, M. (2018b). Exploring the integration of corporate social responsibility into
the strategies of small- and medium-sized enterprises: A systematic literature review. In Journal of Cleaner Production (Vol. 201,
pp. 254–271). Elsevier Ltd. https://doi.org/10.1016/j.jclepro.2018.08.011
Pérez-Cornejo, C., de Quevedo-Puente, E., & Delgado-García, J. B. (2020). Reporting as a booster of the corporate social performance
effect on corporate reputation. Corporate Social Responsibility and Environmental Management, 27(3), 1252–1263.
https://doi.org/10.1002/csr.1881
Perrini, F. (2006). SMEs and CSR theory: Evidence and implications from an Italian perspective. Journal of Business Ethics, 67(3), 305–
316. https://doi.org/10.1007/s10551-006-9186-2
Peters, R., & Mullen, M. (2009). Alguna evidencia de los efectos acumulativos de la responsabilidad social corporativa en el desempeño
financiero. Journal of Global Business, 3(1), 1–14.
http://search.ebscohost.com/login.aspx?direct=true&profile=ehost&scope=site&authtype=crawler&jrnl=1931311X&asa=Y&AN=3
6917631&h=pyJIzlbeix1%2BIpCnav4mSNKC%2BZDYgp0IzyolVb%2FYOh2Fg3z7kZVcy73OEj%2F%2FoGV6RkayVPd5izYH
VQRavx3f2g%3D%3D&crl=c
Pivato, S., Misani, N., & Tencati, A. (2007). The impact of corporate social responsibility on consumer trust: the case of organic food.
Business Ethics: A European Review, 17(1), 3–12. https://doi.org/10.1111/j.1467-8608.2008.00515.x
Podsakoff, P. M., MacKenzie, S. B., Lee, J., & Podsakoff, N. P. (2003). Common Method Bias in Behavioral Research: A Critical Review
of the Literature and. Vol. DOI.
Reverte, C., Gómez-Melero, E., & Cegarra-Navarro, J. G. (2016). The influence of corporate social responsibility practices on
organizational performance: evidence from Eco-Responsible Spanish firms. Journal of Cleaner Production, 112, 2870–2884.
https://doi.org/10.1016/j.jclepro.2015.09.128
Ringle, C., Wende, S., & Becker, J. (2015). Boenningstedt: SmartPLS GmbH. https://www.smartpls.com/
Ringle, C., Wende, S., & Becker, J. (2017). SmartPLS—Statistical Software For Structural Equation Modeling.
https://scholar.google.es/scholar?hl=es&as_sdt=0%2C5&q=Ringle%2C+Wende%2C+%26+Becker%2C+2017+SMARTPLS&btnG
=
Sarstedt, M., Hair, J. F., Cheah, J. H., Becker, J. M., & Ringle, C. M. (2019). How to specify, estimate, and validate higher-order constructs
in PLS-SEM. Australasian Marketing Journal, 27(3), 197–211. https://doi.org/10.1016/j.ausmj.2019.05.003
Sarstedt, M., Ringle, C. M., & Hair, J. F. (2017). Partial Least Squares Structural Equation Modeling. In Handbook of Market Research
(pp. 1–40). Springer International Publishing. https://doi.org/10.1007/978-3-319-05542-8_15-1
Schaltegger, S, & Wagner, M. (2017). Managing the Business Case for Sustainability: The Integration of Social, Environmental and
Economic Performance. Taylor & Francis. https://books.google.es/books?id=Gqo0DwAAQBAJ
Schaltegger, Stefan, Hansen, E. G., & Lüdeke-Freund, F. (2016). Business Models for Sustainability. Organization & Environment, 29(1),
3–10. https://doi.org/10.1177/1086026615599806
Schuberth, F., Henseler, J., & Dijkstra, T. K. (2018). Partial least squares path modeling using ordinal categorical indicators. Quality &
Quantity, 52(1), 9–35. https://doi.org/10.1007/s11135-016-0401-7
Seaborn, P., Olsen, T. D., & Howell, J. (2020). Is Insider Control Good for Environmental Performance? Evidence From Dual-Class Firms.
Business & Society, 59(4), 716–748. https://doi.org/10.1177/0007650317749221
ENTREPRENEURSHIP AND SUSTAINABILITY ISSUES
ISSN 2345-0282 (online) http://jssidoi.org/jesi/
2021 Volume 8 Number 3 (March)
http://doi.org/10.9770/jesi.2021.8.3(41) Make your research more visible, join the Twitter account of ENTREPRENEURSHIP AND SUSTAINABILITY ISSUES: @Entrepr69728810
677
Shafique, I., & Saeed, M. (2020). Linking elements of entrepreneurial orientation and firm performance: examining the moderation of
environmental dynamism. Middle East J. of Management, 7(1), 93. https://doi.org/10.1504/mejm.2020.105228
Spence, L. J. (2016). Small Business Social Responsibility. Business & Society, 55(1), 23–55. https://doi.org/10.1177/0007650314523256
Stewart, W. H., & Roth, P. L. (2007). A Meta‐Analysis of Achievement Motivation Differences between Entrepreneurs and Managers*.
Journal of Small Business Management, 45(4), 401–421. https://doi.org/10.1111/j.1540-627X.2007.00220.x
Tang, Z., & Tang, J. (2012). Stakeholder–firm power difference, stakeholders’ CSR orientation, and SMEs’ environmental performance in
China. Journal of Business Venturing, 27(4), 436–455. https://doi.org/10.1016/j.jbusvent.2011.11.007
Tasdemir, C., Gazo, R., Tasdemir, C., & Gazo, R. (2018). A Systematic Literature Review for Better Understanding of Lean Driven
Sustainability. Sustainability, 10(7), 2544. https://doi.org/10.3390/su10072544
Teece, D J. (2009). Dynamic capabilities and strategic management: organizing for innovation and growth. In O. University (Ed.), Essays
in Technology Management and Policy - Selected Papers of David J. Teece.
Teece, David J. (2007). Explicating Dynamic Capabilities: The Nature and Microfoundations of (Sustainabile) Enterprise Performance.
Strategic Management Journal, 298(13), 1319–1350.
Teece, David J. (2010). Business models, business strategy and innovation. Long Range Planning, 43(2–3), 172–194.
https://doi.org/10.1016/j.lrp.2009.07.003
Teece, David J. (2016). Dynamic capabilities and entrepreneurial management in large organizations: Toward a theory of the
(entrepreneurial) firm. European Economic Review, 86, 202–216. https://doi.org/10.1016/J.EUROECOREV.2015.11.006
Terán-Yépez, E., Marín-Carrillo, G. M., Casado-Belmonte, M. del P., & Capobianco-Uriarte, M. de las M. (2020). Sustainable
entrepreneurship: Review of its evolution and new trends. Journal of Cleaner Production, 252, 119742.
https://doi.org/10.1016/j.jclepro.2019.119742
Tiba, S., van Rijnsoever, F. J., & Hekkert, M. P. (2020). The lighthouse effect: How successful entrepreneurs influence the sustainability-
orientation of entrepreneurial ecosystems. Journal of Cleaner Production, 264, 121616.
https://doi.org/10.1016/j.jclepro.2020.121616
Tuan, L. T. (2015). From corporate social responsibility, through entrepreneurial orientation, to knowledge sharing: A study in Cai Luong
(Renovated Theatre) theatre companies. Learning Organization, 22(2), 74–92. https://doi.org/10.1108/TLO-09-2014-0052
UNO. (2019). United Nations Organization. Sustainable Development Goals 2030. ONU. https://news.un.org/es/news/topic/sdgs
Valdez-Juárez, L. E. (2017). Corporate Social Responsibility : Its Effect on SMEs. Journal of Management and Sustainability, 7(3), 75–89.
https://doi.org/10.5539/jms.v7n3p75
Veronica, S., Alexeis, G. P., Valentina, C., & Elisa, G. (2019). Do stakeholder capabilities promote sustainable business innovation in
small and medium-sized enterprises? Evidence from Italy. Journal of Business Research.
https://doi.org/10.1016/j.jbusres.2019.06.025
Vitolla, F., Rubino, M., & Garzoni, A. (2017). The integration of CSR into strategic management: a dynamic approach based on social
management philosophy. Corporate Governance (Bingley), 17(1), 89–116. https://doi.org/10.1108/CG-03-2016-0064
Wagner, M. (2010). Corporate Social Performance and Innovation with High Social Benefits: A Quantitative Analysis. Journal of Business
Ethics, 94(4), 581–594. https://doi.org/10.1007/s10551-009-0339-y
Wales, W. J. (2016). Entrepreneurial orientation: A review and synthesis of promising research directions. International Small Business
Journal: Researching Entrepreneurship, 34(1), 3–15. https://doi.org/10.1177/0266242615613840
Wang, X., Dass, M., Arnett, D. B., & Yu, X. (2020). Understanding firms’ relative strategic emphases: An entrepreneurial orientation
explanation. Industrial Marketing Management, 84, 151–164. https://doi.org/10.1016/j.indmarman.2019.06.009
Weerawardena, J., & Mavondo, F. T. (2011). Capabilities, innovation and competitive advantage. Industrial Marketing Management,
40(8), 1220–1223. https://doi.org/10.1016/j.indmarman.2011.10.012
West, J., Salter, A., Vanhaverbeke, W., & Chesbrough, H. (2014). Open innovation: The next decade. In Research Policy (Vol. 43, Issue 5,
pp. 805–811). Elsevier B.V. https://doi.org/10.1016/j.respol.2014.03.001
Williams, J., & MacKinnon, D. P. (2008). Resampling and Distribution of the Product Methods for Testing Indirect Effects in Complex
Models. Structural Equation Modeling: A Multidisciplinary Journal, 15(1), 23–51. https://doi.org/10.1080/10705510701758166
Winkler, P., Etter, M., & Castelló, I. (2020). Vicious and Virtuous Circles of Aspirational Talk: From Self-Persuasive to Agonistic CSR
Rhetoric. Business & Society, 59(1), 98–128. https://doi.org/10.1177/0007650319825758
Wright, R. T., Campbell, D. E., Bennett Thatcher, J., Roberts, N., & Bennett, J. (2012). Operationalizing Multidimensional Constructs in
Structural Equation Modeling: Recommendations for IS Research. In Communications of the Association for Information Systems
(Vol. 30, Issue 23). https://aisel.aisnet.org/cgi/viewcontent.cgi?article=3665&context=cais
Yang, M. M., Li, T., & Wang, Y. (2020). What explains the degree of internationalization of early-stage entrepreneurial firms? A
multilevel study on the joint effects of entrepreneurial self-efficacy, opportunity-motivated entrepreneurship, and home-country
institutions. Journal of World Business, 55(6), 101114. https://doi.org/10.1016/j.jwb.2020.101114
Zahra, S. A., & Wright, M. (2016). Understanding the social role of entrepreneurship. Journal of Management Studies, 53(4), 610–629.
https://onlinelibrary.wiley.com/doi/abs/10.1111/joms.12149
Zahra, A. S., Sapienza, J. H., & Davidsson, P. (2006). Entrepreneurship and Dynamic Capabilities: A Review, Model and Research
Agenda. Journal of Management Studies, 43(4), 917–955. https://doi.org/10.1111/j.1467-6486.2006.00616.x
Zahra, S. A. (2007). Contextualizing theory building in entrepreneurship research. Journal of Business Venturing, 22(3), 443–452.
ENTREPRENEURSHIP AND SUSTAINABILITY ISSUES
ISSN 2345-0282 (online) http://jssidoi.org/jesi/
2021 Volume 8 Number 3 (March)
http://doi.org/10.9770/jesi.2021.8.3(41) Make your research more visible, join the Twitter account of ENTREPRENEURSHIP AND SUSTAINABILITY ISSUES: @Entrepr69728810
678
https://doi.org/10.1016/J.JBUSVENT.2006.04.007
Zahra, S. A. (2008). Being entrepreneurial and market driven: implications for company performance. Journal of Strategy and
Management, 1(2), 125–142. https://doi.org/10.1108/17554250810926339
Zahra, S. A., Newey, L. R., & Li, Y. (2014). On the Frontiers: The Implications of Social Entrepreneurship for International
Entrepreneurship. Entrepreneurship Theory and Practice, 38(1), 137–158. https://doi.org/10.1111/etap.12061
Zhao, D., & Smallbone, D. (2019). What affects nascent entrepreneurs’ proactiveness. Asia Pacific Management Review, 24(4), 318–326.
https://doi.org/10.1016/j.apmrv.2018.12.001
Zhao, Z., Meng, F., He, Y., & Gu, Z. (2019). The Influence of Corporate Social Responsibility on Competitive Advantage with Multiple
Mediations from Social Capital and Dynamic Capabilities. Sustainability, 11(1), 218. https://doi.org/10.3390/su11010218
Acknowledgements
This research has been funded with support from the Government of Mexico through the program of the Ministry of Public
Education for the Strengthening of Educational Quality (PFCE 2019, 2020)
https://www.dgespe.sep.gob.mx/pfce/reglas_operacion and with resources from the Technological Institute of Sonora
(ITSON), during the year 2020. European Regional Development Fund and Junta of Extremadura (Business Research
[INVE] Research Group [SEJ022 code]) and by the VI Action Plan 2018–2020 under grant number GR18058.
Luis Enrique VALDEZ-JUÁREZ, is an international PhD in Business Administration and Management from the Polytechnic University
of Cartagena in Spain, he is currently a research professor at the Sonora Technological Institute in Mexico with more than 15 years in the
area of business sciences, lines of research are corporate social responsibility, entrepreneurship and innovation in SMEs.
ORCID ID: https://orcid.org/0000-0002-3754-4349
Dolores GALLARDO-VÁZQUEZ, is a research professor in the department of business sciences at the Polytechnic University of
Cartagena in Spain. She is also responsible for the Office of University Social Responsibility, the lines of research are corporate social
responsibility and sustainability in SMEs. She has more than 20 years of teaching and research experience.
ORCID ID: https://orcid.org/0000-0003-4749-6034
Elva Alicia RAMOS-ESCOBAR, is a research professor at the Technological Institute of Sonora in Mexico. He has more than 20 years of
teaching experience, currently he is in the final phase of his international doctorate in the area of business sciences at the Polytechnic
University of Cartagena in Spain. The lines of research are university entrepreneurship and immigrant entrepreneurship of SMEs.
ORCID ID: https://orcid.org/0000-0001-8912-8964
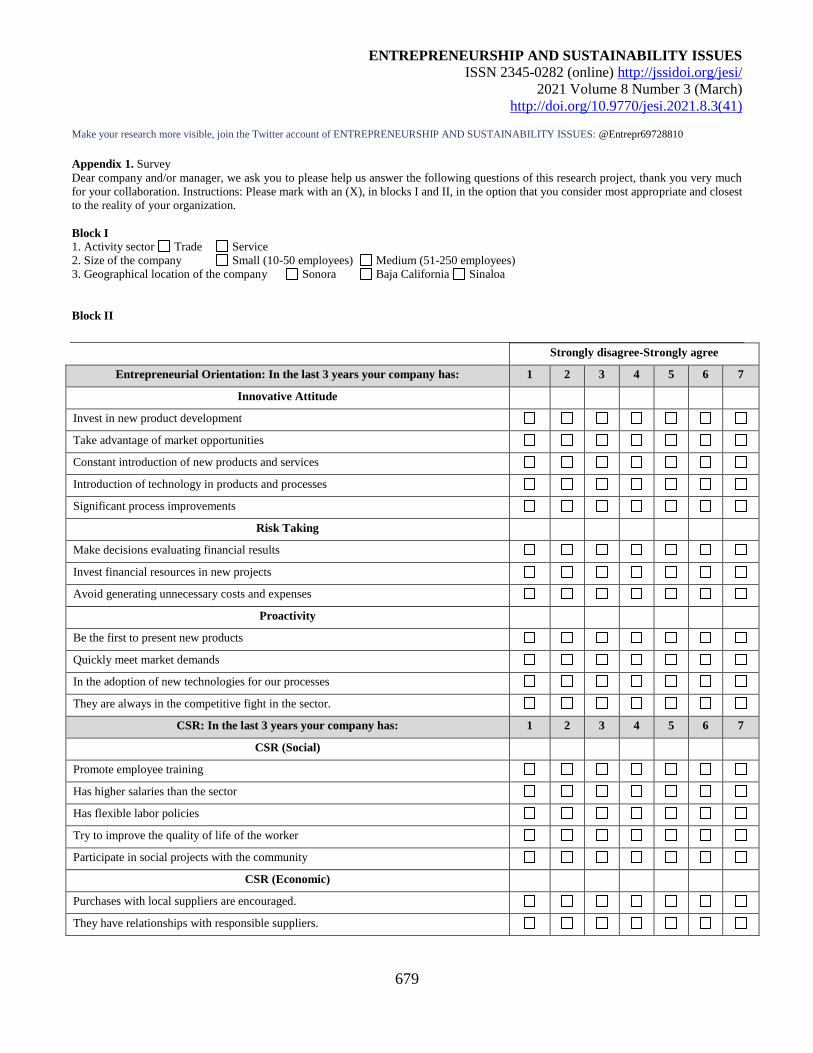
ENTREPRENEURSHIP AND SUSTAINABILITY ISSUES
ISSN 2345-0282 (online) http://jssidoi.org/jesi/
2021 Volume 8 Number 3 (March)
http://doi.org/10.9770/jesi.2021.8.3(41) Make your research more visible, join the Twitter account of ENTREPRENEURSHIP AND SUSTAINABILITY ISSUES: @Entrepr69728810
679
Appendix 1. Survey
Dear company and/or manager, we ask you to please help us answer the following questions of this research project, thank you very much
for your collaboration. Instructions: Please mark with an (X), in blocks I and II, in the option that you consider most appropriate and closest
to the reality of your organization.
Block I
1. Activity sector Trade Service
2. Size of the company Small (10-50 employees) Medium (51-250 employees)
3. Geographical location of the company Sonora Baja California Sinaloa
Block II
Strongly disagree-Strongly agree
Entrepreneurial Orientation: In the last 3 years your company has: 1 2 3 4 5 6 7
Innovative Attitude
Invest in new product development
Take advantage of market opportunities
Constant introduction of new products and services
Introduction of technology in products and processes
Significant process improvements
Risk Taking
Make decisions evaluating financial results
Invest financial resources in new projects
Avoid generating unnecessary costs and expenses
Proactivity
Be the first to present new products
Quickly meet market demands
In the adoption of new technologies for our processes
They are always in the competitive fight in the sector.
CSR: In the last 3 years your company has: 1 2 3 4 5 6 7
CSR (Social)
Promote employee training
Has higher salaries than the sector
Has flexible labor policies
Try to improve the quality of life of the worker
Participate in social projects with the community
CSR (Economic)
Purchases with local suppliers are encouraged.
They have relationships with responsible suppliers.
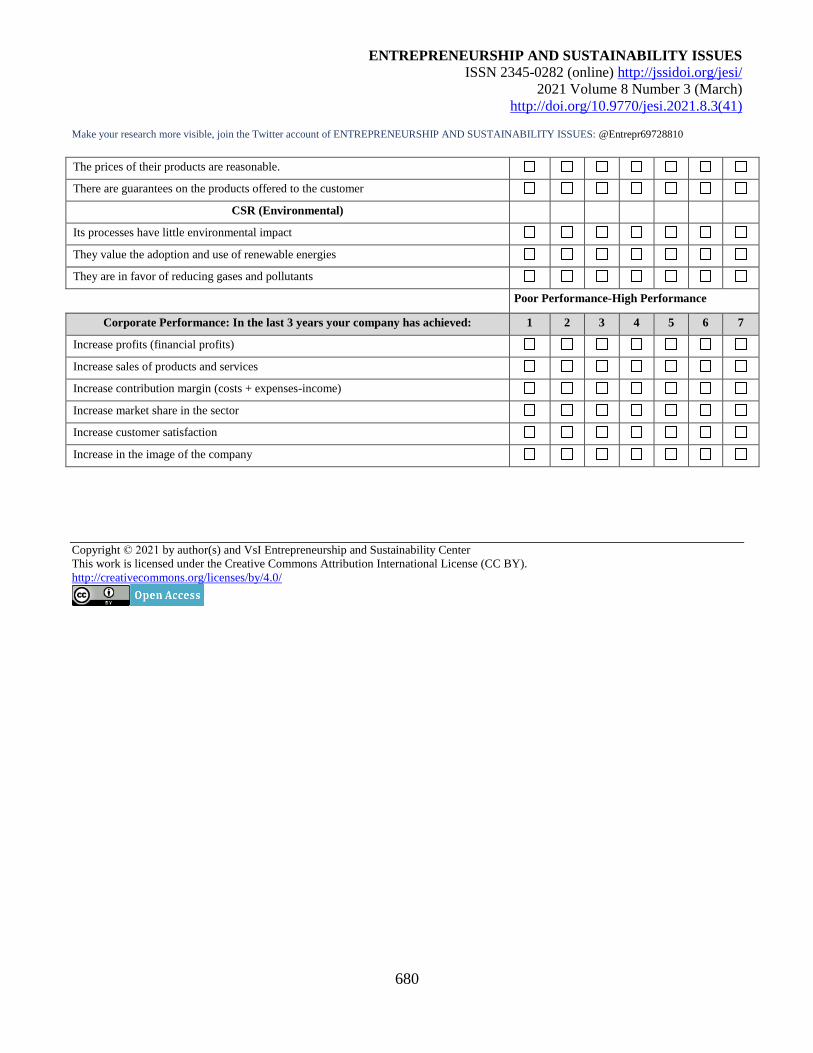
ENTREPRENEURSHIP AND SUSTAINABILITY ISSUES
ISSN 2345-0282 (online) http://jssidoi.org/jesi/
2021 Volume 8 Number 3 (March)
http://doi.org/10.9770/jesi.2021.8.3(41) Make your research more visible, join the Twitter account of ENTREPRENEURSHIP AND SUSTAINABILITY ISSUES: @Entrepr69728810
680
The prices of their products are reasonable.
There are guarantees on the products offered to the customer
CSR (Environmental)
Its processes have little environmental impact
They value the adoption and use of renewable energies
They are in favor of reducing gases and pollutants
Poor Performance-High Performance
Corporate Performance: In the last 3 years your company has achieved: 1 2 3 4 5 6 7
Increase profits (financial profits)
Increase sales of products and services
Increase contribution margin (costs + expenses-income)
Increase market share in the sector
Increase customer satisfaction
Increase in the image of the company
Copyright © 2021 by author(s) and VsI Entrepreneurship and Sustainability Center
This work is licensed under the Creative Commons Attribution International License (CC BY).
http://creativecommons.org/licenses/by/4.0/