eni spa - barchart.com
TRANSCRIPT

ENI SPA
FORM 6-K(Report of Foreign Issuer Pursuant to Rule 13a-16 or 15d-16)
Filed 06/04/12 for the Period Ending 05/31/12
Telephone 011390659824367
CIK 0001002242Symbol E
SIC Code 1311 - Crude Petroleum and Natural GasIndustry Integrated Oil & Gas
Sector EnergyFiscal Year 12/31
http://www.edgar-online.com© Copyright 2022, EDGAR Online, a division of Donnelley Financial Solutions. All Rights Reserved.
Distribution and use of this document restricted under EDGAR Online, a division of Donnelley Financial Solutions, Terms of Use.

Table of Contents
SECURITIES AND EXCHANGE COMMISSION Washington, D.C. 20549
Form 6-K
REPORT OF FOREIGN ISSUER Pursuant to Rule 13a-16 or 15d-16 of the Securities Exchange Act of 1934
For the month of May 2012
Eni S.p.A. (Exact name of Registrant as specified in its charter)
Piazzale Enrico Mattei 1 - 00144 Rome, Italy (Address of principal executive offices)
(Indicate by check mark whether the registrant files or will file annual reports under cover of Form 20-F or Form 40-F.)
Form 20-F Form 40-F �
(Indicate by check mark whether the registrant by furnishing the information contained in this Form is also thereby furnishing the information to the Commission pursuant to Rule 12g3-2b under the Securities Exchange Act of 1934.)
Yes � No
(If “Yes” is marked, indicate below the file number assigned to the registrant in connection with Rule 12g3-2(b): )

Table of Contents
TABLE OF CONTENTS
Press Release dated May 8, 2012
Press Release dated May 9, 2012
Report Eni in 2011
Fact Book 2011
Notice of Shareholders’ Meeting Resolutions
Press Release dated May 16, 2012
Press Release dated May 25, 2012

Table of Contents
SIGNATURES
Pursuant to the requirements of the Securities Exchange Act of 1934, the registrant has duly caused this report to be signed on its behalf by the undersigned, hereunto duly authorised.
Date: May 31, 2012
Eni S.p.A.
Name: Antonio Cristodoro Title: Head of Corporate Secretary's Staff Office
Table of Contents
Eni Shareholders Approve 2011 Financial Statements at Annual Meeting
� 2011 net profit euro 4.21 billion � Total dividend per share for 2011 of euro 1.04
� Remuneration Report approved � Articles 17 and 28 of company by-laws amended, and new article 34 added for gender equality on the
Board of Directors and Board of Statutory Auditors �
Rome, May 8, 2012 - The Ordinary and Extraordinary General Meeting of Eni’s shareholders today resolved the following:
� To approve financial statements for the year ending December 31, 2011, reporting net profit of euro 4,212,687,003.27; � To allocate euro 2,328,880,900.91 out of the 2011 profit of euro 4,212,687,003.27 which remains after the payment of an interim dividend of euro
0.52 per share as resolved by the Board of Directors on September 8, 2011, as follows: � A dividend to shareholders of euro 0.52 for each share owned and outstanding at the ex-dividend date, in addition to the interim dividend
of euro 0.52 per share, thereby bringing the full year dividend for 2011 to euro 1.04 per share; � The amount remaining following the distribution of the proposed euro 1.04 per share dividend will be added to Retained Earnings;
� To pay the balance of the 2011 dividend on May 24, 2012, with the ex-dividend date set for May 21, 2012; � To approve the first section of the Remuneration Report, which sets out the company’s compensation policy for the Board of Directors, general
managers and executives, and lays out the strategic responsibilities and procedures used to adopt and implement the new policy; � To approve amendments to articles 17.3, 17.5 and 28.2 of the company’s by-laws, and the addition of article 34, aimed at establishing gender
equality in the composition of the Board of Directors and Board of Statutory Auditors, pursuant to Law No. 120/2011.
Company Contacts:
Press Office Tel.: +39.0252031875 - +39.06598232030 Freephone for shareholders (from Italy): 800940924 Freephone for shareholders (from abroad): +39. 800 11 22 34 56 Switchboard: +39-0659821
[email protected] [email protected] [email protected]
Web site : www.eni.com

Table of Contents
The New Face of Eni's Chemicals Division New strategy and rebranding to Versalis
Milan, May 9, 2012 - The new face of Eni’s chemicals division is Versalis. Created following the rebranding of Polimeri Europa, it represents a tangible sign of the new strategy for Eni’s chemicals division and a renewal of the historical importance of the business within Eni. The name Versalis is the best example of this new strategy – Daniele Ferrari, CEO of Versalis, explained today in Milan, at Plast 2012 – as it brings to mind the concept of universality, widespread presence, stability, safety and security. Versalis sets out to operate as one of the most advanced chemicals and plastic materials businesses, through an ongoing commitment to research and innovation in products, processes and technology. The European chemical sector currently operates in a very complex environment which has undergone critical challenges in recent years due to the entry of new competitors, a great number of production plants moving to Asia, and the volatility of feedstock and energy prices. In addition, increased focus on protecting the environment has accelerated the trend of these changes. Today, the production of Green chemicals represents an evolution of traditional business, and presents high growth opportunities. Technological innovation is one of the fundamental elements of the re-launch of Eni's chemicals business and the Green District project at Porto Torres, which started from its partnership with Novamont in Matrìca, and will enable Versalis to be well positioned in this new sector. The project for the production of chemicals from renewable sources comprises the construction of one of the biggest industrial complexes in the world at Porto Torres, where bio-monomers and bio-polymers will be produced, through an investment of more than euro 500m (in addition to the investments of the plan). The construction of seven production plants is planned in three phases over the next five years, along with a research centre which was opened in February 2012. Eni's strategy for responding to both old and new challenges in the chemicals industry is based, first of all, on its focus on products with greater added value, through expansion and differentiation of its product portfolio, for which Eni estimates a sales growth target of 50%. In the four-year period from 2012 to 2015, investment – necessary for the creation of market-oriented growth conditions – will be equal to euro 1.6bn., 60% more than in the previous plan, and will mainly be aimed at the re-launch of critical Italian sites to deliver income, growth in the business, and entry into new business areas. A significant portion of this investment, over euro 350m, will be dedicated to the conversion of the chemical plant at Priolo (SR) from now until 2015, with
- 1 -

Table of Contents
special attention paid to the cracking and polyethylene plants, and the construction of new plants which will ensure the site's profitability and increase employment levels. The new plan highlights the development of the elastomers business, a sector in which Versalis is the leader in Europe, for which over euro 500m of investment is envisaged. The objective is to double the company's turnover, increasing the current 15% margin to 30% in the next 5 years, by strengthening the current production lines and developing existing capacity thanks to the construction of new plants at the sites of Ravenna, Ferrara and Grangemouth (UK). The new butadiene line at Dunkerque is fundamental to the supply of raw materials to the elastomer production sites, particularly in the UK. A fundamental characteristic of the business is our constant commitment to business expansion in emerging markets. An important driver will be the use of proprietary technology (licensing and patents) for the development of joint venture agreements with international players, in Asian markets in particular. As the first step, Versalis has recently entered China with Eni Chemicals Shanghai, directly distributing products in the Chinese market, and with Versalis Pacific (which also has offices in Shanghai), which operates in all Asian markets. Implementation of this renewal plan will provide an expected improvement in EBIT of over euro 400m in 2015.
Company Contacts:
Press Office Tel.: +39.0252031875 - +39.06598232030 Freephone for shareholders (from Italy): 800940924 Freephone for shareholders (from abroad): +39. 800 11 22 34 56 Switchboard: +39-0659821
[email protected] [email protected] [email protected]
Web site : www.eni.com
- 2 -

Table of Contents Contents

Contents

Contents

Contents

Table of Contents
4
6
14
20
24
26
30
34
35
37
39
46
50
54 "Eni in 2011" report comprises an extract of the description of the business, the management’s discussion and analysis of financial condition and results of operations and certain other Company information from Eni’s Annual Report for the year ended December 31, 2011. It does not contain sufficient information to allow as full an understanding of financial results, operating performance and business developments of Eni as "Eni 2011 Annual Report". It is not deemed to be filed or submitted with any Italian or US market or other regulatory authorities. You may obtain a copy of "Eni in 2011" and "Eni 2011 Annual Report" on request, free of charge (see the request form on Eni’s web site – eni.com – under the section "Publications"). "Eni in 2011" and "Eni 2011 Annual Report" may be downloaded from Eni’s web site under the section "Publications".
All financial data presented in this report is based on consolidated financial statements prepared in accordance with IFRS. For definitions of certain financial and operating terms see "Frequently used terms" section, on page 46.
This report contains certain forward-looking statements particularly those regarding capital expenditures, development and management of oil and gas resources, dividends, allocation of future cash flow from operations, future operating performance, gearing, targets of production and sale growth, new markets and the progress and timing of
depend on circumstances that will or may occur in the future.
Actual results may differ from those expressed in such statements, depending on a variety of factors, including the timing of bringing new fields on stream; management’s ability in carrying out industrial plans and in succeeding in commercial transactions; future levels of industry product supply; demand and pricing; operational problems; general economic conditions; political stability and economic growth in relevant areas of the world; changes in laws and regulations; development and use of new technologies; changes in public expectations and other changes in business conditions; the actions of competitors and other factors discussed elsewhere in this document.
As Eni shares, in the form of ADRs, are listed on the New York Stock Exchange (NYSE), an Annual Report on Form 20-F has been filed with the US Securities and Exchange Commission in accordance with the US Securities Exchange Act of 1934. Hard copies may be obtained free of charge (see the request form on Eni’s web site – eni.com – under the section "Publications"). Eni discloses on its Annual Report on Form 20-F significant ways in which its corporate governance practices differ from those mandated for US companies under NYSE listing standards. The term "shareholder’" in this report means, unless the context otherwise requires, investors in the equity capital of Eni SpA, both direct and/or indirect.

projects. By their nature, forward-looking statements involve risks and uncertainties because they relate to events and
Eni shares are traded on the Italian Stock Exchange (Mercato Telematico Azionario) and on the New York Stock Exchange (NYSE) under the ticker symbol "E".
Contents
- 2 -
Contents
- 3 -

Contents
2009 2010 2011 (euro million) Net sales from operations 83,227 98,523 109,589 Operating profit 12,055 16,111 17,435 Adjusted operating profit 13,122 17,304 17,974 Net profit attributable to Eni 4,367 6,318 6,860 Adjusted net profit attributable to Eni 5,207 6,869 6,969
Net cash provided by operating activities 11,136 14,694 14,382 Capital expenditures 13,695 13,870 13,438 Investments 2,323 410 360 Cash dividends to Eni shareholders 4,166 3,622 3,695
Total assets at year end 117,529 131,860 142,945 Shareholders' equity including non-controlling interests at year end 50,051 55,728 60,393 Net borrowings at year end 23,055 26,119 28,032 Net capital employed at year end 73,106 81,847 88,425
Adjusted Return On Average Capital Employed (ROACE) (%) 9.2 10.7 9.9 Leverage 0.46 0.47 0.46 Return On Average Equity (ROAE) 9.6 13.0 12.9 Coverage 17.9 22.2 15.4 Current ratio 1.0 1.0 1.1 Debt coverage 48.3 56.3 51.3
Employees at period end (number) 77,718 79,941 78,686 Female managers (%) 17.0 17.7 18.2 Employee injury frequency rate (number of injuries/million of worked hours) 1.00 0.91 0.71 Contractor injury frequency rate 1.18 0.88 0.74 Oil spills (barrels) 6,259 4,269 7,295 Oil spills due to sabotage and terrorism 15,288 18,695 6,127
GHG emission (million ton CO 2 eq) 57.69 60.64 51.10 R&D expenditures (euro million) 207 221 191
Estimated net proved reserves of hydrocarbons (at year end) (mmboe) 6,571 6,843 7,086 Average reserve life index (years) 10.2 10.3 12.3 Production of hydrocarbons (kboe/d) 1,769 1,815 1,581 Worldwide gas sales (bcm) 103.72 97.06 96.76 Customers in Italy (million) 6.88 6.88 7.10 Gas volumes transported in Italy (bcm) 76.90 83.32 78.30 Electricity sold (TWh) 33.96 39.54 40.28 Refining throughputs on own account (mmtonnes) 34.55 34.80 31.96 Retail sales of petroleum products in Europe (mmtonnes) 12.02 11.73 11.37 Service stations in Europe at period end (units) 5,986 6,167 6,287 Average throughput of service stations in Europe (kliters) 2,477 2,353 2,206

- 4 -
Sales of petrochemical products (ktonnes) 4,265 4,731 4,040 Average petrochemical plant utilization rate (%) 65.4 72.9 65.3 Orders acquired (euro million) 9,917 12,935 12,505 Order backlog at period end 18,730 20,505 20,417

Contents
Eni in 2011 Profile of the year
Eni's strategy In the medium term, Eni intends to preserve a solid capital
structure while continuing to invest to fuel growth and returns. Management is committed to lower the company’s net debt to equity ratio to less than 0.4 by the end of the plan period at our long-term Brent price scenario of $85 a barrel. This target takes into account a capital expenditures plan of euro 59.6 billion, of which 75% dedicated to upstream activities, and our progressive dividend policy whereby we have committed to remunerate our shareholders by growing the dividend in line with OECD expected inflation. Eni’s ability to generate strong operating cash flows, investment selection and capital efficiency will underpin the Company’s financial structure.
Management will retain a strong focus on pursuing operational excellence, synergies from integration and developing integrated risk management capabilities in order to sustain Eni’s industrial targets and expected returns. Operational excellence thanks to Eni’s know-how and distinctive competences envisage preventive business conduct when managing the environmental footprint of Eni’s operations and risks to employees and communities’ health and safety. Continuing improvement in efficiency through innovation of business processes will enable the Company to reduce the energy intensity of its productions, optimize plants activities and achieve economies of scale in centralized services.
Integration will enable Eni to capture joint opportunities in the marketplace, reaping the benefits of synergies and maximizing asset returns. Particularly, the new trading unit will develop integrated risk management activities with a view of better coping with the increasingly volatile commodity markets.
The oil&gas industry is copying with a complex scenario featured by the global economic slowdown, particularly in the Euro-zone, and volatile market conditions for energy commodities. In the medium to long-term the main challenges will be driven by rising competitive pressures in accessing reserves by new players, stricter regulation addressing environmental preservation and mitigation of the climate risk, growing importance of renewable sources as well as the role of unconventional resources in satisfying energy needs. Against this backdrop, Eni reaffirms its growth strategy and the adoption of a sustainable business model founded on the pillars of innovation, excellence, inclusiveness, integration, responsibility and cooperation in a framework of straightforward rules of corporate governance. Eni believes that a sustainable business conduct contributes to both the achievement of industrial performance, and the mitigation of political, financial and operational risks. This strengthens Eni’s role as a trustworthy and reliable partner, who is ready to capture new opportunities in the marketplace and able to manage the complexities of the environment. Eni believes that those drivers will help the Company to create value to its shareholders and stakeholders. Eni has designed its industrial plan for the four-year period 2012-2015 along the following strategic guidelines: growing profitably oil and gas production in the upstream, strengthening market leadership in the European gas market, improving downstream oil efficiency, refocusing petrochemical operations and retaining top spots among the best-in-class engineering and construction players in the most technologically- advanced segments.

* @ 90 $/bl in 2012-13; 85 $/bl in 2014-15
- 5 -
Contents
2009 2010 2011
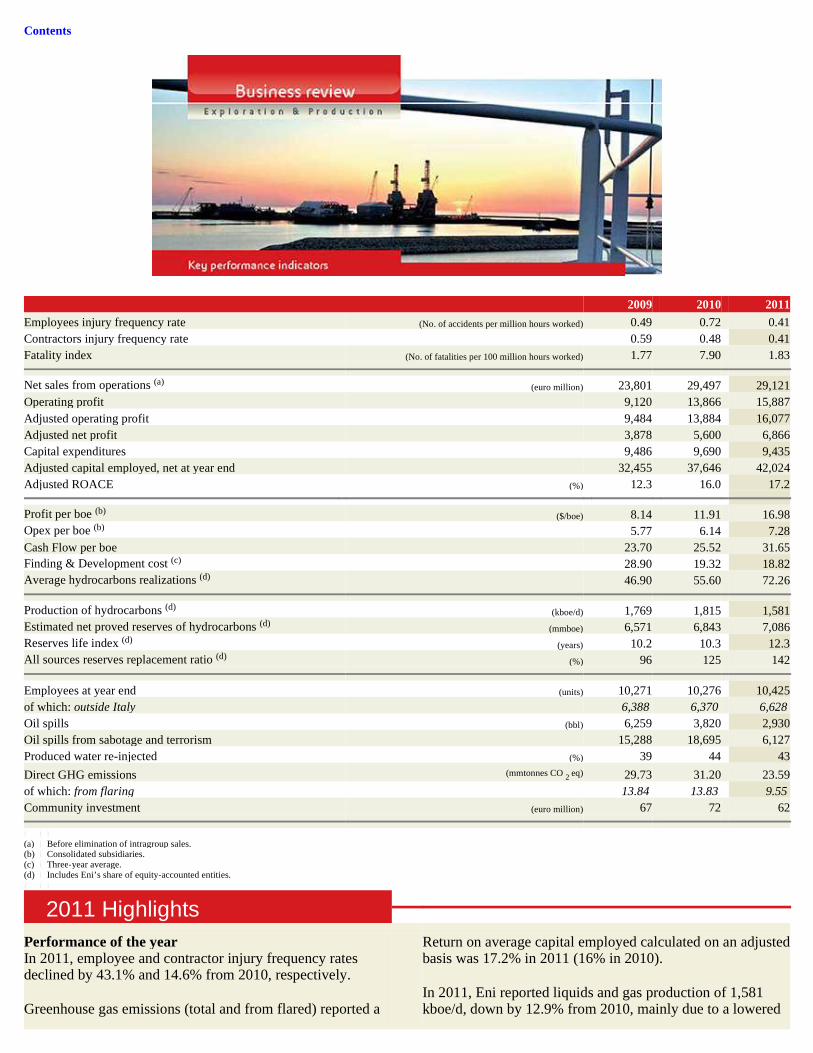
Employees injury frequency rate (No. of accidents per million hours worked) 0.49 0.72 0.41 Contractors injury frequency rate 0.59 0.48 0.41 Fatality index (No. of fatalities per 100 million hours worked) 1.77 7.90 1.83
Net sales from operations (a) (euro million) 23,801 29,497 29,121 Operating profit 9,120 13,866 15,887 Adjusted operating profit 9,484 13,884 16,077 Adjusted net profit 3,878 5,600 6,866 Capital expenditures 9,486 9,690 9,435 Adjusted capital employed, net at year end 32,455 37,646 42,024 Adjusted ROACE (%) 12.3 16.0 17.2
Profit per boe (b) ($/boe) 8.14 11.91 16.98 Opex per boe (b) 5.77 6.14 7.28 Cash Flow per boe 23.70 25.52 31.65 Finding & Development cost (c) 28.90 19.32 18.82 Average hydrocarbons realizations (d) 46.90 55.60 72.26
Production of hydrocarbons (d) (kboe/d) 1,769 1,815 1,581 Estimated net proved reserves of hydrocarbons (d) (mmboe) 6,571 6,843 7,086 Reserves life index (d) (years) 10.2 10.3 12.3 All sources reserves replacement ratio (d) (%) 96 125 142
Employees at year end (units) 10,271 10,276 10,425 of which: outside Italy 6,388 6,370 6,628 Oil spills (bbl) 6,259 3,820 2,930 Oil spills from sabotage and terrorism 15,288 18,695 6,127 Produced water re-injected (%) 39 44 43
Direct GHG emissions (mmtonnes CO 2 eq) 29.73 31.20 23.59 of which: from flaring 13.84 13.83 9.55 Community investment (euro million) 67 72 62
i i i (a) i Before elimination of intragroup sales. (b) i Consolidated subsidiaries. (c) i Three-year average. (d) i Includes Eni’ s share of equity-accounted entities. i i i
2011 Highlights
Performance of the year In 2011, employee and contractor injury frequency rates declined by 43.1% and 14.6% from 2010, respectively.
Greenhouse gas emissions (total and from flared) reported a
Return on average capital employed calculated on an adjusted basis was 17.2% in 2011 (16% in 2010).
In 2011, Eni reported liquids and gas production of 1,581 kboe/d, down by 12.9% from 2010, mainly due to a lowered

- 6 -
steep decline, reflecting the completion of certain gas recovery projects in Nigeria and the reduction in associated gas to feed the ramp-up of two turbo-generators in a power plant in Congo. Performance for the year was also impacted by lowered Libyan activities.
In 2011, the E&P Division reported an excellent performance amounting to euro 6,866 million of adjusted net profit (up 22.6% from 2010), reflecting higher oil prices and the rapid recovery of Libyan output.
output in Libya. Performance was also negatively impacted by lower entitlements in the Company’s Production Sharing Agreements due to higher oil prices with an overall effect of approximately 30 kboe/d from 2010. Net of this effect and the above mentioned loss of Libyan output, production for the year was in line with 2010.
In the year oil spills from accidents declined by 23% from 2010, due to significant prevention activities undertaken.

Contents
Eni in 2011 Business review / Exploration & Production
Estimated net proved reserves at December 31, 2011, were 7.09 bboe (up 3.6% from 2010) based on a 12-month average Brent price of $111 per barrel. All sources reserves replacement ratio was 142%. Excluding the price effect, the replacement ratio would be 159%. The reserves life index is 12.3 years (10.3 years in 2010).
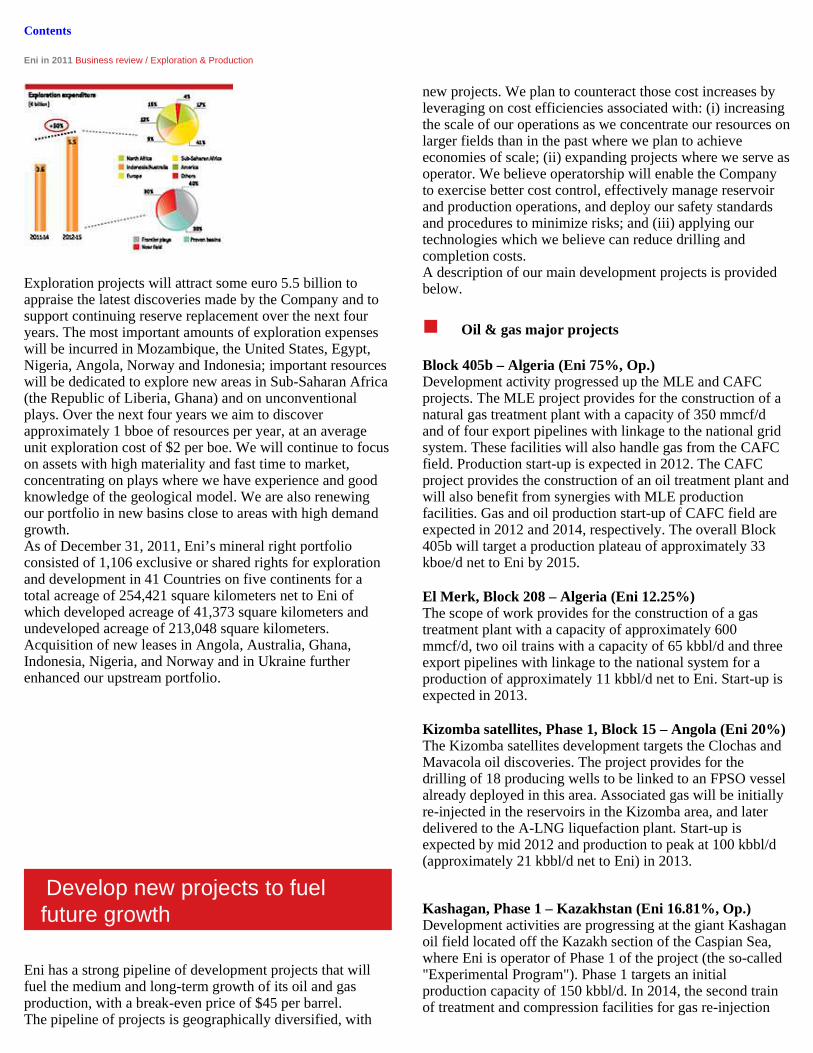
In 2011, capital expenditures amounted to euro 9,435 million to enhance assets in well established areas of Africa, the Gulf of Mexico and Central Asia. Exploration expenditure amounted to euro 1,210 million (up 19.6% from 2010) to execute a selective campaign with the completion of 56 new exploratory wells (28 net to Eni) and an overall commercial success rate of 42% (38.6% net to Eni). In addition 17 exploratory wells drilled are in progress at year end (9.9 net to Eni).
Development expenditure was euro 7,357 million to fuel the growth of major projects in Norway, Kazakhstan, Algeria, the United States, Italy, Congo and Egypt.
In 2011, overall R&D expenditure of Exploration & Production Division amounted to approximately euro 90 million (euro 98 million in 2010).
Restarted Libyan operations The rapid restart of Eni’s Libyan operations reduced the impact of the Revolution on 2011 results. Production at Eni’s Libyan sites is currently flowing at approximately 240 kboe/d and management is targeting to achieve the pre-crisis production plateau of 280 kboe/d and full ramp-up by the second half of 2012.
Giant discovery in Mozambique The giant Mamba discovery in Mozambique opens up extraordinary development opportunities and is ideally placed to serve the fast-growing Asian gas markets. The three exploration wells drilled in Area 4 in the Rovuma basin – Mamba South, Mamba North and Mamba North East – have found volumes of gas in place up to 40 Tcf. This is the largest operated discovery in the Company’s history.
Agreement with Rosneft
containing over 17 Tcf of gas in place with the Venezuelan national oil company PDVSA.
On December 14, 2011, the Republic of Kazakhstan and the contracting companies in the Final Production Sharing Agreement (FPSA) of the giant Karachaganak gas-condensate field reached an agreement to settle all pending claims. The agreement, effective from June 30, 2012 on satisfaction of conditions precedent, involves Kazakhstan’s KazMunaiGas (KMG) acquiring a 10% interest in the project. This will be done by each of the contracting companies transferring 10% of their rights and interest in the Karachaganak FPSA to KMG.
Signed with Chinese oil companies framework agreements to promote joint projects in conventional and unconventional hydrocarbon plays in China and outside China.
Achieved a cooperation agreement with Sonatrach to explore for and develop unconventional hydrocarbons, particularly shale gas plays in Algeria.
Signed a Memorandum of Understanding with South Africa’s State-owned oil company PetroSA to promote joint opportunities in conventional and unconventional hydrocarbons in South Africa and in Africa. Eni will also ensure long-term LNG supplies as well as flows of refined products to support the Country’s economic development.
Acquired from Cadogan Petroleum plc an interest in two licenses for exploration and development in areas included in the Dniepr-Donetz basin in Ukraine.
Reached an agreement with MEO Australia to farm-in the Heron and Blackwood gas discoveries in the NT/P-68 permit, located in the Timor Sea. In addition, Eni acquired a 32.5% stake in the Evans Shoal gas discovery in the Timor Sea with approximately 7 Tcf of volumes of gas in place.
Awarded the Arguni I and the North Ganal operated gas exploration contracts located onshore and offshore Indonesia, respectively. The planned activities provide for the development of natural gas resources to feed existing LNG

- 7 -
On April 25, 2012, Eni and Rosneft signed a strategic cooperation agreement to jointly develop exploration licenses in the Russian offshore of the Barents Sea and the Black Sea. Under the agreement, joint ventures (Eni 33.33%) will explore for and develop the Fedynsky and Tsentralno-Barentsvesky licenses offshore the Barents Sea and the Zapadno-Cernomorsky license offshore the Black Sea. These licenses are estimated to hold recoverable resources of 36 bboe.
Portfolio Signed a Gas Sales Agreement for developing the giant Perla gas discovery,
production plants nearby in both acquired areas.
Awarded the operatorship of the PL657 license (Eni’s interest 80%) located in the Barents Sea nearby the Goliat operated field (Eni’s interest 65%). Any exploratory success will be supported by the existing facilities significantly reducing time-to-market.
Signed with the Angolan authorities the Production Sharing Contract to explore Block 35 (Eni operator with a 30% interest) located in an offshore high potential mineral basin.

Contents
Eni in 2011 Business review / Exploration & Production
Strategies
Eni’s Exploration & Production business boasts a strong competitive position in a number of strategic oil and gas basins in the world, namely the Caspian Region, North and Sub-Saharan Africa, Venezuela and Iraq. Eni’s strategy is to deliver organic production growth with increasing returns and reserve replacement. Growth will be fuelled by increasing flows from Eni’s core areas leveraging Eni’s vast knowledge of reservoirs and geological basins, as well as technical and producing synergies. We intend to drive higher returns and manage the operational risk in our upstream operations by reducing time to market, increasing total volumes of operated production, as operatorship is seen to be the safest way to control risks, as well as selectively picking partners in non-operated joint-projects. Our growth trajectory will be supported by our ongoing commitment in establishing and consolidating our partnerships with key host Countries, leveraging the Eni co-operation model. We expect that continuing technological innovation and competence build-up will drive production growth and increasing rates of reserve recovery, developing
drilling techniques to be applied in complex environment, marginal fields and deep/ultra deep offshore areas. Consistent with the long-term nature of the business, strategic guidelines for our Exploration & Production Division have remained basically unchanged in the years, as follows: � � � � Maintain strong profitable production growth � � � � Invest in exploration to enhance growth prospects over the long-term and ensure reserve replacement � � � � Develop new projects to fuel future growth � � � � Consolidate our industry-leading cost position
To execute these strategies, we plan to spend approximately euro 37.6 billion to explore for and develop new reserves over the next four years. Exploration projects will account for approximately euro 5.5 billion. Approximately euro 1.7 billion will be spent to build transportation infrastructures and LNG projects through equity-accounted entities.
Maintain Strong Production Growth
to-LNG projects and integrated gas projects. Finally, we intend to optimize our portfolio of development properties by focusing on areas where our presence is well established, and divesting non-strategic or marginal assets.
Our global oil and gas operations are conducted in 41 Countries, including Italy, Libya, Egypt, Norway, the United Kingdom, Angola, Congo, Mozambique, Nigeria, the United States, Kazakhstan, Russia, Algeria, Australia, Venezuela and Iraq. Eni’s strategy is to deliver strong profitable production growth via organic developments, leveraging on the planned start-ups of over 60 major projects over the next four years and material expenditures to support the current plateau at our producing fields. Our plans also contemplate certain development projects which will support the Company’s long-term production plateau, particularly we plan to start developing the recent gas discovery offshore Mozambique and to progress large and complex projects in the Barents Sea, Nigeria and Indonesia. We project that new field start-ups will add approximately 700 kboe/d to the Company’s production level in 2015 at our long-term Brent price of $85 a barrel. The most important production start-ups are planned in Nigeria, Angola, Norway, Venezuela, Russia and Kazakhstan and will be mainly focused on key hubs where we plan to benefit from technical and producing synergies. We have a good level of visibility on those new projects as most of them have been already sanctioned and where we serve as operator. Most of these new projects are giant fields characterized by steady and long-lasting production plateaus. These giant fields include three of our fields in the Yamal Peninsula in Russia, Goliat in Norway, Perla and Junin 5 in Venezuela, Block 15/06 in

- 8 -
Angola and Kashagan. A second leg of our growth strategy is to sustain the current plateau at producing fields by counteracting natural field depletion and production optimization. We plan to dedicate strong efforts to this area by executing a huge infilling and work-over campaign. We expect that continuing technological innovation and competence build-up will drive increasing rates of reserve recovery. We intend to implement a number of initiatives to support profitability by exercising tight cost control and reducing the time span which is necessary to develop and market reserves. We are making strong progress in reducing the time to developing and marketing our exploration resources. We have fine-tuned our process and organization to consistently monitor the status and value of resources in the different phases of conversion. Through these actions, we will be able to develop more than 90% of the exploration successes of the last three years within 8 years of their discovery. Eni will pursue further growth options by developing unconventional plays, gas-

Contents
Eni in 2011 Business review / Exploration & Production
� Production and reserves: 2011 and outlook In 2011, Eni reported liquids and gas production of 1,581 kboe/d, down by 12.9% from 2010. This reduction was driven by a lowered flow from Eni’s activities in Libya, which was affected by the shut down of almost all the Company plants and facilities including the GreenStream pipeline throughout the peak of the Country’s internal crisis. In the last part of the year the efforts made to restart the GreenStream pipeline and recover production enabled the Company to bring back online an average Libyan output of 112 kboe/d in the year, partly offsetting the impact of force majeure (down approximately 200 kboe/d). Performance was also negatively impacted by lower entitlements in the Company’s PSAs due to higher oil prices with an overall effect of approximately 30 kboe/d compared to the previous year. Net of these effects, production for 2011 was in line with 2010. Ramp-ups and start-ups were offset by lower-than-anticipated growth in Iraq and planned facility downtime. In the year we achieved eleven start-ups which are expected to add approximately 80 kboe/d at plateau to Eni’s medium-term production. Main start-ups were: (i) the Guendalina (Eni’s interest 80%) and Capparuccia (Eni’s interest 95%) fields, in Italy, with an overall production start-up at approximately 7 kboe/d; (ii) the Denise B field in the El Temsah concession (Eni operator with a 50% interest), in
Egypt. Production peak is expected at 14 kboe/d in 2012; (iii) the Appaloosa field (Eni’s interest 100%), in the Gulf of Mexico, with a production of 7 kbbl/d through linkage to the Corral operated platform with a treatment capacity of 33 kbbl/d net to Eni; (iv) the Nikaitchuq operated field (Eni’s interest 100%), located in North Slope basins offshore Alaska, with resources of 220 million barrels. Development plan completion is expected in 2014 with an average production plateau at approximately 21 kbbl/d net to Eni in 2016; (v) the Kitan oil field (Eni operator with a 40% interest) located between Timor Leste and Australia. Peak production of over 40 kbbl/d is expected in 2012; (vi) the Libondo offshore field (Eni’s interest 35%), in Congo with production of approximately 3 kboe/d net to Eni. Our production outlook remains strong as we plan to achieve a compound average growth rate of over 3% in the next 2012-2015 four-year period, targeting a production plateau of 2.03 million boe per day in 2015. The growth rate has been calculated excluding the impact of disruptions in Libya on the 2011 baseline production. To achieve that target, we intend: • to leverage our robust pipeline of projects start-ups, particularly in Nigeria, Angola, Norway, Venezuela, the Yamal Peninsula in Russia and Kazakhstan, most of which is Eni operated and leveraging our vast knowledge of reservoirs and geological basins, as well as technical and producing synergies;
i i i
Oil and natural gas production (a) (b)
Liquids Natural ga
s Hydrocarbons Liquids Natural
gas Hydrocarbons Liquids Natural
gas Hydrocarbons (kbbl/d) (mmcf/d) (kboe/d) (kbbl/d) (mmcf/d) (kboe/d) (kbbl/d) (mmcf/d) (kboe/d)
2009 2010 2011
Italy 56 652.6 169 61 673.2 183 64 674.3 186
Rest of Europe 133 655.5 247 121 559.2 222 120 537.9 216 Croatia 95.5 17 45.3 8 29.9 5 Norway 78 273.7 126 74 271.6 123 80 284.0 131 United Kingdom 55 286.3 104 47 242.3 91 40 224.0 80 North Africa 292 1,614.2 573 301 1,673.2 602 209 1,271.5 438 Algeria 80 19.7 83 74 20.2 77 69 19.0 72 Egypt 91 793.7 230 96 755.1 232 91 800.7 236 Libya 108 780.4 244 116 871.1 273 36 423.2 112 Tunisia 13 20.4 16 15 26.8 20 13 28.6 18 Sub-Saharan Africa 312 274.3 360 321 441.5 400 278 508.0 370 Angola 125 29.3 130 113 31.9 118 95 34.7 102 Congo 97 27.3 102 98 67.9 110 87 119.1 108 Nigeria 90 217.7 128 110 341.7 172 96 354.2 160 Kazakhstan 70 259.0 115 65 237.0 108 64 231.0 106 Rest of Asia 57 444.8 135 48 463.9 131 34 430.1 112 China 7 8.2 8 6 6.7 7 7 5.0 8 India 3.7 1 1 36.6 8 19.6 4 Indonesia 2 104.8 21 2 94.4 19 2 84.3 18 Iran 35 35 21 21 6 6 Iraq 5 5 7 7 Pakistan 1 328.1 58 1 326.2 59 1 321.2 58 Turkmenistan 12 12 12 12 11 11

America 79 424.7 153 71 396.0 143 65 334.0 125 Brazil 1 1 Ecuador 14 14 11 11 7 7 Trinidad & Tobago 67.0 12 63.6 12 56.7 10 United States 57 357.7 119 49 332.4 109 48 277.3 98 Venezuela 8 8 11 11 9 9 Australia and Oceania 8 48.6 17 9 95.7 26 11 97.8 28 Australia 8 48.6 17 9 95.7 26 11 97.8 28 1,007 4,373.7 1,769 997 4,539.7 1,815 845 4,084.6 1,581 of which equity-accounted entities: 17 38.3 23 19 35.6 25 19 34.0 26 Angola 3 0.7 3 3 0.8 3 3 1.9 4 Brazil 1 1 Indonesia 1 32.1 6 1 28.9 6 1 25.7 6 Tunisia 5 5.5 6 4 5.9 5 5 6.4 6 Venezuela 8 8 11 11 9 9
i i i (a) i From April 1, 2010, Eni has updated the natural gas conversion factor from 5,742 to 5,550 standard cubic feet of gas per barrel of oil equivalent. (b) i Includes volumes of gas consumed in operations (321, 318 and 300 mmcf/d in 2011, 2010 and 2009, respectively).
- 9 -

Contents
Eni in 2011 Business review / Exploration & Production
• to maximize the production recovery rate at our current fields by counteracting natural field depletion. This will require intense development activities of work-over and infilling. We expect that continuing technological innovation and competence build-up will drive increasing rates of reserve recovery; • to monetize our reserves of associated gas in particular in Algeria, Angola, Congo, Iraq, Italy, Libya, Nigeria, Norway and Turkmenistan, targeting to cut the level of gas flaring by 80% from 2007 levels over the next four years-plan. Management is ready to invest approximately euro 4 billion to achieve that target.
Actual production volumes will vary from year to year due to the timing of individual project start-ups, operational outages, reservoir performance, regulatory changes, asset sales, severe weather events, price effects under production sharing contracts and other factors.
Estimated net proved reserves at December 31, 2011, were 7.09 bboe (up 3.6% from 2010) based on a 12-month average Brent price of $111 per barrel. Additions to proved reserves booked in 2011 derived from: (i) extensions, discoveries and other factors, with major increases booked in Russia, Venezuela, the United States and Angola; (ii) revisions of previous estimates mainly reported in Norway, Russia, Italy, Egypt, Kazakhstan and Iraq; (iii) improved recovery mainly reported in Norway and Algeria. The reserves life index is 12.3 years (10.3 years in 2010).
Eni intends to pay special attention to reserve replacement in order to ensure the medium to long-term sustainability of the business. In 2011, we achieved a strong reserve replacement ratio of 142% through fast sanctioning and timely start-ups of new projects. We made final investment decisions to develop large projects such as the jointly-operated Samburgskoye and Urengoskoye giant gas fields in Siberia, the Perla project in Venezuela, as well as projects in Norway and the Gulf of Mexico which enabled us to book noticeable amounts of reserves in the year. Eni will continue focusing on well-established areas of presence where we have experience and good knowledge of the geological model. Those areas include Sub-Saharan Africa, Venezuela, Norway, Russia,
Exploration Exploration activities play a major role in our sustainable growth strategy by fuelling new production and securing access to new opportunities. In 2011, Eni exploration expenditures amounted to euro 1,210 million (up 19.6% from 2010) to execute a selected campaign with the completion of 56 new exploratory wells, of which 80% were successful. 2011 has been an extraordinary year in terms of size and reach of new discoveries. Exploration successes in the year contributed to increase our resource base by 1.1 billion boe. Our exploration success supports our capacity to deliver sustainable returns on new projects under almost any oil-price scenario with a very competitive exploration cost of $1.2 per boe, down from the last three years average of $1.9 per boe. Eni’s resource base achieved 32 bboe. We made the large Mamba gas discovery (Eni operator with a 70% interest) off the Mozambique coast, located in Area 4 in the Rovuma Basin. According to field test results and our internal estimates, we believe that the new discovery may contain up to 40 Tcf amounts of high-quality gas in place. In a final completion configuration, production per well is expected to reach over 140 million cubic feet a day, approximately 25 kboe/d. In the next two years up to 8 additional wells are expected to be drilled in the nearby areas in order to fully assess the high potential of the Mamba reservoir, investing euro 400 million. Further world-class discoveries have been achieved in the Barents Sea with the Skrugard and Havis oil and gas wells with recoverable reserves estimated at approximately 500 million barrels in the PL532 license (Eni’s interest 30%). Both fields are planned to be put in production by means of a fast-track synergic development. Following these major successes, we believe we have cracked the geological code in this part of the basin, and are confident in a significant resource upside. In Venezuela appraisal activities were completed at the large Perla gas field in the Gulf of Venezuela. Results exceeded the initial resource estimate to more than 16,000 billion cubic feet. The target production of approximately 300 million cubic feet a day is expected in 2014. Our consistent performance confirms the effectiveness of our exploration strategy, with its focus on proven basins and a select number of high-potential frontier plays. Building on this success, over the next four years we will increase our exploration efforts to further strengthen the basis of our long-term growth. In the next four years, we are planning to step up expenditures compared to our previous capital budget (an increase of approximately euro 2 billion).

- 10 -
Kazakhstan and Iraq where availability of production facilities will enable the Company to readily put in production discovered reserves. Our reserve replacement will be underpinned by our strong focus on exploration and timely conversion of resources into reserves and production, while at the same time fighting depletion and enhancing the recovery factor in existing fields through effective reservoir management.

Contents
Eni in 2011 Business review / Exploration & Production
- 11 -
Estimated net proved hydrocarbons reserves (mmboe) 2009 2010 2011 At December 31 Consolidated subsidiaries Italy 703 724 707 Rest of Europe 590 601 630 North Africa 1,922 2,096 2,031 Sub-Saharan Africa 1,141 1,133 1,021 Kazakhstan 1,221 1,126 950 Rest of Asia 236 295 230 America 263 230 238 Australia and Oceania 133 127 133 6,209 6,332 5,940
Equity -accounted entities 362 511 1,146
6,571 6,843 7,086
Estimated net proved liquids reserves (mmbbl) 2009 2010 2011
At December 31 Consolidated subsidiaries Italy 233 248 259 Rest of Europe 351 349 372 North Africa 895 978 917 Sub-Saharan Africa 770 750 670 Kazakhstan 849 788 653 Rest of Asia 94 139 106 America 153 134 132 Australia and Oceania 32 29 25 3,377 3,415 3,134
Equity -accounted entities 86 208 300
3,463 3,623 3,434
Estimated net proved natural gas reserves (bcf) 2009 2010 2011
At December 31 Consolidated subsidiaries Italy 2,704 2,644 2,491 Rest of Europe 1,380 1,401 1,425 North Africa 5,894 6,207 6,190 Sub-Saharan Africa 2,127 2,127 1,949 Kazakhstan 2,139 1,874 1,648 Rest of Asia 814 871 685 America 629 530 590 Australia and Oceania 575 544 604 16,262 16,198 15,582
Equity -accounted entities 1,588 1,684 4,700
17,850 17,882 20,282
Contents
Eni in 2011 Business review / Exploration & Production
Exploration projects will attract some euro 5.5 billion to appraise the latest discoveries made by the Company and to support continuing reserve replacement over the next four years. The most important amounts of exploration expenses will be incurred in Mozambique, the United States, Egypt, Nigeria, Angola, Norway and Indonesia; important resources will be dedicated to explore new areas in Sub-Saharan Africa (the Republic of Liberia, Ghana) and on unconventional plays. Over the next four years we aim to discover approximately 1 bboe of resources per year, at an average unit exploration cost of $2 per boe. We will continue to focus on assets with high materiality and fast time to market, concentrating on plays where we have experience and good knowledge of the geological model. We are also renewing our portfolio in new basins close to areas with high demand growth. As of December 31, 2011, Eni’s mineral right portfolio consisted of 1,106 exclusive or shared rights for exploration and development in 41 Countries on five continents for a total acreage of 254,421 square kilometers net to Eni of which developed acreage of 41,373 square kilometers and undeveloped acreage of 213,048 square kilometers. Acquisition of new leases in Angola, Australia, Ghana, Indonesia, Nigeria, and Norway and in Ukraine further enhanced our upstream portfolio.
new projects. We plan to counteract those cost increases by leveraging on cost efficiencies associated with: (i) increasing the scale of our operations as we concentrate our resources on larger fields than in the past where we plan to achieve economies of scale; (ii) expanding projects where we serve as operator. We believe operatorship will enable the Company to exercise better cost control, effectively manage reservoir and production operations, and deploy our safety standards and procedures to minimize risks; and (iii) applying our technologies which we believe can reduce drilling and completion costs. A description of our main development projects is provided below.
� Oil & gas major projects
Block 405b – Algeria (Eni 75%, Op.) Development activity progressed up the MLE and CAFC projects. The MLE project provides for the construction of a natural gas treatment plant with a capacity of 350 mmcf/d and of four export pipelines with linkage to the national grid system. These facilities will also handle gas from the CAFC field. Production start-up is expected in 2012. The CAFC project provides the construction of an oil treatment plant and will also benefit from synergies with MLE production facilities. Gas and oil production start-up of CAFC field are expected in 2012 and 2014, respectively. The overall Block 405b will target a production plateau of approximately 33 kboe/d net to Eni by 2015.
El Merk, Block 208 – Algeria (Eni 12.25%) The scope of work provides for the construction of a gas treatment plant with a capacity of approximately 600 mmcf/d, two oil trains with a capacity of 65 kbbl/d and three export pipelines with linkage to the national system for a production of approximately 11 kbbl/d net to Eni. Start-up is expected in 2013.
Kizomba satellites, Phase 1, Block 15 – Angola (Eni 20%) The Kizomba satellites development targets the Clochas and Mavacola oil discoveries. The project provides for the drilling of 18 producing wells to be linked to an FPSO vessel already deployed in this area. Associated gas will be initially re-injected in the reservoirs in the Kizomba area, and later delivered to the A-LNG liquefaction plant. Start-up is expected by mid 2012 and production to peak at 100 kbbl/d (approximately 21 kbbl/d net to Eni) in 2013.
Develop new projects to fuel future growth
i
Kashagan, Phase 1 – Kazakhstan (Eni 16.81%, Op.) Development activities are progressing at the giant Kashagan oil field located off the Kazakh section of the Caspian Sea, where Eni is operator of Phase 1 of the project (the so-called "Experimental Program"). Phase 1 targets an initial production capacity of 150 kbbl/d. In 2014, the second train of treatment and compression facilities for gas re-injection
Eni has a strong pipeline of development projects that will fuel the medium and long-term growth of its oil and gas production, with a break-even price of $45 per barrel. The pipeline of projects is geographically diversified, with

- 12 -
20% of new production coming from developments in OECD Countries, and 30% from Russia and the Caspian area. However, while our production is geographically diversified it is also focused on a number of key hubs (Yamal Peninsula in Russia, Barents Sea in Norway, Kazakhstan and Venezuela), with synergies in terms of geological and local expertise, infrastructure and relationships with local communities, and which will give a material contribution to long-term production.
We expect that costs to develop and operate fields will increase in the next years due to sector-specific inflation, and growing complexity of
will be completed and come online enabling to increase production capacity up to 370 kbbl/d. The partners are planning to further increase available production capacity up to 450 kbbl/d by installing additional gas compression capacity for re-injection in the reservoir. The partners intend to submit the scheme of this additional gas compression activity to the relevant Kazakh Authorities in the course of 2012 in order to obtain approval to start the engineering design. The partners are currently assessing the Phase 2 of the development of the Kashagan field with a view of optimizing the development lay-out. The review is expected to be completed by 2012. The Consortium continues to target the achievement of first commercial oil production by the end of 2012 or in the early 2013.

Contents
Eni in 2011 Business review / Exploration & Production
- 13 -
Goliat, Prospecting License 229 – Norway (Eni 65%, Op.) Goliat represents the first oil development in the Barents Sea. We have already obtained governmental approval. The project is progressing according to schedule. Development provides for the use of a cylindrical FPSO unit linked to an underwater production system. Gas produced will be injected in the field. Start-up is expected at the end of 2013 with production expected at 100 kbbl/d.
Yamal Peninsula – Russia (Eni 29.4%) We have 5 giant gas and condensates fields to develop in Russia. In 2011 we finalized our gas sales agreements and took the final investment decision on the Samburgskoye field. Start-up was achieved in April 2012 with an expected peak production of approximately 43 kboe/d (14 kboe/d, net to Eni). In addition, the Final Investment Decision of the onshore gas and condensate Urengoskoye field was sanctioned. Start-up is expected in 2014. Activities are progressing also on the Yaro-Yakhinskoye field. Oil production start-up is expected by the end of 2012, while first gas production in 2014. Lastly the Severo field will be in production by the end of 2015 and the definition of the field development plan is progressing. The Yamal hub will be provide over 120 kboe/d by 2015 and we confirm our expectation of long-term plateau of approximately 200 kboe/d.
Junin 5 – Venezuela (Eni 40%) We established a joint-venture with the Venezuelan National Oil Company PDVSA for the development of the giant Junin 5 oil field, located in the Orinoco Oil Belt with certified volumes of oil in place of 35 billion barrels. First oil is expected in 2012 at an initial rate of 75 kbbl/d, targeting a long-term production plateau of 240 kbbl/d by 2018.
Perla – Venezuela (Eni 50%) Perla is a giant gas field which was discovered by an Eni-participated joint venture in 2009 off the Venezuelan coast in the Gulf of Venezuela. The final investment decision for the first development phase was sanctioned in the year and a Gas Sale Agreement was signed. EPC contracts for the project are being awarded. The early production phase includes the utilization of the already successfully drilled wells and the installation of production platforms linked by pipelines to the onshore treatment plant. The target production of approximately 300 mmcf/d is expected in 2014. The investment plan for the first development phase is estimated at $1.4 billion. The development of Perla is currently planned to continue with two more phases by means of the drilling of additional wells and the upgrading of treatment facilities to reach a plateau production of 1,200 mmcf/d.

Contents
2009 2010 2011
Employee injury frequency rate (No. of accidents per million hours worked) 3.85 3.74 2.33 Contractors injury frequency rate 9.48 8.24 8.38
Net sales from operations (a) (euro million) 30,447 29,576 34,731 Operating profit 3,687 2,896 1,758 Adjusted operating profit 3,901 3,119 1,946 Marketing 1,721 733 (550 ) Regulated businesses in Italy 1,796 2,043 2,112 International transport 384 343 384 Adjusted net profit 2,916 2,558 1,541 EBITDA pro-forma adjusted 4,403 3,853 2,565 Marketing 2,392 1,670 364 Regulated businesses in Italy 1,345 1,486 1,535 International transport 666 697 666
Capital expenditures 1,686 1,685 1,721 Adjusted capital employed, net at year end 25,024 27,270 27,660 Adjusted ROACE (%) 12.3 9.8 5.6
Worldwide gas sales (b) (bcm) 103.72 97.06 96.76 LNG sales (c) 12.9 15.0 15.7 Customers in Italy (million) 6.88 6.88 7.10 Gas volumes transported in Italy (bcm) 76.90 83.31 78.30 Electricity sold (TWh) 33.96 39.54 40.28
Employees at year end (units) 11,404 11,245 10,907 Direct GHG emissions (mmtonnes CO 2 eq) 14.60 15.79 14.75 Customer satisfaction index (PSC) (%) 83.7 87.4 91.0 Water consumption/withdrawals per kWheq produced (EniPower) (cm/kWheq) 0.015 0.013 0.014
i i i (a) i Before elimination of intragroup sales. (b) i Include volumes marketed by the Exploration & Production Division of 2.86 bcm (6.17 and 5.65 bcm in 2009 and 2010, respectively). (c) i Refer to LNG sales of the G&P Division (included in worldwide gas sales) and the E&P Division. i i i
2011 Highlights
Agreement with Gazprom In March 2012, as part of their strategic partnership, Eni and Gazprom signed agreements to revise gas supply contracts with retroactive effects from the beginning of 2011. The parties also agreed on a roadmap to commence construction of the South Stream gas pipeline with the Final Investment Decision (FID) expected by the end of 2012.
acquired entities engage in marketing gas and electricity mainly to residential customers and small enterprises in Belgium.
2011 performance The G&P segment posted a 39.8% drop in adjusted net profit to euro 1,541 million, due to sharply lower results of the
Divestment of international pipelines In 2011, Eni divested its interests in the international pipelines importing natural gas from Northern Europe (TENP and Transitgas) and Russia (TAG) to Italy as part of the agreements made with the European Commission in 2010. Total consideration amounted to approximately euro 1.5 billion.
Belgium In January 2012, Eni finalized the acquisition of Nuon Belgium NV and Nuon Power Generation Wallon NV for an outlay of euro 214 million. The
Marketing business. This was negatively impacted by weak demand and continuing competitive pressures fuelled by oversupply which pressured selling margins and reduced volumes opportunities. The performance was also affected by the disruption in Libyan gas. Furthermore, the results reflected only a part of the benefits associated with the renegotiations of gas supply contracts, certain of which have been finalized after 2011 year-end. These lower results were partly offset by the positive operating performance delivered by the International transport and Regulated businesses in Italy.
Worldwide gas sales were basically stable at 96.76 bcm supported by commercial initiatives, despite lower consumption and competitive pressures. We grew in many European Countries and in international LNG
i - 14 -

Contents
Eni in 2011 Business review / Gas & Power
sales, while off-takes from importers to Italy of Libyan gas fell sharply. Return On Average Capital Employed (ROACE) was 5.6% (9.8% in 2010).
Capital expenditures amounted to euro 1,721 million for developing and upgrading transport and distribution networks in Italy, increasing storage
capacity and improving efficiency standards in power generation. Electricity sales of 40.28 TWh increased by 0.74 TWh from 2010, up 1.9%.
Gas volumes transported in Italy were 78.30 bcm, down by 6% from 2010 due to a steep decline in gas demand in Italy.
Strategies
Eni’s Gas & Power segment engages in all phases of the gas value chain: supply, trading and marketing of gas and electricity, gas infrastructures, and LNG supply and marketing. This segment also includes power generation activity, which is ancillary to the marketing of electricity. Eni’s leading position in the European gas market is underpinned by a set of competitive advantages, including our multi-Country approach, long-term gas availability, access to infrastructures, market knowledge, and a strong customer base. Furthermore, integration with our upstream operations provides valuable growth options whereby the Company targets to monetize its large gas reserves. The outlook in the European gas sector is challenging due to ongoing competitive pressures, while perspectives of a recovery in gas demand are muted due to macroeconomic uncertainties. Against this backdrop, we expect weak and volatile gas margins over the short and medium term. We have been implementing a number of initiatives to cope with this unfavorable environment targeting to gradually recover profitability of our marketing operations over the plan period. Firstly, we are committed to renegotiate better economic terms for the Company’s gas purchase contracts, so as to restore the competitiveness of the Company’s cost position. Secondly, we intend to strengthen our market position in the most valuable segments by upgrading our commercial efforts, improving service quality and retaining our large customer base particularly in retail. Finally, we will seek to boost margins by pursuing opportunities in the LNG market and deploying our trading capabilities aiming at capturing possible favorable trends in market prices and extracting value from our assets.
Over the next four years, our strategy is to strengthen our leadership in the European gas markets, while managing through the downturn. We believe that this strategy will put us in a strong position to benefit once a market recovery begins. The strategic guidelines are: � � � � To consolidate competitiveness of supply � � � � To focus on key segments and markets � � � � To recover profitability
Our regulated businesses in gas transport, distribution and storage in Italy will continue focusing on network upgrading and efficient operations. However, we expect to exit these businesses due to a changed Italian regulatory environment in the near future. Finally our International transport business was downsized in 2011 following the divestment of our interests in the pipelines and carrier companies which transport gas from Northern Europe and Russia to core European consumer markets, including Italy. We expect that our residual activities in this business will continue to provide steady returns across the plan period. In the next four-year period, we plan to invest euro 7.2 billion in the business. Planned expenditures will be largely focused on regulated businesses with guaranteed returns, aiming at improving the system’s flexibility and also at expanding gas storage capacity in Italy. In the Marketing business, we will invest about euro 1 billion, mainly in the power generation sector to increase flexibility and plant efficiency.
- 15 -
Gas market trends In 2011, gas demand in Europe fell by 10% (down by 6% in Italy) due to the economic downturn which reduced industrial output and power requirements. Other factors behind demand weakness were the growing adoption of renewable sources, a shift to coal in power generation due to cost advantages, as well as unusual weather conditions. The profitability of the gas sector in 2011 was severely hit by a combination of lower demand, oversupply and a high rate of liquidity at continental hubs. Reduced sales opportunities forced operators to aggressively compete on
pricing, particularly those operators which were exposed to take-or-pay supply contracts. On their part, large clients adopted opportunistic supply patterns, in order to take advantage of the large availability of spot gas on the marketplace. Those drivers led to a squeeze in marketing margins due to decoupling trends between, on one hand, the rising cost of gas supplies that are indexed to the price of oil and its derivatives, as provided by pricing formulas in long-term supply contracts, and, on the other hand, weak selling prices at continental hubs which have become the prevailing benchmark

Contents
Eni in 2011 Business review / Gas & Power
in selling contracts. Management forecasts that weak gas demand trends owing to decelerating economic growth, the persistence of oversupplies on the marketplace and strong competition will represent risk factors to the profitability outlook of the Company gas Marketing business over the next two to three years. However, we expect that things will start improving by 2014-2015. Demand will stage a medium term recovery driven by the secular growth trends of economic development and increasing use of gas in the production of electricity, also considering the ongoing commitment to reduce GHG emissions by EU Member States. Management expects EU demand to increase from around 500 bcm in 2011 to around 565 bcm by 2015, and to close to 600 bcm in 2020, corresponding to an average growth rate of approximately 2% across the period. Gas demand in Italy is expected to grow with an average rate of approximately 2% driven by power generation consumption which is expected to increase from approximately 28 bcm in 2011 to over 40 bcm in 2020. At the same time, we see European supplies tightening mainly due to: - increasing Far East demand, where we estimate that consumption will increase by 16%, or around 90 bcm within 2015, mainly driven by robust rates of economic development, as well as Japan’s shift to gas-fired electricity away from nuclear fuel. This will largely absorb the new LNG production coming on-stream in the region and attract some of the worldwide LNG supplies which are currently being delivered to Europe; - increasing domestic gas consumption in the Middle East and North Africa; - declining European domestic production; and - limited LNG capacity additions for the Atlantic basin. Domestic gas production in Europe will decline from the current level of 173 bcm by around 3% a year, to 156 bcm by 2015 and 130 bcm by 2020. LNG imports will level off after the peak in 2011, with capacity growth being absorbed by strong demand in the Far East and Latin America. In addition, incumbent European suppliers, in particular in Northern Africa, will struggle to increase exports because of strong domestic demand. In this context, our diversified long-term supply portfolio, our increased equity gas and our market leadership in key European countries will be significant competitive advantages, leading to growing profitability in our marketing business.
generation customers and wholesalers by 13 bcm leveraging on our strong commercial platform in the largest consuming countries of traditional presence (Italy, France, Germany, UK, Spain, Belgium) and in our new, target markets (Netherlands, Austria and Hungary). Management also plans to increase Eni’s penetration in the European retail segment, growing our customer base by almost 30% in the next four years.
Gas sales: 2001 and outlook Gas sales by market (bcm) 2009 2010 2011
ITALY 40.04 34.29 34.68
In 2011, sales of natural gas were 96.76 bcm, down 0.30 bcm, or 0.3%. Despite a 6% decline in natural gas demand, sales volumes on the Italian market were substantially stable, to 34.68 bcm (up 0.39 bcm, or 1.1%) due to effective market initiatives that led to higher sales to industrial customers, wholesalers and to the power generation segment. Sales to shippers were down 5.20 bcm, or 61.6%, due to the
Wholesalers 5.92 4.84 5.16
Gas release 1.30 0.68 Italian gas exchange and spot markets 2.37 4.65 5.24
Industries 7.58 6.41 7.21
Medium-sized enterprises and services 1.08 1.09 0.88
Power generation 9.68 4.04 4.31
Residential 6.30 6.39 5.67

- 16 -
impact of force majeure on Libyan supplies. Sales on target markets in Europe of 49.74 bcm showed a positive trend, increasing by 7.9%, except for Benelux where competitive pressure reduced Eni’s sale portfolio. The main increases were recorded in Turkey, France also due to the consolidation of Altergaz, UK/Northern Europe, Germany/Austria and the Iberian Peninsula. The outlook for natural gas sales in 2012 is uncertain due to macroeconomic headwinds, weak demand growth and continuing oversupplies. Against this backdrop, management expects to achieve stable natural gas sales compared to 2011. Management intends to seek to increase sales volumes and market share in Italy and particularly to retain and develop its retail customer base; outside Italy the main drivers of growth will be sales expansion in the key markets of France, Germany/Austria and Benelux and opportunities in the Far East. Those increases will offset lower sales elsewhere. Over the plan period, we intend to increase our sales to industrial, power
Own consumption 5.81 6.19 6.21
INTERNATIONAL SALES 63.68 62.77 62.08
Rest of Europe 55.45 54.52 52.98
Importers in Italy 10.48 8.44 3.24
European markets 44.97 46.08 49.74
Iberian Peninsula 6.81 7.11 7.48
Germany/Austria 5.36 5.67 6.47
Belgium 15.72 14.87 11.95
Hungary 2.58 2.36 2.24
UK/Northern Europe 4.31 5.22 6.10
Turkey 4.79 3.95 6.86
France 4.91 6,09 7.01
Other 0.49 0.81 1.63
Extra European markets 2.06 2.60 6.24
E&P in Europe and in the Gulf of Mexico 6.17 5.65 2.86
WORLDWIDE GAS SALES 103.72 97.06 96.76

Contents
Eni in 2011 Business review / Gas & Power
Marketing strategy: planned actions
market knowledge, and our capacity to offer clients tailor-made solutions; - to increase our penetration in the European retail segment by means of the quality of our offering, service excellence and customer care. We are particularly proud of the results achieved in the Italian market where we have been strengthening our position in retail, adding approximately 500 thousand new contracts last year, through a well-known brand, the commercial growth of the combined offer of gas and electricity and consolidation of innovative marketing channels. At the end of 2011 we boasted a customer portfolio of approximately 7.1 million active contracts. We intend to deploy our valuable Italian experience to other European markets, particularly France and Belgium where we expect to reap the benefits of integrating the recently-acquired subsidiaries Altergaz and Nuon; and - to boost our LNG sales. Finally, we intend to capture margins improvements by means of a new risk management strategy by entering derivatives contracts both in the commodity and the financial trading venues in order to capture possible favorable trends in market prices, within limits set by internal policies and guidelines that define the maximum tolerable level of market risk. Furthermore the Company intends to optimize the value of its assets (gas supply contracts, storage sites, transportation rights, customer base, and market position) by effectively managing the flexibilities associated with these assets. This can be achieved by entering arbitrage contracts to leverage price differentials at various points along the gas value chain or through strategies of dynamic forward trading where the underlying items are represented by the Company’s assets. Asset backed trading activities are mitigated by the natural hedge granted by the assets’ availability. A review of Eni’s presence in key European markets is presented below.
In spite of a challenging market environment and rising competitive pressures, over the next four years we intend to strengthen our leading position in the European gas market targeting to gradually recover profitability by leveraging on the following initiatives:
� on the supply side, we intend to improve the competitiveness of our supply portfolio which is the key factor to cope with the ongoing market downturn and regain profitability once the European market tightens. We believe that our supply portfolio has: - to be competitive with spot prices; - to be flexible on take or pay volumes; and - to give both suppliers and buyers the option to renegotiate more frequently if required by market conditions. We have already made good progress on this front. In the last two years, we have closed contract renegotiations with the Libyan NOC, Sonatrach and, in recent weeks, with Gazprom, which between them account for almost 70% of our supply portfolio. Looking forwards, we will continue to work on the competitiveness and market reflectivity of our portfolio. We plan to open negotiations with other of our suppliers in the second part of 2012;
� on the commercial side of our equation we intend: - to consolidate our leading European position in the business gas market, where we have a well balanced portfolio in terms of geographies, customer segments and contract durations. Over the plan period, we will drive sales and market share gains by leveraging on the multiple presence in a number of markets, the development of a pan-European commercial platform,
In Europe, most of the expected growth will be achieved in:
� Germany/Austria , where Eni is present through its affiliate GVS (Gasversorgung Süddeutschland GmbH - Eni 50%), and a direct marketing structure. We plan to drive growth in direct sales leveraging on the quality of our commercial offer;

- 17 -
� Benelux (Belgium, the Netherlands and Luxembourg), where we will seek to strengthen our leading position granted by the integration with operations of Distrigas and of the recently acquired Nuon, as well as to extract value from our logistics assets and our presence at the continental hubs;
� France , where we plans to expand sales by growing volumes supplied to the business segments and increasing retail customers leveraging on the Altergaz integration and our direct commercial presence; and
� Turkey , where Eni is supplying gas in joint venture with Gazprom to the local company Bota through the Blue Stream pipeline. Gas is carried from Russia across the Black Sea.
term gas purchase contracts with key producing Countries that supply the European gas markets. These contracts have been ensuring approximately 80
Supply In order to secure long-term access to gas availability, particularly with a view of supplying the Italian gas market, Eni has signed a number of long-

Contents
Eni in 2011 Business review / Gas & Power
bcm of gas availability from 2010. Our contract portfolio has a residual life of approximately 17 years and a pricing mechanism that indexes the cost of gas to the price of crude oil and its derivatives (gasoil, fuel oil, etc.). In 2011, Eni’s consolidated subsidiaries supplied 83.38 bcm of natural gas, representing an increase of 0.89 bcm, or 1.1% from 2010.
In addition, we currently operate certain photovoltaic sites in Italy. We have an installed power capacity equal to 5.3 gigawatts 1 , and we plan a further capacity expansion, targeting a fully operational capacity of 5.4 GW by 2016. Supplies of natural gas are expected to amount to approximately 6 bcm/y from Eni’s diversified supply portfolio. In the next four years we plan to complete the capacity upgrading at the Ferrara, Bolgiano and Taranto sites and to improve efficiency and flexibility of our facilities. We are planning to retain an index of GHG emissions below the target level of 415 gCO 2 /kWheq. We are also planning to
build a biomass power plant in Sardinia, Italy, to complement the conversion of the Porto Torres site into an innovative bio-based chemical complex.
LNG
Eni is present in all phases of the LNG business: liquefaction, shipping, re-gasification and sale through operated activities or interests in joint ventures and associates. Eni’s presence in the business is tied to the Company’s plans to develop its large gas reserve base in Africa and elsewhere in the world. The LNG business has been deeply impacted by the economic downturn and oversupply affecting the European gas market, as well as by structural modifications in the US market where large availability of gas from unconventional sources has reduced the Country’s dependence on gas imports via LNG. At present, we participate through our affiliates in a number of facilities located in Spain (regasification) and Egypt (liquefaction). The Company has also access to LNG supplies in Algeria and Qatar. Our main ongoing interest in the LNG business is the joint Pascagoula project with our Exploration & Production business which is targeting the US market. The Pascagoula project envisages construction of an LNG plant in Angola designed to produce 5.2 mmtonnes of LNG (approximately 7.3 bcm/y) destined to the North American market in order to monetize part of the Company’s gas reserves. As part of the downstream leg of the project, Eni signed a 20 year contract with Gulf LNG to buy 5.8 bcm/y of the re-gasification capacity at the Pascagoula plant in Mississippi. The start-up of the re-gasification facility commenced in the fourth quarter of 2011, while the upstream project in Angola will start operations nextly.
Regulated businesses in Italy
Eni, through Snam SpA (Eni’s interest being 52.53%), a company listed on the Italian Stock Exchange, operates most of the Italian natural gas transport network, a re-gasification terminal located in Panigaglia, an extensive grid of local distribution networks and gas underground storage deposits and related facilities. In the next four years, Snam plans to make capital expenditures in the regulated businesses in the amount of approximately euro 6.7 billion of which 1.4 billion will be spent in 2012. These investments will be aimed at improving the security and flexibility of the gas system, by: (i) increasing gas transport capacity by adding approximately 1,000 kilometers of new lines to the existing 32,000 kilometer-long network as at end of 2011 and by increasing the installed power of the compression stations by around 4% versus 2011; and (ii) improving the overall flexibility and security of the storage system through an increase in both the modulation and peak capacity and providing storage services to the industrial market.
Power generation
Transport Activity Snam, through its subsidiary Snam Rete Gas, is the leading Italian natural gas transportation and dispatching operator, and owns almost all the transportation infrastructures in Italy,
- 18 -
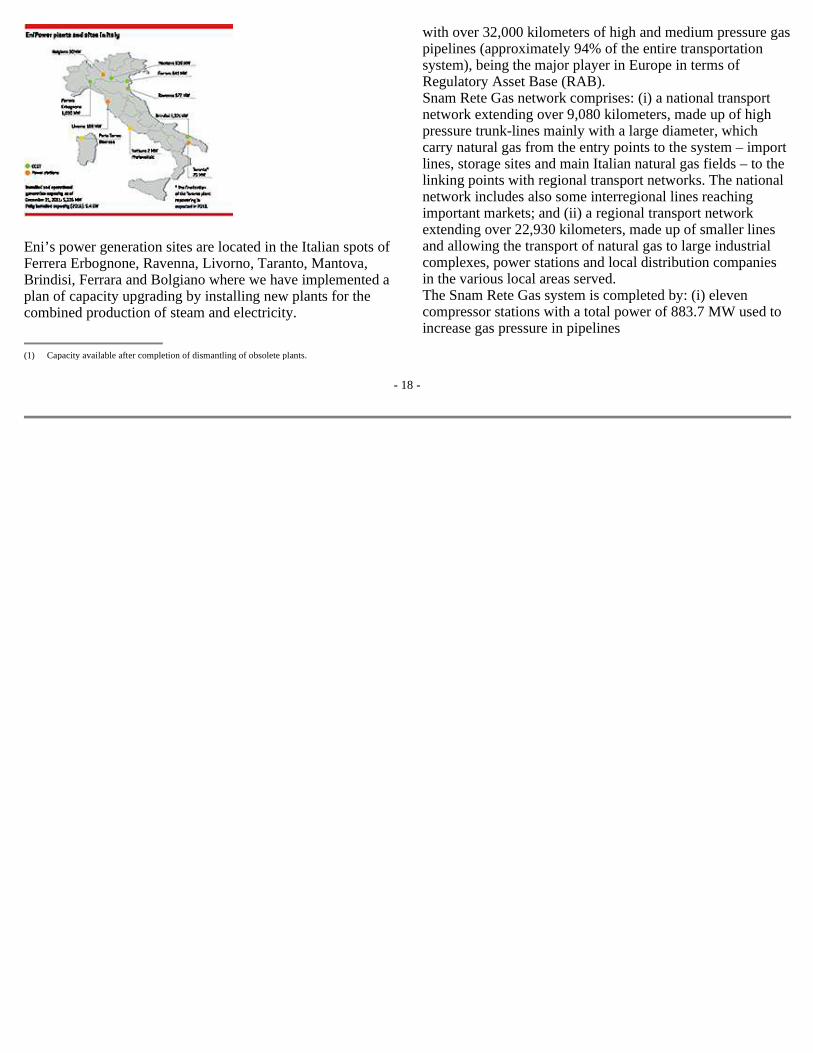
Eni’s power generation sites are located in the Italian spots of Ferrera Erbognone, Ravenna, Livorno, Taranto, Mantova, Brindisi, Ferrara and Bolgiano where we have implemented a plan of capacity upgrading by installing new plants for the combined production of steam and electricity.
with over 32,000 kilometers of high and medium pressure gas pipelines (approximately 94% of the entire transportation system), being the major player in Europe in terms of Regulatory Asset Base (RAB). Snam Rete Gas network comprises: (i) a national transport network extending over 9,080 kilometers, made up of high pressure trunk-lines mainly with a large diameter, which carry natural gas from the entry points to the system – import lines, storage sites and main Italian natural gas fields – to the linking points with regional transport networks. The national network includes also some interregional lines reaching important markets; and (ii) a regional transport network extending over 22,930 kilometers, made up of smaller lines and allowing the transport of natural gas to large industrial complexes, power stations and local distribution companies in the various local areas served. The Snam Rete Gas system is completed by: (i) eleven compressor stations with a total power of 883.7 MW used to increase gas pressure in pipelines
(1) i Capacity available after completion of dismantling of obsolete plants.
Contents
Eni in 2011 Business review / Gas & Power
to the level required for its flow; and (ii) four marine terminals linking underwater pipelines with the on-land network at Mazara del Vallo and Messina in Sicily and Favazzina and Palmi in Calabria. In 2011, volumes of natural gas input in the national grid (78.30 bcm) decreased by 5.01 bcm from 2010 due to declining domestic demand. Distribution Snam through Italgas and other subsidiaries operates in the distribution activity in Italy, which involves the delivery of natural gas to residential and commercial customers in urban centers, serving 1,330 municipalities through a low pressure network consisting of approximately 50,300 kilometers of pipelines supplying 5.9 million customers and distributing 7.64 bcm in 2011. Storage Snam through Stogit, is the leading Italian operator and one of the major operators in this sector in Europe. Stogit provides storage and modulation services, pursuing technical and economic efficiency, on the basis of the concessions granted by the Italian Ministry of Economic Development. Storage operations are provided through depleted gas fields and proper infrastructures and facilities such as treatment and compression plants, and connections to the national transport network. Access to the gas storage service enables suppliers to configure their supplies in order to effectively manage seasonal patterns in gas consumption. Stogit, with its eight storage fields distributed throughout Italy can provide the market with an integrated system that ensures the flexibility requested by suppliers, in line with available storage capacity. In 2011, 7.78 bcm (down 0.22 bcm from 2010) were input to the Company’s storage deposits, while 7.53 bcm of gas were off-taken (slightly lower than one year ago). In 2011, storage capacity amounted to 15 bcm, of which 5 were destined to strategic storage. The share of storage capacity used by third parties was 78% (71% in 2010). Snam is planning to update the flexibility and security of the storage system through an increase in both modulation and peak capacity and providing storage services to the industrial market.
Libya to the main consumption areas in Europe. The Company participates both in pipeline owners and carrier entities. The structure of the Company’s interests in those entities has significantly changed in 2011 following the divestment of Eni’s interests in pipelines importing gas from Northern Europe (TENP and Transitgas) and Russia (TAG) and related carrier companies. The divestiture was agreed with the European Commission in 2010 to settle an antitrust proceeding related to alleged anti-competitive behavior in the gas market. A description of the main international pipelines currently participated or operated by Eni is provided below.
� TTPC The pipeline, 740-kilometer long, made up of two lines that are each 370-kilometer long with a transport capacity of 33.2 bcm/y and five compression stations. This pipeline transports natural gas from Algeria across Tunisia from Oued Saf Saf at the Algerian border to Cap Bon on the Mediterranean coast where it links with the TMPC pipeline.
� TMPC The pipeline for the import of Algerian gas is 775-kilometer long and consists of five lines that are each 155-kilometer long with a transport capacity of 33.5 bcm/y. It crosses the underwater Sicily Channel from Cap Bon to Mazara del Vallo in Sicily, the point of entry into the Italian natural gas transport system.
� GreenStream The pipeline, jointly-owned with the Libyan National Oil Company, started operations in October 2004 for the import of Libyan gas produced at Eni operated fields Bahr Essalam and Wafa. It is 520-kilometer long with a transport capacity of 8 bcm/y (expandable to 11 bcm/y) and crosses underwater in the Mediterranean Sea from Mellitah on the Libyan coast to Gela in Sicily, the point of entry into the Italian natural gas transport system.
� Eni holds a 50% interest in the Blue Stream underwater pipeline (water depth greater than 2,150 meters) linking the Russian coast to the Turkish coast of the Black Sea. This pipeline is 774-kilometer long on two lines and has transport capacity of 16 bcm/y. It is part of a joint venture to sell gas produced in Russia on the Turkish market.
International transport
� INTERNATIONAL TRANSPORT Eni owns capacity entitlements in an extensive network of international high pressure pipelines enabling the Company to import natural gas produced in Russia, Algeria, the North Sea (including the Netherlands and Norway), and

- 19 -

Contents
2009 2010 2011
Employee injury frequency rate (No. of accidents per million hours worked) 3.18 1.77 2.02 Contractors injury frequency rate 4.35 3.59 3.21
Net sales from operations (a) (euro million) 31,769 43,190 51,219 Operating profit (102 ) 149 (273 ) Adjusted operating profit (357 ) (171 ) (535 ) Adjusted net profit (197 ) (49 ) (262 )
Capital expenditures 635 711 866 Adjusted capital employed, net at year end 7,560 7,859 8,600 Adjusted ROACE (%) (2.6 ) (0.6 ) (3.1 )
Refinery throughputs on own account (mmtonnes) 34.55 34.80 31.96 Conversion index (%) 60 61 61 Balanced capacity of refineries (kbbl/d) 747 757 767
Retail sales of petroleum products in Europe (mmtonnes) 12.02 11.73 11.37 Service stations in Europe at year end (units) 5,986 6,167 6,287 Average throughput per service station in Europe (kliters) 2,477 2,353 2,206 Retail efficiency index (%) 1.61 1.53 1.50
Employees at year end (units) 8,166 8,022 7,591 Direct GHG emissions (mmtonnes CO 2 eq) 7.29 7.76 7.23 SO x (sulphur oxide) emissions (ktonnes SO 2 eq) 21.98 28.05 23.07 NO x (nitrogen oxide) emissions (ktonnes NO 2 eq) 7.35 7.96 6.74 Water consumption rate/oil and intermediate throughputs (cm/tonnes) 35.99 28.36 31.07 Customer satisfaction index (likert scale) 7.93 7.84 7.74
i i ii (a) i Before elimination of intragroup sales. i i i
2011 Highlights
Financial and operating results In 2011, our Refining & Marketing Division reported sharply lower adjusted operating losses at minus euro 262 million. The performance was hit by unprofitable refining margins due to rising costs for oil-based feedstock and energy utilities that could not be transferred to prices at the pump pressured by weak demand and excess capacity in the Mediterranean basin.
We continued upgrading our network of retail stations by rebranding, our outlets to the "eni" logo and improving
Effective marketing actions helped us preserve our market share at 30.5% of the domestic consumption of fuels.
Capital expenditure of euro 866 million related mainly to projects designed to improve the conversion capacity and flexibility of refineries, logistics, upgrade of the fuel distribution network in Italy and in the rest of Europe and initiatives in the field of health, safety and the environment.
In spite of a weak outlook for refining margins, management plans to improve results of the Refining & Marketing

quality standards and layout. Since the start of the program in 2010, 1,700 stations have been rebranded.
Division by over euro 550 million by 2015 through efficiency improvements and plant optimizations.
Strategies
We refine and market fuels and other oil products primarily in Italy and Central-Eastern European countries. We are the largest refiner in Italy and the leading operator in the retail marketing of fuels with a market share of 30.5%. Our refining and marketing operations are fully integrated also through the support of a valuable set of logistic assets so as to maximize cost efficiencies. Supply of crude feedstock to our refineries and trading of product deficits/surpluses are ensured by our affiliate Eni Trading & Shipping.
Our Refining & Marketing business has delivered poor results in recent years driven by a weak trading environment. High purchase costs for crude feedstock and oil-linked energy expenses have squeezed refining margins as product prices have lagged behind cost increases due to sluggish demand and excess capacity. At the same time our complex processes have been suffering from narrowing spreads between sour and sweet crudes. The outlook for the next four years remains challenging as we expect that refining margins will stage only
- 20 -

Contents
Eni in 2011 Business review / Refining & Marketing
a modest recovery from currently depressed levels. Against this backdrop, we intend to return to profitability and positive free cash flow generation targeting to improve our operating results by around euro 550 million by 2015 assuming a constant trading environment. The levers to achieve this target are continuing efficiency improvements, plant optimizations and selective capital expenditures to expand margins in our refining operations. In marketing we intend to consolidate the profitability of our operations mainly through network upgrading, expansion of our non-oil activities and growing selectively outside Italy. Our strategic guidelines are:
� Improve profitability of our refining business leveraging on efficiency and optimization
� Consolidate our leading position in the Italian retail market
� Selectively develop our presence outside Italy
� Pursue safe and reliable operations In the 2012-2015 period, we plan to make capital expenditures amounting to euro 2.8 billion, in line with the previous plan, carefully selecting capital projects. Management plans to invest approximately euro 2 billion to upgrade the Company’s best refineries mainly by completing and starting-up the EST (Eni Slurry Technology) project at the Sannazzaro unit which will upgrade the conversion capacity of the refinery, as well as improving plant efficiency, flexibility and reliability. Retail activities will attract some 25% of the planned expenditure which will be mainly directed to upgrade and modernize our service stations in Italy and in selected European Countries, and to complete the network rebranding.
Refining .
� Industry trends In recent years, our refining activity has suffered from an industry-wide downturn due to surging costs for oil feedstock and energy utilities, poor demand for refined products in the face of an economic slowdown and excess capacity. Furthermore, the profitability of our complex refineries was negatively impacted by narrowing price differentials between sweet and sour crude qualities. As a result of those trends, refining margins have plunged to historical lows. Looking forward, we anticipate that a sector recovery will not materialize until 2014 or 2015 as macroeconomic uncertainties are expected to weigh on demand for fuels and high costs for oil and energy utilities continue to pressure refining margins. In the meantime, the industry will undergo an unavoidable restructuring process to eliminate marginal and obsolete refineries and rebalance an ongoing surplus of gasoline with a shift vs. higher yields of middle distillates. Over the long-term, we expect that refining margins will stage a gradual recovery across Europe and in the Mediterranean basin due to the reopening of spreads between sweet and sour crudes and a devaluation of fuel oil on the marketplace due to increasingly strict environmental regulations, particularly in the sector of power generation where fuel oil is expected to be progressively replaced by gas as well as in bunker consumption where new rules will mandate the use of middle distillates.
� Planned actions In the face of a weak market outlook and high and volatile oil costs, we intend to implement all the necessary actions and initiatives to restore the profitability of our refining operations by: - pursuing integration of refinery cycles in order to maximize the value of internally-produced semi-finished products and other feedstock; - maximizing refinery flexibility and conversion to take advantage of the availability of discounted crudes on the marketplace. The start-up of our Eni Slurry Technology conversion unit at the Sannazzaro refinery will significantly upgrade our system and ability to process heavy and extra-heavy crudes; - improving energy efficiency and plant safety and reliability; - reducing fixed costs by rationalizing logistics and pursuing other cost measures in maintenance, fixed industrial expenses and labor; - strictly selecting capital expenditures; and - boosting margins leveraging on risk management activities.

- 21 -

Contents
Eni in 2011 Business review / Refining & Marketing
� Our assets ITALY Eni’s refining system in Italy consists of five wholly-owned refineries and a 50% interest in the Milazzo refinery in Sicily. Each of Eni’s refineries in Italy have operating and strategic features that aim at maximizing the value associated to the asset structure, the geographic positioning with respect to end markets and the integration with Eni’s other activities. SANNAZZARO : the refinery has balanced refining capacity of 190 kbbl/d and a conversion index of 59%. Management believes that this unit is among the most efficient refineries in Europe. Located in the Po Valley, it supplies markets in North-Western Italy and Switzerland. The high degree of flexibility and conversion capacity of this refinery enables to process a wide range of feedstock. From a logistical standpoint this refinery is located along the route of the Central Europe Pipeline, which links the Genoa terminal with French speaking Switzerland. This refinery contains two primary distillation plants and relevant facilities, including three desulphurization units. Conversion is obtained through a fluid catalytic cracker (FCC), two hydrocrackers (HdCK), which enable middle distillate conversion and a visbreaking thermal conversion unit with a gasification facility using the heavy residue from visbreaking (tar) to produce syn-gas to feed the nearby EniPower power plant at Ferrera Erbognone. Eni is developing a conversion plant employing the Eni Slurry Technology with a 23 kbbl/d capacity for the processing of extra heavy crude with high sulphur content producing high quality middle distillates, in particular gasoil, and reducing the yield of fuel oil to zero. Start-up of this facility is scheduled by the end of 2012. In addition the Short Contact Time-Catalytic Partial Oxidation project is underway for the production of hydrogen. TARANTO : the refinery has balanced refining capacity of 120 kbbl/d and a conversion index of 72%. This refinery can process a wide range of crude and other feedstock. It principally produces fuels for automotive use and residential heating purposes for the Southern Italian markets. Besides its primary distillation plants and relevant facilities, including two units for the desulphurization of middle distillates, this refinery contains a two-stage thermal conversion plant (visbreaking/thermal cracking) and an RHU conversion plant for the conversion of high sulphur content residues into valuable products and catalytic cracking feedstocks. It processes most of the oil produced in Eni’s Val d’Agri fields carried to Taranto through the Monte Alpi pipeline (in 2011, a total of 2.5 mmtonnes of this oil were processed). GELA : the refinery has balanced refining capacity of 100 kbbl/d and a conversion index of 142%. This refinery is located on the Southern coast of Sicily and is integrated with upstream operations as it processes heavy crude produced from Eni’s nearby offshore and onshore fields in Sicily. Its high conversion level is ensured by an FCC unit with go-finer for feedstocks upgrading and two coking plants enabling conversion of heavy residues topping or vacuum residues. The power plant of this refinery also contains residue and exhaust fume treatment plants (so-called SNOx) which allow
strengthened by implementing the Energy Management System in accordance with the ISO 50001 international standard. Eni will also invest euro 26 million to reduce SO x and NO x emissions by 2013 on a comparable production
basis. In 2011, NO x and SO x emissions significantly
declined (down 15% and down 18%, respectively) from 2010, due to the use of gas to replace fuel oil and other energy saving measures.
Logistics Eni is a primary operator in storage and transport of petroleum products in Italy with its logistical integrated infrastructure consisting of 20 directly managed storage sites and a network of petroleum product pipelines for the sale and storage of refined products, LPG and crude. Eni’s logistics model is organized in a hub structure on five main areas. These hubs monitor and centralize the handling of product flows aiming at driving cost savings by efficiently collecting orders and delivering goods.
Marketing We are the leader in the retail marketing of refined products in Italy with a 30.5% market share. We market a wide range of refined petroleum products, through an extensive network of operated service stations, franchises and other distribution systems. We intend to consolidate our lead in the Italian retail market by continuing investments in network upgrading and modernization, as well as improving quality standards and layout of our outlets. As part of this strategy, we plan to complete our network rebranding and restyling, to increase the automation of stations and to expand non-oil activities under the "eni" brand. Outside Italy, we intend to continue growing our share in the markets of interest to the Company while assessing a possible divestment of marginal activities.
� Retail - Italy
- 22 -
full compliance with the tightest environmental standards, removing almost all sulphur and nitrogen composites coming from the coke burning-process. An upgrade of the Gela refinery is underway by means of a refurbishment of its power plant, substantially renewing pet-coke boilers, aimed at increasing profitability maximizing synergies deriving from the integration of refining and power generation.
OUTSIDE ITALY In Germany, Eni holds an 8.33% interest in the Schwedt refinery and a 20% interest in Bayernoil , an integrated pole that includes the Vohburg and Neustadt refineries. Eni’s refining capacity in Germany amounts to approximately 60 kbbl/d mainly used to supply Eni’s distribution network in Bavaria and Eastern Germany. In the Czech Republic, Eni holds a 32.4% interest in the Ceska Rafinerska pole, which includes two refineries, Kralupy and Litvinov . Eni’s share of refining capacity amounts approximately to 53 kbbl/d.
� Operational efficiency and environmental performance Eni intends to continue pursuing high levels of operational efficiency and environmental performance at its refineries. Energy saving programs will be
In 2011, the re-branding of Eni’s service stations continued. We plan that by the end of 2012 80% of our proprietary service stations will have been re-branded to the "eni brand". In the context of weak domestic demand for fuels and rising competition, management plans to preserve the market share achieved in 2011 (30.5%). This target factors in a planned reduction of approximately 500 outlets. We expect that effective marketing campaign, the development of the non-oil offering and continuing network upgrading will underpin our market share and client retention. We will continue leveraging

Contents
Eni in 2011 Business review / Refining & Marketing
on our successful promotional initiative "you&eni", a fidelity program which rewards the most loyal customers with prizes commensurated to their purchases of fuels and convenience items. The "you&eni" cards that made at least one transaction in the year were approximately 6.5 million at December 31, 2011, while the average number of active cards was approximately 2.6 million on a monthly basis. Volumes sold under the fidelity program
represented approximately 39% of total throughputs. In 2011, retail sales in Italy of 8.36 mmtonnes decreased by approximately 270 ktonnes, down 3.1% driven by lower consumption of gasoil and gasoline, in particular in highway service station related to the decline in freight transportation. At December 31, 2011, Eni’s retail network in Italy consisted of 4,701 service stations, 159 more than at December 31, 2010 (4,542 service stations).
� Retail - outside Italy Eni’s strategy in the rest of Europe is focused on selectively growing its market share, particularly in Germany and Eastern Countries (e.g. Czech Republic) leveraging on the synergies ensured by the proximity of these markets to Eni’s production and logistic facilities. In 2011, retail sales of refined products marketed in the rest of Europe (3.01 mmtonnes) were down 2.9% (approximately 90 ktonnes) from 2010. Volume additions in Austria, reflecting the purchase of service stations, were offset by lower sales in Germany due to certain lease contract terminations, in France due to the rationalization of service stations with lower throughput and in Eastern Europe due to declining demand. At December 31, 2011, Eni’s retail network in the rest of Europe consisted of 1,586 units.
� Non-oil Non-oil activities have become an integral part of our retail business. We have been upgrading our offering of non-oil products and services by carefully selecting our partners and improving quality and reach of the offering. Our most important service stations in Italy are equipped with franchised outlets, which market a wide range of food items, services and other merchandise. We have two main format: " enicafé ", a format which is present at 350 stations following upgrading of bars and stores; " enicafé&shop ", a format including corners for the sale of food and car-care products in 200 Eni outlets. In 2011 Eni also launched a new self-service option h24 of food, non-food and personal care products by installing Eni branded vending machines in 150 outlets with the aim of extending this service to over 1,000 outlets in the next two years. Non-oil activities in the rest of Europe are present in 1,101 service stations (Eni owned network), of which 321 are in Germany and 144 in France.
over Italy and articulated in local marketing offices and a network of agents and concessionaires. In 2011, sales volumes on wholesale markets in Italy (9.36 mmtonnes) were down by approximately 90 ktonnes from 2010, or 1%, mainly reflecting a decline in demand from transportations and industrial customers due to economic slowdown and strong competitive pressure which particularly affected bunkering and bitumen, but also LPG due to unusual weather conditions. Jet fuel and fuel oil sales increased, while gasoil sales dropped starkly in 2011. Eni’s wholesale market share for 2011 averaged 28.3%, down 0.9 percentage points from 2010 (29.2%).
LPG In Italy, Eni is leader in LPG production, marketing and sale with 601 ktonnes sold for heating and automotive use equal to a 18.9% market share. An additional 214 ktonnes of LPG were marketed through other channels mainly to oil companies and traders. Outside Italy, LPG sales in 2011 amounted to 485 ktonnes of which 384 ktonnes in Ecuador where LPG market share is around 37.5%.
Lubricants Eni operates seven (owned and co-owned) blending plants, in Italy, Europe, North and South America and the Far East. With a wide range of products composed of over 650 different blends Eni masters international state-of-the-art know-how for the formulation of products for vehicles (engine oil, special fluids and transmission oils) and industries (lubricants for hydraulic systems, industrial machinery and metal processing).
Oxygenates Eni, through its subsidiary Ecofuel (Eni’s interest 100%), sells approximately 1.7 mmtonnes/y of oxygenates mainly ethers (approximately 5.3% of world demand) and methanol (approximately 0.9% of world demand). About 80% of

- 23 -
� Wholesale and other businesses Fuels Eni markets gasoline and other fuels on the wholesale market in Italy, including diesel fuel for automotive use and for heating purposes, for agricultural vehicles and for vessels and fuel oil. Major customers are resellers, agricultural users, manufacturing industries, public utilities and transports, as well as final users (transporters, condominiums, farmers, fishers, etc.). Eni provides its customers with its expertise in the area of fuels with a wide range of products that cover all market requirements. Along with traditional products provided with the high quality Eni standard, there is also an innovative low environmental impact line, which includes AdvanceDiesel especially targeted for heavy duty public and private transports. Customer care and product distribution is supported by a widespread commercial and logistical organization presence all
products are manufactured in Italy in Eni’s plants in Ravenna, in Venezuela (in joint venture with Pequiven) and Saudi Arabia (in joint venture with Sabic) and the remaining 20% is bought and resold. Eni also distributes bio-ETBE on the Italian market in compliance with the new legislation indicating the minimum content of bio-fuels. Bio-ETBE is a kind of MTBE that gained a relevant position in the formulation of gasoline in the European Union, due to the fact that it is produced from ethanol from agricultural crops and qualified as bio-component in the European directive on bio-fuels. Starting from March 1, 2010, Italian regulation on bio-fuels content has been changed from 3% to 3.5%. Through bio-ETBE and FAME blending into fossil fuels Eni covered the compliance within 96% in 2011. From January 1, 2012, the compulsory content of bio-fuels has increased to 4.5% from 2011 4%. Eni is addressing the new need through bio-ETBE, FAME and direct blending of ethanol in gasolines.
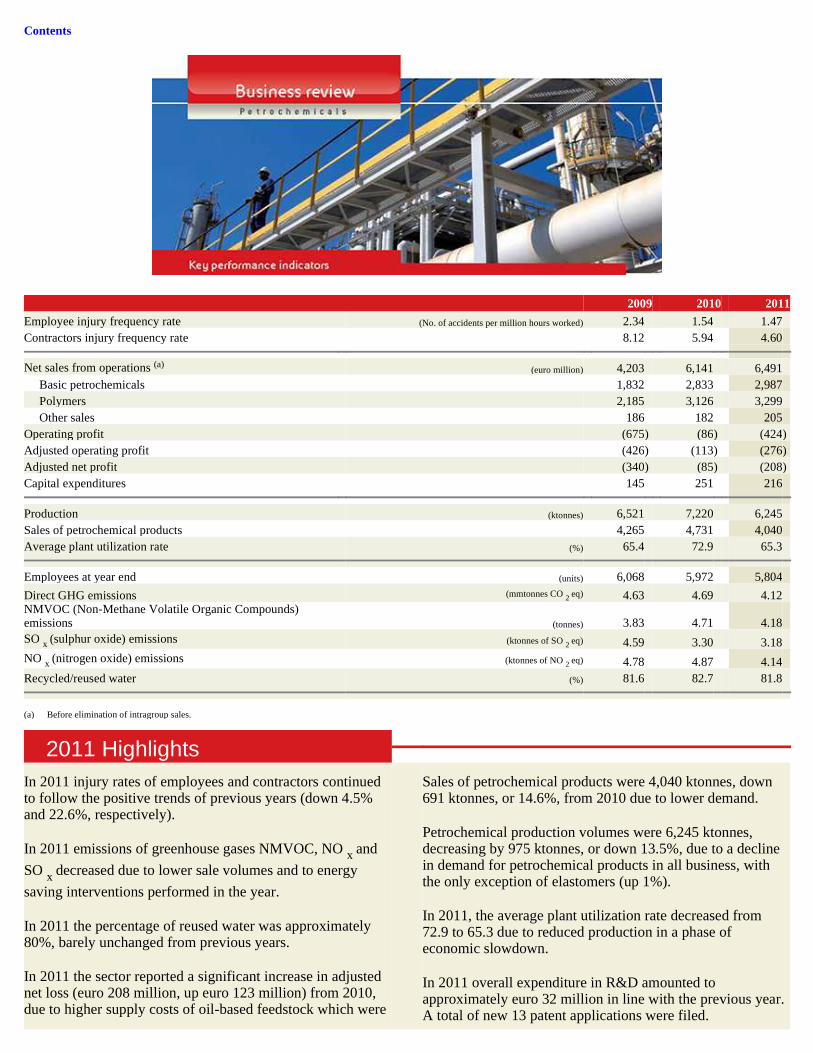
Contents
2009 2010 2011
Employee injury frequency rate (No. of accidents per million hours worked) 2.34 1.54 1.47 Contractors injury frequency rate 8.12 5.94 4.60
Net sales from operations (a) (euro million) 4,203 6,141 6,491 Basic petrochemicals 1,832 2,833 2,987 Polymers 2,185 3,126 3,299 Other sales 186 182 205 Operating profit (675 ) (86 ) (424 ) Adjusted operating profit (426 ) (113 ) (276 ) Adjusted net profit (340 ) (85 ) (208 ) Capital expenditures 145 251 216
Production (ktonnes) 6,521 7,220 6,245 Sales of petrochemical products 4,265 4,731 4,040 Average plant utilization rate (%) 65.4 72.9 65.3
Employees at year end (units) 6,068 5,972 5,804 Direct GHG emissions (mmtonnes CO 2 eq) 4.63 4.69 4.12 NMVOC (Non-Methane Volatile Organic Compounds) emissions (tonnes) 3.83 4.71 4.18 SO x (sulphur oxide) emissions (ktonnes of SO 2 eq) 4.59 3.30 3.18 NO x (nitrogen oxide) emissions (ktonnes of NO 2 eq) 4.78 4.87 4.14 Recycled/reused water (%) 81.6 82.7 81.8
i i ii (a) i Before elimination of intragroup sales. i i ii
2011 Highlights
In 2011 injury rates of employees and contractors continued to follow the positive trends of previous years (down 4.5% and 22.6%, respectively).
In 2011 emissions of greenhouse gases NMVOC, NO x and
SO x decreased due to lower sale volumes and to energy
saving interventions performed in the year.
In 2011 the percentage of reused water was approximately 80%, barely unchanged from previous years.
In 2011 the sector reported a significant increase in adjusted net loss (euro 208 million, up euro 123 million) from 2010, due to higher supply costs of oil-based feedstock which were
Sales of petrochemical products were 4,040 ktonnes, down 691 ktonnes, or 14.6%, from 2010 due to lower demand.
Petrochemical production volumes were 6,245 ktonnes, decreasing by 975 ktonnes, or down 13.5%, due to a decline in demand for petrochemical products in all business, with the only exception of elastomers (up 1%).
In 2011, the average plant utilization rate decreased from 72.9 to 65.3 due to reduced production in a phase of economic slowdown.
In 2011 overall expenditure in R&D amounted to approximately euro 32 million in line with the previous year. A total of new 13 patent applications were filed.

- 24 -
not recovered in sale prices on end markets in a context of substantial decrease in demand.
On April 5, 2012 Polimeri Europa changed its name in Versalis SpA.
Strategies
Eni operates in the businesses of olefins and aromatics, basic and intermediate products, polystyrene, elastomers and polyethylene. Its major production sites are located in Italy and Western Europe. The trading environment in which the Company operates is characterized
by volatility of costs of oil-based feedstock, cyclicality in demand, strong competitive pressures from operators with lower cost structure especially in the Middle-East leveraging on stranded gases, taking into account the commoditized nature of many of Eni’s products. In fact, Eni’s profitability

Contents
Eni in 2011 Business review / Petrochemicals
in the petrochemical businesses is particularly sensitive to movements in product margins that are mainly affected by changes in oil-based feedstock costs and the speed at which product prices adjust to higher oil prices. In order to change this challenges in the future years the Company will pursue the following strategic pillars: � Effectively and efficiently manage operations in order to lower the break-even
� Strengthen the production of higher value added products � Leverage on international expansion � Focus on green-chemistry To target those objectives, management plans to make capital expenditures amounting to approximately euro 1.7 billion over the next four years. The main investment regards the conversion of the Porto Torres unit in Sardinia, Italy, into an innovative bio-based chemical complex to produce bio-plastics and other bio-based chemical products for which significant growth is expected in the medium-long term. In addition, the Company plans to develop the product line in the elastomers and monomers businesses, revamp the efficiency of the Company’s cracking units as well as complying with all applicable regulations on environment, health and safety issues. Management is planning to implement a strategy intended to refocusing the petrochemical business, strengthening the product mix of the Company by developing higher value added products, particularly in the businesses of elastomers, styrenics, resins, EVA and entering into bio-based chemical production. In the next years products demand in those higher value-added segments is planned to grow and margins to be resilient also with higher feedstock prices. Management expects sales of higher value added products to improve by 50% within 2015, with a contribution on total sales amounting to 40% and to deliver euro 400 million of additional operating profit by 2015 at the scenario experienced in 2011.
Business areas Basic petrochemical production (4,101 ktonnes) decreased by
759 ktonnes from last year (down 15.6%), due to lower sales/demand of monomers. Lower ethylene production reflected facility downtimes in the Porto Marghera and Porto Torres plants. In addition, intermediates sales decreased (down 14%) due to unavailability of raw material and planned facility downtimes in the Mantova plant.
� Polymers In polymers business Versalis is active in the production of: • Polyethylene that accounts for 40% of the total volume of world production of plastic materials. It is a basic plastic material, used as a raw material by companies that transform it into a range of finished goods. • Styrenics are polymeric materials based on styrenes that are used in a very large number of sectors through a range of transformation technologies. The most common applications are for industrial packaging and in the food industry, small and large electrical appliances, building isolation, electrical and electronic devices, household appliances, car components and toys. • Elastomers are polymers characterized by high elasticity that allow them to regain their original shape even after having been subjected to extensive deformation. Versalis has a leading position in this sector and produces a wide range of products for the following sectors: tyres, footwear, adhesives,
� Basic petrochemicals Basic petrochemicals accounts for one of the pillars of the petrochemical activities of Versalis, whose products have a range of important industrial uses, such as the production of polyethylene, polypropylene and polystyrene. They are also used in the production of petrochemical intermediates that converge, in turn, into a range of other productive processes: plastics, rubbers, fibers, solvents and lubricants. Basic petrochemicals revenues (euro 2,987 million) increased by euro 154 million from 2010 (up 5.4%) in all main business segments due to the steep increase in average unit prices (olefins/aromatics up 20%, intermediates up 16%) as a result of an improved scenario, partly offset by lower volumes sold (down 18% on average). In particular, a decline was reported in sales volumes of olefins (ethylene down 22%; butadiene down 57% due to the lack of raw material) and intermediates (down 21% on average, in particular phenol and acetone).

- 25 -
building components, pipes, electrical cables, car components and sealings, household appliances; they can be used as modifiers for plastics and bitumens, as additives for lubricating oils (solid elastomers); paper coating and saturation, carpet backing, moulded foams, adhesives (synthetic latex). Versalis is one of the world’s major producers of elastomers and synthetic latex. In 2011 polymer revenues (euro 3,299 million) increased by euro 173 million from 2010 (up 5.5%) due to increases in average unit prices (elastomers up 34%, styrene polymers up 12%; polyethylene up 11%). Sales volumes decreased on average by 11.5% (main decreases were registered in polyethylene, down 16%, lattices down 15%, polybutadiene and thermoplastic rubbers down approximately 9%) due to a steep decline in demand. Sales of ABS and SBR rubbers showed an opposite trend, up 5% and 2%, respectively. Polymer production (2,144 ktonnes) decreased by 216 ktonnes from 2010 (down 9%), mainly polyethylene (down 15%) due to the delay in the restart of the Dunkerque production lines, planned facility downtimes at Priolo, Ragusa and Gela in the last part of the year as well as a decline in demand.

Contents
2009 2010 2011
Employee injury frequency rate (No. of accidents per million hours worked) 0.40 0.45 0.44 Contractors injury frequency rate 0.57 0.33 0.21 Fatality index (No. of fatalities per 100 million hours worked) 0.86 2.14 1.82
Net sales from operations (a) (euro million) 9,664 10,581 11,834 Operating profit 881 1,302 1,422 Adjusted operating profit 1,120 1,326 1,443 Adjusted net profit 892 994 1,098 Capital expenditures 1,630 1,552 1,090 Adjusted ROACE (%) 15.4 14.0 13.9
Orders acquired (euro million) 9,917 12,935 12,505 Order backlog 18,730 20,505 20,417
Employees at year end (units) 35,969 38,826 38,561 Employees outside Italy rate (%) 85.6 87.3 86.5 Local managers rate 41.1 45.3 43.0 Local procurement rate 47.0 61.3 56.4 Healthcare expenditures (euro thousand) 25,205 19,506 32,410 Security expenditures 68,954 26,403 50,541
Direct GHG emissions (mmtonnes CO 2 eq) 1.28 1.11 1.32
i i ii (a) i Before elimination of intragroup sales.
2011 Highlights
The percentage of managerial positions covered by local personnel is constantly higher than 40% of total managerial positions, except for Italy and France, reflecting however fluctuations due to the opening of new yards and short-term projects.
The overall amount of procurement was euro 8,740 million in 2011, of which euro 6,510 million related to operating projects, 56.4% of which was procured with local suppliers.
In 2011 the injury frequency rate improved from 2010 (down 2% and down 36% for employees and contractors, respectively).
Health and safety expenditures for individual protection
Return on average capital employed calculated on an adjusted basis was 13.9% in 2011 (14% in 2010).
Orders acquired amounted to euro 12,505 million (euro 12,935 million in 2010), of these projects to be carried outside Italy represented 91%, while orders from Eni companies amounted to 7% of the total.
Order backlog amounted to euro 20,417 million at December 31, 2011 (euro 20,505 million at December 31, 2010), of which euro 9,451 million to be carried out within 2012.
Capital expenditures amounting to euro 1,090 million (euro 1,552 million in 2010) mainly regarded the upgrading of the drilling and construction fleet.

- 26 -
equipment and medical assistance increased by 81% from 2010 (from euro 46 million to euro 83 million).
In 2011 the Engineering & Construction sector achieved a positive performance with an adjusted net profit amounting to euro 1,098 million, up euro 104 million, or 10.5%, from a year ago, mainly due to a higher turnover and increasing project profitability.
In 2011 overall expenditure in R&D amounting approximately to euro 15 million in line with 2010. A total of 28 new patent applications were filed.

Contents
Eni in 2011 Business review / Engineering & Construction
medium term, leveraging on its business model articulated across various market sectors combined with a strong competitive position in frontier areas, which are traditionally less exposed to the cyclical nature of this activity. In particular, Saipem plans to implement the following strategic guidelines:
� To maximize efficiency in all business areas at the same time maintaining top execution and security standards, preserve competitive supply costs, optimize the utilization rate of the fleet, increase structure flexibility in order to mitigate the effects of negative business cycles as well as develop and promote a Company culture that endorses identification and management of risks and business opportunities;
� To continue focusing on the more complex and difficult projects in the strategic segments of deepwater, FPSO, heavy crude and LNG (offshore and onshore, for the gas monetization) upgrading;
� To promote local content in terms of employment of local contractors and assets in strategic countries where large projects are carried out supporting the development of delocalized logistic hubs and construction yards when requested by clients in order to achieve a long-term consolidation of its market position in those Countries;
� To leverage on the capacity to execute internally more phases of large projects on an EPC and EPIC basis, pursuing better control of costs and terms of execution adapting with flexibility to clients’ needs, thus expanding the Company’s value proposition; and
� To complete the expansion and revamping program of its construction and drilling fleet in consideration of the future needs of the oil&gas industry, in order to confirm the Company’s leading position in the segment of complex projects with high profitability.
Strategies Eni engages in providing engineering, construction and drilling to the oil&gas industry offshore and onshore through Saipem, a subsidiary listed on the Italian Stock Exchange (Eni’s interest is 42.91%), and Saipem’s controlled entities. Saipem boasts a strong competitive position in the segment of executing large, complex EPC contracts for the construction of offshore and onshore facilities and systems to develop hydrocarbons reserves as well as LNG, refining and petrochemicals plants, pipeline layering and offshore and onshore drilling services. The Company owes its market position to technological and operational skills which we believe are acknowledged in the marketplace due to its capabilities to operate in frontier areas and complex ecosystems, efficient and effective project management complemented by engineering competencies and availability of technologically-advanced vessels and rigs. Management expects to further strengthen Saipem’s competitive position in the
Business areas
� Engineering & Construction Offshore Saipem is well positioned in the market of large, complex projects for the development of offshore hydrocarbon fields leveraging on its technical and operational skills, supported by a technologically-advanced fleet, the ability to operate in complex environments, and engineering and project management capabilities acquired on the marketplace over
The most significant orders awarded in 2011 in Engineering & Construction offshore were:
� An EPIC contract on behalf of South Oil Co for the expansion of the Basra oil center and related infrastructures within of the Iraq Crude Oil Export Expansion - Phase 2 project;

- 27 -
recent years. Saipem intends to consolidate its market share strengthening its EPIC oriented business model and leveraging on its satisfactory long-term relationships with the major oil companies and National Oil Companies ("NOCs"). Higher levels of efficiency and flexibility are expected to be achieved by reaching the technological excellence and the highest economies of scale in its engineering hubs employing local resources in contexts where this represents a competitive advantage and integrating the direct management of construction processes through the creation of a large construction yard in South-East Asia. Over the next years, Saipem will continue investing in the upgrading of its fleet by building a pipelayer and other supporting assets for offshore activity.
In 2011 revenues amounted to euro 4,908 million, increasing by 10.4% from 2010, due to higher levels of activity in Northern Europe, Kazakhstan and Asia Pacific. Orders acquired amounted to euro 6,131 million (euro 4,600 million in 2010).
� An EPIC contract on behalf of Saudi Aramco for building the offshore infrastructures within the development of the offshore fields Arabiyah and Hasbah in the Arabian section of the Persian Gulf; and
� An EPIC contract on behalf of Husky Oil China Ltd for the installation of two 79-kilometer long pipelines and umbilicals as well as the construction of a subsea production system for the development of Liwan 3-1 field in water depths of 1,500 meters in the South China Sea.
� Engineering & Construction Onshore Saipem is one of the largest operators in the segment of turn-key onshore construction contracts for the Oil & Gas industry. Saipem operates in the construction of plants for hydrocarbon production (extraction, separation, stabilization, collection of hydrocarbons, water injection)

Contents
Eni in 2011 Business review / Engineering & Construction
and treatment (removal and recovery of sulphur dioxide and carbon dioxide, fractioning of gaseous liquids, recovery of condensates) and in the installation of large onshore transportation systems (pipelines, compression stations, terminals). Saipem preserves its own competitiveness leveraging its technological excellence granted by its engineering hubs, its distinctive know-how in the construction of projects in the high-tech market of LNG and the management of large parts of engineering activities in cost efficient areas. In the medium term, exploiting upward trends in the oil service market, Saipem will be focused on capturing the opportunities arising from the market in the plant and pipeline segments leveraging on its solid competitive position in the execution of complex projects in the strategic areas of Middle-East, Caspian Sea, Northern and Western Africa and Russia.
In 2011 revenues amounted to euro 5,369 million, increasing by 13.6% from 2010, due to higher levels of activity in the Middle East, Canada and Australia. Orders acquired amounted to euro 5,006 million (euro 7,744 million in 2010).
The principal orders awarded in 2011 in Engineering & Construction Onshore were:
� The construction of 39 kilometers high-speed/high-capacity railway along the Treviglio-Brescia railway in Northern Italy on behalf of Rete Ferroviaria SpA;
� An EPC contract for the construction of a Secondary Upgrader with a capacity of 43 kbbl/d of Hydrotreated gas oil. The infrastructure will be part of the Horizon Oil Sands Project – Hydrotreater Phase 2 – in Alberta, in the Athabasca Region, Canada; and
� The EPC contract for the realization of a gas pipeline, 42 inches in diameter and 435-kilometer long, which will connect the gas fields in the Bowen and Surat Basins to the Gladstone State Development Area (GSDA), near the city of Gladstone, in the Western Australian coast on behalf of Gladstone Operations Pty Ltd.
� Offshore drilling Saipem is the only engineering and construction contractor that
provides both offshore and onshore drilling services to oil companies. In the offshore drilling segment, Saipem mainly operates in West Africa, the North Sea, the Mediterranean Sea and the Middle East and boasts significant market positions in the most complex segments of deep and ultra-deep offshore, leveraging on the outstanding technical features of its drilling platforms and vessels, capable of drilling exploration and development wells at a maximum water depth of 9,200 meters. In order to better meet industry demands, Saipem is finalizing an upgrading program of its drilling fleet providing it with state-of-the-art rigs to enhance its role as high quality player capable of operating also in complex and harsh environments. In particular, in the following years, Saipem intends to complete the building of the Scarabeo 8 and 9, new generation semi-submersible platforms, that have been already rented to Eni through multi-year contracts. In parallel, investments are ongoing to renew and to keep up the production capacity of other fleet equipment (upgrade equipment to the characteristics of projects or to clients needs and purchase of support equipment).
In 2011 revenues amounted to euro 833 million, increasing by 11.1% from 2010 mainly due to the entry in full activity of the Saipem 10000 and Saipem 12000 drilling vessels and of the Perro Negro 8 jack up.
The most significant order awarded in 2011 in offshore drilling were:
� A 24-month extension contract, from August 2012, for the lease of the drilling vessel Saipem 10000 on behalf of Eni;
� A 24-month extension contract, from August 2015, for the lease of the drilling vessel Saipem 12000 on behalf of Total E&P Angola; and
� A 36-month extension contract for the lease of the jack-up Perro Negro 7 on behalf of Saudi Aramco.
� Onshore drilling Saipem operates in this area as a main contractor for the major international oil companies and NOCs executing its activity mainly in South America, Saudi Arabia, North Africa and, at a lower extent, in Europe. In this area Saipem can leverage its knowledge of the market,

- 28 -
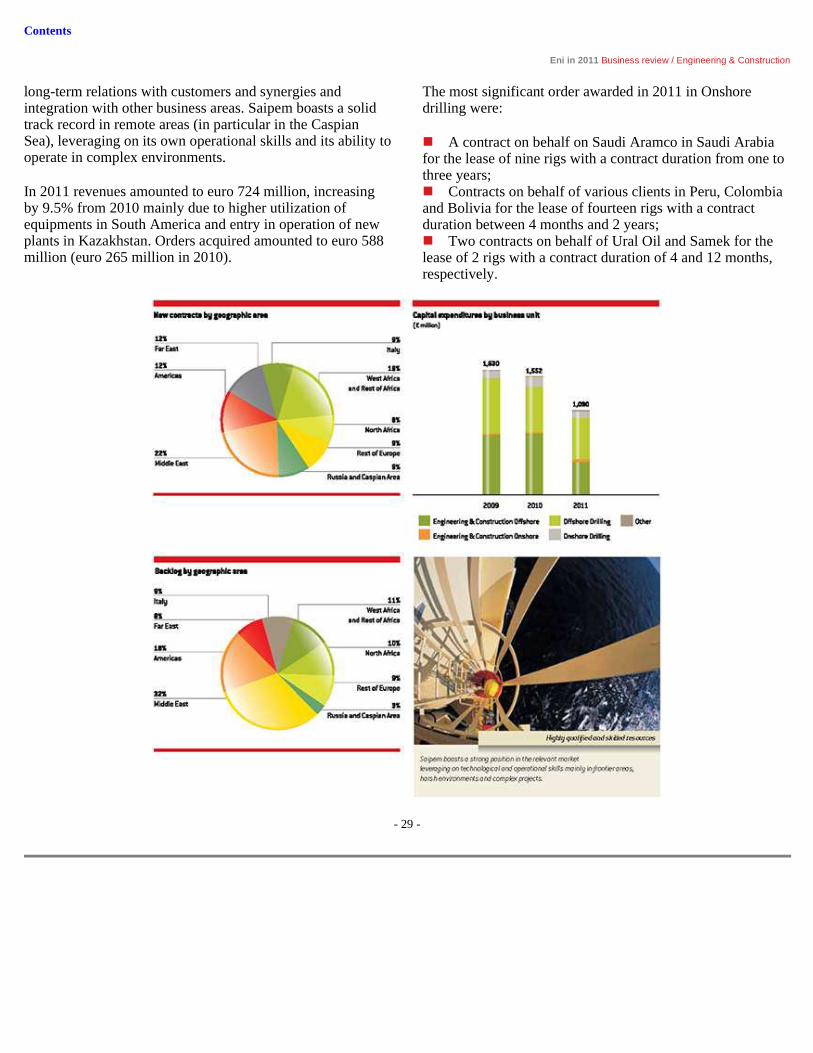
Contents
Eni in 2011 Business review / Engineering & Construction
- 29 -
long-term relations with customers and synergies and integration with other business areas. Saipem boasts a solid track record in remote areas (in particular in the Caspian Sea), leveraging on its own operational skills and its ability to operate in complex environments.
In 2011 revenues amounted to euro 724 million, increasing by 9.5% from 2010 mainly due to higher utilization of equipments in South America and entry in operation of new plants in Kazakhstan. Orders acquired amounted to euro 588 million (euro 265 million in 2010).
The most significant order awarded in 2011 in Onshore drilling were:
� A contract on behalf on Saudi Aramco in Saudi Arabia for the lease of nine rigs with a contract duration from one to three years; � Contracts on behalf of various clients in Peru, Colombia and Bolivia for the lease of fourteen rigs with a contract duration between 4 months and 2 years; � Two contracts on behalf of Ural Oil and Samek for the lease of 2 rigs with a contract duration of 4 and 12 months, respectively.

Contents
Technological research and development ("R&D") and continuous innovation represent key success factors in implementing Eni’s business strategies as they support our long-term competitive performance. The Company believes that the oil industry has to face a number of challenges in the near future and that technology will play a vital role in helping it to effectively manage them. In particular:
� continuing uncertainty about the future evolution of prices and demand for oil and gas;
� limited access to new hydrocarbon resources, with the consequent problems for production growth and reserve replacement;
� a growing importance of renewable sources in satisfying energy need, as well as the role of unconventional resources; and
� greater attention to operations safety in the aftermath of recent accidents in the industry. Against this backdrop, management has identified key technology priorities: • continued technological innovation to increase the recovery factor; to develop drilling technologies to be applied in complex environments and deep/ultra-deep offshore areas; to maximize asset value, especially for gas and marginal fields and by reducing time-to-market; • implementation of new technologies to minimize the environmental footprint of Eni’s operations, actively manage risks to employees and communities’ health and safety; • develop technologies to reduce Greenhouse gas emissions in industrial operations with particular reference to energy efficiency, gas flaring reduction and CO 2 use;
• focusing on innovative fuels and bio-fuels enhancing performance and environmental quality to anticipate stricter regulation; • commitment to develop a potentially breakthrough technologies in the renewable energy (solar and bio-mass). The relevant results achieved in certain research projects, enable us to start up the application phase; • strengthening of strategic alliances and scientific cooperation projects with international academic institutions and research centers which we believe are qualified in the marketplace.
projects underway and streamlining of the existing portfolio in line with Eni’s business strategy. In the year the ratio patents filing/expiring was 1.22 (1.14 in 2010, 0.81 in 2009). In 2011, Eni’s overall expenditure in R&D amounted to euro 191 million which were almost entirely expensed as incurred (euro 221 million in 2010 and euro 207 million in 2009). At December 31, 2011, a total of 925 persons were employed in research and development activities. Below, we describe the main results achieved in the development and application of innovative technologies in 2011. A summary of our main ongoing projects in technological research and development is provided below.
Exploration & Production
� Seismic depth migration . Eni has developed a set of proprietary technologies for more accurate image reconstruction of highly complex subsurface structures, e.g., subsalt environments, deep reservoirs below
carbonates, and fractured reservoirs.
� Eni Common Reflection Surface Stack (e-crs™) . This is a proprietary seismic processing technology that enhances the signal/noise ratio in challenging imaging areas.
� Eni Deep water dual casing running (e-dwdc™) . This proprietary technology for simultaneously drilling and then installing the conductor pipe and the first casing has been applied to drill wells in Angola (Cinguvu-2 and Cabaça South East-3 appraisal wells) and Mozambique (Mamba South 1 and Mamba North 1 discovery wells). Its use reduced the drilling time for this phase, while assuring maximum hole verticality and operational safety.
� Eni Circulation Device (e-cd™) . Proprietary technology has been used to drill wells in Alaska, Angola, China, Egypt, Ghana, and Italy. Eni Circulation Device technology provides enhanced hydraulic control and has demonstrated excellent capacity also for well bore cleaning, opening new application perspectives.
� e-sight, thin layer reservoirs . Proprietary while-

- 30 -
In 2011, Eni filed 79 patent applications (88 in 2010), 37 of these coming from Eni Divisions and Eni Corporate, 13 from Petrochemicals and 28 from the Engineering & Construction activities of Saipem. In particular, 51% of Eni Divisions and Eni Corporate patents concerned exploration activities of unconventional resources, maximizing the recovery factor, transportation and products/processes in the downstream oil segment and 41% were innovation on renewable energy sources. The efficacy and efficiency of intellectual property management and of know-how dissemination are monitored within the R&D performance assessment system. In 2011, the review of Eni’s portfolio was performed following two key aspects: maximizing innovative solutions created by the R&D
drilling and log interpretation technologies (e-sight™) recently industrialized provide an industry-leading capability to identify, quantify and develop thin layer reservoirs, which are by-passed with conventional approaches. This has led to the identification of important additional resources in Italy and internationally, and increased production in 2011.
Contents
Eni in 2011 Research and development
Gas & Power Eni Corporate
� Eni Kassandra meteo forecast . Since 2009 Eni has been developing a new climate weather forecast system in collaboration with the Italian Weather Operations Centre (MOPI) to gain know-how regarding the temperature trend on a regional and seasonal scale. Eni developed "Eni Kassandra meteo forecast", a proprietary system for forecasting temperatures from meteorological and climate data. The system has been validated in 2011 at the European level and is going to be used in the management and sale of energy resources obtaining competitive advantages in both gas and power businesses.
� Pipeline monitoring . With the aim of guaranteeing excellent quality standards and efficient transport services, as part of its activity of pipeline monitoring, Eni developed theoretical models of acoustic-elastic transmission in pipes used for gas and oil transport as well as algorithms for remote localization of impacts and fluid leaks along the pipe. The prototypal system of this monitoring technology will be applied on transport and production pipes in Eni plants in Italy, Tunisia and Nigeria. In addition, studies were also completed on new acoustic sensors with Wi-Fi remote control for offshore pipes that cannot be checked with PIG (Pipeline Inspection Gauges), and radar technologies for remote monitoring of vibrations and pipe displacement.
� Photoactive materials . A Luminescent Solar Concentrator consists of a slab of transparent material (polymeric or glassy) doped with fluorescent molecules, patented by Eni, which works as microscopic light emitters. The emitted radiation is partially concentrated within the slab by total internal reflections and is waveguided toward its edges where PV cells are placed. LSCs allow for a substantial decrease in standard PV module costs by reducing the effective cell surface with respect to the absorbing surface. The positive results obtained at lab level allow the commencement of a demonstration phase.
� Micro-organisms for bio-diesel . Purpose of the project is the use of micro-organisms (yeasts and bacteria) that accumulate lipids similar to those deriving from oil-bearing vegetables, that can easily be turned into bio-diesel. The raw material employed by these micro-organisms derives from the treatment of wood-cellulose bio-mass in order to not compete with food products. The identified yeasts have higher productivity than the traditional oil crops, including palm oil.
� Photoproduction of hydrogen . This project has breakthrough content for water splitting into O 2 and H 2 .
New materials were synthesized for innovative photoelectrodes and demonstration cells were constructed. The new materials (e.g. titanium oxide, tungsten, and iron), based on original processes that use nanotechnology, have lead to interesting efficiency levels in the conversion of solar energy into chemical energy, up to the best levels reached on a world basis.
Refining & Marketing
Results derived from the Eni-MIT alliance
� Eni Slurry Technology (EST) . The EST proprietary technology is an innovative process for hydro-conversion by means of a nanodispersed catalyst (slurry) and a peculiar process scheme to refine various kinds of heavy feedstock: residues from the distillation of heavy and extra-heavy crude (such as the ones from the Orinoco Belt in Venezuela) or non-conventional products such as tar sands, characterized by high contents of sulphur, nitrogen, metals, asphaltenes and other pollutants that are hard to manage in conventional refineries. EST does not produce by-products and completely converts feedstocks into distillates.
� Total Conversion . Successful results have been obtained from the continuous operation of the Slurry Dual Catalyst pilot plant: this technology, based on the combination of two nanocatalysts
� Oil spills in marine environment . The project derives from the discovery of an innovative material with great selective capacity for the absorption of oil dispersed in water. This could be a first step towards new systems for treating oil spills in marine environments.
� Ultraflexible solar cell. One of the most important results obtained by the Solar Frontier Center: these cells made of a thin photoactive material covered by a layer of transparent plastic can be bent without breaking or reducing

could lead to a relevant breakthrough in the EST process, increasing its productivity and improving product quality.
� Short Contact Time-Catalytic Partial Oxidation (SCT-CPO) . It is a reforming technology that can convert gaseous and liquid hydrocarbons (also derived from bio-mass) into synthetic gas (carbon monoxide and hydrogen). This technology can contribute to process intensification as it allows to produce synthetic gas and hydrogen using reactors up to 100 times smaller than those currently in use, with relevant savings. The development of this technology, that makes use of oxygen enriched air, has been completed and another version making use of pure oxygen is under development.
� Zero Waste project . For the treatment of industrial, oil and biological waste generated by the oil industry a thermal process has been studied that allows for the gasification of sludge that is turned into an inert residue. A patent
application has been filed on this project.
performance and this allows to cover irregular surfaces without using metal stilts.
� Solar cells on paper. In this case the photoactive device is made on paper as a printed document. The innovative technique is the same used for producing cells on plastic and flexible substrata. A paper cell can be a low cost solution for application where the key aspect is not duration but fast installation and easy
transport.
- 31 -

Contents
- 32 -

Contents
- 33 -

Contents
- 34 -
Trading environment indicators 2009 2010 2011 Average price of Brent dated crude oil (a) 61.51 79.47 111.27 Average EUR/USD exchange rate (b) 1.393 1.327 1.392 Average price in euro of Brent dated crude oil 44.16 59.89 79.94 Average European refining margin (c) 3.13 2.66 2.06 Average European refining margin Brent/Ural (c) 3.56 3.47 2.90 Average European refining margin in euro 2.25 2.00 1.48 NBP gas price (d) 4.78 6.56 9.03 Euribor - three-month rate (%) 1.2 0.8 1.4 Libor - three-month dollar rate (%) 0.7 0.3 0.3
(a) In USD per barrel. Source: Platt’s Oilgram. (b) Source: ECB. (c) In USD per barrel FOB Mediterranean Brent dated crude oil. Source: Eni calculations based on Platt’ s Oilgram data. (d) In USD per million btu. Source: Platt’s Oilgram.
Eni’s results of operations and the year to year comparability of its financial results are affected by a number of external factors which exist in the industry environment, including changes in oil, natural gas and refined products prices, industry-wide movements in refining and petrochemical margins and fluctuations in exchange rates and interest rates. Changes in weather conditions from year to year can influence demand for natural gas and some petroleum products, thus affecting results of operations of the natural gas business and, to a lesser extent, of the refining and marketing business. In 2011, Eni’s results of operations were achieved on the back of stronger oil and gas realizations (up by 30% on average) driven by a 40% increase
in the price of the Brent crude benchmark compared to 2010. Refining margins remained at unprofitable levels (the marker Brent margin was $2.06 per barrel; down 22.6% from 2010) due to high feedstock costs which were only partially transferred to prices at the pump. Eni’s margins at its high-conversion refineries were also hit by narrowing light-heavy crude differentials in the Mediterranean area. In Europe, gas spot prices which have become the benchmark in contractual selling formulas increased by 37.7% compared with the depressed levels registered in 2010. This positive trend was not reflected in Eni’s gas selling margins due to higher oil-linked supply costs and rising competitive pressure. Results were also affected by the appreciation of the euro vs. the US dollar (up 4.9%).


Contents
Eni in 2011 Group results for the year
2011 Results
In 2011, net profit attributable to Eni’s shareholders was euro 6,860 million, an increase of euro 542 million from 2010, or 8.6%. This increase was driven by an improved operating performance (up euro 1,324 million, or 8.2%) reported by the Exploration & Production Division which was boosted by higher oil prices. The Group’s results were also helped by lower extraordinary pre-tax charges which were down by approximately euro 1 billion year-on-year and a gain of euro 1,044 million recorded on the divestment of Eni’s interests in the international pipelines which transport gas from Northern Europe and
Russia. These positives were partly offset by sharply lower results posted by the Group’s downstream businesses, higher net finance charges (down euro 402 million) and higher income taxes (down euro 1,517 million).
Adjusted net profit attributable to Eni’s shareholders amounted to euro 6,969 million, an increase of euro 100 million from 2010, or 1.5%. Adjusted net profit was calculated by excluding an inventory holding profit of euro 724 million and net special charges of euro 833 million, thus totaling to a positive adjustment of euro 109 million.
Results for the year (euro million) 2006 2007 2007
2009 2010 2011 Change % Ch.
4,367 Net profit attributable to Eni's shareholders 6,318 6,860 542 8.6 (191 ) Exclusion of inventory holding (gain) losses (610 ) (724 )
1,031 Exclusion of special items 1,161 833 of which:
250 - non recurring items (246 ) 69 781 - other special items 1,407 764
5,207 Adjusted net profit attributable to Eni ’s shareholders 6,869 6,969 100 1.5
i
Special charges of the operating profit mainly related to: (i) impairment losses of euro 1,022 million, which were recorded to write down the book values of certain tangible and intangible assets to their lower value-in-use mainly in the refining and gas marketing businesses. These charges reflected our reduced profitability outlook in these businesses driven by a deteriorating macroeconomic environment, volatile commodity prices, and rising competitive pressures. Other impairment losses regarded a number of oil&gas properties in the Exploration & Production Division reflecting a
changed pricing environment and downward reserve revisions; (ii) provisions for redundancy incentives (euro 209 million), including a liability which was taken in connection with the 2010-2011 personnel mobility program in Italy to reflect changed pension requirements as per Law Decree No. 201 of December 2011; (iii) environmental and other risk provisions amounting to euro 274 million.
The breakdown of adjusted net profit by Division is shown in the table below:
ii
Adjusted net profit by Division (euro million) 2006 2007 2007
2009 2010 2011 Change % Ch.
3,878 Exploration & Production 5,600 6,866 1,266 22.6 2,916 Gas & Power 2,558 1,541 (1,017 ) (39.8 ) (197 ) Refining & Marketing (49 ) (262 ) (213 ) .. (340 ) Petrochemicals (85 ) (208 ) (123 ) .. 892 Engineering & Construction 994 1,098 104 10.5
(245 ) Other activities (216 ) (225 ) (9 ) (4.2 ) (744 ) Corporate and financial companies (699 ) (787 ) (88 ) (12.6 )
(3 ) Impact of unrealized intragroup profit elimination (a) (169 ) (111 ) 58 6,157 Adjusted net profit 7,934 7,912 (22 ) (0.3 )
of which attributable to: 950 - Non-controlling interest 1,065 943 (122 ) (11.5 )
5,207 - Eni's shareholders 6,869 6,969 100 1.5
(a) This item concerned mainly intragroup sales of commodities, services and capital goods recorded in the assets of the purchasing business segment as of end of the period.
- 35 -
ii The increase in the Group adjusted net profit reflected a higher adjusted net profit mainly reported by: - the Exploration & Production Division (up euro 1,266 million, or 22.6%) driven by a better operating performance (up euro 2,193 million, or 15.8%), reflecting higher oil and gas realizations in dollar terms (up 40.3% and 7.7%, respectively). This trend was strong enough to fully absorb a reduced operating profit from the Libyan activities. Full year results were impacted by the negative effect of the appreciation of the euro against the dollar (up 4.9%, for an overall impact of approximately euro 490 million); - the Engineering & Construction business (up euro 104 million , or 10.5%)
reported an improved operating performance (up euro 117 million , or 8.8%) driven by revenue growth and higher profitability of works executed. These increases were partly offset by a declining adjusted net profit reported by: - the Gas & Power Division reported sharply lower results due to a decline of euro 1,173 million in adjusted operating profit, down by 37.6%. The decrease was mainly caused by the Marketing business which was negatively impacted by weak demand and mounting competitive pressure fuelled by oversupply which squeezed selling margins and reduced volumes opportunities;

Contents
Eni in 2011 Group results for the year
- the Refining & Marketing Division reported sharply lower adjusted operating losses (from minus euro 49 million in 2010 to minus euro 262 million in 2011). This decrease reflected negative trends in the refining trading environment featured by depressed margins and poor demand for fuels due to weak underlying fundamentals; - the Petrochemical Division was also deeply in the red with reported operating losses down to minus euro 208 million in 2011, much worse than in 2010. The performance was negatively impacted by falling product margins, with the cracker margin severely hit by higher supply costs of oil-based feedstock which were not recovered in sales prices on end markets, and a substantial decrease in demand.
� Capital expenditures In 2011, capital expenditures amounting to euro 13,438 million related mainly to: - development activities (euro 7,357 million) deployed mainly outside Italy, primarily in Norway, Kazakhstan, Algeria, the Unites States,
Congo and Egypt. In addition we acquired certain blocks and paid entry bonuses following interest license awards amounting to euro 754 million, mainly in Nigeria; - exploratory activities (euro 1,210 million) of which 97% was spent outside Italy, were conducted primarily in Australia, Angola, Mozambique, Indonesia, Ghana, Egypt, Nigeria and Norway; - upgrading of the fleet used in the Engineering & Construction Division (euro 1,090 million); - development and upgrading of Eni’s natural gas transport network in Italy (euro 898 million) and distribution network (euro 337 million), the development and the increase of storage capacity (euro 294 million), as well as and the ongoing development of power generation plants (euro 87 million); - projects aimed at improving the conversion capacity and flexibility of refineries (euro 629 million), as well as building and upgrading service stations in Italy and outside Italy (euro 228 million).
Capital expenditures by Division (euro million) 2006 2007 2007
2009 2010 2011 Change % Ch.
9,486 Exploration & Production 9,690 9,435 (255 ) (2.6 ) 1,686 Gas & Power 1,685 1,721 36 2.1
635 Refining & Marketing 711 866 155 21.8 145 Petrochemicals 251 216 (35 ) (13.9 )
1,630 Engineering & Construction 1,552 1,090 (462 ) (29.8 ) 44 Other activities 22 10 (12 ) (54.5 ) 57 Corporate and financial companies 109 128 19 17.4 12 Impact of unrealized intragroup profit elimination (150 ) (28 ) 122
13,695 Capital expenditures 13,870 13,438 (432 ) (3.1 )
� Sources and uses of cash The Company’s cash requirements for capital expenditures, dividends to shareholders, and working capital were financed by a combination of funds generated from operations, borrowings and divestments of non-strategic assets. In 2011, main inflows were associated with net cash provided by operating activities, which amounted to euro 14,382 million and proceeds from asset disposals (euro 1,912 million). These inflows were balanced by outflows for capital expenditures totaling euro 13,438 million, expenditures in joint venture projects (euro 360 million) and dividend payments amounting to euro 4,247 million to Eni shareholders (euro 3,695 million, of which euro 1,884 million relating to the 2011 interim dividend) and to non-controlling interest of Snam Rete Gas, Saipem and other consolidated subsidiaries (euro 552 million).
As a result of these cash flows, net borrowings as of December 31, 2011 increased by euro 1,913 million compared to December 31, 2010.
� Capital structure and ratios The Group continually monitors the balance between cash flow from operating activities, net expenditures, internally generated funds and dividend requirements targeting a sound and well-balanced financing structure.
Eni’s net financial debt of euro 28 billion as of end of 2011 was associated with low risk activities as around euro 11 billion were attributable to Regulated businesses in Italy which ensure stable and solid cash flows that cover their investment needs and contribute to lower the risk profile of Eni’s portfolio. In addition, euro 3 billion of consolidated debt are attributable to Saipem, whose major ongoing investment program, relating to Offshore drilling and construction, will be completed by the end of the year. Finally, euro 14 billion of consolidated debt are attributable to Eni’s core operations and mainly linked to development

- 36 -
projects under PSAs that have a safe and quick pay back period. In the foreseeable future, management is strongly focused on preserving a solid balance sheet and an adequate level of liquidity taking into account macroeconomic uncertainties and tight financial markets. For planning purposes, management projected the Company’s expected cash flows assuming a scenario of Brent prices at 90-85 $/bbl for the years 2012-2015 to assess the financial compatibility of its capital expenditures programs and dividend policy with internal targets of leverage (the ratio of net borrowings to total equity). As of December 31, 2011, the Group leverage was 0.46, compared to the level of 0.47 as of December 31, 2010.

Contents
Eni in 2011 Group results for the year
In 2012, leverage is projected to be roughly in line with the level achieved at the end of 2011 assuming a Brent price of $90 a barrel. Looking forward, management will seek to progressively reduce this ratio to below 40% by the end of the plan period leveraging on the projected future cash flow
from operations which are estimated to generate enough resources to fund both capital expenditures and dividends to Eni’s shareholders. Return On Average Capital Employed (ROACE) calculated on an adjusted basis was 9.9% (10.7% in 2010).
i
Adjusted ROACE (euro million) 2006 2007 2007
2011 E&P G&P R&M Group
Adjusted net profit 6,866 1,541 (262 ) 7,912 Exclusion of after-tax finance expenses/interest income 454
Adjusted net profit unlevered 6,866 1,541 (262 ) 8,366 Adjusted capital employed, net: - at the beginning of period 37,646 27,346 8,321 81,847 - at the end of period 42,024 27,660 8,600 87,701
Adjusted average capital employed, net 39,835 27,503 8,461 84,774
Adjusted ROACE (%) 17.2 5.6 (3.1 ) 9.9
i
� Dividends In the next four-year period management intends to maintain its progressive dividend policy. Eni’s dividend policy in future periods, and the sustainability of the current amount of dividends over the next four-year period, will depend upon a number of factors including future levels of profitability and cash flow provided by operating activities, a sound balance sheet structure, capital expenditures and development plans. The parent Company’s net profit and, therefore, the amounts of earnings available for the payment of dividends will also depend on the level of dividends received from Eni’s subsidiaries. However, subject to such factors, under the Company’s scenario for Brent prices at 90-85 $/bbl over the next four years, management plans to grow the dividend in line with OECD inflation from 2011 onwards. If management assumptions on oil prices were to change, management may revise the dividend and reset the basis for progressive dividend increases. Management plans to pay a dividend of euro 1.04 a share for 2011 subject to approval from the Annual General Shareholders’ Meeting scheduled on May 8, 2012. Of this, euro 0.52 per share was paid in September 2011 as an interim dividend with the balance of euro 0.52 per share expected to be paid late in May 2012.
are anticipated to remain at unprofitable levels due to high costs of oil supplies, sluggish demand and excess capacity. For investment planning purposes and short-term financial projections, Eni assumes a full-year average price of $90 a barrel for the Brent crude benchmark. For the full year 2012, management expects a capital budget almost in line with 2011 (in 2011 capital expenditures amounted to euro 13.44 billion, while expenditures incurred in joint venture initiatives and other investments amounted to euro 0.36 billion). Management plans to continue spending on exploration to appraise the mineral potential of recent discoveries (Mozambique, Norway, Ghana and Indonesia) and investing large amounts on developing growing areas and maintain field plateaus in mature basins. Other investment initiatives will target the upgrading of the gas transport and distribution networks, the completion of the EST project in the refining business, and strengthening selected petrochemical plants.
Risk factors In future years, management expects to continue paying interim dividends for each fiscal year, with the balance for the full-year dividend paid in the following year.
� Market risk and sensitivity to market environment Market risk is the possibility that the exposure to fluctuations in currency
Outlook for 2012 exchange rates, interest rates or commodity prices will adversely affect the value of the Group’s financial assets, liabilities or expected future cash flows. Eni’s financial performance is particularly sensitive to changes in the price of crude oil and movements in the euro/US$ exchange rate. Overall, a rise in the price of crude oil has a positive effect on Eni’s results from operations and liquidity due to increased revenues from oil and gas production. Conversely, a decline
Management expects the 2012 outlook to be challenging due to signs of a continuing economic slowdown, particularly in the Euro-zone, and volatile market conditions. Management expects international oil prices to be supported by robust demand growth from China and other emerging economies,
- 37 -
as well as ongoing geopolitical risks and uncertainties, partly offset by a recovery in the Libyan output. Recovery perspectives look poor in the gas sector. Gas demand is expected to be soft due to slow economic activity and increasing competition from renewable sources; in the meantime the marketplace appears well supplied. Against this backdrop, management expects ongoing margin pressures to continue in 2012, and reduced sales opportunities due to rising competition. Management foresees the persistence of a depressed trading environment in the European refining business. Refining margins
in crude oil prices reduces Eni’s results from operations and liquidity. The impact of changes in crude oil prices on the Company’s downstream gas and refining and marketing businesses and petrochemical operations depends upon the speed at which the prices of finished products adjust to reflect changes in crude oil prices. In addition, the Group’s activities are, to various degrees, sensitive to fluctuations in the euro/US$ exchange rate as commodities are generally priced internationally in US dollars or linked to US dollar denominated products as in the case of gas prices. Overall, an appreciation of the euro against the US dollar reduces the Group’s results from operations and liquidity, and vice versa. The Group actively manages its exposure to commercial risk which arises when a contractual sale of a commodity has occurred or it is highly probable that it will occur and the Group aims at locking in the associated commercial

Contents
Eni in 2011 Group results for the year
margin. The Group’s risk management objectives are to optimize the risk profile of its commercial activities by effectively managing economic margins and safeguarding the value of Eni assets. Also, as part of its risk management activities from 2011 the Group has commenced trading activities in order to seek to profit from short-term market opportunities. The Group’s risk management has evolved particularly in response to the deep changes occurred in the competitive landscape of the gas marketing business, gas volatile margins and development of liquid gas spot markets.
To achieve these targets, Eni enters into commodity derivatives transactions in both commodity and financial markets: (i) to hedge the risk of variability in future cash flows on already contracted or highly probable future sales exposed to commodity risk depending on the circumstance that costs of supplies may be indexed to different market and oil benchmarks compared to the indexing of selling prices. As tight correlation exists between such commodity derivatives transactions and underlying physical contracts, those derivatives are treated in accordance with hedging accounting in compliance with IAS 39, where possible; and (ii) to pursue speculative purposes such as altering the risk profile associated with a portfolio of contracts (purchase contracts, transport entitlements, storage capacity) or leveraging any pricing differences in the marketplace, seeking to increase margins on existing assets in case of favorable trends in the commodity pricing environment or seeking a potential profit based on expectations of trends in future prices.
The Company also intends to implement strategies of dynamic forward trading in order to maximize the economic value of the flexibilities associated with its assets. Price risks related to asset backed trading activities are mitigated by the natural hedge granted by the assets’ availability. These contracts may lead to gains as well as losses, which, in each case, may be significant. These derivatives are accounted for through profit and loss, resulting in higher volatility in Eni’s operating profit, particularly in the gas marketing business. Eni Trading & Shipping is the Group’s entity in charge of managing derivative activities targeting the full spectrum of energy commodities on both the physical and financial trading venues. The objective of this activity is to both hedge part of the Group exposure to the commodity risk and optimize commercial margins by entering speculative derivative transactions. Eni Trading & Shipping SpA and its subsidiaries also provide Group companies with crude oil and products supply, trading and shipping services. The results of this entity are reported within the Gas & Power segment with regard to the results recorded on trading gas and electricity derivatives; while the portion of results which pertains to oil and products trading derivatives and supply and shipping services are reported within the Refining & Marketing segment. As part of its financing and cash management activities, the
Such a situation would negatively impact the Group results of operations and cash flows as it would result in Eni incurring higher borrowing expenses to meet its obligations or, under the worst conditions, the inability of Eni to continue as a going concern. At present, the Group believes it has access to sufficient funding and has also both committed and uncommitted borrowing facilities to meet currently foreseeable borrowing requirements. At December 31, 2011, Eni maintained short-term committed and uncommitted unused borrowing facilities of euro 11,897 million, of which euro 2,551 million were committed, and long-term committed unused borrowing facilities of euro 3,201 million. These facilities bore interest rates that reflected prevailing market conditions. Fees charged for unused facilities were immaterial. Eni has in place a program for the issuance of Euro Medium Term Notes up to euro 15 billion, of which about euro 10.5 billion were drawn as of December 31, 2011. The Group has credit ratings of A and A-1 respectively for long and short-term debt assigned by Standard & Poor’s and A2 and P-1 assigned by Moody’s; the outlook is negative in both ratings.
Credit risk is the potential exposure of the Group to losses in case counterparties fail to perform or pay amounts due. The Group manages differently credit risk depending on whether credit risk arises from exposure to financial counterparties or to customers relating to outstanding receivables. Individual business units and Eni’s corporate financial units and Eni Adfin are responsible for managing credit risk arising in the normal course of the business. The Group has established formal credit systems and processes to ensure that before trading with a new counterpart can start, its creditworthiness is assessed. Also credit litigation and receivable collection activities are assessed. Eni’s corporate units define directions and methods for quantifying and controlling customer’s reliability. With regard to risk arising from financial counterparties, Eni has established guidelines prior to entering into cash management and derivative contracts to assess the counterparty’s financial soundness and rating in view of optimizing the risk profile of financial activities while pursuing operational targets. Maximum limits of risk exposure are set in terms of maximum amounts of credit exposures for categories of counterparties as defined by the Company’s Board of Directors taking into accounts the credit ratings provided by primary credit rating agencies on the marketplace. Credit risk arising from financial counterparties is managed by the Group central finance departments, including Eni’s subsidiary Eni Trading & Shipping which specifically engages in commodity derivatives transactions and by Group companies and Division, only in the case of physical transactions with financial counterparties consistently with the Group centralized finance model. Eligible financial counterparties are closely monitored to check exposures against limits assigned to each counterparty on a daily basis. Exceptional market conditions have forced the Group to adopt contingency plans and under certain

- 38 -
Company uses derivative instruments to manage its exposure to changes in foreign exchange rates and interest rates. These instruments are principally interest rate and currency swaps.
� Liquidity and counterparty risks Liquidity risk is the risk that suitable sources of funding for the Group may not be available, or the Group is unable to sell its assets on the marketplace in order to meet short-term financial requirements and to settle obligations.
circumstances to suspend eligibility to be a Group financial counterparty. Actions implemented also have been intended to limit concentrations of credit risk by maximizing counterparty diversification and turnover. Counterparties have also been selected on more stringent criteria particularly in transactions on derivatives instruments and with maturity longer than a three-month period. As of December 31, 2011, Eni had no significant concentration of credit risk.

Contents
Eni prepares its consolidated financial statements in accordance with the International Financial Reporting Standards (IFRS) issued by the International Accounting Standards Board (IASB) and adopted by the European Union. Differences in certain respects between IFRS as endorsed by the EU and IFRS as issued by IASB are on matters that do not relate to Eni. On this basis, Eni’s financial statements are fully in compliance with IFRS as issued by IASB.
The consolidated financial statements of Eni include accounts of the parent company Eni SpA and of all Italian and foreign significant subsidiaries in which Eni directly or indirectly holds the majority of voting rights or is otherwise able to exercise control as in the case of "de facto" controlled entities. Control comprises the power to govern the financial and operating policies of the investee so as to obtain benefit from its activities. Immaterial subsidiaries, jointly controlled entities, and other entities in which the group is in a position to exercise a significant influence through participation in the financial and operating policy decisions of the investee are generally accounted for under the equity method.
Revenues from sales of crude oil, natural gas, petroleum and petrochemical products are recognized when the products are delivered and title passes to the customer. Revenue recognition in the Engineering & Construction Division is based on the stage of completion of contracts as measured on the cost-to-cost basis applied to contractual revenues.
Eni enters into various derivative financial transactions to manage exposures to certain market risks, including foreign currency exchange rate risks, interest rate risks and commodity risks. Such derivative financial instruments are assets and liabilities recognized at fair value starting on the date on which a derivative contract is entered into and are subsequently re-measured at fair value. Derivatives are designated as hedges when the hedging relationship between the hedged item or transaction and the hedging instrument is highly effective and formally documented. Changes in the fair value of hedging derivatives are recognized: (i) for fair value hedges, hedging the exposure to changes in the fair value of a recognized asset or liability, in the profit and loss account; (ii) for cash flow hedges, hedging exposure to
Inventories of crude oil, natural gas and oil products are stated at the lower of purchase or production cost and net realizable value. Cost is determined by applying the weighted-average cost method. Contract work in progress is recorded on the basis of contractual considerations by reference to the stage of completion of a contract measured on a cost-to-cost basis.
Property, plant and equipment is stated at cost less any accumulated depreciation, depletion and amortization charges and impairment losses. Depreciation, depletion and amortization of oil and gas properties (capitalized costs incurred to obtain access to proved reserves and to provide facilities for extracting, gathering and storing oil and gas) is calculated based on the Unit-Of-Production (UOP) method on proved reserves or proved developed reserves. Other property, plant and equipment is depreciated on a straight-line basis over its expected useful life.
Exploration costs (costs associated with exploratory activities for oil and gas including geological and geophysical exploration costs and exploratory drilling well expenditures) are capitalized and fully amortized as incurred.
Intangible assets are initially stated at cost. Intangible assets having a defined useful life are amortized systematically, based on the straight-line method. Goodwill and intangibles lacking a defined useful life are not amortized but are reviewed periodically for impairment.
Impairment of tangible and intangible assets Eni assesses its property, plant and equipment and intangible assets, including goodwill, for impairment whenever events or changes in circumstances indicate that the carrying values of the assets may not be recoverable. Indications of impairment include changes in the Group’s business plans, changes in commodity prices leading to unprofitable performance and, for oil and gas properties, significant downward revisions of estimated proved reserve quantities. The recoverability of an asset or group of assets is assessed by comparing the carrying value with the recoverable amount represented by the higher of fair value less costs to sell and value in use. In assessing value in use, the Group makes an estimate of the future cash

- 39 -
variability in cash flows, the effective portion is recognized directly in equity, while the ineffective portion is recognized in profit or loss; subsequently amounts taken to equity are transferred to the profit and loss account when the hedged transaction affects profit or loss. Changes in fair value of derivatives held for trading purposes, including derivatives for which the hedging relationship is not formally documented or is ineffective, are recognized in profit or loss.
flows expected to be derived from the use of the asset on the basis of reasonable and documented assumptions that represent the best estimate of the future economic conditions during the remaining useful life of the asset, giving more importance to independent assumptions. Oil, natural gas and petroleum products prices used to quantify the expected future cash flows are estimated based on forward prices prevailing in the marketplace for the first four years of the estimate and management’s long-term planning
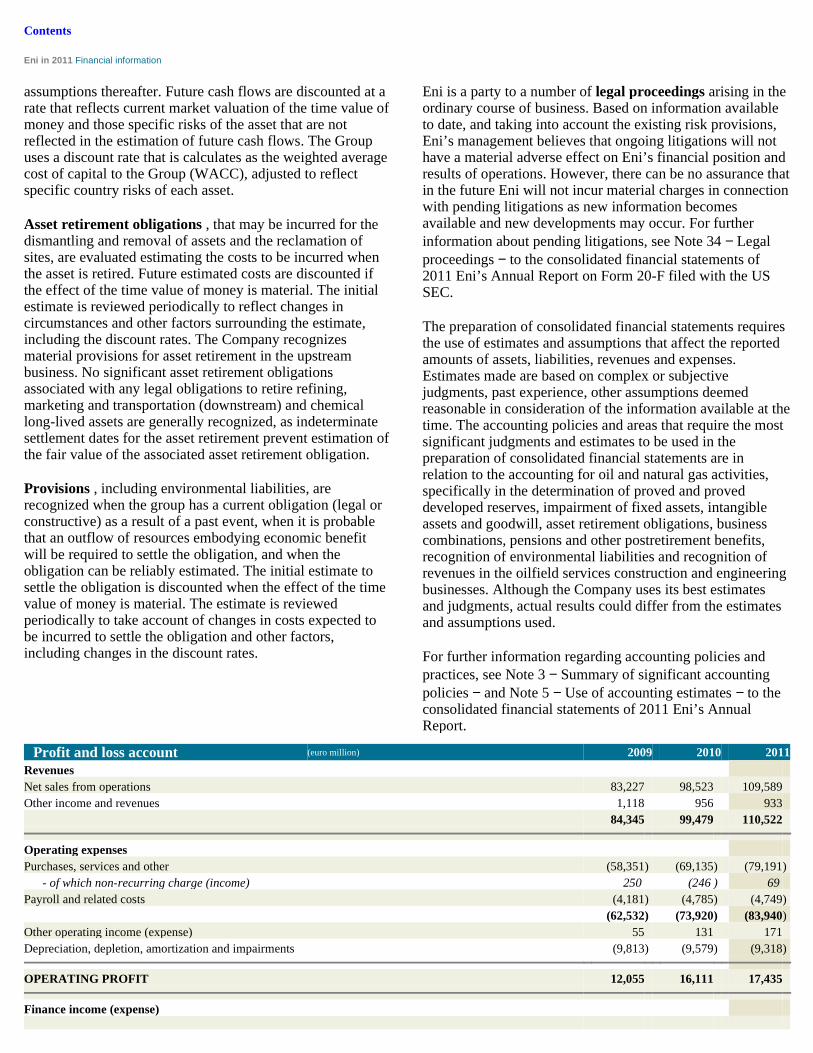
Contents
Eni in 2011 Financial information
assumptions thereafter. Future cash flows are discounted at a rate that reflects current market valuation of the time value of money and those specific risks of the asset that are not reflected in the estimation of future cash flows. The Group uses a discount rate that is calculates as the weighted average cost of capital to the Group (WACC), adjusted to reflect specific country risks of each asset.
Asset retirement obligations , that may be incurred for the dismantling and removal of assets and the reclamation of sites, are evaluated estimating the costs to be incurred when the asset is retired. Future estimated costs are discounted if the effect of the time value of money is material. The initial estimate is reviewed periodically to reflect changes in circumstances and other factors surrounding the estimate, including the discount rates. The Company recognizes material provisions for asset retirement in the upstream business. No significant asset retirement obligations associated with any legal obligations to retire refining, marketing and transportation (downstream) and chemical long-lived assets are generally recognized, as indeterminate settlement dates for the asset retirement prevent estimation of the fair value of the associated asset retirement obligation.
Provisions , including environmental liabilities, are recognized when the group has a current obligation (legal or constructive) as a result of a past event, when it is probable that an outflow of resources embodying economic benefit will be required to settle the obligation, and when the obligation can be reliably estimated. The initial estimate to settle the obligation is discounted when the effect of the time value of money is material. The estimate is reviewed periodically to take account of changes in costs expected to be incurred to settle the obligation and other factors, including changes in the discount rates.
Eni is a party to a number of legal proceedings arising in the ordinary course of business. Based on information available to date, and taking into account the existing risk provisions, Eni’s management believes that ongoing litigations will not have a material adverse effect on Eni’s financial position and results of operations. However, there can be no assurance that in the future Eni will not incur material charges in connection with pending litigations as new information becomes available and new developments may occur. For further information about pending litigations, see Note 34 − Legal proceedings − to the consolidated financial statements of 2011 Eni’s Annual Report on Form 20-F filed with the US SEC.
The preparation of consolidated financial statements requires the use of estimates and assumptions that affect the reported amounts of assets, liabilities, revenues and expenses. Estimates made are based on complex or subjective judgments, past experience, other assumptions deemed reasonable in consideration of the information available at the time. The accounting policies and areas that require the most significant judgments and estimates to be used in the preparation of consolidated financial statements are in relation to the accounting for oil and natural gas activities, specifically in the determination of proved and proved developed reserves, impairment of fixed assets, intangible assets and goodwill, asset retirement obligations, business combinations, pensions and other postretirement benefits, recognition of environmental liabilities and recognition of revenues in the oilfield services construction and engineering businesses. Although the Company uses its best estimates and judgments, actual results could differ from the estimates and assumptions used.
For further information regarding accounting policies and practices, see Note 3 − Summary of significant accounting policies − and Note 5 − Use of accounting estimates − to the consolidated financial statements of 2011 Eni’s Annual Report.
i i i
Profit and loss account (euro million) 2009 2010 2011
Revenues Net sales from operations 83,227 98,523 109,589 Other income and revenues 1,118 956 933 84,345 99,479 110,522
Operating expenses Purchases, services and other (58,351 ) (69,135 ) (79,191 ) - of which non-recurring charge (income) 250 (246 ) 69 Payroll and related costs (4,181 ) (4,785 ) (4,749 ) (62,532 ) (73,920 ) (83,940 ) Other operating income (expense) 55 131 171 Depreciation, depletion, amortization and impairments (9,813 ) (9,579 ) (9,318 )
OPERATING PROFIT 12,055 16,111 17,435
Finance income (expense)

- 40 -
Finance income 5,950 6,117 6,379 Finance expense (6,497 ) (6,713 ) (7,396 ) Derivative financial instruments (4 ) (131 ) (112 ) (551 ) (727 ) (1,129 )
Income (expense) from investments Share of profit (loss) of equity-accounted investments 393 537 544 Other gain (loss) from investments 176 619 1,627 569 1,156 2,171
PROFIT BEFORE INCOME TAXES 12,073 16,540 18,477 Income taxes (6,756 ) (9,157 ) (10,674 ) NET PROFIT 5,317 7,383 7,803 Attributable to: - Eni's shareholders 4,367 6,318 6,860 - Non-controlling interest 950 1,065 943
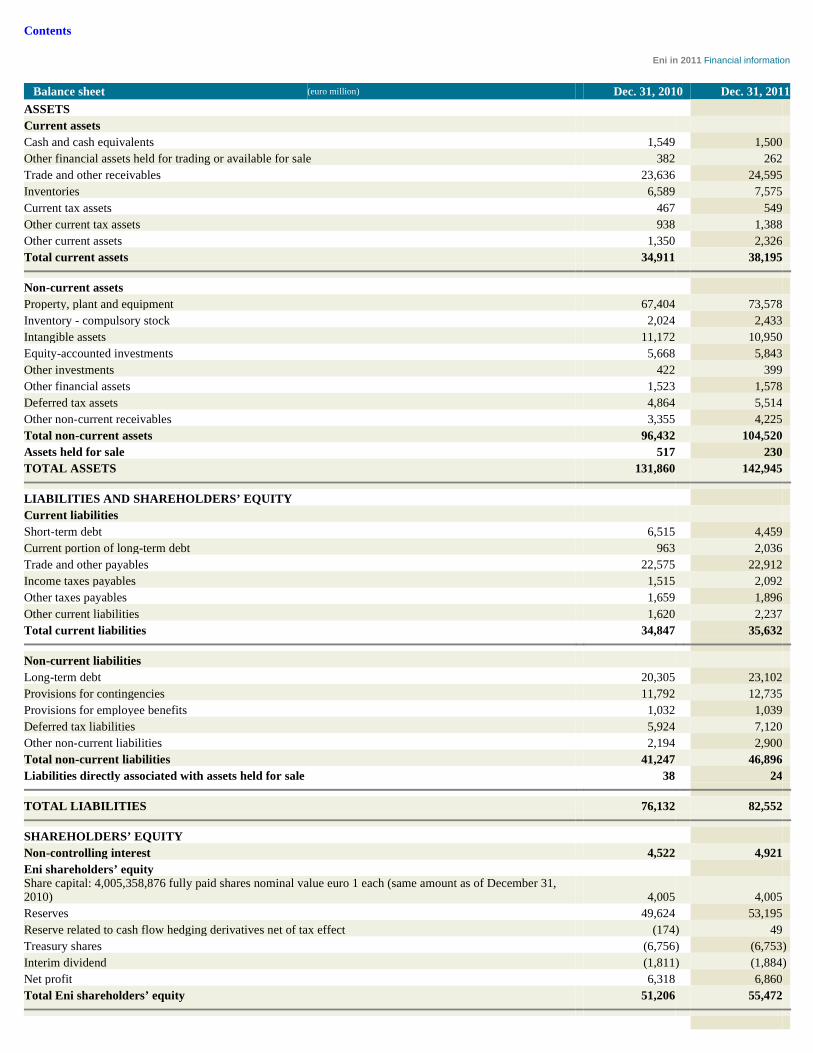
Contents
Eni in 2011 Financial information
Balance sheet (euro million) Dec. 31, 2010 Dec. 31, 2011
ASSETS Current assets Cash and cash equivalents 1,549 1,500 Other financial assets held for trading or available for sale 382 262 Trade and other receivables 23,636 24,595 Inventories 6,589 7,575 Current tax assets 467 549 Other current tax assets 938 1,388 Other current assets 1,350 2,326 Total current assets 34,911 38,195
Non-current assets Property, plant and equipment 67,404 73,578 Inventory - compulsory stock 2,024 2,433 Intangible assets 11,172 10,950 Equity-accounted investments 5,668 5,843 Other investments 422 399 Other financial assets 1,523 1,578 Deferred tax assets 4,864 5,514 Other non-current receivables 3,355 4,225 Total non-current assets 96,432 104,520 Assets held for sale 517 230 TOTAL ASSETS 131,860 142,945
LIABILITIES AND SHAREHOLDERS ’ EQUITY Current liabilities Short-term debt 6,515 4,459 Current portion of long-term debt 963 2,036 Trade and other payables 22,575 22,912 Income taxes payables 1,515 2,092 Other taxes payables 1,659 1,896 Other current liabilities 1,620 2,237 Total current liabilities 34,847 35,632
Non-current liabilities Long-term debt 20,305 23,102 Provisions for contingencies 11,792 12,735 Provisions for employee benefits 1,032 1,039 Deferred tax liabilities 5,924 7,120 Other non-current liabilities 2,194 2,900 Total non-current liabilities 41,247 46,896 Liabilities directly associated with assets held for sale 38 24
TOTAL LIABILITIES 76,132 82,552
SHAREHOLDERS’ EQUITY Non-controlling interest 4,522 4,921 Eni shareholders’ equity Share capital: 4,005,358,876 fully paid shares nominal value euro 1 each (same amount as of December 31, 2010) 4,005 4,005 Reserves 49,624 53,195 Reserve related to cash flow hedging derivatives net of tax effect (174 ) 49 Treasury shares (6,756 ) (6,753 ) Interim dividend (1,811 ) (1,884 ) Net profit 6,318 6,860 Total Eni shareholders’ equity 51,206 55,472

- 41 -
TOTAL SHAREHOLDERS ’ EQUITY 55,728 60,393
TOTAL LIABILITIES AND SHAREHOLDERS ’ EQUITY 131,860 142,945

Contents
Eni in 2011 Financial information
Statements of cash flow (euro million) 2009 2010 2011
Net profit of the year 5,317 7,383 7,803 Adjustments to reconcile net profit to net cash provided by operating activities Depreciation, depletion and amortization 8,762 8,881 8,297 Impairments of tangible and intangible assets, net 1,051 698 1,021 Share of profit (loss) of equity-accounted investments (393 ) (537 ) (544 ) Gain on disposal of assets, net (226 ) (552 ) (1,170 ) Dividend income (164 ) (264 ) (659 ) Interest income (352 ) (96 ) (101 ) Interest expense 603 571 737 Income taxes 6,756 9,157 10,674 Other changes (319 ) (39 ) 331 Changes in working capital: - inventories 52 (1,150 ) (1,422 ) - trade receivables 1,431 (1,918 ) (369 ) - trade payables (2,559 ) 2,770 161 - provisions for contingencies 517 588 122 - other assets and liabilities (636 ) (2,010 ) (668 ) Cash flow from changes in working capital (1,195 ) (1,720 ) (2,176 ) Net change in the provisions for employee benefits 16 21 (10 ) Dividends received 576 799 997 Interest received 594 126 100 Interest paid (583 ) (600 ) (893 ) Income taxes paid, net of tax receivables received (9,307 ) (9,134 ) (10,025 ) Net cash provided by operating activities 11,136 14,694 14,382
Investing activities: - tangible assets (12,032 ) (12,308 ) (11,658 ) - intangible assets (1,663 ) (1,562 ) (1,780 ) - consolidated subsidiaries and businesses (25 ) (143 ) (115 ) - investments (230 ) (267 ) (245 ) - securities (2 ) (50 ) (62 ) - financing receivables (972 ) (866 ) (715 ) - change in payables and receivables in relation to investing activities and capitalized depreciation (97 ) 261 379 Cash flow from investing activities (15,021 ) (14,935 ) (14,196 ) Disposals: - tangible assets 111 272 154 - intangible assets 265 57 41 - consolidated subsidiaries and businesses 215 1,006 - investments 3,219 569 711 - securities 164 14 128 - financing receivables 861 841 695 - change in payables and receivables in relation to disposals 147 2 243 Cash flow from disposals 4,767 1,970 2,978 Net cash used in investing activities (10,254 ) (12,965 ) (11,218 )
Proceeds from long-term debt 8,774 2,953 4,474 Repayments of long-term debt (2,044 ) (3,327 ) (889 ) Increase (decrease) in short-term debt (2,889 ) 2,646 (2,481 ) 3,841 2,272 1,104 Net capital contributions/payments by/to non-controlling interest 1,551 26 Net sale of treasury shares by consolidated subsidiaries 9 37 17 Acquisition of additional interests in consolidated subsidiaries (2,068 ) (126 ) Dividends paid to Eni’s shareholders (4,166 ) (3,622 ) (3,695 ) Dividends paid to non-controlling interest (350 ) (514 ) (552 ) Sale of treasury shares 3 Net cash used in financing activities (1,183 ) (1,827 ) (3,223 )

Effect of change in consolidation (inclusion/exclusion of significant/insignificant subsidiaries) (7 ) Effect of exchange rate changes on cash and cash equivalents and other changes (30 ) 39 17
Net cash flow of the year (331 ) (59 ) (49 )
Cash and cash equivalents - beginning of the year 1,939 1,608 1,549
Cash and cash equivalents - end of the year 1,608 1,549 1,500
- 42 -

Contents
Eni in 2011 Financial information
- 43 -
Non-GAAP measures
� Reconciliation of reported operating profit and reported net profit to results on an adjusted basis
Management evaluates Group and business performance on the basis of adjusted operating profit and adjusted net profit, which are arrived at by excluding inventory holding gains or losses and special items. Furthermore, finance charges on finance debt, interest income, gains or losses deriving from the evaluation of certain derivative financial instruments at fair value through profit or loss (as they do not meet the formal criteria to be assessed as hedges under IFRS, excluding commodity derivatives), and exchange rate differences are all excluded when determining adjusted net profit of each business segment. The taxation effect of the items excluded from adjusted operating or net profit is determined based on the specific rate of taxes applicable to each of them. The Italian statutory tax rate is applied to finance charges and income (38% is applied to charges recorded by companies in the energy sector, whilst a tax rate of 27.5% is applied to all other companies). Adjusted operating profit and adjusted net profit are non-GAAP financial measures under either IFRS, or US GAAP. Management includes them in order to facilitate a comparison of base business performance across periods, and to allow financial analysts to evaluate Eni’s trading performance on the basis of their forecasting models. In addition, management uses segmental adjusted net profit when calculating Return On Average Capital Employed (ROACE) by each business segment.
The following is a description of items that are excluded from the calculation of adjusted results.
Inventory holding gain or loss is the difference between the cost of sales of the volumes sold in the period based on the cost of supplies of the same period and the cost of sales of the volumes sold calculated using the weighted average cost method of inventory accounting.
Special items include certain significant income or charges pertaining to
either: (i) infrequent or unusual events and transactions, being identified as non-recurring items under such circumstances; or (ii) certain events or transactions which are not considered to be representative of the ordinary course of business, as in the case of environmental provisions, restructuring charges, asset impairments or write ups and gains or losses on divestments even though they occurred in past periods or are likely to occur in future ones. As provided for in Decision No. 15519 of July 27, 2006 of the Italian market regulator (Consob), non recurring material income or charges are to be clearly reported in the management’s discussion and financial tables. Also, special items include gains and losses on re-measurement at fair value of certain non-hedging commodity derivatives, including the ineffective portion of cash flow hedges and certain derivatives financial instruments embedded in the pricing formula of long-term gas supply agreements of the Exploration & Production Division.
Finance charges or income related to net borrowings excluded from the adjusted net profit of business segments are comprised of interest charges on finance debt and interest income earned on cash and cash equivalents not related to operations. In addition, gains or losses on the fair value evaluation of the aforementioned derivative financial instruments, excluding commodity derivatives and exchange rate differences are excluded from the adjusted net profit of business segments. Therefore, the adjusted net profit of business segments includes finance charges or income deriving from certain segment-operated assets, i.e., interest income on certain receivable financing and securities related to operations and finance charge pertaining to the accretion of certain provisions recorded on a discounted basis (as in the case of the asset retirement obligations in the Exploration & Production Division). Finance charges or interest income and related taxation effects excluded from the adjusted net profit of the business segments are allocated on the aggregate Corporate and financial companies.
For a reconciliation of adjusted operating profit and adjusted net profit to reported operating profit and reported net profit see tables below.

Contents
Eni in 2011 Financial information
2011 (euro million)
E&P G&P R&M Petrochemicals E&C Other
activities
Corporate and
financial companies
Impact of unrealized intragroup
profit elimination Group
Reported operating profit 15,887 1,758 (273 ) (424 ) 1,422 (427 ) (319 ) (189 ) 17,435 Exclusion of inventory holding (gains) losses (166 ) (907 ) (40 ) (1,113 )
Exclusion of special items of which: Non-recurring (income) charges 10 59 69 Other special (income) charges: 190 354 645 178 21 142 53 1,583 - environmental charges 10 34 1 141 186 - asset impairments 190 145 488 160 35 4 1,022 - gains on disposal of assets (63 ) (4 ) 10 4 (7 ) (1 ) (61 )
- risk provisions 77 8 9 (6 ) 88 - provision for redundancy incentives 44 40 81 17 10 8 9 209 - re-measurement gains/losses on commodity derivatives 1 45 (3 ) (28 ) 15 - other 18 41 27 (13 ) 51 124 Special items of operating profit 190 354 645 188 21 201 53 1,652 Adjusted operating profit 16,077 1,946 (535 ) (276 ) 1,443 (226 ) (266 ) (189 ) 17,974 Net finance (expense) income (a) (231 ) 33 5 (932 ) (1,125 )
Net income (expense) from investments (a) 624 407 99 95 (3 ) 1 1,223 Income taxes (a) (9,604 ) (845 ) 174 68 (440 ) (1 ) 410 78 (10,160 )
Tax rate (%) 58.3 35.4 .. 28.6 56.2 Adjusted net profit 6,866 1,541 (262 ) (208 ) 1,098 (225 ) (787 ) (111 ) 7,912 of which: - Adjusted net profit of non-controlling interest 943 - Adjusted net profit attributable to Eni ’ s shareholders 6,969 Reported net profit attributable to Eni ’s shareholders 6,860 Exclusion of inventory holding (gains) losses (724 )
Exclusion of special items: 833 - non-recurring charges 69 - other special (income) charges 764 Adjusted net profit attributable to Eni ’ s shareholders 6,969
(a) Excluding special items.
2010 (euro million)
E&P G&P R&M Petrochemicals E&C Other
activities
Corporate and
financial companies
Impact of unrealized intragroup
profit elimination Group
Reported operating profit 13,866 2,896 149 (86 ) 1,302 (1,384 ) (361 ) (271 ) 16,111 Exclusion of inventory holding (gains) losses (117 ) (659 ) (105 ) (881 )
Exclusion of special items of which: Non-recurring (income) charges (270 ) 24 (246 )
Other special (income) charges: 18 610 339 78 1,179 96 2,320 - environmental charges 30 25 169 1,145 1,369 - asset impairments 127 436 76 52 3 8 702 - gains on disposal of assets (241 ) 4 (16 ) 5 (248 )
- risk provisions 78 2 7 8 95 - provision for redundancy incentives 97 75 113 26 14 10 88 423 - re-measurement gains/losses on commodity derivatives 30 (10 ) (22 ) (2 )
- other 5 (38 ) 5 9 (19 )
Special items of operating profit 18 340 339 78 24 1,179 96 2,074 Adjusted operating profit 13,884 3,119 (171 ) (113 ) 1,326 (205 ) (265 ) (271 ) 17,304
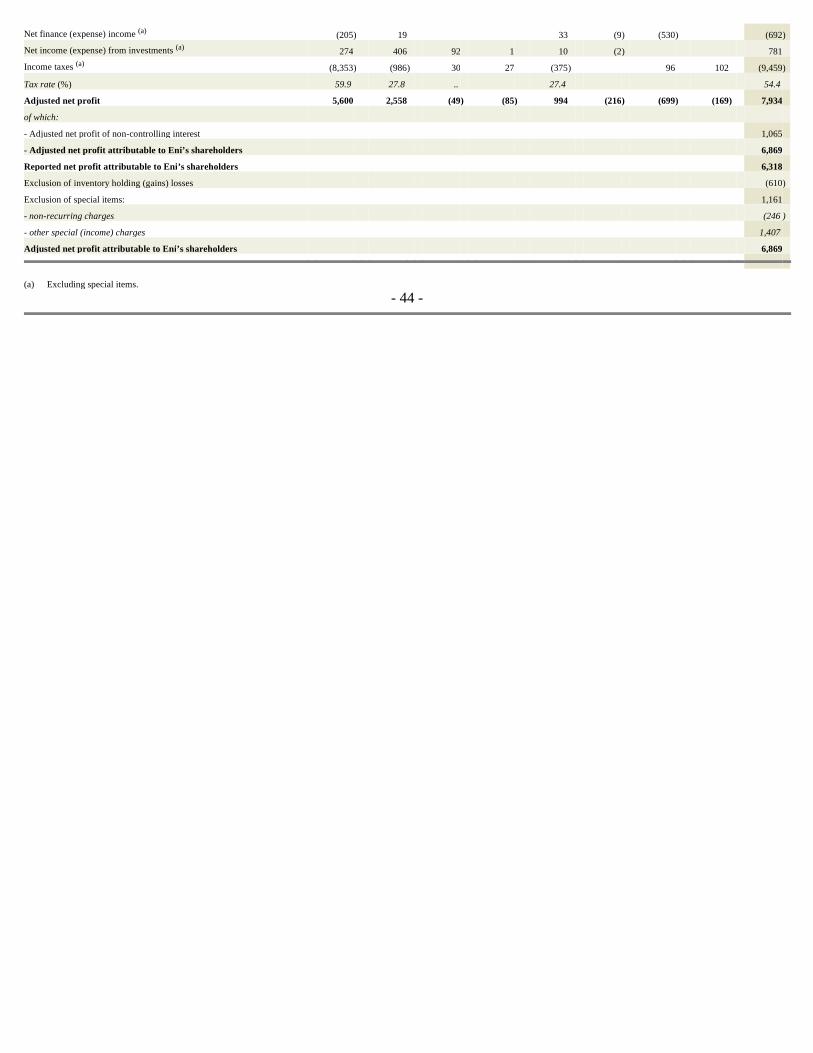
Net finance (expense) income (a) (205 ) 19 33 (9 ) (530 ) (692 )
Net income (expense) from investments (a) 274 406 92 1 10 (2 ) 781 Income taxes (a) (8,353 ) (986 ) 30 27 (375 ) 96 102 (9,459 )
Tax rate (%) 59.9 27.8 .. 27.4 54.4 Adjusted net profit 5,600 2,558 (49 ) (85 ) 994 (216 ) (699 ) (169 ) 7,934 of which: - Adjusted net profit of non-controlling interest 1,065 - Adjusted net profit attributable to Eni ’ s shareholders 6,869 Reported net profit attributable to Eni ’s shareholders 6,318 Exclusion of inventory holding (gains) losses (610 )
Exclusion of special items: 1,161 - non-recurring charges (246 )
- other special (income) charges 1,407 Adjusted net profit attributable to Eni ’ s shareholders 6,869
(a) Excluding special items.
- 44 -

Contents
Eni in 2011 Financial information
2009 (euro million)
E&P G&P R&M Petrochemicals E&C Other
activities
Corporate and
financial companies
Impact of unrealized intragroup
profit elimination Group
Reported operating profit 9,120 3,687 (102 ) (675 ) 881 (436 ) (420 ) 12,055 Exclusion of inventory holding (gains) losses 326 (792 ) 121 (345 )
Exclusion of special items of which: Non-recurring (income) charges 250 250 Other special (income) charges: 364 (112 ) 537 128 (11 ) 178 78 1,162 - environmental charges 19 72 207 298 - asset impairments 618 27 389 121 2 5 1,162 - gains on disposals of assets (270 ) (6 ) (2 ) 3 (2 ) (277 )
- risk provisions 115 17 (4 ) 128 - provision for redundancy incentives 31 25 22 10 8 38 134 - re-measurement gains/losses on commodity derivatives (15 ) (292 ) 39 (3 ) (16 ) (287 )
- other (36 ) 40 4 Special items of operating profit 364 (112 ) 537 128 239 178 78 1,412 Adjusted operating profit 9,484 3,901 (357 ) (426 ) 1,120 (258 ) (342 ) 13,122 Net finance (expense) income (a) (23 ) (15 ) 12 (525 ) (551 )
Net income (expense) from investments (a) 243 332 75 49 1 700 Income taxes (a) (5,826 ) (1,302 ) 85 86 (277 ) 123 (3 ) (7,114 )
Tax rate (%) 60.0 30.9 .. 23.7 53.6 Adjusted net profit 3,878 2,916 (197 ) (340 ) 892 (245 ) (744 ) (3 ) 6,157 of which: - Adjusted net profit of non-controlling interest 950 - Adjusted net profit attributable to Eni ’ s shareholders 5,207 Reported net profit attributable to Eni ’s shareholders 4,367 Exclusion of inventory holding (gains) losses (191 )
Exclusion of special items: 1,031 - non-recurring charges 250 - other special (income) charges 781 Adjusted net profit attributable to Eni ’ s shareholders 5,207
(a) Excluding special items. i i i
Breakdown of special items (euro million) 2009 2010 2011
Non-recurring charges (income) 250 (246 ) 69 of which: - expected settlement of TSKJ proceeding 250 - settlement/payments on antitrust and other Authorities proceedings (246 ) 69 Other special charges (income): 1,162 2,320 1,583 environmental charges 298 1,369 186 asset impairments 1,162 702 1,022 gains on disposal of assets (277 ) (248 ) (61 )
risk provisions 128 95 88 provisions for redundancy incentives 134 423 209 re-measurement gains/losses on commodity derivatives (287 ) (2 ) 15 other 4 (19 ) 124
Special items of operating profit 1,412 2,074 1,652 Net finance (income) expense 35 4 Net (income) expense from investments 179 (324 ) (883 )
of which: - gains from disposal of assets (332 ) (1,122 )
- impairments 28 191

- 45 -
Income taxes (560 ) (624 ) 60 of which: impairment of deferred tax assets E&P 72 29 deferred tax adjustment in a Production Sharing Agreement 552 re-allocation of tax impact on Eni SpA dividends and other special items (219 ) 29 29 taxes on special items of operating profit (413 ) (653 ) (521 )
Total special items of net profit 1,031 1,161 833

Contents
� Summarized Group Balance Sheet The Summarized Group Balance Sheet aggregates the amount of assets and liabilities derived from the statutory balance sheet in accordance with functional criteria which consider the enterprise conventionally divided into the three fundamental areas focusing on resource investments, operations and financing. Management believes that this Summarized Group Balance Sheet is useful
information in assisting investors to assess Eni’s capital structure and to analyze its sources of funds and investments in fixed assets and working capital. Management uses the Summarized Group Balance Sheet to calculate key ratios such as Return On Capital Employed (ROACE) and the proportion of net borrowings to shareholders’ equity (leverage) intended to evaluate whether Eni’s financing structure is sound and well-balanced.
Summarized Group Balance Sheet (euro million) Dec. 31, 2010 Dec. 31, 2011
Fixed assets Property, plant and equipment 67,404 73,578 Inventories - compulsory stock 2,024 2,433 Intangible assets 11,172 10,950 Equity-accounted investments and other investments 6,090 6,242 Receivables and securities held for operating purposes 1,743 1,740 Net payables related to capital expenditures (970 ) (1,576 ) 87,463 93,367
Net working capital Inventories 6,589 7,575 Trade receivables 17,221 17,709 Trade payables (13,111 ) (13,436 ) Tax payables and provisions for net deferred tax liabilities (2,684 ) (3,503 ) Provisions (11,792 ) (12,735 ) Other current assets and liabilities (1,286 ) 281 (5,063 ) (4,109 )
Provisions for employee post-retirement benefits (1,032 ) (1,039 ) Net assets held for sale including related net borrowings 479 206
CAPITAL EMPLOYED, NET 81,847 88,425
Shareholders’ equity: - Eni shareholders' equity 51,206 55,472 - Non-controlling interest 4,522 4,921 55,728 60,393 Net borrowings 26,119 28,032

- 46 -
TOTAL LIABILITIES AND SHAREHOLDERS ’ EQUITY 81,847 88,425

Contents
Eni in 2011 Financial information
� Net borrowings and leverage Eni evaluates its financial condition by reference to net borrowings , which is calculated as total finance debt less: cash, cash equivalents and certain very liquid investments not related to operations, including among others non-operating financing receivables and securities not related to operations. Non-operating financing receivables consist of amounts due to Eni’s financing subsidiaries from banks and other financing institutions and amounts due to other subsidiaries from banks for investing purposes and deposits in escrow. Securities not related to operations consist primarily of government and corporate securities.
Leverage is a measure used by management to assess the Company’s level of indebtedness. It is calculated as a ratio of net borrowings which is calculated by excluding cash and cash equivalents and certain very liquid assets from financial debt to shareholders’ equity, including non-controlling interest. Management periodically reviews leverage in order to assess the soundness and efficiency of the Group balance sheet in terms of optimal mix between net borrowings and net equity, and to carry out benchmark analysis with industry standards.
Net borrowings and leverage (euro million) Dec. 31, 2010 Dec. 31, 2011
Total debt 27,783 29,597 - Short-term debt 7,478 6,495 - Long-term debt 20,305 23,102 Cash and cash equivalents (1,549 ) (1,500 ) Securities held for non-operating purposes (109 ) (37 ) Financing receivables for non-operating purposes (6 ) (28 )
Net borrowings 26,119 28,032
Shareholders’ equity including non-controlling interest 55,728 60,393
Leverage 0.47 0.46
� Summarized Group Cash Flow Statement and Change in net borrowings Eni’s summarized Group cash flow statement derives from the statutory statement of cash flows. It enables investors to understand the link existing between changes in cash and cash equivalents (deriving from the statutory cash flow statement) and in net borrowings (deriving from the summarized cash flow statement) that occurred from the beginning of the period to the end of period. The measure enabling such a link is represented by the free cash flow which is the cash in excess of capital expenditure needs. Starting from free cash flow it is possible to determine either: (i) changes in cash and cash equivalents for the period by adding/
deducting cash flows relating to financing debts/receivables (issuance/repayment of debt and receivables related to financing activities), shareholders’ equity (dividends paid, net repurchase of own shares, capital issuance) and the effect of changes in consolidation and of exchange rate differences; and (ii) change in net borrowings for the period by adding/deducting cash flows relating to shareholders’ equity and the effect of changes in consolidation and of exchange rate differences. The free cash flow is a non-GAAP measure of financial performance.
Summarized Group Cash Flow Statement (euro million) 2009 2010 2011
Net profit 5,317 7,383 7,803 Adjustments to reconcile net profit to net cash provided by operating activities: - depreciation, depletion and amortization and other non monetary items 9,117 9,024 9,095 - net gains on disposal of assets (226 ) (552 ) (1,170 ) - dividends, interest, taxes and other changes 6,843 9,368 10,651 Changes in working capital related to operations (1,195 ) (1,720 ) (2,176 )

- 47 -
Dividends received, taxes paid, interest (paid) received during the period (8,720 ) (8,809 ) (9,821 ) Net cash provided by operating activities 11,136 14,694 14,382 Capital expenditures (13,695 ) (13,870 ) (13,438 ) Investments and purchase of consolidated subsidiaries and businesses (2,323 ) (410 ) (360 ) Disposals 3,595 1,113 1,912 Other cash flow related to capital expenditures, investments and disposals (295 ) 228 627 Free cash flow (1,582 ) 1,755 3,123 Cash flows of financial instruments not related to operations 396 (26 ) 41 Changes in short and long-term finance debt 3,841 2,272 1,104 Dividends paid and changes in non-controlling interests and reserves (2,956 ) (4,099 ) (4,327 ) Effect of changes in consolidation area and exchange differences (30 ) 39 10 NET CASH FLOW FOR THE PERIOD (331 ) (59 ) (49 )

Contents
Eni in 2011 Financial information
Change in net borrowings (euro million) 2009 2010 2011
Free cash flow (1,582 ) 1,755 3,123 Net borrowings of acquired companies (33 ) Net borrowings of divested companies (192 ) Exchange differences on net borrowings and other changes (141 ) (687 ) (517 ) Dividends paid and changes in non-controlling interest and reserves (2,956 ) (4,099 ) (4,327 ) CHANGE IN NET BORROWINGS (4,679 ) (3,064 ) (1,913 )
i i i
� ROACE Return On Average Capital Employed for the Group, on an adjusted basis is the return on the Group average capital invested, calculated as ratio of net adjusted profit before non-controlling interests, plus net finance charges on net borrowings net of the related tax effect, to net average capital employed. The tax rate applied on finance charges is the Italian statutory tax rate of 34%. The capital invested, as of the period end, used
for the calculation of net average capital invested is obtained by deducting inventory gains or losses in the period, net of the related tax effect. ROACE by Division is determined as ratio of adjusted net profit to net average capital invested pertaining to each Division and rectifying the net capital invested as of period-end, from net inventory gains or losses (after applying the business specific tax rate).
i i i ROACE - Return On Average Capital Employed (euro million) 2009 2010 2011
Adjusted net profit 6,157 7,934 7,912 Exclusion of after-tax finance expenses/interest income 283 337 454
Adjusted net profit unlevered 6,440 8,271 8,366 Adjusted capital employed, net: - at the beginning of period 66,886 73,106 81,847 - at the end of period 72,915 81,237 87,701
Adjusted average capital employed, net 69,901 77,172 84,774
Adjusted ROACE (%) 9.2 10.7 9.9
i i i
� Pro-forma adjusted EBITDA EBITDA (Earnings Before Interest, Taxes, Depreciation and Amortization charges) on an adjusted basis is calculated by adding amortization and depreciation charges to adjusted operating profit, which is also modified to take into account the impact associated with certain derivatives instruments as detailed below. This performance indicator includes the adjusted EBITDA of Eni’s wholly owned subsidiaries and Eni’s share of adjusted EBITDA generated by certain associates which are accounted for under the equity method for IFRS purposes. The EBITDA reported by Regulated businesses in Italy is included according to Eni’s share of equity in the parent company Snam SpA (55.53% as of December 31, 2011, which takes into account the amount of own shares held in treasury by the subsidiary itself) due to its listed company status. In order to calculate the EBITDA pro-forma adjusted, the adjusted operating profit of the Marketing business has been modified to take into account the impact of the settlement of certain commodity and exchange rate derivatives that do not meet the formal criteria to be classified as hedges under the IFRS. These are entered into by the Company in view of certain amounts of gas and electricity that the Company expects to supply at fixed prices during future periods.
� Production Sharing Agreements (PSAs) Contract in use in non OECD Countries, regulating relationships between States and oil companies with regard to the exploration and production of hydrocarbons. The mining concession is assigned to the national oil company jointly with the foreign oil company who has exclusive right to perform exploration, development and production activities and can enter agreements with other local or international entities. In this type of contract the national oil company assigns to the international contractor the task of performing exploration and production with the contractor’s equipment and financial resources. Exploration risks are borne by the contractor and production is divided into two portions: "Cost Oil" is used to recover costs borne by the contractor, "Profit Oil" is divided between contractor and national company according to variable schemes and represents the profit deriving from exploration and production. Further terms and conditions may vary from one Country to the other.
� Possible reserves Possible reserves are those additional reserves that are less certain to be recovered than probable reserves.

- 48 -
The impact of those derivatives has been allocated to the EBITDA pro-forma adjusted relating to the reporting periods during which those supplies at fixed prices are recognized. Management believes that the EBITDA pro-forma adjusted is an important alternative measure to assess the performance of Eni’s Gas & Power Division, taking into account evidence that this Division is comparable to European utilities in the gas and power generation sector. This measure is provided in order to assist investors and financial analysts in assessing the divisional performance of Eni Gas & Power, as compared to its European peers, as EBITDA is widely used as the main performance indicator for utilities. The EBITDA pro-forma adjusted is a non-GAAP measure under IFRS.
� Probable reserves Probable reserves are those additional reserves that are less certain to be recovered than proved reserves but which, together with proved reserves, are as likely as not to be recovered.
� Proved reserves Proved oil and gas reserves are those quantities of oil and gas, which, by analysis of geoscience and engineering data, can be estimated with reasonable certainty to be economically producible, from a given date forward, from known reservoirs, and under existing economic conditions, operating methods, and government regulations, prior to the time at which

Contents
Eni in 2011 Financial information
- 49 -
contracts providing the right to operate expire, unless evidence indicates that renewal is reasonably certain, regardless of whether deterministic or probabilistic methods are used for the estimation. The project to extract the hydrocarbons must have commenced or the operator must be reasonably certain that it will commence the project within a reasonable time. Existing economic conditions include prices and costs at which economic producibility from a reservoir is to be determined. The price shall be the average price during the 12-month period prior to the ending date of the period covered by the report, determined as an unweighted arithmetic average of the first-day-of-the-month price for each month within such period, unless prices are defined by contractual arrangements, excluding escalations based upon future conditions. Reserves are classified as either developed and undeveloped. Proved developed oil and gas reserves are reserves that can be expected to be recovered through existing wells with existing equipment and operating methods or in which the cost of the required equipment is relatively minor compared to the cost of a new well, and through installed extraction equipment and infrastructure operational at the time of the reserves estimate if the extraction is by means not involving a well. Proved undeveloped oil and gas reserves are reserves of any category that are expected to be recovered from new wells on undrilled acreage, or from existing wells where a relatively major expenditure is required for recompletion.
� Recoverable reserves Amounts of hydrocarbons included in different categories of reserves (proved, probable and possible), without considering their different degree of uncertainty.
� Reserves Quantities of oil and gas and related substances anticipated to be economically producible, as of a given date, by application of development projects to known accumulations. In addition, there must exist, or there must be a reasonable expectation that will exist, the legal right to produce or a revenue interest in the production, installed means of delivering oil and gas or related substances to market, and all permits and financing required to implement the project. Reserves can be: (i) developed reserves quantities of oil and gas anticipated to be through installed extraction equipment and infrastructure operational at the time of the reserves estimate; (ii) undeveloped reserves: oil and gas expected to be recovered from new wells, facilities and operating methods.
� Reserve replacement ratio Measure of the reserves produced replaced by proved reserves. Indicates the Company’s ability to add new reserves through exploration and purchase of property. A rate higher than 100% indicates that more reserves were added than produced in the period. The ratio should be averaged on a three-year period in order to reduce the distortion deriving from the purchase of proved property, the revision of previous estimates, enhanced recovery, improvement in recovery rates and changes in the value of reserves – in PSAs – due to changes in international oil prices. Management also calculates this ratio by excluding the effect of the purchase of proved property in order to better assess the underlying performance of the Company’s operations.
� Average reserve life index Ratio between the amount of reserves at the end of the year and total production for the year.
� Resource base Oil and gas volumes contained in a reservoir as ascertained based on available engineering and geological data (sum of proved, probable and possible reserves) plus volumes not yet discovered but that are expected to be eventually recovered from the reservoir net of a risk factor (risked exploration resources).
� Take-or-pay Clause included in natural gas supply contracts according to which the purchaser is bound to pay the contractual price or a fraction of such price for a minimum quantity of gas set in the contract whether or not the gas is collected by the purchaser. The purchaser has the option of collecting the gas paid for and not delivered at a price equal to the residual fraction of the price set in the contract in subsequent contract years.
� Conversion Refinery process allowing the transformation of heavy fractions into lighter fractions. Conversion processes are cracking, visbreaking, coking, the gasification of refinery residues, etc. The ratio of overall treatment capacity of these plants and that of primary crude fractioning plants is the conversion rate of a refinery. Flexible refineries have higher rates and higher profitability.

Contents
Giuseppe Recchi Chairman
He has been Chairman of the Board of Eni since May
2011. He is Vice Chairman of GE Capital SpA; member of the Board of Directors and the compensation and audit committees of Exor SpA (listed at Milan Stock Exchange); member of the European Advisory Board of Blackstone and member of the Massachussetts Institute of Technology E.I. External Advisory Board. He is also member of the executive committees of Confindustria (the Confederation of Italian Industries, where he is Chairman of the Foreign Investment Committee), Assonime (Association of Italian Joint Stock Companies), and Aspen Institute Italia; member of the Trilateral Commission; member of the Board of Directors of FEEM - Eni Enrico Mattei Foundation and of the Italian Institute of Technology. He graduated in Engineering at Polytechnic of Turin. In 1989 he started his career as an entrepreneur at Recchi SpA. From 1994 he has served as Executive Chairman of Recchi America Inc, the US branch of the Group and as Managing Director for the overseas activities of Ferrocemento - Recchi Group (now Condotte SpA). In 1999 he joined General Electric, where he held several managerial positions in Europe and in the USA. He served as Director of GE Capital Structure Finance Group; Managing director for Industrial M&A and Business Development for GE EMEA and as President & CEO of GE Italy. Until May 2011 he was President & CEO of GE South Europe.
Paolo Scaroni Chief Executive Officer and General Manager
He has been Chief Executive Officer of Eni since June 2005. He is currently Director of Assicurazioni Generali, Non-Executive Deputy
Executive Officer of Pilkington until May 2002. From May 2002 to May 2005 he was Chief Executive Officer and Chief Operating Officer of Enel. From 2005 to July 2006 he was Chairman of Alliance Unichem. In May 2004 he was decorated as Cavaliere del Lavoro. In November 2007 he was decorated as Officer of the Légion d’honneur.
Carlo Cesare Gatto
He has been a Director of Eni since May 2011. He graduated in Economics and
Business at the Università degli Studi of Turin. He is a registered public auditor. He is currently Chairman of the Board of Statutory Auditors of RAI SpA, Natuzzi SpA and Difesa Servizi SpA, Chairman of the Board of Directors of DeaPrinting Officine Grafiche Novara 1901 SpA, and Chairman of Flenco Fluid System Srl and Director of Arcese Trasporti SpA. He was teacher of Finance, Administration and Control at the Isvor Fiat SpA training institute. In 1968 he was hired by Impresit as Chief Accountant, and managed, in Jordan, the finance department of the local branch. He joined the Fiat Group in 1969 where over the years he held a series of positions of increasing responsibility in the area of finance, administration and control. In 1993 he was the Italian Representative at the European Commission for the fiscal harmonization of member States. In 1992 he was decorated as Cavaliere Ordine al Merito della Repubblica Italiana and, in 1995, as Ufficiale Ordine al Merito della Repubblica Italiana.
Alessandro Lorenzi
He has been a Director of Eni since May 2011. He graduated in Political
Science at the Università degli Studi of Turin. He is currently a founding partner of Tokos Srl, a consulting firm for securities investment, and Chairman of Società Metropolitana Acque Torino
Control at the Ferrero Group and General Manager of Soremartec. In May 2003 he was appointed CFO of Coin Group. In 2006 he became Central Corporate Manager at Lavazza SpA, becoming member of the Board of Directors from 2008 to June 2011. Until this date, he was also Director of LCS Srl as well as Chairman of COFINCAF SpA until May 2011.
Paolo Marchioni
He has been a Director of Eni since June 2008. He is a qualified lawyer
specializing in penal and administrative law, counselor in Supreme Court and superior jurisdictions. He is currently Director of the Provincial Board of the Province of Verbano-Cusio-Ossola. He has been Chairman of the Board of Directors of Finpiemonte partecipazioni SpA since August 2010. He acts as a consultant to government agencies and business organizations on business, corporate, administrative and local government law. He was Mayor of Baveno (Verbania) from April 1995 to June 2004 and Chairman of the Assembly of Mayors of Con.Ser.Vco from September 1995 to June 1999. Until June 2004 he was a member of the Assembly of Mayors of the Asl 14 health authority, the steering committee of the Verbania health district, the Assembly of Mayors of the Valle Ossola waste water consortium, and the Assembly of Mayors of the Verbania social services consortium. From April 2005 to January 2008 he was a member of the Stresa city council. From October 2001 to April 2004 he was Director of CIM SpA of Novara (merchandise interport center) and from December 2002 to December 2005 Director and member of the executive committee of Finpiemonte SpA. From June 2005 to June 2008 he was Director of Consip. He was Provincial Councillor in charge of balance sheet, property, legal affairs and production activities and Vice President of the Province of Verbano-Cusio-

- 50 -
Chairman of the London Stock Exchange Group, Director of Veolia Environnement. He is also member of the Board of Overseers of Columbia Business School, in New York, and Director of Fondazione Teatro alla Scala. After graduating in Economics and Business at the Luigi Bocconi University, in Milan, in 1969, he worked for three years at Chevron, and obtained an MBA from Columbia University, in New York, and continued his career at McKinsey. In 1973, he joined Saint Gobain, where he held a series of managerial positions in Italy and abroad, until his appointment as Head of the Glass Division in Paris in 1984. From 1985 to 1996 he was Deputy Chairman and Chief Executive Officer of Techint. In 1996, he moved to the UK and was Chief
SpA. He began his career at SAIAG SpA. In 1975 he joined Fiat Iveco SpA where he held a series of positions. In 1983 he joined GFT Group where he was: Head of Administration, Finance and Control of Cidat SpA, a GFT SpA subsidiary (1983-1984), Central Controller of GFT Group (1984-1988), Head of Finance and Control of GFT Group (1989-1994) and Managing Director of GFT SpA, with ordinary and extraordinary powers over all operating activities (1994-1995). In 1995 he was appointed Chief Executive Officer of SCI SpA In 1998 he was appointed Central Manager, and subsequently Director of Ersel SIM SpA. In 2000 he became Central Manager of Planning and
Ossola from June 2009 to October 2011.
Roberto Petri
He has been a Director of Eni since May 2011. Born in 1949. He has a degree in
Law from the Università degli Studi Gabriele D’Annunzio, of Chieti and Pescara. Since 2007, he has been part of the Board of Directors of the Ravenna Festival and since 2011, Chairman of the Board of Directors for the company Italimmobili Srl. In 1976, he was hired by Banca Nazionale del Lavoro (BNL) and filled a number of roles therein. In 1990 he was appointed Commercial Manager of Banca Popolare and in 1994 moved to the Cassa di
(*) Appointed by the Ordinary Shareholders’ Meeting held on May 5, 2011, for a three-year period. The Board of Directors appointed Paolo Scaroni Chief Executive Officer. The Board mandate will
expire with the shareholders’ meeting approving the financial statements for the year ending December 31, 2013.

Contents
Eni in 2011 Directors and officers
Risparmio di Ravenna Group (Carisp Ravenna and Banca di Imola), where he held the same role. From 2001 and 2006, he was Chief Secretary to the Under-Secretary of Defense, where he was mainly involved with the Department’s contacts with the defense industry and international relations. From 2008 to 2011, he was Chief Secretary at the Ministry of Defence. From 2003 to 2006, he was Director of Fintecna SpA and from 2005 to 2008 Director of Finmeccanica SpA.
Alessandro Profumo
He has been a Director of Eni since May 2011. He graduated in Business
Administration at the Università Luigi Bocconi of Milan. He is currently Chairman of Appeal Strategy & Finance Srl and member of the Supervisory Board of Sberbank. He is also a member of the Board of Directors of Bocconi University in Milan and of the Fondazione Arnaldo Pomodoro. He began his career in 1977 at the Banco Lariano, becoming Branch Manager in Milan. In 1987 he joined McKinsey where he was Project Manager in the strategy area for the finance sector. In 1989 he was appointed Head of relations with financial institutions and integrated development projects at Bain, Cuneo e Associati (now Bain & Company). In 1991 he left the field of company consultancy to join RAS, Riunione Adriatica di Sicurtà. In 1994 he joined Credito Italiano. In 1997 he was appointed Chief Executive Officer of Credito Italiano and subsequently of Unicredit, a position he held until September 2010. On an international level he was Chairman of the European Banking Federation and Chairman of the IMC Washington. In May 2004 he was decorated as Cavaliere del Lavoro.
Mario Resca
He has been a Director of Eni since May 2002. He graduated in Economics and
Business at the Università Luigi Bocconi of Milan. He is currently General Director of Italian Heritage and
manager of Saifi Finanziaria (Fiat Group) and from 1976 to 1991 he was a partner of Egon Zehnder. In this period he was appointed Director of Lancôme Italia and of companies belonging to the RCS Corriere della Sera Group and the Versace Group. From 1995 to 2007 he was Chairman and Chief Executive Officer of McDonald’s Italia. He was also Chairman of Sambonet SpA and Kenwood Italia SpA, a founding partner of Eric Salmon & Partners and Chairman of the American Chamber of Commerce. He was decorated as a Cavaliere del Lavoro in June 2002.
Francesco Taranto
He has been Director of Eni since June 2008. He is currently Director of Cassa
di Risparmio di Firenze SpA and ERSEL S.I.M. He started working in 1959, in a stock brokerage in Milan; from 1965 to 1982, he worked at Banco di Napoli as deputy manager of the stock market and securities department. He held a series of managerial positions in the asset management field. Notably he was manager of securities funds at Eurogest from 1982 to 1984, and General Manager of Interbancaria Gestioni from 1984 to 1987. After moving to the Prime Group (1987 to 2000), he was Chief Executive Officer of the parent company for a long period. He was also a member of the steering council of Assogestioni and of the Corporate Governance Committee for listed companies formed by Borsa Italiana. He was Director of Enel from October 2000 to June 2008.
B OARD C OMMITTEES Internal Control Committee : Alessandro Lorenzi - Chairman , Carlo Cesare Gatto, Paolo Marchioni and Francesco Taranto
Compensation Committee : Mario Resca - Chairman , Carlo Cesare Gatto, Roberto Petri and Alessandro Profumo
Nominations Committee: Giuseppe Recchi - Chairman , Alessandro Lorenzi, Alessandro Profumo and Mario Resca
Oil - Gas Energy Committee: Alessandro Profumo - Chairman , Alessandro Lorenzi, Paolo Marchioni, Roberto Petri, Mario Resca and Francesco Taranto
B OARD OF S TATUTORY A UDITORS Ugo Marinelli - Chairman, Roberto Ferranti, Paolo Fumagalli, Renato Righetti, Giorgio Silva, Francesco Bilotti and Maurizio Lauri
E XTERNAL A UDITORS Reconta Ernst & Young SpA
G ROUP O FFICERS Paolo Scaroni Chief Executive Officer and General Manager Claudio Descalzi Exploration & Production Chief Operating Officer Umberto Vergine Gas & Power Chief Operating Officer Angelo Fanelli Refining & Marketing Chief Operating Officer Alessandro Bernini Chief Financial Officer Salvatore Sardo Chief Corporate Operations Officer Stefano Lucchini Senior Executive Vice President for Public Affairs and Communication Massimo Mantovani Senior Executive Vice President for General Counsel Legal Affairs Salvatore Meli Executive Vice President for Research and Technological Innovation Marco Petracchini

- 51 -
Antiquities in the Ministry of Cultural Heritage and Activities. He is also Chairman of Confimprese, Chairman of Convention Bureau Italia SpA, Deputy Chairman of Sesto Immobiliare SpA and Director of Mondadori SpA. After graduating he joined Chase Manhattan Bank. In 1974 he was appointed
Senior Executive Vice President for Internal Audit Roberto Ulissi Senior Executive Vice President for Corporate Affairs and Governance Raffaella Leone Executive Assistant to the Chief Executive Officer

Contents
Eni in 2011 Directors and officers
� Remuneration (a)
The Eni Remuneration System is defined consistently with the recommendations of the Borsa Italiana’s Code as transposed in the Eni Code.
Pursuant to Article 84-quater of Consob Decision No. 11971 of May 14,
1999, and subsequent modifications, the table below reports individual remuneration earned in 2011 by each Member of the Board of Directors and Chief Operating Officers. The overall amount earned by Statutory Auditors and other Managers with strategic responsibilities is reported too.
i i i
Remuneration earned by Directors, Statutory Auditors, Chief Operating Officers, and other Managers with strategic responsibilities
(euro thousand) Variable non-equity remuneration
Name Office Term of office
Office expiry
(*) Fixed remuneration
Committee membership
remuneration Bonuses
and other incentives Profit
sharing Non-
monetary benefits Other
remuneration Total
Fair Value of equity
remuneration
(**)
Severance indemnity
for end of office or
termination of
employment
Board of Directors Roberto Poli Chairman 01.01 - 05.05 05.2011 262 375 637 1,000
Giuseppe Recchi Chairman 05.06 - 12.31 04.2014 500 500
Paolo Scaroni CEO and General
Manager 01.01 - 12.31 04.2014 1,430 3,439 15 4,884 175 1,000
Alberto Clô Director 01.01 - 05.05 05.2011 40 16 56 Paolo Andrea Colombo Director 01.01 - 05.05 05.2011 40 13 53 Carlo Cesare Gatto Director 05.06 - 12.31 04.2014 75 32 107 Alessandro Lorenzi Director 05.06 - 12.31 04.2014 75 38 113 Paolo Marchioni Director 01.01 - 12.31 04.2014 115 39 154 Roberto Petri Director 05.06 - 12.31 04.2014 75 24 99 Alessandro Profumo Director 05.06 - 12.31 04.2014 75 29 104 Marco Reboa Director 01.01 - 05.05 05.2011 40 16 56 Mario Resca Director 01.01 - 12.31 04.2014 115 45 160 Pierluigi Scibetta Director 01.01 - 05.05 05.2011 40 13 53 Francesco Taranto Director 01.01 - 12.31 04.2014 115 45 160
Board of Statutory Auditors 435 85 520
Chief Operating Officers Claudio Descalzi E&P Division 01.01 - 12.31 754 1,167 15 595 2,531 24 Domenico Dispenza G&P Division 01.01 - 12.31 740 1,339 13 2,092 41 2,844
Angelo Fanelli R&M Division 01.01 - 12.31 541 504 14 1,059 14
Other Managers with strategic responsibilities (***) 3,910 4,988 96 120 9,114 166
9,377 310 11,812 153 800 22,452 420 4,844
i i i (*) i For directors appointed by the Shareholders’ Meeting of May 5, 2011, the term of office expires with the Shareholders’ Meeting approving the financial statements for the year ending December
31, 2013. (**) i This refers to the 2011 pro-rata value (from January 1 to July 30) of the granting of the 2008 stock option plan in accordance with the breakdown provided for by the accounting standards. (***) i Managers who, during the course of the year and with the Chief Executive Officer and Chief Operating Officers of Eni’ s divisions were permanent members of the management committee and
those who report directly to the Chief Executive Officer (ten managers). i i i
In particular: - the column "Fixed remuneration" reports, following the criteria of competence, fixed remuneration and fixed salary from employment due for the year, gross of social security and tax expenses to be paid by the employee; it excludes lump-sum expense reimbursements and attendance fees, as
- the column "Variable non-equity remuneration - Bonuses and other incentives" reports the incentives paid during the year due to the vesting of the relative rights following the assessment and approval of the relative performance results by the relevant company bodies, in accordance with that specified, in greater detail, in the Table "Monetary incentive

_______________
- 52 -
they are not envisaged. Details on compensation are provided in the notes, as well as separate indication of any indemnities or payments referred to the employment relationship; - the column "Committees membership remuneration" reports, following the criteria of competence, the compensation due to the Directors for participation in the Committees established by the Board. In the notes, compensation for each Committee on which each Director participates is indicated separately;
plans for Directors, Chief Operating Officers, and other Managers with strategic responsibilities"; the column "Profit sharing", does not include any figures, as no form of profit-sharing is envisaged; - the column "Non-monetary benefits" reports, in accordance with competence and taxability criteria, the value of fringe benefits awarded; - the column "Other remuneration" reports, in accordance with the criteria of competence, any other remuneration deriving from other services provided; - the column "Total" reports the sum of the amounts of all the previous items;
(a) For detailed information on Eni’ s remuneration policy and compensation see the "Remuneration Report 2012" available on Eni’ s website under the sections Governance and Investor relations.

Contents
Eni in 2011 Directors and officers
- the column "Fair value of equity remuneration" reports the fair value of competence of the year related to the existing stock option plans, estimated in accordance with international accounting standards which assign the relevant cost in the vesting period; - the column "Severance indemnities for end of office or termination of employment" reports the indemnities accrued, even if not yet paid, for the terminations which occurred during the course of financial year considered or in relation to the end of the office and/or employment.
The structure of Eni’s management remuneration system is made up of: (i) fixed remuneration; (ii) short-term variable incentives tied to a target incentive level (performance=100) and a maximum level (performance=130), set at 110% and 155% respectively of the total fixed remuneration, based on the economic/ financial performance and operational results achieved by Eni in the previous year; (iii) long-term variable component consisting of two distinct plans: - Deferred Monetary Incentive Plan (DMI) with three annual awards, starting in 2012, in relation to the performance of the Company measured in terms of EBITDA. The said Plan maintains the same performance conditions and characteristics as described above for the Plan of the Chief Executive Officer and General Manager. For Chief Operating Officers and other Managers with Strategic Responsibilities the base incentive to be assigned at target level
is differentiated by the grade of the role up to a maximum equal to 40% of the fixed remuneration. The incentive to be paid at the end of the three-year period in question is determined as a percentage between zero and 170% of the value awarded, in relation to the results achieved; - Long-Term Monetary Incentive Plan (LTMI), envisaged for critical managerial staff. This Plan maintains the same performance conditions and characteristics as envisaged in the Plan of the Chief Executive Officer and General Manager. For Chief Operating Officers and other Managers with Strategic Responsibilities the base incentive to be awarded at target level is differentiated by the grade of the role up to a maximum equal to 50% of the fixed remuneration. The incentive to be paid at the end of the three-year period in question is determined as a percentage between zero and 130% of the value awarded, in relation to the results achieved. Studies regarding possible changes to the current Performance conditions of the Plan are in course, in order to take into account the specific structure of the Eni business portfolio with respect to that of the peer group in question; (iv) benefits : For the Chief Executive Officer and General Manager, unchanged from the previous mandate and the policy enacted in 2011, insurance-related benefits are envisaged and, in particular, in respect of that envisaged in the national collective labor agreement and the additional company agreements for Eni senior managers, enrolment in the complementary retirement plan (FOPDIRE) as well as in the additional health plan (FISDE) are envisaged, together with the use of a company car.
The following table sets out long term variable components. Bonuses of the year Bonuses of previous years
Other bonuses
Name Office (euro thousand) paid/
payable deferred no longer
payable paid/
payable (a) still
deferred Roberto Poli Chairman 375 Paolo Scaroni CEO and General Manager 2,110 3,234 1,329 6,791 Claudio Descalzi Chief Operating Officer E&P Division 537 672 280 962 350 Domenico Dispenza (b) Chief Operating Officer G&P Division 453 246 886 Angelo Fanelli Chief Operating Officer R&M Division 345 487 159 564 Other Managers with strategic responsibilities (c) 2,587 2,829 1,751 3,977 650 6,407 7,222 246 4,405 12,294 1,000
i i i (a) i Payment relating to deferred monetary incentive granted in 2008 related to EBITDA performance in the three-year period 2008-2010. (b) i In charge until December 31, 2011. As of January 1, 2012, Umberto Vergine has been appointed as Gas & Power Chief Operating Officer. (c) i Managers who, during the course of the year and with the Chief Executive Officer and Division Chief Operating Officers, were permanent members of the Company Management Committee and the
ones who report directly to the Chief Executive Officer (ten managers). i i i
� Overall remuneration of key management personnel
Remuneration of persons responsible of key positions in planning, direction and control functions of Eni Group companies, including executive and non-executive Directors, Chief Operating Officers and other managers with strategic
(euro million) 2010 2011
Fees and salaries 20 21
Post employment benefits 1 1
Other long-term benefits 10 10
Indemnity upon termination of the office 2 2

- 53 -
responsibilities in charge at December 31, 2011, amounted to euro 34 million, as described in the following table:
33 34

Contents
� Eni share performance in 2011 As of December 31, 2011, the Company’s share capital was euro 4,005,358,876, fully paid-up and represented by 4,005,358,876 ordinary registered shares, each with a nominal value of euro 1.00. The average number of shares outstanding in the period, considering the treasury shares in Eni’s portfolio, was 3,622,616,182 (3,622,454,738 in 2010). In the last session of 2011, the Eni share price, quoted on the Italian Stock Exchange, was euro 16.01, down 2.1 percentage points from the price quoted at the end of 2010 (euro 16.34). The Italian Stock Exchange is the primary market where the Eni share is traded. During the year the FTSE/MIB index, the basket including the 40 most important shares listed on the Italian Stock Exchange, decreased by 25.2 percentage points.
At the end of 2011, the Eni ADR listed on the NYSE was $41.27, down 5.6% compared to the price registered in the last session of 2010 ($43.74). One ADR is equal to two Eni ordinary shares. In the same period the S&P 500 index increased by 5.5% percentage points. Eni market capitalization at the end of 2011 was euro 58 billion (euro 59.2 billion at the end of 2010), confirming Eni as the first company for market capitalization listed on the Italian Stock Exchange. Eni share was one of the more liquid of the Italian market. Shares traded during the year totaled almost 5.9 billion, with an average number of shares traded daily of 22.9 million (20.7 million in 2010). The total trade value of Eni share amounted to approximately euro 92 billion (euro 86 billion in 2010), equal to a daily average of euro 355 million.
i i i Share information 2009 2010 2011
Market quotations for common stock on the Mercato Telematico Azionario (MTA) High (euro) 18.35 18.56 18.42 Low (euro) 12.30 14.61 12.17 Average daily close (euro) 16.59 16.39 15.95 Year-end close (euro) 17.80 16.34 16.01
Market quotations for ADR on the New York Stock Exchange High (US$) 54.45 53.89 53.74 Low (US$) 31.07 35.37 32.98 Average daily close (US$) 46.36 43.56 44.41 Year-end close (US$) 50.61 43.74 41.27
Average daily traded volumes (million of shares) 27.9 20.7 22.8 Value of traded volumes (euro million) 461.7 336.0 355.0

- 54 -

Contents
Eni in 2011 Investor information
Share data 2009 2010 2011
Net profit pertaining to Eni: - per share (a) (euro) 1.21 1.74 1.89 - per ADR (a) (b) (US$) 3.36 4.62 5.27
Adjusted net profit pertaining to Eni: - per share (a) (euro) 1.44 1.90 1.92 - per ADR (a) (b) (US$) 4.01 5.04 5.36
Dividend: - per share (c) (euro) 1.00 1.00 1.04 - per ADR (b) (US$) 2.79 2.65 2.90 Pay-out (%) 83 57 55 Dividend yield (d) (%) 5.8 6.1 6.6 Total shareholder return (TSR) (%) 13.7 (2.2 ) 5.1 Number of shares outstanding: - at year end (e) (million) 3,622.4 3,622.5 3,622.7 - average (fully diluted) (f) (million) 3,622.4 3,622.5 3,622.5
Market capitalization (g) (euro billion) 64.5 59.2 58.0
(a) Ratio of net profit and average number of shares outstanding in the year, assuming dilution. Dollar amounts are converted on the basis of the average EUR/USD exchange rate quoted by the ECB for
the periods presented. (b) One ADR (American Depositary Receipt) is equal to two Eni ordinary shares. (c) Dividend per share pertaining to the year. This dividend is paid in two tranches. An interim dividend is paid in the same year, as approved by the Board; the balance to the full year dividend is paid in
the following calendar year (after approval by the Annual Shareholders’ Meeting). (d) Ratio of dividend for the period to the average price of the Eni shares recorded on the Italian Stock Exchange in December. (e) Excluding treasury shares. (f) Calculated by excluding own shares in portfolio. (g) Number of outstanding shares by references price at year end.
Dividends
Eni announces dividends on its ordinary shares in terms of euros. For the fiscal year 2011, the Annual Shareholders’ Meeting convened on May 8, 2012, is due to approve a dividend proposal made by the Board of Directors to pay a euro 1.04 a share dividend for 2011. Eni paid an interim dividend for fiscal year 2011 amounting to euro 0.52 per share to shares on the register at the ex-dividend date (September 19, 2011). Following shareholders approval, the balance of euro 0.52 to the 2011 dividend is scheduled for payment on May 24, 2012 (being the ex-dividend date May 21, 2012). Holders of ADRs will receive euro 1.04 per ADR, payable late in May 2012 being May 23, 2012 the
the amount in dollars is equal to the official rate recorded on the date of dividend payment in Italy (May 24, 2012). On ADR payment date, Bank of New York Mellon (until January 17, 2012 the depositary bank was JPMorgan Chase Bank, NA) pays the dividend less the amount of any withholding tax under Italian law (currently 27%) to all Depository Trust Company Participants, representing payment of Eni SpA’s gross dividend. By submitting to Bank of New York Mellon certain required documents with respect to each dividend payment, US holders of ADRs will enable the Italian Depositary bank and JPMorgan as ADR Depositary to pay the dividend at the reduced withholding

- 55 -
ex-dividend date.
Eni intends to continue paying interim dividends in the future. Holders of ADRs receive their dividends in US dollars. The rate of exchange used to determine
tax rate of 15%. US shareholders can obtain relevant documents as well as a complete instruction packet to benefit from this tax relief by contacting Bank of New York Mellon at 1.201.680.6825.
Contents
Eni in 2011 Investor information
Publications
1 Annual Report 2011 a comprehensive report on Eni’s activities and financial and sustainability results for the year.
5 Corporate Governance Report 2011 a report on the Corporate Governance system adopted by Eni pursuant to rule 123-bis of Legislative Decree No. 58/1998.
2 Annual Report on Form 20-F 2011 a comprehensive report on Eni’s activities and results to comply with the reporting requirements of the US Securities Exchange Act of 1934 and filed with the US Securities and Exchange Commission.
These and other Eni publications are available on Eni’s internet site eni.com , in the section "Publications" (eni.com/sites/ENI_en_IT/documentation/documentation.page?type=bilrap&lef tbox=documentazione&doc_from=hpeni_left). Shareholders may receive a hard copy of Eni’s publications, free of charge, by filling in the request form found in the section "Publications" or through an email request addressed to [email protected] or to [email protected]. Any other information relevant to shareholders and investors can be found at Eni’s website under the "Investor Relations" section.
3 Fact Book 2011 a report on Eni’s businesses, strategies, objectives and development projects, including a full set of operating and financial statistics.
4 Remuneration Report 2012 a report on Eni’s compensation and remuneration policies pursuant to rule 123-ter of Legislative Decree No. 58/1998.
Financial calendar
The dates of the Board of Directors’ meetings to be held during 2012 in order to approve/review the Company’s quarterly and semi-annual, and annual preliminary results are the following:
� Results for the first quarter of 2012
April 26, 2012 � Results for the third quarter of 2012
October 29, 2012
� Results for the second quarter and first half of 2012 and proposal of interim dividend for the financial year 2012
July 31, 2012 � Preliminary full-year results for the year ending December 31, 2012 and dividend proposal for the financial year 2012
February 2013

- 56 -

Contents

Contents

Contents

Contents

Table of Contents Contents

Table of Contents Contents

Table of Contents Contents

Table of Contents
Fact Book 2011
Contents Tables 4
5
11
15
43
56
66
70
Eni in 2011
Eni’s strategy
How we operate
Exploration & Production
Gas & Power
Refining & Marketing
Petrochemicals
Engineering & Construction
76
89
90
110
Financial data
Employees
Supplemental oil and gas information
Quarterly information
Eni’s Fact Book is a supplement to Eni’s 2011 Annual Report and is designed to provide supplemental financial and operating information. It contains certain forward-looking statements in particular under the section "Outlook" regarding capital expenditure, development and management of oil and gas resources, dividends, allocation of future cash flow from operations, future operating performance, gearing, targets of production and sale growth, new markets, and the progress and timing of projects. By their nature, forward-looking statements involve risks and uncertainties because they relate to events and depend on circumstances that will or may occur in the future. Actual
results may differ from those expressed in such statements, depending on a variety of factors, including the timing of bringing new fields on stream; management’s ability in carrying out industrial plans and in succeeding in commercial transactions; future levels of industry product supply; demand and pricing; operational problems; general economic conditions; political stability and economic growth in relevant areas of the world; changes in laws and governmental regulations; development and use of new technology; changes in public expectations and other changes in business conditions; the actions of competitors and other factors discussed elsewhere in this document.
May 8, 2012
Periodical updates will be available on the web site: www.factbook.eni.com

Contents
Eni Fact Book Eni
Eni is an integrated company engaged in the energy chain. Eni’s strong presence in the gas market and in the liquefaction of natural gas, our skills in the power generation and refinery activities, strengthened by world class skills in engineering and project management, allow us to catch opportunities in the market and to realize integrated projects.
In 2011, adjusted net profit was euro 6.97 billion, up 1.5% from a year ago driven by an excellent performance reported by an excellent performance reported by the Exploration & Production Division on the back of a recovery in crude oil prices. This positive helped the Company withstand the impact of the production shut down in Libya and the sharp contraction in results of the Company’s downstream businesses dragged down by the economic downturn.
Return on Average Capital Employed (ROACE) calculated on an adjusted basis was 9.9%. Net cash generated by operating activities amounted to euro 14.38 billion. Proceeds from divestments amounted to euro 1.9 billion. These inflows enabled the Company to fund the major part of the financing requirements associated with capital expenditure and other investments of euro 13.8 billion and shareholders’ remuneration.
The ratio of net borrowings to total equity was 0.46 at year end (0.47 at December 31, 2010).
The Board of Directors suggested to the Shareholders’ Meeting the distribution of a dividend of euro 1.04 per share for 2011 full year.
In 2011, the injury frequency rate decreased by 22% and 15.9% relating to employees and contractors respectively, compared to the previous year. This positive trend progressed for the sixth consecutive year. In 2011, Eni continued its commitment in incident prevention also by means of training programs on safety and emergency prevention.
In 2011, the Exploration & Production Division reported adjusted net profit amounting to euro 6.87 billion (up 22.6% from 2010). Liquids and gas production was 1,581 kboe/d, down by 12.9% from 2010, mainly due to a
lowered output in Libya. Estimated net proved reserves at December 31, 2011, were 7.09 bboe. All sources reserves replacement ratio was 142%. Excluding price effect, the replacement ratio would be 159%. The reserves life index is 12.3 years (10.3 years in 2010).
In 2011, the Gas & Power Division reported adjusted net profit of euro 1.54 billion, down 39.8% from 2010 due to a sharply lower operating performance of the Marketing business (adjusted operating profit was down euro 1.28 billion) negatively impacted by weak domestic demand (down 6%), and mounting competitive pressures fuelled by oversupply which squeezed selling margins and reduced volumes opportunities. The performance was also impacted by the disruption in Libyan gas availability which negatively impacted the supply mix and reduced sales to importers. Sales in Italy were basically stable (up 1.1%) despite declining demand. Sales in target European markets increased by approximately 8%.
In 2011, the Refining & Marketing segment reported adjusted operating loss of euro 262 million worsening by euro 213 million from 2010, reflecting unprofitable refining margins due to rising costs for oil-based feedstock and for energy utilities linked to the former that could not be transferred to prices at the pump, also due to weak demand and excess capacity in the Mediterranean basin. Marketing results were positive but shrinking due to the decline in retail and wholesale demand for products and high competitive pressure. Despite a decline in retail sales in Italy (down 3%) Eni’s average retail market share for 2011 was 30.5%, up from 2010 due to commercial initiatives and a strong brand name.
In 2011, the Engineering & Construction sector achieved an adjusted net profit amounting to euro 1.1 billion and a flow of new orders that allowed to keep its order backlog to a record of over euro 20 billion.
In 2011, the sector reported a significant increase in adjusted net loss (euro 208 million, down euro 123 million) from 2010, due to lower cracker margins and lower sales volumes, in particular of commodity production. Niche business segments of elastomers and styrenes improved their profitability due to their higher technological content.

- 4 -

Contents
Eni Fact Book Eni
The oil&gas industry is coping with a complex scenario featured by the global economic slowdown, particularly in the Euro-zone, and volatile market conditions for energy commodities. In the medium to long-term the main challenges will be driven by rising competitive pressures in accessing reserves by new players, stricter regulation addressing environmental preservation and mitigation of the climate risk, a growing importance of renewable sources as well as the role of unconventional resources in satisfying energy need. Against this backdrop, Eni confirms its growth strategy and the adoption of a sustainable business model founded on the pillars of innovation, excellence, inclusiveness, integration, responsibility and cooperation in a framework of straightforward rules of corporate governance. Eni believes that a sustainable business conduct contributes to both the achievement of industrial performance, and the mitigation of political, financial and operational risks. This strengthens Eni’s role as a trustworthy and reliable partner, who is ready to capture new opportunities in the marketplace and able to manage the complexities of the environment. Eni believes that those drivers will help the Company to create value to its shareholders and stakeholders.
Eni has designed its industrial plan for the four-year period 2012-2015 along the following strategic guidelines: growing profitable oil and gas production in the upstream, strengthening market leadership in the European gas market, improving downstream oil efficiency, refocusing petrochemical operations and retaining top spots among the best-in-class engineering and construction players in the most technologically advanced segments.
In the medium-term, Eni intends to preserve a solid capital structure while continuing to invest to fuel profitable growth and reward investors. Management is targeting a net debt to equity ratio of less than 0.4 by the end of the plan period which takes into account a capital expenditure plan of euro 59.6 billion, of which 75% dedicated to upstream activities. Eni’s ability to generate strong operating cash flows, investment selection and capital efficiency will underpin the Company’s financial structure.
In the Exploration & Production Division, Eni intends to deliver organic production growth with increasing returns and reserve replacement. The Company’s value proposition in its upstream operations will leverage on strengthening our leadership in core areas, increasing the volume of operated production and retaining a strong portfolio of long-term plateau fields. Eni will pursue further growth options by developing unconventional plays, gas-to-LNG projects and integrated gas projects. Eni’s growth trajectory will be supported by its ongoing commitment in establishing and consolidating its partnerships with key host Countries, leveraging the Eni co-operation model. Management expects that continuing technological innovation and competence build-up will drive production growth and increasing rates of reserve recovery, developing drilling techniques to be applied in complex environment, marginal fields and deep/ultra deep offshore areas. Management is targeting to increase hydrocarbon production to 2.03 mmboe/d by 2015 at an average rate of more than 3% over the next four years. Growth will be fuelled by increasing flows from Eni’s core areas (in Sub-Saharan Africa in particular in Mozambique, Venezuela, Barents Sea, Yamal Peninsula in Russia, Kazakhstan, Iraq and Indonesia) leveraging Eni’s vast knowledge of reservoirs and geological basins, as well as technical and producing synergies. Eni’s exploration activity will play a vital role in securing access to new resources and the long-term business sustainability and we are planning to step-up expenditures over the next four-year plan compared to our previous capital budget (an increase of approximately euro 2 billion). Management plans to achieve a sound balance between exploration projects in legacy areas vs. high risk/high reward basins. Eni intends to drive higher returns and manage the operational risk in its upstream operations by reducing the time-to-market of its portfolio of resources, increasing total
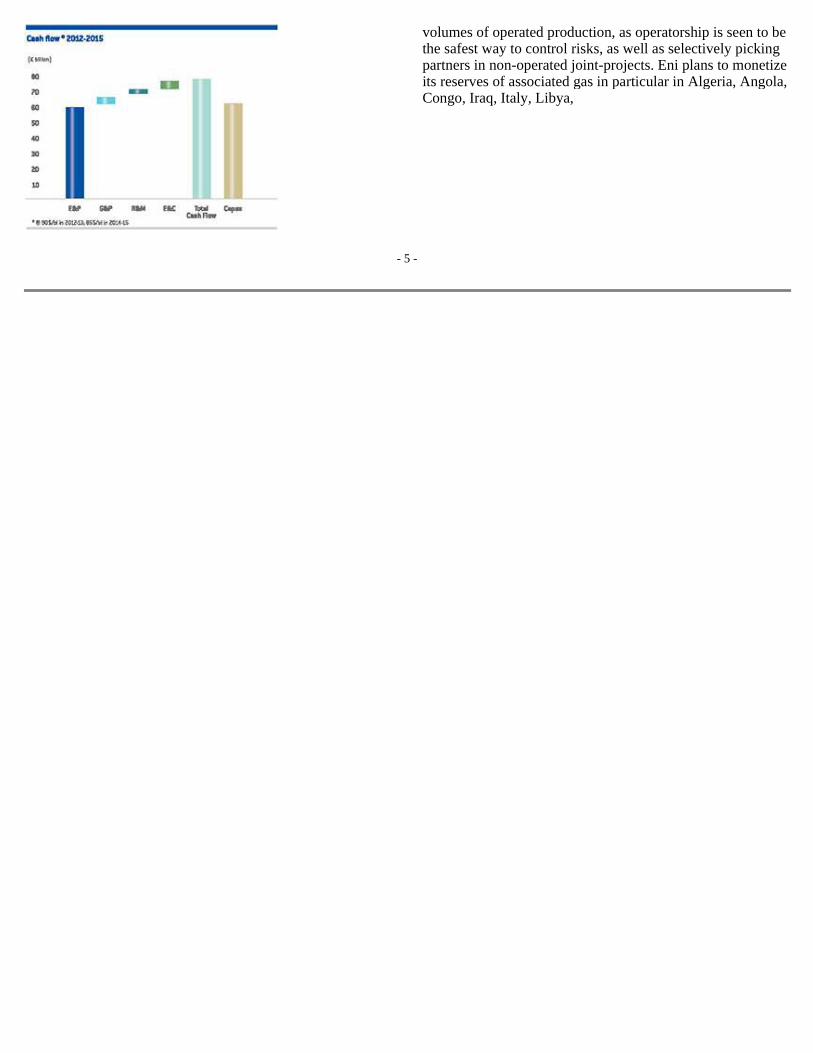
- 5 -
volumes of operated production, as operatorship is seen to be the safest way to control risks, as well as selectively picking partners in non-operated joint-projects. Eni plans to monetize its reserves of associated gas in particular in Algeria, Angola, Congo, Iraq, Italy, Libya,
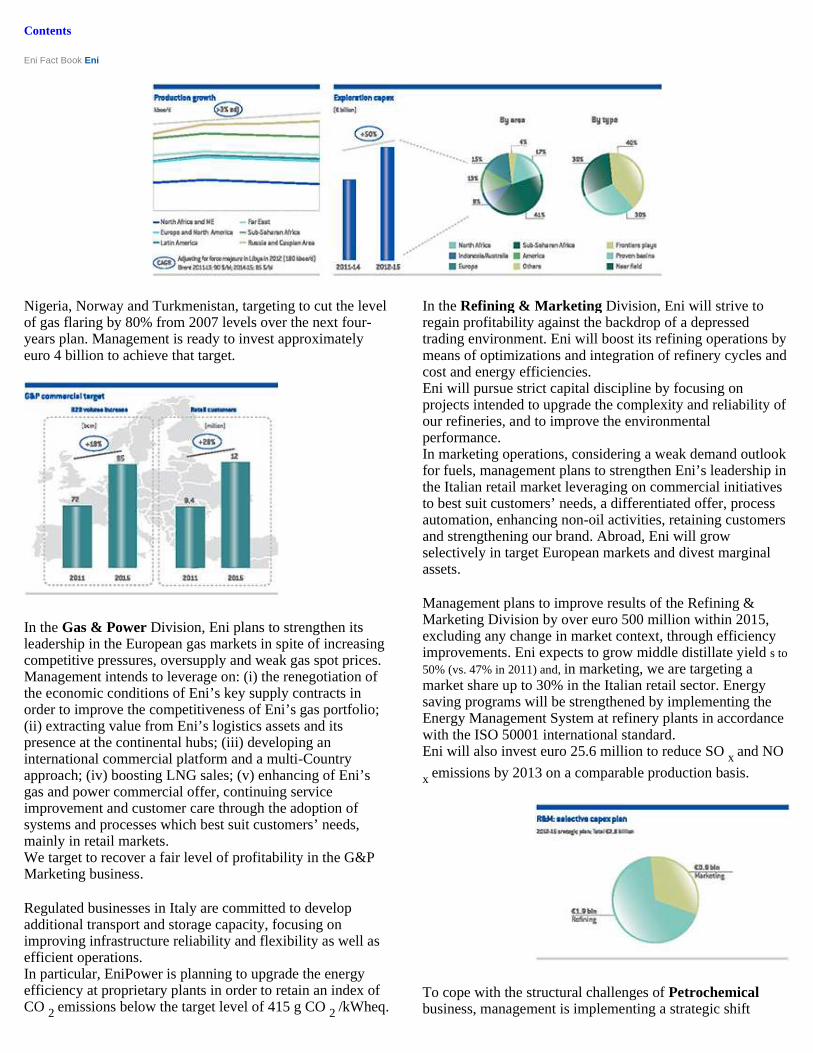
Contents
Eni Fact Book Eni
Nigeria, Norway and Turkmenistan, targeting to cut the level of gas flaring by 80% from 2007 levels over the next four-years plan. Management is ready to invest approximately euro 4 billion to achieve that target.
In the Gas & Power Division, Eni plans to strengthen its leadership in the European gas markets in spite of increasing competitive pressures, oversupply and weak gas spot prices. Management intends to leverage on: (i) the renegotiation of the economic conditions of Eni’s key supply contracts in order to improve the competitiveness of Eni’s gas portfolio; (ii) extracting value from Eni’s logistics assets and its presence at the continental hubs; (iii) developing an international commercial platform and a multi-Country approach; (iv) boosting LNG sales; (v) enhancing of Eni’s gas and power commercial offer, continuing service improvement and customer care through the adoption of systems and processes which best suit customers’ needs, mainly in retail markets. We target to recover a fair level of profitability in the G&P Marketing business.
Regulated businesses in Italy are committed to develop additional transport and storage capacity, focusing on improving infrastructure reliability and flexibility as well as efficient operations. In particular, EniPower is planning to upgrade the energy efficiency at proprietary plants in order to retain an index of CO 2 emissions below the target level of 415 g CO 2 /kWheq.
In the Refining & Marketing Division, Eni will strive to regain profitability against the backdrop of a depressed trading environment. Eni will boost its refining operations by means of optimizations and integration of refinery cycles and cost and energy efficiencies. Eni will pursue strict capital discipline by focusing on projects intended to upgrade the complexity and reliability of our refineries, and to improve the environmental performance. In marketing operations, considering a weak demand outlook for fuels, management plans to strengthen Eni’s leadership in the Italian retail market leveraging on commercial initiatives to best suit customers’ needs, a differentiated offer, process automation, enhancing non-oil activities, retaining customers and strengthening our brand. Abroad, Eni will grow selectively in target European markets and divest marginal assets.
Management plans to improve results of the Refining & Marketing Division by over euro 500 million within 2015, excluding any change in market context, through efficiency improvements. Eni expects to grow middle distillate yield s to 50% (vs. 47% in 2011) and, in marketing, we are targeting a market share up to 30% in the Italian retail sector. Energy saving programs will be strengthened by implementing the Energy Management System at refinery plants in accordance with the ISO 50001 international standard. Eni will also invest euro 25.6 million to reduce SO x and NO
x emissions by 2013 on a comparable production basis.
To cope with the structural challenges of Petrochemical business, management is implementing a strategic shift

- 6 -
Eni will continue pursuing the OHSAS 18001 certification for its health and safety management systems at all its plants.
targeting to restore the economic equilibrium of the business over the medium-term. This new strategy features a gradual reduction of the exposure to the unprofitable, commoditized businesses in favor of growing the

Contents
Eni Fact Book Eni
- 7 -
Company’s presence in niche productions, particularly elastomers and specialties which have shown good profitability. Eni will pursue this goal by reconverting and restructuring loss-making plants, improving plant integration and flexibility, as well as optimization projects. Eni intends to growth its presence in green chemistry leveraging its joint venture project at Porto Torres in Sardinia which targets the restructuring of an obsolete plant into a modern and advanced facility for the production of environmentally-friendly chemicals. The licensing of Eni’s proprietary technologies will support the establishment of strategic alliances with international partners. Over the next four years, Eni will make capital expenditure amounting to euro 1.7 billion, targeting plant upgrading and enhancement in the best positioned businesses, mainly in elastomers. In the medium term Eni plans to break-even business results.
made to boost local assets and logistic centers in key areas (in particular in Brazil) will support the competitive advantages. Management believes that the achievement of Eni’s projected targets and expected returns will be underpinned by Eni’s operational excellence, synergies from integration and the development of integrated risk management capabilities intended to extract value from Eni’s assets. Operational excellence thanks to Eni’s know-how and distinctive competences endorses a preventive business conduct when managing the environmental footprint of Eni’s operations and risks to employees and communities’ health and safety. Continuing improvement in efficiency through innovation of business processes will enable the Company to reduce the energy intensity of its productions, optimize plants activities and achieve economies of scale in centralized services.
Engineering & Construction segment will consolidate its leading position in the Offshore and Onshore businesses leveraging the EPIC-oriented business model and outstanding relationships with the Majors and NOCs. Saipem will continue focusing on the execution of technologically-advanced mega-projects mainly located in frontier areas and complex environments, carefully selecting business opportunities. The upgrading of a world-class drilling and construction offshore fleet, the availability of an important construction yard in Indonesian targeting offshore projects, as well as the expenditures
Integration will enable Eni to capture joint opportunities in the marketplace, reaping the benefits of synergies and maximizing asset returns. Particularly, the new business unit Eni trading will develop integrated risk management activities with a view of better coping with the increasingly volatile commodity markets.
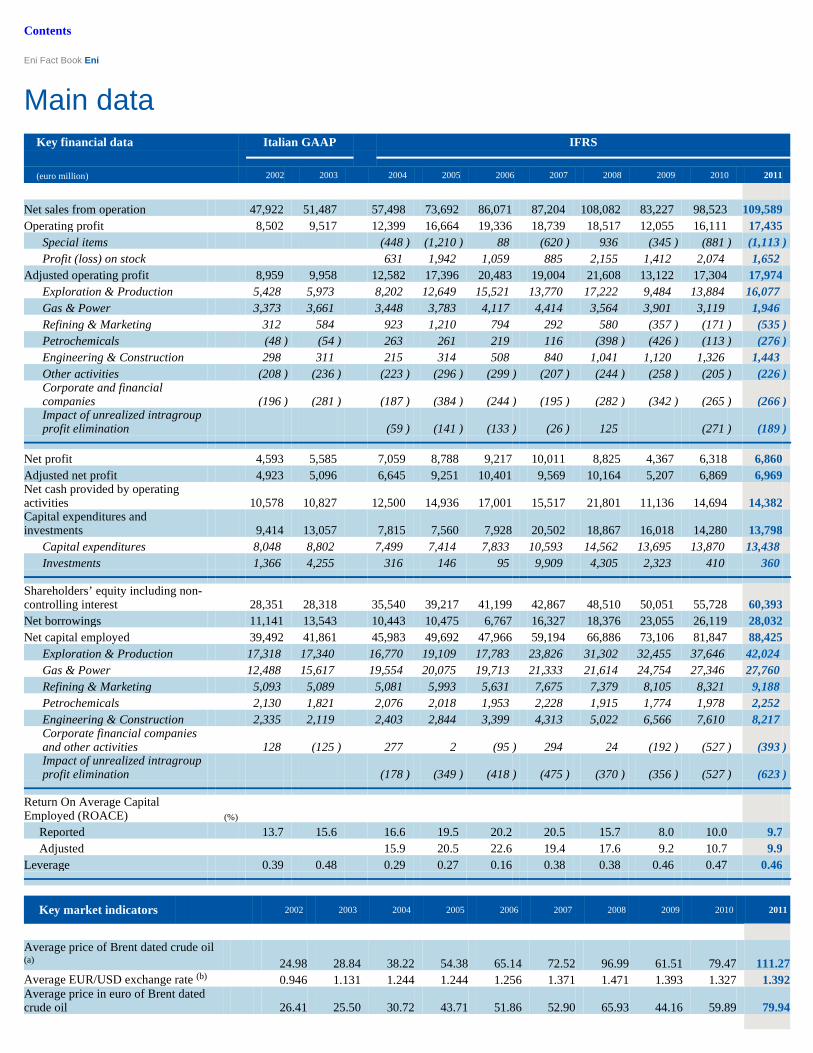
Contents
Eni Fact Book Eni
Main data
Key financial data Italian GAAP IFRS (euro million) 2002 2003 2004 2005 2006 2007 2008 2009 2010 2011 Net sales from operation 47,922 51,487 57,498 73,692 86,071 87,204 108,082 83,227 98,523 109,589 Operating profit 8,502 9,517 12,399 16,664 19,336 18,739 18,517 12,055 16,111 17,435 Special items (448 ) (1,210 ) 88 (620 ) 936 (345 ) (881 ) (1,113 ) Profit (loss) on stock 631 1,942 1,059 885 2,155 1,412 2,074 1,652 Adjusted operating profit 8,959 9,958 12,582 17,396 20,483 19,004 21,608 13,122 17,304 17,974 Exploration & Production 5,428 5,973 8,202 12,649 15,521 13,770 17,222 9,484 13,884 16,077 Gas & Power 3,373 3,661 3,448 3,783 4,117 4,414 3,564 3,901 3,119 1,946 Refining & Marketing 312 584 923 1,210 794 292 580 (357 ) (171 ) (535 ) Petrochemicals (48 ) (54 ) 263 261 219 116 (398 ) (426 ) (113 ) (276 ) Engineering & Construction 298 311 215 314 508 840 1,041 1,120 1,326 1,443 Other activities (208 ) (236 ) (223 ) (296 ) (299 ) (207 ) (244 ) (258 ) (205 ) (226 ) Corporate and financial companies (196 ) (281 ) (187 ) (384 ) (244 ) (195 ) (282 ) (342 ) (265 ) (266 ) Impact of unrealized intragroup profit elimination (59 ) (141 ) (133 ) (26 ) 125 (271 ) (189 )
Net profit 4,593 5,585 7,059 8,788 9,217 10,011 8,825 4,367 6,318 6,860 Adjusted net profit 4,923 5,096 6,645 9,251 10,401 9,569 10,164 5,207 6,869 6,969 Net cash provided by operating activities 10,578 10,827 12,500 14,936 17,001 15,517 21,801 11,136 14,694 14,382 Capital expenditures and investments 9,414 13,057 7,815 7,560 7,928 20,502 18,867 16,018 14,280 13,798 Capital expenditures 8,048 8,802 7,499 7,414 7,833 10,593 14,562 13,695 13,870 13,438 Investments 1,366 4,255 316 146 95 9,909 4,305 2,323 410 360
Shareholders’ equity including non-controlling interest 28,351 28,318 35,540 39,217 41,199 42,867 48,510 50,051 55,728 60,393 Net borrowings 11,141 13,543 10,443 10,475 6,767 16,327 18,376 23,055 26,119 28,032 Net capital employed 39,492 41,861 45,983 49,692 47,966 59,194 66,886 73,106 81,847 88,425 Exploration & Production 17,318 17,340 16,770 19,109 17,783 23,826 31,302 32,455 37,646 42,024 Gas & Power 12,488 15,617 19,554 20,075 19,713 21,333 21,614 24,754 27,346 27,760 Refining & Marketing 5,093 5,089 5,081 5,993 5,631 7,675 7,379 8,105 8,321 9,188 Petrochemicals 2,130 1,821 2,076 2,018 1,953 2,228 1,915 1,774 1,978 2,252 Engineering & Construction 2,335 2,119 2,403 2,844 3,399 4,313 5,022 6,566 7,610 8,217 Corporate financial companies and other activities 128 (125 ) 277 2 (95 ) 294 24 (192 ) (527 ) (393 ) Impact of unrealized intragroup profit elimination (178 ) (349 ) (418 ) (475 ) (370 ) (356 ) (527 ) (623 )
Return On Average Capital Employed (ROACE) (%) Reported 13.7 15.6 16.6 19.5 20.2 20.5 15.7 8.0 10.0 9.7 Adjusted 15.9 20.5 22.6 19.4 17.6 9.2 10.7 9.9 Leverage 0.39 0.48 0.29 0.27 0.16 0.38 0.38 0.46 0.47 0.46
Key market indicators 2002 2003 2004 2005 2006 2007 2008 2009 2010 2011
Average price of Brent dated crude oil (a) 24.98 28.84 38.22 54.38 65.14 72.52 96.99 61.51 79.47 111.27 Average EUR/USD exchange rate (b) 0.946 1.131 1.244 1.244 1.256 1.371 1.471 1.393 1.327 1.392 Average price in euro of Brent dated crude oil 26.41 25.50 30.72 43.71 51.86 52.90 65.93 44.16 59.89 79.94

- 8 -
Average European refining margin (c) 0.80 2.65 4.35 5.78 3.79 4.52 6.49 3.13 2.66 2.06 Average European refining margin Brent/Ural (c) 1.40 3.40 7.03 8.33 6.50 6.45 8.85 3.56 3.47 2.90 Euribor - three-month euro rate (%) 3.3 2.3 2.1 2.2 3.1 4.3 4.6 1.2 0.8 1.4
(a) In US dollars per barrel. Source: Platt’ s Oilgram. (b) Source: ECB. (c) In US dollars per barrel FOB Mediterranean Brent dated crude oil. Source: Eni calculations based on Platt’s Oilgram data.

Contents
Eni Fact Book Eni
Selected operating data 2002 2003 2004 2005 2006 2007 2008 2009 2010 2011
Corporate Employees at period end (number) 80,540 76,529 71,572 71,773 72,850 75,125 78,094 77,718 79,941 78,686
of which: - women 10,274 11,155 10,326 10,620 10,841 10,977 12,221 12,564 12,754 13,185
- outside Italy 39,329 36,678 32,691 34,036 35,818 38,634 41,971 42,633 45,967 45,516
Female managers (%) 10.9 10.9 12.5 12.4 13.5 14.1 16.0 17.0 17.7 18.2 Employee injury frequency rate
(number of injuries/million of worked hours) 4.74 3.79 3.99 2.74 2.45 1.93 1.45 1.00 0.91 0.71
Contractor injury frequency rate 4.71 4.12 7.84 2.59 1.54 1.45 1.40 1.18 0.88 0.74
Oil spills (barrels) 2,198 857 7,813 6,908 6,151 6,731 4,749 6,259 4,269 7,295 Oil spills due to sabotage and terrorism n.a. n.a. n.a. 1,810 7,014 2,608 2,286 15,288 18,695 6,127
GHG emission (mmtonnes CO 2 eq) 52.84 52.27 58.34 61.85 60.72 67.25 62.01 57.69 60.64 51.10
R&D expenditures (a) (euro million) 175 238 257 204 222 208 217 207 221 191
Exploration & Production Proved reserves of hydrocarbons at period end (mmboe) 7,030 7,272 7,218 6,837 6,436 6,370 6,600 6,571 6,843 7,086
Reserve life index (years) 13.2 12.7 12.1 10.8 10.0 10.0 10.0 10.2 10.3 12.3
Hydrocarbons production (kboe/d) 1,472 1,562 1,624 1,737 1,770 1,736 1,797 1,769 1,815 1,581
Gas & Power Sales of consolidated companies (including own consumption) (bcm) 66.14 71.39 76.49 82.62 85.76 84.83 89.32 89.60 82.00 84.37 Sales of Eni’s affiliates (Eni’s share) (bcm) 2.40 6.94 5.84 7.08 7.65 8.74 8.91 7.95 9.41 9.53 Total sales and own consumption (G&P) (bcm) 68.54 78.33 82.33 89.70 93.41 93.57 98.23 97.55 91.41 93.90
E&P gas sales (b) (bcm) 4.70 4.51 4.69 5.39 6.00 6.17 5.65 2.86
Worldwide gas sales (bcm) 68.54 78.33 87.03 94.21 98.10 98.96 104.23 103.72 97.06 96.76
Electricity sold (TWh) 6.74 8.65 16.95 27.56 31.03 33.19 29.93 33.96 39.54 40.28
Refining & Marketing Throughputs on own account (mmtonnes) 37.73 35.43 37.69 38.79 38.04 37.15 35.84 34.55 34.80 31.96 Balanced capacity of wholly-owned refineries at period end (kbbl/d) 504 504 504 524 534 544 737 747 757 767
Sales of refined products (c) (mmtonnes) 52.24 50.43 53.54 51.63 51.13 50.15 49.16 45.59 46.80 45.02
Retail sales in Europe (c) (mmtonnes) 13.71 14.01 14.40 12.42 12.48 12.65 12.03 12.02 11.73 11.37
Service stations at year end (c) (units) 10,762 10,647 9,140 6,282 6,294 6,440 5,956 5,986 6,167 6,287 Average throughput per service station (kliters/y) 1,674 1,771 1,970 2,479 2,470 2,486 2,502 2,477 2,353 2,206
Petrochemicals Production (ktonnes) 7,116 6,907 7,118 7,282 7,072 8,795 7,372 6,521 7,220 6,245
of which: - Basic petrochemicals 4,304 4,014 4,236 4,450 4,275 5,688 5,110 4,350 4,860 4,101
- Polymers 2,812 2,893 2,882 2,832 2,797 3,107 2,262 2,171 2,360 2,144
Average plant utilization rate (%) 74.3 71.3 75.2 78.4 76.4 80.6 68.6 65.4 72.9 65.3
Engineering & Construction Orders acquired (euro million) 7,852 5,876 5,784 8,395 11,172 11,845 13,860 9,917 12,935 12,505
Order backlog at year end (euro million) 10,065 9,405 8,521 10,122 13,191 15,390 19,105 18,370 20,505 20,417
i i i (a) i Net of general and administrative costs. (b) i Includes E&P gas sales in Europe (4.70, 4.51, 4.07, 3.59, 3.36, 2.57, 2.33 and 2.29 bcm in 2004, 2005, 2006, 2007, 2008, 2009, 2010 and 2011, respectively) and in the Gulf of Mexico (0.62, 1.80,
2.64, 3.60, 3.32 and 0.57 in 2006, 2007, 2008, 2009, 2010 and 2011, respectively). (c) i 2008-2009 data do not include downstream activities in the Iberian Peninsula divested to Galp in October 2008. i i i
Share data Italian GAAP IFRS 2002 2003 2004 2005 2006 2007 2008 2009 2010 2011 Net profit (a) (euro) 1.20 1.48 1.87 2.34 2.49 2.73 2.43 1.21 1.74 1.89 Dividend (euro) 0.75 0.75 0.90 1.10 1.25 1.30 1.30 1.00 1.00 1.04 Dividend pertaining to the year (b) (euro million) 2,833 2,828 3,384 4,086 4,594 4,750 4,714 3,622 3,622 3,695
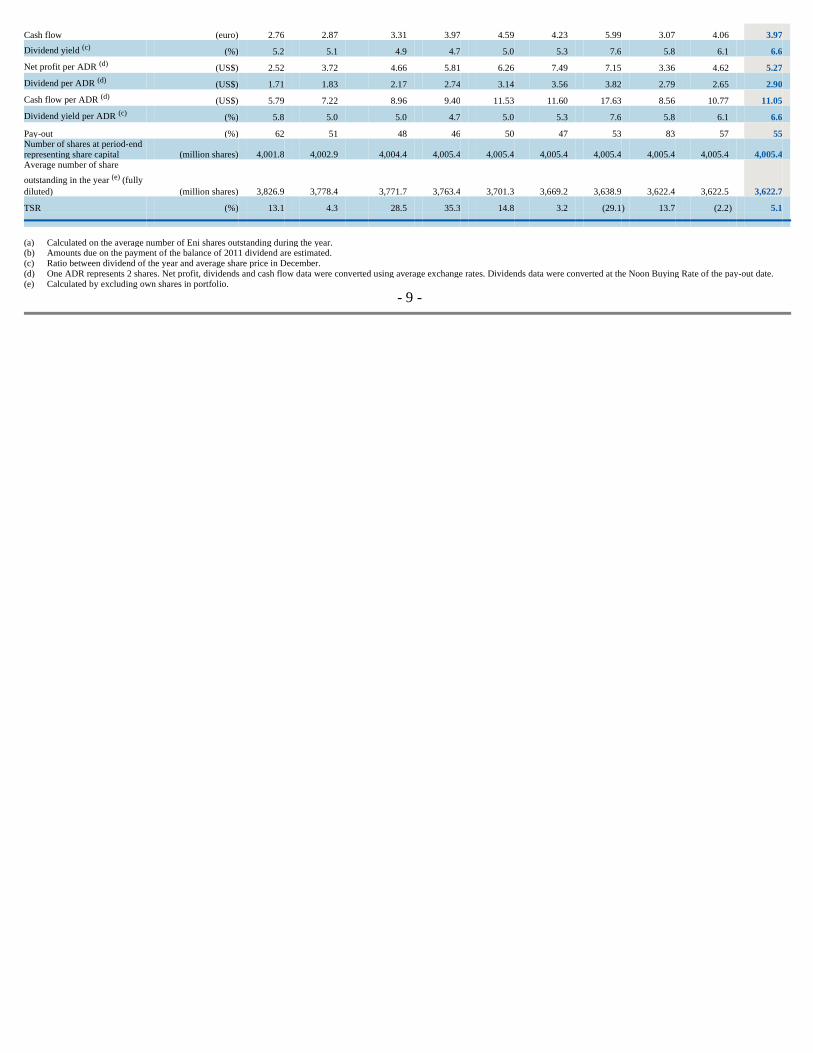
Cash flow (euro) 2.76 2.87 3.31 3.97 4.59 4.23 5.99 3.07 4.06 3.97 Dividend yield (c) (%) 5.2 5.1 4.9 4.7 5.0 5.3 7.6 5.8 6.1 6.6 Net profit per ADR (d) (US$) 2.52 3.72 4.66 5.81 6.26 7.49 7.15 3.36 4.62 5.27 Dividend per ADR (d) (US$) 1.71 1.83 2.17 2.74 3.14 3.56 3.82 2.79 2.65 2.90 Cash flow per ADR (d) (US$) 5.79 7.22 8.96 9.40 11.53 11.60 17.63 8.56 10.77 11.05 Dividend yield per ADR (c) (%) 5.8 5.0 5.0 4.7 5.0 5.3 7.6 5.8 6.1 6.6 Pay-out (%) 62 51 48 46 50 47 53 83 57 55 Number of shares at period-end representing share capital (million shares) 4,001.8 4,002.9 4,004.4 4,005.4 4,005.4 4,005.4 4,005.4 4,005.4 4,005.4 4,005.4 Average number of share
outstanding in the year (e) (fully diluted) (million shares) 3,826.9 3,778.4 3,771.7 3,763.4 3,701.3 3,669.2 3,638.9 3,622.4 3,622.5 3,622.7 TSR (%) 13.1 4.3 28.5 35.3 14.8 3.2 (29.1 ) 13.7 (2.2 ) 5.1
i i i (a) i Calculated on the average number of Eni shares outstanding during the year. (b) i Amounts due on the payment of the balance of 2011 dividend are estimated. (c) i Ratio between dividend of the year and average share price in December. (d) i One ADR represents 2 shares. Net profit, dividends and cash flow data were converted using average exchange rates. Dividends data were converted at the Noon Buying Rate of the pay-out date. (e) i Calculated by excluding own shares in portfolio.
i - 9 -
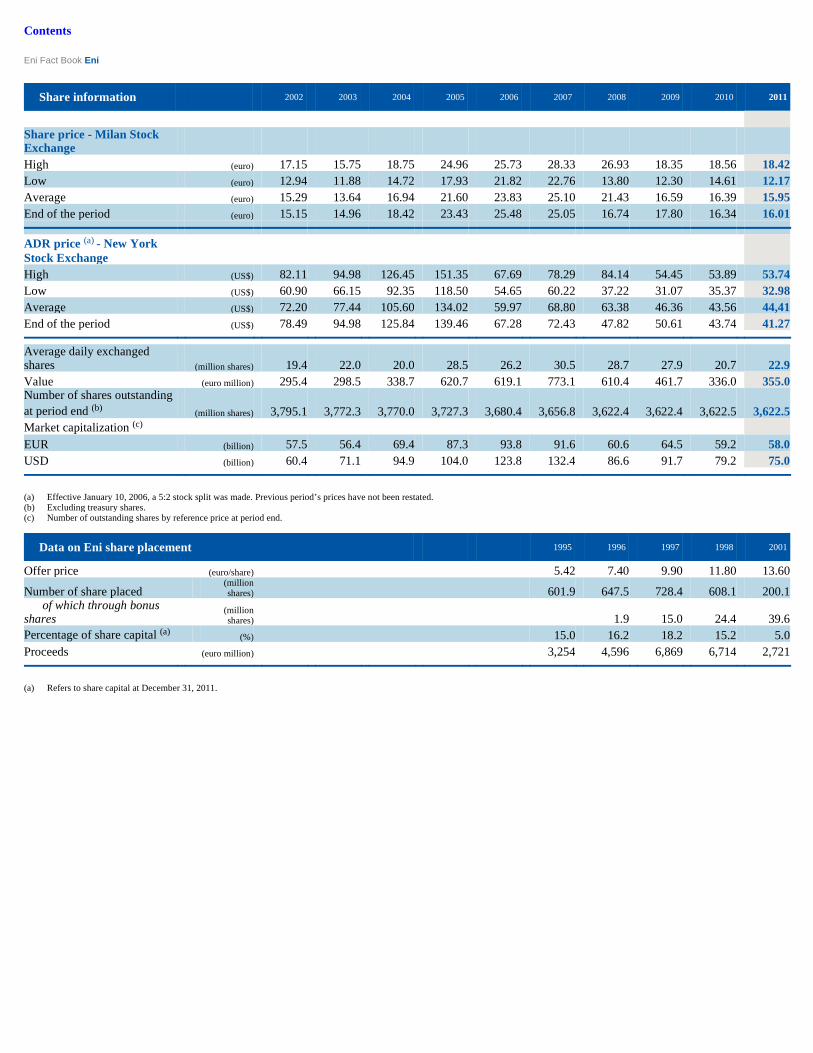
Contents
Eni Fact Book Eni
Share information 2002 2003 2004 2005 2006 2007 2008 2009 2010 2011
Share price - Milan Stock Exchange High (euro) 17.15 15.75 18.75 24.96 25.73 28.33 26.93 18.35 18.56 18.42 Low (euro) 12.94 11.88 14.72 17.93 21.82 22.76 13.80 12.30 14.61 12.17 Average (euro) 15.29 13.64 16.94 21.60 23.83 25.10 21.43 16.59 16.39 15.95 End of the period (euro) 15.15 14.96 18.42 23.43 25.48 25.05 16.74 17.80 16.34 16.01
ADR price (a) - New York Stock Exchange High (US$) 82.11 94.98 126.45 151.35 67.69 78.29 84.14 54.45 53.89 53.74 Low (US$) 60.90 66.15 92.35 118.50 54.65 60.22 37.22 31.07 35.37 32.98 Average (US$) 72.20 77.44 105.60 134.02 59.97 68.80 63.38 46.36 43.56 44,41 End of the period (US$) 78.49 94.98 125.84 139.46 67.28 72.43 47.82 50.61 43.74 41.27
Average daily exchanged shares (million shares) 19.4 22.0 20.0 28.5 26.2 30.5 28.7 27.9 20.7 22.9 Value (euro million) 295.4 298.5 338.7 620.7 619.1 773.1 610.4 461.7 336.0 355.0 Number of shares outstanding at period end (b) (million shares) 3,795.1 3,772.3 3,770.0 3,727.3 3,680.4 3,656.8 3,622.4 3,622.4 3,622.5 3,622.5 Market capitalization (c) EUR (billion) 57.5 56.4 69.4 87.3 93.8 91.6 60.6 64.5 59.2 58.0 USD (billion) 60.4 71.1 94.9 104.0 123.8 132.4 86.6 91.7 79.2 75.0
i i i (a) i Effective January 10, 2006, a 5:2 stock split was made. Previous period’s prices have not been restated. (b) i Excluding treasury shares. (c) i Number of outstanding shares by reference price at period end. i i i
Data on Eni share placement 1995 1996 1997 1998 2001
Offer price (euro/share) 5.42 7.40 9.90 11.80 13.60
Number of share placed (million shares)
601.9 647.5 728.4 608.1 200.1 of which through bonus shares
(million shares)
1.9 15.0 24.4 39.6
Percentage of share capital (a) (%) 15.0 16.2 18.2 15.2 5.0 Proceeds (euro million) 3,254 4,596 6,869 6,714 2,721
i i i (a) i Refers to share capital at December 31, 2011.

- 10 -

Contents
Eni Fact Book How we operate
- 11 -
In the deployment of its activities, Eni built important relations with the external world in order to maintain a constructive confrontation aimed at the diffusion and development of best practices. This has enabled Eni to be seen as a reliable and competitive partner. This approach is based on the respect of universal principles such as the protection of human rights, the adoption of the highest standards of work, the respect of the environment and communities, and the fight against corruption. In addition to this, Eni is oriented at seizing business opportunities while taking account the development of the socio-economic contexts in which it operates. The respect for universal principles incorporated in Eni’s business model is expressed mainly in responsibility towards applicable laws and the adoption of best standards, the inclusion of all its people through fair and non discriminating policies, excellence in operations with the adoption of quality systems and advanced technologies. Integration , innovation and cooperation are the competitive drivers allowing Eni to stand out in the oil&gas industry, to consolidate its presence in Countries that are not always characterized by political stability and at the same time to contribute to the development goals of the United Nations.
Cooperation in the development of the territories where we work, expresses the ability to understand local needs and the willingness to contribute to their fulfillment. Eni is committed to provide concrete response to problems and requirements of the Countries where it operates, in synergy with the development strategies of these Countries and with reference to the Millennium Goals.
The cooperation model with producing Countries, or rather the will to invest with a long-term prospective and the flexibility of offering solutions to the requirements of the Countries, has been an integral part of corporate strategy from the very beginning. This is now transforming into ever greater integration among the Company development projects and the development of growth opportunities in the territories where Eni is hosted.
Integration of all activities along the energy supply chain is a source of crucial synergies for facing market challenges and ensuring competitive advantages. The integrated approach enables greater flexibility in managing relation with producing Countries, to whom Eni proposes solutions that each and every time are adapted to the specific requirements for technology, infrastructure and economic growth of the local society.

Contents
Eni Fact Book How we operate
- 12 -
Innovation is a key element for accessing new energy resources, improving recovery from the subsoil and the efficiency of its use, ensuring respect for and responsible use of natural resources. Eni’s commitment to technological research is aimed at reducing the time-to-market for new scientific discoveries in the traditional oil&gas sectors, at enhancing renewable energy, and at developing innovative methods of environmental conservation.
Excellence in running the operations hinges on making use of best practices, quality systems, advanced technologies and safety systems to ensure full respect for the community and the environment. Environmental responsibility is a basic pillar of sustainable operations, in particular as concerns the environmental impact on health and well-being of communities living in the affected areas. Among the projects carried out by Eni are the reduction of polluting emissions and of greenhouse gases (by means of increased efficiency and flare down projects), the reduction in fresh water consumption, the provision of assessments on ecosystem and biodiversity protection.
Inclusion of all Eni people, with their broadly expressed diversity combines with health and safety protection in the workplace, as well as
their personal development and involvement in the Company’s goals. Thanks to the skills of its employees and to their diversity, which Eni enhances inside its corporate structure, to its ability to integrate with different local contexts, Eni ensures a distinctive offering with significant advantages in terms of competitiveness.
Responsibility in terms of commitment to transparency in the business management, in the fight against corruption, and in the respect for human rights in every sphere of our work is a requisite for effective contribution toward the development of Countries and societies. As concerns human rights, Eni promotes their respect in all its operations and extends this to all its supply chain and to all its stakeholders. The respect of international standards is essential especially in Countries where rules and values for the protection and safeguard of human rights are not implemented. Eni is also engaged in the fight against corruption. Anti-corruption regulations are applied to all corporate levels through an articulated and homogenous system of rules based on the principles of integrity and transparency that have been extended along the entire value chain to promote a sustainable business and full respect of stakeholders.
Safety 2007 2008 2009 2010 2011
Injury frequency rate (number of injuries/million of worked hours) 1.62 1.42 1.11 0.89 0.73 - employees 1.93 1.45 1.00 0.91 0.71 - contractors 1.45 1.40 1.18 0.88 0.74 Fatality index (fatal injuries/one hundred million of worked hours) 2.97 2.68 1.33 4.64 1.89 - employees 1.00 2.43 0.85 6.40 1.15 - contractors 4.04 2.81 1.65 3.48 2.34 Safety expenditures and investments (euro thousand) 446,597 425,593 514,773 283,501 349,229 Professional illnesses reported (number) 109 83 127 184 135 Health and hygiene expenditure and investments (euro thousand) 53,762 68,561 80,896 57,756 81,192
Spending for the territory (euro million) 2007 2008 2009 2010 2011
Total spending for the territory: 85.9 86.5 98.6 108.0 101.8 - project investments 58.1 69.4 70.4 75.4 69.3 - short-term investments and donations 2.7 0.5 1.2 4.5 1.1 - association memberships fees 0.9 1.5 1.5 1.7 1.6 - contributions to the Eni Foundation 8.0 0.0 5.0 5.0 3.0 - sponsorships for the territory 12.9 11.8 16.6 17.6 22.9 - contributions to the Eni Enrico Mattei Foundation 3.3 3.3 3.9 3.9 3.9

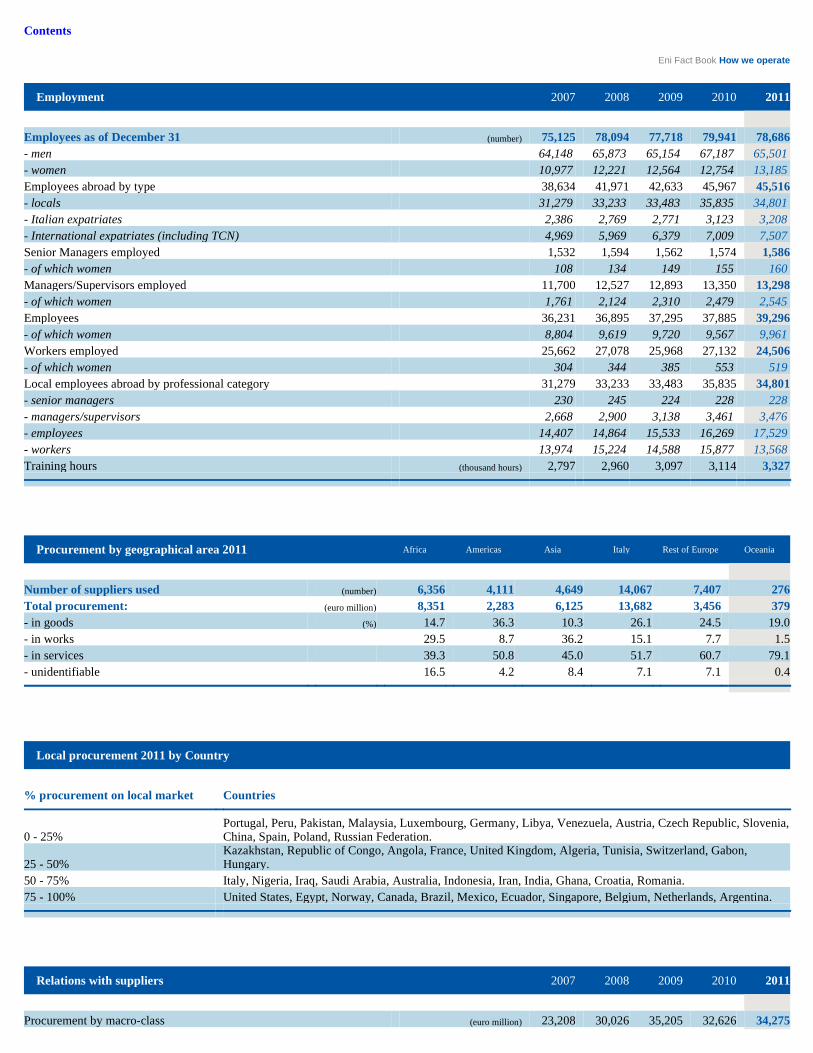
Contents
Eni Fact Book How we operate
Employment 2007 2008 2009 2010 2011
Employees as of December 31 (number) 75,125 78,094 77,718 79,941 78,686 - men 64,148 65,873 65,154 67,187 65,501 - women 10,977 12,221 12,564 12,754 13,185 Employees abroad by type 38,634 41,971 42,633 45,967 45,516 - locals 31,279 33,233 33,483 35,835 34,801 - Italian expatriates 2,386 2,769 2,771 3,123 3,208 - International expatriates (including TCN) 4,969 5,969 6,379 7,009 7,507 Senior Managers employed 1,532 1,594 1,562 1,574 1,586 - of which women 108 134 149 155 160 Managers/Supervisors employed 11,700 12,527 12,893 13,350 13,298 - of which women 1,761 2,124 2,310 2,479 2,545 Employees 36,231 36,895 37,295 37,885 39,296 - of which women 8,804 9,619 9,720 9,567 9,961 Workers employed 25,662 27,078 25,968 27,132 24,506 - of which women 304 344 385 553 519 Local employees abroad by professional category 31,279 33,233 33,483 35,835 34,801 - senior managers 230 245 224 228 228 - managers/supervisors 2,668 2,900 3,138 3,461 3,476 - employees 14,407 14,864 15,533 16,269 17,529 - workers 13,974 15,224 14,588 15,877 13,568 Training hours (thousand hours) 2,797 2,960 3,097 3,114 3,327
Procurement by geographical area 2011 Africa Americas Asia Italy Rest of Europe Oceania
Number of suppliers used (number) 6,356 4,111 4,649 14,067 7,407 276 Total procurement: (euro million) 8,351 2,283 6,125 13,682 3,456 379 - in goods (%) 14.7 36.3 10.3 26.1 24.5 19.0 - in works 29.5 8.7 36.2 15.1 7.7 1.5 - in services 39.3 50.8 45.0 51.7 60.7 79.1 - unidentifiable 16.5 4.2 8.4 7.1 7.1 0.4
Local procurement 2011 by Country
% procurement on local market Countries
0 - 25% Portugal, Peru, Pakistan, Malaysia, Luxembourg, Germany, Libya, Venezuela, Austria, Czech Republic, Slovenia, China, Spain, Poland, Russian Federation.
25 - 50% Kazakhstan, Republic of Congo, Angola, France, United Kingdom, Algeria, Tunisia, Switzerland, Gabon, Hungary.
50 - 75% Italy, Nigeria, Iraq, Saudi Arabia, Australia, Indonesia, Iran, India, Ghana, Croatia, Romania. 75 - 100% United States, Egypt, Norway, Canada, Brazil, Mexico, Ecuador, Singapore, Belgium, Netherlands, Argentina.
Relations with suppliers 2007 2008 2009 2010 2011
Procurement by macro-class (euro million) 23,208 30,026 35,205 32,626 34,275

- 13 -
Supplier concentration top 20 (%) 18 24 25 18 20 Suppliers used (number) 26,270 29,416 35,113 33,961 34,064 Qualification cycles carried out during the year 19,058 15,936 22,108 33,700 29,362 Suppliers subjected to qualification procedures including screening on human rights 5,784 6,174 8,388 10,643 12,300 % procurement from suppliers subjected to qualification procedures including screening on human rights (%) 83 89 87 89 91

Contents
Eni Fact Book How we operate
Relations with customers 2007 2008 2009 2010 2011
R&M Customer satisfaction Customer satisfaction index (likert scale) 8.22 8.14 7.93 7.84 7.74 Clients involved in the survey (number) 33,692 22,609 10,711 30,618 30,524 G&P Customer satisfaction Customer satisfaction index (%) n.a. 75.3 83.7 87.4 91.0 Average Panel (G&P) (a) n.a. 84.9 87.0 87.4 89.8
(a) Referred to companies representing more than 50% of the gas market and totaling over 50,000 customers.
Technological innovation 2007 2008 2009 2010 2011
R&D expenditures (euro million) 205 329 279 268 237 - R&D expenditures net of general and administrative costs 208 217 207 221 191 Tangible value generated by R&D activities (a) n.a. n.a. 362 540 492 (b)
Personnel employed in R&D activities (full time equivalent) (number) 1,001 1,123 1,019 1,019 925 Existing patents 8,122 8,049 7,760 7,998 8,784
(a) Figures refer to E&P, R&M and Polimeri Europa activities and had been measured since 2009, when the measurement process started. (b) The figure is net of benefits related to the increase of reserves.
Operating efficiency 2007 2008 2009 2010 2011
Direct GHG emissions: (tons CO 2 eq) 67,246,179 62,013,146 57,694,175 60,642,340 51,099,412 - of which CO 2 from combustion and process (tonnes) 39,252,511 37,389,394 36,587,311 39,006,120 36,014,381 - of which CO 2 equivalents from flaring (tons CO 2 eq) 20,070,000 16,535,835 13,839,353 13,834,988 9,553,894 - of which CO 2 equivalents from CH 4 (methane) 5,733,668 5,697,220 5,085,309 5,461,211 4,498,120 - of which CO 2 equivalents from venting 2,190,000 2,390,697 2,182,202 2,340,021 1,033,017 CO 2 eq emissions/100% net operated hydrocarbon production (tons CO 2 eq/toe) 0.292 0.265 0.245 0.245 0.206 CO 2 eq emissions/kWheq (EniPower) (kg CO 2 eq/kWheq) 0.400 0.402 0.410 0.407 0.410 CO 2 eq emissions/gas distributed (Italgas) (tons CO 2 eq/mmcm) 96.29 93.04 87.68 92.86 87.00 CO 2 eq emissions/uEDC (R&M) (tons CO 2 eq/kbbl/SD) n.a. 1,297 1,240 1,284 1,230 NO x (nitrogen oxide) emissions (tons NO 2 eq) 111,824 113,952 112,263 107,724 98,117 SO x (sulphur oxide) emissions (tons SO 2 eq) 62,980 47,163 45,988 50,085 37,940 NMVOC (Non-Methane Volatile Organic Compounds) emissions (tonnes) 87,889 80,923 75,392 68,490 46,228 TSP (Total Suspended Particulate) emissions 4,567 4,230 3,973 3,783 3,297 Energy used/net 100% operated hydrocarbon production (GJ/toe) 1.387 1.481 1.746 1.934 1.958 Total water withdrawals (mmcm) 3,370.77 3,028.06 2,844.75 2,791.47 2,583.87 Total production and/or process water extracted (mmcm) 48.34 52.93 59.67 61.15 58.16 - of which re-injected 14.73 14.88 23.32 27.11 25.18 Total recycled and/or reused water (mmcm) n.a. 460.93 490.22 544.63 521.39 Total number of oil spills (a) (number) 367 382 308 330 418 Total volume of oil spills (a) (b) : (barrels) 9,337 7,024 21,547 22,964 13,422 - of which from sabotage and terrorism 2,608 2,286 15,288 18,695 6,127 - of which from accidents 6,729 4,738 6,259 4,269 7,295 Waste from production activities (tonnes) 1,543,619 1,253,750 1,158,645 1,452,717 1,324,808 Hazardous waste from production activities 393,028 487,607 440,244 497,092 477,558

- 14 -
Non-hazardous waste from production activities 1,150,591 766,143 718,401 955,625 847,250 Waste from reclamation activities to be disposed of or recovered/recycled (tonnes) 6,862,915 9,209,054 10,180,216 10,490,267 10,863,767 Environmental expenditures and investments (euro thousand) 1,062,850 1,080,707 1,324,066 1,006,777 1,006,711
(a) For the E&P sector only oil spills of more than one barrel are considered. (b) For 2009 the total volume of spills does not include the Engineering & Construction sector.

Contents
Eni Fact Book Exploration & Production
2007 2008 2009 2010 2011
Employees injury frequency rate (No. of accidents per million hours worked) 0.57 0.84 0.49 0.72 0.41 Contractors injury frequency rate 0.92 0.93 0.59 0.48 0.41 Fatality index (No. of fatalities per 100 million hours worked) 2.34 3.54 1.77 7.90 1.83
Net sales from operations (a) (euro million) 26,920 33,042 23,801 29,497 29,121 Operating profit 13,433 16,239 9,120 13,866 15,887 Adjusted operating profit 13,770 17,222 9,484 13,884 16,077 Adjusted net profit 6,328 7,900 3,878 5,600 6,866 Capital expenditure 6,480 9,281 9,486 9,690 9,435 Adjusted capital employed, net at year end 23,826 30,362 32,455 37,646 42,024 Adjusted ROACE (%) 30.4 29.2 12.3 16.0 17.2
Profit per boe (b) ($/boe) 14.19 16.00 8.14 11.91 16.98 Opex per boe (b) 4.99 5.45 5.77 6.14 7.28 Cash Flow per boe 25.79 32.25 23.70 25.52 31.65 Finding & Development cost (c) 43.44 28.79 28.90 19.32 18.82 Average hydrocarbons realizations (d) 53.17 68.13 46.90 55.60 72.26
Production of hydrocarbons (d) (kboe/d) 1,736 1,797 1,769 1,815 1,581 Estimated net proved reserves of hydrocarbons (d) (mmboe) 6,370 6,600 6,571 6,843 7,086 Reserves life index (d) (years) 10.0 10.0 10.2 10.3 12.3 All sources reserves replacement ratio (d) (%) 90 135 96 125 142
Employees at year end (units) 8,376 10,236 10,271 10,276 10,425 of which: outside Italy 4,446 6,182 6,388 6,370 6,628 Oil spills (bbl) 6,729 4,738 6,259 3,820 2,930 Oil spills from sabotage and terrorism 2,608 2,286 15,288 18,695 6,127 Produced water re-injected (%) 30 28 39 44 43
Direct GHG emissions (mmtonnes CO 2 eq) 36.31 33.21 29.73 31.20 23.59 of which: from flaring 20.07 16.54 13.84 13.83 9.55 Community investment (euro million) 59 65 67 72 62
i i i (a) i Before elimination of intragroup sales. (b) i Consolidated subsidiaries. (c) i Three-year average. (d) i Includes Eni’ s share of equity-accounted entities.
Performance of the year
I I I I In 2011, employee and contractor injury frequency rate
declined by 43.1% and 14.6% from 2010, respectively. - Greenhouse gas emissions (total and from flared) reported a steep decline reflecting the completion of certain gas recovery projects in Nigeria and the reduction associated gas to feed the ramp-up of two turbo-generators in a power plant in Congo. Performance for the year was also impacted by lowered Libyan activities. - In 2011, the E&P Division reported an excellent
Giant discovery in Mozambique
I I I I The volume of natural gas discovered beyond expectation
in Mozambique will lead to a new significant development opportunities in Far East Countries with an energy demand growth at fast pace. The Mamba South, Mamba North and Mamba North East exploration wells were drilled in Area 4 of the offshore Rovuma basin showing the mineral potential of gas in place up to 40 tcf. This is the largest operated discovery in the Company’s exploration history.

- 15 -
performance amounting to euro 6,866 million of adjusted net profit (up 22.6% from 2010), reflecting higher oil prices and the rapid recovery of Libyan output. - Return on average capital employed calculated on an adjusted basis was 17.2% in 2011 (16% in 2010).
Agreement with Rosneft
I I I I On April 25, 2012, Eni and Rosneft signed a strategic
cooperation agreement to jointly develop exploration licenses in the Russian offshore of the Barents Sea and the Black Sea. Under the agreement, joint ventures (Eni 33.33%) will explore for and develop

Contents
Eni Fact Book Exploration & Production
the Fedynsky and Tsentralno-Barentsvesky licenses offshore the Barents Sea and the Zapadno-Cernomorsky license offshore the Black Sea. These licenses are estimated to hold recoverable resources of 36 billion boe. Technology exchange is a key element of the strategic partnership.
Restarted Libyan operations
I I I I The rapid restart of Eni’s Libyan operations reduced the
impact of the Revolution on 2011 results. Production at Eni’s Libyan sites is currently flowing at approximately 240 kboe/d and management is targeting to achieve the pre-crisis production plateau of 280 kboe/d and full ramp-up by the second half of 2012.
Start-up of Perla project in Venezuela
I I I I Signed a Gas Sales Agreement for developing the giant
Perla gas discovery, containing over 17 tcf of gas in place with the Venezuelan national oil company PDVSA. The development plan provides for three phases, targeting production of approximately 9 tcf until 2036 or 1.2 mmcf/d at peak. The gas produced will be used locally and exported. The investment plan for the first development phase is estimated at $1.4 billion at 100%.
Portfolio
I I I I In spite of the year 2011 was marked by the Libyan crisis,
the management continued to pursue our long-term growth strategy. Leveraging its established co-operation model, focusing on core areas and capturing opportunities in high risk/high reward basins, Eni laid foundations for a new development stage: - Signed with PetroChina and Sinopec a framework agreement to promote joint projects in conventional and unconventional hydrocarbon plays in China and outside China. A similar agreement has been signed with Sonatrach to explore for and develop unconventional hydrocarbons in Algeria, particularly shale gas plays. - Signed a Memorandum of Understanding with South Africa’s State-owned oil company PetroSA to promote common opportunities to jointly expand operations in conventional and unconventional hydrocarbons in South Africa and in Africa. Eni will also ensure long-term LNG supplies as well as flows of refined products to support the Country’s economic development. - Acquired from Cadogan Petroleum plc an interest in two licenses for exploration and development in areas included in the Dniepr-Donetz basin in Ukraine. - Reached an agreement with MEO Australia to farm-in the Heron and Blackwood gas discoveries in the NT/P-68 permit, located in the Timor Sea. In addition, Eni acquired a 32.5% stake in the Evans Shoal gas discovery. - Awarded the Arguni I and the North Ganal operated gas
(FPSA) of the giant Karachaganak gas-condensate field reached an agreement to settle all pending claims. The agreement, effective from June 30, 2012 on satisfaction of conditions precedent, involves Kazakhstan’s KazMunaiGas (KMG) acquiring a 10% interest in the project. This will be done by each of the contracting companies transferring 10% of their rights and interest in the Karachaganak FPSA to KMG.
Production
I I I I In 2011, Eni reported liquids and gas production of 1,581
kboe/d, down by 12.9% from 2010, mainly due to a lowered output in Libya. Performance was also negatively impacted by lower entitlements in the Company’s Production Sharing Agreements (PSAs) due to higher oil prices with an overall effect of approximately 30 kboe/d from 2010. Net of this effect and the above mentioned loss of Libyan output, production for the year was in line with 2010. - In the year oil spills from accidents declined by 23% from 2010, due to significant prevention activities undertaken. - In the year start-ups were achieved at eleven oil and gas fields which are expected to add approximately 80 kboe/d at plateau to Eni’s medium-term production. - Made final investment decisions to develop large projects such as the jointly-operated Samburgskoye and Urengoskoye giant gas fields in Siberia, in addition to the above mentioned Perla project, as well as projects in Norway and the Gulf of Mexico which are expected to add 140 kboe/d at plateau in 2015.
Reserves
I I I I Estimated net proved reserves at December 31, 2011,
were 7.09 bboe (up 3.6% from 2010) based on a 12-month average Brent price of $111 per barrel. All sources reserves replacement ratio was 142%. Excluding price effect, the replacement ratio would be 159%. The reserves life index is 12.3 years (10.3 years in 2010).
Capital expenditure
I I I I In 2011, capital expenditure amounted to euro 9,435
million to enhance assets in well established areas of Africa, the Gulf of Mexico and Central Asia. Exploration expenditure amounted to euro 1,210 million (up 19.6% from 2010) to execute a selective campaign with the completion of 56 new exploratory wells (28 net to Eni) and an overall commercial success rate of 42% (38.6% net to Eni). In addition 17 exploratory wells drilled are in progress at year end (9.9 net to Eni). - Exploration successes in the year contributed to increase our resource base by 1.1 bboe. New resources were, in addition to the above mentioned Mozambique discovery, the appraisal of Perla giant field in Venezuela, significant

- 16 -
exploration contracts located onshore and offshore Indonesia, respectively. - Awarded the operatorship of the PL657 license (Eni’s interest 80%) located in the Barents Sea nearby the Goliat operated field (Eni’s interest 65%). - Signed with the Angolan authority the Production Sharing Contract to explore Block 35 (Eni operator with a 30% interest) located in an offshore high mineral potential basin.
New agreement of Karachaganak field in Kazakhstan
I I I I On December 14, 2011, the Republic of Kazakhstan and
the contracting companies in the Final Production Sharing Agreement
discoveries of Jangkrik North East (Eni operator with a 55% interest) in Indonesia and Skrugard/Havis (Eni’s interest 30%) in the Barents Sea, the appraisal/discovery wells in Block 15/06 (Eni operator with a 35% interest) in the Angolan offshore, as well as other successes in the Gulf of Mexico, Ghana, Egypt, Pakistan, the United Kingdom and Nigeria. - Development expenditure was euro 7,357 million to fuel the growth of major projects in Norway, Kazakhstan, Algeria, the United States, Italy, Congo and Egypt. - In 2011 overall R&D expenditure of Exploration & Production Division amounted to approximately euro 90 million (euro 98 million in 2010).

Contents
Eni Fact Book Exploration & Production
Activity areas
� Italy Eni has been operating in Italy since 1926. In 2011, Eni’s oil and gas production amounted to 186 kboe/d. Eni’s activities in Italy are deployed in the Adriatic Sea, the Central Southern Apennines, mainland and offshore Sicily and the Po Valley, on a total acreage of 21,648 square kilometers (16,872 net to Eni). Eni’s exploration and development activities are regulated by concession contracts. During the year, Eni finalized the purchase of an additional interest in the Annamaria field (Eni’s interest 100%). In the R&D area, 11 applications of new technologies and four projects have been developed and applied on Italian assets. Cooperation projects are underway with sixteen academic and research institutions in Italy with an overall expenditure of approximately euro 9 million.
Adriatic Sea Production Fields in the Adriatic Sea accounted for 46% of Eni’s domestic production in 2011. Main fields are Barbara, Angela-Angelina, Porto Garibaldi, Cervia and Bonaccia (for an overall production of approximately 270 mmcf/d). Production is operated by means of 71 fixed platforms (3 of these are manned) installed on the main fields, to which satellite fields are linked by underwater infrastructures. Production is carried by sealine to the mainland where it is input in the national gas network. During the year, Eni renewed the VI Cooperation Agreement over the 2011-2014 period with the city of Ravenna to protect the coastline area.
Development In 2011, production started-up at the Guendalina field (Eni’s interest 80%) flowing at the initial rate of approximately 3 kboe/d. Other activities for the year concerned sidetrack and workover activities on Calpurnia, Daria (Eni’s interest 51%), Barbara and Clara Nord (Eni’s interest 51%) fields for the production optimization. Proprietary technology has been successfully applied on the Clara Est field for the characterization of thin layer fields and it identified approximately 3 mmboe of additional hydrocarbon volumes.
Central-Southern Apennines Production Eni is the operator of the Val d’Agri concession (Eni’s interest 60.77%) in the Basilicata Region in Southern Italy, resulting from the unitization of the Volturino and Grumento Nova concessions made in late 2005. Production from the Monte Alpi, Monte Enoc and Cerro Falcone fields is fed by 24 production wells and is treated by the Viggiano oil center with an oil capacity of 104 kbbl/d. Oil produced is carried to Eni’s refinery in Taranto via a 136-kilometer long pipeline. Gas produced is treated at the Viggiano oil center and then delivered to the national grid system. In 2011, the Val d’Agri concession produced 95 kboe/d (52 kboe/d net to Eni) representing 28% of Eni’s production in Italy. Within the Intent Protocol with the Basilicata Region, the Environmental Observatory of Val d’Agri for the monitoring of the quality of health and the environment in the area has been inaugurated. In 2011, production started-up at the Capparuccia field (Eni’s interest 95%) with an initial production at approximately 4 kboe/d. Development Development activities progressed at the Val d’Agri concession with the linkage of Cerro Falcone to the oil treatment center and sidetrack activity as well as upgrading of production facilities. During the year, upgrading activities of compression plants and treatment facilities were performed at the Crotone plants. Exploration Exploration activity concerned the survey of mineral potential in the area.
Sicily Production Eni is the operator of 14 production concessions onshore and offshore in Sicily. Its main fields are Gela, Ragusa, Giaurone, Fiumetto and Prezioso, which in 2011 accounted for 11% of Eni’s production in Italy. Development Development activities concerned: (i) completion of development activities at the Tresauro field (Eni’s interest 45%); and (ii) sidetrack and workover activities on Gela field.

- 17 -
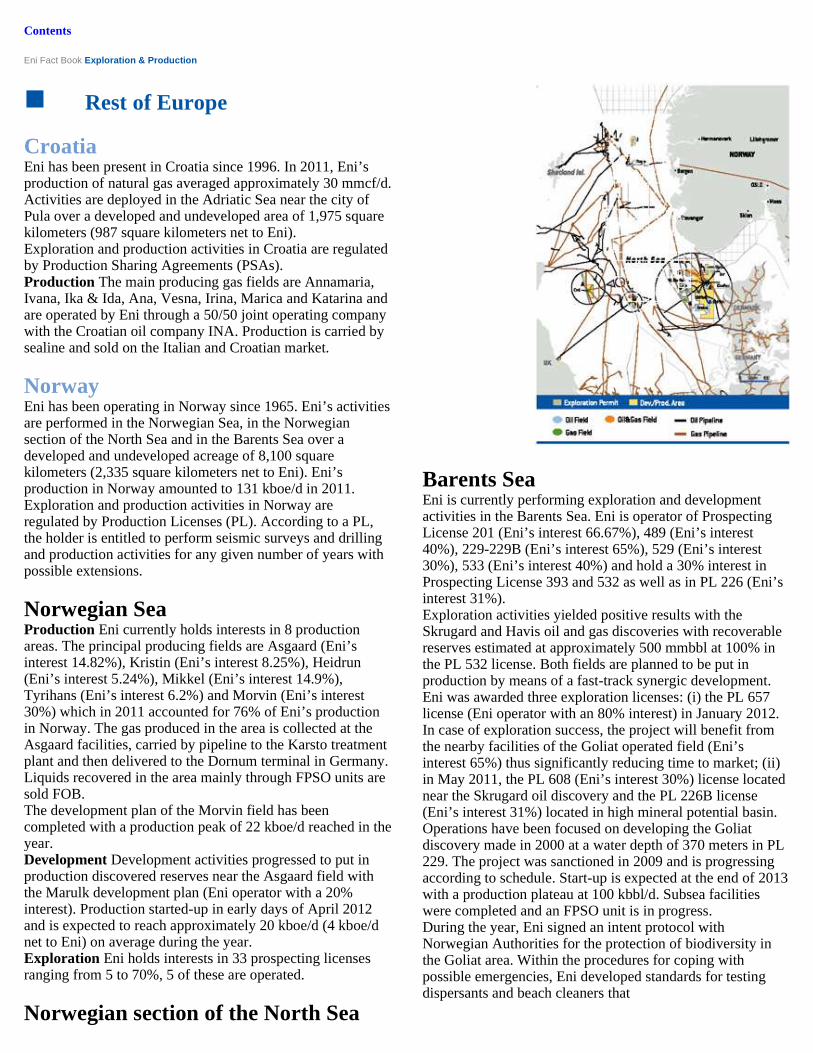
Contents
Eni Fact Book Exploration & Production
� Rest of Europe
Croatia Eni has been present in Croatia since 1996. In 2011, Eni’s production of natural gas averaged approximately 30 mmcf/d. Activities are deployed in the Adriatic Sea near the city of Pula over a developed and undeveloped area of 1,975 square kilometers (987 square kilometers net to Eni). Exploration and production activities in Croatia are regulated by Production Sharing Agreements (PSAs). Production The main producing gas fields are Annamaria, Ivana, Ika & Ida, Ana, Vesna, Irina, Marica and Katarina and are operated by Eni through a 50/50 joint operating company with the Croatian oil company INA. Production is carried by sealine and sold on the Italian and Croatian market.
Norway Eni has been operating in Norway since 1965. Eni’s activities are performed in the Norwegian Sea, in the Norwegian section of the North Sea and in the Barents Sea over a developed and undeveloped acreage of 8,100 square kilometers (2,335 square kilometers net to Eni). Eni’s production in Norway amounted to 131 kboe/d in 2011. Exploration and production activities in Norway are regulated by Production Licenses (PL). According to a PL, the holder is entitled to perform seismic surveys and drilling and production activities for any given number of years with possible extensions.
Norwegian Sea Production Eni currently holds interests in 8 production areas. The principal producing fields are Asgaard (Eni’s interest 14.82%), Kristin (Eni’s interest 8.25%), Heidrun (Eni’s interest 5.24%), Mikkel (Eni’s interest 14.9%), Tyrihans (Eni’s interest 6.2%) and Morvin (Eni’s interest 30%) which in 2011 accounted for 76% of Eni’s production in Norway. The gas produced in the area is collected at the Asgaard facilities, carried by pipeline to the Karsto treatment plant and then delivered to the Dornum terminal in Germany. Liquids recovered in the area mainly through FPSO units are sold FOB. The development plan of the Morvin field has been completed with a production peak of 22 kboe/d reached in the year. Development Development activities progressed to put in production discovered reserves near the Asgaard field with the Marulk development plan (Eni operator with a 20% interest). Production started-up in early days of April 2012 and is expected to reach approximately 20 kboe/d (4 kboe/d net to Eni) on average during the year. Exploration Eni holds interests in 33 prospecting licenses ranging from 5 to 70%, 5 of these are operated.
Norwegian section of the North Sea
Barents Sea Eni is currently performing exploration and development activities in the Barents Sea. Eni is operator of Prospecting License 201 (Eni’s interest 66.67%), 489 (Eni’s interest 40%), 229-229B (Eni’s interest 65%), 529 (Eni’s interest 30%), 533 (Eni’s interest 40%) and hold a 30% interest in Prospecting License 393 and 532 as well as in PL 226 (Eni’s interest 31%). Exploration activities yielded positive results with the Skrugard and Havis oil and gas discoveries with recoverable reserves estimated at approximately 500 mmbbl at 100% in the PL 532 license. Both fields are planned to be put in production by means of a fast-track synergic development. Eni was awarded three exploration licenses: (i) the PL 657 license (Eni operator with an 80% interest) in January 2012. In case of exploration success, the project will benefit from the nearby facilities of the Goliat operated field (Eni’s interest 65%) thus significantly reducing time to market; (ii) in May 2011, the PL 608 (Eni’s interest 30%) license located near the Skrugard oil discovery and the PL 226B license (Eni’s interest 31%) located in high mineral potential basin. Operations have been focused on developing the Goliat discovery made in 2000 at a water depth of 370 meters in PL 229. The project was sanctioned in 2009 and is progressing according to schedule. Start-up is expected at the end of 2013 with a production plateau at 100 kbbl/d. Subsea facilities were completed and an FPSO unit is in progress. During the year, Eni signed an intent protocol with Norwegian Authorities for the protection of biodiversity in the Goliat area. Within the procedures for coping with possible emergencies, Eni developed standards for testing dispersants and beach cleaners that

- 18 -
Production Eni holds interests in 4 production licenses. The main producing field is Ekofisk (Eni’s interest 12.39%) in PL 018, which in 2011 produced approximately 32 kboe/d net to Eni and accounted for 24% of Eni’s production in Norway. Production from Ekofisk and satellites is carried by pipeline to the Teesside terminal in the United Kingdom for oil and to the Emdem terminal in Germany for gas. Development Ongoing activities aimed at maintaining and optimizing production at the Ekofisk field by means of infilling wells, the development of the South Area, upgrading of existing facilities and optimization of water injection. Exploration Eni holds interests in 6 prospecting licenses ranging from 12 to 45%, one of them as operator.

Contents
Eni Fact Book Exploration & Production
could be used in case of oil spills near the coast. These emergency standards will be included in Norwegian laws and later presented internationally. In addition, Eni strengthened its cooperation and partnerships with Norwegian academic institutions for an upgrading of training activities for local professionals and technicians to be employed at the Goliat field and for the management of oil spills.
Ukraine In July 2011, Eni acquired from Cadogan Petroleum plc an interest in two licenses for exploration and development in areas included in the Dniepr-Donetz Basin. Eni acquired 30% with an option to increase its participation to up to 60% in the Pokrovskoe exploration license and the acquisition of 60% interest in the Zagoryanska license.
United Kingdom Eni has been present in the United Kingdom since 1964. Eni’s activities are carried out in the British section of the North Sea, the Irish Sea and certain areas East and West of the Shetland Islands over a developed and undeveloped acreage of 2,899 square kilometers (1,014 square kilometers). In 2011, Eni’s net production of oil and gas averaged 80 kboe/d, the portion of liquids being 50%. Exploration and production activities in the United Kingdom are regulated by concession contracts. Production Eni holds interests in 13 production areas; in the Hewett Area, Eni is operator with an 89% interest. The other main fields are Elgin/Franklin (Eni’s interest 21.87%), West Franklin (Eni’s interest 21.87%), Liverpool Bay (Eni’s interest 53.9%), J Block Area (Eni’s interest 33%), Andrew (Eni’s interest 16.21%), Flotta Catchment Area (Eni’s interest 20%) and MacCulloch (Eni’s interest 40%), which in 2011 accounted for 83% of Eni’s production in the UK. Development Main development activities concerned: (i) the construction of production platform and drilling activities at the gas and liquids Jasmine field (Eni’s interest 33%) with start-up expected at the end of 2012; (ii) Phase 2
and linkage to the Elgin/Franklin treatment plant. Drilling activities are progressing with start-up expected in 2013; (iii) development activities at the oil and gas Kinnoul field (Eni’s interest 16.67%). The drilling of producing subsea wells has been completed while the linkage to the production facilities of the Andrew field is in progress. Start-up is expected in 2013; and (iv) concept definition activities for the Mariner heavy oil field proceed with target to submit the Field Development Plan and sanction the project early in 2013. Exploration Eni holds interests in 43 exploration blocks ranging from 5 to 100%, in 5 of these Eni is operator. Exploration activities yielded positive results with the appraisal of Culzean discovery continuing (Eni’s interest 16.95%), near the Elgin/Franklin producing field.
� North Africa
Algeria Eni has been present in Algeria since 1981. In 2011, Eni’s oil and gas production averaged 72 kboe/d. Operating activities are located in the Bir Rebaa area in the South-Eastern Desert and include the following exploration and production blocks: (i) Blocks 403a/d (Eni’s interest up to 100%); (ii) Block Rom North (Eni’s interest 35%); (iii) Blocks 401a/402a (Eni’s interest 55%); (iv) Blocks 403 (Eni’s interest 50%) and 404a (Eni’s interest 12.25%); (v) Blocks 208 (Eni’s interest 12.25%) and 405b (Eni’s interest 75%) with ongoing development activities; (vi) Block 212 (Eni’s interest 22.38%) with discoveries already made; and (vii) Blocks 316b, 319a and 321a (Eni operator with a 49% interest) in the Kerzaz area with ongoing exploration activities. Developed and undeveloped acreage of Eni’s interests in Algeria was 19,619 square kilometers (9,065 square kilometers net to Eni). In April 2011, Eni signed a cooperation agreement with Sonatrach to explore for and develop unconventional hydrocarbons, particularly shale gas plays. Exploration and production activities in Algeria are regulated by Production Sharing Agreements (PSAs) and concession contracts.

- 19 -
development plan of the West Franklin field with the construction of a well-head platform

Contents
Eni Fact Book Exploration & Production
Blocks 403a/d and Rom North Production Production in the area comes mainly from the HBN and Rom and satellite fields and represented approximately 20% of Eni’s production in Algeria in 2011. Production from Rom and Satellites (Zea, Zek and Rec) is treated at the Rom Central Production Facilities (CPF) and sent to the BRN treatment plant for final treatment, while production from the HBN field is treated at the HBN/HBNS oil center at the Groupment Berkine. Development A new multiphase pumping system is under finalization in compliance with applicable Country law to reduce gas flaring by 2012.
Blocks 401a/402a Production Production from this area is supplied mainly by the ROD/SFNE and satellite fields and accounted for approximately 25% of Eni’s production in Algeria in 2011. Infilling activities are being performed in order to maintain the current production plateau.
Block 403 Production The main fields in the area are BRN, BRW and BRSW which accounted for approximately 18% of Eni’s production in Algeria in 2011.
Block 405b Development Activities in the area concerned the joint development MLE and CAFC, assets acquired from Canadian company First Calgary in 2008. The final investment decision was sanctioned for both projects (MLE in 2009; CAFC in April 2010). The MLE development plan foresees the construction of a natural gas treatment plant with a capacity of 350 mmcf/d and of four export pipelines with linkage to the national grid system. These facilities will also receive gas from the CAFC field. Production start-up is expected in 2012. The CAFC project provides the construction of an oil treatment plant and will also benefit from synergies with MLE production facilities. Gas and oil production start-up of CAFC field are expected in 2012 and 2014, respectively. The overall Block 405b will target a production plateau of approximately 33 kboe/d net to Eni by 2015.
Block 208 Development Block 208 is located south of Bir Rebaa. The El Merk project is designed to jointly develop this block and adjoining blocks operated by other companies. The final investment decision was reached in 2009. The project is progressing with the drilling activities and the construction of treatment facilities. The development program provides for the construction of a gas treatment plant with a capacity of approximately 600 mmcf/d, two oil trains with a capacity of 65 kbbl/d and three export pipelines with linkage to the national system for an overall production of approximately
production mainly comes from the operated or participated concession of North Port Said (Eni’s interest 100%), El Temsah (50% interest), Baltim (50% interest) and Ras el Barr (50% interest, non operated) and all located in the offshore the Nile Delta. In 2011, production from these main concessions accounted for approximately 91% of Eni’s production in Egypt. In July 2011, Eni and the Egyptian Authorities reaffirmed their upstream commitment in the Country, particularly in the Western Desert, the Mediterranean Sea and the Sinai Basins. Agreed plans foresee drilling additional producing wells and the fast track of recent discoveries as well as an exploration plan including the drilling of 12 wells. Development of proprietary technologies progressed with the Eni Circulation Device technology to enhance hydraulic control in drilling activities, an innovative enhanced recovery technique (acoustic simulation) and a system for consolidating sands to keep production sand free. Exploration and production activities in Egypt are regulated by Production Sharing Agreements.
Gulf of Suez Production Production mainly comes from the Belayim field, Eni’s first large oil discovery in Egypt, which produced approximately 59 kbbl/d net to Eni in 2011. Development Infilling activities and basic engineering activities continued for the upgrading of water injection facilities to recover remaining reserves of the Belayim field. Exploration Exploration activities yielded positive results with near field activities in the Belayim concession with three oil discovery wells (BB-10, BLNE-1 and EBLS-1) that were linked to the existing facilities.

- 20 -
11 kbbl/d. Start-up is expected in 2013.
Egypt Eni has been present in Egypt since 1954 and is the first international oil operator with a production amounting to 236 kboe/d net to Eni in 2011 and accounted for 15% of Eni’s total annual hydrocarbon production. Developed and undeveloped acreage in Egypt was 15,836 square kilometers (5,898 square kilometers net to Eni). Eni’s main producing liquid fields are located in the Gulf of Suez, primarily in Belayim field (Eni’s interest 100%) and in the Western Desert mainly Melehia concession (56% interest) and Ras Qattara (75% interest). Gas

Contents
Eni Fact Book Exploration & Production
Nile Delta North Port Said Production Eni’s production for the year amounted to 31 kboe/d net to Eni (approximately 140 mmcf/d of gas and 4 kbbl/d of condensates). Part of the production of this concession is supplied to the NGL (natural gas liquids) plant owned by United Gas Derivatives Co (Eni’s interest 33%) with a treatment capacity of 1.1 bcf/d of natural gas and a yearly production of 380 ktonnes of propane, 305 ktonnes of LPG and 1.5 mmbbl of condensates. A plan is being studied for upgrading the plant’s capacity to 1.3 bcf/d. Development Ongoing development activities aim at supporting current gas production levels. Upgrading progressed at the El Gamil compression facility to support the North Port Said, el Temsah and Ras el Barr production concessions.
Baltim Production In this concession, Eni’s production for the year amounted to approximately 20 kboe/d net to Eni (approximately 106 mmcf/d of gas and 3 kbbl/d of condensates). Development Upgrading was completed at the Abu Madi plant to increase the compression capacity supporting Belayim production.
Ras el Barr Production This concession contains three fields: Ha’py, Akhen and Taurt. Eni’s production in 2011 amounted to approximately 177 mmcf/d net to Eni.
El Temsah Production This concession includes the Temsah, Denise and Tuna fields. Eni’s production in 2011 amounted to approximately 63 kboe/d (approximately 318 mmcf/d of gas and approximately 6 kbbl/d of condensates) net to Eni. In 2011 production was started-up at the Denise B field, the second development phase of the homonymous field with the drilling of 3 other subsea wells linked to the production facilities in the area flowing initially at 7 kboe/d net to Eni. Production peak is expected at 14 kboe/d in 2012. Natural gas production of this concession is supplied to the Damietta natural gas liquefaction plant owned by Unión Fenosa Gas, with 35 bcf/y of feed gas for a 20-year period. Development Main activities of the year were: (i) the upgrading of the El Gamil plant by adding new compression capacity to support production; (ii) the Seth project (Eni’s interest 50%). The development activity provides the drilling of two wells and the installation of production platform. Start-up is expected in 2012.
Exploration in the Nile Delta This area shows a relevant mineral potential. Exploration activities yielded positive results with near field activities in the Abu Madi West development lease (Eni’s interest 75%) with Nidoco West and Nidoco East gas discoveries. The linkage to the existing facilities was completed.
Western Desert Production Other operated production activities are located in the Western Desert, in particular in the Melehia (Eni’s interest 56%), Ras Qattara (Eni’s interest 75%), West Abu Gharadig (Eni’s interest 45%) and West Razzak (Eni’s interest 80%) development permits containing mainly oil. Concessions in the Western Desert accounted for approximately 5% of Eni’s production in Egypt in 2011. Exploration Exploration activities yielded positive results with near field activities in the: (i) Melehia development lease with the Aman SW, Dorra-1X and Melehia North-1X oil wells that were started-up; and (ii) East Kanayis concession (Eni’s interest 100%) with the Qattara Rim-3 and Qattara North-1 oil discoveries.
Libya Eni started operations in Libya in 1959. In 2011, Eni’s oil and gas production averaged 112 kboe/d. Production activity is carried out in the Mediterranean offshore facing Tripoli and in the Libyan Desert area, over a developed and undeveloped acreage of 26,634 square kilometers (13,295 square kilometers net to Eni). Onshore contract areas are: (i) Area A consisting in the former concession 82 (Eni’s interest 50%); (ii) Area B, former concessions 100 (Bu Attifel field) and the NC125 Block (Eni’s interest 50%); (iii) Area E with El Feel (Elephant) field (Eni’s interest 33.3%); and (iv) Area F with former Block NC118 (Eni’s interest 50%). Offshore contract areas are: (i) Area C with the Bouri oil field (Eni’s

- 21 -
interest 50%); and (ii) Area D with Blocks NC41 and NC169 (onshore) including the Western Libyan Gas Project (Eni’s interest 50%). In the exploration phase, Eni is operator in the Kufra area (186/1, 2, 3 & 4) and in the contract Areas A, B and D. Exploration and production activities in Libya are regulated by Exploration and Production Sharing contracts (EPSA). The licenses of Eni’s assets in Libya expire in 2042 and 2047 for oil and gas properties, respectively. In 2011, the situation of conflict forced Eni to shut down almost all its producing facilities including exports through the GreenStream
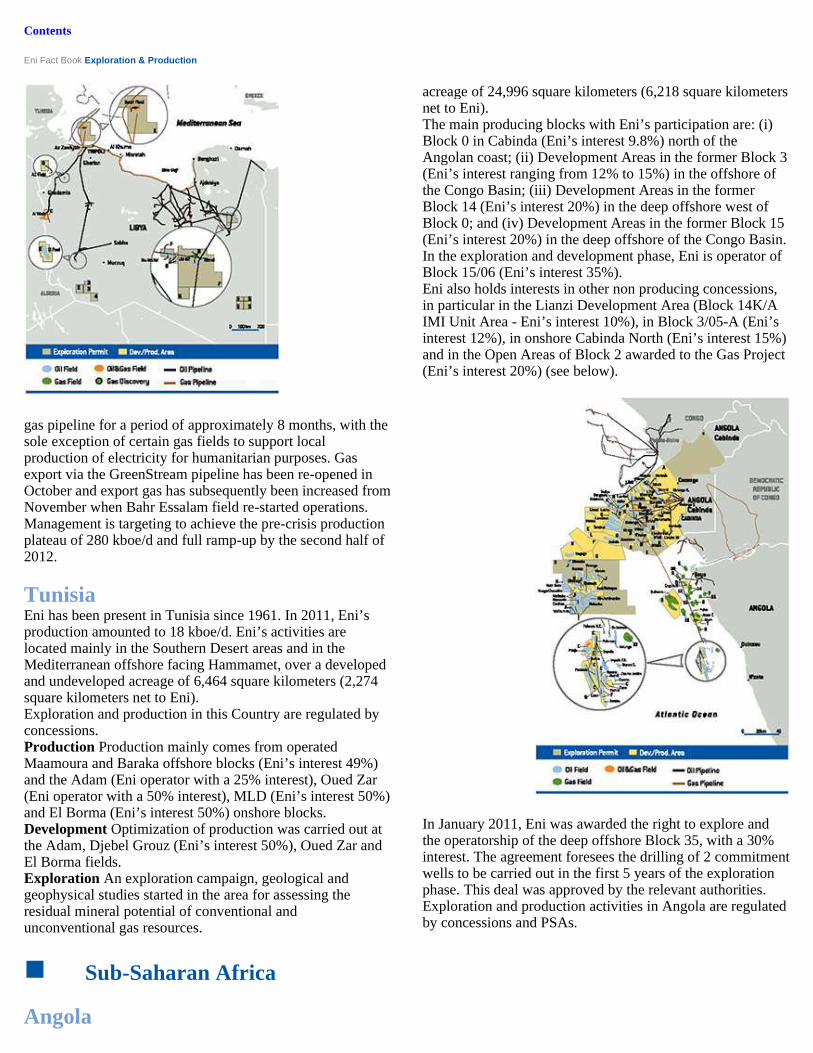
Contents
Eni Fact Book Exploration & Production
gas pipeline for a period of approximately 8 months, with the sole exception of certain gas fields to support local production of electricity for humanitarian purposes. Gas export via the GreenStream pipeline has been re-opened in October and export gas has subsequently been increased from November when Bahr Essalam field re-started operations. Management is targeting to achieve the pre-crisis production plateau of 280 kboe/d and full ramp-up by the second half of 2012.
Tunisia Eni has been present in Tunisia since 1961. In 2011, Eni’s production amounted to 18 kboe/d. Eni’s activities are located mainly in the Southern Desert areas and in the Mediterranean offshore facing Hammamet, over a developed and undeveloped acreage of 6,464 square kilometers (2,274 square kilometers net to Eni). Exploration and production in this Country are regulated by concessions. Production Production mainly comes from operated Maamoura and Baraka offshore blocks (Eni’s interest 49%) and the Adam (Eni operator with a 25% interest), Oued Zar (Eni operator with a 50% interest), MLD (Eni’s interest 50%) and El Borma (Eni’s interest 50%) onshore blocks. Development Optimization of production was carried out at the Adam, Djebel Grouz (Eni’s interest 50%), Oued Zar and El Borma fields. Exploration An exploration campaign, geological and geophysical studies started in the area for assessing the residual mineral potential of conventional and unconventional gas resources.
� Sub-Saharan Africa
Angola
acreage of 24,996 square kilometers (6,218 square kilometers net to Eni). The main producing blocks with Eni’s participation are: (i) Block 0 in Cabinda (Eni’s interest 9.8%) north of the Angolan coast; (ii) Development Areas in the former Block 3 (Eni’s interest ranging from 12% to 15%) in the offshore of the Congo Basin; (iii) Development Areas in the former Block 14 (Eni’s interest 20%) in the deep offshore west of Block 0; and (iv) Development Areas in the former Block 15 (Eni’s interest 20%) in the deep offshore of the Congo Basin. In the exploration and development phase, Eni is operator of Block 15/06 (Eni’s interest 35%). Eni also holds interests in other non producing concessions, in particular in the Lianzi Development Area (Block 14K/A IMI Unit Area - Eni’s interest 10%), in Block 3/05-A (Eni’s interest 12%), in onshore Cabinda North (Eni’s interest 15%) and in the Open Areas of Block 2 awarded to the Gas Project (Eni’s interest 20%) (see below).
In January 2011, Eni was awarded the right to explore and the operatorship of the deep offshore Block 35, with a 30% interest. The agreement foresees the drilling of 2 commitment wells to be carried out in the first 5 years of the exploration phase. This deal was approved by the relevant authorities. Exploration and production activities in Angola are regulated by concessions and PSAs.

- 22 -
Eni has been present in Angola since 1980. In 2011, Eni’s production averaged 102 kboe/d. Eni’s activities are concentrated in the conventional and deep offshore over a developed and undeveloped

Contents
Eni Fact Book Exploration & Production
Block 0 Production Block 0 is divided into Areas A and B. In 2011, production from this block amounted to 364 kbbl/d (approximately 36 kbbl/d net to Eni). Oil production from Area A, deriving mainly from the Takula, Malongo and Mafumeira fields amounted to approximately 23 kbbl/d net to Eni. Production of Area B derives mainly from the Bomboco, Kokongo, Lomba, N’Dola, Nemba and Sanha fields, and amounted to approximately 13 kbbl/d net to Eni. Development Within the activities for reducing gas flaring in Block 0, activity progressed at the Nemba field in Area B. Completion is expected in 2013 reducing flared gas by approximately 85%. Other ongoing projects include: (i) the completion of linkage and treatment facilities at the Malongo plant; and (ii) the installation of a second compression unit at the Nemba platform in Area B. In the Area A the concept definition phase has been completed for the further development of the Mafumeira field. Project sanctioning is expected in 2012 with start-up in 2015. Infilling activities are underway on the whole block in order to contrast natural decline.
Block 3 Production Block 3 is divided into three production offshore areas. In 2011, production from this block amounted to 65 kbbl/d (approximately 5 kbbl/d net to Eni). Development Concept Definition studies are underway in the Punja and Caco-Gazela discoveries.
Block 14 Production In 2011, Development Areas in former Block 14 produced approximately 193 kbbl/d (approximately 23 kbbl/d net to Eni), accounting for approximately 18% of Eni’s production in Angola. It is one of the most fruitful areas in the West African offshore, recording 9 commercial discoveries to date. Its main fields are: (i) Kuito, started-up in 1999, flowing at approximately 3 kbbl/d net to Eni in 2011; (ii) Landana and Tombua, started-up in 2009, flowing at approximately 9 kboe/d net to Eni. Production is supported by a Compliant Piled Tower provided with treatment facilities; (iii) Benguela-Belize/Lobito-Tomboco, started-up in 2006, flowing at approximately 11 kbbl/d net to Eni. Production from these fields is supported by a Compliant Piled Tower provided with treatment facilities for Benguela-Belize and an underwater linkage system for Lobito-Tomboco. Oil produced is treated at the Malongo plant. Associated gas of Landana/Tombua and Benguela-Belize/Lobito-Tomboco will be re-injected in the Nemba reservoir and later it will be delivered via a transport facility under construction to the A-LNG liquefaction plant (see below). Start-up is expected in 2014. Development Concept Selection activities are underway in the recent Malange and Lucapa discoveries. Concept Definition studies are underway in the Lianzi field.
272 kbbl/d (approximately 16 kbbl/d net to Eni). Other fields in Block 15 are Mondo, Saxi/Batuque and Xikombo fields which produced approximately 159 kbbl/d (approximately 17 kbbl/d net to Eni) in 2011. In the medium-term, production plateau will be supported by phased development of satellite discoveries. Development Main projects underway concerned: (i) the satellites of Kizomba Phase 1, with start-up expected before by mid 2012 and peaking production at 100 kbbl/d (approximately 21 kbbl/d net to Eni) in 2013; and (ii) drilling activity at the Mondo and Saxi/Batuque fields to finalize their development plan. The subsea facility of the Gas Gathering project has been completed and will provide for the collection of all the gas of the Kizomba, Mondo and Saxi/Batuque fields to be delivered to the A-LNG liquefaction plant.
Block 15/06 Exploration activities yielded positive results with: (i) the significant gas and condensates Lira discovery; and (ii) the Mukuvo-1 oil discovery and the Cinguvu-2 and Cabaça South East-3 appraisal wells containing oil. The discoveries of Block 15/06 increased the potential resources to be developed within two projects: the West Hub project, sanctioned in 2010, and the East Hub. Drilling and commitment activities were completed in advance of scheduled terms also thanks to the application of proprietary technologies. Eni Deep water dual casing running (e-dwdc TM ), Depth velocity analysis and Eni Circulation Device allowed enhancing the safety of drilling operations in deep water by means of accurate hydraulic control of the well and the real-time updating of subsurface data. The West Hub project includes the development of the Sangos, N’Goma and Cinguvu discoveries which increases the potential of the hub up to more 200 mmbbl. Planned activity concerned drilling of 16 subsea wells (10 producers and 6 injectors) and linkage to an FPSO unit with a capacity of 100 kbbl/d. Associated gas will be re-injected in the reservoir. Start-up is expected in 2014 with a peaking production at 80 kbbl/d. The East Hub project intends to develop the Cabaça North e South-East discoveries with potential resources estimated at more 230 mmbbl. Development activity provides for the drilling of 23 subsea wells and the installation of an FPSO unit with a capacity of 100 kbbl/d. Start-up is expected in 2015. Further development phases are planned to start-up nearby discoveries.
The LNG business in Angola Eni holds a 13.6% interest in the Angola LNG Limited (A-LNG) consortium responsible for the construction of an LNG plant with a processing capacity of approximately 1.1 bcf/d of natural gas and produce 5.2 mmtonnes/y of LNG and over 50 kbbl/d of condensates and LPG. The project has been sanctioned by relevant Angolan Authorities. It envisages the development of 10,594 bcf of gas in 30 years. Exports start-

- 23 -
Block 15 Production Development Areas in former Block 15 produced on average 453 kbbl/d (approximately 34 kbbl/d net to Eni) in 2011. This is considered the most interesting area in the West African offshore with recoverable reserves estimated at 2.55 bbbl of oil. Production derives mainly from the Kizomba discovery area with: (i) the Hungo/Chocalho fields, started-up in August 2004 as part of phase A of the global development plan of the Kizomba reserves; (ii) the Kissanje/Dikanza fields, started-up in July 2005, as part of Phase B. In 2011, these fields operated by FPSO unit yielded production of approximately
up is expected in the second quarter of 2012. LNG may be delivered to the United States market at the re-gasification plant in Pascagoula (Eni’s capacity amounting to approximately 205 bcf/y) in Mississippi. A joint company has been established to assess further possible marketing opportunities. In addition, Eni is part of the Gas Project, a second gas consortium with the Angolan national company and other partners that will explore further potential gas discoveries to support the feasibility of a second LNG train or other marketing projects to deliver gas and associated liquids. Eni is technical advisor with a 20% interest. This Gas Project covers Block 2 and agreement provides for a possible awarding of blocks 1, 3, 15 and 15/06, the Lower Congo Basin located in the Angolan offshore. Exploration activities yielded positive results in

Contents
Eni Fact Book Exploration & Production
the Block 2 with the Garoupa-2 and Garoupa Norte 1 appraisal gas and condensates wells. A project is underway for the upgrade of primary health care services in the Luanda area by means of the rehabilitation of structures providing them with new equipment, among which a new center of nutrition and a network of day care centers. In addition Eni supported vaccination campaigns in cooperation with the local health center also organizing training sessions for local personnel.
Congo Eni has been present in Congo since 1968. In 2011, production averaged 108 kboe/d net to Eni. Eni’s activities are concentrated in the conventional and deep offshore facing Pointe Noire and onshore covering a developed and undeveloped acreage of 9,516 square kilometers (5,020 square kilometers net to Eni). Eni’s main operated oil producing interests in Congo are the Zatchi (Eni’s interest 65%) and Loango (Eni’s interest 50%), Ikalou (Eni’s interest 100%), Djambala, Foukanda and Mwafi (Eni’s interest 65%), Kitina (Eni’s interest 35.75%), Awa Paloukou (Eni’s interest 90%), M’Boundi (Eni’s interest 83%), Kouakouala (Eni’s interest 75%), Zingali and Loufika (Eni’s interest 100%) fields. Other relevant producing areas are a 35% interest in the Pointe Noire Grand Fond, PEX and Likouala permits. In the exploration phase, Eni also holds interests in the Mer Très Profonde Sud deep offshore block (Eni’s interest 30%), the Noumbi onshore permit (Eni’s interest 37%) and the Marine XII offshore permit (Eni operator with a 65% interest). In 2011, Eni signed with the local authorities a Memorandum of Understanding to improve people living conditions in the M’Boundi area. The integrated project concerns health, education, environmental and economic development.
Exploration and production activities in Congo are regulated by Production Sharing Agreements. Production Production is provided mainly by the M’Boundi (43 kboe/d), Awa Paloukou (6 kboe/d), Zatchi (9 kboe/d), Loango (6 kboe/d), Ikalou (6 kboe/d), Foukanda, Djambala and Mwafi and Kitina (overall 7 kboe/d) fields and by non-operated fields located in production PEX, Pointe Noire Grand Fond and Likouala (overall 24 kboe/d) permits. In 2011, production started-up at the Libondo offshore field in the PEX permit with production of approximately 3 kboe/d net to Eni. Development Activities on the M’Boundi field moved forward with the application of advanced recovery techniques and a design to monetize associated gas within the activities aimed at zero gas flaring by 2012. In addition starting from 2009, Eni finalized long-term agreements to supply associated gas from the M’Boundi field to feed three facilities in the Pointe Noire area: (i) the under construction potassium plant, owned by the Canadian Company MAG Industries; (ii) the existing Djeno power plant (CED - Centrale Electrique du Djeno) with a 50 MW generation capacity; and (iii) the recently built CEC Centrale Electrique du Congo power plant (Eni’s interest 20%) with a 300 MW generation capacity. These facilities will also receive in the future gas from the offshore discoveries of the Marine XII permit. In 2011, M’Boundi supply to the CEC and CED power plants was approximately 106 mmcf/d (17 kboe/d net to Eni). The RIT project progressed for the rehabilitation of the power grid from Pointe Noire to Brazzaville within the integrated project to monetize gas in Congo. Other activities in the area concerned the optimization of producing fields by means of new technologies: (i) a drilling technique to increase the well-reservoir contact area at the Loango field with an additional volumes of approximately 300 bbl/d; (ii) in the Zatchi field, a system for consolidating sands to keep production sand free. The zero gas flaring has been achieved at the offshore Kitina field following the completion of the second phase of the water alternate gas project. Within the cooperation agreement, a project concerns the development and extraction of unconventional oil from the Tchikatanga and Tchikatanga-Makola oil sands deposits. The two deposits cover an area of 1,790 square kilometers and are deemed to contain significant amounts of resources based on a recent survey. Eni plans to monetize heavy oils extracted from these sands also through the possible application of its proprietary Eni Slurry Technology (EST). This technology can totally abate heavy residues and maximize light products. The project will also benefit from synergies resulting from the close proximity of the M’Boundi operated field.
Ghana Eni has been present in Ghana since 2009, following the acquisition of the Offshore Cape Three Points South and Offshore Cape Three Points (Eni operator with a 47.2% interest) exploration permits.

- 24 -
Exploration activities yielded positive results with the Sankofa-2 appraisal well and the Gye Nyame discovery, both containing gas and condensates in the Offshore Cape Three Points license. Exploration success was boosted by the application of proprietary technologies in the area of seismic imaging and drilling, such as Eni Circulation Device enhancing hydraulic control of activities. Possible development synergies are under evaluation. During 2011 a project started for the fishing community of the Jomoro District that provides for better access to health services, support to local economy and training programs for improving management of economic activities by women and young people.

Contents
Eni Fact Book Exploration & Production
Mozambique Eni has been present in Mozambique since 2006, following the acquisition of the Area 4 block (Eni operator with a 70% interest) located in the offshore Rovuma Basin. Exploration activities yielded positive results with the following giant gas discoveries: (i) the Mamba South 1 exploration well with mineral potential estimated at 22.5 tcf in place; (ii) the Mamba North 1 with mineral potential estimated at 7.5 tcf; and (iii) the Mamba North East 1 with mineral potential estimated at 10 tcf. Exploration success was boosted by the application of proprietary technologies in the area of seismic imaging. Wells have been drilled with Eni’s proprietary technique deep water dual casing (e-dwdc TM ). The volume of natural gas discovered beyond expectation in Mozambique will lead to a new significant development opportunities in Far East Countries with an energy demand growth at fast pace. This is the largest operated discovery in the Company’s exploration history. In a final completion configuration, production per well is expected to reach over 140 mmcf/d (approximately 25 kboe/d). In the next two years up to 8 additional wells are expected to be drilled in the nearby areas in order to monetize the high potential of the Mamba reservoir, investing euro 400 million.
Nigeria Eni has been present in Nigeria since 1962. In 2011, Eni’s oil and gas production averaged 160 kboe/d over a developed and undeveloped acreage of 40,625 square kilometers (8,491 square kilometers net to
Eni) located mainly in the onshore and offshore of the Niger Delta. In the development/production phase Eni is operator of onshore Oil Mining Leases (OML) 60, 61, 62 and 63 (Eni’s interest 20%) and onshore and offshore OML 125 (Eni’s interest 85%) and OMLs 120-121 (Eni’s interest 40%), holding interests in OML 118 (Eni’s interest 12.5%) as well as in OML 119 and 116 Service Contracts. As partners of SPDC JV, the largest joint venture in the Country, Eni also holds a 5% interest in 28 onshore blocks and a 12.86% interest in 5 conventional offshore blocks. In the exploration phase Eni is operator of offshore Oil Prospecting Leases (OPL) 244 (Eni’s interest 60%), OML 134 (former OPL 211 - Eni’s interest 85%) and onshore OPL 282 (Eni’s interest 90%) and OPL 135 (Eni’s interest 48%). Eni also holds a 12.5% interest in OML 135 (former OPL 219). In 2011, Eni optimized its producing asset portfolio: (i) the purchase from GEC Petroleum Development Co (GDPC) a 49% interest in Block OPL 2009 in addition to the awarding from the Nigerian Government a 50% interest in Block OPL 245 as well as relative license and operatorship; (ii) the divestment of a 5% interest in blocks OML 26 and OML 42; and (iii) the finalization of the divestment of a 40% interest in blocks OML 120 and 121. The transaction is subject to the approval of relevant authorities. During the year facilities to supply electricity in eight villages located in the Niger Delta area were completed with a total expenditure of euro 1 million. The project provides for the construction of required infrastructure for reaching 17 additional local communities.

- 25 -

Contents
Eni Fact Book Exploration & Production
Exploration and production activities in Nigeria are regulated mainly by Production Sharing Agreements and concession contracts as well as service contracts, in two blocks, where Eni acts as contractor for state-owned company.
Blocks OMLs 60, 61, 62 and 63 Production Onshore licenses OMLs 60, 61, 62 and 63 produced 66 kboe/d and accounted for 42% of Eni’s production in Nigeria in 2011. Liquid and gas production is supported by the NGL plant at Obiafu-Obrikom with a treatment capacity of approximately 1 bcf/d and by the oil tanker terminal at Brass with a storage capacity of approximately 3.5 mmbbl. A large portion of the gas reserves of these four OMLs is destined to supply the Bonny liquefaction plant (see below). Another portion of gas production is employed in firing the combined cycle power plant at Kwale-Okpai with a 480 MW generation capacity. In 2011, supplies to this power station were an overall amount of approximately 70 mmcf/d, corresponding to approximately 11 kboe/d (approximately 2 kboe/d net to Eni). This project is part of the Nigerian government and Eni’s plans for the reduction of carbon dioxide emissions and qualifies as CDM (Clean Development Mechanism) as provided for by the Kyoto Protocol. Development Activities aimed at guaranteeing production to feed gas to the Bonny liquefaction plant and flaring down progressed. As part of supply to the Bonny liquefaction plant, the compression and gas export capacity at the Obiafu/Obrikom plant was increased to ensure 170 mmcf/d net to Eni of feed gas for 20 years for sixth train. To the same end the development plan progressed at the Tuomo field with early-production start-up in 2012. Flaring down projects were completed at the Kwale and Obiafu/Obrikom production unit as well as the Ebocha oil center over the 2010-2011 period. The program includes also upgrading of the flowstation at the Idu field and the Ogbainbiri treatment plant with completion expected in 2012.
Block OML 118 Production The Bonga oil field produced approximately 14 kbbl/d of oil net to Eni in 2011. Production is supported by an FPSO unit with a 225 kbbl/d treatment capacity and a 2 mmbbl storage capacity. Associated gas is carried to a collection platform on the EA field and, from there, is delivered to the Bonny liquefaction plant.
Block OML 119 Production Production derived mainly from the Okono/Okpoho fields which yielded approximately 7 kbbl/d of oil net to Eni in 2011. Production is supported by an FPSO unit with an 80 kbbl/d treatment capacity and a 1 mmbbl storage capacity. Phase 2A project progressed to develop 23 mmbbl additional resources. Planned activity provides for the drilling of 2 subsea wells and the linkage to the existing FPSO unit. Start-up is expected in 2012.
development with an early-production of the Zabazaba and Etan fields in 2014. The preliminary development scheme provides for the installation of an FPSO unit with a capacity of 120 kboe/d, the drilling of 28 wells and the construction of transportation facilities to Bonny LNG plant. Exploration commitment concerned the appraisal of already discoveries.
SPDC Joint Venture (NASE) In 2011, production from the SPDC JV accounted for approximately 30% of Eni’s production in Nigeria (47 kboe/d). The Forcados/Yokri oil and gas field is under development as part of the integrated associated gas gathering project aimed at supplying gas to the domestic market through Escravos-Lagos pipeline system. First gas is expected in 2013. In block OML 28 within the integrated oil and natural gas project in the Gbaran-Ubie area, the drilling program progressed. The development plan provides for the construction of a Central Processing Facility (CPF) with treatment capacity of approximately 1 bcf/d of gas and 120 kbbl/d of liquids. Exploration activities yielded positive results in Block OML 36 with the Opugbene 2 appraisal well containing natural gas and condensates.
The LNG business in Nigeria Eni holds a 10.4% interest in Nigeria LNG Ltd responsible for the management of the Bonny liquefaction plant, located in the Eastern Niger Delta. The plant has a design treatment capacity of approximately 1,236 bcf/y of feed gas corresponding to a production of 22 mmtonnes/y of LNG on six trains. The seventh unit is being engineered as it is in the planning phase. When fully operational, total capacity will amount to approximately 30 mmtonnes/y of LNG, corresponding to a feedstock of approximately 1,624 bcf/y. Natural gas supplies to the plant are provided under gas supply agreements with a 20-year term from the SPDC joint venture and the NAOC JV, the latter operating the OMLs 60, 61, 62 and 63 blocks with an overall amount at the end of 2011 of 2,797 mmcf/d (267 mmcf/d net to Eni corresponding to approximately 48 kboe/d). LNG production is sold under long-term contracts and exported to European and American markets by the Bonny Gas Transport fleet, wholly owned by Nigeria LNG Co. Eni holds a 17% interest in Brass LNG Ltd Company for the construction of a natural gas liquefaction plant to be built near the existing Brass terminal, 100 kilometers west of Bonny. This plant is expected to start operating in 2017 with a production capacity of 10 mmtonnes/y of LNG corresponding to 590 bcf/y (approximately 60 net to Eni) of feed gas on two trains for 20-years. Supplies to this plant will derive from the collection of associated gas from nearby producing fields and from the development of gas reserves in the onshore OMLs 60 and 61. The venture signed preliminary long-term contracts to sell the whole LNG production

- 26 -
Block OML 125 Production The Abo field production amounted to approximately 21 kbbl/d of oil net to Eni in 2011. Production is supported by an FPSO unit with a 45 kbbl/d capacity and an 800 kbbl storage capacity.
Block OPL 245 With almost 500 mmbbl of already discovered reserves, this deep-offshore block includes the largest undeveloped mineral resources potential in the Country. Eni’s activities concerned exploration and pre-development phases. Eni’s commitment is for a fast track
capacity. Eni acquired 1.67 mmtonnes/y of LNG capacity (corresponding to approximately 81 bcf/y). LNG will be delivered to the United States market mainly at the re-gasification plant in Cameron, in Louisiana, USA. Eni’s capacity amounts to approximately 201 bcf/y. Front end engineering activities progressed. The final investment decision is expected in 2012.
� Kazakhstan Eni has been present in Kazakhstan since 1992 where the Company co-operates the Karachaganak producing field and is a partner of the consortium of the North Caspian Sea PSA to develop the Kashagan field.

Contents
Eni Fact Book Exploration & Production
Kashagan Eni holds a 16.81% working interest in the North Caspian Sea Production Sharing Agreement (NCSPSA). The NCSPSA defines terms and conditions for the exploration and development of the Kashagan field which was discovered in the Northern section of the contractual area in the year 2000 over an undeveloped area extending for 4,600 square kilometers. Management believes this field contains a large amount of hydrocarbon resources which will eventually be developed in phases. The exploration and development activities of the Kashagan field and the other discoveries made in the contractual area are executed through an operating model which entails an increased role of the Kazakh partner and defines the international parties’ responsibilities in the execution of the subsequent development phases of the project. The North Caspian Operating Company (NCOC) BV participated by the seven partners of the consortium has taken over the operatorship of the project. Subsequently development, drilling and production activities have been delegated by NCOC BV to the main partners of the Consortium: Eni has retained the responsibility for the development of Phase 1 of the project (the so-called "Experimental Program") and the onshore part of Phase 2. The Consortium is currently focused on completing Phase 1 and starting commercial oil production. Management estimates that Phase 1 was 90% completed as of end of December 2011. Tranches 1 and 2 of the scope of work which target commercial production start-up reached approximately 98% at the end of the year. The Consortium continues to target the achievement of first commercial oil production by the end of 2012 or in the early 2013. The project Phase 1 (Experimental Program) as sanctioned by the partners of the venture targets an initial production capacity of 150 kbbl/d. In 2014, the second train of treatment and compression facilities for gas re-injection will be completed and come online enabling to increase the production capacity up to 370 kbbl/d. The partners are planning to further increase available production capacity up to 450 kbbl/d by installing additional gas compression capacity for re-injection in the reservoir. The partners intend to submit the scheme of this additional gas compression activity to the relevant Kazakh Authorities in the course of 2012 in order to obtain approval to start the engineering design. The partners are currently assessing the Phase 2 of the development of the Kashagan field with a view of optimizing the development lay-out. The review is expected to be completed by 2012. However, taking into account that future development expenditures will be incurred over a long time horizon and subsequently to the production start-up, management does not expect any material impact on the Company’s liquidity or its ability to fund these capital expenditures. In addition to the expenditures for developing the field, further capital expenditures will be required to build the infrastructures needed for exporting the production to international markets. Eni continues its commitment in the protection of the
Karachaganak Located in West onshore Kazakhstan, Karachaganak is a giant liquid and gas field with recoverable reserves of 5 bboe. Operations are conducted by the Karachaganak Petroleum Operating consortium (KPO) and are regulated by a PSA lasting 40 years, until 2037. Eni and British Gas are co-operators of the venture with a 32.5% interest each. On December 14, 2011, the Republic of Kazakhstan and the contracting companies of Karachaganak Final Production Sharing Agreement (FPSA) reached an agreement to settle all pending claims. The agreement, effective from June 30, 2012 on satisfaction of conditions precedent, involves Kazakhstan’s KazMunaiGas (KMG) acquiring a 10% interest in the project. This will be done by each of the contracting companies transferring 10% of their rights and interest in the Karachaganak FPSA to KMG. The contracting companies will receive $1 billion net cash consideration ($325 million being Eni’s share). In addition the agreement provides for the allocation of an extra nominal capacity of 2 million tonnes of oil per annum capacity for the Karachaganak project in the Caspian Pipeline Consortium export pipeline. The effects of the agreement on profit and loss, reserve and production entitlements will be recognized in the 2012 financial statements. Production In 2011, production of the Karachaganak field averaged 239 kbbl/d of liquids (64 net to Eni) and 784 mmcf/d of natural gas (231 net to Eni). This field is developed by producing liquids from the deeper layers of the reservoir and re-injecting the associated gas in the higher layers. Approximately 85% of liquid production are stabilized at the Karachaganak Processing Complex (KPC) with a capacity of approximately 240 kbbl/d and exported to Western markets through the Caspian Pipeline Consortium (Eni’s interest 2%) and the Atyrau-Samara pipeline. The remaining volumes of non-stabilized liquid production and associated raw gas not re-injected in the reservoir are marketed at the Russian terminal in Orenburg. Development The fourth liquids stabilization train has been completed
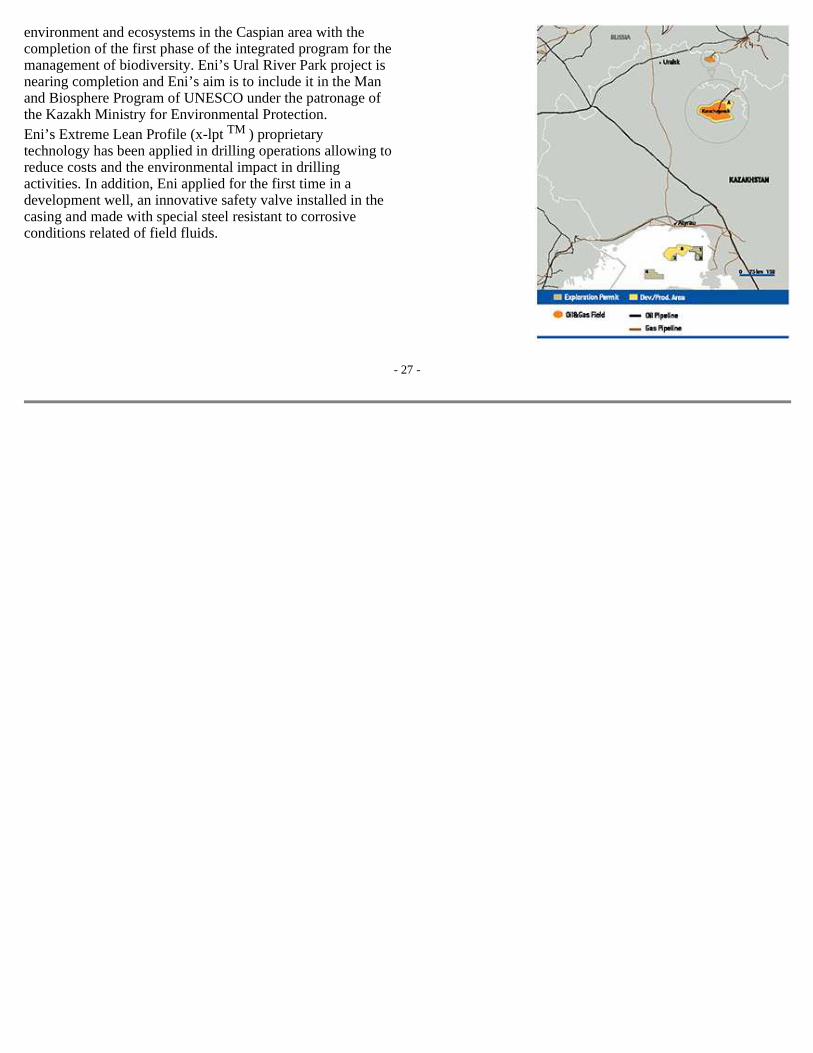
- 27 -
environment and ecosystems in the Caspian area with the completion of the first phase of the integrated program for the management of biodiversity. Eni’s Ural River Park project is nearing completion and Eni’s aim is to include it in the Man and Biosphere Program of UNESCO under the patronage of the Kazakh Ministry for Environmental Protection. Eni’s Extreme Lean Profile (x-lpt TM ) proprietary technology has been applied in drilling operations allowing to reduce costs and the environmental impact in drilling activities. In addition, Eni applied for the first time in a development well, an innovative safety valve installed in the casing and made with special steel resistant to corrosive conditions related of field fluids.
Contents
Eni Fact Book Exploration & Production
and allowed to increase export oil volumes through the Caspian Pipeline Consortium. Phase 3 of the Karachaganak project is currently under study. The project is aimed at further developing gas and condensates reserves by means of the installation of gas treatment plant and re-injection facilities to increase gas sales and liquids production. The development plan is currently in the phase of technical and marketing discussion to be presented to the relevant Authorities. In the area of water and energy management Eni is carrying out projects to support local communities. In particular the construction of the Aksai-Uralsk gas pipeline was completed. Other planned activities include: (i) facilities to increase drinking water availability in the Berezovka area; and (ii) construction of a power grid with the linkage to the Uralsk power station with a 54 MW generation capacity.
� Rest of Asia
China Eni has been present in China since 1984. In 2011, Eni’s production amounted to 8 kboe/d. Activities are located in the South China Sea over a developed and undeveloped acreage of 5,526 square kilometers (5,365 square kilometers net to Eni). In January 2011, Eni signed a Memorandum of Understanding with the national oil company PetroChina to promote common opportunities to jointly expand operations in conventional and unconventional hydrocarbons in China and outside China. The parties will also cooperate in the field of advanced technology, with a special focus on the exploitation of unconventional oil and gas resources. In July 2011, a similar agreement has been signed with Sinopec. In April 2012, Eni and China National Offshore Oil Corporation (CNOOC) signed a Production Sharing Contract for the exploration of Block 30/27, which has a high exploration potential and is located in one of the most attractive areas in the Chinese offshore. The agreement foresees the acquisition seismic 3D data and the drilling of 1 commitment well to be carried out in the first year of the exploration phase. Eni will be the Operator of the project, with a 100% interest. In the case of a discovery, CNOOC has a back-in right of up to 51%. Exploration and production activities in China are regulated by Production Sharing Agreements. Production Hydrocarbons are produced from the offshore Blocks 16/08 and 16/19 through eight platforms connected to an FPSO. Natural gas production from the HZ21-1 field is delivered through a sealine to the Zhuhai Terminal and sold to the CNOOC. Oil is mainly produced from HZ25-4 field (Eni’s interest 49%). Activity is operated by the CACT-Operating Group (Eni’s interest 16.33%).
India Eni has been present in India since 2005 and is performing
Indonesia Eni has been present in Indonesia since 2001. Eni’s production amounted to 18 kboe/d, mainly gas, in 2011. Activities are concentrated in the Eastern offshore and onshore East Kalimantan, offshore Sumatra, and offshore/onshore areas of West Timor, over a developed and undeveloped acreage of 28,841 square kilometers (17,719 square kilometers net to Eni) in 12 blocks. In 2011, Eni was awarded two operated gas exploration licenses: (i) the Arguni I block with a 100% interest located onshore and offshore in the Bintuni Basin near a liquefaction facility. The agreement foresees seismic data acquisition and the drilling of 2 commitment wells to be carried out in the first three years of exploration phase; and (ii) the North Ganal block, located offshore Indonesia near the relevant Jangkrik discoveries and the Bontang liquefaction terminal, in a consortium with other international oil companies. The commitment activities provide for the seismic data acquisition and the drilling of one well in the first three years. Exploration and production activities in Indonesia are regulated by PSAs. Production Production consists mainly of gas and derives from the Sanga Sanga permit (Eni’s interest 37.81%) with seven production fields. This gas is treated at the Bontang liquefaction plant, one of the largest in the world, and is exported to the Japanese, South Korean and Taiwanese markets. Development In 2011, the development plan of the operated Jangkrik (Eni’s interest 55%) and Jau (Eni’s interest 85%) gas fields has been approved by relevant authorities. Planned development activities at the Jangkrik offshore field include drilling of production wells, installation of a Floating Production Unit for gas and condensate treatment and construction of a transport facility connecting to the existing onshore network linked to the Bontang liquefaction plant for gas, while condensates will be supplied to the treatment plants in the area. Start-up is expected in 2016.

- 28 -
exploration and development activities over a developed and undeveloped acreage of 25,570 square kilometers (9,206 square kilometers net to Eni). In 2011, Eni’s production amounted to 4 kboe/d. Eni’s main fields in production/development are located in the offshore Cauvery Basin near the south-eastern coast. Production Production mainly comes from the PY-1 gas field which is part of the assets belonging to Hindustan Oil Exploration Co Ltd (Eni’s interest 47.18%) acquired within the Burren acquisition. Gas production is sold to the local national oil company.

Contents
Eni Fact Book Exploration & Production
The Jau offshore project provides for the drilling of production wells and the linkage to onshore plants via pipeline. Start-up is expected in 2016. The exploration activities related to the coal bed methane project progressed at the Sanga Sanga PSC. Pre-development activities are underway exploiting the synergy opportunities provided by the existing production and treatment facilities also including the Bontang LNG plant. Start-up is expected in 2013. In November 2011, Eni signed with the national power company PT Perusahaan Listrik Negara a Memorandum of Understanding to supply approximately 494 kcf/d of CBM gas for at least 5 years (corresponding to approximately 180 mmcf/y) to feed a power plant. The contract is in the process of being finalized. Within the activities carried out by Eni in support of local communities, medical and surgical interventions were directed to children in the area of East Kalimantan, near the Bukat permit (Eni operator with a 66.25% interest). Exploration Exploration activities yielded positive results with Jangkrik North East gas discovery in the Muara Bakau block (Eni operator with a 55% interest), located in the Kutei basin.
Iran The formal hand over of operations to local partners at the Darquain project is almost completed. This was the sole Eni operated project in the Country. When the final hand over of operations will be completed, Eni’s involvements essentially will consist of being reimbursed for its past investments.
Iraq Eni has been present in Iraq since 2009 and is performing development activities over a developed acreage of 1,074 square kilometers (352 square kilometers net to Eni). Production comes from Zubair oil field (Eni’s interest 32.8%) with a production of 7 kbbl/d net to Eni in 2011. Exploration and production activities in Iraq are regulated by a Technical Service Contract. The project, lasting 20-years term with a further 5 years extension,
foresees to gradually increase production to a target plateau level of 1.2 mmbbl/d by 2016 and provides for two phases: (i) Rehabilitation plan aimed at improving current operations and reducing production decline as well as appraisal of both producing and undeveloped discovered reservoirs; and (ii) Enhanced Redevelopment Plan allowing to reach target plateau. The Water Agribusiness pilot project started in the Zubair area. The program is aimed at implementing a sustainable agricultural production model based on the reuse of water in agricultural activities creating producing units with low management costs also by means of higher energy efficiency. In addition the program aims at creating an international benchmark development model that will increase investment opportunities and promote employment.
Pakistan Eni has been present in Pakistan since 2000. In 2011, Eni’s production averaged 58 kboe/d mainly of gas. Activities are located onshore covering a developed and undeveloped acreage of 22,953 square kilometers (9,289 square kilometers net to Eni). Exploration and production activities in Pakistan are regulated by concessions (onshore) and PSAs (offshore). Production Eni’s main permits in the Country are Bhit (Eni operator with a 40% interest), Sawan (Eni’s interest 23.68%) and Zamzama (Eni’s interest 17.75%) which, in 2011, accounted for approximately 81% of Eni’s production in Pakistan. Development Main development activities were aimed at reducing natural decline in: (i) the Bhit field where the installation of a compression facility was completed. Drilling activities and optimization of current production are underway to extend production plateau; (ii) the Zamzama field where the first phase of the Front End Compression project has been completed. Two additional wells will be drilled in 2012; and (iii) the Miano Front End Compression (Eni’s interest 15%) and Badhra Field Compression (Eni operator with a 40% interest) projects have been completed in 2011. As a part of activity to support local communities, medical centers and drinking water distribution facilities have been built in the Bhit, Badhra and Kadanwari areas. The innovative proprietary algorithms application for processing seismic data, such as the Common Reflection Surface Stack (e-crs TM ) allowed to improve the reservoir structure knowledge thus positioning successfully the Badhra 6 well. Exploration Exploration activity yielded positive results with: (i) the Kadanwari-27 exploration well, in the homonymous permit (Eni’s interest 18.42%) which yielded up to approximately 50 mmcf/d of gas in test production; (ii) the Lundo discovery and Tajjal 4 appraisal well in the Gambat permit (Eni’s interest 23.7%). The latter start-up is expected in 2012; and (iii) the Misri Bhambroo exploration well located in the SW Miano II permit (Eni’s interest

- 29 -
33.3%).
Russia Eni has been present in Russia since 2007 following the acquisition of Lot 2 in the Yukos liquidation procedure. In particular, acquired assets included three Russian companies operating in the exploration and development of natural gas reserves: OAO Arctic Gas Co, ZAO Urengoil Inc and OAO Neftegaztechnologia. In September 2009, Eni and its Italian partner Enel in the 60-40% owned joint venture completed the divestment of the 51% stake in the venture to Gazprom based on the call option exercised by the Russian company. The three companies

Contents
Eni Fact Book Exploration & Production
managed by the subholding OOO SeverEnergia (Eni’s interest 29.4%) own 4 exploration/development blocks located in the Yamal Nenets region, with significant predominantly gas resources estimated in 1.6 bboe: (i) OAO Arctic Gas Company owns two exploration licenses, Sambursky and Yevo-Yakhinsky including seven gas and condensates fields currently in the appraisal/development phase. Main fields are Samburgskoye, Urengoiskoye and Yevo. The Samburgskoye field has been the first to be developed. In September 2011, Eni signed a contract whereby Gazprom commits to purchase volumes of gas produced by the Samburgskoye field. The agreement secured a final investment decision for the field development and in April 2012, Eni started production with an expected peak production of approximately 43 kboe/d (approximately 14 kboe/d, net to Eni). In the year, the Final Investment Decision of the onshore gas and condensate Urengoskoye field was sanctioned. Start-up is expected in 2014; (ii) ZAO Urengoil Inc owns exploration and development licenses for the Yaro-Yakhinskoye gas and condensates field. The development plan is in the process of being approved by relevant Authorities. Start-up is expected in 2012; and (iii) OAO Neftegaztechnologia owns the exploration and development license of the Severo-Chaselskoye field. Full production plateau estimated at an overall 200 kboe/d is expected in 2019 following two additional start-ups of Yevo and Severo fields in 2018.
Turkmenistan Eni started its activities in Turkmenistan with the purchase of the British company Burren Energy plc in 2008. Activities are focused in the Western part of the Country over a developed area of 200 square kilometers net to Eni, splitted into four development areas. In 2011, Eni’s production averaged 11 kbbl/d. Exploration and production activities in Turkmenistan are regulated by PSAs. Production Eni is operator of the Nebit Dag producing block (with a 100% interest). Production derives mainly from the Burun oil field. Oil production is shipped to the Turkmenbashi refinery plant. Eni receives, by means of a swap with the Turkmen Authorities, an equivalent amount of oil at the Okarem field, close to the South coast of the Caspian Sea. Eni’s entitlement is sold FOB. Associated natural gas is used for own consumption and gas lift system. The remaining amount is delivered to Turkmenneft, via national grid.
� America
Ecuador Eni has been present in Ecuador since 1988. Operations are performed in Block 10 (Eni’s interest 100%) located in the Oriente Basin, in the Amazon forest over a developed acreage of 1,985 square kilometers net to Eni. In 2011, Eni’s
kilometers (66 square kilometers net to Eni). Exploration and production activities in Trinidad and Tobago are regulated by PSAs. Production Production is provided by the Chaconia, Ixora, Hibiscus, Ponsettia, Bougainvillea and Heliconia gas fields in the North Coast Marine Area 1 Block (Eni’s interest 17.3%). Production is supported by two fixed platforms linked to the Hibiscus processing facility. Natural gas is used to feed trains 2, 3 and 4 of the Atlantic LNG liquefaction plant on Trinidad’s cost and sold under long-term contracts. LNG production is manly sold in the United States. Additional cargoes are sent to alternative destinations on a spot basis.
United States Eni has been present in the USA since 1968. Activities are performed in the Gulf of Mexico, Alaska and more recently onshore in Texas. Developed and undeveloped acreage covers 8,982 square kilometers (5,123 square kilometers net to Eni). In 2011, Eni’s oil and gas production averaged 98 kboe/d. Exploration and production activities in the USA are regulated by concessions.
Gulf of Mexico Eni holds interests in 307 exploration and production blocks in the conventional and deep-offshore in the Gulf of Mexico, of which 191 are operated by Eni. Production The main fields operated by Eni are Allegheny, Appaloosa and Morpeth (Eni’s interest 100%), Longhorn-Leo, Devils Towers and Triton (Eni’s interest 75%) as well as King Kong (Eni’s interest 54%) and Pegasus (Eni’s interest 58%). Eni also holds interests in the Medusa (Eni’s interest 25%), Europa (Eni’s interest 32%), and Thunder Hawk (Eni’s interest 25%) fields. In 2011, production started at the Appaloosa field with a production of 7 kbbl/d through linkage to the Corral operated platform with a treatment capacity of 33 kbbl/d net to Eni. Development Main activities included work-over activities at the Goldfinger (Eni’s interest 100%) and Spiderman (Eni’s interest 36.7%) fields as well as the drilling of development wells in the Triton field. Exploration Exploration activities yielded positive results in the offshore block KC919 (Eni’s interest 25%) with Hadrian North appraisal well containing oil and natural gas resources. The discovery allowed approving the development of the Greater Hadrian Area project.
Texas Development The development activity progressed at the Alliance area (Eni’s interest 27.5%), in the Fort Worth basin in Texas. This area, including gas shale reserves, was acquired in 2009 following a strategic alliance Eni signed with Quicksilver Resources Inc. Production plateau at 9 kboe/d net to Eni is expected in 2012.

- 30 -
production averaged 7 kbbl/d. Exploration and production activities in Ecuador are regulated by a service contract, due to expire in 2023. Production Production derives from the Villano field, started-up in 1999. Production is carried out by means of a Central Production Facility linked by pipeline to the storage facility located in the Pacific Coast. Main development activities were aimed at reducing natural production decline.
Trinidad & Tobago Eni has been present in Trinidad and Tobago since 1970. In 2011, Eni’s production averaged 57 mmcf/d (10 kboe/d). Activity is concentrated offshore North of Trinidad over a developed acreage of 382 square
Alaska Eni holds interests in 135 exploration and development blocks with interests ranging from 10% to 100%, for 59 of these blocks Eni is the operator. Production The Ooguruk offshore oil field (Eni’s interest 30%) produced 7 kbbl/d (approximately 2 kbbl/d net to Eni) in 2011. Production is treated at the onshore DS-3H plant. In 2011 production started at the Nikaitchuq operated field (Eni’s interest 100%), located in North Slope basins offshore Alaska, with resources of 220 million barrels. Drilling continues as scheduled. Start-up was achieved with application innovative technologies: (i) Eni
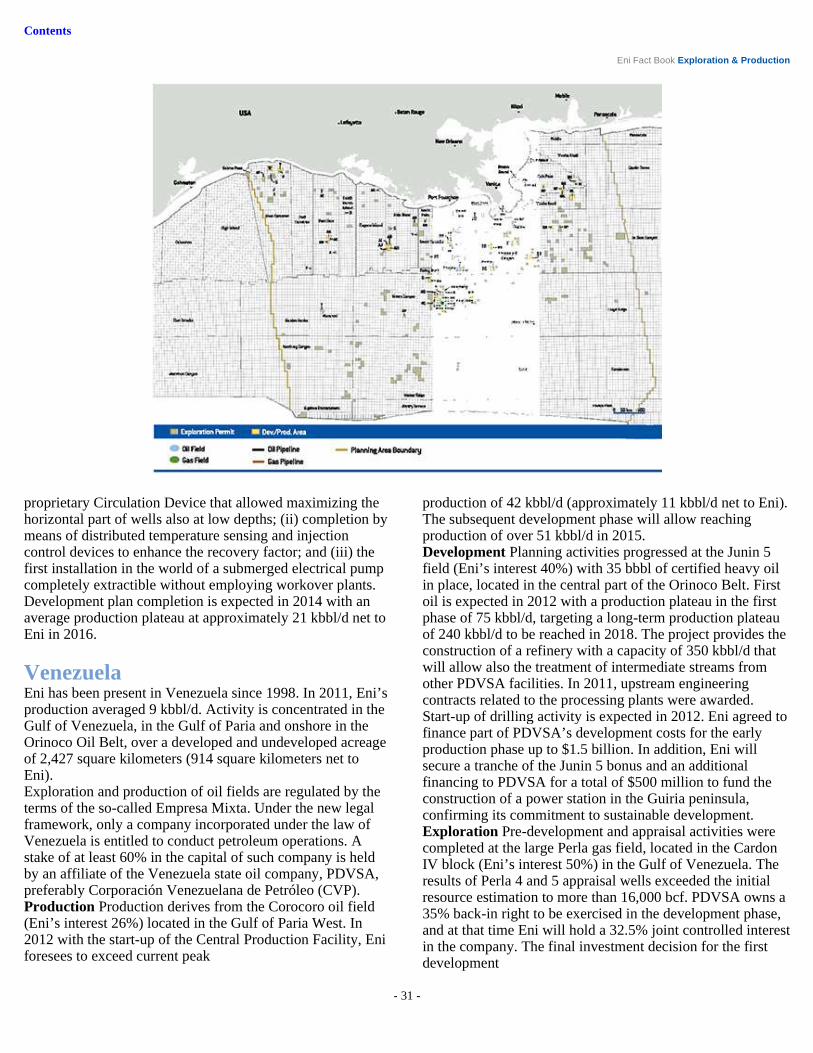
Contents
Eni Fact Book Exploration & Production
- 31 -
proprietary Circulation Device that allowed maximizing the horizontal part of wells also at low depths; (ii) completion by means of distributed temperature sensing and injection control devices to enhance the recovery factor; and (iii) the first installation in the world of a submerged electrical pump completely extractible without employing workover plants. Development plan completion is expected in 2014 with an average production plateau at approximately 21 kbbl/d net to Eni in 2016.
Venezuela Eni has been present in Venezuela since 1998. In 2011, Eni’s production averaged 9 kbbl/d. Activity is concentrated in the Gulf of Venezuela, in the Gulf of Paria and onshore in the Orinoco Oil Belt, over a developed and undeveloped acreage of 2,427 square kilometers (914 square kilometers net to Eni). Exploration and production of oil fields are regulated by the terms of the so-called Empresa Mixta. Under the new legal framework, only a company incorporated under the law of Venezuela is entitled to conduct petroleum operations. A stake of at least 60% in the capital of such company is held by an affiliate of the Venezuela state oil company, PDVSA, preferably Corporación Venezuelana de Petróleo (CVP). Production Production derives from the Corocoro oil field (Eni’s interest 26%) located in the Gulf of Paria West. In 2012 with the start-up of the Central Production Facility, Eni foresees to exceed current peak
production of 42 kbbl/d (approximately 11 kbbl/d net to Eni). The subsequent development phase will allow reaching production of over 51 kbbl/d in 2015. Development Planning activities progressed at the Junin 5 field (Eni’s interest 40%) with 35 bbbl of certified heavy oil in place, located in the central part of the Orinoco Belt. First oil is expected in 2012 with a production plateau in the first phase of 75 kbbl/d, targeting a long-term production plateau of 240 kbbl/d to be reached in 2018. The project provides the construction of a refinery with a capacity of 350 kbbl/d that will allow also the treatment of intermediate streams from other PDVSA facilities. In 2011, upstream engineering contracts related to the processing plants were awarded. Start-up of drilling activity is expected in 2012. Eni agreed to finance part of PDVSA’s development costs for the early production phase up to $1.5 billion. In addition, Eni will secure a tranche of the Junin 5 bonus and an additional financing to PDVSA for a total of $500 million to fund the construction of a power station in the Guiria peninsula, confirming its commitment to sustainable development. Exploration Pre-development and appraisal activities were completed at the large Perla gas field, located in the Cardon IV block (Eni’s interest 50%) in the Gulf of Venezuela. The results of Perla 4 and 5 appraisal wells exceeded the initial resource estimation to more than 16,000 bcf. PDVSA owns a 35% back-in right to be exercised in the development phase, and at that time Eni will hold a 32.5% joint controlled interest in the company. The final investment decision for the first development

Contents
Eni Fact Book Exploration & Production
- 32 -
phase was sanctioned in the year and a Gas Sale Agreement was signed. EPC contracts for the project are being awarded. In addition, as part of the activities to support local communities, Eni started to build schools in the coastal area of the block. The early production phase includes the utilization of the already successfully drilled wells and the installation of production platforms linked by pipelines to the onshore treatment plant. The target production of approximately 300 mmcf/d is expected in 2014. The development of Perla is currently planned to continue with two more phases by means of the drilling of additional wells and the upgrading of treatment facilities to reach a plateau production of 1,200 mmcf/d. Eni is also participating with a 19.5% interest in the Gulfo de Paria Centrale offshore oil exploration block, where the Punta Sur oil discovery is located and with a 40% interest in Punta Pescador and Gulfo de Paria Ovest, the latter coinciding with the Corocoro oil field area.
� Australia and Oceania
Australia Eni has been present in Australia since 2001. In 2011, Eni’s production of oil and natural gas averaged 28 kboe/d. Activities are focused on conventional and deep offshore fields over a developed and undeveloped area of 50,520 square kilometers (25,647 square kilometers net to Eni). The main production blocks in which Eni holds interests are WA-33-L (Eni’s interest 100%), WA-25-L (Eni operator with a 65% interest) and JPDA 03-13 (Eni’s interest 10.99%) and JPDA 06-105 (Eni operator with a 40% interest). In the exploration phase Eni holds interests in 10 licenses (of which one with a 100% interest). In May 2011, Eni signed an agreement with MEO Australia Ltd to farm-in the Heron and Blackwood gas discoveries in permit NT/P-68, located in the Timor Sea. Eni acquired a 50% stake and operatorship in the first gas discovery by financing exploration activities relating to the drilling of two appraisal wells. Eni was granted an option to earn a 50% stake in Blackwood discovery by performing seismic surveys and drilling one well in the area. The agreement also provides an option to acquire an additional 25% in both the discoveries by financing the development plan required to reach a final investment decision. In November 2011, Eni acquired a 32.5% stake in the Evans Shoal gas discovery in the Timor Sea with approximately 7 tcf of volumes of gas in place.
Exploration and production activities in Australia are regulated by concession agreements, whereas in the cooperation zone between Timor Leste and Australia (Joint Petroleum Development Area - JPDA) they are regulated by PSAs.
Block WA-25-L Production The Wollybutt oil field, started-up in 2003, produced approximately 3 kbbl/d (approximately 2 kbbl/d net to Eni) in 2011. Production is supported by horizontal wells and operated by an FPSO unit.
Block JPDA 03-13 Production The liquids and gas Bayu Undan field, started-up in 2004, and produced 190 kboe/d (approximately 13 kboe/d net to Eni) in 2011. Liquid production is supported by 3 treatment platforms and an FSO unit. Production of natural gas is mostly carried by a 500-kilometer long pipeline and is treated at the Darwin liquefaction plant which has a capacity of 3.2 mmtonnes/y of LNG (equivalent to approximately 173 bcf/y of feed gas). LNG is sold to Japanese power generation companies under long-term contracts.
Block WA-33-L Production The Blacktip gas field (Eni’s interest 100%), started-up in 2009, and produced approximately 21 bcf/y in 2011. The project is supported by a production platform and carried by a 108-kilometer long pipeline to an onshore treatment plant with a capacity of 42 bcf/y. Natural gas extracted from this field will be sold under a 25-year contract signed with Power & Water Utility Co.
Block JPDA 06-105 Production In October 2011, production started at the Kitan oil field (Eni operator with a 40% interest) located between Timor Leste and Australia. Start-up was achieved by means of: (i) the completion of drilling activities in the deep offshore, whose positioning has been optimized with the application of innovative methods for seismic data developed by Eni (Depth Velocity Analysis, e-dva™ and Reverse Time Migration); and (ii) the linkage to an FPSO plant (Floating Production Storage and Offloading). Peak production of over 40 kbbl/d is expected in 2012.

Contents
Eni Fact Book Exploration & Production
Estimated net proved hydrocarbons reserves by geographic area (a) (mmboe)
(at December 31) Italy (b) Rest of Europe
North Africa
Sub-Saharan Africa
Kazakhstan (c)
Rest of Asia (d) America
Australia and
Oceania Total
2007 Estimated net proved hydrocarbons reserves 747 638 1,897 1,100 1,061 514 280 133 6,370 Consolidated subsidiaries 747 638 1,879 1,095 1,061 198 259 133 6,010 Equity-accounted entities 18 5 316 21 360 Developed 534 537 1,198 769 494 172 158 63 3,925 Consolidated subsidiaries 534 537 1,183 766 494 127 158 63 3,862 Equity-accounted entities 15 3 45 63 Undeveloped 213 101 699 331 567 342 122 70 2,445 Consolidated subsidiaries 213 101 696 329 567 71 101 70 2,148 Equity-accounted entities 3 2 271 21 297
2008 Estimated net proved hydrocarbons reserves 681 525 1,939 1,154 1,336 579 254 132 6,600 Consolidated subsidiaries 681 525 1,922 1,146 1,336 265 235 132 6,242 Equity-accounted entities 17 8 314 19 358 Developed 465 417 1,242 831 647 212 140 62 4,016 Consolidated subsidiaries 465 417 1,229 827 647 168 133 62 3,948 Equity-accounted entities 13 4 44 7 68 Undeveloped 216 108 697 323 689 367 114 70 2,584 Consolidated subsidiaries 216 108 693 319 689 97 102 70 2,294 Equity-accounted entities 4 4 270 12 290
2009 Estimated net proved hydrocarbons reserves 703 590 1,937 1,163 1,221 545 279 133 6,571 Consolidated subsidiaries 703 590 1,922 1,141 1,221 236 263 133 6,209 Equity-accounted entities 15 22 309 16 362 Developed 490 432 1,278 804 614 183 181 122 4,104 Consolidated subsidiaries 490 432 1,266 799 614 139 168 122 4,030 Equity-accounted entities 12 5 44 13 74 Undeveloped 213 158 659 359 607 362 98 11 2,467 Consolidated subsidiaries 213 158 656 342 607 97 95 11 2,179 Equity-accounted entities 3 17 265 3 288
2010 Estimated net proved hydrocarbons reserves 724 601 2,119 1,161 1,126 612 373 127 6,843 Consolidated subsidiaries 724 601 2,096 1,133 1,126 295 230 127 6,332 Equity-accounted entities 23 28 317 143 511 Developed 554 405 1,237 817 543 182 167 117 4,022 Consolidated subsidiaries 554 405 1,215 812 543 139 141 117 3,926 Equity-accounted entities 22 5 43 26 96 Undeveloped 170 196 882 344 583 430 206 10 2,821 Consolidated subsidiaries 170 196 881 321 583 156 89 10 2,406 Equity-accounted entities 1 23 274 117 415
2011 Estimated net proved hydrocarbons reserves 707 630 2,052 1,104 950 886 624 133 7,086 Consolidated subsidiaries 707 630 2,031 1,021 950 230 238 133 5,940 Equity-accounted entities 21 83 656 386 1,146

Developed 540 374 1,194 746 482 134 188 112 3,770 Consolidated subsidiaries 540 374 1,175 742 482 129 162 112 3,716 Equity-accounted entities 19 4 5 26 54 Undeveloped 167 256 858 358 468 752 436 21 3,316 Consolidated subsidiaries 167 256 856 279 468 101 76 21 2,224 Equity-accounted entities 2 79 651 360 1,092
i i i (a) i From April 1, 2010, Eni has updated the natural gas conversion factor from 5,742 to 5,550 standard cubic feet of gas per barrel of oil equivalent. (b) i Including approximately, 749, 746, 769, 767 and 767 billion of cubic feet of natural gas held in storage at December 31, 2007, 2008, 2009, 2010 and 2011, respectively. (c) i Eni’ s proved reserves of the Kashagan field were determined based on Eni working interest of 16.81% since December 31, 2008 and 18.52% in 2007. (d) i Includes a 29.4% stake of the reserves of the three equity-accounted Russian companies participated by joint venture OOO SeverEnergia, owned by Eni (60%) and its Italian partner Enel (40%)
which on September 23, 2009, completed the divestment of the 51% stake in the venture to Gazprom in line with the call option arrangement.
i - 33 -
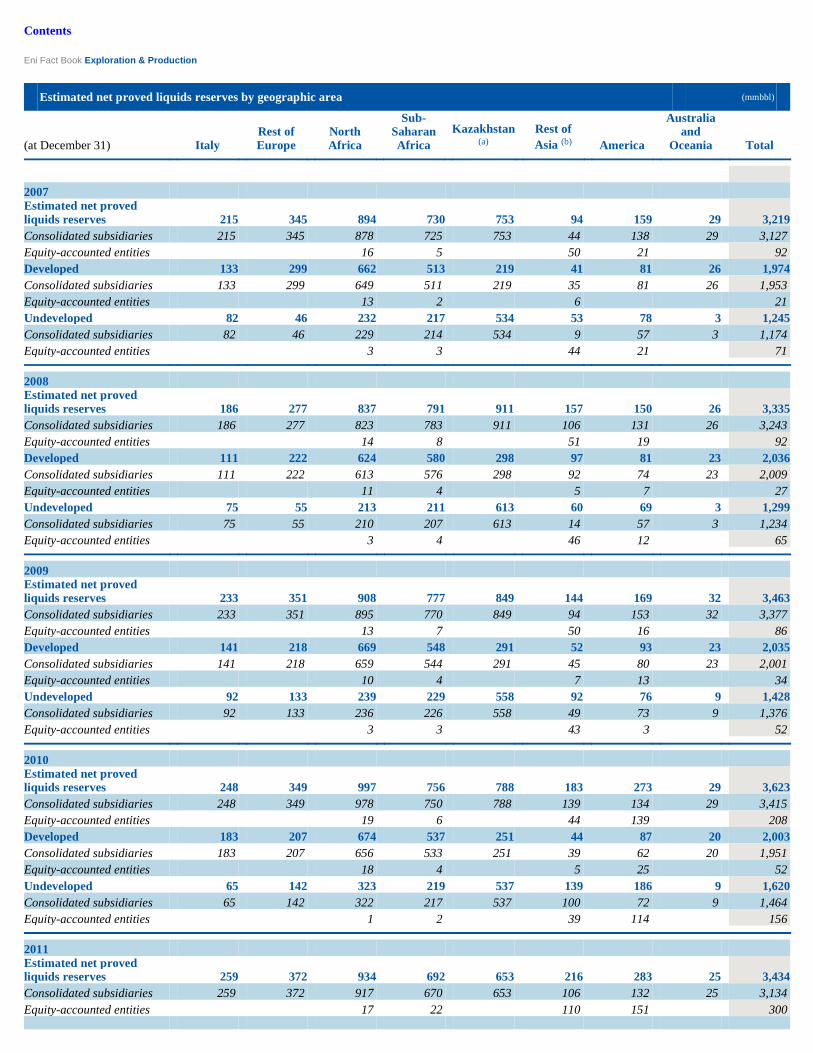
Contents
Eni Fact Book Exploration & Production
Estimated net proved liquids reserves by geographic area (mmbbl)
(at December 31) Italy Rest of Europe
North Africa
Sub-Saharan Africa
Kazakhstan (a)
Rest of Asia (b) America
Australia and
Oceania Total
2007 Estimated net proved liquids reserves 215 345 894 730 753 94 159 29 3,219 Consolidated subsidiaries 215 345 878 725 753 44 138 29 3,127 Equity-accounted entities 16 5 50 21 92 Developed 133 299 662 513 219 41 81 26 1,974 Consolidated subsidiaries 133 299 649 511 219 35 81 26 1,953 Equity-accounted entities 13 2 6 21 Undeveloped 82 46 232 217 534 53 78 3 1,245 Consolidated subsidiaries 82 46 229 214 534 9 57 3 1,174 Equity-accounted entities 3 3 44 21 71
2008 Estimated net proved liquids reserves 186 277 837 791 911 157 150 26 3,335 Consolidated subsidiaries 186 277 823 783 911 106 131 26 3,243 Equity-accounted entities 14 8 51 19 92 Developed 111 222 624 580 298 97 81 23 2,036 Consolidated subsidiaries 111 222 613 576 298 92 74 23 2,009 Equity-accounted entities 11 4 5 7 27 Undeveloped 75 55 213 211 613 60 69 3 1,299 Consolidated subsidiaries 75 55 210 207 613 14 57 3 1,234 Equity-accounted entities 3 4 46 12 65
2009 Estimated net proved liquids reserves 233 351 908 777 849 144 169 32 3,463 Consolidated subsidiaries 233 351 895 770 849 94 153 32 3,377 Equity-accounted entities 13 7 50 16 86 Developed 141 218 669 548 291 52 93 23 2,035 Consolidated subsidiaries 141 218 659 544 291 45 80 23 2,001 Equity-accounted entities 10 4 7 13 34 Undeveloped 92 133 239 229 558 92 76 9 1,428 Consolidated subsidiaries 92 133 236 226 558 49 73 9 1,376 Equity-accounted entities 3 3 43 3 52
2010 Estimated net proved liquids reserves 248 349 997 756 788 183 273 29 3,623 Consolidated subsidiaries 248 349 978 750 788 139 134 29 3,415 Equity-accounted entities 19 6 44 139 208 Developed 183 207 674 537 251 44 87 20 2,003 Consolidated subsidiaries 183 207 656 533 251 39 62 20 1,951 Equity-accounted entities 18 4 5 25 52 Undeveloped 65 142 323 219 537 139 186 9 1,620 Consolidated subsidiaries 65 142 322 217 537 100 72 9 1,464 Equity-accounted entities 1 2 39 114 156
2011 Estimated net proved liquids reserves 259 372 934 692 653 216 283 25 3,434 Consolidated subsidiaries 259 372 917 670 653 106 132 25 3,134 Equity-accounted entities 17 22 110 151 300

- 34 -
Developed 184 195 638 487 215 34 117 25 1,895 Consolidated subsidiaries 184 195 622 483 215 34 92 25 1,850 Equity-accounted entities 16 4 25 45 Undeveloped 75 177 296 205 438 182 166 1,539 Consolidated subsidiaries 75 177 295 187 438 72 40 1,284 Equity-accounted entities 1 18 110 126 255
i i i (a) i Eni’ s proved reserves of the Kashagan field were determined based on Eni working interest of 16.81% since December 31, 2008 and 18.52% in 2007. (b) i Includes a 29.4% stake of the reserves of the three equity-accounted Russian companies participated by joint venture OOO SeverEnergia, owned by Eni (60%) and its Italian partner Enel (40%)
which on September 23, 2009, completed the divestment of the 51% stake in the venture to Gazprom in line with the call option arrangement.

Contents
Eni Fact Book Exploration & Production
Estimated net proved natural gas reserves by geographic area (bcf)
(at December 31) Italy (a) Rest of Europe
North Africa
Sub-Saharan Africa
Kazakhstan (b)
Rest of Asia (c) America
Australia and
Oceania Total
2007 Estimated net proved natural gas reserves 3,057 1,675 5,766 2,124 1,770 2,404 696 598 18,090 Consolidated subsidiaries 3,057 1,675 5,751 2,122 1,770 880 696 598 16,549 Equity-accounted entities 15 2 1,524 1,541 Developed 2,304 1,364 3,077 1,471 1,580 753 442 213 11,204 Consolidated subsidiaries 2,304 1,364 3,065 1,469 1,580 530 442 213 10,967 Equity-accounted entities 12 2 223 237 Undeveloped 753 311 2,689 653 190 1,651 254 385 6,886 Consolidated subsidiaries 753 311 2,686 653 190 350 254 385 5,582 Equity-accounted entities 3 1,301 1,304
2008 Estimated net proved natural gas reserves 2,844 1,421 6,324 2,086 2,437 2,430 600 606 18,748 Consolidated subsidiaries 2,844 1,421 6,311 2,084 2,437 911 600 606 17,214 Equity-accounted entities 13 2 1,519 1,534 Developed 2,031 1,122 3,548 1,444 2,005 657 340 221 11,368 Consolidated subsidiaries 2,031 1,122 3,537 1,443 2,005 439 340 221 11,138 Equity-accounted entities 11 1 218 230 Undeveloped 813 299 2,776 642 432 1,773 260 385 7,380 Consolidated subsidiaries 813 299 2,774 641 432 472 260 385 6,076 Equity-accounted entities 2 1 1,301 1,304
2009 Estimated net proved natural gas reserves 2,704 1,380 5,908 2,212 2,139 2,301 631 575 17,850 Consolidated subsidiaries 2,704 1,380 5,894 2,127 2,139 814 629 575 16,262 Equity-accounted entities 14 85 1,487 2 1,588 Developed 2,001 1,231 3,498 1,468 1,859 756 506 565 11,884 Consolidated subsidiaries 2,001 1,231 3,486 1,463 1,859 539 506 565 11,650 Equity-accounted entities 12 5 217 234 Undeveloped 703 149 2,410 744 280 1,545 125 10 5,966 Consolidated subsidiaries 703 149 2,408 664 280 275 123 10 4,612 Equity-accounted entities 2 80 1,270 2 1,354
2010 Estimated net proved natural gas reserves 2,644 1,401 6,231 2,245 1,874 2,391 552 544 17,882 Consolidated subsidiaries 2,644 1,401 6,207 2,127 1,874 871 530 544 16,198 Equity-accounted entities 24 118 1,520 22 1,684 Developed 2,061 1,103 3,122 1,554 1,621 774 437 539 11,211 Consolidated subsidiaries 2,061 1,103 3,100 1,550 1,621 560 431 539 10,965 Equity-accounted entities 22 4 214 6 246 Undeveloped 583 298 3,109 691 253 1,617 115 5 6,671 Consolidated subsidiaries 583 298 3,107 577 253 311 99 5 5,233 Equity-accounted entities 2 114 1,306 16 1,438
2011 Estimated net proved natural gas reserves 2,491 1,427 6,210 2,287 1,648 3,718 1,897 604 20,282 Consolidated subsidiaries 2,491 1,425 6,190 1,949 1,648 685 590 604 15,582 Equity-accounted entities 2 20 338 3,033 1,307 4,700
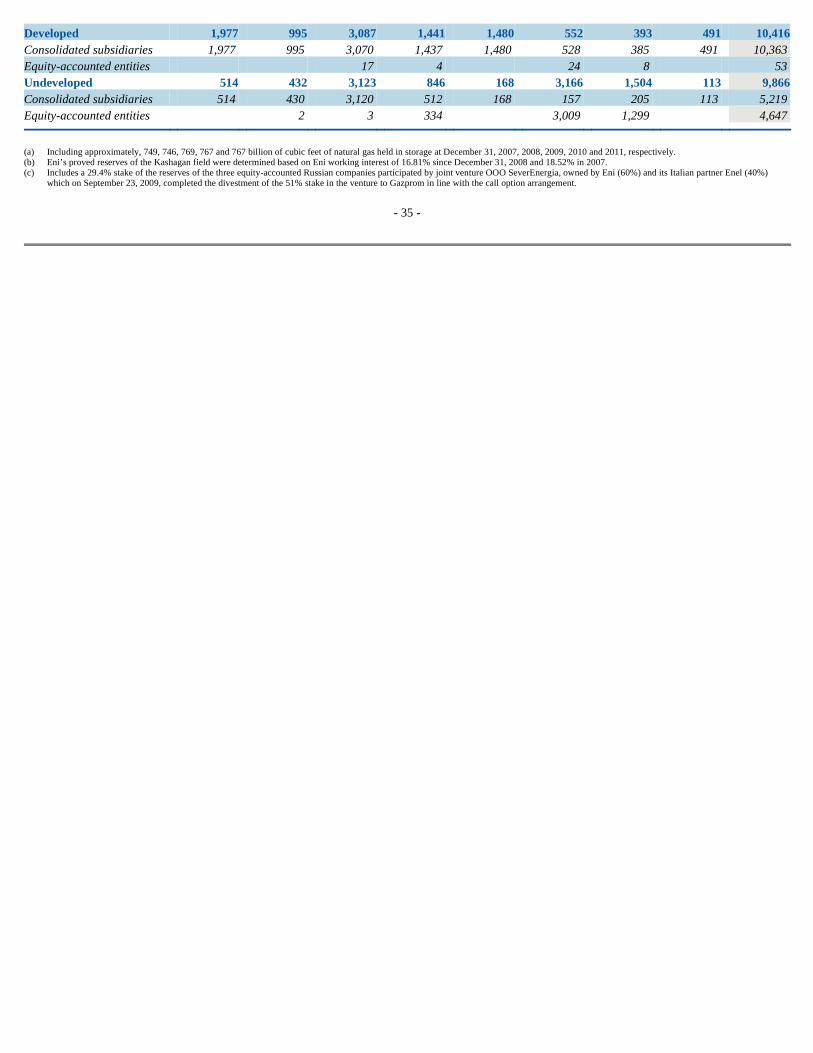
- 35 -
Developed 1,977 995 3,087 1,441 1,480 552 393 491 10,416 Consolidated subsidiaries 1,977 995 3,070 1,437 1,480 528 385 491 10,363 Equity-accounted entities 17 4 24 8 53 Undeveloped 514 432 3,123 846 168 3,166 1,504 113 9,866 Consolidated subsidiaries 514 430 3,120 512 168 157 205 113 5,219 Equity-accounted entities 2 3 334 3,009 1,299 4,647
i i i (a) i Including approximately, 749, 746, 769, 767 and 767 billion of cubic feet of natural gas held in storage at December 31, 2007, 2008, 2009, 2010 and 2011, respectively. (b) i Eni’ s proved reserves of the Kashagan field were determined based on Eni working interest of 16.81% since December 31, 2008 and 18.52% in 2007. (c) i Includes a 29.4% stake of the reserves of the three equity-accounted Russian companies participated by joint venture OOO SeverEnergia, owned by Eni (60%) and its Italian partner Enel (40%)
which on September 23, 2009, completed the divestment of the 51% stake in the venture to Gazprom in line with the call option arrangement.

Contents
Eni Fact Book Exploration & Production
Oil and natural gas production by Country (a) (b) (kboe/d) 2007 2008 2009 2010 2011
Italy 212 199 169 183 186
Rest of Europe 270 249 247 222 216 Croatia 9 12 17 8 5 Norway 137 129 126 123 131 United Kingdom 124 108 104 91 80
North Africa 594 645 573 602 438 Algeria 88 83 83 77 72 Egypt 238 240 230 232 236 Libya 252 306 244 273 112 Tunisia 16 16 16 20 18
Sub-Saharan Africa 327 335 360 400 370 Angola 136 126 130 118 102 Congo 69 87 102 110 108 Nigeria 122 122 128 172 160
Kazakhstan 112 111 115 108 106
Rest of Asia 108 124 135 131 112 China 8 8 8 7 8 India 1 8 4 Indonesia 20 20 21 19 18 Iran 26 28 35 21 6 Iraq 5 7 Pakistan 52 56 58 59 58 Russia 2 Turkmenistan 12 12 12 11
America 95 117 153 143 125 Brazil 1 Ecuador 16 16 14 11 7 Trinidad & Tobago 10 9 12 12 10 United States 69 87 119 109 98 Venezuela 5 8 11 9
Australia and Oceania 18 17 17 26 28 Australia 18 17 17 26 28 Total outside Italy 1,524 1,598 1,600 1,632 1,395 1,736 1,797 1,769 1,815 1,581
of which equity-accounted entities 18 20 23 25 26 Angola 5 3 3 3 4 Brazil 1 Indonesia 6 6 6 6 6 Russia 2 Tunisia 5 6 6 5 6 Venezuela 5 8 11 9
i i i
Oil and natural gas production sold (c) (mmboe) 2007 2008 2009 2010 2011
Oil and natural gas production 633.7 657.5 645.7 662.3 577.0 Change in inventories other (3.5 ) (7.6 ) (3.8 ) (3.4 ) (7.4 )

Own consumption of gas (18.8 ) (17.9 ) (19.1 ) (20.9 ) (21.1 ) Oil and natural gas production sold 611.4 632.0 622.8 638.0 548.5 Oil (mmbbl) 370.28 370.24 365.20 361.30 302.61 - of which to R&M Division 227.68 194.64 224.98 206.41 190.65 Natural gas (bcf) 1,385 1,503 1,479 1,536 1,367 - of which to G&P Division 510 480 444 432 423
i i i (a) i From April 1, 2010, Eni has updated the natural gas conversion factor from 5,742 to 5,550 standard cubic feet of gas per barrel of oil equivalent. (b) i Includes volumes of gas consumed in operations (321, 318, 300, 281 and 296 mmcf/d, in 2011, 2010, 2009, 2008 and 2007, respectively). (c) i Includes 7.7 mmboe of equity-accounted entities production sold in 2011 (8, 7.1, 5.7 and 5.3 mmboe in 2010, 2009, 2008 and 2007, respectively).
- 36 -

Contents
Eni Fact Book Exploration & Production
Liquids production by Country (kbbl/d) 2007 2008 2009 2010 2011
Italy 75 68 56 61 64
Rest of Europe 157 140 133 121 120 Norway 90 83 78 74 80 United Kingdom 67 57 55 47 40
North Africa 337 338 292 301 209 Algeria 85 80 80 74 69 Egypt 97 98 91 96 91 Libya 142 147 108 116 36 Tunisia 13 13 13 15 13
Sub-Saharan Africa 280 289 312 321 278 Angola 132 121 125 113 95 Congo 67 84 97 98 87 Nigeria 81 84 90 110 96
Kazakhstan 70 69 70 65 64
Rest of Asia 37 49 57 48 34 China 6 6 7 6 7 India 1 Indonesia 2 2 2 2 2 Iran 26 28 35 21 6 Iraq 5 7 Pakistan 1 1 1 1 1 Russia 2 Turkmenistan 12 12 12 11
America 53 63 79 71 65 Brazil 1 Ecuador 16 16 14 11 7 United States 37 42 57 49 48 Venezuela 5 8 11 9
Australia and Oceania 11 10 8 9 11 Australia 11 10 8 9 11 Total outside Italy 945 958 951 936 781
1,020 1,026 1,007 997 845
of which equity-accounted entities 12 14 17 19 19 Angola 5 3 3 3 3 Brazil 1 Indonesia 1 1 1 1 1 Russia 2 Tunisia 4 5 5 4 5 Venezuela 5 8 11 9
Oil and natural gas production available for sale (a) (b) (kboe/d) 2007 2008 2009 2010 2011
Italy 208 195 165 178 181 Rest of Europe 263 242 239 214 209 North Africa 573 627 554 582 420 Sub-Saharan Africa 318 325 349 386 354

Kazakhstan 109 108 113 104 102 Rest of Asia 102 119 130 126 106 America 93 116 150 141 124 Australia and Oceania 18 16 16 26 27 1,684 1,748 1,716 1,757 1,523
of which equity-accounted entities 16 19 21 23 23 North Africa 5 5 5 5 5 Sub-Saharan Africa 4 3 3 3 3 Rest of Asia 7 6 5 5 4 America 5 8 10 11
i i i (a) i From April 1, 2010, Eni has updated the natural gas conversion factor from 5,742 to 5,550 standard cubic feet of gas per barrel of oil equivalent. (b) i Do not include natural gas consumed in operation (321, 318, 300, 281 and 296 mmcf/d, in 2011, 2010, 2009, 2008 and 2007, respectively).
- 37 -

Contents
Eni Fact Book Exploration & Production
Natural gas production by Country (a) (b) (mmcf/d) 2007 2008 2009 2010 2011
Italy 789.7 749.9 652.6 673.2 674.3
Rest of Europe 647.2 626.7 655.5 559.2 537.9 Croatia 52.5 68.7 95.5 45.3 29.9 Norway 271.1 264.8 273.7 271.6 284.0 United Kingdom 323.6 293.2 286.3 242.3 224.0
North Africa 1,474.2 1,761.6 1,614.2 1,673.2 1,271.5 Algeria 18.8 18.5 19.7 20.2 19.0 Egypt 811.2 818.4 793.7 755.1 800.7 Libya 629.6 907.6 780.4 871.1 423.2 Tunisia 14.6 17.1 20.4 26.8 28.6
Sub-Saharan Africa 274.2 260.7 274.3 441.5 508.0 Angola 25.1 28.1 29.3 31.9 34.7 Congo 11.4 12.7 27.3 67.9 119.1 Nigeria 237.7 219.9 217.7 341.7 354.2
Kazakhstan 237.9 244.7 259.0 237.0 231.0
Rest of Asia 408.9 426.2 444.8 463.9 430.1 China 11.0 10.9 8.2 6.7 5.0 India 3.7 36.6 19.6 Indonesia 105.4 99.7 104.8 94.4 84.3 Pakistan 292.5 315.6 328.1 326.2 321.2
America 240.3 311.5 424.7 396.0 334.0 Trinidad & Tobago 58.9 54.6 67.0 63.6 56.7 United States 181.4 256.9 357.7 332.4 277.3
Australia and Oceania 41.5 42.2 48.6 95.7 97.8 Australia 41.5 42.2 48.6 95.7 97.8 Total outside Italy 3,324.2 3,673.6 3,721.1 3,866.5 3,410.3
4,113.9 4,423.5 4,373.7 4,539.7 4,084.6
of which equity-accounted entities 37.5 35.6 38.3 35.6 34.0 Angola 0.7 0.6 0.7 0.8 1.9 Indonesia 32.2 30.5 32.1 28.9 25.7 Tunisia 4.6 4.5 5.5 5.9 6.4
Natural gas production available for sale (b) (mmcf/d) 2007 2008 2009 2010 2011
Italy 763 725 630 648 648 Rest of Europe 607 588 608 517 498 North Africa 1,357 1,661 1,503 1,559 1,169 Sub-Saharan Africa 220 204 213 365 422 Kazakhstan 222 227 241 221 212 Rest of Asia 380 396 417 436 398 America 232 304 416 385 323 Australia and Oceania 38 38 46 91 93
3,819 4,143 4,074 4,222 3,763
of which equity-accounted entities 28 26 29 27 24

- 38 -
North Africa 1 1 8 3 4 Sub-Saharan Africa 1 Rest of Asia 26 24 26 24 20
i i i (a) i Includes volumes of gas consumed in operations (321, 318, 300, 281 and 296 mmcf/d, in 2011, 2010, 2009, 2008 and 2007, respectively). (b) i Do not include natural gas consumed in operation.
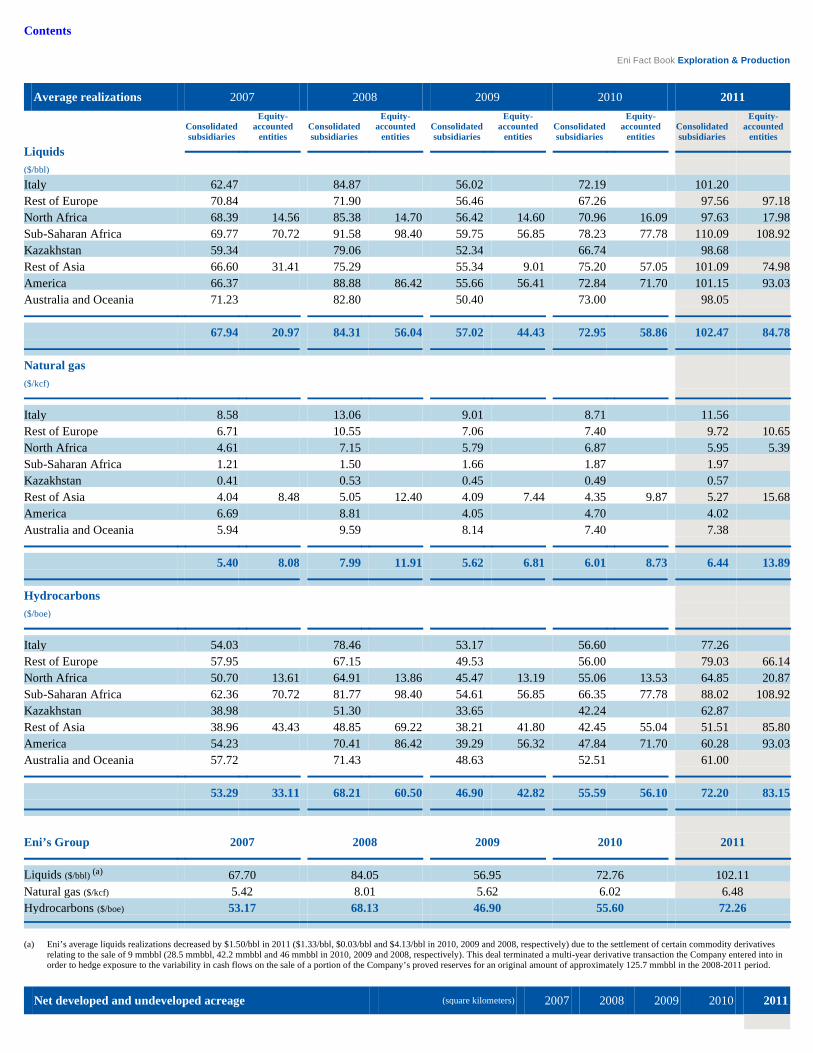
Contents
Eni Fact Book Exploration & Production
Average realizations 2007 2008 2009 2010 2011
Consolidated subsidiaries
Equity - accounted
entities Consolidated subsidiaries
Equity - accounted
entities Consolidated subsidiaries
Equity - accounted
entities Consolidated subsidiaries
Equity - accounted
entities Consolidated subsidiaries
Equity - accounted
entities
Liquids ($/bbl) Italy 62.47 84.87 56.02 72.19 101.20 Rest of Europe 70.84 71.90 56.46 67.26 97.56 97.18 North Africa 68.39 14.56 85.38 14.70 56.42 14.60 70.96 16.09 97.63 17.98 Sub-Saharan Africa 69.77 70.72 91.58 98.40 59.75 56.85 78.23 77.78 110.09 108.92 Kazakhstan 59.34 79.06 52.34 66.74 98.68 Rest of Asia 66.60 31.41 75.29 55.34 9.01 75.20 57.05 101.09 74.98 America 66.37 88.88 86.42 55.66 56.41 72.84 71.70 101.15 93.03 Australia and Oceania 71.23 82.80 50.40 73.00 98.05
67.94 20.97 84.31 56.04 57.02 44.43 72.95 58.86 102.47 84.78
Natural gas ($/kcf)
Italy 8.58 13.06 9.01 8.71 11.56 Rest of Europe 6.71 10.55 7.06 7.40 9.72 10.65 North Africa 4.61 7.15 5.79 6.87 5.95 5.39 Sub-Saharan Africa 1.21 1.50 1.66 1.87 1.97 Kazakhstan 0.41 0.53 0.45 0.49 0.57 Rest of Asia 4.04 8.48 5.05 12.40 4.09 7.44 4.35 9.87 5.27 15.68 America 6.69 8.81 4.05 4.70 4.02 Australia and Oceania 5.94 9.59 8.14 7.40 7.38
5.40 8.08 7.99 11.91 5.62 6.81 6.01 8.73 6.44 13.89
Hydrocarbons ($/boe)
Italy 54.03 78.46 53.17 56.60 77.26 Rest of Europe 57.95 67.15 49.53 56.00 79.03 66.14 North Africa 50.70 13.61 64.91 13.86 45.47 13.19 55.06 13.53 64.85 20.87 Sub-Saharan Africa 62.36 70.72 81.77 98.40 54.61 56.85 66.35 77.78 88.02 108.92 Kazakhstan 38.98 51.30 33.65 42.24 62.87 Rest of Asia 38.96 43.43 48.85 69.22 38.21 41.80 42.45 55.04 51.51 85.80 America 54.23 70.41 86.42 39.29 56.32 47.84 71.70 60.28 93.03 Australia and Oceania 57.72 71.43 48.63 52.51 61.00
53.29 33.11 68.21 60.50 46.90 42.82 55.59 56.10 72.20 83.15
Eni’s Group 2007 2008 2009 2010 2011
Liquids ($/bbl) (a) 67.70 84.05 56.95 72.76 102.11 Natural gas ($/kcf) 5.42 8.01 5.62 6.02 6.48 Hydrocarbons ($/boe) 53.17 68.13 46.90 55.60 72.26
i i i (a) i Eni’ s average liquids realizations decreased by $1.50/bbl in 2011 ($1.33/bbl, $0.03/bbl and $4.13/bbl in 2010, 2009 and 2008, respectively) due to the settlement of certain commodity derivatives
relating to the sale of 9 mmbbl (28.5 mmbbl, 42.2 mmbbl and 46 mmbbl in 2010, 2009 and 2008, respectively). This deal terminated a multi-year derivative transaction the Company entered into in order to hedge exposure to the variability in cash flows on the sale of a portion of the Company’s proved reserves for an original amount of approximately 125.7 mmbbl in the 2008-2011 period.
Net developed and undeveloped acreage (square kilometers) 2007 2008 2009 2010 2011

Europe 32,055 30,511 31,607 29,079 26,023 Italy 20,664 20,409 22,038 19,097 16,872 Rest of Europe 11,391 10,102 9,569 9,982 9,151 Africa 227,932 249,672 158,749 152,671 137,220 North Africa 62,886 31,088 46,011 44,277 30,532 Sub-Saharan Africa 165,046 218,584 112,738 108,394 106,688 Asia 80,339 93,710 125,641 112,745 55,284 Kazakhstan 959 880 880 880 880 Rest of Asia 79,380 92,830 124,761 111,865 54,404 America 12,804 12,043 11,523 11,187 10,209 Australia and Oceania 41,361 29,558 20,342 15,279 25,685
Total 394,491 415,494 347,862 320,961 254,421
- 39 -
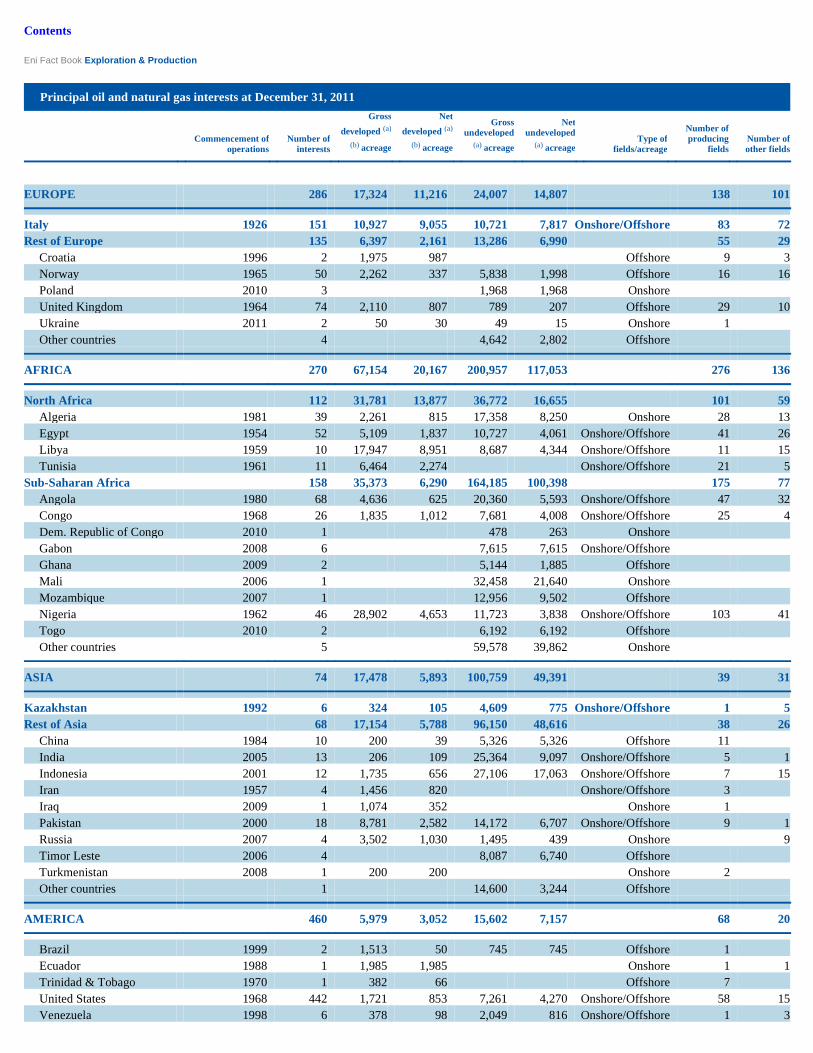
Contents
Eni Fact Book Exploration & Production
Principal oil and natural gas interests at December 31, 2011
Commencement of
operations Number of
interests
Gross
developed (a)
(b) acreage
Net
developed (a)
(b) acreage
Gross undeveloped
(a) acreage
Net undeveloped
(a) acreage Type of
fields/acreage
Number of producing
fields Number of other fields
EUROPE 286 17,324 11,216 24,007 14,807 138 101
Italy 1926 151 10,927 9,055 10,721 7,817 Onshore/Offshore 83 72 Rest of Europe 135 6,397 2,161 13,286 6,990 55 29 Croatia 1996 2 1,975 987 Offshore 9 3 Norway 1965 50 2,262 337 5,838 1,998 Offshore 16 16 Poland 2010 3 1,968 1,968 Onshore United Kingdom 1964 74 2,110 807 789 207 Offshore 29 10 Ukraine 2011 2 50 30 49 15 Onshore 1 Other countries 4 4,642 2,802 Offshore
AFRICA 270 67,154 20,167 200,957 117,053 276 136
North Africa 112 31,781 13,877 36,772 16,655 101 59 Algeria 1981 39 2,261 815 17,358 8,250 Onshore 28 13 Egypt 1954 52 5,109 1,837 10,727 4,061 Onshore/Offshore 41 26 Libya 1959 10 17,947 8,951 8,687 4,344 Onshore/Offshore 11 15 Tunisia 1961 11 6,464 2,274 Onshore/Offshore 21 5 Sub-Saharan Africa 158 35,373 6,290 164,185 100,398 175 77 Angola 1980 68 4,636 625 20,360 5,593 Onshore/Offshore 47 32 Congo 1968 26 1,835 1,012 7,681 4,008 Onshore/Offshore 25 4 Dem. Republic of Congo 2010 1 478 263 Onshore Gabon 2008 6 7,615 7,615 Onshore/Offshore Ghana 2009 2 5,144 1,885 Offshore Mali 2006 1 32,458 21,640 Onshore Mozambique 2007 1 12,956 9,502 Offshore Nigeria 1962 46 28,902 4,653 11,723 3,838 Onshore/Offshore 103 41 Togo 2010 2 6,192 6,192 Offshore Other countries 5 59,578 39,862 Onshore
ASIA 74 17,478 5,893 100,759 49,391 39 31
Kazakhstan 1992 6 324 105 4,609 775 Onshore/Offshore 1 5 Rest of Asia 68 17,154 5,788 96,150 48,616 38 26 China 1984 10 200 39 5,326 5,326 Offshore 11 India 2005 13 206 109 25,364 9,097 Onshore/Offshore 5 1 Indonesia 2001 12 1,735 656 27,106 17,063 Onshore/Offshore 7 15 Iran 1957 4 1,456 820 Onshore/Offshore 3 Iraq 2009 1 1,074 352 Onshore 1 Pakistan 2000 18 8,781 2,582 14,172 6,707 Onshore/Offshore 9 1 Russia 2007 4 3,502 1,030 1,495 439 Onshore 9 Timor Leste 2006 4 8,087 6,740 Offshore Turkmenistan 2008 1 200 200 Onshore 2 Other countries 1 14,600 3,244 Offshore
AMERICA 460 5,979 3,052 15,602 7,157 68 20
Brazil 1999 2 1,513 50 745 745 Offshore 1 Ecuador 1988 1 1,985 1,985 Onshore 1 1 Trinidad & Tobago 1970 1 382 66 Offshore 7 United States 1968 442 1,721 853 7,261 4,270 Onshore/Offshore 58 15 Venezuela 1998 6 378 98 2,049 816 Onshore/Offshore 1 3

- 40 -
Other countries 8 5,547 1,326 Offshore 1
AUSTRALIA AND OCEANIA 16 1,980 1,045 49,304 24,640 4 2
Australia 2001 15 1,980 1,045 48,540 24,602 Offshore 4 2 Other countries 1 764 38 Offshore
Total 1,106 109,915 41,373 390,629 213,048 525 290
i i i (a) i Square kilometers. (b) i Developed acreage refers to those leases in which at least a portion of the area is in production or encompasses proved developed reserves.

Contents
Eni Fact Book Exploration & Production
Capital expenditure (euro million) 2007 2008 2009 2010 2011
Acquisition of proved and unproved properties 96 836 697 754 North Africa 11 626 351 57 Sub-Saharan Africa 210 73 697 Rest of Asia 94 America 85 179
Exploration 1,659 1,918 1,228 1,012 1,210 Italy 104 135 40 34 38 Rest of Europe 195 227 113 114 100 North Africa 373 379 317 84 128 Sub-Saharan Africa 246 485 284 406 482 Kazakhstan 36 16 20 6 6 Rest of Asia 162 187 159 223 156 America 505 441 243 119 60 Australia and Oceania 38 48 52 26 240
Development 4,643 6,429 7,478 8,578 7,357 Italy 461 570 689 630 720 Rest of Europe 429 598 673 863 1,596 North Africa 948 1,246 1,381 2,584 1,380 Sub-Saharan Africa 1,343 1,717 2,105 1,818 1,521 Kazakhstan 733 968 1,083 1,030 897 Rest of Asia 238 355 406 311 361 America 345 655 706 1,187 831 Australia and Oceania 146 320 435 155 51
Other expenditure 82 98 83 100 114
6,480 9,281 9,486 9,690 9,435
i i i
Reserve life index (a) (years) 2007 2008 2009 2010 2011
Italy 9.7 9.3 11.4 10.9 10.4 Rest of Europe 6.5 5.8 6.6 7.4 8.0 North Africa 8.8 8.2 9.3 9.6 12.8 Sub-Saharan Africa 9.2 9.5 8.9 7.9 8.2 Kazakhstan 26.0 32.9 29.0 28.7 24.5 Rest of Asia 13.2 12.8 11.1 12.8 21.7 America 8.1 5.9 5.0 7.2 13.6 Australia and Oceania 19.7 21.0 21.5 13.1 12.8
10.0 10.0 10.2 10.3 12.3
i i i
Reserve replacement ratio, all sources (a) (%) 2007 2008 2009 2010 (b) 2011
Italy 25 10 136 107 75 Rest of Europe 30 - 174 102 136 North Africa 36 118 99 167 58 Sub-Saharan Africa 76 142 106 90 58 Kazakhstan - 776 - - -Rest of Asia 791 248 - 212 771 America 474 40 144 273 647 Australia and Oceania - 75 112 5 163

- 41 -
90 135 96 125 142
i i i (a) i Includes a 29.4% stake of the reserves of the three equity-accounted Russian companies participated by joint-venture OOO SeverEnergia, owned by Eni (60%) and its Italian partner Enel (40%)
which on September 23, 2009, completed the divestment of the 51% stake in the venture to Gazprom in line with the call option arrangement. (b) Net of updating the natural gas conversion factor.

Contents
Eni Fact Book Exploration & Production
Exploratory wells activity
Net wells completed Wells in progress
at Dec. 31 (a) 2009 2010 2011 2011 (units) Productive Dry (b) Productive Dry (b) Productive Dry (b) Gross Net Italy 1.0 0.5 6.0 4.4 Rest of Europe 4.1 0.2 1.7 1.1 0.3 0.7 21.0 6.5 North Africa 4.8 3.8 9.3 8.1 6.2 3.4 21.0 15.7 Sub-Saharan Africa 2.7 2.3 4.7 0.6 2.6 63.0 18.6 Kazakhstan 13.0 2.3 Rest of Asia 2.3 3.9 1.0 2.8 0.2 7.6 16.0 6.9 America 1.0 3.8 6.3 2.5 11.0 3.3 Australia and Oceania 0.8 1.4 1.0 0.4 1.4 13.0 16.8 15.3 23.9 9.8 15.7 151.0 57.7
Development wells activity
Net wells completed Wells in progress at Dec. 31
2009 2010 2011 2011 (units) Productive Dry (b) Productive Dry (b) Productive Dry (b) Gross Net Italy 18.3 23.9 1.0 25.3 3.0 2.0 Rest of Europe 12.5 2.9 0.2 3.3 0.3 18.0 3.9 North Africa 40.7 0.4 44.3 0.3 55.9 1.1 27.0 12.5 Sub-Saharan Africa 35.8 1.9 28.0 2.5 28.2 1.0 28.0 6.6 Kazakhstan 3.8 1.8 1.3 13.0 2.2 Rest of Asia 38.6 4.3 41.7 1.8 39.2 2.5 12.0 5.4 America 15.6 1.0 27.6 0.5 27.6 17.0 6.9 Australia and Oceania 2.2 1.5 0.4 167.5 7.6 171.7 6.3 181.2 4.9 118.0 39.5 i i i
Productive oil and gas wells at Dec. 31, 2011 (c)
2011 Oil wells Natural gas wells (units) Gross Net Gross Net Italy 237.0 191.5 630.0 546.5 Rest of Europe 414.0 63.3 207.0 93.1 North Africa 1,357.0 651.8 144.0 56.0 Sub-Saharan Africa 2,952.0 562.6 479.0 32.1 Kazakhstan 89.0 28.9 Rest of Asia 602.0 381.5 849.0 328.7 America 152.0 79.8 344.0 113.2 Australia and Oceania 7.0 3.8 14.0 3.3 5,810.0 1,963.2 2,667.0 1,172.9 i i i (a) i Includes temporary suspended wells pending further evaluation. (b) i A dry well is an exploratory, development, or extension well that proves to be incapable of producing either oil or gas sufficient quantities to justify completion as an oil or gas well. (c) Includes 2,304 gross (741.7 net) multiple completion wells (more than one producing into the same well bore). Productive wells are producing wells and wells capable of production. One or more
completions in the same bore hole are counted as one well.

- 42 -
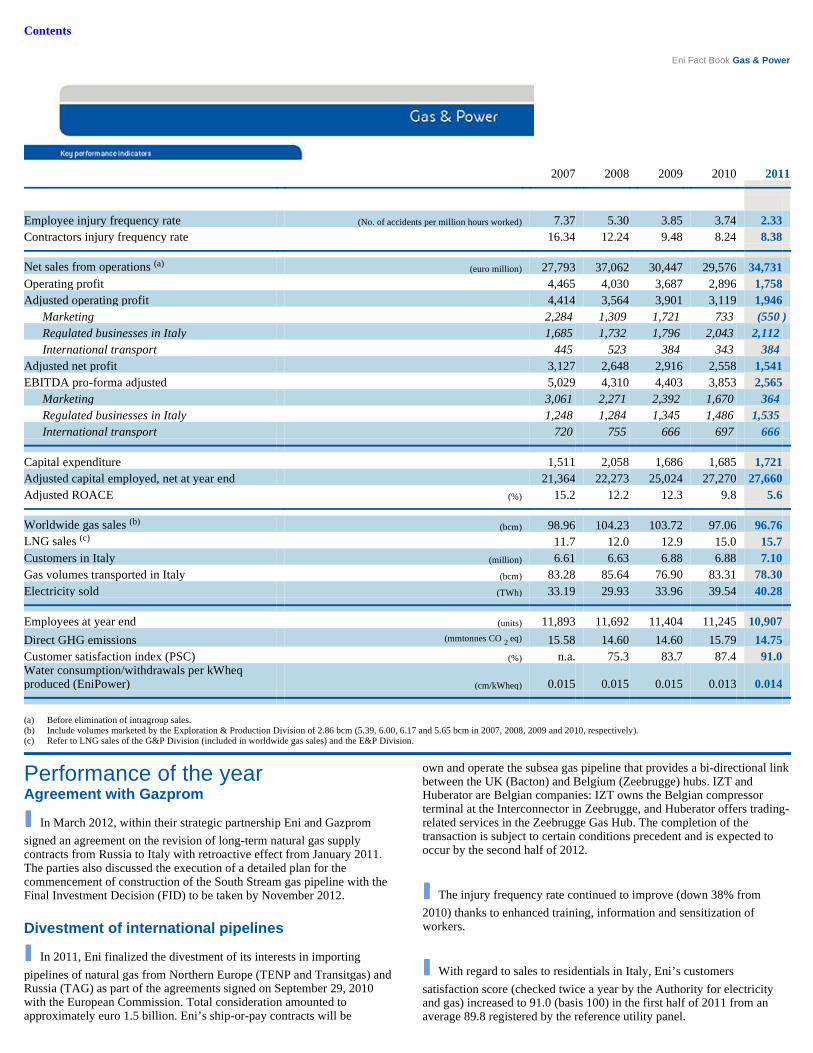
Contents
Eni Fact Book Gas & Power
2007 2008 2009 2010 2011
Employee injury frequency rate (No. of accidents per million hours worked) 7.37 5.30 3.85 3.74 2.33 Contractors injury frequency rate 16.34 12.24 9.48 8.24 8.38
Net sales from operations (a) (euro million) 27,793 37,062 30,447 29,576 34,731 Operating profit 4,465 4,030 3,687 2,896 1,758 Adjusted operating profit 4,414 3,564 3,901 3,119 1,946 Marketing 2,284 1,309 1,721 733 (550 ) Regulated businesses in Italy 1,685 1,732 1,796 2,043 2,112 International transport 445 523 384 343 384 Adjusted net profit 3,127 2,648 2,916 2,558 1,541 EBITDA pro-forma adjusted 5,029 4,310 4,403 3,853 2,565 Marketing 3,061 2,271 2,392 1,670 364 Regulated businesses in Italy 1,248 1,284 1,345 1,486 1,535 International transport 720 755 666 697 666
Capital expenditure 1,511 2,058 1,686 1,685 1,721 Adjusted capital employed, net at year end 21,364 22,273 25,024 27,270 27,660 Adjusted ROACE (%) 15.2 12.2 12.3 9.8 5.6
Worldwide gas sales (b) (bcm) 98.96 104.23 103.72 97.06 96.76 LNG sales (c) 11.7 12.0 12.9 15.0 15.7 Customers in Italy (million) 6.61 6.63 6.88 6.88 7.10 Gas volumes transported in Italy (bcm) 83.28 85.64 76.90 83.31 78.30 Electricity sold (TWh) 33.19 29.93 33.96 39.54 40.28
Employees at year end (units) 11,893 11,692 11,404 11,245 10,907 Direct GHG emissions (mmtonnes CO 2 eq) 15.58 14.60 14.60 15.79 14.75 Customer satisfaction index (PSC) (%) n.a. 75.3 83.7 87.4 91.0 Water consumption/withdrawals per kWheq produced (EniPower) (cm/kWheq) 0.015 0.015 0.015 0.013 0.014
i i i (a) i Before elimination of intragroup sales. (b) i Include volumes marketed by the Exploration & Production Division of 2.86 bcm (5.39, 6.00, 6.17 and 5.65 bcm in 2007, 2008, 2009 and 2010, respectively). (c) i Refer to LNG sales of the G&P Division (included in worldwide gas sales) and the E&P Division.
Performance of the year Agreement with Gazprom
I I I I In March 2012, within their strategic partnership Eni and Gazprom
signed an agreement on the revision of long-term natural gas supply contracts from Russia to Italy with retroactive effect from January 2011. The parties also discussed the execution of a detailed plan for the commencement of construction of the South Stream gas pipeline with the Final Investment Decision (FID) to be taken by November 2012.
Divestment of international pipelines
I I I I In 2011, Eni finalized the divestment of its interests in importing
pipelines of natural gas from Northern Europe (TENP and Transitgas) and Russia (TAG) as part of the agreements signed on September 29, 2010 with the European Commission. Total consideration amounted to approximately euro 1.5 billion. Eni’s ship-or-pay contracts will be
own and operate the subsea gas pipeline that provides a bi-directional link between the UK (Bacton) and Belgium (Zeebrugge) hubs. IZT and Huberator are Belgian companies: IZT owns the Belgian compressor terminal at the Interconnector in Zeebrugge, and Huberator offers trading-related services in the Zeebrugge Gas Hub. The completion of the transaction is subject to certain conditions precedent and is expected to occur by the second half of 2012.
I I I I The injury frequency rate continued to improve (down 38% from
2010) thanks to enhanced training, information and sensitization of workers.
I I I I With regard to sales to residentials in Italy, Eni’s customers
satisfaction score (checked twice a year by the Authority for electricity and gas) increased to 91.0 (basis 100) in the first half of 2011 from an average 89.8 registered by the reference utility panel.
unaffected.
Belgium
I I I I In January 2012, Eni finalized the acquisition of Nuon Belgium NV
and Nuon Power Generation Wallon NV, companies marketing gas and electricity mainly to residential and professional customers in Belgium, for an outlay of euro 214 million.
Divestment of interest in Interconnector
I I I I On February 22, 2012, Snam and Fluxys G signed a preliminary
agreement to purchase Eni’s 16.41% interest in Interconnector (UK) Limited, its 51% interest in Interconnector Zeebrugge Terminal SCRL and its 10% interest in Huberator SA for a total consideration of euro 150 million. These companies
I I I I In 2011, adjusted net profit was euro 1,541 million, down 39.8% from
2010 due to a sharply lower operating performance of the Marketing business negatively impacted by weak demand and mounting competitive pressures fuelled by oversupply which squeezed selling margins and reduced volumes opportunities. The performance was also impacted by the disruption in Libyan gas availability, as well as by the unfavorable trends in energy parameters and unusual winter weather. Furthermore, the results reflected only a part of the benefits associated with the renegotiations of the supply contracts, certain of which have been finalized after 2011 year-end. These lower results were partly offset by the positive operating performance delivered by the International transport and Regulated businesses in Italy.
I I I I Adjusted ROACE was 5.6% (9.8% in 2010).
- 43 -

Contents
Eni Fact Book Gas & Power
- 44 -
I I I I Worldwide gas sales were basically stable at 96.76 bcm
supported by commercial initiatives, despite lower consumption and competitive pressure. We grew in many European Countries and in international LNG sales, while offtakes from importers into Italy of Libyan gas fell sharply and sales fell in Belgium.
I I I I Electricity sales of 40.28 TWh increased by 0.74 TWh
from 2010, up 1.9%.
I I I I Natural gas volumes transported in Italy were 78.30 bcm,
a decline of
6% from 2010 due to a steep decline in gas demand in Italy.
I I I I Capital expenditure amounted to euro 1,721 million for
the development and upkeep of transport and distribution networks in Italy, increasing storage capacity and upgrading and improvement of efficiency standards in power generation.
I I I I In 2011, total R&D expenditure amounted to euro 2
million, net of overhead costs.


Contents
Eni Fact Book Gas & Power
Eni’s Gas & Power segment engages in all phases of the natural gas value chain: supply, trading and marketing of natural gas and electricity, gas infrastructures, and LNG supply and marketing. This segment also includes power generation activity, ancillary to the marketing of electricity. Eni’s leading position in the European gas market is ensured by a set of competitive advantages, including our multi-Country approach, long-term gas availability, access to infrastructures, market knowledge and a strong customer base. Furthermore, integration with our upstream operations provides valuable growth options whereby the Company targets to monetize its large gas reserves.
1. Marketing
1.1 Natural gas
Supply The supply of natural gas is a free activity where prices are determined by free negotiations of demand and supply involving natural gas resellers and producers.
In order to secure long-term access to gas availability, particularly with a view of supplying the Italian gas market, Eni has signed a number of long-term gas supply contracts with key producing Countries that
supply the European gas markets. These contracts have been ensuring approximately 80 bcm of gas availability from 2010 (including the Distrigas portfolio of supplies and excluding Eni’s other subsidiaries and affiliates) with a residual life of approximately 17 years and a pricing mechanism that indexed the cost of gas to the price of crude oil and its derivatives (gasoil, fuel oil, etc.). Further competitive advantages are represented by the availability of natural gas deriving from equity production, the access to all phases of the LNG chain (liquefaction, shipping and regasification) and to other gas infrastructures, and by trading and risk management activity. Eni’s long-term gas requirements are met by natural gas from a total of 12 Countries, where Eni also holds upstream activities and by access to European spot markets. In 2011, Eni’s consolidated subsidiaries supplied 83.38 bcm of natural gas, representing an increase of 0.89 bcm, or 1.1% from 2010. In 2011, main gas volumes from equity production derived from: (i) Italian gas fields (6.7 bcm); (ii) certain Eni fields located in the British and Norwegian sections of the North Sea (2.4 bcm); (iii) the United States (2.2 bcm); and (iv) other European areas (Croatia with 0.3 bcm). Supplies from equity production fell sharply at the Wafa and Bahr Essalam fields (to 0.6 bcm) in Libya due to the conflict in the Country; in 2010 these two fields supplied 2.5 bcm net to Eni. Considering also direct sales of the Exploration & Production segment and LNG supplied from the Bonny liquefaction plant in Nigeria, supplied gas volumes from equity production were approximately 18 bcm representing 18% of total volumes available for sale.
Marketing in Italy Eni operates in a liberalized market where energy customers are allowed to choose the supplier of gas and, according to their specific needs, to evaluate the quality of services and offers. With regard to the retail market in Italy, the Authority for Electricity and Gas regulates and defines the tariff system for those customers who have not chosen their supplier on the free market, mainly residentials and small enterprises. The Italian market includes four segments of customers: large businesses, the power generation sector, wholesalers and residential customers. Large businesses and power generation utilities are directly linked to the regional natural gas network. Wholesalers mainly include local selling companies that resell natural gas to residential customers through low pressure distribution networks. Residential customers include households (also referred to as the retail market), the tertiary sector (mainly commercial outlets, hospitals, schools and local administrations) and small businesses (also referred to as the middle market) located in large metropolitan areas and urban centers. Overall, Eni supplies approximately
Sales and market shares on the Italian gas market (bcm) 2010 2011
Volumes sold Market
share (%) Volumes sold Market
share (%) % Ch. 2011
vs 2010

- 45 -
Italy to third parties 28.10 33.8 28.47 36.6 1.3 Wholesalers 4.84 5.16 6.6 Gas release 0.68 Italian gas exchange and spot markets 4.65 5.24 12.7 Industries 6.41 7.21 12.5 Medium-sized enterprises and services 1.09 0.88 (19.3 ) Power generation 4.04 4.31 6.7 Residential 6.39 5.67 (11.3 )
Own consumption 6.19 6.21 0.3
TOTAL SALES IN ITALY 34.29 41.3 34.68 44.6 1.1
Gas demand (a) 83.10 77.84 (6.3 )
i i i (a) i Source: Italian Ministry of Economic Development.

Contents
Eni Fact Book Gas & Power
3,000 clients including large businesses, power generation utilities, wholesalers and distributors of natural gas for automotive use. Residential users are 7.10 million and include households, professionals, small and medium sized enterprises, and public bodies located all over Italy. In 2011, sales of natural gas were 96.76 bcm, down 0.30 bcm, or 0.3%. Despite a 6% decline in natural gas demand, sales volumes on the Italian market were substantially stable, to 34.68 bcm (up 0.39 bcm, or 1.1%)
due to the positive effect of market initiatives that led to higher sales to industrial customers (up 0.80 bcm), wholesalers (up 0.32 bcm) and to the power generation segment (up 0.27 bcm). Sales on the Italian exchange for gas and spot markets increased by 0.59 bcm. Lower sales volumes to the residential segment (down 0.72 bcm) reflected the impact of unusual weather conditions on seasonal sales and competitive pressures.
Gas sales by market (bcm) 2007 2008 2009 2010 2011
ITALY 56.13 52.87 40.04 34.29 34.68
Wholesalers 10.01 7.52 5.92 4.84 5.16 Gas release 2.37 3.28 1.30 0.68 Italian gas exchange and spot markets 1.90 1.89 2.37 4.65 5.24 Industries 11.77 9.59 7.58 6.41 7.21 Medium-sized enterprises and services 1.00 1.05 1.08 1.09 0.88 Power generation 17.21 17.69 9.68 4.04 4.31 Residential 5.79 6.22 6.30 6.39 5.67 Own consumption 6.08 5.63 5.81 6.19 6.21
INTERNATIONAL SALES 42.83 51.36 63.68 62.77 62.08
Rest of Europe 35.02 43.03 55.45 54.52 52.98
Importers in Italy 10.67 11.25 10.48 8.44 3.24 European markets 24.35 31.78 44.97 46.08 49.74 Iberian Peninsula 6.91 7.44 6.81 7.11 7.48 Germany/Austria 5.03 5.29 5.36 5.67 6.47 Benelux 4.77 15.72 14.87 11.95 Hungary 2.74 2.82 2.58 2.36 2.24 UK/Northern Europe 3.15 3.21 4.31 5.22 6.10 Turkey 4.62 4.93 4.79 3.95 6.86 France 1.62 2.66 4.91 6.09 7.01 Other 0.28 0.66 0.49 0.81 1.63
Extra European markets 2.42 2.33 2.06 2.60 6.24

- 46 -
E&P in Europe and in the Gulf of Mexico 5.39 6.00 6.17 5.65 2.86
WORLDWIDE GAS SALES 98.96 104.23 103.72 97.06 96.76
Marketing in the rest of Europe Despite a challenging market scenario and rising competitive pressure, Eni intends to organically grow in particular in certain European key
market such as France, Germany/Austria and Benelux, leveraging on our competitive cost-position, our multi-Country approach and on a pan-European commercial platform.

Contents
Eni Fact Book Gas & Power
In 2011, sales on target markets in Europe of 49.74 bcm showed a positive trend, increasing by 7.9%, except for Benelux where competitive pressure, in particular in the wholesalers segment, reduced Eni’s sale portfolio. The main increases were recorded in Turkey, due to increased
off-takes by Bota, France also due to the consolidation of Altergaz, UK/Northern Europe, Germany/Austria and the Iberian Peninsula.
A review of Eni’s presence in key European markets is presented below.
Benelux Eni holds a key position in the Benelux Countries (Belgium, the Netherlands and Luxembourg), in particular in Belgium, which are a strategic hub of the continental gas spot market in Western Europe, thanks to their central position and high level of interconnectivity with the gas transit networks of Central and Northern Europe. In 2011, sales in Benelux were mainly directed to industrial companies, wholesalers and power generation and amounted to 11.95 bcm (14.87 bcm in 2010), down by 2.92 bcm, or 19.6%, due to rising competitive pressure, in particular in the wholesalers segment. In January 2012, in order to consolidate its position in Belgium, Eni finalized the acquisition of Nuon Belgium NV and Nuon Power Generation Wallon NV, two companies engaged respectively in marketing gas and electricity mainly to residential and professional customers in the Country, and in managing a project aimed to build a CCGT power plant at Seneffe in Belgium.
France Eni sells natural gas to industrial clients, wholesalers and power generation as well as to the retail and middle market segments. Eni is present in the French market through its direct commercial activities and through its subsidiary Altergaz (Eni’s interest being 98.09% as of December 31, 2011). Furthermore, Eni holds a 34% interest in Gaz de Bordeaux SAS (with a 17% direct interest and a further 17% held by Altergaz) which is engaged in selling natural gas in the municipality of Bordeaux. In 2011, sales in France amounted to 7.01 bcm (6.09 bcm in 2010), an increase of 0.92 bcm, or 15.1%, from a year ago.
Germany/Austria Eni is present in the German natural gas market through its
in Germany and 1.34 bcm in Austria. In 2011, sales in Germany/Austria market amounted to 6.47 bcm, an increase of 0.80 bcm, or 14.1%, from a year ago.
Iberian Peninsula In 2011, total sales in the Iberian Peninsula amounted to 7.48 bcm, an increase of 0.37 bcm, or 5.2%, from a year ago.
Spain. Eni operates in the Spanish gas market through a direct marketing structure that markets its portfolio of LNG and Unión Fenosa Gas (UFG) (Eni’s interest 50%) which mainly supplies natural gas to industrial clients, wholesalers and power generation utilities. In 2011, UFG gas sales in Europe amounted to 4.88 bcm (2.44 bcm Eni’s share). UFG holds an 80% interest in the Damietta liquefaction plant, on the Egyptian coast (see below), and a 7.36% interest in a liquefaction plant in Oman. In addition, it holds interests in the Sagunto (Valencia) and El Ferrol (Galicia) re-gasification plants (42.5% and 18.9%, respectively). In 2011, Eni sales in Spain amounted to 5.79 bcm representing a slight increase from a year ago.
Portugal . Eni operates on the Portuguese market through its affiliate Galp Energia (Eni’s interest 33.34%) which sold approximately 5.49 bcm in 2011 (1.83 bcm net to Eni).
Turkey Eni sells gas supplied from Russia and transported via the Blue Stream pipeline. In 2011, sales amounted to 6.86 bcm, an increase of 2.91 bcm, or 73.7% from a year ago.
UK/Northern Europe Eni through its subsidiary Eni UK Ltd markets in the UK the equity gas produced at Eni’s fields in the North Sea and operates in the main continental natural gas hubs (NBP,

- 47 -
associate GVS (Gasversorgung Süddeutschland GmbH - Eni 50%) which sold approximately 4.68 bcm in 2011 (2.34 bcm net to Eni), and through a direct marketing structure which sold in 2011 approximately 3.23 bcm
Zeebrugge, TTF). In 2011, sales amounted to 6.10 bcm, an increase of 16.9% from a year ago.

Contents
Eni Fact Book Gas & Power
Deborah Gas Storage Project in the Hewett area, UK Eni has progressed in developing the Gas Storage Project on the Deborah field in the Hewett area located in the Southern Gas Basin in the North Sea, near the Bacton terminal. The Deborah Gas Storage Project is designed to provide the UK and North Western Europe markets with 4.6 bcm of working gas. Over the last two years significant progress has been made by completing the Front End Engineering Design ("FEED"), obtaining most of the necessary approvals including the agreement with The Crown Estate, the Gas Storage License from the Department of Energy and Climate Change ("DECC") and relevant permits from the North Norfolk District Counsel on the Bacton terminal. In addition, the UK government has recently designated as strategic for the Country the need to develop storage infrastructures, also to support the development of power generation from renewable sources, which need an adequate production back-up from combined cycle plants in order to mitigate the risk associated to consumption peaks and the related price increases. Eni believes that recent positions taken by the UK authorities are very important and encouraging for the Deborah storage project. Thus, Eni together with other gas storage developers has started contacts with UK authorities to investigate any capacity mechanism that can reduce any possible risk associated to gas storage projects in the UK. FID on the project will depend on the outcome of said contacts with the UK governmental authorities and potential co-investors.
1.2 LNG Eni is present in all phases of the LNG business: liquefaction, shipping, re-gasification and sale through operated activities or interests in joint ventures and associates. Eni’s presence in the business is tied to the Company’s plans to develop its large gas reserve base in Africa and elsewhere in the world. The LNG business has been deeply impacted by the economic downturn and oversupply affecting the European gas market, as well as by structural modifications in the US market where large availability of gas from unconventional sources have reduced the Country’s dependence on gas imports via LNG. Eni’s main assets and projects in the LNG business are described below.
Egypt Eni, through its interest in Unión Fenosa Gas, owns a 40% interest in the Damietta liquefaction plant with a capacity of approximately 5 mmtonnes/y of LNG which equates to a feedstock of 7.56 bcm/y of natural gas out of which the Gas & Power segment interest is up to 2.2 bcm/y to be marketed in Europe.
Spain Eni through Unión Fenosa Gas holds a 21.25% interest in the Sagunto re-gasification plant, near Valencia, with a capacity of 8.8 bcm/y and a LNG storage capacity of 450,000 cm
United States Cameron . The Cameron LNG terminal is situated 18 miles from the Gulf of Mexico along the Calcasieu Channel in Hackberry, Louisiana. The facility where Eni owns a capacity entitlement to treat LNG commenced operations in the third quarter of 2009. In consideration of a changed demand outlook, on March 1, 2010, Eni renegotiated certain terms of the contract with US company Cameron LNG, relating to the farming out of a share of re-gasification capacity of the Cameron terminal. The new agreement provides that Eni will be entitled to a daily send-out of 572,000 mmbtu (approximately 5.7 bcm/y) and a dedicated storage capacity of 160 kcm, giving Eni more flexibility in managing seasonal swings in gas demand. Furthermore, keeping account of the current oversupply of the US gas market, the Brass project (West Africa) for developing gas reserves to fuel the Cameron plant has been rescheduled with start-up in 2017.
Pascagoula. This project is part of an upstream development project related to the construction of an LNG plant in Angola designed to produce 5.2 mmtonnes of LNG (approximately 7.3 bcm/y) destined to the North American market in order to monetize part of the Company’s gas reserves. As part of the downstream leg of the project, Eni signed a 20-year contract with Gulf LNG to buy 5.8 bcm/y of the re-gasification capacity of the plant near Pascagoula in Mississippi. The start-up of the re-gasification facility commenced in the fourth quarter of 2011, while the upstream project in Angola has yet to be started up. At the same time Eni USA Gas Marketing Llc entered a 20-year contract for the purchase of approximately 0.9 bcm/y of re-gasified gas downstream the terminal owned by Angola Supply Services, a company whose partners also own Angola LNG.
Qatar Through its subsidiary Distrigas, Eni increased its development opportunities in the LNG business with access to new supply sources mainly from Qatar, under a 20-year agreement with RasGas (owned by Qatar Petroleum with a 70% interest and ExxonMobil with a 30% interest) and the Zeebrugge LNG terminal on the western coast of Belgium.
1.3 Power generation Eni’s power generation activity is conducted in the Ferrera Erbognone, Ravenna, Livorno, Taranto, Mantova, Brindisi, Ferrara and in Bolgiano plants, as well as in certain photovoltaic sites in Italy. In 2011, power production was 25.23 TWh, down 0.40 TWh, or 1.6% from 2010, mainly due to lower production at the Brindisi plant, partly offset by increases at the Ravenna and Ferrara plants. As of December 31, 2011, installed operational capacity was 5.3 GW 1 (5.3 GW in 2010). Power availability in 2011 was supported by growth in electricity trading activities (up 1.14 TWh, or 8.2%) due to

- 48 -
which will be increased to 600,000 cm after the ongoing construction of a fourth tank. At present, Eni’s re-gasification capacity entitlement amounts to 1.9 bcm/y of gas. Eni through Unión Fenosa Gas also holds a 9.45% interest in the El Ferrol re-gasification plant, located in Galicia, with a treatment capacity of approximately 3.6 bcm/y, of which 0.34 bcm/y being Eni’s capacity entitlements. The LNG storage capacity of the plant is 300,000 cm in two tanks.
higher volumes traded on the Italian power exchange benefiting from lower purchase prices. The power generation development plan mainly refers to the revamping of the Bolgiano plant (Eni 100%), the upgrading of the Taranto plant (Eni 100%), as well as the construction of a bio-mass power plant within the project for the remediation of the Porto Torres site. Development activities are currently underway also at the Ferrara plant (Eni 100%).
(1) Capacity available after completion of dismantling of obsolete plants.

Contents
Eni Fact Book Gas & Power
2. International transport and Regulated businesses in Italy Eni has transport rights on a large European network of integrated infrastructure for transporting natural gas, which links key consumption basins with the main producing areas (Russia, Algeria, Libya and the North Sea). In Italy, Eni operates the major part of the national transport network, a number of gas underground storage deposits and related facilities, a re-gasification plant in Panigaglia and can rely on an extended system of local distribution networks.
2.1 International transportation Eni owns capacity entitlements in an extensive network of international high pressure pipelines enabling the Company to import to Italy natural gas produced in Russia, Algeria, the North Sea, including the Netherlands and Norway, and Libya. The Company participates to both entities which operate the pipelines and entities which manage transport rights. The structure of the Company’s interests in these entities has significantly changed in 2011 following the divestment of Eni’s interests in importing pipelines of natural gas from Northern Europe (TENP and Transitgas) and Russia (TAG) and related carrier companies, as part of the agreements signed on September 29, 2010 with the European Commission to settle an antitrust proceeding related to alleged anti-competitive behavior in the natural gas market. The divestments will not affect Eni’s contractual gas transport rights. A description of the main international pipelines currently participated or operated by Eni is provided below: - the TTPC pipeline , 740-kilometer long, made up of two lines that are each 370-kilometer long with a transport capacity of 33.2 bcm/y and five compression stations. This pipeline transports natural gas from Algeria across Tunisia, from Oued Saf Saf at the Algerian border to Cap Bon on the Mediterranean coast where it links with the TMPC pipeline. The pipeline was recently upgraded by increasing compression capacity in order to enable transportation of an additional 6.5 bcm/y. The upgrade was finalized in 2008 and became fully-operational during 2009; - the TMPC pipeline for the import of Algerian gas is 775-kilometer long and consists of five lines that are each 155-kilometer long with a transport capacity of 33.5 bcm/y. It crosses the underwater Sicily Channel from Cap Bon to Mazara del Vallo in Sicily, the point of entry into the Italian natural gas transport system; - the GreenStream pipeline , jointly-owned with the Libyan National Oil Company, started operations in October 2004 for the import of Libyan gas produced at Eni operated fields Bahr Essalam and Wafa. It is 520-kilometer long with a transport capacity of 8 bcm/y (expandable to 11 bcm/y) and crosses underwater in the Mediterranean Sea from Mellitah on the Libyan coast to Gela in Sicily, the point of entry into the Italian natural gas transport system. From February 22, 2011 to October 2011, in consideration of the crisis in Libya, supplies of

- 49 -

Contents
Eni Fact Book Gas & Power
natural gas through the GreenStream pipeline have been suspended. Operations restarted late in October 2011; - Eni holds a 50% interest in the Blue Stream underwater pipeline (water depth greater than 2,150 meters) linking the Russian coast to the Turkish coast of the Black Sea. This pipeline is 774-kilometer long on two lines and has transport capacity of 16 bcm/y.
2.2 The South Stream project In September 2011, Eni and Gazprom within their strategic partnership signed a series of agreements in areas of common interest including the development of the South Stream project through the definition of terms for the participation to the project of gas operators Wintershall and EDF, each with a 15% stake. Gazprom and Eni hold 50% and 20% interests, respectively. In March 2012, terms for the commencement of construction of the gas pipeline were also agreed with the Final Investment Decision (FID) expected by November 2012.
2.3 Regulated businesses in Italy Reorganization of regulated businesses in Italy Implementing the so-called Third Energy Package, on December 5, 2011 with effect from January 1, 2012, "Snam Rete Gas SpA" changed its company name in "Snam SpA". At the same date Snam SpA transferred the "transportation, dispatch, remote control and metering of natural gas" business unit to a new company that from January 1, 2012, took the name of Snam Rete Gas SpA. The reorganization of Regulated businesses in Italy based on Snam SpA as holding the 100% interest in the four companies operating the transport, re-gasification, storage and distribution of natural gas, intends to build an organizational model meeting the new legal
provisions on the unbundling of transport activities as provided by Italian laws implementing European Directive No. 2009/73/EC.
Infrastructure Eni, through Snam (Eni’s interest being 52.53%), which is listed on the Italian Stock Exchange, operates most of the Italian natural gas transport network, a re-gasification terminal located in Panigaglia, an extensive local distribution network and gas underground storage deposits and related facilities.
Major pricing elements for regulated activities
TRANSPORTATION REGASIFICATION STORAGE DISTRIBUTION
End of regulatory period - December 31, 2013 - September 30, 2012 - December 31, 2014 - December 31, 2012
Calculation of net invested capital recognized for regulatory purposes (RAB)
- Revalued historical cost - Revalued historical cost - Revalued historical cost - Deduction of restoration costs recognized
- Revalued historical cost - Parametric method for centralized assets
Return on net invested capital recognized for regulatory purposes (pre-tax WACC)
- 6.4% (transportation) - 6.9% (metering)
- 7.6% - 6.7% - 7.6% (transportation) - 8% (metering)
Incentives on new investments
- 1% over 5 years (on safety investments) - 2% over 7/10 years (on capacity upgrade investments) - 3% over 10/15 years (on entry capacity upgrade
- 2% over 8 years (on expanding of existing terminals by less than 30%) - 3% over 16 years (on expanding of existing terminals by more than 30%)
- 4% over 8 years (on upgrading of existing capacity) - 4% over 16 years (on developing new storage fields)
- 2% over 8 years (on replacing cast-iron pipes and renovating odorization systems)

- 50 -
investments)
Efficiency factor (X FACTOR)
- 2.1% on operating costs - 0.5% on operating costs - 0.6% on operating costs - 3.2% on distribution operating costs - 3.6% on metering operating costs
Gas demand - 15% of revenues exposed to change in demand
- 10% of revenues exposed to change in demand
- No exposure to change in demand
- No exposure to change in demand
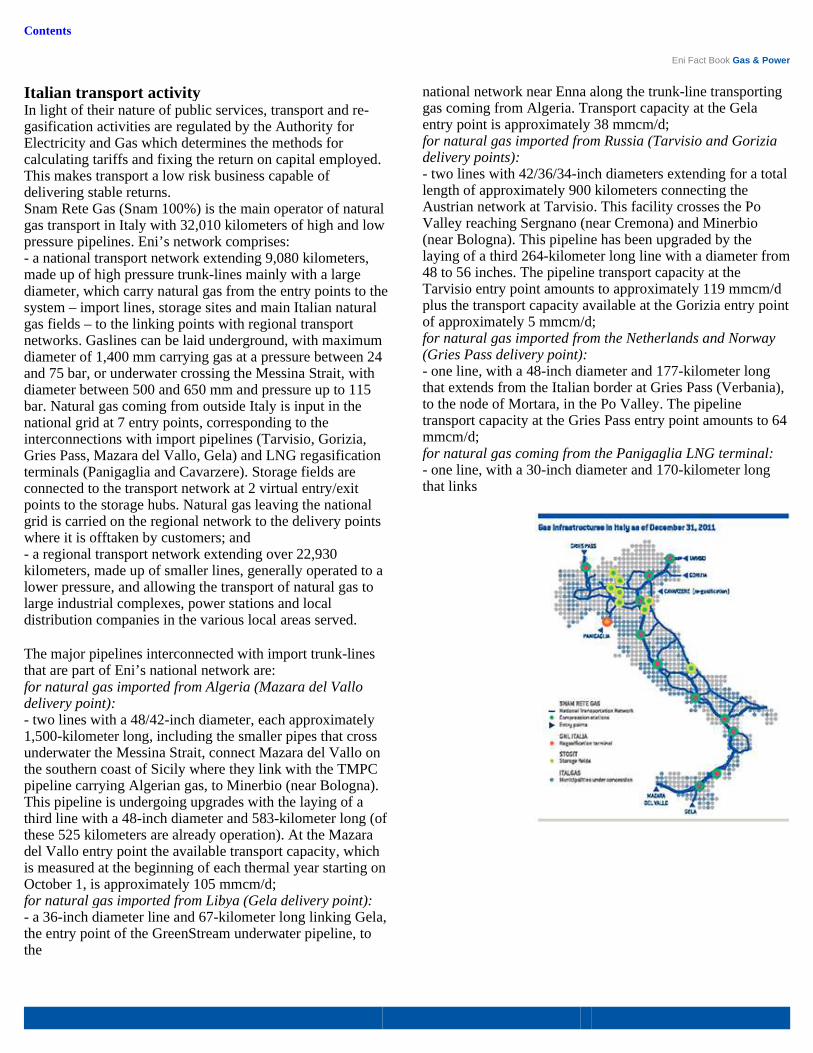
Contents
Eni Fact Book Gas & Power
Italian transport activity In light of their nature of public services, transport and re-gasification activities are regulated by the Authority for Electricity and Gas which determines the methods for calculating tariffs and fixing the return on capital employed. This makes transport a low risk business capable of delivering stable returns. Snam Rete Gas (Snam 100%) is the main operator of natural gas transport in Italy with 32,010 kilometers of high and low pressure pipelines. Eni’s network comprises: - a national transport network extending 9,080 kilometers, made up of high pressure trunk-lines mainly with a large diameter, which carry natural gas from the entry points to the system – import lines, storage sites and main Italian natural gas fields – to the linking points with regional transport networks. Gaslines can be laid underground, with maximum diameter of 1,400 mm carrying gas at a pressure between 24 and 75 bar, or underwater crossing the Messina Strait, with diameter between 500 and 650 mm and pressure up to 115 bar. Natural gas coming from outside Italy is input in the national grid at 7 entry points, corresponding to the interconnections with import pipelines (Tarvisio, Gorizia, Gries Pass, Mazara del Vallo, Gela) and LNG regasification terminals (Panigaglia and Cavarzere). Storage fields are connected to the transport network at 2 virtual entry/exit points to the storage hubs. Natural gas leaving the national grid is carried on the regional network to the delivery points where it is offtaken by customers; and - a regional transport network extending over 22,930 kilometers, made up of smaller lines, generally operated to a lower pressure, and allowing the transport of natural gas to large industrial complexes, power stations and local distribution companies in the various local areas served.
The major pipelines interconnected with import trunk-lines that are part of Eni’s national network are: for natural gas imported from Algeria (Mazara del Vallo delivery point): - two lines with a 48/42-inch diameter, each approximately 1,500-kilometer long, including the smaller pipes that cross underwater the Messina Strait, connect Mazara del Vallo on the southern coast of Sicily where they link with the TMPC pipeline carrying Algerian gas, to Minerbio (near Bologna). This pipeline is undergoing upgrades with the laying of a third line with a 48-inch diameter and 583-kilometer long (of these 525 kilometers are already operation). At the Mazara del Vallo entry point the available transport capacity, which is measured at the beginning of each thermal year starting on October 1, is approximately 105 mmcm/d; for natural gas imported from Libya (Gela delivery point): - a 36-inch diameter line and 67-kilometer long linking Gela, the entry point of the GreenStream underwater pipeline, to the
national network near Enna along the trunk-line transporting gas coming from Algeria. Transport capacity at the Gela entry point is approximately 38 mmcm/d; for natural gas imported from Russia (Tarvisio and Gorizia delivery points): - two lines with 42/36/34-inch diameters extending for a total length of approximately 900 kilometers connecting the Austrian network at Tarvisio. This facility crosses the Po Valley reaching Sergnano (near Cremona) and Minerbio (near Bologna). This pipeline has been upgraded by the laying of a third 264-kilometer long line with a diameter from 48 to 56 inches. The pipeline transport capacity at the Tarvisio entry point amounts to approximately 119 mmcm/d plus the transport capacity available at the Gorizia entry point of approximately 5 mmcm/d; for natural gas imported from the Netherlands and Norway (Gries Pass delivery point): - one line, with a 48-inch diameter and 177-kilometer long that extends from the Italian border at Gries Pass (Verbania), to the node of Mortara, in the Po Valley. The pipeline transport capacity at the Gries Pass entry point amounts to 64 mmcm/d; for natural gas coming from the Panigaglia LNG terminal: - one line, with a 30-inch diameter and 170-kilometer long that links
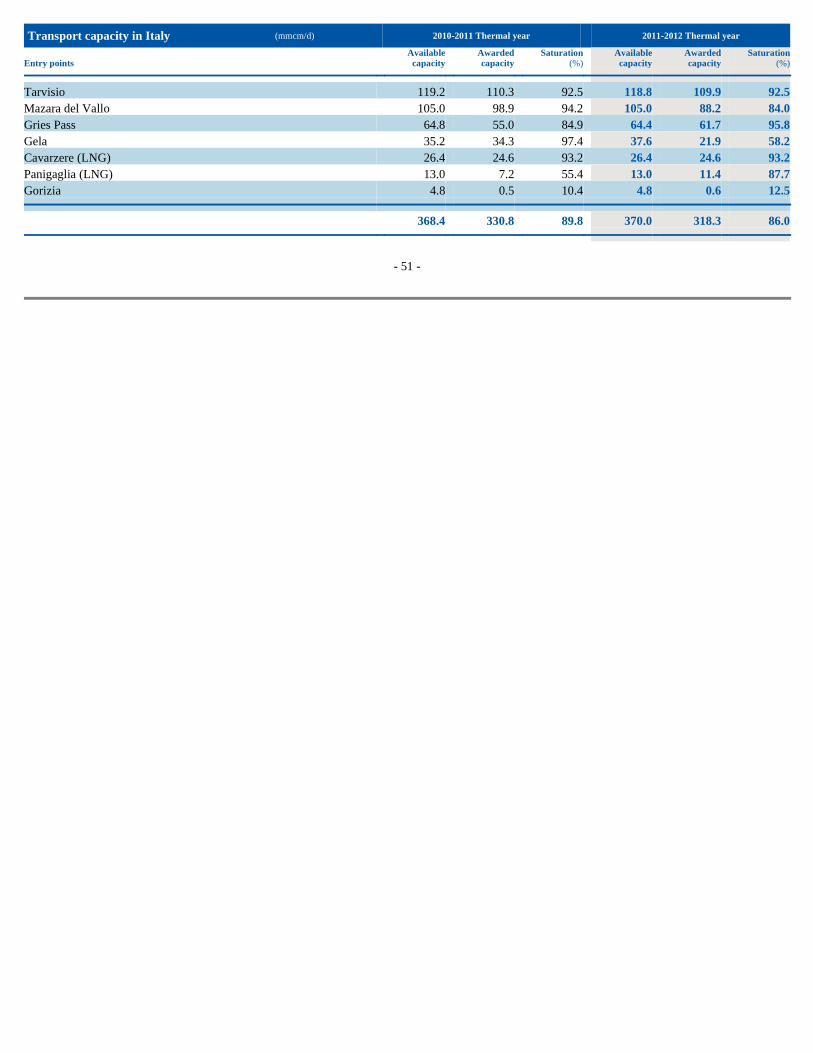
- 51 -
Transport capacity in Italy (mmcm/d) 2010-2011 Thermal year 2011-2012 Thermal year
Entry points Available capacity
Awarded capacity
Saturation (%)
Available capacity
Awarded capacity
Saturation (%)
Tarvisio 119.2 110.3 92.5 118.8 109.9 92.5 Mazara del Vallo 105.0 98.9 94.2 105.0 88.2 84.0 Gries Pass 64.8 55.0 84.9 64.4 61.7 95.8 Gela 35.2 34.3 97.4 37.6 21.9 58.2 Cavarzere (LNG) 26.4 24.6 93.2 26.4 24.6 93.2 Panigaglia (LNG) 13.0 7.2 55.4 13.0 11.4 87.7 Gorizia 4.8 0.5 10.4 4.8 0.6 12.5
368.4 330.8 89.8 370.0 318.3 86.0
Contents
Eni Fact Book Gas & Power
- 52 -
the Panigaglia terminal to the national transport network near Parma. The pipeline transport capacity at the Panigaglia entry point amounts to 13 mmcm/d; and for natural gas coming from the Rovigo Adriatic LNG terminal: - a 36-inch diameter connection at the Minerbio junction with the Cavarzere-Minerbio pipeline belonging to Edison Stoccaggio SpA, which receives gas from the LNG terminal located offshore of Porto Viro. The pipeline transport capacity at the Cavarzere entry point amounts to 26 mmcm/d.
Eni’s transport system also includes: (i) eleven compressor stations with a total power of 883.7 MW used to increase gas pressure in pipelines to the level required for its flow; and (ii) four marine terminals linking underwater pipelines with the on-land network at Mazara del Vallo and Messina in Sicily and Favazzina and Palmi in Calabria. The interconnections managed by Snam Rete Gas in the Italian transport network are guaranteed by 22 linkage and dispatching nodes and by 568 plant units including pressure reduction and regulation plants. These plants allow the regulation of the flow of natural gas in the network and guarantee the connection of pipes working at different pressures. Snam Rete Gas also provides dispatching services through a central operating plant that monitors and controls the operations of the transport network, receiving data from approximately 3,000 plants, of which over 1,500 are remotely controlled and are located all over Italy. In 2011, volumes of natural gas input in the national grid (78.30 bcm) decreasing by 5.01 bcm from 2010 due to declining domestic demand. Eni transported 43.18 bcm of natural gas on behalf of third parties, down 4.68 bcm from 2010, or 9.8%. Eni, through its subsidiary GNL Italia, operates the regasification terminal of Panigaglia (La Spezia, Liguria). At full capacity, this terminal can regasify 17,500 cm of LNG per day and input 3.5 bcm/y into the Italian transport network. In 2011, the LNG terminal in Panigaglia re-gasified 1.89 bcm of natural gas (1.98 bcm in 2010).
Distribution Distribution involves the delivery of natural gas to residential and commercial customers in urban centers through low pressure networks. The Company’s subsidiary Italgas and other subsidiaries operate in the distribution activity in Italy serving 1,330 municipalities through a low pressure network consisting of approximately 50,300 kilometers of pipelines supplying 5.9 million customers and distributing 7.64 bcm in 2011. Distribution activities are considered a public service and therefore are regulated by the Authority for Electricity and Gas which determines
the methods for calculating tariffs and fixing the return on capital employed. Distribution activities are conducted under concession agreements whereby local public administrations award the service of gas distribution to companies. In accordance with the provisions of the relevant legislation, tenders for new natural gas distribution concessions will no longer be issued by each municipality but exclusively by the multi-municipality minimum geographical areas (known as "Ambiti Territoriali Minimi - ATEM", or local areas).
Storage Eni through Stoccaggi Gas Italia SpA, operates in natural gas storage in Italy. Storage services are provided through 8 operating concessions, 4 of which are located in Lombardia (Brugherio, Ripalta, Sergnano e Settala), 3 in Emilia Romagna (Cortemaggiore, Minerbio e Sabbioncello) and 1 in Abruzzo (Fiume Treste). These storage sites are depleted gas fields and have been converted to storage by means of proper infrastructure and facilities that link them to the national grid. In particular, the storage system is managed in order to allow the optimal injection of gas and its supply in respect of technical and management constraints. Storage services are provided by means of: - storage fields; - wells; - linkage facilities; - compression stations; - treatment plants. Storage fields contain cushion gas and working gas. Cushion gas is the amount of gas necessary for the field’s operation and is the minimum indispensable volume present or injected in the field at the beginning of storage, that needs to be always present in the field. Working gas is the volume of gas produced and injected cyclically during the year. Storage activity consists of two separate phases: - injection of gas underground; - offtake of previously injected gas. Injection of gas in the fields, through storage wells, usually taking place between April and October, is achieved through compression plants that increase the pressure of gas taken from the national distribution network. Gas offtake, usually taking place between November and the following March, is achieved through treatment plants required to bring gas back to the marketing specifications. In 2011, 7.78 bcm (down 0.22 bcm from 2010) were input to the Company’s storage deposits, while 7.53 bcm of gas were off-taken (slightly lower than one year ago). In 2011, storage capacity amounted to 15 bcm, of which 5 were destined to strategic storage. The share of storage capacity used by third parties was 78% (71% in 2010).


Contents
Eni Fact Book Gas & Power
Supply of natural gas (bcm) 2007 2008 2009 2010 2011
Italy 8.65 8.00 6.86 7.29 7.22
Outside Italy Russia 23.44 22.91 22.02 14.29 21.00 Algeria (including LNG) 18.41 19.22 13.82 16.23 13.94 Libya 9.24 9.87 9.14 9.36 2.32 Netherlands 7.74 9.83 11.73 10.16 11.02 Norway 5.78 6.97 12.65 11.48 12.30 United Kingdom 3.15 3.12 3.06 4.14 3.57 Hungary 2.87 2.84 0.63 0.66 0.61 Qatar (LNG) 0.71 2.91 2.90 2.90 Other supplies of natural gas 2.20 4.07 4.49 4.42 6.16 Other supplies of LNG 2.32 2.11 1.34 1.56 2.34 75.15 81.65 81.79 75.20 76.16
Total supplies of Eni’s own companies 83.80 89.65 88.65 82.49 83.38
Offtake from (input to) storage 1.49 (0.08 ) 1.25 (0.20 ) 1.79 Network losses, measurement differences and other changes (0.46 ) (0.25 ) (0.30 ) (0.11 ) (0.21 )
AVAILABLE FOR SALE BY ENI'S CONSOLIDATED SUBSIDIARI ES 84.83 89.32 89.60 82.18 84.96 Available for sale of Eni's affiliates 8.74 8.91 7.95 9.23 8.94 E&P volumes 5.39 6.00 6.17 5.65 2.86 GAS VOLUMES AVAILABLE FOR SALE 98.96 104.23 103.72 97.06 96.76
i
Gas sales by entity (bcm) 2007 2008 2009 2010 2011
Sales of consolidated companies 84.83 89.32 89.60 82.00 84.37 Italy (including own consumption) 56.08 52.82 40.04 34.23 34.60 Rest of Europe 27.86 35.61 48.65 46.74 45.16 Outside Europe 0.89 0.89 0.91 1.03 4.61 Sales of Eni’s affiliates (net to Eni) 8.74 8.91 7.95 9.41 9.53 Italy 0.05 0.05 0.06 0.08 Rest of Europe 7.16 7.42 6.80 7.78 7.82 Outside Europe 1.53 1.44 1.15 1.57 1.63 E&P in Europe and in the Gulf of Mexico 5.39 6.00 6.17 5.65 2.86 Worldwide gas sales 98.96 104.23 103.72 97.06 96.76
i
LNG sales (bcm) 2007 2008 2009 2010 2011
G&P sales 8.0 8.4 9.8 11.2 11.8 Italy 1.2 0.3 0.1 0.2 Rest of Europe 5.6 7.0 8.9 9.8 9.8 Extra European markets 1.2 1.1 0.8 1.2 2.0 E&P sales 3.7 3.6 3.1 3.8 3.9 Liquefaction plants: Bontang (Indonesia) 0.7 0.7 0.8 0.7 0.6 Point Fortin (Trinidad & Tobago) 0.6 0.5 0.5 0.6 0.4 Bonny (Nigeria) 2.0 2.0 1.4 2.2 2.5 Darwin (Australia) 0.4 0.4 0.4 0.3 0.4
11.7 12.0 12.9 15.0 15.7
i
Electricity sales (TWh) 2007 2008 2009 2010 2011

- 53 -
Free market 20.73 22.89 24.74 27.48 26.87 Italian Exchange for electricity 8.66 3.82 4.70 7.13 8.67 Industrial plants 2.81 2.71 2.92 3.21 3.23 Other (a) 0.99 0.51 1.60 1.72 1.51
Power sales 33.19 29.93 33.96 39.54 40.28 Power generation 25.49 23.33 24.09 25.63 25.23 Trading of electricity (a) 7.70 6.60 9.87 13.91 15.05
i i i (a) i Include positive and negative imbalances.
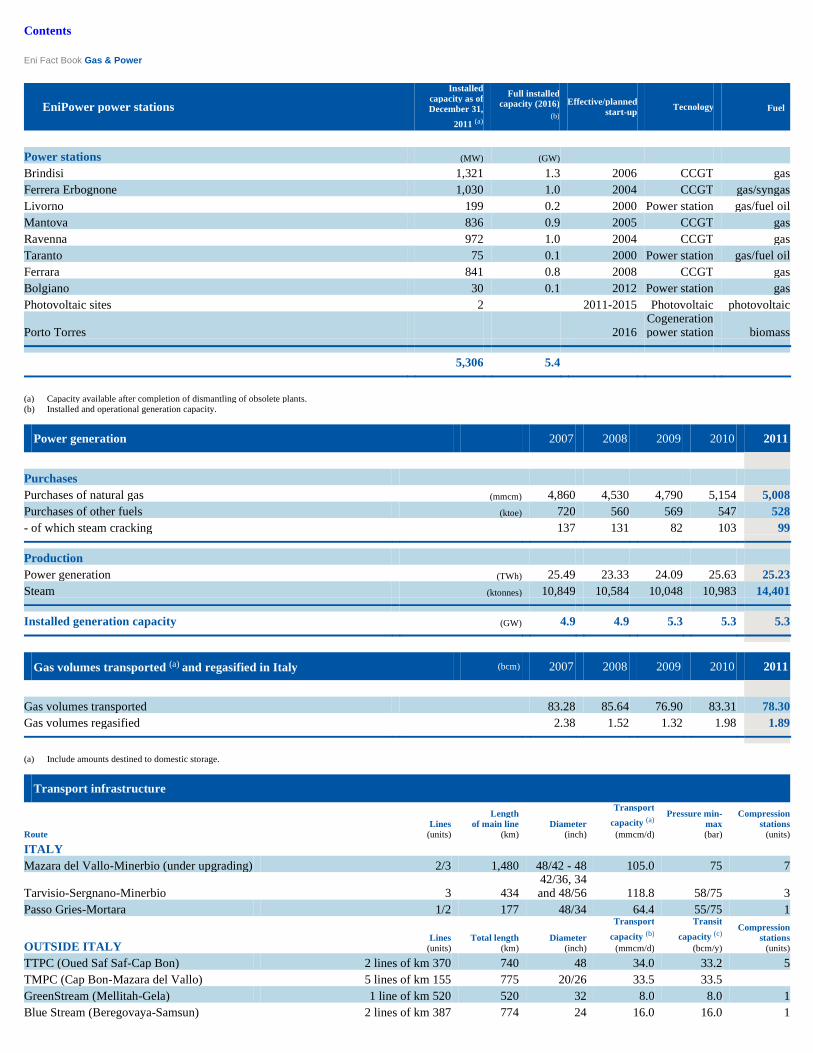
Contents
Eni Fact Book Gas & Power
EniPower power stations Installed
capacity as of December 31,
2011 (a)
Full installed
capacity (2016) (b)
Effective/planned start-up Tecnology Fuel
Power stations (MW) (GW) Brindisi 1,321 1.3 2006 CCGT gas Ferrera Erbognone 1,030 1.0 2004 CCGT gas/syngas Livorno 199 0.2 2000 Power station gas/fuel oil Mantova 836 0.9 2005 CCGT gas Ravenna 972 1.0 2004 CCGT gas Taranto 75 0.1 2000 Power station gas/fuel oil Ferrara 841 0.8 2008 CCGT gas Bolgiano 30 0.1 2012 Power station gas Photovoltaic sites 2 2011-2015 Photovoltaic photovoltaic
Porto Torres 2016 Cogeneration power station biomass
5,306 5.4
i i i (a) i Capacity available after completion of dismantling of obsolete plants. (b) i Installed and operational generation capacity. i i i
Power generation 2007 2008 2009 2010 2011
Purchases Purchases of natural gas (mmcm) 4,860 4,530 4,790 5,154 5,008 Purchases of other fuels (ktoe) 720 560 569 547 528 - of which steam cracking 137 131 82 103 99
Production Power generation (TWh) 25.49 23.33 24.09 25.63 25.23 Steam (ktonnes) 10,849 10,584 10,048 10,983 14,401
Installed generation capacity (GW) 4.9 4.9 5.3 5.3 5.3
it i i
Gas volumes transported (a) and regasified in Italy (bcm) 2007 2008 2009 2010 2011
Gas volumes transported 83.28 85.64 76.90 83.31 78.30 Gas volumes regasified 2.38 1.52 1.32 1.98 1.89
i i i (a) i Include amounts destined to domestic storage. i i i
Transport infrastructure
Route Lines (units)
Length of main line
(km) Diameter
(inch)
Transport
capacity (a)
(mmcm/d)
Pressure min-max (bar)
Compression stations
(units)
ITALY Mazara del Vallo-Minerbio (under upgrading) 2/3 1,480 48/42 - 48 105.0 75 7
Tarvisio-Sergnano-Minerbio 3 434 42/36, 34 and 48/56 118.8 58/75 3
Passo Gries-Mortara 1/2 177 48/34 64.4 55/75 1
OUTSIDE ITALY Lines (units)
Total length (km)
Diameter (inch)
Transport
capacity (b)
(mmcm/d)
Transit
capacity (c)
(bcm/y)
Compression stations
(units)
TTPC (Oued Saf Saf-Cap Bon) 2 lines of km 370 740 48 34.0 33.2 5 TMPC (Cap Bon-Mazara del Vallo) 5 lines of km 155 775 20/26 33.5 33.5 GreenStream (Mellitah-Gela) 1 line of km 520 520 32 8.0 8.0 1 Blue Stream (Beregovaya-Samsun) 2 lines of km 387 774 24 16.0 16.0 1

- 54 -
i i
i
(a) i
Transport capacity refers to the capacity at the Entry Point connected to the import pipelines.
(b) i
Includes both transit capacity and volumes of natural gas destined to local markets and withdrawn at various points along the pipeline.
(c) The maximum volume of natural gas which is input at various entry points along the pipeline and transported to the next pipeline.

Contents
Eni Fact Book Gas & Power
- 55 -
Distribution of natural gas in Italy 2007 2008 2009 2010 2011
Volumes distributed (bcm) 7.44 7.63 7.73 8.15 7.64 to Eni 5.66 6.33 6.26 6.30 5.59 to third parties 1.78 1.30 1.47 1.85 2.05 Installed network (km) 48,746 49,410 49,973 50,307 50,301 Active meters (contracts) 5,598,677 5,676,105 5,770,672 5,848,478 5,896,611 Municipalities served (units) 1,318 1,320 1,322 1,330 1,330
Storage 2007 2008 2009 2010 2011
Total storage capacity: (bcm) 13.6 13.7 13.9 14.2 15.0 - of which strategic storage 5.1 5.1 5.0 5.0 5.0 - of which available storage 8.5 8.6 8.9 9.2 10.0
Available capacity: (%) - share utilized by Eni 44 39 30 29 22 - share utilized by third parties 56 61 70 71 78
Total offtake from (input to) storage: (bcm) 9.27 11.57 16.52 15.59 15.31 - input to storage 4.00 6.30 7.81 8.00 7.78 - offtake from storage 5.27 5.27 8.71 7.59 7.53
Total customers (No.) 44 48 56 60 104
Capital expenditures (euro million) 2007 2008 2009 2010 2011
Italy 1,219 1,750 1,564 1,575 1,661 Outside Italy 292 308 122 110 60
1,511 2,058 1,686 1,685 1,721
Marketing 238 198 175 248 184 Marketing 63 91 102 133 97 Italy 13 16 12 40 45 Outside Italy 50 75 90 93 52 Power generation 175 107 73 115 87 Regulated businesses in Italy 1,031 1,627 1,479 1,420 1,529 Transport 691 1,130 919 842 898 Distribution 195 233 278 328 337 Storage 145 264 282 250 294 International transport 242 233 32 17 8
1,511 2,058 1,686 1,685 1,721

Contents
Eni Fact Book Refining & Marketing
2007 2008 2009 2010 2011
Employee injury frequency rate (No. of accidents per million hours worked) 3.57 2.88 3.18 1.77 2.02 Contractors injury frequency rate 4.31 3.45 4.35 3.59 3.21
Net sales from operations (a) (euro million) 36,349 45,017 31,769 43,190 51,219 Operating profit 686 (988 ) (102 ) 149 (273 ) Adjusted operating profit 292 580 (357 ) (171 ) (535 ) Adjusted net profit 294 521 (197 ) (49 ) (262 )
Capital expenditure 979 965 635 711 866 Adjusted capital employed, net at year end 7,149 8,260 7,560 7,859 8,600 Adjusted ROACE (%) 4.6 6.5 (2.6 ) (0.6 ) (3.1 )
Refinery throughputs on own account (mmtonnes) 37.15 35.84 34.55 34.80 31.96 Conversion index (%) 56 58 60 61 61 Balanced capacity of refineries (kbbl/d) 748 737 747 757 767
Retail sales of petroleum products in Europe (b) (mmtonnes) 12.65 12.03 12.02 11.73 11.37 Service stations in Europe at year end (b) (units) 6,440 5,956 5,986 6,167 6,287 Average throughput per service station in Europe (b) (kliters) 2,486 2,502 2,477 2,353 2,206 Retail efficiency index (%) 1.49 1.56 1.61 1.53 1.50
Employees at year end (units) 9,428 8,327 8,166 8,022 7,591 Direct GHG emissions (mmtonnes CO 2 eq) 8.42 7.74 7.29 7.76 7.23 SO x (sulphur oxide) emissions (ktonnes SO 2 eq) 26.19 23.18 21.98 28.05 23.07 NO x (nitrogen oxide) emissions (ktonnes NO 2 eq) 7.59 7.38 7.35 7.96 6.74 Water consumption rate (cm/tonnes) 36.25 36.29 35.99 28.36 31.07 Customer satisfaction index (likert scale) 8.22 8.14 7.93 7.84 7.74
(a) Before elimination of intragroup sales. (b) 2007 data include downstream activities in the Iberian Peninsula divested to Galp in October 2008.
Performance of the year
I I I I The injury frequency rate for Eni employees increased by
14% from 2010: in 2011, 26 accidents occurred.
I I I I In 2011, NO x and SO x emissions significantly declined
(down 15% and down 18%, respectively) from 2010, due to the use of natural gas to replace fuel oil and to energy saving measures.
I I I I In 2011, this segment reported an adjusted net loss of
euro 262 million worsening by euro 213 million from 2010,
I I I I In 2011, refining throughputs were 31.96 mmtonnes
(down 8.2% from 2010). In Italy, processed volumes decreased by 8.7%, reflecting the decision to cut throughputs at the Venice plant in response to an unfavorable market scenario and the impact of planned standstills at the other plants. Outside Italy, Eni’s refining throughputs decreased by 5.3% in particular in the Czech Republic as a consequence of the relevant planned downtime at the Litvinov refinery.
I I I I Retail sales in Italy of 8.36 mmtonnes decreased by 3.1%,
driven by lower consumption of gasoil and gasoline in an unfavorable market scenario with high competitive pressure. Eni’s average retail market share for 2011 was 30.5%, up 0.1

- 56 -
reflecting unprofitable refining margins due to rising costs for oil-based feedstock and for energy utilities linked to the former that could not be transferred to prices at the pump, also due to weak demand and excess capacity in the Mediterranean basin. Marketing results were positive but shrinking due to the decline in retail and wholesale demand for products.
I I I I Return on average capital employed on an adjusted basis
was a negative 3.1% (-0.6% in 2010).
percentage points from 2010.
I I I I Retail sales in the rest of Europe of 3.01 mmtonnes were
down by 2.9% from 2010. Volume additions in Austria, reflecting 2010 acquisitions were offset by lower sales in Germany due to certain lease contract terminations, in France due to the rationalization of the network of service stations and in Eastern Europe due to declining demand.

Contents
Eni Fact Book Refining & Marketing
I I I I Capital expenditure of euro 866 million related mainly to
projects designed to improve the conversion capacity and flexibility of refineries, logistics, upgrade of the fuel distribution network in Italy and in the rest of Europe and initiatives in the field of health, safety and the environment.
I I I I In 2011, total expenditure in R&D in the Refining &
Marketing Division amounted to approximately euro 32 million, net of general and administrative costs. In the year, 8 patent applications were filed.
Activities
1. Refining
Eni, through its Refining & Marketing Division, is the leader operator in Italy in refining, with its five wholly owned refineries (Sannazzaro, Livorno, Porto Marghera, Taranto and Gela), and in marketing of petroleum products. In the rest of Europe Eni also holds interests in certain refining poles and is active in retail and wholesale sales in Central/Eastern Europe Countries. As of December 31, 2011, Eni’s refining system had total refinery capacity (balanced with conversion capacity) of approximately 38.3 mmtonnes (equal to 767 kbbl/d) and a conversion index of 61%. In 2011, total refinery throughputs were 31.96 mmtonnes, of which 27 mmtonnes in Italy and 4.96 mmtonnes outside Italy. Total throughputs in wholly-owned refineries were 22.75 mmtonnes, down by 2.95 mmtonnes from 2010, or 11.5%, determining a refinery utilization rate of 79%, declining from 2010 consistent with the unfavorable scenario. Approximately 22.3% of processed crude volumes was supplied by Eni’s Exploration & Production segment (15.8% in 2010) representing a 6.5 percentage point increase from 2010.
� Italy Eni’s refining system in Italy is composed of five wholly-owned refineries and a 50% interest in the Milazzo refinery in Sicily. Each of Eni’s refineries in Italy have operating and strategic features that aim at maximizing the value associated to the asset structure, the geographic positioning with respect to end markets and the integration with Eni’s other activities.

- 57 -

Contents
Eni Fact Book Refining & Marketing
Refining system in 2011
Ownership
share (%)
Distillation capacity
(total) (kbbl/d)
Distillation capacity
(Eni’ s share)
(kbbl/d)
Primary balanced refining capacity
(Eni’ s share)
(kbbl/d) Conversion
index (%)
Fluid catalytic
cracking - FCC
(kbbl/d)
Residue conversion
(kbbl/d) Go-Finer
(kbbl/d)
Mild Hydro-
cracking/ Hydro-
cracking (kbbl/d)
Visbreaking/ Thermal
Cracking (kbbl/d)
Coking (kbbl/d)
Distillation capacity
utilization rate (Eni’ s
share) (%)
Balanced refining capacity
utilization rate (Eni’ s
share) (%)
Wholly -owned refineries 685 685 574 64 69 42 37 29 89 46 66 79 Italy Sannazzaro 100 223 223 190 59 34 12 29 29 80 94 Gela 100 129 129 100 142 35 37 46 50 65 Taranto 100 120 120 120 72 30 38 83 83 Livorno 100 106 106 84 11 67 85 Venice 100 107 107 80 20 22 38 51 Partially owned refineries (a) 874 245 193 51 167 25 99 27 88 101 Italy Milazzo 50 248 124 80 76 45 25 32 89 119 Germany Vohburg/Neustadt (Bayernoil) 20 215 43 41 36 49 43 92 92 Schwedt 8.33 231 19 19 42 49 27 105 105 Czech Republic Kralupy and Litvinov (Ceska Rafinerska) 32.4 180 59 53 30 24 24 79 88 Total 1,559 930 767 61 236 67 37 128 116 46 72 85 (a) Capacity of conversion plant is 100%.
Sannazzaro : the refinery has balanced refining capacity of 190 kbbl/d and a conversion index of 59%. Management believes that this unit is among the most efficient refineries in Europe. Located in the Po Valley, it mainly supplies markets in North-Western Italy and Switzerland. The high degree of flexibility and conversion capacity of this refinery allows it to process a wide range of feedstock. From a logistical standpoint this refinery is located along the route of the Central Europe Pipeline, which links the Genoa terminal with French speaking Switzerland. This refinery contains two primary distillation plants and relevant facilities, including three desulphurization units. Conversion is obtained through a fluid catalytic cracker (FCC), two hydrocrackers (HdCK), which enable middle distillate conversion and a visbreaking thermal conversion unit with a gasification facility using the heavy residue from visbreaking (tar) to produce syn-gas to feed the nearby EniPower power plant at Ferrera Erbognone. Eni is developing a conversion plant employing the Eni Slurry Technology with a 23 kbbl/d capacity for the processing of extra heavy crude with high sulphur content producing high quality middle distillates, in particular gasoil, and reducing the yield of fuel oil to zero. Start-up of this facility is scheduled by the end of 2012. In addition the Short Contact Time-Catalytic Partial Oxidation project is underway for the production of hydrogen.
Taranto : the refinery has balanced refining capacity of 120 kbbl/d and a conversion index of 72%. This refinery can process a wide range of crude and other feedstock. It
conversion index of 142%. This refinery is located on the southern coast of Sicily and is integrated with upstream operations as it processes heavy crude produced from Eni’s nearby offshore and onshore fields in Sicily. Its high conversion level is ensured by an FCC unit with go-finer for feedstocks upgrading and two coking plants enabling conversion of heavy residues topping or vacuum residues. The power plant of this refinery also contains residue and exhaust fume treatment plants (so-called SNOx) which allow full compliance with the tightest environmental standards, removing almost all sulphur and nitrogen composites coming from the coke burning-process. An upgrade of the Gela refinery is underway by means of a refurbishment of its power plant, substantially renewing pet-coke boilers, aimed at increasing profitability maximizing synergies deriving from the integration of refining and power generation.
Livorno : the refinery, with balanced refining capacity of 84 kbbl/d and a conversion index of 11%, manufactures mainly gasoline, fuel oil for bunkering and lubricant bases. Besides its primary distillation plants, this refinery contains two lubricant manufacturing lines. Its pipeline links with the local harbor and with the Florence storage sites by means of two pipelines optimizes intake, handling and distribution of products.
Venice : the refinery, with balanced refining capacity of 80 kbbl/d and a conversion index of 20%, this refinery supplies mainly markets in North-Eastern Italy and Austria. Besides
- 58 -
principally produces fuels for automotive use and residential heating purposes for the Southern Italian markets. Besides its primary distillation plants and relevant facilities, including two units for the desulphurization of middle distillates, this refinery contains a two-stage thermal conversion plant (visbreaking/thermal cracking) and an RHU conversion plant for the conversion of high sulphur content residues into valuable products and catalytic cracking feedstocks. It processes most of the oil produced in Eni’s Val d’Agri fields carried to Taranto through the Monte Alpi pipeline (in 2011, a total of 2.5 mmtonnes of this oil were processed).
Gela : the refinery has balanced refining capacity of 100 kbbl/d and a
its primary distillation plants, this refinery contains a two-stage thermal conversion plant (visbreaking/thermal cracking) designed to increase yields of valuable products.
Milazzo : jointly-owned by Eni and Kuwait Petroleum Italy, the refinery has balanced primary refining capacity of 80 kbbl/d (Eni’s share) and a conversion rate of 73%. It is located on the northern coast of Sicily and is provided with two primary distillation plants, one unit of fluid catalytic cracking (FCC), one hydrocracking unit for the conversion of middle distillates (HdCK) and one unit devoted to the residue treatment process (LC-Finer).

Contents
Eni Fact Book Refining & Marketing
� Outside Italy In Germany, Eni holds an 8.33% interest in the Schwedt refinery and a 20% interest in Bayernoil, an integrated pole that included Vohburg and Neustadt refineries. Eni’s refining capacity in Germany amounts to approximately 60 kbbl/d mainly used to supply Eni’s distribution network in Bavaria and Eastern Germany. Eni holds a 32.4% stake in Ceska Rafinerska, which includes two refineries, Kralupy and Litvinov, in the Czech Republic. Eni’s share of refining capacity amounts to about 53 kbbl/d. In addition, through its 33.34% interest in Galp, Eni participates two refineries in Portugal: a small one in Porto specialized in the manufacture of lubricant bases and a larger and more complex refinery in Sines integrated with petrochemical productions.
2. Logistics
Eni is a primary operator in storage and transport of petroleum
products in Italy with its logistical integrated infrastructure consisting of 20 directly managed storage sites and a network of petroleum product pipelines for the sale and storage of refined products, LPG and crude oil. Eni’s logistics model is organized in a hub structure including five main areas. These hubs monitor and centralize the handling of product flows aiming to drive forward more efficiency particularly in cost control of collection and delivery of orders. Eni holds interests in five joint entities established by partnering the major Italian operators. These are located in Vado Ligure-Genova (Petrolig), Arquata Scrivia (Sigemi), Venice (Petroven), Ravenna (Petra) and Trieste (DCT) and aim at reducing logistic cost, and increasing efficiency. Eni operates in the transport of oil and refined products: (i) by sea, through spot and long-term lease contracts of tanker ships; and (ii) on land, through the ownership of a pipeline network extending approximately 1,447 kilometers. Secondary distribution to retail and wholesale markets is effected through third parties who also own their means of transportation.
3. Marketing
� Retail Italy In Italy Eni is leader in retail marketing of refined products with a 30.5% market share, up 0.1 percentage point from 2010. Retail sales in Italy of 8.36 mmtonnes (10.6 billion liters) decreased by approximately 270 ktonnes (10.9 billion liters), or down 3.1%, driven by lower consumption of gasoil and gasoline, particularly in the highway segment which was hit by automotive transport decline.
At December 31, 2011, Eni’s retail network in Italy consisted of 4,701 service stations, 159 more than at December 31, 2010 (4,542 service stations), resulting from the positive balance of acquisitions/releases of lease concessions (158 units), the opening of new service stations (14 units), partly offset by the closing of service stations with low throughput (13 units). The re-branding of Eni’s service stations continued in 2011. We plan that by the end of 2012 80% of our proprietary service stations will have been re-branded to the "eni brand". In the context of weak domestic demand for fuels and rising competition, despite a planned reduction of approximately

- 59 -
Average gasoline and gasoil throughput (2,173 kliters) decreased by approximately 149 kliters from 2010.
500 service stations, management plans to preserve the

Contents
Eni Fact Book Refining & Marketing
market share achieved in 2011 (30.5%) by improving service quality, upgrading our outlets, retaining customers by means of innovative marketing actions and segmentation of the offering (in function of payment modalities or quality of the product, enhancing the role of loyalty programs). Great focus will be dedicated to improve efficiency by the automation of part of the network. Finally we expect a growing contribution to profitability by non-oil activities as we intend to expand the quality and range of products and services offered to our customers and pursue continuing innovation in the layout of our stores located at our proprietary outlets.
Premium fuels In 2011, even sales of premium fuels (fuels of the "eni blu+" line with high performance and lower environmental impact), despite the support of strong promotional campaigns, were affected by the decline in domestic consumption and were lower than the previous year. In particular, sales of eni bludiesel+ amounted to approximately 493 mmtonnes (approximately 592 mmliters) with a decline of approximately 80 ktonnes from 2010 and represented 9% of volumes of gasoil marketed by Eni’s retail network. At December 31, 2011, service stations marketing bludiesel+ totaled 4,130 units (4,071 at 2010 year-end) covering approximately 88% of Eni’s network. Retail sales of blusuper+ amounted to 62 ktonnes (approximately 83 mmliters), with a slight decrease from 2010, and covered 2.4% of gasoline sales on Eni’s retail network (down 0.2% from a year ago). At December 31, 2011, service stations marketing blusuper+ totaled 2,703 units (2,672 at December 31, 2010), covering approximately 57% of Eni’s network. Within the development of innovative fuels and bio-fuels, in addition to the mentioned eni blu+ line, Eni is working at new catalysts for desulphuration for the optimization of gasoil quality and, with particular reference to bio-fuels, is studying the use of non food feedstocks – deriving from biomass at the Donegani Research Center – for its Ecofining proprietary technology, identifying new bio-components pro fuel, and evaluating their compatibility with engines.
Promotional actions you&eni In 2010, Eni launched the new " you&eni " loyalty points program, which will last 3 years until January 31, 2013. This
With reference to the promotional initiative, the cards that made at least one transaction in the period were approximately 6.5 million at December 31, 2011. The average number of cards monthly active was approximately 2.6 million. Volumes sold to customers cumulating points on their card were approximately 39% of total throughputs.
Iperself In 2011, Eni, in addition to its "Iperself" promotional campaign which provides a discount to customers purchasing fuel in self-service stations during closing hours, launched a new promotional campaign denominated "Iperself h24". This promotion provides a discount on the corresponding price at self-service pump during the all day. Jointly with other marketing activities this initiative supported sales against the backdrop of weak demand and increased price elasticity.
Multicard Routex The Routex Multicard paying card is addressed to professional transport (transporters and car fleets) and provides users with services ranging from delayed payment to discounts on fuel prices, centralized invoicing, reports on consumption and distances covered, in addition to toll paying in highways. This initiative aims at gaining loyalty from customers across Europe as the card can be used in Italy on all Agip branded service stations and, in its international version, on the service stations of all members of the Routex consortium (Aral, BP, OMV and Statoil).
Non-oil In 2011, Eni continued to be engaged in increasing its supply of non-oil products and services in its service stations in Italy by developing a chain of franchised outlets, in particular: (i) "enicafé", a format present in 350 stations following the upgrading of bars and stores in its network; (ii) "enicafé&shop", a format including corners for the sale of food and car-care products in 200 Eni outlets. In 2011, Eni also launched a new self-service option h24 of food, non-food and personal care products by means of the installation of Eni branded vending machines in 150 outlets with the aim of extending this service to over 1,000 outlets in the next two years. In 2011, non-oil returns on retail network, including lubricants margins, were euro 67.4 million.
� Retail rest of Europe In 2011, retail sales of refined products marketed in the rest of Europe (3.01 mmtonnes) were down 2.9% (approximately 90 ktonnes) from 2010. Volume additions in Austria, reflecting the 2010 acquisitions, were offset by lower sales in Germany due to certain lease contract terminations, in France due to the rationalization of service stations with lower throughput and in Eastern Europe due to declining demand. At December 31, 2011, Eni’s retail network in the rest of Europe consisted of 1,586 units, a decrease of 39 units from

- 60 -
initiative offers prizes to customers in proportion to their purchases of fuels and convenience items through the accumulation of points on a loyalty card at service stations’ stores as well as at the ones of certain partners to the program.
December 31, 2010 (1,625 service stations). The network evolution was as follows: (i) the closing of 41 low throughput service stations mainly in Austria and France; (ii) the negative balance of acquisitions/releases of lease concessions (17 units) with negative changes in particular in Germany, Austria and Switzerland; (iii) the purchase of 12 service stations, in particular in France and Germany; and (iv) the opening of 7 new outlets. Average throughput (2,299 kliters) decreased by 142 kliters from 2010 (2,441 kliters). Eni’s strategy in the rest of Europe is focused on selectively growing its market share, particularly in Germany and Eastern Countries (e.g. Czech Republic) leveraging on the synergies

Contents
Eni Fact Book Refining & Marketing
ensured by the proximity of these markets to Eni’s production and logistics facilities.
4. Wholesale Business
Fuels Eni markets gasoline and other fuels on the wholesale market in Italy, including diesel fuel for automotive use and for heating purposes, for agricultural vehicles and for vessels and fuel oil. Major customers are resellers, agricultural users, manufacturing industries, public utilities and transports, as well as final users (transporters, condominiums, farmers, fishers, etc.). Eni provides its customers with its expertise in the area of fuels with a wide range of products that cover all market requirements. Customer care and product distribution is supported by a widespread commercial and logistical organization presence all over Italy and articulated in local marketing offices and a network of agents and concessionaires. In 2011, sales volumes on wholesale markets in Italy (9.36 mmtonnes) were down by approximately 90 ktonnes from 2010, or 1%, mainly reflecting a decline in demand from transports and industrial customers due to a generalized slowdown and strong competitive pressure which affected in particular bunkering and bitumen, but also LPG due to unusual weather conditions. Jet fuel and fuel oil sales increased, while gasoil sales dropped starkly in 2011. Eni’s wholesale market share for 2011 averaged 28.3%, down 0.9 percentage points from 2010 (29.2%). Supplies of feedstock to the petrochemical industry (1.71 mmtonnes) were basically in line with 2010 recording a slight decline of 10 ktonnes related to lower feedstock supplies due to lowering demand from industrial customers. Sales on wholesale markets outside Italy (3.84 mmtonnes) decreased by 1%, mainly in Hungary, Germany and the Czech Republic, while sales increased in Austria, Switzerland and France. Other sales (18.31 mmtonnes) decreased by 1.29 mmtonnes, or 6.6%, mainly due to lower sale volumes to oil companies.
Eni also markets jet fuel directly at 49 airports, of which 27 are in Italy. In 2011, these sales amounted to 2.1 mmtonnes (of which 1.6 mmtonnes in Italy). Eni is also active in the international market of bunkering, marketing marine fuel mainly in 120 ports, of which 80 in Italy. In 2011, marine fuel sales were 1.98 mmtonnes (1.91 mmtonnes in Italy).
LPG In Italy, Eni is leader in LPG production, marketing and sale with 601 ktonnes sold for heating and automotive use equal to a 18.9% market share. An additional 214 ktonnes of LPG were marketed through other channels mainly to oil companies and traders. LPG activities in Italy are supported by direct production, availability from 5 bottling plants and 4 owned storage sites, in addition to products imported at coastal storage sites located in Livorno, Naples and Ravenna. Outside Italy, LPG sales in 2011 amounted to 485 ktonnes of which 384 ktonnes in Ecuador where LPG market share is around 37.5%.
Lubricants Eni operates seven (owned and co-owned) blending plants, in Italy, Europe, North and South America, Africa and the Far East. With a wide range of products composed of over 650 different blends Eni masters international state-of-the-art know-how for the formulation of products for vehicles (engine oil, special fluids and transmission oils) and industries (lubricants for hydraulic systems, industrial machinery and metal processing). In Italy, Eni is leader in the manufacture and sale of lubricant bases. Base oils are manufactured primarily at Eni’s refinery in Livorno. Eni also owns one facility for the production of additives and solvents in Robassomero. In 2011, retail and wholesale sales in Italy amounted to 100 ktonnes with a 23.6% market share. Eni also sold approximately 4 ktonnes of special products (white oils, transformer oil and anti-freeze fluids). Outside Italy sales amounted to approximately 140 ktonnes, of these about 60% were registered in Europe (mainly Spain, Germany, Austria and France).
Oxygenates Eni, through its subsidiary Ecofuel (Eni’s interest 100%), sells approximately 1.7 mmtonnes/y of oxygenates mainly ethers (approximately 5.3% of world demand) and methanol (approximately 0.9% of world demand). About 80% of products are manufactured in Italy in Eni’s plants in Ravenna, in Venezuela (in joint venture with Pequiven) and Saudi Arabia (in joint venture with Sabic) and the remaining 20% is bought and resold. Eni also distributes bio-ETBE on the Italian market in compliance with the new legislation indicating the minimum content of bio-fuels. Bio-ETBE is a kind of MTBE that gained a relevant position in the formulation of gasoline in the European Union, due to the fact that it is produced from ethanol from agricultural crops and qualified as bio-component in the European directive on

- 61 -
bio-fuels. Starting from March 1, 2010, Italian regulation on bio-fuels content has been changed from 3% to 3.5%. Through bio-ETBE and FAME blending into fossil fuels Eni covered the compliance within 96% in 2011. From January 1, 2012, the compulsory content of bio-fuels increases to 4.5% from 2011 4%, Eni plans to cover compliance through bio-ETBE, FAME and direct blending of ethanol in gasolines in particular in some extents of Sannazzaro refinery inland.
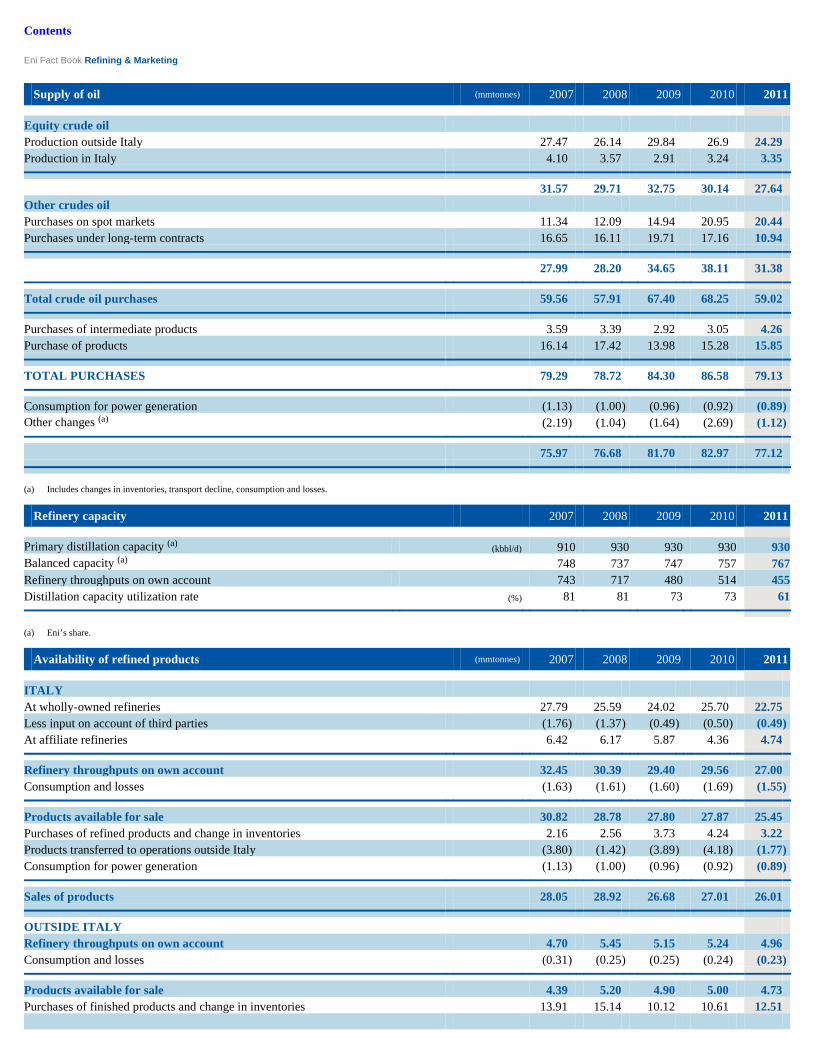
Contents
Eni Fact Book Refining & Marketing
Supply of oil (mmtonnes) 2007 2008 2009 2010 2011
Equity crude oil Production outside Italy 27.47 26.14 29.84 26.9 24.29 Production in Italy 4.10 3.57 2.91 3.24 3.35
31.57 29.71 32.75 30.14 27.64 Other crudes oil Purchases on spot markets 11.34 12.09 14.94 20.95 20.44 Purchases under long-term contracts 16.65 16.11 19.71 17.16 10.94
27.99 28.20 34.65 38.11 31.38
Total crude oil purchases 59.56 57.91 67.40 68.25 59.02
Purchases of intermediate products 3.59 3.39 2.92 3.05 4.26 Purchase of products 16.14 17.42 13.98 15.28 15.85
TOTAL PURCHASES 79.29 78.72 84.30 86.58 79.13
Consumption for power generation (1.13 ) (1.00 ) (0.96 ) (0.92 ) (0.89 ) Other changes (a) (2.19 ) (1.04 ) (1.64 ) (2.69 ) (1.12 )
75.97 76.68 81.70 82.97 77.12
(a) Includes changes in inventories, transport decline, consumption and losses. i i i
Refinery capacity 2007 2008 2009 2010 2011
Primary distillation capacity (a) (kbbl/d) 910 930 930 930 930 Balanced capacity (a) 748 737 747 757 767 Refinery throughputs on own account 743 717 480 514 455 Distillation capacity utilization rate (%) 81 81 73 73 61
(a) Eni’ s share. i i i
Availability of refined products (mmtonnes) 2007 2008 2009 2010 2011
ITALY At wholly-owned refineries 27.79 25.59 24.02 25.70 22.75 Less input on account of third parties (1.76 ) (1.37 ) (0.49 ) (0.50 ) (0.49 ) At affiliate refineries 6.42 6.17 5.87 4.36 4.74
Refinery throughputs on own account 32.45 30.39 29.40 29.56 27.00 Consumption and losses (1.63 ) (1.61 ) (1.60 ) (1.69 ) (1.55 )
Products available for sale 30.82 28.78 27.80 27.87 25.45 Purchases of refined products and change in inventories 2.16 2.56 3.73 4.24 3.22 Products transferred to operations outside Italy (3.80 ) (1.42 ) (3.89 ) (4.18 ) (1.77 ) Consumption for power generation (1.13 ) (1.00 ) (0.96 ) (0.92 ) (0.89 )
Sales of products 28.05 28.92 26.68 27.01 26.01
OUTSIDE ITALY Refinery throughputs on own account 4.70 5.45 5.15 5.24 4.96 Consumption and losses (0.31 ) (0.25 ) (0.25 ) (0.24 ) (0.23 )
Products available for sale 4.39 5.20 4.90 5.00 4.73 Purchases of finished products and change in inventories 13.91 15.14 10.12 10.61 12.51

Products transferred from Italian operations 3.80 1.42 3.89 4.18 1.77
Sales of products 22.10 21.76 18.91 19.79 19.01 Refinery throughputs on own account 37.15 35.84 34.55 34.80 31.96 Total equity crude input 9.29 6.98 5.11 5.02 6.54
Total sales of refined products 50.15 50.68 45.59 46.80 45.02 Crude oil sales 25.82 26.00 36.11 36.17 32.10
TOTAL SALES 75.97 76.68 81.70 82.97 77.12
- 62 -

Contents
Eni Fact Book Refining & Marketing
- 63 -
Production and sales (mmtonnes) 2007 2008 2009 2010 2011
Production: Gasoline 8.85 8.32 8.43 7.81 7.24 Gasoil 13.91 13.44 13.33 13.63 12.95 Jet fuel/kerosene 1.38 1.54 1.42 1.46 1.41 Fuel oil 4.89 4.34 4.01 3.75 2.65 LPG 0.69 0.71 0.66 0.50 0.57 Lubricants 0.64 0.60 0.49 0.67 0.54 Petrochemical feedstock 1.89 2.16 2.08 2.59 2.49 Other 2.96 2.86 2.28 2.46 2.33
Total production 35.21 33.97 32.70 32.87 30.18
Sales:
Italy 28.05 28.92 26.68 27.01 26.01 Gasoline 3.34 3.26 3.17 2.91 2.78 Gasoil 9.67 10.03 10.04 9.94 9.63 Jet fuel/kerosene 1.97 1.94 1.42 1.45 1.64 Fuel oil 0.95 0.85 0.72 0.44 0.46 LPG 0.54 0.57 0.57 0.59 0.60 Lubricants 0.13 0.13 0.09 0.11 0.10 Petrochemical feedstock 1.93 1.70 1.33 1.72 1.71 Other 9.52 10.44 9.34 9.85 9.09
Rest of Europe 20.08 19.63 16.02 16.66 15.88 Gasoline 2.14 2.21 1.89 1.85 1.79 Gasoil 5.16 5.11 3.55 3.95 3.71 Jet fuel/kerosene 0.38 0.47 0.35 0.38 0.48 Fuel oil 0.25 0.23 0.29 0.25 0.23 LPG 0.13 0.16 0.14 0.12 0.12 Lubricants 0.10 0.11 0.08 0.10 0.09 Other 11.92 11.34 9.72 10.01 9.46
Extra Europe 2.02 2.13 2.89 3.13 3.13 Gasoline 1.52 1.63 2.51 2.74 2.62 LPG 0.36 0.37 0.36 0.37 0.38 Lubricants 0.02 0.03 0.02 0.02 0.02 Other 0.12 0.10 0.00 0.00 0.11
Worldwide Gasoline 7.00 7.10 7.57 7.50 7.19 Gasoil 14.83 15.14 13.59 13.89 13.34 Jet fuel/kerosene 2.35 2.41 1.77 1.83 2.12 Fuel oil 1.20 1.08 1.01 0.69 0.69 LPG 1.03 1.10 1.07 1.08 1.10 Lubricants 0.25 0.27 0.19 0.23 0.21 Petrochemical feedstock 1.93 1.70 1.33 1.72 1.71 Other 21.56 21.88 19.06 19.86 18.66
Total sales 50.15 50.68 45.59 46.80 45.02

Contents
Eni Fact Book Refining & Marketing Sales in Italy and outside Italy by market (mmtonnes) 2007 2008 2009 2010 2011
Retail 8.62 8.81 9.03 8.63 8.36 Wholesale 11.09 11.15 9.56 9.45 9.36
19.71 19.96 18.59 18.08 17.72 Petrochemicals 1.93 1.70 1.33 1.72 1.71 Other markets 6.41 7.26 6.76 7.21 6.58
Sales in Italy 28.05 28.92 26.68 27.01 26.01 Retail rest of Europe 4.03 3.22 2.99 3.10 3.01 Wholesale rest of Europe 4.39 3.94 3.66 3.88 3.84 Wholesale outside Europe 0.57 0.56 0.41 0.42 0.43
8.99 7.72 7.06 7.40 7.28 Other markets 13.11 12.52 11.85 12.39 11.73 Sales outside Italy 22.10 20.24 18.91 19.79 19.01
Total sales (a) 50.15 49.16 45.59 46.80 45.02
(a) 2007 data include downstream activities in the Iberian Peninsula divested to Galp in October 2008.
Retail and wholesale sales of refined products (mmtonnes) 2007 2008 2009 2010 2011
Italy 19.71 19.96 18.59 18.08 17.72 Retail sales 8.62 8.81 9.03 8.63 8.36 Gasoline 3.19 3.11 3.05 2.76 2.60 Gasoil 5.25 5.50 5.74 5.58 5.45 LPG 0.17 0.19 0.22 0.26 0.29 Other 0.01 0.01 0.02 0.03 0.02
Wholesale sales 11.09 11.15 9.56 9.45 9.36 Gasoil 4.42 4.52 4.30 4.36 4.18 Fuel oil 0.95 0.85 0.72 0.44 0.46 LPG 0.37 0.38 0.35 0.33 0.31 Gasoline 0.15 0.15 0.12 0.16 0.19 Lubricants 0.13 0.12 0.09 0.10 0.10 Bunker 1.58 1.70 1.38 1.35 1.26 Jet fuel 1.95 1.94 1.43 1.46 1.65 Other 1.54 1.49 1.17 1.25 1.21
Outside Italy (retail + wholesale) 8.99 7.72 7.06 7.40 7.28 Gasoline 2.29 2.12 1.89 1.85 1.79 Gasoil 5.16 3.80 3.54 3.95 3.82 Jet fuel 0.38 0.47 0.35 0.40 0.49 Fuel oil 0.25 0.23 0.28 0.25 0.23 Lubricants 0.09 0.11 0.10 0.10 0.10 LPG 0.49 0.52 0.50 0.49 0.50 Other 0.33 0.47 0.40 0.36 0.35
Total (a) 28.70 27.68 25.65 25.48 25.00
(a) 2007 data include downstream activities in the Iberian Peninsula divested to Galp in October 2008.
Number of service stations (units) 2007 2008 2009 2010 2011
Italy 4,390 4,409 4,474 4,542 4,701 Ordinary stations 4,253 4,273 4,344 4,415 4,574 Highway stations 137 136 130 127 127

Outside Italy 2,050 1,547 1,512 1,625 1,586 Germany 672 521 478 455 454 France 202 199 196 188 181 Iberian Peninsula (a) 371 - - - - Austria/Switzerland 443 458 446 582 547 Eastern Europe 362 369 392 400 404
Service stations selling Blu products 4,357 4,445 4,822 4,994 5,179 "Multi-Energy" service stations 4 4 4 5 5 Service stations selling LPG and natural gas 538 537 690 657 864 Non-oil sales (euro million) 144 153 147 136.9 156
(a) In October 2008 downstream activities including 371 service stations were sold to Galp.
- 64 -

Contents
Eni Fact Book Refining & Marketing
Average throughput (kliters/No. of service stations) 2007 2008 2009 2010 2011
Italy 2,444 2,470 2,482 2,322 2,173 Germany 2,968 2,868 3,167 3,360 3,237 France 2,365 2,152 2,193 2,310 2,209 Iberian Peninsula (a) 2,910 2,519 - - -Austria/Switzerland 1,767 1,763 1,691 1,711 1,645 Eastern Europe 2,348 2,832 2,642 2,508 2,591
Average throughput 2,486 2,502 2,477 2,352 2,206
(a) Refers to the first nine months of 2008. In October 2008 downstream activities including 371 service stations were sold to Galp.
Market shares in Italy (%) 2007 2008 2009 2010 2011
Retail 29.2 30.6 31.5 30.4 30.5 Gasoline 27.3 28.5 29.0 27.9 27.8 Gasoil 31.2 32.7 33.8 32.5 32.6 LPG (automotive) 18.2 19.1 20.2 21.4 22.7 Lubricants 24.3 23.7 21.5 35.7 27.6
Wholesale 29.0 30.4 27.5 29.2 28.3 Gasoil 31.3 31.8 32.0 33.5 30.8 Fuel oil 16.2 16.3 17.2 17.8 25.5 Bunker 44.0 44.6 40.1 40.4 33.6 Lubricants 24.3 25.0 23.3 24.0 23.6
Domestic market share 29.5 31.0 29.3 29.8 29.3
Retail market shares outside Italy (%) 2007 2008 2009 2010 2011
Central Europe Austria 7.8 7.0 7.3 7.0 9.6 Switzerland 5.9 6.4 6.4 6.5 6.6 Germany 4.2 3.8 3.4 3.4 3.1 France 1.1 1.1 1.1 1.1 1.0
Eastern Europe Hungary 7.9 11.6 11.6 11.9 11.9 Czech Republic 7.7 11.4 11.3 11.8 11.6 Slovakia 10.2 9.2 9.7 9.8 Slovenia 2.0 2.1 2.4 2.3 2.2 Romania 1.2 1.5 1.7
Capital expenditures (euro million) 2007 2008 2009 2010 2011
Italy 873 850 581 633 803 Outside Italy 106 115 54 78 63
979 965 635 711 866
Refining, supply and logistic 675 630 436 446 629 Italy 675 630 436 444 626 Outside Italy 2 3 Marketing 282 298 172 246 228

- 65 -
Italy 176 183 118 170 168 Outside Italy 106 115 54 76 60 Other 22 37 27 19 9
979 965 635 711 866
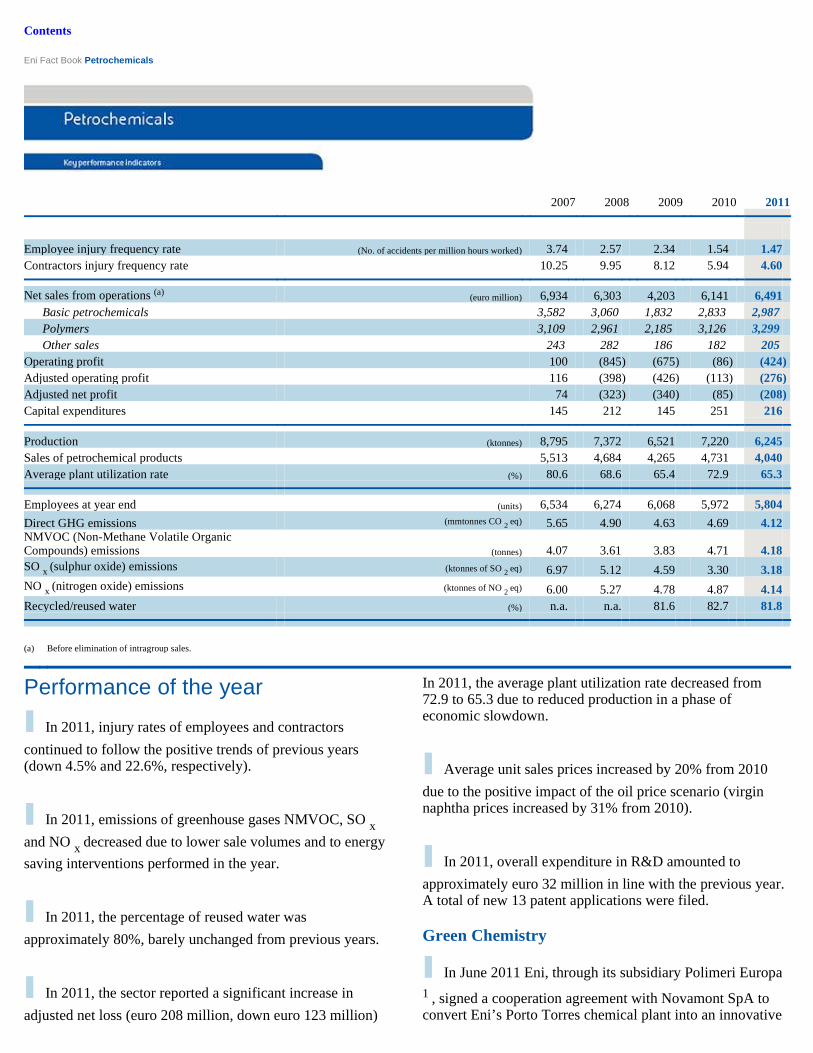
Contents
Eni Fact Book Petrochemicals
2007 2008 2009 2010 2011
Employee injury frequency rate (No. of accidents per million hours worked) 3.74 2.57 2.34 1.54 1.47 Contractors injury frequency rate 10.25 9.95 8.12 5.94 4.60
Net sales from operations (a) (euro million) 6,934 6,303 4,203 6,141 6,491 Basic petrochemicals 3,582 3,060 1,832 2,833 2,987 Polymers 3,109 2,961 2,185 3,126 3,299 Other sales 243 282 186 182 205 Operating profit 100 (845 ) (675 ) (86 ) (424 ) Adjusted operating profit 116 (398 ) (426 ) (113 ) (276 ) Adjusted net profit 74 (323 ) (340 ) (85 ) (208 ) Capital expenditures 145 212 145 251 216
Production (ktonnes) 8,795 7,372 6,521 7,220 6,245 Sales of petrochemical products 5,513 4,684 4,265 4,731 4,040 Average plant utilization rate (%) 80.6 68.6 65.4 72.9 65.3
Employees at year end (units) 6,534 6,274 6,068 5,972 5,804 Direct GHG emissions (mmtonnes CO 2 eq) 5.65 4.90 4.63 4.69 4.12 NMVOC (Non-Methane Volatile Organic Compounds) emissions (tonnes) 4.07 3.61 3.83 4.71 4.18 SO x (sulphur oxide) emissions (ktonnes of SO 2 eq) 6.97 5.12 4.59 3.30 3.18 NO x (nitrogen oxide) emissions (ktonnes of NO 2 eq) 6.00 5.27 4.78 4.87 4.14 Recycled/reused water (%) n.a. n.a. 81.6 82.7 81.8
(a) Before elimination of intragroup sales.
Performance of the year
I I I I In 2011, injury rates of employees and contractors
continued to follow the positive trends of previous years (down 4.5% and 22.6%, respectively).
I I I I In 2011, emissions of greenhouse gases NMVOC, SO x and NO x decreased due to lower sale volumes and to energy
saving interventions performed in the year.
I I I I In 2011, the percentage of reused water was
approximately 80%, barely unchanged from previous years.
I I I I In 2011, the sector reported a significant increase in
adjusted net loss (euro 208 million, down euro 123 million)
In 2011, the average plant utilization rate decreased from 72.9 to 65.3 due to reduced production in a phase of economic slowdown.
I I I I Average unit sales prices increased by 20% from 2010
due to the positive impact of the oil price scenario (virgin naphtha prices increased by 31% from 2010).
I I I I In 2011, overall expenditure in R&D amounted to
approximately euro 32 million in line with the previous year. A total of new 13 patent applications were filed.
Green Chemistry
I I I I In June 2011 Eni, through its subsidiary Polimeri Europa 1 , signed a cooperation agreement with Novamont SpA to convert Eni’s Porto Torres chemical plant into an innovative

from 2010, due to higher supply costs of oil-based feedstock which were not recovered in sale prices on end markets in a context of substantial decrease in demand.
I I I I Sales of petrochemical products were 4,040 ktonnes,
down 691 ktonnes, or 14.6%, from 2010 due to lower demand. Petrochemical production volumes were 6,245 ktonnes, decreased by 975 ktonnes, or down 13.5%, due to a decline in demand for petrochemical products in all business, with the only exception of elastomers (up 1%).
bio-based chemical complex to produce bio-plastics and other bio-based products (bio-lubricants and bio-additives) for which significant growth is expected in the medium/long-term. The project will be supported by an integrated supply chain and raw materials of vegetable origin. Novamont will contribute with its technologies and skills in the bio-plastics and bio-based chemical sector. Eni will contribute to the joint entity with its Porto Torres plant, infrastructure and professional staff as well as its industry, technical engineering and commercial know-how in the petrochemical sector. In addition, Eni aims to build a biomass power plant and to carry out a number of projects for the environmental restoration and clean-up
(1) i From April 5, 2012 Polimeri Europa SpA changed its company name in Versalis.
- 66 -

Contents
Eni Fact Book Petrochemicals
- 67 -
activities. Eni plans to make capital expenditures totaling approximately euro 1.2 billion in the 2011-2016 period to execute the above mentioned projects, directly or through the joint entity.
Activities
Eni through Versalis performs activities of production and marketing of petrochemical products (basic petrochemicals and polymers), leveraging on a wide range of proprietary technologies, advanced production facilities, as well as a large and efficient retail network present
in 18 European Countries. The principal objective of basic petrochemicals is granting the adequate availability of monomers (ethylene, butadiene and benzene) covering the needs of further production processes: in particular olefins production is strictly linked with the polyethylene and elastomers business, aromatics grant the benzene availability necessary to produce intermediate products used in the production of resins, artificial fibers and polystyrene. In polymers business Versalis is one of the most relevant European producers of elastomers, where it is present in almost all the relevant sectors (in particular the automotive industry), polystyrene and polyethylene, whose most relevant use is in flexible packaging.
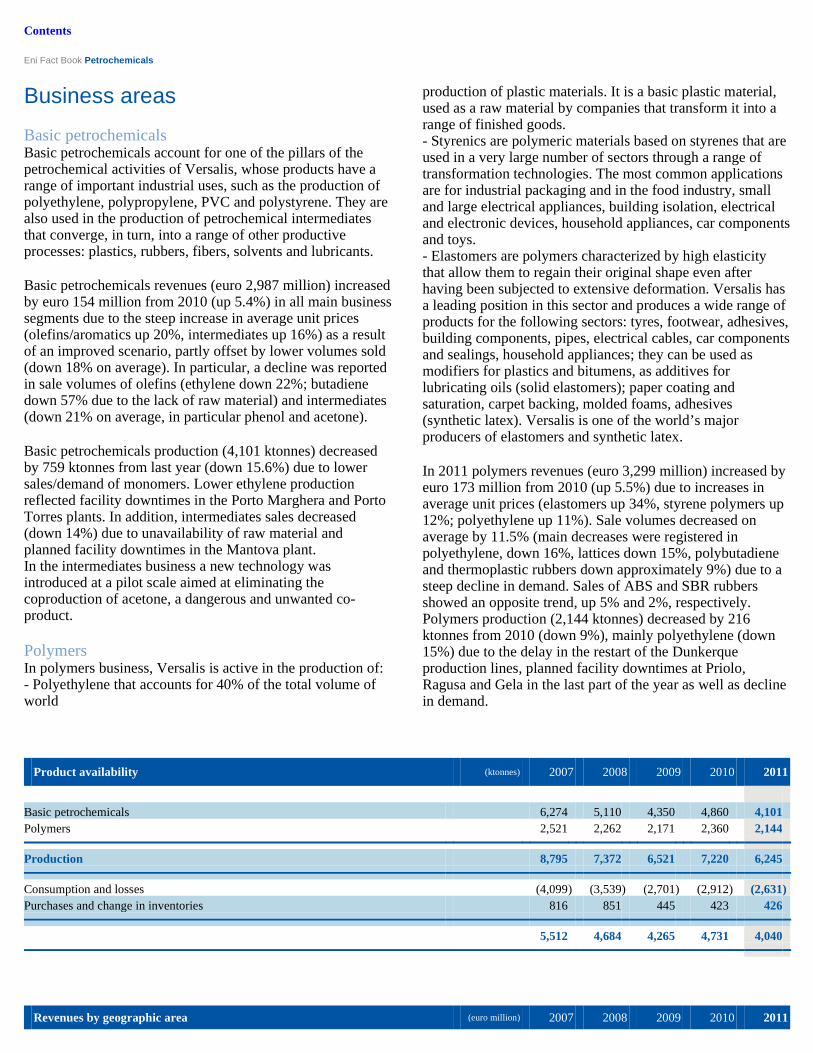
Contents
Eni Fact Book Petrochemicals
Business areas
Basic petrochemicals Basic petrochemicals account for one of the pillars of the petrochemical activities of Versalis, whose products have a range of important industrial uses, such as the production of polyethylene, polypropylene, PVC and polystyrene. They are also used in the production of petrochemical intermediates that converge, in turn, into a range of other productive processes: plastics, rubbers, fibers, solvents and lubricants.
Basic petrochemicals revenues (euro 2,987 million) increased by euro 154 million from 2010 (up 5.4%) in all main business segments due to the steep increase in average unit prices (olefins/aromatics up 20%, intermediates up 16%) as a result of an improved scenario, partly offset by lower volumes sold (down 18% on average). In particular, a decline was reported in sale volumes of olefins (ethylene down 22%; butadiene down 57% due to the lack of raw material) and intermediates (down 21% on average, in particular phenol and acetone).
Basic petrochemicals production (4,101 ktonnes) decreased by 759 ktonnes from last year (down 15.6%) due to lower sales/demand of monomers. Lower ethylene production reflected facility downtimes in the Porto Marghera and Porto Torres plants. In addition, intermediates sales decreased (down 14%) due to unavailability of raw material and planned facility downtimes in the Mantova plant. In the intermediates business a new technology was introduced at a pilot scale aimed at eliminating the coproduction of acetone, a dangerous and unwanted co-product.
Polymers In polymers business, Versalis is active in the production of: - Polyethylene that accounts for 40% of the total volume of world
production of plastic materials. It is a basic plastic material, used as a raw material by companies that transform it into a range of finished goods. - Styrenics are polymeric materials based on styrenes that are used in a very large number of sectors through a range of transformation technologies. The most common applications are for industrial packaging and in the food industry, small and large electrical appliances, building isolation, electrical and electronic devices, household appliances, car components and toys. - Elastomers are polymers characterized by high elasticity that allow them to regain their original shape even after having been subjected to extensive deformation. Versalis has a leading position in this sector and produces a wide range of products for the following sectors: tyres, footwear, adhesives, building components, pipes, electrical cables, car components and sealings, household appliances; they can be used as modifiers for plastics and bitumens, as additives for lubricating oils (solid elastomers); paper coating and saturation, carpet backing, molded foams, adhesives (synthetic latex). Versalis is one of the world’s major producers of elastomers and synthetic latex.
In 2011 polymers revenues (euro 3,299 million) increased by euro 173 million from 2010 (up 5.5%) due to increases in average unit prices (elastomers up 34%, styrene polymers up 12%; polyethylene up 11%). Sale volumes decreased on average by 11.5% (main decreases were registered in polyethylene, down 16%, lattices down 15%, polybutadiene and thermoplastic rubbers down approximately 9%) due to a steep decline in demand. Sales of ABS and SBR rubbers showed an opposite trend, up 5% and 2%, respectively. Polymers production (2,144 ktonnes) decreased by 216 ktonnes from 2010 (down 9%), mainly polyethylene (down 15%) due to the delay in the restart of the Dunkerque production lines, planned facility downtimes at Priolo, Ragusa and Gela in the last part of the year as well as decline in demand.
Product availability (ktonnes) 2007 2008 2009 2010 2011
Basic petrochemicals 6,274 5,110 4,350 4,860 4,101 Polymers 2,521 2,262 2,171 2,360 2,144
Production 8,795 7,372 6,521 7,220 6,245
Consumption and losses (4,099 ) (3,539 ) (2,701 ) (2,912 ) (2,631 ) Purchases and change in inventories 816 851 445 423 426
5,512 4,684 4,265 4,731 4,040
Revenues by geographic area (euro million) 2007 2008 2009 2010 2011

- 68 -
Italy 3,327 3,290 2,215 3,131 3,364 Rest of Europe 3,231 2,646 1,701 2,632 2,747 Asia 190 200 169 139 182 Africa 115 88 76 127 101 Americas 69 75 39 108 93 Other areas 2 4 3 4 4
6,934 6,303 4,203 6,141 6,491

Contents
Eni Fact Book Petrochemicals
- 69 -
Revenues by product (euro million) 2007 2008 2009 2010 2011
Olefins 2,047 1,763 1,059 1,705 1,754 Aromatics 781 679 486 704 835 Intermediates 754 618 287 424 398 Elastomers 709 754 579 834 1,062 Styrenics 718 633 465 695 741 Polyethylene 1,682 1,574 1,140 1,597 1,496 Other 243 282 187 182 205
6,934 6,303 4,203 6,141 6,491
Capital expenditures (euro million) 2007 2008 2009 2010 2011
Total capital expenditures 145 212 145 251 216
of which: - upkeeping 29 84 28 59 59 - plant upgrades 47 51 58 116 53 - HSE 39 41 28 29 46 - energy recovery 45 42

Contents
Eni Fact Book Engineering & Construction
2007 2008 2009 2010 2011
Employee injury frequency rate (No. of accidents per million hours worked) 0.87 0.70 0.40 0.45 0.44 Contractors injury frequency rate 0.62 0.38 0.57 0.33 0.21 Fatality index (No. of fatalities per 100 million hours worked) 4.00 2.83 0.86 2.14 1.82
Net sales from operations (a) (euro million) 8,678 9,176 9,664 10,581 11,834 Operating profit 837 1,045 881 1,302 1,422 Adjusted operating profit 840 1,041 1,120 1,326 1,443 Adjusted net profit 658 784 892 994 1,098 Capital expenditure 1,410 2,027 1,630 1,552 1,090 Adjusted ROACE (%) 17.1 16.8 15.4 14.0 13.9
Orders acquired (euro million) 11,845 13,860 9,917 12,935 12,505 Order backlog 15,390 19,105 18,730 20,505 20,417
Employees at year end (units) 33,111 35,629 35,969 38,826 38,561 Employees outside Italy rate (%) 84.9 84.8 85.6 87.3 86.5 Local managers rate n.a. n.a. 41.1 45.3 43.0 Local procurement rate n.a. n.a. 47.0 61.3 56.4 Healthcare expenditures (euro thousand) 13,064 15,436 25,205 19,506 32,410 Security expenditures 70,523 57,477 68,954 26,403 50,541
Direct GHG emissions (mmtonnes CO 2 eq) 1.07 1.36 1.28 1.11 1.32
(a) Before elimination of intragroup sales.
Performance of the year
I I I I The percentage of managerial positions covered by local
personnel is constantly higher than 40% of total managerial positions, except for Italy and France, reflecting however fluctuations due to the opening of new yards and short-term projects.
I I I I The overall amount of procurement was euro 8,740
million in 2011, of which euro 6,510 million related to operating projects, 56.4% of which was procured with local suppliers.
I I I I In 2011, the injury frequency rate improved from 2010
(down 2% and down 36% for employees and contractors, respectively).
higher turnover and increasing project profitability.
I I I I Return on average capital employed calculated on an
adjusted basis was 13.9% in 2011 (14% in 2010).
I I I I Orders acquired amounted to euro 12,505 million (euro
12,935 million in 2010), of these projects to be carried outside Italy represented 91%, while orders from Eni companies amounted to 7% of the total.
I I I I Order backlog amounted to euro 20,417 million at
December 31, 2011 (euro 20,505 million at December 31, 2010), of which euro 9,451 million to be carried out within 2012.
I I I I Capital expenditures amounting to euro 1,090 million
(euro 1,552 million in 2010) mainly regarded the upgrading

- 70 -
I I I I Health and safety expenditures for individual protection
equipment and medical assistance increased by 81% from 2010 (from euro 46 million to euro 83 million).
I I I I In 2011, the Engineering & Construction sector achieved
a positive performance with an adjusted net profit amounting to euro 1,098 million, up euro 104 million, or 10.5%, from a year ago, mainly due to a
of the drilling and construction fleet.
I I I I In 2011, overall expenditure in R&D amounted
approximately to euro 15 million in line with 2010. A total of 28 new patent applications were filed.
Engineering & Construction Offshore Saipem is well positioned in the market of large, complex projects for the development of offshore hydrocarbon fields leveraging on
its technical and operational skills, supported by a technologically-advanced fleet, the ability to operate in complex environments, and engineering and project management capabilities acquired on the

Contents
Eni Fact Book Engineering & Construction
marketplace over recent years. Saipem intends to consolidate its market share strengthening its EPIC oriented business model and leveraging on its satisfactory long-term relationships with the major oil companies and National Oil Companies ("NOCs"). Higher levels of efficiency and flexibility are expected to be achieved by reaching the technological excellence and the highest economies of scale in its engineering hubs employing local resources in contexts where this represents a competitive advantage, integrating in its own business model the direct management of construction process through the creation of a large construction yard in South-East Asia and revamping/upgrading its construction fleet. Over the next years, Saipem will invest in the upgrading of its fleet, by building a pipelayer and other supporting assets for offshore activity. This capital expenditure will enable Saipem to underpin its operations in deepwater and sub-artic.
In 2011, revenues amounted to euro 4,908 million, increasing by 10.4% from 2010, due to higher levels of activity in Northern Europe, Kazakhstan and Asia Pacific. Orders acquired amounted to euro 6,131 million (euro 4,600 million in 2010).
The most significant order awarded in 2011 in Engineering & Construction Offshore construction were: (i) the EPIC contract on behalf of South Oil Co for the expansion of the Basra oil center and related infrastructures in the field of the Iraq Crude Oil Export Expansion - Phase 2 project; (ii) the EPIC contract on behalf of Saudi Aramco for the realization of the offshore infrastructures in the field of the development of the offshore fields Arabiyah and Hasbah in the Arabian section of the Persian Gulf; and (iii) an EPIC contract on behalf of Husky Oil China Ltd for the installation of two subsea pipelines and related production system for the South China Sea.
Engineering & Construction Onshore In the Engineering & Construction Onshore construction business, Saipem is one of the largest operators on turnkey contract base at a worldwide level in the oil&gas segment, especially through the
acquisition of Snamprogetti. Saipem operates in the construction of plants for hydrocarbon production (extraction, separation, stabilization, collection of hydrocarbons, water injection) and treatment (removal and recovery of sulphur dioxide and carbon dioxide, fractioning of gaseous liquids, recovery of condensates) and in the installation of large onshore transport systems (pipelines, compression stations, terminals). Saipem preserves its own competitiveness through its technology excellence granted by its engineering hubs, its distinctive know-how in the construction of projects in the high-tech market of LNG and the management of large parts of engineering activities in cost efficient areas. In the medium term, underpinning upward trends in the oil service market, Saipem will be focused on taking advantage of the opportunities arising from the market in the plant and pipeline segments leveraging on its solid competitive position in the realization of complex projects in the strategic areas of Middle-East/Caspian Sea, Northern and Western Africa and Russia.
In 2011, revenues amounted to euro 5,369 million, increasing by 13.6% from 2010, due to higher levels of activity in the Middle East, Canada and Australia.
Orders acquired amounted to euro 5,006 million (euro 7,744 million in 2010). The principal orders awarded in 2011 in Engineering & Construction onshore were: (i) the realization of 39 kilometers high-speed/high-capacity railway along the Treviglio-Brescia railway in Northern Italy on behalf of Rete Ferroviaria SpA; (ii) the EPC contract for the construction of a Secondary Upgrader with a capacity of 43 kbbl/d of Hydrotreated gas oil. The infrastructure will be part of the Horizon Oil Sands Project – Hydrotreater Phase 2 – in Alberta, in the Athabasca Region, Canada; and (iii) the EPC contract for the realization of a gas pipeline, 42 inches in diameter and 435-kilometer long, which will connect the gas fields in the Bowen and Surat Basins to the Gladstone State Development Area (GSDA), near the city of Gladstone, in the western Australian coast on behalf of Gladstone Operations Pty Ltd.

- 71 -

Contents
Eni Fact Book Engineering & Construction
Offshore drilling Saipem is the only engineering and construction contractor that provides both offshore and onshore drilling services to oil companies. In the offshore drilling segment, Saipem mainly operates in West Africa, the North Sea, the Mediterranean Sea and the Middle East and boasts significant market positions in the most complex segments of deep and ultra-deep offshore, leveraging on the outstanding technical features of its drilling platforms and vessels, capable of drilling exploration and development wells at a maximum water depth of 3,600 meters. In order to better meet industry demands, Saipem is finalizing an upgrading program of its drilling fleet providing it with state-of-the-art rigs to enhance its role as high quality player capable of operating also in complex and harsh environments. In particular, in the following years, Saipem intends to complete the building of the Scarabeo 8 and 9, new generation semi-submersible platforms, that have been already rented to Eni through multi-year contracts. In parallel, investments are ongoing to renew and to keep up the production capacity of other fleet equipment (upgrade equipment to the characteristics of projects or to clients needs and purchase of support equipment).
In 2011, revenues amounted to euro 833 million, increasing by 11.1% from 2010 mainly due to the entry in full activity of the Saipem 10000 and Saipem 12000 drilling vessels and of the Perro Negro 8 jack up.
In 2001 orders acquired amounted to euro 780 million (euro 326 million in 2010). The most significant order awarded in 2011 in Offshore drilling were: (i) a 24-month extension contract, from August 2012, for the lease of
the drilling vessel Saipem 10000 on behalf of Eni; (ii) a 24-month extension contract, from August 2015, for the lease of the drilling vessel Saipem 12000; and (iii) a 36- month extension contract for the lease of the jack up Perro Negro 7.
Onshore drilling Saipem operates in this area as a main contractor for the major international oil companies and NOCs executing its activity mainly in South America, Saudi Arabia, North Africa and, at a lower extent, in Europe. In this area Saipem can leverage its knowledge of the market, long-term relations with customers and synergies and integration with other business areas. Saipem boasts a solid track record in remote areas (in particular in the Caspian Sea), leveraging on its own operational skills and its ability to operate in complex environments.
In 2011, revenues amounted to euro 724 million, increasing by 9.5% from 2010 mainly due to higher utilization of equipments in South America and entry in operation of new plants in Kazakhstan. Orders acquired amounted to euro 588 million (euro 265 million in 2010). The most significant order awarded in 2011 in Onshore drilling were: (i) a contract on behalf on Saudi Aramco in Saudi Arabia for the lease of nine rigs with a contract duration from one to three years; (ii) contracts on behalf of various clients in Peru, Colombia and Bolivia for the lease of fourteen rigs with a contract duration from 4 to 24 months; and (iii) two contracts on behalf of Ural Oil and Samek for the lease of 2 rigs with a contract duration of 4 and 12 months, respectively.
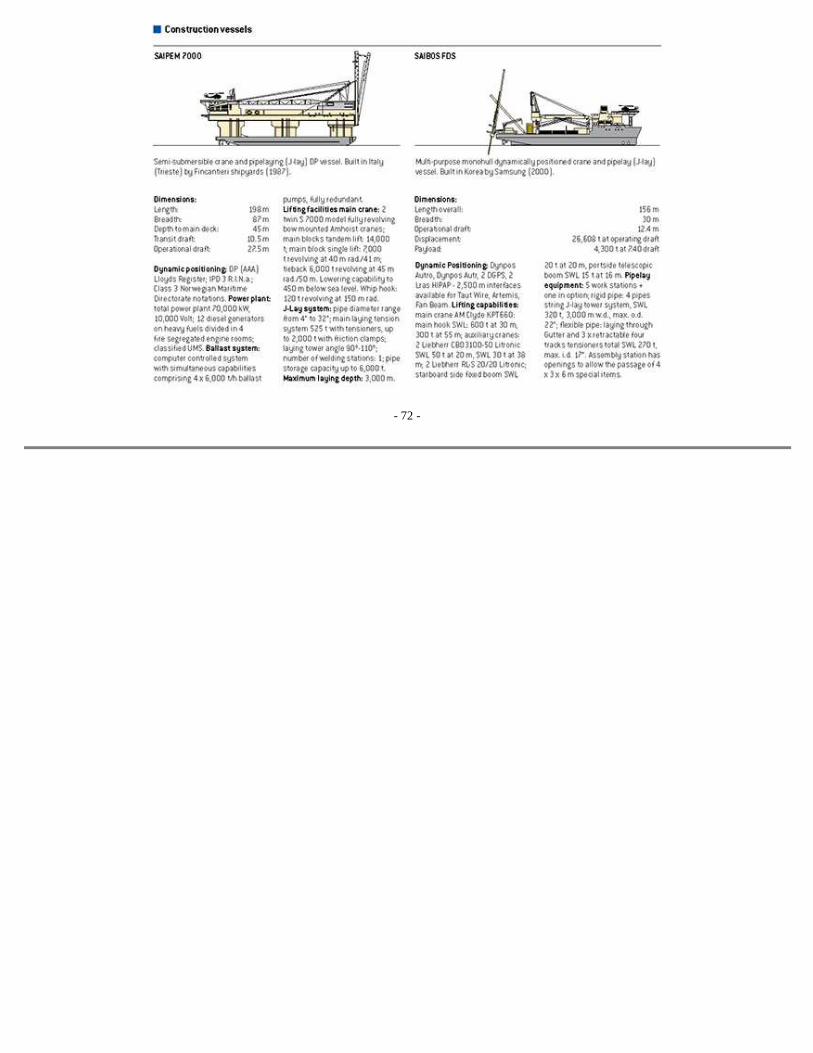
- 72 -

Contents
Eni Fact Book Engineering & Construction
- 73 -

Contents
Eni Fact Book Engineering & Construction
Main operating data 2007 2008 2009 2010 2011
Offshore pipelines laid (km) 665 815 1,000 1,365 1,682 Onshore pipelines laid (km) 770 683 716 385 889
Offshore structures installed (t) 187,054 24,835 62,333 46,606 105,033 Onshore structures installed (t) 194,561 163,137 76,543 874,428 353,480
Offshore drilling (km) 123 150 140 130 178 Onshore drilling (km) 657 622 719 881 985
Offshore wells drilled (units) 47 50 54 44 64 Onshore wells drilled (units) 256 241 241 279 307
Drilling vessels
Name Type Drilling plant Maximum
depth (m)
Drilling maximum
(m) Other
Perro Negro 2 Jack up Oilwell E 2000 90 6,500 Heliport provided Perro Negro 3 Jack up Ideco E 2100 90 6,000 Heliport provided
Perro Negro 4 Jack up National 110
UE 45 5,000 Heliport provided
Perro Negro 5 Jack up National 1320
UE 90 6,500 Heliport provided
Perro Negro 6 Jack up National SSDG
3000 107 9,150 Heliport provided
Perro Negro 7 Jack up National 1625
UE 115 9,150 Heliport provided
Perro Negro 8 Jack up NOV SSDG-
3000 107 9,100
Scarabeo 3 Semi-submersible drilling platform helped propulsion system
National 1625 DE 550 7,600 Heliport provided
Scarabeo 4 Semi-submersible drilling platform helped propulsion system
National 1625 DE 550 7,600 Heliport provided
Scarabeo 5 Semi-submersible drilling platform, self-propelled Emco C3 1,900 8,000 Heliport provided Scarabeo 6 Semi-submersible drilling platform, self-propelled Oilwell E 3000 500 7,600 Heliport provided
Scarabeo 7 Semi-submersible drilling platform, self-propelled Wirth SH 3000
EG 1,500 8,000 Heliport provided Ultra deep waters drillship, self-propelled, dynamic Wirth GH Oil storage capacity: 140,000 bbl;

- 74 -
Saipem 10000 positioning 4500 EG 3,000 9,200 heliport provided
Saipem 12000 Ultra deep waters drillship, self-propelled, dynamic positioning
NOV SSDG-5750 3,650 10,000 Heliport provided
Saipem TAD Tender assisted drilling barge Bentec 1500
Hp 150 4,877 Heliport provided
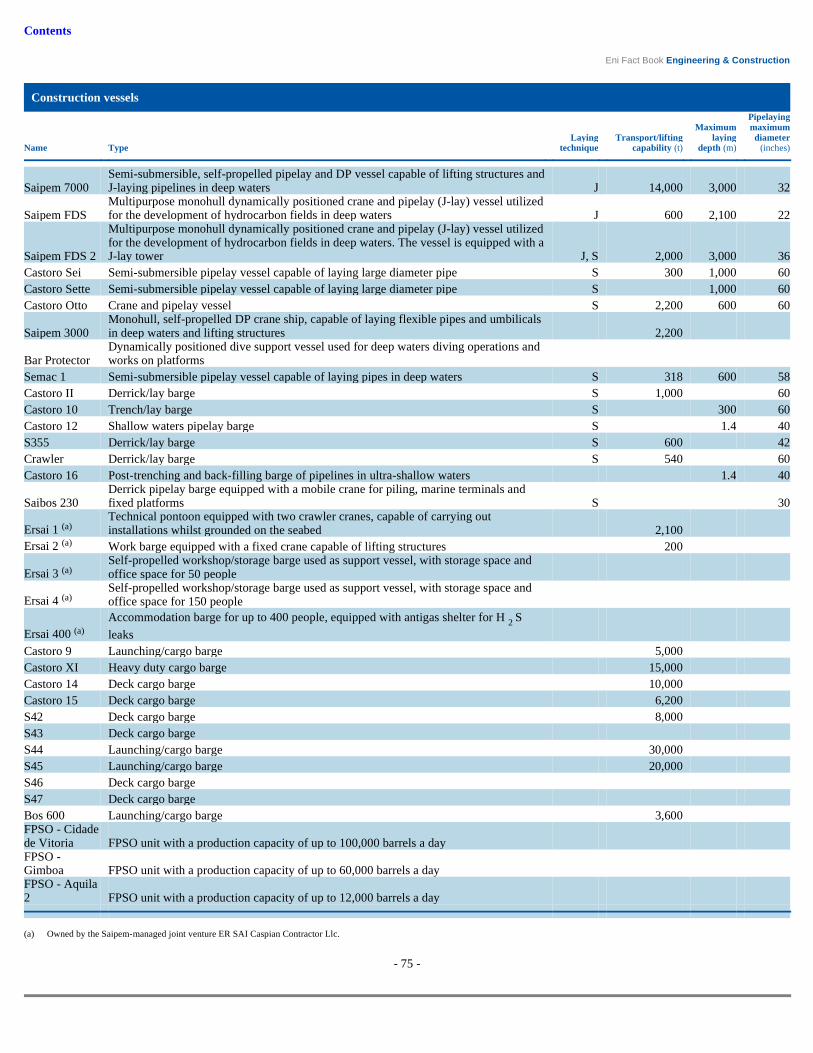
Contents
Eni Fact Book Engineering & Construction
- 75 -
Construction vessels
Name Type Laying
technique Transport/lifting
capability (t) Maximum
laying depth (m)
Pipelaying maximum diameter
(inches)
Saipem 7000 Semi-submersible, self-propelled pipelay and DP vessel capable of lifting structures and J-laying pipelines in deep waters J 14,000 3,000 32
Saipem FDS Multipurpose monohull dynamically positioned crane and pipelay (J-lay) vessel utilized for the development of hydrocarbon fields in deep waters J 600 2,100 22
Saipem FDS 2
Multipurpose monohull dynamically positioned crane and pipelay (J-lay) vessel utilized for the development of hydrocarbon fields in deep waters. The vessel is equipped with a J-lay tower J, S 2,000 3,000 36
Castoro Sei Semi-submersible pipelay vessel capable of laying large diameter pipe S 300 1,000 60 Castoro Sette Semi-submersible pipelay vessel capable of laying large diameter pipe S 1,000 60 Castoro Otto Crane and pipelay vessel S 2,200 600 60
Saipem 3000 Monohull, self-propelled DP crane ship, capable of laying flexible pipes and umbilicals in deep waters and lifting structures 2,200
Bar Protector Dynamically positioned dive support vessel used for deep waters diving operations and works on platforms
Semac 1 Semi-submersible pipelay vessel capable of laying pipes in deep waters S 318 600 58 Castoro II Derrick/lay barge S 1,000 60 Castoro 10 Trench/lay barge S 300 60 Castoro 12 Shallow waters pipelay barge S 1.4 40 S355 Derrick/lay barge S 600 42 Crawler Derrick/lay barge S 540 60 Castoro 16 Post-trenching and back-filling barge of pipelines in ultra-shallow waters 1.4 40
Saibos 230 Derrick pipelay barge equipped with a mobile crane for piling, marine terminals and fixed platforms S 30
Ersai 1 (a) Technical pontoon equipped with two crawler cranes, capable of carrying out installations whilst grounded on the seabed 2,100
Ersai 2 (a) Work barge equipped with a fixed crane capable of lifting structures 200
Ersai 3 (a) Self-propelled workshop/storage barge used as support vessel, with storage space and office space for 50 people
Ersai 4 (a) Self-propelled workshop/storage barge used as support vessel, with storage space and office space for 150 people
Ersai 400 (a) Accommodation barge for up to 400 people, equipped with antigas shelter for H 2 S
leaks Castoro 9 Launching/cargo barge 5,000 Castoro XI Heavy duty cargo barge 15,000 Castoro 14 Deck cargo barge 10,000 Castoro 15 Deck cargo barge 6,200 S42 Deck cargo barge 8,000 S43 Deck cargo barge S44 Launching/cargo barge 30,000 S45 Launching/cargo barge 20,000 S46 Deck cargo barge S47 Deck cargo barge Bos 600 Launching/cargo barge 3,600 FPSO - Cidade de Vitoria FPSO unit with a production capacity of up to 100,000 barrels a day FPSO - Gimboa FPSO unit with a production capacity of up to 60,000 barrels a day FPSO - Aquila 2 FPSO unit with a production capacity of up to 12,000 barrels a day
i i i (a) i Owned by the Saipem-managed joint venture ER SAI Caspian Contractor Llc.

Contents
Eni Fact Book Financial Data
Profit and loss account (euro million) 2007 2008 2009 2010 2011
Net sales from operations 87,204 108,082 83,227 98,523 109,589 Other income and revenues 833 728 1,118 956 933
Total revenues 88,037 108,810 84,345 99,479 110,522 Purchases, services and other (58,133 ) (76,350 ) (58,351 ) (69,135 ) (79,191 ) Payroll and related costs (3,800 ) (4,004 ) (4,181 ) (4,785 ) (4,749 )
Total operating expenses (61,933 ) (80,354 ) (62,532 ) (73,920 ) (83,940 ) Other operating income (expense) (129 ) (124 ) 55 131 171 Depreciation, depletion, amortization and impairments (7,236 ) (9,815 ) (9,813 ) (9,579 ) (9,318 )
Operating profit 18,739 18,517 12,055 16,111 17,435 Finance (expense) income 46 (640 ) (551 ) (727 ) (1,129 ) Net income from investments 1,243 1,373 569 1,156 2,171
Profit before income taxes 20,028 19,250 12,073 16,540 18,477 Income taxes (9,219 ) (9,692 ) (6,756 ) (9,157 ) (10,674 ) Tax rate (%) 46.0 50.3 56.0 55.4 57.8
Net profit 10,809 9,558 5,317 7,383 7,803 Attributable to: - Eni’s shareholders 10,011 8,825 4,367 6,318 6,860 - Non-controlling interest 798 733 950 1,065 943
Net profit attributable to Eni ’s shareholders 10,011 8,825 4,367 6,318 6,860 Exclusion of inventory holding (gains) losses (499 ) 723 (191 ) (610 ) (724 ) Exclusion of special items 57 616 1,031 1,161 833 of which: - non-recurring items 35 (21 ) 250 (246 ) 69 - other special items 22 637 781 1,407 764
Adjusted net profit attributable to Eni ’s shareholders 9,569 10,164 5,207 6,869 6,969
Summarized Group Balance Sheet (euro million) 2007 2008 2009 2010 2011
Fixed assets Property, plant and equipment 50,137 55,933 59,765 67,404 73,578 Other assets 563 Inventories - Compulsory stock 2,171 1,196 1,736 2,024 2,433 Intangible assets 4,333 11,019 11,469 11,172 10,950 Equity-accounted investments and other investments 6,111 5,881 6,244 6,090 6,242 Receivables and securities held for operating purposes 725 1,219 1,261 1,743 1,740 Net payables related to capital expenditures (1,191 ) (787 ) (749 ) (970 ) (1,576 )
62,849 74,461 79,726 87,463 93,367 Net working capital Inventories 5,499 6,082 5,495 6,589 7,575 Trade receivables 15,609 16,444 14,916 17,221 17,709 Trade payables (11,092 ) (12,590 ) (10,078 ) (13,111 ) (13,436 ) Tax payables and provision for net deferred tax liabilities (4,412 ) (5,323 ) (1,988 ) (2,684 ) (3,503 ) Provisions (8,433 ) (9,506 ) (10,319 ) (11,792 ) (12,735 ) Other current assets and liabilities (2,653 ) (4,544 ) (3,968 ) (1,286 ) 281
(5,482 ) (9,437 ) (5,942 ) (5,063 ) (4,109 ) Equity instruments 2,476 2,741 Provisions for employee post-retirement benefits (935 ) (947 ) (944 ) (1,032 ) (1,039 )

Net assets held for sale including related net borrowings 286 68 266 479 206
CAPITAL EMPLOYED, NET 59,194 66,886 73,106 81,847 88,425
Shareholders’ equity: attributable to: - Eni’s shareholders (a) 40,428 44,436 46,073 51,206 55,472 - Non-controlling interest 2,439 4,074 3,978 4,522 4,921
42,867 48,510 50,051 55,728 60,393 Net borrowings 16,327 18,376 23,055 26,119 28,032
TOTAL LIABILITIES AND SHAREHOLDERS ’ EQUITY 59,194 66,886 73,106 81,847 88,425
(a) Net of own shares in portfolio.
- 76 -

Contents
Eni Fact Book Financial Data
Summarized Group Cash Flow Statement (euro million) 2007 2008 2009 2010 2011
Net profit 10,809 9,558 5,317 7,383 7,803 Adjustments to reconcile to cash generated from operating profit before changes in working capital: - amortization and depreciation and other non monetary items 6,320 8,792 9,117 9,024 9,095 - net gains on disposal of assets (309 ) (219 ) (226 ) (552 ) (1,170 ) - dividends, interest, taxes and other changes 8,850 9,399 6,843 9,368 10,651 Changes in working capital related to operations (1,641 ) 4,489 (1,195 ) (1,720 ) (2,176 ) Dividends received, taxes paid, interest (paid) received during the period (8,512 ) (10,218 ) (8,720 ) (8,809 ) (9,821 )
Net cash provided by operating activities 15,517 21,801 11,136 14,694 14,382 Capital expenditures (10,593 ) (14,562 ) (13,695 ) (13,870 ) (13,438 ) Investments and purchase of consolidated subsidiaries and businesses (9,665 ) (4,019 ) (2,323 ) (410 ) (360 ) Disposals 659 979 3,595 1,113 1,912 Other cash flow related to capital expenditures, investments and disposals (35 ) (267 ) (295 ) 228 627
Free cash flow (4,117 ) 3,932 (1,582 ) 1,755 3,123 Borrowings (repayment) of debt related to financing activities (479 ) 911 396 (26 ) 41 Changes in short and long-term financial debt 8,761 980 3,841 2,272 1,104 Dividends paid and changes in non-controlling interest and reserves (5,836 ) (6,005 ) (2,956 ) (4,099 ) (4,327 ) Effect of changes in consolidation and exchange differences (200 ) 7 (30 ) 39 10
NET CASH FLOW FOR THE PERIOD (1,871 ) (175 ) (331 ) (59 ) (49 )
Change in net borrowings (euro million) 2007 2008 2009 2010 2011
Free cash flow (4,117 ) 3,932 (1,582 ) 1,755 3,123 Net borrowings of acquired companies (244 ) (286 ) (33 ) Net borrowings of divested companies 181 (192 ) Exchange differences on net borrowings and other changes 637 129 (141 ) (687 ) (517 ) Dividends paid and changes in non-controlling interest and reserves (5,836 ) (6,005 ) (2,956 ) (4,099 ) (4,327 )
CHANGE IN NET BORROWINGS (9,560 ) (2,049 ) (4,679 ) (3,064 ) (1,913 )
Net sales from operations (euro million) 2007 2008 2009 2010 2011
Exploration & Production 26,920 33,042 23,801 29,497 29,121 Gas & Power 27,793 37,062 30,447 29,576 34,731 Refining & Marketing 36,349 45,017 31,769 43,190 51,219 Petrochemicals 6,934 6,303 4,203 6,141 6,491 Engineering & Construction 8,678 9,176 9,664 10,581 11,834 Other activities 205 185 88 105 85 Corporate and financial companies 1,313 1,331 1,280 1,386 1,365 Impact of unrealized intragroup profit elimination (a) 75 (66 ) 100 (54 ) Consolidation adjustment (20,988 ) (24,109 ) (17,959 ) (22,053 ) (25,203 )
87,204 108,082 83,227 98,523 109,589
i i i (a) i This item concerned mainly intragroup sales of commodities, services and capital goods recorded in the assets of the purchasing business segment as of end of the period.
Net sales to customers (euro million) 2007 2008 2009 2010 2011
Exploration & Production 10,640 14,125 10,171 12,947 10,677 Gas & Power 27,036 36,189 29,812 28,743 33,648 Refining & Marketing 35,073 43,521 30,804 41,845 48,428 Petrochemicals 6,571 5,905 3,965 5,898 6,202

- 77 -
Engineering & Construction 7,496 7,957 8,349 8,779 10,510 Other activities 174 156 64 80 62 Corporate and financial companies 214 154 128 131 116 Impact of unrealized intragroup profit elimination 75 (66 ) 100 (54 )
87,204 108,082 83,227 98,523 109,589

Contents
Eni Fact Book Financial Data
Net sales by geographic area of destination (euro million) 2007 2008 2009 2010 2011
Italy 37,294 42,843 27,950 47,802 33,805 Other EU Countries 23,074 29,341 24,331 21,125 35,536 Rest of Europe 5,507 7,125 5,213 4,172 7,537 Africa 8,010 12,331 10,174 13,068 11,333 Americas 6,447 7,218 7,080 6,282 9,612 Asia 5,840 8,916 8,208 5,785 10,258 Other areas 1,032 308 271 289 1,508 Total outside Italy 49,910 65,239 55,277 50,721 75,784 87,204 108,082 83,227 98,523 109,589
Purchases, services and other (euro million) 2007 2008 2009 2010 2011
Production costs - raw, ancillary and consumable materials and goods 44,850 58,662 40,311 48,261 60,724 Production costs - services 10,828 13,355 13,520 15,400 14,034 Operating leases and other 2,276 2,558 2,567 3,066 3,113 Net provisions 573 884 1,055 1,407 551 Other expenses 1,101 1,660 1,527 1,309 1,214 less: capitalized direct costs associated with self-constructed tangible and intangible assets (1,495 ) (769 ) (629 ) (308 ) (445 ) 58,133 76,350 58,351 69,135 79,191
Principal accountant fees and services (euro million) 2007 2008 2009 2010 2011
Audit fees 26,383 27,962 30,748 21,114 22,407 Audit-related fees 169 152 276 183 1,034 Tax fees 81 46 51 166 26 All other fees 120 1 26,753 28,161 31,075 21,463 23,467
Payroll and related costs (euro million) 2007 2008 2009 2010 2011
Wages and salaries 2,906 3,204 3,330 3,565 3,704 Social security contributions 690 694 706 714 760 Cost related to defined benefit plans and defined contribution plans 161 107 137 164 158 Other costs 275 282 342 600 360 less: capitalized direct costs associated with self-constructed tangible and intangible assets (232 ) (283 ) (334 ) (258 ) (233 ) 3,800 4,004 4,181 4,785 4,749
Depreciation, depletion, amortization and impairments (euro million) 2007 2008 2009 2010 2011
Exploration & Production 5,431 6,678 6,789 6,928 6,251 Gas & Power 739 797 981 963 955 Refining & Marketing 433 430 408 333 351 Petrochemicals 116 116 83 83 90 Engineering & Construction 248 335 433 513 596 Other activities 4 4 2 2 2 Corporate and financial companies 68 76 83 79 75 Impact of unrealized intragroup profit elimination (10 ) (14 ) (17 ) (20 ) (23 ) Total depreciation, depletion and amortization 7,029 8,422 8,762 8,881 8,297 Impairments 207 1,393 1,051 698 1,021
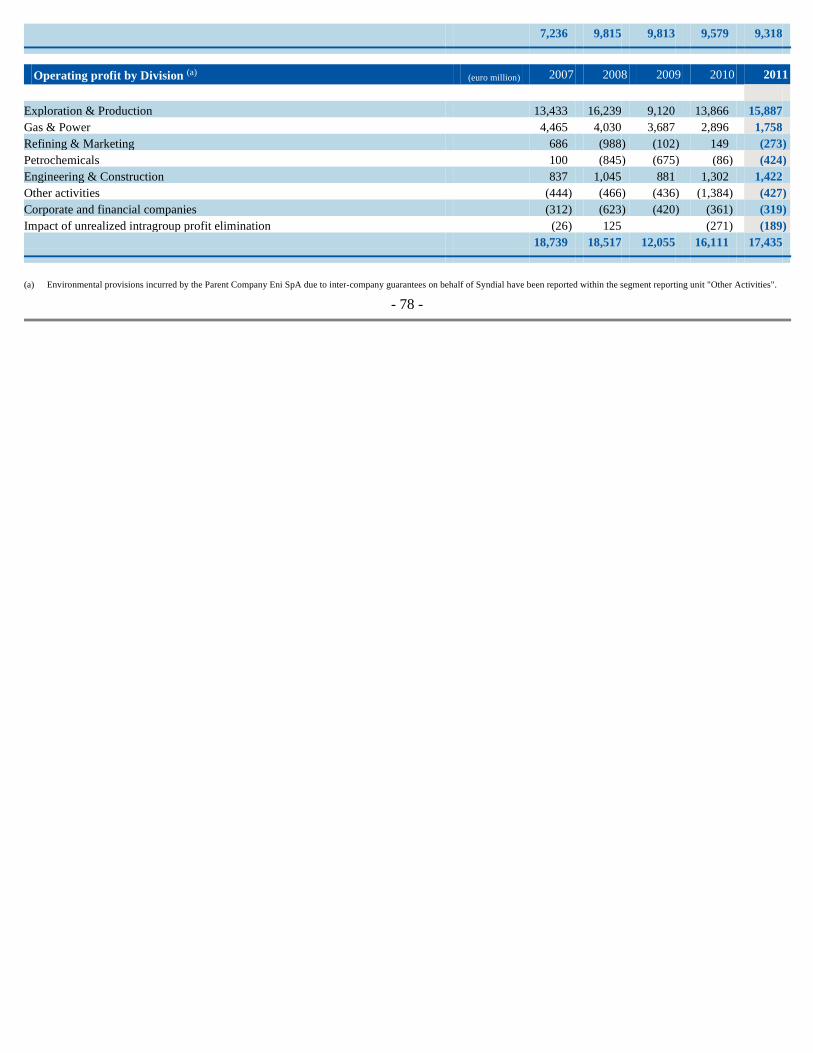
7,236 9,815 9,813 9,579 9,318
Operating profit by Division (a) (euro million) 2007 2008 2009 2010 2011
Exploration & Production 13,433 16,239 9,120 13,866 15,887 Gas & Power 4,465 4,030 3,687 2,896 1,758 Refining & Marketing 686 (988 ) (102 ) 149 (273 ) Petrochemicals 100 (845 ) (675 ) (86 ) (424 ) Engineering & Construction 837 1,045 881 1,302 1,422 Other activities (444 ) (466 ) (436 ) (1,384 ) (427 ) Corporate and financial companies (312 ) (623 ) (420 ) (361 ) (319 ) Impact of unrealized intragroup profit elimination (26 ) 125 (271 ) (189 ) 18,739 18,517 12,055 16,111 17,435
(a) Environmental provisions incurred by the Parent Company Eni SpA due to inter-company guarantees on behalf of Syndial have been reported within the segment reporting unit "Other Activities".
- 78 -

Contents
Eni Fact Book Financial Data
NON-GAAP measures
Reconciliation of reported operating profit and reported net profit to results on an adjusted basis
- 79 -
Management evaluates Group and business performance on the basis of adjusted operating profit and adjusted net profit, which are arrived at by excluding inventory holding gains or losses and special items. Furthermore, finance charges on finance debt, interest income, gains or losses deriving from the evaluation of certain derivative financial instruments at fair value through profit or loss (as they do not meet the formal criteria to be assessed as hedges under IFRS, excluding commodity derivatives), and exchange rate differences are all excluded when determining adjusted net profit of each business segment. The taxation effect of the items excluded from adjusted operating or net profit is determined based on the specific rate of taxes applicable to each of them. The Italian statutory tax rate is applied to finance charges and income (38% is applied to charges recorded by companies in the energy sector, whilst a tax rate of 27.5% is applied to all other companies). Adjusted operating profit and adjusted net profit are non-GAAP financial measures under either IFRS, or US GAAP. Management includes them in order to facilitate a comparison of base business performance across periods, and to allow financial analysts to evaluate Eni’s trading performance on the basis of their forecasting models. In addition, management uses segmental adjusted net profit when calculating return on average capital employed (ROACE) by each business segment.
The following is a description of items that are excluded from the calculation of adjusted results.
Inventory holding gain or loss is the difference between the cost of sales of the volumes sold in the period based on the cost of supplies of the same period and the cost of sales of the volumes sold calculated using the weighted average cost method of inventory accounting.
Special items include certain significant income or charges pertaining to either: (i) infrequent or unusual events and transactions, being identified as non-recurring items under such circumstances; or
(ii) certain events or transactions which are not considered to be representative of the ordinary course of business, as in the case of environmental provisions, restructuring charges, asset impairments or write ups and gains or losses on divestments even though they occurred in past periods or are likely to occur in future ones. As provided for in Decision No. 15519 of July 27, 2006 of the Italian market regulator (Consob), non recurring material income or charges are to be clearly reported in the management’s discussion and financial tables. Also, special items include gains and losses on re-measurement at fair value of certain non-hedging commodity derivatives, including the ineffective portion of cash flow hedges and certain derivatives financial instruments embedded in the pricing formula of long-term gas supply agreements of the Exploration & Production Division.
Finance charges or income related to net borrowings excluded from the adjusted net profit of business segments are comprised of interest charges on finance debt and interest income earned on cash and cash equivalents not related to operations. In addition, gains or losses on the fair value evaluation of the aforementioned derivative financial instruments, excluding commodity derivatives and exchange rate differences are excluded from the adjusted net profit of business segments. Therefore, the adjusted net profit of business segments includes finance charges or income deriving from certain segment-operated assets, i.e., interest income on certain receivable financing and securities related to operations and finance charge pertaining to the accretion of certain provisions recorded on a discounted basis (as in the case of the asset retirement obligations in the Exploration & Production Division). Finance charges or interest income and related taxation effects excluded from the adjusted net profit of the business segments are allocated on the aggregate Corporate and financial companies.
For a reconciliation of adjusted operating profit and adjusted net profit to reported operating profit and reported net profit see tables below.

Contents
Eni Fact Book Financial Data
- 80 -
2007 (euro million)
E&P G&P R&M Petrochemicals E&C Other
activities
Corporate and
financial companies
Impact of unrealized intragroup
profit elimination Group
Reported operating profit 13,433 4,465 686 100 837 (444 ) (312 ) (26 ) 18,739 Exclusion of inventory holding (gains) losses 44 (658 ) (6 ) (620 )
Exclusion of special items of which: Non-recurring (income) charges (11 ) (61 ) 35 (2 ) (4 ) 61 (10 ) 8 Other special (income) charges: 348 (34 ) 229 24 7 176 127 877 - environmental charges 15 128 210 12 365 - asset impairments 226 58 6 290 - risk provisions 9 13 22 - provision for redundancy incentives 6 38 31 24 7 18 32 156 - re-measurement gains/losses on commodity derivatives 74 (16 ) 6 83 147 - other 42 (71 ) (3 ) (71 ) (103 )
Special items of operating profit 337 (95 ) 264 22 3 237 117 885
Adjusted operating profit 13,770 4,414 292 116 840 (207 ) (195 ) (26 ) 19,004 Net finance (expense) income (a) 60 (5 ) 1 (8 ) (25 ) 23 Net income from investments (a) 176 420 126 1 80 5 4 812 Income taxes (a) (7,678 ) (1,702 ) (124 ) (44 ) (262 ) 154 10 (9,646 )
Tax rate (%) 54.8 35.2 29.7 28.5 48.6 Adjusted net profit 6,328 3,127 294 74 658 (210 ) (62 ) (16 ) 10,193
of which attributable to: - Non-controlling interest 624 - Eni’s shareholders 9,569 Reported net profit attributable to Eni's shareholders 10,011 Exclusion of inventory holding (gains) losses (b) (499 ) Exclusion of special items: 57 - non-recurring (income) charges 35 - other special (income) charges 22 Adjusted net profit attributable to Eni ’s shareholders 9,569
(a) Excluding special items. (b) Including euro 110 million related to equity-accounted entities.

Contents
Eni Fact Book Financial Data
- 81 -
2008 (euro million)
E&P G&P R&M Petrochemicals E&C Other
activities
Corporate and
financial companies
Impact of unrealized intragroup
profit elimination Group
Reported operating profit 16,239 4,030 (988 ) (845 ) 1,045 (466 ) (623 ) 125 18,517 Exclusion of inventory holding (gains) losses (429 ) 1,199 166 936
Exclusion of special items of which: Non-recurring (income) charges (21 ) (21 ) Other special (income) charges: 983 (37 ) 390 281 (4 ) 222 341 2,176 - environmental charges 12 76 221 120 309 - asset impairments 989 1 299 278 5 1,572 - gains on disposals of assets 4 7 13 (5 ) (4 ) (14 ) (9 ) (8 ) - risk provisions 4 4 - provision for redundancy incentives 8 20 23 8 4 28 91 - re-measurement gains/losses on commodity derivatives (18 ) (74 ) (21 ) 52 (61 ) - other (3 ) 2 270 269
Special items of operating profit 983 (37 ) 369 281 (4 ) 222 341 2,155
Adjusted operating profit 17,222 3,564 580 (398 ) 1,041 (244 ) (282 ) 125 21,608 Net finance (expense) income (a) 70 (13 ) 1 1 1 (39 ) (661 ) (640 ) Net income from investments (a) 609 420 174 (9 ) 49 4 5 1,252 Income taxes (a) (10,001 ) (1,323 ) (234 ) 83 (307 ) 406 (49 ) (11,425 )
Tax rate (%) 55.9 33.3 31.0 28.1 51.4 Adjusted net profit 7,900 2,648 521 (323 ) 784 (279 ) (532 ) 76 10,795
of which attributable to: - Non-controlling interest 631 - Eni’s shareholders 10,164 Reported net profit attributable to Eni's shareholders 8,825 Exclusion of inventory holding (gains) losses (b) 723 Exclusion of special items: 616 - non-recurring (income) charges (21 ) - other special (income) charges 637 Adjusted net profit attributable to Eni ’s shareholders 10,164
(a) Excluding special items. (b) Including euro 118 million related to equity-accounted entities.

Contents
Eni Fact Book Financial Data
- 82 -
2009 (euro million)
E&P G&P R&M Petrochemicals E&C Other
activities
Corporate and
financial companies
Impact of unrealized intragroup
profit elimination Group
Reported operating profit 9,120 3,687 (102 ) (675 ) 881 (436 ) (420 ) 12,055 Exclusion of inventory holding (gains) losses 326 (792 ) 121 (345 )
Exclusion of special items of which: Non-recurring (income) charges 250 250 Other special (income) charges: 364 (112 ) 537 128 (11 ) 178 78 1,162 - environmental charges 19 72 207 298 - asset impairments 618 27 389 121 2 5 1,162 - gains on disposals of assets (270 ) (6 ) (2 ) 3 (2 ) (277 ) - risk provisions 115 17 (4 ) 128 - provision for redundancy incentives 31 25 22 10 8 38 134 - re-measurement gains/losses on commodity derivatives (15 ) (292 ) 39 (3 ) (16 ) (287 ) - other (36 ) 4
Special items of operating profit 364 (112 ) 537 128 239 178 78 1,412
Adjusted operating profit 9,484 3,901 (357 ) (426 ) 1,120 (258 ) (342 ) 13,122 Net finance (expense) income (a) (23 ) (15 ) 12 (525 ) (551 ) Net income from investments (a) 243 332 75 49 1 700 Income taxes (a) (5,826 ) (1,302 ) 85 86 (277 ) 123 (3 ) (7,114 )
Tax rate (%) 60.0 30.9 .. 23.7 53.6 Adjusted net profit 3,878 2,916 (197 ) (340 ) 892 (245 ) (744 ) (3 ) 6,157
of which attributable to: - Non-controlling interest 950 - Eni’s shareholders 5,207 Reported net profit attributable to Eni's shareholders 4,367 Exclusion of inventory holding (gains) losses (b) (191 ) Exclusion of special items: 1,031 - non-recurring (income) charges 250 - other special (income) charges 781 Adjusted net profit attributable to Eni ’s shareholders 5,207
(a) Excluding special items. (b) Including euro 48 million related to equity-accounted entities.

Contents
Eni Fact Book Financial Data
- 83 -
2010 (euro million)
E&P G&P R&M Petrochemicals E&C Other
activities
Corporate and
financial companies
Impact of unrealized intragroup
profit elimination Group
Reported operating profit 13,866 2,896 149 (86 ) 1,302 (1,384 ) (361 ) (271 ) 16,111 Exclusion of inventory holding (gains) losses (117 ) (659 ) (105 ) (881 )
Exclusion of special items of which: Non-recurring (income) charges (270 ) 24 (246 ) Other special (income) charges: 18 610 339 78 1,179 96 2,320 - environmental charges 30 25 169 1,145 1,369 - asset impairments 127 436 76 52 3 8 702 - gains on disposal of assets (241 ) 4 (16 ) 5 (248 ) - risk provisions 78 2 7 8 95 - provision for redundancy incentives 97 75 113 26 14 10 88 423 - re-measurement gains/losses on commodity derivatives 30 (10 ) (22 ) (2 ) - other 5 (38 ) 5 9 (19 )
Special items of operating profit 18 340 339 78 24 1,179 96 2,074
Adjusted operating profit 13,884 3,119 (171 ) (113 ) 1,326 (205 ) (265 ) (271 ) 17,304 Net finance (expense) income (a) (205 ) 19 33 (9 ) (530 ) (692 ) Net income from investments (a) 274 406 92 1 10 (2 ) 781 Income taxes (a) (8,353 ) (986 ) 30 27 (375 ) 96 102 (9,459 )
Tax rate (%) 59.9 27.8 .. 27.4 54.4 Adjusted net profit 5,600 2,558 (49 ) (85 ) 994 (216 ) (699 ) (169 ) 7,934
of which attributable to: - Non-controlling interest 1,065 - Eni’s shareholders 6,869 Reported net profit attributable to Eni ’s shareholders 6,318 Exclusion of inventory holding (gains) losses (b) (610 ) Exclusion of special items: 1,161 - non-recurring (income) charges (246 ) - other special (income) charges 1,407 Adjusted net profit attributable to Eni ’s shareholders 6,869
(a) Excluding special items. (b) Including euro 51 million related to equity-accounted entities.

Contents
Eni Fact Book Financial Data
- 84 -
2011 (euro million)
E&P G&P R&M Petrochemicals E&C Other
activities
Corporate and
financial companies
Impact of unrealized intragroup
profit elimination Group
Reported operating profit 15,887 1,758 (273 ) (424 ) 1,422 (427 ) (319 ) (189 ) 17,435 Exclusion of inventory holding (gains) losses (166 ) (907 ) (40 ) (1,113 )
Exclusion of special items of which: Non-recurring (income) charges 10 59 69 Other special (income) charges: 190 354 645 178 21 142 53 1,583 - environmental charges 10 34 1 141 186 - asset impairments 190 145 488 160 35 4 1,022 - gains on disposal of assets (63 ) (4 ) 10 4 (7 ) (1 ) (61 ) - risk provisions 77 8 9 (6 ) 88 - provision for redundancy incentives 44 40 81 17 10 8 9 209 - re-measurement gains/losses on commodity derivatives 1 45 (3 ) (28 ) 15 - other 18 41 27 (13 ) 51 124
Special items of operating profit 190 354 645 188 21 201 53 1,652
Adjusted operating profit 16,077 1,946 (535 ) (276 ) 1,443 (226 ) (266 ) (189 ) 17,974 Net finance (expense) income (a) (231 ) 33 5 (932 ) (1,125 ) Net income from investments (a) 624 407 99 95 (3 ) 1 1,223 Income taxes (a) (9,604 ) (845 ) 174 68 (440 ) (1 ) 410 78 (10,160 )
Tax rate (%) 58.3 35.4 .. 28.6 56.2 Adjusted net profit 6,866 1,541 (262 ) (208 ) 1,098 (225 ) (787 ) (111 ) 7,912
of which attributable to: - Non-controlling interest 943 - Eni’s shareholders 6,969 Reported net profit attributable to Eni ’s shareholders 6,860 Exclusion of inventory holding (gains) losses (b) (724 ) Exclusion of special items: 833 - non-recurring (income) charges 69 - other special (income) charges 764 Adjusted net profit attributable to Eni ’s shareholders 6,969
(a) Excluding special items. (b) Including euro 65 million related to equity-accounted entities.

Contents
Eni Fact Book Financial Data
Breakdown of special items (euro million) 2007 2008 2009 2010 2011
Non-recurring charges (income) 8 (21 ) 250 (246 ) 69 of which: estimated charge of the possible resolution of the TSKJ matter 250 curtailment recognized of the reserve for post-retirement benefits for Italian employees (83 ) provisions and utilizations against antitrust proceedings and regulations 91 settlement/payments on antitrust and other Authorities proceedings (21 ) (246 ) 69 Other special charges (income): 877 2,176 1,162 2,320 1,583 - environmental charges 365 309 298 1,369 186 - asset impairments 290 1,572 1,162 702 1,022 - gains on disposal of assets (8 ) (277 ) (248 ) (61 ) - risk provisions 22 4 128 95 88 - provision for redundancy incentives 156 91 134 423 209 - re-measurement gains/losses on commodity derivatives 147 (61 ) (287 ) (2 ) 15 - other (103 ) 269 4 (19 ) 124
Special items of operating profit 885 2,155 1,412 2,074 1,652
Net finance (expense) income (23 ) 35 4 Net income from investments (321 ) (239 ) 179 (324 ) (883 ) of which: gain from the sale of stakes in Haldor Topsøe AS and Camom SA (290 ) gain on divestment of GTT (Gaztransport et Technigaz SAS) (185 ) gains from disposal of International Transport assets 1,044 gains from disposal of assets (332 ) (78 ) impairments 28 191 Income taxes (658 ) (1,402 ) (560 ) (624 ) 60 of which: taxes on special items of operating profit (214 ) (623 ) (413 ) (653 ) (521 ) tax impact pursuant to Law Decree No. 112 of June 25, 2008 for Italian subsidiaries: (270 ) (27 ) - on inventories (176 ) - on deferred taxes (94 ) (27 ) tax impact pursuant Budget Law 2008 for Italian subsidiaries (290 ) adjustment to deferred tax for Italian subsidiaries (394 ) adjustment to deferred tax for Libyan assets (173 ) deferred tax adjustment in a Production Sharing Agreement 552 impairment on deferred tax assets E&P 72 other tax items (50 ) (46 ) (192 ) 29 29
Total special items of net profit (117 ) 514 1,031 1,161 833
attributable to: - Non-controlling interest (174 ) (102 ) - Eni's shareholders 57 616 1,031 1,161 833
Adjusted operating profit by Division (euro million) 2007 2008 2009 2010 2011
Exploration & Production 13,770 17,222 9,484 13,884 16,077 Gas & Power 4,414 3,564 3,901 3,119 1,946 Refining & Marketing 292 580 (357 ) (171 ) (535 ) Petrochemicals 116 (398 ) (426 ) (113 ) (276 ) Engineering & Construction 840 1,041 1,120 1,326 1,443 Other activities (207 ) (244 ) (258 ) (205 ) (226 )

- 85 -
Corporate and financial companies (195 ) (282 ) (342 ) (265 ) (266 ) Impact of unrealized intragroup profit elimination (26 ) 125 (271 ) (189 )
19,004 21,608 13,122 17,304 17,974

Contents
Eni Fact Book Financial Data
- 86 -
Adjusted net profit by Division (euro million) 2007 2008 2009 2010 2011
Exploration & Production 6,328 7,900 3,878 5,600 6,866 Gas & Power 3,127 2,648 2,916 2,558 1,541 Refining & Marketing 294 521 (197 ) (49 ) (262 ) Petrochemicals 74 (323 ) (340 ) (85 ) (208 ) Engineering & Construction 658 784 892 994 1,098 Other activities (210 ) (279 ) (245 ) (216 ) (225 ) Corporate and financial companies (62 ) (532 ) (744 ) (699 ) (787 ) Impact of unrealized intragroup profit elimination (16 ) 76 (3 ) (169 ) (111 )
10,193 10,795 6,157 7,934 7,912
of which attributable to: Non-controlling interest 624 631 950 1,065 943
Eni’s shareholders 9,569 10,164 5,207 6,869 6,969
Finance income (expense) (euro million) 2007 2008 2009 2010 2011
Income from equity instruments 188 241 163 Exchange differences, net (51 ) 206 (106 ) 92 (111 ) Finance income (expense) related to net borrowings and other (279 ) (668 ) (612 ) (634 ) (817 ) Net income from securities 39 21 3 10 9 Financial expense due to the passage of time (accretion discount) (186 ) (249 ) (218 ) (251 ) (247 ) Income (expense) on derivatives 155 (427 ) (4 ) (131 ) (112 ) less: Finance expense capitalized 180 236 223 187 149
46 (640 ) (551 ) (727 ) (1,129 )
of which, net income from receivables and securities held for financing operating activities and interest on tax credits 96 78 40 65 68
Income (expense on) from investments (euro million) 2007 2008 2009 2010 2011
Share of profit of equity-accounted investments 906 761 693 717 678 Share of loss of equity-accounted investments (135 ) (105 ) (241 ) (149 ) (106 ) Gains on disposals 301 218 16 332 1,125 Losses on disposals (1 ) (1 ) Dividends 170 510 164 264 659 Decreases (increases) in the provision for losses on investments 2 (16 ) (59 ) (31 ) (28 ) Other income (expense), net 6 (4 ) 23 (157 )
1,243 1,373 569 1,156 2,171

Contents
Eni Fact Book Financial Data
- 87 -
Property, plant and equipment by Division (at year end) (euro million) 2007 2008 2009 2010 2011
Property, plant and equipment by segment, gross Exploration & Production 52,780 64,338 71,189 85,494 96,561 Gas & Power 24,641 20,729 22,040 22,510 23,655 Refining & Marketing 12,421 12,899 13,378 14,177 14,884 Petrochemicals 4,918 5,036 5,174 5,226 5,438 Engineering & Construction 5,823 7,702 9,163 10,714 11,809 Other activities 1,543 1,550 1,592 1,614 1,617 Corporate and financial companies 344 391 373 372 422 Impact of unrealized intragroup profit elimination (227 ) (355 ) (343 ) (495 ) (523 )
102,243 112,290 122,566 139,612 153,863
Property, plant and equipment by segment, net Exploration & Production 25,751 32,355 34,462 40,521 45,527 Gas & Power 15,204 13,038 13,778 13,876 14,517 Refining & Marketing 4,495 4,496 4,397 4,766 4,758 Petrochemicals 1,099 912 853 990 960 Engineering & Construction 3,513 5,154 6,305 7,422 7,969 Other activities 82 83 79 78 76 Corporate and financial companies 196 212 179 171 196 Impact of unrealized intragroup profit elimination (203 ) (317 ) (288 ) (420 ) (425 )
50,137 55,933 59,765 67,404 73,578
Capital expenditures by Division (euro million) 2007 2008 2009 2010 2011
Exploration & Production 6,480 9,281 9,486 9,690 9,435 Gas & Power 1,511 2,058 1,686 1,685 1,721 Refining & Marketing 979 965 635 711 866 Petrochemicals 145 212 145 251 216 Engineering & Construction 1,410 2,027 1,630 1,552 1,090 Other activities 59 52 44 22 10 Corporate and financial companies 108 95 57 109 128 Impact of unrealized intragroup profit elimination (99 ) (128 ) 12 (150 ) (28 )
10,593 14,562 13,695 13,870 13,438
Capital expenditures by geographic area of origin (euro million) 2007 2008 2009 2010 2011
Italy 3,246 3,674 3,198 3,044 3,587 Other European Union Countries 1,246 1,660 1,454 1,710 1,337 Rest of Europe 469 582 574 724 1,174 Africa 3,152 5,153 4,645 5,083 4,369 Americas 1,004 1,240 1,207 1,156 978 Asia 1,253 1,777 2,033 1,941 1,608 Other areas 223 476 584 212 385 Total outside Italy 7,347 10,888 10,497 10,826 9,851
10,593 14,562 13,695 13,870 13,438


Contents
Eni Fact Book Financial Data
- 88 -
Net borrowings (euro million)
Debt and bonds Cash and cash
equivalents
Securities held for non-
operating purposes
Financing receivables held
for non-operating purposes Total
2007 Short-term debt 8,500 (2,114 ) (174 ) (990 ) 5,222 Long-term debt 11,330 (225 ) 11,105 19,830 (2,114 ) (174 ) (1,215 ) 16,327 2008 Short-term debt 6,908 (1,939 ) (185 ) (337 ) 4,447 Long-term debt 13,929 13,929 20,837 (1,939 ) (185 ) (337 ) 18,376 2009 Short-term debt 6,736 (1,608 ) (64 ) (73 ) 4,991 Long-term debt 18,064 18,064 24,800 (1,608 ) (64 ) (73 ) 23,055 2010 Short-term debt 7,478 (1,549 ) (109 ) (6 ) 5,814 Long-term debt 20,305 20,305 27,783 (1,549 ) (109 ) (6 ) 26,119 2011 Short-term debt 6,495 (1,500 ) (37 ) (28 ) 4,930 Long-term debt 23,102 23,102 29,597 (1,500 ) (37 ) (28 ) 28,032
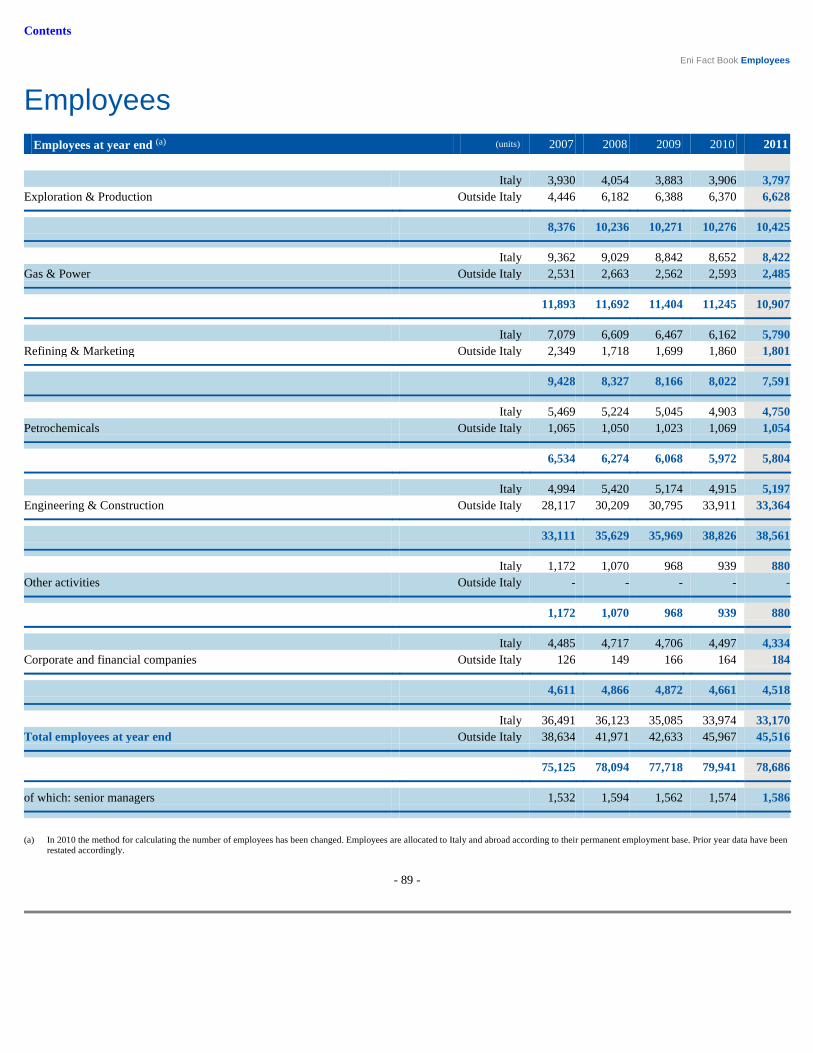
Contents
Eni Fact Book Employees
Employees
- 89 -
Employees at year end (a) (units) 2007 2008 2009 2010 2011
Italy 3,930 4,054 3,883 3,906 3,797 Exploration & Production Outside Italy 4,446 6,182 6,388 6,370 6,628
8,376 10,236 10,271 10,276 10,425
Italy 9,362 9,029 8,842 8,652 8,422 Gas & Power Outside Italy 2,531 2,663 2,562 2,593 2,485
11,893 11,692 11,404 11,245 10,907
Italy 7,079 6,609 6,467 6,162 5,790 Refining & Marketing Outside Italy 2,349 1,718 1,699 1,860 1,801
9,428 8,327 8,166 8,022 7,591
Italy 5,469 5,224 5,045 4,903 4,750 Petrochemicals Outside Italy 1,065 1,050 1,023 1,069 1,054
6,534 6,274 6,068 5,972 5,804
Italy 4,994 5,420 5,174 4,915 5,197 Engineering & Construction Outside Italy 28,117 30,209 30,795 33,911 33,364
33,111 35,629 35,969 38,826 38,561
Italy 1,172 1,070 968 939 880 Other activities Outside Italy - - - - -
1,172 1,070 968 939 880
Italy 4,485 4,717 4,706 4,497 4,334 Corporate and financial companies Outside Italy 126 149 166 164 184
4,611 4,866 4,872 4,661 4,518
Italy 36,491 36,123 35,085 33,974 33,170 Total employees at year end Outside Italy 38,634 41,971 42,633 45,967 45,516
75,125 78,094 77,718 79,941 78,686
of which: senior managers 1,532 1,594 1,562 1,574 1,586
(a) In 2010 the method for calculating the number of employees has been changed. Employees are allocated to Italy and abroad according to their permanent employment base. Prior year data have been
restated accordingly.

Contents
Eni Fact Book Supplemental oil and gas information
Supplemental oil and gas information
Oil and natural gas reserves
Eni’s criteria concerning evaluation and classification of proved developed and undeveloped reserves follow Regulation S-X 4-10 of the US Securities and Exchange Commission and have been disclosed in accordance with FASB Extractive Activities - Oil & Gas (Topic 932). Proved oil and gas reserves are those quantities of oil and gas, which, by analysis of geoscience and engineering data, can be estimated with reasonable certainty to be economically producible, from a given date forward, from known reservoirs, and under existing economic conditions, operating methods, and government regulations, prior to the time at which contracts providing the right to operate expire, unless evidence indicates that renewal is reasonably certain, regardless of whether deterministic or probabilistic methods are used for the estimation. The project to extract the hydrocarbons must have commenced or the operator must be reasonably certain that it will commence the project within a reasonable time. Existing economic conditions include prices and costs at which economic producibility from a reservoir is to be determined. The price shall be the average price during the 12-month period prior to the ending date of the period covered by the report, determined as an un-weighted arithmetic average of the first-day-of-the-month price for each month within such period, unless prices are defined by contractual arrangements, excluding escalations based upon future conditions. In 2011, the marker price for Brent was $111 per barrel. Net proved reserves exclude interests and royalties owned by others. Proved reserves are classified as either developed or undeveloped. Developed oil and gas reserves are reserves that can be expected to be recovered through existing wells with existing equipment and operating methods or in which the cost of the required equipment is relatively minor compared to the cost of a new well. Undeveloped oil and gas reserves are reserves of any category that are expected to be recovered from new wells on undrilled acreage, or from existing wells where a relatively major expenditure is required for recompletion. Since 1991, Eni has requested qualified independent oil engineering companies to carry out an independent evaluation 1 of part of its proved reserves on a rotational basis. The description of qualifications of the person primarily responsible of the reserve audit is included in the third party audit report 2 . In the preparation of their reports, independent evaluators rely, without independent verification, upon data furnished by Eni with respect to property interest, production, current cost of operation and development, sale agreements, prices and other factual information and data that were accepted as represented by the independent evaluators. These data, equally used by Eni in its internal process, include logs, directional surveys, core and PVT (Pressure Volume Temperature) analysis, maps, oil/gas/water
and operating costs. In order to calculate the economic value of Eni equity reserves, actual prices applicable to hydrocarbon sales, price adjustments required by applicable contractual arrangements, and other pertinent information are provided. In 2011, Ryder Scott Company and DeGolyer and MacNaughton 2 provided an independent evaluation of almost 32% of Eni’s total proved reserves as of December 31, 2011 3 , confirming, as in previous years, the reasonableness of Eni’s internal evaluations. In the three year period from 2009 to 2011, 85% of Eni’s total proved reserves were subject to independent evaluation. As of December 31, 2011, the principal property not subjected to independent evaluation in the last three years is Kashagan (Kazakhstan). Eni operates under Production Sharing Agreements, PSAs, in several of the foreign jurisdictions where it has oil and gas exploration and production activities. Reserves of oil and natural gas to which Eni is entitled under PSA arrangements are shown in accordance with Eni’s economic interest in the volumes of oil and natural gas estimated to be recoverable in future years. Such reserves include estimated quantities allocated to Eni for recovery of costs, income taxes owed by Eni but settled by its joint venture partners (which are state-owned entities) out of Eni’s share of production and Eni’s net equity share after cost recovery. Proved oil and gas reserves associated with PSAs represented 57%, 55% and 49% of total proved reserves as of December 31, 2009, 2010 and 2011, respectively, on an oil-equivalent basis. Similar effects as PSAs apply to service and "buy-back" contracts; proved reserves associated with such contracts represented 2%, 3% and 1% of total proved reserves on an oil-equivalent basis as of December 31, 2009, 2010 and 2011, respectively. Oil and gas reserve quantities include: (i) oil and natural gas quantities in excess of cost recovery which the company has an obligation to purchase under certain PSAs with governments or authorities, whereby the company serves as producer of reserves. Reserve volumes associated with oil and gas deriving from such obligation represent 0.3%, 0.6% and 0.8% of total proved reserves as of December 31, 2009, 2010 and 2011, respectively, on an oil-equivalent basis; (ii) volumes of natural gas used for own consumption; (iii) the quantities of hydrocarbons related to the Angola LNG plant; and (iv) volumes of natural gas held in certain Eni storage fields in Italy. Proved reserves attributable to these fields include: (a) the residual natural gas volumes of the reservoirs; and (b) natural gas volumes from other Eni fields input into these reservoirs in subsequent periods. Proved reserves do not include volumes owned by or acquired from third parties. Gas withdrawn from storage is produced and thereby removed from proved reserves when sold. Numerous uncertainties are inherent in estimating quantities of proved reserves, in projecting future productions and development expenditures. The accuracy of any reserve estimate is a function of the quality of available data and engineering and geological interpretation and evaluation.

- 90 -
production/injection data of wells, reservoir studies and technical analysis relevant to field performance, long-term development plans, future capital
(1) i From 1991 to 2002, DeGolyer and MacNaughton, from 2003 also Ryder Scott. (2) i The reports of independent engineers are available on Eni website eni.com, section Publications/Annual Report 2011. (3) i Including reserves of equity-accounted entities.

Contents
Eni Fact Book Supplemental oil and gas information
- 91 -
The results of drilling, testing and production after the date of the estimate may require substantial upward or downward revisions. In addition, changes in oil and natural gas prices have an effect on the quantities of Eni’s proved reserves since estimates of reserves are based on prices and costs relevant to the date when such estimates are made. Consequently, the evaluation of reserves could also
significantly differ from actual oil and natural gas volumes that will be produced. The following table presents yearly changes in estimated proved reserves, developed and undeveloped, of crude oil (including condensate and natural gas liquids) and natural gas as of December 31, 2009, 2010 and 2011.
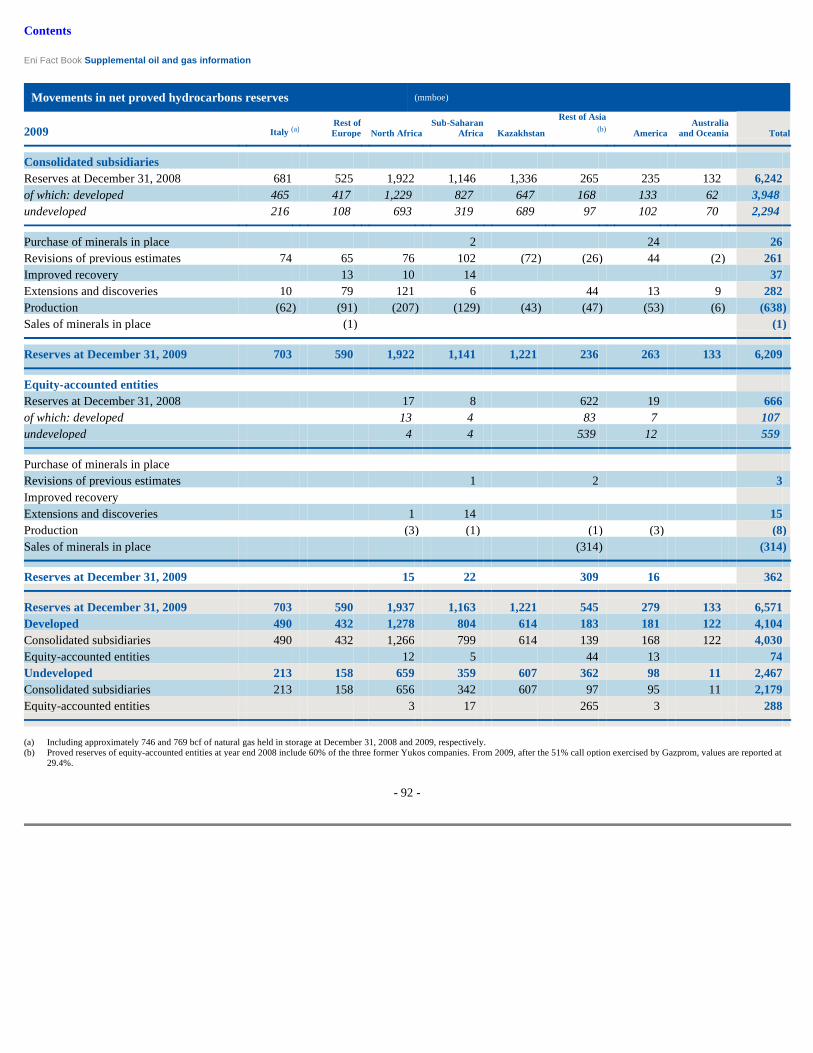
Contents
Eni Fact Book Supplemental oil and gas information
- 92 -
Movements in net proved hydrocarbons reserves (mmboe)
2009 Italy (a) Rest of Europe North Africa
Sub-Saharan Africa Kazakhstan
Rest of Asia (b) America
Australia and Oceania Total
Consolidated subsidiaries Reserves at December 31, 2008 681 525 1,922 1,146 1,336 265 235 132 6,242 of which: developed 465 417 1,229 827 647 168 133 62 3,948 undeveloped 216 108 693 319 689 97 102 70 2,294
Purchase of minerals in place 2 24 26 Revisions of previous estimates 74 65 76 102 (72 ) (26 ) 44 (2 ) 261 Improved recovery 13 10 14 37 Extensions and discoveries 10 79 121 6 44 13 9 282 Production (62 ) (91 ) (207 ) (129 ) (43 ) (47 ) (53 ) (6 ) (638 ) Sales of minerals in place (1 ) (1 )
Reserves at December 31, 2009 703 590 1,922 1,141 1,221 236 263 133 6,209
Equity -accounted entities Reserves at December 31, 2008 17 8 622 19 666 of which: developed 13 4 83 7 107 undeveloped 4 4 539 12 559
Purchase of minerals in place Revisions of previous estimates 1 2 3 Improved recovery Extensions and discoveries 1 14 15 Production (3 ) (1 ) (1 ) (3 ) (8 ) Sales of minerals in place (314 ) (314 )
Reserves at December 31, 2009 15 22 309 16 362
Reserves at December 31, 2009 703 590 1,937 1,163 1,221 545 279 133 6,571 Developed 490 432 1,278 804 614 183 181 122 4,104 Consolidated subsidiaries 490 432 1,266 799 614 139 168 122 4,030 Equity-accounted entities 12 5 44 13 74 Undeveloped 213 158 659 359 607 362 98 11 2,467 Consolidated subsidiaries 213 158 656 342 607 97 95 11 2,179 Equity-accounted entities 3 17 265 3 288
i i i (a) i Including approximately 746 and 769 bcf of natural gas held in storage at December 31, 2008 and 2009, respectively. (b) i Proved reserves of equity-accounted entities at year end 2008 include 60% of the three former Yukos companies. From 2009, after the 51% call option exercised by Gazprom, values are reported at
29.4%.

Contents
Eni Fact Book Supplemental oil and gas information
- 93 -
Movements in net proved hydrocarbons reserves (mmboe)
2010 Italy (a) Rest of Europe North Africa
Sub-Saharan Africa Kazakhstan Rest of Asia America
Australia and Oceania Total
Consolidated subsidiaries Reserves at December 31, 2009 703 590 1,922 1,141 1,221 236 263 133 6,209 of which: developed 490 432 1,266 799 614 139 168 122 4,030 of which: undeveloped 213 158 656 342 607 97 95 11 2,179
Purchase of minerals in place Revisions of previous estimates 97 34 353 116 (56 ) 104 13 661 Improved recovery 1 1 2 Extensions and discoveries 57 39 22 1 2 4 125 Production (67 ) (80 ) (218 ) (145 ) (39 ) (46 ) (48 ) (10 ) (653 ) Sales of minerals in place (9 ) (1 ) (2 ) (12 )
Reserves at December 31, 2010 724 601 2,096 1,133 1,126 295 230 127 6,332
Equity -accounted entities Reserves at December 31, 2009 15 22 309 16 362 of which: developed 12 5 44 13 74 of which: undeveloped 3 17 265 3 288
Purchase of minerals in place Revisions of previous estimates 9 1 10 (1 ) 19 Improved recovery 12 12 Extensions and discoveries 1 6 120 127 Production (2 ) (1 ) (2 ) (4 ) (9 ) Sales of minerals in place
Reserves at December 31, 2010 23 28 317 143 511
Reserves at December 31, 2010 724 601 2,119 1,161 1,126 612 373 127 6,843 Developed 554 405 1,237 817 543 182 167 117 4,022 Consolidated subsidiaries 554 405 1,215 812 543 139 141 117 3,926 Equity-accounted entities 22 5 43 26 96 Undeveloped 170 196 882 344 583 430 206 10 2,821 Consolidated subsidiaries 170 196 881 321 583 156 89 10 2,406 Equity-accounted entities 1 23 274 117 415
i i i (a) i Including approximately 769 and 767 bcf of natural gas held in storage at December 31, 2009 and 2010, respectively.

Contents
Eni Fact Book Supplemental oil and gas information
- 94 -
Movements in net proved hydrocarbons reserves (mmboe)
2011 Italy (a) Rest of Europe North Africa
Sub-Saharan Africa Kazakhstan Rest of Asia America
Australia and Oceania Total
Consolidated subsidiaries Reserves at December 31, 2010 724 601 2,096 1,133 1,126 295 230 127 6,332 of which: developed 554 405 1,215 812 543 139 141 117 3,926 of which: undeveloped 170 196 881 321 583 156 89 10 2,406
Purchase of minerals in place 2 2 Revisions of previous estimates 48 94 88 12 (137 ) (26 ) 10 17 106 Improved recovery 2 2 2 6 Extensions and discoveries 1 13 3 14 40 71 Production (68 ) (78 ) (158 ) (133 ) (39 ) (39 ) (42 ) (11 ) (568 ) Sales of minerals in place (2 ) (7 ) (9 )
Reserves at December 31, 2011 707 630 2,031 1,021 950 230 238 133 5,940
Equity -accounted entities Reserves at December 31, 2010 23 28 317 143 511 of which: developed 22 5 43 26 96 of which: undeveloped 1 23 274 117 415
Purchase of minerals in place Revisions of previous estimates 37 73 13 123 Improved recovery 1 1 Extensions and discoveries 19 268 233 520 Production (2 ) (1 ) (2 ) (4 ) (9 ) Sales of minerals in place
Reserves at December 31, 2011 21 83 656 386 1,146
Reserves at December 31, 2011 707 630 2,052 1,104 950 886 624 133 7,086 Developed 540 374 1,194 746 482 134 188 112 3,770 Consolidated subsidiaries 540 374 1,175 742 482 129 162 112 3,716 Equity-accounted entities 19 4 5 26 54 Undeveloped 167 256 858 358 468 752 436 21 3,316 Consolidated subsidiaries 167 256 856 279 468 101 76 21 2,224 Equity-accounted entities 2 79 651 360 1,092
i i i (a) i Including approximately 767 and 767 bcf of natural gas held in storage at December 31, 2010 and 2011, respectively.
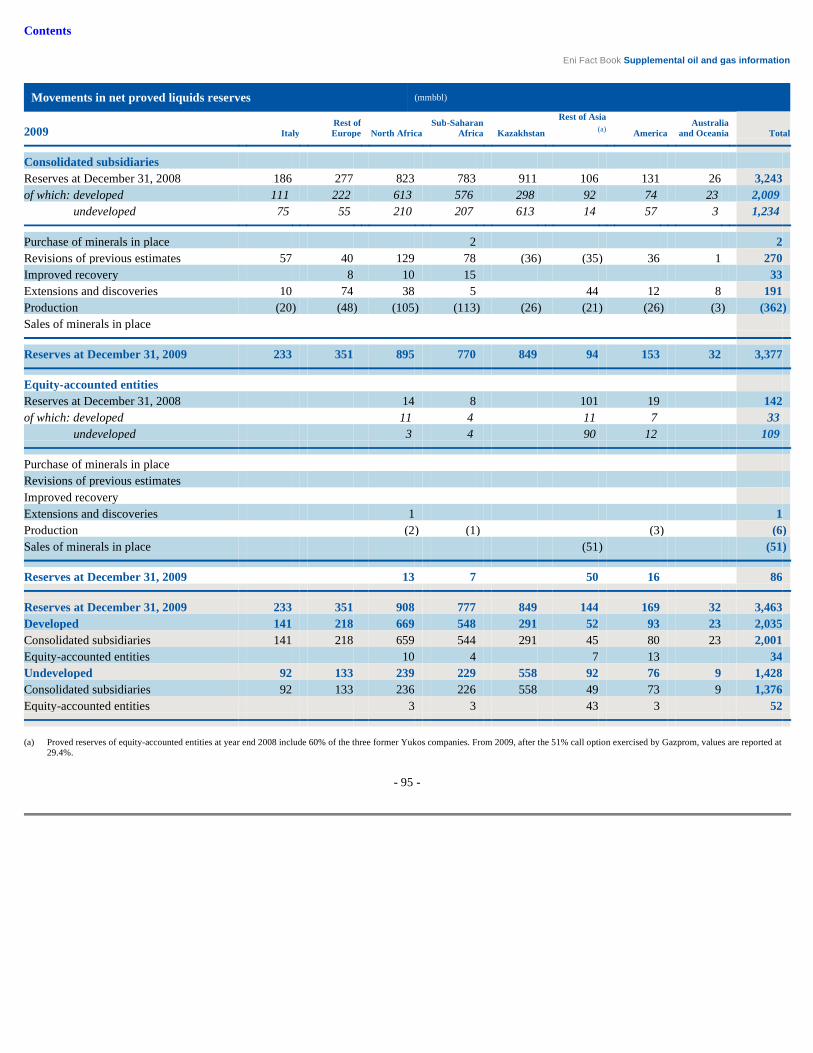
Contents
Eni Fact Book Supplemental oil and gas information
- 95 -
Movements in net proved liquids reserves (mmbbl)
2009 Italy Rest of Europe North Africa
Sub-Saharan Africa Kazakhstan
Rest of Asia (a) America
Australia and Oceania Total
Consolidated subsidiaries Reserves at December 31, 2008 186 277 823 783 911 106 131 26 3,243 of which: developed 111 222 613 576 298 92 74 23 2,009 of which: undeveloped 75 55 210 207 613 14 57 3 1,234
Purchase of minerals in place 2 2 Revisions of previous estimates 57 40 129 78 (36 ) (35 ) 36 1 270 Improved recovery 8 10 15 33 Extensions and discoveries 10 74 38 5 44 12 8 191 Production (20 ) (48 ) (105 ) (113 ) (26 ) (21 ) (26 ) (3 ) (362 ) Sales of minerals in place
Reserves at December 31, 2009 233 351 895 770 849 94 153 32 3,377
Equity -accounted entities Reserves at December 31, 2008 14 8 101 19 142 of which: developed 11 4 11 7 33 of which: undeveloped 3 4 90 12 109
Purchase of minerals in place Revisions of previous estimates Improved recovery Extensions and discoveries 1 1 Production (2 ) (1 ) (3 ) (6 ) Sales of minerals in place (51 ) (51 )
Reserves at December 31, 2009 13 7 50 16 86
Reserves at December 31, 2009 233 351 908 777 849 144 169 32 3,463 Developed 141 218 669 548 291 52 93 23 2,035 Consolidated subsidiaries 141 218 659 544 291 45 80 23 2,001 Equity-accounted entities 10 4 7 13 34 Undeveloped 92 133 239 229 558 92 76 9 1,428 Consolidated subsidiaries 92 133 236 226 558 49 73 9 1,376 Equity-accounted entities 3 3 43 3 52
i i i (a) i Proved reserves of equity-accounted entities at year end 2008 include 60% of the three former Yukos companies. From 2009, after the 51% call option exercised by Gazprom, values are reported at
29.4%.
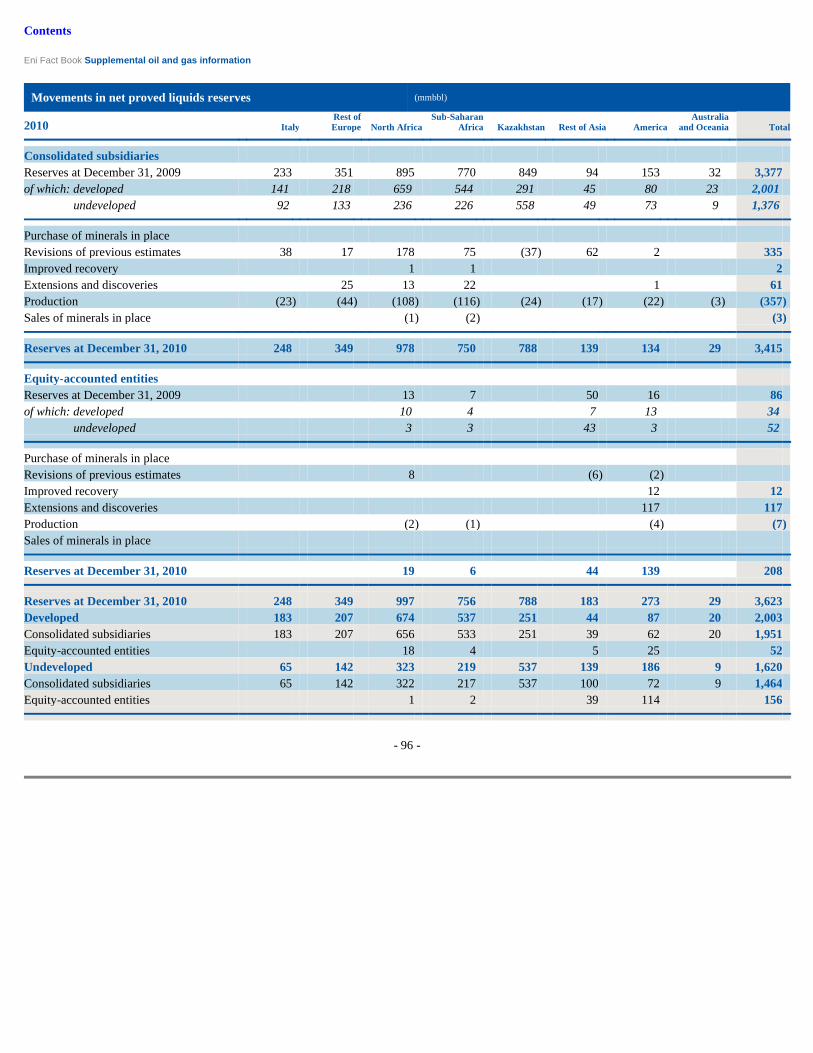
Contents
Eni Fact Book Supplemental oil and gas information
- 96 -
Movements in net proved liquids reserves (mmbbl)
2010 Italy Rest of Europe North Africa
Sub-Saharan Africa Kazakhstan Rest of Asia America
Australia and Oceania Total
Consolidated subsidiaries Reserves at December 31, 2009 233 351 895 770 849 94 153 32 3,377 of which: developed 141 218 659 544 291 45 80 23 2,001 of which: undeveloped 92 133 236 226 558 49 73 9 1,376
Purchase of minerals in place Revisions of previous estimates 38 17 178 75 (37 ) 62 2 335 Improved recovery 1 1 2 Extensions and discoveries 25 13 22 1 61 Production (23 ) (44 ) (108 ) (116 ) (24 ) (17 ) (22 ) (3 ) (357 ) Sales of minerals in place (1 ) (2 ) (3 )
Reserves at December 31, 2010 248 349 978 750 788 139 134 29 3,415
Equity -accounted entities Reserves at December 31, 2009 13 7 50 16 86 of which: developed 10 4 7 13 34 of which: undeveloped 3 3 43 3 52
Purchase of minerals in place Revisions of previous estimates 8 (6 ) (2 ) Improved recovery 12 12 Extensions and discoveries 117 117 Production (2 ) (1 ) (4 ) (7 ) Sales of minerals in place
Reserves at December 31, 2010 19 6 44 139 208
Reserves at December 31, 2010 248 349 997 756 788 183 273 29 3,623 Developed 183 207 674 537 251 44 87 20 2,003 Consolidated subsidiaries 183 207 656 533 251 39 62 20 1,951 Equity-accounted entities 18 4 5 25 52 Undeveloped 65 142 323 219 537 139 186 9 1,620 Consolidated subsidiaries 65 142 322 217 537 100 72 9 1,464 Equity-accounted entities 1 2 39 114 156

Contents
Eni Fact Book Supplemental oil and gas information
- 97 -
Movements in net proved liquids reserves (mmbbl)
2011 Italy Rest of Europe North Africa
Sub-Saharan Africa Kazakhstan Rest of Asia America
Australia and Oceania Total
Consolidated subsidiaries Reserves at December 31, 2010 248 349 978 750 788 139 134 29 3,415 of which: developed 183 207 656 533 251 39 62 20 1,951 of which: undeveloped 65 142 322 217 537 100 72 9 1,464
Purchase of minerals in place Revisions of previous estimates 34 58 10 14 (112 ) (20 ) 1 (15 ) Improved recovery 2 2 2 6 Extensions and discoveries 9 2 11 17 39 Production (23 ) (44 ) (75 ) (100 ) (23 ) (13 ) (20 ) (4 ) (302 ) Sales of minerals in place (2 ) (7 ) (9 )
Reserves at December 31, 2011 259 372 917 670 653 106 132 25 3,134
Equity -accounted entities Reserves at December 31, 2010 19 6 44 139 208 of which: developed 18 4 5 25 52 of which: undeveloped 1 2 39 114 156
Purchase of minerals in place Revisions of previous estimates 11 6 11 28 Improved recovery 1 1 Extensions and discoveries 6 60 4 70 Production (2 ) (1 ) (4 ) (7 ) Sales of minerals in place
Reserves at December 31, 2011 17 22 110 151 300
Reserves at December 31, 2011 259 372 934 692 653 216 283 25 3,434 Developed 184 195 638 487 215 34 117 25 1,895 Consolidated subsidiaries 184 195 622 483 215 34 92 25 1,850 Equity-accounted entities 16 4 25 45 Undeveloped 75 177 296 205 438 182 166 1,539 Consolidated subsidiaries 75 177 295 187 438 72 40 1,284 Equity-accounted entities 1 18 110 126 255
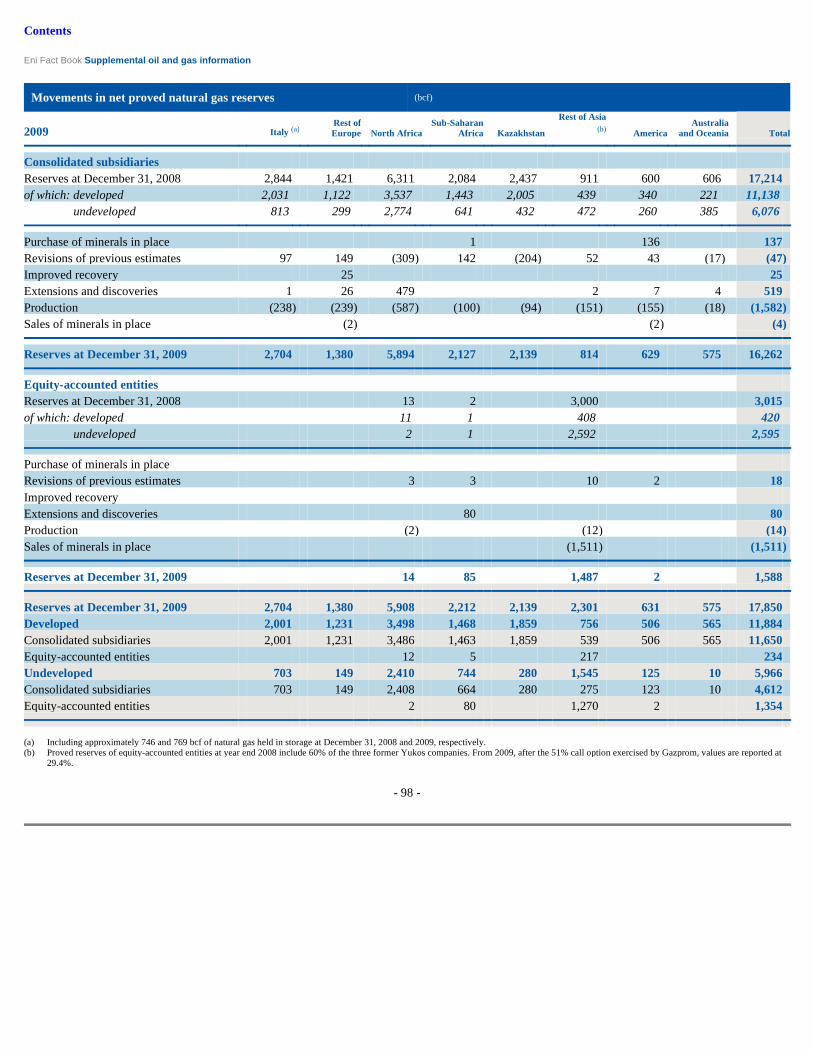
Contents
Eni Fact Book Supplemental oil and gas information
- 98 -
Movements in net proved natural gas reserves (bcf)
2009 Italy (a) Rest of Europe North Africa
Sub-Saharan Africa Kazakhstan
Rest of Asia (b) America
Australia and Oceania Total
Consolidated subsidiaries Reserves at December 31, 2008 2,844 1,421 6,311 2,084 2,437 911 600 606 17,214 of which: developed 2,031 1,122 3,537 1,443 2,005 439 340 221 11,138 of which: undeveloped 813 299 2,774 641 432 472 260 385 6,076
Purchase of minerals in place 1 136 137 Revisions of previous estimates 97 149 (309 ) 142 (204 ) 52 43 (17 ) (47 ) Improved recovery 25 25 Extensions and discoveries 1 26 479 2 7 4 519 Production (238 ) (239 ) (587 ) (100 ) (94 ) (151 ) (155 ) (18 ) (1,582 ) Sales of minerals in place (2 ) (2 ) (4 )
Reserves at December 31, 2009 2,704 1,380 5,894 2,127 2,139 814 629 575 16,262
Equity -accounted entities Reserves at December 31, 2008 13 2 3,000 3,015 of which: developed 11 1 408 420 of which: undeveloped 2 1 2,592 2,595
Purchase of minerals in place Revisions of previous estimates 3 3 10 2 18 Improved recovery Extensions and discoveries 80 80 Production (2 ) (12 ) (14 ) Sales of minerals in place (1,511 ) (1,511 )
Reserves at December 31, 2009 14 85 1,487 2 1,588
Reserves at December 31, 2009 2,704 1,380 5,908 2,212 2,139 2,301 631 575 17,850 Developed 2,001 1,231 3,498 1,468 1,859 756 506 565 11,884 Consolidated subsidiaries 2,001 1,231 3,486 1,463 1,859 539 506 565 11,650 Equity-accounted entities 12 5 217 234 Undeveloped 703 149 2,410 744 280 1,545 125 10 5,966 Consolidated subsidiaries 703 149 2,408 664 280 275 123 10 4,612 Equity-accounted entities 2 80 1,270 2 1,354
i i i (a) i Including approximately 746 and 769 bcf of natural gas held in storage at December 31, 2008 and 2009, respectively. (b) i Proved reserves of equity-accounted entities at year end 2008 include 60% of the three former Yukos companies. From 2009, after the 51% call option exercised by Gazprom, values are reported at
29.4%.

Contents
Eni Fact Book Supplemental oil and gas information
- 99 -
Movements in net proved natural gas reserves (bcf)
2010 Italy (a) Rest of Europe North Africa
Sub-Saharan Africa Kazakhstan Rest of Asia America
Australia and Oceania Total
Consolidated subsidiaries Reserves at December 31, 2009 2,704 1,380 5,894 2,127 2,139 814 629 575 16,262 of which: developed 2,001 1,231 3,486 1,463 1,859 539 506 565 11,650 of which: undeveloped 703 149 2,408 664 280 275 123 10 4,612
Purchase of minerals in place Revisions of previous estimates 234 48 778 161 (179 ) 211 41 (18 ) 1,276 Improved recovery Extensions and discoveries 177 146 4 5 22 354 Production (246 ) (204 ) (609 ) (161 ) (86 ) (158 ) (145 ) (35 ) (1,644 ) Sales of minerals in place (48 ) (2 ) (50 )
Reserves at December 31, 2010 2,644 1,401 6,207 2,127 1,874 871 530 544 16,198
Equity -accounted entities Reserves at December 31, 2009 14 85 1,487 2 1,588 of which: developed 12 5 217 234 of which: undeveloped 2 80 1,270 2 1,354
Purchase of minerals in place Revisions of previous estimates 6 (1 ) 44 2 51 Improved recovery Extensions and discoveries 6 34 18 58 Production (2 ) (11 ) (13 ) Sales of minerals in place
Reserves at December 31, 2010 24 118 1,520 22 1,684
Reserves at December 31, 2010 2,644 1,401 6,231 2,245 1,874 2,391 552 544 17,882 Developed 2,061 1,103 3,122 1,554 1,621 774 437 539 11,211 Consolidated subsidiaries 2,061 1,103 3,100 1,550 1,621 560 431 539 10,965 Equity-accounted entities 22 4 214 6 246 Undeveloped 583 298 3,109 691 253 1,617 115 5 6,671 Consolidated subsidiaries 583 298 3,107 577 253 311 99 5 5,233 Equity-accounted entities 2 114 1,306 16 1,438
i i i (a) i Including, approximately 769 and 767 bcf of natural gas held in storage at December 31, 2009 and 2010, respectively.
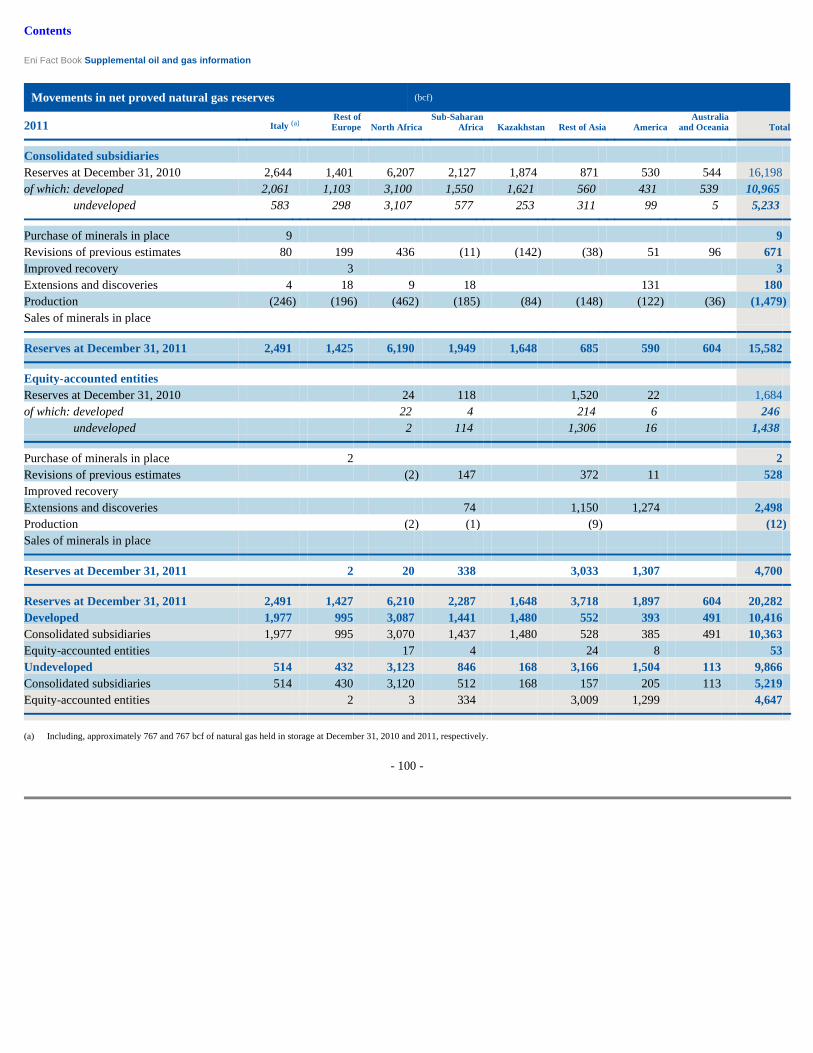
Contents
Eni Fact Book Supplemental oil and gas information
- 100 -
Movements in net proved natural gas reserves (bcf)
2011 Italy (a) Rest of Europe North Africa
Sub-Saharan Africa Kazakhstan Rest of Asia America
Australia and Oceania Total
Consolidated subsidiaries Reserves at December 31, 2010 2,644 1,401 6,207 2,127 1,874 871 530 544 16,198 of which: developed 2,061 1,103 3,100 1,550 1,621 560 431 539 10,965 of which: undeveloped 583 298 3,107 577 253 311 99 5 5,233
Purchase of minerals in place 9 9 Revisions of previous estimates 80 199 436 (11 ) (142 ) (38 ) 51 96 671 Improved recovery 3 3 Extensions and discoveries 4 18 9 18 131 180 Production (246 ) (196 ) (462 ) (185 ) (84 ) (148 ) (122 ) (36 ) (1,479 ) Sales of minerals in place
Reserves at December 31, 2011 2,491 1,425 6,190 1,949 1,648 685 590 604 15,582
Equity -accounted entities Reserves at December 31, 2010 24 118 1,520 22 1,684 of which: developed 22 4 214 6 246 of which: undeveloped 2 114 1,306 16 1,438
Purchase of minerals in place 2 2 Revisions of previous estimates (2 ) 147 372 11 528 Improved recovery Extensions and discoveries 74 1,150 1,274 2,498 Production (2 ) (1 ) (9 ) (12 ) Sales of minerals in place
Reserves at December 31, 2011 2 20 338 3,033 1,307 4,700
Reserves at December 31, 2011 2,491 1,427 6,210 2,287 1,648 3,718 1,897 604 20,282 Developed 1,977 995 3,087 1,441 1,480 552 393 491 10,416 Consolidated subsidiaries 1,977 995 3,070 1,437 1,480 528 385 491 10,363 Equity-accounted entities 17 4 24 8 53 Undeveloped 514 432 3,123 846 168 3,166 1,504 113 9,866 Consolidated subsidiaries 514 430 3,120 512 168 157 205 113 5,219 Equity-accounted entities 2 3 334 3,009 1,299 4,647
i i i (a) i Including, approximately 767 and 767 bcf of natural gas held in storage at December 31, 2010 and 2011, respectively.

Contents
Eni Fact Book Supplemental oil and gas information
- 101 -
Results of operations from oil & gas producing activities (a) (euro million)
2009 Italy Rest of Europe North Africa
Sub-Saharan Africa Kazakhstan Rest of Asia America
Australia and Oceania Total
Consolidated subsidiaries Revenues: - sales to consolidated entities 2,274 2,583 1,738 4,386 245 41 808 29 12,104 - sales to third parties 540 5,037 586 739 1,208 639 181 8,930
Total revenues 2,274 3,123 6,775 4,972 984 1,249 1,447 210 21,034
Operations costs (271 ) (517 ) (553 ) (749 ) (153 ) (78 ) (273 ) (41 ) (2,635 ) Production taxes (148 ) (20 ) (445 ) (34 ) (647 ) Exploration expenses (40 ) (114 ) (319 ) (451 ) (20 ) (204 ) (341 ) (62 ) (1,551 ) D.D. & A. and Provision for abandonment (b) (463 ) (921 ) (956 ) (1,502 ) (78 ) (535 ) (1,108 ) (186 ) (5,749 ) Other income (expenses) (125 ) (134 ) (471 ) (467 ) (186 ) (17 ) 170 (47 ) (1,277 )
Pretax income from producing activities 1,227 1,437 4,456 1,358 547 381 (105 ) (126 ) 9,175
Income taxes (467 ) (833 ) (3,010 ) (1,042 ) (180 ) (67 ) (2 ) 23 (5,578 )
Results of operations from E&P activities of consolidated subsidiaries (c) 760 604 1,446 316 367 314 (107 ) (103 ) 3,597
Equity -accounted entities Revenues: - sales to consolidated entities - sales to third parties 15 45 49 123 232
Total revenues 15 45 49 123 232
Operations costs (11 ) (7 ) (7 ) (9 ) (34 ) Production taxes (3 ) (41 ) (44 ) Exploration expenses (6 ) (1 ) (8 ) (26 ) (41 ) D.D. & A. and Provision for abandonment (1 ) (15 ) (35 ) (25 ) (76 ) Other income (expenses) 1 6 (11 ) (37 ) (41 )
Pretax income from producing activities (5 ) 28 (12 ) (15 ) (4 )
Income taxes 4 (14 ) (10 ) (20 ) (40 )
Results of operations from E&P activities of equity-accounted entities (c) (1 ) 14 (22 ) (35 ) (44 )
i i i (a) i Results of operations from oil and gas producing activities, represent only those revenues and expenses directly associated with such activities, including operating overheads. These amounts do not
include any allocation of interest expense or general corporate overhead and, therefore, are not necessarily indicative of the contributions to consolidated net earnings of Eni. Related income taxes are computed by applying the local income tax rates to the pre-tax income from producing activities. Eni is a party to certain Production Sharing Agreements (PSAs), whereby a portion of Eni’s share of oil and gas production is withheld and sold by its joint venture partners which are state-owned entities, with proceeds being remitted to the state in satisfaction of Eni’s PSA related tax liabilities. Revenue and income taxes include such taxes owed by Eni but paid by state-owned entities out of Eni’ s share of oil and gas production.
(b) i Includes asset impairments amounting to euro 576 million in 2009. (c) i The "Successful Effort Method" application would have led to an increase of result of operations of euro 320 million for the consolidated subsidiaries and an increase of euro 26 million for equity-
accounted entities.

Contents
Eni Fact Book Supplemental oil and gas information
- 102 -
Results of operations from oil & gas producing activities (euro million)
2010 Italy Rest of Europe North Africa
Sub-Saharan Africa Kazakhstan Rest of Asia America
Australia and Oceania Total
Consolidated subsidiaries Revenues: - sales to consolidated entities 2,725 3,006 2,094 5,314 324 34 1,139 69 14,705 - sales to third parties 263 6,604 1,696 890 1,429 562 289 11,733
Total revenues 2,725 3,269 8,698 7,010 1,214 1,463 1,701 358 26,438
Operations costs (278 ) (555 ) (593 ) (902 ) (184 ) (150 ) (292 ) (69 ) (3,023 ) Production taxes (184 ) (300 ) (700 ) (37 ) (1,221 ) Exploration expenses (35 ) (116 ) (85 ) (465 ) (6 ) (263 ) (204 ) (25 ) (1,199 ) D.D. & A. and Provision for abandonment (a) (621 ) (615 ) (1,063 ) (1,739 ) (84 ) (696 ) (872 ) (84 ) (5,774 ) Other income (expenses) (560 ) 254 (392 ) (219 ) (161 ) (138 ) (45 ) (25 ) (1,286 )
Pretax income from producing activities 1,047 2,237 6,265 2,985 779 179 288 155 13,935
Income taxes (382 ) (1,296 ) (4,037 ) (1,962 ) (291 ) (119 ) (154 ) (36 ) (8,277 )
Results of operations from E&P activities of consolidated subsidiaries (b) 665 941 2,228 1,023 488 60 134 119 5,658
Equity -accounted entities Revenues: - sales to consolidated entities - sales to third parties 16 65 69 206 356
Total revenues 16 65 69 206 356
Operations costs (16 ) (9 ) (7 ) (9 ) (41 ) Production taxes (3 ) (69 ) (72 ) Exploration expenses (4 ) (2 ) (4 ) (35 ) (45 ) D.D. & A. and Provision for abandonment (4 ) (26 ) (25 ) (17 ) (72 ) Other income (expenses) 6 12 (10 ) (67 ) (59 )
Pretax income from producing activities (5 ) 40 23 9 67
Income taxes 4 (20 ) (17 ) (33 ) (66 )
Results of operations from E&P activities of equity-accounted entities (b) (1 ) 20 6 (24 ) 1
i i i (a) i Includes asset impairments amounting to euro 123 million. (b) i The "Successful Effort Method" application would have led to a decrease of euro 385 million for the consolidated subsidiaries and a decrease of euro 5 million for equity-accounted entities.

Contents
Eni Fact Book Supplemental oil and gas information
- 103 -
Results of operations from oil & gas producing activities (euro million)
2011 Italy Rest of Europe North Africa
Sub-Saharan Africa Kazakhstan Rest of Asia America
Australia and Oceania Total
Consolidated subsidiaries Revenues: - sales to consolidated entities 3,583 3,695 1,956 5,945 411 178 1,634 93 17,495 - sales to third parties 514 5,090 1,937 1,268 1,233 132 344 10,518
Total revenues 3,583 4,209 7,046 7,882 1,679 1,411 1,766 437 28,013
Operations costs (284 ) (566 ) (483 ) (830 ) (171 ) (183 ) (364 ) (88 ) (2,969 ) Production taxes (245 ) (165 ) (853 ) (37 ) (1,300 ) Exploration expenses (38 ) (113 ) (128 ) (509 ) (6 ) (177 ) (136 ) (58 ) (1,165 ) D.D. & A. and Provision for abandonment (a) (606 ) (704 ) (843 ) (1,435 ) (112 ) (486 ) (901 ) (103 ) (5,190 ) Other income (expenses) (562 ) 142 (508 ) (314 ) (160 ) (151 ) 125 8 (1,420 )
Pretax income from producing activities 1,848 2,968 4,919 3,941 1,230 377 490 196 15,969
Income taxes (761 ) (2,043 ) (3,013 ) (2,680 ) (413 ) (157 ) (184 ) (120 ) (9,371 )
Results of operations from E&P activities of consolidated subsidiaries (b) 1,087 925 1,906 1,261 817 220 306 76 6,598
Equity -accounted entities Revenues: - sales to consolidated entities - sales to third parties 2 19 93 89 262 465
Total revenues 2 19 93 89 262 465
Operations costs (11 ) (10 ) (9 ) (17 ) (47 ) Production taxes (1 ) (4 ) (113 ) (118 ) Exploration expenses (6 ) (5 ) (8 ) (9 ) (28 ) D.D. & A. and Provision for abandonment (1 ) (24 ) (23 ) (21 ) (69 ) Other income (expenses) (4 ) 6 11 (20 ) (51 ) (58 )
Pretax income from producing activities (9 ) 9 65 29 51 145
Income taxes (4 ) (35 ) (32 ) (4 ) (75 )
Results of operations from E&P activities of equity-accounted entities (b) (9 ) 5 30 (3 ) 47 70
i i i (a) i Includes asset impairments amounting to euro 189 million. (b) i The "Successful Effort Method" application would have led to an increase of euro 118 million for the consolidated subsidiaries and an increase of euro 20 million for equity-accounted entities.

Contents
Eni Fact Book Supplemental oil and gas information
Capitalized costs (a) (euro million)
2010 Italy Rest of Europe North Africa
Sub-Saharan Africa Kazakhstan Rest of Asia America
Australia and Oceania Total
Consolidated subsidiaries Proved mineral interests 10,576 10,616 14,051 17,057 1,989 5,552 6,617 1,674 68,132 Unproved mineral interests 32 320 570 2,006 39 1,561 1,979 42 6,549 Support equipment and facilities 270 33 1,391 716 70 21 53 6 2,560 Incomplete wells and other 909 584 2,069 1,089 4,644 107 1,444 84 10,930
Gross capitalized costs 11,787 11,553 18,081 20,868 6,742 7,241 10,093 1,806 88,171
Accumulated depreciation, depletion and amortization (8,020 ) (7,771 ) (8,558 ) (11,067 ) (756 ) (4,699 ) (5,591 ) (522 ) (46,984 )
Net capitalized costs consolidated subsidiaries (b) (c) 3,767 3,782 9,523 9,801 5,986 2,542 4,502 1,284 41,187
Equity -accounted entities Proved mineral interests 79 191 479 178 927 Unproved mineral interests 469 469 Support equipment and facilities 7 6 3 16 Incomplete wells and other 332 139 197 668
Gross capitalized costs 86 523 1,093 378 2,080
Accumulated depreciation, depletion and amortization (73 ) (103 ) (350 ) (66 ) (592 )
Net capitalized costs equity-accounted entities (b) (c) 13 420 743 312 1,488
2011
Consolidated subsidiaries Proved mineral interests 11,356 11,481 15,519 19,539 2,523 6,136 8,976 1,889 77,419 Unproved mineral interests 31 325 582 2,893 40 1,543 1,409 204 7,027 Support equipment and facilities 285 34 1,442 923 85 41 61 13 2,884 Incomplete wells and other 956 1,778 2,755 898 5,333 136 1,029 12,885
Gross capitalized costs 12,628 13,618 20,298 24,253 7,981 7,856 11,475 2,106 100,215
Accumulated depreciation, depletion and amortization (8,633 ) (8,582 ) (9,750 ) (13,069 ) (906 ) (5,411 ) (6,806 ) (650 ) (53,807 )
Net capitalized costs consolidated subsidiaries (b) (c) 3,995 5,036 10,548 11,184 7,075 2,445 4,669 1,456 46,408
Equity -accounted entities Proved mineral interests 2 80 240 698 330 1,350 Unproved mineral interests 44 271 315 Support equipment and facilities 8 6 3 17 Incomplete wells and other 2 1 1,011 185 223 1,422
Gross capitalized costs 48 89 1,251 1,160 556 3,104
Accumulated depreciation, depletion and amortization (2 ) (74 ) (131 ) (388 ) (89 ) (684 )
Net capitalized costs equity-accounted entities (b) (c) 46 15 1,120 772 467 2,420

- 104 -
i i i (a) i Capitalized costs represent the total expenditures for proved and unproved mineral interests and related support equipment and facilities utilized in oil and gas exploration and production activities,
together with related accumulated depreciation, depletion and amortization. (b) i The amounts include net capitalized financial charges totaling euro 591 million in 2010 and euro 614 million in 2011 for the consolidated subsidiaries and euro 6 million in 2010 and euro 11 million
in 2011 for equity-accounted entities. (c) i The amounts do not include costs associated with exploration activities which are capitalized in order to reflect their investment nature and amortized in full when incurred. The "Successful Effort
Method" application would have led to an increase in net capitalized costs of euro 3,410 million in 2010 and euro 3,608 million in 2011 for the consolidated subsidiaries and of euro 76 million in 2010 and euro 101 million in 2011 for equity-accounted entities.

Contents
Eni Fact Book Supplemental oil and gas information
Costs incurred (a) (euro million)
2009 Italy Rest of Europe North Africa
Sub-Saharan Africa Kazakhstan Rest of Asia America
Australia and Oceania Total
Consolidated subsidiaries Proved property acquisitions 298 27 11 131 467 Unproved property acquisitions 54 42 83 43 222 Exploration 40 114 317 284 20 159 242 52 1,228 Development (b) 742 727 1,401 2,121 1,086 423 858 462 7,820
Total costs incurred consolidated subsidiaries 782 841 2,070 2,474 1,106 676 1,274 514 9,737
Equity -accounted entities Proved property acquisitions Unproved property acquisitions Exploration 6 1 9 25 41 Development (c) 3 62 94 47 206
Total costs incurred equity-accounted entities 9 63 103 72 247
2010 Consolidated subsidiaries Proved property acquisitions Unproved property acquisitions Exploration 34 114 84 406 6 223 119 26 1,012 Development (b) 579 890 2,674 1,909 1,031 359 1,309 160 8,911
Total costs incurred consolidated subsidiaries 613 1,004 2,758 2,315 1,037 582 1,428 186 9,923
Equity -accounted entities Proved property acquisitions Unproved property acquisitions Exploration 4 2 4 35 45 Development (c) 7 200 46 114 367
Total costs incurred equity-accounted entities 11 202 50 149 412
2011 Consolidated subsidiaries Proved property acquisitions Unproved property acquisitions 57 697 754 Exploration 38 100 128 482 6 156 60 240 1,210 Development (b) 815 1,921 1,487 1,698 935 385 971 70 8,282
Total costs incurred consolidated subsidiaries 853 2,021 1,672 2,877 941 541 1,031 310 10,246
Equity -accounted entities Proved property acquisitions Unproved property acquisitions Exploration 5 5 8 9 27 Development (c) 2 3 659 68 154 886
Total costs incurred equity-accounted entities 7 3 664 76 163 913
i i i (a) i Costs incurred represent amounts both capitalized and expensed in connection with oil and gas producing activities.

- 105 -
(b) i Includes the abandonment costs of the assets for euro 301 million in 2009, euro 269 million in 2010 and euro 918 million in 2011. (c) i Includes the abandonment costs of the assets for euro -6 million in 2009, euro -3 million in 2010 and euro 15 million in 2011.
Contents
Eni Fact Book Supplemental oil and gas information
Standardized measure of discounted future net cash flows
- 106 -
Estimated future cash inflows represent the revenues that would be received from production and are determined by applying year-end prices of oil and gas for the year ended December 31, 2008, and the average prices during the years ended December 31, 2009, 2010 and 2011 to estimated future production of proved reserves. Future price changes are considered only to the extent provided by contractual arrangements. Estimated future development and production costs are determined by estimating the expenditures to be incurred in developing and producing the proved reserves at the end of the year. Neither the effects of price and cost escalations nor expected future changes in technology and operating practices have been considered. The standardized measure is calculated as the excess of future cash inflows from proved reserves less future costs of producing and developing the reserves, future income taxes and a yearly 10% discount factor. Future production costs include the estimated expenditures related to the production of proved reserves plus any production taxes without
consideration of future inflation. Future development costs include the estimated costs of drilling development wells and installation of production facilities, plus the net costs associated with dismantlement and abandonment of wells and facilities, under the assumption that year-end costs continue without considering future inflation. Future income taxes were calculated in accordance with the tax laws of the Countries in which Eni operates. The standardized measure of discounted future net cash flows, related to the preceding proved oil and gas reserves, is calculated in accordance with the requirements of FASB Extractive Activities - oil&gas (Topic 932). The standardized measure does not purport to reflect realizable values or fair market value of Eni’s proved reserves. An estimate of fair value would also take into account, among other things, hydrocarbon resources other than proved reserves, anticipated changes in future prices and costs and a discount factor representative of the risks inherent in the oil and gas exploration and production activity.

Contents
Eni Fact Book Supplemental oil and gas information
Standardized measure of discounted future net cash flows (euro million)
Italy Rest of Europe North Africa
Sub-Saharan Africa Kazakhstan Rest of Asia America
Australia and Oceania Total
December 31, 2009
Consolidated subsidiaries Future cash inflows 26,243 22,057 59,413 33,676 30,273 5,680 7,088 2,973 187,403 Future production costs (4,732 ) (6,215 ) (7,771 ) (9,737 ) (6,545 ) (1,427 ) (1,797 ) (529 ) (38,753 ) Future development and abandonment costs (5,143 ) (5,375 ) (8,618 ) (5,134 ) (4,345 ) (1,409 ) (1,897 ) (214 ) (32,135 ) Future net inflow before income tax 16,368 10,467 43,024 18,805 19,383 2,844 3,394 2,230 116,515 Future income tax (5,263 ) (6,621 ) (24,230 ) (9,894 ) (4,827 ) (636 ) (694 ) (563 ) (52,728 ) Future net cash flows 11,105 3,846 18,794 8,911 14,556 2,208 2,700 1,667 63,787 10% discount factor (5,868 ) (1,455 ) (9,160 ) (3,102 ) (10,249 ) (520 ) (1,162 ) (771 ) (32,287 )
Standardized measure of discounted future net cash flows 5,237 2,391 9,634 5,809 4,307 1,688 1,538 896 31,500
Equity -accounted entities Future cash inflows 250 427 2,389 652 3,718 Future production costs (147 ) (70 ) (773 ) (261 ) (1,251 ) Future development and abandonment costs (21 ) (137 ) (970 ) (40 ) (1,168 ) Future net inflow before income tax 82 220 646 351 1,299 Future income tax (1 ) (45 ) (260 ) (126 ) (432 ) Future net cash flows 81 175 386 225 867 10% discount factor (28 ) (80 ) (420 ) (82 ) (610 )
Standardized measure of discounted future net cash flows 53 95 (34 ) 143 257
Total 5,237 2,391 9,687 5,904 4,307 1,654 1,681 896 31,757
December 31, 2010
Consolidated subsidiaries Future cash inflows 30,047 27,973 86,728 45,790 41,053 9,701 8,546 3,846 253,684 Future production costs (4,865 ) (7,201 ) (12,896 ) (13,605 ) (6,686 ) (3,201 ) (2,250 ) (611 ) (51,315 ) Future development and abandonment costs (4,499 ) (6,491 ) (8,827 ) (5,310 ) (5,192 ) (3,489 ) (1,713 ) (221 ) (35,742 ) Future net inflow before income tax 20,683 14,281 65,005 26,875 29,175 3,011 4,583 3,014 166,627 Future income tax (6,289 ) (9,562 ) (37,108 ) (14,468 ) (7,213 ) (872 ) (910 ) (805 ) (77,227 ) Future net cash flows 14,394 4,719 27,897 12,407 21,962 2,139 3,673 2,209 89,400 10% discount factor (7,224 ) (1,608 ) (13,117 ) (3,884 ) (14,829 ) (419 ) (1,392 ) (850 ) (43,323 )
Standardized measure of discounted future net cash flows 7,170 3,111 14,780 8,523 7,133 1,720 2,281 1,359 46,077
Equity -accounted entities Future cash inflows 498 750 2,893 7,363 11,504 Future production costs (251 ) (98 ) (972 ) (2,676 ) (3,997 ) Future development and abandonment costs (35 ) (128 ) (879 ) (1,188 ) (2,230 ) Future net inflow before income tax 212 524 1,042 3,499 5,277 Future income tax (2 ) (69 ) (338 ) (2,145 ) (2,554 ) Future net cash flows 210 455 704 1,354 2,723 10% discount factor (113 ) (160 ) (515 ) (852 ) (1,640 )
Standardized measure of discounted future net cash flows 97 295 189 502 1,083

- 107 -
Total 7,170 3,111 14,877 8,818 7,133 1,909 2,783 1,359 47,160

Contents
Eni Fact Book Supplemental oil and gas information
- 108 -
Standardized measure of discounted future net cash flows (euro million)
Italy Rest of Europe North Africa
Sub-Saharan Africa Kazakhstan Rest of Asia America
Australia and Oceania Total
December 31, 2011
Consolidated subsidiaries Future cash inflows 38,200 37,974 109,825 59,263 50,443 10,403 11,980 5,185 323,273 Future production costs (5,740 ) (7,666 ) (17,627 ) (15,191 ) (7,845 ) (3,852 ) (2,687 ) (813 ) (61,421 ) Future development and abandonment costs (4,712 ) (7,059 ) (9,639 ) (5,734 ) (3,705 ) (2,842 ) (1,836 ) (224 ) (35,751 ) Future net inflow before income tax 27,748 23,249 82,559 38,338 38,893 3,709 7,457 4,148 226,101 Future income tax (9,000 ) (15,912 ) (46,676 ) (23,075 ) (9,866 ) (1,124 ) (2,474 ) (1,254 ) (109,381 ) Future net cash flows 18,748 7,337 35,883 15,263 29,027 2,585 4,983 2,894 116,720 10% discount factor (9,692 ) (2,572 ) (16,191 ) (4,833 ) (17,599 ) (559 ) (1,914 ) (1,122 ) (54,482 )
Standardized measure of discounted future net cash flows 9,056 4,765 19,692 10,430 11,428 2,026 3,069 1,772 62,238
Equity -accounted entities Future cash inflows 21 649 1,866 6,141 15,067 23,744 Future production costs (5 ) (259 ) (471 ) (1,540 ) (4,598 ) (6,873 ) Future development and abandonment costs (2 ) (36 ) (147 ) (1,247 ) (1,754 ) (3,186 ) Future net inflow before income tax 14 354 1,248 3,354 8,715 13,685 Future income tax (3 ) (3 ) (189 ) (824 ) (5,368 ) (6,387 ) Future net cash flows 11 351 1,059 2,530 3,347 7,298 10% discount factor (183 ) (475 ) (1,825 ) (2,155 ) (4,638 )
Standardized measure of discounted future net cash flows 11 168 584 705 1,192 2,660
Total 9,056 4,776 19,860 11,014 11,428 2,731 4,261 1,772 64,898

Contents
Eni Fact Book Supplemental oil and gas information
Changes in standardized measure of discounted future net cash flows (euro million)
Total
consolidated subsidiaries
Total equity- accounted
entities Total
Standardized measure of discounted future net cash flows at December 31, 2008 31,452 38 31,490
Increase (Decrease): - sales, net of production costs (17,752 ) (154 ) (17,906 ) - net changes in sales and transfer prices, net of production costs 4,515 286 4,801 - extensions, discoveries and improved recovery, net of future production and development costs 3,587 22 3,609 - changes in estimated future development and abandonment costs (9,915 ) (157 ) (10,072 ) - development costs incurred during the period that reduced future development costs 7,401 208 7,609 - revisions of quantity estimates 4,686 (113 ) 4,573 - accretion of discount 6,112 29 6,141 - net change in income taxes 674 (67 ) 607 - purchase of reserves in-place 161 161 - sale of reserves in-place (7 ) 81 74 - changes in production rates (timing) and other 586 84 670
Net increase (decrease) 48 219 267
Standardized measure of discounted future net cash flows at December 31, 2009 31,500 257 31,757
Increase (Decrease): - sales, net of production costs (22,194 ) (243 ) (22,437 ) - net changes in sales and transfer prices, net of production costs 24,415 406 24,821 - extensions, discoveries and improved recovery, net of future production and development costs 1,926 1,409 3,335 - changes in estimated future development and abandonment costs (6,464 ) (386 ) (6,850 ) - development costs incurred during the period that reduced future development costs 8,520 368 8,888 - revisions of quantity estimates 12,600 143 12,743 - accretion of discount 6,519 53 6,572 - net change in income taxes (11,802 ) (1,115 ) (12,917 ) - purchase of reserves in-place - sale of reserves in-place (177 ) (177 ) - changes in production rates (timing) and other 1,234 191 1,425
Net increase (decrease) 14,577 826 15,403
Standardized measure of discounted future net cash flows at December 31, 2010 46,077 1,083 47,160
Increase (Decrease): - sales, net of production costs (23,744 ) (300 ) (24,044 ) - net changes in sales and transfer prices, net of production costs 40,961 442 41,403 - extensions, discoveries and improved recovery, net of future production and development costs 1,580 2,457 4,037 - changes in estimated future development and abandonment costs (3,890 ) (392 ) (4,282 ) - development costs incurred during the period that reduced future development costs 7,301 866 8,167 - revisions of quantity estimates 1,337 (87 ) 1,250 - accretion of discount 8,640 235 8,875 - net change in income taxes (17,067 ) (1,678 ) (18,745 ) - purchase of reserves in-place 37 10 47 - sale of reserves in-place (146 ) (146 ) - changes in production rates (timing) and other 1,152 24 1,176
Net increase (decrease) 16,161 1,577 17,738
Standardized measure of discounted future net cash flows at December 31, 2011 62,238 2,660 64,898

- 109 -

Contents
Eni Fact Book Quarterly information
Quarterly information
Main financial data (a) (euro million)
2009 2010 2011 I Q II Q III Q IV Q I Q II Q III Q IV Q I Q II Q III Q IV Q Net sales from operations 23,741 18,267 19,142 22,077 83,227 24,804 22,902 22,704 28,113 98,523 28,779 24,596 26,112 30,102 109,589 Operating income: 3,967 2,405 3,217 2,466 12,055 4,847 4,305 4,084 2,875 16,111 5,638 3,810 4,504 3,483 17,435 Exploration & Production 2,374 1,778 2,557 2,411 9,120 3,297 3,401 3,369 3,799 13,866 4,106 3,693 3,919 4,169 15,887 Gas & Power 1,253 863 567 1,004 3,687 1,316 592 438 550 2,896 910 184 338 326 1,758 Refining & Marketing 240 47 34 (423 ) (102 ) 105 255 (65 ) (146 ) 149 303 73 32 (681 ) (273 ) Petrochemicals (167 ) (287 ) (60 ) (161 ) (675 ) 36 17 24 (163 ) (86 ) 108 (113 ) (122 ) (297 ) (424 ) Engineering & Construction 270 310 274 27 881 291 334 327 350 1,302 354 366 304 398 1,422 Other activities (b) (55 ) (122 ) (28 ) (231 ) (436 ) (60 ) (115 ) (58 ) (1,151 ) (1,384 ) (27 ) (138 ) (79 ) (183 ) (427 ) Corporate and financial companies (b) (63 ) (124 ) (134 ) (99 ) (420 ) (70 ) (82 ) (47 ) (162 ) (361 ) (112 ) (76 ) (85 ) (46 ) (319 ) Unrealized profit intragroup elimination 115 (60 ) 7 (62 ) (68 ) (97 ) 96 (202 ) (271 ) (4 ) (179 ) 197 (203 ) (189 ) Net income 1,904 832 1,240 391 4,367 2,222 1,824 1,724 548 6,318 2,547 1,254 1,770 1,289 6,860 Capital expenditures 3,147 3,697 2,957 3,894 13,695 2,779 4,328 2,851 3,912 13,870 2,875 3,740 2,929 3,894 13,438 Investments 2,039 175 63 46 2,323 39 76 186 109 410 41 87 92 140 360 Net borrowings at period end 16,528 18,355 20,540 23,055 23,055 21,052 23,342 25,261 26,119 26,119 24,951 25,978 28,273 28,032 28,032
i i i (a) i Quarterly data are unaudited. (b) i From 2010 certain environmental provisions incurred by the Parent Company Eni SpA due to inter-company guarantees on behalf of Syndial have been reported within the segment reporting unit
"Other Activities". Prior-year data have been reclassified to allow result comparability.
Key market indicator
2009 2010 2011 I Q II Q III Q IV Q I Q II Q III Q IV Q I Q II Q III Q IV Q Average price of Brent dated crude oil (a) 44.40 58.79 68.28 74.57 61.51 76.24 78.30 76.86 86.48 79.47 104.97 117.36 113.46 109.31 111.27 Average EUR/USD exchange rate 1.302 1.362 1.431 1.478 1.393 1.384 1.273 1.291 1.359 1.327 1.367 1.439 1.413 1.348 1.392 Average price in euro of Brent dated crude oil (b) 34.10 43.16 47.71 50.45 44.16 55.09 61.51 59.54 63.64 59.89 76.79 81.56 80.30 81.09 79.94 Average European refining margin (c) 5.34 3.61 2.34 1.24 3.13 2.40 3.39 2.09 2.74 2.66 1.74 1.09 2.87 2.52 2.06 Average European refining margins Brent/Ural (c) 6.28 3.90 2.26 1.80 3.56 3.20 4.56 2.48 3.78 3.47 3.35 2.20 2.92 3.13 2.90 Average European refining margins in euro 4.10 2.65 1.64 0.84 2.25 1.74 2.66 1.62 2.02 2.00 1.27 0.75 2.03 1.87 1.48 Price of NBP gas 6.76 4.26 3.55 4.54 4.78 5.61 5.68 6.68 8.29 6.56 9.09 9.36 8.74 8.92 9.03 Euribor - three-month euro rate (%) 2.0 1.3 0.8 0.7 1.2 0.6 0.7 0.9 1.0 0.8 1.1 1.4 1.6 1.5 1.4 Libor - three-month dollar rate (%) 1.2 0.9 0.4 0.3 0.7 0.3 0.4 0.4 0.3 0.3 0.3 0.3 0.3 0.5 0.3

- 110 -
i i i (a) i In US$ per barrel. Source: Platt’s Oilgram. (b) i Eni calculation. (c) i In US$ per barrel FOB Mediterranean Brent dated crude oil. Eni elaborations on Platt’ s Oilgram data.
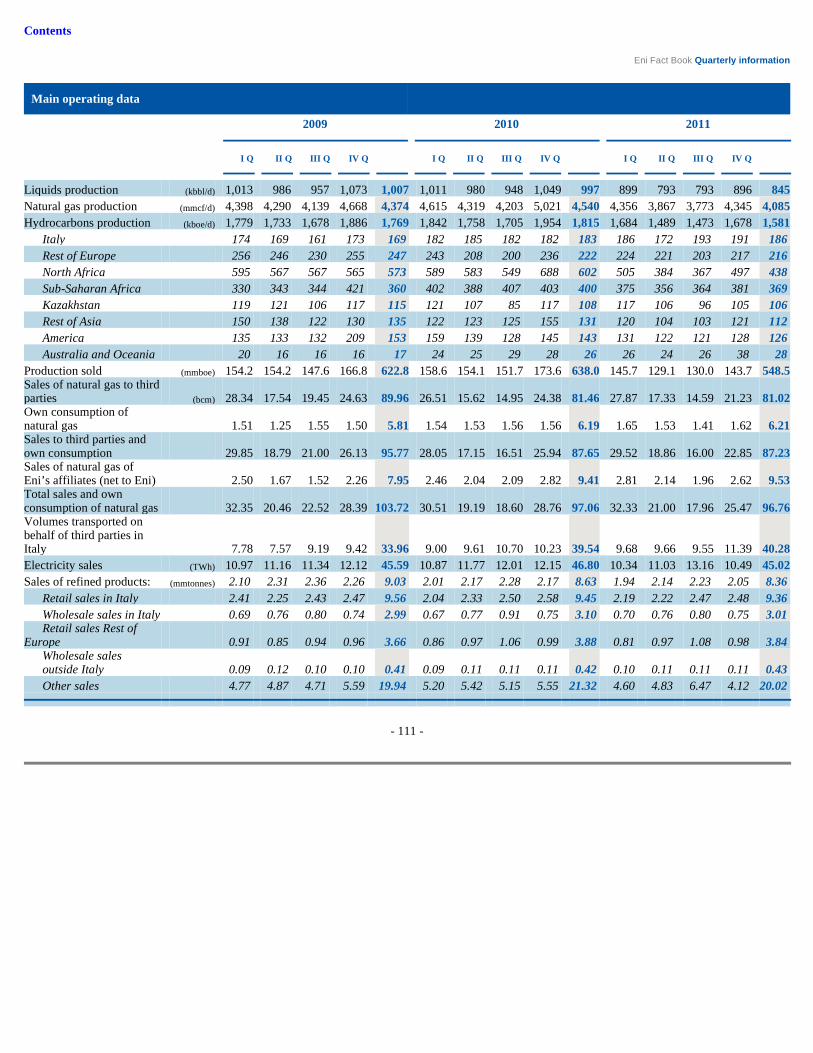
Contents
Eni Fact Book Quarterly information
- 111 -
Main operating data
2009 2010 2011 I Q II Q III Q IV Q I Q II Q III Q IV Q I Q II Q III Q IV Q Liquids production (kbbl/d) 1,013 986 957 1,073 1,007 1,011 980 948 1,049 997 899 793 793 896 845 Natural gas production (mmcf/d) 4,398 4,290 4,139 4,668 4,374 4,615 4,319 4,203 5,021 4,540 4,356 3,867 3,773 4,345 4,085 Hydrocarbons production (kboe/d) 1,779 1,733 1,678 1,886 1,769 1,842 1,758 1,705 1,954 1,815 1,684 1,489 1,473 1,678 1,581 Italy 174 169 161 173 169 182 185 182 182 183 186 172 193 191 186 Rest of Europe 256 246 230 255 247 243 208 200 236 222 224 221 203 217 216 North Africa 595 567 567 565 573 589 583 549 688 602 505 384 367 497 438 Sub-Saharan Africa 330 343 344 421 360 402 388 407 403 400 375 356 364 381 369 Kazakhstan 119 121 106 117 115 121 107 85 117 108 117 106 96 105 106 Rest of Asia 150 138 122 130 135 122 123 125 155 131 120 104 103 121 112 America 135 133 132 209 153 159 139 128 145 143 131 122 121 128 126 Australia and Oceania 20 16 16 16 17 24 25 29 28 26 26 24 26 38 28 Production sold (mmboe) 154.2 154.2 147.6 166.8 622.8 158.6 154.1 151.7 173.6 638.0 145.7 129.1 130.0 143.7 548.5 Sales of natural gas to third parties (bcm) 28.34 17.54 19.45 24.63 89.96 26.51 15.62 14.95 24.38 81.46 27.87 17.33 14.59 21.23 81.02 Own consumption of natural gas 1.51 1.25 1.55 1.50 5.81 1.54 1.53 1.56 1.56 6.19 1.65 1.53 1.41 1.62 6.21 Sales to third parties and own consumption 29.85 18.79 21.00 26.13 95.77 28.05 17.15 16.51 25.94 87.65 29.52 18.86 16.00 22.85 87.23 Sales of natural gas of Eni’s affiliates (net to Eni) 2.50 1.67 1.52 2.26 7.95 2.46 2.04 2.09 2.82 9.41 2.81 2.14 1.96 2.62 9.53 Total sales and own consumption of natural gas 32.35 20.46 22.52 28.39 103.72 30.51 19.19 18.60 28.76 97.06 32.33 21.00 17.96 25.47 96.76 Volumes transported on behalf of third parties in Italy 7.78 7.57 9.19 9.42 33.96 9.00 9.61 10.70 10.23 39.54 9.68 9.66 9.55 11.39 40.28 Electricity sales (TWh) 10.97 11.16 11.34 12.12 45.59 10.87 11.77 12.01 12.15 46.80 10.34 11.03 13.16 10.49 45.02 Sales of refined products: (mmtonnes) 2.10 2.31 2.36 2.26 9.03 2.01 2.17 2.28 2.17 8.63 1.94 2.14 2.23 2.05 8.36 Retail sales in Italy 2.41 2.25 2.43 2.47 9.56 2.04 2.33 2.50 2.58 9.45 2.19 2.22 2.47 2.48 9.36 Wholesale sales in Italy 0.69 0.76 0.80 0.74 2.99 0.67 0.77 0.91 0.75 3.10 0.70 0.76 0.80 0.75 3.01 Retail sales Rest of Europe 0.91 0.85 0.94 0.96 3.66 0.86 0.97 1.06 0.99 3.88 0.81 0.97 1.08 0.98 3.84 Wholesale sales outside Italy 0.09 0.12 0.10 0.10 0.41 0.09 0.11 0.11 0.11 0.42 0.10 0.11 0.11 0.11 0.43 Other sales 4.77 4.87 4.71 5.59 19.94 5.20 5.42 5.15 5.55 21.32 4.60 4.83 6.47 4.12 20.02

Contents

Contents

Contents

Contents

Table of Contents
Ordinary and Extraordinary Shareholders’ Meeting resolutions
Eni S.p.A. Ordinary and Extraordinary Shareholders’ Meeting held on May 8, 2012 resolved: • to approve Eni Financial statements at December 31, 2011, which report net profit amounting to 4,212,687,003.27 euro; • to allocate euro 2,328,880,900.91 of Eni 2011 profit of euro 4,212,687,003.27 left after the payment of an interim dividend of euro 0.52 per share resolved by the Board of Directors on September 8, 2011, as follows: - to pay a dividend of 0.52 euro for each share owned and outstanding on the coupon detachment date, excluding treasury shares in the portfolio on that date. Therefore, in consideration of the payment of the 2011 interim dividend of 0.52 euro per share, the 2011 dividend per share amounts to 1.04 euro; - to the legal Reserve the amount remaining following the distribution of the proposed dividend; • to pay the balance of the 2011 dividend beginning on May 24, 2012, with coupon detachment set for May 21, 2012; • in favor of the first section of the Remuneration report regarding the company’s policy on the remuneration of board directors, general managers and executives with strategic responsibilities and the procedures used to adopt and implement this policy; • to approve the amendments to Articles 17.3, 17.5 and 28.2 of the By-laws of Eni S.p.A. and the addition of the new article 34.
Documents to be distributed
Eni’s Annual Report 2011 (Italian Edition) including the financial statements of Eni, approved by the Shareholders’ Meeting, the consolidated financial statements, the reports of the Directors, the certification pursuant to article 154- bis , paragraph 5, of legislative Decree 58/1998, the report of the statutory auditors, the report of the external auditors,
the 2011 sustainability reporting and the related Independent Assurance Report is available at Eni S.p.A. Registered Office and Borsa Italiana S.p.A. (Italian Stock Exchange: www.borsaitaliana.it).
The minutes of the Meeting will be available under law provisions at Eni S.p.A. Registered Office and Borsa Italiana S.p.A. (Italian Stock Exchange: www.borsaitaliana.it).
The Report on corporate governance and shareholding structure and the Remuneration report are also available at Eni S.p.A. Registered Office and Borsa Italiana S.p.A. (Italian Stock Exchange: www.borsaitaliana.it).
The above-mentioned documents are also available free of charge on the Company website (www.eni.com) and may be requested by e-mail at [email protected] or by calling the Toll-Free number 800 940 924 for calls from Italy and 800 11 22 34 56 for calls from outside Italy, after dialing the international access code (+).
Payment of year 2011 final dividend
Eni S.p.A. Shareholders’ Meeting resolved to pay final dividends as from May 24, 2012, coupon No. 18, being the ex-dividend date May 21, 2012. Therefore, as of this last date, Eni shares will be traded without the right to the payment of 2011 final dividend.
In order to exercise the rights incorporated in the shares owned, Shareholders whose shares are not yet in uncertificated form shall previously deliver said shares to a financial intermediary for their deposit with Monte Titoli S.p.A. (Italian Securities Register Centre) and their subsequent dematerialization.
The payment of dividends to Beneficial Owners of ADRs, each of them representing two Eni shares, listed on the New York Stock Exchange, will be executed through The Bank of New York Mellon.

Table of Contents
Eni: important new discovery in Mozambique
• The discovery made at Coral 1 exploration prospect is estimated to range between 7 and 10 trillion cubic feet (tcf) of gas in place • The overall potential for Area 4 is now estimated to range between 47 and 52 tcf of gas in place
San Donato Milanese (Milan), May 16, 2012 - Eni announces a new giant natural gas discovery in Area 4, offshore Mozambique, at the Coral 1 exploration prospect.
The results for this well, drilled in the southern part of Area 4, are of particular significance. The Coral discovery is estimated to contain between 7 and 10 tcf of gas in place, exclusively located in Area 4. With these new results at Coral 1, Eni estimates that the resources exclusively located in Area 4 range between 15 and 20 tcf of gas in place. The new discovery further increases the total potential of the Mamba complex discovered so far in Area 4 Offshore Rovuma, which is now estimated to hold between 47 and 52 tcf of gas in place.
Coral 1 is located 65 kilometers off the Capo Delgado coast in a water depth of 2,261 meters and reaches a total depth of 4,869 meters. The well was drilled approximately 26 kilometers south east of the Mamba South 1 discovery.
The discovery well encountered a total of 75 meters of gas pay in single high-quality Eocene sand. This discovery is particularly significant since it confirms a new exploration play, which is independent of those drilled so far in previous Mamba wells. Eni will run a production test on the Coral 1 discovery.
Eni plans to drill at least another five wells to fully establish the upside potential of Area 4. Eni is the operator of Area 4 with a 70-percent participating interest. Co-owners in the area are Galp Energia (10 percent), KOGAS (10 percent) and ENH (10 percent, carried through the exploration phase).
Company Contacts:
Press Office Tel.: +39.0252031875 - +39.06598232030 Freephone for shareholders (from Italy): 800940924 Freephone for shareholders (from abroad): +39. 800 11 22 34 56 Switchboard: +39-0659821
[email protected] [email protected] [email protected]
Web site : www.eni.com

Table of Contents
Eni to implement Decree of the President of the Council of Ministers shortly
San Donato Milanese (Milan), May 25, 2012 - Eni notes the Decree of the President of the Council of Ministers issued today which sets out the guidelines for the divestment of its stake in Snam and identifies Cassa Depositi e Prestiti as the appropriate entity to continue to provide stability to Snam’s shareholder base.
Eni is committed to defining the terms of the divestment of its stake shortly, and expects to submit them to its Board of Directors on May 30.
Company Contacts:
Press Office Tel.: +39.0252031875 - +39.06598232030 Freephone for shareholders (from Italy): 800940924 Freephone for shareholders (from abroad): +39. 800 11 22 34 56 Switchboard: +39-0659821
[email protected] [email protected] [email protected]
Web site : www.eni.com