enhanced photocatalytic activity of cobalt-doped ceo2 nanorods
TRANSCRIPT

ORIGINAL PAPER
Enhanced photocatalytic activity of cobalt-doped CeO2 nanorods
N. Sabari Arul • D. Mangalaraj • Pao Chi Chen •
N. Ponpandian • P. Meena • Yoshitake Masuda
Received: 12 August 2012 / Accepted: 18 September 2012 / Published online: 28 September 2012
� Springer Science+Business Media New York 2012
Abstract In this paper, CeO2 and cobalt-doped CeO2
nanorods synthesized by surfactant free co-precipitation
method. The microstructures of the synthesized products
were characterized by XRD, FESEM and TEM. The
structural properties of the grown nanorods have been
investigated using electron diffraction and X-ray diffrac-
tion. High resolution transmission electron microscopy
studies show the polycrystalline nature of the Co-doped
cerium oxide nanorods with a length of about 300 nm and a
diameter of about 10 nm were produced. The X-ray Pho-
toelectron spectrum confirms the presence of cobalt in
cerium oxide nanorods. From BET, the specific surface
area of the CeO2 (Co-doped) nanostructures (131 m2 g-1)
is found to be significantly higher than that of pure CeO2
(52 m2 g-1). The Co-doped cerium nanorods exhibit an
excellent photocatalytic performance in rapidly degrading
azodyes acid orange 7 (AO7) in aqueous solution under
UV illumination.
Keywords Co-doped CeO2 nanorods � Chemical
synthesis � Surface area � Photocatalytic properties �AZO dyes
1 Introduction
One-dimensional (1D) nanostructured materials exhibit
many exclusive physical and chemical properties that are
quite different from the bulk state due to the enhanced sur-
face area to volume ratio and quantum confinement [1–6].
Cerium oxide (CeO2, ceria) is a face-centered cubic fluorite-
type crystal which is stable from room temperature to its
melting point. It has substantially fascinated researchers
due to its wide application as a promising material for cat-
alysts [7], oxygen sensors [8], UV blockers [9], etc. Various
techniques such as, precipitation, hydrothermal, reverse
micelles, sonochemical, sol gel method, etc. have been
employed to synthesize nanostructured ceria by using either
surfactants or costly chemicals as doping materials [10–16].
Among the different synthesis techniques, the precipitation
technique is an attractive one owing to its advantages of low
cost, simple process and easy scale-up. This method involves
simultaneous occurrence of nucleation, growth, coarsening
and agglomeration processes, which significantly affect the
size, morphology and properties of the products [17, 18].
Most of the previous reports were focused on the preparation,
growth and calcination effects of pure and doped cerium
oxide [19], but only a few have reported the growth and
influence of doping effect on the morphology of CeO2
nanostructures [20]. Moreover, doping cerium oxide doubles
its oxygen reserve and transfer capacity, greatly improving
its catalytic activities [21, 22]. The morphology of the cerium
oxide can significantly affects the photocatalytic applica-
tions. CeO2 nanorods are building blocks which are better
N. S. Arul (&) � D. Mangalaraj � N. Ponpandian
Department of Nanoscience and Technology,
Bharathiar University, Coimbatore 641 046, India
e-mail: [email protected]
P. C. Chen
Department of Chemical and Materials Engineering,
Lunghwa University of Science and Technology,
Taoyuan, Taiwan
P. Meena
Department of Physics, PSGR Krishnammal College
for Women, Coimbatore 641 004, India
Y. Masuda
National Institute of Advanced Industrial Science and
Technology (AIST), 2266-98 Anagahora, Shimoshidami,
Moriyama-ku, Nagoya 463-8560, Japan
123
J Sol-Gel Sci Technol (2012) 64:515–523
DOI 10.1007/s10971-012-2883-7

than nanoparticles due to their high aspect ratio enhance the
redox property by predominantly exposing the reactive
planes with well-defined active sites for better catalytic
reaction [23]. The investigation on cobalt-doped CeO2
nanorods has never been reported. Thus the prime aim of this
study was to increase the photodegradation of AO7 dyes by
doping CeO2 with cobalt ions.
This paper reports the data for photocatalytic activity of
CeO2 and Co-doped CeO2 nanorods synthesized by pre-
cipitation method at room temperature. In this synthesis
process, no surfactants, templates or organic solvents were
involved. The microstructures and morphology of the
individual nanorods were investigated. The effects of
cobalt ions doped cerium oxide on photocatalytic activity
of AO7 dyes were investigated in detail.
2 Experimental
2.1 Synthesis of CeO2 and Co-doped CeO2 nanorods
All the chemicals were obtained from Alfa Acer Inc., and
used without further purification. Cerium (III) nitrate
(Ce(NO3)3�6H2O) and cobalt (II) nitrate (Co(NO3)2�6H2O)
with laboratory purity were used as precursors and ammo-
nium hydroxide (NH4OH) was used as a co-precipitating
agent. The cerium precursor was kept fixed (0.5 M) and Co
doping concentration was varied (0.1, 0.3 and 0.5 M). Ini-
tially 0.5 M cerium nitrate solution was prepared and stirred
vigorously at room temperature. The cobalt nitrate solution
with different concentrations was added drop wise to the
prepared cerium nitrate solution to prepare three different
Co-concentrations. The pH was maintained at 11 by using
ammonia solution (28 %). The resultant colloidal solution
was sealed in a vessel to make a precipitate which was aged
at room temperature for 2 days. Finally the precipitates
were separated by centrifuging at 6,000 rpm and washed
several times with ethanol and de-ionized water to remove
the impurities. The final colloidal precipitate was dried at
90 �C for 2 h and then subjected to further characterization.
A similar procedure was adopted to obtain pure cerium
oxide nanoparticles.
2.2 Characterization techniques
Phase identification for the pure and Co-doped cerium oxide
nanorods was performed by X-ray powder diffractometer
(XRD) using Cu-Ka radiation (RIGAKU XRD/MAX-2200).
The microstructure of the Co-doped cerium oxide was
observed using a field emission scanning electron micro-
scope (FESEM) (JEOL JSM-6500) at 30 kV after sputter
coating the samples with gold. The morphology, particle size
and distribution were examined by transmission electron
microscopy (TEM) (JEOL JEM-2100F). Energy dispersive
X-ray analysis (EDAX) and selected-area electron diffrac-
tion (SAED) were also recorded in the TEM with an accel-
erating voltage of 200 kV. SAED pattern was studied to
check the crystalline nature of the synthesized sample.
Brunaur Emmett Teller (BET) nitrogen absorption plots
were used to study the change in the specific surface area of
the CeO2 samples on doping with different Co concentra-
tions. Brunaur Emmett Teller (BET) nitrogen adsorption
plots were used to measure the change in the specific surface
area of the CeO2 nanoparticles and nanorods. The photo-
degradation studies were done by measuring the absorbance
spectra SHIMADZU 3600 UV–Vis-NIR spectrophotometer.
2.3 Photocatalytic activity measurements
The measurement of photocatalytic activity of CeO2 and Co-
doped CeO2 materials was evaluated by analyzing its removal
efficiency of azodye acid orange 7 (AO7). The initial con-
centration of dye solution was 0.3 mM. Catalysts 10 mg were
suspended in 15 mL of AO7 followed by sonication for
10 min in the absence of light so that the equilibrium
adsorption on the surface of catalyst could be attained. Then
the solution was irradiated under UV light source of 2 mW.
The photodegradation studies were carried out by measuring
the maximum absorption of AO7 at 481 nm using SHIMA-
DZU 3600 UV–Vis-NIR spectrophotometer.
3 Results and discussion
3.1 Structural analysis
The crystal structure and phase purity of the prepared
samples were studied by X-ray diffraction. X-ray diffrac-
tion patterns of the as-prepared pure CeO2 and Co-doped
CeO2 nanostructures are depicted in Fig. 1. The major
peaks in all the four patterns are from CeO2 [JCPDS PDF
No 34-0394]. The diffraction pattern shows reflections
corresponding to (111), (200), (220), (311) and (222)
planes of CeO2-face centered cubic (fcc) fluorite structure
(space group: Fm3m). CeO2 with different Co-concentra-
tions shows well defined XRD peaks indicating the good
crystalline nature of the prepared material. Figure 2 shows
the average crystallite size and lattice parameters of pure
CeO2 and Co-doped CeO2 which were calculated from the
XRD diffracted peak at 28.589� corresponds to (111) plane
in [100] direction by using Scherrer formula.
It was revealed that the crystal size of CeO2 was reduced
after doping of cobalt. Comparing with the pure CeO2, the
crystal size of the Co-doped CeO2 nanorods decreases from
15 to 5 nm. This reduction in the crystallite size leads to an
increase in the specific surface area. The lattice parameter
516 J Sol-Gel Sci Technol (2012) 64:515–523
123

of the pure nanocrystalline cerium oxide is 5.427 A, which
is higher than that of its bulk counterpart (5.4113 A). The
increase in lattice expansion of small particles is due to the
increase of oxygen vacancies [24]. The decrease in the
lattice parameter with the increase of Co doping is in good
agreement with the effective ionic radii consideration. The
smaller Co2? (ionic radius = 0.745 A) occupies the posi-
tion of the larger Ce4? and (ionic radius = 1.098 A) as a
consequence, the unit cell volume decreases with increase
of the Co concentration [25, 26].
3.2 Morphological analysis of Co-doped CeO2
Field emission scanning electron microscopy (FESEM) was
used to obtain the morphology of the CeO2 and Co-doped
CeO2. From the FESEM images of the pure and Co-doped
ceria, it can be seen that the nanospheres undergo an evo-
lution from short nanorods to long nanorods on increasing
the concentration of Co. Figure 3a shows the FESEM image
of the pure cerium oxide synthesized by precipitation
method. The surface morphology shows the formation of
spherical particles only after 2 days of aging at room tem-
perature. Further the surface morphologies for the 0.1, 0.3
and 0.5 M Co-doped CeO2 samples prepared with the same
conditions are shown in Fig. 3b–d.
The nanorod formation is initialized on doping CeO2
with 0.1 M Co and it is shown in Fig. 3b. Further increase
in the Co-doping to 0.3 M leads to nucleation that results in
the growth of agglomerated nanoparticles, as depicted in
Fig. 3c. In our study, at equal molar concentration of cer-
ium and cobalt, the aggregates of nanoparticles are highly
terminated. Figure 3d shows the completion of the growth
and nucleation of nanorods at the equimolar concentration
of Co and CeO2. It is magnified and shown in the insert in
Fig. 3d, confirms the complete growth of Co-doped CeO2
1D nanorods. In order to confirm the optimized condition
of Co-doped cerium oxide nanorods, high mole concen-
tration (0.7 M) of Co was introduced into cerium precursor
and same process was carried out and finally FESEM was
carried out (Image not shown). The growth of CeO2
nanorods was terminated and agglomeration of nanoparti-
cles was observed. Because of the availability of sufficient
cobalt ion in the Ce precursor will ensure the growth of
nanorods was confirmed. So the equimolar concentration
(0.5 M) of CeO2 and cobalt provides sufficient ions for the
formation of nanorods. Under this condition, Ostwald rip-
ening exists, where smaller crystals add-up and join toge-
ther to form larger crystals which lead to the formation of
Co-doped CeO2 nanorods at the end of 2 days of aging at
room temperature.
3.3 Microstructural analysis of the nanorods
Transmission electron microscopy (TEM) and high resolu-
tion TEM (HRTEM) images offer additional insight into the
microstructure and morphology of the prepared Co-doped
cerium oxide nanorods. Figure 4a shows the HRTEM image
of the pure cerium oxide. The inset image shows the electron
20 30 40 50 60 70 80
(a)
2θ (degrees)
0.5M Co
0.3M Co
CeO2
(b)
(c)
0.1M Co
Inte
nsi
ty (
arb
.un
its)
(d)
οCeO2
οοοοοοο
111
ο
200
220
311
222
400 331
421
Fig. 1 (colour online) XRD pattern for the CeO2 sample a pure,
b doped with 0.1 M, c 0.3 M and d 0.5 M concentration of Co
0.0M 0.1M 0.3M 0.5M
5.37
5.38
5.39
5.40
5.41
5.42
5.43
Co Concentration (Mole)
Lat
tice
Par
amet
er (
A)
3
6
9
12
15
18
Crystallite size (n
m)
Fig. 2 Average crystal size and lattice parameter of cerium oxide
nanostructures as a function of different Co concentrations
J Sol-Gel Sci Technol (2012) 64:515–523 517
123

diffraction pattern which confirms the polycrystalline nature
of cubic cerium oxide. Clear facets are observed corre-
sponding to (111) planes.
The low and high resolution TEM and HRTEM images of
the as-prepared Co-doped CeO2 nanorods with equimolar
concentrations are represented in Fig. 4b–d. Figure 4b
shows a bright field TEM image of the as-prepared Co-doped
cerium oxide nanorods at low magnification. It is seen that
more than 80 % of the sample is made up of rod like struc-
tures. The magnified image in the insert in Fig. 4b shows the
nanorods with hexagonal structure. Figure 4c is the HRTEM
image of Co-doped single CeO2 nanorod with polycrystal-
line structure. A typical selected area electron diffraction
(SAED) pattern obtained for the CeO2 (Fig. 4a) and Co-
doped CeO2 nanorods is shown in Fig. 4c. The SAED pattern
is indexed according to cubic fluorite phase and it confirms
the polycrystalline nature of the prepared sample. The length
and width of the cerium oxide nanorods are determined from
TEM analysis as *100–300 nm and *10 nm respectively.
The aspect ratio (i.e., length/diameter) of the prepared
nanorods is *15. The lattice spacing value of 3.10 A were
identified as corresponding to (111) plane of CeO2, consis-
tent with the XRD results. The EDAX spectrum and the
corresponding elemental mappings recorded for sample
CeO2 nanoparticles and Co-doped CeO2 nanorods are shown
in Fig. 4e, f. The inset illustrates the actual distribution of Ce,
Co and O separately in the sample, with the Ce/Co ratio equal
to 22.81:2.99.
3.4 Surface area analysis
The surface area and porosity are essential properties of a
catalyst which determine its activity to apply for photocat-
alytic degradation applications. The pore architectures of the
catalysts control the transport phenomena and preside over
the selectivity in various catalyzed reactions. In addition to
FESEM and TEM studies, the pore nature of these CeO2 and
Co-doped CeO2 nanorods was confirmed by pore size dis-
tribution measurements, which were obtained by measuring
the adsorption–desorption isotherm and BJH methods.
Figure 5a, b shows the typical sorption isotherms and the
corresponding pore size distribution of CeO2 nanoparticles
(c)
(b)(a)
(d)
Fig. 3 FESEM images for as-prepared samples aged at room temperature for 48 h a pure, b 0.1, c 0.3 and d 0.5 M Co-doped with CeO2
518 J Sol-Gel Sci Technol (2012) 64:515–523
123

and Co-doped CeO2 nanorods. It is seen that the isotherm is
of type IV, indicating the presence of mesoporous materials
according to the International Union of Pure and Applied
Chemistry (IUPAC) classification [27]. The type-IV iso-
therm with a hysteresis loop (H3) in the range of 0.8–1.0 P/Po
was obtained in our samples. The measured BET data indi-
cates that the synthesized Co-doped CeO2 nanorods possess
pores with mesoporous structures. A quantitative calculation
shows that our samples posses BET surface areas of nearly
52 and 131 m2 g-1 for CeO2 and Co-doped CeO2 nanorods
respectively. The enhanced surface area of the doped sam-
ples demonstrates that these samples are likely to be highly
efficient photocatalysts.
The calculated SSA versus Co-concentration for CeO2 with
various cobalt concentrations is plotted in Fig. 6. CeO2
particles form spherical in shape in the absence of Co ions.
Therefore, the contact areas between the particles are con-
sidered as negligible. The value of the SSA increases promi-
nently from 52 to 110 m2 g-1 on a small addition of 0.1 M Co
into CeO2. The addition of cobalt to CeO2 changes the shape
of the particle from the spherical form to nanorods. Further,
the increase of Co-doping to 0.3 and 0.5 M increased
the surface area to 129 and 131 m2 g-1 respectively. The
increase in the SSA may be due to the change in the shape of
the particle and the addition of Co on cerium oxide lattice in
accordance with the XRD results. Therefore, an appropriate
(e)
Ce Co Ce
(f)
(c)
3.10 Å
(d)
(b) (111)
(a)
Fig. 4 (colour online) a HRTEM image of pure CeO2; b–d TEM images for 0.5 M Co-doped cerium oxide nanorods with low and high
magnification images and inset corresponds to SAED pattern; e EDAX spectrum of CeO2 and f individual CeO2 nanorod doped with cobalt
J Sol-Gel Sci Technol (2012) 64:515–523 519
123

concentration of cobalt in CeO2 assists in stabilizing the
crystal structure and produces nanorod like shapes with a high
SSA. Earlier, researchers achieved a high specific surface area
of 152 m2 g-1 by doping ceria with Pr [20]. In the present
work also, we have achieved comparatively similar SSA for
the ceria by significantly doping with cobalt at room tem-
perature. The nanorod morphology strongly influences the
catalytic response of the cerium oxide because of the increased
SSA and this may be very much useful for the catalytic
applications.
3.5 Growth mechanism
The formation of cerium oxide involves several complicated
reactions [28]. When ammonium hydroxide was added into
the precursor solution, Ce(OH)3 precipitate was formed
immediately due to the extremely low-solubility. In the
present case, the high alkaline environment favored the
oxidation of Ce(OH)3 to hydrated Ce(IV). Oxidation of Ce3?
and Ce4? in solution takes place at high pH [i.e.,
Ce3? ? H2O gives Ce4? ? H? ? e-] with a subsequent
hydrolysis to cerium hydroxide Ce(OH)4. The following
Eq. (1) shows the formation of CeO2.
CeðOHÞ4 ! CeO2 � 2H2O! CeO2 þ 2H2O ð1Þ
The influence of Co concentration on average grain size
(d), morphology and specific surface area (q) is
schematically explained in Fig. 7. The addition of 0.1 M
Co to cerium oxide starts the formation of nanorods from the
spherical shaped particles. When the concentration is
increased to 0.3 M, it is noticed that the proportion of
nanorods increases and a further increase of the cobalt
concentration to a value equal to that of cerium oxide (0.5 M)
leads to the maximum number of nanorods. Correspondingly
the SSA of the pure cerium oxide nanoparticles increases
from 52 to 131 m2 g-1 for the 0.5 M Co-doped cerium oxide
nanorods. The increase in the surface area of nanorods when
compared to that of spherical nanoparticles may be due to
higher grain size and may also be due to the pores which are
clearly visible in the TEM microstructure. The obtained
porous nanorods structure will serve as a very good candidate
for gas sensor and catalytic applications [20, 29].
3.6 Photocatalytic properties
Azodyes are manufactured universally and used in a vari-
ety of applications. They are a rich class of synthetic,
coloured, organic compounds widely contained in waste-
water generated from the textile and dyestuff industries and
pose a major threat to the surrounding ecosystems owing to
their non-biodegradability, toxicity and potential carcino-
genic nature [30]. In this study we have made an attempt to
0.0 0.1 0.2 0.3 0.4 0.5 0.6 0.7 0.8 0.9 1.00
50
100
150
200
Vo
lum
e A
dso
rbed
[cc
/g]
Relative Pressure, P/P0
Adsorption Desorption
(a)CeO
2 nanoparticles
10 100 10000.0000
0.0005
0.0010
Peak positions 2 nm-30 nm
Des
orp
tio
n D
v (d
) [c
c/A
/g]
Pore Diameter [A]
0.0 0.1 0.2 0.3 0.4 0.5 0.6 0.7 0.8 0.9 1.00
50
100
150
200
250
Adsorption Desorption
Vo
lum
e A
dso
rbed
[cc
/g]
Relative Pressure (P/P0)
Co doped CeO2 nanorods (b)
10 100 10000.000
0.001
0.002
0.003
0.004
0.005Peak positions 2 nm-10 nm
Des
orp
tio
n D
v (d
) [c
c/A
/g]
Pore Diameter [A]
Fig. 5 Nitrogen adsorption–desorption isotherm of the prepared
various a CeO2 nanoparticles, b Co-doped CeO2 nanorods (inset of
a and b) corresponding BJH pore size distribution curve calculated
from the desorption branch
0.0 0.1 0.2 0.3 0.4 0.5 0.6 0.740
50
60
70
80
90
100
110
120
130
140
0.1 M Co in CeO2
0.3 M Co in CeO2
0.5 M Co in CeO2
Sp
ecif
ic s
urf
ace
area
-S
SA
(m
2 g-1)
Co concnetration (Mole)
CeO2
Fig. 6 Variation of specific surface area as a function of Co-
concentration
520 J Sol-Gel Sci Technol (2012) 64:515–523
123

the study the degradation of azodyes using cerium oxide
nanorods.
The photodegradation activity of the pure CeO2 nano-
particles and Co-doped cerium oxide nanorods are mea-
sured for the AZO dye (AO7) for different time intervals
and the absorption spectra are shown in Fig. 8a, b. In the
present work, 0.3 mM of azodyes was dissolved in 15 mL
of double distilled water and 0.06 g of pure and Co-doped
cerium oxide was added with the as-prepared dye solution
for photocatalytic measurements. A UV light source of
2 mW with 365 nm wavelength was used for the experi-
ments. The intensity of the absorption spectra decreases
during the photodegradation of the azodye with increasing
time. The absorption spectra for the pure as-prepared dye
(black line), kept in darkness for 10 h (red line), and the
dye kept in UV illumination for 10 h (green line) are
shown in Fig. 8a, b. From the experimental results, it is
seen that there is no change in the intensity for the dye kept
in darkness for 10 h, but a slight decrease in absorption is
observed for the dye exposed to UV illumination for 10 h.
With this initial study, pure and Co-doped cerium oxide
nanorods (catalyst) were dispersed in the dye solution and
illuminated with UV light for different time intervals.
It is seen that in the decomposition of the dye, the Co-doped
CeO2 nanorods in the dispersed medium respond better when
compared to pure CeO2. This better degradation might be due
to the Co induced morphology of the CeO2 nanoparticles and
ρ =52m2 g-1
ρ = 110 m2 g-1
ρ =129 m2 g-1
ρ = 131 m2 g-1
Fig. 7 Schematic illustration for the formation of cobalt-doped cerium oxide nanorods and variation in specific surface area with the
morphology
300 400 500 600 700 8000.0
1.2
2.4
3.6
Wavelength (nm)
0.0
1.2
2.4
3.6
Catalyst - CeO2
(b)
Ab
sorb
ance
AO7 dye
dye in dark(10 hr)
dye kept in UV (10 hr)
dye + Catalyst + UV +1h
dye + Catalyst + UV +2h
dye + Catalyst + UV +4h
dye + Catalyst + UV +6h
dye + Catalyst + UV +8h
dye + Catalyst + UV +10h
(a)
Catalyst - Co doped CeO2
Fig. 8 UV absorbance spectra at different time intervals for a AO7
dye, b Co-doped CeO2 nanorods with AO7 dye solution
J Sol-Gel Sci Technol (2012) 64:515–523 521
123
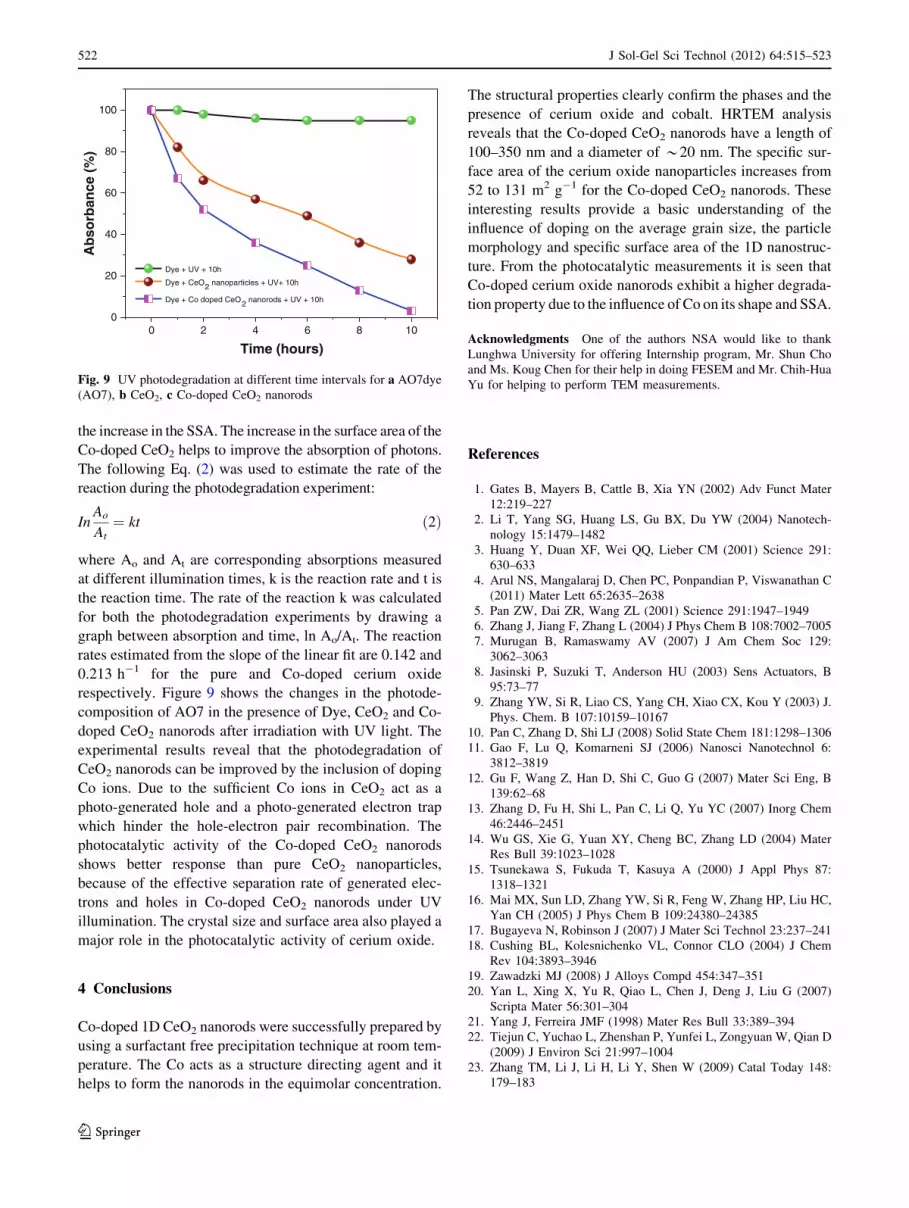
the increase in the SSA. The increase in the surface area of the
Co-doped CeO2 helps to improve the absorption of photons.
The following Eq. (2) was used to estimate the rate of the
reaction during the photodegradation experiment:
InAo
At¼ kt ð2Þ
where Ao and At are corresponding absorptions measured
at different illumination times, k is the reaction rate and t is
the reaction time. The rate of the reaction k was calculated
for both the photodegradation experiments by drawing a
graph between absorption and time, ln Ao/At. The reaction
rates estimated from the slope of the linear fit are 0.142 and
0.213 h-1 for the pure and Co-doped cerium oxide
respectively. Figure 9 shows the changes in the photode-
composition of AO7 in the presence of Dye, CeO2 and Co-
doped CeO2 nanorods after irradiation with UV light. The
experimental results reveal that the photodegradation of
CeO2 nanorods can be improved by the inclusion of doping
Co ions. Due to the sufficient Co ions in CeO2 act as a
photo-generated hole and a photo-generated electron trap
which hinder the hole-electron pair recombination. The
photocatalytic activity of the Co-doped CeO2 nanorods
shows better response than pure CeO2 nanoparticles,
because of the effective separation rate of generated elec-
trons and holes in Co-doped CeO2 nanorods under UV
illumination. The crystal size and surface area also played a
major role in the photocatalytic activity of cerium oxide.
4 Conclusions
Co-doped 1D CeO2 nanorods were successfully prepared by
using a surfactant free precipitation technique at room tem-
perature. The Co acts as a structure directing agent and it
helps to form the nanorods in the equimolar concentration.
The structural properties clearly confirm the phases and the
presence of cerium oxide and cobalt. HRTEM analysis
reveals that the Co-doped CeO2 nanorods have a length of
100–350 nm and a diameter of *20 nm. The specific sur-
face area of the cerium oxide nanoparticles increases from
52 to 131 m2 g-1 for the Co-doped CeO2 nanorods. These
interesting results provide a basic understanding of the
influence of doping on the average grain size, the particle
morphology and specific surface area of the 1D nanostruc-
ture. From the photocatalytic measurements it is seen that
Co-doped cerium oxide nanorods exhibit a higher degrada-
tion property due to the influence of Co on its shape and SSA.
Acknowledgments One of the authors NSA would like to thank
Lunghwa University for offering Internship program, Mr. Shun Cho
and Ms. Koug Chen for their help in doing FESEM and Mr. Chih-Hua
Yu for helping to perform TEM measurements.
References
1. Gates B, Mayers B, Cattle B, Xia YN (2002) Adv Funct Mater
12:219–227
2. Li T, Yang SG, Huang LS, Gu BX, Du YW (2004) Nanotech-
nology 15:1479–1482
3. Huang Y, Duan XF, Wei QQ, Lieber CM (2001) Science 291:
630–633
4. Arul NS, Mangalaraj D, Chen PC, Ponpandian P, Viswanathan C
(2011) Mater Lett 65:2635–2638
5. Pan ZW, Dai ZR, Wang ZL (2001) Science 291:1947–1949
6. Zhang J, Jiang F, Zhang L (2004) J Phys Chem B 108:7002–7005
7. Murugan B, Ramaswamy AV (2007) J Am Chem Soc 129:
3062–3063
8. Jasinski P, Suzuki T, Anderson HU (2003) Sens Actuators, B
95:73–77
9. Zhang YW, Si R, Liao CS, Yang CH, Xiao CX, Kou Y (2003) J.
Phys. Chem. B 107:10159–10167
10. Pan C, Zhang D, Shi LJ (2008) Solid State Chem 181:1298–1306
11. Gao F, Lu Q, Komarneni SJ (2006) Nanosci Nanotechnol 6:
3812–3819
12. Gu F, Wang Z, Han D, Shi C, Guo G (2007) Mater Sci Eng, B
139:62–68
13. Zhang D, Fu H, Shi L, Pan C, Li Q, Yu YC (2007) Inorg Chem
46:2446–2451
14. Wu GS, Xie G, Yuan XY, Cheng BC, Zhang LD (2004) Mater
Res Bull 39:1023–1028
15. Tsunekawa S, Fukuda T, Kasuya A (2000) J Appl Phys 87:
1318–1321
16. Mai MX, Sun LD, Zhang YW, Si R, Feng W, Zhang HP, Liu HC,
Yan CH (2005) J Phys Chem B 109:24380–24385
17. Bugayeva N, Robinson J (2007) J Mater Sci Technol 23:237–241
18. Cushing BL, Kolesnichenko VL, Connor CLO (2004) J Chem
Rev 104:3893–3946
19. Zawadzki MJ (2008) J Alloys Compd 454:347–351
20. Yan L, Xing X, Yu R, Qiao L, Chen J, Deng J, Liu G (2007)
Scripta Mater 56:301–304
21. Yang J, Ferreira JMF (1998) Mater Res Bull 33:389–394
22. Tiejun C, Yuchao L, Zhenshan P, Yunfei L, Zongyuan W, Qian D
(2009) J Environ Sci 21:997–1004
23. Zhang TM, Li J, Li H, Li Y, Shen W (2009) Catal Today 148:
179–183
0 2 4 6 8 100
20
40
60
80
100
Dye + UV + 10h
Dye + CeO2 nanoparticles + UV+ 10h
Dye + Co doped CeO2 nanorods + UV + 10h
Ab
sorb
ance
(%
)
Time (hours)
Fig. 9 UV photodegradation at different time intervals for a AO7dye
(AO7), b CeO2, c Co-doped CeO2 nanorods
522 J Sol-Gel Sci Technol (2012) 64:515–523
123

24. Zhang F, Chan S-W, Spanier JE, Apak E, Jin Q, Robinson RD,
Irving Herman P (2002) Appl Phys Lett 80:127–129
25. May GJ (1978) J Mater Sci 13:261–267
26. Li L, Sasaki T, Shimizu Y, Koshizaki N (2009) J Phys Chem C
113:15948–15954
27. He Y, Li D, Xiao G, Chen W, Chen Y, Sun M, Huang H, Fu X
(2009) J Phys Chem C 113:5254–5262
28. Ferrari V, Llois AM, Vildosola V (2010) J Phys: Condens Matter
22:276002–276010
29. Han WQ, Wu LJ, Zhu YM (2005) J Am Chem Soc 127:12814–
12815
30. Elisangela F, Andrea Z, Fabio DG, Cristiano RM, Regina DL,
Artur CP (2009) Int Biodeterior Biodegrad 63:280–288
J Sol-Gel Sci Technol (2012) 64:515–523 523
123