development of novel photocatalytic overall
TRANSCRIPT

Development of Novel Photocatalytic Overall
Water Splitting Systems at Elevated Temperatures
for Efficient Hydrogen Evolution
Yiyang Li
Inorganic Chemistry Laboratory Department of Chemistry
St Peter’s College University of Oxford
A thesis submitted for the degree of Doctor of Philosophy
Michaelmas Term 2021

i
Table of Contents
Table of Contents ........................................................................................................... i
Dedication ...................................................................................................................... v
Declaration ..................................................................................................................... vi
Acknowledgments ......................................................................................................... vii
Abstract .......................................................................................................................... ix
List of Abbreviations ...................................................................................................... x
List of publications ........................................................................................................ xii
Chapter 1 Introduction ................................................................................................... 1
1.1 Background ...................................................................................................... 1
1.1.1 Photocatalysis .............................................................................................. 1 1.1.2 Conversion and storage of solar energy ...................................................... 2 1.1.3 Hydrogen as a clean solar fuel .................................................................... 4
1.2 POWS on semiconductor photocatalysts ......................................................... 4
1.2.1 Fundamental principles ................................................................................ 4 1.2.2 Developments of the POWS system .......................................................... 10 1.2.3 Factors affecting the POWS performance ................................................. 13
1.3 Strategies for enhancing the POWS performance ......................................... 14
1.3.1 Enhancing light absorption ......................................................................... 14 1.3.2 Facilitating separation of charge carriers ................................................... 18 1.3.3 Promoting surface reactions ...................................................................... 25 1.3.4 Photocatalysis at elevated temperatures ................................................... 28
1.4 Aims and objectives ....................................................................................... 31
1.5 Thesis overview ............................................................................................. 33
1.6 References ..................................................................................................... 35
Chapter 2 Experimental and Characterisation Methods .............................................. 44
2.1 Material synthesis .......................................................................................... 44
2.1.1 Preparation of titanium oxide (TiO2) ........................................................... 44 2.1.2 Synthesis of N-doped TiO2 (N-TiO2) using NH3 treatment ......................... 44 2.1.3 Synthesis of the facet-engineered N-TiO2 .................................................. 45 2.1.4 Synthesis of N-TiO2 using controlled oxidation method ............................. 46 2.1.5 Metal loading of N-TiO2 .............................................................................. 46 2.1.6 Synthesis of single-layer molybdenum disulphide (SL-MoS2) .................... 47 2.1.7 Synthesis of metal decorated SL-MoS2 ..................................................... 48 2.1.8 Synthesis of magnesium oxide (MgO) with different dominating facets .... 48 2.1.9 Synthesis of cerium oxide (CeO2) of different morphologies ..................... 49 2.1.10 Synthesis of zinc oxide (ZnO) nanoplates and nanorods .......................... 50 2.1.11 Synthesis of layered double hydroxides (LDHs) ........................................ 51 2.1.12 Assembly of the photocatalysts with metal oxides or LDHs ....................... 51 2.1.13 Synthesis of iron oxide (Fe3O4) and Fe3O4@SiO2 nanoparticles ............... 52 2.1.14 Synthesis of the N-TiO2, Fe3O4/N-TiO2 and Fe3O4@SiO2/N-TiO2 .............. 53
2.2 Characterisation techniques .......................................................................... 53

ii
2.2.1 X-ray diffraction (XRD) ............................................................................... 53 2.2.2 Electron paramagnetic resonance (EPR) spectroscopy ............................ 56 2.2.3 Nuclear magnetic resonance (NMR) .......................................................... 58 2.2.4 X-ray photoelectron spectroscopy (XPS) ................................................... 61 2.2.5 Ultraviolet-visible diffuse reflectance spectroscopy (UV-Vis DRS) ............. 63 2.2.6 Raman spectroscopy ................................................................................. 65 2.2.7 Time-resolved photoluminescence (TRPL) spectroscopy .......................... 67 2.2.8 Transmission electron microscopy (TEM) .................................................. 70 2.2.9 Scanning transmission electron microscopy (STEM) ................................ 73 2.2.10 Gas chromatography (GC) ......................................................................... 75 2.2.11 Superconducting quantum interference device (SQUID) ........................... 76
2.3 Catalytic testing .............................................................................................. 79
2.3.1 Photocatalytic overall water splitting (POWS) activity tests ....................... 79 2.3.2 Photocatalytic activity tests with light furnace ............................................ 81 2.3.3 Quantum efficiency (QE) measurements and calculation .......................... 81 2.3.4 Solar-to-hydrogen (STH) efficiency measurements and calculation .......... 82
2.4 Density functional theory (DFT) calculations ................................................. 84
2.5 References ..................................................................................................... 86
Chapter 3 Photocatalytic Overall Water Splitting Reaction at Elevated Temperatures on TiO2 Based Materials ...................................................................... 90
3.1 Introduction .................................................................................................... 90
3.2 Objectives ...................................................................................................... 92
3.3 Results and discussion .................................................................................. 94
3.3.1 Characterisations of the N-TiO2 materials .................................................. 94 3.3.1.1 XRD of N-P25 materials ............................................................... 94 3.3.1.2 XPS of N-P25 materials ............................................................... 95 3.3.1.3 UV-Vis absorption of N-P25 materials ......................................... 97 3.3.1.4 Raman spectra of N-P25 materials .............................................. 98 3.3.1.5 HAADF-STEM of N-P25 materials ............................................... 99 3.3.1.6 EPR of N-P25 materials ............................................................. 100
3.3.2 Temperature effect on the POWS reaction .............................................. 104 3.3.3 Separation of charge carriers ................................................................... 110 3.3.4 Practical application of the temperature-promoted POWS system .......... 114
3.4 Conclusion ................................................................................................... 116
3.5 References ................................................................................................... 117
Chapter 4 Effects of the local electric field on photocatalytic overall water splitting reaction ...................................................................................................................... 122
4.1 Introduction .................................................................................................. 122
4.2 Objectives .................................................................................................... 124
4.3 Results and discussion ................................................................................ 125
4.3.1 Electric field effects on TiO2 based materials ........................................... 125 4.3.1.1 LEF introduced by the polar-faceted MgO(111) ......................... 125 4.3.1.2 Investigation of the LEF ............................................................. 131

iii
4.3.2 Electric field effects on 2D MoS2 based materials ................................... 133 4.3.2.1 Characterisations of MoS2 based materials ............................... 133 4.3.2.2 POWS performance of MoS2-based materials ........................... 139 4.3.2.3 Characterisations of the polar-faceted metal oxides .................. 140 4.3.2.4 Assembly of Ru:SL-MoS2 and polar-faceted metal oxides ......... 143 4.3.2.5 Assembly of Ru:SL-MoS2 and LDHs .......................................... 146 4.3.2.6 Correlation of polarisation and POWS performance .................. 148
4.4 Conclusion ................................................................................................... 151
4.5 References ................................................................................................... 152
Chapter 5 Magnetic Field Effects on Photocatalytic Water Splitting Performance .... 155
5.1 Introduction .................................................................................................. 155
5.2 Objectives .................................................................................................... 156
5.3 Results and discussion ................................................................................ 158
5.3.1 Characterisations of the magnetic photocatalysts ................................... 158 5.3.1.1 Structural and morphological characterisations ......................... 158 5.3.1.2 XPS of Fe3O4/N-TiO2 materials .................................................. 161 5.3.1.3 EPR of Fe3O4/N-TiO2 materials .................................................. 162 5.3.1.4 UV-Vis absorption of Fe3O4/N-TiO2 materials ............................ 164 5.3.1.5 Magnetic properties of Fe3O4/N-TiO2 materials .......................... 164
5.3.2 POWS performance and optimisations .................................................... 165 5.3.2.1 Effects of local magnetic flux density ......................................... 165 5.3.2.2 Effects on separation of charge carriers .................................... 170 5.3.2.3 Electron holography of Fe3O4/N-TiO2 materials ......................... 172 5.3.2.4 Correlation of MFEs and POWS performance ........................... 174
5.3.3 Evaluation of the spin-polarisation effect by DFT .................................... 178 5.3.4 Evaluation of practicality .......................................................................... 182
5.4 Conclusion ................................................................................................... 185
5.5 References ................................................................................................... 186
Chapter 6 Photocatalytic Seawater Splitting System ................................................. 189
6.1 Introduction .................................................................................................. 189
6.2 Objectives .................................................................................................... 190
6.3 Results and discussion ................................................................................ 191
6.3.1 Characterisations of the facet-engineered TiO2 nanocrystals .................. 191 6.3.1.1 XRD patterns of TiO2 and N-TiO2 ............................................... 192 6.3.1.2 Microscopic studies of N-TiO2 .................................................... 193 6.3.1.3 XPS of N-TiO2 materials ............................................................. 194 6.3.1.4 EPR of facet-engineered TiO2 based materials ......................... 195 6.3.1.5 UV-Vis DRS of facet-engineered TiO2 based materials ............. 195 6.3.1.6 Raman spectroscopy of the TiO2-based materials ..................... 196
6.3.2 Effect of ionic species on the POWS system ........................................... 197 6.3.2.1 Effect of electrolytes on POWS performance ............................. 197 6.3.2.2 TRPL of N-TiO2 in the presence of electrolyte solution .............. 201 6.3.2.3 Effect of artificial and natural seawater ...................................... 203 6.3.2.4 TRPL study in the presence of artificial seawater ...................... 205

iv
6.3.3 Mechanism investigation of the ionic effect ............................................. 207 6.3.3.1 Facet-selective photo-deposition ............................................... 208 6.3.3.2 In situ AP-XPS study of the facet-controlled N-TiO2 .................. 209 6.3.3.3 DFT studies on the ionic effects ................................................. 212
6.3.4 Evaluation of QE and STH efficiency ....................................................... 216 6.4 Conclusion ................................................................................................... 219
6.5 References ................................................................................................... 220
Chapter 7 Conclusions and outlook ........................................................................... 225
7.1 Conclusions .................................................................................................. 225
7.2 Outlook ......................................................................................................... 230
7.3 References ................................................................................................... 232
Appendix .................................................................................................................... 234
Appendix Note A1 Calculation of QE ......................................................................... 234
Appendix Note A2 Calculations of heat balance ........................................................ 236
Appendix Note A3 Calculation of energy efficiencies ................................................ 238

v
Dedication
To my family and my country,
with my deepest love

vi
Declaration
I confirm that all the research described in this thesis is my own work unless
otherwise stated. All the materials used in this thesis from other sources have been
properly cited and fully acknowledged.
Yiyang Li

vii
Acknowledgments
During the more than four years’ life as a DPhil student at Oxford, there are a lot
of people I would like to acknowledge, without whom I would never be able to
accomplish my DPhil project and write up this thesis.
Firstly, I would like to thank my supervisor, Prof. Edman Tsang, for giving me the
opportunity of working in his research group, for all his help, advice and guidance,
and for his enthusiasm and kindness that inspired me throughout my DPhil study.
There is no need to say that there have been quite a few hard times during this
journey, and it is Edman who has supported me to overcome the difficulties and
has led me to the right directions. Having known Edman for about five years, I feel
that he is more than a supervisor to me now, but a mentor of life, and a friend.
Secondly, my research could not be possible without the professional assistance
that I obtained throughout the DPhil project. Especially, I would like to thank:
Prof. Robert A. Taylor, Dr. Timothy Putchler, Dr. Mo Li and Vitaly Osokin (Oxford
Physics) for the help on time-resolved photoluminescence spectroscopy;
Dr. Dharmalingam Prabhakaran (Oxford Physics) for kindly providing the light
concentrated furnace for my experiments;
Dr. William Myers (Oxford Chemistry) for the help and trainings on the electron
paramagnetic resonance spectroscopy;
Prof. Chen Wu, Zihan Wang (School of Materials Science and Engineering,
Zhejiang University) for the magnetic measurements of my materials;
Prof. Yunhao Lu (Department of Physics) and Yiqi Wang (School of Materials
Science and Engineering) in Zhejiang University for the DFT calculations in
Chapter 5;
Prof. Xin-Ping Wu and Hui Zhou (School of Chemistry and Molecular
Engineering, East China University of Science and Technology) for the DFT
calculations in Chapter 6;
Prof. Georg Held and Dr. Alex Large (Diamond Light Source) for the help and
training on the AP-XPS technique;
Centre -Ernst Ruska(Borkowski and Dr. András Kovács -Prof. Rafal E. Dunin
)for Microscopy and Spectroscopy with Electrons and Peter Grünberg Institute
studies in Chapter 5. microscopicfor the

viii
Dr. Songhua Cai (Department of Applied Physics, The Hong Kong Polytechnic
University) for the microscopic studies presented in Chapter 6.
Dr. Guangchao Li (Wuhan Institute of Physics and Mathematics, Chinese
Academy of Sciences) for the solid-state NMR studies.
Having obtained their assistance and support, have I been able to better conduct
my own research and help the other group members. Also, I would like to thank all
the reviewers who have peer-reviewed my papers during my DPhil study.
Thirdly, I want to thank the examiners of my viva voce, namely, Prof. Andrew Mills
and Prof. Ludmilla Steier, for an enjoyable and unforgettable DPhil viva with
inspiring questions and discussions.
Moreover, many thanks are given to the members of the Tsang group. Especially,
I would like to thank Dr. Jianwei Zheng, Dr. Yung-Kang Peng and Dr. Liangsheng
Hu for the guidance and assistance at the very beginning of my DPhil project. Also,
I would like to thank Dr. Tuğçe Ayvalı and Dr. Pu Zhao for the help and support on
the lab work and discussions of all kinds of problems. Many thanks are given to
Christopher Foo who has collaborated with me on the photocatalytic water splitting
project and explored the photocatalysts using the synchrotron techniques. I would
also like to thank Dr. Tianyi Chen for the help on electron microscopy. Great thanks
are given to Eloise Wootton for proofreading this thesis.
Furthermore, I want to express my gratitude to Dr. Jiaao Wei, Dr. Yao Meng, Dr.
Jiaying Mo, Dr. Simson Wu, and Dr. Linus Wei-Che Lin for the unforgettable
experience and joyful times, which will always be a precious part of my memory.
Last, but definitely not least, I would never reach where I am today without my
family and friends. Many thanks are given to my lifelong friends, Chengxiao Liu
and Fan Wu, who have always been supporting me at all my hard and perplexing
times. Great gratitude must be given to my beloved parents and all my family
members, thank you for all your unconditional and selfless love, and powerful
support in all kinds throughout my life, especially at those most difficult times I
have been through. Most importantly, I would like to thank my one and only love,
Yu He, the love of my life, for the precious, incredible and irreplaceable love, who
has made me complete, and my life colourful and meaningful.

ix
Abstract
Environmental and energy issues have become one of the most important issues
that human beings are facing, and carbon neutrality is a communal target
worldwide nowadays. With the strong international incentives to decarbonise our
fuels and chemicals, the solar-light-driven photocatalytic overall water splitting
(POWS) reaction provides a promising and renewable way to store and utilise the
abundant solar energy in the form of hydrogen which is the cleanest chemical fuel
for mankind. Numerous materials and catalytic systems have been developed for
more effective solar energy conversion, however, the performance achieved so far
is still unsatisfactory.
In this context, this thesis has particularly focused on the design and development
of novel POWS systems at elevated temperatures. Different semiconductor
materials such as TiO2 and MoS2 were systematically studied in this thesis. In-
depth catalytic activity studies illustrated the temperature effect on the POWS
performance. Comprehensive surface characterisations combined with a series of
spectroscopic, imaging and computational techniques were conducted to unravel
the relationship between the activity and the structures of the catalysts.
Subsequently, various strategies have been proposed for improving the POWS
activity at elevated temperatures, including the use of local electric field and local
magnetic field. Remarkable charge polarisation effects have been identified in
each case. Finally, it is demonstrated that the POWS system studied in this thesis
could split seawater into H2 and O2 with extraordinarily high solar-to-hydrogen
conversion efficiency of 20.3 % at 270 oC, exhibiting high potential for future
practical applications.

x
List of Abbreviations
2D Two Dimensional
AFM Atomic Force Microscopy
AP-XPS Ambient Pressure - X-Ray Photoelectron Spectroscopy
BE Binding Energy
CTAB Cetyltrimethylammonium Bromide
DFT Density Functional Calculations
DMSO Dimethyl Sulfoxide
Eads Adsorption Energy
EDS/EDX Energy Dispersive X-Ray Spectrometry
EXAFS Extended X-Ray Absorption Fine Structure
fcc Face Centred Cubic
FTIR Fourier-Transform Infrared Spectroscopy
FWHM Full Width at Half Maximum
GC Gas Chromatography
HAADF High Angle Annular Dark Field
HEP Hydrogen Evolution Photocatalyst
HER Hydrogen Evolution Reaction
HRTEM High-Resolution Transmission Electron Microscopy
IEF Internal Electric Field
LA Lewis Acid
LDH Layered Double Hydroxide
LEF Local Electric Field
MFE Magnetic Field Effect
Ms Saturation Magnetisation

xi
NMR Nuclear Magnetic Resonance
OEP Oxygen Evolution Photocatalyst
OER Oxygen Evolution Reaction
PEC Photoelectrochemical
POWS Photocatalytic Overall Water Splitting
PV-E Photovoltaic-electrolysis
QE Quantum Efficiency
SEM Scanning Electron Microscope
SQUID Superconducting Quantum Interference Device
STEM Scanning Transmission Electron Microscopy
STH Solar To Hydrogen
TCD Thermal Conductivity Detector
TEM Transmission Electron Microscopy
TEOS Tetraethyl Orthosilicate
TMP TriMethylPhosphine
TMPO TriMethylPhosphine Oxide
TRPL Time-Resolved Photoluminescence
TTIP Titanium Tetra-Iso-Propoxide
UV-Vis DRS Ultraviolet-Visible Diffuse Reflectance Spectroscopy
VO Oxygen Vacancy
XANES X-Ray Absorption Near Edge Structure
XAS X-Ray Absorption Spectroscopy
XPS X-Ray Photoelectron Spectroscopy
XRD X-Ray Diffraction Spectroscopy

xii
List of publications
Journal articles
1. Y. Li, H. Zhou, S. Cai, D. Prabhakaran, W. Niu, A. Large, G. Held, R. A. Taylor,
X.-P. Wu*, S. C. E. Tsang*, Photocatalytic Splitting of Seawater with
Remarkable Solar-To-Hydrogen Efficiency. 2022, In Review.
2. Z. Wang#, Y. Li#, C. Wu*, S. C. E. Tsang*, Electric-/magnetic-field-assisted
photocatalysis: Mechanisms and design strategies. Joule, 2022, In Press.
3. Y. Li, Z. Wang, Y. Wang, Borkowski, Y. Lu, -A. Kovács, C. Foo, R. E. Dunin
R. A. Taylor, C. Wu* and S. C. E. Tsang*, Local Magnetic Spin Mismatch
-to-Promoting Photocatalytic Overall Water Splitting with Exceptional Solar
277.–26515, 2022,Energy Environ. Sci. ydrogen Efficiency. H
4. Y. Li, S. C. E. Tsang*, Unusual Catalytic Properties of High-Energetic-Facet
Polar Metal Oxides. Acc. Chem. Res. 2021, 54(2), 366–378.
5. Y. Li, S. Wu, J. Zheng, Y.-K. Peng, D. Prabhakaran, R. A. Taylor, S. C. E.
Tsang*, 2D photocatalysts with tuneable supports for enhanced photocatalytic
water splitting. Materials Today 2020, 41, 34−43. (Inner Cover) 6. Y. Li, S. C. E. Tsang*, Recent Progress and Strategies for Enhancing
Photocatalytic Water Splitting, Materials Today Sustainability 2020, 9, 100032.
7. Y. Li, Y.-K. Peng, L. Hu, J. Zheng, D. Prabhakaran, S. Wu, T. J. Puchtler, M.
Li, K.-Y. Wong, R. A. Taylor, S. C. E. Tsang*, Photocatalytic Water Splitting
by N-TiO2 on Polar Oxides with Exceptional Quantum Efficiencies at Elevated
Temperatures. Nat. Commun. 2019, 10, 4421. (Editor’s Highlight) 8. J. Zheng, K. Lebedev, S. Wu, C. Huang, T. Ayvalı, T.-S. Wu, Y. Li, P.-L. Ho,
Y.-L. Soo, A. Kirkland, S. C. E. Tsang*, High Loading of Transition Metal Single
Atoms on Chalcogenide Catalysts, J. Am. Chem. Soc. 2021, 143 (21), 7979–
7990.
9. J. Mo, E. C. M. Barbosa, S. Wu, Y. Li, Y. Sun, W. Xiang, T. Li, S. Pu, A.
Robertson, T.-S. Wu, Y.-L. Soo, T. V. Alves, P. H. C. Camargo, W. Kuo, S. C.
E. Tsang, Atomic-Precision Tailoring of Au–Ag Core–Shell Composite
Nanoparticles for Direct Electrochemical-Plasmonic Hydrogen Evolution in
Water Splitting, Adv. Funct. Mater. 2021, 31, 2102517.
10. C. Foo, Y. Li, K. Lebedev, T. Chen, S. Day, C. Tang, S. C. E. Tsang*,
Characterisation of oxygen defects and nitrogen impurities in TiO2

xiii
photocatalysts using variable-temperature X-ray powder diffraction. Nat.
Commun. 2021, 12, 661.
11. T. Yoskamtorn, P. Zhao, X.-P. Wu*, K. Purchase, F. Orlandi, P. Manuel, J.
Taylor, Y. Li, S. Day, L. Ye, C. C. Tang, Y. Zhao, S. C. E. Tsang*, Responses
of Defect-Rich Zr-Based Metal-Organic Frameworks toward NH3 Adsorption.
J. Am. Chem. Soc. 2021, 143, 3205−3218.
12. J. Zheng, L. Lu, K. Lebedev, S. Wu, P. Zhao, I. J. McPherson, T.-S. Wu, R.
Kato, Y. Li, P.-L. Ho, G. Li, L. Bai, J. Sun, D. Prabhakaran, R. A. Taylor, Y.-L.
Soo, K. Suenaga, S. C. E. Tsang*, Fe on molecular-layer MoS2 as inorganic
Fe-S2-Mo motifs for light-driven nitrogen fixation to ammonia at elevated
temperatures. Chem Catalysis, 2021, 1 (1), 162-182.
13. Z. Tan, G. Li, H.-L. Chou, Y. Li, X. Yi, A. H. Mahadi, A. Zheng*, S. C. E. Tsang,
Y.-K. Peng*, Differentiating Surface Ce Species Among CeO2 Facets by Solid-
State NMR for Catalytic Correlation. ACS Catal. 2020, 10, 4003−4011.
14. Y.-K. Peng*, B. Keeling, Y. Li, J. Zheng, T. Chen, H.-L. Chou, T. J. Puchtler,
R. A. Taylor, S. C. E. Tsang*, Unravelling the key role of surface features
behind facet-dependent photocatalysis of anatase TiO2. Chem. Commun.,
2019, 55, 4415−4418.
Patent 1. S. C. E. Tsang (2021), Photocatalyst and use thereof. International Patent
Publication No. WO/2019/239129; European Patent Publication No.
EP3807220. (Contributor) Conference 1. Y. Li, J. Zheng, S. Wu, C. Foo, S. C. E. Tsang*, Local Polarization Promoted
Visible-Light-Driven Overall Water Splitting at Elevated Temperatures. Oral
Presentation Abstract for the 17th International Congress on Catalysis (ICC)
2020. (Cancelled due to Covid-19)

Chapter 1 Introduction
1
Chapter 1 Introduction
1.1 Background
1.1.1 Photocatalysis
Catalysis is defined as the process of increasing the rate of a chemical reaction by
adding an appropriate material known as a catalyst which can lower the activation
energy of the chemical reaction. Catalysts are not consumed in the reaction and
therefore can be recycled and reused in principle.1 Photocatalysis, compared to
conventional catalysis, normally requires light irradiation with the appropriate
wavelength. Photons are absorbed and electrons in the photocatalysts are excited
to higher energy levels, leaving a photo-generated hole in the lower energy levels.
The photo-generated electrons and holes subsequently participate in the chemical
redox reactions.2
Photocatalysis using semiconductor catalysts is a relatively new and fast-growing
research area, and many self-cleaning architectural materials (such as glass, paint,
fabric, etc.) based on photocatalytic principles have been commercialised and
widely used.3 In addition, photocatalysis has also been considered as a convenient
and environmentally friendly approach for converting solar energy into chemical
energy in the form of chemical fuels.2 Many early reports are focused on the TiO2-
based semiconductor photocatalysts for photocatalytic water splitting.4–7 In recent
years, photocatalysis has been of great importance in many fields such as energy
regeneration (e.g., H2 production from splitting water), green chemical synthesis,
environmental protection (e.g., degradation of organic dyes, air and water
purification, etc.) and CO2 reduction to fuels, and a wide range of materials have
emerged as promising photocatalysts.8–15

Chapter 1 Introduction
2
1.1.2 Conversion and storage of solar energy
Energy and environmental issues have been of increasing importance in recent
decades, due to the dramatic global climate issues arising from the use of fossil
fuels. Thus, renewable and carbon-emission-free energy sources are in great
demand. Solar energy is an abundant and clean energy resource, making it an
ideal choice to meet future demands, and it has become one of the most promising
renewable replacements for fossil fuels because it is cheap, widely distributed and
almost inexhaustible.8,16–19 However, an obvious disadvantage is that natural solar
light is diffuse, intermittent, and fluctuating, which hinders the direct use of solar
energy.14–17 Instead, for practical application, the solar energy must be efficiently
converted into other energy forms such as electrical energy, chemical energy and
thermal energy, etc., which are storable and transportable, and can be easily used
on demand.20–24 Such requirement has motivated various research fields including
solar cells, photocatalysis, photothermal effect, etc. Photovoltaic (PV) panels, or
solar panels, which convert solar energy to electrical energy by the photovoltaic
effect, have been widely used all around the world. The current PV market is nearly
dominated by crystalline silicon single-junction PV cells which outperform other
counterparts with lower capital costs. Other potential materials for PV cells have
been developed as well, such as halide perovskite materials, which have received
increasing attention in recent years.19 PV panels can either be used to provide
power directly, or in many cases, can be connected to an electrolyser for the
subsequent production of chemical products. Such an integrated system is
commonly known as a photovoltaic-electrolysis (PV-E) system. Moreover,
photoelectrochemical (PEC) cells are also widely studied for the conversion of
solar energy. A PEC cell normally consists of a photoanode/photocathode, a

Chapter 1 Introduction
3
counter electrode, electrolyte, and external circuit. To further simplify the system,
particulate photocatalytic systems have been developed and extensively studied.
Unlike PV-E and PEC systems, a particulate photocatalytic system only requires
a very simple set-up. Photocatalyst particles are directly dispersed in the
appropriate solvent to form a suspension which contains the reactant. Photons
from solar light are absorbed by the photocatalyst particles to trigger subsequent
physical and chemical processes, including the generation of excited electrons
and holes, surface redox reactions, etc., and solar energy is finally stored in
chemical products. Chemical products such as H2, H2O2, NH3, etc. made from
common substances like H2O and CO2 using the energy of sunlight are known as
solar fuels.25 Generation of solar fuels has become one of the main targets of
photocatalysis in the recent decades.
Figure 1.1 Schematic illustration of large-scale hydrogen production via solar energy and subsequent utilisation. Reproduced from ref. 26. Copyright 2010 American Chemical Society.

Chapter 1 Introduction
4
1.1.3 Hydrogen as a clean solar fuel
Solar-to-chemical energy conversion provides a highly promising means of storing
solar energy efficiently as sustainable chemical fuels with minimal environmental
impact or carbon emission. Among the potential chemical fuels produced from
solar energy conversion, H2 is one of the most attractive candidates as it offers the
highest power density (143 MJ kg-1) and the only product of its combustion is
water.27–30 Therefore, the solar-light-driven photocatalytic overall water splitting
(POWS) reaction is considered to provide a platform for H2 production. Water is
decomposed to produce H2 and O2 in the presence of an appropriate photocatalyst
under sunlight irradiation in such POWS system and subsequently, the produced
H2 can be used to generate power in a fuel cell or combined with CO2 for the
syntheses of other chemicals such as methanol.30 An illustration of H2 production
from solar means and the subsequent utilisation is given in Figure 1.1. Clearly,
using H2 as a renewable chemical fuel offers the opportunity for human beings to
mitigate the severe climate and environmental issues that we are facing, and also
contributes to the sustainable developments of human societies.
1.2 POWS on semiconductor photocatalysts
1.2.1 Fundamental principles
Fujishima and Honda demonstrated a photoelectrochemical water splitting system
in 1972,5 which has been frequently referred to as the first demonstration of the
photocatalytic water splitting reaction. In fact, the photo-induced oxygen evolution
on TiO2 can date back to 1968.4 the POWS reaction catalysed by semiconductor
materials has been extensively studied for decades, and significant progress has
been achieved since then.5 A wide range of semiconductors, such as TiO2, SrTiO3,

Chapter 1 Introduction
5
GaN, CdS, MoS2 and some organic conjugated semiconductors, have been
developed and extensively studied as photocatalysts.17,22,23,31–36 Generally, the
POWS reaction over semiconductor materials involves the following fundamental
processes (Figure 1.2a):37–39 (1) generation of the excited charge carriers: the
semiconductor absorbs the photons of appropriate energy range to excite the
electrons from the valence band (VB) to the conduction band (CB), leaving a hole
in the VB; (2) separation and migration of the charge carriers: the photo-generated
electrons and holes separate from each other and travel to the corresponding
surface trapping sites of the catalyst particles. Some of the electrons and holes
recombine with each other, accompanied by heat loss or fluorescence irradiation;
(3) occurrence of surface chemical reactions for H2 and O2 evolution: protons in
water are reduced by the excited electrons in the CB to produce H2, and
simultaneously, water is oxidised by the photo-generated holes in the VB for O2
evolution. Therefore, to achieve the stoichiometric H2 and O2 evolution, the
valence band maximum (VBM) should be more positive than = +1.23 V (vs. NHE)
and the conduction band minimum (CBM) should be more negative than = 0.00 V
(vs. NHE) to allow the O2 and H2 evolution reactions to happen readily to sustain
the photocatalysis (Figure 1.2b). These reactions are summarised below:
Hydrogen evolution reaction (HER):
In an acidic aqueous solution: 2H+ + 2e- → H2
In an alkaline aqueous solution: 2H2O + 2e- → H2 + 2OH-
Oxygen evolution reaction (OER):
In an acidic aqueous solution: 2H2O → O2 + 4e- + 4H+
In an alkaline aqueous solution: 4OH- → O2 + 4e- + 2H2O

Chapter 1 Introduction
6
Obviously, the minimum band gap of the semiconductor POWS photocatalyst is
1.23 eV, corresponding to a wavelength of around 1000 nm. It should be noted
that despite the wide range of solar spectrum, most solar radiation lies in the visible
light regime, which contributes 43% of total solar energy.37 Thus, an ideal
photocatalyst for the water splitting reaction should possess a band gap of lower
than 3.1 eV (corresponding to a wavelength of 400 nm) so as to efficiently utilise
the visible light, bearing in mind that the band gap should be at least 1.23 eV to
provide sufficient thermodynamic driving force for the water splitting reaction.
Figure 1.2 (a) Fundamental steps during photocatalytic water splitting on a semiconductor photocatalyst: (i) photo-excitation, (ii) charge separation and transport, and (iii) surface chemical reactions; (b) Schematic band structure and energy levels for photocatalytic water splitting based on one-step excitation. Reproduced from ref. 37. Copyright 2020 American Chemical Society. The POWS performance is usually evaluated by H2 evolution rate, quantum
efficiency (QE) and solar-to-hydrogen (STH) conversion efficiency. H2 evolution
rate directly indicates how fast H2 is produced in a photocatalytic system. QE is
the ratio of the number of H2 molecules evolved to the number of photons of a
given energy that shines on the photocatalyst. It is normally measured at a specific
wavelength or a small wavelength range rather than a wide spectrum, so as to
understand the behaviour of a photocatalytic system at different wavelengths. QE

Chapter 1 Introduction
7
is defined by the following equation:
QE (%) = !"#$%&()*!#(+%,"+%-×/!"#$%&()01,02%1345(3(1-
× 100 % Equation 1.1
The STH conversion efficiency is a standardised index focusing on the overall
energy conversion efficiency from solar energy to chemical energy, which is
defined as follows:
STH (%) =67(+7%2*!8#("13×∆:;×<×3
× 100 % Equation 1.2
where P is the power of solar irradiation (0.1 W cm-2), S is the illuminating
area in square centimetres; t is the time of reaction in seconds; ∆G is the
Gibbs free energy for the POWS reaction under the reaction conditions; the
evolved H2 amount is typically given in moles.
Figure 1.3 Calculated STH conversion efficiency values as functions of the maximum absorption wavelength for a one-step POWS using semiconductor photocatalysts with various QEs. The calculations are based on standard AM 1.5G solar irradiation. Reproduced from ref. 26. Copyright 2010 American Chemical Society. The STH is closely related to the absorption property of the photocatalysts.
Assuming that only UV light up to 400 nm can be absorbed by the semiconductor

Chapter 1 Introduction
8
photocatalyst with a QE of 100%, the STH would be limited to 2% (if heat loss is
neglected),26 as illustrated in Figure 1.3. If the absorption range is extended into
the visible light region up to 700 and 1000 nm, the maximum STH efficiency would
be increased to 25% and 47%, respectively (Figure 1.3). The United States
Department of Energy has proposed a goal of producing H2 at a cost of 2.00-4.00
USD kg−1 so as to obtain an economically viable alternative to fossil fuels.40 To
achieve this goal, a recent study suggested that a photocatalytic reaction system
should have a STH efficiency of 10% and a lifetime of 10 years.41 Likewise,
assuming a QE of approximately 100%, a photocatalyst requires an absorption
edge of 520 nm to attain the target STH of 10%. In contrast, a semiconductor
capable of harvesting light up to 650 nm could have a QE of less than 60% to
achieve the target STH. Obviously, in order to obtain a satisfactory POWS system,
studies should focus on the semiconductor materials that have good visible light
absorption properties.
Figure 1.4 Illustration of the sacrificial HER and OER systems in the presence of different sacrificial reagents (half reactions of water splitting reaction). Reproduced from ref. 8. Copyright 2009 Royal Society of Chemistry. As mentioned before, the POWS reaction involves two half reactions: H2 evolution
reaction (HER) and O2 evolution reaction (OER), which have been extensively

Chapter 1 Introduction
9
explored separately, with the help of various sacrificial reagents.31,32,42–44 As
mentioned before, excited electrons and holes are generated upon absorption of
photons, and then H+ are reduced by the electrons, while H2O or OH- are oxidised
by the holes at appropriate band positions. However, for some semiconductor
materials, the band positions only partly fulfil the thermodynamic requirements for
POWS reaction, for example, the CB (or VB) is not negative (or positive) enough
to drive the HER (or OER), while the other band is at the appropriate position, thus
sacrificial reagents are required to assist the redox cycles. The sacrificial reagents
act as hole (or electron) scavengers so as to keep the charge balance of the
photocatalysts. For example, organic chemicals such as methanol and ethanol are
most widely used as the hole-scavengers to facilitate the photocatalytic HER,
because they are readily oxidised by the photo-generated holes in the VB;45–47
while FeCl3, AgNO3, KIO3, etc. are frequently used as electron-scavengers in
photocatalytic OER systems, since these oxidative species can consume the
photo-generated electrons in the CB.48–50 Such sacrificial systems are illustrated
in Figure 1.4, which should be differentiated from overall water splitting system,
since H2 and O2 are not generated stoichiometrically in these sacrificial systems.
Han and Hu have recently reported enhanced H2 production using methanol as a
hole-scavenger at elevated temperatures and found that the methanol
decomposition also contributed to the overall H2 production.32 However, the use of
sacrificial reagents exhibits several disadvantages, such as adding up to the total
capital cost and leading to unwanted by-products (hydrocarbons and alcohols,
etc.). For example, when carrying out OER using AgNO3 as the electron-
scavenger (Figure 1.4b), Ag nanoparticles could form after reacting with the photo-
generated electrons and cover the active sites on the surface of photocatalysts,

Chapter 1 Introduction
10
therefore reduce the stability and lifetime of the photocatalytic system. All these
above-mentioned disadvantages would largely hinder the further practical
applications of such systems.
1.2.2 Developments of the POWS system
Figure 1.5 (a) Honda–Fujishima effect-water splitting using a n-type TiO2 photoelectrode.8 (b) A recently reported PV-E device which consists of a triple-junction solar cell and two PEM electrolysers connected in series, showing a STH efficiency over 30%. Reproduced from ref. 51. CC BY 4.0. As mentioned in Section 1.1.2, several systems have been developed to convert
solar energy to other energy forms. The pioneering study of POWS was
demonstrated using a PEC cell, where n-type semiconductor, TiO2, was engaged
as the photoanode. UV-Vis irradiation of wavelengths shorter than 415 nm was
applied to the TiO2 photoanode and a platinum black electrode was used as the
counter electrode (Figure 1.5a). Photocurrents of a few mA and a quantum
efficiency of 0.1% were observed in this pioneering study, which then encouraged
extensive studies of POWS systems.5 PV-E cells have been used for H2 evolution
from water splitting as well. Photons from solar light are absorbed and converted
to electricity by the PV panels, and then the photocurrent can be transferred to an
electrolyser where water is electrolysed to produce H2 and O2 stoichiometrically.51
Such a PV-E POWS system combines the advantages of PV panels and

Chapter 1 Introduction
11
electrolysers: high solar-to-electricity efficiency and high Faraday efficiency of
electrolysers, resulting in high overall STH conversion efficiencies (Figure 1.5b).
However, the main drawback of the PV-E system is the complicated equipment
and high cost.
Particulate POWS systems have been attracting increasing interest in recent years
and have been considered as a low-cost technology with the potential to enable
large-scale solar H2 production, because of the ready synthesis of the associated
photocatalysts as well as the simple reactor and facility designs.52–54 Unlike the
PEC and PV-E cells, a particulate POWS system only involves the use of
photocatalyst particles without further sophisticated fabrications (Figure 1.6). Thus,
through my DPhil project, I mainly work on the particulate POWS system and this
will be the focus of this thesis.
Figure 1.6 Solar H2 production from POWS reaction using particulate photocatalysts dispersed in water under solar light irradiation. Reproduced from ref. 8. Copyright 2009 Royal Society of Chemistry. As mentioned before, a POWS system needs to drive both HER and OER
simultaneously, which means in a conventional POWS system, the CB and VB
positions are required to be at the appropriate energy levels, and additionally, the
band gap should be relatively narrow to efficiently take up the visible light. In reality,

Chapter 1 Introduction
12
it is very difficult for only one material to fulfil all these requirements at the same
time. Apart from the previously mentioned sacrificial systems, the Z-scheme
POWS system has been developed to overcome such difficulties, in which two or
more different semiconductor materials are included. A Z-scheme POWS reaction
normally involves the two-step photo-excitation of a H2 evolution photocatalyst
(HEP) and an O2 evolution photocatalyst (OEP), both of which have narrow band
gaps. Therefore, the required potential difference is divided into several
contributions, and thus the band gap of the photocatalytic material does not have
to straddle both the H2 and O2 evolution potentials. Hence, narrow band gap
semiconductors that are active only for proton reduction or water oxidation can be
employed to split water using solar energy, and the aforementioned sacrificial
systems of the half reactions can be integrated to form a Z-scheme POWS system.
Similar to the conventional one-step POWS system, in a Z-scheme system,
photons trigger the generation of electron-hole pairs in both the HEP and OEP,
and then H+ ions are reduced on the CB of the HEP, while O2 is produced on the
VB of the OEP (Figure 1.7).
To complete the whole POWS cycle, the electrons in the CB of the OEP must pass
through a redox shuttle to combine with holes in the VB of the HEP.55 Redox
couples, such as Fe3+/Fe2+,56–58 IO3−/I−,59–61 etc. have been widely used as the
redox shuttles in order to mediate the electron transfer between the HEP and OEP.
However, the presence of redox shuttles could also bring undesired side reactions,
and sometimes the by-products could result in shading of the photocatalysts from
incident light. Thus, some groups have reported the successful fabrication of redox
shuttle-free Z-scheme systems in which case the inter-particle electron transfer is
achieved by forming attractive electrostatic force between the OEP and HEP

Chapter 1 Introduction
13
particles,62,63 allowing the electrons to migrate between particles when they are in
contact with each other. Based on such ideas, more and more redox-shuttle-free
Z-scheme systems are emerging, and new constructions have been developed to
realise efficient electron transfer from the OEP to the HEP.64–66
Figure 1.7 Z-scheme POWS system mimicking the natural photosynthesis mechanism for artificial photosynthesis. (a) Natural photosynthesis system in plants; (b) Z-scheme POWS system involving HEP and OEP. (PS: photosystem) Reproduced from ref. 67. Copyright 2018 Wiley-VCH. 1.2.3 Factors affecting the POWS performance
As previously mentioned, the overall POWS performance depends on the
efficiency of each fundamental step, and each step, if not efficient, could hamper
the overall photocatalytic activity. Therefore, the overall solar energy conversion
efficiency, η total, should take into account the efficiencies associated with these
three fundamental processes and thus is determined as follows:37
η total = η absorption × η separation × η reaction Equation 1.3
The photon absorption efficiency, η absorption, is defined as the fraction of
electron−hole pairs generated by the photon irradiation. The separation efficiency,
η separation, is the fraction of photo-generated charge carriers that separate and

Chapter 1 Introduction
14
migrate to the surface of photocatalyst particles. The reaction efficiency, η reaction,
is the efficiency of the surface chemical reactions. All these three efficiencies
should be high enough to obtain an ideal η total for POWS reaction, so, different
methodologies have been developed to improve the efficiency of each step, which
are discussed in detail in the following section.
1.3 Strategies for enhancing the POWS performance
1.3.1 Enhancing light absorption
As discussed in the previous section, the POWS performance is determined by
the efficiency of each fundamental step, therefore, much effort has been made to
gain a deeper understanding, leading to different strategies to promoting each step.
First of all, an efficient photocatalyst for POWS reaction must have a broad
absorption range to take up the photons from solar irradiation, which means the
band gap of the semiconductor material is relatively narrow. Thus, band structure
engineering has been developed as a useful technique to narrow the wide band
gap of materials to the visible light regime to maximise the solar energy
capturing7,68–72. One of the most widely used methods is doping with anions or
cations, which inserts new band levels between the original band gap of the
semiconductors or facilitates a band shift to narrow the band gap, thus enhancing
the light absorption properties71,72. One of the milestone studies is the anion-doped
TiO2, which was first reported by Asahi et al. First-principle calculations were
carried out on C, N, F, S and P doped TiO2 (Figure 1.8a), showing that N-doped
TiO2 should possess the best visible light absorption compared with other anion-
doping7. Subsequently, numerous works were carried out on N-doped TiO2. UV-
Vis spectroscopy shows that the absorption of N-doped TiO2 is extended to ca.
500nm compared with the absorption edge of 380 nm for pristine TiO2. N species

Chapter 1 Introduction
15
are observed by X-ray photoelectron spectroscopy (XPS), showing peaks at
396eV and 400eV attributed to substitutional and interstitial N species,
respectively7,73,74. It is also noted that such cation or anion doping is always
accompanied by the formation of surface/bulk defects, such as oxygen vacancies
(VOs) in the case of N-doped TiO2, which are also believed to provide intermediate
band levels or extra energy states that can trap electrons, and contribute to
enhanced visible light absorption75–82.
In actual fact, surface defects are ubiquitous in most semiconductor materials, and
tailoring the defects is recognised as an effective strategy to manipulate the
physical and chemical properties, including electronic structure, surface
adsorption properties, charge density, charge separation, etc.83–86. The surface
defect engineering techniques have also been widely studied, especially the VOs
in metal oxides such as TiO2. VOs exist naturally in most metal oxides at very low
density levels, but higher VO density can be easily achieved by some simple
chemical treatments, such as ion doping73,78, H2 reduction68, NaBH4 chemical
reduction87,88, plasma treatment89, and exfoliation to form two-dimensional (2D)
materials90, etc. Much attention has been given to deeply reduced TiO2, also
known as ‘black titania’, since the pioneering work of Mao et al. in 2011, in which
pure TiO2 was treated in a high-pressure H2 atmosphere at 200 oC and 20 bar for
five days68. The obtained material was black in colour and exhibited greatly
enhanced light absorption up to 900 nm, and the photocatalytic H2 evolution
performance was improved as well (Figure 1.8b). Raman spectroscopy was used
to examine the black titania, and indicated that the deep hydrogenation introduces
defects that can activate the zone-edge and otherwise Raman-forbidden modes
by breaking the Raman selection rule68. VB XPS suggests that the VB of TiO2

Chapter 1 Introduction
16
shifts largely by about 2.18eV, resulting in the greatly enhanced visible light
absorption and photocatalytic performance.68 Subsequently, TiO2 in different
colours have been developed. Liu et al. synthesised a series of coloured TiO2
materials by changing the hydrogenation temperatures, which in turn, modified the
visible light absorption range.91 Defects in such materials are normally
characterised by electron paramagnetic resonance (EPR) spectroscopy. The
signals of Ti3+ arising from its 3d electrons normally appear in the range of g=1.95-
1.98. Meanwhile, O2 molecules can be trapped at the VO site to form O2- species,
resulting in signals of g=2.00-2.0292,93. Both Ti3+ and VO species are considered to
contribute to the enhanced visible light absorption and photocatalytic performance.
Other than VO in TiO2 based materials, VO in other semiconductor materials like
CeO2, perovskite, Fe2O3, WO3 and BiVO4, also promote visible light
absorption.84,88,94–96 Much progress has indeed been achieved in enhancing the
visible light absorption by defect engineering techniques, which has greatly
increased the use of solar energy. Other techniques, such as sensitisation with
organic dyes, where the dye acts as a photosensitiser and injects electrons into
the CB, have also been reported to enhance the visible light absorption of the
semiconductor photocatalysts70. However, it is also found that the surface defects
are not always stable enough throughout the whole catalytic process and can be
readily replenished by contact with oxygen or water. Although bulk defects still take
up the visible light, surface defects are no longer present, and the lack of surface
catalytic activation sites can be harmful to the photocatalytic performance. I also
obtained similar observation in my DPhil project and this will be further discussed
in the following chapters. This observation may also explain the fact that enhanced
visible light absorption does not necessarily lead to better POWS performance.

Chapter 1 Introduction
17
Figure 1.8 (a) Total DOSs of the doped TiO2; Reproduced from ref. 7. Copyright 2001 AAAS. (b) Spectral absorbance of the white and black TiO2 nanocrystals. The inset enlarges the absorption spectrum in the range from approximately 750-1200 nm. Reproduced from ref. 68. Copyright 2011 AAAS. (c) A cross-sectional SEM image of the photocatalyst sheets, showing a monolayer of partially sintered (La),Rh:SrTiO3 particles (blue) embedded (inset) in a 2 µm thick gold back contact (yellow). (d, e) Model of surface depletion in La,Rh:SrTiO3 (d) and Rh:SrTiO3 (e) at different applied potentials in the dark. (f) Photovoltage build up in La,Rh:SrTiO3 (left) and Rh:SrTiO3 (right) under illumination at positive device operation potentials. Reproduced from ref. 97 with permission. On the other hand, cation doping has also been widely reported as a promising
strategy for tailoring the band gap and other photochemical properties.98,99 Very
recently, Domen et al. has developed a band gap-engineered oxide, La and Rh
co-doped SrTiO3 (La,Rh:SrTiO3), which exhibited an enhanced QE of 33% in the
visible regime and an overall STH efficiency of more than 1% using a
‘photocatalyst sheet’ device (Figure 1.8c).64,100–102 With the help of the time-
resolved spectroscopic techniques and DFT calculations, it has been shown that
the Rh-doping induces a strong downward shift in the flat band potential and
narrows the effective optical gap of SrTiO3, thus creating a p-type visible light

Chapter 1 Introduction
18
absorber. Meanwhile, co-doping with La is demonstrated to be an elegant
approach for facilitating the separation of the charge carriers, since the positive
flat band potential and the absence of a mid-gap energy state enable strong
downward band bending for La,Rh:SrTiO3 (Figures 1.8d-1.8f). Such features
subsequently result in efficient bipolar charge accumulation and remarkable
photocatalytic performance.97
1.3.2 Facilitating separation of charge carriers
Figure 1.9 Photoinduced reactions in TiO2 photocatalysis and the corresponding time scales. Reproduced from ref. 103 with permission. Apart from capturing photons from solar light with corresponding band gap, the
separation of the photo-generated charge carriers is also of extremely great

Chapter 1 Introduction
19
importance. As mentioned in the previous section, extensive efforts have been
invested to extend the visible light absorption, however, poor POWS performance
under visible light irradiation and ambient conditions still hinder their further
applications. This is mainly due to the rapid recombination of charge carriers to
dissipate the captured solar energy to heat or photoluminescence. In terms of the
time scales of each process, the photo-excited electron-hole pairs are generated
in femtoseconds after the light irradiation, while the separation and migration of
the charge carriers normally take hundreds of femtoseconds or even picoseconds
to take place (Figure 1.9). Instead of migrating to the surface and reacting with
chemical species, the electrons and holes will recombine to give out the energy in
the form of heat, and this process generally take place in several picoseconds.
However, the interfacial charge transfer to the chemical species is relatively slow
compared with the above steps, which takes place from hundreds of picoseconds
to even microseconds, leading to the fact that most photo-excited electrons and
holes favour recombination with each other instead of migration to the
surface.38,104 Therefore, although the visible light absorption is largely enhanced
for many semiconductor photocatalysts, only a small amount of the photo-
generated electrons and holes can travel through the photocatalyst particles and
reach the surface, leading to the poor QEs. The photo-generated charge carriers
must possess a sufficient lifetime to capture the H+ and OH- species derived from
water dissociation to allow efficient photocatalysis to take place.23 Recent reports
show that polarisation plays an important role in the separation of these photo-
generated electrons and holes, which prolongs the charge carrier lifetime,
effectively leading to enhanced photocatalytic performance.105–107 Various
methodologies have been developed to promote the separation of the photo-

Chapter 1 Introduction
20
generated electrons and holes on the catalyst surface and suppress the
recombination process, including shape and facet engineering, heterojunction
formation, and introduction of internal electric fields, etc.105–110
Figure 1.10 (a) Kinetic traces (probed at 632 nm) as a function of probe delay time and (b) their corresponding normalised traces. All these data were recorded with a 400 nm laser pulse (120 fs); Reproduced with permission from ref. 106. (c) Schematic illustration of the separation and migration of electrons and holes in the bulk of the pure and C-doped Bi3O4Cl; Reproduced with permission from ref. 106. (d) Schematic illustration of Pt and MnOx photo-depositions on BOC-MS. Reproduced with permission from ref. 107. The design of an internal electric field (IEF) to enhance the polarisation within the
photocatalyst particles has recently been demonstrated to be an effective
approach for improving the charge separation both in bulk and on the surface of
the photocatalysts105–107. It is noteworthy that Zhang’s group reported a new
strategy to introduce an IEF to Bi3O4Cl by carbon atom incorporation106. The
resulting C-doped Bi3O4Cl achieved a bulk-charge separation efficiency of 80%,
therefore the charge carrier lifetime was prolonged from less than 500 ps to around

Chapter 1 Introduction
21
4000 ps (Figures 1.10a and b), which is attributed to the strong IEF due to the
potential difference between the doped and undoped layers (Figure 1.10c). The
catalyst enabled the photocatalytic water oxidation half reaction under visible light
irradiation in the absence of sacrificial reagents; however, H2 was scarcely
detected because the CB is more positive than the H2-evolving potential. It was
claimed that the photo-generated electrons either reduced O2 to give H2O2 or
came into the solution to form solvated electrons, but no direct evidence was
given106. Subsequently, the same research group also reported a Janus Cl2-
Bi12O17-MoS2 bilayer junction photocatalyst with an even stronger IEF for H2
evolution (Figures 1.10d and e), in which the carrier lifetime was claimed to be
3446 ns and a H2 evolution rate of 33mmol g-1h-1 was obtained in the presence of
ascorbic acid as the hole scavenger59.
A facile and versatile method to tune the local electric field (LEF) with the help of
polar-faceted materials has recently been developed in our group, in which a
strong LEF is obtained by engaging polar-faceted metal oxides as a support. Firstly,
we need to understand how polarisation occurs in a solid-state material. Taking a
simple ionic model of MgO as an example, Figure 1.11 shows the energy levels of
filled O 2p and unfilled Mg 3s orbitals. For these isolated hard ionic species, the
ionic charge distribution Mg2+-O2− is clearly not stable in the gas phase (the O2−
ion does not even exist because the second electron affinity of O is highly
endothermic). However, these ions can be stabilised in a solid ionic lattice, so they
experience a summation of long-range Coulomb potentials from the ions in the
lattice positions (the so-called Madelung potential) of appropriate sign. At oxide
sites the Madelung potential is positive and thus stabilises electrons; at cation sites
it is negative and correspondingly destabilising, as shown in Figure 1.11. Thus, the

Chapter 1 Introduction
22
most stable crystal structure is composed of ions interspersed with nearby counter
ions and so on in the lattice. If some charges are dislocated from the lattice,
polarisation occurs.
Figure 1.11 Orbital energies of filled oxygen 2p and empty magnesium 3s levels in different states. Reproduced from ref. 83. Copyright 2020 American Chemical Society. The polarisation has been shown to lower the energy of empty (metal) levels and
raise that of filled (oxygen) levels; hence, the binding energies of electrons in filled
levels is reduced. Finally, the broadening of electronic levels due to overlap
between ions gives bands rather than discrete energy levels. In the crystal facets,
similar ion distributions exist in the energy-minimised packing (Figure 1.12). The
most stable surfaces of MgO in this case are (100) or (1̅10), where cations and
anions are evenly interspersed, obtaining the Madelung stabilisation. Although
exposure of high-energetic facets such as O- or Mg-terminated (111) is
thermodynamically unfavourable, it can be kinetically controlled during crystal
growth. It is noteworthy that these thermodynamically unstable high-energetic
facets tend to reduce the surface energy through relaxation processes, which can
exert unusual effects such as band gap reduction, charge carrier stabilisation,
enhanced adsorption of counter ions, and induced surface reconstruction. Polarity
effects have long been studied in catalysis since the late 20th century, and the
studies covered semiconductor surfaces, oxide surfaces, ultra-thin oxide films and

Chapter 1 Introduction
23
oxide interfaces.111–113
Figure 1.12 Structural model of different exposed facets of MgO crystals: Crystal packing of polar and nonpolar faceted MgO. Arrows indicate the polarisation near the polar surface. Reproduced from ref. 83. Copyright 2020 American Chemical Society. For polar surfaces, the orientation is such that each repeat unit grows in the
direction perpendicular to the surface, resulting in a non-zero dipole moment on
the surfaces (as indicated in Figure 1.12). Thus, electric fields and electrostatic
forces are generated on polar surfaces.111 Due to the presence of a macroscopic
dipole, their surface properties and local environment strongly differ from those in
the bulk or their non-polar counterparts. High surface energy means that the polar
surfaces have a large tendency to cancel out the polarity, by charge transfer or
introduction of compensating charges in the outer plane.112 However, the rigidity
of some oxides hampers such processes and leaves considerable polarity and
electrostatic forces on the polar surfaces, which could be good candidates for our
local polarisation effect study. Solid state NMR and TEM were used to confirm that
the surface polarity of crystalline MgO(111) facets induced significant chemical

Chapter 1 Introduction
24
shifts.73 In my DPhil project, I discovered that the polar-faceted MgO(111) could
greatly prolong the lifetime of the photo-generated charge carriers in the N-doped
TiO2 materials, while non-polar MgO(100) and MgO(110) showed no apparent
influence. Accordingly, the MgO(111) promoted Au/N-doped TiO2 photocatalyst
gave a much enhanced and stable H2 evolution rate of 11092 μmol g-1h-1 at 270oC.
The QEs of 81.8% at 437 nm and 3.2% at 1000 nm were also achieved with the
inclusion of MgO(111). We believe that the use of polar-faceted MgO(111) can
introduce an LEF, which prolongs the charge carrier lifetime and therefore
enhances the photocatalytic water splitting activities. The effect of different sizes
and morphologies of the MgO supports were also studied, which will be discussed
in detail in the following chapters.
More systematic studies were carried out on a two-dimensional (2D) material,
single layer MoS2 (SL-MoS2), whilst other polar-faceted oxides such as CeO2(100)
nanocubes (NCs) and ZnO(0001) nanoplates (NPs) were also used to study the
LEF effect. The SL-MoS2 was combined with different polar-faceted metal oxide
supports as mentioned before. As expected, the photocatalytic activities are
greatly improved by the polar-faceted oxides. TRPL spectroscopy confirmed the
changes of the charge carrier lifetime of the photocatalysts, which showed nearly
the same trend as the POWS activities. Therefore, the remarkable enhancement
of photocatalytic activities is attributed to the prolonged the charge carrier lifetime.
A strong LEF is exerted on the catalyst by the surface of the polar-faceted oxide
supports, and such polarisation facilitates the separation of photo-excited electron-
hole pairs on the catalyst surface at the interface and therefore suppresses the
recombination process. Also noteworthy is that the POWS activity and the charge
carrier lifetime both show a linear relationship with the total polarity of the polar

Chapter 1 Introduction
25
material support, which further confirms that the local polarisation effect
contributes to the separation of the photo-excited electron-hole pairs, leading to
the prolonged charge carrier lifetime and the enhanced photocatalytic activities
and QEs. This simple and versatile approach may contribute to the rational design
of photocatalysts with suppressed recombination, for not only the water splitting
system, but also other valuable photocatalytic processes. This part of study will be
demonstrated more deeply in Chapter 4.
1.3.3 Promoting surface reactions
To achieve more efficient surface HER and OER, various cocatalysts are
commonly engaged for different purposes, including lowering the activation energy,
lowering the overpotentials of H2 and O2 evolution, facilitating the surface chemical
reactions, and suppressing the backward water-formation reaction, etc., thus, they
are of great interest in the field of POWS reaction, and have been extensively
explored114–120. Generally, metals such as Pt, Pd, Au, Ru, Ni and Rh are
considered as good H2 evolution cocatalysts, while the metal oxides of Ir, Mn, Co
and Ru function as the O2 evolution cocatalysts121. Cocatalysts are capable of
extracting the photo-generated electrons or holes from the semiconductor,
depending on the nature of the cocatalyst used, therefore, they could act as
surface trapping sites, where the electrons/holes accumulate and surface
reactions take place.23
H2 evolution cocatalysts such as Pt are widely used and much progress has been
made in developing novel cocatalysts. Recently, our laboratory has found that Au
nanoparticles introduced by the photoreduction method show a strong promoting
effect in an N-doped TiO2 photocatalytic water splitting system, leading to a 90%
increase in the H2 evolution rate.73 It should be noted that some metal

Chapter 1 Introduction
26
nanoparticles such as Au and Ag can introduce the localised surface plasmon
resonance (LSPR) effect which may offer a potentially useful approach to
enhancing the visible light absorption of wide band gap semiconductors. LSPR is
an optical phenomenon in which the electron cloud on a metal NP oscillates in
resonance with the electric field induced by the incident light (which is actually an
electromagnetic field). This effect can trigger intense electric fields at the NP
surfaces, giving rise to sharp spectral absorption and scattering peaks (as
illustrated in Figure 1.13). The frequency of this resonance can be tuned by
controlling the NP size and shape, as well as constructing a core-shell structure,
resulting in a potentially wide absorption range within the visible light regime.122–
124
Figure 1.13 (a) Prism coupling configuration of SPR, where a light beam impinges on a thin metallic film deposited on a prism. P-polarised light absorbed by the surface plasmon is seen from a minimum in the reflection spectra. (b) Representation of the localised surface plasmon on nanoparticles and absorbance spectra obtained for binding events on nanoparticles. Reproduced with permission from ref. 125. However, it is noteworthy that H2 evolution cocatalysts also accelerate the
thermodynamically favourable reverse reaction: the water formation reaction,
which is not desirable in a highly efficient POWS system. Therefore, efforts have

Chapter 1 Introduction
27
been made to suppress the backward reaction, whilst also promoting the forward
reaction23. A bimetallic cocatalyst system was reported by the Domen group,
where a Rh@Cr2O3 core-shell structure was synthesised by selective photo-
reduction: the protective Cr2O3 shell in the catalyst prevented the evolved O2 from
reaching the Rh core, therefore limiting the possibility of the evolved O2 to be
reduced again (Figure 1.14).114,126 Microscopic evidence showed that the core-
shell structure was successfully achieved by the photo-deposition method;
Spectroscopic studies also confirmed the compositions and chemical states of the
Rh core and the Cr2O3 shell. Building upon such observation, it was shown that a
solid-solution photocatalyst, GaN:ZnO, exhibited greatly enhanced POWS activity
after loading with a Rh@Cr2O3 core-shell structure due to the backward reaction
being suppressed.127 Using other noble metals, such as Pt and Ir, as the metal
core can also lead to similar performance.114 A similar modification method was
also developed to promote the POWS reaction effectively: amorphous
oxyhydroxides of group IV and V transition metals (Ti, Nb, Ta) were introduced to
a semiconductor photocatalyst, in which the amorphous oxyhydroxides covered
the whole photocatalyst particles, creating a core-shell structure126. The POWS
performance was successfully enhanced after this surface modification, resulting
from the prevention of the reverse reaction. The amorphous oxyhydroxide layers
were believed to function as molecular sieves which selectively filter the reactant
and product molecules. The core-shell structures were confirmed by microscopic
studies, and the permeation behaviour on the core-shell structures was also
studied in detail126. It was demonstrated that this structure was effective for POWS
reaction even when the active sites were covered by the coating, because of a
permeation-controlled behaviour: small H+ ions were allowed to permeate into the

Chapter 1 Introduction
28
shell, and the evolved H2 molecules were allowed to diffuse out. However, as
shown in Figure 1.14b, O2 molecules struggle to permeate into the shell due to
their relatively large molecule sizes. In addition, H2 molecules could hardly come
back in the shell due to the concentration gradient, thus, H2 molecules would
favourably diffuse out. As a result, this permeation-controlled core-shell structure
enabled the prevention of the reverse reaction without suppressing the forward
reaction, leading to a more efficient POWS reaction.
Figure 1.14 Schematic of the differences of the chemical processes before (a) and after (b) the construction of the core-shell structured cocatalysts. Reproduced with permission from ref. 114. 1.3.4 Photocatalysis at elevated temperatures
It should be noted that POWS has been extensively studied mainly at room
temperature for several decades, however, it is well known that elevated
temperatures can lead to enhanced performance of endothermic reactions both
thermodynamically and kinetically, and possibly could lead to new understandings
of this system. Thermolysis of water requires extremely high temperature of more
than 1000 oC which is not practical128, but photocatalysis promoted by elevated
temperatures is presumably able to provide a novel alternative for the solar energy
utilisation especially as the thermal energy could also be provided by solar means.
Moreover, infrared (IR) light contributes almost 50% of the whole solar spectrum

Chapter 1 Introduction
29
and can provide the required heat by thermal radiation instead of using additional
electric heating devices37. A pioneering work has demonstrated a sacrificial
photocatalytic H2 evolution system at elevated temperatures, of which the QE
reached 65.7% on a Pt/black TiO2 catalyst in the visible light range at 280 oC in
the presence of methanol as a sacrificial reagent (Figure 1.15).32 It is claimed that
elevated temperatures add to the thermal energy of the reactants and
subsequently increase the kinetic driving force, leading to the enhanced H2
evolution rate and QE. However, the thermal decomposition of methanol also
contributed to the overall H2 production (Figure 1.15a), and inevitably resulted in
unwanted production of organic chemicals or carbon emission, hindering its further
practical application.
Figure 1.15 (a) Temperature-enhanced photocatalytic H2 production from H2O with a sacrificial agent (30% methanol) without light illumination (blue bar) and with AM 1.5 global sunlight illumination (red bar) and (b) apparent quantum efficiencies of visible light and AM 1.5 global sunlight over the Pt/black TiO2 catalyst at 280 oC. Reproduced with permission from ref. 32. Obviously, a POWS system without the use of any sacrificial reagents will be more
favourable and the idea of using elevated temperatures in photocatalytic systems
is worth further exploration. A recent attempt on this was reported by Tian et al.,
where black phosphorous nanosheets were used for a photocatalytic HER system

Chapter 1 Introduction
30
at elevated temperature as well.129 It was shown that amorphous cobalt phosphide
supported black phosphorous exhibited around nine times enhancement of H2
evolution activity at 353 K compared with that at room temperature, showing a QE
of 42.55 % at 430 nm without addition of any sacrificial reagent in this
photocatalytic system. Although this catalyst showed good stability at room
temperature, it did not give a stoichiometric amount of O2 at 353 K, indicating there
was photo-corrosion of the catalyst at this elevated temperature. Therefore,
special attention should be given to the photocatalyst stability for the photocatalytic
systems operated at elevated temperatures. Also noteworthy is that the water
dissociation equilibrium to H+ and OH- is greatly dependent on temperature: it can
be promoted to about 25 times that at room temperature (about 1×10-14) and peaks
at around 270 oC before rapidly declining130. Obviously, enhanced concentrations
of H+ and OH- are also beneficial to the photocatalytic water splitting performance
kinetically. As mentioned before, in-depth investigation of the POWS systems at
elevated temperatures above 200 oC is still absent in literature right now. Hence,
through my DPhil study, I focused on the exploration of POWS systems at elevated
temperatures using semiconductor materials as the photocatalysts, and the
reactions were conducted in a closed batch reactor (Figure 1.16). At the beginning
of my DPhil project, with the help of electron paramagnetic resonance (EPR)
spectroscopy, I found that the surface modifications of the semiconductor
photocatalysts could be eliminated easily when in contact with water and air, and
the surface defects, such as VOs could be regenerated at elevated temperatures,
whether in N2, liquid water or water vapour. Experimental (e.g., in-situ structural
characterisations) and computational studies suggested that the oxygen mobility
could be greatly enhanced at elevated temperatures for TiO2-based materials,

Chapter 1 Introduction
31
which led to substantially enhanced POWS performance. Such enhanced oxygen
mobility in oxide materials at elevated temperatures has also been widely studied
and used in the solid oxide fuel cells.131 Time-resolved photoluminescence (TRPL)
spectroscopy was then used to probe the recombination rate of photo-excited
electron-hole pairs. Although no obvious change was observed when the TRPL
experiments were conducted in air without water at different elevated
temperatures, it was interesting to find that the charge carrier lifetime varies with
the pH change.73 As previously mentioned, the water dissociation constant
increases with the temperature and peaks at 270 oC, thus, the obvious response
of the charge carrier lifetime to the pH change indicated that the increased
concentration of H+ and OH- ions in water at elevated temperatures could also
influence the separation of the photo-generated charge carriers. More details will
be discussed in the following chapters of this thesis. Clearly, all these above-
mentioned results indicate that performing high-temperature photocatalysis exhibit
major advantages of facilitating the POWS reaction.
1.4 Aims and objectives
As demonstrated before, the POWS at elevated temperatures is a promising
approach to converting solar energy to chemical fuel in the form of H2, but it still
lacks in-depth investigation. Therefore, in this thesis, I aim to explore the POWS
at elevated temperatures as a novel technique to produce solar fuel. The POWS
reaction was carried out at different temperatures to study the temperature effect
on this system first. Starting from the most widely studied photocatalyst, TiO2, I
managed to enhance its visible light absorption by N-doping, and synthesised a
range of other semiconductor materials as the photocatalysts.
As previously discussed, to make the solar-light-driven POWS system competitive

Chapter 1 Introduction
32
for H2 production, the quantum efficiency needs to undergo a substantial increase,
and facilitating the separation of the photo-generated charge carriers by increasing
the local polarisation has become the key. Consequently, different strategies have
been explored through my DPhil study, which are demonstrated in this thesis.
Systematic investigations have been conducted to investigate the effect of the
local electric field introduced by polar-faceted support materials, such as polar-
faceted oxides and layered double hydroxides (LDHs), which are strongly
polarised on the surface. Moreover, magnetic field effects are also explored by
placing semiconductor photocatalysts near the superparamagnetic nanoparticles.
Extensive catalytic studies have been carried out. Deeper understanding of the
novel POWS system cannot be obtained without thorough characterisations of the
materials. Thus, a wide range of spectroscopic and microscopic characterisation
techniques were involved to investigate the relationships between structure and
performance. In combination with the computational studies, possible
mechanisms of the novel POWS system at elevated temperatures have been
derived.
Particulate photocatalytic water splitting systems have the advantage of simplicity
and low cost over other solar energy conversion techniques, such as photovoltaic-
electrolysis systems and photoelectrochemical devices, however, the highest
solar-to-hydrogen conversion efficiency reported so far is only around 1%.102
There is no doubt that future work should be focusing on improving this efficiency
to approximately 10% to meet the practical application requirement.37,121 Therefore,
new strategies to harness the visible or even infrared light are still desirable. Novel
approaches to suppress the charge carrier recombination and the backward
reactions are also required. The following inter-related processes such as

Chapter 1 Introduction
33
separation, purification, transportation, and utilisation of the H2 fuel remain
challenging as well. All these aspects are tremendously essential to realise the
efficient and sustainable production of H2 via solar-light-driven water splitting.
1.5 Thesis overview
This thesis contains seven chapters, with Chapters 3 to 6 describing and
discussing the experimental and computational work performed throughout my
DPhil project.
Chapter 1 (the current chapter) introduces the background of solar energy
conversion and the photocatalytic overall water splitting system, and provides the
fundamental principles of photocatalysis and definitions of the relevant terms.
Some conventional and effective strategies to improving the POWS performance
are then summarised and discussed, including defect engineering, deposition of
cocatalysts, etc. The main challenge in this research field, the suppression of
charge recombination, is then clarified. Building upon such background, a novel
POWS system at elevated temperatures is then proposed and discussed, which
serves as the focus of my DPhil project and this thesis. The overall aim of the
thesis is outlined as a conclusion of this chapter.
Chapter 2 starts with the experimental protocols of the synthesis methods and
outlines various methods of catalytic performance testing. It is then followed by the
detailed description of the background and theory of the main characterisation
techniques used in this thesis.
Chapter 3 demonstrates the feasibility of the POWS reaction using elevated
temperatures on TiO2-based materials. The background with particular emphasis
on the temperature effects on POWS reaction and the modifications of TiO2 is

Chapter 1 Introduction
34
covered. The band gap structure of the commercial P25 TiO2 is engineered by N-
doping to improve the visible light absorption. Extensive characterisations are
included to investigate the structure and the physical chemical properties,
especially the surface properties. Comprehensive photocatalytic tests are
performed, including the temperature effect, surface metal nanoparticle deposition,
stability tests, etc. Time-resolved photoluminescence spectroscopy is used to
investigate the charge separation process. A potential mechanism is derived
based on the above observations.
Chapter 4 focuses on the fabrication of local electric fields (LEFs) to promote the
POWS performance. Different polar-faceted metal oxides including CeO2, MgO,
ZnO, and LDHs are synthesised and assembled with semiconductor materials.
Non-polar CeO2, MgO, and ZnO are also included for comparison. Apart from the
N-doped TiO2 demonstrated in Chapter 3, a 2-dimensional (2D) transition metal
dichalcogenide (TMD) material, monolayer MoS2, is also covered in this chapter.
Extensive efforts are made to investigate the properties of the polar facets and the
monolayers with the help of microscopic techniques. Systematic photocatalytic
tests are performed and relationships between the POWS performance, the
charge carrier lifetime, and the strength of LEFs are also demonstrated in this
chapter.
Chapter 5 investigates the magnetic field effects (MFEs) on the POWS
performance. To enhance the local magnetic flux near the photocatalyst particles,
I managed to combine the N-doped TiO2 with superparamagnetic Fe3O4
nanoparticles (NPs) via a sol-gel method. An external magnetic field is provided
by two permanent magnets placed in parallel. Photocatalytic tests are carried out
to scrutinise the effect of the external magnetic field strength and the concentration

Chapter 1 Introduction
35
of Fe3O4 NPs in the photocatalysts. Careful analysis of the catalytic results and
computational studies is covered, which suggests that both the charge and spin
properties of the electrons play important roles in the POWS system in the
presence of a local magnetic field.
Chapter 6 starts to investigate a more practical case - the photocatalytic splitting
of seawater. The effects of different electrolytes on the POWS performance will be
discussed in this chapter. It is shown that the neutral electrolyte solutions could
greatly enhance the POWS performance by facilitating the charge carriers’
separation. Different characterisation techniques including time-resolved
photoluminescence, in situ X-ray photoelectron spectroscopy, etc. are used to
understand the charge separation processes. Artificial seawater samples are
prepared in lab and natural seawater was collected from Bournemouth, UK, all of
which are shown to enhance the POWS activity at elevated temperatures.
Chapter 7 summarises the findings in the previous chapters and provides
perspectives to the future research in the related research fields.
1.6 References
1. Bowker, M. Heterogeneous catalysis: Fundamentals and applications. Catalysis Letters vol. 142 (Kluwer Academic Publishers, 2012).
2. Qiu, J., Zhang, X., Feng, Y., Zhang, X., Wang, H. & Yao, J. Modified metal-organic frameworks as photocatalysts. Applied Catalysis B: Environmental vol. 231 317–342 (2018).
3. Mills, A., Johnston, J. & O’Rourke, C. Photocatalyst Activity Indicator Inks, paii s, for Assessing Self-Cleaning Films. Accounts Mater. Res. 3, 67–77 (2022).
4. Boddy, P. J. Oxygen Evolution on Semiconducting TiO2. J. Electrochem. Soc. 115, 199 (1968).
5. Fujishima, A. & Honda, K. Electrochemical Photolysis of Water at a Semiconductor Electrode. Nature 238, 37–38 (1972).
6. Fujishima, A., Rao, T. N. & Tryk, D. A. Titanium dioxide photocatalysis. J. Photochem. Photobiol. C Photochem. Rev. 1, 1–21 (2000).
7. Asahi, R., Morikawa, T., Ohwaki, T., Aoki, K. & Taga, Y. Visible-light photocatalysis in nitrogen-doped titanium oxides. Science 293, 269–271 (2001).

Chapter 1 Introduction
36
8. Kudo, A. & Miseki, Y. Heterogeneous photocatalyst materials for water splitting. Chem. Soc. Rev. 38, 253–278 (2009).
9. Li, P., Zhou, Y., Zhao, Z., Xu, Q., Wang, X., Xiao, M. & Zou, Z. Hexahedron prism-anchored octahedronal CeO2: Crystal facet-based homojunction promoting efficient solar fuel synthesis. J. Am. Chem. Soc. 137, 9547–9550 (2015).
10. Tu, W., Zhou, Y. & Zou, Z. Photocatalytic conversion of CO2 into renewable hydrocarbon fuels: State-of-the-art accomplishment, challenges, and prospects. Advanced Materials vol. 26 4607–4626 (2014).
11. Zou, Z., Ye, J., Sayama, K. & Arakawa, H. Direct splitting of water under visible light irradiation with an oxide semiconductor photocatalyst. Nature 414, 625–627 (2001).
12. Chen, H., Nanayakkara, C. E. & Grassian, V. H. Titanium dioxide photocatalysis in atmospheric chemistry. Chem. Rev. 112, 5919–5948 (2012).
13. Chen, C., Ma, W. & Zhao, J. Semiconductor-mediated photodegradation of pollutants under visible-light irradiation. Chem. Soc. Rev. 39, 4206–4219 (2010).
14. Yan, S. C., Li, Z. S. & Zou, Z. G. Photodegradation performance of g-C3N4 fabricated by directly heating melamine. Langmuir 25, 10397–10401 (2009).
15. Han, R., Andrews, R., O’Rourke, C., Hodgen, S. & Mills, A. Photocatalytic air purification: Effect of HNO3 accumulation on NOx and VOC removal. Catal. Today 380, 105–113 (2021).
16. Moniz, S. J. A., Shevlin, S. A., Martin, D. J., Guo, Z. X. & Tang, J. Visible-light driven heterojunction photocatalysts for water splitting-a critical review. Energy Environ. Sci. 8, 731–759 (2015).
17. Wang, Y., Vogel, A., Sachs, M., Sprick, R. S., Wilbraham, L., Moniz, S. J. A., Godin, R., Zwijnenburg, M. A., Durrant, J. R., Cooper, A. I. & Tang, J. Current understanding and challenges of solar-driven hydrogen generation using polymeric photocatalysts. Nat. Energy 4, 746–760 (2019).
18. Ran, J., Zhang, J., Yu, J., Jaroniec, M. & Qiao, S. Z. Earth-abundant cocatalysts for semiconductor-based photocatalytic water splitting. Chem. Soc. Rev. 43, 7787–7812 (2014).
19. Zhu, S. & Wang, D. Photocatalysis: Basic principles, diverse forms of implementations and emerging scientific opportunities. Adv. Energy Mater. 7, 1700841 (2017).
20. Green, M. A. & Bremner, S. P. Energy conversion approaches and materials for high-efficiency photovoltaics. Nat. Mater. 16, 23–34 (2016).
21. Tachibana, Y., Vayssieres, L. & Durrant, J. R. Artificial photosynthesis for solar water-splitting. Nat. Photonics 6, 511–518 (2012).
22. Zhang, L., Ran, J., Qiao, S. Z. & Jaroniec, M. Characterization of semiconductor photocatalysts. Chem. Soc. Rev. 48, 5184–5206 (2019).
23. Wolff, C. M., Frischmann, P. D., Schulze, M., Bohn, B. J., Wein, R., Livadas, P., Carlson, M. T., Jäckel, F., Feldmann, J., Würthner, F. & Stolarczyk, J. K. All-in-one visible-light-driven water splitting by combining nanoparticulate and molecular co-catalysts on CdS nanorods. Nat. Energy 3, 862–869 (2018).
24. Landman, A., Dotan, H., Shter, G. E., Wullenkord, M., Houaijia, A., Maljusch, A., Grader, G. S. & Rothschild, A. Photoelectrochemical water splitting in separate oxygen and hydrogen cells. Nat. Mater. 16, 646–651 (2017).
25. Jafari, T., Moharreri, E., Amin, A. S., Miao, R., Song, W. & Suib, S. L. Photocatalytic

Chapter 1 Introduction
37
water splitting - The untamed dream: A review of recent advances. Molecules 21, 900 (2016).
26. Maeda, K. & Domen, K. Photocatalytic water splitting: Recent progress and future challenges. J. Phys. Chem. Lett. 1, 2655–2661 (2010).
27. Zhou, G., Shan, Y., Wang, L., Hu, Y., Guo, J., Hu, F., Shen, J., Gu, Y., Cui, J., Liu, L. & Wu, X. Photoinduced semiconductor-metal transition in ultrathin troilite FeS nanosheets to trigger efficient hydrogen evolution. Nat. Commun. 10, 399 (2019).
28. Chen, X., Shen, S., Guo, L. & Mao, S. S. Semiconductor-based photocatalytic hydrogen generation. Chem. Rev. 110, 6503–6570 (2010).
29. Li, Q., Guo, B., Yu, J., Ran, J., Zhang, B., Yan, H. & Gong, J. R. Highly efficient visible-light-driven photocatalytic hydrogen production of CdS-cluster-decorated graphene nanosheets. J. Am. Chem. Soc. 133, 10878–10884 (2011).
30. Mazloomi, K. & Gomes, C. Hydrogen as an energy carrier: Prospects and challenges. Renew. Sustain. Energy Rev. 16, 3024–3033 (2012).
31. Tang, J., Durrant, J. R. & Klug, D. R. Mechanism of photocatalytic water splitting in TiO2. Reaction of water with photoholes, importance of charge carrier dynamics, and evidence for four-hole chemistry. J. Am. Chem. Soc. 130, 13885–13891 (2008).
32. Han, B. & Hu, Y. H. Highly Efficient Temperature-Induced Visible Light Photocatalytic Hydrogen Production from Water. J. Phys. Chem. C 119, 18927–18934 (2015).
33. Duonghong, D., Borgarello, E. & Grätzel, M. Dynamics of Light-Induced Water Cleavage in Colloidal Systems. J. Am. Chem. Soc. 103, 4685–4690 (1981).
34. Yin, X. L., Li, L. L., Jiang, W. J., Zhang, Y., Zhang, X., Wan, L. J. & Hu, J. S. MoS2/CdS Nanosheets-on-Nanorod Heterostructure for Highly Efficient Photocatalytic H2 Generation under Visible Light Irradiation. ACS Appl. Mater. Interfaces 8, 15258–15266 (2016).
35. Zhang, Z., Qian, Q., Li, B. & Chen, K. J. Interface Engineering of Monolayer MoS2/GaN Hybrid Heterostructure: Modified Band Alignment for Photocatalytic Water Splitting Application by Nitridation Treatment. ACS Appl. Mater. Interfaces 10, 17419–17426 (2018).
36. Lu, Q., Yu, Y., Ma, Q., Chen, B. & Zhang, H. 2D Transition-Metal-Dichalcogenide-Nanosheet-Based Composites for Photocatalytic and Electrocatalytic Hydrogen Evolution Reactions. Adv. Mater. 28, 1917–1933 (2016).
37. Wang, Q. & Domen, K. Particulate Photocatalysts for Light-Driven Water Splitting: Mechanisms, Challenges, and Design Strategies. Chem. Rev. 120, 919–985 (2020).
38. Peng, Y. K. & Tsang, S. C. E. Facet-dependent photocatalysis of nanosize semiconductive metal oxides and progress of their characterization. Nano Today 18, 15–34 (2018).
39. Li, Y. & Tsang, S. C. E. Recent Progress and Strategies for Enhancing Photocatalytic Water Splitting. Mater. Today Sustain. 9, 100032 (2020).
40. Shaner, M. R., Atwater, H. A., Lewis, N. S. & McFarland, E. W. A comparative technoeconomic analysis of renewable hydrogen production using solar energy. Energy Environ. Sci. 9, 2354–2371 (2016).
41. Hisatomi, T. & Domen, K. Reaction systems for solar hydrogen production via water splitting with particulate semiconductor photocatalysts. Nat. Catal. 2, 387–399 (2019).

Chapter 1 Introduction
38
42. Liu, N., Schneider, C., Freitag, D., Venkatesan, U., Marthala, V. R. R., Hartmann, M., Winter, B., Spiecker, E., Osvet, A., Zolnhofer, E. M., Meyer, K., Nakajima, T., Zhou, X. & Schmuki, P. Hydrogenated anatase: Strong photocatalytic dihydrogen evolution without the use of a co-catalyst. Angew. Chem. Int. Ed. 53, 14201–14205 (2014).
43. Park, K. H., An, Y., Jung, S., Park, H. & Yang, C. The use of an n-type macromolecular additive as a simple yet effective tool for improving and stabilizing the performance of organic solar cells. Energy Environ. Sci. 9, 3464–3471 (2016).
44. Liu, G., Pan, J., Yin, L., Irvine, J. T., Li, F., Tan, J., Wormald, P. & Cheng, H. M. Heteroatom-modulated switching of photocatalytic hydrogen and oxygen evolution preferences of anatase TiO 2 microspheres. Adv. Funct. Mater. 22, 3233–3238 (2012).
45. Zalas, M. & Laniecki, M. Photocatalytic hydrogen generation over lanthanides-doped titania. Sol. Energy Mater. Sol. Cells 89, 287–296 (2005).
46. Sasikala, R., Sudarsan, V., Sudakar, C., Naik, R., Sakuntala, T. & Bharadwaj, S. R. Enhanced photocatalytic hydrogen evolution over nanometer sized Sn and Eu doped titanium oxide. Int. J. Hydrogen Energy 33, 4966–4973 (2008).
47. Jing, D., Zhang, Y. & Guo, L. Study on the synthesis of Ni doped mesoporous TiO2 and its photocatalytic activity for hydrogen evolution in aqueous methanol solution. Chem. Phys. Lett. 415, 74–78 (2005).
48. Yan, H., Zhang, X., Zhou, S., Xie, X., Luo, Y. & Yu, Y. Synthesis of WO3 nanoparticles for photocatalytic O2 evolution by thermal decomposition of ammonium tungstate loading on g-C 3N4. J. Alloys Compd. 509, L232–L235 (2011).
49. Ogawa, K., Tomita, O., Takagi, K., Nakada, A., Higashi, M. & Abe, R. Improved activity of hydrothermally-prepared WO3 photocatalysts by sodium salt additives. Chem. Lett. 47, 985–988 (2018).
50. Townsend, T. K., Sabio, E. M., Browning, N. D. & Osterloh, F. E. Photocatalytic water oxidation with suspended alpha-Fe 2O 3 particles-effects of nanoscaling. Energy Environ. Sci. 4, 4270–4275 (2011).
51. Jia, J., Seitz, L. C., Benck, J. D., Huo, Y., Chen, Y., Ng, J. W. D., Bilir, T., Harris, J. S. & Jaramillo, T. F. Solar water splitting by photovoltaic-electrolysis with a solar-to-hydrogen efficiency over 30%. Nat. Commun. 7, 13237 (2016).
52. Pinaud, B. A., Benck, J. D., Seitz, L. C., Forman, A. J., Chen, Z., Deutsch, T. G., James, B. D., Baum, K. N., Baum, G. N., Ardo, S., Wang, H., Miller, E. & Jaramillo, T. F. Technical and economic feasibility of centralized facilities for solar hydrogen production via photocatalysis and photoelectrochemistry. Energy Environ. Sci. 6, 1983–2002 (2013).
53. Goto, Y., Hisatomi, T., Wang, Q., Higashi, T., Ishikiriyama, K., Maeda, T. Sakata, Y., Okunaka, S., Tokudome, H., Katayama, M., Akiyama, S., Nishiyama, H., Inoue, Y., Takewaki, T., Setoyama, T., Minegishi, T., Takata, T., Yamada, T. & Domen, K. A Particulate Photocatalyst Water-Splitting Panel for Large-Scale Solar Hydrogen Generation. Joule 2, 509–520 (2018).
54. Fabian, D. M., Hu, S., Singh, N., Houle, F. A., Hisatomi, T., Domen, K., Osterloh, F. E. & Ardo, S. Particle suspension reactors and materials for solar-driven water splitting. Energy Environ. Sci. 8, 2825–2850 (2015).
55. Wang, Y., Suzuki, H., Xie, J., Tomita, O., Martin, D. J., Higashi, M., Kong, D., Abe, R. & Tang, J. Mimicking Natural Photosynthesis: Solar to Renewable H2 Fuel Synthesis by Z-Scheme Water Splitting Systems. Chem. Rev. 118, 5201–5241

Chapter 1 Introduction
39
(2018). 56. Suzuki, H., Tomita, O., Higashi, M. & Abe, R. Tungstic acids H2WO4 and H4WO5
as stable photocatalysts for water oxidation under visible light. J. Mater. Chem. A 5, 10280–10288 (2017).
57. Sasaki, Y., Iwase, A., Kato, H. & Kudo, A. The effect of co-catalyst for Z-scheme photocatalysis systems with an Fe3+/Fe2+ electron mediator on overall water splitting under visible light irradiation. J. Catal. 259, 133–137 (2008).
58. Kato, H., Hori, M., Konta, R., Shimodaira, Y. & Kudo, A. Construction of Z-scheme type heterogeneous photocatalysis systems for water splitting into H 2 and O 2 under visible light irradiation. Chem. Lett. 33, 1348–1349 (2004).
59. Tabata, M., Maeda, K., Higashi, M., Lu, D., Takata, T., Abe, R. & Domen, K. Modified Ta3N5 powder as a photocatalyst for O 2 evolution in a two-step water splitting system with an iodate/iodide shuttle redox mediator under visible light. Langmuir 26, 9161–9165 (2010).
60. Higashi, M., Abe, R., Ishikawa, A., Takata, T., Ohtani, B. & Domen, K. Z-scheme overall water splitting on modified-TaOn photocatalysts under visible light (λ < 500 nm). Chem. Lett. 37, 138–139 (2008).
61. Abe, R., Takata, T., Sugihara, H. & Domen, K. Photocatalytic overall water splitting under visible light by TaON and WO3 with an IO3-/I- shuttle redox mediator. Chem. Commun. 3829–3831 (2005).
62. Jia, Q., Iwase, A. & Kudo, A. BiVO4-Ru/SrTiO3:Rh composite Z-scheme photocatalyst for solar water splitting. Chem. Sci. 5, 1513–1519 (2014).
63. Sasaki, Y., Nemoto, H., Saito, K. & Kudo, A. Solar water splitting using powdered photocatalysts driven by Z-schematic interparticle electron transfer without an electron mediator. J. Phys. Chem. C 113, 17536–17542 (2009).
64. Wang, Q., Hisatomi, T., Suzuki, Y., Pan, Z., Seo, J., Katayama, M., Minegishi, T., Nishiyama, H., Takata, T., Seki, K., Kudo, A., Yamada, T. & Domen, K. Particulate Photocatalyst Sheets Based on Carbon Conductor Layer for Efficient Z‐Scheme Pure-Water Splitting at Ambient Pressure. J. Am. Chem. Soc. 139, 1675–1683 (2017).
65. Iwase, A., Ng, Y. H., Ishiguro, Y., Kudo, A. & Amal, R. Reduced graphene oxide as a solid-state electron mediator in Z-scheme photocatalytic water splitting under visible light. J. Am. Chem. Soc. 133, 11054–11057 (2011).
66. Pan, Z., Zhang, G. & Wang, X. Polymeric Carbon Nitride/Reduced Graphene Oxide/Fe2O3: All-Solid-State Z-Scheme System for Photocatalytic Overall Water Splitting. Angew. Chem. Int. Ed. 58, 7102–7106 (2019).
67. Miseki, Y. & Sayama, K. Photocatalytic Water Splitting for Solar Hydrogen Production Using the Carbonate Effect and the Z-Scheme Reaction. Adv. Energy Mater. 9, 1–15 (2019).
68. Chen, X., Liu, L., Yu, P. Y. & Mao, S. S. Increasing solar absorption for photocatalysis with black hydrogenated titanium dioxide nanocrystals. Science 331, 746–750 (2011).
69. Liu, N., Häublein, V., Zhou, X., Venkatesan, U., Hartmann, M., MačKović, M., Nakajima, T., Spiecker, E., Osvet, A., Frey, L. & Schmuki, P. ‘Black’ TiO2 Nanotubes Formed by High-Energy Proton Implantation Show Noble-Metal-co-Catalyst Free Photocatalytic H2-Evolution. Nano Lett. 15, 6815–6820 (2015).
70. Etacheri, V., Di Valentin, C., Schneider, J., Bahnemann, D. & Pillai, S. C. Visible-light activation of TiO2 photocatalysts: Advances in theory and experiments. J.

Chapter 1 Introduction
40
Photochem. Photobiol. C Photochem. Rev. 25, 1–29 (2015). 71. Choi, W., Termin, A. & Hoffmann, M. R. The role of metal ion dopants in quantum-
sized TiO2: Correlation between photoreactivity and charge carrier recombination dynamics. J. Phys. Chem. 98, 13669–13679 (1994).
72. Asahi, R., Morikawa, T., Irie, H. & Ohwaki, T. Nitrogen-doped titanium dioxide as visible-light-sensitive photocatalyst: Designs, developments, and prospects. Chem. Rev. 114, 9824–9852 (2014).
73. Li, Y., Peng, Y.-K., Hu, L., Zheng, J., Prabhakaran, D., Wu, S., Puchtler, T. J., Li, M., Wong, K.-Y., Taylor, R. A. & Tsang, S. C. E. Photocatalytic water splitting by N-TiO2 on MgO (111) with exceptional quantum efficiencies at elevated temperatures. Nat. Commun. 10, 4421 (2019).
74. Wang, J., Tafen, D. N., Lewis, J. P., Hong, Z., Manivannan, A., Zhi, M., Li, M. & Wu, N. Origin of photocatalytic activity of Nitrogen-doped TiO2 nanobelts. J. Am. Chem. Soc. 131, 12290–12297 (2009).
75. Ansari, S. A., Khan, M. M., Ansari, M. O. & Cho, M. H. Nitrogen-doped titanium dioxide (N-doped TiO2) for visible light photocatalysis. New J. Chem. 40, 3000–3009 (2016).
76. Sato, S. Photocatalytic activity of NOx-doped TiO2 in the visible light region. Chem. Phys. Lett. 123, 126–128 (1986).
77. Livraghi, S., Paganini, M. C., Giamello, E., Selloni, A., Di Valentin, C. & Pacchioni, G. Origin of photoactivity of nitrogen-doped titanium dioxide under visible light. J. Am. Chem. Soc. 128, 15666–15671 (2006).
78. Di Valentin, C., Pacchioni, G., Selloni, A., Livraghi, S. & Giamello, E. Characterization of paramagnetic species in N-doped TiO 2 powders by EPR spectroscopy and DFT calculations. J. Phys. Chem. B 109, 11414–11419 (2005).
79. Wang, G., Wang, H., Ling, Y., Tang, Y., Yang, X., Fitzmorris, R. C., Wang, C., Zhang, J. Z. & Li, Y. Hydrogen-treated TiO2 nanowire arrays for photoelectrochemical water splitting. Nano Lett. 11, 3026–3033 (2011).
80. Cowan, A. J., Tang, J., Leng, W., Durrant, J. R. & Klug, D. R. Water splitting by nanocrystalline TiO 2 in a complete photoelectrochemical cell exhibits efficiencies limited by charge recombination. J. Phys. Chem. C 114, 4208–4214 (2010).
81. Imanishi, A., Okamura, T., Ohashi, N., Nakamura, R. & Nakato, Y. Mechanism of water photooxidation reaction at atomically flat TiO 2 (rutile) (110) and (100) surfaces: Dependence on solution pH. J. Am. Chem. Soc. 129, 11569–11578 (2007).
82. Padilha, A. C. M., Raebiger, H., Rocha, A. R. & Dalpian, G. M. Charge storage in oxygen deficient phases of TiO2: Defect Physics without defects. Sci. Rep. 6, 2–8 (2016).
83. Li, Y. & Tsang, S. C. E. Unusual Catalytic Properties of High-Energetic-Facet Polar Metal Oxides. Acc. Chem. Res. 54, 366–378 (2021).
84. Zhang, Y. C., Li, Z., Zhang, L., Pan, L., Zhang, X., Wang, L., Fazal-e-Aleem & Zou, J. J. Role of oxygen vacancies in photocatalytic water oxidation on ceria oxide: Experiment and DFT studies. Appl. Catal. B Environ. 224, 101–108 (2018).
85. Long, M. & Zheng, L. Engineering vacancies for solar photocatalytic applications. Cuihua Xuebao/Chinese J. Catal. 38, 617–624 (2017).
86. Esch, F., Fabris, S., Zhou, L., Montini, T., Africh, C., Fornasiero, P., Comelli, G. & Rosei, R. Chemistry: Electron localization determines defect formation on ceria

Chapter 1 Introduction
41
substrates. Science 309, 752–755 (2005). 87. Tan, H., Zhao, Z., Niu, M., Mao, C., Cao, D., Cheng, D., Feng, P. & Sun, Z. A facile
and versatile method for preparation of colored TiO2 with enhanced solar-driven photocatalytic activity. Nanoscale 6, 10216–10223 (2014).
88. Tan, H., Zhao, Z., Zhu, W. Bin, Coker, E. N., Li, B., Zheng, M., Yu, W., Fan, H. & Sun, Z. Oxygen vacancy enhanced photocatalytic activity of pervoskite SrTiO3. ACS Appl. Mater. Interfaces 6, 19184–19190 (2014).
89. Nakamura, I., Negishi, N., Kutsuna, S., Ihara, T., Sugihara, S. & Takeuchi, K. Role of oxygen vacancy in the plasma-treated TiO2 photocatalyst with visible light activity for NO removal. J. Mol. Catal. A Chem. 161, 205–212 (2000).
90. Guan, M., Xiao, C., Zhang, J., Fan, S., An, R., Cheng, Q., Xie, J., Zhou, M., Ye, B. & Xie, Y. Vacancy associates promoting solar-driven photocatalytic activity of ultrathin bismuth oxychloride nanosheets. J. Am. Chem. Soc. 135, 10411–10417 (2013).
91. Zhou, X., Liu, N. & Schmuki, P. Photocatalysis with TiO2 Nanotubes: ‘Colorful’ Reactivity and Designing Site-Specific Photocatalytic Centers into TiO2 Nanotubes. ACS Catal. 7, 3210–3235 (2017).
92. D’Arienzo, M., Carbajo, J., Bahamonde, A., Crippa, M., Polizzi, S., Scotti, R., Wahba, L. & Morazzoni, F. Photogenerated defects in shape-controlled TiO 2 anatase nanocrystals: A probe to evaluate the role of crystal facets in photocatalytic processes. J. Am. Chem. Soc. 133, 17652–17661 (2011).
93. Carter, E., Carley, A. F. & Murphy, D. M. Evidence for O2- radical stabilization at surface oxygen vacancies on polycrystalline TiO2. J. Phys. Chem. C 111, 10630–10638 (2007).
94. Singh, A. P., Kodan, N., Dey, A., Krishnamurthy, S. & Mehta, B. R. Improvement in the structural, optical, electronic and photoelectrochemical properties of hydrogen treated bismuth vanadate thin films. Int. J. Hydrogen Energy 40, 4311–4319 (2015).
95. Wang, G., Ling, Y., Wang, H., Yang, X., Wang, C., Zhang, J. Z. & Li, Y. Hydrogen-treated WO 3 nanoflakes show enhanced photostability. Energy Environ. Sci. 5, 6180–6187 (2012).
96. Wang, L., Wang, Y., Cheng, Y., Liu, Z., Guo, Q., Ha, M. N. & Zhao, Z. Hydrogen-treated mesoporous WO3 as a reducing agent of CO2 to fuels (CH4 and CH3OH) with enhanced photothermal catalytic performance. J. Mater. Chem. A 4, 5314–5322 (2016).
97. Moss, B., Wang, Q., Butler, K. T., Grau-Crespo, R., Selim, S., Regoutz, A., Hisatomi, T., Godin, R., Payne, D. J., Kafizas, A., Domen, K., Steier, L. & Durrant, J. R. Linking in situ charge accumulation to electronic structure in doped SrTiO3 reveals design principles for hydrogen-evolving photocatalysts. Nat. Mater. 20, 511–517 (2021).
98. Konta, R., Ishii, T., Kato, H. & Kudo, A. Photocatalytic Activities of Noble Metal Ion Doped SrTiO3 under Visible Light Irradiation. J. Phys. Chem. B 108, 8992–8995 (2004).
99. Herrmann, J. M., Disdier, J. & Pichat, P. Effect of chromium doping on the electrical and catalytic properties of powder titania under UV and visible illumination. Chem. Phys. Lett. 108, 618–622 (1984).
100. Wang, Q., Hisatomi, T., Ma, S. S. K., Li, Y. & Domen, K. Core/shell structured La- and Rh-Codoped SrTiO3 as a hydrogen evolution photocatalyst in Z-scheme overall water splitting under visible light irradiation. Chem. Mater. 26, 4144–4150

Chapter 1 Introduction
42
(2014). 101. Wang, Q., Li, Y., Hisatomi, T., Nakabayashi, M., Shibata, N., Kubota, J. & Domen,
K. Z-scheme water splitting using particulate semiconductors immobilized onto metal layers for efficient electron relay. J. Catal. 328, 308–315 (2015).
102. Wang, Q., Hisatomi, T., Jia, Q., Tokudome, H., Zhong, M., Wang, C., Pan, Z., Takata, T., Nakabayashi, M., Shibata, N., Li, Y., Sharp, I. D., Kudo, A., Yamada, T. & Domen, K. Scalable water splitting on particulate photocatalyst sheets with a solar-to-hydrogen energy conversion efficiency exceeding 1%. Nat. Mater. 15, 611–615 (2016).
103. Schneider, J., Matsuoka, M., Takeuchi, M., Zhang, J., Horiuchi, Y., Anpo, M. & Bahnemann, D. W. Understanding TiO2 Photocatalysis: Mechanisms and Materials. Chem. Rev. 114, 9919–9986 (2014).
104. Hussain, H., Tocci, G., Woolcot, T., Torrelles, X., Pang, C. L., Humphrey, D. S., Yim, C. M., Grinter, D. C., Cabailh, G., Bikondoa, O., Lindsay, R., Zegenhagen, J., Michaelides, A. & Thornton, G. Structure of a model TiO2 photocatalytic interface. Nat. Mater. 16, 461–467 (2017).
105. Chen, F., Huang, H., Guo, L., Zhang, Y. & Ma, T. The Role of Polarization in Photocatalysis. Angew. Chem. Int. Ed. 58, 10061–10073 (2019).
106. Li, J., Cai, L., Shang, J., Yu, Y. & Zhang, L. Giant Enhancement of Internal Electric Field Boosting Bulk Charge Separation for Photocatalysis. Adv. Mater. 28, 4059–4064 (2016).
107. Li, J., Zhan, G., Yu, Y. & Zhang, L. Superior visible light hydrogen evolution of Janus bilayer junctions via atomic-level charge flow steering. Nat. Commun. 7, 11480 (2016).
108. Li, R., Zhang, F., Wang, D., Yang, J., Li, M., Zhu, J., Zhou, X., Han, H. & Li, C. Spatial separation of photogenerated electrons and holes among {010} and {110} crystal facets of BiVO 4. Nat. Commun. 4, 1432–1437 (2013).
109. Li, L., Yan, J., Wang, T., Zhao, Z. J., Zhang, J., Gong, J. & Guan, N. Sub-10 nm rutile titanium dioxide nanoparticles for efficient visible-light-driven photocatalytic hydrogen production. Nat. Commun. 6, 5881 (2015).
110. Liu, G., Yang, H. G., Pan, J., Yang, Y. Q., Lu, G. Q. M. & Cheng, H. M. Titanium dioxide crystals with tailored facets. Chem. Rev. 114, 9559–9612 (2014).
111. Noguera, C. Polar oxide surfaces. J. Phys. Condens. Matter 12, R367–R410 (2000). 112. Goniakowski, J., Finocchi, F. & Noguera, C. Polarity of oxide surfaces and
nanostructures. Reports Prog. Phys. 71, 1 (2008). 113. Noguera, C. & Goniakowski, J. Polarity in oxide nano-objects. Chem. Rev. 113,
4073–4105 (2013). 114. Takata, T., Pan, C., Nakabayashi, M., Shibata, N. & Domen, K. Fabrication of a
core-shell-type photocatalyst via photodeposition of group IV and v transition metal oxyhydroxides: An effective surface modification method for overall water splitting. J. Am. Chem. Soc. 137, 9627–9634 (2015).
115. Sun, S., Hisatomi, T., Wang, Q., Chen, S., Ma, G., Liu, J., Nandy, S., Minegishi, T., Kayayama, M. & Domen, K. Efficient Redox-Mediator-Free Z‑Scheme Water Splitting Employing Oxysulfide Photocatalysts under Visible Light.pdf. ACS Catal. 8, 1690–1696 (2018).
116. Chen, S., Takata, T. & Domen, K. Particulate photocatalysts for overall water splitting. Nat. Rev. Mater. 2, 17050 (2017).

Chapter 1 Introduction
43
117. Li, Z., Zhang, F., Han, J., Zhu, J., Li, M., Zhang, B., Fan, W., Lu, J. & Li, C. Using Pd as a Cocatalyst on GaN–ZnO Solid Solution for Visible-Light-Driven Overall Water Splitting. Catal. Letters 148, 933–939 (2018).
118. Inoue, Y. Photocatalytic water splitting by RuO2-loaded metal oxides and nitrides with d0- and d10 -related electronic configurations. Energy Environ. Sci. 2, 364–386 (2009).
119. Jo, W. J., Kang, H. J., Kong, K. J., Lee, Y. S., Park, H., Lee, Y., Buonassisi, T., Gleason, K. K. & Lee, J. S. Phase transition-induced band edge engineering of BiVO4 to split pure water under visible light. Proc. Natl. Acad. Sci. U. S. A. 112, 13774–13778 (2015).
120. Asai, R., Nemoto, H., Jia, Q., Saito, K., Iwase, A. & Kudo, A. A visible light responsive rhodium and antimony-codoped SrTiO3 powdered photocatalyst loaded with an IrO2 cocatalyst for solar water splitting. Chem. Commun. 50, 2543–2546 (2014).
121. Wang, Z., Li, C. & Domen, K. Recent developments in heterogeneous photocatalysts for solar-driven overall water splitting. Chem. Soc. Rev. 48, 2109–2125 (2019).
122. Hou, W. & Cronin, S. B. A review of surface plasmon resonance-enhanced photocatalysis. Adv. Funct. Mater. 23, 1612–1619 (2013).
123. Wang, Z., Yang, C., Lin, T., Yin, H., Chen, P., Wan, D., Xu, F., Huang, F., Lin, J., Xie, X. & Jiang, M. H-doped black titania with very high solar absorption and excellent photocatalysis enhanced by localized surface plasmon resonance. Adv. Funct. Mater. 23, 5444–5450 (2013).
124. Ingram, D. B. & Linic, S. Water splitting on composite plasmonic-metal/semiconductor photoelectrodes: Evidence for selective plasmon-induced formation of charge carriers near the semiconductor surface. J. Am. Chem. Soc. 133, 5202–5205 (2011).
125. Masson, J. F. Portable and field-deployed surface plasmon resonance and plasmonic sensors. Analyst 145, 3776–3800 (2020).
126. Maeda, K., Teramura, K., Lu, D., Saito, N., Inoue, Y. & Domen, K. Noble-Metal/Cr2O3 Core/Shell Nanoparticles as a Cocatalyst for Photocatalytic Overall Water Splitting. Angew. Chemie 118, 7970–7973 (2006).
127. Maeda, K., Teramura, K., Lu, D., Saito, N., Inoue, Y. & Domen, K. Roles of Rh/Cr2O3 (Core/Shell) Nanoparticles Photodeposited on Visible-Light-Responsive (Ga1-xZnx)(N1-xOx) Solid Solutions in Photocatalytic Overall Water Splitting. J. Phys. Chem. C 111, 7554–7560 (2007).
128. Rao, C. N. R. & Dey, S. Solar thermochemical splitting of water to generate hydrogen. Proc. Natl. Acad. Sci. U. S. A. 114, 13385–13393 (2017).
129. Tian, B., Tian, B., Smith, B., Scott, M. C., Hua, R., Lei, Q. & Tian, Y. Supported black phosphorus nanosheets as hydrogen-evolving photocatalyst achieving 5.4% energy conversion efficiency at 353 K. Nat. Commun. 9, 1397 (2018).
130. Bandura, A. V. & Lvov, S. N. The ionization constant of water over wide ranges of temperature and density. J. Phys. Chem. Ref. Data 35, 15–30 (2006).
131. Foo, C., Li, Y., Lebedev, K., Chen, T. T., Day, S., Tang, C. & Tsang, S. C. E. Characterisation of oxygen defects and nitrogen impurities in TiO2 photocatalysts using variable-temperature X-ray powder diffraction. Nat. Commun. 12, 661 (2021).

Chapter 2 Experimental and Characterisation Methods
44
Chapter 2 Experimental and Characterisation Methods
2.1 Material synthesis
2.1.1 Preparation of titanium oxide (TiO2)
Pristine TiO2 samples were obtained from different sources. Phase-pure anatase
TiO2 is commercially available (ST-01 TiO2 powder, Ishihara Sangyo, Japan, mean
particle size ca. 5 nm). Phase-pure rutile TiO2 powder was purchased from Sigma-
Aldrich (mean particle size < 100 nm). Commercial Degussa P25 was also
engaged in this research project, which is a widely used photocatalyst containing
about 80% of anatase and 20% of rutile phase. TiO2 nanoparticles was also
prepared via sol-gel method (mean particle size ca. 25.4 nm). Typically, solution A
was prepared by adding 5 mL of titanium tetraisopropoxide (TTIP) in 15 mL ethanol
and solution B was obtained by mixing 10 mL of deionised water, 10 mL of ethanol
and 1 mL of acetic acid. Then solution A was slowly added to solution B dropwise
under vigorous magnetic stirring. After a transparent gel forms, it was left still for
aging at room temperature overnight (without stirring), following by drying in
vacuum oven at 70 oC. Then the obtained dry gel was calcined in an air flow at
400 oC for 2 h to obtain the TiO2 nanoparticles (white powder), which were then
collected for further use.
2.1.2 Synthesis of N-doped TiO2 (N-TiO2) using NH3 treatment
The N-TiO2 was prepared by treating the pristine TiO2 with pure NH3 gas. In a
typical experiment, 250 mg of TiO2 sample powder (Degussa P25, sol-gel TiO2,
anatase or rutile) was put into a quartz boat which was then loaded in a tubular
furnace. The temperature was subsequently elevated to the required temperature
in the range of 550-750 oC in a step of 5 oC min-1 in a pure NH3 gas flow. The

Chapter 2 Experimental and Characterisation Methods
45
treatment was maintained for 8 h before cooling down to room temperature
naturally. The samples were denoted as N-P25-T, N-sgTiO2-T, N-TiO2(A)-T or N-
TiO2(R)-T depending on the precursor that was used, where T represents the
treatment temperature in NH3. Colour of the obtained N-TiO2 powders varies with
the NH3 treatment temperature, with N-P25-550 showing a yellow colour, while N-
P25-620 showing a dark blue colour (Figure 2.1). The as-prepared materials were
collected and used without further treatment unless specified.
Figure 2.1 A photographic image of N-doped P25 TiO2 materials. From left to right: pristine P25, N-P25-550, N-P25-600, N-P25-620, and N-P25-660. 2.1.3 Synthesis of the facet-engineered N-TiO2
The synthesis of the facet-engineered TiO2 nanocrystals was adopted from our
previous work:1 5.0 mL of titanium butoxide, Ti(OC4H9)4, was mixed with 0.6 mL of
hydrofluoric acid (48 wt.%) in a 50-mL Teflon-lined autoclave and subsequently
heated to 180 °C at a rate of 5 °C min-1. The temperature was kept at 180 °C for
24 h. After the hydrothermal process, the as-obtained white precipitate was
washed with ethanol and deionised water for three times, respectively, and then
dried in an oven at 80 °C overnight. For N-doping, typically, 200 mg as-prepared

Chapter 2 Experimental and Characterisation Methods
46
facet-controlled TiO2 was put in a quartz boat which was then transferred to a
tubular furnace. The sample was then heated to 600 oC at a rate of 5 °C min-1 and
kept for 2 h under NH3 flow, after which it was allowed to cool down naturally and
the dark blue powder, N-doped TiO2 (N-TiO2), was collected. The N-TiO2
photocatalyst, unless stated, was loaded with 1 wt.% Pt nanoparticles as the H2
evolution cocatalyst via a photo-deposition method before the photocatalytic tests.
The photo-deposition process is described in the following sub-section.
2.1.4 Synthesis of N-TiO2 using controlled oxidation method
N-TiO2 was also prepared by oxidising titanium nitride powders, which was
adopted from literature.2 Typically, 500 mg of commercial titanium nitride powder
(Sigma-Aldrich, mean particle size < 300 nm) was put into a quartz boat which was
then loaded in a tubular furnace. Then the sample was calcined in O2 flow at 400
oC, 500 oC, 600 oC and 700 oC, respectively, with a temperature ramping of 5 oC
min-1. The oxidation process took 2 h before cooling down to room temperature
naturally.
2.1.5 Metal loading of N-TiO2
Supported N-TiO2 catalysts were prepared via a photo-deposition method: 100 mg
of the N-TiO2 was suspended in 60 mL methanol aqueous solution (50 vol. %)
under vigorous stirring, and then the aqueous solution containing the required
amount of the corresponding metal precursor was added into the above
suspension. This suspension was then irradiated under a 300W UV lamp (Helios
Italquartz S.R.L.) for 2 h before being filtered and washed with water and ethanol
for 3 times, respectively. The final product was collected after being dried in a 70
oC oven overnight. In a photo-deposition process, the photo-generated electrons

Chapter 2 Experimental and Characterisation Methods
47
in the conduction band (CB) reduce the metal ions in the solution, forming metal
nanoparticles. Methanol acts as a sacrificial reagent, also known as the electron-
scavenger, which is oxidised by the photo-generated holes in the valence band
(VB), producing CO2, CO, or other organic products. Clearly, not all kinds of metal
nanoparticles can be deposited using this method: the CB minimum must have a
more negative potential than the reduction potential of the metal ions, enabling the
electrons in the CB to reduce the metal ions.3 Size and morphology of the
deposited metal NPs were studied by TEM in this thesis. The photocatalytic
reactions of the photo-deposition are shown below.
𝑀=> + 𝑛𝑒? → 𝑀
𝑀𝑒𝑂𝐻 + 𝑛ℎ> → 𝐻/𝑂 + 𝐶𝑂/ + 𝑂𝑟𝑔𝑎𝑛𝑖𝑐𝑝𝑟𝑜𝑑𝑢𝑐𝑡𝑠 (Not balanced)
2.1.6 Synthesis of single-layer molybdenum disulphide (SL-MoS2)
Single layer MoS2 was prepared using the method adopted from our previous
report:4 Typically, 2 g of commercial bulk MoS2 powder was soaked in 16 mL of
1.6 M n-butyl lithium/hexane solution for 72 h under a N2 atmosphere. After the
lithium intercalation process, the above suspension was diluted with 50 mL of
hexane and centrifuged to collect the intercalated MoS2. The collected MoS2 was
then dried under N2. Subsequently, the powder was immersed in 500 mL of water
and the resulting suspension was sonicated for 12 h to assist the exfoliation
process. The dispersion was centrifuged at 4000 rpm for 15 min to remove
unexfoliated precursors and only the supernatant was collected. Eventually, the
exfoliated MoS2 monolayers remained totally suspended in aqueous solution. To
collect the SL-MoS2 in a powder form, HCl solution was added dropwise into the
above SL-MoS2 colloid until the pH value reaching around 7. The precipitate was

Chapter 2 Experimental and Characterisation Methods
48
then washed and collected by centrifugation several times and the final product
was dried at 60 oC under vacuum overnight.
2.1.7 Synthesis of metal decorated SL-MoS2
Metal decorated SL-MoS2 materials (denoted as M:SL-MoS2, where M represents
the metal doping) were prepared using a hydrothermal method. Typically, the
required amount of corresponding metal precursors (calculated loading amount of
2 wt.%) and 150 mg of thiourea were added to 10 mL of water and left overnight
to form the complex. Subsequently this solution was then mixed with a 50 mL
colloid containing 180 mg SL-MoS2 (30 v/v% isopropanol/water with 50 mg of
polyvinylpyrrolidone). A mixed homogeneous solution was then transferred to an
autoclave with a 120-mL Teflon lining, followed by hydrothermal treatment at
160 °C for 24 h. After the reaction, the precipitate was washed three times using
deionised water and then dried under vacuum for 12 h and finally treated with H2
at 300 °C for 1 h prior to storage.
2.1.8 Synthesis of magnesium oxide (MgO) with different dominating facets
MgO(111) was prepared by a hydrothermal method. Typically, 2.0 g of MgCl2•6H2O
and 0.12 g of benzoic acid was dissolved in 60 mL of deionised water at room
temperature under sonication for 1 h. The mixture was then stirred for 10 minutes
before 20 mL of 2 mol L-1 NaOH (aq.) solution was added dropwise. The resulted
slurry was collected and subsequently transferred to a 100 mL-autoclave with
Teflon lining and gradually heated to 180 oC in an oven and maintained at this
temperature for 24 h. The resulted solid was separated by filtration followed by
washing with water and drying at 80 oC under vacuum overnight, and then the
Mg(OH)2 precursor was collected. MgO(111) nanosheets were obtained after

Chapter 2 Experimental and Characterisation Methods
49
calcining the above Mg(OH)2 precursor in an air flow at 500 oC for 6 h.5,6
MgO(110) was prepared by reconstruction of the commercial MgO powders.
Typically, 500 mg of commercial MgO was reacting with 100 mL of deionised water
at 120 oC for 5 h (in a closed hydrothermal autoclave) to form magnesium
hydroxide. The resulted magnesium hydroxide powders were then collected by
filtration and was subsequently dried at 60 oC in air overnight. Then they were
heated under dynamic vacuum at 500 oC for 6 h to form the MgO(110) white
powders.7,8
MgO(100) was prepared by calcining the commercial magnesium nitrate
(Mg(NO3)2). In a typical synthesis, 500 mg of Mg(NO3)2 was placed in a quartz
boat and loaded in a tubular furnace, and then the temperature was increased to
500 oC in a step of 5 oC min-1. The sample was then calcined in an air flow for 6
h.9,10
2.1.9 Synthesis of cerium oxide (CeO2) of different morphologies
CeO2(100) nanocubes were synthesised via a hydrothermal process based on
previous reports.11,12 1.0 g of Ce(NO3)3·6H2O was added to a 60 mL of 15 mol L-1
NaOH aqueous solution under vigorous stirring and kept stirring for 15 min.
Afterwards, the solution was transferred to a Teflon lined 120mL-autoclave inside
an oven of 180 oC, which was then left for 12 h. Following hydrothermal synthesis,
the autoclave was allowed to cool down to room temperature naturally. The
obtained powder was collected by centrifugation, and then washed 3 times with
deionised water and dried at 70 oC under vacuum overnight.
For the synthesis of CeO2 nanospheres, 1 mmol of Ce(NO3)3·6H2O was dissolved
in 32 mL of 0.078 mol L-1 NaOH (aq.) solution in a 100-mL round bottom reaction

Chapter 2 Experimental and Characterisation Methods
50
flask.13 The mixture was vigorously stirred at room temperature for 24 h in air, and
the colour changed to pale yellow. The CeO2 nanospheres were then collected by
centrifugation at 5000 rpm for 10 min, and washed with ethanol and deionised
water, each for three times, then dried at 70 oC under vacuum overnight.
2.1.10 Synthesis of zinc oxide (ZnO) nanoplates and nanorods
ZnO(0001) nanoplates were prepared according to our previous reports:14,15 6.0 g
of zinc acetate dihydrate (Zn(Ac)2·2H2O) and 3.84 g of hexamethylenetetramine
(HMT, C6H12N4) were dissolved in 48 mL of deionised water. The solution was
transferred into a 100-mL Teflon-lined autoclave after a 10-min stirring. The
autoclave was then put into an oven and maintained at 100 °C for 24 h and then
allowed to cool down to room temperature naturally. The white precipitate was
collected by centrifugation at 5000 rpm for 10 min, after which the supernatant was
discarded. The solid was washed repeatedly with ethanol and water to remove
excess precursor, and then was dried at 70 oC overnight. The resulted powder was
calcined in air at 450 °C for 2 h with a heating rate of 10 °C min-1.
The synthesis of ZnO nanorods is also based on our previous reports:14,15 1.487 g
of zinc nitrate hexahydrate (Zn(NO3)2·6H2O) and 6 g of NaOH were dissolved in
10 mL of deionised water. Then 100 mL of ethanol was added to the above solution,
afterwards 5 mL of 1,2-ethanediamine (EDA) was added into the mixture. Then
the mixture was transferred to a covered plastic container with a volume of 250
mL. The reaction container was kept at room temperature under constant stirring
for 3 days. After the synthesis a white precipitate was centrifuged and washed with
deionised water and ethanol repeatedly. The resulted powder was calcined in air
at 450 °C for 2 h with a heating rate of 10 °C min-1 after being dried at 70 oC under
vacuum overnight.

Chapter 2 Experimental and Characterisation Methods
51
2.1.11 Synthesis of layered double hydroxides (LDHs)
All LDHs were synthesised by similar co-precipitation method: magnesium
chloride (MgCl2) and the corresponding trivalent metal precursor (CrCl3·6H2O,
Fe(NO3)3·9H2O, Co(NO3)2·6H2O and Al(NO3)3·9H2O for MgCr-LDH, MgFe-LDH,
MgCo-LDH and MgAl-LDH, respectively) were dissolved in 100 mL of deionised
water firstly. And the molar ratio of Mg and the trivalent metal was controlled as
3:1. Then this solution and 1 mol L-1 NaOH (aq.) were added simultaneously into
25 mL water in a 250-mL three-neck round bottom flask. pH was controlled at
different values by adding 1 mol L-1 NaOH (aq.) solution, because the required pH
for different LDHs varies with the solubility product (MgCr-LDH: pH=7; MgFe-LDH:
pH=10; MgCo-LDH: pH=10; MgAl-LDH: pH=10). Afterwards the slurry was kept
under vigorous stirring for 2 h before centrifugation and washing with water. The
obtained solid product was dispersed in water for further use.
2.1.12 Assembly of the photocatalysts with metal oxides or LDHs
Photocatalysts were mixed and ground with different polar or non-polar metal
oxides thoroughly at the required ratio (typically 1:1 mass ratio) and allowed to
disperse in water and sonicated for 2 h, filtered, dried and calcined in N2 flow at
400 oC for 2 h prior to use.
The assembly of photocatalysts with LDHs was modified from a reported method
in literature:16 photocatalysts were mixed with different LDHs thoroughly at a 1:1
mass ratio and dispersed in 50 mL water, followed by refluxing at 60 oC for 1 h.16
Subsequently the flask was cooled down to room temperature naturally and then
the solid was separated by centrifugation at 5000 rpm for 10 min and washed with
deionised water for 3 times. The product was dried under vacuum for further use.

Chapter 2 Experimental and Characterisation Methods
52
2.1.13 Synthesis of iron oxide (Fe3O4) and Fe3O4@SiO2 nanoparticles
The synthesis method was modified from our previous study.17 The iron-oleate
complex was first prepared by reacting metal chlorides and sodium oleate.
Typically, 1.08 g of FeCl3·6H2O and 3.65 g of sodium oleate were firstly dissolved
in a mixture of 8 mL of ethanol, 6 mL of distilled water, and 14 mL of hexane. The
solution was then heated to 70 oC and maintained for 2 h, after which the upper
organic layer containing the iron-oleate complex was washed for three times with
distilled water. Hexane was evaporated after washing, and iron-oleate complex
was obtained in solid form. For the preparation of 8 nm Fe3O4 NPs, 20 mg of the
iron-oleate complex and 300 μL of oleic acid were dissolved in 20 mL of 1-
octadecene at room temperature. Then the mixture was heated to 310 °C with a
constant heating rate of 5 °C min-1, and kept for 30 min before cooled to room
temperature. Ethanol was then added to the mixture, resulting in a black
precipitate, which was separated via centrifugation. The product was then washed
with isopropanol/hexane several times and dried in an oven. The Fe3O4 NPs with
different mean particle sizes were also prepared by the same procedure by
controlling the amount of oleic acid (450 μL for 10.1 nm; 600 μL for 17.5 nm).
Fe3O4@SiO2 was prepared from reverse micelles using a previously reported
procedure. Briefly, 2 mg of Fe3O4 nanoparticles and 100 μL of tetraethyl
orthosilicate (TEOS) were added to a heterogeneous solution containing
cyclohexane (24 mL), hexanol (4.8 mL), Triton X-100 (6 mL, surfactant for the
controlled growth of SiO2), and deionised water (1 mL). After 6 h of stirring,
NH3·H2O (30 wt.%) (100 mL) was added to initiate the hydrolysis of TEOS. The
reaction was allowed to continue for another 24 h with stirring at room temperature.
The product was well dispersed in ethanol and further purified by centrifugation

Chapter 2 Experimental and Characterisation Methods
53
(14500 rpm, 10 min).
2.1.14 Synthesis of the N-TiO2, Fe3O4/N-TiO2 and Fe3O4@SiO2/N-TiO2
TiO2 nanoparticles was synthesised via a sol-gel process: solution A was prepared
by adding 5 mL of TTIP in 15 mL ethanol, and solution B was obtained by mixing
10 mL of deionised water, 10 mL of ethanol and 1 mL of acetic acid. Then solution
A was added to solution B dropwise under vigorous stirring. After a transparent gel
forms, it was then aged overnight, following by drying in vacuum oven at 70 oC.
Then obtained dry gel was then calcined in N2 atmosphere at 400 oC for 2 h to
obtain the TiO2 nanoparticles, followed by NH3 treatment at 600 °C for 10 h for N-
doping.
Fe3O4/N-TiO2 and Fe3O4@SiO2/N-TiO2 photocatalysts were synthesised following
the similar procedure, but adding the Fe3O4 or Fe3O4@SiO2 nanoparticles which
were dispersed in ethanol in advance to the solution A. Photocatalysts containing
different amount of Fe3O4 were also synthesised by this method by changing the
amount of Fe3O4 NPs added to the solution A. The Fe3O4 NPs content were
calculated to be 10%, 20%, 30% and 40% by weight, and the as-obtained samples
were denoted as Fe3O4/N-TiO2-0, Fe3O4/N-TiO2-1, Fe3O4/N-TiO2-2 and Fe3O4/N-
TiO2-3, respectively.
2.2 Characterisation techniques
2.2.1 X-ray diffraction (XRD)
XRD is one of the most widely used techniques to investigate the crystallographic
structure of solid-state materials.18 The interatomic distances in crystalline
materials are comparable with the wavelengths of X-ray (both in the Angstrom
range), which enables the incident X-ray to diffract through the crystallographic

Chapter 2 Experimental and Characterisation Methods
54
planes which act as gratings. Structural information of crystalline materials
including phase identification, lattice constant calculation, particle size estimation
and unit cell parameters, etc. can be derived from the diffractograms19,20. The high
energy X-ray photons are able to penetrate deeply into the material and thus XRD
is typically regarded as a macroscopic characterisation technique for well-
crystalline bulk structure21.
For lab-sourced X-ray diffractometers, high speed electrons are generated from a
heated filament of the cathode and targeted towards a metal target typically made
up of copper and tungsten. Such collision will cause the ejection of core electrons
from the metal target and then the electrons from higher energy levels will transfer
to the lower energy levels to occupy the vacancy. This electron transfer between
different energy levels results in the X-ray emission with a wavelength specific to
the metal target. Then the X-ray beam will be monochromated and allowed to
illuminate onto the sample material at different incident angles. If the sample is
well crystalline, the X-ray beams diffract through the interlayer spacing grating of
the material and undergo constructive or destructive interference to produce a
unique diffraction pattern: the constructive interference appear as peaks in XRD
diffractograms, while the beams undergone destructive interference cancel out
each other and will not be observed. The interlayer spacing, d, can then be derived
from Bragg’s Law (Equation 2.1):22
nλ = 2dsinθ Equation 2.1
where λ is the wavelength of the X-ray beam, d is the interlayer spacing, and θ is
the angle between the incident X-ray and scattering planes.

Chapter 2 Experimental and Characterisation Methods
55
Figure 2.2 Bragg’s Law depicting the relationship between interlayer spacing, diffraction angle, and wavelength of X-ray. Reproduced from ref. 22. Lattice parameters can be further derived from Miller Indices for different
crystallographic systems. For example, for non-cubic hexagonal crystal structure,
the relationship between lattice parameter and interlayer spacing can be depicted
by (Equation 2.2):
1d =
43E
h/ + hk + k/
a/ I +l/
c/ Equation 2.2
where d is the interlayer spacing; h, k, l is the Miller indices and a, c are the lattice
parameters.
The sharp and well-defined peaks in the diffractograms arise from the destructive
interference that took place at all incident angles other than the diffraction angles.
However, when the size of the material decreases, defects like edges and steps
would readily form, which lead to a wider distribution of interlayer spacing and
result in peak broadening. Thus, building upon this phenomenon, it is possible to
estimate particle size from the peak broadening measured with the full width at
half maximum (FWHM) of the peak. The Scherrer equation is frequently used for
determination of crystallite sizes from XRD diffractograms (Equation 2.3).

Chapter 2 Experimental and Characterisation Methods
56
τ = Kλβcosθ Equation 2.3
where τis the size of the crystallite;K is a dimensionless shape factor (typical
value is about 0.9); λ is the wavelength of X-ray photon, β is the line broadening
at FWHM after subtracting the instrumental line broadening (in radians); and θ is
the diffraction angle.
In this thesis, XRD diffractograms were collected on a Bruker D8 Advance
diffractometer with LynxEye detector and Cu Kα1 radiation (λ= 1.5406 Å),
operating at 40 kV and 25 mA (step size at 0.019°, time per step at 0.10 s, total
number of steps at 4368), unless specified. Samples in powder form were pressed
onto a glass preparative slide which was then attached to a sample holder. All
measurements were scanned at 2θ of 5-90o.
2.2.2 Electron paramagnetic resonance (EPR) spectroscopy
EPR, also known as electron spin resonance (ESR) spectroscopy, is a powerful
technique for studying materials with unpaired electrons. EPR spectroscopy is
particularly useful for studying metal complexes, organic radicals and defects of
solid-state materials. In quantum mechanics, every electron has a magnetic
moment and a spin quantum number of 𝑚@ =A/or − A
/, which have the same
energy in the absence of any external magnetic fields. While in the presence of an
external magnetic field with a strength of 𝐵B , the electron's magnetic moment
aligns itself either antiparallel or parallel to the field, which means the original
energy state splits to two different energy states, known as the Zeeman effect
(Figure 2.3A). The energy of each state can be defined by Equation 2.4:
𝐸CDDEF= = 𝑚@𝑔DµG𝐵B Equation 2.4

Chapter 2 Experimental and Characterisation Methods
57
𝛥𝐸 = 𝑔DµG𝐵B Equation 2.5
where 𝐸CDDEF= is the Zeeman energy; 𝑚@ is the spin quantum number; 𝑔D is the
electron’s g-factor (𝑔D = 2.0023 for the free electron) and µG is the Bohr magneton.
Figure 2.3 (A) Zeeman splitting of the degenerate electronic spin states for an S = 1/2 system. (B) An electron can absorb energy to make a transition to the excited state resulting in an EPR absorption line. (C) Typical experimental EPR resonance line. The point where the line crosses the baseline determines the resonance magnetic field, , which allows the determination of the g-factor of the system.23 Therefore, the energy difference between the lower and the upper state 𝛥𝐸 can
be defined as in Equation 2.5 for unpaired free electrons. Clearly, this equation
indicates that the energy splitting is directly proportional to the strength of the
applied magnetic field. Besides, electrons can change the spin states by either
absorbing or emitting a photon of energy, ℎ𝜈, such that the resonance condition,
ℎ𝜈 = 𝛥𝐸, is obeyed. This leads to the fundamental equation of EPR spectroscopy:
ℎ𝜈 = 𝑔DµG𝐵B Equation 2.6
In actual experiments, the majority of EPR measurements are performed with
microwaves in the 9-10 GHz region, with magnetic fields corresponding to around

Chapter 2 Experimental and Characterisation Methods
58
3500 Gauss (0.35 Tesla). Furthermore, frequency of the microwave is usually kept
fixed, and by increasing the strength of the external magnetic field, the energy gap
is widened until it matches the energy of the microwaves, as shown in Figure 2.3A.
This is when the unpaired electrons can readily transfer between the two spin
states. Since there typically are more electrons in the lower state, due to the
Maxwell–Boltzmann distribution, there is a net absorption of the microwave, thus
the absorption is monitored and recorded into a spectrum (Figure 2.3B). Most
commonly, the continuous wave EPR (cw-EPR) spectra are recorded and
published as the first derivative of the absorption spectra (Figure 2.3C).
In this thesis, cw-EPR is involved to study the unpaired electron species in the
solid-state semiconductor photocatalysts and supports, such as the electrons
trapped in surface defects (colour centres) and the d-electrons of transition metals.
The spectra were collected by an X-band (9.4 GHz) Bruker EMX spectrometer at
293 K. 50 mg powder of each sample was weighed and put into a glass EPR tube
(0.60 i.d. and 0.84 o.d.). All X-Band spectra were collected over a field range of
1000 Gauss and 15 scans were taken and averaged for each measurement.
Signal intensity vs. electron spin numbers were calculated from the double
integration of a defined peak range of the spectra. All measurements were taken
in the Centre for Advanced Electron Spin Resonance (CAESR), Department of
Chemistry, University of Oxford.
2.2.3 Nuclear magnetic resonance (NMR)
NMR is concerned with the interaction between isolated spin pairs of a target
nuclei. NMR is used mainly to investigate the unique features of polar surfaces in
this thesis, with the help of organic chemicals as surface probes. Recent studies
from our group have shown that the surface features on the exposed polar facets

Chapter 2 Experimental and Characterisation Methods
59
can be investigated by probe-assisted solid-state NMR (ssNMR) technique.1,15,24
Among NMR-active basic probes (e.g., 13C, 15N, 31P, etc.), 31P nucleus with 100%
natural abundance and a wide chemical shift (δ 31P) range over 430 ppm has been
proved a sensitive and reliable technique capable of providing both qualitative
information (the type, i.e., Brønsted or Lewis acid, and strength of acid sites) and
quantitative information (concentration of each site). We have engaged trimethyl
phosphine (TMP) and trimethyl phosphine oxide (TMPO) as surface probes in our
studies. This is based on the fact that the nucleophilic probe TMP or TMPO
molecule can form stable adducts with the exposed Lewis acid (LA) sites (i.e.,
cations or protons) on the surface. It should be noted that the LA strength is
sensitive to its chemical micro-environment and can be influenced by the local
electron density, resulting in different binding energies between the surface and
the probes. Also, the different binding energies would then lead to different δ 31P
of the corresponding surface LA-probe complexes. For example, we recently
reported that in the case of TiO2 nanostructures, stronger interaction between TMP
and surface Ti pushes δ 31P toward downfield (i.e., zero ppm), Ti cations on
different facets promoted with various surface groups can thus be distinguished
by corresponding chemical shifts and analysed quantitatively.1
For a nucleus with a spin of one half (e.g., 1H, 13C, 15N, 31P, etc.), it has two linearly
independent spin states, with 𝑚 = A/or − A
/, which is also referred to as spin-up
and spin-down, respectively. In the absence of a magnetic field, these states have
the same energy. Hence the number of nuclei in these two states will be almost
equal at thermal equilibrium. If a nucleus is placed in a magnetic field, however,
the two spin states no longer have the same energy as a result of the interaction
between the nuclear magnetic dipole moment and the external magnetic field:

Chapter 2 Experimental and Characterisation Methods
60
obviously, the direction of nuclear magnetic dipole moment can be either aligning
with the magnetic field or opposing it, resulting in an energy difference (𝛥𝐸 )
between the two spin states that is proportional to the magnetic field strength
(Equation 2.7).25 The effective magnetic moment is affected by the chemical
environment of the target nuclei in which electron shielding effect in different extent
could result in a variation of chemical shift.
𝛥𝐸 = 𝛾ħ𝐵B Equation 2.7
where 𝛾 is the gyromagnetic ratio, ħ is the reduced Planck constant and 𝐵B is the
strength of the external magnetic field.
Figure 2.4 Image showing the energy gap between the spin states in which the magnitude has a direct relationship with the chemical shift in NMR. Figure reproduced from ref.26. In this thesis, this probe-assisted solid-state NMR was used to characterise the
polar-faceted and non-polar metal oxide supports, illustrating the unique physical
and chemical properties of the polar surfaces. The ssNMR experiments were
carried out using a Bruker Avance III 400WB spectrometer at room temperature
for both 1H and 31P nucleus. Particularly, the high-power decoupling (HPDEC) was

Chapter 2 Experimental and Characterisation Methods
61
thus used for the quantitative 31P analysis. The radiofrequency for decoupling was
59 kHz. The spectral width was 400 ppm, from +200 to −200 ppm. All the ssNMR
results in this thesis were obtained by Dr. Guangchao Li and the samples were
synthesised by myself.
2.2.4 X-ray photoelectron spectroscopy (XPS)
X-ray photoelectron spectroscopy is a powerful characterisation technique for
surface sciences study that can identify the chemical state of a material, providing
useful information such as chemical composition, chemical states of elements,
state of hybridisation, as well as the bonding environment.27 In contrast to that in
XRD, the beam used for XPS is usually regarded as soft X-ray where the source
element is aluminium instead of copper resulting in a much lower photon energy
(Al Kα: 1486.7 eV vs Cu Kα: 8047.8 eV). As a result, XPS has high sensitivity for
the surface detection, especially for the first few atomic layers given its much lower
penetration ability. Theoretically, XPS is based on photoelectric effect where
electrons of the target element absorb X-ray photons to be excited and eventually
be ejected as photoelectrons where its kinetic energy is measured (Figure 2.5).
This relationship is described by Rutherford:
𝐸HI=JI=K = ℎ𝑣 − 𝐸LI=DMIN − 𝜑 Equation 2.8
where𝐸HI=JI=Kis the binding energy of the excited electron to the nucleus, ℎ is the
Planck constant,𝑣 is the frequency of the X-ray radiation, 𝐸LI=DMIN is the kinetic
energy of the photoelectron, φ is the work function of the spectrometer.

Chapter 2 Experimental and Characterisation Methods
62
Figure 2.5 Processes that result from x-ray bombardment of a surface include (a) emission of a photoelectron, (b) x-ray fluorescence, and (c) emission of an Auger electron. Reproduced with permission from ref. 27. Typical lab-sourced X-ray photoelectron spectrometers perform the measurement
in an air-tight sample chamber under ultra-high vacuum. This could not only avoid
photoelectrons, which have a limited mean free path, from colliding with any
gaseous molecules, but also protecting the sensitive microchannel plates in the
detectors from moisture.28 A survey scan for the analysis of elemental composition
can be obtained by scanning the binding energy (BE) from 0 eV to 1400 eV. Each
of the peak corresponds to the core energy levels of a specific element in which
the number of detected electrons is directly related to the elemental composition
that could be accurately determined by further incorporating the relative sensitivity
factor (RSF).28 To obtain information of oxidation states, a high-resolution scan can
be performed for a specific binding energy range. By comparing the measured BE
with the standard BE in the database, information of the change of chemical states
can be obtained.
In this thesis, XPS was used mainly to study the chemical states of nitrogen
element in the N-doped TiO2 materials to determine its chemical environment. X-
ray photoelectron spectroscopy measurements were performed on a PHI

Chapter 2 Experimental and Characterisation Methods
63
Quantum-2000 photoelectron spectrometer (Al Kα with 1486.7 eV operating at 15
kV, 35 W and 200 µm spot size) and an Omicron Sphera II hemispherical electron
energy analyser. XPS measurements were carried out on the Thermo Scientific
model Nexsa. The aluminium anode tube for the X-ray emission was operated at
a voltage of 12 kV and kept constant during all measurements. Survey scans were
obtained at a pass energy of 200 eV, 5 scans with step size 1 eV, whereas for
those detailed spectra 50 eV pass energy, 10 scans with 0.1 eV step size were
used. In-situ XPS was carried out in the Diamond Light Source, with the
professional assistance from Dr. Alexander Large and Prof. Georg Held.
2.2.5 Ultraviolet-visible diffuse reflectance spectroscopy (UV-Vis DRS)
UV-Vis DRS is complementary to UV-Vis absorption spectroscopy, which is more
frequently used when studying the light absorption properties of solid-state
semiconductor materials. Unlike the conventional UV-Vis absorption spectroscopy,
where the transmission of light is measured, UV-Vis DRS records the remission
(includes both specular reflection and diffusely back-scattered light) by a material.
Experimentally, appropriate light sources are used to provide the ultraviolet light,
visible light or near infrared light irradiation, and the reflectance of the light is
recorded against the wavelength of the light irradiation. This technique is very
useful when determining the band gap of semiconductor materials. To achieve this,
the reflectance spectra are firstly converted by Kubelka-Munk equation:
𝐹(𝑅O) =
(1 − 𝑅O)/
2𝑅O=𝐾𝑆
Equation 2.9
where 𝑅O is the remission fraction of an infinitely thick layer; K and S are the
absorption and back-scattering coefficients, respectively.
Moreover, Tauc proposed a method of estimating the band gap energy of

Chapter 2 Experimental and Characterisation Methods
64
semiconductors using optical absorption spectra, which was further developed by
Davis and Mott.29 The Tauc method is based on the assumption that the energy-
dependent absorption coefficient can be expressed by the following equation:
(𝛼ℎ𝜈)
AP = 𝐵(ℎ𝜈 − 𝐸K)
Equation 2.10
Where 𝛼 is the absorption coefficient, ℎ is the Planck constant, 𝜈 is the photon’s
frequency, 𝐸K is the band gap energy, and 𝐵 is a constant. The 𝛾 factor depends
on the nature of the electron transition and is equal to A/ or 2 for the direct and
indirect transition band gaps, respectively.29
Figure 2.6 Method of band gap energy (Eg) determination from the Tauc plot. The linear part of the plot is extrapolated to the x-axis.29 In the case of solid-state semiconductors, where UV-Vis DR spectra are collected
rather than absorption spectra, as mentioned above, the measured reflectance
spectra can be transformed to the corresponding absorption spectra by Equation
2.9, and 𝐹(𝑅O) is put into the Equation 2.10 instead of 𝛼. Then (𝐹(𝑅O)ℎ𝜈)"# is
plotted against ℎ𝜈, as shown in Figure 2.6. The region showing a steep, linear

Chapter 2 Experimental and Characterisation Methods
65
increase of light absorption with increasing energy is characteristic of
semiconductor materials. The x-axis intersection point of the linear fit of the Tauc
plot gives an estimated band gap energy.
UV-Vis DR spectra were obtained from a Perkin Elmer Lambda 750S UV-visible
spectrometer at room temperature (equipment provided by the Chemistry
Teaching Laboratory, University of Oxford). 50±5 mg of each sample was loaded
and pressed onto a sample holder and UV-Vis spectra were recorded within the
wavelength range of 200-1500 nm.
2.2.6 Raman spectroscopy
Raman spectroscopy is a widely used characterisation technique typically used to
determine vibrational modes of molecules and solid-state materials, which can
provide a structural fingerprint by which the chemical species can be identified.
Raman spectroscopy depends on inelastic scattering of photons, which is known
as Raman scattering, where a photon excites the sample. The name of Raman
Spectroscopy typically refers to vibrational Raman using laser wavelengths which
are not absorbed by the sample. A source of monochromatic laser in the visible,
near infrared, or near ultraviolet regime is normally used. It should be noted that
the magnitude of the Raman scattering correlates with polarizability of the
electrons in a system. The Raman Effect is based on the interaction between the
electron cloud of a sample and the external electric field of the monochromatic
light, which can create an induced dipole moment within the molecule based on
its polarizability. The photon excitation puts the system into a virtual energy state
for a short time before the photon is emitted. After the Raman scattering event, the
sample is in a different rotational or vibrational state, which means the energy of
the emitted photon is of either lower or higher energy than the original incident

Chapter 2 Experimental and Characterisation Methods
66
photon in order to keep the total energy the same. This energy difference is equal
to that between the initial and final rovibronic states of the studied sample. If the
final state is higher in energy than the initial state, the scattered photon will be
shifted to a lower frequency (lower energy). This shift in frequency is called a
Stokes shift, or downshift. If the final state is lower in energy, the scattered photon
will be shifted to a higher frequency, which is called an anti-Stokes shift, or upshift.
The shifts in photon energy offer information about the vibrational modes in the
system. Raman shifts are typically recorded in wavenumbers (𝜈f), which have units
of inverse length (cm-1), as this value is directly related to energy. In order to
convert between spectral wavelength and wavenumbers of shift in the Raman
spectrum, the following formula can be used:
𝛥𝜈f =1𝜆B−1𝜆A
Equation 2.11
For a molecular system to exhibit the Raman effect, there must be a change in its
polarizability with respect to the vibrational coordinate corresponding to the
rovibronic state. Thus, Raman spectroscopy is considered as a complementary
technique to infrared spectroscopy. In this thesis, Raman spectra were recorded
on a Perkin Elmer Raman Station 400 F spectroscopy system with a laser
excitation of 532 nm (equipment provided by the Chemistry Teaching Laboratory,
University of Oxford). Samples were exposed for 10 seconds for each scan and 8
scans were adopted for each measurement.

Chapter 2 Experimental and Characterisation Methods
67
Figure 2.7 "Jablonski" style diagram of energetic transitions involved in Raman scattering. Rayleigh scattering is elastic: the incident photon is of the same energy as the scattered photon. Raman scattering is inelastic; in Stokes scattering, the incident photon is of greater energy than the scattered photon, while in anti-Stokes scattering, the incident photon is of lower energy.30 2.2.7 Time-resolved photoluminescence (TRPL) spectroscopy
PL is a light emission phenomenon from any form of matter after the absorption of
photons (electromagnetic radiation). Upon absorption of photons, photoexcitation
takes place: electrons are excited to a higher energy level from a lower level in an
atom by the absorbed photons. The excited electrons will subsequently go through
relaxation processes and recombination. Radiative recombination will then give
photoluminescence where photons are emitted. Thus, PL spectroscopy is of great
importance to studying the electron transition behaviours in semiconductor
materials.
In this thesis, all the PL measurements were performed under a non-resonant
excitation condition, where the samples are excited with some excess energy. This
is also the typical situation used in most PL experiments in literature, because the
excitation beam can be easily discriminated using an optical filter. After excitation,

Chapter 2 Experimental and Characterisation Methods
68
the laser photons induce a coherent polarisation in the sample (i.e., the transitions
between electron and hole states oscillate with the laser frequency and a fixed
phase). Such polarisation de-phases typically within 100 fs in case of non-resonant
excitation due to ultra-fast Coulomb- and phonon-scattering.31 Subsequently, the
dephasing leads to creation of populations of electrons and holes in the conduction
band (CB) and the valence band (VB), respectively. During this lifetime a fraction
of electrons and holes may form excitons, depending on the intrinsic properties of
the material, and also the experimental conditions, such as lattice temperature,
excitation density, as well as on the intrinsic material parameters. In the first a few
hundreds of femtoseconds after excitation, the charge carriers are scattered by
phonons, or at elevated carrier densities via Coulomb-interaction. The carrier
system successively relaxes to the Fermi–Dirac distribution typically within the first
picosecond. Finally, the carrier system cools down under the emission of phonons
(optical phonons and/or acoustic phonons). This can take up to several
nanoseconds, depending on the material system, the lattice temperature, and the
excitation conditions such as the surplus energy. Obviously, the charge carriers
lose some energy during the relaxation processes, resulting in the electrons
appearing near the conduction band minima (CBM) and holes near the valence
band maxima (VBM). Then the electrons and holes may undergo the radiative
recombination to give PL or non-radiative recombination pathways, such as Auger
recombination. Time periods between absorption and PL emission vary with the
fundamental processes that the charge carriers undergo, ranging from short
femtosecond-regime to milliseconds for phosphorescence processes. In special
circumstances, delay of emission may even span to minutes. Therefore,
measuring the decay in PL may give information about the electron transition

Chapter 2 Experimental and Characterisation Methods
69
processes in a sample material. TRPL is such a method where the sample is
excited with a laser pulse and then the decay in PL with respect to time is
measured. This technique is useful for measuring the minority carrier lifetime of
semiconductors.
Figure 2.8 Energy diagram showing light absorption and the processes involved in the photoluminescence.32 In this thesis, TRPL was involved to study the change of charge carrier lifetime of
the photocatalysts, which indicated the effect of local fields on the charge
separation processes of the semiconductor materials. Typically, the PL spectra
and the corresponding lifetime of the photo-generated charge carriers were
obtained from a bespoke micro-photoluminescence setup, in which a Ti-Sapphire
laser (λ = 266 nm, pulse duration = 150 fs, repetition rate = 76 MHz) is directed
onto the sample. The diameter of the laser spot on the sample was ca. 200 micron,
and the laser output power was tuned at 2 mW. It should be clarified that this
results in a power density of 5000 mW cm-2, which is 50 times of the power density
of solar light. Time-resolved measurements are performed using the spectrometer
as a monochromator before passing the selected signal to a photomultiplier tube

Chapter 2 Experimental and Characterisation Methods
70
(PMT) detector with an instrument response function width of ~150 ps connected
to a time-correlated single-photon counting module. The TRPL measurements
were carried out under a pulse-picking mode: the recorded signals were selected
using a pulse picker to ensure that the consecutive recorded signals had a long-
enough delay (ca. 100 ns) to allow the excited charge carriers to decay to the
ground states, therefore avoiding the accumulation of charge carriers. The charge
carrier lifetime is obtained by fitting the corresponding background-corrected PL
spectrum with a mono- or bi-exponential decay function (mono- or bi-exponential
decay means there is/are one or two kinds of recombination rate(s) of the charge
carriers), as shown in Equation 2.12.:
Mono- 𝑦 = 𝐴A𝑒?M/R" + 𝑦B
Bi- 𝑦 = 𝐴A𝑒?M/R" + 𝐴/𝑒?M/R! + 𝑦B Equation 2.12
where 𝐴A, 𝐴/, 𝜏A and 𝜏/ are the fitting parameters and 𝑦B is a constant.
The TRPL measurements were performed in the Department of Physics,
University of Oxford, where I have been working as a visiting student, supervised
by Prof. Robert A. Taylor. Professional assistance was kindly offered by Dr.
Timothy Putchler, Dr. Mo Li and Vitaly Osokin.
2.2.8 Transmission electron microscopy (TEM)
It is widely accepted that the catalytic performance is closely related to the shape
and morphology of the catalyst and the catalytic support14,33,34. Therefore,
researchers have been making great efforts in visualising and imaging the
materials with high resolution in order to rationally design functional catalysts. In
contrast to the standard light microscopy which is limited by the Abbe resolution of
1 μm set by the wavelength of visible light (Equation 2.13), transmission electron

Chapter 2 Experimental and Characterisation Methods
71
microscopes (TEM) use transmission electron beam of which the de Broglie
wavelength is significantly smaller than that of visible light35. The operation energy
of TEM ranges from 100 to 200 keV, which is corresponding to an electron beam
with wavelength from 2.5 to 3.7 pm, offering a resolution of 0.3 nm. Moreover, the
wavelength of the electrons can be tuned even smaller in order to obtain a higher
resolution (at the risk of damaging the samples due to higher applied voltage).36
On the other hand, additional detectors could be equipped to the TEM, which
would offer simultaneous acquisition of information on elemental composition
(Energy Dispersion X-ray spectroscopy, EDX or EDS) and electronic structure
(Auger electrons) in addition to the microscopic imaging.
𝑑 = 𝜆
2𝑛𝑠𝑖𝑛𝜃 Equation 2.13
where d is the feature size, λ is the wavelength of light, n is the refraction index of
the medium, and θ is the half-angle subtended by the objective lens.
Typically, the measurements take place in an ultra-high vacuum (10-6 mbar)
chamber to avoid inelastic collision of electrons with any surrounding gaseous
molecules that would lead to the deviation of pathway of the electron beam. The
transmitted electrons will then interact with the sample in an extent according to
the electron density of different atomic species, which are then refocused,
magnified and projected onto a fluorescent screen. Following this, a charge
coupled device is used to convert the beam into digital signals for imaging.
Transmission electron microscopes can be operated in 2 modes, i.e., bright field
and dark field. For the bright field measurements, the transmitted electron beam
is captured by the aperture and the scattered electrons are blocked. As a result,
materials with high mass (or high electron density) with appear darker whereas

Chapter 2 Experimental and Characterisation Methods
72
the background appears bright. On the other hand, in dark field mode, scattered
electrons are selected with the aperture instead, which means the background,
where electrons can directly transmitted through, will be black out while the
material of interest will appear bright depending on the electron density.37 The dark
field mode is important when the contrast between the background and sample is
low, especially when the nanoparticles are small in size and drowned by the
background.
Figure 2.9 Image showing the principal components of a transmission electron microscope (TEM). Figure reproduced from ref. 37. In this thesis, TEM was used to image the morphology of the photocatalysts and
catalyst supports. More discussions will be given in the following chapters. In this
thesis, the morphologies and microstructures of the photocatalysts were examined
by high-resolution TEM (HRTEM) using a JEOL 3000F microscope operated at

Chapter 2 Experimental and Characterisation Methods
73
300 kV. TEM specimens were prepared by pipetting 5 μL of the sample dispersion
in ethanol onto holey carbon-coated copper mesh grids (400 meshes). TEM
images in this thesis were obtained by Dr. Tianyi Chen in the Department of
Materials, University of Oxford.
Figure 2.10 Images demonstrating the difference in image when operated in (A) bright field mode and (B) dark field mode. Figure reproduced from ref. 38. 2.2.9 Scanning transmission electron microscopy (STEM)
Like TEM, high angle annular dark field-scanning transmission electron
microscopy (HAADF-STEM) operates via transmission of an electron beam
through the sample material. Instead of using an aperture to select the electron
beam, STEM is equipped with a condenser lens to converge electron beam to an
ultra-fine spot of 0.05 – 0.2 nm, which is then rastered across the sample by a
scanning coil.39 An annular dark field (ADF) detector is then used to capture the
scattered electrons and exclude the unscattered electrons at a high angle (> 5o)
via the dark field imaging mode. As described above, the scattered electrons
(sample material of interest) appear bright while the transmitted ones (background
with no scattering occurred) appear black under this mode.

Chapter 2 Experimental and Characterisation Methods
74
HAADF-STEM is especially significant in imaging materials with high electron
density, for instance metal nanoparticles. In conventional catalysis, catalyst
materials are usually composed of transition metal (TM) active centre supported
on inorganic oxides where HAADF-STEM serves as an ideal technique to image
the TM as very bright spots with the lightly-coloured support in the background.
However, in the case that the active centre and the catalyst support both contain
TMs, the contrast between them could be negligible, thus, they can hardly be
differentiated from each other. In such cases, electron energy loss spectroscopy
(EELS) is usually simultaneously acquired to give the unique absorption edge of a
particular metal, thus, the chemical species of different TMs can be confirmed.39
Figure 2.11 Schematic illustration of the differences in configuration and detectors between (a) STEM and (b) TEM. Reproduced with permission from ref. 40. In this thesis, HAADF-STEM and EELS were performed respectively to showcase
the atomic dispersion of Ru species supported on the 2D MoS2 monolayers. The
sharp contrast of Ru appearing as a very bright spot compared to the MoS2
background indicated the clear observation of the atomic positions of Ru. HAADF-
STEM samples were ground and coated onto a holey carbon coated Cu TEM grid.

Chapter 2 Experimental and Characterisation Methods
75
The analysis was performed on the JEOL-JEM2100 Aberration-Corrected
Transmission Electron Microscope using the following instrumental conditions:
Voltage 200 kV; Dark-field (Z-contrast) imaging in scanning mode using an off-axis
annular detector and capable of atomic-resolution imaging. Professional
assistance was kindly offered by Zihan Wang, Dr. Songhua Cai, Prof. Rafal E.
Dunin-Borkowski and Dr. András Kovács.
2.2.10 Gas chromatography (GC)
In this thesis, the gaseous products of the photocatalytic water splitting reaction
were separated and analysed in GC equipped with thermal conductivity detectors
(TCD) using He and N2 as carrier gases. In a typical GC analysis, a known volume
of gaseous or liquid analyte is injected through a rubber disk and into a hot,
temperature-controlled port attached to the column. As the carrier gas transports
the analyte molecules through the column, there is adsorption of the analyte
molecules either onto the column walls or onto packing materials (stationary phase)
in the column to give separation. Since each type of molecule has a different rate
of progression, the various components of the analyte mixture are separated as
they progress along the stationary phase and reach the end of the column at
different times (retention time). A detector is used to monitor the time at which each
component reaches the outlet and ultimately the amount of that component can
be determined. Generally, substances are identified (qualitatively) by the order in
which they elute from the column and by the retention time of the analyte in the
column. Other parameters that can be used to alter the order or time of retention
are the carrier gas flow rate, column length and the temperature.

Chapter 2 Experimental and Characterisation Methods
76
2.2.11 Superconducting quantum interference device (SQUID)
In my DPhil project, the magnetic field effects on the photocatalytic performance
were investigated, therefore, static magnetic properties of the solid-state
semiconductor photocatalysts were studied by SQUID magnetometer. Taking
ferromagnetic materials such as iron as an example, the atomic dipoles align
themselves when an external magnetic field is applied. However, when the
external field is removed, some of the alignment will be retained: the material has
become magnetised. To demagnetise the material, it requires heat or a magnetic
field in the opposite direction. Such phenomenon is known as magnetic hysteresis.
Due to the magnetic hysteresis, the field strength H is not in a linear relationship
with magnetisation M in such materials. If the relationship between H and M is
plotted for increasing levels of field strength, M follows the initial magnetisation
curve, which increases rapidly at first and then approaches an asymptote called
magnetic saturation. If the magnetic field is now reduced monotonically, M follows
a different curve. At zero field strength, the magnetisation is offset from the origin
by an amount called the remanence. If the M-H curve is plotted for all strengths of
applied magnetic field, we will obtain a hysteresis loop called the main loop, as
shown in Figure 2.12. The width of the middle section along the H axis is twice the
coercivity of the material (Coercivity is a measure of the ability of a ferromagnetic
material to withstand an external magnetic field without becoming
demagnetised).41 Magnetic hysteresis loops are not exclusive to materials with
ferromagnetic ordering. Other materials also exhibit this phenomenon, such as
paramagnetic and superparamagnetic materials, which show different
characteristic hysteresis loops (Figure 2.12).42 The phenomenon of hysteresis is
considered as the result of two effects: rotation of magnetisation and changes in

Chapter 2 Experimental and Characterisation Methods
77
size or number of magnetic domains. In a single-domain magnet, the
magnetisation responds to a magnetic field by rotating. Larger material can be
divided into lots of magnetic domains. Within each domain, the magnetisation does
not vary in direction or magnitude; but in the thin domain walls between domains,
the direction of magnetisation rotates from the direction of one domain to another.
If the magnetic field changes, the walls move, changing the relative sizes of the
domains.
In this thesis, the materials used can be mainly classified as paramagnetic,
superparamagnetic, ferromagnetic, and diamagnetic materials. Diamagnetism
appears in all materials and is the tendency of a material to oppose an applied
magnetic field. Paramagnetic materials contain unpaired electrons. An unpaired
electron can align its magnetic moment in any direction. When an external
magnetic field is applied, these magnetic moments will tend to align themselves in
the same direction as the applied field, thus reinforcing it. Ferromagnetic materials
also have unpaired electrons. However, in addition to the electrons' tendency to
align their magnetic moments parallelly to an applied field, there is also a tendency
for these magnetic moments to align parallelly to each other to maintain a low-
energy state. Thus, even in the absence of an applied field, the magnetic moments
of the electrons in the material spontaneously line up parallel to one another. When
a ferromagnetic material is sufficiently small, it acts like a single magnetic spin that
is subject to Brownian motion. Therefore, its response to a magnetic field is
qualitatively similar to the response of a paramagnetic material, but much larger.
These materials are known as superparamagnetic materials.
When measuring the magnetisation properties, in general, the sample material is
placed in a varying external H field, as induced by an electromagnet, and the

Chapter 2 Experimental and Characterisation Methods
78
resulting magnetic flux density (B field) is measured, generally by the inductive
electromotive force introduced on a pickup coil nearby the sample. This produces
the characteristic B-H curve; because the hysteresis indicates a memory effect of
the magnetic material, the shape of the B-H curve depends on the history of
changes in H. Alternatively, the hysteresis can be plotted as magnetisation M in
place of B, giving an M-H curve. These two curves are directly related, which can
be converted by Equation 2.14:
𝑩 = µB(𝑯 +𝑴) Equation 2.14
where µB is magnetic permeability.
Figure 2.12 Characteristic hysteresis loops of different magnetic orderings.43 In this thesis, the magnetisation curves were obtained on a superconducting
quantum interference device (SQUID, Quantum Design MPMS-XL-5), which is a
very sensitive magnetometer used to measure extremely subtle magnetic fields,
based on superconducting loops containing Josephson junctions (The Josephson
effect occurs when two superconductors are placed in proximity, with some barrier
or restriction between them. It produces a supercurrent that flows continuously
without any voltage applied, across a device known as a Josephson junction).44
More details are discussed in the following chapters. SQUID measurements

Chapter 2 Experimental and Characterisation Methods
79
shown in Chapter 5 were kindly carried out by Zihan Wang and Prof. Chen Wu in
Zhejiang University, P. R. China.
2.3 Catalytic testing
2.3.1 Photocatalytic overall water splitting (POWS) activity tests
Figure 2.13 Photocatalytic batch reactor for the POWS reaction at elevated temperatures used in this thesis. The POWS reaction was carried out in a 25-mL stainless steel batch reactor
equipped with two quartz windows with an illuminated area of 0.785 cm2 (10 mm
in diameter and 18 mm in thickness each, images shown in Figure 2.13). In a
typical experiment, 5 mg of catalyst was added to 5 mL of aqueous solution (pure
water, artificial seawater or natural seawater) in a glass lining (20 mm i.d. × 24 mm
o.d. × 52 mm height) under magnetic stirring (750 rpm) as a particulate suspension,
then the batch reactor was purged with continuous Ar gas flow for 5 min after well-
sealed to remove the dissolved O2 in water. Then the batch reactor was
pressurised with 6 bar of inert Ar gas. The reactor would then be allowed to heat
up to the required elevated temperature with its saturated water vapour pressure
(e.g., ca. 60 bar at 270 oC).
The use of water vapour at low pressure was also studied instead of the liquid

Chapter 2 Experimental and Characterisation Methods
80
water at its saturated pressure. The photocatalytic activity was determined by
measuring the amounts of H2 and O2 evolved. Reactions were carried out in the
same windowed batch reactor, but the photocatalyst was first deposited onto a
glass slide and put into the batch reactor, facing towards the light irradiation path
through the silica window. A fixed amount of water was added into the batch reactor
at room temperature. This amount of water was calculated to generate the required
pressure when totally vaporised at 270 oC. As a result, variable pressures of water
vapour were established below the saturated pressure of water at 270 oC. After
the addition of water, the reactor was allowed to reach the designated temperature.
Tungsten light (70 W, Glamox Professional 2000) or VeraSol solar simulator (AM
1.5G, 100 mW cm-2) was then used to provide the irradiation through the silica
windows when the reactor reached the required temperature. After a 2-hour
reaction, the batch reactor was cooled down naturally to room temperature.
The amounts of O2 and H2 were measured by a gas chromatograph (GC) equipped
with two thermoconductivity detectors (TCDs) with He and N2 as carrier gas,
respectively, for better sensitivity of each gas. The gaseous product was sampled
by a 0.25-mL Ni sampling loop, and the separation of gaseous components were
completed in Agilent J&W CP-Molsieve 5Å columns. The gaseous sample was
brought into the GC by the inner pressure of the batch reactor, and the sampling
loop is connected to the atmosphere so the pressure inside the sampling loop was
considered as 1 atm. GC analysis was also carried out before reactions to make
sure the air and dissolved O2 were completed removed. The GC signals were
calibrated by external standard quantitation, so that the concentrations (in
percentage) of H2 and O2 could be calculated from the corresponding peak area.
The pressurised gas in the reactor was released to a balloon, of which the volume

Chapter 2 Experimental and Characterisation Methods
81
was measured using a water drainage method, thus, the total volume of gas at 1
bar and room temperature could be obtained. Finally, amounts of the generated
H2 and O2 were calculated using the ideal gas law.
2.3.2 Photocatalytic activity tests with light furnace
The photocatalytic water splitting reaction was also investigated in a light furnace,
in which light was the only energy source, and no electrical heating device was
engaged. Conditions were the same as those for the typical photocatalytic water
splitting activity test previously mentioned. However, the light source was
generated by a four-mirror floating-zone light furnace (Operated at 66.7 V, 15.58
A and 1039 W) from Crystal Systems Inc. equipped with four halogen lamps to
mimic a solar concentrator: the concentrated light was applied through the quartz
windows to heat the batch reactor to 270oC at saturated equilibrium pressure of
water and at the same time irradiated photocatalyst. After 2 h, the reactor was
cooled down naturally and the amounts of H2 and O2 were measured by GC
equipped with TCDs.
2.3.3 Quantum efficiency (QE) measurements and calculation
Apparent quantum efficiency was measured in the same batch reactor and
conditions were kept the same as those for a typical POWS test, while the batch
reactor was then irradiated by a 300 W Xenon lamp (Newport) using different
bandpass filters (UV-Vis spectra of the filters are given in Figure 2.14). The power
of light was measured using a standard photodiode power sensor (Thorlabs
S121C), which had been calibrated by Thorlabs before it was delivered, thus it was
used without further calibration. Then the number of photons was calculated from
the measured power at each wavelength. The apparent QE can be calculated

Chapter 2 Experimental and Characterisation Methods
82
using Equation 2.15.
𝑄𝐸(%) =𝑁𝑢𝑚𝑏𝑒𝑟𝑜𝑓𝐻/𝑚𝑜𝑙𝑒𝑐𝑢𝑙𝑒𝑠 × 2𝑁𝑢𝑚𝑏𝑒𝑟𝑜𝑓𝑖𝑛𝑐𝑖𝑑𝑒𝑛𝑡𝑝ℎ𝑜𝑡𝑜𝑛𝑠 × 100% Equation 2.15
Figure 2.14 UV-Vis transmission spectra of the bandpass filters which were used in QE measurements. An example is given below, taking Fe3O4/N-TiO2-4 as an example (demonstrated
in Chapter 5, and more details are given in Appendix Note 1):
For the measurement of the QE of the Fe3O4/N-TiO2-4 photocatalyst at 437 nm,
the H2 amount analysed by GC is 5.25 µmol in the 2-hour experiment,
corresponding to 3.159×10¹⁸ H2 molecules (N = n x NA). During the period of 2
hours, the energy of the light irradiation: W=P×t. With the bandpass filter of 437
nm, the light irradiation power was measured to be P = 0.45 mW at the centre of
the batch reactor (the power of light was measured using a Thorlabs S121C
standard photodiode power sensor, which had been calibrated by Thorlabs before
it was delivered, and was used without further calibration), therefore, the energy
W = 0.00045 × 7200 = 3.24 J, which contains the photon (437 nm) numbers of

Chapter 2 Experimental and Characterisation Methods
83
7.123×10¹⁸ (𝜀 = ℎ𝜈). Then, the QE can be calculated using Equation 2.15.
QE (%) = (2×3.159×1018)/ (7.123×1018) ×100% = 88.7 %
All the QE values in this thesis are calculated likewise. The irradiation power
measured in the centre of the batch reactor at each wavelength is summarised in
Table 2.1.
Table 2.1 Irradiation power measured in the centre of the batch reactor using the bandpass filters at different wavelengths. A 300-W Xe arc lamp was used as the light source, and the power was measured using a Thorlabs S121C standard photodiode power sensor
Wavelength (nm) Power (mW) 385 1.03 437 0.45 575 1.21 620 5.07 750 3.11 1000 1.07
2.3.4 Solar-to-hydrogen (STH) efficiency measurements and calculation
The 𝜂ST* was measured with a similar procedure: the POWS performance was
evaluated by adding a certain amount (typically 20 mg of the TiO2-based
photocatalyst unless specified otherwise) of photocatalyst which contained 20 mg
of N-TiO2 to 5 mL of Milli-Q H2O under vigorous magnetic stirring (600 rpm), then
the suspension was irradiated by a VeraSol solar simulator (AM 1.5G, 100 mW
cm-2, 1 sun). The amounts of H2 and O2 were measured by a GC equipped with
TCDs. The 𝜂ST* can then be calculated by the following equation:
𝑆𝑇𝐻(%) =𝐸𝑣𝑜𝑙𝑣𝑒𝑑𝐻/𝑎𝑚𝑜𝑢𝑛𝑡 × ∆𝐺
𝑃 × 𝑆 × 𝑡 × 100% Equation 2.16
where P is the power of solar irradiation (0.1 W cm-2), S is the illuminating area in
square centimetres; t is the time of reaction in seconds; ∆G is the Gibbs free

Chapter 2 Experimental and Characterisation Methods
84
energy for the POWS reaction under the reaction conditions; the evolved H2
amount is typically given in moles.
2.4 Density functional theory (DFT) calculations
In Chapter 6, all spin-polarised DFT calculations were carried out using the Vienna
ab-initio Simulation Package (VASP).45 Electronic exchange and correlation were
treated within the generalised gradient approximation (GGA) by using the Perdew-
Burke-Ernzerhof (PBE) functional.46 The projector-augmented wave (PAW)
method 47 with an energy cut-off of 400 eV was employed to describe the
interactions between the core and valence electrons with the Ti (3s, 3p, 3d, 4s), O
(2s, 2p), N (2s, 2p), Na (3s), Mg (3s), Al (3s, 3p), K (3s, 3p, 4s), Ca (3s, 3p, 4s), P
(3s, 3p), S (3s, 3p) and Cl (3s, 3p) shells being treated as valence electrons. For
all the calculations, we applied the on-site Coulomb interaction correction with an
effective U value of 4.2 eV on the Ti 3d orbitals to describe the localised electronic
states accurately.48,49
The N-doped anatase TiO2(101) and the N-doped reconstructed anatase
TiO2(001)-(1×4) surfaces were constructed.50 The former surface was extended at
a (2×2) cell, and the slab contains four TiO2 layers; a 2 × 3 × 1 k-point mesh was
used for the calculations. The latter surface was extended at a (2×1) cell, and the
slab contains eight TiO2 layers; a 3 × 2 × 1 k-point mesh was used for the
calculations. We set a vacuum layer of ~15 Å to avoid interactions between
neighbouring slabs. Geometry optimisations were converged when the Hellman-
Feynman forces of relaxed atoms are less than 0.02 eV Å-1. The relative energies
of the different N-doped TiO2(101) and N-doped TiO2(001)-(1×4) surfaces were
calculated to locate the corresponding most favourable doping site of N.

Chapter 2 Experimental and Characterisation Methods
85
In order to consider ion adsorption and to simulate photo-electron/hole in the
system, the correct number of electrons of such system was controlled by the
NELECT parameter, which is a common practice reported in the literature.51,52
The adsorption energy (Eads) was calculated according to:
𝐸82- = (𝐸810(1/BBA − 𝐸810(1/U83%&) + (𝐸,830(1/ABA − 𝐸,830(1/U83%&)
Equation 2.17
where 𝐸810(1/BBA, 𝐸810(1/U83%&, 𝐸,830(1/ABA, and 𝐸,830(1/U83%& are the calculated total
energies of the N-doped reconstructed anatase TiO2(001)-(1×4) surface slab with
the anion (e.g., Cl-) being adsorbed on the surface, the N-doped reconstructed
anatase TiO2(001)-(1×4) surface slab with the anion being placed in the middle of
the “water” region of the model, the N-doped anatase TiO2(101) surface slab with
the cation (e.g., Na+) being adsorbed on the surface, and the N-doped anatase
TiO2(101) surface slab with the anion being placed in the middle of the “water”
region of the model, respectively. Note that the water environment was treated
implicitly using the VASPsol code with a dielectric constant of 78.4.53 The first part
on the right hand side (i.e., 𝐸810(1/BBA − 𝐸810(1/U83%&) is the adsorption energy of an
anion on the N-doped reconstructed anatase TiO2(001)-(1×4) surface, and the
second part on the right hand side (i.e., 𝐸,830(1/ABA − 𝐸,830(1/U83%&) is the adsorption
energy of a cation on the N-doped anatase TiO2(101) surface. If the two surfaces
are charge-neutral/charged, the 𝐸82- of electrolytes before/after excitation (i.e.,
𝐸82-(BE)/𝐸82-(AE)) can be obtained.
The electrolyte-induced charge polarisation energies (𝐸%,4) can be calculated as
follows:
𝐸%,4 = 𝐸82-(AE) − 𝐸82-(BE) Equation 2.18

Chapter 2 Experimental and Characterisation Methods
86
A negative 𝐸%,4 indicates that the charge polarisation effect is enhanced by
electrolyte.
2.5 References
1. Peng, Y.-K., Hu, Y., Chou, H. L., Fu, Y., Teixeira, I. F., Zhang, L., He, H. & Tsang, S. C. E. Mapping surface-modified titania nanoparticles with implications for activity and facet control. Nat. Commun. 8, 675 (2017).
2. Li, C., Yang, W. & Li, Q. TiO2-based photocatalysts prepared by oxidation of TiN nanoparticles and their photocatalytic activities under visible light illumination. J. Mater. Sci. Technol. 34, 969–975 (2018).
3. Litter, M. I. Heterogeneous photocatalysis: Transition metal ions in photocatalytic systems. Appl. Catal. B Environ. 23, 89–114 (1999).
4. Liu, G., Robertson, A. W., Li, M. M. J., Kuo, W. C. H., Darby, M. T., Muhieddine, M. H., Lin, Y. C., Suenaga, K., Stamatakis, M., Warner, J. H. & Tsang, S. C. E. MoS2 monolayer catalyst doped with isolated Co atoms for the hydrodeoxygenation reaction. Nat. Chem. 9, 810–816 (2017).
5. Zhu, K., Hu, J., Kübel, C. & Richards, R. Efficient preparation and catalytic activity of MgO(111) nanosheets. Angew. Chem. Int. Ed. 45, 7277–7281 (2006).
6. Hu, J., Zhu, K., Chen, L., Kübel, C. & Richards, R. MgO(111) Nanosheets with unusual surface activity. J. Phys. Chem. C 111, 12038–12044 (2007).
7. Richards, R., Li, W., Decker, S., Davidson, C., Koper, O., Zaikovski, V., Volodin, A., Rieker, T. & Klabunde, K. J. Consolidation of metal oxide nanocrystals. Reactive pellets with controllable pore structure that represent a new family of porous, inorganic materials. J. Am. Chem. Soc. 122, 4921–4925 (2000).
8. Verziu, M., Cojocaru, B., Hu, J., Richards, R., Ciuculescu, C., Filip, P. & Parvulescu, V. I. Sunflower and rapeseed oil transesterification to biodiesel over different nanocrystalline MgO catalysts. Green Chem. 10, 373–38 (2008).
9. Hu, J., Song, Z., Chen, L., Yang, H., Li, J. & Richards, R. Adsorption properties of MgO(111) nanoplates for the dye pollutants from wastewater. J. Chem. Eng. Data 55, 3742–3748 (2010).
10. Chen, J., Tian, S., Lu, J. & Xiong, Y. Catalytic performance of MgO with different exposed crystal facets towards the ozonation of 4-chlorophenol. Appl. Catal. A Gen. 506, 118–125 (2015).
11. Torrente-Murciano, L., Gilbank, A., Puertolas, B., Garcia, T., Solsona, B. & Chadwick, D. Shape-dependency activity of nanostructured CeO2 in the total oxidation of polycyclic aromatic hydrocarbons. Appl. Catal. B Environ. 132–133, 116–122 (2013).
12. Mai, H. X., Sun, L. D., Zhang, Y. W., Si, R., Feng, W., Zhang, H. P., Liu, H. C. & Yan, C. H. Shape-selective synthesis and oxygen storage behavior of ceria nanopolyhedra, nanorods, and nanocubes. J. Phys. Chem. B 109, 24380–24385 (2005).
13. Manto, M. J., Xie, P. & Wang, C. Catalytic Dephosphorylation Using Ceria Nanocrystals. ACS Catal. 7, 1931–1938 (2017).
14. Liao, F., Huang, Y., Ge, J., Zheng, W., Tedsree, K., Collier, P., Hong, X. & Tsang, S. C. Morphology-dependent interactions of ZnO with Cu nanoparticles at the

Chapter 2 Experimental and Characterisation Methods
87
materials’ interface in selective hydrogenation of CO2 to CH 3OH. Angew. Chem. Int. Ed. 50, 2162–2165 (2011).
15. Peng, Y. K., Ye, L., Qu, J., Zhang, L., Fu, Y., Teixeira, I. F., McPherson, I. J., He, H. & Tsang, S. C. E. Trimethylphosphine-Assisted Surface Fingerprinting of Metal Oxide Nanoparticle by 31P Solid-State NMR: A Zinc Oxide Case Study. J. Am. Chem. Soc. 138, 2225–2234 (2016).
16. Li, J., Zhan, G., Yu, Y. & Zhang, L. Superior visible light hydrogen evolution of Janus bilayer junctions via atomic-level charge flow steering. Nat. Commun. 7, 11480 (2016).
17. Peng, Y. K., Lui, C. N. P., Chen, Y. W., Chou, S. W., Raine, E., Chou, P. T., Yung, K. K. L. & Tsang, S. C. E. Engineering of Single Magnetic Particle Carrier for Living Brain Cell Imaging: A Tunable T1-/T2-/Dual-Modal Contrast Agent for Magnetic Resonance Imaging Application. Chem. Mater. 29, 4411–4417 (2017).
18. Rohrbaugh, W. J. & Wu, E. L. Factors Affecting X-ray Diffraction Characteristics of Catalyst Materials. ACS Symp. Ser. 411, 279–302 (1989).
19. Thamaphat, K., Limsuwan, P. & Ngotawornchai, B. Phase characterization of TiO2 powder by XRD and TEM. Kasetsart J.(Nat. Sci.) 42, 357–361 (2008).
20. Monshi, A., Foroughi, M. R. & Monshi, M. R. Modified Scherrer Equation to Estimate More Accurately Nano-Crystallite Size Using XRD. World J. Nano Sci. Eng. 02, 154–160 (2012).
21. Miller, M. P. & Dawson, P. R. Understanding local deformation in metallic polycrystals using high energy X-rays and finite elements. Curr. Opin. Solid State Mater. Sci. 18, 286–299 (2014).
22. Bragg, W. H. & Bragg, W. L. The reflection of X-rays by crystals. Proc. R. Soc. A 88, 428–438 (1913).
23. Petasis, D. T. & Hendrich, M. P. Quantitative interpretation of multifrequency multimode EPR spectra of metal containing proteins, enzymes, and biomimetic complexes. Methods Enzymol. 563, 171–208 (2015).
24. Peng, Y. K. & Tsang, S. C. E. Facet-dependent photocatalysis of nanosize semiconductive metal oxides and progress of their characterization. Nano Today 18, 15–34 (2018).
25. Keeler, J. Understanding NMR spectroscopy. Wiley 43, 43–5896 (2006). 26. Rabi, I. I., Zacharias, J. R., Millman, S. & Kusch, P. A New Method of Measuring
Nuclear Magnetic Moment. Phys. Rev. 53, 318 (1938). 27. Stevie, F. A. & Donley, C. L. Introduction to x-ray photoelectron spectroscopy. J.
Vac. Sci. Technol. A 38, 063204 (2020). 28. Held, G., Venturini, F., Grinter, D. C., Ferrer, P., Arrigo, R., Deacon, L., Garzon, W.
Q., Roy, K., Large, A., Stephens, C., Watts, A., Larkin, P., Hand, Matthew H., Wang, H., Pratt L., Mudd, J. J., Richardson, T., Patel, S., Hillmana, M. & Scott, S. Ambient-pressure endstation of the Versatile Soft X-ray (VerSoX) beamline at Diamond Light Source. J. Synchrotron Radiat. 27, 1153–1166 (2020).
29. Makuła, P., Pacia, M. & Macyk, W. How To Correctly Determine the Band Gap Energy of Modified Semiconductor Photocatalysts Based on UV-Vis Spectra. J. Phys. Chem. Lett. 9, 6814–6817 (2018).
30. Ember, K. J. I., Hoeve, M. A., McAughtrie, S. L., Bergholt, M. S., Dwyer, B. J., Stevens, M. M., Faulds, K., Forbes, S. J. & Campbell, C. J. Raman spectroscopy and regenerative medicine: a review. npj Regen. Med. 2, 1–10 (2017).

Chapter 2 Experimental and Characterisation Methods
88
31. Arlt, S., Siegner, U., Kunde, J., Morier-Genoud, F. & Keller, U. Ultrafast dephasing of continuum transitions in bulk semiconductors. Phys. Rev. B - Condens. Matter Mater. Phys. 59, 14860–14863 (1999).
32. Alaoui, I. M. Applications of Luminescence to Fingerprints and Trace Explosives Detection. NATO Sci. Peace Secur. Ser. B Phys. Biophys. 189–196 (2009).
33. Duan, X., Qian, G., Zhou, X., Sui, Z., Chen, D. & Yuan, W. Tuning the size and shape of Fe nanoparticles on carbon nanofibers for catalytic ammonia decomposition. Appl. Catal. B Environ. 101, 189–196 (2011).
34. Ma, Z., Zhao, S., Pei, X., Xiong, X. & Hu, B. New insights into the support morphology-dependent ammonia synthesis activity of Ru/CeO 2 catalysts. Catal. Sci. Technol. 7, 191–199 (2017).
35. Williams, D. B. & Carter, C. B. The Transmission Electron Microscope. Transm. Electron Microsc. 3–17 (1996).
36. Ke, X., Bittencourt, C. & van Tendeloo, G. Possibilities and limitations of advanced transmission electron microscopy for carbon-based nanomaterials. Beilstein J. Nanotechnol. 6, 1541–1557 (2015).
37. Klein, N. D., Hurley, K. R., Feng, Z. V. & Haynes, C. L. Dark Field Transmission Electron Microscopy as a Tool for Identifying Inorganic Nanoparticles in Biological Matrices. Anal. Chem. 87, 4356–4362 (2015).
38. Kundu, P., Deshpande, P. A., Madras, G. & Ravishankar, N. Nanoscale ZnO/CdS heterostructures with engineered interfaces for high photocatalytic activity under solar radiation. J. Mater. Chem. 21, 4209–4216 (2011).
39. Gázquez, J., Sánchez-Santolino, G., Biškup, N., Roldán, M. A., Cabero, M., Pennycook, S. J. & Varela, M. Applications of STEM-EELS to complex oxides. Mater. Sci. Semicond. Process. 65, 49–63 (2017).
40. Wolf, S. G., Shimoni, E., Elbaum, M. & Houben, L. STEM Tomography in Biology. Cell. Imaging 33–60 (2018).
41. Akhter, M. A., Mapps, D. J., Ma Tan, Y. Q., Petford-Long, A. & Doole, R. Thickness and grain-size dependence of the coercivity in permalloy thin films. J. Appl. Phys. 81, 4122 (1997).
42. Monod, P., Préjean, J. J. & Tissier, B. Magnetic hysteresis of CuMn in the spin glass state. J. Appl. Phys. 50, 7324–7329 (1979).
43. Kolhatkar, A. G., Jamison, A. C., Litvinov, D., Willson, R. C. & Lee, T. R. Tuning the magnetic properties of nanoparticles. Int. J. Mol. Sci. 14, 15977–16009 (2013).
44. Josephson, B. D. Possible new effects in superconductive tunnelling. Phys. Lett. 1, 251–253 (1962).
45. Kresse, G. & Hafner, J. Ab initio molecular-dynamics simulation of the liquid-metal–amorphous-semiconductor transition in germanium. Phys. Rev. B 49, 14251 (1994).
46. Perdew, J. P., Burke, K. & Ernzerhof, M. Generalized Gradient Approximation Made Simple. Phys. Rev. Lett. 77, 1396 (1996).
47. Blöchl, P. E. Projector augmented-wave method. Phys. Rev. B 50, 17953 (1994). 48. Deskins, N. A., Rousseau, R. & Dupuis, M. Distribution of Ti3+ surface sites in
reduced TiO2. J. Phys. Chem. C 115, 7562–7572 (2011). 49. Yoon, Y., Du, Y., Garcia, J. C., Zhu, Z., Wang, Z.-T., Petrik, N. G., Kimmel, G. A.,
Dohnalek, Z., Henderson, M. A., Rousseau, R., Deskins, ] N Aaron & Lyubinetsky, I. Anticorrelation between Surface and Subsurface Point Defects and the Impact

Chapter 2 Experimental and Characterisation Methods
89
on the Redox Chemistry of TiO2(110). ChemPhysChem 16, 313–321 (2015). 50. Lazzeri, M. & Selloni, A. Stress-Driven Reconstruction of an Oxide Surface: The
Anatase TiO2(001)−(1×4) Surface. Phys. Rev. Lett. 87, 266105 (2001). 51. Li, F., Wang, D. & Gong, X. Q. Subtle structure matters: boosting surface-directed
photoelectron transfer via the introduction of specific monovalent oxygen vacancies in TiO2. Phys. Chem. Chem. Phys. 23, 19854–19861 (2021).
52. Yan, L. & Chen, H. Migration of holstein polarons in anatase TiO2. J. Chem. Theory Comput. 10, 4995–5001 (2014).
53. Mathew, K., Sundararaman, R., Letchworth-Weaver, K., Arias, T. A. & Hennig, R. G. Implicit solvation model for density-functional study of nanocrystal surfaces and reaction pathways. J. Chem. Phys. 140, 084106 (2014).

Chapter 3 Photocatalytic Overall Water Splitting Reaction at Elevated Temperatures on TiO2 Based Materials
90
Chapter 3 Photocatalytic Overall Water Splitting Reaction at
Elevated Temperatures on TiO2 Based Materials
This chapter is adapted from the work by Yiyang Li, Yung-Kang Peng, Liangsheng
Hu, Jianwei Zheng, Dharmalingam Prabhakaran, Simson Wu, Timothy J. Puchtler,
Mo Li, Kwok-Yin Wong, Robert A. Taylor and Shik Chi Edman Tsang, published in
Nature Communications in 2019. The figures are reproduced with permission.
Copyright 2019 CC BY 4.0.1
3.1 Introduction
Storage and conversion of solar energy has been catching increasing attention for
several decades as a clean energy source since severe environmental issues
were caused by the combustion of fossil fuels. And photocatalysis is considered
as a promising technique to convert the fluctuated solar energy into stable
chemical substances which are easier to store and transfer.2,3 Among various
photocatalytic reactions, the photocatalytic overall water splitting (POWS) reaction
is of great importance. Water is decomposed to H2 and O2 stoichiometrically under
light irradiation in the presence of appropriate photocatalysts in a POWS reaction.
The evolved hydrogen is an alternative energy source which has high energy-
capacity of 143 MJ kg-1 and lots of advantages such as carbon-emission-free,
producing only water after its combustion.4–6 Moreover, except for being used as
a chemical fuel, it is also an important raw material for many industrial synthesis
processes, such as ammonia synthesis and petrochemical industry.7
Although the photo-induced oxygen evolution reaction was reported as early as
1968,8 the POWS reaction has been extensively explored only since the
demonstration over TiO2 in 1972 by Honda and Fujishima.9 Even though various

Chapter 3 Photocatalytic Overall Water Splitting Reaction at Elevated Temperatures on TiO2 Based Materials
91
materials have been synthesised and studied since then, TiO2-based materials are
still the most widely studied photocatalysts. Studies of the POWS reaction over
TiO2-based materials mainly focused on using UV irradiation due to the wide band
gap of 3.2 eV (corresponding to the wavelength of ca. 385 nm),10,11 however, UV
light contributes only about 4% to the solar energy, and nearly 43% of the solar
energy lies in the visible light regime, despite of the wide range of solar spectrum.12
Actually, in terms of an efficient photocatalyst for POWS reaction using solar light,
several prerequisites must be fulfilled:13 (1) the band gap energy is less than 3.0
eV to be able to harness the visible light; (2) valance band maximum is more
positive than = +1.23 eV and conduction band minimum is more negative than =
0 eV to make O2 and H2 evolution happen; (3) the recombination of excited
electrons and holes is greatly suppressed so that they have enough lifetime to
travel to the surface active sites and react with the chemical species on the surface
of the photocatalysts. Although the photo-reduction of protons for H2 evolution is
generally believed as a kinetically facile process, O2 evolution from OH- is a slow
fundamental step1 which is generally a four-electron process.
Therefore, efforts have been made to overcome the drawback of wide band gap
and improve the POWS performances of the TiO2-based materials. It is then found
that the absorption of the TiO2 can be broadened and extended to visible light
regime after ion-doping. A breakthrough relying on the anion-doped TiO2 was
reported by Asahi et al. in 200114 and then one decade later, Chen et al. published
the work on a deeply hydrogenated black TiO2,15 both of which exhibited
impressive visible light absorption and enhanced photocatalytic activity. Therefore,
coloured TiO2 were considered as a panacea for the photocatalytic water splitting
reaction for some time. Defects such as the oxygen vacancies (VOs) and the doped

Chapter 3 Photocatalytic Overall Water Splitting Reaction at Elevated Temperatures on TiO2 Based Materials
92
N are believed to provide intermediate band levels/extra states, and contribute to
enhanced visible light absorption.16–18
In addition to focusing on the visible light absorption properties of the materials,
strategies have also been developed to optimise the photocatalytic water splitting
systems by promoting the charge transfer or surface reactions. The approaches
include cocatalyst decoration, dye-sensitisation and Z-scheme photocatalytic
systems, etc. Metals and metal oxides are often engaged as H2 and O2 cocatalysts,
respectively, to promote the surface evolution reaction by lowering the activation
energy.19 It has also been reported that Rh@Cr2O3 core-shell structure as
cocatalyst can also kinetically prevent the O2 from reaching the metal surface,
therefore limited the possibility of the backward reaction.20 Dye-sensitisation is
also one of the widely used techniques to improve the efficiency of visible light
absorption, where the organic dyes are engaged and act as photosensitisers and
inject electrons into the conduction band of the semiconductors.21,22 Besides, Z-
scheme photocatalytic system has also obtained attention recently, where
normally two photocatalysts are engaged, namely H2 evolution photocatalyst (HEP)
and O2 evolution photocatalyst (OEP), and sometimes redox shuttles are also
required. It has been reported that a Z-scheme POWS system shows a high QE
of 30% at 419 nm and STH efficiency of 1.1% with the help of cocatalysts.23 TiO2-
based materials are also reported to show enhanced performances toward the
photocatalytic H2 evolution reaction (HER) under visible light irradiation in the
presence of sacrificial reagents.24
3.2 Objectives
As discussed above, much progress has been achieved and different approaches
have been developed in recent decades, however, unfortunately the POWS

Chapter 3 Photocatalytic Overall Water Splitting Reaction at Elevated Temperatures on TiO2 Based Materials
93
performances are still far behind the requirement of the practical application. In
addition, many POWS systems require the addition of other chemicals except for
water, such as the organic dyes, redox shuttles or sacrificial reagents, which add
up to the capital costs and more importantly, lead to unwanted side-reactions and
by-products. Materials like sulphides and phosphides, although sometimes are
reported to show good photocatalytic performances, suffer from the photo-
corrosion problems.2,25,26 While there is scarcely any report of high-rate water
splitting system for simultaneous O2 and H2 evolution over TiO2-based materials
under visible light irradiation without sacrificial reagents.
It has been mentioned in previous chapters that visible light absorption of TiO2 has
been considerably enhanced, however, high absorption does not necessarily
result in high QE or photocatalytic activity: for example, the QE decreased sharply
from 90% to less than 5% once ultraviolet irradiation was switched to visible
light27,28 but the reason behind this sudden drop was rarely discussed. It must be
noted that the overall photocatalytic performance is not determined only by
photons absorption, the efficiencies of the photo-generated charge separation and
surface chemical reactions are also important. Therefore, novel systems are
urgently needed to improve the POWS performances instead of simply screening
different materials. In this chapter, the main objective is to demonstrate a state-of-
the-art POWS system at elevated temperatures, where the photo-generated
charge carriers’ separation is greatly facilitated and the POWS performance is
extraordinarily improved. By using the most widely studied photocatalyst, TiO2, the
temperature effect on the POWS system is clearly demonstrated. Moreover, the
feasibility and potential of further practical application are also discussed.

Chapter 3 Photocatalytic Overall Water Splitting Reaction at Elevated Temperatures on TiO2 Based Materials
94
3.3 Results and discussion
3.3.1 Characterisations of the N-TiO2 materials
3.3.1.1 XRD of N-P25 materials
TiO2 (P25) powder was treated by temperature ramping in an NH3 flow to a specific
temperature T (ranging from 550-660 oC, as specified in the sample name) to
obtain the N-TiO2 materials with different concentrations of N-doping, denoted as
N-P25-T. At such high temperatures, N element can get into TiO2 lattice, taking up
either the interstitial sites or the substitutional sites that are originally occupied by
O atoms. In the case of substitution, each two substitutional N3- ions will kick out
three O2- ions to reach charge neutrality, leaving an oxygen vacancy in the material.
The above processes will clearly compromise the crystallinity of TiO2 in the surface
and sub-surface regions, rendering the outmost surface amorphous, as later
shown by TEM images.
Figure 3.1 XRD patterns of N-P25 obtained at different NH3 treatment temperatures. The obtained products were then characterised by XRD, as shown in Figure 3.1.

Chapter 3 Photocatalytic Overall Water Splitting Reaction at Elevated Temperatures on TiO2 Based Materials
95
XRD indicates that N-P25-550, N-P25-600 and N-P25-620 share almost the same
patterns with pristine P25, but with a tiny additional peak at 2θ of 36.9o which might
be attributed to TiN phase. The major characteristic peaks can be observed at 2θ
of 25.3o, 37.9o, 48.1o, 55.2o and 62.9o, which can be attributed to the anatase
crystalline structure; and the peaks observed at 2θ of 27.5o, 36.1o, 48.0o and 53.9o
can be attributed to the rutile phase. The ratio between the peaks of anatase and
rutile maintain unchanged within experimental errors, which means no phase
transformation from anatase to rutile has taken place during the NH3 treatment.
However, further increasing the NH3 treatment temperature to 660 oC leads to a
dramatic transformation to a clear titanium nitride structure, and the diffraction
peaks of either anatase or rutile have totally disappeared. Therefore, further study
will not be carried out on the N-P25-660, but focus on the other N-P25 samples. It
should be mentioned that the surface area decreased to 42 m2 g-1 of N-P25-620
from 57 m2 g-1 of pristine P25, indicating aggregations during the high temperature
treatment. In addition, one of my fellow DPhil students, Christopher Foo, has
demonstrated in a separate research that the local TiN phase and a new oxynitride
phase (TiOxNy) could be observed in the N-P25 samples. Systematic structural
study was carried out in his work, with the help of the variable-temperature
synchrotron XRD technique (see more details in ref. 29).
3.3.1.2 XPS of N-P25 materials
XPS was also engaged to investigate the chemical status of each element of the
N-P25 on the surface and sub-surface region and the Ti 2p, O1s, and N1s spectra
are shown in Figure 3.2, respectively. For each sample, two peaks corresponding
to Ti 2p3/2 and Ti 2p1/2 were observed in the Ti 2p XPS spectra, at the binding
energies of 458.5 eV and 464.2 eV, respectively, which can be attributed to the

Chapter 3 Photocatalytic Overall Water Splitting Reaction at Elevated Temperatures on TiO2 Based Materials
96
main characteristic peaks of Ti4+ on the surface of N-doped TiO2 materials. A single
peak at 529.6 eV was observed in O1s spectra which is the characteristic peak of
lattice oxygen in TiO2 and N-doped TiO2. N 1s XPS spectra shows clearly two
characteristic peaks, located at 396.4 eV and 400.7 eV, which can be assigned to
N substituted at lattice oxygen sites (Ns), and interstitial N atoms (Ni),
respectively.30,31
Figure 3.2 XPS spectra of N-P25 treated at different NH3 treatment temperatures. It is also noteworthy that only interstitial N is detected in N-P25-550, while with
increasing the N-doping level, substitutional N begins to emerge, and the
interstitial N levels off at further higher N concentration. Therefore, it is clear that
under our N-doping conditions, N atoms preferably occupy the interstitial sites at
low doping level, and only start to substitute the O sites when the interstitial sites
are saturated. As mentioned previously, the substitutional N atoms occupy the
original O positions, and this process is accompanied by the generation of surface
oxygen vacancies.30 Unfortunately, we have not resolved the exact positions of the
Ns and Ni in the TiO2 lattice, due to the lack of expertise of appropriate structural
characterisation techniques.

Chapter 3 Photocatalytic Overall Water Splitting Reaction at Elevated Temperatures on TiO2 Based Materials
97
3.3.1.3 UV-Vis absorption of N-P25 materials
Figure 3.3 (a) UV-Vis absorption spectra of N-P25 treated in NH3 at different temperatures; (b) The corresponding Tauc plots. UV-Vis spectroscopy was used to characterise the absorption properties of the N-
P25 samples, and the UV-Vis spectra are shown in Figure 3.3a. It is obvious that
with the inclusion of N, an additional broadened edge at a longer wavelength of
500 nm (visible light) is observed for N-P25-550, apart from the absorption edge
at 395 nm (UV light) of pristine P25. Higher N-doping concentrations lead to a
significant enhancement of the light absorption property, and result in high
absorption in visible and infrared regimes: N-P25-600 and N-P25-620 show quite
strong absorption even at 800-1000 nm. Tauc plots are frequently used to evaluate
the band gap energy of semiconductor materials, as shown in Figure 3.3b.
However, it has been demonstrated that the Tauc plot method for band gap energy
evaluation is not suitable for defected materials, such as the N-P25 samples in this
chapter, or semiconductor mixtures, since it will give falsely small band gap
energies.32 Although the band gap energy of these samples cannot be obtained
from the Tauc plots at this stage, it can be clearly seen from Figure 3.3b that the
intrinsic band gap energy of TiO2 has not been changed after the NH3 treatment,
which is ca. 3.2 eV. It has been reported that the introduction of N-doping in TiO2

Chapter 3 Photocatalytic Overall Water Splitting Reaction at Elevated Temperatures on TiO2 Based Materials
98
can create VOs and Ti3+ and the photo-excitation of these colour centres and
defects as extra intraband levels to the conduction band can therefore contribute
to the visible light absorption of the N-TiO2.31,33
3.3.1.4 Raman spectra of N-P25 materials
Figure 3.4 Raman spectroscopy of N-doped TiO2 treated in NH3 flow at different temperatures. Raman spectroscopy was then utilised to obtain more structural understanding of
the N-P25 samples. As can be seen from Figure 3.4, There are five major peaks
located at 144, 196, 396, 544, and 636 cm-1, respectively, which represent Eg, Eg,
B1g, A1g and Eg Raman active vibrational modes, indicating the predominant phase
of the N-doped TiO2 is anatase,34,35 which is consistent with the XRD results.
Moreover, the Raman peaks of these samples exhibit different degrees of
weakening with inclusion of N doping, implying the disruption of the TiO2 lattice by
interstitial N, substitutional N and VO which are introduced by the NH3
treatment.36,37

Chapter 3 Photocatalytic Overall Water Splitting Reaction at Elevated Temperatures on TiO2 Based Materials
99
3.3.1.5 HAADF-STEM of N-P25 materials
Figure 3.5 HAADF-STEM images of N-P25-620 show the typical lattice spacing of <101> of anatase TiO2 (0.35±0.02 nm) in the bulk structure. However, the top few atomic layers appear to show an amorphous-like sub-surface with a distorted lattice. Scale bars are indicated in the images. STEM images were acquired by Dr. Tianyi Chen of Prof. Edman Tsang’s group. HAADF-STEM images show the typical lattice spacing of <101> of anatase TiO2
(0.35±0.02 nm) in the bulk structure. However, the top few atomic layers appear
to show an amorphous-like sub-surface with a distorted lattice. Scale bars are
given in the images (Figure 3.5).
Now according to all the above characterisations, it is quite clear that after the
high-temperature NH3 treatment, N is doped into the TiO2 lattice significantly
(Figure 3.1), occupying the interstitial sites at low doping levels, and substituting
the O atoms at high doping levels (Figure 3.2). Such a heavy N-doping then results
in the appearance of a local TiN phase and a TiOxNy oxynitride phase, which was
observed using the high-resolution synchrotron XRD, but could not be seen clearly

Chapter 3 Photocatalytic Overall Water Splitting Reaction at Elevated Temperatures on TiO2 Based Materials
100
on the XRD patterns in this thesis (Figure 3.1). The formation of these new phases,
especially the TiN phase, are responsible to the greatly enhanced absorption in
visible and infrared regimes, which actually shows the feature of metallic materials
(Figure 3.3). It is noteworthy that these N-doping, O substitution, and new phase
generation are mainly happening within the sub-surface region. Therefore,
HAADF-STEM images show an amorphous-like sub-surface with a distorted lattice
(Figure 3.5), which means the crystallinity of these regions are substantially
compromised, resulting in the weakening of the Raman-active vibrations and the
Raman signals (Figure 3.4).
3.3.1.6 EPR of N-P25 materials
Figure 3.6 EPR patterns of N-P25 prepared by NH3 treatment at different temperatures. As mentioned before, it has been reported that the inclusion of substitutional N
into TiO2 will lead to the creation of VOs. This is because the N3- ion carries three
negative charges, while O2- carries two negative charges. And to balance the
charges within the whole material to make it stay neutral, three O atoms will be
substituted by only two N atoms, leaving an VO unoccupied. On the other hand,
the VOs are generally considered as trapping sites for electrons and active sites of

Chapter 3 Photocatalytic Overall Water Splitting Reaction at Elevated Temperatures on TiO2 Based Materials
101
many chemical reactions. Moreover, those electrons trapped in the surface VOs
can subsequently interact with O2 molecules in the air to form paramagnetic O2-
species which are detectable by EPR.38,39 For a photocatalyst, the excited
electron-hole pairs that can reach to the surface of the photocatalyst for the
subsequent reactions are more important than those pairs recombine in the bulk.
Consequently, EPR measurements were performed on the N-P25 samples, as
shown in Figure 3.6. It is evident that pure P25 is silent on EPR and shows no
signal at room temperature; while for N-P25-550, N-P25-600 and N-P25-620, an
orthorhombic EPR signal with the g values of gzz=2.023, gyy=2.006 and gxx=1.987
were observed. Also, the EPR signals increase with the N-doping concentrations,
implying that N-doping is always accompanied by the formation of VOs, as
discussed above. The above observations are consistent with the fact that doping
electronegative N species into anatase TiO2 can create defects like Ti3+ and VOs
at different energy levels.31,33 The photo-excitation of these colour centres and
doped N providing extra intra-band levels is thought to account for our observed
strong UV-Vis absorption over a broad range from the UV to the infrared.
Despite the creation of VOs, their stability on the particle surface is still uncertain
and has been rarely discussed in literature. Thus, in order to evaluate the stability
of the surface VOs and investigate the probable degeneration of these surface
defects when exposed to air, EPR measurements were carried out after N-P25-
550 was freshly prepared and exposed to air for different time ranges. Interestingly,
after the sample was exposed to air at ambient conditions for 1.5 hours, 40% of
the EPR signal gradually disappeared and after 24 hours, only 23% of the original
signal remained, suggesting that the surface VOs are not stable in air at room
temperature (Figure 3.7a). This is attributed to the fact that the oxygen sources in

Chapter 3 Photocatalytic Overall Water Splitting Reaction at Elevated Temperatures on TiO2 Based Materials
102
air (i.e., O2 and H2O), when in contact with the particle surface, will gradually
replenish the surface VOs and redistribute the electrons. Such observation could
also explain the fact that N-doped TiO2 or hydrogenated TiO2 do not necessarily
show good photocatalytic overall water splitting activity under visible light
illumination in air, because the surface defects are readily recovered by the oxygen
sources in air. Even though the remaining oxygen defects in bulk can still exert
strong visible light absorption, they hardly contribute to the photocatalytic
performances, since they are not accessible for the chemical species. It should be
clarified that defects are not always good in photocatalysts: defects deeply inside
the band gap, also known as deep-level defects, are not desirable and can lead to
more severe recombination issues. Only the shallow defects are desirable in
photocatalysts, which can prolong the lifetime of the photo-generated charge
carriers.40 Subsequently, I noticed that after re-calcining the N-doped TiO2 in a N2
atmosphere at elevated temperatures, the EPR signals of these materials re-
emerged and became even larger, implying that more surface VOs were
regenerated at elevated temperatures (Figure 3.7b). Control experiments were
performed in an Ar atmosphere at elevated temperatures as well, which gave
similar results as those in the N2 atmosphere, confirming that N2 could not dope
the TiO2 samples with extra N under the given experimental conditions. The
surface VOs formed in N-doped TiO2 are vulnerable to oxygen sources at room
temperature, but at elevated temperatures, the faster subsequent reactions can
regenerate them to sustain the surface photocatalytic processes. DFT calculations
have also demonstrated that N-doping leads to a large reduction in the formation
energy of VOs, indicating that VOs are more easily generated after N-doping,30 in
accordance with the EPR results shown in Figure 3.7b. Similarly, thermal

Chapter 3 Photocatalytic Overall Water Splitting Reaction at Elevated Temperatures on TiO2 Based Materials
103
treatments were also carried out in liquid water at different temperatures,
considering the use of N-TiO2 in water splitting reaction. Samples were dispersed
in deionised water and loaded in a batch reactor, and after the thermal treatment
for one hour, the reaction was quenched and the post-treatment samples were
filtered, dried in vacuum and measured by EPR. As shown in Figure 3.7c, the
increase of EPR signals with the treatment temperatures can be also observed.
Similarly, samples were also treated in 10 bar of water vapour, which exhibits the
same trend of EPR signal increase (Figure 3.7d). The above observation clearly
suggests that the VOs can be also regenerated at elevated temperatures under the
photocatalytic water splitting conditions, even the N-TiO2 particles are surrounded
by water or water vapour.
Figure 3.7 (a) EPR spectra of N-P25-550 after freshly made and exposed to air for different times; (b) EPR spectra of the deactivated N-P25-550 after re-calcination in N2 at different temperatures; (c) EPR spectra of the deactivated N-P25-550 after treatment in liquid water at different temperatures; (d) EPR spectra of the deactivated N-P25-550 after treatment in water vapour at different temperatures.

Chapter 3 Photocatalytic Overall Water Splitting Reaction at Elevated Temperatures on TiO2 Based Materials
104
3.3.2 Temperature effect on the POWS reaction
The POWS activity was then evaluated in pure water under visible light illumination
in a batch reactor equipped with silica windows. The detailed temperature effect
on the POWS activity was initially investigated on the N-P25-620 photocatalyst
that possesses the highest N-doping level and most surface vacancies as the
catalytic active sites, as shown in Figure 3.8. It is interesting to note that the
photocatalytic activity of N-doped TiO2 in water is highly dependent on the applied
temperatures. However, the activity does not increase linearly, despite the kinetic
and entropic contributions upon using higher temperatures where more surface
VOs are also formed. Apparently, the activity reaches a maximum value of H2
production when the temperature rises to near 270oC but declines rapidly on
further increasing the temperature.
Figure 3.8 Left: Photocatalytic water splitting reaction activity tests of N-P25-620 and Au/N-P25-620 at different temperatures. Right: Temperature dependence of pKw at the saturated vapour pressure. Reproduced from ref. 41. Such behaviour in response to the temperature increase cannot be explained by
the promoted kinetics at elevated temperatures, which should be in a positive
correlation instead of a volcanic response. It has been reported that the ionic

Chapter 3 Photocatalytic Overall Water Splitting Reaction at Elevated Temperatures on TiO2 Based Materials
105
dissociation of water to H+ and OH- is dependent on temperature, and the
dissociation constant can be promoted to 25 times that at room temperature (1×
10-14) and peaks at around 260-270 oC before rapidly declining.41 Our observed
volcanic response of the photocatalytic activity against temperature appears to
show a similar pattern as the reported temperature-dependent ionisation constant
of water. We discounted the effect of associated saturated water pressure in the
batch reactor as no promoting effect was observed in equivalent N2 pressure
without heating. In fact, pressure can influence the ionisation constants of water
only at extremely high values.41 As shown in Figure 3.8, the H2 evolution rate of N-
P25-620 reaches 3525 μmol g-1 h-1 at 270 oC.
Table 3.1 Photocatalytic activities (270 oC, under visible light irradiation), VO concentrations, and N-doping concentrations of different N-P25 TiO2 samples in this chapter and pristine P25 as a reference.
Subsequently, the POWS activities of N-P25-550 and N-P25-600 were also
evaluated with similar method at the optimised temperature of 270 oC, and both
show exciting H2 evolution rates of 1980 μmol g-1 h-1 and 2945 μmol g-1 h-1
respectively. It is also noteworthy that the trend of POWS activities of the N-P25
samples correlates well with the trend of VO concentrations determined by EPR
signals and surface N-doping concentrations determined by XPS (Table 3.1),
indicating that the enhanced POWS activities can be attributed to the N-doping
and the regenerable surface VOs to a large extent. The surface VO concentration
NH3 treatment T (oC)
Surface VO (1016 counts mol-1)
N concentration (wt.%) (by XPS)
H2 evolution rate (µmol g-1 h-1) (270 oC)
Not treated Not detected Not detected Not detected 550 1.86 0.53 1980±95 600 8.74 1.41 2945±93 620 13.33 4.60 3525±122

Chapter 3 Photocatalytic Overall Water Splitting Reaction at Elevated Temperatures on TiO2 Based Materials
106
was obtained by double-integration of the EPR signal of the surface VO at g=2.006.
Deposition of metal promoters as cocatalysts is a generally used strategy to
enhance the photocatalytic activities so it was also investigated. Different metal
depositions onto the N-P25-620 were attempted in this thesis, via the photo-
deposition method, including gold, platinum, cobalt, palladium, silver and nickel,
all of which are traditionally considered as good cocatalysts for the HER, and the
results are shown in Figure 3.9. All of the as-prepared photocatalysts show
enhanced water splitting activity compared with N-P25-620 to some extents.
Figure 3.9 Photocatalytic activities of N-P25-620 decorated with different metals (1.0 wt.%) at 270 oC. Error bars indicate standard deviation. However, it must be clarified that the photo-deposition method used here actually
cannot result in Co or Ni nanoparticles due to the insufficiently negative conduction
band minimum (CBM): the reduction potential of Co and Ni are -0.28 and -0.23 V
vs. the standard hydrogen electrode (SHE), while the CBM of TiO2 is ca. 0.3 V vs.
SHE.42 Therefore, Co or Ni nanoparticles cannot be obtained using this method.
This may explain why the photocatalytic activity did not change obviously after
“deposition of Ni” (Figure 3.9). On the contrary, in the case of Co, the photocatalytic
activity was enhanced substantially even though Co nanoparticles could not form

Chapter 3 Photocatalytic Overall Water Splitting Reaction at Elevated Temperatures on TiO2 Based Materials
107
(Figure 3.9). Oxide species, CoOx, may be deposited on the TiO2 surface, which
may facilitate the OER half reaction, and finally result in the enhanced POWS
activity. Among all the metal studied here, gold shows the highest enhancement
effect, presumably due to the surface plasmon resonance (SPR) effect, giving a
H2 evolution rate of 6746 μmol g-1 h-1 at 270 oC. Unfortunately, I was not able to
observe any SPR peak of Au in the UV-Vis spectra, because the N-P25-620
exhibited extremely high absorption across the whole UV-Vis-NIR region, but the
Au nanoparticles could be observed using microscopic techniques. I did not look
into the SPR effect carefully in this thesis, since it is kind of beyond the focus of
this thesis, and the SPR effect of Au in photocatalytic systems has been
extensively studied in literature.43–45 It is noted that this optimal H2 activity at 270
oC is substantially higher than the best photocatalytic systems claimed in the
literature (which have mainly been evaluated at room temperature).
Figure 3.10 Stable splitting of water to 2:1 H2/O2 with no sacrificial reagent over N-P25-620 and Au/N-P25-620 at constant rates for 50 hours. The stoichiometric and stable production of H2 and O2 in a 2:1 ratio is of
tremendous importance when evaluating POWS systems. Therefore, a 50-hour
reaction was then carried out at 270 oC to verify the stability of the 1.0 wt. % Au/N-

Chapter 3 Photocatalytic Overall Water Splitting Reaction at Elevated Temperatures on TiO2 Based Materials
108
P25-620, as shown in Figure 3.10. Obviously, the Au/N-P25-620 photocatalyst
gives a stable production of H2 and O2 in stoichiometric 2:1 molar ratio over 50
hours with no loss of N content according to our chemical analysis, showing an
average H2 evolution rate of around 6600 μmol g-1 h-1 at 270 oC. Unfortunately,
pristine P25 TiO2, with or without the high-temperature treatment in an inert
atmosphere, showed no observable POWS activity under visible light irradiation,
even at 270 oC, confirming that the N-doping is essential in this system.
Table 3.2 POWS performance of 1.0 wt% Au/ N-P25-620 at 270oC/60 bars (saturated equilibrium pressure of water) as compared to selected literature data.
Photocatalyst Light source H2 Evolution Rate (µmol h-1 g-1) Ref.
Au/N-TiO2 (P25) 70 W W-lamp, ≥400 nm 6746±147 This work
CDots-C3N4 300 W Xe lamp, ≥420 nm 566 46
Pt/(Cring)-C3N4 300 W Xe lamp, ≥420 nm 150 47
Pt, Co modified g-C3N4 300 W Xe lamp, ≥420 nm 1.2 48
Cr-Rh oxide/(Ga1–
xZnx)(N1–xOx) 450 W high pressure mercury lamp, ≥436 nm 1543 49
Ni@NiOx/SrTiO3 AM 1.5 solar simulator 18 50
Pt, Co3O4/carbon nitride 300 W Xe lamp, ≥300 nm 155 51
Pt/BixY1-xVO4 300 W Xe lamp, ≥300 nm 139 52

Chapter 3 Photocatalytic Overall Water Splitting Reaction at Elevated Temperatures on TiO2 Based Materials
109
Table 3.3 QE for POWS of 1.0 wt% Au/ N-P25-620 at 270oC/60 bar (saturated equilibrium pressure of water) as compared with selected literature data. *Quantum efficiency results from literature were obtained in the presence of
various amounts of sacrificial reagent such as methanol, while in this work it was measured in pure water (Milli. Q.).
Figure 3.11 QE of the N-P25-620 and the Au/N-P25-620 at different wavelengths evaluated at 270 oC.
For a photocatalytic system, QE is one of the key parameters when evaluating the
conversion efficiency of renewable solar energy to H2 fuel systems.33 Almost all
the reported photocatalytic water splitting TiO2 based systems suffer from
extremely low QE in the visible light region (rarely exceeding 3 % at 420 nm),
Photocatalyst Cocatalyst Wavelength (nm)
QE*(%) Ref.
N-doped P25 Au 437 76.7±2.1 This work
Vacuum-activated P25 Pt 420 1.17 53
Hydrogenated TiO2 Pt 420 2.28 54
Unsupported Au NPs / 300 2.7 55
W-doped TiO2 Au 380 18.3 56
Hydrogenated N doped-TiO2
Pt 420 9.0 57
Li-EDA treated P25 / 420 2.57 58

Chapter 3 Photocatalytic Overall Water Splitting Reaction at Elevated Temperatures on TiO2 Based Materials
110
which largely hinders any potential practical applications. For our photocatalytic
system, the QE was evaluated at 270 oC at wavelengths of visible light and in the
near infrared (NIR) using bandpass filters. The detailed method of the QE
evaluation in this thesis has been described clearly in Chapter 2, and an example
is given in Appendix Note A1. As illustrated in Figure 3.11, the QE becomes larger
with decreasing wavelength and an impressive QE of 76.7% is obtained at 437
nm. Such high QE values in the visible light region have only been reported by
chalcogenide systems with anticipated photo-corrosion issues and with the
addition of a sacrificial reagent.26 Clearly, the QE increased significantly after the
deposition of Au nanoparticles, since Au nanoparticles could trap the photo-
generated electrons and facilitate the H2 evolution reaction. Also, the QE at 575
nm (which is very close to the SPR wavelength of Au nanoparticles, and the SPR
wavelength varies with the particle size) increased more substantially, showing a
110 % enhancement, which could be attribute to the SPR effect of Au nanoparticles.
Here, I demonstrate that this robust N-doped TiO2 system can give equally high
QE at elevated temperatures. Excitingly, this photocatalytic system can operate
even at 1000 nm (1.24 eV), almost the minimum threshold energy required for
water splitting with a QE of 2.7%. To the best of our knowledge, this system is the
first example that the overall water splitting reaction can be accomplished under
NIR irradiation with considerable Q.E. whilst exceptional photoactivity and QE in
the visible region at 270 oC greatly exceeds values reported for TiO2 systems
(Table 3.3).
3.3.3 Separation of charge carriers
Time-resolved photoluminescence (TRPL) was used to investigate the
recombination of photo-excited electron-hole pairs. PL spectra in Figure 3.12a

Chapter 3 Photocatalytic Overall Water Splitting Reaction at Elevated Temperatures on TiO2 Based Materials
111
clearly show that the PL intensity decreases as the N-doping increasing – this is
an indication that the lifetime of the photo-generated charge carriers also is more
prolonged at a higher N-doping concentration. The main PL signal lies in the region
of 400-600 nm, forming a very broad emission band (Figure 3.12a), while for N-
P25-600 and N-P25-620, there is an additional emission signal emerging at ca.
900 nm, which can be attributed to the emission that involves the N-defect band.
Figure 3.12 (a) PL spectra of P25 and N-P25 samples. TRPL spectra of (b) N-P25 treated by NH3 at different temperatures and promoted by Au; (c) N-P25-620 after being soaked in acidic solutions with different pH and (d) N-P25-620 after being soaked in alkaline solutions with different pH. Conditions: the excitation wavelength is 266 nm and the probe wavelength for the TRPL is 500 nm. As shown in Figure 3.12b, introduction of VOs via N doping and subsequent Au
deposition are both able to prolong the charge carrier lifetime, leading to an

Chapter 3 Photocatalytic Overall Water Splitting Reaction at Elevated Temperatures on TiO2 Based Materials
112
increase to 2.56 ns from the 1.12 ns of pristine P25. It is widely agreed that the
separation of photo-excited charge carriers plays an important role in the
photocatalysis; therefore, TRPL can also be a powerful technique to understand
the effect of using elevated temperature. As a result, the TRPL experiments were
first conducted in air without water at different elevated temperatures to see if the
increase in temperature could make any difference to the charge carrier lifetime.
It is interesting to find that the measurements showed no apparent change with
solely the temperature increase (as shown in Figure 3.13). Bear in mind that the
photocatalytic water splitting activity is dramatically increased at elevated
temperature and peaks at 270 oC, which coincides with the maximal water
dissociation constant. It is therefore obvious that the significant temperature effect
observed in the presence of water is due to the increased concentration of both
H+ and OH- from the water dissociation. This can largely contribute to the
enhanced photocatalytic performance at elevated temperatures.
Figure 3.13 TRPL spectra of N-P25-620 measured in air at increasing temperature. Each TRPL spectrum was normalised to its highest intensity (i.e., right after the laser pulse, t=0) for a more straightforward and clearer comparison. The actual intensity/amplitude of all the TRPL spectra in this figure is similar to each other. Therefore, temperature does not obviously influence either the PL spectra or the TRPL spectra.

Chapter 3 Photocatalytic Overall Water Splitting Reaction at Elevated Temperatures on TiO2 Based Materials
113
The TRPL measurements were subsequently carried out in different H+ and OH-
concentrations by soaking the N-P25-620 sample in acidic or alkaline solutions
with various pH at ambient temperature to mimic the high temperature conditions
and to correlate to the charge carrier lifetime. As expected, the charge carrier
lifetime increased dramatically, as shown in Figures 3.12c and 3.12d, the fastest
recombination rate was obtained at pH=7 where there were the lowest
concentrations of H+ and OH-, and the charge carrier lifetime apparently increased
with higher concentration of H+ or OH-, and H+ and OH- showed similar effect on
the charge separation, and the charge carrier lifetimes were prolonged to the same
degree. Clearly, the adsorption of H+ or/and OH- near the surface of the
semiconductor could create a local electric field (LEF) which can attract the
counter charged electron or hole species hence suppressing their recombination
rate and enhancing the overall photocatalytic activity. As stated before,
dissociation of H+ and OH- from water becomes more favourable at higher
temperatures and peaks at around 270 oC. Consequently, the charge carrier
lifetime is prolonged at elevated temperatures, compared to that at room
temperature due to the simultaneously enhanced H+ and OH- concentrations,
which allows chemical reactions to take place. It is noted that the correlation of pH
with photocatalytic activity at a fixed temperature could have a more complex
relationship since the increase in H+ concentration in using lower pH will
simultaneously decrease the concentration of OH- due to water dissociation
constant and will affect the overall kinetics. Thus, the addition of acid or alkali to
the catalytic system may prolong the charge carrier lifetime, but it concomitantly
decreases the concentration of counter ions (OH- or H+) due to ionisation
equilibrium at room temperature, which is unfavourable kinetically, whereas the

Chapter 3 Photocatalytic Overall Water Splitting Reaction at Elevated Temperatures on TiO2 Based Materials
114
use of high temperatures can increase both H+ and OH- at the same time by the
promoted water ionisation, which is a promising and efficient way to promote the
photocatalytic water splitting performances.
3.3.4 Practical application of the temperature-promoted POWS system
Figure 3.14 (a) photographic image of the light furnace used to mimic a solar concentrator; (b) The POWS activity tests of Au/N-P25-620 in the light furnace. This figure shows the total amount of the evolved H2 gas (in μmol) after the reaction time of 2 h and 16 h. Conditions: 5 mg of Au/N-P25-620 was added to 10 mL of deionised H2O in a 25-mL batch reactor under vigorous magnetic stirring, and Ar gas was used as the inert gas. Then the reactor was heated up to 270 oC and maintained for different reaction times. Both the heating and light irradiation are provided solely by the light furnace shown in (a). The light furnace was operated by Dr. Dharmalingam Prabhakaran in the Department of Physics, University of Oxford. Large-scale application of particulate photocatalytic systems has attracted
increasing attention recently, due to its low cost compared with photovoltaic-
powered electrolysis (PV-E) and photoelectrochemical (PEC) processes, and
complicated reactor structures are not required.59–61 Therefore, to demonstrate the
technical feasibility of using solely the renewable light energy to supply the
required thermal heat and visible photons for photocatalytic splitting of water in
this new process, a light furnace was used to mimic the solar light concentrator
without any direct thermal energy input from an electrical device. The reactor

Chapter 3 Photocatalytic Overall Water Splitting Reaction at Elevated Temperatures on TiO2 Based Materials
115
temperature of 270 oC is maintained by this light source with the black body
radiation, and a constant H2 evolution rate of about 12 mmol g-1h-1 is achieved
using Au/N-P25-620 for up to 16 hours of testing time (as shown in Figure 3.14).
Different kinds of configurations and prototypes of solar concentrators were
discussed recently38 which are presumably helpful for scale-up H2 production,
such as parabolic cylinder reflectors that can provide enhanced light irradiation
and temperature for solar energy applications.
Alternatively, the heat required for such a highly efficient photocatalytic water
splitting system to produce H2 may be provided by coupling with other exothermic
processes for the subsequent H2 utilisation at a comparable temperature range.
For example, the formed H2 if combined with N2 (from air separation) can be used
to produce ammonia which is a highly exothermic reaction. In addition, the H2
evolution rate in our LEF enhanced water splitting system appears to match well
with the ammonia evolution rate.62,63 Based on our evaluation, the heat produced
during ammonia synthesis could compensate the energy required for our LEF
enhanced water splitting system, which gives an exciting possibility to turn the
current natural gas dependent Haber-Bosch process to carbon-free photocatalytic
practice for the ammonia synthesis. A similar scenario could be expected to couple
with the strongly exothermic hydrogenation of CO2 to methane, which may spark
a new carbon-recycle technology for energy and environment. Some potential
practical applications could be considered, which include the injection of separated
H2 from the photocatalytic splitting process at elevated temperatures for
decentralised domestic devices into natural gas pipeline in UK and some parts of
Europe, etc for caloric use of this renewable fuel. The calculations of the heat
balance to prove the possibility of coupling the POWS system with other

Chapter 3 Photocatalytic Overall Water Splitting Reaction at Elevated Temperatures on TiO2 Based Materials
116
exothermic systems are shown in Appendix Note A2.
Figure 3.15 POWS performances over Au/N-P25-620 at different water vapour pressures at 270 oC. Error bars are defined as standard deviation. Besides, further study in using water vapour at different pressures instead of liquid
water is initiated, which is more controllable, easier to operate, possesses lower
heat capacity and can be operated at lower pressure for the same temperature.
As seen from Figure 3.15, the visible-light-driven water splitting system works well
even using lower pressures of water vapour. A H2 evolution rate of about 1500
μmol g-1 h-1 is achieved at a pressure of less than 10 bar.
3.4 Conclusion
In conclusion, a novel POWS system at elevated temperatures over N-TiO2 based
materials using visible light has been demonstrated in this chapter. A series of N-
TiO2 photocatalysts have been fabricated by a simple NH3 treatment. XPS results
show that the N species have been incorporated into the TiO2 lattice as
substitutional and interstitial N, respectively. The facilitated formation of surface
VOs in the presence of these N inclusions is also confirmed by EPR. It is evident
that the visible-light-driven POWS reaction depends critically on the N and the

Chapter 3 Photocatalytic Overall Water Splitting Reaction at Elevated Temperatures on TiO2 Based Materials
117
surface VO content of N-TiO2. I have also found that these surface defects as
catalytically active centres are easily replenished in contact with oxygen sources
at room temperature, leading to poor photocatalytic activity despite the existed
bulk defects that can still take up visible light. However, the VOs can be
regenerated when heated to elevated temperatures. TRPL measurements show
that the introduction of VOs and deposition of a metal cocatalyst are both essential
in prolonging the charge carrier lifetime to enable superior water splitting activity
under visible light illumination. More importantly, lifetime of the photo-generated
charge carriers can also be prolonged via local electric fields formed by high
concentrations of adsorbed H+ and OH- resulting from enhanced water ionisation
at elevated temperatures. Under these conditions, both H2 evolution and
regeneration of the electron depleted VOs (photo-generated holes) to produce O2
are greatly facilitated. Obviously, temperature shows remarkable effects on the
POWS performances of N-TiO2 nano-catalysts and extraordinary H2 evolution
rates and QEs have been achieved in this POWS system. Feasibility of potential
practical application has also been considered by using a light furnace, by which
heat and photons are both provided without engaging external electric heating
device, and the sustainable H2 evolution is maintained. Such POWS system may
contribute to the future capture and utilisation of solar energy for H2 production.
3.5 References
1. Li, Y., Peng, Y.-K., Hu, L., Zheng, J., Prabhakaran, D., Wu, S., Puchtler, T. J., Li, M., Wong, K.-Y., Taylor, R. A. & Tsang, S. C. E. Photocatalytic water splitting by N-TiO2 on MgO (111) with exceptional quantum efficiencies at elevated temperatures. Nat. Commun. 10, 4421 (2019).
2. Wolff, C. M., Frischmann, P. D., Schulze, M., Bohn, B. J., Wein, R., Livadas, P., Carlson, M. T., Jäckel, F., Feldmann, J., Würthner, F. & Stolarczyk, J. K. All-in-one visible-light-driven water splitting by combining nanoparticulate and molecular co-catalysts on CdS nanorods. Nat. Energy 3, 862–869 (2018).
3. Landman, A., Dotan, H., Shter, G. E., Wullenkord, M., Houaijia, A., Maljusch, A.,

Chapter 3 Photocatalytic Overall Water Splitting Reaction at Elevated Temperatures on TiO2 Based Materials
118
Grader, G. S. & Rothschild, A. Photoelectrochemical water splitting in separate oxygen and hydrogen cells. Nat. Mater. 16, 646–651 (2017).
4. Zhou, G., Shan, Y., Wang, L., Hu, Y., Guo, J., Hu, F., Shen, J., Gu, Y., Cui, J., Liu, L. & Wu, X. Photoinduced semiconductor-metal transition in ultrathin troilite FeS nanosheets to trigger efficient hydrogen evolution. Nat. Commun. 10, 399 (2019).
5. Chen, X., Shen, S., Guo, L. & Mao, S. S. Semiconductor-based photocatalytic hydrogen generation. Chem. Rev. 110, 6503–6570 (2010).
6. Li, Q., Guo, B., Yu, J., Ran, J., Zhang, B., Yan, H. & Gong, J. R. Highly efficient visible-light-driven photocatalytic hydrogen production of CdS-cluster-decorated graphene nanosheets. J. Am. Chem. Soc. 133, 10878–10884 (2011).
7. Berry, G. D., Pasternak, A. D., Rambach, G. D., Smith, J. R. & Schock, R. N. Hydrogen as a future transportation fuel. Energy 21, 289–303 (1996).
8. Boddy, P. J. Oxygen Evolution on Semiconducting TiO2. J. Electrochem. Soc. 115, 199 (1968).
9. Fujishima, A. & Honda, K. Electrochemical Photolysis of Water at a Semiconductor Electrode. Nature 238, 37–38 (1972).
10. Tabata, S., Nishida, H., Masaki, Y. & Tabata, K. Stoichiometric photocatalytic decomposition of pure water in Pt/TiO2 aqueous suspension system. Catal. Letters 34, 245–249 (1995).
11. Sayama, K. & Arakawa, H. Effect of carbonate salt addition on the photocatalytic decomposition of liquid water over Pt-TiO2 catalyst. J. Chem. Soc. - Faraday Trans. 93, 1647–1654 (1997).
12. Wang, Q. & Domen, K. Particulate Photocatalysts for Light-Driven Water Splitting: Mechanisms, Challenges, and Design Strategies. Chem. Rev. 120, 919–985 (2020).
13. Liu, N., Häublein, V., Zhou, X., Venkatesan, U., Hartmann, M., MačKović, M., Nakajima, T., Spiecker, E., Osvet, A., Frey, L. & Schmuki, P. ‘Black’ TiO2 Nanotubes Formed by High-Energy Proton Implantation Show Noble-Metal-co-Catalyst Free Photocatalytic H2-Evolution. Nano Lett. 15, 6815–6820 (2015).
14. Asahi, R., Morikawa, T., Ohwaki, T., Aoki, K. & Taga, Y. Visible-light photocatalysis in nitrogen-doped titanium oxides. Science 293, 269–271 (2001).
15. Chen, X., Liu, L., Yu, P. Y. & Mao, S. S. Increasing solar absorption for photocatalysis with black hydrogenated titanium dioxide nanocrystals. Science 331, 746–750 (2011).
16. Asahi, R., Morikawa, T., Irie, H. & Ohwaki, T. Nitrogen-doped titanium dioxide as visible-light-sensitive photocatalyst: Designs, developments, and prospects. Chem. Rev. 114, 9824–9852 (2014).
17. Imanishi, A., Okamura, T., Ohashi, N., Nakamura, R. & Nakato, Y. Mechanism of water photooxidation reaction at atomically flat TiO 2 (rutile) (110) and (100) surfaces: Dependence on solution pH. J. Am. Chem. Soc. 129, 11569–11578 (2007).
18. Padilha, A. C. M., Raebiger, H., Rocha, A. R. & Dalpian, G. M. Charge storage in oxygen deficient phases of TiO2: Defect Physics without defects. Sci. Rep. 6, 2–8 (2016).
19. Wang, Z., Li, C. & Domen, K. Recent developments in heterogeneous photocatalysts for solar-driven overall water splitting. Chem. Soc. Rev. 48, 2109–2125 (2019).

Chapter 3 Photocatalytic Overall Water Splitting Reaction at Elevated Temperatures on TiO2 Based Materials
119
20. Maeda, K., Teramura, K., Lu, D., Saito, N., Inoue, Y. & Domen, K. Noble-Metal/Cr2O3 Core/Shell Nanoparticles as a Cocatalyst for Photocatalytic Overall Water Splitting. Angew. Chemie 118, 7970–7973 (2006).
21. Polo, A. S., Itokazu, M. K. & Murakami Iha, N. Y. Metal complex sensitizers in dye-sensitized solar cells. Coord. Chem. Rev. 248, 1343–1361 (2004).
22. Etacheri, V., Di Valentin, C., Schneider, J., Bahnemann, D. & Pillai, S. C. Visible-light activation of TiO2 photocatalysts: Advances in theory and experiments. J. Photochem. Photobiol. C Photochem. Rev. 25, 1–29 (2015).
23. Wang, Q., Hisatomi, T., Jia, Q., Tokudome, H., Zhong, M., Wang, C., Pan, Z., Takata, T., Nakabayashi, M., Shibata, N., Li, Y., Sharp, I. D., Kudo, A., Yamada, T. & Domen, K. Scalable water splitting on particulate photocatalyst sheets with a solar-to-hydrogen energy conversion efficiency exceeding 1%. Nat. Mater. 15, 611–615 (2016).
24. Han, B. & Hu, Y. H. Highly Efficient Temperature-Induced Visible Light Photocatalytic Hydrogen Production from Water. J. Phys. Chem. C 119, 18927–18934 (2015).
25. Tian, B., Tian, B., Smith, B., Scott, M. C., Hua, R., Lei, Q. & Tian, Y. Supported black phosphorus nanosheets as hydrogen-evolving photocatalyst achieving 5.4% energy conversion efficiency at 353 K. Nat. Commun. 9, 1397 (2018).
26. Han, Z., Qiu, F., Eisenberg, R., Holland, P. L. & Krauss, T. D. Robust photogeneration of H2in water using semiconductor nanocrystals and a nickel catalyst. Science 338, 1321–1324 (2012).
27. Zhou, W., Li, W., Wang, J. Q., Qu, Y., Yang, Y., Xie, Y., Zhang, K., Wang, L., Fu, H. & Zhao, D. Ordered mesoporous black TiO2 as highly efficient hydrogen evolution photocatalyst. J. Am. Chem. Soc. 136, 9280–9283 (2014).
28. Park, K. H., An, Y., Jung, S., Park, H. & Yang, C. The use of an n-type macromolecular additive as a simple yet effective tool for improving and stabilizing the performance of organic solar cells. Energy Environ. Sci. 9, 3464–3471 (2016).
29. Foo, C., Li, Y., Lebedev, K., Chen, T. T., Day, S., Tang, C. & Tsang, S. C. E. Characterisation of oxygen defects and nitrogen impurities in TiO2 photocatalysts using variable-temperature X-ray powder diffraction. Nat. Commun. 12, 661 (2021).
30. Di Valentin, C., Pacchioni, G., Selloni, A., Livraghi, S. & Giamello, E. Characterization of paramagnetic species in N-doped TiO 2 powders by EPR spectroscopy and DFT calculations. J. Phys. Chem. B 109, 11414–11419 (2005).
31. Livraghi, S., Paganini, M. C., Giamello, E., Selloni, A., Di Valentin, C. & Pacchioni, G. Origin of photoactivity of nitrogen-doped titanium dioxide under visible light. J. Am. Chem. Soc. 128, 15666–15671 (2006).
32. Makuła, P., Pacia, M. & Macyk, W. How To Correctly Determine the Band Gap Energy of Modified Semiconductor Photocatalysts Based on UV-Vis Spectra. J. Phys. Chem. Lett. 9, 6814–6817 (2018).
33. Wang, J., Tafen, D. N., Lewis, J. P., Hong, Z., Manivannan, A., Zhi, M., Li, M. & Wu, N. Origin of photocatalytic activity of Nitrogen-doped TiO2 nanobelts. J. Am. Chem. Soc. 131, 12290–12297 (2009).
34. Savio, A. K. P. D., Fletcher, J., Smith, K., Iyer, R., Bao, J. M. & Robles Hernández, F. C. Environmentally effective photocatalyst CoO-TiO2 synthesized by thermal precipitation of Co in amorphous TiO2. Appl. Catal. B Environ. 182, 449–455 (2016).
35. Ren, Z., Chen, C., Fu, X., Wang, J., Fan, C., Qian, G. & Wang, Z. TiO2/C composites nanorods synthesized by internal-reflux method for lithium-ion battery

Chapter 3 Photocatalytic Overall Water Splitting Reaction at Elevated Temperatures on TiO2 Based Materials
120
anode materials. Mater. Lett. 117, 124–127 (2014). 36. Liu, X., Xing, Z., Zhang, Y., Li, Z., Wu, X., Tan, S., Yu, X., Zhu, Q. & Zhou, W.
Fabrication of 3D flower-like black N-TiO2-x@MoS2 for unprecedented-high visible-light-driven photocatalytic performance. Appl. Catal. B Environ. 201, 119–127 (2017).
37. Zhang, K., Zhou, W., Zhang, X., Sun, B., Wang, L., Pan, K., Jiang, B., Tian, G. & Fu, H. Self-floating amphiphilic black TiO2 foams with 3D macro-mesoporous architectures as efficient solar-driven photocatalysts. Appl. Catal. B Environ. 206, 336–343 (2017).
38. D’Arienzo, M., Carbajo, J., Bahamonde, A., Crippa, M., Polizzi, S., Scotti, R., Wahba, L. & Morazzoni, F. Photogenerated defects in shape-controlled TiO 2 anatase nanocrystals: A probe to evaluate the role of crystal facets in photocatalytic processes. J. Am. Chem. Soc. 133, 17652–17661 (2011).
39. Zhang, C., Zhou, Y., Bao, J., Sheng, X., Fang, J., Zhao, S., Zhang, Y. & Chen, W. Hierarchical Honeycomb Br-, N-Codoped TiO2 with Enhanced Visible-Light Photocatalytic H2 Production. ACS Appl. Mater. Interfaces 10, 18796–18804 (2018).
40. Moss, B., Wang, Q., Butler, K. T., Grau-Crespo, R., Selim, S., Regoutz, A., Hisatomi, T., Godin, R., Payne, D. J., Kafizas, A., Domen, K., Steier, L. & Durrant, J. R. Linking in situ charge accumulation to electronic structure in doped SrTiO3 reveals design principles for hydrogen-evolving photocatalysts. Nat. Mater. 20, 511–517 (2021).
41. Bandura, A. V. & Lvov, S. N. The ionization constant of water over wide ranges of temperature and density. J. Phys. Chem. Ref. Data 35, 15–30 (2006).
42. Litter, M. I. Heterogeneous photocatalysis: Transition metal ions in photocatalytic systems. Appl. Catal. B Environ. 23, 89–114 (1999).
43. Hou, W. & Cronin, S. B. A review of surface plasmon resonance-enhanced photocatalysis. Adv. Funct. Mater. 23, 1612–1619 (2013).
44. Liu, Z., Hou, W., Pavaskar, P., Aykol, M. & Cronin, S. B. Plasmon resonant enhancement of photocatalytic water splitting under visible illumination. Nano Lett. 11, 1111–1116 (2011).
45. Furube, A., Du, L., Hara, K., Katoh, R. & Tachiya, M. Ultrafast plasmon-induced electron transfer from gold nanodots into TiO2 nanoparticles. J. Am. Chem. Soc. 129, 14852–14853 (2007).
46. Liu, J., Liu, Y., Liu, N., Han, Y., Zhang, X., Huang, H., Lifshitz, Y., Lee, S. T., Zhong, J. & Kang, Z. Metal-free efficient photocatalyst for stable visible water splitting via a two-electron pathway. Science 347, 970–974 (2015).
47. Che, W., Cheng, W., Yao, T., Tang, F., Liu, W., Su, H., Huang, Y., Liu, Q., Liu, J., Hu, F., Pan, Z., Sun, Z. & Wei, S. Fast Photoelectron Transfer in (Cring)-C3N4 Plane Heterostructural Nanosheets for Overall Water Splitting. J. Am. Chem. Soc. 139, 3021–3026 (2017).
48. Zhang, G., Lan, Z. A., Lin, L., Lin, S. & Wang, X. Overall water splitting by Pt/g-C3N4 photocatalysts without using sacrificial agents. Chem. Sci. 7, 3062–3066 (2016).
49. Maeda, K., Teramura, K., Lu, D., Takata, T., Saito, N., Inoue, Y. & Domen, K. Photocatalyst releasing hydrogen from water. Nature 440, 295 (2006).
50. Han, K., Kreuger, T., Mei, B. & Mul, G. Transient Behavior of Ni@NiOx Functionalized SrTiO3 in Overall Water Splitting. ACS Catal. 7, 1610–1614 (2017).

Chapter 3 Photocatalytic Overall Water Splitting Reaction at Elevated Temperatures on TiO2 Based Materials
121
51. Zheng, D., Cao, X. N. & Wang, X. Precise Formation of a Hollow Carbon Nitride Structure with a Janus Surface To Promote Water Splitting by Photoredox Catalysis. Angew. Chem. Int. Ed. 55, 11512–11516 (2016).
52. Fang, W., Liu, J., Yang, D., Wei, Z., Jiang, Z. & Shangguan, W. Effect of Surface Self-Heterojunction Existed in BixY1-xVO4 on Photocatalytic Overall Water Splitting. ACS Sustain. Chem. Eng. 5, 6578–6584 (2017).
53. Xing, M., Zhang, J., Chen, F. & Tian, B. An economic method to prepare vacuum activated photocatalysts with high photo-activities and photosensitivities. Chem. Commun. 47, 4947–4949 (2011).
54. Zuo, F., Bozhilov, K., Dillon, R. J., Wang, L., Smith, P., Zhao, X., Bardeen, C. & Feng, P. Active facets on titanium(III)-doped TiO 2: An effective strategy to improve the visible-light photocatalytic activity. Angew. Chem. Int. Ed. 51, 6223–6226 (2012).
55. Tian, B., Lei, Q., Zhang, W., Cui, Y., Tian, Y. & Tian, B. UV-driven overall water splitting using unsupported gold nanoparticles as photocatalysts. Chem. Commun. 54, 1845–1848 (2018).
56. Liu, B., Su, S., Zhou, W., Wang, Y., Wei, D., Yao, L., Ni, Y., Cao, M. & Hu, C. Photo-reduction assisted synthesis of W-doped TiO2 coupled with Au nanoparticles for highly efficient photocatalytic hydrogen evolution. CrystEngComm 19, 675–683 (2017).
57. Zhang, K., Zhou, W., Chi, L., Zhang, X., Hu, W., Jiang, B., Pan, K., Tian, G. & Jiang, Z. Black N/H-TiO2 nanoplates with a flower-like hierarchical architecture for photocatalytic hydrogen evolution. ChemSusChem 9, 2841–2848 (2016).
58. Zhang, K., Wang, L., Kim, J. K., Ma, M., Veerappan, G., Lee, C. L., Kong, K. J., Lee, H. & Park, J. H. An order/disorder/water junction system for highly efficient co-catalyst-free photocatalytic hydrogen generation. Energy Environ. Sci. 9, 499–503 (2016).
59. Hisatomi, T. & Domen, K. Reaction systems for solar hydrogen production via water splitting with particulate semiconductor photocatalysts. Nat. Catal. 2, 387–399 (2019).
60. Takata, T. & Domen, K. Particulate Photocatalysts for Water Splitting: Recent Advances and Future Prospects. ACS Energy Lett. 4, 542–549 (2019).
61. Pinaud, B. A., Benck, J. D., Seitz, L. C., Forman, A. J., Chen, Z., Deutsch, T. G., James, B. D., Baum, K. N., Baum, G. N., Ardo, S., Wang, H., Miller, E. & Jaramillo, T. F. Technical and economic feasibility of centralized facilities for solar hydrogen production via photocatalysis and photoelectrochemistry. Energy Environ. Sci. 6, 1983–2002 (2013).
62. Inoue, Y., Kitano, M., Kim, S. W., Yokoyama, T., Hara, M. & Hosono, H. Highly dispersed ru on electride [Ca24Al28O 64]4+(e-)4 as a catalyst for ammonia synthesis. ACS Catal. 4, 674–680 (2014).
63. Lin, B., Heng, L., Fang, B., Yin, H., Ni, J., Wang, X., Lin, J. & Jiang, L. Ammonia Synthesis Activity of Alumina-Supported Ruthenium Catalyst Enhanced by Alumina Phase Transformation. ACS Catal. 9, 1635–1644 (2019).

Chapter 4 Effects of the local electric field on photocatalytic overall water splitting reaction
122
Chapter 4 Effects of the local electric field on photocatalytic
overall water splitting reaction
This chapter is adapted from the work by Yiyang Li, Simson Wu, Jianwei Zheng,
Yung-Kang Peng, Dharmalingam Prabhakaran, Robert A. Taylor, Shik Chi Edman
Tsang, published in Materials Today in 2020. The figures are reproduced with
permission. Copyright 2020 Elsevier.1
4.1 Introduction
As demonstrated before, a typical photocatalytic reaction involves three
fundamental steps, namely, excitation, charge separation, and surface chemical
reactions. Much progress has been achieved to broaden the absorption spectra
by band gap engineering and facilitate the surface reactions by loading cocatalysts,
however, the separation of charge carriers remains untamed and in most cases
the charge recombination readily takes place, leading to poor quantum efficiency
(QE) and photocatalytic activities. Apparently, the photo-generated electron-hole
pairs must possess a sufficient lifetime to capture both H+ and OH- species derived
from the water molecules to allow efficient photocatalysis to take place. Therefore,
strategies for suppressing the charge recombination are required.
Recent reports have shown that polarisation plays an important role in the
separation of these photo-generated electrons and holes, which prolongs the
lifetime of charge carriers, therefore leading to enhanced photocatalytic
performance.2–4 The introduction of an electric field to enhance the polarisation
has recently been demonstrated to be an efficient approach for improving the
charge separation both in bulk and on surface of the photocatalysts. Zhang's group
reported a new strategy to introduce an internal electric field to Bi3O4Cl by carbon

Chapter 4 Effects of the local electric field on photocatalytic overall water splitting reaction
123
incorporation.3 The resulting C-doped Bi3O4Cl achieved a bulk charge separation
efficiency of 80 %, therefore the charge carrier lifetime was prolonged from less
than 500 ps to around 4000 ps, which is attributed to the strong internal electric
field. This catalyst enabled photocatalytic water oxidation under visible light in the
absence of sacrificial reagents; however, H2 was scarcely detected because the
CB is more positive than the H2-evolving potential. Likewise, the same research
group also reported a Janus Cl2-Bi12O17-MoS2 bilayer junction photocatalyst with
strong internal electric field for H2 evolution, in which the carrier lifetime was
claimed to be 3446 ns and a H2 evolution rate of 33 mmol g-1 h-1 was obtained with
ascorbic acid as the hole scavenger.4 However, the above strategies require fine
control during the synthesis and only apply to a few circumstances, hindering it
from wider applications.
As demonstrated in Chapter 3, a novel POWS system has been developed which
is operated at elevated temperatures, where the water ionic dissociation is greatly
enhanced and the surface adsorbed ion species create a local polarisation, which
subsequently prolong the charge carrier lifetimes. Enlightened by such
phenomenon, it came to my mind that I can use solid-state materials to create a
stronger local electric field. In fact, polar-faceted materials have long been studied
in catalysis since late 20th century, and the studies covered semiconductor
surfaces, oxide surfaces, ultra-thin oxide films, and oxide interfaces.5–7 For polar
surfaces, the orientation is such that each repeat unit grows in the direction
perpendicular to the surface, resulting in a non-zero dipole moment on the
surfaces. Thus, electric fields and electrostatic forces are generated on polar
surfaces5, making such materials good candidates for the study of local
polarisation effect.

Chapter 4 Effects of the local electric field on photocatalytic overall water splitting reaction
124
In addition, two-dimensional (2D) materials such as graphene, transition metal
dichalcogenides (TMDs), etc. have been proved to show great potential toward
catalysis, energy conversion and many other fields in recent decades, among
which single-layer MoS2 (SL-MoS2) has attracted considerable attention for
photocatalytic and electrochemical H2 evolution reaction (HER) due to its suitable
band structure and low overpotential.8–12 It has also been reported that with the
reduction of the thickness of MoS2, the optical, electronic and magnetic properties
change dramatically.13–15 The absorption properties and band structures have
been therefore well studied,14 which proved that as MoS2 is exfoliated to
monolayer, its band gap is broadened, making its conduction band and valance
band possess sufficient thermodynamic driving forces to drive the H2 and O2
evolution reactions ( 𝐸VG =+1.69𝑉𝑣𝑠. 𝑆𝐻𝐸;𝐸WG = −0.11𝑉𝑣𝑠. 𝑆𝐻𝐸 ),
respectively.16,17 These make the SL-MoS2 promising for solar-light-driven
photocatalytic water splitting systems. However, so far, the SL-MoS2 are still
commonly used as a substitute of noble metal like Pt in photocatalytic or
electrocatalytic H2 evolution systems, and very few studies reported MoS2 alone
as the photocatalyst. Plus, sacrificial reagents are frequently engaged in such
photocatalytic water splitting systems to capture the photo-generated holes due to
the fast intrinsic charge recombination process, leading to unwanted by-products
and extra costs.11,12,18
4.2 Objectives
Here in this chapter, I aim to explore the local polarisation effect on the POWS
reaction system. As stated before, the local polarisation effect can provide local
electric fields (LEFs) which will facilitate the charge carrier separation process,
leading to enhanced POWS performances. Fortunately, the LEF can be provided

Chapter 4 Effects of the local electric field on photocatalytic overall water splitting reaction
125
by polar-faceted materials. Therefore, the N-doped TiO2 is firstly assembled with
polar-faceted MgO (111) and its non-polar counterparts, MgO (110) and MgO (100),
respectively. The influence of the local polarisation on the lifetime and POWS
performance is therefore investigated.
Following the same idea, the 2D SL-MoS2 is studied by assembling with the polar-
faceted materials. The monolayer nature makes it more sensitive to the local
electric field, considering the polarisation is quite localised within a small range;
and the structural flexibility of the monolayer material allows it to form stronger
interactions with the supports. Except for the previously mentioned MgO, CeO2
and ZnO are also studied, and layered double hydroxides (LDHs) are engaged as
well. POWS performances are subsequently investigated and with the help of
time-resolved technique, the influence on the charge separation can also be
studied. By involving two widely studied photocatalysts, TiO2 and MoS2, and
different kinds of polar-faceted materials, the objective of this chapter is to show
that the local polarisation can be a versatile strategy in photocatalysis. And also,
the relationships between polarity, lifetime of the charge carriers, and POWS
activity are carefully investigated and discussed.
4.3 Results and discussion
4.3.1 Electric field effects on TiO2 based materials
4.3.1.1 LEF introduced by the polar-faceted MgO(111)
Enlightened by the results presented in Chapter 3, I realised that the local
polarisation plays an important role in the POWS system. Therefore, the polar-
faceted metal oxides were synthesised as supports to introduce local electric field
due to the strong surface polarities. MgO(111) was firstly explored, and the non-

Chapter 4 Effects of the local electric field on photocatalytic overall water splitting reaction
126
polar counterparts, MgO(110) and MgO(100), were also included for comparison.
As is well known, the polar MgO(111) nanocrystals give surfaces of both negative
(O2-) or positive (Mg2+) terminations,19,20 giving a strong LEF to the catalyst
particles (Figure 4.1A). TEM images shown in Figure 4.1B confirm the lattice
fringes of 0.244 nm, 0.148 nm and 0.214 nm for MgO(111), MgO(110) and
MgO(100) respectively, indicating the successful synthesis of the MgO samples
with different exposed facets.
Figure 4.1 (A) Schematic illustrations of different MgO facets (O: red; Mg: green); (B) HRTEM images of MgO(111), (110) and (100) nanostructures; (C) 1H NMR and TMPO-assisted 31P MAS NMR measurements of MgO (111), (110), (100), respectively, which show the surface polarity of MgO (111) creates substantial chemical shifts to 1H and 31P. HRTEM images were acquired by Dr. Simson Wu, and NMR experiments were performed by Dr. Guangchao Li.

Chapter 4 Effects of the local electric field on photocatalytic overall water splitting reaction
127
Figure 4.2 POWS activity tests of the 1 wt.% Au/N-P25-620 photocatalyst combined with different MgO supporting materials, including non-polar MgO(100) and MgO(110), and also the polar-faceted MgO(111). POWS reaction is performed at 270 oC with visible light irradiation. 1H MAS NMR was carried out to evaluate the interaction of H+ with oxygen anions
in bulk phase of MgO(111), (110) and (100) respectively. As shown in Figure 4.1C,
a chemical shift at around 0.7 ppm can be observed in all MgO supports, which is
attributed to the protons from isolated hydroxyl groups (i.e., Mg-OH) and physical-
adsorbed water molecules;21 while the other peak observed at lower field, which
can be assigned to the protons attached to the bridging oxygen (i.e., Mg-O(H)-Mg),
shifted to 5.43 ppm for MgO(111) compared with 4.78 ppm for MgO(110) and 4.74
ppm for MgO(100). Such a significant difference between polar MgO(111) surface
and non-polar MgO(110) and (100) surface is due to the preferential proton
adsorption on polar surface. Trimethylphosphine oxide (TMPO, chemical formula:
OP(CH3)3) probe assisted 31P MAS NMR was subsequently engaged to further
confirm the surface polarity of MgO(111).21,22 TMPO has lone pairs at the O atom,
so it is a Lewis base and able to interact with the surface Lewis acid species, such
as Mg2+ or H+, which forms Lewis acid-base adducts. Such Lewis acid-base
interactions can be observed through the change of chemical states by the
0
2000
4000
6000
8000
10000
12000
MgO(111)MgO(100)MgO(110)None
H2
evol
utio
n ra
te (µ
mol
g-1
h-1
)

Chapter 4 Effects of the local electric field on photocatalytic overall water splitting reaction
128
difference of chemical shifts in 31P NMR. As shown in Figure 4.1C, a shift to 45.8
ppm for MgO(111) from 43 ppm for MgO(110) and (100) can be observed
(chemical shift of physically adsorbed TMPO in 31P NMR is at around 41 ppm),
which also confirmed the surface polarity of the MgO(111) support.
Figure 4.3 EPR spectra of Au/N-P25-620 with and without mixing with polar MgO(111), and non-polar MgO(100) and MgO(110), respectively. Subsequently, the MgO materials were combined with the 1 wt.% Au/N-P25-620
that shows extraordinary POWS performance as comprehensively studied in
Chapter 3. The POWS activity of the resulted Au/N-P25-620/MgO(111)
photocatalyst was then tested using the same method, which gives a much
enhanced and stable H2 evolution rate of 11092 μmol g-1 h-1 with O2 to H2 at 1:2
ratio at 270 oC, while non-polar Au/N-P25-620/MgO (100) or (110) shows no rate
promotion compared to that without the MgO support (Figure 4.2). To rule out the
influence of other factors like oxygen vacancies (VOs), EPR measurements were
then carried out for the Au/N-P25-620 combined with polar and non-polar MgO
supports. As can be seen from Figure 4.3, all the MgO supports showed small and
similar signal at g=2.003, which can be assigned to the surface defects such as

Chapter 4 Effects of the local electric field on photocatalytic overall water splitting reaction
129
VOs of the MgO.23,24 After mixing with the Au/N-P25-620 the mixtures showed
similar patterns as the Au/N-P25-620 alone. In another word, the enhancement of
the photocatalytic performance could not be due to the change of VO
concentrations, considering the different behaviours between polar MgO(111) and
its non-polar counterparts.
Figure 4.4 TRPL spectra of Au/N-P25-620 with and without MgO supports. As mentioned before, the polarisation effect of the LEF is able to influence the
separation of the photo-generated electron-hole pairs, therefore, TRPL was
engaged to investigate the changes of the charge carrier lifetimes of the TiO2-
based photocatalysts combined with different MgO supports. As shown in Figure
4.4, MgO(111) shows strong effect on prolonging the charge carrier lifetime of the
Au/N-P25-620 from 2.56 ns to 5.76 ns, whereas non-polar MgO(100) or (110)
shows no apparent influence. Thus, it is indicated that the use of polar-faceted
MgO(111) can introduce a strong LEF, which prolongs the charge carrier lifetimes
and therefore enhances the photocatalytic water splitting activities. QE was also
measured, which was further promoted to 81.8 % at 437 nm and 3.2 % at 1000

Chapter 4 Effects of the local electric field on photocatalytic overall water splitting reaction
130
nm with the inclusion of MgO(111) (Figure 4.5). Activities of the MgO supports were
also tested separately to confirm the MgO alone shows no contribution to POWS
activity. A 10-cycle stability test was carried out for the Au/N-P25-620/MgO(111)
which showed a stable photocatalytic activity (Figure 4.6).
Figure 4.5 QEs of Au/N-P25-620/MgO(111) photocatalyst at different wavelengths.
Figure 4.6 Stability test of Au/N-P25-620/MgO(111): 10 mg of Au/N-P25-620/MgO(111) was used in the POWS activity test (detailed method of activity testing has been demonstrated in Chapter 2). After reaction, the photocatalyst was separated by centrifuge and dried at 60 oC under vacuum overnight. This recycled photocatalyst was then used for the POWS activity test again, following exactly the same procedures. The photocatalyst was used and recycled for 10 cycles in total, and the activity of each cycle is shown in this figure.

Chapter 4 Effects of the local electric field on photocatalytic overall water splitting reaction
131
Figure 4.7 Post-reaction characterisations of the photocatalyst. XRD (a) and EPR (b) spectra of Au/N-P25-620 and Au/N-P25-620/MgO(111) before and after the 10-cycle photocatalytic water splitting test. The used catalyst was characterised using XRD and EPR (Figure 4.7), which
again suggested the good stability of the Au/N-P25-620/MgO (111) photocatalyst.
For the Au/N-P25-620/MgO(111) photocatalyst, the XRD peaks of MgO became
sharper after the reaction, indicating that there could be aggregation of the
MgO(111) nanostructures during the POWS reaction at 270 oC. Also, the EPR
signal increases after the reaction for both the Au/N-P25-620 and Au/N-P25-
620/MgO(111), which agrees with the observations demonstrated in Chapter 3: the
surface VOs can be regenerated at elevated temperatures, no matter in an inert
atmosphere or in liquid water, thus giving an increased EPR signal after the POWS
reaction at 270 oC.
4.3.1.2 Investigation of the LEF
Further efforts were made to confirm the enhancement is due to the LEF effect.
Since there might be artefacts introduced by different sizes and morphologies of
the MgO supports, leading to different interfaces and catalytic behaviours, then N-
TiO2 with different particle sized were made and mixed with MgO(111). It has been
considered that the LEF is a localised effect which makes only short-range
influence.2 Theoretically, more obvious LEF effect can be obtained on the N-TiO2
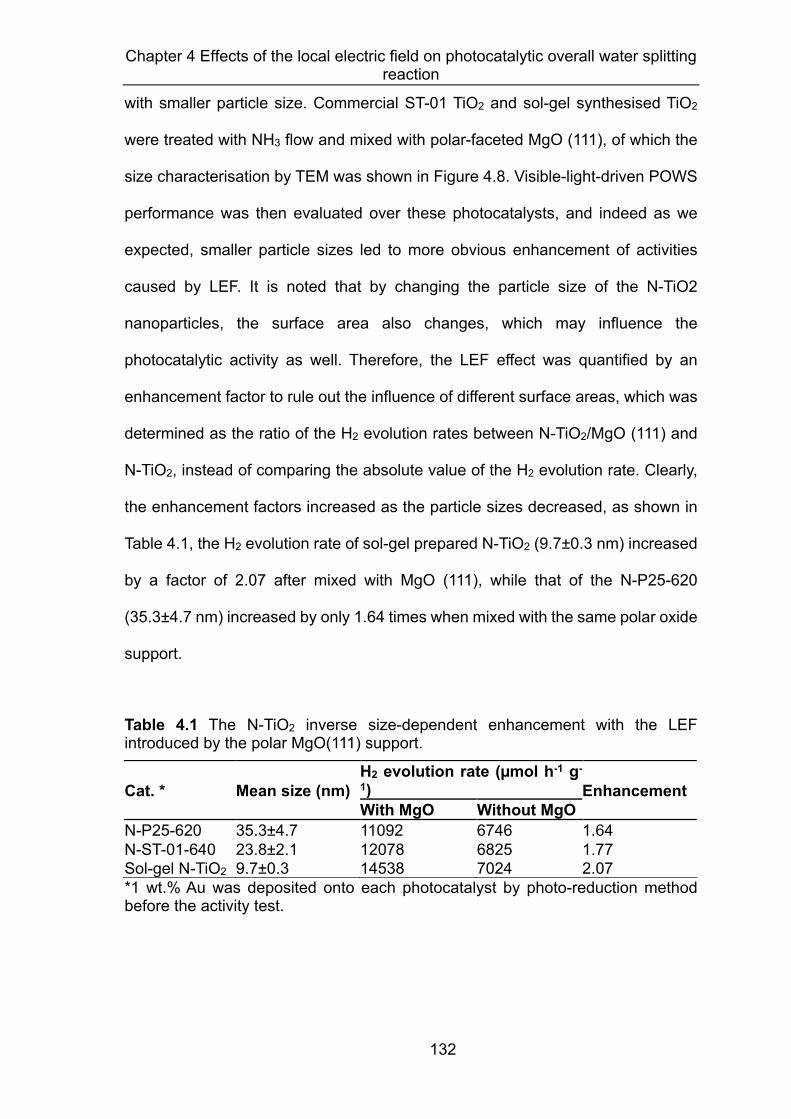
Chapter 4 Effects of the local electric field on photocatalytic overall water splitting reaction
132
with smaller particle size. Commercial ST-01 TiO2 and sol-gel synthesised TiO2
were treated with NH3 flow and mixed with polar-faceted MgO (111), of which the
size characterisation by TEM was shown in Figure 4.8. Visible-light-driven POWS
performance was then evaluated over these photocatalysts, and indeed as we
expected, smaller particle sizes led to more obvious enhancement of activities
caused by LEF. It is noted that by changing the particle size of the N-TiO2
nanoparticles, the surface area also changes, which may influence the
photocatalytic activity as well. Therefore, the LEF effect was quantified by an
enhancement factor to rule out the influence of different surface areas, which was
determined as the ratio of the H2 evolution rates between N-TiO2/MgO (111) and
N-TiO2, instead of comparing the absolute value of the H2 evolution rate. Clearly,
the enhancement factors increased as the particle sizes decreased, as shown in
Table 4.1, the H2 evolution rate of sol-gel prepared N-TiO2 (9.7±0.3 nm) increased
by a factor of 2.07 after mixed with MgO (111), while that of the N-P25-620
(35.3±4.7 nm) increased by only 1.64 times when mixed with the same polar oxide
support.
Table 4.1 The N-TiO2 inverse size-dependent enhancement with the LEF introduced by the polar MgO(111) support.
*1 wt.% Au was deposited onto each photocatalyst by photo-reduction method before the activity test.
Cat. * Mean size (nm) H2 evolution rate (µmol h-1 g-1) Enhancement With MgO Without MgO
N-P25-620 35.3±4.7 11092 6746 1.64 N-ST-01-640 23.8±2.1 12078 6825 1.77 Sol-gel N-TiO2 9.7±0.3 14538 7024 2.07

Chapter 4 Effects of the local electric field on photocatalytic overall water splitting reaction
133
Figure 4.8 TEM images of the N-doped TiO2 photocatalysts. a: different sizes of N-TiO2 prepared by a sol-gel method; b: N-ST-01 and c: N-P25-620, together with the corresponding average particle size dispersions (d-f). TEM images were acquired by Dr. Tianyi Chen. 4.3.2 Electric field effects on 2D MoS2 based materials
4.3.2.1 Characterisations of MoS2 based materials
The above results show that the local polarisation effect becomes more substantial

Chapter 4 Effects of the local electric field on photocatalytic overall water splitting reaction
134
as the photocatalyst particles getting smaller, therefore, I realised that 2D materials
such as SL-MoS2 would presumably be promising for a better investigation of this
effect. SL-MoS2 monolayers were then prepared via a chemical exfoliation method,
and decorated with atomically dispersed metal atoms by hydrothermal process1,15.
The morphologies of the SL-MoS2 were initially characterised by TEM, as shown
in Figure 4.9. Compared with the large particle of extensive layered-structure
morphology of the bulk form, it is exciting to observe the exfoliated SL-MoS2 as
thin monolayers. Atomic force microscopy (AFM) subsequently confirmed that the
thickness of individual layers is about 0.6-0.7 nm, which is in good accordance
with the layer thickness of ca. 0.65 nm of the S-Mo-S building block (Figure 4.10).
Figure 4.9 Conventional TEM image analyses of (a, b) bulk MoS2, showing layered structure of crystal MoS2, with lateral size varying from 0.5 to 2µm; (c) SL-MoS2 and (d) Co:SL-MoS2. After the incorporation of Co atoms, the morphology of SL-MoS2 remains a sheet-like structure. Reproduced from ref. 1,15.

Chapter 4 Effects of the local electric field on photocatalytic overall water splitting reaction
135
Figure 4.10 (a) AFM image of SL-MoS2 spin-coated on a Si substrate; (b) a model of MoS2 structure perpendicular to c axis. (c) height profile of the AFM image. Reproduced with permission from ref. 1,15. 100 flakes in (a) were scanned, with the majority of heights between 0.6-0.7nm. The lateral dimension of the MoS2 monolayers is approximately 20-40 nm. It can be seen that the step heights of individual layers of 0.6-0.7 nm. This value is comparable to ca. 0.65 nm of a single layer of the S-Mo-S building block. Statistical analysis of 100 flakes revealed that 56% of the flakes to be monolayer, 28% of two layers and 13% of three layers and so on. The average topographic height is around 1.04 nm. The metal doped SL-MoS2 materials were then investigated with microscopic
techniques as well, as can be seen in Figure 4.9d, after the incorporation of Co
atoms, the morphologies of SL-MoS2 still remained sheet-like structure. Then the
Co:SL-MoS2 was looked into in more details (Figure 4.11). HAADF-STEM together
with electron energy loss spectroscopy (EELS), confirmed the existence of the Co
single atoms on the Mo atop sites. The HAADF-STEM images of Fe:SL-MoS2 and
Ru:SL-MoS2 are also shown in Figure 4.11, which again imply that single atoms
are attached onto the single layer nanosheets and overlap the Mo and S positions.
XRD measurements were also carried out before and after the chemical exfoliation
process, not surprisingly, the XRD peaks were barely present after the exfoliation,

Chapter 4 Effects of the local electric field on photocatalytic overall water splitting reaction
136
implying the successful preparation of the single layer nanosheets (Figure 4.12).
Moreover, no apparent re-stacking happened after metal loading via hydrothermal
treatment, given that the XRD patterns of the metal doped SL-MoS2 are almost flat
lines (Figure 4.12b).
Figure 4.11 (a) HAADF-STEM image of Co–SMoS2. Scale bar, 0.5 nm. (b) A magnified view of the boxed area of a. Simultaneous acquisition HAADF (c) and EELS (d) acquired along the line in b, with EELS extracted from above (red), on (green), and below (blue) the Co atom on the Mo atop site. The L3 and L2 edges for Co are indicated, confirming the scanned atomic column contains a Co atom. (e, f) HAADF-STEM images of (e) Fe:SL-MoS2 and (f) Ru:SL-MoS2

Chapter 4 Effects of the local electric field on photocatalytic overall water splitting reaction
137
Figure 4.12 (a) XRD patterns of bulk MoS2, SL-MoS2 and the metal-doped SL-MoS2; (b) Enlarged XRD patterns of SL-MoS2 and the metal-doped SL-MoS2 in the range of 10-20o, as indicated in (a).
Figure 4.13 EPR spectra of bulk MoS2, SL-MoS2 and the metal-doped SL-MoS2. EPR experiments were carried out to investigate the surface defects, as shown in
Figure 4.13. SL-MoS2 showed an increased EPR signal at around g=2.005, which
originated from the sulphur vacancies, while bulk MoS2 remained silent on EPR. It
is also shown that after the metal doping, the signal sharply decreased compared
with pure SL-MoS2, implying the metal species were favourably anchored on the
sulphur vacancy sites. A control experiment was carried out by treating the SL-

Chapter 4 Effects of the local electric field on photocatalytic overall water splitting reaction
138
MoS2 with the hydrothermal process, but without adding any metal precursors. The
result showed that EPR signal remained after the hydrothermal treatment in the
absence of the metal precursors.
Figure 4.14 (a) Ru K-edge XANES spectra of the Ru:SL-MoS2 and the Ru (0) foil reference. (b) FT-EXAFS spectra of the Ru:SL-MoS2 and the Ru (0) foil reference for Ru K-edge. (c) Fourier transforms of k3-weighted Ru K-edge of the EXAFS spectrum of the Ru:SL-MoS2. These XANES and EXAFS were performed and analysed by Dr. Simson Wu of Prof. Edman Tsang’ s group. To investigate the local structures of the decorated metal species more precisely,
X-ray absorption near edge structure (XANES) and extended X-ray absorption fine
structure (EXAFS) measurements were conducted. Figure 4.14a shows the
XANES curves of the Ru:SL-MoS2 sample and the Ru (0) foil reference at Ru K-

Chapter 4 Effects of the local electric field on photocatalytic overall water splitting reaction
139
edge. It is found that the Ru:SL-MoS2 shares nearly the same absorption edge as
Ru foil, suggesting the presence of Ru (0) species in the sample. Fourier
transformed (FT) EXAFS spectra of Ru K-edge showed no peak related to Ru-Ru
scattering at 2.42 Å (before phase shift), indicating the absence of Ru-Ru bond in
the Ru:SL-MoS2. Instead, the peak at 1.68±0.03 Å was observed, which is
attributed to the contribution of Ru-S scattering. Subsequent least-squares fitting
of the EXAFS spectrum (Figure 4.14c) revealed a three-sulphur coordination to
the Ru at 1.68±0.03 Å (coordination number: 2.8±0.3; R-range: 1.3-3.0; Debye
Waller’s factor: 0.006±0.001; R-factor: 3.5%), which concomitantly matches with
our expectation that the doped Ru atoms are anchored in the S sites with each Ru
surrounded by 3 nearest sulphur atoms.
4.3.2.2 POWS performance of MoS2-based materials
The POWS performance was then evaluated at 270 oC under visible light
irradiation. The bulk MoS2 showed no activity for this reaction, while SL-MoS2
exhibited a H2 evolution rate of 157 μmol g-1h-1. Control experiments that carried
out in dark or in the absence of catalysts showed no activity, confirming the
stoichiometric H2 and O2 evolution (as will be shown later in this chapter) is due to
the photocatalytic water splitting over the MoS2-based photocatalysts. UV-Vis
diffuse reflectance spectroscopy (DRS) was performed for the SL-MoS2, which
indicates that the SL-MoS2 exhibits good visible light absorption in the range of
400-700 nm (Figure 4.15a), and the Tauc plot gives a band gap energy of 1.93 eV
(Figure 4.15b). The POWS activity can be largely enhanced after the metal doping,
among which the Ru-doped SL-MoS2 (Ru:SL-MoS2) shows the best H2 evolution
rate of 821 μmol g-1h-1 (Figure 4.15c). Therefore, the following study was focused
on the Ru:SL-MoS2.

Chapter 4 Effects of the local electric field on photocatalytic overall water splitting reaction
140
Figure 4.15 (a) UV-Vis absorption spectra of the SL-MoS2 converted from the UV-Vis DRS using the Kubelka-Munk function. (b) Tauc plot of the SL-MoS2 derived from (a). (c) Photocatalytic water splitting performance over different metal-doped MoS2 single layer. Error bars indicate the standard deviations. 4.3.2.3 Characterisations of the polar-faceted metal oxides
Figure 4.16 TEM images of (a) polar-faceted CeO2 nanocubes with predominant (100) surfaces and (b) non-polar CeO2 nanospheres. Subsequently, the study of local polarisation effect was carried out by assembling
the Ru:SL-MoS2 with various polar-faceted metal oxide supports. Besides the
MgO(111), MgO(110), and MgO(100) which have been discussed before, polar
CeO2(100) nanocubes (NCs), polar ZnO(0001) nanoplates (NPs), non-polar CeO2
nanospheres (NSs), and non-polar ZnO nanorods (NRs) were also included for
the study of local polarisation effect. These polar surfaces display alternative anion
and cation layers hence the top surfaces possess non-zero polarity.

Chapter 4 Effects of the local electric field on photocatalytic overall water splitting reaction
141
Figure 4.17 TEM images of (a) polar-faceted ZnO (0001) nanoplates and (b) non-polar ZnO nanorods. (c) Schematic illustration of the polar and non-polar facets of the ZnO nanoplates and nanorods. Microscopic images of the polar and non-polar metal oxide support are displayed
in Figures 4.16 and 4.17. For example, distinctive layers of Ce4+ and O2- in (100)
terminal facets can be directly visualised in Figure 4.16. Morphologies of ZnO
nanoplates and nanorods are shown in Figure 4.17. The unique surface polarity of
the polar oxides was further confirmed by the solid-state nuclear magnetic
resonance (NMR) (Figure 4.18). The probe-assisted 31P NMR results clearly
showed the different 31P chemical shift of the polar-faceted metal oxides compared
with their non-polar counterparts. More characterisations were then carried out to
exclude the influence of the structural differences. XRD patterns barely change
with different dominant facet exposure. Taking CeO2 as an example, the NCs and

Chapter 4 Effects of the local electric field on photocatalytic overall water splitting reaction
142
NSs share similar XRD patterns as can be seen in Figure 4.19, with the NCs
exhibiting slightly stronger signals than the NSs. Such similarities can also be
observed for the MgO and ZnO samples. EPR analysis was then performed on
the polar-faceted and non-polar oxides, which indicates that MgO(111) and ZnO
NPs show no obviously difference compared with their non-polar counterparts,
while CeO2 NCs shows higher signal intensity which can be attributed to the
formation of Ce3+ at the surface,22,25 as shown in Figure 4.20.
Figure 4.18 TMP-probed 31P NMR of polar-faceted and non-polar a: CeO2, b: MgO and c: ZnO.
Figure 4.19 XRD patterns of polar and non-polar faceted a: CeO2, b: MgO and c: ZnO.

Chapter 4 Effects of the local electric field on photocatalytic overall water splitting reaction
143
Figure 4.20 EPR spectra of polar and non-polar faceted a: CeO2, b: MgO and c: ZnO. 4.3.2.4 Assembly of Ru:SL-MoS2 and polar-faceted metal oxides
Figure 4.21 (a) SEM images of Ru:SL-MoS2/CeO2 NCs; (b) TEM and (c) EDS elemental mapping of selected Ru:SL-MoS2 on a cubic CeO2 particle.

Chapter 4 Effects of the local electric field on photocatalytic overall water splitting reaction
144
TEM images of a typical assembled photocatalyst, Ru:SL-MoS2/CeO2 NCs, is
shown in Figure 4.21. Clearly, the SL-MoS2 monolayers are well dispersed on the
surface of the CeO2 nanocubes, which is further confirmed by the energy-
dispersive spectroscopy (EDS) mapping (Figure 4.21c).
Figure 4.22 (a) PL spectrum of the SL-MoS2 (excitation wavelength: 400 nm). (b) TRPL spectra and (c) the POWS activity of the Ru:SL-MoS2 assembled with the polar and non-polar oxide supports. The TRPL spectra were recorded at a probe wavelength of 680 nm. The charge separation process of the assembled materials was investigated by
photoluminescence (PL) spectroscopy. The PL spectrum of the SL-MoS2 shows a
broad emission band ranging from 600 nm to 800 nm (Figure 4.22a). The charge
carrier lifetimes of the Ru:SL-MoS2 were much prolonged after assembled with the
polar faceted oxide materials, showing a more than four-fold improvement from
1.02 ns to 4.53 ns after mixed with CeO2 NCs, and for the assembly with the
MgO(111) and ZnO NPs, the lifetimes were increased to 3.10 ns and 1.32 ns,
respectively. However, those that combined with the non-polar metal oxides
showed no such obvious change (Figure 4.22b). Subsequently, the photocatalytic
water splitting performance of these assembled materials were evaluated.
Excitingly, the photocatalytic activity of Ru:SL-MoS2 was greatly enhanced after
assembled to the polar-faceted oxides. As seen in Figure 4.22c, the Ru:SL-
MoS2/CeO2 NCs shows a high H2 evolution rate of 2977 μmol g-1h-1 under visible

Chapter 4 Effects of the local electric field on photocatalytic overall water splitting reaction
145
light irradiation, while those of Ru:SL-MoS2/MgO(111) and Ru:SL-MoS2/ZnO NPs
are 2184 μmol g-1h-1 and 1152 μmol g-1h-1, respectively. On the other hand, the
combination with their non-polar counterparts were also tested which still showed
no improvement of the photocatalytic activities of overall water splitting reaction
(Figure 4.22c). It is noted that there has been nearly 4 times promotion of activity
when blended with polar CeO2 NCs support. It is noted that CeO2 is also a good
catalyst due to its high oxygen mobility, and it is used in the solid oxide fuel cells.26
In addition, ZnO has been used in the Z-scheme photocatalytic systems to form
heterojunctions for better charge separation.27 Some may argue that the enhanced
POWS activity is due to these favourable properties of the oxide supports.
Obviously, the greatly prolonged lifetime of the photo-generated charge carriers
finally results in the remarkable enhancement of photocatalytic activities.
Figure 4.23 (a) The charge carrier lifetime and (b) the POWS performance of the Ru:SL-MoS2 photocatalysts promoted by the polar-faceted oxide supports plotted against the electronegativities of the metal elements. To strike more understanding of the controlling of the charge separation process
via the polarisation effect by using polar-faceted oxides, we tried to find the
relationship between the polarity and photocatalytic activities. Obviously, polarity
is related to the electronegativity difference of the metal and oxygen in a polar-

Chapter 4 Effects of the local electric field on photocatalytic overall water splitting reaction
146
faceted oxide, and the metal with lower electronegativity gives higher polarity near
the surface of the polar-faceted oxide in this negative to positive layer configuration.
Thus, the photocatalytic activities and the charge carrier lifetimes are plotted
against the polarity, respectively (Figure 4.23). It is interesting to see that both the
photocatalytic activities and the charge carrier lifetimes showed apparent linear
relationships with the polarity within experimental errors, which confirmed that the
charge carrier lifetime of a photocatalyst can be proportionally prolonged by the
local electric field introduced by the polarisation effect of the polar-faceted oxide
supports.
4.3.2.5 Assembly of Ru:SL-MoS2 and LDHs
Figure 4.24 XRD patterns of different Mg-contained LDHs prepared by co-precipitation method. Bearing in mind that the local polarisation effect observed so far should not be
limited to the polar-faceted metal oxides, but can be extended to other material
systems, thus, further exploration of the local polarisation effect was attempted on
layered double hydroxides (LDHs). LDHs are also well-defined materials with
layered structures, which consist of metal layers and hydroxide layers carrying

Chapter 4 Effects of the local electric field on photocatalytic overall water splitting reaction
147
alternative negative and positive charge along their main crystallographic [100]
direction. Thus, the LDHs can also introduce a local electric field via the surface
polarity. Moreover, the surface polarity can be more flexibly controlled by changing
the metal elements and ratios of the LDHs. Various LDHs were thus prepared by
co-precipitation method, including MgAl-LDH, MgCr-LDH, MgFe-LDH and MgCo-
LDH, and each of them was then assembled with the Ru:SL-MoS2 by refluxing in
water. As shown in Figure 4.24, the structure of each LDH was confirmed by XRD,
the characteristic peaks were observed at 2θ=11.4o and 22.9o, implying the
existence of (003) and (006) facets of the layered structure of the LDHs.28,29 There
are also some additional peaks in the XRD spectrum of MgCr-LDH, which is
attributed to Mg(OH)2 and MgO,30 thus, the synthesis of this LDH material needs
further optimisations in the future research.
Obviously, the charge carrier separation was substantially facilitated when Ru:SL-
MoS2 was combined with LDHs, the charge carrier lifetime increases from 1.02 ns
of Ru:SL-MoS2 to 2.62 ns of Ru:SL-MoS2/MgAl-LDH. Photocatalytic activity of
water splitting reaction was then evaluated likewise. As expected, the
photocatalytic performance was also apparently enhanced compared with Ru:SL-
MoS2. It is exciting to see that the most common MgAl-LDH showed the highest
enhancement factor among the four selected LDHs, leading to a H2 evolution rate
of 1811 μmol g-1h-1 (as can be seen from Figure 4.25), which is among the best of
the visible-light-driven overall water splitting systems. The layered structure of
LDHs allows the formation of the oriented polarisation inside the LDHs, which
leads to the presence of the local electric field near the surface, therefore prolongs
the lifetime of the photo-generated charge carriers in the Ru:SL-MoS2, resulting in
the enhanced photocatalytic activities (Figure 4.25).

Chapter 4 Effects of the local electric field on photocatalytic overall water splitting reaction
148
4.3.2.6 Correlation of polarisation and POWS performance
Now that the promotion of polarisation effect introduced by polar-faceted metal
oxides and LDHs as supports have been studied separately, then for better
understanding of this effect and further rational design of photocatalysts with
prolonged the charge carrier lifetimes, the unification of the two systems must be
achieved. It should be taken into account that the binary metal oxides and LDHs
have different compositions and structures. Thus, the contribution of Mg and the
corresponding trivalent metal should both be taken into account, and the metal
ratios should be considered. So, a total polarity is developed as shown in the
following equations:
For polar-faceted metal oxides:
Totalpolarity𝜒T =𝜒XYZKD= − 𝜒EDMF[ Equation 4.1
For LDHs:
Totalpolarity𝜒T =𝜒XYZKD= − (𝜒\K × 𝜔\K + 𝜒/ × 𝜔/) Equation 4.2
where 𝜒XYZKD=, 𝜒EDMF[, 𝜒\K, 𝜒/ are the electronegativity of oxygen, metal ions in
metal oxides, magnesium and the trivalent metal ions in the LDHs; and 𝜔\K, 𝜔/
are the molar percentage of magnesium and the trivalent metal in the LDHs.
In Equation 4.1, the 𝜒T of polar-faceted oxides is defined by the difference
between the electronegativity of oxygen and metal; while for those of LDHs, both
trivalent metal and bivalent metal (Mg) are considered, and the contribution of
each is normalised depending on the molar ratio, as demonstrated in Equation 4.2.
Then all the photocatalytic activities and the charge carrier lifetimes of the Ru:SL-
MoS2 based materials are plotted against the 𝜒T. Interestingly, linear relationships
are clearly observed, as a result, the charge carrier lifetimes are found proportional

Chapter 4 Effects of the local electric field on photocatalytic overall water splitting reaction
149
to the 𝜒T (Figure 4.25a), which confirms that the charge separation process can
be controlled by tuning the local polarity through different polar-faceted supports.
Such facilitated charge separation therefore contributes to the enhanced
photocatalytic performance, making the photocatalytic water splitting activities
also proportional to the total polarities 𝜒T (Figure 4.25b). Strong LEF is exerted to
the catalyst by the surface of the polar-faceted materials, and such polarisation
effect prolong the lifetime of the charge carriers at the interfaces, which largely
enhances the photocatalytic activities. So far, the CeO2 NCs shows the highest
enhancement because of its strongest polarity of Ce-O bond (which is
perpendicular to the exposed (100) surfaces of the CeO2 nanocubes) according to
the difference in electronegativity between Ce and O.
Figure 4.25 The semi-quantitative relationships of total polarity 𝜒T of the Ru:SL-MoS2 photocatalyst enhanced by polar-faceted metal oxides and LDHs supports (a) the relationship between total polarity 𝜒T and the charge carrier lifetime. (b) the relationship between total polarity 𝜒T and the photocatalytic H2 evolution rates. Ru:SL-MoS2 and Ru:SL-MoS2/CeO2 NCs were then tested for 10 hours, both of
which showed good stability without obvious change of the H2 evolution rates. As
shown in Figure 4.26a. Both catalysts showed a stable and stoichiometric
production of H2 and O2. It is widely agreed that for a photocatalytic system, the

Chapter 4 Effects of the local electric field on photocatalytic overall water splitting reaction
150
QE, which evaluates the conversion efficiency of the photons at a certain
wavelength to H2, is one of the most important parameters when evaluating the
performance of renewable solar energy to H2 fuel systems.31
Figure 4.26 (a) POWS activity tests over Ru:SL-MoS2 with and without polar CeO2 NCs support at constant rate for 10 hours. This figure shows the amount of the evolved H2 gas (in μmol) against the reaction time. Conditions: the amount of catalyst that contains 5 mg of the Ru:SL-MoS2 was added to 10 mL of deionised H2O in a 25-mL batch reactor under vigorous magnetic stirring, and Ar gas was used as the inert gas. Then the batch reactor was heated up to 270 oC and maintained for different reaction time before cooling down to room temperature. (b) QEs of Ru:SL-MoS2 with and without the polar CeO2 NCs at different wavelengths. Different from the overall solar-to-hydrogen conversion efficiency or H2 evolution
rate, the QE provides more detailed and fundamental information about the
photocatalytic systems, bearing in mind that a photocatalyst performs differently
when harnessing the photons at different wavelengths. Remarkable QE has been
frequently reported in the presence of sacrificial reagents, unfortunately, for the
overall water splitting system, almost all the reported QEs were extremely low
under the visible light irradiation (rarely exceeding 5% at 420 nm), which cannot
reach the requirement of any practical applications. In our photocatalytic system,
the QE was evaluated at 270 ℃ with the highest water ionisation at wavelengths

Chapter 4 Effects of the local electric field on photocatalytic overall water splitting reaction
151
ranging from ultraviolet to visible light using different band pass filters. As
illustrated in Figure 4.26b, high QE of about 90% were obtained for each
photocatalyst at 385 nm due to high absorption, and it is exciting that when the
light irradiation is changed to visible light, an extraordinary QE of 66.8 % for Ru:SL-
MoS2/CeO2 NCs can still be maintained at 437 nm, which is more than 10 times
higher than most results reported so far. QE sharply drops with further increasing
the wavelength due to the rapid decrease of photon absorption at longer
wavelengths. However, the MoS2-based photocatalysts show considerable QE of
7.5 % at even 650 nm at elevated temperature. Similarly, the POWS reaction was
also performed in the light furnace to mimic the solar light concentrator without any
direct thermal energy input from an electrical device. The reactor temperature of
270 oC is maintained by this light source, and a constant H2 evolution rate of about
3 mmol g-1 h-1 and 10 mmol g-1 h-1 are achieved over Ru:SL-MoS2 without and with
a polar CeO2 support, respectively, indicating the great potential of further
application of this photocatalytic water splitting system over nano-catalysts
4.4 Conclusion
In conclusion, the electric field effects on N-TiO2 and SL-MoS2 based
photocatalysts were systematically demonstrated in this chapter. All the
photocatalysts exhibited greatly enhanced activity for the POWS reaction at
elevated temperature with a LEF introduced by polar-faceted supports. It was
demonstrated that the photo-generated charge carrier separation can be
substantially facilitated by assembling with polar-faceted materials, which can
exert strong LEF in proximity of the interfaces. The resulted prolonged the charge
carrier lifetimes allow the charge carriers travel to the surface of the photocatalysts
and make the subsequent chemical reactions take place. Deeper understandings

Chapter 4 Effects of the local electric field on photocatalytic overall water splitting reaction
152
of the relationships between the strength of LEF, photocatalytic activity and charge
carrier lifetime were obtained by studying the Ru:SL-MoS2 supported on different
polar-faceted supports, with the help of TRPL. The results have shown that both
the photocatalytic activity and the charge carrier lifetime exhibit an obvious linear
relationship with the strength of the LEF. Therefore, the local polarisation effect is
confirmed to show strong enhancement to photocatalysis by promoting the
separation of the photoexcited electron-hole pairs. This observation provides a
simple but versatile approach to control the recombination process and rationally
design the photocatalysts using polar support materials, for not only the water
splitting system, but also other valuable photocatalytic processes, which may also
contribute to the future utilisation of solar energy.
4.5 References
1. Li, Y., Wu, S., Zheng, J., Peng, Y.-K., Prabhakaran, D., Taylor, R. A., Chi, S. & Tsang, S. C. E. 2D photocatalysts with tuneable supports for enhanced photocatalytic water splitting. Mater. Today 41, 34–43 (2020).
2. Chen, F., Huang, H., Guo, L., Zhang, Y. & Ma, T. The Role of Polarization in Photocatalysis. Angew. Chem. Int. Ed. 58, 10061–10073 (2019).
3. Li, J., Cai, L., Shang, J., Yu, Y. & Zhang, L. Giant Enhancement of Internal Electric Field Boosting Bulk Charge Separation for Photocatalysis. Adv. Mater. 28, 4059–4064 (2016).
4. Li, J., Zhan, G., Yu, Y. & Zhang, L. Superior visible light hydrogen evolution of Janus bilayer junctions via atomic-level charge flow steering. Nat. Commun. 7, 11480 (2016).
5. Noguera, C. Polar oxide surfaces. J. Phys. Condens. Matter 12, R367–R410 (2000). 6. Goniakowski, J., Finocchi, F. & Noguera, C. Polarity of oxide surfaces and
nanostructures. Reports Prog. Phys. 71, 1 (2008). 7. Noguera, C. & Goniakowski, J. Polarity in oxide nano-objects. Chem. Rev. 113,
4073–4105 (2013). 8. Pesci, F. M., Sokolikova, M. S., Grotta, C., Sherrell, P. C., Reale, F., Sharda, K.,
Ni, N., Palczynski, P. & Mattevi, C. MoS2/WS2 Heterojunction for Photoelectrochemical Water Oxidation. ACS Catal. 7, 4990–4998 (2017).
9. Jia, T., Kolpin, A., Ma, C., Chau-Ting Chan, R., Kwok, W. M. & Tsang, S. C. E. A graphene dispersed CdS–MoS2 nanocrystal ensemble for cooperative photocatalytic hydrogen production from water. Chem. Commun. 50, 1185–1188 (2014).

Chapter 4 Effects of the local electric field on photocatalytic overall water splitting reaction
153
10. Yin, X. L., Li, L. L., Jiang, W. J., Zhang, Y., Zhang, X., Wan, L. J. & Hu, J. S. MoS2/CdS Nanosheets-on-Nanorod Heterostructure for Highly Efficient Photocatalytic H2 Generation under Visible Light Irradiation. ACS Appl. Mater. Interfaces 8, 15258–15266 (2016).
11. Kumar, D. P., Hong, S., Reddy, D. A. & Kim, T. K. Noble metal-free ultrathin MoS2 nanosheet-decorated CdS nanorods as an efficient photocatalyst for spectacular hydrogen evolution under solar light irradiation. J. Mater. Chem. A 4, 18551–18558 (2016).
12. Chang, K., Li, M., Wang, T., Ouyang, S., Li, P., Liu, L. & Ye, J. Drastic layer-number-dependent activity enhancement in photocatalytic H2 evolution over nMoS2/CdS (n ≥ 1) under visible light. Adv. Energy Mater. 5, 1402279 (2015).
13. Chhowalla, M., Shin, H. S., Eda, G., Li, L. J., Loh, K. P. & Zhang, H. The chemistry of two-dimensional layered transition metal dichalcogenide nanosheets. Nat. Chem. 5, 263–275 (2013).
14. Lau, T. H. M., Lu, X., Kulhavý, J., Wu, S., Lu, L., Wu, T. S., Kato, R., Foord, J. S., Soo, Y. L., Suenaga, K. & Tsang, S. C. E. Transition metal atom doping of the basal plane of MoS2 monolayer nanosheets for electrochemical hydrogen evolution. Chem. Sci. 9, 4769–4776 (2018).
15. Liu, G., Robertson, A. W., Li, M. M. J., Kuo, W. C. H., Darby, M. T., Muhieddine, M. H., Lin, Y. C., Suenaga, K., Stamatakis, M., Warner, J. H. & Tsang, S. C. E. MoS2 monolayer catalyst doped with isolated Co atoms for the hydrodeoxygenation reaction. Nat. Chem. 9, 810–816 (2017).
16. Mak, K. F., Lee, C., Hone, J., Shan, J. & Heinz, T. F. Atomically thin MoS2: A new direct-gap semiconductor. Phys. Rev. Lett. 105, 2–5 (2010).
17. Rasmussen, F. A. & Thygesen, K. S. Computational 2D Materials Database: Electronic Structure of Transition-Metal Dichalcogenides and Oxides. J. Phys. Chem. C 119, 13169–13183 (2015).
18. Zong, X., Yan, H., Wu, G., Ma, G., Wen, F., Wang, L. & Li, C. Enhancement of photocatalytic H2 evolution on CdS by loading MoS2 as cocatalyst under visible light irradiation. J. Am. Chem. Soc. 130, 7176–7177 (2008).
19. Zhu, K., Hu, J., Kübel, C. & Richards, R. Efficient preparation and catalytic activity of MgO(111) nanosheets. Angew. Chem. Int. Ed. 45, 7277–7281 (2006).
20. Hu, J., Zhu, K., Chen, L., Kübel, C. & Richards, R. MgO(111) Nanosheets with unusual surface activity. J. Phys. Chem. C 111, 12038–12044 (2007).
21. Peng, Y. K., Ye, L., Qu, J., Zhang, L., Fu, Y., Teixeira, I. F., McPherson, I. J., He, H. & Tsang, S. C. E. Trimethylphosphine-Assisted Surface Fingerprinting of Metal Oxide Nanoparticle by 31P Solid-State NMR: A Zinc Oxide Case Study. J. Am. Chem. Soc. 138, 2225–2234 (2016).
22. Peng, Y. K., Fu, Y., Zhang, L., Teixeira, I. F., Ye, L., He, H. & Tsang, S. C. E. Probe-Molecule-Assisted NMR Spectroscopy: A Comparison with Photoluminescence and Electron Paramagnetic Resonance Spectroscopy as a Characterization Tool in Facet-Specific Photocatalysis. ChemCatChem 9, 155–160 (2017).
23. Search, H., Journals, C., Contact, A., Iopscience, M., Phys, S. S. & Address, I. P. ESR hyperfine investigation of the Vo centre in MgO. J. Phys. C Solid State Phys. 7, 3981 (1974).
24. Henderson, B. & Wertz, J. E. Defects in the alkaline earth oxides. Adv. Phys. 17, 749–855 (1968).
25. Peng, Y.-K., Hu, Y., Chou, H. L., Fu, Y., Teixeira, I. F., Zhang, L., He, H. & Tsang,

Chapter 4 Effects of the local electric field on photocatalytic overall water splitting reaction
154
S. C. E. Mapping surface-modified titania nanoparticles with implications for activity and facet control. Nat. Commun. 8, 675 (2017).
26. Thieu, C. A., Yang, S., Ji, H. Il, Kim, H., Yoon, K. J., Lee, J. H. & Son, J. W. Achieving performance and longevity with butane-operated low-temperature solid oxide fuel cells using low-cost Cu and CeO2 catalysts. J. Mater. Chem. A 10, 2460–2473 (2022).
27. Maeda, K., Takata, T., Hara, M., Saito, N., Inoue, Y., Kobayashi, H. & Domen, K. GaN:ZnO solid solution as a photocatalyst for visible-light-driven overall water splitting. J. Am. Chem. Soc. 127, 8286–8287 (2005).
28. Zhang, J., Xie, X., Li, C., Wang, H. & Wang, L. The role of soft colloidal templates in the shape evolution of flower-like MgAl-LDH hierarchical microstructures. RSC Adv. 5, 29757–29765 (2015).
29. Silva, C. G., Bouizi, Y., Fornés, V. & García, H. Layered double hydroxides as highly efficient photocatalysts for visible light oxygen generation from water. J. Am. Chem. Soc. 131, 13833–13839 (2009).
30. Wang, H., Sun, X., Liu, Z. & Lei, Z. Creation of nanopores on graphene planes with MgO template for preparing high-performance supercapacitor electrodes. Nanoscale 6, 6577–6584 (2014).
31. Wang, J., Tafen, D. N., Lewis, J. P., Hong, Z., Manivannan, A., Zhi, M., Li, M. & Wu, N. Origin of photocatalytic activity of Nitrogen-doped TiO2 nanobelts. J. Am. Chem. Soc. 131, 12290–12297 (2009).

Chapter 5 Magnetic Field Effects on Photocatalytic Water Splitting Performance
155
Chapter 5 Magnetic Field Effects on Photocatalytic Water
Splitting Performance
This chapter is adapted from the work by Yiyang Li, Zihan Wang, Yiqi Wang,
András Kovács, Christopher Foo, Rafal E. Dunin-Borkowski, Yunhao Lu, Robert
A. Taylor, Chen Wu and Shik Chi Edman Tsang, published in Energy &
Environmental Science in 2022. The figures are reproduced with permission.
Copyright 2022 Royal Society of Chemistry.1
5.1 Introduction
It is quite obvious that most photocatalytic overall water splitting (POWS) systems
reported so far are greatly hindered by the intrinsic slow generation but fast
recombination of the photo-generated charge carriers.2 In the previous chapters,
it was demonstrated that the separation of the photo-generated charge carriers
and the regeneration of oxygen vacancies (VOs) can be promoted by using
elevated temperatures, which leads to enhanced water dissociation and
favourable reaction kinetics (Chapter 3).3–6 Such observation enabled further
investigation of the impacts of local fields: for example, it is illustrated that the
charge carrier lifetime and the POWS activity are both enhanced linearly by the
local electric field introduced by polar-faceted materials at 270 oC (Chapter 4).3,5
Building upon these previous observations, more efforts have been made to find
a more facile and efficient method to facilitate the separation of the charge carriers.
Although the effects of magnetic field in chemical reaction have been studied in
some early organic research since 1920s,7–9 their application in the POWS
reaction using solid-state photocatalysts has rarely been investigated, because it
is generally believed that the Zeeman energy produced by a magnetic field is

Chapter 5 Magnetic Field Effects on Photocatalytic Water Splitting Performance
156
negligible compared to the Gibbs free energy of the POWS reaction (ca. 273 kJ
mol-1).10,11 Here in this chapter, I systematically explored the magnetic field effects
(MFEs) on POWS performance as a novel non-contact technique at elevated
temperatures over N-doped TiO2 (N-TiO2) photocatalysts.
5.2 Objectives
The MFEs on particulate POWS system has scarcely been reported before,
but studies on MFEs for other photocatalytic systems are emerging recently,
including nitrogen fixation,12 denitrification of contaminated water,13 CO2
conversion,14 and dye degradation,10,11,15 where an external magnetic field
is applied during material preparation or reaction. Such effects have been
attributed to the enhanced adsorption of charged species,13 regulation of
internal field,12 facilitated migration of charge carriers,19,20 etc. Obviously,
even though the Zeeman energy is small, MFEs can contribute to
photocatalysis through other pathways. However, it should be noted that
conventional semiconductor photocatalysts such as TiO2 exhibits very low
magnetic flux even under strong magnetic fields,10–13 hence giving
insignificant effect on the photocatalytic performance. Moreover, the
mechanism of the MFEs has not been systematically studied in the reported
works, thus deep understandings of such effects are still absent. Lorentz
force can be produced on charge carriers, the strength of which is dependent
on charge, relative velocity and magnetic induction intensity. The Lorentz
force is always vertical to the moving direction, which changes the
movement of the charge carriers according to the left-hand rule. In general,
excited electrons and holes are generated upon irradiation, where positive
and negative charges are staying very close and moving together. Under the

Chapter 5 Magnetic Field Effects on Photocatalytic Water Splitting Performance
157
influence of a local magnetic field, the positive and negative charges
experience the Lorentz forces to the opposite directions, which will facilitate
the separation especially at elevated temperature, therefore prolonging the
lifetime.
Here in this chapter, I have demonstrated that by placing the N-doped TiO2
(N-TiO2) photocatalyst in proximity to the superparamagnetic Fe3O4
nanoparticles (NPs) under an external magnetic field, a very strong local
magnetic flux can be induced, which leads to an efficient H2 and O2 evolution
in a stoichiometric 2:1 ratio from pure water under visible light irradiation at
270 oC. An extraordinary H2 evolution rate (21.2 mmol g-1 h-1), QE (e. g. 88.7 %
at 437 nm) and an unprecedented STH efficiency of 11.9±0.5% can be
achieved, exceeding the practical STH target of 10 %. An overall energy
efficiency of 1.16±0.05% has been demonstrated as well. Investigations of
the charge and spin properties of electrons suggest that this remarkable
enhancement originates from the magnetically induced Lorentz force
facilitating the charge separation, as well as the dramatic suppression of
charge carrier recombination in a strong spin-polarised energy band in N-
TiO2 during illumination. This facilitates alternative reaction routes to charge
relaxation by water splitting at a high rate at elevated temperature.
Mechanism of the MFEs was explored with the help of time-resolved
photoluminescence (TRPL) technique and first-principles density-functional
theory (DFT) calculations, and the contribution of each effect was studied
quantitatively at different magnetic field strengths.

Chapter 5 Magnetic Field Effects on Photocatalytic Water Splitting Performance
158
5.3 Results and discussion
5.3.1 Characterisations of the magnetic photocatalysts
5.3.1.1 Structural and morphological characterisations
Figure 5.1 Schematic illustration of the encapsulation of Fe3O4 NPs by the reverse micelle method. Superparamagnetic Fe3O4 NPs encapsulated in silica were initially synthesised
using a method adopted from our previous study in order to obtain an enhanced
local magnetic flux under an external magnetic field (Figure 5.1).16 High-resolution
transmission electron microscopy (HRTEM) was then engaged to characterise the
morphology of the as-prepared materials. As shown in Figure 5.2, the length of ten
lattice fringes of a Fe3O4 nanoparticle was measured to be 2.979 nm, of which the
lattice spacing is 0.298 nm, corresponding to the (220) plane of Fe3O4 structure.
Figure 5.2 Left: HRTEM image of an Fe3O4 NP. Right: 10 d-spacings between 11 consecutive lattice fringes are selected and shown in this figure, of which the total distance is 2.979 nm, thus, an average d-spacing can be calculated as ca. 0.298 nm, corresponding to the (220) plane of Fe3O4 structure.

Chapter 5 Magnetic Field Effects on Photocatalytic Water Splitting Performance
159
Figure 5.3 (a) TEM images of Fe3O4 NPs (8 nm). (b) TEM image of Fe3O4@SiO2. These images were acquired by Dr. Tianyi Chen. TEM clearly shows the well-dispersed Fe3O4 NPs have been synthesised with a
high crystallinity, giving a mean particle size of ca. 8 nm, as shown in Figure 5.3a.
Subsequently, using a reverse micelle method, the Fe3O4 NPs are successfully
encapsulated in silica, forming a core/shell nano-structure (denoted as
Fe3O4@SiO2) with an average shell thickness of ca. 26 nm, as shown in Figure
5.3b.
Figure 5.4 Left: Mössbauer spectra of the Fe3O4 NPs with different mean particle sizes (black: collected overall response curves; blue and red (superparamagnetic): Fe3O4 phase; green: Fe2O3 phase). Right: Quantitative analysis of the Mössbauer spectra shown on the left, indicating the composition of Fe3O4 and Fe2O3 in each sample. The synthesis of Fe3O4 NPs with different mean sizes was also attempted by

Chapter 5 Magnetic Field Effects on Photocatalytic Water Splitting Performance
160
controlling the amount of the surfactant, which leads to the coexistence of Fe2O3
and Fe3O4 phases.16 The two phases were differentiated quantitatively by
Mössbauer spectroscopy (Figure 5.4). It was noticed that larger particle size gives
rise to a larger proportion of the Fe2O3 phase due to the partial oxidation. Therefore,
the Fe3O4 NPs with a mean size of 8 nm is further studied in order to explore the
effects of the local magnetic flux.
Characterisations were carried out on X-ray diffraction (XRD), as shown in Figure
5.5. The XRD pattern of pure magnetic Fe3O4 NPs gives the characteristic peaks
at 2θ values of 30.40°, 35.58°, 53.72°, 56.58°, and 62.74°, representing well the
single phase crystalline fcc structure of Fe3O4.17
Figure 5.5 XRD patterns of Fe3O4 NPs, Fe3O4/N-TiO2-2, and N-TiO2, obtained on the Bruker D8 Advance diffractometer in the Department of Chemistry. Unfortunately, the Fe3O4@SiO2 did not show any photocatalytic activity toward the
POWS reaction under visible light irradiation, because of the large band gap of
SiO2 as the shell, while Fe3O4 in the core can hardly absorb the light irradiation
or reach the chemical species in the solution. Subsequently, the Fe3O4 NPs were
then combined with TiO2 via a sol-gel method, followed by a high-temperature NH3

Chapter 5 Magnetic Field Effects on Photocatalytic Water Splitting Performance
161
treatment for N-doping, with a Fe3O4 content of 20 wt.% (denoted as Fe3O4/N-
TiO2-2). The XRD pattern shows peaks at 2θ = 25.48o, 38.06o, 48.21o, 54.19o,
55.28o and 62.91o, indicating the existence of anatase phase TiO2, and no phase
transformation to rutile phase can be observed (Figure 5.5).
5.3.1.2 XPS of Fe3O4/N-TiO2 materials
Figure 5.6 (a) XPS survey spectra of Fe3O4/N-TiO2-2. (b) Fe 2p XPS spectra of Fe3O4/N-TiO2-2 obtained at different ion-sputtering times. Etching was achieved by an Ar+ sputtering gun with a etching rate of 1 nm min-1. High resolution (c) Ti 2p, (d) N 1s and (e) O 1s XPS spectra of Fe3O4/N-TiO2-2 without ion-sputtering. Depth-profiling X-ray photoelectron spectroscopy (XPS) was performed to
investigate the chemical species of Fe3O4/N-TiO2-2. The sample was etched by
an ion-beam for different time periods so as to obtain the chemical information
from the surface/subsurface to the inner region. A typical XPS survey spectrum
shows peaks of N 1s, O 1s, Ti 2p and Fe 2p (Figure 5.6a). Moreover, the Fe 2p
peaks show an increasing trend when the sample is sputtered, indicating the

Chapter 5 Magnetic Field Effects on Photocatalytic Water Splitting Performance
162
Fe3O4 NPs are mostly encapsulated in the N-TiO2 (Figure 5.6b and Table 5.1).
High resolution XPS spectra of Ti 2p, N 1s and O 1s are also shown in Figures
5.6c-5.6e, indicating that the doped N atoms mainly take up the substitutional
positions, with a small portion occupying the interstitial sites, which is similar to
what has been demonstrated in more details in Chapter 3.
Table 5.1 The concentration of Fe species in the Fe3O4/N-TiO2-2 at different etching times derived from the XPS spectra in Figure 5.6b.
Etching time (min)
Fe concentration (wt. %)
0 3.23
0.5 16.28
1 26.37
5.3.1.3 EPR of Fe3O4/N-TiO2 materials
Continuous wave electron paramagnetic resonance (CW-EPR) was performed at
room temperature using an X-band (9.39 GHz) microwave to observe the VOs in
the photocatalysts (Figure 5.7). The Fe3O4 NPs gives a very broad and strong
resonance signal at a field of around 3150 Gauss, due to the unpair electrons of
the paramagnetic Fe(II) and Fe(III) species and the dipolar interaction between the
NPs18. The EPR experiments were also carried out on the Fe3O4/N-TiO2-2
photocatalyst before and after the N doping, both of which showed much smaller
EPR signal compared with that of the Fe3O4 NPs due to the magnetic dilution of
TiO2. Also, the strong and broad signal of Fe3O4 NPs makes the signal changes of
the TiO2 species not distinguishable. Therefore, measurements were performed
on pure anatase TiO2 and N-TiO2 which was synthesised following the same
procedure and N doping. Apparently, pure TiO2 is observed silent on the EPR,
while after N doping, a peak at a g-value of 2.003 can be observed as shown in

Chapter 5 Magnetic Field Effects on Photocatalytic Water Splitting Performance
163
Figure 5.7d, which is attributed to surface VOs.19 The VOs were created during the
ammonia treatment in accordance to our previous study showing that more VOs
can better harness the visible light and facilitate the O2 evolution reaction3,19.
Moreover, further EPR measurements were carried out by calcining the N-TiO2 in
an Ar flow at different temperatures for 1h and allowed to naturally cool down to
room temperature. Then the sample was exposed to air for 10 min before EPR
measurements. As can be seen in Figure 5.7a, it showed an anisotropic g tensor
(gzz=2.026, gyy=2.006, gxx=1.998), which is originated from the 𝑂/∙? radicals
(resulted from the O2 molecules stabilised on the surface VOs);20 another signal of
g=2.012 was observed which can be attributed to the doped interstitial N species.
Clearly, the signal of 𝑂/∙? radicals indicative to the surface VOs increases with the
calcination temperature; while the signal of doped N remains the same.
Figure 5.7 EPR study of the magnetic photocatalysts. (a, b) EPR spectra of N-TiO2 calcined in Ar at different temperatures. (c) EPR spectra of Fe3O4 NPs,

Chapter 5 Magnetic Field Effects on Photocatalytic Water Splitting Performance
164
Fe3O4/N-TiO2-2 and Fe3O4/TiO2-2. (d) EPR spectra of N-TiO2 and TiO2. 5.3.1.4 UV-Vis absorption of Fe3O4/N-TiO2 materials
Figure 5.8 UV-Vis diffuse reflectance spectra of N-TiO2 and TiO2. Spectra were recorded within the wavelength range of 250-1100 nm at room temperature and converted using the Kubelka-Munk function. The visible light absorption of the material was also substantially enhanced after
N doping, which was investigated by UV-Vis DRS (Figure 5.8). Apparently, the
original absorption edge of the pristine TiO2 at around 400 nm was greatly
extended, and the N-doped TiO2 showed strong absorption at even 1000 nm,
which covers the whole visible light spectrum and some near infrared regime.
5.3.1.5 Magnetic properties of Fe3O4/N-TiO2 materials
The magnetic properties of the Fe3O4 NPs, Fe3O4/N-TiO2-2, and N-TiO2 were
investigated with a superconducting quantum interference device (SQUID)
magnetometer, and the magnetisation curves of the materials are shown in Figure
5.9. The saturation magnetisation (Ms) values of Fe3O4 and Fe3O4/N-TiO2-2 are
1.82×10⁵ and 6.85×10⁴ A m-1 (43.01 and 16.19 emu g-1 in CGS unit system). The
saturated magnetisation value of the Fe3O4/N-TiO2-2 is smaller than the Fe3O4
NPs because of the inclusion of the N-TiO2. The as-prepared samples exhibit

Chapter 5 Magnetic Field Effects on Photocatalytic Water Splitting Performance
165
superparamagnetic feature as seen in Figure 5.9 since the Fe3O4 around 8 nm is
smaller than the critical size of 20 nm. Due to the lack of magnetic coupling, the
materials can be magnetised under an external magnetic field but will not retain a
substantial residual magnetism upon removal of the external field.
Figure 5.9 (a) Magnetisation curves of Fe3O4 NPs, Fe3O4/N-TiO2-2 and N-TiO2. (b) Magnetisation curves of Fe3O4/N-TiO2 photocatalysts with different contents of Fe3O4 NPs. 5.3.2 POWS performance and optimisations
5.3.2.1 Effects of local magnetic flux density
The photocatalytic performances of the as-prepared photocatalysts were then
evaluated for the POWS reaction at 270 oC under a visible light irradiation, which
is the optimal temperature in this POWS system as discussed in the previous
chapters. Different metal NPs were deposited on the Fe3O4/N-TiO2-2 photocatalyst
via a photo-reduction method, since previous studies have shown that deposition
of noble metal such as Au and Pt can greatly improve the H2 evolution
performance.3,21–23 According to the volcanic curve for the electrocatalytic H2
evolution reaction, Pt has the optimal adsorption energy with H2, followed by Pd
and Ru.24,25 Basically, the POWS activity of the metal-deposited photocatalysts

Chapter 5 Magnetic Field Effects on Photocatalytic Water Splitting Performance
166
follows this volcano curve, however, the Au-decorated Fe3O4/N-TiO2-2 showed the
highest POWS activity in this case (Figure 5.10a), which is not in accordance with
the volcano curve. Therefore, as mentioned previously in Chapter 3, I believe that
the localised plasmon resonance effect of the Au NPs could play a role in this
POWS system, which has been extensively studied in the Au/TiO2 system in
literature,26,27 but is not studied in detail in this thesis.
Figure 5.10 (a) POWS performance of the Fe3O4/N-TiO2-2 photocatalyst decorated with 1 wt.% of different metal NPs via a photo-deposition method. (b) POWS performance of the Au-decorated Fe3O4/N-TiO2-2 photocatalyst with different Au loading amounts. NMF: no magnetic field; MF: with magnetic field. (c) Isotopic study of the POWS reaction on Fe3O4/N-TiO2-2 photocatalyst decorated with 1 wt.% of Au NPs. The products were measured by mass spectrometer (Hiden Analytical) after the reaction time labelled in each figure, as indicated in the figure. All signals are re-scaled by the signal of the inert component Ar (The relative intensity of Ar is 100 %). Then the loading amount of Au NPs was optimised, as shown in Figure 5.10b.
Clearly, the POWS activity levels off when the loading amount is increased beyond

Chapter 5 Magnetic Field Effects on Photocatalytic Water Splitting Performance
167
1 wt.%; Moreover, the activity shows a small drop when the loading reaches 4
wt.%, which is presumably due to the shielding effect of the NPs, resulting in less
photons reaching the N-TiO2.28 Consequently, 1 wt.% Au NPs were used for all the
photocatalysts as a H2 evolution cocatalyst. Initial experiments were performed
over N-TiO2 and Fe3O4/N-TiO2-2 photocatalysts without external magnetic field,
both of which showed good performance toward POWS, giving similar H2 evolution
rates of around 7000 µmol g-1 h-1. Control experiments were also performed, which
confirmed that Fe3O4 NPs, SiO2 and Fe3O4@SiO2 all showed no detectable H2
evolution, indicating that N-TiO2 is the only photocatalytically active component in
the catalysts under these conditions. Moreover, no activity could be observed at
elevated temperatures if either the light illumination or a photocatalyst is absent.
The stoichiometry of products (H2 and O2) was investigated quantitatively by gas
chromatograph, which indicates a H2:O2 ratio of 2.01±0.04 throughout this work.
N2 was not detected in the gaseous products, which excludes the influence of
mixed air in the system. The isotopic studies were then carried out by using D2O
rather than H2O to confirm that H2 is generated from the POWS reaction instead
of the photocatalyst itself or any other possible organic contaminants (Figure
5.10c). Also, the influence of electron transfer between N-TiO2 and Fe3O4 NPs was
excluded by introducing an insulated silica layer in between (Fe3O4@SiO2/N-TiO2-
2), which showed similar POWS activity as that of Fe3O4/N-TiO2-2 without the silica
layer. The amounts of Fe3O4 and N-TiO2 were maintained the same in each
catalyst and neither SiO2 nor Fe3O4@SiO2 showed any activity toward the POWS
reaction. Thus, the following studies were carried out with the Fe3O4/N-TiO2
materials without the silica layer.
Subsequently, to study the MFE on the POWS system, an external static magnetic

Chapter 5 Magnetic Field Effects on Photocatalytic Water Splitting Performance
168
field of 180 mT was applied by two paralleled permanent magnets near the reactor.
The applied external magnetic flux density Bexternal in the centre of the two magnets
was measured by a Gauss metre. Excitingly, the POWS activity of Fe3O4/N-TiO2-
2 increases to 12210 µmol g-1 h-1, showing an enhancement of 76%. The
photocatalytic activity of the N-TiO2, however, almost keeps the same. The lack of
a detectable change on N-TiO2 with and without an external magnetic field
indicates its weak field flux density whereas superparamagnetic Fe3O4
nanoparticles can generate much stronger local field flux upon magnetisation. The
M-H curves of the samples in Figure 5.9 exhibit that the Fe3O4 NPs are crucial for
providing sufficient local magnetic field induced by the external field.
Figure 5.11 (a) POWS activity tests of Fe3O4/N-TiO2-2 under external magnetic field of different strengths; (b) POWS activity tests of N-TiO2 and Fe3O4/N-TiO2 photocatalysts with and without external magnetic field (180 mT) (NMF=no magnetic field, MF=magnetic field). 1 wt.% Au was deposited onto the photocatalysts via the photo-reduction method before use. More explorations were attempted to further confirm the influence of the magnetic
field on the POWS system. For a magnetic-field-promoted catalytic system, the
enhancement of the photocatalytic performance should show dependency on the

Chapter 5 Magnetic Field Effects on Photocatalytic Water Splitting Performance
169
intensity of the external magnetic field. Therefore, the POWS performance was
then evaluated in magnetic fields of different intensities by changing the distances
between the permanent magnet to the centre of the batch reactor. The permanent
magnet was placed at different distances which results in the field strengths of 105
mT and 10 mT, respectively. The photocatalytic performance was then evaluated,
showing a decreasing trend as the field strength is reduced (Figure 5.11a).
Apparently, the POWS activity over Fe3O4/N-TiO2-2 is clearly dependent on the
strength of the external magnetic field, while the pure N-TiO2 hardly shows any
responses to the external magnetic field change.
To further understand the local MFEs on the POWS system over N-TiO2 based
photocatalysts, a series of Fe3O4/N-TiO2 photocatalysts with increasing Fe3O4 NPs
contents were fabricated (the amounts of the Fe3O4 NPs in Fe3O4/N-TiO2-1,
Fe3O4/N-TiO2-2, Fe3O4/N-TiO2-3 and Fe3O4/N-TiO2-4 are 10 wt.%, 20 wt.%, 30 wt.%
and 40 wt.%, respectively). Then the magnetisation curves of the samples were
measured by SQUID, as shown in Figure 5.9b. Apparently, the saturated
magnetisation values vary with the Fe3O4 NPs content. The POWS activities were
then tested at 270 oC as well under visible light irradiation with an external
magnetic field of 180 mT. The results are shown in Figure 5.11b, which clearly
indicates that the magnetic photocatalysts become more sensitive to the external
magnetic field as the content of the Fe3O4 NPs increasing. This can be attributed
to the stronger local magnetic flux induced by the external static magnetic field, as
indicated by the magnetisation curves: the photocatalysts which contain more
Fe3O4 show stronger magnetism, which means a stronger induced local magnetic
field flux will be generated in close proximity to the photocatalysts. The above
observation further confirms that the POWS activities strongly depend on the

Chapter 5 Magnetic Field Effects on Photocatalytic Water Splitting Performance
170
intensity of the local magnetic flux induced by the external magnetic field, implying
the dramatic MFEs in the POWS systems.
Similar work has also been undertaken on the commercially available P25 TiO2 to
simplify the catalyst design. It was doped with N and then combined with the Fe3O4
NPs. The resulted photocatalyst contains 40 wt.% of Fe3O4 NPs, the same as that
in the Fe3O4/N-TiO2-4. Excitingly, the simple mixture of N-doped P25 and Fe3O4
NPs results in a significantly enhanced POWS performance in the external
magnetic field (180 mT), making such magnetic field promoted system more
practical for further application. It is noteworthy that in this case, the Fe3O4 NPs
have not experienced any high-temperature ammonia treatment. Although this
catalyst exhibited slightly lower enhancement under external magnetic field due to
geometric longer distance between the magnetic phase from catalytic sites, the
high-temperature ammonia treatment causing insurmountable issue on the Fe3O4
nanoparticles is not evidenced. Similar work has also been attempted on
commercial ST-01, which exhibits a similar conclusion.
5.3.2.2 Effects on separation of charge carriers
Time-resolved photoluminescence (TRPL) was engaged in this study to
investigate the changes of charge separation process with or without an external
magnetic field, therefore to understand the MFEs more comprehensively. N-TiO2
and Fe3O4/N-TiO2-2 photocatalysts were firstly measured. Obviously, both
materials show similar charge carrier lifetimes when an external magnetic field is
absent; while the charge carrier lifetime of Fe3O4/N-TiO2-2 was substantially
prolonged when the magnetic field of 180 mT was applied, and that of the pure N-
TiO2 remain unchanged. Such difference of the response to the external magnetic
field coincides well with what was observed in the POWS activity tests. Therefore,

Chapter 5 Magnetic Field Effects on Photocatalytic Water Splitting Performance
171
the enhanced POWS activities are attributed to the facilitated charge carrier
separation.
Figure 5.12 (a) TRPL spectra of Fe3O4@N-TiO2-2 with an external magnetic field of different strengths. (b) TRPL spectra of Fe3O4/N-TiO2 photocatalysts with an external magnetic field of 180 mT. (c) TRPL spectra of Fe3O4/N-TiO2 photocatalysts without the external magnetic field. The Fe3O4NPs content was set to be 10%, 20%, 30% and 40 wt% for Fe3O4/N-TiO2-1, Fe3O4/N-TiO2-2, Fe3O4/N-TiO2-3 and Fe3O4/N-TiO2-4, respectively. As mentioned earlier in this chapter, charge carriers can be influenced by the
Lorentz force when moving in a magnetic field, and the electrons and holes
experience the Lorentz forces to different directions when they are moving
together, according to the left-hand rule. Additionally, magnetisation curves
showed that the Fe3O4/N-TiO2-2 photocatalyst can be readily magnetised which
means a strong local magnetic flux can be induced near the Fe3O4 NPs. Apparently,
the Lorentz force from the strong local magnetic flux density can greatly facilitate
the separation of charge carriers, which results in the prolonged charge carrier
lifetime, as indicated by the TRPL results (Figure 5.12). Subsequently, further
TRPL experiments were carried out on Fe3O4/N-TiO2-2 photocatalyst under
magnetic fields with different field strengths. Not surprisingly, the charge carrier
lifetime increased with the magnetic field strength, confirming that the changes of
the charge carrier lifetime are due to the applied magnetic field, and also
suggesting that the charge recombination process is supressed more significantly

Chapter 5 Magnetic Field Effects on Photocatalytic Water Splitting Performance
172
under a stronger induced magnetic field (Figure 5.12a).
Photocatalysts with different Fe3O4 NPs contents were then tested, and all the
samples show similar TRPL spectra without external magnetic field (Figure 5.12c).
When measured with an external magnetic field of 180 mT, TRPL results show that
the charge carrier lifetime was prolonged more substantially as the content of
Fe3O4 increasing (Figure 5.12b), which is in accordance with the previous
magnetisation experiments and the POWS activity tests. Our previous reports
showed that elevated temperatures solely would not obviously influence the
charge carrier lifetime in our system.3,5 The above observations indicate that the
charge separation in the Fe3O4/N-TiO2 photocatalysts is dominated by the local
magnetic flux induced by the external magnetic field, therefore the N-TiO2 showed
no significant response to the magnetic field because of the weak local magnetic
flux it could generate. In addition, the MFEs become more efficient when the
external magnetic field is stronger, since stronger external field will induce stronger
local magnetic flux according to the magnetisation curves (Figure 5.9). This could
also explain the reason why the samples contain more Fe3O4 NPs show higher
response to the external field even under a fixed external field.
5.3.2.3 Electron holography of Fe3O4/N-TiO2 materials
Combined correlative off-axis electron holography in TEM and energy dispersive
X-ray spectroscopy spectrum imaging in STEM has been studied. It has been
known that the off-axis electron holography allows to recover the electron optical
phase shift of electrons that interact with the in-plane components of the
electromagnetic field present within and around the sample.29 The EDX chemical
measurements were to map the Fe3O4 within the agglomerates and correlate to
the phase measurements of the N-TiO2. Agglomerated areas of the Fe3O4/N-TiO2-

Chapter 5 Magnetic Field Effects on Photocatalytic Water Splitting Performance
173
2 and Fe3O4/N-TiO2-4 samples were briefly examined using both off-axis electron
holography and EDX imaging, as shown in Figure 5.13.
Figure 5.13 Energy dispersive X-ray spectroscopy (EDS) and the correlative off-axis electron holography studies of the (a) Fe3O4/N-TiO2-4 and (b) Fe3O4/N-TiO2-2 photocatalysts. The Fe3O4NPs content was 20% and 40 wt.% for Fe3O4/N-TiO2 and Fe3O4/N-TiO2-4, respectively. The electrostatic (𝜑E) and magnetic phase shifts (𝜑M) was carefully separated by
turning the sample over inside the electron microscope and taking the difference

Chapter 5 Magnetic Field Effects on Photocatalytic Water Splitting Performance
174
of two experiments.29 These preliminary electron holography studies indicated the
superparamagnetic nature of the photocatalysts (Figure 5.13). It is noteworthy that
in both POWS activity tests and TRPL measurements, the photocatalysts have
shown similar responses to the external magnetic field, therefore it is not hard to
realise that the magnetic field influences the photocatalytic process by inducing a
strong local magnetic field near the Fe3O4 NPs, which facilitates the charge
separation and prolongs the charge carrier lifetime, resulting in a greatly enhanced
POWS performance.
5.3.2.4 Correlation of MFEs and POWS performance
As mentioned before, it is known that charged bodies in motion can be affected by
the Lorentz force produced by a magnetic field, and the photo-generated electrons
and holes in the Fe3O4/N-TiO2 experience Lorentz forces to opposite directions
according to the left-hand rule when they are moving together, accounting for the
prolonged charge carrier lifetime. Therefore, the correlation between the
enhancement of POWS performance and the local induced magnetic flux density
Blocal was further investigated to study the Lorentz force effect (Figure 5.14). The
Blocal of the Fe3O4/N-TiO2 samples can be derived from the M-H curves. The
Lorentz force is given by F = q (v x B), where the F changes linearly with B. For
the N-TiO2 sample, the external magnetic field alone shows no obvious effect on
the POWS performance, when the induced local magnetic field is absent.
Therefore, only the local magnetic flux generated by the Fe3O4 NPs is considered
in the correlation. The photocatalytic activity was plotted against the local magnetic
flux density (Blocal) of the Fe3O4 NPs. Surprisingly, the H2 evolution rate, although
showing positive correlation with the local magnetic induction Blocal, did not change
linearly. Also, Fe3O4/N-TiO2 with a higher Fe3O4 content always gives higher

Chapter 5 Magnetic Field Effects on Photocatalytic Water Splitting Performance
175
POWS performance even the local magnetic flux density is similar (Figure 5.14a).
It is noticed that the average distance (r) from the core of Fe3O4 NPs to the catalyst
surface (where the chemical reactions take place) decreases as the concentration
of Fe3O4 NPs increases and the corresponding magnetic field strength is inversely
proportional to r2. The distances were measured from the TEM images and then
the POWS performance was plotted against Blocal/r2 (Bearing in mind that the local
magnetic flux density decays rapidly with the change of distance, only those Fe3O4
NPs near the surface were considered. See Figure 5.14d). Interestingly, upon
calibration of the local magnetic flux density using these distances, all the samples
appeared to show a similar response to Blocal/r2, exhibiting an overall positive
correlation. Further scrutiny indicates that the POWS performance increases
linearly until Blocal/r2= ~0.7, after which point it increases much more sharply,
deviating from a linear relationship (Figure 5.14b). The linear influence originated
from the Lorentz force effect could be described as follows:
H/evolutionrate = 7042.22
𝐁𝐥𝐨𝐜𝐚𝐥𝐫𝟐 + 6988.42
(𝐑𝟐 = 0.9818)
Equation 5.1
where 𝐁𝐥𝐨𝐜𝐚𝐥 is the local induced magnetic flux density and 𝐫 is the average
distance from the core of Fe3O4 NPs to the catalyst surface.
Additionally, 40 wt.% Fe3O4/N-TiO2 with different N-doping concentrations were
also prepared by controlling the temperature of the NH3 treatment during N-
doping,3 and the POWS performance was then tested with and without the external
magnetic field (180 mT). The POWS reaction was carried out at 270 oC with the
irradiation of a 300-W Xe lamp which included UV and visible light, considering the
extremely low absorption of pure TiO2 in the visible light regime. The magnetic field

Chapter 5 Magnetic Field Effects on Photocatalytic Water Splitting Performance
176
effect (MFE) enhancement of each catalyst was defined as:
𝑀𝐹𝐸𝑒𝑛ℎ𝑎𝑛𝑐𝑒𝑚𝑒𝑛𝑡 =𝐴𝑐𝑡𝑖𝑣𝑖𝑡𝑦cIMd\e − 𝐴𝑐𝑡𝑖𝑣𝑖𝑡𝑦f\e
𝐴𝑐𝑡𝑖𝑣𝑖𝑡𝑦f\e Equation 5.2
Clearly, the enhancement introduced by the MFE also shows a linear relationship
with the N concentration at low doping level but increases sharply when the N
concentration is higher (Figure 5.14c). Consequently, the above results imply that
the MFE does not originate solely from the Lorentz force effect, especially when
the local magnetic field is higher than the critical point of Blocal/r2= ~0.7 and the N-
doping content is increased. Such observations lead us to further investigation of
the materials using DFT calculations to identify other factors contributing to the
MFE.

Chapter 5 Magnetic Field Effects on Photocatalytic Water Splitting Performance
177
Figure 5.14 (a) the relationship between the POWS performance of Fe3O4/N-TiO2 photocatalysts with different Fe3O4 concentration and the local magnetic induction Blocal. (b) The relationship between the POWS performance and Blocal/r2. All error bars indicate the standard deviation. (c) The POWS performances of the Fe3O4/N-TiO2 photocatalysts with different N-doping levels in the N-TiO2, of which the Fe3O4 concentrations were all maintained as 40 wt.%, tested with an external magnetic field of 180 mT. (d) A typical HRTEM image of Fe3O4/N-TiO2-4, from which the average distance from Fe3O4 core to the catalyst surface (r) was estimated. The distance distribution is shown as inserted. (e) Summary of the average distance r (with errors) of each sample. The error bar indicates the standard deviation.

Chapter 5 Magnetic Field Effects on Photocatalytic Water Splitting Performance
178
5.3.3 Evaluation of the spin-polarisation effect by DFT
Figure 5.15 (a) M-H curve of N-TiO2 photocatalyst after subtraction of the diamagnetic signal; (b) The constructed Ti16O28N4 supercell for DFT calculation (O: red; Ti: blue; N: purple). (c) Calculated total DOS of Ti16O28N4 supercell (N-TiO2) and Ti16O32 supercell (pure TiO2) with the local magnetic field alignment. (d) Calculated total DOS of the Ti16O28N4 supercell without and with the external magnetic field (NMF=no magnetic field; MF=magnetic field). Apart from the electromagnetic properties, the quantum mechanical
properties of the electron, such as angular momentum (spin) has long been
neglected in photocatalytic studies. It is noted that magnetic moments exist
in the N-TiO2 (Figure 5.15a), implying that the cooperative alignment of such
moments under a magnetic field may influence the POWS performance
together with the above-discussed Lorentz force effect. It has been reported

Chapter 5 Magnetic Field Effects on Photocatalytic Water Splitting Performance
179
that N-substitution of O atoms in N-TiO2 of low N content could generate
defective holes, and the hole-mediated double exchange through the strong
p-p interaction between N and O can give spins correlation to this material30.
Considering the XPS spectra showed the doped N were dominantly in the
substitutional sites, a Ti16O28N4 supercell based on the structure of anatase
TiO2 with ca. 4.4 wt.% substitutional N-doping derived from our recent study
(ref. 31) was constructed and studied by the first-principles DFT calculations,
as shown in Figure 5.15b.
Figure 5.16 (a) 3D spatial distributions of spin polarisation of N-doped Ti16O28N4 model in defect band with the local magnetic field and (b) that without any external magnetic field. Yellow surfaces represent the charge density of spin-up electrons and blue surfaces represent the charge density of spin-down electrons. The value of the iso-surface is set to be 0.001eV/Å. (c) Calculated partial charge density of CBM with the magnetic field. The value of iso-surface is set to be 0.001eV/Å. The yellow surfaces represent the distribution of the total electron densities in the CBM near each atom. The calculated total density of states (DOS) of N-TiO2 clearly showed that
the defect states were created within the band gap near the Fermi level,
which originated from the N-doping, while such an additional band was
absent in the pure TiO2 model (Figure 5.15c). These defect states are not
localised in contrast to the previous literature of the low N content, but form
a wide band extended to the valence band (VB) instead, due to the strong
interaction between the N atoms at our high N-doping concentration, which

Chapter 5 Magnetic Field Effects on Photocatalytic Water Splitting Performance
180
also accounts for the enhanced visible light absorption32. The defect states
can be distributed on two spin channels (spin-up and spin-down), but only
one spin channel occurs in the band gap region of N-TiO2 under a magnetic
field (Figure 5.15d), indicative that the magnetic moments can be well-
aligned in the material.
Figure 5.17 Schematic illustration of the magnetic field promoted POWS system, where the charge separation is facilitated by the local magnetic induction. The calculated spatial spin distribution also indicated a strong spatial spin
polarisation: only the blue surface that represented the spin-down channel
was observed, whist the spin-up channel was absent (Figure 5.16a). On the
other hand, as shown in Figure 5.15d, the total DOS clearly indicates that
the defect band is not polarised, and the magnetic moments are distributed
on the two spin channels when a magnetic field is absent. The presence of
both yellow and blue surfaces in Figure 5.16b also suggests the existence
of both spin channels in the defect band without the influence of a magnetic
field. Meanwhile, the magnetic field has little effect on the conduction band
(CB): the calculated partial charge density of the CBM is almost the same
no matter whether a magnetic field is present or not (Figure 5.16c). Clearly,

Chapter 5 Magnetic Field Effects on Photocatalytic Water Splitting Performance
181
in the presence of an induced local magnetic field from Fe3O4 NPs, the
cooperative magnetic moments in N-TiO2 align in parallel in the high spatial
spin polarised environment. When an electron is excited to the CB, it is likely
to undergo spin relaxation during the transfer, losing its original spin
characteristics and changing to the other state (spin-up), due to spin-orbit
coupling, etc.33 The spin-orbit coupling is a relativistic interaction of an
electron’s spin with its motion inside a potential. It can be thought of as a
Zeeman effect product of two relativistic effects: the apparent magnetic field
seen from the electron’s perspective and the magnetic moment of the
electron associated with its intrinsic spin. Therefore, electrons can change
their spin due to this spin-orbit interaction. Subsequently, upon
recombination, the lack of a spin-up channel makes it more difficult for the
spin-up electrons to come back to the VB. Overall, both the slow spin flips
and the opposing Lorentz forces result in a prolonged charge carrier lifetime,
as observed from TRPL measurements. The above proposed mechanism is
illustrated in Figure 5.17. Considering the photocatalyst particles are highly
dispersed in the suspension during the reaction, the interaction of local
magnetic fields between different particles would be negligible. The
prolonged lifetimes of the photo-generated charge carriers greatly reduce
the chance of recombination, therefore enhance the diffusion to the surface
to facilitate the H+ reduction and OH- oxidation reactions from water. Such
observation can also explain the relationship seen in Figure 5.14c: as the N
concentration increases, the magnetic moments in the defect band (which
consists of N orbitals) also increase, forming an extended energy band,
which accounts for the dramatic spin-polarisation effect. While at low doping

Chapter 5 Magnetic Field Effects on Photocatalytic Water Splitting Performance
182
levels, the defect band is too narrow and localised to show any spin-
polarisation effect in an external magnetic field. Therefore, the spin-
polarisation effect dominates at high N-doping concentration under high
magnetic flux. Since the Lorentz force effect can be described by Equation
5.1, the contribution of the spin-polarisation effect can be evaluated
quantitatively. Analyses of the results shows that at Blocal/r2=0.71, the spin-
polarisation accounted for only 8.9% of the MFEs, while the contribution
increased to 22.6% at a stronger local magnetic flux (Blocal/r2=1.31). These
observations imply the opportunity of rational design of photocatalysts by
modifying different aspects of the MFEs (i.e., charge and spin features) in
order to control the charge separation and charge carrier lifetime, which
presumably have profound meanings to both academic study and practical
application of photocatalytic technologies.
5.3.4 Evaluation of practicality
Figure 5.18 QE of N-TiO2 (a) and Fe3O4/N-TiO2-4 (b) photocatalysts with and without external magnetic field (NMF=no magnetic field; MF=magnetic field of 180 mT). Error bars indicate the standard deviations; (c) Repeatable tests of Fe3O4/N-TiO2-4 photocatalyst at 270 oC and 180 mT followed by cooling to room temperature in each cycle, respectively. The application potential of this POWS system was further evaluated by QE
and STH conversion efficiency, both of which are widely recognised as key

Chapter 5 Magnetic Field Effects on Photocatalytic Water Splitting Performance
183
parameters for solar conversion systems.34
Figure 5.18a clearly shows that the internal QEs of N-TiO2 were not
influenced by an external magnetic field, while Figure 5.18b shows that
Fe3O4/N-TiO2-4 displays a sensitive response to the magnetic field, giving
impressive QEs of 96.2 % at 385 nm and 88.7 % at 437 nm. The
measurement of the internal QE in the near infrared (NIR) regime has also
been attempted by using a bandpass filter which allows a wavelength range
of 800-1200 nm to pass through. Excitingly, it gives an enhanced internal
QE of 10.8 % even in this NIR regime on the Fe3O4/N-TiO2-4 photocatalyst
under a magnetic field of 180 mT. The theoretical efficiency limit of a solar
conversion system was carefully analysed by Shockley and Queisser
(known as Shockley-Queisser limit or detailed-balance limit).35 Such limit
was then further considered for photochemical systems by Ross and
Hsiao.36 It has been demonstrated that there is always a part of the photon
energy that cannot do useful work, thus, for a given reaction, the threshold
energy that is capable of driving the reaction must exceed the minimum
thermodynamic requirement (free energy) of the reaction by 0.2-0.3 eV.35–38
Such energy difference could be minimised by different approaches, such
as engaging light trapping techniques, concentrated light irradiation, high-
purity light absorbers, etc.56 Detailed evaluation and discussions of this
threshold wavelength are given in Appendix Note A1. Moreover, the STH
conversion efficiency has been evaluated for our POWS system. As
demonstrated by Domen et al. recently, it is quite common that the POWS
reaction is carried out under various non-standard conditions including
reduced pressure, cooling, or heating, etc., thus the changes of the free

Chapter 5 Magnetic Field Effects on Photocatalytic Water Splitting Performance
184
energy must be considered by default.39 Also should be noted is that in our
batch process, the partial pressures of the evolved H2 and O2 change as the
reaction proceeding. Additionally, in our system, the reaction is performed at
a constant volume, thus, the Helmholtz free energy is used instead of the
Gibbs free energy. Therefore, the free energy has been corrected for the
operating temperature and the partial pressures in the system (Appendix
Note A3). As a result, a time-averaged STH efficiency of 11.9±0.5% has
been achieved from this local magnetic field promoted POWS system under
a magnetic field of 180 mT (Appendix Note A3). Recyclability of the Fe3O4/N-
TiO2-4 photocatalyst was evaluated by recycling the catalysts for 5 times,
showing no obvious change in photocatalytic activity (Figure 5.18c), and it
is presumably that Fe3O4 NPs are protected by the N-TiO2 coating from
oxidation. It is also noteworthy that our POWS reaction could still proceed
even in the presence of considerable pressures of H2 and O2 that make the
reaction less favourable thermodynamically, and drive the reverse reaction
more considerably. Subsequently, an overall energy conversion efficiency of
1.16±0.05% has been demonstrated when the energy input for heating is
considered (details can be found in Appendix Note A3). Although this overall
energy efficiency of 1.16% appears to be low, it should be emphasised this
is not the situation that is anticipated in the future design. It is apparent that
solar light could also provide heat by irradiation, photothermal effect, etc.
Thus, in an ideal future design, the energy for heating is not provided by
external source but from concentrated solar light, therefore, the energy
consumption for heating the water and reactor could be excluded in that
scenario, and a higher overall energy efficiency could be expected. In

Chapter 5 Magnetic Field Effects on Photocatalytic Water Splitting Performance
185
addition, the superheated water carries quite large thermal energy, which
may subsequently be used for additional energy generation, i.e., H2 by
steam turbine-electrolyser. Thus, by considering the availability of solar
heating and additional H2 generation, the actual overall energy efficiency
could be much higher upon further optimisation. Nevertheless, the current
value is still superior to the recently reported values in literature in the related
fields.40,41
5.4 Conclusion
In conclusion, superparamagnetic Fe3O4 NPs and a series of Fe3O4/N-TiO2
photocatalysts have been successfully synthesised, showing exceptional
POWS performance under visible light irradiation with an external magnetic
field. The structural, absorption and magnetic properties of the materials
have been carefully investigated. A remarkable H2 evolution rate of 21,230
µmol g-1 h-1 and QE of 88.7 % at 437 nm are obtained at 270 oC over 40 wt.%
Fe3O4/N-TiO2 under an external magnetic field of 180 mT due to the greatly
prolonged charge carrier lifetimes over this photocatalyst. An outstanding
STH efficiency of 11.9±0.5% can be demonstrated by our simple set-up
particulate POWS system with anticipated low capex cost. In addition to the
Lorentz force effect, spin-polarisation is for the first time demonstrated
systematically in this N-doped TiO2 structure under an external magnetic
field: the Lorentz effect contributes dominantly when the field strength is
weak, but when the field strength is strong enough (Blocal/r2>0.7), the spin-
polarisation effect can be triggered to further improve the photocatalytic
activity, accounting for 22.6% contribution at Blocal/r2=1.31. Both effects lead
to prolonged charge carrier lifetime and facilitate photocatalysis over the N-

Chapter 5 Magnetic Field Effects on Photocatalytic Water Splitting Performance
186
TiO2 based material. As such this work provides insights on the use of the
two fundamental features of electrons including charge and spin in the
magnetic field promoted photocatalysis. To unlock the full potential of MFEs,
not only can various photocatalytic systems be designed with tuned charge
and/or spin characteristics, but also the strength of the local magnetic field
can be tuned by engineering related photocatalysts in the proximity of
stronger superparamagnetic alloy shells or under a stronger external field,
further contributing to novel responsive solar energy conversion
technologies and the rational design of various photocatalytic systems with
high efficiency.
5.5 References
1. Li, Y., Wang, Z., Wang, Y., Kovács, A., Foo, C., Dunin-Borkowski, R. E., Lu, Y., Taylor, R. A., Wu, C. & Tsang, S. C. E. Local magnetic spin mismatch promoting photocatalytic overall water splitting with exceptional solar-to-hydrogen efficiency. Energy Environ. Sci. 15, 265–277 (2022).
2. Wolff, C. M., Frischmann, P. D., Schulze, M., Bohn, B. J., Wein, R., Livadas, P., Carlson, M. T., Jäckel, F., Feldmann, J., Würthner, F. & Stolarczyk, J. K. All-in-one visible-light-driven water splitting by combining nanoparticulate and molecular co-catalysts on CdS nanorods. Nat. Energy 3, 862–869 (2018).
3. Li, Y., Peng, Y.-K., Hu, L., Zheng, J., Prabhakaran, D., Wu, S., Puchtler, T. J., Li, M., Wong, K.-Y., Taylor, R. A. & Tsang, S. C. E. Photocatalytic water splitting by N-TiO2 on MgO (111) with exceptional quantum efficiencies at elevated temperatures. Nat. Commun. 10, 4421 (2019).
4. Li, Y. & Tsang, S. C. E. Unusual Catalytic Properties of High-Energetic-Facet Polar Metal Oxides. Acc. Chem. Res. 54, 366–378 (2021).
5. Li, Y., Wu, S., Zheng, J., Peng, Y.-K., Prabhakaran, D., Taylor, R. A., Chi, S. & Tsang, S. C. E. 2D photocatalysts with tuneable supports for enhanced photocatalytic water splitting. Mater. Today 41, 34–43 (2020).
6. Li, Y. & Tsang, S. C. E. Recent Progress and Strategies for Enhancing Photocatalytic Water Splitting. Mater. Today Sustain. 9, 100032 (2020).
7. Selwood, P. W. Magnetism and catalysis. Chem. Rev. 38, 41–82 (1946). 8. Steiner, U. E. & Ulrich, T. Magnetic Field Effects in Chemical Kinetics and Related
Phenomena. Chem. Rev. 89, 51–147 (1989). 9. Okumura, H., Endo, S., Joonwichien, S., Yamasue, E. & Ishihara, K. N. Magnetic
field effect on heterogeneous photocatalysis. Catal. Today 258, 634–647 (2015). 10. Li, J., Pei, Q., Wang, R., Zhou, Y., Zhang, Z., Cao, Q., Wang, D., Mi, W. & Du, Y.
Enhanced Photocatalytic Performance through Magnetic Field Boosting Carrier

Chapter 5 Magnetic Field Effects on Photocatalytic Water Splitting Performance
187
Transport. ACS Nano 12, 3351–3359 (2018). 11. Gao, W., Lu, J., Zhang, S., Zhang, X., Wang, Z., Qin, W., Wang, J., Zhou, W., Liu,
H. & Sang, Y. Suppressing Photoinduced Charge Recombination via the Lorentz Force in a Photocatalytic System. Adv. Sci. 6, 1901244 (2019).
12. Zhao, Z., Wang, D., Gao, R., Wen, G., Feng, M., Song, G., Zhu, J., Luo, D., Tan, H., Ge, X., Zhang, W., Zhang, Y., Zheng, L., Li, H. & Chen, Z. Magnetic‐Field‐Stimulated Efficient Photocatalytic N 2 Fixation over Defective BaTiO 3 Perovskites . Angew. Chemie 133, 12017–12025 (2021).
13. Zhao, J., Li, N., Yu, R., Zhao, Z. & Nan, J. Magnetic field enhanced denitrification in nitrate and ammonia contaminated water under 3D/2D Mn2O3/g-C3N4 photocatalysis. Chem. Eng. J. 349, 530–538 (2018).
14. Jiang, M. P., Huang, K. K., Liu, J. H., Wang, D., Wang, Y., Wang, X., Li, Z. Da, Wang, X. Y., Geng, Z. Bin, Hou, X. Y. & Feng, S. H. Magnetic-Field-Regulated TiO2 {100} Facets: A Strategy for C-C Coupling in CO2 Photocatalytic Conversion. Chem 6, 2335–2346 (2020).
15. Zhao, C., Zhou, L., Zhang, Z., Gao, Z., Weng, H., Zhang, W., Li, L. & Song, Y. Y. Insight of the Influence of Magnetic-Field Direction on Magneto-Plasmonic Interfaces for Tuning Photocatalytical Performance of Semiconductors. J. Phys. Chem. Lett. 11, 9931–9937 (2020).
16. Peng, Y. K., Lui, C. N. P., Chen, Y. W., Chou, S. W., Raine, E., Chou, P. T., Yung, K. K. L. & Tsang, S. C. E. Engineering of Single Magnetic Particle Carrier for Living Brain Cell Imaging: A Tunable T1-/T2-/Dual-Modal Contrast Agent for Magnetic Resonance Imaging Application. Chem. Mater. 29, 4411–4417 (2017).
17. Mishra, P., Patnaik, S. & Parida, K. An overview of recent progress on noble metal modified magnetic Fe3O4 for photocatalytic pollutant degradation and H2 evolution. Catal. Sci. Technol. 9, 916–941 (2019).
18. Köseoǧlu, Y. Effect of surfactant coating on magnetic properties of Fe3O4 nanoparticles: ESR study. J. Magn. Magn. Mater. 300, e327–e330 (2006).
19. Di Valentin, C., Pacchioni, G., Selloni, A., Livraghi, S. & Giamello, E. Characterization of paramagnetic species in N-doped TiO 2 powders by EPR spectroscopy and DFT calculations. J. Phys. Chem. B 109, 11414–11419 (2005).
20. Feng, N., Lin, H., Song, H., Yang, L., Tang, D., Deng, F. & Ye, J. Efficient and selective photocatalytic CH4 conversion to CH3OH with O2 by controlling overoxidation on TiO2. Nat. Commun. 12, (2021).
21. Mubeen, S., Hernandez-Sosa, G., Moses, D., Lee, J. & Moskovits, M. Plasmonic photosensitization of a wide band gap semiconductor: Converting plasmons to charge carriers. Nano Lett. 11, 5548–5552 (2011).
22. Hou, W. & Cronin, S. B. A review of surface plasmon resonance-enhanced photocatalysis. Adv. Funct. Mater. 23, 1612–1619 (2013).
23. Zhan, C., Wang, Z. Y., Zhang, X. G., Chen, X. J., Huang, Y. F., Hu, S., Li, J. F., Wu, D. Y., Moskovits, M. & Tian, Z. Q. Interfacial Construction of Plasmonic Nanostructures for the Utilization of the Plasmon-Excited Electrons and Holes. J. Am. Chem. Soc. 141, 8053–8057 (2020).
24. Zeradjanin, A. R., Vimalanandan, A., Polymeros, G., Topalov, A. A., Mayrhofer, K. J. J. & Rohwerder, M. Balanced work function as a driver for facile hydrogen evolution reaction - Comprehension and experimental assessment of interfacial catalytic descriptor. Phys. Chem. Chem. Phys. 19, 17019–17027 (2017).
25. Seh, Z. W., Kibsgaard, J., Dickens, C. F., Chorkendorff, I., Nørskov, J. K. &

Chapter 5 Magnetic Field Effects on Photocatalytic Water Splitting Performance
188
Jaramillo, T. F. Combining theory and experiment in electrocatalysis: Insights into materials design. Science 355, 146 (2017).
26. Ingram, D. B. & Linic, S. Water splitting on composite plasmonic-metal/semiconductor photoelectrodes: Evidence for selective plasmon-induced formation of charge carriers near the semiconductor surface. J. Am. Chem. Soc. 133, 5202–5205 (2011).
27. Furube, A., Du, L., Hara, K., Katoh, R. & Tachiya, M. Ultrafast plasmon-induced electron transfer from gold nanodots into TiO2 nanoparticles. J. Am. Chem. Soc. 129, 14852–14853 (2007).
28. Zhu, S. & Wang, D. Photocatalysis: Basic principles, diverse forms of implementations and emerging scientific opportunities. Adv. Energy Mater. 7, 1700841 (2017).
29. Kovács, A. & Dunin-Borkowski, R. E. Magnetic Imaging of Nanostructures Using Off-Axis Electron Holography. Handb. Magn. Mater. 27, 59–153 (2018).
30. Tao, J. G., Guan, L. X., Pan, J. S., Huan, C. H. A., Wang, L., Kuo, J. L., Zhang, Z., Chai, J. W. & Wang, S. J. Density functional study on ferromagnetism in nitrogen-doped anatase TiO2. Appl. Phys. Lett. 95, 93–96 (2009).
31. Foo, C., Li, Y., Lebedev, K., Chen, T. T., Day, S., Tang, C. & Tsang, S. C. E. Characterisation of oxygen defects and nitrogen impurities in TiO2 photocatalysts using variable-temperature X-ray powder diffraction. Nat. Commun. 12, 661 (2021).
32. Wang, W., Tadé, M. O. & Shao, Z. Nitrogen-doped simple and complex oxides for photocatalysis: A review. Prog. Mater. Sci. 92, 33–63 (2018).
33. Pan, L., Ai, M., Huang, C., Yin, L., Liu, X., Zhang, R., Wang, S., Jiang, Z., Zhang, X., Zou, J. J. & Mi, W. Manipulating spin polarization of titanium dioxide for efficient photocatalysis. Nat. Commun. 11, 418 (2020).
34. Wang, Z., Li, C. & Domen, K. Recent developments in heterogeneous photocatalysts for solar-driven overall water splitting. Chem. Soc. Rev. 48, 2109–2125 (2019).
35. Shockley, W. & Queisser, H. J. Detailed balance limit of efficiency of p-n junction solar cells. J. Appl. Phys. 32, 510–519 (1961).
36. Ross, R. T. & Hsiao, T. L. Limits on the yield of photochemical solar energy conversion. J. Appl. Phys. 48, 4783–4785 (1977).
37. Bolton, J. R., Stricklert, S. J. & Connolly, J. S. Limiting and realizable efficiencies of Solar Photolysis of Water. Nature 316, 495–500 (1985).
38. Bolton, J. R. Solar fuels. Science 202, 705–711 (1978). 39. Wang, Z., Hisatomi, T., Li, R., Sayama, K., Liu, G., Domen, K., Li, C. & Wang, L.
Efficiency Accreditation and Testing Protocols for Particulate Photocatalysts toward Solar Fuel Production. Joule 5, 344–359 (2021).
40. Takata, T., Jiang, J., Sakata, Y., Nakabayashi, M., Shibata, N., Nandal, V., Seki, K., Hisatomi, T. & Domen, K. Photocatalytic water splitting with a quantum efficiency of almost unity. Nature 581, 411–414 (2020).
41. Nishiyama, H., Yamada, T., Nakabayashi, M., Maehara, Y., Yamaguchi, M., Kuromiya, Y., Tokudome, H., Akiyama, S., Watanabe, T., Narushima, R., Okunaka, S., Shibata, N., Takata, T., Hisatomi, T. & Domen, K. Photocatalytic solar hydrogen production from water on a 100 m2-scale. Nature 598, 304–307 (2021).

Chapter 6 Photocatalytic Seawater Splitting System
189
Chapter 6 Photocatalytic Seawater Splitting System
6.1 Introduction
It has been demonstrated in Chapters 3-5 that the local polarisation plays a
tremendously important role in improving the POWS performance at elevated
temperatures, which facilitates the separation of the photo-generated charge
carriers. Many recent studies have also reported similar conclusions.1–5 Different
strategies have been developed and demonstrated in Chapters 3-5, such as using
polar-faceted materials to provide local electric field (LEF), or using the magnetic
field effects (MFEs), etc., which has encouraged me to think deeper about this
high-temperature POWS system and inspired me of further improvement to push
this system closer to the practical applications. Although extensive efforts are
dedicated to the POWS studies in pure water, actually, more than 90% of the water
resource on the earth surface is stored in seas and oceans, which are salty;6–11
not to mention that the desalination and purification (e.g., reverse osmosis,
distillation, ion exchange, etc.) largely adds up to the overall capital costs of this
technology.12–14 Obviously, H2 evolution via splitting of the seawater or brackish
water is more desirable for large-scale applications and able to mitigate the fresh
water resource shortage, however, systematic study and in-depth understanding
of the photocatalytic seawater splitting are still limited. Contradictory views
regarding the effect of seawater on the POWS performance emerge in recent
literature, for example, Tian et al. presented that a supported black phosphor
nanosheets catalyst could split seawater with a much lower H2 evolution rate than
that in pure water;8 while it was reported that photocatalytic H2 evolution could be
enhanced for WO3 nano-arrays and GaN-based catalysts in seawater because of
higher charge mobility.7,15 Meanwhile, the cations in seawater were reported able

Chapter 6 Photocatalytic Seawater Splitting System
190
to polarise the carboxyl groups on the surface of a carbon dots (CDs) photocatalyst,
leading to stronger electron-trapping and resulting in an enhanced H2O2
photoproduction.9 Opinions contradict in the field of seawater electrolysis as
well.10,16–18 Clearly, unlike pure water, the ionic species in seawater exert various
effects on catalytic reactions; and a common concern is that the anions like Cl- can
be photocatalytically oxidised, forming Cl2 or ClO- (see Equations 6.1 and 6.2),
which are corrosive to many materials.15 Thus, it is challenging to develop an
efficient and stable catalytic system for such a salty environment. Also noteworthy
is that the ionic species in seawater carry charges that generate LEF in their vicinity,
and such LEF could facilitate the separation of the photo-generated charge
carriers, as demonstrated in the previous chapters.
Oxidation: 2𝐶𝑙? + 2ℎ> ==𝐶𝑙/
Reduction: 2𝐻/𝑂 + 2𝑒? ==𝐻/ + 2𝑂𝐻? Equation 6.1
Oxidation: 2𝑂𝐻? + 𝐶𝑙? + 2ℎ> == 𝐶𝑙𝑂? + 𝐻/𝑂
Reduction: 2𝐻/𝑂 + 2𝑒? ==𝐻/ + 2𝑂𝐻? Equation 6.2
6.2 Objectives
As mentioned before, the POWS reaction using particulate suspension has been
recognised as a promising approach for harnessing solar energy. Thus, if such
system could be operated using natural seawater, it could be more desirable.
However, the majority of the POWS studies have been focusing on pure water,
while more than 90% of water resource on the earth surface is in seas and oceans,
which are salty water. In this chapter, the facet-engineered N-doped TiO2 (denoted
as N-TiO2) is taken as an example. I systematically studied the POWS reaction in
the salty environments, where H2 and O2 were stoichiometrically and stably

Chapter 6 Photocatalytic Seawater Splitting System
191
produced at 270 oC. Artificial seawaters are prepared to simulate the water
resources at different areas in the world, and a natural seawater sample was
collected from Bournemouth in the UK. I will focus on the effects of the ionic
species in this chapter and attempt to explore the mechanism of this system at
270 oC. Besides, the underlying principles will be investigated with the help of
various techniques. High angle annular dark field scanning transmission electron
microscopy (HAADF-STEM) will be used to understand the facet-dependent
trapping of the charge carriers. Ambient pressure X-ray photoelectron
spectroscopy (AP-XPS) study is carried out using the trimethylphosphine (TMP)
as a surface probe to further understand the polarisation effect. With the help of
density functional theory (DFT) calculations, the surface trappings of the photo-
generated electrons and holes upon photoexcitation will be illustrated. I believe all
these investigations about the local polarisation will help to understand the effects
of the ionic species in the seawater. This versatile system will also be applied to
other important semiconductor photocatalysts, such as perovskite oxynitride
materials.
6.3 Results and discussion
6.3.1 Characterisations of the facet-engineered TiO2 nanocrystals
Facet-controlled TiO2 nanostructures were prepared using hydrofluoric acid as a
structure-directing agent (SDA) based on our previous report, followed by NH3
treatment at high temperature to obtain the N-doped TiO2 (denoted as N-TiO2) and
remove the surface F-group at the same time.2,19 The as-prepared N-TiO2 material
has then been comprehensively characterised by various experimental techniques,
such as transmission electron microscopy (TEM), X-ray powder diffraction (XRD),
Raman spectroscopy, electron paramagnetic resonance (EPR) spectroscopy, X-

Chapter 6 Photocatalytic Seawater Splitting System
192
ray photoelectron spectroscopy (XPS), UV-visible diffuse reflectance spectroscopy
(UV-Vis DRS), etc., which are discussed in details in the following sub-sections.
6.3.1.1 XRD patterns of TiO2 and N-TiO2
Figure 6.1 XRD patterns of the as-prepared facet-engineered TiO2 (red) and N-TiO2 (blue). The N-TiO2 presented here was obtained by treating the facet-engineered TiO2 with NH3 flow at 600 oC for 8 h. The characteristic peaks of anatase TiO2 phase have been labelled. XRD measurements were performed to investigate the structural information of
the as prepared facet-engineered TiO2 and N-TiO2, and the XRD patterns are
shown in Figure 6.1. As can be seen, both the pristine TiO2 and N-TiO2 exhibit the
anatase TiO2 phase. The characteristic peaks at 2θ of 25.3o, 37.8o and 48.1o can
be observed in Figure 6.1 for both materials, which are corresponding to the (101),
(004) and (200) crystal facets of anatase TiO2, respectively. No rutile peak
emerges after the ammonia treatment as shown in Figure 6.1, indicating the high-
temperature ammonia treatment does not lead to a substantial phase
transformation from anatase to the more stable rutile phase. However, it should be
noted that there is a small peak at 2θ of 43.3o emerging after the NH3 treatment,
which could be attributed to the local oxynitride phase (TiOxNy) that has been

Chapter 6 Photocatalytic Seawater Splitting System
193
discussed in Chapter 3.
6.3.1.2 Microscopic studies of N-TiO2
HAADF-STEM was engaged to investigate the morphologies of the TiO2-based
materials. The HAADF-STEM images show that the N-TiO2 exhibits lattice fringes
with d-spacings of 0.237 and 0.352 nm, in accordance with the [004] and [101]
crystallographic planar directions of anatase TiO2, respectively (Figure 6.2), which
indicates the exposure of the polar (001) and non-polar (101) facets for the N-TiO2
nanocrystals. The interfacial angle of 68.3o can also be observed in the HAADF-
STEM images shown in Figure 6.2, which further confirms the exposed facets.
Figure 6.2 STEM images of the as prepared facet-engineered N-TiO2. a low-magnification HAADF-STEM image showing the morphology of N-TiO2; b, c high-magnification HAADF-STEM images showing the lattice spacings and exposed crystal facets. Then, according to the Wulff construction, the ratio of the exposed (101) and (001)
facets can be calculated (Figure 6.3). The percentages of exposed (101) and (001)
facets estimated to be 38 % and 62 %, respectively.

Chapter 6 Photocatalytic Seawater Splitting System
194
Figure 6.3 Simulated shape of the TiO2 anatase single crystal and the calculation process for percentage of (001) facets (θ of 68.3o is the interfacial angle between (001) and (101)).20 6.3.1.3 XPS of N-TiO2 materials
Figure 6.4 High resolution N 1s XPS spectra of the as prepared facet-engineered TiO2 (red) and N-TiO2 (blue). The ex situ XPS was used to obtain the elemental information of the as-prepared
materials, which indicates that the N atoms were successfully doped into the TiO2
nanocrystals and the surface F-groups were removed (Figure 6.4). A peak can be

Chapter 6 Photocatalytic Seawater Splitting System
195
observed at a binding energy (BE) of 396 eV for the N-TiO2, which originates from
the N atoms substituting the original O atoms according to literature;21,22 while
there is obviously no such signal detected for the pristine TiO2. It has been
demonstrated in the previous chapters that the N-doping would lead to greatly
enhanced absorption of visible and infrared light. Also, the surface oxygen
vacancies (VOs) are introduced by the N-doping. More details have been
discussed in Chapter 3.
6.3.1.4 EPR of facet-engineered TiO2 based materials
Figure 6.5 EPR spectra of the as-prepared facet-engineered TiO2 (red) and N-TiO2 (blue). EPR spectroscopy was engaged to investigate the unpaired electron species in
the TiO2-based materials. As demonstrated before, the surface VOs can trap the
unpaired electrons from the semi-conductive oxide, and then form the radicals with
the O2 from air, which is detectable by EPR. As shown in Figure 6.5, an obvious
EPR signal is recorded at g=2.003 for the N-TiO2, while the pristine TiO2 is silent
on EPR measurement.
6.3.1.5 UV-Vis DRS of facet-engineered TiO2 based materials
UV-Vis DRS was used to investigate the absorption properties of the materials,

Chapter 6 Photocatalytic Seawater Splitting System
196
and the measured reflectance spectra were transformed to the corresponding
absorption spectra by applying the Kubelka-Munk function. As shown in Figure 6.6,
the pristine facet-engineered TiO2 exhibits an absorption edge at about 390 nm,
while after NH3 treatment at 600 oC for N-doping, the N-TiO2 shows a greatly
enhanced absorption in both the visible light and near infrared regimes. Such
observation is in accordance with what was demonstrated for the P25 TiO2
materials in Chapter 3. This large enhancement in the absorption property also
results in an obvious colour change from white to navy blue.
Figure 6.6 UV-Vis absorption spectra transformed from UV-Vis DRS by the Kubelka-Munk function. 6.3.1.6 Raman spectroscopy of the TiO2-based materials
Raman spectroscopy was engaged to obtain more structural information of the
TiO2-based materials. As shown in Figure 6.7, four major peaks that represent the
Eg, B1g, A1g and Eg Raman-active vibrational modes, are located at 142, 394, 516
and 636 cm-1, respectively. These results indicate the predominant phase of
anatase.23,24 Obviously, the peaks of the N-doped sample exhibit a certain degree
of weakening and broadening, implying the TiO2 lattice is disrupted by the N-

Chapter 6 Photocatalytic Seawater Splitting System
197
doping and the formation of VOs after the NH3 treatment.25,26 However, the
diffraction peaks are still similar to that of pristine P25, which indicates that the
major anatase structure has not been changed during NH3 treatment, in
consistence with XRD results.
Figure 6.7 Raman spectra of the as-prepared facet-engineered TiO2 (red) and N-TiO2 (blue). 6.3.2 Effect of ionic species on the POWS system
6.3.2.1 Effect of electrolytes on POWS performance
As demonstrated before, the sluggish surface and sub-surface VO regeneration
process, which is widely considered as the rate determining step for the POWS
reaction on TiO2-based materials at ambient conditions, could be greatly
accelerated at elevated temperatures.2,27 Therefore, other effects such as
polarisation effect can be better investigated at elevated temperatures.2
Consequently, in this chapter, the POWS activity tests are carried out at 270 oC
which has been shown to be the optimal temperature in such POWS system
(Chapter 3).2

Chapter 6 Photocatalytic Seawater Splitting System
198
Figure 6.8 Optimisation of cocatalyst loading and loading amount. (a) POWS activity of the facet-controlled N-TiO2 loaded with 1 wt.% of different metal nanoparticles (NPs) as the cocatalyst via a photo-deposition method. (b) POWS activity of the facet-controlled N-TiO2 loaded with Pt NPs of different loading amounts. The POWS activity was evaluated in a batch reactor at 270 oC with simulated solar irradiation (AM 1.5G). Typically, 1 wt.% of Pt nanoparticles (NPs) were deposited on the N-TiO2
nanocrystals via a photo-deposition method before catalytic test as a H2 evolution
cocatalyst. Different metals have also been studied likewise, which shows that Pt
exhibits the highest enhancement on the photocatalytic performance, followed by
Au that has been widely studied for the surface plasmon resonance effect.28,29 This
follows a similar trend as what was discussed in more details in Chapter 5, where
the promoting effect of the metal NPs was compared against the volcano curve for
the electrocatalytic H2 evolution reaction. The loading amount is then optimised as
well, as shown in Figure 6.8. Clearly, the POWS activity levels off when the loading
amount is increased beyond 1 wt.%; moreover, the activity shows a small drop
when the loading amount exceeds 3 wt.%, which is presumably due to the
shielding effect of the NPs, resulting in less photons reaching the N-TiO2
photocatalyst particles.30
In order to understand the effects of ionic species in seawater on the photocatalytic

Chapter 6 Photocatalytic Seawater Splitting System
199
performance in this system, I first used the NaCl aqueous solutions with different
concentrations instead of seawater to avoid the complexity. Bearing in mind that
the salt concentration of seawater is a function of the location, which varies greatly
among different areas of the world, I therefore investigated a wide range of NaCl
concentrations up to 6.0 mol L-1 (Figure 6.9). The POWS performances increase
proportionally with the concentration of the NaCl solution up to 3.0 mol L-1, showing
an enhancement from 6428 to 24750 μmol g-1 h-1, while the enhancement
becomes less significant when the concentration is higher than 3 mol L-1.
Figure 6.9 POWS performance measured in the NaCl aqueous solutions with different concentrations at 270 oC. Error bars indicate the standard deviations of GC analysis. A common concern of the photocatalysis in seawater (or solutions containing Cl-
ions) is that the Cl- oxidation may take place during the photocatalytic splitting of
seawater, resulting in the production of corrosive Cl2 or ClO-. According to
Equations 6.1 and 6.2, the Cl- oxidation reaction will inevitably lead to a pH
increase of the solution. Thus, pH was measured before and after the reaction,
which showed no obvious change, indicating there was no Cl- oxidation observed

Chapter 6 Photocatalytic Seawater Splitting System
200
in this system, probably due to the high oxidation potential of Cl− ions (= +1.36 V
vs. NHE compared with = +1.23 V vs. NHE at pH = 0).15 Gas chromatograph (GC)
analysis of the gaseous product also showed no signal of Cl2 gas.
Subsequently, other neutral electrolytes were also studied likewise: the POWS
activities were measured in different electrolyte solutions that share the same
concentration of 0.2 mol L-1, all of which showed enhanced POWS performance
at 270 oC compared with that measured in pure water (Figure 6.10). But the
enhancement varies among different electrolytes, presumably due to the different
radii and charges of the ions, which will be discussed in detail later. An organic
compound, sodium dodecyl sulphate, which is the main component of many
hygiene products and may also exist in seawater due to water pollution, was also
studied. Even though the H2 evolution rate was enhanced by 55 %, no O2 was
detected in the gas phase after reaction. Instead, CO2 and CO were observed by
GC analysis, which suggested that the organic compound could act as a sacrificial
reagent in this system, leading to the undesired carbon emission. Also noteworthy
is that the acidic or alkaline compounds, such as HCl or Na2CO3, which largely
change the pH of the solution, showed no enhancement to the POWS
performance, but even decelerated the reaction. This is presumably because that
the acidic/alkaline compounds substantially suppress the water dissociation,
resulting in much lowered concentration of OH-/H+ ions, which is kinetically
unfavourable for the corresponding O2/H2 evolution reactions.

Chapter 6 Photocatalytic Seawater Splitting System
201
Figure 6.10 POWS activity of Pt/N-TiO2 tested in different aqueous solutions (the concentration is kept at 0.2 mol L-1 for all measurements) at 270 oC. Error bars show the standard deviation. Typically, 1 wt.% of Pt NPs were loaded to the N-TiO2 as the cocatalyst via a photo-deposition method before use. 6.3.2.2 TRPL of N-TiO2 in the presence of electrolyte solution
TRPL spectroscopy was used to investigate the separation of the photo-generated
charge carriers in the photocatalyst. The TRPL spectra of N-TiO2 photocatalyst
were obtained with the sample being soaked in different aqueous electrolyte
solutions (Figure 6.11). Obviously, as the ionic strength of the NaCl solution
increases, the decay of the TRPL spectrum becomes slower (Figure 6.11a), which
is presumably due to the local electric field generated by the ionic species
adsorbed on the surface of the photocatalyst particles. Moreover, when measured
in different electrolyte solutions with the same ionic strength, the TRPL decay
curves appear almost the same (Figure 6.11b). Then, the obtained spectra were
fitted using a biexponential function and the fitting parameters are given in Table
6.1.

Chapter 6 Photocatalytic Seawater Splitting System
202
Figure 6.11 (a) TRPL spectra of N-TiO2 nanocrystals measured in NaCl aqueous solutions. The concentration of the NaCl solution increases along the arrow and the values are 0, 1, 2, 3, 4, 5 and 6 mol L-1, respectively. (b) TRPL spectra of N-TiO2 nanocrystals measured in different electrolyte aqueous solutions, respectively. The concentration is 0.2 mol L-1 for all the three solutions. Clearly, there are two decay components, of which the fast component can be
attributed to the intrinsic recombination process of TiO2 in the bulk region, which
is hardly influenced by the ionic species in the solution. However, a slow
component was also differentiated which showed a positive correlation with the
ionic strength of the solution, therefore, it is attributed to the suppressed
recombination due to the LEF introduced by the ionic species near the surface:
the photo-generated charge carriers near the surface are obviously more prone to
the LEF of the ionic species adsorbed on the catalyst surface, compared with those
in the bulk. In addition, it should be clarified that this LEF only influences the
dynamics of the charge carriers, without changing the PL spectra, which means
the LEF could not change the energy levels or the band structure of the
photocatalysts, at least this was not observed in this thesis. Consequently, the
average lifetime of the photo-generated charge carriers was greatly prolonged in
the aqueous solutions. Also, it is found that acidic and alkaline electrolytes, HCl

Chapter 6 Photocatalytic Seawater Splitting System
203
and Na2CO3, substantially prolong the charge carrier lifetime, however, they show
negative effects on the POWS performance due to the unfavourable kinetics as
demonstrated in the previous section.
Table 6.1 Fitting parameters of the TRPL spectra of the N-TiO2 photocatalyst in different solutions.a
Solution f1 (%) 𝝉𝟏 (ns) f2 (%) 𝝉𝟐 (ns) 𝝉𝒂𝒗𝒆𝒓𝒂𝒈𝒆
Pure water 26.4 0.75 73.6 2.34 1.92±0.02
1.0 M NaCl (aq.) 9.1 0.70 90.9 4.38 4.05±0.03
2.0 M NaCl (aq.) 6.0 0.76 94.0 6.13 5.81±0.03
3.0 M NaCl (aq.) 5.0 0.72 95.0 7.83 7.47±0.04
4.0 M NaCl (aq.) 5.5 0.69 94.5 8.73 8.29±0.05
5.0 M NaCl (aq.) 4.5 0.73 95.5 9.53 9.13±0.06
6.0 M NaCl (aq.) 4.1 0.74 95.9 10.12 9.75±0.06
0.2 M KCl (aq.) 16.5 0.67 83.5 2.78 2.44±0.03
0.2 M NaCl (aq.) 18.1 0.69 81.9 2.91 2.51±0.03
0.2 M CaCl2 (aq.) 11.0 0.71 89.0 3.61 3.29±0.03
0.2 M MgCl2 (aq.) 13.6 0.70 86.4 3.52 3.14±0.04
0.2 M Na2SO4 (aq.) 11.9 0.71 88.1 3.98 3.59±0.04 a The charge carrier lifetime is obtained by fitting the TRPL spectra using a biexponential decay function. TRPL measurements are performed on the sample powders soaked in different solutions at room temperature. 𝜏A and 𝜏/ are the lifetimes of the fast and the slow decay components; 𝜏FmDnFKD is the average lifetime of the charge carriers; f1 and f2 are the contribution of the fast and the slow decay components to the average lifetime of the charge carriers, respectively. 6.3.2.3 Effect of artificial and natural seawater
So far, it can be clearly seen that the POWS performance of the Pt/N-TiO2
photocatalyst can be greatly enhanced in aqueous solutions of electrolytes, and
the charge carrier lifetime can be substantially prolonged presumably due to the
facilitated local electric field. I then looked into the more complicated cases:
seawater. Although the global average salt concentration of seawater is 3.5 wt.%

Chapter 6 Photocatalytic Seawater Splitting System
204
(ca. 0.6 mol L-1), extreme case like the Dead Sea has a high salt concentration of
around 31.5 wt.%.7,31 Obviously, collecting the natural seawater samples all over
the world in person is unrealistic and unnecessary in this work. Therefore,
seawater of different water areas of the world were selected and simulated in our
lab, based on the analysis data reported in literature (Table 6.2).32–35
Figure 6.12 POWS activity of Pt/N-TiO2 tested in different artificial seawater samples at 270 oC. Error bars show the standard deviation. Table 6.2 Compositions of the simulated seawaters using the data from Ref. 32–35
NaCl KCl CaCl2 MgCl2 Na2SO4 Ionic strength (mol L-1)
Dead sea 3.5 0.3 0.2 0.7 / 6.50
Lop Nor 3.54 0.2 / 0.56 / 5.42
Aral Sea 1 0.06 / 0.5 0.7 4.66
Great Salt Lake 2.4 0.15 / 0.3 0.15 3.90
Red sea 0.62 / / 0.03 / 0.71
Impressively, enhancement of the POWS performance was observed in the
artificial seawaters to different extents (Figure 6.12). The pH of the solutions was

Chapter 6 Photocatalytic Seawater Splitting System
205
measured before and after the reactions as well, which showed no observable
change, indicating the stoichiometric splitting of water and no other side reactions
taking place. The Dead Sea water that has the highest salt content shows the best
H2 evolution rate of 34,035 µmol g-1 h-1, followed by the Lop Nor which exhibits a
rate of 29,968 µmol g-1 h-1. The Red Sea, which has a salt concentration of the
global average (3.5 wt.%, 0.6 mol L-1), gives a lower H2 evolution rate of 9,972
µmol g-1 h-1. Natural seawater was also collected from Bournemouth, UK, and
tested for POWS activity after filtration, which excitingly also showed an enhanced
activity of 11,048 µmol g-1 h-1 compared with that in pure water (Figure 6.12). It
should be noted that the activity obtained from natural seawater is very similar to
that from the artificial Red Sea water, because they share a similar salt
concentration of the global average (3.5 wt.%, 0.6 mol L-1), confirming that the
difference of the POWS activity is mainly originated from the different salt
concentrations of the artificial seawaters.
6.3.2.4 TRPL study in the presence of artificial seawater
TRPL studies were carried out similarly, and the TRPL spectra obtained in different
artificial seawaters are shown in Figure 6.13. Generally, the TRPL signal decays
more slowly when the total ionic strength of the artificial seawater increases, which
is in accordance with the previous observations for NaCl solutions. Then these
spectra were also fitted using a biexponential decay function and the results are
given in Table 6.3. Similarly, both the fast and slow decay components can be
observed in each TRPL spectrum measured in the artificial seawater samples, and
the results indicate that the average lifetime of the electron/hole pairs is greatly
prolonged to different extents in the artificial seawaters. Not surprisingly, the
longest average lifetime of 10.28 ns was observed for Pt/N-TiO2 soaked in the

Chapter 6 Photocatalytic Seawater Splitting System
206
Dead Sea water that has the highest ionic strength (Figure 6.13 and Table 6.2).
Figure 6.13 TRPL spectra of N-TiO2 nanocrystals measured in different artificial seawaters. The composition of the artificial seawater samples is shown in Table 6.2. Table 6.3 Fitting parameters of the TRPL spectra of the N-TiO2 photocatalyst in different artificial seawaters.a
Solution f1 (%) 𝝉𝟏 (ns) f2 (%) 𝝉𝟐 (ns) 𝝉𝒂𝒗𝒆𝒓𝒂𝒈𝒆
Dead sea 3.7 0.73 96.3 10.65 10.28±0.06 Lop Nor 4.8 0.73 95.2 9.71 9.28±0.06 Aral Sea 4.5 0.69 95.5 9.21 8.83±0.05 Great Salt Lake 5.2 0.70 94.8 8.32 7.92±0.04 Red sea 12.5 0.67 87.5 3.64 3.27±0.03
a The charge carrier lifetime is obtained by fitting the TRPL spectra using a biexponential decay function. TRPL measurements are performed on the sample powders soaked in different solutions at room temperature. 𝜏A and 𝜏/ are the lifetimes of the fast and the slow decay components; 𝜏FmDnFKD is the average charge carrier lifetime; f1 and f2 are the contribution of the fast and the slow decay components to the average charge carrier lifetime, respectively.

Chapter 6 Photocatalytic Seawater Splitting System
207
6.3.3 Mechanism investigation of the ionic effect
Figure 6.14 Linear relationships between the charge carrier lifetime and the POWS activity. As can be seen from the section 6.3.2, obviously, the POWS activity shows a
positive correlation with the ionic strength of the electrolyte solutions and artificial
seawaters, and so does the lifetime of the photo-generated charge carriers.
Therefore, the POWS activity (represented by the H2 evolution rate) was then
plotted against the charge carrier lifetime, as shown in Figure 6.14. Clearly, the
POWS performance exhibits a linear relationship with the charge carrier lifetime,
indicating that the ionic species in the aqueous solutions largely prolong the
charge carrier lifetime in the Pt/N-TiO2 photocatalyst and lead to the substantially
enhanced photocatalytic performance. In another word, the ionic species influence
the photocatalytic activity by facilitating the separation of the charge carriers and
suppressing their recombination. Therefore, the charge carrier separation process
has been studied more deeply to illustrate the mechanism of the ionic effect, as
detailed in the following sub-sections.

Chapter 6 Photocatalytic Seawater Splitting System
208
6.3.3.1 Facet-selective photo-deposition
Figure 6.15 HAADF-STEM images and EDS mappings of the facet-controlled N-TiO2 nanocrystals loaded with (a) Pt NPs and (b) CoOx NPs via the facet-selective photo-deposition method, which clearly show that Pt NPs are favourably deposited on (101) facets and CoOx are dominantly deposited on (001) facets. The mechanism of the charge separation process was then investigated by
HAADF-STEM. Different NPs were separately loaded onto the facet-controlled N-
TiO2 via a facet-selective photo-deposition method.36,37 It has been demonstrated
that upon light irradiation, the photo-excited electrons/holes migrate to the
surfaces of semiconductor particles and then reduce/oxidise the chemical species
in the solution, respectively, forming deposited NPs if the chemical potential is
appropriate.1 Therefore, these deposited NPs can be considered as indicators of
the photo-generated electrons and holes on the surface of the catalyst particles.
In this chapter, Pt NPs and CoOx NPs were fabricated through the photo-reduction
and photo-oxidation of the Pt(II) and Co(II) precursors, respectively. As previously
mentioned in Chapter 3, Pt(II) can be readily reduced to Pt(0) by the photo-
generated electrons in the conduction band during the photo-deposition process.
On the contrary, Co(II) cannot be reduced in such conditions, because the
electrons in the conduction band do not have a sufficiently negative potential, but
it can be oxidised by the photo-generated holes in the valence band in the

Chapter 6 Photocatalytic Seawater Splitting System
209
presence of NaIO3 as an electron-scavenger, forming Co(III) oxide (CoOx) NPs.
As shown in Figure 6.15, Pt NPs were deposited preferentially on the (101) facets,
while the CoOx NPs were favourably deposited on the (001) facets. These
observed anisotropic photo-depositions of different NPs indicated a charge
polarisation effect inside the photocatalyst particle, driven by an internal electric
field originated from the work function difference between the facets.1 The above
evidences indicate that the photo-generated electrons favourably migrate to the
(101) facets of the N-TiO2 upon illumination, leaving the holes on the (001) facets.
In a chemical sense, this could mean that the Ti-O bonds on the (001) surfaces
are weaker than those on the (101) surfaces, thus, VOs (holes) are readily
generated on the (001) surfaces upon illumination, which then act as the active
centres for O2 evolution, while the electrons migrate to the (101) surfaces
(accumulate at Ti or metal NPs) for H2 evolution. According to the above
observations, it can be expected that the cations (e.g., Na+) and the anions (e.g.,
Cl-) ions in the solution would preferentially be adsorbed on the respective facet,
depending on the charge that the facet carries (similar to the behaviours observed
for the Pt(II) and Co(II) precursors). This facet-selective adsorption, in turn,
suppresses the charge carriers’ recombination by introducing a local electric field
on the surface.
6.3.3.2 In situ AP-XPS study of the facet-controlled N-TiO2
AP-XPS was then engaged to investigate the surface electronic features of N-TiO2
using TMP as a surface probe. As demonstrated in our previous studies, the
nucleophilic TMP molecule can form stable adducts with the exposed Lewis acid
(LA) sites (e.g., five-coordinated Ti4+) on the surface.19,38 Such interaction between
TMP and the surface LA sites is very sensitive to any change of the surface

Chapter 6 Photocatalytic Seawater Splitting System
210
chemical environment and the local electron density, which can be observed as
the shift of binding energy (BE) on P 2p XPS spectra. Therefore, the surface
charge separations among different facets are allowed to be differentiated and
analysed. Facet-controlled N-TiO2 photocatalyst was investigated by this probe-
assisted AP-XPS technique and 0.2 mbar of TMP was directed into the
experimental chamber during the measurements. XPS spectra were collected with
and without light irradiation. Generally, when TMP is added to the sample, the Ti
2p signal shifts to a lower BE since TMP is a Lewis base that can make the surface
Ti4+ more electron-rich by forming adducts; while the O 1s signal remains the same
(Figure 6.16a. Upon irradiation, the signal of Ti 2p shifts to further lower BE and
that of O 1s shifts to higher BE, mainly because the electrons are excited from the
valence band (VB, consists of O 2p) to the conduction band (CB, consists of Ti 3d).
Also, the shifts of the signals are recovered when light is off, showing that the BE
shifts are due to the photo-excitation instead of any sample damage. It should be
noted that the Ti 2p and O 1s spectra do not only show the surface electronic
features in this case, since it is widely agreed that the XPS sampling depth is up
to several nanometres into the bulk region. On the other hand, the surface features
can be better investigated from the P 2p spectra since the TMP molecules can
only adsorb on the surface of the photocatalyst particle. As shown in the P 2p
spectra in Figure 6.16a, doublet signals can be identified in P 2p spectra, which
are attributed to the P 2p3/2 and P 2p1/2 of the surface adsorbed TMP molecules,
respectively, when illumination is absent. But upon illumination, two sets of doublet
peaks can be observed by deconvolution of the spectrum. Clearly, one set of peaks
shift to a higher BE, while the other to a lower BE (Table 6.4).

Chapter 6 Photocatalytic Seawater Splitting System
211
Figure 6.16 (a) High resolution Ti 2p, O 1s and P 2p AP-XPS spectra of the facet-engineered N-TiO2 nanocrystals. (b) High resolution Ti 2p, O 1s and P 2p AP-XPS spectra of the N-TiO2 powders without facet-engineering. Such a peak splitting could not be observed on the Ti 2p or O 1s spectra, because,
as mentioned before, XPS is not strictly a surface analysis technique, but has a
sampling depth of a few nanometres. Therefore, some subtle surface information
is averaged by the signals from the sub-surface region. On the contrary, TMP
molecules can only adsorb on the outmost surface, which makes the P 2p spectra
extremely sensitive to any change of the surface chemical environments. As
indicated by the STEM studies, the (001) facets favourably host the photo-
generated holes while the electrons favour the (101) facets, rendering them
electropositive and electronegative, respectively. Obviously, this conclusion is
reinforced by the AP-XPS results: (001) become electropositive upon illumination
due to trapping the holes, thus the P 2p of TMP molecules adsorbed on the
electron-deficient (001) facets shifts to a higher BE; on the contrary, those
adsorbed on the electron-rich (101) facets shift to a lower BE. Quantitative analysis

Chapter 6 Photocatalytic Seawater Splitting System
212
suggests that the ratio of the peak areas is around 40:60, which is in accordance
with the ratio of (101) and (001) facets, confirming the attribution of the signals.
Control experiments have been performed on the N-TiO2 powders that exhibit
more than 95% exposure of the (101) facet: the AP-XPS results do not indicate
any surface polarisation effect (Figure 6.16b).
Table 6.4 BE of the fitted components of the AP-XPS P 2p spectra in Figure 6.16. P 2p3/2 P 2p1/2 Light off 130.28 eV 131.23 eV P 2p3/2 up P 2p3/2 down P 2p1/2 up P 2p1/2 down Light on 131.78 eV 129.68 eV 132.68 eV 130.73 eV
6.3.3.3 DFT studies on the ionic effects
DFT calculations were then carried out to understand the effect of the ionic species
in seawater. A N-doped TiO2 supercell was constructed, then the (101) and (001)
facets were studied separately (Figures 6.17a and 6.17b). According to the STEM
and AP-XPS studies demonstrated above, the polarisation takes place among
different surfaces of the particle upon photo-excitation, making the (001) surface
electropositive and the (101) surface electronegative. Therefore, in the DFT
studies, anions and cations are placed onto the (001) and (101) surfaces,
respectively, in order to investigate their adsorption behaviours.
The adsorption energy (Eads) can be calculated in each case (Table 6.5).
Holes/electrons are then added to the surface models deliberately to simulate the
charge polarisation upon excitation. Taking the Cl- ion as an example, when the
(001) surface is neutral (i.e., before excitation), the Eads is calculated to be -0.55
eV. When a hole is placed on this surface (i.e., polarisation takes place between

Chapter 6 Photocatalytic Seawater Splitting System
213
different surface after excitation), the Eads is substantially reduced to -0.82 eV. The
reduction of the Eads indicates the enhanced chemisorption of the ionic species on
the surface due to the stronger charge interactions. Clearly, the above results
indicate that the polarisation effect among surfaces enables stronger interaction
between the ionic species and the surface. Obviously, the intensity of such surface
polarisation effect can be indicated by the difference between the Eads before and
after excitation. Likewise, similar calculations have been attempted for other
cations and anions, as shown in Table 6.5. It can be expected that this effect will
vary among different ions, depending on the ionic radius and charge, since the
nature of this effect is the electrostatic interaction between charge carriers.
Figure 6.17 Correlations of the DFT computational results with the POWS performance and the charge carrier lifetime. (a) Na+ ion adsorbed on (101) facet and (b) Cl- adsorbed on (001) facet. respectively. Correlations between (c) POWS activity and (d) lifetime of the slow decay component with the Eads change for different electrolyte. Correlations between (e) POWS activity and (f) lifetime of the slow decay component with the total Eads change for different artificial seawater. Error bars indicate the standard deviations.

Chapter 6 Photocatalytic Seawater Splitting System
214
Table 6.5 The DFT calculation of the adsorption energy of different ions and electrolytes. †
Chemical species
Eads (neutral surface) (eV)
Eads (charged surface) (eV)
Energy difference (eV)
Ions on (101) surface
K+ 0.05 0 -0.05
Na+ 0.13 0.05 -0.08
Mg2+ 1.05 0.89 -0.16
Ca2+ 0.4 0.23 -0.17
Ions on (001) surface
Cl- -0.55 -0.82 -0.27
SO42- -1.16 -2.06 -0.9
Electrolytes
KCl -0.5 -0.82 -0.32
NaCl -0.42 -0.77 -0.35
CaCl2 -0.7 -1.41 -0.71
MgCl2 -0.05 -0.75 -0.7
Na2SO4 -0.9 -1.96 -1.06 † The Eads change is the difference between the Eads of ion adsorbed on the neutral surface and the charged surface, which simulates the interaction between the adsorbed ion and the charge carrier that is trapped on the surface after photoexcitation. The positive Eads values of the cations in this table (e.g., especially 1.05 eV for Mg2+) indicate that the adsorption of the cations on the TiO2 surfaces is not favourable, but the adsorption can be facilitated to different extents after photo-excitation. For the electrolytes, the Eads values could be derived from the Eads of each individual ion using the corresponding chemical formula of the electrolyte compound. Likewise, the total Eads change for different artificial seawaters can be calculated, taking the concentrations of different electrolytes into account. Therefore, to obtain deeper understandings, the relationship between the POWS
activity, lifetime of the charge carriers, and Eads have been explored. It is noted that
in the computational models, only one cation or anion is placed on the surface in
each case, while in practical situations, we cannot solely study the cation or anion,
since the whole system has to be charge-neutral. Therefore, given that different
electrolytes are studied in this work (Figure 6.10), the Eads of each electrolyte has

Chapter 6 Photocatalytic Seawater Splitting System
215
been calculated based on the respective chemical formula, and in such cases, the
concentration can be considered the same for each electrolyte in the DFT
calculations. Consequently, the POWS performance and the lifetime of the slow
decay component are evaluated in different electrolyte solutions with the same
concentration (0.2 mol L-1) and the results are plotted against the Eads (Figures
6.17c and 6.17d). Clearly, as the polarisation effect becoming stronger (more
negative Eads change), the charge carrier lifetime is greatly prolonged, resulting in
enhanced POWS activity, and linear correlations can be observed. Further
investigations are attempted for the artificial seawaters. As demonstrated before,
artificial seawaters are made by mixing different electrolytes according to the data
in literature. So, the total Eads change can be calculated by considering the
concentration of each electrolyte in the seawater sample (Table 6.5). Excitingly,
both the POWS activity and the charge carrier lifetime, again, show linear
correlations with the total Eads change in the artificial seawaters (Figures 6.17e and
6.17f). Obviously, the strong interaction between the ionic species and the
polarised surfaces plays an important role in this photocatalytic system, which can
facilitate the surface trapping of the photo-generated charge carriers, resulting in
a prolonged lifetime of the photo-generated electron/hole pairs, which is also
supported by the TRPL results. In our POWS system at elevated temperatures,
the separation and surface trapping of the photo-generated charge carriers is the
key step: as shown in Figure 6.14, the POWS activity is positively correlated with
the charge carrier lifetime. The prolonged lifetime will allow higher chance for the
charge carriers to encounter the H+ and OH- ions in the solution to facilitate the H2
and O2 evolution reactions, hence giving higher POWS activity.
Clearly, the above HAADF-STEM, AP-XPS and DFT results together confirm that

Chapter 6 Photocatalytic Seawater Splitting System
216
the surface polarisation takes place upon photoexcitation, due to the electric field
introduced by the different surface energies of (001) and (101) facets: photo-
generated electrons are favourably migrating to the (101) surfaces which possess
lower surface energy, leaving the photo-generated holes on the (001) surfaces,
which facilitates the adsorption of cations and anions on the respective facet. Such
facilitated surface adsorption of the ionic species, in turn, attracts the electrons
and holes by Coulomb force, suppressing the charge recombination and
prolonging the charge carrier lifetime. In our seawater splitting system, the
photocatalyst particles are surrounded by plenty of ionic species and the surface
adsorption can readily take place, thus, the separation of photo-generated charge
carriers is greatly promoted, resulting in enhanced POWS performance. Besides,
the N-doping also makes it easier to regenerate the surface VOs by the sub-surface
O atoms at elevated temperatures, due to enhanced oxygen mobility,27 which also
facilitates the surface charge polarisation.
6.3.4 Evaluation of QE and STH efficiency
QE of Pt/N-TiO2 in different environments was then evaluated, which clearly shows
the remarkable enhancements due to the polarisation effect (Figure 6.18a). High
QE of 97.3 % and 85.8 % are obtained at 385 and 440 nm, respectively, in the
artificial Dead Sea water. While in pure water, the QE drops sharply at longer
wavelengths, giving a QE less than 10 % at long wavelengths (650 to 850 nm),
which is in accordance with previous reports.2,39,40
Such a decrease in QE, especially the sudden drop at 650 nm, can be attributed
to the wavelength-dependent electron-hole pair generation: as recently reported,
the absorbed photons with longer wavelengths may not efficiently generate excited
electron-hole pairs, but excite the local transitions instead, which finally dissipates

Chapter 6 Photocatalytic Seawater Splitting System
217
as heat and does not contribute to photocatalytic reactions.41,42 Besides, it has
been demonstrated that high excess excitation energy (i.e., short-wavelength
excitation) leads to better charge separation and stronger electron-phonon
coupling, which means that these charge carriers are more likely to migrate to the
surface trapping sites instead of taking the radiative recombination pathway.43–45
On the contrary, long wavelength excitation results in enhanced local polaron
formation, which decreases the mobility of the photo-generated charge carriers
and increases their recombination, resulting in less carriers reaching the catalyst
surface to participate in chemical reactions.46,47
Figure 6.18 a QE evaluations of 1 wt.% Pt/N-TiO2 in pure water and artificial Dead Sea water by using incident wavelengths of 385, 437, 575, 620, 750 and 850 nm, respectively, at 270 oC. QE measurements were carried out with a similar procedure as that stated before. Error bars indicate the standard deviation. b 5-cycle stability test of 1 wt.% Pt/N-TiO2 in artificial Dead Sea water. This figure shows the total amount of the evolved H2 and O2 after different reaction time. 5 mg of the catalyst was used and the reaction was carried out at 270 oC under the simulated solar irradiation. When the artificial seawater is used, it is noted that the QE at short wavelengths
is hardly influenced by the surrounding environment since the charge carriers have
high excess energy; while the polarisation effect is more pronounced for the
carriers with lower excess excitation energy, because the moving directions of the

Chapter 6 Photocatalytic Seawater Splitting System
218
charge carriers are easier to be changed by the LEF when the charge carriers
have a low kinetic energy/velocity, resulting in a substantial QE enhancement in
the longer-wavelength regime (575 to 850 nm), and consequently, a high QE of ca.
50 % is recorded at 850 nm (Figure 6.18a).
Table 6.6 Device-to-device comparison of the overall water splitting performance in this work with the related systems reported in literature. System type Catalyst H2 evolution (mL
h-1) / cell voltage ‡ STH (%) † Ref.
Particulate POWS Pt/N-TiO2
4.1 (1 Sun) 9.7 (Concentrated)
20.3 This work
Electrolyser Porous MoO2(+)//Porous MoO2(-) 4.5 / 1.53V 14.5 49
Electrolyser IrO2-Al2O3(+)//Pt/C(-) 7.5 / 3V 7.4 50
Electrolyser NiFe LDH-NS@DG(+)//NiFe LDH-NS@DG(-)
8.7 / 1.5V 14.3 51
Electrolyser NiFe LDH(+)//NiO/Ni-CNT(-) 8.9 / 1.5V 14.8 52
Electrolyser NiFeOOH(+)//MoNi4(-) 61.9 / 1.464V 15.1 53 PV-E CH3NH3PbI3-NiFe LDH 4.5 12.3 54 PV-E Si PV-Fe:Co2Mo3O8 86 15.1 55
PV-E InGaP/GaAs/GaInNAsSb-PEM electrolyser 13.5 30 56
PEC GaInP-GaInAs 7.5 14 57 PEC InGaP/GaAs 2.2 9 58 PEC Ba-Ta3N5 0.75 1.5 59
‡ The H2 evolution rate of various lab-scale devices is compared in in mL h-1 at the reported optimal operating conditions. The electrolysers presented in this table are all single-cell devices. † STH efficiency was evaluated under AM 1.5G simulated solar irradiation. For the electrolyser systems, the electrical-to-chemical energy conversion efficiency was calculated from the cited papers, and then the STH efficiency was calculated assuming the electrolyser was integrated with a silicon-based PV device with a solar-to-electrical energy efficiency of 18 %. For PV-E and PEC systems, the STH efficiency was obtained from the respective paper directly, without any assumption or further mathematic treatments.

Chapter 6 Photocatalytic Seawater Splitting System
219
The STH conversion efficiency of this seawater splitting system is also carefully
investigated. A STH conversion efficiency of 20.3±0.5% is achieved from this
particulate POWS system in the artificial Dead Sea water at 270 oC, which even
exceeds those reported for many PEC and PV-E systems (Table 6.6). Notably, the
Pt/N-TiO2 photocatalyst shows a stable and stoichiometric evolution of H2 and O2
without any obvious activity drop over 5 cycles (Figure 6.18b). Besides, it has been
reported that a proper solar furnace which concentrates natural solar light can
reach a high temperature of even 1000 oC.48 Thus, a lab-scale light concentrated
furnace was used to mimic such solar furnace, which shows that the stable and
efficient POWS activity at 270 oC can be maintained solely by the concentrated
light without any other electrical heating. An even more exceptional photocatalytic
activity of 40,237 µmol g-1 h-1 (equivalent to a H2 evolution rate of ca. 10 mL h-1 at
standard temperature and pressure) is observed over 20 hours, due to the high
intensity of the concentrated light. This H2 evolution rate is comparable in the order
of magnitude with those reported for alkaline electrolysers (Table 6.6), but this
particulate POWS system is a direct single-step light harnessing process with all
thermal and photon energy inputs from the solar concentrator.
6.4 Conclusion
In conclusion, we have systematically studied the effects of ionic species on the
POWS performances over a Pt-supported facet-controlled N-doped TiO2
photocatalyst. It was found that the activities increased with the ionic strength of
the aqueous solutions. With the help of TRPL technique, such enhancement of
photocatalytic activities was correlated with the charge carrier lifetime of the
photocatalyst under different conditions, which were greatly prolonged by the ionic
species. Acidic and alkaline electrolytes were also briefly studied, showing

Chapter 6 Photocatalytic Seawater Splitting System
220
negative effects on this system, while the organic ionic species acted as sacrificial
reagent and led to unwanted CO and CO2 production. A high H2 evolution rate of
34,035±711 µmol g-1 h-1 was observed in an artificial Dead Sea water, with a QE
of 85.8±2.6 % at 440 nm. Excitingly, a STH conversion efficiency of 20.3±0.5 % is
obtained, which even outperformed the PV-E and PEC systems. The mechanism
was deeply investigated by STEM and AP-XPS and it was demonstrated that the
selective adsorption of the ionic species on different facets could facilitate the local
polarisation of the photo-generated electrons and holes, thus resulting in the
prolonged lifetime of charge carriers and enhanced POWS performance. We have
also showed such system has good potential for other semiconductor
photocatalysts, such as perovskite oxynitride. The obtained steady H2 evolution of
10 mL h-1 in the lab-scale solar furnace is comparable with the evolution rate of
electrolysers. A recent life cycle assessment indicates some environmental
concerns about the water electrolysis for large-scale H2 production.60 This direct
single-step light harnessing POWS system may provide an alternative option. It is
also believed this study can provide a novel but pragmatic strategy for harvesting
solar energy by splitting more abundant water resource in seas and oceans.
6.5 References
1. Takata, T., Jiang, J., Sakata, Y., Nakabayashi, M., Shibata, N., Nandal, V., Seki, K., Hisatomi, T. & Domen, K. Photocatalytic water splitting with a quantum efficiency of almost unity. Nature 581, 411–414 (2020).
2. Li, Y., Peng, Y.-K., Hu, L., Zheng, J., Prabhakaran, D., Wu, S., Puchtler, T. J., Li, M., Wong, K.-Y., Taylor, R. A. & Tsang, S. C. E. Photocatalytic water splitting by N-TiO2 on MgO (111) with exceptional quantum efficiencies at elevated temperatures. Nat. Commun. 10, 4421 (2019).
3. Li, Y. & Tsang, S. C. E. Recent Progress and Strategies for Enhancing Photocatalytic Water Splitting. Mater. Today Sustain. 9, 100032 (2020).
4. Chen, F., Huang, H., Guo, L., Zhang, Y. & Ma, T. The Role of Polarization in Photocatalysis. Angew. Chem. Int. Ed. 58, 10061–10073 (2019).
5. Wolff, C. M., Frischmann, P. D., Schulze, M., Bohn, B. J., Wein, R., Livadas, P., Carlson, M. T., Jäckel, F., Feldmann, J., Würthner, F. & Stolarczyk, J. K. All-in-one

Chapter 6 Photocatalytic Seawater Splitting System
221
visible-light-driven water splitting by combining nanoparticulate and molecular co-catalysts on CdS nanorods. Nat. Energy 3, 862–869 (2018).
6. Jin, H., Wang, X., Tang, C., Vasileff, A., Li, L., Slattery, A. & Qiao, S. Z. Stable and Highly Efficient Hydrogen Evolution from Seawater Enabled by an Unsaturated Nickel Surface Nitride. Adv. Mater. 33, 2007508 (2021).
7. Liu, J., Xu, S. M., Li, Y., Zhang, R. & Shao, M. Facet engineering of WO3 arrays toward highly efficient and stable photoelectrochemical hydrogen generation from natural seawater. Appl. Catal. B Environ. 264, 118540 (2020).
8. Tian, B., Tian, B., Smith, B., Scott, M. C., Hua, R., Lei, Q. & Tian, Y. Supported black phosphorus nanosheets as hydrogen-evolving photocatalyst achieving 5.4% energy conversion efficiency at 353 K. Nat. Commun. 9, 1397 (2018).
9. Wu, Q., Cao, J., Wang, X., Liu, Y., Zhao, Y., Wang, H., Liu, Y., Huang, H., Liao, F., Shao, M. & Kang, Z. A metal-free photocatalyst for highly efficient hydrogen peroxide photoproduction in real seawater. Nat. Commun. 12, 483 (2021).
10. Lu, X., Pan, J., Lovell, E., Tan, T. H., Ng, Y. H. & Amal, R. A sea-change: Manganese doped nickel/nickel oxide electrocatalysts for hydrogen generation from seawater. Energy Environ. Sci. 11, 1898–1910 (2018).
11. Mase, K., Yoneda, M., Yamada, Y. & Fukuzumi, S. Seawater usable for production and consumption of hydrogen peroxide as a solar fuel. Nat. Commun. 7, 11470 (2016).
12. Culp, T. E., Khara, B., Brickey, K. P., Geitner, M., Zimudzi, T. J., Wilbur, J. D., Jons, S. D., Roy, A., Paul, M., Ganapathysubramanian, B., Zydney, A. L., Kumar, M. & Gomez, E. D. Nanoscale control of internal inhomogeneity enhances water transport in desalination membranes. Science 371, 72–75 (2021).
13. Di Vincenzo, M., Tiraferri, A., Musteata, V. E., Chisca, S., Sougrat, R., Huang, L. B., Nunes, S. P. & Barboiu, M. Biomimetic artificial water channel membranes for enhanced desalination. Nat. Nanotechnol. 16, 190–196 (2021).
14. Yao, Y., Zhang, P., Jiang, C., DuChanois, R. M., Zhang, X. & Elimelech, M. High performance polyester reverse osmosis desalination membrane with chlorine resistance. Nat. Sustain. 4, 138–146 (2021).
15. Guan, X., Chowdhury, F. A., Pant, N., Guo, L., Vayssieres, L. & Mi, Z. Efficient Unassisted Overall Photocatalytic Seawater Splitting on GaN-Based Nanowire Arrays. J. Phys. Chem. C 122, 13797–13802 (2018).
16. Hausmann, J. N., Schlögl, R., Menezes, P. W. & Driess, M. Is direct seawater splitting economically meaningful? Energy Environ. Sci. 14, 3679–3685 (2021).
17. Kibria, M., Khan, M. A., Al-Attas, T. A., Roy, S., Rahman, M. M., Ghaffour, N., Thangadurai, V., Larter, S., Hu, J. & Ajayan, P. Seawater Electrolysis for Hydrogen Production: A Solution Looking for a Problem? Energy Environ. Sci. 14, 4831–4839 (2021).
18. Ma, Y. Y., Wu, C. X., Feng, X. J., Tan, H. Q., Yan, L. K., Liu, Y., Kang, Z. H., Wang, E. B. & Li, Y. G. Highly efficient hydrogen evolution from seawater by a low-cost and stable CoMoP@C electrocatalyst superior to Pt/C. Energy Environ. Sci. 10, 788–798 (2017).
19. Peng, Y.-K., Hu, Y., Chou, H. L., Fu, Y., Teixeira, I. F., Zhang, L., He, H. & Tsang, S. C. E. Mapping surface-modified titania nanoparticles with implications for activity and facet control. Nat. Commun. 8, 675 (2017).
20. Hu, Y., Guo, B., Fu, Y., Ren, Y., Tang, G., Chen, X., Yue, B. & He, H. Facet-dependent acidic and catalytic properties of sulfated titania solid superacids. Chem.

Chapter 6 Photocatalytic Seawater Splitting System
222
Commun. 51, 14219–14222 (2015). 21. Di Valentin, C., Pacchioni, G., Selloni, A., Livraghi, S. & Giamello, E.
Characterization of paramagnetic species in N-doped TiO 2 powders by EPR spectroscopy and DFT calculations. J. Phys. Chem. B 109, 11414–11419 (2005).
22. Livraghi, S., Paganini, M. C., Giamello, E., Selloni, A., Di Valentin, C. & Pacchioni, G. Origin of photoactivity of nitrogen-doped titanium dioxide under visible light. J. Am. Chem. Soc. 128, 15666–15671 (2006).
23. Savio, A. K. P. D., Fletcher, J., Smith, K., Iyer, R., Bao, J. M. & Robles Hernández, F. C. Environmentally effective photocatalyst CoO-TiO2 synthesized by thermal precipitation of Co in amorphous TiO2. Appl. Catal. B Environ. 182, 449–455 (2016).
24. Ren, Z., Chen, C., Fu, X., Wang, J., Fan, C., Qian, G. & Wang, Z. TiO2/C composites nanorods synthesized by internal-reflux method for lithium-ion battery anode materials. Mater. Lett. 117, 124–127 (2014).
25. Liu, X., Xing, Z., Zhang, Y., Li, Z., Wu, X., Tan, S., Yu, X., Zhu, Q. & Zhou, W. Fabrication of 3D flower-like black N-TiO2-x@MoS2 for unprecedented-high visible-light-driven photocatalytic performance. Appl. Catal. B Environ. 201, 119–127 (2017).
26. Zhang, K., Zhou, W., Zhang, X., Sun, B., Wang, L., Pan, K., Jiang, B., Tian, G. & Fu, H. Self-floating amphiphilic black TiO2 foams with 3D macro-mesoporous architectures as efficient solar-driven photocatalysts. Appl. Catal. B Environ. 206, 336–343 (2017).
27. Foo, C., Li, Y., Lebedev, K., Chen, T. T., Day, S., Tang, C. & Tsang, S. C. E. Characterisation of oxygen defects and nitrogen impurities in TiO2 photocatalysts using variable-temperature X-ray powder diffraction. Nat. Commun. 12, 661 (2021).
28. Ingram, D. B. & Linic, S. Water splitting on composite plasmonic-metal/semiconductor photoelectrodes: Evidence for selective plasmon-induced formation of charge carriers near the semiconductor surface. J. Am. Chem. Soc. 133, 5202–5205 (2011).
29. Furube, A., Du, L., Hara, K., Katoh, R. & Tachiya, M. Ultrafast plasmon-induced electron transfer from gold nanodots into TiO2 nanoparticles. J. Am. Chem. Soc. 129, 14852–14853 (2007).
30. Zhu, S. & Wang, D. Photocatalysis: Basic principles, diverse forms of implementations and emerging scientific opportunities. Adv. Energy Mater. 7, 1700841 (2017).
31. Neev, D. & Emery, K. O. The Dead Sea: Depositional Processes and Environments of Evaporites. Isr. Geol. Surv. Bull. 41, 147 (1967).
32. Gertman, I., Kress, N., Katsenelson, B. & Zavialov, P. Equations of state for the Dead Sea and Aral Sea : Searching for common approaches. IOLR Rep. 7–12 (2010).
33. Nissenbaum, A. The microbiology and biogeochemistry of the Dead Sea. Microb. Ecol. 2, 139–161 (1975).
34. Whelan, J. A. Great Salt Lake, Utah: Chemical and Physical Variations of the Brine. Water-Resources Bull. 17, 11–15 (1973).
35. Sun, M. G. & Ma, L. C. Potassium-rich brine deposit in Lop Nor basin, Xinjiang, China. Sci. Rep. 8, 1–9 (2018).
36. Meng, A., Zhang, J., Xu, D., Cheng, B. & Yu, J. Enhanced photocatalytic H2-production activity of anatase TiO2 nanosheet by selectively depositing dual-

Chapter 6 Photocatalytic Seawater Splitting System
223
cocatalysts on (101) and (001) facets. Appl. Catal. B Environ. 198, 286–294 (2016). 37. Zhang, H., Wang, W., Zhao, H., Zhao, L., Gan, L. Y. & Guo, L. H. Facet-Dependent
Interfacial Charge Transfer in Fe(III)-Grafted TiO2 Nanostructures Activated by Visible Light. ACS Catal. 8, 9399–9407 (2018).
38. Peng, Y.-K., Keeling, B., Li, Y., Zheng, J., Chen, T., Chou, H. L., Puchtler, T. J., Taylor, R. A. & Tsang, S. C. E. Unravelling the key role of surface features behind facet-dependent photocatalysis of anatase TiO2. Chem. Commun. 55, 4415–4418 (2019).
39. Li, Y., Wu, S., Zheng, J., Peng, Y.-K., Prabhakaran, D., Taylor, R. A., Chi, S. & Tsang, S. C. E. 2D photocatalysts with tuneable supports for enhanced photocatalytic water splitting. Mater. Today 41, 34–43 (2020).
40. Li, Y., Wang, Z., Wang, Y., Kovács, A., Foo, C., Dunin-Borkowski, R. E., Lu, Y., Taylor, R. A., Wu, C. & Tsang, S. C. E. Local magnetic spin mismatch promoting photocatalytic overall water splitting with exceptional solar-to-hydrogen efficiency. Energy Environ. Sci. 15, 265–277 (2022).
41. Piekner, Y., Ellis, D. S., Grave, D. A., Tsyganok, A. & Rothschild, A. Wasted photons: photogeneration yield and charge carrier collection efficiency of hematite photoanodes for photoelectrochemical water splitting. Energy Environ. Sci. 14, 4584–4598 (2021).
42. Grave, D. A., Ellis, D. S., Piekner, Y., Kölbach, M., Dotan, H., Kay, A., Schnell, P., van de Krol, R., Abdi, F. F., Friedrich, D. & Rothschild, A. Extraction of mobile charge carrier photogeneration yield spectrum of ultrathin-film metal oxide photoanodes for solar water splitting. Nat. Mater. 20, 833–840 (2021).
43. Ellingson, R. J., Blackburn, J. L., Yu, P., Rumbles, G., Mićić, O. I. & Nozik, A. J. Excitation energy dependent efficiency of charge carrier relaxation and photoluminescence in colloidal InP quantum dots. J. Phys. Chem. B 106, 7758–7765 (2002).
44. Ye, Z., Lin, X., Wang, N., Zhou, J., Zhu, M., Qin, H. & Peng, X. Phonon-assisted up-conversion photoluminescence of quantum dots. Nat. Commun. 12, 4283 (2021).
45. Tautz, R., Da Como, E., Wiebeler, C., Soavi, G., Dumsch, I., Fröhlich, N., Grancini, G., Allard, S., Scherf, U., Cerullo, G., Schumacher, S. & Feldmann, J. Charge photogeneration in donor-acceptor conjugated materials: Influence of excess excitation energy and Chain length. J. Am. Chem. Soc. 135, 4282–4290 (2013).
46. Carneiro, L. M., Cushing, S. K., Liu, C., Su, Y., Yang, P., Alivisatos, A. P. & Leone, S. R. Excitation-wavelength-dependent small polaron trapping of photoexcited carriers in α-Fe2O3. Nat. Mater. 16, 819–825 (2017).
47. Lane, P. A., Cunningham, P. D., Melinger, J. S., Esenturk, O. & Heilweil, E. J. Hot photocarrier dynamics in organic solar cells. Nat. Commun. 6, 7558 (2015).
48. Garcia, D., Liang, D., Tibúrcio, B. D., Almeida, J. & Vistas, C. R. A three-dimensional ring-array concentrator solar furnace. Sol. Energy 193, 915–928 (2019).
49. Jin, Y., Wang, H., Li, J., Yue, X., Han, Y., Shen, P. K. & Cui, Y. Porous MoO2 Nanosheets as Non-noble Bifunctional Electrocatalysts for Overall Water Splitting. Adv. Mater. 28, 3785–3790 (2016).
50. Hamidah, N. L., Shintani, M., Ahmad Fauzi, A. S., Putri, G. K., Kitamura, S., Hatakeyama, K., Sasaki, M., Quitain, A. T. & Kida, T. Graphene Oxide Membranes with Cerium-Enhanced Proton Conductivity for Water Vapor Electrolysis. ACS Appl.

Chapter 6 Photocatalytic Seawater Splitting System
224
Nano Mater. 3, 4292–4304 (2020). 51. Jia, Y., Zhang, L., Gao, G., Chen, H., Wang, B., Zhou, J., Soo, M. T., Hong, M.,
Yan, X., Qian, G., Zou, J., Du, A. & Yao, X. A Heterostructure Coupling of Exfoliated Ni–Fe Hydroxide Nanosheet and Defective Graphene as a Bifunctional Electrocatalyst for Overall Water Splitting. Adv. Mater. 29, 1700017 (2017).
52. Gong, M., Zhou, W., Tsai, M. C., Zhou, J., Guan, M., Lin, M. C., Zhang, B., Hu, Y., Wang, D. Y., Yang, J., Pennycook, S. J., Hwang, B. J. & Dai, H. Nanoscale nickel oxide/nickel heterostructures for active hydrogen evolution electrocatalysis. Nat. Commun. 5, 4695 (2014).
53. Zhou, H., Yu, F., Zhu, Q., Sun, J., Qin, F., Yu, L., Bao, J., Yu, Y., Chen, S. & Ren, Z. Water splitting by electrolysis at high current densities under 1.6 volts. Energy Environ. Sci. 11, 2858–2864 (2018).
54. Luo, J., Im, J. H., Mayer, M. T., Schreier, M., Nazeeruddin, M. K., Park, N. G., Tilley, S. D., Fan, H. J. & Grätzel, M. Water photolysis at 12.3% efficiency via perovskite photovoltaics and Earth-abundant catalysts. Science 345, 1593–1596 (2014).
55. Yi, X., Song, L., Ouyang, S., Wang, N., Chen, H., Wang, J., Lv, J. & Ye, J. Cost-Efficient Photovoltaic-Water Electrolysis over Ultrathin Nanosheets of Cobalt/Iron–Molybdenum Oxides for Potential Large-Scale Hydrogen Production. Small 17, 2102222 (2021).
56. Jia, J., Seitz, L. C., Benck, J. D., Huo, Y., Chen, Y., Ng, J. W. D., Bilir, T., Harris, J. S. & Jaramillo, T. F. Solar water splitting by photovoltaic-electrolysis with a solar-to-hydrogen efficiency over 30%. Nat. Commun. 7, 13237 (2016).
57. May, M. M., Lewerenz, H. J., Lackner, D., Dimroth, F. & Hannappel, T. Efficient direct solar-to-hydrogen conversion by in situ interface transformation of a tandem structure. Nat. Commun. 6, 8286 (2015).
58. Varadhan, P., Fu, H. C., Kao, Y. C., Horng, R. H. & He, J. H. An efficient and stable photoelectrochemical system with 9% solar-to-hydrogen conversion efficiency via InGaP/GaAs double junction. Nat. Commun. 10, 5282 (2019).
59. Li, Y., Zhang, L., Torres-Pardo, A., González-Calbet, J. M., Ma, Y., Oleynikov, P., Terasaki, O., Asahina, S., Shima, M., Cha, D., Zhao, L., Takanabe, K., Kubota, J. & Domen, K. Cobalt phosphate-modified barium-doped tantalum nitride nanorod photoanode with 1.5% solar energy conversion efficiency. Nat. Commun. 4, 2566 (2013).
60. Osman, A. I., Mehta, N., Elgarahy, A. M., Hefny, M., Al-Hinai, A., Al-Muhtaseb, A. H. & Rooney, D. W. Hydrogen production, storage, utilisation and environmental impacts: a review. Environ. Chem. Lett. 20, 153–188 (2022).

Chapter 7 Conclusions and outlook
225
Chapter 7 Conclusions and outlook
7.1 Conclusions
This thesis has systematically demonstrated different strategies for improving the
efficiency of POWS systems for the production of H2 fuel at elevated temperatures.
It is agreed in this field that the efficiency of the POWS system is mainly
determined by three fundamental processes, namely, (i) photon absorption, (ii)
charge carrier separation and migration and (iii) surface chemical reactions.1,2
Since the first demonstration of photoelectrochemical water splitting on TiO2 by
Honda and Fujishima in 1972,3 great progress has been achieved to facilitate the
above-mentioned step (i) and step (iii); however, the efficient charge carrier
separation remains difficult to obtain and deeper understanding of this process is
still required. Therefore, starting from the most widely studied photocatalyst, TiO2,
this thesis has unravelled some fundamental principles behind the POWS reaction,
and developed more efficient approaches for enhancing the efficiency of this
reaction. By involving the elevated reaction temperatures, it is demonstrated that
the POWS performance can be substantially improved due to the facilitated local
electric field (LEF).4 Enlightened by this observation, other strategies including the
use of polar-faceted supports and local magnetic field have been explored to
further promote the separation of the photo-generated electron/hole pairs and
suppress their recombination. Building upon all these works, it is shown that
seawater can be decomposed to H2 and O2 with very promising efficiency, which
takes this POWS system closer to the practical applications.
After introducing the research background and describing the experimental
methods in Chapter 1 and Chapter 2 respectively, Chapter 3 starts to examine the
use of elevated temperatures in the POWS system over TiO2-based catalysts for

Chapter 7 Conclusions and outlook
226
efficient H2 evolution.5 Commercial P25 TiO2 is doped with N at different
concentrations to broaden the visible light absorption range. Unlike most works in
this field that involve the use of sacrificial reagents, only pure water is used as the
reactant in this thesis, which avoids the additional capital costs and unwanted
carbon emission. Detailed investigations of the temperature effect reveal that the
POWS performance reaches the maximum at 260-270 oC, which coincides with
the temperature-dependent ionic dissociation of water. Meanwhile, time-resolved
photoluminescence (TRPL) studies confirm that the increased concentration of H+
or OH- ions in water leads to the prolonged lifetime of the photo-generated
electron/hole pairs. Therefore, at elevated temperatures, the water dissociation is
greatly promoted, increasing the concentrations of H+ and OH- ions in water and
on the surface of the catalyst. The adsorbed ions form strong LEF near the surface,
leading to suppressed charge carrier recombination and the enhanced POWS
activity. Electron paramagnetic resonance studies show that the surface active
sites - surface oxygen vacancies - are easily replenished by water and oxygen in
air; however, they can be regenerated at elevated temperatures, which is further
confirmed by another work in our group, where systematic synchrotron X-ray
diffraction studies have been carried out.6 Such facilitated regeneration of the
surface oxygen vacancies can also contribute to the POWS reaction activity, since
it is an important step in the O2 evolution reaction.7 Consequently, the use of
elevated temperatures is proved to be highly effective to improve the POWS
performance by facilitating the LEF and the regeneration of the oxygen vacancies.
Chapter 4 moves on to further enhancing the LEF through engaging the polar-
faceted supports.8 Polar surfaces, different from the non-polar counterparts, have
a diverging electrostatic surface energy due to the presence of a non-zero dipole

Chapter 7 Conclusions and outlook
227
moment, which makes the polar surfaces quite unique.9 However, such high-
energy surfaces tend to cancel out the surface polarity feature to lower their energy,
which will be thermodynamically more favourable, and such relaxation processes
lead to various surface features such as surface defects, making the polar
surfaces highly active in many chemical reactions.10,11 In Chapter 4, polar-faceted
MgO(111), ZnO(0001), and CeO2(001) have been fabricated, all of which show
enhancements to the POWS activity. TRPL studies indicate that after combining
with the polar-faceted metal oxides, the charge carrier lifetime of the N-doped TiO2
photocatalyst becomes much longer which means that the recombination of the
electron/hole pairs is greatly suppressed. On the other hand, the non-polar MgO,
ZnO and CeO2 do not show such effects, and both the POWS activity and the
charge carrier lifetime remain the same. Obviously, the strong polarisation of the
polar-faceted metal oxides leaves a local electric field on the surface,12 which can
influence the migration of the photo-generated charge carriers and suppress their
recombination, resulting in enhanced POWS performance.8 It is shown that such
effects become more remarkable when the average particle size of the
photocatalyst reduces. Consequently, a two-dimensional (2D) material, MoS2
monolayer, is studied in this chapter as well, to further explore this LEF effect
originating from the surface polarisation. The 2D MoS2 shows more significant
effects after assembling with the polar-faceted metal oxide supports because of
the flexibility of the monolayer and the resulting improved better interaction
between the monolayer and the supports. I further extended the study of the LEF
effects to layered double hydroxide (LDH) materials, which are also polar-faceted
and shows similar surface polarisation. Subsequently, the LEF strength is defined
by considering the structure, composition and the electronegativities of all

Chapter 7 Conclusions and outlook
228
elements in the polar-faceted supports. It is then shown that both the POWS
activity and the lifetime show linear correlation with the LEF strength. It is very
clearly shown in Chapter 3 and Chapter 4 that the separation of the photo-
generated charge carriers plays a really important role in improving the
performance of the POWS system at elevated temperatures and the LEF could
influence the migration of the charge carriers through the Coulomb force.
Chapter 5 then moves on to the magnetic field effects (MFEs) on the POWS
system,13 given that the charge carriers experience the Lorentz force when they
are moving in a magnetic field, which may also facilitate the charge carrier
separation processes. Superparamagnetic Fe3O4 nanoparticles are fabricated and
combined with the N-doped TiO2 photocatalysts, which clearly exhibit substantially
improved POWS activity in the presence of an external magnetic field. Such
enhancement shows obvious linear positive correlation with the strength of the
magnetic field and the concentration of the Fe3O4 NPs in the composite, while the
use of an external magnetic field to bare N-TiO2 does not lead to any change in
the photocatalytic activity. With the help of the superconducting quantum
interference device (SQUID), it is illustrated that a very strong local magnetic flux
could be induced near the superparamagnetic Fe3O4 NPs when an external
magnetic field is present. It is then shown that the POWS activity exhibits a linear
correlation with the local magnetic flux density when the local magnetic flux is
relatively weak. However, when the local magnetic flux density is higher or the N-
doping concentration is increased, the MFEs become more significant, deviating
from the original linear correlation. Therefore, further density functional theory
calculations have been attempted, which suggest a more spin-polarised
environment in the N-TiO2 photocatalysts at a higher doping level. The spin-

Chapter 7 Conclusions and outlook
229
polarised energy band only allows the electrons with one spin state to occupy,
hence suppressing the recombination of the electrons with the forbidden spin state,
which further prolongs the lifetime of the charge carriers.14
Building upon the results demonstrated in Chapters 3-5, Chapter 6 investigates a
more practical case - the photocatalytic splitting of seawater. It has been illustrated
that the local field effects are more significant for the POWS system at elevated
temperatures since the sluggish regeneration of oxygen vacancies is greatly
promoted at such conditions. It is also noted that there is a large number of ionic
species in seawater, which can presumably provide a LEF near the catalyst
surface, similar to what has been discussed in Chapter 3. Different electrolytes are
investigated in this chapter, and it is shown that the neutral electrolyte solutions
could greatly enhance the POWS performance, while the acidic or alkaline
solutions show negative effects, presumably due to the unfavourable kinetics.
Systematic catalytic studies and DFT calculations demonstrate that such
enhancement is highly dependent on the polarisation effect among different facets.
Likewise, the TRPL confirms the suppression of the charge carrier recombination
processes in the solutions. Different artificial seawater samples are prepared in
lab based on the data from literature, all of which exhibit remarkable effects on
both activity and lifetime. Natural seawater was collected from Bournemouth, UK,
which is also proved to enhance the POWS activity at elevated temperatures.
Overall, the thesis has provided some versatile and facile strategies for improving
the efficiency of the POWS system for solar energy conversion and H2 evolution,
especially through tuning the separation of the photo-generated charge carriers at
elevated temperatures. Stable and efficient photocatalysts have been developed
and fabricated, and the fundamental principles are deeply explored by various

Chapter 7 Conclusions and outlook
230
characterisation techniques and computational studies, which is believed to
contribute to the rational design of photocatalysts for the related systems.
Additionally, it offers a novel non-contact approach which involves the use of
magnetic fields. The successful demonstration of the photocatalytic seawater
splitting also brings the POWS system closer to the practical application and will
presumably provide new research directions in this field.
7.2 Outlook
In order to improve the efficiency of the POWS system for H2 evolution at elevated
temperatures, the recombination of the photo-generated charge carriers must be
greatly suppressed. This thesis has provided novel approaches for achieving this
goal, such as using LEF or local magnetic field. Studies have been mainly carried
out on the most widely investigated photocatalyst, TiO2-based materials. Therefore,
the next step could be to explore other material systems. For example, perovskite
materials (cubic structure with a general chemical formula of ABX3) have received
much attention for solar conversion technologies because of their tuneable
structural and physicochemical properties.15–17 Some perovskites exhibit distorted
structures that relate to the ratio of the radii of cation A and B.15 Such structural
distortion may lead to changes of the physical, electrical, and photocatalytic
properties. Moreover, new perovskite derivatives have been developed in recent
years, such as double perovskites15 and layered perovskites16, which all show
interesting properties. Some perovskite materials have been reported to possess
a strong internal electric field within the materials, which could also facilitate the
separation of the electron/hole pairs.18 Moreover, regarding the development of
the magnetic field effects, other magnetic NPs should be constructed, such as
FeCo or FePt alloys, which show a higher response to the external magnetic field

Chapter 7 Conclusions and outlook
231
and generate stronger local magnetic flux.19,20
Further efforts could also be made to improve the practical aspects of this system.
It should be noted that simply illuminating the reactor with the natural sunlight
would not be able to heat up the system to the operating temperature of 270 oC.
Thus, in this thesis, it has been demonstrated that the reaction temperature of 270
oC could be maintained by a light-concentrated furnace, and the ultimate goal is to
use the concentrated solar light. Some prototypes of such solar furnaces have
been demonstrated in literature, which could reach very high temperatures up to
thousands of Kelvins using the concentrated solar light.21–23 Further optimisation
will be needed to match the furnace design with the requirements of the POWS
system in this thesis, and the reactor should be painted with black coating to
maximise the light absorption. Furthermore, it is also noted that in a POWS
reaction, a large portion of the photon energy is actually converted to thermal
energy by the photocatalyst particles, instead of being effectively stored in the
chemical fuel. Such heat is transferred to the surrounding environment. Therefore,
further utilisation of such thermal energy generated during the POWS reaction
should be attempted. In the conventional POWS systems at room temperature,
the low-quality heat is very difficult to be collected and used; however, in the high-
temperature POWS system demonstrated in this thesis, the high-quality heat is
stored in the superheated water and steam; then the steam can be fed into a
turbine generator, followed by water electrolysis for additional H2 evolution. It is
strongly believed that further development and optimisation of such integrated
systems can be accomplished by researchers with engineering expertise.
Therefore, with the strong international incentives to decarbonise our energy
sources, the POWS system at elevated temperatures is a very promising

Chapter 7 Conclusions and outlook
232
technique which will greatly contribute to the solar conversion technologies in the
foreseeable future.
7.3 References
1. Wang, Q. & Domen, K. Particulate Photocatalysts for Light-Driven Water Splitting: Mechanisms, Challenges, and Design Strategies. Chem. Rev. 120, 919–985 (2020).
2. Peng, Y. K. & Tsang, S. C. E. Facet-dependent photocatalysis of nanosize semiconductive metal oxides and progress of their characterization. Nano Today 18, 15–34 (2018).
3. Fujishima, A. & Honda, K. Electrochemical Photolysis of Water at a Semiconductor Electrode. Nature 238, 37–38 (1972).
4. Li, Y. & Tsang, S. C. E. Recent Progress and Strategies for Enhancing Photocatalytic Water Splitting. Mater. Today Sustain. 9, 100032 (2020).
5. Li, Y., Peng, Y.-K., Hu, L., Zheng, J., Prabhakaran, D., Wu, S., Puchtler, T. J., Li, M., Wong, K.-Y., Taylor, R. A. & Tsang, S. C. E. Photocatalytic water splitting by N-TiO2 on MgO (111) with exceptional quantum efficiencies at elevated temperatures. Nat. Commun. 10, 4421 (2019).
6. Foo, C., Li, Y., Lebedev, K., Chen, T. T., Day, S., Tang, C. & Tsang, S. C. E. Characterisation of oxygen defects and nitrogen impurities in TiO2 photocatalysts using variable-temperature X-ray powder diffraction. Nat. Commun. 12, 661 (2021).
7. Di Valentin, C., Pacchioni, G., Selloni, A., Livraghi, S. & Giamello, E. Characterization of paramagnetic species in N-doped TiO 2 powders by EPR spectroscopy and DFT calculations. J. Phys. Chem. B 109, 11414–11419 (2005).
8. Li, Y., Wu, S., Zheng, J., Peng, Y.-K., Prabhakaran, D., Taylor, R. A., Chi, S. & Tsang, S. C. E. 2D photocatalysts with tuneable supports for enhanced photocatalytic water splitting. Mater. Today 41, 34–43 (2020).
9. Nosker, R. W., Mark, P. & Levine, J. D. Polar surfaces of wurtzite and zincblende lattices. Surf. Sci. 19, 291–317 (1970).
10. Diebold, U., Koplitz, L. V. & Dulub, O. Atomic-scale properties of low-index ZnO surfaces. Appl. Surf. Sci. 237, 336–342 (2004).
11. Li, Y. & Tsang, S. C. E. Unusual Catalytic Properties of High-Energetic-Facet Polar Metal Oxides. Acc. Chem. Res. 54, 366–378 (2021).
12. Pojani, A., Finocchi, F., Goniakowski, J. & Noguera, C. A theoretical study of the stability and electronic structure of the polar {111} face of mgo. Surf. Sci. 387, 354–370 (1997).
13. Li, Y., Wang, Z., Wang, Y., Kovács, A., Foo, C., Dunin-Borkowski, R. E., Lu, Y., Taylor, R. A., Wu, C. & Tsang, S. C. E. Local magnetic spin mismatch promoting photocatalytic overall water splitting with exceptional solar-to-hydrogen efficiency. Energy Environ. Sci. 15, 265–277 (2022).
14. Pan, L., Ai, M., Huang, C., Yin, L., Liu, X., Zhang, R., Wang, S., Jiang, Z., Zhang, X., Zou, J. J. & Mi, W. Manipulating spin polarization of titanium dioxide for efficient photocatalysis. Nat. Commun. 11, 418 (2020).
15. Peña, M. A. & Fierro, J. L. G. Chemical structures and performance of perovskite oxides. Chem. Rev. 101, 1981–2017 (2001).

Chapter 7 Conclusions and outlook
233
16. Zhang, G., Liu, G., Wang, L. & Irvine, J. T. S. Inorganic perovskite photocatalysts for solar energy utilization. Chem. Soc. Rev. 45, 5951–5984 (2016).
17. Wang, W., Tadé, M. O. & Shao, Z. Research progress of perovskite materials in photocatalysis- and photovoltaics-related energy conversion and environmental treatment. Chem. Soc. Rev. 44, 5371–5408 (2015).
18. Takata, T., Jiang, J., Sakata, Y., Nakabayashi, M., Shibata, N., Nandal, V., Seki, K., Hisatomi, T. & Domen, K. Photocatalytic water splitting with a quantum efficiency of almost unity. Nature 581, 411–414 (2020).
19. Sun, S. Recent Advances in Chemical Synthesis, Self-Assembly, and Applications of FePt Nanoparticles. Adv. Mater. 18, 393–403 (2006).
20. Bai, G., Jin, J., Wu, C. & Yan, M. Ultrafine FeCo Nanoparticles Isolated by Ultrathin Dielectric Shells for Microwave Application. ACS Appl. Nano Mater. 2, 3570–3576 (2019).
21. Cui, Z., Bai, F., Zhang, X., Zang, C., Zhu, H. & Wang, Z. A line-focused solar furnace for large area thermal experiment. AIP Conf. Proc. 2303, 110001 (2020).
22. Rodriguez, J., Cañadas, I. & Zarza, E. New PSA high concentration solar furnace SF40. AIP Conf. Proc. 1734, 070028 (2016).
23. Garcia, D., Liang, D., Tibúrcio, B. D., Almeida, J. & Vistas, C. R. A three-dimensional ring-array concentrator solar furnace. Sol. Energy 193, 915–928 (2019).

Appendix
234
Appendix
Appendix Note A1 Calculation of QE
A typical QE calculation is shown below, taking Fe3O4/N-TiO2-4 as an example
(demonstrated in Chapter 5):
For the measurement of the QE of the Fe3O4/N-TiO2-4 photocatalyst at 437 nm,
the H2 amount analysed by GC is 5.25 µmol in the 2-hour experiment,
corresponding to 3.159×10¹⁸ H2 molecules (N = n x NA). During the period of 2
hours, the energy of the light irradiation: W=P×t. With the bandpass filter of 437
nm, the light irradiation power was measured to be P = 0.45 mW at the centre of
the batch reactor (the power of light was measured using a Thorlabs S121C
standard photodiode power sensor, which had been calibrated by Thorlabs before
it was delivered, and was used without further calibration), therefore, the energy
W = 0.00045 × 7200 = 3.24 J, which contains the photon (437 nm) numbers of
7.123×10¹⁸ (𝜀 = ℎ𝜈). Then, the QE can be calculated using Equation 2.15.
QE (%) = (2×3.159×1018)/ (7.123×1018) ×100% = 88.7 %
As in the energy evaluation of solar conversion systems by Ross and Bolton, there
is always an energy difference of 0.2-0.3 eV between the absorbed photon energy
and the energy that can do useful work. Thus, the threshold wavelength which is
just capable of driving the reaction can be calculated based on the equation
(assuming an energy loss of 0.3 eV):
𝜆M =ℎ𝑐
∆𝐺o𝑛 + 𝑈[X@@
The result is ca. 970 nm, which means only the photons with a wavelength shorter
than 970 nm can drive the POWS reaction. Bolton et al. gave an example in their

Appendix
235
work: for a reaction with a potential of 1.052 V, the threshold wavelength is 880
nm. In the case shown here, the reaction potential is 0.979 V for a 2-hour reaction,
which is smaller than that in the example. Thus, the calculated threshold
wavelength of 970 nm is reasonable.

Appendix
236
Appendix Note A2 Calculations of heat balance
2H2O === 2H2 + O2
N2 + 3H2 === 2NH3 Δ𝐻1 = -91.8 kJ mol-1
CO2 + 4H2 === CH4 + 2H2O Δ𝐻2 = -165.0 kJ mol-1
For ammonia synthesis reaction, assuming 1 kg NH3 is synthesised, then the
molar number is:
n (NH3) = E(f*q)(K)\(f*q)(K/EX[)
= ABBBKAs.BqAK/EX[
= 58.72 mol
Required amount of H2 to produce 1 kg NH3 is:
n (H2) = n (NH3) (mol) × 1.5 = 58.72 mol × 1.5 = 88.08 mol
Required amount of water to provide 88.08 mol of H2 is:
n (H2O) = n (H2) = 88.08 mol
m (H2O) = n (H2O) ×M (H2O) = 88.08 mol × 18.015 g/mol = 1586.76 g
Heat produced during this ammonia synthesis process is:
Q1= A/ n (NH3)× (−Δ𝐻1) = A
/ ×58.72 mol × 91.8 kJ/mol × 1000 J/kJ = 2.70 × 10⁶ J
Heat required to heat up this amount of water from room temperature (25 oC) to
270 oC (the optimised temperature in our photocatalytic overall water splitting
system) is:
Q2= cmΔ𝑇= 4.18 J∙g-1∙K-1 × 1586.76 g × (270 - 25) K = 1.63 × 10⁶ J
Apparently, Q1 > Q2
For CO2 hydrogenation to methane, assuming 1 kg CH4 is synthesised:
n (CH4) = E(uvw)(K)\(uvw)(K/EX[)
= ABBBKAx.BwqK/EX[
= 62.33 mol

Appendix
237
Required amount of H2 to produce 1 kg CH4 is:
n (H2) = n (CH4) (mol) × 4 = 62.33 mol × 4 = 249.32 mol
Required amount of water to provide 249.32 mol of H2 is:
n (H2O) = n (H2) = 249.32 mol
m (H2O) = n (H2O) (mol) ×M (H2O) (g/mol) = 249.32 mol × 18.015 g/mol =
4491.50 g
Heat produced during the CO2 hydrogenation to methane process is:
Q3 =n (CH4) ×(−Δ𝐻2) = 62.33 mol × 165 kJ/mol × 1000 J/kJ = 1.03 × 10⁷ J
Heat required to heat up this amount of water from room temperature (25 oC) to
270 oC (the optimised temperature in our photocatalytic overall water splitting
system):
Q4 = cmΔ𝑇= 4.18 J∙g-1∙K-1 × 4491.50 g × (270 - 25) K = 4.60 × 10⁶ J
Apparently, Q3 > Q4

Appendix
238
Appendix Note A3 Calculation of energy efficiencies
(Taking the Fe3O4/N-TiO2-4 in Chapter 5 as an example; reaction is performed at
270 oC with an external magnetic field of 180 mT)
a. Calculation of the Gibbs free energy at 298 K and 101.325 kPa
For the reaction:
H2O (l) ==H2 (g) + 0.5O2 (g)
The standard enthalpy of reaction is:
∆&H#ɵ = 0 + 0.5 × 0 − (−286) = 286kJ/mol
The standard entropy change of reaction is:
∆&S#ɵ = 130.684 + 0.5 × 205.138 − 69.91 = 163.343J/(mol ∙ K)
According to the equation of Gibbs free energy:
∆&G#ɵ = ∆&H#ɵ − T∆&S#ɵ
The standard Gibbs free energy at 298 K is:
∆&G#ɵ = 286 − 298 × 163.343 × 10?q = 237kJ/mol
b. Calculation of the Gibbs free energy at 543 K and 101.325 kPa
According to the Van’t Hoff equation:
dln KdT = −
∆Hɵ
RT/
Therefore,
lnK/KA
= −∆Hɵ
R (1T/−1TA)
Also,

Appendix
239
∆&G#ɵ = −RT lnK
Then
−∆&G#ɵ (T/)𝑅T/
+∆&G#ɵ (TA)𝑅TA
= −∆Hɵ
R (1T/−1TA)
Thus, the Gibbs free energy at 543 K and 101.325 kPa can be calculated:
∆&G#ɵ (543K) = 196.73kJ/mol
The reactant at 270 oC in our system is still liquid water, which is under the
saturated vapour pressure of ca. 60 bar at 270 oC. Thus, the phase change from
liquid water to water vapour is not considered, since this process is not involved in
the reaction. As the result shows, the Gibbs free energy at 270 oC (543 K) indeed
decreases by about 40 kJ/mol, but it is still much higher than zero, which means
the reaction is still not thermodynamically favourable at this temperature.
c. Correction of the Gibbs free energy for the reaction pressure
According to the Van’t Hoff isotherm:
∆&G# = ∆&G#ɵ + RT ln Q
where ∆&G# is the Gibbs free energy of reaction under non-standard states at
temperature T; ∆&G#ɵ is the Gibbs free energy of the reaction at T and 101.325 kPa;
Q is the thermodynamic reaction quotient.
For the POWS reaction, Q can be defined as:
Q =pv!pɵ ∙ �
pz!pɵ �
B.{
Also, assuming the gas phase in the batch reactor follows the ideal gas law:
pv!V = nv!RT

Appendix
240
Based on the reaction stoichiometry,
pv! = 2pz!
It should be emphasised that this POWS system was conducted at constant
temperature (T=543 K) and volume (V=20 mL), thus, the Helmholtz free energy,
ΔA, was then used in the subsequent calculation of the efficiencies. Given that:
A = U − TS
G = A + PV
It is also noticed that in our system, the partial pressures of H2 and O2 change over
the reaction progress, resulting in a changing free energy. Therefore, the free
energy has been corrected for different partial pressures throughout the whole
reaction process, and the STH efficiencies can be calculated accordingly.
Consequently, the average free energy and average STH over the reaction
progress are calculated:
𝑇𝑖𝑚𝑒 − 𝑎𝑣𝑒𝑟𝑎𝑔𝑒∆A = 203.3 ± 5.4kJmol?A
𝑇𝑖𝑚𝑒 − 𝑎𝑣𝑒𝑟𝑎𝑔𝑒η<|v = 11.9 ± 0.5%
d. Evaluation of the energy input required for heating
Additionally, I have estimated the energy required to heat your system to 270 oC.
Considering a photocatalytic process operated under steady state at 270 oC,
energy is required to heat the input liquid water from room temperature 25 oC to
270 oC. The energy for heating the reactor is not considered in this calculation
since this is not an intrinsic property of the POWS reaction and highly dependent
on the reactor design; also, when the system is operating under a steady state,
energy is only required to compensate the heat loss, which can be minimised by

Appendix
241
covering the reactor with adiabatic materials, then this part of energy could
presumably be negligible. In our system, 5 mL of water was used as the reactant
when the energy efficiencies were evaluated.
When water is heated to 270 oC, the saturated vapour pressure is established,
which can be calculated according to the Clausius–Clapeyron relation:
dPdT =
PLT/R
where P is the pressure, R is the specific gas constant, L is the specific latent heat
of the substance, and T is the temperature.
Assuming L is independent to the temperature, then the relation can be integrated,
giving:
lnP/PA= −
LR (
1T/−1TA)
For water, L=40.68 kJ/mol, thus, the saturated vapour pressure at 270 oC is:
P(543K) = 60.36bar
Assuming it follows the ideal gas law, the amount of H2O in the gas phase is:
n784("& =pVRT =
60.36 × 101.325kPa × 0.015L8.314 × 543K = 0.02mol
m784("& = 0.02mol × 18gmol = 0.36g
Clearly, only a small portion of water transfers to vapour. Thus, the energy for
heating the 5 mL of H2O from room temperature to 270 oC is calculated as follows,
assuming the heat capacity does not significantly change with temperature:
From 25 oC to 100 oC:

Appendix
242
QA = mU83%&C4,U83%&∆T = 5g × 4.184J
g ∙ K × 75K = 1569J
At 100 oC:
Q/ = nL = 0.02mol × 40680J
mol = 813.6
From 100 oC to 270 oC:
Qq = mU83%&C4,U83%&∆T +m784("&C4,784("&∆T
= 4.64g × 4.184J
g ∙ K × 170K + 0.36g × 1.85J
g ∙ K × 170K
= 3413.56J
Therefore, the total energy required for heating is:
QU83%& = QA + Q/ + Qq = 5796J
The above has shown the energy required to heat water up to 270 oC. Moreover,
I also evaluated the actual overall energy conversion efficiency, η(7%&8++ ,
experimentally. I tried my best to cover the experimental set-up with a band heater
and thermally insulating materials such as silica wool, thermal foil, etc., to reduce
the heat loss, however, a ‘perfect’ insulation layer cannot be achieved and the heat
loss is inevitable. The heating process was controlled by a Parr 4838 thermo-
controller under the proportional integral derivative (PID) mode and monitored with
a SpecView-3 software. When the temperature reached 270 oC, the heater started
to operate at a low output level to compensate the heat loss. Thus, the actual
energy input could be calculated by integrating the power-time curve and the
actual overall energy conversion efficiency can be obtained.
The actually energy consumed for heating up the whole system (reactor + reactant
+ photocatalyst) from 20 to 270 oC and maintaining the temperature at 270 oC for

Appendix
243
20 hours is:
Q8,3"8+ = 53174J
The energy input from the solar simulator is:
E-(+8& = P ∙ π ∙ r/ ∙ t = 5652J
Subsequently, the actual overall energy conversion efficiency can be calculated:
η(7%&8++ =n5~2&(�%1 × averagefreeenergy(543K)
E-(+8& + Q8,3"8+× 100% = 1.16 ± 0.05%
By comparing the QU83%& and Q8,3"8+, it is obvious that the majority of the energy
input is consumed by heating the reactor instead of the reactant, and this part of
energy could vary greatly between different reactor designs. Also, the system
could be working for even longer period of time without the need of heating up the
reactor again, but only a small amount of energy is required to compensate the
heat loss (given that a perfect thermal insulation is hardly achievable).