enhanced photocatalytic activity of ag–zno hybrid plasmonic nanostructures prepared by a facile...
TRANSCRIPT
639
Enhanced photocatalytic activity of Ag–ZnO hybridplasmonic nanostructures prepared
by a facile wet chemical methodSini Kuriakose1, Vandana Choudhary1, Biswarup Satpati2
and Satyabrata Mohapatra*1,§
Full Research Paper Open Access
Address:1School of Basic and Applied Sciences, Guru Gobind SinghIndraprastha University, Dwarka, New Delhi 110078, India and 2SahaInstitute of Nuclear Physics, 1/AF Bidhannagar, Kolkata 700064, India
Email:Satyabrata Mohapatra* - [email protected]
* Corresponding author§ Phone: +91 11 25302414
Keywords:Ag–ZnO; hybrid plasmonic nanostructures; photocatalysis
Beilstein J. Nanotechnol. 2014, 5, 639–650.doi:10.3762/bjnano.5.75
Received: 20 December 2013Accepted: 24 April 2014Published: 15 May 2014
This article is part of the Thematic Series "Photocatalysis".
Guest Editor: R. Xu
© 2014 Kuriakose et al; licensee Beilstein-Institut.License and terms: see end of document.
AbstractWe report the synthesis of Ag–ZnO hybrid plasmonic nanostructures with enhanced photocatalytic activity by a facile wet-chem-
ical method. The structural, optical, plasmonic and photocatalytic properties of the Ag–ZnO hybrid nanostructures were studied by
X-ray diffraction (XRD), field emission scanning electron microscopy (FESEM), transmission electron microscopy (TEM), photo-
luminescence (PL) and UV–visible absorption spectroscopy. The effects of citrate concentration and Ag nanoparticle loading on the
photocatalytic activity of Ag–ZnO hybrid nanostructures towards sun-light driven degradation of methylene blue (MB) have been
investigated. Increase in citrate concentration has been found to result in the formation of nanodisk-like structures, due to citrate-
assisted oriented attachment of ZnO nanoparticles. The decoration of ZnO nanostructures with Ag nanoparticles resulted in a
significant enhancement of the photocatalytic degradation efficiency, which has been found to increase with the extent of Ag
nanoparticle loading.
639
IntroductionThe removal of hazardous materials such as dyes and organic
compounds from waste water has attracted ever increasing
attention over the years. Semiconductor photocatalysis is one of
the most important technologies used for the complete mineral-
ization of a wide range of organic dyes and toxic chemicals.
ZnO, a wide band gap semiconductor with large excitonic
binding energy is suitable for diverse applications including UV
lasers [1], field effect transistors [2], dye sensitized solar cells
[3,4], surface enhanced Raman spectroscopy (SERS) [5] and
biomedical applications [6-10]. ZnO nanostructures are
Beilstein J. Nanotechnol. 2014, 5, 639–650.
640
promising photocatalysts because of their high quantum effi-
ciency, high redox potential, superior physical and chemical
stability, non-toxicity and low cost [11-16]. However, ZnO
nanostructures suffer from drawbacks such as a high
electron–hole recombination rate and the inefficient utilization
of sun light, which limit their photocatalytic activity [17,18].
Several attempts have been made to improve the photocatalytic
efficiency of ZnO by decreasing the rate of recombination of
electrons and holes by surface modification with noble metal
nanoparticles [19-24]. Surface modification of ZnO nanostruc-
tures with noble metal nanoparticles improves the photocat-
alytic efficiency, since the noble metal–ZnO system has two
distinct features. Firstly, noble metal–ZnO contacts result in a
Schottky junction, which creates an internal electric field close
to the interface causing the photogenerated electrons and holes
to move in different directions, which results in a decrease of
their recombination rate [19]. Secondly, noble metal nanoparti-
cles on ZnO exhibit localized surface plasmon resonance
(LSPR) absorption of light which can have significant impact
on semiconductor photocatalysis. The LSPR wavelength of
noble metal nanoparticles can be tuned from near UV to the
visible region by controlling their size, shape, inter-particle
spacing and surrounding medium [25]. In case of ZnO modi-
fied with noble metal nanoparticles, LSPR absorption can lead
to enhanced utilization of UV–visible light as compared to pure
ZnO [26-28]. Silver nanoparticles decorated ZnO nanostruc-
tures of various morphology have shown considerable increase
in the photocatalytic efficiency for the degradation of organic
dyes [19,23,29-34]. Xie et al. [23] have shown that Ag loading
on ZnO nanostructures improves its photostability and enhances
the photocatalytic activity due to increased efficiency for sep-
aration of photogenerated electrons and holes. It has been
shown that Ag–ZnO nanostructures take 80 min for the
complete photocatalytic degradation of 0.2 μM crystal violet
dye under UV irradiation. Liu et al. [30] have studied the effects
of Ag loading on ZnO on the photocatalytic degradation of
rhodamine B (RhB) and showed that the degradation of RhB
over pure Ag nanowires was negligible as compared to ZnO,
the degradation efficiency of which further was increased due to
the decoration with Ag nanoparticles. Deng et al. [19] fabri-
cated Ag nanoparticles decorated ZnO microrods, by photore-
duction of Ag ions onto the surface of the ZnO microrods
prepared through a solvothermal-assisted method, which
showed enhanced sun light active photocatalytic activity. In this
paper, we report the synthesis of Ag–ZnO hybrid plasmonic
nanostructures by a two-step facile wet chemical method
involving the trisodium citrate assisted photoreduction of Ag
ions onto the surface of ZnO nanostructures, prepared by a
facile wet chemical method. The effects of citrate concentration
and Ag nanoparticle loading on the photocatalytic activity of
Ag–ZnO hybrid plasmonic nanostructures towards sun-light
driven degradation of methylene blue (MB) dye have been
investigated.
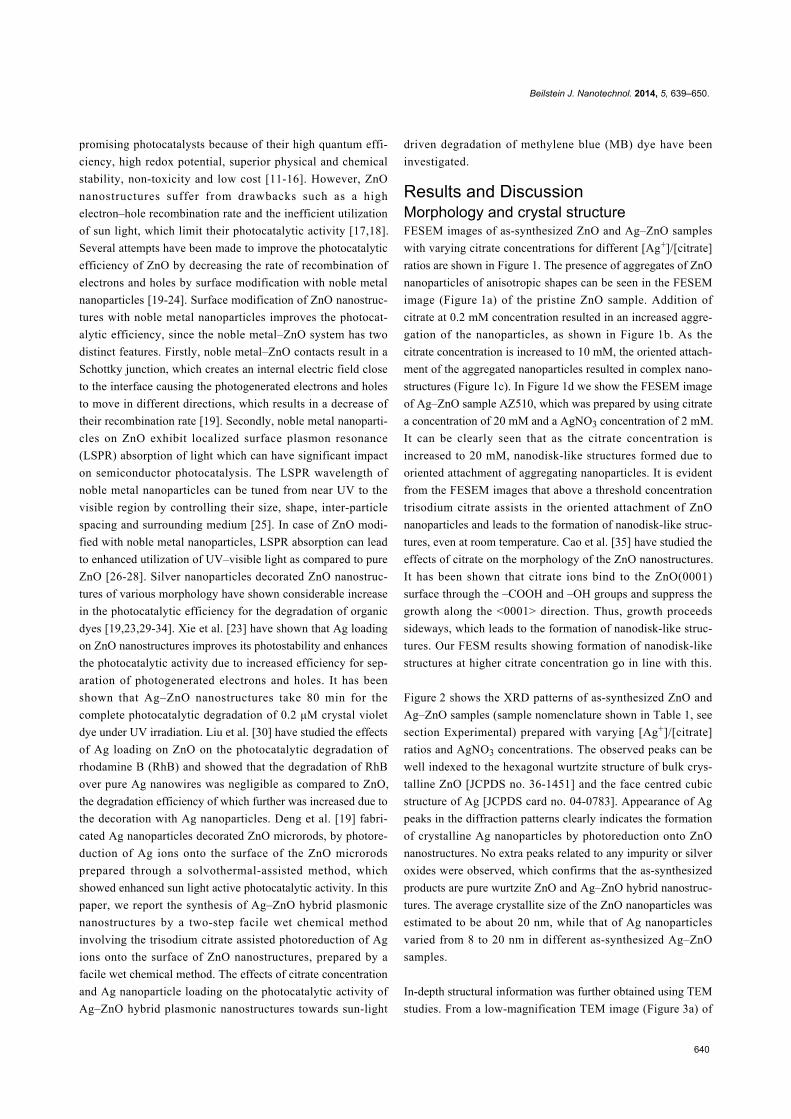
Results and DiscussionMorphology and crystal structureFESEM images of as-synthesized ZnO and Ag–ZnO samples
with varying citrate concentrations for different [Ag+]/[citrate]
ratios are shown in Figure 1. The presence of aggregates of ZnO
nanoparticles of anisotropic shapes can be seen in the FESEM
image (Figure 1a) of the pristine ZnO sample. Addition of
citrate at 0.2 mM concentration resulted in an increased aggre-
gation of the nanoparticles, as shown in Figure 1b. As the
citrate concentration is increased to 10 mM, the oriented attach-
ment of the aggregated nanoparticles resulted in complex nano-
structures (Figure 1c). In Figure 1d we show the FESEM image
of Ag–ZnO sample AZ510, which was prepared by using citrate
a concentration of 20 mM and a AgNO3 concentration of 2 mM.
It can be clearly seen that as the citrate concentration is
increased to 20 mM, nanodisk-like structures formed due to
oriented attachment of aggregating nanoparticles. It is evident
from the FESEM images that above a threshold concentration
trisodium citrate assists in the oriented attachment of ZnO
nanoparticles and leads to the formation of nanodisk-like struc-
tures, even at room temperature. Cao et al. [35] have studied the
effects of citrate on the morphology of the ZnO nanostructures.
It has been shown that citrate ions bind to the ZnO(0001)
surface through the –COOH and –OH groups and suppress the
growth along the <0001> direction. Thus, growth proceeds
sideways, which leads to the formation of nanodisk-like struc-
tures. Our FESM results showing formation of nanodisk-like
structures at higher citrate concentration go in line with this.
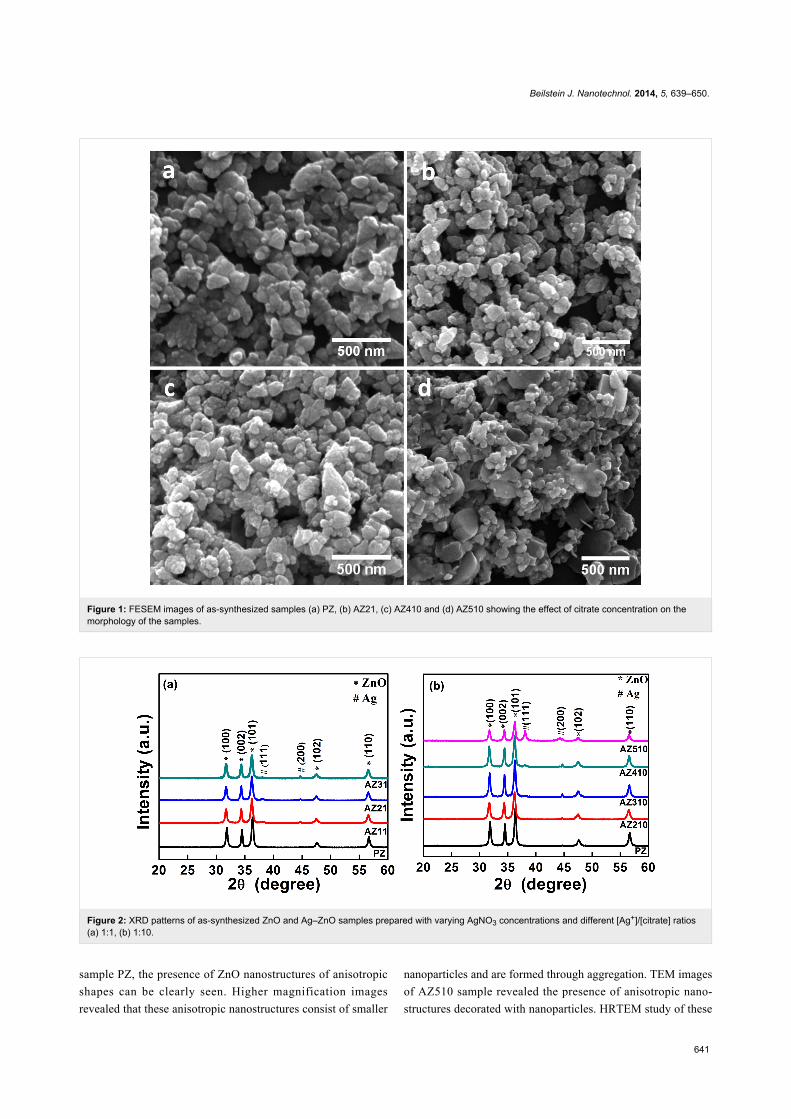
Figure 2 shows the XRD patterns of as-synthesized ZnO and
Ag–ZnO samples (sample nomenclature shown in Table 1, see
section Experimental) prepared with varying [Ag+]/[citrate]
ratios and AgNO3 concentrations. The observed peaks can be
well indexed to the hexagonal wurtzite structure of bulk crys-
talline ZnO [JCPDS no. 36-1451] and the face centred cubic
structure of Ag [JCPDS card no. 04-0783]. Appearance of Ag
peaks in the diffraction patterns clearly indicates the formation
of crystalline Ag nanoparticles by photoreduction onto ZnO
nanostructures. No extra peaks related to any impurity or silver
oxides were observed, which confirms that the as-synthesized
products are pure wurtzite ZnO and Ag–ZnO hybrid nanostruc-
tures. The average crystallite size of the ZnO nanoparticles was
estimated to be about 20 nm, while that of Ag nanoparticles
varied from 8 to 20 nm in different as-synthesized Ag–ZnO
samples.
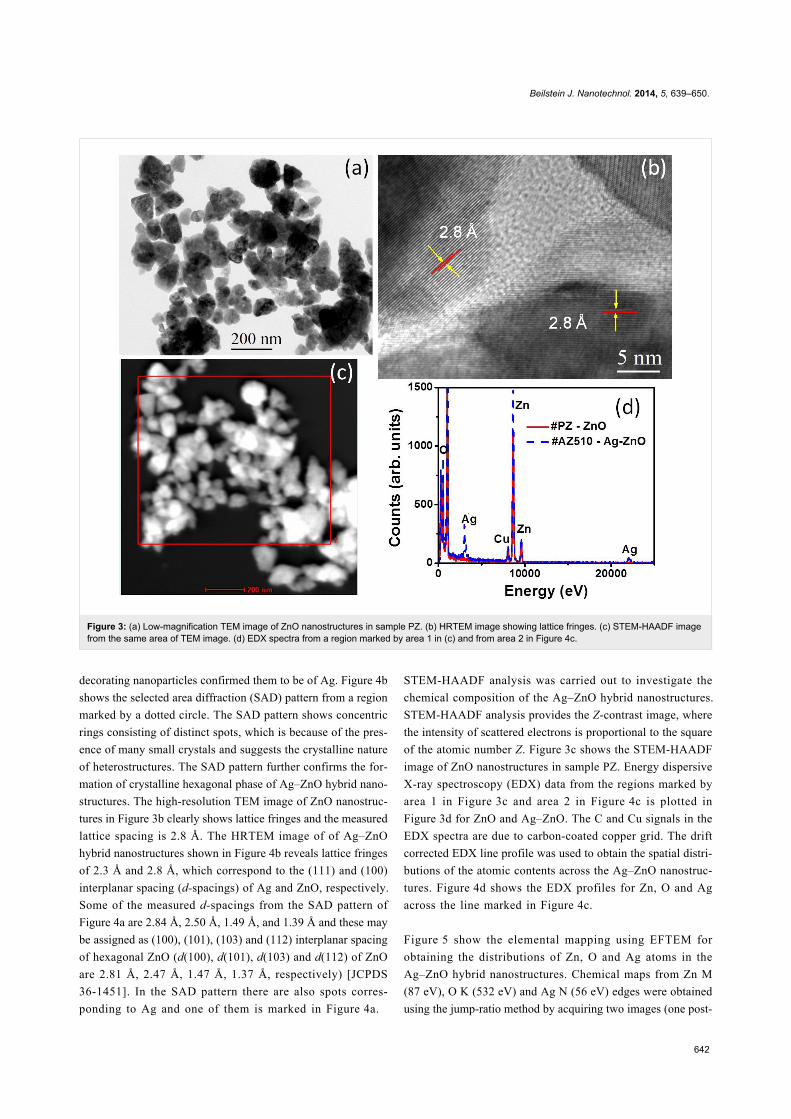
In-depth structural information was further obtained using TEM
studies. From a low-magnification TEM image (Figure 3a) of
Beilstein J. Nanotechnol. 2014, 5, 639–650.
641
Figure 1: FESEM images of as-synthesized samples (a) PZ, (b) AZ21, (c) AZ410 and (d) AZ510 showing the effect of citrate concentration on themorphology of the samples.
Figure 2: XRD patterns of as-synthesized ZnO and Ag–ZnO samples prepared with varying AgNO3 concentrations and different [Ag+]/[citrate] ratios(a) 1:1, (b) 1:10.
sample PZ, the presence of ZnO nanostructures of anisotropic
shapes can be clearly seen. Higher magnification images
revealed that these anisotropic nanostructures consist of smaller
nanoparticles and are formed through aggregation. TEM images
of AZ510 sample revealed the presence of anisotropic nano-
structures decorated with nanoparticles. HRTEM study of these
Beilstein J. Nanotechnol. 2014, 5, 639–650.
642
Figure 3: (a) Low-magnification TEM image of ZnO nanostructures in sample PZ. (b) HRTEM image showing lattice fringes. (c) STEM-HAADF imagefrom the same area of TEM image. (d) EDX spectra from a region marked by area 1 in (c) and from area 2 in Figure 4c.
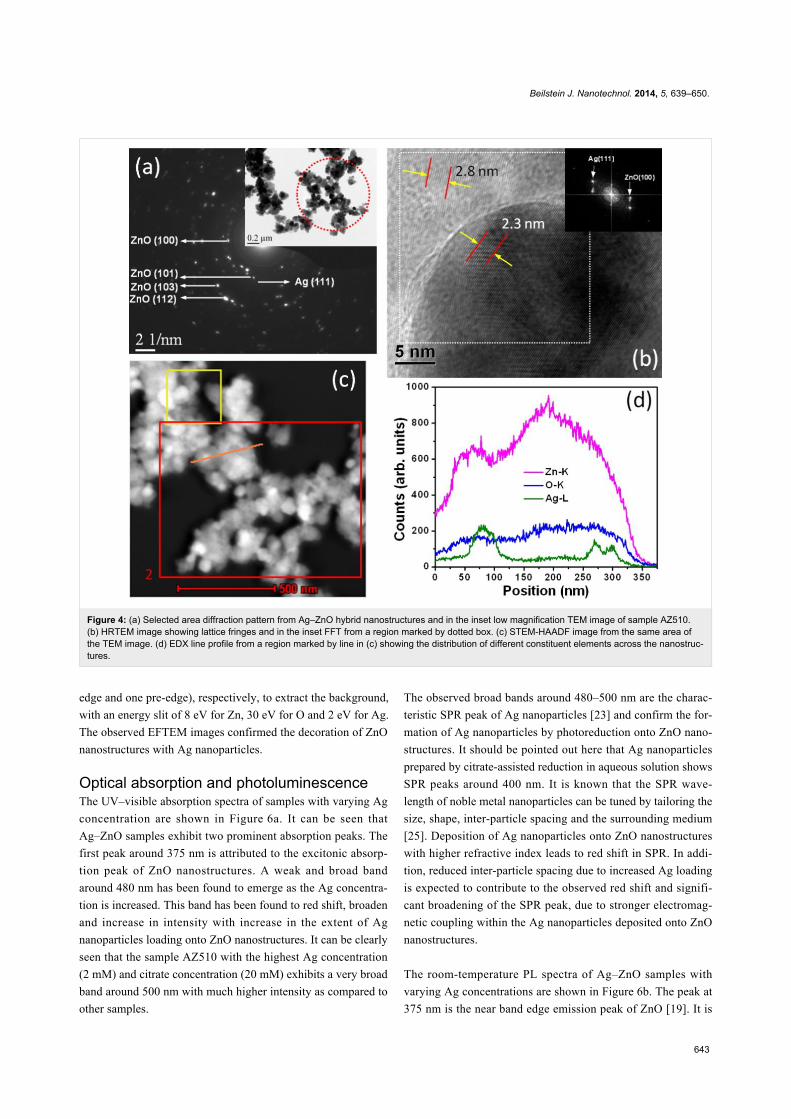
decorating nanoparticles confirmed them to be of Ag. Figure 4b
shows the selected area diffraction (SAD) pattern from a region
marked by a dotted circle. The SAD pattern shows concentric
rings consisting of distinct spots, which is because of the pres-
ence of many small crystals and suggests the crystalline nature
of heterostructures. The SAD pattern further confirms the for-
mation of crystalline hexagonal phase of Ag–ZnO hybrid nano-
structures. The high-resolution TEM image of ZnO nanostruc-
tures in Figure 3b clearly shows lattice fringes and the measured
lattice spacing is 2.8 Å. The HRTEM image of of Ag–ZnO
hybrid nanostructures shown in Figure 4b reveals lattice fringes
of 2.3 Å and 2.8 Å, which correspond to the (111) and (100)
interplanar spacing (d-spacings) of Ag and ZnO, respectively.
Some of the measured d-spacings from the SAD pattern of
Figure 4a are 2.84 Å, 2.50 Å, 1.49 Å, and 1.39 Å and these may
be assigned as (100), (101), (103) and (112) interplanar spacing
of hexagonal ZnO (d(100), d(101), d(103) and d(112) of ZnO
are 2.81 Å, 2.47 Å, 1.47 Å, 1.37 Å, respectively) [JCPDS
36-1451]. In the SAD pattern there are also spots corres-
ponding to Ag and one of them is marked in Figure 4a.
STEM-HAADF analysis was carried out to investigate the
chemical composition of the Ag–ZnO hybrid nanostructures.
STEM-HAADF analysis provides the Z-contrast image, where
the intensity of scattered electrons is proportional to the square
of the atomic number Z. Figure 3c shows the STEM-HAADF
image of ZnO nanostructures in sample PZ. Energy dispersive
X-ray spectroscopy (EDX) data from the regions marked by
area 1 in Figure 3c and area 2 in Figure 4c is plotted in
Figure 3d for ZnO and Ag–ZnO. The C and Cu signals in the
EDX spectra are due to carbon-coated copper grid. The drift
corrected EDX line profile was used to obtain the spatial distri-
butions of the atomic contents across the Ag–ZnO nanostruc-
tures. Figure 4d shows the EDX profiles for Zn, O and Ag
across the line marked in Figure 4c.
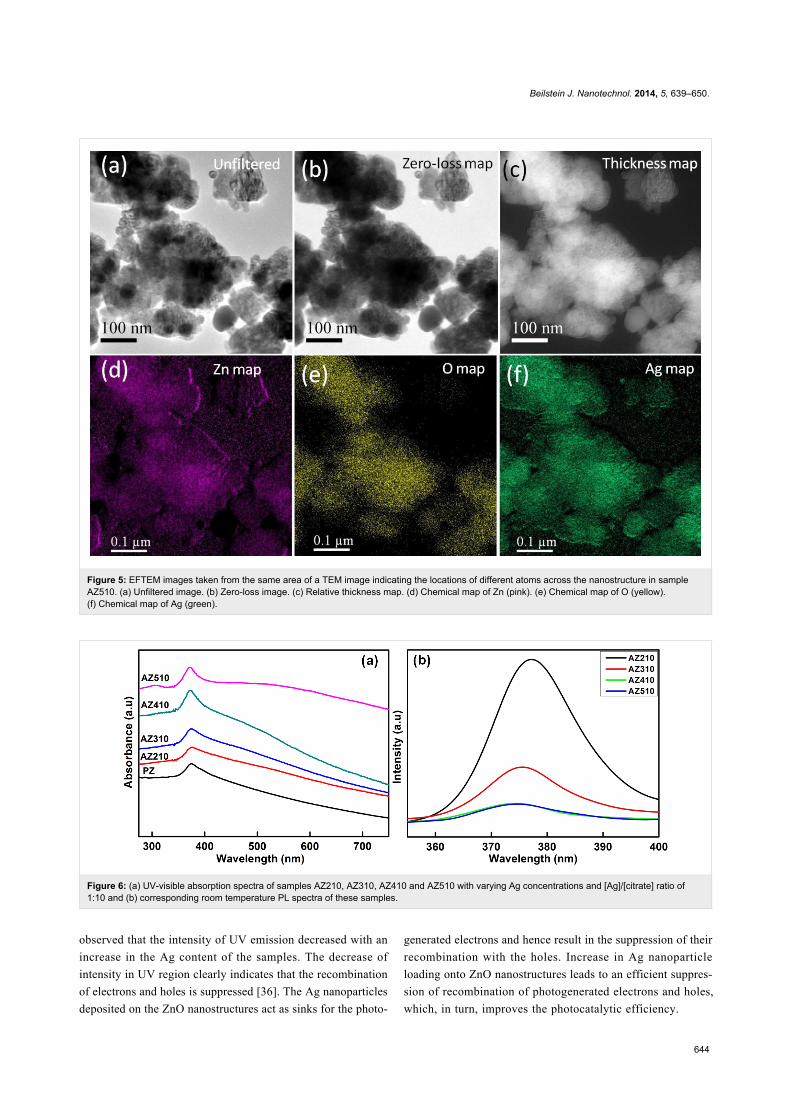
Figure 5 show the elemental mapping using EFTEM for
obtaining the distributions of Zn, O and Ag atoms in the
Ag–ZnO hybrid nanostructures. Chemical maps from Zn M
(87 eV), O K (532 eV) and Ag N (56 eV) edges were obtained
using the jump-ratio method by acquiring two images (one post-
Beilstein J. Nanotechnol. 2014, 5, 639–650.
643
Figure 4: (a) Selected area diffraction pattern from Ag–ZnO hybrid nanostructures and in the inset low magnification TEM image of sample AZ510.(b) HRTEM image showing lattice fringes and in the inset FFT from a region marked by dotted box. (c) STEM-HAADF image from the same area ofthe TEM image. (d) EDX line profile from a region marked by line in (c) showing the distribution of different constituent elements across the nanostruc-tures.
edge and one pre-edge), respectively, to extract the background,
with an energy slit of 8 eV for Zn, 30 eV for O and 2 eV for Ag.
The observed EFTEM images confirmed the decoration of ZnO
nanostructures with Ag nanoparticles.
Optical absorption and photoluminescenceThe UV–visible absorption spectra of samples with varying Ag
concentration are shown in Figure 6a. It can be seen that
Ag–ZnO samples exhibit two prominent absorption peaks. The
first peak around 375 nm is attributed to the excitonic absorp-
tion peak of ZnO nanostructures. A weak and broad band
around 480 nm has been found to emerge as the Ag concentra-
tion is increased. This band has been found to red shift, broaden
and increase in intensity with increase in the extent of Ag
nanoparticles loading onto ZnO nanostructures. It can be clearly
seen that the sample AZ510 with the highest Ag concentration
(2 mM) and citrate concentration (20 mM) exhibits a very broad
band around 500 nm with much higher intensity as compared to
other samples.
The observed broad bands around 480–500 nm are the charac-
teristic SPR peak of Ag nanoparticles [23] and confirm the for-
mation of Ag nanoparticles by photoreduction onto ZnO nano-
structures. It should be pointed out here that Ag nanoparticles
prepared by citrate-assisted reduction in aqueous solution shows
SPR peaks around 400 nm. It is known that the SPR wave-
length of noble metal nanoparticles can be tuned by tailoring the
size, shape, inter-particle spacing and the surrounding medium
[25]. Deposition of Ag nanoparticles onto ZnO nanostructures
with higher refractive index leads to red shift in SPR. In addi-
tion, reduced inter-particle spacing due to increased Ag loading
is expected to contribute to the observed red shift and signifi-
cant broadening of the SPR peak, due to stronger electromag-
netic coupling within the Ag nanoparticles deposited onto ZnO
nanostructures.
The room-temperature PL spectra of Ag–ZnO samples with
varying Ag concentrations are shown in Figure 6b. The peak at
375 nm is the near band edge emission peak of ZnO [19]. It is
Beilstein J. Nanotechnol. 2014, 5, 639–650.
644
Figure 5: EFTEM images taken from the same area of a TEM image indicating the locations of different atoms across the nanostructure in sampleAZ510. (a) Unfiltered image. (b) Zero-loss image. (c) Relative thickness map. (d) Chemical map of Zn (pink). (e) Chemical map of O (yellow).(f) Chemical map of Ag (green).
Figure 6: (a) UV-visible absorption spectra of samples AZ210, AZ310, AZ410 and AZ510 with varying Ag concentrations and [Ag]/[citrate] ratio of1:10 and (b) corresponding room temperature PL spectra of these samples.
observed that the intensity of UV emission decreased with an
increase in the Ag content of the samples. The decrease of
intensity in UV region clearly indicates that the recombination
of electrons and holes is suppressed [36]. The Ag nanoparticles
deposited on the ZnO nanostructures act as sinks for the photo-
generated electrons and hence result in the suppression of their
recombination with the holes. Increase in Ag nanoparticle
loading onto ZnO nanostructures leads to an efficient suppres-
sion of recombination of photogenerated electrons and holes,
which, in turn, improves the photocatalytic efficiency.
Beilstein J. Nanotechnol. 2014, 5, 639–650.
645
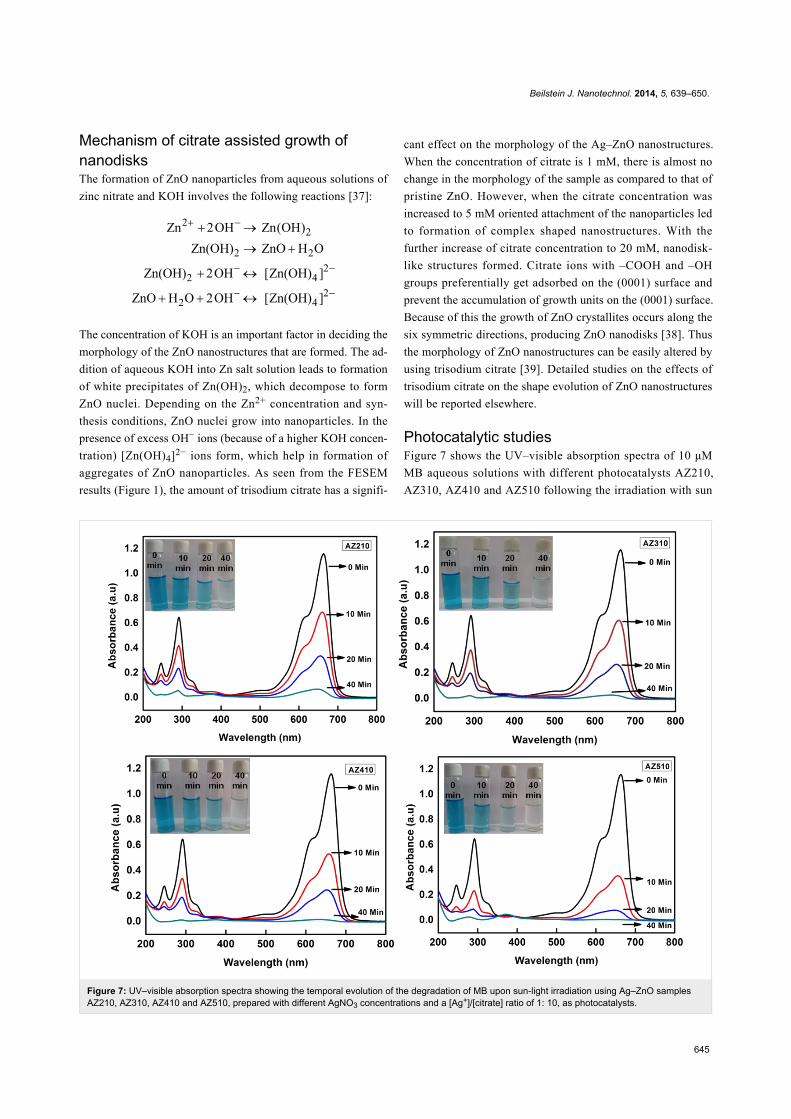
Figure 7: UV–visible absorption spectra showing the temporal evolution of the degradation of MB upon sun-light irradiation using Ag–ZnO samplesAZ210, AZ310, AZ410 and AZ510, prepared with different AgNO3 concentrations and a [Ag+]/[citrate] ratio of 1: 10, as photocatalysts.
Mechanism of citrate assisted growth ofnanodisksThe formation of ZnO nanoparticles from aqueous solutions of
zinc nitrate and KOH involves the following reactions [37]:
The concentration of KOH is an important factor in deciding the
morphology of the ZnO nanostructures that are formed. The ad-
dition of aqueous KOH into Zn salt solution leads to formation
of white precipitates of Zn(OH)2, which decompose to form
ZnO nuclei. Depending on the Zn2+ concentration and syn-
thesis conditions, ZnO nuclei grow into nanoparticles. In the
presence of excess OH− ions (because of a higher KOH concen-
tration) [Zn(OH)4]2− ions form, which help in formation of
aggregates of ZnO nanoparticles. As seen from the FESEM
results (Figure 1), the amount of trisodium citrate has a signifi-
cant effect on the morphology of the Ag–ZnO nanostructures.
When the concentration of citrate is 1 mM, there is almost no
change in the morphology of the sample as compared to that of
pristine ZnO. However, when the citrate concentration was
increased to 5 mM oriented attachment of the nanoparticles led
to formation of complex shaped nanostructures. With the
further increase of citrate concentration to 20 mM, nanodisk-
like structures formed. Citrate ions with –COOH and –OH
groups preferentially get adsorbed on the (0001) surface and
prevent the accumulation of growth units on the (0001) surface.
Because of this the growth of ZnO crystallites occurs along the
six symmetric directions, producing ZnO nanodisks [38]. Thus
the morphology of ZnO nanostructures can be easily altered by
using trisodium citrate [39]. Detailed studies on the effects of
trisodium citrate on the shape evolution of ZnO nanostructures
will be reported elsewhere.
Photocatalytic studiesFigure 7 shows the UV–visible absorption spectra of 10 μM
MB aqueous solutions with different photocatalysts AZ210,
AZ310, AZ410 and AZ510 following the irradiation with sun
Beilstein J. Nanotechnol. 2014, 5, 639–650.
646
light for different durations of time. The characteristic absorp-
tion peak of MB at 664 nm is monitored as a function of sun-
light exposure time. From Figure 7, it is clear that Ag–ZnO
samples with higher Ag content lead to more efficient degrad-
ation of MB for the same exposure time. It can also be clearly
seen that the photocatalytic efficiency is highest for AZ510,
which has the maximum Ag nanoparticles loading and
nanodisk-like structures, formed because of the higher citrate
concentration.
The mechanisms underlying the enhanced photocatalytic
activity of Ag–ZnO hybrid plasmonic nanostructures towards
the degradation of MB can be understood as follows: The SPR
of Ag nanoparticles helps in extending the light absorption of
ZnO from near UV to the visible region, leading to an impro-
ved sun-light utilization efficiency. In addition, decoration with
Ag nanoparticles significantly improves the charge separation
in ZnO. When ZnO absorbs photons of energy greater than or
equal to its band gap, electrons are promoted from its valence
band to conduction band, creating an equal number of holes in
the valence band. Since the energy level of conduction band of
ZnO is higher than the Fermi level of Ag–ZnO hybrid structure,
electrons flow from ZnO nanostructures to Ag nanoparticles.
This way Ag nanoparticles act as efficient sinks for the photo-
generated electrons, preventing their recombination with holes.
This process, known as the direct electron transfer from semi-
conductor to the plasmonic nanostructures, is dependent on the
alignment of electronic band structure of the noble metal and
semiconductor. Furthermore, irradiation with sun light leads to
the excitation of MB dye molecules adsorbed onto the ZnO
nanostructures. The photoexcited MB molecules transfer elec-
trons into the conduction band of ZnO [40]. The photogener-
ated electrons created by the above mentioned processes react
with dissolved O2 molecules forming superoxide anion radicals,
while holes react with H2O leading to the formation of hydroxyl
radicals, both of which cause the degradation of the MB dye.
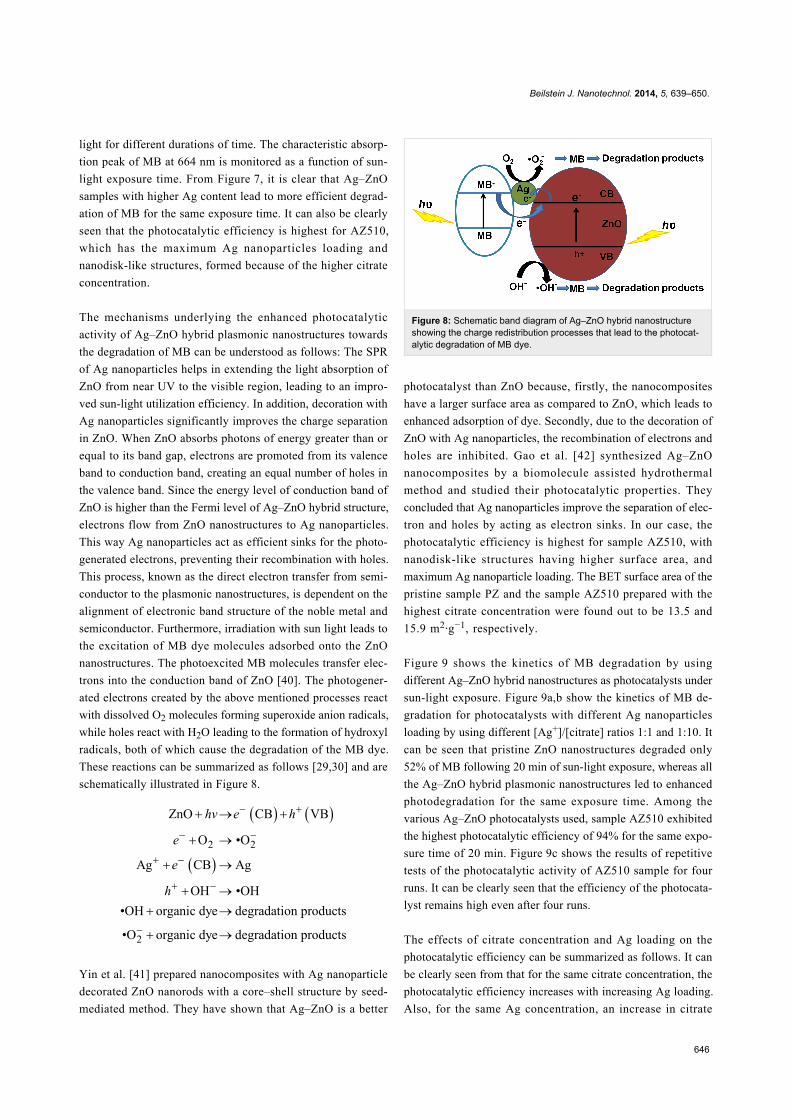
These reactions can be summarized as follows [29,30] and are
schematically illustrated in Figure 8.
Yin et al. [41] prepared nanocomposites with Ag nanoparticle
decorated ZnO nanorods with a core–shell structure by seed-
mediated method. They have shown that Ag–ZnO is a better
Figure 8: Schematic band diagram of Ag–ZnO hybrid nanostructureshowing the charge redistribution processes that lead to the photocat-alytic degradation of MB dye.
photocatalyst than ZnO because, firstly, the nanocomposites
have a larger surface area as compared to ZnO, which leads to
enhanced adsorption of dye. Secondly, due to the decoration of
ZnO with Ag nanoparticles, the recombination of electrons and
holes are inhibited. Gao et al. [42] synthesized Ag–ZnO
nanocomposites by a biomolecule assisted hydrothermal
method and studied their photocatalytic properties. They
concluded that Ag nanoparticles improve the separation of elec-
tron and holes by acting as electron sinks. In our case, the
photocatalytic efficiency is highest for sample AZ510, with
nanodisk-like structures having higher surface area, and
maximum Ag nanoparticle loading. The BET surface area of the
pristine sample PZ and the sample AZ510 prepared with the
highest citrate concentration were found out to be 13.5 and
15.9 m2·g−1, respectively.
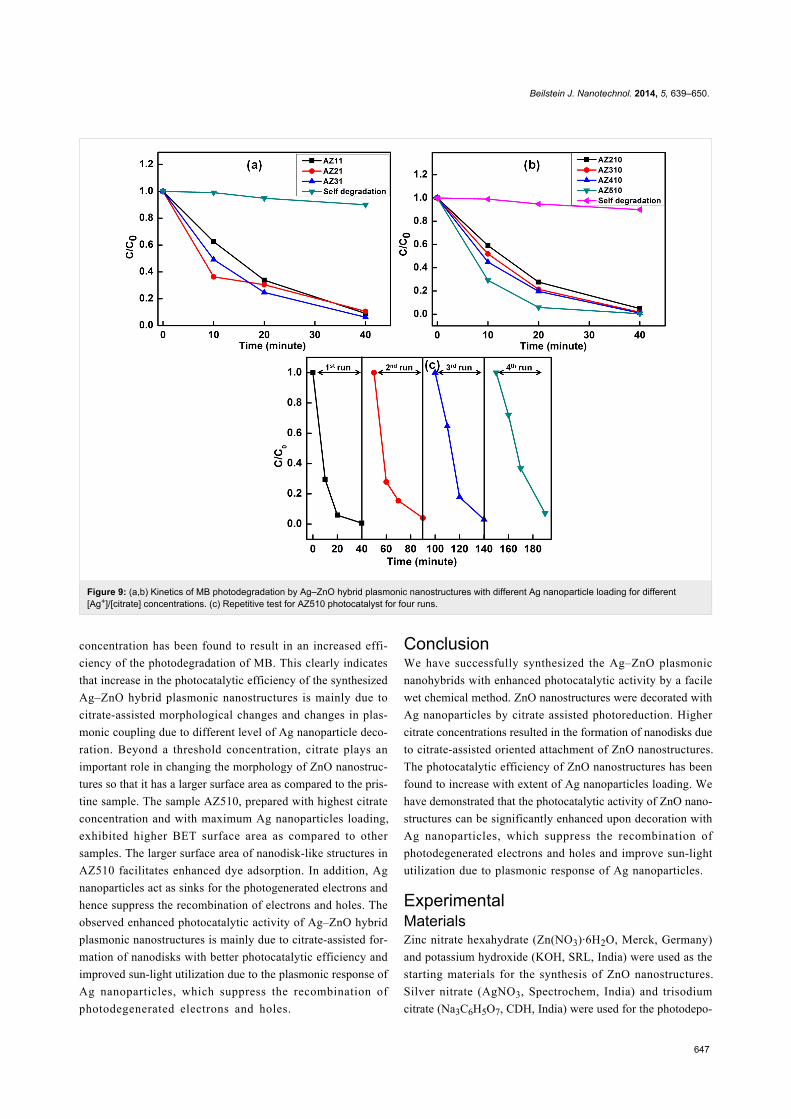
Figure 9 shows the kinetics of MB degradation by using
different Ag–ZnO hybrid nanostructures as photocatalysts under
sun-light exposure. Figure 9a,b show the kinetics of MB de-
gradation for photocatalysts with different Ag nanoparticles
loading by using different [Ag+]/[citrate] ratios 1:1 and 1:10. It
can be seen that pristine ZnO nanostructures degraded only
52% of MB following 20 min of sun-light exposure, whereas all
the Ag–ZnO hybrid plasmonic nanostructures led to enhanced
photodegradation for the same exposure time. Among the
various Ag–ZnO photocatalysts used, sample AZ510 exhibited
the highest photocatalytic efficiency of 94% for the same expo-
sure time of 20 min. Figure 9c shows the results of repetitive
tests of the photocatalytic activity of AZ510 sample for four
runs. It can be clearly seen that the efficiency of the photocata-
lyst remains high even after four runs.
The effects of citrate concentration and Ag loading on the
photocatalytic efficiency can be summarized as follows. It can
be clearly seen from that for the same citrate concentration, the
photocatalytic efficiency increases with increasing Ag loading.
Also, for the same Ag concentration, an increase in citrate
Beilstein J. Nanotechnol. 2014, 5, 639–650.
647
Figure 9: (a,b) Kinetics of MB photodegradation by Ag–ZnO hybrid plasmonic nanostructures with different Ag nanoparticle loading for different[Ag+]/[citrate] concentrations. (c) Repetitive test for AZ510 photocatalyst for four runs.
concentration has been found to result in an increased effi-
ciency of the photodegradation of MB. This clearly indicates
that increase in the photocatalytic efficiency of the synthesized
Ag–ZnO hybrid plasmonic nanostructures is mainly due to
citrate-assisted morphological changes and changes in plas-
monic coupling due to different level of Ag nanoparticle deco-
ration. Beyond a threshold concentration, citrate plays an
important role in changing the morphology of ZnO nanostruc-
tures so that it has a larger surface area as compared to the pris-
tine sample. The sample AZ510, prepared with highest citrate
concentration and with maximum Ag nanoparticles loading,
exhibited higher BET surface area as compared to other
samples. The larger surface area of nanodisk-like structures in
AZ510 facilitates enhanced dye adsorption. In addition, Ag
nanoparticles act as sinks for the photogenerated electrons and
hence suppress the recombination of electrons and holes. The
observed enhanced photocatalytic activity of Ag–ZnO hybrid
plasmonic nanostructures is mainly due to citrate-assisted for-
mation of nanodisks with better photocatalytic efficiency and
improved sun-light utilization due to the plasmonic response of
Ag nanoparticles, which suppress the recombination of
photodegenerated electrons and holes.
ConclusionWe have successfully synthesized the Ag–ZnO plasmonic
nanohybrids with enhanced photocatalytic activity by a facile
wet chemical method. ZnO nanostructures were decorated with
Ag nanoparticles by citrate assisted photoreduction. Higher
citrate concentrations resulted in the formation of nanodisks due
to citrate-assisted oriented attachment of ZnO nanostructures.
The photocatalytic efficiency of ZnO nanostructures has been
found to increase with extent of Ag nanoparticles loading. We
have demonstrated that the photocatalytic activity of ZnO nano-
structures can be significantly enhanced upon decoration with
Ag nanoparticles, which suppress the recombination of
photodegenerated electrons and holes and improve sun-light
utilization due to plasmonic response of Ag nanoparticles.
ExperimentalMaterialsZinc nitrate hexahydrate (Zn(NO3)·6H2O, Merck, Germany)
and potassium hydroxide (KOH, SRL, India) were used as the
starting materials for the synthesis of ZnO nanostructures.
Silver nitrate (AgNO3, Spectrochem, India) and trisodium
citrate (Na3C6H5O7, CDH, India) were used for the photodepo-
Beilstein J. Nanotechnol. 2014, 5, 639–650.
648
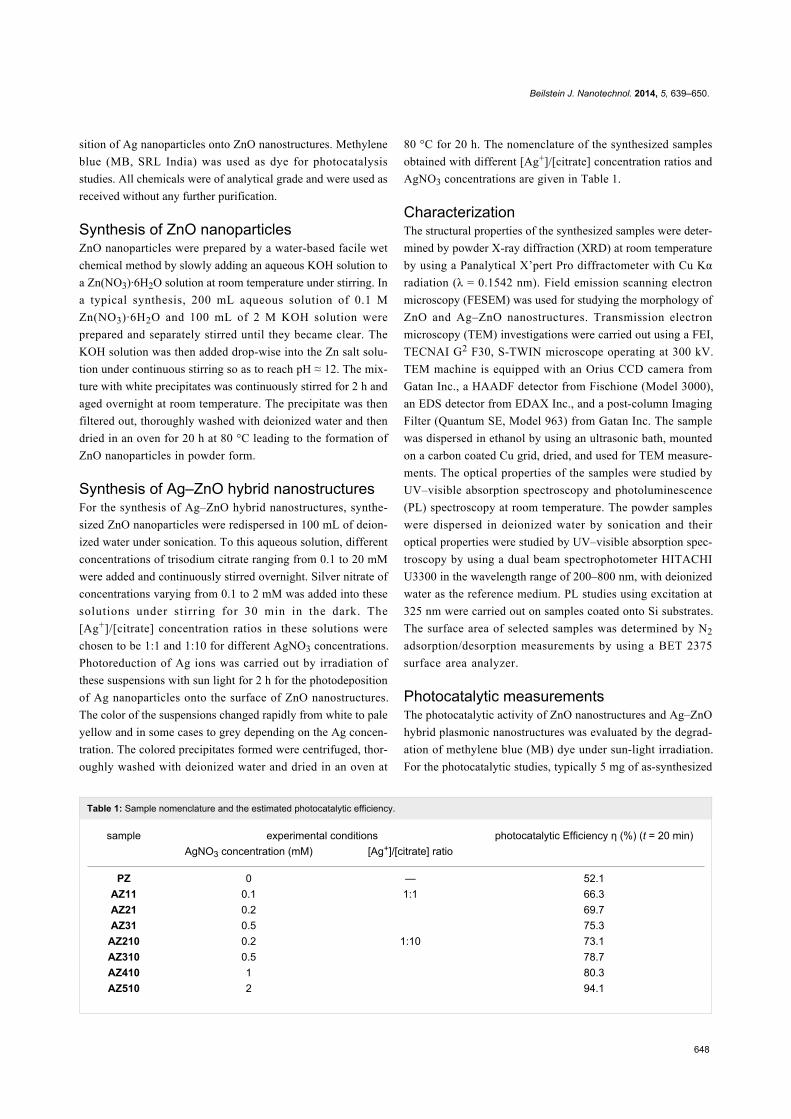
Table 1: Sample nomenclature and the estimated photocatalytic efficiency.
sample experimental conditions photocatalytic Efficiency η (%) (t = 20 min)AgNO3 concentration (mM) [Ag+]/[citrate] ratio
PZ 0 — 52.1AZ11 0.1 1:1 66.3AZ21 0.2 69.7AZ31 0.5 75.3
AZ210 0.2 1:10 73.1AZ310 0.5 78.7AZ410 1 80.3AZ510 2 94.1
sition of Ag nanoparticles onto ZnO nanostructures. Methylene
blue (MB, SRL India) was used as dye for photocatalysis
studies. All chemicals were of analytical grade and were used as
received without any further purification.
Synthesis of ZnO nanoparticlesZnO nanoparticles were prepared by a water-based facile wet
chemical method by slowly adding an aqueous KOH solution to
a Zn(NO3)·6H2O solution at room temperature under stirring. In
a typical synthesis, 200 mL aqueous solution of 0.1 M
Zn(NO3)·6H2O and 100 mL of 2 M KOH solution were
prepared and separately stirred until they became clear. The
KOH solution was then added drop-wise into the Zn salt solu-
tion under continuous stirring so as to reach pH ≈ 12. The mix-
ture with white precipitates was continuously stirred for 2 h and
aged overnight at room temperature. The precipitate was then
filtered out, thoroughly washed with deionized water and then
dried in an oven for 20 h at 80 °C leading to the formation of
ZnO nanoparticles in powder form.
Synthesis of Ag–ZnO hybrid nanostructuresFor the synthesis of Ag–ZnO hybrid nanostructures, synthe-
sized ZnO nanoparticles were redispersed in 100 mL of deion-
ized water under sonication. To this aqueous solution, different
concentrations of trisodium citrate ranging from 0.1 to 20 mM
were added and continuously stirred overnight. Silver nitrate of
concentrations varying from 0.1 to 2 mM was added into these
solutions under stirring for 30 min in the dark. The
[Ag+]/[citrate] concentration ratios in these solutions were
chosen to be 1:1 and 1:10 for different AgNO3 concentrations.
Photoreduction of Ag ions was carried out by irradiation of
these suspensions with sun light for 2 h for the photodeposition
of Ag nanoparticles onto the surface of ZnO nanostructures.
The color of the suspensions changed rapidly from white to pale
yellow and in some cases to grey depending on the Ag concen-
tration. The colored precipitates formed were centrifuged, thor-
oughly washed with deionized water and dried in an oven at
80 °C for 20 h. The nomenclature of the synthesized samples
obtained with different [Ag+]/[citrate] concentration ratios and
AgNO3 concentrations are given in Table 1.
CharacterizationThe structural properties of the synthesized samples were deter-
mined by powder X-ray diffraction (XRD) at room temperature
by using a Panalytical X’pert Pro diffractometer with Cu Kα
radiation (λ = 0.1542 nm). Field emission scanning electron
microscopy (FESEM) was used for studying the morphology of
ZnO and Ag–ZnO nanostructures. Transmission electron
microscopy (TEM) investigations were carried out using a FEI,
TECNAI G2 F30, S-TWIN microscope operating at 300 kV.
TEM machine is equipped with an Orius CCD camera from
Gatan Inc., a HAADF detector from Fischione (Model 3000),
an EDS detector from EDAX Inc., and a post-column Imaging
Filter (Quantum SE, Model 963) from Gatan Inc. The sample
was dispersed in ethanol by using an ultrasonic bath, mounted
on a carbon coated Cu grid, dried, and used for TEM measure-
ments. The optical properties of the samples were studied by
UV–visible absorption spectroscopy and photoluminescence
(PL) spectroscopy at room temperature. The powder samples
were dispersed in deionized water by sonication and their
optical properties were studied by UV–visible absorption spec-
troscopy by using a dual beam spectrophotometer HITACHI
U3300 in the wavelength range of 200–800 nm, with deionized
water as the reference medium. PL studies using excitation at
325 nm were carried out on samples coated onto Si substrates.
The surface area of selected samples was determined by N2
adsorption/desorption measurements by using a BET 2375
surface area analyzer.
Photocatalytic measurementsThe photocatalytic activity of ZnO nanostructures and Ag–ZnO
hybrid plasmonic nanostructures was evaluated by the degrad-
ation of methylene blue (MB) dye under sun-light irradiation.
For the photocatalytic studies, typically 5 mg of as-synthesized
Beilstein J. Nanotechnol. 2014, 5, 639–650.
649
ZnO and Ag–ZnO nanostructures were ultrasonically dispersed
in 5 mL deionized water. Aqueous MB solution was added to
the photocatalyst mixture and thoroughly mixed. The reaction
suspensions containing 10 μM MB and different (ZnO,
Ag–ZnO) photocatalysts were irradiated with sun light for
different times (10, 20, 40 min) with intermittent shaking for
uniform mixing of the photocatalysts with the MB solution. The
photocatalysts were removed from the suspensions by centrifu-
gation following the sun light exposure. The concentration of
MB in the resultant solutions were monitored by UV–visible
absorption spectroscopy studies in the wavelength range of
200–800 nm, with deionized water as the reference medium.
The photocatalytic degradation efficiency of the photocatalysts
for MB dye was calculated using the following formula:
where C0 is the concentration of aqueous MB solution before
addition of any photocatalyst and C is the concentration of MB
in the reaction suspension with photocatalyst following sun-
light exposure for time t.
AcknowledgementsThe authors are thankful to Ankush Vij, Saif A. Khan and
Srikanth for their help in PL, SEM and XRD measurements,
respectively. The authors are grateful to Prof. S. M. Manocha
and Prof. L. M. Manocha for extending the facility for surface
area measuments. SM is thankful to Department of Science and
Technology (DST), New Delhi for providing XRD facility
under Nano Mission program. SM is thankful to University
Grants Commission (UGC), New Delhi for funding under
Major Research Project (F.No: 41-865/2012 (SR)). SK is
thankful to Guru Gobind Singh Indraprastha University, New
Delhi for providing financial assistance through IP Research
Fellowship.
References1. Chu, S.; Wang, G.; Zhou, W.; Lin, Y.; Chernyak, L.; Zhao, J.; Kong, J.;
Li, L.; Ren, J.; Liu, J. Nat. Nanotechnol. 2011, 6, 506–510.doi:10.1038/nnano.2011.97
2. Park, Y. K.; Choi, H. S.; Kim, J.-H.; Kim, J.-H.; Hahn, Y.-B.Nanotechnology 2011, 22, 185310.doi:10.1088/0957-4484/22/18/185310
3. Zhang, Q.; Dandeneau, C. S.; Zhou, X.; Cao, G. Adv. Mater. 2009, 21,4087–4108. doi:10.1002/adma.200803827
4. Seow, Z. L. S.; Wong, A. S. W.; Thavasi, V.; Jose, R.;Ramakrishna, S.; Ho, G. W. Nanotechnology 2009, 20, 045604.doi:10.1088/0957-4484/20/4/045604
5. Wang, Y.; Ruan, W.; Zhang, J.; Yang, B.; Xu, W.; Zhao, B.;Lombardi, J. R. J. Raman Spectrosc. 2009, 40, 1072–1077.doi:10.1002/jrs.2241
6. Papavlassopoulos, H.; Mishra, Y. K.; Kaps, S.; Paulowicz, I.;Abdelaziz, R.; Elbahri, M.; Maser, E.; Adelung, R.; Röhl, C. PLoS One2014, 9, e84983. doi:10.1371/journal.pone.0084983
7. Wahab, R.; Kaushik, N. K.; Kaushik, N.; Choi, E. H.; Umar, A.;Dwivedi, S.; Musarrat, J.; Al-Khedhairy, A. A. J. Biomed. Nanotechnol.2013, 9, 1181–1189.
8. Antoine, T. E.; Mishra, Y. K.; Trigilio, J.; Tiwari, V.; Adelung, R.;Shukla, D. Antiviral Res. 2012, 96, 363–375.doi:10.1016/j.antiviral.2012.09.020
9. Mishra, Y. K.; Adelung, R.; Röhl, C.; Shukla, D.; Spors, F.; Tiwari, V.Antiviral Res. 2011, 92, 305–312. doi:10.1016/j.antiviral.2011.08.017
10. Ul-Islam, M.; Khattak, W. A.; Ullah, M. W.; Khan, S.; Park, J. K.Cellulose 2014, 21, 433–447. doi:10.1007/s10570-013-0109-y
11. Vayssieres, L. Adv. Mater. 2003, 15, 464–466.doi:10.1002/adma.200390108
12. Kamat, P. V. J. Phys. Chem. C 2007, 111, 2834–2860.doi:10.1021/jp066952u
13. Umar, A.; Chauhan, M. S.; Chauhan, S.; Kumar, R.; Kumar, G.;Al-Sayari, S. A.; Hwang, S. W.; Al-Hajry, A. J. Colloid Interface Sci.2011, 363, 521–528. doi:10.1016/j.jcis.2011.07.058
14. Kaneva, N.; Stambolova, I.; Blaskov, V.; Dimitriev, Y.; Bojinova, A.;Dushkin, C. Surf. Coat. Technol. 2012, 207, 5–10.doi:10.1016/j.surfcoat.2011.10.020
15. Liu, Z.; Zhang, Q.; Li, Y.; Wang, H. J. Phys. Chem. Solids 2012, 73,651–655. doi:10.1016/j.jpcs.2012.01.003
16. Yassıtepe, E.; Yatmaz, H. C.; Öztürk, C.; Öztürk, K.; Duran, C.J. Photochem. Photobiol., A 2008, 198, 1–6.doi:10.1016/j.jphotochem.2008.02.007
17. Yıldırım, Ö. A.; Unalan, H. E.; Durucan, C. J. Am. Ceram. Soc. 2013,96, 766–773. doi:10.1111/jace.12218
18. Lu, Y.; Lin, Y.; Wang, D.; Wang, L.; Xie, T.; Jiang, T.J. Phys. D: Appl. Phys. 2011, 44, 315502.doi:10.1088/0022-3727/44/31/315502
19. Deng, Q.; Duan, X.; Ng, D. H. L.; Tang, H.; Yang, Y.; Kong, M.; Wu, Z.;Cai, W.; Wang, G. ACS Appl. Mater. Interfaces 2012, 4, 6030–6037.doi:10.1021/am301682g
20. Wang, Q.; Geng, B.; Wang, S. Environ. Sci. Technol. 2009, 43,8968–8973. doi:10.1021/es902568h
21. Zeng, H.; Liu, P.; Cai, W.; Yang, S.; Xu, X. J. Phys. Chem. C 2008,112, 19620–19624. doi:10.1021/jp807309s
22. Jing, L.; Wang, D.; Wang, B.; Li, S.; Xin, B.; Fu, H.; Sun, J.J. Mol. Catal. A: Chem. 2006, 244, 193–200.doi:10.1016/j.molcata.2005.09.020
23. Xie, W.; Li, Y.; Sun, W.; Huang, J.; Xie, H.; Zhao, X.J. Photochem. Photobiol., A 2010, 216, 149–155.doi:10.1016/j.jphotochem.2010.06.032
24. Zheng, Y.; Zheng, L.; Zhan, Y.; Lin, X.; Zheng, Q.; Wei, K.Inorg. Chem. 2007, 46, 6980–6986. doi:10.1021/ic700688f
25. Kelly, K. L.; Coronado, E.; Zhao, L. L.; Schatz, G. C. J. Phys. Chem. B2003, 107, 668–677. doi:10.1021/jp026731y
26. Mishra, Y. K.; Mohapatra, S.; Singhal, R.; Avasthi, D. K.;Agarwal, D. C.; Ogale, S. B. Appl. Phys. Lett. 2008, 92, 043107.doi:10.1063/1.2838302
27. Mishra, Y. K.; Chakravadhanula, V. S. K.; Hrkac, V.; Jebril, S.;Agarwal, D. C.; Mohapatra, S.; Avasthi, D. K.; Kienle, L.; Adelung, R.J. Appl. Phys. 2012, 112, 064308. doi:10.1063/1.4752469
28. Thomann, I.; Pinaud, B. A.; Chen, Z.; Clemens, B. M.; Jaramillo, T. F.;Brongersma, M. L. Nano Lett. 2011, 11, 3440–3446.doi:10.1021/nl201908s

Beilstein J. Nanotechnol. 2014, 5, 639–650.
650
29. Gu, C.; Cheng, C.; Huang, H.; Wong, T.; Wang, N.; Zhang, T.-Y.Cryst. Growth Des. 2009, 9, 3278–3285. doi:10.1021/cg900043k
30. Liu, H. R.; Shao, G. X.; Zhao, J. F.; Zhang, Z. X.; Zhang, Y.; Liang, J.;Liu, X. G.; Jia, H. S.; Xu, B. S. J. Phys. Chem. C 2012, 116,16182–16190. doi:10.1021/jp2115143
31. Height, M. J.; Pratsinis, S. E.; Mekasuwandumrong, O.;Praserthdam, P. Appl. Catal., B: Environ. 2006, 63, 305–312.doi:10.1016/j.apcatb.2005.10.018
32. Lin, D.; Wu, H.; Zhang, R.; Pan, W. Chem. Mater. 2009, 21,3479–3484. doi:10.1021/cm900225p
33. Georgekutty, R.; Seery, M. K.; Pillai, S. C. J. Phys. Chem. C 2008, 112,13563–13570. doi:10.1021/jp802729a
34. Zheng, Y.; Chen, C.; Zhan, Y.; Lin, X.; Zheng, Q.; Wei, K.; Zhu, J.J. Phys. Chem. C 2008, 112, 10773–10777. doi:10.1021/jp8027275
35. Cao, X.; Zeng, H.; Wang, M.; Xu, X.; Fang, M.; Ji, S.; Zhang, L.J. Phys. Chem. C 2008, 112, 5267–5270. doi:10.1021/jp800499r
36. Liu, X.; Wu, X.; Cao, H.; Chang, R. P. H. J. Appl. Phys. 2004, 95, 3141.doi:10.1063/1.1646440
37. Bian, S.-W.; Mudunkotuwa, I. A.; Rupasinghe, T.; Grassian, V. H.Langmuir 2011, 27, 6059–6068. doi:10.1021/la200570n
38. Cho, S.; Jung, S.-H.; Lee, K.-H. J. Phys. Chem. C 2008, 112,12769–12776. doi:10.1021/jp803783s
39. Sun, Y.; Wang, L.; Yu, X.; Chen, K. CrystEngComm 2012, 14,3199–3204. doi:10.1039/c2ce06335b
40. Rehman, S.; Ullah, R.; Butt, A. M.; Gohar, N. D. J. Hazard. Mater.2009, 170, 560–569. doi:10.1016/j.jhazmat.2009.05.064
41. Yin, X.; Que, W.; Fei, D.; Shen, F.; Guo, Q. J. Alloys Compd. 2012,524, 13–21. doi:10.1016/j.jallcom.2012.02.052
42. Gao, S.; Jia, X.; Yang, S.; Li, Z.; Jiang, K. J. Solid State Chem. 2011,184, 764–769. doi:10.1016/j.jssc.2011.01.025
License and TermsThis is an Open Access article under the terms of the
Creative Commons Attribution License
(http://creativecommons.org/licenses/by/2.0), which
permits unrestricted use, distribution, and reproduction in
any medium, provided the original work is properly cited.
The license is subject to the Beilstein Journal of
Nanotechnology terms and conditions:
(http://www.beilstein-journals.org/bjnano)
The definitive version of this article is the electronic one
which can be found at:
doi:10.3762/bjnano.5.75