energy saving obligations. cutting the goardian knot of leverage?
TRANSCRIPT
1
Energy Saving Obligations
Cutting the Gordian Knot of leverage?
Pre-print version to appear in ‘Energy Efficiency’
Clemens Rohdea, Jan Rosenow
b, Nick Eyre
c, Louis-Gaëtan Giraudet
d
aFraunhofer Institute for systems and innovation research: Breslauer Str. 48, 76139
Karlsruhe, Germany, [email protected]
bOxford University, Environmental Change Institute South Parks Road, Oxford, OX1
3QY, UK, [email protected]
cOxford University, Environmental Change Institute South Parks Road, Oxford, OX1
3QY, UK, [email protected]
d Centre international de recherche sur l’environnement et le développement (CIRED),
45 bis avenue de la Belle Gabrielle, 94736 Nogent sur Marne CEDEX, France, gi-
ABSTRACT
Better leverage of public funding is essential in order to trigger the invest-
ment needed for energy efficiency. In times of austerity governments in-
creasingly look at policy instruments not funded by public expenditure and
Energy Savings Obligations represent one option. Because Energy Savings
Obligations are paid for by all energy customers, the degree to which they
are able to raise additional private capital for energy efficiency invest-
ments is crucial with regard to the financial burden on consumers. In this
paper, we systematically assess how successful Energy Savings Obliga-
tions were in levering capital from parties other than the obligated entities
including private investors and other public bodies. We analyse three
countries with substantial experience with Energy Savings Obligations,
identify the main design differences and the effect this has on the degree of
leverage. We conclude that the design of Energy Savings Obligations
largely determines the degree of leverage and that that there appears to be
a trade-off between high leverage and additionality.
KEYWORDS
Energy Savings Obligation, Leverage, Financing
2
1. INTRODUCTION
Energy Savings Obligation (ESOs) are a prominent policy instrument for increasing the
energy efficiency of the economy - they have been successfully implemented in a grow-
ing number of countries all over the world. Within the US, 34 states have implemented
different variations of ESOs and 6 EU member states now have on-going ESOs. Also
Australia has significant experience with the policy instrument (RAP 2012). The sys-
tems differ very much in design, often a result of different regulatory frameworks. In
this paper, we will focus on the European ESOs.
ESOs already featured in the EU Energy End-Use Efficiency and Energy Services Di-
rective of 2006 (2006/32/EC) as a possible market-based instrument for realising energy
savings. However, the Directive only recommended ESOs and there was no requirement
for member states to implement the instrument. This has now changed: The new Energy
Efficiency Directive of 2012 (2012/27/EU) includes a requirement in Article 7 that all
member states must introduce ESOs. Exemptions from this obligation can be made if
member states provide verification of equivalent savings resulting from alternative in-
struments. So far, the UK, Italy, France, Denmark, the Flanders region, and Poland have
introduced ESOs, although in very different forms. Slovenia is about to implement them
(Bertoldi 2010).
One reason for the increasing prominence of ESOs is that they are widely considered as
an option of using public funding sources (either paid by the taxpayer or via energy
bills) to lever private capital at a time of constrained public budgets (Eichhammer
2012). This leverage effect describes the ratio of public funding to private (and in some
cases other public) capital. In a scheme that obliges profit-oriented organisations such as
energy companies to deliver a certain amount of energy savings it can be expected that
the obligated parties utilise approaches with high leverage effects to minimise their cost.
Achieving high leverage rates with public funds can be considered the Gordian knot of
leverage in policy design.
However, so far no comprehensive analysis exists that compares different ESOs con-
cerning the amount of leverage they create. In this paper, we systematically review three
prominent ESOs, namely the UK, France, and Denmark, and compare their results in
terms of leverage. The restriction of the paper to the three cases is a result of data avail-
ability - in some cases evaluations exist, but those are not available to the public.
The structure of the paper is as follows: First, we analyze different cost allocation paths
within the obligation schemes. Second, we define what we mean by leverage and how it
3
applies to ESOs. Third, we provide background information on how ESOs work in gen-
eral and more specifically in the three countries under investigation. Fourth, we calcu-
late and compare the degree of leverage achieved in the three countries. Finally, we
summarise the findings from the different countries and draw conclusions regarding the
impact of design differences on leverage.
2. COST ALLOCATION
One common aspect of obligation schemes and other policy instruments is that most
schemes do not subsidise the energy efficiency investment by 100 percent and a remain-
ing share of the investment has to be covered by other capital sources. The interest and
repayment should be covered by the reduced energy costs resulting from the energy
savings. Depending on the investor’s financial situation, the capital may come from
own capital sources (e.g. personal savings) or may be refinanced by a commercial bank.
Thus, the measures themselves are also financed by the same target group as they are
implemented by energy consumers. So the main question of cost allocation is how the
money is shifted between the different consumers and how the other actors contribute to
this mechanism1.
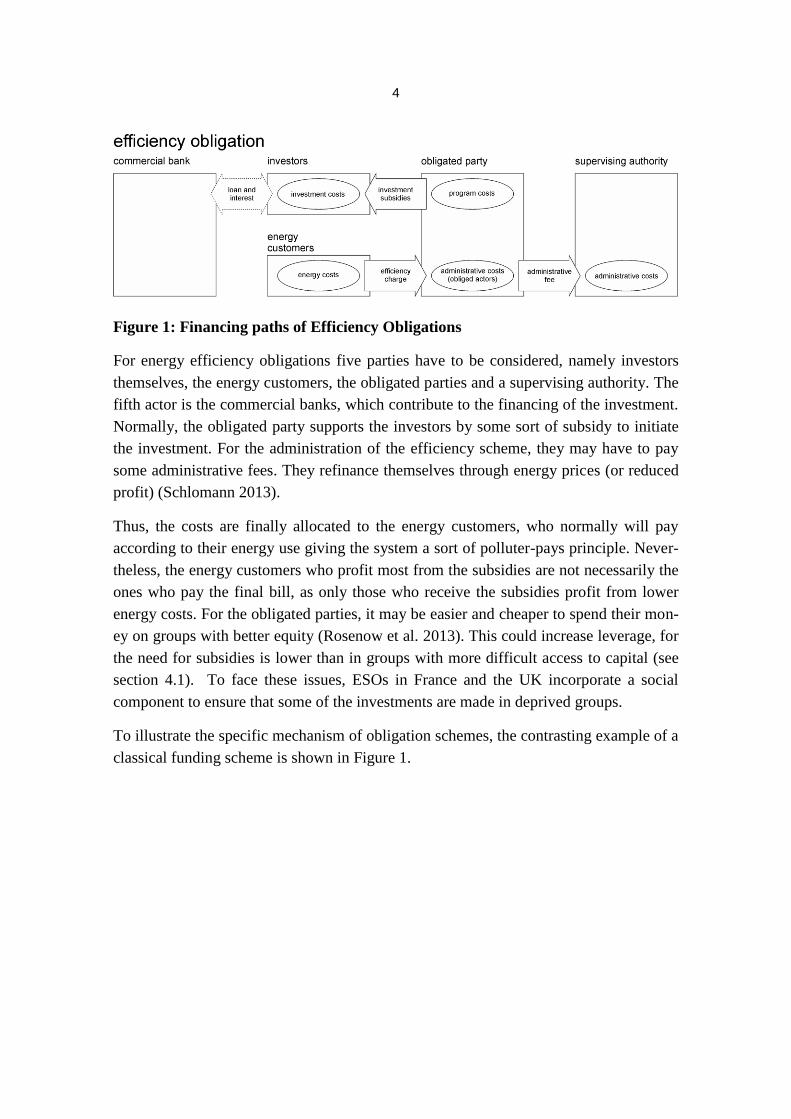
Within the figures below, the capital flows between the actors are shown. Costs that are
not refinanced by another actor, such as administrative costs of the investors, are not
shown in the graphs. Figure 1 shows the cost allocation paths within ESOs. The differ-
ent actors with their corresponding costs are shown and the cost allocation paths are
indicated by arrows (whereas the direction of the arrow indicates the flow of capital).
1 For a more detailed description of saving obligation principles see Bertoldi (2008)
4
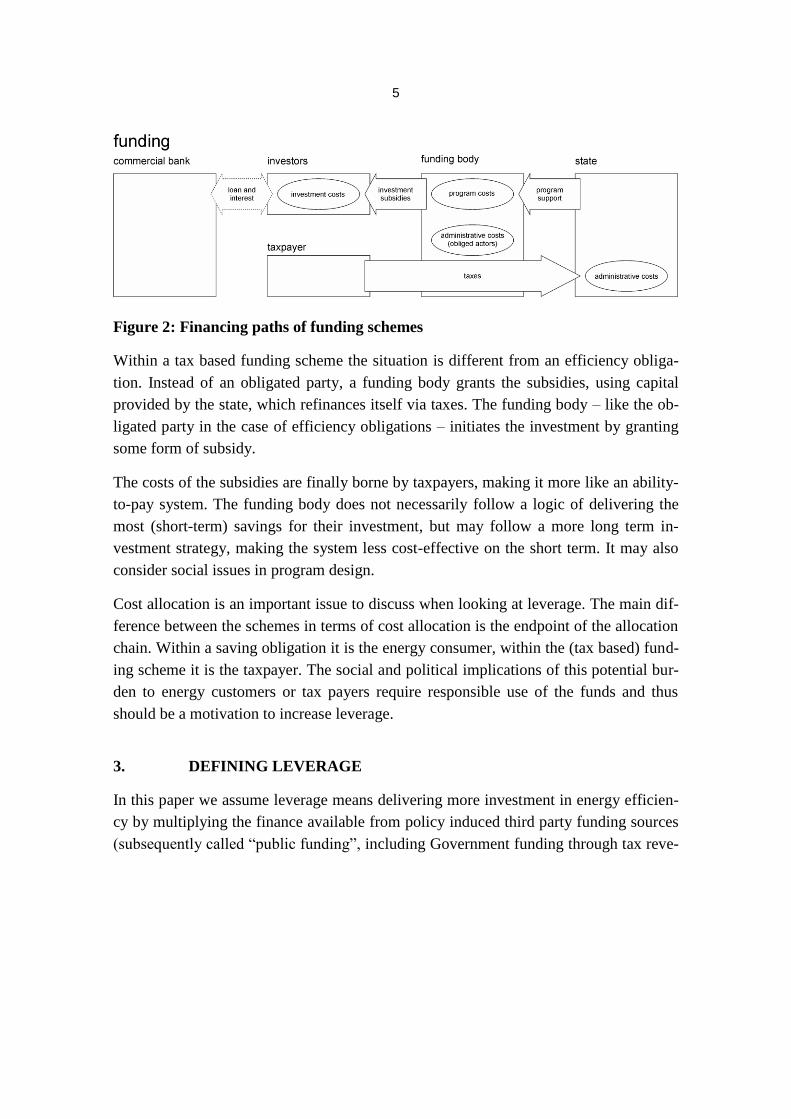
Figure 1: Financing paths of Efficiency Obligations
For energy efficiency obligations five parties have to be considered, namely investors
themselves, the energy customers, the obligated parties and a supervising authority. The
fifth actor is the commercial banks, which contribute to the financing of the investment.
Normally, the obligated party supports the investors by some sort of subsidy to initiate
the investment. For the administration of the efficiency scheme, they may have to pay
some administrative fees. They refinance themselves through energy prices (or reduced
profit) (Schlomann 2013).
Thus, the costs are finally allocated to the energy customers, who normally will pay
according to their energy use giving the system a sort of polluter-pays principle. Never-
theless, the energy customers who profit most from the subsidies are not necessarily the
ones who pay the final bill, as only those who receive the subsidies profit from lower
energy costs. For the obligated parties, it may be easier and cheaper to spend their mon-
ey on groups with better equity (Rosenow et al. 2013). This could increase leverage, for
the need for subsidies is lower than in groups with more difficult access to capital (see
section 4.1). To face these issues, ESOs in France and the UK incorporate a social
component to ensure that some of the investments are made in deprived groups.
To illustrate the specific mechanism of obligation schemes, the contrasting example of a
classical funding scheme is shown in Figure 1.
5
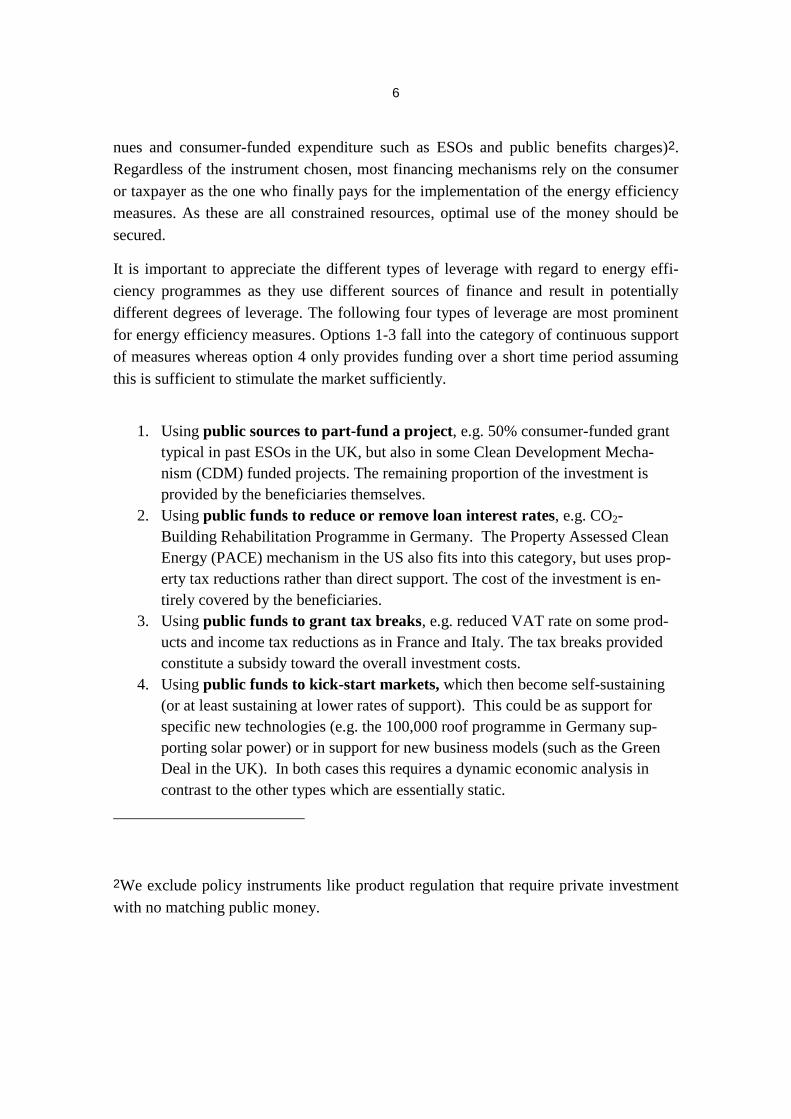
Figure 2: Financing paths of funding schemes
Within a tax based funding scheme the situation is different from an efficiency obliga-
tion. Instead of an obligated party, a funding body grants the subsidies, using capital
provided by the state, which refinances itself via taxes. The funding body – like the ob-
ligated party in the case of efficiency obligations – initiates the investment by granting
some form of subsidy.
The costs of the subsidies are finally borne by taxpayers, making it more like an ability-
to-pay system. The funding body does not necessarily follow a logic of delivering the
most (short-term) savings for their investment, but may follow a more long term in-
vestment strategy, making the system less cost-effective on the short term. It may also
consider social issues in program design.
Cost allocation is an important issue to discuss when looking at leverage. The main dif-
ference between the schemes in terms of cost allocation is the endpoint of the allocation
chain. Within a saving obligation it is the energy consumer, within the (tax based) fund-
ing scheme it is the taxpayer. The social and political implications of this potential bur-
den to energy customers or tax payers require responsible use of the funds and thus
should be a motivation to increase leverage.
3. DEFINING LEVERAGE
In this paper we assume leverage means delivering more investment in energy efficien-
cy by multiplying the finance available from policy induced third party funding sources
(subsequently called “public funding”, including Government funding through tax reve-
6
nues and consumer-funded expenditure such as ESOs and public benefits charges)2.
Regardless of the instrument chosen, most financing mechanisms rely on the consumer
or taxpayer as the one who finally pays for the implementation of the energy efficiency
measures. As these are all constrained resources, optimal use of the money should be
secured.
It is important to appreciate the different types of leverage with regard to energy effi-
ciency programmes as they use different sources of finance and result in potentially
different degrees of leverage. The following four types of leverage are most prominent
for energy efficiency measures. Options 1-3 fall into the category of continuous support
of measures whereas option 4 only provides funding over a short time period assuming
this is sufficient to stimulate the market sufficiently.
1. Using public sources to part-fund a project, e.g. 50% consumer-funded grant
typical in past ESOs in the UK, but also in some Clean Development Mecha-
nism (CDM) funded projects. The remaining proportion of the investment is
provided by the beneficiaries themselves.
2. Using public funds to reduce or remove loan interest rates, e.g. CO2-
Building Rehabilitation Programme in Germany. The Property Assessed Clean
Energy (PACE) mechanism in the US also fits into this category, but uses prop-
erty tax reductions rather than direct support. The cost of the investment is en-
tirely covered by the beneficiaries.
3. Using public funds to grant tax breaks, e.g. reduced VAT rate on some prod-
ucts and income tax reductions as in France and Italy. The tax breaks provided
constitute a subsidy toward the overall investment costs.
4. Using public funds to kick-start markets, which then become self-sustaining
(or at least sustaining at lower rates of support). This could be as support for
specific new technologies (e.g. the 100,000 roof programme in Germany sup-
porting solar power) or in support for new business models (such as the Green
Deal in the UK). In both cases this requires a dynamic economic analysis in
contrast to the other types which are essentially static.
2We exclude policy instruments like product regulation that require private investment
with no matching public money.
7
The additional investment levered is typically provided by the direct beneficiary of the
project – usually the building owner and/or occupant, but in principle from other
sources as well. For type 2 of the above list, this would generally be banks and other
lenders, but this then usually requires the primary beneficiary to repay the loan and any
reduced rate interest. For type 1, third parties may include municipalities or social hous-
ing providers who part-subsidise energy efficiency measures in order to reach a larger
number of participants.
In order to measure leverage we define a leverage factor that is capable of representing
the degree of leverage achieved by a given energy efficiency programme. For the pur-
pose of this paper, we measure leverage in form of a leverage factor defined as:
L = leverage factor
CO = contribution from obligated party to total investment cost
CB = contribution from beneficiary to total investment cost
CT = contributions from any third parties to total investment cost
Ia = other incentives such as tax credits
It follows that leverage is zero for a leverage factor value of 1.0. A leverage factor of
2.0, for example, suggests that contributions from the obligated party were matched
with 100% funding from the beneficiary and third parties.
Our computation of leverage factors is based on the cost estimates available for the dif-
ferent countries: Lees (2008, 2006) for the UK; Giraudet et al. (2012) for France; Toge-
by (2012) for Denmark. The methodology used to derive these estimates is similar
across countries.
Regarding how much beneficiaries spend on a given measure, Lees (2006), Togeby
(2012) and Giraudet et al. (2012) only take into account the share of investment that is
additional to what would have occurred in absence of the obligation. For instance, the
full cost of insulation is considered, while only the cost differential between an efficient
boiler and a standard one is considered.
Regarding additionality i.e., how many beneficiaries are induced by the obligation, Lees
makes the assumption that 20% of the beneficiaries would have invested anyway in the
1
n
O B Ti
i
O a
C C C
LC I
8
absence of the scheme. The figures he provides are net from any free-rider effects. Dif-
ferently, the figures provided by Giraudet et al. (2012) assume full additionality of the
obligation, as no assessment of free-rider effects could be performed. In Denmark,
Bundgaard et al. (2013) assume a rather low additionality of less than 10% for measures
in households (i.e. 90% free-riders), but an additionality of more than 50% in industry,
which is the main focus of investment in Denmark.
Lastly, Lees (2006) and Giraudet et al. (2012) estimated the indirect cost borne by obli-
gated parties for tasks induced by the obligation, such as marketing or development.
These costs are not taken into account in the present study. Rather, the analysis focuses
on direct costs, which constitute the main share of the overall costs. For the beneficiar-
ies, the indirect costs are invisible and not relevant in terms of the economics of indi-
vidual investments in energy efficiency improvements. Using this definition of the lev-
erage factor has the benefit of showing the relative contribution to investments in ener-
gy efficiency measures required in order to mobilise private and/or third party capital. It
does not, however, account for the total cost such as administration costs and search
costs for example. While these costs are not insignificant, estimates for the British
scheme show that they are only a small fraction of the total cost (Lees 2008, 2006).
Further limitations of our definition of the leverage factor include the inability to ac-
count for non-finance measures such as informational measures that indirectly stimulate
the uptake of energy efficiency measures. Further research could develop more sophisti-
cated computations of leverage factors that include such programmes as well.
4. CHARACTERISTICS OF ENERGY SAVINGS OBLIGATIONS
The general concept of an energy saving obligation is to oblige a party to deliver a de-
fined amount of energy savings within a certain time. Those parties are usually final
energy suppliers or the distribution network operators, which is the case in all the Euro-
pean systems. But also independent entities can act as the obligated party. For example,
the ESO in Vermont is designed in such a way, which resembles very much an energy
efficiency funds with a fixed saving target and variable budget.
The energy saving measures that may be undertaken by the obligated parties or other
actors have to be monitored. This is usually done by standard saving scores (also known
as deemed savings), which rely on engineering estimates often corrected by direct
measurements within a representative sample.
ESOs include a trading mechanism, which allows obligated parties and/or other ac-
tors to trade certified savings. If traded in an open market, a price for energy savings
9
will be determined and obligated parties can decide to invest in energy savings them-
selves or buy (white) certificates from other actors.
To secure additionality, the baseline may be set according to existing regulations and
policy instruments already in place. Some systems employ a different approach by de-
liberately allowing an overlap with existing instruments. The main intention of such a
system is then to secure a certain level of energy savings and to promote existing in-
struments to maximise leverage.
We now proceed with a brief overview of the three ESOs discussed in this paper.
4.1 The design of Energy Savings Obligations in the UK
In the UK the ESOs are the most important instrument to deliver energy and carbon
savings in the domestic sector (OFGEM, 2005) and both the 2004 and 2007 Energy
Efficiency Action Plans highlight ESOs as the principal policy mechanism to deliver
energy savings in the domestic sector (2004, 2007). The basic concept of ESOs in Brit-
ain is that Government imposes an energy savings target on large energy suppliers (gas
and electricity) that has to be achieved at the customer end, which may relate to energy
consumption or carbon emissions. Businesses and industrial end-users are not covered
by the scheme; they are targeted by other policy instruments such as the Climate
Change Levy and Climate Change Agreements, as well as the recently introduced Car-
bon Reduction Commitment.
The first ESOs in Britain were introduced in 1994. We focus on the Energy Efficiency
Commitment (EEC) 1 and 2. EEC 1 was in place from 2002 to 2005 and EEC 2 from
2005 to 2008. EEC was eventually renamed in 2008 to the Carbon Emissions Reduction
Target (CERT) that ran from 2008 to 2012.
A distinct feature of the British scheme is the specific targeting of a priority group (PG)
in the scheme, which focuses on households in receipt of specified state benefits and
elderly residents.
In Britain, energy suppliers comply with their obligations by subsidising energy effi-
cient technologies. There were various routes the energy suppliers used including
(Rosenow 2012):
Subsidise installers of insulation: Energy suppliers contracted installers or deliv-
ery agents who contract installers of energy saving measures (for example cavity
wall insulation) that carry out the work in homes.
10
Subsidise products sold via retail: Suppliers have subsidised energy efficient
products (for example insulation material) sold via ‘do it yourself’ (DIY) mar-
kets and other retailers.
Subsidise products sent via mail: Energy companies subsidised certain products,
and, for example, promoted the use of compact fluorescent lamps (CFLs) via
mass mail-outs of free light bulbs, although this is now prohibited.
4.2 The design of Energy Savings Obligations in France
In France, the first obligation period ran from 2006 to 2009. The second obligation pe-
riod has been running since 2011 and will last until 2013. All energy suppliers above a
certain sales threshold are subject to the obligation. Within the second obligation period,
also the gasoline suppliers are among the obligated parties. Differing from the UK sav-
ing obligation, the French system covers all energy demand sectors, with eligible
measures also in the transport sector.
Unlike in the UK, obligated parties in France do not systematically subsidise energy
efficient technologies. They use a broader set of compliance strategies, including:
• Free energy audits and advice: these services are provided for the most part by con-
tracted installers. They are also provided directly by the obligated parties via their call
centres or websites.
• Direct subsidies: they tend to target specifically boilers and other measures on heat-
ing systems. They are by and large the main compliance strategy used by fuel oil sup-
pliers. In contrast, they are little used by electricity suppliers. Department stores whose
gasoline sales are covered by the obligation offer some vouchers for free purchases to
customers who buy energy efficient products in their stores.
• Soft loans: Some major obligated parties have their own banks as subsidiaries and
use them to offer reduced interest rate loans to consumers.
The French scheme does not exclude overlap with other instruments, so the investors
usually combine the subsidies from the saving obligation with various incentives grant-
ed for efficiency products. This includes:
• Income tax reliefs for energy efficient products: This policy was implemented in
2005. All the energy efficient products covered are also eligible within the energy sav-
ing obligation.
• Zero interest rate loans granted by private banks on behalf of the Government: This
policy was implemented in 2009. All the energy efficient products covered are also eli-
gible to the energy saving obligation. However, the overlap between the two instru-
11
ments is limited by the fact that soft loans can only be granted if several measures are
combined, e.g., wall insulation together with an upgrade of the heating system.
4.3 The design of Energy Savings Obligations in Denmark
The Danish ESOs are considered very ambitious, even complying with the 1.5 % target
of article 7 of the EED without major system changes. The Danish obligation is set on
the distribution companies rather then energy suppliers. The target is set in a coopera-
tive process between the obligated parties and the ministry.
The distribution companies implement their measures together with energy service
companies and other actors like energy performance contractors to comply with the ob-
ligation.
For the accounting process deemed savings as well as individual assessments are possi-
ble depending on the type of measure. Measures from all sectors excluding transport are
eligible for the ESOs. The accounting methodology of the savings in the Danish scheme
is different from the British and French approach, which uses (discounted) lifetime sav-
ings. In Denmark, only the first year savings are taken into account. Some uplift factors
are used to account for the different lifetimes of the measures. Nevertheless, the ac-
counting methodology favours measures with shorter lifetimes.
An overlap of the scheme with other instruments is explicitly part of the design. Most of
the measures are implemented in enterprises from the industrial and services sector –
the French and British ESOs focus mainly on domestic customers. In 2011 the share of
savings delivered by enterprises was larger than 60 percent.
5. LEVERAGE – RESULTS FROM ENERGY SAVINGS OBLIGATION
IN EUROPE
5.1 The example of the UK
The different routes entail varying degrees of subsidy and contributions from the recipi-
ents themselves. Detailed figures exist for the obligation periods 2002-2005 and 2005-
2008. The following tables show the contributions for various measures and delivery
routes made by energy suppliers, households, and third parties such as Local Authorities
or Social Housing Providers. The leverage factors are provided as well (1.0 meaning no
leverage i.e. 100% subsidy by supplier and 2.0 representing 50% contribution from the
energy supplier and 50% from recipients and third parties). Note that the contribution is
paid to the total cost of the investment and the percentages refer to the total direct cost
excluding the administration costs.
12
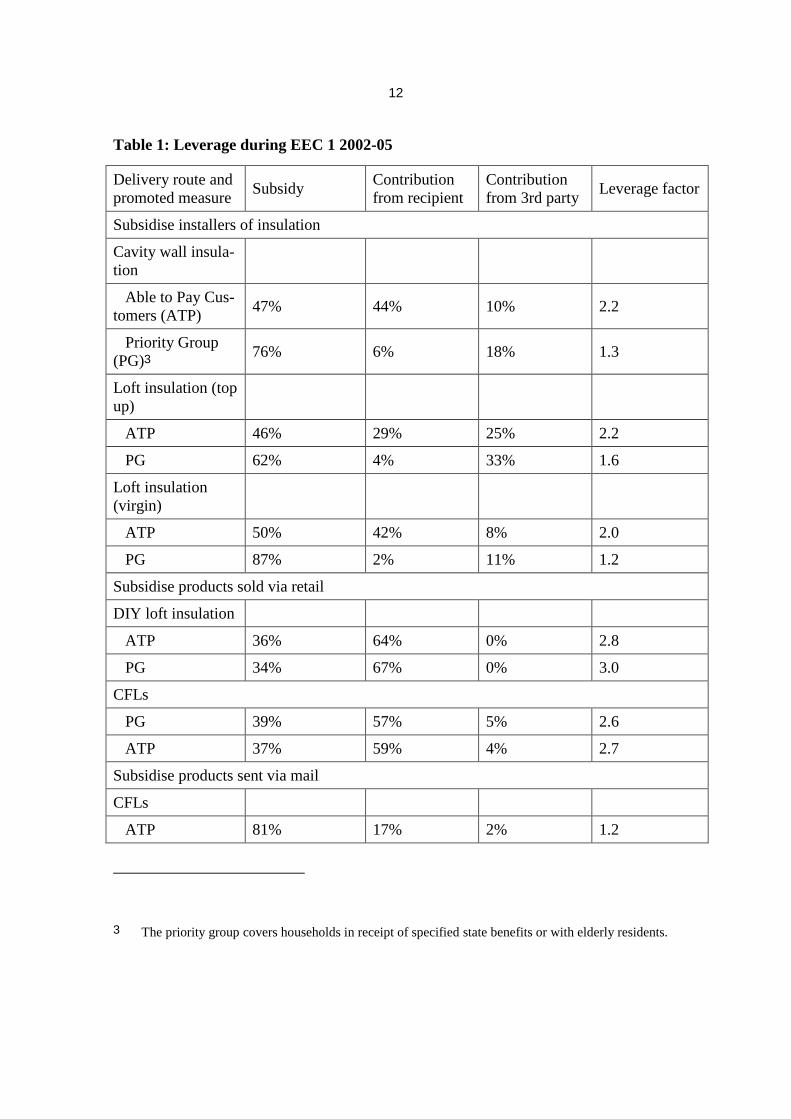
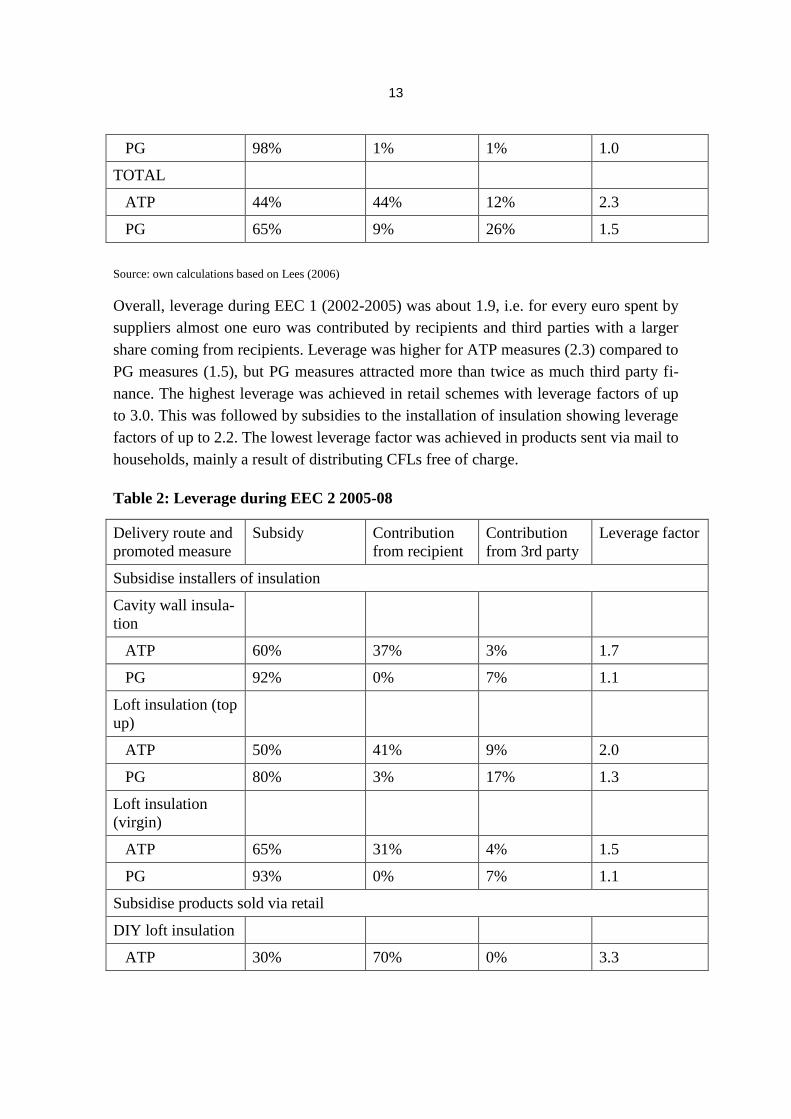
Table 1: Leverage during EEC 1 2002-05
Delivery route and
promoted measure Subsidy
Contribution
from recipient
Contribution
from 3rd party Leverage factor
Subsidise installers of insulation
Cavity wall insula-
tion
Able to Pay Cus-
tomers (ATP) 47% 44% 10% 2.2
Priority Group
(PG)3 76% 6% 18% 1.3
Loft insulation (top
up)
ATP 46% 29% 25% 2.2
PG 62% 4% 33% 1.6
Loft insulation
(virgin)
ATP 50% 42% 8% 2.0
PG 87% 2% 11% 1.2
Subsidise products sold via retail
DIY loft insulation
ATP 36% 64% 0% 2.8
PG 34% 67% 0% 3.0
CFLs
PG 39% 57% 5% 2.6
ATP 37% 59% 4% 2.7
Subsidise products sent via mail
CFLs
ATP 81% 17% 2% 1.2
3 The priority group covers households in receipt of specified state benefits or with elderly residents.
13
PG 98% 1% 1% 1.0
TOTAL
ATP 44% 44% 12% 2.3
PG 65% 9% 26% 1.5
Source: own calculations based on Lees (2006)
Overall, leverage during EEC 1 (2002-2005) was about 1.9, i.e. for every euro spent by
suppliers almost one euro was contributed by recipients and third parties with a larger
share coming from recipients. Leverage was higher for ATP measures (2.3) compared to
PG measures (1.5), but PG measures attracted more than twice as much third party fi-
nance. The highest leverage was achieved in retail schemes with leverage factors of up
to 3.0. This was followed by subsidies to the installation of insulation showing leverage
factors of up to 2.2. The lowest leverage factor was achieved in products sent via mail to
households, mainly a result of distributing CFLs free of charge.
Table 2: Leverage during EEC 2 2005-08
Delivery route and
promoted measure
Subsidy Contribution
from recipient
Contribution
from 3rd party
Leverage factor
Subsidise installers of insulation
Cavity wall insula-
tion
ATP 60% 37% 3% 1.7
PG 92% 0% 7% 1.1
Loft insulation (top
up)
ATP 50% 41% 9% 2.0
PG 80% 3% 17% 1.3
Loft insulation
(virgin)
ATP 65% 31% 4% 1.5
PG 93% 0% 7% 1.1
Subsidise products sold via retail
DIY loft insulation
ATP 30% 70% 0% 3.3
14
PG 30% 70% 0% 3.3
CFLs
PG 39% 61% 0% 2.6
ATP 45% 55% 0% 2.2
Subsidise products sent via mail
CFLs
ATP 99% 1% 0% 1.0
PG 100% 0% 0% 1.0
TOTAL
ATP 54% 39% 7% 1.9
PG 86% 2% 12% 1.2
Source: own calculations based on Lees (2008)
During EEC 2 (2005-2008), leverage was just half of what it was during EEC 1 (1.44
compared to 1.87), i.e. for every euro spent by suppliers 44 cents were contributed by
recipients and third parties. However, leverage was higher in retail schemes than during
EEC 1. The overall picture is similar to EEC 1 with highest leverage achieved in retail
schemes and lowest in mail outs.
Note that the figures presented are direct cost contributions to the measures promoted
and they do not include any indirect cost to the parties involved.
At the time of writing, no data on CERT (2008-2012) was available. However, it is
clear that in the last phase of CERT leverage for schemes subsidising insulation has
declined and was even below 1.0 at the end of the scheme for some measures. This is
where energy suppliers paid households the full cost of the measure plus an additional
incentive.
As we discuss later in chapter 4, the cost allocation is important for the social ac-
ceptance of the instrument. Consumer groups with a rather low willingness to pay are
less likely to be targeted by the obligated party if no specific provisions are included in
the instrument. Therefore, in addition to the existing Priority Group, a Super-Priority
Group (SPG) target was introduced in March 2011 as a sub-target within CERT. CERT
originally required suppliers to deliver 40% of the targeted emission savings with
households deemed to be in the ‘priority group’ (PG), which focused on people who are
above 70 years old or receive certain benefits (DECC 2010). The SPG target required
suppliers to meet 37.5 % of their PG target (15% of their total CERT target) by deliver-
15
ing measures to a subset of households that were considered to be at high risk of fuel
poverty. The SPG differed from the PG because of stricter eligibility requirements re-
garding recipient’s household income and the benefits they receive.
Most suppliers struggled to achieve their SPG targets and because of this some failed to
achieve their overall CERT targets within the obligation period, which ended in De-
cember 2012. This was the first time that a major supplier has failed to deliver on their
obligations. OFGEM granted suppliers an extension period until 31 January to deliver
their obligations (OFGEM 2012a). At the end of CERT, suppliers offered incentives for
SPG recipients including vouchers toward their fuel bill and cash back schemes. Some
suppliers also incentivised referrals by granting those who successfully referred a SPG
household a lump sum. Because non-retail schemes for SPG households were fully
funded in the last phase of CERT, suppliers were paying 100% + x% incentives result-
ing in a leverage factor of <1.0, i.e. for every euro suppliers spend they have to spend
extra in order to achieve the required uptake.
Similar issues occur with insulation for non-SPG households: As part of the CERT ex-
tension in 2011 and for the first time since the inception of the ESO, Government de-
cided to set a minimum share for insulation measures. Subsequently, suppliers were
required to achieve 68% of the target under CERT by investing in insulation measures
(DECC, 2010). Suppliers were also struggling to meet a target specifying they must
achieve at least 68% of their carbon target from March 2011 to January 2013 via insula-
tion measures (DECC, 2010). In June 2012, suppliers had achieved about 65% of their
obligation, leaving 35% for the last 6 months. Energy suppliers offered free insulation
to everyone, regardless of whether they were in the able-to-pay group the or PG. Hence,
leverage for non-retail insulation can be assumed to be zero (i.e. leverage factor of 1.0)
for the last phase of CERT.
The above shows that if the targets get tighter, leverage decreases because suppliers find
it more difficult to achieve their obligations without fully subsidising the measures.
Contributing factors are decreasing potentials for the various measures meaning that
fewer opportunities exist leading to more intense competition and more attractive offers
with lower leverage. As ESOs in Britain moved towards high cost measures mainly
post-2012 (Rosenow and Eyre 2013), the issue of leverage becomes more and more
important: Will households be willing to make a contribution to costly measures? If not,
the cost for suppliers, which will be passed on to all customers, is going to increase.
There is anecdotal evidence that customers are much less willing to make contributions
to the high-cost measures leading to lower leverage factors.
16
5.2 Overlap of instruments – The example of France
The French ESO is Europe’s system with the broadest range of eligible measures. Still,
the measures adopted in practice are only a few. During the first period, the installation
of efficient boilers was the most prominent among them, accounting for more than half
of the measures. Insulation measures were the second largest contributor in terms of
energy savings, making the building domain the primary area that received measures as
part of the ESOs. This breakdown has not changed much in the second period. As of
April 2013, the share of boilers was 35% and insulation was 15% (DGEC 2013).
In the second period, residential buildings still represent 81% of the total energy sav-
ings. Compared to the other eligible sectors, residential buildings is the most cost-
effective potential for energy savings. This is why, for instance, gasoline suppliers pri-
marily rely on the building sector to generate energy savings, instead of focusing on the
transportation sector. Yet within the residential sector, Giraudet et al. (2011) have found
that the measures taken in the first period were not necessarily the cheapest. In a com-
petitive market, one would expect the obligated parties to address the most cost-
effective measures first, assuming that the required contribution is smaller compared to
high-cost measures. This is the point where the interaction of the saving obligation
scheme with other measures becomes important. Most prominent among them4 is the
tax credit scheme, which interacts closely with the saving obligation. During the first
period of the obligation, the tax cuts granted by the tax credit scheme tended to be high-
er for measures on the heating system than for measures on the insulation, despite the
fact that the latter tend to be more cost-effective.
Using cost figures estimated by Giraudet et al. (2012), leverage for the efficiency
measures – set in relation to the additional cost of efficiency measures compared to the
baseline, which is directly comparable to estimates found for the UK – was 1.37 in the
first period. About 65 % of the additional investment was covered by the tax credit.
Considering the overall investment, the tax credits still coverednearly 35% of the total
costs. Compared to these values, the direct contribution of the obligated parties to fi-
nancing is rather limited. In relation to the additional investment, the obligated parties
4No data is available yet about the interaction between the obligation and the soft loan scheme, which
was only implemented in 2009.
17
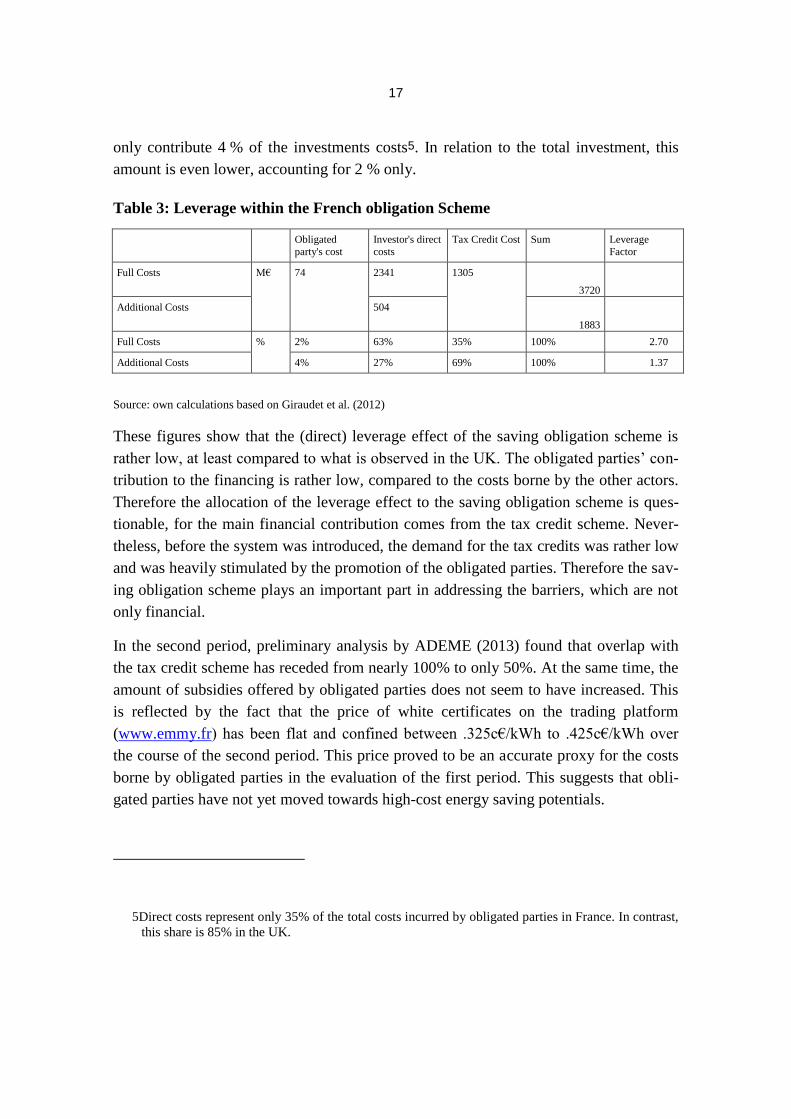
only contribute 4 % of the investments costs5. In relation to the total investment, this
amount is even lower, accounting for 2 % only.
Table 3: Leverage within the French obligation Scheme
Obligated
party's cost
Investor's direct
costs
Tax Credit Cost Sum Leverage
Factor
Full Costs M€ 74 2341 1305
3720
Additional Costs 504
1883
Full Costs % 2% 63% 35% 100% 2.70
Additional Costs 4% 27% 69% 100% 1.37
Source: own calculations based on Giraudet et al. (2012)
These figures show that the (direct) leverage effect of the saving obligation scheme is
rather low, at least compared to what is observed in the UK. The obligated parties’ con-
tribution to the financing is rather low, compared to the costs borne by the other actors.
Therefore the allocation of the leverage effect to the saving obligation scheme is ques-
tionable, for the main financial contribution comes from the tax credit scheme. Never-
theless, before the system was introduced, the demand for the tax credits was rather low
and was heavily stimulated by the promotion of the obligated parties. Therefore the sav-
ing obligation scheme plays an important part in addressing the barriers, which are not
only financial.
In the second period, preliminary analysis by ADEME (2013) found that overlap with
the tax credit scheme has receded from nearly 100% to only 50%. At the same time, the
amount of subsidies offered by obligated parties does not seem to have increased. This
is reflected by the fact that the price of white certificates on the trading platform
(www.emmy.fr) has been flat and confined between .325c€/kWh to .425c€/kWh over
the course of the second period. This price proved to be an accurate proxy for the costs
borne by obligated parties in the evaluation of the first period. This suggests that obli-
gated parties have not yet moved towards high-cost energy saving potentials.
5Direct costs represent only 35% of the total costs incurred by obligated parties in France. In contrast,
this share is 85% in the UK.
18
As a result of the lower contribution from the tax credit and the constant contribution
from the obliged parties, the leverage factor should increase in the second period. This
increase should however be temporary and followed by a decrease in the longer run, as
obligated parties will need to tap harder-to-reach potentials in the future.
Lastly, analysis by ADEME suggests that advice and other information services offered
by obligated parties provide consumers with much satisfaction. This suggests that the
obligation is effective at inducing the obligated parties to address the information gap.
5.3 Denmark
As described in paragraph 3.4 the Danish obligation scheme is – while comparable to
the French scheme in terms of scope – quite different in the actual mix of implemented
measures. It is the only European scheme with a substantial share of measures undertak-
en in the commercial and industrial sector, rather than having a strong focus on domes-
tic buildings. The Italian scheme has changed in that direction over the last few years,
but data on that scheme is hard to access in an international context. Because these two
groups are quite different in their economic behaviour, they are treated separately in the
following considerations.
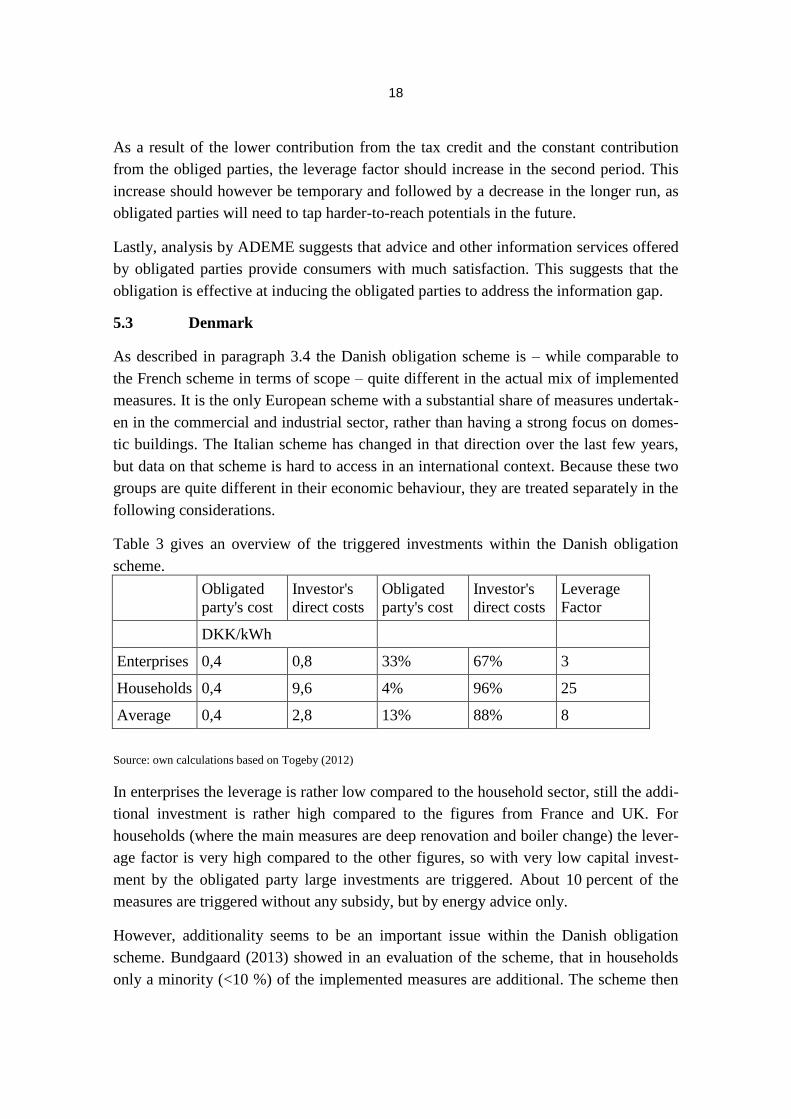
Table 3 gives an overview of the triggered investments within the Danish obligation
scheme.
Obligated
party's cost
Investor's
direct costs
Obligated
party's cost
Investor's
direct costs
Leverage
Factor
DKK/kWh
Enterprises 0,4 0,8 33% 67% 3
Households 0,4 9,6 4% 96% 25
Average 0,4 2,8 13% 88% 8
Source: own calculations based on Togeby (2012)
In enterprises the leverage is rather low compared to the household sector, still the addi-
tional investment is rather high compared to the figures from France and UK. For
households (where the main measures are deep renovation and boiler change) the lever-
age factor is very high compared to the other figures, so with very low capital invest-
ment by the obligated party large investments are triggered. About 10 percent of the
measures are triggered without any subsidy, but by energy advice only.
However, additionality seems to be an important issue within the Danish obligation
scheme. Bundgaard (2013) showed in an evaluation of the scheme, that in households
only a minority (<10 %) of the implemented measures are additional. The scheme then
19
acts as a tool for measurement and verification of energy saving measures undertaken
anyhow, but does not lead to significant additional investments. In contrast, capital go-
ing into such measures may even be withdrawn from more important investment oppor-
tunities. Therefore the high leverage factors of the Danish scheme have to be handled
with care.
Country synthesis
The important question arising from the presented findings is what factors make the
situation in Denmark so different from the British and French situation. The answer
mainly lies in the different system designs. Although the general design of the efficien-
cy obligations is very similar in the three countries, some features make a major differ-
ence.
The sheer number of measures carried out in the UK6 shows that the measures are not
undertaken in the regular maintenance cycle. For those out of schedule measures, the
financial barrier is much more relevant than in case of regular maintenance where only
the additional costs of the efficiency measure are relevant for the barriers because the
investor/consumer has already decided to do something.
Investment within the regular maintenance cycle applies to the Danish scheme, and
therefore the subsidy levels are considerably lower. Thus the leverage effect is much
larger than in the UK and France. Within the French scheme there are large windfall
gains, due to tax credits for installation of measures that may not be additional. This is
nevertheless intended in the system design.
6. CONCLUSION
The required investment in energy efficiency is substantial if the multiple benefits of
energy demand reduction are to be realised. However, government budgets are becom-
ing increasingly constrained by austerity measures, making it increasingly difficult to
provide the funds needed to finance energy efficiency. Equally, rising energy prices and
the reluctance of regulators to add further cost to energy bills limit the ability of ESOs
paid for by energy consumers to provide sufficient funding for energy efficiency. Better
6 The CERT Update gives a number of nearly 2.5 million wall insulation measures and 3.5 million
loft insulation measures, which covers about 20 % of the British building stock
20
leverage of public funding, whether provided in the form of grants (paid for by the ex-
chequer) or through ESOs (paid for by energy consumers), is therefore essential.
We argued that ESOs have traditionally been seen as an instrument with a high leverage
effect i.e. stimulating investments over and above the funds collected through energy
bills from both private investors and other public bodies. However, so far there is no
systematic analysis of the ability of ESOs to lever in private and public capital.
As a first step, we defined a leverage factor which can be used to appraise the degree of
leverage of ESOs (and potentially other policy instruments). This leverage factor takes
into account the amount of public funds provided, the additional private and public
capital levered, but also situations where funding from ESOs is blended with further
incentives (for example tax rebates). We applied this leverage factor to three prominent
ESOs, namely the UK, France and Denmark. Our analysis suggests a wide range of lev-
erage across ESOs and types of energy efficiency measures supported. This spread can
largely be explained by the different design features of ESOs and the degree to which
the measures supported are additional. In general we found that the higher the leverage
factor, the lower the additionality of implemented actions.
ESOs in the UK historically focused on a large number of relatively simple measures
that are in most cases not undertaken as part of the regular maintenance cycle requiring
a higher contribution in the form of public funds. Furthermore, the UK system has a
strong emphasis of social equity, allocating a large proportion of the activity to vulnera-
ble households often on low incomes who cannot make substantial financial contribu-
tions. This leads to a lower leverage effect compared to a scheme that focuses entirely
on the able-to-pay. The French ESOs display very similar leverage factors as the UK
after the effect of tax rebates is taken into account. Without deducting the effect of tax
rebates the French system would show a much higher leverage effect. ESOs in Denmark
show high leverage factors, particularly in the household sector. However, there is con-
siderable doubt regarding the additionality of some of the measures and further research
is required to unravel the dynamics of the Danish scheme.
Future research should focus on how the trade-off between leverage and additionality
can be minimised. More sophisticated methods to incorporate the degree of additionali-
ty into the leverage factor would allow for a systematic analysis of policy instruments
showing the cost and leverage effect for additional energy savings which would be a
more appropriate comparator.
21
REFERENCES
ADEME (2013). Evaluation qualitative du dispositif CEE – 2ème période 2011-2013,
Synthèse
Bertoldi, P., Rezessy, S. (2008) Tradable white certificate schemes: fundamental con-
cepts, Energy Efficiency, November 2008, Volume 1, Issue 4, pp 237-255 , Nether-
lands, Springer
Bertoldi, P. et al. (2010). Energy supplier obligations and white certificate schemes:
Comparative analysis of experiences in the European Union, Original Research Article
Energy Policy, Volume 38, Issue 3, March 2010, Pages 1455-1469 , Elsevier
Bundgaard, S.-S. et al. (2013). Spending to save: evaluation of the energy efficiency
obligation in Denmark, 2013 eceee summer study
DECC (2010). Extending the Carbon Emissions Reduction Target to December
2012.Impact Assessment. London, DECC.
DEFRA (2004). Energy Efficiency: The Government’s Plan for Action. London,
DEFRA.
DEFRA (2007). UK Energy Efficiency Action Plan 2007. London, DEFRA.
DGEC (2013). Lettre d’information CEE, Avril 2013
Eichhammer, W., Schlomann, B., Rohde, C. (2012). Financing the Energy Efficient
Transformation of the Building Sector in the EU. Retrieved 07/10/2013 from
http://www.odyssee-indicators.org/publications/PDF/Building-policies-brochure.pdf
Fraunhofer ISI (2009) Study on the the Energy Energy Saving Saving Potentials Poten-
tials in EU Member States, in EU Member States, Candidate Countries and EEA Coun-
tries. Karlsruhe.
Giraudet, L.-G., D. Finon, 2011, White certificates schemes: the static and dynamic
efficiency of an adaptive policy instrument, CIRED Working Paper No 33-2011
Giraudet, L.-G., Bodineau, L., Finon, D. (2012) The costs and benefits of White Certifi-
cates schemes, Energy Efficiency May 2012, Volume 5, Issue 2, pp 179-199, Nether-
lands, Springer
Heiskanen, Eva, Kaisa Matschoss, and Helka Kuusi (2012). Literature review of key
stakeholders, users and investors. Retrieved 13/10/2013 from www.entranze.eu
22
Lees, E. (2006). Evaluation of the Energy Efficiency Commitment 2002-05. Wantage,
Eoin Lees Energy.
Lees, E. (2008). Evaluation of the Energy Efficiency Commitment 2005-08. Wantage,
Eoin Lees Energy.
OFGEM (2005). A review of the Energy Efficiency Commitment 2002 – 2005. London,
OFGEM.
OFGEM (2012a). Approach to enforcement of the Government’s Carbon Emissions
Reduction Target (CERT) and Community Energy Saving Programme
(CESP)."Retrieved 23/10, 2012, from
http://www.ofgem.gov.uk/Sustainability/Environment/EnergyEff/InfProjMngrs/Docum
ents1/Open%20letter%20CERT%20CESP%20210912.pdf.
OFGEM (2012b). Carbon Emissions Reduction Target update. September 2012. Re-
trieved 11/10, 2012, from
http://www.ofgem.gov.uk/Sustainability/Environment/EnergyEff/CU/Documents1/OfG
em%20CERT%20Q17%20June%202012_v03.pdf.
RAP (2012). “Energy Savings ObligationsGlobal Lessons & the “Efficiency Utility”
Model”, Presentation at the DENEFF workshop in Berlin October 24, 2012 Retrieved
12/06/2012 from http://www.raponline.org/document/download/id/6244
Rosenow, J. (2012). "Energy Savings Obligations in the UK – A History of Change."
Energy Policy 49: 373–382.
Rosenow, J. and N. Eyre (2013) "The Green Deal and the Energy Company Obliga-
tion." Proceedings of the ICE - Energy 166, 127-136.
Rosenow, J., R. Platt and B.Flanagan (2013). "Fuel poverty and energy efficiency obli-
gations – A critical assessment of the supplier obligation in the UK." Energy Policy
62(0): 1194-1203.
Schlomann, B., Rohde, C., Eichhammer, W., Bürger, V., Becker, D. (2013). Which
Role for Market-Oriented Instruments for Achieving Energy Efficiency Targets in Ger-
many?” Energy & Environment, 24(1), 27-56.
Togeby, M. (2012) Evaluering af energiselskabernes energispareaktiviteter, EaEner-
gianalyse, Kopenhagen 2012 Retrieved 11/12/2012 from: http://www.ens.dk/da-
DK/ForbrugOgBesparelser/EnergiselskabernesSpareindsats/Documents/Evaluering2012
/Evaluering2012Hovedrapport.pdf