energ sector management assistance programme
TRANSCRIPT
1 3(o4g
_Vf l- ; - - - Energ Sector Management Assistance Programme
>e2c. )'9T
MauritiusEnergy Sector Review
Report No. 3643-MAS
A joint report with the
Power Development, Efficiency and Household Fuels DivisionIndustry and Energy Department
&
Industry and Energy Operations DivisionCentral Africa and Indian Ocean Department
Africa Region
Pub
lic D
iscl
osur
e A
utho
rized
Pub
lic D
iscl
osur
e A
utho
rized
Pub
lic D
iscl
osur
e A
utho
rized
Pub
lic D
iscl
osur
e A
utho
rized

JOINT UNDP / WORLD BANKENERGY SECTOR MANAGEMENT ASSISTANCE PROGRAMME (ESMAP)
PURPOSE
The Joint UNDP/World Bank Energy Sector Management Assistance Program me (ESMAP) waslaunched in 1983 to complement the Energy Assessment Programme, established three years earlier.ESMAP's original purpose was to implement key recommenidations of the Energy Assessmentreports and ensure that proposed investments in the energy sector represented the most efficient useof scarce domestic and external resources. In 1990, an international Commission addressedESMAP's role for the 1990s and, noting the vital role of adequate and affordable energy ineconomic growth, concluded that the Progran1 ne shoulld intensify its efforts to assist developingcountries to manage their energy sectors more effectively. The Commission also recommended thatESMAP concentrate on making long-term efforts in a smaller number of countries. TheComunission's report was endorsed at ESMAP's November 1990 Annual Meeting and prompted anextensive reorganization and reorientation of the Programme. Today, ESMAP is conducting EnergyAssessments, performing preinvestment and prefeasibility work, and providing institutional andpolicy advice in selected developing countries. Through these efforts, ESMAP aims to assistgovemrnments, donors, and potential investors in identfying, funding, and implementing economicallyand environmentally sound energy strategies.
GOVERNANCE AND OPERATIONS
ESMAP is governed by a Consultative Group (ESMAP CG), composed of representatives of theUNDP and World Bank, the governments and institutions providing financial support, andrepresentatives of the recipients of ESMAP's assistance. The ESMAP CG is chaired by the WorldBank's Vice President, Finance and Private Sector Development, and advised by a TechnicalAdvisory Group (TAG) of independent energy experts that reviews the Programme's strategicagenda, its work program, and other issues. ESMAP is staffed by a cadre of engineers, energyplanners and economists from the Industry and Energy Departnent of the World Bank. TheDirector of this Departnent is also the Manager of ESMAP, responsible for administering theProgramme.
FUNDING
ESMAP is a cooperative effort supported by the World Bank, UNDP and other United Na:ionsagencies, the European Conununity, Organization of American States (OAS), Latin AmericanEnergy Organization (OLADE), and countries including Australia, Belgium, Canada, Denmark,Germany, Finland, France, Iceland, Ireland, Italy, Japan, the Netherlands, Newr Zealand, Norway,Portugal, Sweden, Switzerland, the United Kingdom, and the United States.
FURTHER INFORMATION
For furdter information or copies of completed ESMAP reports, contact:
ESMAPc/o Industry and Energy Departmnent
The World Bank1818 H Street N.W.
Washington, D.C. 20433U.S.A.

MAURITIUS
ENERGY SECTOR REVIEW
December 1994
A JOINT REPORT
Power Development, Efficiency Industry and Energy Operations Divisionand Household Fuels Division Cental Africa and Indian Ocean DepartmentIndustry and Energy Department Africa RegionThe World Bank1818 H Street, N.W.Washington, D.C. 20433
This document has restricted distribution and may be usedby recipients only in the performance of their officialdwties. Its c-ntent; may not otherwise be disclosed withoutWorld Bank authorizationi.
ABBREVIATIONS
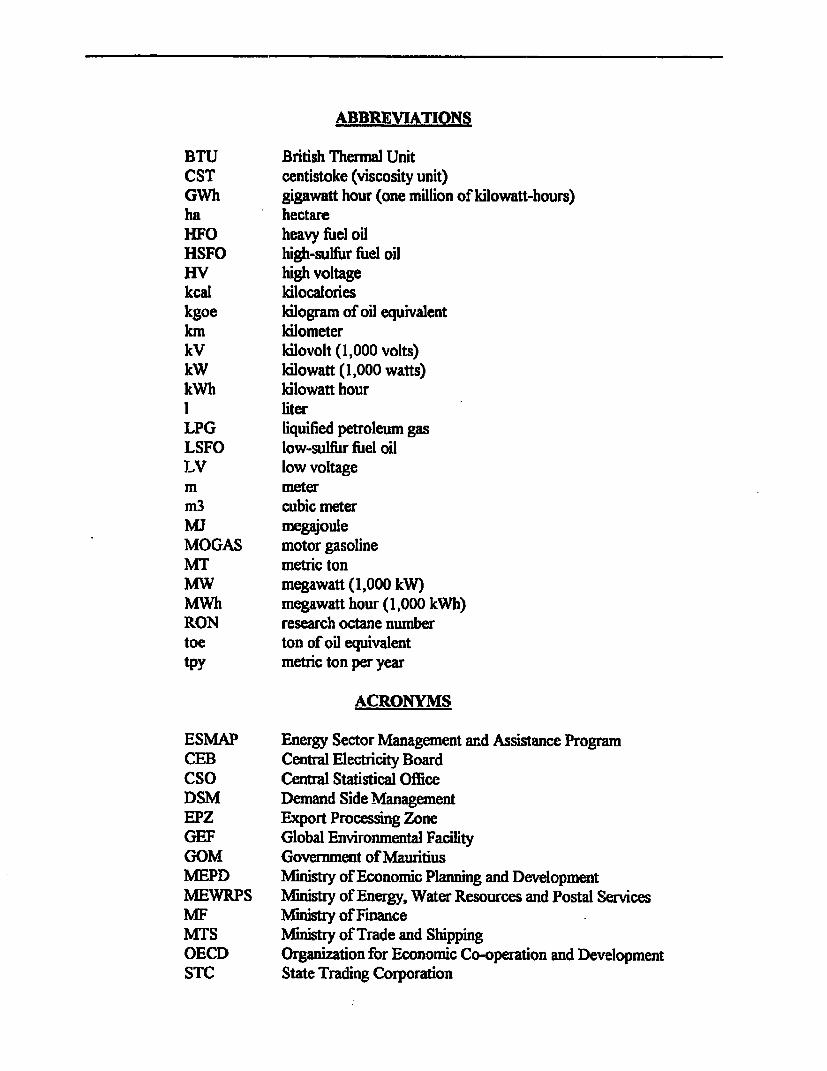
BTU British Thermal UnitCST centistoke (viscosity unit)GWh gigawatt hour (one million of kilowatt-hours)ha hectareHFO heavy fuel oilHSFO high-sulfur fuel oilHV high voltagekcal kilocalorieskgoe kilogram of oil equivalentkm kilometerkV kilovolt (1,000 volts)kW kilowatt (1,000 watts)kWh kilowatt hourI literLPG liquified petroleum gasLSFO low-sulfur fuel oilIV low voltagem meterm3 cubic meterMJ megajouleMOGAS motor gasolineMIT metric tonMW megawatt (1,000 kW)MWh megawatt hour (1,000 kWh)RON research octane numbertoe ton of oil equivalenttpy metric ton per year
ACRONYMS
ESMAP Energy Sector Management and Assistance ProgramCEB Central Electricity BoardCSO Central Statistical OfficeDSM Demand Side ManagementEPZ Export Processing ZoneGEF Global Environmental FacilityGOM Government of MauritiusMEPD Ministry of Economic Planning and DevelopmentMEWRPS Ministry of Energy, Water Resources and Postal ServicesMF Ministry of FinanceMTS Minstry of Trade and ShippingOECD Organization for Economic Co-operation and DevelopmentSTC State Trading Corporation

FISCAL YEAR
July 1 - June 30
CURRENCY EQUIVALENTS
Currency Unit Mauritian Rupee (Rs.)US$1 = Rs 17.80 (March 1994)
= Rs 15.363 (1992 avcrage)= Rs 17.648 (1993 avcragc)= Rs 18.331 (1994 first six months)
ENERGY CONVERSION FACTORS
Energy Source Density (MT/m3) Oil Equivalent (toe/MT)
Liquid fuelsGasoline 0.75 1.08Kerosene 0.80 1.04Gas Oil 0.85 1.01Fuel Oil 1.00 0.96LPG 0.50 1.08
Coal 0.62Bagasse 0.16Electricity (1 kWh - 3.6 MJ = 860 kcal = 3,412 BTU 0.086 kgoe)
FOR OFFICIAL USE ONLY
PREFA CE
This report is based on the findings of an energy review mission which visitedMauritius in March 1994. The mission comprised Messrs. Nourredine Bouzaher (TaskManager), Witold Teplitz-Sembitsky (Economist, Consultant), Joao Baptista (PowerSector Specialist, Consultant), B. Wiese (Power Engineer, Consultant), 0. Dietrich(Energy Conservation and Demand Management Specialist, Consultant), and Ms. N. U.Tronstad (Petroleum Downstream Specialist, Consultant). Guidance and advice receivedfromn Robin Bates (IENPD), peer reviewer, and Ulrich Thumm, Lead Economist(AF3DR), are gratefully aknowledged. Ms. Liliane Yomekpe, Language Staff Assistant(AF3IE), provided secreterial support. Messrs. lain Christie (AF3IE) and FranciscoAguirre-Sacasa (AF3DR) are the managing Division Chief and Department Director,respectively.
Messrs. lain Christie, Michel Del Buono (IENPD) and Nourredine Bouzaherdiscussed the main conclusions of this report with the Mauritian authorities in December1994.
The preparation of this energy sector review was cofinanced by the World Bank,the Norwegian Core Fund (ESMAP), and the Danish and Portuguese Trust Funds.
MAURITIUS: ENERGY SECTOR REVIEW
Table of Contents
EXECUTIVE SUMMARY ............................................... iChapter 1: Introduction ............................................... IChapter 2: Energy Sector Review ............................................... 4
Country Background ............................................... 4Energy and the Economy ............................................... 5
Energy Resources .............................................. S5Primary Energy Requirements ............................................... 7Final Energy ............................................... 8Energy Intensity .............................................. 10Real Price Developments .............................................. IIPast Demand and Supply Growth .............................................. 11The Energy Sector and Public Finances .............................................. 14
Overview of Sector Management Issues .............................................. 15Chapter 3: Future Demand for Energy and the Role of
Energy Pricing and Taxation .............................................. 18Pricing and Taxation .............................................. 18
Electricity Tariffs .............................................. 18Electricity Purchases .............................................. 20Bagasse Transfer Price and Other Incentives to Bagasse
Generated Electricity .............................................. 21Improvements in Power Purchasing Agreements ......................... ......... 22
Petroleum Products .............................................. 22Taxation .............................................. 22Pricing .............................................. 24
Income and Price Elasticities .............................................. 25Future Demand .............................................. 26
Electricity Demand .............................................. 26Demand for Petroleum Products ............................ .................. 28
Energy Conservation and Demand Management ........................................ 29Chapter 4: Planning Future Expansion .......................... .................... 31
The Power Sector .............................................. 31Generation .............................................. 31Capacity Balance .............................................. 32
Alternatives for Generation Expansion .......................................... .... 33Short-TermT .............................................. 33Medium-and Long-Term .............................................. 34
Plant Candidates .............................................. 34Hydro Plants .............................................. 34
Purchases from Sugar Estates and the Role of Bagassein Power Generation ............ 34Diesel Generators .. .................,36Gas Turbines: Single-cycle and Combined-cycle .36Coal Fired Plants................ . 37Comparison of Alternative Projects ........................ ,.,...,.37
Generation Expansion Plan, 1994-2010 .......................... 38Main Assumptions ............ 38Main Results ......... .. ,. 38
Transmission and Distribution ........................ 39Transmission.3.9............................. 39Primary Distribution . 40LV Distribution .......... 40System Operation ............. 40Transmission and Distribution Losses .41Transmission Expansion Plan .42
Petroleum Products ............... 43Renewable Energy .44
Solar Water Heating ............ 44Wind Energy ....... 45
Environmental Issues .45Chapter 5: Institutional Issues .47
Challenges Facing the Mauritian Sector .47Responding to the Challenges ................... 48
In the Power Subsector....................... 48The Way Ahead: Reforming the Power Sector .49
In the Petroleum Downstream Subsector .50The Role of STC ..................... 51Institutional Strengthening . 52
The Ministry of Energy .52The Central Electricity Board .52
Tables
Table 2.1: Energy Balance .8Table 2.2: Key Energy Consumption Figures (in toe) .9Table 2.3: Composition of Real GDP (in %) .10Table 2.4: Changes in Real Electricity Tariffs and Domestic Fuel Prices 11Table 2.5: Growth Rates Power Sector .12Table 2.6: Power Sector Investments (in Rs million) .15Table 3.1: CEB Thermal Generation Operating Costs, 1993 ................................. 19Table 3.2: Taxation of Key Petroleum Products .23Table 3.3: Vertical Breakdown of Petroleum Product Prices .24Table 3.4: Estimated Demand Elasticities .26Table 3.5: Electricity Sales and Peak Load Forecast, Base Case Scenario .27
Table 3.6: Electricity Sales and Peak Load Forecast, Low GDP Growth Scenaro. 27Table 3.7: Generation and Peak Demand Forecast ................................................ 28Table 3.8: Forecast of Domestic Petroleum Product Consumption .29Table 4.1: Effective Dependable Base and Peak-Load Capacity .31Table 4.2: CEB's Transmission and Distribution iLvestment Plan, 1994-1996 . 42Table 4.3: Peak Load Growth and Transmission and Distribution Investments .43
Annexes
Annex 1: Time series dataAnnex 2.1: Energy Data 1992Annex 2.2: Sales by consumer categoriesAnnex 2.3: Electricity Tariffs 1980-93, in real termsAnnex 2.4: Demand for Petroleum Products, 1986-92Annex 3.1: Demand Elasticities and ForecastingAnnex 3.2: Electricity TariffsAnnex 3.3: Avoided Costs, Average Generation Costs and TariffsAnnex 3.4: Energy ConservationAnnex 4.1: Electricity StatisticsAnnex 4.2: Comparison of Candidates for Power GenerationAnn,x 4.3: Tentative Generation Expansion PlansAnnex 4.4: Investments in Transmission and Distribution, 1980-1992Annex 5.1:Current and Proposed Organization Chart of the Ministry of Energy, Water
Resources and Postal ServicesAnnex 5.2: CEB Organization Chart
MAP
IBRD 26081

MAURITI US: ENERGY SECTOR REVIEW
EXECUTIVE SUMMARY
St9
1. The Mauritius Country FRconomic Memorandum' identified the need for greaterefficiency in the public sector, including a reduction in public expenditures as a keyelement in Mauritius' transition to a higher level of economic performance. The energysector, particularly the power subsector, has placed an increasing financial burder; on thegoverment budget, especially since the second half of the 1980s when CEB hunched asequence of investments financed through external borrowing in response to strongelectricity demand, which grew faster than GDP over most of the decade. Investmentprograms departed from least-cost principles to the extent that: (i) prices did not reflecteconomic costs; and (ii) delays in the implementation and procurement of generationequipment kept CEB off its least-cost expansion path. In the petroleum sector, price andmargin controls have been in effect for some time. This has distorted incentives, resourceallocation, and consumer choices.
2. This has had a negative effect on Mauritius' macroeconomic situation, throughhigher public irvestment and debt and a larger public deficit. The government should optfor a determined application of economic pricing and investment policies in the energysector. These policies should be coupled with institutional changes, in terms of a moreclearly defined and less interventionist government role, an adequate regulatoryfranework, and increased private sector participation.
3. The evolution of the final energy consumption by sector in Mauritius, over theperiod 1979-1992, reveals a moderate shift in the structure of final energy use away fromthe commercial and residential sectors towards industry and transport. This period is alsocharacterized by a decline in the relative importance of bagasse. While the sugar industrycontinued to use bagasse as a fuel at roughly the same level that prevailed in the late1970s, the rest of the economy (transport and power generation, in particular) met itsrapidly rising primary energy requirements with petroleum products.
Challensies in the Energy Sector:
4. There is a growing demand for electricity and petroleum products in the Mauritianeconomy. Given the precarious financial position of CEB and the constraints facing thepetroleum products industry on pricing (tightly controlled margins), demand will not bemet under the current envirornent and the sector will consequently be a drag on theeconomy. The challenge facing the government is to remove these botiltnecks to growththrough policies designed to support an appropriate fiamework in which a liberalizedsector would have the incentives to respond to market signals.
I Maufius: Comutr Economic Memondmn (The Worid Bank, lune 1994)
i Mauriftus: Energy Sector Review
Electric Power
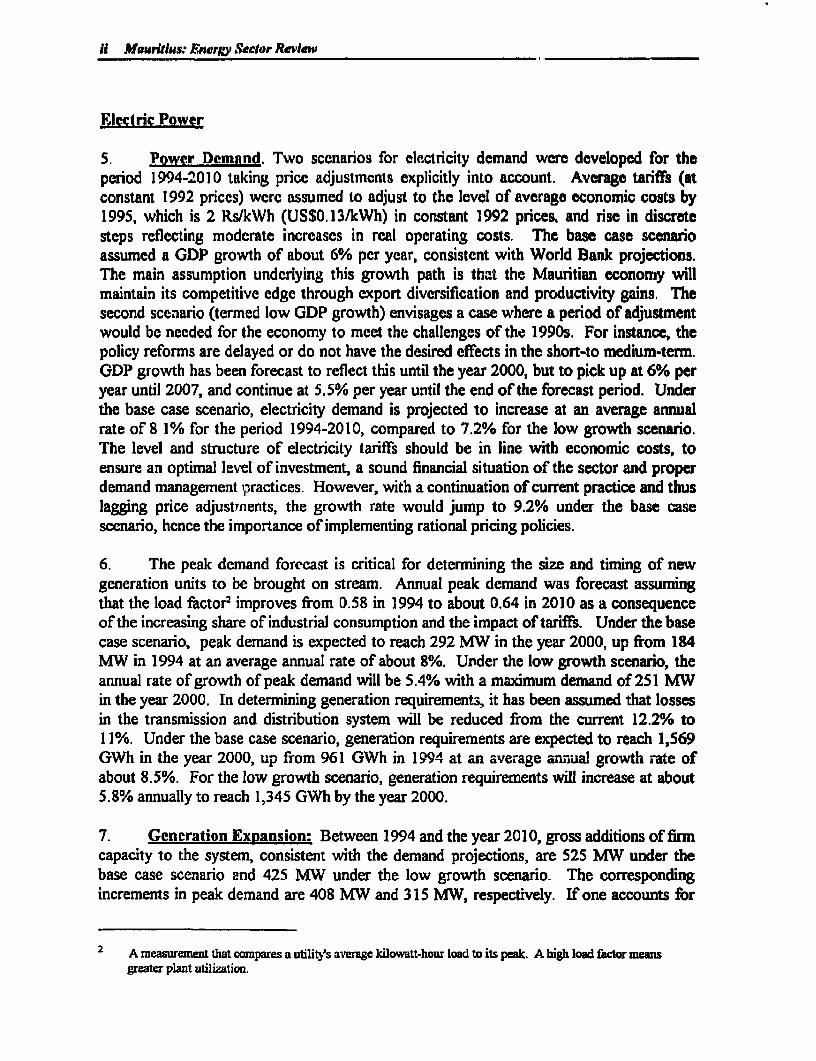
5. Power Demand. Two scenarios for clectricity demand were developed for theperiod 1994-2010 taking price adjustmcnts explicitly into account. Average tariffs (atconstant 1992 prices) were assumed to adjust to the level of average economic costs by1995, which is 2 Rs/kWh (US$0.13/kWh) in constant 1992 prices. and rise in discretesteps reflecting moderate increases in real operating costs. The base case scenarioassumed a GDP growth of about 6% per year, consistent with World Bank projections.The main assumption underlying this growth path is that the Mauritian economy willmaintain its competitive edge through export diversification and productivity gains. Thesecond scenario (termed low GDP growth) envisages a case where a period of adjustmentwould be needed for the economy to meet the challenges of the 1990s. For instance, thepolicy reforms are delayed or do not have the desired effects in the short-to medium-term.GDP growth has been forecast to reflect this until the year 2000, but to pick up at 6% peryear until 2007, and continue at 5.5% per year until the end of the forecast period. Underthe base case scenario, electricity demand is projected to increase at an average annualrate of 8 1% for the period 1994-2010, compared to 7.2% for the low growth scenario.The level and structure of electricity tariffs should be in line with economic costs, toensure an optimal level of investment, a sound financial situation of the sector and properdemand management ipractices. However, with a continuation of current practice and thuslagging price adjustments, the growth rate would jump to 9.2% under the base casescenario, hence the importance of implementing rational pricing policies.
6. The peak demand forecast is critical for detennining the size and timing of newgeneration units to be brought on stream. Annual peak demand was forecast assumingthat the load factor2 improves from 0.58 in 1994 to about 0.64 in 2010 as a consequenceof the increasing share of industrial consumption and the impact of tariffs. Under the basecase scenario, peak demand is expected to reach 292 MW in the year 2000, up from 184MW in 1994 at an average annual rate of about 8%. Under the low growth scenario, theannual rate of growth of peak demand will be 5.4% with a maximum demand of 251 MWin the year 2000. In determining generation requirements, it has been assumed that lossesin the transmission and distribution system will be reduced from the current 12.2% to11%. Under the base case scenano, generation requirements are expected to reach 1,569GWh in the year 2000, up from 961 GWh in 1994 at an average anual growth rate ofabout 8.5%. For the low growth scenario, generation requirements will increase at about5.8% annually to reach 1,345 GWh by the year 2000.
7. Generation Eixansion: Between 1994 and the year 2010, gross additions of finncapacity to the system, consistent with the demand projections, are 525 MW under thebase case scenario and 425 MW under the low growth scenario. The correspondingincrements in peak demand are 408 MW and 315 MW, respectively. If one accounts for
2 A measurement that compares a utiliWs average kilowatt-hour load to its peak. A high load factor meansgreater plant utilization.
ExeculJe Summry iII
the decommissioning of 80 MW c9 firm capacity (due to aging, breakdowns and othertechnical factors), the net additions are 445 MW and 345 MW respectively, which is closeto the peak demand increments.
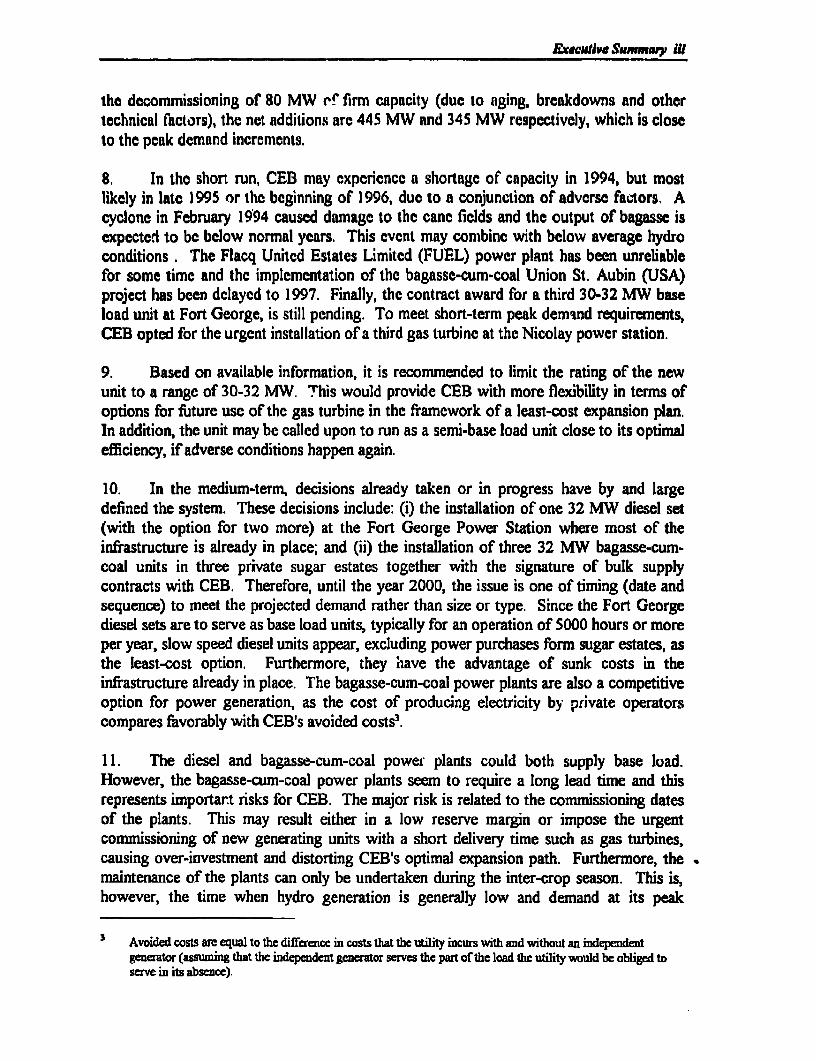
8. In the short run, CEB may experience a shortage of capacity in 1994, but mostlikely in late 1995 or the beginning of 1996, duo to a conjunction of adverse factors, Acyclone in February 1994 caused damage to the cane fields and the output of bagasse isexpected to be below normal years. This event may combine with below average hydroconditions . The Flacq United Estates Limited (FUEL) power plant has been unreliablefor some time and the implementation of the bagasse-cum-coal Union St. Aubin (USA)project has been delayed to 1997. Finally, the contract award for a third 30-32 MW baseload unit at Fort George, is still pending. To meet short-term peak demand requirements,CEB opted for the urgent installation of a third gas turbine at the Nicolay power station.
9. Based on available informration, it is recommended to limit the rating of the newunit to a range of 30-32 MW. This would provide CEB with more flexibility in terms ofoptions for future use of the gas turbine in the framework of a least-cost expansion plan.In addition, the unit may be called upon to run as a semi-base load unit close to its optimalefficiency, if adverse conditions happen again.
10. In the medium-term, decisions already taken or in progress have by and largedefined the system. These decisions include: (i) the installation of one 32 MW diesel set(with the option for two more) at the Fort George Power Station where most of theinfrastructure is already in place; and (ii) the installation of three 32 MW bagasse-cum-coal units in three private sugar estates together with the signature of bulk supplycontracts with CEB. Therefore, until the year 2000, the issue is one of timing (date andsequence) to meet the projected demand rather than size or type. Since the Fort Georgediesel sets are to serve as base load units, typically for an operation of 5000 hours or moreper year, slow speed diesel units appear, excluding power purchases form sugar estates, asthe least-cost option. Furthermore, they have the advantage of sunk costs in theinfrastructure already in place. The bagasse-cum-coal power plants are also a competitiveoption for power generation, as the cost of producing electricity by private operatorscompares favorably with CEB's avoided costs3.
11. The diesel and bagasse-cum-coal power plants could both supply base load.However, the bagasse-cum-coal power plants seem to require a long lead time and thisrepresents importar.t risks for CEB. The major risk is related to the commissioning datesof the plants. This may result either in a low reserve margin or impose the urgentcommissioning of new generating units with a short delivery time such as gas turbines,causing over-investment and distorting CEB's optimal expansion path. Furthermore, themaintenance of the plants can only be undertaken during the inter-crop season. This is,however, the time when hydro generation is generally low and demand at its peak
3 Avoided costs are equal to the difference in costs that the utility incurs wfith and without an indepmendentgenerator (assumiir that the independent genemtor serves the part of the load thc utility would be obliged toscrve in its absence)-

iv Mauritius: Enery Sector Review
(December-January). As a normal part of its operations, CEB should therefore undertaketo simulate all these events on the system's ability to supply the load and take remedialaction, as necessary.
12 Depending on the scenario, bagasse-cum-coal power plants would be required in1997, 2000 and 2002 in the base case, and in 1999, 2002 and 2003 in the low growthscenario.
13 In the long-term, coal-fired power plants might be least-cost candidates when thepeak demand reaches 250 MW or more. Coal-fired power plants, however, should becarefully evaluated because of the lack of space for coal storage, ash disposal and for thepower plant itself. Fuithernore, the negative air quality impact might also be serious.
14. Transmission and Distribution. A transmission and distribution expansion plantied to generation developments and to the growth of demand should be prepared. Thetransmission plan should include a revision of the design assumptions and main linecharacteristics as well as costs (in the past, the cost of 66 kV lines was excessive). Plansto develop an extensive underground MV network should be postponed and theintroduction of a new voltage should be carefilly evaluated. In distribution, CEB seemsto be on the right track although a more detailed knowledge of consumers' chamcteristicsis necessary. Primary distribution at 6.6 kV should only be abandoned when the existingnevtwrks risk overloading or require frequent and extensive repairs. CEB's loss reductionprogram has been a success with losses averaging about 12%, down from 16% in 1986.Further improvements are possible but a better knowledge of how losses are split betweenthe MV and LV networks is necessary, which implies a campaign of measurementstogether with simulation (load flow) studies.
Petroleum Products
15. Domestic sales of petroleum products are expected to increase at about 5% a yearbetween 1994 andi 2005. Gasoline sales are expected to grow at 7.2% per year, diesel at4.7%, fuel oil at 4% and LPG at 7.4%. The demand for kerosene will continL't to bedominated by the fuel requirements of CEB's gas turbines. For the coming years, it isexpected that the existing units, probably supplemented by a third in 1995, will continue toserve peak and intermediate loads, resulting in a high level of kerosne consumption unfilnew diesel units come on stream. It is expected that both the coming on stream of newdiesel units and the removal of the kerosene tax exemption will reduce CEB's demand toabout 30,000 tons after the year 2000.
16. Given the expected growth of demand for petroleumn products, an expansion ofhandling and storage facilities will be needed in the near future. There is, however, strongdisagreement among different entities in Mauritius about relocating the existing facilitiesout of the port area and in particular about who is to bear the costs. On grounds of safety,the Mauritius Marine Authority (MMA) wants the oil companies to relocate their facilitiesout of the port area into a location close to CEB's Fort George power station and to the
ExecaFave Summary v
existing terminal. This would require substantial investments from the oil companies. Theoil companies, however, see these investments as impossible to carry out, given thepresent level of the marketers margin, Furthermore, the oil companies claim that thisrequest by MMA to relocate their facilities and their inability to do so is a pretext for StateTrading Corporation (STC) to intervene in the handling and storage of petroleumproducts by building a tank farm at the new location. There is no economic rationale forusing scarce public resources instead of involving the private sector, which is in a farbetter position to handle the whole chain of petroleum operations A compromise couldbe reached between the legitimate concern for the safety of oil operations in the port area(see para. 29) and the burden that investments in new facilities impose on oil companies.It is recommended that the government engage a dialogue with the private oil companiesdesigned to lead to a removal of these bottlenecks to growth. The issues of price controlsimposed on the petroleum industry and the monopoly of imports granted to STC areaddressed below (paras. 25, 33 and 34).
Pricing and Taxation
17. Given Mauritius' need to rely on productivity gains as a source of continued rapideconomic growth, there is a key role to be played by sound pricing and taxation policiesthat guide the allocation of both domestic and imported forms of energy.
18. Electricity Tariffs: Since 1979, CEB's tariffs have been revised six times, thelast three adjustments took place in 1984, 1990 and 1992. Between 1985 and 1990,however, there was a steady erosion in real tariffs. This trend came to a halt in 1991/92,but continued in 1993. In earlv 1994, average tarifTs in real terms were about 30% belowtheir 1985 level, in spite of upward adjustments in 1990 and 1992. While CEB's revenuerequirements prompted these increases, the basic structure of the tariff system, save forminor refinements, has been kept unchanged for more than a decade. The rates in placedo not give electricity consumers the proper signals about scarcities and about the coststhey impose on the utility. They encourage wasteful consumption and provide little or norewards to those prepared to invest in energy conserv.ation.
19. To remedy these shortcomings, bold steps need to be taken to modernize CEB'stariff system applicable to both consumers and sellers of electricity. The main thrust of areformed tariff level and strdcture would be to charge electricity consumers the real coststhey impose upon the system. Tariffs that more accurately reflect economic costs andadjusted, as necessary, to meet CEB's financial requirements, will be more efficient andmore equitable. This will remove subsidies, give electricity users and autogeneratorseconomically correct incentives, and protect CEB, and therefore the govemment againstfinancial drains.
20. It is recommended that the government commnission a study leading to a new tariffsystem to reflect more closely the cost of generating, transmintting and distributingelectricity, depending on the consumer category served, its voltage level, the season andtime of use.

vi Mawitiuas: EnerV Sector Review
21. Petroleum Product Taxation: In the case of petroleum products, the pricelevel has been kept reasonably close to the international level over a long period of time,but now the structure has some serious shortcomings.
22. Domestic taxes levied on petroleum products are economicaly justified on thebasis of the negative externalities associated with their use such as pollution, wear and tearof the infrastructure, noise, etc. Taxation should be such that the internal price structureof petroleum products does not lead to inefficient interfuiel substitution. In Mauritius,taxes are also a major source of goveinment revenue, which lead to a number ofdistortions. In the future, a balance needs to be struck between pure fiscal revenue andother considerations (infrastructure use, environment, etc.). The best course of actionmay be to align taxation closely with Mauritius' main OECD trading partners and its maincompetitors.
23. Taxes on gasoline are the largest source of tax revenues from petroleum products.In 1993, the tax burden was UScents 28.1 per liter of gasoline, UScents 9.8 per liter forgas oil, and UScents 7.2 per liter of fuel-oil. On the other hand, no taxes are levied onkerosene and LPG. Of concern is the large spread in retail prices resulting from differenttax rates imposed on gasoline and diesel. While the present cost of importing gasolineexceeds that of diesel oil by only 3%, at the retail level, gasoline is 73% more expensivethan diesel oil. To avoid inefficient interfuel substitution between gasoline and diesel, thespread between the two fuels should be reduced.
24. Because fiLel oil is taxed, whereas kerosene and LPG are not, kerosene which iscostlier to import, is sold at a lower retail price than fuel-oil. This distorts CEB's fueloptions by making kerosene artificially cheaper than competing fuels. Petroleum producttaxation and pricing policy should ensure that in power generation, kerosene, which isused in peaker plants, proves costlier than fuel-oil (as an interim measure, some reliefcould be given to CEB by lowering the tax on fuel-oil). Furthermore, since there was asignificant shift of household kerosene demand to LPG, there is no longer a socialobligation to keep kerosene cheap. Taxation of kerosene would remove incentives tosubstitute kerosene for inferior fuels or to switch back from LPG to kerosene.
25. The retail prices and the margins of mark-eters and retailers have been fixed for along period of time. Price controls have been inposed in Mauritius to combat inflationand to protect consumers. However, price controls have never proved to be an efficienttool to contain inflation and healthy competition is a more effective way to protectconsumers. Furthermore, energy prices are not an appropriate vehicle for implementingthe government's income distribution policy. More efficient ways of helping thedisadvantaged include targeted support programs that meet both distributive and cost-saving objectives. The elimination of price controls would provide a great stimulus toincrease the efficiency with which resources are deployed in the petroleum sector.Furthermore, the actual level of profit margns, which have been frozen for about adecade, implying an erosion in real terni, makes it difficult for the private oil companies

Executive Summty vu
to mobilize the necessary capital for expanding the supply infrastructure to meet thegrowing demand for petroleum products. To meet this challenge, it is recommended thatprice controls in the petroleum sector be eliminated and that the import and marketing ofpetroleum products be completely liberalized. At the same time, the government shouldremove all barriers to entry into the petroleum sector and devise safeguards againstcollusion.
Enernr Conservation and Renewable Energy: The Importance of Pricing
26. The level and structure of energy prices are the critical elements in any effectiveenergy conservation strategy. It is recommended that the govemment rely to a greaterextent on economic pricing and competition to enhance energy conservation in Mauritius,especially in view of the expected continued strong growth of demand for energy in theyears to come. On the supply side, the role of the govemrnent should be limited toregulatory functions, including the provision of a credible and efficient institutional/legalframework that levels the playing field to encourage more private sector participation andprotects of the environment.
27. Savings of fossil fuels and electricity can also be accomplished through marketmechanisms that would lead to the economic expansion of the use of renewable energysources. Since Mauritius' hydro potential is almost exhausted, the scope for renewableenergy is limited to bagasse (which has already been discussed in the context of powergeneration), solar energy for water heating (photovoltaic power generation isuneconomic), and wind energy. The government could foster the use of renewable energyresources by making sure that the level and structure of electricity and petroleum productprices reflect economic costs.
28. Mauritius has favorable conditions for utilizing solar water heaters. There arepresently about 10,000 solar water heaters installed on the island, but the potential marketis estimated at five to ten times that number. This potential can be realized to a greatextent if the distortions that exist in electricity tariffs and petroleum product prices areremoved. The country also has a good wind regime. Although the experience with windgenerators has, so far, not been encouraging, the utilization of wind energy may proveattractive at selected sites.
Environmental Issues
29. It is recommended that the government adopt market based mechanisms,particularly taxation, as the main instrument for bringing about desired environmentaloutcomes, and ensure that its fiscal and environmental policies are compatible andmutually reinforcing. The goverrnent should also take steps to monitor theenviromnental impact of energy production and use and investigate the need for remedialactions, including taxation. Because there are potentially serious risks for the port and itssurrounding area, in the event of fire or other disaster, the provision of a contingency planfor the oil storage facilities should receive the highest priority. Should the use of coal in
viii Masuriius: Eiwrgy Sector Review
power generation and in other industrial applications continue to increase, closeenvironmental monitoring and the introduction of mitigation strategies will becomeimperative.
Institutional Issues
30. The actions recommended above on energy pricing should be complemented byinstitutional changes, notably private sector participation, to increase efficiency and tomobilize alternative sources to finance the expected expansion of power and petroleumsupply infrastructure. In the longer run, the energy sector could be transformed into adynamic part of the economy where the driving forces are the reliance on economic signalsand competition.
31. Electricitv. An enhanced role for the private sector in the development of thepower sector is important because of the potential it offers for contributing financial andmanagerial resources, as well as increasing efficiency through competition. To enablegreater private participation in all aspects of the provision of electric power, Mauritius hasseveral options to choose from, none of which, however, will work without some degreeof price efficiency. A competitive environment would be maintained so that privateenterprises could participate in any activity in the sector, with price as the main criterion ofchoice and efficiency would be stimulated through the pressure of actual or potentialcompetition
32. It is recommnended that the government appoint a working group to evaluate thedifferent options that are available for reforming the power sector, evaluate the options forsector regulation and set out a program for implementing the financial, legal andinstitutional reforms and propose measures for managing the transitione.
33. The Role of STC Under the recommended process of price deregulation andimport liberalization, there would be no role for STC to play in the petroleum sector However, since STC's levies on petroleum products are used to subsidize basiccommodities such as rice and flour, actions to improve efficiency may not be withoutundesirable equity and fiscal impacts, considerations at the center of Mauritian concerns.Fiscal neutrality should be respected. Income distribution has become more equal inMauritius during the last decade, which reduces the justification of some of thegovemment interventions of the 80s. More importantly, the time may have come toimprove the efficiency of income distribution policies. Proper targeting may be consistentwith both efficiency and fiscal considerations. In addition, international experience hasshown that efficient growth is the most powerful tool of income distribution.
34. STC's levies on petroleum products can be assimilated to a form of taxation and tothe extent that the govermment wishes to keep them, they can be collected as for other
4 lhere is some debatc in Mauritius surromunding these recommnedations.

Executive Sun,wy Lx
trade taxes and duties by the Ministry of Finance. If the government wishes to subsidizebasic commodities, such as rice and flour, in favor of groups it deems in need ofassistance, it can do so through appropriations ii' the general budget in a fully transparentmanner. This would help the government better iarget its interventions and eliminateacross-the-board subsidies.

1
INTRODUCTION
Obiectives of the Renort
1l1 The purpose of this report is to contribute to the discussion recently initiatedwithin the government of Mauritius on future energy sector developments in the short-,medium-, and long-term, through: (i) an assessment of the issues facing the energy sector;and (ii) the identification of the available options and the formulation of recommendationson the changes needed to stimulate sustainable energy sector development to better servethe country's overall development strategy of continued rapid economic growth throughgreater competitiveness of the economy and diversification.
The Enermv Sector and Country Stratear
1.2 Recent economic developments in Mauritius, particularly during the period 1989-1993, show that the economy has entered a period of slower growth in which inflation-induced macroeconomic instability and loss of international competitiveness are particulardangers. The govemment is devising a strategy to overcome internal and externalconstraints to firther rapid growth of the economy. During the transition, the governmentneeds to consolidate the macroeconomic and incentive framework in support of private-sector-led growth, and to reorient public sector activities to reduce their claims on thecountry's resources. In the energy sector, this has led to interest in redefining anddiminishing the role of government in the petroleum and power subsectors; introducingsound pricing policies and commercial principles, and where appropriate, competition intovarious elements of the sector; attracting private investors; and re-thinking the principlesof sector regulation and the administrative arrangements for making them work.
Survey of World Bank Involvement in the Sector
1.3 Under the joint UNDP/World Bank Energy Assessment Program (ESMAP), anenergy assessment of Mauritius was conducted in 1981. The Mauritius: Issues andOptions in the Energy Sector (Report No. 3510-MAS), identified: (i) the reduction ofelectricity losses, the rehabilitation of generating plants, and peak demand management;and (ii) the country's dependence in imported fuels as pinmary issues in the energy sector.These issues were addressed in two subsequent ESMAP reports. The first through thePower System Efficiency Study which was published in May 1987 (Report No. 070/87)
2 Mauritias: Energ Sedor Revww
and the second through the Bagasse Power Potential, 1987-2000 which was published inOctober 1987 (Report No.077/87).
1.4 The Power System Efficiency Study identified opportunities for operationalimprovements in hydroelectric plant rehabilitation; transmission and distribution powerloss reduction; and peak demand management. Notably, the report recommended theestablishment of a cobrporate planning unit to conduct market research and loadforecasting, investment planning in generation, transmission and distribution and tariffstudies. The implementation of the technical recommendations of the study led tosubstantial improvements in the reliability and cost of supply, particularly through thereduction of electricity losses. The recommendation concerning the corporate planningunit was not implemented.
1.5 On the second issue identified, the Bagasse Power Potential, 1987-2000 studyconcluded that the major option is to substitute indigenous bagasse for imported fuels inpower generation. This requires economizing on bagasse use in the sugar industry,handling and storing the resulting surplus, and transporting it to power generating stationsfor use as fuel. This was seen as an opportunity for the sugar industry to increase its valueadded and diversify revenue sources, reduce the countys dependence on imported fossilfiiels, meet a rapidly expanding demand for electricity at low cost, and reduce overall airemissions from the power sector by displacing fossil fuels.
1.6 In August 1991, a partnership was concluded between the government and thesugar industry through the adoption of the Bagasse Energy Development Program(BEDP). The BEDP envisaged investments in power generation and sugar millimprovements to effectively capture available bagasse for producing electricity, with coalserving as a supplementary off-season fuel. The purchase of electricity by the powerutility (CEB) was to be based on the avoided cost principle.
1.7 In 1991, the government requested assistance from the World Bank Group inlaunching the BEDP. In response, the Sugar Energy Development Project (Ln. 3458-MTS) of US$15.0 million and the Sugar Blo-Energy Technology Project (TF 028603), aGlobal Environmental Facility (GEF) grant of US$3.3 million were approved by the Boardof the World Bank in March 31, 1992. The main objective of the Sugar EnergyDevelopment Project is to expand electricity generation from bagasse from 70 to 120gigawatt hours (GWh) over a five year period by constructing a bagasse-cum-coal firedpower plant at the Union St. Aubin (USA) sugar factory in southern Mauritius andimproving the efficiency of sugar mills in the generation and use of steam. The GEF grantsupports the achievement of low carbon emission targets through the burning of bagassein replacement for fossil fuels. The institutional framework for enviromental protectionhas been developed by the government with the assistance of the World Bank whichsupported its implementation through the Environmental Monitoring and DevelopmentProject (Ln 3277-MA S) which was approved in 1990.
Chapter 1: Introdudion 3
1.8 Faced with the deterioration of the financial situation of the Central ElectricityBoard and requests by the utility for a tariff increase, the government felt thatinefficiencies that may exist in the utility should not be passed on to consumers andrequested the World Bank for assistance to carry out a study on Power SectorManagement and Restructuring. An Institutional Development Fund (IDF) grant ofUS$230,000 was approved in November 1993 to finance it. The study, which alsoincludes workshops to' familiarize decision makers with several aspects of power sectormanagement and restructuring, is underway.
1.9 In 1993, the World Bank was also requested by the government to review theenergy sector, identify issues and advise on possible options. The emphasis was placed ondevelopments in the power sector and World Bank advice was sought on the reasonablessof the power sector expansion program. Two World Bank missions were fielded for thispurpose. The first, in January 1994, worked closely with the government, particularly theMinistry of Energy, Water and Postal Services (MOE), the public and the private sector,to identify the issues in the energy sector to be covered in the energy sector review. Thesecond, in March 1994, covered the issues identified in some detail. These issues aresummarized in Chapter II of this report. Chapter I1 also presents an overview of theenergy sector in Mauritius. This sets the stage for a detailed discussion of pricing andtaxation and the role they play in affecting the future demandc for energy and energyconservation.in Chapter III. This leads naturally to a discussion on the planning of futureexpansion to meet the forecast demand growth in Chapter IV. Finally, Chapter Vconcludes with a review of the institutional issues confronting the energy sector and inparticular the role of the private sector.
2
ENERGY SECTOR OVERVIEW
Country Background
2.1 Mauritius, a small island nation of about 1.1 million inhabitants, comprises a groupof four islands in the Indian Ocean, with a total area of 1,870 square kilometers. The mainisland of Mauritius, located some 800 km east of Madagascar, accounts for 91 percent ofthe land area and 97 percent of the population. The other islands are Rodriguez(population: 38,000) and the two islands of Agalega (total population: 400).
2.2 In spite of severe macroeconomic imbalances in the early 1980s, the countrymanaged to grow at 6.7% a year between 1984 and 1993 (5.7% on a per capita basis).Solid growth was spearheaded by buoyant export industries (sugar, textile/garment,tourism) built on favorable external markets and use of low-cost labor. Benefits fromeconomic progress have been widely shared through broad-based social programs andhuman capital formation, thus transforming growth into stable and reasonably equitable
development.
2.3 With a GNP per capita of about US$ 3,000, and owing to the govemment's abilityto design and successfully implement flexible economic policies, Mauritius is in the processof becoming an upper-middle income country. New challenges, however, have beenunfolding since the late 1980s. Labor-intensive growth has reached the point of fiulemployment, placing an upward pressure on wages and unit costs. Other factors ofproduction, land and capital are also being heavily utilized. Export industries experienceincreased international competition, less favorable external market access, and stagnantforeign investment. The economic and regulatory system, created in the past to underpintwo distinct incentive environments for the export sector and the domestic sector, fostersmarket rigidities and hampers needed changes in industry structure, management and theperformance of markets.
2.4 The objective set by the medium-term (1992-94) National Development Plan is toattain a real GNP per capita of 5% growth annually through the year 1994 and 6%thereafter. This performance would double per capita income in just over a decade.
IThe trend fbr a more equitable development is confirmed by recent data collected by the 1991/92
housebold budget survey. The data show that the Gni coefficent fel from 0.445 in the early 1980s to0.379 in the early 1990s, i.e. the Lorenz curve became less convex and income is less concentrated andmore widely spread (Cemnal Statistical Offlc, 1992).
S Maurifis. Ener8y Secdor Review
Future growth of the magnitude envisaged is expected to come from greater efficiency inthe traditional growth sources and from new sources such as making Mauritius si IndianOcean hub for financial and maritime services. During the transition from ane ievel ofstrong performance to a higher plateau, good macroeconomic policy to hold aggregatedemand in line with the less vigorous supply is essential. One implication of thiS s a needfor greater efficiency in the public sector, including: (i) a reduction in current expendituregrowth; and (ii) a rationalization of the regulatory and incentive framework. The energysector is an area where efficiency gains could be realized and a process of rationalizationcould begin. Given the already high rate of utilization of the country's resource base,effbrts and incentives that channel productive factors to their best use are critical instimulating increased productivity and improved quality - the essential ingredients inachieving competitiveness at world standards.
Energy and the Economy
Energy Resources
2.5 Mauritius' indigenous energy resources are limited. Its hydroelectric potential haslargely been developed, and the remaining hydro resources are confined to non-energyuses (water supply and irrigation). While the installed hydro capacity is about 60 MW,output has been uneven. Over the last ten years, hydro generation varied between 64 GWhin 1984 and 147 GWh in 1989, with an average annual output of 104 GWh (equivalent to34,000 tons of oil). The medium-to-longer term prospects are that hydro generation willcontribute at most 130 GWh a year.
2.6 The most plentiful indigenous source of energy is bagasse, a by-product of sugarcane processing. Currently, sugarcane production anounts to 5.8 million tons a year,yielding about 1.7 million tons of bagasse. The bagasse is almost entirely used by sugarfctories for process heat and power generation, with excess power sold to the grid. In
21992, excess supply was 85 GWh generated frem 265,000 tons of bagasse. This leftabout 1.44 million tons of bagasse for internal consumption by the factories. Based on theenergy content that bagasse "commands" as a substitute for coal in power generation, theprimary energy equivalent of the power sales was 42,400 tons of oil (about 6%/o of totalprimary energy requirements), while the factories' own bagasse use made up for about229,000 tons of oil.
2.7 The potential availability of bagasse for power generation and other purposes isinexorably linked to the future of the sugar industry in Mauritius. Despite recentexpansion and diversification of the industrial sector, sugar production continues to be animportant economic activity in the country, accounting for 27.7% of total merchandiseexports and about 16% of employment in 1992. In the power sector, seasonality nd
2Bagasse conversion efficiencies vary significantly, rangig from 8 kg/Wh for 'tenntten' power to 227 kg/kWh
in the case of 'firm" power.
Chapter 2: Energy Sector Overview 6
variability in sugar production require power plants at sugar mills to use a dual fuel system(bagasse-cum-coal) to supply power to the grid at guaranteed levels all year ("firm"supply). The only plant that supplies firm power is the Flacq United Estates Limited(FUEL) sugar factory, which uses bagasse as fuel during the crop season (July-December)and coal the rest of the year. Two factories use bagasse to supply the grid during the cropseason only ("continuous" supply) and 12 other factories supply electricity intermnittently.There are no major etonomic uses for additional bagasse in Mauritius other than powergeneration. Its economic opportunity cost is therefore zero. Maximum economic benefitfrom bagasse use will be realized only if all the economically-competitive supply for powergeneration is so utilized. The role of bagasse in power generation is discussed in somedetail in Chapter 4. Planning Future Expansion.
2.8 Forest lands (plantations, nature reserves) cover 28,000 ha, and there are 28,000ha, mainly scrub and grazing land which is privately owned. In 1990, total supply ofindigenous forest products and wastewood was estimated at 140,000 m3 (roundwood), ofwhich 100,300 rm3 (about 65,000 tons, equivalent to 24,000 toe) qualify as woodfuels.Estimated woodfuel supply is roughly in line with figures on household woodfuel usewhich showed a downward trend during the 1980s. The Forestry Service estimates that by
31990 only 26% of the households relied on woodfuel . Based on an average consumptionof 100 kg per month and per household, the total woodfuel consumption was about
460,000 tons a year. Since 1990, the observed downward trend in woodfuel consumptionhas continued in line with the growth of per capita income as households substituted LPGfor woodfiiel.
2.9 At present, the impact of the other renewable sources of energy such as wind andsolar radiation is negligible. According to the Mauritius Meteorological Services,however, at many sites, particularly along the coasts, there is a favorable wind regime (upto an average annual speed of 8 mIs). Solar energy is plentiful, but has had only limitedapplications, for water heating in particular.
2.10 Mauritius has no (know-i) reserves of oil, gas, or coal and no refinery. Therefore,petroleum products as well as coal have to be imported. The size of these imports were amajor concern during the 1970s and in the early 1980s; yet the dependence onhydrocarbon imports has since become economically less precarious. While grosspetroleum product imports claimed about 23% of the country's (merchandise) exportearnings in 1982, the share came down to 9% in 1992, with net imports accounting for
3In 1985, one third of urban households and five out of seven households in rural areas were using
woodfuel.
4The figure of 100 kg/month/household was recorded by a household energy consumption surveyconducted in 1988 (Baguant, 1990). The same survey found that the average household size was 5.5members. With a population of 1.05 million in nid-1990, the total number of households was 191,000.
7 Mauritius: Eneqy Sector Review
little more than 6% of the export earnings. Nevertheless, between 1979 and 1992, grossimports of petroleum products almost tripled from 210,000 toe to about 600,000 toe, ofwhich 377,000 toe (about 63%) were used domestically, with the balance accounted forby re-exports and international bunkers. During the same period, coal imports climbedfrom 1,000 toe to 45,000 toe.
Primary Energy Requirements
2.11 Estimates of total primary energy use vary significantly depending on whether thesugar industry's auto consumption of bagasse is included or not. In fact, different energyaccounting rules were applied to bagasse in the past. Strictly speaking, however, theprimary energy equivalent of bagasse put into energy uses (heat and power) should beconsidered as part of the country's overall energy requirements. Since coal is the preferredalternative at the margin, coal in power generation qualifies as the benchmark for
calculating the energy content of bagasse used for cane processing.
2.12 In 1992, total primary energy requirements amounted to 718,000 toe (see Table2. 1), or 662 kgoe per capita. For comparison, per capita primuy energy consumption was570 kgoe in Costa Rica with per capita income of US$2,000, 858 kgoe in Jamaica withper capita income of US$1,500, and 1,066 kgoe in Malaysia with per capita income ofUS$2,600.
2.13 Between 1976 and 1992, total primary energy consumption rose by 239,500 toe,equivalent to 2.6% a year. If the sugar factorTies' internal bagasse consumption is excluded,primarv energy use increased by an impressive 289,000 toe, frozi about 198,000 toe in1976 to 487,000 in 1992, equivalent to an increase of 5.8% per year. Hence, the sugarindustry's primary energy requirements, which are a iunction of the volume of harvestedcane, were to a large extent stagnant; and the large increase in primary energy use ismainly attributable to the rest of the economy.
2.14 In 1992, oil products accounted for 52.5% of total primary energy consumption,followed by bagasse (37.8%) and hydro/coal (9.7%). Domestic consumption of oilproducts soared from 172,000 toe in 1976 to 377,000 toe in 1992, equivalent to anaverage annual growth rate of 5%. The only period where this strong upward trend in oilproduct consumption came to a halt was between 1979 and 1982 when the economy wasexposed to a sharp rise in oil prices. This temporary decline notwithstanding, petroleumproduct demand (derived mainly from transport and power generation) was the drivingforce behind the country's rapid growth of primary energy requirements.
The exact heating value of bagasse iepends on ;. moistur content. At 50% moisture contcnt, forinstance, estimates range between 7.5 and 10 GJIt. However, since in power generation one ton of bagassesubstitutes for 0.26 ton of coal, and given that one ton of coal is equivalent (on a heating value basis) to0.62 ton of oil, the adjusted energy content of a ton of bagasse matches that of 0.16 ton of oil (equivalentto about 6.6 GJ per ton of bagasse). The latter figure is used in this report.
Chapter 2: Energy Sedor Ovieaw 8
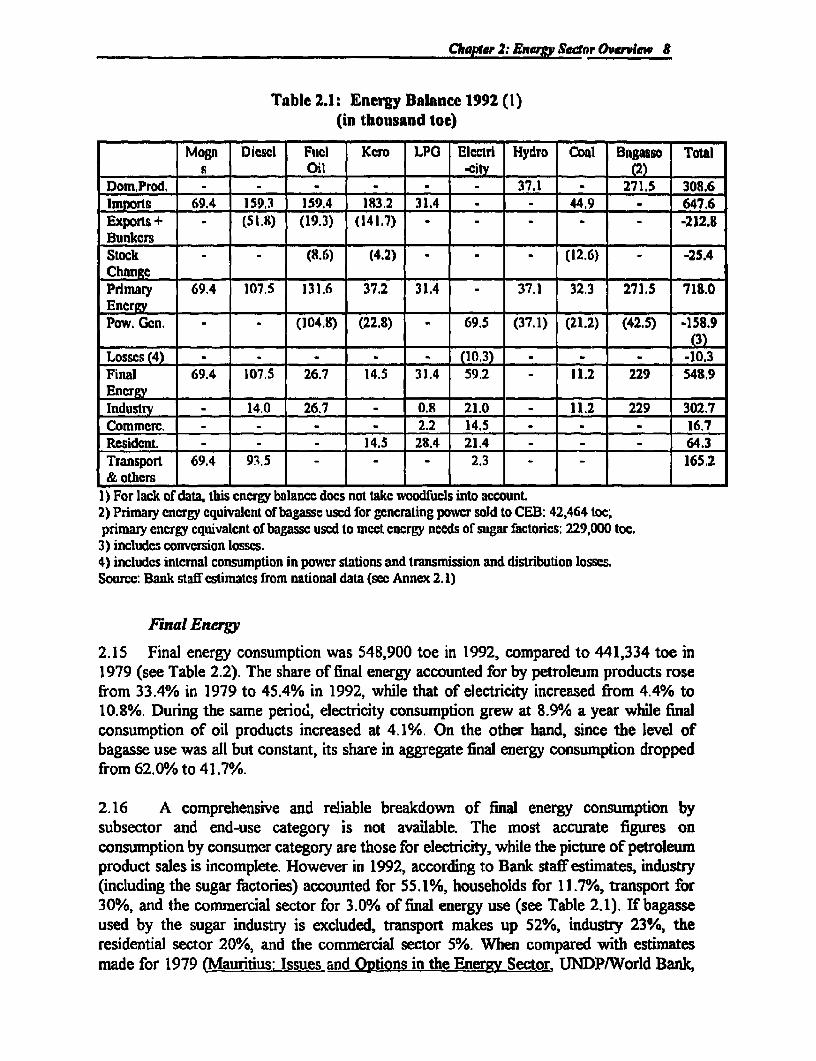
Table 2.1: Energy Balance 1992 (1)(in thousand toe)
Mogn Diesl Fucl Kcro LPG Electri Hydro Coal Bagalso Totals Oil _cily c2)
Dom,Prod. . . . . . 37.1 271.5 308.6Imports 69.4 159.3 159.4 183.2 31.4 . 44.9 - 647.6Exports+ - (51.8) (19.3) (141.7) - -212.5Bunkers ___Stock - - (8.6) (4.2) - - - (12.6) - -25.4Change - -- - - - - -
Primary 69.4 107.5 131.6 37.2 31.4 37.1 32.3 271.5 718.0EnergyPow. Gcn. (104.8) (22.8) - 69.5 (37.1) (21.2) (42.5) -158.9
- . . -~~~~~1(3)Losscs (4) - . - _ (10.3) - - -10.3Final 69.4 107.5 26.7 14.5 31.4 59.2 . 11.2 229 548.9
Industry - 14.0 26.7 - 0.8 21.0 . 11.2 229 302.7Commerc. - - 2.2 14.5 - - - 16.7Resident. - - 14.5 28.4 21.4 - - - 64.3Transport 69.4 93.5 -- - 2.3 = - 165.2& others - -- - - - --
l) For lack of data, this cnergy balance docs not takc woodfucls into accounL2) Primary cncrgy cquivalent of bagasse uscd for gncrating power sold to CEB: 42,464 toc;primary encrgy cquivalent of bagassc used to mcet energy needs of sugar factorics: 229,000 toc.3) includes conversion losses.4) includes intcrnal consumption in power stations and transmission and distribution losses.Source: Bank staff estimates from national data (see Annex 2.1)
Final Energy
2.15 Final energy consumption was 548,900 toe in 1992, compared to 441,334 toe in1979 (see Table 2.2). The share of final energy accounted for by petroleum products rosefrom 33.4% in 1979 to 45.4% in 1992, while that of electricity increased from 4.4% to10.8%. During the same period, electricity consumption grew at 8.9% a year while finalconsumption of oil products increased at 4.1%. On the other hand, since the level ofbagasse use was all but constant, its share in aggregate final energy consumption droppedfrom 62.0% to 41.7%.
2.16 A comprehensive and reliable breakdown of final energy consumption bysubsector and end-use category is not available. The most accurate figures onconsumption by consumer category are those for electricity, while the picture of petroleumproduct sales is incomplete. However in 1992, according to Bank staff estimates, industry(including the sugar factories) accounted for 55.1%, households for 11.7%, transport for30%, and the commercial sector for 3.0% of final energy use (see Table 2.1). If bagasseused by the sugar industry is excluded, transport makes up 52%, industry 23%, theresidential sector 20%, and the commercial sector 5%. When compared with estimatesmade for 1979 (Mauritius: Issues and Options in the Energy Sector, LINDPIWorld Bank,
9 Mauriius: EMerwy Sector Reiew
1981), the net-of-bagasse figures suggest that during the 1980s there was n moderate shiftin the structure of final energy use away from the commercial and residential sectorstowards industry and transport.
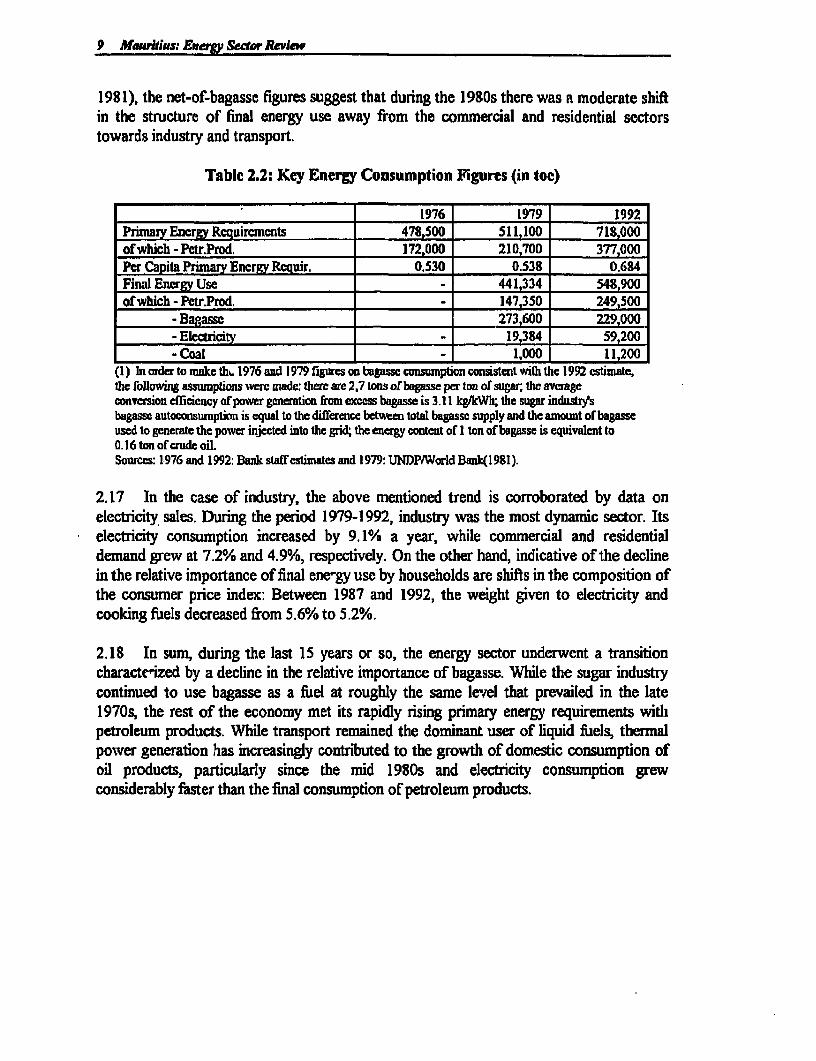
Table 2.2: Key Energy Consumption Figures (in toe)
.___________ _____________________ $1976 1979 1992Primazy Encrgy Rcquircments 478,500 511,100 718,000of which - Petr.Prod. 172,000 210,700 377,000Per Capita Pimary Energy Requir. 0.530 0.53B 0.684Final Energy Use - 441,334 548,900of which - Pctr.Prod. 147,350 249,500
-Bagasse 273 600 229,000-Electricity 19,384 59,200-Coal 1,000 11,200
(1) In order to make th. 1976 and 1979 figmres on bagass consumption consistent with the 1992 cstimate,the following assunptions warc made: there are 2,7 tons of bagasse per ton of sugar, the averageconversion efliciency of pawer generation firm excess bagasse is 3.11 kg/kWh; the sugar indusrsbagasse autoconsumption is equal to the difference between total bagasse supply and the amount of bagasseused to generate the power injected into the grid; the energy content of I ton of bagasse is equivalent to0.16 ton of crude oil.Sources: 1976 and 1992: Bank staff estimates and 1979: UNDP/World Bank(l 981).
2.17 In the case of industry, the above mentioned trend is corroborated by data onelectricity sales. During the period 1979-1992, industry was the most dynamic sector. Itselectricity consumption increased by 9.1% a year, while commercial and residentialdemand grew at 7.2%/o and 4.9%, respectively. On the other hand, indicative of the declinein the relative importance of final ene-gy use by households are shifts in the composition ofthe consumer price index: Between 1987 and 1992, the weight given to electricity andcooking fuels decreased from 5.6% to 5.2%.
2.18 In sum, during the last 15 years or so, the energy sector underwent a transitioncharacte'ized by a decline in the relative importance of bagasse. While the sugar industrycontinued to use bagasse as a fuel at roughly the same level that prevailed in the late1970s, the rest of the economy met its rapidly rising primary energy requirements withlpetroleum products. While transport remained the dominant user of liquid fuels, thermalpoNver generation has increasingly contributed to the growth of domestic consumption ofoil products, particularly since the mid 1980s and electricity consumption grewconsiderably faster than the final consumption of petroleum products.
Chapter 2: &Eerg Setor Overview 10
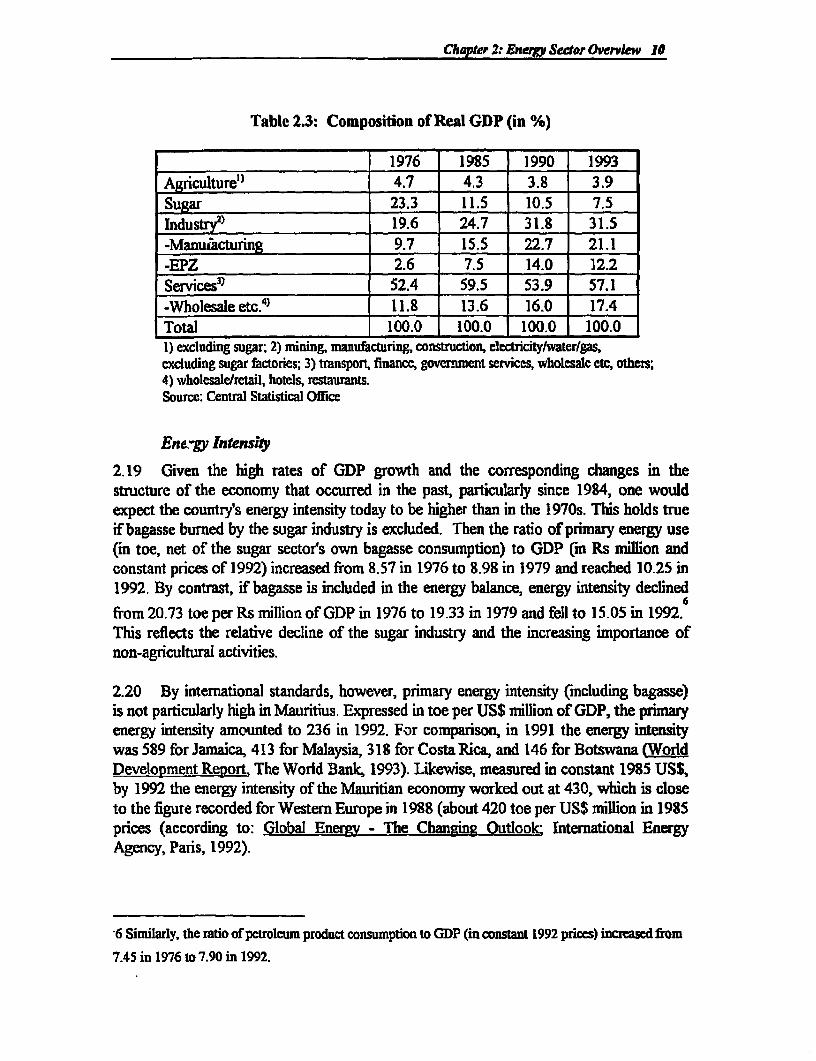
Table 2.3: Composition of Real GDP (in %)
1976 1985 1990 1993Agriculture" 4.7 4.3 3.8 3.9Sugar 23.3 11.5 10.5 7.5Industry2) 19.6 24.7 31.8 31.5-Manufacturing 9.7 15.5 22.7 21.1-EPZ 2.6 7.5 14.0 12.2Services3) 52.4 59.5 53.9 57.1-Wholesale etc.4) 11.8 13.6 16.0 17.4Total 100.0 100.0 100.0 100.01) excluding sugar; 2) mining, manufacturing, construction, electuicitytwatertgas,excluding sugar factories; 3) transpon, finance, government services, wholesale etc, others;4) wholesaletretail, hotels, restaurants.Source: Central Statistical Office
Energy Intensity
2.19 Given the high rates of GDP growth and the corresponding changes in thestructure of the economy that occurred in the past, particularly since 1984, one wouldexpect the country's energy intensity today to be higher than in the 1970s. This holds trueif bagasse burned by the sugar industry is excluded. Then the ratio of primary energy use(in toe, net of the sugar sector's own bagasse consumption) to GDP (in Rs milion andconstant prices of 1992) increased from 8.57 in 1976 to 8.98 in 1979 and reached 10.25 in1992. By contrast, if bagasse is included in the energy balance, energy intensity declined
6from 20.73 toe per Rs million of GDP in 1976 to 19.33 in 1979 and fell to 15.05 in 1992.This reflects the relative decline of the sugar industry and the increasing importance ofnon-agricultural activities.
2.20 By international standards, however, primary energy intensity (including bagasse)is not particularly high in Mauritius. Expressed in toe per US$ million of GDP, the primaryenergy intensity amounted to 236 in 1992. For comparison, in 1991 the energy intensitywas 589 for Jamaica, 413 for Malaysia, 318 for Costa Rica, and 146 for Botswana (orldDevelopment teport. The World Bank, 1993). Likewise, measured in constant 1985 US$,by 1992 the energy intensity of the Mauritian economy worked out at 430, which is closeto the figure recorded for Western Europe in 1988 (about 420 toe per US$ million in 1985prices (according to: Global Energy - The Changing Outlook' International EnergyAgency, Paris, 1992).
'6 Similarly, the ratio of petroleum product oDnsumption to GDP (in constant 1992 prices) incrcased frmm7.45 in 1976 to 7.90 in 1992.
11 Mauaritius: Energy Sector Review
Real Price Developments
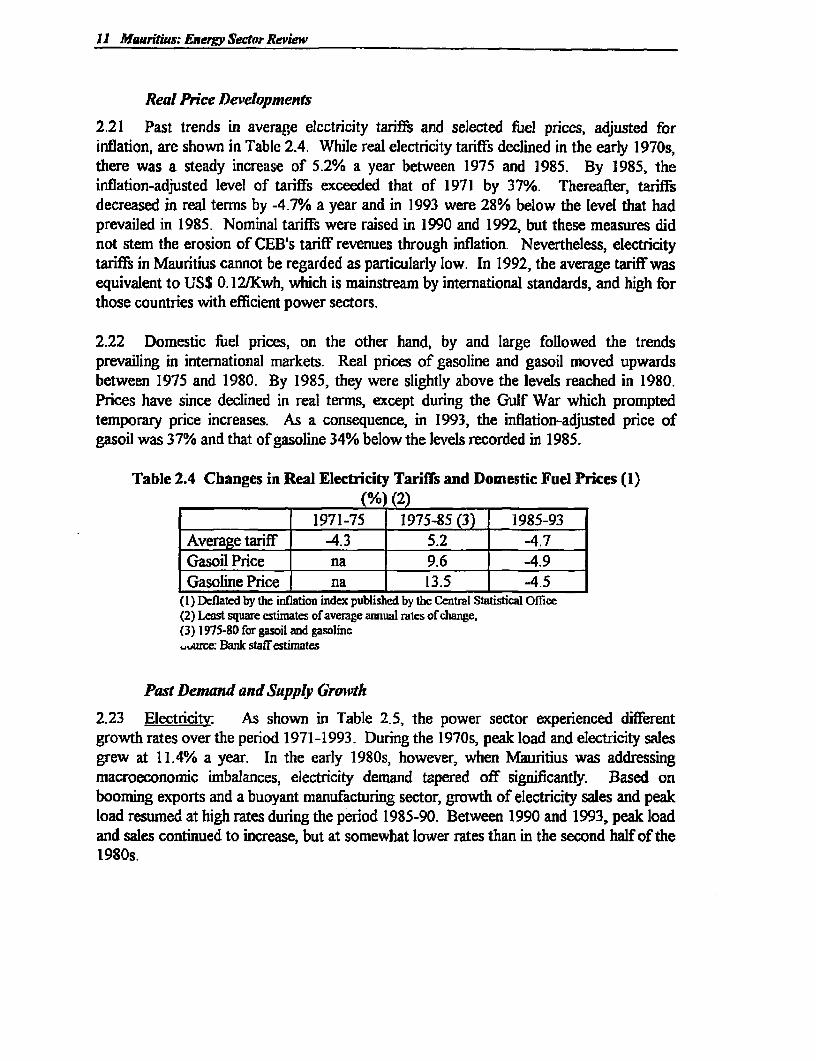
2.21 Past trends in average electricity tariffs and selected fUiel prices, adjusted forinflation, are shown in Table 2.4. While real electricity tariffs declined in the early 1970s,there was a steady increase of 5.2% a year between 1975 and 1985. By 1985, theinflation-adjusted level of tariffs exceeded that of 1971 by 37%. Thereafter, tariffsdecreased in real terms by -4.7% 0a year and in 1993 were 28% below the level that hadprevailed in 1985. Nominal tariffs were raised in 1990 and 1992, but these measures didnot stem the erosion of CEB's tariff revenues through inflation. Nevertheless, electricitytariffs in Mauritius cannot be regarded as particularly low. In 1992, the average tariff wasequivalent to US$ 0.12/Kwh, which is mainstream by international standards, and high forthose countries with efficient power sectors.
2.22 Domestic fuel prices, on the other hand, by and large followed the trendsprevailing in international markets. Real prices of gasoline and gasoil moved upwardsbetween 1975 and 1980. By 1985, they were slightly above the levels reached in 1980.Prices have since declined in real terms, except during the Gulf War which promptedtemporary price increases. As a consequence, in 1993, the inflation-adjusted price ofgasoil was 37% and that of gasoline 34% below the levels recorded in 1985.
Table 2.4 Changes in Real Electricity Tariffs and Domestic Fuel Prices (l).~(%Mo (2)1971-75 1975-85 (3) 1985-93
Average tariff -4.3 5.2 -4.7Gasoil Price na J 9.6 -4.9Gasoline Price na J 13.5 -4.5
(I) Deflated by the inflation index published by the Central Statistical Office(2) Least squarc estimates of average anual rates of change,(3) 1975-80 for gasoil and gasoline-urce: Bank staffestimates
Past Demand and Supply Growtk
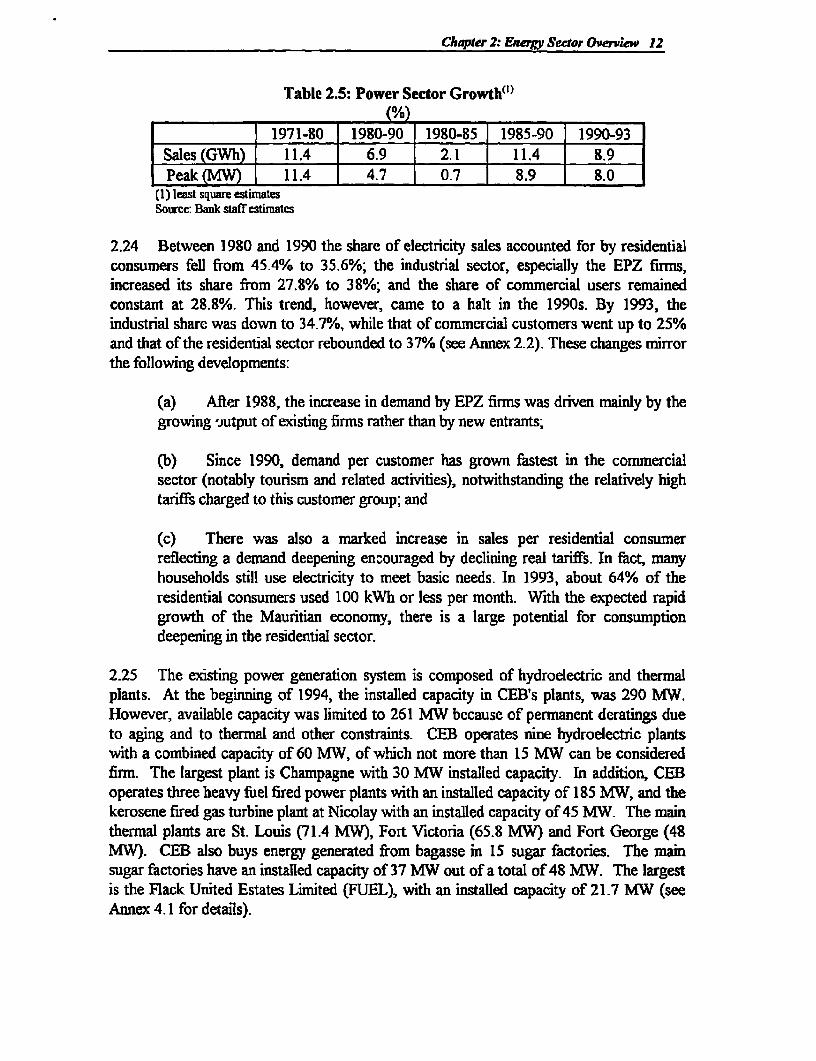
2.23 Electrcity: As shown in Table 2.5, the power sector experienced differentgrowth rates over the period 1971-1993. During the 1970s, peak load and electricity salesgrew at 11.4% a year. In the early 1980s, however, when Mauritius was addressingmacroeconomic imbalances, electricity demand tapered off significantly. Based onbooming exports and a buoyant manufacturing sector, growth of electricity sales and peakload resumed at high rates during the period 1985-90. Between 1990 and 1993, peak loadand sales continued to increase, but at somewhat lower rates than in the second half of the1980s.
Chapter 2: Energy Sector Overview 12
Table 2.5: Power Sector Growth"'}( ).
1971-80 1980-90 1980-85 1985-90 1990-93Sales (GWh) 11.4 6.9 2.1 11.4 8.9Peak MD 11.4 4.7 0.7 8.9 8.0
(1) least square estimatesSource: Bank staff estirmates
2.24 Between 1980 and 1990 the share of electricity sales accounted for by residentialconsumers fell from 45.4% to 35.6%; the industrial sector, especially the EPZ firms,increased its share from 27.8% to 38%; and the share of commercial users remainedconstant at 28.8%. This trend, however, came to a halt in the 1990s. By 1993, theindustrial share was down to 34.7%, while that of commercial customers went up to 25%and that of the residential sector rebounded to 37% (see Annex 2.2). These changes mirrorthe following developments:
(a) After 1988, the increase in demand by EPZ firms was driven mainly by thegrowing 'jutput of existing firms rather than by new entrants;
(b) Since 1990, demand per customer has grown fastest in the commercialsector (notably tourism and related activities), notwithstanding the relatively hightariffs charged to this customer group; and
(c) There was also a marked increase in sales per residential consumerreflecting a demand deepening enzouraged by declining real tariffs. In fact, manyhouseholds still use electricity to meet basic needs. In 1993, about 64% of theresidential consumers used 100 kWh or less per month. With the expected rapidgrowth of the Mauritian economy, there is a large potential for consumptiondeepening in the residential sector.
2.25 The existing power generation system is composed of hydroelectric and thermalplants. At the beginning of 1994, the installed capacity in CEB's plants, was 290 MW.However, available capacity was limited to 261 MW because of permanent deratings dueto aging and to thermal and other constraints. CEB operates nine hydroelectric plantswith a combined capacity of 60 MW, of which not more than 15 MW can be consideredfirm. The largest plant is Champagne with 30 MW installed capacity. In addition, CEBoperates three heavy fuel fired power plants with an installed capacity of 185 MW, and thekerosene fired gas turbine plant at Nicolay with an installed capacity of 45 MW. The mainthermal plants are St. Louis (71.4 MW), Fort Victoria (65.8 MW) and Fort George (48MW). CEB also buys energy generated from bagasse in 15 sugar factories. The mainsugar factories have an installed capacity of 37 MW out of a total of 48 MW. The largestis the Flack United Estates Limited (FUEL), with an installed capacity of 21.7 MW (seeAnnex 4.1 for details).
13 Mauritius: Enry Senor Review
2.26 The oil thermal power stations, all using imported fossil fuels, produced 654 GWh,or about 75% of the energy produced in 1993. The hydropower power plants accountedfor just under 12%, and the sugar factories 13%. Of the latter, 9.3% was generated byFUEL from bagasse and coal, and 3.7% from bagasse only and supplied by 14 other sugarfactories. Between 1987 and 1993, generation has increased at an average annual rate of10.8%. During the same period, peak demand increased by 69 MW, at 9% per year. Thedifference between these growth rates reflects an improvement in the system load factormainly due to the increasing share of industrial loads. As purchases from sugar factoriesremained relatively constant, the whole increase was met by new generating capacity.
2.27 Providing electricity with a high standard of reliability to meet the strong demandof an economy growing in complexity and sophistication is the main challenge of thepower sector in Mauritius. Delays in the implementation of major projects (e.g. anadditional diesel set at the Fort George Power Station and the in the commissioning of theUnion St. Aubin bagasse-cum-coal fired power plant) has put CEB off its optimal, ornormal, expansion path. The utility had to rely on gas turbines, designed principally forpeaking duty and acquired at great cost, to fill the gap. Unless action is taken to moveprojects forward more units with short lead time will probably be needed. An importantquestion that will continue to face power planners is the place and use to be made of thesegas turbines once CEB returns to a somewhat normal expansion path. However, while thethennal additions might not have been the optimal supply response if the shortfall had beencorrectly anticipated, this solution is nevertheless preferable to accepting the economiclosses associated with power shortages. The impact of these decisions on the medium-tern least-cost generation expansion plan needs to be studied.
2.28 Petroleum Products: Propelled by the high rates of economic growth Mauritiushas experienced since the mid-1980s, domestic petroleum product consumption increasedat an average annual rate of 14.9% between 1986 and 1992. Consequently, the share ofimports accounted for by sales on the domestic market climbed from 50.1% to 66.9%.Total imports, on the other hand, grew at a lower rate of 8.9% a year, from 340,000 tonsin 1986 to 601,000 tons in 1992. The most notable change in re-exports and intemationalbunkers, which grew at only 1.4% a year, was a shift away from diesel and fuel oiltowards jet fuel. By 1992, jet fuel made up 22% of total imports.
2.29 Annex 2.3 shows the demand for petroleum products between 1986-1992 for eachpetroleum product as well as the distribution of the consumption of these productsbetween domestic and international use. Of special note is:
(a) the dominance of three fuels in the petroleum market in 1992: fuel oil, dualpurpose kerosene (78% of which is jet fuel) and gasoil. Between 1986 and 1992, thedemand for fuel oil rose at 14.6%, increasing its share to 40.5% by 1992. gasoil andgasoline consumption rose at 8.9% a year and in 1992 accounted for 26.4% and 15.9% oftotal domestic petroleum product demand;
Chapter 2: Energy Sector Ouerview 14
(b) The most rapid growth was recorded for LPG (33% a year). In 1992 LPGmade up 8% of domestic petroleum product sales. It is used mainly by households (as asubstitute for kerosene in cooking) but also by commercial and industrial users. Householddemand for LPG was driven for the most part by rising income. In fact, during the period1986-1990 when per capita GDP grew at 6,4% year, LPG consumption soared by almost40% a year; and
(c) Despite the substitution of LPG for kerosene in the residential sector,domestic kerosene consumption rose by 11.9% a year between 1986 and 1992, mainlybecause of the increased use of kerosene in power generation (gas turbines) due to itsfavorable tax treatment.
The Energ Sector and Public Finances
2.30 The power sector has placed an increasing financial burden on the governmentbudget, especially since the second half of the 1980s when CEB staged a sequence ofinvestments financed tbrough external borrowing. CEB's debt rose from Rs 1.2 billion, (Rs1.9 billion in prices of 1992) or US$89 million in 1986 to almost Rs 3 billion, or US$176million, at the end of 1992. Furthermore, since 1987 the utility persistently ran into losses.By 1991, more than one third of the debt accrued from government (or government-mediated) loans, of which 44%/o were arrears. In order to ease CEB's financial difficulties,the government decided in 1992 to write off the arrears worth more than Rs 700 million(US$ 45 million), equivalent to almost 4% of total government debt in the same year. In1992, the cash-flow shortfall for the power sector was estimated at about Rs 63.4 million(US$ 3.6 million). CEB's losses are expected to reach Rs 62.9 million, or US$ 3.5 million,in 1994.
2.31 Reform is needed to increase the efficiency of the sector and to attract privateinvestment to respond to the challenge of rapidly growing demand and the need to expandcapacity. The financial situation of the power sector is likely to worsen with theimplementation of CEB's 1994-1996 investment program. The total cost of this programis estimated at Rs 4.5 billion (US$ 250 million). In addition to CEB's efforts to increasesupply, plans call for a US$ 50 million (Rs 900 million) investment in a 32 MW dual-fuelpower plant at the Union St. Aubin sugar factory to be jointly owned by the private sectorand CEB and to be completed before the turn of the century. In sum, public and privatepower sector investments during the 1990s can be expected to reach high levels.
2.32 In 1992, taxation of petroleum product imports raised about Rs 920 million, whichwas about 20% of government revenues from import tariffs and 8% of total governmentrevenues. Among petroleum products, the largest single source of tax revenues is gasolinewhich is charged a 200% ad valorem tax ("import duty") and a 17% o"import levy", bothon the cif-value. Fuel oil and gas oil are subject to a 17% import levy and a per-unit importduty of 1.00 Rs/l and 1.30 Rs/l, respectively. In 1993, the latter were equivalent to advalorem taxes of 50% on diesel and 70% on fuel oil. Unlike gasoline, however, taxation of
15 Maur;itus: Energy Sedor Review
fuel oil and gas oil is open to a number of exemptions. At any rate, in 1992, the average7
tariff paid on all petroleum products was about 52%.
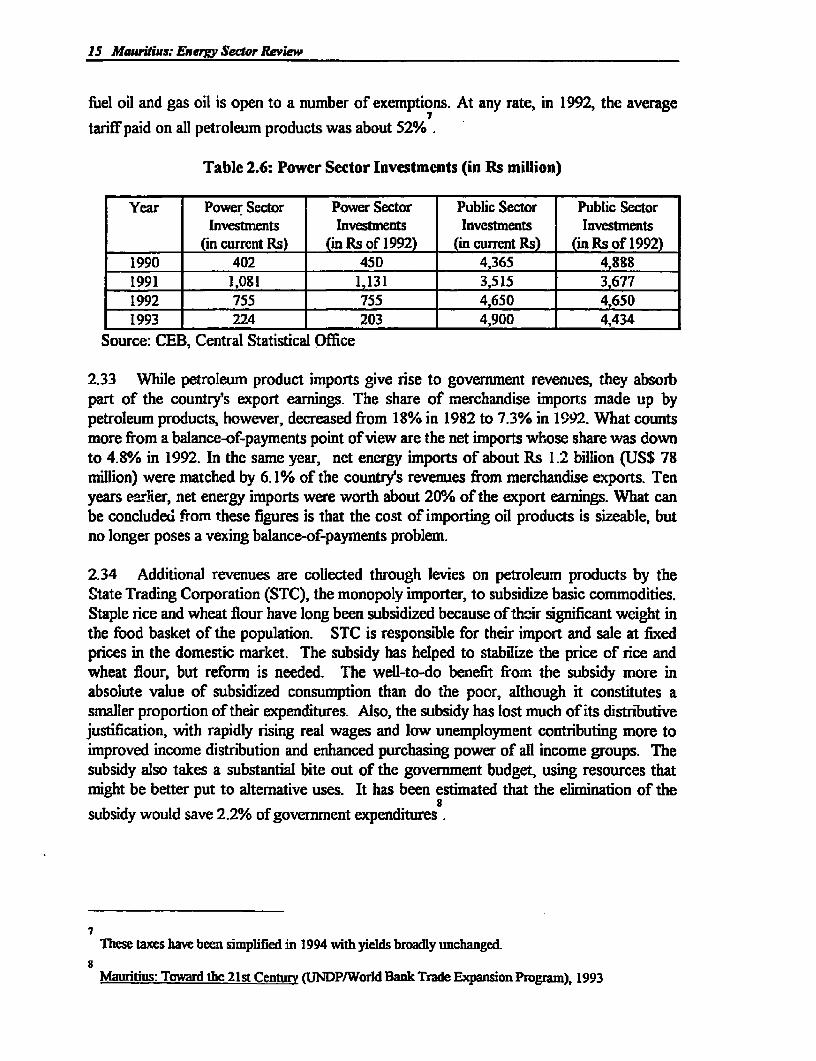
Table 2.6: Power Sector Investments (in Rs million)
Year Power Sector Power Sector Public Sector Public SectorInvestments Investments Investments Investments
(in current Rs) (in Rs of 1992) (in current Rs) (in Rs of 1992)1990 402 450 4,365 4,8881991 1,081 1,131 3,515 3,6771992 755 755 4,650 4,6501993 _ 224 _ 203 4,900 4,434
Source: CEB, Central Statistical Office
2.33 While petroleum product imports give rise to government revenues, they absorbpart of the country's export earnings. The share of merchandise impon:s made up bypetroleum products, however, decreased from 18% in 1982 to 7.3% in ]992. What countsmore from a balance-of-payments point of view are the net imports whose share was downto 4.8% in 1992. In the same year, net energy imports of about Rs 1.2 billion (US$ 78million) were matched by 6.1% of the country's revenues from merchandise exports. Tenyears earlier, net energy imports were worth about 20O%/ of the export earnings. What canbe concluded from these figures is that the cost of importing oil products is sizeable, butno longer poses a vexing balance-of-payments problem.
2.34 Additional revenues are collected through levies on petroleum products by theState Trading Corporation (STC), the monopoly importer, to subsidize basic commodities.Staple rice and wheat flour have long been subsidized because of thcir significant weight inthe food basket of the population. STC is responsible for their import and sale at fixedprices in the domestic market. The subsidy has helped to stabilize the price of rice andwheat flour, but reform is needed. The well-to-do benefit forr. the subsidy more inabsolute value of subsidized consumption than do the poor, although it constitutes asmaller proportion of their expenditures. Also, the subsidy has lost much of its distributivejustification, with rapidly rising real wages and low unemployment contributing more toimproved income distribution and enhanced purchasing power of all income groups. Thesubsidy also takes a substantial bite out of the government budget, using resources thatmight be better put to alternative uses. It has been estimated that the elimination of the
subsidy would save 2.2% of government expenditures.
These taxes have been simplified in 1994 with yields broadly unchanged.
Mauritius: Toward th 21st Ce (UNDP/World Bank Trade Expansion Program), 1993
Chapter 2: Energy Sedor Overview 16
Overview of Sector Management Issues
2.35 There are five basic issues to be dealt with in formulating an energy strategy tosupport Mauritius in its drive to achieve a higher level of economic performance.
2.36 The first concerns pricing policies. In the electric power subsector, the level andstructure of electricity tariffs need to be revised to convey to consumers the real costs theyimpose upon the power system through their consumption. Furthermore, the financialsituation of the sector is unsustainable. It imposes a heavy burden on the government'sbudget and raises questions about the ability of CEB to meet the expected strong growthof demand in time and at least-cost. In the petroleum subsector, prices of petroleumproducts have generally been kept close to intemational levels. However, there areproblems with the price structure which is distorted by inappropriate taxation. Thisconcerns notably the excessive price differential between gasoline and diesel. While theimport cost of gasoline exceeds that of diesel by only 3%, the retail price is 73% higher.This creates a strong incentive for the dieselization of ground transport which would becostly to the country. Another shortcoming of the current tax regime is that while fuel oilis taxed, kerosene and LPG are not. Kerosene, in particular, which is costlier to import, issold at a lower retail price than fuel oil and diesel. First, this creates an incentive to blendkerosene and gasoline for use in gasoline engines. Second, the kerosene tax exemptiondiatorts the fuel options and technology choice in power generation by making keroseneartificially cheaper than competing fuels.
2.37 A credible program for energy demand management and conservation would begreatly enhanced by appropriate price signals, in particular by increasing the level andstructure of electricity tariffs and by adjusting the price structure of petroleum products.
2.38 The second issue relates to price controls in the petroleum subsector. Pricecontrols have been imposed in Mauritius for quite some time to combat inflation andprotect consumers. In the petroleum subsector, this control also extends to the margins ofmarketers and retailers. These margins have been frozen for the last ten years or so,implying an erosion in real terms. For the oil companies to be able to expand andmodernize the facilities to meet the expected growth of demand for petroleum products,they should be able to earn a reasonable return as determined by competition. For this tohappen, the market, including imports, should be completely liberalized and price andmargin controls should be lifted. The problem with price controls is that they haveconsiderable potential to cause harm. They distort incentives, resource allocation, andconsumer choices.
2.39 The third issue relates to the future expansion of electric power facilities and therole bagasse can play in this regard. Bagasse-cum-coal power plants are a competitiveoption for power generation as the marginal cost of these plants is inferior to the cost CEBwould have incurred by generating its own electricity. Three plants are planned which willexhaust the surplus bagasse that could economically be made available for power
17 Manritius: Energy Sector Review
generation. The problem does not appear to be one of economic viability per se , althoughsome improvements could be made such as the removal of the bagasse premium forbagasse generated electricity and a better contractual agreement between CEB and privateproducers, but timely implementation of these projects. If they are to fit into CEB's least-cost expansion plan, they should be in a position to supply the grid at the right time. Ifthey are not, this could either dangerously decrease the reserve margin of the system ornecessitate the urgent commissioning of equipment with short delivery such as gasturbines, which may not be optimal. The consequences can be serious for the utility andthe country. Also, the considerable delay in achieving the procurement of powergeneration equipment (e.g. the diesel set for the Fort George power station) is anotherelement of this timeliness problem.
2.40 The fourth issue relates to envirnamental concerns and the instrument ormechanism best suited to bring desiraule environmental outcomes. In the port area,the highest priority is to be given to the establishment of a contingency plan, to dealefficiently with a fire or other disaster in the oil facilities. Also the govemment shouldmonitor the incidence of energy use and take remedial action as necessary, includingtaxation.
2.41 The fifth issue concems the role of energy institutions and the role of theprivate sector can play in securing the necessary supply response to the growing energydemand. For some time and for good reason, given the size of the investment required insupply expansion, the government has been thinking of privatizing CEB and attractingprivate financial flows to the sector. This report offers several alternatives for bringingthis about and one in particular which we recommend because we think it is best suited tothe present stage of deveiopment of thb power subsector in Mauritius. With therecommended liberalization of the petroleum market and the lifting of price controls, therole of STC in the petroleum subsector as well as the justification of subsidies providedacross-the-board on staple foods such as rice and flour through levies imposed on oilproducts are open to question. Although outside the purview of this report, it is suggestedthat may be the time has come to have a fresh look at the justification of governmentinterventions in the SOs which may no longer be valid today and at the efficiency ofincome distribution policies. In an economy relying to the greatest extent on price signalsand on the functioning of markets, the role of the government also has to change andbecome less interventionist and more a facilitator of private enterprise.
2.42 These and other issues, as well as possible solutions, will be discussed in thefollowing chapters.
9Bagasse Power Potential. 1987-2000 (The World Bank, October 1987); and Suaar Enerp. DevelopmentProicct Staff Appraisal Report (The World Bank, March 1992
3
FUTURE DEMAND FOR ENERGY AND THE ROLEOF ENERGY PRICING AND TAXATION
3.1 Energy demand forecasts are central to the analysis of the energy sector, influencinginvestment, pricing and finances. Energy consumption is affected by income, prices and othersocio-economic variables. The nature and speed of economic growth and the pricing and taxationsystem adopted determine to a large extent how energy demand grows. The failure to use energypricing effectively, especially in the power sector, as an instrument for energy conservation anddemand management during the 80s and early 90s had serious adverse consequences on energyefficiency. As the price of electricity, for instance, declined in real terms, electricity consumptionrose by more than what could be explained by the growth of income alone. The econometricanalysis (Annex 3.1) confirms the responsiveness of energy demand to prices, especially in thelong-mun but also in the short-run, for gasoline and diesel.
Pricing and Taxation
3.2 Efficient pricing requires the implementation of energy prices which reflect the level aswell as the structure of economic costs. Regarding petroleum products, domestic prices shouldbe in line with prices at which products are traded on international markets. Since Mauritius is aneconomically small net importer of these products, the benchmark for domestic pricing is importparity (cif-value). In the case of electricity, optimal tariffs should be based on long-run marginalcosts.
3.3 In the case of petroleum products as a group, prices were kept reasonably close tointernational levels over a long period of time but the structure has some serious shortcomings. Inthe power sector both the level and the structure are inadequate.
3.4 The major concern in the taxation of energy supplies is that taxes not heavily distortallocative decisions. Regarding final consumers, care should be taken that the incidence of energytaxes does not foreclose choices that would be economic in the first place, i.e. in the presence ofefficient relative prices not excessively distorted by taxes.
Electricity Tariffs
3.5 Save for minor refinements, the basic structure of the tariff system has been kept intact formore than a decade. As shown in Annex 3.2, the rate structure in place distinguishes betweenconsumer categories, consumption levels (kWh/month), contracted load (kW), and maxmumdemand (kVA). There are increasing block rates for residential users, while EPZ-enterprisesenjoy declining block rates which even start at a lower level than that applying to non-EPZindustrial users. Not shown in Table 3.2 are the rates for street lighting, irrigation, and sugarfactories. The latter pay an energy charge of 2.50 Rs/kWh, plus monthly charges for standbycapacity, ranging from Rs 2,000 (< 500 kVA) to Rs 5,800 (1,501-2,500 kVA). Irrigation is

19 Mauitius: Energy Sector Review
subject to a rate of 1.35 Rs/kWh and charges for contracted loads, starting at Rs 45 for 10 kW orless, to Rs 1,500 for more than 200 kW.
3.6 Tariffs do not reflect the cost structure of CEB's supply system. In particular, the capacitycharges are substantially below the cost of serving the loads at peak. As shown in Annex 3.3, thecost of power injected into the grid is about 145 RslkW/month, and the cost of power delivered atthe low-voltage level is estimated at 292 Rs/kW/month. The rates charged for energy varysignificantly, ranging from 1.2 Rs/kWh, which is slightly above average thermal operating costs(Table 3.1) but below the costs of supplying high voltage consumers (Annex 3.4), to 3.2 Rs/kWh.Also, the tariff structure involves a variety of cross-subsidies and discriminatory features whichare difficult to justify on economic grounds.
Table 3.1: CEB Thermal Generation Operating Costs, 1993(Rs/kWh)
Fuel + Lubes4) Salaries etc. TotalNicolay"' 1.32 0.15 1.47
Ft.George 3) 0.54 0.04 0.58
St.Louis22 0.77 0.27 1.04System Average 0.73 0.23 0.93
Ft.Victoria)| 0.69 0.20 0.891) Gas turbinc, specific kerosene consumption: 0.395 l/kWh, tax-frec preferential wholesale price of kerosene: 3.32Rs/kWh;2) average specific fuel oil (180 cst) consumption: 0.231 1/kWh, wholesale price: 3.06 RslkWh, expected output for1994: 225 Gwh;3) Sulzer diesel (2x24 MW), specific fuel oil (380 cst) consumption: 0.206 lkWh, preferential wholesale price:2.56 Rsll;4) FLGeorge and St.Louis use small amounts of gas oil to start and stop the engines;5) MAN diesel generators only.Source: CEB
3.7 As a rule, consumers who by and large are identical in terms of load characteristics andenergy use should be served in a non-discriminatory, albeit cost-efficient, way. For instance, non-EPZ and EPZ firms having the same load characteristics should be treated equally.Discriminatory features in the tariff system should be eliminated. Electricity prices that do notcover the economic costs of supply do not encourage consumers -many of whom produe: othergoods- to use electricity efficiently, select the most economic fuel, or use the technology thatwould best meet their needs. In addition, this tariff policy strains the sector financially. Finally,the usefulness of the increasing block rates applied to residential customers is questionable. Amore efficient solution would be to apply a flat rate of, say, Rs 50 per month to households with amonthly consumption of 25 kWh or less', and subject the remaining residential users to a demandcharge that accounts for the customer group's contribution to system peak, and a uniform rate foruse of energy. The implementation of such rates should go hand in hand with more sophisticatedmetering and the use of load limiterslcircuit breakers. The funds needed to undertake thesemeasures could be raised in conjunction with financing schemes for planned investmemts intransmission and distribution facilities.
' This group currently accounts for 15% of all residential customers.
Chapter 3:Future Demandfor Energy andthe hRole of Energy icing and Taxation 20
3.8 CEB should give the highest priority to measures that improve the efficiency of electricitysupply. Most importantly, govemment should approve, and CEB should adopt, a new tariffsystem that more closely reflects the cost of generating, transmitting and distributing electricity,depending on the consumer category served, its voltage level, the season and the time of use. Inthe same vein, efforts CEB can make to enhance the efficient use of electricity on the part of itsconsumers should focus on load management (e.g. air conditioner cycling prograns). Utility-sponsored conservation programs, however, that in one way or another subsidize electricity usersare a questionable strategy, particularly when an efficient tariff system is in place.
Electricity Purchases
3.9 In the past, between 12% and 16% of the electricity injected into the grid was bought byCEB from autogenerators in the sugar industry. In 1992, when the share of purchases was 16%,about two thirds of the sugar factories' electricity sales were generated from bagasse, while thebalance came from coal used by the FUEL plant. 93.8 GWh (73.1% of the sales) were firm powersupplied by FUEL; 34.6 GWh (19.2%) fell into the category of "continuous power" (in the sensethat the factories have a contract with CEB for continuous supplies during the crop season fromJuly to December), while 9.9 GWh (7.7%) ranked as "intermittent power". Depending on thereliability of supply, CEB currently pays 0.70 Rs/kWh for firm power', 0.50 Rs/kWh forcontinuous power, and 0. 17 Rs/kWh for intermiittent supplies. In 1993 the average rate was 0.82RsAkWh, with an average of 0.76 Rs/kWh for bagasse-based power and 0.94 Rs/kWh for coal-based power.
3.10 There has been considerable debate over the appropriateness of the rates CEB paid in thepast and what rates should apply to new non-utility suppliers. In theory, the value powerpurchases from independent generators has to an electric utility is equal to its "avoided costs".Basically, avoided costs are equal to the difference in costs that the utility incurs with and withoutan independent generator, assuming that the independent generator serves the part of the load theutility would be obliged to serve in its absence. At the margin, avoided costs tend toward theutility's marginal costs. Thus, avoided costs have nothing to do with the costs of independentpower generation. Rather, in calculating avoided costs, the focus is on the utility's mix of plant,load duration curve, investment requirements and merit order dispatch with and without anindependent supplier (for details see Annex 3.3). Conversely, the minimum price that the privategenerator should be prepared to accept (on a long-term basis) is its own long run marginal cost ofsupply (including a reasonable return on investmaent).
3.11 Intermittent supplies from independent generators should be subject to a price ceilinggiven by CEB's operating costs. In fact, since salaries and related expenses are fixed in the short-run, CEB should not pay more than what it can save in terms of fuel costs. As shown in Table3.1, the potential savings range from 0.54 Rs/kWh to 1.32 Rs/kWh, depending on the unitdisplaced by power purchases.
2This is an average figure. Rates for firm power vary from 0.55 Rs/kWh for up to 30 GWh, 0.65 RsfkWh for 31-35GWh, and 0.78 Rs/kWh for more than 35 GWh.
21 Mauritius: Enegy Sedor Rcview
3.12 Practically more relevant and economically more significant is the case of firm suppliesfrom an independent generator. A firm supplier commits capacity to the utility for dispatch, andtherefore is entitled to an avoided cost paymcnt that consists of a capacity clarge (Rs/kW) and arate for energy (Rs/kWh). As shown in Annex 3.3; for an indepcndent supplicr like the USApower station, which is planned to serve base load (and thus would displacc CEB investments inbase load capacity), the corresponding figures would be 4,374 Rs/kW (243 UlS$/kW) and 0.58RsfkWh (0.032 US$/kWh). The capacity payment, however, is subject to the condition that theindependent producer's plant is called upon or operated (at least) 5,850 hours a year. Violatingthis condition leads to penalties in the form of deductions from the capacity payment.3 Onaverage, however, the independent producer serving base load would get 1.332 Rs1kWh or 0.074US$1kWh (in market prices of early 1994). This is roughly in line with an net-of-tax estimate theBank made in 1992 (World Bank, 1992, p.15).
Bagasse Transfer Price and Other Incentives to Bagasse Generated Electricity
3.13 The bagasse transfer fund (established in 1985 under the Sugar Industry Act) was createdon the premise that generating and selling power from bagasse at a price based on CEB's avoidedcosts is a beneficial venture, and that part of the rents or benefits which power generating millersreap in the form of profits should be diverted to suppliers of cane (or, what comes to the samething, bagasse) who do not own cane-processing and power-generating facilities. To the extent,however, that the transfer charge is passed on to CEB, the fund becomes a means of subsidizingthe sugar sector through electricity tariffs. Put another way, if CEB and, thus its customers, pay aprice covering avoided costs plus a premium, the Bagasse Transfer Price Fund works so as toredistribute income from electricity users to sugar producers, an arrangement that is difficult tojustify on economic grounds. Avoidance of this economic cost requires either: (a) elimination ofthe bagasse payment or (b) modification of the payment system so that it does not affect thecompetitiveness of potential economic bagasse supply.
3.14 A number of other incentives are already in place to foster the use of excess bagasse forpower generation. For instance, millers are entitled to a rebate on their sugar export tax if bagasseis converted into firm or continuous power, or sold to firm power generators.' Also, 6 0 %/o of theproceeds from firn power sales are exempted from income taxation. Moreover, sugar producingpower generators enjoy a rebate on their sugar export tax equivalent to 15% of capitalexpenditures for power generating equipment. These numerous incentives increase the econoniccosts of power generation from bagasse. A consolidation and a rationalizalion of these incentivesis necessary.
3 Alternatively, one can opt for a uniforn per kWh payment equal to the average payment resulting from the abovearrangement (4,374 Rs/kW, 0.58 Rs/kWh, 5,850 operating hours), which is 1.332 Rs/kWh. With a fixed per-kWhrate, the payments to the independent producer will be proportional to the number of kWhs delivered. Thisapproach has been chosen in the report on the "Sugar Energy Development Project" (World Bank, 1992).
4 The rebate is 0.2% per kg for the first 100 kg of excess bagasse from a ton of processed cane, and 0.25% for eachadditional kg. As a rough estimate, in 1993 this translated into Rs 17 per ton of excess bagasse.
Chapter 3:ruture' emand fir Energ tandthe Role ofEnery Pricing and T=axion 22
Improvenments in Pms'er Patrchavsing AIgrrements
3.15 There are a number ol' iipiovenierns that could be made to power purchasing agreementsin the future, taking into account ilte recently concluded agreement between CEB and Union St.Aubin. The price that ClEB will pay for firm power supplied by the sugar industry includes abagasse transfer price component, and the premium added on top of avoided costs (cstimated at1.33 Rs/kWh, inclusive of taxes tlhat CEB would have to pay). This premium increases (indiscrete stcps) in direct proportion to the kWhs delivcred, from 0.05 Rs/kWh to 0.50 Rs/kWh.The economic rationale for such a premium is dubious. If not for the savings in fucl costs, whyshould bagassc be converted into clectricity and injected into the grid? It is not clear thereforewhy CEB and its customers should pay more for bagasse-gencrated electricity than it costs (orwould cost) CEB to generate the samc amount of cicctricity with its own facilities?
3.16 The supply contract between CEB and USA includes some peculiar features: (i) differentprices are paid for coal and bagasse generated electricity; (li) any variation in the bagasse transferprice component within the price of energy from bagasse will be supported by CEB; and (iii) thepossibility is left for CEB to supply coal to the USA power station. Also, the public participationat the level of 35 % in the future company, to be tentatively financed by a loan from the EuropeanInvestment Bank, is questionable. Public participation in an essentially private venture shouldhave been zero or limited to a minimal amount to provide comfort to private operators.
Petroleum Products
3.17 The issues in this subsector relate to petroleum product taxation and to price controls onthe industry.
Taxation
3.18 In 1992, taxes on oil products accounted for 8%zo of total government revenues. Eventhough petroleum product taxes are mandated by law, there is considerable scope for discretion.For instance, while the law calls for import taxes of 42% on LPG, under the current practice LPGimporters are exempted. Also, the effective tax rates often fall short of nominal or statutory rates.This is particularly true for gas oil. Taxes on gasoline, on he other hand, tend to be collected in amore stringent way.
3.19 All petroleum product taxes are designed as import taxes (there is no sales tax on oilproducts). Gasoline is the largest source of tax revenues from oil products and the tax burden perlitre was UScents 28.1 for gasoline, UScents 9.8 for gas oil, and only 7.2 UScents for fuel oil..No taxes are levied on kerosene and LPG and reexports and international bunkers are tax-free, asis customary5.
5 Import duties and lcvies on petoleum products has recently been consolidated with rates and yields broadly unchanged.
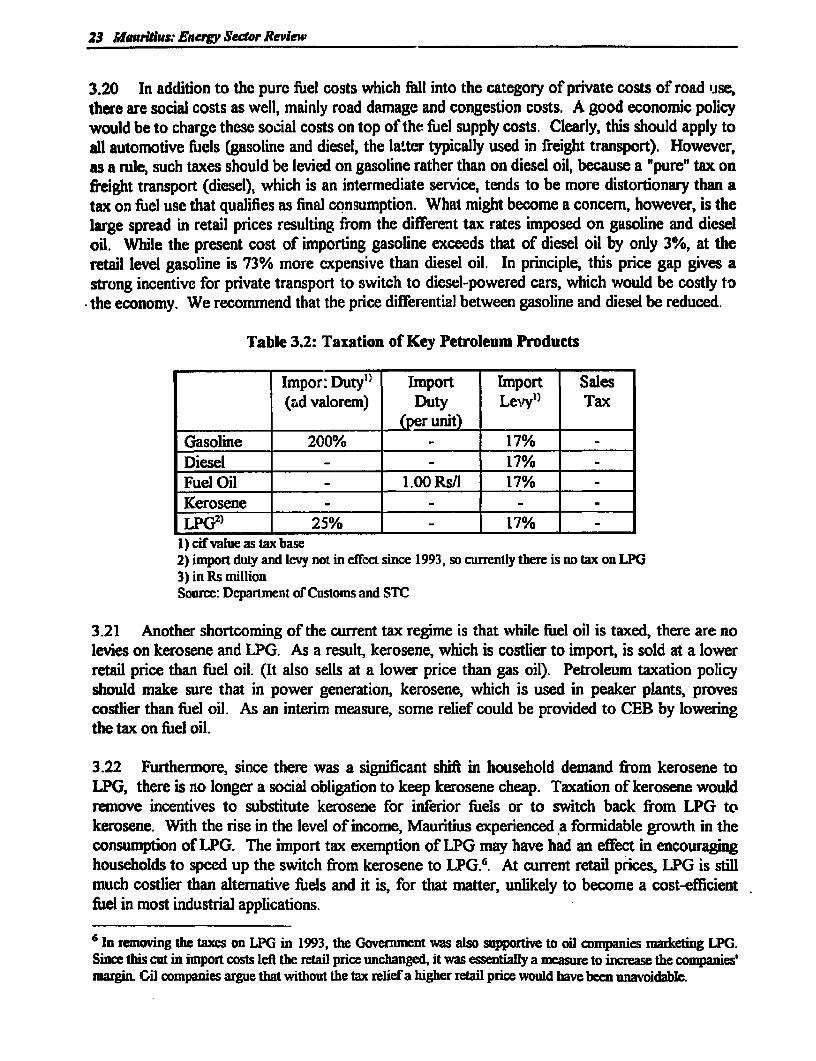
23 Ma&ritius; Encrgy Secdor Review
3.20 In addition to the pure fuel costs which fall into the category of private costs of road luse,there are social costs as well, mainly road damage and congestion costs. A good economic policywould be to charge these social costs on top of the fiel supply costs. Clearly, this should apply toall automotive fuels (gasoline and diesel, the latter typically used in freight transport). However,as a mle, such taxes should be levied on gasoline rather than on diesel oil, because a "pure" tax onfreight transport (diesel), which is an intermediate service, tends to be more distortionary than atax on fuel use that qualifies as final consumption. What might become a concem, however, is thelarge spread in retail prices resulting from the different tax rates imposed on gasoline and dieseloil. While the present cost of importing gasoline exceeds that of diesel oil by only 3%, at theretail level gasoline is 73% more expensive than diesel oil. In principle, this price gap gives astrong incentive for private transport to switch to diesel-powered cars, which would be costly to
* the economy. We recommend that the price differential between gasoline and diesel be reduced.
Table 3.2: Taxation of Key Petroleum Products
Impor: Duty" Import Import Sales(ad valorem) Duty Le.vyl) Tax
(per unit)Gasoline 200% - 17%Diesel - - 17% -
Fuel Oil - 1.00 Rsl 17%Kerosene - - -
LPG2 ) 25% - 17% _1) cif value as tax base2) import duty and levy not in effcct since 1993, so currently there is no tax on LPG3) in Rs millionSource: Department of Customs and STC
3.21 Another shortcoming of the current tax regime is that while fuel oil is taxed, there are nolevies on kerosene and LPG. As a result, kerosene, which is costlier to import, is sold at a lowerretail price than fuel oil. (It also sells at a lower price than gas oil). Petroleum taxation policyshould make sure that in power generation, kerosene, which is used in peaker plants, provescostlier than fuel oil. As an interim measure, some relief could be provided to CEB by loweringthe tax on fuel oil.
3.22 Furthermore, since there was a significant shift in household demand from kerosene toLPG, there is no longer a social obligation to keep kerosene cheap. Taxation of kerosene wouldremove incentives to substitute kerosene for inferior fuels or to switch back from LPG tokerosene. With the rise in the level of income, Mauritius experienced a formidable growth in theconsumption of LPG. The import tax exemption of LPG may have had an effect in encouraginghouseholds to speed up the switch from kerosene to LPG.'. At current retail prices, LPG is stillmuch costlier than alternative fuels and it is, for that matter, unlikely to become a cost-efficientfuel in most industrial applications.
'6 In removing the taxes on LPG in 1993, the Govenmuent was also supportive to oil companies marketing LPG.Since this cut in import costs lef the retail price unchanged, it was essenfialy a measure to increase the companies'margin. Cil companies argue that without the tax relief a higher retail price would have been unavoidable.

Chapter 3:Future Demandfor Energy and the Role of Energy Pricno and Taxation 24
Pricing
3.23 Petroleum products sold in the domestic market are denominated in Rs, while reexportsand international bunkers are priced competitively in US$. The oil companies serving thedomestic market buy the products from STC at a fixed transfer price. This price covers the costof importing the products, taxes, and a margin accruing to STC. Since transfer prices are keptconstant over long periods, STC's margin acts like a buffer that transforms changes ininternational prices or exchange rate fluctuations into losses or extra-profits for STC. As Table3.3 indicates, the companies' margin is a small fraction of STC's margin (0.13 Rs/l across allproducts). The retailers' margin, on the other hand, varies between 0.32 Rs/l and 0.38 Rs/l.
3.24 Due to the fact that the profit margins and the retail prices are fixed for long periods oftime, there is little or no competition in the petroleum industry. Price controls have been imposedin Mauritius to combat inflation and to protect consumers. But price controls have never provedto be an efficient tool to contain inflation and healthy competition is a more effective way ofprotecting consumers. Price controls benefit better-off consumers as well as the poor and haveconsiderable potential to cause harm. Flexibility in resource allocation requires that prices andprofit margins rise in some sectors and fall in others in accordance with relative scarcities. Priceand margin controls prevent this from happening, thereby distorting incentives, resourceallocation, and consumer choices. Those associated with subsidies also constitute an unnecessaryfiscal burden for the government.
Table 3.3: Vertical Breakdown of Petroleum Product Prices2 )
Gasoline Diesel Domestic LPG Fuel Oil(Rs/l) (RS/1) Kerosene (Rs/kg) (Rs/l)
CIF 2.22 2.16 2.44 5.62 1.30Eiport Taxes 4.77 1.67 0 0 1.22STC Margin 1.38 0.79 0.49 -
STC Transfer 8.37 4.62 2.93 -
Price _ _ _ _
Miscellan. 0.29 0.10 0.04
Marketing 0.33 0.33 0.33 1.96Expenses
Profit Oil 0.13 0.13 0.13 3.00CompaniesWholesale 9.12 5.18 3.43 10.58Price 1 ) _ _ _ _ __ _ _ _ _
Retail Margin 0.38 0.32 0.37 1.50
Retail Price 9.50 5.50 3.80 12.08 4.451) CEB pays 3.2 RsA for kerosene, 5. 18 Rs/i for gas oil, and 3.08 RsJl for fuel oil 180.2) March 1994Source: STC and private oil companies.
3 25 More efficient ways of helping the disadvantaged include targeted support programs thatmeet both distributive and cost-saving objectives. The elimination of price controls, and their

2S Mauritius: Enery Secdor Review
replacement by incentives, would provide a great stimulus to increase the efficiency with whichresources are deployed in the petroleum subsector. The Bank mission recommends that theimport and marketing of all petroleum products be completely liberalized and prices decontrolled.At the same time, the government should put in place a policy and regulatory framework thatwould address t'-e following: (a) government policy in the petroleum downstream subsector andthe respective roles of the state and of the private sector; (b) petroleum product taxation. Taxeson petroleum products can be justified economically on the basis of the negative extemalitiesassociated with their use (pollution, wear and tear of the infrastructure, noise, etc.) and should besuch that the internal price structure of petroleum products does not lead to inefficient interfuelsubstitution; (c) safeguards against collusion; and (d) environmental regulations (hazardous wastedisposal, fire, oil spill and other disaster prevention and contingency plans, surface andunderground storage tanks safety, etc.).
Income and Price Elasticities
3.26 The estimated short-run and long-run price and income elasticities of demand forelectricity, gasoline and diesel are presented in Annex 3.1 and summarized in Table 3.4. Theseresults play an important role in the forecasting of energy demand and in the discussion of energyconservation. The statistical analysis shows relatively inelastic demands with respect to both priceand income changes in the short-run. In spite of this, the short-run price elasticities- are stillsignificant for gasoline and diesel, -0.387 and -0.224 respectively.
3.27 The short-run response of electricity demand to a price change is low: -0.098. This couldbe explained by: (i) the very small number of close substitutes. The availability of a small numberof close substitutes decreases the price elasticity. If the price of electricity increases, consumershave few substitutes to tum to; (ii) the small share of electricity in the budget of all consumergroups. Smaller shares are generally associated with smaller electricity price elasticities becausechanges in the price of electricity have a larger budgetary impact on those who spend a largershare on this good and thus are more likely to reduce their electricity consumption. For instance,the recently published 1987 input-output table, shows that the share of electricity in the value ofoutput of the industrial sector (non-EPZ and EPZ firms), which represented 35% of electricitysales in 1993, was only about 3%; and (iii) in spite of the steady increase in the overall domesticconsumption, 64% of the residential consumers still use electricity to satisfy requirements (100kWh or less per month) and many would probably regard electricity as a near necessity Ci.e. asubstantial price increase would be needed for consumers to forego the consumption of electricityand revert back to inferior and cheaper energy sources).
3.28 The short-run income elasticities are significant and the long-run price and incomeelasticities are substantially higher as time is allowed for consumers to adjust. The estimatedlong-rn price elasticities vary from -0.296 for electricity to -0.517 for gasoline. GDP growth hada significant impact on the demand for electricity and petroleum products. In the case ofelectricity and gasoline the long-run income elasticity was above unity, implying that a higherGDP tends .o increase the ratio of electricity/gasoline consumption to GDP.

Chapter 3.Fture Demandfor Energ and hcA Role of Encjv Pricing and Taxaion 26
Table 3.4: Estimated Demand Elasticities
Elasticity Electicity Gasoline Dieselshort-run income 0.508 0.957 0.485long-run income 1.535 1.279 0.970short-run price -0.098 -0.387 -0.224long-runP ncc 0.296 0.517 -0.448
Source: Annex 3.1
Future Demand
3.29 Predictions of energy demand are a planning tool for policy and decision makers. Demandforecasts can be generated to assess the potential impact that policy decisions taken now have inthe fiiture. They also assist energy supply industries in making decisions upon long-terminvestments in plant and infrastructure, financial targets, and inventory levels. Forecasting ofdemand is particularly important in the power sector where the development of a least-ostexpansion plan with a lead time of 15 years or more crucially depends on the expected future patnof capacity and energy demand.
3.30 In the following lines, forecasting of energy demand is done mainly with help of regressionmodels estimated in Annex 3.1. Statistically significant and reasonably stable relationshipsbetween demand (with sales as a proxy), GDP, and prices are available for electricity, gasolineand diesel oil. In these cases, the demand forecasts are conditional on predictions of GDP growthand real price development. Demand for LPG, kerosene and fuel oil is predicted on the basis ofpast trends taking into account possible impacts of correlated variables.
Electicit> Demand
3.31 In order to forecast electricity sales for the period 1994-2010 from the regression modelestimated in Annex 3.1, one has to predict, or to form expectations about, future changes in (real)GDP and average tariffs (at constant prices of 1992). Average tariffs are assumed to adjust to thelevel of cost recovery by 1995, which is 2 Rs/kWh in constant prices of 1992. Thereafter, averagetariffs are projected to rise in discreie steps reflecting moderate increases in real operating costs.
3.32 GDP growth is predicted for two scenarios. The base case scenario is composed of themost recent World Bank projections for the period 1994-2002 and extrapolations for the period2003-2010. The main assumption underlying this growth path is that the Mlauitian economymaintains its competitive edge through export diversification and productivity gains. However, aperiod of adjustment cannot be ruled out where the policy reforms needed to meet the challengesof the 1990s are delayed or do not have the desired effects in the short-to-medium term. In thisevent, the growth rates are likely to fall short of the base-case predictions until the turn of thecentury. Thereafter, GDP growth is assumed to pick up at 6% a year and to slow down to 5.5%by 2007. This prospect is called the 'ow-growth scenario.
3.33 The different scenario assumptions and the resulting sales forecasts for selected years aregiven in tables 3.5 and 3.6 below (details are given in Annex 3.1).

27 Mauritius: Energy Sector Review
3.34 Under the base case scenario, electricity sales are predicted to increase at an averageannual rate of 8.1%, compared to 7.2% for the low-growth scenario (least-square estimates forthe period 1994-2010). The key difference between the two scenarios lies in the period 1994-2000. While the base case assumptions imply that sales increase at 8.6% a year during the first 6years (which is close to growth rate observed in the early 1990s), low GDP growth would reducethe rate to 5.7% a year. The impacts that the different scenarios have on CEB's least-cost-expansion plan are discussed in Chapter 4.
Table 3.5: Electricity Sales and Peak Load Forecast, 1994-2010Base Case Scenario
Year GDP Aver. Tariff Sales Forecast() (2) (GWh)
1994 53080 1.8 8211995 _ 56185 2.0 896
2000 74130 2.2 13452005 96619 2.3 20032010 126157 2.5 2951
1) Predicted GDP at constant prices of 1992, million Rs14462) Predicted average tariff in constant prices of 1992, Rs/IcWhSource: Annex 3.1
Table 3.6: Electricity Sales and Peak Load Forecast, 1994-2010Low GDP Growth Scenario
Year GDP Aver. Tariff Sales Forecast(1) (2) (GWh)
1994 52604 1.8 8171995 54708 2.0 8812000 64659 2.2 11542005 86523 2.3 16732010 113618 2.5 2497
1) Predicted GDP at constant prices of 1992, million Rs2) Predicted average tariff in constant prices of 1992, Rs/kWh .Source: Annex 3.1
3.35 The projections of peak demand are critical to define the size and timing of the new units.Annual peak demand was predicted assuming that the load factor (referred to the energy sent-out)would improve from 0.58, in 1994, to about 0.64, in 2010, as a consequence of the increasingshare of industrial consumption and the impact of tariffs. To determine generation requirements,it has been assumed that a slight improvement in transmission and distribution losses will beachieved, reducing their level from the current 12.2% to 11%. A summary of the forecasts isgiven in Table 3.7

Chapter 3:Future Demandfor Energy and the Role of Energy Pricing and Taxation 28
Table 3.7: Generation and Peak Demand Forecast. 1994 - 2010
Ycar Gencration (GWh) Peak Demand (MW)Base Low Base Low
1994 961 957 184 1831995 1,048 1,031 199 1941996 1,136 1,095 215 2051997 1.235 1.158 233 2161998 1,334 1,211 252 2271999 1,446 1,274 271 2382000 1.569 1,345 292 2512005 2,320 1,938 421 3472010 3,418 2,892 591 498
Source: Annex 4.3
Demand For Petroleum Products
3.36 The estimated demand functions for gasoline and diesel oil (Annex 3.1) have been used togenerate consumption forecasts for the period 1994-2005 conditional on the World Bank'spredictions of GDP growth and assumptions about the development of retail prices. The keypricing premise is that there will be no major changes in international oil markets. In the case ofgasoline it is assumed that tihe retail price remains at 9.5 Rsllitre (in constant prices of 1992). Theprice of diesel oil is assumed to remain at 5.5 Rs/litre until 1996, and to increase to 5.8 Rs/litre in1997 and to 6.2 Rs/litre by 2002 (in constant prices of 1992). These price increases reflect theeffect of higher taxes designed to reduce the price differential between gasoline and diesel oil.
3.37 In the past, the lion's share of domestic fuel oil consumption was accounted for by powergeneration. Since the mid 1980s, however, the share of thermal power generation based on fueloil has varied between 45 and 73%. For the future, it is assumed that given the expected rapidgrowth of electricity demand, the share of fuel-oil-based power generation will rise beyond thepresent level, exceeding 70% of total generation during the second half of the 1990s. As a result,domestic sales of fuel oil are projected to increase during the period 1994-2005 at an averageannual rate of 4%.
3.38 Kerosene consumption will be driven by CEB's needs to serve peak and intermediate loadson the basis gas turbines. An additional turbine (30-35 MW) will be required in 1995 (under anyscenario), and it is most likely that the level of kerosene use by CEB will rise until new diesel unitscome on stream. Thereafter, CEB's kerosene demand is expected to decline, probably down to30,000 tons a year. Finally, consumption of LPG, which surged since the mid 1980s, can beexpected to grow at about 9% a year during the 1990s and at about 6% after 2000. On average,LPG demand is projected to grow at 7.4% a year during the period 1994-2005.
3.39 The model-based forecasts of domestic demand for gas oil and gasoline as well as theprojections of kerosene, fiiel oil and LPG demand are shown in Table 3.8 for selected years(details are given in Annex 3.1). The fastest increase is predicted for LPG and gasoline; by 2005the consumption level of both fuels will be more than 300% higher than in 1990. With themoderate growth rates of 4.7% and 4% a year, diesel and fuel oil demand can be expected toexceed the 1990 consumption levels by more than 200% in 2005.
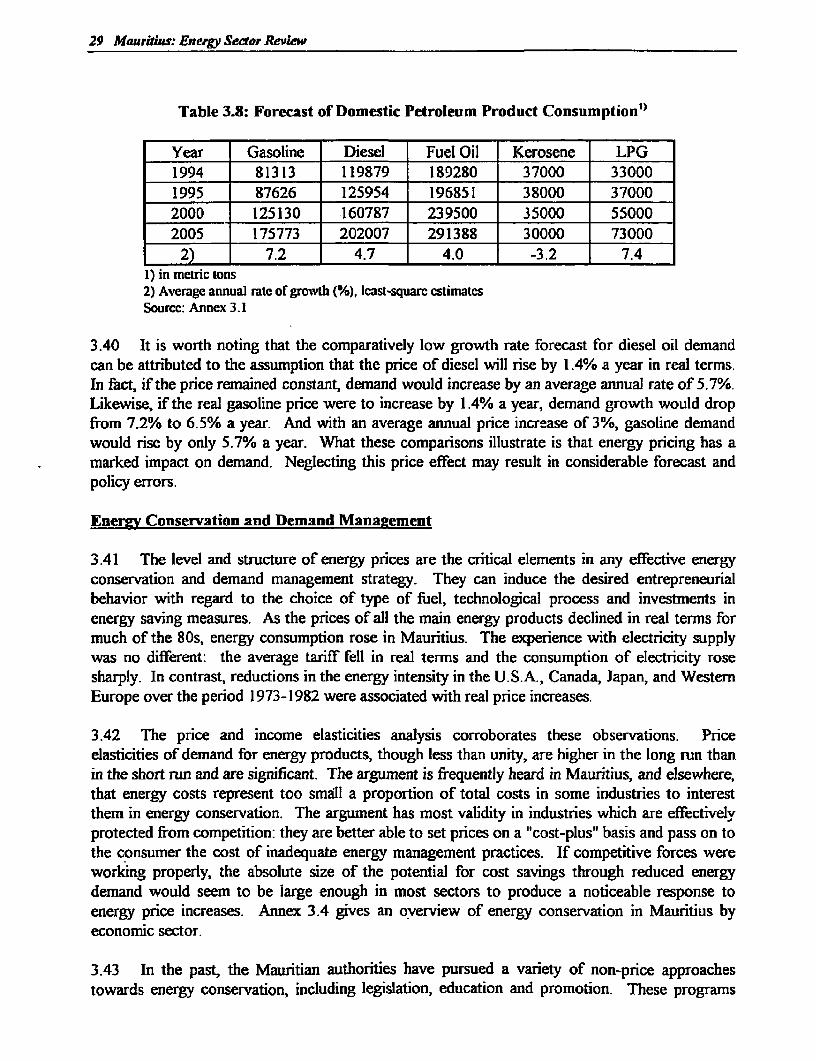
29 Mau inius: Energy Sector Review
Table 3.8: Forecast of Domestic Petroleum Product Consumption'"
Year Gasoline Diesel Fuel Oil Kerosene LPG1994 81313 119879 189280 37000 330001995 87626 125954 196851 38000 370002000 125130 160787 239500 35000 550002005 175773 202007 291388 30000 73000
2) 7.2 4.7 4.0 -3,2 7.41) in metric ions2) Averagc annual ratc of growth (%), leasl-square cstimatesSource: Annex 3.1
3.40 It is worth noting that the comparatively low growth rate forecast for diesel oil demandcan be attributed to the assumption that the price of diesel will rise by 1.4% a year in real terms.In fact, if the price remained constant, demand would increase by an average annual rate of 5.7%.Likewise, if the real gasoline price were to increase by 1.4% a year, demand growth would dropfrom 7.2% to 6.5% a year. And with an average annual price increase of 3%, gasoline demandwould rise by only 5.7% a year. What these comparisons illustrate is that energy pricing has amarked impact on demand. Neglecting this price effect may result in considerable forecast andpolicy errors.
Enerng Conservation and Demand Management
3.41 The level and structure of energy prices are the critical elements in any effective energyconservation and demand management strategy. They can induce the desired entrepreneurialbehavior with regard to the choice of type of fuel, technological process and investments inenergy saving measures. As the prices of all the main energy products declined in real terms formuch of the 80s, energy consumption rose in Mauritius. The experience with electricity supplywas no different: the average tariff fell in real terms and the consumption of electricity rosesharply. In contrast, reductions in the energy intensity in the U.S.A., Canada, Japan, and WestemEurope over the period 1973-1982 were associated with real price increases.
3.42 The price and income elasticities analysis corroborates these observations. Priceelasticities of demand for energy products, though less than unity, are higher in the long run thanin the short run and are significant. The argument is frequently heard in Mauritius, and elsewhere,that energy costs represent too small a proportion of total costs in some industries to interestthem in energy conservation. The argument has most validity in industries which are effectivelyprotected from competition: they are better able to set prices on a "cost-plus" basis and pass on tothe consumer the cost of inadequate energy management practices. If competitive forces wereworking properly, the absolute size of the potential for cost savings through reduced energydemand would seem to be large enough in most sectors to produce a noticeable response toenergy price increases. Annex 3.4 gives an overview of energy conservation in Mauritius byeconomic sector.
3.43 In the past, the Mauritian authorities have pursued a variety of non-price approachestowards energy conservation, including legislation, education and promotion. These programs

Chapter 3:Fature Demandfor Energy andthe Role of Energy Pricing and Taxation 30
have been discontinued for lack of funding. The government should create a policy framework inwhich energy prices can secure an efficient allocation of resources. Evidently, efforts to reducethe costs of public enterprises are a normal part of efficiency improvements, e.g. the reduction inline losses in the electricity industry. Furthermore, to the extent that environmental considerationsinfluence energy conservation efforts in electricity supply, the power sector should fullyincorporate ("internalize") environmental costs in its long-run marginal cost calculations and least-cost programs.
3.44 On the demand side, the main concern is energy pricing. In fact, once prices are set toreflect the economic cost that energy use imposes on the economy, supply can by and large beexpected to adjust to its optimal level relative to demand and no case can be made for governmentintervention. This is particularly tine for countries like Mauritius where the energy supplyinfrastructure is reasonably well developed and severe negative externalities are absent.
3.45 On the supply side, the role of the government should be limited to regulatory functions,including the provision of a credible and efficient institutional/legal framework that levels theplaying field. Government should refrain from imposing price controls, or should remove suchcontrols where they are in place, unless markets or market segments have monopoly elements.Government policies should also ease and encourage private sector initiatives to intermediate andarbitrate energy conservation services designed for larger-scale consumers and supplied on acommercial basis. What is not needed, however, is the creation of a separate energy efficiencyinstitution financed and run by the gov Lrnment. Likewise, the government should resist thetemptation to enact mandatory performance standards for energy-using equipment unless there iscompelling evidence that the (marginal) benefits from the standards are on a par with the(marginal) costs they impose on energy users. Finally, pricing and taxation play a critical role instimulating efficient interfuel substitution. The government could foster the economicdevelopment and use of renewable energy resources in Mauritius (see page 44 below) by relyingon market signals and on non-distortionary taxation.
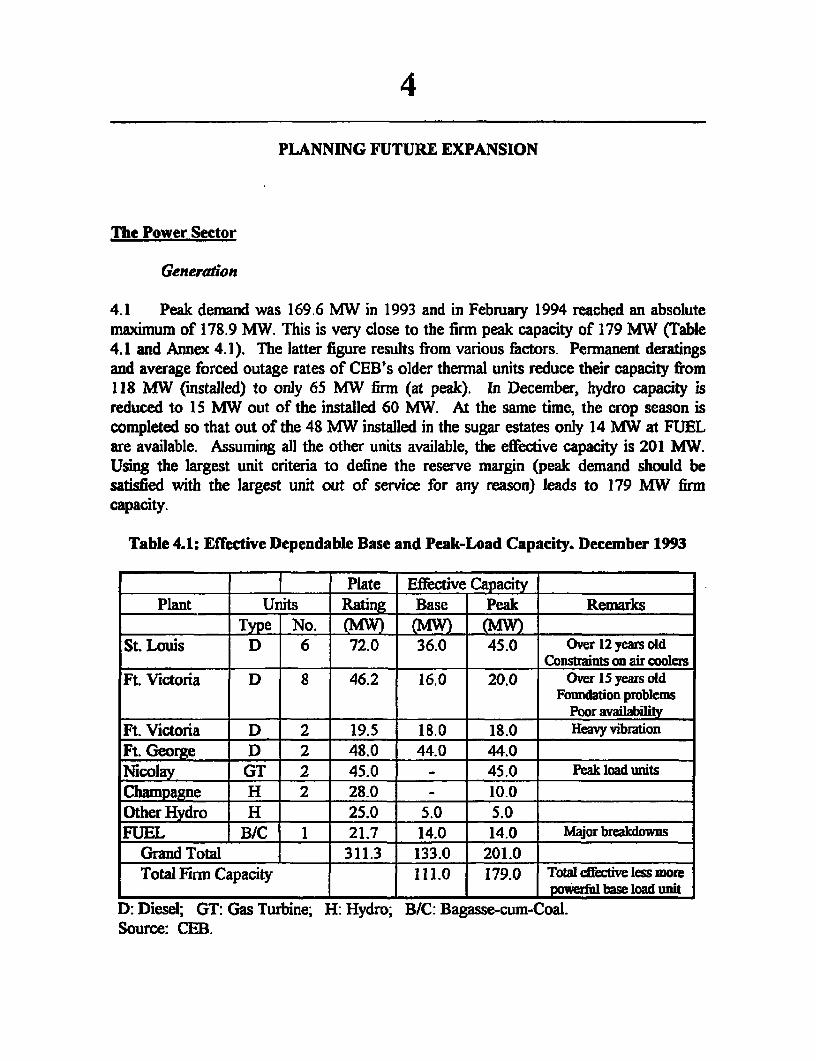
4
PLANNING FUTURE EXPANSION
The Power Sector
Generalion
4.1 Peak demand was 169.6 MW in 1993 and in February 1994 reached an absolutemaximum of 178.9 MW. This is very close to the firm peak capacity of 179 MW (Table4.1 and Annex 4.1). The latter figure results from various factors. Permanent deratingsand average forced outage rates of CEB's older thermal units reduce their capacity from118 MW (installed) to only 65 MW finn (at peak). In December, hydro capacity isreduced to 15 MW out of the installed 60 MW. At the same time, the crop season iscompleted so that out of the 48 MW installed in the sugar estates only 14 MW at FUELare available. Assuming all the other units available, the effective capacity is 201 MW.Using the largest unit criteria to define the reserve margin (peak demand should besatisfied with the largest unit out of service for any reason) leads to 179 MW firmcapacity.
Table 4.1: Effective Dependable Base and Peak-Load Capacity. December 1993
l___ _ l | Plate Effective CapacityPlant Units Rating Base Peak Remarks
T Type No. | NlW)
St. Louis D 6 72.0 36.0 45.0 Over 12 years oldI Constraints on air coolers
Ft. Victoria D 8 46.2 16.0 20.0 Over 15 years oldFoundation problems
_ _ _ _ _ _ _ _ _ _ _ _ _ Poor availabilit
Ft. Victoria D 2 19.5 18.0 18.0 Heavy vibrationFt. George D 2 48.0 44.0 44.0Nicolay CGT 2 45.0 _ 45.0 Peak load unitsChampagne H 2 28.0 10.0Other Hydro H 25.0 5.0 5.0FUEL B/C 1 21.7 14.0 14.0 Majorbreakdowns
Grand Total 3 311.3 133.0 201.0
Total Finn Capacity 111.0 179.0 Total cfftive less morel__ _ _ _ _ _ _ _ l_ _ _ _ _ _ p - l base load unit
D: Diesel; GT: Gas Turbine; H: Hydro; B/C: Bagasse-cum-Coal.Source: CEB.
32 Mauritius: Energy Sector Review
4.2 The rating of the largest unit in CEB's system is 23 MW, equivalent to 13 % of thecurrent peak demand. CEB has already defined the rating of the future base load units tobe 32 MW, which is acceptable from a system's standpoint. This reduces the frequency ofnew additions and allows some gains in specific capital costs. A decision on the award ofthe contract for the supply of the first 32 MW diesel unit was pending at the time of theBank's mnission visit. Space for this unit and for two additional similar units is available atFort George that is designed to eventually accommodate a total installed capacity of 144MW'.
Capacity Balance
4.3 To cope with demand increases the additional capacity to introduce in an electricalsystem is determined by either the energy consumption or by the peak power demand. Dueto its predominant thermal characteristics, CEB's system is capacity constrained. Thecapabilities for meeting peak demand dictate the basic size and timing of expansionadditions.
4.4 The particular conditions of Mauritius justify a high reserve margin in the powersystem. As an insular country, no potential assistance is available to the grid throughinterconnections in case of outage or insufficient generation capacity. Also, practically thewhole population has access to electricity and economic agents have become accustomedand expect a relatively high standard of reliability of supply. With the exception ofcyclone conditions, the loss of load probability (LOLP) has been of the order of 0.3 %,i.e., some 27 hours of interruption per year. This standard of reliability is stronglydependent upon the reserve margin and proper plant maintenance.
4.5 The ratio between the effective capacity of production and peak demand has astrong incidence on the LOLP. The ratio is influenced by the cost of unserved demandwhich is a function of the duration and depth of interruption. There are no estimates ofthat cost for Mauritius but typical figures in other countries, with similar developmentlevels and share of industrial consumption, range between 10 to 15 times the averageelectricity price, i.e., 20 to 30 RsAkWh (1.1 to 1.7 US$ per unserved kWh). Using thecapital and operating costs of a gas turbine (a peaking unit) as reference, the annualacceptable duration for excess demand, Without justifEying the addition of extra capacity,would be between 60 to 100 hours. For the current shape of the load duration curve thisis equivalent to accept a load-shedding risk of 5 to 9 MW.
4.6 The firm capacity of 179 MW is hardly sufficient to meet demand by late 1994 andmight likely lead to a deficit in the order of 10 to 20 MW in 1995. The situation is equallydifficult for semi-base load conditions. Daily load factors are around 75% and demandbetween the morning and the evening peaks (a period of 8 to 10 hours) remains only
'During the discussion of this report, the Bank was informed ftat the contract had bcen awarded
Chapter 4: Planung Fuure Expasion 33
slightly below the peak. Ideally, the next unit to install should be a base load unit and theappropriate commissioning date should have been the middle of 1995.
Alternatives for Generation Expansion
Short Term
4.7 CEB may experience a shortage of capacity in 1994, and more likely so in late1995 or beginning of 1996, due to a conjunction of adverse factors. A cyclone inFebruary 1994 caused damage to the cane fields and the output of bagasse is expected tobe below nornal years. This event may combine with hydro conditions below average.The FUEL plant has been unreliable for some time and the bagasse-cum-coal Union St.Aubin project has been postponed to 1997. Finally, the contract award for a third 30-32MW base load diesel, at Fort George, is still pending.
4.8 To answer these problems and to meet short-term peak requirements, CEB optedfor the urgent installation of a third gas turbine at the Nicolay power station. At a laterstage this unit could be transferred to a new site, close to Fort George, becoming part of acombined-cycle plant, should this option fit into the least cost plan. It should have been, inprinciple, feasible to bring the proposed gas turbine on stream by December 1994, thusensuring that expected peak demand in that month will be met, had a prompt decision beentaken soon after the Bank's mission visit2. The short delivery time is the single mostimportant justification for the choice of a gas turbine (a peaking unit). The least-costsolution would have required a base load unit instead.
4.9 The main problem with the gas turbine is the potential conflict between, on onehand, the minimum size to meet peak demand during the gap until the commissioning ofmore economical base load units (not before the end of 1996) and, on the other, itssuitability for later integration in a combined-cycle plant. The plant rating, considered as"one unit", should not exceed 20-25% of the system's peak demand. For a peak loadaround 290 MW in the year 2000, that rating would not exceed 58-72 MW. A 30 MWgas turbine installed now (1994) may still prove too large to meet that requirement for along time. The final choice will hence be a compromise between the immediate needs andthe foreseeable applications of the turbine.
4.10 Based on the available information, it is recommended to limit the rating of thenew unit to the 30-32 MW range. A tender for a broad range of capacities like 30-50 MW,as envisaged at a certain moment by CEB, would most likely create evaluation problemsand put at risk the possibility of having the gas turbine available for December 1994.Additionally, a smaller size like 30-32 MW leaves CEB with more margin for a largerrange of options regarding the optimum solution for later base-load requirements. The
2 In December 1994, the Bank was infonmed that a 32 MW gas turbine was acquired and will be on stream inJanuary 1995
34 Maiaeft: Energy Sector Rcvcw
total investment is smaller and the unit may even be called upon to run, close to its optimalefficiency, as a semi-base load unit, if adverse conditions happen again,
Medium and Long Term
Plant Candidates
4.11 For a relatively small system, CEB faces complex choices to establish the optimalmix of energy sources and generation technologies to serve future power demand. Apartfrom the third gas turbine (30-32 MW) in 1995, the potential candidates for generationexpansion may be classified in three categories: a) hydroelectric plants; b) purchases fromsugar estates; and c) classical thermal plants: diesel, coal and gas turbines.
Hydro Plants
4.12 The economically useful hydroelectric potential has been reached andtopographical and hydrological constraints lirnit the potential of new hydro schemes.Furthermore, the Midlands dam water supply project, scheduled for the year 2000, willwithdraw water from the Champagne reservoir and reduce its energy capability to half ofwhat it is now.
Purchases from Sugar Estates and the Role of Bagasse in Power Generation
4.13 Power generation is by far the largest current or potential use of surplus bagasse.Expanded use of bagasse for electricity generation would allow Mauritius to substitute alocal renewable biomass fuel for imported fossil fuels, with economic benefits to thecountry, financial benefits to the utility and the sugar industry and positive environmentalconsequences. This is the main objective of the Bagasse Energy Development Program(BEDP) approved by the government in August 1991. The proposed BEDP investmentprogram anticipated capital expenditures in the order of 80 million US$ (in 1991 prices)between 1992-1998 and is based on a strategy to promote the construction of bagasse-cum-coal fired power plants to supply the grid under long-term contracts with CEB.
4.14 Three plants, located in major sugar producing areas and with a firm capacity of 70to 80 MW, are planned to be installed by private producers in the next 6-7 years, obviatingthe need for equivalent capacity by CEB. The plants would use the entire incrementalbagasse surplus, and thereby exhaust the economically available potential of bagasse forpower generation, during the crushing season, relying on coal during the off-season. For asystem with annual growth rates of about 8% and an expected peak demand of 290 MWby the year 2000, that potential private capacity has a -major impact on CEB's investmentdecisions and generation mix.
4.15 The first plant will be located at the Union St. Aubin sugar fhctory, in the southernpart of the country. The initial rated capacity of 22 MW has been raised to 32 MW but thefirm capacity will be limited to 22 MW, when burning bagasse, and to 25 MW when
Chapter 4: Planning Future Expansion 35
burning coal, (in December). Potential bagasse available for electricity generation is about100,000 tons. A second plant is envisaged at Belle Vue, in the north, where about128,000 tons of bagasse would be available and a third plant, equally of about 32 MW,will probably be established at FUEL, and could use about 130,000 tons of bagasse tosupply the grid. For an efficiency of 485 kWh/ton of bagasse - higher than the current 440kWh/t at FUEL - the potential supplies to the grid would be 48 GWh, 62 GWh and 63GWh, respectively. The overall annual equivalent savings in HFO in diesel plants wouldbe 5.4 million US$ (at market prices) or 2.9 million US$ (at border prices), in 1994.Bagasse is therefore a competitive option for power generation.
4.16 The investment for the 30 MW at Union St. Aubin is about Rs 900 million (92prices), or US$50 million (1,667 US$/kW) but the financing package is not yet finalized.Compliance with tighter environmental regulations is a major justification for highinvestment costs as they will impose: a) electrostatic precipitators; and b) a 40 m highstack, which must be designed to endure strong cyclones.
4.17 The successful operation of the new piants depends critically on several factors.To guarantee their operation, about 12 sugar mills should undertake importantinvestments - estimated at US$20 million - to free up the 'incremental bagasse surplus"Moreover, a quantity of about 220,000 tons of bagasse (in contrast with the 25,000 tonscurrently supplied to FUEL) should be transported to the three power stations, during thecrushing season, over a five-month period every year. Bagasse is a bulky commodity andthe roads connecting the sugar factories are narrow and often traverse hilly terrain.Hence, cost effectiveness of bagasse transport has to be dramatically improved to reducetransport costs, increase the load per trip and utilize slack time in traffic.
4 18 Of particular concern to CEB is the timeliness of the proposed power plantinvestments. Any delay in commissioning dates may result either in too low a reservemargin or impose the urgent commissioning of new generating units with short deliverytime such as gas turbines, causing over investments and distorting CEB's optimalexpansion path. The likely postponement of the commissioning date of the Union St.Aubin plant from 1994 to early 1997 is already a major change whose full implicationsshould be urgently evaluated in the framework of a comprehensive expansion study.
4.19 The Union St. Aubin plant will burn coal with a net calorific value of 6,200kcal/kg, an efficiency of 25 % and a specific coal consumption of about 540 g/kWh. For acoal price of 66 US$/t, as currently paid by CEB, its variable fuel costs would be 0.64Rs/kWh, (or 0.67 Rs/kWh sent out, assuming 5% of plant own consumption).
4.20 With capital costs of 1,750 US$/kW, 30 years useful life and 12% discount rate,annualized capital costs amount to 217 US$/kW (3,900 RsAkW), disregarding interestduring construction. For an equivalent yearly operation of roughly 6,000 hours at 30MW, generation would be 180 GWh and the levelized capital costs per kWh would be0,70 Rs/kWh. When running on coal, total cost per kWh sent out would be around 1.10Rs/kWh, whereas when running on bagasse the cost would be lower. Average annual
36 Mauritius: Energy Sedtor Review
generation costs would remain below 1.10 Rs/kWh, a figure that compares favorably withthe estimated 1.33 Rs/kWh for the avoided costs of CEB and which makes the projectattractive to both sides.
Diesel Generators
4.21 Diesel generators will play a dominant role in CEB's generation expansion. For theexpected load growth rates and the prevailing price structure for oil products, larger sizes(>30 MW) running on HFO will be cconomically the most interesting option. Two-strokelow speed engines up to approximately 50 MW have been installed in other countries withefficiencies up to 50%. In spite of higher specific investment costs, nmaintenance isrelatively simplc. Specific capital costs of a 30 MW diesel unit have been estimated torange between 25,000 and 30,000 Rs/kW (1,390 to 1,670 US$/kW). Specificconsumption per kWh sent out is 199 g/kWh. Assuming that CEB buys HFO (380 cSt) ata market price of 155 US$/t, fuel variable costs are 0.56 Rs/kWh sent out (or 3.1USc/kWh).
Gas Turbines: Single-cycle and Combined -cycle
4.22 Single-cycle gas turbines are an economical solution for peak use. They have alower cost per kW installed and less space requirements compared to other types of primemovers. Delivery time is short, often less than 12 months, and efficiencies can go up to 30% for units of 20 MW and above. Gas turbines can use either gaseous or liquid fuels andthe most common are natural gas, kerosene and gasoil. Some types can also run on HFObut impose restrictions on the fuel characteristics. Installed unit costs were estimated inthe range of 500 to 700 US$/kW (9,200 to 12,600 Rs/kW). Operating costs, running onkerosene and assuming no changes in the current pricing policy, are 1.31 Rs/kWh (7.3USc/kWh) sent out.
4.23 Combined-cycle plants, with two gas turbines and one steam turbine and withefficiencies in the order of 51 to 53%, are the most interesting option for base or semni-base load if natural gas is available. Investment costs are estimated at 15,800 R(s/kW (880US$/kW), which is 50 to 60% of the capital costs of diesel units. In spite of their higherefficiency, the need to bum kerosene raises energy costs high above the costs of dieselunits and up to 0.79 Rs/kWh (4.4 USc/kWh). At border prices, the difference in favor ofdiesel is still more striking: 0.30 Rs/kWh for diesel versus 0.79 Rs/kWh for combined-cycle. In Mauritius, as natural gas is out of question and HFO would require an expensiveand sophisticated installation to improve the fuel quality, kerosene would remain the onlyfuel option for combined-cycle plants. Their suitability and their economic competitivenessunder Mauritian conditions will be dictated by the pricing policy of oil pruducts. It is thusnot certain that the gas turbine to be commissioned soon will ever be an element of acombined-cycle plant.
Chapter 4: PManning Future Expansion 37
Coal fired Plants
4.24 Medium-sized coal fired thermal units have already been considered by CEB as anexpansion alternative. No detailed study was undertaken but the option was not deemedfeasible due to lack of space for coal storage and ash disposal, negative environmentalimpacts and high specific investment. With the current (1994) load forecasts this type ofplant may be a potential candidate to meet base load demand in the long term. As theminimum size to secure a reasonable efficiency would be around 50 MW and as singleunits should not represent more than 20 % of the system's peak load, coal fired units mightbe candidates after peak demand has reached, or prefbrably exceeded, 250 MW.
Comparison of Candidates
4.25 The thermal power plants that may be added to the system encompass a widevariety depending on the fuel to be used and the duty to perform. In the long term,expansion requirements could be addressed through several investment options. In the midterm, at least until the year 2000, the decisions already taken or in progress have by andlarge defined the system. These decisions involve: a) the installation of one 32 MW diesel(with the option for 2 additional similar units) at Fort George, where most of theinfrastructure is already in place; and b) the installation of the three 32 MW bagasa _-cum-coal units in three private sugar estates together with the establishment of firm bulk supplycontracts with CEB. Until the year 2000, the issue is one of timning (date and sequence)rather than of size or type.
4.26 Altemative candidates are compared based on the data shown in Annex 4.2.Figures are tentative although supported by actual costs as far as possible. Calculations aremade at market prices (financial costs) and border prices (economic costs), assumingdiscount/interest rates of 120% and 15%. The estimated variable is the "break-even" or"crossover" annual duration of operation that equalizes the cost if the kWh of potentialcandidates taken in pairs.
4.27 The results of Annex 4.2 on the best solution for various annual duration ofoperation are summarized below, using a 12% discount rate. The conclusions are asfollows:
a) single-cycle gas turbine preferable to combined-cycle:from 0 to 2,700 hours, at market prices or at border prices (no difference);
b) single-cycle gas turbine preferable to 2-stroke, slow speed diesel:from 0 to 3,400 hours, at market prices;from 0 to 2,500 hours, at border prices;
c) combined-cycle plant preferable to 2-stroke, slow speed diesel:from 0 to 4,800 hours, at market prices;from 0 to 2,300 hours at border prices;
38 Mauritius: Energy Sector Review
d) 2-stroke, slow speed diesel preferable to coal fired unit:always preferable, for any duration of operation, both at market and borderprices.
4.28 The striking features of the analysis are: i) the complete change of competitivenessbetween combined-cycle and diesel when changing from market to border prices; and ii)the unattractiveness of any purely coal-fired unit compared with slow speed diesels. Gasturbines, burning kerosene, are the preferred peaking units, and they can be competitivelyoperated up to 2,500 hours per year. For base load, typically 5,000 hours and above, slowspeed diesels are the economic option. For semi-base operation, between 3,000 and 4,500hours per year, combined-cycle plants, burning kerosene, may be an option for CEB(market prices) but not for the country (border prices).
Generation Expansion Plan. 1994-2010
Main Assumptions
4.29 Using the Bank's mission demand scenarios, two tentative generation expansionplans were prepared. The results are shown in Annex 4.3. It is assumed that 8 Mirrleesunits of Fort Victoria (8x4 MW effective capacity) and 6 Pielstick units (6x10 MW) of St.Louis will be decommissioned before and after 2000 respectively. As previously stated, itis assumed that 6 units of 30 MW will come on line before any larger unit is introducedinto the system. Three of them are the 32 MW diesel units for Fort George; the otherthree correspond to the bagasse-cum-coal fired power plants at Union St.Aubin, Belle Vueand FUEL, or, alternatively, additional diesel units to be installed by CEB, if the bagasseprojects are delayed or do not materialize.
4.30 Capacities of the new units should be considered as firm capacities, and about 90%of their nameplate rating. This procedure aims at keeping a low probability of not meetingpeak demand (although accepting an outage risk) and is represented by allowing a non-served demand of up to 11 MW in various years. In any case, CEB can play with thedecommissioning dates of the older units to adjust the reserve margin.
Main Results
4.31 Apart from the bagasse-and-coal units, the development of the system wouldcontinue to rely on 2-stroke, low speed diesel units using heavy fuel oil (380 cSt). Thecomparison of avoided costs shows that this is the best option for base and semi-baseoperation. After the peak demand has reached 350 MW, the unit size was increased to 50MW units, with turbocharger, which have a higher efficiency. Once adequate simulationmodels are available, the option for a combined-cycle plant should be tested to check ifand when it would fit into a least-cost solution. For that purpose an evaluation of thediscounted investment and operating costs (including non served energy costs) is required.
Chapter 4: PMannig Flture Expa_n 39
4.32 Gross additions to the system (firm capacities) between 1994 and 2010 are 525MW, in the '13ase Case' and 425 MW, in the 'Low Growth Case" Correspondingincrements in peak demand are 408 MW and 315 MW. Accounting fir thedecommissioning of 80 MW (firm capacity), the net additions are 445 MW and 345 MW,which is rather close to the peak increments.
4.33 As explained earlier, bagasse-cum-coal power plants are a competitive option forpower generation. Depending on the scenario, bagasse-and-coal units would be requiredin 1997, 2000 and 2002, in the "Base Case", or in 1999, 2002 and 2003, in the "LowGrowth Case". There is some flexibility in these dates through adjustments in thecommissioning dates of the three 30 MW diesel units at the Fort George power station.
Transmission and Distribution
4.34 Standard voltages of 66, 22 and 6.6 kV are currently used for transmission andprimary distribution. Low voltage distribution is made at 230/400 V and the frequency is50 Hz. Existing voltage levels are adequate to the size and load carrying requirements ofthe system.
Transmission
4.35 As of March 1994 the transmission system consisted of 152 km of overhead linesand about 10 km of underground cable. The overhead network is mounted on steel towersand consists mainly of double circuit lines. For the same transport capacity double circuitlines represent a less expensive solution than two single-circuit lines (20 to 40%O lower).but trade-offs between costs and reliability of supply corresponding to single- and double-circuit lines are very much country-specific. Local limitations to the manufactuwing andrepair of steel towers and the very high cost of international services recommend that,unless it can be proved that steel towers warrant a drastic improvement in the reliabiiity ofthe network in case of cyclones, local conditions do not fhvor their use.
4.36 Figures provided by CEB for 66 kV single- and double-circuit lines are around4,000,000 RsIkm and 8,500,000 Rs/knm, respectively, or 220,000 US$/km and 470,000US$/kin, which is roughly 4 to 6 times average international levels. On the other hand,CEB has just built its first 66 kV line with wood poles which has performed well during acyclone in early 1994. Wood poles may, hence, represent a realistic and cheaperalternative for future 66 kV extensions, with unit costs around 48,000 US$/km (900,000Rslkm). It is recommended that CEB undertakes a complete reappraisal of its designstandards together with the comparison of wood-, concrete- and steel-tower mountedlines, from the standpoint of system reliability, usefill life, ease of maintenance and cost.
4.37 The distribution feeders are supplied from nine main 66/22 kV substations, with atotal installed transformer capacity of 480 MVA, for a peak demand of currently 178 MW(February 1994). The normal practice of CEB is the use of two identical transfonners ineach substation, thus reducing to 50% the ratio between firm and installed capacity. As

40 Mauritius: Energy Sector Review
long as enough spare capacity is available through the 22 kV feeders and quick procedurescan be relied upon to switch configurations in case of faults, the unavailability of a powertransformer is not a limitation to supply.
Primary Distribution
4.38 Primary distribution is carried out at 22 kV and 6.6 kV but the 6.6 kV network isbeing phased out and replaced by 22 kV. This strategy, however, should be pursued onlywhen the 6.6 kV feeders approach saturation or require extensive repairs. The 22 kVsystem is the backbone of the distribution system and consists of 1,300 km of overheadlines (three phase) and about 42 kin of underground cables. The underground cables arelaid in the center of the main cities and are also used to connect substations to overheadsub transmission feeders.
4.39 Unit costs for 22 kV overhead lines and underground cables are in line withintemational experience. Concrete-pole mounted lines have a unit cost of about 360,000Rs/km (20,000 US$/km) and an ABC (or "torsade") line is 3 times more expensive.Underground cables have unit costs nearly 10 times those of overhead lines and their useshould be reserved for very specific local conditions.
LVDistribution
4.40 Low vcltage (secondary distribution) is made at 400 V, three-phase, and 230 V,single-phase. At the end of 1993, there were about 3,400 km of overhead lines and 92 knof underground cables. Overhead lines are mounted on concrete or wood poles and theuse of ABC solutions (twisted insulated overhead cables) is increasing. The networkappears to be in good condition and is well maintained. The old ground-mounteddistribution substations, supplying feeders normally over I km long, have beenprogressively replaced by smaller pole-mounted transformers, reducing the typical lengthof LV feeders and bringing down LV losses. For lack of adequate measurements orsimulation studies on simplified models the exact amount of the reduction cannot beestimated but the trend should be pursued.
System Operation
4.41 The generating stations and the 66/22 kV substations are controlled with the helpof a SCADA (System Control and Data Acquisition) system. The main control center islocated in CEB's headquarters, in Curepipe, and operates under the responsibility of theTransmission and Distribution Manager. The main circuit breakers can be operated fromthe control center but the system has no dispatching facilities and has no memory so thatall historical data must be kept on paper. The monitors provide only rough figures ofvoltages and power flows and more reliable hourly readings are requested from the plantoperators to draw the daily load diagram. The upgrading of the control center and of thecontrol system as a whole (including communication links and data transmissionequipment) is under way.
Chapter 4: Planning Future Epansion 41
4.42 Substations are generally unmanned and without local meters to record energyflows or peak demand. Hence, the basic information to compare with simulation studiescan only be obtained from the rough readings at the control center or through aspecifically designed measurement and recording campaign. This activity is important toimprove the knowledge of the current loading conditions, to check the validity of futureload-flow studies and to support well founded decisions on the expansion andreinforcement of the MV network. Some redundant personnel in distribution areas couldbe employed in that campaign, with unquestionable benefits for the planning process ofdistribution networks.
Transmission and Distribution Losses
4.43 In 1993, total losses in the transmission and distribution system averaged 12.2% ofincoming energy at generator busbars. This value is a significant improvement from the16% figure of 1986. It is not possible to allocate losses to the various voltage levels butestimates made in 1987 using simplified models suggest 5% in the 66 and 22 kV voltagelevels and 7% in the LV system. In 1987, non-technical losses were estimated at 2% oftotal generation. The figure has likely been reduced due to improvements in billing andservice inspection together with more systematic meter calibration.
4.44 While it has no specific program, CEB pursues every opportunity to reduce losses.The figure of 12% is acceptable but there is scope for firther reduction. It should beemphasized that off-peak loss factors are lower than peak loss factors. The peak losscoefficient for power, at peak hours, may be 50% higher than the average energy losscoefficient, i.e.,. it may reach 18% for an energy loss coefficient of 12%. For a peakdemand of 180 MW (at generator busbars) peak losses would amount to 32 MW. Hence,each percentage point gained in energy losses would correspond to 1.5% decrease in peaklosses or to a decrease of 2.7 MW in peak demand. For a capital cost of 12,600 Rs/kW ofa gas turbine, the annualized investment reduction may be 1.8 million Rs per year ingeneration capacity. In a capacity constrained system this represents substantial savingsand deserves detailed analysis.
4.45 The evaluation of potential loss reduction benefits and the design of any lossreduction program requires a correct picture of the current loss distribution. For thatpurpose, CEB should carry simulation studies using the load flow program included in thepower systems analysis package recently installed in the Control Center (or using aspecific loss evaluation program). Field surveys and measurements would also benecessary to validate the results of the studies. Such comprehensive work would lead to acostfbenefit analysis to estimate if, where, and to what extent any loss reduction planwould be economically efficient. The updated picture of the current transmission anddistribution losses is also a prerequisite to evaluate the LRMC at the various voltage levelsand to design a new tariff structure.
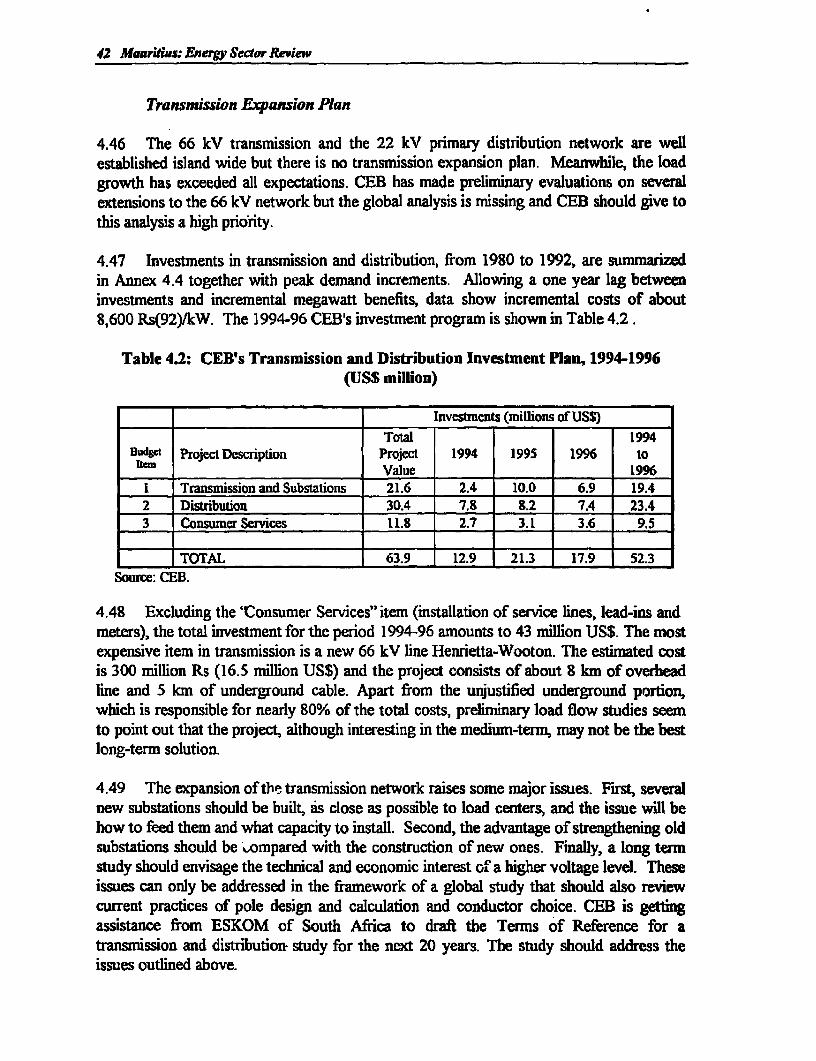
42 Macaurkis: Energy Sedor Revikw
Transmission Expansion Plan
4.46 The 66 kV transmission and the 22 kV primary distribution network are wellestablished island wide but there is no transmission expansion plan. Meanwhile, the loadgrowth has exceeded all expectations. CEB has made preliminary evaluations on severalextensions to the 66 kV network but the global analysis is missing and CEB should give tothis analysis a high priority.
4.47 Investments in transmission and distribution, from 1980 to 1992, are summarizedin Annex 4.4 together with peak demand increments. Allowing a one year lag betweeninvestments and incremental megawatt benefits, data show incremental costs of about8,600 Rs(92)/kW. The 1994-96 CEB's investment program is shown in Table 4.2.
Table 4.2: CEB's Transmission and Distribution Investment Plan, 1994-1996(US$ million)
l_____ Investments (millions of USS)
Total 1994Budget Project DScription Project 1994 1995 1996 to
item _ _ __ _ __ _ _ Value _ _ _ _ 1996
l Transmission and Substations 21.6 2.4 10.0 6.9 19.42 Distribution 30.4 7.8 8.2 7.4 23.43 Consumer Services 11.8 2.7 3.1 3.6 9.5
TOTAL 63.9 12.9 21.3 17.9 52.3Source: CEB.
4.48 Excluding the 'Consumer Services" item (installation of service lines, lead-ins andmeters), the total investment for the period 1994-96 amounts to 43 million IJS$. The mostexpensive item in transmission is a new 66 kV line Henrietta-Wooton. The estimated costis 300 million Rs (16.5 million US$) and the project consists of about 8 kn of overheadline and 5 km of underground cable. Apart from the unjustified underground portion,which is responsible for nearly 80% of the total costs, preliminary load flow studies seemto point out that the project, although interesting in the medium-term, may not be the bestlong-term solution.
4.49 The expansion of the transmission network raises some major issues. First, severalnew substations should be built, as close as possible to load centers, and the issue will behow to feed them and what capacity to install. Second, the advantage of strengthening oldsubstations should be .ompared with the construction of new ones. Finally, a long termstudy should envisage the technical and economic interest of a higher voltage level. Theseissues can only be addressed in the framework of a global study that should also reviewcurrent practices of pole design and calculation and conductor choice. CEB is gettingassistance from ESKOM of South Africa to draft the Terms of Reference for atransmission and distribution study for the next 20 years. The study should address theissues outlined above.
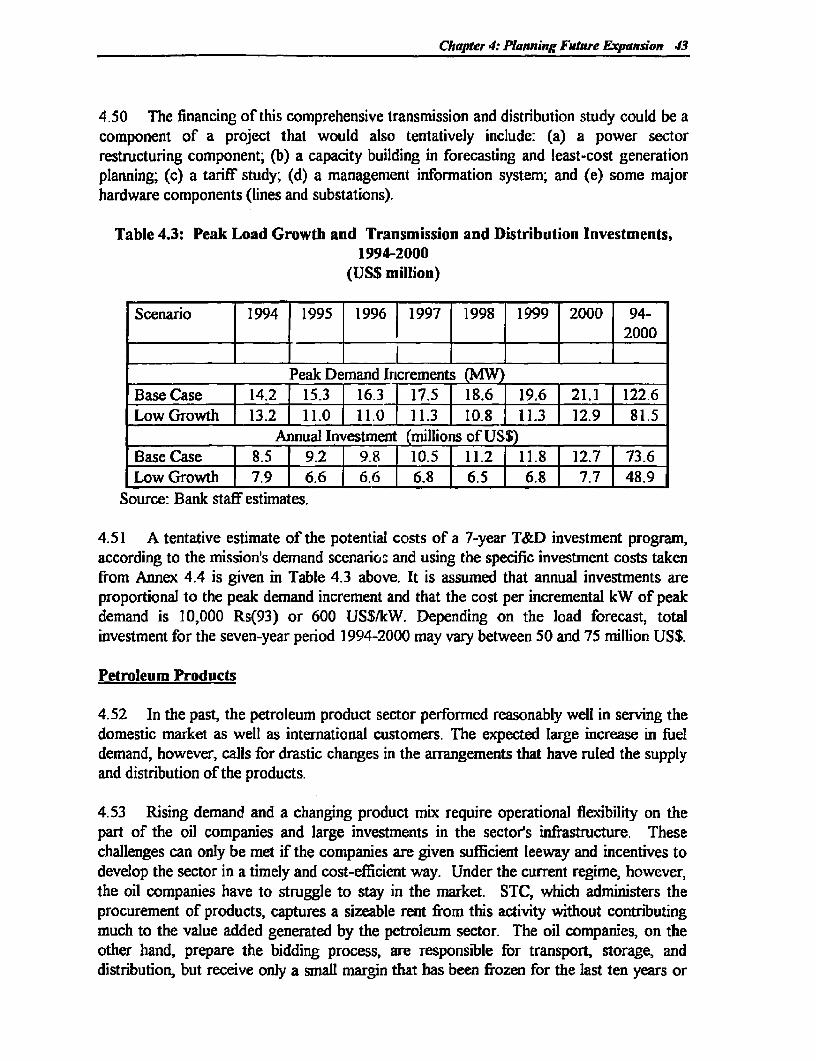
Chapter 4: Planning Future Expansion 43
4.50 The financing of this comprehensive transmission and distribution study could be acomponent of a project that would also tentatively include: (a) a power sectorrestructuring component; (b) a capacity building in forecasting and least-cost generationplanning; (c) a tariff study; (d) a management information system; and (e) some majorhardware components (lines and substations).
Table 4.3: Peak Load Growth and Transmission and Distribution Investments,1994-2000
(US$ million)
Scenario 1994 1995 1996 1997 1998 1999 2000 94-____________ ______ j 2000
Peak Demand Increments (MW)Base Case 14.2 15.3 16.3 1 17.5 18.6 | 19.6| 21.1 122.6LowGrowth 13.2 11.0 11.0 [ 11.3 10.8 T 11.3 12.9 J81.5
Annual Investment (millions of US$)Base Case [ 8.5 9.2 9.8 10.5 11.2 11.8 J 12.7 J 73.6Low Growth 7.9 6.6 6.6 6.8 6.5 6.8 7.7 J 48.9
Source: Bank staff estimates.
4.51 A tentative estimate of the potential costs of a 7-year T&D investment program,according to the mission's demand scenarios and using the specific investment costs takenfrom Annex 4.4 is given in Table 4.3 above. It is assumed that annual investments areproportional to the peak demand increment and that the cost per incremental kW of peakdemand is 10,000 Rs(93) or 600 US$/kW. Depending on the load forecast, totalinvestment for the seven-year period 1994-2000 may vary between 50 and 75 million US$.
Petroleum Products
4.52 In the past, the petroleum product sector performed reasonably well in serving thedomestic market as well as intemational customers. The expected large increase in fueldemand, however, calls for drastic changes in the arrangements that have ruled the supplyand distribution of the products.
4.53 Rising demand and a changing product mix require operational flexibility on thepart of the oil companies and large investments in the sector's infrastucture. Thesechallenges can only be met if the companies are given sufficient leeway and incentives todevelop the sector in a timely and cost-efficient way. Under the current regime, however,the oil companies have to struggle to stay in the market. STC, which administers theprocurement of products, captures a sizeable rent from this activity without contributingmuch to the value added generated by the petroleum sector. The oil companies, on theother hand, prepare the bidding process, are responsible for transport, storage, anddistribution, but receive only a small margin that has been frozen for the last ten years or
44 Mauridhus: Enery Sccdor Review
so. In addition, the companies are subject to tight price controls and pervasive regulatorydiscretion.
4.54 The oil companies should be entitled to earn a reasonable return as determined bycompetition. This would make it possible for them to raise and invest the funds needed tomaintain and expand the supply infrastructure of petroleum products. The governmentshould prepare the ground for such investments through a credible system of incentivesand regulations that takes both the risks borne by the companies and the interest of thepublic into account.
4.55 While there is a foreseeable need to increase the storage capacities of petroleumproducts, it is not advisable establish minimum compulsory stock requirements. Currently,normal stock operation is about 3540 days of supply, depending on the particularproduct. Disruptions in supply have not occurred. The oil companies have sufficientexperience and knowledge to increase their operating stocks whenever market conditionsrequire it. Also, Mauritius has a variety of supply sources to choose from and can accessessentially unlimited supplies. With proper economic incentives, shortages are unlikely toarise in the future.
Renewable Enery
4.56 Economic pricing and taxation play a critical role in fostering an efficient interftelsubstitution (see pages 29-30). Savings of fossil fuels and electricity can be accomplishedthrough market mechanisms that would lead to expanding the X e of renewable energysources. Since the islands' hydro potential is almost exhausted, the scope for renewablesis limited to bagasse (which has already been discussed), solar energy for water heating(photovoltaic power generation can be dismissed as uneconomic), and wind energy.
Sol,rr Water Heating
4.57 Mauritius has favorable conditions for utilizing solar water heaters. The tropicalsun shines evenly all year around, and the technology is available: A simple black coatedcollector of 2-4 m2 , connected to a storage tank elevated above the collector and usingnatural circulation, can supply about 200 1 of hot water at 60-70° C per day, usuallyenough even for a large family. The conditions are best in the coastal regions, where smallcollectors will do the job; in the central plateau area around Curepipe larger-sized unitswill be necessary during winter time. The pay-back time for investment in a solar waterheater is reported to be attractive. Installed costs of a standard unit (not includingplumbing) amount to Rs 11,000. Solar water heater have the extra benefit of facilitatingwater storage because tap water is often restricted to certain periods of the day inMauritius
4158 There are presently about 10,000 solar water heaters installed on the island, but thepotential market is estimated to exceed this number by a factor of 5 to 10. Some 12manufacturers and 3 importers of solar water heaters operate in Mauritius. The
Chapter 4: Planuing Future Expanswin 45
govermment can support the expansion of solar water heaters by ensuring that the leveland structure of electricity and petroleum product prices reflect economic costs.
Wind Energy
4.59 Mauritius has a good wind regime. A wind energy resource assessment programwas carried out fron 1983 to 1985 under the auspices of UNDP. The MauritiusMeteorological Services collected wind data from 10 sites and edited a wind atlas of theisland. A number of locations on the northern, eastern and southern coasts were found tohave a good potential for electricity generation. Especially the southern coast line offersexcellent sites with average yearly wind speeds of about 8 mls at 30 m above ground level.
4.60 So far, however. the experience with wind generators has not been veryencouraging. A demonstration project that started in 1987 with the installation of a Danish180 kW wind energy conversion system at Grand Bassin proved a disaster. The chosensite had a poor wind regime; the generator stood still most of the time; the Danishmanufacturer went out of business; and CEB, which was responsible for operation, lostconfidence and interest in the project. Four wind generators were installed on the island ofRodrigues in 1989. They produced 327 MWh before they were damaged by the cycloneBella in 1991. Most of them are now overhauled and seem to operate satisfactorily.
4.61 The technology of modern wind generators has improved over the past years. Themost economic units have a rated capacity of about 500 kW, and are pitch regulated sothat they are more resistant to strong winds during cyclones. In the light of thesedevelopments, potential private wind energy developers may venture a new w-ind energyproject. One option is to install a 5-10 MW mind farm at Gris Gris at the South Shore,next to the planned coal/bagasse fired CHP plant at Union St. Aubin. This site has thebest wind condition in Mauritius, the electric grid will most probably need no extrareinforcement, and the daily operation and maintenance could be cared for by technicalstaff of the neighboring power plant. The utilization of wind energy may prove attractiveat other selected sites
Environmental Issues
4.62 It is recommended that the government adopt market based mechanisms, andparticularly taxation, as the main instrument for bringing about desired environmentaloutcomes. Market based mechanisms provide greater flexibility than "command andcontrol" regulations both to polluters who are free to adapt to market signals and to publicenvirornental policies. The criteria for choosing a tax should be its efficacy in achievingenvironmental protection, taking into account the relative costs involved. The tax shouldalso be coherent with other taxation objectives and the basic principles underlying modemtax systems (i.e. equity, neutrality and administrative efficiency) The government shouldalso take steps to make its fiscal and environmental policies compatible and mutuallyreinforcing, which may require the modification or removal of certain taxes. Existingtaxes and subsidies should also be re-examined as they may have unintended detrimental
46 Mauritius: Energy Senor Review
effects on the environment, particularly when they apply to such sectors as transport andenergy.
4.63 In 1988, the government took the first steps to outline environmental goals, andguidelines. To coordinate environmental policies the government established a NationalEnvironment Commission at ministerial level, chaired by the Prime Minister. TheCommission has approved a National Environmental Action Plan, prepared with supportfrom the World Bank, and a White Paper on National Environmental Policy.
4.64 The government also established the Department of Environment (DOE), presentlyunder the Ministry of Environment and Quality of Life. DOE is the admninistrative agencyresponsible for environmental policies. Its legislative mandate for implementing thesepolicies is the Environment Protection Act, which was enacted in 1991. The majorprovisions of the Act are: authority for enforcement, mandatory environmentalassessments, national environmental standards, and a national environment fund.
4.65 Within the energy sector, the major environmental concem are emissions ofpollutalnts to the air from burning fossil fuels and exhaust gases from vehicles. Regardingthe power sector, the Environment Protection Act calls for an Environmental ImpactAssessinent for any new project. Since, at present, there are no specific standards for airemissions, effluent discharges, etc., the assessments refer to practices of developedcountries and guidelines of the World Bank. Arrangements are made under the NationalEnvironmental Action Plan to organize a national program for monitoring air quality,which might lead to the establishment of national emission standards.
4.66 A standard for the maximum sulfur content of fuels is presently in force, but thelimit is set as high as 3,5%. The majir portion of sulfurous fuel (380 CSt fuel oil) is usedat the Fort George Power Stzt.ton north-west of Port Louis. With the prevailing wind fromthe south-east, most exhaust gases and particulates are expelled offshore. However, toprotect the tourism industry, an environmental study should be undertaken to determinethe appropriate level of the sulfur content of fuels. Sulfur content in gas oil came downfrom 1% to 0.5% during the last few years. Lead content in gasoline is 0.4 grams per litreat present.
4.67 The responsibility for monitoring emissions from motor vehicles rests with theMinstry of Works and its executing ann, the National Transport Authority. Sponsored bythe World Bank, a comprehensive air emission study was conducted in 1992. The studyoutlines an Action Program for phasing in vehicle and fuel standards which are in line withpractices in the US and Europe. Such changes, however, will be costly. Furthermore,introducing new product grades in addition to those currently in use will pose storageproblems both at the oil terminals and at the retail service stations. In particular, theoption of unleaded gasoline, which is currently under discussion, faces the difficulty that anumber of cars in operation need lead as a cylinder lubricant. Therefore, introducingunleaded gasoline would be equivalent to adding a new grade. In this case, it might beuseful to market a low-lead gasoline, rather than a no-lead one.

Chapter 4: Punig Futaure Euansime 47
4.68 Oil product storage always runs the risk of leakages, spills and ruptures. So farthere was only one incident in 1993 when a fuel tank operated by Esso broke apart. Acontingency plan for the harbor area should be prepared and implemented immediately.Another problem area is the disposal of "used oil". In the past used oil has been collectedfrom the service stations and stored in the harbor area. There is, however, no policy onwhat to do in the event the storage capacity at the harbor is exiausted.
4.69 With the rapid rise in living standards, the amount of household waste andcombustible industrial residues is bound to increase. At some stage, the continued use ofdumps will no longer be environmentally acceptable. One solution to this waste disposalproblem is Ic utilize the energy content of the waste either in designated refiuseincineration plants or possibly combine the combustion of waste and bagasse. An earlyand more detailed examination of this issue is advisable.

5
INSTITUTIONAL ISSUES
5.1 Greater efficiency in the public sector and an expanded role for the private sectorare essential elements of a sound macroeconomic framework that should sustain Mauxitiusin its drive to achieve higher economic performance in the years ahead. The governmentis aware of the need to respond to the challenges posed by the important growth ofdemand for electricity and petroleum products, and to adequately address existingproblems in the energy sector. The short-term objective is to ensure the availability ofenergy, and over the medium-and longer-term, expand energy supplies through greaterprivate sector participation, promote efficient energy use and competition in energymarkets, whenever possible. The private sector already plays an important role inMauritius' energy sector. In power generation, the private sector participates throughcogeneration arrangements and dedicated generation projects with public participation.The storage and distribution of petroleum products, the manufacturing, import andmarketing of renewable energy technologies, particularly solar, are entirely in privatehands. However, a clear government policy on privatization and on the role of the privatesector in the electricity and petroleum subsectors, is not yet in place. Privatization inparticular, is challenging many of the traditional attitudes towards the role of thegovernment and of parastatals in the provision of energy supplies.
Challenges Facinz the Mauritian Enerm Sector
5.2 Average and peak demand for electricity are expected to grow at over 8% per yearover the period 1994-2000, and the demand for petroleum products is expected to followsimilar high growth trends. The main challenge facing the govemment is how to respondadequately and in time to this continuing rapid growth of demand. The ability of theenergy sector to meet this challenge is hampered by the following: (a) the financialsituation of CEB has been deteriorating for some time and there is excessive reliance onthe government to finance its investment program; (b) delays in commissioning powerplants have led CEB to devise ways to fill the gaps and avoid load-shedding such asthrough the acquisition of gas turbines, which may not be optimal considering fuiel costand the role these units will serve in the fiuture; (c) the utility lacks autonomy in itsmanagement and its relationship with the govermment is highly politicized, as evidencedrecently in the bidding for a diesel set for the Fort George power station; (d) inadequatetariff structure for electricity; and (e) price controls on petroleum products and theinability of private oil companies to finance the needed expansion of downstreaminfrastructure.
48 Mauritius: Energy Sedor Review
Responding to the Challenees
In dIhe Power Subsector
5.3 Changes in the Electric Power Industry: Global Trends and InternationalExperience. After many years of readily available public resources, many utilitiesworldwide have recognized that, with increasing demand, this source of flnds isincreasingly problematic. Many countries themselves accept the limitations of publicfinance for the finding of the power sector and are looking to the private sector as analternative. A number of these countries go beyond the need for financial resources andaccept the basic rationale of competitive markets as a necessity for improving efficiencyand the development of capital markets. The changes that are taking place in the electricpower industry are part of the pattern of increased globalisation of industry under thepressures of growing competition and accelerating technological change. This isparalleled by developments in capital markets in which the financial flows are increasinglyresponding to global rather than national trends.
5.4 Norway, the UK. and the U.S.A. provide examples of sectoral reform inindustrialized countries. The reforms in Norway and in the U.S. sought to limit risingelectricity rates through competitive market-based pricing and improved efficiency inenergy production and utilization. In the UK., the government sought to promote privateparticipation in the sector, to reduce the sector's claim on public resources and to improveefficiency in energy production, utilization and investment through competitive market-based pricing and price cap regulation. In the developing world, many Latin Americanand Caribbean countries (Argentina, Chile, Peru, Colombia, Costa Rica and Jamaica) havelegislated reforms primarily to improve the power sector's operating performance, reduceits financial dependence on public resources and enable private participation. In Chile,Argentina and Peru, power sector reforms occurred within the context of macroeconomicreforms in the fiscal, monetary and trade areas. These macroeconomic reforms facilitatedthe successful implementation of the power sector privatization programs in Chile andArgentina. The reforms improved the overall investment climate, while privatizationprograms undertaken in other sectors gave additional reassurance to potential investors inthe power sector.
5.5 Power sector reforms enabled or enhanced private sector ownership of electricenterprises, with the legal and regulatory framework appropriately modified to provideequitable and transparent operating and pricing rules to all participants. In addition,pricing schemes using competitive, market-based pricing at the bulk power level were (orare) being introduced, retaining regulated tariffs mainly for monopolistic transmission anddistribution functions. Concurrently, all the countries are emphasizing energyconservation, demand-side management and the use of cleaner and more efficienttechnologies. Comprehensive environmental regulations have often been promoted inparallel with restructuring and privatization processes and environmental costs and risksare generally being slhifted from governments to privately-owned power enterprises.
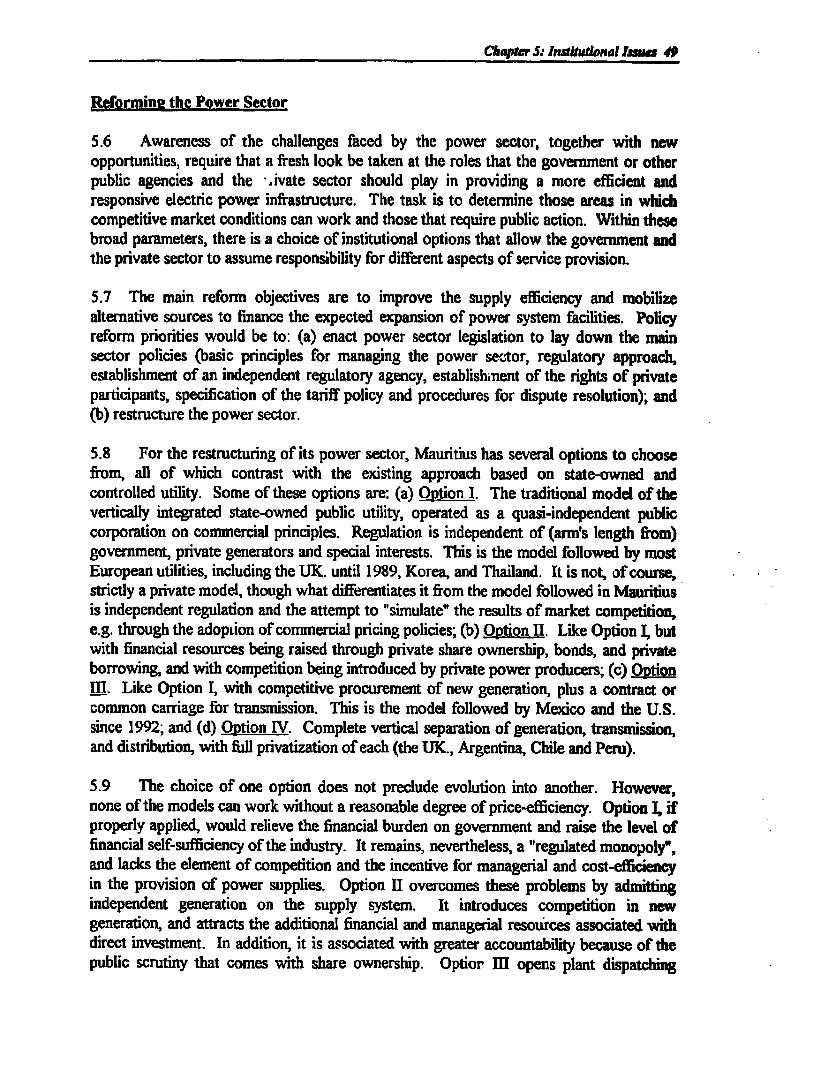
Chapter S: Insitudional laun d
Reformin the Power Sector
5.6 Awareness of the challenges faced by the power sector, together with newopportunities, require that a fresh look be taken at the roles that the government or otherpublic agencies and the ,.ivate sector should play in providing a more efficient andresponsive electric power infrastructure. The task is to determine those areas in whichcompetitive market conditions can work and those that require public action. Within thesebroad parameters, there is a choice of institutional options that allow the government andthe private sector to assume responsibility for different aspects of service provision.
5.7 The main reform objectives are to improve the supply efficiency and mobilizealternative sources to finance the expected expansion of power system facilities. Policyreform priorities would be to: (a) enact power sector legislation to lay down the mainsector policies (basic principles for managing the power sector, regulatory approach,establishment of an independent regulatory agency, establishinent of the rights of privateparticipants, specification of the tariff policy and procedures for dispute resolution); and(b) restructure the power sector.
5.8 For the restructuring of its power sector, Mauritius has several options to choosefrom, all of which contrast with the existing approach based on state-owned andcontrolled utility. Some of these options are: (a) Option I. The traditional model of thevertically integrated state-owned public utility, operated as a quasi-independent publiccorporation on comnmercial principles. Regulation is independent of (arm's length from)government, private generators and special interests. This is the model followed by mostEuropean utilities, including the UK. until 1989, Korea, and Thailand. It is not, of course,strictly a private model, though what differentiates it from the model followed in Mauritiusis independent regulation and the attempt to "simulate" the results of market competition,e.g. through the adopLion of cormmercial pricing policies; (b) Option H. Like Option I, butwith financial resources being raised through private share ownership, bonds, and privateborrowing, and with competition being introduced by private power producers; (c) OptionIII. Like Option I, with competitive procurement of new generation, plus a contract orcommon carriage for transmission. This is the model followed by Mexico and the U.S.since 1992; and (d) Option IV. Complete vertical separation of generation, transmission,and distribution, with full privatization of each (the UK., Argentina, Chile and Peru).
5.9 The choice of one option does not preclude evolution into another. However,none of the models can work without a reasonable degree of price-efficiency. Option L ifproperly applied, would relieve the financial burden on government and raise the level offinancial self-sufficiency of the industry. It remains, nevertheless, a "regulated monopoly",and lacks the element of competition and the incentive for managerial and cost-efficiencyin the provision of power supplies. Option II overcomes these problems by admittingindependent generation on the supply system. It introduces competition in newgeneration, and attracts the additional financial and managerial resou'rces associated withdirect investment. In addition, it is associated with greater accountability because of thepublic scrutiny that comes with share ownership. Optior IH opens plant dispatching

50 Maarikius: Energ Sector Review
schedules to competition. Prices would, in theory, be bid down to marginal fuil andoperating costs during off-peak, and up to marginal capital plus fuel and operating costsduring peak hours. Option IV allows for the franchising of distribution services.
5.10 The government may wish to appoix.t a working group to: (a) evaluate these andother options for restructuring Mauritius' power sector; (b) evaluate options for sectorregulation; (c) clarify trade-offs among options in order to meet government's objectives;(d) recommend structural and regulatory approaches; (e) set out a program forimplementing the fipancial, legal and institutional reforms; and (f) propose measures formanaging the transition process.
In The Petroleum Downstream Subsector
S.11 Up to 1983, petroleum products -were imported by private oil companies. In 1983,the State Trading Corporation (STC) which imports and sells some basic staple foods suchas rice and flour at subsidized prices, was empowered by govemment to take over fromexisting importers of petroleum products, the import of 25% of the country'srequirements. In 1984, this share was increased to 50% and in 1985, STC took over theimport of all petroleum products, including those destined for international trade/bunkerand aviation fuel. In practice, LPG and lubricants are directly imported by private oilcompanies and major consumers such as CEB have at times also imported part of their oilrequirements directly. However, while STC has a limited monopoly on imports, thestorage of the petroleum products once they arrive in Mauritius and their distribution isentirely effected by private oil companies (Shell, Caltex, Elf, Total and Esso).
5.12 Looking ahead and especially at the demand forecast for petroleum products forthe period 1994-2000, an expansion of the oil terminal will probably be needed.Discussions in Mauritius have centered on the expansion of storage capacity and on thesafety of existing instaliations. There seems to be a general consensus on the need toexpand the storage capacity in the near future. However, there are strong disagreementsabout relocating the existing facilities out of the port area and in particular about who is tobear the costs. On grounds of safety, the Mauritius Marine Authority (MMA) wants theoil companies to relocate their facilities out of the port area into a location, close to CEB'sFort George power station and to the existing oil terminal. HIowever, this would requiresubstantial investments from the oil companies. The oil companies, however, see theseinvestments as impossible to carry out, given the present level of the marketees margin.Furthermore, the oil companies claim that this request by MNMA to relocate their facilitiesand their inability to do so is a pretext for STC to intervene in the handling and storage ofpetroleum products by building a tank farm at the new location, an event which is viewedwith deep concern.
5.13 The private petroleum industry has served Mauritius well and it is recommendedthat the privately-led development strategy for the sector be continued and expanded. Theprivate oil companies which manage the existing system have the following advantages:(a) knowledge and access to worldwide supply sources and shipping; (b) ability to use

Chapter 5: Intstitutional Issues 51
their knowledge and contacts more easily in coordinating, planning and schedulingreplenishment of supplies; (c) expertise in handling product quality problems; (d)experience in handling and storage management; and (e) access to technical assistancewhen needed fTom related overseas companies. A compromise could be reached betweenthe concern for the safety of petroleum operations in the port area and the burden thatinvestments in new facilities would impose on the oil companies. The private oilcompanies are considering the area that would be required to house an oil terminal to meettheir forecast volume to 2025. They will be forwarding these dimensions to MMA andrequest that they be advised if such a quantity of land is available and of the anticipatedcost and time schedule. It is recommended that the government respond and engage adialogue with the oil companies to resolve this problem. Furthermore, the planning of thestorage capacity expansion should take into account the requirements of the power sector,especially for kerosene and fuel oil.
The Role of STC
5.14 Under the proposed process of deregulation and complete liberalization of imports,there would be no role for STC to play in the petroleum downstream subsector.However, actions to improve efficiency may not be without undesirable equity and fiscalimpacts, considerations at the center of Mauritian concerns. Fiscal neutrality should berespected. Income distribution has become more equal in Mauritius during the lastdecade, which reduces the justification of some of the government interventions of the80s. More importantly, the time may have come to improve the efficiency of incomedistribution policies. Proper targeting may be consistent with both efficiency and fiscalconsiderations. In addition, international experience has shown that efficient growth is themost powerful tool of income distribution.
5.15 The levies that STC takes on -petroleum products can be assimilated to a form oftaxation and to extent that the govemment wishes to keep them, they can be collected, asfor other trade taxes and duties, by the Department of Customs of the Ministry of Finance.If the government wishes to subsidize basic commodities such as rice and flour, it can doso through appropriations in the general budget in favor of groups deemed in need ofassistance. This system would help the government better target its intervention andeliminate across-the-board subsidies that exist at present.
Institutional Strengthening
The Ministry of Energy
5.16 MOE should limit itself to policy and regulatory functions, including the provisionof a credible and efficient institutional/legal framework that defines the level-playing field.To carry out these fuinctions dependably, MOE needs to develop its capability and staffingin the areas of policy formulation, pricing and regulation for both the power and petroleumr.subsectors. A minor reorganization of MOE's structure, such as the one proposed inAnnex 5.1, which is very much in line with what exists in other Ministries, would: (a) pave

52 Mauritius: Energy Sector Review
the way to this enhancement of MOE's capabilities; (b) introduce more rationality in theflow and handling of information and tasks; and (c) relieve policy-makers of day-to-dayoperational problems.
The Central Electricity Board
5,17 CEB's organization is structured along functional lines (see Annex 5.2 for thecurrent organization chart). It consists of seven main departments: generation,transmission and distribution, commercial, financial, human resources, administrative andaudit. Although CEB's organizational structure appears to be appropriate for itsresponsibilities, it suffers from the lack of a corporate plan through which performancetargets could be set and egainst which achievements could be assessed. In terms ofoperational planning, CEB has relied solely on consultants to undertake demand forecasts(including revisions), and least-cost generation and transmission planning. However, sincethe planning process needs continuous monitoring and updating, there is a strong need forthis activity to be undertaken in-house, as is done in almost all utilities worldwide. Thecreation of this corporate unit had already been recommended by the World Bank in 1987(Power System Efficiency Study, Joint UNDP/World Bank report, May 1987). Werecommend again that this unit be created.
5.18 Four other areas need improvements: (a) Simplification of procurement:cumbersome government procedures required for the award of supply contracts haveresulted in costly delays in the implementation of CEB's investment program. The issue isthat such delays have nothing to do with the merits of the projects themselves, or withCEB's technical capacity to implement, and therefore constitute an unnecessary drag onthe efficiency of the power sector as a whole. The objective should be to transfer to CEBfull authority and accountability for all its procurement decisions; (b) Effectiveness of theBoard of Directors: the board of directors has not been very effective in arresting thefinancial deterioration of CEB over the last five years. This ineffectiveness can be relatedto three main reasons: (i) the lack of a corporate strategy and plan; (ii) governmentintrusiveness in the management of CEB and (iii) the lack of accountability of boardmembers. Board effectiveness should be raised and it is recommended that this issue beexamined as part of the restructuring of CEB; (c) Staff Productiv y: In 1991, CEB had1,861 employees. This number has been remarkably stable since at least 1982 with anincrease of less than 6%, in spite of the large increase in demand and in the number ofconsumers which has grown from 171,382 in 1982 to 227,699 in 1991. CEB hasapproximate.ly 122 consumers per employee. This performance ratio could be improvedupon and brought to about 200 consumers per employee; and (d) Staff Compensation:CEB's staff is dedicated and qualified and the relatively good reliability of service isindicative of the efficient performance of the technical staff; particularly with regard to theoperation and maintenance of the generation, transmission and distribution facilities.However, to attract and retain high caliber staff, it is recommended that CEB keep itscompensation package under periodic review so that it remains competitive with what isoffered in the private sector.

- 53 -
References
Baguant, J. and Beeharry, P. R. (1990), Household Energy Consumption Survey,University of Mauritius
Central Statistical Office (1992), Advance Results of the 1991-92 Household BudgetSurvey, Port Louis
Hamilton, J.D. (1992), Time Series Analysis, Princeton, N.J.
UNDP/World Bank (1993), Mauritius: Toward the 21st Century, Country Report 12,Washington, D.C.
UNDP/The World Bank (1981), Mauritius: Issues and Options in the Energy Sector,Report No. 3510-MAS, Washington, D.C.
World Bank (1992), Mauritius Sugar Energy Development Project. Report No. 10037-MAS, Washington, D.C.
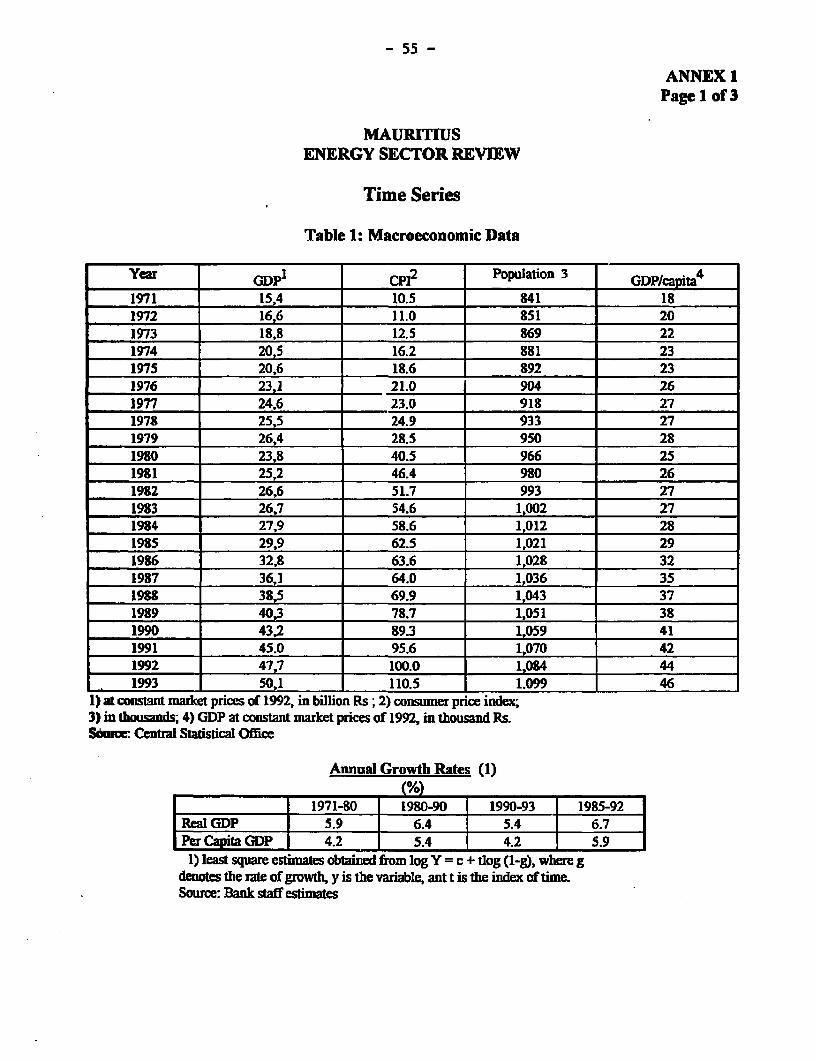
- 55 -
ANNEX 1Page 1 of 3
MAURITIUSENERGY SECTOR REVIEW
Time Series
Table 1: Macroeconomic Data
__________ GDP1 Cp__ | Population 3 GDP/capita4
1971 15,4 10.5 841 181972 16,6 11.0 851 201973 18,8 12.5 869 221974 20,5 16.2 X81 231975 20,6 18.6 892 231976 23,1 21.0 904 261977 24.6 23.0 918 271978 25.5 24.9 933 271979 26,4 28.5 950 281980 23,8 40.5 966 251981 25,2 46.4 980 261982 26,6 51.7 993 271983 26,7 54.6 1,002 271984 27,9 58.6 1,012 281985 29,9 62.5 1,021 291986 32.8 63.6 1,028 321987 36,1 64.0 1,036 351988 38,5 69.9 1,043 371989 40,3 78.7 1,051 381990 43,2 89.3 1,059 411991 45.0 95.6 1,070 421992 47,7 100.0 1,084 441993 50,1 110.5 1.099 46
1) at constant marlket prices of 1992, in billion Rs ; 2) consumer price index;3) in housands; 4) GDP at constant market prices of 1992, in thousand Rs.Souroc Central Statstical Office
Annual Growth Rates (1)
(%/0)_ __ _ 1971-80 1980-90 1 1990-93 1985-92
IReal GDP 5.9 6.4 5.4 6.7Per Capita GDP 4.2 5.4 4.2 5.9
1) least square ecsmates obtained fom log Y = c + tlog (1-g), where gdenotes the rate of growth, y is the variable, ant t is the index of time.Source: Bank staff egimates
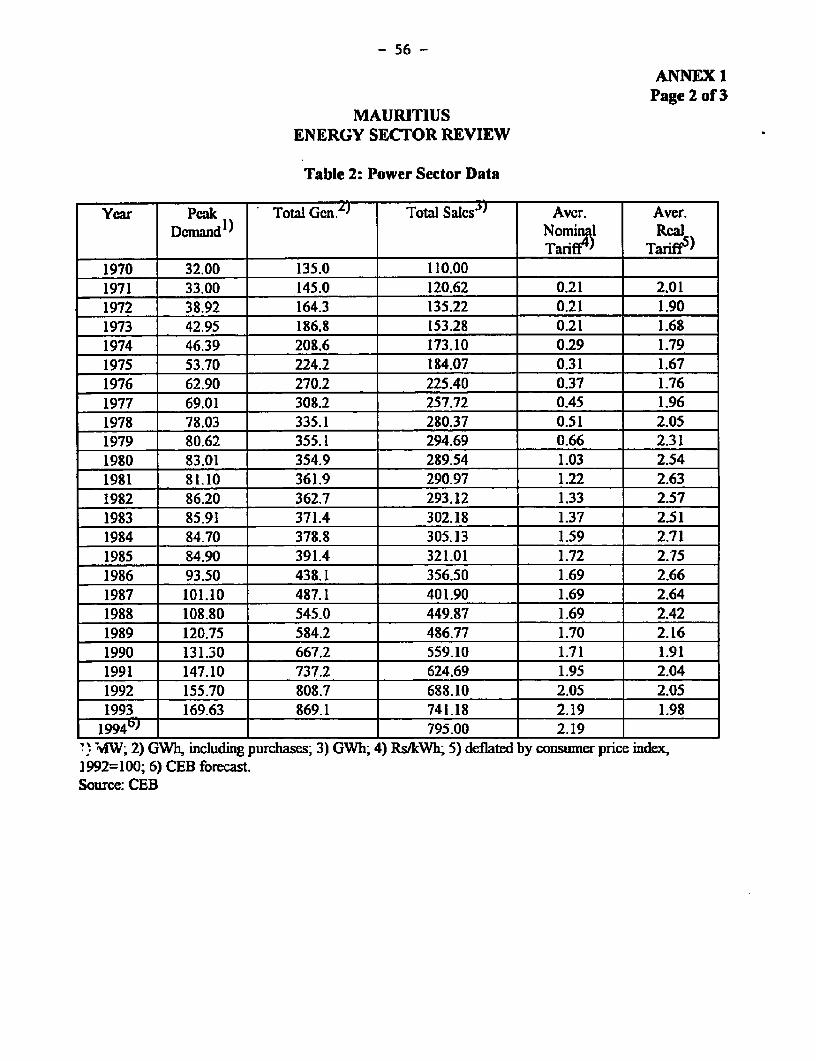
- 56 -
ANNEX IPage 2 of 3
MAURITIUSENERGY SECTOR REVIEW
Table 2: Power Sector Data
Year Pcak Total GCcn,-) Total Salcs3) Avcr. Aver.Dcmandl) NominA,l Real
Tarifft Tariff5)1970 32.00 135.0 110.001971 33.00 145.0 120.62 0.21 2.011972 38.92 164.3 135.22 0.21 1.901973 42.95 186.8 153.28 0.21 1.681974 46.39 208.6 173.10 0.29 1.791975 53.70 224.2 184.07 0.31 1.671976 62.90 270.2 225.40 0.37 1.761977 69.01 308.2 257.72 0.45 1.961978 78.03 335.1 280.37 0.51 2.051979 80.62 355.1 294.69 0.66 2.311980 83.01 354.9 289.54 1.03 2.541981 81.10 361.9 290.97 1.22 2.631982 86.20 362.7 293.12 1.33 2.571983 85.91 371.4 302.18 1.37 2.511984 84.70 378.8 305.13 1.59 2.711985 84.90 391.4 321.01 1.72 2.751986 93.50 438.1 356.50 1.69 2.661987 101.10 487.1 401.90 1.69 2.641988 108.80 545.0 449.87 1.69 2.421989 120.75 584.2 486.77 1.70 2.161990 131.30 667.2 559.10 1.71 1.911991 147.10 737.2 624.69 1.95 2.041992 155.70 808.7 688.10 2.05 2.051993 169.63 869.1 741.18 2.19 1.98
1994 _) 795.00 2.19''MW; 2) GWh, including purchases; 3) GWh; 4) Rs/kWh, 5) deflated by consumer price index,1992=100; 6) CEB forecast.Source: CEB

- 57 -
ANNEX IPage 3 of 3
MAURITIUSENERGY SECTOR REVIEW
Table 3: Petroleum Products
Year Gasoline DieselRsAlitre') Dom.Sales2 3 Rs/litre') Dom.Sales2 )
1975 7.06 47,992 4.47 61,5161976 7.08 56,418 4.71 65,7911977 7.40 67,323 4.79 74,8941978 8.02 72,499 4.57 74,9151979 11.17 70,220 5.71 69,6721980 12.91 56,372 7.67 65,4701985 13.07 47,996 7.92 68,0001986 12.10 52,000 7.09 74,0001987 12.03 59,000 7.04 83,0001988 11.01 65,000 6.45 91,0001989 9.78 74,000 5.73 96,0001990 9.55 84,000 5.69 108,0001991 10.46 86,000 6.21 116,0001992 9.50 94,000 5.50 126,000
1) average annual retail price adjusted for inflation (1992 as base year);2) in 1,000 litresSource: Oil companies, STC
Annual Rates of Growth (1)_(%0)
_ ______________ 1971-80 1980-90 1990-93 1985-92Electricity Sales 11.4 6.9 8.9 11.7Domestic Gasoline - - - 10.4Sales 10.4Domestic Diesel 9.1
1) least square estimates obtained from log Y= c + tlog (1-g), where g denotesthe rate of growth, y is the variable, and t is the index of time.
Source: Bank staff estimates

- 58 -
ANNEX 2.1
MAURITIUSENERGY SECTOR REVIEW
Energy Data 1992 8)
|M20"IJ Diesd' -- Fusel i1A|K eoJ | I LP'G,) I Qsoilr.S) HJJt2 co | BaR)Domec - - 35,711 265.4
Nod.~~ ~ ~ ~ ~ ~ ~~ ~ ~ ~ ~ ~~~~~~~~~~~~~ _ _ _ _ _ _ __
imports 64,255 157722 166035 176 S 29,051 -. 4REXg+-Bu - (51326) (20,057) (136258) = - -
Stock - (8,962) (4,036) (20,334)aCa,.p4 ) _ __Primary 64,255 106396 137.0 35,310 29,051 3,711 52,164 265.4EnePow.Clen') - (109,215) (213 - 30.1 ,35711Q (34,164A CASALosses - 19 - - - -)
Fia 64,255 106,396 27.851 13,929 29,051 683.3
Induisr _ _ - _ _ 27,851 - 700 244.5 - iko Coman_. -- ...2_92.000 163.3 . _Laid. __ _ _13 _ - 13,929 26,351 249.3
Traspml& 64,255 - - - 2 I -1
1) mactiC tons;2) OWh; sanil smM of dicsd oil wed to am stop engines ae not cozide;c3) rimaryr equne ivalentad an gssu bine(in to ofk eoa);4) note ad a ugetive flow co re9ponds to an crease in dock;5) bgag used for gneratig powrsoldto CEB, in 0W0 tam6) buker data infer to fls spplied to ships and airrfla for internaioa uianpoada iwmapective oftbr flag efth cari,7) hydm: 113.1 GWh, coal: 43.3 OGW; bagasse 34.6 GOW. Kemsac 69.3 CWh, fiel cil: 4973 OWh3-) figur in parern are negaive; woodfilc counuptiand aI par indusi ovm conumpio. of bagas are induded
Souwce: Bank staff estimates fiDm national data.
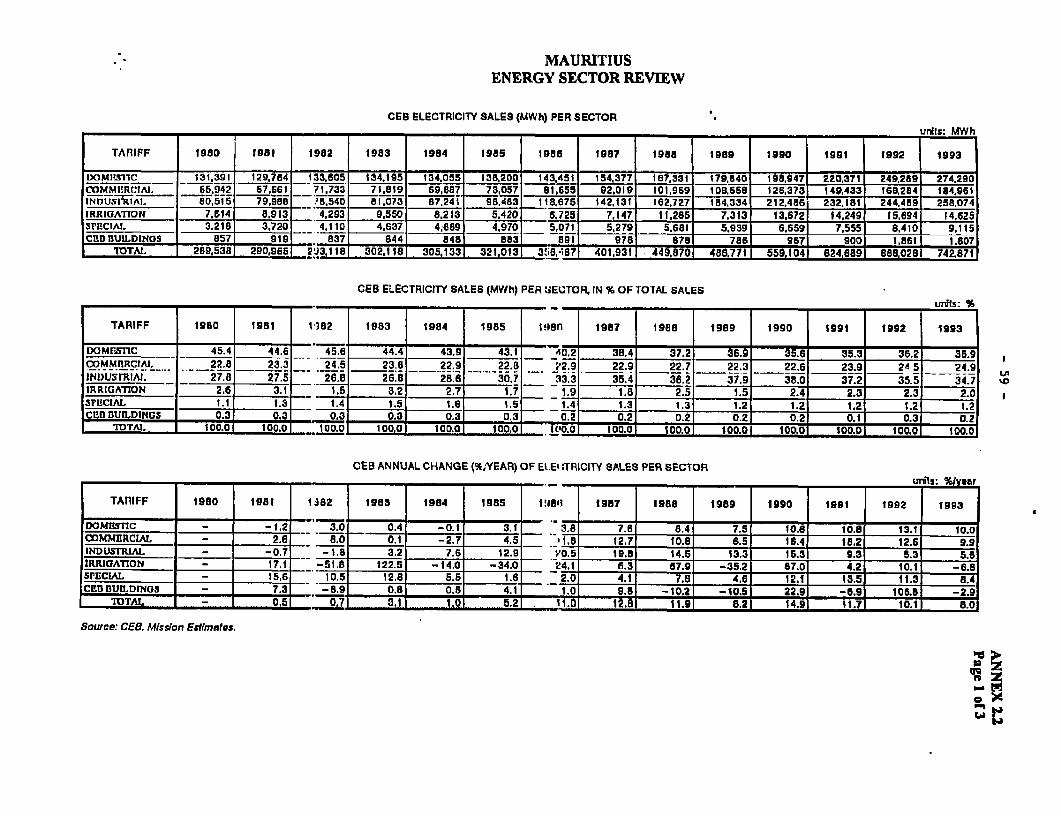
MAURITIUSENERGY SECTOR REVIEW
CEB ELECTRICITY SALES (MWh) PER SECTORuSits: MWh
TARIFF 1980 1981 i982 1983 1984 1985 1986 1987 1988 1989 1990 _991 1992 1993
DOMIiSTIc _ 131.391 129,7E4 133,605 134.195 134.055 138.200 143,451 154,377 167,331 179,840 198,947 220,371 249,289 274,290COMMI!Rt:IAI. 65.942 67.661 __ 71.733 71,819 69,887 73,057 81,655 92.019 101,969 1t0,558 126,373 149,433 168,284 184,961INtltliiiiAI. 80.515 79.98e 6,8,540 81.073 87.241 98,483 118,675 142,131 162,727 184,334 212.486 232.181 244.489 258,074IRRIGATION 7,614 8.913 4.293 9.550 8.213 5.420 6.725 7,147 11.285 7,313 13.672 14.249 15.694 14,625SPECIAL. 3.218 3,720 4.,110 4.637 4,889 4,970 5,071 5,279 5,681 5.939 6,659 7,555 8,410 9,11s_CE___BULDINGS 857 919 837 844 848 883 891 978 878 786 967 900 1,S61 I i807
I TAL 289,538 29036_5 232 118 302,118 305.133 321,013 .3 i,-67 401,931 449,870 486,771 559,104 624,689 688,0281 74Z871
CEB ELECTRICITY SALES (MWh) PER :iECTOR, IN % OF TOTAL SALES________ ~~~~~~~~~~~~~~~~~~~~unlls: %
TARIFF 1980 t181 1 182 1953 1984 1985 | 18f | 1987 r e |t989 | 1990 1991 1992 1993
DOMl'tnC 45.4 44.6 45.6 44.4 43.9 43.1 40.2 38.4 37.2 369 35.8 35.3 362 36.9aOMMPtRCAl, _22.8 23.3 24.5 23.8 22.9 22.8 22.9 22.9 22.7 22.3 22.6 23.9 24 51 24.9INi)USMRIAIL 27.8 27.5 26.8 26 8 28 a 30.7 33.3 35.4 36 2 37.9 38.0 37.2 35.5 34.7 wIRRIGATION 2.6 3.1 __ .5 32 2.7 1.7| 1.9 1.8 2.5 15 2.4 2.3 23 2.0SICIclAL LI1 1.3 __ 1.4 1.5 1.6 1.5 ___ 1.4 1.3 1.3 1.2 1.2 1.2 1.2 1.2CPO0BUILDINGS 0.3 0.3 _ 0.3 0.3 0 0.3 E.l 0.21 0.2 02. 0.2 0.1 03. 0.2
lOTAI. 10.O0 100.0 _100. 100,0 100.o 100.0 l('o.0 100.01 100.0 100.0 100.0 100.0 100.0 100.0
CEB ANNUAL CHANGE (%,YEAR) OF El.Etl:TRICITY SALES PER SECtOR
TARIFF 1980 1981 1382 1983 1984 1985 119861 1987 1988 1989 1990 1991 1992 1993
DOMEHS1C - - 1.2 3.0 0.4 -0.1 3.11 3.8 78 8.4 7.5 10.6 10.8 13.1 10.0COMMERCIAL 2.6 6.0 01. -2.7 4.5 _ |1.8 12.7 10.8 6.5 16.4 18.2 12.6 9.9INDUSTRIAL - -0.7 -1.8 32 76 12.9 2°.5 19.83 14.5| 13.3 15.3 9.3 5.3 5.6IRRIGATION - 17.1 -51.8 122.5 -14.0 -34.0 24.1 |3 a7.9 -35.2 87.0 4.2 11 -6.55I'ECIAL | - 0 - 15,6 10.5 12.8 5.5 1.6 2.0 4.1 7.8 4.8 12.1 13.5 11.3 8.4SPECEA uLDr a 13 31 8..-8.CElsflUn.DrNGS - 7.3 -8. 9 ~08, 0.5 4.1 1.0 9.8 -10.2 -10.5 29, - 6.9 105.81 -2.9
UTAL. - I 0,5 =071 3.1 1.0 5.2 11.0 12.86 11.9 8.2 14.9 11.7 10.1 0
Source: CEO. Mlsskin Esffmates.
ZW"5'

CEB. NUM8EM OF CONSUMERS AT END OF YEAR
TARIFF lD00 19B1 1D82 1903 i904 1905 19BG 1987 1900 ita9 1o90 1991 1f92 1993
I)MI'Sl'll:1- 140.302 144,995 154,79? 159.342 163,507 160013 173,6B5 179,687 155.609 169.759 196.312 203.741 211,655 220.309.tiMM.Bit'IAI. -? )55G _,_.13.07 ,04 13,995 14,349 ___ j,7 _ _f __ _ 75 117l.06 15.510 1_;_00 20.50_
I N IMIHI Sl'R IAI. 2,033 2,007 2,022 2,92i ._._3 3250 3.510 3,795 4.199 4.511 4.832 5, 122 5.36 5.592krIArWrton -127 123 _20 124 1l5 - -- 1i7 'i 1-1 231 12 -a i5- . 9 211
SrPCIAL 139 -. 3 - 13i9 __ l IiZ__ 142 16 1 171 1 1- i92- 194 196 _ 197CIMt1 T11JII.IINCIS _ _ _ _ _ -. _ _ _ _ _ _ _
TOTAL 155,95i 197I,82 176.5251 , 9 2,7 . 3 10V72 1 63 206J172 2 11.274 219,064 227 23,e2 24551 !
0
CEI ANNUAL GROWTH RATE (%Iyear) OF NUMBEROFCONSUMERS
TAnIFF 1980 1981 1952 1953 19B4 1955 1988 1987 190B 1959 1990 1991 1992 1993- I - - -- - --
DOlMFST1C 3.3 6B. 2.9 2.6 2.8 3.4 a.5 3.3 2.2 3.5 3.B 3.9 4.1~COMMU4(RCIAL. 4.2 3.3 3.6 2.5 3.1f 3.4 -. 6.2 3.9 5.5 5.2 4.5 5.7INI)IISTRII. - - -0.9 0. _3_7 5.1 5.7 0.0 __6.1 10.5 7.4 _7. .0 4.7 . 43IRRIOIATII)N _ -31 -2.4 2.5 0.8 -4.0 -. 0 5 6.5 U.5 _ -5 _ __5.7 _ _45.4 11.6SPLCIAL. _ o o 0.0 0.0 _ 2. 0.0 13.4 6.2 8.2 3.8 1.0 1.0 0.5 1.5CI!nIJI ifLI)INOS _ _ _ _ _ _ _ _ _ . _ _ _ _-
TOTAL _ 3,3 6,4 3.0 2.6 2.8 3.5 3.2 3.7 2.5 3.7 3.9 4.0 4.21
Source: CEB.
'>
o x_ N
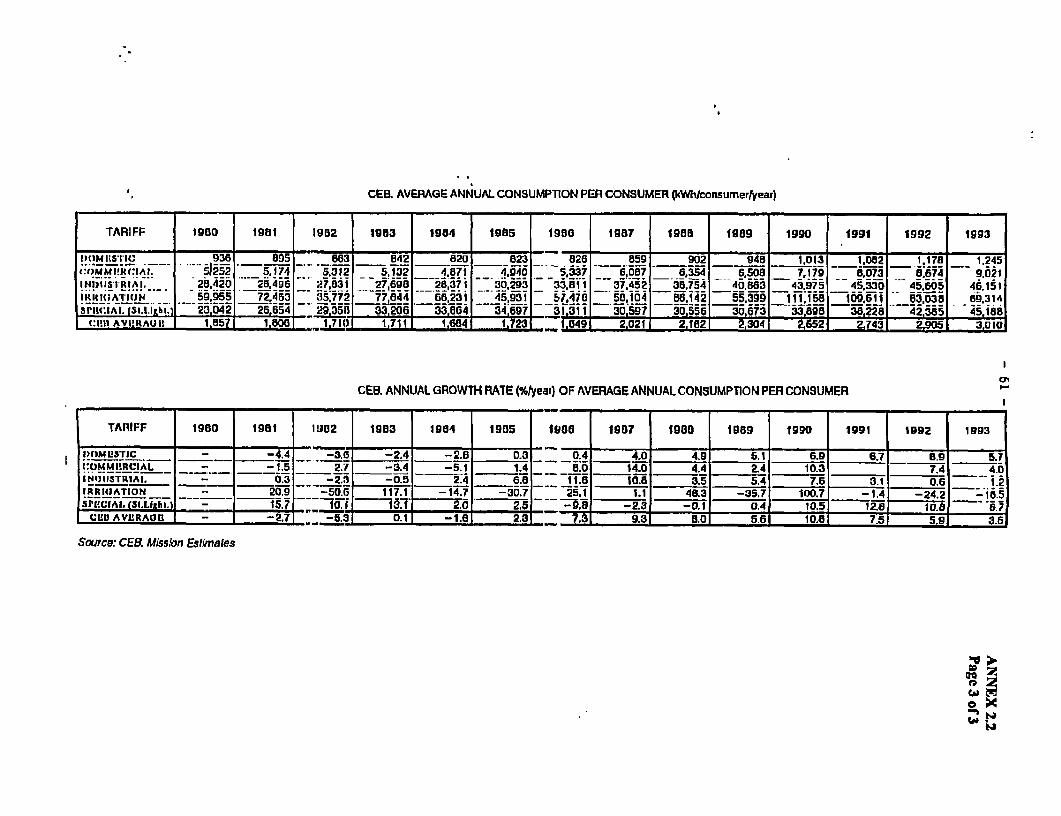
CEE. AVERAGE ANNUAL CONSUMPTION PER CONSUMER (kWh/aonsumerlyear)
TARIFF 1900 1901 1902 1953 1954 1985 1900 1987 190s 1909 1990 1991 1992 1993
IIU"MItSIC - - -936 895 G63 4 842 - e20 823 1826 859 902 945 1.013 1.082 1.178 1.245:E;MbtWRvt:lAl 51252 5.174 5.312 _ 5,132 __ 487 4,94o 8 5.37 6,0e7 _ 6 ,354 _ 6,50B o 7,179 8,073 - _. -_ 6.
!X!!^!) RIAL -_ 1..420 282496 21 27,698 20,371 33,511 37.452 35.754 40.863 43.975 45.330 45.605 46.151!R R I4ICATICItJN_ __ .59.955 72!463 35.772 77,644 65,231 45,931 5i,4i6 5. 08.142 55.3_9 111,15S 10W 611 63,035 69,3143tU(:IAI.(SI.I.IAhg.1 b 23,042 26,654 _%O B n 0 6 . _ _ _ ._ __ _ 30;597.311 30_597 -. 55 673 6306.s 3223 2365 4518
tIA VAI!KA0 1, 1j7 I ( 1,7111 1,604 1.723 _1049 ___20I 2,1 Q 2,3041 2552 Z. 743 1 3
CEB. ANNUAL GROWTH RATE (%Iyear) OF AVERAGE ANNUAL CONSUMPTION PER CONSUMER
TAnIFF 1980 1901 1 UE2 1903 1904 1905 1900 1907 1900 1959 1990 1991 1992 1993
tItfbl)LTIC ___ -4.4 -3.0 -2.4 -2.6 _ . -_ _4 4.9 5.1 6.e 6.7 _ .9 5.7COMI t-uMCI!AL _ _ _ 5 _21 5 .- 3.4 -51 _ 1.4____ .0 14.0 4.4 2-4 10.3 7.4 4.0ttI~IWTRIAI. -0.3 -23 -0-5 ~ 2K4 ~ 6.5 11.0 10. -3. 5.4 ~7.6 3.1 0.6 1.-TRRIOATION 20.9 _ _ 0 117.1 -14.7 - 25.1 1.1_ 45.3 -35.7 100.7 -1.4 -24.2 -10.5srfl!CIA L(LipI.) -_5.7 _ I t1 2.0 2.5 _ _ - .5 -2.3 -0.1 0.4 10.5 12Z8 10.8 _ .?
CLUD AVURAB _ -2.7 -5.3 0.1 -1.6 2.a 7.3 9.3 5.0 5.6 10.5 7.5 5.9 3.6
Source: CEB. Mission Estimales
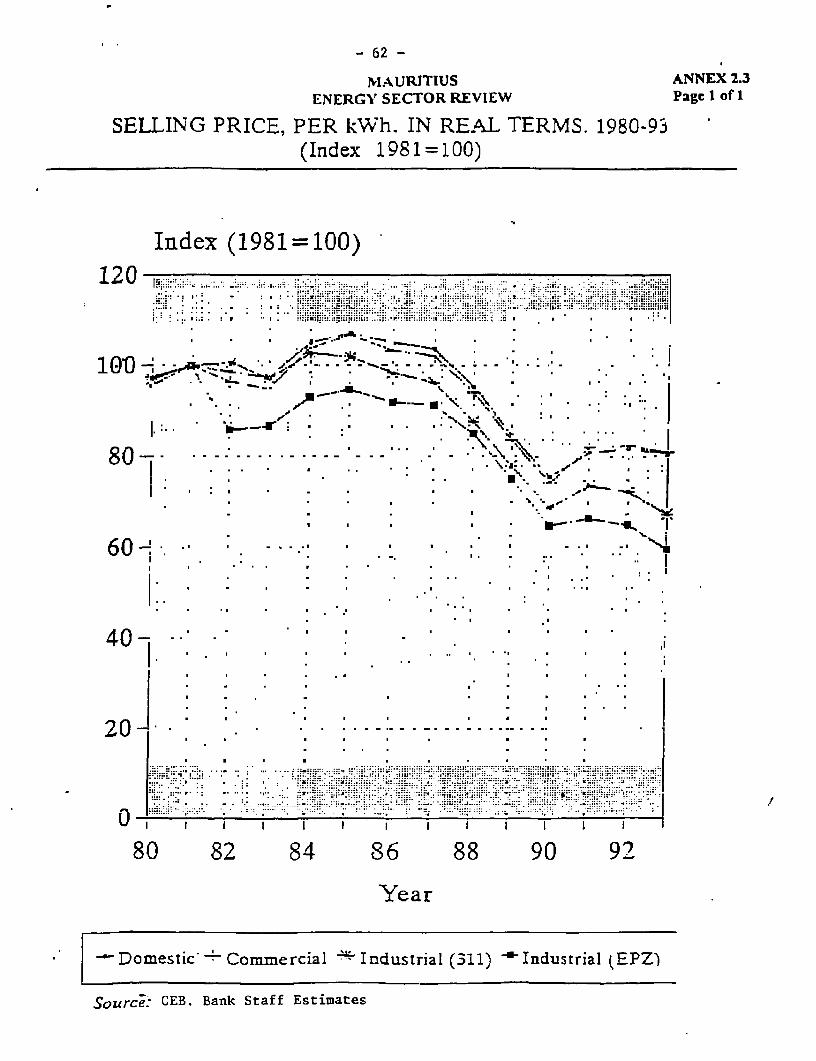
- 62 -
NIAURITIUS ANNEX 2.3ENERGY SECTOR REVIEW Page I of I
SELLING PRICE, PER kWh. IN REAL TERMS. 1980-93(Index 1981=100)
Index (1981=100)120~ *1. . ..
~~~~~~~~~~~* '
1. .:........... . .... .. ....... .. i....
.. . , , ,, .,:; j. , ., .., jy;t. .. .. ..... .... w' . ... ., ........
1 ....* ... . ..; . .... ..... ...... .
XS0 1 ' ~~* '. . . _ *E'\\B. J-E.r I
0-- N. 7R\~~~~~~~~~~N60 *. * * * ' .* -*' ., .. :
I | : * * . * ' ' *- - o ~. . .
I~ ~~ ~~ ~ ~ - . -| , *. w
I~~~~~~~~~~ ." tm:;:; -1'
A~~~~~~~~~~~~~~~~
nO - -".: . ... . ..-..
807 8 4 8 8 0 9.. ... . . . . .. . . .. . . . .. . .. .. . . .. . ........ .. .... . .... . . ............ ....~~~~~~~~~~~~~~~~~~~~~~~~~~~~~~~~~~~~~~~~~~~~~~~~~~~~~~. .... ...... ....... .... .. .. ....... .. .... .....
| ~~~~~~~~~~~~~~~~~~~~~~~~~~~~~~~~~~~~~... . . ....... ...... .........
.. ~ ~ ~ ~~ ~~ ~~~~~~~~~~~~~~~ - ..... .. .. ... . ....
U N. . . . ... .! ! N . . . .. .
0. .... .. .. ....
Year
.[.o~Domestic Commercial Industrial (311) ' Industrial (EPZ)
SouercP. CEB. Bank Staff Estimates
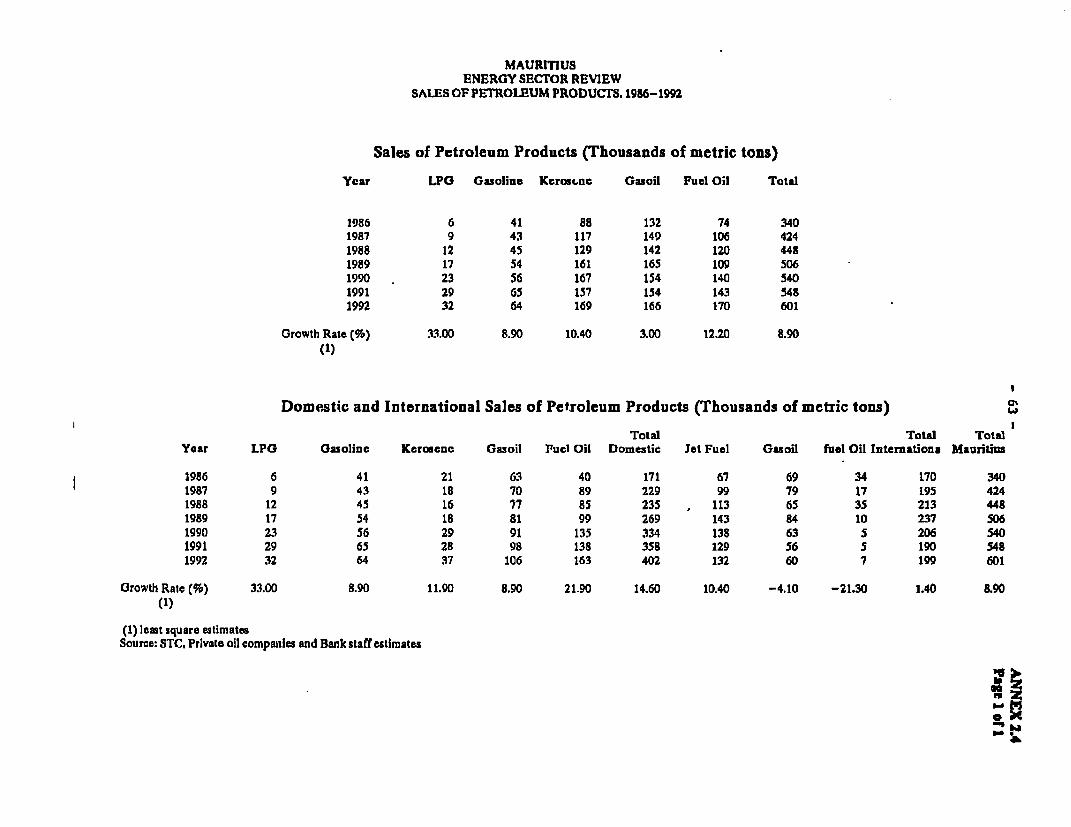
MAURITIUSENERGY SECTOR REVIEW
SALES OF PETROLEUM PRODUCTS. 1986-1IM
Sales of Petroleum Products (Thousands of metric tons)
Year LPG Gasoline Kercsine GOmoil Fuel Oil Total
1986 6 41 88 132 74 3401987 9 43 117 149 106 4241988 12 45 129 142 120 4491989 17 54 161 165 109 5061990 23 56 167 154 140 5401991 29 65 157 154 143 5481992 32 64 169 166 170 601
Growth Rate (%) 33.00 8.90 10.40 3.00 12.20 8.90
(1)
Domestic and International Sales of Petroleum Products (Thousands of metric tons)
Total Total TotalYear LPG Gasoline Kerosene Gasoil Fuct Oil Domestic Jet Fuel Gasoil fuel Oil Internationa Mauritius
1986 6 41 21 63 40 171 67 69 34 170 3401987 9 43 18 70 89 229 99 79 17 195 4241988 12 45 16 77 85 235 , 113 65 35 213 4481989 17 54 18 81 99 269 143 84 10 237 5061990 23 56 29 91 135 334 138 63 5 206 5401991 29 65 28 98 138 358 129 56 5 190 5481992 32 64 37 106 163 402 132 60 7 199 601
Growth Rawe (7) 33.00 8.90 11.90 8.90 21.90 14.60 10.40 -4.10 -21.30 1.40 8.90
(1)
(1) least square estimatesSource: STC, Private oil companies and Bank staff estimates
" a5
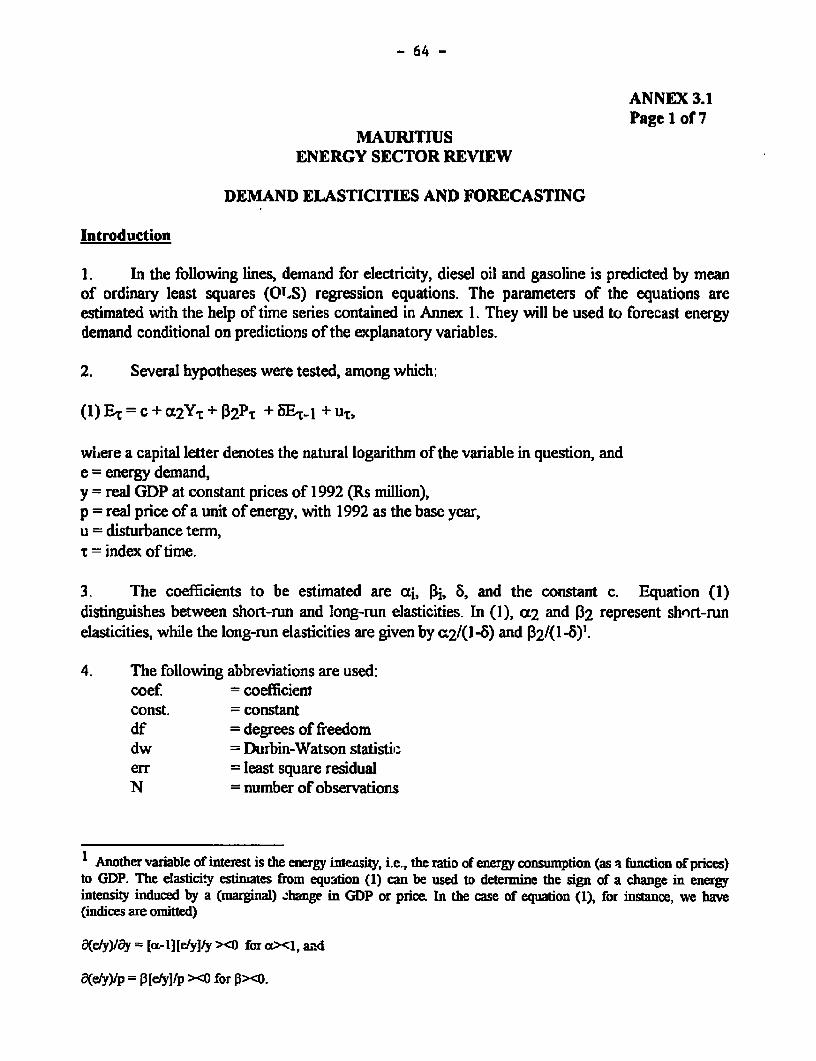
- 64 -
ANNEX 3.1Page 1 of 7
MAURITIUSENERGY SECTOR REVIEW
DEMAND ELASTICITIES AND FORECASTING
Introduction
1. In the following lines, demand for electricity, diesel oil and gasoline is predicted by meanof ordinary least squares (OTYS) regression equations. The parameters of the equations areestimated with the help of time series contained in Annex 1. They will be used to forecast energydemand conditional on predictions of the explanatory variables.
2. Several hypotheses were tested, among which:
(1) EI - c + at2Yt + I2Pt + 5E- I + uc,
wihere a capital letter denotes the natural logarithm of the variable in question, ande = energy demand,y = real GDP at constant prices of 1992 (Rs million),p = real price of a unit of energy, with 1992 as the base year,u = disturbance term,z = index of time.
3. The coefficients to be estimated are ai, [i, 5, and the constant c. Equation (1)distinguishes between short-run and long-run elasticities. In (1), a2 and [B2 represent short-runelasticities, while the long-run elasticities are given by c2/(I -8) and [2/(1-8)'.
4. The following abbreviations are used:coef = coefficientconst. = constantdf = degrees of freedomdw = Durbin-Watson statistic,err = least square residualN = number of observations
1 Another variable of interest is the energy intensity, i.e., the ratio of energy consumption (as t function of prices)to GDP. The elasticity estinates from equuation (1) can be used to determine the sign of a change in energyintensity induced by a (marginal) change in GDP or price. In the case of equation (1), for instance, we have(indices are omitted)
6(ey)/Oy = [cx-l][ety]/y >xO for a>ci, and
8(ely)lp = 3[e/y]fp >xO for 3><O.
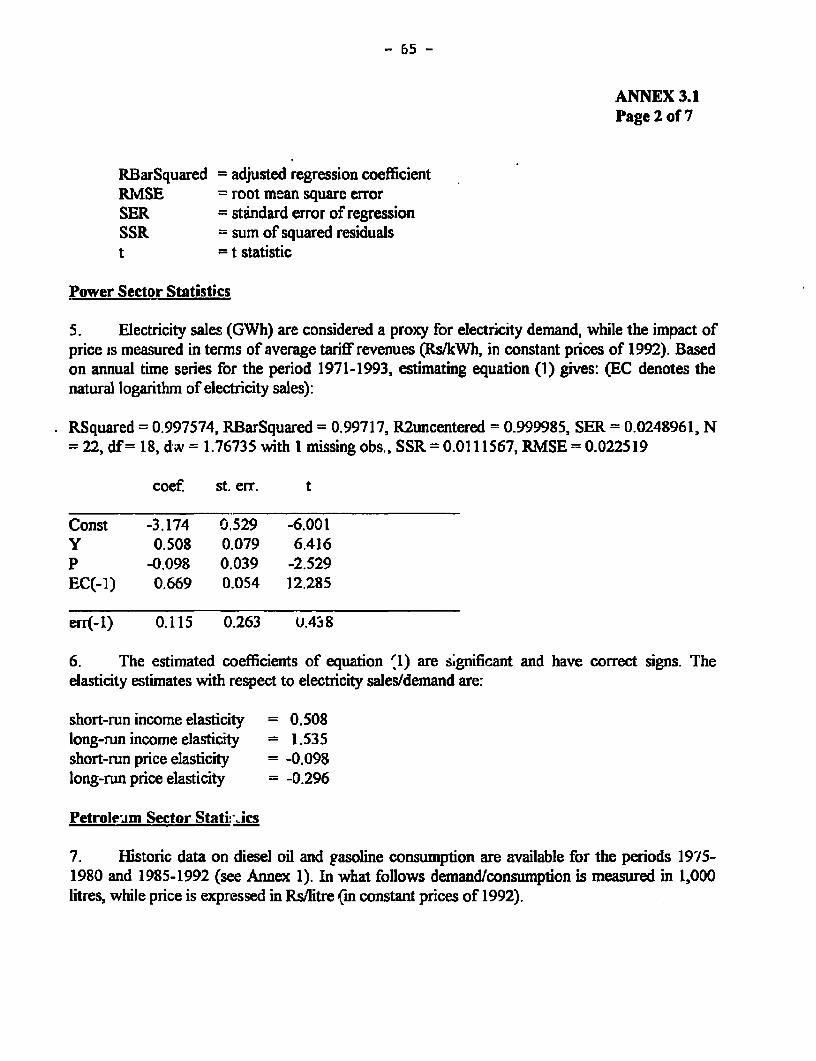
- 65 -
ANNEX 3.1Page 2 of 7
RBarSquared = adjusted regression coefficientRMSE = root mean square errorSER = standard error of regressionSSR = sum of squared residualst = t statistic
Power Sector Statistics
5. Electricity sales (GWh) are considered a proxy for electricity demand, while the impact ofprice is measured in terms of average tariff revenues (s/kWh, in constant prices of 1992). Basedon annual time series for the period 1971-1993, estimating equation (1) gives: (EC denotes thenatural logarithm of electricity sales):
RSquared = 0.997574, RBarSquared = 0.99717, R2uncentered = 0.999985, SER = 0.0248961, N2 22, df= 18, div = 1.76735 with I missing obs., SSR = 0.0111567, RMSE = 0.022519
coef st. err. t
Const -3.174 0.529 -6.001Y 0.508 0.079 6.416P -0.098 0.039 -2.529EC(-1) 0.669 0.054 12.285
err(-1) 0.115 0.263 U.438
6. The estimated coefficients of equation 'I) are significant and have correct signs. Theelasticity estimates with respect to electricity sales/demand are:
short-run income elasticity = 0.508long-run income elasticity = 1.535short-run price elasticity = -0.098long-run price elasticity = -0.296
Petroleum Sector Stati-ics
7. Historic data on diesel oil and gasoline consumption are available for the periods 1975-1980 and 1985-1992 (see Annex 1). In what follows demand/consumption is measured in 1,000litres, while price is expressed in Rs/litre (in constant prices of 1992).

- 66 -
ANNEX 3.1Page 3 of 7
D:lesfel Consumption
S. The regression results for the pooled data are (DC denotes the natural logarithm of dieselconsumption):
R.Squared = 0.977558, RBarSquared = 0.970078, R2uncentered = 0.999992, SER = 0.0386653,N 13, df= 9, dw = 2.26441 with I nissing obs., SSR = 0.013455, RBMSE = 0.03217
coef st. err. t
Const 1.057 0.733 1.442Y 0.485 0.103 4.728P -0.224 0.072 -3.091DC(-1) 0.500 0.132 3.798
err(-1) -0.183 0.424 -0.431
The parameter estimates of (1) are stable and can be used to forecast diesel oil demand. Theelasticity estimates are:
short-run income elasticity = 0.485long-nm income elasticity = 0.970short-run price elasticity = -0.224long-run price elasticity = -0.448
Gasoline Demand
9. Regarding gasoline demand, the parameter estimates of equation (I) from the pooled dataare: (GC denotes the natural logaritin of gasoline consumption):
RSquared = 0.952907, RBarSquared = 0.937209, R2uncentered = 0.999985, SER = 0.0510597,N 13. df= 9, dw = 1.89677 with 1 missing obs., SSR = 0.02346, RIMSE = 0.042482
coef st. err. t
ConS 1.443 0.869 1.660Y 0.324 0.066 4.929p -0.488 0.075 -6.522GC(-l) 0.672 0.086 7.830
However, the coefficient equality of the pooled data cannot be accepted.

- 67 -
ANNEX 3.1Page 4 of 7
10. Among the subsets of data, the best fit of equation (1) can be achieved for the period1985-19!'2:
RSquared = 0.997971, RBarSquared = O.996449,R2 uncentered = 0.999999, SER = 0.01471, N- 8, df= 4, dw = 2.36865 with 6 missing obs., SSR = 0.000866
coef. st. err. t
Const -0.848 1.194 -0.711Y 0.957 0.112 8.515p -0.387 0.116 -3.345GC(-1) 0.252 0.054 4.668
err(-1) -0.893 1.180 -0.750
The above estimates will be used to forecast gasoline demand. The elasticities are:
short-run income elasticity = 0.9571omg-run income elasticity = 1.279short-run price elasticity = -0.387long-run price elasticity -0.517
Forecast of Electricity Sales
11 In order to forecast electricity sales for the period 1994-2010 from regression model (1),one has to predict, or to forn expectations about, the future evolution of (real) GDP and averagetariffs (at constant prices of 1992). As for the tariffs, it is assumed that they adjust to the level ofcost recovery by 1995 and thereafter rise in discrete steps to pass on moderate increases inoperating costs (adjusted for inflation).
12 There are two scenarios of GDP growth. The base case scenario is based on World Bankprojections for the period I994-2002, extrapolated intil the year 2010. The key assumptionunderlying this outlook is that the Mauritian economny maintains its competitive edge throughexport diversification and productivity gains. Altematively, an adjustment period for the economymight be necessary if the policy reforms to meet the challenges of the 1990s are delayed or do nothave the expected impact over the short to medium term, GDP growth is expected to slow downuntil the turn of the century. Thereafter, it is assumed that GDP growth will pick up at rates of5% or more. This prospect is captured by the "low"-growth scenario.
13 The different scenario assumptions and the resulting forecasts are given in the Tablesbelow. The lower and upper band of the 95% confidence intervals of the forecasts rest on theassumption that the explanatory variables are predicted without error. Without this assumption,the intervals would be considerably larger.
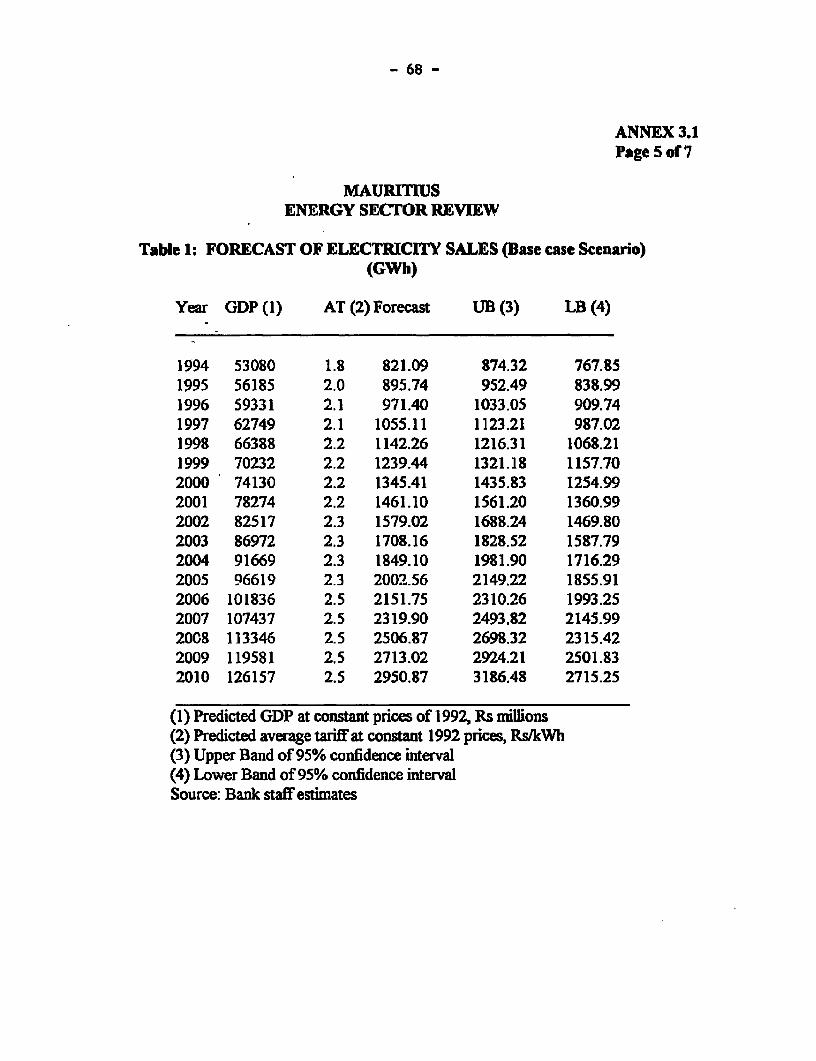
- 68 -
ANNEX 3.1Page 5 of 7
MAURrUSENERGY SECTOR REVIEW
Table 1: FORECAST OF ELECTRICITY SALES (Base case Scenario)(GWh)
Year GDP (1) AT (2) Forecast UB (3) LB (4)
1994 53080 1.8 821.09 874.32 767.851995 56185 2.0 895.74 952.49 838.991996 59331 2.1 971.40 1033.05 909.741997 62749 2.1 1055.11 1123.21 987.021998 66388 2.2 1142.26 1216.31 1068.211999 70232 2.2 1239.M 1321.18 1157.702000 74130 2.2 1345.41 1435.83 1254.992001 78274 2.2 1461.10 1561.20 1360.992002 82517 2.3 1579.02 1688.24 1469.802003 86972 2.3 1708.16 1828.52 1587.792004 91669 2.3 1849.10 1981.90 1716.292005 96619 2.3 2002.56 2149.22 1855.912006 101836 2.5 2151.75 2310.26 1993.252007 107437 2.5 2319.90 2493.82 2145.9920C8 113346 2.5 2506.87 2698.32 2315.422009 119581 2.5 2713.02 2924.21 2501.832010 126157 2.5 2950.87 3186.48 2715.25
(1) Predicted GDP at constant prices of 1992, Rs millions(2) Predicted average tariff at constant 1992 prices, Rs/kWh(3) Upper Band of 95% confidence interval(4) Lower Band of 95% confidence intervalSource: Bank staff estimates
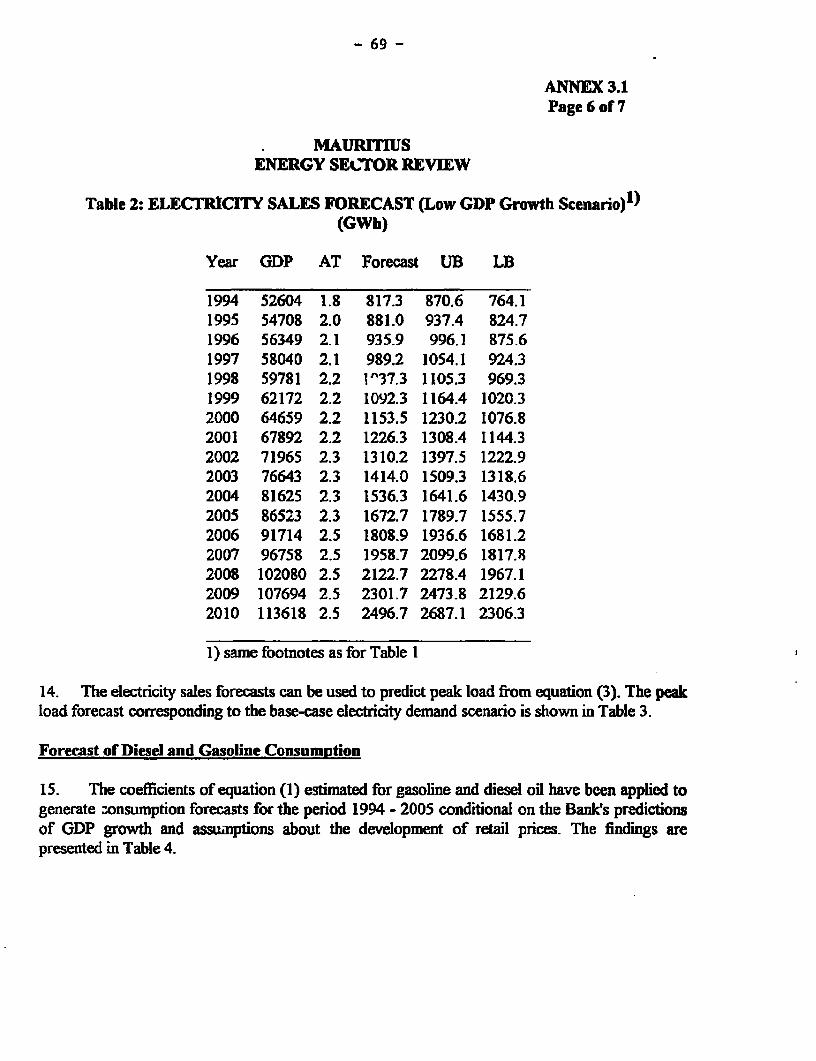
- 69 -
ANNEX 3.1Page 6 of 7
MAURrTUSENERGY SECTOR REVIEW
Table 2: ELECTRICITY SALES FORECAST (Low GDP Growth Scenario)')(GWh)
Year GDP AT Forecast UB LB
1994 52604 1.8 817.3 870.6 764.11995 54708 2.0 881.0 937.4 824.71996 56349 2.1 935.9 996.1 875.61997 58040 2.1 989.2 1054.1 924.31998 59781 2.2 T"37.3 1105.3 969.31999 62172 2.2 1092.3 1164.4 1020.32000 64659 2.2 1153.5 1230.2 1076.82001 67892 2.2 1226.3 1308.4 1144.32002 71965 2.3 1310.2 1397.5 1222.92003 76643 2.3 1414.0 1509.3 1318.62004 81625 2.3 1536.3 1641.6 1430.92005 86523 2.3 1672.7 1789.7 1555.72006 91714 2.5 1808.9 1936.6 1681.22007 96758 2.5 1958.7 2099.6 1817.82008 102080 2.5 2122.7 2278.4 1967.12009 107694 2.5 2301.7 2473.8 2129.62010 113618 2.5 2496.7 2687.1 2306.3
1) same footnotes as for Table I
14. The electricity sales forecasts can be used to predict peak load from equation (3). The peakload forecast corresponding to the base-case electricity demand scenario is shown in Table 3.
Forecast of Diesel and Gasoline Consumption
15. The coefficients of equation (1) estimated for gasoline and diesel oil have been applied togenerate zonsumption forecasts for the period 1994 - 2005 conditional on the Bankes predictionsof GDP growth and assumptions about the development of retail prices. The findings arepresented in Table 4.

- 70 -
ANNEX 3.1Page 7 of 7
MAURITIUSENERGY SECTOR REVIEW
Table 4: FORECAST OF GASOLINE AND DIESEL CONSUMPTION
Average Price2) Consumption Forecast3)Year GDP1 ) Gasoil. Diesel Gasoline Diesel
1994 53080 9.5 5.5 108417.2 141034.21995 56185 9.5 5.5 116834.4 148180.71996 59331 9.5 5.5 125428.9 155954.21997 62749 9.5 5.5 134724.1 164396.91998 66388 9.5 5.8 144776.9 171417.71999 70232 9.5 5.8 155585.6 179883.02000 74130 9.5 5.8 166839.9 189161.02001 78274 9.5 5.8 178875.5 199161.62002 82517 9.5 6.2 191475.9 206553.62003 86972 9.5 6.2 204841.6 215784.32004 91669 9.5 6.2 219110.7 226250.32005 96619 9.5 6.2 234364.2 237655.5
1) predicted GDP at constant prices of 1992, million Rs2) predicted retail price at constant prices of 1992, Rs/litre3) in 1000 litresSource: Bank staff estimates
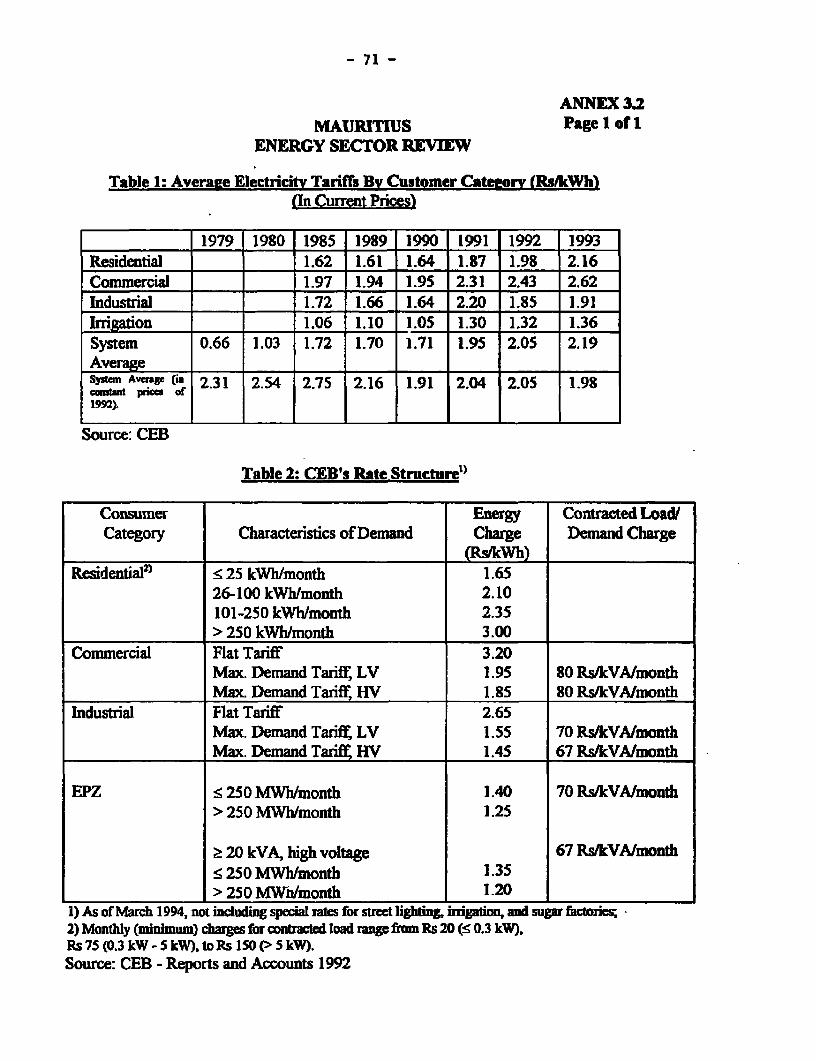
- 71 -
ANNEX 3.2MAURITIUS Page I of I
ENERGY SECTOR REVIEW
Table 1: Averaue Electricity Tariffs BY Customer Cateeuery (Rs/kWh)(In Curent Prris)
_ 1979 1980 1985 1 989 1990 1991 1992 1993Residential 1.62 1.61 1.64 1.87 1.98 2.16Commercial 1.97 1.94 1.95 2.31 2.43 2.62Industrial 1.72 1.66 1.64 2.20 1.85 1.91Irrigation 1.06 1.10 1.05 1.30 1.32 1.36System 0.66 1.03 1.72 1.70 1.71 1.95 2.05 2.19Aver-ageSyste Averge (in 2.31 2.54 2.75 2.16 1.91 2.04 2.05 1.98
1992)._
Source: CEB
Table 2: CEB's Rate Structure')
Consumer Energy Contracted Load/Category Characteristics of Demand Charge Demand Charge
"UWh)Residential') < 25 kWh/month 1.65
26-100 kWh/monffi 2.10101-250 kWh/month 2.35> 250 kWh/month 3.00
Cornnercial Flat Tariff 3.20Max. Demand Tariff, LV 1.95 80 Rs/kVA/monthMax. Demand Tarif HV 1.85 80 Rs&kVA/month
Industrial Flat Tariff 2.65Max. Demand TaxilZ LV 1.55 70 Rs/kVAfmonthMax. Demand Tarit HV 1.45 67 Rs/kVA/month
EPZ < 250 MWhlmonth 1.40 70 Rs/kVA/month> 250 MWh/month 1.25
2 20 kVA, high voltage 67 Rs/kVA/month< 250 MWh/month 1.35> 250 MWnlmonth 1.20
1) As of March 1994, not including special rates for suret lighting, irrigaon and sugar fctofies;2) Monthly (minimum) charges for contacted load range from Rs 20 (S 0.3 kW),Rs 75 (0.3 kW - 5 kW), to Rs 150 (> 5 kW).Source: CEB - Reports and Accounts 1992
- 72 -
ANNEX 3.3Page 1 of 6
MAURITIUS- ENERGY SECTOR REVIEWAvoided Costs, Average Generation Costs, and Tariffs
Avoided Costs
1. The rationale for avoided cost pricing is that marginal costs be equalized across allgenerating units, no matter whether the units are run by a utility or by non-utility powerproducers. Otherwise, a necessary condition for economic efficiency would be violated.Under avoided cost pricing a utility saddled with the obligation to serve will be indifferentbetween the options of generating or purchasing the power needed to meet electricitydemand of its customers. As a consequence, when the utility buys electricity fromindependent generators, its customers are charged the same rates that would prevail if theutility generated the electricity with its own plant.
2. The main problerr. with measuring avoided costs is Lhat power purchases mayaffect the utility's merit order dispatch and thus its structure of generating costs. If so,there will be savings or extra-costs to the utility, compared with the situation of nopurchases. These savings or costs need to be estimated and internalized into the powerpurchase price. It should be noted that savings will occur if the utility's plant mix issuboptimal relative to its load profile (which is almost always the case since pastinvestments are irreversible) and the electricity purchases allow the utility to dispatch itsgeneration faciities in a more cost-efficient way.
3. In order to obtain an easily computable proxy for the costs that CEB can avoid bypurchasing electricity from the sugar industry, however, it is assumed in the following linesthat CEB's configuration of plant is optimal in the absence of purchases and would remainoptimal if the services (capacity and energy) delivered by the sugar industry were tocomply with the specifications of the contract.' Another simplifying assumption is thatCEB's generation plant mix is composed of a peaker unit (gas turbine) and a base load unit(diesel generator).
4. With optimally designed generation ficilities, the Sross capacity costs of the leastcapital-intensive plant must be equal (by definition) to the net-apacity costs of a morecapital-intensive pP nt. Net capacity costs are defined as gross capacity costs less thesavings in operating costs that could be achieved by displacing the less capital-intensiveplant with the more capital-intensive one. The above equality can be written as:
'This case can descnrbed best in terms of an outward shift in MB's geneation duration curve, with theentire generation incmuent provided (via the main gid) by an independent producer.
- 73 -
ANNEX 3.3Page 2 of 6
(1) K, = K2 - hIC[c - CJ,
where the indices 1, 2 refer to the less, more capital-intensive plant, andK = unit capacity costs (Rs/kW/year),c = unit operating costs (RsAkWh),h = number of hours a plant is run during a year,* = index of optimality.
5. Regarding the gas turbine, it is assumed that its installed unit costs amount to 700US$/kW (12,600 Rs/kW at 18 Rs/US$) while the useful economic life of the plant is 20years.2 Applying a discountfinterest rate of 12% a year, the annuitized unit costs work outat 95 US$/kW. Based on a recent tender for a 30 MW unit, the installed costs of a dieselgenerator are estimated at 1,700 US$/kW (30,600 Rs/kW). With a useful life of 25 yearsand 12% interest paid during construction (one year) and thereafter, the levelized costsamount to 243 US$/kW/year. Operating costs are 1.48 Rs/kWh for the gas turbine and0.58 Rs/kWh for the diesel generator. The implied optimal utilization rate of the gasturbine is 3,060 hours a year.3
6. Now consider the situation where a sugar factory offers CEB electricity for sale. Ifthe electricity is supplied on an intermittent, irregular basis, the purchase price should bewhat it would cost CEB to operate its own plant rather than to purchase the offeredamount of kWhs. The more interesting option is that of firn power sales which relieveCEB of the need to invest in generating capacity. A case in point is the planned 32 MWdual-fired power station at Union St. Aubin (USA). Firm capacity and energy contractedfrom USA would displace investments in base load diesel generating capacity that CEBwould have had to provide in the fu ure. One might argue that the costs CEB can avoidare simply equal to the known investment costs of the diesel plant (i.e, K), plus the unitoperating costs of the diesel plant (c2) multiplied by the number of kWhs bought. Asequation (1) suggests, however, the deal tends to be more complicated.
2 The unit investment costs are on the higher end, accounting for the fadt that in Mauuitius gas ubineshave been run more frequentely and over longer periods than is common so that their useful life is likelyto fail short of 20 years
3 This is longer than the turbines in place are expected to ran (even thogh the units have already beenoperating for 18 hours a day during several weeks). In part, the discrepancy is reflecting the fact thatCEB's plant mix (which consists of more than two plant types) is diffeent from a theoretical ideaL Whatalso militates in favor of a comparatively long "opthmal utilization rate of gas turbines is their low unitcost (vis a vis that of a diesel generator) and the relatively low price of kerosene (vis a vis fiel oil), inMauritius.
- 74 -
ANNEX 3.3Page 3 of 6
7. Depending on the load that CEB's least cost capacity expansion plan has assignedto the diesel unit, the value that a contracted kW of capacity has to CEB is contingent ona minimum number of operating hours (per year) and the number of hours that are on-peak.4 Let h2 be the required nminimum run time, x the actual operating time, and h, thelength of the peak period (hours). Then equation (1) can be used to define avoided unitcapacity costs as:
(2) AK = K, + {h1 + Xix - h2])[c,-c2] S K2,
with %=I if x < h2 and 1=0 if x 2 h2.
B. According to formula (2), the avoided cost payment per kW of contracted capacityshould be equal to the unit costs of a diesel plant, provided that the independent generator,USA, meets the minimum operating requirement. If not, a penalty on bad performanceshould apply, i.e., the capacity payment to USA will be less than the capacity costs of thedisplaced diesel plant. The penalty accounts for the extra costs that the independentgenerator imposes on CEB by requiring the utility to operate the peaker plant during off-peak periods.
9. Let h2 = 5,850 hours, while h, = 3,060 hours, K, = 95 US$/kW, c,-c2 = 0.50USS/kWh (as assumed above). Clearly, if the independent generator lives up to theminimum operating requirement of 5,850 hours, the unit capacity payment is 243 US$IkWand the average avoided cost payment works out at 0.074 US$IkWh (1.332 Rs/kWh).5 Onthe other hand, if the independent producer's plant runs only 4,500 hours a year, thecapacity payment drops to 180.5 US$/kW while the average avoided cost paymentremains in the vicinity of 0.074 US$/kWh. The example illustrates an essential feature ofavoided cost pricing: Electricity purchases based on avoided costs leave the utility and itscustomers with the same level and structure of costs that would prevail in the absence ofpurchases. The independent producer, on the other hand, will capture cost savings in theform of profits (if his/her generating costs fall short of the utility's avoided 4osts), but hasalso to bear the risk of losses (If the utility's avoided costs do not cover the costs ofindependent power generation).
4n the case where the contracted capacity seres the purpose of a stand-by uimt (to improve or maintanthe system's level of reliability), the minimum requirement is defined in terms of availability.
sAKI5850 + c2 = 243/5,850 + 0.032 = 0.074 (US$/kWh).
6AK = 95+ [3060 + 4,500 - 5,8501 0.05 = 180.50 (IJS$/W).
- 75 -
ANNEX 3.3Page 4 of 6
Average Generation Costs
10. The peak-off peak technology mix of gas turbines (run on kerosene) and dieselgenerators (run on fuel oil) is a reasonably realistic description of CEB's best choice. Ifdecisions taken in the past were reversible, CEB would replace hydropower stations suchas Champagne with gas turbines.7 And future additions to base and intermediate loadcapacitity will be made up by diesel plants as inherited older units which are expensive tooperate and maintain become obsolete.
11. In the absence of a comprehensive least cost expansion plan that would provide amore reliable basis for computing CEB's incremental generation costs, the above plant mixcan be used to approximate long-run average generation costs. To accomplish this task,recourse is made to a stylized (annual) load duration curve (in MW) of the form
(3) L= 156-0.0145X, 0CXc8,760.
Equation (3) is a linearized version of CEB's load duration curve observed in 1992.Integrating (3) yields 810,212 MWh.
12. The threshold operating time at which a gas turbine incurs the same total costs asdoes a diesel unit (of equal size) divides the load dujration curve into a peak and off-peakportion. As was argued in the preceding section, the capacity costs of meeting an additionlkW of peak load amount to US$ 95 (not including transmission and distribution losses). Ifcapacity costs and plant-specific operating costs are apportioned in accordance with theprinciple of peak-load pricing', the following picture emerges:
Table 1: CEB Generation Costs')
l__ _ I Capacity Costs Operating Costs Average Costs 2)Peak 1,710 Rs/kW/year 1.48 Rs1kWh 2.42 Rs1kWhOff-Peak | 0.58 Rs1kWh 7 0.58 Rs/kWh |System - 0.90 Rs/kWh) | 1.23 Rs/kWh
1) Estimate for early 1994 at 18 RsJUS$;2) Weighted sum of peak and off-peak.
7 This conclusion was also drawn by Coopers and Lybrand which was in charge of revaluing CEB's assetsin 1991.
s That is, peak load is charged with capacity costs plus corresponding operating costs, while off-peak loadis held accountable for the operating costs of the base-load plant
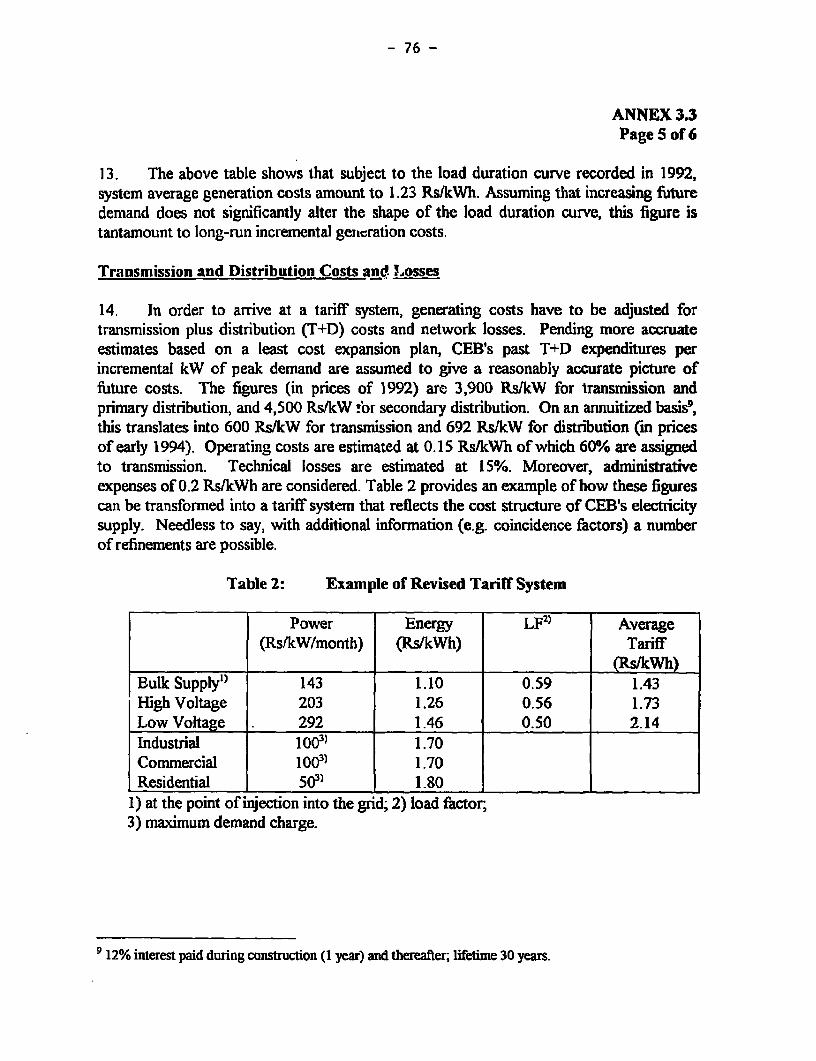
- 76 -
ANNEX 3.3Page 5 of 6
13. The above table shows that subject to the load duration curve recorded in 1992,system average generation costs amount to 1.23 RslkWh. Assuming that increasing faturedemand does not significantly alter the shape of the load duration curve, this figure istantamount to long-run incremental generation costs.
Transmission and Distribution Costs and tosses
14. In order to arrive at a tariff system, generating costs have to be adjusted fortransmission plus distribution (T+D) costs and network losses. Pending more accruateestimates based on a least cost expansion plan, CEB's past T+D expenditures perincremental kW of peak demand are assumed to give a reasonably accurate picture offuture costs. The figures (in prices of 1992) are 3,900 Rs1kW for transmission andprimary distribution, and 4,500 Rs/kW for secondary distribution. On an annuitized basis9,this translates into 600 Rs/kW for transmission and 692 Rs/kW for distribution (in pricesof early 1994). Operating costs are estimated at 0.15 Rs/kWh of which 60% are assignedto transmission. Technical losses are estimated at 15%. Moreover, administrativeexpenses of 0.2 RslkWh are considered. Table 2 provides an example of how these figurescan be transformed into a tariff system that reflects the cost structure of CEB's electricitysupply. Needless to say, with additional information (e.g. coincidence factors) a numberof refinements are possible.
Table 2: Example of Revised Tariff System
Power Energy LF2) Average(RsfkW/month) (Rs/kWh) Tariff
Bulk Supply" 143 1.10 0.59 1.43High Voltage 203 1.26 0.56 1.73Low Voltage . 292 1.46 0.50 2.14Industrial 1OO') 1.70Commercial iO&') 1.70Residential 503) 1.80
1) at the point of injection into the grid; 2) load factor;3) maximum demand charge.
9 12% interest paid during construction (1 year) and thereafter; lifetime 30 years.
- 77 -
ANNEX 3.3Page 6 of 6
15. The tariffs for bulk supplies and supplies at the high and low voltage level consistof a capacity charge for loads on peak (measured, say, hourly) and an energy charge.Capacity charges include capital costs related to the transnmission and distribution system.Alternatively, T+D-related investment costs could be shifted to an off-peak capacitycharge. On the other hand, smaller, low-voltage consumers are subject to a two-part tariff,comprising a maximum demand charge (per contracted kW) and an energy charge. Thesize of the demand fee should depend on how strongly the customer group's maximumdemand is correlated with the system peak. The stronger (i.e., the more positive) thecorrelation, the closer should this fee resemble a capacity charge on peak load. It is aisoworth noting that in the case of residential customers, the two-part tariff would implycross-subsidies from customers with an above-average consumption level to below-average users.
16. A question that needs to be addressed is whether the proposed tariff systemrenders CEB financially viable. The answer is that given the assumed load duration curve,the rates would in fact enable CEB to break even at constant prices. However, inflationand/or changes in the load profile call for timely adjustments to retain this balance. Onesolution to the problem of inflation is indexation. Another approach would be to let CEBrevise its tariffs subject to regulatory approval.'0 Finally, the corporate structure and goalsof CEB may'tbange resulting in a commitment to earn profits and, thus, requiring afurther tariff revision.
17. Implementing a tariff system like the one described in Table 2 calls forcomplementary measures on the technical front: load limiters/circuit breakers are neededfor customers subject to a maximum demand charge, and hourly load metering is requiredfor large consumers (say, with demand in excess of 100 kVA).
" The disadvantage of this approach lies in the difficulty to design, implement and apply a regulatoryprocedure that is reasonably receptive to different iews of the matter (CEB, custoreus, etc) withoutopening the door to haggling, litigation, or other obstacles.
- 78 -
ANNEX 3.4Page 1 of 5
MAURITIUSENERGY SECTCR REVIEW
ENERGY CONSERVATIONAN OVERVIEW BY SECTOR
Industry
1. The industrial sector comprises the manufacturing sector (including the EPZfirms), beverage, tea, textile, food processing industries, etc. The sugar factories usingbagasse to satisfy their energy needs are dealt wKith below. The energy mix used by theindustrial sector ranges from fuel oil, coal, electricity, to LPG. Coal was first introduced in1984 in conjunction with the commissioning of the FUEL bagasse/coal fired power plant,and its use in industrial applications (process steam) has since been increasing at theexpense of fuel oil. LPG, on the other hand, plays only a marginal role.
2 In 1985/86 the Ministry of Energy conducted a series of pilot energy audits inselected industries. The results indicated that there was a considerable saving potentialfrom an engineering standpoint, and it was estimated that, depending on the industry type,between 5% and 30% of the sector's energy consumption could be reduced with minorinvestments and/or through improved maintenance and process control. Governmentformulated a set of reconmmendations and offered some financial incentives for energysavings (e.g. the removal of duties on insulating materials, power factor correctors, stand-by generators and photo-voltaic equipment). However, only few industries responded tothe recommendations and incentives, partly because energy expenditures for Mauritianindustries typically account for, at most, 5% of total production costs.
3. Over the last decade government successfully encouraged the diversification of theindustrial sector, particularly through the promotion of EPZs. Recently, the parliament hasenacted "The Industrial Expansion Act 1993" defining a nt' legal framework andprovidinz Escal incentives to foster industrial modernisation, technology transfer, and theupgrading of small and medium size enterprises, and to protect the environment. Althoughthe new legislation does not merntion eflicient use of energy as a policy goal or prerequisitefor fiscal support, the incentives to install modem and environmentally benigii equipmentwill have positive effects in terms of embodied energy savings and a reduction in peakpower demand. This will do little, however, to encourage firms to retrofit existingproduction equipment.
4. An initiative taken by a private company, the Ferney Spinning Mills Ltd., helpsillustrate the potential benefits from conservation activities to the company itself andindirectly to CEB (through the reduction of peak load). The factory operates 10 largespinning machines and a number of dying machines. Through the installation of modempower electronics and phase condensers that optiniize the operation of motors (reduce
- 79 -
ANNEX 3.4Page 2 of 5
speed and reactive power) the factoLy has cut its electricity bill by 50%. With aninvestment of Rs 0.5 million the pay-back period was approximately one year. Byincreasing the power factor from a typical figure of 0.7 to almost 1, the factory ha3reduced its demand on CEB's peak power capacity by about 30%. Further reduction couldbe achieved, if CEB would offer time-of-use tariffs or some other form of loadmanagement.
5. The above example shows that a large company staffed with innovative engineersmay discover and exploit potentials for energy conservation without external advisory orfinancial help. But many small-and medium-size industries may lack the in-house expertiseneeded to devise and implement energy savings strategies. A private company, EnergyManagement Ltd. (EML), a subsidiary of the electrical appliance company DynamotorsLtd, has tried to meet this challenge with a new concept. EML offers small-and medium-size industries the service of auditing and revamping their facilities (e.g. through installingequipment for reactive power reduction). The installed energy-saving equipment remainsthe property of EML during the contract period, but the client has the option to buy itwhen the service contract expires. EML guarantees a lower electricity bill, and providedthe yearly electricity consumption remains below an agreed upper limit, the client agreesto pay a per-kwh service fee. The aim is that with a reduced electricity consumption level,the client's total cost (including the service fees) will be lower than before, thus renderingthe service contract financiallv attractive.
6. Whether EMILs business concept will be successful remains to be seen. The idea ofhaving essential equipment within the premises of a factory being owned by a third partymight not be easily acceptable to many industries. A consultancy approach based ontechnical and financial assistance might be more attractive. But even though the Ministryof Industry and Industrial Technology has been prepared to provide tax incentives toforeign consultancy companies advising on energy conservation, this scheme has notworked in practice so far. At any rate, a policy that promotes market-based incentives andefforts to conserve energy is a step in the right direction. Rather than staging energyconservation programs to attract the industrial sector with costly subsidies, governmentshould continue, as it has so far done, to prepare the giound for private sector initiativesthat intermediate and arbitrate information, technology, and management assistance tofacilitate energy savings.
Agriculture
7. Sugar cane is the dominant crop on Mauritius. Consequently, the sugar industry(growing and processing) is by fir the largest energy user in the agricultural sector. Withbagasse as the main fuel source, it accounts for about 43% of the country's final energyuse. Surplus electricity generated by sugar factories from bagasse (supplemented by coal
- 80 -
ANNEX 3.4Page 3 of 5
outside the crop season at FUEL) is supplied to the grid. In 1992, the sugar factoriessupplied 16% of the electricity generated on the island.
Households
8. The residential sector uses energy for cooking, water heating, lighting, andelectrical appliances. Households use woody biomass, kerosene, LPG and electricity. Twosurveys have been carried out to investigate household energy consumption in Mauritius,one in 1985 by the Ministry of Energy and another in 1988 by the University of Mauritius.The results showed that the use of fire wood and charcoal for cooking and water heatingwas widespread, particularly among the low-income groups, but declining. There isevidently some uncertainty in assessing the exact amount and the energy content ofwoodfuels, but this source may well have accounted for about 40% of total householdprimary energy requirement.
9. Since fire wood and charcoal are combusted with a comparatively low conversionefficiency (15-25%), government feared that excessive woodfuel use would lead todeforestation. In order to discourage the use of woodftels, kerosene has long beenexempted from taxation. This was in line with the social policy of supporting low-incomeflmilies which were becomaing the main users of kerosene for cooking. In the 1990s, theGovernment encouraged the introduction of LPG as a substitute for both woodfuels andelectricity (water heating). Govenment has removed all import levies from LPGappliances, whereas electric stoves and electric water heaters are subject to a 48% importlevy. In the case of other electric appliances for which alternatives are not easily available(e.g refrigerators and freezers) the import levy is 18%.
10. With the growth of income of the general population, the use of LPG becamewidespread and woodfitl consumption was reduced significantly. In 1992, biomass wasestimated to account for only 12% of household energy use. Kerosene consumption hasmore than halved over the last 15 years and the consumption of LPG has increased by afactor of 15 in the same period.
1I. Solar water heaters are an option for households using hot water. Governmentencourages the installation of solar heaters by exempting materials used fir theirproduction from import taxes. About 10,000 solar water heaters are presently installed,but while the potential market seems to be much higher, current sales are low.
Comnurciad Sector
12. The major source of energy within this sector is electricity for lighting, cooling andelectrical appliances. Commercial activities make up 25% of total electricity demand. Also,the sector pays the highest electricity tariffs on average.
- B1. -
ANNEX 3.4Page 4 of 5
13. Obvious canditates for energy saving measures are lighting and air conditioning.One option in commercial buildings is to replace incandescent light bulbs with fluorescentlamps in reflecting fittings. Air conditioning which is installed in most commercialpremises is a heavy energy consumer. The general impression is that many rooms are over-cooled, so the temperature could comfortably be raised several degrees. Cooling devicesare also potential power savers in periods with maximum load. For instance, centralcooling systems in large building complexes could be switched off during peak periods,allowing temperature to rise only a few degrees. Moreover, in some cases it might beworthwhile installing cooling storage facilities.
14. Thermal building standards do not exist in Mauritius. In the future it mightbecome useful to establish a thermal building code for new buildings, while existingbuildings equipped with electric air-conditioning be required to comply with such codes atsome later stage.
Transport
15. Transportation is an expanding activity with increasing liquid fuel requirements.Including the fuels for airborne traffic, the sector accounts for 32% of the islands' totalpetroleum product consumption and 45% of imported fuels. Land transport aloneconsumes 23% of imported fiiels, 44% of which is 95 octane gasoline, and 56% diesel.
16. All surface transport is on roads; there are no railways on the island. A rail linkbetween Port Louis and the second largest city of Curepipe was abandoned in 1960.Currently, thought is being given to the option of building a new light rail line to servicethe two cities and the highly populated area between them, in order to ease the heavy loadon the road system.
17. The number of road vehicles has more than doubled over the last decade and isforecast to increase by 8% per year until the turn of the century. Since congestionproblems are already severe in and around the larger cities, traffic management willbecome a high priority. Upon request of the government, a comprehensive review of theurban road transport problems was conducted in 1993 by the UK Transport ResearchLaboratory (TRL). The study developed a series of traffic and safety measures which willbe included in a master plan. Among the plans currently under consideration is theconstruction of a ring road around and inland of Port Louis in order to reduce the heavytraffic load during rush hours on the north-south route through the city.
18. From an energy conservation point of view, a well-functioning public transportservice is an important alternative to individual cars. The bus transport system in Mauritiusappears to be reasonably efficient, and it is possible to get to almost any part of the islandby bus at reasonable rates. In order to encourage more passengers to switch to public
- 82 -
ANNEX 3.4Page 5 of 5
modes of transport, the TRL study suggests that buses be enabled to by-pass trafficcongestion (e.g. through separate bus lanes).
19. The average age of the operational bus fleet is about 6 years, two years "younger"than the average age of cars and dual purpose vehicles. The authorities have decided thatby 1995 the maximum age of a bus in operation be 16 years. Vehicle inspection does exastin Mauritius, but its standards could be raisci by requiring emission controls.
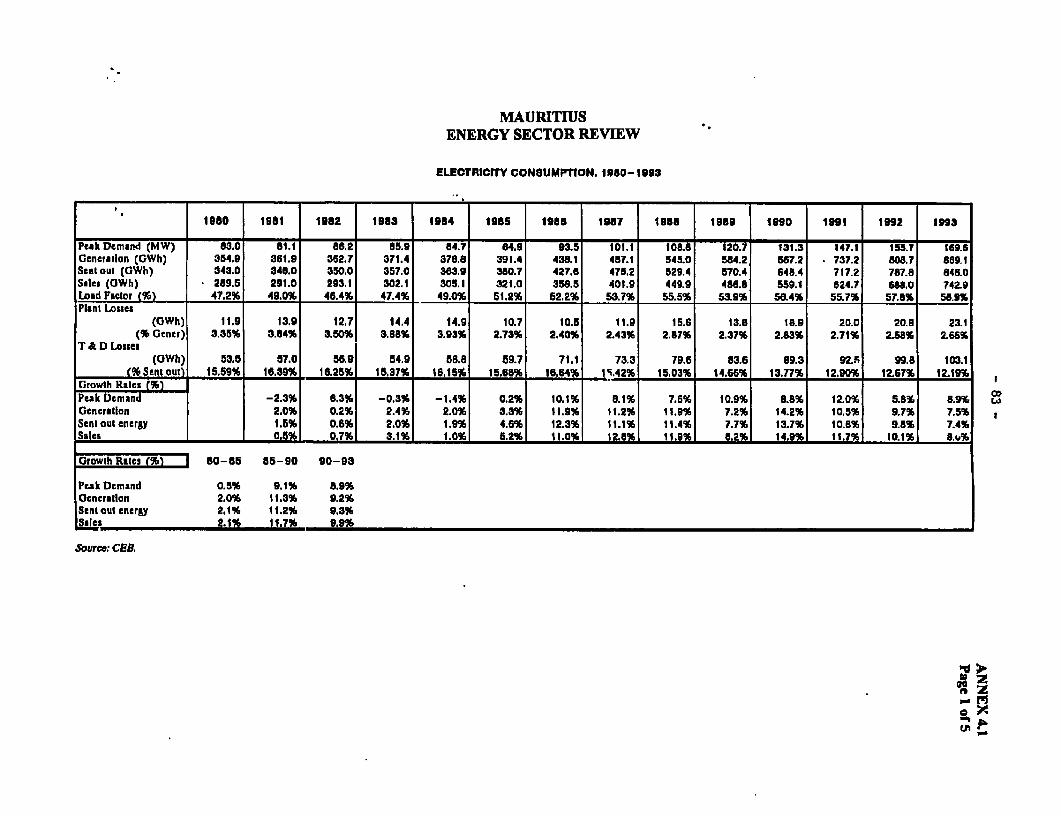
MAURMUSENERGY SECTOR REVIEW
ELECTRICITY CONSUMPTION. 1980- 1993
1980 1181 1982 1983 1984 1985 1985 1987 1 BOll 1951 1990 1991 1992 1913
Peak Deman!d (MW) 83.0 81.1 86.2 85.9 84.7 84.9 93.5 101.1 108.8 120.7 131.3 147.1 155.7 ite9.Generation (GWh) 354.9 361.9 362.7 871.4 378.8 391.4 438.1 487.1 545.0 584.2 687.2 - 737.2 808.7 8691Sent out (OWh) 343.0 348.0 350.0 357.0 363.9 380.7 427.6 475.2 529.4 570.4 548.4 717.2 787.8 846.0Sales (GWh) 2a9.5 291.0 293.1 302.1 305.1 321.0 358.5 401.9 449.9 486.8 559.1 624.7 681.0 742.9Load FVctor (9) 47.2% 49.0% 46.4% 47.4% 49.0% 51.2% 52.2% 53.7% 55.5% 53.9% 58.4% 85.7% 57.8%l 55.9%Plant Losses
(OWh) 11.9 13.9 12.7 14.4 14.9 10.7 10.5 11.9 15.6 13.8 18.9 20.0 20.8 23.1(% Gtner) 3.35% 3.84% 350% 3.88% 3.93% 2.73% 2.40% 2.43% 2.87% 2.37% 2.83% 2.71% 2.58% 2.66%
T & D Losses(GWh) 53.5 57.0 56.9 84.9 58.8 59.7 71.1 73.3 79.6 83.6 89.3 92. 99.8 103.1
t% Sent out) 15.59% 16.39% 16.25% 15.37% 16.15% 15.65% 16.64% 19.42% 15.03% 14.66% 13.77% 12.90% 12.67% 12.199Growth Rates t%)Peak Demand -2.3% 6,3% -0.3% -1.4% 0.2% 10.1% 8.1% 7.6% 10.9% 8.8% 12.0% 5.8% 8.9%Generation 2.0% 0.2% 2.4% 2.0% 3.3% 11.9% 11.2% 11.9% 7.2% 14.2% 10.5% 9.7% 7.5%Sent out energy 1.5% 0.6% 2.0% 1.9% 4.6% 12.3% 11.1% 11.4% 7.7% 13.7% 10.8% 9.8% 7.4%Sales 0.5% 0.7% 3.1% 1.0% 5.2% 11.0% 12.6% 11.9% 8.2% 14.9% 11.7% 10.1% 8.t%.
Growth Rates (% 60-05 85-90 90-93
Peak Demand 0.5% 9.1% 8.9%Oeneration 2.0% 11.3% 9.2%Senl out energy 2.1% 11.2% 9.3%Sal es 2.1% I1.7% 9.9%
Source: cEa.
>,
Ul
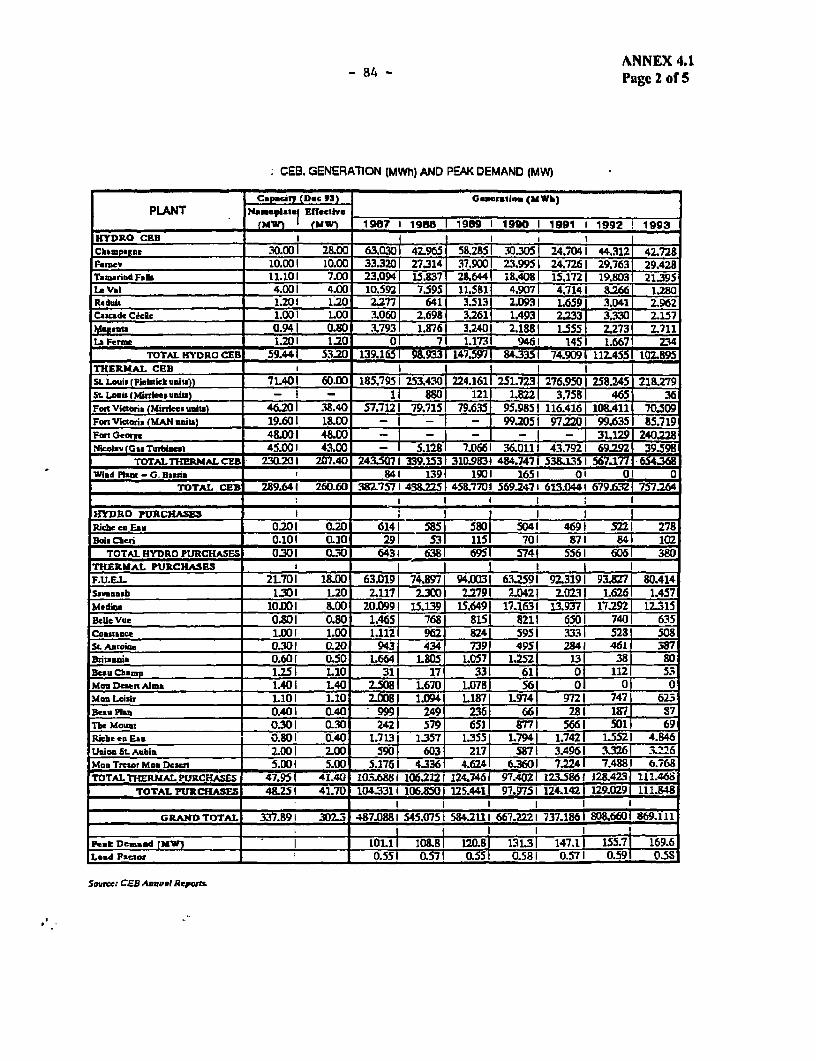
ANNEX 4.1- 84 - Page 2 of5
CEB. GENERATION (MWhI AND PEAK DEMAND (MW)
Capicmiq (Dcc 93) ___ Gecratie (MWl)PLANT Namelatel Efective
oAwl I 196 I98___________________ a~~~~1 ~I1u (MW 1hi87 igiiT1990iigg 1991g 1992 1993
HYDRO CeB _ I I_ i_.001 28.00 630301 459S,2B 30.3051 24.7041
chimpatu__ __ _ __ __ __ _ __ _ 42__ __309062. 44__312 42.72
FirDeme _ 10.001 10.00 33.3201 27.314 37.9001 23.9951 24.7261 29.763 29.428Tamaribd Fs Is 11.101 7.00 2.3.094 -5.83 2:4 1 184081 1541721 19.803 21.395La Val 4.001 4.00 10.5921 7395T151i[ 4.9071 4.7141 8.266 1_.0R_duig 1.201 1.20 2.277 641 3.5131 2.0931 .65913.041 2.962C:au:de CBc _ 1.001 I 3.0601 2.698 3.2611 1.4931 22331 3.330 2.157
Malcolm 0.941 0.80 .3.7931 1.876 3.40 2.18BI lS555I 2.273 2.711la ere _1_011_0____46 1451 1.667 234
TOTAL HYDRO CEB 59.____ 5__20 139.165 r 3 I 1.51 84.33r 74.9091 112-455 102.895
THERLtAL CECIE BI
SL Louis I ieluitck nulls)) 71.401 60.00 185.7951 253.430j 224.161U 251.7231 276,9501 258.245 218.2795sL Louis _Miffic_s nit i - I 1880 121 1.822n 3.7581465 36Fort Viietous IM rrcmsaltsu) 4620 1 38.40 57.712 1 79.7151 79.635 95.985 11i6.4161 108.4111 70.Fon Victoria 4MAN unils) 19.601 18.00 - I 99.2051 97.2201 99.635 85.719Fen Georpe 4&OD 1 48.00 _ I _ I _ _ I - I 31.129 24022Z8NiclavfGas Turbiums) 45.001 43.00 - I 5.12BI 7.0661 6.0111 43.7921 69.2921 39.598
TOTALTHERMALCKB- 230.201 207.40 243.57 339.15311931 484.7471 538.1351 567.171 .368Wind Plant - G. B_i _ _841 1391 1901 1651 0'1 01 0
TOTAL CEB 289.641 260.60 3827571 432251 458.7701 569.247I 613.0441 679.632 7$7.264
lrYDRo PuRciiAsEs E__ 1 1 _ Ridco_Eau _ 0.201 0.20 6141 S857 5801 5041 4691 5221 278
BdoizCheri 0_101 0.10 291 5 31 115 701 871 841 102TOTAL HYDRO PURCHASES 0.301 O.,o 643I 6381 6951 574 5561 6061 380
THERMUAL PURCHA'SES II I I I I I
F.UE.L. 27001 18.00 63.0191 74.8971 94.003 63.2591 92.3191 93.827 80.414Savannah 1.301 1.20 2.1171 2300 2.2791 2.0421 2.0231 1.6261 1.457Mediee _ 10.001 8.00 20.0991 15.1391 15.6491 17.1631 13.9371 172921 12315B__le v_ __ 0.801 0.80 1.465[ 768 8151 8211 6501 7401 635
Cost_ ue 1.001 1.00 1.1121 962 824 5951 3331 5281 508SL Aetoie_ 0.301 0.20 943 4.34 739 4951 2841 461 387Brit_u_su 0.601 0.50 1.664 1 L805 1.057 1.2521 131 381 80Beau Cbamp 12S I L10 311 17 331 611 0 t 1121 53
MonDemen Alma 1.401 1.40 2.508 1.670 1.078 561 01 0l 0
_en Lobsir 1101 1.10 2.00 1.094 1.187 L974 9721 7471 623Beau Plan' 0.401 0.40 999 249 236 661 281 1871 S7The Mounts 0.301 0.30 242 579 651 8771 5661 5011 69
Ri_be_oeeEau a_D.1 0.40 1.713i 1357 1.355 L794 1.7421 L5521 4.846
Union St. Aubi| 2.001 2.00 S901 603 2177 5871 3.4961 3.326 .. 226Mon Treact Man Deseul 5.00 1 5.00 5.176 1 4-336 4.624 63601 7.2241 7.4881 6.768TOTAL THERMAL PURCHASES 47.951 41.40 IWL6881 106.2121 124.746 97.402 123.5861 128423 111.468
TOTAL PUMCRASES 4B.251 41.70 104.3311 106.8501 125.441 97.9751124.142 129.029 111.848
GRAND, TOTAL 3 -302.3 487.081 545.0751 584.2111 667.2 737.1861 8086601
_ _ _ _ _ _ _ _ _ _ _ _ _ _ _ _ _ I I I .I..I
Peak Demand fdW) . I 0 i 120.8! 131.31 147.11 155.71 169.6
Lead Factor 0_ 0.55!IQ571 0.551 0.581 0.571 0.591 U.S
Saurce: CEB Annual Reporu
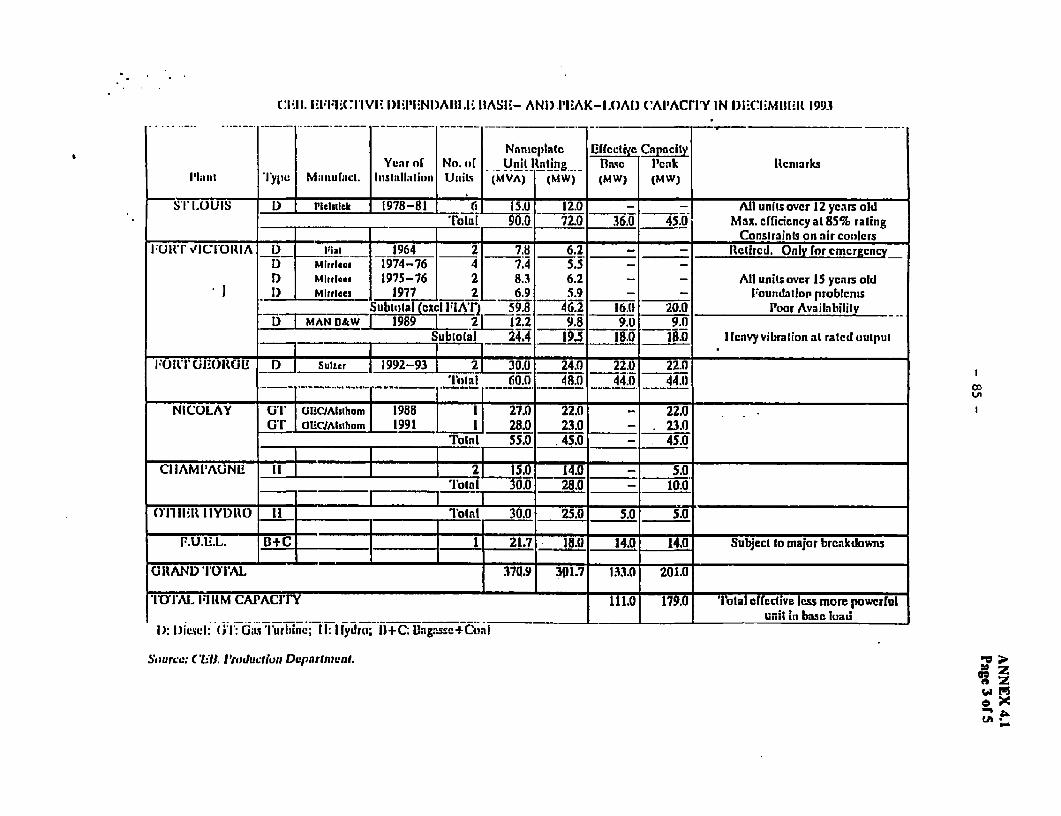
Cl.II. i 1 IVI. Iil'liNi)AIII.I ltASII- ANI) .I'IAK-I()AD) C'APACITY IN D)1ECEIIMBIEIR 1993
Nameplate 13Ifcctc CapacityYear of No. or Unit Rting II.c lPctk ltcniarks
IPlant l'ylp Manurau1c. Insal;lalitill UtiLs (MVA) (MW) (MW) (MW)
S1 I LOUIS D PieCisick 1978-81 _ 15.U 12.0 All units ovcr 12 years old_rotal 90. 72.0 36.0 45.0 Max. CfrCiCnCy at 85% rating
__________________ _________ I lConstraints on nir couilers
-I;r-VICI DRIA D L)_I _964 2 7.8 6.2 - - ltlirted. Only for cmcrgcncyD Mili,eas 1974-76 4 7.4 5.5Dr MIlrrtes 1975-76 2 8.3 6.2 _ _ All units ovcr 15 ycnus old1) MittIeEs 1977 2 t 6.9 5.9 - _ ountIdatio probicnrs
_____________Subtotal (cxci FiNli 59.8 16.2 616A 20.0 Poor Availa,biityvD IMAN tI&w[ 1989__L.! I.J 2 9. 9.0 9.0
________Sublota _ 24.4 1 9.5 18.0 18.0 I Icavy vibration at rated outpul
IlOIUI'Ul()IBIAG I j SUt±er-- 2992-93 1 1 3- --- 2iD.0 22.1) 22.0FORT- GEI( tl 2z!3l l 30.0 48.0 44.0 _44.
_ _ _ _ I I ~~~~~~~~~~~~~~I Ia T 4 . _ _R _ _ _ __ _ _
NICOLAY Gl I GJI(CJAIsthom | 198B [ 27D 22.0 22.0Ur O.ricAtstiiom 1991 I 28.0 2310 - 23.0
ToItR 55.0 450 45.0
CIIAMI'AUNU If __ J 2 G5. _ 14.0 _ 5.0________ 'Iota I 30.0 28.0 - 10.0
Oil IRR IIYDRO -_ ibtal 30.0 25.0 5.0 5.0
PU.U.L.L. D+C .- - - --- -27_150.- 140 14.0 Subject to major breakdowns
GITANI) 'lOI'AL 370.9 301.7 133.0 201.0
*I Ol JA, FIRM CAPACITIY 111.0 179.0 'I'Tal crrdcive ISS more powerful.... __ ____. ______ _____ unil in basc luad
ID: I)ici: t;I: G;L5 lurhinc: tl: hydra; IS+C: Uag.nssc+C'onl
Source; c(-L;. Prlductioi Dcparlnwlen. >
! :ZftQ
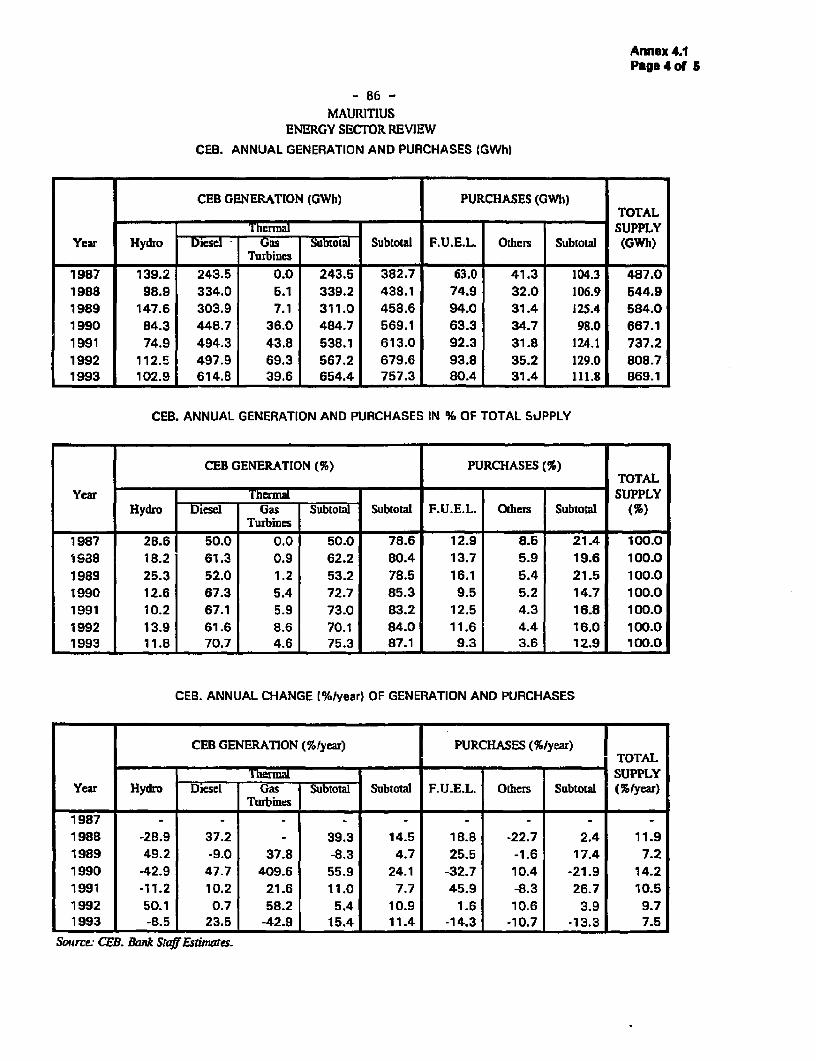
Annex 4.1Page 4of 5
- 86 -
MAURITIUSENERGY SECTOR REVIEW
CEB. ANNUAL GENERATION AND PURCHASES (GWhI
CEB GENERATION (GWh) PURCHASES (GWh)____________________ ~~~TOTAL
Thermal | SUPPLYYear Hydro Dicsel TuGas Subtotal SubLotal F.U.E.L. Others Subtotal (GWh)
TurbinesI
1987 139.2 243.5 0.0 243.5 382.7 63.0 41.3 104.3 487.01988 98.9 334.0 5.1 339.2 438.1 74.9 32.0 106.9 544.91989 147.6 303.9 7.1 311.0 458.6 94.0 31.4 125.4 584.01990 84.3 448.7 36.0 484.7 569.1 63.3 34.7 98.0 667.11991 74.9 494.3 43.8 538.1 613.0 92.3 31.8 124.1 737.21992 112.5 497.9 69.3 567.2 679.6 93.8 35.2 129.0 808.71993 102.9 614.8 39.6 654.4 757.3 80.4 31.4 111.8 869.1
CEB. ANNUAL GENERATION AND PURCHASES IN % OF TOTAL SUPPLY
CEB GENERATION (%) PURCHASES I%)TOTAL
Yewar Thermal SUPPLYHydro Diesel Gas Subtoa Subtotal F.U.E.L. Others Subtotal (%)
1987 2B.6 50.0 0.0 50.0 78.6 12.9 8.5 21.4 100.019 a8 18.2 61.3 0.9 62.2 80.4 13.7 5.9 19.6 100.01989 25.3 52.0 1.2 53.2 78.5 16.1 5.4 21.5 100.01990 12.6 67.3 5.4 72.7 85.3 9.5 5.2 14.7 100.01991 10.2 67.1 5.9 73.0 83.2 12.5 4.3 16.8 100.01992 13.9 61.6 8.6 70.1 84.0 11.6 4.4 16.0 100.01993 11.8 70.7 4.6 75.3 87.1 9.3 3.6 12.9 100.0
CEB. ANNUAL CHANGE (%/year) OF GENERATION AND PURCHASES
CEB GENERATION (%/year) PURCHASES (%/year) 1_ I ~~~~~~~~~~TOTAL
Thermal SUPPLYYear Hydro Diesel Gas Subtotal Subtotal F.U.E.L. Others Subtotal (%Iyear)
- I Turbines -----
1987 - -- -----
1988 -23.9 37.2 - 39.3 14.5 18.8 -22.7 2.4 11.91989 49.2 -9.0 37.8 -8.3 4.7 25.5 -1.6 17.4 7.21990 -42.9 47.7 409.6 55.9 24.1 -32.7 10.4 -21.9 14.21991 -11.2 10.2 21.6 11.0 7.7 45.9 -8.3 26.7 10.51992 50.1 0.7 58.2 5.4 10.9 1.6 10.6 3.9 9.71993 -8.5 23.5 -42.9 15.4 11.4 -14.3 -10.7 -13.3 7.5
Source: CEB. Bank SaffEstimares.
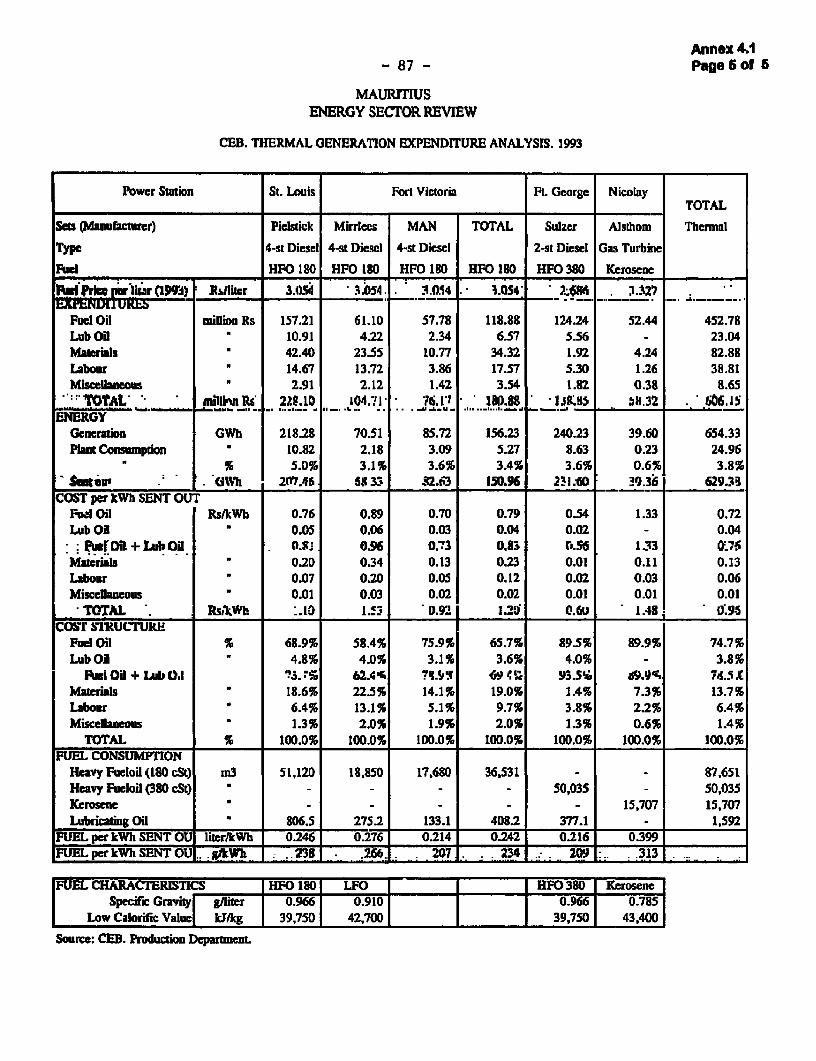
Annex 4.1- 87 - Page6 5f 6
MAURITIUSENERGY SECTOR REVIEW
CEO. THERMAL GENERATION EXPENDITURE ANALYSIS. 1993
Power Station St. Louis Fort Victoria Ft. George Nicolay__ _TOTAL
Sea (Manuacturer) Pielstick Mirriecs MAN TOTAL Sulzer Alsthom Thermnal
Type 4-si Diesel 4-st Diesel 4-st Diesel 2-st Diesel Gas Turbine
Fuel HFO 180 HFO 180 HFO IBO HFO 180 HFO 380 Kerosene
P rel ak lihar (19'4j) lliLr _3.tOS 3.054 _..04 1.054 2;6E . 12 .327
Fuel Oil million Rs 157.21 61.10 57.78 118.88 124.24 52.44 452.78Lub Oil 10.91 4.22 2.34 6.57 5.56 - 23.04Materiels U 42.40 23.55 10.77 34.32 1.92 4.24 82.88Labour 14.67 13.72 3.86 17.57 5.30 1.26 38.81Mfiscellaneous 2.91 2.12 1.42 3.54 1.82 0.38 8.65
.tOtA . *fmilliWn R6 2218.10 14.7i1 76. r- 180.8s Is:Ar 5l.32 . 606. I 5NR __- _ ..... . _ - ., -.-.......... U. - .. .......... . _ENERGY
Generaion GWh1 218.28 70.51 85.72 156.23 240.23 39.60 654.33Pat Consumption 10.82 2.18 3.09 5.27 8.63 0.23 24.96
.. % 5.0% 3.1% 3.6% 3.4% 3.6% 0.6% 3.8%Smut .1 . Ol%i 207.45 61 33 82.6-3 150.96 23 L.D 39.36 629.7s3
COST per kWh SENT OUTFul Oil Rs/kWh 0.76 0.89 0.70 0.79 0.54 1.33 0.72Lub 01 . 0.05 0.06 0.03 0.04 0.2 - 0.04
:.r On +. lab Olo . 0.S 0.9 6 0.'3 0.83 UL6 133 O.76Materials .0.20 0.34 0.13 0.23 0.01 0.11 0.13Labour 0.07 0.20 0.05 0.12 0.02 0.03 0.06Miscellaneous 0.01 0.03 0.02 0.02 0.01 0.01 0.01
TOTAL . Rs,kWb :.10 i.U D. 9 1.ll I.__ 1.483. 119-S
COST STRUCTUREFuel Oil % 68.9% 58.4% 75.9% 65.7% 89.5% 89.9% 74.7%Lub Oil 4.8% 4.0% 3.1% 3.6% 4.0% - 3.8%
tei Oil + Lub 0.1 u; Is 62. 4C 71.5'! t5 9S.5' dS%.'J 754.5CMaterials 18.6% 22.5% 14.1% 19.0% 1.4% 7.3% 13.7%Labour 6.4% 13.1% 5.1% 9.7% 3.8% 2.2% 6.4%MiscelIaneous 1.3% 2.0% 1.9% 2.0% 1.3% 0.6% 1.4%
TOTAL % 100.0% 100.0% 100.0% 100.0% 100.0% 100.0% 100.0%FUEL CONSUMPTION
Heavy Fneloil (180 cSt) m3 51,120 18,850 17,680 36,531 - 87,651Heavy Fueloil (380 cSt) - - - - 50,035 - 50,035Kerosene - - - - - 15,707 15,707Lubricating Oil . 806.5 275.2 133.1 408.2 377.1 - 1,592
FUEL per kWh SENT 01 liter/kWh 0.246 0.276 0.214 0.242 0.216 0.399FUELper kWhSENTOU kWh .. 23 266. 207 ..2 4. .: . 0... .313.
FUEL CHARACTERISTICS | HFO 180| LFO _ _ |HFO 390 J Kerosene|SpecUfic GTE rISTS gEr 0O.966 0.910 0.966 0.785I Low Caodif ValueF Ikkg 39,750 42,700 39,750 43,400
Source: CEB. Production Department.
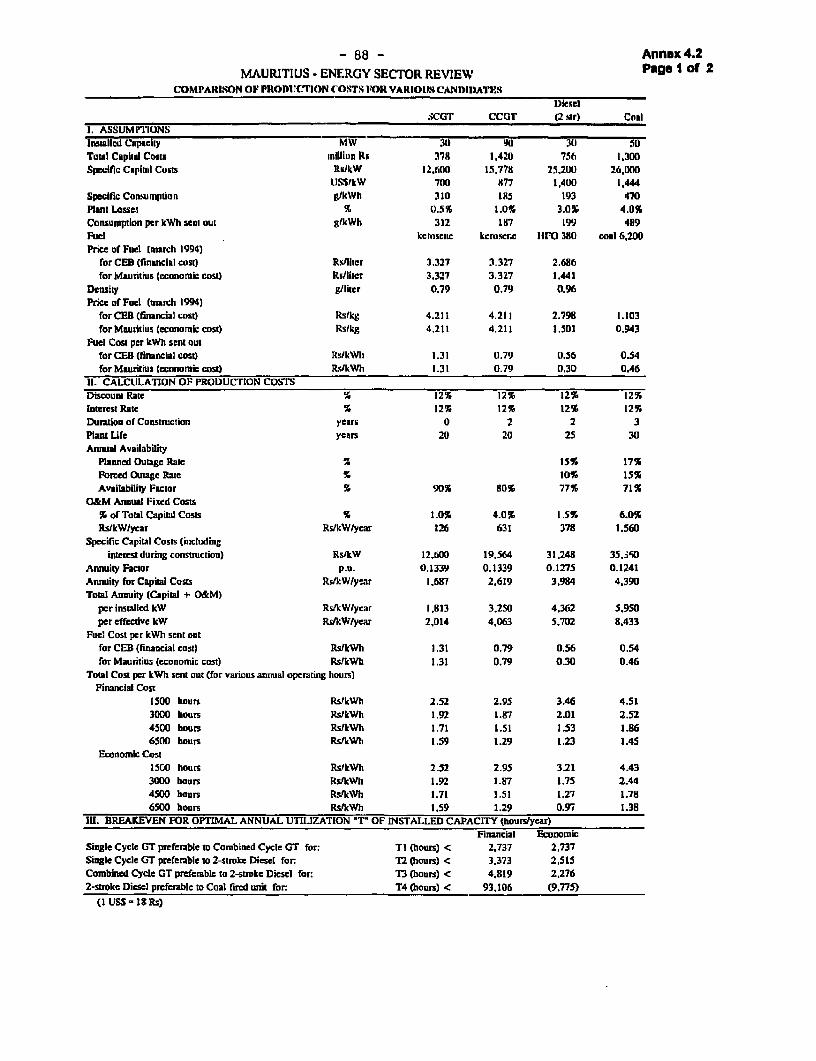
- 88 - Annex 4.2MAURITIUS - ENERGY SECTOR REVIEW Page 1 of 2
COMPARISON OF PRODUC'IION (OSTS FOR VARIOLIS CANDIDATESDiesel
SCGT CCOT (2 mr) Coal1. ASSUMPl'IUNSInstalled Capacity MW 311 9X 30 50Totl Capital Cosis million Rs 3781 1.420 756 1.300Specific Capirtl Costs Rs/kW 12,tjx 15.778 25,200 26.000
US$IkW 700 877 1.400 1.444Specific Consumption g/kWh 310 15 193 470Plant Losses % 0.5% 1.0% 3.0% 4.0%Consumption per kWh senm out glkWh 312 187 199 489Fttel ,kcroseitc kerosene IrFO 380 coal 6,200Price of Fuel (march 1994)
for CEB (financial cost) RsJliter 3.327 3.327 2.686for Mauritius (economic cost) Rs/liter 3.327 3.327 1.441
Density glliter 0.79 0.79 0.96Price of Fuel (march 1994)
forCEB(financialcost) Rsfkg 4.211 4.211 2.798 1.103for Mauritius (economic cost) Rs/kg 4.211 4.211 1.501 0.943
Fuel Cost per kWh sent outfor CEB (financial cost) RsikWA 1.31 0.79 0.56 0.54for Mauritius (economic cost) RsikWh 1.31 0.79 0.30 0.46
11 CALCULATION OF PRODUCTION CoSTsDiscount Rate % 12% 12% 12% 12%Interest Rate % 12% 12% 12% 12%Duration of Construction years 0 2 2 3Plant Life years 20 20 25 30Annual Availability
Planned Outage Rate % 15% 17%Forced Outage Rate % 10% 15%Availability Factor F 90% 110% 77% 71%
O&M Annual Fixed Costs% of Total Capital Costs % 1.0% 4.0% 1.5% 6.0%RslkW/year Rs1kW/year 126 631 378 1.560
Specific Capital Costs (includinginterest during constrction) RsIkW 12,600 19.564 31.248 35.i'i0
Annuity Factor p.u. 0.1339 0.1339 0.1275 0.1241Annuity for Capital Costs Rs/kW/y-ar 1.687 2.619 3,984 4,390Total Annuity (Capital + OkM)
per installed kW Rs/kWlycar 1,813 3.250 4.362 5.950per effeedve kW Rs/kW/year 2,014 4,063 5.702 E.433
Fuel Cost per kWh sent outfor CEB (financial cost) Rs/kWh 1.31 0.79 0.56 0.54for Mauritius (economic cost) Rs/kWh 1.31 0.79 0.30 0.46
Total Cost per kWh sent out (for various annual operating hours)Financial Cost
1500 hours. Rs/kWh 2.52 2.95 3.46 4.513000 hours Rs/kWh 1.92 1.87 2.01 2.524500 hours Rs/kWh 1.71 1.51 1.53 1.66500 hours Rs/kWh 1.59 1129 1.23 1.45
Economic Cost1500 hours Rs1kWh 2.52 2.95 3121 4.433000 hours Rs/kWh 1.92 1.87 1.75 2.444500 hours Rs/kWh 1.71 1.51 1.27 1.786500 hours Rs/kWh 1.59 1.29 0.97 1.38
111. BREAKEVEN FOR OPTIMAL ANNUAL UTILIZATION 'T' OF INSTALLED CAPACITY (hours/year)Financial Economic
Singe Cycle GT preferable to Combined Cycle GT for: TI (hours) c 2.737 2.737Single Cycle GT preferable to 2-stroke Diesel for T2 (hours) < 3.373 2,515Combined Cycle GT preferable to 2-strokc Diesel for T3 (hours) < 4.819 2,2762-stroke Diesel preftable to Coal fired unit for: T4 (hours) < 93.106 (9.775)
(I USS IS Rs)
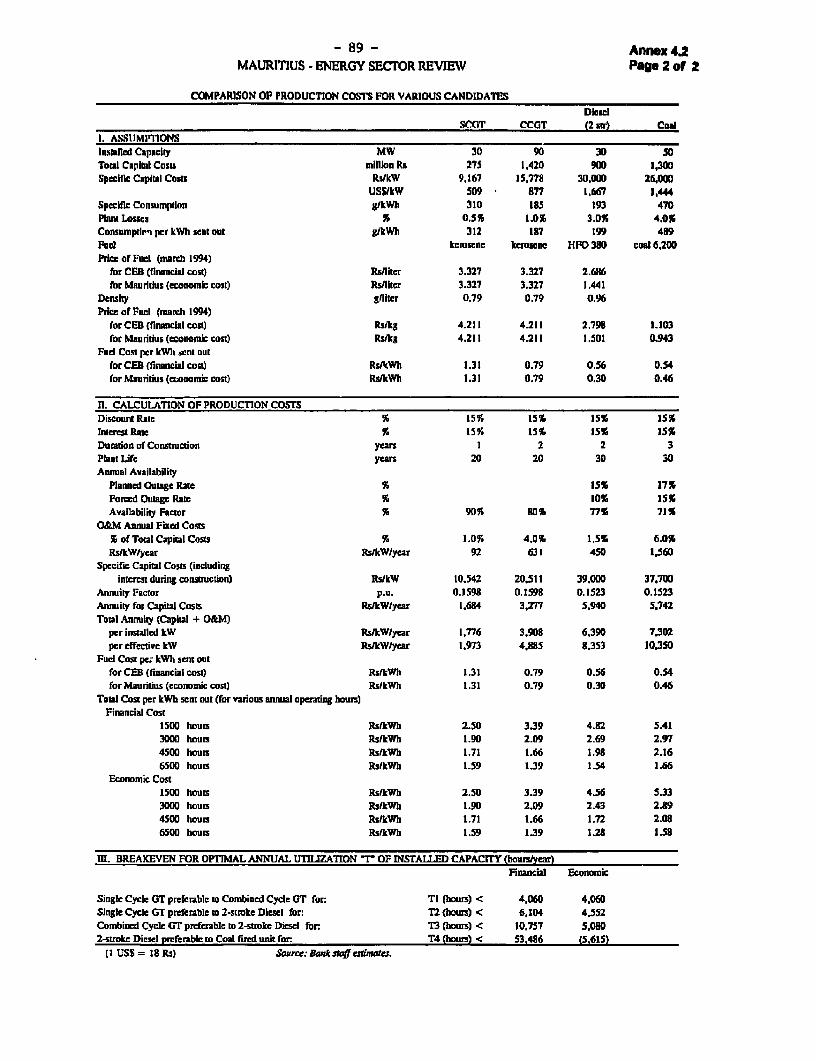
- 89 - Annex 4.2MAURITIUS - ENERGY SECTOR REVIEW Page 2 of 2
COMPARISON OF PRODUCTION COSTS FOR VARIOUS CANDIDATES
DieselSCOiT CCOT (2 str) Coal
1. ASSUMPTIONSInstalled Capacity MW 30 90 30 50Total Caplitl Costs million Rs 275 1.420 900 1,300Specific Capital Costs Ri/kW 9.167 15,778 30,000 26.000
USS/kW 509 877 1,667 1444Specific Consumpuion g/kWh 310 185 193 470
Plan Losses % 0.5% 1.01 3.0% 4.0%Consumptlei per kWh sent out g/kWh 312 137 199 489
Fuel kerosenc kerosene HPO 380 coal 6.200
Price of Fuel (march 1994)for CEB (financial cost) Rs/liter 3.327 3.327 2.6H6
for Mauridus (economic cost) Rs/ilter 3.327 3.327 1.441
Density g/liter 0.79 0.79 0.96Price of Fuel (mmrch 1994)
forCED(flnancialcost) Rsikg 4.211 4.211 2.796 1.103
for Maurtius (economic cost) Rs/kg 4.211 4.211 1.501 0.943Fud Cost per kWh sent oUt
for CEB (finanrcil cost) RshuWh 1.31 0.79 0.56 0.54
for Mauritius (ecanomic cost) Rs/kWh 1.31 0.79 0.30 0.46
11. CALCULATION OF PRODUCTION COSTS
Disount Rate % 15% 15% 15% 25%Interest Rate % 15% 15% 15% 15%Duration of Constuction years 1 2 2 3
Plant Life years 20 20 30 30Annual Availability
Planned Outage Rate % 15% 17%Forced Outage Rate ! 10% 15%Availability Factor % 90% 80% 77% 71%
O&M Annual Fixed CostsI of Total Capital Costu S 1.0% 4.0% 1.5% 6.0%RsfkW/year Rs/kW/year 92 631 450 1.560
Specific Capital Costs (including
interest during construction) Rs/kW 10.542 20.511 39.00W 37.700Annuity Factor p.u. 0.1598 0.1598 0.1523 0.1523
Annuity for Capital Costs Rs/kW/year 1.684 3,277 5.940 5.742Total Annuity (Capital + O&M)
per instIlled kW Rs/kW/year 1,776 3.908 6.390 7.302per effective kW Rs/kW/year 1,973 4.885 8.353 10.350
Fuel Cost oe kWh sent outforCEB (fnancial cost) RsIkWh 1.31 0.79 0.56 0.54for Mauritius (economic cost) Rs/kWh 1.31 0.79 0.30 0.46
Tota Cost per kWh sent out (for various annual operating hours)Financial Cost
1500 hours Rs/kWh 2.50 3.39 4.82 5.413000 houis Rs/kWh 1.90 2.09 2.69 2.974500 hours Rs/kWh 1.71 1.66 1.98 2.166500 hours Rs/kWh 1.59 139 1.54 1.66
Economic Cost1500 hours Rs/kWh 2.50 3.39 4.56 5.333000 hours Rs/kWh 1.90 2.09 2.43 2.894500 houis Rs/kWh 1.71 1.66 1.72 2.086500 hours Rs/kWh 1.59 1.39 1.28 1.58
m. BREAKEVEN FOR OPTIMAL ANNUAL UTILZATION *r OF INSTALLED CAPACITY (hours/year)Fichial Econouic
Singk Cyclc GT preferable so Combined Cyde GT for TI (hours) < 4.060 4.06DSingle Cycle CT prehrable m 2-srke Diesel for: n2 (hours) < 6.104 4.552Combined Cycle GT preferable to 2-stroke Diesel for. T3 (hours) C 10.757 5.0502-rokc Diesel prferablc to Coal fired unit for T4 thours) c 53.486 (5.615)
(I USS = 18 Rs) So&urce:. Bo*s4esmates.
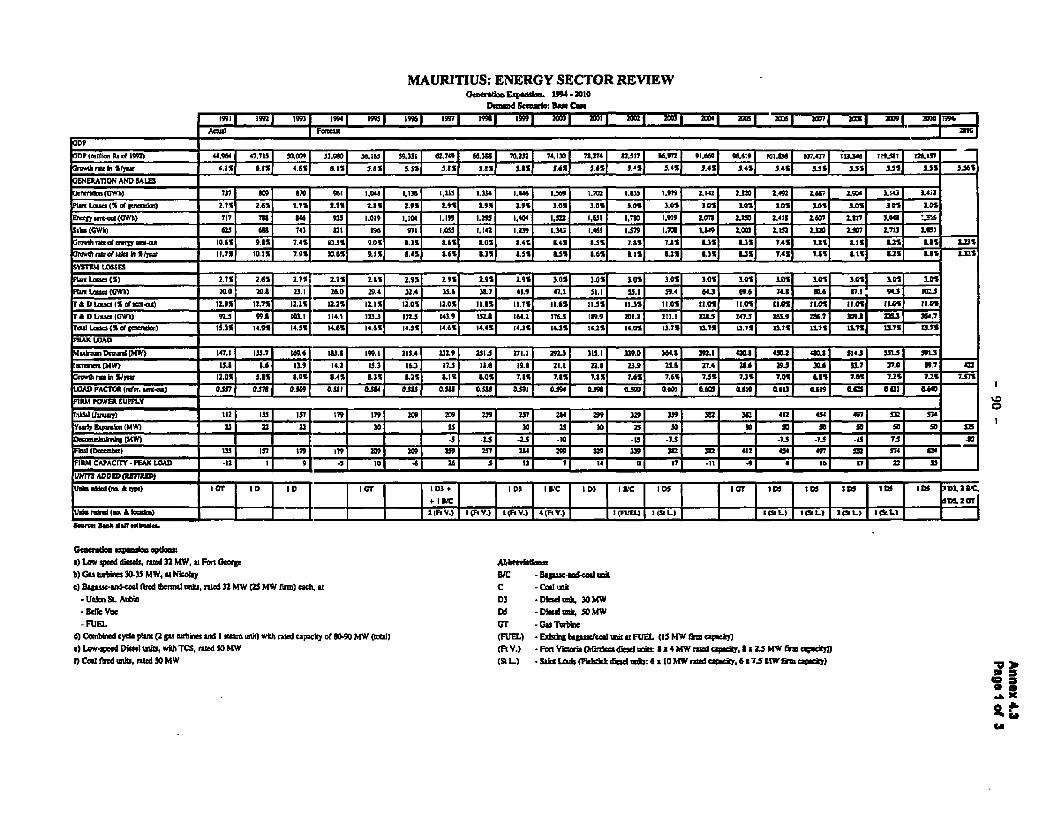
MAURITIUS: ENERGY SECTOR REVIEWOccensdia qanim. 1904 -2010
____________________ ~~~~~jJ7~~iwr 2.1ST 2.11 ~~~'~~I i@i~~7ff~ji 201 201 205 2.01 2MLIos IMMn] rns.n insiIso I4I Imi 19. 1901 2943 324J 33 31.7 ~ioj j7 mi I 3MM a9m t 4. J is i
& Dli Rs o 19 d4cm.a) ii~Fit7.717 I 091[ 23.21k0 12A.11 i9.331iJ 74 I 6S 113 1 7i22 17lj 1301 71.3 1 2.3511 lgI 20 1 2.6051 22.0-91] 1.ILOS I7.nJ7 ii@f 225 2
a2Lasa(Sd~~~~~~enS) 7j~4.%1j I '9 l 4.351 24.01[ 2401 45151 2481 5144 1 SS 2431 421L 2401 1.. 1 227S.41 13.1S1 5331 "SI 3HWj MS US) n M
at nDcuadCMW 24.2% 23.% 2696 2353 29.21 22341 22.9 2333 212S I 9.3 3332 3392 3 04. 393.3 mmO 4320 m 3243 II 1
WAD FACTOG £~~~~~~ ~~ ~ ~~1j U 43 ut 29 24.31 14i ' L a " 9 2221 1243 239 2531 27 2433____LO___6____9 4 321 301 104735 10 7051 7.11% 73 . 1t I ~ 7. .
0.36 til 90.31 0313 LOS ti4l 1194% 03611 0 42 0.0 02 003t5 f
Ptx ow(Gb)200 0. 2.1 260 9- - - J .6 1. 2159 470 23 20 5. 23 453 9 20. 74. 5 53 5
T A D Lwa JGWk) 99.11 I .1 114.1 123.3 132.5 143. 15-t -34.3 .10& 1. D. 1 nu 2773 1Zu 2673 23_1 73 -U
ToW Lascs IS al', I i in 21476 am.6 am.5 K41 14T4 1350 1430 1329 1439 1.Sc 13.7 L.2 ITS II I71Ln37
PEAK LOAI]T I 17k I! 2./ D DlT aM 2 W W [~{ 32 C
147.1 15.71 16961 133.9 199.11 31 2(41 L) 22':1.)1 111 3 1. Iq9.U.) 4(fl..12(I1133 I(5L4 20L4I M14 lOlL) 514L 1 SW I..1.
Gnash. - -~~~~~~~58 16 1.1 42 5.1 11 1.1 36I 1. 1 2. - U9 39 36 2.1 M 9J1 3.1 Z 1 3. 97 4a) La ~ced dinob, ratS 32MW, i 12For George A.bbcg II 1011 7y1h .% 781 7.5 761 7.S .3I 701 11 .1 -- -2 5b) Gas s.rbbu 30-33 MW, uaNkoby aSl 1 a-4 *Su au Ou I it) O.;A I~s~c t-a I L fl1 us1 C60I CA L1 .s1 ] ~ A
- UT - Gas Tubbie~~~~~~~~~~~~~~~~~~~~~~~~~~~~~~~~~~~~~~~~~~~~~~~~~~~~ia m iis i'-
a oute )I bies) I2 ge ttW.)ndI (Fswh)wh atdV.)dy f *IW(am! FUL.) Ez4i(RV.) Ipstm iaa a IFE (S5 L) 2kmIL 191A.hy]
e) Low qccd Dcd will, wilt T2CS, i anted p A0MW(ft .) *lut Auu Mnaidwl : Wridaah,Ia35 aey
0Cm reed w-ill,, ratec t a b d 532MWMW5NW(Ii L) t CM SaksLt(h k s : :0MWedky 675MW2m yUnkn SL Aubbm D3 Dind tok. 30 MW~~~~3scue vue DS Dind mg, SD AM ~ ~ ~ ~ ~ ~ ~ ~ ~ ~ ~ ~ ~ C FUEL qr Gas Twbim ~ ~ ~ ~ ~ ~ ~ ~ ~ ~ ~ ~ S
4) Cwbgd cyle plm (2 s Lzrkm an I mmmh) wk mud apckyof W9 MW (eal) FUEL) F-bti- tapmud w&a FUE (15 4W fi a 36
c) Lrw-pedDkm uns, kh CS,mto 50 W (E V) Fn Vcox MukcsCmdw~ 8x 4MW ad -q8 nL5 4W M op.n0 Cad wM mb mted50 KW(St LI -SdtL*(Pkhddcsd b:GzIMWrzmdimeir.6z7.LfW&m , 'g3
fd
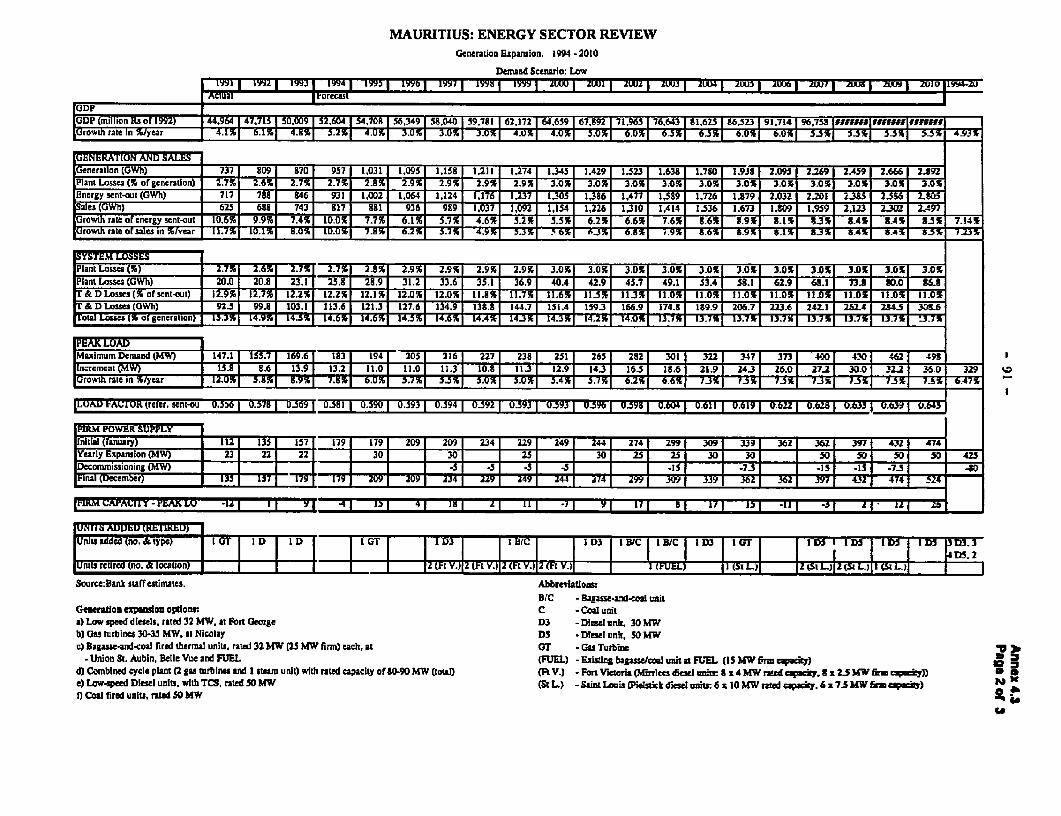
MAURITIUS: ENERGY SECTOR REVIEWVGeneration Expansion. 1994 -2010
Demand Scenario: Low
etIUs arrecas[GDP j,mnii(millionRitsof 1992) r44,964 I47.715 50.009 5 2,604 54,708 56,349 158,040 5 9,782 62.172 64.659 167.892 171,965 176,643 1 5.623 866023 191,714 196,7531151DM11IFM[Growth rate in %iyea J.. . J .UV X6 .. .6 4.* . .U% MI03 0 -)l -.% .i*133- 1331551-*
GENERATION AND SLEGener2tion (GWli) 737 309 870 957j 1,031 1.095 1,158 1 1,21 1.274 1 1.345 1.429 r1.523 1.638 1.7W0 1.938 2.095 2.269 2,459 T2.666 2.192PlIant Losses (% of generation) 2.7! 12.6% 21-% 2.7 % 2.8%1 2.9% 2.9% 2.9% 2.9%I 6 3.0% ( 3.0% 3.0% 3.0% I 3.0% 3.0% T 3.0% 3.0% T 3.0% 3.0%301Eniergy sent-out (GWh) 717 788 846 931 1,002 1,064 1.224 1.176 2.2371 1I30 1.3861 1,477 1,589 1,7261 1.879 2.032 T2.21 2.385 2.556 2305
GrTowth rate or energy sent-out' 10.6! -9.9% 7.4% 10.0% 7.7% 6.1% 5.7% 4.6TI 5.2% 5.5% 6.21 6.61 7.6% 8.61 8.9% 3.1% 13% 814% 1.A% 1.5% 7.141GurowLh rate or sales in %.Ivear I~l- -0El ~f 7ll~7f 5l - ~ ~ ~~*l ~f~ ~ ff T X .rw 01t f T t 3
YTM LOSSE-S1PatLoLsse(S) 2.71 2.6% 2.7% 2T7h 2*8R 2Tfl 2.9% 2.9% 2.9% 3.0% 3.0% 3.01 3T0l 3.0% 3.0% 3.0% 3.0% 3.01 3.0% 3TI0PatLosses (GWh) X 20.0 0 8 23.2 2518 28.9 32.2 33.6 35.1 36.9 40.4 42.9 45.7' 49.1 53.4 58.21 62.9 63.1 13.8 80.0 15.8
& Losses(% of seni.out) 12.9% 22.7% 22.2% 12.2% 12.1%j 22.0% 12.0% iTfl% 11.7% 12.6% 12.5% 11.3% 12.0% 21.0% 11.0% 11.01 11.0% 11.01 11.0% II-Os•DLouses(GWh) j 92.5 99.8 203.2 123.6 12131 127.6 134.9 132.8 144.7 151.4 159.3 166.9 174.F 119.9 206.7 223.6 242.2 262.4 214.5 303.6Iaa Losses (% or gen-era2ti-on) iTfl Mflfl 1Tl fTTh -ITrfl f l - flf *flf -TlflWf*l* ** -T*f 1f* 7l - T-yT 1n -- 7 -Tn - rn n -'1TT Wfl
Ii 147:25 155:7~U9I6 1831 205 ~ 1 1 227 1 23 2515 2655 2121 32 321 47 4(5 40 25 f
ILUAU) tAL;1UR (reter, sentaou 0.556 I0.575 U.569 U53 U54 U52 U53 U53 U561058106410611069106Z 06 .3 .3 .4
___________ 11 19 791 09 209 234 229 249 244 1 274 1 299 309 339 362 362 9 42 7
DeoUnissad ning(n MWtyp) 1 IG j I5IDj l 13 l/C i/C ID J 7- IGY I 15 7
_________ I I ~ ~~ ~~ ~ ~ J~~Z~_L D5.2Units retired (no. £ laIon ______ J j I Y.1 1 ( TFUEj 1(SLp) L(1L)L( -IIt!?
Source:Bank staff'esdmtes. Abtreruvloas
Gemevado. uxpanston 0080o5: C Coal unita) Low speed diesels, rate 32 MW. at Fort George 03 -Diesel unit. 30MWb) On5 turbines 30-35 MW. Al NicoIlay 05 -Diesel unix, 50 MWc) Bagasse-arnd-coal rired thermal units, rated 32 MW (25 MW firm) each, at UT -Gas Tutntie cg),0
-Union St. Aubin, Belle Vue and FUEL (Jj4-na a42UL(538 ~ d) Combined cycle plant (2 gastmrbinrs ang I steam unit) with rated apachty of 80.90 MW (tmotl (Ft V.) -FortVi=ctia (MirTlees mduiesel oiu 4MW rated carek. 12-5MWW Em WcjrDj)e) Low-speed Diese units, with TCS. rated 50 MW (St L.) - Saint Louis (Piclstick diesel unite: 6:a10 MW raze capacity. 6:x73 MW fie aopacity) I) Coal fired unIts, ratSd 50MKW
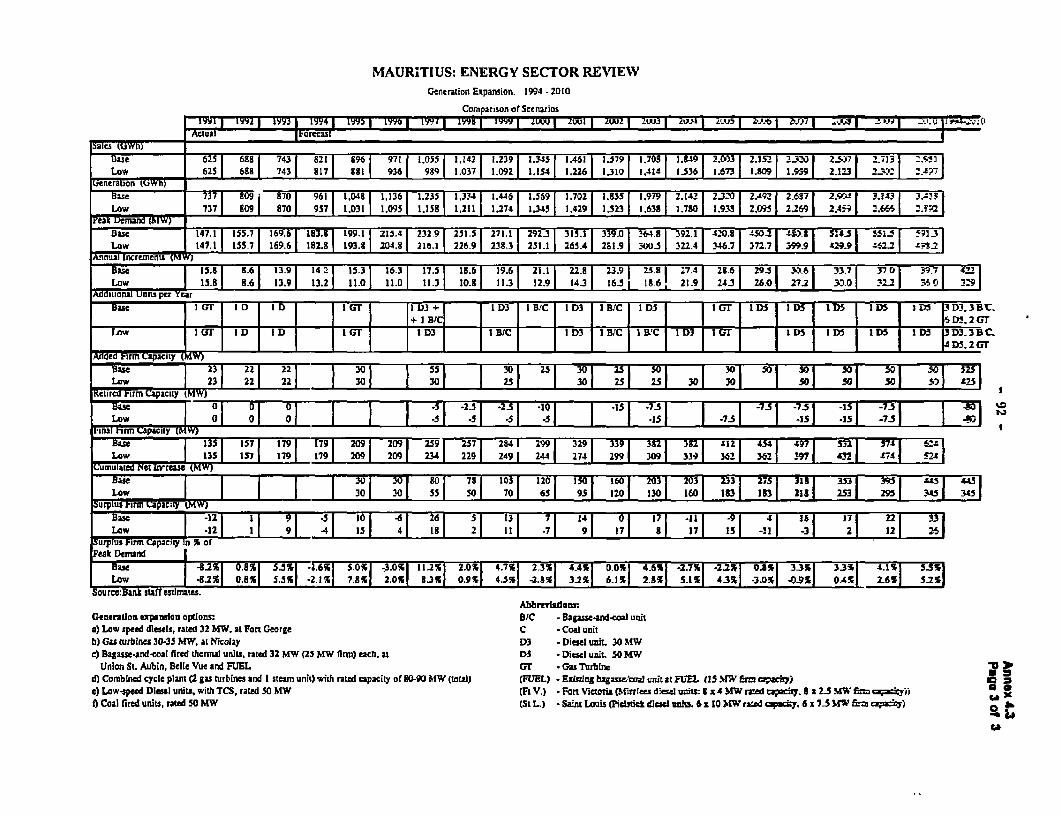
MAURITIUS: ENERGY SECTOR REVIEWGveneration Expanuion. 1994 -2010
Conmparison of Scenasios19951 I961 190 19961IVWI ZUU I LU I I A? IAJJ3 sW J LUt '.1 j..,1j5j .4),? I .J. II
AClU& Orrecailialc.s tUWhl
B3ase 625 638 743 8271 896 971 1.053 1,142 1.239 1.345 1.461 1.579 1.708 1.849 2k033 2.152 2.320 2-337 23713 Sd) Low 65 638 743 81 I 881 936 98 ,3 .9 3.3 .2 .3 ,1 36 1.673 I."0 1.939 2.12.3 2.32 2.J7
D2at 737 F 809 370 961 1.048 1.136 1.235 1.334 1.446 1.569 1.702 13.53 1,979 2.142 2-32-0 2.4'32 2.6U7 2.V931 333 3~J
Low 737 80 80 937 301 ,95 1.338 1,23 3.7 1.345 1.429 3.523 3.638 1.750 1.933 2.C95 2269 2.459 2.665 2SF:2meax D)emnand 1Miw)
Baut 1SF8 ID6 13D9 1 153 163 17.3 4 19.)3 1. 2B/C 18) 233C 215. 174 2. 95 3WD. 33117 .37-0 3975 43D32Low I1ST .ID 3D9 132 SF. 1 3113 to. 13/ 3143 16C IC 13 1S 1 15 18. 19 2- 60 2.12-2 11) DC32
__________ ~~~~~~~~~~~~~~~~~~~~+3I BIC D S. 2 GT
A00eC ?lirm capacs t dW)Biase 2330 55 3 23 30 25 310 30 5 0 3 0 3 525
Low 30 30 25 ~~~ ~~~ ~~~ ~~~~30 25 25 30 30 3 0 3 ) .2
Ban ~~01 01 DI I -5 I -2.51 .2 51 -301I I .35 1 -7-SI I I731 -7-5I1 -7.5 I -15 1 73 I
mial tam cpacity WBane 133 33 179 37 209 1 209 17259 2,57 2814 299 329 339 332 382 412 44 47 53 34 64
Low 135 157 179 379 209 209 24 229 249 1 244 27 29 309 339 362 362 197 Q42 474 5249uInsuI Sled Net unease (MW)
BaseI I 301 305 805 735 103 1 20 3305 1605 2035 2035 2335 2751 313 35 39 "-' f 4Low 301 301 5 so1 705 6531 ~1320 I 130 I 160 1 835 1'I ll 253w 20 _W u 35
'urplu ims capacity tMW)Low I .3~~~~~2 I5 9 -. 105 46 2S6 S 13 7f 14 Of 17j -:13 -3753f I ~ 3
Base -12 4 33 1 1841~ I ~ 91 7 375 -14 -' 2! 121 6Surpius Finn CapaCisy in S ofPeak Demand
Base j 4~~~-.21 0.8%T 3.3% -1.6%1 30%1 -3.0%1 112%1 2.0% 4.7% 2% 4% 0% 46% -27 2% 0% 3% 3% 41 5%Low 5 8.2% 0.8%1 5.5% 2.1 7.8% 2.0% 8.3% 0.9 4I5% 2.8% 3.2%1 61%1 21% 53% 43% -3.0% 0-09%1 0A4% 2-6% 5.2%
Source:Bank stufrestimutes.Ahbbrldadonn
GenieratIon expinson optionLs: BIC -Bagasse-and-coal unLita) Low speed diesels, rated 32 MW. at Fant George C -Coal tnintsb) Gas turbines 30.35 MW, at Nicolay 1)3 -Diesel unit, 30 MfWc) Bagaas-and-coul fired thermal units, rated 32 KW (23 MlW finn) each, at DS Diesel unit. 30MW
Union St. Aubin, Belle Vue aLnd FUEL SF -Gas Turbined) Comnbined cycle planit (2 gas turbine-s and I steam unit) wish mratd capacity of 80.90 14W (total) (FUEL) Existingbhagaesea!oa1unit at FJUL (15 MW frm orsiy) la ze) Low-speed Diesel units, with TCS, rated 50 MW (Ft V.) - Fort Victoria (Mkirtles d'ieselunits: 34MW azedrc-iaci. 8 a235MW fircm :a;kyj) eo Coal fired urits, rated 50 MW (St L.) - Saint Louis (Peistick diese wunt. 6SilO MW ea:zd capacity. 61x7-3 MW &m capa*:y) Pa
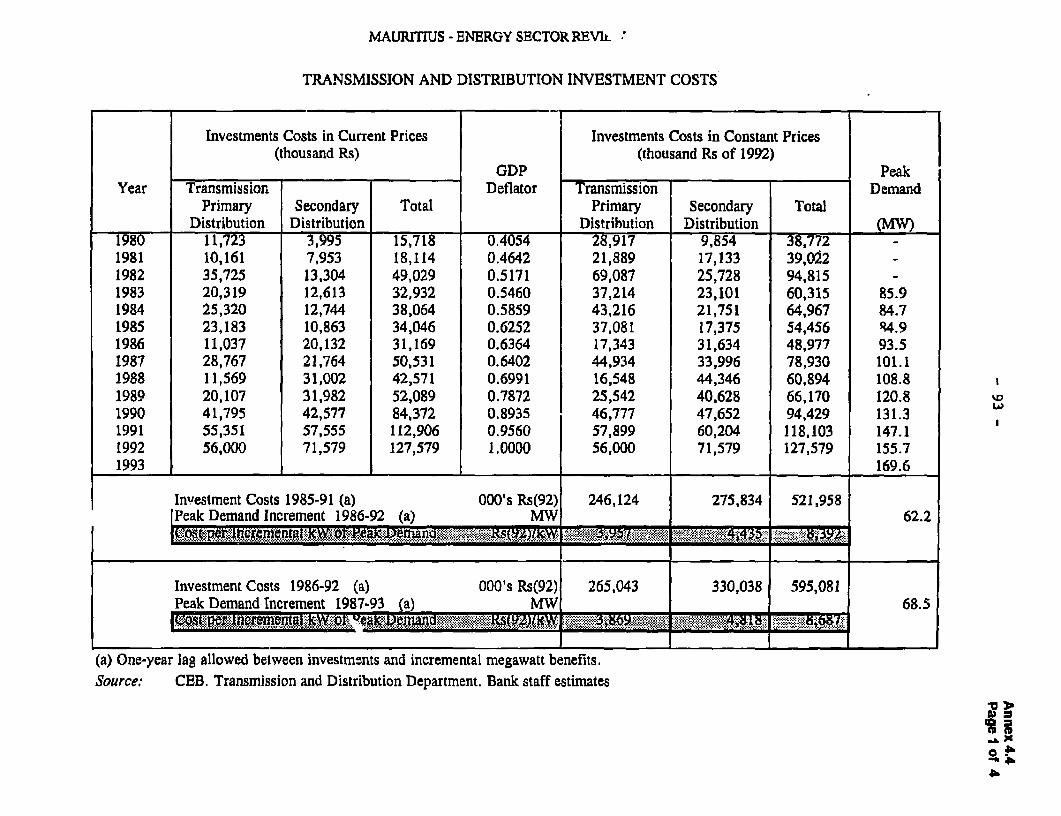
MAURITIUS - ENERGY SECTOR REVLL '
TRANSMISSION AND DISTRIBUTION INVESTMENT COSTS
Investments Costs in Current Prices Investments Costs in Constant Prices(thousand Rs) (thousand Rs of 1992)
_______ GDP PeakYear Transmission Deflator Transniission Demand
Primary Secondary Total Primary Secondary TotalDistribution Distribution _ Distribution Distribution (MW)
1980 11,723 3,995 15,718 0.4054 28,917 9,854 38,7721981 10,161 7,953 18,114 0.4642 21,889 17,133 39,0221982 35,725 13,304 49,029 0.5171 69,087 25,728 94,8151983 20,319 12,613 32,932 0.5460 37,214 23,101 60,315 85.91984 25,320 12,744 38,064 0.5859 43,216 21,751 64,967 84.71985 23,183 10,863 34,046 0.6252 37,081 17,375 54,456 R4.91986 11,037 20,132 31,169 0.6364 17,343 31,634 48,977 93.51987 28,767 21,764 50,531 0.6402 44,934 33,996 78,930 101.11988 11,569 31,002 42,571 0.6991 16,548 44,346 60,894 108.81989 20,107 31,982 52,089 0.7872 25,542 40,628 66,170 120.81990 41,795 42,577 84,372 0.8935 46,777 47,652 94,429 131.31991 55,351 57,555 112,906 0.9560 57,899 60,204 118,103 147.11992 56,000 71,579 127,579 1.0000 56,000 71,579 127,579 155.71993 1 ___ _ 169.6
Investment Costs 1985-91 (a) 000's Rs(92) 246,124 275,834 521,958IPeak Demand Increment 1986-92 (a) MW 62.2
. .~~~~~~~~~~~~~~~~~~~~~~~~~~~~~~~~~~~~~~~~~~~~~~~~~~~~~~U
Investment Costs 1986-92 (a) 000's Rs(92) 265,043 330,038 595,081Peak Demand Increment 1987-93 (a) MW 68.5
(a) One-year lag allowed between investments and incremental megawatt benefits.Source: CEB. Transmission and Distribution Department. Bank staff estimates
P-f.
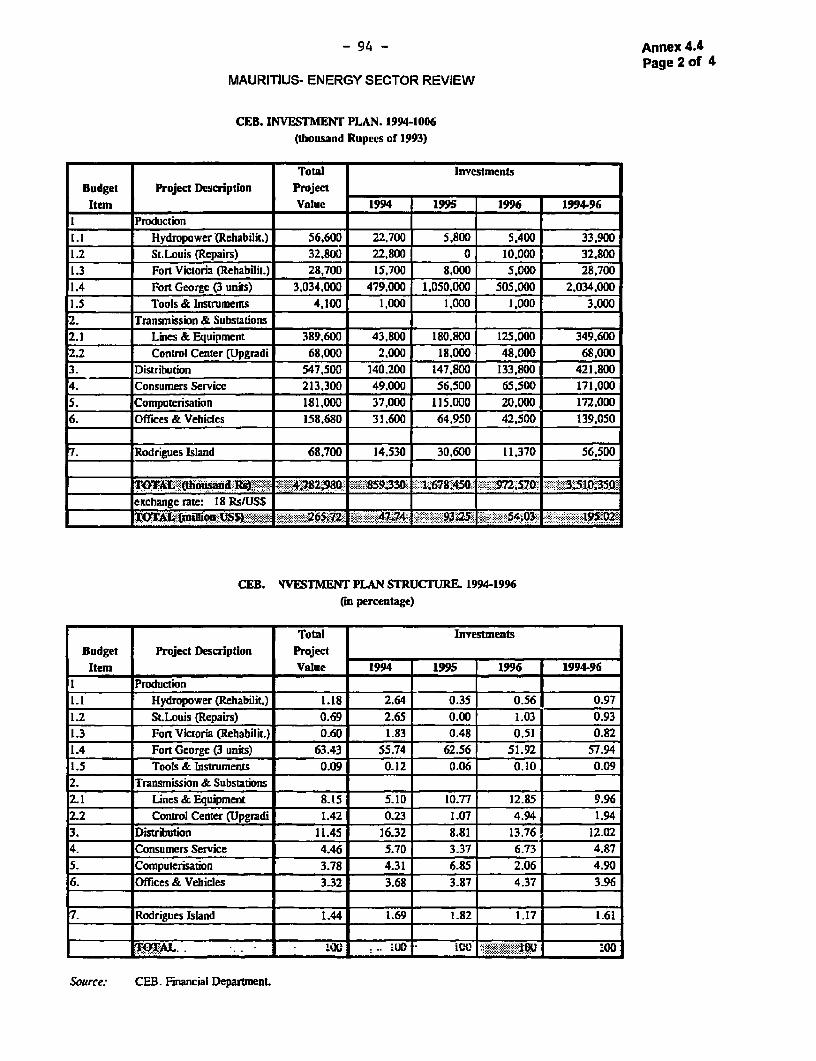
-94- Annex 4.4Page 2 of 4
MAURITIUS- ENERGY SECTOR REVIEW
CEB. INVESTMENT PLAN. 1994-1006
(thousand Rupees of 1993)
Total InvestmentsBudget Project Description Project
Item Value 1994 1995 1996 199496Production
[.1 Hydropower (Rehabilit.) 56,600 22,700 5,800 5,400 33.9001.2 St.Louis (Repairs) 32,800 22,800 0 10.000 32,800
1.3 Fort Victoria (RehabiliL.) 28,700 15,700 8,000 5.000 28,700
1.4 Fort George (3 units) 3,034.000 479,000 1.050,000 505.000 2,034,000
1.5 Tools & Instruments 4,100 1.000 1,000 1,000 3.000
2. Transmission & Substations2.1 Lines & Equipment 389,600 43,800 180,800 125,000 349,6002.2 Control Center (Upgradi 68,000 2,000 11,000 48.000 68,000
3 I:Distribution 547,500 140.200 147,800 133.800 421,8004. Consumers Servicc 213,300 49,000 56,500 65,500 171,000
5. Computerisation 181,000 37,000 115,000 20,000 172.00W6. Offices & Vehicles 158,680 31,600 64,950 42,500 139,050
7. Rodrigues Island 68,700 14,530 30,600 11,370 56,500
.______ TOTAL' (thousand 16EŽt trA-.4;78298 _33 _757 .3:5I35
exchange rate:- 18 Rs/US$
CEB. WVESTMENT PLAN STRUCTURE. 1994-1996
(in percentage)
Total InvestmentsBudget Project Description Project
Item Value 1994 1995 1996 1994-96
I ProductionI.! Hydropower (Rehabilit.) 1.18 2.64 0.35 0.56 0.971.2 St.Louis (Repairs) 0.69 2.65 0.00 1.03 0.93
1.3 Fort Viaoria (Rebabilit.) 0.60 1.83 0.48 0.51 0.82
1.4 Fort George (3 units) 63.43 55.74 62.56 51.92 57.94
1.5 Tools & Instruments 0.09 0.12 0.06 0.10 0.09
2. Transmission & Substations _ _
2.1 Lines & Equipment 8.15 5.10 10.77 12.85 9.96
2.2 Control Center (Upgradi 1.42 0.23 1.07 4.94 1.943. Distribution 11.45 16.32 8.81 13.76 12.024. Consumers Service 4.46 5.70 3.37 6.73 4.87
5. Computerisation 3.78 4.31 6.85 2.06 4.906. Offices & Vehicles 3.32 3.68 3.87 4.37 3.96
7. Rodrigues Island 1.44 1.69 1.82 1.17 1.61
_-lix -o it( QU iOO
Source: CEB. Financial Department.

- 95 - Annex 4.4Page 3 o 4
MAURrITUSENERGY SECTOR REVIEW
CEB. 66 kV TRANSMISSION LiNES CHARACTERISTICS. 1993
Capacity (MVA)No. Condof Cond per
LINE Route circ. size phase per Observ.(km) (mm2) circuit total
St.Louis - Nicolay 8.7 2 150 1 50 100Fort George - Nicol 2.5 2 570 1 100 200Nicolay - Belle Vue 15.0 2 150 1 50 100Belle Vue - F.U.E. 21.7 2 150 1 50 100F.U.E.L. - Champ 18.0 1 228 1 60 60Champagne - Woot 22.7 1 95 2 80 80St. Louis - Chaumi 9.2 2 150 2 100 200Chaumiere - Henrie 13.8 2 150 2 100 200Henrietta - Combo 23.0 1 150 1 50 50 (a)St.Louis - Rose Hill 7.8 2 95 1 40 80Rose Hill Wooton 10.0 2 95 1 40 80
TOTAL 152.4-Note: All lines mounted on steel poles. Conductor type: SILMALEC.(a) Wood Poles. Line temporarily operated at 22 kV.Source: CEB. Transmission and Distribution Department.
CEB. SUBSTATIONS 66/22 kV. TRANSFORMER CAPACITY(1993)
Capacity (MVA)No.__ _
SUBSTATION of _transformers installed firm Observ.
St.Louis 2x15 + lx 10 40T 25Nicolay 2 x 30 60 ?qBelle Vue 2 x 30 60 30F.U.E.L. 2 x 30 60 30Champagne 2 x 20 40 20Rose Hill 2 x 30 60 30Wooton 2 x 15 + 1 x 10 40 25Chaumiere 2 x 30 60 30Henietta 2 x 30 60 30Combo 2 x 10 20 10 (a)
TOTAL I __ 500 260
(a) To be commissioned in 1995.Source: CFB. Transmission and Distribution Departme.
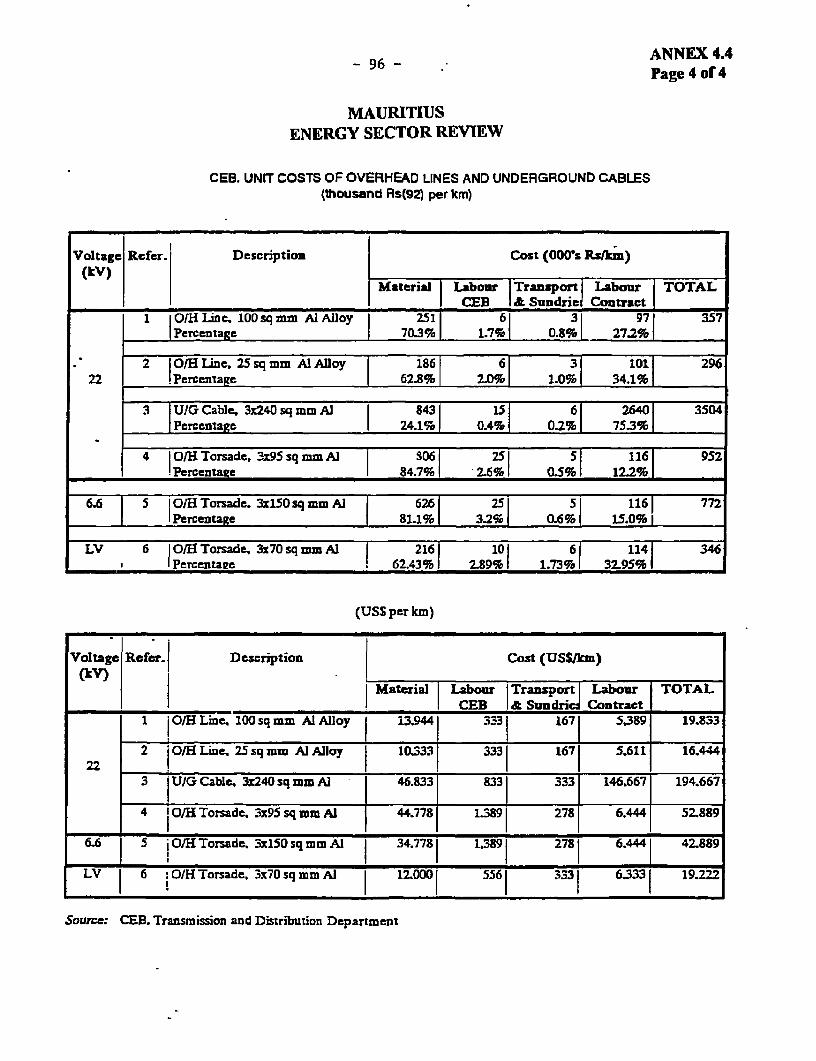
- 96 ANNEX 4.4Page 4 of 4
MAURTITWSENERGY SECTOR REVIEW
CEB. UNIT COSTS OF OVERHEAD LINES AND UNDERGROUND CABLES(thousand Rs(92) per km)
Voltage Rcfer. Description Cost (000'sR Rs"m)
Materia b | -Laor I Tranlsport I Labour |TOTALMaeIa CEB lidSundr-iel Contract|
I gOflHLin c. 100 sq mm 0.3llo 1. 61Sl. 31 97l 357| Percentage A Aloy 703% 1.7% 0.8% 27.2%
2 10/TiLine, 25 sq mm AlAlloy 1861 61 31 101 29622 IPercentage L 62.8% 2.0% 1.0% 34.1%
3 UIG Cable, 3x240 sq mi Al 843 1 61 - 3504IPercentage 1 24.1% 0.4% 0.2%61 7S3%
4 OHTrsade. 3x9sq mAm 306A 25_ 5T 1161I 952.Percentate 1 84.7% 2.6% % 12.2% 1
6.6 5 IOlHTorsade. 3xlS0sqmm Al I 6261 25 5 1161 772_ IPercentage 1 81.1% 3.2%1 0.6% I 15.0% I
LV 6 O/HTorsade, 3x7Osq mmAl 216 101 361 114 341 I PercentaQe , 62.43% 21891% 32.95%
(USS per km)
Voltage Refer.| Description Cost (USSIlim)( k V) I _ _ _ _ _ _ _ _
Material Labour Transport Labour TOTALI_I____ CEB I& Sundric Contract .
- O/HLine, 100sqmm AIAlloy __i3.944 3E 167 5,3 19.833
22 2 jOffLine. :5sqmm AlAlloy I 10.333 3331 1671 5,611 16.4443 1U/GCable. 3x240 sq mm1 Al 4683 331 333 146.667 194.667
4 O/H Torsade. 3x95 sq mm Al 44.778 1.3891 27B 6,444 52.889
6.6 5 iO/H Torsade. 3x150 sq mm Al 34.7781 1.3891 278 6.4441 42.889
Sourcc: CEB. Transmission and Distribution Department
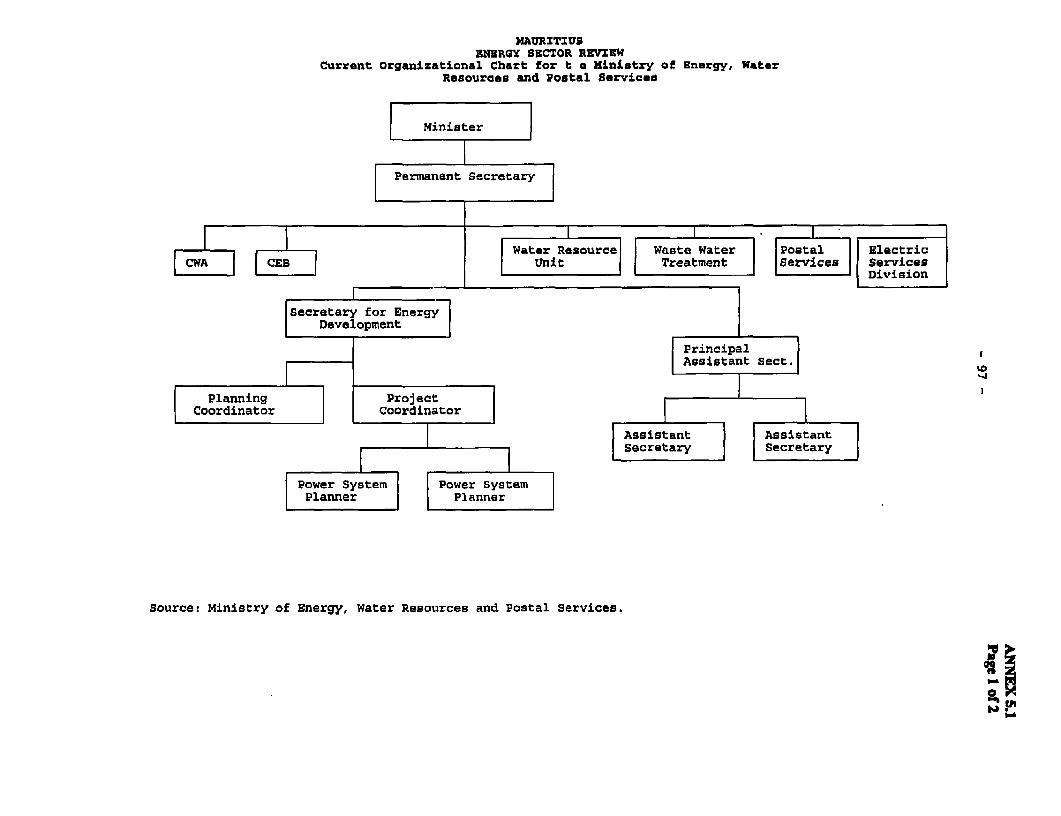
MAtURITIUENERGY SECTOR REVXIW
Current Organizational Chart for t a Ministry of Energy, WaterResources and Postal Services
Minister
F Permanent Secretary
Water Resource Waste Water Postal ElectricCWA CEB Unit Treatment Services Services
I I F Division
Secretary for EnergyDevelopment
PrincipalAssistant sect.
Planning Project ICoordinator Coordinator
Assistant AssistantSecretary Secretary
|Pwr System | |Power System l
| Pannr | lanner l
Source: Ministry of Energy, Water Resources and Postal Services.
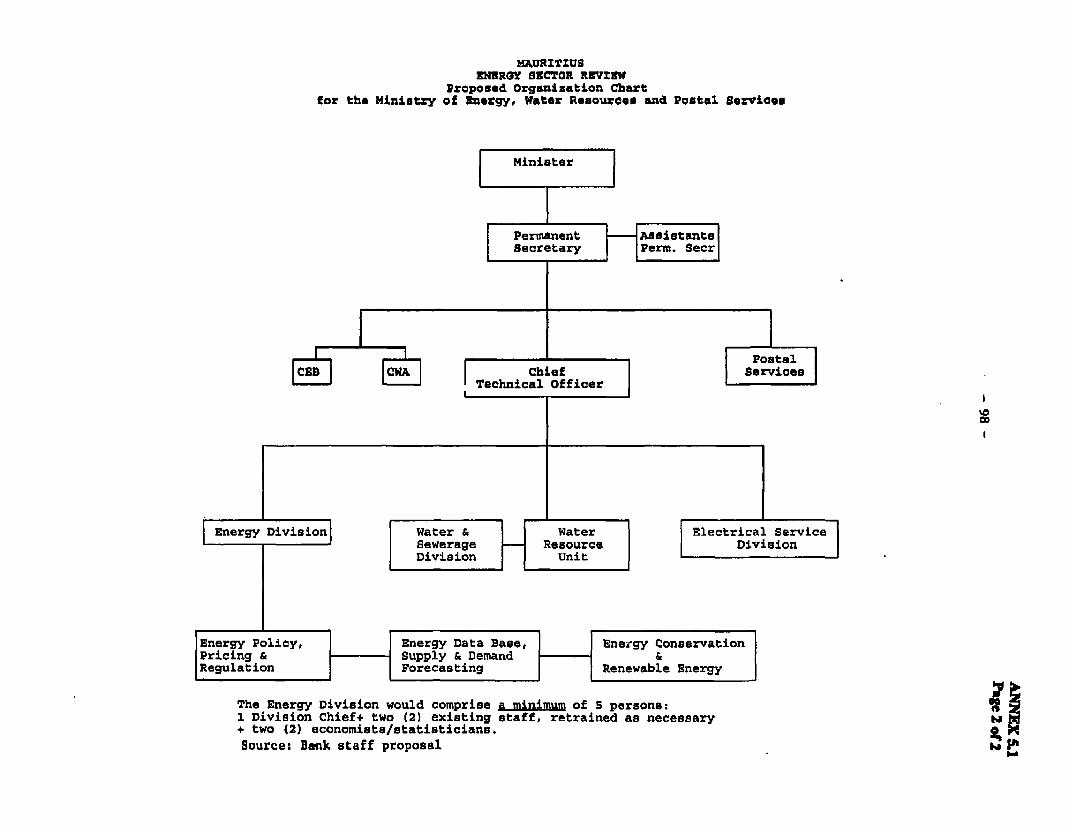
MAURITIUSENORGY 9ECTOR REVISW
Proposed Orgunization Chartfor the Ministry of Energy, Water Resources and Postal Services
Ministr
Postal
FCN B-BCWA CChief ServicesTechnical Officer
Energy Division| 1 Water & Water Electrical ServiceSewerage Resource DivisionDivision Unit
Energy Policy, Energy Data Baae, Energy ConservationPricing & Supply & Demand &Regulation Forecasting Renewable Energy
The Energy Division would comprise a minimum of 5 persons:
1 Division Chief+ two (2) existing staff, retrained as necessary *1+ two (2) economists/statisticians.
Source: Bank staff proposal
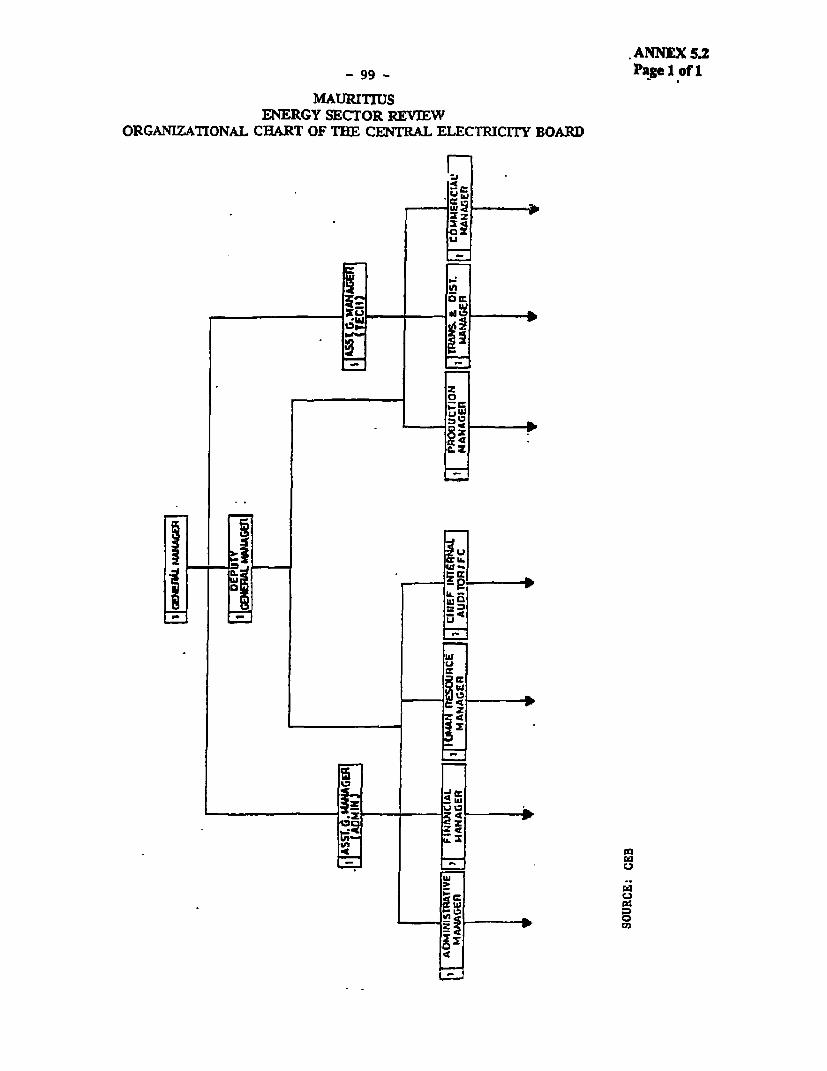
.ANNEX 5.2
g 99 Ppa 1 of 1
MAURITIUSENERGY SECTOR REVIEW
ORGANIZATIONAL CHART OF THE CENTRAL ELECTRICITY BOARD
p_q~~~~~~~~~~.
at
Ii
U'
' we
U L ~~~~~~~~~~~
- EL X~~~~~~~~~
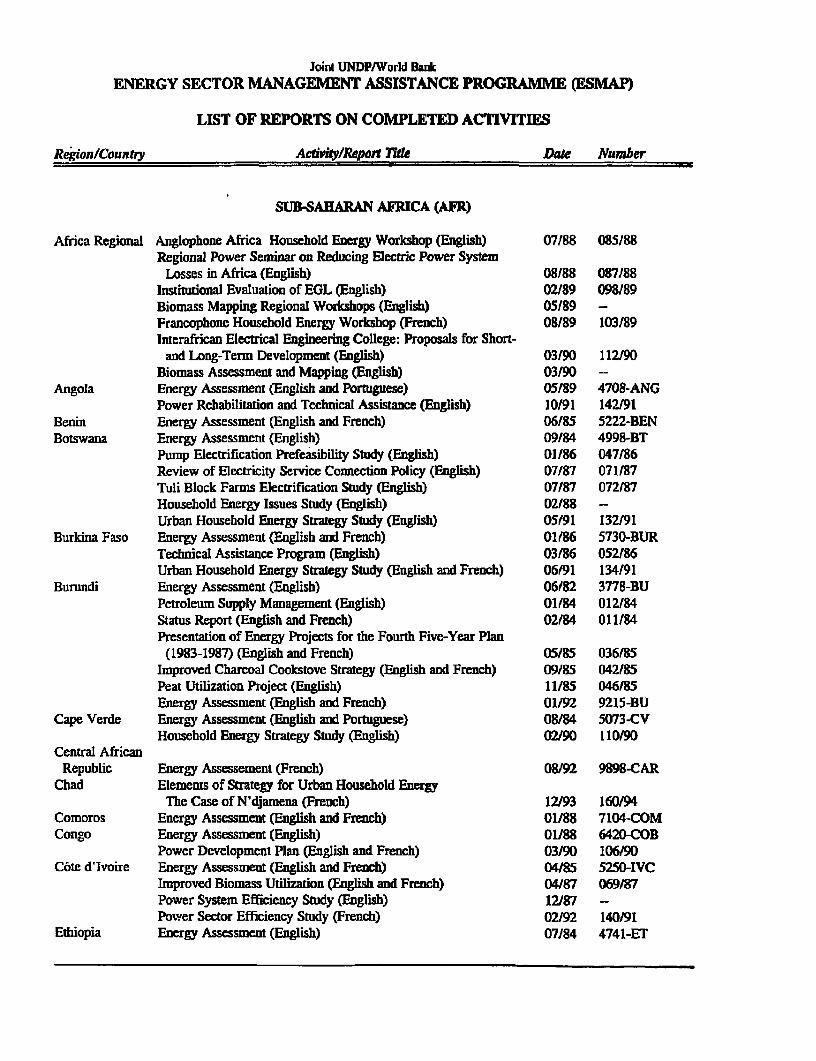
Joint UNDP/World BankENERGY SECTOR MANAGEMENT ASSISTANCE PROGRAMME (ESMAP)
LIST OF REPORTS ON COMPLETED ACTIVITIES
Rekion/Country Acdvity/Repon Thk Date Number
SUB-SAHARAN AFICA (AFR)
Africa Regional Anglophone Africa Household Energy Workshop (English) 07188 085/88Regional Power Seminar on Reducing Electric Power System
Losses in Africa (English) 08188 087188Institutional Evaluation of EGL (English) 02189 098/89Biomass Mapping Regional Workshops (English) 05189 -
Francophone Household Energy Workshop (French) 08/89 103189Interafrican Electrical Engineering College: Proposals for Short-
and Long-Term Development (English) 03/90 112/90Biomass Assessment and Mapping (English) 03/90 --
Angola Energy Assessment (English and Portuguese) 05/89 4708-ANGPower Rehabilitation and Technical Assistance (English) 10/91 142191
Benin Energy Assessment (English and French) 06/B5 5222-BENBotswana Energy Assessment (English) 09/84 4998-BT
Pump Electrification Prefeasibility Study (English) 01/86 047186Review of Electricity Service Connection Policy (English) 07/87 071187Tuli Block Farms Electrification Study (English) 07187 072/87Household Energy Issues Study (English) 02/88 -
Urban Household Energy Strategy Study (English) 05/91 132/91Burkina Faso Energy Assessment (English and French) 01/86 5730-BUR
Technical Assistance Program (EngLish) 03/86 052/86Urban Household Energy Strategy Study (English and French) 06/9l 134/91
Burundi Energy Assessment (English) 06/82 3778-BUPetroleum Supply Management (English) O/84 012/84Status Report (English and French) 02/84 011/84Presentation of Energy Projects for the Fourth Five-Year Plan
(1983-1987) (English and French) 05/85 036f85Improved Charcoal Cookstove Strategy (English and French) 09/85 042/85Peat Utilization Project (English) 11/85 046/85Energy Assessment (English and French) 01/92 9215-BU
Cape Verde Energy Assessment (English and Portuguese) 08/84 5073-CVHousehold Energy Strategy Study (English) 02/90 110/90
Central AfricanRepublic Energy Assessement (French) 08/92 9898-CAR
Chad Elements of Strategy for Urban Household EnergyThe Case of N'djamena (French) 12/93 160/94
Comoros Energy Assessment (English and French) 01/88 7104-COMCongo Energy Assessment (English) 01/88 6420-COB
Power Development Plan (English and French) 03/90 106/90Cote d'lvoire Energy Assessment (English and French) 04/85 5250-IVC
Improved Biomass Utilization (English and French) 04/87 069/87Power System Efficiency Study (English) 12/87 -
Power Sector Efficiency Study (French) 02/92 140/91Ethiopia Energy Assessment (English) 07/84 4741-ET

-2 -
Reg*nu/Country Activity/Report Title Date Number
Ethiopia Power System Efficiency Study (English) 10/85 045/85Agricultural Residue Briquetting Pilot Projecl (English) 12/86 062186Bagasse Study (English) 12/86 063/86Cooking Efficiency Project (English) 12/87 --
C-abon Energy Assessment (English) 07/88 6915-GAThe Gambia Energy Asscssment (English) 11/83 4743-GM
Solar Water Heating Retrofit Project (English) 02/85 030/85Solar Photovoltaic Applications (English) 03/85 032/85Petroleum Supply Management Assistance (English) 04/85 035/85
Ghana Energy Assessment (English) 11/86 6234-GHEnergy Rationalization in the Industrial Sector (English) 06/88 084/88Sawmill Residues Utilization Study (English) 11/88 074/87Industrial Energy Efficiency (English) 11/92 148/92
Guinea Energy Assessment (English) 11/86 6137-GUIHousehold Energy Strategy (English and French) 01/94 163/94
Guinea-Bissau Energy Assessment (English and Portuguese) 08184 5083-GUBRecommended Technical Assistance Projects (English &
Portuguese) 04/85 033/85Management Options for the Electric Power and Water Supply
Subsectors (English) 02/90 100/90Power and Water Institutional Restmcturing (French) 04/91 118)91
Kenya Energy Assessment (English) 05/82 3800-KEPower System Efficiency Study (English) 03/84 014184Status Report (English) 05/84 016184Coal Conversion Action P,an (English) 02/87 -
Solar Water Heating Study (English) 02187 066/87Peri-Urban Woodfuel Development (English) 10/87 076187Power Master Plan (English) 11187 -
Lesotho Energy Assessment (English) 01/84 4676-LSOLiberia Energy Assessment (English) 12/84 5279-LBR
Rccommended Technical Assistance Projects (English) 06/85 038/85Power Systemi Efficiency Study (English) 12/87 081/87
Madagascar Energy Assessment (English) 01/87 5700-MAGPower System Efficiency Study (English and French) 12/87 075/87
Malawi Energy Assessment (English) 08/82 3903-MALTechnical Assistance to Improve the Efficiency of Fuelwood
Use in the Tobacco Industry (English) 11/83 009/83Status Report (English) 01/84 013/84
Mali Energy Assessment (English and French) 11/91 8423-MLIHousehold Energy Strategy (English and French) 03/92 147/92
Ilamic Republicof Mauritania Energy Assessment (English and French) 04/85 5224-MAU
Household Energy Strategy Study (English and French) 07/90 123/90Mauritius Energy Assessment (English) 12/81 3510-MAS
Status Report (English) 10183 008/83Power System Efficiency Audit (English) 05/87 070/87Bagasse Power Potential (English) 10/87 077/87Energy Sector Review (English) 12/94 3643-MAS
Mozambique Energy Assessment (English) 01/87 6128-MOZHousehold Electricity Utilization Study (English) 03190 113190
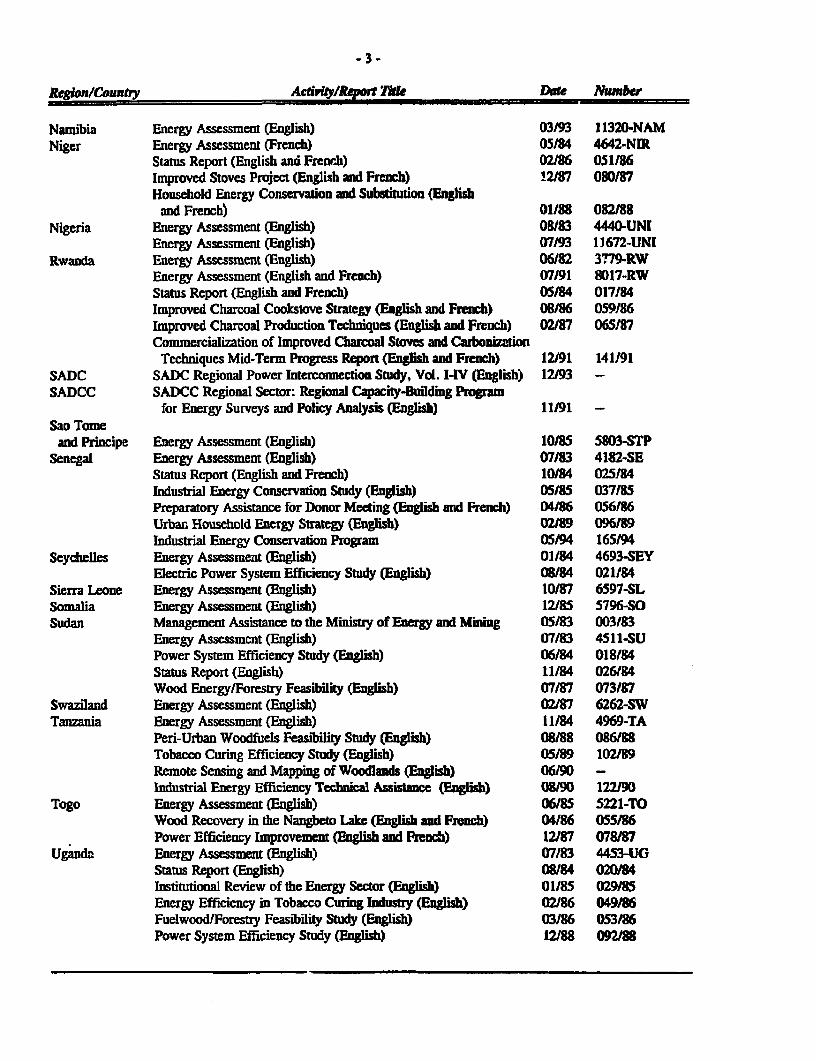
-3 -
Regien/Country Achyhpf le Date Afumbet
Namibia Energy Assessment (English) 03/93 11320-NAMNiger Energy Assessment (French) 05/84 4642-NIR
Status Report (English and French) 02/86 051186Improved Stoves Project (English and Frenb) 12/87 080187Household Energy Conservation and Substitution (English
and French) 01/88 O02188Nigeria Energy Assessment (English) OB/83 4440-UNI
Energy Assessment (English) 07/93 11672-UNIRwanda Energy Assessment (English) 06/82 3779-RW
Energy Assessment (English and French) 07/91 8017-RWStatus Report (English and Frech) 05/84 017184Improved Charcoal Cookstove Strategy (English and Frnh) 08/86 059186Improved Charcoal Producdon Techniques (English and French) 02/87 065/87Commercialization of Improved Charcoal Stoves and Carbonization
Techniques Mid-Term Progress Report (English and French) 12/91 141/91SADC SADC Regional Power Interconnection Study, Vol. I-IV (English) 12/93 -
SADCC SADCC Regional Sector: Regional Capacity-Building Progamfor Energy Surveys and Policy Analysis (English) 11/91 -
Sao Tomeand Principe Energy Assessment (English) 10/85 5803-STP
Senegal Energy Assessment (English) 07/83 4182-SEStatus Report (English and French) 10/84 025184Industrial Energy Conservation Study (English) 05/85 037/85Preparatory Assistance for Donor Meeting (English and French) 04/86 056186Urban Household Energy Strategy (English) 02189 096199Industrial Energy Conservation Program 05/94 165194
Seychelles Energy Assessment (English) 01/84 4693-SEYElectric Power System Efficiency Study (English) 08/84 021/84
Sierra Leone Energy Assement (English) 10/87 6597-SLSomalia Energy Assessment (English) 12/85 5796-SOSudan Management Assistance to the Ministy of Energy and Minig 05/83 003183
Energy Assessment (English) 07/83 4511-SUPower System Efficiency Study (English) 06184 018184Status Report (English) 11/84 026184Wood Energy/Forestry Feasibiliy (English) 07/87 073187
Swaziland Energy Assessment (English) 02187 6262-SWTanzania Energy Assessment (English) 11/84 4969-TA
Peri-Urban Woodfuels Feasibility Study (English) 08188 086188Tobacco Curing Efficiency Study (English) 05/89 102/89Remote Sensing and Mapping of Woodlands (Enlgish) 06190 -
Industrial Energy Efficiency Technical Assistance (English) 08/90 122190Togo Energy Assessment (English) 06185 5221-rn
Wood Recovery in the Nangbeto Lake (Enish and French) 04/86 055/86Power Efficiency Improvement (Eglish anl French) 12/87 078187
Uganda Energy Assessment (English) 07/83 453-UGStatus Report (English) 08/84 020/84Institutional Review of the Energy Sector English) 01/85 029/85Energy Efficiency in Tobacco Curing Idustry (English) 02/86 049/86Fuelwood/Forestry Feasibility Study (English) 03/86 053/86Power System Efficiency Study (English) 12188 092/88
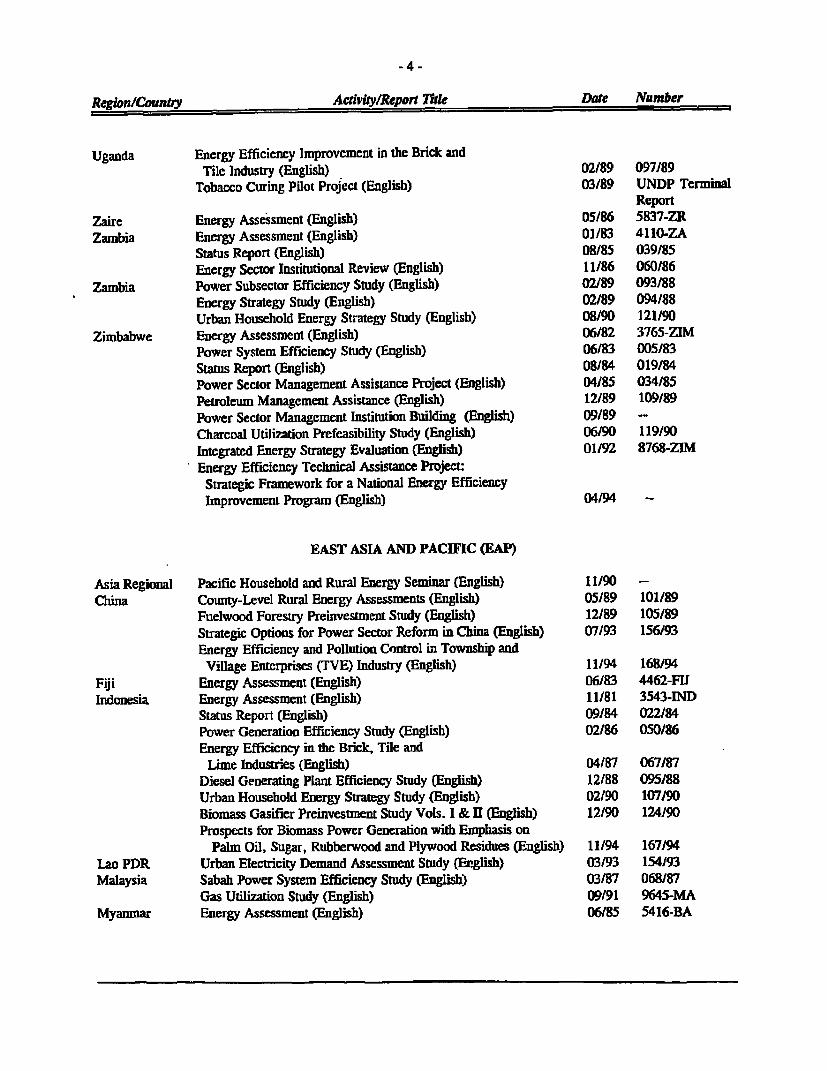
- 4 -
RegionCourutry Activity/Repon Title Date Number
Uganda Energy Efficiency Improvement in the Brick andTile Industry (English) 02/89 097/89
Tobacco Curing Pilot Project (English) 03(89 UNDP TerminalReport
Zaire Energy Assessment (English) 05/86 5837-ZRZambia Energy Assessment (English) 01/83 4110-ZA
Status Report (English) 08/85 039/85Energy Sector Institutional Review (English) 11/86 060/86
Zambia Power Subsector Efficiency Study (English) 02/89 093/88Energy Strategy Study (English) 02/89 094/88Urban Household Energy Strategy Study (English) 08/90 121/90
Zimbabwe Energy Assessment (English) 06/82 3765-ZIMPower System Efficiency Study (English) 06/83 005/83Status Report (English) 08/84 019/84Power Sector Management Assistance Project (English) 04/85 034/85Petroleum Management Assistance (English) 12/89 109/89Power Sector Management Institution Building (English) O/89 --
Charcoal Utilization Prefeasibility Study (English) 06/90 119/90Integrated Energy Strategy Evaluation (English) 01/92 8768-ZIMEnergy Efficiency Technical Assistance Project:
Strategic Framework for a National Energy EfficiencyImprovement Program (English) 04/94
EAST ASIA AND PACIFIC (EAP)
Asia Regional Pacific Household and Rural Energy Seminar (English) 11/90China County-Level Rural Energy Assessments (English) 05/89 101/89
Fuelwood Forestry Preinvesiment Study (English) 12/89 105/89Strategic Options for Power Sector Reform in China (English) 07/93 156/93Energy Efficiency and Pollution Control in Towniship andVillage Enterprises (TVE) Industry (English) 11/94 168/94
Fiji Energy Assessment (English) 06/83 4462-FUIndonesia Energy Assessment (English) 11/81 3543-lND
Status Report (English) 09/84 022/84Power Generation Efficiency Study (English) 02/86 050/86Energy Efficiency in the Brick, Tile and
Lime Industries (English) 04/87 067/87Diesel Generating Plant Efficiency Study English) 12(88 095/88Urban Household Energy Strategy Study (English) 02/90 107/90Biomass Gasifier Preinvestment Study Vols. I & H (English) 12/90 124/90Prospects for Biomass Power Generation with Emphasis on
Palm Oil, Sugar, Rubberwood and Plywood Residues (English) 11194 167194Lao PDR Urban Electricity Demand Assessment Study (English) 03/93 154/93Malaysia Sabah Power System Efficiency Study (English) 03/87 068/87
Gas Utlization Study (English) 09/91 9645-MAMyanmar Energy Assessment (English) 06/85 5416-BA
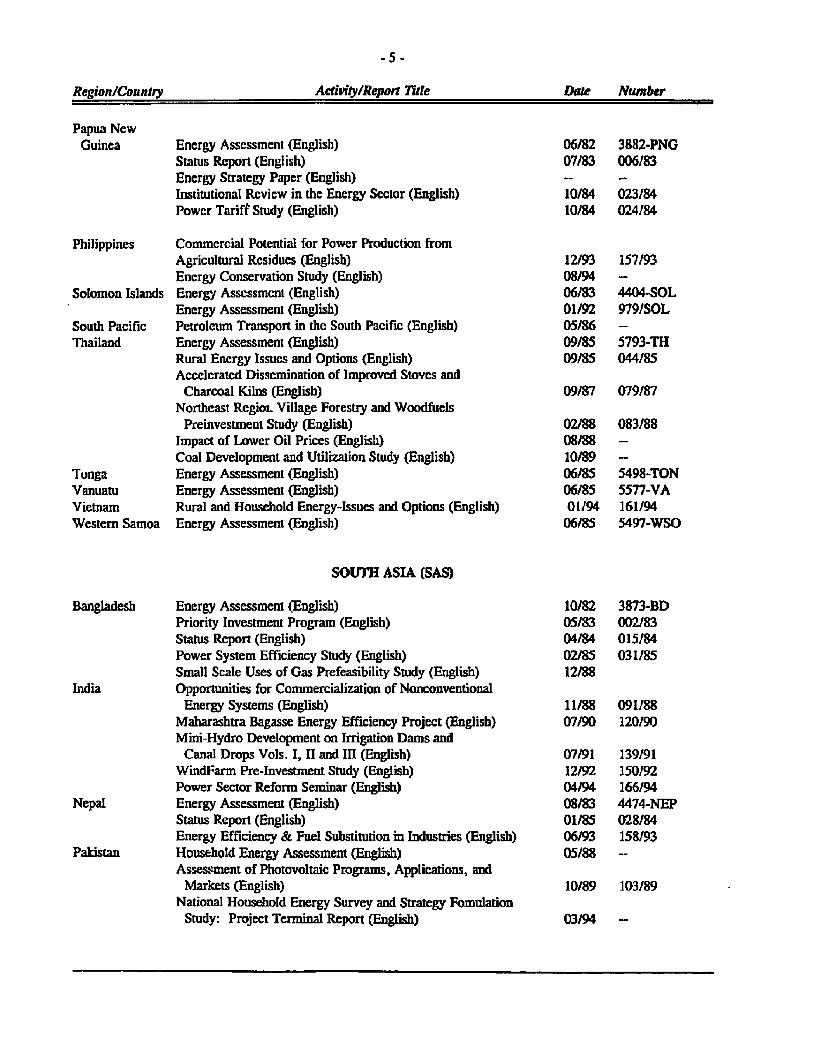
Region/Country Activfty/Report NThe Daze Number
Papua NcwGuinea Energy Assessment (English) 06/82 3882-PNG
Status Report (English) 07/83 006/83Energy Strategy Paper (English)Institutional Revicw in the Energy Seclor (English) 10/84 023184Power Tariff Study (English) 10/84 024/84
Philippines Commercial Potential for Power Production fromAgricultural Residues (English) 12/93 157/93Energy Conservation Study (English) 08/94 --
Solomon Islands Energy Assessment (English) 06/83 4404-SOLEnergy Assessment (English) 01/92 919/SOL
South Pacific Petroletun Transport in the South Pacific (English) 05/86 --Thailand Energy Assessment (English) 09/85 5793-TH
Rural Energy Issues and Options (English) 09/85 044/85Accelerated Dissemination of Improved Stoves and
Charcoal Kilns (English) 09/87 079/87Northeast RegioL Village Forestry and Woodfuels
Preinvestment Study (English) 02/88 083/88Impact of Lower Oil Prices (English) 08/88 -
Coal Development and Utilization Study (English) 10/89 -
Tonga Energy Assessment (English) 06/85 5498-TONVanuatu Energy Assessment (English) 06/85 5577-VAVietnam Rural and Household Energy-Issues and Options (English) 01/94 161/94Westem Samoa Energy Assessment (English) 06/85 5497-WSO
SOUTH ASIA (SAS)
Bangladesh Energy Assessment (English) 10/82 3873-BDPriority Investment Program (English) 05/83 002183Status Report (English) 04/84 015/84Power System Efficiency Study (English) 02/85 031185Small Scale Uses of Gas Prefeasibility Study (English) 12/88
India Opportunities for Commercialization of NonconventionalEnergy Systems (English) 11/88 091188
Maharashtra Bagasse Energy Efficiency Project (English) 07/90 120190Mini-Hydro Development on Irrigation Dams and
Canal Drops Vols. . II and III (English) 07/91 139/91WindFann Pre-lnvestment Study (English) 12/92 150192Power Sector Reform Seminar (English) 04/94 166/94
Nepal Energy Assessment (English) 08/83 4474-NEPStatus Report (English) 01/85 028/84Energy Efficiency & Fuel Substitution in Industries (English) 06/93 158/93
Palistan Household Energy Assessment (English) 05/88 -
Assessment of Photovoltaic Programs, Applications, andMarkets (English) 10/89 103/89
National Household Energy Survey and Strategy FomulationStudy: Project Terminal Report (English) 03/94 -
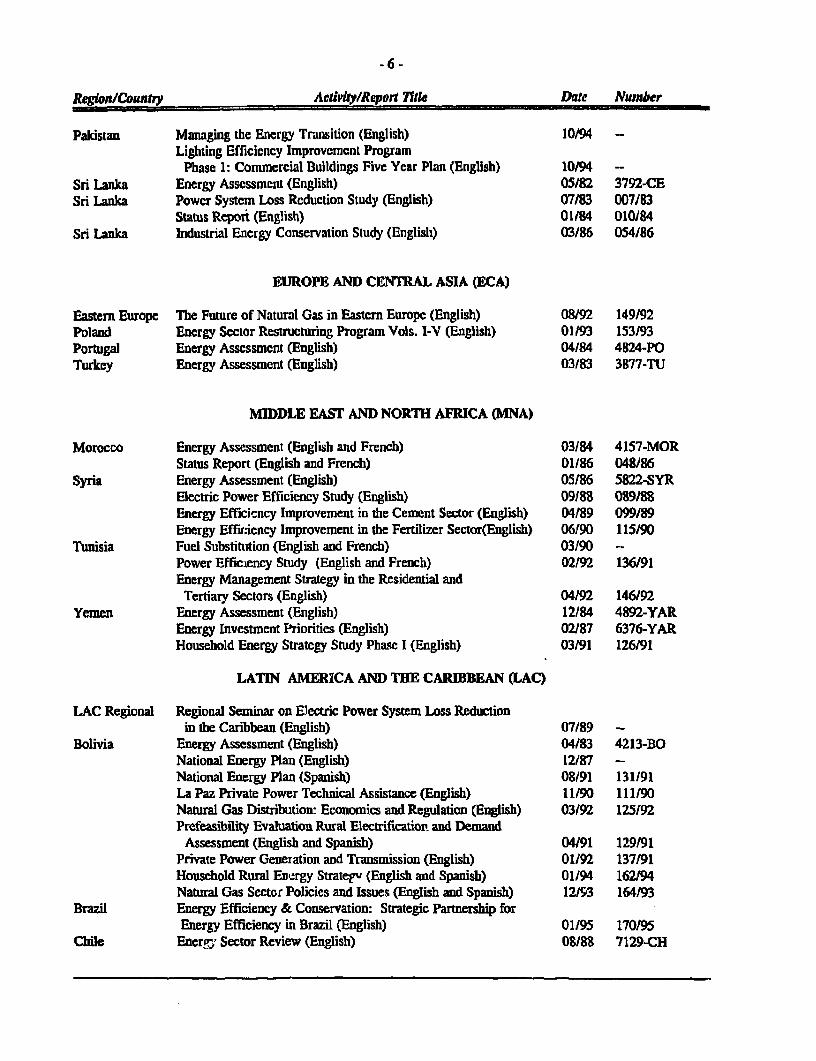
-6 -
Regloa/Country Activity/Report 7Tilc Dan Numnber
Pakistan Managing the Energy Transition (English) 10/94Lighting Efficiency Improvement Program
Phase 1: Commercial Buildings Five Year Plan (English) 10/94 --
Sri Lanka Energy Assessment (English) 05/82 3792-CESri Lanka Powcr System Loss Reduction Study (English) 07/83 007/83
Status Report (English) 01184 010184Sri Lanka industrial Energy Conservation Study (Englisl) 03/86 054/86
EUROPE AND CE NTRAL ASIA (ECA)
Eastern Europe The Future of Natural Gas in Eastern Europc (English) 08/92 149/92Poland Energy Sector Restructuring Program Vols. 1-V (English) 01/93 153/93Portugal Energy Assessment (English) 04/84 4824-POTurkey Energy Assessment (English) 03(83 3877-TU
MIDDLE EAST AND NORTH AFRICA (MNA)
Morocco Energy Assessment (English and French) 03184 4157-MORStatus Report (English and French) 01/86 048/86
Syria Energy Assessment (English) 05186 5822-SYRElectric Power Efficiency Study (English) 09188 089188Energy Efficiency Improvement in the Cement Sector (English) 04189 099/89Energy Efficiency Improvement in the Fertilizer Sector(English) 06190 115/90
Tunisia Fuel Substitution (English and French) 03/90 -
Power Effic:iency Study (English and French) 02/92 136/91Energy Management Strategy in the Residential andTertiary Sectors (English) 04/92 146/92
Yemen Energy Assessment (English) 12184 4892-YAREnergy Investment Priorities (English) 02187 6376-YARHousehold Energy Strategy Study Phase I (English) 03/91 126/91
LATIN AMERICA AND TEHE CARIBBEAN (LAC)
LAC Regional Regional Seminar on Electric Power System Loss Reductionin the Caribbean (English) 07(89 -
Bolivia Energy Assessment (English) 04/83 4213-BONational Energy Plan (English) 12/87 -
National Energy Plan (Spanish) 08/91 131191La Paz Private Power Technical Assistance (English) 11/90 111/90Natural Gas Distnbution: Economics and Regulation (English) 03(92 125192Prefeasibility Evaluation Rural Electrificatior and Demand
Assessment (English and Spanish) 04(91 129191Private Power Generation and Transmission (English) 01/92 137191Household Rural Energy Stratepv (English and Spanish) 01/94 162194Natural Gas Sector Policies and Issues (English and Spanish) 12/93 164/93
Brazil Energy Efficiency & Conservation: Strategic Partnership forEnergy Efficiency in Brazil (English) 01/95 170/95
Chile Enerry Sector Review (English) 08/88 7129-CH
-7-
Region/Counyr hAkvvly/Reporn TYhic Date Number
Colombin Energy Strategy Paper (English) 12(86 --Power Scclor Restruclturing (English) 1 1/94 169/94
Cosia Ricn Energy Assessmcnt (English nnd Spanish) 01/84 4655-CRRecommcnded Tcchnical Assistance Projects (English) 11/84 027/84
Costa Rica Forcst Rcsiducs Utilization Study (English and Spanish) 02/90 108/90DominicanRcpublic Energy Asscssment (English) 05/91 8234-DO
Ecuador Energy Assessment (Spanish) 12/85 5865-ECEncrgy Strategy Phasc I (Spanish) 07/88 --
Ecuador Encrgy Stratcgy (English) 04/91 --
Private Minihydropower Development Study (English) 11/92Encrgy Pricing Subsidics and Interfucl Substitution (English) 08/94 1 1798-ECEnergy Pricing, Povcrty and Social Mitigation (English) 08/94 12831-EC
Guatemala Issues and Options in the Encrgy Sector (English) 09/93 12160-GUHaiti Energy Assessment (English and Frcnch) 06/82 3672-HA
Status Rcport (English and Frcnch) 08/85 041185Haiti Houschold Encty Strategy (English and French) 12/91 143/91Honduras Energy Asscssmcn (English) 08/87 6476-HO
Petrolcum Supply Management (English) 03/91 128/91Jamaica Encrgy Asscssment (English) 04/85 5466-JM
Pctrolcum Procuremcnt, Refining, andDistribution Study (English) 11/86 061/86
Encrgy Efficiency Building Codc Phasc I (English) 03/88 --Energy Efficiency Standards and
Labels Phase I (English) 03/88 --
Management Information System Phase I (English) 03/88 --
Charcoal Production Project (English) 09/88 090/88FIDCO Sawmill Residues Ulilization Study (English) 09/88 088/88Energy Sector Strategy and Investment Planning Study (English) 07/92 135/92
Mexico Improved Charcoal Production Within Forest Management for 08/91 138/91the State of Veracruz (English and Spanish)
Panama Power System Efficiency Study (English) 06/83 004/83Paraguay Energy Assessment (English) 10/84 5145-PA
Recommended Technical Assistance Projects (English) 09/85 --Status Report (English and Spanish) 09/85 043/85
Peru Energy Assessment (baglish) 01/84 4677-PEStatus Report (English) 08/85 040/85Proposal for a Stove Dissemination Program in
the Sierra (English and Spanish) 02/87 064/87Energy Strategy (English and Spanish) 12/90 --Study of Energy Taxation and Liberalization
of the Hydrocarbons Sector (English and Spanish) 120193 159/93Saint Lucia Energy Assessment (English) 09184 5111-SLU
St. Vincent andthe Grenadines Energy Assessment (English) 09/84 5103-STV
Trinidad andTobago Energy Assessment (English) 12/85 593D-TR

-8-
Region/Country Acdvity/Report Tile Date Number
GLOBAL
Encrgy End Usc Efricicncy: Research and Strategy (English) 11/89Guidelines for Utility Customcr Management and
Mctcring (English and Spanish) 07/91 --
Women and Energy--A Resource GuideThe International Network: Policies and Experience (English) 04/90 --
Assessment of Personal Computer Models for EnergyPlanning in Developing Countries (English) 10/91 --
Long-Term Gas Contracts Principles and Applications (English) 02/93 152/93Comparative Behavior of Firms Under Public and Private
Ownership (English) 05/93 155/93Development of Rcgional Electric Power Networks (English) 10/94Roundtable on Energy Efficiency (English) 02/95 171195
03/09/95
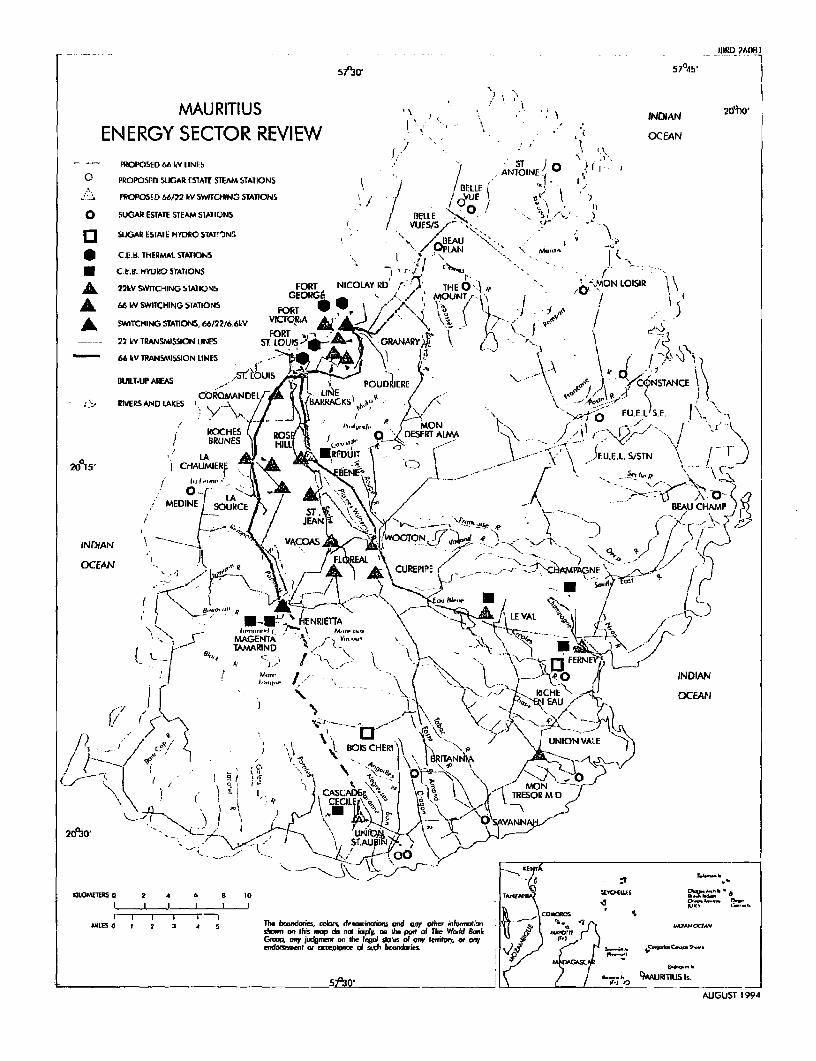
_ iIDRD 7,01H I
57030 ~~~~~ ~ ~~~~~~~~57045I1}.'
MAURITIUS ! I INDIAN 2?dt0'
ENERGY SECTOR REVIEW OCEAN
- -- PROPOSED 66 IV LINES ANIOIJE °
O PROPOSFD SLGAR fSTATE STEAM STATIONS I } /BL,|.
;l_.~ PROPOSED 66n2 V SWirciwNG STATIONS VUE \
0 SUGAR ESTATE STEAM STATIONS / B /I ULESfS a SUGAR ESTATE HYDRO STAT'INS. , F, ,
o C.L ::. THERMAL STATIONS N / ! -
C.E.B. HfoRO STATIONS / EAU .
A 227V SWlTCHING STATIONS FORT NICOLAY RD , THE MON LOISIRGEORGE' _ ,,/ 0' &ON,L{8 s2
A 66 IW SWITCHING 5TATIONS FORT tO T I /A F~~~~~VCORTAA ~
AL SWITCHING STATIONS,b/. \-. |f
------- 22 kV TRANSMISSION UNES ST tOuIs20-;Ar GRANARY \66kV TRANSMISSION LINES * G ¶ N \ R
BUILT-UP AREAS ,• UNS S! POUDTIERE \ ,c \QANSTANCECOROMANDEL ~~LINE PODR
,:, RIVERSAND LAKES I BARRACKS' 10-|
ROCH-ES RT ALI . MO A~ ~ I~ BRUNES EQ 0 DESERTA
0 LA H~~~~~~~~~~~~~ILL ~RFUT -\~'
2015' CHAUMIERE - C ¼,) r \ _JFE. /
MEDINE P~~~~~NE1z1^eLA - a } \°)/ " t - g, MEDINE L SOURCE ST BEAU.C- M P
INDIAN - - VACOAS TON4V4Ia C>
OCEAN CURE P, EA ,) IPE _
- fN / -- |4o^, fJ > ~ffiu hiruI* - ' - t_
j0.,uo[t-l' b E K5 INZIEllA tLE VAL @ |
1¶.tZANwEt,~~~~~~~~~~~~~~~~ NDA
i --R\, C MAGENTAS \jL C> x v.n tC\a~~~~~- \ v. TAMRIN "¶7 - _;t-'t> =\~zFERNEYi
C ./- SMr; LI 6'- * '~ ( ' I .-- 4O 1 INDIAN
,;j , ?z 1<,,, RI,CH> OCEAtN
I j 5 'NA { BOIS CHERI"1
ob ,- Al, 0,-v ,1,..~~~~~CAScMAB\\.TRESOR M
20"W~~~~~~~~~~~~~~~~~~'2d030' - I " TUBN , \ \s
-A t ' S
IOIDMfETrSio 2 * 6 BG 10 DCEK r
hALES 0 I 2 r *i 5 The boundorie coors, dench,cias andi any odinlDmx;kmtŽn q*s on oitis rop do not imply, 'he prt ol the Wodd Bnk morGmwp, on judg.m. on fhe Il doru of any teffiorf, or eny ta endorsermeeal or MI!om 1Z oclisvo,seM tepar c Dn ofonl such boundaries. . V, ,, ;
57a30 _ \ g / - -ST E~~~~~~~%ARITIUS h.
AUGUST I 994

ESMAPc/o Industry and Energy DepartmentThe World Bank1818 H Street, N. W.Washington, D. C. 20433U. S. A.