employee buyouts: causes, structure, and consequences1
TRANSCRIPT
*Corresponding author: Tel.: 804/924-4810; fax: 804/243-7676; email: [email protected].
1The authors appreciate the helpful comments received from Edward Rice (the referee), CliffordSmith (the editor), Tom George, N.R. Prahbala, Greg Roth, Anil Shivdasani, Neil Sicherman, LuigiZingales, the seminar participants at Harvard University, Michigan State University, the Universi-ties of Georgia, Pittsburgh, and South Carolina, the 1994 Financial Management AssociationMeeting, the 1994 Western Finance Association Meeting, the research assistance of Rohan Christie-David, Andy Saporoschenko, Tom Smythe, and Cynthia McDonald.
Journal of Financial Economics 48 (1998) 283—332
Employee buyouts:causes, structure, and consequences1
Susan Chaplinsky!,*, Greg Niehaus", Linda Van de Gucht#! Colgate Darden Graduate School of Business Administration, University of Virginia, Charlottesville,
VA 22906, USA" The Darla Moore School of Business, The University of South Carolina, Columbia, SC 29208, USA
# Department of Applied Economics, Catholic University Leuven, 3000 Leuven, Belgium
Received 7 December 1994; received in revised form 25 August 1997
Abstract
This paper investigates the motivations for and consequences of including a broadgroup of employees in leveraged buyouts by comparing employee buyouts (EBOs) totransactions where only top level managers participate, or management buyouts(MBOs). We examine the implications of including employees in a buyout from a laborcontracting, financing, and management control point of view. A major finding is thatemployee participation helps to finance the buyout. The EBO allows firms to gain accessto excess pension assets by converting employees’ defined benefit pension capital intoequity claims, thus freeing the excess assets in the pension plan to help fund the buyout.Also, employee participation substitutes equity claims for cash labor compensation costsand therefore allows the firm to borrow more than otherwise would be possible. There isalso evidence consistent with managers including employees to maintain or enhanceincumbent management’s control. ( 1998 Elsevier Science S.A. All rights reserved.
JEL classification: G34
Keywords: ESOP; LBO; Employee ownership; Labor contracts
0304-405X/98/$19.00 ( 1998 Elsevier Science S.A. All rights reservedPII S 0 3 0 4 - 4 0 5 X ( 9 8 ) 0 0 0 1 3 - 0
2For literature on MBOs, see, DeAngelo et al. (1984), DeAngelo and DeAngelo (1987), Lehn andPoulsen (1989), Hite and Vetsuypens (1989), Kaplan (1989a,b), and Palepu (1990).
1. Introduction
During the 1980s, a small number of U.S. corporations went private by sellinga large part of the firm’s equity to a broad group of employees through anemployee stock ownership plan (ESOP). Because employee buyouts (EBOs)result in a large increase in employee ownership, these transactions present anopportunity to examine the implications of making employees residual claim-ants in their firm. Despite a number of studies examining going private transac-tions, systematic evidence on the factors that motivate employee participation inbuyouts remains unexplored.2 In this paper, we examine and provide evidenceon a number of hypotheses concerning the costs and benefits of employeeownership. We focus, in particular, on the circumstances that lead employees toparticipate in a buyout, and on the consequences of their participation for thestructure and decisions of the post-buyout firm.
One approach to investigating why a broad group of employees participate ina buyout is to examine the issue from the perspective of an optimal laborcontract. Cash flow rights can improve employee incentives (see, Alchian andDemsetz, 1972). These rights can also mitigate asymmetric information prob-lems when negotiating labor contracts (Ben-Ner and Jun, 1996; Kovenock andSparks, 1990). In addition, employee control rights can help protect employees’firm-specific capital (see, e.g., Klein et al., 1978; Williamson, 1979). However,a related cost of employee ownership is inefficient risk-sharing.
An alternative, but not mutually exclusive perspective, from which to examineemployee participation is that of corporate finance. For example, leveragedESOPs can provide a tax-advantaged source of funds (Beatty, 1995). Anotherfinancing benefit of including employees in buyout transactions occurs if theshares received by employees substitute for ongoing cash compensation com-mitments to pay wages or retirement plan contributions. In this case, part of thefirm’s existing operating commitments to labor costs are reduced in the post-buyout firm, and these funds become available to service the interest paymentson the buyout debt. This substitution lowers leverage-related costs and allowsEBO firms to borrow more than otherwise would be possible (Stewart, 1991).A potential cost of raising funds through an ESOP, however, is the presence ofa new claimant group — employees — whose interests can conflict with those ofother capital providers (Jensen and Meckling, 1979).
A third perspective from which we examine employee participation is that ofmanagerial control. In particular, we examine whether employees are includedbecause the ESOP helps incumbent management to maintain or enhance theircontrol (see, e.g., Stulz, 1988; Gordon and Pound, 1990; Chang, 1990; Chang and
284 S. Chaplinsky et al./Journal of Financial Economics 48 (1998) 283—332

Mayers, 1992; and Chaplinsky and Niehaus, 1994). This motivation does notexclude other perspectives. Indeed, if there are financing or labor contractadvantages to including employees in a buyout, then doing so will also helpmanagers maintain control. On the other hand, due to potential wealth trans-fers, the inclusion of employees in the buyout transaction could enhance mana-gerial control even when there are no net financing or labor contractingadvantages.
We compare EBOs to buyout transactions in which the only employeesparticipating are top-level managers, or management buyouts (MBOs). Thisapproach controls for the other organizational changes that are associated withemployee buyout transactions, such as the increase in leverage and managementownership, and the change to private ownership.
Our findings suggest that all three perspectives are relevant to understandingwhy employees participate in buyouts. Consistent with the optimal labor con-tract perspective, there is evidence suggesting that employee incentives, firm-specific capital, and risk-bearing are important considerations. For example, allof the consulting firms in our buyout sample include employees as equityparticipants, which is consistent with employee ownership being more likelywhen employee effort is difficult to monitor. EBO firms are more likely thanMBO firms to have excess pension assets, which is consistent with employees ofEBO firms having more firm-specific capital that is subject to appropriation.And consistent with risk-sharing considerations, employee participation is morelikely in firms where the ownership can be spread more diffusely across em-ployees, such as in firms with relatively low values of assets per employee.
Consistent with optimal financing policy, we find that tax avoidance isa strong motivation for including employees for a few firms, but not for themajority. Motivations related to financing considerations, nevertheless, appearimportant. As mentioned above, EBO firms are more likely to have excesspension assets in defined benefit pension plans than MBO firms. Almost always,EBO firms with excess pension assets undertake an excess asset reversion at thetime of the buyout. The excess pension assets materially reduce the amount ofoutside debt financing that is needed for the buyout. The existing literature oftenassociates the termination of pension plans with the appropriation of employees’firm-specific pension capital (see, e.g., Pontiff et al., 1990; Ippolito and James,1992). An alternative interpretation, which is consistent with the structure ofEBO transactions, is that the EBO converts employees’ defined benefit pensioncapital into equity claims, which frees the excess cash assets in the pension planto help finance the buyout.
Also consistent with the financing perspective is the evidence that EBO firmshave significantly lower pre-buyout stock price performance, indicating lowerfuture expected cash flows, and lower pre-buyout financial leverage, suggestinghigher leverage-related costs, than MBO firms. These findings suggest that EBOfirms are more likely to be constrained in their ability to raise outside capital. By
S. Chaplinsky et al./Journal of Financial Economics 48 (1998) 283—332 285

substituting equity claims for cash compensation, EBO firms increase theirability to support the debt needed to fund the buyout. In addition, a number ofEBOs take place in industries that are under competitive pressure to lower laborcosts, such as the textile, steel, and automobile industries. Consistent with theasymmetric information argument, employee ownership appears to be beneficialin obtaining concessions from employees. These concessions, in turn, enhancethe firm’s ability to borrow.
Some of the above findings, as well as additional results, are also consistentwith the hypothesis that EBOs are used by managers to maintain or enhancetheir control. Relative to MBO firms, EBO firms are more frequently undertakeover pressure, and their poorer prior performance suggests managers ofEBO firms would be concerned about losing their jobs. In addition, managers ofEBO firms tend to have lower pre-buyout ownership than managers of MBOfirms, suggesting that EBO managers have less ability to defend against a take-over bid. Finally, the evidence on post-buyout ownership indicates that EBOmanagers typically have greater control in the post-buyout firm than MBOmanagers, owing to the lack of third-party equity participation in EBOs and thefailure of employees to gain significant control rights early in the buyout.Typically employees do not control the voting of unallocated ESOP shares, andthey rarely receive board representation. While these findings are consistentwith EBOs being used to enhance managerial control, the general lack ofemployee control rights and the low level of third-party equity participation arealso consistent with EBOs being structured to minimize potential conflictsamong the providers of the buyout capital.
The paper proceeds as follows. In the next Section, we describe our sample ofEBOs and MBOs and describe the institutional features of employee buyouts. InSection 3, we discuss the hypotheses concerning the benefits and costs ofemployee participation in buyouts. The evidence presented in Section 4 isdivided into three parts: (1) evidence on the pre-buyout characteristics of firmsundertaking EBOs versus MBOs, (2) evidence on the financial and ownershipstructure of EBO firms, and (3) evidence on the post-buyout asset sales andemployment growth. We end with a short summary and our interpretation ofthe evidence.
2. Design of the study and sample descriptions
Because of the large increase in employee ownership occurring at the time ofthe transaction, employee buyouts provide an opportunity to examine the costsand benefits of employee ownership. To control for the other organizationalchanges occurring simultaneously with the increase in employee ownership (theincrease in managerial ownership and leverage associated with going-privatetransactions), we compare EBO transactions to management buyouts without
286 S. Chaplinsky et al./Journal of Financial Economics 48 (1998) 283—332
3As a result of our focus on publicly held companies, the sample does not contain somewell-known buyouts, including Avis, Inc., Simmons, Inc., and Burlington Industries. Buyouts werealso attempted by employees but did not ensue in a number of cases, including Alaska Airlines,Eastern Airlines, Frontier Airlines, Pan American Airlines, Peoples Express, and Scott and Fetzer.
broad employee participation or MBOs. Thus, the analysis focuses on theprimary distinction between EBOs and MBOs, which is the breadth of employeeownership.
Generally speaking EBOs involve more broad based employee participationthan MBOs, although the breadth of employee participation varies in bothtypes of transactions. Some MBOs can involve a very large management buyoutgroup. For example, the MBO of CS-First Boston included 290 managers in thebuyout group. Conversely, employee participation in EBOs may be limited toa subset of employees, such as those EBOs that include only salaried workers asequity participants.
2.1. EBO sample
We search the Wall Street Journal Index, the NEXIS database, and a list ofleveraged ESOP transactions supplied by the National Center for EmployeeOwnership (NCEO) to identify publicly held firms during 1980—1990 that eithersuccessfully go private while giving non-managerial employees equity stakes inthe post-buyout firm through an ESOP, or divest assets to a newly formedprivate firm in which non-managerial employees have an equity stake throughan ESOP. The former type of transaction is referred to as a full EBO and thelatter as a spinoff EBO.
To be included in the sample, a transaction must satisfy each of the followingconditions. First, the post-buyout firm must not be publicly traded. Second, thebuyout announcement must appear in the Wall Street Journal Index or NEXIS.Third, we can obtain a Securities and Exchange Commission (SEC) filingdescribing the transaction, such as a proxy statement, a Schedule 13E-3, or 8-Kfiling.
We gather information on each EBO from SEC filings and collect pre- andpost-transaction information from the Wall Street Journal, NEXIS, and publi-cations included in ABI Proquest. Other financial data are taken from Compus-tat and the Center for Research in Security Prices (CRSP). There are 18 fullEBOs and 14 spinoff EBOs satisfying these conditions. The name, transactionsize, as measured by the market value of repurchased securities, and the generalindustry affiliation of each EBO is listed in Table 1. A brief case description ofeach full EBO appears in Appendix A.3
In all of the EBOs, employees receive their equity stakes through ESOPs,which are defined contribution pension plans with two unique features. First, at
S. Chaplinsky et al./Journal of Financial Economics 48 (1998) 283—332 287
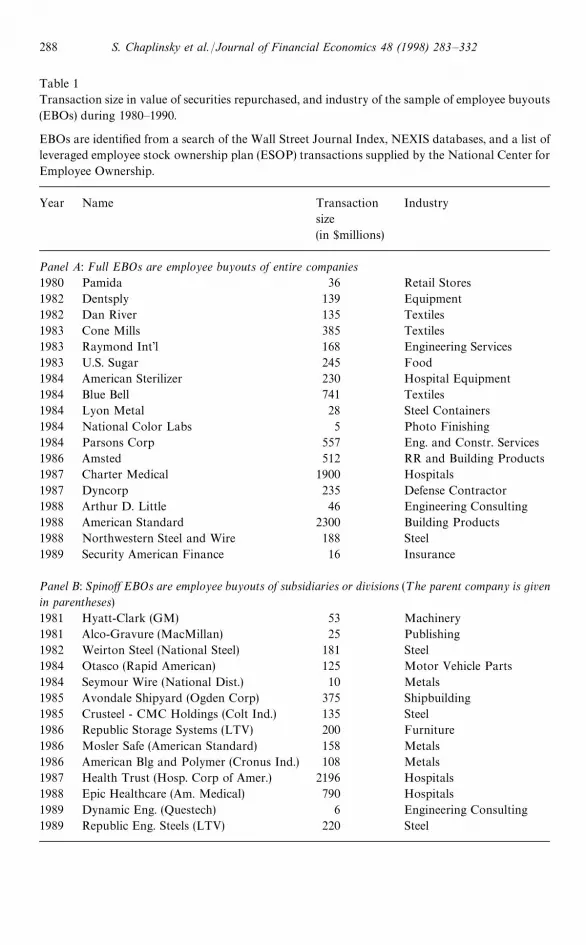
Table 1Transaction size in value of securities repurchased, and industry of the sample of employee buyouts(EBOs) during 1980—1990.
EBOs are identified from a search of the Wall Street Journal Index, NEXIS databases, and a list ofleveraged employee stock ownership plan (ESOP) transactions supplied by the National Center forEmployee Ownership.
Year Name Transactionsize(in $millions)
Industry
Panel A: Full EBOs are employee buyouts of entire companies1980 Pamida 36 Retail Stores1982 Dentsply 139 Equipment1982 Dan River 135 Textiles1983 Cone Mills 385 Textiles1983 Raymond Int’l 168 Engineering Services1983 U.S. Sugar 245 Food1984 American Sterilizer 230 Hospital Equipment1984 Blue Bell 741 Textiles1984 Lyon Metal 28 Steel Containers1984 National Color Labs 5 Photo Finishing1984 Parsons Corp 557 Eng. and Constr. Services1986 Amsted 512 RR and Building Products1987 Charter Medical 1900 Hospitals1987 Dyncorp 235 Defense Contractor1988 Arthur D. Little 46 Engineering Consulting1988 American Standard 2300 Building Products1988 Northwestern Steel and Wire 188 Steel1989 Security American Finance 16 Insurance
Panel B: Spinoff EBOs are employee buyouts of subsidiaries or divisions (¹he parent company is givenin parentheses)1981 Hyatt-Clark (GM) 53 Machinery1981 Alco-Gravure (MacMillan) 25 Publishing1982 Weirton Steel (National Steel) 181 Steel1984 Otasco (Rapid American) 125 Motor Vehicle Parts1984 Seymour Wire (National Dist.) 10 Metals1985 Avondale Shipyard (Ogden Corp) 375 Shipbuilding1985 Crusteel - CMC Holdings (Colt Ind.) 135 Steel1986 Republic Storage Systems (LTV) 200 Furniture1986 Mosler Safe (American Standard) 158 Metals1986 American Blg and Polymer (Cronus Ind.) 108 Metals1987 Health Trust (Hosp. Corp of Amer.) 2196 Hospitals1988 Epic Healthcare (Am. Medical) 790 Hospitals1989 Dynamic Eng. (Questech) 6 Engineering Consulting1989 Republic Eng. Steels (LTV) 220 Steel
288 S. Chaplinsky et al./Journal of Financial Economics 48 (1998) 283—332
least 50% of an ESOP’s assets must be invested in the equity securities of thesponsoring plan. Second, the ESOP can borrow funds for the purpose ofpurchasing the employer’s securities. In our sample, all of the firms use leveragedESOPs, with the exception of Cone Mills.
In a typical EBO, the ESOP trust borrows funds that are then transferred tothe buyout firm in exchange for equity claims. The funds from the ESOP loan,along with other equity and debt funds, are then used to repurchase the firm’sexisting equity securities, converting all publicly held shares to privately heldshares. Contrary to what the term ‘employee buyout’ may suggest, in mostinstances the ESOP does not become the sole equity holder. Managers typicallyobtain ownership claims outside of the ESOP and in some cases, investmentbanks, and other institutional investors receive equity stakes.
The firm usually guarantees the ESOP loan by committing to make thecontributions to the ESOP necessary to service the loan. As the ESOP loan ispaid off, shares are allocated to employees’ individual accounts, usually inproportion to their compensation. Since the ESOP loan is nominally repaidfrom the firm’s cash flows, it may appear that employees receive shares withoutcontributing capital for the buyout. However, employees often contribute capi-tal indirectly, by foregoing some other form of compensation (Chaplinsky andNiehaus, 1990). We document the types of compensation changes that occur infull EBOs in Appendix A, and the types of compensation changes that occur inspinoff EBOs in Appendix B. As noted there, compensation changes occurringat the time of the EBO range from work-rule changes to large reductions in cashwages. For most firms in our sample, however, employees contribute capital byaccepting the elimination of, or reductions in, existing deferred compensationplans. From an economic perspective, employees pay a fair price for their ESOPshares if the present value of employee compensation concessions, which repres-ents the capital contributed by employees, is equal to the value of the ESOPshares. The complex nature of the compensation exchanges and the lack ofdetailed reporting often prevents assessment of whether the price paid byemployees is equal to the value of their ESOP shares.
Employees cannot remove the shares allocated to their ESOP accounts untiltheir service with the firm ends. Private firms, like EBO firms, must offer torepurchase retirees’ stock at a price determined by an independent valuation. Inthis way, retirees can cash out and diversify. In addition, employees who havereached the age of 55 or have achieved 10 years of service, whichever is later, canrequire that the assets in their ESOP account be diversified (Scholes andWolfson, 1990). However, assuming the inability of employees to use ESOPshares as collateral, the illiquidity of ESOP shares can impose costs on em-ployees without other resources or savings to cover expenses that may occurover time.
Conceivably, EBOs could take place without an ESOP. Employees could allagree individually to borrow on their personal accounts the funds needed to
S. Chaplinsky et al./Journal of Financial Economics 48 (1998) 283—332 289

purchase a large stake in the firm. The leveraged ESOP, however, providesseveral advantages, one being tax benefits (see later sections and Beatty, 1995).In addition, the ESOP mechanism is likely to reduce transaction costs andexpected default costs. Finally, assuming there is an advantage to havingemployees as a group own a large stake, an ESOP enhances cooperativebehavior among employees by restricting their ability to sell shares to non-employee investors.
2.2. Comparison sample of MBOs
For comparison purposes, a sample of MBOs completed during the 1980sis collected from information obtained from Securities Data Corporationand the IDD Mergers and Acquisition database. To be included in the MBOsample, a buyout announcement must appear in the Wall Street JournalIndex or NEXIS, and top level management must take a stake in the post-buyout equity. The full MBO and parent firms of spinoff MBOs must beincluded in CRSP. The MBO sample consists of 118 full MBO and 64 spinoffMBOs.
The industry concentration of EBOs (see Table 1) indicates that three of the18 full EBO firms and one of the spinoff EBO firms are in the engineeringconsulting business, and have the Standard Industrial Classification (SIC) codeof 87. However, none of the MBOs is in the consulting business. On the otherhand, every two-digit SIC code with more than four full MBOs also has at leastone EBO. Both EBOs and MBOs occur with some frequency in the steel andtextile industries. Eight EBOs and seven full MBOs are in the steel industry (SICcodes "33, 34), and three EBOs and seven full MBOs are in the textile industry(SIC codes "22, 23, 24). The latter findings suggest that employee participationis not determined solely by industry factors.
Table 2 provides summary statistics on the size of EBO and MBO transac-tions as measured by the market value of repurchased securities. Full EBOsrange in size from $5 million to $2.3 billion, and have a median value $209million. Full MBOs range in size from $5 million to $3.7 billion, and havea median value of $172 million. Although smaller, the median size of MBOtransactions is not statistically different from EBOs. Spinoff EBOs range from$6 million to $2.2 billion, with a median of $147 million. The median spinoffMBO transaction is $205 million, which is not statistically different from that ofspinoff EBOs.
Table 3 investigates the market-adjusted returns surrounding the announce-ments of EBOs and MBOs. Market-adjusted returns are computed for each dayt as the firm’s stock return minus the return on the CRSP equal weighted index.The median three-day market-adjusted return from the day before the buyoutannouncement through day one following the announcement is 13.3% for fullEBOs. This is similar to the 11.5% return that Chang (1990) reports for his
290 S. Chaplinsky et al./Journal of Financial Economics 48 (1998) 283—332
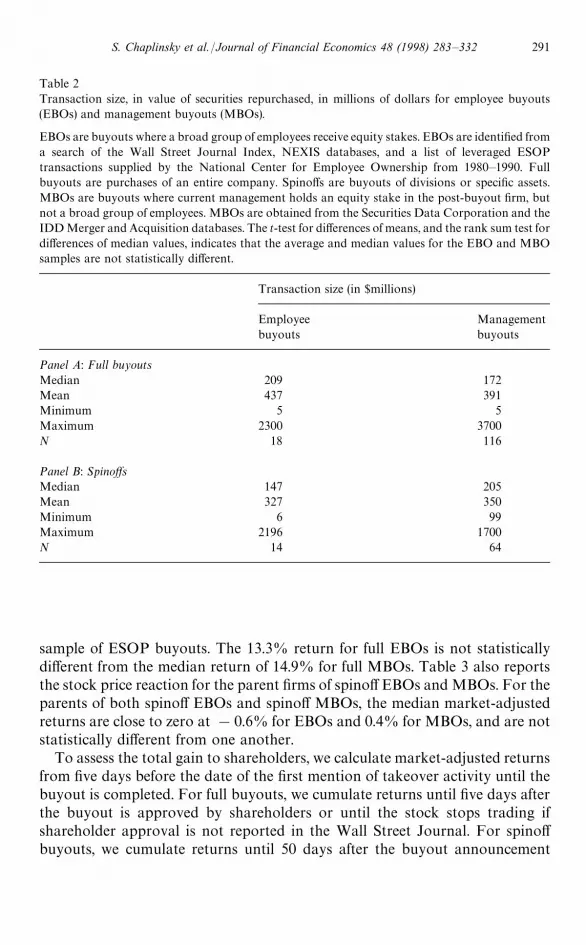
Table 2Transaction size, in value of securities repurchased, in millions of dollars for employee buyouts(EBOs) and management buyouts (MBOs).
EBOs are buyouts where a broad group of employees receive equity stakes. EBOs are identified froma search of the Wall Street Journal Index, NEXIS databases, and a list of leveraged ESOPtransactions supplied by the National Center for Employee Ownership from 1980—1990. Fullbuyouts are purchases of an entire company. Spinoffs are buyouts of divisions or specific assets.MBOs are buyouts where current management holds an equity stake in the post-buyout firm, butnot a broad group of employees. MBOs are obtained from the Securities Data Corporation and theIDD Merger and Acquisition databases. The t-test for differences of means, and the rank sum test fordifferences of median values, indicates that the average and median values for the EBO and MBOsamples are not statistically different.
Transaction size (in $millions)
Employeebuyouts
Managementbuyouts
Panel A: Full buyoutsMedian 209 172Mean 437 391Minimum 5 5Maximum 2300 3700N 18 116
Panel B: SpinoffsMedian 147 205Mean 327 350Minimum 6 99Maximum 2196 1700N 14 64
sample of ESOP buyouts. The 13.3% return for full EBOs is not statisticallydifferent from the median return of 14.9% for full MBOs. Table 3 also reportsthe stock price reaction for the parent firms of spinoff EBOs and MBOs. For theparents of both spinoff EBOs and spinoff MBOs, the median market-adjustedreturns are close to zero at !0.6% for EBOs and 0.4% for MBOs, and are notstatistically different from one another.
To assess the total gain to shareholders, we calculate market-adjusted returnsfrom five days before the date of the first mention of takeover activity until thebuyout is completed. For full buyouts, we cumulate returns until five days afterthe buyout is approved by shareholders or until the stock stops trading ifshareholder approval is not reported in the Wall Street Journal. For spinoffbuyouts, we cumulate returns until 50 days after the buyout announcement
S. Chaplinsky et al./Journal of Financial Economics 48 (1998) 283—332 291
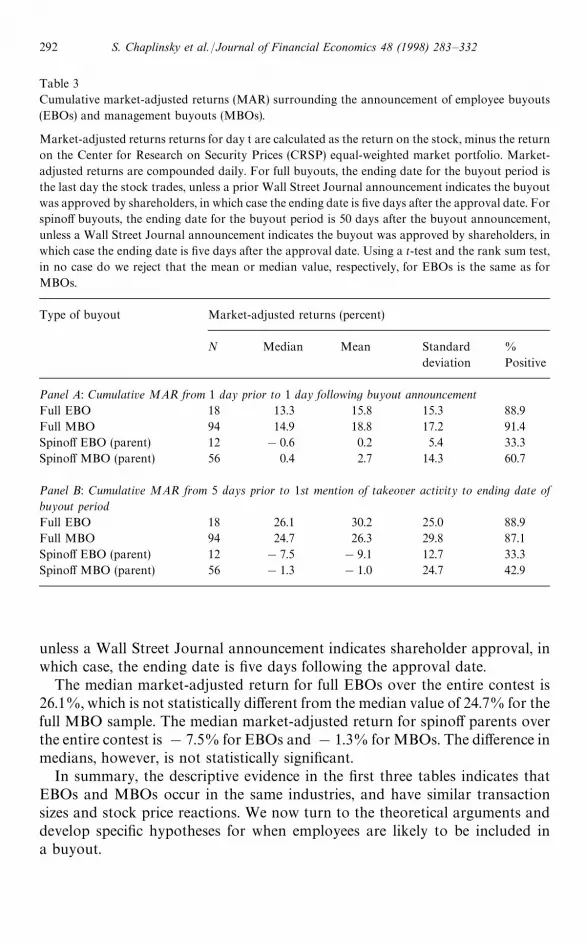
Table 3Cumulative market-adjusted returns (MAR) surrounding the announcement of employee buyouts(EBOs) and management buyouts (MBOs).
Market-adjusted returns returns for day t are calculated as the return on the stock, minus the returnon the Center for Research on Security Prices (CRSP) equal-weighted market portfolio. Market-adjusted returns are compounded daily. For full buyouts, the ending date for the buyout period isthe last day the stock trades, unless a prior Wall Street Journal announcement indicates the buyoutwas approved by shareholders, in which case the ending date is five days after the approval date. Forspinoff buyouts, the ending date for the buyout period is 50 days after the buyout announcement,unless a Wall Street Journal announcement indicates the buyout was approved by shareholders, inwhich case the ending date is five days after the approval date. Using a t-test and the rank sum test,in no case do we reject that the mean or median value, respectively, for EBOs is the same as forMBOs.
Type of buyout Market-adjusted returns (percent)
N Median Mean Standarddeviation
%Positive
Panel A: Cumulative MAR from 1 day prior to 1 day following buyout announcementFull EBO 18 13.3 15.8 15.3 88.9Full MBO 94 14.9 18.8 17.2 91.4Spinoff EBO (parent) 12 !0.6 0.2 5.4 33.3Spinoff MBO (parent) 56 0.4 2.7 14.3 60.7
Panel B: Cumulative MAR from 5 days prior to 1st mention of takeover activity to ending date ofbuyout periodFull EBO 18 26.1 30.2 25.0 88.9Full MBO 94 24.7 26.3 29.8 87.1Spinoff EBO (parent) 12 !7.5 !9.1 12.7 33.3Spinoff MBO (parent) 56 !1.3 !1.0 24.7 42.9
unless a Wall Street Journal announcement indicates shareholder approval, inwhich case, the ending date is five days following the approval date.
The median market-adjusted return for full EBOs over the entire contest is26.1%, which is not statistically different from the median value of 24.7% for thefull MBO sample. The median market-adjusted return for spinoff parents overthe entire contest is !7.5% for EBOs and !1.3% for MBOs. The difference inmedians, however, is not statistically significant.
In summary, the descriptive evidence in the first three tables indicates thatEBOs and MBOs occur in the same industries, and have similar transactionsizes and stock price reactions. We now turn to the theoretical arguments anddevelop specific hypotheses for when employees are likely to be included ina buyout.
292 S. Chaplinsky et al./Journal of Financial Economics 48 (1998) 283—332

4While some authors suggest unions are an effective mechanism for protecting firm-specificcapital from opportunism, Howse and Trebilcock (1993) argue that collective bargaining rules aregenerally insufficient for this purpose. Fruhan (1985) suggests that some EBOs occur because unioncontracts contain shutdown benefits that create a large liability that offsets the potential benefits ofliquidation. However, we are aware of only one instance of shutdown benefits in our sample, andthat involves Weirton Steel.
3. Benefits and costs of including employees in a buyout
In this section, we summarize the costs and benefits of employee ownershipthat have been proposed in the labor contracting and finance literatures.Traditionally, the role of employee ownership in labor contracts is studiedwithout consideration of the financing and managerial control implications tothe firm. Likewise, the finance literature often does not take into account thelabor contract motivations for establishing a leveraged ESOP, but insteadfocuses on tax and managerial control issues. We argue, however, that laborcontracting, financing, tax, and control considerations are important in deter-mining whether employees participate in a buyout.
3.1. Labor contract restructuring
We first hold financing fixed and focus on the impact of employee ownershipfrom an optimal labor contract perspective. The labor economics literature suggeststhat the desirability of employee ownership depends on four factors: employees’firm-specific capital, asymmetric information, incentives, and risk-sharing.
3.1.1. Protecting employees+ firm-specific capitalKlein et al. (1978) and Williamson (1979) suggest that employee control rights
can protect employees’ firm-specific capital. Specialized skills (Becker, 1975),monitoring costs (Lazear, 1981), and information asymmetries (Salop and Salop,1976) can result in employment contracts with the feature that the present valueof an employee’s expected future compensation from their current employmentexceeds the employee’s next best alternative. For example, contracts that payless than the value of marginal product early in an employee’s career, and morethan the value of marginal product late in the employee’s career, create a situ-ation where older employees earn more than they can earn in their next bestalternative. These contracts may be implicit. Informed employees will be con-cerned prior to entering such a contract that these quasi-rents will be appro-priated by opportunistic owners. Employees can protect themselves fromopportunism by obtaining control rights, either through board representation,also known as codetermination, or share ownership. Thus, employee ownershipcan be part of an efficient labor contract that induces employees to make firm-specific investments in the future (Furubotn, 1988; Chapman, 1993; Hyde, 1993).4
S. Chaplinsky et al./Journal of Financial Economics 48 (1998) 283—332 293

This argument implies that EBOs are more likely when other mechanisms forprotecting employees’ capital, such as implicit contracts, have become lesseffective and when firm-specific investments enhance productivity. Implicitcontracts prevent opportunism when the one-time gain from opportunisticbehavior is less than the present value of future rents foregone as a result ofemployees no longer trusting their employer (Klein and Leffler, 1981). Hence,implicit contracts are likely to become less effective when a firm is performingpoorly, because the firm’s expected life is shorter and future foregone rents willbe lower.
The previous discussion raises the issue of whether EBOs can be used toprotect employees’ existing firm-specific capital that has accumulated from pastinvestments as opposed to capital from future investments. In particular, sup-pose that as a result of past implicit contracts, employees have accumulatedfirm-specific capital, and that circumstances have changed so that the implicitcontract is more likely to be broken and the capital appropriated. Can em-ployees prevent the appropriation by purchasing control rights from existingshareholders? The problem this scenario presents to employees is that they haveto compensate shareholders for foregoing the gains from appropriation. Thus,shareholders would seem to extract the value of employees’ existing capitalthrough the buyout price. However, if employees place a higher value on theright to control whether their capital is appropriated than shareholders dobecause of risk aversion or a higher perceived likelihood of appropriation, or ifthe dissipative costs associated with shareholder appropriation are high, thena mutually beneficial trade between employees and existing shareholders couldtake place. The likelihood that the protection of existing capital would motivatean EBO increases as employees’ existing firm-specific capital increases, and asthe immediate threat of appropriation increases.
The protection of employees’ existing or future firm-specific capital ultimatelyis a concern about employees being compensated for the value of their marginalproduct. A related argument that does not rely on employees accruing firm-specific capital posits that because of asymmetric information employees areconcerned about the negotiated level of compensation. As we now discuss, thereis potentially a role for EBOs to improve labor contracting in this context,but employee cash flow rights play the key role in this argument, not controlrights.
3.1.2. Labor contract restructuring under asymmetric informationIf managers are better informed than employees about the value of the
marginal product of labor, or about rents that the firm is earning, employeesmay doubt managers’ claims when negotiating new labor contracts. Ben-Nerand Jun (1996) and Kovenock and Sparks (1990) present models where grantingemployees cash flow rights can reduce inefficiencies associated with this asym-metric information. To convey the intuition of these models, suppose that
294 S. Chaplinsky et al./Journal of Financial Economics 48 (1998) 283—332
employees are less informed about product market conditions than manage-ment. Then employees will be concerned that managers, acting on behalf ofowners, will seek a labor contract that gives employees less than the value oftheir marginal product. Employees, knowing that they have inferior informa-tion, interpret a fixed wage offer as indicating that the managers have goodinformation about product market conditions. In contrast, an offer with equityshares suggests managers want to share the bad results with employees. Anequilibrium is established where profitable firms pay fixed wages and poorlyperforming firms compensate employees with equity shares. The key predictionfrom these models is that poorly performing firms are more likely to engage inan EBO than an MBO.
Employees are more likely to distrust management’s motives when wageconcessions are sought or when employees’ firm-specific capital is threatened.Thus, the firm-specific capital arguments discussed above, and the asymmetricinformation arguments are complementary in the sense that both are likely to beimportant under similar circumstances. The importance of credibility in negotiat-ing wage concessions is emphasized in DeAngelo and DeAngelo’s analysis oflabor contract restructuring in the steel industry (DeAngelo and DeAngelo, 1991).They show that layoffs, reductions in management compensation and dividends,and lower reported earnings are often combined in a concerted effort to makecredible the need for union concessions. Granting employees cash flow rights isa potential substitute for these actions. The relatively large number of EBO firmsin industries, like steel and textiles, that faced increased competition during the1980s from foreign firms with lower labor costs is consistent with the argumentthat employee ownership helps these firms negotiate compensation concessions.
3.1.3. Improved incentivesA potential benefit of employees sharing in the firm’s residual cash flows is
greater employee effort and improved monitoring of employees and managers(Alchian and Demsetz, 1972). Accordingly, a large number of EBO firms citeimproved employee performance as a rationale for greater employee ownership.Free rider problems, however, are likely to reduce the magnitude of potentialproductivity gains, especially in firms with large workforces. Employee owner-ship is more likely to be used as an incentive mechanism when the productivityof a team member is difficult to assess, as in professional activities such asconsulting and law (Alchian and Demsetz, 1972). The fact that all four buyoutfirms in the consulting business include employees is consistent with the incen-tive hypothesis.
3.1.4. Inefficient risk-sharingBecause of their relatively large equity stakes, managers in both EBOs and
MBOs are likely to hold undiversified portfolios. With EBOs, however, generalemployees also are likely to hold undiversified portfolios. All things being equal,
S. Chaplinsky et al./Journal of Financial Economics 48 (1998) 283—332 295
5There is some evidence that firms structure the plans to reduce risk-sharing costs. For example,Amsted established additional defined benefit plans with an offset provision tied to the ESOP’sperformance that provided a floor on retirement income. Also, ESOPs hold preferred stock in six ofthe 18 full EBOs in our sample.
the resulting cost of employee risk-bearing increases with the proportion of eachemployee’s wealth invested in the firm, and with the variability of cash flows.5Thus, the greater the number of employees over which a given aggregateemployee ownership stake can be spread, the less risk that each individualemployee must bear in an EBO. Holding firm size and managerial ownershipfixed, risk-bearing costs for employees decline as the number of employeesincreases and as the variability of cash flows decreases, and thus we expect thelikelihood of employee participation to vary with these factors. However, if theabove ceteris paribus condition is not met, and managerial ownership inparticular is not held constant, then the prediction about the variability of cashflows does not necessarily follow. As the variability of cash flows increasesmanagers may be more likely to seek general employee participation in an effortto reduce their own risk-bearing costs without sacrificing control. This predic-tion is considered further in Section 3.4.
3.2. Tax advantages
One frequently cited motivation for EBOs is the tax benefits available to thesponsoring firm when employees participate in a buyout through an ESOP.These benefits include the following:
Interest exclusion. After 1984, financial institutions that make loans to ESOPscan exclude 50% of the interest received on the loans from taxable income. AfterJuly 1989, the interest exclusion only applies if the ESOP holds more than 50%of the sponsoring firm’s equity.
Dividend deduction. Dividends paid on ESOP stock are deductible expenses atthe corporate level if they are distributed directly to employees (effective post-1984) or used to pay off the ESOP loan (effective post-1986).
Avoid excise tax on excess pension assets. In 1986, Congress introduced anexcise tax on reversions of excess assets from a defined benefit plan. However, ifexcess pension assets are placed in an ESOP, the excise tax is reduced.
Ability to use loss carryforwards. The Tax Reform Act of 1986 restricts theability of corporations to carry losses forward following a change in control,unless an ESOP purchases at least 50% of the equity.
Owners of closely held firms can defer capital gains tax. After 1984, an owner ofa closely held company can defer capital gains taxes arising from a buyout byselling at least 30% of the outstanding shares to an ESOP.
Beatty (1995) finds that the interest exclusion and dividend deduction incen-tives provide measurable tax benefits to public firms using leveraged ESOPs.
296 S. Chaplinsky et al./Journal of Financial Economics 48 (1998) 283—332

However, since more than half of the EBOs occur prior to the enactment of theseESOP tax benefits, taxes cannot be the sole explanation for employee participa-tion in buyouts. The tax benefits associated with ESOPs do not yield a uniformprediction about the circumstances in which EBOs would arise. The dividenddeduction suggests that firms with a higher demand for tax shields would bemore likely to include employees in the buyout. The pension tax benefit impliesthat EBOs after 1986 would be more likely than MBOs to have overfundedpension plans, and the tax loss carryforward benefit implies that EBOs would bemore likely to have unused tax loss carryforwards.
3.3. Financing implications
We now discuss the effects of ESOP financing on leverage-related costs andincentive conflicts among capital providers.
3.3.1. Lowering leverage-related costsSubstituting equity claims for cash employee compensation costs, consisting
of wages and contributions to pension plans, can lower the leverage-relatedcosts arising from potential bankruptcy and agency costs for a given level ofdebt (Peterson, 1994; Stewart, 1991). To illustrate, suppose that fixed wages arereduced and employees receive equity claims of equal present value. Althoughthe present value of expected cash flows to employees is unchanged by thissubstitution, the substitution creates flexibility for the firm because cash flowsthat would have been allocated to employees can now be used for otherpurposes, such as paying off debt. In addition, to the extent that bankruptcycourts treat employee equity claims like other equity claims, the substitutionplaces creditor claims above part of employee compensation in the event ofdefault, which also could lower leverage-related costs.
In essence, the substitution lowers the priority of at least part of employeecompensation costs for an on-going firm. Further, if employee participation helpsto elicit compensation concessions, as suggested by Ben-Ner and Jun (1996) andKovenock and Sparks (1990), these savings are also available to service thebuyout debt. The implication of these arguments is that employee participationfacilitates financing for the buyout and, in the extreme, can relax a borrowingconstraint that prevents a buyout from occurring. Accordingly, firms with higherleverage-related costs are more likely to include employees in the buyout.
The capital structure literature suggests that leverage-related costs depend onexpected cash flows, the variability of cash flows, and the costs of redeployingassets. Myers (1977) and Williamson (1979) suggest that redeployment costs arehigher for firm-specific assets. Further, Shleifer and Vishny (1992) point out thatredeployment costs are likely to be high when secondary markets are illiquid,which might occur, for example, when there are few buyers for the assets becauseof depressed industry performance.
S. Chaplinsky et al./Journal of Financial Economics 48 (1998) 283—332 297
6There are additional costs of resolving conflicts among EBO stakeholders because of theill-defined nature of the laws concerning employee participation in buyouts. Both MBOs and EBOsare frequently subjected to lawsuits by pre-buyout shareholders. However, under the EmployeeRetirement Income Security Act (ERISA), the Department of Labor (DOL) has responsibility toensure that employees are treated ‘fairly’ when an ESOP is used in a buyout (Chaplinsky et al., 1994;Seelig, 1986). In our sample of full EBOs, four firms are subject to challenge under ERISA and thesesuits take an average of four years to settle.
3.3.2. Conflicts among claimantsMaking employees substantial equity holders can create additional conflicts
among capital providers. For example, conflicts can arise between employeesand outside investors over the level of wages and benefits, and over strategicdecisions like plant closings and layoffs that are difficult to anticipate andresolve contractually. The costs of resolving conflicts are further likely toincrease when employees are heterogeneous in their interests and skills(Hansmann, 1990, 1993).
One way to reduce conflicts between EBO debtholders and employees is tolimit employees’ control rights while the debt is outstanding. The institutionalfeatures of the ESOP loan are well suited for this purpose. ESOP shares areallocated to employees as the principal on the ESOP loan is repaid. Whileemployees must receive control rights on allocated shares, the control rights onunallocated shares can rest with the ESOP trustee. Thus, conflicts betweenemployees and ESOP lenders can be mitigated by having an ESOP trustee whocontrols unallocated shares and is appointed by non-employee capitalproviders.
Outside equity holders, on the other hand, cannot avoid potential conflictswith employees indefinitely because ESOP shares eventually are allocated toemployees. At this point, outside equity holders must contend with anothersizable blockholder group whose interests may conflict with their own. If agencycosts associated with outside equity are higher in EBOs than in MBOs, then lessoutside equity should be observed in EBOs.6
3.4. Management control
Finally, we examine whether employee participation in a buyout is motivatedby managers’ desire to enhance or retain control. Stulz (1988), Gordon andPound (1990), and Chang and Mayers (1992) argue that ESOPs can expandmanagers’ control rights beyond their percentage ownership if managers dir-ectly control unallocated shares, or if the parties controlling ESOP shares, eitherthe employees or the trustee, are more likely to be aligned with managers thanoutside investors. Accordingly, EBO managers can obtain greater control in thepost-buyout firm than MBO managers, holding constant managers’ percentageownership and the firm’s leverage. Moreover, to the extent that employee
298 S. Chaplinsky et al./Journal of Financial Economics 48 (1998) 283—332
7Greater managerial control can be wealth increasing or decreasing. We therefore do not use theterm ‘entrenchment’ which typically has a negative connotation. We do not attempt to estimate thewealth effects associated with greater management control in EBO transactions because it wouldrequire controlling for (1) all of the costs and benefits of employee ownership previously discussed,(2) all the determinants of value from going private transactions in general, and (3) all the potentialwealth transfers from employees and other stakeholder groups.
8See Chapman (1993) for a critical evaluation of the Shleifer and Summers (1988) hypothesis.Whether the breaching of implicit contracts with employees is the motivation for leveraged buyoutsis explored theoretically by Habib (1995) and empirically by Ippolito and James (1992).
ownership replaces equity ownership by third party investors, such as moretypically Kohlberg, Kravis, and Roberts, Inc. (KKR), who are likely to monitormanagement, managerial control can be further enhanced relative to MBOs.7
Managers would be more likely to include employees and enhance theircontrol if they are concerned about being replaced if the alternative in ouranalysis, an MBO took place. Managers’ concerns about being replaced arelikely to be related to several observable factors. First, prior takeover pressurecould suggest that at least some outsiders believe management should bereplaced. Second, poor pre-buyout performance could foster the perception thatincumbent management is part of the problem. Third, low pre-buyout manage-rial ownership suggests managers are more vulnerable to replacement. Inaddition, including employees in a buyout could help managers retain control ifemployees believed that an outsider is more likely to appropriate their firm-specific capital than incumbent management (Shleifer and Summers, 1988). Inthis case, employees could be willing to contribute part of their capital to helpincumbent management maintain control.8 Thus, the managerial controlhypothesis predicts that managers are more likely to pursue an EBO when thefirm is under takeover pressure, performs poorly, has low managerial ownership,or when employees have firm-specific capital that is subject to appropriation.
4. Evidence
The evidence compares EBOs and MBOs with respect to their: (1) pre-buyoutcharacteristics, (2) post-buyout financial structure, and (3) decisions and experi-ence after the buyout.
4.1. Pre-buyout characteristics
In this section we relate the pre-buyout characteristics of EBOs to thetheoretical motivations developed in the previous section. The pre-buyoutcharacteristics reviewed are financial performance, pension plans, takeoverpressure, the ownership by directors and officers, firm-specific assets, leverage,
S. Chaplinsky et al./Journal of Financial Economics 48 (1998) 283—332 299
9Market model abnormal returns generally indicate that the median EBO underperforms relativeto the median MBO, but the difference is not statistically significant. We place more emphasis on themarket-adjusted returns because of concerns about cumulating estimation errors in market modelparameters over long intervals and because the market model results are sensitive to the estimationperiod.
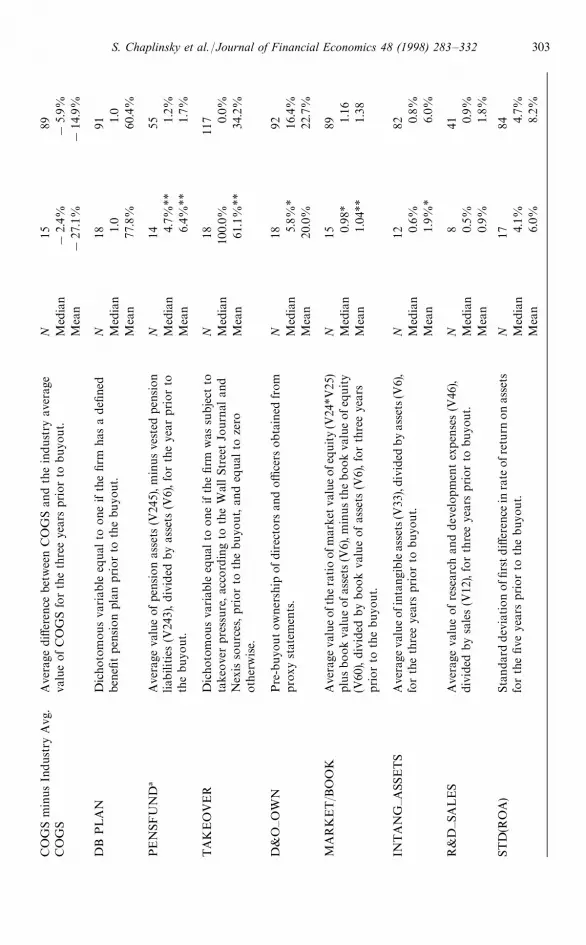
and assets per employee. We begin with univariate comparisons of the pre-buyout characteristics of EBO and MBO firms in Table 4. For the most part,the hypotheses are stated as predictions about a particular variable holdingother factors constant. Therefore, the univariate analysis should be viewed moreas data description than hypothesis testing.
4.1.1. Univariate analysisPre-buyout performance bears on a number of the motivations for EBOs. In
particular, the arguments about how employee ownership affects leverage-related costs, labor contracting under asymmetric information, the possibleappropriation of employees’ firm-specific capital, and managerial control allimply that employee participation is more likely when the firm is performingpoorly. Only the tax motivation implies the opposite. Stock price performanceevidence indicates that EBOs generally have poorer performance than MBOsprior to the buyout. For example, the median market-adjusted return from 550days before the buyout through 50 days before the first indication of a change incontrol (MAR[!550,!50]) is !23.3% for EBOs versus !3.6% for MBOs,a difference that is significant at the 1% level. Moreover, 16 of the 18 full EBOshave negative market-adjusted returns over this pre-buyout period. The twofirms with positive market-adjusted returns are consulting firms. To control fordifferences in risk, we also examine size-decile returns as calculated by Dimsonand Marsh (1986). The median value of size-decile returns for EBOs is !33.7%,significantly less than the 1.4% observed for MBOs.9
With respect to accounting-based performance measures, the median valuesof the pre-buyout return on assets (ROA) and sales growth (SALESGR)measures for EBOs are less than the medians for MBOs, but the differences arenot statistically significant. We find the same result after controlling for industryfactors by subtracting the industry averages from each firm’s value.
Additionally, we examine the production costs of EBOs and MBOs usinga variable that measures the average cost of goods sold, divided by sales(COGS). Cost of goods sold typically includes labor costs, raw materials, andoperating expenses depending on whether the firm is in the manufacturingor service sector. The results indicate that the value of COGS is signi-ficantly higher, and therefore the gross profit margin is lower in EBOs thanMBOs. However, we do not find significant differences after controlling forindustry.
300 S. Chaplinsky et al./Journal of Financial Economics 48 (1998) 283—332
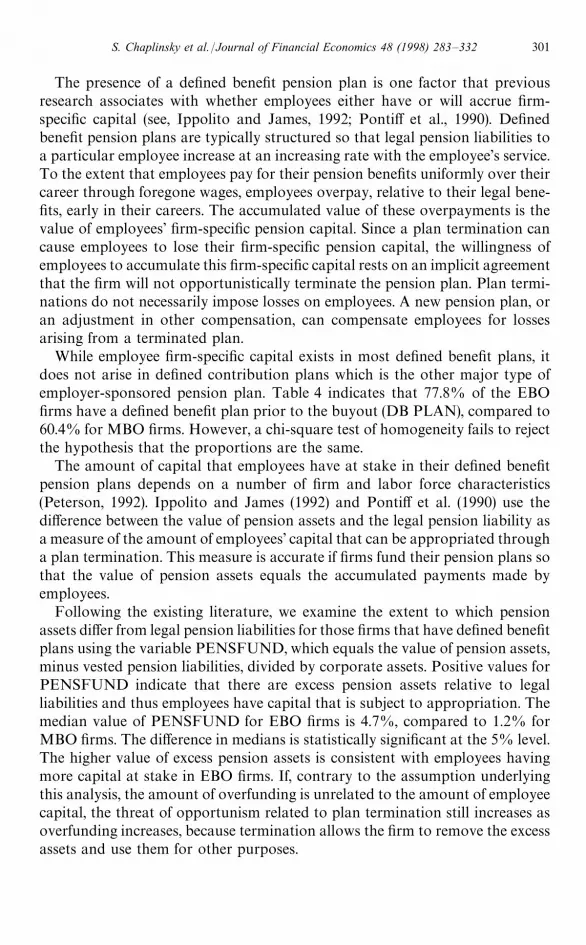
The presence of a defined benefit pension plan is one factor that previousresearch associates with whether employees either have or will accrue firm-specific capital (see, Ippolito and James, 1992; Pontiff et al., 1990). Definedbenefit pension plans are typically structured so that legal pension liabilities toa particular employee increase at an increasing rate with the employee’s service.To the extent that employees pay for their pension benefits uniformly over theircareer through foregone wages, employees overpay, relative to their legal bene-fits, early in their careers. The accumulated value of these overpayments is thevalue of employees’ firm-specific pension capital. Since a plan termination cancause employees to lose their firm-specific pension capital, the willingness ofemployees to accumulate this firm-specific capital rests on an implicit agreementthat the firm will not opportunistically terminate the pension plan. Plan termi-nations do not necessarily impose losses on employees. A new pension plan, oran adjustment in other compensation, can compensate employees for lossesarising from a terminated plan.
While employee firm-specific capital exists in most defined benefit plans, itdoes not arise in defined contribution plans which is the other major type ofemployer-sponsored pension plan. Table 4 indicates that 77.8% of the EBOfirms have a defined benefit plan prior to the buyout (DB PLAN), compared to60.4% for MBO firms. However, a chi-square test of homogeneity fails to rejectthe hypothesis that the proportions are the same.
The amount of capital that employees have at stake in their defined benefitpension plans depends on a number of firm and labor force characteristics(Peterson, 1992). Ippolito and James (1992) and Pontiff et al. (1990) use thedifference between the value of pension assets and the legal pension liability asa measure of the amount of employees’ capital that can be appropriated througha plan termination. This measure is accurate if firms fund their pension plans sothat the value of pension assets equals the accumulated payments made byemployees.
Following the existing literature, we examine the extent to which pensionassets differ from legal pension liabilities for those firms that have defined benefitplans using the variable PENSFUND, which equals the value of pension assets,minus vested pension liabilities, divided by corporate assets. Positive values forPENSFUND indicate that there are excess pension assets relative to legalliabilities and thus employees have capital that is subject to appropriation. Themedian value of PENSFUND for EBO firms is 4.7%, compared to 1.2% forMBO firms. The difference in medians is statistically significant at the 5% level.The higher value of excess pension assets is consistent with employees havingmore capital at stake in EBO firms. If, contrary to the assumption underlyingthis analysis, the amount of overfunding is unrelated to the amount of employeecapital, the threat of opportunism related to plan termination still increases asoverfunding increases, because termination allows the firm to remove the excessassets and use them for other purposes.
S. Chaplinsky et al./Journal of Financial Economics 48 (1998) 283—332 301

Tab
le4
Pre
-buyo
utch
arac
terist
ics
ofem
plo
yee
buyo
uts
(EBO
s)an
dm
anag
emen
tbu
youts
(MBO
s)ofen
tire
com
pan
ies
com
ple
ted
during
1980
—199
0.
Com
pust
atva
riab
les
are
indi
cate
din
pare
nth
eses
with
the
desc
ript
ion
ofea
chan
alys
isva
riab
le.T
he
mea
nan
dm
edia
nva
lues
for
each
variab
lear
eco
mpa
red
for
the
EBO
sam
ple
and
the
MBO
sam
ple.
Stat
istica
lsign
ifica
nce
atth
e1%
,5%
,an
d10
%le
vels
are
note
d,re
spec
tive
ly,w
ith
*,**
,**
*.D
iffer
ence
inm
eans
isbas
edon
at-
test
,an
ddiff
eren
cein
med
ians
isba
sed
ona
rank
sum
test
.For
two
dic
hoto
mou
sva
riab
les,
DB
PLA
Nan
dTA
KEO
VER
,a
chi-sq
uar
ete
stis
used
tom
easu
reth
edi
ffere
nce
inpro
por
tions
.U
nle
ssoth
erw
ise
note
d,an
nua
lfinan
cial
stat
emen
tda
taar
efrom
Com
pust
at,M
oody’
s,or
Sec
uritie
san
dE
xcha
nge
Com
mission
discl
osu
redo
cum
ents
,and
stock
retu
rndat
aar
efrom
the
Cen
terfo
rR
esea
rch
on
Sec
urity
Price
s(C
RSP).
Var
iable
Des
crip
tion
Sta
tist
icEB
Os
MBO
s
MA
R[!
550,!
50]
Mar
ket
adju
sted
hold
ing
per
iod
retu
rnfrom
day!
550
today
!50
,wher
eday
0is
thefirs
tindi
cation
ofa
pos
sible
chan
gein
contr
ol.
N18
95M
edia
n!
23.3
%*
!3.
6%M
ean
!24
.3%
*6.
2%
Size
-Dec
ileA
dju
sted
Ret
urn
[!55
0,!
50]
Hold
ing
per
iod
retu
rnnet
ofsize
deci
leho
ldin
gpe
riod
retu
rnfrom
day
!55
0to
day!
50,w
her
eday
0is
the
first
indic
atio
nofa
poss
ible
chan
gein
contr
ol.
N18
95M
edia
n!
33.7
%**
*1.
4%M
ean
!32
.4%
**12
.2%
RO
AR
etur
non
asse
ts(R
OA
),ta
ken
asav
erag
ean
nua
loper
atin
gin
com
e(V
13),
divi
ded
by
tota
lass
ets(V
6),f
orth
ree
year
spr
ior
toth
ebuy
out
.
N17
89M
edia
n!
14.4
%**
*16
.0%
Mea
n!
11.8
%11
.9%
RO
Am
inus
Indus
try
Avg
.R
OA
Ave
rage
diff
eren
cebe
twee
nR
OA
and
indus
try
aver
age
valu
eofR
OA
for
thre
eye
ars
prior
toth
ebuyo
ut.
N17
89M
edia
n4.
5%6.
8%M
ean
6.8%
4.3%
SAL
ESG
RA
vera
gean
nual
grow
thin
sale
s(V
12)f
orth
eth
ree
year
sprior
toth
ebuy
out
.N
1786
Med
ian
8.3%
10.7
%M
ean
9.1%
13.3
%
SA
LESG
Rm
inus
Indus
try
Avg
.SA
LE
SGR
Ave
rage
diff
eren
cebe
twee
nSA
LE
SGR
and
the
indust
ryav
erag
eva
lue
ofSA
LESG
Rfo
rth
eth
ree
year
sprior
tobuy
out
.
N17
86M
edia
n!
11.6
%!
8.2%
Mea
n!
30.4
%!
38.5
%
CO
GS
Ave
rage
valu
eof
cost
ofg
ood
sso
ld(C
OG
S),(
V41
)di
vide
dby
sale
s(V
12),
for
the
thre
eye
ars
prio
rto
buyo
ut.
N15
89M
edia
n76
.1%
**68
.8%
Mea
n76
.7%
**66
.8%
302 S. Chaplinsky et al./Journal of Financial Economics 48 (1998) 283—332
CO
GS
min
us
Indust
ryA
vg.
CO
GS
Ave
rage
diff
eren
cebe
twee
nC
OG
San
dth
ein
dust
ryav
erag
eva
lue
ofC
OG
Sfo
rth
eth
ree
year
sprior
tobuy
out.
N15
89M
edia
n!
2.4%
!5.
9%M
ean
!27
.1%
!14
.9%
DB
PLA
ND
icho
tom
ous
variab
leeq
ual
toone
ifth
efir
mha
sa
defi
ned
ben
efitpen
sion
plan
prior
toth
ebu
yout.
N18
91M
edia
n1.
01.
0M
ean
77.8
%60
.4%
PEN
SFU
ND
!A
vera
geva
lue
ofpe
nsio
nas
sets
(V24
5),m
inus
vest
edpen
sion
liabili
ties
(V24
3),div
ided
by
asse
ts(V
6),fo
rth
eye
arprior
toth
ebuy
out.
N14
55M
edia
n4.
7%**
1.2%
Mea
n6.
4%**
1.7%
TA
KE
OV
ER
Dic
hoto
mou
sva
riab
leeq
ualto
one
ifth
efirm
was
subj
ectto
take
ove
rpre
ssure
,ac
cord
ing
toth
eW
allStr
eet
Jour
nal
and
Nex
isso
urc
es,pr
ior
toth
ebuyo
ut,
and
equa
lto
zero
oth
erw
ise.
N18
117
Med
ian
100.
0%0.
0%M
ean
61.1
%**
34.2
%
D&
O—O
WN
Pre
-buyo
utow
ner
ship
ofdi
rect
ors
and
offi
cers
obta
ined
from
pro
xyst
atem
ents
.N
1892
Med
ian
5.8%
*16
.4%
Mea
n20
.0%
22.7
%
MA
RK
ET
/BO
OK
Ave
rage
valu
eoft
hera
tio
ofm
arke
tva
lueofe
quity
(V24
*V25
)pl
usbo
okva
lue
ofa
sset
s(V
6),m
inusth
ebook
valu
eofe
quity
(V60
),div
ided
by
boo
kva
lue
ofas
sets
(V6)
,fo
rth
ree
year
sprior
toth
ebuy
out.
N15
89M
edia
n0.
98*
1.16
Mea
n1.
04**
1.38
INT
AN
G—A
SSETS
Ave
rage
valu
eof
inta
ngib
leas
sets
(V33
),div
ided
byas
sets
(V6)
,fo
rth
eth
ree
year
spr
ior
tobuyo
ut.
N12
82M
edia
n0.
6%0.
8%M
ean
1.9%
*6.
0%
R&
D—S
ALES
Ave
rage
valu
eof
rese
arch
and
dev
elop
men
tex
pen
ses
(V46
),di
vide
dby
sale
s(V
12),
for
thre
eye
ars
prior
tobuyo
ut.
N8
41M
edia
n0.
5%0.
9%M
ean
0.9%
1.8%
STD
(RO
A)
Sta
nda
rddev
iation
offi
rstdiff
eren
cein
rate
ofr
eturn
on
asse
tsfo
rth
efive
year
sprior
toth
ebuy
out.
N17
84M
edia
n4.
1%4.
7%M
ean
6.0%
8.2%
S. Chaplinsky et al./Journal of Financial Economics 48 (1998) 283—332 303
Tab
le4
(Con
tinued
)
Var
iable
Dec
ription
Sta
tist
icEBO
sM
BO
s
LTD
—VA
LU
EA
vera
geva
lue
ofl
ong
term
deb
t(V
9)ove
rth
em
arket
valu
eof
equity
(V24
*V25
)plu
slo
ng
term
deb
t(V
9)fo
rth
reeye
arspr
ior
toth
ebuy
out
.
N17
89M
edia
n12
.0%
*27
.0%
Mea
n15
.8%
*29
.5%
LTD
—ASS
ETS
Ave
rage
valu
eof
long
term
deb
tplu
sde
btin
curr
entliab
ility
(V34
)ove
ras
sets
(V6)
for
thre
eye
ars
prior
toth
ebuy
out.
N17
89M
edia
n9.
5%*
30.4
%M
ean
14.9
%*
39.4
%
UN
USE
DLO
SSC
AR
RY
-FO
RW
AR
DS
Ave
rage
valu
eofun
use
dlo
ssca
rryf
orw
ards
(V52
)div
ided
byto
talas
sets
(V6)
for
thre
eye
ars
prior
toth
ebuy
out
.N
1583
Med
ian
0.0%
0.0%
Mea
n2.
3%1.
1%
EM
PL
OY
EE
SA
vera
genum
berofe
mpl
oye
es(in
thousa
nds)
during
the
thre
eye
ars
prior
toth
ebuyo
ut.
N17
89M
edia
n7.
6*2.
4M
ean
10.3
***
5.0
ASS
ET
S—E
MP
Ave
rage
annu
alto
talas
sets
(V6)
per
empl
oye
e(V
30)fo
rth
eth
ree
year
sprior
toth
ebuy
out
."N
1788
Med
ian
44.9
*60
.5M
ean
46.0
212.
8
!Only
firm
sw
ith
defi
ned
ben
efit
plan
sar
ein
cluded
."A
few
finan
cial
inst
itut
ions
with
very
larg
eva
lues
ofa
sset
sre
lative
toem
ploye
esin
crea
seth
em
ean
sign
ifica
ntly
.Exc
ludi
ng
fina
nci
alin
stitutionsdoes
not
chan
geth
eco
nclu
sions
ofth
ean
alys
is.
304 S. Chaplinsky et al./Journal of Financial Economics 48 (1998) 283—332

Nine of the 13 full EBOs with excess pension assets terminate a pension planat the time of the EBO. In seven of the nine cases, it appears that the firm usesthe excess assets to finance the buyout without necessarily imposing losses onemployees. The mechanism by which this occurs is best illustrated with a simpleexample. Suppose that a firm with $50 million in excess pension assets estab-lishes an ESOP that borrows $50 million. The proceeds of the ESOP loan aregiven to the sponsoring firm to repurchase outstanding shares. In exchange, theESOP receives shares in the post-buyout firm, all of which are unallocated.Immediately following the buyout, the overfunded pension plan is terminatedand the excess assets are used to pay off the ESOP loan, which allocates sharesto employees. Provided employees do not pay for their ESOP shares byforegoing other compensation, the essential aspect of the transaction is thatemployees trade their defined benefit pension capital for equity capital. TheESOP loan serves simply as a bridge loan that gives the firm access to the cash inthe overfunded pension plan until the plan is terminated. This scenario effec-tively describes seven of the nine terminations, where the excess assets wererolled into the ESOP to repay the ESOP loan immediately following the buyout.
Management’s reluctance to impose losses on employees could suggest thatthey perceive the loss of future employee investments in the firm to be animportant source of value. Alternatively, as Shleifer and Summers (1988) sug-gest, incumbent managers may be more reluctant to appropriate employees’firm-specific capital even though it is in shareholders’ best interest to do so.Another potential interpretation is that the excess pension assets are rolled intothe ESOP to reduce excise taxes on pension reversions. However, only three ofthe nine pension plan reversions take place after the excise tax becomes effectivein 1986. Finally, the use of excess pension assets to reduce the level of debt couldreflect creditors’ desire to reduce quickly the post-buyout level of debt.
We also examine whether EBOs and MBOs are subject to prior takeoveractivity (TAKEOVER), which is defined as either a takeover bid or a Schedule13D filing in the year prior to the buyout announcement. We find that 61.1% ofthe full EBOs experience takeover pressure prior to the buyout, compared toonly 34.2% of the full MBOs, a difference which is statistically significant at the5% level. The higher incidence of takeover pressure for EBOs is consistent withEBOs being motivated as a means to protect employees’ firm-specific capital,and also with the managerial control hypothesis.
The ownership by directors and officers is examined to provide insight intohow capable management is of fending off a takeover threat. Pre-buyoutownership by directors and officers (D&O—OWN), as reported in the firm’sproxy statement during the year prior to the buyout, is 5.8% for the medianEBO and 16.4% for the median MBO, and this difference is statisticallysignificant. Among firms that are subject to takeover pressure, the median valueof director and officer ownership also is lower for EBOs at 3.0%, than for MBOsat 7.4%, however, the difference is not statistically significant. These findings are
S. Chaplinsky et al./Journal of Financial Economics 48 (1998) 283—332 305

consistent with the argument that managers with low ownership stakes are morelikely to include employees in a buyout when they have limited means ofdefending against a takeover attempt.
Since EBOs are predicted to have greater leverage-related costs, we examinewhether EBOs have assets with greater firm-specific value (Myers, 1977; Will-iamson, 1979). While measuring the extent to which assets have firm-specificvalue is difficult, we follow the existing literature and use the following proxies:(1) the market-to-book ratio (MARKET/BOOK) which equals the market valueof equity, plus the book value of assets, minus the book value of equity, dividedby the book value of assets (Smith and Watts, 1992), (2) the ratio of intangibleassets to total assets (Titman and Wessels, 1988), and (3) the ratio of researchand development expenses to sales (Long and Malitz, 1985).
Contrary to the prediction that EBO firms have a higher proportion offirm-specific assets, the median values of all three measures indicate that EBOfirms typically have a lower proportion of firm-specific assets than MBO firms,although the difference is statistically significant only for the market-to-bookratio. One explanation for the lower market-to-book ratios observed for EBOsfollows from the earlier evidence that EBO firms typically have poor perfor-mance prior to the buyout which, in turn, suggests a higher likelihood ofdistress. All else being equal, a higher likelihood of distress would reduce themarket value of the firm and lower the market-to-book ratio.
Capital structure theory generally hypothesizes that leverage-related costs arepositively related to the variability of cash flows. Accordingly, firms with highervariability of cash flows may be more likely to include employees in a buyout,because their leverage-related costs make it more costly to borrow the fundsnecessary for the buyout without a change in operating commitments to em-ployees. The arguments concerning risk-bearing costs have conflicting predic-tions about the effect of cash flow variability on the likelihood of employeeparticipation. The risk-bearing costs associated with employee ownership implythat employee participation would be less likely the higher the variability of thefirm’s cash flows, holding managerial ownership fixed. However, managers, inan effort to maintain control, while at the same time reducing their ownrisk-bearing costs, may be more inclined to include employees in a buyout, thegreater the variability of cash flows. Consistent with conflicting effects, thestandard deviation of the first difference in the ratio of operating income toassets, shown in Table 4 as the variable STD(ROA), does not differ significantlyfor EBO firms and MBO firms.
An alternative approach to assessing leverage-related costs is to examine thefirm’s pre-buyout financial leverage ratios. A large body of theory proposes thata firm’s leverage ratio is endogenously chosen by management to take accountof all of the costs and benefits of debt. Since many of the costs and benefits areadmittedly hard to measure, the firm’s pre-buyout leverage provides a ‘reducedform’ measure of a firm’s leverage-related costs under the assumption that the
306 S. Chaplinsky et al./Journal of Financial Economics 48 (1998) 283—332
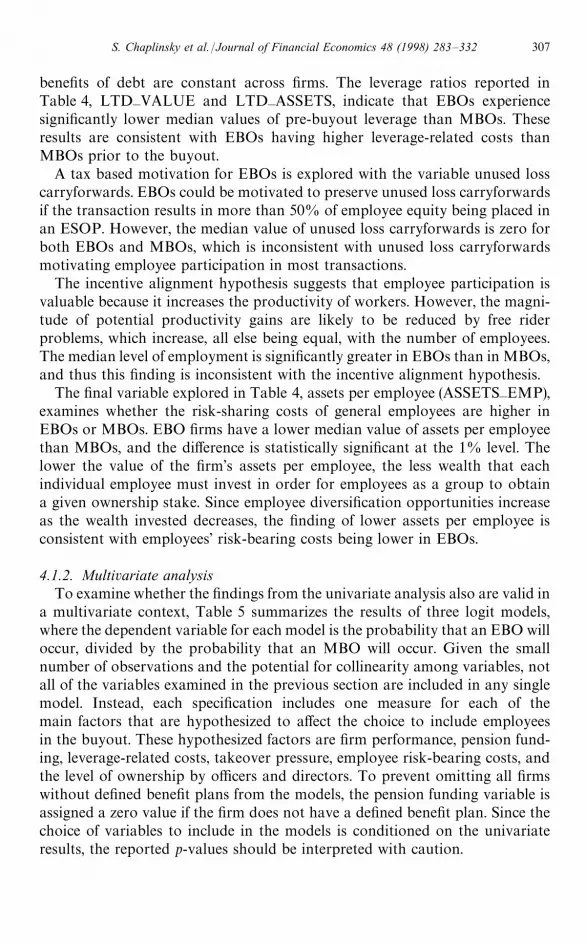
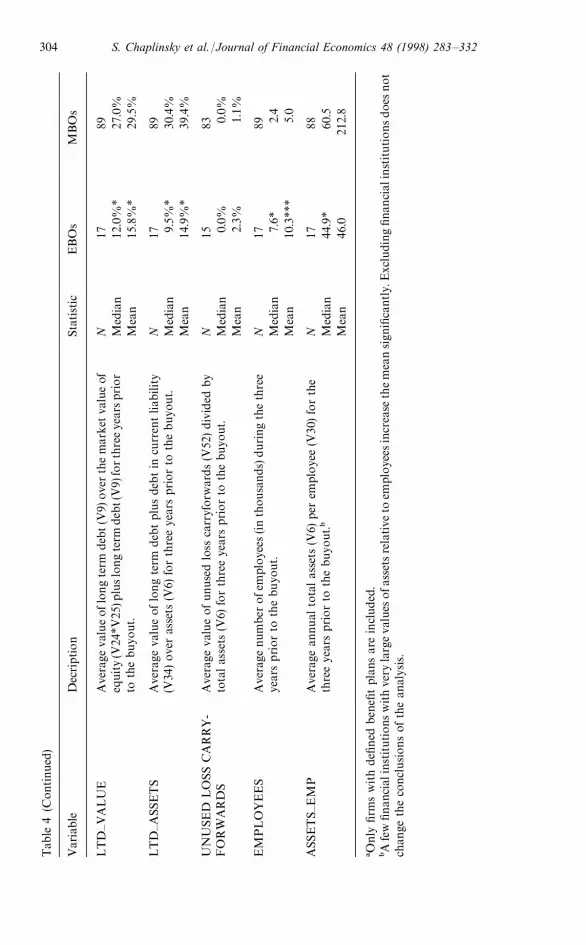
benefits of debt are constant across firms. The leverage ratios reported inTable 4, LTD—VALUE and LTD—ASSETS, indicate that EBOs experiencesignificantly lower median values of pre-buyout leverage than MBOs. Theseresults are consistent with EBOs having higher leverage-related costs thanMBOs prior to the buyout.
A tax based motivation for EBOs is explored with the variable unused losscarryforwards. EBOs could be motivated to preserve unused loss carryforwardsif the transaction results in more than 50% of employee equity being placed inan ESOP. However, the median value of unused loss carryforwards is zero forboth EBOs and MBOs, which is inconsistent with unused loss carryforwardsmotivating employee participation in most transactions.
The incentive alignment hypothesis suggests that employee participation isvaluable because it increases the productivity of workers. However, the magni-tude of potential productivity gains are likely to be reduced by free riderproblems, which increase, all else being equal, with the number of employees.The median level of employment is significantly greater in EBOs than in MBOs,and thus this finding is inconsistent with the incentive alignment hypothesis.
The final variable explored in Table 4, assets per employee (ASSETS—EMP),examines whether the risk-sharing costs of general employees are higher inEBOs or MBOs. EBO firms have a lower median value of assets per employeethan MBOs, and the difference is statistically significant at the 1% level. Thelower the value of the firm’s assets per employee, the less wealth that eachindividual employee must invest in order for employees as a group to obtaina given ownership stake. Since employee diversification opportunities increaseas the wealth invested decreases, the finding of lower assets per employee isconsistent with employees’ risk-bearing costs being lower in EBOs.
4.1.2. Multivariate analysisTo examine whether the findings from the univariate analysis also are valid in
a multivariate context, Table 5 summarizes the results of three logit models,where the dependent variable for each model is the probability that an EBO willoccur, divided by the probability that an MBO will occur. Given the smallnumber of observations and the potential for collinearity among variables, notall of the variables examined in the previous section are included in any singlemodel. Instead, each specification includes one measure for each of themain factors that are hypothesized to affect the choice to include employeesin the buyout. These hypothesized factors are firm performance, pension fund-ing, leverage-related costs, takeover pressure, employee risk-bearing costs, andthe level of ownership by officers and directors. To prevent omitting all firmswithout defined benefit plans from the models, the pension funding variable isassigned a zero value if the firm does not have a defined benefit plan. Since thechoice of variables to include in the models is conditioned on the univariateresults, the reported p-values should be interpreted with caution.
S. Chaplinsky et al./Journal of Financial Economics 48 (1998) 283—332 307

Table 5Logit analysis of the probability of an employee buyout (EBO) relative to a management buyout(MBO) of entire companies.
The dependent variable equals the probability that an EBO will occur, divided by the probabilitythat an MBO will occur. Coefficient estimates are reported with p-values below in parentheses.Independent variables are defined in Table 4.
Underlying factor Independent variable Model 1 Model 2 Model 3
Intercept Intercept !0.34 !0.03 0.77(0.74) (0.98) (0.43)
Firm performance MAR[!550,!50] !2.59 !2.62 !2.18(0.06) (0.05) (0.08)
Pension funding PENSFUND 11.64 16.85 15.17(0.14) (0.07) (0.06)
Leverage-related costs LTD—VALUE !5.41 !5.68(0.02) (0.02)
Leverage-related costs MARKET/BOOK !0.02(0.42)
Takeover pressure TAKEOVER 1.46 1.28 0.66(0.05) (0.11) (0.40)
Employee risk-bearing costs ASSETS—EMP !0.03 !0.03 !0.02(0.03) (0.03) (0.11)
Ownership of officers anddirectors
D&O—OWN 0.02(0.41)
Sample size d of EBOs 17 17 15d of MBOs 73 63 69
The logit models indicate that, after controlling for other factors, the likeli-hood of an EBO is (1) negatively related to pre-buyout stock market perfor-mance, (2) positively related to pension funding, (3) negatively related topre-buyout leverage, and (4) negatively related to the value of assets per em-ployee. In the last specification, the coefficient on the market-to-book ratio isnegative, but not statistically significant, which suggests that after controllingfor other factors, EBO firms do not have lower market-to-book ratios.
Two important conclusions emerge from the evidence on the pre-buyoutcharacteristics that help explain why employees participate in buyouts. First,EBO firms often have excess pension assets that can be used to help finance thebuyout. By rolling over the excess assets into an ESOP and allocating shares toemployees, managers gain access to the cash in the pension plan withoutnecessarily imposing losses on employees. Further, EBOs’ poorer performanceand lower pre-buyout financial leverage suggest that EBO firms havehigher leverage-related costs than MBO firms under their pre-buyout operating
308 S. Chaplinsky et al./Journal of Financial Economics 48 (1998) 283—332
commitments. By substituting equity for part of ongoing cash labor compensa-tion costs and perhaps even lowering these costs, the EBO firm increases itsability to cover interest payments, which helps the firm to obtain borrowing forthe buyout. Second, there is evidence consistent with managers including em-ployees in the buyout to enhance managerial control. This conclusion followsfrom the results indicating that, relative to MBOs, EBOs have poorer perfor-mance, greater takeover pressure, lower levels of pre-buyout managementownership, and greater risk of appropriation of employees’ capital.
4.2. Structure of EBO transactions
4.2.1. Labor contract restructuringCash commitments for employee compensation will be reduced following the
buyout to the extent that an ESOP replaces pre-buyout cash commitments forwages and pension plans. In addition, an EBO may also be accompanied byconcessions that lower the level of post-buyout cash payments promised toemployees. Since either of these changes can be instrumental in obtainingfinancing, we look for changes in non-management employee compensationoccurring at the time of EBOs that are consistent with reductions in cashcompensation costs. The case descriptions in Appendix A summarize the re-ported labor contract changes for the full EBOs and Appendix B summarizesthe reported changes for five spinoff EBOs. For the 18 full EBOs, the evidenceindicates that one firm reports wage reductions, eight firms terminate definedbenefit plans, and one firm terminates a defined benefit plan and lowers wages.Thus, ten of the full EBOs, representing 56% of the sample, involve compensa-tion changes that reduce the cash burden of labor costs relative to the pre-buyout period.
While the evidence indicates that EBOs frequently involve labor contractchanges that enhance debt repayment, some MBOs involve similar changes (e.g.,see Denis, 1995, for a discussion of Safeway’s LBO). Therefore, we examineproxy, Schedule 13E-3, and 14D-1 statements describing MBO transactions forevidence of labor contract changes at the time of the buyout. These statementsare obtained from the SEC Edgar On-line Proxy Service and from Disclosure,Inc. Because disclosure documents are not available for a number of the MBOs,the sample is reduced to 39 full MBOs. The average transaction size of theseMBOs does not differ significantly from the average transaction size of the fullEBOs. In contrast to the EBO firms, no MBO reduces wages and only oneMBO terminates a pension plan. Four EBO firms and two MBO firms alsoterminate other compensation plans like profit sharing, stock option, or bonusplans, but it is not possible to discern the effects of these changes on cashcompensation costs. Thus, one of 39, or 2.6%, of the MBO transactions showsevidence of labor contract changes that lower pre-buyout cash commitments for
S. Chaplinsky et al./Journal of Financial Economics 48 (1998) 283—332 309

10We also searched the MAJPAP and PRNEWS files of NEXIS for evidence of labor contractchanges in EBOs and MBOs in the buyout year and for the three years thereafter. We found fewreports of labor contract changes, and no evidence that distinguished EBO firms from MBO firms.Therefore, SEC disclosure documents appear to be a better source for labor contract changes.
11The post-buyout leverage ratio for MBOs is lower than the 89.1% reported in Kaplan andStein (1993). However, our sample includes smaller MBOs than Kaplan and Stein, who examineMBOs which exceed $100 million in size. The median MBO transaction size in Kaplan and Stein is$395 million, versus $256 million for our MBO subsample.
employee compensation costs versus 56% of the EBOs.10 A chi-square testrejects the hypothesis that the proportions are the same at the 1% level. Thisevidence is consistent with EBOs being motivated in part by attempts toenhance the firm’s ability to borrow funds for the buyout.
Additional evidence that employee participation influences the ability of firmsto borrow to finance a buyout is the observation that four full EBOs arepreceded by failed attempts at an MBO or leveraged buyout (LBO). In part, thefailure is due to a lack of financing. In three of the four, we observe laborcontract changes at the time of the EBO which reduce cash compensation costs.For example, the EBO at Lyon Metal, following two failed takeover attempts byoutside bidders and a failed MBO, was not successful until the court approvedthe use of excess pension benefits to finance the buyout and the union agreed toconcessions. The case studies for Amsted Industries, Blue Bell, and Dan Riverillustrate this point further.
4.2.2. Post-buyout financial structureIn Table 6, we report information on the financial structure of the full EBO
firms and the subsample of 39 full MBOs for which we were able to obtainpost-buyout financial information. Table 6 reports the leverage ratios, debtclaims, and equity claims for these firms.
¸everage. In Table 6 we compare the post-buyout leverage ratios of EBO andMBO firms. Leverage is measured as the ratio of long term-debt inclusive ofdebt in current liabilities and capitalized leases, to total capitalization. Totalcapitalization is taken from the pro-forma statement of capitalization for thebuyout transaction. When this information is unavailable, total capital is thesum of preexisting debt, less noted repayments, if any, plus acquisition-relatedlong-term debt, preferred stock, and common stock. As previously noted, nineEBO firms and one MBO firm use excess pension assets to finance the buyout.Typically, firms use the excess assets to repay part of the buyout debt, andtherefore we report a leverage ratio before and after the reversion of excess assets.
Using the pre-reversion measure of leverage, the median EBO has a post-buyout leverage ratio of 89.6%. By comparison, the median post-buyout lever-age ratio for MBOs is 74.8%, which is significantly different at the 1% level fromthe EBO leverage ratio.11 Factoring in the reversion of excess assets, the median
310 S. Chaplinsky et al./Journal of Financial Economics 48 (1998) 283—332
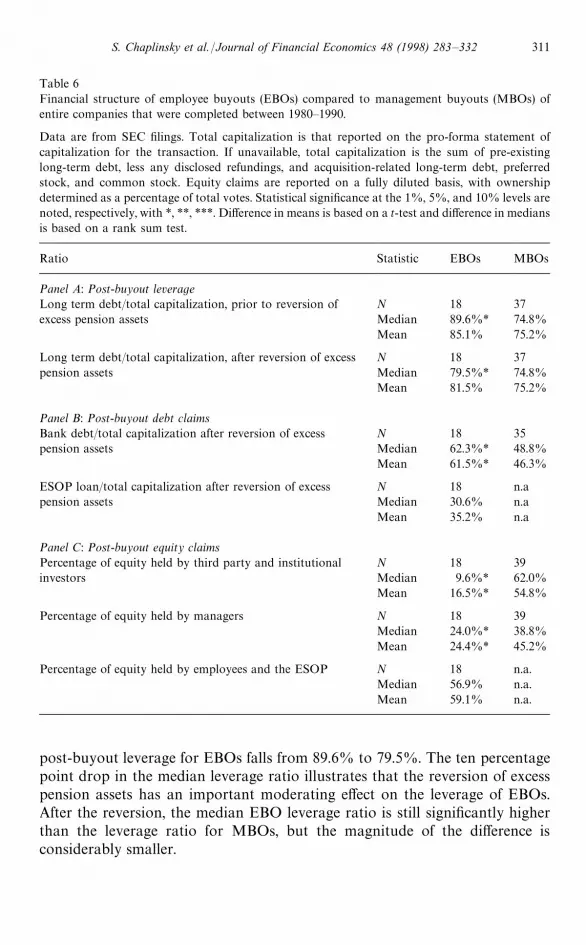
Table 6Financial structure of employee buyouts (EBOs) compared to management buyouts (MBOs) ofentire companies that were completed between 1980—1990.
Data are from SEC filings. Total capitalization is that reported on the pro-forma statement ofcapitalization for the transaction. If unavailable, total capitalization is the sum of pre-existinglong-term debt, less any disclosed refundings, and acquisition-related long-term debt, preferredstock, and common stock. Equity claims are reported on a fully diluted basis, with ownershipdetermined as a percentage of total votes. Statistical significance at the 1%, 5%, and 10% levels arenoted, respectively, with *, **, ***. Difference in means is based on a t-test and difference in mediansis based on a rank sum test.
Ratio Statistic EBOs MBOs
Panel A: Post-buyout leverageLong term debt/total capitalization, prior to reversion ofexcess pension assets
N 18 37Median 89.6%* 74.8%Mean 85.1% 75.2%
Long term debt/total capitalization, after reversion of excesspension assets
N 18 37Median 79.5%* 74.8%Mean 81.5% 75.2%
Panel B: Post-buyout debt claimsBank debt/total capitalization after reversion of excesspension assets
N 18 35Median 62.3%* 48.8%Mean 61.5%* 46.3%
ESOP loan/total capitalization after reversion of excesspension assets
N 18 n.aMedian 30.6% n.aMean 35.2% n.a
Panel C: Post-buyout equity claimsPercentage of equity held by third party and institutionalinvestors
N 18 39Median 9.6%* 62.0%Mean 16.5%* 54.8%
Percentage of equity held by managers N 18 39Median 24.0%* 38.8%Mean 24.4%* 45.2%
Percentage of equity held by employees and the ESOP N 18 n.a.Median 56.9% n.a.Mean 59.1% n.a.
post-buyout leverage for EBOs falls from 89.6% to 79.5%. The ten percentagepoint drop in the median leverage ratio illustrates that the reversion of excesspension assets has an important moderating effect on the leverage of EBOs.After the reversion, the median EBO leverage ratio is still significantly higherthan the leverage ratio for MBOs, but the magnitude of the difference isconsiderably smaller.
S. Chaplinsky et al./Journal of Financial Economics 48 (1998) 283—332 311

Debt claims. Jensen (1989) and James (1987) argue that the type of debtfinancing used, whether private or bank debt versus public debt, can haveimportant implications for monitoring management. In particular, a bank’sincentive to monitor firm performance will likely increase with the ratio of bankdebt to total capital. Hence, we investigate the extent to which EBOs and MBOsdiffer in this ratio. For the median EBO, the ratio of bank debt to total capital is62.3% versus 48.8% for MBOs, a difference that is significant at the 1% level.The reliance on bank debt by EBOs is further highlighted by the fact that in 12of the 18 full EBOs, bank debt in conjunction with excess pension assetsprovides all of non-equity funding for the transaction.
Typically, the ESOP loan, which represents 30.6% of the total capital for themedian EBO, is borrowed from a bank. The use of bank debt could be related tothe tax benefits of the interest exclusion received on ESOP loans made by banks.However, the interest exclusion became applicable after 1984, and ten of theeleven EBOs conducted before 1985 were financed solely with bank debt.
Public debt, and in particular high-yield debt, become more prevalent asa source of LBO financing during the latter half of 1980s (Kaplan and Stein,1993). To determine whether the greater use of bank debt in EBOs can beattributed to the timing of the transaction, we estimated the following regression:
(Bank Debt)/(Total Capitalization)"a#b1*
EBO#b2*
Trend#e, (1)
where EBO equals 1 if the transaction is an EBO, and 0 if it is an MBO, andTrend is a time trend. The results indicate that the estimate of b
1is positive and
significant at the 10% level, and the estimate of b2
is not significant, suggestingthat timing is not a major driver of bank debt.
The greater use of bank debt in EBOs is consistent with some of the earlierevidence presented on the factors that distinguish EBOs and MBOs. First, asmentioned above, James (1987) suggests that banks offer valuable monitoringservices that help resolve informational asymmetries between management andoutside creditors. The periodic reevaluation of credit at relatively short intervals,which would occur with bank loans or lines of credit, is likely to be especiallyvaluable for EBO firms with high debt levels and a recent history of poorperformance. Conversely, EBOs unwilling to submit to such scrutiny could findpublic market funding alternatives considerably more costly. The poor pre-buyout performance of EBOs is also consistent with Gilson et al. (1990) andJensen’s (1989) view that buyouts that are structured with concentrated holdingsof private debt help to reduce the direct costs of financial distress.
Equity claims. The structure of equity claims provides information on theallocation of control, as well as additional information on monitoring per-formed in EBOs. In the typical MBO, institutional or third party investors holdmajority equity stakes in the post-buyout firm. It is generally accepted that largeownership stakes by buyout specialists provide an important monitoring func-tion (Jensen, 1989). However, similar equity holdings are not observed in EBOs.
312 S. Chaplinsky et al./Journal of Financial Economics 48 (1998) 283—332

For the full EBOs, third party and institutional investors obtain a median 9.6%of the post-buyout equity, compared to 62.0% for MBOs.
The relative absence of third party equity investors in EBOs is consistent withoutside equity holders being reluctant to participate in EBOs given the potentialfor conflicts of interest with employee owners. An alternative explanation is thatEBO managers pursue an EBO to enhance their control, replacing third partyinvestors with the ESOP, whose shares are either controlled by management, bytrustees appointed by management, or by employees. Regardless of the reason,monitoring by third party and institutional investors is limited in EBOs. Unlessbanks provide an alternative monitoring mechanism (see James, 1987), theevidence suggests that EBO managers operate with less outside monitoring thanMBO managers.
Another factor affecting managerial control is the post-buyout ownership bymanagers. As reported in Table 6, the median level of managerial ownership is24.0% for EBOs, and 38.8% for MBOs, and the difference in medians issignificantly different from zero. By comparison, Kaplan (1989a) reports thatMBOs with a minimum transaction size of $50 million have a median post-buyout management ownership of 22.6%. While this suggests that MBO man-agers have at least as much control as EBO managers, this interpretationignores the possibility that EBO managers control unallocated ESOP shares, anissue we review below.
4.2.3. Employee control in EBOsTable 6 indicates that for the sample of full EBOs, the median level of shares
held by the ESOP and post-buyout employee ownership is 56.9%, on a fullydiluted basis. This compares to a median level of pre-buyout employee owner-ship, which includes pre-existing ESOP shares and shares held by other pensionplans, of 1.5%. Thus, when the ESOP loan is repaid, which occurs after nineyears for the median firm, and the ESOP shares are fully allocated to employees’accounts, employees typically end up as majority shareholders in EBO firms.However, since most ESOP shares are unallocated immediately following thebuyout, the ownership percentage reported for employees on a fully allocatedbasis overstates the actual control rights employees initially receive in an EBO.Employees must receive the cash flow and control rights on their allocatedshares, but they do not necessarily receive the rights associated with unallocatedshares.
Employees can control the voting of unallocated ESOP shares, if the trustee isdirected by the plan document to vote the unallocated shares in the sameproportion as the allocated shares are voted. Chaplinsky and Niehaus (1994)report that over 80% of ESOPs in publicly held firms require the trustee to voteunallocated shares as allocated shares are voted. Thus, in most public firms,employees effectively control the voting of all ESOP shares, regardless ofwhether the shares are actually allocated. In contrast to the experience of public
S. Chaplinsky et al./Journal of Financial Economics 48 (1998) 283—332 313
firms, in only three of the full EBOs do employees control the unallocatedshares. That is, trustees generally vote unallocated shares independently of howallocated shares are voted. The implication is that employees do not receive thecontrol rights associated with unallocated ESOP shares. These rights usually restwith a trustee who is either appointed by the board or is a member of the board.
To examine employee control rights one year after the buyout, we assume thatthe ESOP loan is repaid uniformly over time, and that excess pension assets areused to increase allocated shares immediately following the buyout. Under theseassumptions, employees control 15.7% of the shares one year after the buyoutfor the median firm, well below the 56.9% reported on a fully allocated basis.
Even though direct voting of shares by employees is limited, employeespotentially can influence firm decision-making through board representation.However, in only three of the 18 full EBOs do we find employee representativeson the board and then only as minority members. Employee influence is morefrequent in spinoff EBOs, as six of the 14 spinoff EBOs have employeesrepresented on the board. In five of the six spinoff EBOs with employeerepresentation, unions negotiate on behalf of employees in the buyout (seeAppendix B). Employee representation also appears to be related to the level ofemployee ownership, as employee ownership is close to 100% in all but one ofthe transactions with employee representation. More importantly, even in thetransactions with employee representation, employees typically do not obtaina majority of the board seats. Among the spinoff EBOs, only Seymour Wire’sboard has more employee members than managers and outsiders.
The general lack of initial employee voting rights and board representation isconsistent with lenders providing funding only if the potential conflicts betweenemployees and non-employee investors over corporate policy are mitigated.One way to mitigate such conflicts is to reduce employee control rights until thedebt is repaid. A revealing example of this strategy is Weirton Steel (seeAppendix B). Following the buyout, its board consisted of three union represen-tatives, the CEO, and eight outside members. Outside members were added tothe board at creditors’ insistence so that the firm would be independent ofemployee control for the first six years after the buyout. Hence, the evidencesuggests that EBOs are structured to reduce the costs of employee ownership.
The lack of employee control of unallocated ESOP shares is also consistentwith the hypothesis that managers include employees to enhance managerialcontrol. When ESOP shares are combined with the shares directly owned bymanagement, EBO managers generally obtain greater control in the post-buyout period than MBO managers. The possibility that employees wouldcompete with managers for control once the ESOP shares are allocated toemployees suggests that the managers, at the time of the buyout, are willing toaccept the possibility of less control in the future for additional control immedi-ately following the buyout. Of course, control-seeking managers who anticipateleaving the firm after a few years might find this to be a desirable tradeoff.
314 S. Chaplinsky et al./Journal of Financial Economics 48 (1998) 283—332

4.3. Post-buyout record
Previous studies investigate whether the high debt service payments resultingfrom leveraged buyouts lead to asset sales, layoffs, and, ultimately, the failure ofthe enterprise (see, e.g., Kaplan, 1991; Muscarella and Vetsuypens, 1990; andOpler, 1993). As discussed earlier, a potential disadvantage of employee owner-ship is that it could lead to conflicts between employees and other investors, andinhibit managers’ ability to restructure and, therefore, to survive. On the otherhand, one would expect EBOs to be structured to minimize these conflicts, andindeed the evidence on employees’ limited control rights is consistent with thisview. To investigate whether employee participation affects a buyout firm’sability to restructure, we compare EBOs and MBOs with respect to asset sales,employment growth, and survivorship.
Using information from the Wall Street Journal Index, we compare theproportion of EBO firms that sell assets relative to the number of MBO firmsthat sell assets subsequent to the buyout, through 1993. Although our tests donot account for the size and quality of the assets sold, we find that 16.7% of the18 full EBOs had asset sales, compared to 38.5% of the 118 full MBOs.A chi-square test of homogeneity rejects the hypothesis that the proportions arethe same at the 10% level. It is not clear whether the reduced number of assetsales by EBO firms is indicative of a lack of assets valuable to others or whetheremployee ownership hampers managers’ ability to restructure. In theory, onereason EBO firms could have fewer assets that have value to others is that theirassets have more firm-specific value. However, our earlier presented measures offirm-specific assets do not support this explanation.
To examine whether employment growth differs between EBOs and MBOs inthe post-buyout period, we gather firm-level employment data from Standardand Poors’ Register of Corporations, Directors and Officers for the year prior tothe buyout, and for the third and fifth year after the buyout. Table 7 summarizesthe post-buyout employment changes for full EBOs and full MBOs. The medianEBO firm reduces employment in the three years after the buyout by 3.8%,while the median MBO firm does not change employment. The difference inmedian values for EBOs and MBOs is not statistically significant at the 10%level. For the five-year period, the median percentage decline in employment is7.7% for EBOs, and 0.0% for MBOs, but again the difference in median valuesis not statistically significant.
The last two rows of Table 7 present employment changes after adjusting forindustry effects. Specifically, we calculate the difference between the percentagechange in employment for each firm and subtract the percentage change inindustry employment over the period, where industry employment is based onthe figure reported in Employment and Earnings for the three-digit standardindustrial classification (SIC) code. For this measure, if the three-digit data areunavailable, the two-digit code is used. Relative to their industry, both the
S. Chaplinsky et al./Journal of Financial Economics 48 (1998) 283—332 315

Table 7Percentage change in employment, for employee buyouts (EBOs) and full management buyouts(MBOs) of entire companies completed during 1980—1990, from one year before the buyout throughthree and five years after the buyout.
Data are adjusted for industry by taking the buyout firm’s percentage change in employment andsubtracting the percentage change in employment for all firms in the same industry, as defined by thethree-digit standard industrial classification (SIC) code. The two-digit SIC code is used if the three-digit code is unavailable. Industry data are reported by Employment and Earnings. In no case do wereject that the mean or median value for EBOs is the same as for MBOs. Difference in means is basedon a t-test, and difference in medians is based on a rank sum test.
Employment growthPost-buyouttime period
Industryadjusted
Statistic
EBOs MBOs
3 Years No N 18 94Median !3.8% 0.0%Mean !1.4% 19.3%
5 years No N 15Median !7.7% 0.0%Mean 3.3% 22.6%
3 years Yes N 18 80Median !9.6% !1.8%Mean !1.6% 21.2%
5 years Yes N 15 81Median !10.8% !1.7%Mean 2.4% 26.4%
median EBO and MBO firms reduce employment after the buyout. While thedecrease for EBO firms is larger than for MBO firms, the difference between themedian values of EBO and MBO firms is not statistically different from zero.Thus, the results indicate that employee ownership does not prevent managersfrom reducing employment to the same extent as in MBOs. In addition, we findbased on information obtained from the Wall Street Journal, NEXIS, and ABIProquest, that at least seven of the 18 full EBO firms announce layoffs or plantclosings, and three of the 14 spinoff EBOs announce layoffs or plant closingssubsequent to the buyout, through 1993. This evidence is consistent with thefinding that EBOs are structured to reduce the influence of employees and thepotential conflicts posed by employee control.
The long-term outcomes for EBOs and MBOs as ongoing concerns aresimilar. By the end of 1993, 12.5% of 32 EBO firms undergo Chapter 11reorganizations, 18.8% are acquired, and 18.8% go public. Thus, 50% of theEBO firms remain private with considerable employee ownership. The resultsfor the MBO sample are similar: 14.8% go into bankruptcy proceedings, 16.2%
316 S. Chaplinsky et al./Journal of Financial Economics 48 (1998) 283—332

12These results are consistent with the LBO studies by Kaplan (1991), Degeorge and Zeckhauser(1993), and Van de Gucht and Moore (1997).
are acquired, and 23.2% go public.12 Thus, the survival rate for MBO firms is45.8%. Additional evidence on the longer term effects of employee ownership isprovided in the epilogues for the full EBOs in Appendix A. This evidence, andthe evidence on survivorship rates, suggests that EBOs are a viable organiza-tional structure for certain firms.
5. Conclusions
This article is the first study to empirically examine the factors that motivateemployee participation in a buyout. The analysis yields a number of importantfindings that help to explain why employees participate in buyouts. Prior to thebuyout, we observe that, relative to MBOs:
f EBO firms usually have a lower value of assets per employee.f EBO firms have poorer stock price performance, and lower leverage.f EBO firms are more likely to have overfunded pension plans.f EBO firms are more likely to be under takeover pressure.f EBO firms usually have lower ownership by officers and directors.
Following the buyout, we observe that:f Cash-reducing compensation changes are reported by only 2.6% of MBOs
compared to 56% of EBOs.f EBO firms are as highly leveraged as MBO firms, but use a higher proportion
of bank debt.f EBO firms have lower percentage ownership by third party and institutional
investors.f Employees fail to obtain substantial control rights early in EBOs.f EBO firms do not appear to differ from MBO firms with regard to employ-
ment growth or long-term outcomes.
As the number and scope of the findings might suggest, the evidence does notpoint to a single force motivating employee participation in buyouts. This is notsurprising given the large number of theoretical factors affecting the costs andbenefits of employee ownership, and given that EBOs involve substantialfinancial and operating changes. Nevertheless, we find three general themespresent in many of the findings.
The first theme concerns the role that employee participation plays inthe restructuring of labor contracts, and how the resulting changes facilitate
S. Chaplinsky et al./Journal of Financial Economics 48 (1998) 283—332 317
financing of the buyout. By having employees trade their capital in definedpension benefit plans for stock in the post-buyout firm, the firm is able to gainaccess to excess pension assets, which reduces the amount of outside borrowingthat is needed. Also, EBO firms restructure labor contracts in ways that lowerthe pre-buyout cash commitments of employee compensation costs, and, per-haps, in some instances, lower the level of employee compensation costs. Thesechanges, in turn, help the firm obtain the financing needed for the buyout. Thepoor performance of EBO firms, and their low level of pre-buyout leverage,suggests that these firms would have a hard time borrowing the funds necessaryfor the buyout absent these changes in labor contracts.
The second theme is that EBOs have characteristics and are structured tomitigate the costs of employee ownership. EBOs tend to have lower employeerisk-bearing costs, as indicated by lower asset-to-labor ratios. Conflicts ofinterest between employees and debtholders are attenuated by withholdingsubstantial control rights from employees until most of the buyout debt isretired. Perhaps to avoid the potential conflicts with employees, third-partyequity investors have limited participation in EBOs. Consistent with the con-flicts being effectively mitigated, post-buyout employment growth and long-term outcomes for EBO and MBO firms are similar.
Finally, the circumstances in which EBOs tend to occur, including lowpre-buyout ownership by officers and directors, poor performance, takeoverpressure, and high risk of employee firm-specific capital appropriation, are alsothe circumstances in which managers might be motivated to use an EBO tomaintain control. As noted above, the ownership structure that emerges inEBOs typically features a large degree of managerial control. Our evidence,however, cannot distinguish whether this high degree of managerial controloccurs from managers’ desire for greater control, or to reduce the potential forconflicts among the capital providers to the buyout.
Appendix A. Case studies of full employee buyouts
Information for the case studies is obtained from SEC disclosure documentsfor the buyouts and text searches of Nexis and ABI Proquest files. Unlessotherwise noted, employment information gathered from Standard and Poors’Register of Corporations is for one year before and five years after the EBO.Financial performance is measured by the pre-buyout market-adjusted stockreturn from day !550 to day !50 (MAR[!550,!50]), relative to the firstmention of takeover activity. The appendix is updated for events throughDecember 1993.
1. American Standard, Inc.American Standard is a leading manufacturer of plumbing supplies, air-
conditioners, and auto-related products. Prior to the buyout in March 1988,
318 S. Chaplinsky et al./Journal of Financial Economics 48 (1998) 283—332
American Standard attempted to change its strategic focus, selling several of itsdivisions, including Mosler Safe, to a management group in an ESOP spinoff.The firm’s pre-buyout market-adjusted return in the two years leading up to theEBO, MAR[!550,!50], was !7.4%. In January 1988, Black and Deckermade an unsolicited bid of $56 per share for American Standard. After invitingoffers from other parties, management proposed a recapitalization plan thatincluded an ESOP. Black and Decker withdrew a $77 per share offer in Marchsubsequent to American Standard’s acceptance of a $78 per share, or $2.5billion, buyout offer from Kelso and Company, Inc. No other outside bidderscompeted for the company.
The firm terminated its existing pension plan, and used the excess assets of $50million to repay part of the ESOP loan. Subsequent to the buyout, the firm hasrecovered from financial distress suffered in 1990 in part due to greatly improvedoperating efficiency. This improvement generated some $200 million that hasbeen used to reduce the buyout debt. The number of employees decreased from50,400 employed one year prior to the buyout to 33,300 employed five yearslater. The firm remains privately held.
2. American Sterilizer Co.American Sterilizer is a manufacturer of hospital equipment and health care
products. There is no evidence of takeover pressure prior to the buyout inFebruary 1985. However, during the year prior to the buyout, the firm omitteda dividend, combined two divisions, sold a division, and closed a plant. TheMAR[!550,!50] was !31.7%. Bristol-Myers provided $30 million infinancing for the buyout in exchange for an option to acquire the AMSCO-HallSurgical division. An additional $25 million was provided by the termination ofan over-funded pension plan.
Subsequent to the buyout, American Sterilizer was merged in 1987 into a newcompany with new management, Amsco International. By the end of 1990, saleshad increased, net income had doubled, and long-term debt was significantlyreduced. In March of 1991, Amsco International went public. In the yearfollowing the IPO, its stock traded at prices 60% above the IPO offer price. Thenumber of employees decreased from 3500 prior to the buyout to 2500 five yearslater.
3. Amsted Industries, Inc.Amsted Industries is a diversified manufacturer of products for the construc-
tion, building, and railroad industries. In April 1985, Maxxam Associates fileda Schedule 13D with the SEC, disclosing its ownership of 8.6% of the shares. Inresponse, Amsted filed suit and took other defensive measures such as adoptinga poison pill. The firm’s MAR[!550,!50] was !1.8%. After investigatinga number of alternative transactions, including the use of an ESOP ina leveraged buyout, an ESOP was established. In October 1985, the definedbenefit pension plans were terminated. A month later, management and theemployees proposed an EBO for $550 million, or $50 per share, but did not
S. Chaplinsky et al./Journal of Financial Economics 48 (1998) 283—332 319
obtain financing for the transaction. In early 1986, directors considered a revisedbuyout offer of $517 million by management and employees which, after furtherrevision, was approved by shareholders in May 1986. The proposed ESOPincluded a feature that guaranteed employees a minimum retirement benefit.Excess assets from the termination of an over-funded pension plan coveringsalaried workers provided $75 million, which was used to repay part of theESOP loan. Union pension plans continued as before the EBO. Other changesin compensation include the termination of a stock appreciation plan, and anemployee capital accumulation plan.
Due to expenses for the ESOP, the firm reported losses in its first year, butincome has improved since then. The firm has reopened several plants, acquiredanother firm, and its bond rating has improved. Preferred stock issued inconnection with the EBO has been recalled. Employment increased over the fiveyears following the EBO from 6900 to 8100. The firm remains privately held.
4. Blue Bell Inc.Blue Bell manufactures apparel products under three major brands: Wran-
gler, Jantzen, and Red Kap. The pre-buyout market-adjusted return for BlueBell in the two years leading up to the EBO in May 1984 was !45.9%. In 1981,Bass Brothers Enterprises began accumulating Blue Bell stock, and had ac-quired 23% of the stock by 1984. When Blue Bell management and Bass couldnot come to terms, Blue Bell repurchased the shares from Bass in severaltransactions. Prior to the last repurchase, Blue Bell management approachedKohlberg, Kravis, and Roberts, Inc. (KKR) in April 1983, and Kelso andCompany, Inc. in July 1983, about the possibility of a buyout, but no proposalmaterialized. In April 1984, Canada’s Belzberg family made a Schedule 13Ddisclosure, and by June had requested U.S. government clearance to acquire halfof Blue Bell’s stock. In response, Blue Bell’s management approached For-stmann, Little and Company about a possible buyout. No proposal materializedfrom that approach and Blue Bell’s management again requested Kelso todevelop a proposal for a buyout. In July, after encountering difficulties inobtaining financing at $51 per share, Blue Bell agreed to an EBO at $47.50 pershare. There is no evidence that excess assets from terminated pension fundsprovided funds for the transaction. Five established pension plans coveringgeneral workers continued after the EBO.
Two years after the buyout, Blue Bell was acquired by VF Corporation,a rival firm and the maker of Lee jeans. VF Corporation’s overall acquisitioncost was $90 million above the buyout price. Analysts attribute some of thegain in value to the improved operating performance. The ESOP became thesecond-largest holder of VF stock. Employment fell from 34,000 prior to theEBO to 20,000 at the time of VF’s purchase.
5. Charter Medical CorporationCharter Medical operates a network of psychiatric hospitals, and is a major
supplier of employee mental health care services. In the early to mid 1980s, the
320 S. Chaplinsky et al./Journal of Financial Economics 48 (1998) 283—332

psychiatric hospital industry experienced rapid growth. Employee mentalhealth-care coverage plans made up 70% of Charter’s revenues, leaving thecompany vulnerable in the late 1980s when many firms reduced spending onthese plans. In response, the firm laid off workers and closed some clinics. Priorto the EBO in September 1987, the MAR[!550,!50] was !34.6%. InSeptember 1987, senior managers proposed to take the firm private at $40per share. No competing bids followed, largely because the Chief ExecutiveOfficer (CEO), William A. Fickling Jr., and his family controlled over 75% ofthe shares. The stock market crash in October 1987 changed the outlook forthe company. For a time, it appeared that available financing would fail toproduce an offer high enough to be deemed fair from the shareholders’ pointof view. In March 1988 the board approved a revised plan to take the firmprivate for $30.25 per share in cash, and $7.00 per share in pay-in-kinddebentures.
The ESOP, which served as the sole pension plan for the 14,000 employees,acquired 68% of the equity at the time of the buyout. A year later, despitereported losses, the ESOP bought more shares from Fickling at a price 15%higher than at the time of the buyout, which was a price provided in the originalbuyout agreement, and employee ownership increased to 81%. Less than onemonth later, Charter executives revealed accounting errors that might have ledto the overvaluation of the firm. By the end of 1990, Charter defaulted on $1.8billion in debt. Charter filed for Chapter 11 in June 1992, and emerged a monthlater as a publicly held firm with bondholders owning 93% of the equity. TheESOP retained only 2.4% ownership, worth $16.8 million, in contrast to itsoriginal stake of $455 million. Because the value of the ESOP had been sodiluted, the firm committed to a second pension plan. The Department of Laborsuccessfully filed suit against the ESOP trustee and Fickling claiming that thevaluation in the second ESOP transaction failed to properly account for thedebt issued to finance the ESOP stake.
Since exiting from Chapter 11, Charter has achieved a modest comeback.Operating income has increased 21%, and its stock price rose from $7 per share,when the firm emerged from bankruptcy to $11 per share in July 1993. Theseven-member board, controlled by four outside members, ousted Fickling, whoheld options to hold up to 13% of post-reorganization equity, from his positionas CEO and chairman. Despite the firm’s problems, employment grew from6,200 prior to the EBO to 17,000 five years later.
6. Cone Mills CorporationCone Mills manufactures and markets textile products. In late October 1983,
Western Pacific Industries announced both that it held 333,000 shares, and thatit had acquired an option to purchase 600,000 more shares from Caesar Cone II,a director and member of the founding family. Cone Mills resisted WesternPacific’s attempts to gain control, and searched for a friendly buyer. A buyoutplan involving current managers, an ESOP, and institutional investors was
S. Chaplinsky et al./Journal of Financial Economics 48 (1998) 283—332 321

proposed in November 1983. Prior to the formation of the buyout plan, thefirm’s MAR[!550,!50] was !15.9%. Shareholders approved the $70 pershare EBO in March 1984.
The firm terminated an existing pension plan at the time of the buyout,generating approximately $50 million in excess assets. Since employees receivedpreferred shares with no voting rights in the ESOP, management and institu-tional investors held all of the post-EBO control, holding 83.3% and 16.7% ofthe voting shares, respectively. In 1991, the courts ruled that employees hadbeen misled about their retirement benefits. When the firm went public in1992, part of the IPO was earmarked to redeem 49% of the preferred stockheld by employees. The union challenged the fairness of the IPO whereincommon shareholders stood to gain 1,200% on their investment, while the valueof the preferred shares held by employees had not increased. In response,the firm agreed to establish a 401(k) plan for employees. In 1993, the courtsawarded $15 million to employees, thereby ending the five-year class actionsuit.
Shortly after the buyout, Cone Mills closed eight plants due to competitionfrom high levels of imported goods, and reduced domestic demand for thecompany‘s goods. However, the firm has made acquisitions in the U.S. andinternationally, and in recent years has experienced growing revenues frominternational sales. Within one year after the IPO, the stock price increased by50%. At the end of 1993, Cone Mills was the world’s largest producer of denim,with a market share of 25%. Employees, which numbered 14,000 before thebuyout, numbered 10,100 five years later.
7. Dan River, Inc.Dan River, Inc. manufactures and markets textile products. Prior to the EBO
in December 1982, the firm embarked on a reorganization plan that resulted inlayoffs at all levels of the firm. In 1982, Dan River halved its quarterly dividend,and salaried employees accepted a 6-month delay, and subsequent reduction, ofordinary merit increases. The MAR[!550,!50] was !18.3%. In September1982, Carl Icahn with firms controlled by him, acquired 6.9% of the commonstock of Dan River, and expressed interest in acquiring Dan River at a price ofapproximately $16 per share. In response, Dan River’s board of directorsauthorized a series of cumulative convertible voting preferred stock, and issuedall shares to a stock bonus plan for salaried employees. The board maintainedthat the immediate issue of shares to the stock bonus plan was compensation forthe earlier reduction in merit increases. Icahn filed suit to void the stock bonusplan, and commenced a tender offer of $18 per share in October 1982 with theintent of liquidating a portion of the firm after the takeover. The board ofdirectors rejected Icahn’s offer. Dan River explored several transactions tothwart the hostile tender offer, including a self-tender and a leveraged buyout,but no action was taken, in part due to uncertainties over financing. In lateDecember 1982, Kelso and Company, Inc. presented a proposal to Dan River’s
322 S. Chaplinsky et al./Journal of Financial Economics 48 (1998) 283—332

management to acquire the firm in a leveraged buyout at $20 per share, or $135million, with the intention of continuing operations. In April 1983, the boardapproved the EBO at $22.50 per share. The firm replaced its existing pensionplans with the ESOP, and used $16 million in excess assets from the terminatedplans to repay part of the ESOP loan. Employees also agreed to the terminationof Dan River’s profit sharing and stock bonus plans.
In 1985, Dan River sold five plants to Alchem Capital. In 1987, the firmconsidered raising capital by going public. However, the IPO did not material-ize. In 1989, Dan River was acquired by a private investment group headed byJoseph Lanier. The ESOP trustee agreed to the acquisition because it providedthe firm with the capital necessary to further modernize and expand facilities.Employees, numbering 17,000 before the buyout, numbered 7000 at the time ofLanier’s purchase.
8. Dentsply International, Inc.Dentsply International is the world’s largest manufacturer and distributor of
dental supplies and equipment. In late 1980, Cooper Laboratories took a smallposition in Dentsply, and began discussions with the firm about a possibletakeover. In October 1981, Cooper increased this position to 7%, and stated ina Schedule 13D disclosure its intention to acquire more shares. Dentsply’s boardrejected Cooper’s overtures, and developed an EBO proposal in response. Thefirm’s MAR[!550,!50] was !42.8%. Management claimed that its motiva-tion for the proposal was eliminating Cooper’s threat by gaining majorityownership through the ESOP. In May 1982, the board of directors approved thebuyout, including the repurchase of Cooper’s shares, at $25.50 per share, or $130million. The buyout was partially funded by $10 million in excess assets froma terminated pension plan. The ESOP also resulted in the termination of theexisting employee stock purchase plan.
Since the buyout, the firm has performed well. Sales in 1981 were $200 millioncompared to approximately $400 million in 1992. Employees, numbering 7100before the buyout, numbered 3500 five years later. Ten years after the buyout,Dentsply merged with Gendex Corporation, a publicly held maker of dentalX-ray equipment. Under the terms of the merger, all shares of Dentsply wereexchanged for 13.8 million shares of Gendex common stock in a transactionworth $590 million, or over five times the original EBO stock valuation.Dentsply’s ESOP received 56% of the post-merger shares.
9. Dyncorp Inc. ( formerly Dynalectron Corporation)Dyncorp is a professional service company that provides technical support for
defense and commercial aviation. Prior to the EBO in October 1987, theMAR[!550,!50] was !20.6%. The completion of the EBO in 1988 cul-minated an internal struggle for control between Dyncorp’s chairman of theboard, Jorge Carnicero and its president and chief executive officer, DanielBannister. Carnicero initiated the takeover battle by offering to purchase all ofDyncorp’s shares in an MBO, to be known as CJM Holdings, for $24 per share
S. Chaplinsky et al./Journal of Financial Economics 48 (1998) 283—332 323
in September 1987. A special committee assembled to consider the buyoutannounced its intention to solicit other offers. Two weeks later, Bannister hadformed a group, consisting of two outside investors, Capricorn Investors, L.P.and Pittsfield Finance Company, and employees, known as DME holdings, thatproposed to buy the firm for $24.25 per share, or $235 million. UltimatelyBannister’s plan prevailed. Bannister noted that his plan differed from the rivalCarnicero plan largely on the basis of the potential productivity gains underemployee ownership. The company terminated an over-funded pension planthat generated $7.5 million in excess assets, which was used to repay part of theloan. At the same time, the firm instituted a new stock incentive plan for keyemployees.
The post-EBO performance of the company appears to be excellent. In 1993,the company announced the completion of its tenth acquisition since thebuyout. Through these acquisitions, the company has successfully reduced itsreliance on contracts sponsored by the Department of Defense. Despite the largegrowth in assets, the company is ahead of schedule on debt repayment, an-nouncing an early redemption of some of its buyout debt in 1992. Prior to thebuyout, the company had 9950 employees, who five years later numbered18,000. The company remains privately held.
10. Arthur D. ¸ittle, Inc.Arthur D. Little is a multinational professional services company whose
primary business is technology and management consulting. Prior to the EBOin March 1988, the company performed well, as evidenced by a MAR[!500,!50] of 7.6%. At the time of the EBO, 70% of the company’s equity was heldby employees in the Memorial Drive Trust (MDT). In July 1987, PlenumPublishing Corporation made an unsolicited offer to buy the remaining 30% ofpublicly held equity. A.D. Little rejected Plenum’s offer, and proposed to buythe public equity through an ESOP for $60 per share. Funding for the transac-tion did not involve excess pension assets. In addition to the ESOP, pensionbenefits continued to be paid from MDT and a 401(k) plan.
The post-EBO performance of the firm also appears to be strong. Annualrevenues of A.D. Little reached a record $358 million in 1991, a 13% increaseover 1990. Employment levels decreased slightly, from 2600 prior to the buyoutto 2400 five years later. The company remains employee-owned and privatelyheld.
11. ¸yon Metal ProductsLyon Metal Products manufactures metal storage products and storage
systems. The $28 million EBO announced in February 1985 followed an ex-tended period of sub-par performance, and a two-year takeover battle for thefirm. In the two years leading up to the EBO, the firm reported earnings losses,omitted a dividend, and initiated a cost-containment program that included thesale of a plant. The MAR[!550,!50] was !60.0%. During the same period,the firm agreed to separate mergers with Minstar Inc. and Auron Corporation,
324 S. Chaplinsky et al./Journal of Financial Economics 48 (1998) 283—332
but both offers failed. The proposed merger with Auron failed when a lawsuitover the ownership of excess pension assets prevented the timely use of the assetsfor financing. A management buyout of the firm also failed when compensationconcessions required to finance the buyout were rejected by union employees inJuly 1984. In February 1985, management and salaried workers, with the use ofan ESOP, offered to purchase the outstanding public equity at $20 per share.This offer was contingent on the use of the disputed $12 million in excesspension assets to finance the buyout. The excess assets were used to purchaseESOP shares. In connection with the offer, the EBO repurchased the 38% stakeheld by Jacobs, and terminated an existing stock option plan.
Subsequent to the EBO, the firm purchased Model Industries and AMDIndustries, both steel storage manufacturers, in 1987. Before the buyout, em-ployees numbered 1100, and three years later, the firm employed 628. The firm isthe leading U.S. manufacturer of steel shelving and related storage products.The firm remains employee-owned and privately held.
12. National Color ¸aboratories, Inc.National Color Laboratories (NCL) specializes in photographic imaging and
film processing. Immediately prior to the buyout in August 1984, there is noevidence of takeover-related activity, which is not surprising given that fourmanagement shareholders collectively owned 72% of the shares. In August of1982, two years before the EBO, Carnation Company discussed a possiblepurchase of NCL, but these talks terminated without further interest surfacing.Prior to the buyout, the MAR[!550,!50] was !3.5%. An acquisitiongroup of major shareholders and an ESOP completed a leveraged buyout forthe firm, valued at $4.50 per share, or $5.2 million, in February 1985. While themajor shareholders retained a 36% stake, terms were arranged for the firm topurchase the remaining shares in the future. Excess assets from terminatedpension plans do not appear to have provided any of the buyout financing.However, an employee stock purchase plan and an employee stock awardplan were terminated, and the firm ended contributions to the profit sharingplan.
Little is reported about the post buyout performance of the company exceptthat the firm remains privately owned. Employment levels are unchanged sincethe time of the buyout, and remain at 175 employees.
13. Northwestern Steel and ¼ireNorthwestern Steel and Wire is a leading U.S. producer of structural steel
products and fabricated wire products. Since May of 1986, Northwestern’smanagement had been under pressure from a group of shareholders, who hadcollectively filed a Schedule 13D with the SEC, to increase shareholder value.The shareholder group consisted primarily of descendants of the founder, andheld 54% of the equity. The company’s MAR[!550,!50] was !3.8%. Inresponse to this pressure, management considered an MBO, as well as severalbids made by the shareholder group, but none gained board approval. In
S. Chaplinsky et al./Journal of Financial Economics 48 (1998) 283—332 325
response to a proposal by the United Steelworkers of America (USW), manage-ment explored and ultimately agreed to an EBO in February 1988. As part of theagreement, USW workers agreed to a 7% reduction in employment costs fromexisting levels, and to the termination of their profit sharing plan. Unionworkers would receive $10 million in cash from the plan as part of the termina-tion. Salaried workers, except for management, agreed to a 7% cut in employ-ment costs, and to the suspension of existing stock bonus and incentiveplans.
Following the EBO, Northwestern has achieved substantial operating im-provements, but has also struggled with a high debt load. In March 1992,Kohlberg and Co. purchased $35 million of newly issued shares, representing 52percent of the common stock. In June 1993, the company completed an initialpublic offering, and issued senior notes. Together these issues reduced aggregateindebtedness, and lowered interest expense. After the sale, Kohlberg owned 36%of the outstanding common shares, management 44%, and the ESOP 20%.Before the buyout, employees numbered 2300, and five years later, the firmemployed 2800.
14. Pamida, Inc.Pamida is a general retailer that operates a chain of discount stores through-
out the Midwest. Prior to the buyout in June 1980, there is no evidence ofcontrol-related activities, most likely because D.J. Witherspoon, the CEO andchairman of the board, owned 44% of the equity. Throughout the 1970s, thefirm considered a variety of ways for Witherspoon to retire and transfer thecompany to new management. The firm had poor pre-buyout financial perfor-mance, as the MAR[!550,!50] was !65.0%. The EBO finally proposed in1980 was designed to provide for Witherspoon in retirement, to protect the valueof investments to shareholders, and to preserve the jobs of employees. A revisedoffer of $6 per share was made and approved by shareholders in January 1981.Pre-buyout senior management and officials were retained, except for the chair-man and the vice-chairman of the board. Excess assets from terminated pensionplans do not appear to have provided any of the buyout financing.
In 1986, Pamida agreed to be acquired by management, Citicorp CapitalInvestors, and other institutional investors for $169.5 million. In this transac-tion, employees received $70.63 per share, compared to the $6 buyout price. In1991, the firm went public again. In May 1993, Pamida operated 180 stores,compared to 200 prior to the buyout. Employment levels have remained steadyat around 5000 employees since the buyout.
15. Parsons CorporationParsons is an engineering company specializing in heavy construction and
building contracting. Parsons established its ESOP in 1975 through a whollyowned subsidiary RMP Inc., when it acquired a 30% stake from the trust of thelate founder, Ralph M. Parsons. Prior to the EBO in September 1984, the firmperformed exceptionally well, with a MAR[!550,!50] of 36.1%. Although
326 S. Chaplinsky et al./Journal of Financial Economics 48 (1998) 283—332
not known at the time, in early 1984 the firm received an unsolicited inquiryproposing an LBO with management at $30 per share. The firm rejected theoffer, and no further discussions ensued with the third party. The firm began toconsider going private through an ESOP with Kelso and Company, Inc. early in1984. In September 1984, the firm accepted a revised $32 per share offer for the71% of shares not already owned by the ESOP. Pre-existing defined contribu-tion plans were consolidated into the ESOP.
The firm has performed well in the post-buyout years. In 1993, Parsonsranked second in the industry in domestic contracts. Employment levels de-creased from 14,000 prior to the buyout to 8800 five years later. The companyremains privately owned.
16. Raymond International, Inc.Raymond International is an international engineering and construction
company. Prior to the EBO proposal in May 1983, the firm performed poorly,with a MAR(!500,!50) of !67.7%. The EBO was preceded by the dis-closure in January that Jacobs Engineering Group had acquired a 9.9% interestin the firm. In late April, Raymond entered a standstill agreement with JacobsEngineering, and repurchased its shares at $20.25 per share. Shortly thereafter,the company publicly announced that it was considering an EBO in whichmanagement, salaried employees, and Kelso and Company, Inc. would partici-pate. In the original offer, common shareholders received $25.00 per share. Thisoffer was later increased to $27.50 per share. The ESOP replaced Raymond’sexisting pension plan. Terminating the pension plan provided $20 million inexcess assets, which was used to repay part of the ESOP loan.
Revenues dropped from $1.6 billion in 1982, shortly before the EBO, to $845million in 1984, the first year post-EBO. Raymond defaulted on $30 million inloans in 1986. The chairman and CEO who led the buyout attempt resigned,and banks took control of the firm in 1986. Attempts to renegotiate loanagreements and reorganize the firm ultimately failed, and the firm filed forChapter 11 in August 1989. At that time, the firm employed only 500 employees,compared to 6000 prior to the EBO.
17. Securities American Financial Enterprises, Inc. (SAFE)Securities American Financial Enterprises (SAFE) is the parent company of
Security Life Insurance Co. of America (SLICA), which writes individual andgroup life and health insurance for firms of 15 to 5000 employees. At the time ofthe buyout proposal in February 1989, there is no evidence that the firm wasunder takeover threat, although management subsequently admitted to beingapproached in prior months by outside buyers. The firm’s MAR[!550,!50]was !26.10%. The terms of the buyout called for the ESOP to repurchase thepublic, non-management, shares for $10.50 per share. As a result, SAFE’s ESOPwould increase its holding from 12% to 53%. The EBO was structured to allowfor the eventual liquidation of shares by the Chairman and founder of the firm,without a change in control that might involve the loss of other key personnel.
S. Chaplinsky et al./Journal of Financial Economics 48 (1998) 283—332 327

The post-EBO performance has been satisfactory. Duff and Phelps Credit RatingCo. lowered its rating from AA! to A# in July 1993. Return on assets declinedfrom 6.61% in 1988 to 0.37% in 1992. As of December 1992, SAFE had reduced itsEBO debt to $11 million from the original $15 million. Employment has remainedsteady at 86 employees since the buyout. The firm remains privately held.
18. ºnited States Sugar, Inc.U.S. Sugar is one of the nation’s leading agricultural products companies.
Prior to the buyout in September 1983, the MAR[!550,!50] was !35.4%.However, there is no evidence of prior takeover activity. The motivation for thebuyout appears to have been the desire of the C. S. Mott Family Holdings toreduce its 70% equity stake in the company to pursue several charitableactivities connected with its foundations. Following completion of the EBO, theCharles Stewart Mott Foundation, the Mott Children’s Health Center, andmembers of the Mott family continued to own in excess of 50% of the commonstock. Although the firm intended to go private in 1983, following the tenderoffer, 5% of the public shares remained outstanding. A follow-up repurchase bythe ESOP in 1987 completed the transaction to create a privately held company,and increased employee ownership to 44.2%.
Since the buyout, the firm has expanded into the growing and processing ofcitrus, as the growth in demand for raw sugar has declined. The firm establishednew labor practices to reduce costs and increase efficiency. Employment in-creased from 2100 prior to the EBO to 2400 three years later. The companyremains privately held.
Appendix B.
Description of changes in compensation at the time of buyout and the composi-tion of Boards of Directors (BOD) for spinoff EBOs.
EBO ESOPStake
Employees Changes in compensation Members ofBOD
Hyatt-Clark
100% Wages were cutapproximately 25% andbenefits by 50%.Compensation under thenew plan includes loweredbase pay, a monthly pro-ductivity bonus, sharingof after-tax profits above$500,000, and payment of15% of salary as stock.
Threemanagement,3 unionrepresentatives,and7 independentmembers
328 S. Chaplinsky et al./Journal of Financial Economics 48 (1998) 283—332

EBO ESOPStake
Employees Changes in compensation Members ofBOD
RepublicEngineeredSteel
76% 1000Salaried,3900 Union
Forty-two monthagreement whereby unionemployees were creditedwith $16 million towardspurchase price fromconcessions granted underprior contracts. Unionemployees got $0.40 perhour increase in wages,plus some additional ben-efits. Salaried employeesagree to salary reductionsequal to $4.3 million.
Fourmanagement,4 union, and5 independentmembersapproved byUSW andcompany
RepublicStorageSystems
100% 250 Salaried,350 Union
All employees accept$0.15 per hour cut inwages and benefits forundisclosed period oftime. A portion of futureprofit sharing is directedto repay the ESOP loan.
Twomanagement,2 employee, and3 independentmembers
SeymourWire
100% 55 Salaried,165 Union
Work rule changes affectscheduling, reducedworkforce throughattrition.
Companypresident, unionpresident,5 electedemployees, and2 independentmembersselected by othermembers
WeirtonSteel
100% 1300Salaried,6700 Union
Independent Steel Workers(ISW) accept hourly wagereductions from $25 to$19.70. With additionalreductions in benefits, totallabor costs fall to $16.94per hour. Agreement callsfor a six-year wage freezeand no-strike agreement.
CEO,2 management,ISW president,2 unionapprovedmembers, and8 independentmembers.
S. Chaplinsky et al./Journal of Financial Economics 48 (1998) 283—332 329

References
Alchian, A., Demsetz, H., 1972. Production, information costs, and economic organization. Ameri-can Economic Review 62, 777—795.
Beatty, A., 1995. The cash flow and informational effects of employee stock ownership plans. Journalof Financial Economics 38, 211—240.
Becker, G., 1975. Human Capital, 2nd edn., Columbia University Press, New York.Ben-Ner, A., Jun, B., 1996. Buy-out in a bargaining game with asymmetric information. American
Economic Review 86, 502—523.Chang, S., 1990. Employee stock ownership plans and shareholder wealth: an empirical investiga-
tion. Financial Management 19, 48—58.Chang, S., Mayers, D., 1992. Managerial vote ownership and shareholder wealth. Journal of
Financial Economics 32, 103—131.Chaplinsky, S., Niehaus, G., 1990. The tax and distribution effects of leveraged ESOPs. Financial
Management 19, 29—38.Chaplinsky, S., Niehaus, G., 1994. The role of ESOPs in takeover contests. Journal of Finance 49,
1451—1470.Chaplinsky, S., Niehaus, G., Van de Gucht, L., 1994. Resolving the controversy over the valuation of
employee claims in ESOP buyouts. Benefits Quarterly 10, 58—66.Chapman, B., 1993. Trust, economic rationality, and the corporate fiduciary obligation. University
of Toronto Law Journal 43, 547—588.DeAngelo, H., DeAngelo, L., 1987. Management buyouts of publicly traded corporations. Financial
Analysts Journal 43, 38—49.DeAngelo, H., DeAngelo, L., 1991. Union negotiations and corporate policy: a study of labor
concessions in the domestic steel industry during the 1980s. Journal of Financial Economics 30,3—44.
DeAngelo, H., DeAngelo, L., Rice, E., 1984. Going private: minority freezeouts and stockholderwealth. Journal of Law and Economics 27, 367—401.
Degeorge, F., Zeckhauser, R., 1993. The reverse LBO decision and firm performance: theory andevidence. Journal of Finance 48, 1323—1348.
Denis, D., 1995. Organizational form and the consequences of highly leveraged transactions:Kroger’s recapitalization and Safeway’s LBO. Journal of Financial Economics 36, 193—224.
Dimson, E., Marsh, P., 1986. Event study methodologies and the size effect: the case of U.K. pressrecommendations. Journal of Financial Economics 17, 113—142.
Fruhan, W., 1985. Labor, management and the goose that laid the golden egg. Harvard BusinessReview 63, 131—141.
Furubotn, E., 1988. Codetermination and the modern theory of the firm: a property-rights analysis.Journal of Business 61, 165—181.
Gilson, S., John, K., Lang, L., 1990. Troubled debt restructuring: an empirical study of privatereorganization of firms in default. Journal of Financial Economics 27, 315—353.
Gordon, L., Pound, J., 1990. ESOPs and corporate control. Journal of Financial Economics 27, 525—555.Habib, M., 1995. Monitoring, implicit contracts and the lack of permanence in leveraged buyouts.
IFA working paper 178—1996, London Business School.Hansmann, H., 1990. When does worker ownership work? ESOPs, law firms, codetermination, and
economic democracy. The Yale Law Journal 99, 1749—1816.Hansmann, H., 1993. Worker participation and corporate governance. University of Toronto Law
Review 43, 589—606.Hite, G., Vetsuypens, M., 1989. Management buyouts of divisions and shareholder wealth. Journal
of Finance 44, 953—970.Howse, R., Trebilcock, M., 1993. Protecting the employment bargain. University of Toronto Law
Review 43, 751—796.
330 S. Chaplinsky et al./Journal of Financial Economics 48 (1998) 283—332

Hyde, A., 1993. Ownership, contract, and politics in the protection of employees against risk.University of Toronto Law Journal 43, 721—749.
Ippolito, R., James, W., 1992. LBOs, reversions and implicit contracts. Journal of Finance 47,139—167.
James, C., 1987. Some evidence on the uniqueness of bank loans. Journal of Financial Economics 19,217—235.
Jensen, M., 1989. Capital markets, organizational innovation, and restructuring. Unpublishedworking paper 89—047, Harvard Business School.
Jensen, M., Meckling, W., 1979. Rights and production functions: an application to labor-managedfirms and codetermination. Journal of Business 52, 469—506.
Kaplan, S., 1989a. The effects of management buyouts on operating performance and value. Journalof Financial Economics 28, 217—254.
Kaplan, S., 1989b. Management buyouts: Evidence on taxes as source of value. Journal of Finance44, 611—632.
Kaplan, S., 1991. The staying power of leveraged buyouts. Journal of Financial Economics 29,287—313.
Kaplan, S., Stein, J., 1993. The evolution of buyout pricing and financial structure in the 1980s.Quarterly Journal of Economics 108, 313—357.
Klein, B., Crawford, R., Alchian, A., 1978. Vertical integration, appropriable rents, and the competi-tive contracting process. Journal of Law and Economics 21, 297—326.
Klein, B., Leffler, K., 1981. The role of market forces in assuring contractual performance. Journal ofPolitical Economy 89, 615—641.
Kovenock, D., Sparks, R., 1990. An implicit contract approach to employee stock ownership plans.Journal of Comparative Economics 14, 424—451.
Lazear, E., 1981. Agency, earnings profiles, productivity, and hours restrictions. American EconomicReview 71, 606—620.
Lehn, K., Poulsen, A., 1989. Free cash flow and stockholder gains in going private transactions.Journal of Finance 44, 771—788.
Long, M., Malitz, I., 1985. Investment patterns and financial leverage. In: Friedman, B. (Ed.),Corporate Capital Structures in the United States. University of Chicago Press, Chicago.
Muscarella, C., Vetsuypens, M., 1990. Efficiency and organizational structure: a study of reverseLBOs. Journal of Finance 45, 1389—1413.
Myers, S., 1977. Determinants of corporate borrowing. Journal of Financial Economics 5,147—175.
Opler, T., 1993. Controlling financial distress costs in leveraged buyouts with financial innovations.Financial Management 22, 50—57.
Palepu, K., 1990. Consequences of leveraged buyouts. Journal of Financial Economics 27, 247—262.Peterson, M., 1992. Pension reversions and worker-stockholder wealth transfers. Quarterly Journal
of Economics 107, 1033—1056.Peterson, M., 1994. Cash flow variability and firm’s pension choice: a role for operating leverage.
Journal of Financial Economics 36, 361—384.Pontiff, J., Shleifer, A., Weisbach, M., 1990. Reversions of excess pension assets after takeovers.
RAND Journal of Economics 21, 600—613.Salop, J., Salop, S., 1976. Self selection and turnover in the labor market. Quarterly Journal of
Economics 90, 620—627.Scholes, M., Wolfson, M., 1990. Employee stock ownership plans and corporate restructuring:
myths and realities. Financial Management 19, 12—28.Seelig, S., 1986. Department of Labor puts hold on ESOP use in leveraged buyouts. Tax Notes 30,
922—924.Shleifer, A., Summers, L., 1988. Breach of trust in hostile takeover. In: Auerbach, A. (Ed.), Corporate
Takeovers: Causes and Consequences. University of Chicago Press, Chicago.
S. Chaplinsky et al./Journal of Financial Economics 48 (1998) 283—332 331

Shleifer, A., Vishny, R., 1992. Liquidation values and debt capacity: a market equilibrium approach.Journal of Finance 47, 1343—1366.
Smith, C., Watts, R., 1992. The investment opportunity set and corporate financing, dividend, andcompensation policies. Journal of Financial Economics 32, 263—292.
Stewart, G.B., 1991. The Quest for Value: A Guide for Senior Managers. Harper Collins, New York.Stulz, R., 1988. Managerial control of voting rights: financing policies and the market for corporate
control. Journal of Financial Economics 20, 25—54.Titman, S., Wessels, R., 1988. The determinants of capital structure choice. Journal of Finance 43,
1—19.Van de Gucht, L., Moore, W., 1997. Predicting the duration and reversal probability of leveraged
buyouts. Journal of Empirical Finance, forthcoming.Williamson, O., 1979. Transaction-cost economics: the governance of contractual relations. Journal
of Law and Economics 22, 233—261.
332 S. Chaplinsky et al./Journal of Financial Economics 48 (1998) 283—332