emissions scenarios: a final response
TRANSCRIPT

EMISSIONS SCENARIOS A FINAL RESPONSE1
Arnulf Gruumlbler Nebojsa Nakicenovic Joe Alcamo Ged Davis Joergen Fenhann Bill Hare Shunsuke Mori Bill Pepper Hugh Pitcher
Keywan Riahi Hans-Holger Rogner Emilo Lebre La Rovere Alexei Sankovski Michael Schlesinger RP Shukla Rob Swart
Nadejda Victor and Tae Yong Jung
ACKNOWLEDGEMENTSWe thank Vadim Chirkov and Erik Slentoe for their assistance in preparing thisresponse
ABSTRACT This note is a final response to the debate raised by Mr Castles and Mr Henderson(for brevity we refer here to the two authors simply as CampH) in this Journal (vol14 no 2amp3 and no 4) on the issue of economic growth in developing countries insome of the emissions scenarios published in the IPCC Special Report onEmissions Scenarios (SRES) (Nakicenovic et al 2000) We first outline areas ofagreement and then the remaining areas of disagreement Two important areas ofagreement have emerged from the debate according to our view
First both parties agree that scenarios assuming a conditional convergence inincome levels ie a higher growth in per capita income in poorer countries whencompared to countries with higher levels of affluence are both ldquoplausible and wellattested in economic historyrdquo (CampH p 424) Thus the fundamental structuralcharacteristic of some of the SRES scenarios contested by CampH are not challengedper se but rather how fast such trends could unfold in the future
Second there is agreement on the value of considering purchasing powerparities (PPP) in the international comparison of income levels and the need forfurther research to improve on the paucity of reliable PPP estimates for developingcountries within the International Comparisons Project (ICP) (CampH p 432) Weappreciate that CampH have now acknowledged that PPPs were considered indeveloping the SRES scenarios and that they are reported in the data appendix of
11
1Views or opinions expressed herein are those of the authors and do not necessarily represent those of theIntergovernmental Panel on Climate Change or any other organization Correspondence should be sent toNebojsa Nakicenovic IIASA A-2361 Laxenburg Austria (email nakiiiasaacat)
The following lead authors of the Special Report on Emissions Scenarios did not have time to review andcontribute to this response written by Nakicenovic et al (this issue) They wish to express their support forthe general technical points made and affirm the overall soundness of the SRES Ernst Worrell and XiaoshiXing
the report (CampH p 422-423) Thus it was not ignorance as suggested by CampH butrather sound empirical and methodological reasons that led the SRES team to usemarket exchange rates (MER) as the main metric in developing long-termemissions scenarios This is in agreement with the underlying scenario literatureHowever we do agree with CampH on the value of considering PPP as acomplementary metric and have indeed reported corresponding PPP scenarios inSRES We disagree with CampH that PPP ought to be used as the sole measure indeveloping long-term emissions scenarios
This leads us to the remaining areas of disagreement(1) An important area of disagreement is that emissions do not depend on the
metric used to measure economic activities Evidently historical emissions do notchange as a function of whether historical development is measured in PPP or MERand both measures can be used interchangeably given appropriate model calibrationsare deployed to assess the resulting emissions More importantly future emissionsdepend first of all on the physical characteristics of the energy system land use andother human activities that need to be represented in models to calculate futureemissions of greenhouse gases These physical model representations are unaffectedby the choice of PPP or MER for measuring economic growth This fact explainswhy many of the emissions scenarios in the literature do not include economicdevelopment paths but rather determine emissions from human activities such asenergy and food services We have addressed this argument extensively in the earlierissue of this Journal (vol 14 no 2amp3)
(2) There also remains an important disagreement on the issue of using marketexchange rates (MER) GDP in developing emission scenarios CampH hold theextreme view that MER ndash a directly observable economic variable as opposed toPPP which is an elaborate statistical construct ndash should not be used at all ineconomic comparisons and in developing scenarios of GDP growth We reiterate thatthere are good theoretical methodological and empirical reasons for using MERContrary to their claim of ldquounsoundrdquo practices the SRES scenarios are consistentwith the underlying literature available methodologies and existing practices ofeconomic growth projections of leading international (eg the World Bank) andnational institutions (eg the US DOE Energy Information Administration)
(3) A final area of disagreement is whether the CampH criticism is significant or aldquored herringrdquo CampH (p 428-429) claim that by lowering the economic growth ratesfor developing countries in the lowest SRES emission-scenarios one should obtaineven lower future emissions Thus they claim that the SRES scenarios have failedto represent the lower bound of uncertainty of future emission levels Here CampHdisplay either a misunderstanding or misrepresentation of economic activity as thesole independent driver of future emissions Higher economic growth generallyresults in higher RampD more rapid capital turnover more energy efficiency andhigher preferences for pollution controls all of which tend to reduce GHGemissions Depending on how these are modeled lower GDP growth may actuallyresult in higher GHG emissions and may not as CampH contend significantly lowerthe SRES emissions in the absence of climate policies We disagree that lowereconomic development would necessarily result in lower emissions
12 Energy amp Environment middot Vol 15 No 1 2004
We conclude our response with some suggestions for improved clarity in thedebate and the need to quantify differences in opinion through alternativescenarios published in the peer-reviewed literature
1 INTRODUCTIONPrevious issues of this Journal (vol 14 no 2amp3 and no 4) have presented a debatepublicly initiated by CampH (Mr Castles and Mr Henderson) on the appropriateeconomic metric and numerical values for long-term economic growth scenarioswithin the context of long-term greenhouse gas (GHG) emissions scenarios aspresented in the IPCC Special Report on Emissions Scenarios (SRES) The presentnote is a concluding rejoinder to the last article by CampH that appeared in vol 14 no 4pp 415-435 of this Journal in which CampH have restated their arguments atconsiderable length in part responding to our earlier exchange (vol 14 no 2amp3)
Our comments will be brief as we do not believe that voluminous repetition lendsany additional credence to the arguments we consider have already been dispelled inour previous exchanges with CampH
As a reminder to the readers of this Journal the present debate centers around theissue of economic growth in developing countries as modeled in SRES CampH haveaccused the SRES authors and the IPCC as a whole of acting in a professionallyldquounsoundrdquo manner According to their view long-term economic growth must solely bedescribed using purchasing power parities (PPP) rather than market exchange rates(MER) for comparing gross domestic products (GDP) of different world regions CampHalso contend that the growth rates assumed in some of the SRES scenarios fordeveloping countries are ldquoabsurdlyrdquo high inconsistent with historical experience andthe underlying scenario literature We have argued that the SRES in its use of MERfully reflects the state-of-the art methodology for developing such long-term scenariosFurther SRES did also use PPP for many of its scenarios as an alternativecomplementary metric Regardless of whether MER or PPP is used consistently in acomparison with the underlying scenario literature with the same metric (MER or PPPrespectively) the SRES scenarios ndash contrary to the claims by CampH ndash do not appear atall extreme Rather they reflect a wide range of future possibilities that characterize ourcurrent understanding of the uncertainties of the drivers of future emissions patterns
In the following sections we briefly outline our understanding of the areas ofagreement that have emerged in the debate and the important differences that remainWe conclude with some observations on the way CampH have conducted the debate thusfar We feel that CampH have quoted selectively from the literature and that much greaterclarity precision and comprehensiveness is required in the presentation and criticismof SRES A peer-reviewed evaluation of their criticisms could resolve some of theseissues and help inform future emissions assessments We also call for a more open-minded discussion of the uncertainties associated with inevitably unknowable futuresminimizing any preconceived ideological or methodological biases Finally weemphasize the need for publication of alternative emissions scenarios in the peer-reviewed literature so these can be given appropriate consideration in future scientificassessments
Emissions Scenarios A Final Response 13
2 AREAS OF AGREEMENTAn important area of agreement that emerged from the debate in our view is that CampHagree with the conceptual model of conditional convergence that underlies the SRESscenarios We also agree that it is plausible that economic growth may proceed morerapidly in developing countries than in the already industrialized nations CampHcriticized the SRES for being overoptimistic on economic growth in developingcountries They now call scenarios in which per capita incomes in poorer countriesgrow faster than in high-income mature economies both ldquoplausible and well attestedin economic historyrdquo (CampH p 424) a statement with which we also fully agree Weemphasize here the term conditional convergence meaning a closing of the incomegap (however measured) in relative terms only as no SRES scenario assumes thatpresent disparities in per capita incomes would eventually close in absolute terms Infact absolute per capita income differences continue to grow across all SRESscenarios this occurs independently of the metric ndash either MER or PPP ndash used toexpress current income differences2 Further one of the four scenario families the A2group of scenarios does not lead to convergence between the developed anddeveloping countries in per capita PPP the current PPP income difference ratio ofabout four to one being maintained throughout the 21st century
We accept that CampH consider some SRES scenarios to be unrealistic Thisnotwithstanding it is important to emphasize that even for the most extreme scenarioswith the highest rates of economic growth there is no disagreement on the fundamentalstructural characteristic of conditional convergence underlying the economicdevelopment patterns of the scenario Rather there is disagreement on what should bethe appropriate rates of growth The SRES scenarios were rightly designed to assessthe relevant uncertainties in important driving forces of future GHG emissions andeconomic development is indeed one of the most important ones Disagreement is thuson model parameters rather than on the conceptual model underlying the contestedSRES B1 scenario It is particularly important to emphasize this in view of the claimsof CampH that such a scenario renders the work of SRES methodologically ldquounsoundrdquo
It is also important to reiterate at this point that the purpose of any scenario exercisesuch as SRES (as opposed to a deterministic ldquoforecastrdquo) is not to artificially compressfuture uncertainties through some subjective a priori constraints on the range of ldquowhat-if-thenrdquo conditions that can be explored in a scenario exercise especially relying oncriteria which a limited group deem ldquorealisticrdquo The mandate for the SRES team was toreflect the scientific uncertainty as represented by publications in the available scenarioliterature It is in this context that the high growth rates in some of the SRES scenarios
14 Energy amp Environment middot Vol 15 No 1 2004
2For instance in the much contested SRES B1 scenario which we agree with CampH is very optimistic averageper capita incomes in developing countries would increase from $2280 (PPP) in 1990 to approach some$40000 (PPP) per capita by 2100 about twice the current OECD average but only about 60 percent of theOECD average of $65000 (PPP) per capita in 2100 In absolute terms the gap between the average incomein developing and OECD countries increases substantially from $14000 (PPP) in 1990 to $24900 in 2100
We also wish to add that the economic growth projections in MER of the B1 scenario were developed inclose collaboration with the Dutch Economic Planning Bureau and their WorldScan model ie drawingprecisely the kind of expertise residing in national economic agencies CampH have criticized the SRES forhaving insufficiently drawn upon
criticized by CampH fulfill an important role well inside the bounds of the underlyingliterature review (cf discussion below) All those users of the SRES scenariosincluding those who disagree with a particular subset of the range of possibilities asoutlined by the entire set of 40 scenarios should consider the alternatives as outlinedfor instance in the A2 and B2 scenario families The SRES was designed to provideinsights on uncertainty from a range of plausible scenarios and not to assign likelihoodto any of the alternative futures described by the set of 40 scenarios
For an exercise assessing important uncertainties of future GHG emissions it wouldconstitute a serious methodological flaw to exclude the possibility of rapid economicdevelopment in the current developing countries Likewise it would also constitute aserious flaw in the analysis not to consider alternative scenario uncertainties of a rapidor slow demographic transition as well as rapid or slow technology developments ineither fossil fuel or renewable technologies Censorship of which major scenariouncertainties should be considered in the assessment would indeed be both poor scienceand a poor guide to policy-makers who must consider potential trade-offs (or not)among stated socio-economic goals for all relevant contingencies of futuredevelopments In the case of the SRES scenarios the main assumptions and scenariooutcomes are both consistent with the historical experience and the underlyingliterature Indeed CampH may have missed the main insight here ndash that SRES suggeststhat even rapid economic growth may be compatible with low-end GHG futures
We now turn to the issue of economic metric ie to the issue of MER versus PPPWe agree with CampH on the value of considering PPP as an alternative measure incross-country comparisons of quantities such as income levels and energy intensityThis is amply documented in the publication record of many of the SRES authors Itis also evident in the SRES report that presents PPP results for all key SRES scenariosWe also agree with CampH on the importance of further research to increase the numberof reliable PPP estimates for developing countries within the InternationalComparisons Project (ICP) (CampH p 432) These are needed to address the datainadequacies that drove SRES decisions to prefer MER as the more reliable measureof developing scenarios of long-term economic development There is furtheragreement on the importance of complementing traditional expenditure-based PPPestimates with estimates focusing on value-added PPP Our agreement with CampH alsostems from our desire to explore further methodological pluralism in the field ofdeveloping long-term emission scenarios However this is also the point where ourpositions depart sharply
3 AREAS OF DISAGREEMENT This section is divided into three subsections
31 Driving forces of emissions As we have argued extensively in the earlier issue of this Journal (vol 14 no 2amp3)emissions do not depend on the metric used to measure economic activities Evidentlyhistorical emissions do not change as a function of whether historical development ismeasured in PPP or MER and both measures can be used interchangeably givenappropriate model calibration to the resulting emissions variable This in fact is
Emissions Scenarios A Final Response 15
reflected in integrated assessment models that report both metrics of GDP such as theIIASA integrated set of models used in SRES More importantly future emissionsdepend on physical characteristics of the energy system land use and other humanactivities that need to be represented in models to calculate future emissions ofgreenhouse gases These physical model representations like levels and structure offuture diets or types of technologies used in electricity generation are unaffected by thechoice of the calibrating parameter for economic growth Evidently there areadditional economic variables that will affect consumer and producer choices asreflected for instance in energy prices However as we argue below there are soundempirical and methodological reasons to use MER exchange rates in describing pricesof internationally traded commodities Our continued disagreement with CampH in ourview arises from the fact that CampH narrowly focus in their debate on the economicmetric for GDP growth ignoring the essential further analytical steps in therepresentation of physical systems that are needed to calculate greenhouse gasemissions In other words GDP is an important but in itself insufficient explanatoryvariable for describing differences in emissions past present or future This factexplains why many of the emissions scenarios in the literature do not includeeconomic development paths but rather determine emissions from human activitiessuch as energy and food services We have addressed this argument extensively in theearlier issue of this Journal (vol 14 no 2amp3)
32 Reasons for using MER and PPPWe appreciate that CampH now acknowledge that the SRES authors and reviewersexplicitly considered the use of PPP in the SRES report and its underlying scenariomodeling work This fact was pointed out to CampH repeatedly even prior to the firstcritique published in this Journal Contrary to the allegation by CampH that ldquoflawedrdquomethodology was used to develop the SRES scenarios and their contention that theomission of a primary use of PPP is the result of an ignorance among the SRES authorsand reviewers three of us (Gruumlbler Nakicenovic and Rogner) have developed jointlywith other colleagues the first set of PPP-based long-term emissions scenarios in a jointstudy between IIASA and the World Energy Council (Nakicenovic et al 1998) whichwas quoted by CampH as an example of how PPP can be used in such scenarios
We are also surprised to see that CampH continue to dismiss the PPP scenariosderived with the IIASA integrated model as mere ldquomemorandum itemsrdquo (p 423)despite the fact that the PPP scenarios portray exactly the features for which they callThe SRES shows that the differences between the MER and PPP growth rates arelargest for developing regions where the two exchange rates currently differsubstantially but are insignificant for regions in which the current differences aresmall (ie for the OECD region)3 In other words assuming that conditional
16 Energy amp Environment middot Vol 15 No 1 2004
3The fact that MER and PPP scenarios are identical for the OECD region simply arises from the fact thatthe differences between these two measures are very small and would not affect the results substantiallyHence no alternative scenarios for the evolution of relative prices eg of Japan versus the US over a periodof 100 years were formulated We certainly welcome any suggestions CampH have to offer to improve uponPPP scenarios for OECD countries but as mentioned above the impact on aggregate scenario results will beminor
convergence holds it implies much higher growth rates for MER than for PPP fordeveloping countries and this is reflected in the SRES scenarios Contrary to CampHclaims (p 422) that the main difference between the growth rates between the twomeasures is simply due to different weights in regional averages one needs to considerthe differences between MER and PPP exchange rates not only from a staticperspective (as appropriate for cross-country comparisons at any given moment intime) but also from a dynamic perspective The important additional factor to considerin long-term scenarios is the tendency for factor price equalization as economiesdevelop and are progressively integrated into world trade for successively largercomponents of their GDP which leads to declining differences between PPP andMER This again is reflected in the scenarios reported in SRES as well as in thescenario studies that report both GDP metrics most notably those of the World EnergyCouncil
It is surprising to see that CampH applaud the PPP scenarios of the World EnergyCouncil as exemplary while dismissing the PPP scenarios presented in the SRESreport as both sets of PPP scenarios were derived with exactly the same methodologyand the same integrated model CampH correctly point out the few studies available inthe literature to date that have used PPP Altogether CampH and we have been able toidentify only nine scenarios (cf Table 2 below) outside SRES that report economicgrowth in terms of PPP either exclusively or as an alternative metric to MER Incontrast eight out of the 40 SRES scenarios report both MER and PPP It is thusparticularly striking to see CampH short-shrifting the SRES scenarios in comparison tothose in the available scenario literature One of the important mandates for any IPCCdocument is to reflect the current state of knowledge through a careful literaturereview The SRES report reviews 416 scenarios in the literature Of those 166scenarios report GDP for the year 2050 and 148 for the year 2100 In all of them ndashexcept for the nine cases mentioned above ndash MER is used to describe GDP growthMost recent results including a study by Manne and Richels (2003) regarding the useof PPP and MER in measuring economic development in integrated assessmentmodels confirm our position that the choice of exchange rate will have only a smallinfluence on the emissions and the resulting temperature in the year 2100
MER continues to be the most widely used metric in scenarios of futuredevelopments of the world economy energy use and emissions The SRES scenariostherefore follow state-of-the-art well established practices of international or nationalinstitutions as exemplified for instance by the World Bank (2003) Global EconomicProspects or the US Departments of Energyrsquos Energy Information Administration(USDOE 2003) International Energy Outlook all published since SRES and all usingMER
We therefore restate that the SRES scenarios constitute an importantmethodological improvement over much of the scenario literature in that GDP growthis described therein using PPP (using one of the six integrated models that participatedin SRES) in addition to the traditional MER In contrast to this methodologicalpluralism CampH have set out on a crusade to dislodge the use of MER be it fordeveloping economic growth projections emissions scenarios or nationalsubmissions to the UNFCCC Their effort would be more productive if they would
Emissions Scenarios A Final Response 17
instead attempt to develop long-term scenarios that incorporate some of thecharacteristics they claim to be essential for a more ldquorealisticrdquo view of future economicdevelopment in the world
We continue to state our case on the methodological soundness of the use of MERfor developing long-term emissions scenarios Our reasons are both empirical andtheoretical MER can be observed in market transactions for any currency usedanywhere globally at any instant of time whereas PPP is a set of varying elaboratestatistical constructs estimated at (irregular) time intervals or for a shorter time periodEven given the most valuable estimation efforts as performed eg by the ICP thereare important uncertainties remaining and PPP time series estimates are generallyavailable only for shorter periods of time4 We believe that the complex statisticalconstruct that PPP represents is a long way from being sufficiently reliable to serve asthe sole basis of any analysis of income comparisons in a cross section analysis muchless serve as the sole basis of long term trend analysis In fact the right strategy giventhese assessments is exactly what SRES pursued-using a MER based approach withparallel analysis using PPP to supplement the data Given the SRES mandate to pursuethe literature the approach of only using PPP as suggested by CampH would also havebeen both inconsistent with the underlying literature and at risk of being weak onmethodological grounds at least until the 2003-2005 work of ICP will be completed
Even considering that with ongoing statistical work some of the uncertaintyproblems can be overcome in the future with more comprehensive and reliable PPPestimates especially for developing countries that would not reduce the value ofinformation contained in MER
The problem at hand for emissions scenarios is not the postulation of GDP growthscenarios in some metric whether MER or PPP but rather to explore the implicationsthat economic growth has for energy use agricultural practices the deployment oftechnologies and the resulting emissions The main characteristic of energy andtechnology (and to a smaller extent also food) is that these commodities are tradedglobally Hence their availability at any instant of time for a national economy cannotbe determined on the basis of PPP exchange rates but rather on the basis of MER Theissue of trade is also of central importance for GHG emissions scenarios when variousclimate policies are to be assessed as well (Recall that the main motivation of theSRES scenarios was to serve as a basis for the subsequent analysis of climate changemitigation adaptation and impacts within the framework of the IPCC assessments)Again carbon trade prices will be determined at the international level and not on thebasis of PPP exchange rates
There are thus fundamental and methodologically sound reasons why long-termemission scenario models have to date almost exclusively relied on MER Whereas somemodels (including the IIASA integrated models) include an internal module to translatebetween MER and PPP MER continues to be indispensable For instance the amount of
18 Energy amp Environment middot Vol 15 No 1 2004
4Eg the 2001 World Bank Development indicators on a CD ROM (World Bank 2001) include country-level GDP MER from 1960 to 1999 and GDP PPP estimates from 1975 to 1999 based on only 34participating countries in 1975 64 in 1985 (UN 1992) and reaching a global representative level in 1993with 118 participating countries (ICP 2003)
oil China can import (and that may become available for domestic consumption)depends on the prevailing level of crude oil prices at the international level In turn itscosts to the Chinese economy are determined by the MER of the Chinese currency andnot by the PPP exchange rate The same can be said on the availability of jet aircraft forthe transport sector or advanced energy technologies such as combined-cycle gasturbines It is these among many other numerous relationships that need to berepresented to model alternative scenarios that link economic growth to growth in energyuse changes in the technology stock of an economy and the resulting GHG emissions
CampH claim (p 430) that it is ldquoa mistake to give the model-based scenario approachsuch near-exclusive emphasisrdquo but they offer no alternative Evidently givenadequate PPP estimates it may be possible to formulate PPP GDP growth scenariosrelying exclusively on this measure using a simple spreadsheet But what about thesubsequent steps in the analysis As mentioned above we challenge CampH to constructlong-term emission scenarios that contain (1) all the salient information needed forclimate models on all species of GHGs arising from a multitude of human activitiesand from many different sectors and (2) all the information needed for subsequentpolicy analysis such as energy (and carbon) prices and quantities
This would also be the only way for them to demonstrate their alleged claim thatthe lowest SRES scenario in terms of cumulative carbon emissions (B1T-MESSAGE)does not represent a lower bound of emissions5 in the absence of climate policiesCampH have argued that by lowering the GDP growth rates of this (and similar)scenarios emissions levels would be reduced presumably proportionally although itremains unclear what level of emission reductions CampH would expect in the case of asubstantially lowered economic growth scenario for developing countries
33 Lowering economic growthWe disagree with CampH that significantly lowering the economic growth rates ofdeveloping countries in the SRES B1T scenario would reduce emissions correspondinglyThe B1T scenario explores the upper bounds of the diffusion of non-fossil energytechnologies and results in the lowest cumulative GHG emissions of the SRES scenariosWe disagree on theoretical and numerical grounds with the simplistic scaling perspectivethat CampH advance namely that lower GDP automatically leads to lower emissions
There is wide agreement in both the theoretical and empirical literature of theeconomics of technological change that technological progress does not come as a freegood (Gruumlbler et al 1999) The widespread diffusion of advanced low- and zero-carbontechnologies that make a low-emission path as described by the SRES B1T scenariofeasible is in fact contingent on sustained high levels of RampD and technology deploymentin niche markets Only under such conditions could the prices of these advancedtechnologies be lowered to a level that they would become cost-competitive withconventional fossil fuel based technologies even in absence of climate policies It is
Emissions Scenarios A Final Response 19
5In fact even assuming such a scenario could be developed it would not matter for the assessment ofclimate change uncertainties such as temperature change The lower bound of future emissions is definedby climate policy scenarios which were explicitly excluded from SRES but analyzed subsequently in theIPCC Third Assessment Report (TAR)
equally a well-attested theoretical and empirical fact that diffusion rates of newtechnologies are closely linked to market growth ie the rate of capital turnover in aneconomy (eg Mansfield et al 1977 Freeman 1994) If growth is stagnant fewopportunities arise for the deployment of new technologies resulting in slower technologyimprovement rates compared to a case with rapid capital turnover Similar statements alsohold for energy end-use technologies (efficiency improvements) Higher macroeconomicproductivity growth (GDP per capita growth) leads to higher rates of structural change inan economy and to higher potentials for deployment of more efficient capital vintages Asa result improvements in energy intensity (energy use per unit of GDP) have beenidentified as being closely related to macroeconomic productivity growth (WEA 2000)It is because of the non-linear interdependence among variables that simplistic scalingassumptions are both inconsistent with theory and counterfactual
Growth in emissions is frequently described in the literature as being the sum ofcomponent growth rates in underlying driving forces along the so-called IPAT identityAfter some initial disagreement CampH (p 428) have conceded to our viewpoint onstressing the importance of the interdependence between the IPAT variables in otherwords on the linkages between productivity growth (GDP per capita) energy intensity(energy use per unit GDP) and emissions intensity of energy (eg carbon emissionsper unit energy) Despite the apparent dismissal of formal modeling by CampH it isprecisely these models that can help shed light on the complex interplay between thevariables We disagreed earlier with the CampH conjecture that significantly lowereconomic growth rates for developing countries would reduce emissions In factlower economic growth might instead increase emissions compared to the base caseIn the meantime we have developed a new scenario to address this question theresults of which are summarized in Table 1 The new scenario is called simply B2Pand does not result in lower emissions than B2 that served as the base case forlowering economic development perspectives
Taking the original SRES B26 as a base case we have assumed that economicgrowth rates in developing countries would be substantially lower (reaching incomelevels of $9000 per capita in PPP terms by 2100 instead of the original $18000)Given this lower economic growth we then used the integrated set of IIASA modelsto analyze the implications for energy use (impact on energy intensity) and thediffusion of advanced non-carbon technologies (carbon intensity) As can be seenfrom Table 1 the impacts are substantial and non-linear Lower economic growthwould lead to slower improvements in energy intensity (ie energy use in B2P issignificantly above those values a linear ldquodownscalingrdquo of GDP growth wouldsuggest) It also leads to a very slow diffusion of advanced technologies (practicallyno improvements in carbon intensities) The resulting impact on emissions is that theyare substantially higher than in the original base-case scenario (155 GtC by 2100compared to some 138 GtC in the original B2 scenario and that with a world GDP thatfalls from 232 Trillion PPP$ in the base case B2 scenario to 145 Trillion in the B2Pscenario) Thus the modeling results confirm our initial hypothesis that emissions
20 Energy amp Environment middot Vol 15 No 1 2004
6We adopt the SRES-B2 scenario as a base case as it portrays an intermediary level of per capita GDPgrowth in developing countries among the 4 SRES scenario families
would tend to increase rather than decrease in the case of substantial slower economicgrowth rates in the developing countries This is in perfect agreement with both theoryand empirical observations Thus we continue to maintain that the lowest SRESscenarios indeed represent a reasonable lower bound of future emissions in theabsence of climate policies The same is the case with the highest of the SRESemissions scenarios We would welcome others to either corroborate our results orprove the contrary ideally using an accepted formal methodology that enables therigorous analysis of all salient interdependencies characteristic of the system driversof GHG emissions However we would be also interested in ldquoback-of-the-enveloperdquocalculations Given that CampH and we agree on the importance of the interrelationshipsamong the variables as described in an IPAT identity the only way to benefit thedebate in a constructive manner is to work the numbers through in a consistent fashionrefraining from simplistic erroneous ldquopro-ratardquo scaling techniques
Table 1 Components of the IPAT identity and their growth rates
34 Economic growth ratesWe maintain that the SRES scenarios reflect well our current understanding of theuncertainties involved in future GHG emissions including the issue of economicgrowth When the comparison is made at the level of the appropriate and comparablemetric (PPP or MER) the SRES scenarios compare well with the literature7 This is
acute acute acute
Emissions Scenarios A Final Response 21
7The A1B-AIM scenario portrays higher growth rates in the first decades of the next century but lower onesthereafter When considered over the entire time period and in terms of resulting per capita income levelsby 2100 this scenario also lies within the range of comparable high growth scenarios available in theliterature as explained in our previous response to CampH
amply illustrated in Table 2 It shows that regardless of whether MER or PPP is usedin a comparison with the underlying scenario literature with the same metric (MER orPPP respectively) the SRES scenarios ndash contrary to the claims by CampH ndash do notappear at all extreme especially when considering PPP the preferred metric by CampHRather the scenarios reflect a wide range of future possibilities that characterize ourcurrent understanding of the range of future economic growth in emission scenarios
Table 2 Economic growth in developing countries
CampH have in their critique used selective quotation in making their case They haveexcluded scenarios from the literature with high rates of economic growth and haveinstead compared (high) MER growth rates in SRES scenarios with (low) PPP growthrates from the literature Such comparison of ldquoapples with orangesrdquo ie MER andPPP is inappropriate and misleading This is perhaps best illustrated by Table 1 (p426) of their previous contribution to this Journal In their comparison of the SRESscenarios with the literature they first selected 5 high growth cases from the set of 40SRES scenarios but only 2 of the lower growth cases In fact in terms of economic
22 Energy amp Environment middot Vol 15 No 1 2004
growth there are only four major scenarios referred to as scenario families in theSRES report so CampH choice of scenarios is skewed They omitted in their comparisonwith the literature precisely those PPP scenarios of the World Energy Council 1993study they applaud earlier in their very paper In conclusion CampH have been seedingconfusion by inappropriately comparing MER and PPP growth rates reported indifferent literature sources as illustrated by both of their contributions to this JournalTable 2 corrects the comparison of SRES with other scenarios in the literature byshowing separately PPP and MER growth rates following the original CampH format
Further CampH have misinformed readers by suggesting that in SRES per capitaincomes of developing countries would surpass those of the USA whereas in realitythis is not the case in any SRES scenario They have made these claims by attributingto SRES unpublished and experimental attempts to downscale economic growth fromthe 4 world regions of SRES to national levels These unpublished attempts werenever agreed to by the SRES authors and were made well after the publication ofSRES The SRES report contains information only at the level of 4 world regions Itis also a well-established practice in science not to quote from unpublished work inprogress by others without seeking permission from the authors concerned Eventhough this downscaling exercise was neither a part of the SRES process nor is it inany way connected to the SRES report as published we wish to express our concernhere on the ridicule insinuated by CampH both in academic journals and in the popularpress of unpublished work in progress out of context and without the consent of theauthors concerned
4 CONCLUSIONWe maintain that the SRES scenarios reflect well our current understanding of theuncertainties involved in future GHG emissions including the issue of economicgrowth When the comparison is made at the level of the appropriate and comparablemetric (PPP or MER) the SRES scenarios compare well with the literature
We express our hope however that despite disagreement on numbers andeconomic metrics in long-term scenarios CampH can join us in our plea for improvedclarity and precision and careful documentation of numbers whether they refer toMER or PPP If this can be achieved this debate might have finally resulted insomething useful as well
We also call upon for greater efforts in clarifying differences in emissionsperspectives not only by qualitative critique but also through scenario quantificationsWe have taken note of the disagreement of CampH with some of the SRES scenarios butcontinue to miss specific suggestions for improvement
Finally we feel that in order to improve upon future work in this domain there is anurgent need to rely more on the peer-review process and literature We are confident thata dialogue in rigorously peer-reviewed journals might help to eliminate much of thespurious controversy to date and identify areas where further improvement of methodsand scenarios is required A peer-reviewed evaluation of their criticisms could resolvesome of these issues and help inform future work in this area Publication of alternativeemissions scenarios in the peer-reviewed literature are also a necessary precondition inorder that these can be given appropriate consideration in future scientific assessments
Emissions Scenarios A Final Response 23
REFERENCESCastles I and Henderson D (2003) The IPCC Emission Scenarios An Economic-StatisticalCritique Energy and Environment Vol 14 No 2amp3 pp 159-185
Castles I and Henderson D (2003) Economics Emissions Scenarios and the Work of theIPCC Energy and Environment Vol 14 No 4 pp 415-435
Criqui P and Kouvaritakis N (2000) World energy projections to 2030 International Journalof Global Energy Issues Vol 14 No 1-4 pp 116-136
European Commission (2003) World energy technology and climate policy outlook (WETO)European Communities Luxemburg
Freeman C (1994) The ecomomics of technical change Cambridge Journal of EconomicsVol 18 pp 463-514
Gruumlbler A Nakicenovic N and Victor DG (1999) Dynamics of energy technologies andglobal change Energy Policy Vol 27 pp 247-280
International Comparison Program (ICP) (2003) About the International ComparisonProgram httpwwwworldbankorgdataicpabouticphtm
International Energy Agency (IEA) (2002) World Energy Outlook 2002 OECDIEA Paris
Manne A S and Richels G (2003) Market Exchange Rates or Purchasing Power ParityDoes the Choice Make a Difference to the Climate Debate Working Paper 03-11 Sep 2003AEI-Brookings Joint Center for Regulatory Studies httpaei-brookingsorgadminpdffilesphpqDpdf
Mansfield E et al (1977) The Production and Application of New Industrial TechnologyWW Norton amp Company Inc New York NY
Nakicenovic N et al (2003) IPCC SRES Revisited A Response Energy and EnvironmentVol 14 No 2amp3 pp 187-214
Nakicenovic N Alcamo J Davis G de Vries B Fenhann J Gaffin S Gregory KGruumlbler A et al (2000) Special Report on Emissions Scenarios (SRES) IntergovernmentalPanel on Climate Change (IPCC) Cambridge University Press Cambridge
Nakicenovic N Gruumlbler A and McDonald A (eds) (1998) Global Energy PerspectivesCambridge University Press Cambridge
United Nations (UN) (1992) Handbook of the International Comparison Programme UNNew York NY
US Department of Energy (USDOE) (2003) International Energy Outlook 2003 DOEEIAhttpwwweiadoegovemeuinternationalforecasthtmlMid-Term
World Energy Assessment (WEA) (2000) Energy and the challenge of sustainability UNDPNew York NY
World Energy Council (WEC) (1993) Energy for Tomorrowrsquos World Kogan Page StMartinrsquosPress New York NY
World Bank (2001) World Bank Development Indicators ndash 2001 World Bank CD-ROM
World Bank (2003) Global Economic Prospects and the Developing Countries 2003httpwwwworldbankorgprospectsgep2003fullhtm
24 Energy amp Environment middot Vol 15 No 1 2004
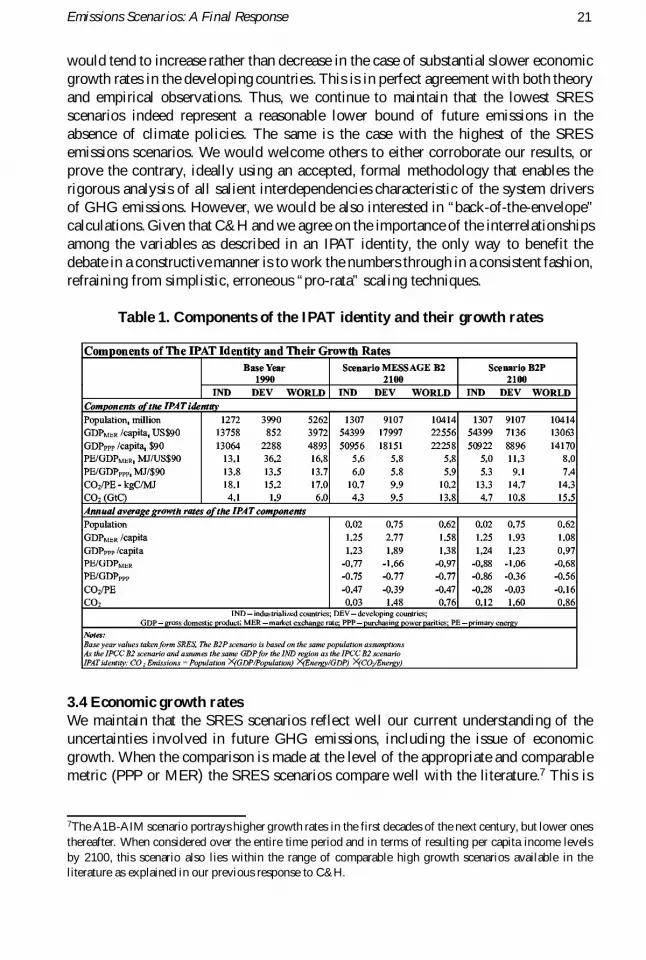