elsevier editorial system(tm) for materials science and engineering b
TRANSCRIPT
Elsevier Editorial System(tm) for Materials Science and Engineering B Manuscript Draft Manuscript Number: MSB-D-12-00028 Title: A 2D approach to determine the glass transition temperature for thin film metallic glass of Pd - Cu - Ni -P Article Type: All Regular Article Types Keywords: Thin film metallic glass; liquid diffusion; glass transition; icosahedral symmetry Corresponding Author: Dr. Haimanti Chakrabarti, Ph.D Corresponding Author's Institution: Lady Brabourne College, University of Calcutta First Author: Baishali Kanjilal Order of Authors: Baishali Kanjilal; Chhanda Basu Chaudhuri; Haimanti Chakrabarti, Ph.D
Cover Letter
Dear Editor,
We are submitting the manuscript of our paper titled “A 2D approach to determine the
glass transition temperature for thin film metallic glass of Pd – Cu – Ni –P” ” for
publication in your esteemed journal. It contains 1 table together with 3 figures. The
work reports a 2 D approach to determining the glass transition of Thin Film Metallic
Glasses of Pd-Cu-Ni-P. The computed results are close to experimentally revealed
findings corresponding very well with the experimental data reported very recently (till
December, 2009) in international journals by different groups. Since the work is very
interesting we are looking forward to your kind response.
Regards
Baishali Kanjilal
Haimanti Chakrabarti
Chhanda Basu Chaudhuri
Cover Letter
This is a pioneering work which reports for the first time a 2 D model which is
compatible with experimentally revealed findings, of the structure of TFMG (thin
film metallic glass) of Pd-Cu-Ni-P and utilises it to analytically calculate the glass
transition temperature, for various compositions of the referred system. It
corresponds very well with the experimental data reported in international journals
by different groups. The data obtained is congruent with experimentally measured
glass transition temperatures within a maximum of ±10% variation and
underscores the significance of Pd as a glass former. Such systems are of immense
current interest for their applicability in high tech industry as high performance
materials. The theory of such systems makes for frontline research since it is yet to
be explored completely.
*Prime Novelty Statement
A novel 2 D approach to theoretical elucidation of Tg of Pd-Cu-Ni-P TFMG
Study applies liquid state theories and analyses transport properties
The model is based on pentagonal symmetries arising from icosahedral
orders
Diffusion is used as a probe for explaining glassification.
Results agree well with experimental data
Such systems are of immense current interest for their hi-tech applicabilities
*Highlights
A 2D approach to determine the glass transition temperature for thin film metallic
glass of Pd – Cu – Ni –P.
Baishali Kanjilal1,2
, Chhanda Basu Chaudhuri1, Haimanti Chakrabarti
1*
1Department of Physics (UG & PG), Lady Brabourne College, University of Calcutta
P – 1/2 Suhrawardy Avenue, Kolkata 700017, India
Telephone Number: 00919830447839
2Current address: Institute of Materials Science, University of Connecticut, 97 North Eagleville Road,
Storrs CT 06269, USA.
Abstract
Our work reports a novel two dimensional approach to the theoretical elucidation of glass transition of the
Pd-Cu-Ni-P thin film system for the first time with the existing liquid state theories in the realm of
transport properties. It is found that this particular combination of metals set a characteristic trend in
variation of glass transition temperature irrespective of their compositional ratio. Our investigation on these
2D systems uses pentagonal symmetries of variable orientations and justifies their appropriateness in the
class of Pd-Cu-Ni-P system. The data obtained is congruent with experimentally measured glass transition
temperatures within a maximum of ±10% variation and underscores the significance of Pd as a glass
former.
Keywords: Thin film metallic glass, liquid diffusion, glass transition, icosahedral symmetry
PACS No.: 61.25.Mv, 66.10.C-, 61.44.Br, 64.70.pe
*Text OnlyClick here to view linked References
2
2
Introduction:
Thin Film metallic glasses, with their superior mechano-chemical properties, structural speciality due to the
absence of grain boundaries and segregation, antimicrobial properties and plausible integration with silicon
circuit technology are making rapid forays into applications in ameliorating the ductility of conventional
stainless steel [1] or as micro cantilevers [2] and advanced metal electrodes for MIM electronics [3].
Additionally there have been rapid strides in using Pd based TFMGs for piezoelectric ultrasound motors
and micro actuators and chemical sensors, [4-7] and as the basic building blocks of MEMS & NEMS [8,9] .
The structural novelty of TFMGs, and in particular the technological and scientific significance of the Pd-
Cu-Ni-P system has resulted in systematic structural and physical elucidation by different pioneering
groups. Current advances as recent as 2012, entail a spectrum of studies [10- 22].Despite the superior
properties and proffered by TFMG and the recent strides made in their applications, their characterization
and theoretical explication leaves room for substantial further investigation. Experimentally, such thin film
systems are classified as metallic glasses on the basis of their structure and the existence of a glass
transition [23, 24] which separates significantly different regimes of behavior in any such material and is a
key physical characteristic. The realm of vitrification in TFMGs remains a largely underexplored area
even though glass transition of Pd-Cu-Ni-P bulk metallic glasses have been studied by several groups of
workers using thermodynamic and kinetic concepts[25].
Our work reports a novel two dimensional approach to the theoretical elucidation of glass transition of the
Pd-Cu-Ni-P thin film system for the first time. Conceptually a thin film is a layer of material ranging from
fractions of a nanometer (monolayer) to several micrometers in thickness. Although, till date there has not
been significant breakthrough in preparing thin films of thickness less than 10 nanometers, with the rapid
progress of technology, it shall be possible to fabricate and employ such structures [26]. The 2 D system
being put forward in our model is an attempt to rationalize and explain such structures to a close
approximation. We have used diffusion as a probe for this investigation since glassification is intimately
associated with the dramatic slowing down of the diffusive motion of particles [27].
Our theoretical investigation on these 2D systems uses pentagonal symmetries and justifies their
appropriateness in the referred system since Metallic glass is modelled as a structure with icosahedral
orientational order over finite length scales [28] and the presence of this symmetry has also been
3
3
experimentally demonstrated [29]. The local as well as the global transport has been studied utilising
existing liquid state theories in the realm of transport properties.Since the structure of TFMGs offers ways
and means of tailoring properties by adjusting the constituent atomic compositions and altering the distance
between constituent atoms, the atomic size has been subsequently demonstrated as a key parameter in our
model.In this study, a number of compositions of Pd-Cu-Ni-P have been investigated, consequently
determining the temperature dependence of the diffusion coefficients. For this quaternary system, there is a
characteristic trend in the aforementioned variation irrespective of their compositional ratio. A monotonic
transition between the supercooled liquid state & liquid state ensues according to the theoretical model,
enabling precise determination of the glass transition temperature. While considering the glass transition
temperatures for all such compositions the study arrives at important information.
System modulation
Metallic glasses may be thought to have a continuous random network resulting from the dual of fcc and
rcp structures [30]. The packing of metallic glasses may be hypothesized to develop from three disks
forming a triangle in 2D which eventually crystallize to HCP in 3D. To this, the addition of a fourth sphere
forms a tetrahedron a number of which come together to an icosahedron which does not pack
crystallographically. Analogously, in 2D crystals, intermediate hexatic phases exist which have long range
six-fold orientational order but no long range translational order [31]. We have modelled a pentagonal cell
in 2D using geometries appositely offering the best plausible estimate of the local structure of the Pd-Cu-
Ni-P quaternary system.
Simulations show that diffusive atomic displacements vary with the type and composition of the
amorphous alloys [32]. In the supercooled liquid state both collective chainlike and single jump
displacements occur. However, the former is more in numbers. Far above the glass transition temperature
liquid like viscous flow via atomic collisions prevails. Studies of the isotope effect of diffusion [33] reveal
a transition from large isotope effects in the ordinary liquid state [34] to very small ones in the supercooled
state, similar to those observed by experiments in the glassy state. A thorough literature survey reveals that
the logarithm of the pre-exponential factors and the activation enthalpies for diffusers bear a linear
relationship for solute diffusion in crystalline metals whereas for relaxed metallic glasses the variation of
this factor is orders of magnitude larger than for crystalline metals. This distinct difference between them
4
4
makes diffusion by means of single atom jumps in metallic glasses an unlikely phenomenon [33].
Moreover molecular dynamics simulations show that the linear Arrhenius behaviors observed in diffusion
studies is only due to the limited temperature dependence of the measurements [35]. The atomic size
dependence of the activation enthalpy of self and solute diffusion in metallic glasses is distinctly different
from that of solute diffusion in crystalline solvent and is corroborated by the dependence of the activation
enthalpies on the size of the diffusing atoms. Thus the size of the atom has been taken as one of the key
factors in our model. According to mode coupling theory a liquid like flow freezes in well above the caloric
glass transition temperature. Our model supports such features for 2D systems.
Our Model
Crystallographic evidence supports the existence of quasicrystalline structures (icosahedral symmetry) in
metallic glasses, and there are several earlier works of importance wherein it was concluded that fivefold
geometry, originating from the arrangement of five tetrahedrons around a common edge, appears with
pentagonal prisms in thin film of metal particles [36 ]. The tetrahedral subunits of the fcc structure are
organised in fivefold ring by the aggregation of crystalline units breaking translational order through
pentagonal multiple twinning [36].
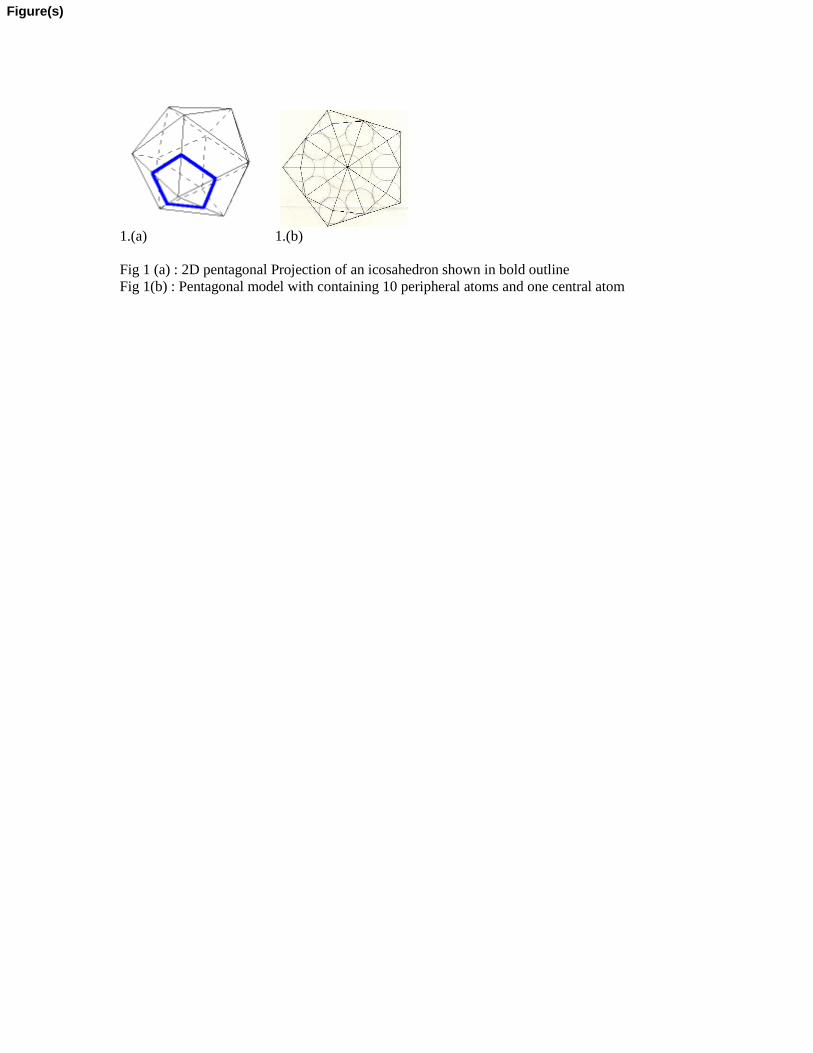
In view of corroborating the icosahedral symmetry, a regular pentagonal cell containing 10 peripheral
atoms and a central atom, has been considered for our system. The geometry most appropriately represents
a planar projection of an icosahedral cell in all directons except when the icosahedrons is sliced through its
centre. The pentagonal projection and the model considered are illustrated in Figures 1(a) & 1(b).
This pentagonal cell takes care of the collective motion when combined with the Newton’s definition of
fluid viscosity and the mass and momentum conservation laws which results in the Navier – Stokes
equation. While local motion may be visualized as entailing atoms hopping and exchanging positions
between the vertices of a single given pentagon, global motion may be elucidated as the entire pentagonal
cell hopping across the icosahedral structure.
∂u/∂t + u. u = () 2u - - - - - - - - ---------------------- (1)
Equation (1) presumes that viscosity and density are constant and that there are negligible external field
effects. Scalar u represents the x component of the fluid velocity vector, u. Considering the pentagonal cell
5
5
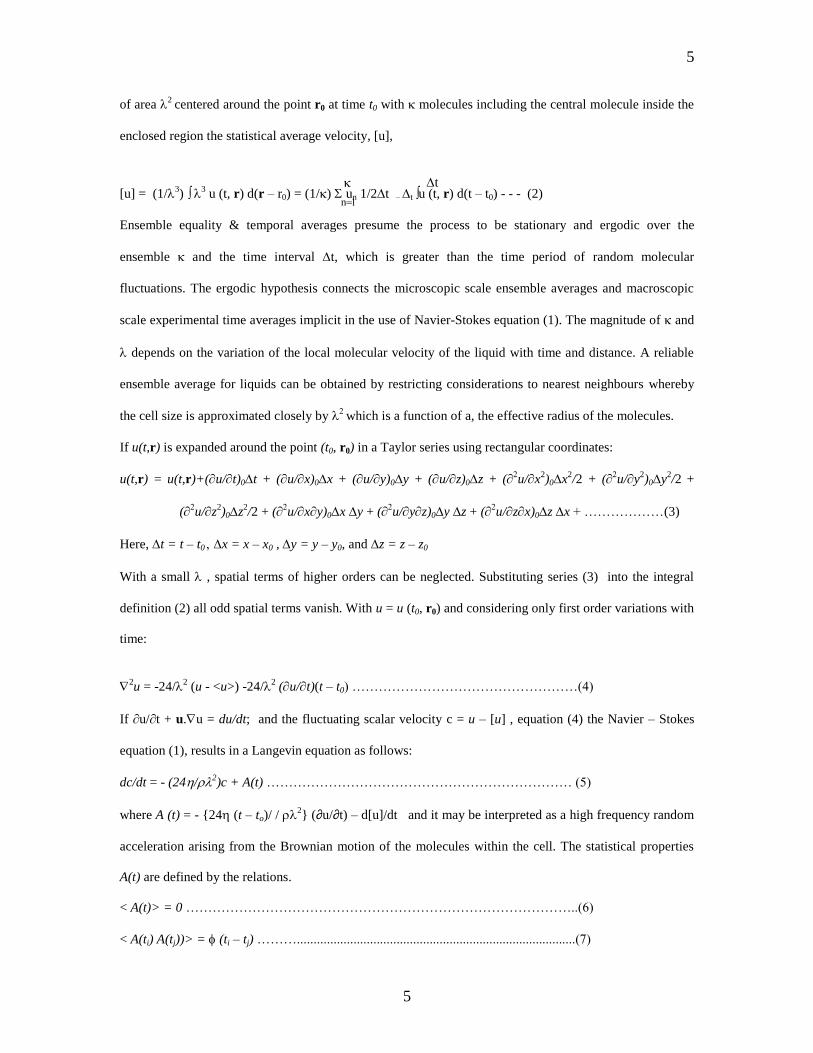
of area 2
centered around the point r0 at time t0 with molecules including the central molecule inside the
enclosed region the statistical average velocity, [u],
[u] = (1/3)
3 u (t, r) d(r – r0) = (1/) un 1/2t – t u (t, r) d(t – t0) - - - (2)
Ensemble equality & temporal averages presume the process to be stationary and ergodic over the
ensemble and the time interval t, which is greater than the time period of random molecular
fluctuations. The ergodic hypothesis connects the microscopic scale ensemble averages and macroscopic
scale experimental time averages implicit in the use of Navier-Stokes equation (1). The magnitude of and
depends on the variation of the local molecular velocity of the liquid with time and distance. A reliable
ensemble average for liquids can be obtained by restricting considerations to nearest neighbours whereby
the cell size is approximated closely by
which is a function of a, the effective radius of the molecules.
If u(t,r) is expanded around the point (t0, r0) in a Taylor series using rectangular coordinates:
u(t,r) = u(t,r)+(u/t)0t + (u/x)0x + (u/y)0y + (u/z)0z + (u/x
2)0x
2/2 + (
u/y
2)0y
2/2 +
(u/z
2)0z
2/2 + (
u/xy)0xy + (
u/yz)0yz + (
u/zx)0zx + ………………(3)
Here, t = t – t0 x = x – x0 , y = y – y0, and z = z – z0
With a small , spatial terms of higher orders can be neglected. Substituting series (3) into the integral
definition (2) all odd spatial terms vanish. With u = u (t0, r0) and considering only first order variations with
time:
2u = -24/
2 (u - <u>) -24/
2 (u/t)(t – t0) ……………………………………………(4)
If ∂u/∂t + u.u = du/dt; and the fluctuating scalar velocity c = u – [u] , equation (4) the Navier – Stokes
equation (1), results in a Langevin equation as follows:
dc/dt = - (24/2)c + A(t) …………………………………………………………… (5)
where A (t) = - 24 (t – to)/ / 2 (∂u/∂t) – d[u]/dt and it may be interpreted as a high frequency random
acceleration arising from the Brownian motion of the molecules within the cell. The statistical properties
A(t) are defined by the relations.
< A(t)> = 0 ……………………………………………………………………………..(6)
< A(ti) A(tj))> = (ti – tj) ………....................................................................................(7)
n
t
6
6
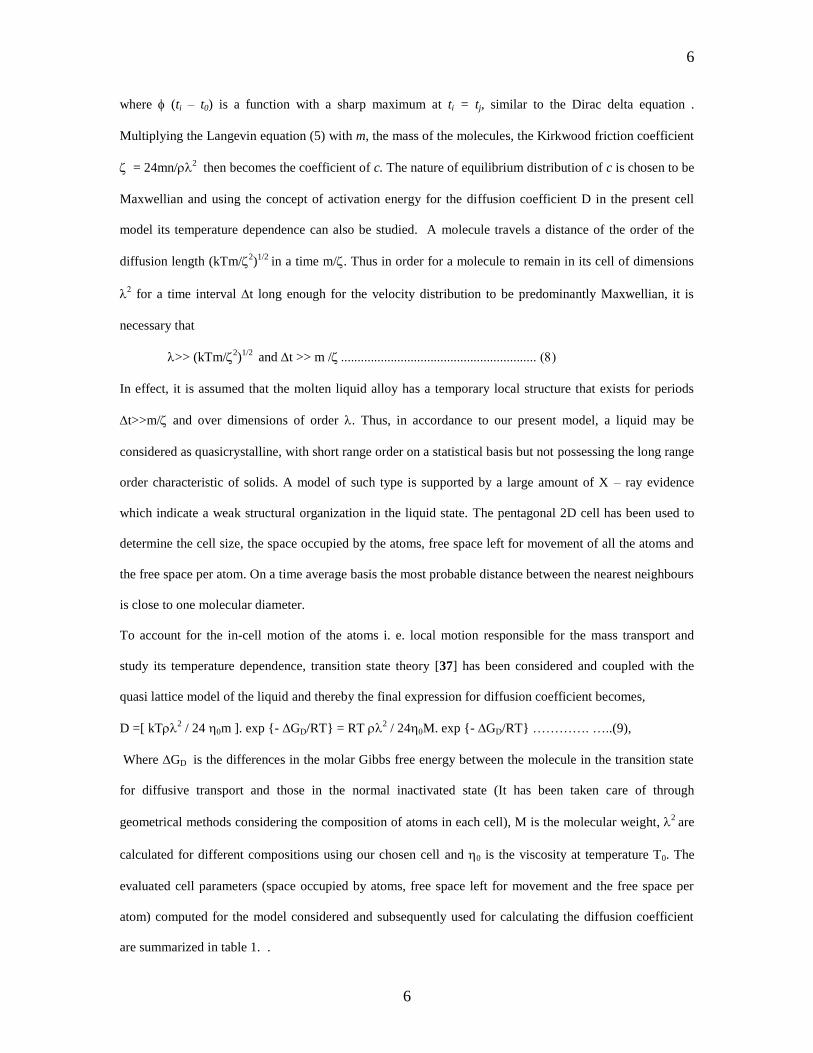
where (ti – t0) is a function with a sharp maximum at ti = tj, similar to the Dirac delta equation .
Multiplying the Langevin equation (5) with m, the mass of the molecules, the Kirkwood friction coefficient
= 24mn/2 then becomes the coefficient of c. The nature of equilibrium distribution of c is chosen to be
Maxwellian and using the concept of activation energy for the diffusion coefficient D in the present cell
model its temperature dependence can also be studied. A molecule travels a distance of the order of the
diffusion length (kTm/2)
1/2 in a time m/. Thus in order for a molecule to remain in its cell of dimensions
for a time interval t long enough for the velocity distribution to be predominantly Maxwellian, it is
necessary that
>> (kTm/2)
1/2 and t >> m /
In effect, it is assumed that the molten liquid alloy has a temporary local structure that exists for periods
t>>m/ and over dimensions of order . Thus, in accordance to our present model, a liquid may be
considered as quasicrystalline, with short range order on a statistical basis but not possessing the long range
order characteristic of solids. A model of such type is supported by a large amount of X – ray evidence
which indicate a weak structural organization in the liquid state. The pentagonal 2D cell has been used to
determine the cell size, the space occupied by the atoms, free space left for movement of all the atoms and
the free space per atom. On a time average basis the most probable distance between the nearest neighbours
is close to one molecular diameter.
To account for the in-cell motion of the atoms i. e. local motion responsible for the mass transport and
study its temperature dependence, transition state theory [37] has been considered and coupled with the
quasi lattice model of the liquid and thereby the final expression for diffusion coefficient becomes,
D =[ kT2 / 24 m ]. exp - ∆GD/RT = RT
2 / 24M. exp - ∆GD/RT …………. …..(9),
Where ∆GD is the differences in the molar Gibbs free energy between the molecule in the transition state
for diffusive transport and those in the normal inactivated state (It has been taken care of through
geometrical methods considering the composition of atoms in each cell), M is the molecular weight, 2
are
calculated for different compositions using our chosen cell and 0 is the viscosity at temperature T0. The
evaluated cell parameters (space occupied by atoms, free space left for movement and the free space per
atom) computed for the model considered and subsequently used for calculating the diffusion coefficient
are summarized in table 1. .
7
7
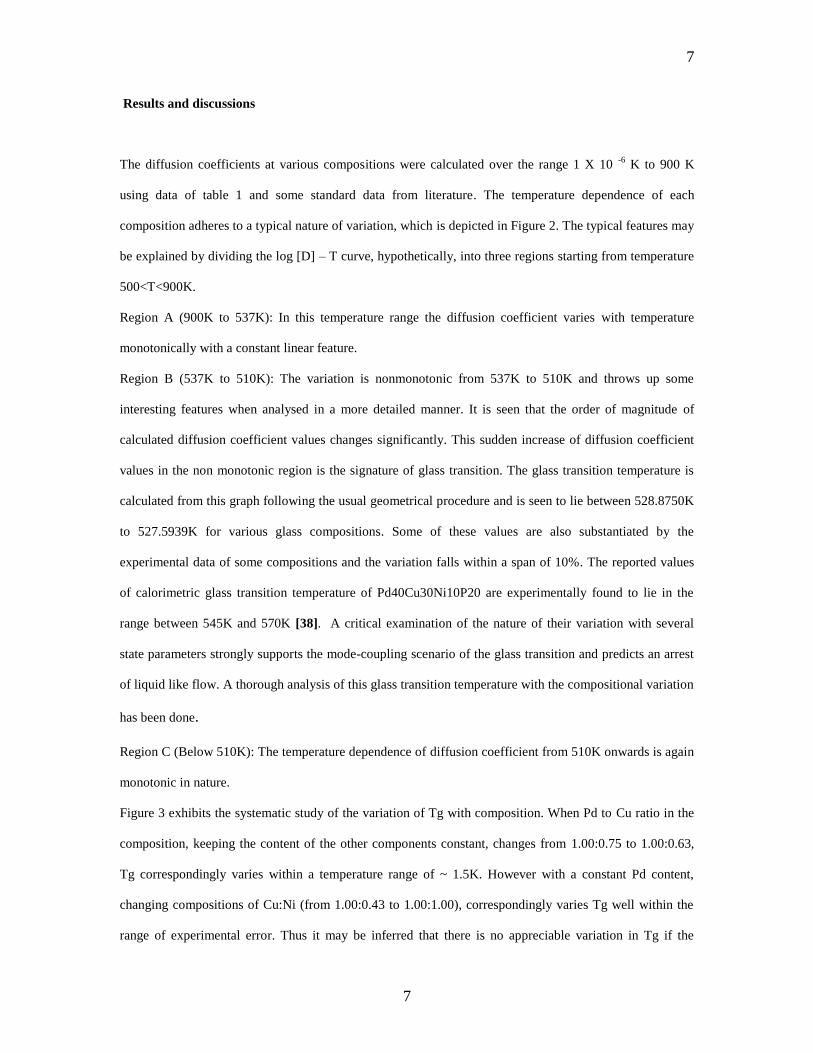
Results and discussions
The diffusion coefficients at various compositions were calculated over the range 1 X 10 -6
K to 900 K
using data of table 1 and some standard data from literature. The temperature dependence of each
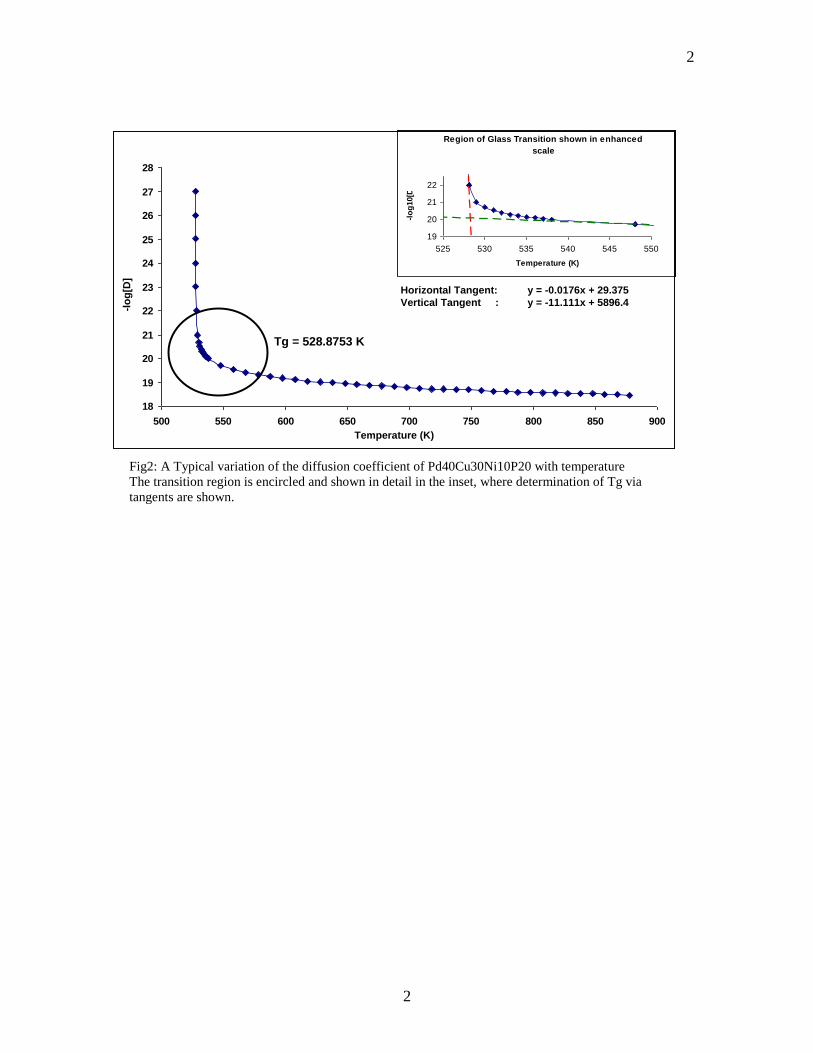
composition adheres to a typical nature of variation, which is depicted in Figure 2. The typical features may
be explained by dividing the log [D] – T curve, hypothetically, into three regions starting from temperature
500<T<900K.
Region A (900K to 537K): In this temperature range the diffusion coefficient varies with temperature
monotonically with a constant linear feature.
Region B (537K to 510K): The variation is nonmonotonic from 537K to 510K and throws up some
interesting features when analysed in a more detailed manner. It is seen that the order of magnitude of
calculated diffusion coefficient values changes significantly. This sudden increase of diffusion coefficient
values in the non monotonic region is the signature of glass transition. The glass transition temperature is
calculated from this graph following the usual geometrical procedure and is seen to lie between 528.8750K
to 527.5939K for various glass compositions. Some of these values are also substantiated by the
experimental data of some compositions and the variation falls within a span of 10%. The reported values
of calorimetric glass transition temperature of Pd40Cu30Ni10P20 are experimentally found to lie in the
range between 545K and 570K [38]. A critical examination of the nature of their variation with several
state parameters strongly supports the mode-coupling scenario of the glass transition and predicts an arrest
of liquid like flow. A thorough analysis of this glass transition temperature with the compositional variation
has been done.
Region C (Below 510K): The temperature dependence of diffusion coefficient from 510K onwards is again
monotonic in nature.
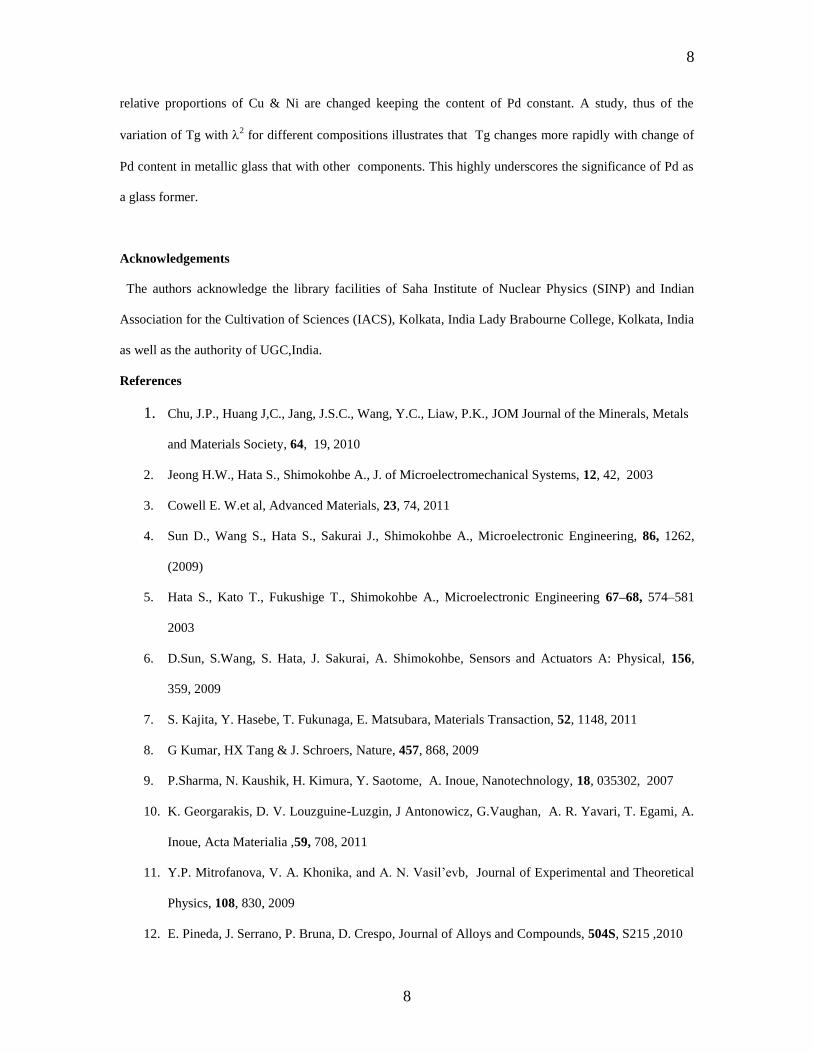
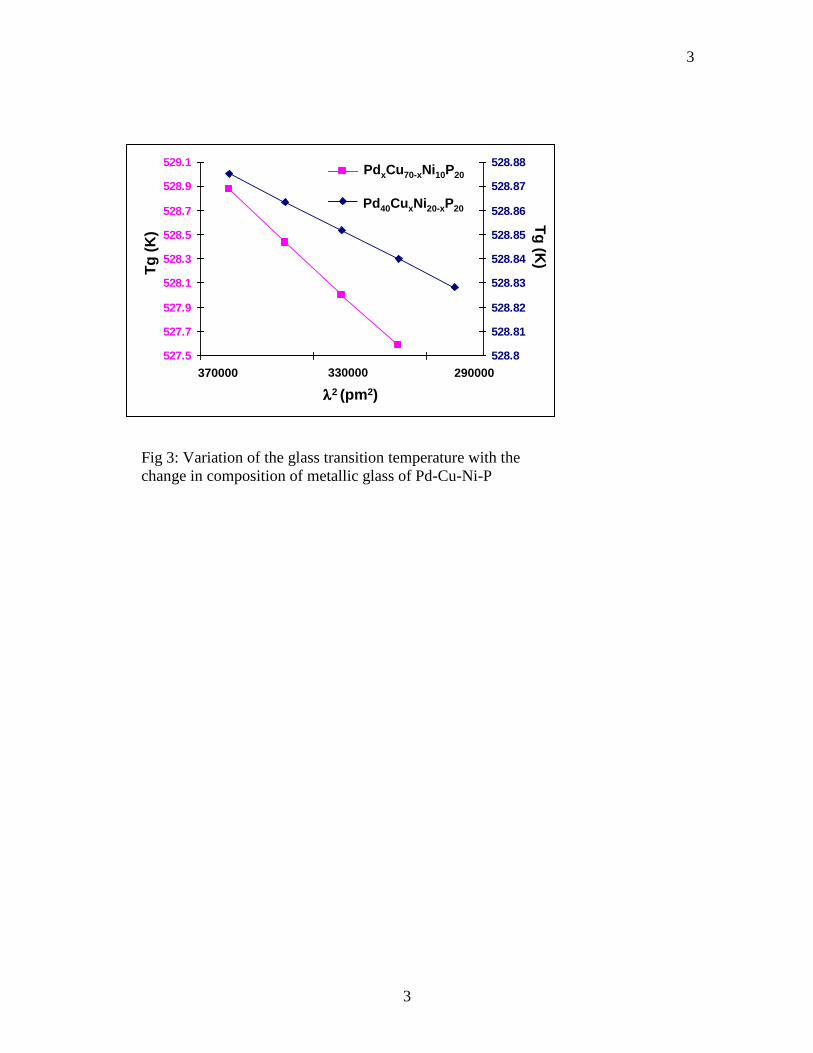
Figure 3 exhibits the systematic study of the variation of Tg with composition. When Pd to Cu ratio in the
composition, keeping the content of the other components constant, changes from 1.00:0.75 to 1.00:0.63,
Tg correspondingly varies within a temperature range of ~ 1.5K. However with a constant Pd content,
changing compositions of Cu:Ni (from 1.00:0.43 to 1.00:1.00), correspondingly varies Tg well within the
range of experimental error. Thus it may be inferred that there is no appreciable variation in Tg if the
8
8
relative proportions of Cu & Ni are changed keeping the content of Pd constant. A study, thus of the
variation of Tg with 2 for different compositions illustrates that Tg changes more rapidly with change of
Pd content in metallic glass that with other components. This highly underscores the significance of Pd as
a glass former.
Acknowledgements
The authors acknowledge the library facilities of Saha Institute of Nuclear Physics (SINP) and Indian
Association for the Cultivation of Sciences (IACS), Kolkata, India Lady Brabourne College, Kolkata, India
as well as the authority of UGC,India.
References
1. Chu, J.P., Huang J,C., Jang, J.S.C., Wang, Y.C., Liaw, P.K., JOM Journal of the Minerals, Metals
and Materials Society, 64, 19, 2010
2. Jeong H.W., Hata S., Shimokohbe A., J. of Microelectromechanical Systems, 12, 42, 2003
3. Cowell E. W.et al, Advanced Materials, 23, 74, 2011
4. Sun D., Wang S., Hata S., Sakurai J., Shimokohbe A., Microelectronic Engineering, 86, 1262,
(2009)
5. Hata S., Kato T., Fukushige T., Shimokohbe A., Microelectronic Engineering 67–68, 574–581
2003
6. D.Sun, S.Wang, S. Hata, J. Sakurai, A. Shimokohbe, Sensors and Actuators A: Physical, 156,
359, 2009
7. S. Kajita, Y. Hasebe, T. Fukunaga, E. Matsubara, Materials Transaction, 52, 1148, 2011
8. G Kumar, HX Tang & J. Schroers, Nature, 457, 868, 2009
9. P.Sharma, N. Kaushik, H. Kimura, Y. Saotome, A. Inoue, Nanotechnology, 18, 035302, 2007
10. K. Georgarakis, D. V. Louzguine-Luzgin, J Antonowicz, G.Vaughan, A. R. Yavari, T. Egami, A.
Inoue, Acta Materialia ,59, 708, 2011
11. Y.P. Mitrofanova, V. A. Khonika, and A. N. Vasil’evb, Journal of Experimental and Theoretical
Physics, 108, 830, 2009
12. E. Pineda, J. Serrano, P. Bruna, D. Crespo, Journal of Alloys and Compounds, 504S, S215 ,2010
9
9
13. S. Hosokawa, H. Sato, N. Happo, T. Ichitsubo, E. Matsubara, N. Nishiyama, ,
Rev.Adv.Mater.Sci. 18, 180, 2008
14. S. Hosokawa, H. Sato, K. Mimura, N. Happo, Y. Tezuka, T. Ichitsubo, E. Matsubara, N.
Nishiyama, Journal of Electron Spectroscopy and Related Phenomena, 156–158 , 426, 2007
15. R. Yamauchi, S. Hata, J. Sakurai and A. Shimokohbe, Jap. J. Appl. Phys., 45, 5911, 2006.
16. Q. Guo, L. Zhang, A.S. Zeiger, Y.Li, K.J., Van Vlietet, Scripta Materialia, 64, 41, 2011,
17. Y Aono, J Sakurai, A Shimokobe, S Hata, Jap. J. of Appl Phys, 50 , 055601, 2011.
18. H.S. Chou, M.C. Liu, S.Y. Kuan, J.C. Huang, Intermetallics, 21, 26, 2012 (to be published)
19. T. C. Hufnagel, R. T. Ott, J. Almer, Phys. Rev. B, 73, 064204, 2006
20. G.E. Abrosimova, N.S. Afonikova, N.P. Kobelev, E.L. Kolyvanov, V.A. Khonik, Physics of the
Solid State, 49, 2099, 2007
21. Y. Zhang & A.L. Greer, J. Alloys Comp., 2, 434, 2007.
22. K. Takenaka, N. Togashi, N.Nishiyama, A. Inoue, Journal of Non-Crystalline Solids, 356, 1542,
2010
23. A.Shibata, Y. Imamura, M. Sone, C. Ishiyama, Y. Higo, Thin Solid Films, 517, 1935, 2009
24. Nishuyama, N., Inoue, A., Materials Transactions, 43, 1913, 2002
25. D. Xu, W.L. Johnson, Physical Review B, 74, 024207 ,2006
26. AL Greer, Materials Today, 12, 14, 2009
27. C. A. Angell, Science, 267, 1924, 1995
28. S. Sachdev and D.R. Nelson, Physical Review Letters, 53, 1947,1984
29. The Physics of quasicrystals, P.J. Steinhardt, S. Ostlund, World Scientific Publishing PTE,
Singapore, 1987 (Book)
30. J. D. Bernal, Proc. R. Soc. London, Ser. A 280, 299 ,1964
31. P. M. Chaikin, T. C. Lubensky, Principles of Condensed Matter Physics, Cambridge ,1998 (Book)
32. V. Zöllmer, K. Rätzke, F. Faupel, A. Rehmet, U. Geyer, Phys. Rev. B 65, 220201(R) ,2002.
33. F. Faupel, W. Frank, M.P. Macht, H. Mehrer, V. Naundorf, K. Rätzke, H. R. Schober, S. K.
Sharma, H. Teichler, Rev. Mod. Phys. 75, 237, 2003
34. H. Chakrabarti, Phys. Rev. B, 51, 12809 ,1995
10
10
35. H. Teichler, J. Non-Cryst. Solids, 293, 339, 2001
36. H. Hofmeister, J. of Metastable and Nanocrystalline Materials, 2 – 6, 325 1999
37. G: Glasstone S, Laidler, K., Eyring, H., The theory of rate processes, McGraw-Hill New York,
1941(Book)
38. V.A. Khonik, U.P. Mitrofanov, S.V. Khonik, S.N. Saltikov, J. of Non Crystalline solids, 358,1191,
2010.
1.(a) 1.(b)
Fig 1 (a) : 2D pentagonal Projection of an icosahedron shown in bold outline
Fig 1(b) : Pentagonal model with containing 10 peripheral atoms and one central atom
Figure(s)
2
2
18
19
20
21
22
23
24
25
26
27
28
500 550 600 650 700 750 800 850 900
Region of Glass Transition shown in enhanced
scale
19
20
21
22
525 530 535 540 545 550
Temperature (K)
-lo
g10[D
]
Horizontal Tangent: y = -0.0176x + 29.375
Vertical Tangent : y = -11.111x + 5896.4
Tg = 528.8753 K
Temperature (K)
-lo
g[D
]
Fig2: A Typical variation of the diffusion coefficient of Pd40Cu30Ni10P20 with temperature
The transition region is encircled and shown in detail in the inset, where determination of Tg via
tangents are shown.
3
3
527.5
527.7
527.9
528.1
528.3
528.5
528.7
528.9
529.1
373201.4557 316199.568
528.8
528.81
528.82
528.83
528.84
528.85
528.86
528.87
528.88PdxCu70-xNi10P20
Pd40CuxNi20-xP20
370000 290000330000
PdxCu70-xNi10P20
Pd40CuxNi20-xP20
2 (pm2)
Tg
(K)
Tg
(K)
527.5
527.7
527.9
528.1
528.3
528.5
528.7
528.9
529.1
373201.4557 316199.568
528.8
528.81
528.82
528.83
528.84
528.85
528.86
528.87
528.88PdxCu70-xNi10P20
Pd40CuxNi20-xP20
370000 290000330000
PdxCu70-xNi10P20
Pd40CuxNi20-xP20
527.5
527.7
527.9
528.1
528.3
528.5
528.7
528.9
529.1
373201.4557 316199.568
528.8
528.81
528.82
528.83
528.84
528.85
528.86
528.87
528.88PdxCu70-xNi10P20
Pd40CuxNi20-xP20
527.5
527.7
527.9
528.1
528.3
528.5
528.7
528.9
529.1
373201.4557 316199.568
528.8
528.81
528.82
528.83
528.84
528.85
528.86
528.87
528.88PdxCu70-xNi10P20
Pd40CuxNi20-xP20
370000 290000330000
PdxCu70-xNi10P20
Pd40CuxNi20-xP20
2 (pm2)
Tg
(K)
Tg
(K)
Fig 3: Variation of the glass transition temperature with the
change in composition of metallic glass of Pd-Cu-Ni-P
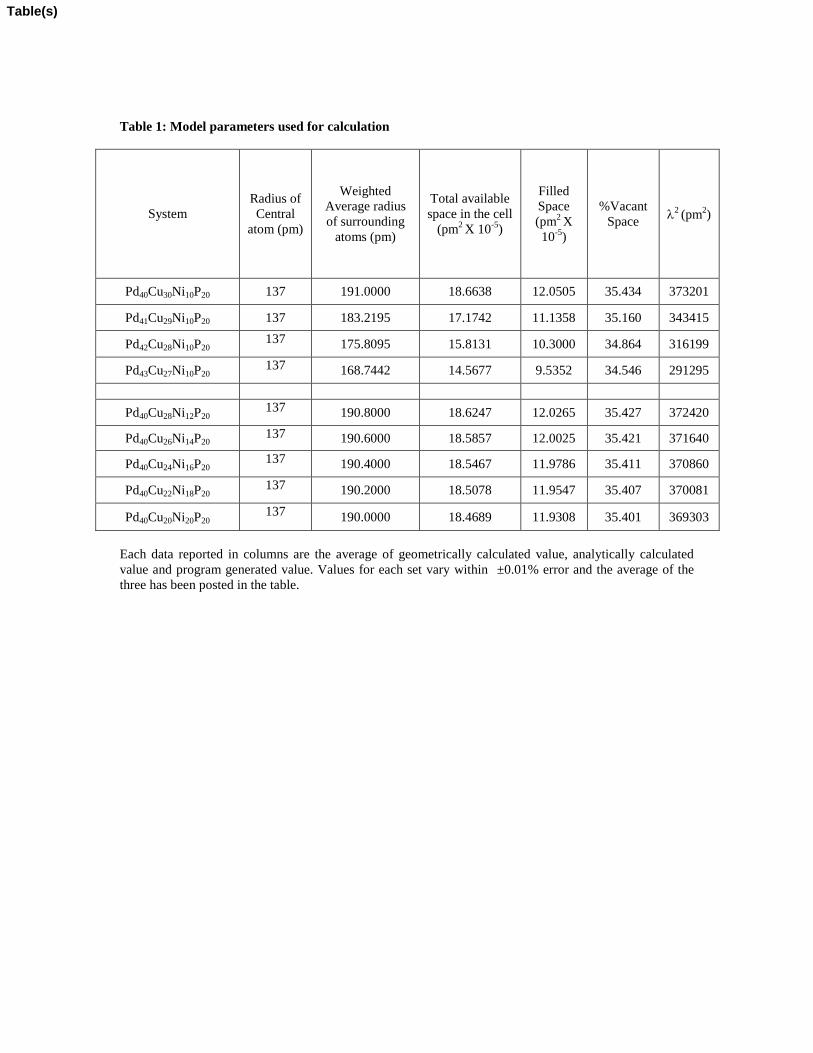
Table 1: Model parameters used for calculation
System
Radius of
Central
atom (pm)
Weighted
Average radius
of surrounding
atoms (pm)
Total available
space in the cell
(pm2 X 10
-5)
Filled
Space
(pm2 X
10-5
)
%Vacant
Space
2 (pm
2)
Pd40Cu30Ni10P20 137 191.0000 18.6638 12.0505 35.434 373201
Pd41Cu29Ni10P20 137 183.2195 17.1742 11.1358 35.160 343415
Pd42Cu28Ni10P20 137 175.8095 15.8131 10.3000 34.864 316199
Pd43Cu27Ni10P20 137 168.7442 14.5677 9.5352 34.546 291295
Pd40Cu28Ni12P20 137 190.8000 18.6247 12.0265 35.427 372420
Pd40Cu26Ni14P20 137 190.6000 18.5857 12.0025 35.421 371640
Pd40Cu24Ni16P20 137 190.4000 18.5467 11.9786 35.411 370860
Pd40Cu22Ni18P20 137 190.2000 18.5078 11.9547 35.407 370081
Pd40Cu20Ni20P20 137 190.0000 18.4689 11.9308 35.401 369303
Each data reported in columns are the average of geometrically calculated value, analytically calculated
value and program generated value. Values for each set vary within ±0.01% error and the average of the
three has been posted in the table.
Table(s)