electronics vs. non-electronic voucher card systems in ethio
TRANSCRIPT
Addis Ababa University
College of Business and Economics
Department of Public Administration and Development Management
Electronics Vs. Non-Electronic Voucher card systems in Ethio-
telecom: Implication to service accessibility and customer
satisfaction
Prepared by
Dirshaye Tessema
Advisor:
Yohannes Workaferah (Phd)
A thesis submitted to the Department of Public Administration and Development Management
of Addis Ababa University in partial fulfilment of the requirements for the Degree of master’s
in public management and Policy (MPMP)
June 2020
Addis Ababa

ii
Addis Ababa University
College of Business and Economics Department of Public Administration and Development Management
This is to certify that the thesis prepared by Dirshaye Tessema entitled Electronics Vs. Non
Electronic Voucher card systems in Ethio- telecom: Implication to service accessibility and
customer satisfaction which is submitted in partial fulfilment of the requirements for the
Degree of Master in Public Management and Policy (MPMP), complies with the regulations
of the University and meets the accepted standards with respect to originality and quality.
Approved by Board of Examiners:
_____________________________ Signature_______________ Date________________
Advisor
_____________________________ Signature_______________ Date________________
External Examiner
_____________________________ Signature_______________ Date________________
Internal Examiner
____________________________ Signature________________ Date________________
Chair of Department or Graduate Programs Coordinator
iii
CERTIFICATE
This is to certify that this project work, “Electronics Vs. Non Electronic Voucher card systems
in Ethio- telecom: Implication to service accessibility and customer satisfaction undertaken by
Dirshaye Tessema in Partial fulfilment of the award of Master ‘s degree Public Administration
and Development Management, in Addis Ababa University
College of Business and Economics is an Original work and not submitted earlier for any
degree either at this University or any other University.
_________________________
Yohannes Workaferah (Phd)
Advisor
iv
DECLARATION
I declare that the research project work named “ Electronic Vs Non-Electronic Voucher card
systems in Ethio- telecom: Implication to service accessibility and customer satisfaction is my
own work and that all the sources that I have been indicated and acknowledged by means of
complete references.
Declared by: Confirmed by Advisor
Name: Dirshaye Tessema Name: Yohannes Workaferah (Phd)
Signature Signature
Date: 18 June 2020
v
ACKNOWLEDGEMENT
First and foremost, I would like to thank God who has kept me safe and healthy and helped me
to complete my studies and the thesis.
Second, I would like to stretch my gratitude to my advisor Yohannes Workaferah (Phd) who
has been a tremendous support in editing my thesis and guiding me through the process on end.
In addition, I would like to thank Addis Ababa University for facilitating the scholarship.
My heartfelt gratitude goes to my honourable friend Mr. Anteneh Gebray who has been greatly
assisting me in editing each part of the thesis, providing me with ideas, correcting the mistakes
and helping me to use SPSS in order to analyse the data. I feel greatly indebted to Miss
Betelihem Amare who is IT Support Specialists at Ethiotelecom who have immensely helped
me in installing the data analysis application, providing me tutorial videos and arranging the
document format. Also, I would like to take this opportunity to thank my brother Mr. Daniel
Birhanu who assisted me in gathering and delivering documents which I could use as input to
my thesis.
I feel immensely indebted to Mr. Misbah Ali, an Alternative Sales Channels Director, Mr.
Tewodros Tsegaye, a Billing Operations Manager (ISD), Mr. Yonas Million, an Organized
Sales Channel Expert, and Mr. Hadgo Belay, a customer service senior supervisor who
provided me with the necessary information through hard copies and e-mails and helped me in
accessing partners full address and informing them to cooperate with my inquiries.
Moreover, my deepest gratitude goes out to Ethiotelecom employees Mrs. Addisalem
Mengestu, a Service Provisioning Specialist, Miss Tsegereda Teklu, a Customer Service
Supervisor and Mr. Melkamu Alemayehu, an Indirect Channels POS Coordinator, and Miss
Yordanos Gessesse who tremendously helped me in acquiring ready-made data and documents
from the system and in delivering questionnaires to major partners and sub-distributors.
Last but no least, I would love to thank my friends and partners who, directly or indirectly,
made valuable contributions in developing, editing and strengthening my thesis.
vi
List of Table
Table 2.1. Definitions if electronic service quality………………………………………… .26
Table 2.2. Dimensions of electronic service quality…………………………………………27
Table 3.1. Electronic voucher distributor (EVD) agents…………………………………….42
Table 3.2. Voucher card distributors (VC) agents…………………………………………....43
Table 3.3. Reliability Statistics …………...……………………………………..….……….46
Table 4.1. Descriptive statistics analysis of EVD…………………………………………....50
Table 4.2. Descriptive statistics analysis of VC………………………………………...……52
Table 4.3. Correlation analysis of EVD service quality parameters…………………………54
Table 4.4. Correlation analysis of VC service quality parameters……………………….…..58
Table 4.5. Model Summary of EVD…………………………………………………………60
Table 4.6. Multiple regression analysis of EVD……………………………………………..60
Table 4.7. Model summary of Regression Analysis for VC…………………………………...……63
Table 4.8. Regression Analysis of VC………………………………………...………..……63
Table 4.9. Paired Samples Test…………………………….………………………………...66
Table 4.10 Aggregated Result of VC and EVD Service Quality Plat form Paired Samples ..66
List of Figures
Figure 1: Gender and Age Distribution of Respondents…………………………..………....47
Figure 2: Academic status of Respondents………………………………………………..…48
Figure 3: Work title/position of Respondent……………………………………………..…..49
vii
ACRONYMS & ABBREVIATIONS
EVD Electronic voucher distribute
EV Electronic voucher
VC Voucher cared
VCS Voucher card system
DV Dependent variable
IVs Independent variable
ID Identification
POS Point of sales
GSM Global System for Mobile Communications
GPRS Ground Penetrating Radar Systems
CDMA Code Division Multiple Access
VPN Virtual privet network
SMS Short message service
MNO Mobile Network operator
ATM Automated Teller Machine
SP Service provider
MM Mobile Money
viii
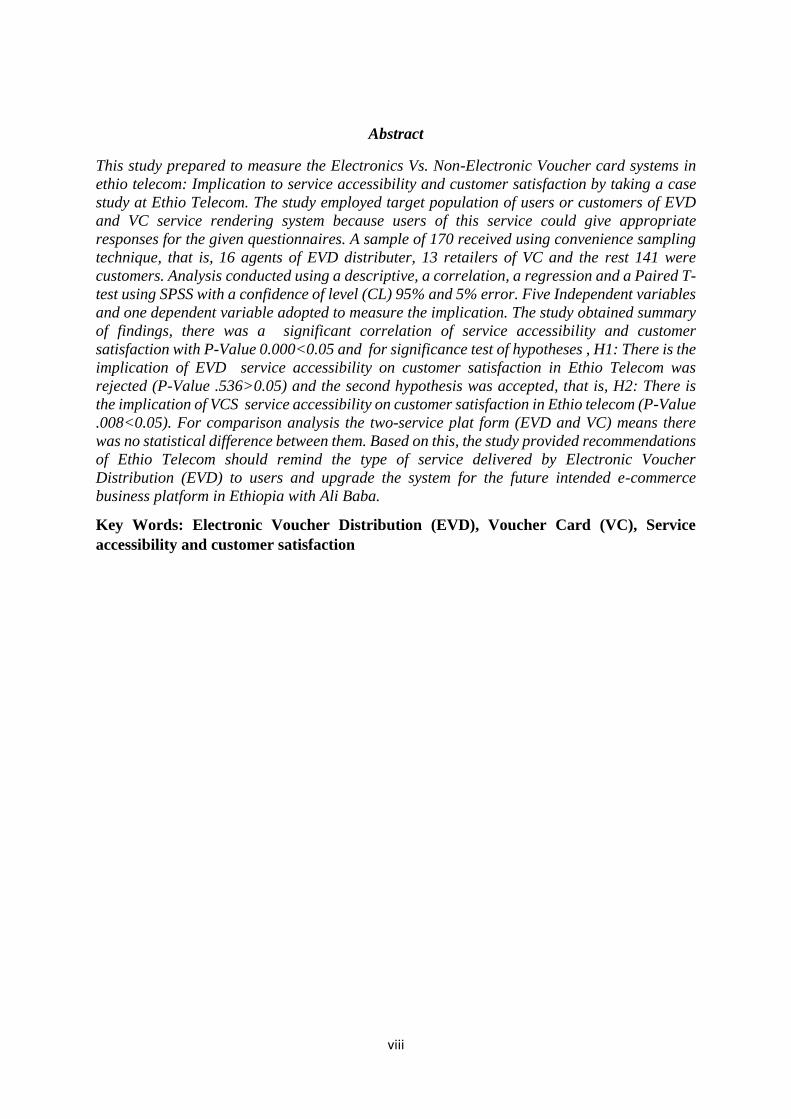
Abstract
This study prepared to measure the Electronics Vs. Non-Electronic Voucher card systems in
ethio telecom: Implication to service accessibility and customer satisfaction by taking a case
study at Ethio Telecom. The study employed target population of users or customers of EVD
and VC service rendering system because users of this service could give appropriate
responses for the given questionnaires. A sample of 170 received using convenience sampling
technique, that is, 16 agents of EVD distributer, 13 retailers of VC and the rest 141 were
customers. Analysis conducted using a descriptive, a correlation, a regression and a Paired T-
test using SPSS with a confidence of level (CL) 95% and 5% error. Five Independent variables
and one dependent variable adopted to measure the implication. The study obtained summary
of findings, there was a significant correlation of service accessibility and customer
satisfaction with P-Value 0.000<0.05 and for significance test of hypotheses , H1: There is the
implication of EVD service accessibility on customer satisfaction in Ethio Telecom was
rejected (P-Value .536>0.05) and the second hypothesis was accepted, that is, H2: There is
the implication of VCS service accessibility on customer satisfaction in Ethio telecom (P-Value
.008<0.05). For comparison analysis the two-service plat form (EVD and VC) means there
was no statistical difference between them. Based on this, the study provided recommendations
of Ethio Telecom should remind the type of service delivered by Electronic Voucher
Distribution (EVD) to users and upgrade the system for the future intended e-commerce
business platform in Ethiopia with Ali Baba.
Key Words: Electronic Voucher Distribution (EVD), Voucher Card (VC), Service
accessibility and customer satisfaction
ix
Contents Acknowledgment ……………………………………………………………………………………..iii
List of Table………..………………………………………………………………………………….iv
List of Figures………………………………………………………………………………………….iv
Acronyms & Abbreviations……………………………………………………………………………v
Abstract……………………………………………………………………………………………….Vi
Chapter One: Introduction ..................................................................................................................... 1
1.1. Background of the Study......................................................................................................... 1
1.2. Statement of the Problem ........................................................................................................ 3
1.3. Basic Research Question ......................................................................................................... 5
1.4. Objective of the Study............................................................................................................. 5
1.4.1. General Objective of the Study ....................................................................................... 5
1.4.2. Specific Objective of the Study ...................................................................................... 5
1.5. Hypothesis............................................................................................................................... 6
1.6. Scope of the study ................................................................................................................... 6
1.7. Limitation of the study ............................................................................................................ 6
1.8. Significance of the Study ........................................................................................................ 6
1.9. Organization of the Study ....................................................................................................... 7
Chapter Two: Literature Review............................................................................................................. 8
Introduction ......................................................................................................................................... 8
2.1. Customer Satisfaction ............................................................................................................. 8
2.2. Service quality ........................................................................................................................ 9
2.3. Customer satisfaction and service quality ............................................................................. 11
2.4. What is Electronic Voucher Distribution System? ............................................................... 14
2.5. How? Where? Who? ............................................................................................................. 14
2.6. Applications of Electronic Voucher Distribution system ..................................................... 14
2.7. Why EVD? ............................................................................................................................ 15
2.8. Voucher ................................................................................................................................. 16
2.9. E-transfer Advantages and Disadvantages ............................................................................ 17
2.9.1. Potential advantages of E-transfers ................................................................................... 18
2.9.2. Potential disadvantages of E-transfers .............................................................................. 18
2.10. E-Transfer Product Profiles .............................................................................................. 19
E-vouchers ........................................................................................................................................ 20
2.10.1. Product Profile: ............................................................................................................. 20
2.9.2. Power requirements: ........................................................................................................... 20
x
2.11. Authentication process: ..................................................................................................... 20
2.12. Merchant PRO Smartphone E-vouchers ........................................................................... 21
2.13. Benefits of Using E-Voucher Platform ............................................................................. 22
2.14. How It Works: ................................................................................................................... 22
2.15. Choosing between electronic and paper motivation vouchers .......................................... 23
2.16. Vouchers: Electronic Vs paper ......................................................................................... 24
2.17. Electronic service concept ................................................................................................ 24
2.18. Dimensions of Electronic service quality ......................................................................... 27
2.18.1. Reliability ...................................................................................................................... 28
2.18.2. Ease of use: ................................................................................................................... 28
2.18.3. Efficiency: ..................................................................................................................... 29
2.18.4. Website design: ............................................................................................................. 30
2.18.5. Responsiveness: ............................................................................................................ 30
2.19. Customer Satisfaction of electronic service ...................................................................... 31
2.19.1. Electronic service quality and Customer Satisfaction ....................................................... 31
2.20. Conventional service quality and Customer Satisfaction .................................................. 32
2.21. Theoretical framework ...................................................................................................... 33
2.22. Empirical Review ............................................................................................................... 34
2.22.1. Challenges of E-services ............................................................................................... 37
2.22.2. Drivers of virtual Airtime Adoption ............................................................................. 39
Chapter Three: Research Methodology ................................................................................................ 41
3.1. Research Design ......................................................................................................................... 41
3.2. Target Population ....................................................................................................................... 41
3.3. Sampling Size and Techniques .................................................................................................. 42
3.4. Data Collection Methods ........................................................................................................... 42
3.5. Definition of Variables.......................................................................................................... 43
3.6. Model of Regression Analysis .............................................................................................. 45
3.7. Validity and Reliability of the Instruments ........................................................................... 45
3.8. Data Analysis ........................................................................................................................ 46
Chapter Four: Data Analysis ................................................................................................................. 47
Introduction ....................................................................................................................................... 47
4.1. Response Rate ....................................................................................................................... 47
4.2. Demographic Characteristics of Respondents ...................................................................... 47
4.2.1. Gender and Age of Respondents ................................................................................... 47
4.2.2. Academic status of Respondents ................................................................................... 48
4.2.3. Work title or position of respondents ............................................................................ 49
xi
4.3. Descriptive Statistics Analysis .............................................................................................. 49
4.3.1. Descriptive Statistics Analysis for Electronic Voucher Distribution (EVD) ................ 50
4.3.2. Descriptive Statistics Analysis for Voucher Card (VC)................................................ 51
4.4. A Pearson Correlation Analysis of the IVs and DV for EVD and VC ................................. 53
4.4.1. A Pearson Correlation Analysis of EVD ...................................................................... 54
4.4.2. A Pearson Correlation Analysis of VC ......................................................................... 55
4.5. Diagnostic Analysis of assumption of Multiple Regression Analysis .................................. 57
4.6. Multiple Regression Analysis of EVD and VC .................................................................... 59
4.6.1. Multiple Regression Analysis of EVD .......................................................................... 59
4.6.2. Multiple Regression Analysis of VC ............................................................................ 63
4.7. Comparison between Voucher Card and Electronic Voucher Card Distribution Service
Quality65
Chapter Five: Summary of Findings, Conclusions, and Recommendations .......................................... 68
5.1. Summary of Findings ............................................................................................................ 68
5.2. Conclusions ........................................................................................................................... 70
5.3. Recommendations ................................................................................................................. 72
Reference .......................................................................................................................................... 73
Annex 1 ................................................................................................................................................. 81
Assumption 1. Linearity Assumption of Electronic Voucher Distribution ........................................ 81
Annex 2 ............................................................................................................................................. 82
Assumption 2. Multicollinearity Diagnostics .................................................................................... 82
Assumption 3. Durbin-Watson Test /The values of the residuals are independent/Autocorrelation 82
Annex 3 ............................................................................................................................................. 83
Assumption 4. Test of Homoscedasticity ......................................................................................... 83
Assumption5. Test of Normality ...................................................................................................... 84
Annex4 .............................................................................................................................................. 84
Assumption #6: There are no influential cases biasing your model. ............................................... 84
Annex 5 ............................................................................................................................................. 86
Assumption 1. Linearity Assumption of Voucher Card for VC .......................................................... 86
Annex 6 ............................................................................................................................................. 87
Assumption 2. Multicollinearity Diagnostics ..................................................................................... 87
Annex 7 ............................................................................................................................................. 88
Assumption 3. Durbin-Watson Test /The values of the residuals are independent/Autocorrelation
for VC ............................................................................................................................................... 88
Annex 8 ............................................................................................................................................. 89
Assumption 4. Test of Homoscedasticity for VC ............................................................................. 89
xii
Annex 9 ............................................................................................................................................. 90
Assumption5. Test of Normality for VC ......................................................................................... 90
Assumption #6: There are no influential cases biasing your model for VC .................................... 90
Annex 9 ............................................................................................................................................. 91
Questionnaire to be filled by Respondents for EVD ......................................................................... 91
Questionnaire to be filled by Respondents for VC ........................................................................... 95
1
Chapter One: Introduction
This study is prepared to exhibit research that compares Electronics Vs. Non-Electronic
Voucher card systems in Ethio- telecom: Implication to service accessibility and customer
satisfaction. To prepare the proposal, the researcher attempted to observe EVD implementation
in Ethio telecom and analysing its service accessibility with the voucher card system. In
addition to this, the thesis endeavour to set the implication of the system of the model of service
quality and customer satisfaction.
1.1. Background of the Study
A voucher can be paper or electronic and has benefits to facilitate the exchange of transactions
in designated shops or fairs. Vouchers have advantages when there is a high risk of inflation
since they help to absorb the increasing cost of a commodity or service, and restrict how a
beneficiary uses the transfer value. Furthermore, a voucher also minimizes risks that may incur
in a commodity or service exchange. According to (WFP,2014) demonstrated the e-voucher
system entails the inclusion of private parties in the distribution of inputs, regarding this, the
rationale behind this is, the market works better in sharing of information with the public. A
voucher refers to a coupon that is issued to clients with the necessary face value, and can be
also applied in participating locations, however; an e-voucher is an advanced voucher system
and used in conjunction with an electronic system, recording, and transmission.
In addition to this, there are also mobile vouchers that are a combination of an electronic system
and mobile phones, mobile phones are used to receive and redeem e-vouchers. In reasons, in
the distribution networks, e-voucher programs enable rural retail shops as the distribution
networks, and studies have shown that villagers need inputs stock is n’t close to their villages
(Alloyce, Gabagambi, and Hella, 2014). Regarding this, the Vouchers allow users to minimize
spending patterns and reduce logistics expenses. The systems implementation can be complex
since it takes more time to establish and to set the control protocol to avoid forgery. The other
aspects here are e-voucher, which requires sufficient infrastructure to establish the technology,
and merchants with shops of sufficient size and product or service depth to make ensure the
beneficiary access to the necessary quality goods. E-vouchers are applying for a Smart card
(chip or magnetic stripe) and have data that can be purported to recognize the user’s identity.
2
In this global landscape, currently, people perceive most things virtually since they have virtual
friends, shop from a virtual platform, enjoy virtual reality, and travel places virtually. This
indicates that the future nascent to use virtualization. So EVD allows people to pay bills,
recharge mobile phones, purchase in retail stores, book tickets, and even buy lotteries with e-
money. Furthermore, e-voucher is becoming one of the most indispensable modes for inputs
subsidy programs since the e-voucher crowds in the private sector, this may enhance farmers’
that access and lower inputs diversion (Mason, Jayne and Mofya Mukuka, 2013). E-voucher
purports private enterprises' involvement to limit the government’s interferences and motivate
the demand for commercial fertilizer to support farmers, (Kijima, 2016).
Furthermore, the EVD system has significance, such as it is safe, and customers are not worried
about carrying money in their pockets anymore from the customer's point of view. For example,
in Nigeria implemented the E-wallet under GESS1, the scheme targeted the most vulnerable
households, aimed at increasing agriculture information dissemination and input supply
(Fadairo, Oluteggbe, and Tijani, 2015), this minimizes operational costs by improving
operational excellence since the system saves time and money. However, contrary to this, the
card paper method of conducting service has a disadvantage compared to EVD since it entails
high transaction costs, production costs, and operation expenses.
Thus far, the study will emphasize more on EVD and Voucher Card System service of Ethio
telecom, and its implication on customer satisfaction through the service quality. Customer
satisfaction has been considered to be based on the customer’s experience on a particular
service encounter (Cronin &Taylor, 1992) that aligned with the service quality. Here the
service quality comes from the output of the service provider organization. Other authors
emphasized that customer satisfaction relates to a specific transaction, which means, the
difference between predicted service and perceived service) on the contrary, to attitudes
(Lewis, 1993, p.4-12).
Before the e-voucher is sent to the beneficiaries, a registration process is done, and information
collected usually includes national ID, name, mobile number, and input requirements
(Elijah,2017).
There are several tasks involved in the implementation of the e-voucher, some key ones
include; beneficiary identification, users such as farmers, etc registration, coupon security,
input security, input distribution, coupon redistribution, coordination, and control (SOAS,
2008; Dorward and Chirwa, 2011). In evaluating subsidy implementation focus must be on
3
cost, modalities, timing, targeting, rationing of input access (SOAS, 2008 cited in Dorward and
Chirwa, 2011). After mentioning this, the researcher is motivated to prepare this proposal to be
intensively studied.
1.2. Statement of the Problem
There is no doubt that the application of EVD users tremendously increases currently due to
the high change rate of technological advancement. So in this growing trend, the EVD will take
over the paper-based schemes in the future. In addition to this, there are also mobile vouchers
that are a combination of an electronic system and mobile phones, mobile phones are used to
receive and redeem e-vouchers. In reasons, in the distribution networks, e-voucher programs
enable rural retail shops as the distribution networks, and studies have shown that villagers
need inputs stock is not close to their villages (Alloyce, Gabagambi, and Hella, 2014).
According to Johnson, Director General at the voucher trade body stated that retailers offer
electronic gift cards, which has purported to build the market, the paper-based reward system
still accounts about 70% of the market share. One of the advantages of using electronic voucher
schemes helps to motivate employees, customers, etc..., and has incurred less administration
cost. EVD is very simple to give rewards for customers as well as employees in the
organization. The other key advantage of EVD is that they are easy to manage since it entails
sending of email.
On the contrary to this, some organization still employs a paper-based card system or vouchers
since they believed that paper-based vouchers to support for discount. The E-Voucher Transfer
Platform is a tool that makes it easier, more efficient, and more secure to reach participants
with social protection programs such as cash transfers. Related to this, scratch cards come with
high costs for service providers. This means the entire process of generating vouchers,
assigning batches, printing, and distributing. Not only this, but there is also an additional cost
of managing an inventory of scratch cards. The other challenges of scratch cards have also
challenged to forecast the total number and denomination. E-voucher is becoming one of the
most indispensable modes for inputs subsidy programs since the e-voucher crowds in the
private sector, this may enhance farmers’ that access and lower inputs diversion (Mason, Jayne
and Mofya Mukuka, 2013).
4
So the study here attempted to evaluate the implication of the service quality rendering system
regarding EVD and VC on service accessibility and customer satisfaction in Ethio Telecom.
Customer satisfaction studied the indifferent approach by various researchers. Some
considered service/product quality, price, customer handling, etc. relationship with users’
satisfaction. Some researchers have given a possible way for measuring customer satisfaction
(Levy, 2009; NBRI, 2009). Other like (Wilson et al.,2008, p.79-80) described factors that affect
customer satisfaction like product and service quality, price, personal and situational factors.
Since customer satisfaction is also addressed the level of service quality given by the
organization and service quality can be a determinant of customer satisfaction (Lee et al.,2000,
p.226) and (Wilson et al., 2008, page 79-80). In addition to this, other researchers in China,
(Wang & Hing-Po, 2002, p. 50-60) attempted to measure service quality in the mobile phone
market and delivered there was the relationship among service quality, customer value,
customer satisfaction and their encouragement in the future behaviors of after the indispensable
customer value and customer satisfaction factors identified. Furthermore, (Negi,2009)
evaluated the relationship of customer-oriented service quality in determining the satisfaction
of customers as a whole in the context of mobile services. The result exhibited that reliability
and network quality were related factors to evaluate service quality and ensure that tangibles,
empathy, and assurance were necessary when evaluating perceived quality and customer
satisfaction. Related to this, (Ahmed et at.,2010) performed customer satisfaction research
based on the relationship between service quality by applying the SERVQUAL model’s 5
dimensions (tangibles, responsiveness, empathy, assurance, and reliability) to evaluate service
quality). All these above-written articles attempted to indicate the relationship between
customer satisfaction and service quality (based on model 5).
Keeping this in mind, from the customer point of view, the study attempted to identify some
gaps in customer satisfaction that could challenge the service rendering quality in the market
sector of voucher card (VC) and electronic voucher card (EVD) in Ethio Telecom. According
to the survey, customers had been faced some problems regarding the EVD, such as lack of
awareness to use properly the system, no willingness to apply YIMULU recharging of the
mobile, the system unable to exhibit the name of the customer so some customer missed the
charging value since wrongly transfer to another person, and sometimes there is network
malfunction. Regarding the paper-based voucher (VC), some customers had not been felt
convenience to use lightly, also the problem of flexibility that is had no enough lead time when
5
to fill the scratched numbers (quick time out), card refilling was also time taking and not simple
for customers.
So regarding this, the study emphasized evaluating the implication of EVD implementation
service rendering versus VC service rendering system on service accessibility and customer
satisfaction.
1.3. Basic Research Question
The research has the following basic research questions:
1. What is the correlation of service quality dimensions of EVD on customer satiation
satisfaction?
2. What is the correlation of service quality dimensions of the voucher card system on
customer satisfaction?
3. What is the comparative of service quality dimension of EVD and voucher card system
on customer satisfaction?
1.4. Objective of the Study
The purpose of the study addressed the general and specific objectives.
1.4.1. General Objective of the Study
The general purpose of the study is to evaluate the implication of EVD versus Voucher Card
System on service accessibility and customer satisfaction.
1.4.2. Specific Objective of the Study
The study has the following specific objective
1. To evaluate the correlation of the Electronic Voucher Distribution (EVD) service
rendering system on the service accessibility and customer satisfaction.
2. To evaluate the correlation of Voucher Card (VC) service rendering System on service
accessibility and customer satisfaction
3. To evaluate the comparison of Electronic Voucher Distribution (EVD) versus Voucher
Card (VC) service rendering implication on service accessibility and customer
satisfaction.
6
1.5. Hypothesis
To measure the implication of both EVD and Voucher Card System on service accessibility
and customer satisfactions, the study will develop the following hypotheses:
H1: There is significant implication of service accessibility of EVD on customer satisfaction
in Ethio Telecom.
H2: There is significant implication of service accessibility of Voucher Card service rendering
on customer satisfaction in Ethio telecom.
1.6. Scope of the study
The study had an area, literature, and methodological scope. Accordingly, the study restricted
to observing service accessibility and customer satisfaction in Addis Ababa. This means,
questionnaires distributed to customers that live in Addis Ababa only. In the case of literature
concepts, the study encompassed related concepts with EVD and Voucher Card System
including the relationship between service quality dimensions (based on SERVQUAL) and
customer satisfaction. Furthermore, the study applied judgmental and convenience approach to
select the appropriate sample.
1.7. Limitation of the study
The core limitation of the study was ethio telecom gives service all over the country and it has
above 15 zonas and region office and it has above 48 million customers and 16 and 152 third
party agents for both services. It was difficult to collect the data from all customers and the
respondent not willing to fill the questionnaire special the third-party agents. To fill this
limitation the study applied convenience scientific techniques.
1.8. Significance of the Study
The study will have benefits to Ethio telecom to reform its operation in EVD and Voucher Card
service rendering system to enhance its service quality that bring customer satisfaction. The
output of the study will give sound information to Ethio telecom to improve its services, and
to improve more its EVD and Voucher Card service rendering system. Furthermore, it will be
a benchmark for other researchers to conduct intensive study.
7
1.9. Organization of the Study
The structure of the study had five Chapters, that is, the first Chapter emphasized about the
introduction, background, statement of the problem, hypotheses, scope of the study, limitation
of the study, and the benefit of the study. Following this, Chapter two, emphasized about the
literature concepts of EVD and Voucher Card System, service quality and customer
satisfaction. Chapter three, focused on the research design or methodology, and next to this,
Chapter IV, addressed data analysis, interpretation, and result discussion. At the end, the last
Chapter V, incorporated summary of findings, conclusions, and recommendations.
8
Chapter Two: Literature Review
Introduction
Under this chapter, the study incorporates concepts about EVD, Voucher Card System, service
quality, customer satisfaction, and theoretical framework of the study. The researcher
attempted to exhibit both the conventional and electronic service quality since EVD address
electronic service activities, whereas the conventional way of service quality more deals about
Voucher Cared System of serving of clients.
2.1. Customer Satisfaction
Customer satisfaction has been studied in different directions, from measurement to its
relationships with other business aspects. Some researchers have provided possible means of
measuring customer satisfaction (Levy, 2009; NBRI, 2009). Meanwhile other authors like
(Wilson et al. (2008) demonstrated some determinants of customer satisfaction to be product
and service quality, price, personal and situational factors (Wilson et el., 2008, p. 79-80). Some
researchers have looked into the relationship between total quality management and customer
satisfaction. (Wen-Yi , et al,. 2009, p. 957-975).
Because customer satisfaction is also based upon the level of service quality provided by the
service provider (Lee et al., 2000, p. 226) and service quality acts as a determinant of customer
satisfaction (Wilson et al., 2008, page 79-80). Other authors have brought out theories relating
customer satisfaction and service quality in their researches. (Wang & Hing-Po, 2002, p. 50-
60) measured service quality in China’s mobile phone market and emphasis on the dynamic
relationship among service quality, customer value, customer satisfaction and their influence
on future behaviours after the key drives of customer value and customer satisfaction are
identified.
Barkensjo (2005 suggested, (Negi 2009), investigated the relevance of customer-perceived
service quality in determining the overall satisfaction of customers in the context of mobile
services. The result was that reliability and network quality were relevant factors to evaluate
service quality and he confirms that tangibles, empathy and assurance should not be neglected
when evaluating perceived service quality and customer satisfaction. Still with the idea of using
service quality dimensions to study customer satisfaction, (Ahmed et al., 2010) conducted a
mediation of customer satisfaction relationship between service quality and repurchase
9
intentions for the telecom sector among university students, with the SERVQUAL model’s 5
dimensions (tangibles, responsiveness, empathy, assurance, and reliability) by (Parasuraman
et al.1988) to measure service quality. To confirm the fact researchers are still working on
customer satisfaction especially on its relationship with service quality dimensions.
Measuring customer satisfaction could be very difficult at times because it is an attempt to
measure human feelings. It was for this reason that some existing researchers presented that
“the simplest way to know how customers feel, and what they want is to ask them” this applied
to the informal measures (Levy, 2009, p. 6; NBRI, 2009). (Levy 2009, p. 6) in his studies,
suggested three ways of measuring customer satisfaction:
• A survey where customer feedback can be transformed into measurable
quantitative data:
• Focus group or informal where discussions orchestrated by a trained moderator
reveal what customers think.
• Informal measures like reading blocs, talking directly to customers.
There exist two conceptualizations of customer satisfaction; transaction-specific and
cumulative (Boulding, et al., 1993; Andreassen, 2000). Transaction-specific, customer
satisfaction is viewed as a post-choice evaluation judgment of a specific purchase occasion
(Oliver,1980) until the present date, researchers have developed a rich body of literature
focusing on this antecedents and consequences of this type of customer satisfaction at the
individual level (Yi, 1990). Cumulative customer satisfaction is an overall evaluation based on
the total purchase and consumption experiences with a product or service over time. (Fornell,
1992, Johnson & Fornell 1991) This is more fundamental and useful than transaction
specificity customer satisfaction in predicting customer subsequent behavior and the firm’s
past, present, and future performances. It is the cumulative customer satisfaction that motivates
a firm’s investment in customer satisfaction.
2.2. Service quality
For a company’s offer to reach customers, there is a need for services. These services depend
on the type of product and it differs in various organizations. Service can be defined in many
ways depending on which area the term is being used. An author defines service as “an
intangible act or performance that one party offers to another that does not result in the
ownership of anything” (Kotler & Keller, 2009, p. 789). In all, service can also be defined as
an intangible offer by one party to another in exchange for money for pleasure.
10
Quality is one of the things that consumers look for in an offer, which service happens to be
one (Solomon 2009, p. 413). Quality can also be defined as the totality of features and
characteristics of a product or services that bear on its ability to satisfy stated or implied needs
(Kotler et al., 2002, p. 831). Quality is also related to the value of an offer, which could evoke
satisfaction or dissatisfaction on the part of the user.
Service quality in the management and marketing literature is the extent to which customers'
perceptions of service meet and/or exceed their expectations for example as defined by
(Zeithaml et al. ,1990), cited in (Bowen & David, 2005, p. 340) Thus service quality can intend
to be how customers are served in an organization which could be good or poor. Parasuraman
defines service quality as “the differences between customer expectations and perceptions of
service” (Parasuraman, 1988). They argued that measuring service quality as the difference
between perceived and expected service was a valid way and could make management to
identify gaps to what they offer as services.
The SERVQUAL scale which is also known as the gap model by (Parasuraman, et al. ,1988)
has been proven to be one of the best ways to measure the quality of services provided to
customers. This service evaluation method has been proven consistent and reliable by some
authors (Brown et al., 1993). They held that, when perceived or experienced service is less than
the expected service; it implies less than satisfactory service quality; and when perceived
service is more than expected service, the obvious inference is that service quality is more than
satisfactory (Jain et al., 2004, p. 27). From the way this theory is presented, it seems the idea
of SERVQUAL best fits the evaluation of service quality form the customer perspective. This
is because when it is stated “perceived” and “expected” service, it is very clear that this goes
to the person, who is going to or is consuming the service; who is the consumer/customer.
To confirm the validity of SERVQUAL model in the evaluation of service quality, (Zeithaml
et al ,2006), stated that “service quality is a focused evaluation that reflects the customer’s
perception of reliability, assurance, responsiveness, empathy, and tangibles” (Zeithaml et al.,
2006, p. 106-107). They added that among these dimensions, “reliability” has been shown
consistently to be the most important dimension in service quality (Zeithaml et al., 2006, p.
106-107).
11
2.3. Customer satisfaction and service quality
Since customer satisfaction has been considered to be based on the customer’s experience on
a particular service encounter, (Cronin & Taylor, 1992) it is in line with the fact that service
quality is a determinant of customer satisfaction, because service quality comes from outcome
of the services from service providers in organizations. Another author stated in his theory that
“definitions of consumer satisfaction relate to a specific transaction (the difference between
predicted service and perceived service) in contrast with ‘attitudes’, which are more enduring
and less situational-oriented,” (Lewis, 1993, p. 4-12) This is in line with the idea of
(Zeithaml et al,2006, p. 106-107).
Regarding the relationship between customer satisfaction and service quality, Oliver (1993)
first suggested that service quality would be antecedent to customer satisfaction regardless of
whether these constructs were cumulative or transaction specific. Some researchers have found
empirical supports for the view of the point mentioned above (Anderson & Sullivan, 1993;
Fornell et al 1996, Spreng & Macky 1996); where customer satisfaction came as a result of
service quality.
In relating to customer satisfaction and service quality, researchers have been more precise
about the meaning and measurements of satisfaction and service quality. Satisfaction and
service quality have certain things in common, but satisfaction generally is a broader concept,
whereas service quality focuses specifically on dimensions of service. (Wilson et al., 2008, p.
78). Although it is stated that other factors such as price and product quality can affect customer
satisfaction, perceived service quality is a component of customer satisfaction (Zeithaml et al.
2006, p. 106-107). This theory complies with the idea of (Wilson et al. ,2008) and has been
confirmed by the definition of customer satisfaction presented by other researchers.
It has been proven from past researches on service quality and customer satisfaction that
Customer satisfaction and service quality are related from their definitions to their relationships
with other aspects of the business. Some authors have agreed to the fact that service quality
determines customer satisfaction. (Parasuraman et al., 1985) in their study, it proposed that
when perceived service quality is high, then it will lead to an increase in customer satisfaction.
Some other authors did comprehend with the idea brought up by (Parasuraman,1995) and they
acknowledged that “Customer satisfaction is based upon the level of service quality that is
provided by the service providers” (Saravana & Rao, 2007, p. 436, Lee et al., 2000, p. 226).
12
As a result of the definition of customer satisfaction presented by (Lewis, 1993, p. 412),
(Sivadas & Baker-Prewitt 2000, p. 73-82) used a national random telephone survey of 542
shoppers to examine the relationship between service quality, customer satisfaction, and store
loyalty within the retail department store context. One of the results was that service quality
influences relative attitude and satisfaction with department stores. They found out that there
is a relationship between customer satisfaction and service quality. In line with the findings
of (Sivadas & Baker-Prewitt (2000, p. 73-82), ( Su et al., 2002, p. 372) in their study of
customer satisfaction and service quality, found out that; these two variables are related,
confirming the definitions of both variables which have always been linked. They also dictated
that service quality is more abstract because it may be affected by perceptions of value or by
the experiences of others that may not be so good, than customer satisfaction which reflects the
customer’s feelings about many encounters and experiences with service firms. (Su et al., 2002,
p. 372).
In addition to what the other researchers have found out from customer satisfaction and service
quality, some other authors (Wang & Hing-Po, 2002), went into details to bring in customer
value in the study of the relationship between customer satisfaction and service quality. Their
study used the SERVQUAL model in measuring service quality in China’s mobile phone
market, but with modification on the basis of focus group discussions and expert opinions to
reflect the specific industry attributes and the special culture of China. Emphasis was then paid
to the study of the dynamic relationships among service quality, customer value, customer
satisfaction, and their influences on future behaviors after the key drivers of customer value
and customer satisfaction were identified. All of them were based on the development of
structural equation models by using PLS-GRAPH Package. (Wang & Hing-Po, 2002 p. 50-60)
This study blended the study of customer satisfaction and service quality with customer value
which added more weight to the linkage between customer satisfaction and service quality
because the value is what customers look in an offer.
With regards to the above statistics; (Kuo, 2003) conducted a research on service quality of
virtual community websites with the purpose of constructing an instrument to evaluate service
quality and to have a further discussion of the relationship between service quality dimensions
and overall service quality, customer satisfaction and loyalty. The researcher used Factor
analysis, t-test, and Pearson correlation analysis to analyze the data collected from college
students of three major universities in Taiwan. One of the results was that “on-line quality and
information safety are positively related to the overall service quality, customer satisfaction,
13
and loyalty, but the service quality level of this dimension was the poorest.” (Kuo, 2003, 461-
473).
In contrast to the above studies, (Bennett & Barkensjo, 2005) studied relationship quality,
relationship marketing, and client perceptions of the levels of service quality of charitable
organizations. Questions were asked to 100 people on their perceptions of service quality of
the organizations that had given them assistance, their satisfaction with a charity service, etc.
they constructed a model and estimated using the method of partial least square. Also,
perceived service quality was measured via adaptations of the SERVQUAL instrument but
without any assessments of the respondents' prior expectations concerning the services, they
would receive from an organization. In their results, relationship marketing was found to
represent an effective weapon for improving both relationship quality and beneficiaries'
satisfaction with service provision. They stated that “relationship quality and actual service
quality induced beneficiaries to want to recommend a charity to other people and to engage in
positive word-of-mouth.” (Bennett & Barkensjo, 2005, p. 101). Meaning the beneficiaries who
stood as the customers were satisfied since the recommendation is a signal of satisfaction,
confirming the idea that service quality is related to customer satisfaction. They were not
directly conducting a research on the relationship between customer satisfaction and service
quality, but because when talking about client perceptions, one must think of their satisfaction,
and when talking about service quality there is a link between these two as has been proven by
many researchers ( Baker-Prewitt, 2000, p. 73-82; Kuo-YF, 2003, 461-473; Gera, 2011, p. 2-
20) This means it could be useful to test these three variables (Customer satisfaction, service
quality, and Service quality dimensions). The study of (Bennett & Barkensjo 2005) stated that
“the hypothesis elements of SERVQUAL model (Tangible, assurance, etc.) were scientifically
associated with the service quality construct” (Bennett & Barkensjo, 2005, p. 101). It could be
interesting to test the SERVQUAL model with the five dimensions and service quality
assuming that expectations are included to see if it will be significantly associated.
To crown the fact that customer satisfaction and service quality are important variables in
business research on customers, (Gera, 2011) investigated the link between service quality,
value, satisfaction and behavioral intentions in a public sector bank in India and one of their
results state that “Service quality was found to significantly impact on customer satisfaction
and value perceptions” (Gera, 2011, p. 2-20). The literature review shows the latest researches
up to 2011 on the relationship between customer satisfaction and service quality.
14
2.4. What is Electronic Voucher Distribution System?
In this information era, we perceive most things virtually. We make virtual friends, shop from
a virtual platform, enjoy virtual reality, and travel places virtually. The future promises much
more to virtualization. There is no wonder that we have started transacting money this way. It
sounds like playing monopoly. Yet it is true. The Electronic Voucher Distribution System
(EVD) allows you to pay your bills, recharge mobile phones, purchase in retail stores, book
tickets, and even buy lotteries with e-money. All you need to do is select a service, punch in
some information, and get your vouchers. Let us see how this works1
2.5. How? Where? Who?
The two major components in an Electronic Voucher Distribution system are a centralized web
server and a portable Point-of-Sale (POS) terminal. The server is maintained by the companies
and all their dealers have a POS terminal unit in their retail stores. The end users can avail of a
service, say prepaid mobile recharge, by entering their account information in the POS and the
denomination of the amount to be recharged. This information is sent to the server, which first
authenticates the transaction and then sends a recharge code to the terminal. Simultaneously,
the customer’s account will be updated with the debited amount. At the end of the transaction,
the POS would generate a voucher for the customer to authenticate the completed transaction.
These vouchers can either be downloaded instantly or can also be stored in the terminal as a
record.
The transaction can also be made without PIN information being sent back to the terminal. In
that case, POS in the store will be authenticated by the operator once and the balance detail of
the retailer is updated regularly in the server. Along with the voucher for the transaction, the
retailer also receives the acknowledgment of the balance. Apart from these details, EVD
software can also keep track of sales data like daily sales, denomination-wise sales, and event
logs. The POS devices are portable and can be used in areas with GSM-GPRS, CDMA, or VPN
network connectivity.
2.6. Applications of Electronic Voucher Distribution system
The Electronic Voucher Distribution system comes in handy for the customers as well as the
dealers. It can be used for recharging your prepaid connection or paying your post-paid bills
for mobile phones. EVD facilitates easier bill payment at water or gas or internet broadband
centers. It also offers simpler solutions for booking tickets and bank transactions.
15
Apart from these facilities, this system ensures easier card recharge options. For instance,
customers can obtain a voucher beforehand using an Electronic Voucher Distribution system
with calling codes for international calling. The POS system is also made to read the
consumer’s credit/debit card in retail stores and with the help of the secured PIN number
provided by the customer, transactions are made in the retail stores without any hassle. In this
case, the customer’s card and PIN details are kept confidential that even the retailer or the
central server would not be aware of the information entered. The Electronic Voucher
Distribution system is slowly making its way into all other purchase places and the newer
designs are created to meet the challenges of the retail world
2.7. Why EVD?
The advantages of the Electronic Voucher Distribution system are aplenty. To state the first
and the most obvious advantage- it is safe. The customers need not be worried about carrying
money around in their pockets anymore. With a little precaution, this type of transaction can
be the ideal way for them to shop.
From the dealers’ point of view, this Electronic Voucher Distribution system is much less
work. No more printing of physical vouchers or maintaining a whole new database. This
system saves a lot of time and money for them and also proves to be a smart way to handle
their business transactions.
From the manufacturer’s point of view, the system offers much transparency with the dealers.
They will know the complete sales and transaction history of the dealers. By managing a
centralized accounting system, it gets very easy for them to process multiple data easily and
effectively.
Thus, the Electronic Voucher Distribution system proves to be a win-win model for everyone
in the business world. Welcome to the new world of safe and easy transactions!
Source: http://www.dusaneinfotech.com/what-is-electronic-voucher-distribution-system/.
Retrieved on December 13, 2019.
E-vouchers are useful where sufficient infrastructure exists to establish the technology, and
there are merchants with shops of sufficient size and diversity of commodities to ensure
beneficiary access to quality goods. E-vouchers are usually loaded onto a Smart card (chip or
magnetic stripe) and contain data that can be used to verify the beneficiaries’ identity. They are
16
discrete, only need to be distributed once, thus reducing logistics, and expenditure data can be
easily harvested through automatic systems. Where the network coverage and service, exist, e-
vouchers can also be sent through the mobile phone network in the form of SMS codes. The
vouchers allow partners to restrict spending and reduce logistics. The systems can be complex,
however, in that they take time to set up and establish the necessary controls to avoid forgery,
although the time necessary to do so can be avoided where systems are established before an
emergency. Vouchers tend to limit any positive market impacts to large merchants with the
capacity to engage in the approach, and thus may not be appropriate in remote areas unless in
a fair context, and share similar risks of inflation as a cash transfer, as they increase the demand
on local markets.
Vouchers can be paper or electronic and are usually exchanged in designated shops or fairs.
They may be denominated either in cash, commodity, or service value. These are described
respectively as value-based, commodity-based, or service-based vouchers. Combined
vouchers, for example, cashback options where a beneficiary can exchange a portion of their
vouchers for cash, also exist. If the vouchers are not tied to a set of pre-defined commodities
or services (i.e. are value-based vouchers), then they will be considered cash transfers.
2.8. Voucher
Vouchers are used where there is a high risk of inflation compare to (thus the agency absorbs
the increasing cost of a commodity or service), it is necessary to restrict how a beneficiary uses
the transfer they receive (for example for nutrition or shelter programs) and/ or, particularly in
the case of value-based vouchers, where a security and risk analysis concludes that it is not
possible to distribute cash. Examples of vouchers include milling vouchers to complement food
distributions, NFI vouchers exchanged in NFI fairs, and vouchers to procure specific livelihood
inputs and assets.
Voucher programs require enough local traders that have:
• The capacity to increase and/ or maintain a stock sufficient quantity and quality of the
necessary commodities to respond to increased demand by beneficiaries,
• The willingness to cooperate in the scheme and.
17
• The capacity to engage in partnership with the implementing organization. A fair and
transparent way to select the traders must be ensured and a secure and reliable way of
paying the traders must be available and agreed to by both the partner and the traders.
The Vouchers allow partners to restrict spending and reduce logistics. The systems can be
complex, however, in that they take time to set up and establish the necessary controls to avoid
forgery, although the time necessary to do so can be avoided where systems are established
before an emergency. Vouchers tend to limit any positive market impacts to large merchants
with the capacity to engage in the approach, and thus may not be appropriate in remote areas
unless in a fair context, and share similar risks of inflation as a cash transfer, as they increase
the demand on local markets.
Vouchers can be distributed as paper vouchers or electronic vouchers and be valued, or
commodity based. In both cases, sensitization to the modality and supporting during
distribution and procurement is necessary for both beneficiaries- in particular, vulnerable
groups such as children and the elderly- and traders. Paper vouchers may be more familiar to
beneficiaries but must be printed and distributed with every distribution. They are less likely
to be affected by national legislation, for example, those that limit the amount of beneficiary
information that can be held by an agency, but that may be necessary to set up an e-voucher
system.
The e-transfer field is vast. Because of this, the Implementation Guide is built around the two
e-transfer types used most frequently by Mercy Corps: e-cash (cash, replaced with mobile
money, prepaid debit/
cards or other forms of digital cash) and e-vouchers (digital replacements of paper vouchers).
E-voucher: A card or code electronically redeemed by program participants at a participating
vendor. E-vouchers can be cash or commodity vouchers and are redeemed using mobile
phones, point-of-sale (POS) devices, and/or computers.
2.9. E-transfer Advantages and Disadvantages
In comparison with traditional disbursement mechanisms, e-transfers have key advantages and
disadvantages. We highlight some below.
18
2.9.1. Potential advantages of E-transfers
Time savings for program participants E-transfers can save time for program participants if
they can be redeemed close to home and if transfers are staggered to reduce lines at vendors or
transfer agents. Privacy for program participants’ discreet delivery can reduce the social
pressure to share transfers with extended family and/or neighbors. Improved security E-
transfers can improve security for program participants, team members, and transfer agents in
insecure environments. Improved transparency and program data Instead of waiting for
manually collected program monitoring data (or voucher stubs that must be processed
manually), e-transfers offer quick access to automatically collect e-transfer data. This easily
accessible data can guide and inform program decision-making. Financial inclusion In certain
situations, e-transfers can link participants to valuable financial services. This benefit is not
automatic; it requires additional programmatic work to promote the uptake of financial
services. Reduced burden on vendors (voucher programs only) In paper voucher programs,
vendors are responsible for ensuring the integrity of vouchers, submitting itemized invoices,
and traveling to Mercy Corps offices or payment centres to be reimbursed. E-transfers can
reduce the level of effort required of vendors and streamline vendor reimbursement
2.9.2. Potential disadvantages of E-transfers
Accessibility for program participants’ Numeric PINs and/or multi-step transactions can be
difficult for illiterate participants or those with limited exposure to technology. Often, these
participants rely on friends, family, and/or transfer agents to collect their transfer. This may
create the risk of theft or obligation to share. Financial regulations (like “Know Your
Customer” rules8) can pose barriers for vulnerable populations by requiring formal ID for
account registration. Infrastructure requirements E-transfers require some level of electricity
and network connectivity, though requirements for some mechanisms (like smart cards) are
minimal. Unreliable or non-existent connectivity can severely hamper implementation.
Liquidity management E-transfers requiring cash-out can increase the demand for cash beyond
transfer agents’ ability to keep that cash on hand. This causes shortages and can delay
participants’ receipt of cash. It can also increase the agents’ workload and risk to maintain
sufficient cash balances. Consistency and reliability of service the quality and reliability of e-
transfer services vary greatly and will impact your program. These can be difficult to assess in
advance and may vary by agent or branch. E-transfer program managers often cite service
19
provider management as their major challenge. Weak data protection policies and practices
Data collected for e-transfer programs can include participant names, official document
numbers, and phone numbers (which can be used to monitor and even trace the physical
location of participants). Poor data management can pose risks to program participants and
team members. Slow start-up for implementing agency the time-saving components of e-
transfer programs often occur in storage, distribution, and reconciliation of vouchers or cash
transfers. However, the setup of e-transfer programs often requires more work than traditional
distribution mechanisms. This is especially true with partnership development and
contracting.[1] Basic Requirements for All E-transfer Systems To effectively assess your local
options and your program’s participants’ ability to interact with them, you need to understand
the basics of an e-transfer system. Unfortunately, this means we need to get a bit technical.
Bear with us as we give you the briefest possible introduction to e-transfer systems.E-transfer
systems consist of a “front end” and “back end.” The front end is what the participant sees and
directly interacts with. This can be physical hardware – like a credit card – or an electronic
value transferred via a short message service (SMS) message or code. The front end also
includes hardware used by transfer agents to accept e-transfers, e.g., mobile phones or POS
devices that recognize the e-transfer. And finally, the frontend function includes authentication,
the process by which a participant’s identity is confirmed. This may occur by entering a PIN,
checking ID documents, etc. E-transfers also require a back end. The back end is an online
platform, accessible to Mercy Corps, but powered by software that is owned and maintained
by the service provider (SP)[2].
2.10. E-Transfer Product Profiles
We have introduced you to the general advantages and disadvantages of e-transfers and their
basic system requirements. In this section, we will describe the specific e-transfer products
used most frequently by Mercy Corps: mobile money (a type of e-cash that can be used to send
bulk e-transfers through mobile networks) and e-vouchers. Mobile money products and their
providers are sourced locally. E-vouchers are provided by global service providers that are pre-
qualified by Mercy Corps. Mobile Money (MM) systems are usually operated by local mobile
network operators (MNOs) and rely on a network of registered transfer agents. These agents –
often the same types of small business owners who sell airtime – have a contract with the MM
operator allowing them to register new MM clients and disburse and accept MM. Because

20
MM systems assume some banking functions, they are subject to local banking and anti-money
laundering regulations.
E-vouchers
E-voucher systems are established and managed using hardware and software from an e-
voucher service provider (SP). Similar to a traditional voucher program, Mercy Corps
establishes a network of local vendors and equips them with the hardware and training to accept
e-vouchers. Unlike e-cash, e-vouchers are not reliant on local payment networks and
infrastructure and can be deployed globally. The benefit to using a pre-qualified SP is that it
can offer teams pre-tested global e-voucher product without lengthy tendering.
The two recommended e-voucher products we profile below differ in their connectivity and
hardware requirements, but offer common features1:
2.10.1. Product Profile:
Quid Smart Card E-vouchers in April 2014 piloted the use of e-vouchers in the DRC using the
sQuid system. In the first phase of the program, e-voucher smart cards worth approximately
USD 80 were distributed to 862 program participants. Participants used them at fairs and in
regular markets to purchase food and non-food items from local business owners and to pay
school and health care fees. The POS devices were distributed to vendors, most of whom used
them in a completely offline environment. At the end of each fair, the POS devices were
brought back to Mercy Corps’ offices to sync the smart card transactions.
2.9.2. Power requirements:
POS devicescan run for approximately six hours of heavy use on a charged battery. For
continuous use, they need extra batteries or a nightly charge. A dead battery takes three to four
hours to fully charge.
2.11. Authentication process:
The system does not currently provide authentication options. Participants are ID by Mercy
Corps when the card is distributed. Mercy Corps could manually add a name to the smart card
and require vendors to check the name against a photo ID. •
1file:///C:/Users/cbe/AppData/Local/Microsoft/Windows/INetCache/IE/JJ6FYZAF/E-TransferGuideAllAnnexes.pdf. Retrieved on November,2019
21
2.12. Merchant PRO Smartphone E-vouchers
In early 2013, Mercy Corps conducted a pilot in Nepal to test e-vouchers and partnered with
Transversal, a Haitian company, as our SP. The e-vouchers required vendors to have a
Smartphone loaded with Transversal’s “Voucher PRO” application and access to a mobile
connection. A participant received his or her unique voucher number and PIN code on a paper
card from Mercy Corps. To complete a transaction, the vendor entered the voucher code and
purchase the amount into the application and handed the phone to the beneficiary for PIN entry.
The e-vouchers worked well with a small group program participant in an urban environment
with reliable mobile networks
Merchant PRO E-voucher Product Details:
✓ Connectivity requirements: Requires continuous connection to mobile data networks.
✓ Hardware requirements: Requires an Android Smartphone for vendors. Participants
can be equipped with voucher codes and PIN numbers on paper or scratch cards.
✓ Power requirements: Vendors need a regular power source to charge smartphones;
batteries typically last three to seven hours.
✓ Authentication process: Participants can be assigned a PIN number or can be required
to show ID at the time of the transaction.
✓ Accessibility issues: Low if the photo ID verification option is selected. Medium if
touch screen PIN entry is required
Prepaid Airtime Voucher Distribution (also known an Electronic Voucher Distribution System,
EVD, E-Voucher Distribution, PIN code distribution, PIN Voucher, mobile top-up, airtime
top-up, e-top up, mobile reload, micro-top-up) has dramatically become an essential
commodity for the emerging markets and truly the unbanked areas in the globe. It is one of the
value-added services that is, of paramount importance for retailers/merchants to provide their
customers. No physical airtime stock (vouchers/scratch cards) is kept on-site, reduction in risk
of theft.
Prepaid Airtime Voucher Distribution enables the vending of Prepaid Airtime for retailers and
offers airtime vouchers from all network operators via its mobile carriers. Not only does it
provide the opportunity to earn revenue from a new product stream, but Prepaid Airtime
Voucher Distribution is also able to draw new customers into the stores/outlets. Novotel
Innovations can apply diversified Prepaid Airtime Voucher Distribution onto POS (Point of
Sale) terminals, Android Device and Laptop, etc. Our professional team has years of experience
in delivering a tailored solution with customized features to customers efficiently.
22
The E-Voucher Transfer Platform is a tool that makes it easier, more efficient, and more secure
to reach participants with social protection programs such as cash transfers. E-vouchers are
being used successfully in CARE Haiti’s Kore Lavi program to improve the access of the poor
to adequate and nutritious local food. Using vouchers also strengthens local markets by creating
a stable demand for local producers and suppliers to produce diverse and nutritious food
Food insecure households living in extreme poverty are identified using specific targeting
criteria. In Haiti, Kore Lavi uses the Haitian Deprivation Index to reach the most vulnerable
families. Each family in the target group receives monthly vouchers, equal to approximately
25% of the average local household food consumption. Households are provided with two
types of vouchers: paper and electronic. Paper vouchers can be used to purchase fresh items
like fruit and fish; while electronic vouchers can be used to purchase staples, such as maize and
bean. Both vouchers can be used to purchase locally grown products to support local farmers2.
2.13. Benefits of Using E-Voucher Platform
✓ It’s easy to administer the program
✓ The system holds personalized beneficiary information
✓ All beneficiary and transfer information are easily accessible by staff so transfer
duties can be easily segregated.
✓ Program administrators know how much each participant is receiving
✓ If there is a technical glitch, the precise tracking means that troubleshooting can
begin at once
✓ The tracking ability means that the approach is scalable & can serve more than
one implementing agency
✓ It does not require beneficiaries to own a cell phone
✓ Transactions are faster for households to receive their benefits
✓ Families feel securer using e-payments as no cash changes hands
2.14. How It Works:
1. Participating households receive an E-Voucher Card, which contains personal info,
a photo of the household representative and a unique registration number,
2 https://www.slideshare.net/Movotek/movotek-mobile-money-prepaid-airtime-solution. Retrieved on November 2019.
23
2. Each household receives a monthly deposit on their card and has a month to redeem
it at selected merchant locations (only accredited merchants can redeem the e-
vouchers),
3. To redeem the voucher, the merchant enters the unique card number into his/her cell
phone,
4. TPAGO, the electronic platform, confirms the beneficiary ID and the amount and
processes the transfer from the purchaser’s e-account, to that of the merchant,
5. The merchant hands over the food and both the buyer and seller sign three copies of
the receipt, one for the buyer, one for the seller and one for the program,
6. The merchant receives payment on his/her account for the vouchers spent twice a
month,
7. All the transactions are managed and monitored by the relevant program staff who
have the final authority to validate and authorize voucher redemptions, as well as the
payment of the merchants.
2.15. Choosing between electronic and paper motivation vouchers
When deciding whether to use paper or electronic motivation vouchers employers must
consider a host of issues including discounts, public recognition, and theft, says Nick Golding.
There is no question that use of electronic motivation vouchers by employers has become more
widespread. Although electronic formats still lag some way behind traditional paper-based
schemes, the likelihood is that technology could overtake paper in the future. Andrew Johnson,
director general at voucher trade body, The VA, says: “Many more retailers now offer
electronic gift cards, which have helped build the market, but paper-based reward still accounts
for about 70% of the market.” Employers that wish to offer an electronic scheme can choose
from pre-paid cards where cash is loaded on to a credit card for staff, electronic gift cards which
can be bought from retailers with a selected amount pre-loaded for employees to spend, or
online point systems where staffs are awarded points that they can then redeem at various
online outlets. One advantage of using electronic voucher schemes to motivate staff is that they
entail less administration on the part of employers. When using an online points system or pre-
paid credit card, it is possible for employers to reward staff at the click of a button, so saving
the need to order vouchers and either send or present them to employees. “The key advantage
24
of the electronic vouchers is that they are easy to administer because you just send an email,”
says Johnson3.
Some employers, however, prefer to stick with the more traditional paper-based vouchers
offered by retailers. Lloyds TSB, for example, has chosen to do so because it believes that this
is the most financially viable way to offer retail vouchers to staff. Liz Yates, manager,
compensation and benefits, explains: “With paper-based vouchers we can negotiate greater
discounts because the retailer knows how much we are going to spend with them.”
2.16. Vouchers: Electronic Vs paper4
➢ Electronic vouchers can help to reduce the amount of administration that employers
undertake because they can be awarded at the click of a button via email or an online
points system.
➢ Paper vouchers can be more motivational if presented in the right way. An employee
that is awarded a wad of vouchers in front of his or her colleagues will find this far
more motivational than if they are simply notified by email of their award.
➢ Employers may find that electronic vouchers are far more secure than transferable paper
versions. Paper vouchers can be the subject of fraud or easily lost. However, passcodes
and pin numbers can help to make electronic versions more secure.
➢ Organisations may find it easier to secure discounts with retailers using paper vouchers
because these can often only be spent at one store, compared to pre-paid cards where
employers load money onto a credit card that can typically be spent at some stores.
2.17. Electronic service concept
As a result of living in an age of information technology (Mahmood, 2013; Marchica, 2004)
and with the rapid growth of electronic commerce, and development of technology-based
systems (Akinyele and Akinyele, 2008) there are two competing worlds: the visible physical
world, and the electronic world of information (Rayport and Sviokla, 1995), and from here
emerged and developed the concept of websites due to the rapid expansion of the Internet, and
3 https://employeebenefits.co.uk/issues/september-2007/choosing-between-electronic-and-paper-motivation-vouchers/. Retrieved on November, 2019. 4 https://employeebenefits.co.uk/issues/september-2007/choosing-between-electronic-and-paper-motivation-vouchers/. Retrieved on November,2019.
25
Internet-based services began to emerge which changed the way companies interact with
consumers (Herington and Weaven, 2009) which led many organizations to reconsider their
strategies and using the most appropriate and flexible methods in service and product delivery
along with conventional methods (Brich and Young, 1997), and in turn led to the emergence
of electronic service (Cabello and Kumar, 2006), and became the modern trend of organizations
is moving from traditional services to e-services. Electronic service is defined as delivering all
interactive services via the Internet, and the use of advanced communications and information
and multimedia technology (Boyers et al., 2002). (Lemo and Rust,2001) defined electronic
service as an information service, while electronic service defined as a set of businesses done
through information and communications technology (Rowley, 2006). Electronic service is
provided via a mobile phone, Internet, and self-service centers, electronic service includes
several elements, which are electronic retail, customer support: service itself, and service
delivery (Akinyele and Olorunleke, 2010). The importance of electronic service as strong
source of competitive differentiation through customer involved in the product development
process through quick feedback and enhance customer relationships, in addition to the e-service
help get services at a lower cost, as it achieves excellence in quality (DeRuyter et al., 2001).
Electronic service enables companies to exceed the expectations of customers, and go beyond
traditional consumer service, which helps these companies to invest in the long term by
promoting the growth of customers and keep customers in case of company loyalty (Lake and
Hickey, 2002). As a result, the uses of technology in customer service are important for access
to the most basic survival goals of an organization (Wilson, 2004; Mahmood, 2013). Electronic
service is a self-service (Surjadaja et al., 2003; Gera, 2011) instead of access to service by
speaking to an employee over the phone or from behind the desk, the service is obtained
through mechanical interaction and mutual between the applicant and machine (Wetoahir,
2012), and noticed that there are some challenges to electronic service providers since there is
no direct contact between staff and customers, and consequently, the website became the basis
for interaction between customers and organizations (Fadeleh, 2010) electronic service must,
therefore, meet customer's desires, and to be more responsive to his expectations (Al-Alaq,
2004). (Van Riel et al. , 2001) added two key elements: the Complementary service, and e-
services through the client can access the services provided by the company (User Interface),
extended services can add value to the central service, by contrast, the complimentary service
are separate products don't add value to the central service (Szymanski and His, 2000) so the
central service, support, and complement can be referred by the next question. What is the
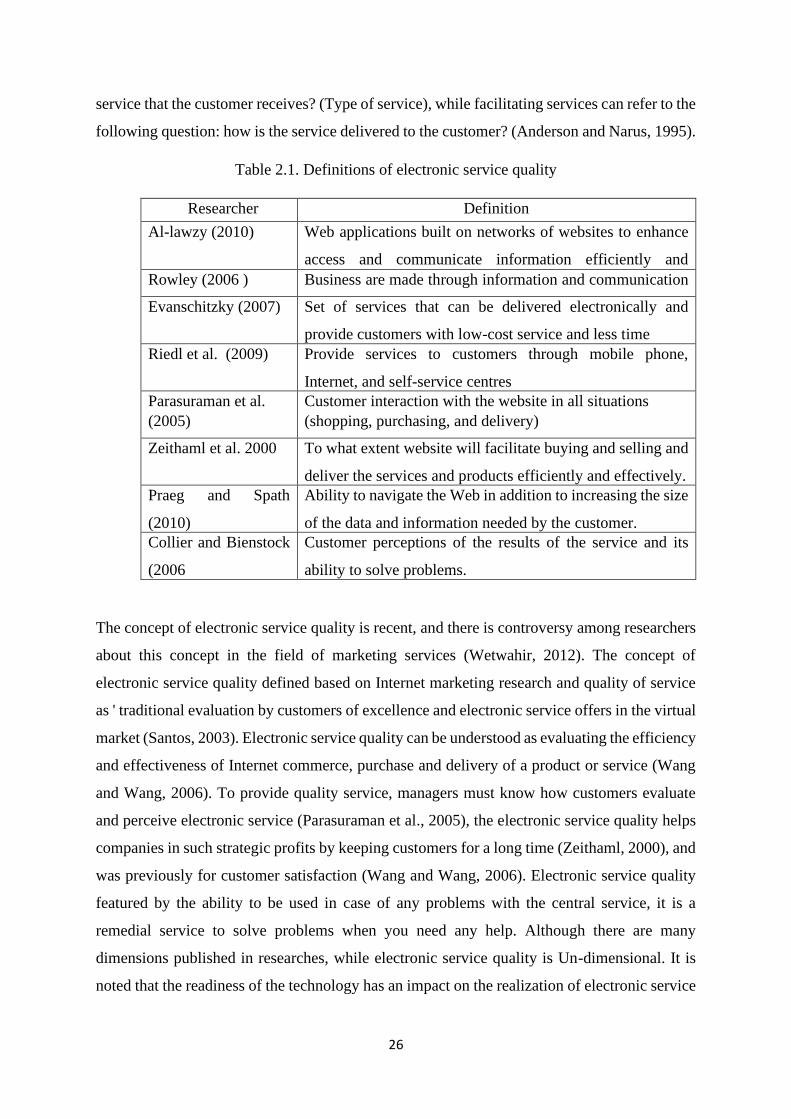
26
service that the customer receives? (Type of service), while facilitating services can refer to the
following question: how is the service delivered to the customer? (Anderson and Narus, 1995).
Table 2.1. Definitions of electronic service quality
Researcher Definition
Al-lawzy (2010) Web applications built on networks of websites to enhance
access and communicate information efficiently and
effectively Rowley (2006 )
Business are made through information and communication
technology Evanschitzky (2007) Set of services that can be delivered electronically and
provide customers with low-cost service and less time
Riedl et al. (2009)
Provide services to customers through mobile phone,
Internet, and self-service centres
Parasuraman et al.
(2005)
Customer interaction with the website in all situations
(shopping, purchasing, and delivery)
Zeithaml et al. 2000
To what extent website will facilitate buying and selling and
deliver the services and products efficiently and effectively.
Praeg and Spath
(2010)
Ability to navigate the Web in addition to increasing the size
of the data and information needed by the customer.
Collier and Bienstock
(2006
Customer perceptions of the results of the service and its
ability to solve problems.
The concept of electronic service quality is recent, and there is controversy among researchers
about this concept in the field of marketing services (Wetwahir, 2012). The concept of
electronic service quality defined based on Internet marketing research and quality of service
as ' traditional evaluation by customers of excellence and electronic service offers in the virtual
market (Santos, 2003). Electronic service quality can be understood as evaluating the efficiency
and effectiveness of Internet commerce, purchase and delivery of a product or service (Wang
and Wang, 2006). To provide quality service, managers must know how customers evaluate
and perceive electronic service (Parasuraman et al., 2005), the electronic service quality helps
companies in such strategic profits by keeping customers for a long time (Zeithaml, 2000), and
was previously for customer satisfaction (Wang and Wang, 2006). Electronic service quality
featured by the ability to be used in case of any problems with the central service, it is a
remedial service to solve problems when you need any help. Although there are many
dimensions published in researches, while electronic service quality is Un-dimensional. It is
noted that the readiness of the technology has an impact on the realization of electronic service
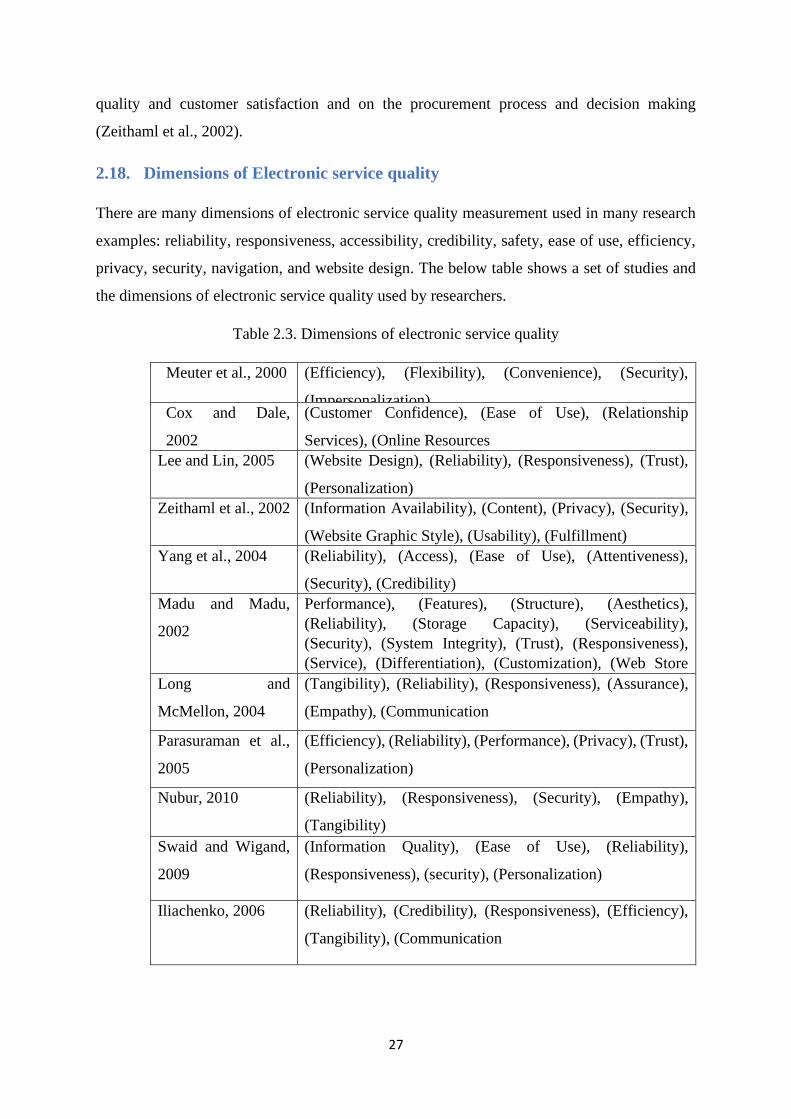
27
quality and customer satisfaction and on the procurement process and decision making
(Zeithaml et al., 2002).
2.18. Dimensions of Electronic service quality
There are many dimensions of electronic service quality measurement used in many research
examples: reliability, responsiveness, accessibility, credibility, safety, ease of use, efficiency,
privacy, security, navigation, and website design. The below table shows a set of studies and
the dimensions of electronic service quality used by researchers.
Table 2.3. Dimensions of electronic service quality
Meuter et al., 2000 (Efficiency), (Flexibility), (Convenience), (Security),
(Impersonalization) Cox and Dale,
2002
(Customer Confidence), (Ease of Use), (Relationship
Services), (Online Resources
Lee and Lin, 2005
(Website Design), (Reliability), (Responsiveness), (Trust),
(Personalization)
Zeithaml et al., 2002 (Information Availability), (Content), (Privacy), (Security),
(Website Graphic Style), (Usability), (Fulfillment)
Yang et al., 2004 (Reliability), (Access), (Ease of Use), (Attentiveness),
(Security), (Credibility)
Madu and Madu,
2002
Performance), (Features), (Structure), (Aesthetics),
(Reliability), (Storage Capacity), (Serviceability),
(Security), (System Integrity), (Trust), (Responsiveness),
(Service), (Differentiation), (Customization), (Web Store
Policies), (Reputation), (Assurance)
Long and
McMellon, 2004
(Tangibility), (Reliability), (Responsiveness), (Assurance),
(Empathy), (Communication
Parasuraman et al.,
2005
(Efficiency), (Reliability), (Performance), (Privacy), (Trust),
(Personalization)
Nubur, 2010 (Reliability), (Responsiveness), (Security), (Empathy),
(Tangibility)
Swaid and Wigand,
2009
(Information Quality), (Ease of Use), (Reliability),
(Responsiveness), (security), (Personalization)
Iliachenko, 2006 (Reliability), (Credibility), (Responsiveness), (Efficiency),
(Tangibility), (Communication
28
Based on previous studies, the following dimensions were used in this study: Reliability, and
Ease of Use, and Efficiency, Website Design, Privacy, Responsiveness. Reliability:
2.18.1. Reliability
Reliability is the first determinant of customer satisfaction, and the second determinant of
customer loyalty to the website (Zeithaml et al., 2002). Reliability is defined as a service-based
capability to provide customers with confidence and high resolution (Sung et al., 2009). To
achieve reliability, companies (must provide service as promised by the company and reliably
(Al-Dmour, 2005). It includes the correct technical recruitment of the website and precision in
obligations and promises of service (delivery of customer orders, delivery time, advertising,
and product information) (Parasuraman et al., 2005), plus the correct completion of the request,
and direct delivery of applications, and the accuracy of the advertising (Yang et al., 2004).
Reliability measured by providing a website permanently and right action (Gerrard and Barton,
2005). Reliability refers to the company's ability to deliver the quality of information which
matches the criteria of timeliness, accuracy, understandability, relevance, in addition to its
ability to fulfill pledges to the customer thereby achieving a high level of satisfaction (Swaid
and Wigand, 2007). International Journal of Academic Research in Accounting, Finance and
Management Sciences Vol. 7 (1), pp. 170–188, © 2017 HRMARS).
Sung et al. (2009) The service provider's ability to provide beneficiaries with confidence and
high fidelity. Zeithaml et al. (2000) Website must be easy to use and organized properly and
requires a minimum of information that answer customer technical recruitment. Parasuraman
et al. (2005). Correct Interventions for the website and the accuracy of the service offered by
the company. Yang et al. (2004) Reliability include correct completion of the request and
accurate advertisement. Al-Dmour (2005) The ability to provide service as promised by the
organization with a high degree of speed and accuracy.
2.18.2. Ease of use:
Ease of website use is the most important element that makes customers repeat using the
website (Madu and Madu, 2002). Ease of use may be defined as ' anticipating expected
customer that he does not need to use the system a great effort ' (Zeithaml et al., 2002). Ease
of use consists many factors such as (Website Structure), (Ease of Navigation) (Shang, Chen,
and Shen, 2004), clarity of orders, action steps, enter the facilities with the query; in addition
to customer satisfaction on how to modify the query (Griffiths and Brophy, 2005).
29
Ease of use is linked to easily remember the Web address (URL) and the website must be
complex and well organized (Yang et al., 2004).
Ease of Navigation helps customers to get what they want without difficulty because having a
good search engine leading to navigate between pages quickly and easily (Zeithaml et al.,
2000).
Fassnacht and Koese (2006) Easy of using by customers, including searches and scans.
Zeithaml et al. ( 2002). anticipating expected customers that he does not need to use the system
a great effort. Yang et al. (2004). Usability connected easily remember the website address
(URL) and that the location is well organized and well-constructed, easy to follow instructions,
and the ability to browse and navigate pages easily, and the contents of the website should be
comprehensible and concise terms. Bresselles and Durrieu (2008) The applicability of
interacting with the website and easily navigate and organizes well. Davis (1989) How far the
customer thinks that using a particular system won't need to effortlessly use.
2.18.3. Efficiency:
Efficiency may be defined as customer's ability to accessing and using this website quickly and
easily (Mummalaneni and Meng, 2009) and to be efficient site should be easy to use and
designed in a proper manner and appropriate (Parasuraman, 2005), as must be organized well
and doesn't need a lot of information to answer customer interventions (Zeithaml et al., 2000),
and the traditional service efficiency vary from electronic service efficiency,
as efficient traditional service related to skill and ability of the service provider and his
knowledge, and merit that help them to perform their task properly (Al-Dmour, 2005).
Parasuraman et al. (2005) The website is easy to use and properly constructed and suitable and
needs less information about customers to use the website. Zeithaml et al. (2000) The website
easy to use and organized properly and requires a minimum of information that answers
customer interventions. Mummalaneni and Meng (2009) The ability of customers to access and
use the website quickly and easily. Al-Dmour (2005) The ability to easily access the website,
the ease of use, and access to information associated with the requested service.
30
2.18.4. Website design:
Website design is an influencing dimension on buyers’ customer perceptions (Zeithaml et al.,
2002), and the website design defined as providing customers with information in a fun way
and have a distinctive and attractive website design (Bresselles et al., 2008). Numerous studies
have shown that Web design includes Website Appearance, and Visual design (Shang et al.,
2004), and according to Bauer et al. 2006), the website design is to design in aesthetic attributes
and content and features. To assess the standards of aesthetic appearances on the website, one
must question about types, sizes, and clearly, (wemkrueh texts ,Madu and Madu, 2002), as well
as for image clarity, quality and use appropriate visuals from the website Privacy: Privacy is
one of the essential attributes of the dimensions of electronic service quality appears confidence
to the user to make online transactions (Zeithaml et al., 2002), (Iliachenko, 2006) defines
privacy as ' protect customers from fraud and protect their personal information '. And increase
privacy by securing the website for customers of intervention and protection of their personal
information (Zeithaml et al., 2000). This dimension can be measured by assessing the degree
of protection and maintain customer information of hack plus how customers feeling safe on
their special information while dealing with the website (Sheng and Liu, 2010). The importance
of privacy comes from the ability of internet services to deliver reliable and
dependable[DTM1] to build confidence among customers (Madu and Madu, 2002).
The privacy of service quality can be described by different authors: Iliachenko (2006)
Protection of personal information and protect users from the dangers of fraud and financial
loss. Sheng and liu (2010). Protection and Province website on information concerning
customers of penetration and how customers feel safe on their own while dealing with the
website. Parasuraman et al. (2005) Site more secure and protect customer information Javadi
(2011) The degree to which the customer thinks that the website is safe from intrusion and that
personal information is protected. Liu et al (2009)
2.18.5. Responsiveness:
Garvin, 1988 defines responsiveness in general as the ability to repair the product or modify
service when problems occur because the consumer does not have sufficient expertise for
processing and repair. Responsiveness in traditional service centered around the ability of the
service to answer customers questions, respond to them without errors in minutes plus
immediate delivery to the customer (Zeithaml et al., 2002), and electronic service
31
responsiveness known as rapid response and get help in case of a problem or a question. In
electronic service quality, responsiveness measures – the level of assistance received by the
customer during the search, and when needed while using electronic service, in addition to
measuring the extent of guidance and instructions for using electronic service and assistance
when problems arise in the service (Griffiths and Brophy, 2005), in addition to the company's
ability to provide a solution to the problems electronically (Iliachenko, 2006), responsiveness
reflects the desire to help the customer, and it can be measured by the service availability on
time, and to meet all requirements of the customer, and to achieve a response quick service
request (Al-Bakri, 2005).
Griffiths and Brophy , 2005 The level of assistance available to customers through search, and
at the point of need during use, and the availability of instructions and guidance through
context-sensitive assistance when you stop the service or mistakes in use. Parasuraman et al.
(2005) Respond effectively to address the problems and return via the site.
2.19. Customer Satisfaction of electronic service
Customer satisfaction is more important in the case of electronic service because it's hard to
maintain customers in the virtual world and get their loyalty (Zavareh et al., 2012). Electronic
satisfaction can be defined as ' the outcome of previous experience with the services provided
by the website and allows this experience to assess the effectiveness of the distribution channel
of the Web and determine how he satisfied about the website ' (Al-Hawari and Toaher, 2012).
The importance of customer satisfaction for e-service as a mission to achieve financial
performance as it is possible customer loss if he could not access the website or if the website
is unsatisfactory (Heskett et al., 1994). In banks-where traditional electronic service — lack of
direct interaction in Internet banks requires the need to test the role of technology for building
electronic customer service (Schaupp and Belanger, 2005). Accordingly, the Bank must obtain
information on how to satisfy the e-service customers and Internet banks.
2.19.1. Electronic service quality and Customer Satisfaction
(Parasuramn et al. ,1985) noted that receive the high quality service will lead to a rise in
customer satisfaction, (Palmer ,2005) says that ' the distinction between quality and customer
satisfaction is important for all managers and researchers alike where the service provider needs
32
to know whether their goal should draw consumers satisfied with their performance or to
deliver the highest level of quality service. Arguably, service quality and customer satisfaction
have been instrumental in the success and continuation of work (Daniel and Berinyuy, 2010).
(Su et al., 2002) Emphasizes that there is a link between quality of service and customer
satisfaction, customer satisfaction depends on the quality of service provided service by
providers (Lee et al., 2000). (Tarawneh, 2011) referred to an effect of electronic service quality
collectively and individually on customer satisfaction.
(Zavareh et al., 2012) referred that electronic service quality dimensions need to reinterpret
especially when used in online banking service quality, in addition to a positive relationship
between electronic service quality and customer satisfaction in online banking. (Sheng and Liu
, 2010) found that efficiency; achieve privacy requirement have a positive impact on customer
loyalty. (Carlson and Ocass ,2010) study results indicated that electronic service quality
positively impacts on consumer satisfaction and attitudes towards website, and behaviour about
a particular service provided by website with central content in the field of sports and
professional services. (Lee and Len, 2005) referred that the dimensions of electronic service
quality affect overall service quality and customer satisfaction, and customer satisfaction
significantly associated with purchase intention, and customization dimension is not linked to
overall service quality and customer satisfaction. Based on the above literature, the study
hypotheses can be formulated as: H1: There is a statistically significant effect of Electronic
service quality on customer satisfaction of Islamic banks in Jordan. More specifically: (H1a):
There is a statistically significant effect of Reliability on customer satisfaction of Islamic banks
in Jordan. (H1b): There is a statistically significant effect of Ease of Use on customer
satisfaction of Islamic banks in Jordan. (H1c): There is a statistically significant effect of
Efficiency on customer satisfaction of Islamic banks in Jordan. (H1d): There is a statistically
significant effect of Website Design on customer satisfaction of Islamic banks in Jordan.
(H1e): There is a statistically significant effect of Privacy on customer satisfaction of Islamic
banks in Jordan. (H1f): There is a statistically significant effect of Responsiveness on customer
satisfaction of Islamic banks in Jordan.
2.20. Conventional service quality and Customer Satisfaction
Under this title, the study attempted to show the conventional approach of the service quality
and customer satisfaction. The conventional way of service quality is different from the
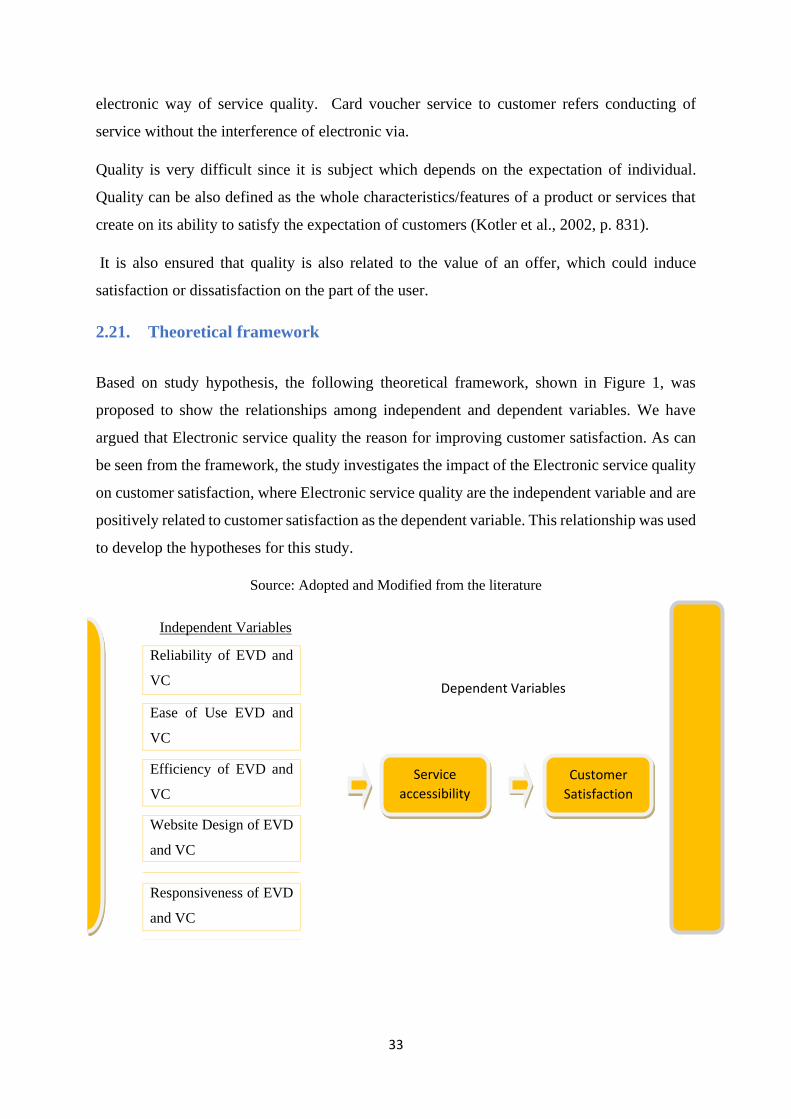
33
electronic way of service quality. Card voucher service to customer refers conducting of
service without the interference of electronic via.
Quality is very difficult since it is subject which depends on the expectation of individual.
Quality can be also defined as the whole characteristics/features of a product or services that
create on its ability to satisfy the expectation of customers (Kotler et al., 2002, p. 831).
It is also ensured that quality is also related to the value of an offer, which could induce
satisfaction or dissatisfaction on the part of the user.
2.21. Theoretical framework
Based on study hypothesis, the following theoretical framework, shown in Figure 1, was
proposed to show the relationships among independent and dependent variables. We have
argued that Electronic service quality the reason for improving customer satisfaction. As can
be seen from the framework, the study investigates the impact of the Electronic service quality
on customer satisfaction, where Electronic service quality are the independent variable and are
positively related to customer satisfaction as the dependent variable. This relationship was used
to develop the hypotheses for this study.
Source: Adopted and Modified from the literature
Independent Variables
Reliability of EVD and
VC
Ease of Use EVD and
VC
Efficiency of EVD and
VC
Website Design of EVD
and VC
Responsiveness of EVD
and VC
Customer
Satisfaction
Dependent Variables
Service
accessibility
34
2.22. Empirical Review
Electronic service quality concept is still new and controversial among in the field of marketing
services for the difficulty in measuring the quality of service, because they are things that are
difficult for consumer to evaluate compared to goods, prior to 1985, there were only a limited
number of studies on the quality of service concepts and its dimensions without address and
evaluate methods of measurement, where attributed the first attempt to measure the quality of
service to Parasuraman and others, regarding the electronic service quality, e-marketing
literature lacked clear concepts (AlHawary and Toahir, 2012), where electronic services have
reduced direct contribution of the human component of the self service to customers, and the
absence of physical evidence which usually exist in traditional services, measurement process
of electronic services quality is one of modern topics that are still at the stage of building
standards to form a reliable model.
Customer satisfaction plays an important role in the success of business strategies (Gil and
Cervera, 2008); customer satisfaction helps keep customers from request service or product
from competitors (Fawcell and Sewnson, 1998).
Customer satisfaction helps organizations and businesses to increase their return and achieve
competitive advantage (Lewin, 2009), in addition to customer satisfaction leads to long term
profits by making the customer loyal to the Organization (Jochen, 2003), so customer
satisfaction stems from recognizing companies that they have to interact with changing
environment consistent with the behavior of customers to maintain the survival and continuity
of firms in competitive markets (Smith, 1996). In this digital age, interest has increased in
financial services over the past few years that require development and modernization, which
became a major challenge for marketers and academics alike, prompting banks to seek to
improve their electronic services offered to customers in order to maintain current customers,
and trying to attract new customers, and even to make banks able to be distinguished in
providing its services, they must keep pace with technology.
Islamic banks have evolved dramatically in recent times, which operates under Islamic
principles, that were adopted to outlaw Islam because usury basically and cancel the interest
system. Islamic banks also seek in Jordan to provide distinct electronic banking services,
developed and improved, and invent new services in accordance with Islamic principles and
35
values, and meet the expectations of customers by reviewing quality objectives in accordance
with the requirements of international standards.
The importance of the study stems from being a vital and important topic in Banking marketing,
which is one of the basic pillars of electronic services quality, that help Islamic banks in the
possession of the customer attention and attract them to deal with them to achieve satisfaction,
and increase profitability and gain new market share in line with Islamic principles. It also
contributes to provide data base of customer assessment for electronic service quality provided
to them that help banks improve and develop those services, to enhance their competitive
position. So the study aims to identify the impact of electronic service quality dimensions
(reliability, ease of use, efficiency, Privacy, website design and responsiveness) on customer
satisfaction of Islamic banks in Northern Territory in Jordan.
One of Electronic Voucher Distribution (EVD) product is e ticketing. The research related to
this conducted by Mazen Kamal Qteishat,Haitham Hmoud Alshibly, and Mohammad
Atwah Al-ma'aitah under the title of “The Empact of E-ticketing technique on Customer
Satisfaction: Empirical analysis, which conducted in the Albalqa Applied University, Amman,
Jordan. The study investigated empirically examines the impact of e-ticketing technique on
customer satisfaction; a convenience sample of Jordanian airline passengers that had booked
flights in the last 12 months through companies offering e-ticketing services was acquired. The
findings indicate that customer satisfaction with e-ticketing services was influenced by all of
the independent variables measured (Data security, Customer and Technical Support, and User-
Friendliness) were noted to have significant impact on customer satisfaction with e-ticketing
services.
OVERVIEW The E-Voucher Transfer Platform is a tool that makes it easier, more efficient,
and more secure to reach participants with social protection programs such as cash transfers.
E-vouchers are being used successfully in CARE Haiti’s Kore Lavi program to improve the
access of the poorest to adequate and nutritious local food. Using vouchers also strengthens
local markets by creating a stable demand for local producers and suppliers to produce diverse
and nutritious food
Food insecure households living in extreme poverty are identified using specific targeting
criteria. In Haiti, Kore Lavi uses the Haitian Deprivation Index to reach the most vulnerable
families. Each family in the target group receives monthly vouchers, equal to approximately
36
25% of the average local household food consumption. Households are provided with two
types of vouchers: paper and electronic. Paper vouchers can be used to purchase fresh items
like fruit and fish; while electronic vouchers can be used to purchase staples, such as maize and
bean. Both vouchers can be used to purchase locally grown products in order to support local
farmers.
Literatures regarding to challenges and prospects of e-payment in Ethiopia is scanty most of
the studies focus on challenges to adopt the e-payment system in Ethiopia.( Wondwossen and
Tsegai, 2005) also studied on the challenges and opportunities of E-payments in Ethiopia; their
objective was studying of E-payment practices in developing countries, Africa and Ethiopia.
The authors employs interview and on site observation to investigate challenges to E-payment
in Ethiopia and found that, the main obstacles to the development of E-payments are, lack of
customers trust in the initiatives, Unavailability of payment laws and regulations particularly
for E-payment, Lack of skilled manpower and Frequent power disruption. According to
(Wondwossen and Tsegai, 2005), an adequate legal structure and security framework could
foster the use of E-payments, which is contradicting with the finding of the previous study.
(Gardachew ,2010) conducted research on the opportunities and challenges of E-banking in
Ethiopia. The aim of his study was focused on analysing the status of electronic banking in
Ethiopia and investigates the main challenges and opportunities of implementing E-banking
system. The author conducted a survey on the existing operating style of banks and identifies
some challenges of using E-banking system, such as, lack of suitable legal and regulatory frame
works for E-commerce and E- payments, political instability in neighbouring countries, high
rates of illiteracy and absence of financial networks that links different banks. According to
(Gardachew, 2010), Opportunities offered by ICT through e-learning programs and
Commitment of the governments on development of ICT infrastructures is considered as
drivers of using E-commerce and E-payment systems. (Ghazi and Khalid, 2012), found that,
the most important barriers for E-business growth are technological issues, such as, security
risk, quality of internet and cost of implementation to be the most prominent.
The study conducted by (Daghfous and Toufaily, 2007) on factors affecting adoption of E-
banking technology in Lebanese banks. The study was conducted on the factors that can lead
to success the adoption of E-banking and the other factors that can constitute as challises to its
adoption, it focus on the organizational, structural and strategic factors. Data, used in their
study were collected using semi structured interviews and survey questionnaire that was given
37
to E-banking managers all the banks on the official list of institutions operating on the Lebanese
market, with a total of 57 banks, 31 of them operate internationally and 26 are strictly local
were used to gather data.
The results of the study revealed that the organizational variables (bank size, functional
divisions, technical staff, technical infrastructure, perceived risks, decision makers`
international experience and mastery of innovation) are variables which exert significant
impact on the adoption of E-banking, among the structural characteristics, the result revealed
that internal technological environment of the bank is a very important factor in determining
the adoption of E-banking, also the result shows that banks which are developing in the
international scale are more likely to adopt E-banking innovations. Finally, the result of the
study indicated that extent of penetration of E-banking in the growth phase of an emerging
market has an important correlation with the improvement of commercial performance.
(Rasoulian and Safari, 2011) carried out research concerning reasons as to why there was a lack
of E-banking achievement; the result of the first chapter of their study showed the importance
of Internet use, frameworks and encouraging policies to impress beneficiaries to use electronic
banking. The second part introduced cultural elements as the most important challenge
followed on by financial elements (the cost of the Internet and commissions) as the second
influencing factor. The significance of technical elements is fading away according to their
study due to improvements in the banking system. In addition, their study highlighted other
parameters such as management obstacles as also playing an important role in electronic
banking in Iran.
2.22.1. Challenges of E-services
According to (Harrison , 2012), it is hypothesized that many of the factors affecting the
successful adoption of new technologies such as e-commerce and E-banking are generic and
that the successful adoption of internet technologies in part depends on how these are used in
conjunction with the other technologies and management practices that form a technology
cluster. However, the most critical challenges can be ascribed to the very limited information
and communication infrastructure available in most developing countries. Reasons vary widely
among sectors and countries and are most commonly related to lack of applicability to the
business, preferences for established business models, (OECD, 2004).
38
Common challenges include; enabling factors (availability of ICT skills, qualified personnel,
network infrastructure); cost factors (ICT equipment and networks, software and re-
organization); security and trust factors (security and reliability of ecommerce systems,
uncertainty of payment methods, legal frameworks and intellectual property right); and
challenges in areas of management skills, technological capability, productivity and
competitiveness. Lack of reliable trust and redress systems and cross country legal and
regulatory differences was also impeding e-commerce adoption (OECD, 2004). It is however
important to note that challenge to e-commerce adoption work differently according to
organizational type and culture. Areas of training and people development need to be addressed
Harrison (2012).
Ziad et al., (2009) also analyzed E-commerce challenges in terms of three categories:
economic, socio-political, and cognitive. The economic obstacles include several factors that
affect the diffusion of e-commerce such as slow internet diffusion, unavailability of credit
cards, unavailability of a physical delivery system, and low bandwidth availability. The socio-
political challenges take account of government regulations like privacy and security, lacks of
business laws for e-commerce, lacks of legal. Finally, the cognitive hindrances contain many
factors which lead to a negative cognitive assessment of E-commerce of individuals and
organizations like inadequate awareness, knowledge, skills, and confidence; a lack of
awareness and understanding of potential opportunities; lack of confidence in service providers
and the postal network and computer illiteracy. Japhet and Usman (2010) identified the
following specific challenges hindering the adoption of e-commerce in developing countries.
Exploratory study conducted by (Alhaji Ibrahim H., 2009) the following are among the critical
challenges for the adoption of E-banking in Nigeria: -
A Lack of Technological Infrastructure – the implementation of e-payment is been impeded by
unavailability of ICT infrastructure. Most rural areas where majority of small and medium scale
industries are concentrated have no access to internet facilities B ICT Equipment Costs where
available, the cost of ICT is a critical factor relative to per capital income. This makes the cost
of entry higher compared to developed countries. C Regulatory and Legal Issues – inexistence
of proper legal and regulatory framework. D Non-readiness of banks and other stake holders
(acceptability) – even though some have shown impressive willingness, some banks are still
not fully ready to for this new payment regime. E Resistance to changes in technology among
customers and staff due to: · Lack of awareness on the benefits of new technologies F Fear of
39
risk among banks o Lack of trained personnel in key organizations and o Tendency to be
content with the existing structures o People are resistant to new payment mechanisms; G
Security – where disclosure of private information, counterfeiting and illegal alteration of
payment data may be rampant. H Frequent connectivity failure in telephone lines.
2.22.2. Drivers of virtual Airtime Adoption
From the discussion of currencies, it can be said that both mobile money and airtime are forms of digital
currencies. Mobile money is clearly a form of e-money since it is backed by a one -to- one ratio with
fiat money. Airtime is not e-money as it lacks this characteristic. Both mobile money and airtime have
in-built security features that prevent interference by third parties. They may not be crypto currencies
in the traditional sense but it is clear that there is some low level of encryption. This allows a digital
tracking of mobile money and airtime transactions. On the other hand, an airtime code which may be
written in the form of a coupon may be obtained by an unauthorized third party who can use it. The
system would not prevent this as it would assume the airtime code is being validly used. As indicated,
there is always a digital trace left by airtime and mobile money transactions (Sunduzwayo,2017).
In answering the question whether mobile money and airtime are money, it may be said that in the
classical sense they are not. However, as Bitcoin has proved, the future may lie in decentralization of
sovereign monetary power. Being legal tender may no longer be the yardstick for money. It may well
all depend on whether one provides an economic definition of money or the legal definition of money.
It can therefore be said that mobile money and airtime are emerging forms of money. How successfully
they will fulfil the function of money will depend on how they develop. As has been shown earlier,
evolution of money has been a constant attribute of money from its origins. Evolution is a part of the
character of money. It can therefore be asserted that with advances in technology, demands of society
and changes in procurement habits, ‘money will continue to evolve’ (Kelley jr., 2016) of the two, mobile
money has shown characteristics that demonstrate that it is on a faster route to being accepted as money.
However, it is argued that although airtime does not at first glance come out as money, it should also
start being considered as such, especially in the context of rural areas of countries such as Malaŵi.
Other study which addressed the title of “Impact of Electronic Service Quality on Customers
Satisfaction of Islamic Banks in Jordan” that the study conducted by Sulieman Ibraheem
Shelash AL-HAWARY and AL-SMERA. The study will deal about the Electronic Service
Quality represented by (Reliability, Ease of use, Effectiveness, Web Site Design, privacy, and
Responsiveness). The study considered the population of the study consisted customers of
Islamic banks in the North territory of Jordan (Jordanian Islamic Bank, International Arab
Islamic Bank), a random sample was taken amounted (300) participants, SPSS was used to
40
examine the study hypotheses and achieve its objectives. The researcher found that there is
statistically significant impact of the Electronic Service Quality (Ease of use, Web Site Design,
privacy, and Responsiveness) on Customers Satisfaction of Islamic Banks in Jordan. Regarding
the dimensions of reliability and effectiveness, the study indicates that they had insignificant
impact on Customers Satisfaction. The researcher recommended the use of specialists in the
field of electronic sites design in particular, because the site attractiveness needs experience
sufficient experience in this ainmplrea to support its attractiveness for customers, and to benefit
from the experiences of the developed countries in the field of software technology control and
protection of customer information, to strengthen current Software application to those banks
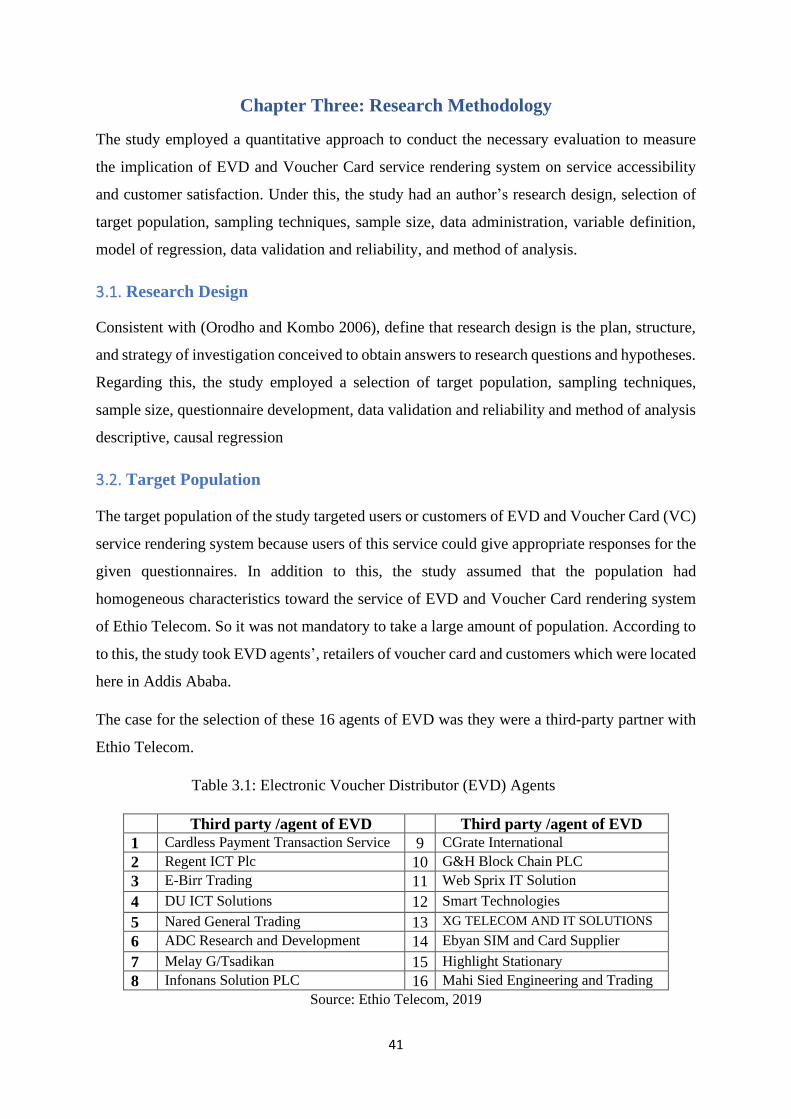
41
Chapter Three: Research Methodology
The study employed a quantitative approach to conduct the necessary evaluation to measure
the implication of EVD and Voucher Card service rendering system on service accessibility
and customer satisfaction. Under this, the study had an author’s research design, selection of
target population, sampling techniques, sample size, data administration, variable definition,
model of regression, data validation and reliability, and method of analysis.
3.1. Research Design
Consistent with (Orodho and Kombo 2006), define that research design is the plan, structure,
and strategy of investigation conceived to obtain answers to research questions and hypotheses.
Regarding this, the study employed a selection of target population, sampling techniques,
sample size, questionnaire development, data validation and reliability and method of analysis
descriptive, causal regression
3.2. Target Population
The target population of the study targeted users or customers of EVD and Voucher Card (VC)
service rendering system because users of this service could give appropriate responses for the
given questionnaires. In addition to this, the study assumed that the population had
homogeneous characteristics toward the service of EVD and Voucher Card rendering system
of Ethio Telecom. So it was not mandatory to take a large amount of population. According to
to this, the study took EVD agents’, retailers of voucher card and customers which were located
here in Addis Ababa.
The case for the selection of these 16 agents of EVD was they were a third-party partner with
Ethio Telecom.
Table 3.1: Electronic Voucher Distributor (EVD) Agents
Third party /agent of EVD Third party /agent of EVD
1 Cardless Payment Transaction Service 9 CGrate International
2 Regent ICT Plc 10 G&H Block Chain PLC
3 E-Birr Trading 11 Web Sprix IT Solution
4 DU ICT Solutions 12 Smart Technologies
5 Nared General Trading 13 XG TELECOM AND IT SOLUTIONS
6 ADC Research and Development 14 Ebyan SIM and Card Supplier
7 Melay G/Tsadikan 15 Highlight Stationary
8 Infonans Solution PLC 16 Mahi Sied Engineering and Trading
Source: Ethio Telecom, 2019
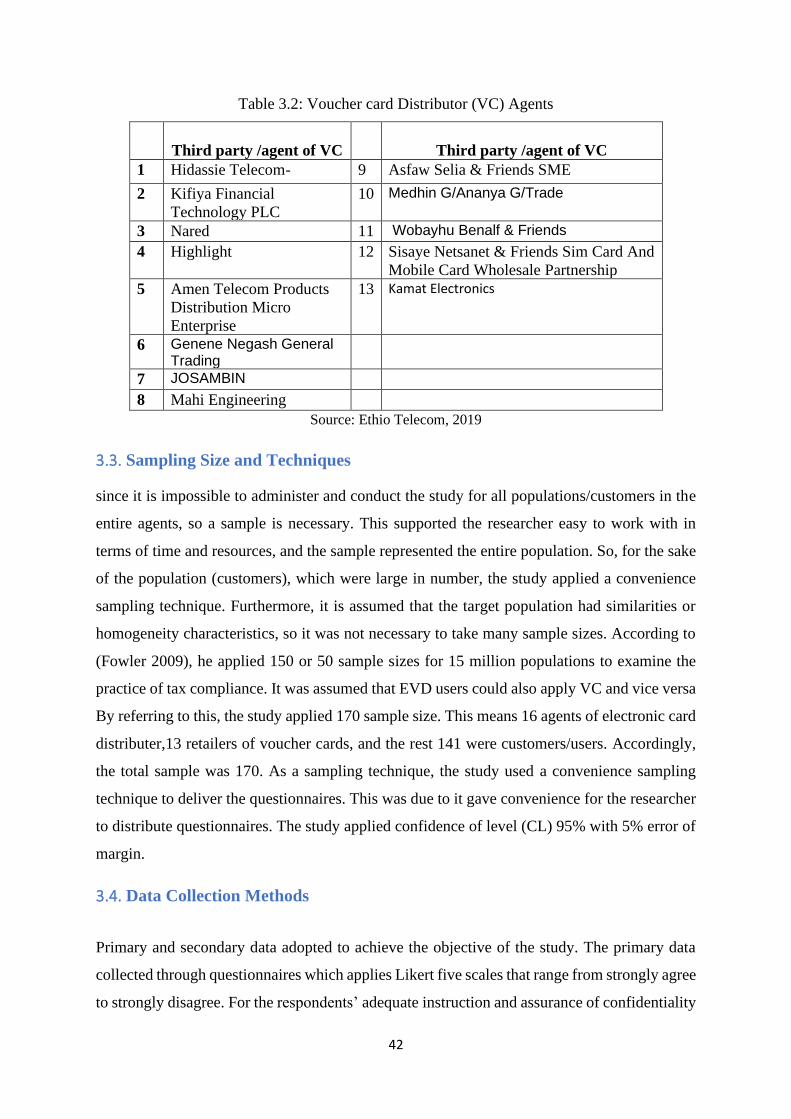
42
Table 3.2: Voucher card Distributor (VC) Agents
Third party /agent of VC
Third party /agent of VC
1 Hidassie Telecom- 9 Asfaw Selia & Friends SME
2 Kifiya Financial
Technology PLC
10 Medhin G/Ananya G/Trade
3 Nared 11 Wobayhu Benalf & Friends
4 Highlight 12 Sisaye Netsanet & Friends Sim Card And
Mobile Card Wholesale Partnership
5 Amen Telecom Products
Distribution Micro
Enterprise
13 Kamat Electronics
6 Genene Negash General Trading
7 JOSAMBIN
8 Mahi Engineering
Source: Ethio Telecom, 2019
3.3. Sampling Size and Techniques
since it is impossible to administer and conduct the study for all populations/customers in the
entire agents, so a sample is necessary. This supported the researcher easy to work with in
terms of time and resources, and the sample represented the entire population. So, for the sake
of the population (customers), which were large in number, the study applied a convenience
sampling technique. Furthermore, it is assumed that the target population had similarities or
homogeneity characteristics, so it was not necessary to take many sample sizes. According to
(Fowler 2009), he applied 150 or 50 sample sizes for 15 million populations to examine the
practice of tax compliance. It was assumed that EVD users could also apply VC and vice versa
By referring to this, the study applied 170 sample size. This means 16 agents of electronic card
distributer,13 retailers of voucher cards, and the rest 141 were customers/users. Accordingly,
the total sample was 170. As a sampling technique, the study used a convenience sampling
technique to deliver the questionnaires. This was due to it gave convenience for the researcher
to distribute questionnaires. The study applied confidence of level (CL) 95% with 5% error of
margin.
3.4. Data Collection Methods
Primary and secondary data adopted to achieve the objective of the study. The primary data
collected through questionnaires which applies Likert five scales that range from strongly agree
to strongly disagree. For the respondents’ adequate instruction and assurance of confidentiality
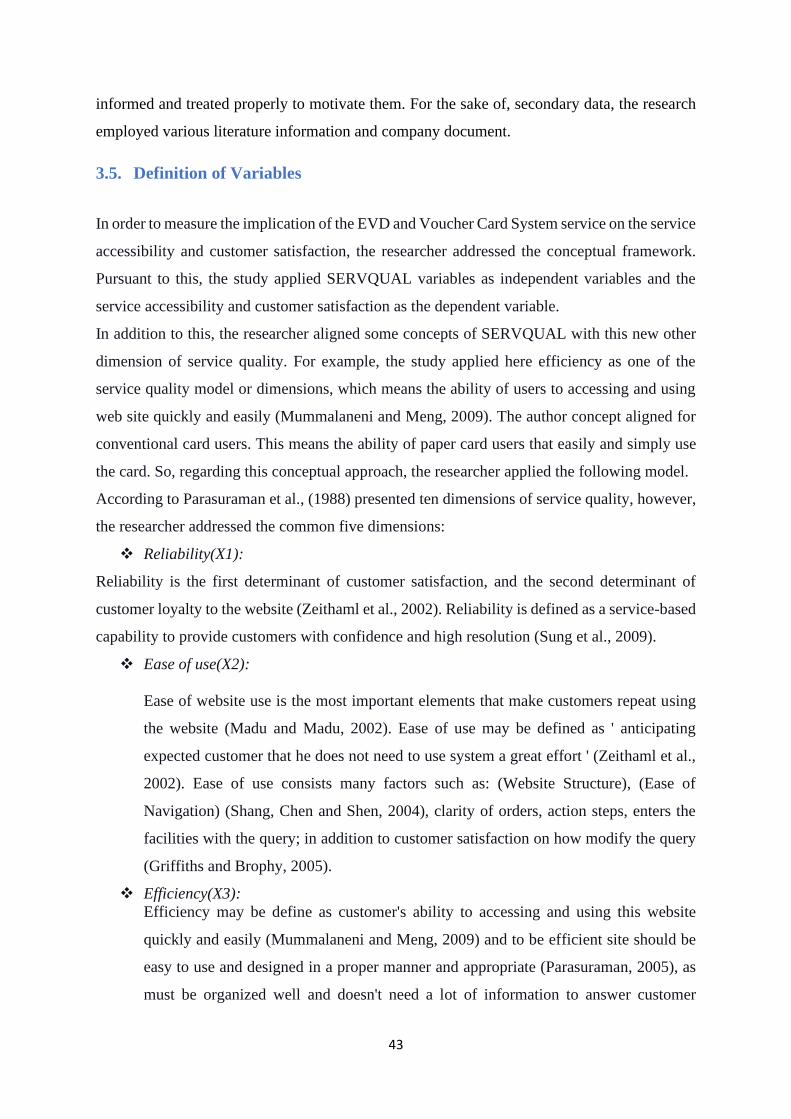
43
informed and treated properly to motivate them. For the sake of, secondary data, the research
employed various literature information and company document.
3.5. Definition of Variables
In order to measure the implication of the EVD and Voucher Card System service on the service
accessibility and customer satisfaction, the researcher addressed the conceptual framework.
Pursuant to this, the study applied SERVQUAL variables as independent variables and the
service accessibility and customer satisfaction as the dependent variable.
In addition to this, the researcher aligned some concepts of SERVQUAL with this new other
dimension of service quality. For example, the study applied here efficiency as one of the
service quality model or dimensions, which means the ability of users to accessing and using
web site quickly and easily (Mummalaneni and Meng, 2009). The author concept aligned for
conventional card users. This means the ability of paper card users that easily and simply use
the card. So, regarding this conceptual approach, the researcher applied the following model.
According to Parasuraman et al., (1988) presented ten dimensions of service quality, however,
the researcher addressed the common five dimensions:
❖ Reliability(X1):
Reliability is the first determinant of customer satisfaction, and the second determinant of
customer loyalty to the website (Zeithaml et al., 2002). Reliability is defined as a service-based
capability to provide customers with confidence and high resolution (Sung et al., 2009).
❖ Ease of use(X2):
Ease of website use is the most important elements that make customers repeat using
the website (Madu and Madu, 2002). Ease of use may be defined as ' anticipating
expected customer that he does not need to use system a great effort ' (Zeithaml et al.,
2002). Ease of use consists many factors such as: (Website Structure), (Ease of
Navigation) (Shang, Chen and Shen, 2004), clarity of orders, action steps, enters the
facilities with the query; in addition to customer satisfaction on how modify the query
(Griffiths and Brophy, 2005).
❖ Efficiency(X3):
Efficiency may be define as customer's ability to accessing and using this website
quickly and easily (Mummalaneni and Meng, 2009) and to be efficient site should be
easy to use and designed in a proper manner and appropriate (Parasuraman, 2005), as
must be organized well and doesn't need a lot of information to answer customer
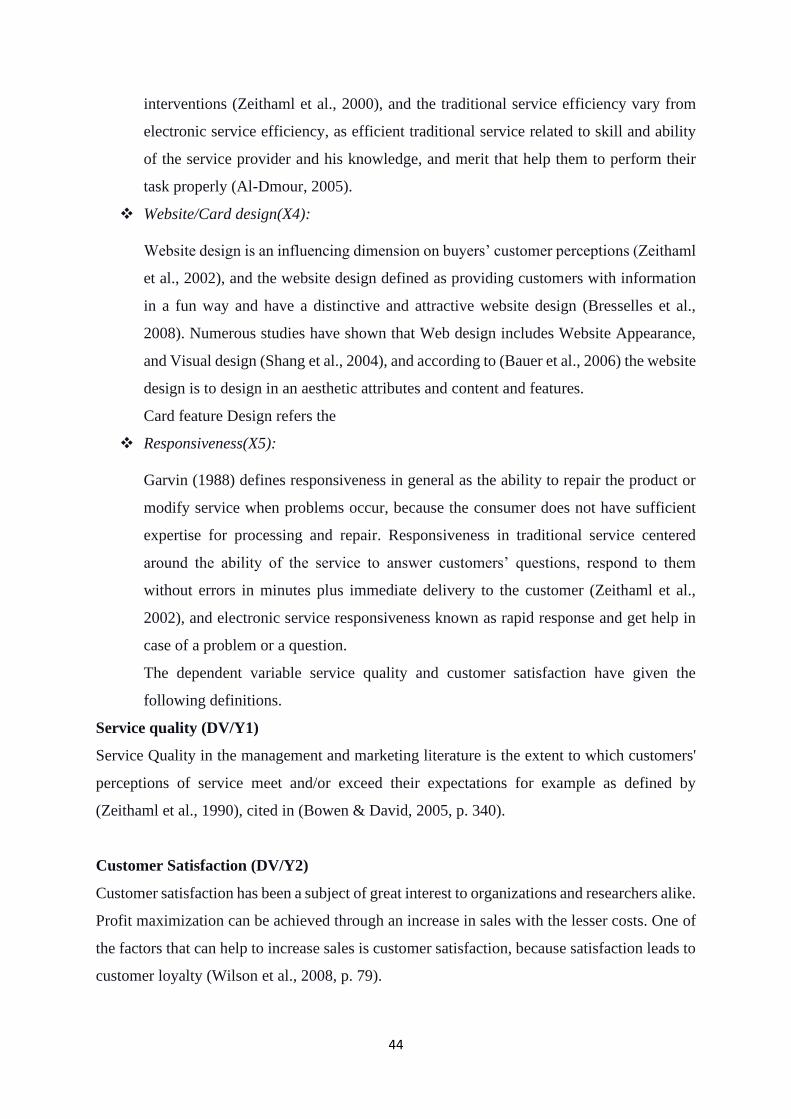
44
interventions (Zeithaml et al., 2000), and the traditional service efficiency vary from
electronic service efficiency, as efficient traditional service related to skill and ability
of the service provider and his knowledge, and merit that help them to perform their
task properly (Al-Dmour, 2005).
❖ Website/Card design(X4):
Website design is an influencing dimension on buyers’ customer perceptions (Zeithaml
et al., 2002), and the website design defined as providing customers with information
in a fun way and have a distinctive and attractive website design (Bresselles et al.,
2008). Numerous studies have shown that Web design includes Website Appearance,
and Visual design (Shang et al., 2004), and according to (Bauer et al., 2006) the website
design is to design in an aesthetic attributes and content and features.
Card feature Design refers the
❖ Responsiveness(X5):
Garvin (1988) defines responsiveness in general as the ability to repair the product or
modify service when problems occur, because the consumer does not have sufficient
expertise for processing and repair. Responsiveness in traditional service centered
around the ability of the service to answer customers’ questions, respond to them
without errors in minutes plus immediate delivery to the customer (Zeithaml et al.,
2002), and electronic service responsiveness known as rapid response and get help in
case of a problem or a question.
The dependent variable service quality and customer satisfaction have given the
following definitions.
Service quality (DV/Y1)
Service Quality in the management and marketing literature is the extent to which customers'
perceptions of service meet and/or exceed their expectations for example as defined by
(Zeithaml et al., 1990), cited in (Bowen & David, 2005, p. 340).
Customer Satisfaction (DV/Y2)
Customer satisfaction has been a subject of great interest to organizations and researchers alike.
Profit maximization can be achieved through an increase in sales with the lesser costs. One of
the factors that can help to increase sales is customer satisfaction, because satisfaction leads to
customer loyalty (Wilson et al., 2008, p. 79).
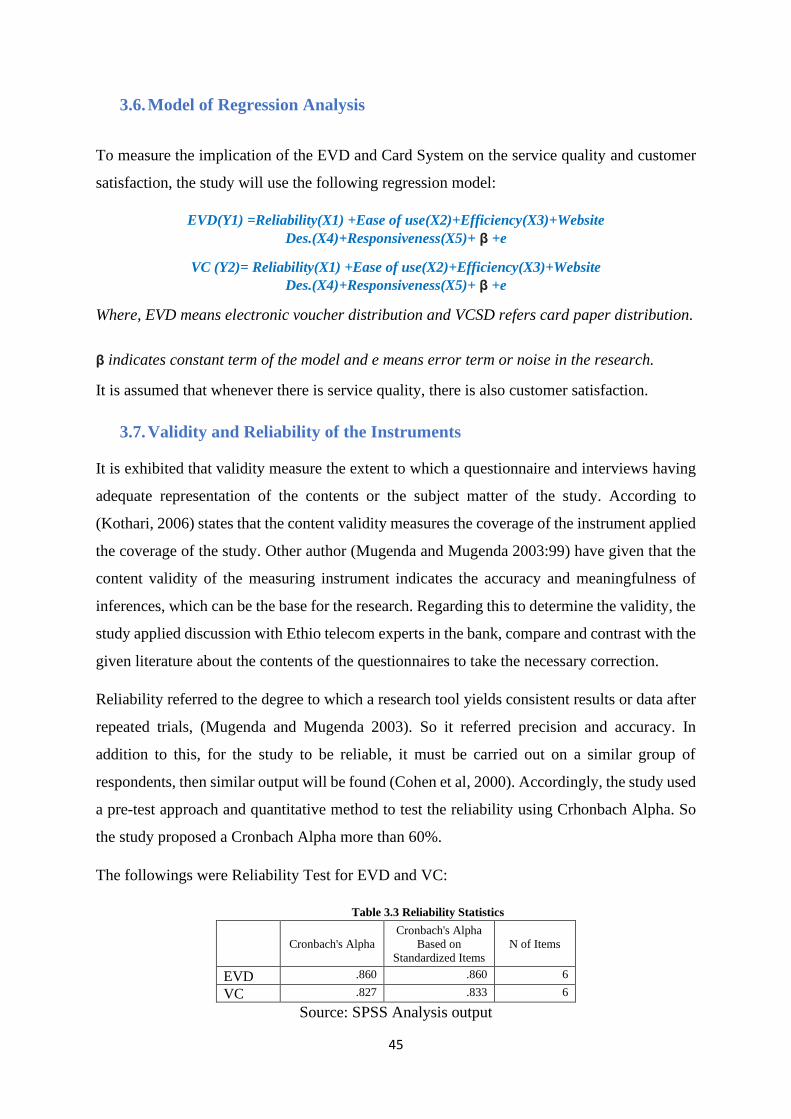
45
3.6. Model of Regression Analysis
To measure the implication of the EVD and Card System on the service quality and customer
satisfaction, the study will use the following regression model:
EVD(Y1) =Reliability(X1) +Ease of use(X2)+Efficiency(X3)+Website
Des.(X4)+Responsiveness(X5)+ β +e
VC (Y2)= Reliability(X1) +Ease of use(X2)+Efficiency(X3)+Website
Des.(X4)+Responsiveness(X5)+ β +e
Where, EVD means electronic voucher distribution and VCSD refers card paper distribution.
β indicates constant term of the model and e means error term or noise in the research.
It is assumed that whenever there is service quality, there is also customer satisfaction.
3.7. Validity and Reliability of the Instruments
It is exhibited that validity measure the extent to which a questionnaire and interviews having
adequate representation of the contents or the subject matter of the study. According to
(Kothari, 2006) states that the content validity measures the coverage of the instrument applied
the coverage of the study. Other author (Mugenda and Mugenda 2003:99) have given that the
content validity of the measuring instrument indicates the accuracy and meaningfulness of
inferences, which can be the base for the research. Regarding this to determine the validity, the
study applied discussion with Ethio telecom experts in the bank, compare and contrast with the
given literature about the contents of the questionnaires to take the necessary correction.
Reliability referred to the degree to which a research tool yields consistent results or data after
repeated trials, (Mugenda and Mugenda 2003). So it referred precision and accuracy. In
addition to this, for the study to be reliable, it must be carried out on a similar group of
respondents, then similar output will be found (Cohen et al, 2000). Accordingly, the study used
a pre-test approach and quantitative method to test the reliability using Crhonbach Alpha. So
the study proposed a Cronbach Alpha more than 60%.
The followings were Reliability Test for EVD and VC:
Table 3.3 Reliability Statistics
Cronbach's Alpha
Cronbach's Alpha
Based on
Standardized Items
N of Items
EVD .860 .860 6
VC .827 .833 6
Source: SPSS Analysis output
46
According Table 3.3.1the reliability test indicated Cronbach’s Alpha had value of 86.0% and
82.7% which were very good.
3.8. Data Analysis
Data analysis involved the segregation of data, to distinguish its component parts separately or
in relation to the whole (Oso and Onen, 2008). This study used a descriptive statistical analysis,
correlation, t-test for comparison of electronic charging of telephone etc. and using of paper
card scratching and multiple regression analysis using the tool of Statistical Package for Social
Science (SPSS) version 20 software for quantitative data. The impact of the independent
variables on the accessibility and customer satisfaction measured using multiple regression
analysis. The result displayed using mean tables, and bar graphs. The frequencies converted
into percentage to illustrate the respondents’ feeling/opinions.
For the purpose of the judgment of the resulting discussion of descriptive statistics analysis,
the study took a mean value 1.00-1.80 (Strongly Disagree), 1.81-2.60 (Disagree),2.61-3.40 (To
some extent/Neutral),3.41-4.20 (Agree), and 4.21-5.00 (strongly Agree)5. In addition to this,
the margin of error of the study was 5% with a confidence level of 95%.
5 Retrieved from: https://www.researchgate.net/post/Interpret_mean_of_3_neutral_in_5_point_agreement_scale-
can_anyone_help. On April 2020
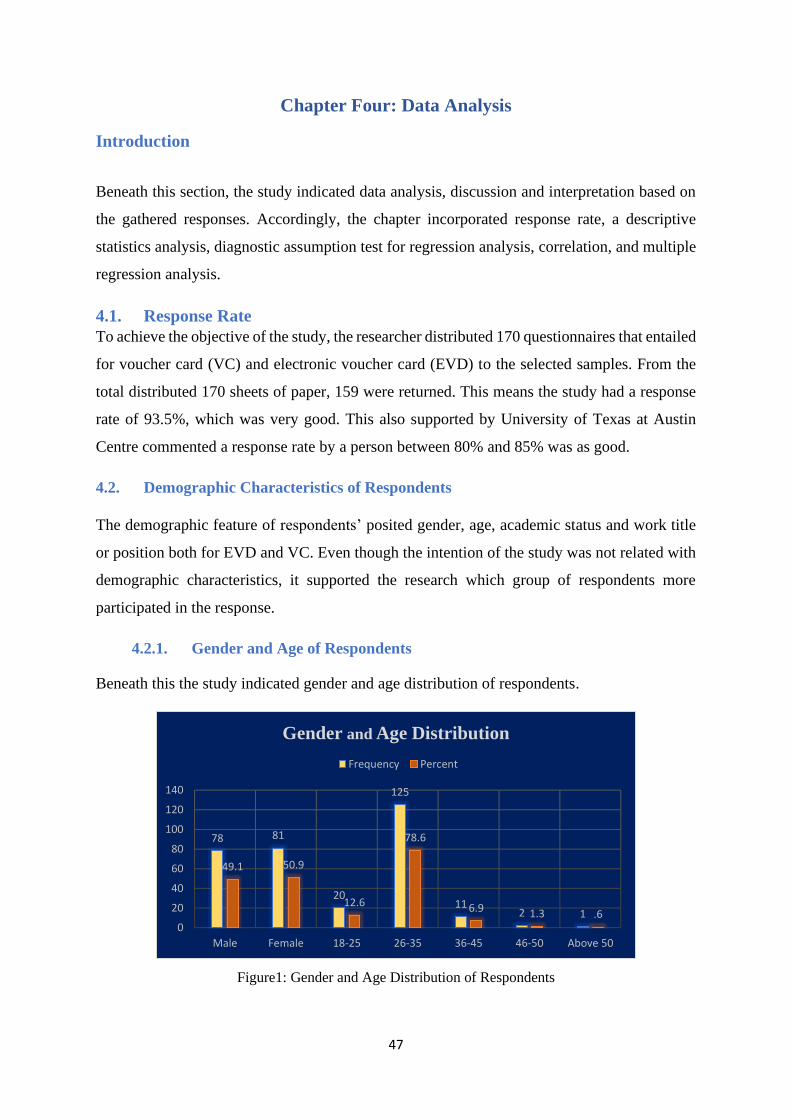
47
Chapter Four: Data Analysis
Introduction
Beneath this section, the study indicated data analysis, discussion and interpretation based on
the gathered responses. Accordingly, the chapter incorporated response rate, a descriptive
statistics analysis, diagnostic assumption test for regression analysis, correlation, and multiple
regression analysis.
4.1. Response Rate
To achieve the objective of the study, the researcher distributed 170 questionnaires that entailed
for voucher card (VC) and electronic voucher card (EVD) to the selected samples. From the
total distributed 170 sheets of paper, 159 were returned. This means the study had a response
rate of 93.5%, which was very good. This also supported by University of Texas at Austin
Centre commented a response rate by a person between 80% and 85% was as good.
4.2. Demographic Characteristics of Respondents
The demographic feature of respondents’ posited gender, age, academic status and work title
or position both for EVD and VC. Even though the intention of the study was not related with
demographic characteristics, it supported the research which group of respondents more
participated in the response.
4.2.1. Gender and Age of Respondents
Beneath this the study indicated gender and age distribution of respondents.
Figure1: Gender and Age Distribution of Respondents
78 81
20
125
112 1
49.1 50.9
12.6
78.6
6.9 1.3 .60
20
40
60
80
100
120
140
Male Female 18-25 26-35 36-45 46-50 Above 50
Gender and Age Distribution
Frequency Percent
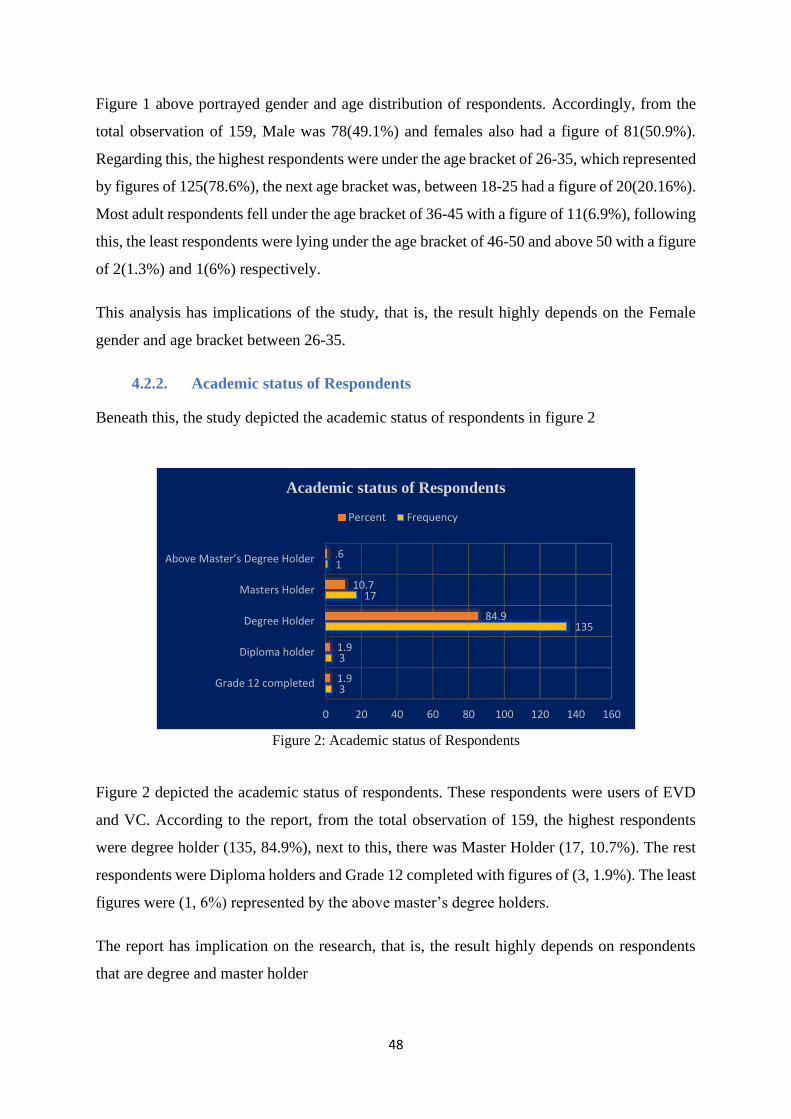
48
Figure 1 above portrayed gender and age distribution of respondents. Accordingly, from the
total observation of 159, Male was 78(49.1%) and females also had a figure of 81(50.9%).
Regarding this, the highest respondents were under the age bracket of 26-35, which represented
by figures of 125(78.6%), the next age bracket was, between 18-25 had a figure of 20(20.16%).
Most adult respondents fell under the age bracket of 36-45 with a figure of 11(6.9%), following
this, the least respondents were lying under the age bracket of 46-50 and above 50 with a figure
of 2(1.3%) and 1(6%) respectively.
This analysis has implications of the study, that is, the result highly depends on the Female
gender and age bracket between 26-35.
4.2.2. Academic status of Respondents
Beneath this, the study depicted the academic status of respondents in figure 2
Figure 2: Academic status of Respondents
Figure 2 depicted the academic status of respondents. These respondents were users of EVD
and VC. According to the report, from the total observation of 159, the highest respondents
were degree holder (135, 84.9%), next to this, there was Master Holder (17, 10.7%). The rest
respondents were Diploma holders and Grade 12 completed with figures of (3, 1.9%). The least
figures were (1, 6%) represented by the above master’s degree holders.
The report has implication on the research, that is, the result highly depends on respondents
that are degree and master holder
3
3
135
17
1
1.9
1.9
84.9
10.7
.6
0 20 40 60 80 100 120 140 160
Grade 12 completed
Diploma holder
Degree Holder
Masters Holder
Above Master’s Degree Holder
Academic status of Respondents
Percent Frequency
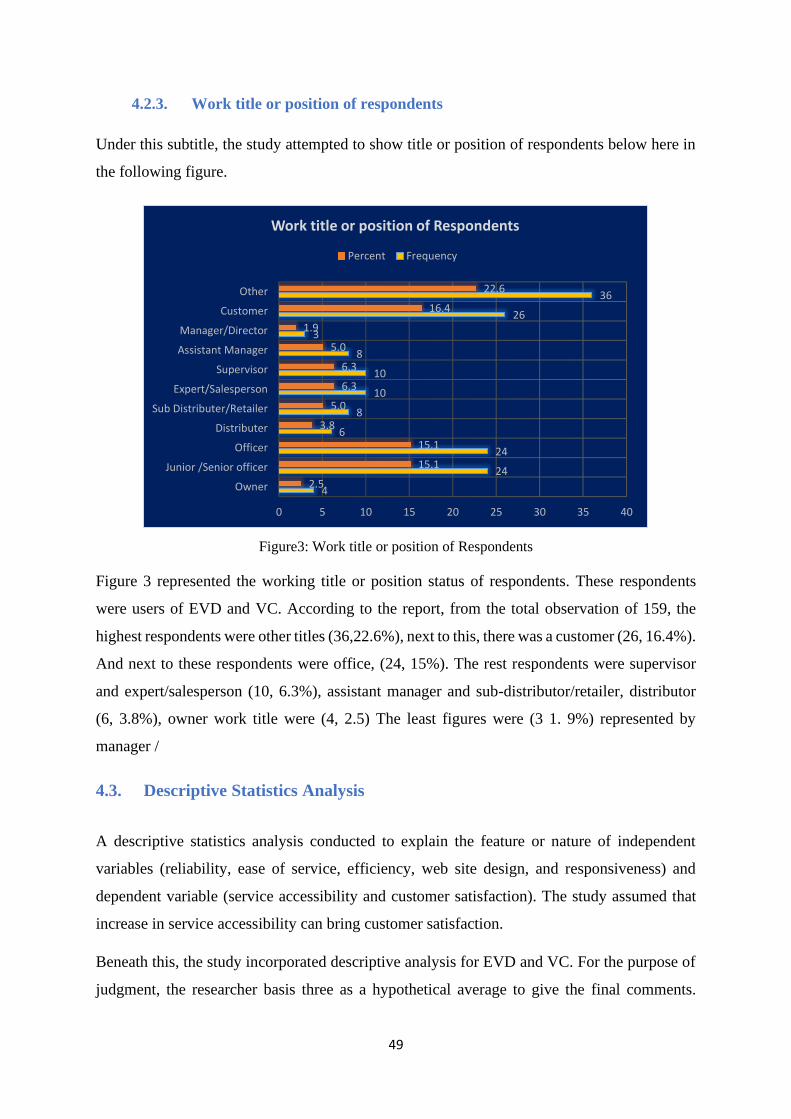
49
4.2.3. Work title or position of respondents
Under this subtitle, the study attempted to show title or position of respondents below here in
the following figure.
Figure3: Work title or position of Respondents
Figure 3 represented the working title or position status of respondents. These respondents
were users of EVD and VC. According to the report, from the total observation of 159, the
highest respondents were other titles (36,22.6%), next to this, there was a customer (26, 16.4%).
And next to these respondents were office, (24, 15%). The rest respondents were supervisor
and expert/salesperson (10, 6.3%), assistant manager and sub-distributor/retailer, distributor
(6, 3.8%), owner work title were (4, 2.5) The least figures were (3 1. 9%) represented by
manager /
4.3. Descriptive Statistics Analysis
A descriptive statistics analysis conducted to explain the feature or nature of independent
variables (reliability, ease of service, efficiency, web site design, and responsiveness) and
dependent variable (service accessibility and customer satisfaction). The study assumed that
increase in service accessibility can bring customer satisfaction.
Beneath this, the study incorporated descriptive analysis for EVD and VC. For the purpose of
judgment, the researcher basis three as a hypothetical average to give the final comments.
4
24
24
6
8
10
10
8
3
26
36
2.5
15.1
15.1
3.8
5.0
6.3
6.3
5.0
1.9
16.4
22.6
0 5 10 15 20 25 30 35 40
Owner
Junior /Senior officer
Officer
Distributer
Sub Distributer/Retailer
Expert/Salesperson
Supervisor
Assistant Manager
Manager/Director
Customer
Other
Work title or position of Respondents
Percent Frequency
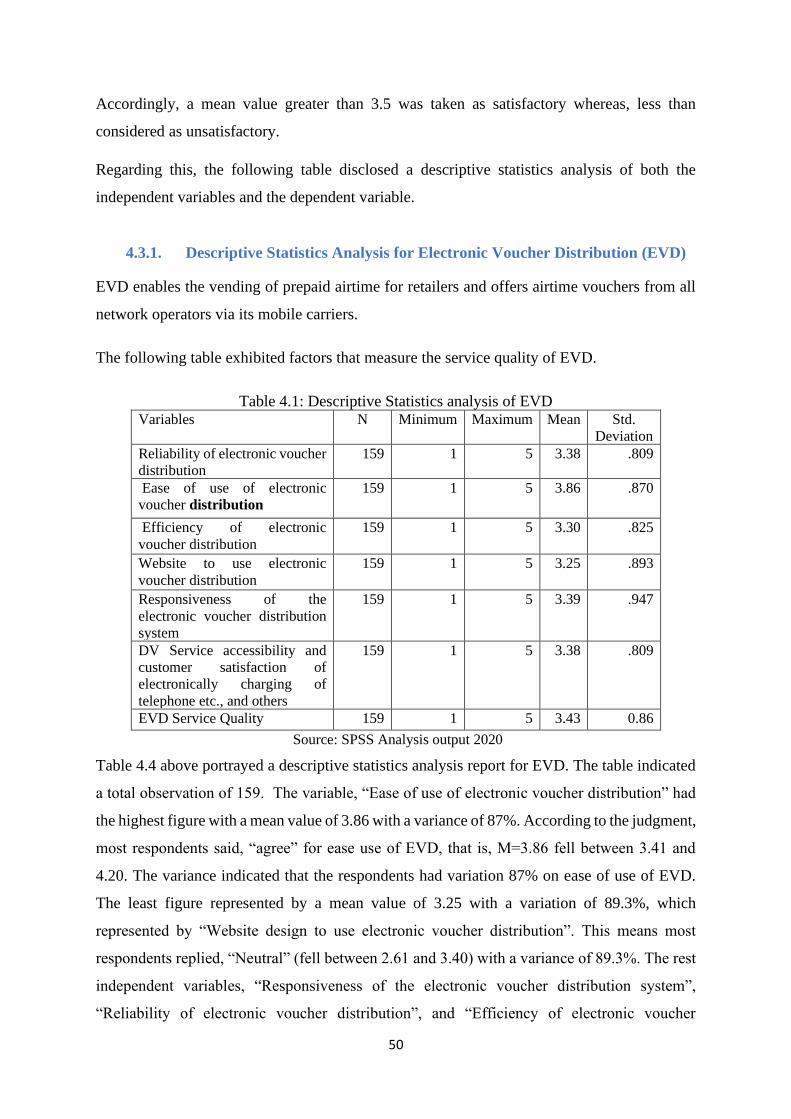
50
Accordingly, a mean value greater than 3.5 was taken as satisfactory whereas, less than
considered as unsatisfactory.
Regarding this, the following table disclosed a descriptive statistics analysis of both the
independent variables and the dependent variable.
4.3.1. Descriptive Statistics Analysis for Electronic Voucher Distribution (EVD)
EVD enables the vending of prepaid airtime for retailers and offers airtime vouchers from all
network operators via its mobile carriers.
The following table exhibited factors that measure the service quality of EVD.
Table 4.1: Descriptive Statistics analysis of EVD Variables N Minimum Maximum Mean Std.
Deviation
Reliability of electronic voucher
distribution
159 1 5 3.38 .809
Ease of use of electronic
voucher distribution
159 1 5 3.86 .870
Efficiency of electronic
voucher distribution
159 1 5 3.30 .825
Website to use electronic
voucher distribution
159 1 5 3.25 .893
Responsiveness of the
electronic voucher distribution
system
159 1 5 3.39 .947
DV Service accessibility and
customer satisfaction of
electronically charging of
telephone etc., and others
159 1 5 3.38 .809
EVD Service Quality 159 1 5 3.43 0.86
Source: SPSS Analysis output 2020
Table 4.4 above portrayed a descriptive statistics analysis report for EVD. The table indicated
a total observation of 159. The variable, “Ease of use of electronic voucher distribution” had
the highest figure with a mean value of 3.86 with a variance of 87%. According to the judgment,
most respondents said, “agree” for ease use of EVD, that is, M=3.86 fell between 3.41 and
4.20. The variance indicated that the respondents had variation 87% on ease of use of EVD.
The least figure represented by a mean value of 3.25 with a variation of 89.3%, which
represented by “Website design to use electronic voucher distribution”. This means most
respondents replied, “Neutral” (fell between 2.61 and 3.40) with a variance of 89.3%. The rest
independent variables, “Responsiveness of the electronic voucher distribution system”,
“Reliability of electronic voucher distribution”, and “Efficiency of electronic voucher
51
distribution”, had mean figures of 3.39, 3.38, and 3.30 with a variance of .947, .809, and .825.
The judgment of these variables posited “Neutral” which means all fell between 2.61 and 3.40.
The aggregate result of the service accessibility and customer satisfaction of the descriptive
analysis exhibited a mean value of 3.43, which means “Agree” that fell between 3.41 and 4.20
with a variance of 80%. This means most respondents were satisfied with the service
accessibility with a variation on the quality by 80% from the mean.
Accordingly, the Analysis implies that the ease of use of electronic voucher distribution, which
means the customers are interested to use repeatedly is delivered satisfactorily by Ethio
telecom, however, most respondents have the feeling of neutral (neither satisfies nor
dissatisfied) for the rest variables such as reliability, efficiency, website design, and
responsiveness.
Literature indicated that reliability is the first and the second factor for customer satisfaction to
the website (Zeithaml et al., 2002). To achieve reliability, companies must deliver service as
promised by the company and reliably (Al-Dmour, 2005). “Ease of website” refers to the
anticipation of users do not need to use the system in a great effort (Zeithaml et al., 2002). The
other important aspect is the ability of customers to use the system easily that is, the efficiency
of the service (Mummalaneni and Meng, 2009) and to be efficient site should be easy to use
and designed in a proper manner and appropriate (Parasuraman, 2005).
Furthermore, the website design is one of the indispensable issues to attract customers to use
EVD system. Website design is an influencing dimension on buyers’ customer perceptions
(Zeithaml et al., 2002). It refers to providing information to customers in a fun and attractive
way (Bresselles et al., 2008). The last parameter is responsiveness, which is the ability to repair
the product or modify service when problems occur because the consumer does not have
sufficient expertise for processing and repair (Garvin, 1988). So this research indicates that
ease of use of EVD is more satisfactory by Ethio Telecom instead of the rest independent
variables.
4.3.2. Descriptive Statistics Analysis for Voucher Card (VC)
Voucher Card refers a paper-based card that used by customers to charge their own mobile and
effect traditional payment transaction in the business environment.
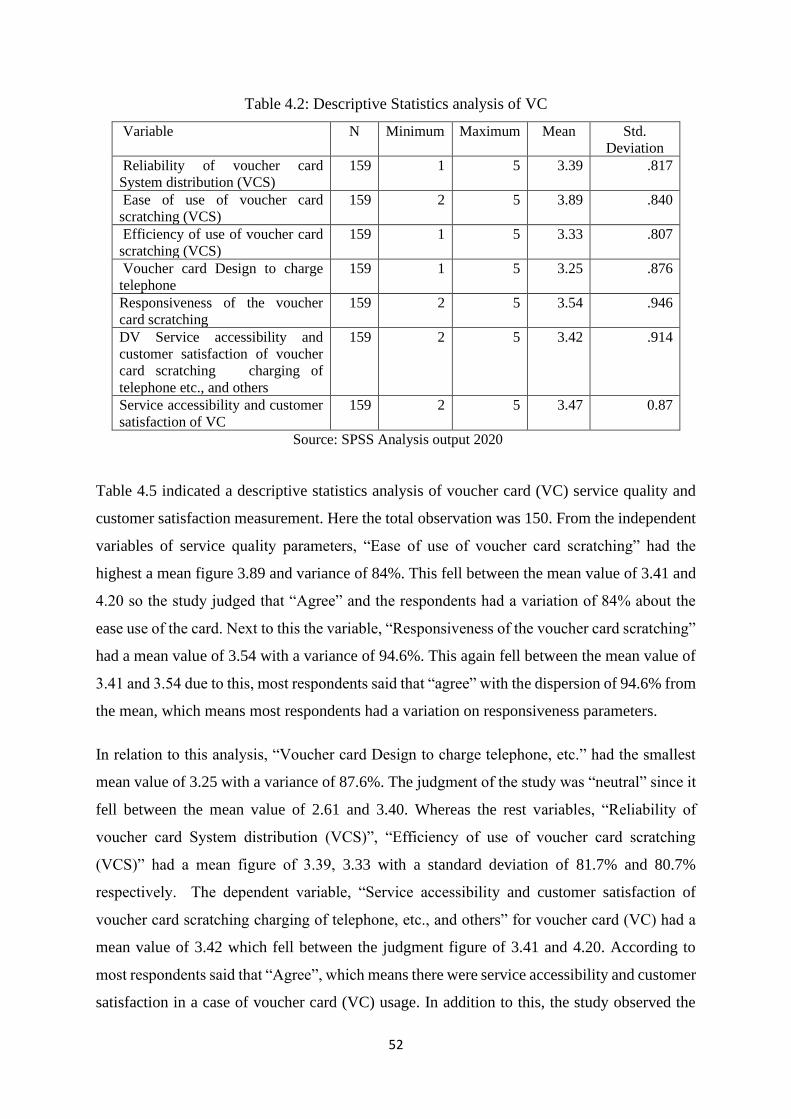
52
Table 4.2: Descriptive Statistics analysis of VC
Variable N Minimum Maximum Mean Std.
Deviation
Reliability of voucher card
System distribution (VCS)
159 1 5 3.39 .817
Ease of use of voucher card
scratching (VCS)
159 2 5 3.89 .840
Efficiency of use of voucher card
scratching (VCS)
159 1 5 3.33 .807
Voucher card Design to charge
telephone
159 1 5 3.25 .876
Responsiveness of the voucher
card scratching
159 2 5 3.54 .946
DV Service accessibility and
customer satisfaction of voucher
card scratching charging of
telephone etc., and others
159 2 5 3.42 .914
Service accessibility and customer
satisfaction of VC
159 2 5 3.47 0.87
Source: SPSS Analysis output 2020
Table 4.5 indicated a descriptive statistics analysis of voucher card (VC) service quality and
customer satisfaction measurement. Here the total observation was 150. From the independent
variables of service quality parameters, “Ease of use of voucher card scratching” had the
highest a mean figure 3.89 and variance of 84%. This fell between the mean value of 3.41 and
4.20 so the study judged that “Agree” and the respondents had a variation of 84% about the
ease use of the card. Next to this the variable, “Responsiveness of the voucher card scratching”
had a mean value of 3.54 with a variance of 94.6%. This again fell between the mean value of
3.41 and 3.54 due to this, most respondents said that “agree” with the dispersion of 94.6% from
the mean, which means most respondents had a variation on responsiveness parameters.
In relation to this analysis, “Voucher card Design to charge telephone, etc.” had the smallest
mean value of 3.25 with a variance of 87.6%. The judgment of the study was “neutral” since it
fell between the mean value of 2.61 and 3.40. Whereas the rest variables, “Reliability of
voucher card System distribution (VCS)”, “Efficiency of use of voucher card scratching
(VCS)” had a mean figure of 3.39, 3.33 with a standard deviation of 81.7% and 80.7%
respectively. The dependent variable, “Service accessibility and customer satisfaction of
voucher card scratching charging of telephone, etc., and others” for voucher card (VC) had a
mean value of 3.42 which fell between the judgment figure of 3.41 and 4.20. According to
most respondents said that “Agree”, which means there were service accessibility and customer
satisfaction in a case of voucher card (VC) usage. In addition to this, the study observed the
53
aggregate result of the service accessibility and customer satisfaction, it obtained a mean value
of 3.47 that fell between 3.41 and 4.20, which means most respondents suggested, “Agree”.
This means there were satisfactory service accessibility and related customer satisfaction of
usage of paper-based voucher card.
This analysis implies a similar result with electronic voucher distribution (EVD). According to
literature (Al-Dmour, 2005), reliability is the ability of the organization to provide service as
promised and reliably, here Ethio telecom has provided satisfactory service accessibly to
customers. However, the maximum service accessibility and related customer satisfaction
achieve through ease use of voucher cards since users can repeatedly use the card (Madu and
Madu, 2002) easily and simply. The other one is the efficiency of service accessibility, here
the researcher is expected easy accessing and using of the voucher card quickly and easily,
however, compared to the other variables, its accessibility is not a such satisfactory that is,
most respondents have the feeling of neutral this is due to users have low expectation toward
their ability accessing and using this card (Mummalaneni and Meng, 2009). For the rest
voucher card design (tangibility) of the service, accessibility is very low to attract customers
and easily scratching the card. Here most users have a neutral feeling which means they do not
even recognize its tangibility or design of voucher cards. In the case of the responsiveness of
using of voucher card service accessibility which means the ability to users to get the service
easily and respond to them is satisfactory that is, Ethio telecom has given prompt responses
when there are some errors by customers when using the voucher card (Zeithaml et al., 2002).
Aggregately, this research indicates that ease of use of EVD is more satisfactory by the Ethio
Telecom instead of the rest independent variables.
4.4. A Pearson Correlation Analysis of the IVs and DV for EVD and VC
A Pearson correlation analysis is conducted to envisage the correlation of the independent
variables (Reliability of electronic voucher distribution EVD/VC, Ease of use of EVD/VC,
Website design/card design to use EVD/VC, Efficiency of EVD/VC, and Responsiveness of
the EVD/VC) with the dependent variable (Service accessibility and customer satisfaction
users). The IVs referred to the parameters of the service quality that assumed a relationship
with service quality and customer satisfaction.
Regarding this, the researcher determined the service quality as service accessibility that
resulted in customer satisfaction. For the sake of simplicity and clarification for readers, the
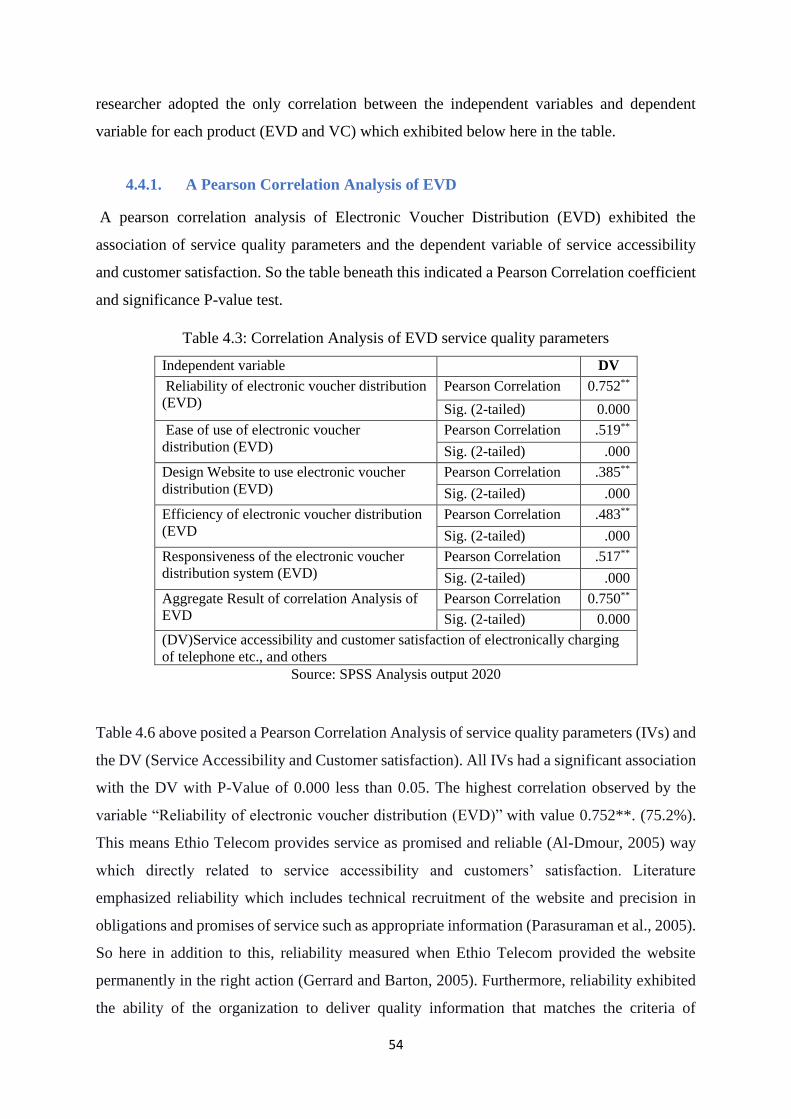
54
researcher adopted the only correlation between the independent variables and dependent
variable for each product (EVD and VC) which exhibited below here in the table.
4.4.1. A Pearson Correlation Analysis of EVD
A pearson correlation analysis of Electronic Voucher Distribution (EVD) exhibited the
association of service quality parameters and the dependent variable of service accessibility
and customer satisfaction. So the table beneath this indicated a Pearson Correlation coefficient
and significance P-value test.
Table 4.3: Correlation Analysis of EVD service quality parameters
Independent variable DV
Reliability of electronic voucher distribution
(EVD)
Pearson Correlation 0.752**
Sig. (2-tailed) 0.000
Ease of use of electronic voucher
distribution (EVD)
Pearson Correlation .519**
Sig. (2-tailed) .000
Design Website to use electronic voucher
distribution (EVD)
Pearson Correlation .385**
Sig. (2-tailed) .000
Efficiency of electronic voucher distribution
(EVD
Pearson Correlation .483**
Sig. (2-tailed) .000
Responsiveness of the electronic voucher
distribution system (EVD)
Pearson Correlation .517**
Sig. (2-tailed) .000
Aggregate Result of correlation Analysis of
EVD
Pearson Correlation 0.750**
Sig. (2-tailed) 0.000
(DV)Service accessibility and customer satisfaction of electronically charging
of telephone etc., and others
Source: SPSS Analysis output 2020
Table 4.6 above posited a Pearson Correlation Analysis of service quality parameters (IVs) and
the DV (Service Accessibility and Customer satisfaction). All IVs had a significant association
with the DV with P-Value of 0.000 less than 0.05. The highest correlation observed by the
variable “Reliability of electronic voucher distribution (EVD)” with value 0.752**. (75.2%).
This means Ethio Telecom provides service as promised and reliable (Al-Dmour, 2005) way
which directly related to service accessibility and customers’ satisfaction. Literature
emphasized reliability which includes technical recruitment of the website and precision in
obligations and promises of service such as appropriate information (Parasuraman et al., 2005).
So here in addition to this, reliability measured when Ethio Telecom provided the website
permanently in the right action (Gerrard and Barton, 2005). Furthermore, reliability exhibited
the ability of the organization to deliver quality information that matches the criteria of
55
timeliness, accuracy, easily recognized, relevance to fulfill the interest of the customer (Swaid
and Wigand, 2007).
The coefficient of correlation which had values less than 50% represented by the variables,
“Design by Website to use EVD” and “Efficiency of electronic voucher distribution (EVD)”
with Pearson correlation of.385** (38.5%) and.483** (48.3%) respectively. However, the
variable, “Responsiveness of the electronic voucher distribution system (EVD)” had a Pearson
coefficient .517** (51.7%), which was almost equal to 50%. The aggregate result of the service
quality parameters had a Pearson Correlation of 0.750** with a significance P-value 0.000 less
than 0.05.
According to the analysis of the study, it implies that the whole service quality parameters have
a significant correlation with service accessibility and customer satisfaction in the usage of
electronic voucher distribution (EVD) in Ethio Telecom. In Ethio Telecom web site design and
efficiency parameters of service quality have less association with service accessibility and
customer satisfaction compare to the rest factors such as reliability.
Literature exhibits efficiency is the ability of users to access and use the website quickly and
easily (Mummalaneni and Meng, 2009), so to be an efficient site there is easy to use and design
in a proper manner (Parasuraman, 2005). It requires a well-organized and does need a lot of
information to answer customer innervations (Zeithaml et al., 2000). Here Ethio Telecom lacks
this property. The other aspect is web site design, which refers to providing customers with
information in a fun way that having a distinctive and attractive design (Bresselles et al., 2008).
Many other types of research have indicated that web design incorporates website appearance,
and visual design (Shang et al., 2004). It is better to encompass an aesthetic attribute, content,
and features. This also possesses standards of aesthetic appearances on websites such as types,
sizes, and clear texts (Madu and Madu, 2002). Privacy is one of the essential characteristics of
electronic service quality that appears confident to the user to make online transactions
(Zeithaml et al., 2002). So in this regard, the EVD of Ethio Telecom has faced problems that
attract users.
4.4.2. A Pearson Correlation Analysis of VC
A Voucher Card (VC) is a conventional/traditional way of performing mobile charges, etc.
using paper based. The parameters for service quality of VC have similarities with EVD
since the researcher adopted in the form of the conventional way of service quality.
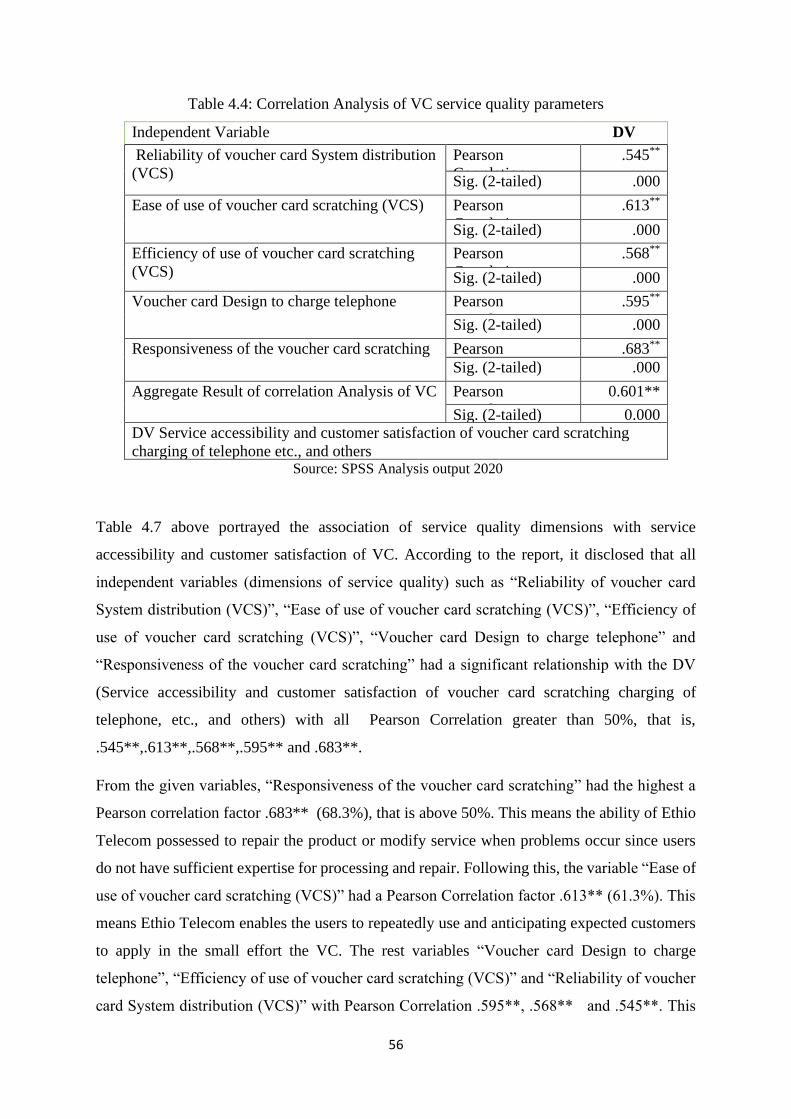
56
Table 4.4: Correlation Analysis of VC service quality parameters
Independent Variable DV
Reliability of voucher card System distribution
(VCS)
Pearson
Correlation
.545**
Sig. (2-tailed) .000
Ease of use of voucher card scratching (VCS) Pearson
Correlation
.613**
Sig. (2-tailed) .000
Efficiency of use of voucher card scratching
(VCS)
Pearson
Correlation
.568**
Sig. (2-tailed) .000
Voucher card Design to charge telephone Pearson
Correlation
.595**
Sig. (2-tailed) .000
Responsiveness of the voucher card scratching Pearson
Correlation
.683**
Sig. (2-tailed) .000
Aggregate Result of correlation Analysis of VC Pearson
Correlation
0.601**
Sig. (2-tailed) 0.000 DV Service accessibility and customer satisfaction of voucher card scratching
charging of telephone etc., and others Source: SPSS Analysis output 2020
Table 4.7 above portrayed the association of service quality dimensions with service
accessibility and customer satisfaction of VC. According to the report, it disclosed that all
independent variables (dimensions of service quality) such as “Reliability of voucher card
System distribution (VCS)”, “Ease of use of voucher card scratching (VCS)”, “Efficiency of
use of voucher card scratching (VCS)”, “Voucher card Design to charge telephone” and
“Responsiveness of the voucher card scratching” had a significant relationship with the DV
(Service accessibility and customer satisfaction of voucher card scratching charging of
telephone, etc., and others) with all Pearson Correlation greater than 50%, that is,
.545**,.613**,.568**,.595** and .683**.
From the given variables, “Responsiveness of the voucher card scratching” had the highest a
Pearson correlation factor .683** (68.3%), that is above 50%. This means the ability of Ethio
Telecom possessed to repair the product or modify service when problems occur since users
do not have sufficient expertise for processing and repair. Following this, the variable “Ease of
use of voucher card scratching (VCS)” had a Pearson Correlation factor .613** (61.3%). This
means Ethio Telecom enables the users to repeatedly use and anticipating expected customers
to apply in the small effort the VC. The rest variables “Voucher card Design to charge
telephone”, “Efficiency of use of voucher card scratching (VCS)” and “Reliability of voucher
card System distribution (VCS)” with Pearson Correlation .595**, .568** and .545**. This
57
means the tangibility or the voucher card design (VC), ability to use and access VC quickly
and easily by the customer (efficiency), and “ability to perform the promised service
dependably and accurately” by Ethio Telecom (Parasuraman et al., 1988, p.23) are satisfactory.
When the study observed the aggregate result of the VC service quality parameters association
with DV (Service accessibility and customer satisfaction of voucher card scratching charging
of telephone etc., and others) had a significant Pearson Correlation factor with the value of
0.601**. From the average (0.601**), two variables Ease of use of voucher card scratching
(.613**) and Responsiveness of the voucher card scratching, (.683**) had greater correlation
factor compared to the rest service quality parameters (reliability, efficiency, and design) so
regarding this, reliability, efficiency and design of VC were not satisfactory correlated compare
to ease of use and responsiveness of VC.
Efficiency may be defined as customer's ability to accessing and using this website quickly and
easily (Mummalaneni and Meng, 2009) and to be efficient site should be easy to use and
designed in a proper manner and appropriate (Parasuraman, 2005), as must be organized well
and doesn't need a lot of information to answer customer interventions (Zeithaml et al., 2000),
and the traditional service efficiency varies from electronic service efficiency, as efficient
traditional service related to skill and ability of the service provider and his knowledge, and
merit that help them to perform their task properly (Al-Dmour, 2005).
4.5. Diagnostic Analysis of assumption of Multiple Regression Analysis
This referred to the assumptions of linearity, normality, independence (serial autocorrelation),
multicollinearity, and homoscedasticity under the subtitle of diagnostic analysis.
Assumption #1: The relationship between IVs and the DV of Linearity
The relationship between independent and dependent variables is considered linear when they
are consistent and directly proportional to each other (Steven, 2009, Tabachnick & Fidell,
2006). It is imperative that to examine the analysis for nonlinearity as there are many instances
in the social sciences where nonlinear relationships occur (Kivilu, 2003; Steven, 2009). And
Violations of this assumption may result in the estimates obtained from the analysis, such as
R2, regression coefficients, standard errors, and statistical significance, being biased; thus, not
indicating the accurate or true population values ((Osborne & Waters, 2002; Tabachnick &
Fidell, 2006).
58
Beneath this test, the study examined the relationship of the mean value of each independent
variable that is, “Reliability of electronic voucher distribution (EVD)”, “Ease of use of
electronic voucher distribution (EVD)”, “Design of Website to use electronic voucher
distribution (EVD)”, “Efficiency of electronic voucher distribution (EVD)”, and
“Responsiveness of the electronic voucher distribution system (EVD)” with Service
accessibility and customer satisfaction of voucher card scratching charging of telephone, etc.,
and others (DV). Please refer to Annex 1.
Assumption #2: There is no multicollinearity for EVD
This is essentially the assumption that your predictors are not too highly correlated with one
another. The study applied variance inflation factor (VIF), that is, if inflation factor VIF less
than 10 had no possibility of multicollinearity problem, multicollinearity, Marquardt (1970)
advised using the variance inflation factor (VIF) (p. 600). In addition to this, the study used
Montgomery and Peck (1983) rules, which referred that for the condition number (CN) to
measure multicollinearity, if CN<100 indicated none of the multicollinearity if the CN fell
between 100<CN<1,000, it posited a moderate to strong multicollinearity, whereas if CN>1000
the multicollinearity had a serious problem. Please refer to Annex 2
Assumption #3: The values of the residuals are independent/Autocorrelation
This indicated that the observations (or individual data points) to be independent of one another
(or uncorrelated), and this could be tested using the Durbin-Watson statistic. A serial
autocorrelation is common in much of the economic and business research. To detect
autocorrelation, one can use many tests, but the most widely used is the Durbin S. Shahabuddin
Watson (D) test, which tests the hypothesis of whether the correlation between error terms
exists or not (Koutsoyiannis, 1973). Please refer to Annex 2.
Assumption #4: Test of homoscedasticity
This exhibited the variance of the residuals was constant, which referred homoscedasticity, and
indicated the assumption that the variation in the residuals (or amount of error in the model) is
similar at each point across the model. In other words, the spread of the residuals should be
fairly constant at each point of the predictor variables (or across the linear model). The
assumption of homoscedasticity refers to the equal variance of errors across all levels of the
independent variables (Osborne & Waters, 2002). This means that researchers assume that
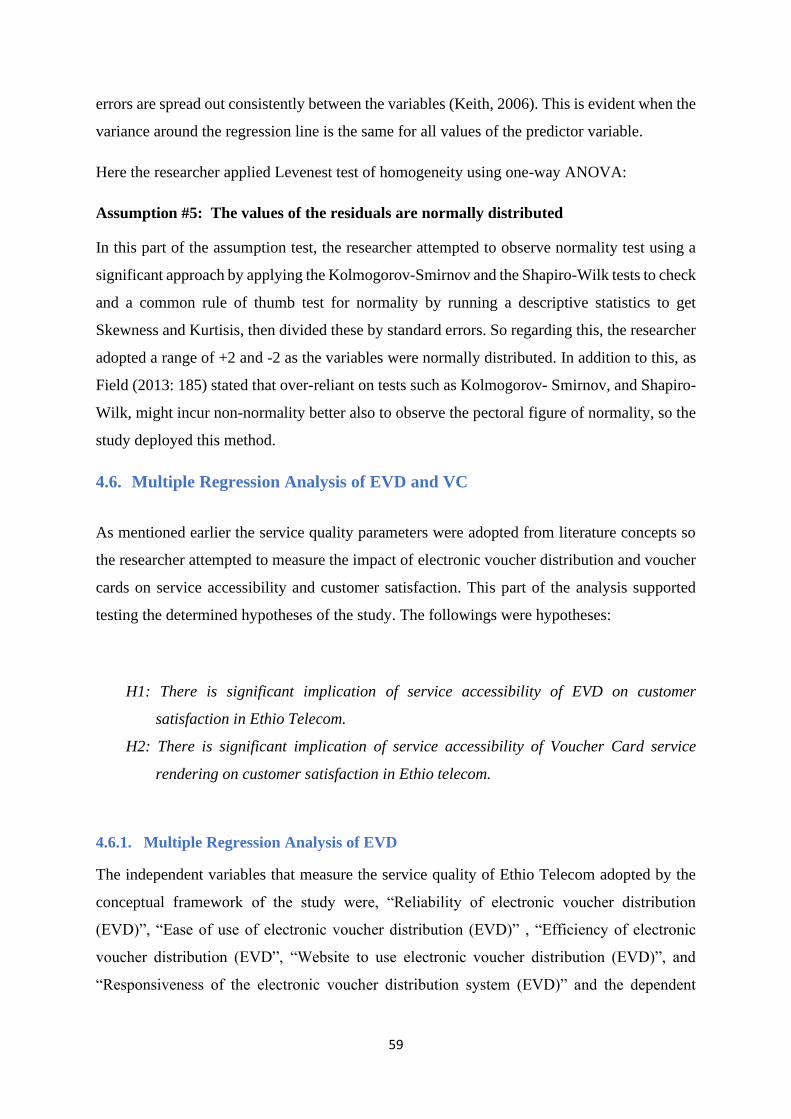
59
errors are spread out consistently between the variables (Keith, 2006). This is evident when the
variance around the regression line is the same for all values of the predictor variable.
Here the researcher applied Levenest test of homogeneity using one-way ANOVA:
Assumption #5: The values of the residuals are normally distributed
In this part of the assumption test, the researcher attempted to observe normality test using a
significant approach by applying the Kolmogorov-Smirnov and the Shapiro-Wilk tests to check
and a common rule of thumb test for normality by running a descriptive statistics to get
Skewness and Kurtisis, then divided these by standard errors. So regarding this, the researcher
adopted a range of +2 and -2 as the variables were normally distributed. In addition to this, as
Field (2013: 185) stated that over-reliant on tests such as Kolmogorov- Smirnov, and Shapiro-
Wilk, might incur non-normality better also to observe the pectoral figure of normality, so the
study deployed this method.
4.6. Multiple Regression Analysis of EVD and VC
As mentioned earlier the service quality parameters were adopted from literature concepts so
the researcher attempted to measure the impact of electronic voucher distribution and voucher
cards on service accessibility and customer satisfaction. This part of the analysis supported
testing the determined hypotheses of the study. The followings were hypotheses:
H1: There is significant implication of service accessibility of EVD on customer
satisfaction in Ethio Telecom.
H2: There is significant implication of service accessibility of Voucher Card service
rendering on customer satisfaction in Ethio telecom.
4.6.1. Multiple Regression Analysis of EVD
The independent variables that measure the service quality of Ethio Telecom adopted by the
conceptual framework of the study were, “Reliability of electronic voucher distribution
(EVD)”, “Ease of use of electronic voucher distribution (EVD)” , “Efficiency of electronic
voucher distribution (EVD”, “Website to use electronic voucher distribution (EVD)”, and
“Responsiveness of the electronic voucher distribution system (EVD)” and the dependent
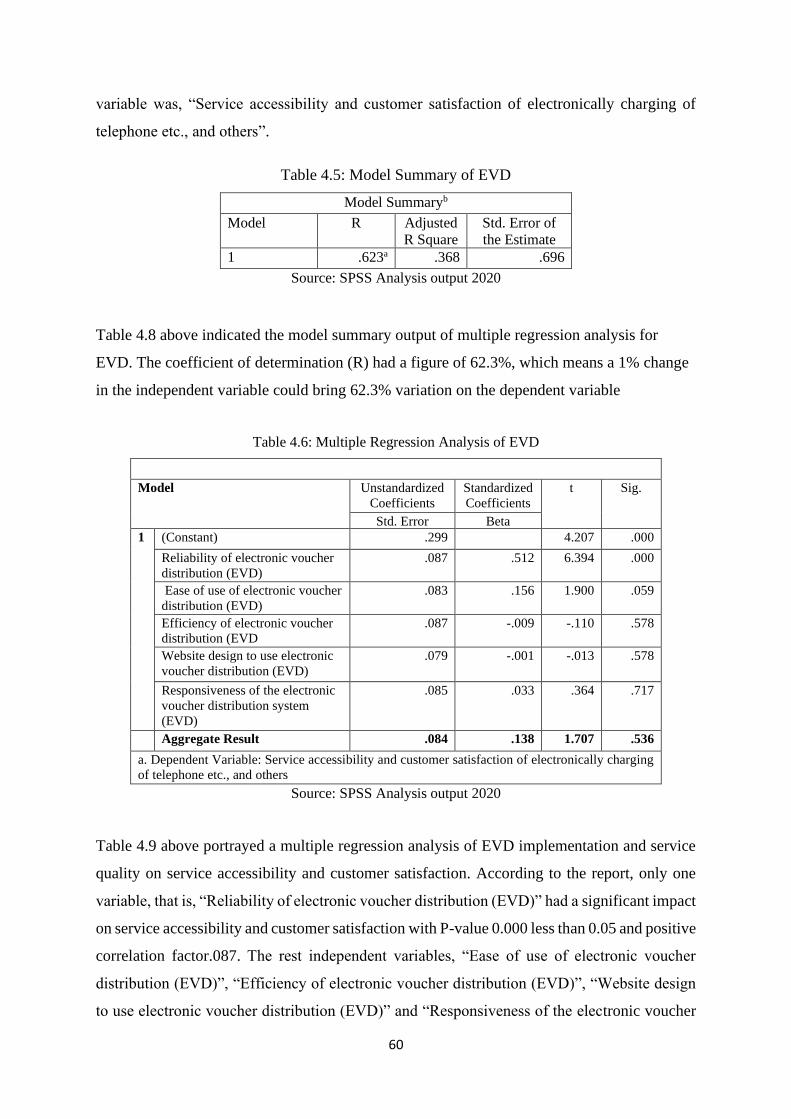
60
variable was, “Service accessibility and customer satisfaction of electronically charging of
telephone etc., and others”.
Table 4.5: Model Summary of EVD
Model Summaryb
Model R Adjusted
R Square
Std. Error of
the Estimate
1 .623a .368 .696
Source: SPSS Analysis output 2020
Table 4.8 above indicated the model summary output of multiple regression analysis for
EVD. The coefficient of determination (R) had a figure of 62.3%, which means a 1% change
in the independent variable could bring 62.3% variation on the dependent variable
Table 4.6: Multiple Regression Analysis of EVD
Coefficientsa
Model Unstandardized
Coefficients
Standardized
Coefficients
t Sig.
Std. Error Beta
1 (Constant) .299 4.207 .000
Reliability of electronic voucher
distribution (EVD)
.087 .512 6.394 .000
Ease of use of electronic voucher
distribution (EVD)
.083 .156 1.900 .059
Efficiency of electronic voucher
distribution (EVD
.087 -.009 -.110 .578
Website design to use electronic
voucher distribution (EVD)
.079 -.001 -.013 .578
Responsiveness of the electronic
voucher distribution system
(EVD)
.085 .033 .364 .717
Aggregate Result .084 .138 1.707 .536
a. Dependent Variable: Service accessibility and customer satisfaction of electronically charging
of telephone etc., and others
Source: SPSS Analysis output 2020
Table 4.9 above portrayed a multiple regression analysis of EVD implementation and service
quality on service accessibility and customer satisfaction. According to the report, only one
variable, that is, “Reliability of electronic voucher distribution (EVD)” had a significant impact
on service accessibility and customer satisfaction with P-value 0.000 less than 0.05 and positive
correlation factor.087. The rest independent variables, “Ease of use of electronic voucher
distribution (EVD)”, “Efficiency of electronic voucher distribution (EVD)”, “Website design
to use electronic voucher distribution (EVD)” and “Responsiveness of the electronic voucher
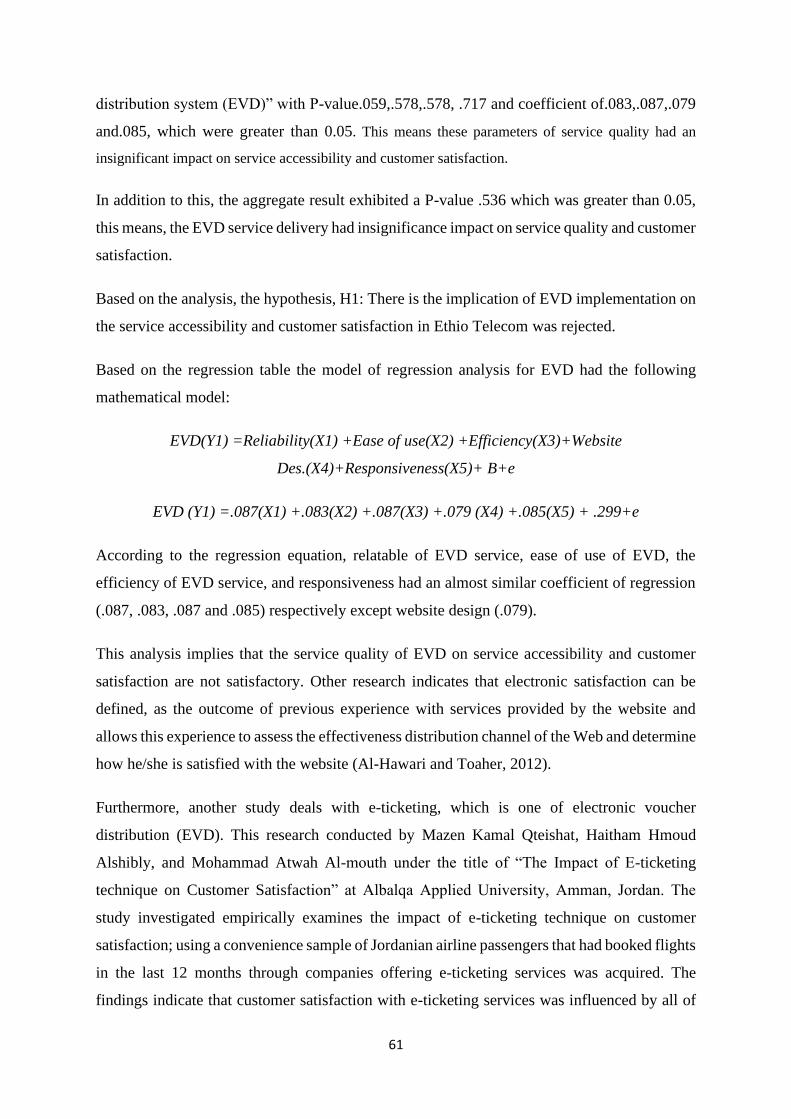
61
distribution system (EVD)” with P-value.059,.578,.578, .717 and coefficient of.083,.087,.079
and.085, which were greater than 0.05. This means these parameters of service quality had an
insignificant impact on service accessibility and customer satisfaction.
In addition to this, the aggregate result exhibited a P-value .536 which was greater than 0.05,
this means, the EVD service delivery had insignificance impact on service quality and customer
satisfaction.
Based on the analysis, the hypothesis, H1: There is the implication of EVD implementation on
the service accessibility and customer satisfaction in Ethio Telecom was rejected.
Based on the regression table the model of regression analysis for EVD had the following
mathematical model:
EVD(Y1) =Reliability(X1) +Ease of use(X2) +Efficiency(X3)+Website
Des.(X4)+Responsiveness(X5)+ B+e
EVD (Y1) =.087(X1) +.083(X2) +.087(X3) +.079 (X4) +.085(X5) + .299+e
According to the regression equation, relatable of EVD service, ease of use of EVD, the
efficiency of EVD service, and responsiveness had an almost similar coefficient of regression
(.087, .083, .087 and .085) respectively except website design (.079).
This analysis implies that the service quality of EVD on service accessibility and customer
satisfaction are not satisfactory. Other research indicates that electronic satisfaction can be
defined, as the outcome of previous experience with services provided by the website and
allows this experience to assess the effectiveness distribution channel of the Web and determine
how he/she is satisfied with the website (Al-Hawari and Toaher, 2012).
Furthermore, another study deals with e-ticketing, which is one of electronic voucher
distribution (EVD). This research conducted by Mazen Kamal Qteishat, Haitham Hmoud
Alshibly, and Mohammad Atwah Al-mouth under the title of “The Impact of E-ticketing
technique on Customer Satisfaction” at Albalqa Applied University, Amman, Jordan. The
study investigated empirically examines the impact of e-ticketing technique on customer
satisfaction; using a convenience sample of Jordanian airline passengers that had booked flights
in the last 12 months through companies offering e-ticketing services was acquired. The
findings indicate that customer satisfaction with e-ticketing services was influenced by all of
62
the independent variables measured (Data security, Customer and Technical Support, and User-
Friendliness) were noted to have a significant impact on customer satisfaction with e-ticketing
services.
When this study related to the findings, data security referred in all parameters of service
quality, the other factor customer and technical support related to the responsiveness of the
service quality, user-friendliness similar to ease of use of the service of EVD. So regarding the
output of this study, only reliability has a significant impact on service accessibility and
customer satisfaction. The rest (user-friendliness/ease of use of EVD, customer, and technical
support /responsiveness) have an insignificant impact on service accessibility and customer
satisfaction in contrary to Albalqa Applied University study.
The literature states that service quality and customer satisfaction have been instrumental in
the success and continuation of work (Daniel and Berinyuy, 2010), and there is also a link
between the quality of service and customer satisfaction which depends on the quality of
service provided service by the provider (Lee et al., 2000).
(Tarawneh , 2011) referred to an effect of electronic service quality collectively and
individually on customer satisfaction. However, this study has a proven insignificant effect on
customer satisfaction. And another author Sheng and Liu (2010) found that efficiency; achieve
privacy requirement have a positive impact on customer loyalty, however, the student obtains
that efficiency has no positive impact on customer satisfaction since customer loyalty has a
relationship with satisfaction. On the contrary to this research, Carlson and Ocass (2010) study
results indicated that electronic service quality positively impacts on consumer satisfaction and
attitudes towards the website, and behavior about a particular service provided by website with
a central content in the field of sports and professional services.
According to this study, Ethio Telecom has achieved satisfactory reliability, service, which is
significant to customer satisfaction. Reliability means providing service as promised by the
company and reliably (Al-Dmour, 2005). This includes the correct technical recruitment of the
website and precision in obligations and promises of service (Parasuraman et al., 2005) plus
the correct completion of the request, and direct delivery of applications, and the accuracy of
information (Yang et al., 2004).
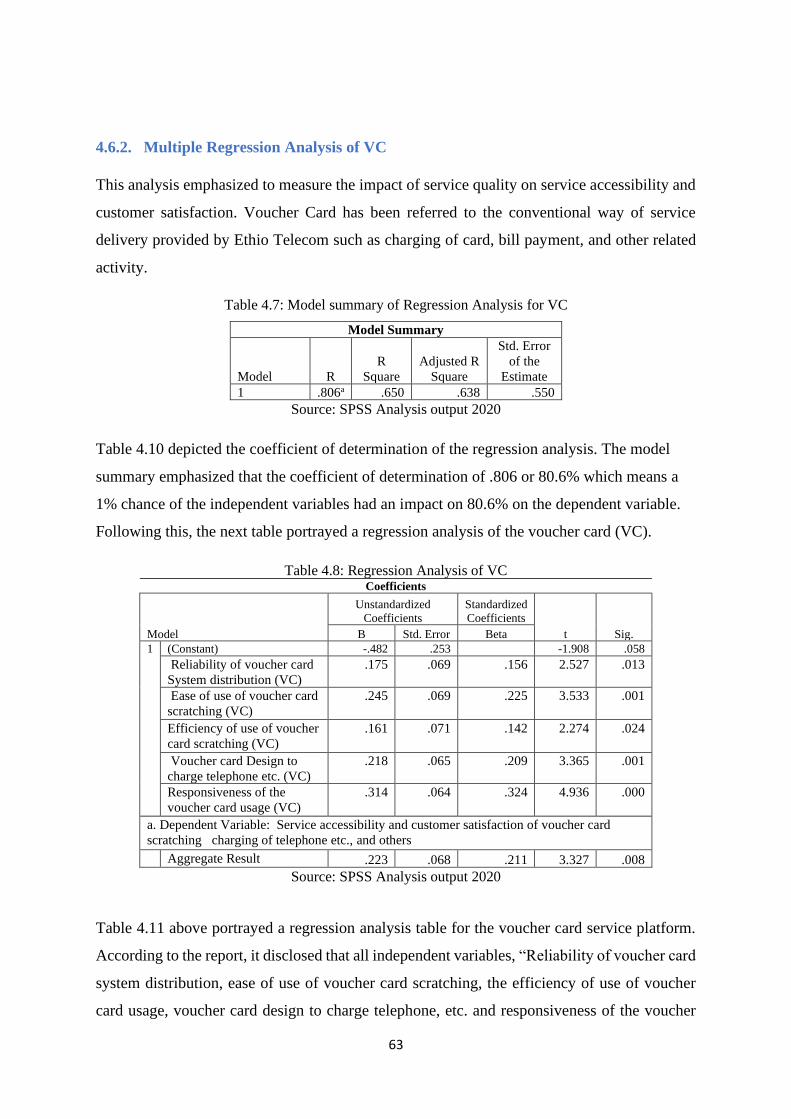
63
4.6.2. Multiple Regression Analysis of VC
This analysis emphasized to measure the impact of service quality on service accessibility and
customer satisfaction. Voucher Card has been referred to the conventional way of service
delivery provided by Ethio Telecom such as charging of card, bill payment, and other related
activity.
Table 4.7: Model summary of Regression Analysis for VC
Model Summary
Model R
R
Square
Adjusted R
Square
Std. Error
of the
Estimate
1 .806a .650 .638 .550
Source: SPSS Analysis output 2020
Table 4.10 depicted the coefficient of determination of the regression analysis. The model
summary emphasized that the coefficient of determination of .806 or 80.6% which means a
1% chance of the independent variables had an impact on 80.6% on the dependent variable.
Following this, the next table portrayed a regression analysis of the voucher card (VC).
Table 4.8: Regression Analysis of VC
Coefficients
Model
Unstandardized
Coefficients
Standardized
Coefficients
t Sig. B Std. Error Beta
1 (Constant) -.482 .253 -1.908 .058
Reliability of voucher card
System distribution (VC)
.175 .069 .156 2.527 .013
Ease of use of voucher card
scratching (VC)
.245 .069 .225 3.533 .001
Efficiency of use of voucher
card scratching (VC)
.161 .071 .142 2.274 .024
Voucher card Design to
charge telephone etc. (VC)
.218 .065 .209 3.365 .001
Responsiveness of the
voucher card usage (VC)
.314 .064 .324 4.936 .000
a. Dependent Variable: Service accessibility and customer satisfaction of voucher card
scratching charging of telephone etc., and others
Aggregate Result .223 .068 .211 3.327 .008
Source: SPSS Analysis output 2020
Table 4.11 above portrayed a regression analysis table for the voucher card service platform.
According to the report, it disclosed that all independent variables, “Reliability of voucher card
system distribution, ease of use of voucher card scratching, the efficiency of use of voucher
card usage, voucher card design to charge telephone, etc. and responsiveness of the voucher
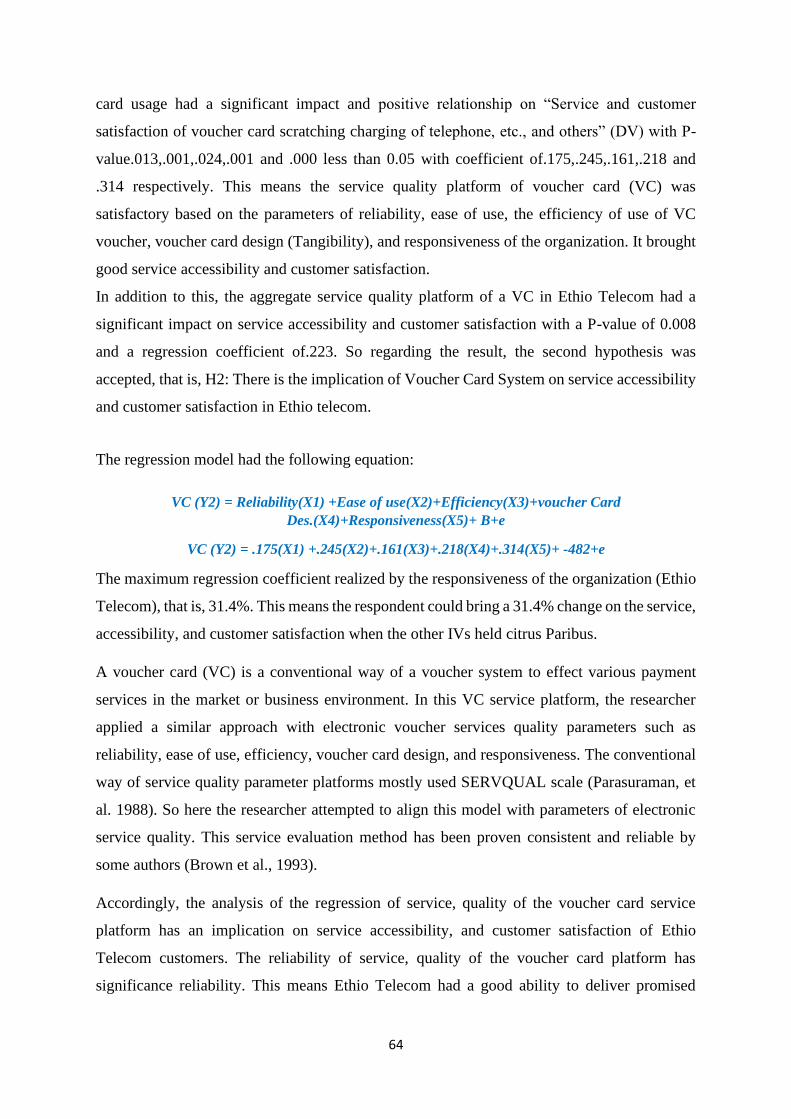
64
card usage had a significant impact and positive relationship on “Service and customer
satisfaction of voucher card scratching charging of telephone, etc., and others” (DV) with P-
value.013,.001,.024,.001 and .000 less than 0.05 with coefficient of.175,.245,.161,.218 and
.314 respectively. This means the service quality platform of voucher card (VC) was
satisfactory based on the parameters of reliability, ease of use, the efficiency of use of VC
voucher, voucher card design (Tangibility), and responsiveness of the organization. It brought
good service accessibility and customer satisfaction.
In addition to this, the aggregate service quality platform of a VC in Ethio Telecom had a
significant impact on service accessibility and customer satisfaction with a P-value of 0.008
and a regression coefficient of.223. So regarding the result, the second hypothesis was
accepted, that is, H2: There is the implication of Voucher Card System on service accessibility
and customer satisfaction in Ethio telecom.
The regression model had the following equation:
VC (Y2) = Reliability(X1) +Ease of use(X2)+Efficiency(X3)+voucher Card
Des.(X4)+Responsiveness(X5)+ B+e
VC (Y2) = .175(X1) +.245(X2)+.161(X3)+.218(X4)+.314(X5)+ -482+e
The maximum regression coefficient realized by the responsiveness of the organization (Ethio
Telecom), that is, 31.4%. This means the respondent could bring a 31.4% change on the service,
accessibility, and customer satisfaction when the other IVs held citrus Paribus.
A voucher card (VC) is a conventional way of a voucher system to effect various payment
services in the market or business environment. In this VC service platform, the researcher
applied a similar approach with electronic voucher services quality parameters such as
reliability, ease of use, efficiency, voucher card design, and responsiveness. The conventional
way of service quality parameter platforms mostly used SERVQUAL scale (Parasuraman, et
al. 1988). So here the researcher attempted to align this model with parameters of electronic
service quality. This service evaluation method has been proven consistent and reliable by
some authors (Brown et al., 1993).
Accordingly, the analysis of the regression of service, quality of the voucher card service
platform has an implication on service accessibility, and customer satisfaction of Ethio
Telecom customers. The reliability of service, quality of the voucher card platform has
significance reliability. This means Ethio Telecom had a good ability to deliver promised
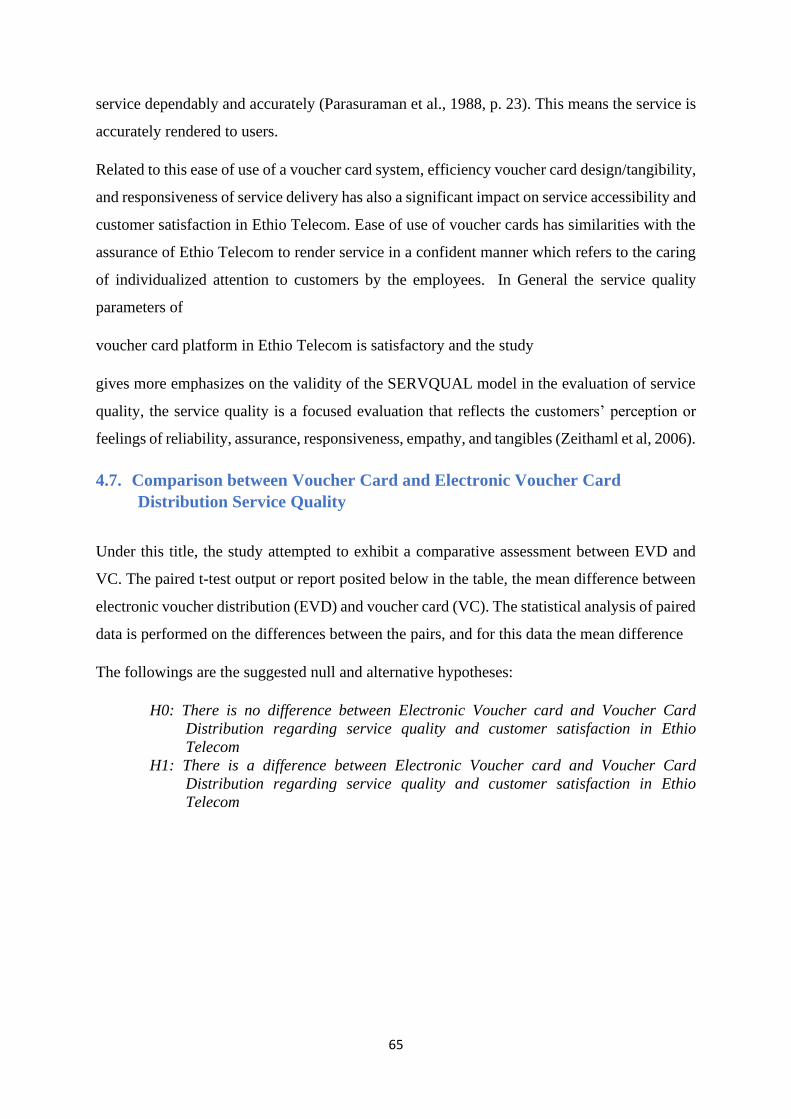
65
service dependably and accurately (Parasuraman et al., 1988, p. 23). This means the service is
accurately rendered to users.
Related to this ease of use of a voucher card system, efficiency voucher card design/tangibility,
and responsiveness of service delivery has also a significant impact on service accessibility and
customer satisfaction in Ethio Telecom. Ease of use of voucher cards has similarities with the
assurance of Ethio Telecom to render service in a confident manner which refers to the caring
of individualized attention to customers by the employees. In General the service quality
parameters of
voucher card platform in Ethio Telecom is satisfactory and the study
gives more emphasizes on the validity of the SERVQUAL model in the evaluation of service
quality, the service quality is a focused evaluation that reflects the customers’ perception or
feelings of reliability, assurance, responsiveness, empathy, and tangibles (Zeithaml et al, 2006).
4.7. Comparison between Voucher Card and Electronic Voucher Card
Distribution Service Quality
Under this title, the study attempted to exhibit a comparative assessment between EVD and
VC. The paired t-test output or report posited below in the table, the mean difference between
electronic voucher distribution (EVD) and voucher card (VC). The statistical analysis of paired
data is performed on the differences between the pairs, and for this data the mean difference
The followings are the suggested null and alternative hypotheses:
H0: There is no difference between Electronic Voucher card and Voucher Card
Distribution regarding service quality and customer satisfaction in Ethio
Telecom
H1: There is a difference between Electronic Voucher card and Voucher Card
Distribution regarding service quality and customer satisfaction in Ethio
Telecom
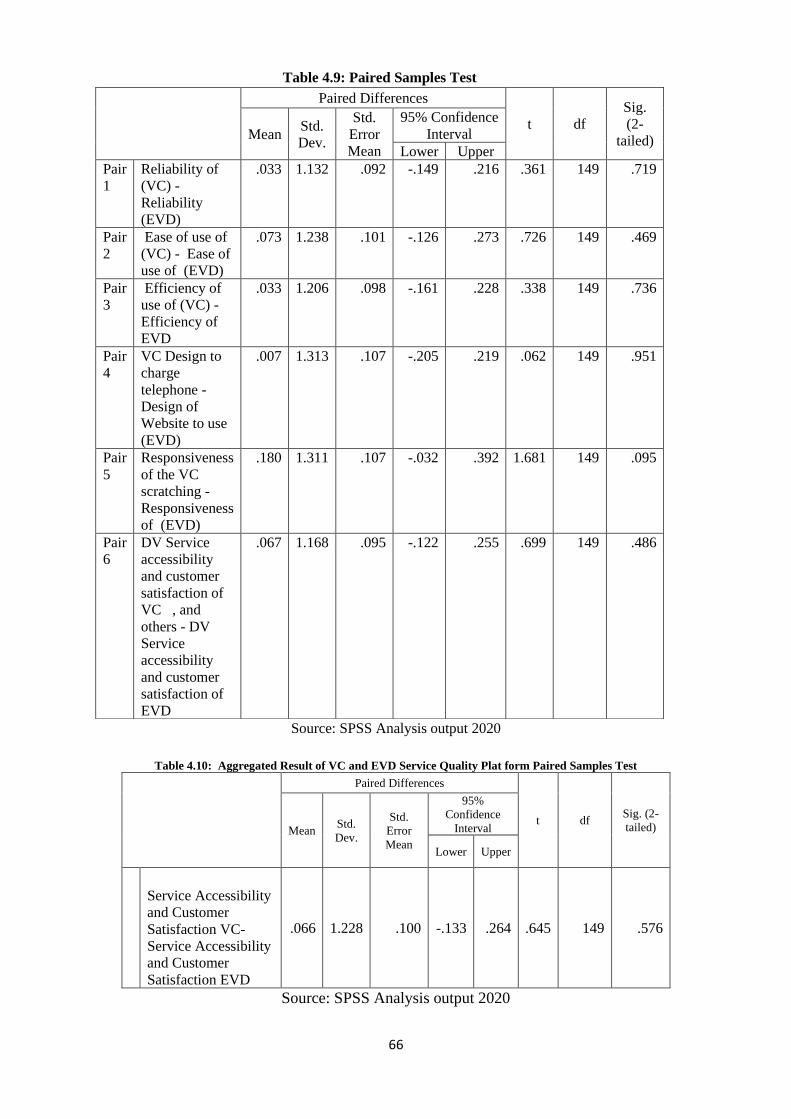
66
Source: SPSS Analysis output 2020
Table 4.10: Aggregated Result of VC and EVD Service Quality Plat form Paired Samples Test
Paired Differences
t df Sig. (2-
tailed) Mean Std.
Dev.
Std.
Error
Mean
95%
Confidence
Interval
Lower Upper
Service Accessibility
and Customer
Satisfaction VC-
Service Accessibility
and Customer
Satisfaction EVD
.066 1.228 .100 -.133 .264 .645 149 .576
Source: SPSS Analysis output 2020
Table 4.9: Paired Samples Test
Paired Differences
t df
Sig.
(2-
tailed) Mean Std.
Dev.
Std.
Error
Mean
95% Confidence
Interval
Lower Upper
Pair
1
Reliability of
(VC) -
Reliability
(EVD)
.033 1.132 .092 -.149 .216 .361 149 .719
Pair
2
Ease of use of
(VC) - Ease of
use of (EVD)
.073 1.238 .101 -.126 .273 .726 149 .469
Pair
3
Efficiency of
use of (VC) -
Efficiency of
EVD
.033 1.206 .098 -.161 .228 .338 149 .736
Pair
4
VC Design to
charge
telephone -
Design of
Website to use
(EVD)
.007 1.313 .107 -.205 .219 .062 149 .951
Pair
5
Responsiveness
of the VC
scratching -
Responsiveness
of (EVD)
.180 1.311 .107 -.032 .392 1.681 149 .095
Pair
6
DV Service
accessibility
and customer
satisfaction of
VC , and
others - DV
Service
accessibility
and customer
satisfaction of
EVD
.067 1.168 .095 -.122 .255 .699 149 .486
67
Table 4.13 above axiomatically posited the comparison t-test between the voucher card (VC)
and Electronic Voucher Card Distribution (EVD) in Ethio Telecom toward the service
accessibility and customer satisfaction.
The outputs were exhibited in the above table and indicated the sample means and the mean
difference, their standard deviations, and the standard errors. The 95% confidence interval for
the mean difference in the mean difference was also shown as well as the t-test of the null
hypothesis that the “mean difference equal to 0” versus (Vs.) the alternative hypothesis that the
“mean difference is not equal to 0”. The p-value for each independent variable for VC and
EVC variables including the dependent variable (service accessibility and customer
satisfaction) were observed in table 4.13.
The significance P-value result .719, .469, .736, .951,.095, and .486 were greater than 0.05,
which means there was no statistical difference between the two service rendering platform of
Voucher Card and Electronic Voucher Card Distribution in Ethio Telecom.
Furthermore, Table 14.13 indicated the aggregate result of the service quality /rendering plat
between VC and EVD.
The result indicated a slight mean difference, M= .066(6.6%), and a standard deviation of 1.228
from the mean, which means the service quality/rendering of VC was slightly better than EVD
service rendering platform.
The analysis examined that the two-service rendering platform that is Voucher Card (VC) and
Electronic Voucher Card (EVD) had no much difference with significance P-value
=0.576>0.05.
So the alternative hypothesis (H1) was rejected and (H0) accepted
H0: There is no difference between Voucher Distribution and Electronic Voucher
Card Distribution regarding service quality and customer satisfaction in Ethio
Telecom
H1: There is a difference between Voucher Distribution and Electronic Voucher Card
Distribution regarding service quality and customer satisfaction in Ethio
Telecom
So regarding the output, there is no practical difference between the two service rendering of
voucher card (VC) and Electronic Voucher Card (EVD) in Ethio Telecom. This again refers to
the users have a similar perception of service quality of VC and EVC in Ethio Telecom.
68
Chapter Five: Summary of Findings, Conclusions, and Recommendations
Beneath this title, the paper dealt with the summary of findings based on the analysis result.
Following this, conclusions were given regarding the research specific objectives and
hypotheses. Finally, the recommendations were proposed considering the conclusion of the
study.
5.1. Summary of Findings
• To achieve its intended target, the study applied a convenience method of sampling
technique and selected 170 samples. From distributed Likert Scale type questionnaires,
159 were returned to the study had a response rate of 93.5%.
• The demographic characteristics of the gender of respondents had the highest figure of
“female” 81 (50.9%) whereas the rest 78 (49.1%) were “Male”. Following this the
higher age category of respondents was between 26-35, they were youngsters. Related
to this, the least were above 50 years old. The academic status of most respondents was
degree holder 135 (84.9%) and followed by Mater holders 17 (10.7%). The least was
grade 12 completed 3 (1.9%). The working title of respondents indicated other
respondents that is, represented by 36(22.6%).
The descriptive statistics analysis of the service quality parameters for both VC and EVD
platform indicated the following result.
• The aggregate result of the service accessibility and customer satisfaction of the
descriptive analysis exhibited a mean value of 3.43, which means “Agree” that fell
between 3.41 and 4.20 with a variance of 80%. This means most respondents were
satisfied with the service, accessibility with a variation on the quality by 80% from the
mean.
• In addition to this, the study observed the aggregate result of the service, accessibility,
and customer satisfaction, it obtained a mean value of 3.47 that fell between 3.41 and
4.20, which means most respondents suggested, “Agree”. This means there were
satisfactory service accessibility and related customer satisfaction of usage of the paper-
based voucher card.
69
Pearson Correlation Analysis of the service quality dimensions for EVD and CV:
• The coefficient of correlation which had values less than 50% represented by the
variables, “Design by Website to use EVD” and “Efficiency of electronic voucher
distribution (EVD)” with Pearson correlation of.385** (38.5%) and.483** (48.3%)
respectively. However, the variable, “Responsiveness of the electronic voucher
distribution system (EVD)” had a Pearson coefficient .517** (51.7%), which was
almost equal to 50%. The aggregate result of the service quality parameters had a
Pearson Correlation of 0.750** with a significance P-value 0.000 less than 0.05.
• The aggregate result of the VC service quality parameters association with DV (Service
accessibility and customer satisfaction of voucher card scratching charging of telephone
etc., and others) had a significant Pearson Correlation factor with a value of 0.601**.
From the average (0.601**), two variables Ease of use of voucher card scratching
(.613**) and Responsiveness of the voucher card scratching, (.683**) had greater
correlation factor compared to the rest service quality parameters (reliability,
efficiency, and design) so regarding this, reliability, efficiency and design of VC were
not satisfactory correlated compare to ease of use and responsiveness of VC.
Multiple regression analysis of the service quality dimensions of VC and EVD and their
implication on service accessibility and customer satisfaction.
• The aggregate result exhibited a P-value .536 which was greater than 0.05, this means,
the EVD service delivery had insignificance impact on service quality and customer
satisfaction.
Based on the analysis, the hypothesis, H1: There is the implication of EVD
implementation on the service accessibility and customer satisfaction in Ethio Telecom
was rejected.
• In addition to this, the aggregate service quality platform of a VC in Ethio Telecom had
a significant impact on service accessibility and customer satisfaction with a P-value of
0.008 and a regression coefficient of.223. So regarding the result, the second hypothesis
was accepted, that is, H2: There is the implication of the Voucher Card System on
service accessibility and customer satisfaction in Ethio telecom.
70
Comparison between VC and EVD service quality plat form
The significance P-value result .719,.469,.736,.951,.095, and .486 were greater than 0.05,
which means there was no statistical difference between the two service rendering platform of
Voucher Card and Electronic Voucher Card Distribution in Ethio Telecom.
Furthermore, Table 12.1 indicated the aggregate result of the service quality /rendering
platform between VC and EVD.
The result indicated a slight mean difference, M= .066(6.6%) and standard deviation of 1.228
from the mean, which means the service quality/rendering of VC was slightly better than EVD
service rendering plat form.
The analysis examined that the two service rendering plat form that is Voucher Card(VC) and
Electronic Voucher Card (EVD) had no much difference with significance P-value
=0.576>0.05.
So the alternative hypothesis (H0) was accepted and (H1) rejected
H0: There is no difference between Voucher Distribution and Electronic Voucher
Card Distribution regarding service quality and customer satisfaction in Ethio
Telecom
H1: There is a difference between Voucher Distribution and Electronic Voucher Card
Distribution regarding service quality and customer satisfaction in Ethio
Telecom
5.2. Conclusions
Based on the specific objectives and hypotheses of the research the following conclusions
forwarded:
For the first objective, which stated that: To evaluate the correlation of EVD on the service
accessibility and customer satisfaction.
The coefficient of correlation which had values less than 50% represented by the variables, this
means, “Design by Website to use EVD” and “Efficiency of electronic voucher distribution
(EVD)” with service accessibility and customer satisfaction h
However, the variable, “Responsiveness of the electronic voucher distribution system (EVD)”
had a Pearson coefficient which was almost equal to 50% with service accessibility and
customer satisfaction. The aggregate result of the service quality parameters or dimensions had
less relationship with service accessibility and customer satisfaction.
71
Following this, for the case of the second objective, the study described the following
conclusion:
The aggregate result of the VC service quality parameters association with DV (Service
accessibility and customer satisfaction of voucher card scratching charging of telephone etc.,
and others) had a significant relationship. From the average, two variables, “Ease of use of
voucher card scratching and Responsiveness of the voucher card scratching, had greater
correlation factor compared to the rest service quality parameters (reliability, efficiency, and
design) so regarding this, reliability, efficiency and design of VC were not satisfactory
correlated compare to ease of use and responsiveness of VC.
The last objective of the study was to evaluate the comparison between the service quality
dimensions of EVD and VC, the following conclusion was derived:
The result indicated a slight mean difference between the two service quality platforms, that is,
VC and EVD which means the service quality/rendering of VC was slightly better than EVD
service rendering platform.
The analysis examined that the two service rendering platform that is Voucher Card(VC) and
Electronic Voucher Card (EVD) had no much difference with significance due to this the first
hypothesis was accepted, and the second was rejected, that is,
H0: There is no difference between Voucher Distribution and Electronic Voucher Card
Distribution regarding service quality and customer satisfaction in Ethio Telecom
Based on multiple regression analysis of service quality dimensions’/platform of EVD and VC
the following conclusions were determined:
To measure the implication of both EVD on service accessibility and customer satisfaction,
that is, H1: There is the implication of EVD service accessibility and customer satisfaction in
Ethio Telecom.
As the study the hole result exhibited a P-value .536 which was greater than 0.05, this means,
the EVD service delivery had insignificance impact on service quality and customer
satisfaction. Based on the analysis, the hypothesis, H1: There is the implication of EVD service
accessibility and customer satisfaction in Ethio Telecom was rejected.
72
To measure the implication VC on service accessibility and customer satisfaction, that is, H2:
There is the implication of the Voucher Card System on the service accessibility and customer
satisfaction in Ethio telecom.
The aggregate service quality platform of a VC in Ethio Telecom had a significant impact on
service accessibility and customer satisfaction. So regarding this, the second hypothesis was
accepted.
5.3. Recommendations
Since Electronic Voucher Distribution (EVD) was implemented soon however voucher Card
system implemented a long time. So when the study considered the summary of findings, EVD
service quality system or platform was not significant to bring easy service accessibility and
customer satisfaction. In contrary to this, Voucher Card had significant implications on service
Ethio Telecom should gradually minimize or replace the service of a voucher card system with
electronic voucher distribution and develop new products/services related to EVD.
Ethio Telecom should create an integration with commercial banks and other organizations in
the business environment to generate the electronic type of payment system such as bill
payment of telephone.
Finally, there should be further research on electronic voucher distribution in Ethiopia, so
another researcher is better to conduct more research on this title.
73
Reference Akinyele, S.T. and Akinyele, F.A. (2008). An evaluation of service quality: A critical review
and measurement. Journal of Contemporary Management, 2, 1-21.
Akinyele, S.T. and Olorunleke, K. (2010). Technology and service quality in banking industry:
An empirical study of various factors in electronic banking services. International
Business Management, 4(4), 209-221.
Al-Alaq, Bashir (2004). Electronic services between theory and practice. Cairo, Egypt:
Arabic Nile Group.
Al-Bakri Yasser, (2005). Marketing health services, scientific. Amman, Jordan: Publishing
Aliazoi.
Al-Dmour, Hani (2005). Marketing services. Amman, Jordan: Wael publishing and
distribution.
AlHawari, Jamal Toahir, Abdul Jalil (2012). Trying to measure customer satisfaction on the
quality of the online services using the NetQual scale. Enterprise Performance
magazine, (2), Algeria, 97-106
Aloyce G. M, Gabagambi D. M. and Hella J. P. (2014). Assessment of operational aspects of
the input supply chain under national agriculture input voucher scheme (NAIVS) in
Tanzania. Journal of Development and Agricultural Economics Vol. 6(3), pp. 94-104,
Anderson, E.W., Fornell, C., & Lehmann, D.R. (1994), customer satisfaction, market share and
profitability: findings from Sweden, Journal of Marketing, 58(3), 53-66
Anderson, J. and Narus (1995). Capturing the value of supplementary services. Harvard
Business Review, 73(1), 75-83.
Bagozzi, Richard P. and Phillips, Lynn W. (1982). Representing and Testing Organizational
Theories: A Holistic Construal. Administrative Science Quarterly. 27(3), 459- 89.
Barclay, D. W., Thompson, R. and Higgins, C. (1995). The partial least squares (PLS)
approach to causal modeling: personal computer adoption and use an illustration.
Technology Studies. 2(2), 285-309.
Bauer, H.H., Falk, T. and Hammerschmidt, M. (2006). E-trans Qual: A transactional process
– based approach for capturing service quality in online shopping. Journal of
Business Research, 59(7), 866875.
Bennett. R and Barkensio A. (2005) Relationship quality, relationship marketing, and client
perceptions of the levels of service quality of charitable organisations, International
Journal of Service Industry Management, 16(1) 81-106
Boyers, K.K., Hallowell, R. and Roth, A.V. (2002). E-service operations strategy – a case
study and a method for analyzing operational benefits. Journal of Operations
Management, 20(2), 175-188.
74
Bresselles, G. and Durrieu, F. (2008). Segmenting online customers based on electronic
service quality dimensions: An application to wine websites. 4th International
Conference of the Academy of Wine Business Research, Siena.
Brich, D. and Young, A.M (1997). Financial services and the internet: What does cyberspace
mean for the financial services industry. Internet Research, 7(2), 120-128.
Cabello, D.B. and Kumar, R.U. (2006). Public e-service Marketing. Unpublished Master
Thesis, Lulea University of Technology, Lulea, Sweden
Carlson, J. (2010). Exploring the relationships between e-service quality, satisfaction,
attitudes and behaviours in content-driven e-service web site. Emerald Group
Publishing Limited, 24, 127-112.
Cattel, R.B. (1966). The Scree Test for the number of factors. Multivariate Behavioural
Research. 1(1), 140-161.
Chang, H., Wang, Y. and Yang, W. (2009), The impact of e-service quality, customer
satisfaction and loyalty on e-marketing: Moderating effect of perceived value. Total
Quality Management, 20(4), 423443.
Chen, Z. and Dubinsky, A.J. (2003), "A conceptual model of perceived customer value in
ecommerce: a preliminary investigation", Psychology and Marketing, Vol. 20,
No.4, pp. 323-347.
Collier and Bienstock, C.C. (2006). Measuring service quality in e-retailing. Journal of
Service Research, 8(3), 260-75.
Cox, J. and B.G.Dale (2002). “Key Quality Factors in Web Site Design and Use: An
Examination,” International Journal of Quality and Reliability Management, Vol.
17, No. 7:862-888.
Cronin, J. J., & Taylor, S. A. (1992) Measuring service quality; a re-examination and Extension.
The Journal of Marketing, 56, (3), 55-68.
Parasuraman, A., Zeithaml, V. A., & Berry, L. L. (1985). A conceptual model of service quality
and its implications for future research, Journal of Marketing, 49, 41-50
Daniel, C. and Berinyuy, L. (2010). Using the Servqual Model to assess service quality and
customer satisfaction. Master Thesis, UMEA University
Davis, F.D. (1989). Perceived usefulness, perceived ease of use, and user acceptance of
information technology. Management Science, 35(8), 982-1003.
De Ruyter, K., Wetzels, M. and Kleijnen, M. (2001). Customer adoption of e-service: an
experimental study. International Journal of Service Industry Management, 12(2),
184-207.
Deng, Z. Lu, Y., Wei, K. and Zhang, J. (2010), Understanding customer satisfaction and loyalty:
An empirical study of mobile instant messages in China. International Journal of
Information Management, 3, 289-300
75
Evanschitzky, H.E., Lyer, G.R. (2007). E-services opportunities and threats, Duv.
Fadeleh, Shroff. (2010). The impact of marketing on the quality of banking services' case study
of some banks in Algeria. Unpublished master thesis, University Montwedi,
Constantine, Algeria.
Fassnacht, M. and Koese, I. (2006). Quality of electronic services: Conceptualizing and testing
a hierarchical model. Journal of Service Research, 9(1), 19-31.
Fornell, C., Johnson, M.D., Anderson, E.W., Cha, J. and Bryant, B.E. (1996), The American
customer satisfaction index: nature, purpose and findings, Journal of Business
Research, 60(4), 7-18
Garvin, D. (1988), Managing Quality, New York: Macmillan.
Gera, Rajat (2011), Modeling e-service quality and its consequences in India: an sem approach.
Emerland Group Publishing Limited, 5(2/3), 203-225.
Gerrard, P., and Barton Cunningham, J. (2003). The diffusion of Internet banking among
Singapore consumers. International Journal of Bank Marketing, 21 (1), 16-28.
Gil, I. Berenguer, G. and Cervera, A. (2008). The roles of service encounters, service value and
job satisfaction in achieving customer satisfaction in business relationships.
Industrial Marketing Management, 37, 921-939.
Griffiths, J.R. and Brophy, P. (2005), Student searching behavior and the web: Use of academic
resources and Google. Library Trends, 53(4), 539-554.
Hair, J.F. Jr, Anderson, R.E., Tatham, R.L. and Black, W.C. (1998). Multivariate Data Analysis.
5th ed., Upper Saddle River, NJ: Prentice-Hall International.
Herington, C. and Weaven, S. (2009), E-retailing by banks: E-service quality and its importance
to customer satisfaction. Emerland Group Publishing Limited., 43(9/10), 1220-1231.
Herington, Carmel and Weaven, Scott (2009). E- retailing by banks: e-service quality and its
importance to customer satisfaction. European Journal of Marketing, 43, 1220-1231.
Heskett, J., Jones, T., Loverman, G. and Sasser, E. (1994). Putting the service-profit chain to
work. Harvard Business Review, 72, 164-174.
Idris, Thabet Abdul Rahman (2006). Efficiency and quality of logistics services. (Edition1),
Alexandria, Egypt: Al-DarAl-Jami'a.
Iliachenko, E.Y. (2006). Electronic service quality (E-SQ) in tourism; Development of a scale
for the assessment of E-SQ of tourism website. Unpublished Doctoral Dissertation,
Lulea University of Technology, Lulea, Sweden
Jamie Carlson, Aron O'Cass, (2010). "Exploring the relationships between e‐service quality,
satisfaction, attitudes and behaviours in content‐driven e‐service web sites", Journal
of Services Marketing, Vol. 24 Iss: 2, pp.112 - 127
Javadi, P. (2011). Impact of E-service quality on sustaining competitive Advantage for Iranian
IT firms. Unpublished master thesis, Lulea University Of Technology.
76
Jernberg, P.M. (2009), Web-site quality evaluation: A case study on a Swedish business-to
business company web-marketing. Published Master Thesis, Malardalen University,
Vasteras, Sweden
Jochen, Wirtz (2003). Halo in customer satisfaction measures – the role of purpose of rating
number of attributes, and customer involvement. International Journal of Service
Industry Management, 14(1), 96-119.
Jun, M. and Cai, S. (2001). The key determinants of internet banking service quality: a content
analysis. International Journal of Bank Marketing, 19(7), 276-291.
Khan, Mohammad (2007). Studies on some aspects of service quality evaluation with specific
relevance to Indian service industries. Unpublished Doctoral Thesis, National
Institute Of Technology, India.
Kim, J. O., and Mueller, C. W. (1978). Introduction to factor analysis: What it is and how to do
it. Beverly Hills, CA: Sage.
Kotler, P.H. (2000). Marketing Management, New Jersey: Prentice Hall.
Kotler, P.H. and Keller, K.L. (2006). Marketing Management. Upper Saddle River, New Jersey:
Pearson Prentice Hall.
Kuo, Y. F. (2003), A study on service quality of virtual community web sites. Total Quality
Management, 14(4), 461-473.
Kuo. YF (2003) A study on service quality of virtual community websites, Total Quality
Management & Business Excellence, 13 (4), 461-473
Lake, K. and Hickey, J. (2002). Service quality: A qualitative assessment. J. Market, 56, 55-68.
Lee, Gow-Guang, Lin, Hsiu-Fen (2005). Customer Perception Of E-Service Quality In Online
Shopping. Emerland Group Publishing Limited, 33(2), 161-176. 51. Lemo, K. and
Rust, R. (2001).
Lemo, K. and Rust, R. (2001). E-service and the consumer. International Journal of Electronic
Commerce, 5(3), 58-101
Lewin, J. (2009). Business customers’ satisfaction: What happens when supplier downsize?
Industrial Marketing Management, 38, 283-299.
Li, H., Lin, Y. and Suomi, R. (2009). Measurement of e-service quality: An empirical study on
online travel service. 17th European Conference on Information Systems, 1-13.
Lin, G. and Sun, C.C. (2009), Factors influencing satisfaction and loyalty in online shopping:
an integrated model. Online Information Review, 33 (3), 458-475.
Lodenius, Eva (2011). Customer satisfaction measurement within the road sector further
development of customer feedback systems and a public input model. Unpublished
Master Thesis, Department of Civil and Environment Engineering, Aalto University,
Finland
77
Long, M. and McMellon, C. (2004). Exploring the determinants of retail service quality on the
Internet. Journal of Services Marketing, 18(1), 78 -90.
Loonam, Mary and O’Loughlin, Deirdre (2008), Exploring e-service quality: a study of Irish
online banking. Emerland group publishing, 26(7), 759-780.
Madu, C.N. and Madu, A.A. (2002). Dimensions of e-quality. International Journal of Quality
and Reliability Management, 19(3), 246-259.
Mahmood, F. (2013). Impact of Information Technology usage by Banks on customer
satisfaction in banking sector of Pakistan. Management and Administrative Science
Review, 2(2), 221-232.
Mansour, Kasser (2003). Service culture and ethics’ pillars. (1), Damascus, Syria: Dar Al-Reda
for publishing and distribution
Marchica, J. (2004). The accountable organization: Reclaiming integrity, restoring trust,
DaviesBlack Publishing.
Mason, N.M., T.S. Jayne, and R. Mofya-Mukuka. 2013. Zambia’s Input Subsidy Programmes.
Agricultural Economics 44: 613-28.
Meuter, M.L., Ostrom, A.L., Roundtree, R.I. and Bit ner, M.J. (2000), “Self-service technologies:
understanding customer satisfaction with technology-based service encounters”,
Journal of Marketing, Vol. 64 No. 3, pp. 50-64.
Movotek mobile money & prepaid airtime solution 1Retrieved on November 2019
https://www.slideshare.net/Movotek/movotek-mobile-money-prepaid-airtime-
solution.
Mummalaneni, V. and Meng, J. (2009). An exploratory study of young Chinese customrers’
online shopping behaviors and service quality perceptions. Young Consumers, 10(2),
157-169.
Nick Golding 3rd September 2007 3:00 pm Choosing between electronic and paper
motivation Retrieved in November 2019 https://employeebenefits.co.uk/issues/september-
2007/choosing-between-electronic-and-paper-motivation-vouchers
Nosrati L. (2008). The impact of website quality on customer satisfactions. Published Master
Thesis, Lulea University of Technology, Lulea, Sweden
Oliver, R. L. (1999). Whence customer loyalty? Journal of Marketing, 63, 33–44.
Palmer, A. (2005). Principles of Services marketing. (4th ed.). McGraw-Hill.
Parasuraman, A., Zeithaml, V. A., & Berry, L. L. (1988). SERVQUAL: A multiple-item scale for
measuring consumer perceptions of service quality, Journal of Retailing, 64 (1), p.12-
40
78
Parasuraman, A., Zeithaml, V.A. and Berry, L.L. (1985). A conceptual model of service quality
and its implication. Journal of Marketing, 49, Fall, 41-50.
Parasuraman, A., Zeithaml, V.A. and Malhotra, A. (2005). ESQual: A multiple item scale for
assessing electronic service quality. Journal of Service Research, 7(3),1-21
Parasuraman, A., Zethamel, V.A and Molhotra, A. (2005). A Conceptual model of service quality
and its implication for future research. Journal of Marketing, 49(4), 41-50.
Praeg, C.A. and Spath, D. (2010). Quality management for IT service “perspectives on business
and process performance. USA.
Rayport, J.F. and Sviokla, J.J. (1995). Exploiting virtual chain. Harvard Business Review, 73(6),
75-85
Razavi, S., Safari, H. and Shafie, H. (2012). Relationships among service value: Evidence from
Iran’s software industry. Journal of Management Strategy, 3(3), 28-37.
Rexha, N. (2005), The impact of internet banking service quality on business customer
commitment, ANZMAC 2005 Conference: Services marketing, Curtin University of
Technology.
Rolland, Sylvia and Freeman, Ina (2010), A new measure of e-service quality in France.
Emerland Group Publishing Limited, 38(7), 497-517.
Rowley, J. (2006). An analysis of the e-service literature towards a research agenda. Internet
Research, 16(3), 339-359.
Sahadev, S. and Purani, K. (2008), Modeling the consequences of e-service quality. Marketing
Intelligence and Planning, 26(6), 605-620.
Santos, J. (2003). E-service quality – a model of virtual service dimensions. Managing Service
Quality, 13(3), 233-246.
Sam Jee, The University of Manchester Interpret mean of 3 (neutral) in 5 point agreement
scale - can anyon e help? : Retrieved in April 2020
.https://www.researchgate.net/post/Interpret_mean_of_3_neutral_in_5_point_agreement_scale-
can_anyone_help
Saravanan, R. & Rao, K. S. P. (2007). Measurement of service quality from the customer’s
perspective – An empirical study, Total Quality Management, 18(4) p.435-449.
Schaupp, L.C. and Belange3r, F. (2005). A conjoint analysis of online consumer satisfaction.
Journal of Electronic Commerce Research, 6(2), 95-111.
Shang, R., Chen, Y. and Shen, L. (2004). Extrinsic versus intrinsic motivations for consumers to
shop on-line. Information and Management, 42(3), 401-413.
Sheng, Tianxiang and Liu (2010). An empirical study on the effect of e-service quality on online
customer satisfaction and loyalty. Emerland Group Publishing Limited, 1(3), 273-
283.
79
Sivadas, Eugene; Baker-Prewitt, Jamie L (2000) An examination of the relationship between
service quality, customer satisfaction, and store loyalty, Journal of Retail &
Distribution Management, 28(2)73-82
Smith, H.J. (1996). Information privacy: Measuring individuals’ concerns about organizational
practices. MIS Quarterly, 20(2), 167-197.
Spreng, R.A., Mackenzie, S.B. and Olshavsky, R.W. (1996) A re-examination of the determinant
of customer satisfaction, journal of Marketing, 60(3), 15-32
Stiakakis, Emmanouil and Georgiadis, Christos (2009), E-service quality: comparing the
perception of providers and customer. Emerland Group Publishing Limited, 19(4),
410-430.
Sung, Y., Liu, S., Liao, H. and Liu, C. (2009). Service Quality between e-government users and
administrators. Electronic Journal of I-Ways: The Journal of E-Government Policy
and Regulation, 32(4), 241248.
Surjadaja, H., Ghosh, S. and Antony, F. (2003). Determinants and assessing the determinants
of e- service operation. Managing Service Quality, 13(1), 39-44.
Swaid, S.I. and Wigand, R.T. (2007). Key dimensions of e-commerce service quality and its
relationships to merging and emerging technologies. Processes And Institution, Bled,
Slovenia, 1-15.
Szymanski, D.M. and Hise, R.T. (2000). E Satisfaction: An Initial Examination. Journal of
Retailing, 76(5), 309-322.
Tarawneh, Naim (2011). The impact of electronic service quality dimensions in achieving
satisfaction among representatives of enterprises under the social security. Master
thesis, University of the Middle East, Amman, Jordan
Tracey, M., Vonderembse, M. and Lim, J-S. (1999). Manufacturing technology and strategy
formulation: key to enhancing competitiveness and improving performance. Journal
of Operations Management, 17(4), 411-428.
Van Riel, A.C.R. Liljander, V. and Jurriens, P. (2001). Exploring customer evaluation for e-
service: A portal site. International Journal of Service Industry Management, 12(4),
359-377.
Wang and Wang (2006). The impact of internet on service quality in banking sector.
Unpublished Master Thesis, Lulea University of Technology.
Wang Y. & Hing-Po L. (2002.) Service quality, customer satisfaction and behaviour intentions:
Evidence from China’s telecommunication industry, 4(6), 50-60.
Wilson, E.J. (2004). The Information revolution and developing countries. The MIT Press.
Wolfinbarger, M. and Gilly, M. (2003), eTailQ: dimensionalizing, measuring, and predicting
retail quality. Journal of Retailing, 79(3), 183-193.
80
Yang, Z., Jun, M. and Peterson, R.T. (2004). Measuring customer perceived online service
quality: Scale development and managerial implications. International Journal of
Operations and Production Management, 24(11), 1149-1174
Yen, C. and Lu, H. (2008). Effects of e-service quality on loyalty intention: an empirical study
in online auction. Managing Service Quality, 18(2), 127-146.
Zavareh, F. B., Ariff, M. S. M., Jusoh, A., Zakuan, N., Bahari, A. Z. and Ashourian, M.. (2012).
Eservice quality dimensions and their effect on e-customer satisfaction in internet
banking service. Procidia Social and Behavioral Sciences, 40, 441-445.
Zavareh, F. B., Ariff, M. S. M., Jusoh, A., Zakuan, N., Bahari, A. Z. and Ashourian, M.. (2012),
Eservice quality dimensions and their effect on e-customer satisfaction in internet
banking service. Procidia Social and Behavioral Sciences, 40, 441-445.
Zeithaml, V.A., Parasuraman, A. and Malhotra, A. (2000a). A conceptual framework for
understanding e service quality: implications for future research and managerial
practice. MIS working paper series, No 00-115, Cambridge, MA, 1-49
Zeithaml, V.A., Parasuraman, A. and Malhotra, A. (2000b). E-service quality: Definition,
dimensions, and conceptual model. Working Paper, Marketing Science Institute,
Cambridge, M.A.
Zeithaml, V.A., Parasuraman, A. and Malhotra, A. (2002). Service quality delivery through web
sites: a critical review of extant knowledge. Journal of the academy of the marketing
science, 30(4), 362375
Zhang, X. and Prybutok, V.R. (2005). A consumer perspective of e service quality. IEEE
transactions on engineering management, 52(4), 461-477
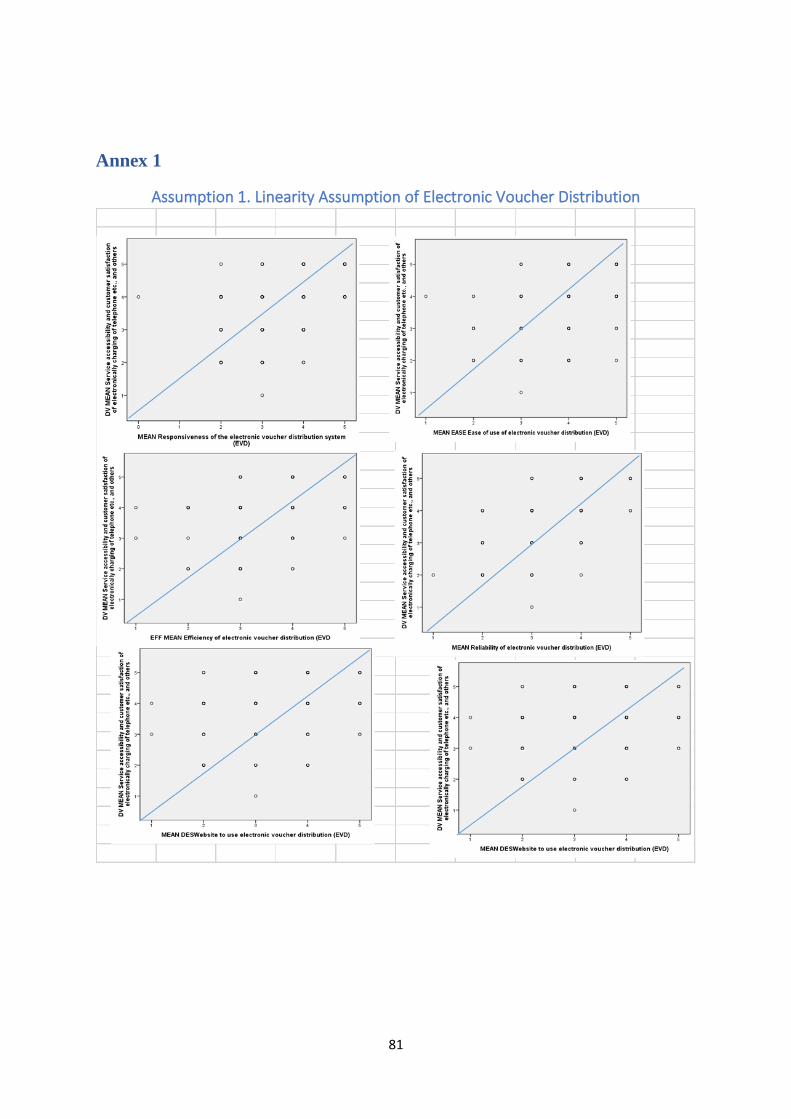
81
Annex 1
Assumption 1. Linearity Assumption of Electronic Voucher Distribution
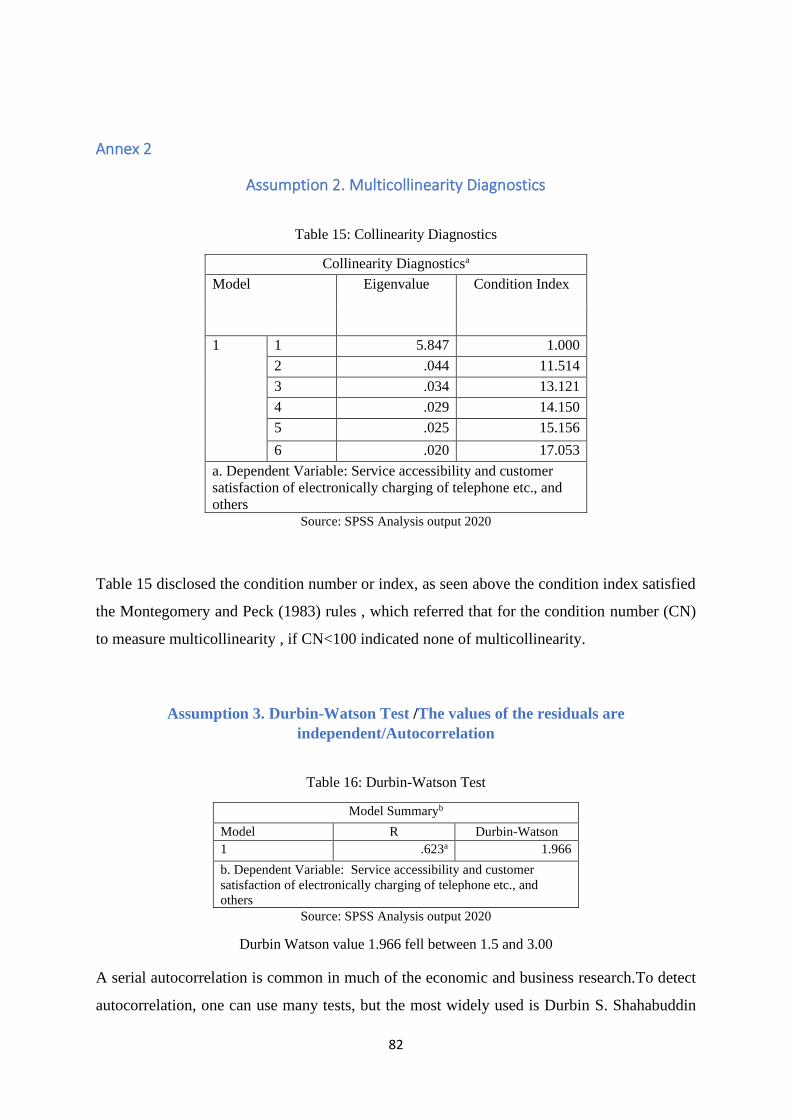
82
Annex 2
Assumption 2. Multicollinearity Diagnostics
Table 15: Collinearity Diagnostics
Collinearity Diagnosticsa
Model Eigenvalue Condition Index
1 1 5.847 1.000
2 .044 11.514
3 .034 13.121
4 .029 14.150
5 .025 15.156
6 .020 17.053
a. Dependent Variable: Service accessibility and customer
satisfaction of electronically charging of telephone etc., and
others Source: SPSS Analysis output 2020
Table 15 disclosed the condition number or index, as seen above the condition index satisfied
the Montegomery and Peck (1983) rules , which referred that for the condition number (CN)
to measure multicollinearity , if CN<100 indicated none of multicollinearity.
Assumption 3. Durbin-Watson Test /The values of the residuals are
independent/Autocorrelation
Table 16: Durbin-Watson Test
Model Summaryb
Model R Durbin-Watson
1 .623a 1.966
b. Dependent Variable: Service accessibility and customer
satisfaction of electronically charging of telephone etc., and
others
Source: SPSS Analysis output 2020
Durbin Watson value 1.966 fell between 1.5 and 3.00
A serial autocorrelation is common in much of the economic and business research.To detect
autocorrelation, one can use many tests, but the most widely used is Durbin S. Shahabuddin
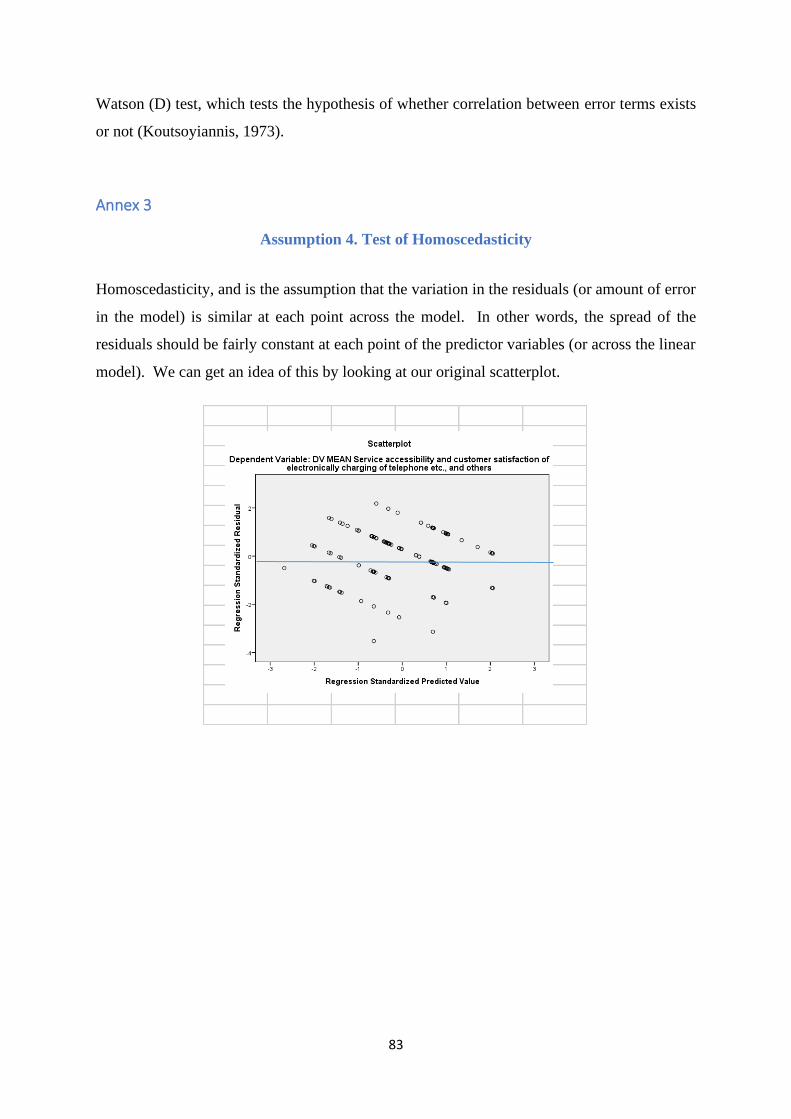
83
Watson (D) test, which tests the hypothesis of whether correlation between error terms exists
or not (Koutsoyiannis, 1973).
Annex 3
Assumption 4. Test of Homoscedasticity
Homoscedasticity, and is the assumption that the variation in the residuals (or amount of error
in the model) is similar at each point across the model. In other words, the spread of the
residuals should be fairly constant at each point of the predictor variables (or across the linear
model). We can get an idea of this by looking at our original scatterplot.
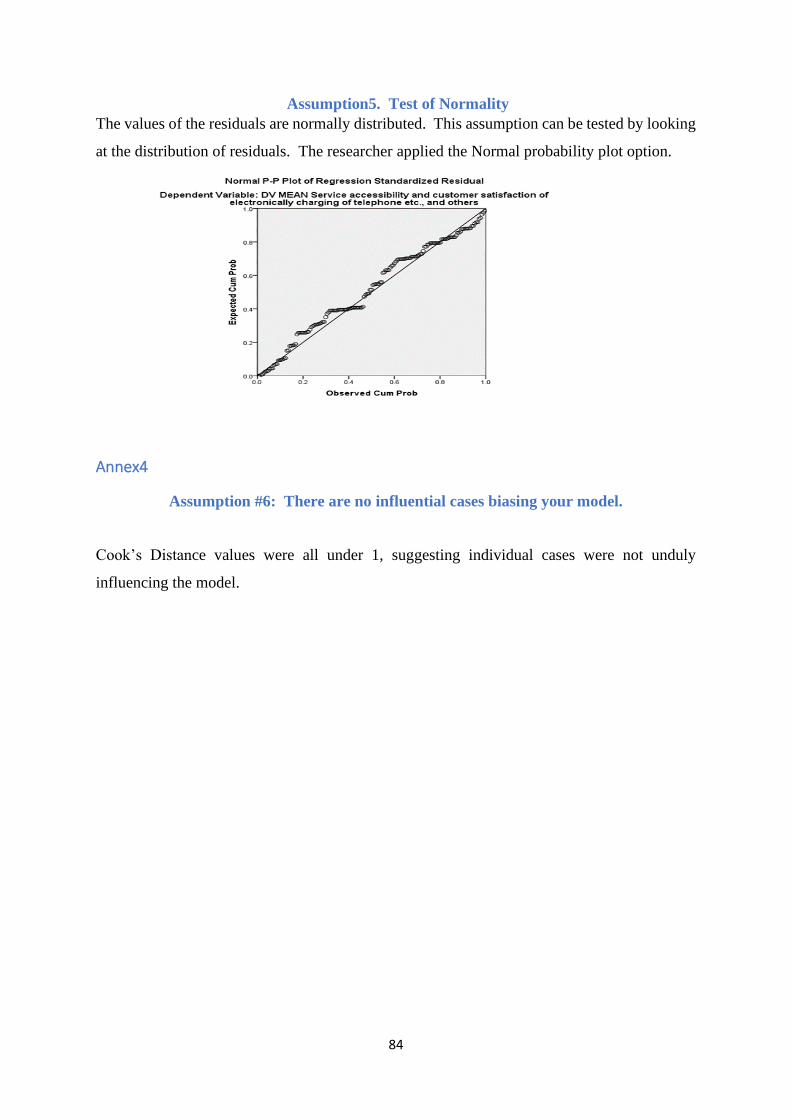
84
Assumption5. Test of Normality
The values of the residuals are normally distributed. This assumption can be tested by looking
at the distribution of residuals. The researcher applied the Normal probability plot option.
Annex4
Assumption #6: There are no influential cases biasing your model.
Cook’s Distance values were all under 1, suggesting individual cases were not unduly
influencing the model.
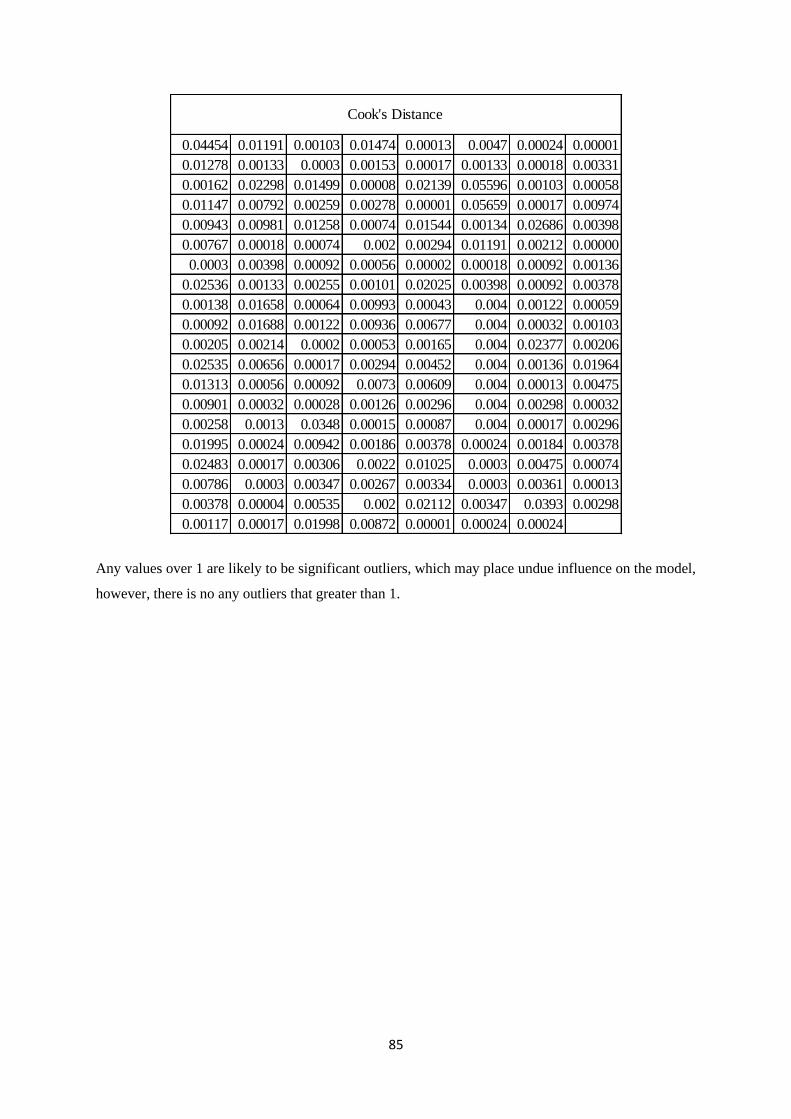
85
Any values over 1 are likely to be significant outliers, which may place undue influence on the model,
however, there is no any outliers that greater than 1.
0.04454 0.01191 0.00103 0.01474 0.00013 0.0047 0.00024 0.00001
0.01278 0.00133 0.0003 0.00153 0.00017 0.00133 0.00018 0.00331
0.00162 0.02298 0.01499 0.00008 0.02139 0.05596 0.00103 0.00058
0.01147 0.00792 0.00259 0.00278 0.00001 0.05659 0.00017 0.00974
0.00943 0.00981 0.01258 0.00074 0.01544 0.00134 0.02686 0.00398
0.00767 0.00018 0.00074 0.002 0.00294 0.01191 0.00212 0.00000
0.0003 0.00398 0.00092 0.00056 0.00002 0.00018 0.00092 0.00136
0.02536 0.00133 0.00255 0.00101 0.02025 0.00398 0.00092 0.00378
0.00138 0.01658 0.00064 0.00993 0.00043 0.004 0.00122 0.00059
0.00092 0.01688 0.00122 0.00936 0.00677 0.004 0.00032 0.00103
0.00205 0.00214 0.0002 0.00053 0.00165 0.004 0.02377 0.00206
0.02535 0.00656 0.00017 0.00294 0.00452 0.004 0.00136 0.01964
0.01313 0.00056 0.00092 0.0073 0.00609 0.004 0.00013 0.00475
0.00901 0.00032 0.00028 0.00126 0.00296 0.004 0.00298 0.00032
0.00258 0.0013 0.0348 0.00015 0.00087 0.004 0.00017 0.00296
0.01995 0.00024 0.00942 0.00186 0.00378 0.00024 0.00184 0.00378
0.02483 0.00017 0.00306 0.0022 0.01025 0.0003 0.00475 0.00074
0.00786 0.0003 0.00347 0.00267 0.00334 0.0003 0.00361 0.00013
0.00378 0.00004 0.00535 0.002 0.02112 0.00347 0.0393 0.00298
0.00117 0.00017 0.01998 0.00872 0.00001 0.00024 0.00024
Cook's Distance
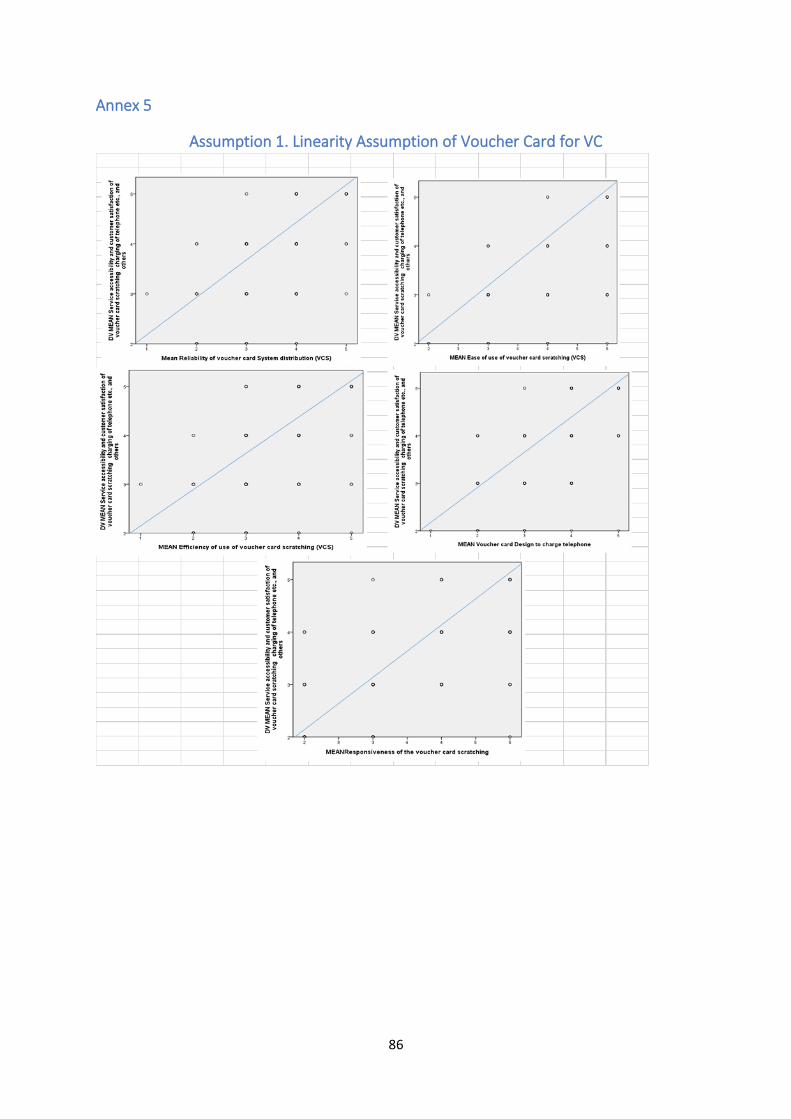
86
Annex 5
Assumption 1. Linearity Assumption of Voucher Card for VC
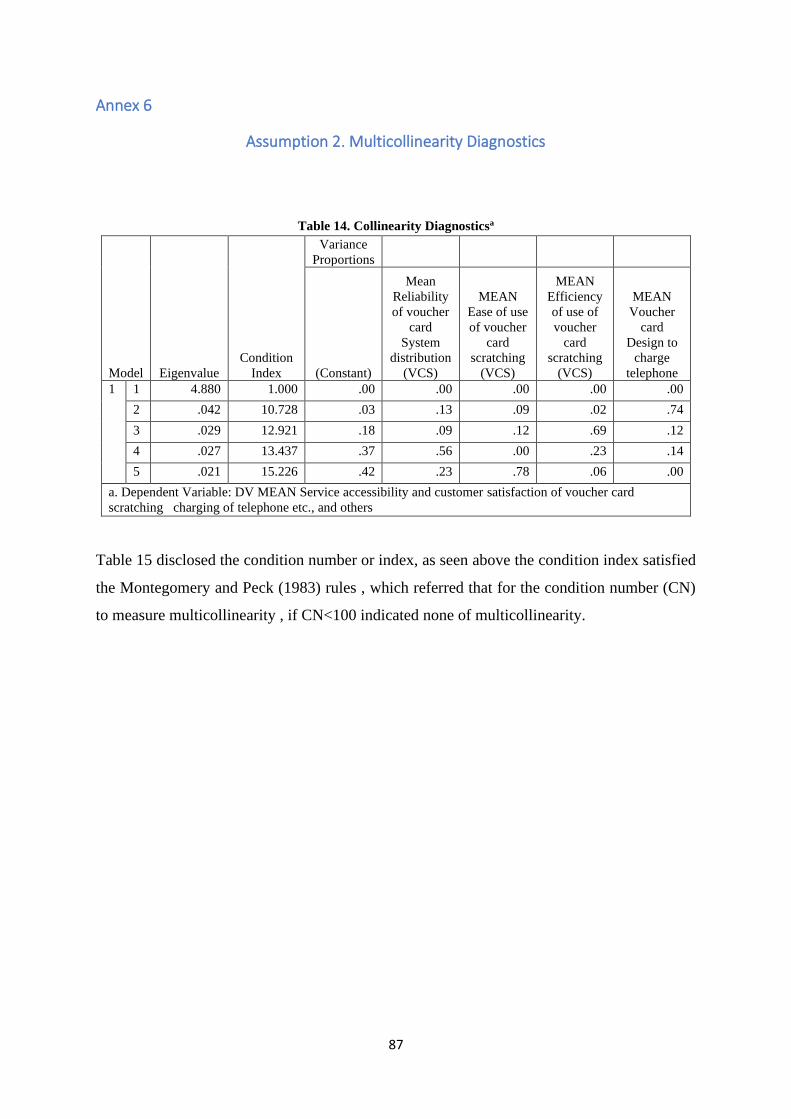
87
Annex 6
Assumption 2. Multicollinearity Diagnostics
Table 14. Collinearity Diagnosticsa
Model Eigenvalue
Condition
Index
Variance
Proportions
(Constant)
Mean
Reliability
of voucher
card
System
distribution
(VCS)
MEAN
Ease of use
of voucher
card
scratching
(VCS)
MEAN
Efficiency
of use of
voucher
card
scratching
(VCS)
MEAN
Voucher
card
Design to
charge
telephone
1 1 4.880 1.000 .00 .00 .00 .00 .00
2 .042 10.728 .03 .13 .09 .02 .74
3 .029 12.921 .18 .09 .12 .69 .12
4 .027 13.437 .37 .56 .00 .23 .14
5 .021 15.226 .42 .23 .78 .06 .00
a. Dependent Variable: DV MEAN Service accessibility and customer satisfaction of voucher card
scratching charging of telephone etc., and others
Table 15 disclosed the condition number or index, as seen above the condition index satisfied
the Montegomery and Peck (1983) rules , which referred that for the condition number (CN)
to measure multicollinearity , if CN<100 indicated none of multicollinearity.
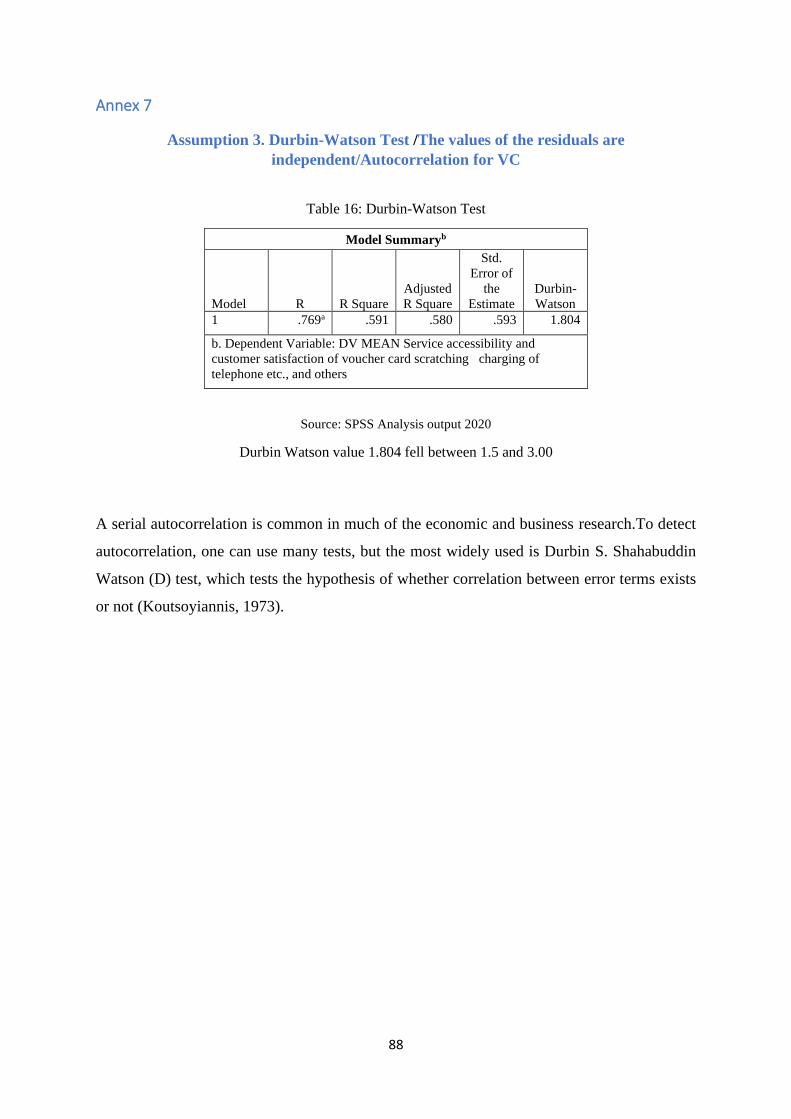
88
Annex 7
Assumption 3. Durbin-Watson Test /The values of the residuals are
independent/Autocorrelation for VC
Table 16: Durbin-Watson Test
Model Summaryb
Model R R Square
Adjusted
R Square
Std.
Error of
the
Estimate
Durbin-
Watson
1 .769a .591 .580 .593 1.804
b. Dependent Variable: DV MEAN Service accessibility and
customer satisfaction of voucher card scratching charging of
telephone etc., and others
Source: SPSS Analysis output 2020
Durbin Watson value 1.804 fell between 1.5 and 3.00
A serial autocorrelation is common in much of the economic and business research.To detect
autocorrelation, one can use many tests, but the most widely used is Durbin S. Shahabuddin
Watson (D) test, which tests the hypothesis of whether correlation between error terms exists
or not (Koutsoyiannis, 1973).
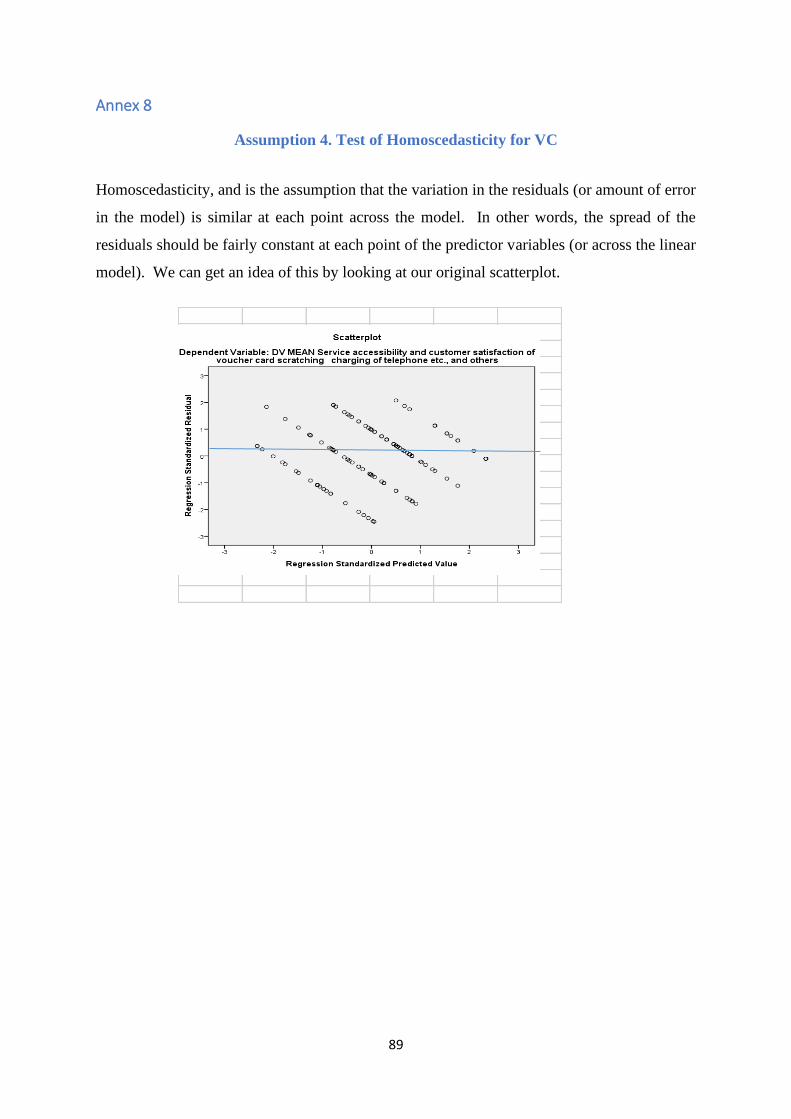
89
Annex 8
Assumption 4. Test of Homoscedasticity for VC
Homoscedasticity, and is the assumption that the variation in the residuals (or amount of error
in the model) is similar at each point across the model. In other words, the spread of the
residuals should be fairly constant at each point of the predictor variables (or across the linear
model). We can get an idea of this by looking at our original scatterplot.
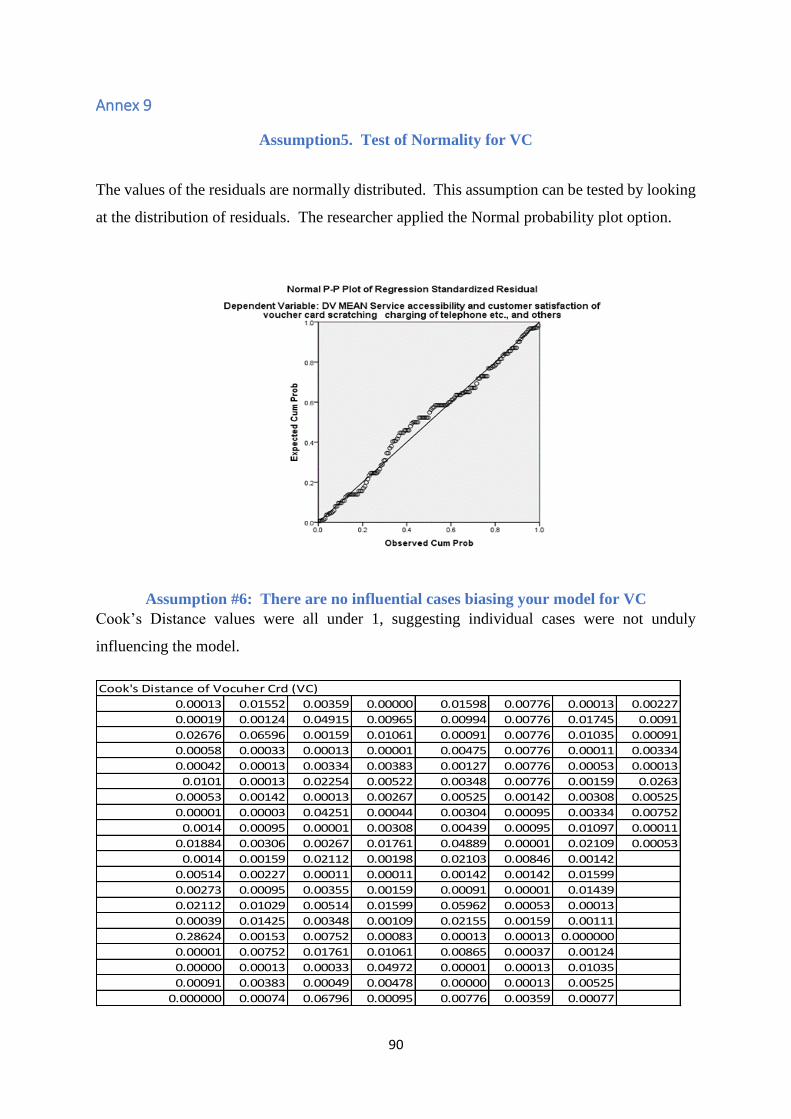
90
Annex 9
Assumption5. Test of Normality for VC
The values of the residuals are normally distributed. This assumption can be tested by looking
at the distribution of residuals. The researcher applied the Normal probability plot option.
Assumption #6: There are no influential cases biasing your model for VC Cook’s Distance values were all under 1, suggesting individual cases were not unduly
influencing the model.
0.00013 0.01552 0.00359 0.00000 0.01598 0.00776 0.00013 0.00227
0.00019 0.00124 0.04915 0.00965 0.00994 0.00776 0.01745 0.0091
0.02676 0.06596 0.00159 0.01061 0.00091 0.00776 0.01035 0.00091
0.00058 0.00033 0.00013 0.00001 0.00475 0.00776 0.00011 0.00334
0.00042 0.00013 0.00334 0.00383 0.00127 0.00776 0.00053 0.00013
0.0101 0.00013 0.02254 0.00522 0.00348 0.00776 0.00159 0.0263
0.00053 0.00142 0.00013 0.00267 0.00525 0.00142 0.00308 0.00525
0.00001 0.00003 0.04251 0.00044 0.00304 0.00095 0.00334 0.00752
0.0014 0.00095 0.00001 0.00308 0.00439 0.00095 0.01097 0.00011
0.01884 0.00306 0.00267 0.01761 0.04889 0.00001 0.02109 0.00053
0.0014 0.00159 0.02112 0.00198 0.02103 0.00846 0.00142
0.00514 0.00227 0.00011 0.00011 0.00142 0.00142 0.01599
0.00273 0.00095 0.00355 0.00159 0.00091 0.00001 0.01439
0.02112 0.01029 0.00514 0.01599 0.05962 0.00053 0.00013
0.00039 0.01425 0.00348 0.00109 0.02155 0.00159 0.00111
0.28624 0.00153 0.00752 0.00083 0.00013 0.00013 0.000000
0.00001 0.00752 0.01761 0.01061 0.00865 0.00037 0.00124
0.00000 0.00013 0.00033 0.04972 0.00001 0.00013 0.01035
0.00091 0.00383 0.00049 0.00478 0.00000 0.00013 0.00525
0.000000 0.00074 0.06796 0.00095 0.00776 0.00359 0.00077
Cook's Distance of Vocuher Crd (VC)
91
Annex 9
Questionnaire to be filled by Respondents for EVD Dear Respondent.
With a great appreciation, I would like to request, kindly your responses to the following
research questions. I am currently doing my Master of Art in Public Management and Policy
(MPMP) at Addis Ababa University as partial fulfilment towards the completion of my
postgraduate degree. My research has a title of “Electronics voucher distribution (EVD)
versus Voucher Card system in Ethio-telecom and their implication to service
accessibility and satisfaction to the customers: the case of Ethio Telecom.
Hence, I kindly requested you to give your responses to the following questionnaires. So, I
would like to assure you, the information will not be treated for other purposes, it will be used
for academic purpose only. So kindly, request you fill in this questionnaire that assuring you
the information will not be used for other purpose.
In addition to this, I would also like to remind you that your fair and impartial feedback will
make this research a very successful one.
Thank you for your cooperation and assistance.
Sincerely,
Please respond to each item by putting a tick mark “✓” in the box & fill in the blank on the
number which best reflects your own perception.
For more information
Name: Dirshaye Tessema
Phone : 0911502547
Section I: Demographic characteristics Questions
I. Gender of Respondents
1. Male
2. Female
92
II. Age Brackets of Respondents
1. 18-25
2. 26-35
3. 36-45
4. 46-50
5. Above 50
III. Academic status of Respondents
1. Grade 12 completed
2. Diploma holder
3. Degree Holder
4. Masters Holder
5. Above Master’s Degree Holder
IV. Work title or position/EVD Engagement
1. Owner
2. Junior /Senior officer
3. Officer
4. Distributer
5. Sub Distributer/Retailer
6. Expert/Salesperson
7. Supervisor
8. Assistant Manager/CSM
9. Manager/Director
10. Customer
11. Other
Section II: Questions related to the Impact of Electronic Voucher Distribution (EVD) on
service accessibility and customer satisfaction.
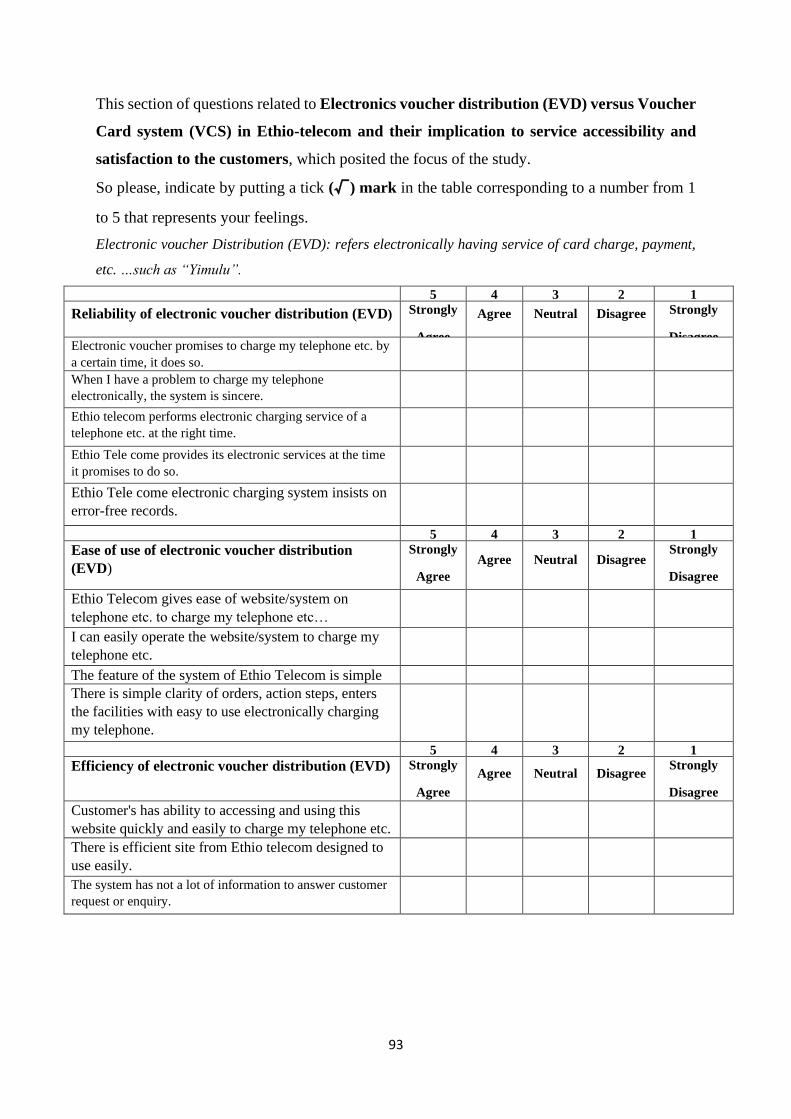
93
This section of questions related to Electronics voucher distribution (EVD) versus Voucher
Card system (VCS) in Ethio-telecom and their implication to service accessibility and
satisfaction to the customers, which posited the focus of the study.
So please, indicate by putting a tick (√) mark in the table corresponding to a number from 1
to 5 that represents your feelings.
Electronic voucher Distribution (EVD): refers electronically having service of card charge, payment,
etc. …such as “Yimulu”.
5
4 3 2 1
Reliability of electronic voucher distribution (EVD) Strongly
Agree
Agree Neutral Disagree Strongly
Disagree Electronic voucher promises to charge my telephone etc. by
a certain time, it does so.
When I have a problem to charge my telephone
electronically, the system is sincere.
Ethio telecom performs electronic charging service of a
telephone etc. at the right time.
Ethio Tele come provides its electronic services at the time
it promises to do so.
Ethio Tele come electronic charging system insists on
error-free records.
5
4 3 2 1
Ease of use of electronic voucher distribution
(EVD)
Strongly
Agree
Agree Neutral Disagree Strongly
Disagree
Ethio Telecom gives ease of website/system on
telephone etc. to charge my telephone etc…
I can easily operate the website/system to charge my
telephone etc.
The feature of the system of Ethio Telecom is simple
to use.
There is simple clarity of orders, action steps, enters
the facilities with easy to use electronically charging
my telephone.
5
4 3 2 1
Efficiency of electronic voucher distribution (EVD) Strongly
Agree
Agree Neutral Disagree Strongly
Disagree
Customer's has ability to accessing and using this
website quickly and easily to charge my telephone etc.
There is efficient site from Ethio telecom designed to
use easily.
The system has not a lot of information to answer customer
request or enquiry.
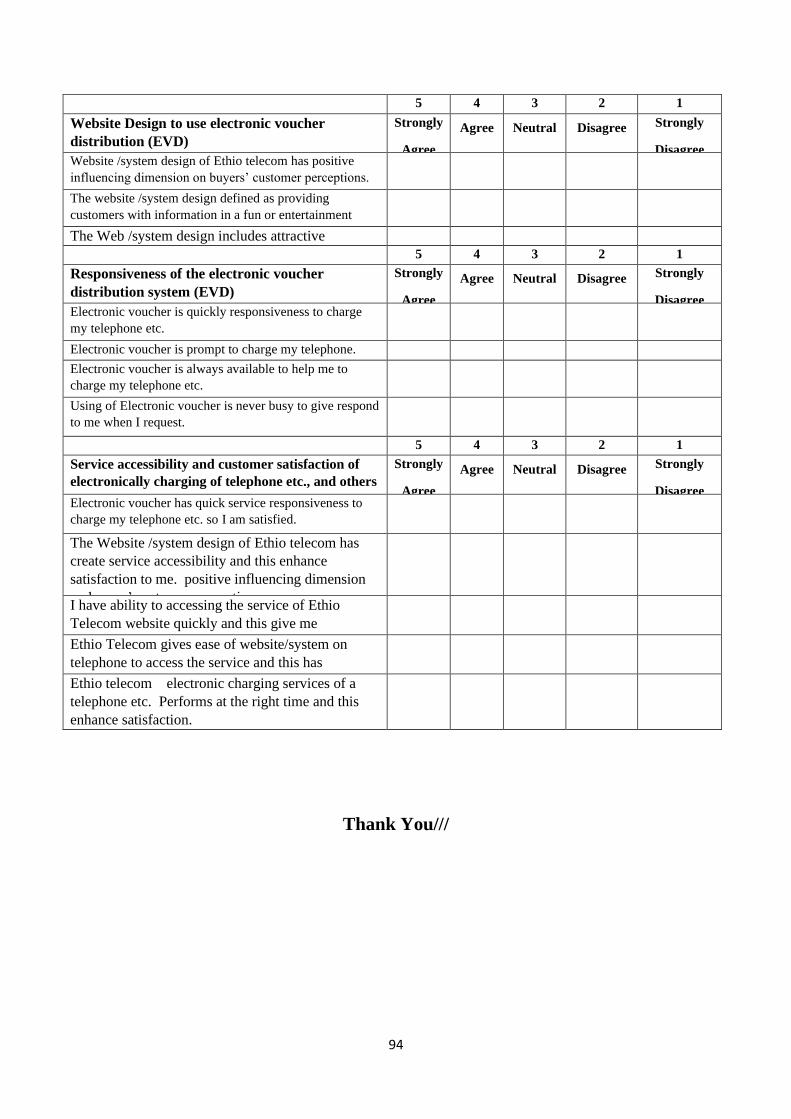
94
5
4 3 2 1
Website Design to use electronic voucher
distribution (EVD)
Strongly
Agree
Agree Neutral Disagree Strongly
Disagree Website /system design of Ethio telecom has positive
influencing dimension on buyers’ customer perceptions.
The website /system design defined as providing
customers with information in a fun or entertainment
way.
The Web /system design includes attractive
appearance.
5
4 3 2 1
Responsiveness of the electronic voucher
distribution system (EVD)
Strongly
Agree
Agree Neutral Disagree Strongly
Disagree Electronic voucher is quickly responsiveness to charge
my telephone etc.
Electronic voucher is prompt to charge my telephone. Electronic voucher is always available to help me to
charge my telephone etc.
Using of Electronic voucher is never busy to give respond
to me when I request.
5
4 3 2 1
Service accessibility and customer satisfaction of
electronically charging of telephone etc., and others
Strongly
Agree
Agree Neutral Disagree Strongly
Disagree Electronic voucher has quick service responsiveness to
charge my telephone etc. so I am satisfied.
The Website /system design of Ethio telecom has
create service accessibility and this enhance
satisfaction to me. positive influencing dimension
on buyers’ customer perceptions
I have ability to accessing the service of Ethio
Telecom website quickly and this give me
satisfaction.
Ethio Telecom gives ease of website/system on
telephone to access the service and this has
increased satisfaction.
Ethio telecom electronic charging services of a
telephone etc. Performs at the right time and this
enhance satisfaction.
Thank You///
95
Questionnaire to be filled by Respondents for VC
Dear Respondent.
With a great appreciation, I would like to request, kindly your responses to the following
research questions. I am currently doing my Master of Art in Public Management and Policy
(MPMP) at Addis Ababa University as partial fulfilment towards the completion of my
postgraduate degree. My research has a title of “Electronic voucher distribution (EVD)
versus Voucher Card system (VCS) in Ethio-telecom and their implication to service
accessibility and satisfaction to the customers: the case of Ethio Telecom.
Hence, I kindly requested you to give your responses to the following questionnaires. So, I
would like to assure you, the information will not be treated for other purposes, it will be used
for academic purpose only. So kindly, request you fill in this questionnaire that assuring you
the information will not be used for other purpose.
In addition to this, I would also like to remind you that your fair and impartial feedback will
make this research a very successful one.
Thank you for your cooperation and assistance.
Sincerely,
Please respond to each item by putting a tick mark “✓” in the box & fill in the blank on the
number which best reflects your own perception.
Section I: Demographic characteristics Questions
I. Gender of Respondents
1. Male
2. Female
II. Age Brackets of Respondents
1. 18-25
2. 26-35
3. 36-45
4. 46-50
5. Above 50
96
III. Academic status of Respondents
1. Grade 12 completed
2. Diploma holder
3. Degree Holder
4. Masters Holder
5. Above Master’s Degree Holder
IV. Work title or position/VC Engagement
1. Owner
2. Junior /senior officer
3. Officer
4. Distributer
5. Sub Distributer/Retailer
6. Expert/Salesperson
7. Supervisor
8. Assistant Manager/CSM
9. Manager/Director
10. Customer
11. Other
Section II: Questions related to the Impact of Voucher Card system to charge for
telephone etc… on service accessibility and customer satisfaction.
This section of questions related to Electronics voucher distribution (EVD) versus Voucher
Card system (VC) in Ethio-telecom and their implication to service accessibility and
satisfaction to the customers, which posited the focus of the study.
So please, indicate by putting a tick (√) mark in the table corresponding to a number from 1 to
5 that represents your feelings.
Voucher Card (scratching paper) refers manually having service of card charge on telephone etc.by
scratching the paper
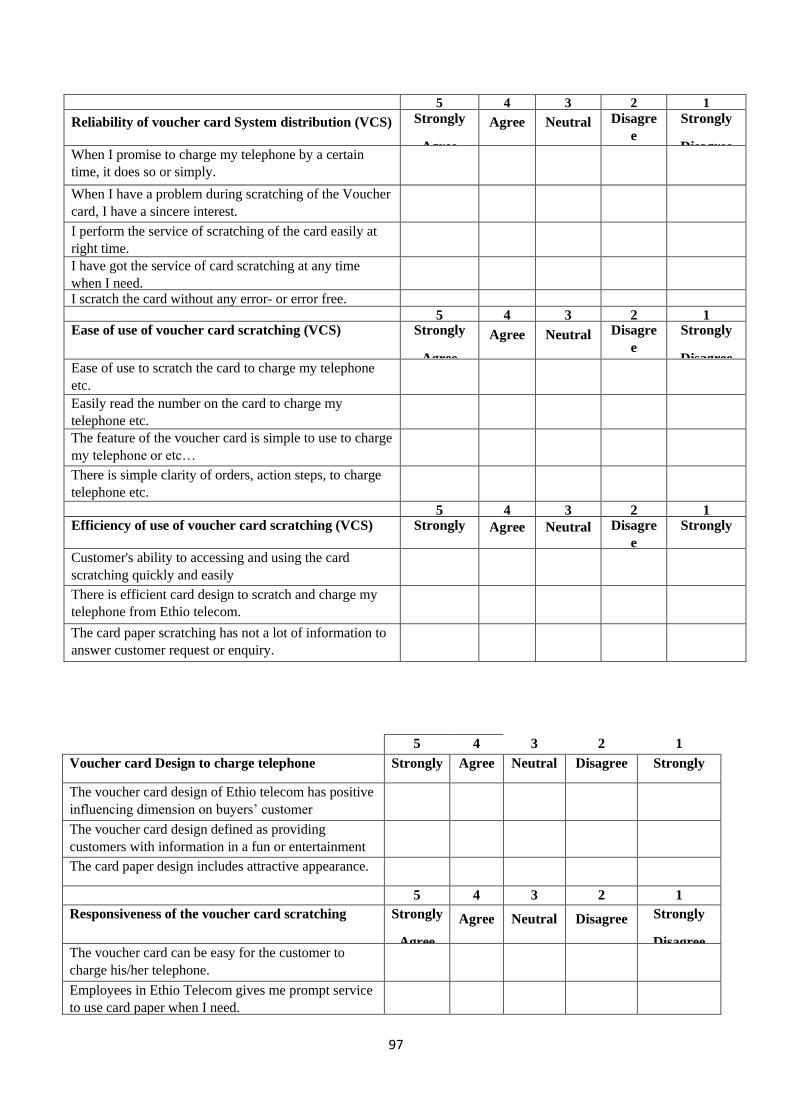
97
5
4 3 2 1
Reliability of voucher card System distribution (VCS) Strongly
Agree
Agree Neutral Disagre
e
Strongly
Disagree When I promise to charge my telephone by a certain
time, it does so or simply.
When I have a problem during scratching of the Voucher
card, I have a sincere interest.
I perform the service of scratching of the card easily at
right time.
I have got the service of card scratching at any time
when I need.
I scratch the card without any error- or error free.
5
4 3 2 1
Ease of use of voucher card scratching (VCS) Strongly
Agree
Agree Neutral Disagre
e
Strongly
Disagree Ease of use to scratch the card to charge my telephone
etc.
Easily read the number on the card to charge my
telephone etc.
The feature of the voucher card is simple to use to charge
my telephone or etc…
There is simple clarity of orders, action steps, to charge
telephone etc.
5
4 3 2 1
Efficiency of use of voucher card scratching (VCS) Strongly
Agree
Agree Neutral Disagre
e
Strongly
Disagree Customer's ability to accessing and using the card
scratching quickly and easily
There is efficient card design to scratch and charge my
telephone from Ethio telecom.
The card paper scratching has not a lot of information to
answer customer request or enquiry.
5
4 3 2 1
Voucher card Design to charge telephone Strongly
Agree
Agree Neutral Disagree Strongly
Disagree The voucher card design of Ethio telecom has positive
influencing dimension on buyers’ customer
perceptions.
The voucher card design defined as providing
customers with information in a fun or entertainment
way.
The card paper design includes attractive appearance.
5
4 3 2 1
Responsiveness of the voucher card scratching Strongly
Agree
Agree Neutral Disagree Strongly
Disagree The voucher card can be easy for the customer to
charge his/her telephone.
Employees in Ethio Telecom gives me prompt service
to use card paper when I need.
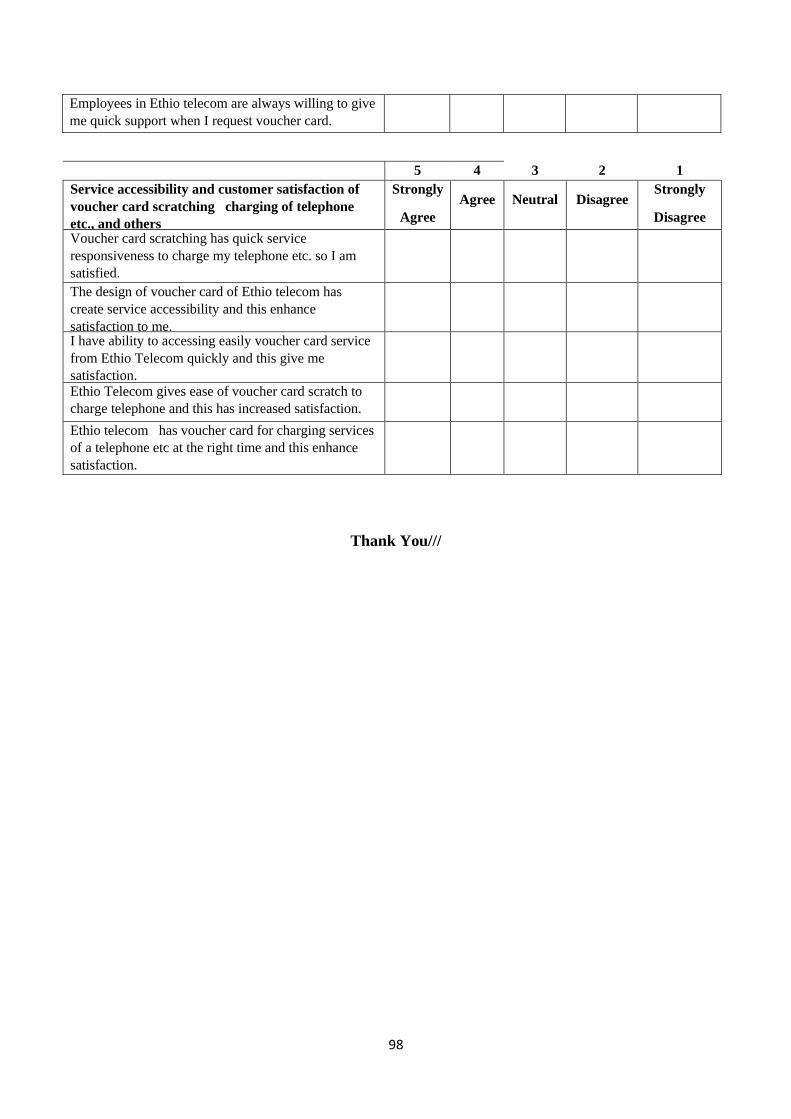
98
Employees in Ethio telecom are always willing to give
me quick support when I request voucher card.
5
4 3 2 1
Service accessibility and customer satisfaction of
voucher card scratching charging of telephone
etc., and others
Strongly
Agree
Agree Neutral Disagree Strongly
Disagree
Voucher card scratching has quick service
responsiveness to charge my telephone etc. so I am
satisfied.
The design of voucher card of Ethio telecom has
create service accessibility and this enhance
satisfaction to me.
I have ability to accessing easily voucher card service
from Ethio Telecom quickly and this give me
satisfaction.
Ethio Telecom gives ease of voucher card scratch to
charge telephone and this has increased satisfaction.
Ethio telecom has voucher card for charging services
of a telephone etc at the right time and this enhance
satisfaction.
Thank You///