electrical and electronic engineering final
TRANSCRIPT

i
ELECTRICAL AND ELECTRONIC ENGINEERING
FINAL YEAR PROJECT 2
FINAL REPORT
NAME : WATHIEQ AKRAM BIN ANWAR
ID : 12895
PROJECT : HEALTHCARE MONITORING SYSTEM
USING WBAN
SUPERVISOR : DR. AZLAN AWANG
ii
HEALTHCARE MONITORING SYSTEM
USING WBAN
By
WATHIEQ AKRAM BIN ANWAR
FINAL PROJECT REPORT
Submitted to the Department of Electrical & Electronic Engineering in Partial Fulfillment of the Requirements
for the Degree
Bachelor of Engineering (Hons) (Electrical & Electronic Engineering)
Universiti Teknologi PETRONAS
Bandar Seri Iskandar
31750 Tronoh
Perak Darul Ridzuan
Ó Copyright 2013
by
Wathieq Akram Bin Anwar, 2013
iii
CERTIFICATION OF APPROVAL
HEALTHCARE MONITORING SYSTEM
USING WBAN
by
Wathieq Akram Bin Anwar
A project dissertation submitted to the Department of Electrical & Electronic Engineering
Universiti Teknologi PETRONAS in partial fulfilment of the requirement for the
Bachelor of Engineering (Hons) (Electrical & Electronic Engineering)
Approved:
__________________________
Dr. Azlan Awang
Project Supervisor
UNIVERSITI TEKNOLOGI PETRONAS
TRONOH, PERAK
June 2013

iv
CERTIFICATION OF ORIGINALITY
This is to certify that I am responsible for the work submitted in this project, that the
original work is my own except as specified in the references and
acknowledgements, and that the original work contained herein have not been
undertaken or done by unspecified sources or persons.
__________________________
Wathieq Akram Bin Anwar

v
ABSTRACT
The conventional health care monitoring system cannot give real time updates on the
medical records of a patient and is bounded by distance, hence resulting in abnormal
signs on a patient to go unnoticed until it is too late. The aim of the study is to
develop a prototype of healthcare monitoring system that is able to detect and
wirelessly transmit pulse rate and temperature of a human body to a host PC. Using
Arduino Uno R3 as the platform, a prototype is developed with ZigBee technology
chosen as the wireless framework. Later, the precision of the sensors of the prototype
is tested by calculating the standard deviation of the data set obtained. Next, the
accuracy of the reading is tested by calculating the percentage error of the mean
value from the set of data taking readings from established sensors as real value.
From the test, the pulse sensor produces 1.35 for the standard deviation and 1.61% of
percentage error, while the temperature sensor scores 0.74 for standard deviation and
0.75 for percentage error. Finally, an interface that is able to display the data on the
host PC and provide the alarm in case of abnormal reading is design. As a
conclusion, the prototype that is built is a success as it is able to detect and wirelessly
transmit pulse rate and temperature of a human body to a host PC with precision and
accuracy.

vi
ACKNOWLEDGEMENT
First of all, I would like to express my greatest praises to Allah, God
Almighty for all His blessing and guidance throughout my life, especially during this
period for me to complete my Final Year Project 1 and 2. For without Him, I am a
mere nothing without any significance. Next, I would like to show my appreciation
to Universiti Teknologi Petronas for giving me the chance to do my Final Year
Project as it have given me valuable amount of experience
My sincerest thank to my supervisor, Dr Azlan Awang for giving me to the
chance to partake under his Wireless Body Area Network project that give the rise to
my project. His tutelage and guidance that he has given me will always be a memory
that I hold strong and cherish. Finally, I would express my sincerest apologies if in
any time that I have done anything that is not to his liking.
To all the lab technicians from Electrical & Electronic Engineering
Department, I offer a thousand thanks for always there in supporting me in my
conquest to finish my Final Year Project. The knowledge and technical hands-on that
I have obtained from this team I will treasured it throughout my life as it is the most
valuable item that I have obtained here. From deep inside my heart, there are no
words that can describe the amount of gratitude that I have for your support
Next, to my brothers and sisters in arm from Electrical and Electronic
Engineering Department, I hope that our bond here will last forever and my sincerest
appreciation for always be there for me in my time of need in supporting me
throughout this journey of maturity. Finally, thank you to everyone involved in the
completion of my Industrial Internship program, whether directly or indirectly. Your
support, however small it is, very helpful to me. May God bless all of you.

vii
TABLE OF CONTENTS
LIST OF TABLES ....................................................................................................... ix
LIST OF FIGURES ...................................................................................................... x
LIST OF ABBREVIATIONS ..................................................................................... xii
CHAPTER 1 INTRODUCTION .................................................................................. 1
1.1 Background of Study ........................................................................ 1
1.2 Problem Statement ........................................................................... 3
1.3 Objective of Study ............................................................................ 3
1.4 Scope of Study ................................................................................. 3
1.5 Feasibility of Study .......................................................................... 4
CHAPTER 2 LITERATURE REVIEW ....................................................................... 5
2.1 Human Health Monitoring System .................................................. 5
2.2 Human Vital Signs .......................................................................... 5
2.2.1 Body Temperature ................................................................... 5
2.2.2 Pulse Rate ................................................................................ 6
2.3 Wireless Area Network (WBAN) ................................................... 7
2.4 ZigBee ........................................................................................... 10
CHAPTER 3 METHODOLOGY ............................................................................... 14
3.1 Research Methodology and Project Activities .............................. 14
3.2 Project Activities ........................................................................... 15
3.3 Tools .............................................................................................. 16
3.4 Application .................................................................................... 16
CHAPTER 4 RESULT AND DISCUSSION ............................................................. 17
4.1 Design of Prototype ....................................................................... 17
4.1.1 Sensor .................................................................................... 17
4.1.2 Microprocessor ...................................................................... 18
4.1.3 Transmitter and Receiver ....................................................... 19
4.1.4 Power Source ......................................................................... 19
4.1.5 Application ............................................................................ 20
4.2 Result ............................................................................................. 22
4.2.1 Initial Testing ......................................................................... 22
4.2.2 Test on Heart Rate Sensor-Pulse Sensor Amped .................. 24
viii
4.2.3 Test on Temperature Sensor-LM35 Centigrade Sensor ........ 27
4.2.4 Testing of Full Prototype with XBee Transmitter ................. 31
4.2.5 Interface Testing .................................................................... 35
CHAPTER 5 CONCLUSION AND RECOMMENDATIONS ................................. 39
5.1 Conclusion ..................................................................................... 39
5.2 Discussion ..................................................................................... 40
REFERENCES............................................................................................................ 41
APPENDICES ............................................................................................................ 42
APPENDIX A FYP 1 GANTT CHART .............................................. 43
APPENDIX B FYP 2 GANTT CHART .............................................. 44
APPENDIX C CODING FOR PROTOTYPE ..................................... 45
APPENDIX D CODING FOR INTERFACE ...................................... 51
APPENDIX E FLOWCHART OF INTERFACE ................................ 55

ix
LIST OF TABLES
Table 1 Table of normal pulse rate according to stages in life ..................................... 6
Table 2 Applications and usage .................................................................................. 16
Table 3 Standard deviation between fingers ............................................................... 25
Table 4 Statistical analysis between pulse sensor and Omron Heart Rate Monitor ... 26
Table 5 Temperature sensor reading when placed at two materials ........................... 28
Table 6 Temperature sensor reading when placed at different area of arm ................ 29
Table 7 Standard Deviation for different parts of hand .............................................. 29
Table 8 Statistical analysis between LM35 and Mastech Infrared Thermometer ....... 31
Table 9 Statistical analysis between Pulse Sensor and Temperature .......................... 34
x
LIST OF FIGURES
Figure 1 Example of WBAN implementation .............................................................. 8
Figure 2 Graph of Power consumption versus data rate spectrum ............................... 9
Figure 3 Layers in ZigBee protocol ............................................................................ 11
Figure 4 Inverse square law ........................................................................................ 12
Figure 5 Wireless network topologies supported by ZigBee ...................................... 12
Figure 6 Flowchart of project activities ...................................................................... 14
Figure 7 Wireless Health Monitoring system ............................................................. 17
Figure 8 Pulse Sensor Amped ..................................................................................... 18
Figure 9 LM35 Centigrade Temperature Sensor ........................................................ 18
Figure 10 Arduino Uno R3 ......................................................................................... 18
Figure 11 XBee Series 2 ............................................................................................. 19
Figure 12 SKXBEE board........................................................................................... 19
Figure 13 POWER Battery Bank with USB and mini USB output ............................ 19
Figure 14 Processing 1.5.1 interface ........................................................................... 20
Figure 15 Arduino 1.0.3 interface .............................................................................. 20
Figure 16 First prototype (without power source) ...................................................... 21
Figure 17 Final Prototype ........................................................................................... 21
Figure 18 Result from pulse sensor............................................................................. 22
Figure 19 Result from temperature sensor .................................................................. 23
Figure 20 Graph of pulse rate against number of reading according to finger ........... 24
Figure 21 Percentage error formulae .......................................................................... 26
Figure 22 Graph of Pulse Rate against number of reading ......................................... 26
Figure 23 Calculation of percentage error of mean value ........................................... 27
Figure 24 Graph of temperature for different area of arm against number of reading 29
Figure 25 Graph of Temperature against number of reading ...................................... 30
Figure 26 Percentage Error calculation ....................................................................... 31
Figure 27 Graph of Pulse Rate against number of reading ......................................... 31
Figure 28 Graph of Temperature against number of reading ...................................... 33
Figure 29 Graph of BPM against number of reading.................................................. 34
Figure 30 Interface for Healthcare Monitoring System .............................................. 36
Figure 31 Reading on interface ................................................................................... 36

xi
Figure 32 Reading on serial port ................................................................................. 36
Figure 33 Alarm High ................................................................................................. 37
Figure 34 Alarm Low .................................................................................................. 38

xii
LIST OF ABBREVIATIONS
WBAN Wireless Body Area Network
WPAN Wireless Personal Area Network
WSN Wireless Sensor Network
FYP Final Year Project
USB Universal Serial Bus
BPM Beats Per Minute
1
CHAPTER 1
INTRODUCTION
1.1 Background of Study
Health monitoring is one of the most essential procedures that are done every
day in healthcare. Basically, health monitoring is done taking by the measurement of
specific vital signals of the human body in determining the well being of patient in
the hospital while helping in the diagnosis of the diseases. Four of the most common
vital signs that that are measured are body temperature, pulse rate, blood pressure
and respiratory rate. These 4 vital signs are detrimental for medical practitioners in
determining the health condition of patient and also act as a warning in case a
symptom arises. Overall, good health monitoring is the backbone in providing the
best healthcare towards the community.
In recent years, health monitoring has been the highlight in the development
of medical fields. As of now, most of the monitoring works are done by nurses that
will be recorded in charts that will later be examined by the medical officers.
However problem arises when there are cases where patients that are exhibiting
dangerous symptom on their vital signal go unnoticed, until only when the symptom
has gone bad or the patients simply die. Besides that, there exist hurdles to monitor
patients that are far away from hospital or simply refrain from being hospitalised.
Third problem is that the current system need is not efficient in term of cost and
manpower usage. To check on the health condition of the patients, time is consumes
as there are higher number of patient as compared to nurses. While the problem can
simply be solved by increasing the number of nurses, this will later increase the cost
of management, burdening the hospital administrative. Thus, it is vital for a new
health monitoring system that can give the accurate measurement in real time,
without the constraint of distance and also low cost is developed.
2
Wireless Body Area Network or simply called WBAN is among the
initiatives that are proposed in developing the new health monitoring system. Due to
advancement in the technology of physical sensors, low energy integrated circuits
and wireless communication, man can now develop a more accurate and reliable
wireless sensor network (WSN) with low cost. Overall, WBAN is the branch of
WSN discipline that involves in developing a health monitoring system that is able to
capture the measurement in real time, updating the medical records online. The
system achieved this by a framework of intelligent sensors placed at human body,
working together to measure the human vital signs. Using the wireless technology
used in Wireless Personal Area Network (WPAN), WBAN is expected to be able to
empower medical practitioners by giving them real time access of every patient
medical condition anytime anywhere, helping in diagnosis and warning if dangerous
symptom arises. Hopefully, as the technology matures enough, it will be able to
replace the conventional method of health monitoring system used now.
Thus, that is the aim of this project which is to devise a working prototype of
a Health Monitoring System using WBAN approach by using the ZigBee standard.
The prototype will be able to detect body temperature and pulse rate using sensors
working together in a wireless network around the body that will relay the
information obtain to a host, display the result. The prototype will also come with a
program with user interface to display the result.

3
1.2 Problem Statement
The current health monitoring system used is unable to give real time health
update of the patient and is bounded by the distance of the patient from the hospital.
Besides the current system takes time to collect the measurement form the patients
and is also not cost effective. A new system that is low cost, able to deliver real time
health update, anytime anywhere is to be constructed.
1.3 Objectives of Study
1. To design a prototype of a health monitoring system that is able to:
a) measure the pulse rate and body temperature
b) transmit the data to a host computer in real time
c) display the data received from the sensors
d) able to give alarm when abnormal reading is detected
2. To test the prototype on a human being.
1.4 Scope of Study
This project ultimate goal is to produce a prototype that is able to satisfy the
objectives listed above. Among the scope of the study is to:
a) Choose the sensor for the prototype
b) Determine the placement of the sensor on body
c) Configure the wireless framework
d) Develop the user interface to display the result and give alarm as abnormal
reading is detected
e) Test the prototype

4
1.5 Feasibility of the project
The student is given 2 semesters effective from January 2013 to complete
project divided to FYP 1 and FYP 2. Within the time period, the student is entitled to
complete the project.
Based on the knowledge in project management, the student has developed a
well and organize Gantt’s chart to plan the project (refer methodology). By having
regular informal discussion with the supervisor, it helps the student to gather
information in requirement scoping.
As a conclusion, Gantt’s chart and regular informal discussion will ensure the
project to be on track and fulfil the FYP 1 and FYP 2 need.
5
CHAPTER 2
LITERATURE REVIEW
2.1 Human Health Monitoring System
Health monitoring system is to perform routine measurement on the vital
signs of the human body. Health monitoring is important as it gives the data needed
by the medical practitioners to assess the condition of a patient while developing a
diagnosis of the problem experienced by the patients. As of now, the health
monitoring system is rapidly being developed as the system now is not able to give
health updates in real time and bounded by the constrict of distance. It is the hope of
this project to be able to build a prototype of a working wireless health monitoring
system that is able to update the health records of a patient no matter when or where
they are.
2.2 Human vital signs
Human vital signs are the measurements that are taken by medical
practitioners on the most basic of human bodily functions. These vital signs are
important as their changes from the normal threshold or current condition signifies
that the bodily functions are not working well. Furthermore, by routine updates on
the measurement of vital signs, a trending can be made to assess whether a patient is
improving or vice versa. These measurements may seem simple, but it also acts as a
warning on the future condition or symptom that will surface on the patient. Four of
primary vital signs that are recorded are body temperature, blood pressure, pulse rate
and respiration rate. However in this project, only two vital signs are concerned
which are:
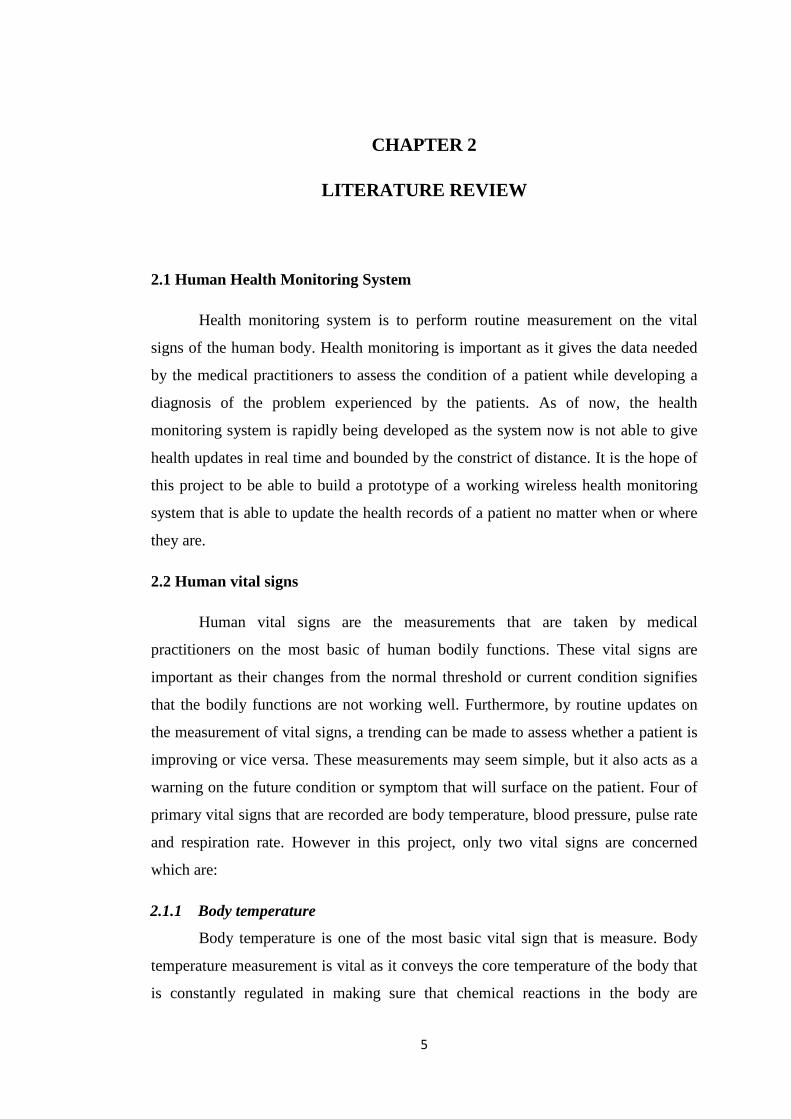
2.1.1 Body temperature
Body temperature is one of the most basic vital sign that is measure. Body
temperature measurement is vital as it conveys the core temperature of the body that
is constantly regulated in making sure that chemical reactions in the body are
6
happening efficiently. Simply, in order for our body to function, it needs to maintain
a regular set of core body temperature and if the core body temperature increased or
decrease, it will signify that the thermoregulation of the body is not functioning,
indicating arising problem. Normally, the human body temperature is at 37°C,
however trending must first be establish to indicate a good baseline of the normal
temperature for a patient specifically.
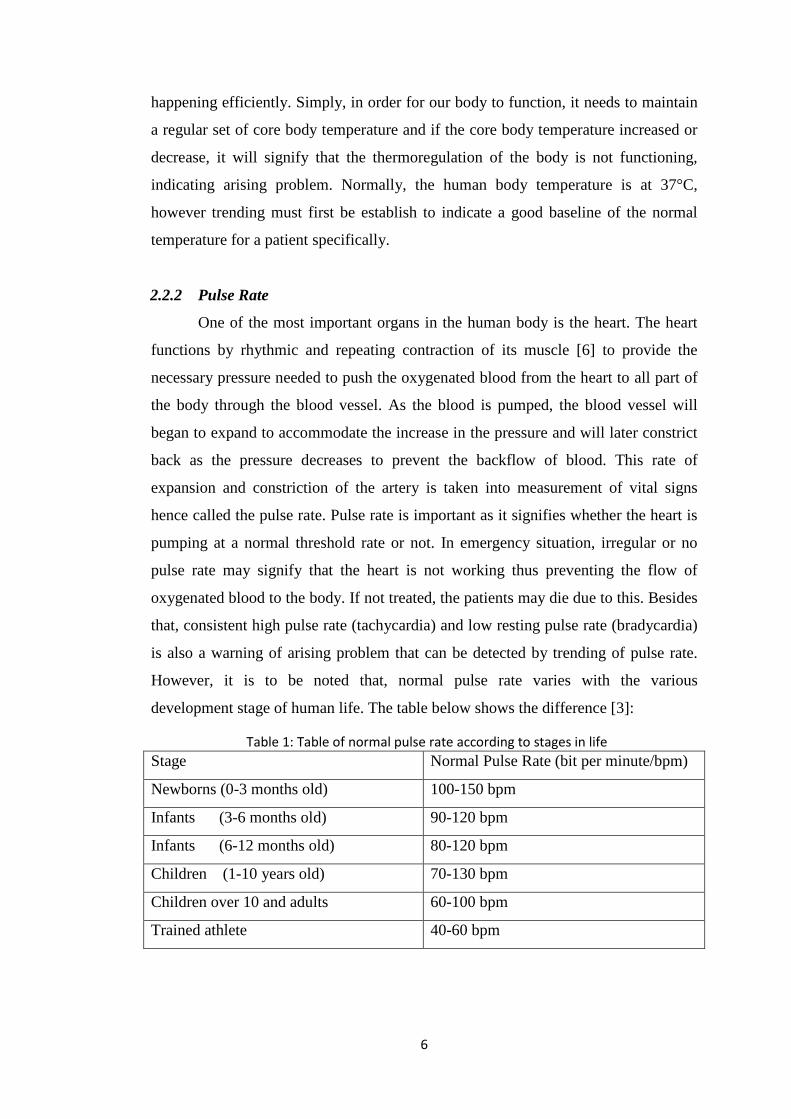
2.2.2 Pulse Rate
One of the most important organs in the human body is the heart. The heart
functions by rhythmic and repeating contraction of its muscle [6] to provide the
necessary pressure needed to push the oxygenated blood from the heart to all part of
the body through the blood vessel. As the blood is pumped, the blood vessel will
began to expand to accommodate the increase in the pressure and will later constrict
back as the pressure decreases to prevent the backflow of blood. This rate of
expansion and constriction of the artery is taken into measurement of vital signs
hence called the pulse rate. Pulse rate is important as it signifies whether the heart is
pumping at a normal threshold rate or not. In emergency situation, irregular or no
pulse rate may signify that the heart is not working thus preventing the flow of
oxygenated blood to the body. If not treated, the patients may die due to this. Besides
that, consistent high pulse rate (tachycardia) and low resting pulse rate (bradycardia)
is also a warning of arising problem that can be detected by trending of pulse rate.
However, it is to be noted that, normal pulse rate varies with the various
development stage of human life. The table below shows the difference [3]:
Stage Normal Pulse Rate (bit per minute/bpm)
Newborns (0-3 months old) 100-150 bpm
Infants (3-6 months old) 90-120 bpm
Infants (6-12 months old) 80-120 bpm
Children (1-10 years old) 70-130 bpm
Children over 10 and adults 60-100 bpm
Trained athlete 40-60 bpm
Table 1: Table of normal pulse rate according to stages in life
7
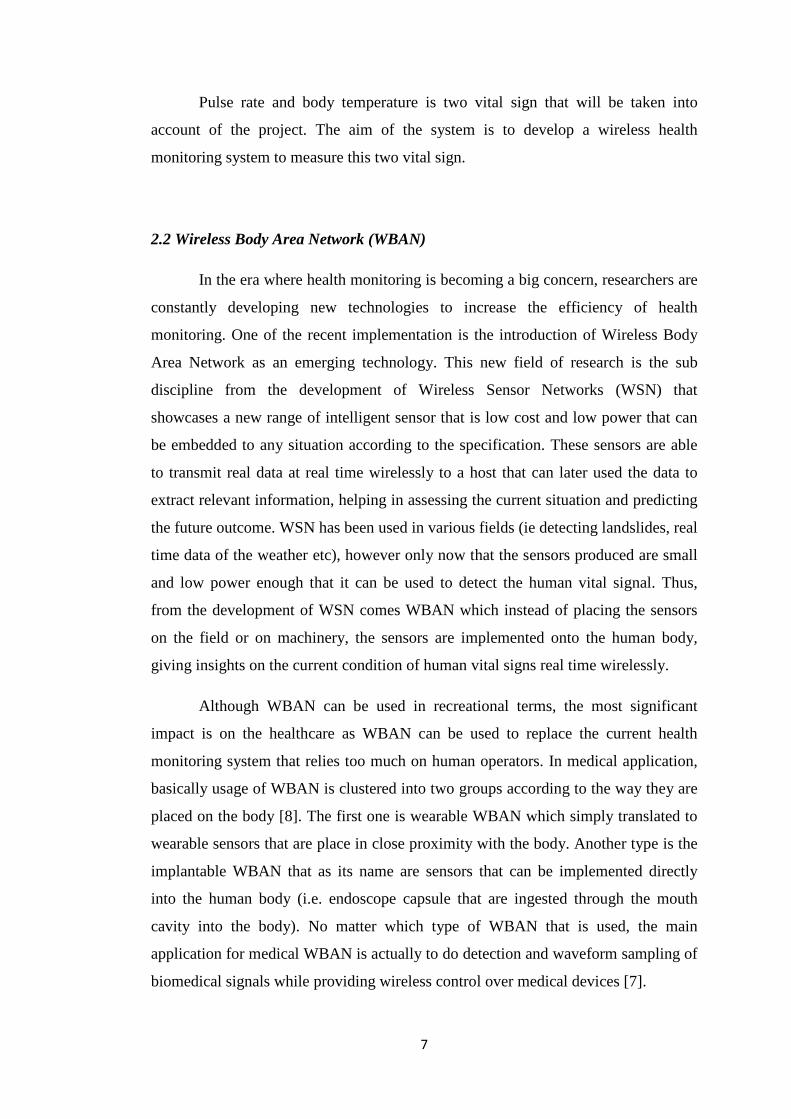
Pulse rate and body temperature is two vital sign that will be taken into
account of the project. The aim of the system is to develop a wireless health
monitoring system to measure this two vital sign.
2.2 Wireless Body Area Network (WBAN)
In the era where health monitoring is becoming a big concern, researchers are
constantly developing new technologies to increase the efficiency of health
monitoring. One of the recent implementation is the introduction of Wireless Body
Area Network as an emerging technology. This new field of research is the sub
discipline from the development of Wireless Sensor Networks (WSN) that
showcases a new range of intelligent sensor that is low cost and low power that can
be embedded to any situation according to the specification. These sensors are able
to transmit real data at real time wirelessly to a host that can later used the data to
extract relevant information, helping in assessing the current situation and predicting
the future outcome. WSN has been used in various fields (ie detecting landslides, real
time data of the weather etc), however only now that the sensors produced are small
and low power enough that it can be used to detect the human vital signal. Thus,
from the development of WSN comes WBAN which instead of placing the sensors
on the field or on machinery, the sensors are implemented onto the human body,
giving insights on the current condition of human vital signs real time wirelessly.
Although WBAN can be used in recreational terms, the most significant
impact is on the healthcare as WBAN can be used to replace the current health
monitoring system that relies too much on human operators. In medical application,
basically usage of WBAN is clustered into two groups according to the way they are
placed on the body [8]. The first one is wearable WBAN which simply translated to
wearable sensors that are place in close proximity with the body. Another type is the
implantable WBAN that as its name are sensors that can be implemented directly
into the human body (i.e. endoscope capsule that are ingested through the mouth
cavity into the body). No matter which type of WBAN that is used, the main
application for medical WBAN is actually to do detection and waveform sampling of
biomedical signals while providing wireless control over medical devices [7].
8
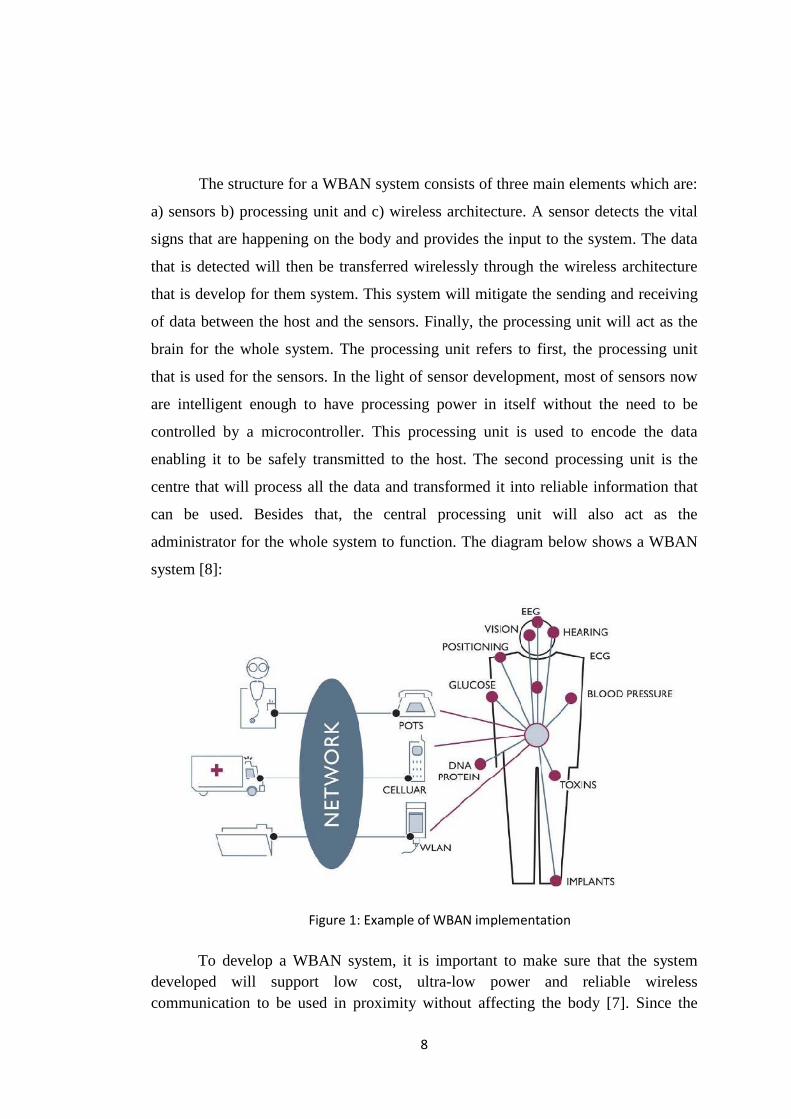
The structure for a WBAN system consists of three main elements which are:
a) sensors b) processing unit and c) wireless architecture. A sensor detects the vital
signs that are happening on the body and provides the input to the system. The data
that is detected will then be transferred wirelessly through the wireless architecture
that is develop for them system. This system will mitigate the sending and receiving
of data between the host and the sensors. Finally, the processing unit will act as the
brain for the whole system. The processing unit refers to first, the processing unit
that is used for the sensors. In the light of sensor development, most of sensors now
are intelligent enough to have processing power in itself without the need to be
controlled by a microcontroller. This processing unit is used to encode the data
enabling it to be safely transmitted to the host. The second processing unit is the
centre that will process all the data and transformed it into reliable information that
can be used. Besides that, the central processing unit will also act as the
administrator for the whole system to function. The diagram below shows a WBAN
system [8]:
To develop a WBAN system, it is important to make sure that the system developed will support low cost, ultra-low power and reliable wireless communication to be used in proximity without affecting the body [7]. Since the
Figure 1: Example of WBAN implementation
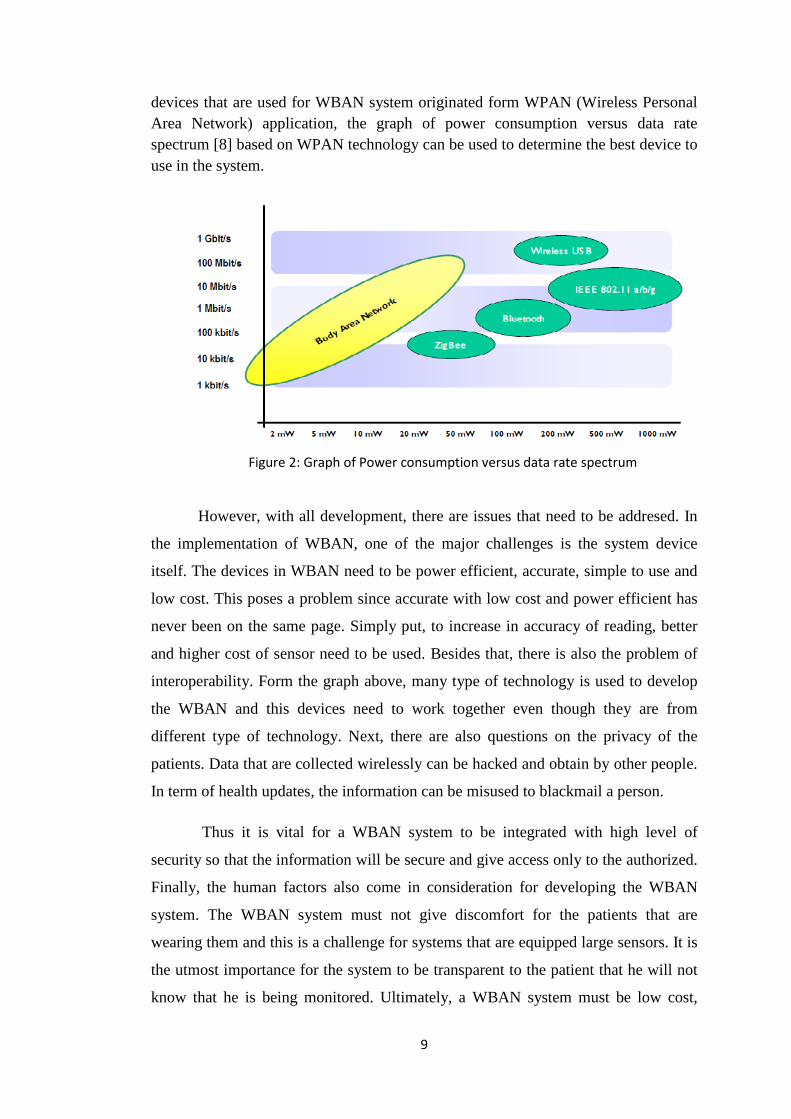
9
devices that are used for WBAN system originated form WPAN (Wireless Personal Area Network) application, the graph of power consumption versus data rate spectrum [8] based on WPAN technology can be used to determine the best device to use in the system.
However, with all development, there are issues that need to be addresed. In
the implementation of WBAN, one of the major challenges is the system device
itself. The devices in WBAN need to be power efficient, accurate, simple to use and
low cost. This poses a problem since accurate with low cost and power efficient has
never been on the same page. Simply put, to increase in accuracy of reading, better
and higher cost of sensor need to be used. Besides that, there is also the problem of
interoperability. Form the graph above, many type of technology is used to develop
the WBAN and this devices need to work together even though they are from
different type of technology. Next, there are also questions on the privacy of the
patients. Data that are collected wirelessly can be hacked and obtain by other people.
In term of health updates, the information can be misused to blackmail a person.
Thus it is vital for a WBAN system to be integrated with high level of
security so that the information will be secure and give access only to the authorized.
Finally, the human factors also come in consideration for developing the WBAN
system. The WBAN system must not give discomfort for the patients that are
wearing them and this is a challenge for systems that are equipped large sensors. It is
the utmost importance for the system to be transparent to the patient that he will not
know that he is being monitored. Ultimately, a WBAN system must be low cost,
Figure 2: Graph of Power consumption versus data rate spectrum
10
power efficient, transparent from the patient, accurate and have a high level of
security to protect from hacking.
Hence in this project, ZigBee technology will be used as the wireless
architecture using two sensors, pulse sensor and temperature sensor controlled by
Arduino based board to develop the WBAN.
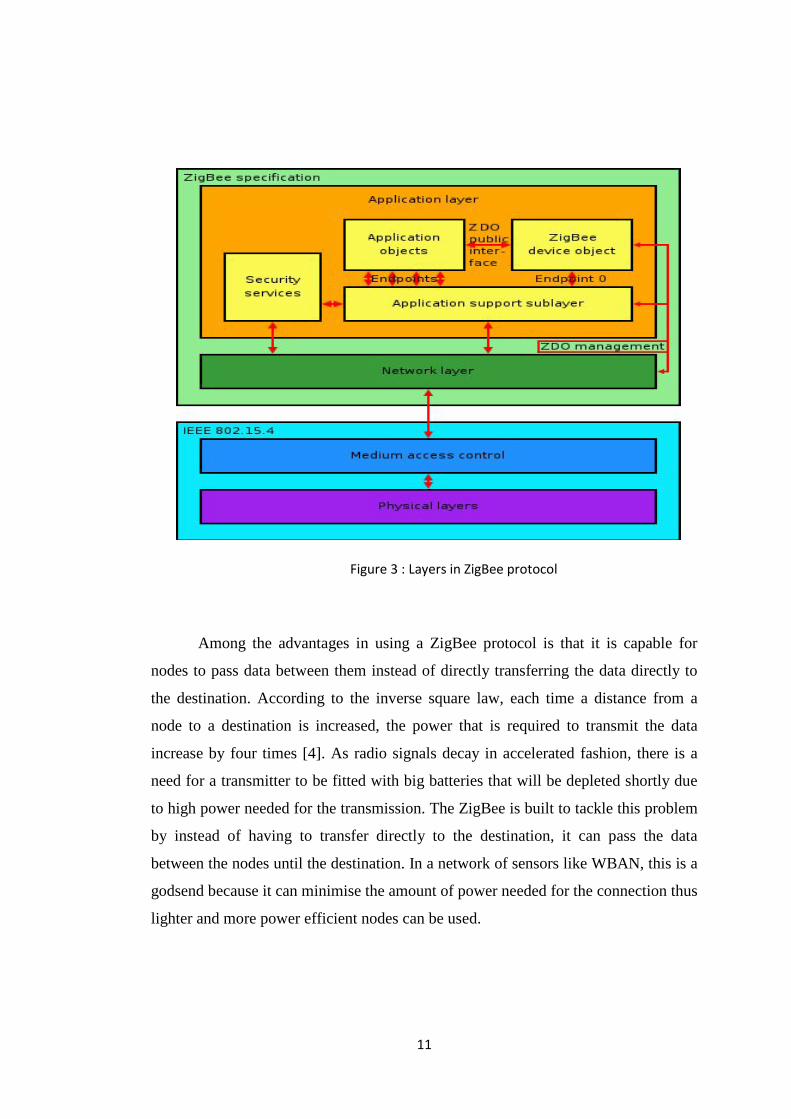
2.3 ZigBee
ZigBee is the protocol that will be used to develop the wireless framework for
this project. ZigBee, a standard communications protocol for low power, wireless
mesh networking is developed from the network layer known as IEEE 802.15.4 [5].
IEEE 802.15.4 is the standard that specifies the physical layer and media access
control for low rate wireless personal area networks. This standard defines the power
management, addressing, error correction, massage formats and other point to point
specific necessary for wireless communication to be established using radio
frequency. Meanwhile, ZigBee is built upon this standard and added the upper layers
that are not there in IEEE 802.15.4. The layers are[4]:
a) Routing
Routing determines the framework of how a transmitter can pass data from a
series of other transmitter all the way to the destination.
b) Ad Hoc Network creation
This enables the radio to create an entire network automatically without help
from outside.
c) Self Healing Mesh
An automated process whereby the radio that are broken are detected and
measures are taken to reconfigure the network to repair broken routes.
11
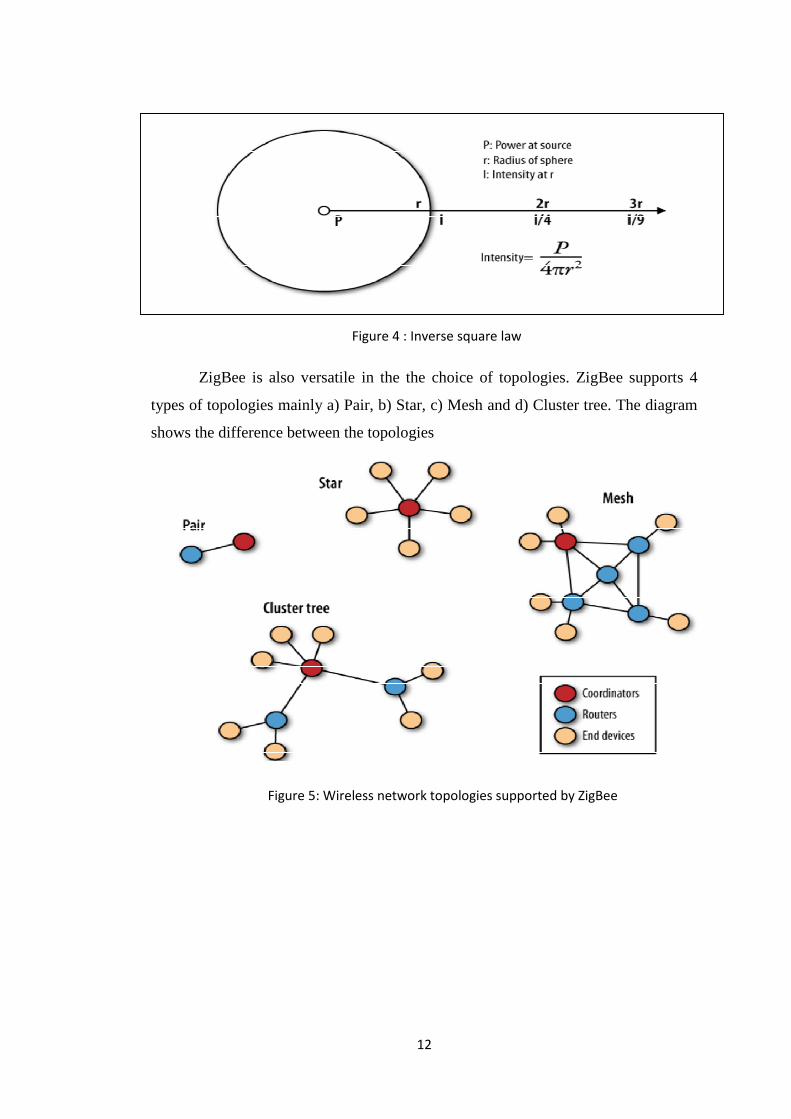
Among the advantages in using a ZigBee protocol is that it is capable for
nodes to pass data between them instead of directly transferring the data directly to
the destination. According to the inverse square law, each time a distance from a
node to a destination is increased, the power that is required to transmit the data
increase by four times [4]. As radio signals decay in accelerated fashion, there is a
need for a transmitter to be fitted with big batteries that will be depleted shortly due
to high power needed for the transmission. The ZigBee is built to tackle this problem
by instead of having to transfer directly to the destination, it can pass the data
between the nodes until the destination. In a network of sensors like WBAN, this is a
godsend because it can minimise the amount of power needed for the connection thus
lighter and more power efficient nodes can be used.
Figure 3 : Layers in ZigBee protocol
12
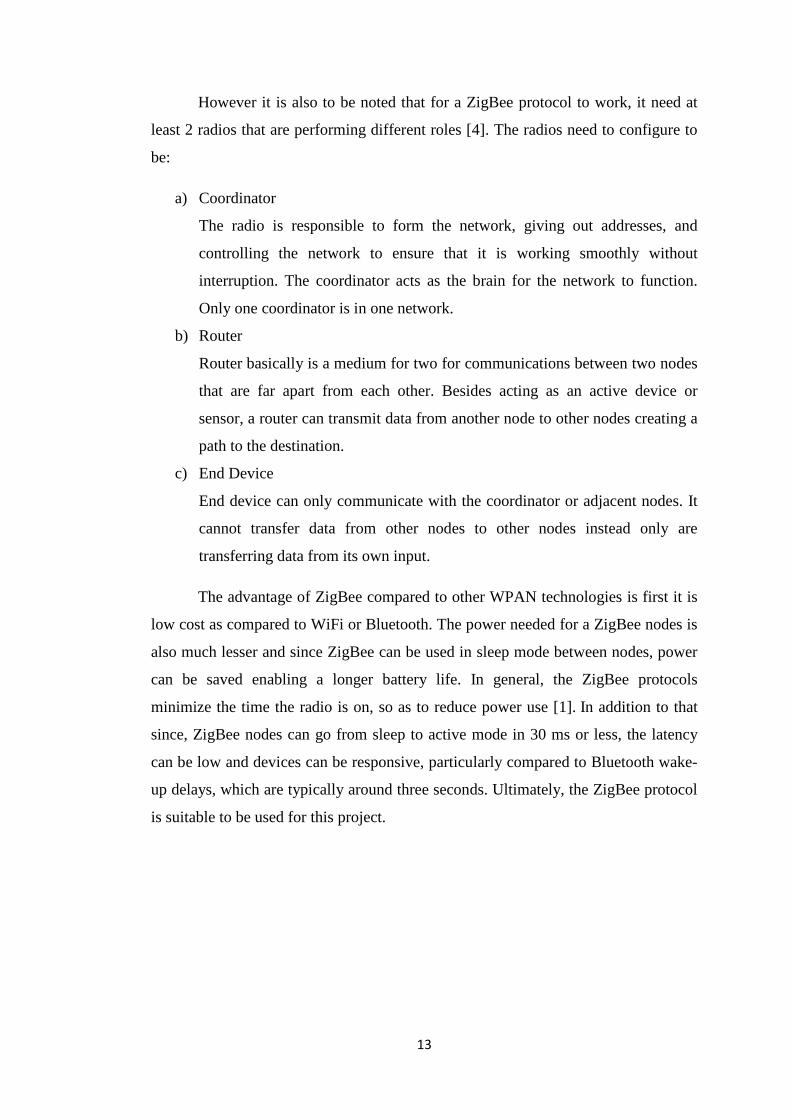
ZigBee is also versatile in the the choice of topologies. ZigBee supports 4
types of topologies mainly a) Pair, b) Star, c) Mesh and d) Cluster tree. The diagram
shows the difference between the topologies
Figure 4 : Inverse square law
Figure 5: Wireless network topologies supported by ZigBee
13
However it is also to be noted that for a ZigBee protocol to work, it need at
least 2 radios that are performing different roles [4]. The radios need to configure to
be:
a) Coordinator
The radio is responsible to form the network, giving out addresses, and
controlling the network to ensure that it is working smoothly without
interruption. The coordinator acts as the brain for the network to function.
Only one coordinator is in one network.
b) Router
Router basically is a medium for two for communications between two nodes
that are far apart from each other. Besides acting as an active device or
sensor, a router can transmit data from another node to other nodes creating a
path to the destination.
c) End Device
End device can only communicate with the coordinator or adjacent nodes. It
cannot transfer data from other nodes to other nodes instead only are
transferring data from its own input.
The advantage of ZigBee compared to other WPAN technologies is first it is
low cost as compared to WiFi or Bluetooth. The power needed for a ZigBee nodes is
also much lesser and since ZigBee can be used in sleep mode between nodes, power
can be saved enabling a longer battery life. In general, the ZigBee protocols
minimize the time the radio is on, so as to reduce power use [1]. In addition to that
since, ZigBee nodes can go from sleep to active mode in 30 ms or less, the latency
can be low and devices can be responsive, particularly compared to Bluetooth wake-
up delays, which are typically around three seconds. Ultimately, the ZigBee protocol
is suitable to be used for this project.
14
CHAPTER 3
METHODOLOGY
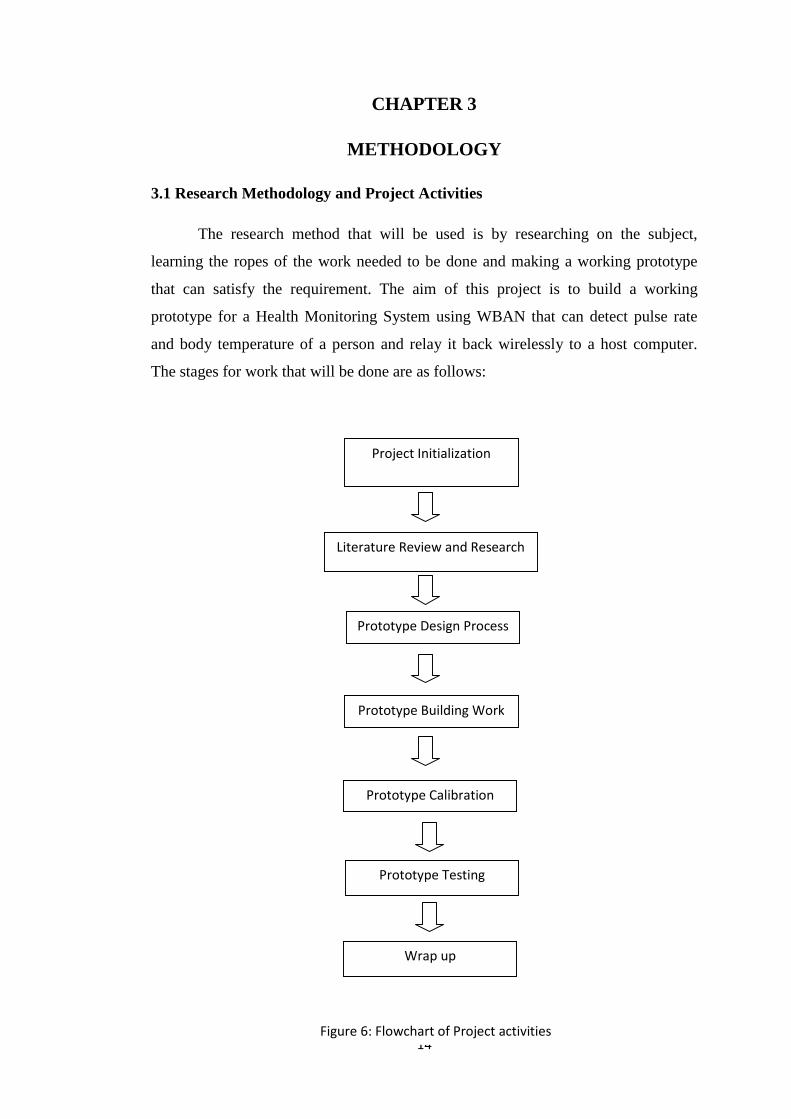
3.1 Research Methodology and Project Activities
The research method that will be used is by researching on the subject,
learning the ropes of the work needed to be done and making a working prototype
that can satisfy the requirement. The aim of this project is to build a working
prototype for a Health Monitoring System using WBAN that can detect pulse rate
and body temperature of a person and relay it back wirelessly to a host computer.
The stages for work that will be done are as follows:
Project Initialization
Literature Review and Research
Prototype Design Process
Prototype Building Work
Prototype Calibration
Prototype Testing
Wrap up
Figure 6: Flowchart of Project activities

15
3.2 Project Activities
a) Project Initialization
Project is given to the student by Dr Azlan. The project is divided to FYP 1
and FYP 2. FYP 1 is more on finding literature review of the subject and
coming up with the design for the prototype while FYP 2 concerns with
building, calibrating and testing the prototype.
b) Literature Review and Research
Research is done on the proposed project title. Information is gained from
literature review done on past experiments and projects, journal papers,
internet and books. An understanding on the topics in the research must be
established at the end of this activity. Problem statement, objectives and
project scope is determined here.
c) Prototype Design Process
The design of the prototype will be constructed and finalised in this activity.
The design processes that will follow are:
A. Choosing the sensor, microcontroller and technology to develop the
wireless network
B. Design of the prototype
C. Architecture for the programming
D. Wireless network topologies
E. User interface for the prototype
d) Prototype Building work
The prototype will be built during this stage. Minor adjustments may be done
on initial design to compensate for any problem surfacing. The programming
will also be done in this stage.
e) Prototype Calibration
Since the prototype developed is a measuring device, it need to be calibrated
so that it functions normally and able to detect the vital signals.
f) Prototype testing
The prototype will be tested on human being to ensure whether it passed the
objectives set at the start of the project.
g) Wrap-Up
Preparation of paperwork for the project is conducted here.

16
3.3 Tools
a) Sensor
i. Temperature sensor
ii. Pulse oximeter
b) Board
i. Adruino Uno
ii. Input Output Shield
iii. ZigBee Shield
c) ZigBee Communication
i. Xbee ZigBee Module
ii. Xbee Explorer
d) Jumper wire
e) USB to mini USB wire
f) Power Supply cable
g) Power bank
3.4 Applications
Application Usage X-CTU -program developed Digi International Inc. That is used to configure
the Xbee Series 2 transmitter Adruino 1.0.3 -Java based IDE developed by Arduino team that uses C/C++
language to make writing code and uploading to the Arduino easier Processing 1.5.1 -Java based open source programming language created by the
Processing team for people who want to create images, animations,
and interactions.
Table 2: Applications and usage
17
CHAPTER 4
RESULT AND DISCUSSION
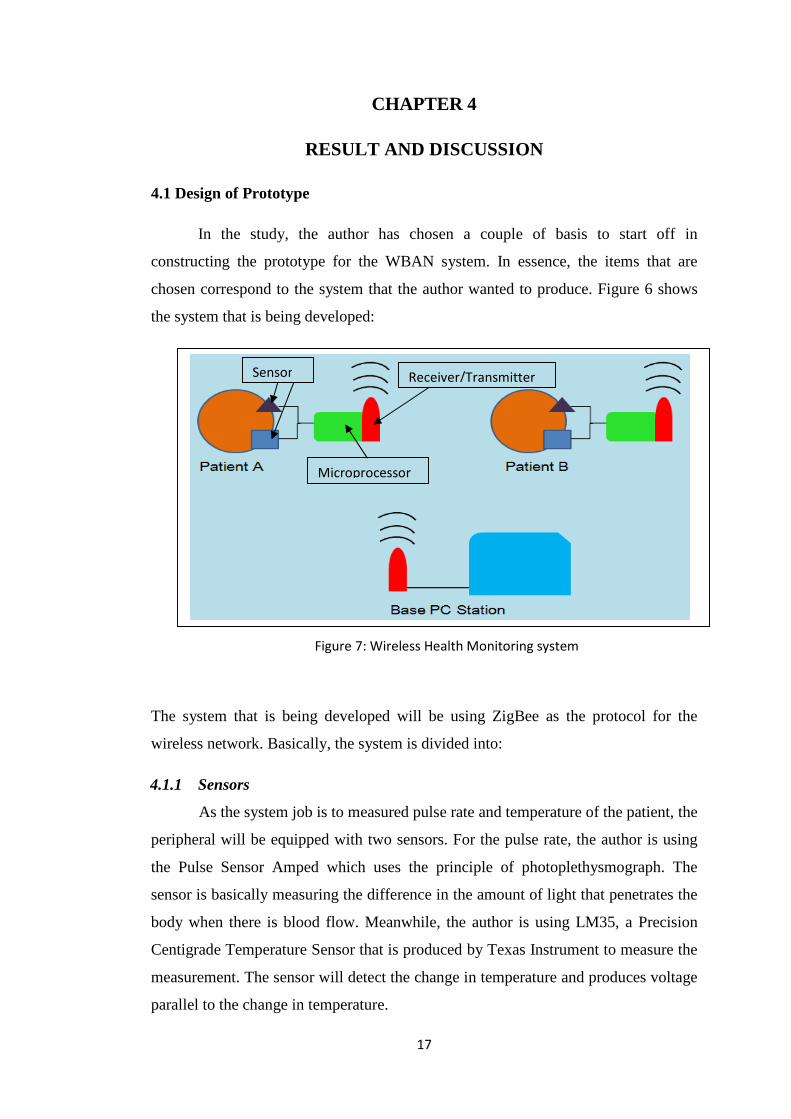
4.1 Design of Prototype
In the study, the author has chosen a couple of basis to start off in
constructing the prototype for the WBAN system. In essence, the items that are
chosen correspond to the system that the author wanted to produce. Figure 6 shows
the system that is being developed:
The system that is being developed will be using ZigBee as the protocol for the
wireless network. Basically, the system is divided into:
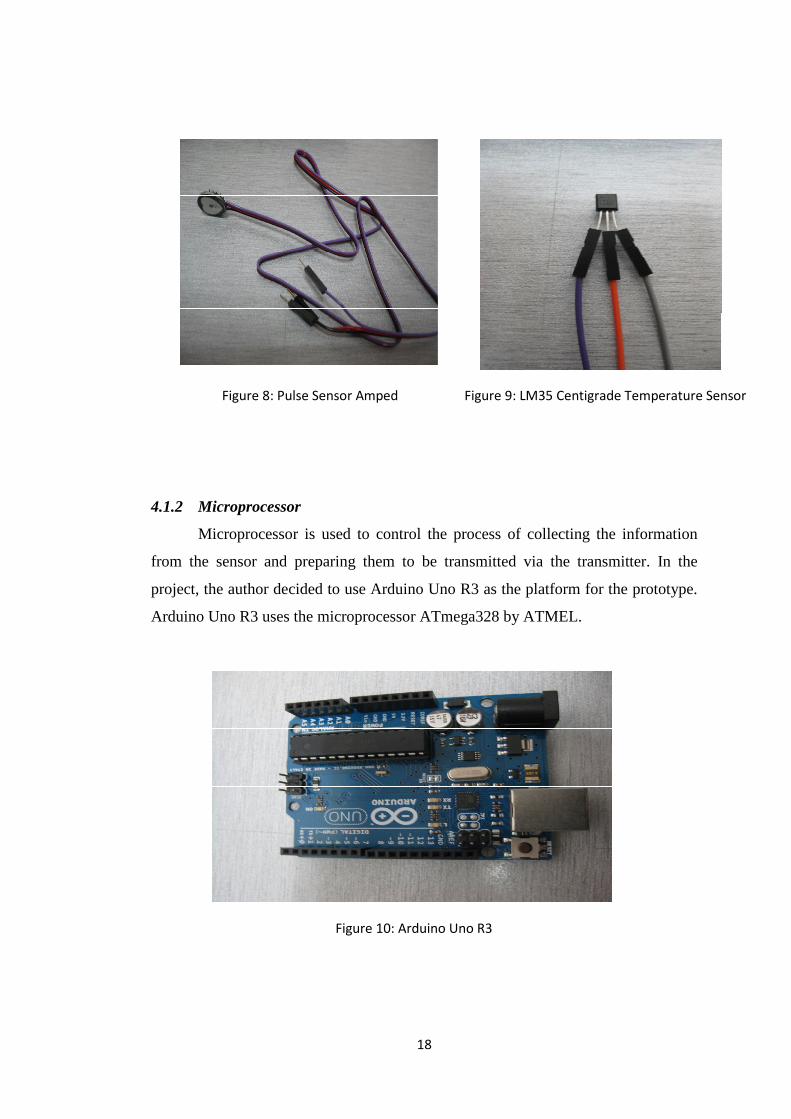
4.1.1 Sensors
As the system job is to measured pulse rate and temperature of the patient, the
peripheral will be equipped with two sensors. For the pulse rate, the author is using
the Pulse Sensor Amped which uses the principle of photoplethysmograph. The
sensor is basically measuring the difference in the amount of light that penetrates the
body when there is blood flow. Meanwhile, the author is using LM35, a Precision
Centigrade Temperature Sensor that is produced by Texas Instrument to measure the
measurement. The sensor will detect the change in temperature and produces voltage
parallel to the change in temperature.
Sensor
Microprocessor
Receiver/Transmitter
Figure 7: Wireless Health Monitoring system
18
4.1.2 Microprocessor
Microprocessor is used to control the process of collecting the information
from the sensor and preparing them to be transmitted via the transmitter. In the
project, the author decided to use Arduino Uno R3 as the platform for the prototype.
Arduino Uno R3 uses the microprocessor ATmega328 by ATMEL.
Figure 8: Pulse Sensor Amped Figure 9: LM35 Centigrade Temperature Sensor
Figure 10: Arduino Uno R3
19
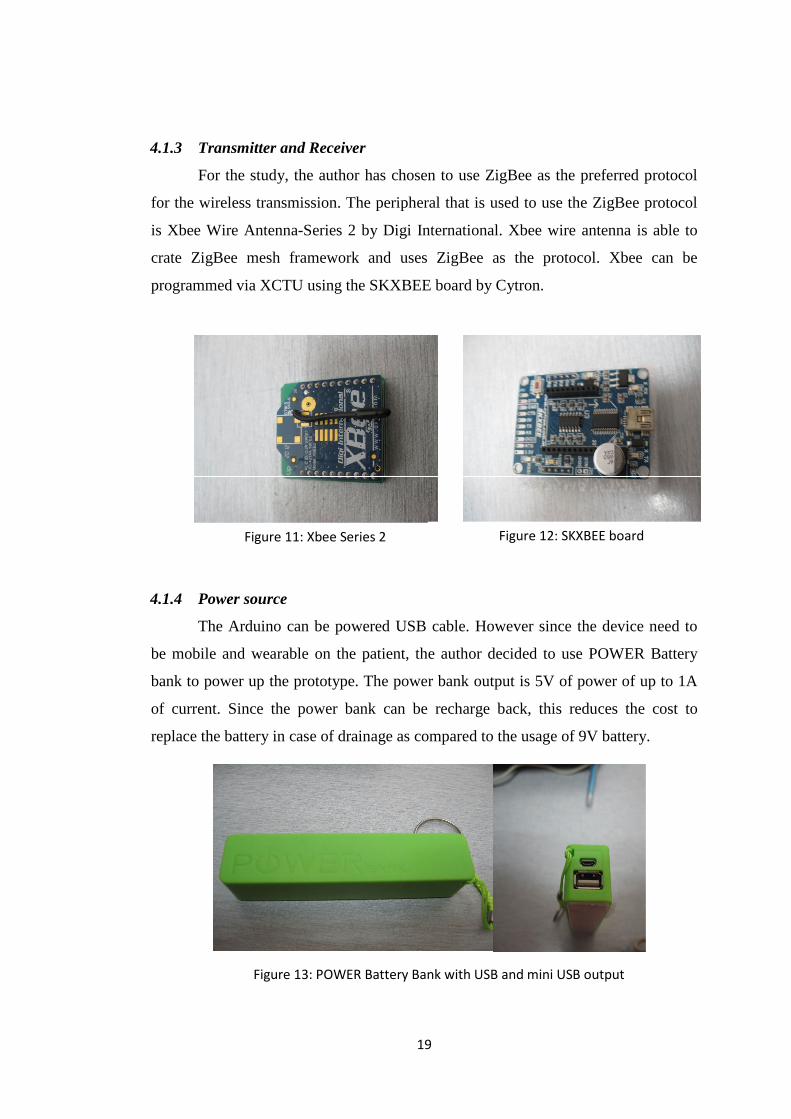
4.1.3 Transmitter and Receiver
For the study, the author has chosen to use ZigBee as the preferred protocol
for the wireless transmission. The peripheral that is used to use the ZigBee protocol
is Xbee Wire Antenna-Series 2 by Digi International. Xbee wire antenna is able to
crate ZigBee mesh framework and uses ZigBee as the protocol. Xbee can be
programmed via XCTU using the SKXBEE board by Cytron.
4.1.4 Power source
The Arduino can be powered USB cable. However since the device need to
be mobile and wearable on the patient, the author decided to use POWER Battery
bank to power up the prototype. The power bank output is 5V of power of up to 1A
of current. Since the power bank can be recharge back, this reduces the cost to
replace the battery in case of drainage as compared to the usage of 9V battery.
Figure 11: Xbee Series 2 Figure 12: SKXBEE board
Figure 13: POWER Battery Bank with USB and mini USB output
20
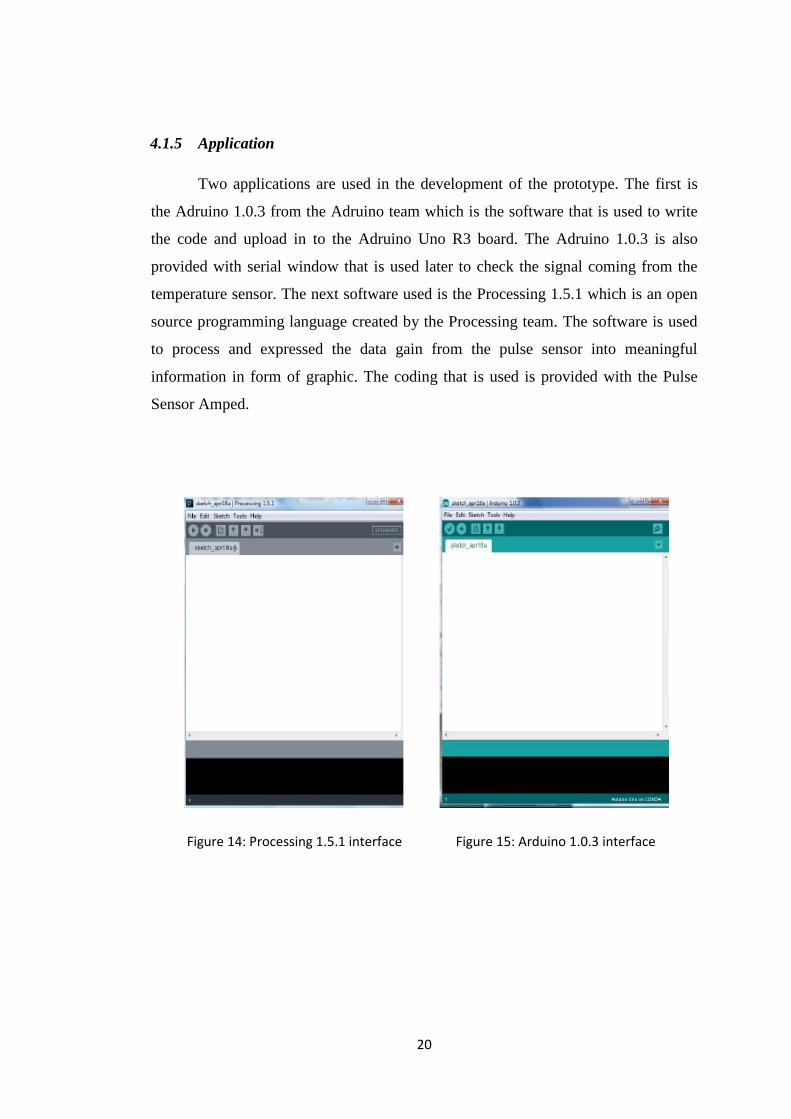
4.1.5 Application
Two applications are used in the development of the prototype. The first is
the Adruino 1.0.3 from the Adruino team which is the software that is used to write
the code and upload in to the Adruino Uno R3 board. The Adruino 1.0.3 is also
provided with serial window that is used later to check the signal coming from the
temperature sensor. The next software used is the Processing 1.5.1 which is an open
source programming language created by the Processing team. The software is used
to process and expressed the data gain from the pulse sensor into meaningful
information in form of graphic. The coding that is used is provided with the Pulse
Sensor Amped.
Figure 14: Processing 1.5.1 interface Figure 15: Arduino 1.0.3 interface
21
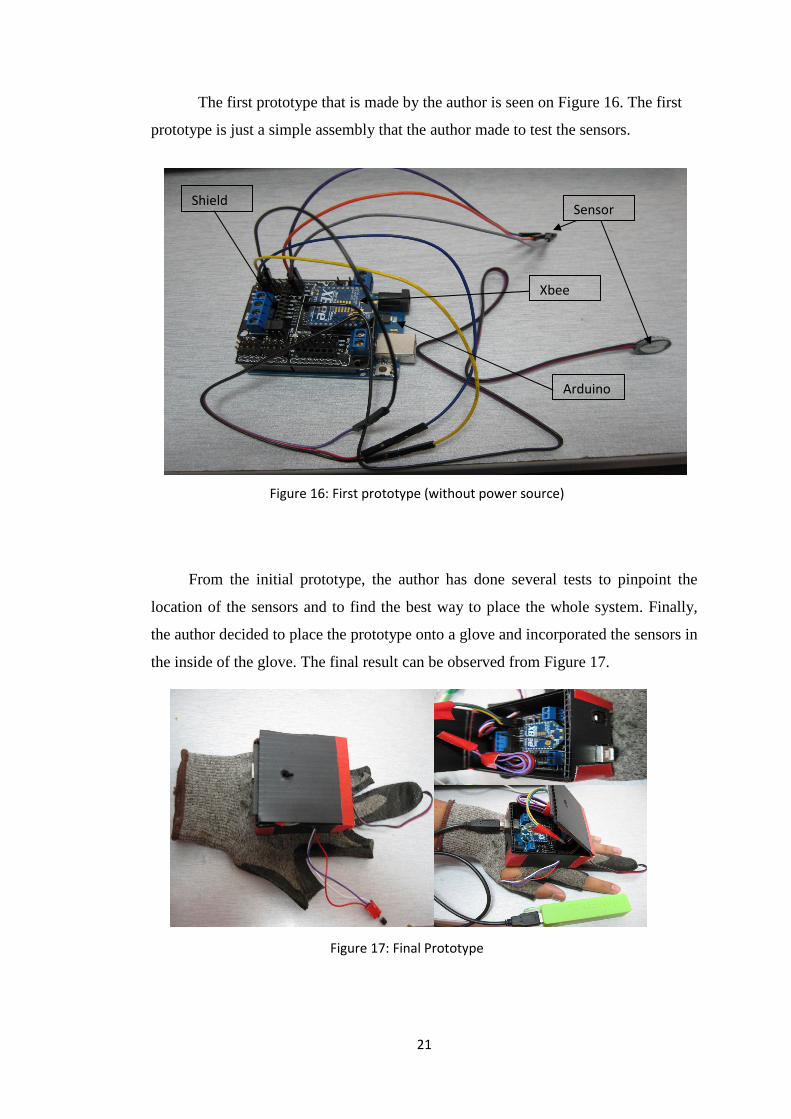
The first prototype that is made by the author is seen on Figure 16. The first
prototype is just a simple assembly that the author made to test the sensors.
From the initial prototype, the author has done several tests to pinpoint the
location of the sensors and to find the best way to place the whole system. Finally,
the author decided to place the prototype onto a glove and incorporated the sensors in
the inside of the glove. The final result can be observed from Figure 17.
Sensor
Xbee
Arduino
Shield
Figure 16: First prototype (without power source)
Figure 17: Final Prototype
22
4.2 Result
After assembling the prototype, the author had done several tests that are aimed
at testing the capability of the device to satisfy the objectives that had been set. From
the tests, tuning is made on the physical hardware of the prototype and coding of the
Arduino as to improve the precision and accuracy of the sensors. Among the tests
that are already done and their results are:
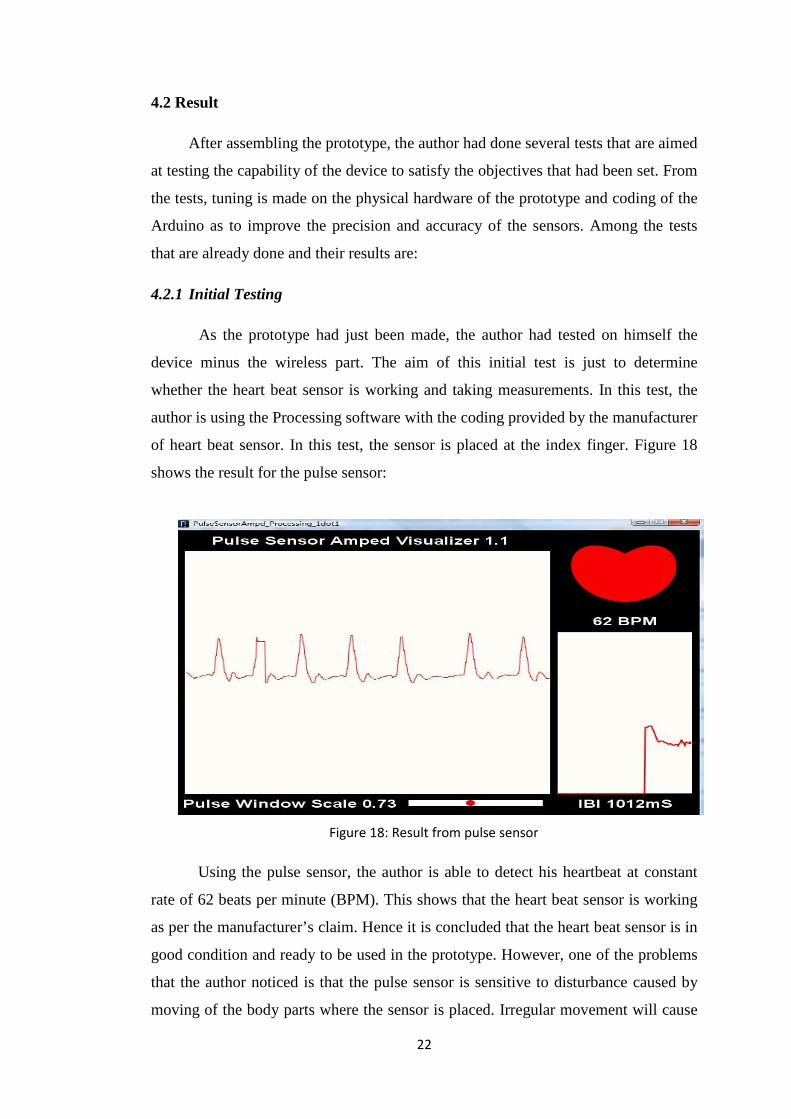
4.2.1 Initial Testing
As the prototype had just been made, the author had tested on himself the
device minus the wireless part. The aim of this initial test is just to determine
whether the heart beat sensor is working and taking measurements. In this test, the
author is using the Processing software with the coding provided by the manufacturer
of heart beat sensor. In this test, the sensor is placed at the index finger. Figure 18
shows the result for the pulse sensor:
Using the pulse sensor, the author is able to detect his heartbeat at constant
rate of 62 beats per minute (BPM). This shows that the heart beat sensor is working
as per the manufacturer’s claim. Hence it is concluded that the heart beat sensor is in
good condition and ready to be used in the prototype. However, one of the problems
that the author noticed is that the pulse sensor is sensitive to disturbance caused by
moving of the body parts where the sensor is placed. Irregular movement will cause
Figure 18: Result from pulse sensor
23
the measurement to not be constant hence not producing good results. Since the
initial test is only aimed at testing the working of the heart beat sensor, no adjustment
is made. The problem is rectified during other tests.
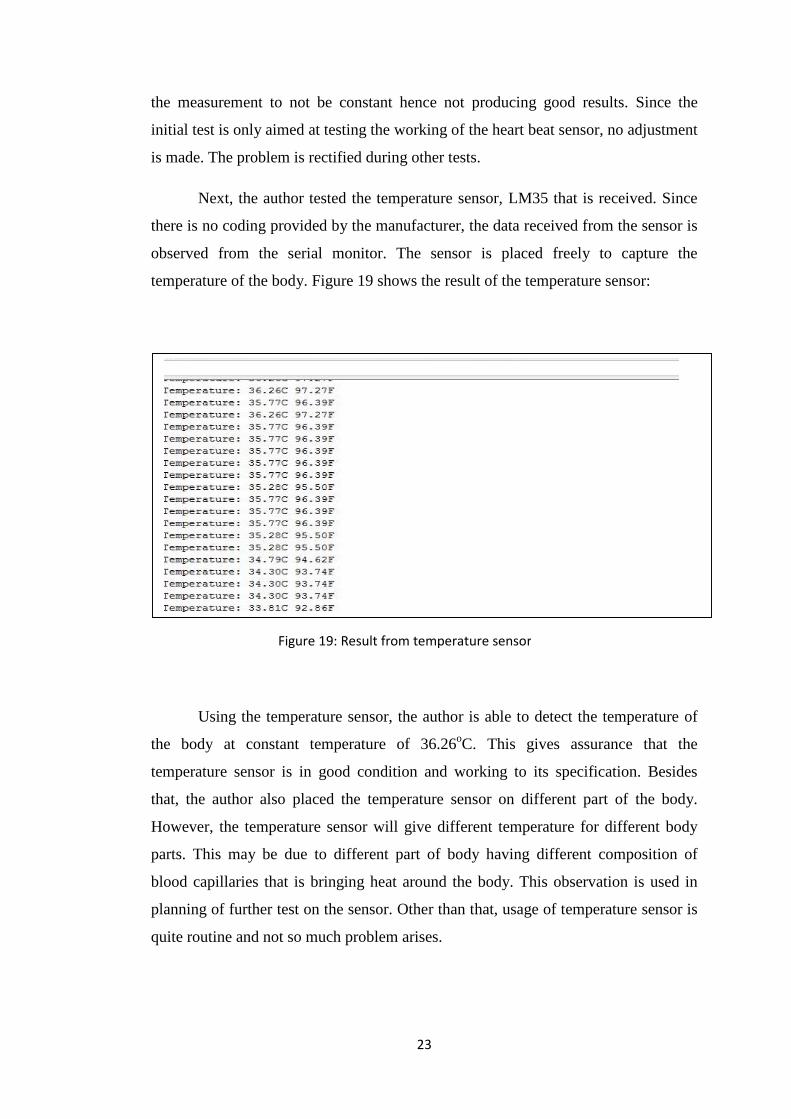
Next, the author tested the temperature sensor, LM35 that is received. Since
there is no coding provided by the manufacturer, the data received from the sensor is
observed from the serial monitor. The sensor is placed freely to capture the
temperature of the body. Figure 19 shows the result of the temperature sensor:
Using the temperature sensor, the author is able to detect the temperature of
the body at constant temperature of 36.26oC. This gives assurance that the
temperature sensor is in good condition and working to its specification. Besides
that, the author also placed the temperature sensor on different part of the body.
However, the temperature sensor will give different temperature for different body
parts. This may be due to different part of body having different composition of
blood capillaries that is bringing heat around the body. This observation is used in
planning of further test on the sensor. Other than that, usage of temperature sensor is
quite routine and not so much problem arises.
Figure 19: Result from temperature sensor
24
4.2.2 Test on Heart Rate Sensor- Pulse Sensor Amped
One of the main objectives of the project is to produce a prototype that is able
to monitor heart rate and temperature of the body with precision and accuracy.
Hence, among the characteristics of the reading that the author wanted is for it to be
constant, with only gradual increase and decrease without apparent inconsistencies in
reading. Thus in achieving this, the author had done series of test, starting with the
heart rate sensor.
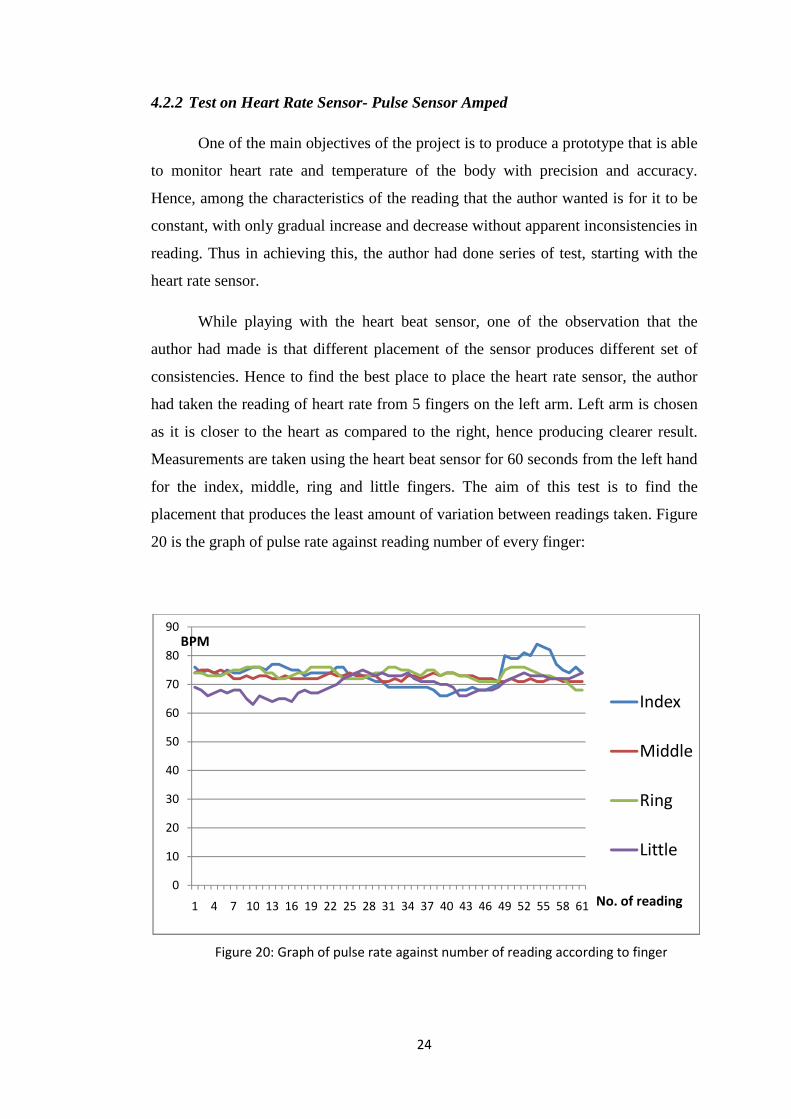
While playing with the heart beat sensor, one of the observation that the
author had made is that different placement of the sensor produces different set of
consistencies. Hence to find the best place to place the heart rate sensor, the author
had taken the reading of heart rate from 5 fingers on the left arm. Left arm is chosen
as it is closer to the heart as compared to the right, hence producing clearer result.
Measurements are taken using the heart beat sensor for 60 seconds from the left hand
for the index, middle, ring and little fingers. The aim of this test is to find the
placement that produces the least amount of variation between readings taken. Figure
20 is the graph of pulse rate against reading number of every finger:
0
10
20
30
40
50
60
70
80
90
1 4 7 10 13 16 19 22 25 28 31 34 37 40 43 46 49 52 55 58 61
Index
Middle
Ring
Little
No. of reading
BPM
Figure 20: Graph of pulse rate against number of reading according to finger
25
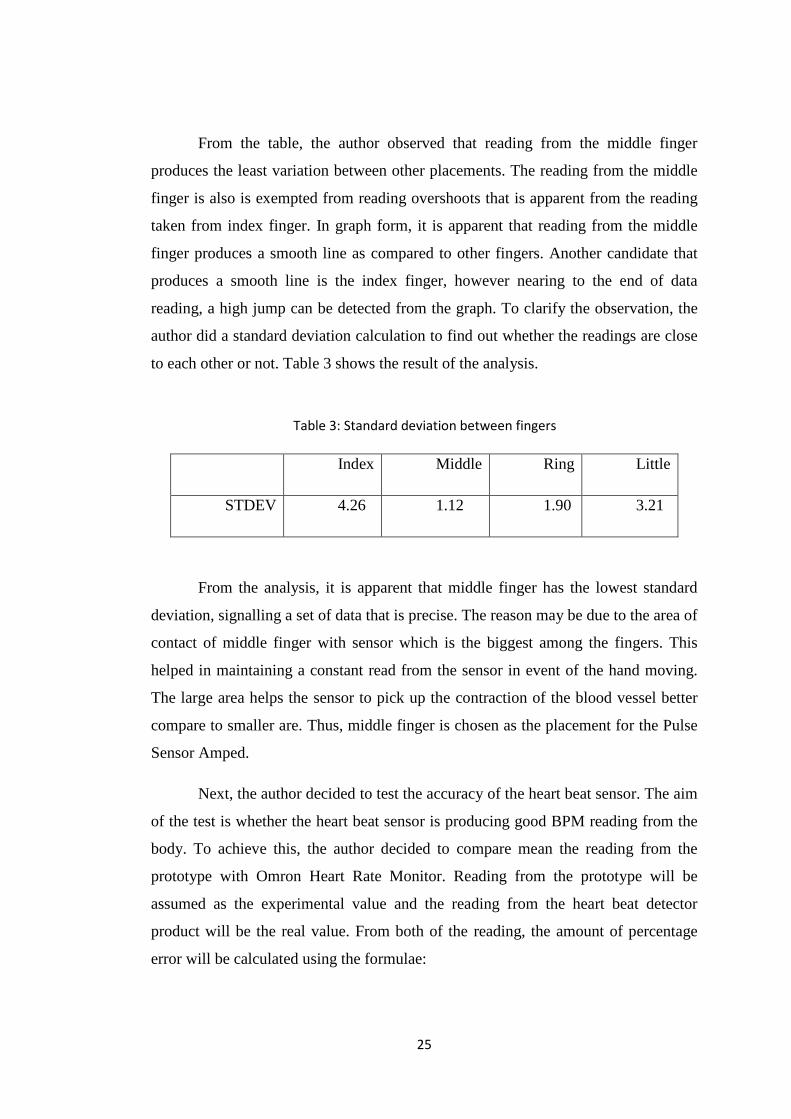
From the table, the author observed that reading from the middle finger
produces the least variation between other placements. The reading from the middle
finger is also is exempted from reading overshoots that is apparent from the reading
taken from index finger. In graph form, it is apparent that reading from the middle
finger produces a smooth line as compared to other fingers. Another candidate that
produces a smooth line is the index finger, however nearing to the end of data
reading, a high jump can be detected from the graph. To clarify the observation, the
author did a standard deviation calculation to find out whether the readings are close
to each other or not. Table 3 shows the result of the analysis.
From the analysis, it is apparent that middle finger has the lowest standard
deviation, signalling a set of data that is precise. The reason may be due to the area of
contact of middle finger with sensor which is the biggest among the fingers. This
helped in maintaining a constant read from the sensor in event of the hand moving.
The large area helps the sensor to pick up the contraction of the blood vessel better
compare to smaller are. Thus, middle finger is chosen as the placement for the Pulse
Sensor Amped.
Next, the author decided to test the accuracy of the heart beat sensor. The aim
of the test is whether the heart beat sensor is producing good BPM reading from the
body. To achieve this, the author decided to compare mean the reading from the
prototype with Omron Heart Rate Monitor. Reading from the prototype will be
assumed as the experimental value and the reading from the heart beat detector
product will be the real value. From both of the reading, the amount of percentage
error will be calculated using the formulae:
Index Middle Ring Little
STDEV 4.26 1.12 1.90 3.21
Table 3: Standard deviation between fingers
26
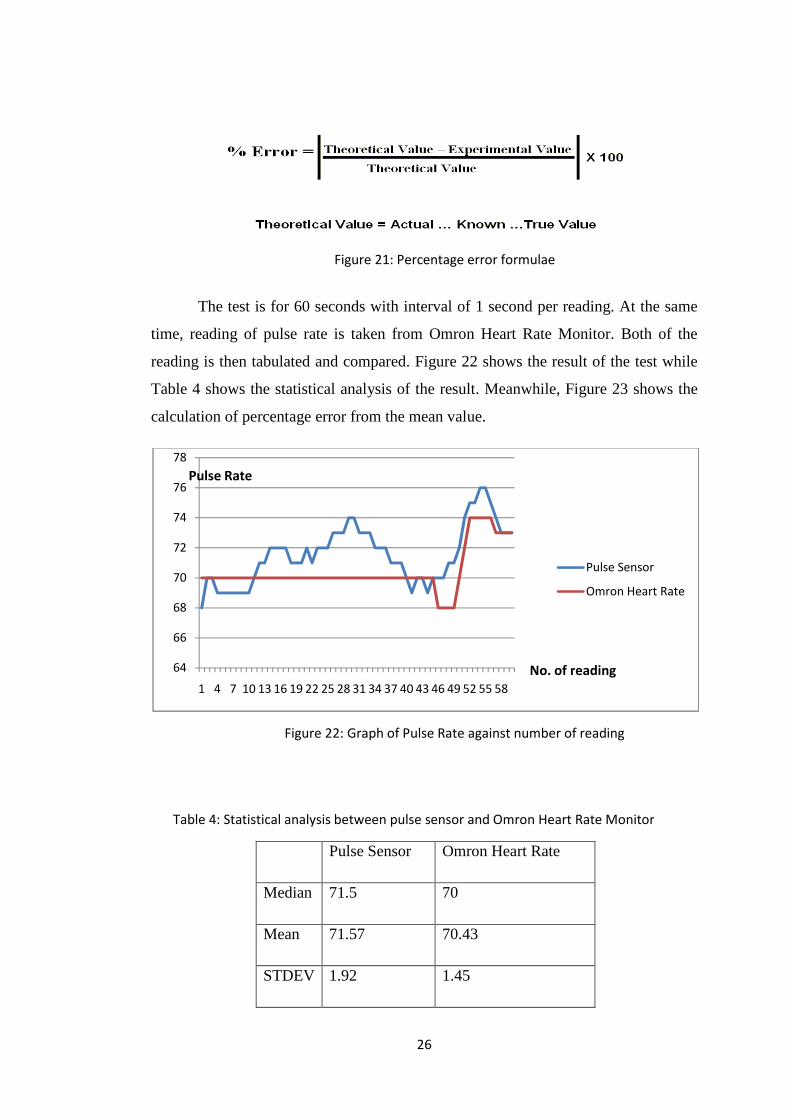
The test is for 60 seconds with interval of 1 second per reading. At the same
time, reading of pulse rate is taken from Omron Heart Rate Monitor. Both of the
reading is then tabulated and compared. Figure 22 shows the result of the test while
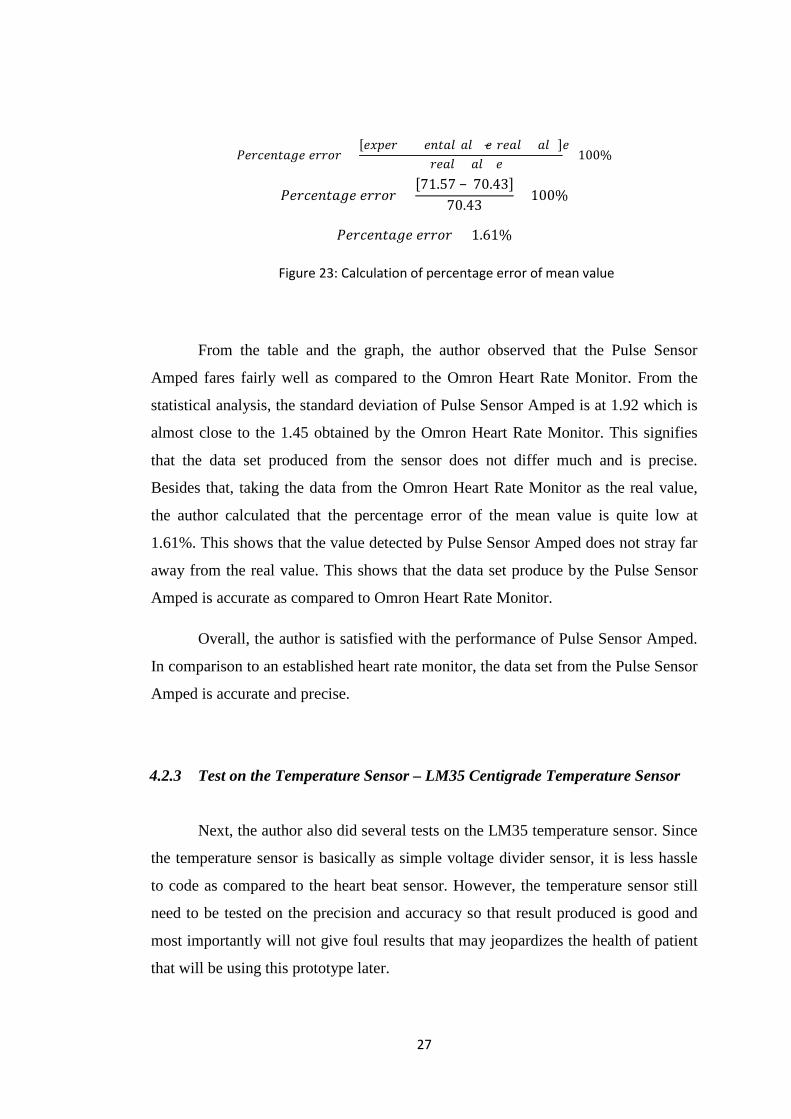
Table 4 shows the statistical analysis of the result. Meanwhile, Figure 23 shows the
calculation of percentage error from the mean value.
64
66
68
70
72
74
76
78
1 4 7 10 13 16 19 22 25 28 31 34 37 40 43 46 49 52 55 58
Pulse Sensor
Omron Heart Rate
Pulse Rate
No. of reading
Pulse Sensor Omron Heart Rate
Median 71.5 70
Mean 71.57 70.43
STDEV 1.92 1.45
Figure 21: Percentage error formulae
Figure 22: Graph of Pulse Rate against number of reading
Table 4: Statistical analysis between pulse sensor and Omron Heart Rate Monitor
27
�hPnh i4eh hPPEP = �h�RhP轨桂h i45 郭45锅h− Ph45 郭45锅h�Ph45 郭45锅h × 100% �hPnh i4eh hPPEP = �71.57 − 70.43�70.43 × 100% �hPnh i4eh hPPEP = 1.61%
From the table and the graph, the author observed that the Pulse Sensor
Amped fares fairly well as compared to the Omron Heart Rate Monitor. From the
statistical analysis, the standard deviation of Pulse Sensor Amped is at 1.92 which is
almost close to the 1.45 obtained by the Omron Heart Rate Monitor. This signifies
that the data set produced from the sensor does not differ much and is precise.
Besides that, taking the data from the Omron Heart Rate Monitor as the real value,
the author calculated that the percentage error of the mean value is quite low at
1.61%. This shows that the value detected by Pulse Sensor Amped does not stray far
away from the real value. This shows that the data set produce by the Pulse Sensor
Amped is accurate as compared to Omron Heart Rate Monitor.
Overall, the author is satisfied with the performance of Pulse Sensor Amped.
In comparison to an established heart rate monitor, the data set from the Pulse Sensor
Amped is accurate and precise.
4.2.3 Test on the Temperature Sensor – LM35 Centigrade Temperature Sensor
Next, the author also did several tests on the LM35 temperature sensor. Since
the temperature sensor is basically as simple voltage divider sensor, it is less hassle
to code as compared to the heart beat sensor. However, the temperature sensor still
need to be tested on the precision and accuracy so that result produced is good and
most importantly will not give foul results that may jeopardizes the health of patient
that will be using this prototype later.
Figure 23: Calculation of percentage error of mean value
28
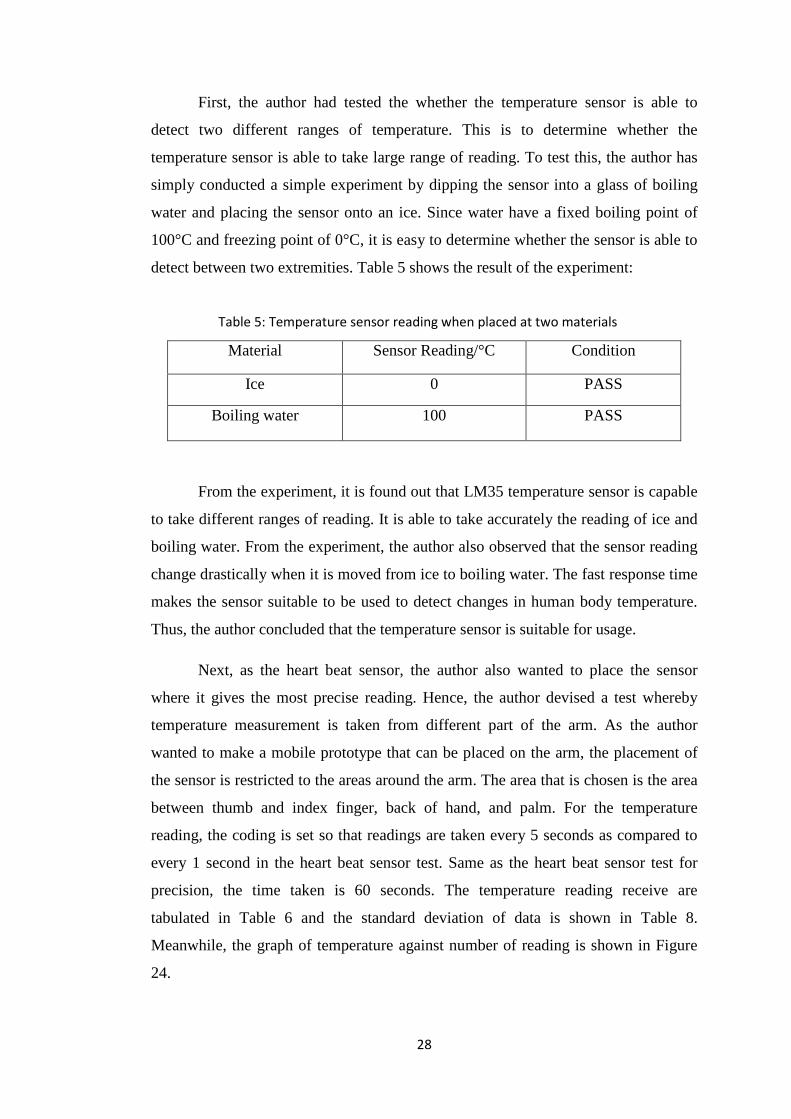
First, the author had tested the whether the temperature sensor is able to
detect two different ranges of temperature. This is to determine whether the
temperature sensor is able to take large range of reading. To test this, the author has
simply conducted a simple experiment by dipping the sensor into a glass of boiling
water and placing the sensor onto an ice. Since water have a fixed boiling point of
100°C and freezing point of 0°C, it is easy to determine whether the sensor is able to
detect between two extremities. Table 5 shows the result of the experiment:
Material Sensor Reading/°C Condition
Ice 0 PASS
Boiling water 100 PASS
From the experiment, it is found out that LM35 temperature sensor is capable
to take different ranges of reading. It is able to take accurately the reading of ice and
boiling water. From the experiment, the author also observed that the sensor reading
change drastically when it is moved from ice to boiling water. The fast response time
makes the sensor suitable to be used to detect changes in human body temperature.
Thus, the author concluded that the temperature sensor is suitable for usage.
Next, as the heart beat sensor, the author also wanted to place the sensor
where it gives the most precise reading. Hence, the author devised a test whereby
temperature measurement is taken from different part of the arm. As the author
wanted to make a mobile prototype that can be placed on the arm, the placement of
the sensor is restricted to the areas around the arm. The area that is chosen is the area
between thumb and index finger, back of hand, and palm. For the temperature
reading, the coding is set so that readings are taken every 5 seconds as compared to
every 1 second in the heart beat sensor test. Same as the heart beat sensor test for
precision, the time taken is 60 seconds. The temperature reading receive are
tabulated in Table 6 and the standard deviation of data is shown in Table 8.
Meanwhile, the graph of temperature against number of reading is shown in Figure
24.
Table 5: Temperature sensor reading when placed at two materials
29
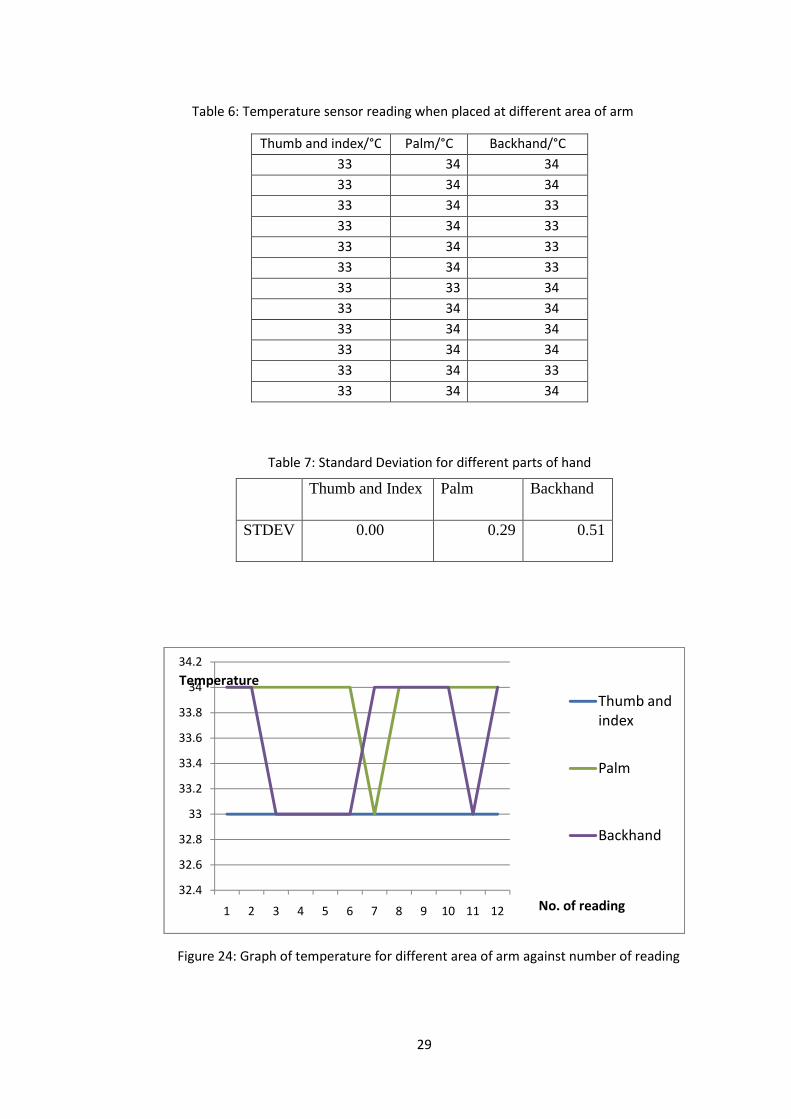
Thumb and index/°C Palm/°C Backhand/°C 33 34 34 33 34 34 33 34 33 33 34 33 33 34 33 33 34 33 33 33 34 33 34 34 33 34 34 33 34 34 33 34 33 33 34 34
32.4
32.6
32.8
33
33.2
33.4
33.6
33.8
34
34.2
1 2 3 4 5 6 7 8 9 10 11 12
Thumb and index
Palm
Backhand
No. of reading
Temperature
Thumb and Index Palm Backhand
STDEV 0.00 0.29 0.51
Table 6: Temperature sensor reading when placed at different area of arm
Figure 24: Graph of temperature for different area of arm against number of reading
Table 7: Standard Deviation for different parts of hand
30
From the graph, the author observed that different placement will produce
different range of temperature. This is due to that as blood travels from the heart, it
loses heat to the surrounding body part. That is why the armpit produces a higher
range of temperature as compared to backhand which is father from the heart. Next,
among the areas, palm and between the thumb and index finger have the least value
of standard deviation which is at 0.29 and 0 respectively. Thus, the reading at these
two places is more precise as compare to others. However, for the area between
thumb and index finger, it is a hassle for the user to keep on squeezing the sensor at
this area. Thus, this makes palm the better candidate for the placement of the
temperature sensor. Besides, the placement of the sensor at the palm area also
corresponds to the design plan of the author to devise a prototype that can be
equipped at hand.
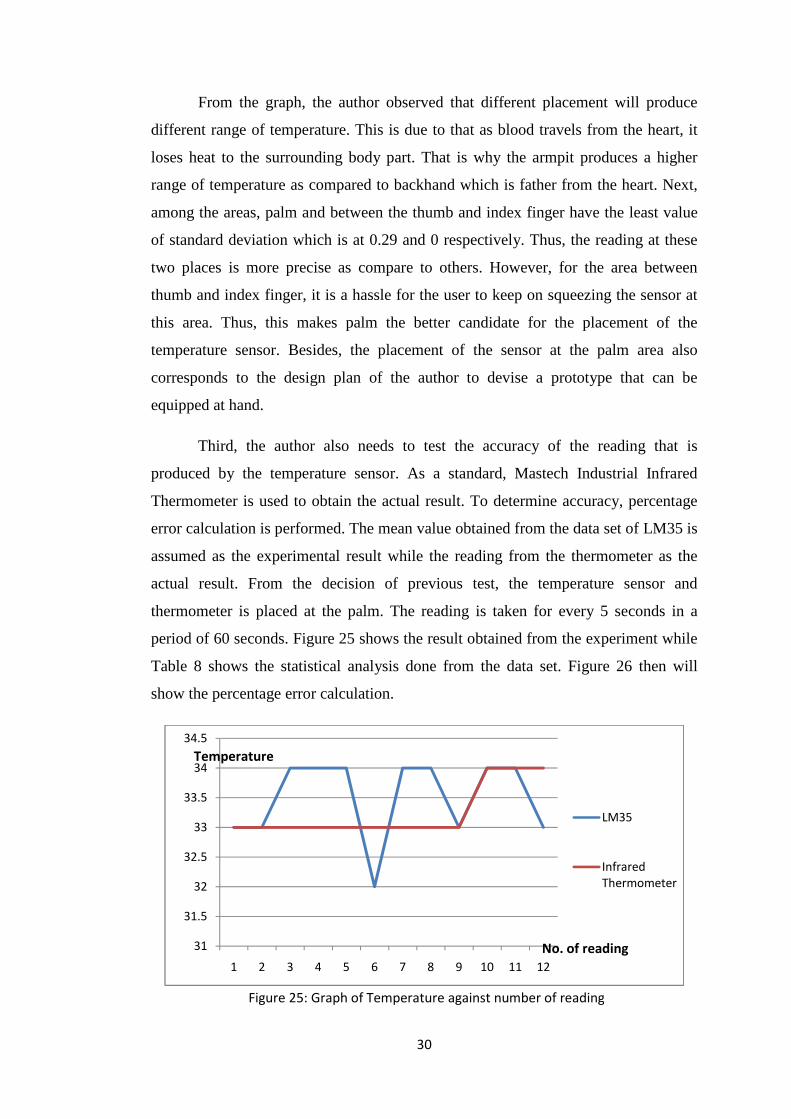
Third, the author also needs to test the accuracy of the reading that is
produced by the temperature sensor. As a standard, Mastech Industrial Infrared
Thermometer is used to obtain the actual result. To determine accuracy, percentage
error calculation is performed. The mean value obtained from the data set of LM35 is
assumed as the experimental result while the reading from the thermometer as the
actual result. From the decision of previous test, the temperature sensor and
thermometer is placed at the palm. The reading is taken for every 5 seconds in a
period of 60 seconds. Figure 25 shows the result obtained from the experiment while
Table 8 shows the statistical analysis done from the data set. Figure 26 then will
show the percentage error calculation.
31
31.5
32
32.5
33
33.5
34
34.5
1 2 3 4 5 6 7 8 9 10 11 12
LM35
Infrared Thermometer
Temperature
No. of reading
Figure 25: Graph of Temperature against number of reading
31
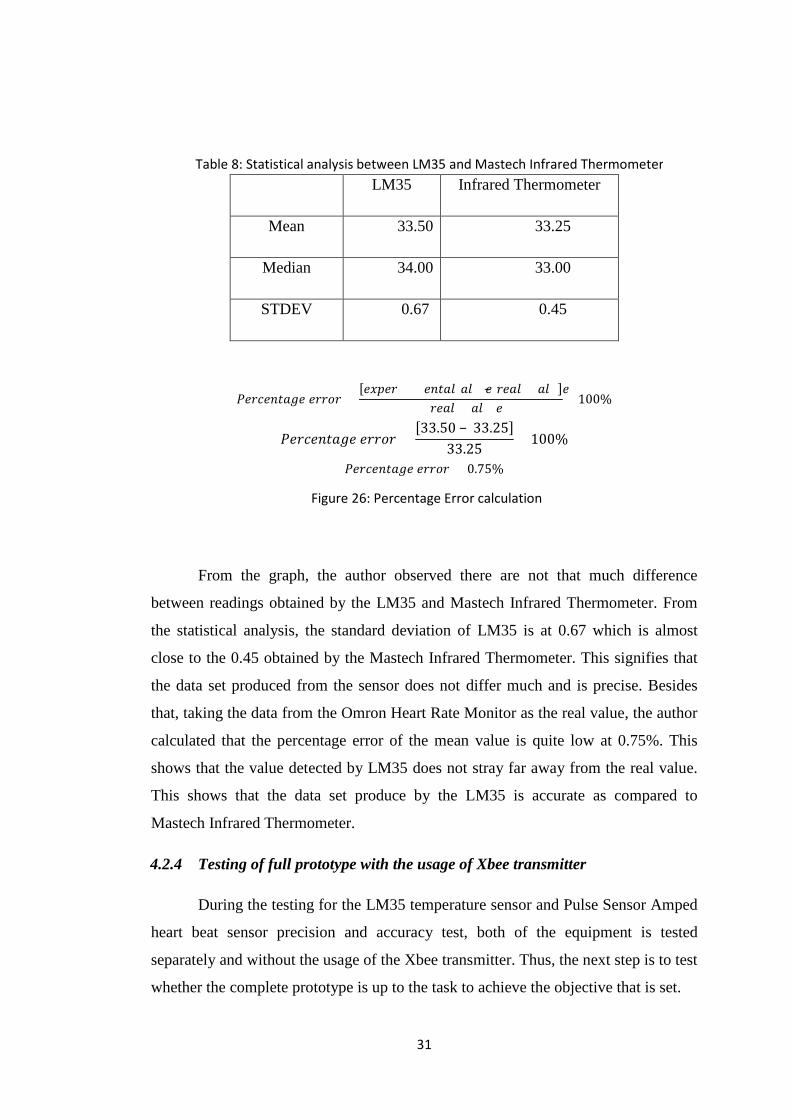
LM35 Infrared Thermometer
Mean 33.50 33.25
Median 34.00 33.00
STDEV 0.67 0.45
�hPnh i4eh hPPEP = �h�RhP轨桂h i45 郭45锅h− Ph45 郭45锅h�Ph45 郭45锅h × 100% �hPnh i4eh hPPEP = �33.50 − 33.25�33.25 × 100% �hPnh i4eh hPPEP = 0.75%
From the graph, the author observed there are not that much difference
between readings obtained by the LM35 and Mastech Infrared Thermometer. From
the statistical analysis, the standard deviation of LM35 is at 0.67 which is almost
close to the 0.45 obtained by the Mastech Infrared Thermometer. This signifies that
the data set produced from the sensor does not differ much and is precise. Besides
that, taking the data from the Omron Heart Rate Monitor as the real value, the author
calculated that the percentage error of the mean value is quite low at 0.75%. This
shows that the value detected by LM35 does not stray far away from the real value.
This shows that the data set produce by the LM35 is accurate as compared to
Mastech Infrared Thermometer.
4.2.4 Testing of full prototype with the usage of Xbee transmitter
During the testing for the LM35 temperature sensor and Pulse Sensor Amped
heart beat sensor precision and accuracy test, both of the equipment is tested
separately and without the usage of the Xbee transmitter. Thus, the next step is to test
whether the complete prototype is up to the task to achieve the objective that is set.
Figure 26: Percentage Error calculation
Table 8: Statistical analysis between LM35 and Mastech Infrared Thermometer
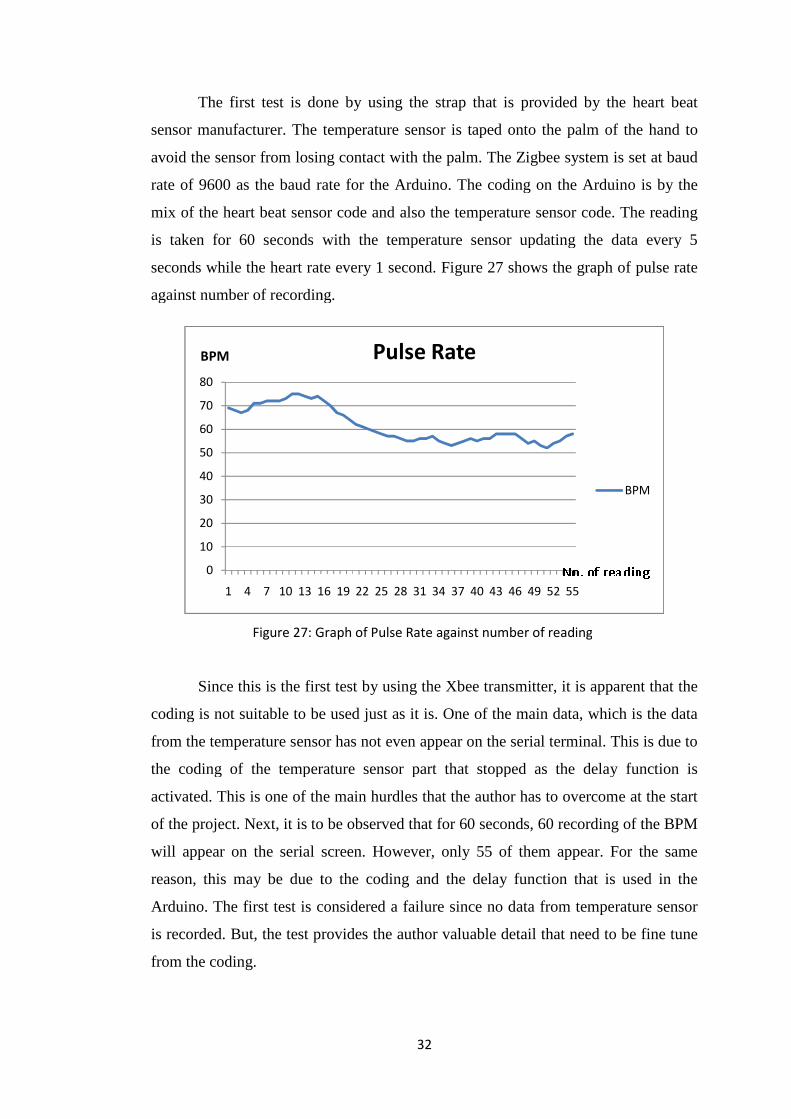
The first test is done by using the strap that is provided by the heart beat
sensor manufacturer. The temperature sensor is taped onto the palm of the hand to
avoid the sensor from losing contact with the palm. The Zigbee system is set at baud
rate of 9600 as the baud rate for the Arduino. The coding on the Arduino is by the
mix of the heart beat sensor code and also the temperature sensor code. The reading
is taken for 60 seconds with the temperature sensor updating the data every 5
seconds while the heart rate every 1 second.
against number of recording.
Since this is the first test by using the
coding is not suitable to be used just as it is. One of the main data, which is the data
from the temperature sensor has not even appear on the serial terminal. This is due to
the coding of the temperature sensor part that stopped as the delay
activated. This is one of the main hurdles that the author has to overcome at the start
of the project. Next, it is to be observed that for 60 seconds, 60 recording of the BPM
will appear on the serial screen. However, only 55 of them appear. F
reason, this may be due to the coding and the delay function that is used in the
Arduino. The first test is considered a failure since no data from temperature sensor
is recorded. But, the test provides the author valuable detail that need to b
from the coding.
0
10
20
30
40
50
60
70
80
1 4 7 10 13 16
BPM
Figure 27: Graph of Pulse Rate against number of reading
32
The first test is done by using the strap that is provided by the heart beat
sensor manufacturer. The temperature sensor is taped onto the palm of the hand to
sensor from losing contact with the palm. The Zigbee system is set at baud
rate of 9600 as the baud rate for the Arduino. The coding on the Arduino is by the
mix of the heart beat sensor code and also the temperature sensor code. The reading
60 seconds with the temperature sensor updating the data every 5
seconds while the heart rate every 1 second. Figure 27 shows the graph of
against number of recording.
Since this is the first test by using the Xbee transmitter, it is appare
coding is not suitable to be used just as it is. One of the main data, which is the data
from the temperature sensor has not even appear on the serial terminal. This is due to
the coding of the temperature sensor part that stopped as the delay
activated. This is one of the main hurdles that the author has to overcome at the start
of the project. Next, it is to be observed that for 60 seconds, 60 recording of the BPM
will appear on the serial screen. However, only 55 of them appear. For the same
reason, this may be due to the coding and the delay function that is used in the
Arduino. The first test is considered a failure since no data from temperature sensor
is recorded. But, the test provides the author valuable detail that need to b
16 19 22 25 28 31 34 37 40 43 46 49 52 55
Pulse Rate
Figure 27: Graph of Pulse Rate against number of reading
The first test is done by using the strap that is provided by the heart beat
sensor manufacturer. The temperature sensor is taped onto the palm of the hand to
sensor from losing contact with the palm. The Zigbee system is set at baud
rate of 9600 as the baud rate for the Arduino. The coding on the Arduino is by the
mix of the heart beat sensor code and also the temperature sensor code. The reading
60 seconds with the temperature sensor updating the data every 5
shows the graph of pulse rate
Xbee transmitter, it is apparent that the
coding is not suitable to be used just as it is. One of the main data, which is the data
from the temperature sensor has not even appear on the serial terminal. This is due to
the coding of the temperature sensor part that stopped as the delay function is
activated. This is one of the main hurdles that the author has to overcome at the start
of the project. Next, it is to be observed that for 60 seconds, 60 recording of the BPM
or the same
reason, this may be due to the coding and the delay function that is used in the
Arduino. The first test is considered a failure since no data from temperature sensor
is recorded. But, the test provides the author valuable detail that need to be fine tune
BPM
Next, the author had altered the source code for the second test. Among the
initiatives that the author had done is to include TimerMaster library into the coding.
This library will enable the author to determine when a functi
proceed. In test 2, instead of using the delay function, the author had programmed the
Arduino to keep on updating the data from the heart beat sensor while the timer will
call upon the function for the temperature sensor to activate a
Another change that is done on the coding is to change the temperature sensor pin
from pin 1 which is directly besides the pin for
3. This is to prevent and reduce any disturbance between the two se
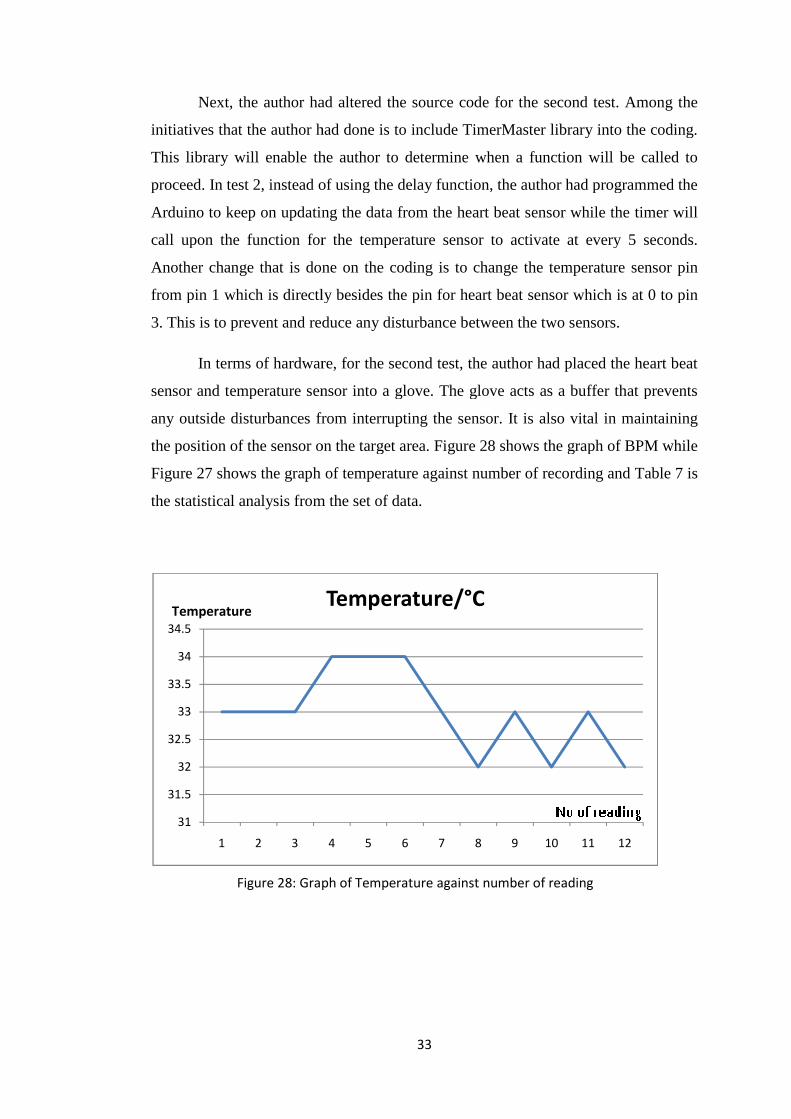
In terms of hardware, for the second test, the author had placed the heart beat
sensor and temperature sensor into a glove. The glove acts as a buffer that prevents
any outside disturbances from interrupting the sensor. It is also vital in mainta
the position of the sensor on the target area.
Figure 27 shows the graph of temperature
the statistical analysis from the set of data.
31
31.5
32
32.5
33
33.5
34
34.5
1 2 3
Temperature
Figure 28: Graph of Temperature against numb
33
Next, the author had altered the source code for the second test. Among the
initiatives that the author had done is to include TimerMaster library into the coding.
This library will enable the author to determine when a function will be called to
proceed. In test 2, instead of using the delay function, the author had programmed the
Arduino to keep on updating the data from the heart beat sensor while the timer will
call upon the function for the temperature sensor to activate at every 5 seconds.
Another change that is done on the coding is to change the temperature sensor pin
from pin 1 which is directly besides the pin for heart beat sensor which is at 0 to pin
3. This is to prevent and reduce any disturbance between the two sensors.
In terms of hardware, for the second test, the author had placed the heart beat
sensor and temperature sensor into a glove. The glove acts as a buffer that prevents
any outside disturbances from interrupting the sensor. It is also vital in mainta
the position of the sensor on the target area. Figure 28 shows the graph of BPM
shows the graph of temperature against number of recording and Table 7 is
the statistical analysis from the set of data.
4 5 6 7 8 9 10 11 12
Temperature/°C
Figure 28: Graph of Temperature against number of reading
Next, the author had altered the source code for the second test. Among the
initiatives that the author had done is to include TimerMaster library into the coding.
on will be called to
proceed. In test 2, instead of using the delay function, the author had programmed the
Arduino to keep on updating the data from the heart beat sensor while the timer will
t every 5 seconds.
Another change that is done on the coding is to change the temperature sensor pin
heart beat sensor which is at 0 to pin
nsors.
In terms of hardware, for the second test, the author had placed the heart beat
sensor and temperature sensor into a glove. The glove acts as a buffer that prevents
any outside disturbances from interrupting the sensor. It is also vital in maintaining
shows the graph of BPM while
against number of recording and Table 7 is
12
Mean
Median
STDEV
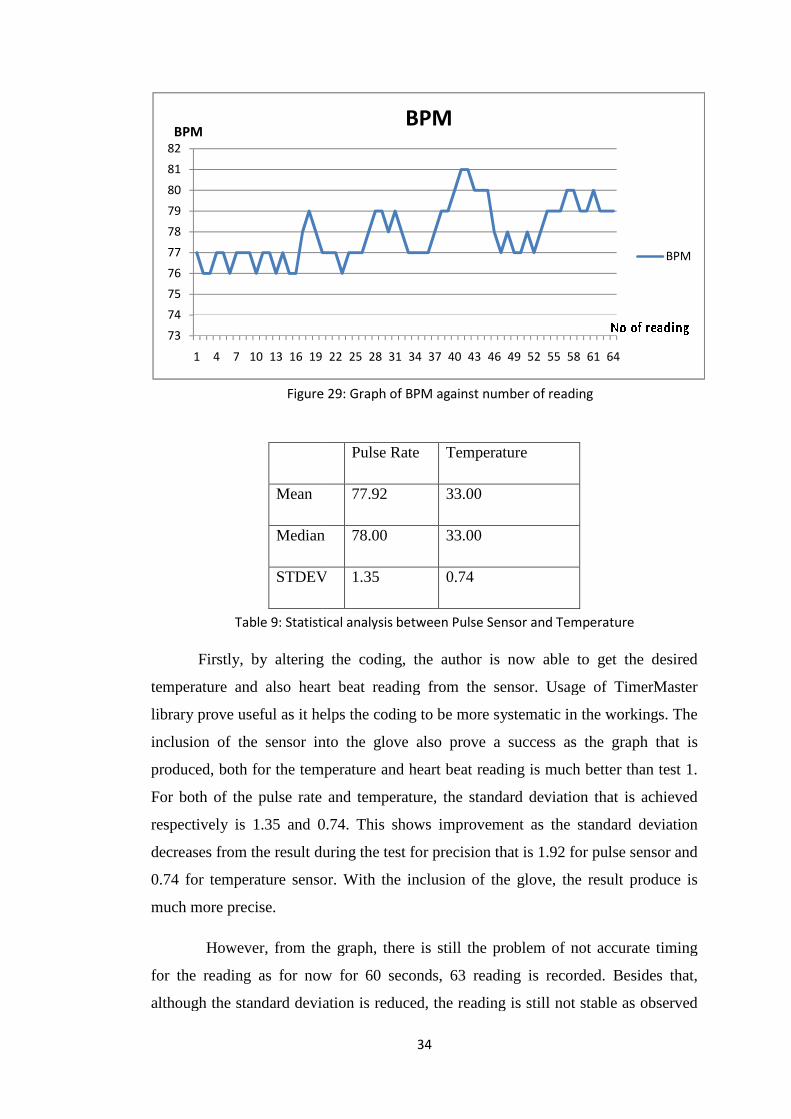
Firstly, by altering the coding, the author is now able to get the desired
temperature and also heart beat reading from the sensor. Usage of TimerMaster
library prove useful as it helps t
inclusion of the sensor into the glove also prove a success as the graph that is
produced, both for the temperature and heart beat reading is much better than test 1.
For both of the pulse rate and tempe
respectively is 1.35 and 0.74. This shows improvement as the standard deviation
decreases from the result during the test for precision that is 1.92 for pulse sensor and
0.74 for temperature sensor. With the
much more precise.
However, from the graph,
for the reading as for now for 60 seconds, 63 reading is recorded.
although the standard deviation
73
74
75
76
77
78
79
80
81
82
1 4 7 10 13 16 19
BPM
Figure 29: Graph of BPM against number of reading
Table 9: Statistical analysis between Pulse Sensor and Temperature
34
Pulse Rate Temperature
77.92 33.00
Median 78.00 33.00
STDEV 1.35 0.74
Firstly, by altering the coding, the author is now able to get the desired
temperature and also heart beat reading from the sensor. Usage of TimerMaster
library prove useful as it helps the coding to be more systematic in the workings. The
inclusion of the sensor into the glove also prove a success as the graph that is
produced, both for the temperature and heart beat reading is much better than test 1.
For both of the pulse rate and temperature, the standard deviation that is achieved
respectively is 1.35 and 0.74. This shows improvement as the standard deviation
decreases from the result during the test for precision that is 1.92 for pulse sensor and
0.74 for temperature sensor. With the inclusion of the glove, the result produce is
from the graph, there is still the problem of not accurate timing
the reading as for now for 60 seconds, 63 reading is recorded. Besides that,
although the standard deviation is reduced, the reading is still not stable as observed
22 25 28 31 34 37 40 43 46 49 52 55 58 61 64
BPM
Figure 29: Graph of BPM against number of reading
Table 9: Statistical analysis between Pulse Sensor and Temperature
Firstly, by altering the coding, the author is now able to get the desired
temperature and also heart beat reading from the sensor. Usage of TimerMaster
he coding to be more systematic in the workings. The
inclusion of the sensor into the glove also prove a success as the graph that is
produced, both for the temperature and heart beat reading is much better than test 1.
rature, the standard deviation that is achieved
respectively is 1.35 and 0.74. This shows improvement as the standard deviation
decreases from the result during the test for precision that is 1.92 for pulse sensor and
inclusion of the glove, the result produce is
accurate timing
Besides that,
is reduced, the reading is still not stable as observed
BPM
Table 9: Statistical analysis between Pulse Sensor and Temperature
35
from the graph. This may be due to movement of hands that give false beat as the
photo sensor detects the changes in volume of tissue. But, the result that is received
still satisfies the author is the prototype now is able to get quite accurate and precise
result as apparent from the test.
4.2.5 Interface Testing
Besides establishing a wireless system that is able to transmit the data from
the sensor to the host PC, the study objective is also to develop an interface that is
able to display the data received and provide alarm when the data that is received is
not in the acceptable range of data. To achieve this, the author had use the
programme Processing V1.5.1 to develop the needed interface. The programme that
is produced is tasked to: a) read data that is transmitted to the serial port, b)
differentiate between temperature data and pulse rate data, c) display the data for
temperature and pulse rate, d) checks for data that is not in range, and d) provide
alarm when data is not in range. The flow chart of the interface developed can be
observed in the appendix.
The interface is design to be able to display the information that is transferred
wirelessly and also to warn the user on abnormal reading that is detected on the
patient’s temperature and pulse rate. For the pulse rate, the range is fixed at 60bpm
for the low range and 100bpm for the high range. 60-100bpm is considered as the
normal pulse rate for a human and a value outside of this range is considered
abnormal. Meanwhile for temperature, the a average human body temperature is
37°C and the range is fixed at 33°C to 39°C. For a human, 40°C is already
considered high and indicates fever is developing inside the patient’s body. Thus, a
body temperature outside of this range is considered abnormal.
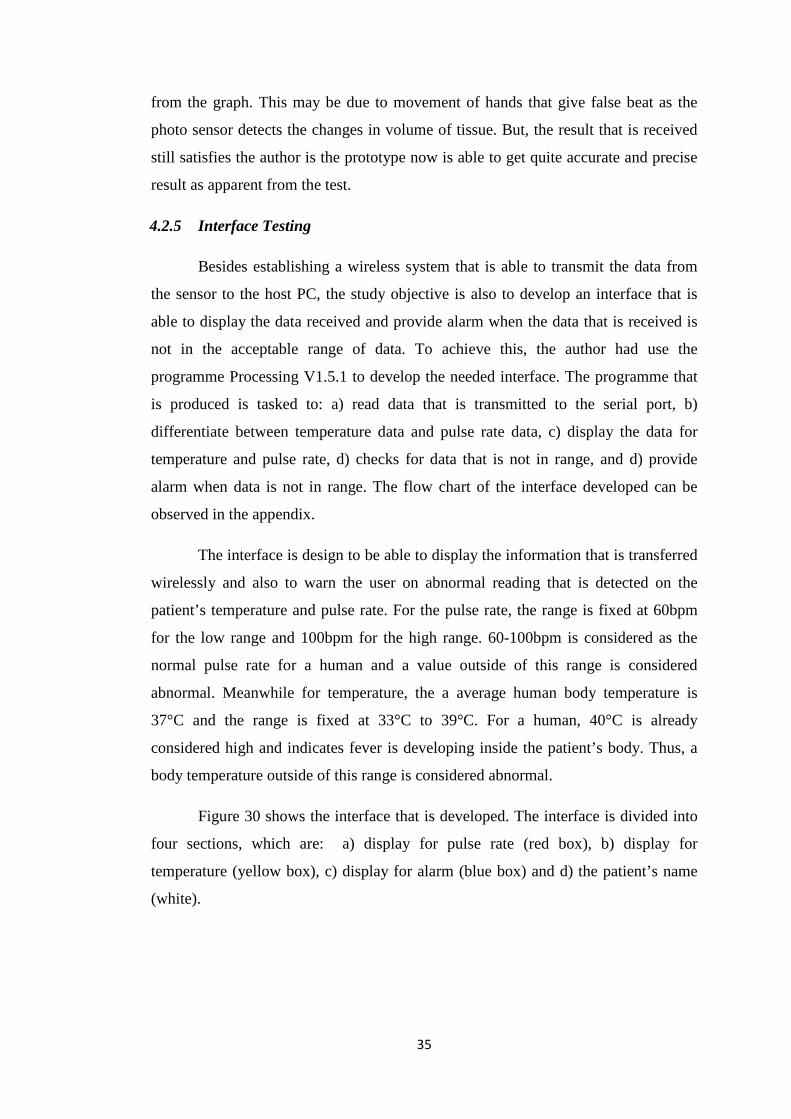
Figure 30 shows the interface that is developed. The interface is divided into
four sections, which are: a) display for pulse rate (red box), b) display for
temperature (yellow box), c) display for alarm (blue box) and d) the patient’s name
(white).
36
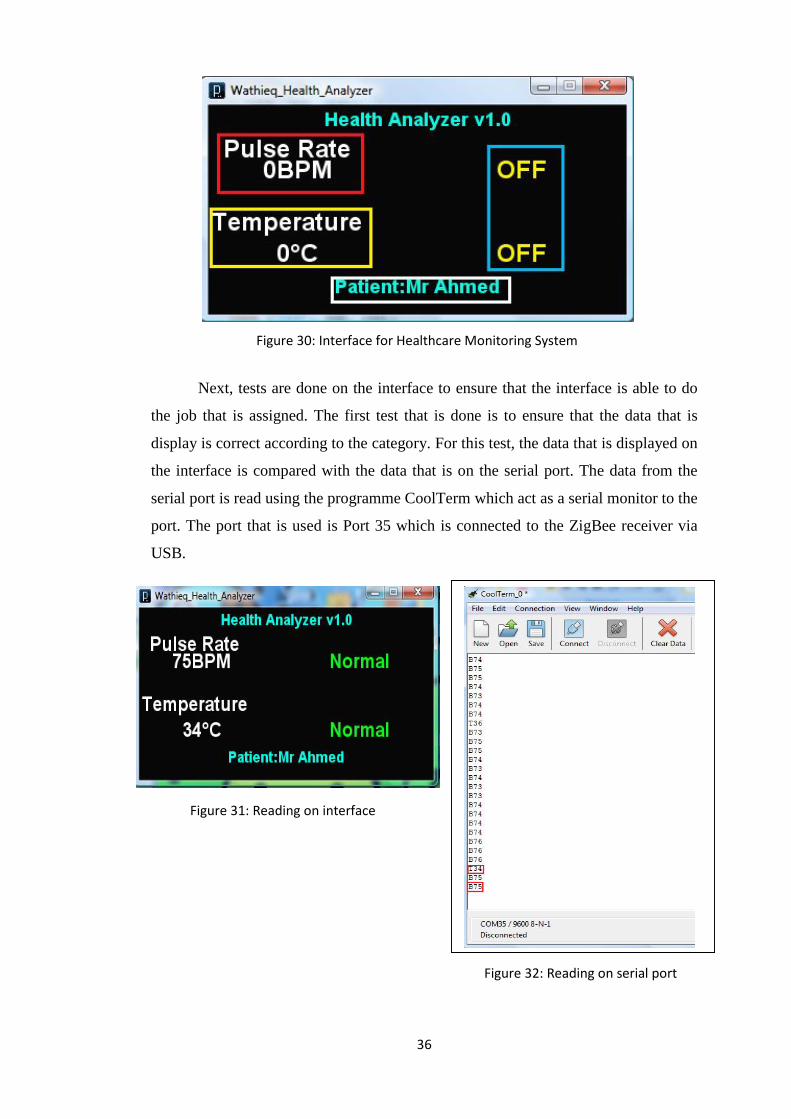
Next, tests are done on the interface to ensure that the interface is able to do
the job that is assigned. The first test that is done is to ensure that the data that is
display is correct according to the category. For this test, the data that is displayed on
the interface is compared with the data that is on the serial port. The data from the
serial port is read using the programme CoolTerm which act as a serial monitor to the
port. The port that is used is Port 35 which is connected to the ZigBee receiver via
USB.
Figure 30: Interface for Healthcare Monitoring System
Figure 31: Reading on interface
Figure 32: Reading on serial port
37
From Figure 31, it can be observed that the interface is doing its job. The
interface is displaying the data that is sent by the transmitter to the receiver. Figure
32 shows the reading that is on the serial port and by comparison we can see that the
interface is showing the exact value on the serial port. Besides that, the interface is
also able to distinguish between data for pulse rate and temperature of the patient.
This is achieved by assigning specific initial on the start of the data to differentiate
the two data.
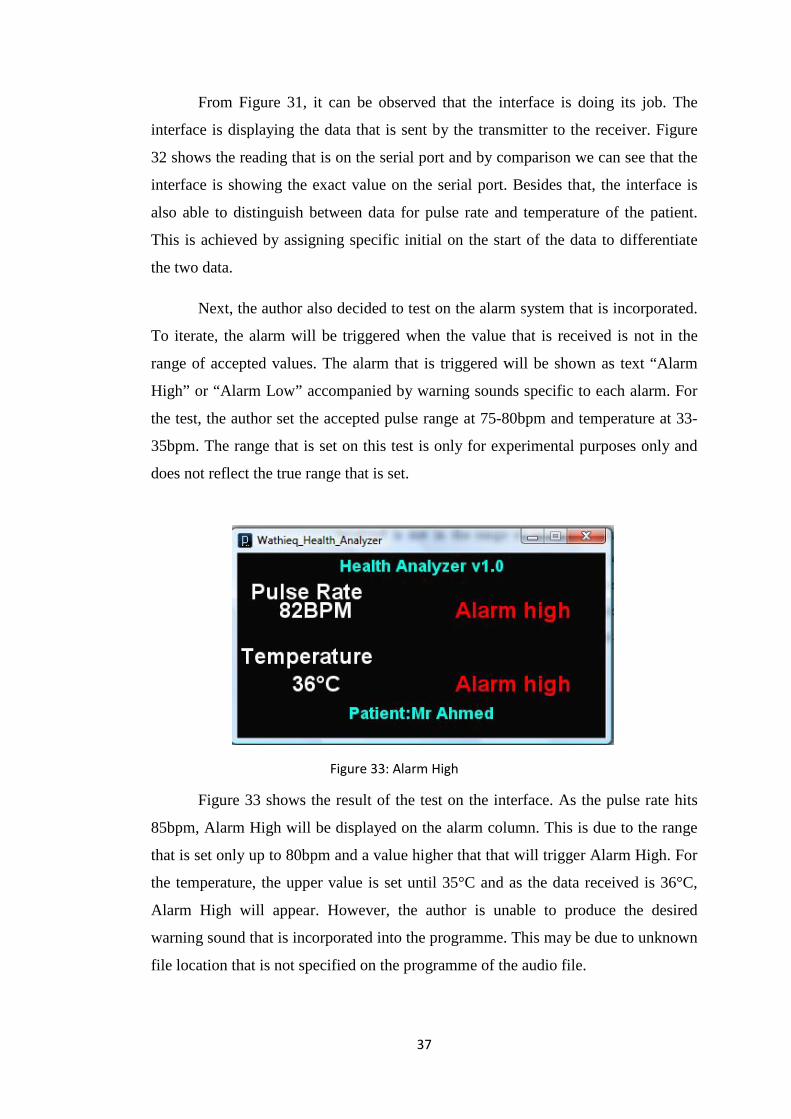
Next, the author also decided to test on the alarm system that is incorporated.
To iterate, the alarm will be triggered when the value that is received is not in the
range of accepted values. The alarm that is triggered will be shown as text “Alarm
High” or “Alarm Low” accompanied by warning sounds specific to each alarm. For
the test, the author set the accepted pulse range at 75-80bpm and temperature at 33-
35bpm. The range that is set on this test is only for experimental purposes only and
does not reflect the true range that is set.
Figure 33 shows the result of the test on the interface. As the pulse rate hits
85bpm, Alarm High will be displayed on the alarm column. This is due to the range
that is set only up to 80bpm and a value higher that that will trigger Alarm High. For
the temperature, the upper value is set until 35°C and as the data received is 36°C,
Alarm High will appear. However, the author is unable to produce the desired
warning sound that is incorporated into the programme. This may be due to unknown
file location that is not specified on the programme of the audio file.
Figure 33: Alarm High
38
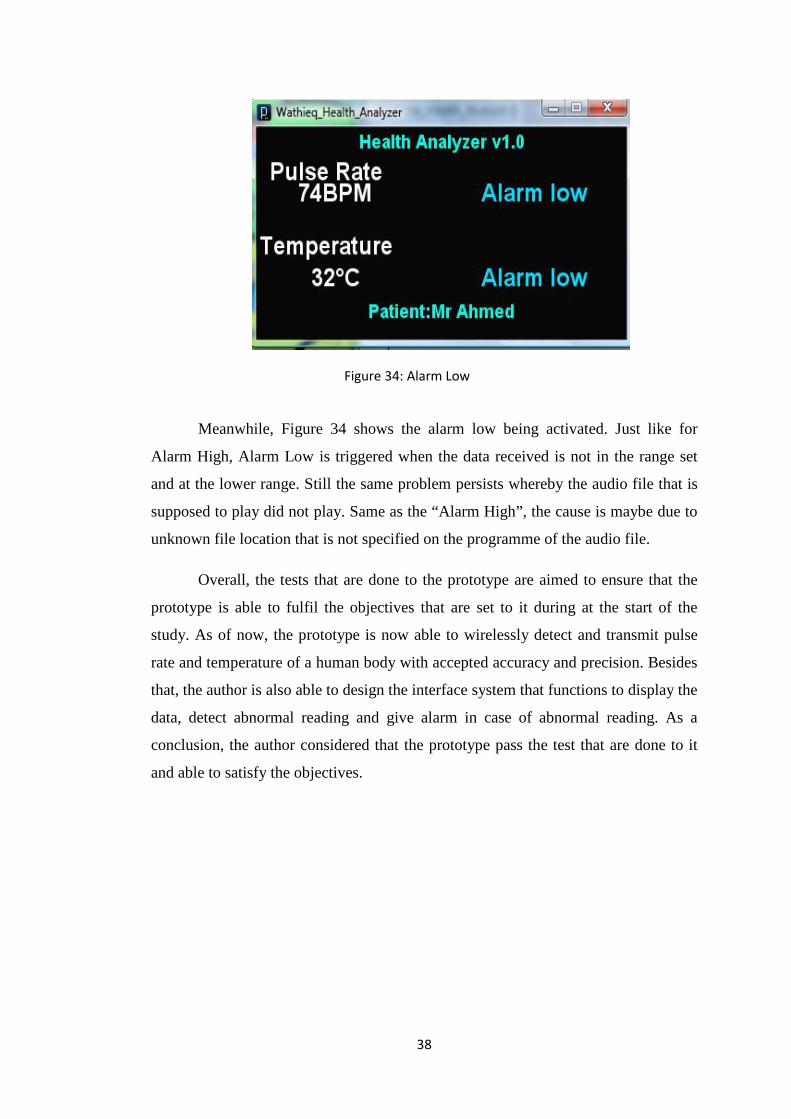
Meanwhile, Figure 34 shows the alarm low being activated. Just like for
Alarm High, Alarm Low is triggered when the data received is not in the range set
and at the lower range. Still the same problem persists whereby the audio file that is
supposed to play did not play. Same as the “Alarm High”, the cause is maybe due to
unknown file location that is not specified on the programme of the audio file.
Overall, the tests that are done to the prototype are aimed to ensure that the
prototype is able to fulfil the objectives that are set to it during at the start of the
study. As of now, the prototype is now able to wirelessly detect and transmit pulse
rate and temperature of a human body with accepted accuracy and precision. Besides
that, the author is also able to design the interface system that functions to display the
data, detect abnormal reading and give alarm in case of abnormal reading. As a
conclusion, the author considered that the prototype pass the test that are done to it
and able to satisfy the objectives.
Figure 34: Alarm Low

39
CHAPTER 5
CONCLUSION AND RECOMMENDATION
5.1 Conclusion
A new system of healthcare monitoring system need to be introduced to
overcome the limitation of current system that cannot give real time update on the
patient’s condition. The healthcare monitoring system that is designed must be able
to update the patient’s vital sign in real time without the constraint of distance and
have the ability to give warning in case of abnormal changes in the vital signs. The
study that is done aimed at producing a prototype with these abilities.
With grace from God, Alhamdulillah, the author is able to finish the project.
A prototype that is able to detect and wirelessly transmit pulse rate and temperature
of a human body to a host PC has been built. Besides that, the author had also
designed an interface that can display the transmitted data while preparing to give out
alarm in case of abnormal readings. As an added bonus, the prototype that is
developed had been tested extensively and produced results that show that the
prototype is able to give accurate and precise data. Overall, the prototype that is
developed is able to satisfy the objectives that the author had set at the start of the
study.
However, the prototype that is developed is not without fault. First of all, the
pulse sensor that is used is still too sensitive that large movement from the arm will
cause the reading to jump. This is due to the sensor detecting a large amount of blood
that rushes to the tissues and regarded that as pulses. Secondly, the author does feel
that the prototype developed is uncomfortable to be used for a long time. The weight
of the prototype is apparent and the glove inhibits the movement of user. Finally, the
current wireless system the author used is only a single hop interaction between the
XBee transmitter and receiver. To fully utilize the ZigBee technology, the system
that is built should be able to support multiple hops and multiple input interaction.
These are among the issues that the author feels need to be addressed before the
system is able to replace the current healthcare monitoring system.

40
In conclusion, the prototype developed is a success. The healthcare
monitoring system is able to gather data and transmit them to a host pc wirelessly at
real time without the constraint of distance. However, the author feels that the system
still does not qualify to replace the conventional healthcare monitoring system as
there are several issues that need to be solved before the system can be deployed.
Still, the author hopes that the prototype will be able to pave the way for a wireless
healthcare monitoring system to be incorporated in the health institution and
ultimately saves lives of human.
5.1 Recommendations
For future works, the author would like to recommend on upgrades that can
be done to the prototype, which are:
a) to reduce the effect of movement to the reading of the sensors, particularly
the pulse rate sensor
b) to include more sensors that can detect other human vital signs such as blood
glucose level, blood pressure monitor, CO2 level in blood and respiration rate
sensor
c) to introduce the multi hop and multi input capabilities into the system
d) to reduce the weight of the prototype and make it more comfortable for long
term usage.
The upgrades are necessary so that the system can be more suitable to replace the
current healthcare monitoring system.
Meanwhile, for the interface, the author proposes these functions are
introduced to the system:
a) ability to record and trend data that is received
b) ability to change the range of normal reading
c) ability for the PC to give instruction to the prototype
This will ensure that the user is empowered and the interface to play a more active
role in the system
41
REFERENCES
[1] ZigBee Technology. Rertrieved on July 18, 2011 from http://www.digi.com
[2] A. Hoshang and L. Tang,“Wireless Network For Health Monitoring: Heart
Rate and Temperature Sensor” in 2011 Fifth International Conference on Sensing
Technology 2011© IEEE
[3] Bernstein D. History and physical evaluation. In: Kliegman RM, Behrman
RE, Jenson HB, Stanton BF, eds.Nelson Textbook of Pediatrics. 18th ed.
Philadelphia, Pa: Saunders Elsevier; 2007:chap 422.
[4] R. Faludi, Building Wireless Sensor Network., California: O’Reilly Media,
2010, pp. 23-56.
[5] Gascón, David (February 5, 2009). "Security in 802.15.4 and ZigBee
networks". Retrieved 9 December 2010.
[6] Bin Zhen, Maulin Patel, SungHyup Lee, EunTae Won and Arthur Astrin,
“TG6 Technical Requirements Document (TRD)”, IEEE P802.15-08-0644-05-0006
[7] S. Drude, “Tutorial on body area networks”, IEEE 15-06-0331-000ban
[8] Guido Dolmans, “Applications, Channels, and Radio Architectures”, IEEE
P802.15-08-0163-00-0006

42
APPENDICES
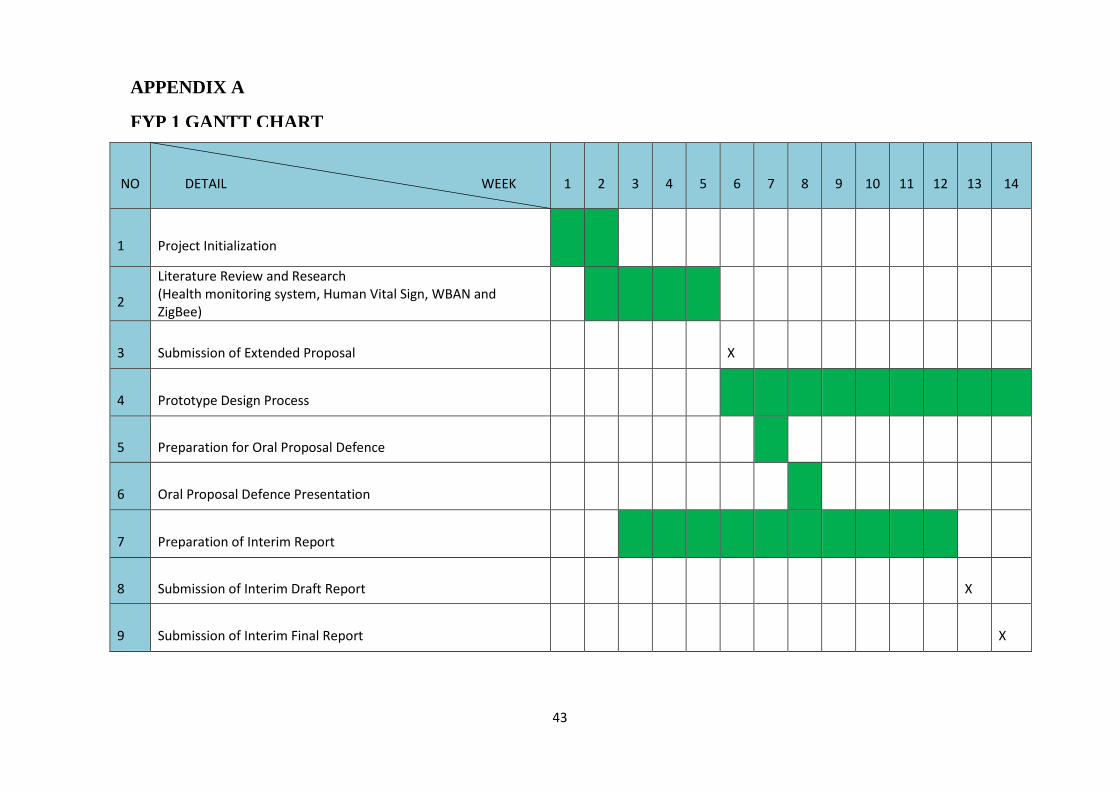
43
NO DETAIL WEEK 1 2 3 4 5 6 7 8 9 10 11 12 13 14
1 Project Initialization
2
Literature Review and Research (Health monitoring system, Human Vital Sign, WBAN and ZigBee)
3 Submission of Extended Proposal X
4 Prototype Design Process
5 Preparation for Oral Proposal Defence
6 Oral Proposal Defence Presentation
7 Preparation of Interim Report
8 Submission of Interim Draft Report X
9 Submission of Interim Final Report X
APPENDIX A
FYP 1 GANTT CHART

44
NO DETAIL WEEK 1 2 3 4 5 6 7 8 9 10 11 12 13 14
1 Model Development
2 Model Testing and Improvement
3 Preparation of Progress Report
4 Submission of Progress Report X
5 ELECTREX X
6 Preparation of Final Report and Technical Paper
7 Submission of Draft Final Report X
8 Submission of Technical Paper X
9 Final Presentation X
10 Submission of Final Report X
APPENDIX B
FYP 2 GANTT CHART
45
APPENDIX C
CODING FOR PROTOTYPE
a) Main Coding
#include <Event.h>
#include <Timer.h>
// VARIABLES
int tempPin = 3;
float tempC;
int pulsePin = 0; // Pulse Sensor purple wire connected to analog pin 0
int blinkPin = 13; // pin to blink led at each beat
int fadePin = 5; // pin to do fancy classy fading blink at each beat
int fadeRate = 0; // used to fade LED on with PWM on fadePin
Timer t;
// these variables are volatile because they are used during the interrupt service routine!
volatile int BPM; // used to hold the pulse rate
volatile int Signal; // holds the incoming raw data
volatile int IBI = 600; // holds the time between beats, the Inter-Beat Interval
volatile boolean Pulse = false; // true when pulse wave is high, false when it's low
volatile boolean QS = false; // becomes true when Arduoino finds a beat.
void setup(){
t.every (15000, temp);
pinMode(blinkPin,OUTPUT); // pin that will blink to your heartbeat!
pinMode(fadePin,OUTPUT); // pin that will fade to your heartbeat!
Serial.begin(9600); // we agree to talk fast!
interruptSetup(); // sets up to read Pulse Sensor signal every 2mS
// UN-COMMENT THE NEXT LINE IF YOU ARE POWERING The Pulse Sensor AT LOW VOLTAGE,
46
// AND APPLY THAT VOLTAGE TO THE A-REF PIN
//analogReference(EXTERNAL);
}
void loop(){
t.update();
//sendDataToProcessing('S', Signal); // send Processing the raw Pulse Sensor data
if (QS == true){ // Quantified Self flag is true when arduino finds a heartbeat
fadeRate = 255; // Set 'fadeRate' Variable to 255 to fade LED with pulse
sendDataToProcessing('B',BPM); // send heart rate with a 'B' prefix
//sendDataToProcessing('Q',IBI); // send time between beats with a 'Q' prefix
QS = false; // reset the Quantified Self flag for next time
}
ledFadeToBeat();
delay(1000); // take a break
}
void ledFadeToBeat(){
fadeRate -= 15; // set LED fade value
fadeRate = constrain(fadeRate,0,255); // keep LED fade value from going into negative numbers!
analogWrite(fadePin,fadeRate); // fade LED
}
void sendDataToProcessing(char symbol, int data ){
Serial.print(symbol); // symbol prefix tells Processing what type of data is coming
Serial.println(data); // the data to send culminating in a carriage return
47
}
void temp(){
tempC = analogRead(tempPin); //read the value from the sensor
tempC = (5.0 * tempC * 100.0)/1024.0;
Serial.print ("T");
Serial.println((byte)tempC);
}
b) Interrupt
volatile int rate[10]; // used to hold last ten IBI values
volatile unsigned long sampleCounter = 0; // used to determine pulse timing
volatile unsigned long lastBeatTime = 0; // used to find the inter beat interval
volatile int P =512; // used to find peak in pulse wave
volatile int T = 512; // used to find trough in pulse wave
volatile int thresh = 512; // used to find instant moment of heart beat
volatile int amp = 100; // used to hold amplitude of pulse waveform
volatile boolean firstBeat = true; // used to seed rate array so we startup with reasonable BPM
volatile boolean secondBeat = true; // used to seed rate array so we startup with reasonable BPM
void interruptSetup(){
// Initializes Timer2 to throw an interrupt every 2mS.
TCCR2A = 0x02; // DISABLE PWM ON DIGITAL PINS 3 AND 11, AND GO INTO CTC MODE
TCCR2B = 0x06; // DON'T FORCE COMPARE, 256 PRESCALER
OCR2A = 0X7C; // SET THE TOP OF THE COUNT TO 124 FOR 500Hz SAMPLE RATE
TIMSK2 = 0x02; // ENABLE INTERRUPT ON MATCH BETWEEN TIMER2 AND OCR2A
sei(); // MAKE SURE GLOBAL INTERRUPTS ARE ENABLED
}
48
// THIS IS THE TIMER 2 INTERRUPT SERVICE ROUTINE.
// Timer 2 makes sure that we take a reading every 2 miliseconds
ISR(TIMER2_COMPA_vect){ // triggered when Timer2 counts to 124
cli(); // disable interrupts while we do this
Signal = analogRead(pulsePin); // read the Pulse Sensor
sampleCounter += 2; // keep track of the time in mS with this variable
int N = sampleCounter - lastBeatTime; // monitor the time since the last beat to avoid noise
// find the peak and trough of the pulse wave
if(Signal < thresh && N > (IBI/5)*3){ // avoid dichrotic noise by waiting 3/5 of last IBI
if (Signal < T){ // T is the trough
T = Signal; // keep track of lowest point in pulse wave
}
}
if(Signal > thresh && Signal > P){ // thresh condition helps avoid noise
P = Signal; // P is the peak
} // keep track of highest point in pulse wave
// NOW IT'S TIME TO LOOK FOR THE HEART BEAT
// signal surges up in value every time there is a pulse
if (N > 250){ // avoid high frequency noise
if ( (Signal > thresh) && (Pulse == false) && (N > (IBI/5)*3) ){
Pulse = true; // set the Pulse flag when we think there is a pulse
digitalWrite(blinkPin,HIGH); // turn on pin 13 LED
IBI = sampleCounter - lastBeatTime; // measure time between beats in mS
lastBeatTime = sampleCounter; // keep track of time for next pulse
if(firstBeat){ // if it's the first time we found a beat, if firstBeat == TRUE
49
firstBeat = false; // clear firstBeat flag
return; // IBI value is unreliable so discard it
}
if(secondBeat){ // if this is the second beat, if secondBeat == TRUE
secondBeat = false; // clear secondBeat flag
for(int i=0; i<=9; i++){ // seed the running total to get a realisitic BPM at startup
rate[i] = IBI;
}
}
// keep a running total of the last 10 IBI values
word runningTotal = 0; // clear the runningTotal variable
for(int i=0; i<=8; i++){ // shift data in the rate array
rate[i] = rate[i+1]; // and drop the oldest IBI value
runningTotal += rate[i]; // add up the 9 oldest IBI values
}
rate[9] = IBI; // add the latest IBI to the rate array
runningTotal += rate[9]; // add the latest IBI to runningTotal
runningTotal /= 10; // average the last 10 IBI values
BPM = 60000/runningTotal; // how many beats can fit into a minute? that's BPM!
QS = true; // set Quantified Self flag
// QS FLAG IS NOT CLEARED INSIDE THIS ISR
}
}
if (Signal < thresh && Pulse == true){ // when the values are going down, the beat is over
digitalWrite(blinkPin,LOW); // turn off pin 13 LED
Pulse = false; // reset the Pulse flag so we can do it again
50
amp = P - T; // get amplitude of the pulse wave
thresh = amp/2 + T; // set thresh at 50% of the amplitude
P = thresh; // reset these for next time
T = thresh;
}
if (N > 2500){ // if 2.5 seconds go by without a beat
thresh = 512; // set thresh default
P = 512; // set P default
T = 512; // set T default
lastBeatTime = sampleCounter; // bring the lastBeatTime up to date
firstBeat = true; // set these to avoid noise
secondBeat = true; // when we get the heartbeat back
}
sei(); // enable interrupts when youre done!
}// end isr
51
APPENDIX D
CODING FOR INTERFACE
a) Main Coding
import ddf.minim.*;
import ddf.minim.signals.*;
import ddf.minim.analysis.*;
import ddf.minim.effects.*;
import processing.serial.*;
PFont font;
Serial port;
Minim minim;
AudioPlayer song;
AudioPlayer sound;
AudioPlayer alarm;
int BPM; // HOLDS HEART RATE VALUE FROM ARDUINO
int T;
void setup() {
size(400, 200); // Stage size
frameRate(100);
font = loadFont("Arial-BoldMT-24.vlw");
textFont(font);
textAlign(CENTER);
rectMode(CENTER);
ellipseMode(CENTER);
52
// GO FIND THE ARDUINO
//println(Serial.list()); // print a list of available serial ports
//choose the number between the [] that is connected to the Arduino
//port = new Serial(this, Serial.list()[0], 9600); // make sure Arduino is talking serial at this baud rate
//port.clear(); // flush buffer
//port.bufferUntil('\n'); // set buffer full flag on receipt of carriage return
minim = new Minim(this);
song = minim.loadFile("alone.mp3");
sound = minim.loadFile("lucky.mp3");
alarm = minim.loadFile("alarm.mp3");
}
void draw() {
background(8, 7, 8);
noStroke();
// DRAW OUT THE PULSE WINDOW AND BPM WINDOW RECTANGLES
textSize(24);
fill (255, 255, 255);
text("Pulse Rate",75,50);
text(BPM+"BPM" , 85,70);
text("Temperature",75,120);
text(T + "°C", 85,150);
if (T>35){

53
fill (252, 2, 6);
text ("Alarm high", 300, 150);
}
if (T==0){
fill (250, 242, 5);
text ("OFF", 300, 150);
//sound.play();
}
if ((T<20)&&(T>1)){
fill (8, 220, 255);
text ("Alarm low", 300, 150);
}
if ((T>20)&&(T<35)){
fill (8, 250, 21);
text ("Normal", 300, 150);
}
if (BPM>80){
fill (252, 2, 6);
text ("Alarm high", 300, 70);
}
if (BPM==0){
fill (250, 242, 5);
text ("OFF", 300, 70);
}
if ((BPM<60)&&(BPM>1)){
fill (8, 220, 255);
text ("Alarm low", 300, 70);
}
if ((BPM>60)&&(BPM<80)){

54
fill (8, 250, 21);
text ("Normal", 300, 70);
}
textSize(18);
fill (8, 250, 228);
text("Health Analyzer v1.0", 200, 20);
text("Patient:Mr Ahmed", 200, 180);
}
b) Serial Event
void serialEvent(Serial port){
String inData = port.readStringUntil('\n');
inData = trim(inData); // cut off white space (carriage return)
if (inData.charAt(0) == 'B'){ // leading 'B' for BPM data
inData = inData.substring(1); // cut off the leading 'B'
BPM = int(inData);
}
if (inData.charAt(0) == 'T'){ // leading 'Q' means IBI data
inData = inData.substring(1); // cut off the leading 'Q'
T = int(inData); // convert the string to usable int
}
}
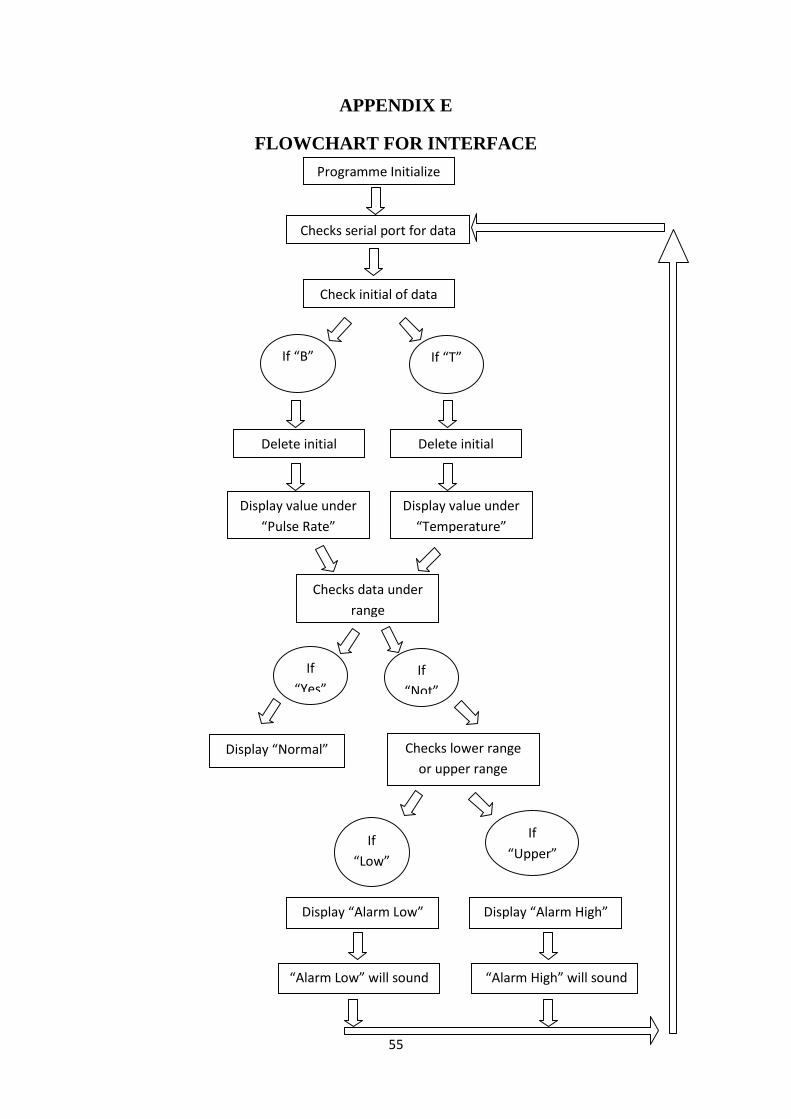
55
APPENDIX E
FLOWCHART FOR INTERFACE
Programme Initialize
Checks serial port for data
Check initial of data
If “B” If “T”
Delete initial Delete initial
Display value under “Pulse Rate”
Display value under “Temperature”
Checks data under range
If “Yes”
If “Not”
Display “Normal” Checks lower range or upper range
If “Low”
If “Upper”
Display “Alarm Low” Display “Alarm High”
“Alarm Low” will sound “Alarm High” will sound

56