efficient internal and surface fingerprint extraction and blending using optical coherence...
TRANSCRIPT

Efficient internal and surface fingerprintextraction and blending using optical coherencetomographyLUKE NICHOLAS DARLOW1,2,* AND JAMES CONNAN1
1Department of Computer Science, Rhodes University, Grahamstown EC 6139, South Africa2Modelling and Digital Science, Council for Scientific and Industrial Research, Pretoria GP 0184, South Africa*Corresponding author: [email protected]
Received 21 July 2015; revised 11 September 2015; accepted 1 October 2015; posted 1 October 2015 (Doc. ID 246485);published 28 October 2015
Optical coherence tomography provides a 3D representation of fingertip skin where surface and internal finger-prints are found. These fingerprints are topographically identical. However, the surface skin is prone to damage,distortion, and spoofing; and the internal fingerprint is difficult to access and extract. This research presents anovel scaling-resolution approach to fingerprint zone detection and extraction. Furthermore, a local-quality-based blending procedure is also proposed. The accuracy of the zone-detection algorithm is comparable to anearlier work, yielding a mean-squared error of 25.9 and structural similarity of 95.8% (compared to a ground-truth estimate). Blending the surface and internal fingerprints improved the National Institute of Science andTechnology’s Fingerprint Image Quality scores and the average maximum match scores (when matched againstconventional surface counterparts). The fingerprint blending procedure was able to combine high-quality regionsfrom both fingerprints, thus mitigating surface wrinkles and anomalous poor-quality regions. Furthermore,spoof detection via a surface-to-internal fingerprint comparison was proposed and tested. © 2015 Optical
Society of America
OCIS codes: (100.2960) Image analysis; (100.2980) Image enhancement; (100.6950) Tomographic image processing; (110.4500)
Optical coherence tomography; (110.3000) Image quality assessment; (030.6140) Speckle.
http://dx.doi.org/10.1364/AO.54.009258
1. INTRODUCTION
The fingerprint is a well-established biometric. Fingerprintsperform well regarding false rejection and acceptance rates, areuniversal, and are biologically distinctive. However, the finger-tip’s surface skin is prone to degradation and is known to distortupon scanning [1]. The surface fingerprint is also prone tospoof attacks as commercially available fingerprint scanners arelimited to a 2D representation of the fingertip skin [2].
The internal fingerprint is a solution for contending withthe above-mentioned disadvantages. It exists as the topographi-cal undulations of the papillary junction, an intermediary layerof skin between the dermis and epidermis layers. The internalfingerprint possesses the same advantages as the surface finger-print, and, because the surface skin grows from the papillaryjunction, the internal and surface fingerprints are structurallyidentical.
Optical coherence tomography (OCT) is the imaging tech-nology used to capture a 3D representation of the fingertip’sskin. First developed to study the eye [3] and improved for der-matology [4,5], OCT is a powerful biomedical imaging tool.
OCT is touchless and capable of providing a tomographic scanthat captures both the surface and internal fingerprints. It alsocaptures details on a finer scale than other tomographic imag-ing tools.
Although the cost of OCT scanners is diminishing becauseof high demand, they remain expensive. The research presentedhere endeavors, in part, to provide a proof-of-concept finger-print extraction technique that preempts and prompts the de-sign and establishment of cost-effective and fingertip-specificOCT systems. Although earlier attempts have been made toextract fingerprints from OCT fingertip scans, there remaina number of challenges yet to be decisively overcome. This re-search introduces solutions to the following problems:
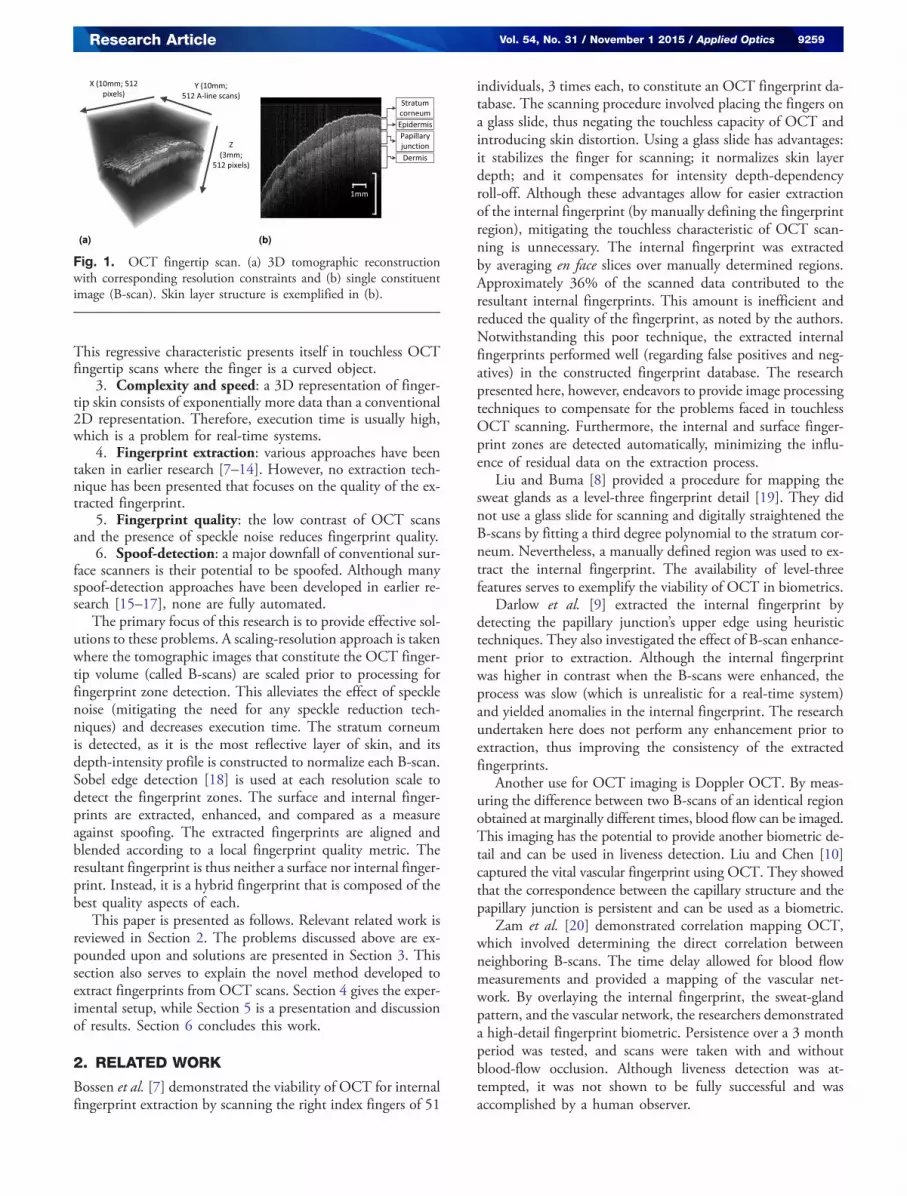
1. Fingerprint zone detection: surface and internal fin-gerprints exist as the undulations of the stratum corneum andthe papillary junction (see Fig. 1), respectively. Identification ofthese skin layers is complicated because OCT scans exhibit lowcontrast and are obscured by speckle noise [6].
2. Intensity depth-dependency roll-off: media furtheraway from the OCT scanner results in relatively lower intensity.
9258 Vol. 54, No. 31 / November 1 2015 / Applied Optics Research Article
1559-128X/15/319258-11$15/0$15.00 © 2015 Optical Society of America
This regressive characteristic presents itself in touchless OCTfingertip scans where the finger is a curved object.
3. Complexity and speed: a 3D representation of finger-tip skin consists of exponentially more data than a conventional2D representation. Therefore, execution time is usually high,which is a problem for real-time systems.
4. Fingerprint extraction: various approaches have beentaken in earlier research [7–14]. However, no extraction tech-nique has been presented that focuses on the quality of the ex-tracted fingerprint.
5. Fingerprint quality: the low contrast of OCT scansand the presence of speckle noise reduces fingerprint quality.
6. Spoof-detection: a major downfall of conventional sur-face scanners is their potential to be spoofed. Although manyspoof-detection approaches have been developed in earlier re-search [15–17], none are fully automated.
The primary focus of this research is to provide effective sol-utions to these problems. A scaling-resolution approach is takenwhere the tomographic images that constitute the OCT finger-tip volume (called B-scans) are scaled prior to processing forfingerprint zone detection. This alleviates the effect of specklenoise (mitigating the need for any speckle reduction tech-niques) and decreases execution time. The stratum corneumis detected, as it is the most reflective layer of skin, and itsdepth-intensity profile is constructed to normalize each B-scan.Sobel edge detection [18] is used at each resolution scale todetect the fingerprint zones. The surface and internal finger-prints are extracted, enhanced, and compared as a measureagainst spoofing. The extracted fingerprints are aligned andblended according to a local fingerprint quality metric. Theresultant fingerprint is thus neither a surface nor internal finger-print. Instead, it is a hybrid fingerprint that is composed of thebest quality aspects of each.
This paper is presented as follows. Relevant related work isreviewed in Section 2. The problems discussed above are ex-pounded upon and solutions are presented in Section 3. Thissection also serves to explain the novel method developed toextract fingerprints from OCT scans. Section 4 gives the exper-imental setup, while Section 5 is a presentation and discussionof results. Section 6 concludes this work.
2. RELATED WORK
Bossen et al. [7] demonstrated the viability of OCT for internalfingerprint extraction by scanning the right index fingers of 51
individuals, 3 times each, to constitute an OCT fingerprint da-tabase. The scanning procedure involved placing the fingers ona glass slide, thus negating the touchless capacity of OCT andintroducing skin distortion. Using a glass slide has advantages:it stabilizes the finger for scanning; it normalizes skin layerdepth; and it compensates for intensity depth-dependencyroll-off. Although these advantages allow for easier extractionof the internal fingerprint (by manually defining the fingerprintregion), mitigating the touchless characteristic of OCT scan-ning is unnecessary. The internal fingerprint was extractedby averaging en face slices over manually determined regions.Approximately 36% of the scanned data contributed to theresultant internal fingerprints. This amount is inefficient andreduced the quality of the fingerprint, as noted by the authors.Notwithstanding this poor technique, the extracted internalfingerprints performed well (regarding false positives and neg-atives) in the constructed fingerprint database. The researchpresented here, however, endeavors to provide image processingtechniques to compensate for the problems faced in touchlessOCT scanning. Furthermore, the internal and surface finger-print zones are detected automatically, minimizing the influ-ence of residual data on the extraction process.
Liu and Buma [8] provided a procedure for mapping thesweat glands as a level-three fingerprint detail [19]. They didnot use a glass slide for scanning and digitally straightened theB-scans by fitting a third degree polynomial to the stratum cor-neum. Nevertheless, a manually defined region was used to ex-tract the internal fingerprint. The availability of level-threefeatures serves to exemplify the viability of OCT in biometrics.
Darlow et al. [9] extracted the internal fingerprint bydetecting the papillary junction’s upper edge using heuristictechniques. They also investigated the effect of B-scan enhance-ment prior to extraction. Although the internal fingerprintwas higher in contrast when the B-scans were enhanced, theprocess was slow (which is unrealistic for a real-time system)and yielded anomalies in the internal fingerprint. The researchundertaken here does not perform any enhancement prior toextraction, thus improving the consistency of the extractedfingerprints.
Another use for OCT imaging is Doppler OCT. By meas-uring the difference between two B-scans of an identical regionobtained at marginally different times, blood flow can be imaged.This imaging has the potential to provide another biometric de-tail and can be used in liveness detection. Liu and Chen [10]captured the vital vascular fingerprint using OCT. They showedthat the correspondence between the capillary structure and thepapillary junction is persistent and can be used as a biometric.
Zam et al. [20] demonstrated correlation mapping OCT,which involved determining the direct correlation betweenneighboring B-scans. The time delay allowed for blood flowmeasurements and provided a mapping of the vascular net-work. By overlaying the internal fingerprint, the sweat-glandpattern, and the vascular network, the researchers demonstrateda high-detail fingerprint biometric. Persistence over a 3 monthperiod was tested, and scans were taken with and withoutblood-flow occlusion. Although liveness detection was at-tempted, it was not shown to be fully successful and wasaccomplished by a human observer.
Fig. 1. OCT fingertip scan. (a) 3D tomographic reconstructionwith corresponding resolution constraints and (b) single constituentimage (B-scan). Skin layer structure is exemplified in (b).
Research Article Vol. 54, No. 31 / November 1 2015 / Applied Optics 9259

Korohoda et al. [11] developed an internal fingerprint ac-quisition algorithm that was sensitive to the papillary junction’supper edge. The algorithm involved: reducing noise in B-scansusing a median filter; using a Sobel operator to detect edges;heuristically determining skin layers by some manually definedprobe region and predetermined intensity threshold; and enhanc-ing the detected 2D depth profiles to yield the surface and internalfingerprints. The manual definitions of probe depth and intensitythreshold are only possible because a glass slide was used in thescanning process. This approach cannot work when applied to atouchless OCT scan as the depth-dependency roll-off problemrenders a static-intensity threshold useless. Furthermore, the tech-nique was optimized for a single OCT scan; more data is neededto ensure robustness. The authors did identify this fault.
Darlow et al. [12] developed an internal fingerprint zone-detection algorithm based on k-means clustering. By definingsuitable features to describe local maxima in en face 1D signals(known as A-lines), the researchers were able to detect the in-ternal fingerprint zone accurately and used that information toextract the internal fingerprint. Although this approach was ac-curate, the procedure was slow as it involved smoothing many1D signals, detecting local maxima in these signals, and post-processing the clustering output. The research presented here,however, provides a technique that is comparable regarding ac-curacy and is superior in terms of time taken. Akhoury andDarlow [13] also detected the papillary junction in a similarfashion, but extracted the internal fingerprint by processingthe 2D papillary junction’s upper-edge coordinates. This ap-proach assumes that the coordinates obtained are always accu-rate. This is an idealistic and impractical scenario. An improvedapproach to internal fingerprint extraction is presented in thisresearch.
Sousedik and Busch [14] were able to detect skin layers byfitting smooth surfaces to data clusters. They used a back-propagation neural network that was trained to representsmooth surfaces. The focus of their research was to addressthe effect of OCT scan quality on the internal fingerprint.Furthermore, the layer detection method was used for authen-ticity detection. A large dataset was used to demonstrate thesuccess of this approach. No enhancement of the extracted fin-gerprints was attempted.
A new approach to fingerprint extraction from OCT finger-tip scans is presented in this research. Touchless OCT scans areassumed as input data, creating the need to address certainproblems related to fingerprint extraction. The following sec-tion serves to detail the internal fingerprint extraction processdeveloped here and provides solutions to several problems en-countered in this field of research.
3. METHODOLOGY: SCALING-RESOLUTIONZONE DETECTION AND ROBUST FINGERPRINTEXTRACTION
There is an inherent connection between hardware capabilityand the quality of resultant OCT scans. For instance, it is pos-sible to reduce the effect of speckle noise through hardwaredesign [6] or by averaging the signal returned from the OCTscanner for a smoother result. Furthermore, depth-dependencyroll-off can be mitigated through enhanced depth imaging [21].
The use of a glass slide during scanning may also improve thescan quality by improving the stability of the finger and nor-malizing the curvature of the finger. However, a design con-straint placed on this research is that the relationship betweenhardware and software must not be strong, that is, the imple-mentations and algorithms developed and presented in thissection are software-based solutions for problems that existin some but not all cases. Although solutions could be foundby placing specific constraints on hardware design and use,those constraints would not make the effectiveness and useful-ness of the techniques proposed here redundant. The hardwareused (detailed in Section 4) has not been designed specificallyfor the task of fingerprint extraction, but is able to provide scansof sufficient en face resolution corresponding to the constraintof high-resolution fingerprints (at least 500 dpi). Future re-search will involve the application, testing, and comparativeanalysis of hardware-specific solutions to the same problemssolved herein.
Obtaining a fingerprint of sufficient quality from an OCTfingertip scan (shown in Fig. 1) is a three-stage process. First,the fingerprint zone—internal or surface—is detected using ascaling-resolution edge-detection procedure. Second, the finger-print is extracted by using a statistical evaluation of the edgethat describes the fingerprint undulations (viz., the fingerprintzone, a depth profile represented as 2D coordinates) and byaveraging en face pixels over a dynamic region. The fingerprintis also enhanced at this stage. Finally, the surface and internalfingerprints are compared (for spoof detection) and blendedaccording to a local-quality measure (the orientation certaintylevel (OCL) [22] in this case). Figures 2 and 3 are flow chartsexplaining the fingerprint extraction and blending procedures,respectively.
Fig. 2. Fingerprint zone detection and extraction. The sparsity fac-tor is denoted by sf .
9260 Vol. 54, No. 31 / November 1 2015 / Applied Optics Research Article

The resultant fingerprint is a local-quality-specific blend ofthe internal and surface fingerprints. Table 1 lists the relevantadvantages and disadvantages of these two fingerprints and pro-vides motivations for a “blend” fingerprint that possesses theadvantages of both and the disadvantages of neither.
Sections A through F describe and provide solutions to vari-ous problems encountered when extracting fingerprints fromOCT fingertip scans.
A. SpeedA 3D OCT scan, with resolution constraints as shown inFig. 1, consists of 262,144 A-lines–columns in Fig. 1(b).Each of these A-lines could contain the edges describing bothfingerprint zones. In order to extract the fingerprints from saidzones, these zones must be detected as 2D coordinates that de-scribe their depths throughout the volume. Darlow et al. [12]
developed a technique that clustered A-line local maxima toapproximate the papillary junction location. A fine-tuning pro-cedure further localized the internal fingerprint zone. Althoughaccuracy was high, the technique was slow; processing tookseveral minutes to complete on current hardware, which isunsatisfactory.
The research presented here details the accurate and fast de-tection of the internal and surface fingerprint zones. The aimregarding execution speed is to ensure times lower than thetime taken to perform an OCT scan on current hardware,which is achieved by simplifying the detection process andprocessing fewer A-lines. B-scans are resized to one-eighth oftheir original size (i.e., 64 × 64 pixels) prior to zone detection.Area-based interpolation effectively alleviates speckle noise.The following section details this process.
B. Fingerprint Zone DetectionThe detection of fingerprint zones is key to fingerprint extrac-tion. A combination of Sobel edge detection (as exemplified inFig. 2) and interpolation is used to define the locations of thepapillary junction’s upper edge (internal fingerprint zone) andthe location of the stratum corneum (the surface fingerprintzone). Because each of these layers is relatively reflective whencompared to the dermis and epidermis, they result in brighterregions in B-scans, and their edges can be detected.
The stratum corneum is detected at a low resolution(64 × 64 pixel B-scans and every eighth B-scan). The brightestpixel in each column of the Sobel-filtered B-scans is the stratumcorneum. If the brightest pixel is below some threshold, thefingerprint zone is flagged for interpolation using an establishedinterpolation method, known as inpaintnan [23].
The locations and intensities of the stratum corneum ina single B-scan are used to normalize that B-scan (as perSection 3C). The stratum corneum is detected again usingthe normalized B-scans. Following this, the Sobel-filteredB-scans are probed to detect the strongest edge in a definedregion. This region is defined according to which fingerprintzone is being detected: 4 pixels above and below the stratumcorneum for the surface fingerprint zone, and between 5 and12 pixels below the stratum corneum for the internal finger-print zone.
Because this resizing and skipping (of B-scans) gives asparse estimate of the fingerprint zones, the degree of resize(and the number of B-scans skipped) is referred to as thesparsity factor from here on out. For instance, the lowest-resolution resize corresponds to a sparsity factor of 8 becausethe original B-scans’ dimensions are decreased by this factor.
At this stage, the locations of the strongest edges are anapproximation of a fingerprint zone. These locations can befurther defined by the following iterative process:
1. Resize original B-scans using a sparsity factor equal tohalf of the previous iteration’s sparsity factor.
2. Interpolate the missing fingerprint zone coordinatesusing inpaintnan. Interpolation is necessary in the followingscenarios: (a) the strongest edge detected in the Sobel-filteredB-scans (in the previous iteration) is below a threshold value(manually set); (b) the lower sparsity factor means the finger-print zone is required to be less sparse—the one detected at theprevious sparsity factor is less descriptive and values are missing;
Fig. 3. Fingerprint blending algorithm.
Table 1. Advantages and Disadvantages of Internal andSurface Fingerprints
Advantages Disadvantages
Internal Protected from damage Difficult to accessNo scanning distortion Difficult to extractDifficult to spoof Low contrastIdentical to surface
Surface Widely accepted Subject to distortionEasy to access Subject to damageHigher contrast Easy to spoof
Research Article Vol. 54, No. 31 / November 1 2015 / Applied Optics 9261
or (c) the zone could not be detected in some locations, neces-sitating interpolation.
3. Normalize resized B-scans as per Section 3C.4. Filter for horizontal edges using a Sobel filter.5. Probe 4 pixels on either side of the previous fingerprint
zone locations for the strongest edges.6. Repeat steps 1–5 until satisfactory accuracy is achieved
or until the sparsity factor is equal to 1.
This scaling-resolution approach to fingerprint zone detec-tion allows for a trade-off between accurate knowledge of fin-gerprint zone undulations and speed of execution. Sparsityfactors of 8, 4, 2, and 1 are used and tested in this research.The relationship between accuracy and execution time willbe shown in Section 4. A vital component to this executionis B-scan normalization, which is discussed in the followingsection.
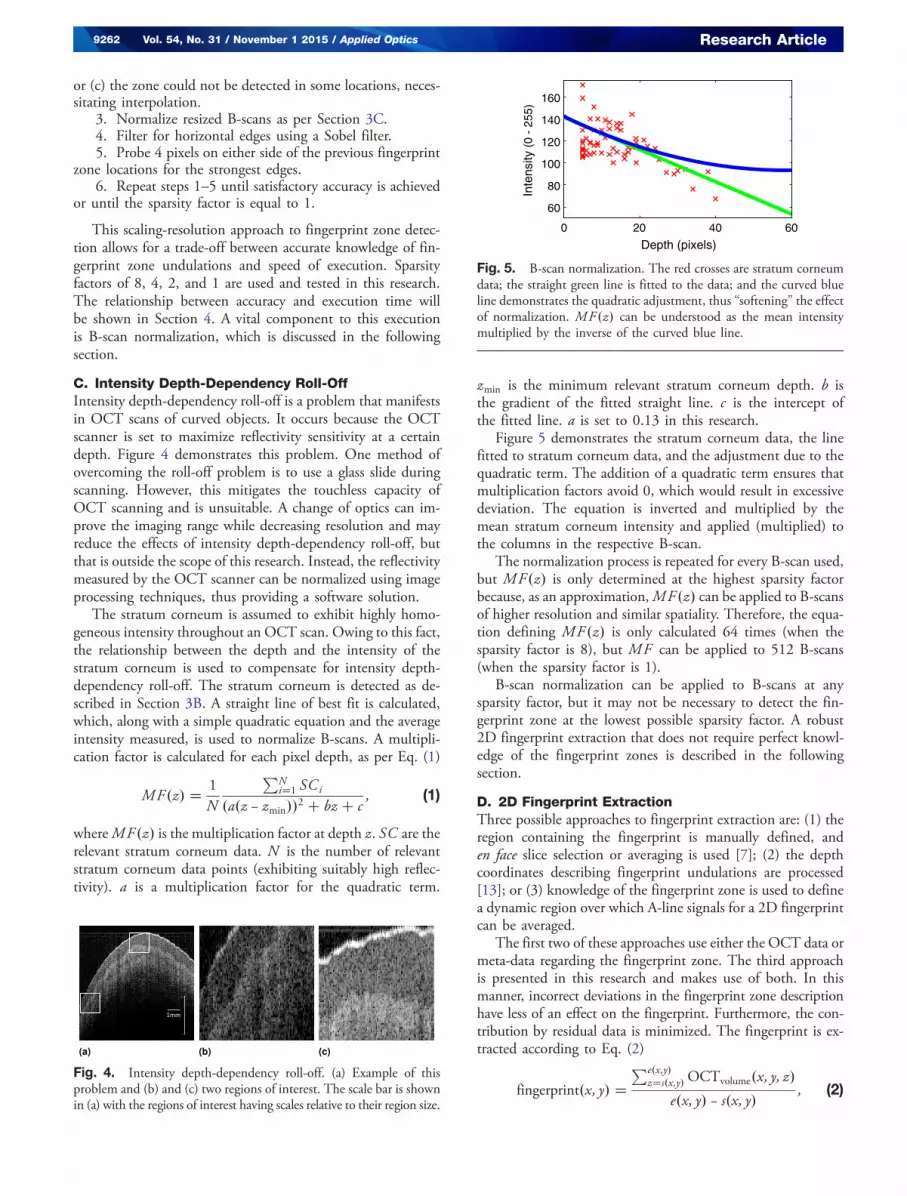
C. Intensity Depth-Dependency Roll-OffIntensity depth-dependency roll-off is a problem that manifestsin OCT scans of curved objects. It occurs because the OCTscanner is set to maximize reflectivity sensitivity at a certaindepth. Figure 4 demonstrates this problem. One method ofovercoming the roll-off problem is to use a glass slide duringscanning. However, this mitigates the touchless capacity ofOCT scanning and is unsuitable. A change of optics can im-prove the imaging range while decreasing resolution and mayreduce the effects of intensity depth-dependency roll-off, butthat is outside the scope of this research. Instead, the reflectivitymeasured by the OCT scanner can be normalized using imageprocessing techniques, thus providing a software solution.
The stratum corneum is assumed to exhibit highly homo-geneous intensity throughout an OCT scan. Owing to this fact,the relationship between the depth and the intensity of thestratum corneum is used to compensate for intensity depth-dependency roll-off. The stratum corneum is detected as de-scribed in Section 3B. A straight line of best fit is calculated,which, along with a simple quadratic equation and the averageintensity measured, is used to normalize B-scans. A multipli-cation factor is calculated for each pixel depth, as per Eq. (1)
MF �z� � 1
N
PNi�1 SCi
�a�z − zmin��2 � bz � c; (1)
whereMF �z� is the multiplication factor at depth z. SC are therelevant stratum corneum data. N is the number of relevantstratum corneum data points (exhibiting suitably high reflec-tivity). a is a multiplication factor for the quadratic term.
zmin is the minimum relevant stratum corneum depth. b isthe gradient of the fitted straight line. c is the intercept ofthe fitted line. a is set to 0.13 in this research.
Figure 5 demonstrates the stratum corneum data, the linefitted to stratum corneum data, and the adjustment due to thequadratic term. The addition of a quadratic term ensures thatmultiplication factors avoid 0, which would result in excessivedeviation. The equation is inverted and multiplied by themean stratum corneum intensity and applied (multiplied) tothe columns in the respective B-scan.
The normalization process is repeated for every B-scan used,but MF�z� is only determined at the highest sparsity factorbecause, as an approximation,MF �z� can be applied to B-scansof higher resolution and similar spatiality. Therefore, the equa-tion defining MF �z� is only calculated 64 times (when thesparsity factor is 8), but MF can be applied to 512 B-scans(when the sparsity factor is 1).
B-scan normalization can be applied to B-scans at anysparsity factor, but it may not be necessary to detect the fin-gerprint zone at the lowest possible sparsity factor. A robust2D fingerprint extraction that does not require perfect knowl-edge of the fingerprint zones is described in the followingsection.
D. 2D Fingerprint ExtractionThree possible approaches to fingerprint extraction are: (1) theregion containing the fingerprint is manually defined, anden face slice selection or averaging is used [7]; (2) the depthcoordinates describing fingerprint undulations are processed[13]; or (3) knowledge of the fingerprint zone is used to definea dynamic region over which A-line signals for a 2D fingerprintcan be averaged.
The first two of these approaches use either the OCT data ormeta-data regarding the fingerprint zone. The third approachis presented in this research and makes use of both. In thismanner, incorrect deviations in the fingerprint zone descriptionhave less of an effect on the fingerprint. Furthermore, the con-tribution by residual data is minimized. The fingerprint is ex-tracted according to Eq. (2)
fingerprint�x; y� �Pe�x;y�
z�s�x;y� OCTvolume�x; y; z�e�x; y� − s�x; y� ; (2)
Fig. 4. Intensity depth-dependency roll-off. (a) Example of thisproblem and (b) and (c) two regions of interest. The scale bar is shownin (a) with the regions of interest having scales relative to their region size.
0 20 40 60
60
80
100
120
140
160
Depth (pixels)
Inte
nsity
(0
- 25
5)
Fig. 5. B-scan normalization. The red crosses are stratum corneumdata; the straight green line is fitted to the data; and the curved blueline demonstrates the quadratic adjustment, thus “softening” the effectof normalization. MF �z� can be understood as the mean intensitymultiplied by the inverse of the curved blue line.
9262 Vol. 54, No. 31 / November 1 2015 / Applied Optics Research Article
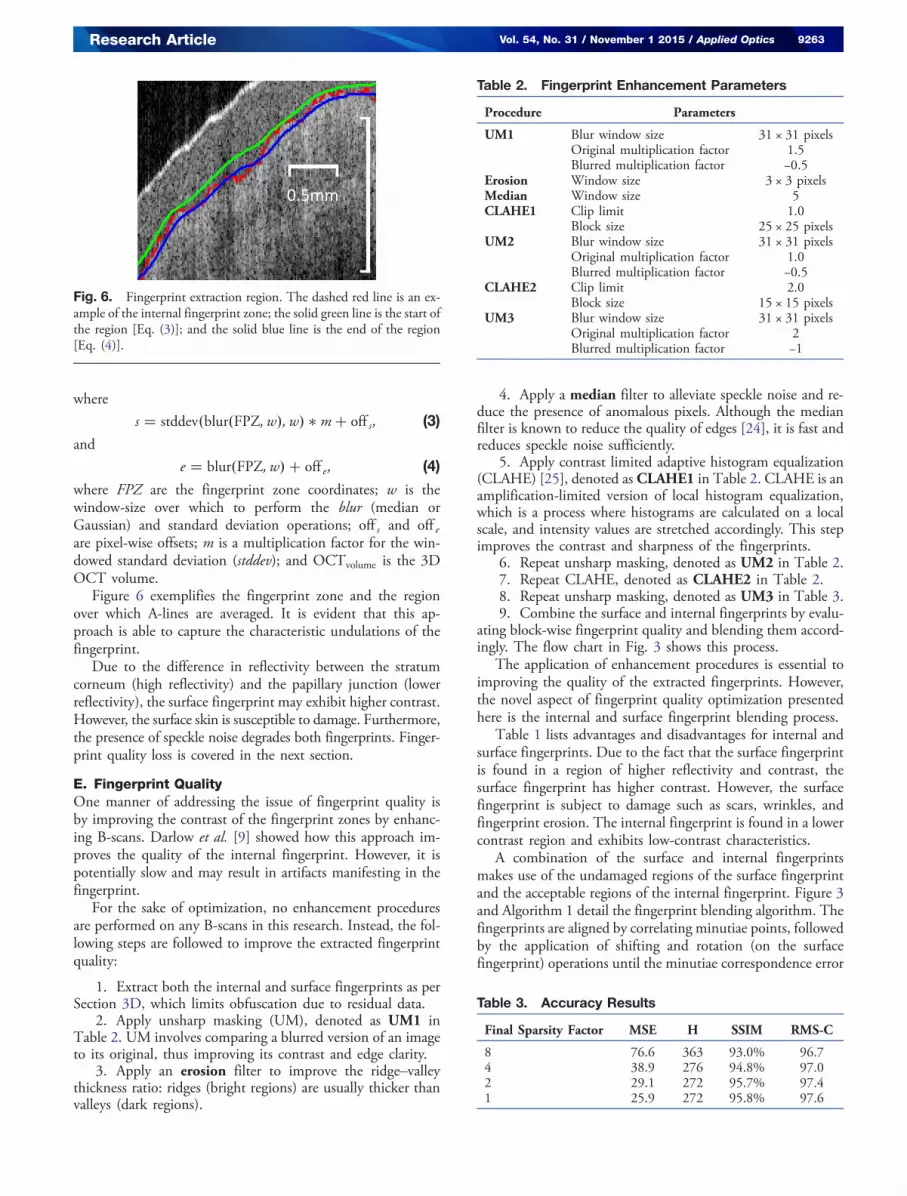
wheres � stddev�blur�FPZ; w�; w� � m� off s ; (3)
ande � blur�FPZ; w� � off e ; (4)
where FPZ are the fingerprint zone coordinates; w is thewindow-size over which to perform the blur (median orGaussian) and standard deviation operations; off s and off eare pixel-wise offsets; m is a multiplication factor for the win-dowed standard deviation (stddev); and OCTvolume is the 3DOCT volume.
Figure 6 exemplifies the fingerprint zone and the regionover which A-lines are averaged. It is evident that this ap-proach is able to capture the characteristic undulations of thefingerprint.
Due to the difference in reflectivity between the stratumcorneum (high reflectivity) and the papillary junction (lowerreflectivity), the surface fingerprint may exhibit higher contrast.However, the surface skin is susceptible to damage. Furthermore,the presence of speckle noise degrades both fingerprints. Finger-print quality loss is covered in the next section.
E. Fingerprint QualityOne manner of addressing the issue of fingerprint quality isby improving the contrast of the fingerprint zones by enhanc-ing B-scans. Darlow et al. [9] showed how this approach im-proves the quality of the internal fingerprint. However, it ispotentially slow and may result in artifacts manifesting in thefingerprint.
For the sake of optimization, no enhancement proceduresare performed on any B-scans in this research. Instead, the fol-lowing steps are followed to improve the extracted fingerprintquality:
1. Extract both the internal and surface fingerprints as perSection 3D, which limits obfuscation due to residual data.
2. Apply unsharp masking (UM), denoted as UM1 inTable 2. UM involves comparing a blurred version of an imageto its original, thus improving its contrast and edge clarity.
3. Apply an erosion filter to improve the ridge–valleythickness ratio: ridges (bright regions) are usually thicker thanvalleys (dark regions).
4. Apply a median filter to alleviate speckle noise and re-duce the presence of anomalous pixels. Although the medianfilter is known to reduce the quality of edges [24], it is fast andreduces speckle noise sufficiently.
5. Apply contrast limited adaptive histogram equalization(CLAHE) [25], denoted as CLAHE1 in Table 2. CLAHE is anamplification-limited version of local histogram equalization,which is a process where histograms are calculated on a localscale, and intensity values are stretched accordingly. This stepimproves the contrast and sharpness of the fingerprints.
6. Repeat unsharp masking, denoted as UM2 in Table 2.7. Repeat CLAHE, denoted as CLAHE2 in Table 2.8. Repeat unsharp masking, denoted as UM3 in Table 3.9. Combine the surface and internal fingerprints by evalu-
ating block-wise fingerprint quality and blending them accord-ingly. The flow chart in Fig. 3 shows this process.
The application of enhancement procedures is essential toimproving the quality of the extracted fingerprints. However,the novel aspect of fingerprint quality optimization presentedhere is the internal and surface fingerprint blending process.
Table 1 lists advantages and disadvantages for internal andsurface fingerprints. Due to the fact that the surface fingerprintis found in a region of higher reflectivity and contrast, thesurface fingerprint has higher contrast. However, the surfacefingerprint is subject to damage such as scars, wrinkles, andfingerprint erosion. The internal fingerprint is found in a lowercontrast region and exhibits low-contrast characteristics.
A combination of the surface and internal fingerprintsmakes use of the undamaged regions of the surface fingerprintand the acceptable regions of the internal fingerprint. Figure 3and Algorithm 1 detail the fingerprint blending algorithm. Thefingerprints are aligned by correlating minutiae points, followedby the application of shifting and rotation (on the surfacefingerprint) operations until the minutiae correspondence error
Fig. 6. Fingerprint extraction region. The dashed red line is an ex-ample of the internal fingerprint zone; the solid green line is the start ofthe region [Eq. (3)]; and the solid blue line is the end of the region[Eq. (4)].
Table 2. Fingerprint Enhancement Parameters
Procedure Parameters
UM1 Blur window size 31 × 31 pixelsOriginal multiplication factor 1.5Blurred multiplication factor −0.5
Erosion Window size 3 × 3 pixelsMedian Window size 5CLAHE1 Clip limit 1.0
Block size 25 × 25 pixelsUM2 Blur window size 31 × 31 pixels
Original multiplication factor 1.0Blurred multiplication factor −0.5
CLAHE2 Clip limit 2.0Block size 15 × 15 pixels
UM3 Blur window size 31 × 31 pixelsOriginal multiplication factor 2Blurred multiplication factor −1
Table 3. Accuracy Results
Final Sparsity Factor MSE H SSIM RMS-C
8 76.6 363 93.0% 96.74 38.9 276 94.8% 97.02 29.1 272 95.7% 97.41 25.9 272 95.8% 97.6
Research Article Vol. 54, No. 31 / November 1 2015 / Applied Optics 9263

is minimized. The adjusted surface fingerprint and the internalfingerprint are combined initially using pixel averaging. Ablock-wise fingerprint quality assessment is calculated for thesurface, internal, and average-blended fingerprints. These threefingerprints are combined according to adjusted and weightedlocal-quality assessments. In this research, OCL is used to de-fine region quality, although any local fingerprint quality met-rics could be used.
Algorithm 1. Fingerprint Blending. F i and Fs are theinternal and surface fingerprints, respectively. Ioff, Soff,and Aoff are the OCL offsets for the internal, surface, andaverage-blended fingerprints, respectively. m1, m2, andm3 are multiplication factors for the best, second-best,and worst pixel-wise scores.
1: Procedure BLEND �F i; F s; I of f ; Sof f ; Aof f ; m1; m2; m3�2: Mii ← mindtct�F i� ▹Calculate minutiae of F i3: Mis ← mindtct�F s� ▹Calculate minutiae of F s4: Error ← compare�Mii;Mis� ▹Minutiae error5: BestX shif t ← 0 ▹Store X-shift6: BestY shif t ← 0 ▹Store Y-shift7: BestRotation ← 0 ▹Store Rotation8: for xshif t ← −5; 5 do9: for yshif t ← −5; 5 do10: for rotation ← −4; 0.1; 4 do11: Rotate�Shif t�Mis; xshif t ; yshif t�; rotation�12: NewError ← compare�Mii;Mis�13: if NewError < Error then14: BestX shif t ← xshif t15: BestY shif t ← yshif t16: BestRotation ← rotation17: Error ← NewError18: Adjust�F s; BestX shif t; BestY shif t; BestRotation� ▹Align19: Fa ← Average�F i; F s� ▹Pixel-wise average20: �OCLi; OCLs; OCLa � ← OCL�F i; F s; Fm� ▹Calculate OCL21: for x ← 0; 511 do ▹Rows22: for y ← 0; 511 do ▹Columns23: si ← 1 −OCLi�x; y� � I of f ▹F i score24: ss ← 1 −OCLs�x; y� � Sof f ▹F s score25: sa ← 1 − OCLa�x; y� � Aof f ▹F s score26: sortedS ← Sort�si ; ss ; sa�27: sortedS ← sortedS � �m1; m2; m3� ▹bias28: total ← si � ss � sa29: �si ; ss ; sa � ← �si ; ss ; sa �∕�si � ss � sa� ▹Percentage30: Fb ← F i�x; y� � si � F s�x; y� � ss � Fa�x; y� � sa
Another useful byproduct of extracting both the surface andinternal fingerprints is the potential for spoof detection. Thefollowing section proposes a spoof-detection technique.
F. Spoof-Detection: a PropositionFingerprint spoof detection has been presented in earlier re-search [15–17]. These approaches often involved human in-tervention. A fingerprint spoof-detection technique is proposedin this research that is a direct surface to internal fingerprintcomparison.
It is assumed that the internal fingerprint will remain un-changed when an additional layer (for an action of a dubiousnature) is placed on the fingertip skin. If the surface fingerprintdoes not match the internal fingerprint, it is very likely a fin-gerprint spoof. Although it is not the focus of this research toprovide a thorough fingerprint spoof-detection technique, the
proposition presented here is easy to implement and not with-out merit.
The experiments designed to test the solutions described inthe preceding sections are outlined in the following section.
4. EXPERIMENTAL SETUP
The Thorlabs OCS1300SS OCT scanner (refer to Fig. 7) wasused to obtain 13 OCT fingertip scans. It has an axial scan rateof 16 kHz, a spectral bandwidth of 100 nm, a central wave-length of 1300 nm, and an average output power of 10 mW.The lateral resolution is 15 μm, and the axial resolutions in airand water are 12 μm and 9 μm, respectively. The maximumimaging depth is 3.0 mm. The depth of focus is 0.3 mm, about10 orders smaller than the imaging depth. The coherencelength is 6 mm, and the imaging speed (at 512 A-lines perB-scan) is 25 fps. Each scan resulted in 512 B-scans, each con-sisting of 512 A-lines. Although Thorlabs does not explicitlystate the fall-off sensitivity of this system, the company doesindicate that signal decay is not significant owing to the rela-tionship between the coherence length and maximum depth.
Numerous area scans of 10 mm2 and 15 mm2 were taken,but only those capturing a suitably large and well-positionedfingerprint area were accepted to ensure that the results arefairly independent of scan area quality. The result was a datasetconsisting of 13 usable fingertip scans. Each scan took approx-imately 20 s to complete.
Corresponding surface scans were also captured to give anindication of the fingerprints’ performance. The IntegratedBiometrics Watson Mini (and the IBScanUltimate 1.6.10 soft-ware) and the SecuGen Hamster Plus (and the demo software)were used to capture 16 surface scans of each fingertip.
All code was written in C++ using the open source computervision image computing library (found at opencv.org) and par-allelized using the multi-platform open multi-processing appli-cation programming interface (found at openmp.org). Thefingerprint enhancement procedure, as given in Section 3E,was applied with parameters according to Table 2.
The accuracy of fingerprint zone detection was tested usingthe same four quantitative assessment metrics used by Darlowet al. [12]: mean-squared error (MSE), the Hausdorff distance
Fig. 7. OCT system (OCS1300SS, Thorlabs). SLS, swept lasersource; BS, beam splitter; PD, photodiode detector; DSP, digital signalprocessor; S, sample. Reproduced with permission, courtesy of Darlowet al. [12].
9264 Vol. 54, No. 31 / November 1 2015 / Applied Optics Research Article
metric [26,27] (H), structural similarity [28,29] (SSIM), androot-mean-squared contrast [30] (RMS-contrast). The reader isreferred to [12] for explanations of these metrics.
The accuracy of internal fingerprint zone detection wastested on a single OCT fingertip volume, using final sparsityfactors of 1, 2, 4, and 8. The above-mentioned quantitativemetrics were used to estimate the correspondence of the de-tected zone with a ground-truth internal fingerprint zone.The ground truth was determined manually on unprocessedB-scans.
Accuracy of zone detection and the execution time are de-pendent on the final sparsity factor, which will be exhibited.In addition, OCL and the National Institute of Science andTechnology’s Fingerprint Image Quality (NIST NFIQ) [31]fingerprint scores were also calculated for all extracted finger-prints. OCL provides a block-wise ridge-orientation certaintyscore by measuring ridge–valley orientation consistency in smallregions. OCL ranges from 0 to 1, and lower OCL scores indicatebetter orientation certainty. The OCL for a single fingerprintis calculated as the mean OCL score for all relevant blocks.The NFIQ number predicts a fingerprint’s overall positive ornegative contribution to a fingerprint matching system. NFIQnumbers are integers that range from 1 to 5, and a lowerNFIQ number indicates a better fingerprint.
The NIST fingerprint minutiae extractor (mindtct) andmatching algorithm (bozarth3) were used to quantify the cor-respondence between fingerprints extracted from the OCTscans and those obtained using the surface scanners. NISTstates that a “true match” exhibits a score above 40, whichis the criterion to detect a possible fingerprint spoof. Matchscores were calculated for all corresponding surface and internalfingerprints.
The final assessment was a qualitative analysis to show theaccuracy of internal fingerprint zone detection, the scaling-resolution approach, and the fingerprint blending procedure.
5. RESULTS AND DISCUSSION
Table 3 and Fig. 8 exhibit the accuracy results of internalfingerprint zone detection. The quantitative results at lowerfinal sparsity factors were comparable to those found in thework by Darlow et al. [12]. The MSE results were withinthe deviation calculated from human volunteers’ attempts at
internal fingerprint zone detection (see [12]). Furthermore, theSSIM results obtained here were an improvement. Figure 8demonstrates the dependency of zone detection on the finalsparsity factor.
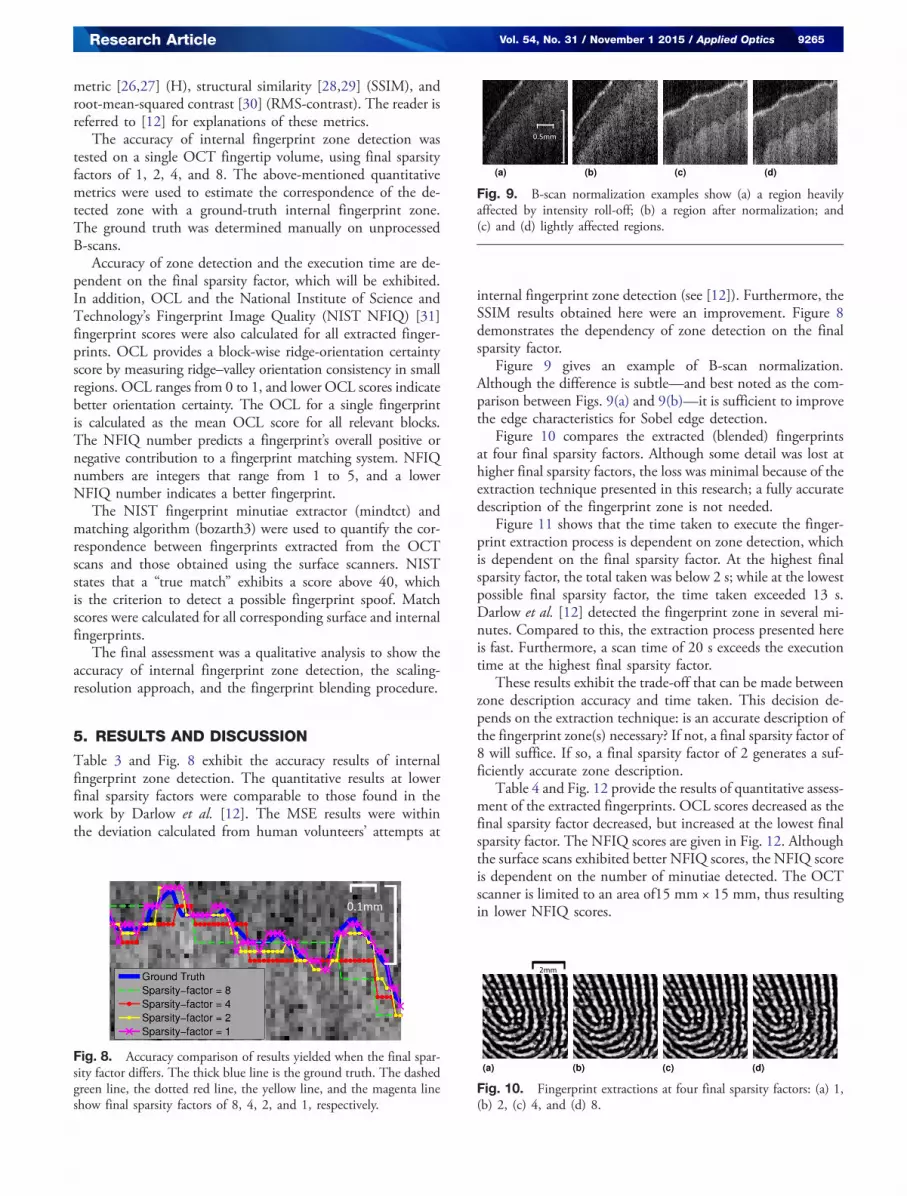
Figure 9 gives an example of B-scan normalization.Although the difference is subtle—and best noted as the com-parison between Figs. 9(a) and 9(b)—it is sufficient to improvethe edge characteristics for Sobel edge detection.
Figure 10 compares the extracted (blended) fingerprintsat four final sparsity factors. Although some detail was lost athigher final sparsity factors, the loss was minimal because of theextraction technique presented in this research; a fully accuratedescription of the fingerprint zone is not needed.
Figure 11 shows that the time taken to execute the finger-print extraction process is dependent on zone detection, whichis dependent on the final sparsity factor. At the highest finalsparsity factor, the total taken was below 2 s; while at the lowestpossible final sparsity factor, the time taken exceeded 13 s.Darlow et al. [12] detected the fingerprint zone in several mi-nutes. Compared to this, the extraction process presented hereis fast. Furthermore, a scan time of 20 s exceeds the executiontime at the highest final sparsity factor.
These results exhibit the trade-off that can be made betweenzone description accuracy and time taken. This decision de-pends on the extraction technique: is an accurate description ofthe fingerprint zone(s) necessary? If not, a final sparsity factor of8 will suffice. If so, a final sparsity factor of 2 generates a suf-ficiently accurate zone description.
Table 4 and Fig. 12 provide the results of quantitative assess-ment of the extracted fingerprints. OCL scores decreased as thefinal sparsity factor decreased, but increased at the lowest finalsparsity factor. The NFIQ scores are given in Fig. 12. Althoughthe surface scans exhibited better NFIQ scores, the NFIQ scoreis dependent on the number of minutiae detected. The OCTscanner is limited to an area of15 mm × 15 mm, thus resultingin lower NFIQ scores.
Fig. 8. Accuracy comparison of results yielded when the final spar-sity factor differs. The thick blue line is the ground truth. The dashedgreen line, the dotted red line, the yellow line, and the magenta lineshow final sparsity factors of 8, 4, 2, and 1, respectively.
Fig. 9. B-scan normalization examples show (a) a region heavilyaffected by intensity roll-off; (b) a region after normalization; and(c) and (d) lightly affected regions.
Fig. 10. Fingerprint extractions at four final sparsity factors: (a) 1,(b) 2, (c) 4, and (d) 8.
Research Article Vol. 54, No. 31 / November 1 2015 / Applied Optics 9265

The NFIQ scores were clearly improved by the fingerprintblending process. Figures 12(b) and 12(c) are the NFIQ scoresfor the extracted surface and internal fingerprints, respectively.Figure 12(d) shows the NFIQ scores for the blended finger-prints: more NFIQ scores of 1 and no NFIQ scores of 3.
Match scores were calculated by comparing all extracted fin-gerprints to their corresponding conventional surface finger-prints. The mean match scores were calculated as the averagematch scores for all comparisons, while the maximum matchscores were calculated as the average of the maximum matchscores (since each extracted fingerprint is compared to 16 con-ventional surface counterparts). Both were given because fin-gerprint identification and verification may make use of either,and the maximum match scores indicate a “best-case scenario.”
The mean and average maximum match scores did notexhibit dependence on the final sparsity factor. Additionally,the average maximum match scores were improved by blending.
The extracted internal fingerprints had 58% true matches.The extracted surface fingerprints had 38% true matches. Theblended fingerprints had 40% true matches, which may seemto exhibit poor performance, but there are underlying factors:
• The capability of the NISTminutiae extractor and matcher.• The orientation and scale differences between the ex-
tracted and conventional fingerprints.• Distortion incurred by the conventional scanning.
• The lack of an “unwrapping” procedure [32] when ex-tracting from the OCT scan.
• The qualitative differences between compared fingerprints.
There is, therefore, a compound explanation for the incon-gruent matching behavior between the extracted fingerprintsand the conventional surface fingerprints. Figures 13(c)–13(f )demonstrate this by comparing the extracted fingerprints witha conventional surface fingerprint. The blended fingerprint isqualitatively superior to the conventional surface fingerprintand the extracted internal and surface fingerprints.
Fig. 11. Timing results. At high final sparsity factors, the time takento detect the fingerprint zone(s) is minimal, but at low final sparsityfactors, this time is unrealistic.
2
1
3
Surface: conventional
(a)
1
2
Surface: OCT
(b)
1
2
3
Internal
(c)
12
Blended
(d)
Fig. 12. NFIQ scores. Part (a) shows the distribution of NFIQscores for the fingerprints obtained using conventional surface scan-ners, while parts (b), (c), and (d) exhibit the NFIQ scores for the ex-tracted surface, internal, and blended fingerprints, respectively.
Table 4. Results: TheMean andMaximumMatch ScoresAre the Average and Maximum Scores, Respectively,Calculated Against Surface Counterpartsa
Type sf OCL Mean Match Max Match
Internal 8 0.336 0.036 31 17 49 25Internal 4 0.327 0.035 28 14 44 19Internal 2 0.323 0.038 27 12 45 19Internal 1 0.324 0.039 28 14 45 23Surface 8 0.255 0.074 33 24 40 19Surface 4 0.230 0.076 34 26 44 21Surface 2 0.231 0.079 35 27 40 14Surface 1 0.234 0.077 34 26 44 14Blended 8 0.263 0.031 27 12 53 40Blended 4 0.253 0.054 28 14 55 44Blended 2 0.242 0.046 25 9 55 44Blended 1 0.251 0.055 28 10 55 41
asf refers to the sparsity factor.
Fig. 13. Fingerprint enhancement. Parts (a) and (b) are examples ofinternal and surface fingerprint enhancements, respectively, displayedwith overlays of the extracted fingerprints to highlight the differences.Parts (c) through (e) exemplify fingerprint blending: (c) is an extractedsurface fingerprint with a region of interest highlighting wrinkles; (d) isan extracted internal fingerprint, exhibiting fewer wrinkles, but lowerquality regions (in the region of interest); and (e) is after blendingwhen the regions of interest exhibit less quality degradation, and theeffect of wrinkles is lessened. Part (f ) is the corresponding surfacefingerprint obtained using a conventional scanner.
9266 Vol. 54, No. 31 / November 1 2015 / Applied Optics Research Article

Figure 13 demonstrates the fingerprint enhancement andblending procedures. The unprocessed surface fingerprint wasof higher contrast than its internal counterpart. However, uponapplying the same enhancement procedure, the contrast andclarity of ridges and valleys was improved in each case. Blendingthese two fingerprints combines the best aspects of both.
This research also proposed a technique for fingerprint spoofdetection. Regarding this, the average surface-to-internal fin-gerprint match score was 124 59. Only one case exhibiteda score that was below the true match threshold. The next lowestmatch score was 74, almost double the criterion for a true match.The proposition for spoof detection presented in this research,although not exhaustively tested, is promising in its simplicityand performance. This technique must be tested to assess per-formance compared to other spoof-detection solutions.
6. CONCLUSION
The research presented here provides solutions to problemsfaced when extracting fingerprints from touchless OCT finger-tip scans. The scaling-resolution approach to fingerprint zonedetection diminished the effect of speckle noise and simplifiedthe process through data minimization. This technique is effi-cient, fast, and robust: high-quality fingerprints (regarding themetrics measured in this research) were extracted from 13 OCTscans in less time than it took to perform the scans.
The scaling-resolution approach effectively minimized thedata to process by a factor denoted as the sparsity factor.The fingerprint zones were detected at the lowest resolutionprior to an iterative resolution-doubling procedure and zoneredefinitions.
When the final sparsity factor was set to the highest one usedin this research (i.e., processing only occurred at the lowest res-olution), the fingerprint zones obtained were not sufficient de-scriptions of the fingerprint topography. However, this scenarioallows for a trade-off between accuracy of the fingerprint zonedescription and speed of execution. When the final sparsity fac-tor was set to 1, the accuracy obtained was comparable to anearlier work with an MSE of 25.9 and an SSIM of 95.8%.
A novel B-scan normalization procedure was also presented.The stratum corneum was detected, and a depth-intensity re-lationship was defined for depth-wise pixel normalization. Indoing so, the intensity depth-dependency roll-off problem ismitigated without the use of a glass slide during scanning.Normalization was applied prior to Sobel edge detection foridentification of the internal and surface fingerprint zones.
Both surface and internal fingerprints were extracted fromeach OCT scan, on which enhancement procedures were car-ried out. These were blended according to a local fingerprintquality assessment, resulting in a hybrid fingerprint that adoptsthe advantages of both available fingerprints.
The extracted surface, internal, and blended fingerprintswere assessed using OCL and NFIQ. Quantitative evidenceshowed that the blended fingerprints were an improvementand that a final sparsity factor of 2 is sufficient.
Extracted fingerprints were matched against conventionalsurface counterparts, revealing performance improvements dueto fingerprint blending. Blended fingerprints exhibited averagemaximum match scores above 50 at all final sparsity factors.
A spoof-detection technique was proposed where the surfaceand internal fingerprints are compared using the NIST match-ing algorithm. Only one scan showed anomalous behavior.
The techniques and solutions presented in this work are noveland provide a means of extracting and blending fingerprints fromtouchless OCT scans. Future work will entail refining the algo-rithms, constructing an OCT fingerprint database for testing,and analyzing the proposed spoof-detection approach.
Fingerprint-extraction-specific hardware can be designedand will follow as a future work. Highly parallelized implemen-tations of the algorithms (such as on a graphics processing unitor a field-programmable gate array) may also serve to improvethe execution speed. This will be explored in a future work.
Acknowledgment. The authors would like to thank theCSIR National Laser Center for providing the OCT scans usedin this research.
REFERENCES1. A. W. Senior and R. M. Bolle, “Improved fingerprint matching by dis-
tortion removal,” IEICE Trans. Inf. Syst. 84, 825–832 (2001).2. T. Matsumoto, H. Matsumoto, K. Yamada, and S. Hoshino, “Impact of
artificial ‘gummy’ fingers on fingerprint systems,” Proc. SPIE 4677,275–289 (2002).
3. J. G. Fujimoto, M. E. Brezinski, G. J. Tearney, S. A. Boppart, B.Bouma, M. R. Hee, J. F. Southern, and E. A. Swanson, “Optical biopsyand imaging using optical coherence tomography,” Nat. Med. 1, 970–972 (1995).
4. J. Welzel, “Optical coherence tomography in dermatology: a review,”Skin Res. Technol. 7, 1–9 (2001).
5. J. Schmitt, “Optical coherence tomography (OCT): a review,” IEEE J.Sel. Top. Quantum Electron. 5, 1205–1215 (1999).
6. J. M. Schmitt, S. H. Xiang, and K. M. Yung, “Speckle in optical coher-ence tomography,” J. Biomed. Opt. 4, 95–105 (1999).
7. A. Bossen, R. Lehmann, and C. Meier, “Internal fingerprint identifica-tion with optical coherence tomography,” IEEE Photon. Technol. Lett.22, 507–509 (2010).
8. M. Liu and T. Buma, “Biometric mapping of fingertip eccrine glandswith optical coherence tomography,” IEEE Photon. Technol. Lett.22, 1677–1679 (2010).
9. L. N. Darlow, S. S. Akhoury, and J. Connan, “Internal fingerprint acquis-ition from optical coherence tomography fingertip scans,” in Proceedingsof IEEE Third International Conference onDigital Information, Networking,and Wireless Communications (IEEE, 2015), pp. 188–191.
10. G. Liu and Z. Chen, “Capturing the vital vascular fingerprint with opti-cal coherence tomography,” Appl. Opt. 52, 5473–5477 (2013).
11. P. Korohoda, A. Dabrowski, and P. Pawlowski, “Optical coherencetomography for fingerprint acquisition from internal layer-A casestudy,” in Proceedings of IEEE Conference on Signal Processing:Algorithms, Architectures, Arrangements, and Applications (IEEE,2014), pp. 176–180.
12. L. N. Darlow, J. Connan, and S. S. Akhoury, “Internal fingerprintzone detection in optical coherence tomography fingertip scans,”J. Electron. Imaging 24, 023027 (2015).
13. S. S. Akhoury and L. N. Darlow, “Extracting subsurface fingerprintsusing optical coherence tomography,” in Proceedings of IEEE ThirdInternational Conference on Digital Information, Networking, andWireless Communications (IEEE, 2015), pp. 184–187.
14. C. Sousedik and C. Busch, “Quality of fingerprint scans capturedusing optical coherence tomography,” in Proceedings of IEEEInternational Joint Conference on Biometrics (IEEE, 2014), pp. 1–8.
15. Y. Cheng and K. V. Larin, “Artificial fingerprint recognition by usingoptical coherence tomography with autocorrelation analysis,” Appl.Opt. 45, 9238–9245 (2006).
16. M.-R. Nasiri-Avanaki, A. Meadway, A. Bradu, R. M. Khoshki, A.Hojjatoleslami, and A. G. Podoleanu, “Anti-spoof reliable biometry
Research Article Vol. 54, No. 31 / November 1 2015 / Applied Optics 9267

of fingerprints using en-face optical coherence tomography,” Opt.Photon. J. 1, 91 (2011).
17. S. Meissner, R. Breithaupt, and E. Koch, “Defense of fake fingerprintattacks using a swept source laser optical coherence tomographysetup,” Proc. SPIE 8611, 86110 (2013).
18. I. Sobel and G. Feldman, “A 3 × 3 isotropic gradient operator for imageprocessing,” in Pattern Classification and Scene Analysis, R. Dudaand P. Hart, eds. (Wiley, 1968), pp. 271–272.
19. A. K. Jain, Y. Chen, and M. Demirkus, “Pores and ridges: high-resolution fingerprint matching using level 3 features,” IEEE Trans.Pattern Anal. Mach. Intell. 29, 15–27 (2007).
20. A. Zam, R. Dsouza, H. M. Subhash, M.-L. O’Connell, J. Enfield, K.Larin, and M. J. Leahy, “Feasibility of correlation mapping opticalcoherence tomography (cmOCT) for anti-spoof sub-surface finger-printing,” J. Biophotonics 6, 663–667 (2013).
21. I. Y. Wong, H. Koizumi, and W. W. Lai, “Enhanced depth imagingoptical coherence tomography,” Ophthalmic Surg. Lasers Imaging42, S75–S84 (2011).
22. E. Lim, X. Jiang, and W. Yau, “Fingerprint quality and validity analy-sis,” in Proceedings of IEEE International Conference on ImageProcessing (IEEE, 2002), pp. 469–472.
23. D. Garcia, “Robust smoothing of gridded data in one and higher di-mensions with missing values,” Computnl. Statist. Data Anal. 54,1167–1178 (2010).
24. L. N. Darlow, S. S. Akhoury, and J. Connan, “A review of state-of-the-art speckle reduction techniques for optical coherence tomographyfingertip scans,” Proc. SPIE 6445, 944523 (2014).
25. K. Zuiderveld, “Contrast limited adaptive histogram equalization,” inGraphics Gems IV (Academic, 1994), pp. 474–485.
26. D. P. Huttenlocher, G. A. Klanderman, and W. J. Rucklidge,“Comparing images using the Hausdorff distance,” IEEE Trans.Pattern Anal. Mach. Intell. 15, 850–863 (1993).
27. M. P. Dubuisson and A. K. Jain, “A modified Hausdorff distancefor object matching,” in Proceedings of IEEE IAPR InternationalConference on Pattern Recognition, Conference A: ComputerVision & Image Processing (IEEE, 1994), pp. 566–568.
28. Z. Wang and A. C. Bovik, “A universal image quality index,” IEEE Sig.Process. Lett. 9, 81–84 (2002).
29. Z. Wang, A. C. Bovik, H. R. Sheikh, and E. P. Simoncelli, “Image qual-ity assessment: from error visibility to structural similarity,” IEEETrans. Image Process. 13, 600–612 (2004).
30. E. Peli, “Contrast in complex images,” J. Opt. Soc. Am. A 7, 2032–2040 (1990).
31. E. Tabassi, C. Elham, C. Wilson, and C. Watson, “NIST fingerprintimage quality,” NIST Research Report NISTIR7151 (1990).
32. Y. Wang, D. L. Lau, and L. G. Hassebrook, “Fit-sphere unwrappingand performance analysis of 3D fingerprints,” Appl. Opt. 49, 592–600 (2010).
9268 Vol. 54, No. 31 / November 1 2015 / Applied Optics Research Article