effects of selected psychosocial factors on students
TRANSCRIPT
EFFECTS OF SELECTED PSYCHOSOCIAL FACTORS ON STUDENTS’
ACADEMIC PERFORMANCE IN KENYA CERTIFICATE OF SECONDARY
EDUCATION IN PUBLIC DAY SECONDARY SCHOOLS IN MARANI SUB-
COUNTY, KISII COUNTY, KENYA
CHRISTINE MWIKALI MUOKI
THESIS SUBMITTED TO THE SCHOOL OF EDUCATION IN PARTIAL
FULFILMENT OF THE REQUIREMENTS OF THE AWARD OF THE
DEGREE OF MASTER OF EDUCATION IN EDUCATIONAL
PSYCHOLOGY
OF MAASAI MARA UNIVERSITY
2021
ii
DECLARATION AND APPROVAL
Declaration:
This thesis is my original work and has not been presented to any other university for
examination.
Christine Mwikali Muoki
Reg. No.: EM13/S/6000/2012
Sign…………………………………………………….Date…27/10/2021………
Approval by the supervisors:
This thesis has been submitted for examination with our approval as the University
Supervisors
Dr. James Mwaura Kimani
Department of Education Foundation and Psychology.
Maasai Mara University
Sign………………………………………Date………………………………………
Dr. Newton Asakhulu Mukolwe
Department of Educational Foundation and Psychology
Maasai Mara University.
Sign………………………………………………….Date…………………………….
iii
DEDICATION
I dedicate this thesis to my beloved parents Mr. Julius Ndile and Edith Munya the late
mother, my husband Philip Andrew and my children Lydia Edith, Kevin Rasugu and
Brian. My parents with care support gave me the backbone of education and
background in life. Their inspiration encouraged me greatly. Their devotion to
consistently talk of education enabled me to have a future positive target and perception
in life.

iv
ACKNOWLEDGEMENT
I would like to thank the lord our God for having led me through my studies and this
research work. I am grateful to Maasai Mara University for having given me the
opportunity to continue my studies. My humble pleasure goes to my supervisors, Dr.
James Kimani Mwaura and Dr. Newton Asakhulu Mukolwe for their academic
guidance and advice during every stage of learning in this research work. Credit also
goes to my other lecturers from the Department of Educational Foundation and
Psychology with special mention to, Dr. Naftali Rop, Dr. Mary Consolata Shinali
School of Education and Dr. Alexander K. Ronoh. May the Almighty God bless you
greatly. I also thank my classmates, Faith, Rael, Josephine and Maureen who motivated
and inspired me during my studies. My typists, Shem Obegi and Lydia Bogonko who
worked with me throughout this research are highly appreciated. Last but not least,
sincere gratitude goes to all whom I met in the cyber and assisted in printing and
photocopying. Their motivation and encouragement helped me to complete this thesis.
May our good God bless you.
v
ABSTRACT
Psychosocial factors have effects in the students’ Academic Performance in Marani
Sub- County. The purpose of this study was to examine the selected Psychosocial
factors and their effects on students’ Academic Performance in Kenya Certificate of
Secondary Education in public day secondary schools in Marani sub-county, Kisii
county, Kenya. The specific objectives for this study were; to determine the effects of
Peer Pressure on students’ Academic Performance in public day secondary schools of
Marani Sub-County; to determine the effects of Parents’ Socio-economic Status on the
students’ Academic Performance in Kenya Certificate of Secondary Education in
public day secondary schools in Marani Sub- County; and to determine the effects of
Students’ Attitude towards learning on students’ Academic Performance in public day
secondary schools in Marani Sub- County. The study used descriptive research design.
The target population from which the sample was drawn consisted of 29 public day
secondary schools. The unit of analysis consisted of 1501 form four students, 29
principals and 301 teachers. A total of 30 teachers and 150 students was sampled using
Random Sampling technique. Purposive Sampling was applied in selecting 9 Principals
to participate in the study. Purposive Sampling enabled the researcher to reach the
targeted sample quickly. The sample distribution was 150 Students, 30 Teachers and 9
Principals, giving a Sample size of 189 Respondents. The study used Questionnaires
and Interview Guide as Data collection tools. The Questionnaires were given to
Students and Teachers, while Interview Schedule was used when collecting data from
Principals. This study employed Content validity and the Reliability coefficient of
0.8390 which was obtained using Cronbach’s Alpha and was taken as being a reliable
measure of the instruments of data collection. Quantitative data analysis involved the
calculation of Descriptive and Inferential statistics for all scales in the present study.
Qualitative data analysis was done using content analysis .Data presentation was done
using likert’s scale;- frequencies, pie charts, tables and percentages. The findings of this
study indicated that there was a significant difference between the Students’ Peer
Pressure and Academic Performance of the Students. It was established that the lower
the Socio-economic status of the Parents, the lower the Academic Performance while
the higher the Parents’ Socio-economic Status the higher the Academic Performance of
the students. The students with negative attitude towards learning performed poorly in
their Academics 45% Peer Pressure affected students’ Academic Performance in KSCE
in Public day secondary schools in Marani Sub-County. 54% Parents’ Socio-economic
Status affects Students’ Academic Performance in Public day secondary schools. 64 %
Students’ Attitude towards learning affects their Academic Performance in KSCE in
Public day secondary schools in Marani Sub- County. It was recommended that Parents
need to monitor the kind of Peer Groups and what they watch from Media their Students
have and find ways of enabling the Students’ to escape the bad effects which might fail
them in their Academic Performance. Kisii county government in collaboration with
Ministry of education should sensitize Parents with low level of education, to attend
adult classes organised by the communities for them, to be explained about the reading
culture, writing; nurture and monitoring Students’ Academic Performance in KCSE in
Public day secondary schools, activities both at home and at school. The Principals and
Teachers need to encourage Students to have peer teaching, peer guidance and
counselling, consultative learning in order to have a positive Attitude towards learning
in public Day schools in Marani sub-county.
vi
TABLE OF CONTENTS
DECLARATION AND APPROVAL ........................................................................... ii
DEDICATION ............................................................................................................. iii
ACKNOWLEDGEMENT ............................................................................................ iv
ABSTRACT ................................................................................................................... v
TABLE OF CONTENTS .............................................................................................. vi
LIST OF FIGURES ....................................................................................................... x
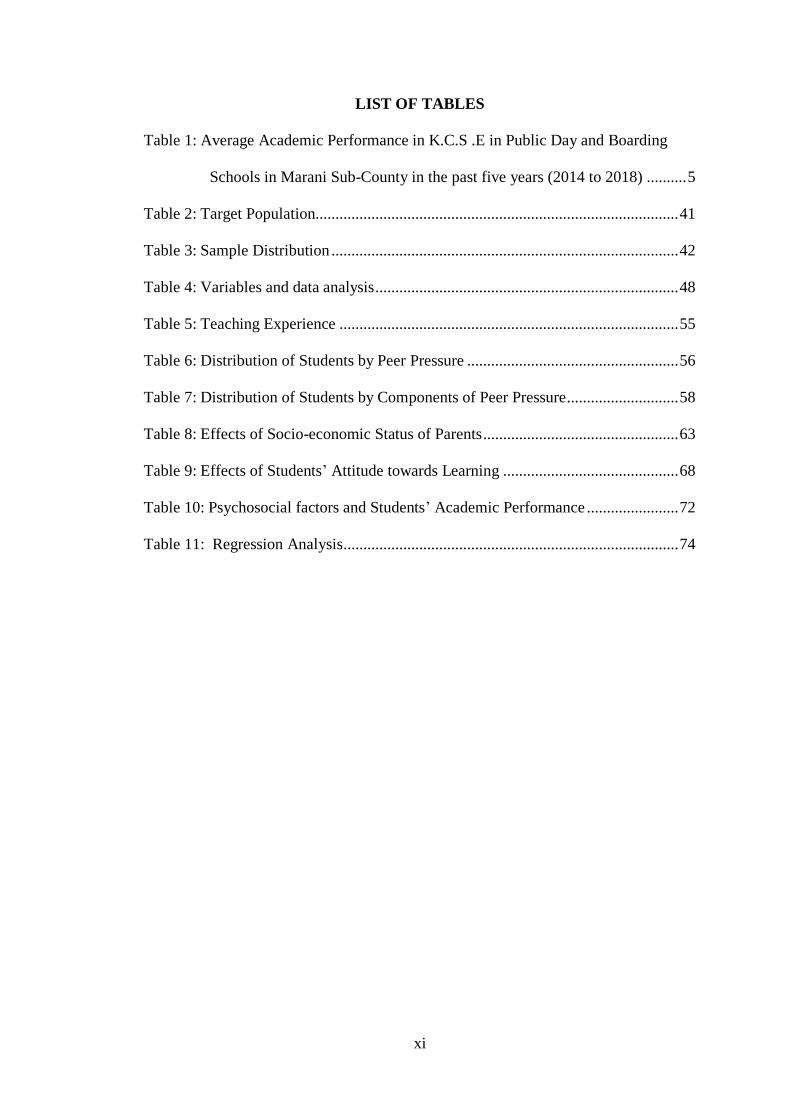
LIST OF TABLES ........................................................................................................ xi
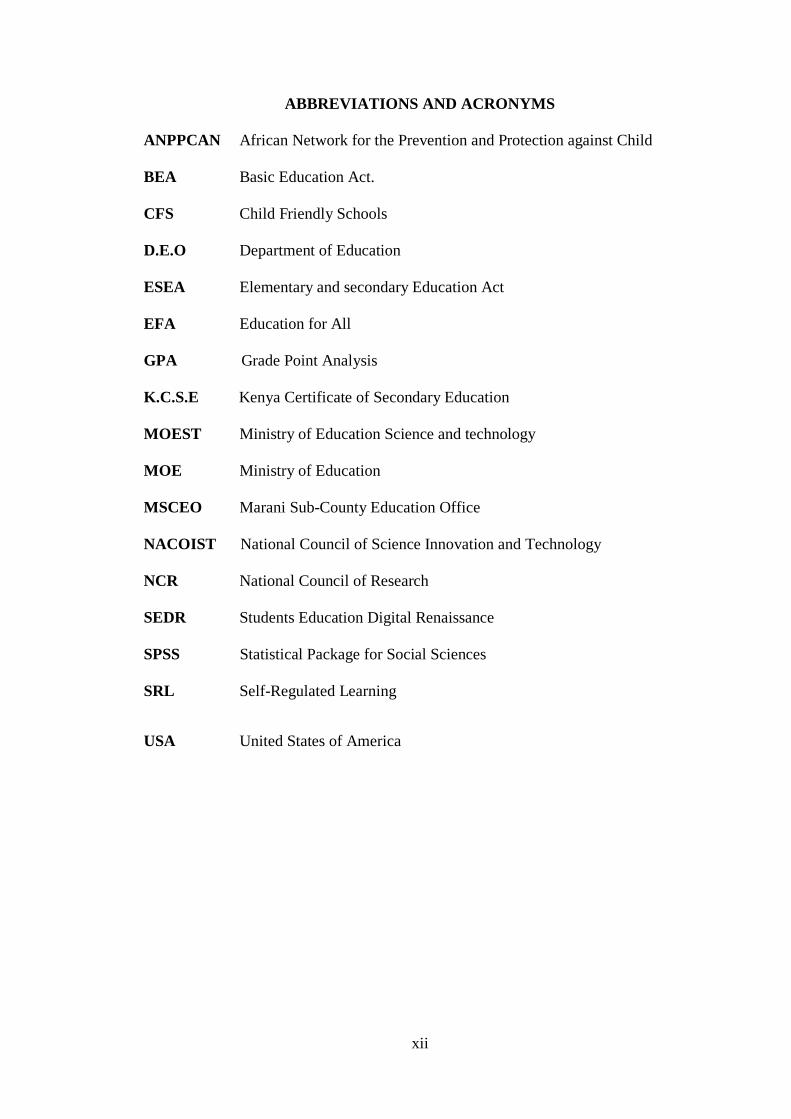
ABBREVIATIONS AND ACRONYMS .................................................................... xii
CHAPTER ONE ............................................................................................................ 1
INTRODUCTION ......................................................................................................... 1
1.0 Introduction .............................................................................................................. 1
1.1 Background of the Study ......................................................................................... 1
1.2 Statement of the Problem ......................................................................................... 5
1.3 Purpose of the Study ................................................................................................ 6
1.4 Objectives of the Study ............................................................................................ 6
1.5 Research Hypotheses ............................................................................................... 7
1.6 Significance of the Study ......................................................................................... 7
1.7 Scope of the Study ................................................................................................... 8
1.8 Limitations of the Study........................................................................................... 9
1.9 Assumptions ............................................................................................................. 9
1.10 Operational Definition Of Terms ......................................................................... 10
CHAPTER TWO ......................................................................................................... 12
LITERATURE REVIEW ............................................................................................ 12
2.0 Introduction ............................................................................................................ 12
vii
2.1 Conceptual Literature Review ............................................................................... 12
2.1.1 Effects of Peer Pressure on Students’ Academic Performance in KCSE in Public
Day Secondary Schools in Marani Sub - County ........................................ 12
2.1.2 Effects of Socio –economic Status of Parents on Academic Performance in
KCSE in Public Day Secondary Schools in Marani Sub – County. ............ 13
2.1.3 Students’ Attitude effects on Academic Performance in KCSE in Public Day
Secondary Schools in Marani Sub - County ............................................... 14
2.3 Empirical Literature Review .................................................................................. 14
2.3.1 Effects of Peer Pressure on Students’ Academic Performance in KCSE in Public
Day Secondary Schools in Marani Sub - County ........................................ 14
2.3.2 Effects of Socio –economic Status of Parents on Academic Performance in
KCSE in Public Day Secondary Schools in Marani Sub - County ............. 21
2.3.3 Effects of Students Attitude on Academic Performance in KCSE in Public Day
Secondary Schools in Marani Sub - County ............................................... 23
2.4 Summary of the Literature Review ........................................................................ 26
2.5 Theoretical Framework .......................................................................................... 27
2.5.1 Walberg’s Theory of Educational Productivity .................................................. 27
2.5.2 Attitudinal Theory ............................................................................................... 29
2.6 Conceptual Framework ........................................................................................ 30
CHAPTER THREE ..................................................................................................... 32
RESEARCH METHODOLOGY................................................................................. 32
3.0 Introduction ............................................................................................................ 32
3.1 Research Design..................................................................................................... 32
3.2 Study Location ....................................................................................................... 33
3.3Target Population .................................................................................................... 33
viii
3.4 Sampling Procedure and Sample Size ................................................................... 34
3.5 Research Instrument............................................................................................... 35
3.6 Data Collection Instruments .................................................................................. 36
3.6.1 Questionnaires..................................................................................................... 36
3.6.2 Interview Schedule.............................................................................................. 36
3.7 Pilot Study .............................................................................................................. 37
3.7.1Validity of Research Instruments......................................................................... 37
3.7.2 Reliability of Research Instruments .................................................................... 38
3.8 Data Collection Procedure ..................................................................................... 39
3.9 Data Analysis ......................................................................................................... 40
3.10 Summary of Variables and Data Analysis Approaches ....................................... 41
3.11 Ethical and Logical Considerations ..................................................................... 42
CHAPTER FOUR ........................................................................................................ 45
RESULTS AND DISCUSSIONS ................................................................................ 45
4.0 Introduction ............................................................................................................ 45
4.1 Response Rate ........................................................................................................ 45
4.2 Demographic Information ...................................................................................... 46
4.2.1 Distribution of Students by their Caretakers ....................................................... 46
4.2.2 Distribution of Teachers by their Teaching Experience ..................................... 47
4.3 Distribution of Students by Peer Pressure ............................................................. 48
4.4 Distribution of Respondents by effects of Socio-economic Status of Parents....... 54
4.5 Effects of Students’ Attitude towards Learning..................................................... 58
4.6 Psychosocial Factors and Students’ Academic Performance ................................ 61
4.7 Regression Analysis ............................................................................................... 64

ix
CHAPTER FIVE ......................................................................................................... 68
SUMMARY, CONCLUSIONS AND RECOMMENDATIONS................................ 68
5.0 Introduction ............................................................................................................ 68
5.1 Summary of the Study Findings ............................................................................ 68
5.2 Conclusions ............................................................................................................ 69
5.3 Recommendations .................................................................................................. 70
5.4 Suggestions for Further Research .......................................................................... 71
REFERENCES ............................................................................................................ 72
APPENDICES ............................................................................................................. 78
APPENDIX I: INTRODUCTORY LETTER .............................................................. 78
APPENDIXII: STUDENT’S QUESTIONNAIRE ...................................................... 79
APPENDIX III: TEACHER’S QUESTIONNAIRE ................................................... 86
APPENDIX IV: INTERVIEW SCHEDULE FOR PRINCIPALS .............................. 92
APPENDIX V: MAP OF MARANI SUB-COUNTY SHOWING STUDYAREA .... 94
APPENDIX VI: RESEARCH PERMIT ...................................................................... 95
APPENDIX VII: RESEARCH AUTHORIZATION NATIONAL COMMISSION
FOR SCIENCE,TECHNOLOGY AND INNOVATION ........................... 96
APPENDIX VIII: RESEARCH AUTHORIZATION MINISTRY OF EDUCATION
..................................................................................................................... 97
APPENDIX IX: INTRODCTION LETTER FROM UNIVERSITY …………...….98
x
LIST OF FIGURES
Fig.1: Conceptual framework for the affects of selected Psychosocial factors and
Students’ Academic Performance in K.C.S.E ............................................. 37
Fig.2: Caretakers Staying with Students ...................................................................... 53
Fig.3: Distribution of KCPE Marks by Peer Groups ................................................... 57
Fig.4: Source of Parents’/Guardians’ Income .............................................................. 61
Fig..5: Education Level of Parents ............................................................................... 62
Fig.6: Students’ Attitude towards Learning ................................................................. 67
Fig.7: Causes of poor academic performance .............................................................. 71
xi
LIST OF TABLES
Table 1: Average Academic Performance in K.C.S .E in Public Day and Boarding
Schools in Marani Sub-County in the past five years (2014 to 2018) .......... 5
Table 2: Target Population........................................................................................... 41
Table 3: Sample Distribution ....................................................................................... 42
Table 4: Variables and data analysis ............................................................................ 48
Table 5: Teaching Experience ..................................................................................... 55
Table 6: Distribution of Students by Peer Pressure ..................................................... 56
Table 7: Distribution of Students by Components of Peer Pressure ............................ 58
Table 8: Effects of Socio-economic Status of Parents ................................................. 63
Table 9: Effects of Students’ Attitude towards Learning ............................................ 68
Table 10: Psychosocial factors and Students’ Academic Performance ....................... 72
Table 11: Regression Analysis.................................................................................... 74
xii
ABBREVIATIONS AND ACRONYMS
ANPPCAN African Network for the Prevention and Protection against Child
BEA Basic Education Act.
CFS Child Friendly Schools
D.E.O Department of Education
ESEA Elementary and secondary Education Act
EFA Education for All
GPA Grade Point Analysis
K.C.S.E Kenya Certificate of Secondary Education
MOEST Ministry of Education Science and technology
MOE Ministry of Education
MSCEO Marani Sub-County Education Office
NACOIST National Council of Science Innovation and Technology
NCR National Council of Research
SEDR Students Education Digital Renaissance
SPSS Statistical Package for Social Sciences
SRL Self-Regulated Learning
USA United States of America
1
CHAPTER ONE
INTRODUCTION
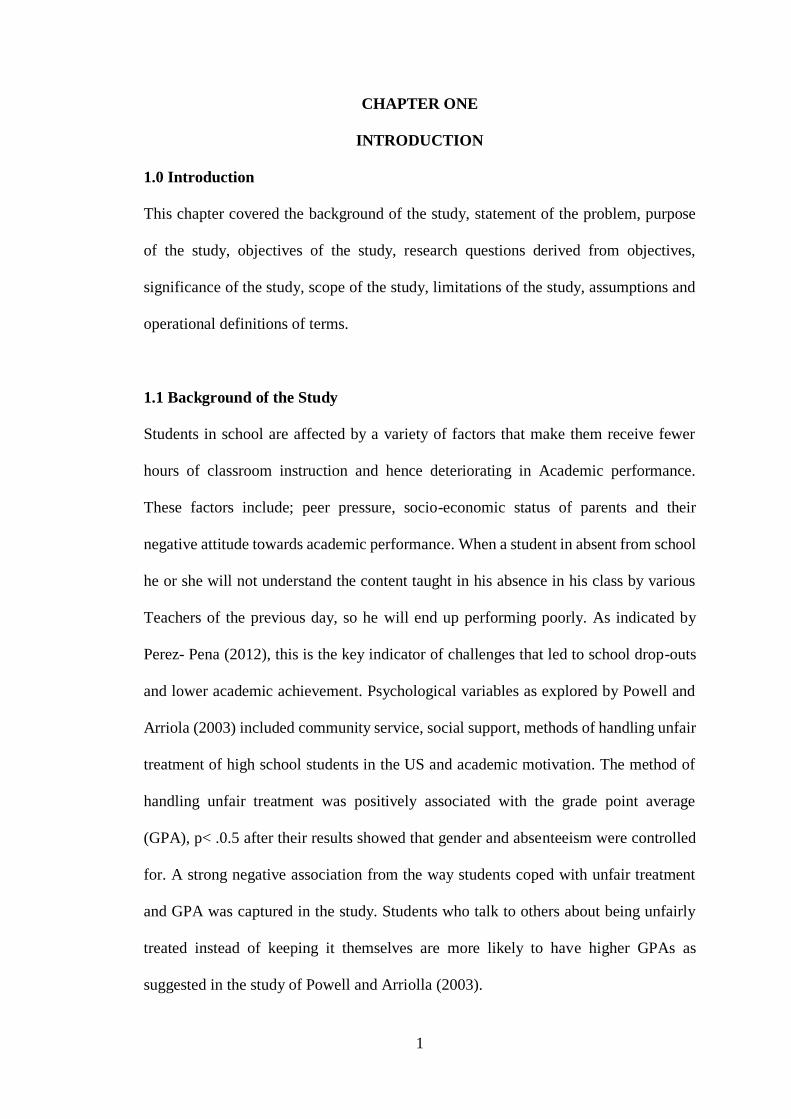
1.0 Introduction
This chapter covered the background of the study, statement of the problem, purpose
of the study, objectives of the study, research questions derived from objectives,
significance of the study, scope of the study, limitations of the study, assumptions and
operational definitions of terms.
1.1 Background of the Study
Students in school are affected by a variety of factors that make them receive fewer
hours of classroom instruction and hence deteriorating in Academic performance.
These factors include; peer pressure, socio-economic status of parents and their
negative attitude towards academic performance. When a student in absent from school
he or she will not understand the content taught in his absence in his class by various
Teachers of the previous day, so he will end up performing poorly. As indicated by
Perez- Pena (2012), this is the key indicator of challenges that led to school drop-outs
and lower academic achievement. Psychological variables as explored by Powell and
Arriola (2003) included community service, social support, methods of handling unfair
treatment of high school students in the US and academic motivation. The method of
handling unfair treatment was positively associated with the grade point average
(GPA), p< .0.5 after their results showed that gender and absenteeism were controlled
for. A strong negative association from the way students coped with unfair treatment
and GPA was captured in the study. Students who talk to others about being unfairly
treated instead of keeping it themselves are more likely to have higher GPAs as
suggested in the study of Powell and Arriolla (2003).
2
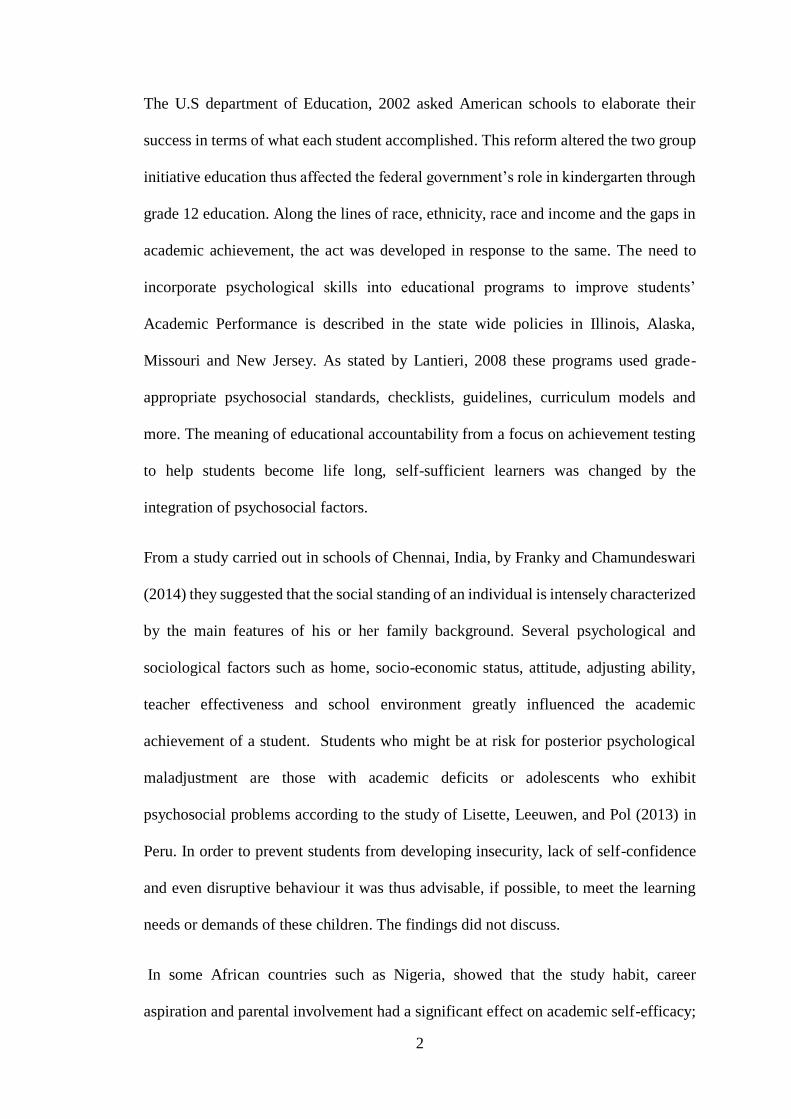
The U.S department of Education, 2002 asked American schools to elaborate their
success in terms of what each student accomplished. This reform altered the two group
initiative education thus affected the federal government’s role in kindergarten through
grade 12 education. Along the lines of race, ethnicity, race and income and the gaps in
academic achievement, the act was developed in response to the same. The need to
incorporate psychological skills into educational programs to improve students’
Academic Performance is described in the state wide policies in Illinois, Alaska,
Missouri and New Jersey. As stated by Lantieri, 2008 these programs used grade-
appropriate psychosocial standards, checklists, guidelines, curriculum models and
more. The meaning of educational accountability from a focus on achievement testing
to help students become life long, self-sufficient learners was changed by the
integration of psychosocial factors.
From a study carried out in schools of Chennai, India, by Franky and Chamundeswari
(2014) they suggested that the social standing of an individual is intensely characterized
by the main features of his or her family background. Several psychological and
sociological factors such as home, socio-economic status, attitude, adjusting ability,
teacher effectiveness and school environment greatly influenced the academic
achievement of a student. Students who might be at risk for posterior psychological
maladjustment are those with academic deficits or adolescents who exhibit
psychosocial problems according to the study of Lisette, Leeuwen, and Pol (2013) in
Peru. In order to prevent students from developing insecurity, lack of self-confidence
and even disruptive behaviour it was thus advisable, if possible, to meet the learning
needs or demands of these children. The findings did not discuss.
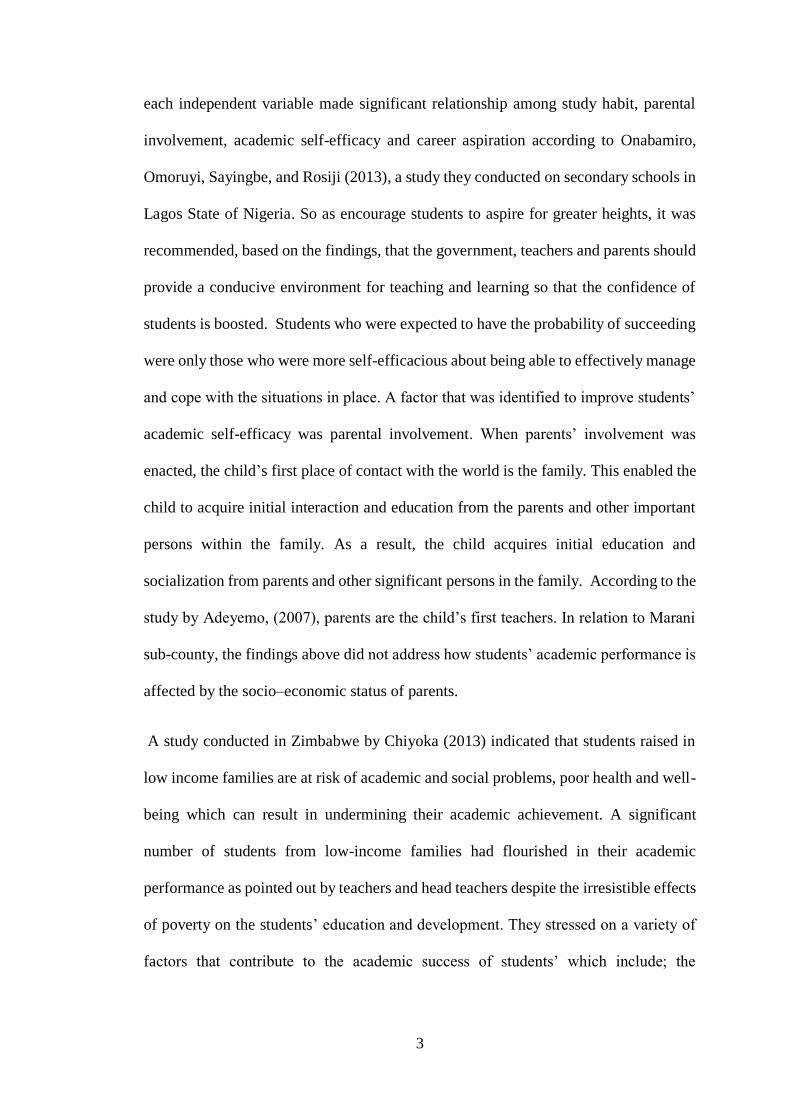
In some African countries such as Nigeria, showed that the study habit, career
aspiration and parental involvement had a significant effect on academic self-efficacy;
3
each independent variable made significant relationship among study habit, parental
involvement, academic self-efficacy and career aspiration according to Onabamiro,
Omoruyi, Sayingbe, and Rosiji (2013), a study they conducted on secondary schools in
Lagos State of Nigeria. So as encourage students to aspire for greater heights, it was
recommended, based on the findings, that the government, teachers and parents should
provide a conducive environment for teaching and learning so that the confidence of
students is boosted. Students who were expected to have the probability of succeeding
were only those who were more self-efficacious about being able to effectively manage
and cope with the situations in place. A factor that was identified to improve students’
academic self-efficacy was parental involvement. When parents’ involvement was
enacted, the child’s first place of contact with the world is the family. This enabled the
child to acquire initial interaction and education from the parents and other important
persons within the family. As a result, the child acquires initial education and
socialization from parents and other significant persons in the family. According to the
study by Adeyemo, (2007), parents are the child’s first teachers. In relation to Marani
sub-county, the findings above did not address how students’ academic performance is
affected by the socio–economic status of parents.
A study conducted in Zimbabwe by Chiyoka (2013) indicated that students raised in
low income families are at risk of academic and social problems, poor health and well-
being which can result in undermining their academic achievement. A significant
number of students from low-income families had flourished in their academic
performance as pointed out by teachers and head teachers despite the irresistible effects
of poverty on the students’ education and development. They stressed on a variety of
factors that contribute to the academic success of students’ which include; the

4
significance of self-efficacy, elasticity among the learners, the financial, material and
psychological support of the parents.
In Tanzania, according to a study conducted by Boa (2014) highlighted that students
who performed extremely well were those who had an optimistic approach towards
their studies thus they were able to be hardworking, diligent, self-confident and
motivated. In order for these features to be put into action, schools came up with
trips/tours, providing students with extra take away assignments to perform at home,
awarding certificates and giving them special privileges in schools. Academic
performance in secondary schools may not necessarily occur due to students’
characteristics only, according to occur Boa (2014) argument, as this may be connected
to the support the students get from their families and school environment. Students
will not value themselves or the education they pursue if they are not supported by their
families through consistent reminders of their roles and what is expected of them.
Findings show that academic performance at the Kenya Certificate of Secondary
Examination (K.C.S.E) is affected by the parents’ socio-economic status and provision
of learning resources according to Mwaura (2014). School attendance of learners is
affected by the socio-economic status according to this study. In relation to students’
academic performance, previous scholars such as Aming’a (2015) had studied on
students’ characteristics, gender, school environment and teachers experience. In
relation to students’ academic performance in public day secondary school these studies
had not explained entirely on how psychosocial factors affect them especially in Marani
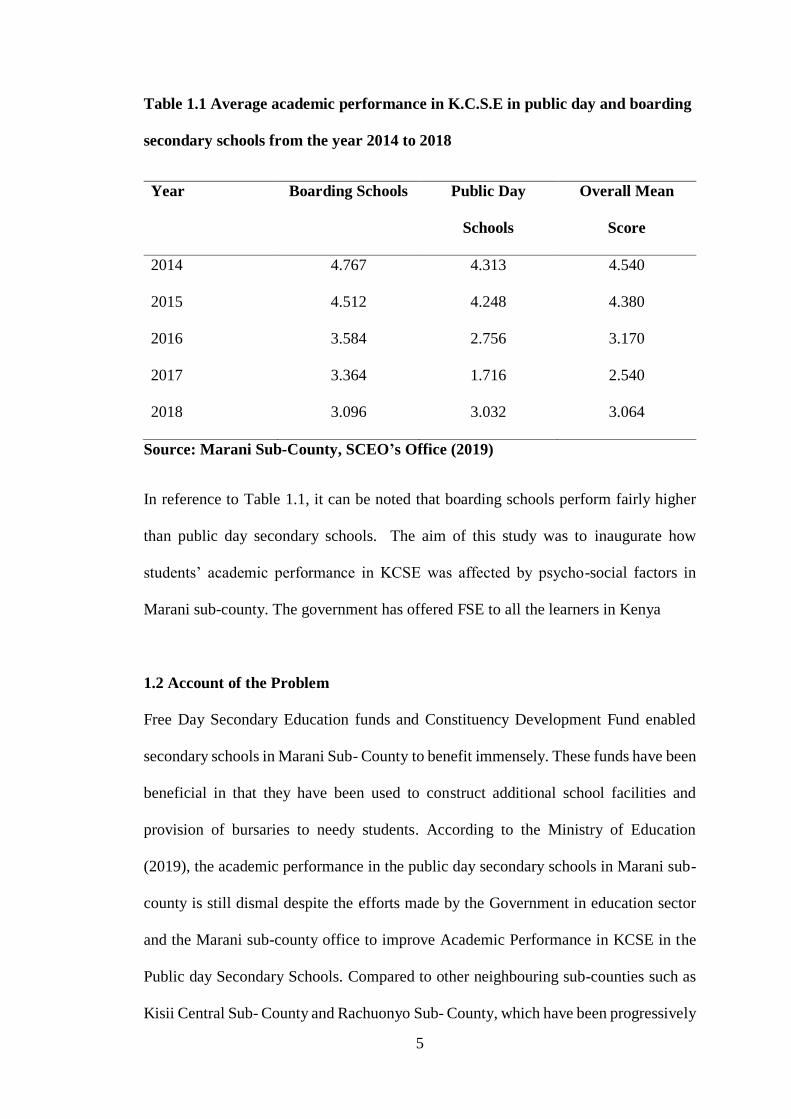
Sub-County. Dismal Academic Performance in K.C.S.E was realized in Public day
secondary schools in Mariani sub-county. The table below (Table1.1) shows the
average Academic Performance for the Public day secondary schools in Marani Sub-
County from 2014 to 2018.
5
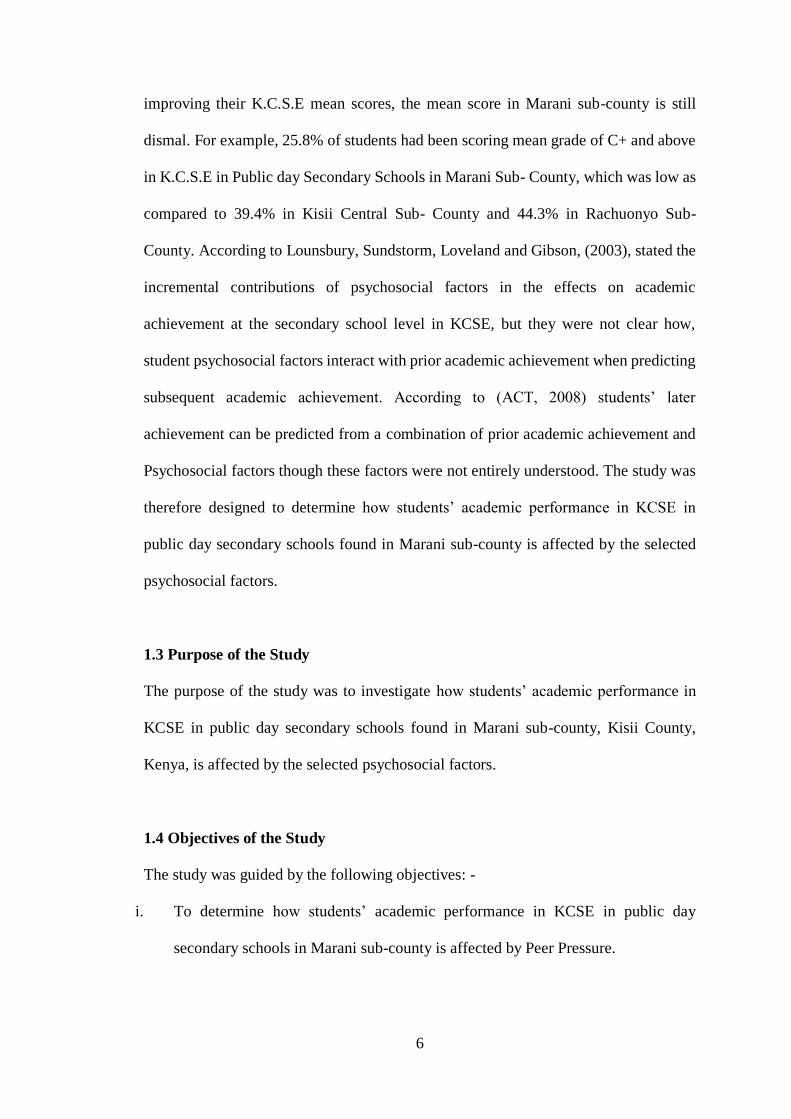
Table 1.1 Average academic performance in K.C.S.E in public day and boarding
secondary schools from the year 2014 to 2018
Year Boarding Schools Public Day
Schools
Overall Mean
Score
2014 4.767 4.313 4.540
2015 4.512 4.248 4.380
2016 3.584 2.756 3.170
2017 3.364 1.716 2.540
2018 3.096 3.032 3.064
Source: Marani Sub-County, SCEO’s Office (2019)
In reference to Table 1.1, it can be noted that boarding schools perform fairly higher
than public day secondary schools. The aim of this study was to inaugurate how
students’ academic performance in KCSE was affected by psycho-social factors in
Marani sub-county. The government has offered FSE to all the learners in Kenya
1.2 Account of the Problem
Free Day Secondary Education funds and Constituency Development Fund enabled
secondary schools in Marani Sub- County to benefit immensely. These funds have been
beneficial in that they have been used to construct additional school facilities and
provision of bursaries to needy students. According to the Ministry of Education
(2019), the academic performance in the public day secondary schools in Marani sub-
county is still dismal despite the efforts made by the Government in education sector
and the Marani sub-county office to improve Academic Performance in KCSE in the
Public day Secondary Schools. Compared to other neighbouring sub-counties such as
Kisii Central Sub- County and Rachuonyo Sub- County, which have been progressively
6
improving their K.C.S.E mean scores, the mean score in Marani sub-county is still
dismal. For example, 25.8% of students had been scoring mean grade of C+ and above
in K.C.S.E in Public day Secondary Schools in Marani Sub- County, which was low as
compared to 39.4% in Kisii Central Sub- County and 44.3% in Rachuonyo Sub-
County. According to Lounsbury, Sundstorm, Loveland and Gibson, (2003), stated the
incremental contributions of psychosocial factors in the effects on academic
achievement at the secondary school level in KCSE, but they were not clear how,
student psychosocial factors interact with prior academic achievement when predicting
subsequent academic achievement. According to (ACT, 2008) students’ later
achievement can be predicted from a combination of prior academic achievement and
Psychosocial factors though these factors were not entirely understood. The study was
therefore designed to determine how students’ academic performance in KCSE in
public day secondary schools found in Marani sub-county is affected by the selected
psychosocial factors.
1.3 Purpose of the Study
The purpose of the study was to investigate how students’ academic performance in
KCSE in public day secondary schools found in Marani sub-county, Kisii County,
Kenya, is affected by the selected psychosocial factors.
1.4 Objectives of the Study
The study was guided by the following objectives: -
i. To determine how students’ academic performance in KCSE in public day
secondary schools in Marani sub-county is affected by Peer Pressure.
7
ii. To evaluate the extent to which Parents’ Socio-economic status affects Students’
Academic Performance in KCSE in Public day secondary schools in Marani Sub-
County.
iii. To inaugurate how students’ optimistic approach towards learning affects their
Academic Performance in KCSE in Public day Secondary Schools in Marani Sub-
County.
1.5 Research Hypotheses
𝐇𝟎𝟏 : In relation to students’ Academic Performance in KCSE in public day
secondary schools in Marani Sub- County, there is no statistical significant
effects of peer pressure.
𝐇𝟎𝟐 : There is no arithmetic significant effects of Parents’ socio-economic status
on students’ Academic Performance in KCSE in public day secondary
schools in Marani Sub- County.
𝐇𝟎𝟑 : There is no numerical substantial effects of Students’ attitude towards
learning on students’ Academic Performance in KCSE in public day
secondary schools in Marani Sub-County.
1.6 Significance of the Study
The study findings may contribute to the existing body of academic knowledge on
selected Psycho-social factors affecting Students’ Academic Performance in KCSE in
Public day Secondary Schools in Marani Sub- County and shed light into this research
study. The study identified, the selected Psycho-social factors effects on students’
Academic Performance, in KCSE in Public day, secondary schools in order to, create
awareness among the stakeholders in education sector. This may help, to curb students’
low grades, in Academic Performance in KCSE, in Marani Sub-County.
8
In addition, the findings may help the Principals, Teachers, guidance and counselling
Teachers, Stakeholders and SCEOs, to address the Psycho-social issues underlying
Students’ Academic Performance in KCSE in the Public day Secondary Schools in
Marani Sub-County Kisii County. The principals will benefit to educate teachers,
students and stakeholders on how to embrace good relationship to students in learning
both inside and outside the classroom. The teachers will learn how to manage students
in class participation and also moral behaviour inside and outside class. The students
will benefit from guidance and counselling department to know various situations of
difficult and how to overcome the challenges involved in them especially during
learning session.
The Policy Makers and Planners in the Ministry of Education may use the
recommendations in this study, for future planning as they draw plans for Education for
All (EFA).
The findings, conclusions and recommendations of this study may enhance existing
literature to formulate policies, to ensure effective learning process in learning
institutions. The curriculum developers and implementers may find the study findings
helpful in enlightening the Teachers, Community Members, Parents and other
Stakeholders, on their role in enhancing the Education for All (EFA). This may create
a concern of awareness, to quality Education, hence, reduce the number of dependants,
since the students would perform better and become gainfully occupied in future.
1.7 Scope of the Study
This study was carried out in Marani Sub-County Kisii County. It concentrated on 29
public secondary schools. Only form four students were selected a total of 150 students,
9
30 teachers and 9 principals to study the Psychosocial factors: Peer Pressure, Parents’
Socio-economic Status and students’ attitude towards learning affecting students’
Academic Performance in K.C.S.E in public day secondary schools in Marani Sub-
County, Kisii County
1.8 Limitations of the Study
The study relied on opinions, attitudes and experiences of the respondents, whereby
some teachers had classes to attend to during the collection of data. The researcher used
lunch break and after class to request the teachers to answer the questionnaires. The
principals had more work to do and for that reason, interview schedule was suitable to
use. Some of the respondents felt that the information provided about the Academic
Performance could be confidential. This was solved by researcher assuring the
respondents that the information would be used for academic purposes only and would
be kept confidential. Some of the respondents were in a position to respond better than
others, which led to biasness. To solve this problem, the researcher varied the
respondents.
The study was limited to only two research tools: questionnaire and interview schedule
while others were not relevant to the study. There were no other exams to be used.
K.C.S.E was the only option.
1.9 Assumptions
The study was based on the following Delimitations
i. This study was based on the assumption that various public day secondary
schools had well-kept academic records of previous years students’ Academic
10
Performance and reflected the effects of Peer Pressure on academic
performance of students.
ii. It was assumed that the respondents gave necessary data required by this study
and not propaganda about the effects of Parents’ Socio-economic Status on
students’ academic performance.
iii. The study assumed that schools analyse the KCSE results and take the results
to sub-County office for recording in every year.
1.10 Operational Definition Of Terms
The following terms had been operationally defined in this study:
Academic Performance: This refers to students’ accomplishments in the final
examination and usually given by the final mean grade in
KCSE using average points. Grade A-E. C plus and above
university entry points, below C plus entry in other middle
level colleges and other institutions of low calliper.
Attitude: This is a hypothetical construct that indicates student’s like
or dislike towards academic studies.
Day school: In this study means an institution registered under the Basic
Education Act (2013) that meets the basic prescribed
standards and usually offers out of school since learners do
not reside.
Peer Pressure: This refers to the effects exerted by a peer group in
encouraging a student to change his/her attitudes, values in
order to abide to group interests. This was measured by

11
giving the questionnaires and interview schedule to the
respondents.
Psycho-social Factors: These are the factors that affect the mind of a student to behave
in a certain way, different from others as he/she interacts
with them such as peer pressure. They also include parents’
socio-economic status and students’ attitude towards
learning.
Socio-economic Status of parents: This refers to the income, parental education
levels, and parental occupation based on mother’s
education, father’s education, mother’s occupation,
father’s occupation and combined income. It was measured
through responses provided by respondents in the
questionnaires and interview schedule provided.

12
CHAPTER TWO
LITERATURE REVIEW
2.0 Introduction
This chapter presented the previous literature of various scholars on selected
psychosocial factors which included: effects of peer pressure, socio-economic status of
parents and students’ attitude towards learning; the theoretical framework and the
conceptual framework. It also identified the research gaps on the previous literature.
Peer pressure involved the effects individuals of the same age group. Socio-economic
status of parents involved parental education, employment rate, family composition and
family income. Students’ attitude determined students’ ability, willingness to learn,
choice of action and response to challenges.
2.1 Conceptual Literature Review
2.1.1 Effects of Peer Pressure on Students’ Academic Performance in KCSE in
Public Day Secondary Schools in Marani Sub - County
Peer Pressure refers to the effects exerted by a peer group in encouraging a student to
change his or her attitude and value to abide to group interests. Students’ Peer Pressure
effects on students’ Academic Performance in K.C.S.E in Marani Sub County was one
of the major factors affecting dismal results in K.C.S.E in Public day Secondary
Schools.
Peer Pressure is normally related with adolescent risk-taking behaviour; such as crime,
drug abuse and sexual behaviours. These behaviours are connected with peer influence.
The positive result is also seen due to the effect of peer pressure, for instance, a marked
increase in the achievement, voluntary charity, public work, etc. (Kellie 2013)
suggested but contrarily, the maximum result is for negative behaviour. Usually, the
13
student skips classes, steals, and cheats, takes to drugs or alcohol as a cause of peer
pressure effects of peer may be in all ages and places, such as in work place, in school,
or in society. Peer pressure tends to affect the group to loiter in the street, watch films,
bunk class, tease others, steal, spoil public properties as found by (Arief,2011).
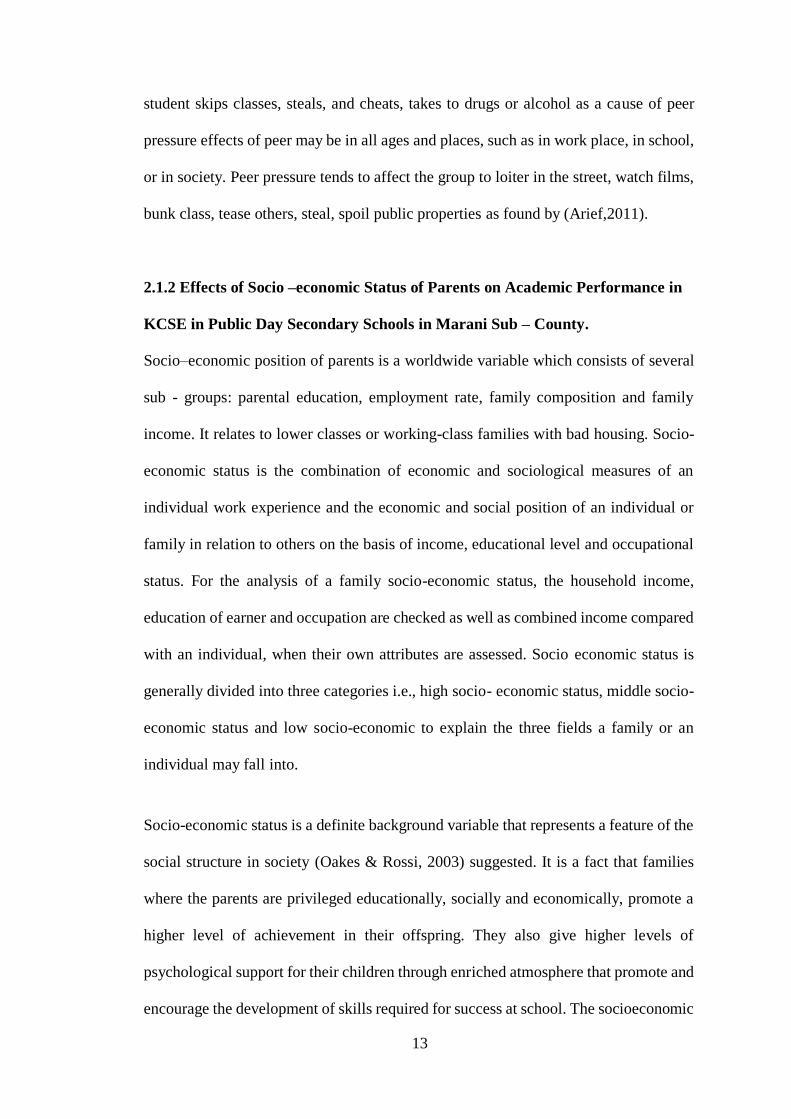
2.1.2 Effects of Socio –economic Status of Parents on Academic Performance in
KCSE in Public Day Secondary Schools in Marani Sub – County.
Socio–economic position of parents is a worldwide variable which consists of several
sub - groups: parental education, employment rate, family composition and family
income. It relates to lower classes or working-class families with bad housing. Socio-
economic status is the combination of economic and sociological measures of an
individual work experience and the economic and social position of an individual or
family in relation to others on the basis of income, educational level and occupational
status. For the analysis of a family socio-economic status, the household income,
education of earner and occupation are checked as well as combined income compared
with an individual, when their own attributes are assessed. Socio economic status is
generally divided into three categories i.e., high socio- economic status, middle socio-
economic status and low socio-economic to explain the three fields a family or an
individual may fall into.
Socio-economic status is a definite background variable that represents a feature of the
social structure in society (Oakes & Rossi, 2003) suggested. It is a fact that families
where the parents are privileged educationally, socially and economically, promote a
higher level of achievement in their offspring. They also give higher levels of
psychological support for their children through enriched atmosphere that promote and
encourage the development of skills required for success at school. The socioeconomic

14
status of a child is usually determined by parental educational level, parental
occupational status and income level (Jeynes, 2002) found out.
2.1.3 Students’ Attitude effects on Academic Performance in KCSE in Public
Day Secondary Schools in Marani Sub - County
Students’ attitudes towards a subject can be affected by the curriculum and motivated
by social forces inside and outside the school as found by (Kant, 2008).Attitudes are
psychological orientations developed as a result of one’s experiences which affects a
person’s view of situations, objects people and how to respond to them either positively
or negatively or favourably or unfavourably (Mensah et al, 2013) suggested. Attitude
is an organization of beliefs feelings and behavioural tendencies towards an object as
found by (Vaughan& Hogg, 2005).Attitudes are positive or negative views about a
person, object, idea or situation which affects individual choice of action and responses
to challenges (Marianne & Elaine, 2005) suggested.
2.3 Empirical Literature Review
2.3.1 Effects of Peer Pressure on Students’ Academic Performance in KCSE in
Public Day Secondary Schools in Marani Sub - County
In their study, in USA, Reich and Somers (2012) revealed that Peer Pressure can be
either positive or negative and is based on the individual’s intrinsic desire to belong, or
to ‘fit in’. Students develop the desire to be liked early-on in childhood; and, through
personal interactions (most often in the school setting), cull their playmates according
to individual perception of desirability and need, a term referred to as “homophily.”
According to Reich and Somers (2012), homophily is a form of modelling; a term
coined by sociologists in the 1950’s, and defined as, “love of the same”. In peer
15
relationships, homophily is a result of individuals that associate and bond with one
another based on similar likes, dislikes, and other dynamic social attributes. This
research was done in USA and not in Marani sub- County so the researcher felt that it
could be done to understand whether the same Peer Pressure influence could also apply
to Marani Sub- County.
Studies had shown that modelling played a crucial role in the shaping of behaviour, and
occurs within peer groups. This especially applied to Academic Performance among
adolescents. Observing a friend’s commitment to schoolwork, or voicing a belief about
the meaning of school, could introduce an individual to new behaviours and
viewpoints. The study by Reich and Somers (2012) did not discuss vividly on the Peer
Pressure effects on students’ Academic Performance, especially in public day
secondary schools.so it rose the curiosity for the researcher to do research in Marani
sub-county to come up with clear points on Peer Pressure effects in K.C.S.E in Public
day schools in Marani sub –county.
Students’ Academic Performance effects can be the result of positive or negative Peer
Pressure, either through friends, or as peer group influences. According to study in
USA by Jones, Audley-Piotrowski and Kiefer (2012), it should be noted that there is
often not a direct relationship from friends’ behaviours to a student’s Academic
Performance. Rather, friends effects one’s self-beliefs, which may then alter academic
behaviours as suggested by (Jones, Audley-Piotrowski, & Kiefer, 2012). An illustration
of this point might involve interactions between students in social or romantic
activities, and devoid of mutual discussions involving students’ Academic
Performance. This study missed to explain the reasons why the students’ deviant
16
behaviour could lead to their Academic Performance drop. Then the need for this study,
for further research.
In India, Deepika and Prema (2017) revealed that as students involved in antisocial
behaviour that is when they deviated from their normal behaviour and they may also
encourage their friends to involve in the abnormal activities which decline their
academic achievement. This study revealed that the Peer Pressure is one of the sources
for deviant behaviour among school children. When their behaviour is something
deviated, automatically their academic achievement also is getting declined. This study
also revealed that girl students are easily anguished than the male students towards peer
influence. Students are prone to deviancy at the age group 16-18 than the other younger
groups. The study noted that peer pressure may not be negative always since it also
increases the academic achievement. The study did not explain how Peer Pressure
increases the academic achievement in K.C.S.E in Marani Sub –County.
According to study by Khodadady and Zabetipour (2013) in Ferdowsi University of
Mashhad, the five latent variables of peer pressure influence underlie normal students’
attitudes towards their top peers, i.e., debilitating, motivating, marginalizing,
referencing and inspiring. While out of the three positive factors, motivating and
referencing indicated no significant relationship with students’ academic achievement,
it related significantly but negatively to the inspiring factor calling for further research
study to find out whether ability measures such as language proficiency tests hold
similar relationships with these factors. Since the debilitating and marginalizing factors
have the highest and lowest significant relationships with academic achievement
respectively, it seems that the more normal students compare themselves with their top
peers, the less they strive to achieve academically. However, these results must be
17
treated with caution because many variables such as the enrolment of many low-
proficient students in private universities, scarcity of jobs available in the market and
the ever-increasing irrelevance of qualification in getting employed might have resulted
in the negative relationships found in this study. This study is missing the discussion
on the relationship between the Peer Pressure and students’ Academic Performance,
particularly in Secondary Schools.
The findings of the study in Selected Secondary Schools in Atiba Local Government
Area of Oyo State in Nigeria by Olalekan and Alayande (2016) revealed that the peer
group influences learning and certain factors like the social economic status and
parental factor as they determine membership in most groups. The study also revealed
that students are closer to their friends than to their teachers and parents concerning
their academics and that parents monitor their children’s peer group association. The
study had not revealed how the close friendship of students’affected Academic
Performance and compare with the effects of Teachers and Parents.
The Peer Group can indulge in juvenile delinquency that is taking of alcohol at early
ages. This leads to students’ poor Academic Performance. Negative attitude towards
schooling is a Psychosocial factor affecting their Academic Performance. Based on the
records of MOE; a total of 24,840 students in 2006 and 21,060 in 2007, were found to
have failed examinations due to bad effects of Peer Pressure (Davies & Lee,
2006).Students affected by bad company due to Peer Pressurel probably ended up in
drug abuse, joined gangsters groups besides indulging in alcohol, sex abuse, gambling
and street loitering.
18
According to the study by Mosha (2017) in secondary schools in Tanzania, it was
established that peer group had both positive and negative effects on adolescent
students’ Academic Performance at the selected schools. Comparatively, the influence
was found higher in public than the private owned secondary schools. It was also
established that peer’s relationship, socialization, environment, globalization, and drug
use had a great influence in determining students’ Academic Performance. According
to the findings, the study recommended guidance and counselling services at the
schools for purposes of building self-confidence. These services might help the
students cope with challenges that were found to affect their performance at schools.
The study also recommended that the Ministry of Education and Vocational Training
should provide in-service training to teachers on guidance and counselling in order for
them to modify adolescent students’ behaviour and attitude to develop a good identity.
This study needs more expansion on the necessity of peer counselling services, which
formed the basis of the study.
The concept of peer pressure effects on students’ Academic Performance is based on
the fact that all children despite what age, what social group one belongs to, are
susceptible to falling prey. Sharma (2005) suggested that peer-group is the most
important agent with strong bearing on students’ Academic Performance. Students’
Academic Performance is affected by their peers who persuade them not to attend
school while encouraging them to engage in activities outside the school. Students’ get
involved into bad ways, respondents for this research reported that the students did not
manage to complete their studies. They attributed this to bad character, which include;
sneaking into towns where they indulge in drinking alcohol, watching videos, drug
abuse and sexual promiscuity. Students’ poor Academic Performance originates from
lack of parental knowledge.
19
Reid (2005) suggested that parents play a major role to students’ Academic
Performance because some neglect the responsibility of ensuring their children avoid
bad company which has bad effects of peer pressure. Furthermore, students’ poor
Academic Performance can be affected by a variety of reasons which may include;
attitudes, the curriculum set -up, and family aspects besides bullying. However, this
study did not elaborate on the effects of Peer Pressure on student’s Academic
Performance, especially through social groups and Peer Pressure. This study sought
and discussed it in Marani sub-county.
From the study of Korir and Kipkemboi(2014) in students’ Academic Performance in
Vihiga County in Kenya, peer level factors also have a relationship with students’
Academic Performance. Students whose friends engage in negative activities such as
use of drugs, sneaking out of school and being absent from school chronically are likely
to have lower Academic Performance. The study by Korir and Kipkemboi (2014) has
not explained on how Peer Pressure influences students’ Academic Performance in
K.C.S.E particularly in Public day schools.
In their study, in primary schools in Kapsoya Zone of Uasin Gishu County in Kenya,
Wangeci, Kipruto and Mulambula (2018) found out that within the school
environment, peer group influence has always been considered less important in
influencing Academic Performance and more often ignored by the teachers but
examination Performance in lower grade was better than upper grade like class seven.
The findings for this study showed that there was no significant impact that existed
between gender and age. In contrast, there was a significant relationship between type
of the school and peer effects. This implied that Academic Performance of the pupils
depends on the types of school but not the age and gender of the pupil. According to
20
the study, the teachers and pupils reported that there was positive influence of peer
group discussion, peer group behaviour and peer group conflict on the Academic
Performance. But this influence was weak and insignificant. Although the peer group
discussion and peer group behaviour had positive relationship with performance, peer
group conflict had negative relationship with Academic Performance. This study did
not explain how the peer effects had weak relationship with the Academic Performance.
In the study carried out by Omollo and Yambo(2017) in Rongo Subcounty in Migori
County of Kenya, they opined that many school dropouts have been attributed to
negative peer effects on students by their colleagues who are indiscipline. There are
three major categories of peer effects that can lead to school dropout which included
outside effects, lack of interest in gaining education and teen pregnancies. This study
failed to reveal the negative effects of Peer Pressure on students’ Academic
Performance
Onsoti and Mbii (2018) in Embakasi Sub-county of Nairobi County in Kenya
suggested that, most students abused drugs in order to be accepted among their peers,
which led to negative change in behaviour in school. The study suggested that there
was need to strengthen, enforce the school rules and regulations, strengthen guidance
and counselling, and train the teachers with skills of facing new trends of students’
indiscipline. Some students didn’t even know when they were making decisions
whether they were based on Peer Pressure or independent. Peer Counsellors were
essential because they taught others the positive aspects of behaviour. They could
enlighten their fellow peers on the dangers of negative peer influence and how to
choose friends wisely. This study missed to elaborate on the influence of various social
groups and social media by Peer Pressure on students’ Academic Performance, which
21
formed the basis of the study. Socio –economic Status of Parents on Academic
Performance.
2.3.2 Effects of Socio –economic Status of Parents on Academic Performance in
KCSE in Public Day Secondary Schools in Marani Sub - County
As per Rothestein (2004), socio-economic position of parents has a major upshot on
students’ Academic Performance. Parents of diverse occupation classes frequently
have different ways of raising, correcting and reacting to their children. These
differences do not express themselves steadily as anticipated in the case of every
family; rather they affect the average inclinations of families for different occupational
classes (Rothestein, 2004). This study did not illuminate on the effects of socio-
economic status of parents on students’ Academic Performance.
Livumbaze and Achoka (2016) in their study, proposed that students retroceded
educationally at the secondary schooling level as a result of poor parents’ socio-
economic position. The minority from well-to-do families attained good scores. This
study suggested that the government ought to build a supporting atmosphere for parents
to be freelance for them to provide their children’s educational necessities like the
subsidized school fees. This study failed to provide the negative effect of both high and
low socio-economic positions of parents on students’ Academic Performance. It did
not also highlight the impacts of every kind of socio-economic rank.
Juma, Muasya and Masese (2016) in their studies in public secondary schools in Tana
River County in Kenya, they established that there is a substantial positive link between
parents’ income and students’ Academic Performance. This is a result of higher income
parents being able to pay school fees in time, provide the vital learning materials and
22
establish a more friendly learning atmosphere at home not like low income parents who
are financially unable to provide students’ educational needs. There is a noteworthy
positive link between parents’ education level and students’ Academic Performance.
This is a result of parents with high level of education highly appreciating the worth of
education and hence setting a more enabling learning atmosphere for their children and
helping their children with assignments/homework in contrast to their counterparts with
lower level of education. There is a considerable positive link between parents’ job and
students’ Academic Performance. Students whose parents are in good formal
employment display greater academic grade achievements in K.C.S.E compared to
those whose parents practice nomadic, peasantry or non-employed. The study by Juma,
Muasya and Masese (2016) has not comprehensively linked the Parents’ Socio-
economic Status to the Students’ Academic Performance in K.C.S.E in Public day
secondary schools in Marani sub-county.
The study of Nadenge (2015) in selected secondary schools in urban settlement in
Westlands Division of Nairobi in Kenya, found that the parents’ occupation influenced
their children’s Academic Performance. The effect can be both positive and negative.
The parents’ job defined if they had plenty time with their children and took part in
their learning or be capable of paying their fees and offer for other requirements. The
study ascertained that there was a non-significant relationship between the occupation
of parents and Academic Performance of learners. It was found from the outlook where
occupation influenced capability of parents to fund the education of their children, it is
possible to affect Academic Performance as a result of parents who are unable to
finance education being likely to have their children deficient of most academic
requirements and hence have their performance affected. Occupation also defines time
available for parents to follow up on the discipline of their children as well as their
23
academic progress. On a different tactic, children from poor families were seen to work
extra hard to free themselves from such surroundings and are thus likely to accomplish
better educationally. Nadenge (2015) failed to discuss about rural day secondary
schools regarding the effects of socio-economic status of parents on students’
Academic Performance.
2.3.3 Effects of Students Attitude on Academic Performance in KCSE in Public
Day Secondary Schools in Marani Sub - County
According to Mbuga (1986), attitudes towards Art and Design among learners are
influenced by their social environment way before they join secondary schools. Such
social environment includes among others; teachers, family, friends, peers, the
community, the church and the mass media. He continues to explain that, the acquired
attitudes from all these quarters influence the minds of learners more. They include
opinions like; some subjects like math are for the academically gifted. It is found that
the 8-4-4 Curriculum System is loaded with several subjects, there are eleven to thirteen
subjects in form one, this affects the students negatively attitude since the students are
forced to put in, more hours even during holidays to study privately. This pressure has
reduced students playing time and reduced their intrinsic motivation for learning. Most
students give up learning and, in the process, miss school and later drop out of school.
The study by Kant (2008) has not explained comprehensively on how the students
attitudes towards learning has influenced their Academic Performance.
The study by Awang, et al. (2013), revealed that students’perception of their teachers
played a significant role in determining their learning outcomes in Malaysian
Studies,while the teachers were of the opinion that learning environment was a factor
which contributed significantly to the students’ achievement in Academic

24
Performance. The study suggested that the teachers should build upon excellent rapport
with students and create an attractive and enjoyable environment to get the students to
dynamically involve inthe classroom activities and learn the Malaysian Studies
enthusiastically and efficiently. This study did not reveal in details on the influence of
students’ attitude towards learning.
Nyamubi (2016) study in six secondary schools in Morogoro Urban and Mvomero
districts in Morogoro Region in Tanzania, revealed that students differed in terms of
their mastery of English, scoring higher in the structure section, while composition was
the most poorly scored section. In all, students, in both Form One and Form Four, had
strong and positive attitudes to English. Specifically, while Form One students had
more positive interest attitudes than their counterparts, Form Four students displayed
more utilitarian attitudes to learning English, compared to Form One students.This was
because in primary schools, the learners used Kiswahili in their communication, which
made it difficult to change to English at secondary level as they join Form one.
However, this study only emphasized on English as a subject and did not discuss about
other subjects, which formed the basis of the study.
According to Mulala and Odiemo (2015) in their study in Mukaa Sub-County, in
Makueni County, teaching methods influence the students’ attitude and hence the
Academic Performance. Teachers’ qualification and experience significantly influence
the students’ confidence. Parental involvement and encouragement influences the
student positively to like the subject. This study asserts that teachers and other
stakeholders in the education sector should organize forums such as seminars and
workshops for students, parents, teachers and school administrators to strengthen and
promote positive attitudes towards learning. There is a gap in this study since other
25
factors also influence attitude and Academic Performance of the students. For example,
gender bias and therefore there is need for more study on students’ attitude towards
learning.
In the study by Langat, Itegi and Magoma (2015) in public secondary schools in
Kiambu in Kenya noted that students’ positive attitudes are key to providing conducive
environment for learning as the students learn better if they enjoy what they are
learning. However, this is not reflected in their Academic Performances. Student
attitude is among the strongest predictor variables affecting students’ achievement. The
learning abilities and positive minds of the students enabled them to view various
subjects as something learnable, achievable and were related to most of the
environmental activities. The beliefs about their competencies affected their attitudes
towards each subject as the students felt that not everyone can be good in all subjects.
Attitude towards learning determines students’ ability, willingness to learn, choice of
action and response to challenges. It determines the level of engagement, interest,
personal effort without which one can hardly perform. This study has not addressed the
influence of students’ attitude towards learning on Academic Performance in other
subjects apart from mathematics. It only discussed about mathematics and has not
talked about other subjects. This created the basis of this study involving students
attitude towards learning on Acdemic Performance.
Motanya and Matheka (2018) study found that Academic Performance in K.C.S.E in
public Secondary Schools in North Masaba Sub-County of Nyamira County, most
students prejudged that mathematics is a difficult and tedious subject. They revealed
there was fear and anxiety among students during lessons and examinations of
mathematics. The study noted that most schools did not have enough learning materials
26
in mathematics and teachers used poor teaching methods such as lecture method, which
made the students to develop negative attitude towards learning of the subject. The
study suggested that all stakeholders should work together to change the mentallity of
the students towards the subject and invest in purchase of teaching and learning
materials. This study did not discuss on the students’ attitude towards learning effects
in various subjects since it only studied about mathematics.
2.4 Summary of the Literature Review
Several researches have been done concerning psychosocial factors and students’
Academic Performancefor example byVangie, Biton, Gonzaga and Moneva (2019)
who declared that there were several factors that could affect students’ Academic
Performance in school regarding Peer Pressure. This study was conducted on students
in boarding schools and for graduating class. The study did not elaborate on how the
peer pressure indirectly affect students’ Academic Performance in K.C.S.E in public
day secondary schools in Marani Sub-County. Therefore, this study seeks to determine
the Peer Pressure effects on students’ Academic Performance in K.C.S.E in public day
secondary schools to compare with the findings of Vangie, Biton, Gonzaga and
Moneva (2019). Suleman, Hussain, Khan and Nissa (2012) conducted a study on
effects of parental socio-economic status on the Academic achievement of secondary
school students in Karak District of Pakistan. The outcomes showed that parental
education and occupation and facilities at home affects the student’s achievement.
However, they did not show the effects of all the socio-economic components of
parents on the students’ Academic Performance. This study assessed the extent to
which parents’ socio-economic status affects students’ Academic Performance in
K.C.S.E in Public day Secondary Schools as a gap. Wei, Hung, Lee and Chen (2011)
27
studied on learning atmosphere and found out that most students are very fond of the
teachers who were adept at organizing fun activities in class. This statement was also
approved by the teachers. However, this study was not clear on what makes students
enjoy in learning various subjects. Therefore, this study established the students’
attitude towards learning effects on students’ Academic Performance in K.C.S.E in
public day secondary schools in Marani Sub-County,Kisii.
2.5 Theoretical Framework
The theories used in this study included Walberg’s Theory and Attitudinal Theory.
These theories were suitable for this study because they had direct relationship with this
research study and the objectives of this study. They supported the relationship between
the independent and dependent variables.
2.5.1 Walberg’s Theory of Educational Productivity
This study used Walberg’s theory of productivity updated by Zins Weisseberg, Wang
& Walberg (2004) which proposes that schools are the hub for the positive impacts on
a student’s academic achievement. There are other several aspects in attaining success
beyond the jurisdiction of curriculum, instructional stratagems and practices.
Community backing, parental participation, and the Psychological features of students
also play a crucial role in the academic attainment of all students. Walberg’s theory is
pertinent in defining the different aspects that affects Academic Performance.
Walberg’s theory has shown the significance of the realms of motivational directions,
self-adjusting learning approaches, and social/interpersonal skills in promoting
Academic Performance. He reports that, basing on the large-scale execution of a Social-
Emotional Learning (SEL) program, that students’ who became more self-aware and
28
confident in their learning abilities, who were more inspired, who set learning goals,
and who were planned in their tactic to work, Self- Regulated Learning (SRL), achieved
better in school.
Walberg indicated that the most important aspect of academic success for students from
poor Parental Socio-economic Status is the home surroundings. It is more crucial than
other factors that impact Academic Achievement, like parental income and education.
Schools cannot alter the features of parental education and income but can have
affirmative effects on the home surroundings by educating and working with parents.
Walberg proposes that the family’s Socio-economic Status plays a substantial role in
the involvement of the students’ educational process. Research discloses that families
from a high socio-economic background are more involved in the educational process
than those from a low socio-economic background.
Additionally, Walberg’s theory proposes the significance of the realm of motivational
orientations; he discloses that families from high socio-economic background greatly
take part in education than low socio-economic background. This can be utilized in
explaining the peer pressure impacts on students’ Academic Performance. Students
whose Peers are from high class background are likely to affect those from high Socio-
economic background and may do well in class whereas those from low-Socio-
economic background are also likely to be affected by those of their status thus
performing poorly as per objectives of this study. This theory supports the maxim
stating that “Birds of the same feathers flock together”.
29
2.5.2 Attitudinal Theory
This study utilized another theory, the attitudinal theory of Fishbein and Leak Ajzen
updated on (2012) – also applies to this study. It has three main constituents; - cognitive,
affective and psychomotor. The three constituents ought to be parallel on the continuous
of primary attitude and intermediate attitude target attitude, if not conflict comes up.
The learner should plan to alter his attitude so as to accomplish well in school. In this
study the selected Psychosocial factors effects on students’ Academic Performance in
public day in Marani sub- county was established to be affected by Peer Pressure,
Socio-Economic Status of Parents and their own inherent view of students on Academic
Performance in KCSE. Then if the three components were to be attained then the
students’ Academic drop could rise up and students’ could perform well and
impeccably join the university level of learning in enormous numbers in Marani sub-
county.
30
2.6 Conceptual Framework
dependent variable
Intervening variables
Independent variables
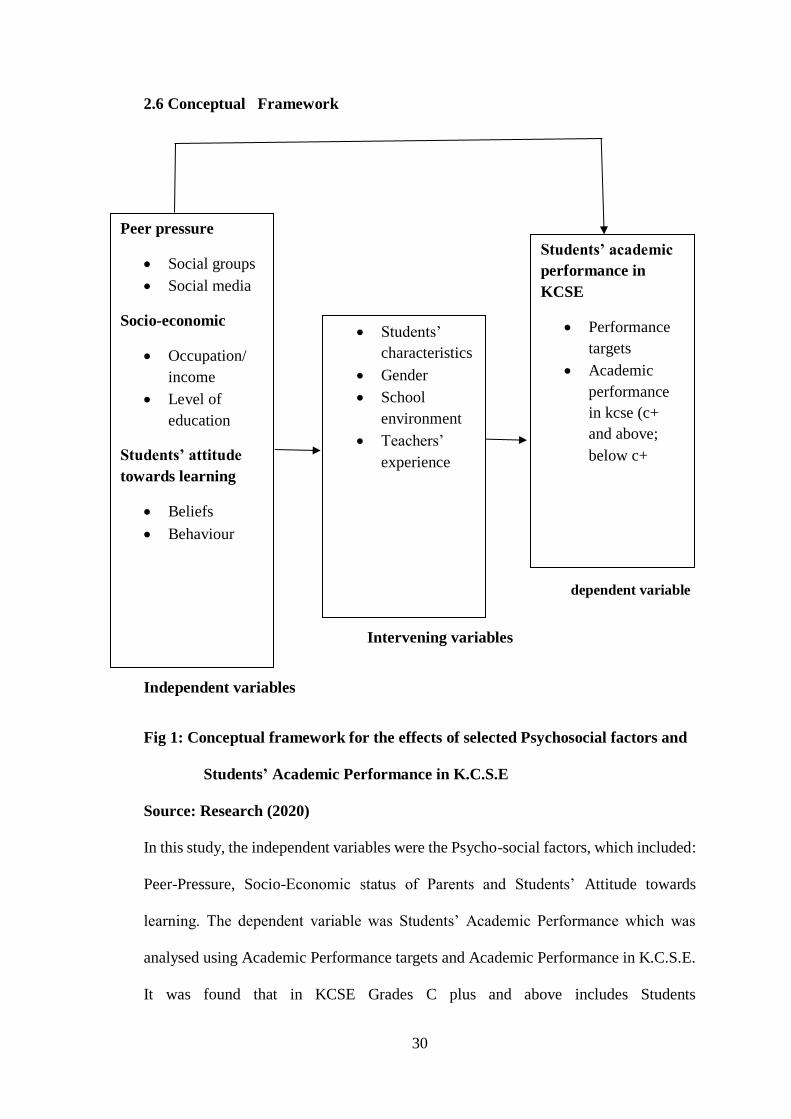
Fig 1: Conceptual framework for the effects of selected Psychosocial factors and
Students’ Academic Performance in K.C.S.E
Source: Research (2020)
In this study, the independent variables were the Psycho-social factors, which included:
Peer-Pressure, Socio-Economic status of Parents and Students’ Attitude towards
learning. The dependent variable was Students’ Academic Performance which was
analysed using Academic Performance targets and Academic Performance in K.C.S.E.
It was found that in KCSE Grades C plus and above includes Students
Peer pressure
Social groups
Social media
Socio-economic
Occupation/
income
Level of
education
Students’ attitude
towards learning
Beliefs
Behaviour
Students’
characteristics
Gender
School
environment
Teachers’
experience
Students’ academic
performance in
KCSE
Performance
targets
Academic
performance
in kcse (c+
and above;
below c+

31
who score good Grades and join university. C plus and below are scored by those
students who score low Grades in KCSE and join middle level colleges and other
institutions of lower cadre which offers Diplomas and Certificates. Therefore, in this
study the Independent variables directly affect Students’ Academic Performance in
KCSE in Marani Sub-County. The independent variables were measurable and the
indicators were included in the data collection tools such as questionnaire and interview
schedule. The intervening variables were Students’ characteristics, gender, school
environment and teachers’ experience. These were the ones the researcher controlled
during the research study and concentrated on the objectives of the study.
32
CHAPTER THREE
RESEARCH METHODOLOGY
3.0 Introduction
This chapter presented the research design, study population, sample procedure and
sampling size research instruments, piloting, validity of the research instrument and
reliability of research instruments, data collection procedure and data analysis.
3.1 Research Design
This study used descriptive research design. It collects information over a large and
wider area. Research design is an organized study with a structure that supports a
person in executing a duty, the organization of settings for gathering and scrutiny of
data in a way that purposes to join relevance to the research purpose, with economy of
information in the procedure (Orodho, 2006). According to Kothari (2004), descriptive
research design is the research design concerned with describing, recording, analysing
and reporting circumstances that are available. Descriptive design pursued to display
the influence of psychosocial aspects in secondary schools. The descriptive design
aided in gathering of data from students, class teachers and principals on their views,
feelings and experience teachers are part of the respondents. The study used descriptive
survey design which drew information from studying a larger area and in a short period
of time, therefore, it was suitable to this study because it assisted the researcher to
complete study work in a short time. It enabled the collection of information that
described the students’ population with respect to psychosocial factors affecting
students’ Academic Performance in Day Public day secondary schools. The design
involved collection of information by interviewing teachers using interview schedule
or administering questionnaires to a sample population as stated by (Orodho, 2006).
33
Descriptive research is a study designed to depict the participants in an accurate way.
Both qualitative and quantitative approaches of data collection were used (Mugenda &
Mugenda, 2003).
3.2 Study Location
This study was carried in Marani Sub – County in Kisii County, Kenya which bordered
Manga Sub - County to the East, Rachuonyo Sub- County to the North and Kisii County
to the south. This location was chosen for the study because it could give reliable and
adequate information regarding Academic Performance in KCSE so as to give the basis
for studying on the effects of psychosocial factors: Peer Pressure, Parents Socio-
Economic Status and Students’ Attitude towards learning on Academic Performance.
This implied that the respondents were rich with information required by the study.
3.3 Target Population
The study targeted form four students since they had been in school for longer and had
good information to respond to the Questions required than the other ones in lower
classes. Therefore, they delivered dependable information for the study. The target
population from which the sample size was taken comprised of 29 public day secondary
schools in Marani Sub- County which had 1501 form four Students, 29 Principals and
301 Teachers. Therefore, the target population comprised of 1831 respondents as
illustrated in Table 2.
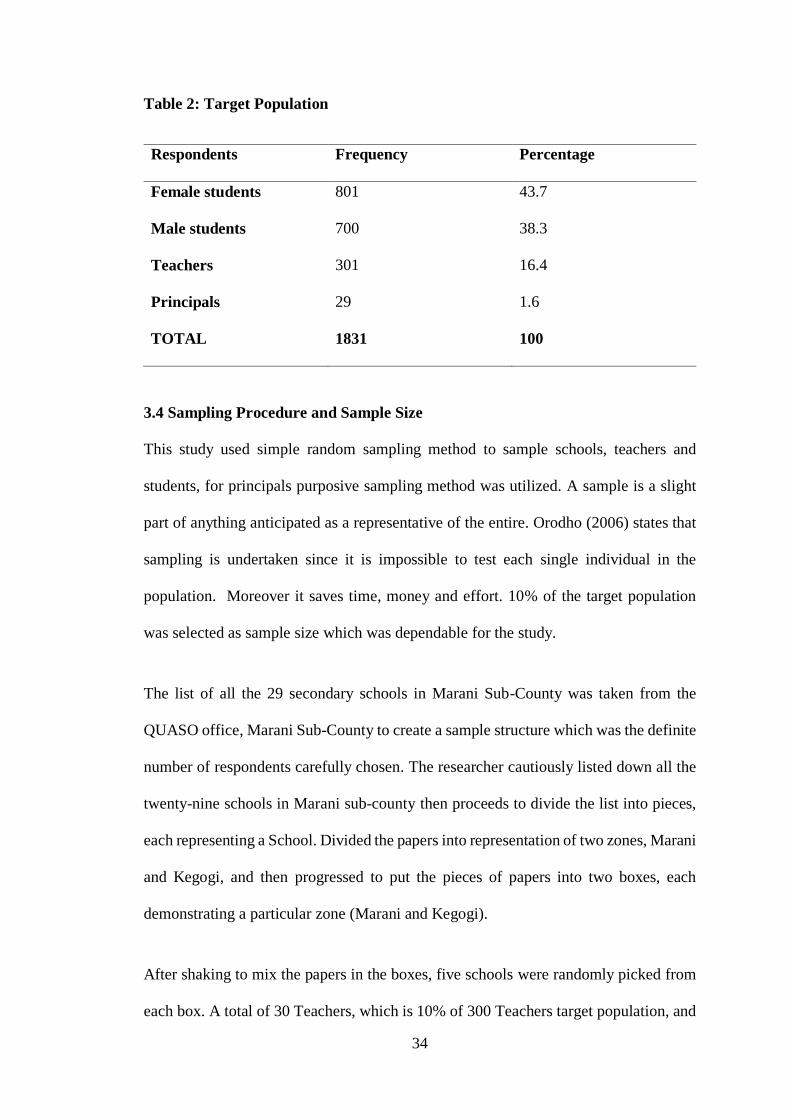
34
Table 2: Target Population
Respondents Frequency Percentage
Female students 801 43.7
Male students 700 38.3
Teachers 301 16.4
Principals 29 1.6
TOTAL 1831 100
3.4 Sampling Procedure and Sample Size
This study used simple random sampling method to sample schools, teachers and
students, for principals purposive sampling method was utilized. A sample is a slight
part of anything anticipated as a representative of the entire. Orodho (2006) states that
sampling is undertaken since it is impossible to test each single individual in the
population. Moreover it saves time, money and effort. 10% of the target population
was selected as sample size which was dependable for the study.
The list of all the 29 secondary schools in Marani Sub-County was taken from the
QUASO office, Marani Sub-County to create a sample structure which was the definite
number of respondents carefully chosen. The researcher cautiously listed down all the
twenty-nine schools in Marani sub-county then proceeds to divide the list into pieces,
each representing a School. Divided the papers into representation of two zones, Marani
and Kegogi, and then progressed to put the pieces of papers into two boxes, each
demonstrating a particular zone (Marani and Kegogi).
After shaking to mix the papers in the boxes, five schools were randomly picked from
each box. A total of 30 Teachers, which is 10% of 300 Teachers target population, and
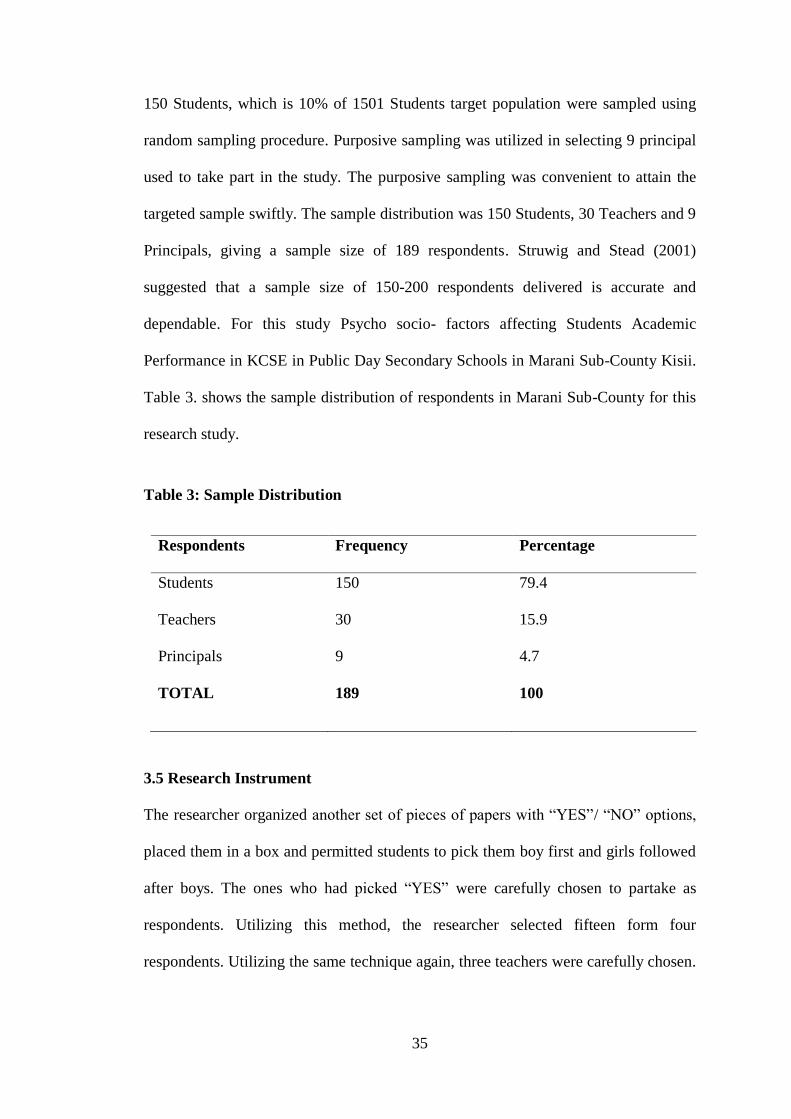
35
150 Students, which is 10% of 1501 Students target population were sampled using
random sampling procedure. Purposive sampling was utilized in selecting 9 principal
used to take part in the study. The purposive sampling was convenient to attain the
targeted sample swiftly. The sample distribution was 150 Students, 30 Teachers and 9
Principals, giving a sample size of 189 respondents. Struwig and Stead (2001)
suggested that a sample size of 150-200 respondents delivered is accurate and
dependable. For this study Psycho socio- factors affecting Students Academic
Performance in KCSE in Public Day Secondary Schools in Marani Sub-County Kisii.
Table 3. shows the sample distribution of respondents in Marani Sub-County for this
research study.
Table 3: Sample Distribution
Respondents Frequency Percentage
Students 150 79.4
Teachers 30 15.9
Principals 9 4.7
TOTAL 189 100
3.5 Research Instrument
The researcher organized another set of pieces of papers with “YES”/ “NO” options,
placed them in a box and permitted students to pick them boy first and girls followed
after boys. The ones who had picked “YES” were carefully chosen to partake as
respondents. Utilizing this method, the researcher selected fifteen form four
respondents. Utilizing the same technique again, three teachers were carefully chosen.
36
This was reiterated in all the 10 randomly selected schools to pick the students’
respondents and teachers to actively take part in the research study.
Kathuri and Pals(1993) states that, provided proper sampling procedure is followed this
method of sampling provides an equal opportunity to each unit to be included in the
sample size. This procedure is free from bias. This allows for meaningful statistics of
analysis where Frankfort-Nachmias and Nachmias(1997) add that simple random
sampling provides a useful blend which enables quantitative and qualitative research to
be recognized.
3.6 Data Collection Instruments
3.6.1 Questionnaires
A questionnaire was used to gather data over a large sample as suggested by (Kombo
& Tromp, 2006). The questionnaires utilized in this study was made up of both
structured and unstructured questions. Structured questions are easier to analyse and
administer since every item is followed by substitute answers. Respondents’ responses
were given an understanding by the researcher into respondents feelings, background,
motivation, interest and decisions as found by (Mugenda & Mugenda, 2003). There
were two sets of questionnaires; Teachers’ Questionnaires and students’ Questionnaires
in this research study.
3.6.2 Interview Schedule
The interview schedule was prepared in a written or taped form. It involved a
conversation between two or more people. Questions were asked by the interviewer to
elicit facts or statements from the interviewee. Interview guide directs the conversation
37
towards the topic and issues one needs to learn. They help one to know what to ask,
what sequence, how to pose questions and to pose follow-ups. They guided what was
next after the interviewee had answered the last question as found by (Kombo & Tromp,
2006).
The use of interview schedule as a tool in research is quite efficient because through
them the researcher was able to obtain personal views from the respondents directly.
In this interview schedule, structured or closed ended questions were used. Closed
ended questions were used with the aim of helping the researcher to obtain the personal
views of the respondents. The interview schedule was administered to Principals. The
Principals were expected to provide adequate and appropriate information to assist the
researcher in the collection of valid and up-to date data in this study.
3.7 Pilot Study
A pilot study is a small-scale test of the procedures and techniques utilized on a higher
scale. Porta (2008) states that the ultimate purpose of executing a pilot study is to
scrutinize the achievability of an approach that is intended to in the long run be used in
a larger scale study. Reliability of the instruments of data collection was checked
through piloting, whereby student population of 100 from 5 sampled schools, 5
Teachers and 2 Principals from neighbouring Sub-counties, Manga Sub-County and
Kisii County were piloted. The respondents in pilot study did not take part in the main
study.
3.7.1 Validity of Research Instruments
Validity is an indication of how sound the study is. More specifically, validity applies
to both the design and the methods of research. Validity in data collection means that
findings truly represent the phenomenon one is claiming to measure. Valid claims are
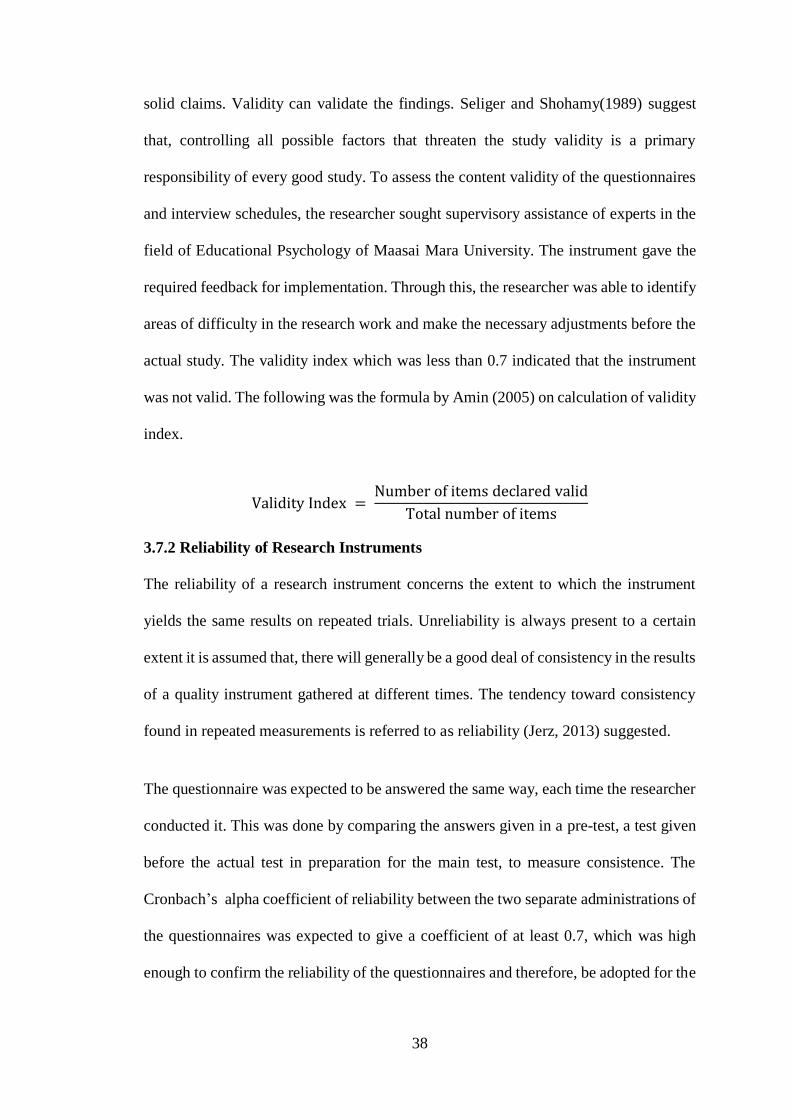
38
solid claims. Validity can validate the findings. Seliger and Shohamy(1989) suggest
that, controlling all possible factors that threaten the study validity is a primary
responsibility of every good study. To assess the content validity of the questionnaires
and interview schedules, the researcher sought supervisory assistance of experts in the
field of Educational Psychology of Maasai Mara University. The instrument gave the
required feedback for implementation. Through this, the researcher was able to identify
areas of difficulty in the research work and make the necessary adjustments before the
actual study. The validity index which was less than 0.7 indicated that the instrument
was not valid. The following was the formula by Amin (2005) on calculation of validity
index.
Validity Index = Number of items declared valid
Total number of items
3.7.2 Reliability of Research Instruments
The reliability of a research instrument concerns the extent to which the instrument
yields the same results on repeated trials. Unreliability is always present to a certain
extent it is assumed that, there will generally be a good deal of consistency in the results
of a quality instrument gathered at different times. The tendency toward consistency
found in repeated measurements is referred to as reliability (Jerz, 2013) suggested.
The questionnaire was expected to be answered the same way, each time the researcher
conducted it. This was done by comparing the answers given in a pre-test, a test given
before the actual test in preparation for the main test, to measure consistence. The
Cronbach’s alpha coefficient of reliability between the two separate administrations of
the questionnaires was expected to give a coefficient of at least 0.7, which was high
enough to confirm the reliability of the questionnaires and therefore, be adopted for the
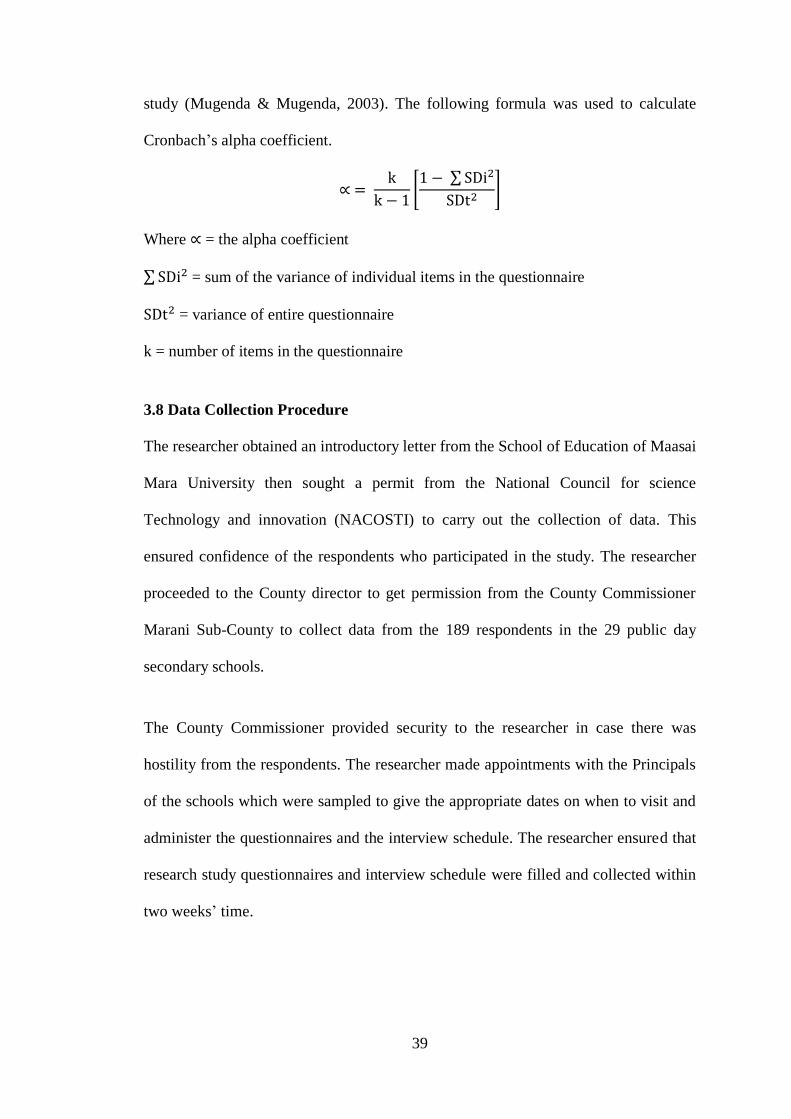
39
study (Mugenda & Mugenda, 2003). The following formula was used to calculate
Cronbach’s alpha coefficient.
∝ = k
k − 1[1 − ∑ SDi2
SDt2]
Where ∝ = the alpha coefficient
∑ SDi2 = sum of the variance of individual items in the questionnaire
SDt2 = variance of entire questionnaire
k = number of items in the questionnaire
3.8 Data Collection Procedure
The researcher obtained an introductory letter from the School of Education of Maasai
Mara University then sought a permit from the National Council for science
Technology and innovation (NACOSTI) to carry out the collection of data. This
ensured confidence of the respondents who participated in the study. The researcher
proceeded to the County director to get permission from the County Commissioner
Marani Sub-County to collect data from the 189 respondents in the 29 public day
secondary schools.
The County Commissioner provided security to the researcher in case there was
hostility from the respondents. The researcher made appointments with the Principals
of the schools which were sampled to give the appropriate dates on when to visit and
administer the questionnaires and the interview schedule. The researcher ensured that
research study questionnaires and interview schedule were filled and collected within
two weeks’ time.

40
3.9 Data Analysis
This Study used both quantitative and qualitative method to analyse the effects of
psychosocial factors on Students’ Academic Performance in Public Day Secondary
Schools in Marani Sub- County, Kisii County, Kenya. Qualitative analysis used content
analysis method, which involved the non-quantitative data, especially the data from
interview schedule. It is a strong tool that effectively addresses the social issues that
affect individual and families at large. It seeks to explain phenomena more deeply and
more exhaustively when collecting data. Quantitative data analysis involved analysis
of data from the questionnaires. Quantitative data analysis involved the calculation of
descriptive statistics for all scales in the present study using SPSS version 24. The SPSS
was also used in the inferential statistics such as simple regression analysis, which
involved the following equation. This was used to test the stated hypotheses.
Y = β0
+ β1
X1 + β2
X2 + β3
X3 + ε
Where, Y = Students’ Academic Performance;
β0 = Y intercept, i.e. the value of Y when X is zero;
β1
, β2
and β3 = Coefficients of X1, X2 and X3 respectively, indicating the
changes in Y when the variables change;
X1 = Peer pressure;
X2 = Socio-Economic Status of Parents;
X3 = Students’ Attitude towards learning;
ε = Error term
The descriptive statistics included the calculation of means, standard deviations and
range of scores (minimum and maximum), calculated percentages, frequency tables,
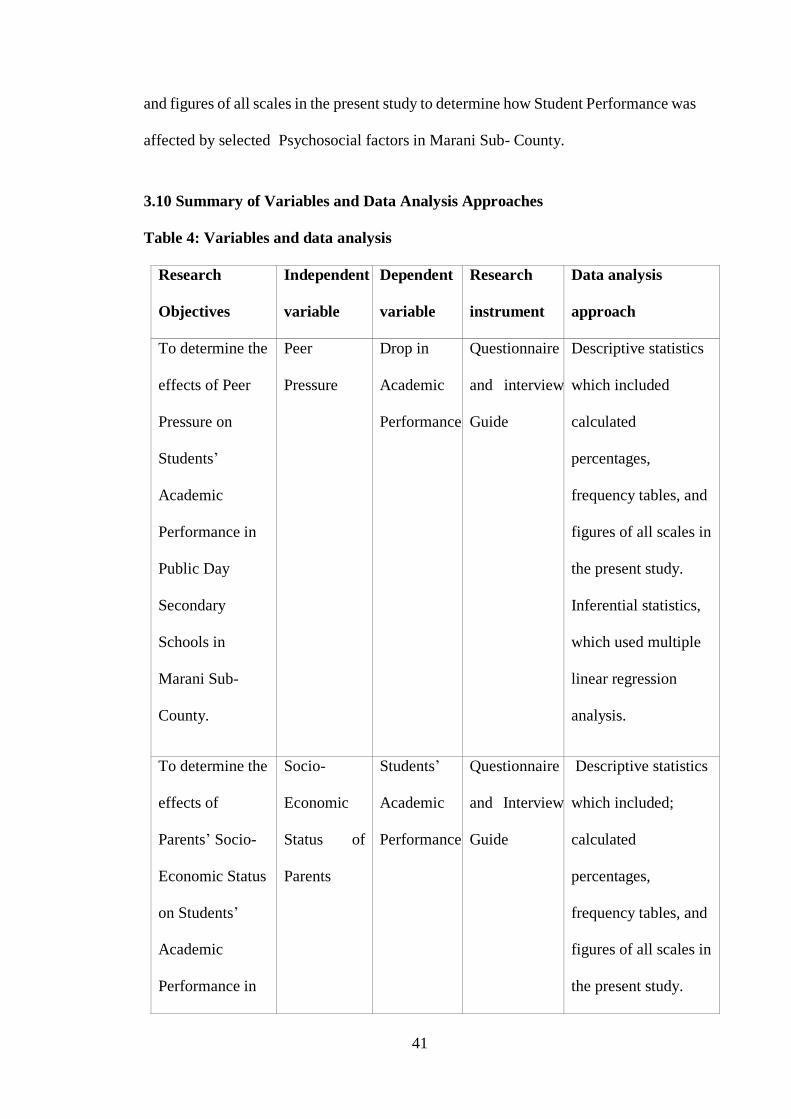
41
and figures of all scales in the present study to determine how Student Performance was
affected by selected Psychosocial factors in Marani Sub- County.
3.10 Summary of Variables and Data Analysis Approaches
Table 4: Variables and data analysis
Research
Objectives
Independent
variable
Dependent
variable
Research
instrument
Data analysis
approach
To determine the
effects of Peer
Pressure on
Students’
Academic
Performance in
Public Day
Secondary
Schools in
Marani Sub-
County.
Peer
Pressure
Drop in
Academic
Performance
Questionnaire
and interview
Guide
Descriptive statistics
which included
calculated
percentages,
frequency tables, and
figures of all scales in
the present study.
Inferential statistics,
which used multiple
linear regression
analysis.
To determine the
effects of
Parents’ Socio-
Economic Status
on Students’
Academic
Performance in
Socio-
Economic
Status of
Parents
Students’
Academic
Performance
Questionnaire
and Interview
Guide
Descriptive statistics
which included;
calculated
percentages,
frequency tables, and
figures of all scales in
the present study.

42
Public Day
Secondary
Schools in
Marani Sub-
County
Inferential statistics
which used multiple
linear regression
analysis.
To determine the
effects of
Students’
Attitude towards
learning on
Academic
Performance in
Public day
Secondary
Schools in
Marani Sub-
County of Kisii
County
Students’
Attitude
Students’
Academic
Performance
Questionnaire
and interview
Guide
Descriptive statistics
which included
calculated
percentages,
frequency tables, and
figures of all scales in
the present study.
Inferential statistics
which used multiple
linear regression
analysis was used
3.11 Ethical and Logical Considerations
The researcher employed confidentiality in this study to successfully interact with the
respondents who were very vital in this study. The respondents consent was sought
before the actual day a letter was written to the respondents by the researcher to inform
the respondents of what the researcher requires in this study. Then there was assurance
that the information collected will be private and confidential. The respondents were
43
informed in case they required the information being collected they were to be the first
beneficiaries. Those were the principals, teachers and students of Marani Sub-County
in Kisii County. They were informed that the topic is very relevant to them because it
dealt with students’ challenges in their academic performance, which was key to them
at this particular time. Their names were to be preserved not to be written in the
questionnaire or indicated anywhere in this study.
Their opinions thoughts and feelings, which were given in narration form in this study,
was not to be discussed outside this research study. The respondents freely participated
and gave valid and relevant information after they had been counselled and guided by
the researcher in a friendly, respectful manner, which ensured 100% participation and
response.
The research methods had respect for respondents in collecting data where the
quantitative and qualitative data collected was geared towards simplified questions
which could be easily understood by the respondents and answer them with ease,
leaving the calculation sections to the researcher. To finalise the percentages, mean
regression analysis, charts, tables and figures.
The researcher had a wide range of research study to exhaustively give aims and goals
of a reliable research study. Hence used at least three broad areas of psychosocial
factors affecting students’ academic performance.
The information of this study took care of plagiarism which is a professional
misconduct by citing or acknowledging the other researchers who have also done the
same research, what they have said and addressing the research gaps. The lectures
44
guided this research to be original work and ensured professional originality throughout
this study.
There was authority consent from respondents, teachers, principals, Ministry of
Education from Maasai Mara University lectures and also from NACOSTI National
Council of Science Technology and Innovation. This guaranteed the research humble
interaction with the respondents and reliable research study outcome.
45
CHAPTER FOUR
RESULTS AND DISCUSSIONS
4.0 Introduction
This chapter covered data analysis and the interpretation of findings. The data presented
includes demographic information of the respondents, effects of Peer Pressure, Socio-
Economic Status of Parents and Students’ Attitudes towards learning as some of the
Psycho- social factors affecting Students’ Academic Performance in Public Day
Secondary Schools in Marani Sub-county, Kisii County.
Qualitative analysis used content analysis method, which involved the non-quantitative
data, especially the data from Interview Schedule. Quantitative data analysis involved
analysis of data from the Questionnaires. Quantitative data analysis involved the
calculation of descriptive statistics for all scales in the study using SPSS. In addition,
the SPSS was used in the inferential statistics such as simple regression analysis. In this
manner the data for various sections were quantified according to objectives.
4.1 Response Rate
All the 189 Questionnaires were returned and all Interviews were conducted effectively
resulting to a 100% response rate. Mugenda and Mugenda (2003) suggested that 50%
response rate was adequate, 60% good and above 70% rated very good. This implies
that the 100% response rate in this study was very good. This is due to the effective
data collection techniques used and close supervision of data collection by the
researcher.
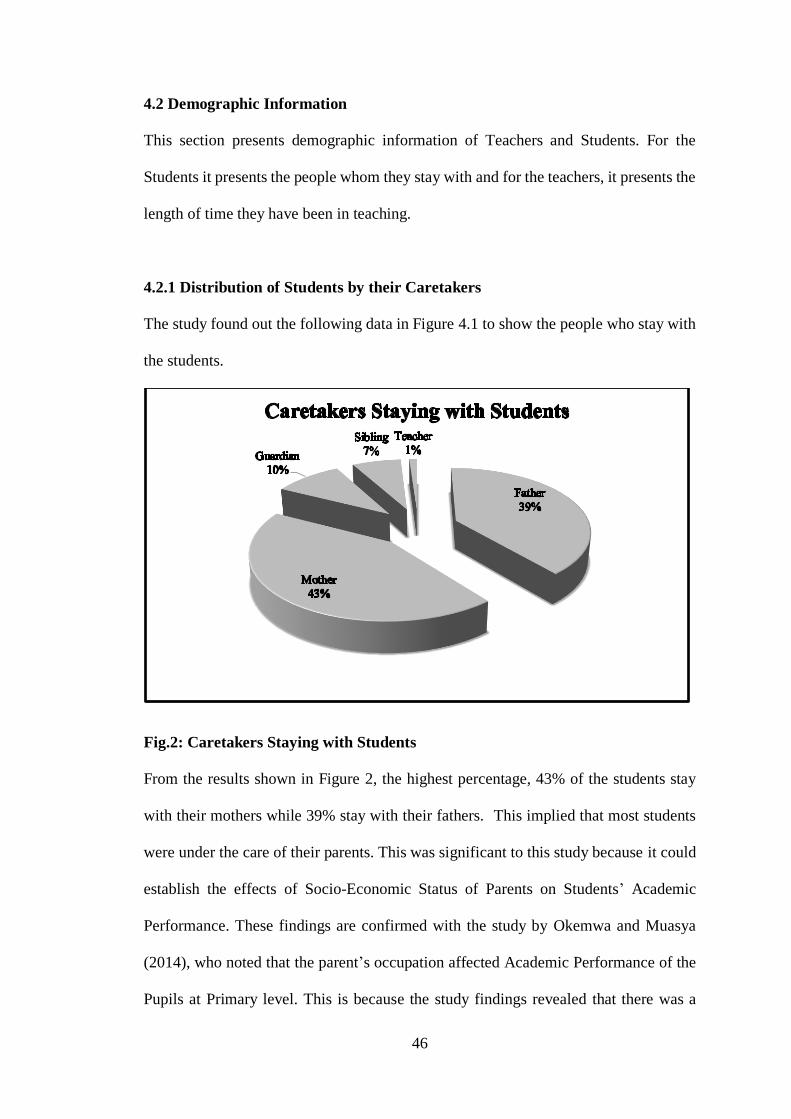
46
4.2 Demographic Information
This section presents demographic information of Teachers and Students. For the
Students it presents the people whom they stay with and for the teachers, it presents the
length of time they have been in teaching.
4.2.1 Distribution of Students by their Caretakers
The study found out the following data in Figure 4.1 to show the people who stay with
the students.
Fig.2: Caretakers Staying with Students
From the results shown in Figure 2, the highest percentage, 43% of the students stay
with their mothers while 39% stay with their fathers. This implied that most students
were under the care of their parents. This was significant to this study because it could
establish the effects of Socio-Economic Status of Parents on Students’ Academic
Performance. These findings are confirmed with the study by Okemwa and Muasya
(2014), who noted that the parent’s occupation affected Academic Performance of the
Pupils at Primary level. This is because the study findings revealed that there was a
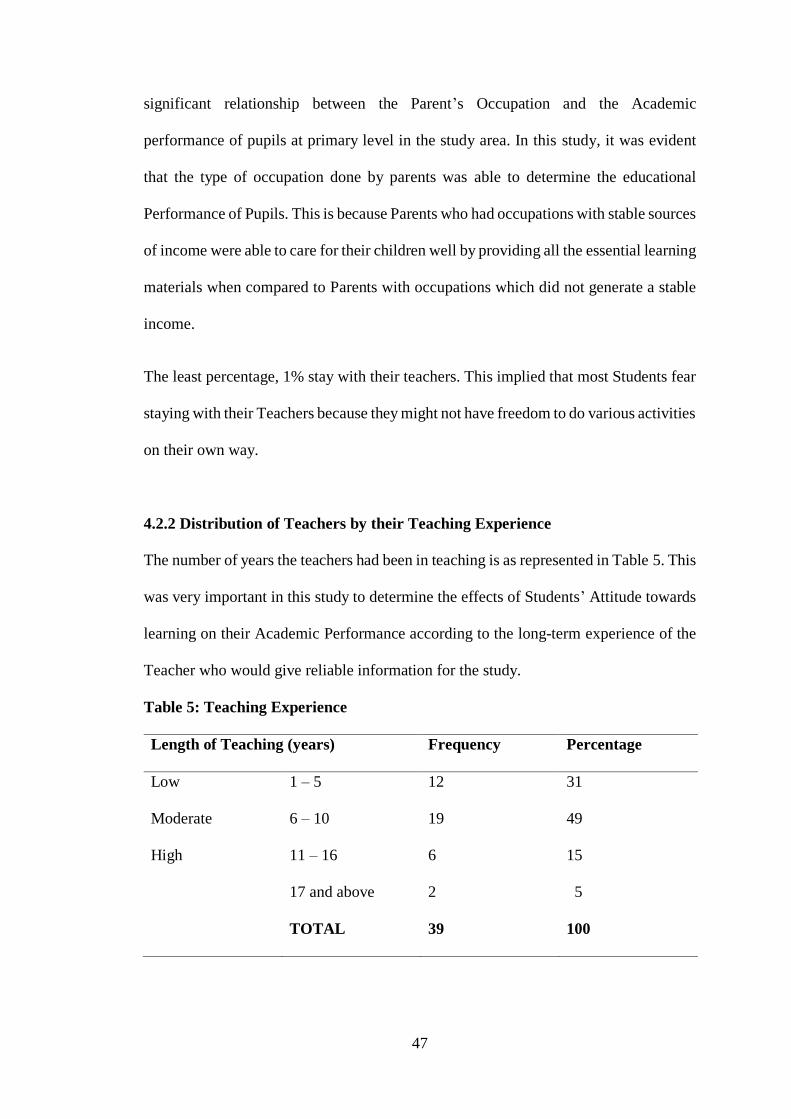
47
significant relationship between the Parent’s Occupation and the Academic
performance of pupils at primary level in the study area. In this study, it was evident
that the type of occupation done by parents was able to determine the educational
Performance of Pupils. This is because Parents who had occupations with stable sources
of income were able to care for their children well by providing all the essential learning
materials when compared to Parents with occupations which did not generate a stable
income.
The least percentage, 1% stay with their teachers. This implied that most Students fear
staying with their Teachers because they might not have freedom to do various activities
on their own way.
4.2.2 Distribution of Teachers by their Teaching Experience
The number of years the teachers had been in teaching is as represented in Table 5. This
was very important in this study to determine the effects of Students’ Attitude towards
learning on their Academic Performance according to the long-term experience of the
Teacher who would give reliable information for the study.
Table 5: Teaching Experience
Length of Teaching (years) Frequency Percentage
Low 1 – 5 12 31
Moderate 6 – 10 19 49
High 11 – 16 6 15
17 and above 2 5
TOTAL 39 100
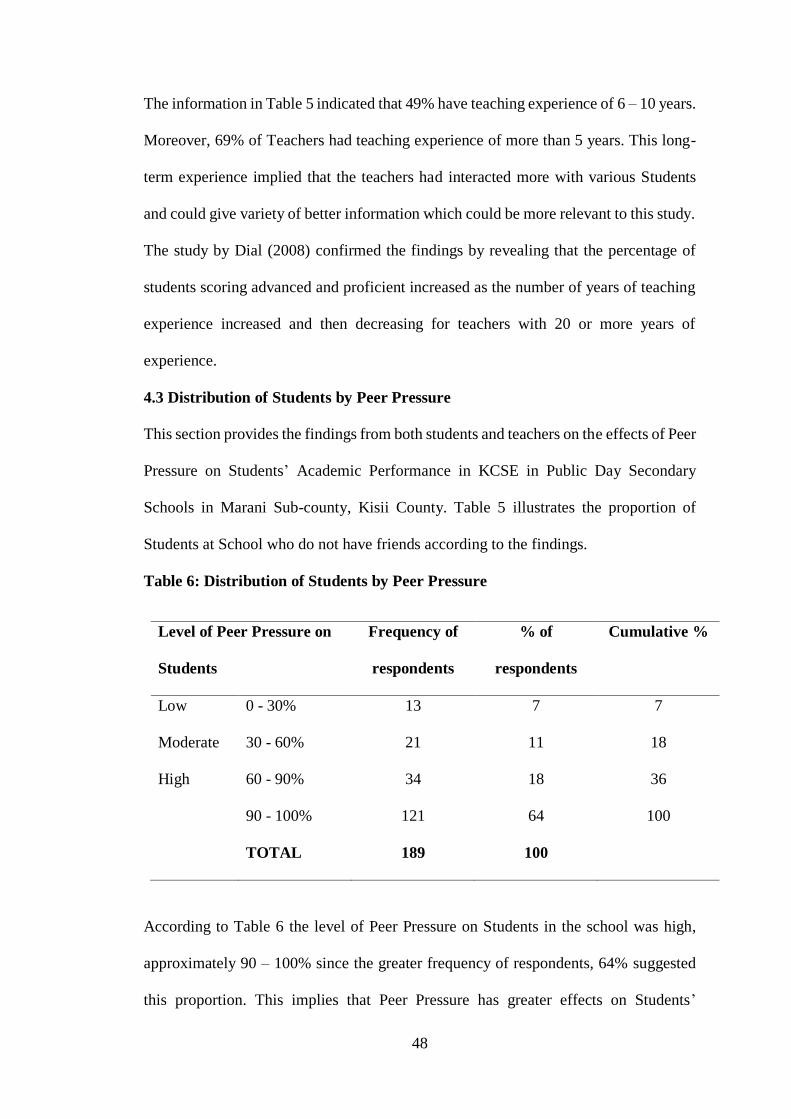
48
The information in Table 5 indicated that 49% have teaching experience of 6 – 10 years.
Moreover, 69% of Teachers had teaching experience of more than 5 years. This long-
term experience implied that the teachers had interacted more with various Students
and could give variety of better information which could be more relevant to this study.
The study by Dial (2008) confirmed the findings by revealing that the percentage of
students scoring advanced and proficient increased as the number of years of teaching
experience increased and then decreasing for teachers with 20 or more years of
experience.
4.3 Distribution of Students by Peer Pressure
This section provides the findings from both students and teachers on the effects of Peer
Pressure on Students’ Academic Performance in KCSE in Public Day Secondary
Schools in Marani Sub-county, Kisii County. Table 5 illustrates the proportion of
Students at School who do not have friends according to the findings.
Table 6: Distribution of Students by Peer Pressure
Level of Peer Pressure on
Students
Frequency of
respondents
% of
respondents
Cumulative %
Low 0 - 30% 13 7 7
Moderate 30 - 60% 21 11 18
High 60 - 90% 34 18 36
90 - 100% 121 64 100
TOTAL 189 100
According to Table 6 the level of Peer Pressure on Students in the school was high,
approximately 90 – 100% since the greater frequency of respondents, 64% suggested
this proportion. This implies that Peer Pressure has greater effects on Students’
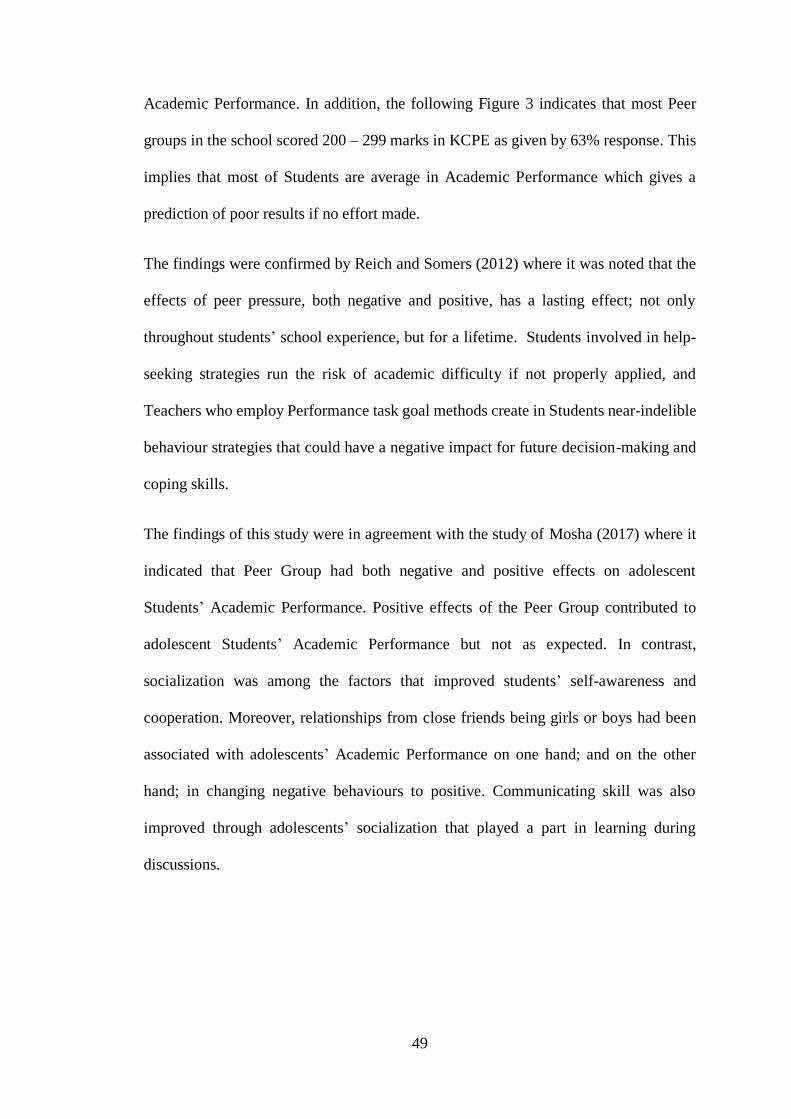
49
Academic Performance. In addition, the following Figure 3 indicates that most Peer
groups in the school scored 200 – 299 marks in KCPE as given by 63% response. This
implies that most of Students are average in Academic Performance which gives a
prediction of poor results if no effort made.
The findings were confirmed by Reich and Somers (2012) where it was noted that the
effects of peer pressure, both negative and positive, has a lasting effect; not only
throughout students’ school experience, but for a lifetime. Students involved in help-
seeking strategies run the risk of academic difficulty if not properly applied, and
Teachers who employ Performance task goal methods create in Students near-indelible
behaviour strategies that could have a negative impact for future decision-making and
coping skills.
The findings of this study were in agreement with the study of Mosha (2017) where it
indicated that Peer Group had both negative and positive effects on adolescent
Students’ Academic Performance. Positive effects of the Peer Group contributed to
adolescent Students’ Academic Performance but not as expected. In contrast,
socialization was among the factors that improved students’ self-awareness and
cooperation. Moreover, relationships from close friends being girls or boys had been
associated with adolescents’ Academic Performance on one hand; and on the other
hand; in changing negative behaviours to positive. Communicating skill was also
improved through adolescents’ socialization that played a part in learning during
discussions.
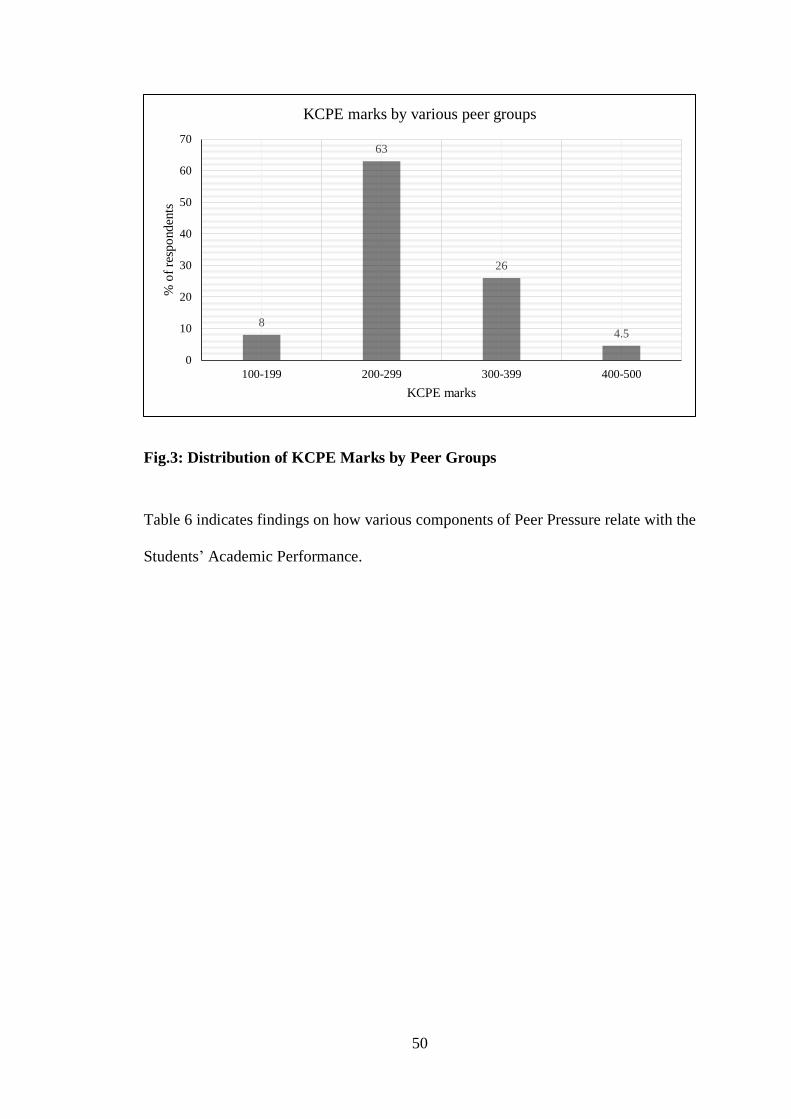
50
Fig.3: Distribution of KCPE Marks by Peer Groups
Table 6 indicates findings on how various components of Peer Pressure relate with the
Students’ Academic Performance.
8
63
26
4.5
0
10
20
30
40
50
60
70
100-199 200-299 300-399 400-500
% o
f re
spo
nden
ts
KCPE marks
KCPE marks by various peer groups
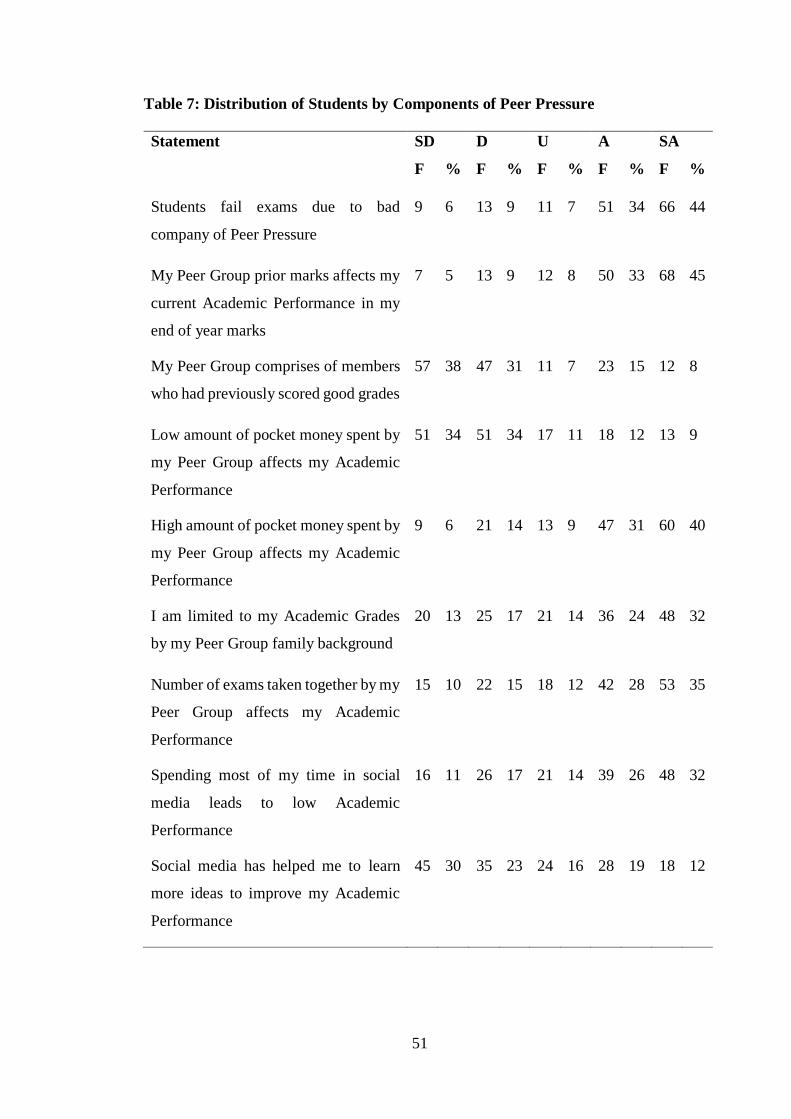
51
Table 7: Distribution of Students by Components of Peer Pressure
Statement SD D U A SA
F % F % F % F % F %
Students fail exams due to bad
company of Peer Pressure
9 6 13 9 11 7 51 34 66 44
My Peer Group prior marks affects my
current Academic Performance in my
end of year marks
7 5 13 9 12 8 50 33 68 45
My Peer Group comprises of members
who had previously scored good grades
57 38 47 31 11 7 23 15 12 8
Low amount of pocket money spent by
my Peer Group affects my Academic
Performance
51 34 51 34 17 11 18 12 13 9
High amount of pocket money spent by
my Peer Group affects my Academic
Performance
9 6 21 14 13 9 47 31 60 40
I am limited to my Academic Grades
by my Peer Group family background
20 13 25 17 21 14 36 24 48 32
Number of exams taken together by my
Peer Group affects my Academic
Performance
15 10 22 15 18 12 42 28 53 35
Spending most of my time in social
media leads to low Academic
Performance
16 11 26 17 21 14 39 26 48 32
Social media has helped me to learn
more ideas to improve my Academic
Performance
45 30 35 23 24 16 28 19 18 12

52
From Table 7, the findings revealed that Students failed exam due to bad company of
Peer Pressure. This is indicated through greater percentage, 44% of the responds who
strongly agreed with the statement while the least percentage of 6% strongly disagreed.
45% of the respondents strongly agreed that Peer Group prior marks affects the
Students’ Academic Performance in end of year marks while 5% strongly disagreed.
This indicated that Peer Group prior marks might have controlled the individual
Student’s marks in examinations.
Most of the respondents, 38% confirmed that most Peer Groups do not comprise of
members who had previously scored good grades. Only 8% strongly agreed and
therefore, this is evident that the previous scores had poor grades. This indicated that
the poor Academic Performance of Students was affected by Peer Pressure.
Surprisingly enough, 40% of the respondents strongly agreed that high amount of
pocket money spent by peer groups influenced the Students’ Academic Performance.
In support of this, 34% strongly disagreed that low amount of pocket money spent by
peer groups affected the Students’ Academic Performance. This reveals that the large
amount of pocket money given to the Peer Groups contributed to poor Academic
Performance.
32% of the respondents strongly agreed that their academic grades are limited by their
Peer Group family background. This is because the peer pressure instils the habit of
reading or studying, which in turn limits the Academic Grades. The greater percentage,
35% confirmed that the number of exams taken together by the peer groups affects the
Students’ Academic Performance. The duration and learning environment where the
Peer Groups would like to take determines their performance depending on what they
choose.
53
It was revealed by 32% of the respondents that spending most of my time in social
media led to low Academic Performance, while only 12% strongly agreed that social
media had helped them to learn more ideas to improve their Academic Performance.
This is an implication that social media had done more harm than good on the Academic
Performance of Students, since they took a lot of their time on non-Academic matters
which lead to their failure in examinations, hence poor Academic Performance.
According to the findings of the study, 80% of the respondents agreed that the number
of times the students are counselled had affected their Academic Performance. This was
due to the fact that counselling led to change in habit of reading and enabled the
students’ reduce wastage of time. It also reduced bad effects from the social media.
The findings for this study on Peer Pressure were confirmed in Bankole and Ogunsakin
(2015) which suggested that Peer Group plays an essential role in the Academic
Performance of secondary school students. They form an important part of the
environment of school and they create and maintain a culture separate from the home
and adult community in which individual Peers were raised. Also, it can be concluded
that to achieve effective teaching, Teachers should concentrate on promoting
classrooms of acceptance; they should avoid playing favouritism and abandon negative
image of student(s) that they already possessed.
In addition, Parents should observe the types of Peer their children move with either in
the school or outside the home. They should see to it that their children move with Peers
who can positively affects them and have good effects on their Academic Performance.
Finally, counsellors should play a major and leading role in the matter by organizing
lectures, seminars, career talk and the like so that the performance of secondary school
students will be improved.
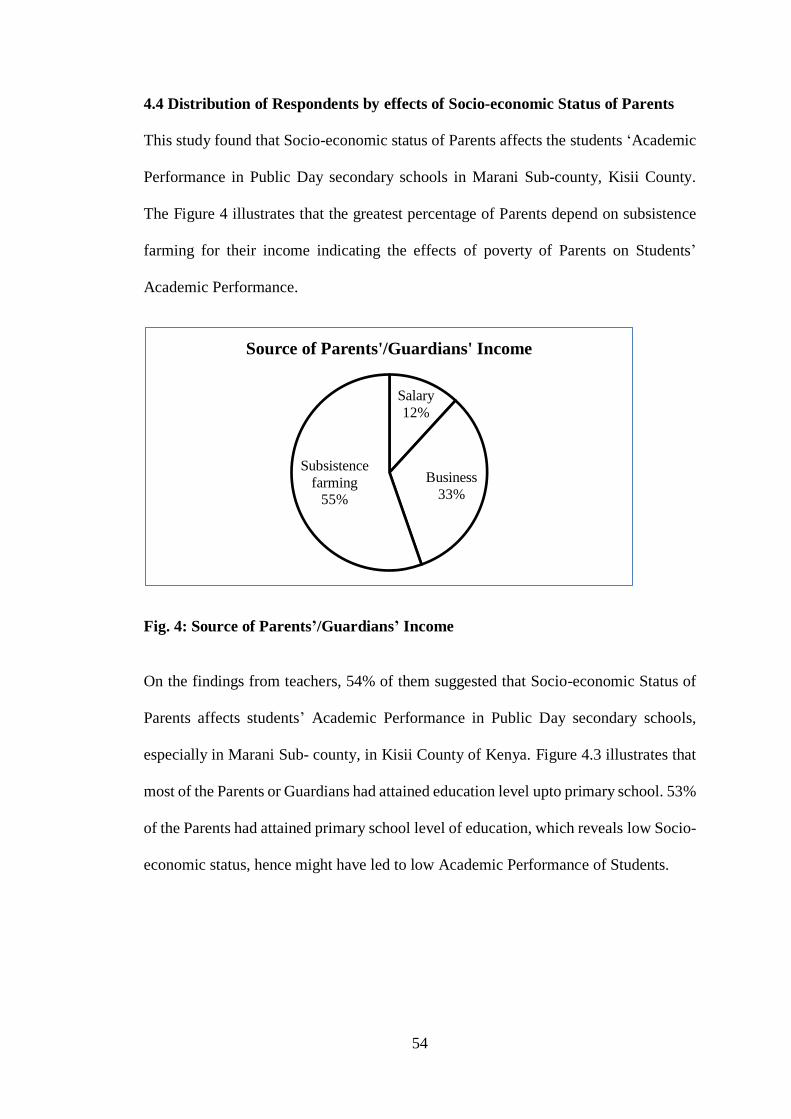
54
4.4 Distribution of Respondents by effects of Socio-economic Status of Parents
This study found that Socio-economic status of Parents affects the students ‘Academic
Performance in Public Day secondary schools in Marani Sub-county, Kisii County.
The Figure 4 illustrates that the greatest percentage of Parents depend on subsistence
farming for their income indicating the effects of poverty of Parents on Students’
Academic Performance.
Fig. 4: Source of Parents’/Guardians’ Income
On the findings from teachers, 54% of them suggested that Socio-economic Status of
Parents affects students’ Academic Performance in Public Day secondary schools,
especially in Marani Sub- county, in Kisii County of Kenya. Figure 4.3 illustrates that
most of the Parents or Guardians had attained education level upto primary school. 53%
of the Parents had attained primary school level of education, which reveals low Socio-
economic status, hence might have led to low Academic Performance of Students.
Salary
12%
Business
33%
Subsistence
farming
55%
Source of Parents'/Guardians' Income
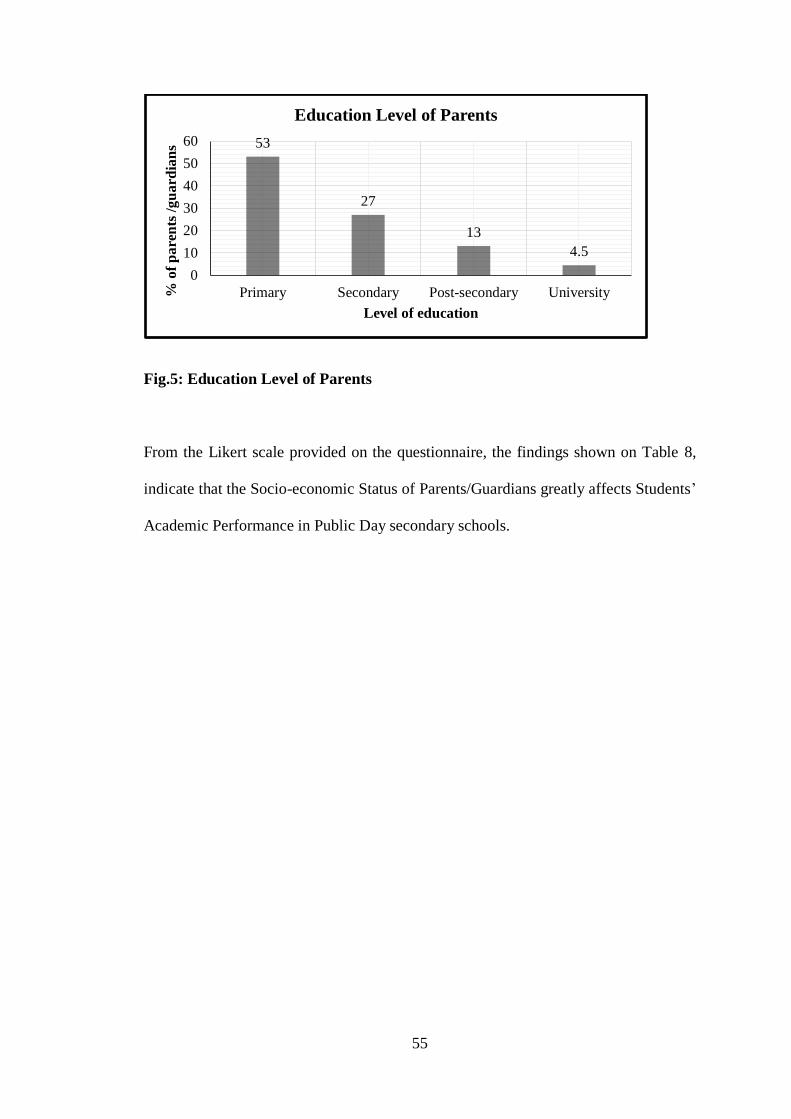
55
Fig.5: Education Level of Parents
From the Likert scale provided on the questionnaire, the findings shown on Table 8,
indicate that the Socio-economic Status of Parents/Guardians greatly affects Students’
Academic Performance in Public Day secondary schools.
53
27
13
4.5
0
10
20
30
40
50
60
Primary Secondary Post-secondary University% o
f p
are
nts
/g
ua
rdia
ns
Level of education
Education Level of Parents
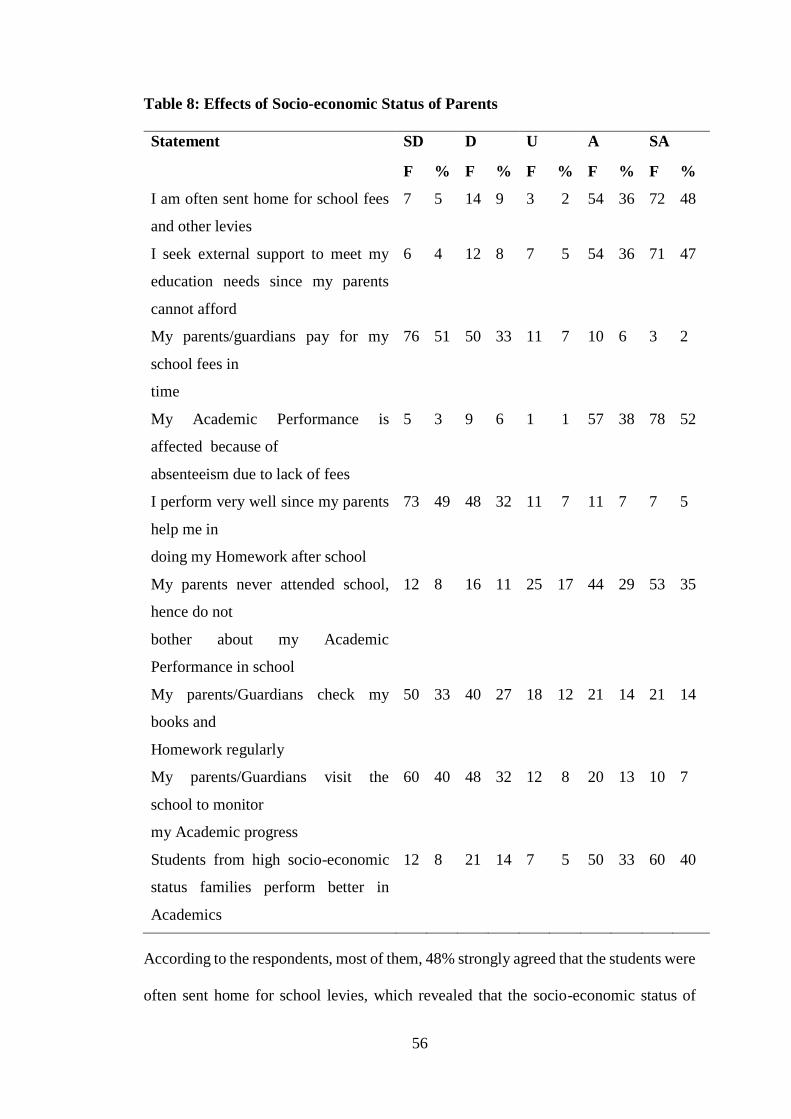
56
Table 8: Effects of Socio-economic Status of Parents
Statement SD D U A SA
F % F % F % F % F %
I am often sent home for school fees
and other levies
7 5 14 9 3 2 54 36 72 48
I seek external support to meet my
education needs since my parents
cannot afford
6 4 12 8 7 5 54 36 71 47
My parents/guardians pay for my
school fees in
time
76 51 50 33 11 7 10 6 3 2
My Academic Performance is
affected because of
absenteeism due to lack of fees
5 3 9 6 1 1 57 38 78 52
I perform very well since my parents
help me in
doing my Homework after school
73 49 48 32 11 7 11 7 7 5
My parents never attended school,
hence do not
bother about my Academic
Performance in school
12 8 16 11 25 17 44 29 53 35
My parents/Guardians check my
books and
Homework regularly
50 33 40 27 18 12 21 14 21 14
My parents/Guardians visit the
school to monitor
my Academic progress
60 40 48 32 12 8 20 13 10 7
Students from high socio-economic
status families perform better in
Academics
12 8 21 14 7 5 50 33 60 40
According to the respondents, most of them, 48% strongly agreed that the students were
often sent home for school levies, which revealed that the socio-economic status of
57
parents was low, hence negatively effects on the students’ Academic Performance. 47%
strongly agreed that the students sought external support to sustain their education since
their parents could not afford. This was very evident as 51% strongly disagreed that
their parents paid school levies in time. 52% strongly agreed that their Academic
Performance was affected by absenteeism due to lack of fees.
From the findings, it was indicated that 49% strongly disagreed that students perform
very well since their parents helped them in doing their homework after school. This
implied that the parents’ educational level was low which led to poor Academic
Performance of the students. This was also supported by 35% of respondents who
strongly agreed that the parents never attended school, thus not bothering about the
students’ Academic Performance in school.
33% of the respondents was the greatest percentage who strongly disagreed that the
parents checked the students’ books and homework regularly. Most of the respondents,
40% strongly disagreed that parents visited school to monitor the students’ Academic
Performance. The greatest percentage, 40% of the respondents strongly agreed that
students from high socio-economic status families performed better in academics. The
studies revealed that socio-economic status of parents influenced the students’
Academic Performance.
These results were confirmed through the study undertaken by Suleman, Hussain, Khan
and Nissa (2012) where it was ascertained that academic attainment of a student is
directly proportional to the income of parents, education and occupation. That is why
it is right to suggest that high Socio-Economic status of the parents plays an essential
and vital role in the heightening of their children’s academic achievement.
58
The study by Juma, Muasya and Masese (2016) approved the discoveries by disclosing
that there is a substantial positive correlation between parents’ income and students’
academic performance in Tana River County. This is due to the fact that higher income
parents have the ability to pay school fees in time, provide the required learning
materials and set a more favourable learning environment at home unlike low income
parents who do not have financial ability to cater for students’ educational needs.
4.5 Effects of Students’ Attitude towards Learning
From the findings of this study, greater percentage of respondents indicated that most
of the students had negative attitude towards learning. Figure 6 indicates that 22% had
positive attitude and 62% had negative attitude. From the results, it implied that the
students’ negative attitude towards learning negatively affected the students’ Academic
Performance. The reasons given by the respondents was that the negative attitude came
as a result of the poor environmental conditions at homes and school; discouragement
by peers, relatives and some teachers; and also, the poor behaviour of the students. For
example, the study findings revealed that 49% of the students’ general behaviour was
average, 34% was poor, 14% was good and 3% was very good.
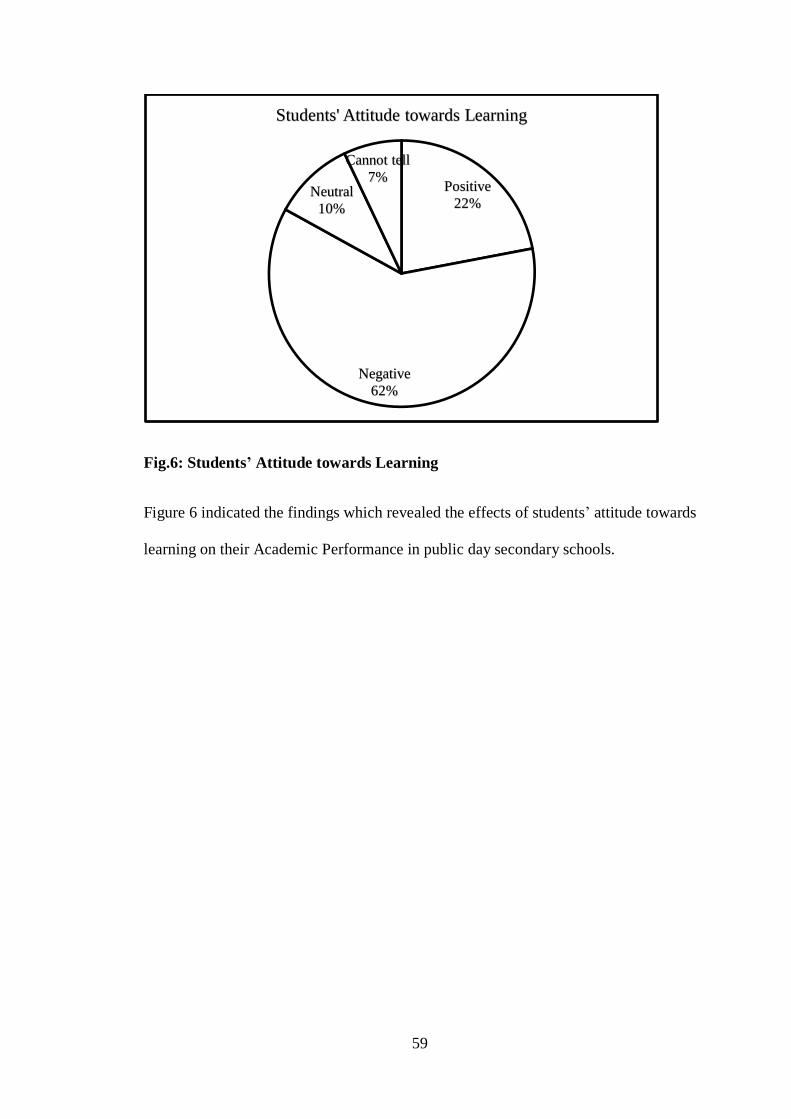
59
Fig.6: Students’ Attitude towards Learning
Figure 6 indicated the findings which revealed the effects of students’ attitude towards
learning on their Academic Performance in public day secondary schools.
Positive
22%
Negative
62%
Neutral
10%
Cannot tell
7%
Students' Attitude towards Learning
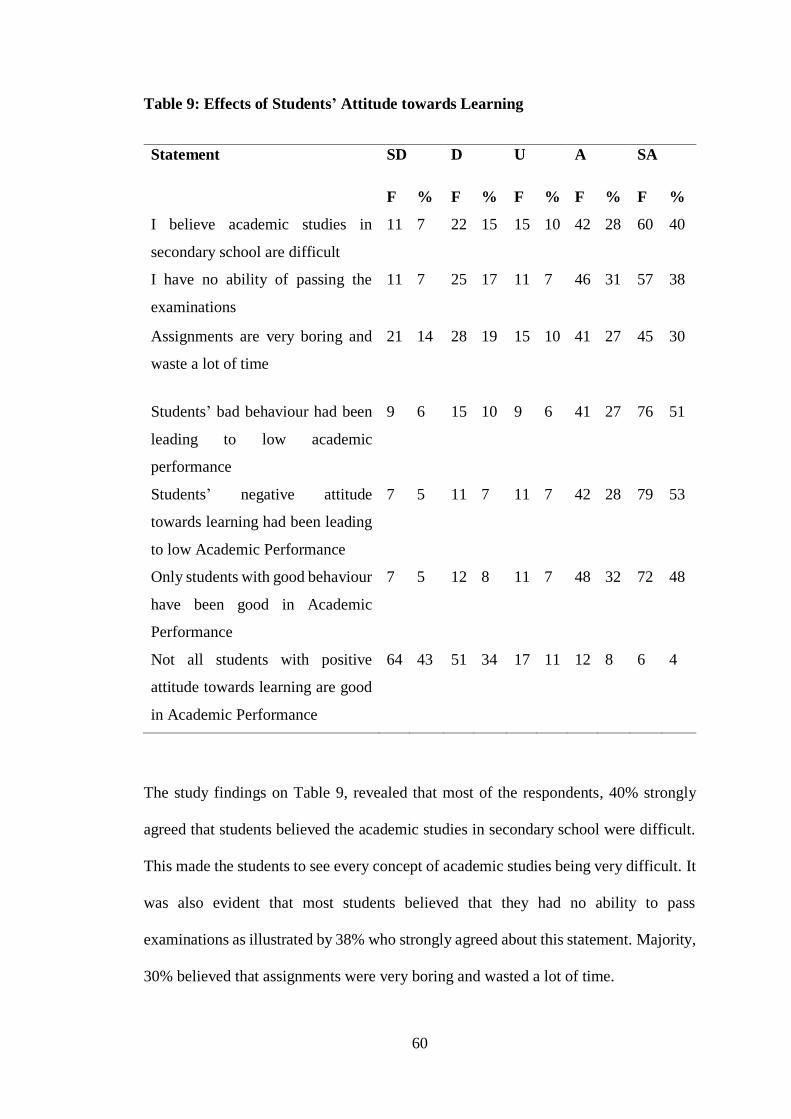
60
Table 9: Effects of Students’ Attitude towards Learning
Statement SD D U A SA
F % F % F % F % F %
I believe academic studies in
secondary school are difficult
11 7 22 15 15 10 42 28 60 40
I have no ability of passing the
examinations
11 7 25 17 11 7 46 31 57 38
Assignments are very boring and
waste a lot of time
21 14 28 19 15 10 41 27 45 30
Students’ bad behaviour had been
leading to low academic
performance
9 6 15 10 9 6 41 27 76 51
Students’ negative attitude
towards learning had been leading
to low Academic Performance
7 5 11 7 11 7 42 28 79 53
Only students with good behaviour
have been good in Academic
Performance
7 5 12 8 11 7 48 32 72 48
Not all students with positive
attitude towards learning are good
in Academic Performance
64 43 51 34 17 11 12 8 6 4
The study findings on Table 9, revealed that most of the respondents, 40% strongly
agreed that students believed the academic studies in secondary school were difficult.
This made the students to see every concept of academic studies being very difficult. It
was also evident that most students believed that they had no ability to pass
examinations as illustrated by 38% who strongly agreed about this statement. Majority,
30% believed that assignments were very boring and wasted a lot of time.
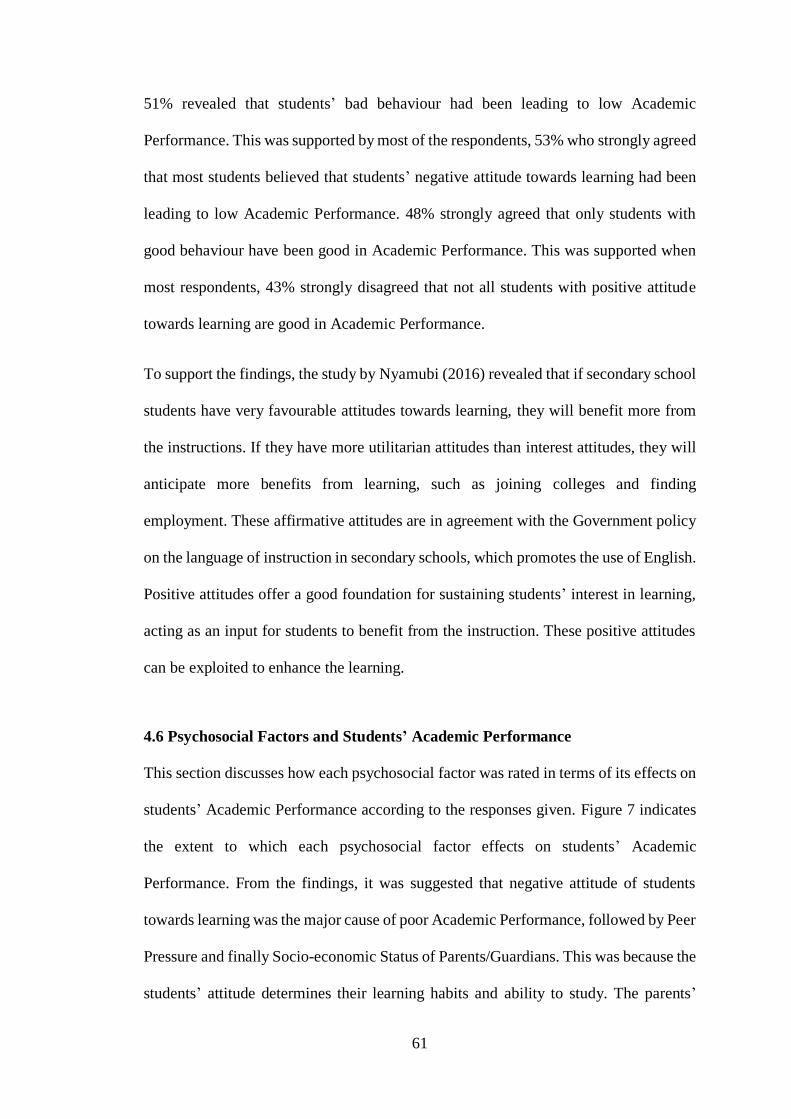
61
51% revealed that students’ bad behaviour had been leading to low Academic
Performance. This was supported by most of the respondents, 53% who strongly agreed
that most students believed that students’ negative attitude towards learning had been
leading to low Academic Performance. 48% strongly agreed that only students with
good behaviour have been good in Academic Performance. This was supported when
most respondents, 43% strongly disagreed that not all students with positive attitude
towards learning are good in Academic Performance.
To support the findings, the study by Nyamubi (2016) revealed that if secondary school
students have very favourable attitudes towards learning, they will benefit more from
the instructions. If they have more utilitarian attitudes than interest attitudes, they will
anticipate more benefits from learning, such as joining colleges and finding
employment. These affirmative attitudes are in agreement with the Government policy
on the language of instruction in secondary schools, which promotes the use of English.
Positive attitudes offer a good foundation for sustaining students’ interest in learning,
acting as an input for students to benefit from the instruction. These positive attitudes
can be exploited to enhance the learning.
4.6 Psychosocial Factors and Students’ Academic Performance
This section discusses how each psychosocial factor was rated in terms of its effects on
students’ Academic Performance according to the responses given. Figure 7 indicates
the extent to which each psychosocial factor effects on students’ Academic
Performance. From the findings, it was suggested that negative attitude of students
towards learning was the major cause of poor Academic Performance, followed by Peer
Pressure and finally Socio-economic Status of Parents/Guardians. This was because the
students’ attitude determines their learning habits and ability to study. The parents’
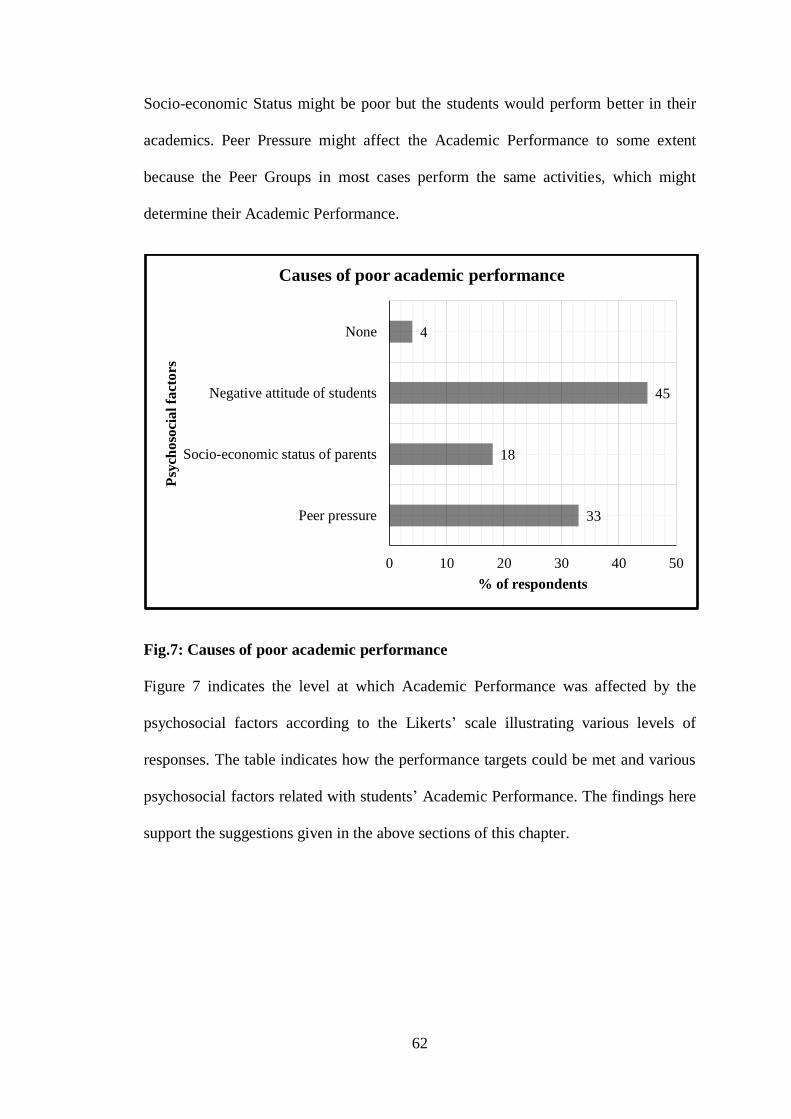
62
Socio-economic Status might be poor but the students would perform better in their
academics. Peer Pressure might affect the Academic Performance to some extent
because the Peer Groups in most cases perform the same activities, which might
determine their Academic Performance.
Fig.7: Causes of poor academic performance
Figure 7 indicates the level at which Academic Performance was affected by the
psychosocial factors according to the Likerts’ scale illustrating various levels of
responses. The table indicates how the performance targets could be met and various
psychosocial factors related with students’ Academic Performance. The findings here
support the suggestions given in the above sections of this chapter.
33
18
45
4
0 10 20 30 40 50
Peer pressure
Socio-economic status of parents
Negative attitude of students
None
% of respondents
Psy
cho
soci
al
fact
ors
Causes of poor academic performance
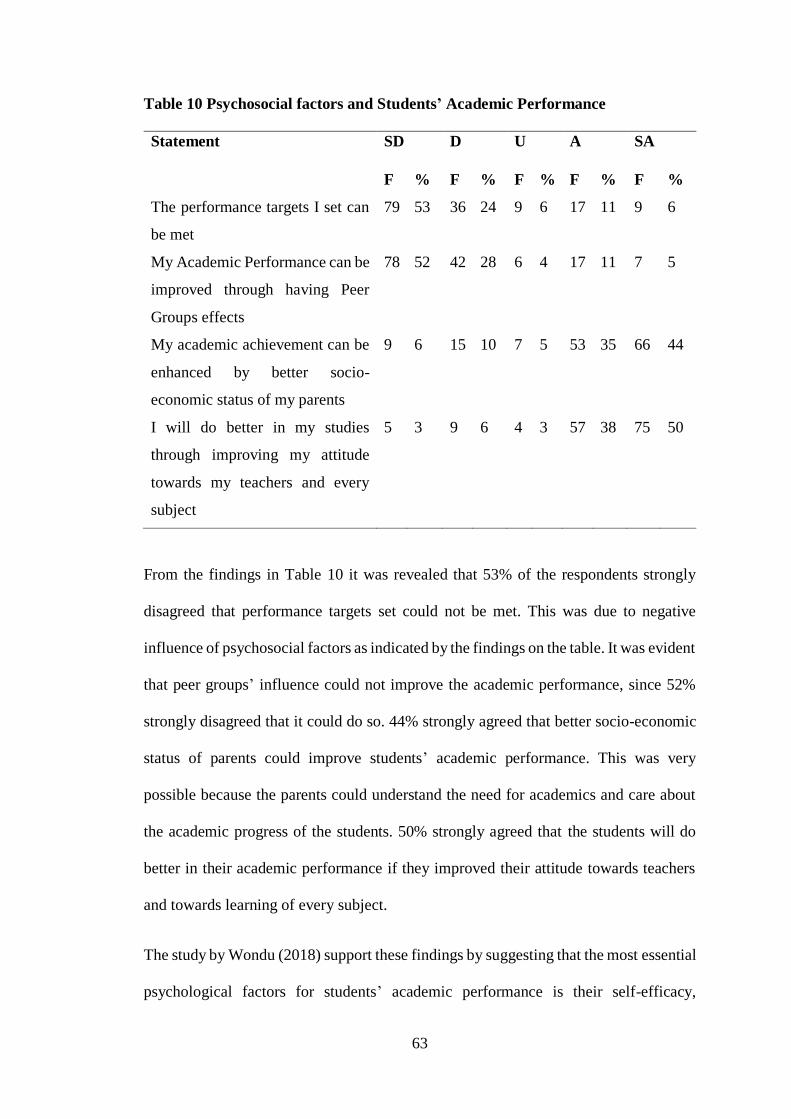
63
Table 10 Psychosocial factors and Students’ Academic Performance
Statement SD D U A SA
F % F % F % F % F %
The performance targets I set can
be met
79 53 36 24 9 6 17 11 9 6
My Academic Performance can be
improved through having Peer
Groups effects
78 52 42 28 6 4 17 11 7 5
My academic achievement can be
enhanced by better socio-
economic status of my parents
9 6 15 10 7 5 53 35 66 44
I will do better in my studies
through improving my attitude
towards my teachers and every
subject
5 3 9 6 4 3 57 38 75 50
From the findings in Table 10 it was revealed that 53% of the respondents strongly
disagreed that performance targets set could not be met. This was due to negative
influence of psychosocial factors as indicated by the findings on the table. It was evident
that peer groups’ influence could not improve the academic performance, since 52%
strongly disagreed that it could do so. 44% strongly agreed that better socio-economic
status of parents could improve students’ academic performance. This was very
possible because the parents could understand the need for academics and care about
the academic progress of the students. 50% strongly agreed that the students will do
better in their academic performance if they improved their attitude towards teachers
and towards learning of every subject.
The study by Wondu (2018) support these findings by suggesting that the most essential
psychological factors for students’ academic performance is their self-efficacy,
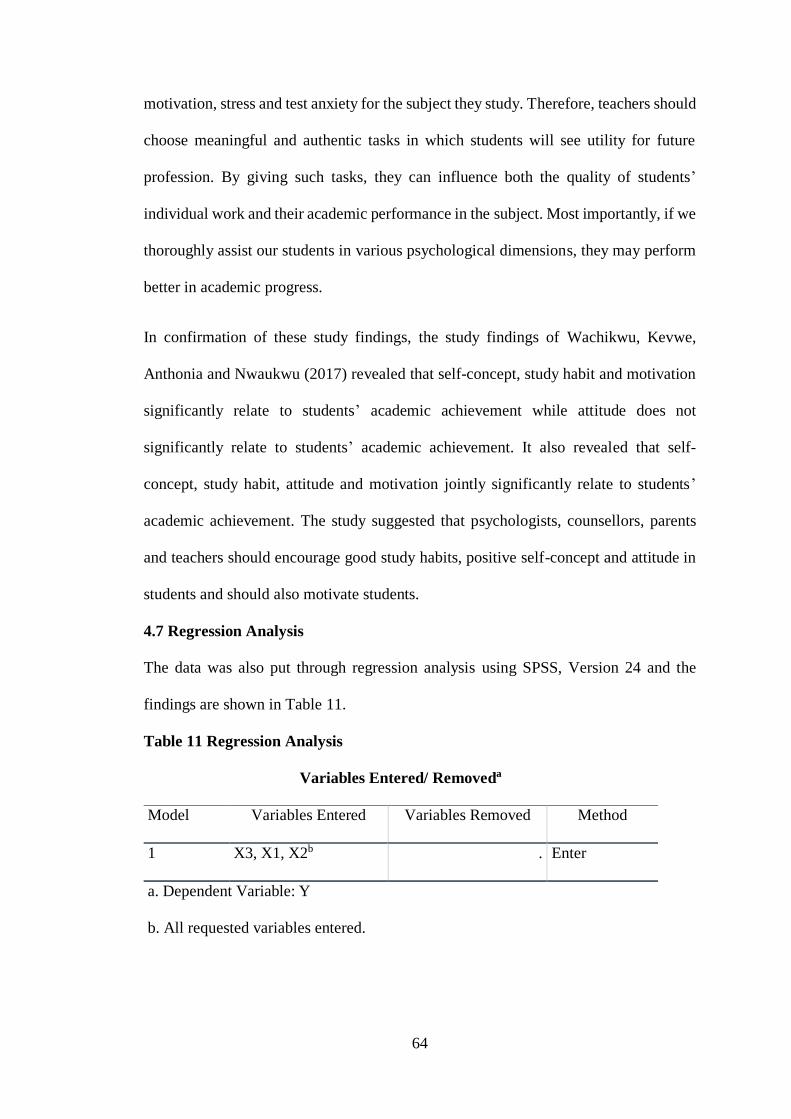
64
motivation, stress and test anxiety for the subject they study. Therefore, teachers should
choose meaningful and authentic tasks in which students will see utility for future
profession. By giving such tasks, they can influence both the quality of students’
individual work and their academic performance in the subject. Most importantly, if we
thoroughly assist our students in various psychological dimensions, they may perform
better in academic progress.
In confirmation of these study findings, the study findings of Wachikwu, Kevwe,
Anthonia and Nwaukwu (2017) revealed that self-concept, study habit and motivation
significantly relate to students’ academic achievement while attitude does not
significantly relate to students’ academic achievement. It also revealed that self-
concept, study habit, attitude and motivation jointly significantly relate to students’
academic achievement. The study suggested that psychologists, counsellors, parents
and teachers should encourage good study habits, positive self-concept and attitude in
students and should also motivate students.
4.7 Regression Analysis
The data was also put through regression analysis using SPSS, Version 24 and the
findings are shown in Table 11.
Table 11 Regression Analysis
Variables Entered/ Removeda
Model Variables Entered Variables Removed Method
1 X3, X1, X2b . Enter
a. Dependent Variable: Y
b. All requested variables entered.
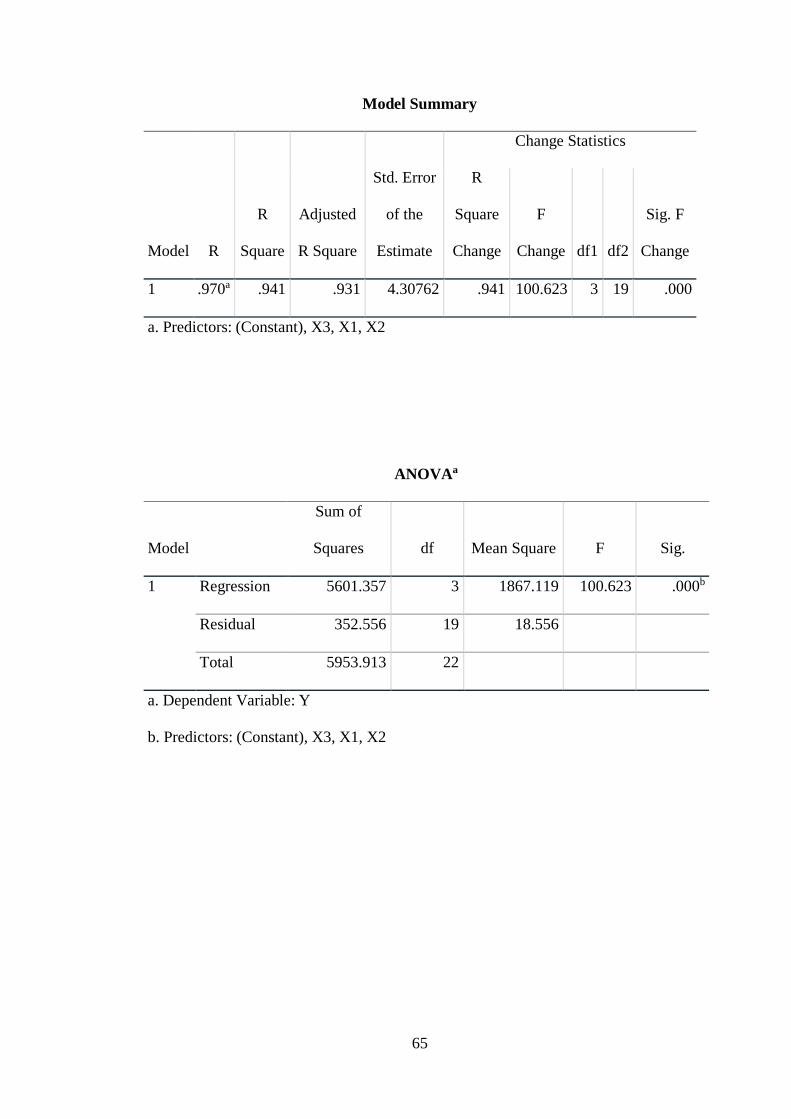
65
Model Summary
Model R
R
Square
Adjusted
R Square
Std. Error
of the
Estimate
Change Statistics
R
Square
Change
F
Change df1 df2
Sig. F
Change
1 .970a .941 .931 4.30762 .941 100.623 3 19 .000
a. Predictors: (Constant), X3, X1, X2
ANOVAa
Model
Sum of
Squares df Mean Square F Sig.
1 Regression 5601.357 3 1867.119 100.623 .000b
Residual 352.556 19 18.556
Total 5953.913 22
a. Dependent Variable: Y
b. Predictors: (Constant), X3, X1, X2
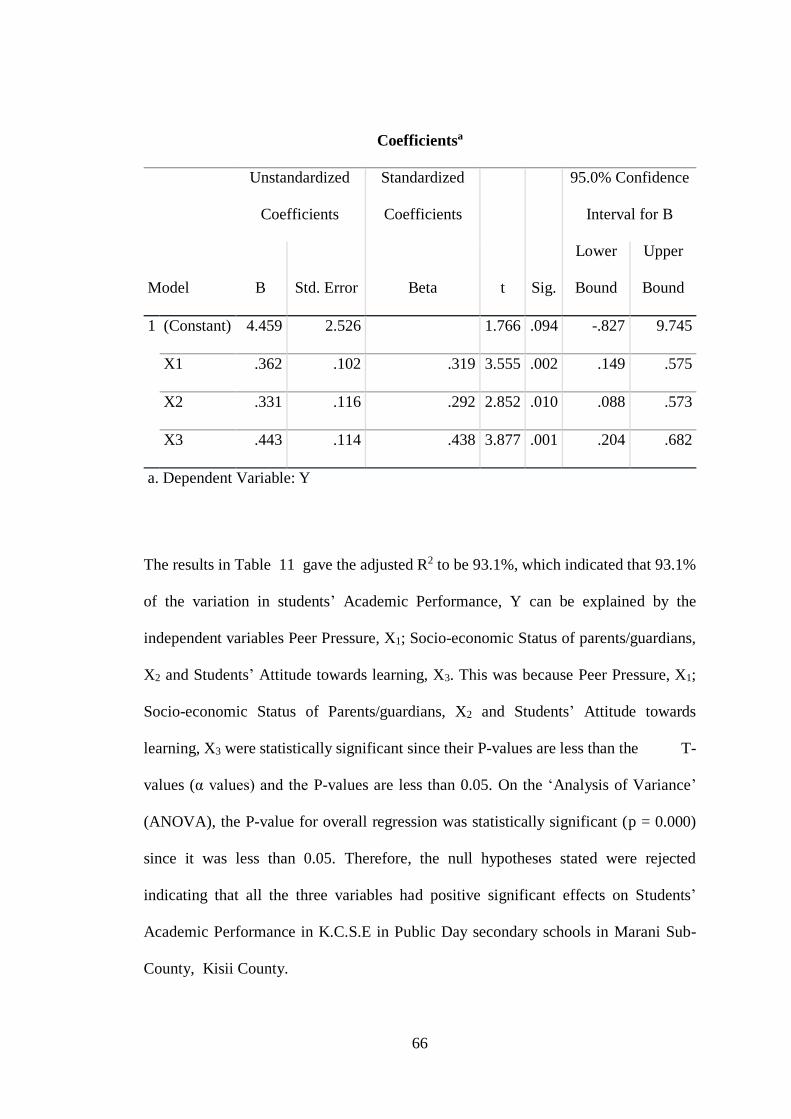
66
Coefficientsa
Model
Unstandardized
Coefficients
Standardized
Coefficients
t Sig.
95.0% Confidence
Interval for B
B Std. Error Beta
Lower
Bound
Upper
Bound
1 (Constant) 4.459 2.526 1.766 .094 -.827 9.745
X1 .362 .102 .319 3.555 .002 .149 .575
X2 .331 .116 .292 2.852 .010 .088 .573
X3 .443 .114 .438 3.877 .001 .204 .682
a. Dependent Variable: Y
The results in Table 11 gave the adjusted R2 to be 93.1%, which indicated that 93.1%
of the variation in students’ Academic Performance, Y can be explained by the
independent variables Peer Pressure, X1; Socio-economic Status of parents/guardians,
X2 and Students’ Attitude towards learning, X3. This was because Peer Pressure, X1;
Socio-economic Status of Parents/guardians, X2 and Students’ Attitude towards
learning, X3 were statistically significant since their P-values are less than the T-
values (α values) and the P-values are less than 0.05. On the ‘Analysis of Variance’
(ANOVA), the P-value for overall regression was statistically significant (p = 0.000)
since it was less than 0.05. Therefore, the null hypotheses stated were rejected
indicating that all the three variables had positive significant effects on Students’
Academic Performance in K.C.S.E in Public Day secondary schools in Marani Sub-
County, Kisii County.
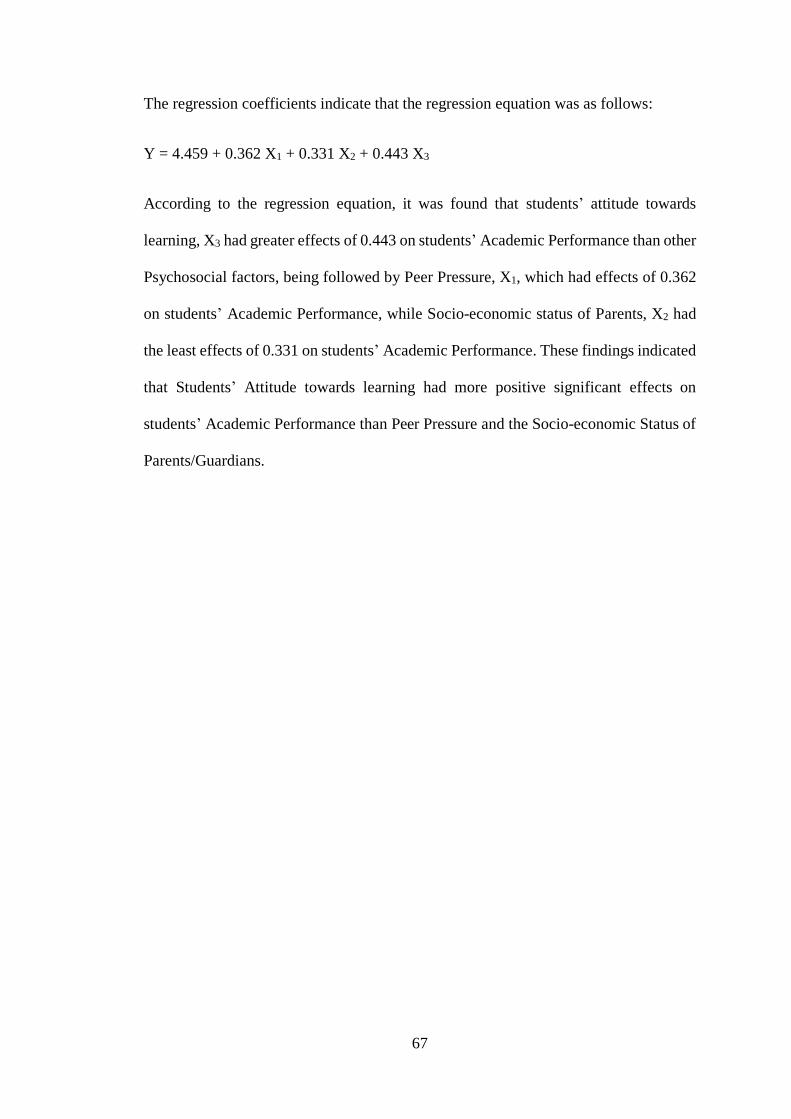
67
The regression coefficients indicate that the regression equation was as follows:
Y = 4.459 + 0.362 X1 + 0.331 X2 + 0.443 X3
According to the regression equation, it was found that students’ attitude towards
learning, X3 had greater effects of 0.443 on students’ Academic Performance than other
Psychosocial factors, being followed by Peer Pressure, X1, which had effects of 0.362
on students’ Academic Performance, while Socio-economic status of Parents, X2 had
the least effects of 0.331 on students’ Academic Performance. These findings indicated
that Students’ Attitude towards learning had more positive significant effects on
students’ Academic Performance than Peer Pressure and the Socio-economic Status of
Parents/Guardians.
68
CHAPTER FIVE
SUMMARY, CONCLUSIONS AND RECOMMENDATIONS
5.0 Introduction
This chapter covered the summary of the study findings, conclusions and
recommendations. It also covers suggestions for further study.
5.1 Summary of the Study Findings
The purpose of the study was to examine the selected psychosocial factors and their
effects on students’ Academic Performance in Kenya Certificate of Secondary
Education in public day secondary schools in Marani sub-county, Kisii county, Kenya.
The objectives of the study were; to determine the effects of Peer Pressure on students’
Academic Performance in Public Day secondary schools of Marani Sub-County; to
determine the effects of Parents’ Socio-economic Status on the students’ Academic
Performance in Kenya Certificate of Secondary Education in Public Day secondary
schools in Marani Sub- County; and to determine the effects of Students’ Attitude
towards learning on students’ Academic Performance in Public Day secondary schools
in Marani Sub- County.
1. The study revealed that the Peer Pressure affects students’ Academic Performance
as indicated by responses from 32% of the respondents who strongly agreed that
the academic grades of students are limited by their Peer Group family background.
2. The study also established that Parents’ Socio-economic Status affects Students’
Performance because of the level of education and income of the parents. This was
indicated by the respondents who agreed that 53% of the parents had attained
primary school level of education, which reveals low Socio-economic Status, hence
might have led to low Academic Performance of Students
69
3. The study revealed that students’ attitude towards learning was a key Psychosocial
factor which affects Students’ Performance as indicated by the regression equation,
where X3 had greater effects of 0.443 on students’ Academic Performance than
other Psychosocial factors.
5.2 Conclusions
1. In conclusion, Peer Group Pressure affected the students’ Academic Performance
more than the Parents’ Socio-economic Status. This was because the Peer Groups
felt that there should be similarity in activities and levels of achievement for them
to sustain these groups. Moreover, the Students can be in families with low Socio-
economic status of Parents and yet perform better due to external effects such as
Peer Groups and school environment. This is supported by Abraham Maslow’s
Theory of Motivation where it demonstrated the importance of self-actualization
needs in facilitating Academic Performance.
2. Socio-economic Status of Parent affected the students’ Academic Performance. It
was revealed that Socio-economic Status of Parents’ affected Students’ completion
of school assignments and ability of students to revise for examinations. Parents
with high level of education participate better in Academic Performance and
understand the importance of academics better. These parents had set a good
example to the Students, which the students could wish to have and they could wish
to leave a better legacy as the Parents. In contrast, Parents with low level of
education contributed to Students’ participation in home chores. More time was
used on home chores than on school work. This lack of balance made Students to
see that the home chores were better than Academics. Students could not
concentrate on school work due to much of their time spent on home chores. In
70
addition, these parents did not check the students’ academic work both at home and
at school. This is supported by Walberg’s Theory of Educational Productivity where
it demonstrated the importance of schools making collaborative efforts to involve
parents in facilitating Academic Performance.
3. Students’ attitude towards learning had greatest effects on Academic Performance.
This was because the negative attitude might have been caused by the poor
environmental conditions at homes and school; discouragement by peers, relatives
and some teachers; and also, the poor behaviour or indiscipline cases of the students.
This is supported by Walberg’s Theory of Educational Productivity where it
demonstrated the importance of motivational orientations, self-regulated learning
strategies and interpersonal abilities in facilitating Academic Performance.
5.3 Recommendations
Based on the conclusions made, the following recommendations were made:
1. To escape the bad effects which might affects the peers in their Academic
Performance. Students’ should be to be self reliance, independent ,Monitor the kind
of peer groups that the they have and find ways to enable , control them and be
able to make personal decisions without depending on others.
2. Parents with low level of education should attend adult classes organised by the
communities for them to be explained about the reading culture and writing nurture
and mentor and monitoring Students’ Academic activities both at home and at
school. Schools should also have Parents’ meetings in schools to explain to them
on how to improve the Academics standards of the Students. Students should not
use the poverty of their parents as an excuse for failing in Academics.
3. The Students’ Attitude towards learning should be improved by improving their
environmental conditions, both at home and school; avoid discouraging students by
71
telling them that certain subjects are very difficult to understand or by telling them
that some teachers are not able to teach them those subjects; and also instil good
behaviour gradually by involving guidance and counselling together with rewards.
5.4 Suggestions for Further Research
The following areas were suggested for further studies:
1. Since the study focused on Psychosocial factors only in Marani Sub- County,
another study should be made on a wider area, especially in the entire country of
Kenya for comparison purposes. Additional studies using a larger population of
respondents in a larger geographic area should be conducted to determine other
variables that affects Academic achievement to reinforce the results of this study.
Employing different variables to determine the Socio-economic Status of the
Students would enhance the efficacy of the results.
2. Apart from the factors covered in this study, other Psychosocial factors should be
studied on how they affect Students’ Academic Performance. For example, the
school climate and teachers’ behaviour. More studies should be carried out on other
variables considering the fact that Psychosocial factors in this study can only
explain a small percentage of variance towards Academic Performance.
72
REFERENCES
ACT. (2008). The forgotten middle: Ensuring that all students are on target for college
and career readiness before high school. Iowa : IA.
Adeniyi, M., & Kolawole, V. (2015). The influence of peer pressure adolescents’social
behaviour. University of Mauritius Research Journal, 21.
Adewale, A. (2002). Implication of parasitic infections on school performance among
school-age children. Ilorin Journal of Science Education, Vol.2, 78-81.
Adeyemo, D. (2007). Moderating influence of emotional intelligence on the link
between self-efficacy and achievement of university students. Psychology and
Developing Society, 19(2), 199-213.
Amin, M. (2005). Social science research: Conception, methodology and analysis.
Kampala: Makerere University Printery.
Aming’a, O. (2015). An evaluation of the influence of pupils’ psychological needs
satisfaction on academic performance of public primary schools in Eastern
zone of Nakuru Municipality, Kenya. Narok, Kenya: Maasai Mara University.
Austin, O., & Omomia, T. (2014). Relevance of Skinner’s Theory of Reinforcement on
Effective School Evaluaution and Management. European Journal of
Psychological Studies, 4(4), 174-180.
Awang, M., Ahmad, A., Bakar, N., Ghani, S., Yunus, A., Ibrahim, M., . . . Rahman, M.
(2013). Students’ Attitudes and Their Academic Performance in Nationhood
Education. International Education Studies, Vol. 6, No. 11, 21-28.
Bankole, E., & Ogunsakin, F. (2015). Influence of Peer Group on Academic
Performance of Secondary School Students in Ekiti State. International Journal
of Innovative Research and Development, Vol. 4, Issue 1, 324-331.
Boa, Y. (2014). Determinants of high academic performance in secondary schools in
Kilimanjaro Region. Arusha, Tanzania: The Open University of Tanzania.
Bonein, A., & Denant-Boement, L. (2013). Self-control, commitment and peer
pressure: a laboratory experiment. Center for Research in Economics and
Management.
Chinyoka, K. (2013). Psychosocial effects of poverty on the academic performance of
the girl child in Zimbabwe. Johannesburg: University of South Africa.
Davies, J., & Lee, J. (2006). Factors controlling attendance. New York: Prentice Hall.
Deepika, K., & Prema, N. (2017). Peer Pressure in Relation to Academic Achievement
of Deviant Students. International Journal of Environmental and Science
Education, Vol. 12, No. 8, 1931-1943.
Dial, J. (2008). The effect of teacher experience and teacher degree levels on student
achievement in communication arts and mathematics. Baldwin City, Kansas:
Baker University.
73
Eze, O. (2002). The effects of parental economic status and pupil sex on school
achievement in English language. Journal of Vocational and Technical
Education in Nigeria, 3(3), 27.
Frankfort-Nachmias, C., & Nachmias, D. (1997). Research methods in the social
sciences. London: Edward Arnold.
Franky, D., & Chamundeswari, S. (2014). Psycho-social correlates of academic
achievement of students. International Journal of Current Research and
Academic Review, 2(2), 148-158.
Freitas, A., & Leonard, L. (2011). Maslow’s hierarchy of needs and student academic
success. Teaching and Learning in Nursing, 6(1), 9-13.
Gobin, B. A., Teeroovengadum, V., Becceea, N. B., & Teeroovengadum, V. (2012).
Investigating into the relationship between the present level of tertiary students’
needs relative to Maslow’s hierarchy: a case study at the university of Mauritius.
International Journal of Learning, 18(11), 203-219.
Guerin, N., Reinberg, A., Testu, F., Boulenguiez, S., & Mechkouri, M. T. (2001). Role
of school schedule, age and parental socio-economic status on sleep duration
and sleepiness of Parisian children. Chronobio Int., 18(6), 1005-1017.
Jerz, L. (2013, March 22). Reliability and Validity Assessment: Quantitative
Applications in the Social Sciences. Retrieved July 9, 2017, from Quantitative
Applications in the Social Sciences:
https://www.johnljerz.com/superduper/tlxdownloadsiteMAIN/id601.html
Jeynes, W. H. (2002). Examining the effects of Parental absence on academic
achievement of adolescents: the challenge controlling for family income.
Journal of Family and Economic Issues, 23(2).
Jones, M., Audley-Piotrowski, S., & Kiefer, S. (2012). Relationships among
adolescents’ perceptions of friends’ behaviours, academic self-concept, and
math performance. Journal of Educational Psychology, Vol. 104, No. 1, 19 - 31.
Juma, S., Muasya, I., & Masese, A. (2016). Influence of parental socio-economic status
on students’ academic performance in public secondary schools in Tana River
County, Kenya. Nairobi, Kenya: University of Nairobi.
Kant, I. (2008). Groundwork of Metaphysics of Morals. Beograd: DERETA.
Kathuri, J., & Pals, D. (1993). Introduction to Education Research. Egerton University,
Njoro: Educational Media Centre.
Khodadady, E., & Zabetipour, M. (2013). Top Peer Pressure and Academic
Achievement within a Domain Controlled Field. Journal of Basic and Applied
Scientific Research, 3(6), 1132-1140.
Kombo, D., & Tromp, D. (2006). Proposal and Thesis Writing: An Introduction.
Nairobi: Paulines Publications Africa.
74
Korir, D., & Kipkemboi, F. (2014). The impact of school environment and peer
influence on students’ academic performance in Vihiga County, Kenya. Journal
of Education and Practice, 5 (11).
Kothari, C. (2004). Research Methodology: Methods and Techniques, Second Revised
Edition. New Delhi, India: New International Publishers.
Langat, A., Itegi, F., & Magoma, C. (2015). Students’ attitudes and their effects on
learning and achievement in Mathematics: A case study of public secondary
schools in Kiambu County, Kenya. Nairobi: Kenyatta University.
Lantieri, L. (2008). Social and emotional learning as a basis of a new vision of education
in the United States. In C. Clouder, B. Dahlin, R. Diekstra, P. Berrocal, B. Heys,
L. Lantieri, & H. Paschen, Social and Emotional Education: An International
Analysis (pp. 189-224). USA: Educational Foundation.
Lisette, D., Leeuwen, K., & Pol, G. (2013). Associations between psychosocial
functioning and academic achievement: The Peruvian Case. Universitas
Psychologica, 12(3), 725-737.
Livumbaze, A. G., & Achoka, J. S. (2016). Effect of parents’ socio-economic status on
students’ academic achievement in secondary schools in Hamisi Sub-county,
Vihiga County - Kenya. European Journal of Education Studies - Volume 2,
Issue 12, 65-81.
Lounsbury, J., Sundstrom, E., Loveland, J., & Gibson, L. (2003). Broad versus narrow
personality traits in predicting academic performance of adolescents. Learning
and Individual Differences, 14(1), 67-77.
Machebe, C., & Ifelunni, C. (2014). Influence of Parental Socio-Economic Status on
academic achievement of Students in Selected Schools in Nigeria: A case Study
of Enugu State. Journal of Education and Practice, Vol.5, No.2, 105-110.
Marani SCEO Report. (2016). KCSE ANALYSIS REPORT. Kisii: Sub-county
Education Office.
Mbuga, A. (1986). Art and Design in the Kenyan Secondary Schools: Problems and
Suggested Solutions. Nairobi: Kenyatta University .
Memon, G., Joubish, M., & Khurram, M. (2010). Impact of Parental Socio-Economic
Status on Students’ Educational Achievements at Secondary Schools of District
Malir, Karachi. Middle-East Journal of Scientific Research 6 (6), 678-687.
Misanya, S. (2013). Peer influence on academic performance of form one students in
girls boarding secondary schools in Kanduyi Constituency: Kenya. Nairobi:
University of Nairobi.
Mosha, M. (2017). The influence of peer group on academic performance of adolescent
students in secondary schools in Tanzania. Research Journal of Educational
Studies and Review, Vol. 3(1), 18-26.
Motanya, B., & Matheka, V. (2018). Impact of students attitude on mathematics
performance among public secondary schools students in Masaba North
Subcounty, Nyamira County. Nairobi, Kenya: University of Nairobi.
75
Mugenda, O., & Mugenda, A. (2003). Research Methods and Ethics. Nairobi: ACTS
Press.
Mulala, S., & Odiemo, L. (2015). Factors influencing students’ attitudes towards
Mathematics and its effects on performance of Mathematics among secondary
school level students in Kenya: A Case Study in Mukaa Sub-County in Makueni
County. Nairobi, Kenya: University of Nairobi.
Muola, H. (2010). A study of the relationship between academic achievement
motivation and home environment among standard eight pupils. Educational
Research and Review, 5(5), 213-217.
Musangu, M., Ghazali, B., & Mohammad, I. (2017). Parental Socioeconomic Status
and Academic Performance of Secondary School Students in the Western
Province of the Republic of Zambia. Malaya, Malaysia: University of Malaya.
Mwaura, P. (2014). Home-based factors influencing students’ performance in K.C.S.E
in public day secondary schools in Lari District, Kiambu County. Nairobi,
Kenya: University of Nairobi.
Nadenge, M. (2015). Relationship between parental socio-economic status and student
academic achievement: The case of selected secondary schools in urban
informal settlements in Westlands Division, Nairobi County. Nairobi:
University of Nairobi.
Nyamubi, G. (2016). Students’ Attitudes and English Language Performance in
Secondary Schools in Tanzania. International Journal of Learning, Teaching
and Educational Research, Vol. 15, No. 2, 117-133.
Oakes, J., & Rossi, P. H. (2003). The measurement of SES in health research. Social
Science and Medicine, 56, 769-784.
Okemwa, H., & Muasya, I. (2014). The influence of parental socio-economic status on
pupil’s academic performance at Kenya Certificate of Primary Education in
Kiamokama Division of Kisii County . Nairobi, Kenya: University of Nairobi.
Olalekan, A., & Alayande, E. (2016). Influence of Peer Group Relationship on the
Academic Performance of Students in Secondary Schools (A Case Study of
Selected Secondary Schools in Atiba Local Government Area of Oyo State).
Global Journal of Human-Social Science: Arts and Humanities - Psychology,
Volume 16, Issue 4, Version 1.0, 34-48.
Omollo, A., & Yambo, O. (2017). Influence of peer pressure on secondary school
students drop out in Rongo Sub-County, Migori County, Kenya. Journal of
Education and Practice, 8(9).
Onabamiro, A., Omoruyi, A., Sayingbe, A., & Rosiji, C. (2013). Psychosocial factors
predicting secondary schools academic self-efficacy in Lagos State, Nigeria.
International Journal of Humanities and Social Science Intervention, 2(4), 10-
17.
76
Oni, A. (2007). Socio-economic status as predictor of deviant behaviours among
Nigeria Secondary School Students. International Journal of Educational
Research, 3(2), 225-236.
Onsoti, O., & Mbii, M. (2018). Influence of peer pressure on form two students’
discipline in public secondary schools ( A case of Embakasi Subcounty -
Nairobi, Kenya. Nairobi, Kenya: University of Nairobi.
Orodho, A. (2006). Essentials of Educational and Social Sciences Research Method.
Maseno: Kanezja Publishers.
Perez-Pena, R. (2012). Studies find more students cheating, even high achievers. The
New York Times.
Porta, M. (2008). A Dictionary of Epidemiology. 5th Edition. Oxford: Oxford
University Press.
Powell, C., & Arriola, K. (2003). Relationship between psychosocial factors and
academic achievement among African American students. The Journal of
Educational Research, 96(3).
Reich, P., & Somers, C. (2012). Effects of peer influences on academic performance.
NY: Wayne State University.
Reid, K. (2005). The causes, views and traits of school absenteeism and truancy.
Research in Education, 74, 59-82.
Rothestein, R. (2004). Class and schools using social economic and educational reforms
to close the white and black achievement gap. Economic Policy Institute.
Seliger, H., & Shohamy, E. (1989). What isresearch? A paradigm for second language
research. Second Language Research Methods. Oxford, UK: Oxford University
Press.
Sharma, I. (2005). The relationship between attendance in student-centred Physics
tutorial and performance. International Journal of Science Education, 27, 11-
21.
Skinner, B. (1953). Science and Human Behaviour. New York: Macmillan.
Smith, G., Ferguson, D., & Caris, M. (2001). Teaching College Courses Online vs.
Face-to-Face. The Journal, 28(9), 18-25.
Struwig, F., & Stead, G. (2001). Planning, Reporting and Designing . Research Journal.
Suleman, Q., Hussain, I., Khan, F., & Nissa, Z. (2012). Effects of Parental
Socioeconomic Status on the Academic Achievement of Secondary School
Students in Karak District, Pakistan . International Journal of Human Resource
Studies, Vol. 2, No. 4, 14-31.
U.S Department of Education. (2002, May 15). Introduction: No child left behind.
Retrieved February 1, 2003, from nclb:
http://www.nlcb.gov/next/overview/index.html
77
Vangie, M., Biton, C., Gonzaga, D., & Moneva, J. (2019). Students, Peer Pressure and
their Academic Performance in School. International Journal of Scientific and
Research Publications, Volume 9, Issue 1, 300-304.
Wachikwu, T., Kevwe, O., Anthonia, M., & Nwaukwu, C. (2017). Psychological
factors and students’ academic achievement in mathematics in Ughelli-South
Local Government Area of Delta State, Nigeria. British Journal of Education,
Vol.5, No.10, 8-21.
Wangeci, F., Kipruto, J., & Mulambula, S. (2018). Peer influence and academic
performance in primary schools in Kapsoya zone, Uasin Gishu County, Kenya.
Eldoret, Kenya: Moi University.
Wei, C. W., Hung, I. C., Lee, L., & Chen, N. S. (2011). A Joyful Classroom Learning
System with Robot Learning Companion for Children to Learn Mathematics
Multiplication. TOJET: The Turkish Online Journal of Educational
Technology, 10(2), 11-23.
Wondu, T. (2018). Psychological Factors Affecting Students Academic Performance
Among Freshman Psychology Students in Dire Dawa University. Journal of
Education and Practice, Vol.9, No.4, 59-65.
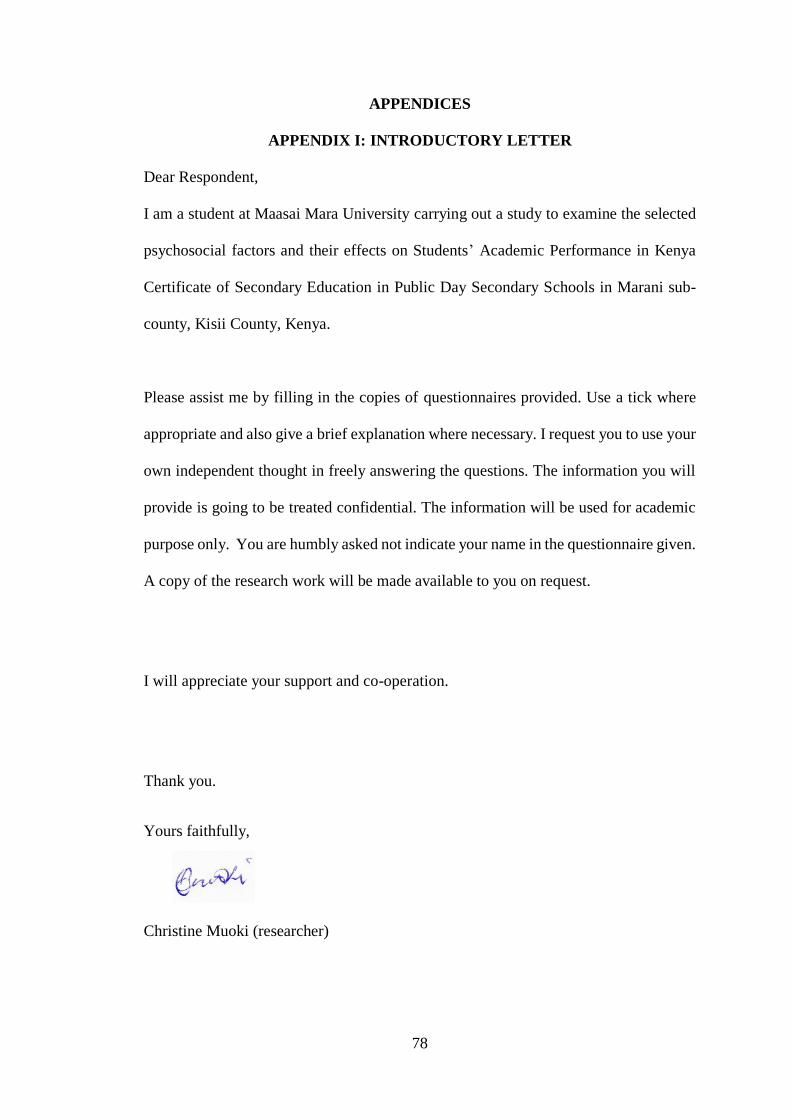
78
APPENDICES
APPENDIX I: INTRODUCTORY LETTER
Dear Respondent,
I am a student at Maasai Mara University carrying out a study to examine the selected
psychosocial factors and their effects on Students’ Academic Performance in Kenya
Certificate of Secondary Education in Public Day Secondary Schools in Marani sub-
county, Kisii County, Kenya.
Please assist me by filling in the copies of questionnaires provided. Use a tick where
appropriate and also give a brief explanation where necessary. I request you to use your
own independent thought in freely answering the questions. The information you will
provide is going to be treated confidential. The information will be used for academic
purpose only. You are humbly asked not indicate your name in the questionnaire given.
A copy of the research work will be made available to you on request.
I will appreciate your support and co-operation.
Thank you.
Yours faithfully,
Christine Muoki (researcher)
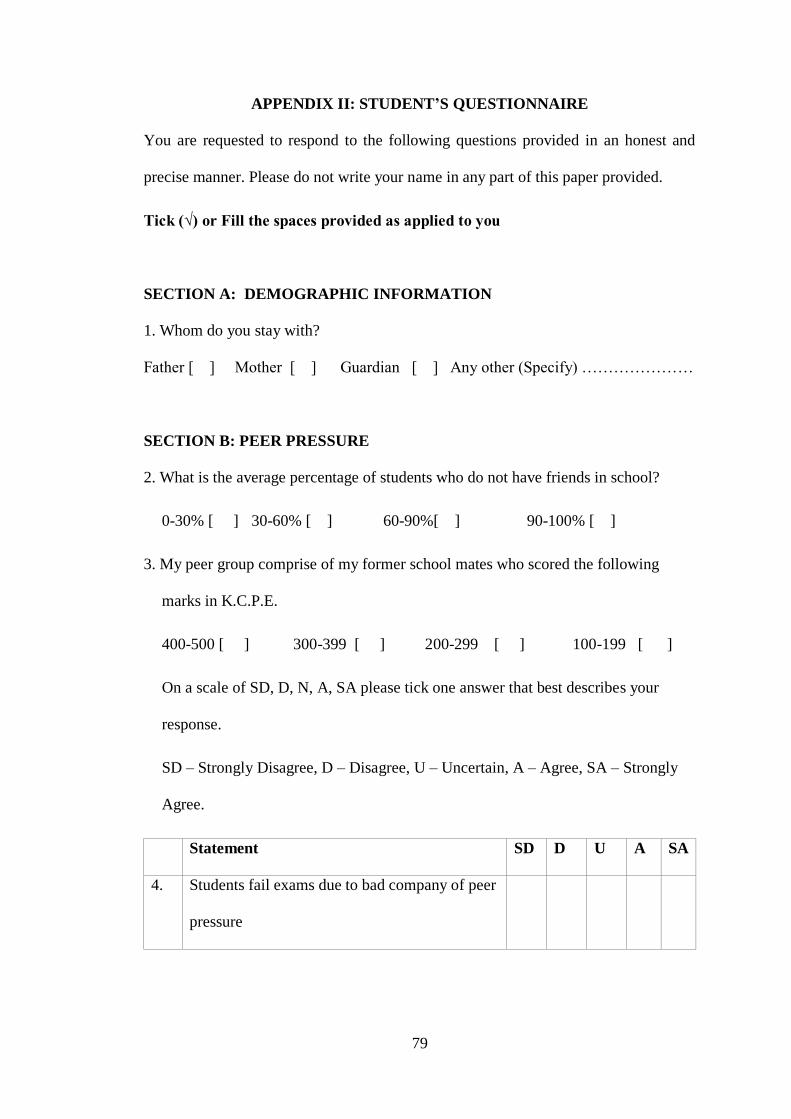
79
APPENDIX II: STUDENT’S QUESTIONNAIRE
You are requested to respond to the following questions provided in an honest and
precise manner. Please do not write your name in any part of this paper provided.
Tick (√) or Fill the spaces provided as applied to you
SECTION A: DEMOGRAPHIC INFORMATION
1. Whom do you stay with?
Father [ ] Mother [ ] Guardian [ ] Any other (Specify) …………………
SECTION B: PEER PRESSURE
2. What is the average percentage of students who do not have friends in school?
0-30% [ ] 30-60% [ ] 60-90%[ ] 90-100% [ ]
3. My peer group comprise of my former school mates who scored the following
marks in K.C.P.E.
400-500 [ ] 300-399 [ ] 200-299 [ ] 100-199 [ ]
On a scale of SD, D, N, A, SA please tick one answer that best describes your
response.
SD – Strongly Disagree, D – Disagree, U – Uncertain, A – Agree, SA – Strongly
Agree.
Statement SD D U A SA
4. Students fail exams due to bad company of peer
pressure

80
5. My peer group prior marks affects my current
Academic Performance in my end of year marks
6. My peer group comprises of members who had
previously scored good grades
7. Low amount of pocket money spend by my peer
group influence my Academic Performance
8. High amount of pocket money spend by my
peer group influence my Academic
Performance
9. I am limited to my Academic Grades by my
Peer Group family background
10. Number of exams taken together by my Peer
Group affects my Academic Performance
11. Spending most of my time in social media leads
to low Academic Performance
12. Social media has helped me to learn more ideas
to improve my Academic Performance
13. a) Does the number of times counselled have any effects to Academic
Performance?
Yes [ ] No [ ]
b) If yes, explain how
…………………………………………………...………………………………
…………………………………………………………………………………..
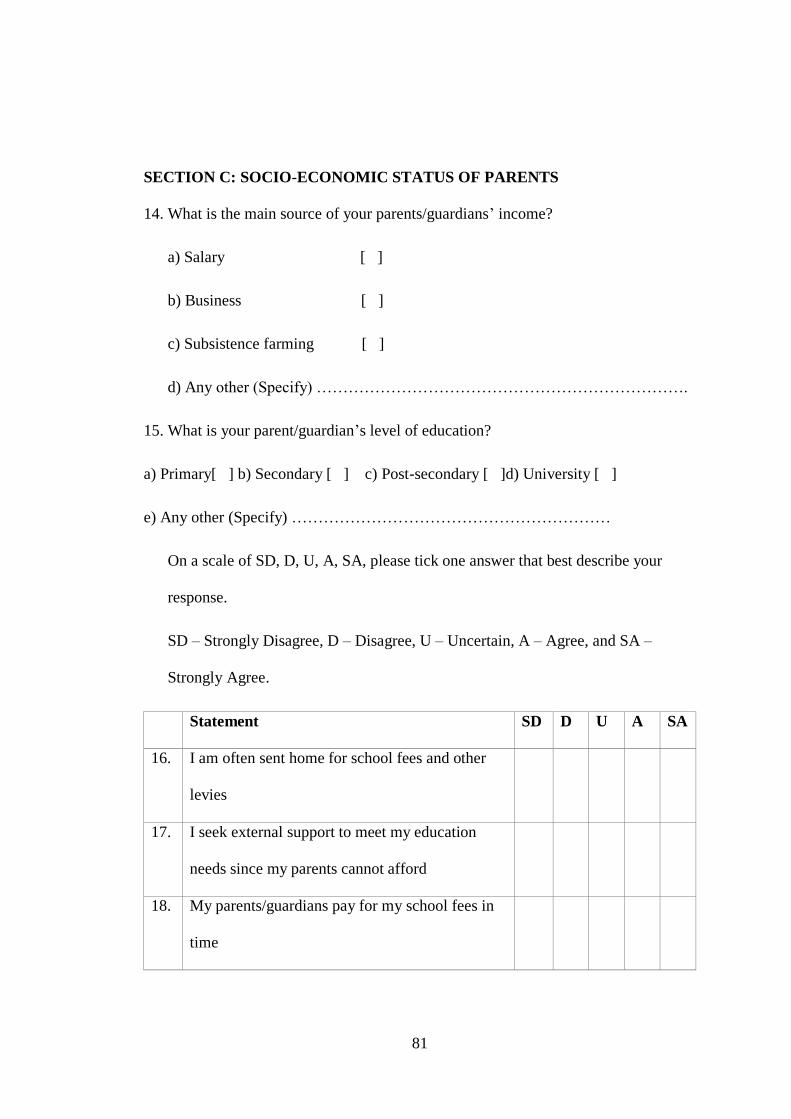
81
SECTION C: SOCIO-ECONOMIC STATUS OF PARENTS
14. What is the main source of your parents/guardians’ income?
a) Salary [ ]
b) Business [ ]
c) Subsistence farming [ ]
d) Any other (Specify) …………………………………………………………….
15. What is your parent/guardian’s level of education?
a) Primary[ ] b) Secondary [ ] c) Post-secondary [ ]d) University [ ]
e) Any other (Specify) ……………………………………………………
On a scale of SD, D, U, A, SA, please tick one answer that best describe your
response.
SD – Strongly Disagree, D – Disagree, U – Uncertain, A – Agree, and SA –
Strongly Agree.
Statement SD D U A SA
16. I am often sent home for school fees and other
levies
17. I seek external support to meet my education
needs since my parents cannot afford
18. My parents/guardians pay for my school fees in
time

82
19. My Academic Performance is affected because
of absenteeism due to lack of fees
20. I perform very well since my parents help me in
doing my homework after school
21. My parents never attended school, hence do not
bother about my Academic Performance in
school
22. My parents/Guardians check my books and
Homework regularly
23. My parents/Guardians visit the school to monitor
my Academic progress
24. To what extent does your Parents’ economic status affect your Academic
Performance in school?
a) To a greater extent [ ]
b) To some extent [ ]
c) To no extent [ ]
d) Not sure [ ]
25. To what extent does your parents’ education level affect your Academic
Performance?
a) To a greater extent [ ]
b) To some extent [ ]
c) To no extent [ ]
d) Not sure [ ]
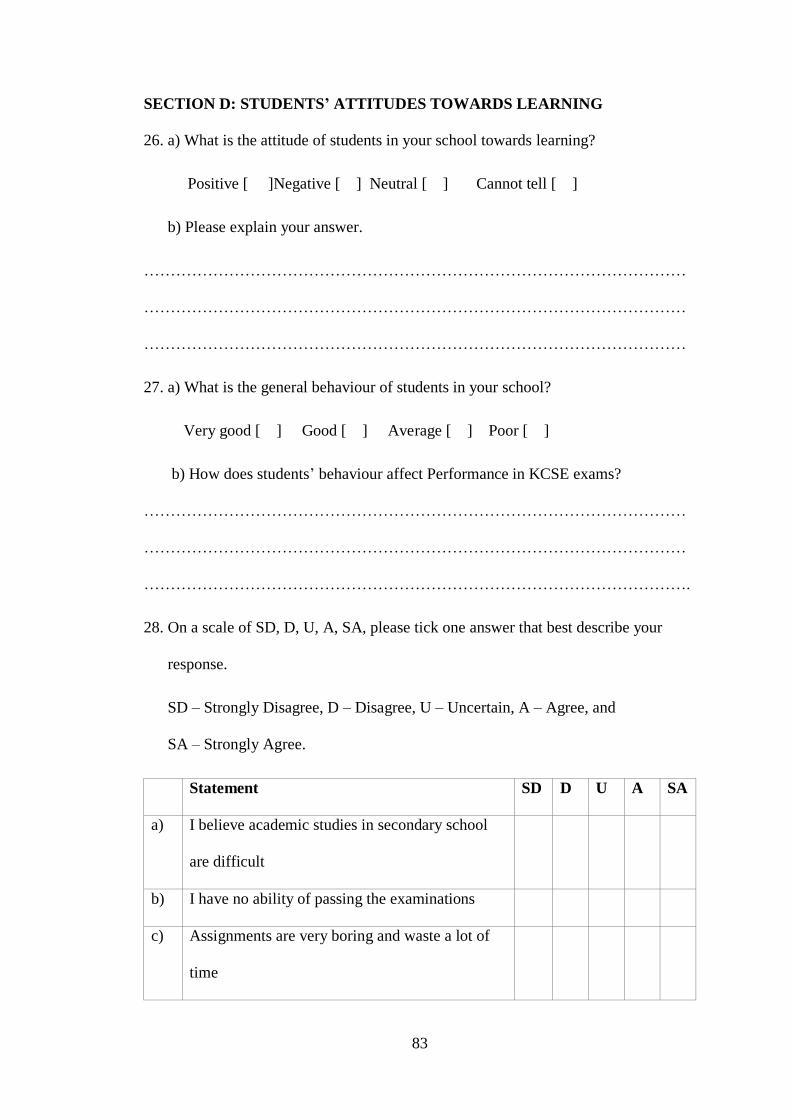
83
SECTION D: STUDENTS’ ATTITUDES TOWARDS LEARNING
26. a) What is the attitude of students in your school towards learning?
Positive [ ]Negative [ ] Neutral [ ] Cannot tell [ ]
b) Please explain your answer.
…………………………………………………………………………………………
…………………………………………………………………………………………
…………………………………………………………………………………………
27. a) What is the general behaviour of students in your school?
Very good [ ] Good [ ] Average [ ] Poor [ ]
b) How does students’ behaviour affect Performance in KCSE exams?
…………………………………………………………………………………………
…………………………………………………………………………………………
………………………………………………………………………………………….
28. On a scale of SD, D, U, A, SA, please tick one answer that best describe your
response.
SD – Strongly Disagree, D – Disagree, U – Uncertain, A – Agree, and
SA – Strongly Agree.
Statement SD D U A SA
a) I believe academic studies in secondary school
are difficult
b) I have no ability of passing the examinations
c) Assignments are very boring and waste a lot of
time

84
d) Students’ bad behaviour had been leading to low
Academic Performance
e) Students’ negative attitude towards learning had
been leading to low Academic Performance
f) Only students with good behaviour have been
good in Academic Performance
g) Not all students with positive attitude towards
learning are good in Academic Performance
SECTION E: STUDENTS’ ACADEMIC PERFORMANCE
29. What is the cause of your poor Academic Performance?
Peer Pressure [ ] Socio-economic status of Parents [ ] Negative attitude [ ]
None of the above [ ]
30. a) What is your performance target? ……………………………………………….
b) Have you ever achieved it in any examination? Yes/No………………………...
If it is No, give reasons for your answer ………………………………………..
...............................................................................................................................
………………………………………………………………………………….
On a scale of SD, D, U, A, SA, please tick one answer that best describe your
response.
SD – Strongly Disagree, D – Disagree, U – Uncertain, A – Agree, and SA – Strongly
Agree.
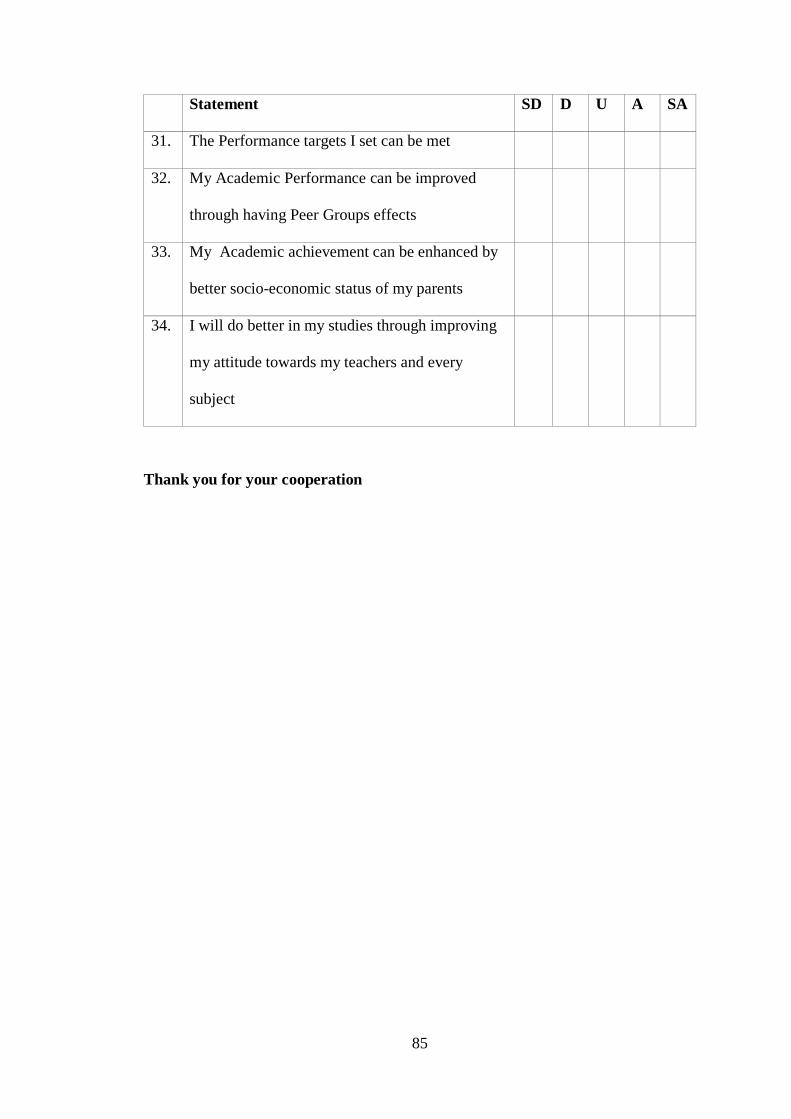
85
Statement SD D U A SA
31. The Performance targets I set can be met
32. My Academic Performance can be improved
through having Peer Groups effects
33. My Academic achievement can be enhanced by
better socio-economic status of my parents
34. I will do better in my studies through improving
my attitude towards my teachers and every
subject
Thank you for your cooperation
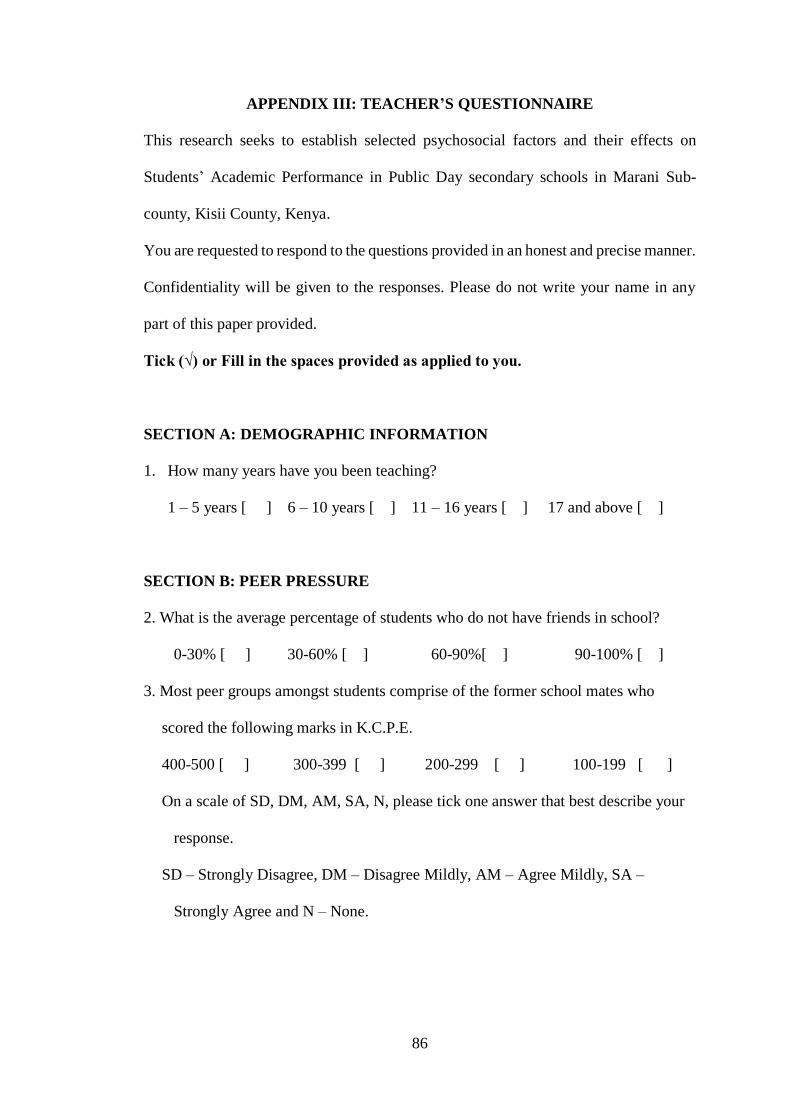
86
APPENDIX III: TEACHER’S QUESTIONNAIRE
This research seeks to establish selected psychosocial factors and their effects on
Students’ Academic Performance in Public Day secondary schools in Marani Sub-
county, Kisii County, Kenya.
You are requested to respond to the questions provided in an honest and precise manner.
Confidentiality will be given to the responses. Please do not write your name in any
part of this paper provided.
Tick (√) or Fill in the spaces provided as applied to you.
SECTION A: DEMOGRAPHIC INFORMATION
1. How many years have you been teaching?
1 – 5 years [ ] 6 – 10 years [ ] 11 – 16 years [ ] 17 and above [ ]
SECTION B: PEER PRESSURE
2. What is the average percentage of students who do not have friends in school?
0-30% [ ] 30-60% [ ] 60-90%[ ] 90-100% [ ]
3. Most peer groups amongst students comprise of the former school mates who
scored the following marks in K.C.P.E.
400-500 [ ] 300-399 [ ] 200-299 [ ] 100-199 [ ]
On a scale of SD, DM, AM, SA, N, please tick one answer that best describe your
response.
SD – Strongly Disagree, DM – Disagree Mildly, AM – Agree Mildly, SA –
Strongly Agree and N – None.
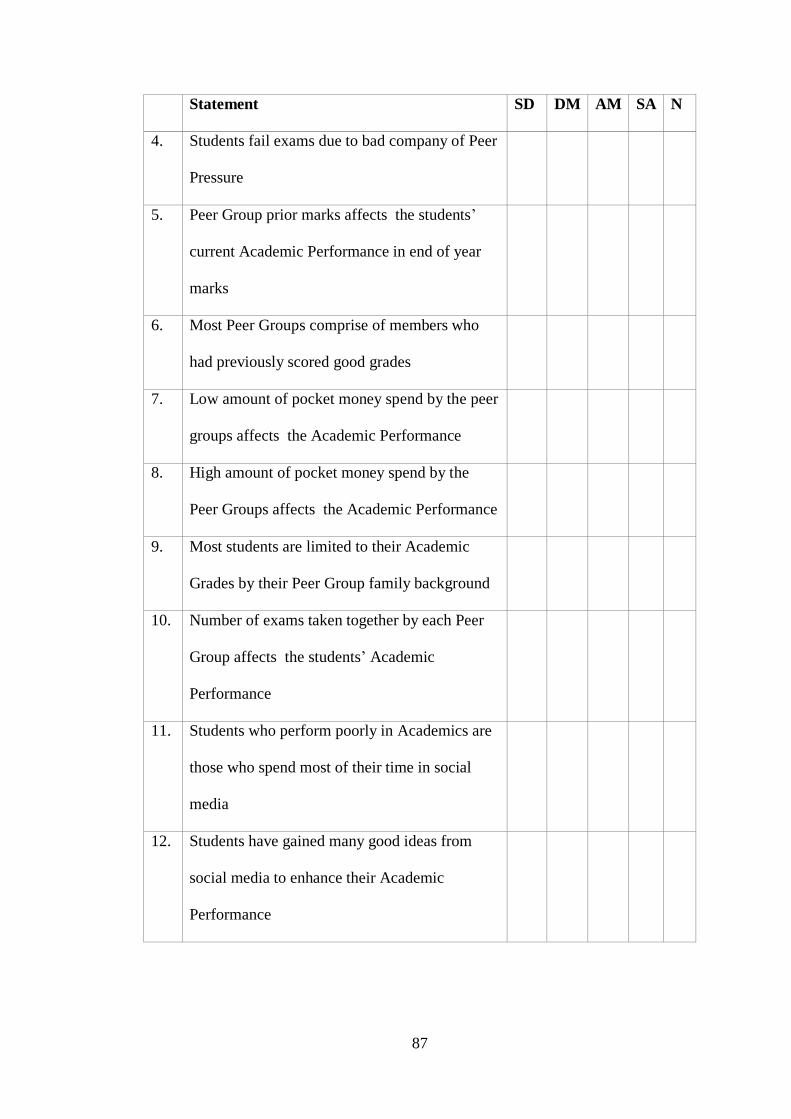
87
Statement SD DM AM SA N
4. Students fail exams due to bad company of Peer
Pressure
5. Peer Group prior marks affects the students’
current Academic Performance in end of year
marks
6. Most Peer Groups comprise of members who
had previously scored good grades
7. Low amount of pocket money spend by the peer
groups affects the Academic Performance
8. High amount of pocket money spend by the
Peer Groups affects the Academic Performance
9. Most students are limited to their Academic
Grades by their Peer Group family background
10. Number of exams taken together by each Peer
Group affects the students’ Academic
Performance
11. Students who perform poorly in Academics are
those who spend most of their time in social
media
12. Students have gained many good ideas from
social media to enhance their Academic
Performance
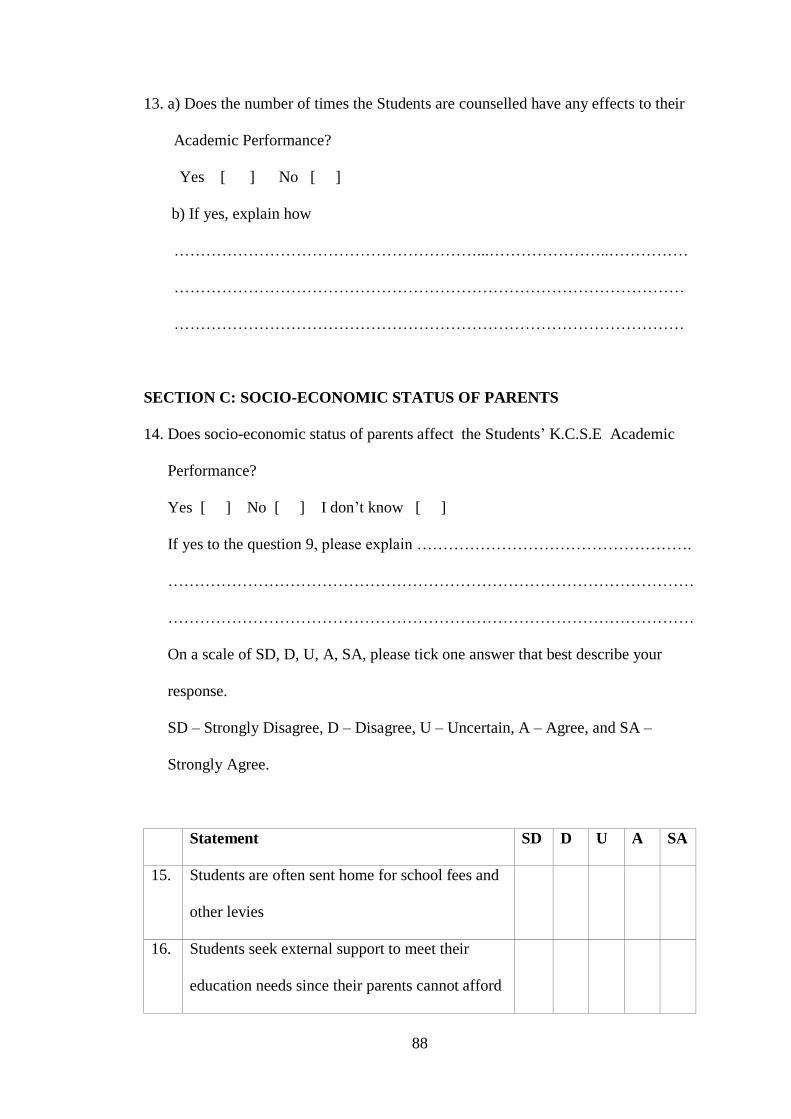
88
13. a) Does the number of times the Students are counselled have any effects to their
Academic Performance?
Yes [ ] No [ ]
b) If yes, explain how
…………………………………………………...…………………..……………
……………………………………………………………………………………
……………………………………………………………………………………
SECTION C: SOCIO-ECONOMIC STATUS OF PARENTS
14. Does socio-economic status of parents affect the Students’ K.C.S.E Academic
Performance?
Yes [ ] No [ ] I don’t know [ ]
If yes to the question 9, please explain …………………………………………….
………………………………………………………………………………………
………………………………………………………………………………………
On a scale of SD, D, U, A, SA, please tick one answer that best describe your
response.
SD – Strongly Disagree, D – Disagree, U – Uncertain, A – Agree, and SA –
Strongly Agree.
Statement SD D U A SA
15. Students are often sent home for school fees and
other levies
16. Students seek external support to meet their
education needs since their parents cannot afford

89
17. Most parents/guardians pay for Students’ school
fees in time
18. Students’ Academic Performance is affected
because of absenteeism due to lack of fees
19. Students’ perform very well since their parents
help them in doing their homework after school
20. Most Parents never attend school; hence they do
not bother about the Students ‘Academic
Performance in school.
21. Parents/Guardians check the Students’ books and
Homework
22. Parents/Guardians visit the school to monitor
the Academic Progress of Students’
23. Students from high Socio-economic Status
families perform better in Academics
SECTION D: STUDENTS’ ATTITUDES TOWARDS LEARNING
24. a) What is the attitude of students in your school towards learning?
Positive [ ] Negative [ ] Neutral [ ] Cannot tell [ ]
b) Please explain your answer.
………………………………………………………………………………………
………………………………………………………………………………………
………………………………………………………………………………………
25. a) What is the general behaviour of students in your school?
Very good [ ] Good [ ] Average [ ] Poor [ ]
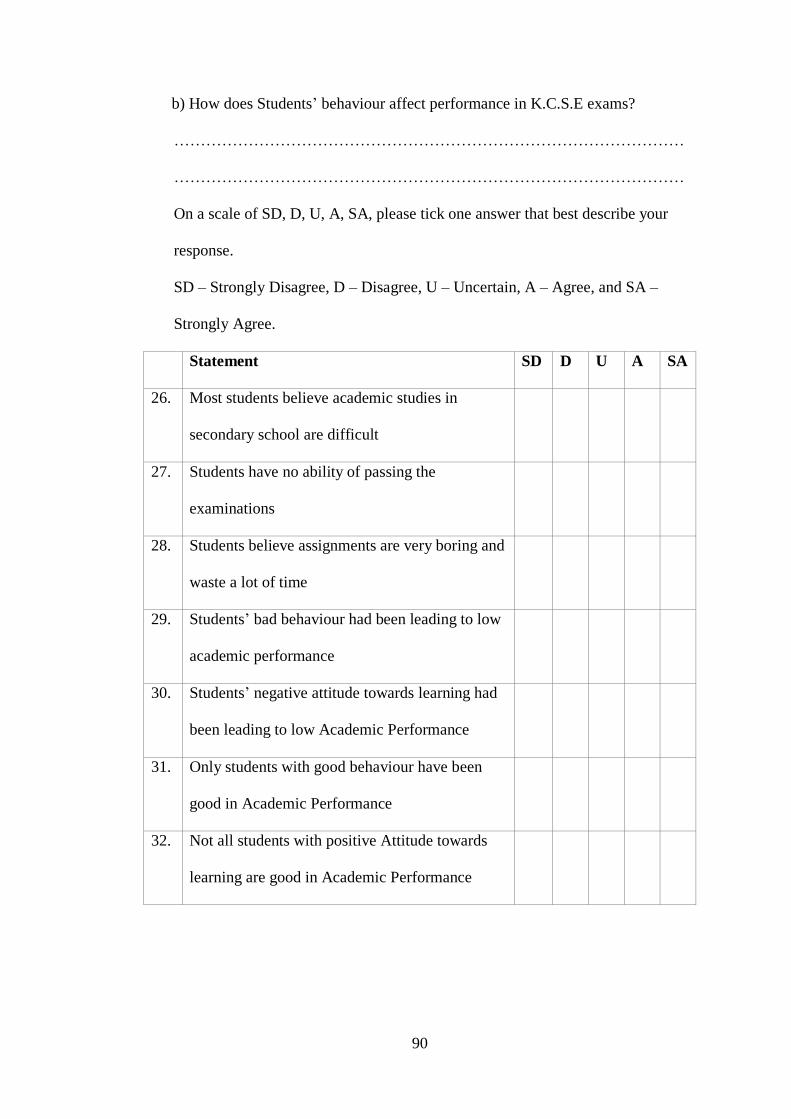
90
b) How does Students’ behaviour affect performance in K.C.S.E exams?
……………………………………………………………………………………
……………………………………………………………………………………
On a scale of SD, D, U, A, SA, please tick one answer that best describe your
response.
SD – Strongly Disagree, D – Disagree, U – Uncertain, A – Agree, and SA –
Strongly Agree.
Statement SD D U A SA
26. Most students believe academic studies in
secondary school are difficult
27. Students have no ability of passing the
examinations
28. Students believe assignments are very boring and
waste a lot of time
29. Students’ bad behaviour had been leading to low
academic performance
30. Students’ negative attitude towards learning had
been leading to low Academic Performance
31. Only students with good behaviour have been
good in Academic Performance
32. Not all students with positive Attitude towards
learning are good in Academic Performance
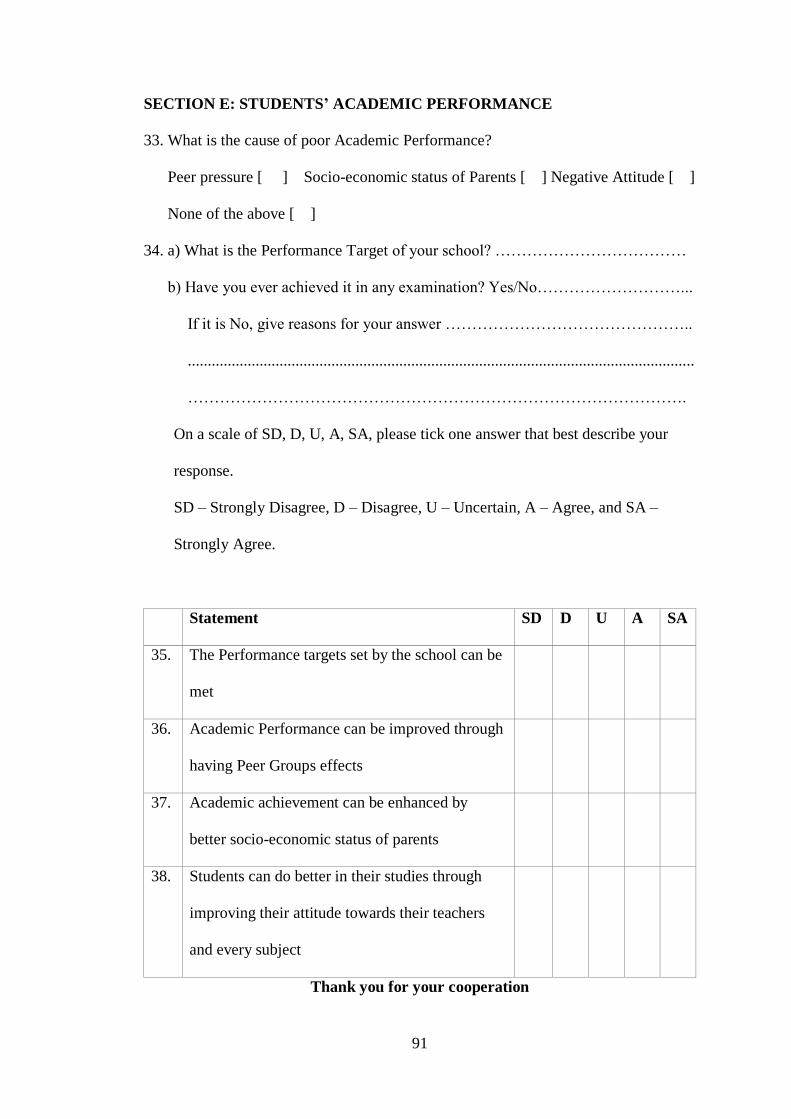
91
SECTION E: STUDENTS’ ACADEMIC PERFORMANCE
33. What is the cause of poor Academic Performance?
Peer pressure [ ] Socio-economic status of Parents [ ] Negative Attitude [ ]
None of the above [ ]
34. a) What is the Performance Target of your school? ………………………………
b) Have you ever achieved it in any examination? Yes/No………………………...
If it is No, give reasons for your answer ………………………………………..
...............................................................................................................................
………………………………………………………………………………….
On a scale of SD, D, U, A, SA, please tick one answer that best describe your
response.
SD – Strongly Disagree, D – Disagree, U – Uncertain, A – Agree, and SA –
Strongly Agree.
Statement SD D U A SA
35. The Performance targets set by the school can be
met
36. Academic Performance can be improved through
having Peer Groups effects
37. Academic achievement can be enhanced by
better socio-economic status of parents
38. Students can do better in their studies through
improving their attitude towards their teachers
and every subject
Thank you for your cooperation
92
APPENDIX IV: INTERVIEW SCHEDULE FOR PRINCIPALS
This research seeks to examine the selected psychosocial factors and their effects on
Students’ Academic Performance in Kenya Certificate of Secondary Education in
Public Day secondary schools in Marani sub-county, Kisii County, Kenya.
You are requested to respond to the questions provided in an honest and precise manner.
Confidentiality will be given to the responses. Please do not write your name in any
part of this paper provided.
Tick (√) or Fill in the spaces provided as applied to you.
1. How often do you confirm that teachers mark students ‘Attendance register?
Daily [ ] Once a week [ ] Rarely [ ]
2. How often do you meet with your teacher to see the progress of students’ discipline
and Academic Performance?
Once a week [ ] Rarely [ ] Monthly [ ] Termly [ ] Yearly [ ]
3. Does Guidance and Counselling correct Students’ deviant behaviour in your school?
If yes, how have they been doing it?
4. What challenges does bad effect02 of Peer Pressure bring to students’ poor
Academic Performance in your school?
5. How do you monitor Peer Pressure and Students’ Attitude towards learning to
improve Academic Performance?
6. In which ways do Parents’ cooperate with the administration to monitor the
Students’ school attendance?
7. Do Parents come to school for consultation? If yes how many times per term?
93
8. Do Students’ change their Academic Performance and improve after
consultation?
9. How do you grade yours Students’?
10. What possible opinions can you give to improve Students’ Academic
Performance in your school and Marani Sub-County?
11. What target mean do you think you should move to so that you can be seen that
you are assisting students’ pass well? Which mean should you move from?
Thank you for your cooperation

94
APPENDIX V: MAP OF MARANI SUB-COUNTY SHOWING STUDY AREA
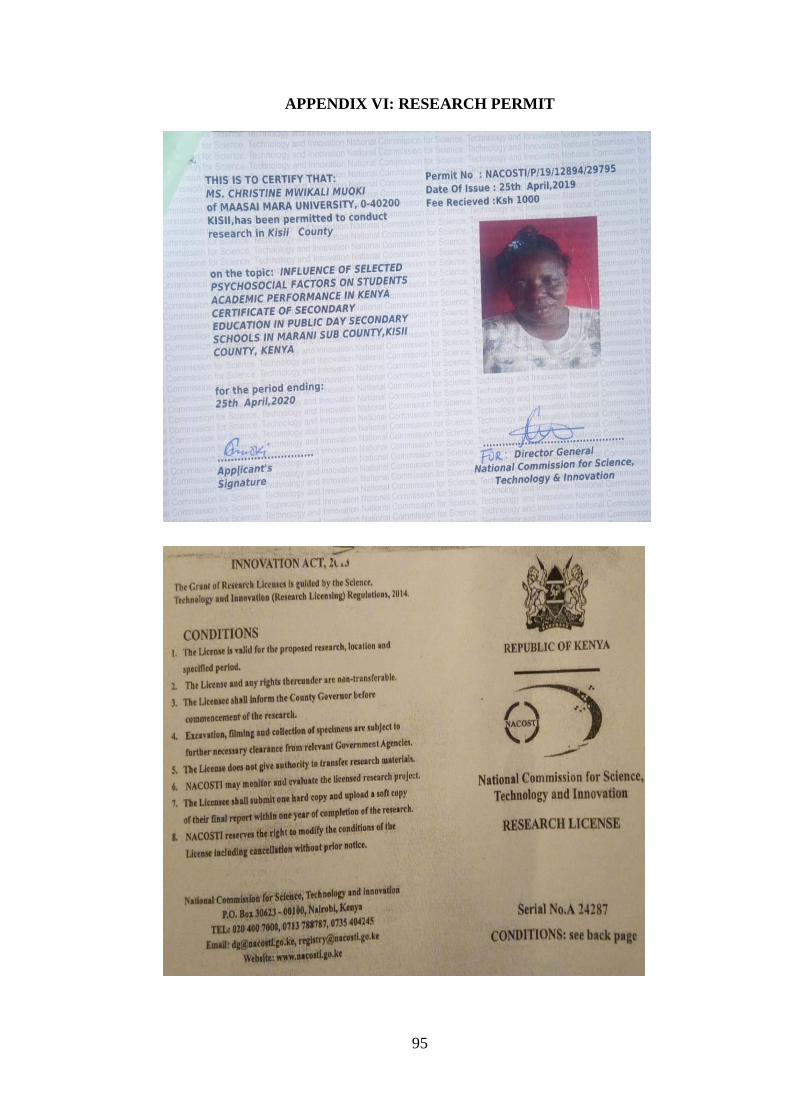
95
APPENDIX VI: RESEARCH PERMIT
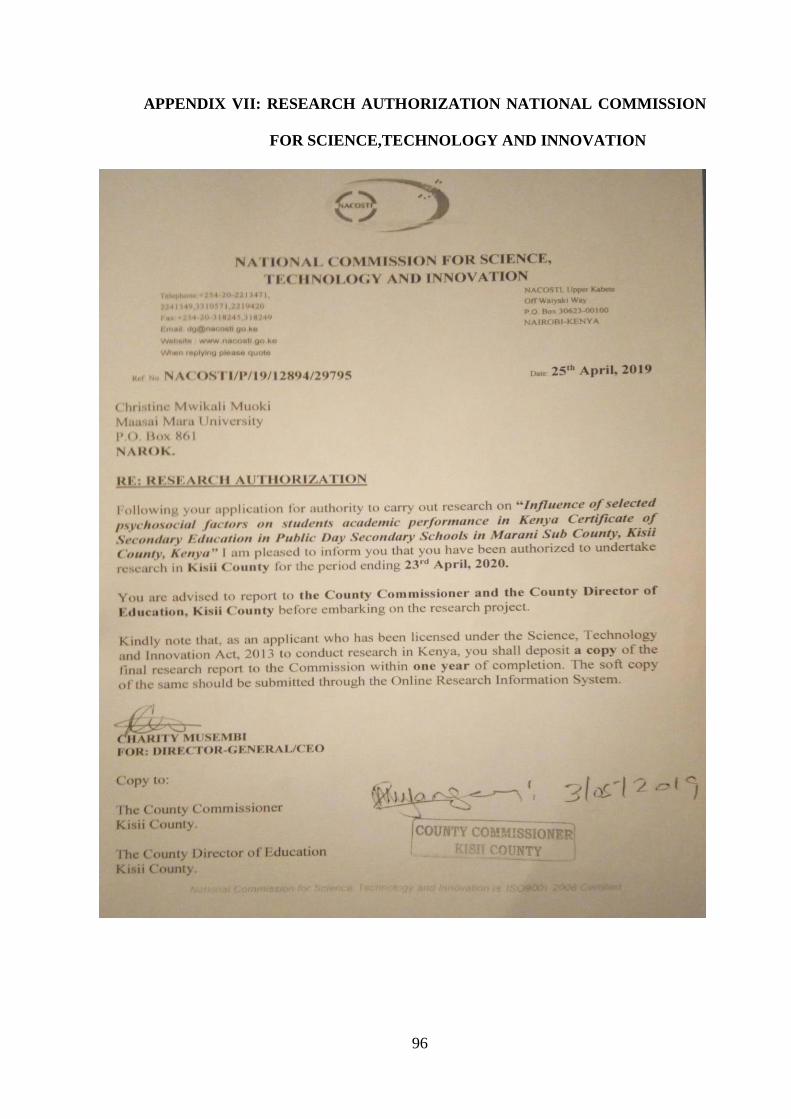
96
APPENDIX VII: RESEARCH AUTHORIZATION NATIONAL COMMISSION
FOR SCIENCE,TECHNOLOGY AND INNOVATION
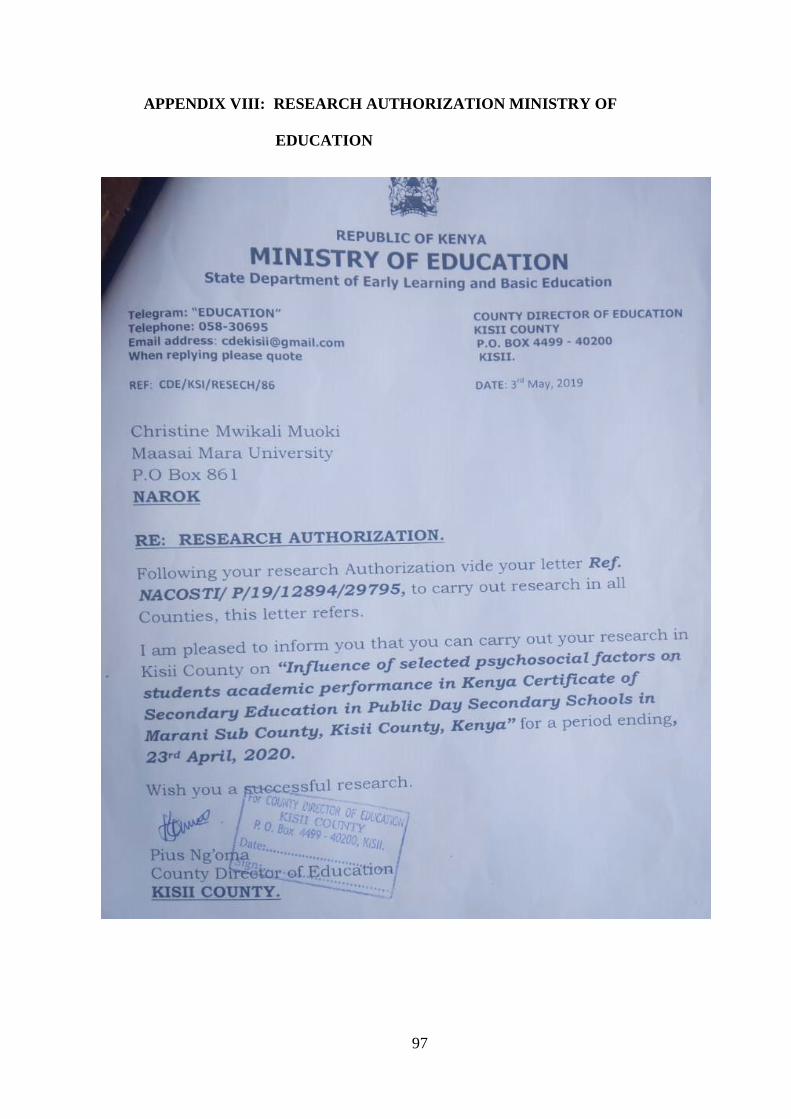
97
APPENDIX VIII: RESEARCH AUTHORIZATION MINISTRY OF
EDUCATION
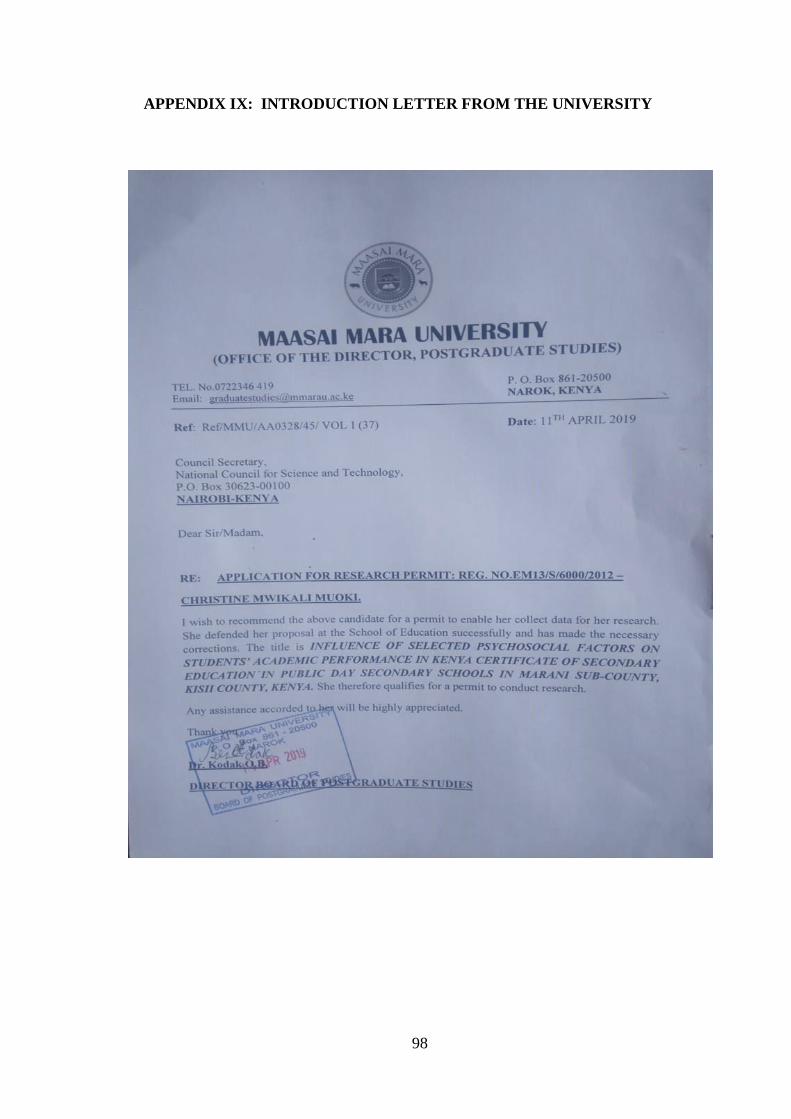
98
APPENDIX IX: INTRODUCTION LETTER FROM THE UNIVERSITY