selected readings - bilderlernen
TRANSCRIPT

-1
Rune Pettersson
Selected Readings
Institutet för infologi

0

1
Selected Readings
Rune Pettersson
Institutet för infologi

2
The picture on the cover shows a section of a foundation to a house in Skultuna,Västmanland, Sweden. The foundation is probably more than 250 years old.
ISBN 91-85-20-0 © Rune PetterssonTullinge 2007
3
Contents
Contents 3
Preface 5
Sender processes
1. Verbo-visual communication 72. What is information design? 193. Objectives 394. Gearing communications 555. Research in information design 79
Text design
6. Literacies in the new millennium 917. Comprehensibility 1138. Credibility 1379. From cave art to CAVE art 149
10. Media and learning 169
Image design
11. Visual literacy in message design 18512. Image functions 21313. Assessing image contents 23314. Kinship diagrams 24715. Associations from Pictures 259
Graphic design
16. Proposal for a taxonomy 27117. Circles, triangles and squares 29518. Graphic symbols 30719. At the turn of two centuries 32520. Image manipulation 341
Receiver processes
21. Attention 35322. Interpreting image content 38723. Learning from visuals 40524. Information and knowledge 42125. Infodidactics 441
Paper references 463

4
5
Preface
During the past decades I have written more than two hundred “papers” andmore than 60 books. Most of my papers include some aspects of communication,design, learning, media development or visual literacy. Like the single stonesin a stonewall all these papers help to build a joint structure.
Many of my papers have been presented at international research confer-ences. Several papers are published in peer reviewed conference proceedingsand several papers are published in scholarly journals.
This anthology includes a selection of 25 papers. The complete referencesto these selected papers are placed at the end of the book (p. 463). In the bookseveral titles are shortened. The papers present various aspects of informationdesign and visual communication. However, since each paper was written fora specific purpose some basic information design sections are included in sev-eral papers.
Most conference organisers provide specific guidelines with respect to lay-out, typography and writing style. In this publication all papers are adoptedto one uniform graphic standard.
Rune Pettersson, Ph.D.Professor of Information DesignDepartment of Innovation, Design and Product DevelopmentChairman Art & Design, Faculty of Science & TechnologyMälardalen University, Eskilstuna, Sweden

6
7
Paper 1
Verbo-visual communication
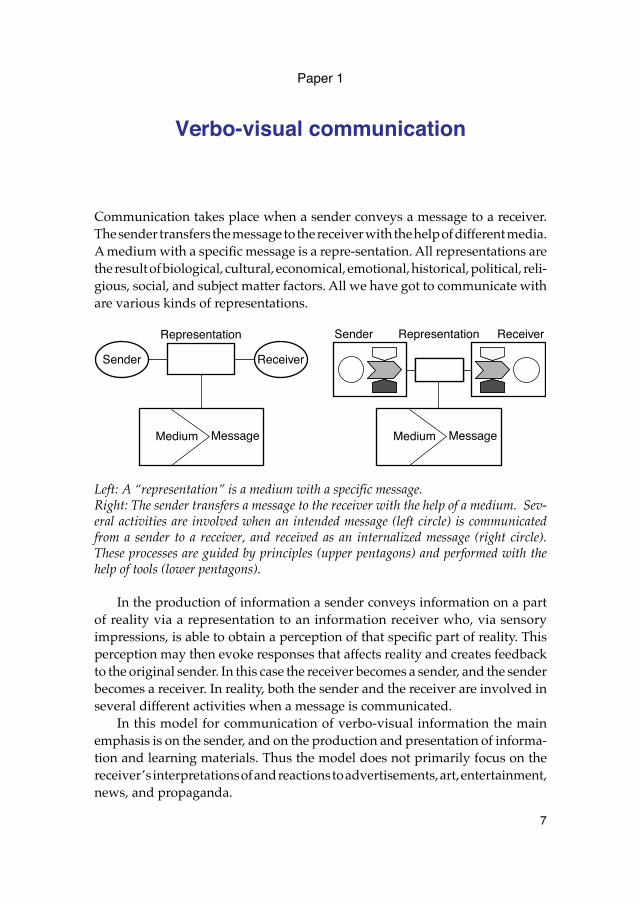
Communication takes place when a sender conveys a message to a receiver.The sender transfers the message to the receiver with the help of different media.A medium with a specific message is a repre-sentation. All representations arethe result of biological, cultural, economical, emotional, historical, political, reli-gious, social, and subject matter factors. All we have got to communicate withare various kinds of representations.
Left: A “representation” is a medium with a specific message. Right: The sender transfers a message to the receiver with the help of a medium. Sev-eral activities are involved when an intended message (left circle) is communicatedfrom a sender to a receiver, and received as an internalized message (right circle).These processes are guided by principles (upper pentagons) and performed with thehelp of tools (lower pentagons).
In the production of information a sender conveys information on a partof reality via a representation to an information receiver who, via sensoryimpressions, is able to obtain a perception of that specific part of reality. Thisperception may then evoke responses that affects reality and creates feedbackto the original sender. In this case the receiver becomes a sender, and the senderbecomes a receiver. In reality, both the sender and the receiver are involved inseveral different activities when a message is communicated.
In this model for communication of verbo-visual information the mainemphasis is on the sender, and on the production and presentation of informa-tion and learning materials. Thus the model does not primarily focus on thereceiver’s interpretations of and reactions to advertisements, art, entertainment,news, and propaganda.
Sender Receiver
Medium Message
Representation Representation ReceiverSender
Medium Message
8
Combinations of words and visuals
In the late twentieth century technical developments have moved at a very rapidpace. The pace of development is more likely to increase than decrease in thefuture. Visual messages in different forms will become increasingly important.However, only limited knowledge is available about visual communications,pictures as a means of linguistic communications and the interplay betweenverbal and visual messages.
Attention should be devoted to issues concerning the production, trans-mission and perception of messages consisting of verbal (written or oral) andvisual presentations (verbo-visual presentations) in all types of media. Since“visual literacy” is a very broad and somewhat confusing concept, and doesnot include verbal information, Pettersson (1989) coined the term
infology
, anddefined it as the presentation and perception of verbo-visual information.
According to Pettersson, infology encompasses studies of the way a verbo-visual representation should be designed to achieve optimum communicationbetween sender and receiver. Like visual literacy, infology is interdisciplinaryand encompasses many aspects from established fields such as aesthetics, art,audiovisual media, cinema, computer graphics, computer science, education,film, graphic design, information ergonomics, information science, informationtechnology, information theory, journalism, linguistics, mass communications,media, pedagogics, photography, physiology, psychological information the-ory, semantic information theory, semiology, sociology, speech communication,television, trade language, visual arts and visual thinking.
The concept
information design
usually concentrates on typography andgraphic design of information materials (Tufte 1990). Thus, information designdoes not cover the same fields as infology.
Infology includes the study of parts of the communications process as wellas various types of presentations. Each “part” and each “type” can be dividedin several sections.
Communication
Infology, when viewed from a communications perspective, encompasses stud-ies of the way a representation should be designed to achieve optimum com-munications between the sender and the receiver. Thus, some studies are con-centrated on the communications process as such, some on the sender, someon the receiver and some on the representation. As noted in the introduction,a representation is a medium with its specific message. The message has a con-tent as well as an execution. Different media are undergoing comprehensivechanges. The representation is always used in a certain context and it has a spe-cific format.
9
Presentation
Based on how the verbal information is presented to the receivers, three maintypes of verbo-visual information can be distinguished. The text is
read
in
lexi-visual representations
, such as messages printed in a book or displayed on a com-puter screen. Speech is
listened
to in
audio-visual representations
, such as in oralpresentations with slides or overhead transparencies and in television pro-grams. In
multi-visual representations
, such as interactive multimedia systems,there is a combination of lexi-visual and audio-visual representations.
Information materials often consist of words. There is probably no otherinstructional device that leads to more consistently beneficial results than add-ing pictures to a verbal presentation, oral or written. There can be no doubt thatpictures combined with words can produce strong facilitative effects on reten-tion and learning. These effects prove to be valid for a broad range of texts, pic-tures, learner characteristics and learning tasks (Levie & Lentz 1982, Levin &Lesgold 1978, Pettersson 1989, 1993).
Audio-visual representations may consist of “oral presentations” and“recorded representations”. In each group there are several ways of combiningthe verbal and the visual information.
In interactive systems and simulators it is possible to have an active coop-eration between lexi-visual and audio-visual representations. In each groupthere are several ways of combining the verbal and the visual information. Itis possible to create the “total information material” and the “total teaching aid”with completely new dimensions (Pettersson 1989, 1993). In this case the infor-mation may be digitally stored on an optical disc, such as a CD-I (Compact DiscInteractive).
Characteristics of verbal language
Some characteristics of verbal language, oral and written, are listed with shortsummary statements, referring to relevant research.
• Verbal languages have digital coding using combinations of letters (and/ornumerals) to represent content (Elkind 1975).
• There is no direct correspondence between groups of letters, words andreality. Each meaning is defined and must be learned (Elkind 1975).
• The properties of letters are limited. A letter has a given position in analphabet, it has a name, it is represented by one or more sounds and is usedin a context (Elkind 1975).
• Verbal languages have varying levels of meaning (Eco 1971): (i) phonemes(without meaning); (ii) morphemes (with meaning); (iii) syntagms, sub-meanings; (iv) complete meanings.
10
• Semantic codes, grammar and syntax must be defined (exactly) (Chomsky,1959).
• The perception of linear representations requires a slow and sequential pro-cessing for comprehension of content (Perfetti 1977, Sinatra 1986).
• Memory retrieval is a serial integration process and entails sequential pro-cessing by auditory-motor perception systems (Sinatra 1986).
• Dissatisfaction with the execution of a message may cause dissatisfactionwith the content of the message (Pettersson 1989).
Characteristics of visual language
Some characteristics of visual language are listed below with short summarystatements, referring to relevant research.
• Visual languages have analog coding employing combinations of basicgraphic elements (dots, lines, areas and volumes) for depicting reality (Pet-tersson 1989).
• Visual languages attempt equivalence with reality. Visuals are iconic. Theynormally resemble the thing they represent. Meaning is apparent on a basiclevel, but the visual language must be learned for true comprehension.There are major differences between the concepts “seeing”, “looking” and“reading” (Pettersson 1989).
• Visual languaging abilities develop prior to, and serve as the foundationfor, verbal language development (Reynolds-Myers, 1985).
• Development of visual languaging abilities is dependent upon learnerinteraction with objects, images and body language (Reynolds-Myers1985).
• Perception of two- or three-dimensional representations entails fast, paral-lel, simultaneous and holistic processing (Gazzaniga 1967; Sperry 1973,1982).
• It may take only 2-3 seconds to recognize the content in an image (Paivio1979; Postman 1979), but 20-30 seconds to read a verbal description of thesame image (Lawson 1968; Ekwall 1977) and 60-90 seconds to read it aloud(Sinatra 1986). In verbal and visual languages, prior experience and contextare very important to the perception of contents.
• Memory for pictures is superior to memory for words (Paivio 1983). This iscalled the “pictorial superiority effect.”
• Memory for a picture-word combination is superior to memory for wordsalone or pictures alone (Haber and Myers 1982).
11
Sender activities
In the production and distribution of a verbo-visual message, the sender willuse several processes and production tools. Hopefully, the sender is guided bysome solid principles and guidelines.
Generally speaking the sender may be an advertiser, an artist, a businessperson, an instructor, a subject matter expert, a teacher, a writer, a book pub-lisher, a film producer, a television producer, or anyone else who wants to conveyan intended message to one or more receivers.
Intended message
An intended message may
consist of
specific ideas, thoughts, data, informationor some subject matter facts. It is always very important for the sender to maketwo decisions as early as possible:
1. Define the
purpose
of the intended message2. Define the
receiver
of the intended message3. Define the type of
representation
for the intended message
The
purpose
of an intended message may be advertising, a business proposal,education, entertainment, information, instruction, learning, training, a changeof behaviour, an action of any kind, or any combination of these.
There are many groups of
receivers
. The receiver of an intended messagemay be business partners, colleagues, dentists, employees, course participants,ministers, students, teachers, veterinary surgeons, retired professors, teenagegirls or a “general” audience. It is obvious that a person may belong to severalgroups of receivers, or target groups. There are always individual differencesamong members of any group. The sender needs to consider age and gender,and cultural, economical, historical, political, religious, and social factors.
It is also very important to decide on the
type of representation
as early aspossible. Lexi-visual, audio-visual, and multi-visual representations are subjectto different message design processes. Different types of representations arepartly guided by different principles, and different tools are used. However,some principles, and some tools are the same for different representations.
In this paper the main emphasis is on learning. Here, the sender wants areceiver to learn about a specific subject matter. Thus, the sender produces alearning material to be used by the receiver.
The sender’s creative processes
The sender’s creative processes are influenced by message design principles,and are performed with message design tools. The design principles can be seen
12
as guidelines for design and development of any verbo-visual message. Thesender should:
• Edit the verbo-visual message for better comprehensibility and easierunderstanding. Editing for a selected target group includes: subject matterdepth, structure, clarity, simplicity, consistency and unity.
• Adapt the verbo-visual message to human attention and perception inorder to facilitate learning.
• Consider costs.• Secure quality.• Respect copyright, ethical rules and media-specific ethical guidelines.
Main creative processes include the following activities:
• Organize the work.• Analyse the intended message.• Define the objectives.• Analyse the receivers. Consider age, gender, and socio-economic factors.• Consider views and any feedback expressed by receivers.• Analyse information requirement.• Select a method for framing of the verbo-visual message.• Select a suitable medium.• Produce synopsis: text and pictures.• Produce draft: text and pictures.• Produce script: text and pictures.• Produce originals: text and pictures.• Revise quality.
Main design tools include:
• Text: printed and spoken• Symbols• Pictures: drawings and photos• Typography and layout• Sound and sound effects
The sender’s production processes
The sender’s production processes are influenced by production principles, andare performed with production tools. The production principles can be seen
13
as guidelines for production of any verbo-visual message. Main productionprinciples include:
• Live media principles• Sound media principles• Film media principles• Broadcast media principles• Video media principles• Models and exhibitions principles• Graphical media principles• Telecommunications media principles• Computer media principles
Main production processes include:
• Live media production• Sound media production• Film media production• Broadcast media production• Video media production• Models and exhibitions production• Graphical media production• Telecommunications media production• Computer media production• Quality reviews
Main production tools include:
• Pens, pencils and other materials for manual work• Computers and software to process texts and images• Printers, copying machines and printing presses• Cameras (still, film and video)
The sender’s distribution processes
The sender’s distribution processes are influenced by distribution principles,and are performed with distribution tools. Main distribution principles include:
• Economy• Efficiency• Timing
14
Main distribution processes include:
• Stock keeping• Marketing and advertising• Selling and distribution • Billing and bookkeeping
Main distribution tools include:
• Warehouses and stores• Databases, Internet etc
Representation
As noted at the beginning a representation is a medium with a specific content.Representations are used in different presentations:
• Lexi-visual representations– Manual productions– Technical productions
• Audio-visual representations– Oral presentations– Recorded representations
• Multi-visual representations– Interactive systems– Simulator systems
Different media can represent reality with varying facility owing to differencesin the structure, in the kind of representation involved, and in the content. Thereare several areas of interest. Regardless of the purpose, and the intended receiverit is possible to study and analyse the representation with respect to areas like:
• Interplay of words and visuals• Legibility of text and pictures• Readability of text and pictures
Main media considerations include:
• Costs• Credibility• Mass media and mass communication• Media and society• Media characteristics
15
• Economical, political, and social situation• Technology trends
Main message considerations include areas such as: advertising, aesthetics, art,business presentations, education, entertainment, factual information, instruc-tion, news, and training.
Receiver activities
In the receiving of a verbo-visual message, the receiver will use several processesand “reception tools”. The processes are influenced by reception principles. Allreceiver processes are influenced by prior experience in relation to age and gen-der, as well as by cultural, economical, historical, political, religious, and socialfactors. Such experiences will influence our selection processes, our mental pro-cess, and our response processes. The influence of these factors have a majorinfluence on how receivers relate to verbo-visual messages of different kinds,and on how meaning is constructed.
The receiver’s selection processes
The receiver’s selection processes are influenced by selection principles, andare performed with search and selection tools. Main selection principles includethe following areas:
• Available time• Costs• Credibility of the sender• Credibility of the information• The role of media in society• Various cultural, economical and social factors• Ease of use• Individual interests• Language• Needs• Reading value
Main receiver processes include:
• Search for information• Selection of information
16
Main search and selection tools include:• Indexes, directories, and catalogues• Computers and databases• Libraries• TV sets
The receiver’s mental processes
The receiver’s mental processes are influenced by attention, perception, andlearning principles, and are performed with sensory organs and the nervoussystem. The interpretation of an intended message will be influenced by theexperiences of the individual receiver. In many situations different individualswill interpret the same representation in different ways. Main perception prin-ciples include the following areas:
• Attention principles• Perception principles such as closure, common fate, constancy, context,
continuity, contrast, figure and ground, objective set, principle of economy,proximity, and similarity
• Processing principles such as cue theory, fual code model, and schema the-ory
• Subliminal perception
Main mental processes include:
• Attention• Perception• Mental processing• Application• Reading• Intellectual development• Understanding
In perceiving a verbo-visual message the receiver makes use of sensory organsand the nervous system:
• Sensory organs for feeling, hearing, listening, seeing, smelling, tasting• The nervous system• The brain• Previous experience and knowledge• Inner images
17
The receiver’s response processes
The receiver’s response processes are influenced by response principles, andare performed with response tools. Main response principles include:
• Rules• Guidelines• Standards• Values
Main response processes include:
• Application of knowledge• Change of behaviour• Change of emotional status
– Anger– Disgust– Fear– Happiness– Sadness– Surprise
In some situations it may be possible for the receivers to provide the senderwith feedback. This feedback may be of great value for the sender when updat-ing the information material. However, in many situations it is not at all possiblefor the individual to give any feedback to the sender. Main response toolsinclude:
• Body language • Verbal language• Visual language
The internalized message
When a message is internalized the receiver has got a set of new emotions, newexperiences, new feelings, new knowledge or new understanding. The inter-nalized message will influence the interpretation of future messages.
References
Chomsky, N. (1959). Review of verbal behaviour. In B. F. Skinner, (Ed.).
Lan-guage, 35,
26-58.
18
Eco, U. (1971).
Den frånvarande strukturen. Introduktion till den semiotiska for-skningen
. Lund, Swedish translation.Ekwall, E. (1977).
Diagnosis and Remediation of the Disabled Reader.
Boston: Allyn and Bacon.
Elkind, D. (1975). We can teach reading better.
Today's Education, 64,
34-38.Gazzaniga, M. (1967). The split brain in man.
Scientific American, 217,
24-29.Haber, R. N., & Myers, B. L. (1982). Memory for pictograms, pictures, and
words separately and all mixed up.
Perception, 11,
57-64.Lawson, L. (1968).
Ophthalmological factors in learning disabilities.
In H. Mykle-bust, (Ed.).
Progress in Learning Disabilities.
(Vol. 1.) New York, Grune and Stratton.
Levie, W. H., & Lentz. R. (1982). Effects of Text Illustrations: A Review of Research.
ECTJ, 30,
195-232.Levin, J. R., & Lesgold, A. M. (1978). On pictures in prose.
ECTJ 26
, 233-243.Paivio, A. (1979).
Imagery and Verbal Processes.
Hillsdale, New Jersey: Lawrence Erlbaum Associates.
Paivio, A. (1983).
The empirical case for dual coding.
In J.C. Yuille.
Imagery, mem-ory and cognition.
Hillsdale, NJ: Erlbaum, 307-332.Perfetti, C. (1977).
Language comprehension and fast decoding: Some psycholinguis-tic prerequisites for skilled reading comprehension
. In J. Guthrie, (Ed.),
Cogni-tion, Curriculum, and Comprehension.
Newark, Delaware, International Reading Association.
Pettersson, R. (1989).
Visuals for Information, Research and practice.
Englewood Cliffs. N.J.(USA): Educational Technology Publications.
Pettersson, R. (1993).
Visual Information.
Englewood Cliffs. N.J.(USA): Educa-tional Technology Publications.
Postman, N. (1979). Teaching as a Conserving Activity. New York, Delacorte Press.
Reynolds-Myers, P. (1985).
Visual literacy, higher order reasoning, and high tech-nology.
In N. H. Thayer and S. Clayton-Randolph (Eds.).
Visual Literacy, cruising into the future. Readings from the 16th annual conference of the Interna-tional Visual Literacy Association.
Bloomington, Western Sun Printing Co, Inc.
Sinatra, R. (1986).
Visual Literacy Connections to Thinking, Reading and Writing
. Springfield. Illinois, Charles C. Thomas.
Sperry, R. (1973).
Lateral specialization of cerebral functions in the surgically sepa-rated hemispheres.
In F. J. McGuigan and R. A. Schoonever, (Eds.).
The Psy-chophysiology of Thinking: Studies of Covert Processes.
New York, Academic Press.
Sperry, R. (1982). Some effects of disconnecting the hemisphere.
Science, 217,
1223-1226.
Tufte, E. (1990).
Envisioning Information.
Graphics Press: New Haven Connet-icut.
19
Paper 2
What is information design?
Abstract
. In order to satisfy the information needs of the intended receivers informa-tion design comprises analysis, planning, presentation and understanding of a mes-sage—its content, language and form. Regardless of the selected medium, a welldesigned information material will satisfy aesthetic, economic, ergonomic, as well assubject matter requirements. Information design is a multi-disciplinary, multi-dimensional and worldwide consideration with influences from areas such as lan-guage, art and aesthetics, information, communication, behaviour and cognition,business and law, as well as media production technologies.
This paper has three main sections. The first section,
Information
, presents def-initions of the term
information
and reviews several information disciplines. Thesecond section,
Message design
, presents definitions of the term
design, and pre-sents various views on instructional design and instructional message design. Thethird section, Information design, presents several views on information design.As a discipline information design has three main areas of knowledge: (1) infog-raphy, (2) infology, and (3) infodidactics. Information design encompasses stud-ies of the way a representation should be designed in order to achieve optimumcommunication between the sender and the receiver.
InformationThe term information is derived from the Latin noun informatio which meansa conception or an idea. Information has therefore long been synonymous with(1) data, details, facts, and intelligence. However, the term information hasacquired additional meanings. It may also refer to (2) the import ascribed tospecific data. Then information does not arise until the received data, e.g., atext or a picture, are interpreted by the receiver for formation or moulding ofthe mind. The term information is also sometimes used for (3) data processedin a computer. Yet another meaning (4) is “an internal structure which regulatesprocesses.” The latter meaning is used in computer science and in genetics.According to The new Shorter Oxford English Dictionary on Historical Principles(Brown, 1993, p. 1364) the term information can also be used for (5) a formalwritten statement or accusation, (6) the action of informing against a person;and (7) the giving of a form or essential character to something; inspiration.
20
The verb inform means to supply or convey information or to provide knowl-edge of something and is therefore an unidirectional process, e.g., from one per-son to another. In my view, to communicate entails an interplay between two ormore persons. Thus information is a richly varied concept covering manyimportant disciplines and areas of knowledge. Most people are involved withcommunications and communications systems in one way or another. Someof these systems have soft, human or linguistic dimensions, whereas others pos-sess hard, technological dimensions. Some subject fields have been well-estab-lished for many years. Others are relatively new. These fields can be regardedas independent scientific disciplines or branches of learning. In severalinstances, there is some overlapping because certain sub-issues are addressedin different disciplines, even if the approaches may vary. The main informationdisciplines are briefly reviewed below (in alphabetical order).
Computer science comprises research on the principles for construction, oper-ation, programming and applications of computers. A special focus is on com-puter software, and analysis of instructions and information needed to solveformalized problems. Practical applications are seen in the development of var-ious computer-aided systems, such as computer-aided software engineering.
Human computer interaction (HCI) comprises research on the design of com-puter systems that support people so that they can carry out their activities andtasks productively and safely. Human computer interaction has a role in thedesign and development of all kinds of man–machine systems. Safety aspectsare very important in the design of control systems for air traffic and nuclearplants. High productivity and job satisfaction are important issues in office sys-tems. Entertainment and fun are key concepts in the design of computer games.Interactive information systems are needed in all these cases.
Information economics comprises research on the business development ofinformation industries. There are a lot of information jobs in all kinds of work-places, and an increasing number of employees are working with information.Other areas of research are the impact of information and communication, theapplication of information technology in the work-place, the history and geog-raphy of information labour and capital, the regulation and provision of infor-mation infrastructure, and the use of computers and networks.
Information ergonomics comprises research and development of the ergo-nomic design of man-machine systems. The design of an information systemmust be based on studies of the information user’s aims, knowledge, experience,and way of working. Tasks making particularly heavy information demandsoccur in work at computer terminals, work at complex information panels, andin signal systems (e.g., for the monitoring of industrial processes and tools).Information ergonomics include lighting, the design of instrument panels,video display units, characters, symbols, signals, etc.
21
Information management (IM) comprises research and development of man-agement of information in organisations. Information is divided in small units,sometimes called information elements. These elements are linked to objects andcan be managed in computer systems, information management systems (IMS).An information element may be e.g., one or more paragraphs of text, a table,or a picture. Sometimes these elements are called information modules.
Information processing is a discipline comprising the processing of informa-tion so as to yield new or more useful information. Researchers use mathemat-ical and numerical analysis plus methods and techniques for administrativedata processing. The discipline also comprises the study of information searchesin databases, information systems, computer aided translation, computer aidededucation, computer aided problem solving, computer aided design, etc. Theterm information processing is often used as a synonym for data processing,i.e., the execution of a systematic series of operations on data. The term is alsosometimes used for studies of the way people process information mentally.
Information retrieval (IR) comprises actions, methods, and procedures fortracing of data and information stored in computers, libraries, etc. in order toprovide information on a given subject. Information retrieval is also a part ofinformation science, but is sometimes considered a research area of its own.
Information science, or library and information science, is an interdisciplinaryarea of research. It comprises the study of information in general, and storageof information with sub-areas like classification, indexing, cataloguing, and bib-liographic and other databases. Other important areas are seeking, retrieval,and dissemination of information, especially scientific and technical informa-tion. Information science also comprises various library information serviceactivities. The main activities include administration, collections, circulation aswell as scientific communication, use of information, and information resourcesmanagement. The task of an informatic, i.e., documentalist, is to collect and tab-ulate scientific information. This information is often sought in national as wellas international databases.
Information systems (IS) comprises studies on development, use, and eval-uation of computer-based information systems in various kinds of organisa-tions. The social context where these systems are used are important areas ofresearch. Introduction of new information systems usually cause changes in thetraditional work processes as well as reorganisation of the administrative rou-tines and organisations.
Information technology (IT) comprises research and development of the tech-nical systems used for making production, distribution, storage, and other infor-mation handling more efficient. This includes computer technology and elec-tronics. The term information society is sometimes used in informationtechnology. This is a designation for the society which follows after an industrialsociety and in which man’s thinking power is supported by information pro-
22
cessing computer systems and modern telecommunications techniques. Theinformation society is dominated by the resource information instead of the tra-ditional resources energy, raw materials, labour, and capital.
Information theory is a scientific discipline which comprises quantitativemeasurement of transmitted information and comparison of various commu-nications systems, especially in telecommunications. In information theory, theinformation’s contents lack inherent interest. Information theory is based on amathematical theory presented in the 1940s by the American mathematicianClaude E. Shannon. It subsequently came to be known as the Shannon andWeaver mathematical communications model. In this kind of communicationssystem, a sender (e.g., a telex unit) communicates with one or more receivers(other telex units) via a channel. The sender codes the transmitted signal, andthe receiver decodes the received signal. Information theory utilizes the bit asthe smallest unit of information. A bit can either be a one or a zero, representing,e.g., yes/no or on/off. The Shannon and Weaver communications theory wasoriginally developed for studies of telecommunications and other technical sys-tems. However, the theory has also been used as a model for communicationsbetween people.
Media and communications is a wide area of research. At universities in Swe-den media and communication studies take an interest in research on mediatedcommunication, in contrast to research on personal communication which iscommon in many other countries. Mediated communication comprises thestudy of the communication processes, including the technical production ofmedia. A few years ago the main focus was on the senders, who wanted to reachout with their messages to large groups of receivers in mass-communication.These messages were mainly intended to provide entertainment, informationand news, and to some extent also advertising and propaganda. Today it is morecommon in media and communication studies to focus on the individual receiv-ers, their individual interpretations of the varying messages, and the construc-tions of meaning made by the receivers.
Planned communications or persuasive communication, comprises studies onadvertising, propaganda, and other carefully planned information activities.Here the goal is always related to some kind of change in the behaviour of thereceivers. Receivers are typically asked to do something. Ads may ask peopleto vote, go to church or stop smoking, and often the intention is to persuadethem to buy a special service or a special product. While advertising presentspositive images, propaganda often creates negative images. Propaganda rein-forces our prejudices and feelings regarding events, groups of people, or prod-ucts. In order to influence others, the senders must exchange information, accu-rately transmit their message and intentions, and identify and understand thehabits of the receivers.
23
Psychological information theory is the designation for one of the mainbranches of cognitive psychology. It refers to the study of man’s mental infor-mation processing of text, pictures and other representations. A major principlein cognitive psychology is that man organizes impressions and knowledge intomeaningful units. This process starts with attention and perception. Psycho-logical information theory describes the cognitive processes in the brain as aflow of information between different memory functions.
In philosophy, semantic information theory refers to the information suppliedby a proposition in terms of the proposition’s probability, and specifies the prin-ciples for measuring information.
Social information, i.e., the result of all information measures whose aim isto make it easier for citizens to know what their rights, privileges, and obliga-tions are, is studied in social science subjects. Good social information shouldbe readily accessible, tailored to local requirements, readily grasped, adaptedto individual needs, and capable of creating a state of preparedness in thereceiver. Social information must be closely integrated with the activities of therespective authorities, professionally planned and designed, and disseminatedthrough efficient media.
Message designIn the The new Shorter Oxford English Dictionary on Historical Principles (Brown,1993, p. 1752) the term message is defined as: “brief communication transmittedthrough a messenger or other agency; an oral, written, or recorded communi-cation sent from one person or a group to another.” Please note, that it is impliedhere that the message actually is received by the receivers. And the general mean-ing of design is defined (p. 645) as: “plan and execute (a structure, work of art,etc.); fashion, shape; make a preliminary sketch for (a work of art, etc.); makedrawings and plans for the construction of production of (a building, machine,garment, etc.).”
People have been designing, planning and executing messages in all times.Design and presentation of messages, as well as perception and cognition ofmessages, are activities that some of the different research fields within infor-mation and communication have in common. In this section the focus is oninstruction, and thus on presentations and on messages intended for learning.
Instructional designWith roots in the use of audiovisual media in teaching and research on educa-tional technology, the term instructional technology was introduced in the 1960s.For the first 25 years the name of the scholarly journal published by the Asso-
24
ciation for Educational Communications and Technology (AECT) was AV Commu-nication Review. In 1978 the title of the journal was changed to Educational Com-munications and Technology — A Journal of Theory, Research, and Development(ECTJ). In 1989, ECTJ and the Journal of Instructional Development (JID) were con-solidated and merged into Educational Technology Research, and Development(ETR&D). It is since the main publication of the AECT. According to Dijkstra,van Hout Wolters, and van der Sijde (1990) the term instructional technology wasintroduced in order to give a description of methods and procedures of instruc-tion used to promote the acquisition of knowledge and cognitive skills, mainlyin classrooms and other formal learning situations. Heinich, Molenda, and Rus-sell (1982, p. 19) defined technology of instruction as: “the application of our sci-entific knowledge about human learning to the practical tasks of teaching andlearning.”
In 1974 Gagné and Briggs introduced the term instructional design. Theyshowed the influence of cognitive psychology on the description of differenttypes of learning, and on the analysis of the learning task. Glaser (1978) showedthat the study of acquisition of complex human behaviours in formal instruc-tional settings will contribute both (1) to the theory of knowledge acquisitionwithin the science of cognition, and (2) to the technology of instruction. LaterBriggs and Wager (1989) published a handbook of the procedures for the designof instruction. Here the central focus is on the design of instructional materials,whether print or non-print. Thus the book is mainly written for those instructorswho want to learn how to: “develop predesigned, materials-centered instruction,as distinct from teacher-centered instruction” (p. v).
According to Fleming and Levie (1993, p. x) Reigeluth (1983) defined instruc-tional design as “the process of deciding what methods of instruction are bestfor bringing about desired changes in student knowledge and skills for a specificcourse content and a specific student population.” Later Reigeluth (1987)applied the appropriate models and theories to the design of lessons. And in1993 Wileman (p. 112) defined instructional design as “the process of planninglessons based on learning objectives.” Reigeluth (1983, 1987) defined three typesof main variables in instructional design. These variables are (1) methods, (2)outcomes, and (3) conditions. Thus, when a designer shall solve an instructionalproblem, he or she will use the available knowledge about the system and theconditions at hand, and vary the method variables in such a way and towardsuch values that the desired outcome is achieved.
Instructional message design In 1982 Heinich et al. (p. 9) defined the term instruction as: “Deliberate arrange-ment of experience(s) to help a learner achieve a desirable change in perfor-mance; the management of learning, which in education and training is pri-
25
marily the function of the instructor.” And in 1990 Warries (p. 3) definedinstruction as: “Bringing about by means of a well-defined method, that, undergiven conditions, a learner within a system, will reach a predefined goal.”
Fleming and Levie (1978) specified that the term instructional message designrefers to the process of manipulating, or planning for the manipulation of, apattern of signs and symbols that may provide the conditions for learning. Itis assumed that practitioners in this domain can be more effective if they makeuse of appropriate generalized research findings from the behavioural sciences.Here the term instruction refer as well to classroom contexts as to more informalcontexts where attitudes, concepts, and skills are communicated. According toFleming and Levie (1993, p. x): “A “message” is a pattern of signs (words, pic-tures, gestures) produced for the purpose of modifying the psychomotor, cog-nitive, or affective behaviour of one or more persons. The term does not implyany particular medium or vehicle of instruction.” In principle the term messageis valid for all media. And design (op. cit.): “refers to a deliberate process of anal-ysis and synthesis that begins with an instructional problem and concludes witha concrete plan or blueprint for a solution.” The influence of cognitive psychol-ogy on instructional message design were further developed by Gagné, Briggsand Wager (1988), and by (Dijkstra et al. 1990).
Instructional design theories provide principles for the design of instruc-tion. In a few cases they intend also to provide teachers with prescriptions. Dur-ing the last two decades design models and theories of instruction have becomeimportant for the work of professional instructional designers. Although designtheories frequently refer to descriptive theory and propositions, their main func-tion is to guide the designers on how to design and how to produce coursesand lessons.
The International Visual Literacy Association (IVLA) was established in 1968to provide a multidisciplinary forum for the exploration, presentation and dis-cussion of all aspects of visual communication and their applications throughthe concept of visual languaging, visual literacy, and literacies in general. TheJournal of Visual Literacy (JVL) is the official scholarly journal of IVLA for pre-sentation of theory and research in this area. For the first seven and a half yearsthe title of the journal was Journal of Visual Verbal Languaging (JVVL).
We can note a paradigm shift from the old an d traditional focus on teachingto a focus on learning. In summary, the main function of instructional technology,instructional design as well as of instructional message design is to guide the pro-fessional designers on how to design and how to produce courses and lessonsintended for learning. There seem to be no major difference between these areas.And they are all closely related to information design. The instructional areas are,however, more narrow than information design.
26
Information designInformation studies as well as media and communication studies are broadresearch areas with connections to several other areas of research. Many studieshave mainly dealt with various aspects of verbal information in different media.Quite often the pictures and images in the messages have been overlooked andforgotten. In many cases researchers have dealt with many aspects of the textbut not at all with the pictures.
In the 1950s and 1960s Lidman and Lund (1972) described the advantageswith an informative layout where text, pictures and graphic design work togetherto form a message that is easy for the reader to receive and understand. Theycalled this the third language as well as lexi-visual layout. In contrast to the tra-ditional artistic layout, which may please the individual artistic graphic designer,but which has no relation to the content of the message. An informative layouthas a practical purpose. The lexi-visual narrator was encouraged by Lidman andLund to consider three important aspects: (1) the theme of the content, (2) thepedagogical purpose, and (3) the aesthetic form. Lexi-visual products are theresult of teamwork between subject matter experts, visualizers and editors. Thelexi-visual layout was used in the production of visualized encyclopedias fora general market.
Tufte (1990) noted that the term information design (ID) has often been usedfor aesthetic graphic design of information materials. However, Easterby andZwaga (1984) had provided a wider view of information design when theyedited the proceedings from the NATO Conference on Visual Presentation of Infor-mation in 1978. In the preface to the book Information Design (p. xxi–xxii) theywrote: “information presentation involves a wide range of professional interestgroups concerned with its development and use; graphic designers, industrialdesigners and typographers are primarily concerned with design but willacknowledge the importance of evaluation; psychologists and ergonomistshave an interest in evaluating the effectiveness of displayed information andsome, but not all, will acknowledge the importance of graphic design; architects,planners and engineers have a professional interest in using information as acomponent in the artefacts they create for society—buildings, roads, industrialmachinery and consumer products—but many may not be prepared toacknowledge the importance of design and evaluation of such information. Theproblem that arises is that each of these professionals approaches informationdisplay from a different standpoint—aesthetic, empirical, evaluative, quanti-tative, pragmatic, practical—and also to differing degrees, depending on therelative importance that these aspects have in relation to their own professionalinterest and obligations.”
In 1979 the Information Design Journal (IDJ) started. According to Waller(IDA, 1997) IDJ was intended to be a counterpoint to the corporate identity and
27
glitzy graphics that seemed to take over graphic design in the 1980s. From thebeginning IDJ used a distinctive meaning for the term information design: “toapply processes of design (that is, planning) to the communication of informa-tion (its content and language as well as its form).” With reference to the displayof quantitative information Tufte (1983, p. 87) noted that graphical competencedemands three quite varying skills: “the substantive, statistical, and artistic. Yetmost graphical work today, particularly in news publications, is under the direc-tion of but a single expertise—the artistic. Allowing artist-illustrators to controlthe design and content of statistical graphics is almost like allowing typogra-phers to control the content, style, and editing of prose. Substantive and quan-titative expertise must also participate in the design of data graphics, at leastif statistical integrity and graphical sophistication are to be achieved.” It shouldbe noted that that this statement was made in 1983. Today, the situation maybe different.
A search on the WWW (in January 1998) for the term information designgave more than 6,500 hits. These hits indicated that the term now is used for awider concept than graphic design of information materials. Now the focusseems to be on functional verbo-visual communication rather than on aestheticsalone. In the age of information we have an ever increasing need for computerinterfaces, educational materials, exhibitions, forms, graphic symbols, instruc-tional materials, learning materials, lists, maintenance information, manuals,non-fiction books, on-line help for managing computer-based systems, proce-dural aids, product descriptions, public information signs, reference books,road traffic signs, system descriptions, tables, technical reports, tickets, web-pages, and other kinds of information materials. These are examples of infor-mation utility goods that we need to perform our tasks at work. We also need anincreasing amount of information materials during our leisure time, in orderto be able to handle things like new cameras, cars, CD-players, computers, com-puter software, etc. Thus a well designed information material makes everyday lifeeasier for people, and it grants good credibility to the senders or sources.
However, in the future we will focus more on the information content ratherthan on the traditional information materials as such. We may need access to theinformation required for maintenance of a machine, not necessarily for a printeddocument with this information. Thus many traditional printed documents willbe replaced by on-line services. This is a paradigm shift.
Marsh (1983) discussed the term communication design for “messages thatwork”. He made a clear distinction between an artistic approach and a designapproach. These two approaches differ in their goals. Marsh commented thatthe artistic approach strives for perfection, while the design approach strives forworkability in a cost effective context. The design approach minimizes the needfor rewriting and editing by careful planning of the work. The two approachesresult in vastly different final products. The artistic approach tends to judge suc-
28
cess by whether the product feels right and whether the critics like it or not.The design approach judge its success by whether the product achieves theobjectives as specified by measurable performance objectives, within the spec-ified resources and situational constraints. And the School of Design at CarnegieMellon University (1997) has defined communication design “as the effectivepresentation of ideas and information by means of type and image, whetherin the traditional medium of print or in the new digital medium that supportsinteractive computer displays, multimedia communication technology, andinformation systems”. Also here the focus is on workability.
Wileman (1993, p. 6) noted that: “Communication can be judged successfulonly when it conveys the information it sets out to convey. This is as true forvisual modes as it is for verbal modes.” Also Brandt (1997) provided a practical,workability and useability view related to information utility goods, anddefined information design as “the ability to search for information, makechoices, create and package information.” He further remarked that “the mes-sage must reach the receivers in a proper way.” A well designed informationproduct will satisfy aesthetic, economic, ergonomic, as well as subject matterrequirements. Mullet and Sano (1995, p. 2) remarked that: “The goal of com-munication-oriented design is to develop a message that can be accurately trans-mitted and correctly interpreted, and which will produce the desired behav-ioural outcome after it has been understood by its recipient.” Pettersson (1996,1997) provided a process-oriented workability and usability view of commu-nication, and discussed message design principles as well as message designtools.
On its WWW-homepage the International Institute for Information Design(IIID) defines design in the following way (1997): “Design is the identifying ofa problem and the intellectual creative effort of an originator, manifesting itselfin drawings or plans which include schemes and specifications.” And infor-mation design: “Information design is the defining, planning, and shaping ofthe contents of a message and the environments it is presented in with the inten-tion of achieving particular objectives in relation to the needs of users. At thispoint of the development IIID is concerned with the design of visual informationbut it could in the future include the design of information other than visualone.” These two definitions were recommended by the 2nd IIID Conference in1994. They are also published in several issues of the ID News. The main concernof the IIID is to contribute to a better understanding within the human com-munity with respect to cultural and economic issues by means of improvedvisual communication. IIID is supported by UNESCO (1995), and endeavoursto develop information design as an independent interdisciplinary field ofknowledge and professional activities.
Thus information design is indeed an interdisciplinary field of knowledge,and as far as I have been able to find out it encompasses influences and facts
29
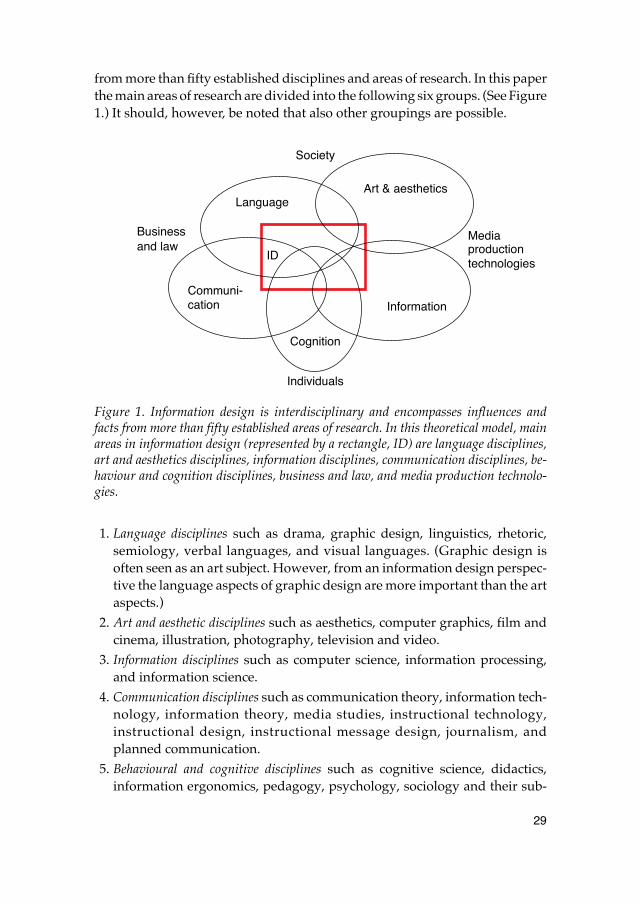
from more than fifty established disciplines and areas of research. In this paperthe main areas of research are divided into the following six groups. (See Figure1.) It should, however, be noted that also other groupings are possible.
Figure 1. Information design is interdisciplinary and encompasses influences andfacts from more than fifty established areas of research. In this theoretical model, mainareas in information design (represented by a rectangle, ID) are language disciplines,art and aesthetics disciplines, information disciplines, communication disciplines, be-haviour and cognition disciplines, business and law, and media production technolo-gies.
1. Language disciplines such as drama, graphic design, linguistics, rhetoric,semiology, verbal languages, and visual languages. (Graphic design isoften seen as an art subject. However, from an information design perspec-tive the language aspects of graphic design are more important than the artaspects.)
2. Art and aesthetic disciplines such as aesthetics, computer graphics, film andcinema, illustration, photography, television and video.
3. Information disciplines such as computer science, information processing,and information science.
4. Communication disciplines such as communication theory, information tech-nology, information theory, media studies, instructional technology,instructional design, instructional message design, journalism, andplanned communication.
5. Behavioural and cognitive disciplines such as cognitive science, didactics,information ergonomics, pedagogy, psychology, sociology and their sub-
Individuals
Business
Society
and lawMedia
technologiesproduction
Cognition
LanguageArt & aesthetics
Communi-Information
ID
cation
30
areas. The study of attention, perception, cognitive skills, and memory areespecially important. Some aspects deal with individuals, and some withthe societies in which we live.
6. Business and media production technology disciplines such as business eco-nomics and management, information economics, information manage-ment, law, and various technologies for production and distribution of dif-ferent media.
Thus information design does not primarily include areas like advertising,entertainment, fine arts, news or propaganda. Tufte (1990) noted that the prin-ciples of information design are universal, and are not tied to unique featuresof a particular language or culture. And IIID (op. cit.) noted that: “Special atten-tion is paid to the potential of graphic information design to overcome bothsocial and language barriers”.
In summary, the study of information design is a multi-disciplinary, a multi-dimensional and a worldwide consideration. We can view and describe infor-mation design from various perspectives, or research angles. In my view thefour most prominent perspectives are:
1. Areas of knowledge2. Parts of communication3. Types of presentation4. Information contexts
Areas of knowledgeAs previously noted the concept of information design is more wide-embracingthan the concepts of instructional design and instructional message design.Thus from a cognitive point of view, information design is less demanding thaninstructional design and instructional message design. In instructional designand instructional message design the receiver shall (usually) learn from the mes-sage. However, in information design the receiver shall be able to understandthe message in order to use the information in a practical situation. In manysituations this will, of course, also result in learning. But this is usually notrequired.
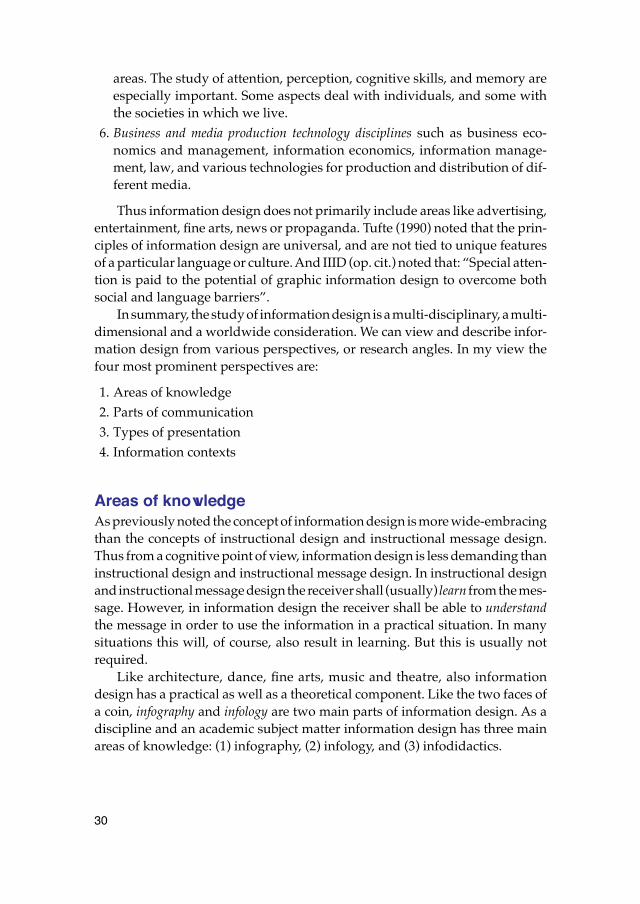
Like architecture, dance, fine arts, music and theatre, also informationdesign has a practical as well as a theoretical component. Like the two faces ofa coin, infography and infology are two main parts of information design. As adiscipline and an academic subject matter information design has three mainareas of knowledge: (1) infography, (2) infology, and (3) infodidactics.
31
Figure 2. Information design has three main areas of knowledge: (1) infography, (2)infology, and (3) infodidactics.
InfographyInfography is the actual, practical formation and execution of structured com-binations of text, pictures, and graphic design (Pettersson; 1989, 1993). The termwas initially used mainly for information graphics in newspapers and televi-sion, but have later been used in a wider perspective for formation and executionof all kinds of verbo-visual messages used for the presentation of informationin all media. The goal is to achieve excellent design skills. An information designer(or infographer) needs to have skills in writing comprehensible, clear and con-sistent texts, in creating clear illustrations, and in creating a clear, transparenttypography and layout that aids understanding and learning (Pettersson, 1997).The legibility of a graphical message is determined by the design of its text andpictures, as well as by their clarity. Usually a team of people with skills in thedifferent areas are working together. The task is usually too overwhelming fora single person.
Art is valued for its originality and expressiveness. Its focus is on individualartifacts crafted through the manual and aesthetic virtuosity of the artist.Design, in contrast, is valued for its fitness to a particular user and to a particulartask. Of course many designers may want to provide aesthetic experienceswhere possible, but the design aesthetic is always related to the intended func-tion of the information products intended for widespread distribution and use.
InfologyInfology is the science of verbo-visual presentation of information. On the basisof man’s prerequisites, infology encompasses studies of the way a verbo-visualrepresentation should be designed in order to achieve optimum communica-tions between sender and receiver (Pettersson, 1989, 1993). Infology models con-tain both theoretical (descriptive) elements and normative (prescriptive) ele-ments.
Producers of information and learning materials can facilitate communi-cation, and the learning processes of the readers. Complicated language, in bothtexts and pictures, will impair the understanding of the message. Active voice,clarity, comprehensibility, consistency, legibility, precision, readability, readingvalue, simplicity, and structure are the key concepts in information design. Any
1
2
3
32
graphical message shall be legible, readable, and well worth reading for theintended audience. Any audial message shall be audible, distinct, and wellworth listening to for the intended audience. The goal in information designshould be clarity of communication (Pettersson, 1997).
InfodidacticsInfodidactics is the methods used for teaching the various aspects of informationdesign. The huge spread among the different disciplines makes informationdesign an interesting, but also a complex area of research and teaching. The goalof all scientific enterprise is understanding. When we understand a subject mat-ter we are able to explain phenomena and predict new phenomena. Althoughinformation design theories frequently refer to descriptive theory and propo-sitions, their main function is to guide the information designers how to actuallydesign, present and produce information. In order to do this, it is important towork with problem-oriented learning in realistic projects; with existing and trueinformation problems, with regular senders, with actual information materials,and with real receivers that need the information. This also provides realisticexperience with budget and time limits.
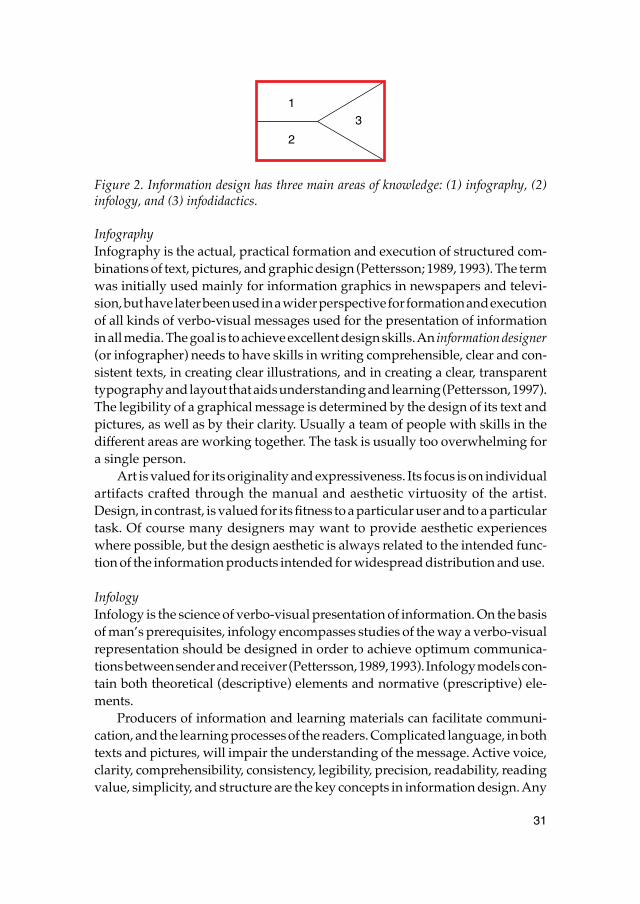
Parts of communicationInformation design encompasses studies of the way a representation shouldbe designed in order to achieve optimum communication between the senderand the receiver. Thus, some studies are concentrated on (1) the communicationsprocesses as such, some on (2) the sender, some on (3) the representation, andsome on (4) the receiver.
Figure 3. In information design some studies are concentrated on (1) the communica-tions processes as such (the whole ID-rectangle), some on (2) the sender, some on (3)the representation, and some on (4) the receiver.
The communications processesIn the information society, people are being exposed to an increasing volumeof messages from many different senders. The messages are transmitted fromsenders to receivers with the aid of different media. In all communications (evenin mass communication), many individuals are the recipients of the messages.Both texts and pictures can be interpreted in many different ways. As far as com-
42 31
33
munication of information is concerned, text, and pictures should therefore con-vey the same message/contents so as to reduce the number of potential inter-pretations and increase the learning effect. Captions are needed to tie down oneof many possible interpretations of pictures.
The senderThe production of a message commences with an idea occurring to someoneor with the need to convey information to an intended audience. When an out-line is ready, then the generation of text, draft sketches, editing, graphical design,the production of originals, masters, and, ultimately, a given quantity will begin.The sender produces a representation of reality. Other tasks for the sender arestock-keeping, distribution, marketing, advertising, selling, billing, book-keep-ing, etc. A message with a given form is conveyed by the sender to the receiverwith the aid of a medium. Today various media are undergoing comprehensive(technical) changes, changes in terms of production, duplication, stock-keeping,distribution, and presentation of messages. Some of these developments areproceeding in the same direction and working together. Others are on separatepaths. Some are even counteracting one another. In information design the taskof the sender is actually not completed until the receivers have received andunderstood the intended message.
The representationThis second part includes three areas of activities: analysing a verbo-visual mes-sage, studying the relationships of the message, and studying the developmentof new media. There are several different research questions at issue within eachof these areas.
The receiverThe receiver’s perception of a given message is not likely to coincide with thesender’s perception of, or intention for a given message. A number of studieshave shown that there is a considerable difference between intended and per-ceived messages. In one instance, the differences amounted to 22 units whena scale ranging from 0 to 100 was used (Pettersson, 1985).
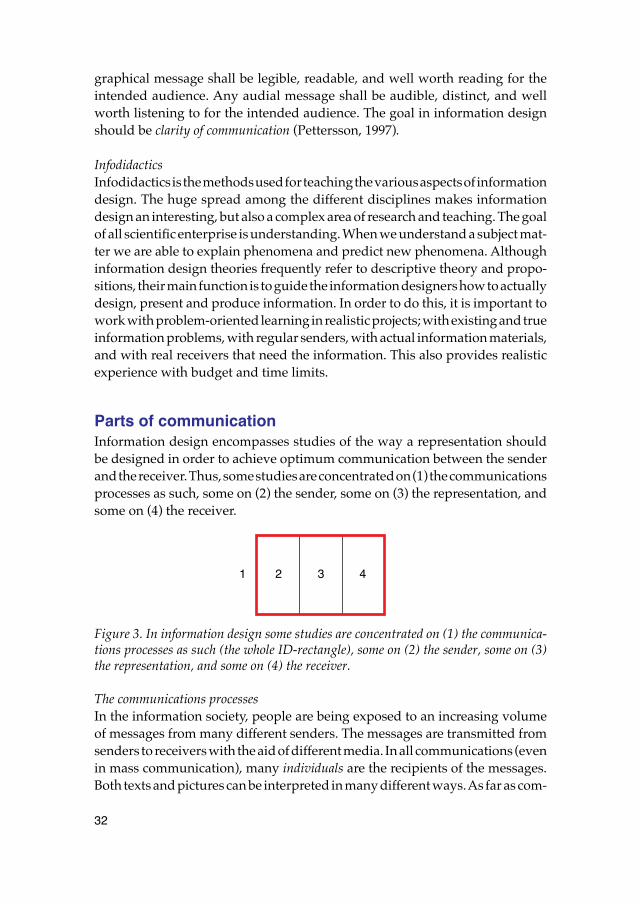
Types of presentationA verbo-visual representation can be designed in different ways. Based on howthe verbal information is presented to the receivers, we can distinguish threemain types of verbo-visual representations (Pettersson, 1989, 1993).
1. We read the printed words in lexi-visual representations, such as messagesprinted in a book or messages displayed on a computer screen.
34
2. We listen to the spoken words in audio-visual representations, such as oralpresentations with slides or overhead transparencies and in television pro-grammes.
3. We read printed words and listen to spoken words in a combination of lexi-visual and audio-visual representations in multi-visual representations, suchas interactive multimedia systems.
Figure 4. In information design some studies are concentrated on (1) lexi-visual rep-resentations, some on (2) audio-visual representations, and some on (3) multi-visualrepresentations.
Lexi-visual representationsInformation materials often consist of text. Probably no other instructionaldevice leads to more consistently beneficial results than does adding picturesto a text. There can be no doubt that pictures combined with texts can producestrong facilitative effects on retention and learning. These effects prove to bevalid for a broad range of texts, pictures, learner characteristics, and learningtasks (Levie and Lentz, 1982; Levin and Lesgold, 1978; Pettersson, 1989). Lexi-visual representations can be manually produced, “manual productions,” ormanufactured graphical media, “technical productions.” In each group thereare several ways of combining the verbal and the visual information.
Audio-visual representationsAudio-visual representations may consist of oral presentations and recordedrepresentations. In each group there are several ways of combining the verbaland the visual information.
Multi-visual representationsIn interactive systems and simulator systems it is possible to have an active coop-eration between lexi-visual and audio-visual representations. In each groupthere are several ways of combining the verbal and the visual information. Itis possible to create the total information material and the total teaching aidwith completely new dimensions (Pettersson, 1989).
1
2
3
35
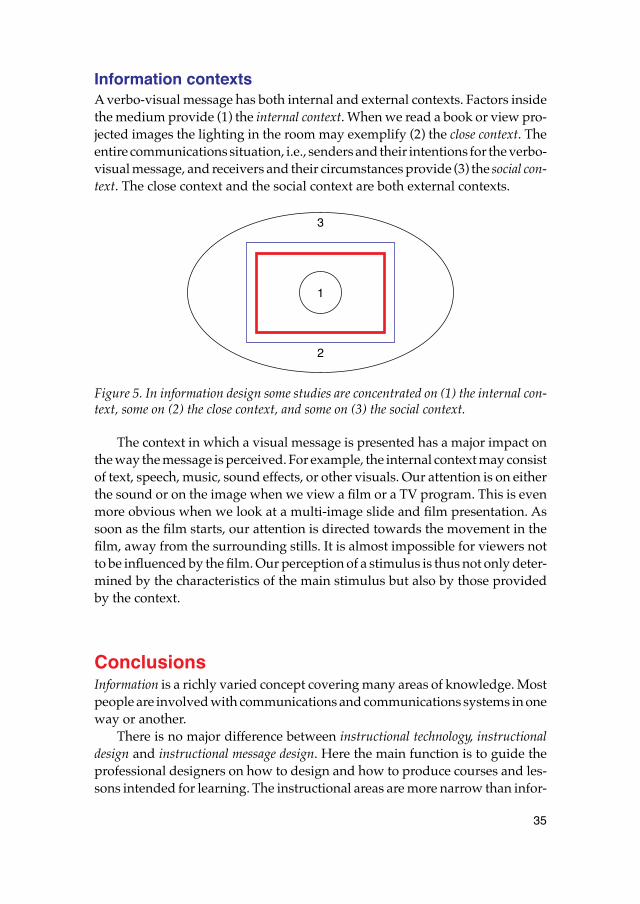
Information contextsA verbo-visual message has both internal and external contexts. Factors insidethe medium provide (1) the internal context. When we read a book or view pro-jected images the lighting in the room may exemplify (2) the close context. Theentire communications situation, i.e., senders and their intentions for the verbo-visual message, and receivers and their circumstances provide (3) the social con-text. The close context and the social context are both external contexts.
Figure 5. In information design some studies are concentrated on (1) the internal con-text, some on (2) the close context, and some on (3) the social context.
The context in which a visual message is presented has a major impact onthe way the message is perceived. For example, the internal context may consistof text, speech, music, sound effects, or other visuals. Our attention is on eitherthe sound or on the image when we view a film or a TV program. This is evenmore obvious when we look at a multi-image slide and film presentation. Assoon as the film starts, our attention is directed towards the movement in thefilm, away from the surrounding stills. It is almost impossible for viewers notto be influenced by the film. Our perception of a stimulus is thus not only deter-mined by the characteristics of the main stimulus but also by those providedby the context.
ConclusionsInformation is a richly varied concept covering many areas of knowledge. Mostpeople are involved with communications and communications systems in oneway or another.
There is no major difference between instructional technology, instructionaldesign and instructional message design. Here the main function is to guide theprofessional designers on how to design and how to produce courses and les-sons intended for learning. The instructional areas are more narrow than infor-
1
2
3
36
mation design. There is no major difference between communication design andinformation design.
In order to satisfy the information needs of the intended receivers infor-mation design comprises analysis, planning, presentation and understandingof a message—its content, language and form. Regardless of the selectedmedium, a well designed information material will satisfy aesthetic, economic,ergonomic, as well as subject matter requirements. Information design is amulti-disciplinary, multi-dimensional and worldwide consideration with influ-ences from areas such as language, art and aesthetics, information, communi-cation, behaviour and cognition, business and law, as well as media productiontechnologies. A well designed information material makes everyday life easierfor people, and it grants good credibility to the senders or sources.
ReferencesBrandt, J. (1997). det brinner av entusiasm på informationsdesign. Mälardalens
högskola: Eskilstuna.Briggs, L. J., & Wager, W. W. (1989) Handbook of procedures for the design of
instruction. Englewood Cliffs. N.J.(USA): Educational Technology Publica-tions.
Brown, L. (Ed.) (1993). The new Shorter Oxford English Dictionary on Historical Principles. Oxford: Clarendon Press.
Dijkstra, S., van Hout Wolters, B. H. A. M., & van der Sijde, P. C. (Eds.) (1990). Research on Instruction Design and Effects. Englewood Cliffs, NJ: Educational Technology Publications.
Easterby, R. & Zwaga, H. (Eds.) (1984). Information Design. The design and eval-uation of signs and printed material. John Wiley and Sons Ltd.
Fleming, M., & Levie, W. H. (1978). Instructional Message Design. Englewood Cliffs. N.J.: Educational Technology Publications.
Fleming, M. L., & Levie, W. H. (Eds.) (1993). Instructional Message Design (2nd ed.). Englewood Cliffs, NJ: Educational Technology Publications.
Gagné, R. W., & Briggs, L. J. (1974). Principles of Instructional Design. New York: Holt, Rinehart, & Winston.
Gagné, R. M., Briggs, L. J., & Wager, W. W. (1988). Principles of Instructional Design (Third Edition). New York: Holt, Rinehart, & Winston.
Glaser, R. (1966). The design of instruction. In J. I. Goodland (Ed.), The changing american school: NSSE 65th Yearbook. Chicago: University of Chicago Press.
Heinich, R., Molenda, M., & Russell, J. D. (1982). Instructional Media and the New Technologies of Instruction. New York: Macmillan
IDA, The Information Design Association. (1997). The origins of the IDA. http://www.popcomm.co.uk/ida/origins.html
37
IIID, International Institute for Information Design. (1997). International Insti-tute for Information Design. Definitions. http://www.simlinger–iiid.mag-net.at/simlinger–iiid/English–2.html
Levie, W. H., & Lentz, R. (1982). Effects of text illustrations: A review of research. ECTJ, 30, 4, 195–232.
Levin, J. R., & Lesgold, A. M. (1978). On pictures in prose. ECTJ, 26, 233–243.Lidman, S. , & Lund, A. M. (1972). Berätta med bilder. Stockholm: Bonniers.Marsh, P. O. (1983). Messages That Work: A Guide to Communication Design.
Englewood Cliffs, NJ: Educational Technology Publications.Mullet, K. & Sano, D. (1995). Designing Visual Interfaces Communication Ori-
ented Techniques. Mountain View, California: SunSoft Press A Prentice Hall Title.
Pettersson, R. (1985). Intended and perceived image content. Presentation at the 17th Annual Conference of the International Visual Literacy Association. Claremont. Nov. 1–2. In L. W. Miller (Ed.). (1986). Creating Meaning. Read-ings from the Visual Literacy Conference at California State Polytechnic Univer-sity at Pomona (pp. 11-15).
Pettersson, R. (1989). Visuals for Information, Research and practice. Englewood Cliffs. N.J.(USA): Educational Technology Publications.
Pettersson, R. (1993). Visual Information. Englewood Cliffs, NJ: Educational Technology Publications.
Pettersson, R. (1996). Verbo-Visual Communication. Presentation at the 4th International Research Symposium on Visual Verbal Literacy, Process and Product: Media Education in Praxis, The Rijkshogeschool, IJselland, and the International Visual Literacy Association, Deventer, Holland, May 6- 11, 1996. In T. Velders (Ed.) (1996). Beeldenstorm in Deventer. Multimedia Education in Praxis. Selected Readings (pp. 143-148). Deventer.
Pettersson, R. (1997). Verbo-visual Communication – Presentation of Clear Mes-sages for Information and Learning. Göteborg: Valfrid Publishing Association and Research Centre for Library and Information Studies, Göteborg Uni-versity.
Reigeluth, C. M. (1983). Instructional design: What is it and why is it? In C. M. Reigeluth (Ed.), Instructional design theories and models: An overview of their current status. Hillsdale, NJ: Lawrence Erlbaum Associates.
Reigeluth, C. M. (1987). Instructional theories in action: Lessons illustrating selected theories and models. Hillsdale, NJ: Lawrence Erlbaum Associates.
School of Design at Carnegie Mellon University. (1997). Design @ Carnegie Mel-lon. Programs. Bachelor of Fine Arts. Communication Design. http://www.cmu.edu/cfa/design/programs/cd/cd.html
Shannon, C. E., & Weaver, W. (1949). The Mathematical Theory of Communica-tion. Champaign, IL: The University of Illinois Press.
Tufte, E. R. (1983). The Visual Display of Quantitative Information. Cheshire, CT: Graphics Press.

38
Tufte, E. R. (1990). Envisioning Information. Graphics Press: New Haven Con-neticut.
UNESCO. (1995). Co-operation on matters in Information Design. Resolution 4.9 of the 28th General Conference of UNESCO, Paris.
Warries, E. (1990). Theory and the Systematic Design of Instruction. In S. Dijkstra, B. H. A. M. van Hout Wolters, & P. C. van der Sijde, (Eds.) (1990). Research on Instruction Design and Effects (pp. 1-20). Englewood Cliffs, NJ: Educa-tional Technology Publications.
Wileman, R. E. (1993). Visual Communicating. Englewood Cliffs, NJ: Educa-tional Technology Publications.
39
Paper 3
Objectives
Abstract. After a short introduction this paper deals with “The objectives dimensionin message design”. Various areas of design have different objectives, and the materi-als and products reach out to different groups of receivers. Message objectives dia-grams may be used to map various information sets.
In the design of messages, information materials, information sets, or repre-sentations the designer makes certain information available for different groupsof people. An information set may be a book, a paper, a poster, a symbol on asignpost, a web-page, and many other products. In each case the designer mayhave clear intentions and objectives with the information content. However, itis always up to the individual interpreter to conceive or misconceive the avail-able information, to use or not use it, to use or misuse it.
• In graphic design the main intentions are to provide functional, aesthetic,and organised structure to all kinds of information sets. The interpreter/smay develop new views, relaxation, emotions, awareness, attention, andunderstanding.
• In persuasive design the main intentions are to provide advertising or propa-ganda in order to persuade interpreters to buy a product or a service, or tochange behaviour. The interpreter/s may develop new prejudices, appre-hensions, willingness to buy, beliefs, reinforced attitudes, emotions, opin-ions, and views.
• In mass design the main intentions are to provide news, views, and enter-tainment. The interpreter/s may develop views, relaxation, emotions, andawareness.
• In information design the main intentions are to provide information materi-als needed by the interpreter in order to perform a specific task. The inter-preter/s may develop new skills, understanding, and experience.
• In instruction design the main intentions are to provide courses and learningmaterials needed by the interpreter in order to modify behaviour withrespect to learning. The interpreter/s may develop new understanding,experience, comprehension, knowledge, insight, and finally wisdom.
40
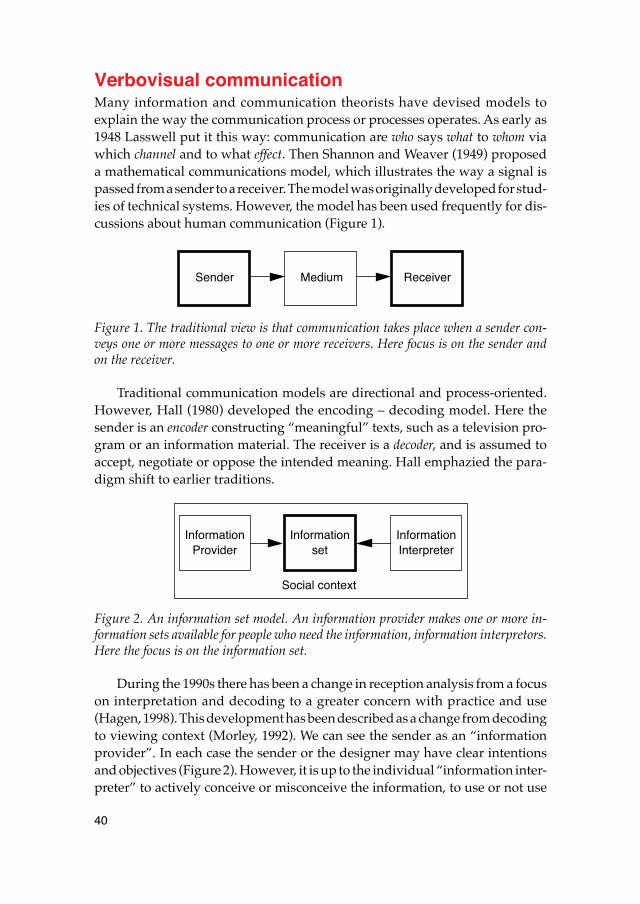
Verbovisual communicationMany information and communication theorists have devised models toexplain the way the communication process or processes operates. As early as1948 Lasswell put it this way: communication are who says what to whom viawhich channel and to what effect. Then Shannon and Weaver (1949) proposeda mathematical communications model, which illustrates the way a signal ispassed from a sender to a receiver. The model was originally developed for stud-ies of technical systems. However, the model has been used frequently for dis-cussions about human communication (Figure 1).
Figure 1. The traditional view is that communication takes place when a sender con-veys one or more messages to one or more receivers. Here focus is on the sender andon the receiver.
Traditional communication models are directional and process-oriented.However, Hall (1980) developed the encoding – decoding model. Here thesender is an encoder constructing “meaningful” texts, such as a television pro-gram or an information material. The receiver is a decoder, and is assumed toaccept, negotiate or oppose the intended meaning. Hall emphazied the para-digm shift to earlier traditions.
Figure 2. An information set model. An information provider makes one or more in-formation sets available for people who need the information, information interpretors.Here the focus is on the information set.
During the 1990s there has been a change in reception analysis from a focuson interpretation and decoding to a greater concern with practice and use(Hagen, 1998). This development has been described as a change from decodingto viewing context (Morley, 1992). We can see the sender as an “informationprovider”. In each case the sender or the designer may have clear intentionsand objectives (Figure 2). However, it is up to the individual “information inter-preter” to actively conceive or misconceive the information, to use or not use
ReceiverSender Medium
Information InformationInformationset
Social context
Provider Interpreter
41
it, to use or misuse it. This view is specially valid for information sets that peoplemake available to an unknown audience, e.g. on the Internet and the WWW.Here it is usually not possible to know much about the people who search for,and use the information.
Design of information sets There are many kinds of information materials in modern society. We may seeinformation sets in most areas of human activities. Here are some importantcategories of information sets.
1. Administrative information2. Consumer information3. Economical information4. Geographical information5. Information on goods and products6. Information on pharmaceutical preparations and drugs 7. Social information8. Technical information9. Tourist information
Different media may be used to carry and hold the information content inany information set. Here are some examples:
1. Signs, information signs, sign-posts2. Posters, information sheets, booklets, brochures3. Catalogues, manuals, non-fiction books4. Package, wrapping5. Sound tape, CD-records, radio6. AV-materials, slides, OH-transparencies7. film, video, TV8. WWW-home pages9. Exhibitions
Different skills and experiences may be needed in order to produce infor-mation sets that work. There are several academic disciplines that may con-tribute with data and information that is useful for the designer. To some extent“information set design”, or “message design” disciplines are similar. However,there are also some important differences between them.
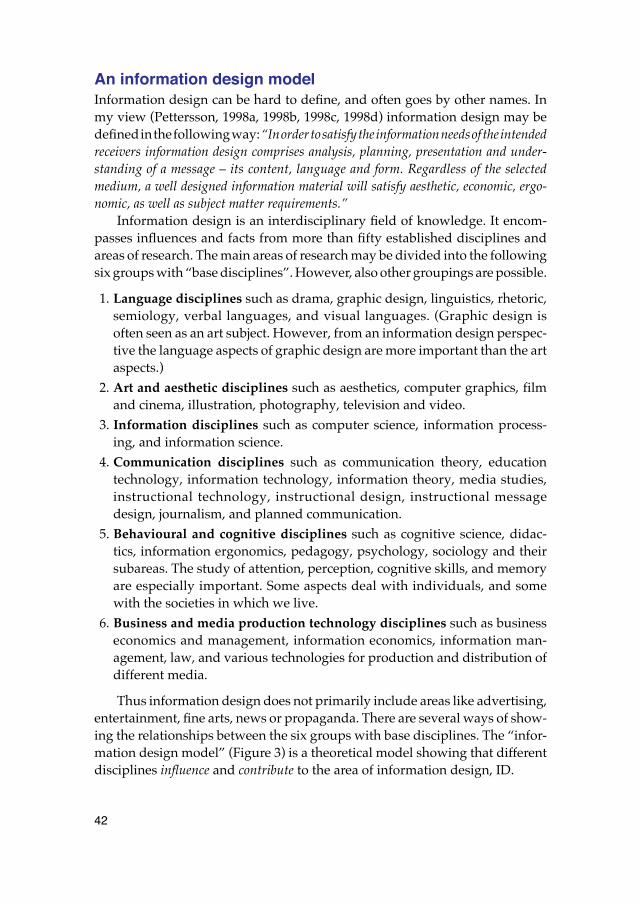
42
An information design modelInformation design can be hard to define, and often goes by other names. Inmy view (Pettersson, 1998a, 1998b, 1998c, 1998d) information design may bedefined in the following way: “In order to satisfy the information needs of the intendedreceivers information design comprises analysis, planning, presentation and under-standing of a message – its content, language and form. Regardless of the selectedmedium, a well designed information material will satisfy aesthetic, economic, ergo-nomic, as well as subject matter requirements.”
Information design is an interdisciplinary field of knowledge. It encom-passes influences and facts from more than fifty established disciplines andareas of research. The main areas of research may be divided into the followingsix groups with “base disciplines”. However, also other groupings are possible.
1. Language disciplines such as drama, graphic design, linguistics, rhetoric,semiology, verbal languages, and visual languages. (Graphic design isoften seen as an art subject. However, from an information design perspec-tive the language aspects of graphic design are more important than the artaspects.)
2. Art and aesthetic disciplines such as aesthetics, computer graphics, filmand cinema, illustration, photography, television and video.
3. Information disciplines such as computer science, information process-ing, and information science.
4. Communication disciplines such as communication theory, educationtechnology, information technology, information theory, media studies,instructional technology, instructional design, instructional messagedesign, journalism, and planned communication.
5. Behavioural and cognitive disciplines such as cognitive science, didac-tics, information ergonomics, pedagogy, psychology, sociology and theirsubareas. The study of attention, perception, cognitive skills, and memoryare especially important. Some aspects deal with individuals, and somewith the societies in which we live.
6. Business and media production technology disciplines such as businesseconomics and management, information economics, information man-agement, law, and various technologies for production and distribution ofdifferent media.
Thus information design does not primarily include areas like advertising,entertainment, fine arts, news or propaganda. There are several ways of show-ing the relationships between the six groups with base disciplines. The “infor-mation design model” (Figure 3) is a theoretical model showing that differentdisciplines influence and contribute to the area of information design, ID.
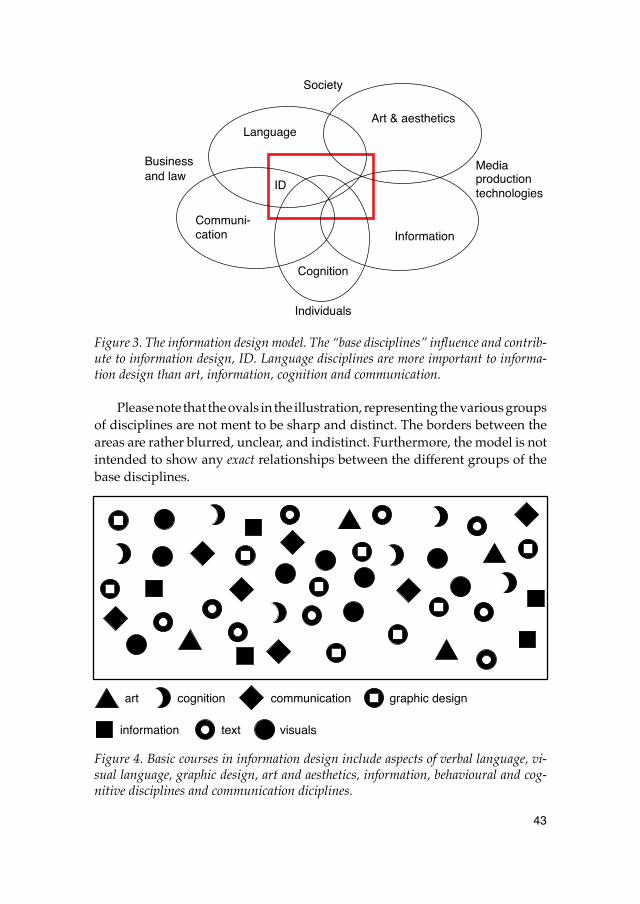
43
Figure 3. The information design model. The “base disciplines” influence and contrib-ute to information design, ID. Language disciplines are more important to informa-tion design than art, information, cognition and communication.
Please note that the ovals in the illustration, representing the various groupsof disciplines are not ment to be sharp and distinct. The borders between theareas are rather blurred, unclear, and indistinct. Furthermore, the model is notintended to show any exact relationships between the different groups of thebase disciplines.
Figure 4. Basic courses in information design include aspects of verbal language, vi-sual language, graphic design, art and aesthetics, information, behavioural and cog-nitive disciplines and communication diciplines.
Individuals
Business
Society
and lawMedia
technologiesproduction
Cognition
LanguageArt & aesthetics
Communi-Information
ID
cation
visualstext
graphic designart cognition communication
information
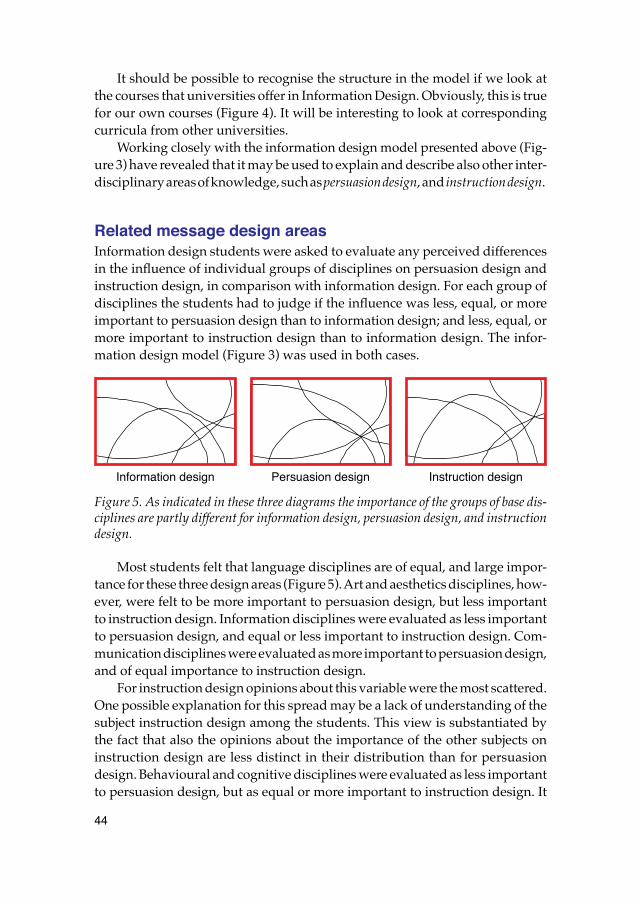
44
It should be possible to recognise the structure in the model if we look atthe courses that universities offer in Information Design. Obviously, this is truefor our own courses (Figure 4). It will be interesting to look at correspondingcurricula from other universities.
Working closely with the information design model presented above (Fig-ure 3) have revealed that it may be used to explain and describe also other inter-disciplinary areas of knowledge, such as persuasion design, and instruction design.
Related message design areasInformation design students were asked to evaluate any perceived differencesin the influence of individual groups of disciplines on persuasion design andinstruction design, in comparison with information design. For each group ofdisciplines the students had to judge if the influence was less, equal, or moreimportant to persuasion design than to information design; and less, equal, ormore important to instruction design than to information design. The infor-mation design model (Figure 3) was used in both cases.
Figure 5. As indicated in these three diagrams the importance of the groups of base dis-ciplines are partly different for information design, persuasion design, and instructiondesign.
Most students felt that language disciplines are of equal, and large impor-tance for these three design areas (Figure 5). Art and aesthetics disciplines, how-ever, were felt to be more important to persuasion design, but less importantto instruction design. Information disciplines were evaluated as less importantto persuasion design, and equal or less important to instruction design. Com-munication disciplines were evaluated as more important to persuasion design,and of equal importance to instruction design.
For instruction design opinions about this variable were the most scattered.One possible explanation for this spread may be a lack of understanding of thesubject instruction design among the students. This view is substantiated bythe fact that also the opinions about the importance of the other subjects oninstruction design are less distinct in their distribution than for persuasiondesign. Behavioural and cognitive disciplines were evaluated as less importantto persuasion design, but as equal or more important to instruction design. It
Information design Persuasion design Instruction design
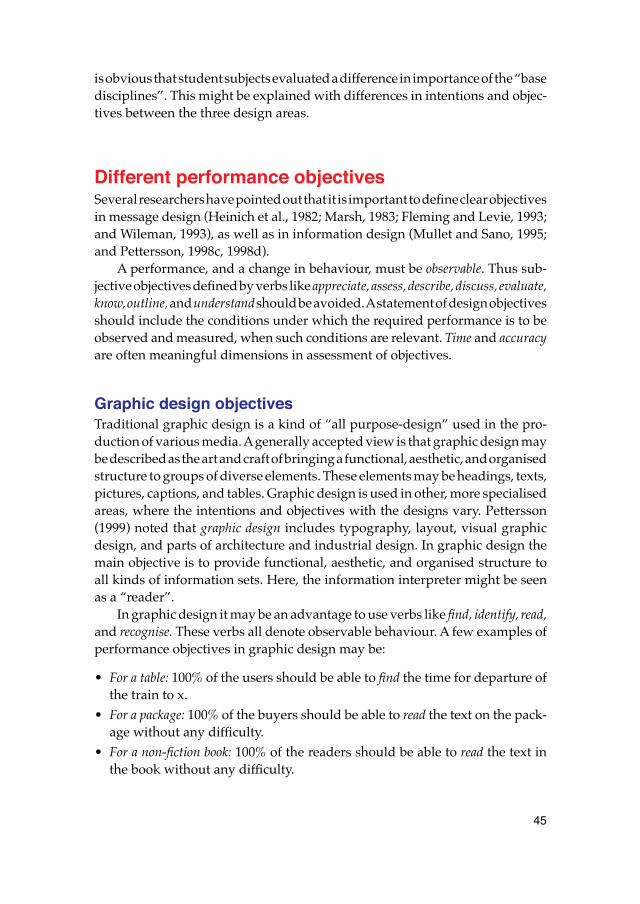
45
is obvious that student subjects evaluated a difference in importance of the “basedisciplines”. This might be explained with differences in intentions and objec-tives between the three design areas.
Different performance objectivesSeveral researchers have pointed out that it is important to define clear objectivesin message design (Heinich et al., 1982; Marsh, 1983; Fleming and Levie, 1993;and Wileman, 1993), as well as in information design (Mullet and Sano, 1995;and Pettersson, 1998c, 1998d).
A performance, and a change in behaviour, must be observable. Thus sub-jective objectives defined by verbs like appreciate, assess, describe, discuss, evaluate,know, outline, and understand should be avoided. A statement of design objectivesshould include the conditions under which the required performance is to beobserved and measured, when such conditions are relevant. Time and accuracyare often meaningful dimensions in assessment of objectives.
Graphic design objectivesTraditional graphic design is a kind of “all purpose-design” used in the pro-duction of various media. A generally accepted view is that graphic design maybe described as the art and craft of bringing a functional, aesthetic, and organisedstructure to groups of diverse elements. These elements may be headings, texts,pictures, captions, and tables. Graphic design is used in other, more specialisedareas, where the intentions and objectives with the designs vary. Pettersson(1999) noted that graphic design includes typography, layout, visual graphicdesign, and parts of architecture and industrial design. In graphic design themain objective is to provide functional, aesthetic, and organised structure toall kinds of information sets. Here, the information interpreter might be seenas a “reader”.
In graphic design it may be an advantage to use verbs like find, identify, read,and recognise. These verbs all denote observable behaviour. A few examples ofperformance objectives in graphic design may be:
• For a table: 100% of the users should be able to find the time for departure ofthe train to x.
• For a package: 100% of the buyers should be able to read the text on the pack-age without any difficulty.
• For a non-fiction book: 100% of the readers should be able to read the text inthe book without any difficulty.
46
• For a logotype: 60% of the readers should be able to identify a new logotypewithin six weeks.
Of course the actual numbers, with respect to percent and allowed time,have to be decided in each specific case.
Mass design objectivesMass design includes aspects from communication studies, mass-communica-tion, media studies, and journalism. Here the main intentions are to providenews, views, and entertainment. The information interpreter might be seen asa “relaxer”.
In mass design it may be an advantage to use verbs like feel, laugh, look, read,and relax. These verbs all denote observable behaviour. A few examples of per-formance objectives in graphic design may be:
• For a magazine: 100% of the readers should be able to read the text in the mag-azine without any difficulty.
• For news on television: 70% of the subscribers should look at the program atleast once every day.
• For entertainment on television: 80% of the viewers should have fun and laughat the jokes.
The actual numbers, with respect to percent and allowed time, have to bedecided in each specific case.
Persuasion design objectivesIn persuasion design the main objective is to persuade the receiver, or ratherthe “interpreter of the message,” to buy a product or a service, or to change hisor her behaviour. Persuasive design includes knowledge areas like advertising,propaganda, planned communication and persuasive communication. Theinformation interpreter might be seen as a “possible buyer”, a “prospect”.
In persuasive design it may be an advantage to use verbs like appreciate,believe, buy, change (behaviour), desire, dread, fear, feel (relaxed), hate, and have (fun)in the writing of persuasion design objectives. These verbs all denote observablebehaviour. A few examples of performance objectives in persuasion design maybe:
• For a warning: 90% of the viewers should change their behaviour when theyhave seen the information once.
• For a new product: 75% of the viewers should desire their own sample of theproduct when they have seen the information twice.
47
• In propaganda: 90% of the population should hate a specific behaviour whenthey have heard the arguments.
• In advertising: 50% of the readers should buy the new consumer productwithin two weeks.
• In marketing: The market share for a particular product must increase fromten to 25% within one year.
The actual numbers, with respect to percent and allowed time, have to bedecided in each specific case.
Information design objectivesInformation design includes knowledge areas like technical illustration, tech-nical writing, technical communication, informative layout, lexi-visual layout,communication design, visual interface design, and parts of information ergo-nomics, and design of graphical user interfaces. In information design the mainobjective is to provide information materials needed by the interpreter in orderto perform specific tasks. The information interpreter might be seen as a “doer”.
In information design it may be an advantage to use verbs like apply, arrange,assemble, build, change, code, complete, compose, conduct, construct, cut, demonstrate,develop, draw, explain, find, generate, get, identify, illustrate, install, label, locate, make,modify, name, operate, pack, paste, predict, prepare, produce, put, read, recognise, recon-struct, remove, revise, sort, specify, start, type, verify, and write in the writing ofinformation design objectives. These verbs all denote observable behaviour. Afew examples of performance objectives in information design may be:
• For a computer interface: 95% of the users should be able to start a new appli-cation within five minutes.
• For an exhibition: 90% of adult visitors should be able to read the texts onlabels used in the exhibition without any difficulty.
• For an instruction: 90% of the customers should be able to follow the instruc-tions, put the different parts together, and build a complete set of furniturewithin 15 minutes.
• For a list: 90% of the users should be able to get correct information aboutflight departure and arrival times within two minutes.
• For a manual: 80% of the customers should be able to install the new com-puter software within 15 minutes.
• For a traffic information system: 100% of motorists should recognise the signswhile they are passing during night.
The actual numbers, with respect to percent and allowed time, have to bedecided in each specific case.
48
When performance is qualitative rather than quantitative, the performancemay be assessed by a group of experts. It should be noted that there is an increas-ing incidence of law suits being brought against manufacturers in the USA.These law suits claim damages as a result of accidents occurring, or productsbreaking because of poor quality in the language of instruction manuals (Helyar,1992). The courts are demanding that technical manuals, brochures, informationsheets, and labels be written in comprehensible language, and that descriptionsand instructions be readable and legible. Everywhere, plaintiffs' counsels aresearching frenetically for sections of text and parts of pictures that might be inter-preted in conflicting ways. If a manufacturer's technical documentation is dif-ficult to understand, he can lose a lawsuit and then have to pay large sums ofmoney.
Instruction design objectivesInstruction design includes knowledge areas like audio-visual instruction, edu-cational technology, instructional technology, visual literacy, technology ofinstruction, instructional design, instructional message design, and design ofinstructional materials . In instruction design the main objective is to providecourses and learning materials needed by the interpreter in order to modifybehaviour with respect to learning. The information interpreter might be seenas a “learner”.
In instruction design it may be an advantage to use verbs like apply, arrange,complete, compose, conduct, construct, define, demonstrate, explain, find, identify,illustrate, label, modify, name, predict, prepare, recognise, reconstruct, revise, specify,verify, and write in the writing of instruction design objectives. These verbs alldenote observable behaviour. A few examples of performance objectives ininstruction design may be:
• For an exercise: 100% of the students should be able to complete a the exercisewithin 15 minutes.
• For an excursion: 100% of the students should be able to identify and namefive of the most common flowers in the area during the excursion.
• For an experiment: 90% of the students should be able to explain the varioussteps in the experiment.
• For an educational video program: 90% of the students should be able to illus-trate the main topic in the program.
• For a textbook: 90% of the users should be able to reconstruct a segment of atext within ten minutes.
• For a textbook: 90% of the users should be able to explain four ideas presentedin the text.
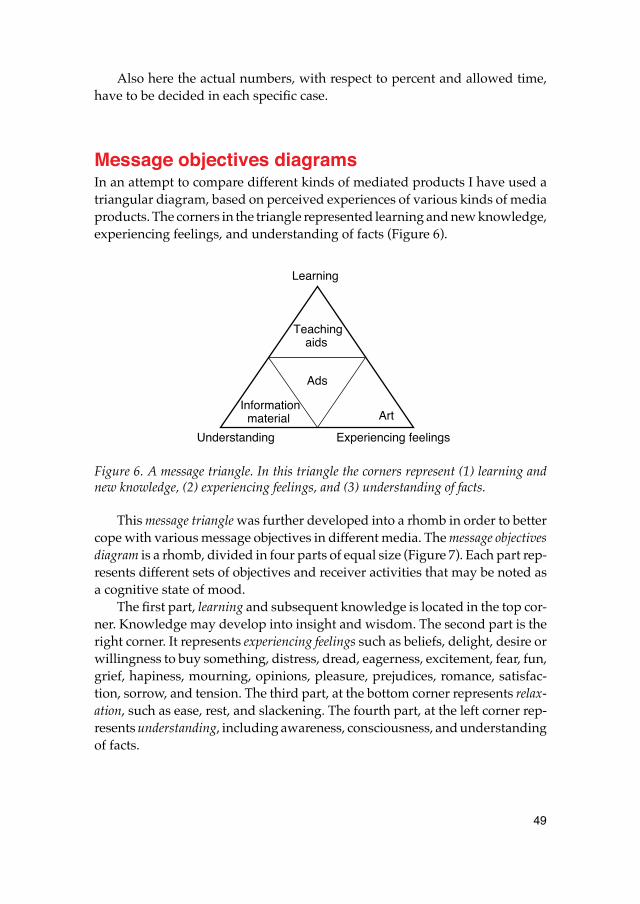
49
Also here the actual numbers, with respect to percent and allowed time,have to be decided in each specific case.
Message objectives diagramsIn an attempt to compare different kinds of mediated products I have used atriangular diagram, based on perceived experiences of various kinds of mediaproducts. The corners in the triangle represented learning and new knowledge,experiencing feelings, and understanding of facts (Figure 6).
Figure 6. A message triangle. In this triangle the corners represent (1) learning andnew knowledge, (2) experiencing feelings, and (3) understanding of facts.
This message triangle was further developed into a rhomb in order to bettercope with various message objectives in different media. The message objectivesdiagram is a rhomb, divided in four parts of equal size (Figure 7). Each part rep-resents different sets of objectives and receiver activities that may be noted asa cognitive state of mood.
The first part, learning and subsequent knowledge is located in the top cor-ner. Knowledge may develop into insight and wisdom. The second part is theright corner. It represents experiencing feelings such as beliefs, delight, desire orwillingness to buy something, distress, dread, eagerness, excitement, fear, fun,grief, hapiness, mourning, opinions, pleasure, prejudices, romance, satisfac-tion, sorrow, and tension. The third part, at the bottom corner represents relax-ation, such as ease, rest, and slackening. The fourth part, at the left corner rep-resents understanding, including awareness, consciousness, and understandingof facts.
Understanding
Learning
Experiencing feelings
Teaching
Art Information
material
aids
Ads
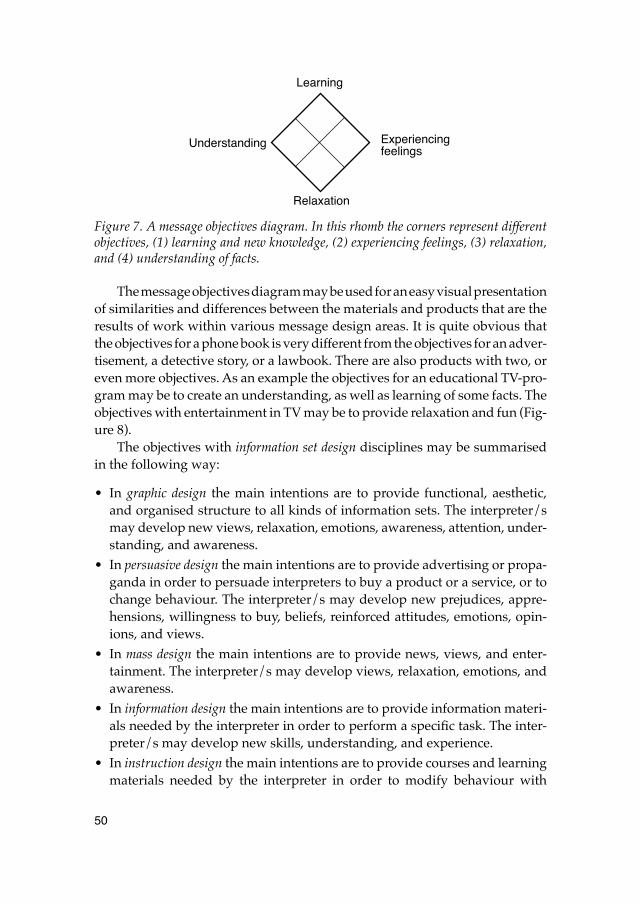
50
Figure 7. A message objectives diagram. In this rhomb the corners represent differentobjectives, (1) learning and new knowledge, (2) experiencing feelings, (3) relaxation,and (4) understanding of facts.
The message objectives diagram may be used for an easy visual presentationof similarities and differences between the materials and products that are theresults of work within various message design areas. It is quite obvious thatthe objectives for a phone book is very different from the objectives for an adver-tisement, a detective story, or a lawbook. There are also products with two, oreven more objectives. As an example the objectives for an educational TV-pro-gram may be to create an understanding, as well as learning of some facts. Theobjectives with entertainment in TV may be to provide relaxation and fun (Fig-ure 8).
The objectives with information set design disciplines may be summarisedin the following way:
• In graphic design the main intentions are to provide functional, aesthetic,and organised structure to all kinds of information sets. The interpreter/smay develop new views, relaxation, emotions, awareness, attention, under-standing, and awareness.
• In persuasive design the main intentions are to provide advertising or propa-ganda in order to persuade interpreters to buy a product or a service, or tochange behaviour. The interpreter/s may develop new prejudices, appre-hensions, willingness to buy, beliefs, reinforced attitudes, emotions, opin-ions, and views.
• In mass design the main intentions are to provide news, views, and enter-tainment. The interpreter/s may develop views, relaxation, emotions, andawareness.
• In information design the main intentions are to provide information materi-als needed by the interpreter in order to perform a specific task. The inter-preter/s may develop new skills, understanding, and experience.
• In instruction design the main intentions are to provide courses and learningmaterials needed by the interpreter in order to modify behaviour with
Understanding
Learning
Experiencing
Relaxation
feelings
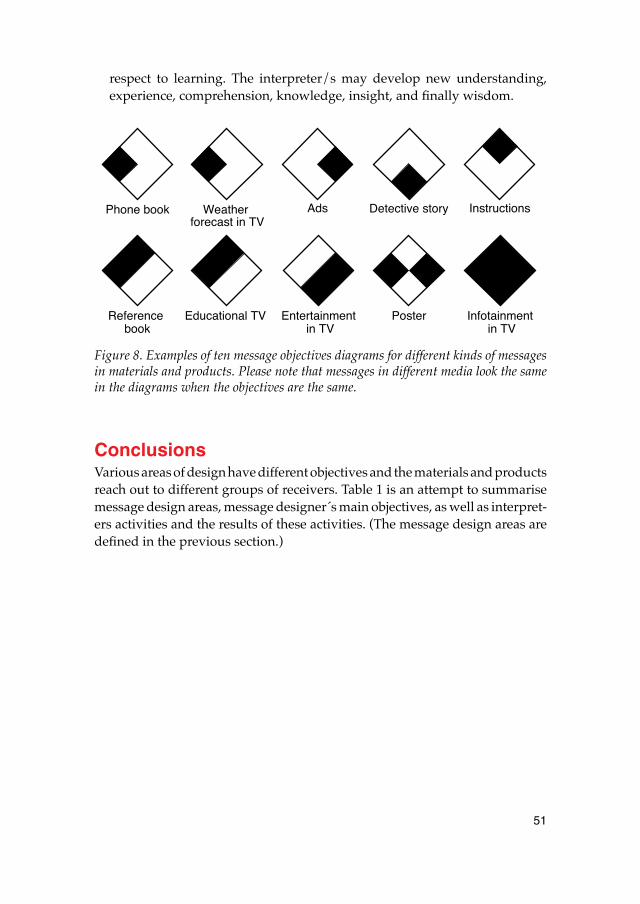
51
respect to learning. The interpreter/s may develop new understanding,experience, comprehension, knowledge, insight, and finally wisdom.
Figure 8. Examples of ten message objectives diagrams for different kinds of messagesin materials and products. Please note that messages in different media look the samein the diagrams when the objectives are the same.
ConclusionsVarious areas of design have different objectives and the materials and productsreach out to different groups of receivers. Table 1 is an attempt to summarisemessage design areas, message designer´s main objectives, as well as interpret-ers activities and the results of these activities. (The message design areas aredefined in the previous section.)
Phone book Ads Detective story
PosterReference
Instructions
InfotainmentEntertainment
Weather
Educational TV
forecast in TV
book in TV in TV
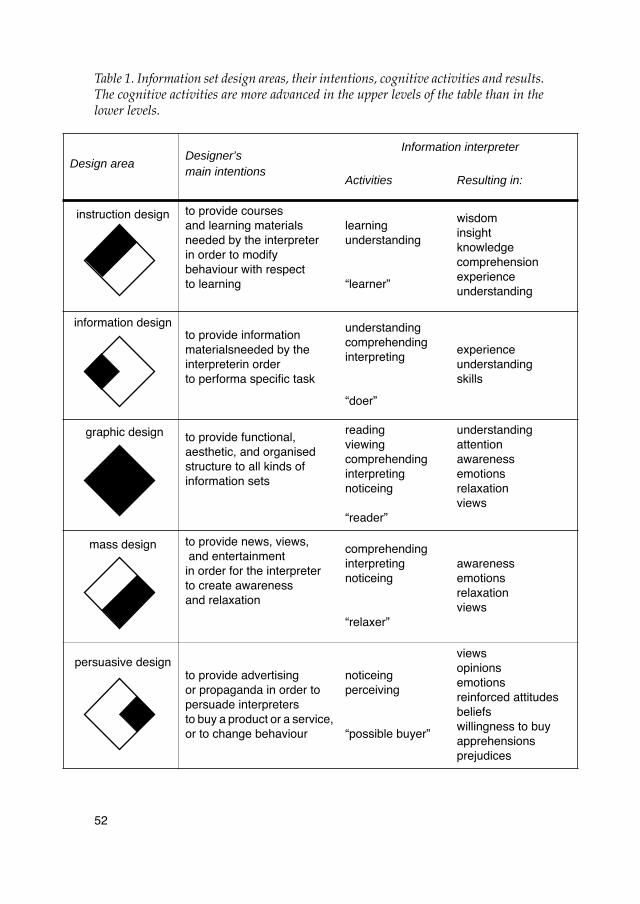
52
Table 1. Information set design areas, their intentions, cognitive activities and results. The cognitive activities are more advanced in the upper levels of the table than in the lower levels.
Design areaDesigner’s main intentions
Information interpreter
Activities Resulting in:
instruction design to provide coursesand learning materials needed by the interpreterin order to modify behaviour with respect to learning
learningunderstanding
“learner”
wisdominsightknowledgecomprehensionexperienceunderstanding
information designto provide informationmaterialsneeded by the interpreterin order to performa specific task
understandingcomprehendinginterpreting
“doer”
experienceunderstandingskills
graphic design to provide functional, aesthetic, and organisedstructure to all kinds ofinformation sets
readingviewingcomprehendinginterpretingnoticeing
“reader”
understandingattentionawarenessemotionsrelaxationviews
mass design to provide news, views, and entertainment in order for the interpreter to create awareness and relaxation
comprehendinginterpretingnoticeing
“relaxer”
awarenessemotionsrelaxationviews
persuasive designto provide advertisingor propaganda in order to persuade interpretersto buy a product or a service, or to change behaviour
noticeingperceiving
“possible buyer”
viewsopinionsemotionsreinforced attitudesbeliefswillingness to buyapprehensionsprejudices
53
ReferencesFleming, M. L., & Levie, W. H. (1978). Instructional Message Design. Englewood
Cliffs, NJ: Educational Technology Publications.Fleming, M. L., & Levie, W. H. (Eds.) (1993). Instructional Message Design (2nd
ed.). Englewood Cliffs, NJ: Educational Technology Publications.Hagen, I. (1998). Creation of Socio—Cultural Meaning. Media Reception Research
and Cognitive Psychology. In B. Höijer and A. Werner (Eds.). Cultural Cogni-tion. New perspectives in audience theory. NORDICOM: Göteborg University.
Hall, S. (1980). Encoding/Decoding. In S. HAll, D. Dobson, A. Lowe, and P. Wil-lis (Eds.). Culture, Media, Language. London: Hutchinson.
Heinich, R., Molenda, M., & Russell, J. D. (1982). Instructional Media and the New Technologies of Instruction. New York: Macmillan
Helyar, P. S. (1992). Products Liability: Meeting Legal Standards for Adequate Instructions. Journal of Technical Writing and Communication. 22, 2, 125-147.
Lasswell, H. (1948). The structure and function of communication in society. In L. Bryson (Ed.). The Communication of Ideas. New York: Harper & Brothers.
Marsh, P. O. (1983). Messages That Work: A Guide to Communication Design. Englewood Cliffs, NJ: Educational Technology Publications.
Morley, D. (1992). Television, Audiences and Cultural Studies. London: Rout-ledge.
Mullet, K. & Sano, D. (1995). Designing Visual Interfaces Communication Ori-ented Techniques. Mountain View, California: SunSoft Press A Prentice Hall Title.
Pettersson, R. (1998a). What is Information Design? Presentation at Vision Plus 4. The Republic of Information. Carnegie Mellon University, Pittsburgh, Pennsylvania, March 26 - 29. Printed in Proceedings Book, The Republic of Information, Vision Plus 4. Carnegie Mellon University, School of Design & International Institute for Information Design, 58 - 74.
Pettersson, R. (1998b). Beyond Literacy. Presentation at InfoDesign98, Informa-tion Design & the Learning Society, Cambridge University, April 20-21, 1998.
Pettersson, R. (1998c). Information Design and Learning. Presentation at Vision Plus 5. Learning meets Information Design, Information Design meets Learning. International Institute for Information Design, Fachhochschul-Studiengänge-Vorarlberg, Austrian Federal Ministry of Science and Trans-portation, Ministry of Education and Art, UNESCO. Schwarzenberg, Vorarlberg, Austria, July 2-4, 1998.
Pettersson, R. (1998d). Information Design. Västerås: Mälardalens Högskola Research & Reports. Opuscula Nr 36.

54
Pettersson, R. (1999). Visual Information Verbo-Visual Communications. Presen-tation at CONTACTO VISUAL, XIV congreso diseno grafico, Universidad de las Americas, Cholula, Puebla, Mexico, February 24-27, 1999.
Shannon, C. E., & Weaver, W. (1949). The Mathematical Theory of Communica-tion. Champaign, IL: The University of Illinois Press.
Wileman, R. E. (1993). Visual Communicating. Englewood Cliffs, NJ: Educa-tional Technology Publications.
55
Paper 4
Gearing communications
Abstract. Knowledge of graphic design, information design, visual communication,visual language, and visual literacy might be important for our ability to better pro-duce effective messages — “messages that really work”. In this study eight groups ofID students ranked lists of “information design characteristics”, a total of 50 researchfindings. These masters students were asked to discuss and rank how they perceive theimportance of research findings related to (1) sender processes, (2) text design, (3)image design, (4) graphic design, and (5) receiver processes.
We need many information utility goods in order to perform our tasks at work.We also need an increasing amount of information materials during our leisuretime, in order to be able to handle things like cameras, cars, CD-players, com-puters, computer software, etc. A well designed information material makeseveryday life easier for people, and it grants good credibility to the senders orsources. Information design may be described in the following way:
In order to satisfy the information needs of the intended receivers infor-mation design comprises analysis, planning, presentation and under-standing of a message – its content, language and form. Regardless of theselected medium, a well designed information set will satisfy aesthetic,economic, ergonomic, as well as subject matter requirements. (Petters-son, 1998a, 2002)
Information design is a multi-disciplinary, multi-dimensional, and world-wide consideration with influences from areas such as language, art and aes-thetics, information, communication, behaviour and cognition, business andlaw, as well as media production technologies. Information designers, technicalwriters and others who want to produce information sets and learning materialsmay all benefit from the results of research related to message design, textdesign, image design, graphic design, and cognition. These are all importantareas of information design.
Message design. We are today living in mass-media societies. Every day weare bombarded with information. Visual messages in different forms are increas-ingly important. The study of presentation of verbo-visual messages is a multi-disciplinary, multi-dimensional and worldwide consideration.
56
Text design. There are many kinds of languages. Results from researchexplain some of the characteristics of verbal language, spoken as well as written.Combinations of different kinds of languages may be used in communication.
Image design. Results from research explain some of the characteristics ofvisual language. Its functions, levels of meaning, properties, and structure maybe explained. Combinations of different kinds of languages are used in masscommunication. Yet little is known about the effects of various linguistic com-binations. Different linguistic combinations must be studied in detail beforeoptimum combinations can be found for various purposes.
Graphic design. Although we may not think about it, the practice of graphicdesign is as old as recorded history. We see the results of graphic design everyday. Often graphic design is thought of with regard to the print medium, butit is used in all media. Graphic design is the art and craft of bringing a functional,aesthetic, and organized structure to groups of diverse elements. These elementsmay be headings, texts, pictures, captions, tables, and even sounds and motionin motion pictures, on television, and computers.
Cognition. Results from research may explain some of the functions relatedto our senses, attention, perception, processing, mental images, and applicationof new knowledge. The goal of communication-oriented design of messagesshould always be clarity of communication. In information design the task of thesender or source is actually not completed until the receivers or interpretershave received and understood the intended message.
There are more areas of information design such as audio design, exhibitiondesign, event design, light design, time design as well as modern web design.These areas are, however, not included in this study. For this study some of ourinformation design students are ranking findings from research.
Findings from research For many years I have “collected” research findings that I personally felt wereimportant for the understanding of information design, visual communication,visual language, and visual literacy. This body of knowledge might be importantand interesting for our ability to better produce effective messages — “messagesthat really work”. Thus I have put together lists of “information design char-acteristics”, a total of 50. The research findings discussed in this study are listedbelow. Here they are sorted according to the final rank order that was the resultof the study.
57
Sender processes1. Communication is not complete until the receivers understand the mes-
sages. Information materials shall be legible, readable and well worthreading for the intended audience (Pettersson, 1989).
2. Information is most useful to have exactly at the time when we need it (Pet-tersson, 1998b).
3. We have to adopt verbal as well as visual messages to suit each group ofreceivers. (Pettersson, 1998b)
4. The graphical message's legibility is determined by the technical design ofthe text and the pictures, that is, their clarity. Good legibility is always eco-nomically advantageous, whereas poor legibility is a costly business. (Pet-tersson, 1993)
5. Information materials which provides the wrong information may give anegative result, and the learner may end up less competent than before thelearning experience. (Pettersson, 1993)
6. It is better not to have any pictures at all than employing pictures with poorquality (Pettersson, 1989).
7. The perception of linear representations requires slow, sequential, process-ing for comprehension of content. (Perfetti, 1977; Sinatra, 1986)
8. Image manipulation implies the improper control of people's perception ofa given reality through the use of pictures.(Pettersson, 2002)
9. The classical “borders” between the media groups will dissolve. In thefuture most media will interact and partly overlap each other. (Pettersson,1989).
10. Word identification is a multi-stage process. Visual-featural analysis is car-ried out by the right brain hemisphere. Word naming and word meaningare processed by the left hemisphere. (Pirozzolo and Rayner, 1979)
Text design 1. It may take only 2-3 seconds to recognize the content in an image (Paivio,
1979; Postman, 1979), but 20 – 30 seconds to read a verbal description of thesame image (Lawson 1968; Ekwall, 1977) and 60 – 90 seconds to read italoud (Sinatra, 1986). In verbal and visual languages prior experience andcontext are very important to the perception of contents.
2. When illustrations provide text-redundant information, learning informa-tion in the text that is also shown in pictures will be facilitated. (Levie andLentz, 1982; Melin, 1999).
3. There is no direct correspondence between groups of letters, words, andreality. Each meaning is defined and must be learned. (Elkind, 1975)
58
4. When illustrations are not relevant to prose content they can have a nega-tive effect. (Levie and Lentz, 1982; Melin, 1999)
5. Perception of verbal content is apparently easier when a text is read thanheard. Thus it is easier to assimilate and profit from a rich language byreading than by listening (Pettersson, 1986).
6. People usually have no difficulty in reading the jargon used in professionalor technical languages but understanding the concepts the words repre-sent may be difficult for a non-specialist (Melin, 1986b).
7. The more abstract a word is the harder it is to relate it to any specific activ-ity (Melin, 1986a).
8. Verbal languages have varying levels of meaning (Eco, 1971): (i) phonemes(without meaning); (ii) morphemes (with meaning); (iii) syntagms, sub-meanings; (iv) complete meanings.
9. The end of a sentance should be determined by syntax rather than by a setwidth of a line. (Hartley, 1980; Bork, 1982)
10. A written text can convey information, contain analyses and describe feel-ings and facts. (Melin, 1986a)
Image design 1. Content is more important than execution, context, and format. Pictures
have a strong emotional impact. (Pettersson; 1987, 1989)2. Seeing is believing. Most people believe that pictures tell the truth. (Lef-
ferts, 1982)3. The same visuals are not equally effective for learners in different grade
levels, and for learners with different prior knowledge. (Dwyer, 1972)4. Persuasion tends to be accomplished in both children and adolescents
almost exclusively through imagery. (Barry, 1998)5. The effectiveness of a visual depends on the medium, on the type of infor-
mation, and also on the amount of time learners are permitted to interactwith the material. (Dwyer, 1972)
6. All types of visuals are not equally effective. Line drawings are most effec-tive in formats where the learner’s study time is limited. More realistic ver-sions of art work, however, may be more effective in formats where unlim-ited study time is allowed. (Dwyer, 1972)
7. Visual languages attempt equivalence with reality. Visuals are iconic. Theynormally resemble the thing they represent. Meaning is apparent on abasic level, but the visual language must be learned for true comprehen-sion. (Pettersson, 1989)
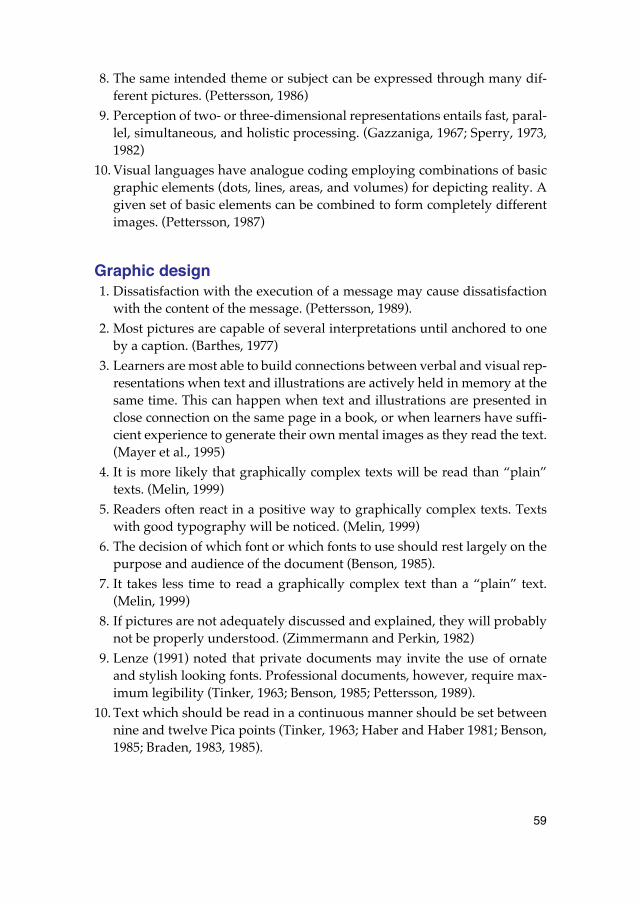
59
8. The same intended theme or subject can be expressed through many dif-ferent pictures. (Pettersson, 1986)
9. Perception of two- or three-dimensional representations entails fast, paral-lel, simultaneous, and holistic processing. (Gazzaniga, 1967; Sperry, 1973,1982)
10. Visual languages have analogue coding employing combinations of basicgraphic elements (dots, lines, areas, and volumes) for depicting reality. Agiven set of basic elements can be combined to form completely differentimages. (Pettersson, 1987)
Graphic design1. Dissatisfaction with the execution of a message may cause dissatisfaction
with the content of the message. (Pettersson, 1989).2. Most pictures are capable of several interpretations until anchored to one
by a caption. (Barthes, 1977)3. Learners are most able to build connections between verbal and visual rep-
resentations when text and illustrations are actively held in memory at thesame time. This can happen when text and illustrations are presented inclose connection on the same page in a book, or when learners have suffi-cient experience to generate their own mental images as they read the text.(Mayer et al., 1995)
4. It is more likely that graphically complex texts will be read than “plain”texts. (Melin, 1999)
5. Readers often react in a positive way to graphically complex texts. Textswith good typography will be noticed. (Melin, 1999)
6. The decision of which font or which fonts to use should rest largely on thepurpose and audience of the document (Benson, 1985).
7. It takes less time to read a graphically complex text than a “plain” text.(Melin, 1999)
8. If pictures are not adequately discussed and explained, they will probablynot be properly understood. (Zimmermann and Perkin, 1982)
9. Lenze (1991) noted that private documents may invite the use of ornateand stylish looking fonts. Professional documents, however, require max-imum legibility (Tinker, 1963; Benson, 1985; Pettersson, 1989).
10. Text which should be read in a continuous manner should be set betweennine and twelve Pica points (Tinker, 1963; Haber and Haber 1981; Benson,1985; Braden, 1983, 1985).
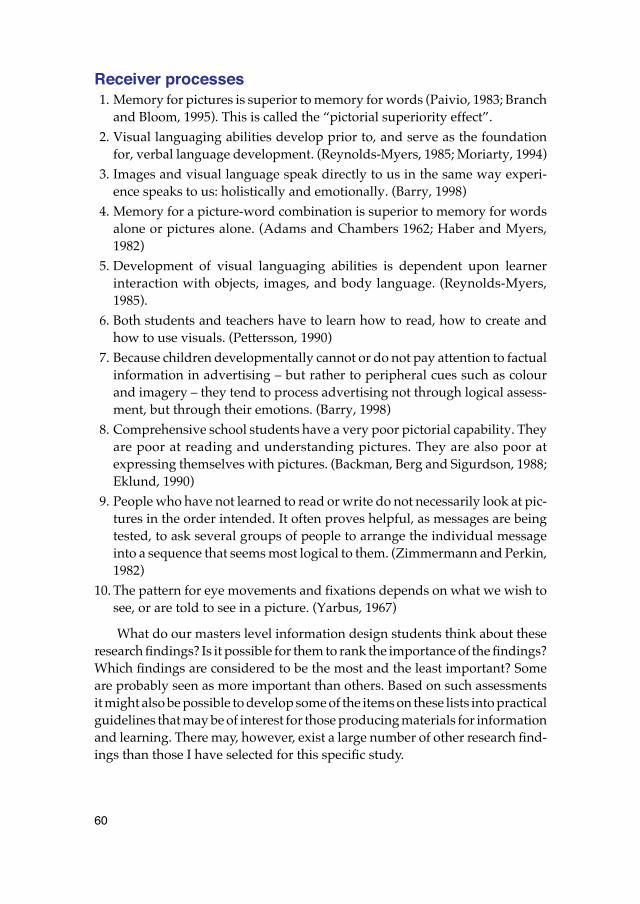
60
Receiver processes 1. Memory for pictures is superior to memory for words (Paivio, 1983; Branch
and Bloom, 1995). This is called the “pictorial superiority effect”.2. Visual languaging abilities develop prior to, and serve as the foundation
for, verbal language development. (Reynolds-Myers, 1985; Moriarty, 1994)3. Images and visual language speak directly to us in the same way experi-
ence speaks to us: holistically and emotionally. (Barry, 1998)4. Memory for a picture-word combination is superior to memory for words
alone or pictures alone. (Adams and Chambers 1962; Haber and Myers,1982)
5. Development of visual languaging abilities is dependent upon learnerinteraction with objects, images, and body language. (Reynolds-Myers,1985).
6. Both students and teachers have to learn how to read, how to create andhow to use visuals. (Pettersson, 1990)
7. Because children developmentally cannot or do not pay attention to factualinformation in advertising – but rather to peripheral cues such as colourand imagery – they tend to process advertising not through logical assess-ment, but through their emotions. (Barry, 1998)
8. Comprehensive school students have a very poor pictorial capability. Theyare poor at reading and understanding pictures. They are also poor atexpressing themselves with pictures. (Backman, Berg and Sigurdson, 1988;Eklund, 1990)
9. People who have not learned to read or write do not necessarily look at pic-tures in the order intended. It often proves helpful, as messages are beingtested, to ask several groups of people to arrange the individual messageinto a sequence that seems most logical to them. (Zimmermann and Perkin,1982)
10. The pattern for eye movements and fixations depends on what we wish tosee, or are told to see in a picture. (Yarbus, 1967)
What do our masters level information design students think about theseresearch findings? Is it possible for them to rank the importance of the findings?Which findings are considered to be the most and the least important? Someare probably seen as more important than others. Based on such assessmentsit might also be possible to develop some of the items on these lists into practicalguidelines that may be of interest for those producing materials for informationand learning. There may, however, exist a large number of other research find-ings than those I have selected for this specific study.
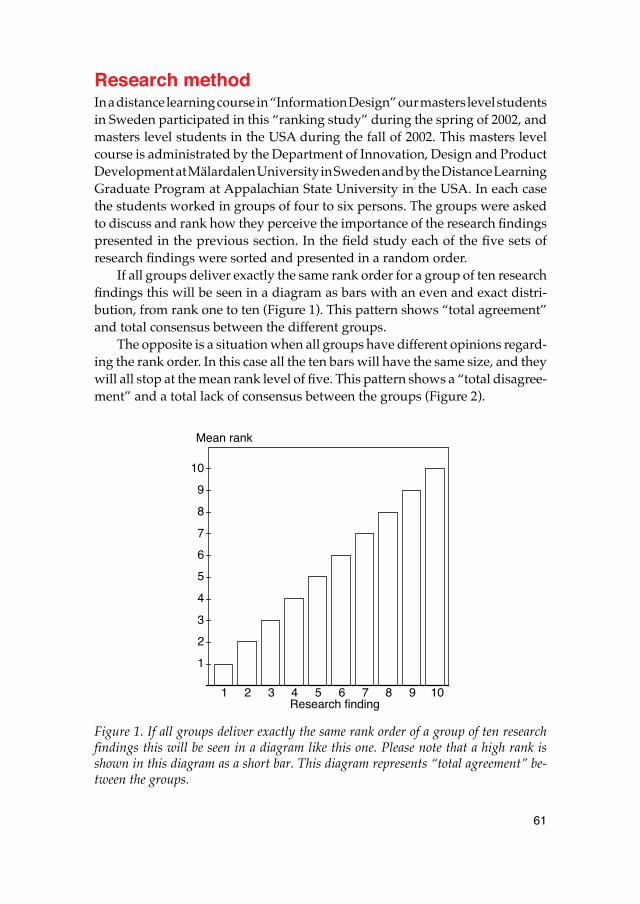
61
Research methodIn a distance learning course in “Information Design” our masters level studentsin Sweden participated in this “ranking study” during the spring of 2002, andmasters level students in the USA during the fall of 2002. This masters levelcourse is administrated by the Department of Innovation, Design and ProductDevelopment at Mälardalen University in Sweden and by the Distance LearningGraduate Program at Appalachian State University in the USA. In each casethe students worked in groups of four to six persons. The groups were askedto discuss and rank how they perceive the importance of the research findingspresented in the previous section. In the field study each of the five sets ofresearch findings were sorted and presented in a random order.
If all groups deliver exactly the same rank order for a group of ten researchfindings this will be seen in a diagram as bars with an even and exact distri-bution, from rank one to ten (Figure 1). This pattern shows “total agreement”and total consensus between the different groups.
The opposite is a situation when all groups have different opinions regard-ing the rank order. In this case all the ten bars will have the same size, and theywill all stop at the mean rank level of five. This pattern shows a “total disagree-ment” and a total lack of consensus between the groups (Figure 2).
Figure 1. If all groups deliver exactly the same rank order of a group of ten researchfindings this will be seen in a diagram like this one. Please note that a high rank isshown in this diagram as a short bar. This diagram represents “total agreement” be-tween the groups.
1
7
5
9
2
10
8
6
4
3
1 2 3 4 5 6 7 8 9 10
Mean rank
Research finding
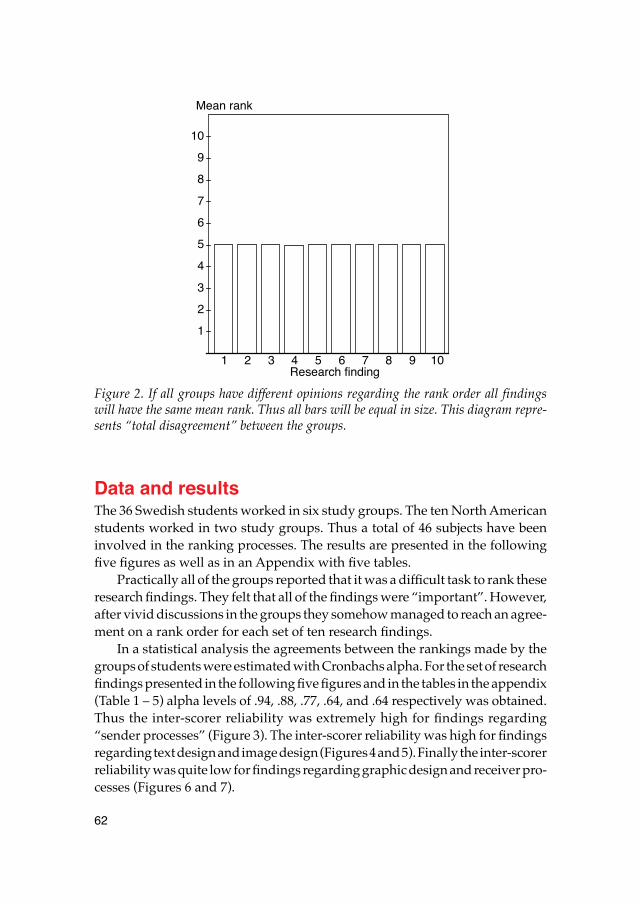
62
Figure 2. If all groups have different opinions regarding the rank order all findingswill have the same mean rank. Thus all bars will be equal in size. This diagram repre-sents “total disagreement” between the groups.
Data and resultsThe 36 Swedish students worked in six study groups. The ten North Americanstudents worked in two study groups. Thus a total of 46 subjects have beeninvolved in the ranking processes. The results are presented in the followingfive figures as well as in an Appendix with five tables.
Practically all of the groups reported that it was a difficult task to rank theseresearch findings. They felt that all of the findings were “important”. However,after vivid discussions in the groups they somehow managed to reach an agree-ment on a rank order for each set of ten research findings.
In a statistical analysis the agreements between the rankings made by thegroups of students were estimated with Cronbachs alpha. For the set of researchfindings presented in the following five figures and in the tables in the appendix(Table 1 – 5) alpha levels of .94, .88, .77, .64, and .64 respectively was obtained.Thus the inter-scorer reliability was extremely high for findings regarding“sender processes” (Figure 3). The inter-scorer reliability was high for findingsregarding text design and image design (Figures 4 and 5). Finally the inter-scorerreliability was quite low for findings regarding graphic design and receiver pro-cesses (Figures 6 and 7).
1
7
5
9
2
10
8
6
4
3
1 2 3 4 5 6 7 8 9 10
Mean rank
Research finding
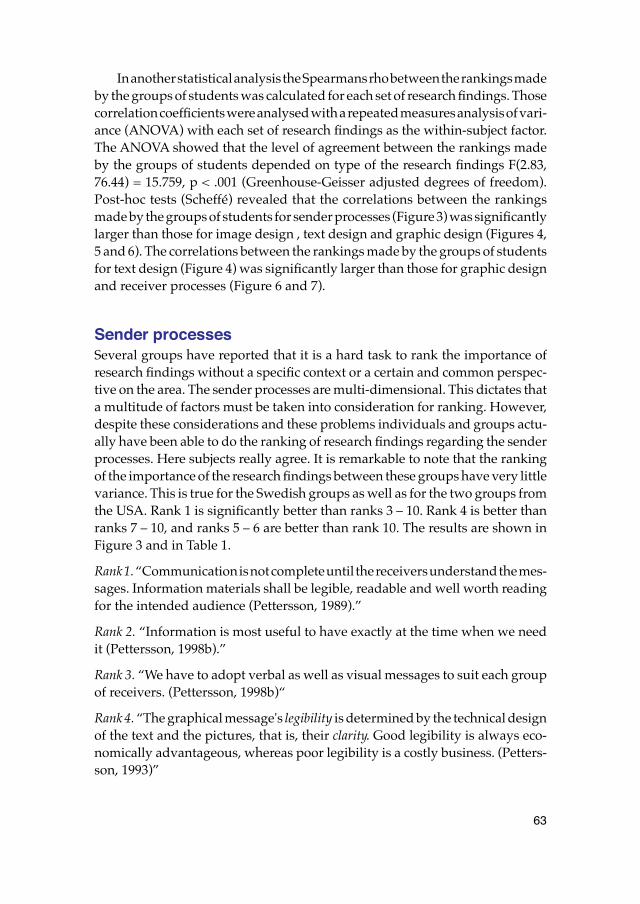
63
In another statistical analysis the Spearmans rho between the rankings madeby the groups of students was calculated for each set of research findings. Thosecorrelation coefficients were analysed with a repeated measures analysis of vari-ance (ANOVA) with each set of research findings as the within-subject factor.The ANOVA showed that the level of agreement between the rankings madeby the groups of students depended on type of the research findings F(2.83,76.44) = 15.759, p < .001 (Greenhouse-Geisser adjusted degrees of freedom).Post-hoc tests (Scheffé) revealed that the correlations between the rankingsmade by the groups of students for sender processes (Figure 3) was significantlylarger than those for image design , text design and graphic design (Figures 4,5 and 6). The correlations between the rankings made by the groups of studentsfor text design (Figure 4) was significantly larger than those for graphic designand receiver processes (Figure 6 and 7).
Sender processes Several groups have reported that it is a hard task to rank the importance ofresearch findings without a specific context or a certain and common perspec-tive on the area. The sender processes are multi-dimensional. This dictates thata multitude of factors must be taken into consideration for ranking. However,despite these considerations and these problems individuals and groups actu-ally have been able to do the ranking of research findings regarding the senderprocesses. Here subjects really agree. It is remarkable to note that the rankingof the importance of the research findings between these groups have very littlevariance. This is true for the Swedish groups as well as for the two groups fromthe USA. Rank 1 is significantly better than ranks 3 – 10. Rank 4 is better thanranks 7 – 10, and ranks 5 – 6 are better than rank 10. The results are shown inFigure 3 and in Table 1.
Rank 1. “Communication is not complete until the receivers understand the mes-sages. Information materials shall be legible, readable and well worth readingfor the intended audience (Pettersson, 1989).”
Rank 2. “Information is most useful to have exactly at the time when we needit (Pettersson, 1998b).”
Rank 3. “We have to adopt verbal as well as visual messages to suit each groupof receivers. (Pettersson, 1998b)“
Rank 4. “The graphical message's legibility is determined by the technical designof the text and the pictures, that is, their clarity. Good legibility is always eco-nomically advantageous, whereas poor legibility is a costly business. (Petters-son, 1993)”
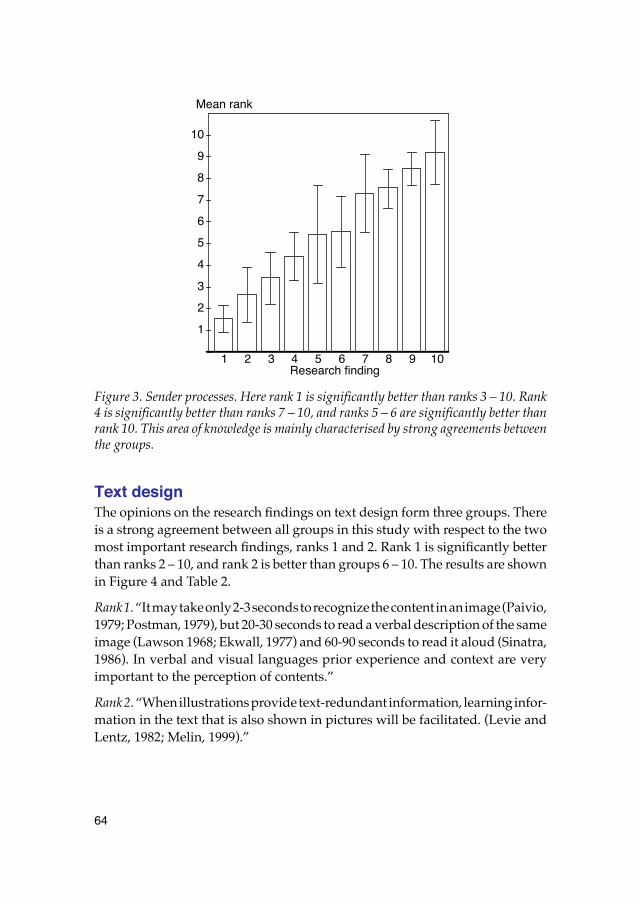
64
Figure 3. Sender processes. Here rank 1 is significantly better than ranks 3 – 10. Rank4 is significantly better than ranks 7 – 10, and ranks 5 – 6 are significantly better thanrank 10. This area of knowledge is mainly characterised by strong agreements betweenthe groups.
Text design The opinions on the research findings on text design form three groups. Thereis a strong agreement between all groups in this study with respect to the twomost important research findings, ranks 1 and 2. Rank 1 is significantly betterthan ranks 2 – 10, and rank 2 is better than groups 6 – 10. The results are shownin Figure 4 and Table 2.
Rank 1. “It may take only 2-3 seconds to recognize the content in an image (Paivio,1979; Postman, 1979), but 20-30 seconds to read a verbal description of the sameimage (Lawson 1968; Ekwall, 1977) and 60-90 seconds to read it aloud (Sinatra,1986). In verbal and visual languages prior experience and context are veryimportant to the perception of contents.”
Rank 2. “When illustrations provide text-redundant information, learning infor-mation in the text that is also shown in pictures will be facilitated. (Levie andLentz, 1982; Melin, 1999).”
1
7
5
9
2
10
8
6
4
3
1 2 3 4 5 6 7 8 9 10
Mean rank
Research finding
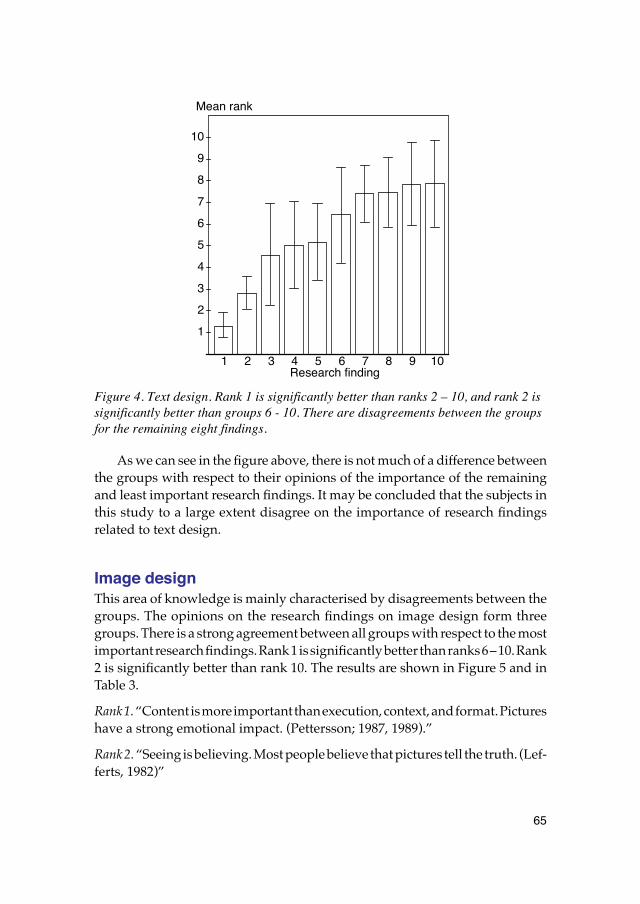
65
Figure 4. Text design. Rank 1 is significantly better than ranks 2 – 10, and rank 2 is significantly better than groups 6 - 10. There are disagreements between the groups for the remaining eight findings.
As we can see in the figure above, there is not much of a difference betweenthe groups with respect to their opinions of the importance of the remainingand least important research findings. It may be concluded that the subjects inthis study to a large extent disagree on the importance of research findingsrelated to text design.
Image design This area of knowledge is mainly characterised by disagreements between thegroups. The opinions on the research findings on image design form threegroups. There is a strong agreement between all groups with respect to the mostimportant research findings. Rank 1 is significantly better than ranks 6 – 10. Rank2 is significantly better than rank 10. The results are shown in Figure 5 and inTable 3.
Rank 1. “Content is more important than execution, context, and format. Pictureshave a strong emotional impact. (Pettersson; 1987, 1989).”
Rank 2. “Seeing is believing. Most people believe that pictures tell the truth. (Lef-ferts, 1982)”
1
7
5
9
2
10
8
6
4
3
1 2 3 4 5 6 7 8 9 10
Mean rank
Research finding
66
As we can see in figure 5 there is not much of a difference between the groupswith respect to their opinions of the importance of the other findings. Thesefindings are the least important. This distribution is rather similar to that of textdesign. It may be concluded that the subjects in this study to a large extent dis-agree on the importance of of the selected research findings related to imagedesign.
Figure 5. Image design. Rank 1 is significantly better than ranks 6 – 10. This area ofknowledge is mainly characterised by disagreements between the groups.
Graphic design This area of knowledge is mainly characterised by strong disagreementsbetween the groups of students. In this area the groups reported that their “opin-ions varied wildly” when they worked with this specific assignment. It seemsthat individual agendas, backgrounds, cultures, differences and experiencescause more disagreements than in the previous areas.
However, there is a strong agreement between all groups with respect tothe most important research finding. The first rank is significantly better thanranks 5 – 10. The results are shown in Figure 6 on the next page and in Table 4in the appendix.
Rank 1. “Dissatisfaction with the execution of a message may cause dissatis-faction with the content of the message. (Pettersson, 1989).”
1
7
5
9
2
10
8
6
4
3
1 2 3 4 5 6 7 8 9 10
Mean rank
Research finding
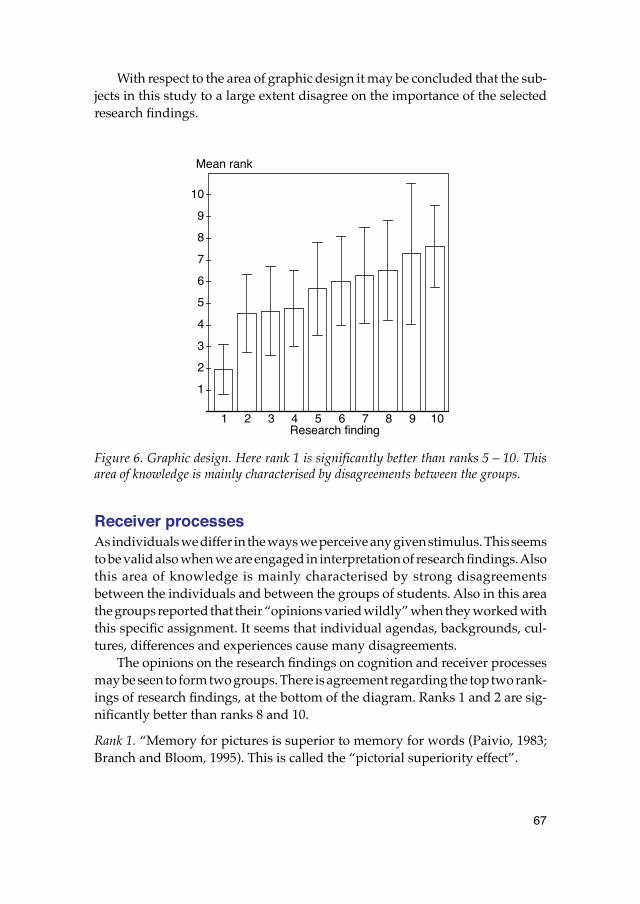
67
With respect to the area of graphic design it may be concluded that the sub-jects in this study to a large extent disagree on the importance of the selectedresearch findings.
Figure 6. Graphic design. Here rank 1 is significantly better than ranks 5 – 10. Thisarea of knowledge is mainly characterised by disagreements between the groups.
Receiver processes As individuals we differ in the ways we perceive any given stimulus. This seemsto be valid also when we are engaged in interpretation of research findings. Alsothis area of knowledge is mainly characterised by strong disagreementsbetween the individuals and between the groups of students. Also in this areathe groups reported that their “opinions varied wildly” when they worked withthis specific assignment. It seems that individual agendas, backgrounds, cul-tures, differences and experiences cause many disagreements.
The opinions on the research findings on cognition and receiver processesmay be seen to form two groups. There is agreement regarding the top two rank-ings of research findings, at the bottom of the diagram. Ranks 1 and 2 are sig-nificantly better than ranks 8 and 10.
Rank 1. “Memory for pictures is superior to memory for words (Paivio, 1983;Branch and Bloom, 1995). This is called the “pictorial superiority effect”.
1
7
5
9
2
10
8
6
4
3
1 2 3 4 5 6 7 8 9 10
Mean rank
Research finding
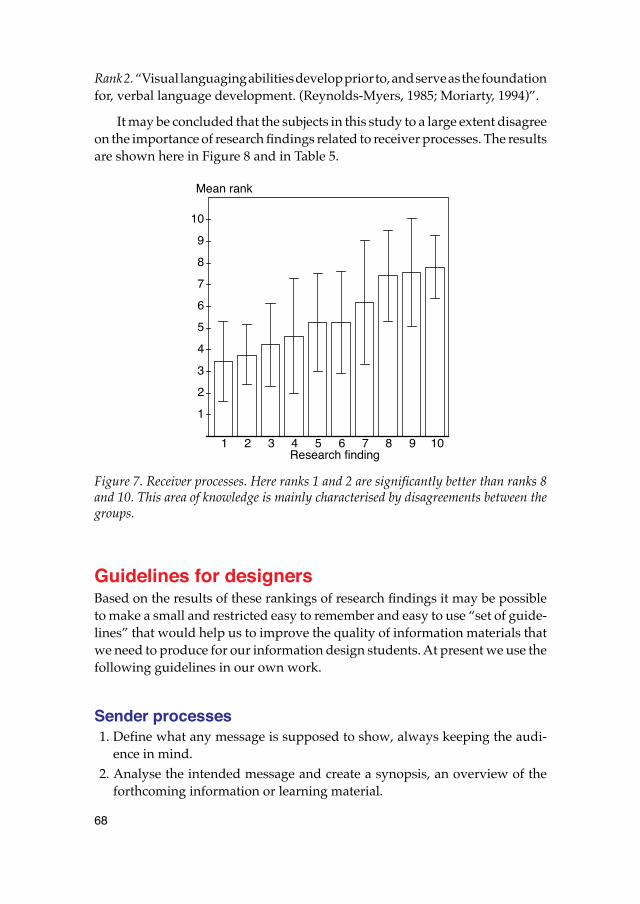
68
Rank 2. “Visual languaging abilities develop prior to, and serve as the foundationfor, verbal language development. (Reynolds-Myers, 1985; Moriarty, 1994)”.
It may be concluded that the subjects in this study to a large extent disagreeon the importance of research findings related to receiver processes. The resultsare shown here in Figure 8 and in Table 5.
Figure 7. Receiver processes. Here ranks 1 and 2 are significantly better than ranks 8and 10. This area of knowledge is mainly characterised by disagreements between thegroups.
Guidelines for designersBased on the results of these rankings of research findings it may be possibleto make a small and restricted easy to remember and easy to use “set of guide-lines” that would help us to improve the quality of information materials thatwe need to produce for our information design students. At present we use thefollowing guidelines in our own work.
Sender processes1. Define what any message is supposed to show, always keeping the audi-
ence in mind. 2. Analyse the intended message and create a synopsis, an overview of the
forthcoming information or learning material.
1
7
5
9
2
10
8
6
4
3
1 2 3 4 5 6 7 8 9 10
Mean rank
Research finding
69
3. Do not include too much realism in the representations because it maydetract from the learning processes. A moderate amount of carefullyselected realism often provides the best representation.
Text design1. Provide the time that is necessary for the audience. It may take quite a long
time to perceive and interpret a verbal message. A message is only compre-hensible if it can be grasped by the receiver without difficulty.
2. Ensure that the context of messages are seen and can convey a “pre-under-standing” of the contents. Prior experience and context are important tothe perception of contents.
3. Provide illustrations with text-redundant information in order to facilitateunderstanding and learning. Do not always assume that everyone is “liter-ate”.
Image design1. Consider that pictures have a strong emotional impact. Image content is
more important than its execution, context, and format. 2. Consider how an image may be perceived. Most people still believe that
pictures “tell the truth”. 3. Define the objective for each visual. The same visuals are not equally effec-
tive for people with different prior knowledge. The context in which a mes-sage is presented impacts the perception of the message.
Graphic design1. Adjust the execution of a message to its content. 2. Design for clarity and optimum legibility. Keep the graphical form simple
and direct. Use regular type for continuous text. Bold and italics may beused for emphasis and headings.
3. Present text and illustrations in close connection. Use legends to explainpictures.
Receiver processes1. Create combined verbal and visual messages when the message content is
complex factual information. Visual language abilities develop prior to,and serve as the foundation for, verbal language development. Memoryfor pictures is superior to memory for words.
70
2. Create verbal messages when the message content is analytical, detailed, log-ical, narrative, theoretical, and sequential.
3. Create visual messages when the message content is emotional, holistic,immediate, spatial and visual. Images and visual language speak directlyto the audience.
Despite the restricted number of subjecs in this study it is quite possiblethat these guidelines will be valuable when any information designer has toproduce information sets for other groups of receivers. Our long term goal isto be able to create information design guidelines of a “general nature” forbroader audiences. Thus our studies will continue. Thus it is possible that someguidelines will be changed or replaced in the future.
ReferencesAdams, J. , & Chambers, R. (1962). Response to simultaneous stimulus of two
sense modalities. Journal of Experimental Psychology, 63, 125–198. Backman, J. , Berg, T. , & Sigurdson, T. (1988). Grundskoleelevers produktion och
reception av bilder. Umeå: Umeå universitet. Institutionen för bildlärarut-bildning. Rapport nr 7.
Barry, A-M. (1998). The Joe Camel Story: Tobacco Industry Manipulation and the Necessity for Visual Intelligence. Paper presented at Viscom 12, Winter Park, CO, June 26.
Barthes, R. (1977). The rhetoric of the image. In Image, Music, Text, Essays. Translated by S. Heath. London: Fontana.
Benson, P. J. (1985). Writing visually: Design considerations in technical pub-lications. Technical Communications Journal. Fourth Quarter, 35–39.
Bork, A. (1982). Information Display and Screen Design. Paper presented at the American Educational Research Association Conference. New York.
Braden, R. A. (1983). Visualizing the verbal and verbalizing the visual. In R. Braden, & A. Walker (Eds.). Seeing Ourselves: Visualization in a Social Con-text. Readings from the 14th Annual Confernce of the International Visual Literacy Association. Blacksburg: Virginia Tech University.
Braden, R. A. (1985). The stylish look: A format for visual literacy writers. In N. H. Thayer, & S. Clayton-Randolph (Eds. ). Visual Literacy: Cruising into the Future. Readings from the 16th Annual Conference of the International Visual Literacy Association. Bloomington, IN: Western Sun Printing Co.
Branch, R. C. , Bloom, J. R. (1995). The Role of Graphic Elements in the Accurate Portrayal of Instructional Design. In D. G. Beauchamp, R. A. Braden, and R. E. Griffin (Eds. ). Imagery and Visual Literacy. The International Visual Lit-eracy Association.
71
Dwyer, F. M. (1972). A Guide for Improving Visualized Instruction. State College, PA: Learning Services.
Eco, U. (1971). Den frånvarande strukturen. Introduktion till den semiotiska for-skningen. Lund, Swedish translation.
Eklund, S. (1990). Bedömning av kunskaper och färdigheter i bild, årskurs 2. Del av en nationell utvärdering av grundskolan. Umeå. Umeå Universitet. Institu-tionen för bildlärarutbildning. Rapport nr. 10.
Ekwall, E. (1977). Diagnosis and Remediation of the Disabled Reader. Boston: Allyn and Bacon.
Elkind, D. (1975). We can teach reading better. Today’s Education, 64, 34–38. Gabrielsson, A., Lindström, B. & Elger, G. (1983). Assessment of perceived sound
quality of eighteen high fidelity loudspeakers. Report T A No. 106, Karolinska Institutet, Dept. of Technical Audiology.
Gazzaniga, M. S. (1967). The split brain in man. Scientific American, 217, 24–29. Haber, R. N. , & Haber, L. R. (1981). Visual components of the reading process.
Visual Language, 15, 149. Haber, R. N. , & Myers, B. L. (1982). Memory for pictograms, pictures, and
words separately and all mixed up. Perception, 11, 57–64. Hartley, J. (1980). Spatial cues in text: Some comments on the paper by Frase,
& Schwartz (1979). Visible Language, XIV, 62–79. Lawson, L. (1968). Ophthalmological factors in learning disabilities. In H.
Myklebust (Ed.). Progress in Learning Disabilities, Volume 1. New York: Grune and Stratton.
Lefferts, R. (1982). How to Prepare Charts and Graphs for Effective Reports. New York: Barns & Noble.
Lenze, J. S. (1991). Serif vs. san serif type fonts: A comparison based on reader comprehension. In D. G. Beauchamp, J. Clark-Baca, & R. A. Braden (Eds. ). Investigating Visual Literacy. Selected Readings from the 22nd Annual Con-ference of the International Visual Literacy Association. Blacksburg: Vir-ginia Tech University.
Levie, W. H. , & Lentz, R. (1982). Effects of text illustrations: A review of research. ECTJ, 30, 4, 195–232.
Mayer, R. E. , Steinhoff, K. , Boweer, G. , & Mars, R. (1995). A Generative The-ory of Textbook Design: Using Annotatated Illustrations to Foster Mean-ingful Learning of Science Text. ETR&D, 43, 1, 31-43.
Melin, L. (1986a). Text, bild, lexivision. En studie i text-bild-samverkan i en lärobok. Stockholm: Stockholm University, Department of Nordic Languages.
Melin, L. (1986b). Termer – Ett kompendium om terminologi och termbildning. Stockholm: Stockholm University, Department of Nordic Languages.
Melin, L. (1999). Gör illustrationen vad vi tror? Nordicom 1–2: 1999. Medie- och kommunikationsforskning i Norden, 52–60.
72
Moriarty, S. E. (1994). Visual Communication as a Primary Sytem. Journal of Visual Literacy, 14, 2, 11–21.
Paivio, A. (1979). Imagery and Verbal Processes. Hillsdale, NJ: Lawrence Erlbaum Associates.
Paivio, A. (1983). The empirical case for dual coding. In J. C. Yuille (Ed. ). Imag-ery, Memory, and Cognition. Hillsdale, NJ: Lawrence Erlbaum Associates.
Perfetti, C. (1977). Language comprehension and fast decoding: Some psycho-linguistic prerequisites for skilled reading comprehension. In J. Guthrie (Ed. ). Cognition, Curriculum, and Comprehension. Newark, DE: International Reading Association.
Pettersson, R. (1985). Intended and perceived image content. Presentation at the 17th Annual Conference of the International Visual Literacy Association. In L. W. Miller (Ed.). Creating Meaning. Readings from the Visual Literacy Conference at California State Polytechnic University at Pomona.
Pettersson, R. (1986). Image – Word – Image. Paper presented at the 18th Annual Conference of the International Visual Literacy Association. Madison, Wis-consin, Oct. 30 – Nov. 2.Also presented at the Information Design Conference 3, at the University of Warwick, England, Dec. 15 – 17.Published in: Journal of Visual Verbal Languaging. Fall 1986, 6, 2, 7–21.Also published in: R.A. Braden, D.G. Beauchamp and L.W. Miller (Eds.) 1987: Visible & Viable. The Role of Images in Instruction and Communication. East Texas State University. Commerce. Texas, 165–181.
Pettersson, R. (1987). Interpretation of Image Content. Paper presented at the 19th Annual Conference of the International Visual Literacy Association. Tulsa, Oct. 28 –Nov. 1. 1987. Published in: R. A. Braden, B. Braden, D. G. Beauchamp and L. Miller (Eds. ) 1988: Visual Literacy in Life and Learning. Virginia Tech University. Blacksburg, Virginia, 233–246. A shorter version published 1988 in ECTJ, 36, 1, 45–55.
Pettersson, R. (1989). Visuals for Information: Research and Practice. Englewood Cliffs, NJ: Educational Technology Publications.
Pettersson, R. (1990). Teachers, Students and Visuals. Journal of Visual Literacy, 10, 1, 45–62..
Pettersson, R. (1993). Visual Information. Englewood Cliffs, NJ: Educational Technology Publications.
Pettersson, R. (1998a). What is Information Design? Presentation at Vision Plus 4. The Republic of Information. Carnegie Mellon University, Pittsburgh, Pennsylvania, March 26 - 29. Printed in Proceedings Book, The Republic of Information, Vision Plus 4. Carnegie Mellon University, School of Design & International Institute for Information Design, 58 - 74.
Pettersson, R. (1998b). Information i informationsåldern. Tullinge: Institutet för Infologi.
73
Pettersson, R. (2000). Assessing Image Contents. Presentation at the 32nd Annual Conference of the International Visual Literacy Association, Iowa State University, Ames, Iowa, October 11-14, 2000.Published in: R. E. Griffin, V. S. Villiams & J. Lee (Eds.) 2001: Exploring the Visual Future: Art Design, Science & Technology. Selected Readings of the Inter-national Visual Literacy Association. International Visual Literacy Associa-tion.
Pettersson, R. (2001). Bildmanipulering. Stockholm: Styrelsen för psykologiskt försvar. Rapport 181.
Pettersson, R. (2002). Information Design, An Introduction. Amsterdam; Phila-delphia: John Benjamins Publishing Company.
Pirozzolo, F., & Rayner, K. (1979). Cerebral organization and reading disabil-ity. Neuropsychologia, 17, 485–491.
Postman, N. (1979). Teaching as a Conserving Activity. New York: Delacorte Press.
Reynolds-Myers, P. (1985). Visual literacy, higher order reasoning, and high technology. In N. H. Thayer, & S. Clayton-Randolph (Eds.). Visual Literacy: Cruising into the Future. Readings from the 16th annual conference of the International Visual Literacy Association. Bloomington: Western Sun Printing Co.
Sinatra, R. (1986). Visual Literacy Connections to Thinking, Reading, and Writing. Springfield, IL: Charles C. Thomas.
Sperry, R. W. (1973). Lateral specialization of cerebral functions in the surgi-cally separated hemispheres. In F. J. McGuigan, & R. A. Schoonever (Eds.). The Psychophysiology of Thinking: Studies of Covert Processes. New York: Aca-demic Press.
Sperry, R. W. (1982). Some effects of disconnecting the hemisphere. Science, 217, 1223–1226.
Tinker, M. A. (1963). The Legibility of Print. Ames: Iowa State University Press.Yarbus, A. (1967). Eye Movements and Vision. New York: Plenum Press.Zimmermann, M. L., & Perkin, G. W. (1982). Instructing through pictures:
print materials for people who do not read. Information design journal, 3/2, 119-134.
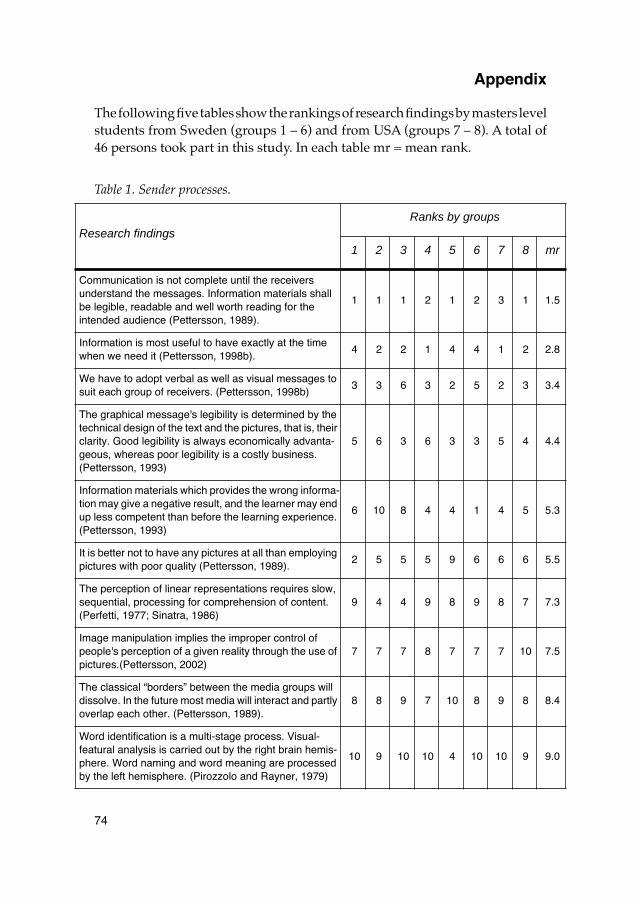
74
Appendix
The following five tables show the rankings of research findings by masters levelstudents from Sweden (groups 1 – 6) and from USA (groups 7 – 8). A total of46 persons took part in this study. In each table mr = mean rank.
Table 1. Sender processes.
Research findings Ranks by groups
1 2 3 4 5 6 7 8 mr
Communication is not complete until the receivers understand the messages. Information materials shall be legible, readable and well worth reading for the intended audience (Pettersson, 1989).
1 1 1 2 1 2 3 1 1.5
Information is most useful to have exactly at the time when we need it (Pettersson, 1998b).
4 2 2 1 4 4 1 2 2.8
We have to adopt verbal as well as visual messages to suit each group of receivers. (Pettersson, 1998b)
3 3 6 3 2 5 2 3 3.4
The graphical message's legibility is determined by the technical design of the text and the pictures, that is, their clarity. Good legibility is always economically advanta-geous, whereas poor legibility is a costly business. (Pettersson, 1993)
5 6 3 6 3 3 5 4 4.4
Information materials which provides the wrong informa-tion may give a negative result, and the learner may end up less competent than before the learning experience. (Pettersson, 1993)
6 10 8 4 4 1 4 5 5.3
It is better not to have any pictures at all than employing pictures with poor quality (Pettersson, 1989).
2 5 5 5 9 6 6 6 5.5
The perception of linear representations requires slow, sequential, processing for comprehension of content. (Perfetti, 1977; Sinatra, 1986)
9 4 4 9 8 9 8 7 7.3
Image manipulation implies the improper control of people's perception of a given reality through the use of pictures.(Pettersson, 2002)
7 7 7 8 7 7 7 10 7.5
The classical “borders” between the media groups will dissolve. In the future most media will interact and partly overlap each other. (Pettersson, 1989).
8 8 9 7 10 8 9 8 8.4
Word identification is a multi-stage process. Visual-featural analysis is carried out by the right brain hemis-phere. Word naming and word meaning are processed by the left hemisphere. (Pirozzolo and Rayner, 1979)
10 9 10 10 4 10 10 9 9.0
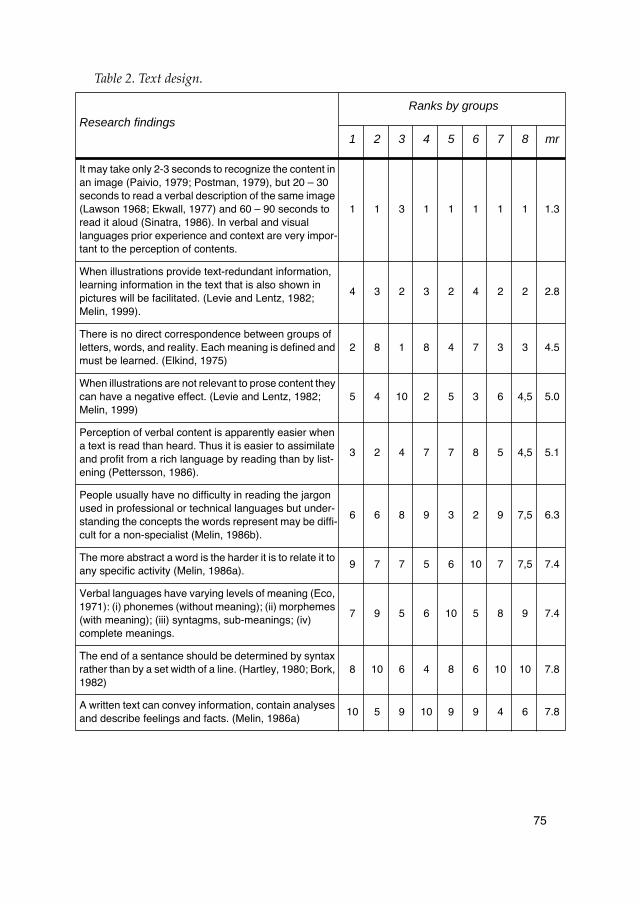
75
Table 2. Text design.
Research findings Ranks by groups
1 2 3 4 5 6 7 8 mr
It may take only 2-3 seconds to recognize the content in an image (Paivio, 1979; Postman, 1979), but 20 – 30 seconds to read a verbal description of the same image (Lawson 1968; Ekwall, 1977) and 60 – 90 seconds to read it aloud (Sinatra, 1986). In verbal and visual languages prior experience and context are very impor-tant to the perception of contents.
1 1 3 1 1 1 1 1 1.3
When illustrations provide text-redundant information, learning information in the text that is also shown in pictures will be facilitated. (Levie and Lentz, 1982; Melin, 1999).
4 3 2 3 2 4 2 2 2.8
There is no direct correspondence between groups of letters, words, and reality. Each meaning is defined and must be learned. (Elkind, 1975)
2 8 1 8 4 7 3 3 4.5
When illustrations are not relevant to prose content they can have a negative effect. (Levie and Lentz, 1982; Melin, 1999)
5 4 10 2 5 3 6 4,5 5.0
Perception of verbal content is apparently easier when a text is read than heard. Thus it is easier to assimilate and profit from a rich language by reading than by list-ening (Pettersson, 1986).
3 2 4 7 7 8 5 4,5 5.1
People usually have no difficulty in reading the jargon used in professional or technical languages but under-standing the concepts the words represent may be diffi-cult for a non-specialist (Melin, 1986b).
6 6 8 9 3 2 9 7,5 6.3
The more abstract a word is the harder it is to relate it to any specific activity (Melin, 1986a).
9 7 7 5 6 10 7 7,5 7.4
Verbal languages have varying levels of meaning (Eco, 1971): (i) phonemes (without meaning); (ii) morphemes (with meaning); (iii) syntagms, sub-meanings; (iv) complete meanings.
7 9 5 6 10 5 8 9 7.4
The end of a sentance should be determined by syntax rather than by a set width of a line. (Hartley, 1980; Bork, 1982)
8 10 6 4 8 6 10 10 7.8
A written text can convey information, contain analyses and describe feelings and facts. (Melin, 1986a)
10 5 9 10 9 9 4 6 7.8
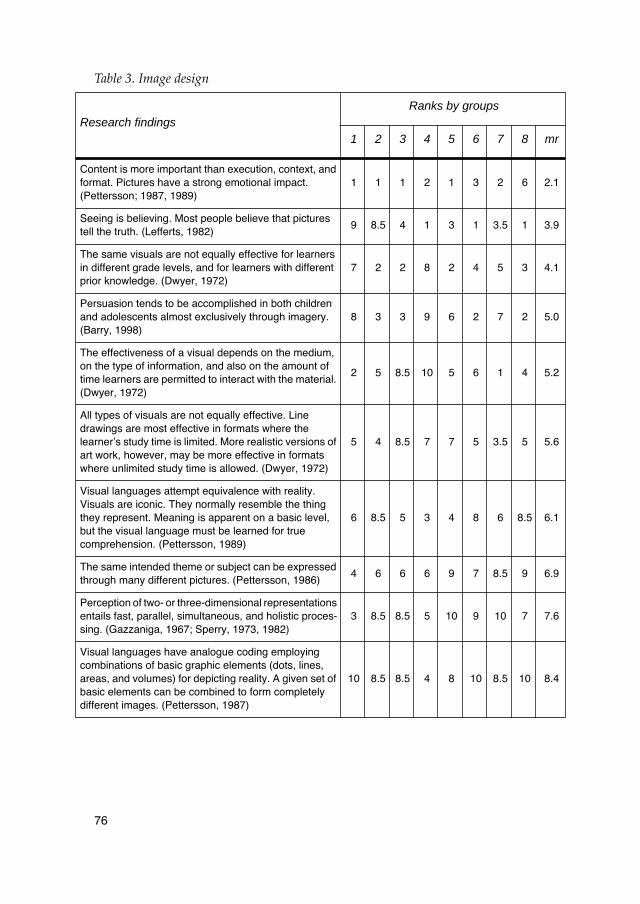
76
Table 3. Image design
Research findings Ranks by groups
1 2 3 4 5 6 7 8 mr
Content is more important than execution, context, and format. Pictures have a strong emotional impact. (Pettersson; 1987, 1989)
1 1 1 2 1 3 2 6 2.1
Seeing is believing. Most people believe that pictures tell the truth. (Lefferts, 1982)
9 8.5 4 1 3 1 3.5 1 3.9
The same visuals are not equally effective for learners in different grade levels, and for learners with different prior knowledge. (Dwyer, 1972)
7 2 2 8 2 4 5 3 4.1
Persuasion tends to be accomplished in both children and adolescents almost exclusively through imagery. (Barry, 1998)
8 3 3 9 6 2 7 2 5.0
The effectiveness of a visual depends on the medium, on the type of information, and also on the amount of time learners are permitted to interact with the material. (Dwyer, 1972)
2 5 8.5 10 5 6 1 4 5.2
All types of visuals are not equally effective. Line drawings are most effective in formats where the learner’s study time is limited. More realistic versions of art work, however, may be more effective in formats where unlimited study time is allowed. (Dwyer, 1972)
5 4 8.5 7 7 5 3.5 5 5.6
Visual languages attempt equivalence with reality. Visuals are iconic. They normally resemble the thing they represent. Meaning is apparent on a basic level, but the visual language must be learned for true comprehension. (Pettersson, 1989)
6 8.5 5 3 4 8 6 8.5 6.1
The same intended theme or subject can be expressed through many different pictures. (Pettersson, 1986)
4 6 6 6 9 7 8.5 9 6.9
Perception of two- or three-dimensional representations entails fast, parallel, simultaneous, and holistic proces-sing. (Gazzaniga, 1967; Sperry, 1973, 1982)
3 8.5 8.5 5 10 9 10 7 7.6
Visual languages have analogue coding employing combinations of basic graphic elements (dots, lines, areas, and volumes) for depicting reality. A given set of basic elements can be combined to form completely different images. (Pettersson, 1987)
10 8.5 8.5 4 8 10 8.5 10 8.4
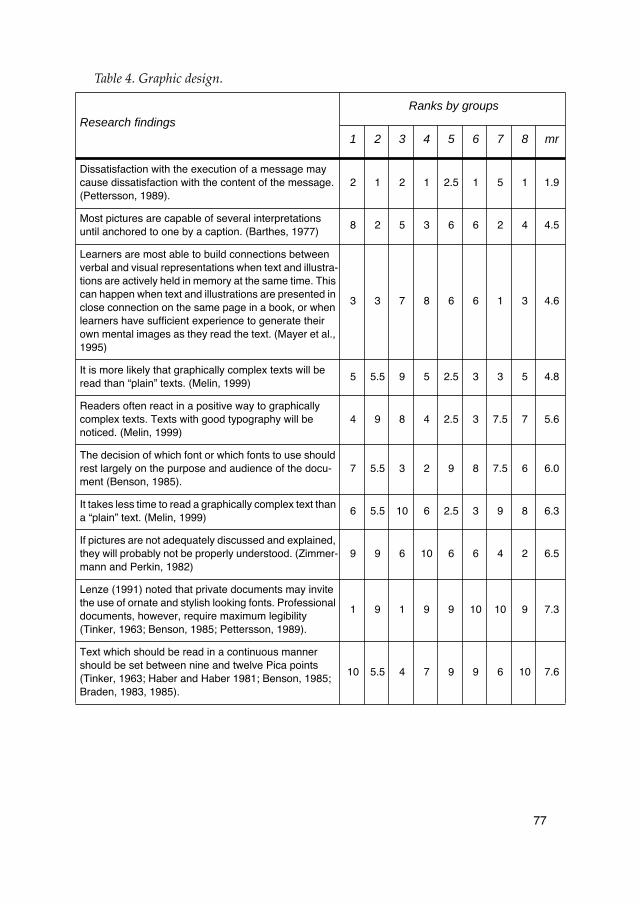
77
Table 4. Graphic design.
Research findings Ranks by groups
1 2 3 4 5 6 7 8 mr
Dissatisfaction with the execution of a message may cause dissatisfaction with the content of the message. (Pettersson, 1989).
2 1 2 1 2.5 1 5 1 1.9
Most pictures are capable of several interpretations until anchored to one by a caption. (Barthes, 1977)
8 2 5 3 6 6 2 4 4.5
Learners are most able to build connections between verbal and visual representations when text and illustra-tions are actively held in memory at the same time. This can happen when text and illustrations are presented in close connection on the same page in a book, or when learners have sufficient experience to generate their own mental images as they read the text. (Mayer et al., 1995)
3 3 7 8 6 6 1 3 4.6
It is more likely that graphically complex texts will be read than “plain” texts. (Melin, 1999)
5 5.5 9 5 2.5 3 3 5 4.8
Readers often react in a positive way to graphically complex texts. Texts with good typography will be noticed. (Melin, 1999)
4 9 8 4 2.5 3 7.5 7 5.6
The decision of which font or which fonts to use should rest largely on the purpose and audience of the docu-ment (Benson, 1985).
7 5.5 3 2 9 8 7.5 6 6.0
It takes less time to read a graphically complex text than a “plain” text. (Melin, 1999)
6 5.5 10 6 2.5 3 9 8 6.3
If pictures are not adequately discussed and explained, they will probably not be properly understood. (Zimmer-mann and Perkin, 1982)
9 9 6 10 6 6 4 2 6.5
Lenze (1991) noted that private documents may invite the use of ornate and stylish looking fonts. Professional documents, however, require maximum legibility (Tinker, 1963; Benson, 1985; Pettersson, 1989).
1 9 1 9 9 10 10 9 7.3
Text which should be read in a continuous manner should be set between nine and twelve Pica points (Tinker, 1963; Haber and Haber 1981; Benson, 1985; Braden, 1983, 1985).
10 5.5 4 7 9 9 6 10 7.6

78
Table 5. Receiver processes
Research findings Ranks by groups
1 2 3 4 5 6 7 8 mr
Memory for pictures is superior to memory for words (Paivio, 1983; Branch and Bloom, 1995). This is called the “pictorial superiority effect”.
5 2 2 7.5 2 5 2 1 3.4
Visual languaging abilities develop prior to, and serve as the foundation for, verbal language development. (Reynolds-Myers, 1985; Moriarty, 1994)
2 3 3 5 6 3 6 2 3.8
Images and visual language speak directly to us in the same way experience speaks to us: holistically and emotionally. (Barry, 1998)
7 7 4 1.5 5 1 5 3 4.2
Memory for a picture-word combination is superior to memory for words alone or pictures alone. (Adams and Chambers 1962; Haber and Myers, 1982)
6 1 1 7.5 3 10 2 5 4,6
Development of visual languaging abilities is dependent upon learner interaction with objects, images, and body language. (Reynolds-Myers, 1985).
3 4 9 1.5 8 6 2 7 5.2
Both students and teachers have to learn how to read, how to create and how to use visuals. (Pettersson, 1990)
9 8 8 3.5 4 4 1 4 5.2
Because children developmentally cannot or do not pay attention to factual information in advertising – but rather to peripheral cues such as colour and imagery – they tend to process advertising not through logical assess-ment, but through their emotions. (Barry, 1998)
1 5 5 10 9 2 8 9 6.1
Comprehensive school students have a very poor picto-rial capability. They are poor at reading and understan-ding pictures. They are also poor at expressing them-selves with pictures. (Backman, Berg and Sigurdson, 1988; Eklund, 1990)
4 9 7 3.5 7 8 10 10 7.3
People who have not learned to read or write do not necessarily look at pictures in the order intended. It often proves helpful, as messages are being tested, to ask several groups of people to arrange the individual message into a sequence that seems most logical to them. (Zimmermann and Perkin, 1982)
10 10 6 9 1 7 9 8 7.5
The pattern for eye movements and fixations depends on what we wish to see, or are told to see in a picture. (Yarbus, 1967)
8 6 10 6 10 9 7 6 7.8
79
Paper 5
Research in information design
Abstract. Like architecture, engineering, and other broad disciplines, informationdesign has a practical and a theoretical part. To a large extent research in informationdesign consists of applied research. Critically selected results from other research areasmay often be used as a starting point for the development of new theories. It may beconcluded that the study of information design and the presentation of verbo-visualmessages is a multi-disciplinary, multi-dimensional and worldwide consideration.Information literacy, visual language, visual literacy, perception and learning areimportant concepts here. Several different research methods are used in informationdesign research.
Design In Sweden the National Agency for Higher Education (Högskoleverket) pro-vides information about specific courses and complete academic programs thatare available to students. On their web page studera.nu (study now) studentsmay find information on current options. This database includes more than 700academic disciplines. The word “design” gave more than one thousand “hits”on March 29th, 2005. A closer look at the documents for individual courses andprograms show that many are very different.
What do we mean by the term design? It is related to the Latin word designare,to mark out, define; de-, out, from + signare, to mark (Little, 1965). In variousdefinitions of the word design the authors note aesthetic and artistic propertiesas well as functional properties related to articles for everyday use.
We may conclude that the meaning of the word design is very broad andit encompasses several different concepts.
Pettersson (2002, p. 6) distinguished between several design concepts suchas design processes, design activities, design areas, design levels, design per-spectives, design discourse, and final designs.
A design process includes the development from a concept or an idea to afinal product. Steps in the design process may be called design activities, suchas: the work with conceptual design, embodiment design, detail design, anddesign reviews. Thus the design process includes cognitive as well as practicalaspects and activities.
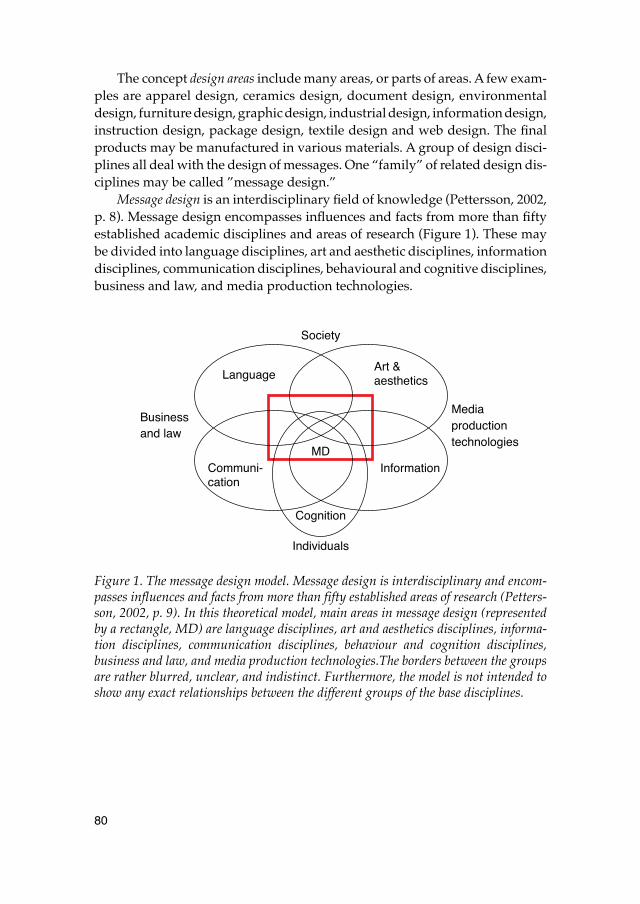
80
The concept design areas include many areas, or parts of areas. A few exam-ples are apparel design, ceramics design, document design, environmentaldesign, furniture design, graphic design, industrial design, information design,instruction design, package design, textile design and web design. The finalproducts may be manufactured in various materials. A group of design disci-plines all deal with the design of messages. One “family” of related design dis-ciplines may be called ”message design.”
Message design is an interdisciplinary field of knowledge (Pettersson, 2002,p. 8). Message design encompasses influences and facts from more than fiftyestablished academic disciplines and areas of research (Figure 1). These maybe divided into language disciplines, art and aesthetic disciplines, informationdisciplines, communication disciplines, behavioural and cognitive disciplines,business and law, and media production technologies.
Figure 1. The message design model. Message design is interdisciplinary and encom-passes influences and facts from more than fifty established areas of research (Petters-son, 2002, p. 9). In this theoretical model, main areas in message design (representedby a rectangle, MD) are language disciplines, art and aesthetics disciplines, informa-tion disciplines, communication disciplines, behaviour and cognition disciplines,business and law, and media production technologies.The borders between the groupsare rather blurred, unclear, and indistinct. Furthermore, the model is not intended toshow any exact relationships between the different groups of the base disciplines.
Individuals
Business
Society
and law
Media
technologiesproduction
Cognition
LanguageArt &
Communi- InformationMD
cation
aesthetics
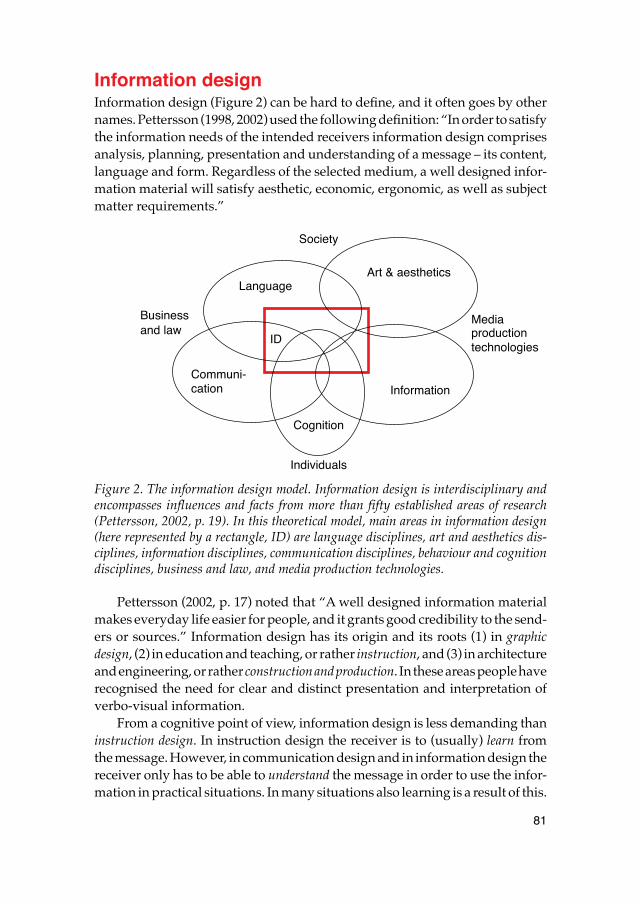
81
Information designInformation design (Figure 2) can be hard to define, and it often goes by othernames. Pettersson (1998, 2002) used the following definition: “In order to satisfythe information needs of the intended receivers information design comprisesanalysis, planning, presentation and understanding of a message – its content,language and form. Regardless of the selected medium, a well designed infor-mation material will satisfy aesthetic, economic, ergonomic, as well as subjectmatter requirements.”
Figure 2. The information design model. Information design is interdisciplinary andencompasses influences and facts from more than fifty established areas of research(Pettersson, 2002, p. 19). In this theoretical model, main areas in information design(here represented by a rectangle, ID) are language disciplines, art and aesthetics dis-ciplines, information disciplines, communication disciplines, behaviour and cognitiondisciplines, business and law, and media production technologies.
Pettersson (2002, p. 17) noted that “A well designed information materialmakes everyday life easier for people, and it grants good credibility to the send-ers or sources.” Information design has its origin and its roots (1) in graphicdesign, (2) in education and teaching, or rather instruction, and (3) in architectureand engineering, or rather construction and production. In these areas people haverecognised the need for clear and distinct presentation and interpretation ofverbo-visual information.
From a cognitive point of view, information design is less demanding thaninstruction design. In instruction design the receiver is to (usually) learn fromthe message. However, in communication design and in information design thereceiver only has to be able to understand the message in order to use the infor-mation in practical situations. In many situations also learning is a result of this.
Individuals
Business
Society
and lawMedia
technologiesproduction
Cognition
LanguageArt & aesthetics
Communi-Information
ID
cation
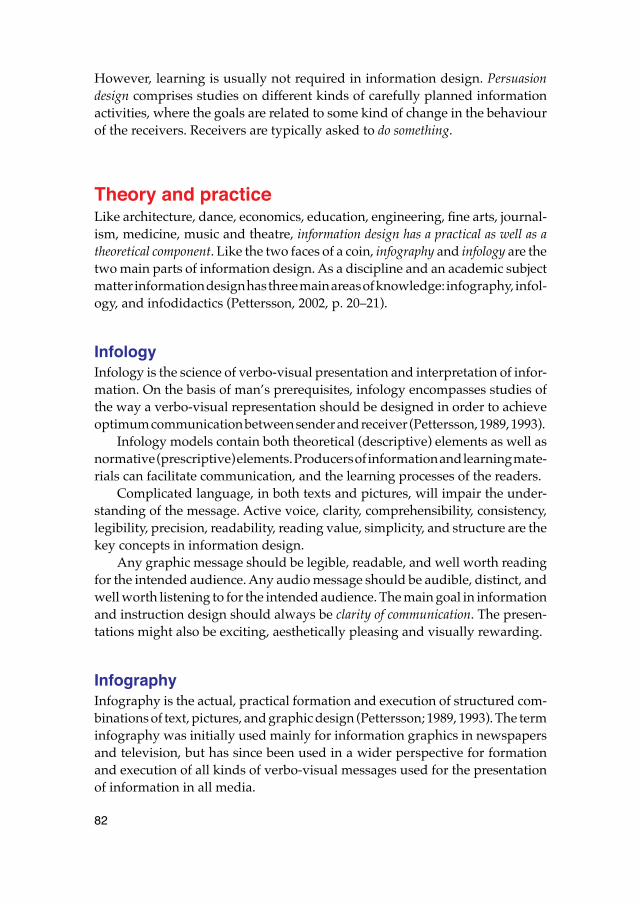
82
However, learning is usually not required in information design. Persuasiondesign comprises studies on different kinds of carefully planned informationactivities, where the goals are related to some kind of change in the behaviourof the receivers. Receivers are typically asked to do something.
Theory and practiceLike architecture, dance, economics, education, engineering, fine arts, journal-ism, medicine, music and theatre, information design has a practical as well as atheoretical component. Like the two faces of a coin, infography and infology are thetwo main parts of information design. As a discipline and an academic subjectmatter information design has three main areas of knowledge: infography, infol-ogy, and infodidactics (Pettersson, 2002, p. 20–21).
InfologyInfology is the science of verbo-visual presentation and interpretation of infor-mation. On the basis of man’s prerequisites, infology encompasses studies ofthe way a verbo-visual representation should be designed in order to achieveoptimum communication between sender and receiver (Pettersson, 1989, 1993).
Infology models contain both theoretical (descriptive) elements as well asnormative (prescriptive) elements. Producers of information and learning mate-rials can facilitate communication, and the learning processes of the readers.
Complicated language, in both texts and pictures, will impair the under-standing of the message. Active voice, clarity, comprehensibility, consistency,legibility, precision, readability, reading value, simplicity, and structure are thekey concepts in information design.
Any graphic message should be legible, readable, and well worth readingfor the intended audience. Any audio message should be audible, distinct, andwell worth listening to for the intended audience. The main goal in informationand instruction design should always be clarity of communication. The presen-tations might also be exciting, aesthetically pleasing and visually rewarding.
InfographyInfography is the actual, practical formation and execution of structured com-binations of text, pictures, and graphic design (Pettersson; 1989, 1993). The terminfography was initially used mainly for information graphics in newspapersand television, but has since been used in a wider perspective for formationand execution of all kinds of verbo-visual messages used for the presentationof information in all media.
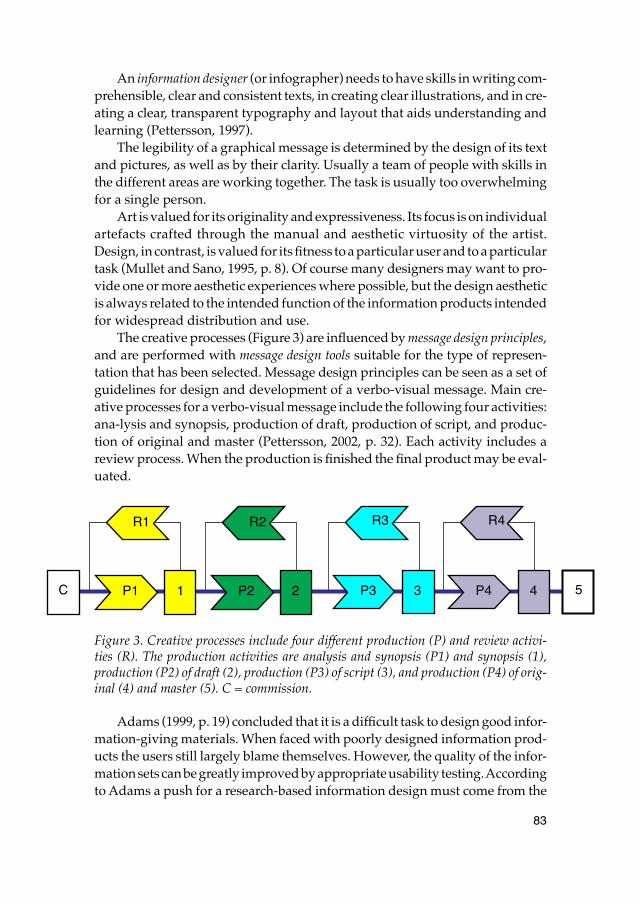
83
An information designer (or infographer) needs to have skills in writing com-prehensible, clear and consistent texts, in creating clear illustrations, and in cre-ating a clear, transparent typography and layout that aids understanding andlearning (Pettersson, 1997).
The legibility of a graphical message is determined by the design of its textand pictures, as well as by their clarity. Usually a team of people with skills inthe different areas are working together. The task is usually too overwhelmingfor a single person.
Art is valued for its originality and expressiveness. Its focus is on individualartefacts crafted through the manual and aesthetic virtuosity of the artist.Design, in contrast, is valued for its fitness to a particular user and to a particulartask (Mullet and Sano, 1995, p. 8). Of course many designers may want to pro-vide one or more aesthetic experiences where possible, but the design aestheticis always related to the intended function of the information products intendedfor widespread distribution and use.
The creative processes (Figure 3) are influenced by message design principles,and are performed with message design tools suitable for the type of represen-tation that has been selected. Message design principles can be seen as a set ofguidelines for design and development of a verbo-visual message. Main cre-ative processes for a verbo-visual message include the following four activities:ana-lysis and synopsis, production of draft, production of script, and produc-tion of original and master (Pettersson, 2002, p. 32). Each activity includes areview process. When the production is finished the final product may be eval-uated.
Figure 3. Creative processes include four different production (P) and review activi-ties (R). The production activities are analysis and synopsis (P1) and synopsis (1),production (P2) of draft (2), production (P3) of script (3), and production (P4) of orig-inal (4) and master (5). C = commission.
Adams (1999, p. 19) concluded that it is a difficult task to design good infor-mation-giving materials. When faced with poorly designed information prod-ucts the users still largely blame themselves. However, the quality of the infor-mation sets can be greatly improved by appropriate usability testing. Accordingto Adams a push for a research-based information design must come from the
R1 R2 R3 R4
P1 P2 P3 P4 C 1 2 3 4 5
84
information designers. In each case members of the specific user group maybe invited to evaluate preliminary texts and sketches for drawings and photo-graphs.
InfodidacticsInfodidactics is the methods used for teaching the various aspects of informationdesign. The huge spread among the different disciplines makes informationdesign an interesting, but also a complex area of research and teaching. The goalof all scientific enterprise is understanding. When we understand a subject matterwe are able to explain phenomena and predict new phenomena.
Although information design theories frequently refer to descriptive theoryand propositions, their main function is to guide the information designers inhow to actually design, present and produce information sets. In order to dothis, it is important to work with problem-oriented learning in realistic projects;with existing and true problems, with regular “senders” or “information pro-viders”, with actual information materials, and with real “receivers” “infor-mation interpreters” that need the information. This also provides realistic expe-rience with budget and time limits.
Areas of research Information design studies is a broad area with contacts to several other areasof research. Many studies have mainly dealt with various aspects of verbal infor-mation in different media. Quite often pictures and images in the messages havebeen overlooked and “forgotten.”
In my own work the goal has been to study the presentation of visual and verbo-visual messages in information and learning contexts in order to gain a better under-standing of the conditions related to the design, use, and interpretation of such infor-mation. Most of my own work has been related to audience interpretation andperception of verbo-visual messages, to visual literacy and to the question ofa visual language and its representations.
Areas of design In information design it is always important that the intended audience willbe able to understand the messages. The reader must always be able to distin-guish between figure and ground without any trouble. Production of informa-tion materials is the opposite to camouflage, where the intention is to make afigure as much like the background as possible. At an oral presentation it maybe better not to use any visuals at all than having to use low quality images.
85
Poorly executed and poorly presented images will influence the understandingsof the whole oral presentation. Simple pictures are “immediate.” They speakto us holistically and emotionally. When readers get the “wrong impression”it may be very hard to change this later on. A “design perspective” or “executionperspective” of message design and information design includes:
1. Text design 2. Image design 3. Shape design 4. Sound design 5. Light design 6. Spatial design 7. Time design
Types of contentIt is important to understand the intended content in informative messages andinformation materials. What is the meaning with informative messages? Whatis the influence of culture? A “types of content perspective” includes:
1. Informative entertainment2. Brief messages3. Administrative documentation4. Actual information5. Instructions
Parts of communicationInformation design encompasses studies of the way a representation shouldbe designed in order to achieve optimum communication between the senderand the receiver. We can study the whole communications procecss, for examplewith respect to social aspects or “noise” in the system. We can also study thethree distinct parts of the communications process. Each “part” can be dividedin several sections:
1. The sender– Framing a verbo-visual message– Producing an original, master, and edition– “Sending” a verbo-visual message
2. The representation– Analyzing a verbo-visual message– Studying the relationships of the message
86
– Studying the development of new media3. The receiver
– Receiving a verbo-visual message– Understanding a verbo-visual message– Reacting to a verbo-visual message
Types of representationsA verbo-visual representation can be designed in different ways. Based on howthe verbal information is presented to the receivers, we can distinguish threemain types of verbo-visual representations (Pettersson, 1989, 1993).
We read the printed words in lexi-visual representations, such as messagesprinted in a book or messages displayed on a computer screen.
We listen to the spoken words in audio-visual representations, such as oralpresentations with slides or overhead transparencies and in television pro-grammes.
We read printed words and listen to spoken words in a combination of lexi-visual and audio-visual representations in multi-visual representations, suchas interactive multimedia systems. Each “type” can be divided in several sec-tions:
1. Lexi-visual representations– Manual productions – Technical productions
2. Audio-visual representations– Oral presentations – Recorded representations
3. Multi-visual representations– Interactive systems– Simulator systems
Message contexts Factors inside the medium provide the inner context. The inner context is aninternal context. In a book it is the relationship between various text elements,pictures and layout. We may also discuss the relationships between the imageelements within a single picture.
The entire communications situation, i.e. senders and their intentions forthe verbo-visual message, and receivers and their circumstances provide thesocial context. When we read a book or view projected images the lighting inthe room may exemplify the close context. The close context and the social con-text are both external contexts. The context in which a specific message is pre-
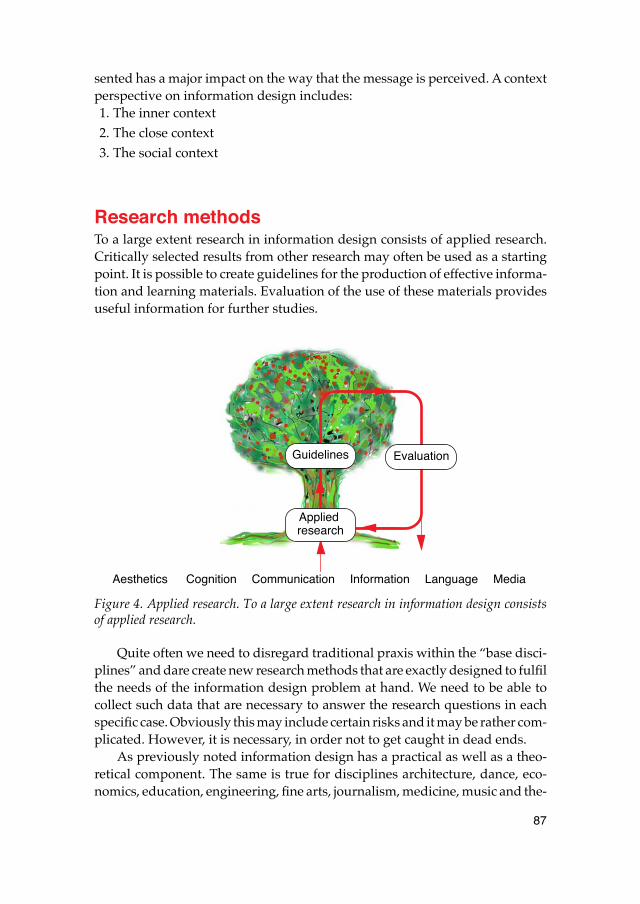
87
sented has a major impact on the way that the message is perceived. A contextperspective on information design includes:1. The inner context2. The close context3. The social context
Research methods To a large extent research in information design consists of applied research.Critically selected results from other research may often be used as a startingpoint. It is possible to create guidelines for the production of effective informa-tion and learning materials. Evaluation of the use of these materials providesuseful information for further studies.
Figure 4. Applied research. To a large extent research in information design consistsof applied research.
Quite often we need to disregard traditional praxis within the “base disci-plines” and dare create new research methods that are exactly designed to fulfilthe needs of the information design problem at hand. We need to be able tocollect such data that are necessary to answer the research questions in eachspecific case. Obviously this may include certain risks and it may be rather com-plicated. However, it is necessary, in order not to get caught in dead ends.
As previously noted information design has a practical as well as a theo-retical component. The same is true for disciplines architecture, dance, eco-nomics, education, engineering, fine arts, journalism, medicine, music and the-
EvaluationGuidelines
Applied research
Aesthetics InformationCommunication Cognition Language Media
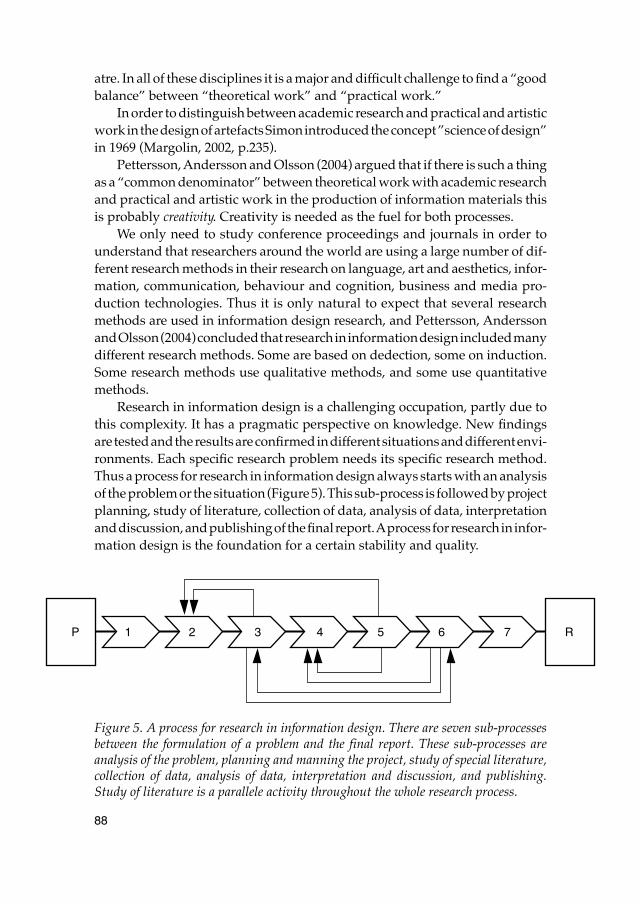
88
atre. In all of these disciplines it is a major and difficult challenge to find a “goodbalance” between “theoretical work” and “practical work.”
In order to distinguish between academic research and practical and artisticwork in the design of artefacts Simon introduced the concept ”science of design”in 1969 (Margolin, 2002, p.235).
Pettersson, Andersson and Olsson (2004) argued that if there is such a thingas a “common denominator” between theoretical work with academic researchand practical and artistic work in the production of information materials thisis probably creativity. Creativity is needed as the fuel for both processes.
We only need to study conference proceedings and journals in order tounderstand that researchers around the world are using a large number of dif-ferent research methods in their research on language, art and aesthetics, infor-mation, communication, behaviour and cognition, business and media pro-duction technologies. Thus it is only natural to expect that several researchmethods are used in information design research, and Pettersson, Anderssonand Olsson (2004) concluded that research in information design included manydifferent research methods. Some are based on dedection, some on induction.Some research methods use qualitative methods, and some use quantitativemethods.
Research in information design is a challenging occupation, partly due tothis complexity. It has a pragmatic perspective on knowledge. New findingsare tested and the results are confirmed in different situations and different envi-ronments. Each specific research problem needs its specific research method.Thus a process for research in information design always starts with an analysisof the problem or the situation (Figure 5). This sub-process is followed by projectplanning, study of literature, collection of data, analysis of data, interpretationand discussion, and publishing of the final report. A process for research in infor-mation design is the foundation for a certain stability and quality.
Figure 5. A process for research in information design. There are seven sub-processesbetween the formulation of a problem and the final report. These sub-processes areanalysis of the problem, planning and manning the project, study of special literature,collection of data, analysis of data, interpretation and discussion, and publishing.Study of literature is a parallele activity throughout the whole research process.
P 1 2 3 4 5 6 7 R
89
Pettersson, Andersson and Olsson (2004) compared this theoretical researchprocess with the practical production process in information design noted abovein sub-section Infography. The comparison revealed that these processes basi-cally include the same methods.
Nijhuis and Boersema (1999) made similar observations when they studiedco-operation between researchers in behavioural science and graphic designers.They noted that it was not only possible to construct congruent strategic modelsof the two disciplines, but it was also shown that the corresponding tactics wereremarkably similar. Differences in attitudes towards time and money onlyexisted at the operational level, where specific skills and methods are used toachieve intermediate results.
Summary and conclusionIt may be concluded that the study of information design and the presentationof verbo-visual messages is a multi-disciplinary, multi-dimensional and world-wide consideration. Information literacy, visual language, visual literacy, per-ception and learning are important concepts. We should not only use one or afew accepted research methods in information design. We should use theresearch methods that are needed in order to answer the research questions ineach specific case.
ReferencesAdams, A. (1999). Usability testing in information design. In H. J. G. Zwaga, T.
Boersma, and H. C. M. Hoonhout (Eds. ). Visual information for everyday use. Design and research perspectives. Taylor & Francis: London, Philadelphia.
Högskoleverkets webbplats för information om högskolestudier. (2005, March 29). studera.nu, <http://www.studera.nu/index.shtml>
Little, W. (Ed.) (1965). The Shorter Oxford English Dictionary on Historical Prin-ciples. Oxford: Clarendon Press.
Margolin, V. (2002). The politics of the artificial – Essays on Design and Design Studies. Chicago: The University of Chicago Press.
Mullet, K. & Sano, D. (1995). Designing Visual Interfaces Communication Ori-ented Techniques. Mountain View, California: SunSoft Press A Prentice Hall Title.
Nijhuis, W. & Boersema, T. (1999). Cooperation between graphic designers and applied behavioural researchers. In H. J. G. Zwaga, T. Boersema, & H. C. M. Hoonhout. (Eds.). Visual information for everyday use. Design and research per-spectives. London: Taylor & Francis Ltd. Philadelphia: Taylor & Francis Inc.
90
Pettersson, R. (1989). Visuals for Information: Research and Practice. Englewood Cliffs, NJ: Educational Technology Publications.
Pettersson, R. (1993). Visual Information. Englewood Cliffs, NJ: Educational Technology Publications.
Pettersson, R. (1997). Verbo-visual Communication – Presentation of Clear Mes-sages for Information and Learning. Göteborg: Valfrid Publishing Association and Research Centre for Library and Information Studies, Göteborg Uni-versity.
Pettersson, R. (1998). Information Design. Västerås: Mälardalens Högskola Research & Reports. Opuscula Nr 36.
Pettersson, R. (2002). Information Design, An introduction. Amsterdam/Phila-delphia: John Benjamins Publishing Company.
Pettersson, R., Andersson, C., & Olsson, B. (2004). Philosophy of Information Design Research Methods. Paper presented at the 3rd CEPHAD-conference (The Centre for European Philosophy, Art, and Design). March 16th, 2004, Bornholm, Denmark.
91
Paper 6
Literacies in the new millennium
Abstract. This paper includes a discussion of literacies in the new millennium. Read-ing and writing means more than recognizing words; it also implies comprehendingthe meaning of the words that we read or write. Today the concept of literacy is muchbroader. A person may be computer literate, culturally literate, economic literate, filmliterate, information literate, media literate, political literate, scientifically literate,technically literate, television literate, video literate, and visually literate. Conse-quently a person may be illiterate in all these aspects.
In the industrialized, cultural sphere, we are bombarded with information viathe media, at home, in school, at work, and in the society in general. It is difficultat times to avoid information and it may be just as hard to obtain the informationthat we really need at the time. Audio, text, and visuals compete for our atten-tion. It is quite possible that we miss the information in which we are reallyinterested. In addition to radio, television, books, newspapers, and magazines,vast amounts of information are distributed in the form of advertising throw-aways, posters, placards, and photocopies.
Throughout the 1980s, major changes occurred in the way our society pro-duced, stored, and accessed information. Monfils (1993) concluded that regard-less of the specific application of technology, consensus had been reached onthe increasing impact of modern information technology on all aspects of ourlives. Modern research and development produce more information than everbefore and people frequently find that their knowledge is inadequate and frag-mented.
Traditionally, the concept of literacy was restricted to the state of being lit-erate. A literate person is one who is able to read and write printed text. Consequently,an illiterate person is unable to read and write. However, reading and writingmeans more than recognizing words; it also implies comprehending the mean-ing of the words that we read or write. During recent decades, however, peoplehave recognized the need for a wide array of other “literacies” rather than asingular “literacy”, based on the traditional medium of print. Beyond the basicskills of reading, writing, and arithmetic, the citizen of the twenty-first centuryneeds complex analytical skills.
The tools of the Information Age have put vast volumes of information atour fingertips. According to Scott, Kirsch, and Jenkins (1998, p. 17) the Adult
92
Literacy Survey (IALS) defined literacy as “using printed and written infor-mation to function in society, to achieve one’s goals, and to develop one’s knowl-edge and potential”. Hugo and Skibbe (1991) argued that the illiterate of thefuture might not be those who cannot read, but those who cannot see.
Today the concept of literacy is much broader. Other literacies are computerliteracy, cultural literacy, diagrammatic literacy, document literacy, economicliteracy, environmental literacy, film literacy, information literacy, mathematicalliteracy, media literacy, music literacy, political literacy, scientific literacy, tech-nical literacy, television literacy, video literacy, and visual literacy. Thus a personmay be computer literate, culturally literate, diagrammatic literate, economi-cally literate, environmentally literate, film literate, information literate, math-ematically literate, media literate, musically literate, politically literate, scien-tifically literate, technically literate, television literate, video literate, andvisually literate. Consequently a person may be illiterate in all these aspects,which would be hard in our modern society. We have, and indeed we fail tohave many different literacies. Erstad (1998) pointed out that we need to aban-don the notion of literacy as a set of disembodied “skills” and to recognise thatliteracies are always inevitably situated within specific practices and specificsocial contexts, what some educators term a social theory of media literacy.Information literacy is a potential tool of empowerment for all.
Computer literacyConsidine and Haley (1992) argued that computer literacy clearly relates bothvisual literacy and media literacy to the traditional concepts of literacy, namelyreading and writing. Monfils (1993) argued that to be computer-literate oneneeds only be a computer user, not a computer programmer. It is, however, notalways easy to be a computer user. Sterner (1997) noted that users of all kindsof appliances often expect to be able to use the specific appliances without firstreading any instructions for use at all. When people fail and realize that theyneed instructions for use they expect to be able to follow a clear text with pictures,and a well developed index, as well as a trouble-shooting guide. This however,is usually not at all the case. Instruction manuals may be hard to understandand they do not always meet even modest quality expectations.
Modern computer systems often have user interfaces based on symbolsintended to function in various countries, in various cultures and subcultures.These symbols may, however, actually not function at all for the intended users.Griffin et al. (1994) studied how international business people interpreted andunderstood commonly used clip art graphic symbols. The symbols were takenfrom a Harward Graphics software package for business presentations. Basedon 4,530 opinions expressed by 302 subjects in Japan, Sweden, Tanzania and
93
the USA, regarding 15 of the symbols in the software package, Griffin et al. madethe following two conclusions:
• There are many ways to interpret symbols. Very few people share the sameunderstanding of any given symbol.
• There are strong cultural differences in interpreting the meanings of sym-bols.
Computer users should not be satisfied with the present situation. Users shoulddemand better graphical interfaces as well as better instructions for use. Betteruser interfaces would probably fast increase the number of computer literateusers.
Environmental literacyEnvironmental literacy is essentially the capacity to perceive and interpret therelative health of environmental systems and take appropriate action to main-tain, restore, or improve the health of those systems (Roth, 1992). Levels of lit-eracy are generally assumed to exist but are not often defined. With respect toenvironmental literacy , Roth proposed the identification of three levels:
• Nominal, indicating ability to recognize many of the basic terms used incommunicating about the environment and to provide rough, if unsophis-ticated , working definitions of their meanings.
• Functional, indicating a broader knowledge and understanding of thenature and interactions between human social systems and other naturalsystems.
• Operational, indicating progress beyond functional literacy in both thebreadth and depth of understandings and skills.
These three levels of literacy; nominal, functional, and operational, could alsobe used in other literacies.
Information literacyFrom a terminological point of view the concept “information” may be placedsomewhere between the concepts “data” and “knowledge”. It is not easy todraw strict borderlines between these concepts. We may view information fromvarious perspectives with respect to how we create, present, produce, distribute,search, sort, index, store, receive, process, value, respond to, make use of, andrenew information. Often several groups of people with different skills are
94
needed for these activities. Each person has a set of individual experiences andvalues which will influence their view of information. Vickery and Vickery(1987) pointed out that information is a merchandise, however quite differentfrom other kinds of commodities. They wrote (p. 27):
Information is a peculiar commodity. When transferred from source torecipient, or from seller to buyer, it remains available to both. Unlike thesale of a material product, information transfer does not give the recipi-ent the right of exclusive use, ...
Most people are involved with communication and with communication sys-tems in one way or another. Some of these systems have “soft” and human orlinguistic dimensions. Other systems possess “hard” and technological dimen-sions. Within library and information science some research areas are well estab-lished since many years. Other areas are relatively new and can be regardedas independent scientific disciplines. In several instances certain issues areaddressed in different disciplines, even if the approaches may vary.
Research in library and information science (Höglund, 1995) emphasizesthe conveying of information and culture that is stored in any kind of document.Research projects range from historical and social aspects of information, tomodern information technology like multimedia, the World Wide Web (WWW),and other information tools on the Internet. In WWW several “home pages”include graphics and image maps with hyperlinks to related information. Imagemaps range from very simple to very complex, from simple schematic picturesto works of art. Many information studies have mainly dealt with variousaspects of verbal information, such as classification, indexing, cataloguing, stor-ing, and retrieval of text. However, the visual image has occupied a central rolein human communication, and in documents, since the dawn of civilisation.Harrison (1981) noted that pictures are sources for information (p. 3):
A picture is a source of visual information. It may be a photograph of awork of art or it may be a work of art itself, but in library terms it is apiece of information to be used and evaluated as any other informationavailable in the library. The information contained in a picture may betaken from life, of geographical features, scenery, street scenes, naturalphenomena, animals, people, or activities, or a direct presentation of awork of art.
In the USA, the American Library Association (ALA, 1989) defined informationliteracy as follows (p. 1): “To be information-literate, a person must be able torecognize when information is needed and have the ability to locate, evaluate,and use effectively the needed information.” The same year, a National Forumon Information Literacy was established in the USA as an umbrella group fornational organizations committed to helping people become effective consum-
95
ers of information. This group wants to show that literacy can no longer be con-sidered merely to be the ability to read and memorize a base of knowledge;instead, literacy must entail the ability to acquire and evaluate the informationthat is needed in any situation. According to Senn Breivik and Jones (1993), soci-ety has reached the point where the traditional literacies sought by liberal edu-cation are insufficient (p. 26): “Higher education is being called upon to defineand develop a new learning style that fosters within students the abilitiesneeded to be information-literate”.
Doyle (1994) defined information literacy as “the ability to access, evaluate,and use information from a variety of sources”. She created a list of character-istics of an information literate person. An information literate person has infor-mation competence, and accesses, evaluates and uses information in a qualifiedway. In accordance with Doyle an information literate person is one who:
• recognizes that accurate and complete information is the basis for intelli-gent decision making
• recognizes the need for information• formulates questions based on information needs • identifies potential sources of information • develops successful search strategies • accesses sources of information including computer-based and other tech-
nologies• is a competent reader, evaluates information, and determines accuracy and
relevance • recognizes point of view and opinion versus factual knowledge • rejects inaccurate and misleading information • organizes information for practical application • integrates new information into an existing body of knowledge • uses information in critical thinking and problem solving
Doyle (1994) concluded that as American society has shifted from an economybased on capital goods (industrial) to an economy based on services (informa-tion), there has been a corresponding shift in what is expected from Americaneducation. Knowing how to ask the right questions may be the single mostimportant step in learning. The process that is conducted in order to findanswers to the right questions leads to the point at which information becomesknowledge. Information literacy is central to all successful learning and byextension to all successful living. All of us face an information-rich future inwhich change will be one of the few constants of our life experience. The abilityto adapt and fulfil our individual potentials will require us to be life-long learn-ers and independent decision-makers. In Canada the Association for Teacher-
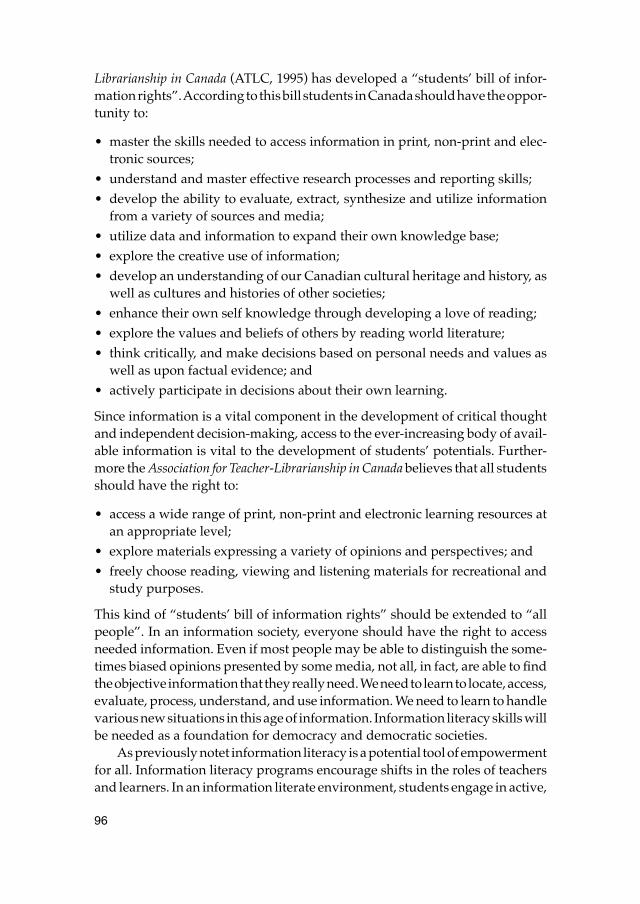
96
Librarianship in Canada (ATLC, 1995) has developed a “students’ bill of infor-mation rights”. According to this bill students in Canada should have the oppor-tunity to:
• master the skills needed to access information in print, non-print and elec-tronic sources;
• understand and master effective research processes and reporting skills; • develop the ability to evaluate, extract, synthesize and utilize information
from a variety of sources and media; • utilize data and information to expand their own knowledge base; • explore the creative use of information; • develop an understanding of our Canadian cultural heritage and history, as
well as cultures and histories of other societies; • enhance their own self knowledge through developing a love of reading; • explore the values and beliefs of others by reading world literature; • think critically, and make decisions based on personal needs and values as
well as upon factual evidence; and • actively participate in decisions about their own learning.
Since information is a vital component in the development of critical thoughtand independent decision-making, access to the ever-increasing body of avail-able information is vital to the development of students’ potentials. Further-more the Association for Teacher-Librarianship in Canada believes that all studentsshould have the right to:
• access a wide range of print, non-print and electronic learning resources atan appropriate level;
• explore materials expressing a variety of opinions and perspectives; and • freely choose reading, viewing and listening materials for recreational and
study purposes.
This kind of “students’ bill of information rights” should be extended to “allpeople”. In an information society, everyone should have the right to accessneeded information. Even if most people may be able to distinguish the some-times biased opinions presented by some media, not all, in fact, are able to findthe objective information that they really need. We need to learn to locate, access,evaluate, process, understand, and use information. We need to learn to handlevarious new situations in this age of information. Information literacy skills willbe needed as a foundation for democracy and democratic societies.
As previously notet information literacy is a potential tool of empowermentfor all. Information literacy programs encourage shifts in the roles of teachersand learners. In an information literate environment, students engage in active,
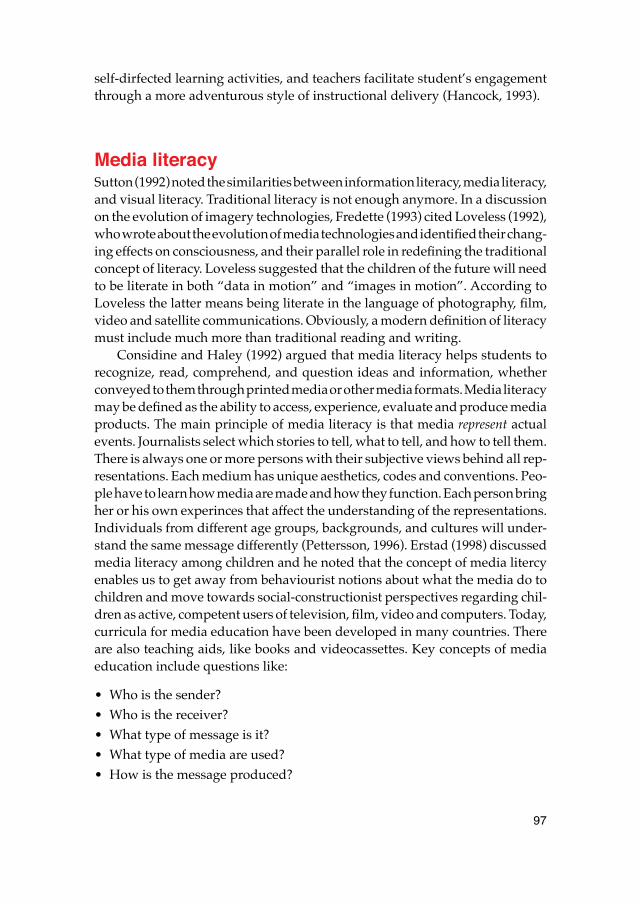
97
self-dirfected learning activities, and teachers facilitate student’s engagementthrough a more adventurous style of instructional delivery (Hancock, 1993).
Media literacySutton (1992) noted the similarities between information literacy, media literacy,and visual literacy. Traditional literacy is not enough anymore. In a discussionon the evolution of imagery technologies, Fredette (1993) cited Loveless (1992),who wrote about the evolution of media technologies and identified their chang-ing effects on consciousness, and their parallel role in redefining the traditionalconcept of literacy. Loveless suggested that the children of the future will needto be literate in both “data in motion” and “images in motion”. According toLoveless the latter means being literate in the language of photography, film,video and satellite communications. Obviously, a modern definition of literacymust include much more than traditional reading and writing.
Considine and Haley (1992) argued that media literacy helps students torecognize, read, comprehend, and question ideas and information, whetherconveyed to them through printed media or other media formats. Media literacymay be defined as the ability to access, experience, evaluate and produce mediaproducts. The main principle of media literacy is that media represent actualevents. Journalists select which stories to tell, what to tell, and how to tell them.There is always one or more persons with their subjective views behind all rep-resentations. Each medium has unique aesthetics, codes and conventions. Peo-ple have to learn how media are made and how they function. Each person bringher or his own experinces that affect the understanding of the representations.Individuals from different age groups, backgrounds, and cultures will under-stand the same message differently (Pettersson, 1996). Erstad (1998) discussedmedia literacy among children and he noted that the concept of media litercyenables us to get away from behaviourist notions about what the media do tochildren and move towards social-constructionist perspectives regarding chil-dren as active, competent users of television, film, video and computers. Today,curricula for media education have been developed in many countries. Thereare also teaching aids, like books and videocassettes. Key concepts of mediaeducation include questions like:
• Who is the sender?• Who is the receiver?• What type of message is it?• What type of media are used?• How is the message produced?
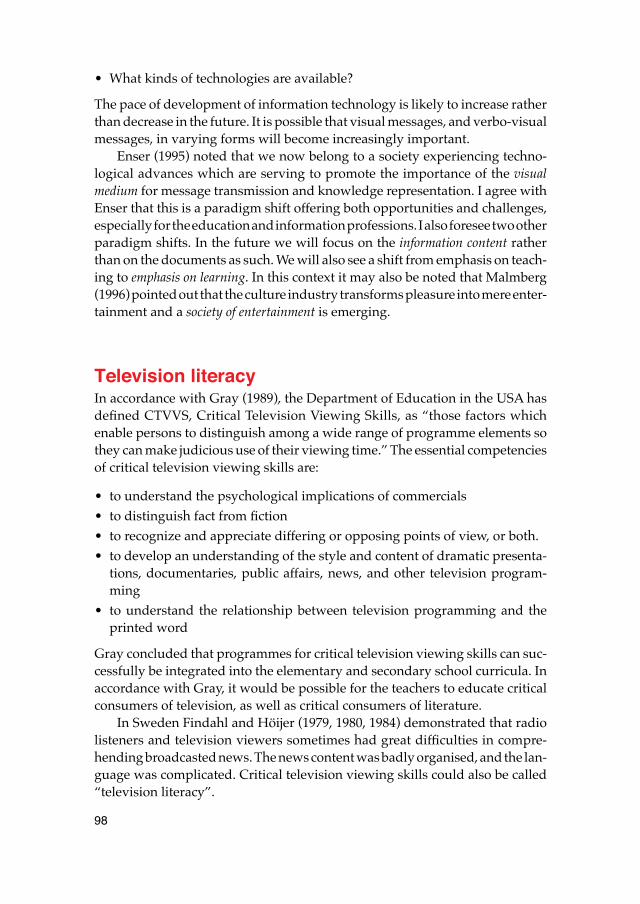
98
• What kinds of technologies are available?
The pace of development of information technology is likely to increase ratherthan decrease in the future. It is possible that visual messages, and verbo-visualmessages, in varying forms will become increasingly important.
Enser (1995) noted that we now belong to a society experiencing techno-logical advances which are serving to promote the importance of the visualmedium for message transmission and knowledge representation. I agree withEnser that this is a paradigm shift offering both opportunities and challenges,especially for the education and information professions. I also foresee two otherparadigm shifts. In the future we will focus on the information content ratherthan on the documents as such. We will also see a shift from emphasis on teach-ing to emphasis on learning. In this context it may also be noted that Malmberg(1996) pointed out that the culture industry transforms pleasure into mere enter-tainment and a society of entertainment is emerging.
Television literacyIn accordance with Gray (1989), the Department of Education in the USA hasdefined CTVVS, Critical Television Viewing Skills, as “those factors whichenable persons to distinguish among a wide range of programme elements sothey can make judicious use of their viewing time.” The essential competenciesof critical television viewing skills are:
• to understand the psychological implications of commercials• to distinguish fact from fiction• to recognize and appreciate differing or opposing points of view, or both.• to develop an understanding of the style and content of dramatic presenta-
tions, documentaries, public affairs, news, and other television program-ming
• to understand the relationship between television programming and theprinted word
Gray concluded that programmes for critical television viewing skills can suc-cessfully be integrated into the elementary and secondary school curricula. Inaccordance with Gray, it would be possible for the teachers to educate criticalconsumers of television, as well as critical consumers of literature.
In Sweden Findahl and Höijer (1979, 1980, 1984) demonstrated that radiolisteners and television viewers sometimes had great difficulties in compre-hending broadcasted news. The news content was badly organised, and the lan-guage was complicated. Critical television viewing skills could also be called“television literacy”.
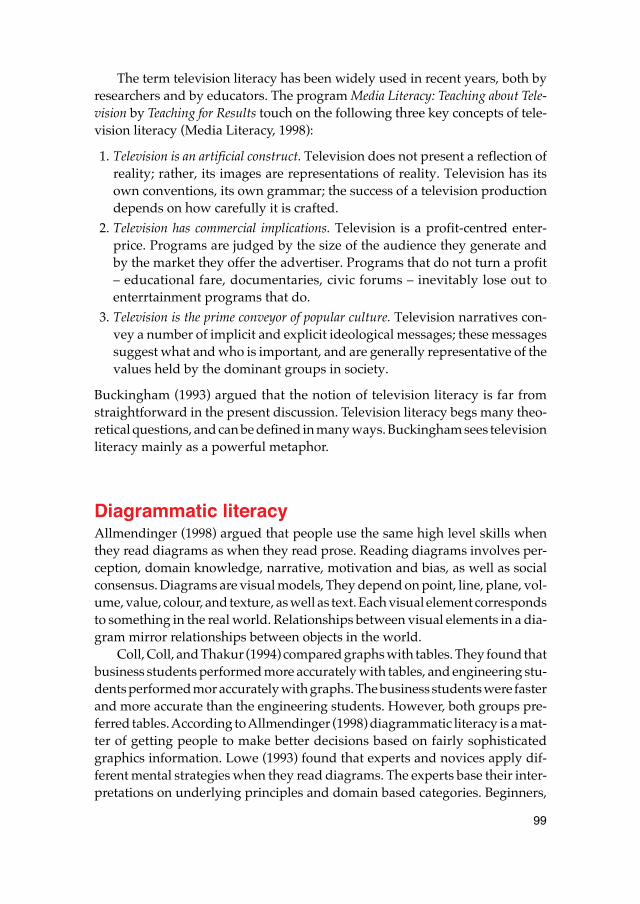
99
The term television literacy has been widely used in recent years, both byresearchers and by educators. The program Media Literacy: Teaching about Tele-vision by Teaching for Results touch on the following three key concepts of tele-vision literacy (Media Literacy, 1998):
1. Television is an artificial construct. Television does not present a reflection ofreality; rather, its images are representations of reality. Television has itsown conventions, its own grammar; the success of a television productiondepends on how carefully it is crafted.
2. Television has commercial implications. Television is a profit-centred enter-price. Programs are judged by the size of the audience they generate andby the market they offer the advertiser. Programs that do not turn a profit– educational fare, documentaries, civic forums – inevitably lose out toenterrtainment programs that do.
3. Television is the prime conveyor of popular culture. Television narratives con-vey a number of implicit and explicit ideological messages; these messagessuggest what and who is important, and are generally representative of thevalues held by the dominant groups in society.
Buckingham (1993) argued that the notion of television literacy is far fromstraightforward in the present discussion. Television literacy begs many theo-retical questions, and can be defined in many ways. Buckingham sees televisionliteracy mainly as a powerful metaphor.
Diagrammatic literacyAllmendinger (1998) argued that people use the same high level skills whenthey read diagrams as when they read prose. Reading diagrams involves per-ception, domain knowledge, narrative, motivation and bias, as well as socialconsensus. Diagrams are visual models, They depend on point, line, plane, vol-ume, value, colour, and texture, as well as text. Each visual element correspondsto something in the real world. Relationships between visual elements in a dia-gram mirror relationships between objects in the world.
Coll, Coll, and Thakur (1994) compared graphs with tables. They found thatbusiness students performed more accurately with tables, and engineering stu-dents performed mor accurately with graphs. The business students were fasterand more accurate than the engineering students. However, both groups pre-ferred tables. According to Allmendinger (1998) diagrammatic literacy is a mat-ter of getting people to make better decisions based on fairly sophisticatedgraphics information. Lowe (1993) found that experts and novices apply dif-ferent mental strategies when they read diagrams. The experts base their inter-pretations on underlying principles and domain based categories. Beginners,
100
however, rely more on visual patterns in the diagrams. So far there are no uni-versal conventions for diagrams.
Visual literacyAlthough the term “visual literacy” may be modern, it is not at all a new ideaor a new concept. Discussions about the use of images and pictures have a longhistory. Ancient philosophers used images for visual communication. In anat-omy and medicine, Aristotle employed anatomical illustrations. In mathemat-ics, Phythagoras, Socrates, and Plato used visual images to teach geometry.
Jesus Christ and other religious educators and prophets helped their lis-teners create inner images by means of different metaphors. In Mesoamerica,the old cultures and civilizations used advanced pictorial messages, especiallyin their temple cities.
Visual literacy is a broad and interdisciplinary concept including theoreticalperspectives, visual language perspectives, presentational perspectives, tech-nological development, and bits and pieces from several other “establishedfields” of research. Despite all the efforts during the past 30 years visual literacyand the “visual literacy movement” has not been able to attract enough interestfrom society and from those responsible for school curricula. An important rea-son may be a general lack of focus.
Definitions of visual literacyThere has been, and there still are considerable disagreements concerning a def-inition of visual literacy. It is clear that it is difficult to describe verbally a conceptthat is primarily nonverbal. Over time, definitions have varied from very narrowto very broad explanations of greater or lesser complexity. A number of research-ers have practically rejected the whole concept of visual literacy.
Heinich, Molenda, and Russell (1982) recognized that there are differentaspects of visual literacy. They compared visual literacy with print literacy andoffered the following definition (p. 62): “Visual literacy is the learned ability tointerpret visual messages accurately and to create such messages. Thus inter-pretation and creation in visual literacy can be said to parallel reading and writ-ing in print literacy. ” In my opinion this is a very good definition of visual lit-eracy. The definition reflects the perspective that visual literacy is a concept inwhich particular skills, knowledge, and attitudes can be taught and learned,which enhance our abilities to communicate.
The International Visual Literacy Association, IVLA, was established as anon-profit association in the State of New York in 1968 to provide a multi-dis-ciplinary forum for the exploration, presentation, and discussion of all aspects
101
of visual communication and their various applications through visual images,visual literacy, and literacy in general. IVLA serves as the organizational baseand communications bond for professionals from various disciplines who areinterested in visual literacy. IVLA provides the following four “official defini-tions” of visual literacy (printed on official leaflet, 1989):1. A group of vision competencies a human being can develop by seeing and
at the same time having and integrating other sensory experiences.2. The learned ability to interpret the communication of visual symbols
(images), and to create messages using visual symbols.3. The ability to translate visual images into verbal language and vice versa.4. The ability to search for and evaluate visual information in visual media.
The bulk of all visual literacy research has been done with learning and instruc-tion in mind.
Visual languagesTo be able to produce an effective visual message it is important to understandthe characteristics, possibilities, and restrictions, of visual language and of theactual pictures. We need to know how visual languages are constructed, per-ceived, and differ from verbal languages. Several variables in visual languageare noted in the following sub-sections: (1) Visual content, (2) Execution of visu-als, (3) Context, and (4) Image formats.
Visual contentMessages including visuals are preferred by most subjects and attract attention.Generally speaking, humans, especially their faces, are the kind of content thatwill get maximum attention in images. It is also known that objects and picturesof objects are remembered better than their names. Structure of content, factualcontent (objects, time, place, and statistics), events (motion, sound, humor, andrelationships), emotions, credibility, symbolism, and viewer completion areexamples of variables related to visual content.
It is important to define how the illustrations may be used. The most impor-tant factors seem to be information and learning objectives, and user charac-teristics. In some situations pictures may be distracting, and should not be usedat all. Visuals must always be relevant to the situation. Without clear content,a visual will not be able to function well. What information or knowledge isthe visual intended to convey? Who is the sender? Who are the receivers? Andin which medium or media is the visual to be distributed? Cues for under-standing the message in a visual are different in various cultures as well as indifferent socioeconomic groups.
102
Execution of visualsInformative pictures should always be designed so they are easy to read. Thegoal should be clarity of communication. Several authors have pointed out that“form follows function”. Industrial products are often shaped by what they do.To make everyday life easier we want to have products with as good functionas possible. However, in message design the subjective tastes of the individualdesigners are often allowed to dominate, sometimes with a serious malfunctionas a result.
Picture type (drawings, paintings, photos, etc.), size, shape, colour (hue,value and saturation), contrast, texture, light and shadows, emphasis, compo-sition, perspectives, technical quality, texts in pictures, pace, speed changes,editing, zooming in, zooming out and panning are examples of factors relatedto execution of visuals.
An artist or a painter producing a picture may use lead, crayons, India ink,various kinds of paint, paper, canvas, and several other kinds of material in avariety of different combinations. The image is gradually produced by combi-nations of dots, lines, and areas. The actual picture is built up from materialsand pigments which, according to intentions, can be completely separated orgradually mixed. In computer-based systems bit-mapped pictures consist of pic-ture elements defined by their positions, and object oriented pictures are definedby algorithms.
ContextA verbo-visual message has both internal and external contexts. Factors insidethe medium (internal) provide (1) the inner context such as text, speech, music,sound effects, or other visuals. Our attention is on either the sound or on theimage when we view a film or a TV program. This is even more obvious whenwe look at a multi-image slide and film presentation. As soon as the film starts,our attention is directed towards the movement in the film from the surroundingstills. It is just impossible for viewers not to be influenced by the film.
When we read a book or view projected images the lighting in the roommay exemplify (2) the close context. In an oral presentation the audience is influ-enced not only by the presenter and her or his projected images but also by thetemperature, the furniture, the room itself, outside noise, noise from the pro-jector , and noise from other persons. The lighting conditions may be the mostimportant variable for our perception of all kinds of images. A projected imageis perceived as having high image quality in a dark room. When the lightincreases, the perceived quality decreases. A printed image is perceived as hav-ing high image quality in a light room. When the light decreases, the perceivedquality decreases.
103
The entire communications situation, i.e., the senders and their intentionsfor the verbo-visual message, and the receivers and their cultural, economicaland social circumstances provide (3) the social context.
The close context and the social context are both external contexts. The contextin which a message is presented has a major impact on the way the messageis perceived. Perception of brightness, colour, size, shape, pattern, and motionhave all been shown to be influenced by contextual variables. One and the samevisual may be perceived in different ways in different contexts. A single picturefrom a series may be hard to decipher, but the visual’s content becomes easierto comprehend when that picture is returned to its proper sequential context.
Image formatsOur perception of a visual is affected by its medium, e.g., as a photograph, aprinted image, a slide projected on a white screen, and a computer-generatedimage. A movie evokes different perceptions when a viewer watches it aloneon a TV-set, or in a crowded movie theater with a wide-screen and high-qualitysound and images. An image is a multidimensional representation of an inneror an external reality, depicting the physical structures of the objects or eventsit represents.
Mirror images and other virtual images, created by mirrors, lenses, andother optical systems, can be seen but not “captured” and shown on a screenof any sort. A virtual image is located at a point from which divergent light beamsseem to start before they have passed the optical system. Like our inner images,e.g., memories, virtual images lack an obvious physical format. All other kindsof images have a physical format.
In technical systems the whole motif may be captured at once with a tra-ditional camera, or it may be scanned line by line with a TV-camera. Except forthe printing of line drawings, all other pictures have to be divided into smallelements, picture elements, or pixels, in the technical process of duplication.The image has a vertical (y) and a horizontal (x) resolution, and it has also a“depth resolution” (z). An individual pixel may vary with respect to shape, size,position, value, grain, colour, and grey scale. Normally these pixels are verysmall. At normal reading distance they can hardly be seen. In fact an image withgood quality must have a resolution that is better than that of our own vision. It takestime to read an image. This inertia enables us to see the motion in the stills whichcomprise movie film and television.
Visual literacy skillsDebes (1969) identified 35 visual literacy skills. These range from the ability todistinguish light from dark to the ability to read and express a sequence of bodylanguage arranged to express a personal emotion. Partly based on these skillsAvgerinou (1997) is developing a test for visual literacy skills. In the work of
104
Fransecky and Debes (1972) the objectives for the visually literate student are(p. 12):
• To be able to read visuals made for intentional communication.• To be able to plan visuals for intentional communication.• To be able to create visuals for intentional communication.• To be able to combine visuals and verbals for intentional communication.
Thus, according to Fransecky and Debes, the competencies of visual literacyare defined as reading, planning and creating visuals, and combining visuals andverbals for intentional communication.
Esdale and Robinson (1982) argued that visual literacy should be integratedacross all curricular areas in an effort to both expand ability and to prevent cat-egorization which could limit learning and the use of visual literacy skills.
Schiller (1987) argued that all the different viewpoints of visual literacyshow that every visual medium has its own characteristic form. Thus, there areclearly different visual literacies, and there are different skills to be learned interms of their characteristic techniques and methods of expression. As a con-sequence people should concentrate on more limited concepts, such as com-puter literacy, film literacy, video literacy, and television literacy. Indeed, itmight be impossible to create one single definition of the broad concept of visualliteracy. Hanson, Silver and Strong (1988) argued that the skills and under-standing of visual literacy are not taught in schools in any organized way. How-ever, these skills are directly related to academic success, and especially to suc-cess in reading. According to Hanson et al. the successful student can (p. 285– 286):
1. Recognize instances of the same element in different contexts.2. Produce graphic likeness.3. Recognize an object when seen from different angles. 4. Transform one element into another by imagining movement, rotation,
inversion, or internal displacements among the parts.5. Identify or correctly configure elements within a spatial configuration
which could otherwise represent distortions because of the observer’s ori-entation.
6. Identify lines of force, tension, balance, and composition so as to identifythe principles that make the visual arts aesthetically satisfying.
7. Identify resemblances, symbols, or signs across seemingly unrelated areasof existing knowledge or personal experience.
105
Whiteside (1985) discussed visual literacy awareness in college-level edu-cational media courses. He used a seven-step approach to plan and implementvisual literacy modules:
1. Defining visual literacy.2. Identifying visual literacy needs.3. Selecting and prioritizing needs, goals, and objectives.4. Selecting appropriate media.5. Planning classroom activities.6. Implementation of visual literacy modules.7. Planning for future activities.
Considine and Haley (1992) noted that the effective integration of imagery intoinstruction can facilitate the student's ability to read, recall, and comprehendthe content of the message. Visual literacy can therefore support traditional lit-eracy. In cultures where magazines, newspapers, film, television, and video pro-liferate the natural learning of visual literacy becomes incidental and developsover a long period. In fact this learning may never occur.
In South Africa deLange (1996) proposed that adults in developing coun-tries, that are not exposed to a visual culture as found in North America andWestern Europe, might never develop a basic ability to read pictures. Theirframe of reference and their level of understanding could possibly extend onlyto the limited number of visuals that they have actually been in contact with.Thus, it may not be enough to merely modify visuals in print media for thesecultures. In many situations new pictures may be needed. Schiffman (1995) stud-ied information design guidelines for designing and evaluating visual compo-nents of educational materials for ethnic populations within the USA. She con-cluded that it is necessary to adopt visual messages to various ethnical groups(p. 76): “Visually translating health educational materials will be critical to thesuccess of communication efforts, particularly as our population continues tochange ethnically and less developed countries continue to develop.”
Information designThe various literacies and modes of thinking required in an information societywill challenge the capacities of every person. While a variety of means are beingfound to help build and maintain these information resources, new vistas ofcapacity lie before us. These opportunities, and how we respond to them willdetermine our collective future in a world society grown closer through mutualdependence upon shared intellectual resources. Beyond traditional literacy isinformation design.
106
In the age of information we have an ever increasing need for computerinterfaces, educational materials, exhibitions, forms, graphic symbols, instruc-tional materials, learning materials, lists, maintenance information, manuals,non-fiction books, on-line help for managing computer-based systems, proce-dural aids, product descriptions, public information signs, reference books,road traffic signs, system descriptions, tables, technical reports, tickets, web-pages, and other kinds of information materials. These are examples of infor-mation utility goods that we need to perform our tasks at work. We also need anincreasing amount of information materials during our leisure time, in orderto be able to handle things like new cameras, cars, CD-players, computers, com-puter software, etc.
Thus well designed information material makes everyday life easier for people, andit grants good credibility to the senders or sources.
Marsh (1983) discussed the term communication design for “messages thatwork.” He made a clear distinction between an artistic approach and a designapproach. These two approaches differ in their goals. Marsh commented thatthe artistic approach strives for perfection, while the design approach strives forworkability in a cost effective context. The design approach minimizes the needfor rewriting and editing by careful planning of the work. The two approachesresult in vastly different final products. The artistic approach tends to judge suc-cess by whether the product feels right and whether the critics like it or not.The design approach judge its success by whether the product achieves theobjectives as specified by measurable performance objectives, within the spec-ified resources and situational constraints. In addition the School of Design atCarnegie Mellon University (1997) has defined communication design “as theeffective presentation of ideas and information by means of type and image,whether in the traditional medium of print or in the new digital medium thatsupports interactive computer displays, multimedia communication technol-ogy, and information systems.” Also here the focus is on workability. Wileman(1993, p. 6) noted that: “Communication can be judged successful only whenit conveys the information it sets out to convey. This is as true for visual modesas it is for verbal modes.” Also Brandt (1997) provided a practical, workabilityand useability view related to information utility goods, and defined informa-tion design as “the ability to search for information, make choices, create andpackage information.” He further remarked that “the message must reach thereceivers in a proper way.” A well designed information product will satisfyaesthetic, economic, ergonomic, as well as subject matter requirements. Mulletand Sano (1995, p. 2) remarked that: “The goal of communication-orienteddesign is to develop a message that can be accurately transmitted and correctlyinterpreted, and which will produce the desired behavioural outcome after ithas been understood by its recipient.” Pettersson (1996, 1997) provided a pro-
107
cess-oriented workability and usability view of communication, and discussedmessage design principles as well as message design tools.
On its WWW-homepage the International Institute for Information Design(IIID) defines design in the following way (1997): “Design is the identifying ofa problem and the intellectual creative effort of an originator, manifesting itselfin drawings or plans which include schemes and specifications.” And infor-mation design: “Information design is the defining, planning, and shaping ofthe contents of a message and the environments it is presented in with the inten-tion of achieving particular objectives in relation to the needs of users. At thispoint of the development IIID is concerned with the design of visual informationbut it could in the future include the design of information other than visualone.” These two definitions were recommended by the 2nd IIID Conference in1994. They have also been published in several issues of the ID News. The mainconcern of the IIID is to contribute to a better understanding within the humancommunity with respect to cultural and economic issues by means of improvedvisual communication. IIID is supported by UNESCO (1995), and endeavoursto develop information design as an independent interdisciplinary field ofknowledge and professional activities.
Thus information design is indeed an interdisciplinary field of knowledge,and as far as I have been able to find out it encompasses influences and factsfrom more than fifty established disciplines and areas of research. In this paperthe main areas of research are divided into the following six groups. It should,however, be noted that other groupings are also possible.
1. Language disciplines such as drama, graphic design, linguistics, rhetoric,semiology, verbal languages, and visual languages. (Graphic design isoften seen as an art subject. However, from an information design perspec-tive the language aspects of graphic design are more important than the artaspects.)
2. Art and aesthetic disciplines such as aesthetics, computer graphics, film andcinema, illustration, photography, television and video.
3. Information disciplines such as computer science, information processing,and information science.
4. Communication disciplines such as communication theory, information tech-nology, information theory, media studies, instructional technology,instructional design, instructional message design, journalism, andplanned communication.
5. Behavioural and cognitive disciplines such as cognitive science, didactics,information ergonomics, pedagogy, psychology, sociology and their sub-areas. The study of attention, perception, cognitive skills, and memory areespecially important. Some aspects deal with individuals, and some withthe societies in which we live.
108
6. Business and media production technology disciplines such as business eco-nomics and management, information economics, information manage-ment, law, and various technologies for production and distribution of dif-ferent media.
Thus information design does not primarily include areas like advertising,entertainment, fine arts, news or propaganda. Tufte (1990) noted that the prin-ciples of information design are universal, and are not tied to unique featuresof a particular language or culture. And IIID (op. cit.) noted that: “Special atten-tion is paid to the potential of graphic information design to overcome bothsocial and language barriers”. The study of information design can be summa-rized as a multi-disciplinary, multi-dimensional and worldwide consideration.
ReferencesALA, American Library Association. (1989). ALA Presidential Committee on
Information Literacy Final Report. Chicago: ALA, 1989, 7.Allmendinger, L. (1998). Diagrammatic Literacy. Presentation at Vision Plus 5.
Learning meets Information Design, Information Design meets Learning. International Institute for Information Design, Fachhochschul-Studi-engänge-Vorarlberg, Austrian Federal Ministry of Science and Transporta-tion, Ministry of Education and Art, UNESCO. Schwarzenberg, Vorarl-berg, Austria, July 2-4, 1998.
ATLC, Association for Teacher-Librarianshipin Canada. (1995). Students’ Bill of Information Rights. http://www.sbe.saskatoon.sk.ca/~atlc/stud-righ.htm
Avgerinou, M. (1997). Testing Visual Literacy: Some progress with research? Pre-sentation at the 29th Annual Conference of the International Visual Liter-acy Association. University Park, Pennsylvania, October 18–22.
Brandt, J. (1997). det brinner av entusiasm på informationsdesign. Mälardalens högskola: Eskilstuna.
Buckingham, D. (1993). Children Talking Television: The Making of Television Lit-eracy. London: The Falmer Press.
Coll, R., Coll, J, H., & Thakur, G. (1994). Graphs and tables: a four factor exper-iment. Communications of the ACM, 37(4), 77-86.
Considine, D. M., & Haley, G. E. (1992). Visual Messages. Integrating Imagery into Instruction. Englewood , Colorado. Teacher Ideas Press.
Debes, J. L. (1969). The loom of visual literacy. Audiovisual Instruction, 14, 25–27.
deLange, R, W. (1996). Cultural Modifications in Visuals as a Support to Printed Educational Media in Africa: an Erroneous Paradigm. Paper presented at The 4th International Research Symposium on Visual Verbal Literacy, Process
109
and Product: Media Education in Praxis, The Rijkshogeschool, IJselland, and the International Visual Literacy Association, Deventer, Holland, May 6- 11, 1996.
Doyle, C. A. (1994). Final Report to the National Forum on Information Literacy. In From Library Skills to Information Literacy: A Handbook for the 21st Century. Castle Rock, CO: Hi Willow Research & Publishing. (See http://inet.ed. gov/databases/ERIC_Digests/ed372756.html)
Enser, P. G. B. (1995). Progress in documentation. Pictorial information retrieval. Journal of Documentation, 51,2, 126–170.
Erstad, O. (1998). Media Literacy among Young People. Integrating Culture, Com-munication and Cognition. In B. Höijer and A. Werner (Eds.). Cultural Cogni-tion. New perspectives in audience theory. NORDICOM: Göteborg.
Esdale, B., & Robinson, R. (1982). Viewing in Secondary Language Arts. Edmon-ton, Alberta: Alberta Education.
Findahl, O., & Höijer, B. (1979). Vad säger oss nyhetsprogrammen? Del 1. Krisen i svensk industri. Sveriges Radio, PUB, 5.
Findahl, O., & Höijer, B. (1980). Vad säger oss nyhetsprogrammen? Del 2. Avtals-rörelsen, kärnkraften, löntagarfonderna. Sveriges Radio, PUB, 8.
Findahl, O., & Höijer, B. (1984). Begriplighetsanalys. Lund: Studentlitteratur.Fransecky, R. B., & Debes, J. L. (1972). Visual literacy: A way to learn – a way to
teach. Washington, DC: Association for Educational Communications and Technology.
Fredette, B. W. (1993). Aesthetics for the 21st century: another challange for educa-tion. Presentation at the 3rd International Symposium of the International Visual Literacy Association. Verbo-Visual Literacy: Understanding and Application of new Educational Communication Media Technologies. Delphi, Greece, June 26-29, 1993.
Gray, B. (1989). Critical TV Viewing Skills: A Paradigm for Program Development. In R.A. Braden, D.G. Beauchamp, L.V.W. Miller, & D.M. Moore (Eds.). About Visuals: Research, Teaching and Applications. Readings From the 20th Annual Conference of the International Visual Literacy Association. Blacksburg: Virginia Tech University, 161–166.
Griffin, R. E., Pettersson, R., Semali, L., & Takakuwa, Y. (1994). Using Symbols In International Business Presentations: How Well are They Understood? Paper presented at the 26th Annual Conference of the International Visual Liter-acy Association. Tempe, Oct. 12–16. Published in: D. G. Beauchamp, R. A. Braden & R. E. Griffin, (Eds.) 1994: Imagery and Visual Literacy. Selected Readings from the 26th Annual Conference of the International Visual Literacy Association. International Visual Literacy Association. 1995.
Hancock, V. (1993). Information Literacy for Lifelong Learning. ERIC Digest. ED 358870.
110
Hanson, J. R. (1988). Learning styles, visual literacies, and a framework for reading instruction. Reading Psychology: An International Quarterly, 9, 409–430.
Hanson, J. R., Silver, H. F., & Strong, R. W. (1988). Learning styles and visual lit-eracy: Connections and actions. In R. A. Braden, D. G. Beauchamp, & L. Miller (Eds.). Visual Literacy in Life and Learning. Blacksburg: Virginia Tech Uni-versity.
Heinich, R., Molenda, M., & Russell, J. D. (1982). Instructional Media and the New Technologies of Instruction. New York: Macmillan
Harrison, H. (Ed.). (1981). Picture Librarianship. (Handbook on Library practice.) Library Association Publishing: London.
Hugo, J. & Skibbe, A. (1991). Facing visual illiteracy in South African health education: a pilot study. Journal of Audiovisual Media in Medicine 14, 47–50.
Höglund, L. (Ed.). (1995). Biblioteken, kulturen och den sociala intelligensen. Aktu-ell forskning inom biblioteks- och informationsvetenskap. Forskningsråd-snämnden, Publiceringsföreningen VALFRID: Göteborg.
IIID, International Institute for Information Design. (1997). International Insti-tute for Information Design. Definitions. http://www.simlinger–iiid.magnet.at/simlinger–iiid/English–2.html
Loveless, R. (1992). Open the Window to the 21st Century by Chancing a Romance with Contemporary Media Forms: A Challange for the Arts in Higher Education. In Norman C. Yakel (Ed.). The Future: Challange of Change. Reston, VA: National Art Education Association.
Lowe, R. (1993). Diagrammatic information: techniques for exploring its men-tal representation and processing. Information Design Journal, 7(1), 3-17.
Malmberg, T. (1996). Critical Theory and Audiovisual Media. Nordicom-Infor-mation om medie- och kommunikationsforskning i Norden, 1, 19–22.
Marsh, P. O. (1983). Messages That Work: A Guide to Communication Design. Englewood Cliffs, NJ: Educational Technology Publications.
Media Literacy. (1998). http://www2.tvo.org/education/pdtv/tfr/medialit-eracy.html
Monfils, B. S. (1993). Privacy in the Computer Age: Perceptions and Realities. Pre-sentation at the 3rd International Symposium of the International Visual Literacy Association. Verbo-Visual Literacy: Understanding and Applica-tion of new Educational Communication Media Technologies. Delphi, Greece, June 26-29, 1993.
Mullet, K. & Sano, D. (1995). Designing Visual Interfaces Communication Ori-ented Techniques. Mountain View, California: SunSoft Press A Prentice Hall Title.
Pettersson, R. (1986). Image–word–image. Presentation at the 18th Annual Con-ference of the International Visual Literacy Association. Madison, Wiscon-sin, Oct. 30–Nov. 2. In R. A. Braden, D. G. Beauchamp, & L. W. Miller (Eds.). (1987). Visible & Viable: The Role of Images in Instruction and Commu-
111
nication. Readings from the 18th Annual Conference of the International Visual Literacy Association. Commerce: East Texas State University.
Pettersson, R. (1996). Verbo-Visual Communication. Presentation at the 4th International Research Symposium on Visual Verbal Literacy, Process and Product: Media Education in Praxis, The Rijkshogeschool, IJselland, and the International Visual Literacy Association, Deventer, Holland, May 6- 11, 1996. In T. Velders (Ed.) (1996). Beeldenstorm in Deventer. Multimedia Education in Praxis. Selected Readings (pp. 11-15). Deventer.
Pettersson, R. (1997a). Verbo-visual Communication – Presentation of Clear Mes-sages for Information and Learning. Göteborg: Valfrid Publishing Association and Research Centre for Library and Information Studies, Göteborg Uni-versity.
Pettersson, R. (1997b). Verbo-visual Communication – 12 Selected Papers. Göte-borg: Valfrid Publishing Association and Research Centre for Library and Information Studies, Göteborg University.
Roth, C, E. (1992). Environmental literacy: Its roots, evolution, and directions in the 1990s. Columbus, OH:ERIC/CSMEE. ED351201.
Schiffman, C. B. (1995). Visually Translating Educational Materials for Ethnic Pop-ulations. Paper presented at the 27th Annual Conference of the Interna-tional Visual Literacy Association. Chicago, Oct. 18 – 22. 1995. Published in: R. E. Griffin. D. G. Beauchamp, J. M. Hunter & C. B. Shiffman, (Eds.) 1996: Eyes on the Future: Converging Images, Ideas and Instruction. Selected Readings of the International Visual Literacy Association. International Visual Literacy Association.
Schiller, H. A. (1987). Visual literacy in ancient and modern man (part one). In R. A. Braden, D. G. Beauchamp, & L. W. Miller (Eds.). Visible & Viable: The Role of Images in Instruction and Communication. Commerce: East Texas State University.
School of Design at Carnegie Mellon University. (1997). Design @ Carnegie Mel-lon. Programs. Bachelor of Fine Arts. Communication Design. http://www.cmu.edu/cfa/design/programs/cd/cd.html
Scott, M, T., Kirsch, I, S., & Jenkins, L, B. (1998). International Adult Literacy Sur-vey. http://nces.ed.gov/spider/webspider/98053XXXXX.html
Senn Breivik, P., & Jones D. L. (1993). Information Literacy. Liberal Education for the Information Age. Liberal Education, 79, 1, 24–28.
Sterner, J. (1997). Bruksanvisningar: Är de så dåliga? Kvalitetsaspekter på produk-tanvändning och bruksanvisningar. Research Reports No 1997:7. School of Business, Stockholm University, Stockholm.
Sutton, R. E. (1992). Information Literacy Meets Media Literacy and Visual Liter-acy. Presentation at the 29th Annual Conference of the International Visual Literacy Association, Pittsburgh, Sept. 30–Oct. 4.
Tufte, E. R. (1990). Envisioning Information. Cheshire, New Haven Conneticut: Graphics Press.

112
UNESCO. (1995). Co-operation on matters in Information Design. Resolution 4.9 of the 28th General Conference of UNESCO, Paris.
Vickery, B., Vickery, A. (1987). Information Science in theory and practice. Lon-don, Butterworth.
Whiteside, C. (1985). Visual literacy awareness in college-level educational media courses. In L. W. Miller (Ed.). Creating Meaning. Readings from the Visual Literacy Conference at California State Polytechnic University at Pomona.
Wileman, R. E. (1993). Visual Communicating. Englewood Cliffs, NJ: Educa-tional Technology Publications.
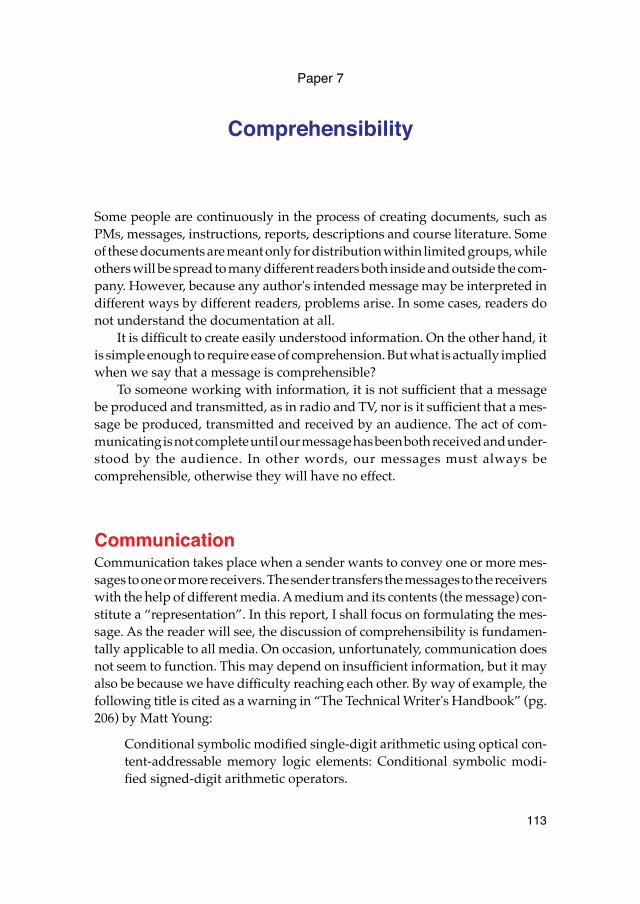
113
Paper 7
Comprehensibility
Some people are continuously in the process of creating documents, such asPMs, messages, instructions, reports, descriptions and course literature. Someof these documents are meant only for distribution within limited groups, whileothers will be spread to many different readers both inside and outside the com-pany. However, because any author's intended message may be interpreted indifferent ways by different readers, problems arise. In some cases, readers donot understand the documentation at all.
It is difficult to create easily understood information. On the other hand, itis simple enough to require ease of comprehension. But what is actually impliedwhen we say that a message is comprehensible?
To someone working with information, it is not sufficient that a messagebe produced and transmitted, as in radio and TV, nor is it sufficient that a mes-sage be produced, transmitted and received by an audience. The act of com-municating is not complete until our message has been both received and under-stood by the audience. In other words, our messages must always becomprehensible, otherwise they will have no effect.
CommunicationCommunication takes place when a sender wants to convey one or more mes-sages to one or more receivers. The sender transfers the messages to the receiverswith the help of different media. A medium and its contents (the message) con-stitute a “representation”. In this report, I shall focus on formulating the mes-sage. As the reader will see, the discussion of comprehensibility is fundamen-tally applicable to all media. On occasion, unfortunately, communication doesnot seem to function. This may depend on insufficient information, but it mayalso be because we have difficulty reaching each other. By way of example, thefollowing title is cited as a warning in “The Technical Writer's Handbook” (pg.206) by Matt Young:
Conditional symbolic modified single-digit arithmetic using optical con-tent-addressable memory logic elements: Conditional symbolic modi-fied signed-digit arithmetic operators.
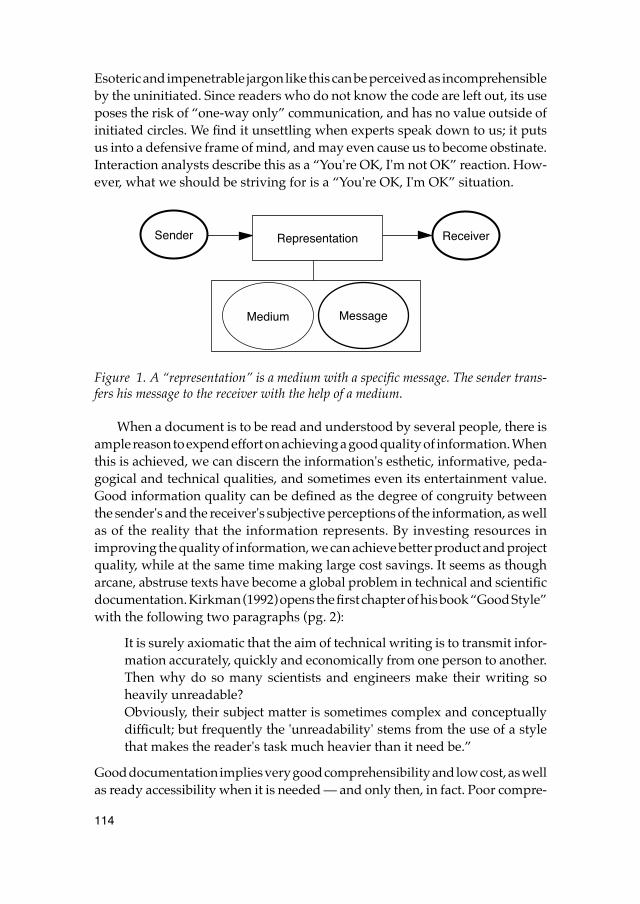
114
Esoteric and impenetrable jargon like this can be perceived as incomprehensibleby the uninitiated. Since readers who do not know the code are left out, its useposes the risk of “one-way only” communication, and has no value outside ofinitiated circles. We find it unsettling when experts speak down to us; it putsus into a defensive frame of mind, and may even cause us to become obstinate.Interaction analysts describe this as a “You're OK, I'm not OK” reaction. How-ever, what we should be striving for is a “You're OK, I'm OK” situation.
Figure 1. A “representation” is a medium with a specific message. The sender trans-fers his message to the receiver with the help of a medium.
When a document is to be read and understood by several people, there isample reason to expend effort on achieving a good quality of information. Whenthis is achieved, we can discern the information's esthetic, informative, peda-gogical and technical qualities, and sometimes even its entertainment value.Good information quality can be defined as the degree of congruity betweenthe sender's and the receiver's subjective perceptions of the information, as wellas of the reality that the information represents. By investing resources inimproving the quality of information, we can achieve better product and projectquality, while at the same time making large cost savings. It seems as thougharcane, abstruse texts have become a global problem in technical and scientificdocumentation. Kirkman (1992) opens the first chapter of his book “Good Style”with the following two paragraphs (pg. 2):
It is surely axiomatic that the aim of technical writing is to transmit infor-mation accurately, quickly and economically from one person to another.Then why do so many scientists and engineers make their writing soheavily unreadable?Obviously, their subject matter is sometimes complex and conceptuallydifficult; but frequently the 'unreadability' stems from the use of a stylethat makes the reader's task much heavier than it need be.”
Good documentation implies very good comprehensibility and low cost, as wellas ready accessibility when it is needed — and only then, in fact. Poor compre-
Medium
Sender Representation Receiver
Message
115
hensibility causes the receiver's confidence in the sender to diminish, andheightens the risk of unsound decisions being made. Many good suggestionsmay be rejected because those whose job it is to determine their practical meritsimply do not understand what the suggestions call for.
Comprehending means understanding the immediate or fundamentalmeaning of something. A message is comprehensible if it can be grasped withoutdifficulty. Whether a message — for example, a technical report — can be under-stood or not is dependent on many different factors, of which some relate tothe sender, others relate to the message or representation, and still others relateto the receiver. Speaking and writing are language-related activities performedby the sender. These activities are influenced by the sender's earlier observa-tions, as well as by his terminology and the language he uses. Besides being“active”, the sender is in charge of “encoding” the message, i.e., its productionand distribution.
Listening and reading are language-related activities performed by thereceiver. As is the case with the sender, the receiver's activities are influencedby his earlier observations, as well as by his terminology and the language heuses. Besides being relatively “passive”, the receiver is in charge of acceptingand “decoding” the message.
The figure on the next page shows a model of comprehensibility with agraphic verbovisual message as an example. This model is also applicable tooral communication and communication via audio-visual media. The readabil-ity, legibility and reading value of the graphic message are of decisive impor-tance to the receiver's ability to understand it. Moreover, these factors — besidesbeing influenced by the writing process — are all prerequisites for the readingprocess. (Audibility, distinctness and listening value are of similar importanceto the understanding of oral texts.) Therefore, we shall attempt here to showthe relation of readability, legibility and reading value, as well as credibility andesthetics, to the message rather than to the sender or the receiver. By proceedingfrom the writing process (i.e., the terminology of the message, as well as its cred-ibility and linguistic value), we shall try to analyse how we can achieve greatercomprehensibility.
It is clear that we must help those who work with documentation, infor-mation and training to become better writers themselves, a goal that will alsorequire the help of professional technical instructors, translators, graphicsexperts and designers. By developing explicit terminology, we can make thingseasier for writers as well as for their readers.
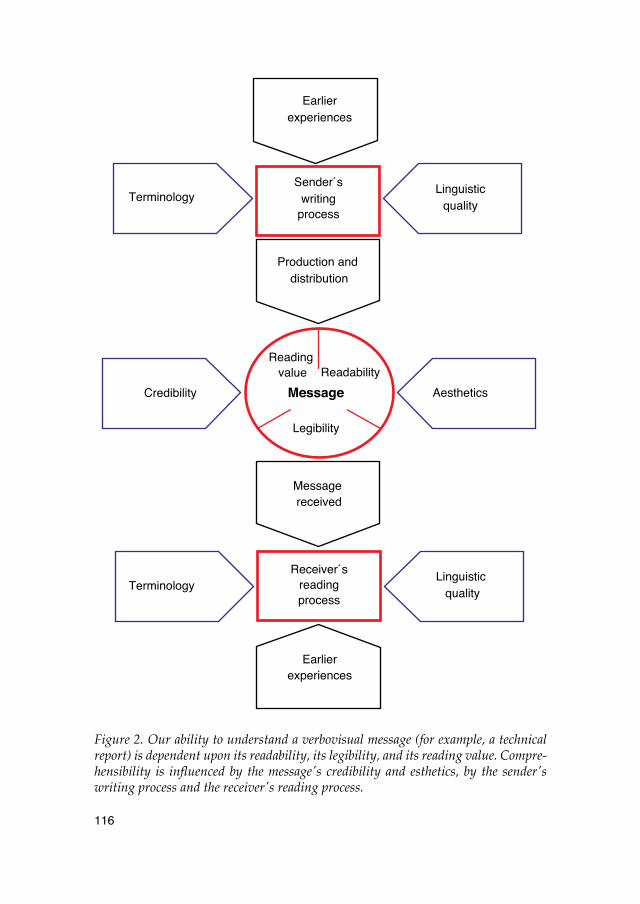
116
Figure 2. Our ability to understand a verbovisual message (for example, a technicalreport) is dependent upon its readability, its legibility, and its reading value. Compre-hensibility is influenced by the message's credibility and esthetics, by the sender'swriting process and the receiver's reading process.
Terminology
Message
Credibility
Production and
Sender´sLinguistic
Earlier
Message
TerminologyReceiver´s
Linguistic
Earlier
experiences
writingquality
process
distribution
Legibility
Reading Readability
Aesthetics
value
received
readingprocess
experiences
quality
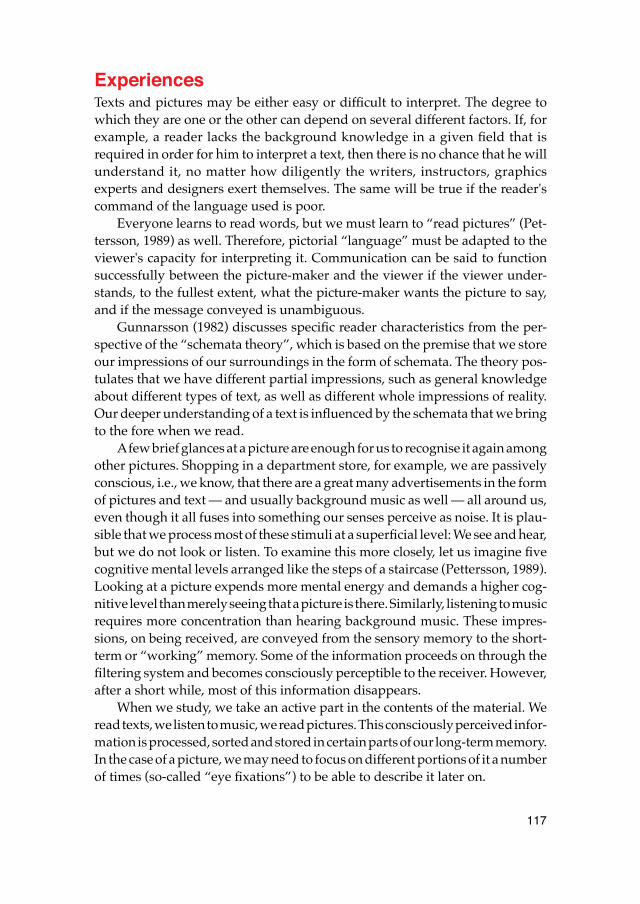
117
ExperiencesTexts and pictures may be either easy or difficult to interpret. The degree towhich they are one or the other can depend on several different factors. If, forexample, a reader lacks the background knowledge in a given field that isrequired in order for him to interpret a text, then there is no chance that he willunderstand it, no matter how diligently the writers, instructors, graphicsexperts and designers exert themselves. The same will be true if the reader'scommand of the language used is poor.
Everyone learns to read words, but we must learn to “read pictures” (Pet-tersson, 1989) as well. Therefore, pictorial “language” must be adapted to theviewer's capacity for interpreting it. Communication can be said to functionsuccessfully between the picture-maker and the viewer if the viewer under-stands, to the fullest extent, what the picture-maker wants the picture to say,and if the message conveyed is unambiguous.
Gunnarsson (1982) discusses specific reader characteristics from the per-spective of the “schemata theory”, which is based on the premise that we storeour impressions of our surroundings in the form of schemata. The theory pos-tulates that we have different partial impressions, such as general knowledgeabout different types of text, as well as different whole impressions of reality.Our deeper understanding of a text is influenced by the schemata that we bringto the fore when we read.
A few brief glances at a picture are enough for us to recognise it again amongother pictures. Shopping in a department store, for example, we are passivelyconscious, i.e., we know, that there are a great many advertisements in the formof pictures and text — and usually background music as well — all around us,even though it all fuses into something our senses perceive as noise. It is plau-sible that we process most of these stimuli at a superficial level: We see and hear,but we do not look or listen. To examine this more closely, let us imagine fivecognitive mental levels arranged like the steps of a staircase (Pettersson, 1989).Looking at a picture expends more mental energy and demands a higher cog-nitive level than merely seeing that a picture is there. Similarly, listening to musicrequires more concentration than hearing background music. These impres-sions, on being received, are conveyed from the sensory memory to the short-term or “working” memory. Some of the information proceeds on through thefiltering system and becomes consciously perceptible to the receiver. However,after a short while, most of this information disappears.
When we study, we take an active part in the contents of the material. Weread texts, we listen to music, we read pictures. This consciously perceived infor-mation is processed, sorted and stored in certain parts of our long-term memory.In the case of a picture, we may need to focus on different portions of it a numberof times (so-called “eye fixations”) to be able to describe it later on.
118
Conscious analysis of verbal messages requires even greater expenditureof mental energy and demands a still higher cognitive level. Most demandingof all are the creative processes that make it possible to create texts, music andpictures. Authors, composers and artists all bear witness to the mental strainthat can be a part of the creative process. The cognitive model with its five levels,as shown above, presupposes a dynamic mental process in which we changecognitive levels both consciously and unconsciously.
Our sensory organs react to changes in our surroundings. Normally, we canperceive changes (in spatial properties, for example) that are greater than abouttwo per cent. On the other hand, we adapt ourselves to slow, gradual changes,so that we barely notice them at all. Our normal condition, therefore, is a stateof mental repose that affords us the capacity for sudden, rapid activity. Corre-spondingly, we cannot keep ourselves at the highest cognitive levels for morethan a limited time; the effort would require too much energy and would prob-ably induce some kind of mental “cramp”. Like a pike lurking among reeds,or a cat spying outside a mouse's hole, we know what our surroundings looklike. If something happens to change some familiar element in our milieu, wecan react swiftly and decisively, impelled by a rush of mental and physicalenergy. Sometimes things turn out fine: The pike gets his minnow, the cat getsher field-mouse, and we find the information we are looking for. But things canturn into a muddle, too: The predators fail to capture their prey, and we endup wasting time and energy trying to make sense out of uninteresting infor-mation.
Because they influence us in an emotional way, pictures have an enormousimpact. Children, for example, can be easily frightened by violent action on TV,but they are not upset by reading about violent action in a book. This is in partbecause what we see seems more tangible to us than what we read, but it isalso because reading a text requires a higher cognitive level than viewing a pic-ture does. Several researchers, among them Tröger (1963) and Noble (1975), havedemonstrated that very small children are incapable of taking an active partin the content, or understanding the context, of material shown on a TV screen.Most parents with toddlers have made the same observation.
There are no fixed or distinct borders between the five levels of our cognitivemodel. Depending on cultural, social and intellectual factors, there may be greatdifferences between various persons' ways of conforming to the model. Thentoo, mood, health, surroundings and a number of other circumstances can causeone and the same individual to react very differently at different times. However,what the model reveals is that there is in fact a great difference between theconcepts of seeing — looking — reading and hearing — listening.
Actively taking part in a linguistic message that consists of text, sound orpictures, either together or separately, always implies the exertion of effort, i.e.,work. Reading or listening taxes our faculties; sooner or later we become tired.
119
Furthermore, material that is poorly constructed and/or presented strikes usas dull, and not only causes our interest in the subject to wane, but leaves usexhausted.
This applies irrespective of whether a message is meant to impart informa-tion, instruction or entertainment, It also applies irrespective of the mediumof conveyance, except insofar as different media have entirely different capac-ities for conveying a message from a sender to a receiver.
Strömquist (1991) points out that we all have proficiency in, and insight into,the labours of writing. We all know how writing is done. We know that “thewriting process” consists of more than simply committing words to paper;indeed, it presupposes long-term memory and familiarity with the things thathave to do with writing. In other words, writing is an extensive, time-consum-ing, dynamic, gradual, cognitive and strenuous business.
The writing processThe section “Writing advice” contains concrete instructions, i.e., rules of thumb,on how to write so that your text will be understandable. The physical act ofwriting down one's thoughts with the help of a pen or a keyboard does not usu-ally require a great deal of time. It generally takes longer to think what the textshould consist of than to formulate it. Thus, the writing process encompassesmuch more than merely writing, and it is relatively independent of the languageused. We work more or less the same way when we write English as when wewrite Swedish or any other language.
Before we begin writing, we need to identify the subject and define the pur-pose of the message. This always requires analysis of the target group or receiver.Receiver analysis might contain evaluation of the receiver's basic understandingof the subject, his trade knowledge, experiences, skills, comprehensive capacity,attitudes, prejudices, motivation, linguistic competence, social background andvocation, as well as his age and the groups he belongs to or identifies with.Because all of these factors influence how the receiver takes in and understandsa message, they are decisive to how we shall formulate the text.
To begin with, we shall need to gather and sort our material, as well as planand outline our presentation. We need to choose the type-face, graphical formand medium. It may be possible to use fixed writing patterns and establishedmodels. When we have formulated the text, we shall need to process it and adaptit, so that it will suit our target group. We may have to rewrite the text as manyas ten times before it is right. Although it may be true that even the most com-plicated texts can be presented in a comprehensible form, all writers need prac-tice, practice and still more practice. Liljestrand and Arwidsson (1979, pg. 15 )assert the following (in translation):
120
Complicated texts are often defended on the grounds that their subjectmatter is complicated. In reality, however, the more difficult the subjectis, the more one must attempt to express it in a comprehensible way. It issurely more reasonable to expect that someone who is writing for severalpeople expend effort on the writing of his text, than that the variousreceivers be obliged, each on his own, to expend effort interpreting it!
Also Strömquist (1991, pg. 35) maintains that everyone must practice writingto become good at it. Writing is a skill that we can learn. She says the following(in translation):
It is only by writing oneself that one can fully understand the compli-cated writing process; it is only by writing oneself that one discoverswhere the problem lies.
Texts may need to be augmented by the addition of pictures, for example, pho-tographs or schematic diagrams. I often begin the work of writing by makinga comprehensive picture, which sometimes develops into a short suite of pic-tures before I begin work on the text. Bergquist (1991) gives textbook authorsfive terse, vigorous instructions in the form of “commandments ”(in transla-tion):
• The first commandment: Don't write! Even if the author's first impulse is tostart writing at once, it is essential to begin with an outline.
• The second commandment: Use pictures! Get a picture to illustrate eachsection; wait with your text.
• The third commandment: Write captions for each picture! Each pictureshould have a relevant text, which may even have a heading.
• The fourth commandment: Talk to your editor! Together, the writer and theeditor can expand a factual outline into a detailed outline for each layout.The outline contains room for both text and pictures.
• The fifth commandment: Write in a structured manner! The text shouldcomplement the pictures. Therefore, write in the space between the pic-tures. The editor provides the author with exact data about the number ofstrokes each line of text may fill.
The actual process of designing and creating integrated verbovisual infor-mation is called “infography”. When text, picture and graphic form are inte-grated into a fully delimited, structured surface (a functioning whole), the resultis a graphical information entity, usually known as information graphics, thatcan be interwoven with texts and pictures in an information layout.
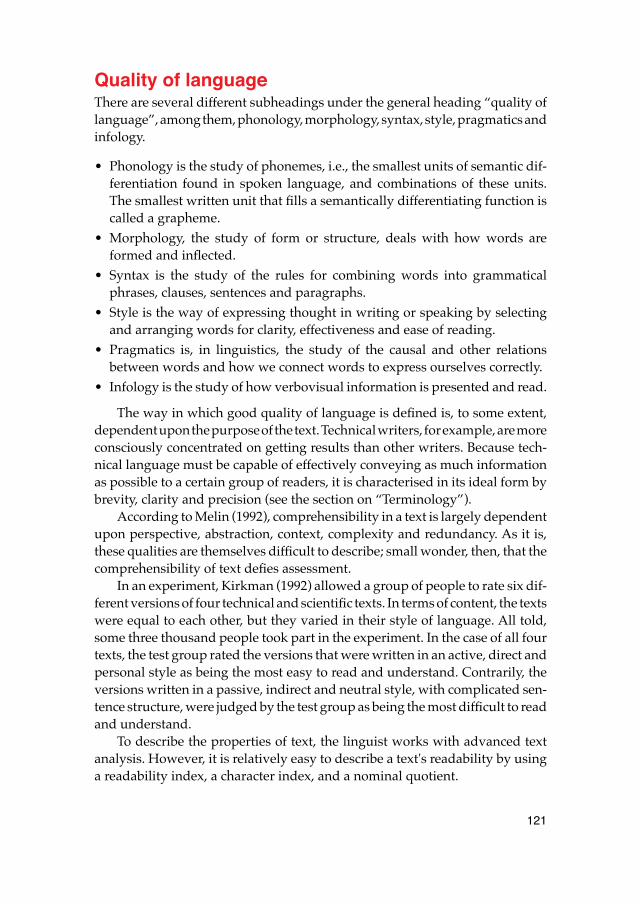
121
Quality of languageThere are several different subheadings under the general heading “quality oflanguage”, among them, phonology, morphology, syntax, style, pragmatics andinfology.
• Phonology is the study of phonemes, i.e., the smallest units of semantic dif-ferentiation found in spoken language, and combinations of these units.The smallest written unit that fills a semantically differentiating function iscalled a grapheme.
• Morphology, the study of form or structure, deals with how words areformed and inflected.
• Syntax is the study of the rules for combining words into grammaticalphrases, clauses, sentences and paragraphs.
• Style is the way of expressing thought in writing or speaking by selectingand arranging words for clarity, effectiveness and ease of reading.
• Pragmatics is, in linguistics, the study of the causal and other relationsbetween words and how we connect words to express ourselves correctly.
• Infology is the study of how verbovisual information is presented and read.
The way in which good quality of language is defined is, to some extent,dependent upon the purpose of the text. Technical writers, for example, are moreconsciously concentrated on getting results than other writers. Because tech-nical language must be capable of effectively conveying as much informationas possible to a certain group of readers, it is characterised in its ideal form bybrevity, clarity and precision (see the section on “Terminology”).
According to Melin (1992), comprehensibility in a text is largely dependentupon perspective, abstraction, context, complexity and redundancy. As it is,these qualities are themselves difficult to describe; small wonder, then, that thecomprehensibility of text defies assessment.
In an experiment, Kirkman (1992) allowed a group of people to rate six dif-ferent versions of four technical and scientific texts. In terms of content, the textswere equal to each other, but they varied in their style of language. All told,some three thousand people took part in the experiment. In the case of all fourtexts, the test group rated the versions that were written in an active, direct andpersonal style as being the most easy to read and understand. Contrarily, theversions written in a passive, indirect and neutral style, with complicated sen-tence structure, were judged by the test group as being the most difficult to readand understand.
To describe the properties of text, the linguist works with advanced textanalysis. However, it is relatively easy to describe a text's readability by usinga readability index, a character index, and a nominal quotient.
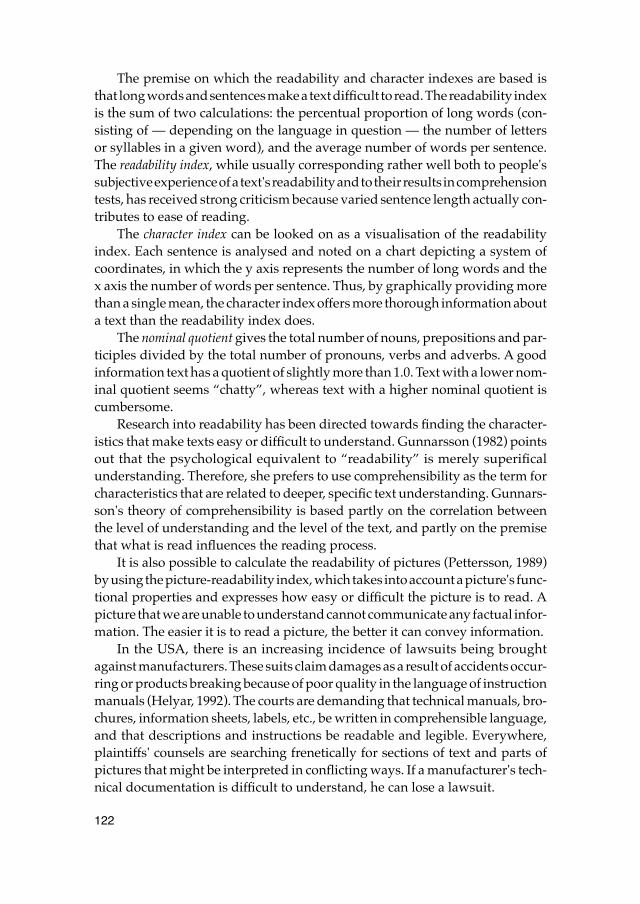
122
The premise on which the readability and character indexes are based isthat long words and sentences make a text difficult to read. The readability indexis the sum of two calculations: the percentual proportion of long words (con-sisting of — depending on the language in question — the number of lettersor syllables in a given word), and the average number of words per sentence.The readability index, while usually corresponding rather well both to people'ssubjective experience of a text's readability and to their results in comprehensiontests, has received strong criticism because varied sentence length actually con-tributes to ease of reading.
The character index can be looked on as a visualisation of the readabilityindex. Each sentence is analysed and noted on a chart depicting a system ofcoordinates, in which the y axis represents the number of long words and thex axis the number of words per sentence. Thus, by graphically providing morethan a single mean, the character index offers more thorough information abouta text than the readability index does.
The nominal quotient gives the total number of nouns, prepositions and par-ticiples divided by the total number of pronouns, verbs and adverbs. A goodinformation text has a quotient of slightly more than 1.0. Text with a lower nom-inal quotient seems “chatty”, whereas text with a higher nominal quotient iscumbersome.
Research into readability has been directed towards finding the character-istics that make texts easy or difficult to understand. Gunnarsson (1982) pointsout that the psychological equivalent to “readability” is merely superificalunderstanding. Therefore, she prefers to use comprehensibility as the term forcharacteristics that are related to deeper, specific text understanding. Gunnars-son's theory of comprehensibility is based partly on the correlation betweenthe level of understanding and the level of the text, and partly on the premisethat what is read influences the reading process.
It is also possible to calculate the readability of pictures (Pettersson, 1989)by using the picture-readability index, which takes into account a picture's func-tional properties and expresses how easy or difficult the picture is to read. Apicture that we are unable to understand cannot communicate any factual infor-mation. The easier it is to read a picture, the better it can convey information.
In the USA, there is an increasing incidence of lawsuits being broughtagainst manufacturers. These suits claim damages as a result of accidents occur-ring or products breaking because of poor quality in the language of instructionmanuals (Helyar, 1992). The courts are demanding that technical manuals, bro-chures, information sheets, labels, etc., be written in comprehensible language,and that descriptions and instructions be readable and legible. Everywhere,plaintiffs' counsels are searching frenetically for sections of text and parts ofpictures that might be interpreted in conflicting ways. If a manufacturer's tech-nical documentation is difficult to understand, he can lose a lawsuit.
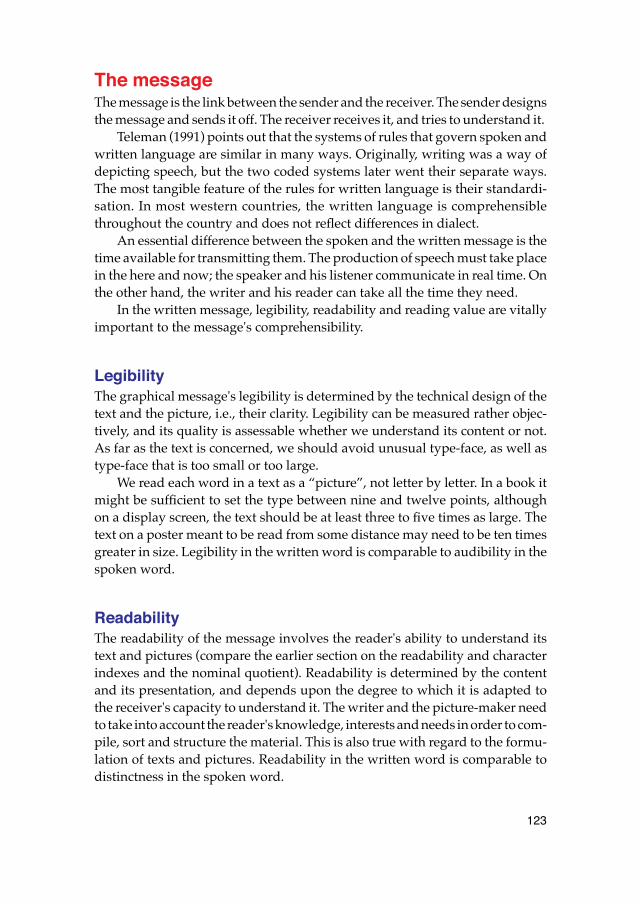
123
The messageThe message is the link between the sender and the receiver. The sender designsthe message and sends it off. The receiver receives it, and tries to understand it.
Teleman (1991) points out that the systems of rules that govern spoken andwritten language are similar in many ways. Originally, writing was a way ofdepicting speech, but the two coded systems later went their separate ways.The most tangible feature of the rules for written language is their standardi-sation. In most western countries, the written language is comprehensiblethroughout the country and does not reflect differences in dialect.
An essential difference between the spoken and the written message is thetime available for transmitting them. The production of speech must take placein the here and now; the speaker and his listener communicate in real time. Onthe other hand, the writer and his reader can take all the time they need.
In the written message, legibility, readability and reading value are vitallyimportant to the message's comprehensibility.
LegibilityThe graphical message's legibility is determined by the technical design of thetext and the picture, i.e., their clarity. Legibility can be measured rather objec-tively, and its quality is assessable whether we understand its content or not.As far as the text is concerned, we should avoid unusual type-face, as well astype-face that is too small or too large.
We read each word in a text as a “picture”, not letter by letter. In a book itmight be sufficient to set the type between nine and twelve points, althoughon a display screen, the text should be at least three to five times as large. Thetext on a poster meant to be read from some distance may need to be ten timesgreater in size. Legibility in the written word is comparable to audibility in thespoken word.
ReadabilityThe readability of the message involves the reader's ability to understand itstext and pictures (compare the earlier section on the readability and characterindexes and the nominal quotient). Readability is determined by the contentand its presentation, and depends upon the degree to which it is adapted tothe receiver's capacity to understand it. The writer and the picture-maker needto take into account the reader's knowledge, interests and needs in order to com-pile, sort and structure the material. This is also true with regard to the formu-lation of texts and pictures. Readability in the written word is comparable todistinctness in the spoken word.
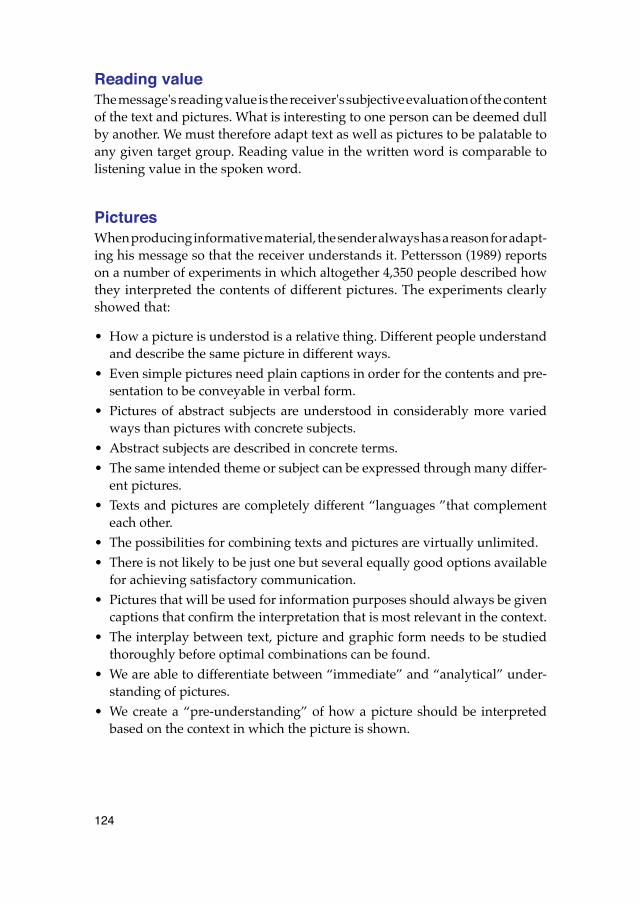
124
Reading valueThe message's reading value is the receiver's subjective evaluation of the contentof the text and pictures. What is interesting to one person can be deemed dullby another. We must therefore adapt text as well as pictures to be palatable toany given target group. Reading value in the written word is comparable tolistening value in the spoken word.
PicturesWhen producing informative material, the sender always has a reason for adapt-ing his message so that the receiver understands it. Pettersson (1989) reportson a number of experiments in which altogether 4,350 people described howthey interpreted the contents of different pictures. The experiments clearlyshowed that:
• How a picture is understod is a relative thing. Different people understandand describe the same picture in different ways.
• Even simple pictures need plain captions in order for the contents and pre-sentation to be conveyable in verbal form.
• Pictures of abstract subjects are understood in considerably more variedways than pictures with concrete subjects.
• Abstract subjects are described in concrete terms. • The same intended theme or subject can be expressed through many differ-
ent pictures.• Texts and pictures are completely different “languages ”that complement
each other. • The possibilities for combining texts and pictures are virtually unlimited.• There is not likely to be just one but several equally good options available
for achieving satisfactory communication. • Pictures that will be used for information purposes should always be given
captions that confirm the interpretation that is most relevant in the context.• The interplay between text, picture and graphic form needs to be studied
thoroughly before optimal combinations can be found. • We are able to differentiate between “immediate” and “analytical” under-
standing of pictures. • We create a “pre-understanding” of how a picture should be interpreted
based on the context in which the picture is shown.
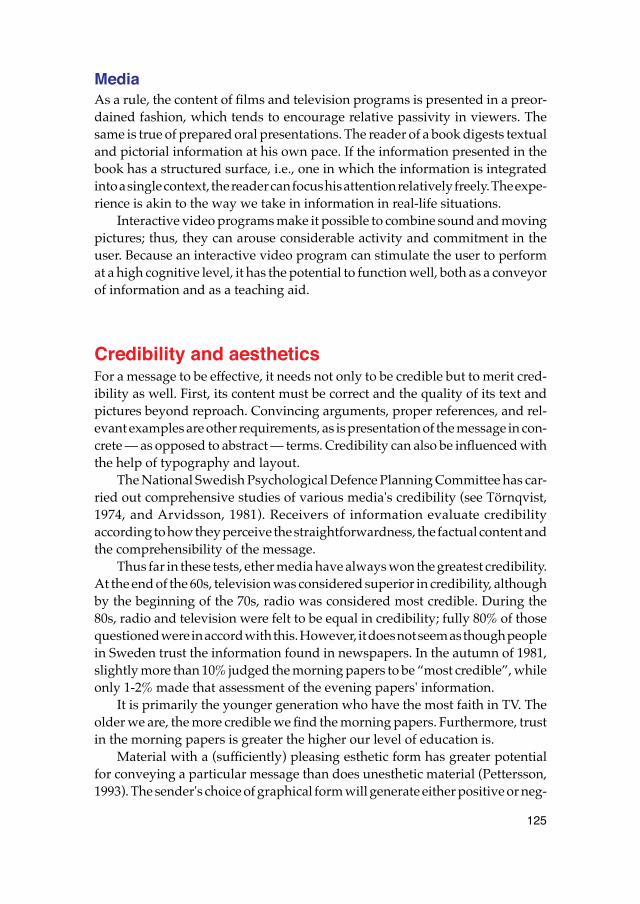
125
MediaAs a rule, the content of films and television programs is presented in a preor-dained fashion, which tends to encourage relative passivity in viewers. Thesame is true of prepared oral presentations. The reader of a book digests textualand pictorial information at his own pace. If the information presented in thebook has a structured surface, i.e., one in which the information is integratedinto a single context, the reader can focus his attention relatively freely. The expe-rience is akin to the way we take in information in real-life situations.
Interactive video programs make it possible to combine sound and movingpictures; thus, they can arouse considerable activity and commitment in theuser. Because an interactive video program can stimulate the user to performat a high cognitive level, it has the potential to function well, both as a conveyorof information and as a teaching aid.
Credibility and aestheticsFor a message to be effective, it needs not only to be credible but to merit cred-ibility as well. First, its content must be correct and the quality of its text andpictures beyond reproach. Convincing arguments, proper references, and rel-evant examples are other requirements, as is presentation of the message in con-crete — as opposed to abstract — terms. Credibility can also be influenced withthe help of typography and layout.
The National Swedish Psychological Defence Planning Committee has car-ried out comprehensive studies of various media's credibility (see Törnqvist,1974, and Arvidsson, 1981). Receivers of information evaluate credibilityaccording to how they perceive the straightforwardness, the factual content andthe comprehensibility of the message.
Thus far in these tests, ether media have always won the greatest credibility.At the end of the 60s, television was considered superior in credibility, althoughby the beginning of the 70s, radio was considered most credible. During the80s, radio and television were felt to be equal in credibility; fully 80% of thosequestioned were in accord with this. However, it does not seem as though peoplein Sweden trust the information found in newspapers. In the autumn of 1981,slightly more than 10% judged the morning papers to be “most credible”, whileonly 1-2% made that assessment of the evening papers' information.
It is primarily the younger generation who have the most faith in TV. Theolder we are, the more credible we find the morning papers. Furthermore, trustin the morning papers is greater the higher our level of education is.
Material with a (sufficiently) pleasing esthetic form has greater potentialfor conveying a particular message than does unesthetic material (Pettersson,1993). The sender's choice of graphical form will generate either positive or neg-
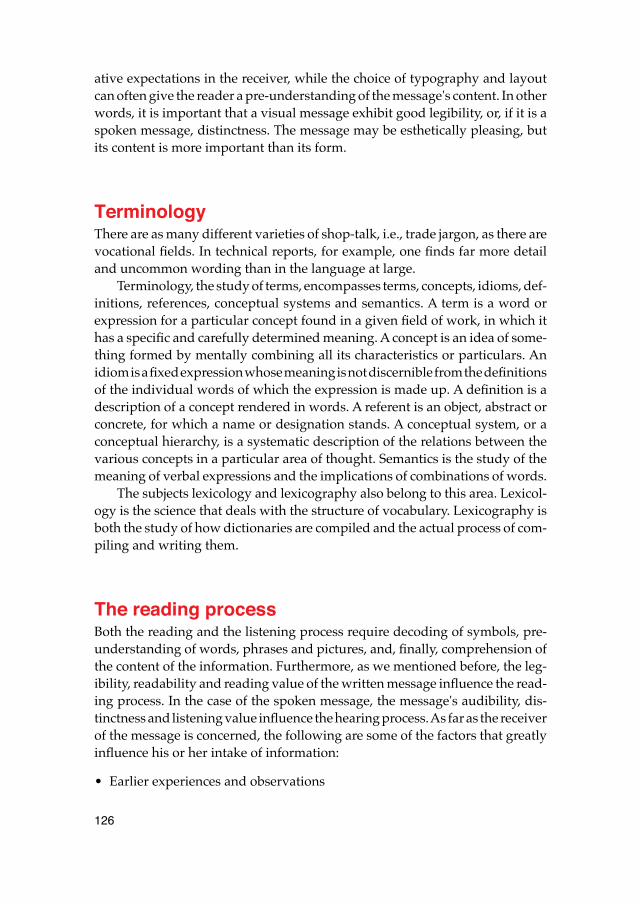
126
ative expectations in the receiver, while the choice of typography and layoutcan often give the reader a pre-understanding of the message's content. In otherwords, it is important that a visual message exhibit good legibility, or, if it is aspoken message, distinctness. The message may be esthetically pleasing, butits content is more important than its form.
TerminologyThere are as many different varieties of shop-talk, i.e., trade jargon, as there arevocational fields. In technical reports, for example, one finds far more detailand uncommon wording than in the language at large.
Terminology, the study of terms, encompasses terms, concepts, idioms, def-initions, references, conceptual systems and semantics. A term is a word orexpression for a particular concept found in a given field of work, in which ithas a specific and carefully determined meaning. A concept is an idea of some-thing formed by mentally combining all its characteristics or particulars. Anidiom is a fixed expression whose meaning is not discernible from the definitionsof the individual words of which the expression is made up. A definition is adescription of a concept rendered in words. A referent is an object, abstract orconcrete, for which a name or designation stands. A conceptual system, or aconceptual hierarchy, is a systematic description of the relations between thevarious concepts in a particular area of thought. Semantics is the study of themeaning of verbal expressions and the implications of combinations of words.
The subjects lexicology and lexicography also belong to this area. Lexicol-ogy is the science that deals with the structure of vocabulary. Lexicography isboth the study of how dictionaries are compiled and the actual process of com-piling and writing them.
The reading processBoth the reading and the listening process require decoding of symbols, pre-understanding of words, phrases and pictures, and, finally, comprehension ofthe content of the information. Furthermore, as we mentioned before, the leg-ibility, readability and reading value of the written message influence the read-ing process. In the case of the spoken message, the message's audibility, dis-tinctness and listening value influence the hearing process. As far as the receiverof the message is concerned, the following are some of the factors that greatlyinfluence his or her intake of information:
• Earlier experiences and observations
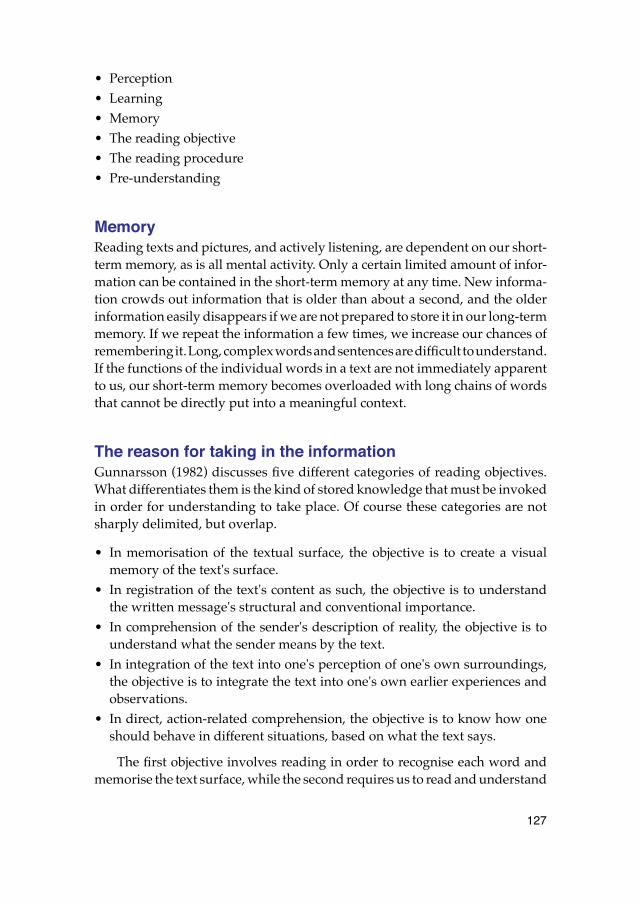
127
• Perception• Learning• Memory• The reading objective• The reading procedure• Pre-understanding
MemoryReading texts and pictures, and actively listening, are dependent on our short-term memory, as is all mental activity. Only a certain limited amount of infor-mation can be contained in the short-term memory at any time. New informa-tion crowds out information that is older than about a second, and the olderinformation easily disappears if we are not prepared to store it in our long-termmemory. If we repeat the information a few times, we increase our chances ofremembering it. Long, complex words and sentences are difficult to understand.If the functions of the individual words in a text are not immediately apparentto us, our short-term memory becomes overloaded with long chains of wordsthat cannot be directly put into a meaningful context.
The reason for taking in the informationGunnarsson (1982) discusses five different categories of reading objectives.What differentiates them is the kind of stored knowledge that must be invokedin order for understanding to take place. Of course these categories are notsharply delimited, but overlap.
• In memorisation of the textual surface, the objective is to create a visualmemory of the text's surface.
• In registration of the text's content as such, the objective is to understandthe written message's structural and conventional importance.
• In comprehension of the sender's description of reality, the objective is tounderstand what the sender means by the text.
• In integration of the text into one's perception of one's own surroundings,the objective is to integrate the text into one's own earlier experiences andobservations.
• In direct, action-related comprehension, the objective is to know how oneshould behave in different situations, based on what the text says.
The first objective involves reading in order to recognise each word andmemorise the text surface, while the second requires us to read and understand
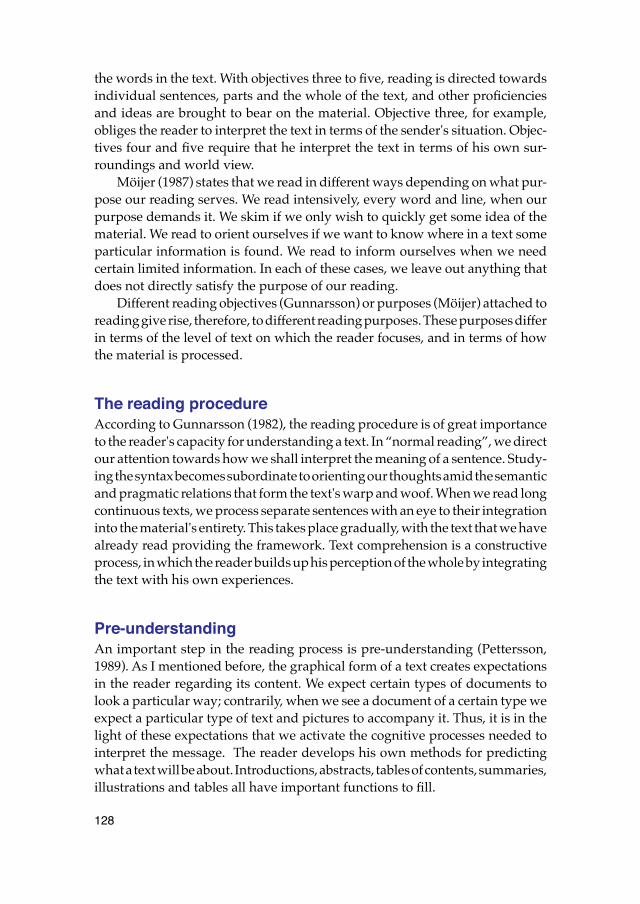
128
the words in the text. With objectives three to five, reading is directed towardsindividual sentences, parts and the whole of the text, and other proficienciesand ideas are brought to bear on the material. Objective three, for example,obliges the reader to interpret the text in terms of the sender's situation. Objec-tives four and five require that he interpret the text in terms of his own sur-roundings and world view.
Möijer (1987) states that we read in different ways depending on what pur-pose our reading serves. We read intensively, every word and line, when ourpurpose demands it. We skim if we only wish to quickly get some idea of thematerial. We read to orient ourselves if we want to know where in a text someparticular information is found. We read to inform ourselves when we needcertain limited information. In each of these cases, we leave out anything thatdoes not directly satisfy the purpose of our reading.
Different reading objectives (Gunnarsson) or purposes (Möijer) attached toreading give rise, therefore, to different reading purposes. These purposes differin terms of the level of text on which the reader focuses, and in terms of howthe material is processed.
The reading procedureAccording to Gunnarsson (1982), the reading procedure is of great importanceto the reader's capacity for understanding a text. In “normal reading”, we directour attention towards how we shall interpret the meaning of a sentence. Study-ing the syntax becomes subordinate to orienting our thoughts amid the semanticand pragmatic relations that form the text's warp and woof. When we read longcontinuous texts, we process separate sentences with an eye to their integrationinto the material's entirety. This takes place gradually, with the text that we havealready read providing the framework. Text comprehension is a constructiveprocess, in which the reader builds up his perception of the whole by integratingthe text with his own experiences.
Pre-understandingAn important step in the reading process is pre-understanding (Pettersson,1989). As I mentioned before, the graphical form of a text creates expectationsin the reader regarding its content. We expect certain types of documents tolook a particular way; contrarily, when we see a document of a certain type weexpect a particular type of text and pictures to accompany it. Thus, it is in thelight of these expectations that we activate the cognitive processes needed tointerpret the message. The reader develops his own methods for predictingwhat a text will be about. Introductions, abstracts, tables of contents, summaries,illustrations and tables all have important functions to fill.
129
Television producers are usually good at showing what their programs areabout. In countries with a great many TV channels, it has been noted that viewersswitch rapidly between different channels until they find a program that awakestheir interest. Sometimes a viewer will make up his mind within the space ofa couple of seconds (Matsushita, 1988).
Language that is rich in similes and metaphors makes it easier for the readerto paint his own inner pictures. A well constructed text with clear, distinctarrangement and lucid paragraph disposition, organised under well formu-lated headings and captions, affords the best reading experience.
CostsWhen a great many people are required to read and understand informationduring working hours, the cost incurred is great. It can be expensive to produceinformation, but it costs even more to store, find and use it. The greater the num-ber of individuals who must partake of certain information, the greater the costwill be. The cost of reading is determined by the type of documents that willbe read, as well as by the groups that will read them. Thus, presenting infor-mation in a suitable way offers great opportunities for saving money. In thehandbook called “Plain Talk from the Cabinet Office”,that is provided for useby members of that body, Ehrenberg-Sundin (1982) states that judicious plan-ning of texts can save millions. She writes as follows (in translation):
It is expensive to read texts! The cost of reading is often many timesgreater than the cost of writing and printing the material. Besides, if read-ers do not understand the text, or if they interpret it incorrectly, itbecomes VERY expensive! This problem can be solved by planning textbetter. It should have a purpose and the selection of its content mustagree with that purpose. Thus, we can avoid the greatest readingexpense. If we help the reader further by writing comprehensible lan-guage and giving the text a sensible presentation as well as an arrange-ment that is logical to him, we shall have saved still more time andmoney.
The cost of reading and understanding text is in most cases many times greaterthan the cost of producing it. Ehrenberg-Sundin offers an estimate:
For a report that has cost SEK 80,000 to print and just as much to write(four months' salary for a committee secretary), the cost of reading it willbe SEK 1,600,000 if 1,000 persons spend eight working hours each (at SEK
130
200 per hour) to read and understand it.The greater the number of people who are meant to read a text, thegreater the incentive is to expend extra effort on making it easy to read!
In private companies, the cost per hour is usually reckoned at SEK 400 ormore, instead of SEK 200. (Since 1982 these costs have increased considerablydue to inflation; however, the ratios remain the same.) Thus, in industry, savingsin this area can be still greater than they might be in the public sector.
Melin and others (1986) refer to a cost estimate that was carried out at theSwedish Telecommunications Administration (Televerket). The total cost of a20-page technical report was estimated in SEK per page as follows: writing 5.60,printing 1.40, storage 25.00, and reading 225.00. In other words, the cost of read-ing the report was many times greater than all the other costs put together. Theauthor's work on the text represented only two percent of the total cost.
Writing adviceAgainst the background of the previous discussions (regarding comprehensi-bility, communication, experiences, the writing process, quality of language,message clarity, credibility and esthetics, terminology, the reading process, andcosts), it is possible to give some concrete advice, or rules of thumb, on goodwriting strategy as the key to good comprehensibility. These rules of thumb,besides being written so that any writer can easily follow them, are divided intothe following sections: Analysis, preparation, writing, using pictures, and doingthe final touchingup. In some places, references to relevant literature are given,if you want to penetrate the material more deeply.
Analysis• Investigate who will read your text.• What characteristics do the readers have?• What is the purpose of your message? Do you want to inform, give instruc-
tions or influence your readers?• Are the readers positively or negatively disposed to your message? What
are their expectations?• How will you convey your message to the readers? What medium or media
will you use?• What financial conditions or limitations apply to your work?• What external factors can influence how the readers will interpret your
message?
131
Preparation• When you create a message, always proceed from what you yourself know
about the readers. What is the readers' level of knowledge?• Draw up a preliminary plan for your writing. Allot sufficient time for it. • Gather material, for example, by reading, interviewing people, making
observations and performing experiments. • Collect the pictorial material (see “Using Pictures” below).• Sort out the material that will be included with your text. Proceed from
what you know about the readers' potential for understanding it. Focus onthe most important aspects.
• Structure the material. Make an outline of your subject; it can later berefined and given more detail. A technical report should have a title, a tableof contents, an abstract or summary, an introduction, description and anal-ysis, a conclusion (including your own viewpoints) and a list of sources orreferences. Avoid footnotes and appendices, as they are seldom read.
• There are different types of outlines, for example, narrative and logical out-lines. Do not switch between different types in the same document.
• Write an interesting title and, if you like, a subtitle. • Choose a graphical form that suits the material. It will make things easier
for the readers if information of the same kind is presented in a similar way.A well-thought-out graphical form contributes to the readers' understand-ing.
Writing text
General
• Let your writing be simple, clear and concise. Express yourself in specificrather than unspecific terms.
• Use a style that is natural for you. Avoid both colloquial language andexcessively formal constructions.
• Analyse, argue, describe, compare, refer, make associations, spin a tale, allaccording to what you think is needed.
• Try not to insinuate subjective values into your text. If it is your own opin-ion you are expressing, make this plain.
• Avoid writing in a style that is too laconic or sterile, but don't allow yourselfto become “chatty”. Sentences that are too dense, i.e. sentences in which toomany ideas are concentrated, will make your text tedious reading.
132
• Use aids, such as dictionaries and encyclopedias. For a guide to Englishwriting, see The Economist (1991) “Style Guide”, “Good Style” by Kirkman(1992), and “The Elements of Style” by Strunk and White (1979).
Words
• Avoid long, polysyllabic, complicated words. • Avoid buzz-words, slang and expert jargon.• Use defined, established terminology. If you are obliged to use abbrevia-
tions, define them in full the first time they appear in the text.
Sentences
• Try to have your sentences say one thing at a time, don't cram them withideas. In general, try to vary the length of your sentences to increase readingease, but avoid sentences that are too short or too long.
• Avoid complicated word order and subordinated clauses. Be particularlycareful in your placement of modifiers. Avoid the passive voice (“The B pro-cess is affected by A”); write active sentences (“A affects the B process”).Use verbs instead of nouns and gerunds.
Paragraphs
• Let every paragraph encompass a single unit of content. Avoid long, convo-luted paragraphs that meander in all directions.
• Link sentences and paragraphs with conjunctions and/or adverbs (and,nevertheless, moreover, because, but, however, therefore, although,because, since, or, even, thus), making sure at the same time that the thingslinked together bear a logical relation to each other. In the sentence “theproject was terminated due to calculated project costs and more profitableuse of resources”, the phrase “terminated due to” implies that whatever isto follow will have had a negative effect on the project's progress. However,“calculated project costs” and “more profitable use of resources”, besidesbeing neutral rather than negative in effect, have no logical relation to eachother, nor do they tell why the project was terminated. The sentence shouldread: “The project was terminated due in part to project costs being calcu-lated as excessive, and in part to the necessity of putting resources to moreprofitable use.”
The entire piece
• There should be a “red thread” running through the text. Try to find a uni-fying principle. Clearly show what it is that you want to express.
133
• If the subject is on a high plane of abstraction, use concrete examples thatillustrate the principles.
• Use similes and metaphors. They make it possible for readers to paint aninner picture.
• If the text shows a high degree of specification and examines a great manyseparate details, you should summarise every now and then, and draw con-clusions.
• Sometimes you may find it necessary to write your foreword, introductionand summary after the body of the piece is written.
• List your references clearly.
Using pictures• Use pictures to make it easy for the reader to understand your message.• Any pictures you use should be clear and easily read. Pictures should
always have captions. • Pictures and text must interact to produce a seamless unity.• Place texts and pictures that belong together as close to each other as possi-
ble.• Do not change the content of a picture by using different forms of computer
manipulation. This practice is often unlawful, and always unethical.• Never try to pass off inauthentic pictures as being true depictions of reality.• The source of any borrowed pictures should be identified.• For a guide to visual language see “Visuals for information. Research and
practice” (Pettersson, 1989).
Doing the touching-up• Let your text “rest” for a week or so, then read it from the reader's point of
view. Make the necessary amendments.• Check that the finished text corresponds to the text as you had planned it.• Edit your text! Polish it. Trim away any unneccessary bulk. Iron out incon-
sistencies. Simplify the language. Clean up the punctuation. Every sentenceshould be easy to read!
• Check style and grammar. Discrepancies in grammar and style hinder thereader's progress and make the writer less credible in his eyes.
• Check spelling and word division at the end of lines. In some cases, func-tions in your word processing program can help you with this.
• Check references and other formal aspects of your paper.
134
• Refine the typography and layout so that the headings, tables and picturesare presented in a lucid, esthetically pleasing graphical form. Make optimaluse of the possibilities that typography offers.
ReferencesArvidson, P. (1981). Tror vi på våra massmedier? Psykologiskt försvar.109.
Beredskapsnämnden för psykologiskt försvar: Stockholm.Bergquist, L. (1991). Rationellt författarskap. In S. Selander, L. Olsson, R. Pet-
tersson och E. Romare (Eds.). Specialnummer: läromedel. Ett utbildnings-material om pedagogiska texter. Spov 14/15, 17-18.
Ehrenberg-Sundin, B. (1982). Bättre planerade texter sparar miljoner kronor. Klarspråk från SB, Språkspalter i Klara-Posten, 1982-1985.
Gunnarsson, B-L. (1982). Lagtexters begriplighet. En språkfunktionell studie av medbestämmandelagen. Liber Förlag: Stockholm.
Helyar, P. S. (1992). Products Liability: Meeting Legal Standards for Adequate Instructions. Journal of Technical Writing and Communication. 22, 2, 125-147.
Kirkman, J. (1992). Good style. Writing for science and technology. E & FN Spon: London.
Liljestrand, B. och Arwidson, M. (1979). Skrivstrategi. Esselte Studium: Stock-holm.
Matsushita, K. (1988). A summary version of the Comprehensive Report on Hi-OVIS PROJECT Jul. ´78–Mar.´86. Tokyo: New Media Development.
Melin, L., Melin, S., och Eriksson, D. (1986). Effektiv svenska för tekniker. Natur och Kultur: Stockholm.
Melin, L. (1992). Lätt eller svårt. Ett kompendium om begriplighet i text. Stock-holms Universitet. Institutionen för Nordiska språk.
Möijer, K. (1987). Skapa Skriva. Att växa i språket. Esselte Studium: Stockholm.Noble, G. (1975). Children in Front of the Small Screen. Beverly Hills, California,
SagePettersson, R. (1989). Visuals for Information. Research and practice. Educational
Technology Publications: Englewood Cliffs. New Jersey. USA.Pettersson, R. (1993). Visual Information. Educational Technology Publications:
Englewood Cliffs. New Jersey. USA.Strunk, W. & White, E. B. (1979). The Elements of Style. MacMillan Publishing
Co Inc. New York.Strömquist, S. (1991). Skrivprocess och skrivundervisning. In G. Malmgren och C.
Sandqvist (red.). Skrivpedagogik. Studentlitteratur. p. 27-50.Teleman, U. (1991). Vad kan man när man kan skriva? In G. Malmgren och C.
Sandqvist (Eds.). Skrivpedagogik. Studentlitteratur. p. 11-26.The Economist (1991). Style Guide. The Economist Books. London.

135
Tröger, W. (1963). Der Film und die Antwort der Erziehung. München/Basel: Reinhardt.
Törnqvist, K. (1974). Förtroendet till massmedierna. En opinionsundersökn-ing i november–december 1973. Psykologiskt försvar. 63. Bered-skapsnämnden för psykologiskt försvar: Stockholm.
Young, M. (1989). The Technical Writer’s Handbook. University Science Books. Mill Valley, CA.

136
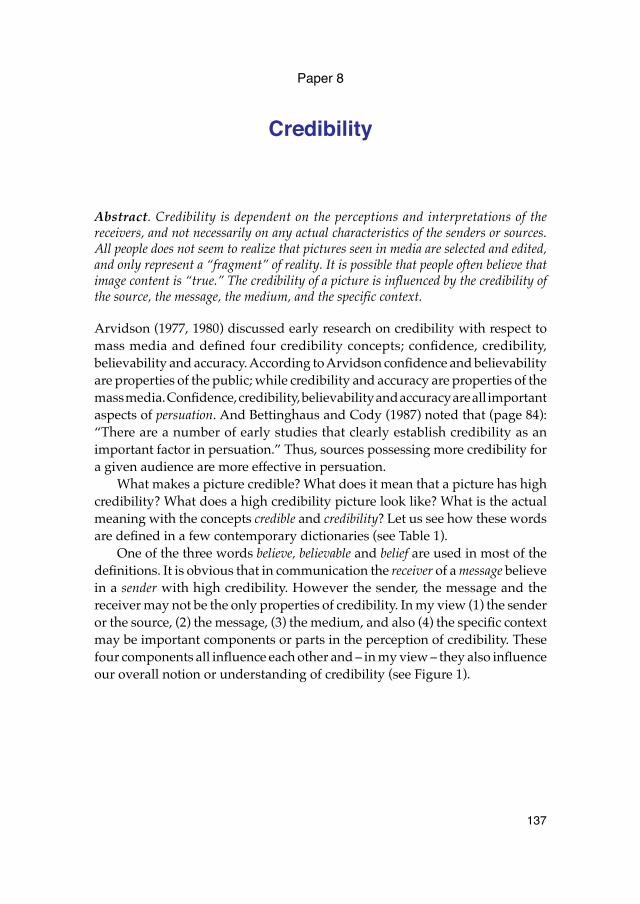
137
Paper 8
Credibility
Abstract. Credibility is dependent on the perceptions and interpretations of thereceivers, and not necessarily on any actual characteristics of the senders or sources.All people does not seem to realize that pictures seen in media are selected and edited,and only represent a “fragment” of reality. It is possible that people often believe thatimage content is “true.” The credibility of a picture is influenced by the credibility ofthe source, the message, the medium, and the specific context.
Arvidson (1977, 1980) discussed early research on credibility with respect tomass media and defined four credibility concepts; confidence, credibility,believability and accuracy. According to Arvidson confidence and believabilityare properties of the public; while credibility and accuracy are properties of themass media. Confidence, credibility, believability and accuracy are all importantaspects of persuation. And Bettinghaus and Cody (1987) noted that (page 84):“There are a number of early studies that clearly establish credibility as animportant factor in persuation.” Thus, sources possessing more credibility fora given audience are more effective in persuation.
What makes a picture credible? What does it mean that a picture has highcredibility? What does a high credibility picture look like? What is the actualmeaning with the concepts credible and credibility? Let us see how these wordsare defined in a few contemporary dictionaries (see Table 1).
One of the three words believe, believable and belief are used in most of thedefinitions. It is obvious that in communication the receiver of a message believein a sender with high credibility. However the sender, the message and thereceiver may not be the only properties of credibility. In my view (1) the senderor the source, (2) the message, (3) the medium, and also (4) the specific contextmay be important components or parts in the perception of credibility. Thesefour components all influence each other and – in my view – they also influenceour overall notion or understanding of credibility (see Figure 1).
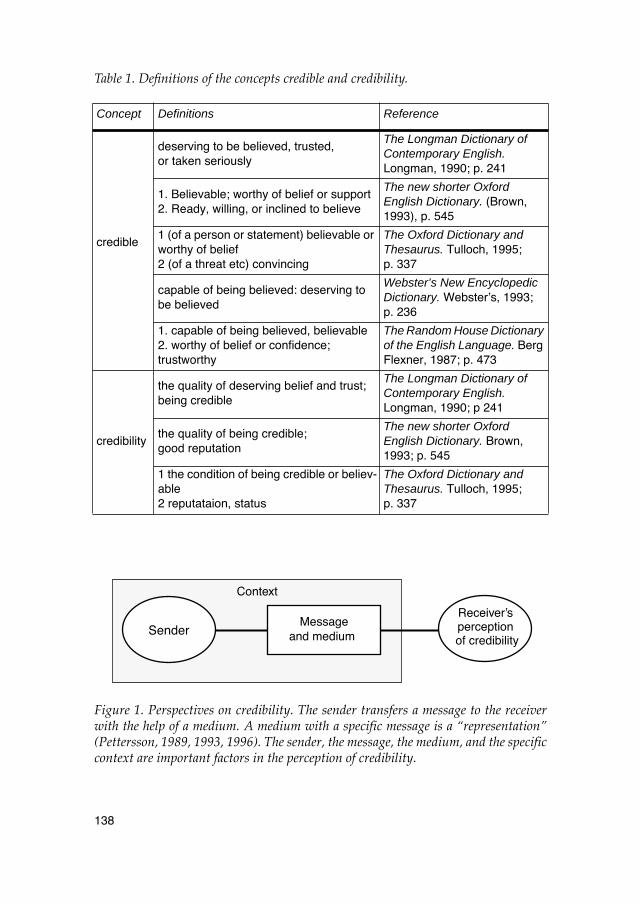
138
Table 1. Definitions of the concepts credible and credibility.
Figure 1. Perspectives on credibility. The sender transfers a message to the receiverwith the help of a medium. A medium with a specific message is a “representation”(Pettersson, 1989, 1993, 1996). The sender, the message, the medium, and the specificcontext are important factors in the perception of credibility.
Concept Definitions Reference
credible
deserving to be believed, trusted, or taken seriously
The Longman Dictionary of Contemporary English. Longman, 1990; p. 241
1. Believable; worthy of belief or support2. Ready, willing, or inclined to believe
The new shorter Oxford English Dictionary. (Brown, 1993), p. 545
1 (of a person or statement) believable or worthy of belief2 (of a threat etc) convincing
The Oxford Dictionary and Thesaurus. Tulloch, 1995; p. 337
capable of being believed: deserving to be believed
Webster’s New Encyclopedic Dictionary. Webster’s, 1993; p. 236
1. capable of being believed, believable2. worthy of belief or confidence;trustworthy
The Random House Dictionary of the English Language. Berg Flexner, 1987; p. 473
credibility
the quality of deserving belief and trust; being credible
The Longman Dictionary of Contemporary English. Longman, 1990; p 241
the quality of being credible;good reputation
The new shorter Oxford English Dictionary. Brown, 1993; p. 545
1 the condition of being credible or believ-able2 reputataion, status
The Oxford Dictionary and Thesaurus. Tulloch, 1995; p. 337
SenderReceiver’s
Context
Messageand medium
perception of credibility
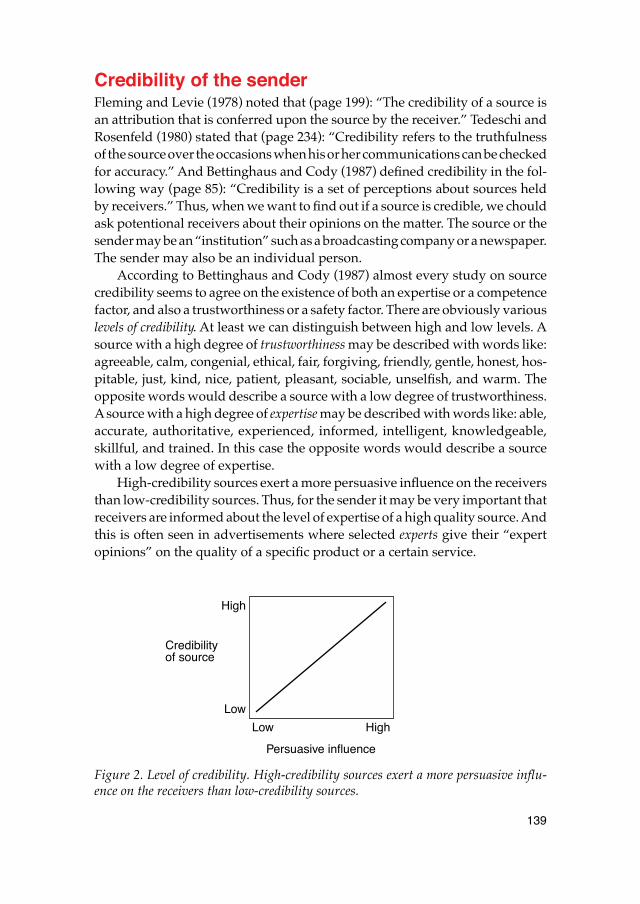
139
Credibility of the senderFleming and Levie (1978) noted that (page 199): “The credibility of a source isan attribution that is conferred upon the source by the receiver.” Tedeschi andRosenfeld (1980) stated that (page 234): “Credibility refers to the truthfulnessof the source over the occasions when his or her communications can be checkedfor accuracy.” And Bettinghaus and Cody (1987) defined credibility in the fol-lowing way (page 85): “Credibility is a set of perceptions about sources heldby receivers.” Thus, when we want to find out if a source is credible, we chouldask potentional receivers about their opinions on the matter. The source or thesender may be an “institution” such as a broadcasting company or a newspaper.The sender may also be an individual person.
According to Bettinghaus and Cody (1987) almost every study on sourcecredibility seems to agree on the existence of both an expertise or a competencefactor, and also a trustworthiness or a safety factor. There are obviously variouslevels of credibility. At least we can distinguish between high and low levels. Asource with a high degree of trustworthiness may be described with words like:agreeable, calm, congenial, ethical, fair, forgiving, friendly, gentle, honest, hos-pitable, just, kind, nice, patient, pleasant, sociable, unselfish, and warm. Theopposite words would describe a source with a low degree of trustworthiness.A source with a high degree of expertise may be described with words like: able,accurate, authoritative, experienced, informed, intelligent, knowledgeable,skillful, and trained. In this case the opposite words would describe a sourcewith a low degree of expertise.
High-credibility sources exert a more persuasive influence on the receiversthan low-credibility sources. Thus, for the sender it may be very important thatreceivers are informed about the level of expertise of a high quality source. Andthis is often seen in advertisements where selected experts give their “expertopinions” on the quality of a specific product or a certain service.
Figure 2. Level of credibility. High-credibility sources exert a more persuasive influ-ence on the receivers than low-credibility sources.
Credibility
High
Persuasive influence
Low
of source
HighLow
140
Hovland, Janis and Kelley (1953) stated that people who show high accep-tance of a message from a high credibility source may show less acceptance lateron, after a few weeks. They called this the “sleeper effect.” Through the 1950sand 1960s the sleeper effect had a firm place in the persuation literature. How-ever, later Cook and Flay (1978) demonstrated that the sleeper effect could notbe reliably demonstrated without very specific conditions.
According to Fleming and Levie (1978, page 225) the adverse effects of alow credibility source can be lessened if the source is identified after, rather thanbefore the message is presented to the audience. Once people have made uptheir minds and formed their opinions they are not always inclined to changethese opinions easily. Hovland, Janis and Kelley (1953) also argued that peoplewho receive a message from a source with low credibility may show an increasein acceptance of the message after some time has passed. The negative influencefrom the source diminish.
Kouzes and Posner (1993) studied the credibility of leaders, and how leadersin business may gain and may lose their credibility. They found that most peopleappreciate leaders with high credibility. Above all such leaders are honest, fore-sighted, inspiring, and competent. They are also just, fair, supporting, liberaland broadminded. According to Kouzes and Posner a credible source is reliable,objective and dynamic.
Ehrenborg (1984) declared that the credibility of a speaker is very much influ-enced by his or her actual performance in front of the live audience. Any messagemust always be in close agreement with the body language. A speaker that islying will usually be exposed by his or her body language. An audience willbelieve what they see much more than what they hear. Thus it is also very impor-tant for the speaker to use slides, overhead transparencies and other visual sup-port of high quality. When a speaker uses visual aids of poor quality this willinfluence the receiver’s perception of the credibility of the speaker. The use ofinferior overhead transparencies and slides may actually be devastating for thecredibility of the speaker as well as the credibility of the message.
In connection with accidents, crimes and verdicts several researchers havediscussed the credibility of eyewitnesses. Eyewitness identification has been citedas the single most persuasive source of all kinds of evidence that can be usedin a court of law (see Woocher, 1977; and Loftus 1996), but also as the most fre-quent cause of wrongful convictions (Rattner, 1988). The reliability of testimonydepends on many factors, including circumstances at the time of an event, thewitness’s emotional state and memory function, etc.
According to Lindsay (1994) eyewitnesses are generally considered byjurors to be highly credible sources of evidence. However, many factors canintervene and create inaccurate testimonies. Memory can be radically alteredby the way an eyewitness is questioned, new memories can be implanted andold ones altered in subtle ways (Loftus, 1996). Some witnesses find it easy to
141
remember events accurately and in great detail. The memory of other witnessesmay be faulty. They sometimes fill in memory blanks unconsciously so a mem-ory still seems correct to them. Such a witness might then be convinced thatshe/he is supplying highly accurate information, even when it is highly inac-curate. According to Christianson (1990), witnesses often change their recol-lections to conform with descriptions supplied by other witnesses or informa-tion in the media. This is a subconscious process that is independent of whetheran event was emotionally charged or banal.
After a series of experiments with mock jury studies Lindsay (1994) foundthat witness confidence consistently influenced juror verdicts and perceptionsof witness accuracy, whereas a variety of other factors had little or no effect onthe verdicts. Jurors actually made a determination of guilt or innocence by dis-torting the evidence to conform their decisions. Lindsay concluded that the mostimportant contributions that psychologists can make in the eyewitness area willresult from developing techniques that increase the accuracy of eyewitnessreports, or the accuracy of eyewitness identifications.
Leippe (1994) discussed the appraisal of eyewitness testimonies. In threeexperiments credibility judgements of witnesses’ memory reports included rat-ings of believability, confidence, consistency, estimate of cued recall, and con-fidence in identification accuracy. Leippe views eyewitness testimony as “per-suasive communication” whereby the witness attempts to persuade the jurythat his or her testimony is accurate. A variety of factors influence the believ-ability of eyewitness testimony. Leippe concluded that a thorough understand-ing of eyewitness persuasion is an important theoretical and practical goal. Thisis an area where a lot of work remains to be done.
Credibility of the mediumCommunication takes place when a sender successfully conveys a message toa receiver. The sender transfers the message to the receiver with the help of dif-ferent media. A medium with a specific message is a representation (Pettersson1989, 1993, 1996). All representations are the result of biological, cultural, eco-nomical, emotional, historical, political, religious, social, and subject matter fac-tors. Actually, all we have got to communicate with are various kinds of rep-resentations. Obviously, the sender wants the representation to have highcredibility.
According to Becker, Martino, and Towers (1976) the credibility of a mediumdepends on a number of variables, including receiver characteristics such asage, gender and level of education. The National Swedish PsychologicalDefence Planning Committee has carried out comprehensive studies of the cred-ibility of various media (see Törnqvist, 1974; and Arvidsson, 1977, 1980, 1981a,
142
1981b). At the end of the 60s, television was considered superior in credibility,although by the beginning of the 70s, radio was considered most credible. Dur-ing the 80s, radio and television were felt to be equal in credibility; fully 80%of those questioned were in accord with this. It does not seem as though all peo-ple in Sweden trust the information found in newspapers. In the autumn of1981, slightly more than 10% judged the morning papers to be “most credible”,while only 1-2% made that assessment of the information in the evening papers.It is primarily the younger generation who have the most faith in television.The older we are, the more credible we find the morning papers. Furthermore,trust in the morning papers increases with our level of education.
According to Keller and Burkman (1993) learners will be more motivatedto learn if they believe in the truth and appropriateness of the materials pre-sented to them. The credibility of an instructor or a set of course materials isinfluenced by several factors concerning the qualifications of the instructor, thereputation of the publisher, the quality and structure of the arguments in a mes-sage, and the correspondence of values and beliefs between the learners andthe source of materials. Thus Keller and Burkman formulated the following“principle of motivation” (page 22): “Learner confidence and efforts to succedare increased in proportion to the perceived credibility of the source.” Kellerand Burkman also noted that commercial producers have found that users' firstimpressions of a media product are very important to getting them to adopt(buy) it. Consequently, they spend a lot of time and money in giving their prod-ucts a favorable feel or “image.”
Material with a (sufficiently) pleasing aesthetic form has greater potentialfor conveying a particular message than does unesthetic material. The sender'schoice of graphical form will generate either positive or negative expectationsin the receiver, while the choice of typography and layout can often give thereader a pre-understanding of the message's content. In other words, it is impor-tant that a visual message exhibit good legibility, or, if it is a spoken message,distinctness. The message may be aesthetically pleasing, but its content is moreimportant than its form.
Credibility of the messageIt is quite obvious that different specimens within a medium, such as individualnewspapers, books, television programmes, movies, records etc, will differwidely in their credibility depending on the contents of the various messages.Thus the credibility of the message is influenced by the credibility of the specificmedium; and the credibility of the medium is influenced by the credibility ofthe message. The same message will be perceived in different ways in differentrepresentations. And the same kind of interactive influence can be seen between
143
the representation and the sender. Fleming and Levie (1978) noted that (page203): “The receiver’s evaluation of the message will affect the receiver’s eval-uation of the source.” Thus an effective message has to be both credible and tomerit credibility.
And Bettinghaus and Cody (1987) stated (page 100): “What sources say isextremely important, but how they say it and how they behave while sayingit does dramatically affect the receiver’s perceptions of the source, thus influ-encing the extent of attitude change the receiver is likely to experience.”
What is typical for a message with high credibility? In my opinion it mustbe possible to understand the message and to be able to believe that the infor-mation is correct. The information can not be too divergent from the usual sit-uations. Furthermore a high credibility message has a good structure, convinc-ing arguments, proper references, and relevant examples. It is also a majoradvantage if text and pictures have good legibility as well as good readability.In my view a picture used in information materials should depict reality in amanner appropriate to the content and be as relevant and credible as possible.However, many pictures in textbooks and newspapers have been edited in orderto change their importance and impact. The pictures can easily be enlarged orreduced in size, which will influence readability. It is often very easy to cropthe original picture. However, cropping is not merely an aid to art or to jour-nalism; it may also be a tool for unscrupulus editors. Many photographs lendthemselves to manipulation of the representation of the truth. They are sus-ceptible to different crops to support different meanings and various ideas. Itis also possible to expand the original picture. Parts of the picture can be deleted,added, altered, moved or changed in shape. A colour can be changed, removedor added. This practice of editing is often unlawful. The picture's expressivenesscan also be altered by the choice of method for reproduction and printing andthe choice of paper or other materials.
Still as well as moving photographic images are not always imprints of whatactually was in front of the camera. Movie productions often use special effectscenes created with a blend of techniques. Digital manipulation of images hasnow reached a point where it is often impossible for viewers to see what hasbeen altered and what has not. Fetveit (1997) suggested that our trust in filmimageswill be a product of institutional warrent rather than blind faith in thedocumentary power of photography. To some extent trust will pass from thephotpgraphic technology to the institutions and to the discourses where theimages are used. When people view movies like Jurassic Park and IndependenceDay they are not likely to believe that these actually are true stories. Here thepurpose is entertainment and not information. The intentiion is not to presenta representation of the “real world” but to present a representation of an “imag-ined world”, a fantasy or a dream. In such a situation a manipulated image mayemploy high credibility.
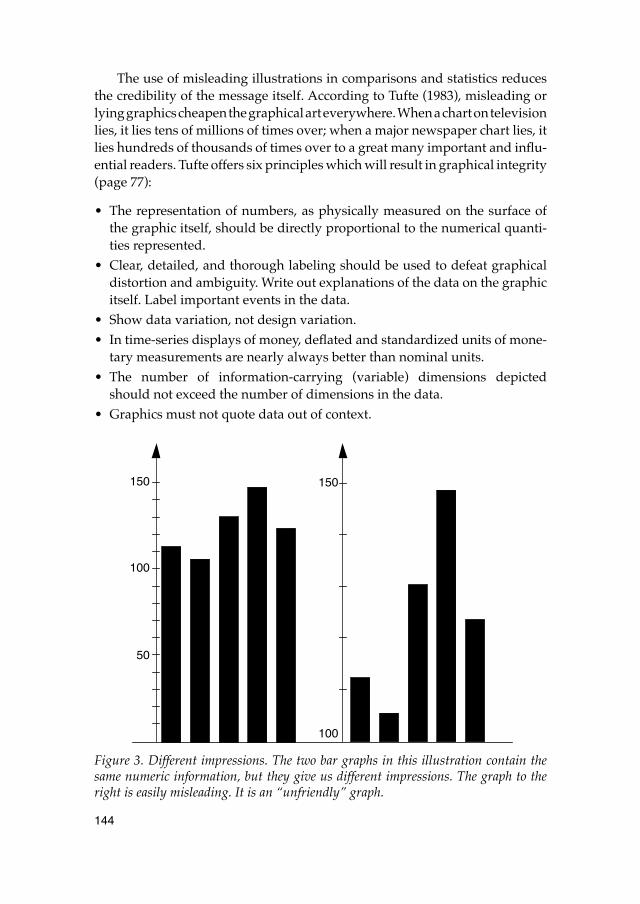
144
The use of misleading illustrations in comparisons and statistics reducesthe credibility of the message itself. According to Tufte (1983), misleading orlying graphics cheapen the graphical art everywhere. When a chart on televisionlies, it lies tens of millions of times over; when a major newspaper chart lies, itlies hundreds of thousands of times over to a great many important and influ-ential readers. Tufte offers six principles which will result in graphical integrity(page 77):
• The representation of numbers, as physically measured on the surface ofthe graphic itself, should be directly proportional to the numerical quanti-ties represented.
• Clear, detailed, and thorough labeling should be used to defeat graphicaldistortion and ambiguity. Write out explanations of the data on the graphicitself. Label important events in the data.
• Show data variation, not design variation.• In time-series displays of money, deflated and standardized units of mone-
tary measurements are nearly always better than nominal units.• The number of information-carrying (variable) dimensions depicted
should not exceed the number of dimensions in the data.• Graphics must not quote data out of context.
Figure 3. Different impressions. The two bar graphs in this illustration contain thesame numeric information, but they give us different impressions. The graph to theright is easily misleading. It is an “unfriendly” graph.
150
50
100
100
150
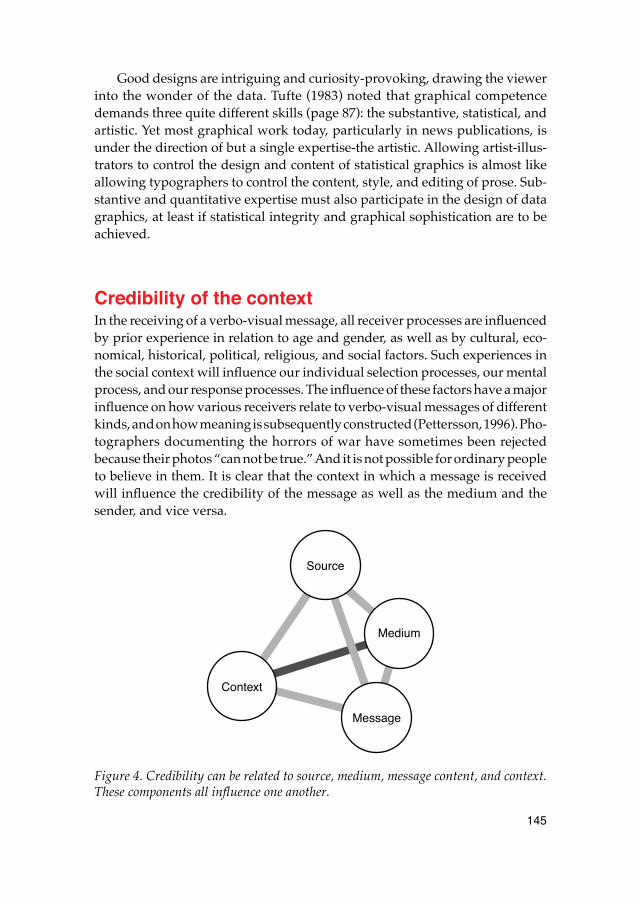
145
Good designs are intriguing and curiosity-provoking, drawing the viewerinto the wonder of the data. Tufte (1983) noted that graphical competencedemands three quite different skills (page 87): the substantive, statistical, andartistic. Yet most graphical work today, particularly in news publications, isunder the direction of but a single expertise-the artistic. Allowing artist-illus-trators to control the design and content of statistical graphics is almost likeallowing typographers to control the content, style, and editing of prose. Sub-stantive and quantitative expertise must also participate in the design of datagraphics, at least if statistical integrity and graphical sophistication are to beachieved.
Credibility of the contextIn the receiving of a verbo-visual message, all receiver processes are influencedby prior experience in relation to age and gender, as well as by cultural, eco-nomical, historical, political, religious, and social factors. Such experiences inthe social context will influence our individual selection processes, our mentalprocess, and our response processes. The influence of these factors have a majorinfluence on how various receivers relate to verbo-visual messages of differentkinds, and on how meaning is subsequently constructed (Pettersson, 1996). Pho-tographers documenting the horrors of war have sometimes been rejectedbecause their photos “can not be true.” And it is not possible for ordinary peopleto believe in them. It is clear that the context in which a message is receivedwill influence the credibility of the message as well as the medium and thesender, and vice versa.
Figure 4. Credibility can be related to source, medium, message content, and context.These components all influence one another.
Source
Context
Medium
Message
146
There is also an internal context. Within a medium credibility may be influ-enced with the help of typography, layout, sound and sound effects. For exam-ple, different placements of a message within a newspaper may influence thecredibility of that specific message. For many people textbook authors are “high-credibility” sources. People believe in them. However, throughout history theuse of pictures in various media has always been highly subjective. Many read-ers and viewers may not understand that all pictures that are used in variousmedia often have been subject to selection, sometimes several times.
In the production of pictures in a textbook the author produces a manuscriptand often also ideas for illustrations. The editor develops some ideas to picturedescriptions and orders drawings and photographs. Artists deliver the draw-ings. Photographs are delivered by photographers and from picture archives.Pictures are selected, edited and produced. The readers make the final selectionsin the printed book. In the production of pictures in a paper specific event arepresented with text and pictures and cause individual interpretations. The pho-tographers selects among various possible motives and, later among the prints.Editorial staff make a selection among the prints, and produces text. The readersmake their selections among the printed information.
Evans (1978) noted that a sequence of photographs may add credibility toa central picture (page 175). One way of “manipulating” and effecting the inter-pretation of image content is the careful writing of captions (Pettersson, 1986).Views expressed in the captions regarding the messages in the pictures mayvary from very negative to very positive. Thus the captions will influence whatthe readers actually select to “see”, or rather “interpret” from the contents inthe images. Lidman and Lund (1972) claimed that a combination of a drawingand a photo will aid credibility. They wrote (page 30): “Through the drawingwe understand the photo, through the photo we believe the drawing.” Thusthe drawing would influence our perception of the photo, and vice versa. Thismay very well be true in some situations. The context may also be external,directly outside the medium, i.e. the communications situation. Here differentsituations may influence the credibility of the message.
ConclusionsIt may be concluded that the credibility of pictures are dependent on the per-ceptions and interpretations of the receivers, and not necessarily on any actualcharacteristics of the senders or sources. People does not seem to realize thatpictures seen in media are selected and edited, and only represent a “fragment”of reality. It is possible that people often believe that image content is “true.”The credibility of a picture is influenced by the credibility of the source, the mes-sage, the medium, and the specific context.
147
ReferencesArvidson, P. (1977). Trovärdighet hos massmedier. En granskning av trovärdighets-
forskningens begrepp och metoder. Psykologiskt försvar. Nr 81. Bered-skapsnämnden för psykologiskt försvar: Stockholm.
Arvidson, P. (1980 ). Trovärdighet och förtroende, tillförlitlighet och tillit. Psykol-ogiskt försvar. Nr 103. Beredskapsnämnden för psykologiskt försvar: Stockholm.
Arvidson, P. (1981a). Tror vi på våra massmedier? Psykologiskt försvar. Nr 109. Beredskapsnämnden för psykologiskt försvar: Stockholm.
Arvidson, P. (1981b). Massmediernas trovärdighet. Sammanfattning av en doktor-savhandling. Universitetet i Lund.
Becker, L. B., Martino, R. A., and Towers, W. M. (1976). Media advertising credibility. Journalism Quarterly, 53, 216-222.
Berg Flexner, S., Hanck, L. (Eds.). (1987). The Random House Dictionary of the English Language. Second Edition. New York: Random House.
Bettinghaus, E. P., Cody, M. J. (1987). Persuasive Communication. Fort Wort: Harcourt Brace Jovanovich College Publishers.
Brown, L. (Ed.) (1993). The new shorter Oxford English Dictionary on Historical Principles. Oxford: Clarendon Press.
Christianson, S-Å. (1990). Vad minns vi av en fasansfull upplevelse? Forskning och Framsteg, 1/90, 14–19.
Cook, T. D., & Flay, B. (1978). The Temporal Persistence of Experimentally Induced Attitude Change: An Evaluative Review. In L. Berkowitz (Ed.). (1978) Advances in Experimental Social Psychology. New York: Academic.
Ehrenborg, J. (1984). Muntlig kommunikation. Göteborg: Svenska Management-Gruppen.
Evans, H. (1978). Editing and Design. Pictures on a Page. London: Heinemann.Fetveit, A. (1997). The digitalized screen: revisiting the issue of indexicality. Paper
presented at The 13th Nordic Conference for Research on Mass Communi-cations, August 9.12, Jyväskylä, Finland.
Fleming, M. L., & Levie, W. H. (1978). Instructional Message Design. Englewood Cliffs, NJ: Educational Technology Publications.
Hovland, C. I., Janis, I. L., and Kelley, H.H. (1953). Communication and persua-tion. New Haven, Conn.: Yale University Press.
Keller, J. & Burkman, E. (1993). Motivation Principles. In M. Fleming & W. H. Levie (Eds.). Instructional Message Design: Principles from the Behavioral and Cognitive Sciences (2nd ed.). Englewood Cliffs, NJ: Educational Technology Publications.
Kouzes, J. M. & Posner, B. Z. (1993). Credibility: How Leaders Gain and Lose It, Why People Demand It. San Francisco: The Jossey-Bass Inc.
Leippe, M. R. (1994). The appraisal of eyewitness testimony. In D. F. Ross, J. D. Read, and M. P. Toglia (Eds.). (1994). Adult Eyewitness Testimony. Current trends and developments. New York: Cambridge University Press.
148
Lidman, S. , & Lund, A. M. (1972). Berätta med bilder. Stockholm: Bonniers.Lindsay, R. C. L. (1994). Expectations of eyewitness performance: Jurors’ verdicts do
not follow from their beliefs. In D. F. Ross, J. D. Read, and M. P. Toglia (Eds.). (1994). Adult Eyewitness Testimony. Current trends and developments. New York: Cambridge University Press.
Loftus, E. F. (1996). Eyewitness Testimony. Cambridge, MA: Harward Univer-sity Press.
Longman (1990). The Longman Dictionary of Contemporary English. Essex: Long-man Group UK Limited.
Pettersson, R. (1986). Image – Word – Image. Paper presented at the 18th Annual Conference of the International Visual Literacy Association. Madison, Wis-consin, Oct 30 – Nov 2. Published in: R.A. Braden, D.G. Beauchamp and L. W. Miller (Eds.) 1987: Visible, & Viable. The Role of Images in Instruction and Communication. East Texas State University. Commerce. Texas, 165–181.
Pettersson, R. (1989). Visuals for Information, Research and Practice. Englewood Cliffs, NJ: Educational Technology Publications.
Pettersson, R. (1993). Visual information. Englewood Cliffs, NJ: Educational Technology Publications.
Pettersson, R. (1996). Verbo-Visual Communication. Paper presented at The 4th International Research Symposium on Visual Verbal Literacy, Process and Product: Media Education in Praxis, The Rijkshogeschool, IJselland, and the International Visual Literacy Association, Deventer, Holland, May 6- 11, 1996. Published in T. Velders (Ed.) (1996). Beeldenstorm in Deventer. Mul-timedia Education in Praxis. Selected Readings. Deventer.
Rattner, A. (1988). Convicted but innocent: Wrongful conviction and the crim-inal justice system. Law and Human Behavior, 12, 283-293.
Tedeschi, J. T., & Rosenfeld, P. (1980). Communication in Bargaining and Negoti-ations. In M. E. Roloff and G. R. Miller (Eds.). Persuation: New Directions in Theory and Research. Beverly Hills, Ca.: Sage.
Tufte, E. R. (1983). The Visual Display of Quantitative Information. Cheshire, CT: Graphics Press.
Tulloch, S. (1995). The Oxford Dictionary and Thesaurus. Oxford, Melbourne: Oxford University Press.
Törnqvist, K. (1974). Förtroendet till massmedierna. En opinionsundersökning i november—december 1973. Psykologiskt försvar. Nr 63. Bered-skapsnämnden för psykologiskt försvar: Stockholm.
Webster (1993). Webster’s New Encyclopedic Dictionary. New York: Black Dog & Leventhal Publishing Inc.
Woocher, F.D. (1977). Did your eyes deceive you? Expert psychological testi-mony on the unreliability of eyewitness identification. Stanford Law Review, 29, 969-1030.
149
Paper 9
From cave art to CAVE art
Abstract. This paper provides some examples of early European visual language arte-facts used for visual communication purposes. Examples include rock art, the Bayeuxtapestry, early books, early data graphics, posters and wall charts, and the moderncomputerbased CAVE art.
Although the term “visual literacy” may be modern, it is not at all a new ideaor a new concept. Discussions about the use of images and pictures have a longhistory. Even ancient philosophers used images for visual communication. Inanatomy and medicine, Aristotle employed anatomical illustrations. In math-ematics, Pythagoras, Socrates, and Plato used visual images to teach geometry.Jesus Christ and other religious prophets helped their listeners create innerimages by means of different metaphors. In Mesoamerica, the old cultures andcivilizations used advanced pictorial messages, especially in their temple cities.Velders (1999) concluded that (p. 10):
The history of visual communication goes back to the cave paintings30,000 years ago, the description of it only 2,500. ... visual literacy is 2,500years old (as a skill) and 30 years young (as a term).
A recent definition of the term “visual literacy” was provided by Avgerinou(2000). She used the following operational definition of visual literacy (p. 26):
In the context of human, intentional visual communication, visual liter-acy refers to a group of largely acquired abilities, i.e. the abilities tounderstand (read) and use (write) images, as well as to think and learnin terms of images.
These abilities are not entirely new skills.
Pictures on rocksPrehistoric rock art is art produced on rock surfaces by early nonliterate indi-viduals. Rock art is found in Europe and in many other parts of the world. Datingtechniques based on analysis of the pigments used by the prehistoric artists hasshown that the dates vary considerably. Some rock art may be at least 30,000
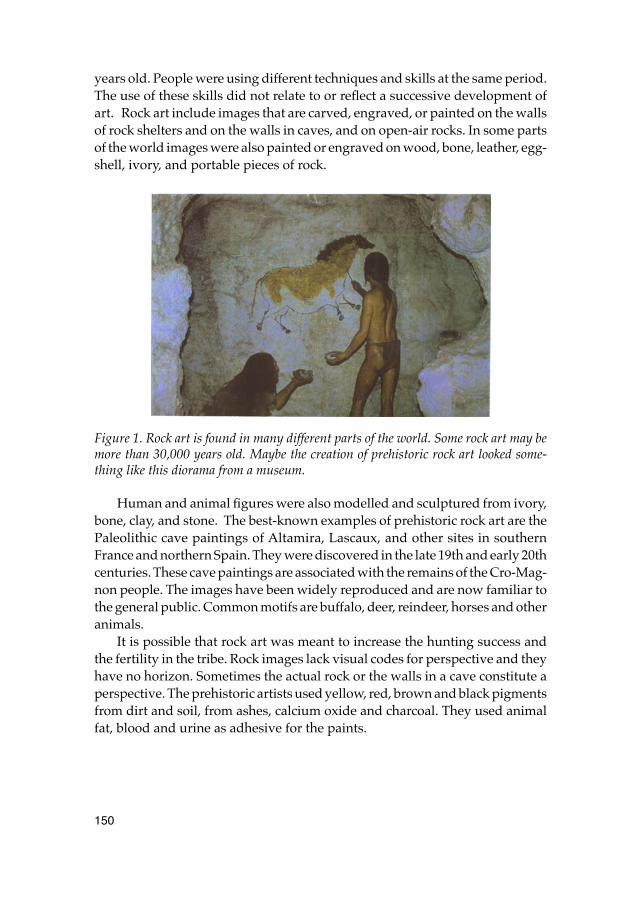
150
years old. People were using different techniques and skills at the same period.The use of these skills did not relate to or reflect a successive development ofart. Rock art include images that are carved, engraved, or painted on the wallsof rock shelters and on the walls in caves, and on open-air rocks. In some partsof the world images were also painted or engraved on wood, bone, leather, egg-shell, ivory, and portable pieces of rock.
Figure 1. Rock art is found in many different parts of the world. Some rock art may bemore than 30,000 years old. Maybe the creation of prehistoric rock art looked some-thing like this diorama from a museum.
Human and animal figures were also modelled and sculptured from ivory,bone, clay, and stone. The best-known examples of prehistoric rock art are thePaleolithic cave paintings of Altamira, Lascaux, and other sites in southernFrance and northern Spain. They were discovered in the late 19th and early 20thcenturies. These cave paintings are associated with the remains of the Cro-Mag-non people. The images have been widely reproduced and are now familiar tothe general public. Common motifs are buffalo, deer, reindeer, horses and otheranimals.
It is possible that rock art was meant to increase the hunting success andthe fertility in the tribe. Rock images lack visual codes for perspective and theyhave no horizon. Sometimes the actual rock or the walls in a cave constitute aperspective. The prehistoric artists used yellow, red, brown and black pigmentsfrom dirt and soil, from ashes, calcium oxide and charcoal. They used animalfat, blood and urine as adhesive for the paints.
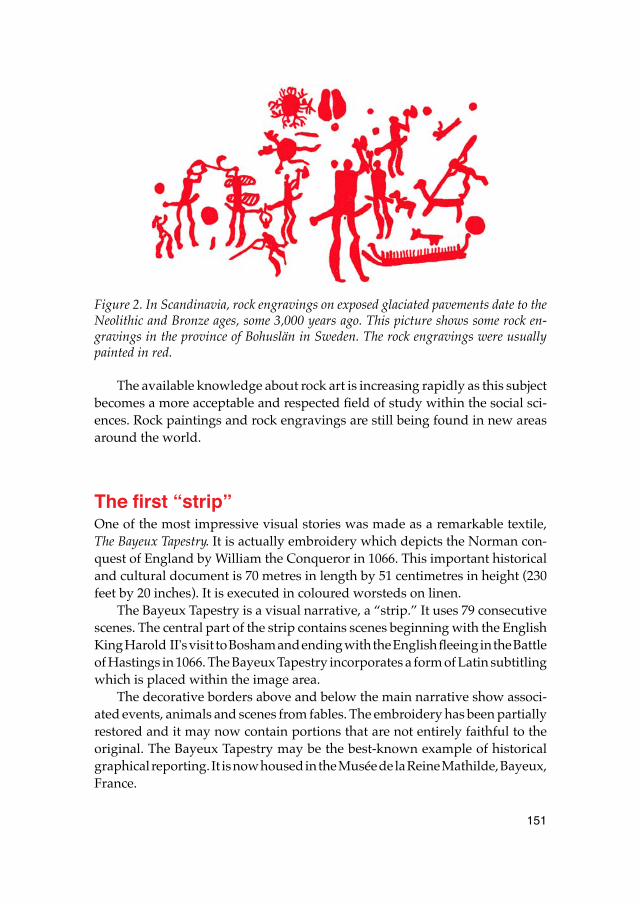
151
Figure 2. In Scandinavia, rock engravings on exposed glaciated pavements date to theNeolithic and Bronze ages, some 3,000 years ago. This picture shows some rock en-gravings in the province of Bohuslän in Sweden. The rock engravings were usuallypainted in red.
The available knowledge about rock art is increasing rapidly as this subjectbecomes a more acceptable and respected field of study within the social sci-ences. Rock paintings and rock engravings are still being found in new areasaround the world.
The first “strip” One of the most impressive visual stories was made as a remarkable textile,The Bayeux Tapestry. It is actually embroidery which depicts the Norman con-quest of England by William the Conqueror in 1066. This important historicaland cultural document is 70 metres in length by 51 centimetres in height (230feet by 20 inches). It is executed in coloured worsteds on linen.
The Bayeux Tapestry is a visual narrative, a “strip.” It uses 79 consecutivescenes. The central part of the strip contains scenes beginning with the EnglishKing Harold II's visit to Bosham and ending with the English fleeing in the Battleof Hastings in 1066. The Bayeux Tapestry incorporates a form of Latin subtitlingwhich is placed within the image area.
The decorative borders above and below the main narrative show associ-ated events, animals and scenes from fables. The embroidery has been partiallyrestored and it may now contain portions that are not entirely faithful to theoriginal. The Bayeux Tapestry may be the best-known example of historicalgraphical reporting. It is now housed in the Musée de la Reine Mathilde, Bayeux,France.
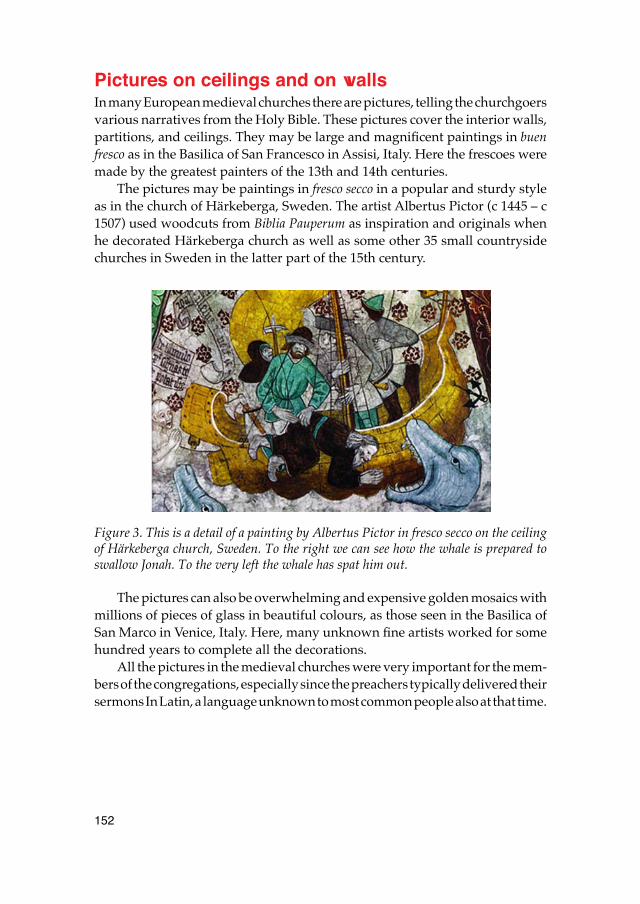
152
Pictures on ceilings and on wallsIn many European medieval churches there are pictures, telling the churchgoersvarious narratives from the Holy Bible. These pictures cover the interior walls,partitions, and ceilings. They may be large and magnificent paintings in buenfresco as in the Basilica of San Francesco in Assisi, Italy. Here the frescoes weremade by the greatest painters of the 13th and 14th centuries.
The pictures may be paintings in fresco secco in a popular and sturdy styleas in the church of Härkeberga, Sweden. The artist Albertus Pictor (c 1445 – c1507) used woodcuts from Biblia Pauperum as inspiration and originals whenhe decorated Härkeberga church as well as some other 35 small countrysidechurches in Sweden in the latter part of the 15th century.
Figure 3. This is a detail of a painting by Albertus Pictor in fresco secco on the ceilingof Härkeberga church, Sweden. To the right we can see how the whale is prepared toswallow Jonah. To the very left the whale has spat him out.
The pictures can also be overwhelming and expensive golden mosaics withmillions of pieces of glass in beautiful colours, as those seen in the Basilica ofSan Marco in Venice, Italy. Here, many unknown fine artists worked for somehundred years to complete all the decorations.
All the pictures in the medieval churches were very important for the mem-bers of the congregations, especially since the preachers typically delivered theirsermons In Latin, a language unknown to most common people also at that time.
153
Pictures in early booksThe ability to print images on paper was achieved in Europe in the 14th century.The block book contained text that was written by hand but had printed images,coloured by hand. These printed images invariably included some form of cap-tions or texts. When the moveable type was introduced during the 15th century,it became possible to produce books in larger quantities. This was the beginningof a cultural revolution. A dramatic growth in the quantity and quality of booksand other printed learning materials like maps followed. Informative drawingsdeveloped.
“What writing is to the reader, pictures are to those who cannot read,” statedPope Gregory the Great (540–604). Already by the Middle Ages, a wide spectrumof image types was used for teaching and training purposes. The pictures rangedfrom realistic drawings to abstract diagrams. Pictures were used for the iden-tification of important medical herbs, for instruction on how to load and use acannon, how to swim, how to fight with a sword, how to construct a building,and for training the art of angling. Manuals and instructions from the 15th cen-tury and onwards are preserved. Mijksenaar and Westendorp (1999, p. 21) men-tioned a fencing manual by Hans Thalhoffer (1443) that includes visual instruc-tions in wrestling and unarmed combat.
The industrial production of books is a comparatively modern phenome-non. Despite the fact that books began to be printed more than 500 years ago,printing remained an exclusive and painstaking handicraft for many years.Gutenberg’s bible for example was printed on 316 pages and took three yearsto make (1452–1455) in an edition comprising 200 copies. Some 170 of these cop-ies were printed on paper and 30 on parchment. A total of 5,000 calfskins wererequired for the parchment versions. One goatskin was needed for the coverof each book.
Transmitting a message from an author to the readers requires people suchas text and picture editors, graphic designers, typesetters, repro technicians,printers, bookbinders, stockroom staff, salespersons, order takers, bookstoreemployees, librarians, buyers, and administrators.
The different steps involved in publishing are still time-consuming andjointly represent a major expense. About ten percent of the price of a book, notincluding tax, usually goes to the author. Electronic publishing may change thissituation to some extent. That would reduce the distance between authors andreaders. New opportunities for a dialogue might then develop in someinstances.
154
The RenaissanceThe development of moveable type was very important for the production ofprinted text. But the new printing technology impaired the possibilities for closeintegration of words and visuals into verbo-visual messages. In manuscriptsit had been easy to put words and visuals anywhere on a page. There the skillsof integrating words with visuals were gradually developed. Many famous nat-uralists and explorers had relied on making verbal as well as visual notes oftheir findings. However, with the exception of private notes, words and visualswere now basically separated until the development of desktop publishing inthe late 20th century.
A Renaissance artist and genius The most noticeable example may be Leonardo da Vinci (1452–1519). He wasone of the greatest artists of the Italian Renaissance. He entered the painters'guild in 1472 and in his Florentine workshop acquired a variety of skills.Leonardo da Vinci became deeply interested in subjects like anatomy, biology,engineering, mathematics, mechanics, and physics. He displayed genius inalmost every arts and sciences and his notebooks are filled with sketches of ana-tomical studies, animals, and machines. The manuscripts reveal that da Vinciexplored virtually every field of science. Not only do they contain solutions topractical problems of the day, but they also envision such future possibilitiesas flying machines and automation.
Nearly 7,000 pages from his notebooks still exist. Leonardo da Vincisketched drawings of ideas and inventions along with his verbal notes. He wasleft-handed and he used mirror writing in his personal notes. But with the helpof a mirror his scripts can be read clearly. Another unusual feature is the newfunction he gave to illustrations. He formulated his own principle of graphicpresentation, which he called “dimostrazione” (demonstrations). He gave pre-cedence to the illustration over the written word. The text served to explain thepictures. Leonardo da Vinci was clearly a precursor of modern verbo-visualcommunication and of modern scientific illustration. His notes, however, wereprobably not seen by any large audiences.
The majority of Leonardo's technical notes and sketches make up the CodexAtlanticus in the Ambrosian Library in Milan, Italy. At an early date they wereseparated from the artistic drawings. Some 600 of these documents now belongto the British Royal Collection at Windsor Castle.
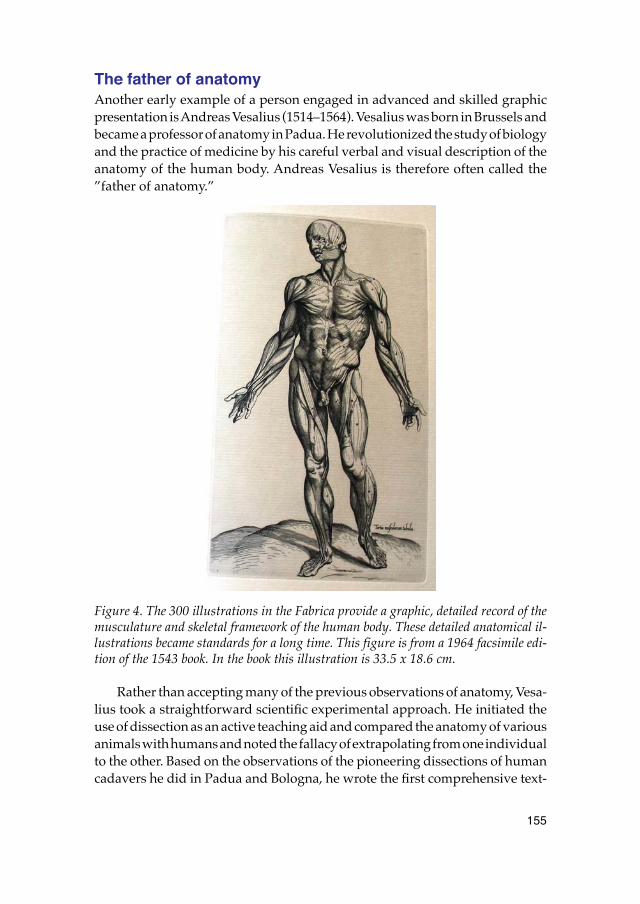
155
The father of anatomyAnother early example of a person engaged in advanced and skilled graphicpresentation is Andreas Vesalius (1514–1564). Vesalius was born in Brussels andbecame a professor of anatomy in Padua. He revolutionized the study of biologyand the practice of medicine by his careful verbal and visual description of theanatomy of the human body. Andreas Vesalius is therefore often called the”father of anatomy.”
Figure 4. The 300 illustrations in the Fabrica provide a graphic, detailed record of themusculature and skeletal framework of the human body. These detailed anatomical il-lustrations became standards for a long time. This figure is from a 1964 facsimile edi-tion of the 1543 book. In the book this illustration is 33.5 x 18.6 cm.
Rather than accepting many of the previous observations of anatomy, Vesa-lius took a straightforward scientific experimental approach. He initiated theuse of dissection as an active teaching aid and compared the anatomy of variousanimals with humans and noted the fallacy of extrapolating from one individualto the other. Based on the observations of the pioneering dissections of humancadavers he did in Padua and Bologna, he wrote the first comprehensive text-
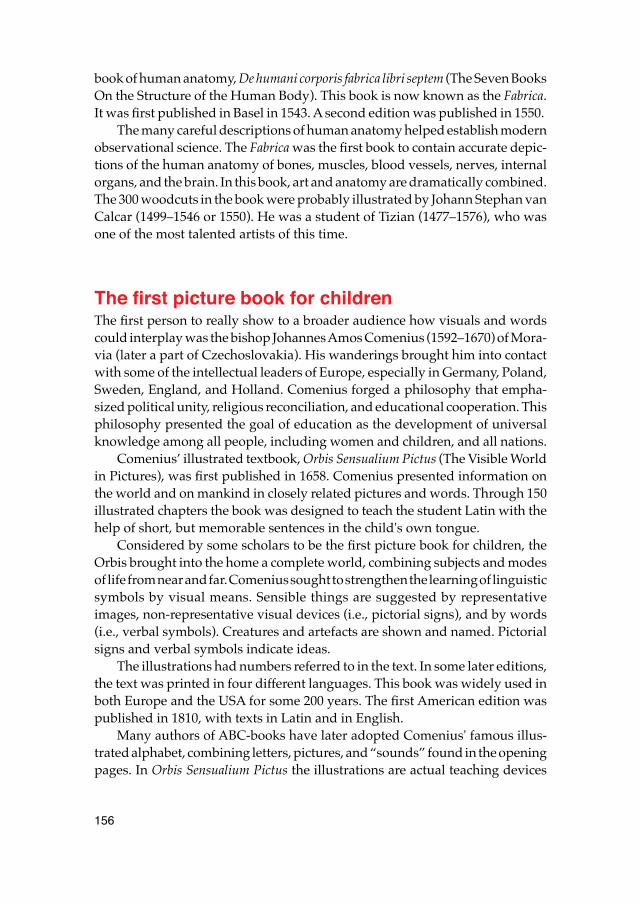
156
book of human anatomy, De humani corporis fabrica libri septem (The Seven BooksOn the Structure of the Human Body). This book is now known as the Fabrica.It was first published in Basel in 1543. A second edition was published in 1550.
The many careful descriptions of human anatomy helped establish modernobservational science. The Fabrica was the first book to contain accurate depic-tions of the human anatomy of bones, muscles, blood vessels, nerves, internalorgans, and the brain. In this book, art and anatomy are dramatically combined.The 300 woodcuts in the book were probably illustrated by Johann Stephan vanCalcar (1499–1546 or 1550). He was a student of Tizian (1477–1576), who wasone of the most talented artists of this time.
The first picture book for childrenThe first person to really show to a broader audience how visuals and wordscould interplay was the bishop Johannes Amos Comenius (1592–1670) of Mora-via (later a part of Czechoslovakia). His wanderings brought him into contactwith some of the intellectual leaders of Europe, especially in Germany, Poland,Sweden, England, and Holland. Comenius forged a philosophy that empha-sized political unity, religious reconciliation, and educational cooperation. Thisphilosophy presented the goal of education as the development of universalknowledge among all people, including women and children, and all nations.
Comenius’ illustrated textbook, Orbis Sensualium Pictus (The Visible Worldin Pictures), was first published in 1658. Comenius presented information onthe world and on mankind in closely related pictures and words. Through 150illustrated chapters the book was designed to teach the student Latin with thehelp of short, but memorable sentences in the child's own tongue.
Considered by some scholars to be the first picture book for children, theOrbis brought into the home a complete world, combining subjects and modesof life from near and far. Comenius sought to strengthen the learning of linguisticsymbols by visual means. Sensible things are suggested by representativeimages, non-representative visual devices (i.e., pictorial signs), and by words(i.e., verbal symbols). Creatures and artefacts are shown and named. Pictorialsigns and verbal symbols indicate ideas.
The illustrations had numbers referred to in the text. In some later editions,the text was printed in four different languages. This book was widely used inboth Europe and the USA for some 200 years. The first American edition waspublished in 1810, with texts in Latin and in English.
Many authors of ABC-books have later adopted Comenius' famous illus-trated alphabet, combining letters, pictures, and “sounds” found in the openingpages. In Orbis Sensualium Pictus the illustrations are actual teaching devices
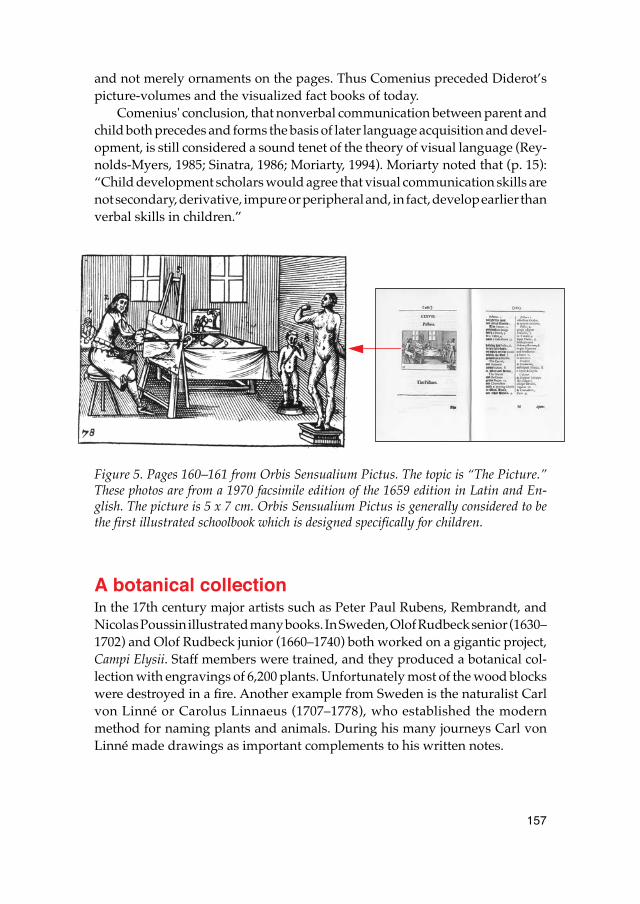
157
and not merely ornaments on the pages. Thus Comenius preceded Diderot’spicture-volumes and the visualized fact books of today.
Comenius' conclusion, that nonverbal communication between parent andchild both precedes and forms the basis of later language acquisition and devel-opment, is still considered a sound tenet of the theory of visual language (Rey-nolds-Myers, 1985; Sinatra, 1986; Moriarty, 1994). Moriarty noted that (p. 15):“Child development scholars would agree that visual communication skills arenot secondary, derivative, impure or peripheral and, in fact, develop earlier thanverbal skills in children.”
Figure 5. Pages 160–161 from Orbis Sensualium Pictus. The topic is “The Picture.”These photos are from a 1970 facsimile edition of the 1659 edition in Latin and En-glish. The picture is 5 x 7 cm. Orbis Sensualium Pictus is generally considered to bethe first illustrated schoolbook which is designed specifically for children.
A botanical collectionIn the 17th century major artists such as Peter Paul Rubens, Rembrandt, andNicolas Poussin illustrated many books. In Sweden, Olof Rudbeck senior (1630–1702) and Olof Rudbeck junior (1660–1740) both worked on a gigantic project,Campi Elysii. Staff members were trained, and they produced a botanical col-lection with engravings of 6,200 plants. Unfortunately most of the wood blockswere destroyed in a fire. Another example from Sweden is the naturalist Carlvon Linné or Carolus Linnaeus (1707–1778), who established the modernmethod for naming plants and animals. During his many journeys Carl vonLinné made drawings as important complements to his written notes.
158
La Grande EncyclopédieThe greatest early enterprise in visual information and in message design isthe French encyclopaedia La Grande Encyclopédie. The first volume appeared in1751 under the co-editorship of Denis Diderot (1713–1784) and Jean d'Alembert(1717–1783). The Encyclopédie was a huge undertaking that occupied Diderotas chief editor for a quarter of a century.
The Encyclopédie exerted great influence throughout the world. It was agenuinely progressive work with 17 volumes of text, supplemented by 11 vol-umes of illustrations. The Encyclopédie included 71,818 articles. No less than3,300 plates with detailed illustrations were designed and printed from copperengravings.
Figure 6. The Encyclopédie included no less than 3,300 plates with detailed illustra-tions were designed and printed from copper engravings. This is a detail.
The structure of the encyclopaedia was based on Francis Bacon's classifi-cation of universal knowledge, the most complete and systematic inventory ofareas of knowledge and human achievement at that time. This assured repre-sentation of topics across the entire spectrum of knowledge. Leading personssuch as Rousseau, Turgot, Montesquieu, and Voltaire wrote articles for the ency-clopaedia. The general attitude was tolerant, liberal, and above all, rational.
Also today, combined verbal and visual information is very important inthe natural sciences. In engineering, science, and business, clear thinking is oftensynonymous with visual thinking. Horton (1991) noted that Albert Einstein andseveral other highly valued thinkers relied on visual images. Moore and Dwyer(1994) stated that visuals may be the main source for information and commu-nication in many cases today .
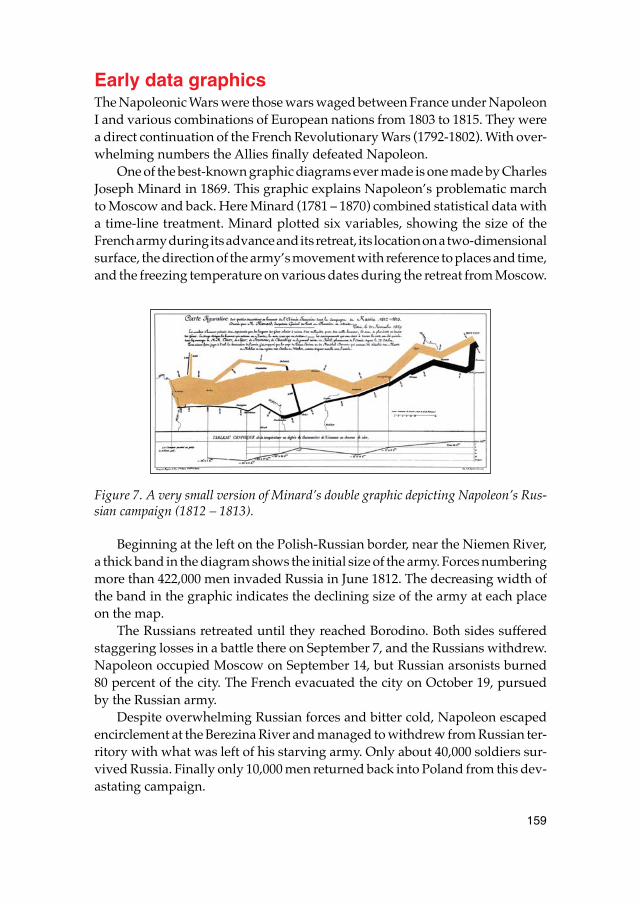
159
Early data graphicsThe Napoleonic Wars were those wars waged between France under NapoleonI and various combinations of European nations from 1803 to 1815. They werea direct continuation of the French Revolutionary Wars (1792-1802). With over-whelming numbers the Allies finally defeated Napoleon.
One of the best-known graphic diagrams ever made is one made by CharlesJoseph Minard in 1869. This graphic explains Napoleon’s problematic marchto Moscow and back. Here Minard (1781 – 1870) combined statistical data witha time-line treatment. Minard plotted six variables, showing the size of theFrench army during its advance and its retreat, its location on a two-dimensionalsurface, the direction of the army’s movement with reference to places and time,and the freezing temperature on various dates during the retreat from Moscow.
Figure 7. A very small version of Minard’s double graphic depicting Napoleon’s Rus-sian campaign (1812 – 1813).
Beginning at the left on the Polish-Russian border, near the Niemen River,a thick band in the diagram shows the initial size of the army. Forces numberingmore than 422,000 men invaded Russia in June 1812. The decreasing width ofthe band in the graphic indicates the declining size of the army at each placeon the map.
The Russians retreated until they reached Borodino. Both sides sufferedstaggering losses in a battle there on September 7, and the Russians withdrew.Napoleon occupied Moscow on September 14, but Russian arsonists burned80 percent of the city. The French evacuated the city on October 19, pursuedby the Russian army.
Despite overwhelming Russian forces and bitter cold, Napoleon escapedencirclement at the Berezina River and managed to withdrew from Russian ter-ritory with what was left of his starving army. Only about 40,000 soldiers sur-vived Russia. Finally only 10,000 men returned back into Poland from this dev-astating campaign.
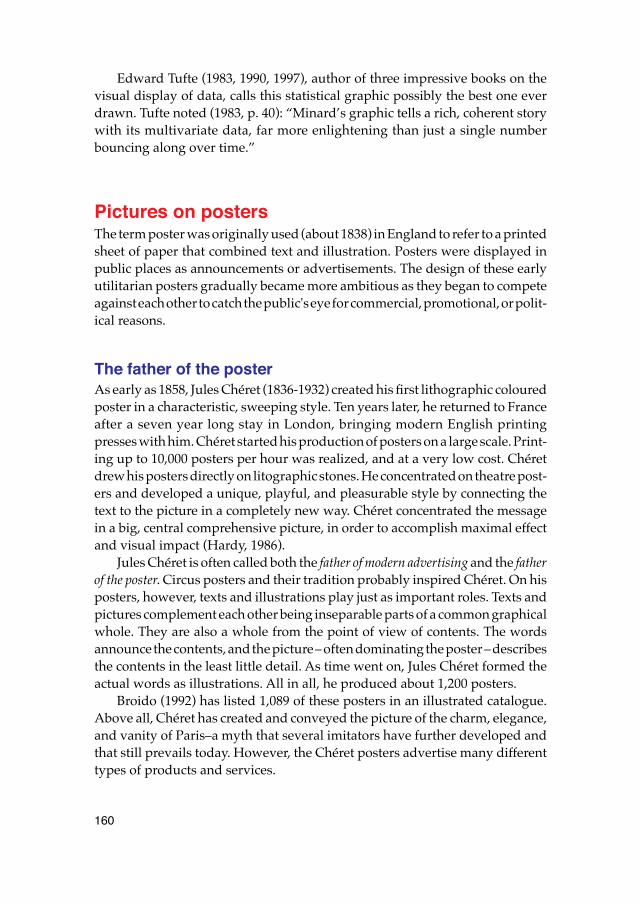
160
Edward Tufte (1983, 1990, 1997), author of three impressive books on thevisual display of data, calls this statistical graphic possibly the best one everdrawn. Tufte noted (1983, p. 40): “Minard’s graphic tells a rich, coherent storywith its multivariate data, far more enlightening than just a single numberbouncing along over time.”
Pictures on posters The term poster was originally used (about 1838) in England to refer to a printedsheet of paper that combined text and illustration. Posters were displayed inpublic places as announcements or advertisements. The design of these earlyutilitarian posters gradually became more ambitious as they began to competeagainst each other to catch the public's eye for commercial, promotional, or polit-ical reasons.
The father of the posterAs early as 1858, Jules Chéret (1836-1932) created his first lithographic colouredposter in a characteristic, sweeping style. Ten years later, he returned to Franceafter a seven year long stay in London, bringing modern English printingpresses with him. Chéret started his production of posters on a large scale. Print-ing up to 10,000 posters per hour was realized, and at a very low cost. Chéretdrew his posters directly on litographic stones. He concentrated on theatre post-ers and developed a unique, playful, and pleasurable style by connecting thetext to the picture in a completely new way. Chéret concentrated the messagein a big, central comprehensive picture, in order to accomplish maximal effectand visual impact (Hardy, 1986).
Jules Chéret is often called both the father of modern advertising and the fatherof the poster. Circus posters and their tradition probably inspired Chéret. On hisposters, however, texts and illustrations play just as important roles. Texts andpictures complement each other being inseparable parts of a common graphicalwhole. They are also a whole from the point of view of contents. The wordsannounce the contents, and the picture – often dominating the poster – describesthe contents in the least little detail. As time went on, Jules Chéret formed theactual words as illustrations. All in all, he produced about 1,200 posters.
Broido (1992) has listed 1,089 of these posters in an illustrated catalogue.Above all, Chéret has created and conveyed the picture of the charm, elegance,and vanity of Paris–a myth that several imitators have further developed andthat still prevails today. However, the Chéret posters advertise many differenttypes of products and services.
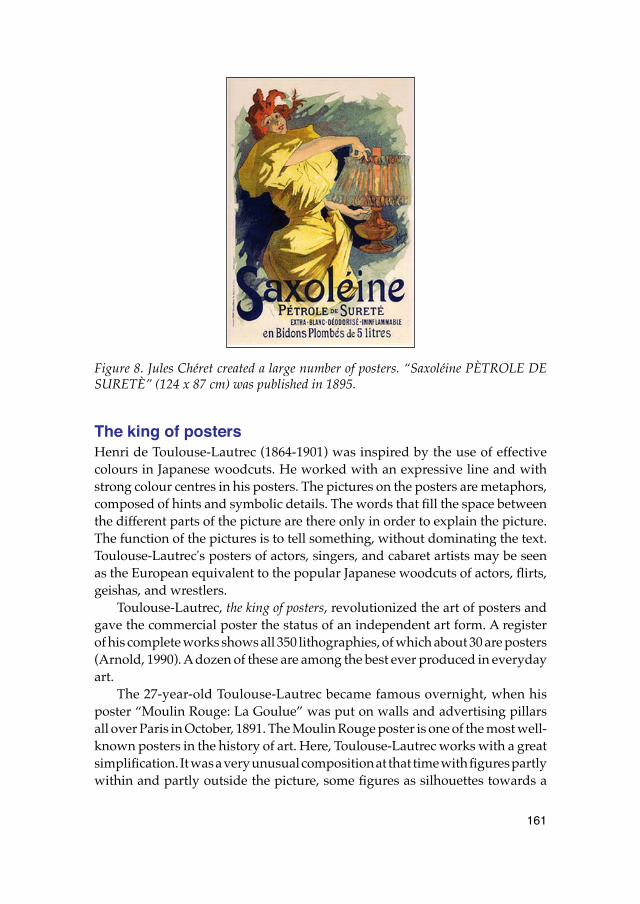
161
Figure 8. Jules Chéret created a large number of posters. “Saxoléine PÈTROLE DESURETÈ” (124 x 87 cm) was published in 1895.
The king of postersHenri de Toulouse-Lautrec (1864-1901) was inspired by the use of effectivecolours in Japanese woodcuts. He worked with an expressive line and withstrong colour centres in his posters. The pictures on the posters are metaphors,composed of hints and symbolic details. The words that fill the space betweenthe different parts of the picture are there only in order to explain the picture.The function of the pictures is to tell something, without dominating the text.Toulouse-Lautrec's posters of actors, singers, and cabaret artists may be seenas the European equivalent to the popular Japanese woodcuts of actors, flirts,geishas, and wrestlers.
Toulouse-Lautrec, the king of posters, revolutionized the art of posters andgave the commercial poster the status of an independent art form. A registerof his complete works shows all 350 lithographies, of which about 30 are posters(Arnold, 1990). A dozen of these are among the best ever produced in everydayart.
The 27-year-old Toulouse-Lautrec became famous overnight, when hisposter “Moulin Rouge: La Goulue” was put on walls and advertising pillarsall over Paris in October, 1891. The Moulin Rouge poster is one of the most well-known posters in the history of art. Here, Toulouse-Lautrec works with a greatsimplification. It was a very unusual composition at that time with figures partlywithin and partly outside the picture, some figures as silhouettes towards a
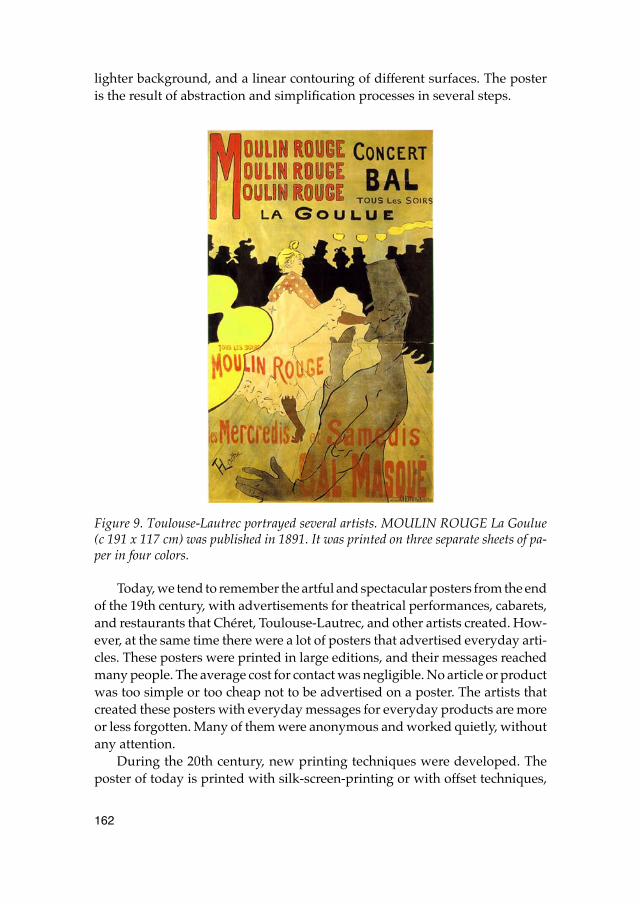
162
lighter background, and a linear contouring of different surfaces. The posteris the result of abstraction and simplification processes in several steps.
Figure 9. Toulouse-Lautrec portrayed several artists. MOULIN ROUGE La Goulue(c 191 x 117 cm) was published in 1891. It was printed on three separate sheets of pa-per in four colors.
Today, we tend to remember the artful and spectacular posters from the endof the 19th century, with advertisements for theatrical performances, cabarets,and restaurants that Chéret, Toulouse-Lautrec, and other artists created. How-ever, at the same time there were a lot of posters that advertised everyday arti-cles. These posters were printed in large editions, and their messages reachedmany people. The average cost for contact was negligible. No article or productwas too simple or too cheap not to be advertised on a poster. The artists thatcreated these posters with everyday messages for everyday products are moreor less forgotten. Many of them were anonymous and worked quietly, withoutany attention.
During the 20th century, new printing techniques were developed. Theposter of today is printed with silk-screen-printing or with offset techniques,
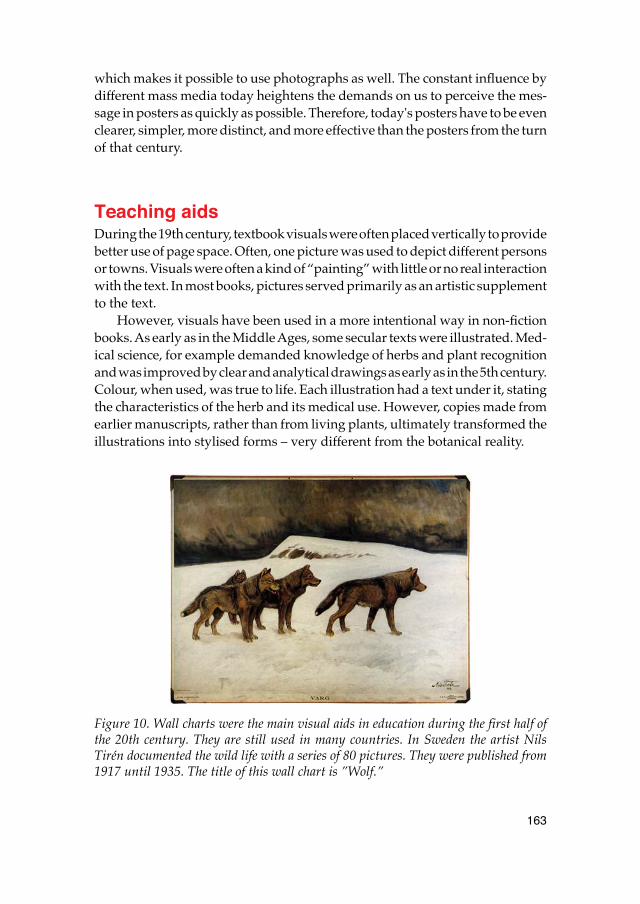
163
which makes it possible to use photographs as well. The constant influence bydifferent mass media today heightens the demands on us to perceive the mes-sage in posters as quickly as possible. Therefore, today's posters have to be evenclearer, simpler, more distinct, and more effective than the posters from the turnof that century.
Teaching aidsDuring the 19th century, textbook visuals were often placed vertically to providebetter use of page space. Often, one picture was used to depict different personsor towns. Visuals were often a kind of “painting” with little or no real interactionwith the text. In most books, pictures served primarily as an artistic supplementto the text.
However, visuals have been used in a more intentional way in non-fictionbooks. As early as in the Middle Ages, some secular texts were illustrated. Med-ical science, for example demanded knowledge of herbs and plant recognitionand was improved by clear and analytical drawings as early as in the 5th century.Colour, when used, was true to life. Each illustration had a text under it, statingthe characteristics of the herb and its medical use. However, copies made fromearlier manuscripts, rather than from living plants, ultimately transformed theillustrations into stylised forms – very different from the botanical reality.
Figure 10. Wall charts were the main visual aids in education during the first half ofthe 20th century. They are still used in many countries. In Sweden the artist NilsTirén documented the wild life with a series of 80 pictures. They were published from1917 until 1935. The title of this wall chart is ”Wolf.”
164
Wall charts, mounted photographs, some posters, picture collages, wallmaps, and roller blind-type maps are usually excellent teaching aids, if theyare relevant to the context and large enough for the audience to see distinctly.Sometimes wall charts include combined verbal and visual messages.
From an instructional point of view, there was not much development invisual instructional language from the 15th until the 20th century. Mijksenaarand Westendorp (1999, p. 22) concluded that: “The next major advance in visualinstructions occurred during World War II, when the military used pictorial lan-guage to train soldiers. The Walt Disney Company, for instance, adapted its car-tooning skills to create training documentation and films such as the movieemploying Mickey Mouse to explain how to use a Browning.50 water-cooledmachine gun. The defence industry in general also played a role in augmentingand applying visual instructional language during this period.”
The age of informationIn the industrialized part of the world we are living in mass-media societies.Every day we are bombarded with information via the media, at home, in school,at work, and in society in general. It is rather hard to avoid information and itmay be just as hard to obtain the information that we really need at the time.Audio, text, and visuals compete to get our attention. It is quite possible thatwe miss the information in which we are really interested. In addition to radio,television, books, newspapers, and magazines, vast amounts of information aredistributed in the form of letters, advertising flyers, posters, placards, photo-copies, and photographs.
Throughout the 1980s, major changes occurred in the way our society pro-duced, stored, processed, and accessed information. Monfils (1993) noted thatregardless of the specific application of technology, consensus had been reachedon the increasing impact of modern information technology on all aspects ofour lives. The amount of information that is available to most people is seenas increasing every day. Modern research and development produce more infor-mation than ever before. Our society views the availability of, and the need forinformation as the basis for decision-making as continually increasing. Quitefrequently, people in a variety of occupational settings find that their basicknowledge is inadequate.
We can easily learn a little about a great many subjects. However, this kindof learning leaves us with little more than a broad base of superficial knowledge.For some people, the ultimate goal actually seems to be to know a little some-thing about everything, resulting in an altogether fragmented knowledge base.In an information society, everyone should have the right to access needed infor-mation. Even though most people may be able to distinguish the sometimes-
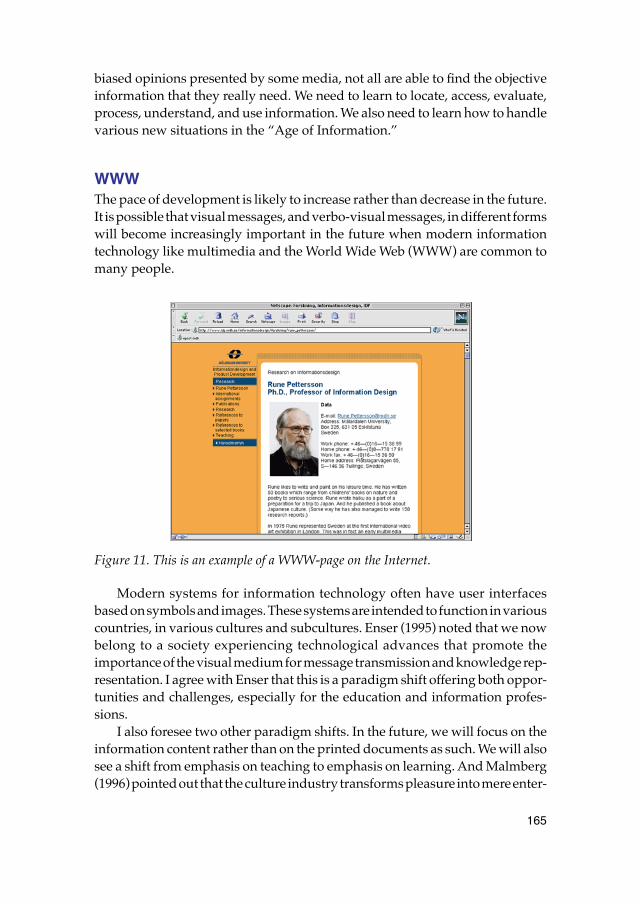
165
biased opinions presented by some media, not all are able to find the objectiveinformation that they really need. We need to learn to locate, access, evaluate,process, understand, and use information. We also need to learn how to handlevarious new situations in the “Age of Information.”
WWW The pace of development is likely to increase rather than decrease in the future.It is possible that visual messages, and verbo-visual messages, in different formswill become increasingly important in the future when modern informationtechnology like multimedia and the World Wide Web (WWW) are common tomany people.
Figure 11. This is an example of a WWW-page on the Internet.
Modern systems for information technology often have user interfacesbased on symbols and images. These systems are intended to function in variouscountries, in various cultures and subcultures. Enser (1995) noted that we nowbelong to a society experiencing technological advances that promote theimportance of the visual medium for message transmission and knowledge rep-resentation. I agree with Enser that this is a paradigm shift offering both oppor-tunities and challenges, especially for the education and information profes-sions.
I also foresee two other paradigm shifts. In the future, we will focus on theinformation content rather than on the printed documents as such. We will alsosee a shift from emphasis on teaching to emphasis on learning. And Malmberg(1996) pointed out that the culture industry transforms pleasure into mere enter-
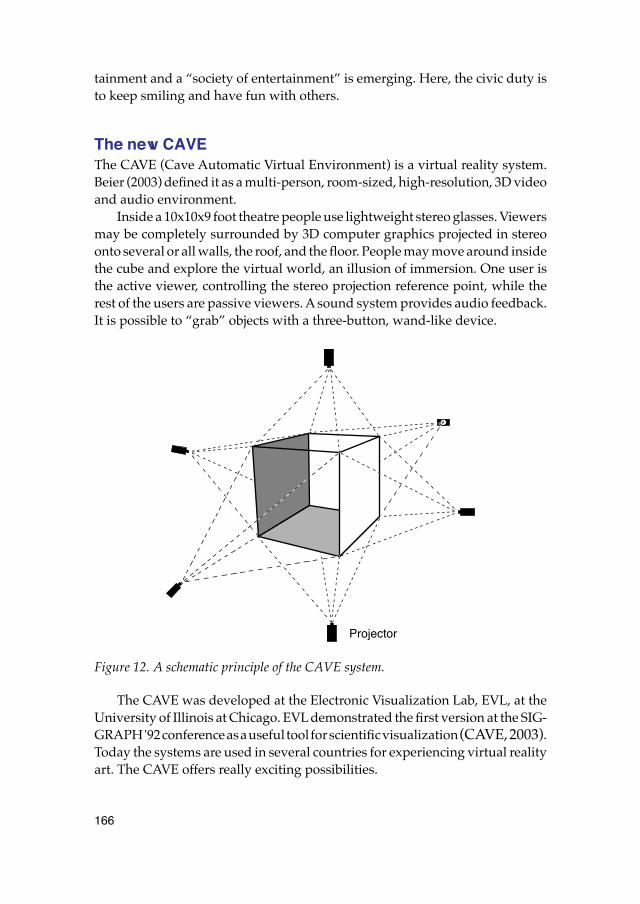
166
tainment and a “society of entertainment” is emerging. Here, the civic duty isto keep smiling and have fun with others.
The new CAVE The CAVE (Cave Automatic Virtual Environment) is a virtual reality system.Beier (2003) defined it as a multi-person, room-sized, high-resolution, 3D videoand audio environment.
Inside a 10x10x9 foot theatre people use lightweight stereo glasses. Viewersmay be completely surrounded by 3D computer graphics projected in stereoonto several or all walls, the roof, and the floor. People may move around insidethe cube and explore the virtual world, an illusion of immersion. One user isthe active viewer, controlling the stereo projection reference point, while therest of the users are passive viewers. A sound system provides audio feedback.It is possible to “grab” objects with a three-button, wand-like device.
Figure 12. A schematic principle of the CAVE system.
The CAVE was developed at the Electronic Visualization Lab, EVL, at theUniversity of Illinois at Chicago. EVL demonstrated the first version at the SIG-GRAPH '92 conference as a useful tool for scientific visualization (CAVE, 2003).Today the systems are used in several countries for experiencing virtual realityart. The CAVE offers really exciting possibilities.
Projector
167
ReferencesArnold, M. (1990). Henri de Toulouse-Lautrec 1864 – 1901. Köln: Benedikt
Taschen. Avgerinou, M. (2000). Towards A Visual Literacy Index. Presentation at the
32nd Annual Conference of the International Visual Literacy Association, Iowa State University, Ames, Iowa, October 11-14, 2000. Published in: R. E. Griffin, V. S. Villiams & J. Lee (Eds.) 2001: Exploring the Visual Future: Art Design, Science & Technology. Selected Readings of the Inter-national Visual Literacy Association. International Visual Literacy Associa-tion.
Beier, K. P. (2003). Virtual Reality: A Short Introduction. <http://www.vrl. umich.edu/intro/>
Broido, L. (1992). The posters of Jules Chéret. New York: Dover Publications, Inc. CAVE. (2003). The CAVE Virtual Reality System.
<http://www.evl.uic.edu/pape/CAVE/> and <http://> and <www.evl.uic.edu/pape/CAVE/oldCAVE/CAVE.htm>
Chéret. http://www.yaneff.com/html/artists/cheret.htmlComenius, J. A. (1659). Orbis Sensualium Pictus. Translated by Charles Hoole.
English Linguistics 1500–1800 (A Collection of Facsimilie Reprints) Selected and Edited by R. C. Alston. No. 222. The Scolar Press Limited, Menston, England, 1970. <http://digilander.libero.it/Marziale/Grex/biblio/comenius/><http://gallica.bnf.fr/themes/PhiXVIIb.htm><http://www.lmrl.lu/comenius/1100.htm>
Diderot. <http://www.visitvoltaire.com/f_v_diderot. htm> <http://www.kirjasto.sci.fi/diderot.htm>
Enser, P. G. B. (1995). Progress in documentation. Pictorial information retrieval. Journal of Documentation, 51,2, 126–170.
Hardy, W. (1986). A guide to Art Nouveau Style. London: Apple Press Ltd. Horton, W. (1991). Illustrating Computer Documentation. The Art of Presenting
Information Graphically on Paper and Online. New York: John Wiley & Sons, Inc.
Leonardo da Vinci. <http://www.mos.org/sln/Leonardo/LeoHomePage.html><http://www.visi.com/~reuteler/leonardo.html><http://www.leonet.it/comuni/vinci/>
Malmberg, T. (1996). Critical Theory and Audiovisual Media. Nordicom-Infor-mation om medie- och kommunikationsforskning i Norden, 1, 19–22.
Mijksenaar, P. & Westendorp, P. (1999). Open Here The Art Of Instructional Design. London: Thames & Hudson Ltd.
Monfils, B. S. (1993). Privacy in the Computer Age: Perceptions and Realities. Pre-sentation at the 3rd International Symposium of the International Visual
168
Literacy Association. Verbo-Visual Literacy: Understanding and Applica-tion of new Educational Communication Media Technologies. Delphi, Greece, June 26-29, 1993.
Moore, D. M., & Dwyer, F. M. (Eds.) (1994). Visual Literacy: A Spectrum of Visual Learning. Englewood Cliffs, NJ: Educational Technology Publica-tions.
Moriarty, S. E. (1994). Visual Communication as a Primary System. Journal of Visual Literacy, 14, 2, 11–21.
Reynolds-Myers, P. (1985). Visual literacy, higher order reasoning, and high technology. In N. H. Thayer, & S. Clayton-Randolph (Eds.). Visual Literacy: Cruising into the Future. Readings from the 16th annual conference of the International Visual Literacy Association. Bloomington: Western Sun Printing Co.
Sinatra, R. (1986). Visual Literacy Connections to Thinking, Reading, and Writing. Springfield, IL: Charles C. Thomas.
Tufte, E. R. (1983). The Visual Display of Quantitative Information. Cheshire, New Haven Connecticut: Graphics Press.
Tufte, E. R. (1990). Envisioning Information. Cheshire, New Haven Connecticut: Graphics Press.
Tufte, E. R. (1997). Visual Explanations. Cheshire, New Haven Connecticut: Graphics Press.
Velders, T. (1999). Introduction. Presentation at the 5th Symposium on Verbo-visual Literacy: Information Design. Eskilstuna, Sweden, November 9–11.
Vesalius, A. (1543). De humani corporis fabrica libri septem. Basileae. Facsimilie Reprint, Bruxelles, 1964. Andreae Vesalii De humani corporis fabrica libri sep-tem.
Vesalius. <http://www.mic.ki.se/vesalius.html><http://hsc.virginia.edu/hs-library/historical/antiqua/texth.htm><http://images.umdl.umich.edu/w/wantz/vesd1.htm>
169
Paper 10
Media and learning
Abstract. There are many kinds of media research. However, in this paper only mediaresearch related to the availability of media and the use of media in teaching and inlearning are briefly presented in the following sections: (1) Access to media, (2) Useof pictures in textbooks, (3) Media influences on learning, and (4) References.
Access to mediaAn explanation for all the media hardware and software in schools, and theuse of media in teaching can be traced back to the 1940s and 1950s. The “realismtheories” include the iconicity theory (Morris, 1946), the cone of experience(Dale, 1946), and the sign similarity orientation theory (Carpenter, 1953). Thebasic assumption from each of these theories is that learning will be more com-plete as the number of cues in the learning situation increases.
It might be interesting to take a closer look at the actual access to media,and use of media. Sweden is used as an example in the following sections. In1994, Sweden had 3.8 million households and a total population of 8.8 millionpeople. In Sweden most people have access to mass media like radio, television,newspapers, periodicals, and books. In Sweden, 1.2 million children attendcompulsory school and upper secondary school, taught by 133,000 teachers ofwhich around two thirds (65%) are women (Statistics Sweden, 1995). They worktogether in more than 50,000 classrooms in 4,900 schools.
Metallinos et al., (1990) studied the use of textbooks in schools in Australia,Greece, Japan, Sweden, and the USA. There were both interesting similaritiesand interesting differences between the five countries. A follow-up study (Pet-tersson et al., 1991) focused on the teachers and their actual use of media andpictures in their teaching. A total of 178 social studies and geography teachersmade 4,358 statements in a questionnaire study. To be able to compare the useof each medium (and each picture type) we ranked the use of media (and picturetype), and calculated an “index of utilization”. The media index range from 0to 100 (Pettersson, 1990a). A medium that is used every lesson is assigned a mediaindex of 100, once a week 50, once a month 25, once a term 12.5, and never has amedia index of 0.
170
Results suggested that there is a substantial difference between differentindividual teachers. The blackboard and textbooks have the highest rank order.They are used every lesson in all five countries. As noted in the following sectionsmany media are seldom used at all.
Blackboards and booksEven if publishers of school textbooks in many countries have experienced dif-ficulties and have complained frequently about the decline in sales of textbooks,there are still a great number of books in school store-rooms and in classrooms.It is difficult to form a clear picture of just how many textbooks there actuallyare in the schools. In Sweden it seems reasonable to suppose that there is anaverage of 15 books per student. Then there would be 18 million books in Swed-ish schools. In addition, both students and teachers may use the school libraries.The estimated number of books in Swedish school libraries is 28 million. Schoollibrary loans amount to 17 million per year, which is around 14 books per studentper year. Local community libraries also lend books that are used for schoolwork(Statistics Sweden, 1995). During the latter part of the 1980s, the volume of infor-mation was growing at such a rate that conventional information storage andretrieval methods could no longer keep pace. Boyer (1987) noted that:
Today, about one out of every four undergraduates spends no time in thelibrary during a normal week, and 65 percent use the library four hoursor less each week. (page 160)
This gap between the classroom and the library, first reported almost halfa century ago, still exists for higher education. With the help of observationsand long-term studies, Gustafsson (1980a, 1980b) and Sigurgeirsson (1990) havemapped how teachers use their time in the classroom. The result of both thesestudies, carried out in Sweden and in Iceland showed that textbooks were usedmore than anything else in the classroom, during 72% and 80%, respectively,of the lesson time. Textbooks were used both more often than anything else,and for longer periods. Sigurgeirsson found that 70-90% of teaching is basedon teachers and students using textbooks and worksheets. The text receivedalmost all the attention. The illustrations in the etxtbooks were almost neverused as sources of information.
The second cross-cultural study (Pettersson et al., 1991) showed that theblackboard and the textbooks in geography had the highest rank order. In Swe-den, this group of teachers uses the blackboard every lesson (index=93), or everyday. The same applies to Australia (83), and to Japan (100), while in the USAthis is not the case (58), nor in Greece (40). The geography teachers in Swedenused textbooks every lesson or at least once a day (index=88). At least once aweek, these teachers used a school atlas (57), other books (56) and wall maps (48).
171
When Svingby et al. (1990) asked social studies and geography teachers inSweden to what extent they used different media in their classrooms they gotsimilar responses. For the study of geography and history, the textbooks werejudged to be “important” or “very important” by around 80% of the teachers.Among 157 teachers, 60% used so called subject literature “once a week”.
deLange (1996) noted that textbooks and chalkboards are the main mediain schools in Southern Africa. The lack of electricity makes most other kindsof media obsolete. deLange wrote:
Research in Third World countries and in Southern Africa, found thatsmaller classes, science laboratories in high schools and increasing teach-ers’ salaries were some elements that did not raise pupil achievement.Increased educational expenditure on textbooks and libraries, whichconstitutes printed material, were some measures that raised pupils per-formance in classrooms (Mncwabe 1993: 216-218). (page 2)
And Schiffman (1995) concluded that while encumbered by challenges, text-books and other print materials continue to be a primary format for educationalmaterials. Unlike many new technologies, they can be easily tailored to the needsof special audiences. The general conclusion is that textbooks are, and will beimportant sources for verbo-visual information also in the future. We shall notmake the mistake to “forget” the printed and copied media in the informationage. At low cost blackboards, compendia and books provide an impressivedegree of flexibility.
Overhead transparencies and slidesThere is an overhead projector or a slide projector, or both, in most classroomsin Sweden (Pettersson, 1991). All schools have collections of overhead trans-parencies and slides. Some of these are series produced by publishing compa-nies and other commercial producers, and other series are produced locally bythe teachers themselves. The situation seems to be similar in many other coun-tries.
Despite easy access, overhead transparencies and slides are not used veryoften during lessons. In accordance with Gustafsson (1980a, 1980b) and Sigur-geirsson (1990), besides textbooks, teachers seldom or never use any mediaother than overhead transparencies, and even these are used in only 6%(Gustafsson) and 7% (Sigurgeirsson) of lessons. The cross-cultural study (Pet-tersson et al., 1991) found that the social studies and geography teachers in Swe-den used overhead transparencies (index=32) and overhead transparency maps(22) at least once per month. They also used slides (27) and film strips (21) atleast once per month. However, in this study it was found that there were majorindividual differences between teachers in how much they used these media.
172
It was clear that some teachers never use any media at all (except for blackboardsand textbooks), while others may use media quite often.
Radio programmes, sound tapes, and gramophone recordsRadios are found in one out of two classrooms in Swedish schools (Forsslund,1991). During 1992, Utbildningsradion (the educational wing of the SwedishBroadcasting Corporation) broadcasted 1,430 hours of school radio pro-grammes (Carlsson and Anshelm, 1993). In other words, there was a significantnumber and variety of programmes for the teachers to choose from. Radio pro-grammes may be used at the time of their broadcast, or may be borrowed lateras sound tapes from the AV and teaching aids centres.
In accordance with a study in which 800 teachers responded to a question-naire, only one third of them (36%) used any radio programmes in their teachingat least on one occasion during the spring school term of 1990 (Forsslund, 1991).Since many classes may have several teachers, it is not possible to estimate towhat extent each student has access to radio programmes during lessons fromthis total figure.
In most schools, there are cassette players, tape players, and record players(Forss-lund, 1991). Many schools, and even some teachers, have their own col-lections of sound tapes, cassette tapes, and records. Sound tapes are used par-ticularly in the teaching of the foreign languages and of music.
Gustafsson (1980a, 1980b) observed that sound tapes were used quite oftenin up to one fifth of the total lesson time (19%), for the teaching of English inthe Swedish schools. During 1990, a total of 1,000,000 loans of sound tapes andcassettes were registered by the AV and teaching aids centres (Forsslund, 1991).
Television, video and filmMost schools have television sets (96%) and video cassette players (94%) in Swe-den. Many schools also have video cameras (54%), but teletext is still relativelyrare (11%) (Forsslund, 1991).
In 1992, Utbildningsradion broadcasted 125 hours of school television(Carlsson and Anshelm, 1993). These programmes can be used at the time ofbroadcast, or borrowed later as video cassettes from the AV and teaching aidscentres. Some teachers record school television programmes themselves, andalso other more general programmes, for use in their teaching. A few teachersalso produce their own programmes with video cameras.
Forsslund (1991) found that only just over half of the teachers (56%) usedtelevision in their teaching at least once during the spring school term of 1990.In 1990, 140,000 loans of video cassettes were registered. This means that, dis-tributed over the entire country, teachers used 2.5 video cassettes per class per
173
school year. Since many classes may have different teachers it is not possibleto estimate to what extent each student is exposed to television or video pro-grammes during lessons. The cross-cultural study (Pettersson et al., 1991) foundthat the social studies and geography teachers in Sweden used video cassettesin their lessons at least once per month (index=18) and they used school tele-vision programmes at least once per term (10). Svingby et al. (1990) got similarresults. In their study most teachers (76%) used radio and television pro-grammes “several times per term”.
In accordance with Considine and Haley (1992), a study conducted by theDepartment of Education in 1988 found that eight graders in the USA spent21.2 hours per week watching television compared to 5.5 hours per week spenton homework. In Sweden too, we can anticipate that children spend more timewatching television than they spend on homework.
In Sweden almost all schools have access to 16-mm film projectors (Pet-tersson, 1991). During 1990, 500,000 loans from the AV and teaching aids centreswere registered. This means that, spread over the entire country, teachers used9.1 films per class. Since many teachers never use radio, television, or film intheir teaching, it is likely that the teachers who do use these media use themquite often. The showing of films is, therefore, probably unevenly distributedover the country. The cross-cultural study (Pettersson et al., 1991) found thatthe social studies and geography teachers in Sweden used films in their lessonsat least once per month (index=18).
Computers and other mediaIn Sweden most schools have computer rooms for teaching computer studies.Some schools also have modems, which make it possible to access informationin traditional databases. However, the costs to access these databases are oftenprohibitive for the schools, so the use of this facility is very restricted. The cross-cultural study (Pettersson et al., 1991) showed that the social studies and geog-raphy teachers in Sweden used computer programs in their lessons at least onceper term (index=4). Some schools are now exploring the use of multimedia andthe World Wide Web. Several people express high expectations on the Internetand various experiments have recently started.
The cross-cultural study (Pettersson et al., 1991) showed that the social stud-ies and geography teachers in Sweden used wall maps (index=48) at least onceper week. At least once per month, they used newspaper and magazine articles(31). Svingby et al. (1990) also found that more than half of the teachers usednewspapers and magazines “a couple of times per term”, which is roughly onceper month. They used flip pads (7) and charts (6) at least once per term.
174
Chalk talkMany teachers in different countries spend most of their time in the classroomstalking to their classes (Gustafsson, 1980a, 1980b; Sigurgeirsson, 1990; P10, Pet-tersson, 1991; Ferrington, 1994). It appears that teachers generally teach the waythey were taught, following the traditional approach to education, providingprepackaged information to students. Heinich et al. (1982) noted that studentsmust be able to analyse the structure of a lecture to distinguish between relevantand irrelevant information. Students must be information literate to be able tolearn effectively. The cross-cultural study (Pettersson et al., 1991) showed thatthe total average media usage in schools was surprisingly similar in Japan (37),Australia (32), Sweden (32), and the USA (30). In Greece (18), teachers were moreconservative in their use of media in teaching than the teachers in the other coun-tries in the study. Despite the fact that we live in the information society, andare witnessing rapid technological development, it is still chalk talk to a largeextent that counts in the school environment.
In Sweden Skolverket (The National Agency for Education), which devel-ops new curricula for Swedish schools, carried out a comprehensive study ofschools. In this report, entitled “Bilden av skolan 1993” (A picture of the school,1993), Skolverket concludes that Swedish students have good basic knowledgein many subjects. They are among the best in the world at reading and com-prehending. They are good at mathematics and English as a second language,but they have remarkably poor knowledge in the natural sciences. They are alsopoor at solving problems and have difficulty in using their knowledge in anindependent and active way. The fact that students have difficulty solving prob-lems and understanding contexts reflects the school's way of teaching, the headof Skolverket, Ulf P. Lundgren, said in an interview (Ljunghill, 1993). The dom-inant method is still the traditional method of the teacher lecturing and studentspassively listening and answering questions. In Lundgren's opinion, teachingin Swedish schools is more conventional and traditional than in most othercountries.
An active, investigative method of working, which the writers of the schoolcurricula have advocated for more than two decades (since 1969), has not yetmade any major impact on the school's daily work. The main impression onegets of the teaching in Swedish schools is that students passively receive whatthe teachers have selected for them, which primarily comes from school text-books. The students get almost no practice in searching for information them-selves or in solving problems. The introduction of the Internet may change thissituation in the future.
It may be concluded that most teachers have access to different media. How-ever, media is not widely used in teaching. Despite the rapid technologicaldevelopment teaching is still chalk talk to a large extent.
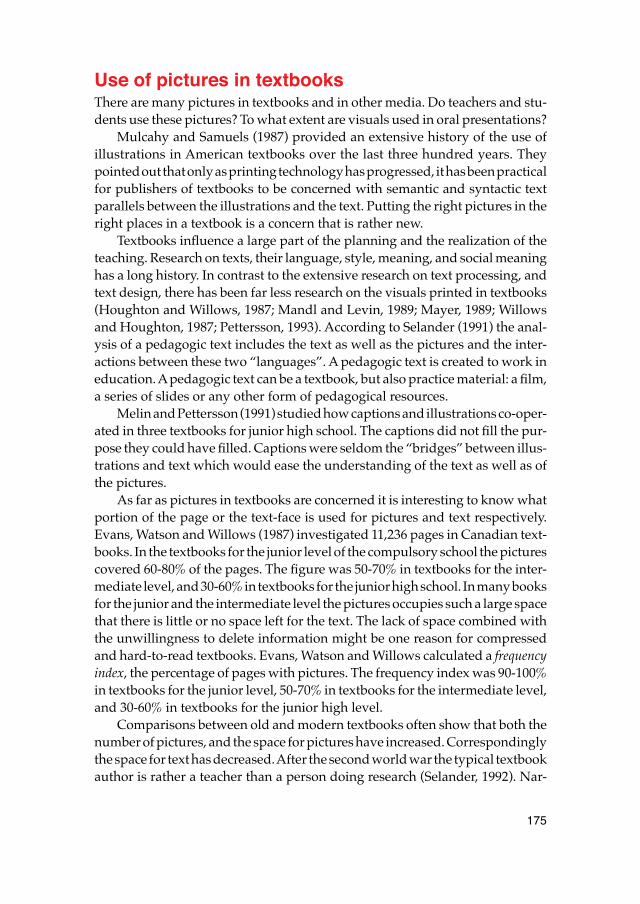
175
Use of pictures in textbooksThere are many pictures in textbooks and in other media. Do teachers and stu-dents use these pictures? To what extent are visuals used in oral presentations?
Mulcahy and Samuels (1987) provided an extensive history of the use ofillustrations in American textbooks over the last three hundred years. Theypointed out that only as printing technology has progressed, it has been practicalfor publishers of textbooks to be concerned with semantic and syntactic textparallels between the illustrations and the text. Putting the right pictures in theright places in a textbook is a concern that is rather new.
Textbooks influence a large part of the planning and the realization of theteaching. Research on texts, their language, style, meaning, and social meaninghas a long history. In contrast to the extensive research on text processing, andtext design, there has been far less research on the visuals printed in textbooks(Houghton and Willows, 1987; Mandl and Levin, 1989; Mayer, 1989; Willowsand Houghton, 1987; Pettersson, 1993). According to Selander (1991) the anal-ysis of a pedagogic text includes the text as well as the pictures and the inter-actions between these two “languages”. A pedagogic text is created to work ineducation. A pedagogic text can be a textbook, but also practice material: a film,a series of slides or any other form of pedagogical resources.
Melin and Pettersson (1991) studied how captions and illustrations co-oper-ated in three textbooks for junior high school. The captions did not fill the pur-pose they could have filled. Captions were seldom the “bridges” between illus-trations and text which would ease the understanding of the text as well as ofthe pictures.
As far as pictures in textbooks are concerned it is interesting to know whatportion of the page or the text-face is used for pictures and text respectively.Evans, Watson and Willows (1987) investigated 11,236 pages in Canadian text-books. In the textbooks for the junior level of the compulsory school the picturescovered 60-80% of the pages. The figure was 50-70% in textbooks for the inter-mediate level, and 30-60% in textbooks for the junior high school. In many booksfor the junior and the intermediate level the pictures occupies such a large spacethat there is little or no space left for the text. The lack of space combined withthe unwillingness to delete information might be one reason for compressedand hard-to-read textbooks. Evans, Watson and Willows calculated a frequencyindex, the percentage of pages with pictures. The frequency index was 90-100%in textbooks for the junior level, 50-70% in textbooks for the intermediate level,and 30-60% in textbooks for the junior high level.
Comparisons between old and modern textbooks often show that both thenumber of pictures, and the space for pictures have increased. Correspondinglythe space for text has decreased. After the second world war the typical textbookauthor is rather a teacher than a person doing research (Selander, 1992). Nar-
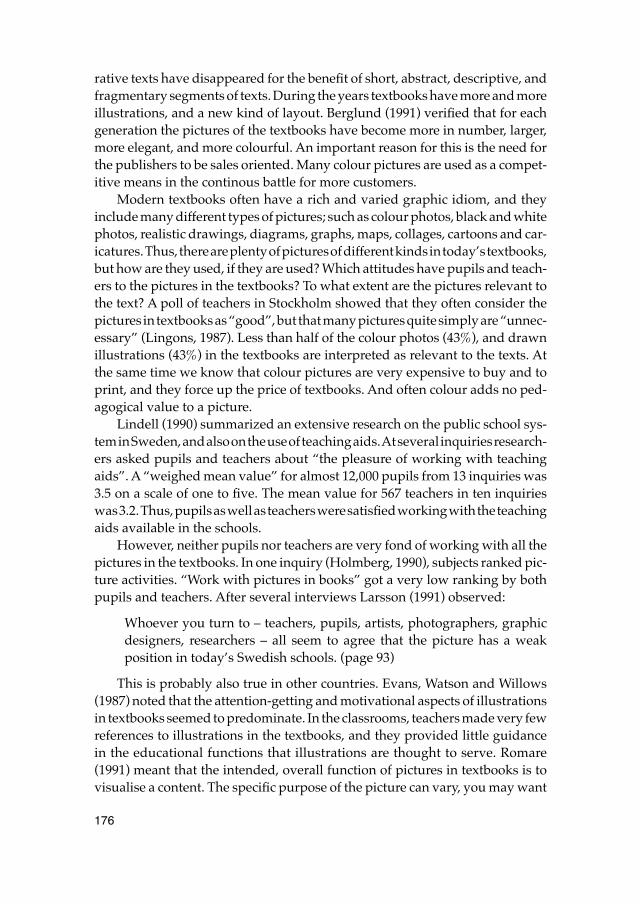
176
rative texts have disappeared for the benefit of short, abstract, descriptive, andfragmentary segments of texts. During the years textbooks have more and moreillustrations, and a new kind of layout. Berglund (1991) verified that for eachgeneration the pictures of the textbooks have become more in number, larger,more elegant, and more colourful. An important reason for this is the need forthe publishers to be sales oriented. Many colour pictures are used as a compet-itive means in the continous battle for more customers.
Modern textbooks often have a rich and varied graphic idiom, and theyinclude many different types of pictures; such as colour photos, black and whitephotos, realistic drawings, diagrams, graphs, maps, collages, cartoons and car-icatures. Thus, there are plenty of pictures of different kinds in today’s textbooks,but how are they used, if they are used? Which attitudes have pupils and teach-ers to the pictures in the textbooks? To what extent are the pictures relevant tothe text? A poll of teachers in Stockholm showed that they often consider thepictures in textbooks as “good”, but that many pictures quite simply are “unnec-essary” (Lingons, 1987). Less than half of the colour photos (43%), and drawnillustrations (43%) in the textbooks are interpreted as relevant to the texts. Atthe same time we know that colour pictures are very expensive to buy and toprint, and they force up the price of textbooks. And often colour adds no ped-agogical value to a picture.
Lindell (1990) summarized an extensive research on the public school sys-tem in Sweden, and also on the use of teaching aids. At several inquiries research-ers asked pupils and teachers about “the pleasure of working with teachingaids”. A “weighed mean value” for almost 12,000 pupils from 13 inquiries was3.5 on a scale of one to five. The mean value for 567 teachers in ten inquirieswas 3.2. Thus, pupils as well as teachers were satisfied working with the teachingaids available in the schools.
However, neither pupils nor teachers are very fond of working with all thepictures in the textbooks. In one inquiry (Holmberg, 1990), subjects ranked pic-ture activities. “Work with pictures in books” got a very low ranking by bothpupils and teachers. After several interviews Larsson (1991) observed:
Whoever you turn to – teachers, pupils, artists, photographers, graphicdesigners, researchers – all seem to agree that the picture has a weakposition in today’s Swedish schools. (page 93)
This is probably also true in other countries. Evans, Watson and Willows(1987) noted that the attention-getting and motivational aspects of illustrationsin textbooks seemed to predominate. In the classrooms, teachers made very fewreferences to illustrations in the textbooks, and they provided little guidancein the educational functions that illustrations are thought to serve. Romare(1991) meant that the intended, overall function of pictures in textbooks is tovisualise a content. The specific purpose of the picture can vary, you may want
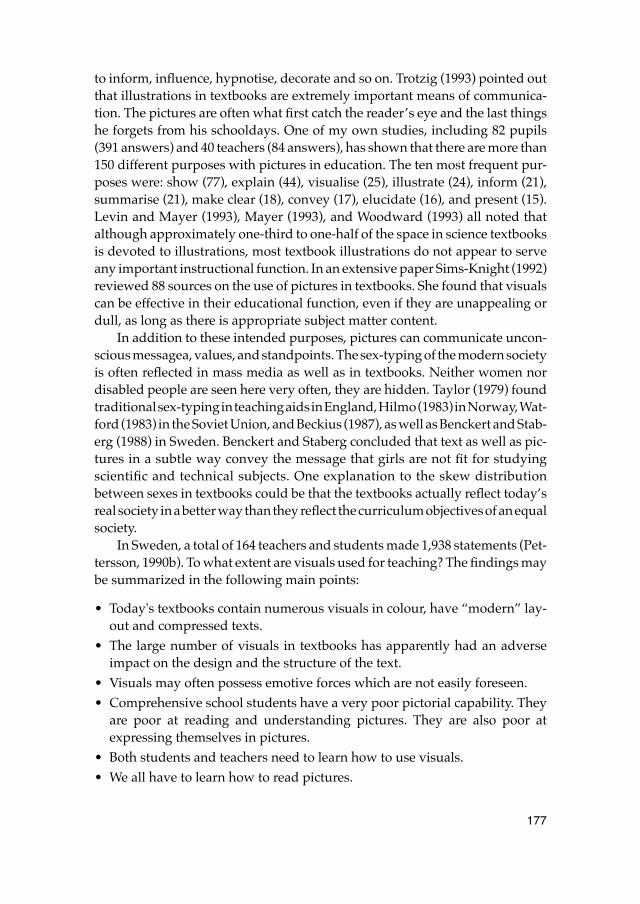
177
to inform, influence, hypnotise, decorate and so on. Trotzig (1993) pointed outthat illustrations in textbooks are extremely important means of communica-tion. The pictures are often what first catch the reader’s eye and the last thingshe forgets from his schooldays. One of my own studies, including 82 pupils(391 answers) and 40 teachers (84 answers), has shown that there are more than150 different purposes with pictures in education. The ten most frequent pur-poses were: show (77), explain (44), visualise (25), illustrate (24), inform (21),summarise (21), make clear (18), convey (17), elucidate (16), and present (15).Levin and Mayer (1993), Mayer (1993), and Woodward (1993) all noted thatalthough approximately one-third to one-half of the space in science textbooksis devoted to illustrations, most textbook illustrations do not appear to serveany important instructional function. In an extensive paper Sims-Knight (1992)reviewed 88 sources on the use of pictures in textbooks. She found that visualscan be effective in their educational function, even if they are unappealing ordull, as long as there is appropriate subject matter content.
In addition to these intended purposes, pictures can communicate uncon-scious messagea, values, and standpoints. The sex-typing of the modern societyis often reflected in mass media as well as in textbooks. Neither women nordisabled people are seen here very often, they are hidden. Taylor (1979) foundtraditional sex-typing in teaching aids in England, Hilmo (1983) in Norway, Wat-ford (1983) in the Soviet Union, and Beckius (1987), as well as Benckert and Stab-erg (1988) in Sweden. Benckert and Staberg concluded that text as well as pic-tures in a subtle way convey the message that girls are not fit for studyingscientific and technical subjects. One explanation to the skew distributionbetween sexes in textbooks could be that the textbooks actually reflect today’sreal society in a better way than they reflect the curriculum objectives of an equalsociety.
In Sweden, a total of 164 teachers and students made 1,938 statements (Pet-tersson, 1990b). To what extent are visuals used for teaching? The findings maybe summarized in the following main points:
• Today's textbooks contain numerous visuals in colour, have “modern” lay-out and compressed texts.
• The large number of visuals in textbooks has apparently had an adverseimpact on the design and the structure of the text.
• Visuals may often possess emotive forces which are not easily foreseen.• Comprehensive school students have a very poor pictorial capability. They
are poor at reading and understanding pictures. They are also poor atexpressing themselves in pictures.
• Both students and teachers need to learn how to use visuals.• We all have to learn how to read pictures.
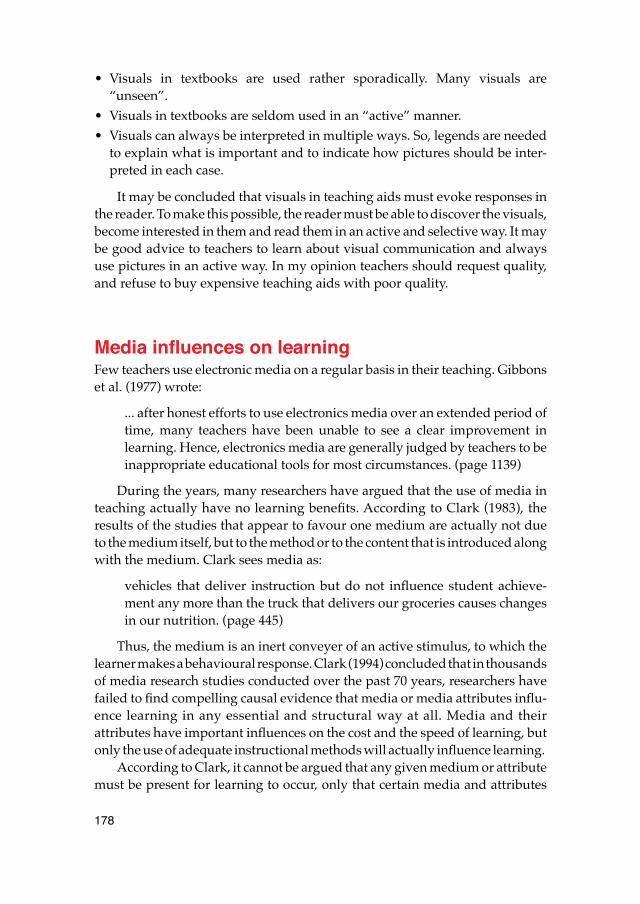
178
• Visuals in textbooks are used rather sporadically. Many visuals are“unseen”.
• Visuals in textbooks are seldom used in an “active” manner.• Visuals can always be interpreted in multiple ways. So, legends are needed
to explain what is important and to indicate how pictures should be inter-preted in each case.
It may be concluded that visuals in teaching aids must evoke responses inthe reader. To make this possible, the reader must be able to discover the visuals,become interested in them and read them in an active and selective way. It maybe good advice to teachers to learn about visual communication and alwaysuse pictures in an active way. In my opinion teachers should request quality,and refuse to buy expensive teaching aids with poor quality.
Media influences on learningFew teachers use electronic media on a regular basis in their teaching. Gibbonset al. (1977) wrote:
... after honest efforts to use electronics media over an extended period oftime, many teachers have been unable to see a clear improvement inlearning. Hence, electronics media are generally judged by teachers to beinappropriate educational tools for most circumstances. (page 1139)
During the years, many researchers have argued that the use of media inteaching actually have no learning benefits. According to Clark (1983), theresults of the studies that appear to favour one medium are actually not dueto the medium itself, but to the method or to the content that is introduced alongwith the medium. Clark sees media as:
vehicles that deliver instruction but do not influence student achieve-ment any more than the truck that delivers our groceries causes changesin our nutrition. (page 445)
Thus, the medium is an inert conveyer of an active stimulus, to which thelearner makes a behavioural response. Clark (1994) concluded that in thousandsof media research studies conducted over the past 70 years, researchers havefailed to find compelling causal evidence that media or media attributes influ-ence learning in any essential and structural way at all. Media and theirattributes have important influences on the cost and the speed of learning, butonly the use of adequate instructional methods will actually influence learning.
According to Clark, it cannot be argued that any given medium or attributemust be present for learning to occur, only that certain media and attributes
179
are more efficient for certain learners, learning goals, and tasks. Clark concludedthat delivery technologies influence the cost and access of instruction and infor-mation, and that design technologies make it possible to influence studentachievements. However, instructional designers, developers, and researchersoften fail to link their work adequately to the basic and applied research on learn-ing from instruction.
However, according to Kozma (1994), learning is not the receptive responseto delivery of instruction. Learning is an active, constructive, cognitive, andsocial process by which the learner strategically manages available cognitive,physical, and social resources to create new knowledge. This is done by inter-acting with information in the environment and information that is stored inour memories. Reiser (1994) argued that Clark fails to acknowledge the fact thatcertain media attributes make certain methods possible:
Returning to Clark’s truck analogy, the successful delivery of frozenfoods requires the use of a vehicle with refrigeration. (page 45)
Clark (1994) accepts Kozma’s (1994) point that whenever learning occurs,some medium or mix of media must be present to deliver instruction. However,if learning occurs as a result of exposure to any media, the learning is causedby the instructional method embedded in the media presentation. Clark claimsthat media research is merely a triumph of enthusiasm over substantive exam-ination of structural processes in learning and instruction.
Salomon, Perkins, and Globerson (1991) argued that media should focuson the effects of learners’ cognitions with technology, as opposed to the effectsof technology. We should see media as facilitators of constructive learning,instead of the conveyors of instruction. Instead of using multimedia to deliverinstruction or even create environments for learning, multimedia are better usedas environments or tools that enable learners to construct their own artifacts(Kommers, Jonassen, and Mayes, 1992; Lehrer, 1993).
According to Ross (1994), both Clark and Kozma may be right. From a pos-itivistic perspective, Clark is correct in arguing that media studies are limitedfor isolating the instructional strategies or essential “ingredients” that causegains in learning. But, from an applied perspective, Kozma is also correct insupporting the design of media-based delivery systems by systematicallyselecting and combining effective strategies/ingredients.
I support Jonassen, Campbell, and Davidson (1994) who advised a shift inthe debate and a shift in the practice of instructional design from instruction-and media-centred to a learner-centred conception of learning. The debateshould focus on the attributes of the human learner involved in learning, andon the role of media in supporting, not controlling, the learning process. Jonas-sen, Campbell, and Davidson concluded that the most important debate is notabout the relative efficacy of instructional components; instead it is the role of
180
the learner and the context of learning. While learning, students interact withboth media and methods, and it is difficult to isolate the effects of media fromthe effects of the methods. As previously noted Bjørgen (Kristiansen et al., 1994),advocate a similar opinion.
In my view the further education programme at the Norwegian Universityof Technology has been very successful. Based on experiences from the TVI-method, Tutored Video Instruction, that was developed some twenty years agoat Stanford University, a method of team learning supported by media has beendeveloped in Norway. The TVI-method is based on the common-sense notionthat students can learn more from a lecture if they are free to interrupt it at placeswhere they need more discussion or explanation of a point or a concept (Gibbonset al., 1977). The TVI-method supports the communication processes by pro-viding a tutor who acts as a catalyst between the individual learners. In variousworkplaces in Norway, groups of people engage in this distance education pro-gramme.
Each team receives video cassettes with recordings from ordinary lecturesin the university courses. The members of the teams view these recordings, andinteract in various group discussions and group activities. People are active andmotivated to learn. Hebnes (1995) reported that 90% of the members in threeteams (30 persons) preferred this kind of media-supported team learning com-pared with traditional lectures. It was claimed that the factor of success is notthe video as such, but the group interaction.
The TVI-method has been extended into a TMI-method, Tutored MediaInstruction, making use of other instructional media such as computer aidedinstruction and multimedia. The TMI-model provides a very flexible frame-work for the use of instructional media. It can be adapted towards regional,institutional, content-specific, and above all it can be adopted to learner-specificneeds, individual learning experiences and learning styles, previous knowl-edge, and different cultural backgrounds.
ReferencesBeckius, C. (1987). Granskningsrapport om könsroller i grundskolans läroböcker i
engelska, tyska och franska. Stockholm: SIL, Statens Institut för Läromedels-information. Rapport 1987:2.
Benckert, S., & Staberg, E. (1988). Riktar sig läroböckerna i NO-äm-nen mer till pojkar än till flickor? Granskning av några läroböcker i naturorienterade ämnen. Stockholm: Skolöverstyrelsen, R 88:11- Rapporter, planering, uppföljning, utvärdering.
Berglund, L. (1991). Att tänka på vid läroboksvalet. In L. Berglund (Ed.) Lärobok om läroböcker. Stockholm: Läromedelsförfattar-nas Förening.
181
Boyer, E. L. (1987). The Undergraduate Experience in America. New York: Harper & Row.
Carlsson, U. & Anshelm, M. (Eds.) (1993). MedieSverige 1993, Statistik och analys. NORDICOM-Sverige.
Carpenter, C. (1953). A theoretical orientation for instructional film research. AV Communication Review, 1, 38-52.
Clark, R. E. (1983). Reconsidering research on learning from media. Review of Educational Research, 53, 4, 445-459.
Clark, R. E. (1994). Media Will Never Influence Learning. Educational Techno-logy, Research and Development, 42, 2, 21-29.
Considine, D. M., & Haley, G. E. (1992) Visual Messages. Integrating Imagery into Instruction. Englewood , Colorado. Teacher Ideas Press.
Dale, E. (1946). Audio-visual methods in teaching. New York: Dryden Press.deLange, R, W. (1996). Cultural Modifications in Visuals as a Support to Printed
Educational Media in Africa: an Erroneous Paradigm. Paper presented at The 4th International Research Symposium on Visual Verbal Literacy, Process and Product: Media Education in Praxis, The Rijkshogeschool, IJselland, and the International Visual Literacy Association, Deventer, Holland, May 6- 11, 1996.
Evans, M. A., Watson, C., & Willows, D. M. (1987). A Naturalistic Inquiry into Illustrations in Instructional Textbooks. In H. A. Houghton and D. M. Wil-lows. (Eds.). The Psychology of illustrations: Vol 2. Instructional Issues, 53 - 85. NY: Springer-Verlag.
Ferrington, G. (1994). Keep your Ear-Lids Open. Journal of Visual Literacy, 14, 2, 51–61.
Forsslund, T. (1991). Lärares attityder till och användning av TV och radio i grund-skolan våren 1990. UR, Utbildningsradion. F&U Rapport 2-91.
Gibbons, J. F., Kincheloe, W. R., & Down, K.S. (1977). Tutored Instruction: A new Use of Electronics Media in Education. Science, 195, 1139-1146.
Gustafsson, C. (1980a). Läromedlens funktion i undervisningen. En rapport från utredningen om läromedelsmarknaden. DsU 1980:4.
Gustafsson, C. (1980b). Läromedlens funktion i undervisningen. Bila-gedel. En rap-port från utredningen om läromedelsmarknaden. DsU 1980:5.
Hebnes, I. (1995). Videostöttet laering. Norsk konferense om utdanning og laering. Universitetet i Trondheim. 3-4 februar 1995.
Heinich, R., Molenda, M., & Rusell, J. D. (1982). Instructional media and the new technologies of instruction. New York: John Wiley and Sons.
Hilmo, I. (1983). An analysis of Norweigian textbooks in science. Contributions to the second GASAT conference. Oslo.
Holmberg, L. (1990). Undervisning i bild och svenska i åk 5 enligt lärar- och eleven-käter (Bild och svenska 5. Rapport 6.). Kalmar: Ins-titutionen för lärarutbild-ning, Rapport D, 1990:1.
182
Houghton, H. A., & Willows, D. M. (Eds.). (1987). The psychology of illustration: Vol. 2, Instructional issues. New York: Springer-Verlag.
Jonassen, D. H., Campbell, J. P., & Davidson, M, E. (1994). Learning with Media: Restructuring the Debate. Educational Technology, Research and Development, 42, 2, 31-39.
Kommers, P. A. M., Jonassen, D. H., & Mayes, T. (1992). Cognitive tools for learning. Berlin: Springer-Verlag.
Kozma, R. B. (1994). Will Media Influence Learning? Reframing the Debate. Educational Technology, Research and Development, 42, 2, 21-29.
Kristiansen, T., Bjørgen, I, A., & Jørgensen, T, R. (1994). Norwegian Experiences in Flexible Distance Learning in View of Assumptions of and Barriers in the Present Educational Culture. Presentation at the Educational and Cultural Barriers to Open and Distance Learning University of Sheffield, June 1994.
Larsson, B. (1991). Sätt att se på. In L. Berglund (Ed.) Lärobok om läroböcker. Stockholm: Läromedelsförfattarnas Förening.
Lehrer, R. (1993). Authors of knowledge: Patterns of hypermedia design. In S. P. LaJoie & S. J. Derry (Eds.), Computers as cognitive tools. Hillsdale, NJ: Lawrence Erlbaum.
Levin, J. R., & Mayer, R. E. (1993). Understanding illustrations in text. In B. K. Britton, A. Woodward, & M. Binkley (Eds.). Learning from textbooks: Theory and practice. Hillsdale, NJ: Erlbaum.
Lindell, E. (1990). Läromedel i grundskolan – attityder och effekter. Skolöversty-relsen. Stockholm. F 909:4/Vad säger forskningen?
Lingons, B. (1987). Rapporter från Stockholms Skolor. Läromedelssituationen i några Stockholmsskolor 1986/87. Stockholms skolförvaltning 1987:4.
Ljunghill, L. F. (1993). Svenska elever har goda kunskaper men är dåliga på att använda dem. Lärarnas tidning. 19, 4-5.
Mandl, H., & Levin, J. R. (Eds.). (1989). Knowledge acquisition from text and pic-tures. Amsterdam: Elsevier.
Mayer, R. E. (1989). Systematic thinking fostered by illustrations in scientific text. Journal of Educational Psychology, 81, 240-246.
Mayer, R. E. (1993). Illustrations that instruct. In R. Glaser (Ed.), Advances in instructional psychology, Volume 5. Hillsdale, JH: Erlbaum.
Melin, L., & Pettersson; R. (1991). Bildtexter i läroböcker. Stockholm: Stockholm University, Department of Nordic Languages.
Metallinos, N., Muffoletto, R., Pettersson, R., Shaw, J. and Takakuwa, Y. (1990). The use of Verbo-Visual Information in Textbooks – a Cross-Cultural Experience. Paper presented at the International Visual Literacy Associa-tion Symposium 1990. Verbo–Visual Literacy. Mapping the Field. July 10–13. University of London, Institute of Education.Published 1991 by The Council of Aesthetics and Visual Literacy. Research Paper No. 1. Sydney, Australia.
183
Mncwabe, M. P. (1993). Post-Apartheid Education. New York: University Press of America.
Morris, C. D. (1946). Signs, languages, and behavior. New York: Prentice-Hall.Mulcahy, P., & Samuels, J. S. (1987). Three hundred years of illustrations in Amer-
ican textbooks. In H. A. Houghton & D. M. Willows. (Eds.). (1987). The psy-chology of illustration: Vol. 2, Instructional issues. New York: Springer-Verlag.
Pettersson, R. (1990a). How do we measure illustrations? The Visual Literacy Review. 19, 3, 5–7.
Pettersson, R. (1990b). Teachers, Students and Visuals. Journal of Visual Liter-acy, 10, 1, 45–62.
Pettersson, R. (1991). Bilder i läromedel. Tullinge: Institutet för Infologi.Pettersson, R. (1993). Visual information. Englewood Cliffs, NJ: Educational
Technology Publications.Pettersson, R., Metallinos, N., Muffoletto, R., Shaw, J. and Takakuwa, Y.
(1991). The use of verbo–visual information in teaching of geography – views from teachers. Presentation at the 23rd Annual Conference of the International Visual Literacy Association. Washington, Oct. 9–13.Published in: J. Clark–Baca, D. G. Beauchamp & R. A. Braden, (Eds.) 1992: Visual Communication: Bridging Across Cultures Selected Readings from the 23rd Annual Conference of the International Visual Literacy Association. Inter-national Visual Literacy Association. Blacksburg, VA. p. 211–222.Also published 1993 in: ETR&D, Vol. 41, 1 101–107.
Reiser, R. A. (1994). Clark’s Invitation to the Dance: An Instructional Designer’s Response. Educational Technology, Research and Development, 42, 2, 45-48.
Romare, E. (1991). Exempel på bildspråklig kommunikation. In S. Selander, L. Ols-son, R. Pettersson och E. Romare (Eds.). Specialnummer: läromedel. Ett utbildningsmaterial om pedagogiska texter. Spov 14/15.
Salomon, G., Perkins, D. N., & Globerson, T. (1991). Partners in cognition: Extending human intelligence with intelligent technologies. Educational Researcher, 20(3), 2-9.
Schiffman, C. B. (1995). Visually Translating Educational Materials for Ethnic Pop-ulations. Paper presented at the 27th Annual Conference of the Interna-tional Visual Literacy Association. Chicago, Oct. 18 – 22. 1995. Published in: R. E. Griffin. D. G. Beauchamp, J. M. Hunter & C. B. Shiffman, (Eds.) 1996: Eyes on the Future: Converging Images, Ideas and Instruction. Selected Readings of the International Visual Literacy Association. International Visual Literacy Association.
Selander, S. (1991). Forskning om läromedel. In i S. Selander, L. Olsson, R. Pet-tersson & E. Romare (Eds.). Specialnummer: läromedel. Ett utbildnings-material om pedagogiska texter. Spov 14/15.
Selander, S. (1992). Pedagogiska texter som forskningsfält. Forskning om utbildning. Tidskrift för analys och debatt, 4, 41–53.
184
Sigurgeirsson, I. (1990). The Use of Reference Materials, Other Books, Audio–Visuals and Educational Equipment. Presentation vid konferensen Nor-dträff, 2–5 August 1990.
Sims-Knight, J. E. (1992). To Picture or Not to Picture: How to Decide. Visible Language, 26, 3, 325-388.
Skolverket (1993). Bilden av skolan 1993. Stockholm: Skolverket.Statistics Sweden. (1995). Statistical Yearbook of Sweden 1996. Official Statistics
of Sweden. Statistics Sweden: Stockholm.Svingby, G. Lendahls, B., & Ekbom, D. (1990). Omvärldskunskap: SO, Bakgrund,
Beskrivning av undervisningen, Fostran till demok-rati. Göteborgs universitet. Rapporter från institutionen för pedagogik 1990:02.
Taylor, J. (1979). Sexist Bias in Physics Textbooks. Physics Education, 14, 277.Trotzig, G. (1993). Forskaren och skolboken — en arkeologisk fallstudie. Spov,
20, 13–25.Watford, G. (1983). Science education and sexism in the Soviet Union. School
Science Review, Dec, 213-224.Willows, D. M. & Houghton, H. A. (Eds.). (1987). The psychology of illustration.
Vol.1. Basic research. New York: Springer-Verlag.Woodward, A. (1993). Do illustrations serve an instructional purpose in U.S. text-
books? In B. K. Britton, A. Woodward, & M. Binkley (Eds.). Learning from textbooks: Theory and practice. Hillsdale, NJ: Erlbaum.
185
Paper 11
Visual literacy in message design
Abstract. The theme for this 33rd Annual Conference of the International Visual Lit-eracy Association in Eskilstuna, Sweden, is “Visual Literacy in Message Design”.Both visual literacy and message design are broad concepts, each with a long history.Researchers with different kinds of backgrounds have shown an interest in visual lit-eracy. This is also true for message design, which can be divided in several categories.Various areas of design have different objectives and the information materials reachout to different groups of receivers. Visual literacy and the use of images is importantin message design. At the same time message design is important in the study of visualliteracy. The concepts of visual literacy and message design partly overlap oneanother.
Visual literacyAlthough the term “visual literacy” may be modern, it is not at all a new ideaor a new concept. Discussions about the use of images and pictures have a longhistory. Already ancient philosophers used images for visual communication.In anatomy and medicine, Aristotle employed anatomical illustrations. In math-ematics, Phythagoras, Socrates, and Plato used visual images to teach geometry.Jesus Christ and other religious educators and prophets helped their listenerscreate inner images by means of different metaphors. In Mesoamerica, the oldcultures and civilizations used advanced pictorial messages, especially in theirtemple cities. Velders (1999) concluded that (p. 10): “The history of visual com-munication goes back to the cave paintings 30,000 years ago, the descriptionof it only 2,500. ... visual literacy is 2,500 years old (as a skill) and 30 years young(as a term).”
DefinitionsThe International Visual Literacy Association, IVLA, was established as a non-profit association incorporated in the State of New York in 1968 to provide amulti-disciplinary forum for the exploration, presentation, and discussion ofall aspects of visual communication and their various applications throughvisual images, visual literacy, and literacy in general. Since then IVLA membersand others have formulated a number of definitions, descriptions and discus-
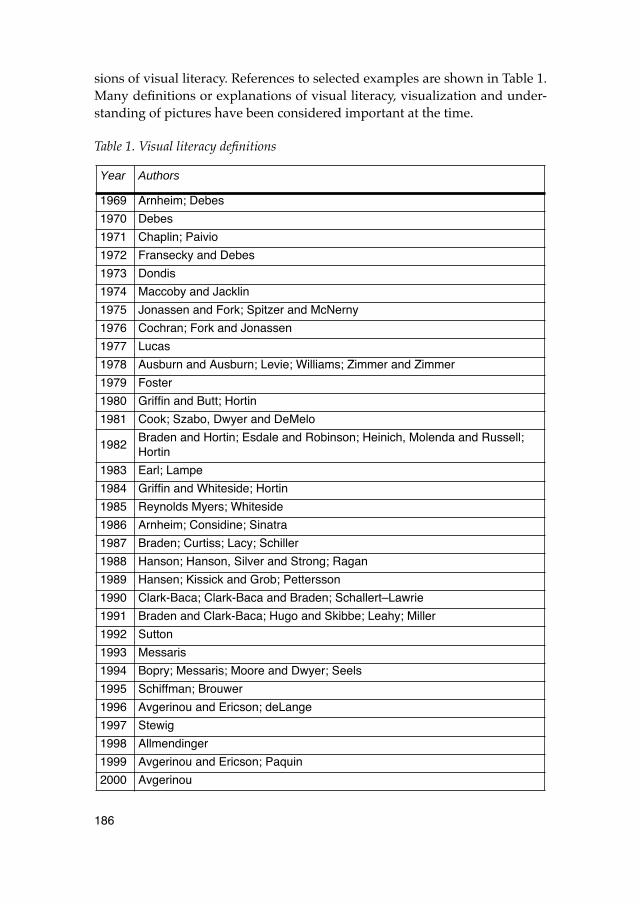
186
sions of visual literacy. References to selected examples are shown in Table 1.Many definitions or explanations of visual literacy, visualization and under-standing of pictures have been considered important at the time.
Table 1. Visual literacy definitions
Year Authors
1969 Arnheim; Debes
1970 Debes
1971 Chaplin; Paivio
1972 Fransecky and Debes
1973 Dondis
1974 Maccoby and Jacklin
1975 Jonassen and Fork; Spitzer and McNerny
1976 Cochran; Fork and Jonassen
1977 Lucas
1978 Ausburn and Ausburn; Levie; Williams; Zimmer and Zimmer
1979 Foster
1980 Griffin and Butt; Hortin
1981 Cook; Szabo, Dwyer and DeMelo
1982Braden and Hortin; Esdale and Robinson; Heinich, Molenda and Russell; Hortin
1983 Earl; Lampe
1984 Griffin and Whiteside; Hortin
1985 Reynolds Myers; Whiteside
1986 Arnheim; Considine; Sinatra
1987 Braden; Curtiss; Lacy; Schiller
1988 Hanson; Hanson, Silver and Strong; Ragan
1989 Hansen; Kissick and Grob; Pettersson
1990 Clark-Baca; Clark-Baca and Braden; Schallert–Lawrie
1991 Braden and Clark-Baca; Hugo and Skibbe; Leahy; Miller
1992 Sutton
1993 Messaris
1994 Bopry; Messaris; Moore and Dwyer; Seels
1995 Schiffman; Brouwer
1996 Avgerinou and Ericson; deLange
1997 Stewig
1998 Allmendinger
1999 Avgerinou and Ericson; Paquin
2000 Avgerinou
187
A recent definition was provided by Avgerinou (2000). Avgerinou used thefollowing operational definition of visual literacy (p. 26): “In the context of human,intentional visual communication, visual literacy refers to a group of largelyacquired abilities, i.e. the abilities to understand (read), and use (write) images,as well as to think and learn in terms of images.”
Over time, definitions have varied from very narrow to very broad expla-nations of greater or lesser complexity. In accordance with Avgerinou and Eric-son (1999, p. 22) there seem to be as many definitions as there are visual litera-cists. There has been, and there still are considerable disagreements concerninga common definition of visual literacy. Avgerinou and Ericson (1997) concludedthat many have tried to define the concept of visual literacy, but so far they hadfound no consensus. It is clear that it is difficult to describe verbally a conceptthat is primarily nonverbal. A number of researchers have practically rejectedthe whole concept of “visual literacy” and they search for something else.
InterdisciplinaryVisual literacy is really a broad and interdisciplinary concept including biolog-ical perspectives, communication perspectives, presentational perspectives,religious perspectives, social perspectives, technological perspectives, visuallanguage perspectives, and bits and pieces from several other “establishedfields” of research. Many researchers from different disciplines have explainedtheir views and interpretations and written about visual literacy from their var-ious perspectives. Selected references to such papers are shown in Table 2.
Table 2. Visual literacy perspectives
Fields Authors
advertising Griffin and Whiteside 1984; Besser 1987; Velders 1996
aesthetics Bakony 1983; Metallinos 1991; Seward Barry 1994; Velders 1996
adult education Kissick and Grob 1989; Velders 1995
anatomy Metallinos 1994
art Arnheim 1969; Gonsalves 1983; Arnheim 1986; Curtiss 1987; Hortin 1994; Seward Barry 1994; Velders 1996
art education Dondis 1973
art history Garoian 1989; Velders 1995, 1999
audiovisual media Cochran 1976
biology Lord 1985; Wandersee 1992
brain research Lampe 1983; Sinatra 1986
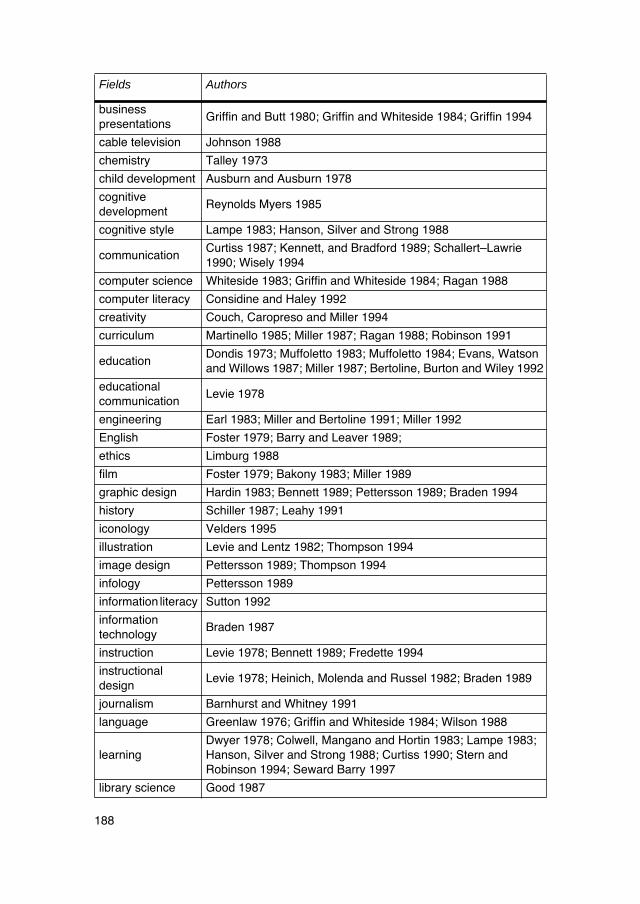
188
business presentations
Griffin and Butt 1980; Griffin and Whiteside 1984; Griffin 1994
cable television Johnson 1988
chemistry Talley 1973
child development Ausburn and Ausburn 1978
cognitive development
Reynolds Myers 1985
cognitive style Lampe 1983; Hanson, Silver and Strong 1988
communication Curtiss 1987; Kennett, and Bradford 1989; Schallert–Lawrie 1990; Wisely 1994
computer science Whiteside 1983; Griffin and Whiteside 1984; Ragan 1988
computer literacy Considine and Haley 1992
creativity Couch, Caropreso and Miller 1994
curriculum Martinello 1985; Miller 1987; Ragan 1988; Robinson 1991
education Dondis 1973; Muffoletto 1983; Muffoletto 1984; Evans, Watson and Willows 1987; Miller 1987; Bertoline, Burton and Wiley 1992
educational communication
Levie 1978
engineering Earl 1983; Miller and Bertoline 1991; Miller 1992
English Foster 1979; Barry and Leaver 1989;
ethics Limburg 1988
film Foster 1979; Bakony 1983; Miller 1989
graphic design Hardin 1983; Bennett 1989; Pettersson 1989; Braden 1994
history Schiller 1987; Leahy 1991
iconology Velders 1995
illustration Levie and Lentz 1982; Thompson 1994
image design Pettersson 1989; Thompson 1994
infology Pettersson 1989
information literacy Sutton 1992
informationtechnology
Braden 1987
instruction Levie 1978; Bennett 1989; Fredette 1994
instructional design
Levie 1978; Heinich, Molenda and Russel 1982; Braden 1989
journalism Barnhurst and Whitney 1991
language Greenlaw 1976; Griffin and Whiteside 1984; Wilson 1988
learning Dwyer 1978; Colwell, Mangano and Hortin 1983; Lampe 1983; Hanson, Silver and Strong 1988; Curtiss 1990; Stern and Robinson 1994; Seward Barry 1997
library science Good 1987
Fields Authors
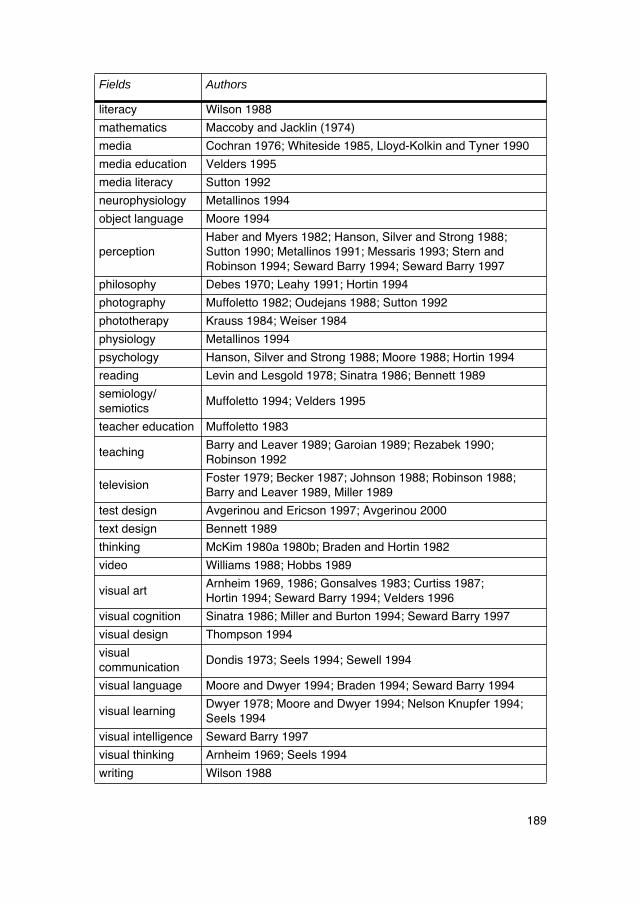
189
literacy Wilson 1988
mathematics Maccoby and Jacklin (1974)
media Cochran 1976; Whiteside 1985, Lloyd-Kolkin and Tyner 1990
media education Velders 1995
media literacy Sutton 1992
neurophysiology Metallinos 1994
object language Moore 1994
perception Haber and Myers 1982; Hanson, Silver and Strong 1988; Sutton 1990; Metallinos 1991; Messaris 1993; Stern and Robinson 1994; Seward Barry 1994; Seward Barry 1997
philosophy Debes 1970; Leahy 1991; Hortin 1994
photography Muffoletto 1982; Oudejans 1988; Sutton 1992
phototherapy Krauss 1984; Weiser 1984
physiology Metallinos 1994
psychology Hanson, Silver and Strong 1988; Moore 1988; Hortin 1994
reading Levin and Lesgold 1978; Sinatra 1986; Bennett 1989
semiology/semiotics
Muffoletto 1994; Velders 1995
teacher education Muffoletto 1983
teaching Barry and Leaver 1989; Garoian 1989; Rezabek 1990; Robinson 1992
television Foster 1979; Becker 1987; Johnson 1988; Robinson 1988; Barry and Leaver 1989, Miller 1989
test design Avgerinou and Ericson 1997; Avgerinou 2000
text design Bennett 1989
thinking McKim 1980a 1980b; Braden and Hortin 1982
video Williams 1988; Hobbs 1989
visual art Arnheim 1969, 1986; Gonsalves 1983; Curtiss 1987; Hortin 1994; Seward Barry 1994; Velders 1996
visual cognition Sinatra 1986; Miller and Burton 1994; Seward Barry 1997
visual design Thompson 1994
visual communication
Dondis 1973; Seels 1994; Sewell 1994
visual language Moore and Dwyer 1994; Braden 1994; Seward Barry 1994
visual learning Dwyer 1978; Moore and Dwyer 1994; Nelson Knupfer 1994; Seels 1994
visual intelligence Seward Barry 1997
visual thinking Arnheim 1969; Seels 1994
writing Wilson 1988
Fields Authors
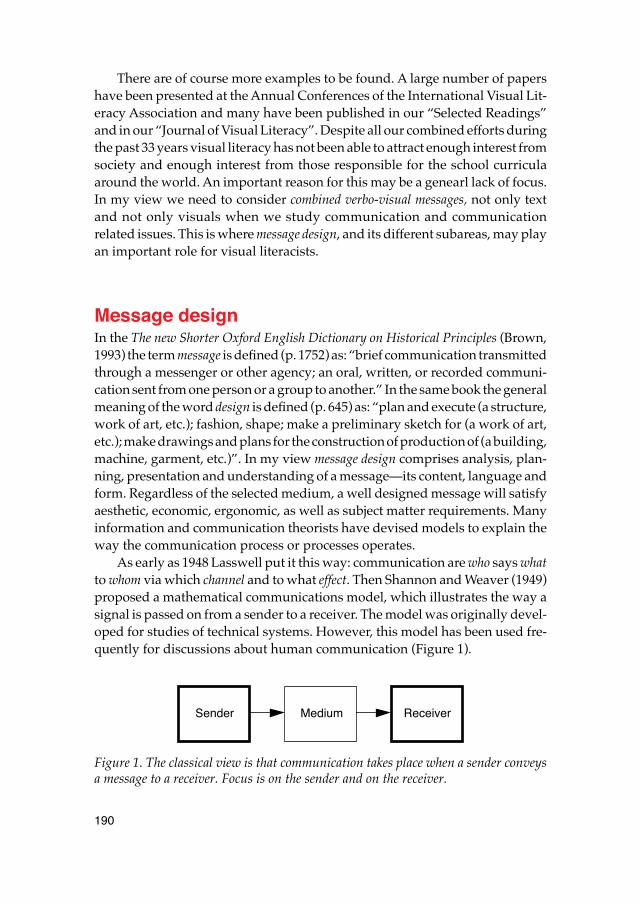
190
There are of course more examples to be found. A large number of papershave been presented at the Annual Conferences of the International Visual Lit-eracy Association and many have been published in our “Selected Readings”and in our “Journal of Visual Literacy”. Despite all our combined efforts duringthe past 33 years visual literacy has not been able to attract enough interest fromsociety and enough interest from those responsible for the school curriculaaround the world. An important reason for this may be a genearl lack of focus.In my view we need to consider combined verbo-visual messages, not only textand not only visuals when we study communication and communicationrelated issues. This is where message design, and its different subareas, may playan important role for visual literacists.
Message designIn the The new Shorter Oxford English Dictionary on Historical Principles (Brown,1993) the term message is defined (p. 1752) as: “brief communication transmittedthrough a messenger or other agency; an oral, written, or recorded communi-cation sent from one person or a group to another.” In the same book the generalmeaning of the word design is defined (p. 645) as: “plan and execute (a structure,work of art, etc.); fashion, shape; make a preliminary sketch for (a work of art,etc.); make drawings and plans for the construction of production of (a building,machine, garment, etc.)”. In my view message design comprises analysis, plan-ning, presentation and understanding of a message—its content, language andform. Regardless of the selected medium, a well designed message will satisfyaesthetic, economic, ergonomic, as well as subject matter requirements. Manyinformation and communication theorists have devised models to explain theway the communication process or processes operates.
As early as 1948 Lasswell put it this way: communication are who says whatto whom via which channel and to what effect. Then Shannon and Weaver (1949)proposed a mathematical communications model, which illustrates the way asignal is passed on from a sender to a receiver. The model was originally devel-oped for studies of technical systems. However, this model has been used fre-quently for discussions about human communication (Figure 1).
Figure 1. The classical view is that communication takes place when a sender conveysa message to a receiver. Focus is on the sender and on the receiver.
ReceiverSender Medium
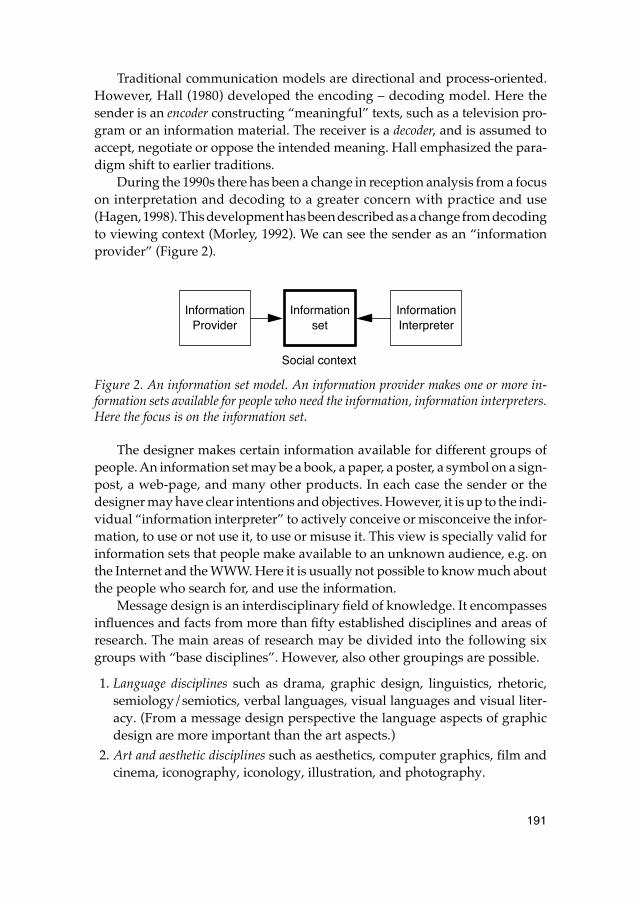
191
Traditional communication models are directional and process-oriented.However, Hall (1980) developed the encoding – decoding model. Here thesender is an encoder constructing “meaningful” texts, such as a television pro-gram or an information material. The receiver is a decoder, and is assumed toaccept, negotiate or oppose the intended meaning. Hall emphasized the para-digm shift to earlier traditions.
During the 1990s there has been a change in reception analysis from a focuson interpretation and decoding to a greater concern with practice and use(Hagen, 1998). This development has been described as a change from decodingto viewing context (Morley, 1992). We can see the sender as an “informationprovider” (Figure 2).
Figure 2. An information set model. An information provider makes one or more in-formation sets available for people who need the information, information interpreters.Here the focus is on the information set.
The designer makes certain information available for different groups ofpeople. An information set may be a book, a paper, a poster, a symbol on a sign-post, a web-page, and many other products. In each case the sender or thedesigner may have clear intentions and objectives. However, it is up to the indi-vidual “information interpreter” to actively conceive or misconceive the infor-mation, to use or not use it, to use or misuse it. This view is specially valid forinformation sets that people make available to an unknown audience, e.g. onthe Internet and the WWW. Here it is usually not possible to know much aboutthe people who search for, and use the information.
Message design is an interdisciplinary field of knowledge. It encompassesinfluences and facts from more than fifty established disciplines and areas ofresearch. The main areas of research may be divided into the following sixgroups with “base disciplines”. However, also other groupings are possible.
1. Language disciplines such as drama, graphic design, linguistics, rhetoric,semiology/semiotics, verbal languages, visual languages and visual liter-acy. (From a message design perspective the language aspects of graphicdesign are more important than the art aspects.)
2. Art and aesthetic disciplines such as aesthetics, computer graphics, film andcinema, iconography, iconology, illustration, and photography.
Information InformationInformationset
Social context
Provider Interpreter
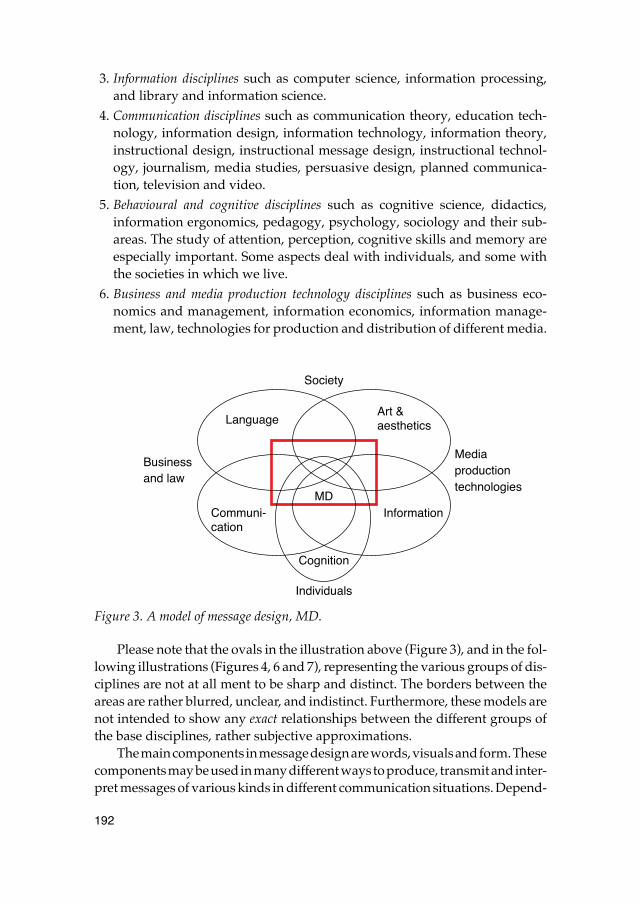
192
3. Information disciplines such as computer science, information processing,and library and information science.
4. Communication disciplines such as communication theory, education tech-nology, information design, information technology, information theory,instructional design, instructional message design, instructional technol-ogy, journalism, media studies, persuasive design, planned communica-tion, television and video.
5. Behavioural and cognitive disciplines such as cognitive science, didactics,information ergonomics, pedagogy, psychology, sociology and their sub-areas. The study of attention, perception, cognitive skills and memory areespecially important. Some aspects deal with individuals, and some withthe societies in which we live.
6. Business and media production technology disciplines such as business eco-nomics and management, information economics, information manage-ment, law, technologies for production and distribution of different media.
Figure 3. A model of message design, MD.
Please note that the ovals in the illustration above (Figure 3), and in the fol-lowing illustrations (Figures 4, 6 and 7), representing the various groups of dis-ciplines are not at all ment to be sharp and distinct. The borders between theareas are rather blurred, unclear, and indistinct. Furthermore, these models arenot intended to show any exact relationships between the different groups ofthe base disciplines, rather subjective approximations.
The main components in message design are words, visuals and form. Thesecomponents may be used in many different ways to produce, transmit and inter-pret messages of various kinds in different communication situations. Depend-
Individuals
Business
Society
and law
Media
technologiesproduction
Cognition
LanguageArt &
Communi- InformationMD
cation
aesthetics
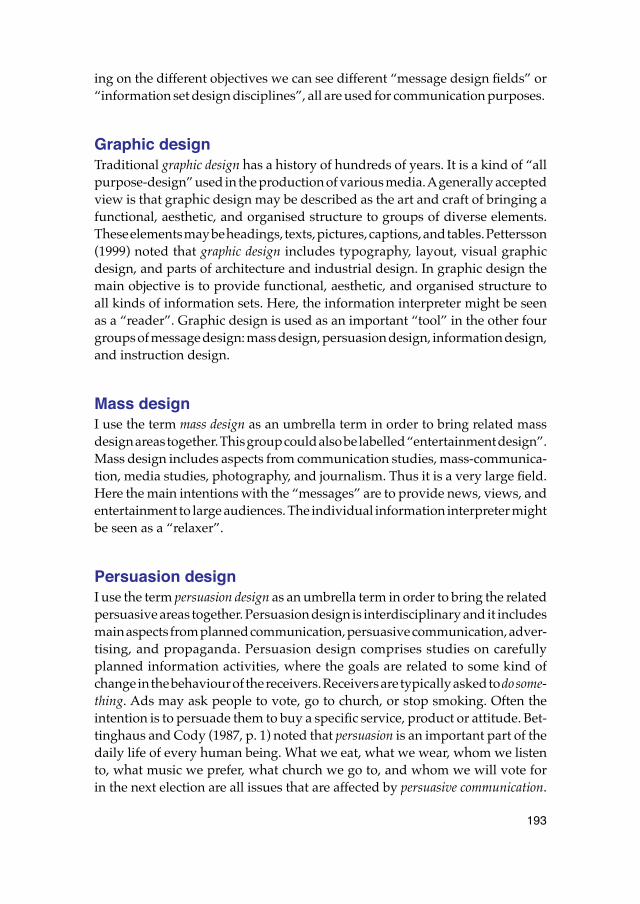
193
ing on the different objectives we can see different “message design fields” or“information set design disciplines”, all are used for communication purposes.
Graphic designTraditional graphic design has a history of hundreds of years. It is a kind of “allpurpose-design” used in the production of various media. A generally acceptedview is that graphic design may be described as the art and craft of bringing afunctional, aesthetic, and organised structure to groups of diverse elements.These elements may be headings, texts, pictures, captions, and tables. Pettersson(1999) noted that graphic design includes typography, layout, visual graphicdesign, and parts of architecture and industrial design. In graphic design themain objective is to provide functional, aesthetic, and organised structure toall kinds of information sets. Here, the information interpreter might be seenas a “reader”. Graphic design is used as an important “tool” in the other fourgroups of message design: mass design, persuasion design, information design,and instruction design.
Mass designI use the term mass design as an umbrella term in order to bring related massdesign areas together. This group could also be labelled “entertainment design”.Mass design includes aspects from communication studies, mass-communica-tion, media studies, photography, and journalism. Thus it is a very large field.Here the main intentions with the “messages” are to provide news, views, andentertainment to large audiences. The individual information interpreter mightbe seen as a “relaxer”.
Persuasion designI use the term persuasion design as an umbrella term in order to bring the relatedpersuasive areas together. Persuasion design is interdisciplinary and it includesmain aspects from planned communication, persuasive communication, adver-tising, and propaganda. Persuasion design comprises studies on carefullyplanned information activities, where the goals are related to some kind ofchange in the behaviour of the receivers. Receivers are typically asked to do some-thing. Ads may ask people to vote, go to church, or stop smoking. Often theintention is to persuade them to buy a specific service, product or attitude. Bet-tinghaus and Cody (1987, p. 1) noted that persuasion is an important part of thedaily life of every human being. What we eat, what we wear, whom we listento, what music we prefer, what church we go to, and whom we will vote forin the next election are all issues that are affected by persuasive communication.
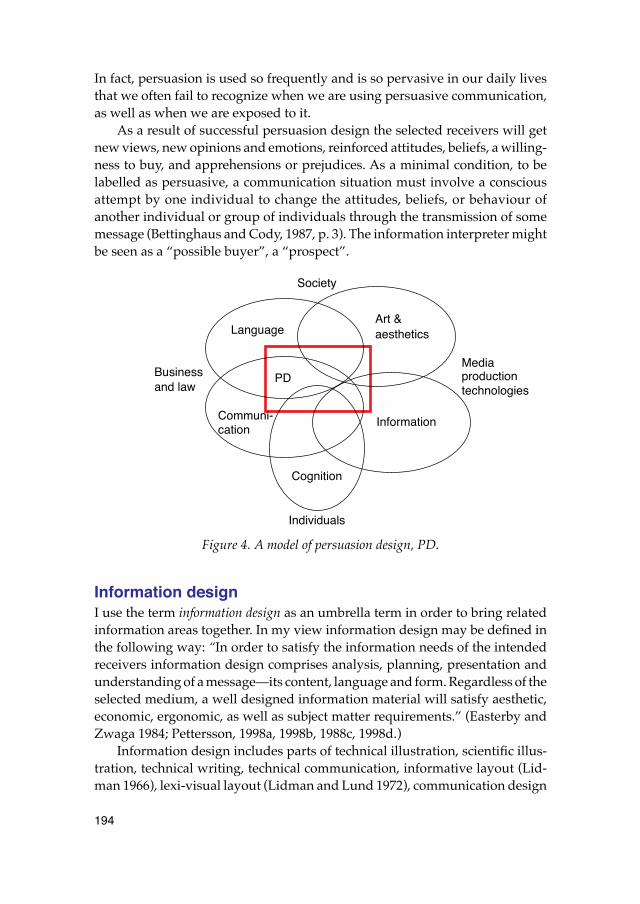
194
In fact, persuasion is used so frequently and is so pervasive in our daily livesthat we often fail to recognize when we are using persuasive communication,as well as when we are exposed to it.
As a result of successful persuasion design the selected receivers will getnew views, new opinions and emotions, reinforced attitudes, beliefs, a willing-ness to buy, and apprehensions or prejudices. As a minimal condition, to belabelled as persuasive, a communication situation must involve a consciousattempt by one individual to change the attitudes, beliefs, or behaviour ofanother individual or group of individuals through the transmission of somemessage (Bettinghaus and Cody, 1987, p. 3). The information interpreter mightbe seen as a “possible buyer”, a “prospect”.
Figure 4. A model of persuasion design, PD.
Information designI use the term information design as an umbrella term in order to bring relatedinformation areas together. In my view information design may be defined inthe following way: “In order to satisfy the information needs of the intendedreceivers information design comprises analysis, planning, presentation andunderstanding of a message—its content, language and form. Regardless of theselected medium, a well designed information material will satisfy aesthetic,economic, ergonomic, as well as subject matter requirements.” (Easterby andZwaga 1984; Pettersson, 1998a, 1998b, 1988c, 1998d.)
Information design includes parts of technical illustration, scientific illus-tration, technical writing, technical communication, informative layout (Lid-man 1966), lexi-visual layout (Lidman and Lund 1972), communication design
Individuals
Business
Society
and law
Media
technologiesproduction
Cognition
LanguageArt &
Communi- Information
PD
aesthetics
cation
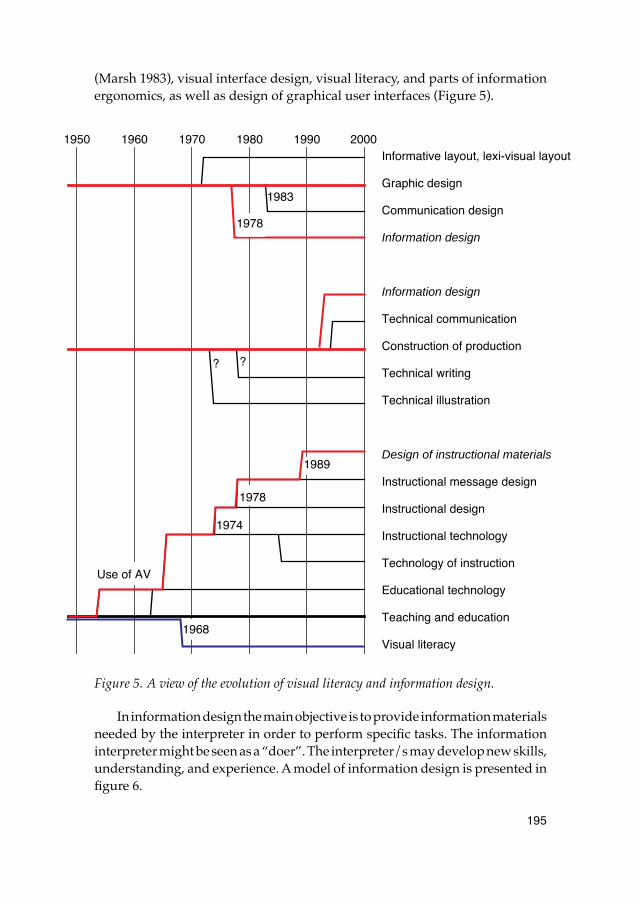
195
(Marsh 1983), visual interface design, visual literacy, and parts of informationergonomics, as well as design of graphical user interfaces (Figure 5).
Figure 5. A view of the evolution of visual literacy and information design.
In information design the main objective is to provide information materialsneeded by the interpreter in order to perform specific tasks. The informationinterpreter might be seen as a “doer”. The interpreter/s may develop new skills,understanding, and experience. A model of information design is presented infigure 6.
Informative layout, lexi-visual layout
Graphic design
Communication design
Information design
Information design
Technical communication
Construction of production
Technical writing
Technical illustration
Design of instructional materials
Instructional message design
Instructional design
Instructional technology
Technology of instruction
Educational technology
Teaching and education
Visual literacy
1950 1960 1970 1980 1990 2000
1983
??
1974
1968
1989
1978
1978
Use of AV
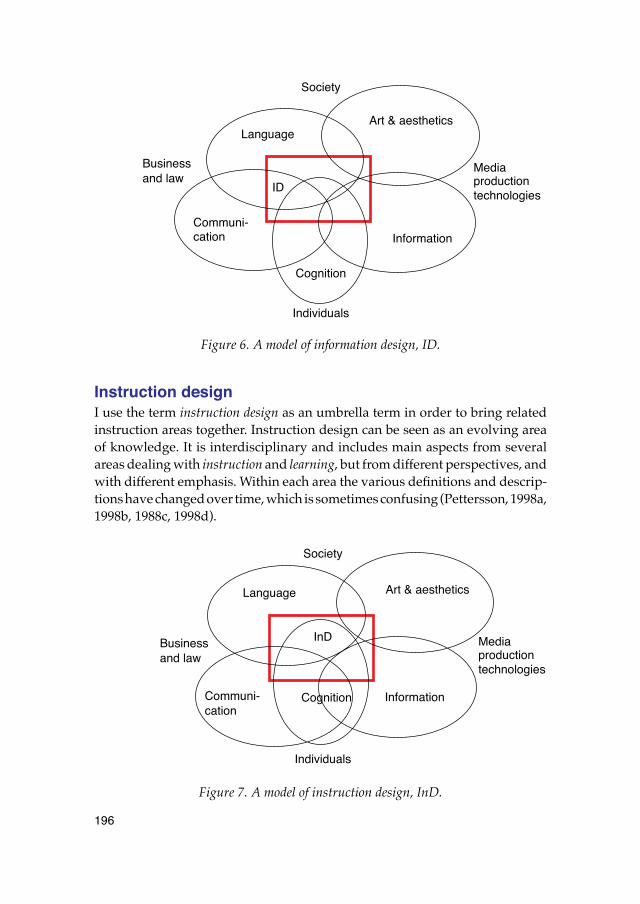
196
Figure 6. A model of information design, ID.
Instruction designI use the term instruction design as an umbrella term in order to bring relatedinstruction areas together. Instruction design can be seen as an evolving areaof knowledge. It is interdisciplinary and includes main aspects from severalareas dealing with instruction and learning, but from different perspectives, andwith different emphasis. Within each area the various definitions and descrip-tions have changed over time, which is sometimes confusing (Pettersson, 1998a,1998b, 1988c, 1998d).
Figure 7. A model of instruction design, InD.
Individuals
Business
Society
and lawMedia
technologiesproduction
Cognition
LanguageArt & aesthetics
Communi-Information
ID
cation
Individuals
Business
Society
and lawMedia
technologiesproduction
Cognition
Language Art & aesthetics
Communi- Information
InD
cation
197
Instruction design (Figure 5) includes parts of audio-visual instruction(Saettler 1968), educational technology (Morgan 1970), instructional technology(Saettler 1968), visual literacy, technology of instruction (Glaser 1978), instruc-tional design (Gagne and Briggs 1974), instructional message design (Flemingand Levie 1978), and design of instructional materials (Briggs and Wager 1989).There seems to be no major difference between these areas, and they are allclosely related to information design. The various instructional areas are, how-ever, more narrow than information design. The main intentions are to providecourses lessons and materials intended for learning. The interpreter/s maydevelop new understanding, experience, comprehension, knowledge, insight,and finally wisdom. We can note a paradigm shift from the old and traditionalfocus on teaching to a focus on learning.
Performance objectivesSeveral researchers have pointed out that it is important to define clear objectivesin message design (Heinich, Molenda and Russell, 1982; Marsh, 1983; Flemingand Levie, 1993; and Wileman, 1993), as well as in information design (Mulletand Sano, 1995; and Pettersson, 1998c, 1998d).
A performance, and a change in behaviour, must be observable. Thus sub-jective objectives defined by verbs like appreciate, assess, describe, discuss, evaluate,know, outline, and understand should be avoided. A statement of design objectivesshould include the conditions under which the required performance is to beobserved and measured, when such conditions are relevant. Time and accuracyare often meaningful dimensions in assessment of objectives.
When performance is qualitative rather than quantitative, the performancemay be assessed by a group of experts. It should be noted that there is an increas-ing incidence of law suits being brought against manufacturers in the USA.These law suits claim damages as a result of accidents occurring, or productsbreaking because of poor quality in the language of instruction manuals (Helyar,1992). The courts are demanding that technical manuals, brochures, informationsheets, and labels be written in comprehensible language, and that descriptionsand instructions be readable and legible. Everywhere, plaintiffs' counsels aresearching frenetically for sections of text and parts of pictures that might be inter-preted in conflicting ways. If a manufacturer's technical documentation is dif-ficult to understand, the company can lose a lawsuit and then have to pay largesums of money.
In graphic design it may be an advantage to use verbs like find, identify,read, and recognise. These verbs all denote observable behaviour.
In mass design it may be an advantage to use verbs like feel, laugh, look, read,and relax. These verbs all denote observable behaviour.
198
In persuasion design it may be an advantage to use verbs like appreciate, believe,buy, change (behaviour), desire, dread, fear, feel (relaxed), hate, and have (fun) in thewriting of persuasion design objectives. These verbs all denote observablebehaviour.
In information design it may be an advantage to use verbs like apply, arrange,assemble, build, change, code, complete, compose, conduct, construct, cut, demonstrate,develop, draw, explain, find, generate, get, identify, illustrate, install, label, locate, make,modify, name, operate, pack, paste, predict, prepare, produce, put, read, recognise, recon-struct, remove, revise, sort, specify, start, type, verify, and write in the writing ofinformation design objectives. These verbs all denote observable behaviour.
In instruction design it may be an advantage to use verbs like apply, arrange,complete, compose, conduct, construct, define, demonstrate, explain, find, identify,illustrate, label, modify, name, predict, prepare, recognise, reconstruct, revise, specify,verify, and write in the writing of instruction design objectives. These verbs alldenote observable behaviour.
The objectives with information set design disciplines may be summarisedin the following way:
• In graphic design the main intentions are to provide functional, aesthetic,and organised structure to all kinds of information sets. The interpreter/smay develop new views, relaxation, emotions, attention, understanding,and awareness.
• In mass design the main intentions are to provide news, views, and enter-tainment. The interpreter/s may develop views, relaxation, emotions, andawareness.
• In persuasion design the main intentions are to provide advertising or propa-ganda in order to persuade interpreters to buy a product or a service, or tochange behaviour. The interpreter/s may develop new prejudices, appre-hensions, willingness to buy, beliefs, reinforced attitudes, emotions, opin-ions, and views.
• In information design the main intentions are to provide information materi-als needed by the interpreter in order to perform a specific task. The inter-preter/s may develop new skills, understanding, and experience.
• In instruction design the main intentions are to provide courses and learningmaterials needed by the interpreter in order to modify behaviour withrespect to learning. The interpreter/s may develop new understanding,experience, comprehension, knowledge, insight, and finally wisdom.
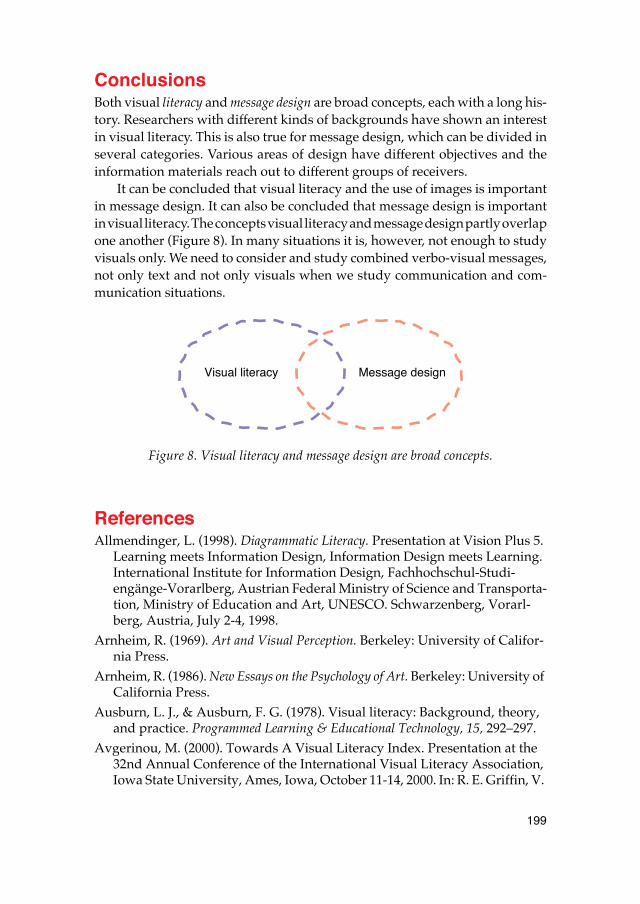
199
ConclusionsBoth visual literacy and message design are broad concepts, each with a long his-tory. Researchers with different kinds of backgrounds have shown an interestin visual literacy. This is also true for message design, which can be divided inseveral categories. Various areas of design have different objectives and theinformation materials reach out to different groups of receivers.
It can be concluded that visual literacy and the use of images is importantin message design. It can also be concluded that message design is importantin visual literacy. The concepts visual literacy and message design partly overlapone another (Figure 8). In many situations it is, however, not enough to studyvisuals only. We need to consider and study combined verbo-visual messages,not only text and not only visuals when we study communication and com-munication situations.
Figure 8. Visual literacy and message design are broad concepts.
ReferencesAllmendinger, L. (1998). Diagrammatic Literacy. Presentation at Vision Plus 5.
Learning meets Information Design, Information Design meets Learning. International Institute for Information Design, Fachhochschul-Studi-engänge-Vorarlberg, Austrian Federal Ministry of Science and Transporta-tion, Ministry of Education and Art, UNESCO. Schwarzenberg, Vorarl-berg, Austria, July 2-4, 1998.
Arnheim, R. (1969). Art and Visual Perception. Berkeley: University of Califor-nia Press.
Arnheim, R. (1986). New Essays on the Psychology of Art. Berkeley: University of California Press.
Ausburn, L. J., & Ausburn, F. G. (1978). Visual literacy: Background, theory, and practice. Programmed Learning & Educational Technology, 15, 292–297.
Avgerinou, M. (2000). Towards A Visual Literacy Index. Presentation at the 32nd Annual Conference of the International Visual Literacy Association, Iowa State University, Ames, Iowa, October 11-14, 2000. In: R. E. Griffin, V.
Visual literacy Message design
200
S. Villiams & J. Lee (Eds.) 2001: Exploring the Visual Future: Art Design, Sci-ence & Technology. Selected Readings of the International Visual Literacy Asso-ciation. International Visual Literacy Association.
Avgerinou, M., & Ericson, J. (1996). Debes’ hierarchy: A springboard for assessing visual literacy skills? In T. Velders (Ed. ) (1996). Beeldenstorm in Deventer. Multimedia Education in Praxis. Selected Readings. Deventer.
Avgerinou, M., & Ericson, J. (1997). A review of the concept of visual literacy. British Journal of Educational Technology, 28(4), 280-291.
Avgerinou, M, & Ericson, J. (1999). Testing Visual Literacy: Some Progress With Research? In R. E. Griffin, W. J. Gibbs, & B. Wiegman (Eds.) 1999: Visual Lit-eracy In An Information Age. International Visual Literacy Association.
Bakony, E. (1983). Some aspects of meaning in film aesthetics. In R. Braden, & A. Walker (Eds.). Seeing Ourselves: Visualization in a Social Context. Readings from the 14th Annual Confernce of the International Visual Literacy Asso-ciation. Blacksburg: Virginia Tech University.
Barnhurst, K. G., & Whitney, D. C. (1991). Visual literacy training: Changing how journalism students reason about layout. In D. G. Beauchamp, J. Clark-Baca, & R. A. Braden (Eds.). Investigating Visual Literacy. Selected Readings from the 22nd Annual Conference of the International Visual Literacy Associa-tion. Blacksburg: Virginia Tech University.
Barry, A-M., & Leaver, A. (1989). Teaching visual literacy through newspeak: A unit model for integrating visual literacy principles and practices in the secondary English classroom. In R. A. Braden, D. G. Beauchamp, L. V. W. Miller, & D. M. Moore (Eds.). About Visuals: Research, Teaching, and Applications. Read-ings from the 20th Annual Conference of the International Visual Literacy Association. Blacksburg: Virginia Tech University.
Becker, A. D. (1987). Tracing the codes of educational and instructional television. In R .A. Braden, D. G. Beauchamp, & L. V. W. Miller (Eds.). Visible & Viable: The Role of Images in Instruction and Communication. Commerce: East Texas State University.
Bennett, L.T. (1989). Visual Literacy: A Factor of Text Design and Reading Instruction. Published in: R. A. Braden, D. G. Beauchamp, L. V. W. Miller, & D. M. Moore (Eds.). About Visuals: Research, Teaching, and Applications. Readings from the 20th Annual Conference of the International Visual Lit-eracy Association. Blacksburg: Virginia Tech University.
Bertoline, G. R. , Burton, T. L. , & Wiley, S. E. (1992). Technical graphics as a catalyst for developing visual literacy within general education. In J. Clark-Baca, D. G. Beauchamp, & R. A. Braden (Eds. ). Visual Communication: Bridging Across Cultures. Selected Readings from the 23rd Annual Confer-ence of the International Visual Literacy Association. Blacksburg: Virginia Tech University.
201
Besser, H. (1987). Computers for art analysis. In R. A. Braden, D. G. Beauchamp, & L. V. W. Miller (Eds.). Visible & Viable: The Role of Images in Instruction and Communication. Commerce: East Texas State University.
Bettinghaus, E. P., Cody, M. J. (1987). Persuasive Communication. Fort Wort: Harcourt Brace Jovanovich College Publishers.
Bopry, J. (1994). Visual literacy on education: Asemiotic perspective. Journal of Visual Litearcy, 14 (1), 35-49.
Braden, R. A. (1987). High Impact Technology and Visual Literacy: Reacting to Change. Paper presented at the Symposium on Verbo-Visual Literacy: Research and Theory. Stockholm, June 10–13, 1987.
Braden, R. A. (1989). Task Analysis for Visual-Verbal Cross Coding Learning Tasks. In R. A. Braden, D. G. Beauchamp, L. V. W. Miller, & D. M. Moore (Eds.). About Visuals: Research, Teaching, and Applications. Readings from the 20th Annual Conference of the International Visual Literacy Association. Blacksburg: Virginia Tech University.
Braden, R. A. (1994). Visual Verbal Relationships. In Moore, D. M., & Dwyer, F. M. (Eds.). Visual Literacy: A Spectrum of Visual Learning. Englewood Cliffs, NJ: Educational Technology Publications.
Braden, R. A. , & Clark-Baca, J. (1991). Toward a conceptual map for visual lit-eracy constructs. In D. G. Beauchamp, J. Clark-Baca, & R. A. Braden (Eds. ). Investigating Visual Literacy: Selected Readings from the 22nd Annual Conference of the International Visual Literacy Association. Blacksburg: Virginia Tech University.
Braden, R. A., & Hortin, J. A. (1982). Identifying the theoretical foundations of visual literacy. Journal of Visual Verbal Languaging, 2(2), 37–51.
Briggs, L. J. , & Wager, W. W. (1989) Handbook of procedures for the design of instruction. Englewood Cliffs. N. J. (USA): Educational Technology Publi-cations.
Brouwer, H. (1995). Communicating with pictures. The Role of Pictures in Health Education in Outpatient Clinics of Rural African Hospitals. Visual Sociology 10 (1–2), 15–27.
Brown, L. (Ed.) (1993). The new Shorter Oxford English Dictionary on Historical Principles. Oxford: Clarendon Press.
Chaplin, J. (1971). Picture perception in Africa. London: Penrose Annual. Clark-Baca, J. (1990). Identification by Consensus of the Critical Constructs of
Visual Literacy: A Delphi Study (Doctoral dissertation, East Texas State Uni-versity, 1990).
Clark-Baca, J., & Braden, R. A. (1990). The delphi study: A proposed method for resolving visual literacy uncertainties. In R. A. Braden, D. G. Beauchamp, & J. Clark-Baca (Eds.). Perceptions of Visual Literacy. Selected Readings from the 21st Annual Conference of the International Visual Literacy Association. Conway: University of Central Arkansas.
202
Cochran, L. (1976). Defining Visual Literacy. AECT Research and Theory Divi-sion Newsletter, 5, 3–4.
Colwell, C. G., Mangano, N.G., & Hortin, J.A. (1983). Humor and Visual Liter-acy: Keys to Effective Learning. In A. D. Walker, R. A. Braden, & L. H. Dunker (Eds. ) 1984: Enhancing human potential. Readings from the 15th Annual Con-ference of the International Visual Literacy Association. Blacksburg, Virginia. 313–320.
Considine, D. M. (1986). Visual Literacy & Children’s Books: An Integrated Approach. School Library Journal, September, 38–42.
Considine, D. M. , & Haley, G. E. (1992). Visual Messages. Integrating Imagery into Instruction. Englewood , Colorado. Teacher Ideas Press.
Cook, B. L. (1981). Understanding Pictures in Papua New Guinea. Elgin, IL: David C. Cook Foundation.
Couch, R. A., Caropreso, E. J. and Miller, H. B. (1994). Making Meaning from Visuals: Creative Thinking and Interpretation of Visual Information. In Moore, D. M., & Dwyer, F. M. (Eds.). Visual Literacy: A Spectrum of Visual Learning. Englewood Cliffs, NJ: Educational Technology Publications.
Curtiss, D. (1987). Introdction to visual literacy a guide to the visual arts and com-munication. Englewood Cliffs, New Jersey: Prentice–Hall, Inc.
Curtiss, D. (1990). Visual Literacy Outreach Possibilities. In R. A. Braden, D. G. Beauchamp, & J. Clark–Baca (Eds. ) 1990: Perceptions of Visual Literacy. Selected Readings from the 21st Annual Conference of the International Visual Literacy Association. University of Central Arkansas Conway. Arkansas.
Debes, J. L. (1969). The loom of visual literacy. Audiovisual Instruction, 14, 25–27.
Debes, J. L. (1970). The loom of visual literacy – an overview. In C.M. Williams & J. L. Debes (Eds). Proceedings of the First National Conference on Visual Liter-acy. New York: Pitman Publishing Corporation.
deLange, R, W. (1996). Cultural Modifications in Visuals as a Support to Printed Educational Media in Africa: an Erroneous Paradigm. In T. Velders (Ed. ) (1996). Beeldenstorm in Deventer. Multimedia Education in Praxis. Selected Readings. Deventer.
Dondis, D. A. (1973). A Primer of Visual Literacy. Cambridge, MA: Massachu-setts Institute of Technology.
Dwyer, F. M. (1978). Strategies for Improving Visual Learning. State College, PA: Learning Services.
Earl, J.H. (1983). Engineering Design Graphics. Reading, Mass. Addison-Wesley Publishing Company.
Easterby, R. & Zwaga, H. (Eds.) (1984). Information Design. The design and eval-uation of signs and printed material. John Wiley and Sons Ltd.
Ericson, J, D. (1998). Educational Technology: Product or Process? University of Bath, School of Education, ET1-25 iii.
203
Esdale, B., & Robinson, R. (1982). Viewing in Secondary Language Arts. Edmon-ton, Alberta: Alberta Education.
Evans, M. A. , Watson, C. , & Willows, D. M. (1987). A naturalistic inquiry into illustrations in instructional textbooks. In H. A. Houghton, & D. M. Wil-lows (Eds. ). The Psychology of Illustrations: Vol. 2. Instructional Issues, New York: Springer-Verlag.
Fleming, M. L. , & Levie, W. H. (1978). Instructional Message Design. Engle-wood Cliffs, NJ: Educational Technology Publications.
Fleming, M. L., & Levie, W. H. (Eds.) (1993). Instructional Message Design (2nd ed.). Englewood Cliffs, NJ: Educational Technology Publications.
Fork, D. J. , & Jonassen, D. H. (1976). Research in Visual Literacy: Where to Begin? AECT Research and Theory Division Newsletter, 5, 12–14. (ERIC Doc-ument Reproduction Service No. ED 136 822).
Foster, H. M. (1979). The New Literacy: The Language of Film and Television. Urbana, IL, National Council of Teachers of English.
Fransecky, R. B., & Debes, J. L. (1972). Visual literacy: A way to learn – a way to teach. Washington, DC: Association for Educational Communications and Technology.
Fredette, B. W. (1994). Use of Visuals in Schools. (Curriculum and Instruction). In Moore, D. M., & Dwyer, F. M. (Eds.). Visual Literacy: A Spectrum of Visual Learning. Englewood Cliffs, NJ: Educational Technology Publications.
Gagné, R. W. , & Briggs, L. J. (1974). Principles of Instructional Design. New York: Holt, Rinehart, & Winston.
Garoian, C. R. (1989). Teaching visual literacy through art history in high school. In R. A. Braden, D. G. Beauchamp, L. V. W. Miller, & D. M. Moore (Eds.). About Visuals: Research, Teaching, and Applications. Readings from the 20th Annual Conference of the International Visual Literacy Association. Blacksburg: Virginia Tech University.
Glaser, R. (1978). The design of instruction. In J. I. Goodland (Ed. ), The changing American school: NSSE 65th Yearbook. Chicago: University of Chicago Press.
Gonsalves, A. A. (1983). Validating visual literacy experiences – a five-year affective study. In A. D. Walker, R. A. Braden, & L. H. Dunker (Eds. ) 1984: Enhancing human potential. Readings from the 15th Annual Conference of the International Visual Literacy Association. Blacksburg, Virginia. 187–196.
Good, B. L. (1987). K–12 curriculum integrated library media skills: The impact of visual motivators. In R.A. Braden, D.G. Beauchamp, & L.W. Miller (Eds.). Visible & Viable: The Role of Images in Instruction and Communication. Com-merce: East Texas State University.
Greenlaw, M. J. (1976). Visual Literacy and reading instruction: From books to media and back to books. Language Arts, 53 (7), 786–790.
204
Griffin, R. E. (1994). Use of Visuals: Business and Industry. In Moore, D. M., & Dwyer, F. M. (Eds.). Visual Literacy: A Spectrum of Visual Learning. Engle-wood Cliffs, NJ: Educational Technology Publications.
Griffin, R. E., & Butt, D, E. 1980. A communication component in a business administration curriculum: A frontier for visual literacy. College Park, Maryland: Paper presented at the Annual Conference on Visual Litearcy, November.
Griffin, R. E., & Whiteside, J. A. (1984). Visual literacy: A model for understanding the discipline. In A. D. Walker, R. A. Braden, & L. H. Dunker (Eds.). Visual Literacy: Enhancing Human Potential. Blacksburg: Virginia Tech University.
Haber, R. N., & Myers, B. L. (1982). Memory for pictograms, pictures, and words separately and all mixed up. Perception, 11, 57–64.
Hagen, I. (1998). Creation of Socio—Cultural Meaning. Media Reception Research and Cognitive Psychology. In B. Höijer and A. Werner (Eds.). Cultural Cogni-tion. New perspectives in audience theory. NORDICOM: Göteborg University.
Hall, S. (1980). Encoding/Decoding. In S. Hall, D. Dobson, A. Lowe, and P. Willis (Eds.). Culture, Media, Language. London: Hutchinson.
Hansen, Y. (1989). An Adult Handbook to Develop Visual Thinking: How to Use Simple Graphic Tools for Thinking, Planning, and Problem Solving. In R. A. Braden, D. G. Beauchamp, L. V. W. Miller, & D. M. Moore (Eds.). About Visuals: Research, Teaching, and Applications. Readings from the 20th Annual Conference of the International Visual Literacy Association. Blacksburg: Virginia Tech University.
Hanson, J. R. (1988). Learning styles, visual literacies, and a framework for reading instruction. Reading Psychology: An International Quarterly, 9, 409–430.
Hanson, J. R., Silver, H. F., & Strong, R. W. (1988). Learning styles and visual lit-eracy: Connections and actions. In R. A. Braden, D. G. Beauchamp, & L. Miller (Eds.). Visual Literacy in Life and Learning. Blacksburg: Virginia Tech Uni-versity.
Hardin, P. (1983). Investigating visual communication in diagrams. In A. D. Walker, R. A. Braden, & L. H. Dunker (Eds.). Seeing Ourselves: Visualization in a Social Context. Blacksburg: Virginia Tech University.
Heinich, R., Molenda, M., & Russell, J. D. (1982). Instructional Media and the New Technologies of Instruction. New York: Macmillan
Helyar, P. S. (1992). Products Liability: Meeting Legal Standards for Adequate Instructions. Journal of Technical Writing and Communication. 22, 2, 125-147.
Hobbs, R. (1989). Taft school media project, year one: Uniting video production and critical television viewing. In R. A. Braden, D. G. Beauchamp, L. V. W. Miller, & D. M. Moore (Eds.). About Visuals: Research, Teaching, and Applications. Readings from the 20th Annual Conference of the International Visual Lit-eracy Association. Blacksburg: Virginia Tech University.
205
Hortin, J. A. (1980). Sources for developing a theory of visual literacy. Manhattan, Kansas. ERIC Document Reproduction Service No. ED204716.
Hortin, J. A. (1982). A Need for a Theory of Visual Literacy. Reading Improve-ment, 19, 257–267.
Hortin, J. A. (1984). Visual literacy and visual thinking. In L. Burbank, & D. Pett (Eds.) Contributions to the study of visual literacy. IVLA.
Hortin, J. A. (1994). Theoretical Foundations of Visual Literacy. In Moore, D. M., & Dwyer, F. M. (Eds.). Visual Literacy: A Spectrum of Visual Learning. Engle-wood Cliffs, NJ: Educational Technology Publications.
Hugo, J. & Skibbe, A. (1991). Facing visual illiteracy in South African health education: a pilot study. Journal of Audiovisual Media in Medicine 14, 47–50.
Johnson, L. (1988). Cable Television – Public Schools – Visual Literacy. In R. A. Braden, D. G. Beauchamp, & L. Miller (Eds.). Visual Literacy in Life and Learning. Blacksburg: Virginia Tech University.
Jonassen, D. H., & Fork, D. J. (1975). Visual Literacy: A Bibliographic Survey. Paper presented at The Pennsylvania Learning Resources Association Annual Conference. (ERIC Document Reproduction Service No. ED 131 837).
Kissick, B. & Grob, D.H. (1989). As You See It: Visual Literacy for Adults. In R. A. Braden, D. G. Beauchamp, L. V. W. Miller, & D. M. Moore (Eds.). About Visuals: Research, Teaching, and Applications. Readings from the 20th Annual Conference of the International Visual Literacy Association. Blacksburg: Virginia Tech University.
Krauss, D. A. (1984). A phototherapy project. In A. D. Walker, R. A. Braden, & L. H. Dunker (Eds.). Visual Literacy: Enhancing Human Potential. Blacksburg, VA: Virginia Tech University.
Lacy, L. (1987). An interdisciplinary approach for students in K–12 using visuals of all kinds. In R. A. Braden, D. G. Beauchamp, & L. W. Miller (Eds.). Visible & Viable: The Role of Images in Instruction and Communication. Commerce: East Texas State University.
Lampe, S. L. (1983). Visual Literacy and Cognitive Style: Assessing Field Depen-dency With theatrical Slides. In A. D. Walker, R. A. Braden, & L. H. Dunker (Eds. ) 1984: Enhancing human potential. Readings from the 15th Annual Con-ference of the International Visual Literacy Association. Blacksburg, Virginia. 116–128.
Lasswell, H. (1948). The structure and function of communication in society. In L. Bryson (Ed.). The Communication of Ideas. New York: Harper & Brothers.
Leahy, S. B. (1991). Visual literacy: Investigation of visual literacy concepts as his-torically developed in writings of selected western philosophers from the pre-Socratics to Comenius. In D. G. Beauchamp, J. Clark-Baca, & R. A. Braden (Eds.). Investigating Visual Literacy. Selected Readings from the 22nd
206
Annual Conference of the International Visual Literacy Association. Blacksburg: Virginia Tech University.
Levie, W. H. (1978). A prospectus for instructional research on visual literacy. ECTJ, 26, 25–36.
Levie, W. H., & Lentz, R. (1982). Effects of text illustrations: A review of research. ECTJ, 30, 4, 195–232.
Levin, J. R., & Lesgold, A. M. (1978). On pictures in prose. ECTJ, 26, 233–243. Lidman, S. (1966). Bildning i bildåldern. Malmö: Förlagshuset Norden. Lidman, S., & Lund, A-M. (1972). Berätta med bilder. Stockholm: Bonniers.Limburg, V. E. (1988). Ethical considerations in visual literacy. In R. A. Braden,
D. G. Beauchamp, & L. Miller (Eds. ). Visual Literacy in Life and Learning. Blacksburg: Virginia Tech University.
Lloyd-Kolkin, D., & Tyner, K. (1990). Media literacy education needs for elemen-tary schools: A survey. In R. A. Braden, D. G. Beauchamp, & J. Clark-Baca (Eds.). Perceptions of Visual Literacy. Selected Readings from the 21st Annual Conference of the International Visual Literacy Association. Con-way: University of Central Arkansas.
Lord, T. R. (1985). Enhancing the visual-spatial aptitude of students. Journal of College Science Teaching, 22, 395–405.
Lucas, F. D. (1977). Fifth-grade children’s preferences for illustrations in mid-dle grade basal reading materials. Dissertation Abstracts, 38, 3270–3271.
Maccoby, E. & Jacklin, C. (1974). The Psychology of Sex Differences. The Stanford University Press.
Marsh, P. O. (1983). Messages That Work: A Guide to Communication Design. Englewood Cliffs, NJ: Educational Technology Publications.
Martinello, M. L. (1985). Visual thinking in the elementary curriculum: Strategies and learning activities. In L. W. Miller (Ed.). Creating Meaning. Readings from the Visual Literacy Conference at California State Polytechnic Uni-versity at Pomona.
McKim, R. H. (1980a). Thinking Visually? A Strategy Manual for Problem Solving. Belmont, CA: Lifetime Learning Publications.
McKim, R. H. (1980b). Experience in Visual Thinking, 2nd edition. Monterey, CA: Brooks/Cole.
Messaris, P. (1993). Perceptual Bases of Visual Literacy. In R. A. Braden, J. Clark–Baca, & D. G. Beauchamp (Eds. ) 1993: Art, Science, & Visual Literacy Selected Readings from the 24th Annual Conference of the International Visual Literacy Association. International Visual Literacy Association. Blacksburg, VA. p. 283–288.
Messaris, P. (1994). Visual “Literacy”: Image, Mind, and Reality. Boulder CO: Westview Press.
207
Metallinos, N. (1991). High definition television: New perceptual, cognitive, and aesthetic challanges. In D. G. Beauchamp, J. Clark-Baca, & R. A. Braden (Eds.). Investigating Visual Literacy. Selected Readings from the 22nd Annual Conference of the International Visual Literacy Association. Blacksburg: Virginia Tech University.
Metallinos, N. (1994). Physiological and Cognitive Factors in the Study of Visual Images. In Moore, D. M., & Dwyer, F. M. (Eds.). Visual Literacy: A Spectrum of Visual Learning. Englewood Cliffs, NJ: Educational Technology Publica-tions.
Miller C. L. (1992). Enhancing Visual Literacy of Engineering Students Through the Use of Real and Computer generated Models. In D. G. Beauchamp, J. Clark-Baca, & R. A. Braden (Eds. ). Investigating Visual Literacy: Selected Readings from the 22nd Annual Conference of the International Visual Literacy Association. Blacksburg: Virginia Tech University.
Miller C. L. & Bertoline, G. R. (1991). Visual Literacy for Engineers.In D. G. Beau-champ, J. Clark-Baca, & R. A. Braden (Eds. ). Investigating Visual Literacy: Selected Readings from the 22nd Annual Conference of the International Visual Literacy Association. Blacksburg: Virginia Tech University.
Miller, H. B. & Burton, J. K. (1994). Images and Imagery Theory. In Moore, D. M., & Dwyer, F. M. (Eds.). Visual Literacy: A Spectrum of Visual Learning. Engle-wood Cliffs, NJ: Educational Technology Publications.
Miller, L. W. (1987). Visual literacy across the curriculum. In R. A. Braden, D. G. Beauchamp, & L. W. Miller (Eds.). Visible & Viable: The Role of Images in Instruction and Communication. Commerce: East Texas State University.
Miller, L. W. (1989). Teaching visual literacy with films and video. In R. A. Braden, D. G. Beauchamp, L. V. W. Miller, & D. M. Moore (Eds.). About Visuals: Research, Teaching, and Applications. Readings from the 20th Annual Confer-ence of the International Visual Literacy Association. Blacksburg: Virginia Tech University.
Moore, D. M. (1988). The effects of presentation order and contextual background on cognitive style. In R. A. Braden, D. G. Beauchamp, & L. Miller (Eds.). Visual Literacy in Life and Learning. Blacksburg: Virginia Tech University.
Moore, D. M. (1994). Action and Object Language. In Moore, D. M., & Dwyer, F. M. (Eds.). Visual Literacy: A Spectrum of Visual Learning. Englewood Cliffs, NJ: Educational Technology Publications.
Moore, D. M., & Dwyer, F. M. (Eds.) (1994). Visual Literacy: A Spectrum of Visual Learning. Englewood Cliffs, NJ: Educational Technology Publica-tions.
Morgan, R. M. (1978). Educational Technology—adolescence to adulthood. Educational Communication and Technology Journal, 26, 142-152.
Morley, D. (1992). Television, Audiences and Cultural Studies. London: Rout-ledge.
208
Muffoletto, R. (1982). The Reading of Pictures: A Consideration for Developing a Critical Model. In R. A. Braden & A. D. Walker (Eds. ) 1982: Television and isual Literacy
Muffoletto, R. (1983). Visual literacy and teacher education: a pedagogical strategy. In A. D. Walker, R. A. Braden, & L. H. Dunker (Eds. ) 1984: Enhancing human potential. Readings from the 15th Annual Conference of the International Visual Literacy Association. Blacksburg, Virginia. 263–274.
Muffoletto, R. (1984). Reflective Teaching and Visual Literacy: Teacher Intervention and Programmed Instruction. In N. J. Thayer, & S. Clayton–Randolph. (Eds.). 1985: Visual Literacy. Cruising into the Future. Readings from the 16th Annual Conference of the International Visual Literacy Association. Bloomington: Western Sun Printing Co. Inc. , 121–136.
Muffoletto, R. (1994). Representations: You, Me, and Them. In Moore, D. M., & Dwyer, F. M. (Eds.). Visual Literacy: A Spectrum of Visual Learning. Engle-wood Cliffs, NJ: Educational Technology Publications.
Mullet, K. & Sano, D. (1995). Designing Visual Interfaces Communication Ori-ented Techniques. Mountain View, California: SunSoft Press A Prentice Hall Title.
Nelson Knupfer, N. (1994). Computers and Visual Learning. In Moore, D. M., & Dwyer, F. M. (Eds.). Visual Literacy: A Spectrum of Visual Learning. Engle-wood Cliffs, NJ: Educational Technology Publications.
Oudejans, M. (1988). The photograph: An icon of violence or peace? In R. A. Braden, D. G. Beauchamp, & L. Miller (Eds.). Visual Literacy in Life and Learning. Blacksburg: Virginia Tech University.
Paivio, A. (1971). Imagery and the Verbal Process. New York: Holt, Rinehart, & Winston.
Paquin, R. L. (1999). Competencies of Visual Literacy. In R. E. Griffin, W. J. Gibbs, & B. Wiegman (Eds.) 1999: Visual Literacy In An Information Age. Interna-tional Visual Literacy Association.
Pettersson, R. (1989). Visuals for Information: Research and Practice. Englewood Cliffs, NJ: Educational Technology Publications.
Pettersson, R. (1998a). What is Information Design? Presentation at Vision Plus 4. The Republic of Information. Carnegie Mellon University, Pittsburgh, Pennsylvania, March 26 - 29. Printed in Proceedings Book, The Republic of Information, Vision Plus 4. Carnegie Mellon University, School of Design & International Institute for Information Design, 58 - 74.
Pettersson, R. (1998b). Beyond Literacy. Presentation at InfoDesign98, Informa-tion Design & the Learning Society, Cambridge University, April 20-21, 1998.
Pettersson, R. (1998c). Information Design and Learning. Presentation at Vision Plus 5. Learning meets Information Design, Information Design meets Learning. International Institute for Information Design, Fachhochschul-
209
Studiengänge-Vorarlberg, Austrian Federal Ministry of Science and Trans-portation, Ministry of Education and Art, UNESCO. Schwarzenberg, Vorarlberg, Austria, July 2-4, 1998.
Pettersson, R. (1998d). Information Design. Västerås: Mälardalens Högskola Research & Reports. Opuscula Nr 36.
Pettersson, R. (1999). Visual Information Verbo-Visual Communications. Presen-tation at CONTACTO VISUAL, XIV congreso diseno grafico, Universidad de las Americas, Cholula, Puebla, Mexico, February 24-27, 1999.
Piaget, J. (1963). The Origin of Intelligence in Children. New York: Norton. Ragan, T. J. (1988). Foundations for a visual perceptual development curriculum. In
R. A. Braden, D. G. Beauchamp, & L. Miller (Eds.). Visual Literacy in Life and Learning. Blacksburg: Virginia Tech University.
Reynolds-Myers, P. (1985). Visual literacy, higher order reasoning, and high technology. In N. H. Thayer, & S. Clayton-Randolph (Eds.). Visual Literacy: Cruising into the Future. Readings from the 16th annual conference of the International Visual Literacy Association. Bloomington: Western Sun Printing Co.
Rezabek, L. (1990). Teaching visual literacy using a computer-based audiographic telecommunication system. In R. A. Braden, D. G. Beauchamp, & J. Clark-Baca (Eds.). Perceptions of Visual Literacy. Selected Readings from the 21st Annual Conference of the International Visual Literacy Association. Con-way: University of Central Arkansas.
Robinson R. S. (1988). An investigation of narrative television comprehension: Fac-tors of visual literacy. In R. A. Braden, D. G. Beauchamp, & L. Miller (Eds.). Visual Literacy in Life and Learning. Blacksburg: Virginia Tech University.
Robinson R. S. (1991). Investigating visual literacy: Developing skills across the cur-riculum. In D. G. Beauchamp, J. Clark-Baca, & R. A. Braden (Eds.). Investi-gating Visual Literacy. Selected Readings from the 22nd Annual Conference of the International Visual Literacy Association. Blacksburg: Virginia Tech University.
Robinson, R. S. (1992). Teaching Visual Literacy: Questions and Concerns about Curicula. In D. G. Beauchamp, J. Clark-Baca, & R. A. Braden (Eds. ). Inves-tigating Visual Literacy: Selected Readings from the 22nd Annual Confer-ence of the International Visual Literacy Association. Blacksburg: Virginia Tech University.
Saettler, L. P. (1968). A history of instructional technology. New York: McGraw-Hill.
Schallert–Lawrie, P. (1990). Visual Literacy and Communications. In R. A. Braden, D. G. Beauchamp, & J. Clark–Baca (Eds. ) 1990: Perceptions of Visual Literacy. Selected Readings from the 21st Annual Conference of the International Visual Literacy Association. University of Central Arkansas Conway. Arkan-sas.
210
Schiffman, C. B. (1995). Visually Translating Educational Materials for Ethnic Pop-ulations. In R. E. Griffin. D. G. Beauchamp, J. M. Hunter & C. B. Shiffman, (Eds.) 1996: Eyes on the Future: Converging Images, Ideas and Instruction. Selected Readings of the International Visual Literacy Association. International Visual Literacy Association.
Schiller, H. A. (1987). Visual literacy in ancient and modern man (part one). In R. A. Braden, D. G. Beauchamp, & L. W. Miller (Eds.). Visible & Viable: The Role of Images in Instruction and Communication. Commerce: East Texas State University.
Seels, B. A. (1994). Visual Literacy: The Definition Problem. In D. M. Moore & F. M. Dwyer (Eds.). Visual Literacy. Englewood Cliffs, NJ: Educational Tech-nology Publications.
Seward Barry, A. M. (1994). Perceptual Aesthetics and Visual Language. In Moore, D. M., & Dwyer, F. M. (Eds.). Visual Literacy: A Spectrum of Visual Learning. Englewood Cliffs, NJ: Educational Technology Publications.
Seward Barry, A. M. (1997). Visual Intelligence Perception, Image, and Manipula-tion in Visual Communication. Albany: State University of New York Press.
Sewell, E. H. (1994). Visual Symbols. In Moore, D. M., & Dwyer, F. M. (Eds.). Visual Literacy: A Spectrum of Visual Learning. Englewood Cliffs, NJ: Educa-tional Technology Publications.
Shannon, C. E., & Weaver, W. (1949). The Mathematical Theory of Communica-tion. Champaign, IL: The University of Illinois Press.
Sinatra, R. (1986). Visual Literacy Connections to Thinking, Reading, and Writing. Springfield, IL: Charles C. Thomas.
Spitzer, D.R. & McNerny, T.O. (1975). Operationally defining “Visual Liter-acy”. A research challenge. Audiovisual Instruction, (10), 30–31.
Stern, R, C., & Robinson, R. (1994). Perception and Its Role in Communication and Learning. In D. M. Moore, & F. M. Dwyer (Eds.). Visual Literacy. A Spectrum of Visual Learning. Englewood Cliffs, NJ: Educational Technology Publica-tions.
Stewig, J. W. (1997). Fifth Grade Children Write About Picture Books. Journal of Visual Literacy, Spring 1997, 17, (1), 23-33.
Sutton, R. E. (1990). Subliminal Reception and Visual Literacy. Paper presented at the IVLA Symposium on Verbo-Visual Literacy: Mapping the Field. Lon-don, July 10–13.
Sutton, R. E. (1992). Information Literacy meets Media Literacy and Visual Literacy. Presentation at the 29th Annual Conference of the International Visual Lit-eracy Association, Pittsburgh, Sept. 30–Oct. 4. In R. A. Braden, J. Clark–Baca, & D. G. Beauchamp (Eds. ) 1993: Art, Science, & Visual Literacy Selected Readings from the 24th Annual Conference of the International Visual Literacy Association. International Visual Literacy Association. Blacksburg, VA.
211
Szabo, M., Dwyer, F. M., & DeMelo, H. (1981). Visual testing– visual literacy’s second dimension. ECTJ, 29 (3), 177–187.
Talley, L. H. (1973). The use of three-dimensional visualization as a moderator in the higher cognitive learing of concepts in college level chemistry. Jour-nal of Research in Science Teaching, 10, 263–269.
Thompson, M. E. (1994). Design Considerations of Visuals. In D. M. Moore, & F. M. Dwyer (Eds.). Visual Literacy. A Spectrum of Visual Learning. Englewood Cliffs, NJ: Educational Technology Publications.
Velders, T. (1995). Reading Images, approaches for Visual Literacy. Paper pre-sented at the 27th Annual Conference of the International Visual Literacy Association. Chicago, Oct. 18 – 22.
Velders, T. (1996). Art, Aesthetics and Advertisement. Three A, Three Graces or the Triad as Visual Metaphor. In T. Velders (Ed.). Beldenstorm in Deventer. Multi-media Education in Praxis. Selected Readings. Deventer.
Velders, T. (1999). Introduction. Presentation at the 5th Symposium on Verbo-visual Literacy: Information Design. Eskilstuna, Sweden, November 9–11.
Wandersee, J. H. (1992). The Graphic Representation of Biological Knowlwdge: Integrating Words and Images. Presentation at the 24th Annual Conference of the International Visual Literacy Association. Pittsburgh, Sept. 30 – Oct. 4.
Weiser, J. (1984). Phototherapy–becoming visually literate about oneself. In A. D. Walker, R. A. Braden, & L. H. Dunker (Eds.). Visual Literacy: Enhancing Human Potential. Blacksburg, VA: Virginia Tech University.
Whiteside, C. (1983). Enhancing Computer Literacy Through Visual Literacy. In A. D. Walker, R. A. Braden, & L. H. Dunker (Eds. ) 1984: Enhancing human potential. Readings from the 15th Annual Conference of the International Visual Literacy Association. Blacksburg, Virginia. 263–274.
Whiteside, C. (1985). Visual literacy awareness in college-level educational media courses. In L. W. Miller (Ed.). Creating Meaning. Readings from the Visual Literacy Conference at California State Polytechnic University at Pomona.
Wileman, R. E. (1993). Visual Communicating. Englewood Cliffs, NJ: Educa-tional Technology Publications.
Williams, C. (1978). Concept and purpose of visual literacy. Educational Media International, (3), 26–29.
Williams, E. E. (1988). How I teach video literacy in my basic educational media class. In R. A. Braden, D. G. Beauchamp, & L. Miller (Eds.). Visual Literacy in Life and Learning. Blacksburg: Virginia Tech University.
Wilson, J. J. (1988). A Reality: Visual Literacy´s Connection to Literacy in the Lanaguage Arts. In R. A. Braden, D. G. Beauchamp, & L. Miller (Eds.). Visual Literacy in Life and Learning. Blacksburg: Virginia Tech University.

212
Wisely, F. G. (1994). Communication Models. In Moore, D. M., & Dwyer, F. M. (Eds.). Visual Literacy: A Spectrum of Visual Learning. Englewood Cliffs, NJ: Educational Technology Publications.
Wisely, F. G., Kennett, D., & Bradford, J. (1989). Development of visual commu-nication courses. In R. A. Braden, D. G. Beauchamp, L. V. W. Miller, & D. M. Moore (Eds.). About Visuals: Research, Teaching, and Applications. Readings from the 20th Annual Conference of the International Visual Literacy Association. Blacksburg: Virginia Tech University.
Zimmer, A., & Zimmer, F. (1978). Visual Literacy in Communication: Designing for Development. Hulton Educational Publications Ltd., in cooperation with the International Institute for Adult Literacy Methods, Teheran.
213
Paper 12
Image functions
Abstract. This paper presents functions of pictures used in printed media, evalua-tions of intentions of the sender’s, evaluations of the purposes for using visuals inteaching, and examples of the purposes for using visuals in information materials inprinted media. The paper includes a discussion about selection and use of pictureswith emphasis of the use of pictures in information design.
Traditional image functionsVisuals are perceived much more rapidly and readily than text (Fleming andLevie, 1978, 1993; Sinatra, 1986). Lester (1995:73) noted that: “Visual messagesare a powerful form of communication because they stimulate both intellectualand emotional responses — they make us think as well as feel.” Many papershave suggested various roles, functions, objectives and purposes for the use ofillustrations — often without a great deal of evidence to support the suggestions.
Still picturesAccording to literature in the areas of instructional message design, visual lit-eracy, and visual communication visuals may be used in order to:
add concreteness to prose (Levin, Anglin & Carney, 1987)adopt a new attitude (Heinich, Molenda & Russell, 1982) adorn something (Selander, 1988) advance organizing of text comprehension (Bernard, Petersen & Ally, 1981)aid credibility (Fleming & Levie, 1978)anchor an image in memory (Moriarty, 1991)appeal to the eye (Duchastel, 1983; Levin, 1981)assist in concept development (Fredette, 1994)associate the product with certain symbols and lifestyles (Moriarty, 1991)attract attention to a given material or a given subject (Duchastel, 1978; Duchas-
tel & Waller, 1979; Holliday, 1980; Heinich et al., 1982; Levie & Lentz, 1982; Evans, Watson & Willows, 1987; Levin et al., 1987; Pettersson, 1993; Keller
214
& Burkman, 1993; Wileman, 1993; Lester, 1995) be effective (Keller & Burkman, 1993)beautify something (Selander, 1988)break up longer blocks of text and make the pages more appealing (Duchastel,
1978)bring inaccessible processes such as historical events or microscopic changes
to the audience (Moriarty, 1991)bring into the classroom inaccessible processes, events, situations, materials,
and phase changes in either space or time (Dwyer, 1978)build new experience (Fredette, 1994)carry the proof of a presentation (Griffin, 1994)change a viewer’s attitude (Lester, 1995)clarify opinions (Fredette, 1994)clarify oral and printed communication (Dwyer, 1978)clarify passages in a text (Levin et al., 1987)clarify pieces of an abstract, language-based concept (Wileman, 1993)communicate a message in an efficient way (Wileman, 1993)compare (Fredette, 1994)compare one image content with another (Hunter, Crismore & Pearson, 1987)compensate poor readers (Duchastel, 1978)contrast (Fredette, 1994)contrast one image content with another (Hunter, Crismore & Pearson, 1987)contribute to curiosity (Keller & Burkman, 1993)convey an idea (Lester, 1995)convey information to the reader or viewer (Dondis, 1973; Pettersson, 1989)convince someone using factual information, persuasion (Lester, 1995)correct misconceptions (Fredette, 1994)create believability through realism (Moriarty, 1991)create interest in a given material or in a given subject (Duchastel, 1978; Du-
chastel & Waller, 1979; Holliday, 1980; Levie & Lentz, 1982; Levin et al., 1987; Pettersson, 1993)
deceive learners; aesthetically pleasing visuals may deceive learners about their instructional value (Dwyer, 1972)
decorate something (Dondis, 1973; Levin et al., 1987; Selander, 1988; Fredette, 1994)
demonstrate product features (Moriarty, 1991)depict elements of the instructional content (Levin et al., 1987)depict reality (Pettersson, 1989)
215
depict situations and settings (Moriarty, 1991)designate spatial orientation (Pettersson, 1989)develop appreciation (Heinich et al., 1982)discriminate among facts (Heinich et al., 1982)display information (Fredette, 1994)dupe an unsuspecting public through misleading or false information, propa-
ganda (Lester, 1995)elaborate the text (Hunter et al., 1987)embellish the text (Hunter et al., 1987)emphasize aural and printed instruction (Dwyer, 1978)encourage the expression and clarification of opinions (Fredette, 1994)enhance enjoyment (Levie & Lentz, 1982)enhance the reality of a material for the reader (Smith & Smith, 1966)enrich reading (Dale, 1969)establish a mood (Moriarty, 1991)establish a product personality (Moriarty, 1991)evaluate learning (Fredette, 1994)exemplify something (Melin, 1986a; Pettersson, 1989)explain difficult phenomena (Winn, 1993)explain things (Pettersson, 1989)express opinions (Fredette, 1994)express the artist’s feelings (Dondis, 1973)extend curiosity (Peeck, 1987)facilitate cognitive processes (Levin et al., 1987)facilitate discrimination and identification of relevant cues (Dwyer, 1978)facilitate learner acquisition of information (Dwyer, 1978)facilitate learning from a text by enhancing comprehension and memory
(Levin & Lesgold, 1978; Duchastel, 1981; Levie & Lentz, 1982; Levin et al., 1987)
facilitate reading, make it easier for poor readers to comprehend, learn, and re-call things they read in a text (Duchastel, 1978)
facilitate retention (Dwyer, 1978; Winn, 1993)facilitate understanding (Pettersson, 1989)flatter the audience (Zakia, 1985)focus on a particular aspect (Wileman, 1993)foster generalizations of responses to new situations (Dwyer, 1978)gain or get attention (Duchastel, 1978; Duchastel & Waller, 1979; Holliday, 1980;
216
Levie & Lentz, 1982; Evans et al., 1987; Levin et al., 1987; Moriarty, 1991; Keller & Burkman, 1993; Pettersson, 1993; Wileman, 1993; Lester, 1995)
give precise descriptions and information (Zimmer & Zimmer, 1978)glorify an individual or a group (Dondis, 1973)guide learners to think carefully and make conclusions (Dwyer, 1978)help learners remember what they read (Levie & Lentz, 1982)help learners understand what they read (Levie & Lentz, 1982)help people remember (Wileman, 1993)hold attention (Levin et al., 1987)identify something (Dwyer, 1972; Dondis, 1973; Heinich et al., 1982)illustrate appearance (Pettersson, 1989)illustrate key points, and relationships (Massoumian, 1989)illustrate oral and printed communication (Dwyer, 1978)illustrate selected main points (Fredette, 1994)illustrate something (Melin, 1986a)impact emotions (Vernon, 1953)increase learner interest, motivation, curiosity, and concentration (Dwyer,
1978)increase learning retention (Wileman, 1993)increase reliability of communication (Dwyer, 1978)induce perspective into a text (Peeck & Goud, 1985)influence viewers (Lester, 1995)inform, as a main information source (Fredette, 1994)instruct (Levie & Lentz, 1982; Pettersson, 1989)integrate facts, skills, and judgements (Dwyer, 1978)interpret and explain difficult phenomena (Levin et al., 1987; Winn, 1993)introduce new information (Dwyer, 1978; Griffin, 1994)isolate specific instructional characteristics (Dwyer, 1978)label facts (Levie & Lentz, 1982)link information, and maintain the continuity of a presentation (Griffin, 1994)maintain interest by presenting a mesmerizing image or sequence (Moriarty,
1991)maintain learner attention (Keller & Burkman, 1993)maintain the continuity of a presentation (Griffin, 1994)make learning more precise and complete (Dwyer, 1978)make reading more concrete (Travers & Alvarado, 1970; Duchastel, 1978)make reading more enjoyable (Duchastel & Waller, 1979)
217
memorialize an individual or a group (Dondis, 1973)memorize facts (Heinich et al., 1982)modify behaviour (Lester, 1995)motivate a person to pick up, browse through, and read a text (Duchastel, 1978,
1983)motivate students (Heinich et al., 1982; Evans et al., 1987; Winn, 1993; Fredette,
1994)organize information, temporal and spatial relationships (Levin et al., 1987)organize new information (Dwyer, 1978)overcome time and distance (Dwyer, 1978; Moriarty, 1991)perpetuate ideas that words alone cannot (Lester, 1995)persuade ideas that words alone cannot (Lester, 1995)persuade people to buy a particular product or think a specific way (Lester,
1995)persuade someone (Heinich et al., 1982; Lester, 1995)persuade the audience (Zakia, 1985; O’Keefe, 1990)present a variety of vantage points, locations of parts, relationships (Dwyer,
1978)present abstract and difficult material (Levin et al., 1987)present more information than text in a given amount of space (Wileman, 1993)present new information (Dwyer, 1978)present outlines, lists, and complex materials (Massoumian, 1989)preserve people, places, and objects (Dondis, 1973)prevent misconceptions (Fredette, 1994)provide authority, information, overview, and variation (Pettersson, 1989)provide background information (Fredette, 1994)provide extra linguistic information (Levie & Lentz, 1982)provide greater flexibility and variety in the organization of instruction (Dw-
yer, 1978)provide instructional feedback (Dwyer, 1978)provide organization and a framework for a text (Levin et al., 1987)raise questions (Dwyer, 1978)record people, places, and objects (Dondis, 1973)reinforce aural and printed instruction (Dwyer, 1978)reinforce memory (Winn, 1993)reinforce oral and printed communication (Dwyer, 1978)reinforce the creative concept (Moriarty, 1991)
218
reinforce the text (Hunter et al., 1987)replicate people, places, and objects (Dondis, 1973)represent instructional content (Levin et al., 1987; Winn, 1993)respond to need (Dondis, 1973)scare the audience (Zakia, 1985)seduce the audience (Zakia, 1985)serve as advance organizers of information (Wileman, 1993)shame the audience (Zakia, 1985)sharpen powers of observation (Dwyer, 1978)show spatial relationships (Zimmer & Zimmer, 1978)show steps in a process (Levin et al., 1987)show time and magnitude relationships (Pettersson, 1989)simplify complex concepts (Wileman, 1993)solve problems (Fredette, 1994)span linguistic barriers (Dwyer, 1978)stimulate discussion (Dwyer, 1978)stimulate incidental learning (Fredette, 1994)stimulate interest (Keller & Burkman, 1993)substitute words (Levie & Lentz, 1982)sum up information for retention and recall (Massoumian, 1989)summarize important parts of a text (Hunter et al., 1987)summarize the important points in a lesson (Dwyer, 1978)supplement verbal information through elaboration (Fredette, 1994)support statements made by linking visuals in a presentation (Griffin, 1994)sustain statements made by linking visuals in a presentation (Griffin, 1994)tease the audience (Zakia, 1985)transfer culture to immigrants when employed in teaching aids (Aronsson,
1983)transform content (Levin et al., 1987)verify research (Fredette, 1994)visualize instruction (Dwyer, 1978)wrap up information in a presentation (Griffin, 1994)
The above list contains 169 opinions about image functions. More than onehundred different explanatory verbs are used to express these opinions. Accord-ing to researchers in the areas of instructional message design, visual literacy,and visual communication the most common opinions on functions of visualsconcern attention: attract, gain, get, hold and maintain attention are mentioned.
219
Other common explanatory verbs are: facilitate, provide, persuade, create (an inter-est in), illustrate, clarify, motivate, present, and reinforce information (to someone).As would be expected most of these purposes can be looked upon as clearlypedagogical or cognitive, in contrast to pictures used for entertainment, deco-ration, advertising or marketing.
Moving pictures and multi-mediaMoving pictures can be affective and provide readers with entertainment andreinforce an experience both positively and negatively. They can trigger associ-ations and influence emotions and attitudes, especially in movies and TV (Zakia,1985). In advertising and television, pictures may carry subliminal messages. Adsfor liquor or cigarettes, for example, sometimes use sexual symbols (Zakia,1985). Leshin, Pollock, and Reigeluth (1992) noted the attention-getting capabil-ity of several visual devices. They mentioned zoom lens movement to empha-size important details. Other devices are split screens, shading and contrast,voice-over narration, text, and graphics. Leshin et al. (op. cit.) suggested thatvisual images can facilitate comprehension and retention of information throughorganizational, structural, and mne-monic (assisting memory) functions.Rowntree (1990) identified motion as a valuable characteristic of video.Theauthor suggested the following video applications in which movement is animportant attribute:
• To demonstrate the operation of tools or equipment.• To demonstrate skills that learners are expected to emulate.• To conduct experiments in which the processes must be observed.• To present a dramatic or musical performance in which it is necessary for
learners to see as well as hear the performers.• To analyze change over time using animation, slow motion, or time lapse
photography.• To reveal the spatial, three-dimensional qualities of an object or structure.• To transport learners into situations that could not otherwise be experienced• To present primary source material for analysis, such as archival film of his-
torical events or videotapes of naturally occurring situations.
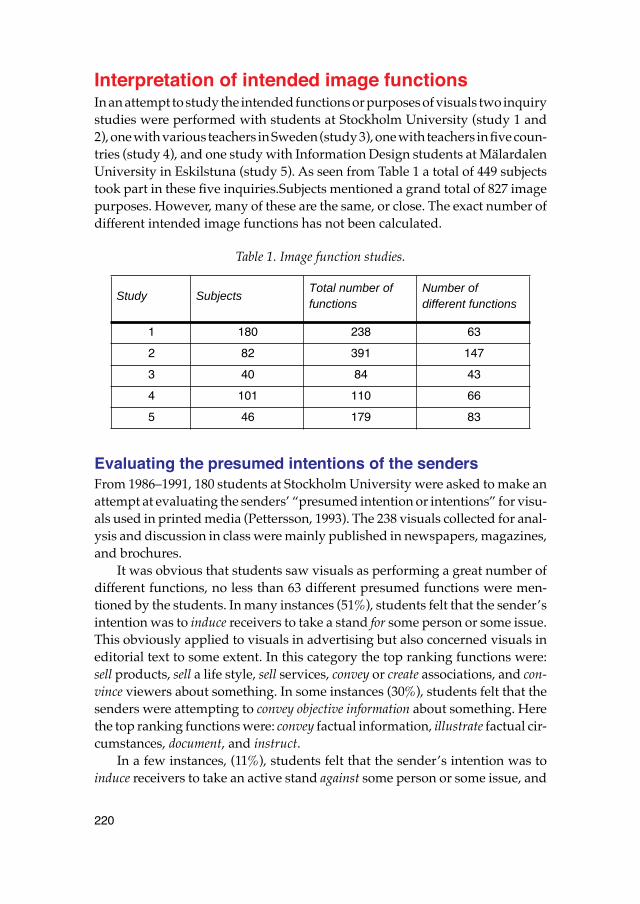
220
Interpretation of intended image functionsIn an attempt to study the intended functions or purposes of visuals two inquirystudies were performed with students at Stockholm University (study 1 and2), one with various teachers in Sweden (study 3), one with teachers in five coun-tries (study 4), and one study with Information Design students at MälardalenUniversity in Eskilstuna (study 5). As seen from Table 1 a total of 449 subjectstook part in these five inquiries.Subjects mentioned a grand total of 827 imagepurposes. However, many of these are the same, or close. The exact number ofdifferent intended image functions has not been calculated.
Table 1. Image function studies.
Evaluating the presumed intentions of the sendersFrom 1986–1991, 180 students at Stockholm University were asked to make anattempt at evaluating the senders’ “presumed intention or intentions” for visu-als used in printed media (Pettersson, 1993). The 238 visuals collected for anal-ysis and discussion in class were mainly published in newspapers, magazines,and brochures.
It was obvious that students saw visuals as performing a great number ofdifferent functions, no less than 63 different presumed functions were men-tioned by the students. In many instances (51%), students felt that the sender’sintention was to induce receivers to take a stand for some person or some issue.This obviously applied to visuals in advertising but also concerned visuals ineditorial text to some extent. In this category the top ranking functions were:sell products, sell a life style, sell services, convey or create associations, and con-vince viewers about something. In some instances (30%), students felt that thesenders were attempting to convey objective information about something. Herethe top ranking functions were: convey factual information, illustrate factual cir-cumstances, document, and instruct.
In a few instances, (11%), students felt that the sender’s intention was toinduce receivers to take an active stand against some person or some issue, and
Study SubjectsTotal number of functions
Number of different functions
1 180 238 63
2 82 391 147
3 40 84 43
4 101 110 66
5 46 179 83
221
in a few instanc-es, students felt that senders were attempting to provide enter-tainment (5%), or that visuals were used as adornment or decoration (3%). Thefunctions arouse interest, create needs, document, sell, and supply informationwere not mentioned in the literature reviewed above.
Evaluating the presumed purposes for using visuals in teachingFrom 1990–1991, 82 students at Stockholm University were asked to exemplifytheir teachers’ “presumed purposes” for using visuals of different kinds in theirteaching. The students gave a total of 391 presumed purposes (147 different).Some students provided one or two purposes, others gave more examples. Someof the purposes are fairly common, while other purposes are very specific. Sev-eral purposes are the same, some are synonyms or closely related to each other.After grouping and ranking it is clear that the most outstanding purposes areto show (77), and to explain (44). Other common purposes are to visualize (25),illustrate (24), clarify (23), inform (21), summarize (21), convey (17), learn and remem-ber (17), mediate (17), elucidate (16), present (15), and give perceptions (13). Lesscommon purposes are instruct (11), describe (10), entertain (10), complete (9),facilitate reading (9), inspire (8), make concrete (8), document (6), exemplify (5),compare (5), and “other” (10). The functions complete, describe, document, elu-cidate, inspire, and mediate were not mentioned in the literature reviewedabove.
Evaluating the purposes for using visuals in teachingIn one assignment 40 teachers at junior high schools in Sweden revealed theirpurposes for which pictures were used in their classrooms in 1990. These teach-ers provided a total of 84 purposes (43 different). To a large extent we find these“teacher purposes” also in the material provided by the students above. Theteachers only mentioned cognitive and pedagogical uses. The most commonpurposes were to explain (20), show (19), and present (8). Several additional pur-poses were also mentioned. Some of these were not mentioned in the literaturereviewed above: context, deepening, describe, elucidate the evolution, give abackground, give a break, give a perspective, inspire to writing stories, mini-mize abstractions, and one picture says more than a thousand words.
Pettersson et al. (1991) focused the interest on the teachers and their actualuse of media and pictures in their teaching of geography in secondary schoolsin five countries: Australia, Greece, Japan, Sweden, and the USA. 101 teachersprovided 110 purposes for using pictures in the teaching of geography. Therewere no less than 66 different purposes. Results from this study confirmed theabove studies. Visuals are used for many different and individual purposes.
222
The most commonly cited purposes were: for factual realization to get realisticunderstanding and knowledge (13), to attract interest of students (9), and tomake images of the area (9).
Evaluating the purposes for using visuals in information materialsIn a fifth inquiry (1998) Information Design students at Mälardalen Universityin Eskilstuna were asked to provide one to five examples of the purposes forusing visuals in information materials in printed media. 46 students answeredthe inquiry with a total of 179 purposes (83 different). Some of the purposesare fairly common, while other purposes are very specific. Several purposesare the same, some are synonyms or closely related to each other.
Among the students’ opinions about the purposes with visuals in informa-tion materials we find most of the purposes mentioned in the literature, butalso other purposes. The most outstanding purposes are to visualize (33), clarify(28), inform (22), attract attention (20), facilitate reading (19), explain (17), and conveyinformation (9).
DiscussionPictures and images are often used in teaching and learning, and in informationmaterials. It is obvious that visuals may have many different functions.
Teaching and learningAccording to Fredette (1994:243) a 1978 survey of 72 sixth through ninth gradeteachers in Australia revealed the purposes for which photographs were usedin their classrooms. The main reasons were for display only, to add decoration,to illustrate selected main points, for motivation, and to stimulate incidental learn-ing. According to the body of research cited in the first section of this paper themain functions of still pictures are to: attract, gain, get, hold and maintain attention,to facilitate, persuade, provide, create (an interest in), illustrate, clarify, motivate,present, and reinforce. The inquiries with students and teachers presented in theprevious section showed that there may be many purposes for the use of visualsin printed media. Most of the purposes can be looked upon as clearly peda-gogical or cognitive, in contrast to pictures used for entertainment, decoration,advertising or marketing. According to students the most common purposesof pictures in the school environment were to: show, explain, visualize, illustrate,clarify, inform, summarize, convey, mediate, elucidate, present, give, instruct anddescribe. The teachers noted: explain, show, factual realization, attract interest,
223
present, and make images. Evans, Watson and Willows (1987) noted that the atten-tion-getting and motivational aspects of illustrations in textbooks seemed topredominate among the teachers in Canada. This was however, not the caseamong the teachers in the sample from Sweden. The Canadian teachers madevery few direct references to illustrations in the classroom, and they providedlittle guidance in the educational functions that illustrations are thought toserve. Gustafsson (1980a, 1980b) found that this also was the case in Sweden.
Experiments with pupils in junior schools (Eklund, 1990), in intermediateschools and in junior high schools (Backman, Berg, and Sigurdson, 1988)showed that pupils in Sweden had a very low “pictorial capability”. At all levelspupils have large difficulties in interpreting, as well as in expressing picturecontent. Low “pictorial capability” is largely true also for the teachers, who veryoften lack both education and training in visual language and in visual com-munication. This is quite remarkable since the curricula in Sweden both assumeand require all teachers to be responsible for teaching about visuals as a meansof communication. I agree with Larsson (1991) who wrote (p. 105, in translation):“... it is important that all persons involved increase their knowledge of picturesand the function of pictures in textbooks: teachers, pupils, publishers, authors,designers, artists”. Gayer (1992) stated that different types of visuals can be ofgreat use in education. She certified that it is a serious deficiency that many teach-ers have insufficient knowledge of how visuals function. We know that picturescan have a positive, a neutral, or a negative effect on learning (Levin et al., 1987;Sims-Knight, 1992; Winn, 1993; and Rieber, 1994).
Regardless of the intended functions pictures are not always used in anactive way at school (Pettersson, 1990). On the contrary pictures in textbooksare often ignored and “skipped” (Lindström, 1990). Most students do not attendto the visuals unless they are instructed to do so (Reinking, 1986; Pettersson,1990). Hannus (1996) used eye-movement equipment and studied how pupilspicked up information while learning from textbooks. He concluded that thelearning effects of textbook illustrations are slight because not enough attentionis paid to the illustrations in the books. Thus the learning functions of illustra-tions were less than expected.
In some textbooks the purpose of many pictures seems to be purely deco-rative or entertaining and not at all cognitive. If a textbook has many pictureswhich only are decorative and entertaining, it may well contribute to “imageoverload” and cognitive pictures being skipped. This may be one reason fortextbook pictures not being used effectively. In such cases pictures may actuallydecrease the quality of the textbook, and only raise its price. It is possible thatcertain types of illustrations, incorporated to “stimulate” the reader’s imagi-nation and interest, could instead have a heavily governing effect which stiflesthe imagination and diverts interest from the information the author wishesto convey.
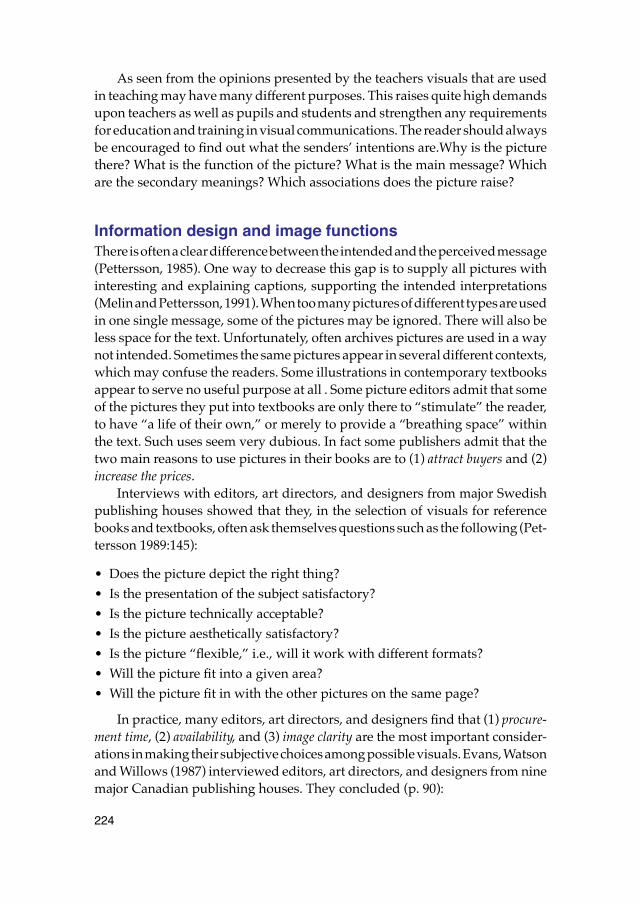
224
As seen from the opinions presented by the teachers visuals that are usedin teaching may have many different purposes. This raises quite high demandsupon teachers as well as pupils and students and strengthen any requirementsfor education and training in visual communications. The reader should alwaysbe encouraged to find out what the senders’ intentions are.Why is the picturethere? What is the function of the picture? What is the main message? Whichare the secondary meanings? Which associations does the picture raise?
Information design and image functionsThere is often a clear difference between the intended and the perceived message(Pettersson, 1985). One way to decrease this gap is to supply all pictures withinteresting and explaining captions, supporting the intended interpretations(Melin and Pettersson, 1991). When too many pictures of different types are usedin one single message, some of the pictures may be ignored. There will also beless space for the text. Unfortunately, often archives pictures are used in a waynot intended. Sometimes the same pictures appear in several different contexts,which may confuse the readers. Some illustrations in contemporary textbooksappear to serve no useful purpose at all . Some picture editors admit that someof the pictures they put into textbooks are only there to “stimulate” the reader,to have “a life of their own,” or merely to provide a “breathing space” withinthe text. Such uses seem very dubious. In fact some publishers admit that thetwo main reasons to use pictures in their books are to (1) attract buyers and (2)increase the prices.
Interviews with editors, art directors, and designers from major Swedishpublishing houses showed that they, in the selection of visuals for referencebooks and textbooks, often ask themselves questions such as the following (Pet-tersson 1989:145):
• Does the picture depict the right thing? • Is the presentation of the subject satisfactory? • Is the picture technically acceptable? • Is the picture aesthetically satisfactory? • Is the picture “flexible,” i.e., will it work with different formats? • Will the picture fit into a given area? • Will the picture fit in with the other pictures on the same page?
In practice, many editors, art directors, and designers find that (1) procure-ment time, (2) availability, and (3) image clarity are the most important consider-ations in making their subjective choices among possible visuals. Evans, Watsonand Willows (1987) interviewed editors, art directors, and designers from ninemajor Canadian publishing houses. They concluded (p. 90):
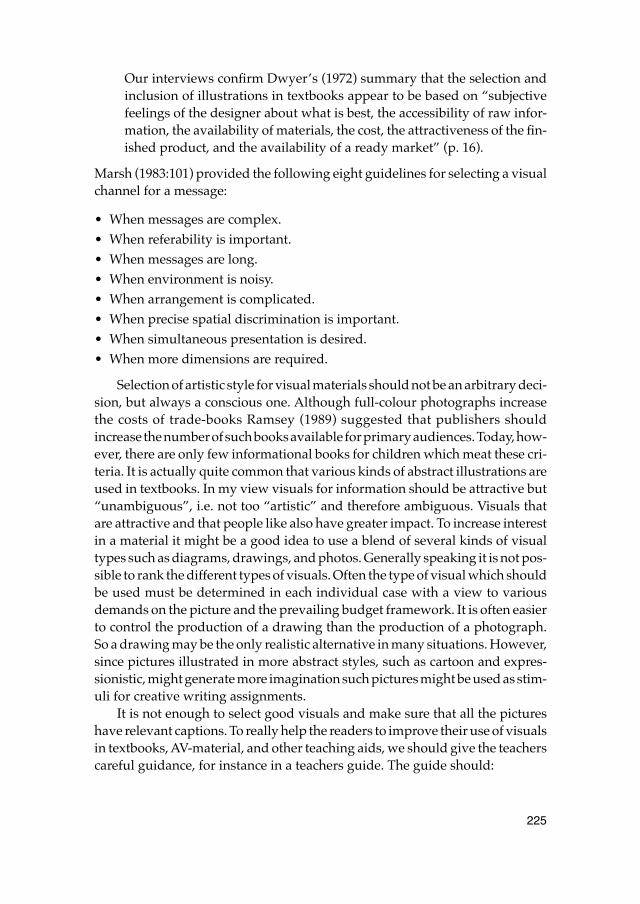
225
Our interviews confirm Dwyer’s (1972) summary that the selection andinclusion of illustrations in textbooks appear to be based on “subjectivefeelings of the designer about what is best, the accessibility of raw infor-mation, the availability of materials, the cost, the attractiveness of the fin-ished product, and the availability of a ready market” (p. 16).
Marsh (1983:101) provided the following eight guidelines for selecting a visualchannel for a message:
• When messages are complex.• When referability is important.• When messages are long.• When environment is noisy.• When arrangement is complicated.• When precise spatial discrimination is important.• When simultaneous presentation is desired.• When more dimensions are required.
Selection of artistic style for visual materials should not be an arbitrary deci-sion, but always a conscious one. Although full-colour photographs increasethe costs of trade-books Ramsey (1989) suggested that publishers shouldincrease the number of such books available for primary audiences. Today, how-ever, there are only few informational books for children which meat these cri-teria. It is actually quite common that various kinds of abstract illustrations areused in textbooks. In my view visuals for information should be attractive but“unambiguous”, i.e. not too “artistic” and therefore ambiguous. Visuals thatare attractive and that people like also have greater impact. To increase interestin a material it might be a good idea to use a blend of several kinds of visualtypes such as diagrams, drawings, and photos. Generally speaking it is not pos-sible to rank the different types of visuals. Often the type of visual which shouldbe used must be determined in each individual case with a view to variousdemands on the picture and the prevailing budget framework. It is often easierto control the production of a drawing than the production of a photograph.So a drawing may be the only realistic alternative in many situations. However,since pictures illustrated in more abstract styles, such as cartoon and expres-sionistic, might generate more imagination such pictures might be used as stim-uli for creative writing assignments.
It is not enough to select good visuals and make sure that all the pictureshave relevant captions. To really help the readers to improve their use of visualsin textbooks, AV-material, and other teaching aids, we should give the teacherscareful guidance, for instance in a teachers guide. The guide should:
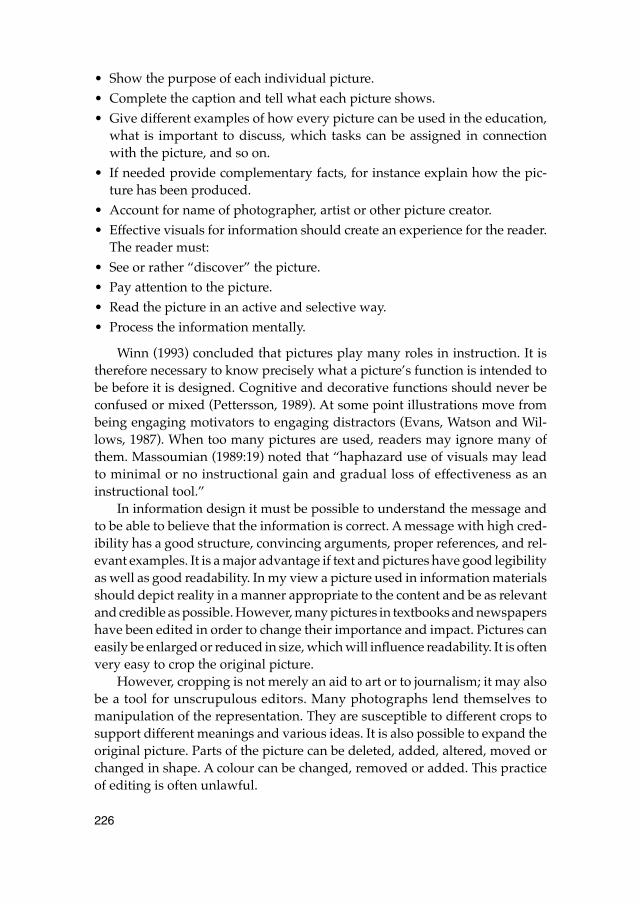
226
• Show the purpose of each individual picture.• Complete the caption and tell what each picture shows.• Give different examples of how every picture can be used in the education,
what is important to discuss, which tasks can be assigned in connectionwith the picture, and so on.
• If needed provide complementary facts, for instance explain how the pic-ture has been produced.
• Account for name of photographer, artist or other picture creator.• Effective visuals for information should create an experience for the reader.
The reader must:• See or rather “discover” the picture.• Pay attention to the picture.• Read the picture in an active and selective way.• Process the information mentally.
Winn (1993) concluded that pictures play many roles in instruction. It istherefore necessary to know precisely what a picture’s function is intended tobe before it is designed. Cognitive and decorative functions should never beconfused or mixed (Pettersson, 1989). At some point illustrations move frombeing engaging motivators to engaging distractors (Evans, Watson and Wil-lows, 1987). When too many pictures are used, readers may ignore many ofthem. Massoumian (1989:19) noted that “haphazard use of visuals may leadto minimal or no instructional gain and gradual loss of effectiveness as aninstructional tool.”
In information design it must be possible to understand the message andto be able to believe that the information is correct. A message with high cred-ibility has a good structure, convincing arguments, proper references, and rel-evant examples. It is a major advantage if text and pictures have good legibilityas well as good readability. In my view a picture used in information materialsshould depict reality in a manner appropriate to the content and be as relevantand credible as possible. However, many pictures in textbooks and newspapershave been edited in order to change their importance and impact. Pictures caneasily be enlarged or reduced in size, which will influence readability. It is oftenvery easy to crop the original picture.
However, cropping is not merely an aid to art or to journalism; it may alsobe a tool for unscrupulous editors. Many photographs lend themselves tomanipulation of the representation. They are susceptible to different crops tosupport different meanings and various ideas. It is also possible to expand theoriginal picture. Parts of the picture can be deleted, added, altered, moved orchanged in shape. A colour can be changed, removed or added. This practiceof editing is often unlawful.
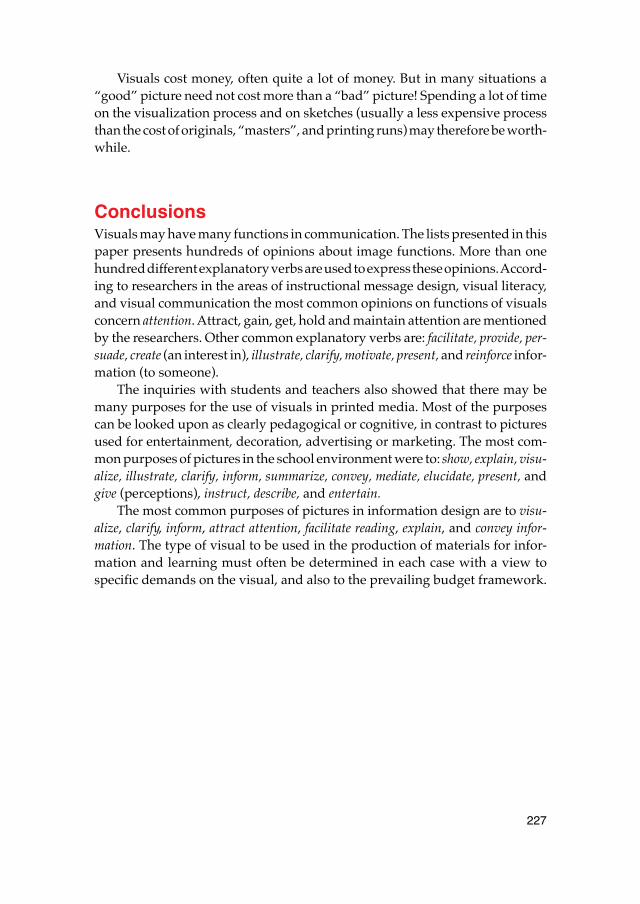
227
Visuals cost money, often quite a lot of money. But in many situations a“good” picture need not cost more than a “bad” picture! Spending a lot of timeon the visualization process and on sketches (usually a less expensive processthan the cost of originals, “masters”, and printing runs) may therefore be worth-while.
ConclusionsVisuals may have many functions in communication. The lists presented in thispaper presents hundreds of opinions about image functions. More than onehundred different explanatory verbs are used to express these opinions. Accord-ing to researchers in the areas of instructional message design, visual literacy,and visual communication the most common opinions on functions of visualsconcern attention. Attract, gain, get, hold and maintain attention are mentionedby the researchers. Other common explanatory verbs are: facilitate, provide, per-suade, create (an interest in), illustrate, clarify, motivate, present, and reinforce infor-mation (to someone).
The inquiries with students and teachers also showed that there may bemany purposes for the use of visuals in printed media. Most of the purposescan be looked upon as clearly pedagogical or cognitive, in contrast to picturesused for entertainment, decoration, advertising or marketing. The most com-mon purposes of pictures in the school environment were to: show, explain, visu-alize, illustrate, clarify, inform, summarize, convey, mediate, elucidate, present, andgive (perceptions), instruct, describe, and entertain.
The most common purposes of pictures in information design are to visu-alize, clarify, inform, attract attention, facilitate reading, explain, and convey infor-mation. The type of visual to be used in the production of materials for infor-mation and learning must often be determined in each case with a view tospecific demands on the visual, and also to the prevailing budget framework.
228
ReferencesAronsson, K. (1983). Verklighetens mångtydighet och pekbokens begränsningar.
Om bild och begrepp i språkläromedel. In L. Gustavsson och H. Hult. (Red.). Text och bild i läromedel, SIC 4, 7–24. Linköping: Universitetet i Linköping. Tema Kommunikation.
Backman, J., Berg, T., & Sigurdson, T. (1988). Grundskoleelevers produktion och reception av bilder. Umeå. Umeå universitet. Institutionen för bildlärarut-bildning. Rapport nr 7.
Beckius, C. (1987). Granskningsrapport om könsroller i grundskolans läroböcker i engelska, tyska och franska. Stockholm: SIL, Statens Institut för Läro-medels-information. Rapport 1987:2.
Benckert, S. & Staberg, E. (1988). Riktar sig läroböckerna i NO-ämnen mer till pojkar än till flickor? Granskning av några läroböcker i naturorienterade ämnen. Stockholm: Skolöverstyrelsen, R 88:11– Rapporter, planering, uppföljning, utvärdering.
Berglund, L. (1991). Att tänka på vid läroboksvalet. In L. Berglund (Ed.) Lärobok om läroböcker. Stockholm: Läromedelsförfattarnas Förening.
Bernard, R.M., Petersen, C.H., & Ally, M. (1981). Can images provide contex-tual support for prose? Educational Communication and Technology Journal, 29, 101-108.
Dale, E. (1946). Audio-visual methods in teaching. New York: Dryden Press. (2nd ed., 1954; 3rd ed., 1969).
Dondis, D. A. (1973). A Primer of Visual Literacy. Cambridge, MA: Massachu-setts Institute of Technology.
Duchastel, P. C. (1978). Illustrating instructional texts. Educational Technology, 18 (11), 36–39.
Duchastel, P. C. (1981). Illustrations in text: A retentional role. Programmed Learning and Educational Technology, 18, 11–15.
Duchastel, P. C. (1983). Text Illustrations. Performance and Instruction, 22, 3–5.
Duchastel, P. C., & Waller, R. (1979). Pictorial illustration in instructional texts. Educational Technology, 19, 20–25.
Dwyer, F. M. (1972). A Guide for Improving visualized Instruction. State College, PA: Learning Services.
Dwyer, F. M. (1978). Strategies for Improving Visual Learning. State College, PA: Learning Services.
Eklund, S. (1990). Bedömning av kunskaper och färdigheter i bild, årskurs 2. Del av en nationell utvärdering av grundskolan. Umeå. Umeå Universitet. Institu-tionen för bildlärarutbildning. Rapport nr. 10.
Evans, M. A., Watson, C., & Willows, D. M. (1987). A naturalistic inquiry into illustrations in instructional textbooks. In H. A. Houghton & D. M. Wil-
229
lows (Eds.). The Psychology of Illustrations: Vol. 2. Instructional Issues, New York: Springer-Verlag.
Fleming, M. L., & Levie, W. H. (1978). Instructional Message Design. Englewood Cliffs, NJ: Educational Technology Publications.
Fredette, B. W. (1994). Use of Visuals in Schools (Curriculum and Instruction). In D. M. Moore & F. M. Dwyer (Eds.). Visual Literacy. Englewood Cliffs, NJ: Educational Technology Publications.
Gayer, G. (1992). Att arbeta utan läromedel. Spov, 16, 17–39.Griffin, R. E. (1994). Use of Visuals: Business and Industry. In D. M. Moore & F.
M. Dwyer (Eds.). Visual Literacy. Englewood Cliffs, NJ: Educational Tech-nology Publications.
Gustafsson, C. (1980a). Läromedlens funktion i undervisningen. En rapport från utredningen om lärome-delsmarknaden. DsU 1980:4.
Gustafsson, C. (1980b). Läromedlens funktion i undervisningen. Bilagedel. En rap-port från utredningen om läromedelsmarknaden. DsU 1980:5.
Hannus, M. (1996). Oppikirjan kuvitus koriste vai ymmärtämisen apu (Textbook illustrations – decoration or an aid to understanding). Turku: Turun Ylio-piston Julkaisuja Annales Universtatis Turkuensis.
Heinich, R., Molenda, M., & Russell, J. D. (1982). Instructional Media and the New Technologies of Instruction. New York: Macmillan
Hilmo, I. (1983). An analysis of Norwegian textbooks in science. Contributions to the second GASAT conference. Oslo.
Holliday, W. (1980). Using visuals to teach concepts. Science and Children, 17, 9–10.
Hunter, B., Crismore, A., & Pearson, P. D. (1987). Visual displays in basal read-ers and social studies textbooks. In H. A. Houghton, & D. M. Willows (Eds.). The Psychology of Illustrations: Vol 2. Instructional Issues. New York: Springer-Verlag.
Keller, J., & Burkman, E. (1993). Motivation principles. In M. Fleming, & W. H. Levie (Eds.). Instructional Message Design: Principles from the Behav-ioral and Cognitive Sciences (2nd ed.). Englewood Cliffs, NJ: Educational Technology Publications.
Larsson, B. (1991). Sätt att se på. In L. Berglund (Ed.) Lärobok om läroböcker. Stockholm: Läromedelsförfattarnas Förening.
Leshin, C. B., Pollock, J. & Reigeluth, C. M. (1992). Instructional design strategies and tactics. Englewood Cliffs, NJ: Educational Technology Publications.
Lester, P, M. (1995). Visual Communication. Images with Messages. Belmont, CA: Wadsworth Publishing Company. A Division of International Thomson Publishing Inc.
Levie, W. H., & Lentz, R. (1982). Effects of text illustrations: A review of research. ECTJ, 30, 4, 195–232.
230
Levin, J. R., Anglin, G. J., & Carney, R. N. (1987). On empirically validating functions of pictures in prose. In D. M. Willows & H. A. Houghton (Eds.). The Psychology of Illustration: Vol. 1. Basic Research. New York: Springer-Ver-lag.
Lindell, E. (1990). Läromedel i grundskolan – attityder och effekter. Skolöversty-relsen. Stockholm. F 909:4/Vad säger forskningen.
Lindström, A. (1990). Bilder i läromedel, lärarsynpunkter. Stockholm: Stock-holms Universitet. Konstfack, Institutionen för bildpedagogik.
Lingons, B. (1987). Rapporter från Stockholms Skolor. Läromedelssituationen i några Stockholmsskolor 1986/87. Stockholms skolförvaltning 1987:4.
Marsh, P. O. (1983). Messages That Work: A Guide to Communication Design. Englewood Cliffs, NJ: Educational Technology Publications.
Massoumian, B. (1989). Successful teaching via two-way interactive video. TechTrends, 34 (2), 16 -19.
Melin, L. (1986a). Text, bild, lexivision. En studie i text-bild-samverkan i en lärobok. Stockholm: Stockholm University, Department of Nordic Lan-guages.
Melin, L. (1986b). Termer — Ett kompendium om terminologi och termbildn-ing. Stockholm: Stockholm University, Department of Nordic Languages.
Melin, L. & Pettersson; R. (1991). Bildtexter i läroböc-ker. Stockholm. Stock-holms Universitet: Nordiska Språk.
Metallinos, N., Muffoletto, R., Pettersson, R., Shaw, J. and Takakuwa, Y. (1990). The use of Verbo–visual Information in Textbooks — a cross–cultural experience. Paper presented at the International Visual Literacy Association Symposium 1990. Verbo–Visual Literacy. Mapping the Field. July 10–13. University of London, Institute of Education.
Moriarty, S. E. (1991). Creative Advertising. Theory and Practice. Englewood Cliffs, NJ: Prentice Hall.
O’Keefe, D.J. (1990). Persuasion. Theory and Research. Newbury Park: SAGE Publ.
Peeck, J. (1987). The Role of Illustrations in Processing and Remembering Illustrated Text. In D. M. Willows, & H. A. Houghton (Eds.). The Psychology of IIlustration: Vol. 1. Basic Research. New York: Springer-Verlag.
Peeck, J., & Goud, A. (1985). Perspective-inducing effects of text illustrations. Human Learning, 4, 243-249.
Pettersson, R. (1985). Intended and perceived image content. Presentation at the 17th Annual Conference of the International Visual Literacy Associa-tion. In L. W. Miller (Ed.). Creating Meaning. Readings from the Visual Lit-eracy Conference at California State Polytechnic University at Pomona.
Pettersson, R. (1989). Visuals for Information: Research and Practice. Englewood Cliffs, NJ: Educational Technology Publications.
Pettersson, R. (1990). Teachers, Students and Visuals. Journal of Visual Literacy, 10, 1, 45–62.
231
Pettersson, R. (1993). Visual Information. Englewood Cliffs, NJ: Educational Technology Publications.
Pettersson, R., Metallinos, N., Muffoletto, R., Shaw, J. and Takakuwa, Y. (1991). The use of verbo–visual information in teaching of geography – views from teachers. Presentation at the 23rd Annual Conference of the International Visual Literacy Association. Washington, Oct. 9–13.Published in: J. Clark–Baca, D. G. Beauchamp & R. A. Braden, (Eds.) 1992: Visual Communication: Bridging Across Cultures. Selected Readings from the 23rd Annual Conference of the International Visual Literacy Association. Inter-national Visual Literacy Association. Blacksburg, VA. p. 211–222.Also published 1993 in: ETR&D, Vol. 41, 1 101–107.Ramsey, I. L. (1989). Pri-mary children’s ability to distinguish between illustrative styles. JVL, 9(2), 69–82.
Ramsey, I. L. (1989). Primary children’s ability to distinguish between illustra-tive styles. JVL, 9(2), 69–82.
Reinking, D. (1986). Integrating graphic aids into content area instruction: The graphic information lesson. Journal of Reading, 30(2), 146–151.
Rieber, L. P. (1994). Computers, Graphics, & Learning. Madison: Brown & Bench-mark Publishers.
Romare, E. (1991). Exempel på bildspråklig kommuni-kation. In S. Selander, L. Olsson, R. Pettersson och E. Romare (Eds.). Specialnummer: läromedel. Ett utbildningsmaterial om pedagogiska texter. Spov 14/15.
Rowntree, D. (1990). Teaching through self-instruction. How to develop open learn-ing materials (2nd ed.). New York: Nichols Publishing.
Selander, S. (1991). Forskning om läromedel. In i S. Selander, L. Olsson, R. Pet-tersson och E. Romare (Eds.). Specialnummer: läromedel. Ett utbildnings-material om pedagogiska texter. Spov 14/15.
Selander , S. (1992). Pedagogiska texter som forsk-ningsfält. Forskning om utbildning. Tidskrift för analys och debatt, 4, 41–53.
Sims-Knight, J. E. (1992). To Picture or Not to Picture: How to Decide. Visible Language, 26, 3, 325-388.
Sinatra, R. (1986). Visual Literacy Connections to Thinking, Reading, and Writing. Springfield, IL: Charles C. Thomas.
Smith, K.U., & Smith, M.F. (1966). Cybernetic principles of learning and educa-tional design. New York: Holt, Rinehart & Winston.
Taylor, J. (1979). Sexist Bias in Physics Textbooks. Physics Education, 14, 277.Travers, R.M.W., & Alvarado, V. (1970). The design of pictures for teaching
children in elementary schools. AV Communication Review, 18, 47-64.Trotzig, G. (1993). Forskaren och skolboken — en arkeologisk fallstudie. Spov,
20, 13–25.Tufte, E. R. (1983). The Visual Display of Quantitative Information. Cheshire, CT:
Graphics Press.
232
Vernon, M.D. (1953). The value of pictorial illustration. British Journal of Psy-chology, 23, 180-187.
Watford, G. (1983). Science education and sexism in the Soviet Union. School Science Review, Dec, 213-224.
Wileman, R. E. (1993). Visual Communicating. Englewood Cliffs, NJ: Educa-tional Technology Publications.
Winn, W. (1993). Perception principles. In M. Fleming & W. H. Levie (Eds.). Instructional Message Design: Principles from the Behavioral and Cognitive Sci-ences (2nd ed.). Englewood Cliffs, NJ: Educational Technology Publica-tions.
Zakia, R. D. (1985). Advertising and sexual ethic. International Journal of Visual Sociology, 3, 1, 42–58.
Zimmer, A., & Zimmer, F. (1978). Visual Literacy in Communication: Designing for Development. Hulton Educational Publications Ltd., in cooperation with the International Institute for Adult Literacy Methods, Teheran.
233
Paper 13
Assessing image contents
Abstract. This paper includes a discussion of methods for assessing image contents.It is relatively easy to assess concrete image contents. However, it is not at all as easyto measure aspects of abstract image contents. A subject matter can be depicted withmany different kinds of pictures and a single picture can be perceived in many differentways. In order to be able to produce better information materials we need to study theimportance of various variables in visual language. We need to further develop meth-ods for measuring image properties.
IntroductionThere are many different kinds of visuals, and they can be classified accordingto various criteria. Generally speaking scholars agree that complicated lan-guage, in both texts and pictures, will impair the understanding of any intendedmessage. Text and pictures for information should be designed so that they areeasy to read. Any graphical message should be legible, readable, and also wellworth reading for the intended audience. Any audial message should be audi-ble, distinct, and also well worth listening to for the intended audience. Themessage may be aesthetically pleasing, but its content is more important thanits form.
In order to further develop information materials we need to be able to findways of comparing the advantages and disadvantages of various variables invisual language. We need to develop methods for assessing and measuringimage properties, and perception of images. In this paper I discuss methodsfor assessing and measuring concrete and abstract image contents, and I com-pare the importance of two different means of production.
Classification of visualsVisuals can be classified according to various criteria, such as sender, receiver,content, execution, context, and format, and even according to criteria such asfunction, use, and the means of production, etc. In picture archives, picturesmay be stored, e.g., according to content categories.
234
Doblin (1980) classified iconographic (visual) information into several cat-egories: ideogrammatic (symbols that attempt to convey a single meaning, suchas a road sign), diagrammatic (charts, graphs, or diagrams), and isogrammatic(photography, drawing, and drafting). Hunter, Crismore, and Pearson (1987)presented a classification as points along a continuum from realistic to abstract:photography, artwork, diagrams and maps, graphics and formulae, tables andcharts, and orthography (icons). In their study on Visual Displays in Basal Readersand Social Studies Textbooks, they used the following categories: sequentialgraphs, quantitative graphs, maps, diagrams, tables and charts, and verbal-visual displays.
For Wileman (1993) all kinds of representations of an object are symbols. Heargued that there are three major ways to represent objects: as (1) pictorial sym-bols, as (2) graphic symbols, and as (3) verbal symbols – ranging from concreteto abstract representations. The first group, pictorial symbols, includes photo-graphs and illustrations or drawings. Viewers should easily be able to translatea pictorial symbol to a real-world example. The second group, graphic symbols,has image-related graphics, concept-related graphics, and arbitrary graphics.Image-related graphics can be characterized as silhouettes or profiles of theobject. Concept-related graphics look like the object but have less detail thanimage-related graphics. Arbitrary graphics are abstract symbols for objects, con-structed out of the designer’s imagination. The third group, verbal symbols, isdivided into two sub-groups, verbal descriptions and nouns or labels. Only peo-ple who comprehend the language used to describe the objects can understandverbal symbols.
There seem to be no major difference in “abstractness” between abstractarbitrary graphic symbols and verbal symbols to me (Pettersson, 1993). Thus,I prefer to talk about two categories of representations: (1) figurative and (2)non-figurative. Figurative representations include two groups, visuals andgraphic symbols. Visuals include three-dimensional images, photographs, real-istic drawings, and schematic drawings. Graphic symbols include pictorialsymbols, abstract symbols, and arbitrary symbols. Non-figurative representa-tions or verbal symbols include verbal descriptions, nouns or labels, and lettersand characters.
There are many more possibilities for classification of visuals. One way isthe style. Sloan (1971) discussed four pictorial artistic styles, (1) photographic,(2) representational, (2) expressionistic, and (4) cartoon. Photographic style wasdefined as a colored photograph of the subject. Representational style wasdefined as an artist´s rendition of the subject which conforms to the subject inits true form. Expressionistic style was defined as an artist’s rendition of the sub-ject, which leans heavily towards abstraction. Cartoon style was defined as ananimated caricature of the subject. These four artistic styles form a realistic toan abstract continuum.
235
Dondis (1973) discussed the anatomy of a visual message, another kind ofstyle. According to Dondis we express and receive visual messages on threelevels; (1) representationally, (2) symbolically, and (3) abstractly. Representa-tional forms of illustrations are actual photographs of things. In symbolicalforms pictures show one thing and connote another. In abstract forms illustra-tions provide minimal visual information on the phenomenon illustrated.
In addition to size, shape, color etc., the way pictures are shot is important.With reference to the distance to and size of the motif, photographers may clas-sify pictures as long shots, full-length portraits, half-length portraits, and close-ups. The aesthetic value of a long shot is different from that of a medium shotor close-up. According to Zettl (1990) a scene can be presented (1) objectively(usually a long shot), (2) subjectively (usually a close-up), or (3) creatively (cre-ated by the medium itself, for example, superimposition, picture montage, etc.).Metallinos (1990) developed a schema, which explains these three forms of pic-ture presentations in accordance with their functional aesthetic value. We can(1) remain totally objective and look at an event and, (2) become subjectivelyinvolved and look into an event; and (3) where the event is totally dependenton the medium for its existence we can create an event.
Measuring concrete image contentsThe execution of a visual can be measured by objective as well as by subjectivemethods. However, the image contents may only be assessed and measured bysubjective means. Variables in visual language have functional as well as sug-gestive properties (Pettersson, 1989). The functional properties are related tocognitive factual information in content, execution, context, and format. Thesuggestive properties are related to emotions, conceptions, aesthetic perception,tension, fright, etc.
Functional properties predominate in symbols. They are also more importantthan suggestive properties in informative and educational pictures, since theirtask is to convey certain information in the most effective manner possible. Theobjective for a picture for information may also be to convey certain emotionsand arouse the viewer’s interest and involvement (e.g., regarding conditionsin other countries and cultures, or in past times).
Suggestive properties are more important than functional properties in “artis-tic pictures”. Art is not primarily a question of objects. It is more a visual lan-guage for dissemination of ideas and experiences that are difficult to put acrossin words. Irrespective of the sender’s intentions, different receivers mayrespond in an emotional manner to a picture with mainly functional properties.In the corresponding manner, some viewers may respond unemotional andfunctional to pictures with predominantly suggestive properties.
236
In the USA more than 50,000 high school, college, and adult learners haveparticipated in more than 200 visual research studies. Dwyer has reportedresults from these studies several times (1972, 1978, 1982-3, 1985, and 1994).Throughout these studies, continuity was maintained by utilizing the same2,000 word instructional unit on the human heart. Visuals range from simpleline drawings to realistic photographs, in black and white as well as in color.A variety of presentation formats, such as booklets, television, and slide-audio-tape presentations have been used in these studies.
Pictures with concrete contents have also been used in a number of otherstudies. In several experiments subjects have been given various assignments.Thus subjects have been asked to name image contents, to describe image con-tents, to index image contents, to write legends, to assess image contents, tocreate images, to complete a story, to illustrate a story, to produce informationsets, to produce information graphics and to describe picture context. SeeCohen, Ebeling, and Kulik (1981), Goldsmith (1984, 1986), and Pettersson (1989,1993) for reviews of such studies.
Figure 1. Concrete image content “Two house martins.”
Pictures which are easy to read are usually rated as aesthetically pleasingand suitable for use in the dissemination of concrete information (Pettersson,1986). Here, we often find a close agreement between intended and perceivedimage contents. It is relatively easy to assess and measure concrete image con-tents. However, it is not at all as easy to measure aspects of abstract image con-tents.
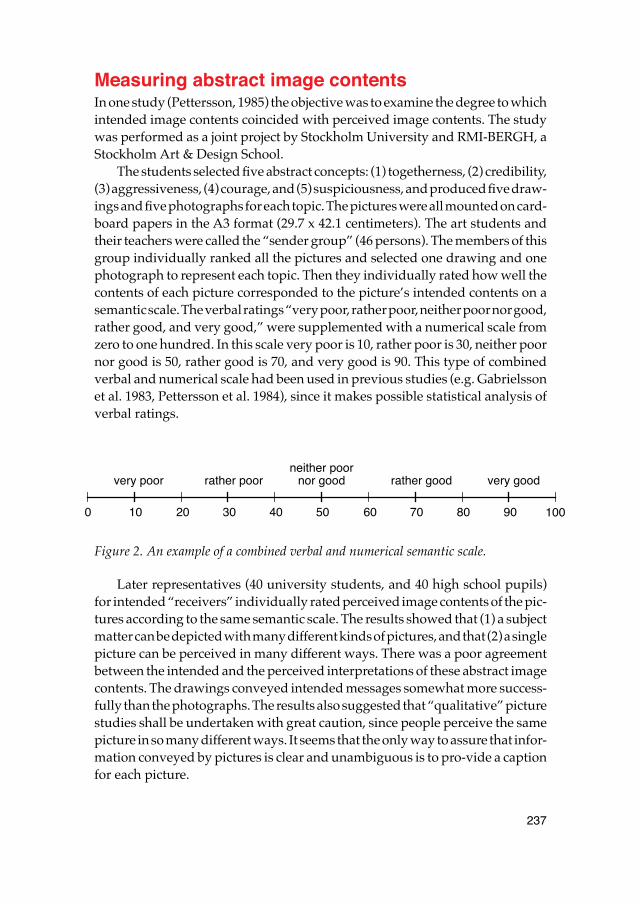
237
Measuring abstract image contentsIn one study (Pettersson, 1985) the objective was to examine the degree to whichintended image contents coincided with perceived image contents. The studywas performed as a joint project by Stockholm University and RMI-BERGH, aStockholm Art & Design School.
The students selected five abstract concepts: (1) togetherness, (2) credibility,(3) aggressiveness, (4) courage, and (5) suspiciousness, and produced five draw-ings and five photographs for each topic. The pictures were all mounted on card-board papers in the A3 format (29.7 x 42.1 centimeters). The art students andtheir teachers were called the “sender group” (46 persons). The members of thisgroup individually ranked all the pictures and selected one drawing and onephotograph to represent each topic. Then they individually rated how well thecontents of each picture corresponded to the picture’s intended contents on asemantic scale. The verbal ratings “very poor, rather poor, neither poor nor good,rather good, and very good,” were supplemented with a numerical scale fromzero to one hundred. In this scale very poor is 10, rather poor is 30, neither poornor good is 50, rather good is 70, and very good is 90. This type of combinedverbal and numerical scale had been used in previous studies (e.g. Gabrielssonet al. 1983, Pettersson et al. 1984), since it makes possible statistical analysis ofverbal ratings.
Figure 2. An example of a combined verbal and numerical semantic scale.
Later representatives (40 university students, and 40 high school pupils)for intended “receivers” individually rated perceived image contents of the pic-tures according to the same semantic scale. The results showed that (1) a subjectmatter can be depicted with many different kinds of pictures, and that (2) a singlepicture can be perceived in many different ways. There was a poor agreementbetween the intended and the perceived interpretations of these abstract imagecontents. The drawings conveyed intended messages somewhat more success-fully than the photographs. The results also suggested that “qualitative” picturestudies shall be undertaken with great caution, since people perceive the samepicture in so many different ways. It seems that the only way to assure that infor-mation conveyed by pictures is clear and unambiguous is to pro-vide a captionfor each picture.
1000 10 40 50 60 70 80 903020
very poor very goodnor goodrather poor rather goodneither poor
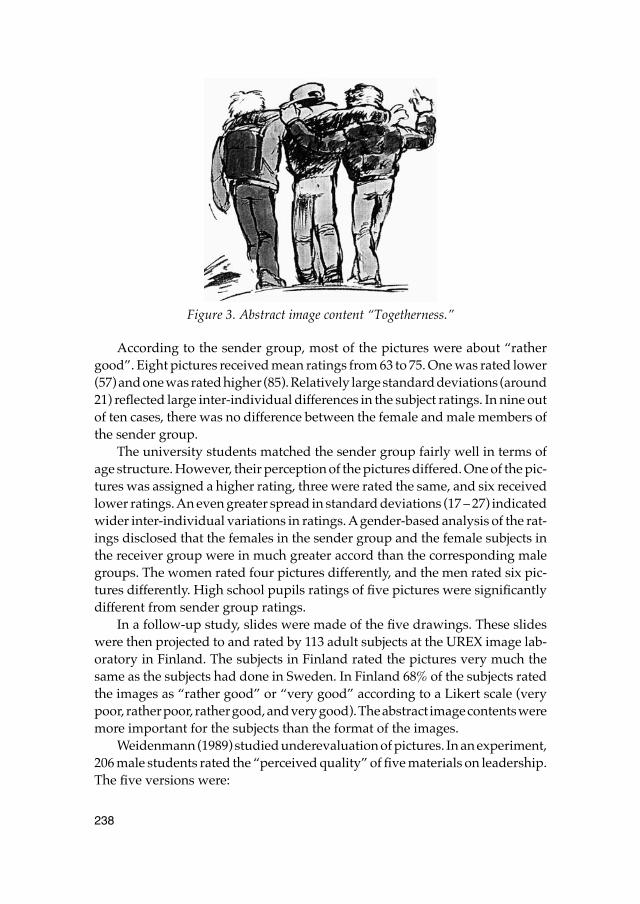
238
Figure 3. Abstract image content “Togetherness.”
According to the sender group, most of the pictures were about “rathergood”. Eight pictures received mean ratings from 63 to 75. One was rated lower(57) and one was rated higher (85). Relatively large standard deviations (around21) reflected large inter-individual differences in the subject ratings. In nine outof ten cases, there was no difference between the female and male members ofthe sender group.
The university students matched the sender group fairly well in terms ofage structure. However, their perception of the pictures differed. One of the pic-tures was assigned a higher rating, three were rated the same, and six receivedlower ratings. An even greater spread in standard deviations (17 – 27) indicatedwider inter-individual variations in ratings. A gender-based analysis of the rat-ings disclosed that the females in the sender group and the female subjects inthe receiver group were in much greater accord than the corresponding malegroups. The women rated four pictures differently, and the men rated six pic-tures differently. High school pupils ratings of five pictures were significantlydifferent from sender group ratings.
In a follow-up study, slides were made of the five drawings. These slideswere then projected to and rated by 113 adult subjects at the UREX image lab-oratory in Finland. The subjects in Finland rated the pictures very much thesame as the subjects had done in Sweden. In Finland 68% of the subjects ratedthe images as “rather good” or “very good” according to a Likert scale (verypoor, rather poor, rather good, and very good). The abstract image contents weremore important for the subjects than the format of the images.
Weidenmann (1989) studied underevaluation of pictures. In an experiment,206 male students rated the “perceived quality” of five materials on leadership.The five versions were:
239
1. text2. text with “imagination instructions”3. text with pictures and no instructions4. text with pictures and picture-oriented instructions5. text with pictures and imagination instructions
The “illustrated text with picture-oriented instructions”-group rated thematerial more positively with respect to four factors: (1) comprehensibility, (2)concreteness, (3) attractiveness, and (4) memorability. The three groups withinstructions in their texts each rated the material lower in scientific “serious-ness” than did the two other groups. After two weeks 159 subjects received aquestionnaire concerning main ideas and details of the text. Results showedthat the “illustrated text with picture-oriented instructions”-group recalled sig-nificantly more main ideas and details of the text than did all other groups. Thedifferences among the other four groups were statistically equivalent. It can beconcluded that an underevaluation of pictures can be compensated for byexplicit picture-oriented instructions. In materials for information and instruc-tion pictures need legends.
Importance of the means of productionThe introduction of personal computers and different software packages havechanged the way many people work. This is true for writing of text, and alsotrue for the production of many kinds of visuals, especially schematic picturesand different kinds of graphics. It is easy to change the typography of a textand thus adopt the legibility of that specific text for different media and for dif-ferent audiences. But how do people perceive text and pictures with differentstyles that are dependent on the means of production?
ObjectiveIn a recent study at the department of Information Design at Mälardalen Uni-versity the objective was to examine if the means of production of a message willinfluence our perception of that message.
The specific research question was: “Are there any general differencesbetween traditionally hand-made and computer generated pictures?” Thehypothesis was that computer generated pictures will provide a “better expe-rience” for the receivers than hand-made pictures with the same subject matterwill be able to do. We anticipated that receivers should find that computer gen-erated messages will provide better legibility, better readability, better readingvalue, better aesthetic value, optimal image complexity and also better credi-
240
bility. There are a number of sources of possible errors for all kinds of qualitativestudies of pictures, of visual language and of combined verbo-visual messages.It may be hard, or it may even be impossible to draw any general conclusionsfrom a limited number of experimental pictures and a limited number of sub-jects, even if they are statistically selected at random. Also, the skill of individualfine artists and the skill of individual illustrators or photographers will influencethe quality of the final pictures. Receivers will probably always have their indi-vidual preferences and interpretations with respect to the visuals that we usefor information sets and learning materials. If a teacher acts as a leader for avisual language experiment this may also influence our student subjects. How-ever, we have tried to design this study in order to reduce the importance ofthese different problems.
DefinitionsIn this study the six main concepts that we have studied were described in thefollowing way.
Legibility. The message's legibility is determined by the technical design ofthe text and the pictures, that is, their clarity. We should avoid unusual typefaces,as well as typefaces that are too small or too large. Typeface and font size mustbe adapted partly to the medium and partly to the choice of technical produc-tion. A drawing has good legibility if it is easy to read, from the viewpoint thatthe reader should easily be able to see and distinguish all the different parts ofthe picture. Legibility can be measured rather objectively, and its quality isassessable whether we understand the content of the message or not.
Readability. What makes a message difficult to read is not as often the subjectmatter as the style. The choice of words, symbols, and picture elements createsthe style. The readability is determined by content and formulations, and howwell the language and style is adapted to the readers. A drawing style thatincludes many different kinds of patterns, shadings, and lines, and inconsistentuse of symbols may obstruct the reading of the pictures. A schematic picturehas good readability if it is easy for the reader to understand the message.
Reading value. The message should be well worth reading. This designatesthe properties of the content of a message and is very subjectively dependenton the reader’s degree of interest in the message. Each group of readers selectsinformation material on the basis of her or his personal preferences. What isinteresting for one person may be perceived as boring by another person. Thesame message may be interesting at one instance but uninteresting at anotheroccasion.
Aesthetic value. The aesthetic value of a message is how the intended receiv-ers perceive it with respect to beauty. Aesthetics aims to establish the generalprinciples of art and beauty, harmony and proportion. Material with a (suffi-
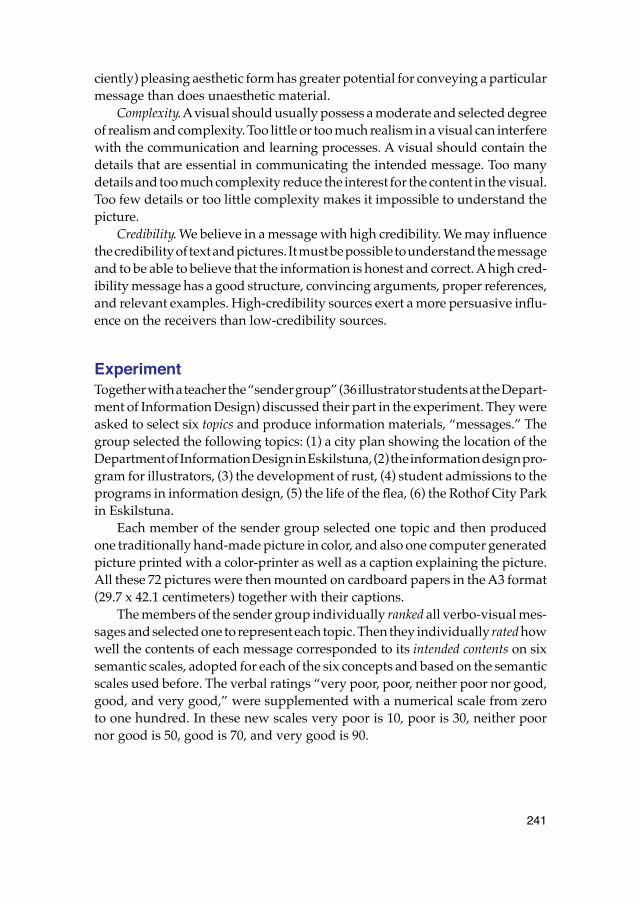
241
ciently) pleasing aesthetic form has greater potential for conveying a particularmessage than does unaesthetic material.
Complexity. A visual should usually possess a moderate and selected degreeof realism and complexity. Too little or too much realism in a visual can interferewith the communication and learning processes. A visual should contain thedetails that are essential in communicating the intended message. Too manydetails and too much complexity reduce the interest for the content in the visual.Too few details or too little complexity makes it impossible to understand thepicture.
Credibility. We believe in a message with high credibility. We may influencethe credibility of text and pictures. It must be possible to understand the messageand to be able to believe that the information is honest and correct. A high cred-ibility message has a good structure, convincing arguments, proper references,and relevant examples. High-credibility sources exert a more persuasive influ-ence on the receivers than low-credibility sources.
ExperimentTogether with a teacher the “sender group” (36 illustrator students at the Depart-ment of Information Design) discussed their part in the experiment. They wereasked to select six topics and produce information materials, “messages.” Thegroup selected the following topics: (1) a city plan showing the location of theDepartment of Information Design in Eskilstuna, (2) the information design pro-gram for illustrators, (3) the development of rust, (4) student admissions to theprograms in information design, (5) the life of the flea, (6) the Rothof City Parkin Eskilstuna.
Each member of the sender group selected one topic and then producedone traditionally hand-made picture in color, and also one computer generatedpicture printed with a color-printer as well as a caption explaining the picture.All these 72 pictures were then mounted on cardboard papers in the A3 format(29.7 x 42.1 centimeters) together with their captions.
The members of the sender group individually ranked all verbo-visual mes-sages and selected one to represent each topic. Then they individually rated howwell the contents of each message corresponded to its intended contents on sixsemantic scales, adopted for each of the six concepts and based on the semanticscales used before. The verbal ratings “very poor, poor, neither poor nor good,good, and very good,” were supplemented with a numerical scale from zeroto one hundred. In these new scales very poor is 10, poor is 30, neither poornor good is 50, good is 70, and very good is 90.
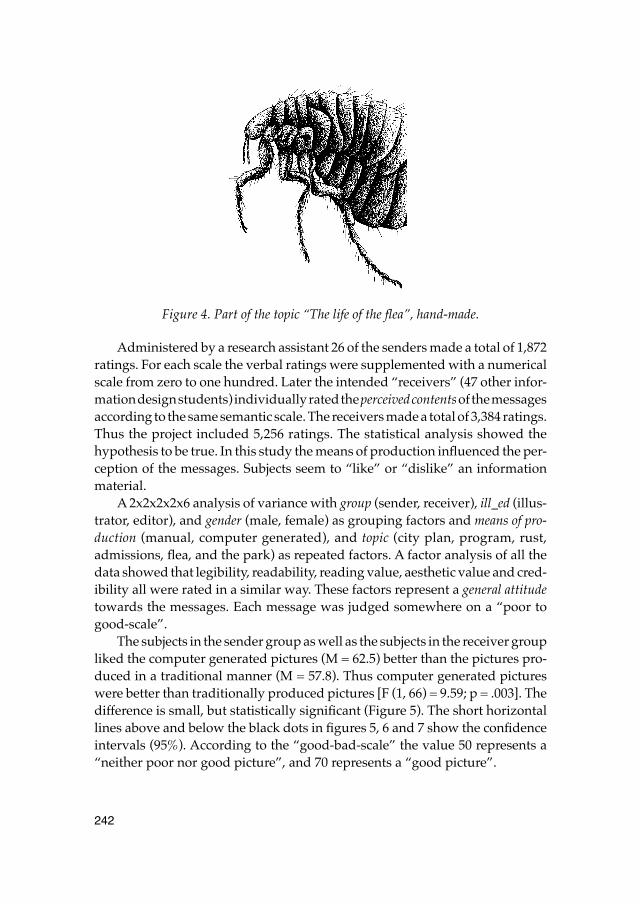
242
Figure 4. Part of the topic “The life of the flea”, hand-made.
Administered by a research assistant 26 of the senders made a total of 1,872ratings. For each scale the verbal ratings were supplemented with a numericalscale from zero to one hundred. Later the intended “receivers” (47 other infor-mation design students) individually rated the perceived contents of the messagesaccording to the same semantic scale. The receivers made a total of 3,384 ratings.Thus the project included 5,256 ratings. The statistical analysis showed thehypothesis to be true. In this study the means of production influenced the per-ception of the messages. Subjects seem to “like” or “dislike” an informationmaterial.
A 2x2x2x2x6 analysis of variance with group (sender, receiver), ill_ed (illus-trator, editor), and gender (male, female) as grouping factors and means of pro-duction (manual, computer generated), and topic (city plan, program, rust,admissions, flea, and the park) as repeated factors. A factor analysis of all thedata showed that legibility, readability, reading value, aesthetic value and cred-ibility all were rated in a similar way. These factors represent a general attitudetowards the messages. Each message was judged somewhere on a “poor togood-scale”.
The subjects in the sender group as well as the subjects in the receiver groupliked the computer generated pictures (M = 62.5) better than the pictures pro-duced in a traditional manner (M = 57.8). Thus computer generated pictureswere better than traditionally produced pictures [F (1, 66) = 9.59; p = .003]. Thedifference is small, but statistically significant (Figure 5). The short horizontallines above and below the black dots in figures 5, 6 and 7 show the confidenceintervals (95%). According to the “good-bad-scale” the value 50 represents a“neither poor nor good picture”, and 70 represents a “good picture”.
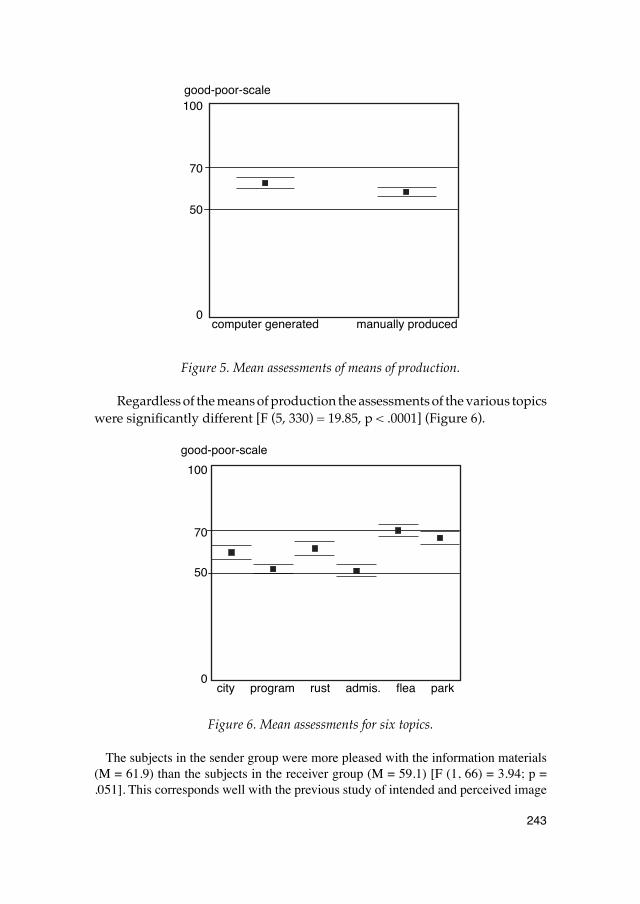
243
Figure 5. Mean assessments of means of production.
Regardless of the means of production the assessments of the various topicswere significantly different [F (5, 330) = 19.85, p < .0001] (Figure 6).
Figure 6. Mean assessments for six topics.
The subjects in the sender group were more pleased with the information materials(M = 61.9) than the subjects in the receiver group (M = 59.1) [F (1, 66) = 3.94; p =.051]. This corresponds well with the previous study of intended and perceived image
100
50
0computer generated manually produced
good-poor-scale
70
good-poor-scale
city program admis.rust flea park
100
50
0
70
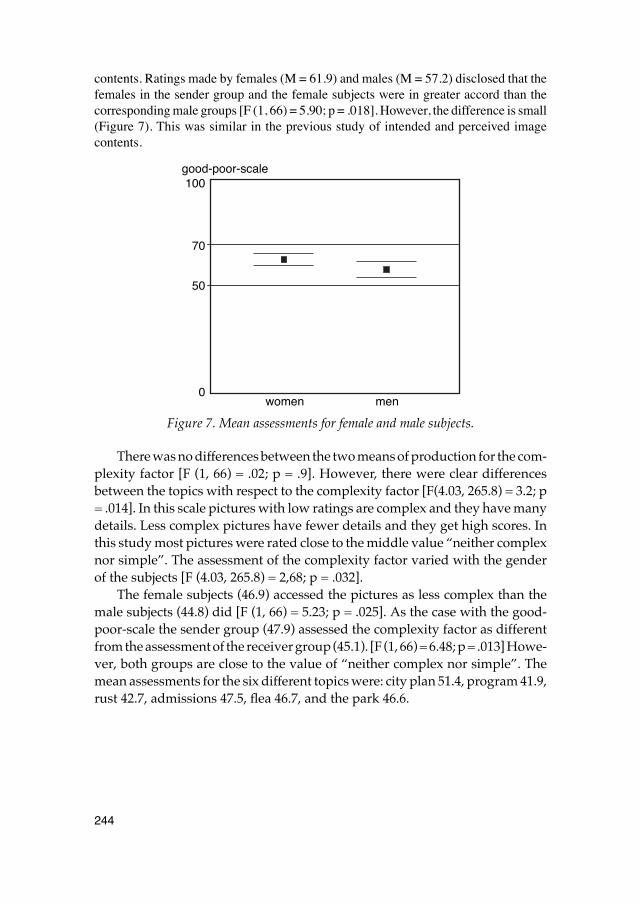
244
contents. Ratings made by females (M = 61.9) and males (M = 57.2) disclosed that thefemales in the sender group and the female subjects were in greater accord than thecorresponding male groups [F (1, 66) = 5.90; p = .018]. However, the difference is small(Figure 7). This was similar in the previous study of intended and perceived imagecontents.
Figure 7. Mean assessments for female and male subjects.
There was no differences between the two means of production for the com-plexity factor [F (1, 66) = .02; p = .9]. However, there were clear differencesbetween the topics with respect to the complexity factor [F(4.03, 265.8) = 3.2; p= .014]. In this scale pictures with low ratings are complex and they have manydetails. Less complex pictures have fewer details and they get high scores. Inthis study most pictures were rated close to the middle value “neither complexnor simple”. The assessment of the complexity factor varied with the genderof the subjects [F (4.03, 265.8) = 2,68; p = .032].
The female subjects (46.9) accessed the pictures as less complex than themale subjects (44.8) did [F (1, 66) = 5.23; p = .025]. As the case with the good-poor-scale the sender group (47.9) assessed the complexity factor as differentfrom the assessment of the receiver group (45.1). [F (1, 66) = 6.48; p = .013] Howe-ver, both groups are close to the value of “neither complex nor simple”. Themean assessments for the six different topics were: city plan 51.4, program 41.9,rust 42.7, admissions 47.5, flea 46.7, and the park 46.6.
women men
good-poor-scale100
50
0
70
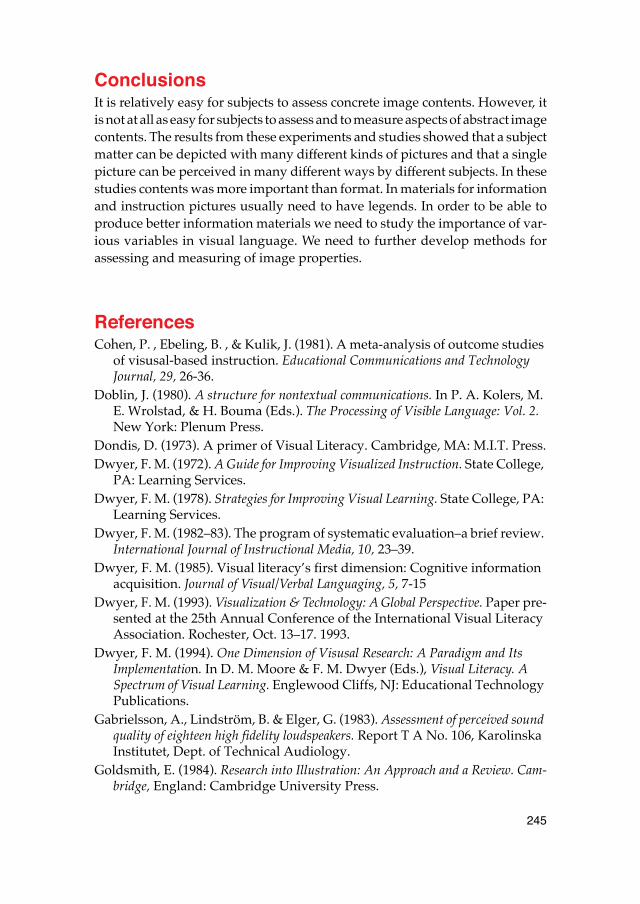
245
ConclusionsIt is relatively easy for subjects to assess concrete image contents. However, itis not at all as easy for subjects to assess and to measure aspects of abstract imagecontents. The results from these experiments and studies showed that a subjectmatter can be depicted with many different kinds of pictures and that a singlepicture can be perceived in many different ways by different subjects. In thesestudies contents was more important than format. In materials for informationand instruction pictures usually need to have legends. In order to be able toproduce better information materials we need to study the importance of var-ious variables in visual language. We need to further develop methods forassessing and measuring of image properties.
ReferencesCohen, P. , Ebeling, B. , & Kulik, J. (1981). A meta-analysis of outcome studies
of visusal-based instruction. Educational Communications and Technology Journal, 29, 26-36.
Doblin, J. (1980). A structure for nontextual communications. In P. A. Kolers, M. E. Wrolstad, & H. Bouma (Eds.). The Processing of Visible Language: Vol. 2. New York: Plenum Press.
Dondis, D. (1973). A primer of Visual Literacy. Cambridge, MA: M.I.T. Press.Dwyer, F. M. (1972). A Guide for Improving Visualized Instruction. State College,
PA: Learning Services.Dwyer, F. M. (1978). Strategies for Improving Visual Learning. State College, PA:
Learning Services.Dwyer, F. M. (1982–83). The program of systematic evaluation–a brief review.
International Journal of Instructional Media, 10, 23–39.Dwyer, F. M. (1985). Visual literacy’s first dimension: Cognitive information
acquisition. Journal of Visual/Verbal Languaging, 5, 7-15Dwyer, F. M. (1993). Visualization & Technology: A Global Perspective. Paper pre-
sented at the 25th Annual Conference of the International Visual Literacy Association. Rochester, Oct. 13–17. 1993.
Dwyer, F. M. (1994). One Dimension of Visusal Research: A Paradigm and Its Implementation. In D. M. Moore & F. M. Dwyer (Eds.), Visual Literacy. A Spectrum of Visual Learning. Englewood Cliffs, NJ: Educational Technology Publications.
Gabrielsson, A., Lindström, B. & Elger, G. (1983). Assessment of perceived sound quality of eighteen high fidelity loudspeakers. Report T A No. 106, Karolinska Institutet, Dept. of Technical Audiology.
Goldsmith, E. (1984). Research into Illustration: An Approach and a Review. Cam-bridge, England: Cambridge University Press.
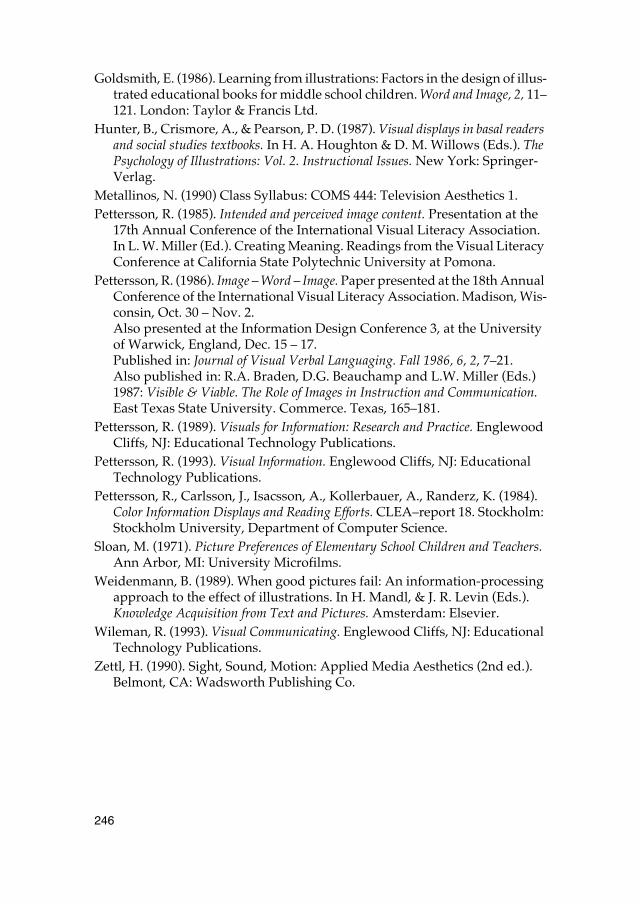
246
Goldsmith, E. (1986). Learning from illustrations: Factors in the design of illus-trated educational books for middle school children. Word and Image, 2, 11–121. London: Taylor & Francis Ltd.
Hunter, B., Crismore, A., & Pearson, P. D. (1987). Visual displays in basal readers and social studies textbooks. In H. A. Houghton & D. M. Willows (Eds.). The Psychology of Illustrations: Vol. 2. Instructional Issues. New York: Springer-Verlag.
Metallinos, N. (1990) Class Syllabus: COMS 444: Television Aesthetics 1.Pettersson, R. (1985). Intended and perceived image content. Presentation at the
17th Annual Conference of the International Visual Literacy Association. In L. W. Miller (Ed.). Creating Meaning. Readings from the Visual Literacy Conference at California State Polytechnic University at Pomona.
Pettersson, R. (1986). Image – Word – Image. Paper presented at the 18th Annual Conference of the International Visual Literacy Association. Madison, Wis-consin, Oct. 30 – Nov. 2.Also presented at the Information Design Conference 3, at the University of Warwick, England, Dec. 15 – 17.Published in: Journal of Visual Verbal Languaging. Fall 1986, 6, 2, 7–21.Also published in: R.A. Braden, D.G. Beauchamp and L.W. Miller (Eds.) 1987: Visible & Viable. The Role of Images in Instruction and Communication. East Texas State University. Commerce. Texas, 165–181.
Pettersson, R. (1989). Visuals for Information: Research and Practice. Englewood Cliffs, NJ: Educational Technology Publications.
Pettersson, R. (1993). Visual Information. Englewood Cliffs, NJ: Educational Technology Publications.
Pettersson, R., Carlsson, J., Isacsson, A., Kollerbauer, A., Randerz, K. (1984). Color Information Displays and Reading Efforts. CLEA–report 18. Stockholm: Stockholm University, Department of Computer Science.
Sloan, M. (1971). Picture Preferences of Elementary School Children and Teachers. Ann Arbor, MI: University Microfilms.
Weidenmann, B. (1989). When good pictures fail: An information-processing approach to the effect of illustrations. In H. Mandl, & J. R. Levin (Eds.). Knowledge Acquisition from Text and Pictures. Amsterdam: Elsevier.
Wileman, R. (1993). Visual Communicating. Englewood Cliffs, NJ: Educational Technology Publications.
Zettl, H. (1990). Sight, Sound, Motion: Applied Media Aesthetics (2nd ed.). Belmont, CA: Wadsworth Publishing Co.
247
Paper 14
Kinship diagrams
Abstract. This study presents 36 kinship diagrams based on more than 3 500 state-ments. Kinship diagrams may be used as one of many tools when we want to study therelationships of views on image contents. Pictures can generate a great variety of asso-ciations in audiences. Different assignments to a picture will influence its meaning inthe mind of the viewer. A picture may always be interpreted in different ways.
AssociationsPictures can generate a great variety of associations in audiences. In my study“Interpreting Image Content” (Pettersson, 2001) I concluded that:
• Different assignments to a picture will influence its meaning in the mind ofthe viewer.
• Realistic photographs can generate a great variety of associations in audi-ences. Visual experience is subject to individual interpretation.
• Humans, especially their faces, are the kind of image content that will getmaximum attention.
• Quite often perceived image content is different from intended image con-tent.
• In information design it is not sufficient merely to choose and use good pic-tures. In information and instructional materials pictures should alwayshave captions to guide the understanding of their intended content.
Interpreting image contentStudents at the Department of Information Design at Mälardalen Universityanswered four questions regarding nine photographs:1. What does this picture represent?2. What happens in the picture?3. What do you think of when you see this picture?4. Why do you think so?
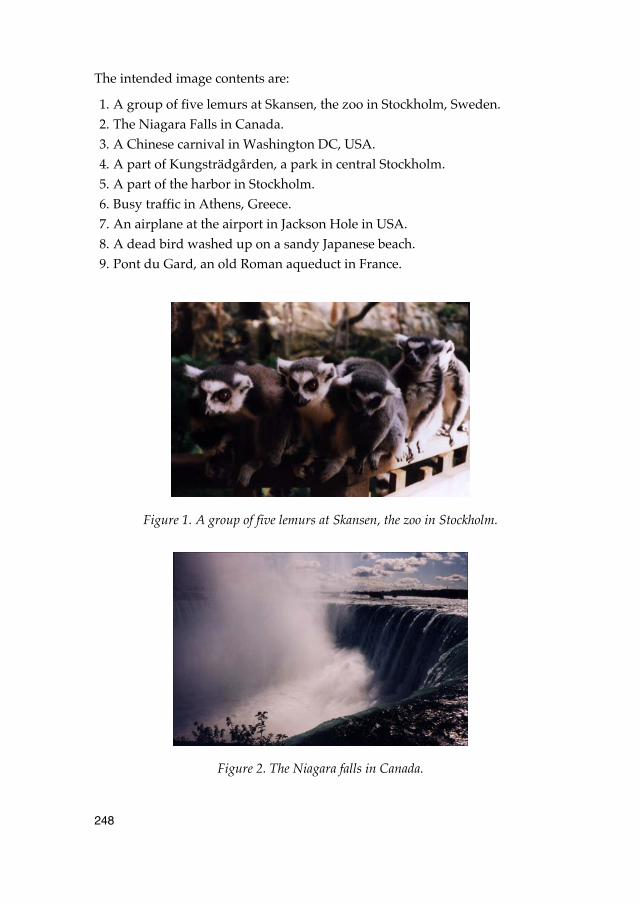
248
The intended image contents are:
1. A group of five lemurs at Skansen, the zoo in Stockholm, Sweden.2. The Niagara Falls in Canada.3. A Chinese carnival in Washington DC, USA.4. A part of Kungsträdgården, a park in central Stockholm.5. A part of the harbor in Stockholm.6. Busy traffic in Athens, Greece.7. An airplane at the airport in Jackson Hole in USA.8. A dead bird washed up on a sandy Japanese beach.9. Pont du Gard, an old Roman aqueduct in France.
Figure 1. A group of five lemurs at Skansen, the zoo in Stockholm.
Figure 2. The Niagara falls in Canada.
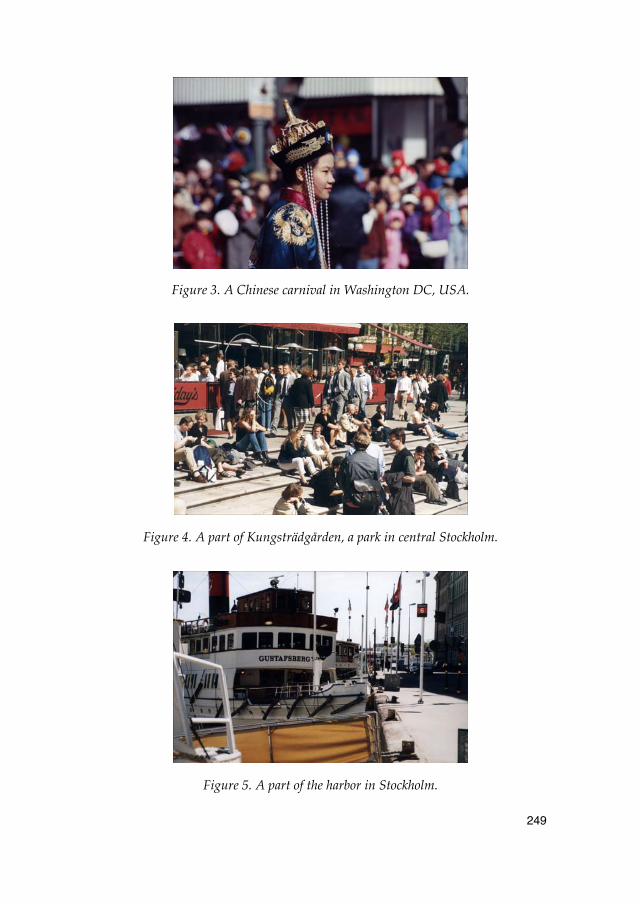
249
Figure 3. A Chinese carnival in Washington DC, USA.
Figure 4. A part of Kungsträdgården, a park in central Stockholm.
Figure 5. A part of the harbor in Stockholm.
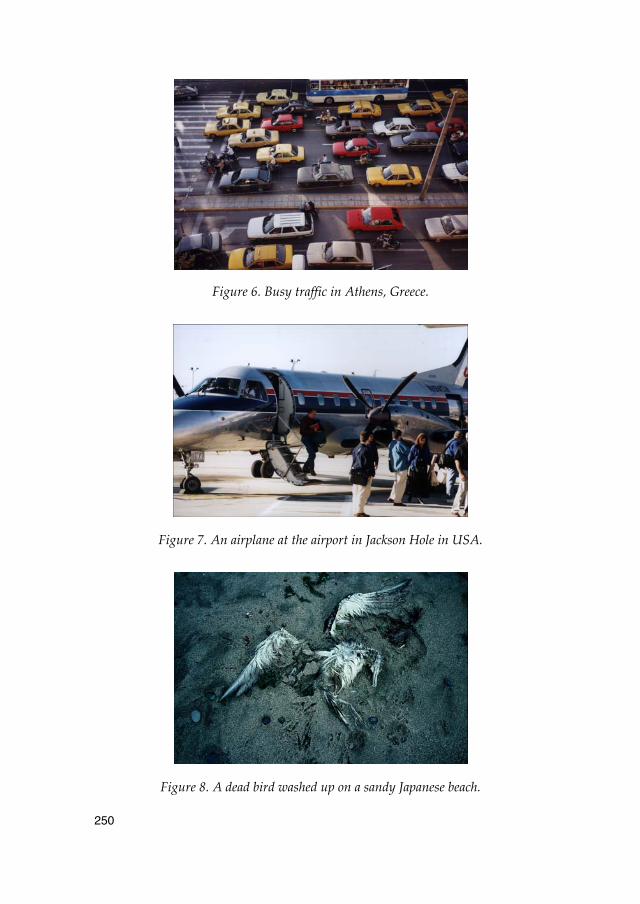
250
Figure 6. Busy traffic in Athens, Greece.
Figure 7. An airplane at the airport in Jackson Hole in USA.
Figure 8. A dead bird washed up on a sandy Japanese beach.
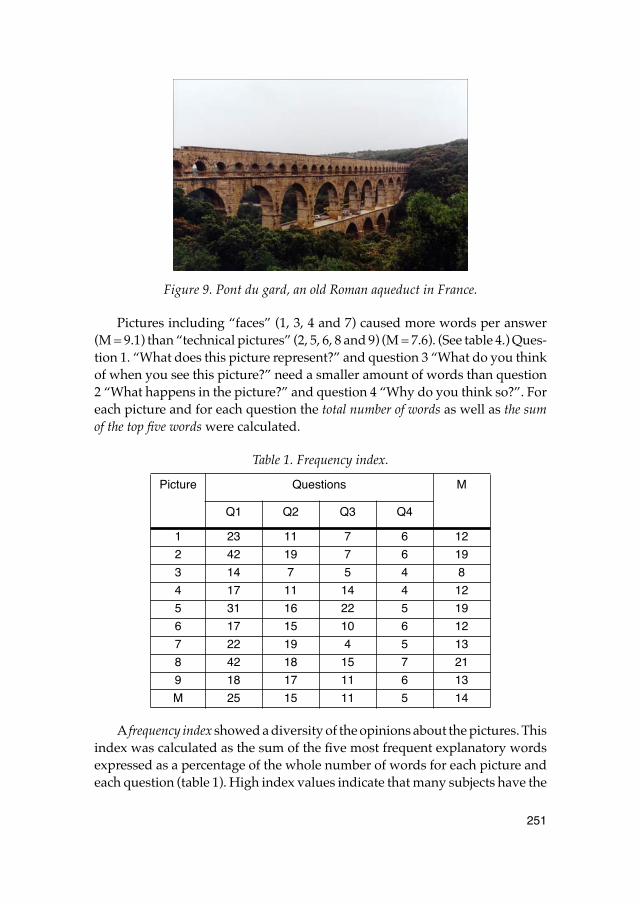
251
Figure 9. Pont du gard, an old Roman aqueduct in France.
Pictures including “faces” (1, 3, 4 and 7) caused more words per answer(M = 9.1) than “technical pictures” (2, 5, 6, 8 and 9) (M = 7.6). (See table 4.) Ques-tion 1. “What does this picture represent?” and question 3 “What do you thinkof when you see this picture?” need a smaller amount of words than question2 “What happens in the picture?” and question 4 “Why do you think so?”. Foreach picture and for each question the total number of words as well as the sumof the top five words were calculated.
Table 1. Frequency index.
A frequency index showed a diversity of the opinions about the pictures. Thisindex was calculated as the sum of the five most frequent explanatory wordsexpressed as a percentage of the whole number of words for each picture andeach question (table 1). High index values indicate that many subjects have the
Picture Questions M
Q1 Q2 Q3 Q4
1 23 11 7 6 12
2 42 19 7 6 19
3 14 7 5 4 8
4 17 11 14 4 12
5 31 16 22 5 19
6 17 15 10 6 12
7 22 19 4 5 13
8 42 18 15 7 21
9 18 17 11 6 13
M 25 15 11 5 14
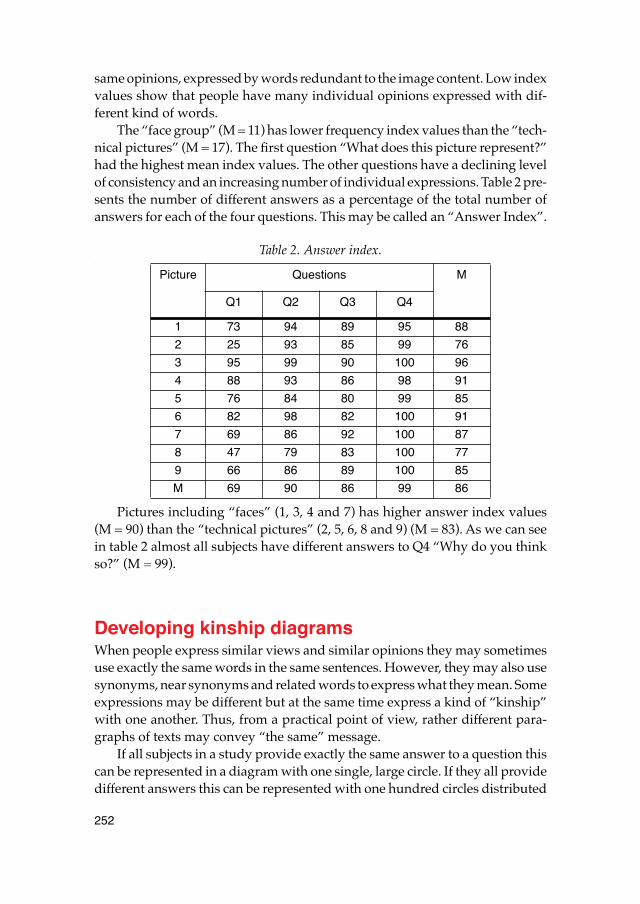
252
same opinions, expressed by words redundant to the image content. Low indexvalues show that people have many individual opinions expressed with dif-ferent kind of words.
The “face group” (M = 11) has lower frequency index values than the “tech-nical pictures” (M = 17). The first question “What does this picture represent?”had the highest mean index values. The other questions have a declining levelof consistency and an increasing number of individual expressions. Table 2 pre-sents the number of different answers as a percentage of the total number ofanswers for each of the four questions. This may be called an “Answer Index”.
Table 2. Answer index. .
Pictures including “faces” (1, 3, 4 and 7) has higher answer index values(M = 90) than the “technical pictures” (2, 5, 6, 8 and 9) (M = 83). As we can seein table 2 almost all subjects have different answers to Q4 “Why do you thinkso?” (M = 99).
Developing kinship diagramsWhen people express similar views and similar opinions they may sometimesuse exactly the same words in the same sentences. However, they may also usesynonyms, near synonyms and related words to express what they mean. Someexpressions may be different but at the same time express a kind of “kinship”with one another. Thus, from a practical point of view, rather different para-graphs of texts may convey “the same” message.
If all subjects in a study provide exactly the same answer to a question thiscan be represented in a diagram with one single, large circle. If they all providedifferent answers this can be represented with one hundred circles distributed
Picture Questions M
Q1 Q2 Q3 Q4
1 73 94 89 95 88
2 25 93 85 99 76
3 95 99 90 100 96
4 88 93 86 98 91
5 76 84 80 99 85
6 82 98 82 100 91
7 69 86 92 100 87
8 47 79 83 100 77
9 66 86 89 100 85
M 69 90 86 99 86
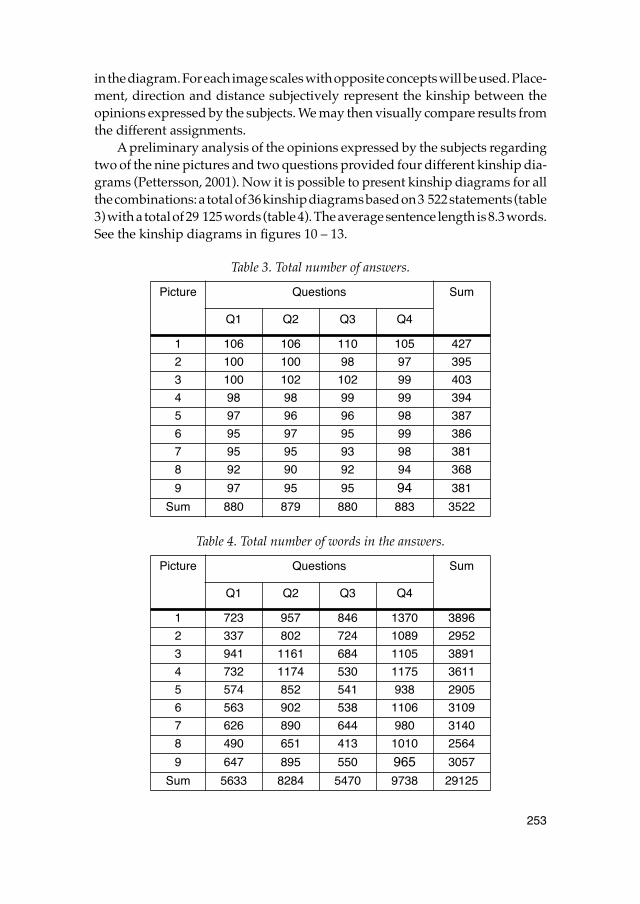
253
in the diagram. For each image scales with opposite concepts will be used. Place-ment, direction and distance subjectively represent the kinship between theopinions expressed by the subjects. We may then visually compare results fromthe different assignments.
A preliminary analysis of the opinions expressed by the subjects regardingtwo of the nine pictures and two questions provided four different kinship dia-grams (Pettersson, 2001). Now it is possible to present kinship diagrams for allthe combinations: a total of 36 kinship diagrams based on 3 522 statements (table3) with a total of 29 125 words (table 4). The average sentence length is 8.3 words.See the kinship diagrams in figures 10 – 13.
Table 3. Total number of answers.
Table 4. Total number of words in the answers.
Picture Questions Sum
Q1 Q2 Q3 Q4
1 106 106 110 105 427
2 100 100 98 97 395
3 100 102 102 99 403
4 98 98 99 99 394
5 97 96 96 98 387
6 95 97 95 99 386
7 95 95 93 98 381
8 92 90 92 94 368
9 97 95 95 94 381
Sum 880 879 880 883 3522
Picture Questions Sum
Q1 Q2 Q3 Q4
1 723 957 846 1370 3896
2 337 802 724 1089 2952
3 941 1161 684 1105 3891
4 732 1174 530 1175 3611
5 574 852 541 938 2905
6 563 902 538 1106 3109
7 626 890 644 980 3140
8 490 651 413 1010 2564
9 647 895 550 965 3057
Sum 5633 8284 5470 9738 29125
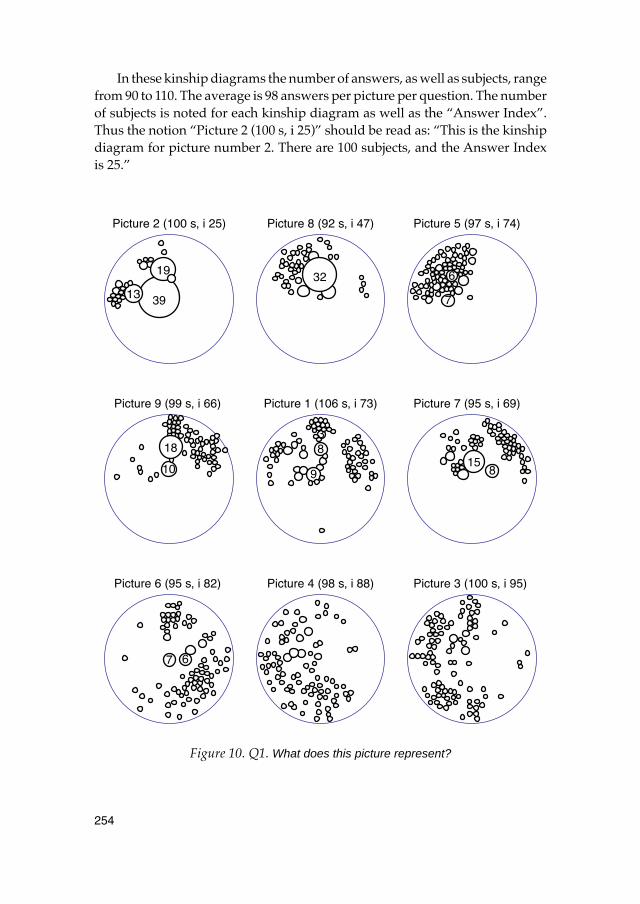
254
In these kinship diagrams the number of answers, as well as subjects, rangefrom 90 to 110. The average is 98 answers per picture per question. The numberof subjects is noted for each kinship diagram as well as the “Answer Index”.Thus the notion “Picture 2 (100 s, i 25)” should be read as: “This is the kinshipdiagram for picture number 2. There are 100 subjects, and the Answer Indexis 25.”
Figure 10. Q1. What does this picture represent?
Picture 2 (100 s, i 25)
39
19
13
Picture 8 (92 s, i 47)
32
Picture 5 (97 s, i 74)
7
6
Picture 9 (99 s, i 66)
10
18
Picture 1 (106 s, i 73)
38
9
Picture 7 (95 s, i 69)
158
Picture 3 (100 s, i 95) Picture 4 (98 s, i 88) Picture 6 (95 s, i 82)
7 6
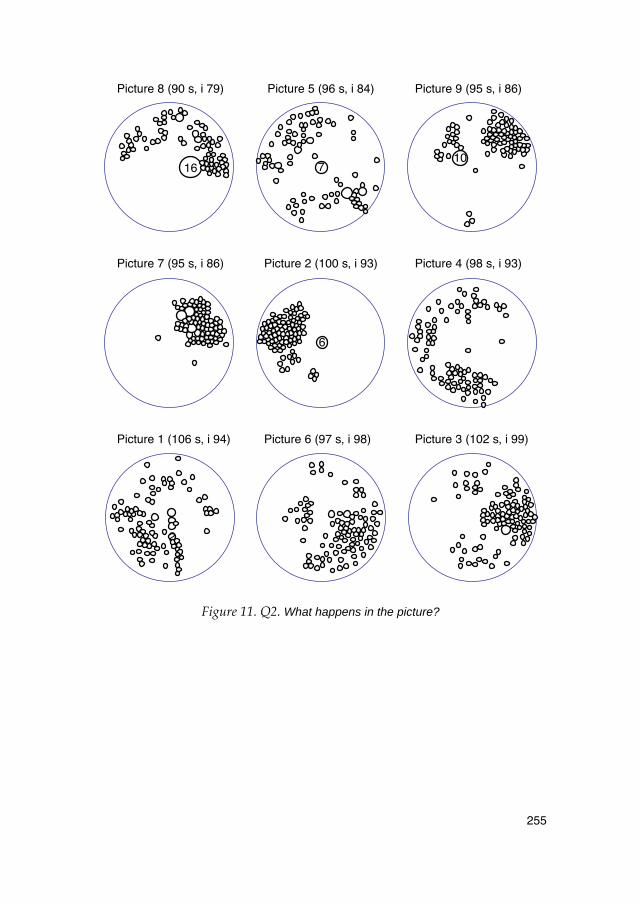
255
Figure 11. Q2. What happens in the picture?
Picture 1 (106 s, i 94)
2
Picture 3 (102 s, i 99)
Picture 8 (90 s, i 79)
16
Picture 5 (96 s, i 84)
7
Picture 9 (95 s, i 86)
10
Picture 7 (95 s, i 86) Picture 2 (100 s, i 93)
6
Picture 4 (98 s, i 93)
Picture 6 (97 s, i 98)
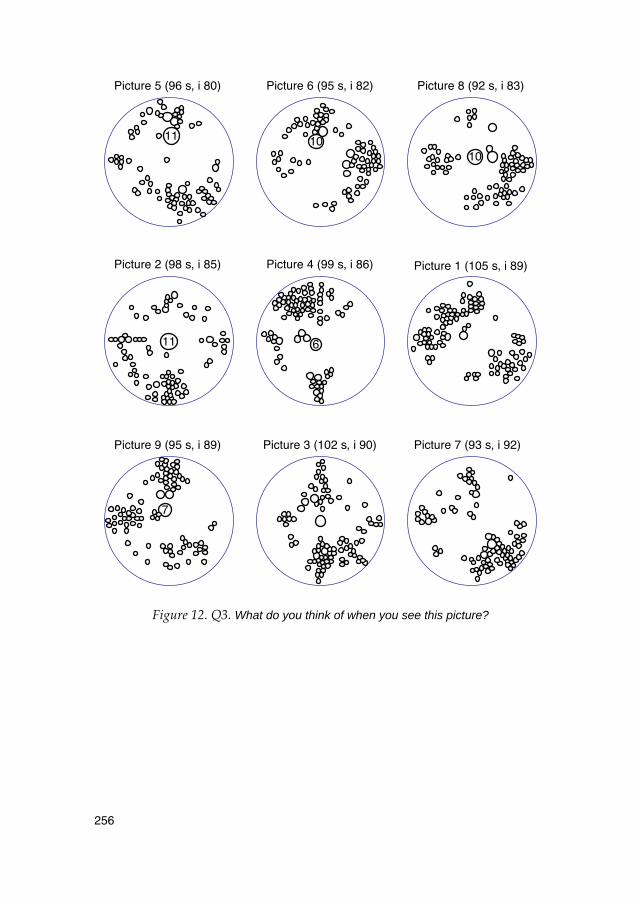
256
Figure 12. Q3. What do you think of when you see this picture?
Picture 5 (96 s, i 80)
11
Picture 6 (95 s, i 82)
10
Picture 8 (92 s, i 83)
10
Picture 2 (98 s, i 85)
11
Picture 4 (99 s, i 86)
6
Picture 1 (105 s, i 89)
Picture 9 (95 s, i 89)
7
Picture 3 (102 s, i 90) Picture 7 (93 s, i 92)
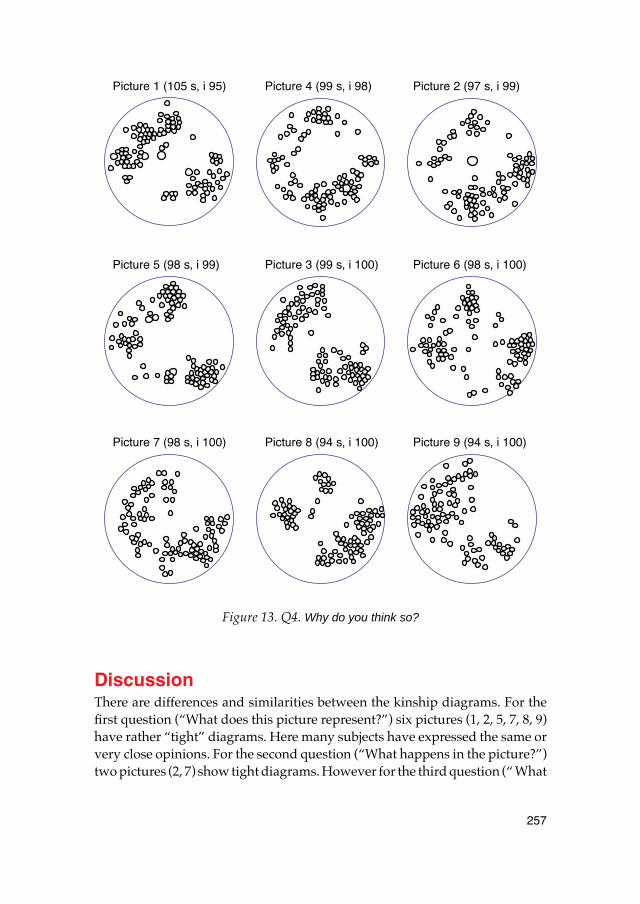
257
Figure 13. Q4. Why do you think so?
DiscussionThere are differences and similarities between the kinship diagrams. For thefirst question (“What does this picture represent?”) six pictures (1, 2, 5, 7, 8, 9)have rather “tight” diagrams. Here many subjects have expressed the same orvery close opinions. For the second question (“What happens in the picture?”)two pictures (2, 7) show tight diagrams. However for the third question (“ What
Picture 1 (105 s, i 95) Picture 4 (99 s, i 98) Picture 2 (97 s, i 99)
Picture 5 (98 s, i 99) Picture 3 (99 s, i 100) Picture 6 (98 s, i 100)
Picture 7 (98 s, i 100) Picture 8 (94 s, i 100) Picture 9 (94 s, i 100)
258
do you think of when you see this picture?”), and the fourth question (“Whydo you think so?”) all diagrams show week kinship between the answers.
In a corresponding way an analysis with the “Answer Index” show a similarresult. The first question has got the lowest mean index (Q1M = 69). Here onlythree pictures (3, 4, 6) have high index values. For the other questions all pictureshave high (Q2M = 90, Q3M = 86) or very high index values (Q4M = 99). Forfive pictures (3, 6, 7, 8, 9) all of the subjects have expressed different opinions(index = 100).
Conclusions It is quite clear that kinship diagrams and index values can be used when wewant to compare verbal statements regarding visual contents. This study con-firms the findings in the 2001 study.
• Different assignments to a picture will influence the meaning in the mindof the viewer.
• Realistic photographs can generate a great variety of associations in audi-ences. Due to every individual’s experience the interpretations will differ.
• Humans, especially their faces, are the kind of image content that will getmaximum attention.
• Quite often perceived image content is different from intended image con-tent.
• In information design it is not sufficient merely to choose and use good pic-tures. In information and instructional materials pictures should alwayshave captions to guide the understanding of their intended content.
Reference Pettersson, R. (2001). Interpreting Image Content. Presentation at the 33rd
Annual Conference of the International Visual Literacy Association. Mälardalen University, Eskilstuna, Sweden, November 7- 11, November 7- 11, 2001. Published in: R. E. Griffin, J. Lee & V. S. Villiams (Eds.) 2002: Visual Literacy in Message Design. Selected Readings of the International Visual Literacy Association. International Visual Literacy Association.
259
Paper 15
Associations from Pictures
Abstract. Pictures can generate a great variety of associations in audiences. Picturescan always be interpreted in a number of different ways, and that it is the texts that tosome degree determine or revise our understanding of the pictures. There is often con-siderable disparity between the sender's “intended message” and the receiver's “per-ceived message”. Indeed, it is sometimes doubtful whether the receiver has understoodanything at all of what the sender wants to convey.
In comparison to a written text, a visual contains an infinite amount of infor-mation (Pettersson, 1985). By selecting and utilizing different parts of the infor-mation in a picture on different occasions, we can experience completely newand different perceptions when we re-see a picture in new contexts. Like otherlanguages, pictures consist of coded messages that are comprehensible in agiven social context and in a given age. For example, we often find it difficultto interpret the messages in pictures from unfamiliar cultures and ages. “Mod-ern art” puzzles its viewers who have not yet learned to decipher the new codes.The reader (viewer) always has greater freedom in interpreting a visual messagethan a verbal message. Pictures almost always convey multiple messages. Extra-neous messages may compete with the messages the sender regards as signif-icant and important. Thus, pictures always incorporate some ambiguity andnumerous “correct” interpretations, although not always a picture’s intendedor anticipated interpretation. The way in which a picture is interpreted dependsto a great extent on the reader’s code in relation to the sender’s code. Studiesof intended vs. perceived image content give clear evidence that there are majordifferences between intended and perceived image content.
In recent studies, questionnaires completed by pupils and teachers showthat there are many different purposes served by the pictures that are used inschools (Pettersson, 1990). Most of these pictures can be perceived as pedagog-ical or cognitive in purpose as opposed to pictures that are used to entertain,or as decoration, or in advertising and marketing. In one study made at the sec-ondary school level, eighty-two pupils questioned mentioned 391 purposes inall, while forty teachers named 84 purposes (Pettersson, 1993). Many of theanswers were similar, some were even synonymous or closely related to eachother. By far the most common purposes of the pictures shown in school were
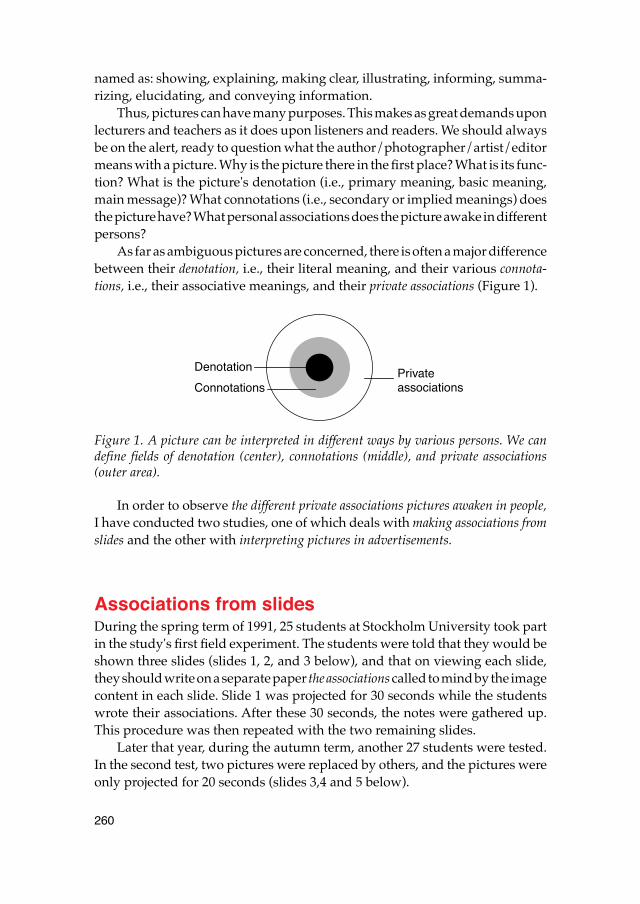
260
named as: showing, explaining, making clear, illustrating, informing, summa-rizing, elucidating, and conveying information.
Thus, pictures can have many purposes. This makes as great demands uponlecturers and teachers as it does upon listeners and readers. We should alwaysbe on the alert, ready to question what the author/photographer/artist/editormeans with a picture. Why is the picture there in the first place? What is its func-tion? What is the picture's denotation (i.e., primary meaning, basic meaning,main message)? What connotations (i.e., secondary or implied meanings) doesthe picture have? What personal associations does the picture awake in differentpersons?
As far as ambiguous pictures are concerned, there is often a major differencebetween their denotation, i.e., their literal meaning, and their various connota-tions, i.e., their associative meanings, and their private associations (Figure 1).
Figure 1. A picture can be interpreted in different ways by various persons. We candefine fields of denotation (center), connotations (middle), and private associations(outer area).
In order to observe the different private associations pictures awaken in people,I have conducted two studies, one of which deals with making associations fromslides and the other with interpreting pictures in advertisements.
Associations from slidesDuring the spring term of 1991, 25 students at Stockholm University took partin the study's first field experiment. The students were told that they would beshown three slides (slides 1, 2, and 3 below), and that on viewing each slide,they should write on a separate paper the associations called to mind by the imagecontent in each slide. Slide 1 was projected for 30 seconds while the studentswrote their associations. After these 30 seconds, the notes were gathered up.This procedure was then repeated with the two remaining slides.
Later that year, during the autumn term, another 27 students were tested.In the second test, two pictures were replaced by others, and the pictures wereonly projected for 20 seconds (slides 3,4 and 5 below).
Private associations
Denotation
Connotations
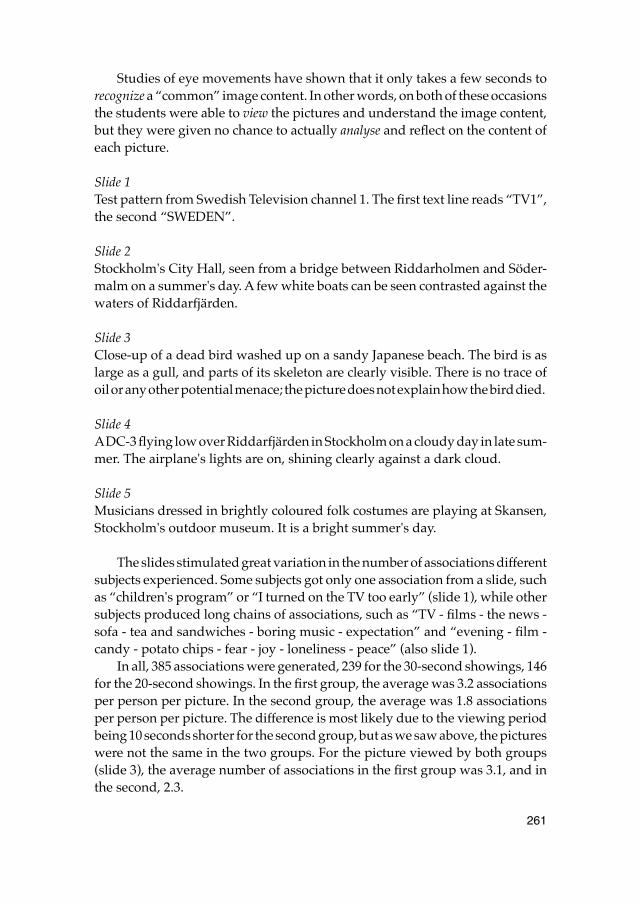
261
Studies of eye movements have shown that it only takes a few seconds torecognize a “common” image content. In other words, on both of these occasionsthe students were able to view the pictures and understand the image content,but they were given no chance to actually analyse and reflect on the content ofeach picture.
Slide 1 Test pattern from Swedish Television channel 1. The first text line reads “TV1”,the second “SWEDEN”.
Slide 2 Stockholm's City Hall, seen from a bridge between Riddarholmen and Söder-malm on a summer's day. A few white boats can be seen contrasted against thewaters of Riddarfjärden.
Slide 3Close-up of a dead bird washed up on a sandy Japanese beach. The bird is aslarge as a gull, and parts of its skeleton are clearly visible. There is no trace ofoil or any other potential menace; the picture does not explain how the bird died.
Slide 4A DC-3 flying low over Riddarfjärden in Stockholm on a cloudy day in late sum-mer. The airplane's lights are on, shining clearly against a dark cloud.
Slide 5Musicians dressed in brightly coloured folk costumes are playing at Skansen,Stockholm's outdoor museum. It is a bright summer's day.
The slides stimulated great variation in the number of associations differentsubjects experienced. Some subjects got only one association from a slide, suchas “children's program” or “I turned on the TV too early” (slide 1), while othersubjects produced long chains of associations, such as “TV - films - the news -sofa - tea and sandwiches - boring music - expectation” and “evening - film -candy - potato chips - fear - joy - loneliness - peace” (also slide 1).
In all, 385 associations were generated, 239 for the 30-second showings, 146for the 20-second showings. In the first group, the average was 3.2 associationsper person per picture. In the second group, the average was 1.8 associationsper person per picture. The difference is most likely due to the viewing periodbeing 10 seconds shorter for the second group, but as we saw above, the pictureswere not the same in the two groups. For the picture viewed by both groups(slide 3), the average number of associations in the first group was 3.1, and inthe second, 2.3.
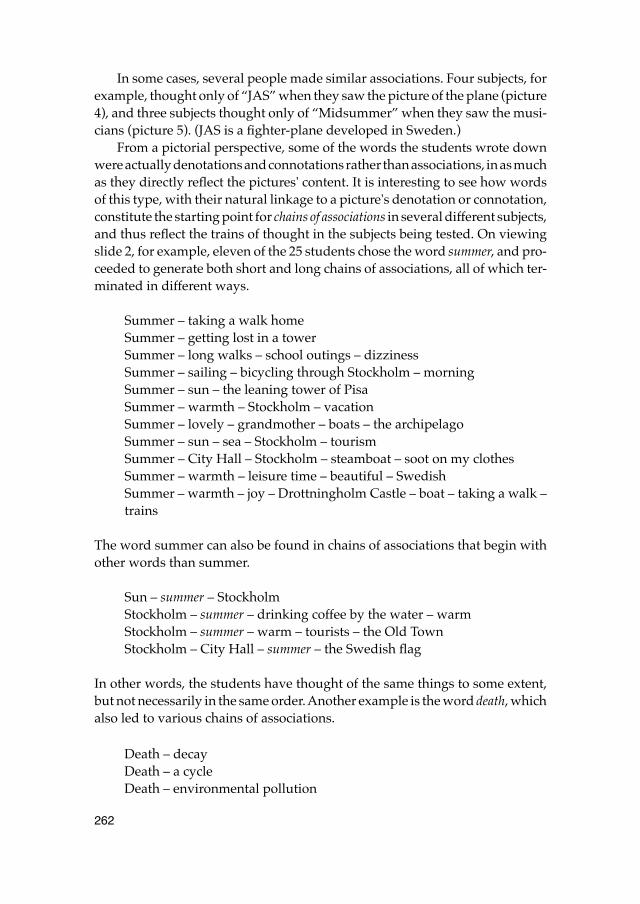
262
In some cases, several people made similar associations. Four subjects, forexample, thought only of “JAS” when they saw the picture of the plane (picture4), and three subjects thought only of “Midsummer” when they saw the musi-cians (picture 5). (JAS is a fighter-plane developed in Sweden.)
From a pictorial perspective, some of the words the students wrote downwere actually denotations and connotations rather than associations, in as muchas they directly reflect the pictures' content. It is interesting to see how wordsof this type, with their natural linkage to a picture's denotation or connotation,constitute the starting point for chains of associations in several different subjects,and thus reflect the trains of thought in the subjects being tested. On viewingslide 2, for example, eleven of the 25 students chose the word summer, and pro-ceeded to generate both short and long chains of associations, all of which ter-minated in different ways.
Summer – taking a walk home Summer – getting lost in a tower Summer – long walks – school outings – dizzinessSummer – sailing – bicycling through Stockholm – morning Summer – sun – the leaning tower of Pisa Summer – warmth – Stockholm – vacation Summer – lovely – grandmother – boats – the archipelago Summer – sun – sea – Stockholm – tourism Summer – City Hall – Stockholm – steamboat – soot on my clothes Summer – warmth – leisure time – beautiful – Swedish Summer – warmth – joy – Drottningholm Castle – boat – taking a walk –trains
The word summer can also be found in chains of associations that begin withother words than summer.
Sun – summer – StockholmStockholm – summer – drinking coffee by the water – warmStockholm – summer – warm – tourists – the Old TownStockholm – City Hall – summer – the Swedish flag
In other words, the students have thought of the same things to some extent,but not necessarily in the same order. Another example is the word death, whichalso led to various chains of associations.
Death – decay Death – a cycle Death – environmental pollution
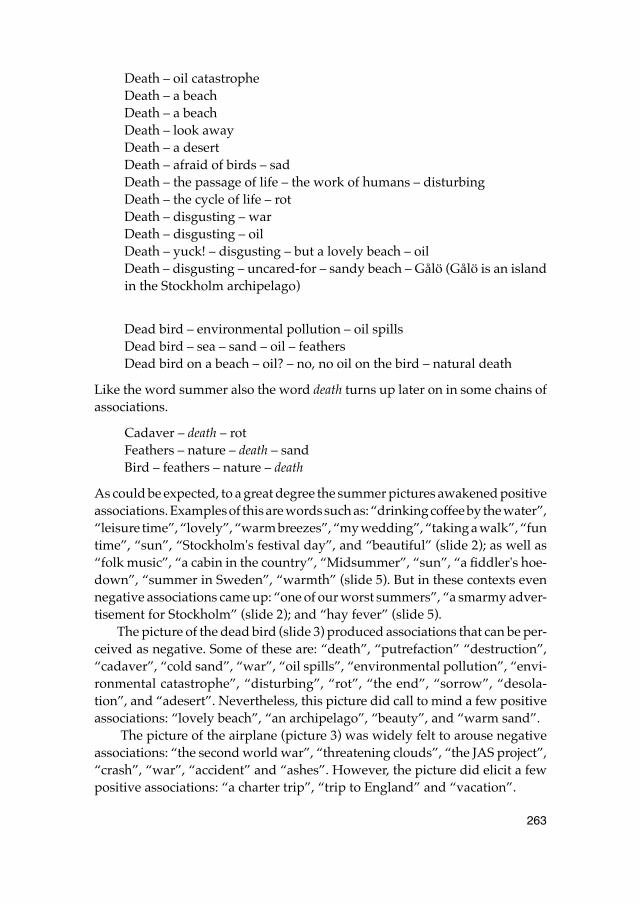
263
Death – oil catastrophe Death – a beach Death – a beach Death – look away Death – a desert Death – afraid of birds – sad Death – the passage of life – the work of humans – disturbing Death – the cycle of life – rot Death – disgusting – war Death – disgusting – oil Death – yuck! – disgusting – but a lovely beach – oil Death – disgusting – uncared-for – sandy beach – Gålö (Gålö is an islandin the Stockholm archipelago)
Dead bird – environmental pollution – oil spills Dead bird – sea – sand – oil – feathers Dead bird on a beach – oil? – no, no oil on the bird – natural death
Like the word summer also the word death turns up later on in some chains ofassociations.
Cadaver – death – rotFeathers – nature – death – sandBird – feathers – nature – death
As could be expected, to a great degree the summer pictures awakened positiveassociations. Examples of this are words such as: “drinking coffee by the water”,“leisure time”, “lovely”, “warm breezes”, “my wedding”, “taking a walk”, “funtime”, “sun”, “Stockholm's festival day”, and “beautiful” (slide 2); as well as“folk music”, “a cabin in the country”, “Midsummer”, “sun”, “a fiddler's hoe-down”, “summer in Sweden”, “warmth” (slide 5). But in these contexts evennegative associations came up: “one of our worst summers”, “a smarmy adver-tisement for Stockholm” (slide 2); and “hay fever” (slide 5).
The picture of the dead bird (slide 3) produced associations that can be per-ceived as negative. Some of these are: “death”, “putrefaction” “destruction”,“cadaver”, “cold sand”, “war”, “oil spills”, “environmental pollution”, “envi-ronmental catastrophe”, “disturbing”, “rot”, “the end”, “sorrow”, “desola-tion”, and “adesert”. Nevertheless, this picture did call to mind a few positiveassociations: “lovely beach”, “an archipelago”, “beauty”, and “warm sand”.
The picture of the airplane (picture 3) was widely felt to arouse negativeassociations: “the second world war”, “threatening clouds”, “the JAS project”,“crash”, “war”, “accident” and “ashes”. However, the picture did elicit a fewpositive associations: “a charter trip”, “trip to England” and “vacation”.
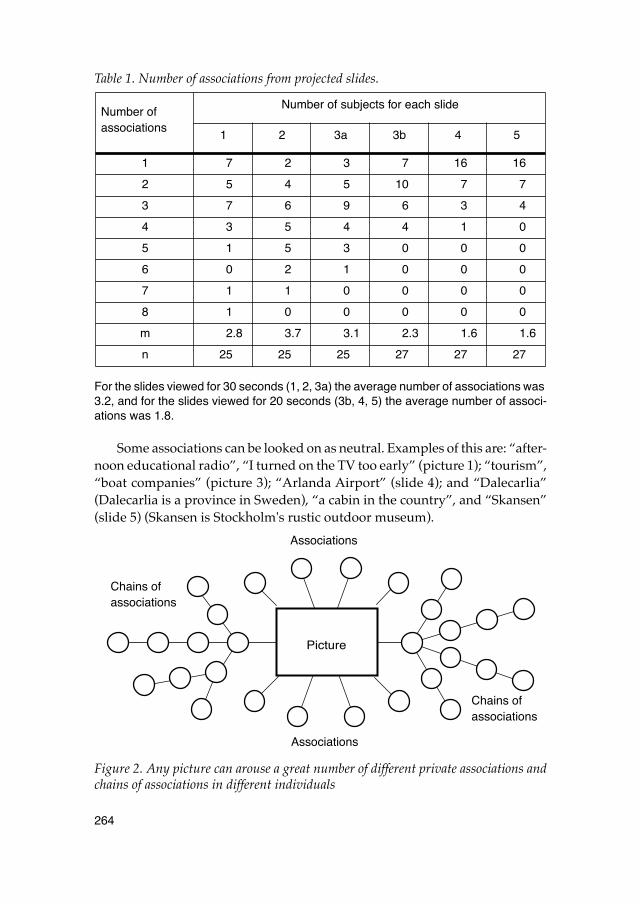
264
Table 1. Number of associations from projected slides.
For the slides viewed for 30 seconds (1, 2, 3a) the average number of associations was 3.2, and for the slides viewed for 20 seconds (3b, 4, 5) the average number of associ-ations was 1.8.
Some associations can be looked on as neutral. Examples of this are: “after-noon educational radio”, “I turned on the TV too early” (picture 1); “tourism”,“boat companies” (picture 3); “Arlanda Airport” (slide 4); and “Dalecarlia”(Dalecarlia is a province in Sweden), “a cabin in the country”, and “Skansen”(slide 5) (Skansen is Stockholm's rustic outdoor museum).
Figure 2. Any picture can arouse a great number of different private associations andchains of associations in different individuals
Number ofassociations
Number of subjects for each slide
1 2 3a 3b 4 5
1 7 2 3 7 16 16
2 5 4 5 10 7 7
3 7 6 9 6 3 4
4 3 5 4 4 1 0
5 1 5 3 0 0 0
6 0 2 1 0 0 0
7 1 1 0 0 0 0
8 1 0 0 0 0 0
m 2.8 3.7 3.1 2.3 1.6 1.6
n 25 25 25 27 27 27
Picture
Chains of
Chains of
Associations
Associations
associations
associations
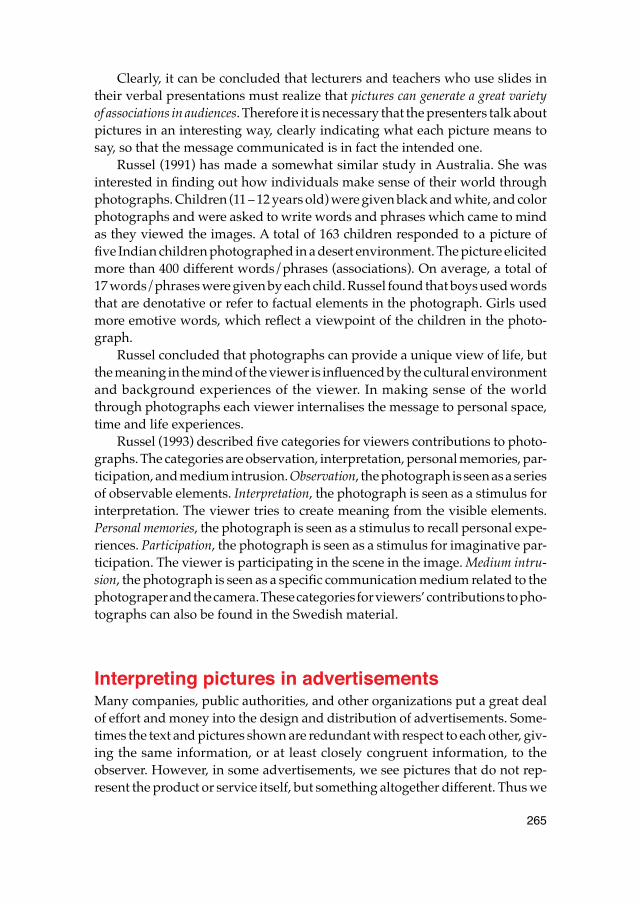
265
Clearly, it can be concluded that lecturers and teachers who use slides intheir verbal presentations must realize that pictures can generate a great varietyof associations in audiences. Therefore it is necessary that the presenters talk aboutpictures in an interesting way, clearly indicating what each picture means tosay, so that the message communicated is in fact the intended one.
Russel (1991) has made a somewhat similar study in Australia. She wasinterested in finding out how individuals make sense of their world throughphotographs. Children (11 – 12 years old) were given black and white, and colorphotographs and were asked to write words and phrases which came to mindas they viewed the images. A total of 163 children responded to a picture offive Indian children photographed in a desert environment. The picture elicitedmore than 400 different words/phrases (associations). On average, a total of17 words/phrases were given by each child. Russel found that boys used wordsthat are denotative or refer to factual elements in the photograph. Girls usedmore emotive words, which reflect a viewpoint of the children in the photo-graph.
Russel concluded that photographs can provide a unique view of life, butthe meaning in the mind of the viewer is influenced by the cultural environmentand background experiences of the viewer. In making sense of the worldthrough photographs each viewer internalises the message to personal space,time and life experiences.
Russel (1993) described five categories for viewers contributions to photo-graphs. The categories are observation, interpretation, personal memories, par-ticipation, and medium intrusion. Observation, the photograph is seen as a seriesof observable elements. Interpretation, the photograph is seen as a stimulus forinterpretation. The viewer tries to create meaning from the visible elements.Personal memories, the photograph is seen as a stimulus to recall personal expe-riences. Participation, the photograph is seen as a stimulus for imaginative par-ticipation. The viewer is participating in the scene in the image. Medium intru-sion, the photograph is seen as a specific communication medium related to thephotograper and the camera. These categories for viewers’ contributions to pho-tographs can also be found in the Swedish material.
Interpreting pictures in advertisementsMany companies, public authorities, and other organizations put a great dealof effort and money into the design and distribution of advertisements. Some-times the text and pictures shown are redundant with respect to each other, giv-ing the same information, or at least closely congruent information, to theobserver. However, in some advertisements, we see pictures that do not rep-resent the product or service itself, but something altogether different. Thus we
266
ask ourselves what function these pictures have, and which associations andthoughts they awake in the observer. Are the associations that they bring to mindlinked to the advertised product or service? To the company or trade mark? Tothe “branch” or the entire business as such? Or do they inspire completely dif-ferent associations?
By way of experiment, I chose at random six advertisements from SCAN-ORAMA, an airline magazine published by SAS, that is meant to be read bypassengers on flights and in transit halls. The advertisers are all well-knowncompanies, whose products and services are offered internationally. The adver-tisements I chose, which were all of full-page format, can be briefly describedas follows:
Ad 1 Picture: A black sports car - Toyota - without a driver, seen at an angle from above.The car is close to the road's white line. Text: Describes the advantages of the product. Layout: The picture almost covers the upper half of the page. There is a line oftext above the picture, and a rather long text below it. Advertiser: Mobil Oil. Product: Mobil 1 Fully Synthetic Lubricant.
Ad 2 Picture: A hand gloved in white holding a silver tray with a coffee pot, two cupsof coffee, two silver spoons, and two flowers. Black background. Text: Names various fine restaurants that accept Diners Club Cards. Layout: The picture almost covers the upper half of the page. The text, whiteagainst a black background, takes up the other half of the page. In the lowerright-hand corner, inserted into the body of the text, there is a picture of a DinersClub Card. Advertiser: Diners Club InternationalProduct: Diners Club Card.
Ad 3 Picture: Part of the foredeck, a bit of the mast and the sail of a boat in roughweather. Text: Tells that the advertiser sponsors the world's toughest sailboat competi-tion, “The Whitbread Round-the-World Race”. Layout: The picture covers about two-thirds of the page. In the lower right corner,inserted into the body of the text, is a picture of an open bottle of Beefeater DryGin and a full glass. Advertiser: Beefeater Product: Dry gin.
267
Ad 4Picture: A man in a pilot's helmet and goggles, with wings strapped to his arms,a suitcase in each hand and a bag that he carries by holding its strap in his mouth. Text: The airline company SAS has its own hotels in various places, and offersspecial service for business travelers. Layout: The picture covers about two-thirds of the page. There is a line of textabove the picture. The main text covers the lower third of the page. Advertiser: SAS International Hotels Product: Lodging at SAS hotels.
Ad 5 Picture: A Japanese air-hostess, kimono-clad, holding a bowl in her hands. Text: Tells about the airline's fine service. Layout: There is text both above and below the picture, which covers a bit morethan half the page. In the lower right-hand corner, there is a small picture of aplane partially inserted into the large picture. Advertiser: All-Nippon Airways, ANA Product: Air travel.
Ad 6 Picture: The face, throat and shoulders of a young woman. Text: “Giorgio Armani Parfums”, the name of the advertiser. Layout: The picture covers the whole page. In the lower right-hand corner, apicture of a perfume bottle is inserted. The short text is inside the smaller picture. Advertiser: Giorgio Armani Parfums. (The name “Armani” is on the perfumebottle.) Product: Perfume.
The six main pictures were cut out, pasted on white paper and numberedrandomly. Two of the pictures (5 and 6) were clipped so that no trade markscould be seen.
In a field study in the spring of 1990, 50 students at Stockholm Universitytook part. The participants were told that the pictures were clipped from adver-tisements for products made by well-known international companies. Theywere also told that the advertisements had been published in an airline's mag-azine, but they were not told the names of either the airline or the magazine.The students got to study each picture for as long as they needed – usually a half-minute at the most – to decide what company they thought it represented. Thenthey were asked to write down the type of product and the company or trademark that they believed the advertisement was meant to promote. The studentswere also asked whether they had seen the pictures before.
268
The results showed that only a few of the students tested had ever seen somepictures before (5 occasions out of 300), and since they were so very few, thematerial includes them as well. Only a few of the students associated the “right”picture with the “right” product and the “right” company. Four of the six pic-tures caused all the students to associate them with the “wrong” products. Inone case (ad 6), two of the students (4%) associated a picture with the right prod-uct, and in another case (ad 5), thirteen students (26%) named the right product.However, only incorrect companies were associated with five of the six pictures.Six students (12%) associated one picture (ad 4) with the right company.
Table 2. Associations from ads.
In this table, “right” indicates the percentage of correct answers with regard to the pro-duct or the company. “Wrong” indicates the percentage of answers in which the product or company named was incorrect. “Answers” indicates the actual number of different answers regarding products and companies given (not persons who answered) inclu-ding the alternative “Don't know”. The number of subjects were 50.
As shown in table 2, one picture (ad 5) produced 17 different suggestionsas to what the product might be. As for companies, another picture (ad 2) elicited15 different suggestions. Thus it is very obvious that the pictures seldom gaverise to associations that were directly linked to the advertised product or service,or to the advertising company or trade mark. On the other hand, they did pro-duce associations linked to the “branch”, or to similar products or operations.Generally speaking, however, the pictures awakened quite disparate associa-tions.
In reaction to the advertisement for “Beefeater Dry Gin” (Ad 3), the productwas guessed to be the following 16 products (number of persons in parenteses):Beer (10), spirits (3), sailboats (3), after-shave lotion (3), a soft drink (2), a boat(2), a trip (2), clothing (2), boat accessories (1), whiskey (1), “use a life-preserver”(1), a bank (1), tarpaulins (1), chewing-gum (1), and oil (1). Furthermore, quite
AdvertismentProduct Company
Right Wrong Answers Right Wrong Answers
1 0 100 5 0 100 5
2 0 100 6 0 100 15
3 0 100 16 0 100§ 14
4 0 100 8 12 88 9
5 26 74 17 0 100 10
6 96 11 0 100 13
269
a few students (16) had no idea what the product could be. As for guessing thecompany or trade mark, the test group came up with several names, but notthe right one.
The advertisement for “Georgio Armani Parfums” (ad 6), produced the fol-lowing eleven suggestions as to what the product could be (number of personsin parentheses): Cosmetics (20), make-up (11), skin lotion (6), beauty products(5), tea (3), clothing (3), perfume (2), hair-care products (2), air journey (1), food(1), and a few subjects (3) had no answer at all. As for guessing the companyname or trade mark, here again names were suggested, but not the right one.
It can be concluded then, as in earlier studies (Pettersson, 1985, 1986, 1988,and 1989), that pictures can always be interpreted in a number of different ways.Yet it cannot be said that the pictures in these advertisements were inappropriateto the products they were meant to promote. In the contexts in which theyappear, i.e., magazines, billboards, etc., the pictures are shown together withthe texts, and it is the texts that to some degree determine or revise our understandingof the pictures. It is not very likely that the average observer questions whethera certain picture would suit another product better than the one it advertises.Obviously, the picture's function is not to sell the product in a direct manner,but rather to stimulate the observer's interest in the advertisement as such,thereby enticing him to read the verbal message and thus absorbing informationabout the product as well as the advertiser.
ConclusionsThe first study showed that pictures can generate a great variety of associationsin audiences. Thus, it may be concluded that pictures used in information andinstructional materials always should have captions to guide the understandingof the content.
The second study showed that pictures can always be interpreted in a num-ber of different ways, and that it is the texts that to some degree determine orrevise our understanding of the pictures.
We know from earlier studies (Pettersson, 1985) that, as far as words andpictures are concerned, there is often considerable disparity between thesender's “intended message” and the receiver's “perceived message”. Indeed,it is sometimes doubtful whether the receiver has understood anything at allof what the sender wants to convey.
Listeners and readers create their own associations and chains of associa-tions. However, one way of diminishing the gap between the sender's intentionwith a picture and the receiver's understanding of it, is to present the picturewith interesting verbal comments and/or explanatory texts that can actively
270
“confirm” the intended interpretations (Pettersson, 1993; Melin and Pettersson,1991).
All the same, it is not sufficient merely to choose good pictures and see toit that they have adequate explanations. To provide readers and listeners withreal help in interpreting pictures in AV material, student handbooks and otherteaching aids, lecturers and teachers should be given proper guidance, for exam-ple, special instruction in pictorial presentation, the aim of which should be toenable them:
• To explain the purpose of each individual picture. • To supplement the text by telling what the picture shows.• To give various examples of how each picture can be used in the classroom,
i.e., what is important enough to bear discussion? What tasks can beassigned in connection with a given picture?
• To provide, where necessary, supplementary facts about each picture, forexample, how the picture was produced.
• To name and discuss the photographer, or artist or other producer of thepictures shown.
ReferencesMelin, L. and Pettersson; R. (1991). Bildtexter i läroböcker. Stockholm. Stock-
holms Universitet: Nordiska Språk.Pettersson, R. (1985). Intended and Perceived Image Content. In L. W. Miller
(Ed.), Creating Meaning. Readings from the Visual Literacy Conference at California State Polytechnic University at Pomona. International Visual Literacy Association, Inc. 11–16.
Pettersson, R. (1986). Image – Word – Image. Journal of Visual Verbal Languag-ing. Fall 1986, 6, 2, 7–21.
Pettersson, R. (1988). Interpretation of image content. ECTJ, 36, 1, 45–55.Pettersson, R. (1990). Teachers, Students and Visuals. Journal of Visual Literacy,
10, 1, 45–62.Pettersson, R. (1991). Bilder i läromedel. Tullinge: Institutet för Infologi.Pettersson, R. (1993). Visual Information. Englewood Cliffs. N.J.: Educational
Technology Publications.Russel, A. (1991). Photographs: Perceptions of reality. Presentation at the Austra-
lian Communications Association Conference, Sydney, July. 1991.Russel, A. (1993). Viewers' Contributions to a Photograph. Paper presented at the
25th Annual Conference of the International Visual Literacy Association. Rochester, Oct. 13–17. 1993.
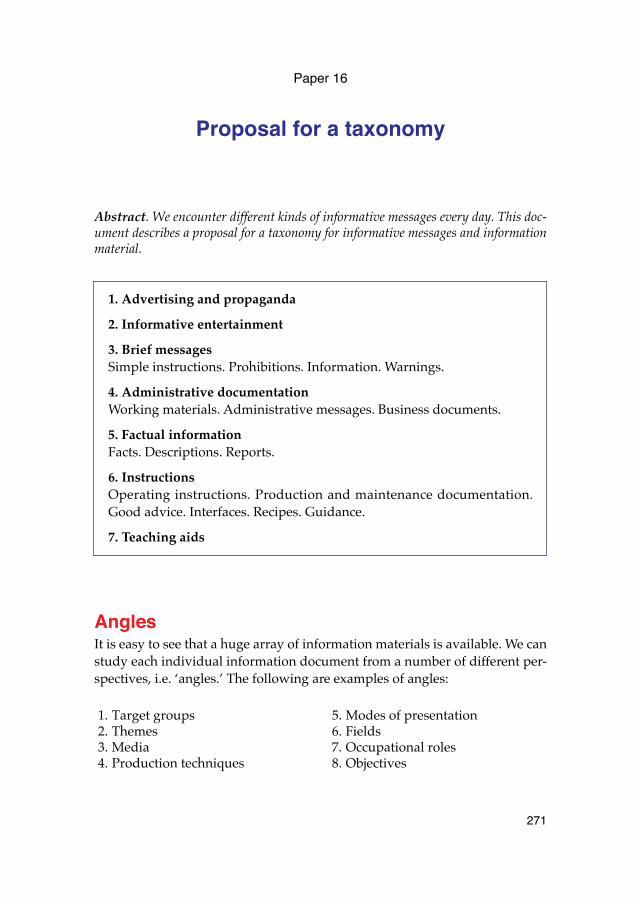
271
Paper 16
Proposal for a taxonomy
Abstract. We encounter different kinds of informative messages every day. This doc-ument describes a proposal for a taxonomy for informative messages and informationmaterial.
AnglesIt is easy to see that a huge array of information materials is available. We canstudy each individual information document from a number of different per-spectives, i.e. ‘angles.’ The following are examples of angles:
1. Advertising and propaganda
2. Informative entertainment
3. Brief messagesSimple instructions. Prohibitions. Information. Warnings.
4. Administrative documentationWorking materials. Administrative messages. Business documents.
5. Factual informationFacts. Descriptions. Reports.
6. InstructionsOperating instructions. Production and maintenance documentation.Good advice. Interfaces. Recipes. Guidance.
7. Teaching aids
1. Target groups2. Themes3. Media4. Production techniques
5. Modes of presentation 6. Fields7. Occupational roles8. Objectives
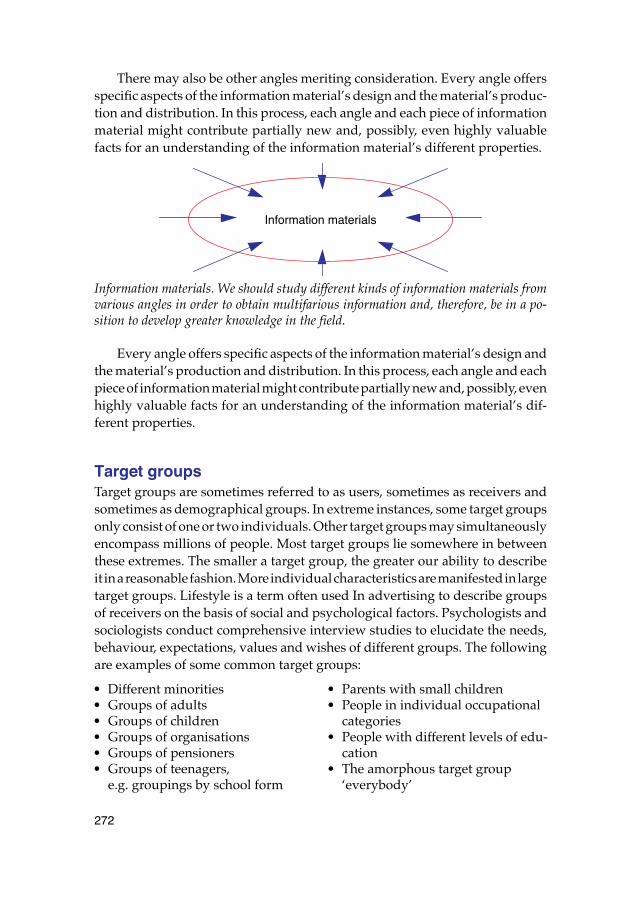
272
There may also be other angles meriting consideration. Every angle offersspecific aspects of the information material’s design and the material’s produc-tion and distribution. In this process, each angle and each piece of informationmaterial might contribute partially new and, possibly, even highly valuablefacts for an understanding of the information material’s different properties.
Information materials. We should study different kinds of information materials fromvarious angles in order to obtain multifarious information and, therefore, be in a po-sition to develop greater knowledge in the field.
Every angle offers specific aspects of the information material’s design andthe material’s production and distribution. In this process, each angle and eachpiece of information material might contribute partially new and, possibly, evenhighly valuable facts for an understanding of the information material’s dif-ferent properties.
Target groupsTarget groups are sometimes referred to as users, sometimes as receivers andsometimes as demographical groups. In extreme instances, some target groupsonly consist of one or two individuals. Other target groups may simultaneouslyencompass millions of people. Most target groups lie somewhere in betweenthese extremes. The smaller a target group, the greater our ability to describeit in a reasonable fashion. More individual characteristics are manifested in largetarget groups. Lifestyle is a term often used In advertising to describe groupsof receivers on the basis of social and psychological factors. Psychologists andsociologists conduct comprehensive interview studies to elucidate the needs,behaviour, expectations, values and wishes of different groups. The followingare examples of some common target groups:
Information materials
• Different minorities• Groups of adults• Groups of children• Groups of organisations• Groups of pensioners• Groups of teenagers,
e.g. groupings by school form
• Parents with small children• People in individual occupational
categories• People with different levels of edu-
cation• The amorphous target group
‘everybody’
273
A very large number of different target groups can readily be defined. It isvery important to have the clearest and most accurate picture possible of whichof all the conceivable target groups senders are striving to reach with each mes-sage. The more information we have on a particular target group, the greaterour ability to address the intended target group with our message and thereafterbe understood. Cf Smith & Ragan (1999) for an extensive discussion of the waydifferent target groups are described!
ThemesIn this context, the term ‘themes’ refers to information material groupings con-taining some form of conceptual or practical common denominator. A largenumber of different themes are conceivable for information materials. The fol-lowing are examples of some important themes:
• Individual sectors, such as trading in raw materials, public health, pharma-ceuticals, freight shipments and the transportation of people.
• Information from the authorities, such as information on tax returns, taxa-tion, laws, regulations, local statutes etc.
• Different kinds of information material or media, such as brochures, pack-aging and manuals.
• Special I events, such as sporting and cultural events.• Special ideologies, such as political or religious ideologies.• Special times. They could concern something happening now, something
which happened in the past or something which may happen at some pointin the future.
• Selected locations, such as in a particular exhibition hall, at an airport, at arailway station or in an urban setting.
MediaHere, ‘media’ refers to different aids used for transmitting a message from asender to one or more receivers. Media often encompass very concrete products.The following are the main groups of media (Pettersson 1993):
1. Live media2. Sound media3. Film media4. Broadcast media
5. Video media6. Models and exhibitions7. Graphical media8. Telecommunications media9. Computer media
274
Live media are personal communications using speech and body language,i.e. ballet, puppet theatre, group communications with social body language,conferences, churches, live music, pantomime, the school and theatre. In verbalpresentations, the spoken word can be combined with body language, dem-onstrations, stills and even brief sequences employing moving images.
Sound media are CD-DA, gramophone records, cassette tapes, soundarchives, tape recordings, audio cassettes and sound cards.
Film media are media projected in some device and viewed on a screen orsimilar device. Film strips, different kinds of movies, transparencies, microfilm,microfiches, amateur film, overhead pictures, and widescreen films are exam-ples of film media.
Broadcast media are media distributed to groups of people through the‘ether’, e.g. national radio, local radio, community radio, cell radio, CB radio,national TV, local TV, community TV and text TV. Mobile telephony also belongsto this category.
Video media provide a high level of information content in a simple-to-under-stand form. Major examples videotape, videosheet, video discs, and “firm”memory.
Models and exhibitions: In contrast to other media groups, exhibitions aremultidimensional. The depth dimension makes it possible to exhibit modelsand real objects with a spatial relationship to each other and to the public. Theuse of acoustic media provides some idea of the chronology. Film and videomedia also contribute movement, distinct processes and courses of events.Lighting, texture, smells and tastes can also be utilised. Many exhibitions offervisitors opportunities to perform their own activities.
Graphical media are made using manual or technical methods. Graphicalprints, paintings, signs and drawings are examples of manually producedimages. Letters, manuscripts and signs are examples of manually produced text.Evening newspapers, morning newspapers, the popular press and comic booksare examples of periodic publications. Children’s books, non-fiction, cook-books, course literature, textbooks, periodic books, reference books, comicbooks and fiction are examples of books. Different types of packaging belongto the category ‘graphical media’, as they often have printed pictures and text.The main task of packaging is obviously to enclose and protect the contents.Text and pictures often describe both what packaging contains and how thecontents are used.
Tele media are viewphones, datel, datex, Internet, Intranet, voicemail, fac-simile, teleconferencing, telephone calls, telegraphy, telepak, ‘telesvar ’(answering service/ voicemail), teletex, telex, videoconferencing and videotex.
Computer media are fields such as artificial intelligence, expert systems, com-puter programs and computer games. A ‘computer program’ is a program ina form enabling it to be processed by a computer. Computer programs may
275
require transformation, e.g. by compilation, assembly or interpretation of allavailable data, before being executed by the computer.
Production techniquesHere, ‘production techniques’ refers to the manner in which different kinds ofinformation materials and information products are produced. Historicalaspects and the evolution from rather primitive methods to more advancedproduction techniques can be studied for most groups of information materials.Production techniques are closely related to media. Production techniques havemade rapid advances in recent years. Computers are being used to an everincreasing degree in conjunction with the production of different media. Oncedata have been stored in digital form, they can be easily presented in a mannertailored to the optimum conditions for different media. The following generaltrends are discernible for new technology and new media:
1. A shift from goods to services2. A shift towards increased segmentation3. A shift towards greater flexibility4. A new ‘distribution of roles’, and tradition areas of competence will be bro-
ken up and superseded by new ones5. A shift towards new production systems6. A shift towards new channels for marketing7. Increased competition for the individual consumer’s time and money8. The borderlines between different groups of media will gradually disap-
pear9. Many new media and new technologies will be developed by ‘hybridisa-
tion’10. An international, integrated digital telecommunications system will
replace today’s different systems11. A common world standard for television will be developed12. Increased copyright problems.
The term information material refers to the physical representation of a spe-cific information message. Information material is a representation, is intendedfor a specific target group, is devised in a specific fashion, has a specific purposeand is distributed with the aid of a medium.
Information materials comprise both information products (primary infor-mation products) and other types of products with an information content (sec-ondary information products.) The term ‘information product’ refers to clearlydelineated information materials whose primary purpose is to convey infor-
276
mation. Examples of primary information products are posters, brochures,instruction booklets, instruction programs on video and manuals. Examples ofsecondary information products are daily newspapers with informative graph-ics, magazines with recipes, instructions and packaging with declarations ofcontents, descriptions and instructions. The primary purpose here is alwayssomething other than conveying information. Conveying information is a sec-ondary purpose.
Modes of presentationThere is often a considerable discrepancy between the sender’s intended mes-sage and the message perceived by the receiver, both as regards words andimages. It is sometimes doubtful whether receivers perceive anything. Every-thing usually works better when words, pictures and graphical design areallowed to interact.
Words and pictures can be presented in different ways and with the aid ofdifferent media. We can make a distinction between two main groups as regardsthe presentation of words. We read lexivisual representations and listen toaudiovisual representations. Information is only interesting when the receiverhas the required basic knowledge enabling her/him to interpret and understandthe specific information.
The presentation of all the information available in a field is seldom possible.Normally, information-providers and other writers make a selection. This selec-tion can be more or less subjective. The selection is seldom, or perhaps never,objective. This is difficult or even impossible. You need to have access to allthe information to be presented before you can decide on the mix of words andpictures. This decision depends on the most appropriate form of representationin every individual instance. The different media have completely different abil-ities to convey information. For example, reading texts on a television screenis difficult.
Occupational rolesThere are many information professions. Groups which mainly work with infor-mation, such as e.g. information providers, journalists, editors and marketers,all have similar knowledge of Man and knowledge of information and com-munications as starting points. They utilise basically the same methods andtechniques in their jobs. However, their roles differ in society. Professional rolesgive each group a special identity and make different demands on loyalty, expe-rience and know-how. The loyalty of an information-provider is to his employer.The loyalty of a journalist should be to her/his readers, listeners and viewers
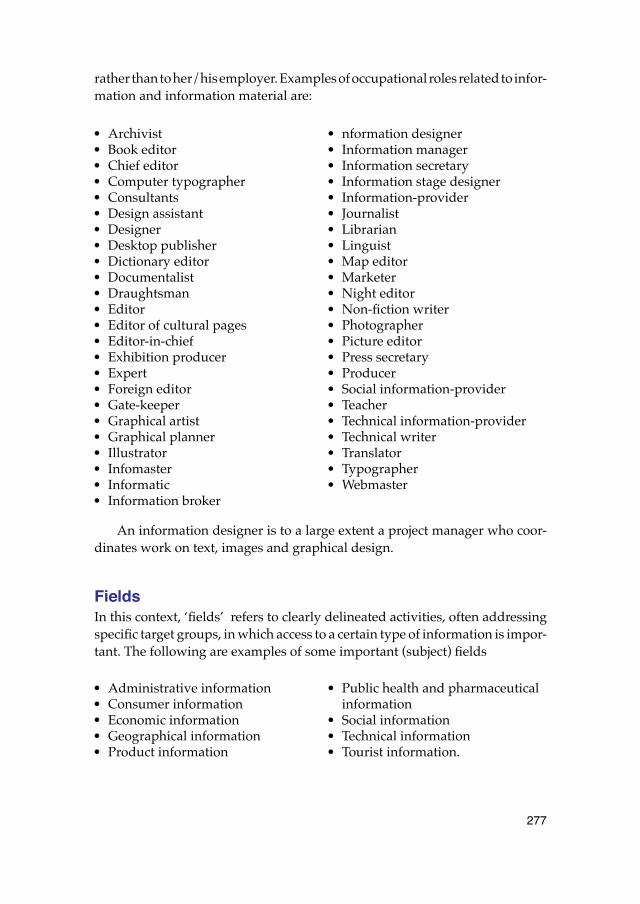
277
rather than to her/his employer. Examples of occupational roles related to infor-mation and information material are:
An information designer is to a large extent a project manager who coor-dinates work on text, images and graphical design.
FieldsIn this context, ‘fields’ refers to clearly delineated activities, often addressingspecific target groups, in which access to a certain type of information is impor-tant. The following are examples of some important (subject) fields
• Archivist• Book editor• Chief editor• Computer typographer• Consultants• Design assistant• Designer• Desktop publisher• Dictionary editor• Documentalist• Draughtsman• Editor• Editor of cultural pages• Editor-in-chief• Exhibition producer• Expert• Foreign editor• Gate-keeper• Graphical artist• Graphical planner• Illustrator• Infomaster• Informatic• Information broker
• nformation designer• Information manager• Information secretary• Information stage designer• Information-provider• Journalist• Librarian• Linguist• Map editor• Marketer• Night editor• Non-fiction writer• Photographer• Picture editor• Press secretary• Producer• Social information-provider• Teacher• Technical information-provider• Technical writer• Translator• Typographer• Webmaster
• Administrative information• Consumer information• Economic information• Geographical information• Product information
• Public health and pharmaceutical information
• Social information• Technical information• Tourist information.
278
We could obviously mention even more fields in which information mate-rials may be important. Different kinds of information products and, accord-ingly, different media can be used in each field.
ObjectivesIn this text, the term objectives refers to what the sender wishes to achieve withher/his message, i.e. the goal(s) the sender wishes to attain. The objective ofinformation material is usually linked to some utilitarian aspect in which thereceiver is supposed to understand how something works or how she or heshould behave in a given situation in order to avoid or resolve a problem.
Good information material has a distinct structure, it is relevant, legible andreadable by the intended target group. Good information materials meet strin-gent demands on good economics, good contents and good linguistic and tech-nical quality. Different information materials may have multiple functions andmore than one objective all at the same time. As a result of the aforementionedproperties and demands, good information materials make everyday life sim-pler for receivers who need the specific information and provide senders witha good economic return and good credibility. With the main objectives as thestarting point, seven distinct groups of information materials are discernible.Differences between information materials are considerable, or even very con-siderable, within each group. There are usually clear and distinct differencesbetween the seven groups. The seven groups are:
1. Advertising and propaganda
2. Informative entertainment
3. Brief messages1. Simple instructions2. Prohibitions3. Information4. Warnings
4. Administrative documentation1. Working materials2. Administrative messages 3. Business documents
5. Factual information1. Facts2. Descriptions
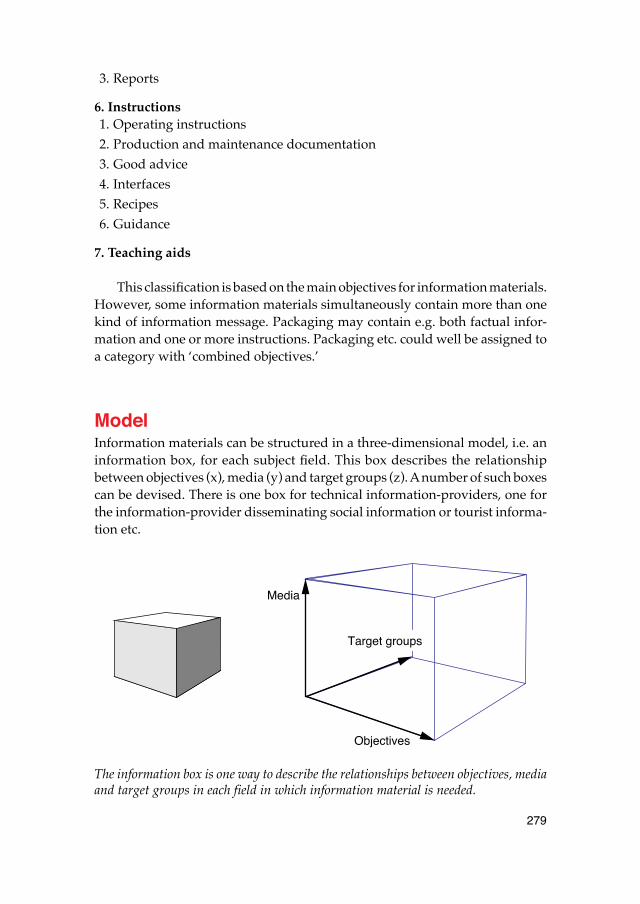
279
3. Reports
6. Instructions1. Operating instructions2. Production and maintenance documentation3. Good advice4. Interfaces5. Recipes6. Guidance
7. Teaching aids
This classification is based on the main objectives for information materials.However, some information materials simultaneously contain more than onekind of information message. Packaging may contain e.g. both factual infor-mation and one or more instructions. Packaging etc. could well be assigned toa category with ‘combined objectives.’
ModelInformation materials can be structured in a three-dimensional model, i.e. aninformation box, for each subject field. This box describes the relationshipbetween objectives (x), media (y) and target groups (z). A number of such boxescan be devised. There is one box for technical information-providers, one forthe information-provider disseminating social information or tourist informa-tion etc.
The information box is one way to describe the relationships between objectives, mediaand target groups in each field in which information material is needed.
Objectives
Media
Target groups
280
Each box covers hundreds of conceivable types of information materials,all with specific subject content. A number of examples of information materialsa professional information designer might be asked to produce are suppliedon the following pages. Here, the information materials are arrayed into theseven groups with main purposes, according to increasing cognitive and mentaldemands made on receivers in the different target groups. Some groups com-prise more than one type. There are usually a large number of individual exam-ples in each type of information material.
The term ‘text’ when used in descriptions of the seven groups of informationmaterials refers to words, pictures and shapes. So the concept ‘informative texts’refers to the sum of (1) informative words, (2) informative pictures and (3) infor-mative graphical shapes. This total is sometimes referred to as discourse (Nor-dström, 1996). In some instances, different kinds of sound, music, movement,spatial rendition, special lighting or various effects are also involved.
Advertising and propagandaCertain kinds of advertising and propaganda can be included in the conceptinformation material, broadly interpreted. As regards advertising and propa-ganda, the idea is for the receiver to imitate, emulate or mimic, i.e. to intention-ally try to resemble someone else, become convinced of something, behave ina particular way, adopt a particular attitude or buy a product or an idea. Wecan use the following in achieving these objectives:
We can make a distinction between two groups of advertising and propaganda:(1) advertising and (2) propaganda.
AdvertisingThe objective of advertising is to sell products and services. This group of infor-mation materials works mainly with persuasion, as well as marketing. Adver-tising and propaganda can resemble both infotainment and factual information.This applies e.g. to TV commercials.
PropagandaThe objective of propaganda is to disseminate an idea, an opinion or a philos-ophy. Propaganda often reinforces our prejudices in a negative or positive fash-
• Advertising texts• Agitation• Persuasive texts
• Propaganda texts • Rhetoric
281
ion. One of the reasons why pictures and imaging media have such importancein advertising and propaganda is because they directly appeal to our emotions.Pictures are seldom scrutinised as critically as texts.
Media for advertising and propagandaFilms, graphical media (such as posters, brochures, labels, packaging and news-papers), radio, TV, video and the WWW are examples of media for advertisingand propaganda. TV advertising has undergone an explosive economic devel-opment in Sweden in recent years. Advertisers are investing increasing amountsof money in TV advertising. But according to a study conducted by the NationalSwedish Board for Consumer Policies (1993), Swedish TV viewers are criticalof TV commercials. Only one out of ten (11%) people felt that TV advertisingsupplies correct information about goods and services.
We seldom, or never, expect advertising and propaganda materials to becompletely objective and unbiased. We should always try to retain some pre-paredness for interpreting these messages. However, both advertising and pro-paganda messages are often promulgated in a highly insidious fashion. Picturescan often have a subconscious impact on people’s emotions. Content is thennever critically analysed nor processed. It may sometimes be very difficult forpeople to shield themselves against advertising and propaganda messages,especially when the messages are frequently repeated. A definite ‘attritioneffect’ occurs. If a message is repeated often enough, we may lose our abilityto be critical and analytical about it.
Many culturally and historically interesting messages, such as paintings inmedieval churches and the design of church buildings, castles and manorhouses, can be included in this category of information materials. Art and lavishbuildings currently convey a clear message about power and influence.
Informative entertainmentSeveral types of materials designed to entertain can be included in any inter-pretation of the concept ‘information material’ (infotainment). The materialshould enable the reader to relax, obtain recreation, pleasure and enjoymentfor the moment without making any major demands on her/his mental activityto achieve a deeper understanding. The following can be used for obtainingthese objectives:
282
Information fieldsThis group of information materials operates mainly in media design, journal-ism and, to some extent, even information design. We can easily comprehendfragments of individual events from around the world because television is asuitable choice for supplying fragments out of context, often without any realvalue. According to Postman (1985), television in the U.S. has made entertain-ment the natural form for all presentations of reality. Postman wrote (p. 95):“The problem is not that TV supplies us with entertainment but that all subjectsare supplied as entertainment.” In my view, a news program in North AmericanTV is a kind of entertainment rather than a source of factual information. Newsprograms in Europe are usually more factual information than entertainment.However, TV news broadcasts in Japan appear to me to have features clearlysuggestive of popular education
Media for informative entertainmentExamples of common media for infotainment are motion pictures, graphicalmedia (such as books and magazines), radio, TV and video. We anticipateincreasingly rapid development of infotainment on the Internet and WW.
Brief messagesInformation materials and information messages in the Brief Messages categoryhave two objectives. The receiver shall notice, i.e. direct her/his attention to,certain information, then perceive, i.e. become aware of, something and heedand respect e.g. bans and warnings. We can use the following in achieving theseobjectives:
A message is information conveyed from a sender to a receiver in a singlecontext on one occasion. A message is usually brief and clearly delineated inthe form of a signal, i.e. transmitted characters with a mutually agreed meaning.This category of information materials is found both in persuasion design (espe-cially in planned communications) and in information design. We can easilymake a distinction between four kinds of brief messages: (1) Simple instructions,(2) Prohibitions, (3) Information and (4) Warnings.
• Fireworks• Interviews• Light shows• Literary texts
• Narrative texts• Poetry• Prose• Reportage texts
283
Simple instructionsAn instruction is explanatory information on an appropriate procedure in agiven situation. Short, distinct instructions are involved. The instructions maybe impressed or printed on different products, such as doors, signs and radios,in the form of words, letters or symbols. Distinguishing between ‘push’ and‘pull’ may be appropriate when we open a door. In traffic, for example, manyroad signs provide instructions on how people should drive in different situ-ations.
Instructions can also be conveyed with systems of signals and characters.This may be the case e.g. when an umpire gives orders to players in a footballmatch or when ground staff instructs a pilot in a taxiing aircraft about the rightgate, enabling passengers to disembark and making space for new travellersto go on board.
ProhibitionsA prohibition is a regulation stipulating something which must not occur orbe done, often because of the risk of injury to people or property damage. Aprohibition may be impressed or printed on different products, such as machin-ery, signs and fences, in the form of words, letters or symbols. Trespassing onprivate property, diving from a trampoline, entering a construction site, camp-ing, various activities in traffic etc. are examples of prohibitions.
InformationHere, information refers to a brief message intended to be of direct, practicalbenefit to the receiver. Information can be impressed or printed on differentproducts, such as machinery and signs, in the form of words, letters or symbols.Much useful information is supplied in traffic, e.g. on route signs. Other exam-
• Acoustic signals• Body language• Combined acoustic and optical sig-
nals• Emergency signals• Graphical symbols• Instrument panels• Instrument windows• Olfactory signals
• Optical signals• Planning boards• Prohibition texts• Prose• Sensory signals• Signal lamps• Signal texts• Symbols• Warning texts.
284
ples of information are emergency signals, such as flares or signal rockets fromships in distress or hikers who get lost or injured.
WarningsA warning refers to the designation of a possible hazard which can be avoidedby caution and responsible behaviour. Like other instructions, prohibitions andinformation, warnings can also be impressed or printed on different products,such as machinery in the form of words, letters or symbols designating e.g. anelectrical safety hazard or high voltage. Warnings on signs may concern warn-ings for shallow water or thin ice, warnings to car drivers, pilots, locomotivedrivers and machinery operators etc. Warnings of different kinds are oftenprinted on packaging, such as warnings for hazardous substances and warningson the use of certain drugs in conjunction with driving (as they would makedrivers less attentive in traffic). Warnings can be conveyed with acoustic signals,e.g. fire alarms and fire-drill warnings. Warnings may also be issued in weatherforecasts, e.g. warnings for icy roads, hail, storms or, at worst, a tornado, thingswe would rather avoid.
Media for brief messagesToday, graphical media, such as brochures, packaging and catalogues, signs,warning flags, signal systems and warning triangles, are examples of mediacommonly used for warnings and prohibitions. We can use our own bodies,body language and gestures to convey distinct messages to other people, notthe least when warnings and invitations are involved. However, the signals needto be interpreted in the right way.
Administrative documentation We need administrative documentation in many situations in our professionaland private lives. Having your paperwork in order is important in contacts withbanks, insurance companies, public health units, public agencies and evenmany organisations. Good administrative documentation and reliable routinescreate good conditions for satisfactory operation of various activities. The fol-lowing information components can be used in maintaining functional admin-istrative documentation:
In both graphical design and information design, people often work with‘templates’ for administrative documentation. Ready-to-use templates saveconsiderable time and contribute to the creation of a distinct and uniform struc-ture for documentation and to a uniform identity for an organisation. Each
285
organisation needs a carefully thought-out programme for its graphical profile.Many organisations utilize a set of governing ‘profile rules’. It must be easy foran organisation’s own employees, as well as external receivers, to find relevantinformation in each administrative document. This involves the organisation’sname and logo and other administrative information, such as the address, num-ber of pages, the date, the type of document, the author, the approving party,the examiner, the version, the degree of confidentiality and the subject.
Working materialsCommonplace objectives may be to work with information by revising, pro-cessing and structuring different data. Finding suitable forms for distributingcertain information may be important. Examples of common types of workingmaterials are:
Administrative messagesSome of the objectives of administrative documentation are to show how to dealwith various processes and issues, i.e. to explain, inform, report and describe.Examples of common types of administrative messages are:
• A standardized layout for all kinds of administrative documentation in an organisation, i.e. ‘graphical templates”
• A system for numbering docu-ments
• A system for numbering versions
• Addresses• Bank giro account numbers• Dates• Logotypes• Postal giro account numbers• Prose• Tables
• Forms/blanks• Lists (of various kinds)• Memos
• Minutes• Notes (taken at meetings)• Tables
• Agendas (for meetings)• Calendars• Directives (on work tasks)• Distribution lists• Electronic mail• Fax messages• Letters
• Lists (of various kinds)• Lists of appendices• Lists of documents• Memos• Minutes• Summonses to meetings• Tables
286
Business documentsAdministrative documents are important for documenting, filing, storing andsaving information on events, prices, processes and products. We can also useadministrative documentation for monitoring, controlling and verifying vari-ous processes and products. Quality assurance, for example, always generatesa great need for continuous:
Many contemporary business documents have their roots in the medievalbookkeeping conducted by churches and monasteries. We can learn a great dealby studying administrative routines in different organisations. Very importantchanges in administration took place in Sweden from 1500 to 1720. Svensson(1988) states that control and information were then the predominant functionsof all communications. The spoken language was still the predominant form,but written and printed texts ultimately began to make their influence felt
Media for administrative documentationGraphical media are still most common, but electronic mail and storage in data-bases are becoming increasingly popular for administrative documentation.The need for carefully thought out typography and layouts is even greater incomputer media than in traditional graphical media. This is mainly because ofthe major limitations still prevailing in the resolution of computer screens.
Swedish archival capacity is inadequate. Growth in the public sector aloneamounts to 40,000 shelf-metres a year. The National Archives, the MilitaryArchives, the provincial archives, the Municipal Archives in Stockholm andMalmö and the Audiovisual Archives are Sweden’s archival authorities.
As early as 1983, three Japanese electronics companies, Toshiba, Sony andMatsushita, introduced optical discs for recording, storing and displaying doc-uments, such as letters, articles etc., with both text and pictures. Various formsof digital information storage can contribute to a solution of the archival capacityproblem. One small optical disc is capable of storing thousands of pages of text.
• Contracts• Cover notes• Fax messages• Forms/blanks• Invoices
• Letters• Memos• Minutes• Receipts• Tables
287
Factual informationSupplying information is by far the most common of all perceived objectives.This is the primary task of a large number of information materials, such asposters, descriptions, brochures, instruction booklets, information sheets,handbooks, web sites for the WWW, informative graphics, information sys-tems, maps, catalogues, route signs, reports, schematic drawings, signs, sym-bols and certain exhibitions. We can use some of the information componentsbelow in developing the kind of information material listed on the next page.
The group could conceivably even be referred to as ‘facts’ or just ‘informa-tion’, but this would be needlessly confusing, as the term ‘information’ is usedin so many different contexts and in so many different ways. Factual informationis always more comprehensive than brief, simple messages. This category ofinformation materials is usually produced in the field of information design.The group is both very broad and very deep, i.e. many different examples ofinformation material of the same type are found. This type of information isvery commonplace. Information material in the factual information categorycan impinge on the advertising and propaganda group.
We can make a distinction between three types of factual information: (1) facts,(2) descriptions and (3) reports.
FactsThe objective of facts is for the receiver to comprehend, i.e. to succeed in under-standing the meaning of something and possibly, but not invariably, forming
• Addresses• Article numbers• Bank giro account numbers• Bar codes• Dates• Declarations of contents• Delivery terms• Descriptive texts• Drawings• Indices of various kinds• Informative graphics• Informative texts• Informative texts• ISBN numbers• ISSN numbers• Lists of various kinds
• Maps and plans• Narrative texts• Non-fiction texts• Postal giro account numbers• Price information• Product numbers• Prose• Registration numbers• Schematic pictures, diagrams and
graphs• Serial numbers• Subject indices• Summaries• Symbols• Tables
288
her/his own opinion about it. Examples of information areas or themes for factsare:
• Information on current events, historical events, future events.• Information on geographical location; where something is, the best route to
get there.• Information on goods and services, prices, dimensions, delivery times,
delivery terms, performance etc.• Information on organisations, their addresses, bank giro account number,
managers, complete names, legal status, postal giro account number, busi-ness hours etc.
• Information on times. What time does the bus, ship, flight, train depart?What time does the show begin? How much time do I have left on the park-ing meter?
• Safety information, e.g. evacuation from a ship, aircraft, hotel. public build-ing etc. in the event of a fire or other hazard.
DescriptionsThe purpose of descriptions is to enable the user to comprehend, i.e. understand,certain information with respect to its immediate or basic meaning. Descriptionsare different kinds of materials which depict what something looks like or howit works. Examples of information fields or themes for descriptions are:
Descriptions can sometimes be related to facts, reports and instructions.
ReportsThe purpose of reports is often to help the receiver understand, i.e. to absorbconceptual concepts in reports and form an understanding. Understandingmore or less complex relationships, comparing different alternatives with oneanother and reaching her/his own conclusions about the way to act in other
• Anatomical descriptions• Biological descriptions• Company descriptions• Consequence descriptions• Construction descriptions• Ecological descriptions• Economic descriptions• Event descriptions• Historical descriptions
• Job descriptions• Medical descriptions• Physiological descriptions• Process descriptions: courses of
events and processes • Product descriptions: goods and
services• System descriptions• Technical descriptions
289
situations are examples of what is involved. Reports are formal accounts ofstudies and completed assignments. Examples in the information field orthemes for reports are:
Reports can be closely related to descriptions.
Media for factual informationFactual information is presented in all media, even if graphical media, such asbrochures, posters, fact sheets, non-fiction books, handbills, packaging, hand-books, booklets, product sheets, information sheets, maps, catalogues, productsheets, signs, tables, magazines and reference books, are still most common.However, the amount of information in different databases, on various kindsof optical discs, on the Internet and various intranets is increasing at a rapidrate. Information systems vary greatly in complexity and scope. Examples of‘simple information systems’ are systems for indicating arrival and departuretimes for buses, ships, flights and trains. These systems can be analogue or dig-ital. Examples of more advanced systems are digital map and positioning ornavigation systems, ‘information towers’ with stacks of video discs and data-bases etc. Cave art, petroglyphs, rune stones, picture stones and some of ourchurch paintings are examples of historically interesting messages in this cat-egory.
Instructions Instructions are directions and explanatory information on appropriate proce-dures for achieving specific results in a safe and reliable manner. This categoryof information materials differs from the Brief Messages group, which com-prises simple instructions, prohibitions, information and warnings, by demand-ing more comprehensive action in multiple stages. The purpose of instructionsand directions is to enable the user to perform some concrete task. We can usethe following in achieving this purpose:
• Conference reports• Final reports• Financial reports, such as final
accounts, forecasts, annual reports etc.
• Inspection reports• Interim reports
• Position reports• Reports issued by experts• Scientific reports• Technical reports• Test reports• Traffic reports• Weather reports.
290
The text “Push” on a door is a brief message. The simple text “In an emer-gency / turn the handle /open the door / manually” in a train is an instruction,as it comprises multiple stages (/ designates line breaks). Instructions some-times place special emphasis on practice and learning. However, all you needto do is follow the instructions in directions for use, manuals or user handbookson one or a few occasions. Instructions may be closely related to descriptions.People work with this category of information materials mainly in informationdesign. We can make a distinction between six groups of instructions: (1) Direc-tions for use, (2) Production and maintenance documentation, (3) Good advice,(4) Interfaces, (5) Recipes and (6) Guidance.
Directions for useDirections for use are written instructions explaining what someone has to doin order to use some device etc. This especially applies to instruments, machin-ery and tools. The people who will be using the product in question are thetarget group for directions for use. Directions for use are often in the form ofprinted sheets or booklets as well as in digital media. Users often need theinstructions in directions for use just to ‘get started’. Once a TV set and a VCRhave been installed, using these products seldom presents any problem. ‘Incor-porating’ directions for use into technical systems is becoming increasinglycommon. Necessary information can then be viewed on a monitor. Since infor-mation cannot be accessed in the event of a power failure, we will still need tohave some information in graphical media in the future.
Production and maintenance documentationWe are accustomed to turning in our cars for periodic servicing. This also appliesto many other products. Instructions for production and maintenance must beprepared for every new car model, ship, computer system, aircraft, nuclearpower plant, motorcycle, chain saw, paper-making machinery, telecommuni-cations system, train, video camera and many other types of products. Someof these instructions are intended for people making routine use of the products.Other documentation, e.g. with instructions on how to perform certain func-tional tests, how to trace and find faults, how to replace or repair defective partsetc. so equipment operates reliably, is intended for specially trained service tech-nicians. Production and maintenance documentation is often collected in bind-
• Directions• Drawings• Explanatory texts• Instructive texts
• Prose• Prose• Subject indices• Symbols
291
ers but is also in the form of instruction films and databases accessible on CDor the internet.
Good advice‘Good advice’ provides a simple explanation of how to perform various prac-tical tasks. Newspapers, magazines and some TV programs offer good advice.They give us e.g. tips on how to arrange flowers, how to diet, how to build fur-niture and how to use makeup according to the latest fashion trends.
InterfacesMany products have fixed interfaces in e.g. instruments and instrument panels.One example is the instrument panel in a car. The instruments consist of e.g. aspeedometer, fuel gauge, thermometer, clock and tachometer. Words or simplecharacters or symbols are impressed or printed on the product. They can beprinted on labels or signs. Some messages from a fixed interface are brief mes-sages, whereas others comprise instructions requiring action in several stages.Fixed interfaces are gradually being superseded by graphical interfaces in manyproducts. Graphical interfaces differ from fixed interfaces by tailoring infor-mation to different situations and e.g. only displaying information importantfor the moment. Graphical interfaces can supply instructions on when, whereand how the user or operator should enter data in different computer systemsand certain equipment, e.g. in process industries to ensure that equipment oper-ates in a satisfactory and safe fashion. Instructions on the way the graphicalinterface operates are usually referred to as manuals which are actually the sameas directions for use.
RecipesAn increasing number of raw materials and semi-manufactured products aresupplied with information on the contents inside packaging and ways to pre-pare those contents. This obviously applies to directions on preparing variousdishes but also includes different kinds of chemical products, such as commer-cial fertiliser and insecticides, Recipes and instructions on how to prepare foodare frequent features in weeklies, cook books and TV shows.
Guidance‘Guidance’ provides assistance and uses detailed written instructions to explainhow to behave in a general, professional and appropriate manner e.g. in solvinga problem or performing certain tasks. A handbook provides broad, sum-
292
marised information on subjects, often practical in nature. It may deal with e.g.the art of angling, riding, painting, growing flowers, collecting stamps, birdwatching in the field, drawing etc. Guidance in brochures and handbooks maybe more than superficial. You often need to return repeatedly to guidance.
Media for instructionsSeveral examples of media appropriate for instructions were noted in conjunc-tion with the aforementioned accounts.
Teaching aidsThe objective of ‘teaching aids’ is for the receiver to learn an intended subject,i.e. acquire new knowledge and new experience. In time, the receiver maybecome familiar with the subject, gain insight and learning and, ultimately,knowledge in one or more subjects. We can use the following for achieving theseobjectives:
Teaching aids are pedagogic adjuncts for direct use in training, instruction andeducation. The following are examples of products:
Information fieldsThe following are examples of information fields or themes for teaching aids:
• Subjects in compulsory education• Other subjects
In this category of information materials, people work in information designand instruction design.
• Argumentative textsDescriptive texts
• Discussion texts• Explanatory texts• Indices• Indices of subjects
• Instructive texts• ISBN numbers• ISSN numbers• Prose• Summaries
• Non-fiction books• Practice materials.• Reference books
• Teacher’s manuals• Textbooks
293
Media for teaching aidsA-V media, graphical media, such as textbooks and reference books, radio, TV,video and different kinds of databases, are examples of common media.
ReferenserAllén, S. (Red.). (1996). Nationalencyklopedins Ordbok. Höganäs: Bokförlaget
Bra Böcker.Bettinghaus, E. P., Cody, M. J. (1987). Persuasive Communication. Fort Wort:
Harcourt Brace Jovanovich College Publishers.De Vaney, A., & Butler, R. P. (1997). Voices of the Founders: Early Discourses in
Educational Technology. In D. H. Jonassen (Ed.). Handbook of Research for Edu-cational Communications and Technology. Simon & Schuster: New York.
Fiske, J. (1982). Introduction to Communication Studies. Methuen: London.Hagen, I. (1998). Creation of Socio—Cultural Meaning. Media Reception Research
and Cognitive Psychology. In B. Höijer and A. Werner (Eds.). Cultural Cogni-tion. New perspectives in audience theory. NORDICOM: Göteborg University.
Hall, S. (1980). Encoding/Decoding. In S. HAll, D. Dobson, A. Lowe, and P. Wil-lis (Eds.). Culture, Media, Language. London: Hutchinson.
Konsumentverket (1993). Allmänhetens inställning till reklamTV. Resultat från en undersökning hösten 1993. Konsumentverket: Stockholm.
Moriarty, S. E. (1991). Creative Advertising. Theory and Practice. Englewood Cliffs, NJ: Prentice Hall.
Morley, D. (1992). Television, Audiences and Cultural Studies. London: Rout-ledge.
Nordenstreng, K. (1978). Kommunikationsteori. Uppsala.Nordström, G. Z. (1996). Tidningssidans dramaturgi. I G. Z. Nordström, B-M
KÜhlhorn, T. Marthinsen. Estonia – Bilder av en katastrof. Stockholm: Sty-relsen för psykologiskt försvar. Meddelande 168-4.
Pettersson, R. (1993). Visual Information. Englewood Cliffs, NJ: Educational Technology Publications.
Pettersson, R. (1998a). What is Information Design? Presentation at Vision Plus 4. The Republic of Information. Carnegie Mellon University, Pittsburgh, Pennsylvania, March 26 –29. Printed in Proceedings Book, The Republic of Information, Vision Plus 4. Carnegie Mellon University, School of Design & International Institute for Information Design, 58 –74.
Pettersson, R. (1998b). Beyond Literacy. Presentation at InfoDesign98, Informa-tion Design & the Learning Society, Cambridge University, April 2021, 1998.
Pettersson, R. (1998c). Information Design and Learning. Presentation at Vision Plus 5. Learning meets Information Design, Information Design meets
294
Learning. International Institute for Information Design, Fachhochschul-StudiengängeVorarlberg, Austrian Federal Ministry of Science and Trans-portation, Ministry of Education and Art, UNESCO. Schwarzenberg, Vorarlberg, Austria, July 24, 1998.
Pettersson, R. (1998d). Information Design. Västerås: Mälardalens Högskola Research & Reports. Opuscula Nr 36.
Pettersson, R. (1999). Design of Information Sets. Presentation at the 13th Annual Visual Communication Conference 1999, Lake Tahoe, California, June 23–27.
Postman, N. (1985). Amusing Ourselves to Death. I svensk översättning 1986: Underhållning till döds. Prisma: Stockholm.
Smith, P. L., and Ragan, T. J. (1999). Instructional Design. Merrill, Prentice Hall. Columbus, Ohio.
Svensson, J. (1988). Kommunikationshistoria. Studentlitteratur: Lund.
295
Paper 17
Circles, triangles and squares
Abstract. The circle and the triangle, as well as the square, are shapes that have beennatural to man for a very long time. There have always been circles and triangles inour natural environment, and they have already been used as important symbols inpre-historic cultures. This paper presents the use of circles, triangles and squares assacred symbols in the old Mayan civilization. The paper also presents one of the oldestforms of mediated communication through moving images, the “moving picture” inChichén Itzá, Mexico.
SymbolsSymbols are signs representing objects or ideas. In specific areas symbols area supplement to all languages to help create better and faster understanding.Today symbols have evolved to the point of universal acceptance in such areasas music, mathematics, and many branches of science. Taking up only a verysmall amount of space, symbols can convey a message containing a largeamount of varying information, equivalent to one or more sentences of text.Image perception is very rapid, virtually “instantaneous”. Reading and com-prehending the equivalent message in words takes much more time. So symbolspermit rapid reading. This is important in numerous situations, e.g., in traffic,industry, and aviation.
Some figurative graphic symbols are pictorial and representational (Petters-son, 1993). They are “image related” and simplified pictures. Pictorial symbolsresemble the objects they represent. They can be characterized as silhouettesor profiles with no surface detail. An old traffic sign with a silhouette of a loco-motive, to denote a railroad crossing, is an example of a pictorial symbol.
In the design process, some pictorial symbols may be successively simpli-fied into figurative and abstract graphic symbols (op. cit.). They still look likethe objects they represent but have less detail than pictorial symbols. In athleticcontests, like the olympic games, abstract graphic symbols are often used todenote the different kinds of sports. Good abstract graphic symbols are intuitive.We should be able to understand their meaning.
Some figurative symbols are arbitrary graphic symbols (op. cit.). They areinvented and constructed from the designer's imagination. Usually arbitrary
296
graphic symbols have no resemblance at all to the objects or to the ideas thatthey represent. Many are based on geometric shapes. Many signposts and trafficsigns are often good examples of arbitrary symbols. They are unambiguous byconvention; we agree and decide on their meanings. Just as new words haveto be learned when we begin to study a new topic, we have to learn arbitrarygraphic symbols.
Many non-figurative verbal symbols, written characters, and letters of var-ious alphabets have evolved from simplified pictures (op. cit.). Verbal symbolsare used in written languages and in many branches of science. In many areas,verbal symbols have reached universal acceptance.
When small children scribble they make dots, lines, and endless open cir-cular movements (Kellog, 1955). Already at the age of three children may drawsolid circles, triangles and squares (Berefelt, 1977). In my view, we perceive cir-cles, triangles and squares at a low cognitive level without any special analysis(Pettersson, 1989). Due to their simplicity, circles, triangles and squares are oftenused as icons or symbols in modern verbo-visual communication, and as pictureelements in schematic pictures. However, this simplicity also means that thesesimple shapes can be perceived in many ways by different people. Functional,instructive graphic symbols are probably older than words, and they are prob-ably found in every culture however primitive. From the following example,the old Maya civilization, we can see that it is possible to trace a meaningfuluse of basic geometric shapes as symbols far back in time and history. Circles,triangles and squares were important for the Mayans, and they were probablyalso important in many other prehistoric cultures.
The Maya civilizationThe first humans who came to North America where tribes of nomadic hunter-gatherers from Siberia. They followed the big game over the land connectionbetween Asia and Alaska. This was some 30,000 – 40,000 years ago (Coe etal.,1986; Stora Focus, 1987–1989). These groups of people gradually movedsouth without further contacts with the old world. Already 5,000 – 6,000 yearsago people began to grow maize (or corn) in different places in Mesoamerica,a region stretching from northern central Mexico to Costa Rica in Central Amer-ica (Harrell, 1994). Cultivation of maize was a prerequisite for groups of peopleand tribes to settle down into farming villages, and thus also a prerequisite forthe later high civilizations in Mesoamerica.
Already more than 3,000 years ago the Maya Indians spoke dialects of theMayan language in the highlands of Guatemala and Belize (Blacker, 1965;Salmoral, 1990). Maya traders had the advantage of a common language. Theoldest Mayan ceramics and pottery, dated at 2,500 B.C., has been found in Belize
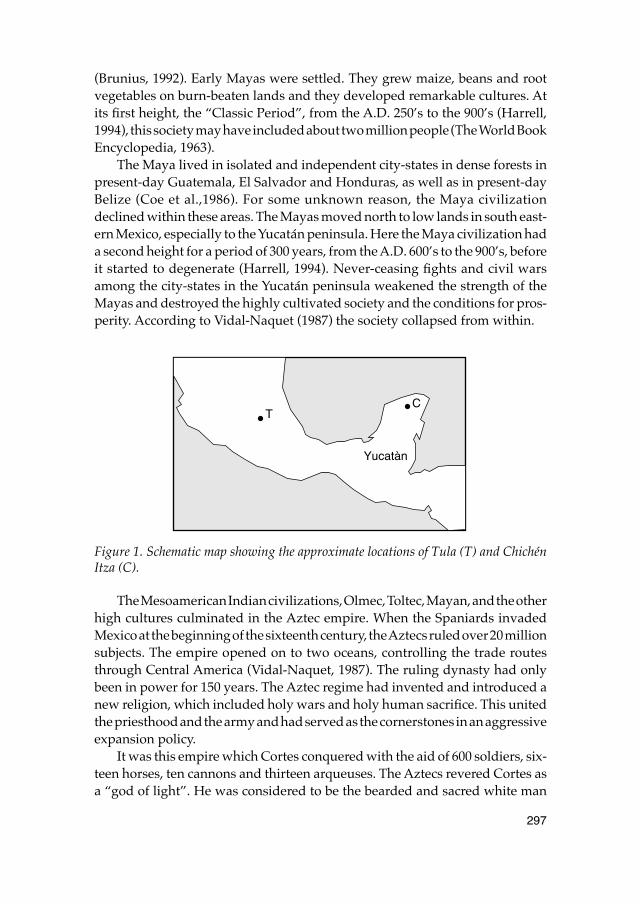
297
(Brunius, 1992). Early Mayas were settled. They grew maize, beans and rootvegetables on burn-beaten lands and they developed remarkable cultures. Atits first height, the “Classic Period”, from the A.D. 250’s to the 900’s (Harrell,1994), this society may have included about two million people (The World BookEncyclopedia, 1963).
The Maya lived in isolated and independent city-states in dense forests inpresent-day Guatemala, El Salvador and Honduras, as well as in present-dayBelize (Coe et al.,1986). For some unknown reason, the Maya civilizationdeclined within these areas. The Mayas moved north to low lands in south east-ern Mexico, especially to the Yucatán peninsula. Here the Maya civilization hada second height for a period of 300 years, from the A.D. 600’s to the 900’s, beforeit started to degenerate (Harrell, 1994). Never-ceasing fights and civil warsamong the city-states in the Yucatán peninsula weakened the strength of theMayas and destroyed the highly cultivated society and the conditions for pros-perity. According to Vidal-Naquet (1987) the society collapsed from within.
Figure 1. Schematic map showing the approximate locations of Tula (T) and ChichénItza (C).
The Mesoamerican Indian civilizations, Olmec, Toltec, Mayan, and the otherhigh cultures culminated in the Aztec empire. When the Spaniards invadedMexico at the beginning of the sixteenth century, the Aztecs ruled over 20 millionsubjects. The empire opened on to two oceans, controlling the trade routesthrough Central America (Vidal-Naquet, 1987). The ruling dynasty had onlybeen in power for 150 years. The Aztec regime had invented and introduced anew religion, which included holy wars and holy human sacrifice. This unitedthe priesthood and the army and had served as the cornerstones in an aggressiveexpansion policy.
It was this empire which Cortes conquered with the aid of 600 soldiers, six-teen horses, ten cannons and thirteen arqueuses. The Aztecs revered Cortes asa “god of light”. He was considered to be the bearded and sacred white man
TC
Yucatàn
298
which they had been waiting for (Dineen, 1992). The Spanish conquerorsdestroyed as much as they could of the cultures in Mesoamerica (Blacker, 1965).Only ten years after the first fights (1519) Mexico was captured. The invadersbrought diseases like smallpox, measles, and typhus. The original populationshad no resistance to these new diseases. More people died from diseases thanfrom the cruel treatment from the Spaniards. However, in some places the localresistance was strong. The last Maya city, Tayasal, did not surrender until 1697(Harrell, 1994).
Temple citiesAncient Maya achievements include superb art and architecture, a highly devel-oped style of hieroglyphic writing and of mathematics, and a precision in track-ing time day by day over centuries. Hundreds of Maya cities were centers forreligious festivals, markets, and courts of justice (The World Book Encyclopedia,1963). These temple cities are spread throughout south-eastern Mexico and Gua-temala. They are also believed to have served a function similar to universitiesof today. Each major Maya city was carefully planned with monumental andremarkable buildings of stone, such as temple-topped pyramids and palacesin the center, astronomical observatories, dwells, aqueducts, and decoratedstone pillars, a nearby ball court for the famous pre-Hispanic team sport (Ven-tura and Ceserini, 1982).
During the religious ceremonies the priests lived in the ceremonial centerof the town. The priests and the nobility had embroided or painted clothingsmade of cotton and decorated with feathers. Common people had clothes ofpounded tree bark or sisal hamp. Many had necklaces of seeds or beetle wings.The common people lived throughout the countryside in simple huts made ofpoles, mud, grass and palm leaves. They grew maize, beans, squash, chili pep-pers, avocado, sweet potatoes, papaya and some other crops. Stone-surfacedroads connected cities and parts of cities. This was at a time when their Europeancounterparts were largely dependent on dirt tracks. Some of the most importantMayan cities are Bonampák, Chichén Itzá, Copán, Labná, Palenque, PiedrasNegras, Tikal and Uxmal (Coe et al.,1986).
The Mayan architects built their pyramids, temples, and observatories withcores of dirt which they covered with facings of limestone. One of the Maya’sunique contributions to architecture is the Korbal Arch, also called the MayaArch. This was formed by projecting stone blocks out from each side of a walluntil they met forming a peak. This technique was a good substitute for a truearch (Coe et al.,1986; Stora Focus, 1987–1989). Some of these almost “solid”buildings have lasted for hundreds of years. Since they had no wheeled vehicles,people had to carry all the building materials.
299
Decorated stone pillars, reliefs and mural paintings tell us about the dailylife of the Mayas. Extraordinary mural paintings were discovered in a smalltemple in Bonampák in Mexico in connection with a movie production in the1940s. The pictures show musicians playing drums, trumpets and maracas(Salmoral, 1990). Unfortunately the colors started to fade in contact with theair outside the temple.
Maya traders came to the markets in the cities. They had developed com-plicated networks in the southern parts of Mexico and in the northern parts ofCentral America (Dineen, 1992). Local farmers brought maize, beans, squash,chili peppers, avocado, sweet potatoes, papaya and honey. People of the low-lands traded jaguar pelts, feathers, copal incense, lime, flint knives, and ediblehearts of palm trees. In return, they received the highly prized quetzal feathersand jade of the highlands, and sharp obsidian, or volcanic glass, which was usedfor knives.
After the Spanish invasion the temple cities were forgotten for centuries.They were covered by trees and other plants. During an expedition 1839–1840the American lawyer John Stephens and the British artist Frederick Catherwooddiscovered the three cities Copán, Palenque and Uxmal. Their findings becamea sensation, of the same order as the first expedition to the moon in our time.It is quite possible that people will discover temple cities still unknown in thevast jungles in Mesoamerica.
Calculation of timeScience was in the hands of the Mayan priesthood. Priests were very good atastronomy and mathematics (Ventura and Ceserini, 1982; Harrell, 1994). Theastronomers developed systems for accurate calculation of time. Every divisionof time was “lucky” or “unlucky”, and was ruled by a separate god. The priestsmade calendres and tables of dates on which to prepare religious ceremoniesand daily life. The year of the sun, tun, had 365 days and was divided in 18periods of 20 days. In addition there was an “unlucky” period of five days with-out ruling by any god. Many evil things could happen during these five days.The other calendre was a sacred year comprising of 260 days and divided into13 periods of 20 days. The Mayans believed that history would repeat itself incycles of 260 years.
In contrast to other high civilizations the Mayas created a system of num-bering which included a symbol roughly equivalent to our zero, although itreally stood for completion (The World Book Encyclopedia, 1963). Therefore itwas possible for astronomers and mathematicians to make calculations withlarge numbers. The Mayan system of numbering was vigesimal and based onthe number 20 (the number of fingers and toes) instead of ten, as in our num-bering system. Numbers one to four are written with dots. Number five is a
300
dash. Zero is a symbol for a shell of a clam. Vertical positions of the three symbolsdenominate their values. Numbers on the baseline (kin) are multiplied by one.Numbers in the second position (uinal) are multiplied by 20, numbers in thethird position (tun) are multiplied by 360, numbers in the fourth position (katun)are multiplied by 7,200, and finally numbers in the fifth position (baktun) aremultiplied by 144,000.
The Maya had a more advanced type of writing than any other Indian group.Their symbols stood partly for sounds and partly for ideas. It was a kind ofhieroglyphic writing. One glyph may stand for a word. Only fragments of therich literature are preserved. Archeologists, linguists and other researchers arestill trying to understand the hieroglyphic writing of the Mayas. Much of thiswork is done in archives in Spain, Guatemala and Mexico.
Religious ceremoniesThe Spanish monk and bishop Diego de Landa arrived in Mexico a few yearsafter the conquest. Through his careful notes and through his letters to the Span-ish king researchers today know a lot of the religious lives of the Aztecs, theToltecs and the Mayas, and especially about their special religious sacrifice cer-emonies (Salmoral, 1990; Dineen, 1992). Diego de Landa had a genuine interestfor the Mayas, but he fought against their religion. He ordered the conquistadorsto burn as many of the Mayan bark-cloth books, or rather manuscripts, as theycould find. Diego de Landa thought these books contained nothing but super-stitions and falsehoods of the Devil (Brunius, 1992). Only three of the manu-scripts survived, each called a codex. These manuscripts are now kept in muse-ums in Dresden, Madrid and Paris. Pictures are painted in red, yellow, blue andblack.
The Indian civilizations in Central America and in Mexico all had severalgods. People were very religious and worshipped the powerful forces in nature.The gods appeared in various forms and ruled over all aspects of human life.Gods decided on birth and death, on rain and dry weather, on warmth and coldweather, on good crops or bad crops which results in hunger and starvation.The Maya priests read in their calenders, and made astrological interpretationsof their astronomical observations. They knew what kind of sacrifice and whatkind of religious ceremonies that were needed in each case in order to makethe gods happy. Several of the gods demanded blood, above all blood fromhumans. When it was needed a person was placed on a special altar. Severalpriests held the person to be sacrificed. The master of ceremonies used a sharpknife of flint or obsidian and cut the heart out of the body. Then he offered theheart to the god. Later the body was prepared for a ritual meal (Salmoral, 1990;Dineen, 1992). Some of the gods where pleased with more simple sacrifices, like
301
blood from humans or animals, incense, pearls, beautiful and rare feathers orproducts from farming.
The superior gods of the Mayas lived above the earth on nine levels inheaven (Harrell, 1994). The most powerful gods lived at the top level. Heavenwas supported by four gods standing in the four corners of the world and sus-pended above the world like a ceiling. Red was the holy color for east, blackfor west, white for north, and yellow for south. In my view we can name thehanging heaven the sacred square of the Mayas. Mayas believed that all the godsand all human beings descended from father sun and mother moon. The moongoddess looked out for women’s activities, particularly weaving and childbirth.There are special temples for the sun god as well as for the moon goddess inseveral Maya cities. In my view we can name the sun and the moon the sacredcircles of the Mayas. Since these gods lived high in the sky it was necessary tobuild their altars and temples as close to the gods as possible.
According to the legends the god Quetzalcoatl was one of the most importantgods in the city of Tula, north west of Mexico City (Blacker, 1965; Moltke-Hoff,1990). Tula was the center for the Toltec culture. At its height, a period of 300years, from the A.D. 900’s to the 1200’s, Tula may have included up to 30,000inhabitants. Before that Quetzalcoatl was an important god in the older cityTeotihuacan, north east of Mexico City. During a long period of prosperity, fromthe B.C. 200’s to the A.D. 700’s, Teotihuacan sometimes had more than 125,000inhabitants. Later the Aztecs revered him as the god of light returning from theeast. That was the reason for the weak resistance and easy surrender to the Span-iards.
For the Toltecs Quetzalcoatl was the god of the wind, of learning and ofknowledge (Salmoral, 1990). He fertilized the ground and he was very specialto the priesthood. In Tula Quetzalcoatl used to be disguised as a Toltec ruler,Topiltzin Quetzalcoatl, but he could also appear as an eagle, as well as a bigsnake. Thus Quetzalcoatl was called “the Great Feathered Serpent”. Accordingto Mayan legend a prominent war god chased Quetzalcoatl out of Tula in thejoint between two time cycles, A.D. 987 (Coe et al., 1986). Together with a groupof people Quetzalcoatl fled in a boat across the sea and moved to the city ChichénItza, strategically located in the center of the Yucatán peninsula. There hechanged his name to Kukulcan (Blacker, 1965). The Mayans regarded Kukulcanas the great organizer who founded cities, formulated laws and invented theMayan calendar.
The “Moving picture” in Chichén Itza Today Chichén Itza, 120 km east of Mérida, may be the most famous of the Mayanruins, and it is also the best excavated and restored. This ancient city was alreadyfounded 445 A.C. The city covers an area of approximately six square kilometers.
302
It was the religious and political center for the whole Mayan culture duringthe second height, from the A.D. 600’s to the 900’s, (Harrell, 1994). The Itzá, agroup of Maya from Guatemala, entered the Yucatán peninsula and conqueredChichén Itza in 918. In about 975 the inhabitants had to surrender to the Toltecs.As noted above they forced the Mayas to worship their god Quetzalcoatl withthe new name Kukulcan. Toltecs and Mayas built several new buildings in orderto develop Chichén Itza into a better version of Tula.
Chichén Itza became a strong central machinery of power on the Yucatánpeninsula. The cities could no longer survive just by crops from the poor soilin the jungle. People in the ruling cities got their food by trade and they requiredtaxes from people whom they had conquered in war. During the 12th century,the cities Izamal and Mayapán joined forces, and together they defeatedChichén Itza. Mayapán became the new capital and Chichén Itza was aban-doned. The Spaniards came to Chichén Itza in 1541. The remains of the aban-doned Chichén Itza were re-discovered at the end of the 19th century. The ruinedcity was cleared from trees and other plants and partly reconstructed in the 1920sand 1930s.
On top of the big pyramid in Chichén Itza is a temple built on a square plat-form. (As noted earlier the heaven was a square.) The temple, El Castillo, (thecastle) was completed about 830 A.D. for the god Kukulcan. Actually the pyr-amid is a huge calendar, rising 21 meters above the jungle floor. The view fromthe sacred square platform is magnificent. You can see that the original citystretched for miles in all directions out to the jungle. From this main templeyou have a view of several other buildings like the “Pyramid of the Warriors”where a stiffly posed figure called “chac mol” holds a receptacle for offerings,the “Pyramid of the Jaguar”, and the “Ball Court”, all more spectacular thanthe buildings at Tula (Coe et al., 1986). Chac mol was the Mayan divine mes-senger. Twenty or so structures of the several hundred at the site have been fullyexplored.
The pyramid is built in nine square terraces or levels, one for each monthin the Mayan calendar, also indicating the nine heavens; 54 indented squares,one for each week; and 365 steps, one for each day of the year. Each side of thepyramid has a steep staircase with 91 steps. All the steps and the square platformmakes 365. At the bottom of the staircase at the northern side of the pyramid,there are two snake heads in stone, which represent Kukulcan.
The sun travels 182 days to the north and returns 182 days to the south againevery Mayan Earth year. This is the season or cycle of the solstices. At the mid-point of this season/cycle is another cycle of the east and the west called theEquinoxes. On the Equinox, the sun crosses at a center point of all four seasonsmaking exact 90 degrees angles directly on top of the pyramid of Kukulcan.At the vernal Equinox (March 21) and at the autumnal Equinox (September 21)up to 40,000 people gather on the ground in front of the pyramid. They want
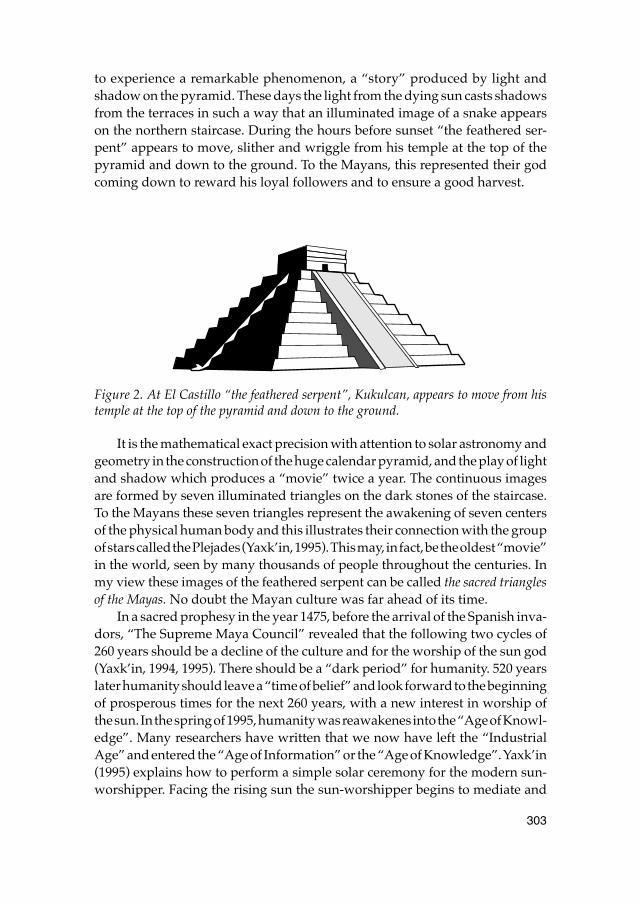
303
to experience a remarkable phenomenon, a “story” produced by light andshadow on the pyramid. These days the light from the dying sun casts shadowsfrom the terraces in such a way that an illuminated image of a snake appearson the northern staircase. During the hours before sunset “the feathered ser-pent” appears to move, slither and wriggle from his temple at the top of thepyramid and down to the ground. To the Mayans, this represented their godcoming down to reward his loyal followers and to ensure a good harvest.
Figure 2. At El Castillo “the feathered serpent”, Kukulcan, appears to move from histemple at the top of the pyramid and down to the ground.
It is the mathematical exact precision with attention to solar astronomy andgeometry in the construction of the huge calendar pyramid, and the play of lightand shadow which produces a “movie” twice a year. The continuous imagesare formed by seven illuminated triangles on the dark stones of the staircase.To the Mayans these seven triangles represent the awakening of seven centersof the physical human body and this illustrates their connection with the groupof stars called the Plejades (Yaxk’in, 1995). This may, in fact, be the oldest “movie”in the world, seen by many thousands of people throughout the centuries. Inmy view these images of the feathered serpent can be called the sacred trianglesof the Mayas. No doubt the Mayan culture was far ahead of its time.
In a sacred prophesy in the year 1475, before the arrival of the Spanish inva-dors, “The Supreme Maya Council” revealed that the following two cycles of260 years should be a decline of the culture and for the worship of the sun god(Yaxk’in, 1994, 1995). There should be a “dark period” for humanity. 520 yearslater humanity should leave a “time of belief” and look forward to the beginningof prosperous times for the next 260 years, with a new interest in worship ofthe sun. In the spring of 1995, humanity was reawakenes into the “Age of Knowl-edge”. Many researchers have written that we now have left the “IndustrialAge” and entered the “Age of Information” or the “Age of Knowledge”. Yaxk’in(1995) explains how to perform a simple solar ceremony for the modern sun-worshipper. Facing the rising sun the sun-worshipper begins to mediate and
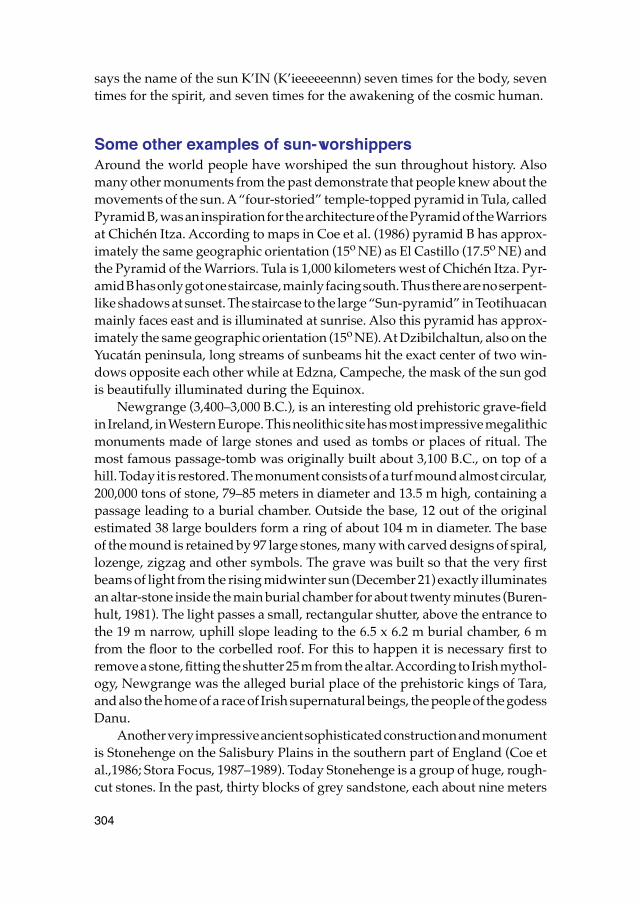
304
says the name of the sun K’IN (K’ieeeeeennn) seven times for the body, seventimes for the spirit, and seven times for the awakening of the cosmic human.
Some other examples of sun-worshippersAround the world people have worshiped the sun throughout history. Alsomany other monuments from the past demonstrate that people knew about themovements of the sun. A “four-storied” temple-topped pyramid in Tula, calledPyramid B, was an inspiration for the architecture of the Pyramid of the Warriorsat Chichén Itza. According to maps in Coe et al. (1986) pyramid B has approx-imately the same geographic orientation (15o NE) as El Castillo (17.5o NE) andthe Pyramid of the Warriors. Tula is 1,000 kilometers west of Chichén Itza. Pyr-amid B has only got one staircase, mainly facing south. Thus there are no serpent-like shadows at sunset. The staircase to the large “Sun-pyramid” in Teotihuacanmainly faces east and is illuminated at sunrise. Also this pyramid has approx-imately the same geographic orientation (15o NE). At Dzibilchaltun, also on theYucatán peninsula, long streams of sunbeams hit the exact center of two win-dows opposite each other while at Edzna, Campeche, the mask of the sun godis beautifully illuminated during the Equinox.
Newgrange (3,400–3,000 B.C.), is an interesting old prehistoric grave-fieldin Ireland, in Western Europe. This neolithic site has most impressive megalithicmonuments made of large stones and used as tombs or places of ritual. Themost famous passage-tomb was originally built about 3,100 B.C., on top of ahill. Today it is restored. The monument consists of a turf mound almost circular,200,000 tons of stone, 79–85 meters in diameter and 13.5 m high, containing apassage leading to a burial chamber. Outside the base, 12 out of the originalestimated 38 large boulders form a ring of about 104 m in diameter. The baseof the mound is retained by 97 large stones, many with carved designs of spiral,lozenge, zigzag and other symbols. The grave was built so that the very firstbeams of light from the rising midwinter sun (December 21) exactly illuminatesan altar-stone inside the main burial chamber for about twenty minutes (Buren-hult, 1981). The light passes a small, rectangular shutter, above the entrance tothe 19 m narrow, uphill slope leading to the 6.5 x 6.2 m burial chamber, 6 mfrom the floor to the corbelled roof. For this to happen it is necessary first toremove a stone, fitting the shutter 25 m from the altar. According to Irish mythol-ogy, Newgrange was the alleged burial place of the prehistoric kings of Tara,and also the home of a race of Irish supernatural beings, the people of the godessDanu.
Another very impressive ancient sophisticated construction and monumentis Stonehenge on the Salisbury Plains in the southern part of England (Coe etal.,1986; Stora Focus, 1987–1989). Today Stonehenge is a group of huge, rough-cut stones. In the past, thirty blocks of grey sandstone, each about nine meters
305
in length and weighing up to 50 tons, stood in a circle with a diameter of 30 m.A continuous circle of smaller blocks was laid on top of them. Inside was a circleof about 60 blue stones. Inside this inner circle were two sets of stones in a U-shape, opening toward the northeast. Some of the stones had to be brought some380 kilometers to this site. Stonehenge was constructed during a long periodof time, from 2,800 to 1,550 B.C. Every stone was carefully placed in a calculatedposition with reference to the movements of the sun, the moon and the seasons.Stonehenge was designed as an observatory, and the openings in the arches wereprobably used to make intricate astronomical observations. A special stone wasset to cast a shadow 25 m away on a stone altar inside the inner U-shape at dawnof the summer solstice (June 21). An earth wall about 97 m in diameter sur-rounded the monument. There are over 900 other stone circles found throughoutBritain and Ireland, although none of them are as elaborate in their structureas Stonehenge. Also the great pyramids in Egypt were positioned with referenceto the movements of the sun.
We may conclude that circles, triangles and squares have been used asimportant symbols by mankind for thousands of years.
ReferencesBerefelt, R. (1977). Barn och bild. Stockholm.Blacker, I, R. (1965). Cortes and the Aztec conquest. New York: American Heri-
tage Publishing Co.Bonniers Lexikon. (1964–1967). Bonniers Lexikon. Stockholm: AB Nordiska
Uppslagsböcker.Brunius, S. (1992). Maya. Stockholm: Folkens museum.Burenhult, G. (1981). Stenåldersbilder. Hällristningar och stenåldersekonomi.
Stockholm: Stureförlaget.Coe, M., Snow, D., & Benson, E. (1986). Atlas of Ancient America. New York:
Facts On File Publications.Dineen, J. (1992). The Aztecs. London: Heineman Educational Books Ltd.Harrell, M-A. (1994). Mesoamerica. In: Wonders of the Ancient World. National
Geographic Atlas of Archeology. National Geographic Society.Kellog, R. (1955). What children scribble and why. San Francisco.Moltke-Hoff, A-M. (1990). Maya. Leksand.Nationalencyklopedin. (1989–1996). Nationalencyklopedin. Höganäs: Bokför-
laget Bra Böcker.Pettersson, R. (1989). Visuals for Information: Research and Practice. Englewood
Cliffs, NJ: Educational Technology Publications.Pettersson, R. (1993). Visual Information. Englewood Cliffs, NJ: Educational
Technology Publications.

306
Salmoral, M, L. (1990). América – retrato de un continente hace quinientos anos. (Amerika 1492. Den nya världen för femhundra år sedan.) Fenice 2000 s.r.l., Milano: Anaya. (Wiken, 1992)
Stora Focus. (1987–1989). Stora Focus. Stockholm: Esselte Focus Uppslags-böcker AB.
The World Book Encyclopedia. (1963). The World Book Encyclopedia. Chicago: Field Enterprises Educational Corporation.
Ventura, P. , & Ceserini, G. P. (1982). I Maya L’avventura di un mondo. Milano: Arnoldo Mondadori Editore S.P.A.
Vidal-Naquet, P. (Ed.) (1987). The Collins Atlas of World History. London: Col-lins.
Yaxk’in, A, J. (1994). Mayan Prophesy. The Reawakening of Cosmic Human. Pub-lished on Internet: [email protected]
Yaxk’in, A, J. (1995). Mayan Prophesy. The Reawakening of Cosmic Human. Pub-lished on Internet: [email protected] (CMCIMS)
307
Paper 18
Graphic symbols
Abstract. This paper includes a study of 52 different pedestrian warning and infor-mation crossing road signs from 32 different countries. Every situation and every con-text demands a consistent use of symbols, an explanation of the symbols used, andlearning of the meaning of those symbols. Well-designed symbols can be used, and canwork in different cultures, in different parts of the world.
IntroductionThe use of symbols have a long tradition. Symbols first appeared as paintingsor carvings on caves and stone walls as early as 50,000 BC, with the first depictionof humans dating back about 11,000 years (Dewar, 1999). There is a need forvarious symbols in modern societies. Taking up only a very small amount ofspace, symbols can convey information, equivalent to one or more sentencesof text. Quirk, Greenbaum, Leech, and Svartvik (1985) noted that pictogramsmost reliably can substitute for words in “block language”— single-word cap-tions, headings, and labels — as distinct from sentenced language. Eco (1976)suggested that the verbal equivalent of an iconic sign is not a word but a phraseor indeed a whole story. This is, of course, also the case with the large numberof Chinese kanji-characters, designating different words and sometimesphrases. The modern symbols typically found in airports and in travel guidesare intended to convey generalities of the same order of abstractness as words.Their characteristic graphic neutrality is perhaps the most significant aspect oftheir invention by the Isotype Institute (Neurath, 1936).
Symbols may be visually more distinctive than text. Their syntax andsemantics may be simpler. Image perception is rapid, virtually “instantaneous.”Reading and comprehending the equivalent message in words takes much moretime, and may fail if it is hard to read the text. So symbols permit rapid readingand comprehension, and they may require less time and effort for learning. Thisis important in numerous situations, e.g., in traffic, in industry, and in aviation.With the increase in international travel and trade, there is a growing need tocommunicate with people who do not understand the language of the countrythey are in. The use of symbols is one of the most common ways to deal withthis situation. However, there may also be some disadvantages with symbols.
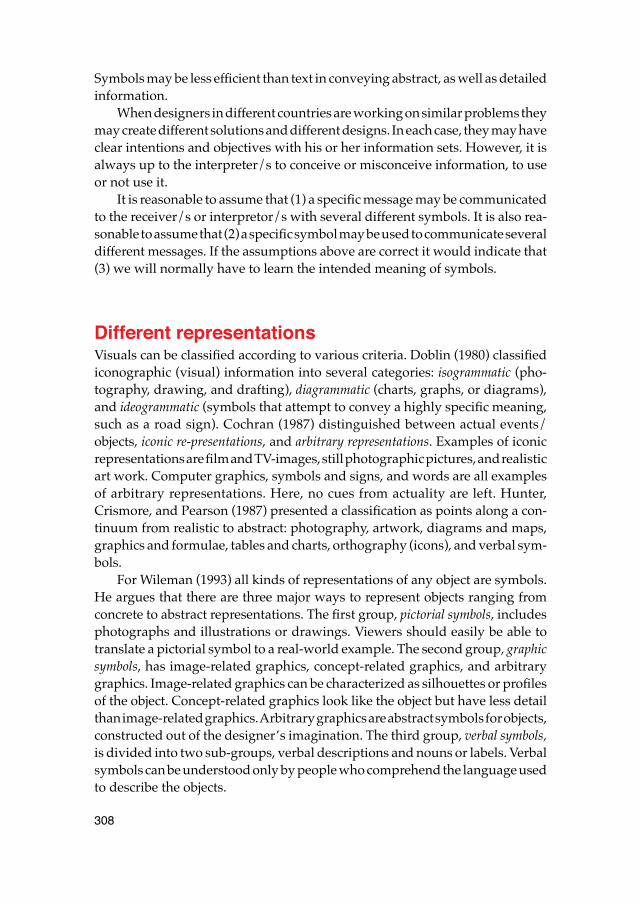
308
Symbols may be less efficient than text in conveying abstract, as well as detailedinformation.
When designers in different countries are working on similar problems theymay create different solutions and different designs. In each case, they may haveclear intentions and objectives with his or her information sets. However, it isalways up to the interpreter/s to conceive or misconceive information, to useor not use it.
It is reasonable to assume that (1) a specific message may be communicatedto the receiver/s or interpretor/s with several different symbols. It is also rea-sonable to assume that (2) a specific symbol may be used to communicate severaldifferent messages. If the assumptions above are correct it would indicate that(3) we will normally have to learn the intended meaning of symbols.
Different representationsVisuals can be classified according to various criteria. Doblin (1980) classifiediconographic (visual) information into several categories: isogrammatic (pho-tography, drawing, and drafting), diagrammatic (charts, graphs, or diagrams),and ideogrammatic (symbols that attempt to convey a highly specific meaning,such as a road sign). Cochran (1987) distinguished between actual events/objects, iconic re-presentations, and arbitrary representations. Examples of iconicrepresentations are film and TV-images, still photographic pictures, and realisticart work. Computer graphics, symbols and signs, and words are all examplesof arbitrary representations. Here, no cues from actuality are left. Hunter,Crismore, and Pearson (1987) presented a classification as points along a con-tinuum from realistic to abstract: photography, artwork, diagrams and maps,graphics and formulae, tables and charts, orthography (icons), and verbal sym-bols.
For Wileman (1993) all kinds of representations of any object are symbols.He argues that there are three major ways to represent objects ranging fromconcrete to abstract representations. The first group, pictorial symbols, includesphotographs and illustrations or drawings. Viewers should easily be able totranslate a pictorial symbol to a real-world example. The second group, graphicsymbols, has image-related graphics, concept-related graphics, and arbitrarygraphics. Image-related graphics can be characterized as silhouettes or profilesof the object. Concept-related graphics look like the object but have less detailthan image-related graphics. Arbitrary graphics are abstract symbols for objects,constructed out of the designer’s imagination. The third group, verbal symbols,is divided into two sub-groups, verbal descriptions and nouns or labels. Verbalsymbols can be understood only by people who comprehend the language usedto describe the objects.
309
However, in my view, there seems to be no major difference in “abstractness”between the abstract arbitrary graphic symbols and the verbal symbols. Basedon the above classifications I prefer to distinguish between two main categoriesof representations, (I) figurative representations, and (II) non-figurative repre-sentations (Pettersson, 1993). Figurative representations include two sub-groups: (1) visuals and (2) graphic symbols. Also non-figurative representationsinclude two subgroups: (1) verbal symbols and (2) non-visual representations.
In this paper, the main focus is on graphic symbols, and its three subgroupspictorial symbols, abstract symbols, and arbitrary symbols. Graphic symbolsmay represent objects as well as ideas. Functional graphic symbols are actuallyolder than words. They are found in every culture however primitive. In specificareas symbols are a supplement to all languages to help create better and fasterunderstanding. Graphic symbols have evolved to the point of universal accep-tance in such areas as music, mathematics, and in many branches of science.
Pictorial symbols (or representational symbols) are “image related” and sim-plified pictures. Pictorial symbols resemble the objects they represent. They canbe characterized as silhouettes, shadows, or profiles with no surface detail. Atraffic sign with a silhouette of a locomotive, to denote a railroad crossing, isan example of a pictorial symbol. (See Figure 3.)
In the design process, some pictorial symbols may be successively simpli-fied into figurative and abstract symbols. To some extent, abstract symbols stilllook like the objects they represent but they have less detail than pictorial sym-bols and they may consist of several graphical elements; dots, lines, and areas.In athletic contests, like the olympic games, abstract graphic symbols are oftenused to denote the different kinds of sports. Good abstract graphic symbols areintuitive and we should be able to understand their meaning without any prob-lems.
Some figurative symbols are arbitrary symbols. They are invented and con-structed out of the designer's imagination. Usually arbitrary graphic symbolshave no resemblance at all to the objects or the ideas they represent. Many arebased only on the use of geometric shapes and colours. Many signposts andsome traffic signs are examples of signs with arbitrary symbols. Arbitrary sym-bols are unambiguous by convention. We agree and decide on their meaning.Just as new terms have to be learned when we begin to study a new topic, wehave to learn arbitrary graphic symbols, and every motorist have to pass a testin order to get a driver’s licence.
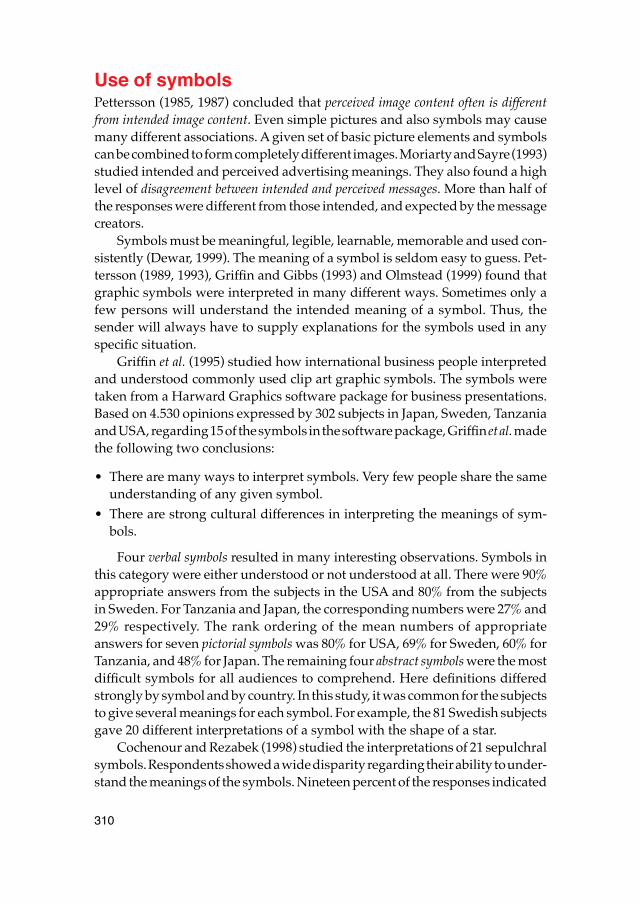
310
Use of symbolsPettersson (1985, 1987) concluded that perceived image content often is differentfrom intended image content. Even simple pictures and also symbols may causemany different associations. A given set of basic picture elements and symbolscan be combined to form completely different images. Moriarty and Sayre (1993)studied intended and perceived advertising meanings. They also found a highlevel of disagreement between intended and perceived messages. More than half ofthe responses were different from those intended, and expected by the messagecreators.
Symbols must be meaningful, legible, learnable, memorable and used con-sistently (Dewar, 1999). The meaning of a symbol is seldom easy to guess. Pet-tersson (1989, 1993), Griffin and Gibbs (1993) and Olmstead (1999) found thatgraphic symbols were interpreted in many different ways. Sometimes only afew persons will understand the intended meaning of a symbol. Thus, thesender will always have to supply explanations for the symbols used in anyspecific situation.
Griffin et al. (1995) studied how international business people interpretedand understood commonly used clip art graphic symbols. The symbols weretaken from a Harward Graphics software package for business presentations.Based on 4.530 opinions expressed by 302 subjects in Japan, Sweden, Tanzaniaand USA, regarding 15 of the symbols in the software package, Griffin et al. madethe following two conclusions:
• There are many ways to interpret symbols. Very few people share the sameunderstanding of any given symbol.
• There are strong cultural differences in interpreting the meanings of sym-bols.
Four verbal symbols resulted in many interesting observations. Symbols inthis category were either understood or not understood at all. There were 90%appropriate answers from the subjects in the USA and 80% from the subjectsin Sweden. For Tanzania and Japan, the corresponding numbers were 27% and29% respectively. The rank ordering of the mean numbers of appropriateanswers for seven pictorial symbols was 80% for USA, 69% for Sweden, 60% forTanzania, and 48% for Japan. The remaining four abstract symbols were the mostdifficult symbols for all audiences to comprehend. Here definitions differedstrongly by symbol and by country. In this study, it was common for the subjectsto give several meanings for each symbol. For example, the 81 Swedish subjectsgave 20 different interpretations of a symbol with the shape of a star.
Cochenour and Rezabek (1998) studied the interpretations of 21 sepulchralsymbols. Respondents showed a wide disparity regarding their ability to under-stand the meanings of the symbols. Nineteen percent of the responses indicated
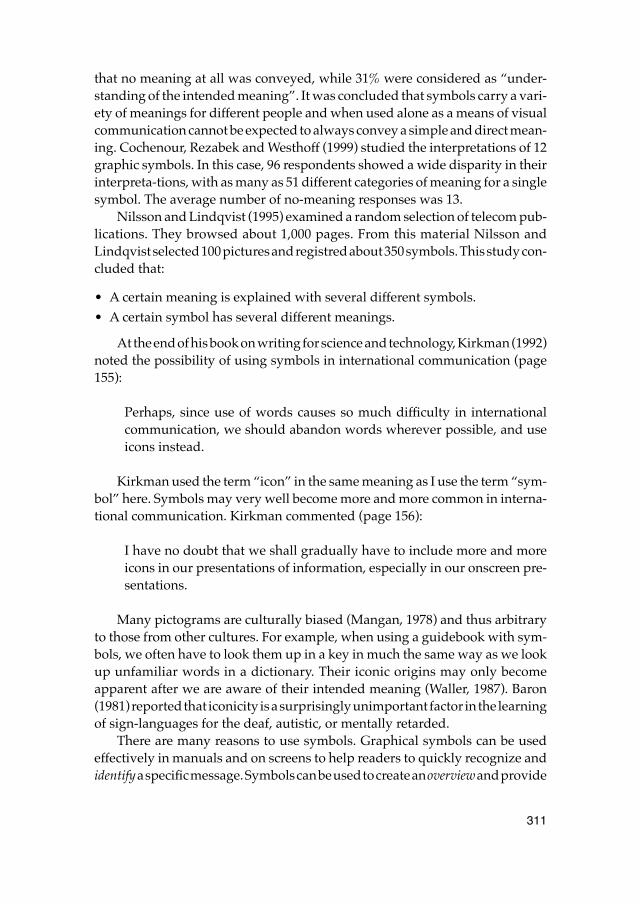
311
that no meaning at all was conveyed, while 31% were considered as “under-standing of the intended meaning”. It was concluded that symbols carry a vari-ety of meanings for different people and when used alone as a means of visualcommunication cannot be expected to always convey a simple and direct mean-ing. Cochenour, Rezabek and Westhoff (1999) studied the interpretations of 12graphic symbols. In this case, 96 respondents showed a wide disparity in theirinterpreta-tions, with as many as 51 different categories of meaning for a singlesymbol. The average number of no-meaning responses was 13.
Nilsson and Lindqvist (1995) examined a random selection of telecom pub-lications. They browsed about 1,000 pages. From this material Nilsson andLindqvist selected 100 pictures and registred about 350 symbols. This study con-cluded that:
• A certain meaning is explained with several different symbols.• A certain symbol has several different meanings.
At the end of his book on writing for science and technology, Kirkman (1992)noted the possibility of using symbols in international communication (page155):
Perhaps, since use of words causes so much difficulty in internationalcommunication, we should abandon words wherever possible, and useicons instead.
Kirkman used the term “icon” in the same meaning as I use the term “sym-bol” here. Symbols may very well become more and more common in interna-tional communication. Kirkman commented (page 156):
I have no doubt that we shall gradually have to include more and moreicons in our presentations of information, especially in our onscreen pre-sentations.
Many pictograms are culturally biased (Mangan, 1978) and thus arbitraryto those from other cultures. For example, when using a guidebook with sym-bols, we often have to look them up in a key in much the same way as we lookup unfamiliar words in a dictionary. Their iconic origins may only becomeapparent after we are aware of their intended meaning (Waller, 1987). Baron(1981) reported that iconicity is a surprisingly unimportant factor in the learningof sign-languages for the deaf, autistic, or mentally retarded.
There are many reasons to use symbols. Graphical symbols can be usedeffectively in manuals and on screens to help readers to quickly recognize andidentify a specific message. Symbols can be used to create an overview and provide
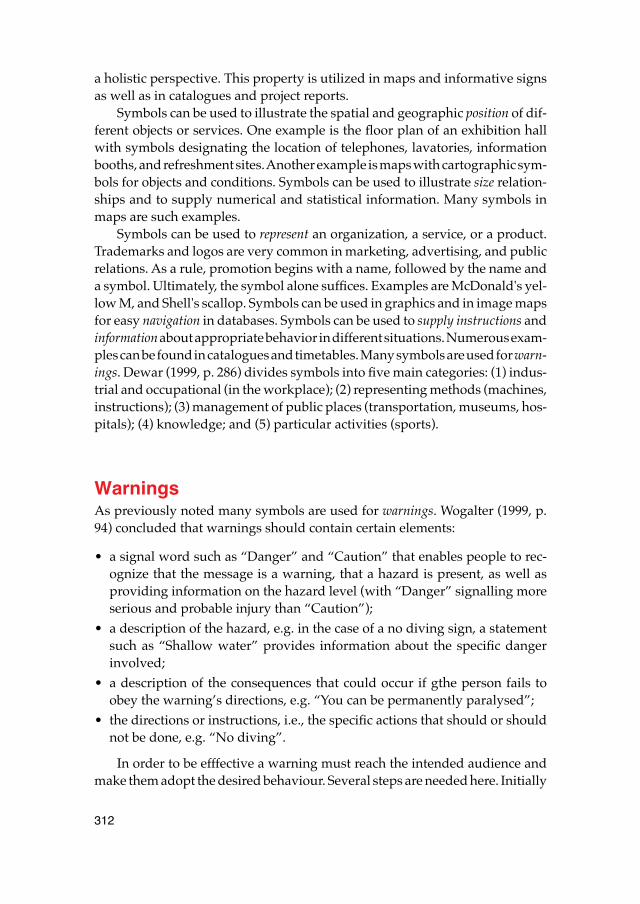
312
a holistic perspective. This property is utilized in maps and informative signsas well as in catalogues and project reports.
Symbols can be used to illustrate the spatial and geographic position of dif-ferent objects or services. One example is the floor plan of an exhibition hallwith symbols designating the location of telephones, lavatories, informationbooths, and refreshment sites. Another example is maps with cartographic sym-bols for objects and conditions. Symbols can be used to illustrate size relation-ships and to supply numerical and statistical information. Many symbols inmaps are such examples.
Symbols can be used to represent an organization, a service, or a product.Trademarks and logos are very common in marketing, advertising, and publicrelations. As a rule, promotion begins with a name, followed by the name anda symbol. Ultimately, the symbol alone suffices. Examples are McDonald's yel-low M, and Shell's scallop. Symbols can be used in graphics and in image mapsfor easy navigation in databases. Symbols can be used to supply instructions andinformation about appropriate behavior in different situations. Numerous exam-ples can be found in catalogues and timetables. Many symbols are used for warn-ings. Dewar (1999, p. 286) divides symbols into five main categories: (1) indus-trial and occupational (in the workplace); (2) representing methods (machines,instructions); (3) management of public places (transportation, museums, hos-pitals); (4) knowledge; and (5) particular activities (sports).
WarningsAs previously noted many symbols are used for warnings. Wogalter (1999, p.94) concluded that warnings should contain certain elements:
• a signal word such as “Danger” and “Caution” that enables people to rec-ognize that the message is a warning, that a hazard is present, as well asproviding information on the hazard level (with “Danger” signalling moreserious and probable injury than “Caution”);
• a description of the hazard, e.g. in the case of a no diving sign, a statementsuch as “Shallow water” provides information about the specific dangerinvolved;
• a description of the consequences that could occur if gthe person fails toobey the warning’s directions, e.g. “You can be permanently paralysed”;
• the directions or instructions, i.e., the specific actions that should or shouldnot be done, e.g. “No diving”.
In order to be efffective a warning must reach the intended audience andmake them adopt the desired behaviour. Several steps are needed here. Initially
313
any warning, and any symbol, must attract and capture the attention of theintended audience, the persons who need the information. The message mustbe legible at the appropriate distance, and must often be legible when seen fora short period of time under bad lighting conditions. A driver on a highwaymay only have a second or two to read a signpost. Then the message in the warn-ing must be mentally processed and understood correctly by the intended audi-ence. The action to be taken should be immediately obvious. Furthermore themessage in the warning must be able to motivate the audience to comply withthe desired behaviour.
Wogalter pointed out that warnings should have properties that allow themto be seen in degraded conditions such as low illumination, smoke or fog. Inaddition warnings should be adequately lit by direct light or by back-lightingand/or have good reflectance so that they are visible under reduced-light con-ditions.
Design of graphic symbolsDewar (1999) pointed out that the specific criteria for individual symbols orsets of symbols depend on their application. Legibility distance is essential inthe case of traffic signs and many building signs, but not for symbols on mapsor consumer products. There is a need to have as much uniformity as possibleacross different information systems. Symbols are often composed of simplegraphical elements, such as lines, circles, ovals, squares, rectangles, triangles,or combinations thereof. Distinctively shaped letters are often utilized. Regular,simple, geometrical figures are identified more quickly than complex ones.Keates (1982) noted that discriminatory responses to map symbols depend oncontrast in form, dimension, and colour. The problem of discrimination is gener-ally more critical in monochrome maps, in which only contrasts in form anddimensions are possible for lines and small symbols.
The graphic symbol should be simple and clear with a distinct contrast tothe background. A clear and stable figure to ground articulation is essential(Easterby, 1970; Dewar, 1999). The figure (“foreground”) should be stable, i.e.spontaneosly organised as one unit. This is achieved by close boundaries, appro-priate line thickness and any other graphical means that help the visual systemto organise the figure as one unit. It is most appropriate to use silhouette (side)views of certain components such as vehicles (Dewar, 1999). The graphic symbolshould be as symmetrical as possible. It should appear in an optimal size. A goodsymbol is designed so it can be used in many different situations and in manycontexts. For example, the McDonald’s M or “golden arch” is designed to workin every conceivable size, from a few millimeters high in a brochure to morethan six feet high in outdoor signs. It is often an advantage that a symbol is
314
iconic, that is, that it looks like the real thing it represents. Then it may be intuitiveto the users. In technical and scientific systems and documentation, hardwaremay be symbolised by squares and rectangles or the like. Software may be rep-resented by “softer” forms, such as circles or ovals.
Graphic symbols often make use of bright colours to intensify their meaning– in fact in some instances a change of colour creates a diametric change of mean-ing. Common hues are pure yellow, red, blue, green, white and black, or com-binations of the same. Colour creates instant impact. It becomes a vital part ofthe first impression created. Industry employs colour coding in many areas. Thecountless wires in a complex cable are instantly traced by their hue; the coloursof knobs and buttons on vehicles and machinery signify what they control(Dreyfuss, 1972). However, since many people are colour-blind colour can onlybe used to code the information redundantly. Colour may be combined withshape or position. Complementary colours contrast and provide a warm – cooleffect.
Warnings should have high contrast relative to the background (Barlow andWogalter, 1991; Sanders and McGormick, 1993). They should have large, legiblebold-faced alphanumeric characters (Wogalter, 1999). Legibility of symbols canbe enhanced with the application of a few simple guidelines:
• Use realistic figures rather than abstract forms.• Make important figures and characters large.• Eliminate unnecessary elements.• Use solid figures, not outline figures.• Maximize separation between features in symbols.• Maximize the luminance between a symbol and its background.• Maximize the colour contrast between a symbol and its background.
According to Keates (1982), the use of colour on maps introduces a largenumber of variables which can enhance contrast, and therefore extend the num-ber of perceptual differences that can be employed in discrimi-nation. The effectis to aid legibility, and therefore to increase the total range of information whichthe map can present. Shape and colour components are often used for desig-nating a link or relationship between groups of messages. The recognition ofgeographical features is much enhanced when areas are differentiated by hue.At the same time, complex colour arrangements may raise problems in dis-crimination, so that although multi-colour maps enlarge the graphic possibil-ities, they also increase the probability of errors in the judgment of discrimina-tion. According to Keates (1982), the most common case of quantitativejudgment on maps occurs in the use of proportional symbols, that is, point orline symbols constructed to represent specific quantities.
315
Many symbols are officially recommended by standardisation bodies likeISO (International Standards Organisation) and IEC (Commissioin Electrotech-nique Internationale). Symbols are employed in different media. They are staticand immutable in graphical media and may be more changeable in computer-based media. As noted in the introduction designers in different countries maybe working on similar problems, and they will often create different designs.Most, if not all, countries have traffic signs. In order to study similarities anddifferences in the design of a highly restricted message I have analyzed pedes-trian warning and information signs. This study is presented in the followingsection.
Pedestrian crossing road signsTraffic signs and signposts are various devices with symbols, placed along,beside, or above a highway, roadway, pathway, or any other route in order towarn, guide, and regulate the flow of traffic. The symbols may also be paintedon the streets, and sometimes on the walls of houses. The traffic may includemany kinds of motor vehicles, bicycles, pedestrians, equestrians, and other trav-elers. Road signs and signposts may be divided into four main groups: (1) warn-ing signs, (2) mandatory signs, (3) prohibitory signs, (4) information signs, andthe STOP sign. Today road signs are manufactured in different materials suchas aluminium, galvanized sheet iron, and flat or canned panel. The symbolson the signs may be painted, printed or duplicated in other ways. The motifsare designed in different ways even if they carry the same or similar messages.
In communication senders want to communicate messages or make infor-mation sets available to receivers or rather interpreters. In the case of warningfor and information about pedestrian crossing road signs the city authoritiesare the senders. The warning sign for a pedestrian crossing (Figure 1a) conveya simple, but important message to the motorists: “Look out and slow down,there is a pedestrian crossing ahead.” This particular sign is used in Germanyand in Luxembourg. The wide line along the edge of the triangular sign is red.The triangular area in the middle of the symbol is white. The three graphicalelements representing a person and the five graphical elements representingstreet lines are black. This symbol is classified as abstract. The warning sign isusually triangular, sometimes with soft corners. The actual symbol consists ofa wide line forming a red triangle on a light background. Graphical elements,dots, lines, and areas, are combined to form a simple figurative representationof a person. Some graphical elements may also represent street lines showinga pedestrian crossing.
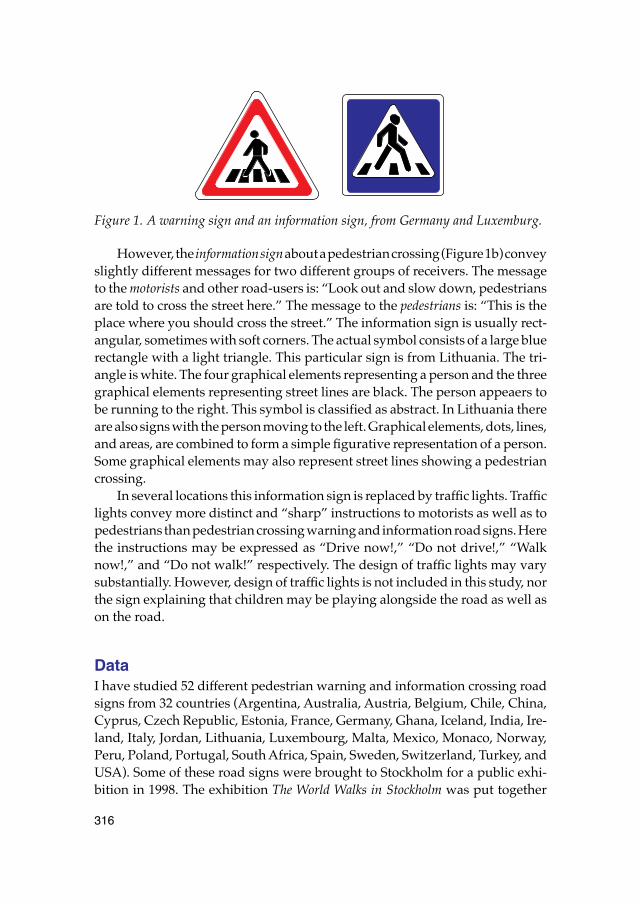
316
Figure 1. A warning sign and an information sign, from Germany and Luxemburg.
However, the information sign about a pedestrian crossing (Figure 1b) conveyslightly different messages for two different groups of receivers. The messageto the motorists and other road-users is: “Look out and slow down, pedestriansare told to cross the street here.” The message to the pedestrians is: “This is theplace where you should cross the street.” The information sign is usually rect-angular, sometimes with soft corners. The actual symbol consists of a large bluerectangle with a light triangle. This particular sign is from Lithuania. The tri-angle is white. The four graphical elements representing a person and the threegraphical elements representing street lines are black. The person appeaers tobe running to the right. This symbol is classified as abstract. In Lithuania thereare also signs with the person moving to the left. Graphical elements, dots, lines,and areas, are combined to form a simple figurative representation of a person.Some graphical elements may also represent street lines showing a pedestriancrossing.
In several locations this information sign is replaced by traffic lights. Trafficlights convey more distinct and “sharp” instructions to motorists as well as topedestrians than pedestrian crossing warning and information road signs. Herethe instructions may be expressed as “Drive now!,” “Do not drive!,” “Walknow!,” and “Do not walk!” respectively. The design of traffic lights may varysubstantially. However, design of traffic lights is not included in this study, northe sign explaining that children may be playing alongside the road as well ason the road.
DataI have studied 52 different pedestrian warning and information crossing roadsigns from 32 countries (Argentina, Australia, Austria, Belgium, Chile, China,Cyprus, Czech Republic, Estonia, France, Germany, Ghana, Iceland, India, Ire-land, Italy, Jordan, Lithuania, Luxembourg, Malta, Mexico, Monaco, Norway,Peru, Poland, Portugal, South Africa, Spain, Sweden, Switzerland, Turkey, andUSA). Some of these road signs were brought to Stockholm for a public exhi-bition in 1998. The exhibition The World Walks in Stockholm was put together
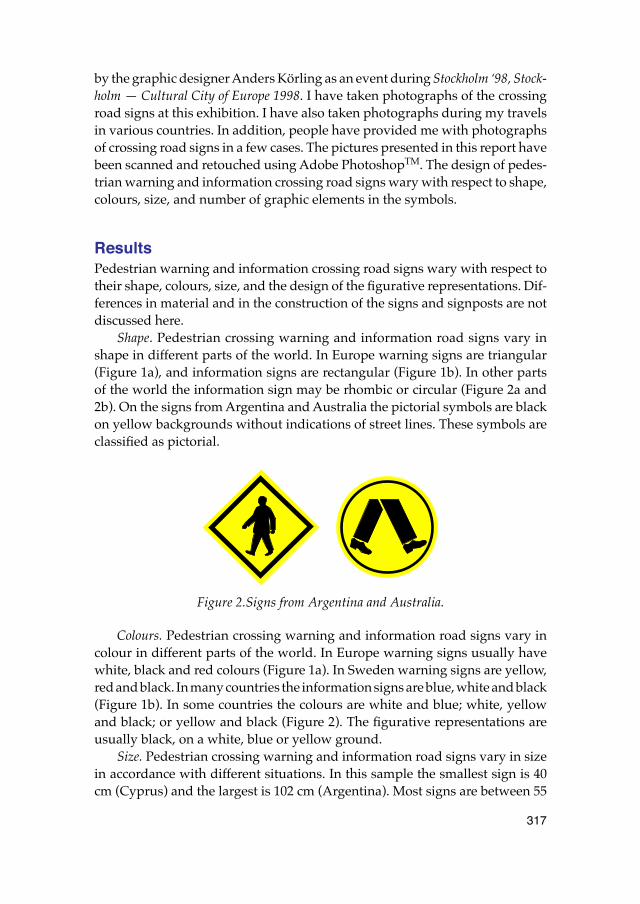
317
by the graphic designer Anders Körling as an event during Stockholm ‘98, Stock-holm — Cultural City of Europe 1998. I have taken photographs of the crossingroad signs at this exhibition. I have also taken photographs during my travelsin various countries. In addition, people have provided me with photographsof crossing road signs in a few cases. The pictures presented in this report havebeen scanned and retouched using Adobe PhotoshopTM. The design of pedes-trian warning and information crossing road signs wary with respect to shape,colours, size, and number of graphic elements in the symbols.
ResultsPedestrian warning and information crossing road signs wary with respect totheir shape, colours, size, and the design of the figurative representations. Dif-ferences in material and in the construction of the signs and signposts are notdiscussed here.
Shape. Pedestrian crossing warning and information road signs vary inshape in different parts of the world. In Europe warning signs are triangular(Figure 1a), and information signs are rectangular (Figure 1b). In other partsof the world the information sign may be rhombic or circular (Figure 2a and2b). On the signs from Argentina and Australia the pictorial symbols are blackon yellow backgrounds without indications of street lines. These symbols areclassified as pictorial.
Figure 2.Signs from Argentina and Australia.
Colours. Pedestrian crossing warning and information road signs vary incolour in different parts of the world. In Europe warning signs usually havewhite, black and red colours (Figure 1a). In Sweden warning signs are yellow,red and black. In many countries the information signs are blue, white and black(Figure 1b). In some countries the colours are white and blue; white, yellowand black; or yellow and black (Figure 2). The figurative representations areusually black, on a white, blue or yellow ground.
Size. Pedestrian crossing warning and information road signs vary in sizein accordance with different situations. In this sample the smallest sign is 40cm (Cyprus) and the largest is 102 cm (Argentina). Most signs are between 55
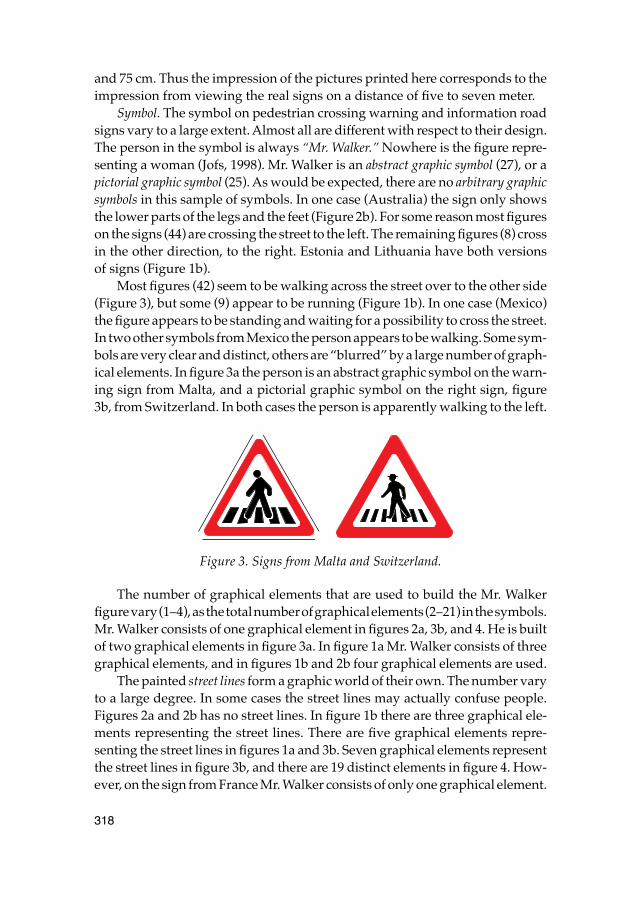
318
and 75 cm. Thus the impression of the pictures printed here corresponds to theimpression from viewing the real signs on a distance of five to seven meter.
Symbol. The symbol on pedestrian crossing warning and information roadsigns vary to a large extent. Almost all are different with respect to their design.The person in the symbol is always “Mr. Walker.” Nowhere is the figure repre-senting a woman (Jofs, 1998). Mr. Walker is an abstract graphic symbol (27), or apictorial graphic symbol (25). As would be expected, there are no arbitrary graphicsymbols in this sample of symbols. In one case (Australia) the sign only showsthe lower parts of the legs and the feet (Figure 2b). For some reason most figureson the signs (44) are crossing the street to the left. The remaining figures (8) crossin the other direction, to the right. Estonia and Lithuania have both versionsof signs (Figure 1b).
Most figures (42) seem to be walking across the street over to the other side(Figure 3), but some (9) appear to be running (Figure 1b). In one case (Mexico)the figure appears to be standing and waiting for a possibility to cross the street.In two other symbols from Mexico the person appears to be walking. Some sym-bols are very clear and distinct, others are “blurred” by a large number of graph-ical elements. In figure 3a the person is an abstract graphic symbol on the warn-ing sign from Malta, and a pictorial graphic symbol on the right sign, figure3b, from Switzerland. In both cases the person is apparently walking to the left.
Figure 3. Signs from Malta and Switzerland.
The number of graphical elements that are used to build the Mr. Walkerfigure vary (1–4), as the total number of graphical elements (2–21) in the symbols.Mr. Walker consists of one graphical element in figures 2a, 3b, and 4. He is builtof two graphical elements in figure 3a. In figure 1a Mr. Walker consists of threegraphical elements, and in figures 1b and 2b four graphical elements are used.
The painted street lines form a graphic world of their own. The number varyto a large degree. In some cases the street lines may actually confuse people.Figures 2a and 2b has no street lines. In figure 1b there are three graphical ele-ments representing the street lines. There are five graphical elements repre-senting the street lines in figures 1a and 3b. Seven graphical elements representthe street lines in figure 3b, and there are 19 distinct elements in figure 4. How-ever, on the sign from France Mr. Walker consists of only one graphical element.
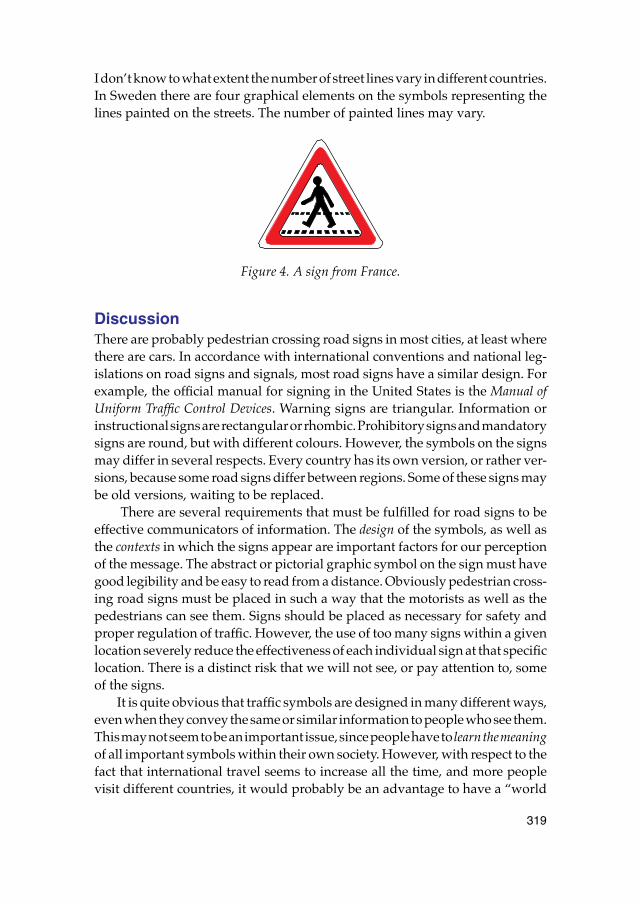
319
I don’t know to what extent the number of street lines vary in different countries.In Sweden there are four graphical elements on the symbols representing thelines painted on the streets. The number of painted lines may vary.
Figure 4. A sign from France.
DiscussionThere are probably pedestrian crossing road signs in most cities, at least wherethere are cars. In accordance with international conventions and national leg-islations on road signs and signals, most road signs have a similar design. Forexample, the official manual for signing in the United States is the Manual ofUniform Traffic Control Devices. Warning signs are triangular. Information orinstructional signs are rectangular or rhombic. Prohibitory signs and mandatorysigns are round, but with different colours. However, the symbols on the signsmay differ in several respects. Every country has its own version, or rather ver-sions, because some road signs differ between regions. Some of these signs maybe old versions, waiting to be replaced.
There are several requirements that must be fulfilled for road signs to beeffective communicators of information. The design of the symbols, as well asthe contexts in which the signs appear are important factors for our perceptionof the message. The abstract or pictorial graphic symbol on the sign must havegood legibility and be easy to read from a distance. Obviously pedestrian cross-ing road signs must be placed in such a way that the motorists as well as thepedestrians can see them. Signs should be placed as necessary for safety andproper regulation of traffic. However, the use of too many signs within a givenlocation severely reduce the effectiveness of each individual sign at that specificlocation. There is a distinct risk that we will not see, or pay attention to, someof the signs.
It is quite obvious that traffic symbols are designed in many different ways,even when they convey the same or similar information to people who see them.This may not seem to be an important issue, since people have to learn the meaningof all important symbols within their own society. However, with respect to thefact that international travel seems to increase all the time, and more peoplevisit different countries, it would probably be an advantage to have a “world
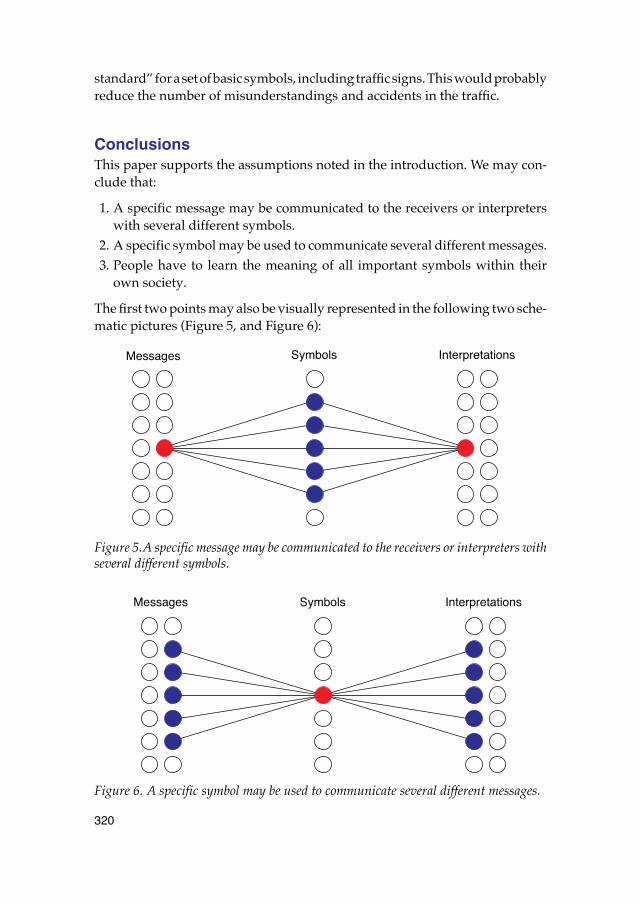
320
standard” for a set of basic symbols, including traffic signs. This would probablyreduce the number of misunderstandings and accidents in the traffic.
ConclusionsThis paper supports the assumptions noted in the introduction. We may con-clude that:
1. A specific message may be communicated to the receivers or interpreterswith several different symbols.
2. A specific symbol may be used to communicate several different messages.3. People have to learn the meaning of all important symbols within their
own society.
The first two points may also be visually represented in the following two sche-matic pictures (Figure 5, and Figure 6):
Figure 5.A specific message may be communicated to the receivers or interpreters withseveral different symbols.
Figure 6. A specific symbol may be used to communicate several different messages.
Messages InterpretationsSymbols
Messages InterpretationsSymbols
321
With respect to the design and the use of symbols it may further be con-cluded that:
1. Receivers may interpret symbols in many ways.– Few people share the same understanding of any given symbol.– People can usually not guess the meaning of symbols.– There are strong cultural differences in interpreting the meanings of sym-
bols.2. The senders will always have to supply explanations for symbols.
– Symbols should be used in a consistent way. – A symbol must always have the same meaning within a specified con-
text. 3. A good symbol is designed so it can be used in many different situations
and in many contexts. A good symbol:– is simple and clear– has optimal size and good contrast in form, dimension, and colour
4. Graphical symbols may be intended to convey generalities of the sameorder of abstractness as verbal terms. In some cases we can see graphicalsymbols as visual terms. Graphical symbols may be used to:– create an overview– identify information– illustrate position– illustrate size relationships– navigate in databases– provide a holistic perspective– recognize information– represent an organization, a service, or a product– supply information– supply instructions
ReferencesBarlow, T. and Wogalter, M. S. (1991). Increasing the surface area on small product
containers to facilitate communication of label information and warnings. In Pro-ceedings of the Interface 91, 88–93, Santa Monica, CA: Human Factors Soci-ety.
Baron, N. S. (1981). Speech, Writing, and Signs. Bloomington: Indiana Univer-sity Press.
Cochenour, J. J., & Rezabek, L. (1998). Visual Symbols: Communication or Confu-sion. In: R. E. Griffin, C. B. Shiffman, & W. J. Gibbs (Eds.) 1998: Connecting with the Community: Exploring Resources for Visual Learning & Expression. Selected Readings of the International Visual Literacy Association. International Visual Literacy Association.
322
Cochenour, J. J., Rezabek, L., & Westhoff, G. (1999). Interpreting Symbols: The Spread Of Visual Meaning. In: R. E. Griffin, W. J. Gibbs, & B. Wiegman (Eds.) 1999: Visual Literacy In An Information Age. International Visual Literacy Association.
Cochran, L. M. (1987). Visual/Verbal Languaging as Metaphor. Paper presented at the Symposium on Verbo-Visual Literacy: Research and Theory. Stock-holm, June 10–13.
Dewar, R. (1999). Design and evaluation of public information systems. In H. J. G. Zwaga, T. Boersma, and H. C. M. Hoonhout (Eds.). Visual information for everyday use. Design and research perspectives. London, Philadelphia: Taylor & Francis.
Doblin, J. (1980). A structure for nontextual communications. In P. A. Kolers, M. E. Wrolstad, & H. Bouma (Eds.). The Processing of Visible Language: Vol. 2. New York: Plenum Press.
Dreyfuss, H. (1972). Symbol Sourcebook. New York: McGraw-Hill Book Com-pany.
Easterby, R. S. (1970). The perception of symbols for machine displays. Ergo-nomics, 13, 1, 149–158.
Eco, U. (1976). A Theory of Semiotics. Bloomington: Indiana University Press.Government Printing Office. (19xx). Manual of Uniform Traffic Control Devices.
Government Printing Office. Griffin, R. E., & Gibbs, W. J. (1993). International Icon Symbols: How Well Are
These Symbols Understood? In R. A. Braden, J. Clark–Baca, & D. G. Beau-champ (Eds.). Art, Science, & Visual Literacy Selected Readings from the 24th Annual Conference of the International Visual Literacy Association. International Visual Literacy Association. Blacksburg, VA.
Griffin, R. E., Pettersson, R., Semali, L., & Takakuwa, Y. (1995). Using Symbols In International Business Presentations: How Well are They Understood? In D. G. Beauchamp, R. A. Braden & R. E. Griffin, (Eds.). Imagery and Visual Lit-eracy. Selected Readings from the 26th Annual Conference of the International Visual Literacy Association. International Visual Literacy Association.
Hunter, B., Crismore, A., & Pearson, P. D. (1987). Visual Displays in Basal Read-ers and Social Studies Textbooks. In H. A. Houghton & D. M. Willows (Eds.). The Psychology of Illustrations: Vol. 2. Instructional Issues. New York: Springer-Verlag.
Jofs, S. (1998). The World Walks in Stockholm. Stockhom ´98. Stockholm—Cul-tural Capital of Europe 1998, May, p. 20.
Keates, J.S. (1982). Understanding maps. London and New York: Longman.Kirkman, J. (1992). Good style. Writing for science and technology. E & FN Spon:
London.Mangan, J. (1978). Cultural conventions of pictorial representation: Iconic lit-
eracy and education. Educational Communications and Technology, 26, 245–267
323
Moriarty, S. E., & Sayre, S. (1993). Technology and Art: A Postmodern Reading of Orwell As Advertising. In R. A. Braden, J. Clark–Baca, & D. G. Beauchamp (Eds.). Art, Science & Visual Literacy Selected Readings from the 24th Annual Conference of the International Visual Literacy Association. International Visual Literacy Association. Blacksburg, VA.
Neurath, O. (1936). International Picture Language. London: Kegan Paul. Nilsson, S., & Lindqvist, M. (1995). Symbol Prestudy. Ericsson Report U 95
60055.Olmstead, W. T. (1999). The usability of symbols for health care facilities: the effects
of culture, gender and age. In In H. J. G. Zwaga, T. Boersma, and H. C. M. Hoonhout (Eds.). Visual information for everyday use. Design and research per-spectives. London, Philadelphia: Taylor & Francis.
Pettersson, R. (1985). Intended and perceived image content. Presentation at the 17th Annual Conference of the International Visual Literacy Association. In L. W. Miller (Ed.). Creating Meaning. Readings from the Visual Literacy Conference at California State Polytechnic University at Pomona.
Pettersson, R. (1987). Interpretation of Image Content. Paper presented at the 19th Annual Conference of the International Visual Literacy Association. Tulsa, Oklahoma, Oct. 28–Nov. 1. 1987.
Pettersson, R. (1989). Visuals for Information: Research and Practice. Englewood Cliffs, NJ: Educational Technology Publications.
Pettersson, R. (1993). Visual Information. Englewood Cliffs, NJ: Educational Technology Publications.
Quirk, R., Greenbaum, S., Leech, G., & Svartvik, J. (1985). A Comprehensive Grammar of the English Language. London: Longman.
Sanders, M. S. and McGormick, E. J. (1993). Human Factors in Engineering and Design (7th edn). New York: McGraw-Hill.
Waller, R. (1987). The Typographic Contribution to Language: Towards a Model of Typographic Genres and Their Underlying Structures. Reading: University of Reading, Department of Typography & Graphic Communication.
Wileman, R. (1993). Visual Communicating. Englewood Cliffs, NJ: Educational Technology Publications.
Wogalter, M. S. (1999). Factors influencing the effectiveness of warnings. In H. J. G. Zwaga, T. Boersma, and H. C. M. Hoonhout (Eds.). Visual information for everyday use. Design and research perspectives. London, Philadelphia: Taylor & Francis.

324
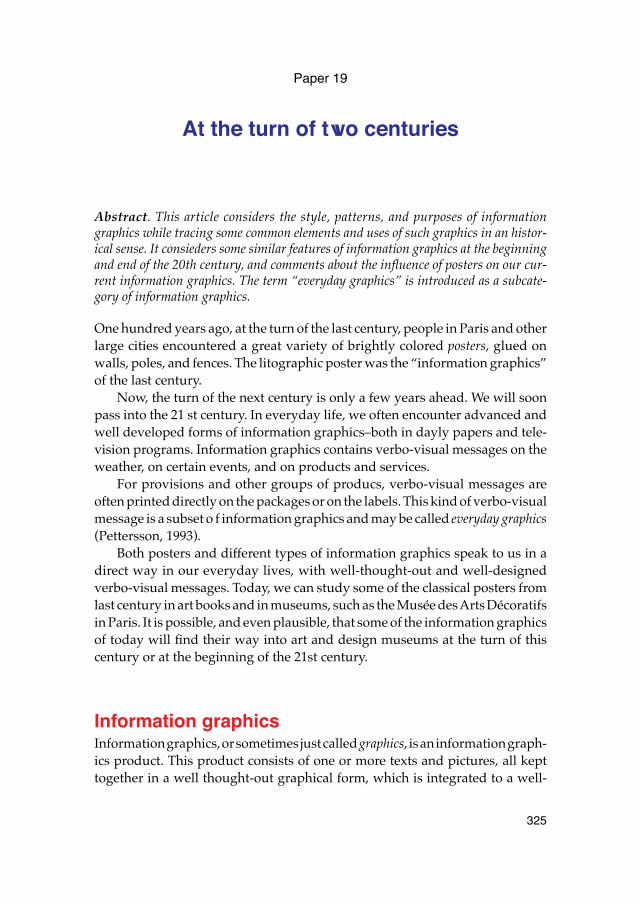
325
Paper 19
At the turn of two centuries
Abstract. This article considers the style, patterns, and purposes of informationgraphics while tracing some common elements and uses of such graphics in an histor-ical sense. It consieders some similar features of information graphics at the beginningand end of the 20th century, and comments about the influence of posters on our cur-rent information graphics. The term “everyday graphics” is introduced as a subcate-gory of information graphics.
One hundred years ago, at the turn of the last century, people in Paris and otherlarge cities encountered a great variety of brightly colored posters, glued onwalls, poles, and fences. The litographic poster was the “information graphics”of the last century.
Now, the turn of the next century is only a few years ahead. We will soonpass into the 21 st century. In everyday life, we often encounter advanced andwell developed forms of information graphics–both in dayly papers and tele-vision programs. Information graphics contains verbo-visual messages on theweather, on certain events, and on products and services.
For provisions and other groups of producs, verbo-visual messages areoften printed directly on the packages or on the labels. This kind of verbo-visualmessage is a subset o f information graphics and may be called everyday graphics(Pettersson, 1993).
Both posters and different types of information graphics speak to us in adirect way in our everyday lives, with well-thought-out and well-designedverbo-visual messages. Today, we can study some of the classical posters fromlast century in art books and in museums, such as the Musée des Arts Décoratifsin Paris. It is possible, and even plausible, that some of the information graphicsof today will find their way into art and design museums at the turn of thiscentury or at the beginning of the 21st century.
Information graphics Information graphics, or sometimes just called graphics, is an information graph-ics product. This product consists of one or more texts and pictures, all kepttogether in a well thought-out graphical form, which is integrated to a well-
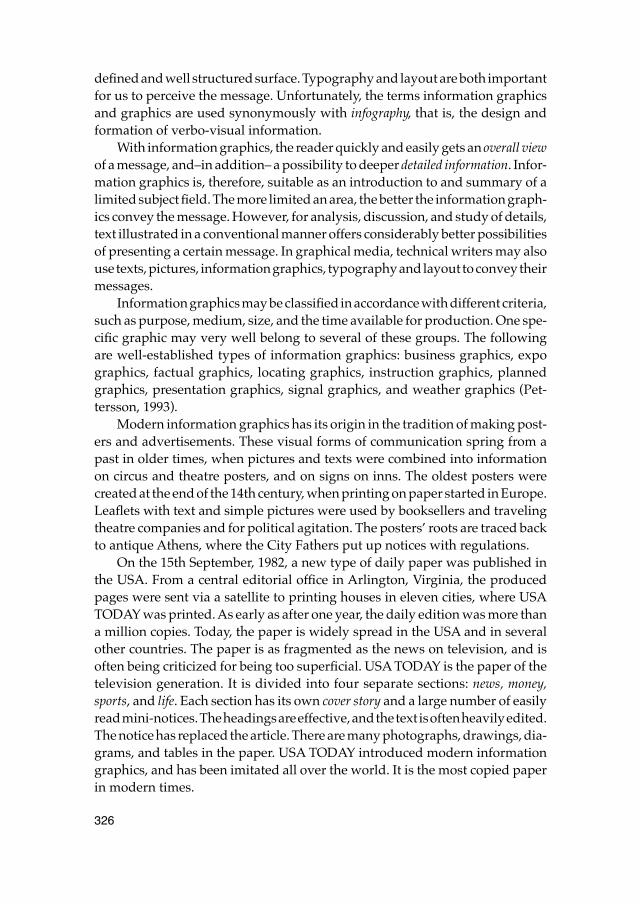
326
defined and well structured surface. Typography and layout are both importantfor us to perceive the message. Unfortunately, the terms information graphicsand graphics are used synonymously with infography, that is, the design andformation of verbo-visual information.
With information graphics, the reader quickly and easily gets an overall viewof a message, and–in addition– a possibility to deeper detailed information. Infor-mation graphics is, therefore, suitable as an introduction to and summary of alimited subject field. The more limited an area, the better the information graph-ics convey the message. However, for analysis, discussion, and study of details,text illustrated in a conventional manner offers considerably better possibilitiesof presenting a certain message. In graphical media, technical writers may alsouse texts, pictures, information graphics, typography and layout to convey theirmessages.
Information graphics may be classified in accordance with different criteria,such as purpose, medium, size, and the time available for production. One spe-cific graphic may very well belong to several of these groups. The followingare well-established types of information graphics: business graphics, expographics, factual graphics, locating graphics, instruction graphics, plannedgraphics, presentation graphics, signal graphics, and weather graphics (Pet-tersson, 1993).
Modern information graphics has its origin in the tradition of making post-ers and advertisements. These visual forms of communication spring from apast in older times, when pictures and texts were combined into informationon circus and theatre posters, and on signs on inns. The oldest posters werecreated at the end of the 14th century, when printing on paper started in Europe.Leaflets with text and simple pictures were used by booksellers and travelingtheatre companies and for political agitation. The posters’ roots are traced backto antique Athens, where the City Fathers put up notices with regulations.
On the 15th September, 1982, a new type of daily paper was published inthe USA. From a central editorial office in Arlington, Virginia, the producedpages were sent via a satellite to printing houses in eleven cities, where USATODAY was printed. As early as after one year, the daily edition was more thana million copies. Today, the paper is widely spread in the USA and in severalother countries. The paper is as fragmented as the news on television, and isoften being criticized for being too superficial. USA TODAY is the paper of thetelevision generation. It is divided into four separate sections: news, money,sports, and life. Each section has its own cover story and a large number of easilyread mini-notices. The headings are effective, and the text is often heavily edited.The notice has replaced the article. There are many photographs, drawings, dia-grams, and tables in the paper. USA TODAY introduced modern informationgraphics, and has been imitated all over the world. It is the most copied paperin modern times.
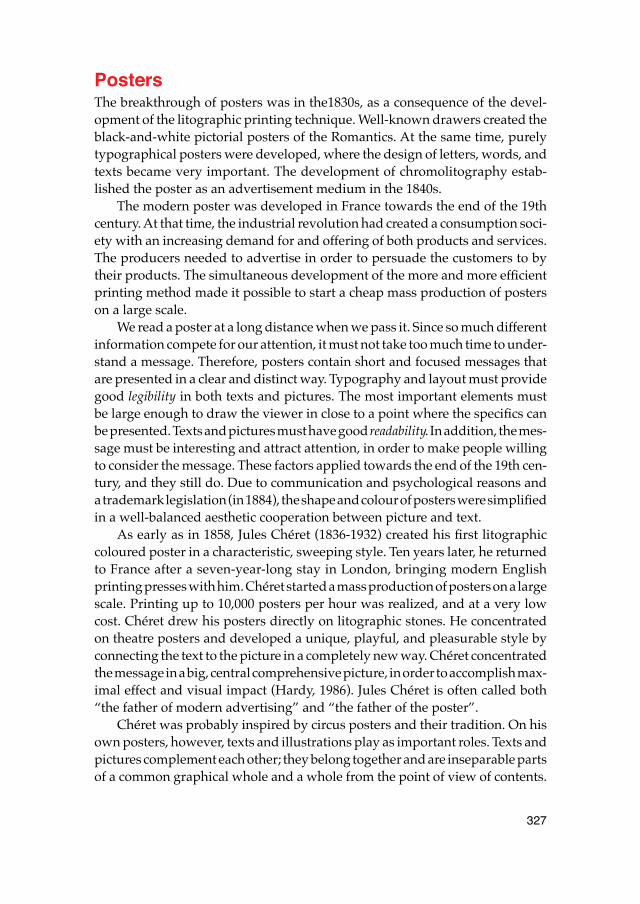
327
PostersThe breakthrough of posters was in the1830s, as a consequence of the devel-opment of the litographic printing technique. Well-known drawers created theblack-and-white pictorial posters of the Romantics. At the same time, purelytypographical posters were developed, where the design of letters, words, andtexts became very important. The development of chromolitography estab-lished the poster as an advertisement medium in the 1840s.
The modern poster was developed in France towards the end of the 19thcentury. At that time, the industrial revolution had created a consumption soci-ety with an increasing demand for and offering of both products and services.The producers needed to advertise in order to persuade the customers to bytheir products. The simultaneous development of the more and more efficientprinting method made it possible to start a cheap mass production of posterson a large scale.
We read a poster at a long distance when we pass it. Since so much differentinformation compete for our attention, it must not take too much time to under-stand a message. Therefore, posters contain short and focused messages thatare presented in a clear and distinct way. Typography and layout must providegood legibility in both texts and pictures. The most important elements mustbe large enough to draw the viewer in close to a point where the specifics canbe presented. Texts and pictures must have good readability. In addition, the mes-sage must be interesting and attract attention, in order to make people willingto consider the message. These factors applied towards the end of the 19th cen-tury, and they still do. Due to communication and psychological reasons anda trademark legislation (in 1884), the shape and colour of posters were simplifiedin a well-balanced aesthetic cooperation between picture and text.
As early as in 1858, Jules Chéret (1836-1932) created his first litographiccoloured poster in a characteristic, sweeping style. Ten years later, he returnedto France after a seven-year-long stay in London, bringing modern Englishprinting presses with him. Chéret started a mass production of posters on a largescale. Printing up to 10,000 posters per hour was realized, and at a very lowcost. Chéret drew his posters directly on litographic stones. He concentratedon theatre posters and developed a unique, playful, and pleasurable style byconnecting the text to the picture in a completely new way. Chéret concentratedthe message in a big, central comprehensive picture, in order to accomplish max-imal effect and visual impact (Hardy, 1986). Jules Chéret is often called both“the father of modern advertising” and “the father of the poster”.
Chéret was probably inspired by circus posters and their tradition. On hisown posters, however, texts and illustrations play as important roles. Texts andpictures complement each other; they belong together and are inseparable partsof a common graphical whole and a whole from the point of view of contents.
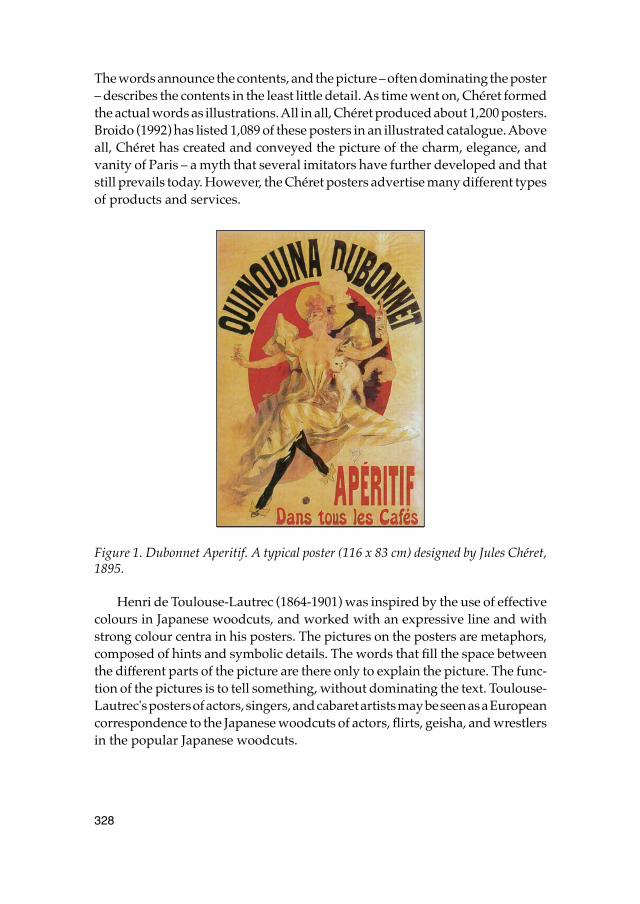
328
The words announce the contents, and the picture – often dominating the poster– describes the contents in the least little detail. As time went on, Chéret formedthe actual words as illustrations. All in all, Chéret produced about 1,200 posters.Broido (1992) has listed 1,089 of these posters in an illustrated catalogue. Aboveall, Chéret has created and conveyed the picture of the charm, elegance, andvanity of Paris – a myth that several imitators have further developed and thatstill prevails today. However, the Chéret posters advertise many different typesof products and services.
Figure 1. Dubonnet Aperitif. A typical poster (116 x 83 cm) designed by Jules Chéret,1895.
Henri de Toulouse-Lautrec (1864-1901) was inspired by the use of effectivecolours in Japanese woodcuts, and worked with an expressive line and withstrong colour centra in his posters. The pictures on the posters are metaphors,composed of hints and symbolic details. The words that fill the space betweenthe different parts of the picture are there only to explain the picture. The func-tion of the pictures is to tell something, without dominating the text. Toulouse-Lautrec's posters of actors, singers, and cabaret artists may be seen as a Europeancorrespondence to the Japanese woodcuts of actors, flirts, geisha, and wrestlersin the popular Japanese woodcuts.
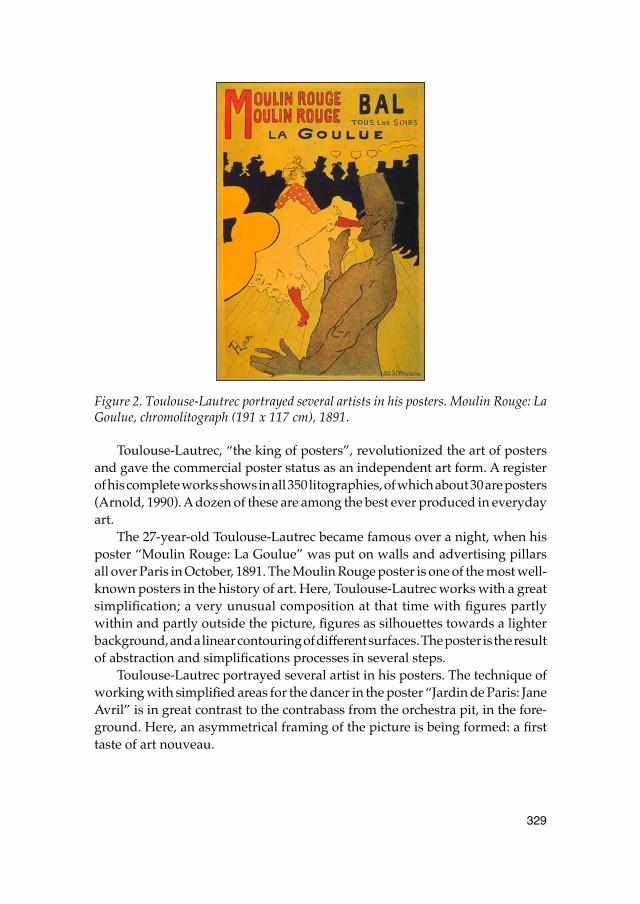
329
Figure 2. Toulouse-Lautrec portrayed several artists in his posters. Moulin Rouge: LaGoulue, chromolitograph (191 x 117 cm), 1891.
Toulouse-Lautrec, “the king of posters”, revolutionized the art of postersand gave the commercial poster status as an independent art form. A registerof his complete works shows in all 350 litographies, of which about 30 are posters(Arnold, 1990). A dozen of these are among the best ever produced in everydayart.
The 27-year-old Toulouse-Lautrec became famous over a night, when hisposter “Moulin Rouge: La Goulue” was put on walls and advertising pillarsall over Paris in October, 1891. The Moulin Rouge poster is one of the most well-known posters in the history of art. Here, Toulouse-Lautrec works with a greatsimplification; a very unusual composition at that time with figures partlywithin and partly outside the picture, figures as silhouettes towards a lighterbackground, and a linear contouring of different surfaces. The poster is the resultof abstraction and simplifications processes in several steps.
Toulouse-Lautrec portrayed several artist in his posters. The technique ofworking with simplified areas for the dancer in the poster “Jardin de Paris: JaneAvril” is in great contrast to the contrabass from the orchestra pit, in the fore-ground. Here, an asymmetrical framing of the picture is being formed: a firsttaste of art nouveau.
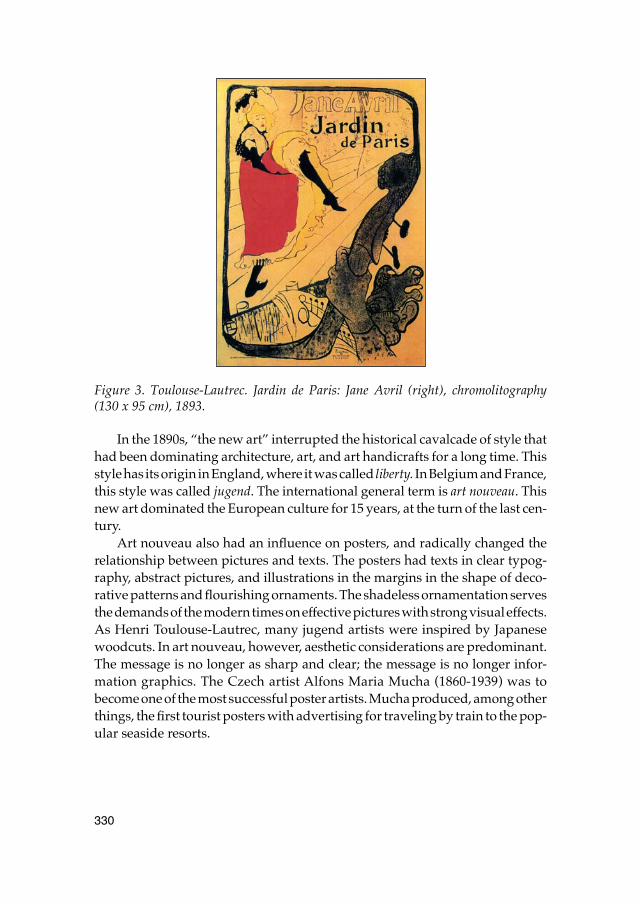
330
Figure 3. Toulouse-Lautrec. Jardin de Paris: Jane Avril (right), chromolitography(130 x 95 cm), 1893.
In the 1890s, “the new art” interrupted the historical cavalcade of style thathad been dominating architecture, art, and art handicrafts for a long time. Thisstyle has its origin in England, where it was called liberty. In Belgium and France,this style was called jugend. The international general term is art nouveau. Thisnew art dominated the European culture for 15 years, at the turn of the last cen-tury.
Art nouveau also had an influence on posters, and radically changed therelationship between pictures and texts. The posters had texts in clear typog-raphy, abstract pictures, and illustrations in the margins in the shape of deco-rative patterns and flourishing ornaments. The shadeless ornamentation servesthe demands of the modern times on effective pictures with strong visual effects.As Henri Toulouse-Lautrec, many jugend artists were inspired by Japanesewoodcuts. In art nouveau, however, aesthetic considerations are predominant.The message is no longer as sharp and clear; the message is no longer infor-mation graphics. The Czech artist Alfons Maria Mucha (1860-1939) was tobecome one of the most successful poster artists. Mucha produced, among otherthings, the first tourist posters with advertising for traveling by train to the pop-ular seaside resorts.
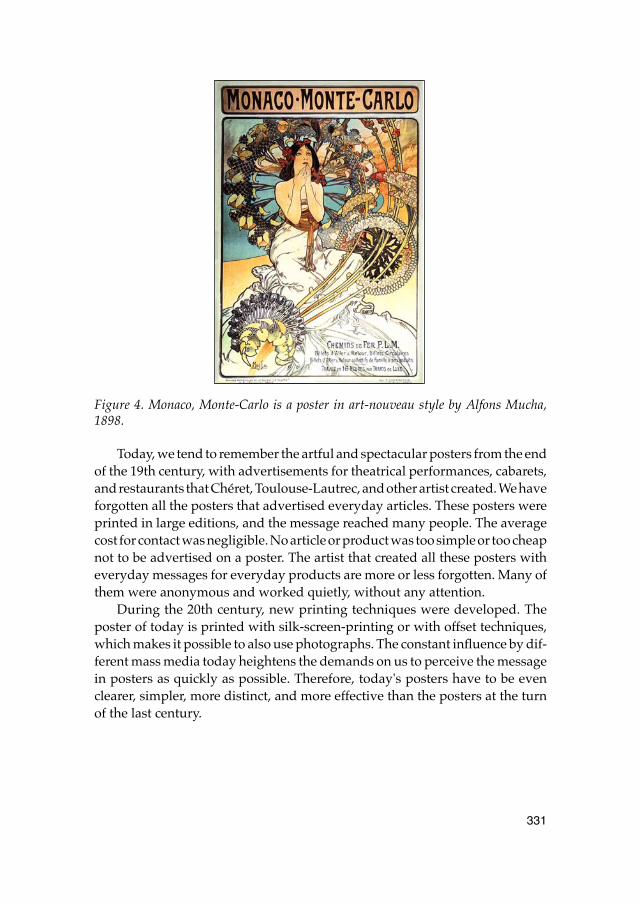
331
Figure 4. Monaco, Monte-Carlo is a poster in art-nouveau style by Alfons Mucha,1898.
Today, we tend to remember the artful and spectacular posters from the endof the 19th century, with advertisements for theatrical performances, cabarets,and restaurants that Chéret, Toulouse-Lautrec, and other artist created. We haveforgotten all the posters that advertised everyday articles. These posters wereprinted in large editions, and the message reached many people. The averagecost for contact was negligible. No article or product was too simple or too cheapnot to be advertised on a poster. The artist that created all these posters witheveryday messages for everyday products are more or less forgotten. Many ofthem were anonymous and worked quietly, without any attention.
During the 20th century, new printing techniques were developed. Theposter of today is printed with silk-screen-printing or with offset techniques,which makes it possible to also use photographs. The constant influence by dif-ferent mass media today heightens the demands on us to perceive the messagein posters as quickly as possible. Therefore, today's posters have to be evenclearer, simpler, more distinct, and more effective than the posters at the turnof the last century.
332
Everyday graphicsIn several respects, everyday graphics differs from other types of informationgraphics. Contrary to the producer of news graphics, but in conformity withthe producer of posters, the producer of everyday graphics often has timeenough to plan and design the messages in an optimal way. However, the spaceis often very limited for everyday graphics. The amount of the article and thesize of the product decide the space available for the design of the verbo-visualmessage. In practice, however, there is the same space for about the same amountof information on a small label as on a normal-sized poster. When we read alabel of 4x4 cm at normal reading distance (30-40 cm), it corresponds to a posterof 100 x 100 cm when reading it at a distance of 7-10 metres. When it comes toreading posters, the most common way of reading is at a distance.
Just as posters, everyday graphics have short and concentrated messages,expressed in a clear and distinct way. We read everyday graphics close at hand,but the retinal picture is about the same as the retinal picture of a poster. Usually,we do not take much interest in a label or a package. The same applies as forposters: it must not take too much time to perceive the message in everydaygraphics. Just one glance should be enough to perceive the contents of a package.Does the bag contain sugar, salt, or pepper? Is there raspberry jam or strawberryjam in the jar? Is the contents poisonous, or harmful for us in any other way?In several respects almost the same conditions apply when taking in informationprinted on a poster and on a label or a lid.
When it comes to small packages, the message still has to be designed inorder to fit in all the necessary information. Sometimes, there is a national lawon how to describe the contents in detail. For some products, there may alsoexist different types of instruction, enclosed inside the package. As producersof posters, the producers of everyday graphics are usually totally anonymousto the consumers. In other forms of information graphics, however, the namesof the originators are often mentioned, and thus known. Everyday graphics mayhave different purposes. It may be used to instruct, to inform, and to tempt apresumptive customer to buy the product in question.
InstructingSometimes, schematic pictures are used to show how something is to be per-formed in several steps, in a practical, simple, quick, and safe way. One exampleis how to open a vacuum package with cheese, and another example is how toput together several separate parts in a box into a chair or a table. Symbols areoften used. An arrow, for example, may be used to show where to open a packageand to explain in which order and in which way to join different parts.
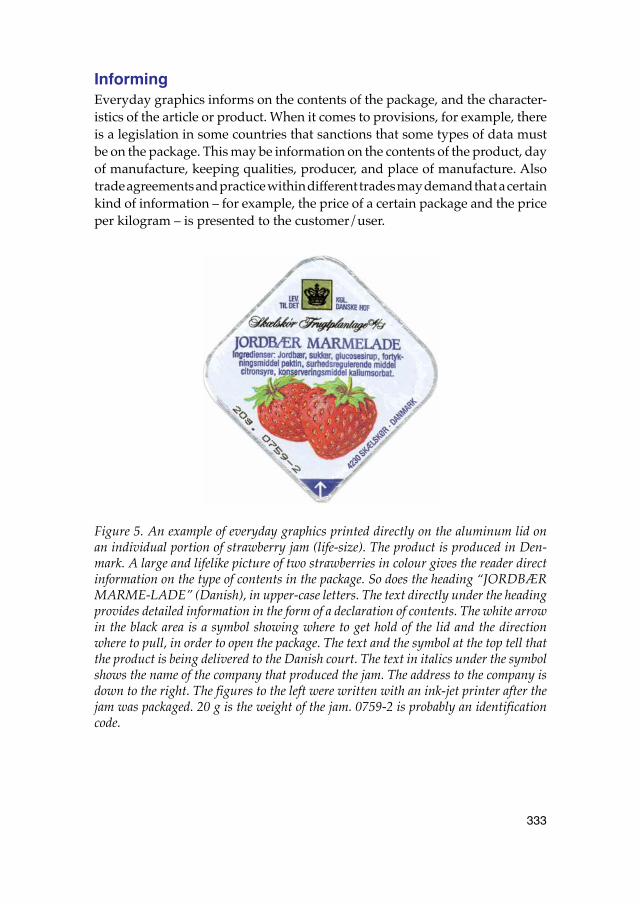
333
InformingEveryday graphics informs on the contents of the package, and the character-istics of the article or product. When it comes to provisions, for example, thereis a legislation in some countries that sanctions that some types of data mustbe on the package. This may be information on the contents of the product, dayof manufacture, keeping qualities, producer, and place of manufacture. Alsotrade agreements and practice within different trades may demand that a certainkind of information – for example, the price of a certain package and the priceper kilogram – is presented to the customer/user.
Figure 5. An example of everyday graphics printed directly on the aluminum lid onan individual portion of strawberry jam (life-size). The product is produced in Den-mark. A large and lifelike picture of two strawberries in colour gives the reader directinformation on the type of contents in the package. So does the heading “JORDBÆRMARME-LADE” (Danish), in upper-case letters. The text directly under the headingprovides detailed information in the form of a declaration of contents. The white arrowin the black area is a symbol showing where to get hold of the lid and the directionwhere to pull, in order to open the package. The text and the symbol at the top tell thatthe product is being delivered to the Danish court. The text in italics under the symbolshows the name of the company that produced the jam. The address to the company isdown to the right. The figures to the left were written with an ink-jet printer after thejam was packaged. 20 g is the weight of the jam. 0759-2 is probably an identificationcode.
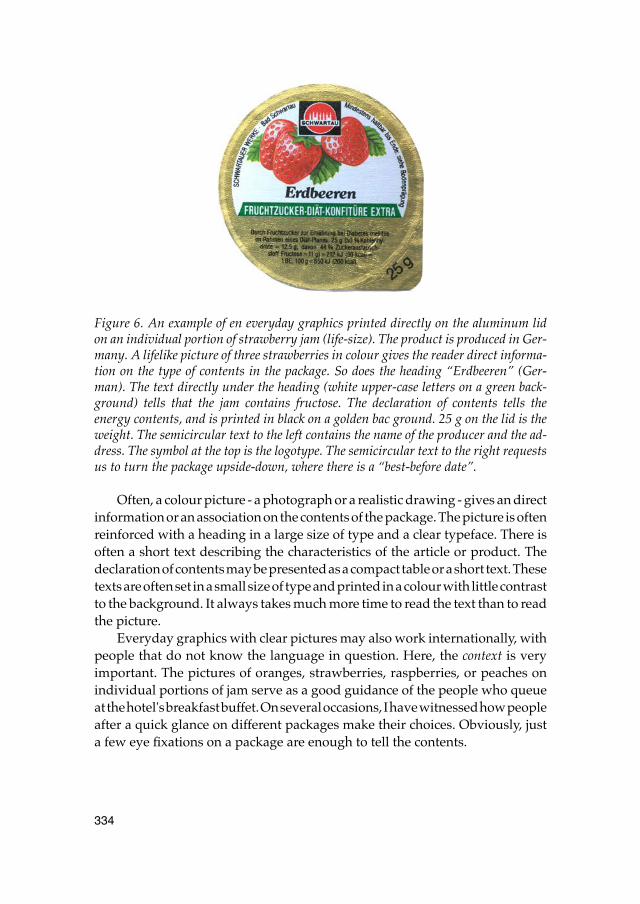
334
Figure 6. An example of en everyday graphics printed directly on the aluminum lidon an individual portion of strawberry jam (life-size). The product is produced in Ger-many. A lifelike picture of three strawberries in colour gives the reader direct informa-tion on the type of contents in the package. So does the heading “Erdbeeren” (Ger-man). The text directly under the heading (white upper-case letters on a green back-ground) tells that the jam contains fructose. The declaration of contents tells theenergy contents, and is printed in black on a golden bac ground. 25 g on the lid is theweight. The semicircular text to the left contains the name of the producer and the ad-dress. The symbol at the top is the logotype. The semicircular text to the right requestsus to turn the package upside-down, where there is a “best-before date”.
Often, a colour picture - a photograph or a realistic drawing - gives an directinformation or an association on the contents of the package. The picture is oftenreinforced with a heading in a large size of type and a clear typeface. There isoften a short text describing the characteristics of the article or product. Thedeclaration of contents may be presented as a compact table or a short text. Thesetexts are often set in a small size of type and printed in a colour with little contrastto the background. It always takes much more time to read the text than to readthe picture.
Everyday graphics with clear pictures may also work internationally, withpeople that do not know the language in question. Here, the context is veryimportant. The pictures of oranges, strawberries, raspberries, or peaches onindividual portions of jam serve as a good guidance of the people who queueat the hotel's breakfast buffet. On several occasions, I have witnessed how peopleafter a quick glance on different packages make their choices. Obviously, justa few eye fixations on a package are enough to tell the contents.
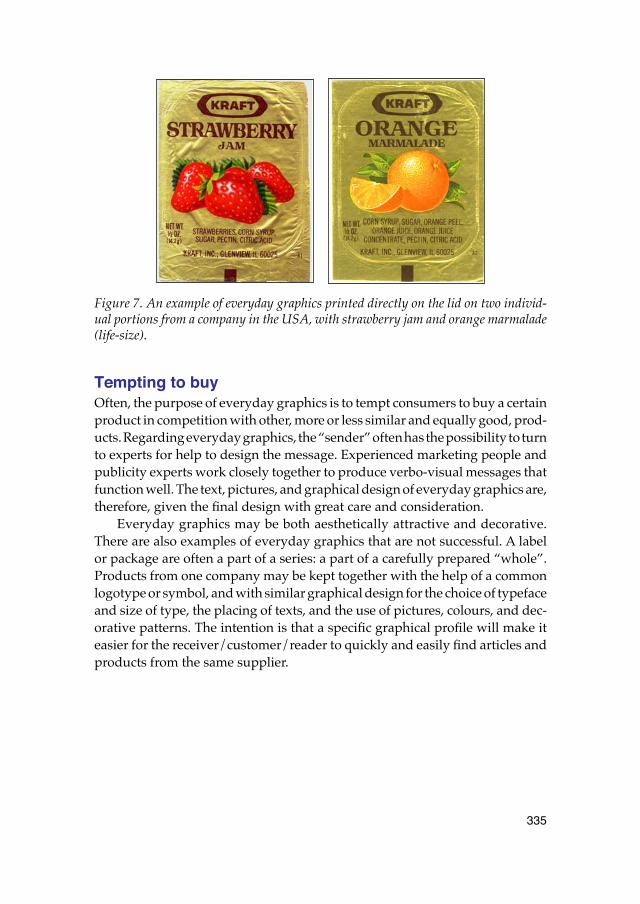
335
Figure 7. An example of everyday graphics printed directly on the lid on two individ-ual portions from a company in the USA, with strawberry jam and orange marmalade(life-size).
Tempting to buyOften, the purpose of everyday graphics is to tempt consumers to buy a certainproduct in competition with other, more or less similar and equally good, prod-ucts. Regarding everyday graphics, the “sender” often has the possibility to turnto experts for help to design the message. Experienced marketing people andpublicity experts work closely together to produce verbo-visual messages thatfunction well. The text, pictures, and graphical design of everyday graphics are,therefore, given the final design with great care and consideration.
Everyday graphics may be both aesthetically attractive and decorative.There are also examples of everyday graphics that are not successful. A labelor package are often a part of a series: a part of a carefully prepared “whole”.Products from one company may be kept together with the help of a commonlogotype or symbol, and with similar graphical design for the choice of typefaceand size of type, the placing of texts, and the use of pictures, colours, and dec-orative patterns. The intention is that a specific graphical profile will make iteasier for the receiver/customer/reader to quickly and easily find articles andproducts from the same supplier.
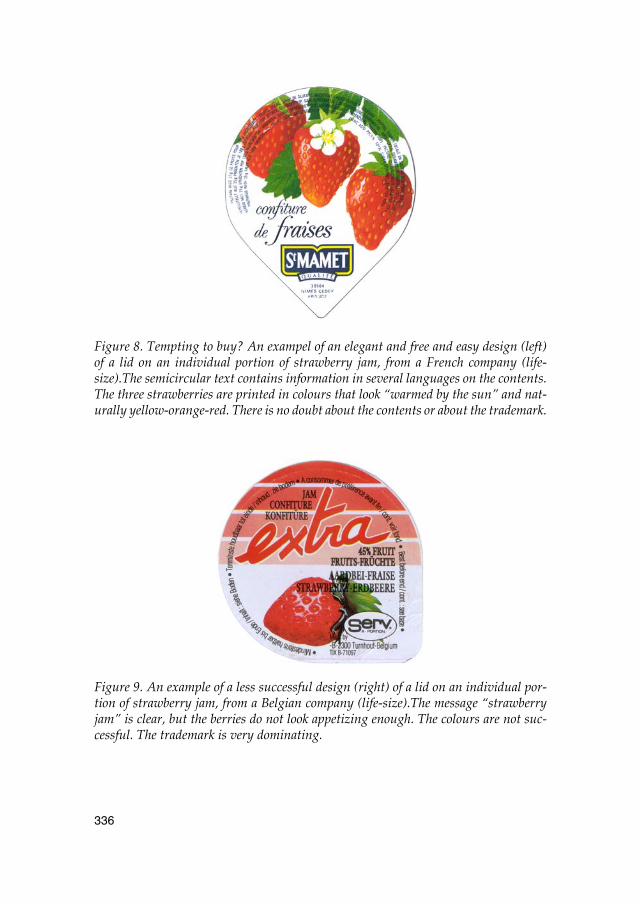
336
Figure 8. Tempting to buy? An exampel of an elegant and free and easy design (left)of a lid on an individual portion of strawberry jam, from a French company (life-size).The semicircular text contains information in several languages on the contents.The three strawberries are printed in colours that look “warmed by the sun” and nat-urally yellow-orange-red. There is no doubt about the contents or about the trademark.
Figure 9. An example of a less successful design (right) of a lid on an individual por-tion of strawberry jam, from a Belgian company (life-size).The message “strawberryjam” is clear, but the berries do not look appetizing enough. The colours are not suc-cessful. The trademark is very dominating.
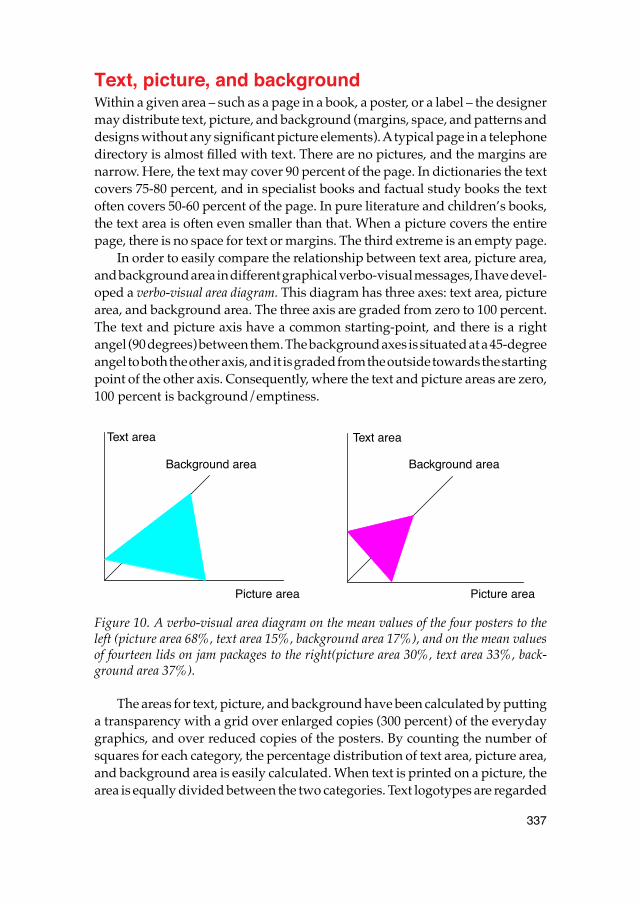
337
Text, picture, and backgroundWithin a given area – such as a page in a book, a poster, or a label – the designermay distribute text, picture, and background (margins, space, and patterns anddesigns without any significant picture elements). A typical page in a telephonedirectory is almost filled with text. There are no pictures, and the margins arenarrow. Here, the text may cover 90 percent of the page. In dictionaries the textcovers 75-80 percent, and in specialist books and factual study books the textoften covers 50-60 percent of the page. In pure literature and children’s books,the text area is often even smaller than that. When a picture covers the entirepage, there is no space for text or margins. The third extreme is an empty page.
In order to easily compare the relationship between text area, picture area,and background area in different graphical verbo-visual messages, I have devel-oped a verbo-visual area diagram. This diagram has three axes: text area, picturearea, and background area. The three axis are graded from zero to 100 percent.The text and picture axis have a common starting-point, and there is a rightangel (90 degrees) between them. The background axes is situated at a 45-degreeangel to both the other axis, and it is graded from the outside towards the startingpoint of the other axis. Consequently, where the text and picture areas are zero,100 percent is background/emptiness.
Figure 10. A verbo-visual area diagram on the mean values of the four posters to theleft (picture area 68%, text area 15%, background area 17%), and on the mean valuesof fourteen lids on jam packages to the right(picture area 30%, text area 33%, back-ground area 37%).
The areas for text, picture, and background have been calculated by puttinga transparency with a grid over enlarged copies (300 percent) of the everydaygraphics, and over reduced copies of the posters. By counting the number ofsquares for each category, the percentage distribution of text area, picture area,and background area is easily calculated. When text is printed on a picture, thearea is equally divided between the two categories. Text logotypes are regarded
Text area
Background area
Picture area
Text area
Background area
Picture area
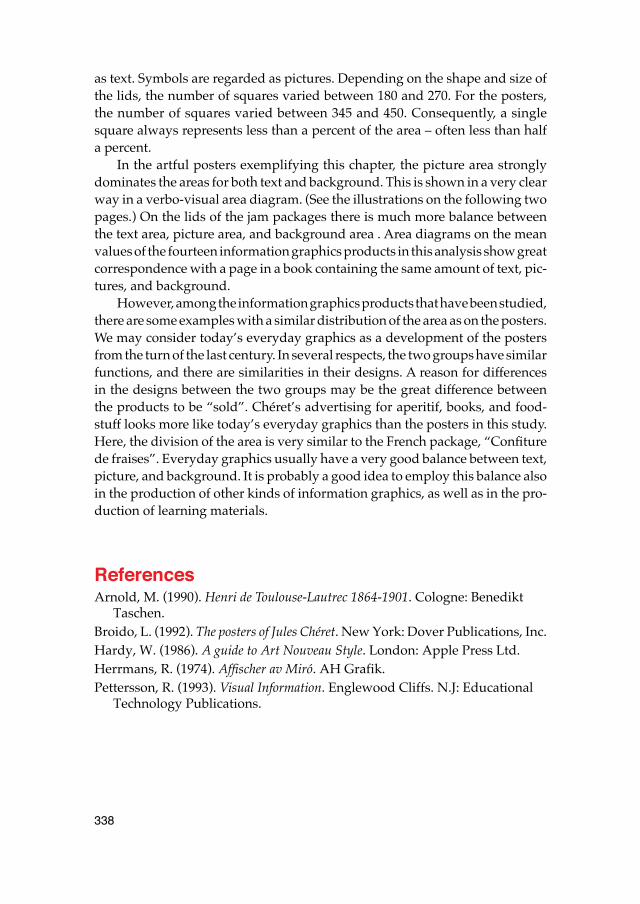
338
as text. Symbols are regarded as pictures. Depending on the shape and size ofthe lids, the number of squares varied between 180 and 270. For the posters,the number of squares varied between 345 and 450. Consequently, a singlesquare always represents less than a percent of the area – often less than halfa percent.
In the artful posters exemplifying this chapter, the picture area stronglydominates the areas for both text and background. This is shown in a very clearway in a verbo-visual area diagram. (See the illustrations on the following twopages.) On the lids of the jam packages there is much more balance betweenthe text area, picture area, and background area . Area diagrams on the meanvalues of the fourteen information graphics products in this analysis show greatcorrespondence with a page in a book containing the same amount of text, pic-tures, and background.
However, among the information graphics products that have been studied,there are some examples with a similar distribution of the area as on the posters.We may consider today’s everyday graphics as a development of the postersfrom the turn of the last century. In several respects, the two groups have similarfunctions, and there are similarities in their designs. A reason for differencesin the designs between the two groups may be the great difference betweenthe products to be “sold”. Chéret’s advertising for aperitif, books, and food-stuff looks more like today’s everyday graphics than the posters in this study.Here, the division of the area is very similar to the French package, “Confiturede fraises”. Everyday graphics usually have a very good balance between text,picture, and background. It is probably a good idea to employ this balance alsoin the production of other kinds of information graphics, as well as in the pro-duction of learning materials.
ReferencesArnold, M. (1990). Henri de Toulouse-Lautrec 1864-1901. Cologne: Benedikt
Taschen.Broido, L. (1992). The posters of Jules Chéret. New York: Dover Publications, Inc.Hardy, W. (1986). A guide to Art Nouveau Style. London: Apple Press Ltd.Herrmans, R. (1974). Affischer av Miró. AH Grafik.Pettersson, R. (1993). Visual Information. Englewood Cliffs. N.J: Educational
Technology Publications.
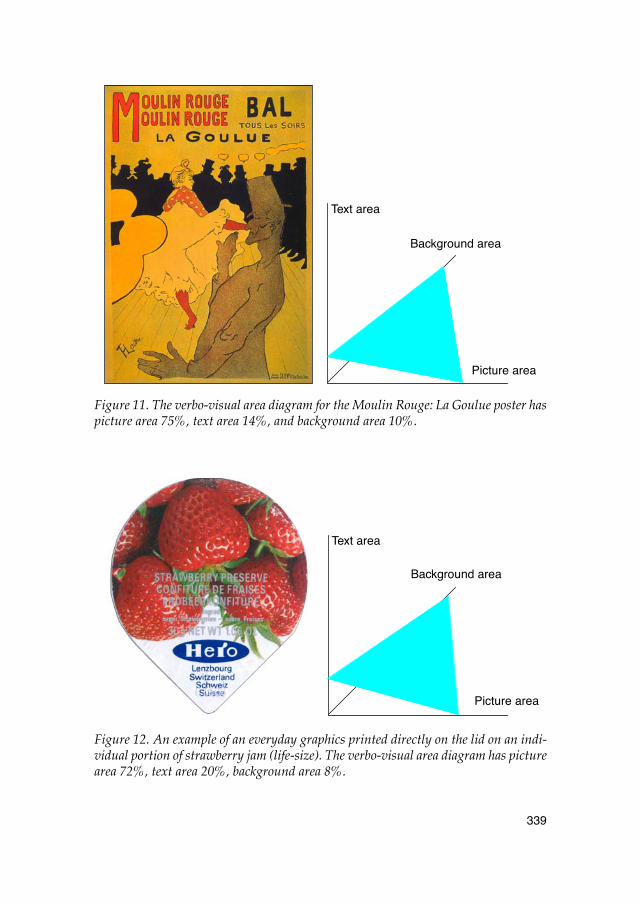
339
Figure 11. The verbo-visual area diagram for the Moulin Rouge: La Goulue poster haspicture area 75%, text area 14%, and background area 10%.
Figure 12. An example of an everyday graphics printed directly on the lid on an indi-vidual portion of strawberry jam (life-size). The verbo-visual area diagram has picturearea 72%, text area 20%, background area 8%.
Text area
Background area
Picture area
Text area
Background area
Picture area
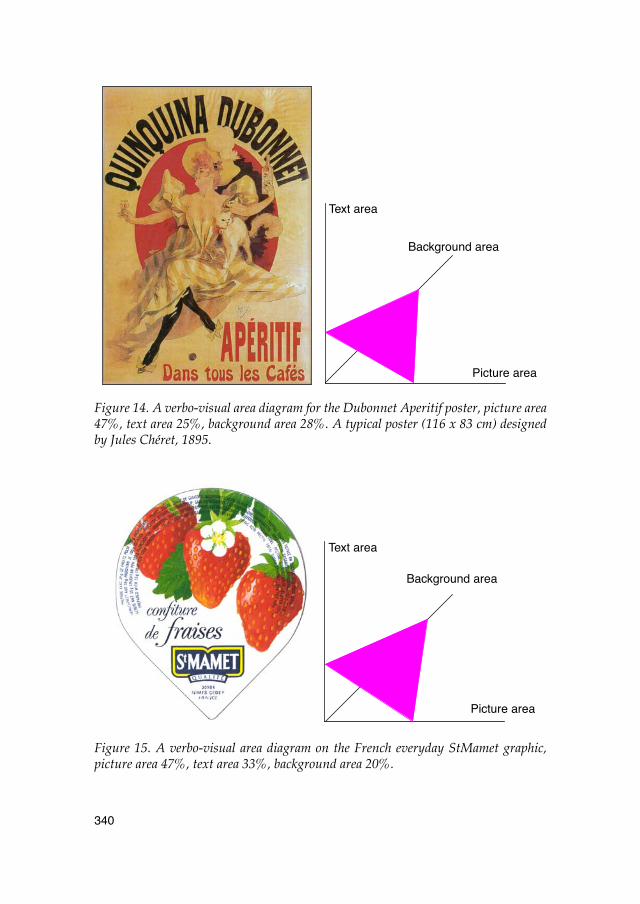
340
Figure 14. A verbo-visual area diagram for the Dubonnet Aperitif poster, picture area47%, text area 25%, background area 28%. A typical poster (116 x 83 cm) designedby Jules Chéret, 1895.
Figure 15. A verbo-visual area diagram on the French everyday StMamet graphic,picture area 47%, text area 33%, background area 20%.
Text area
Background area
Picture area
Text area
Background area
Picture area
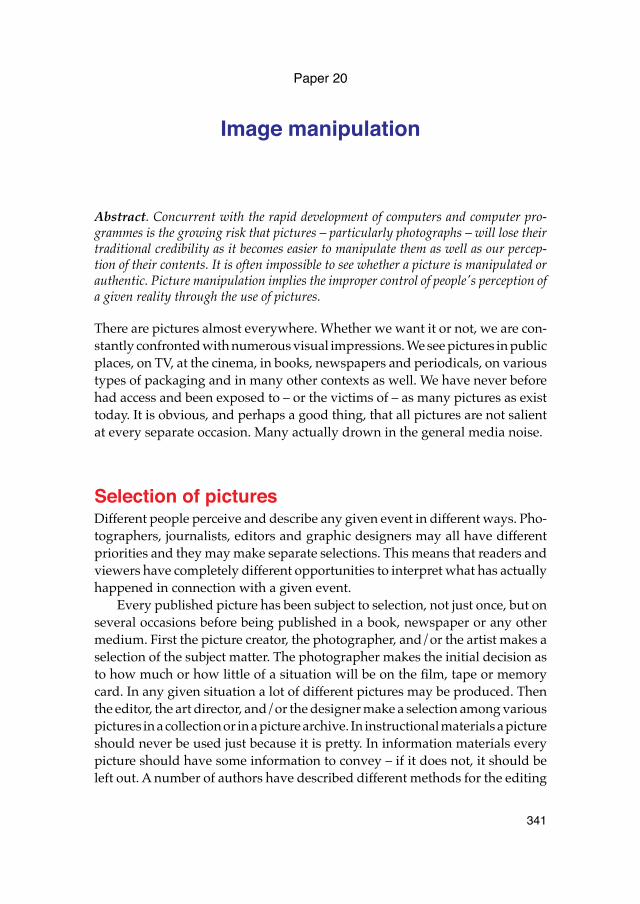
341
Paper 20
Image manipulation
Abstract. Concurrent with the rapid development of computers and computer pro-grammes is the growing risk that pictures – particularly photographs – will lose theirtraditional credibility as it becomes easier to manipulate them as well as our percep-tion of their contents. It is often impossible to see whether a picture is manipulated orauthentic. Picture manipulation implies the improper control of people's perception ofa given reality through the use of pictures.
There are pictures almost everywhere. Whether we want it or not, we are con-stantly confronted with numerous visual impressions. We see pictures in publicplaces, on TV, at the cinema, in books, newspapers and periodicals, on varioustypes of packaging and in many other contexts as well. We have never beforehad access and been exposed to – or the victims of – as many pictures as existtoday. It is obvious, and perhaps a good thing, that all pictures are not salientat every separate occasion. Many actually drown in the general media noise.
Selection of picturesDifferent people perceive and describe any given event in different ways. Pho-tographers, journalists, editors and graphic designers may all have differentpriorities and they may make separate selections. This means that readers andviewers have completely different opportunities to interpret what has actuallyhappened in connection with a given event.
Every published picture has been subject to selection, not just once, but onseveral occasions before being published in a book, newspaper or any othermedium. First the picture creator, the photographer, and/or the artist makes aselection of the subject matter. The photographer makes the initial decision asto how much or how little of a situation will be on the film, tape or memorycard. In any given situation a lot of different pictures may be produced. Thenthe editor, the art director, and/or the designer make a selection among variouspictures in a collection or in a picture archive. In instructional materials a pictureshould never be used just because it is pretty. In information materials everypicture should have some information to convey – if it does not, it should beleft out. A number of authors have described different methods for the editing
342
of visuals so as to change their importance and impact. Some important changes,which can be made to a visual prior to publication, should be mentioned (Pet-tersson, 1993). For example, a picture editor may elect to crop or expand theoriginal picture. Parts of the picture can be deleted, added, altered, moved orchanged in shape. The picture can also be enlarged or reduced in size. A colourcan be changed, removed or added. The picture's expressiveness can be alteredby the choice of repro method etc.
Conscious and perhaps even unconscious deception, falsification andmanipulation of pictures – through tampering, biased selection or impropercaptions – occur rather often, resulting in readers being manipulated, deludedand misled (Pettersson, 2002). Readers are seldom or never able to judge andunderstand what has happened before or after the moment a photograph wastaken. Nor do they know what occurred in proximity to the situation in question.
Views on image manipulationStudents at the department of Information Design at Mälardalen University inSweden took part in a study regarding their views and opinions on imagemanipulation during the spring term of year 2000. The students were asked toanswer the following five questions.
1. How do you define the concept image manipulation?2. What media do you think use image manipulation?3. How common do you think that image manipulation is?4. What do you think about image manipulation?5. Can you see if an image is manipulated?
The students wrote their answers on special forms. After registration of par-ticipation it was no longer possible to link any opinion to a specific person. Atotal of 186 subjects took part in the study. This is about half of all the studentsat the department. Most students are between twenty and thirty years old. The930 answers to the five questions presented more than 1,300 opinions aboutimage manipulation. In this study it is not possible to distinguish between opin-ions from female and from male subjects.
DefinitionsThe answers to the first question (“How do you define the concept image manip-ulation?”) can be divided in categories of descriptions rather than definitions.The students have used 390 verbs or expressions in their descriptions. Most ofthe descriptions (86%) explain how the “sender” somehow makes changes in the
343
picture. Quite a few descriptions use similar expressions. In some cases syn-onyms are used. In the second group (14%) some answers describe “possibleobjectives” for the image manipulation. These descriptions therefore representanother perspective on the concept image manipulation than that of the firstgroup. The five most common verbs are change (28%), transform (15%), add(8%), delete (8%), and distort (7%). We may note that some subjects mix up andconfuse image and reality. For example four individuals have answered,“Improve reality.” They probably mean, “Improve the image of reality.”
MediaThe answers to the second question (“What media do you think use imagemanipulation?”) were sorted in such a way that similar answers and answerswith basically the same contents are put in “media groups”. This questionresulted in 368 explanatory expressions for media. The most frequent answersinclude (1) print media (33%), (2) television (19%), and (3) “all” or “most” mediawith images (19%).
Occurrence The answers to the third question (“How common do you think that imagemanipulation is?”) were sorted so that similar answers with basically the samecontents are put in “types”. The subjects provided 186 explanatory answers.Most students (91%) consider image manipulation to be “frequent”. A smallgroup (6%) view image manipulation to be “uncommon”. A few subjects (3%)do not know that image manipulation may occur or they have no comments.
OpinionsThe answers to the fourth question (What do you think about image manipu-lation?) may be put in five groups:
1. Image manipulation is a good thing. (6%)2. Image manipulation is acceptable when this is clearly noted. (7%)3. Sometimes image manipulation is acceptable. (68%)4. Image manipulation is wrong. (14%)5. Other views. (6%)
Thus a small portion of the students (14%) view that image manipulationis wrong. However, a clear majority have the view that image manipulation maybe acceptable. According to many of the answers things like “the context, the spe-cific situation and the objective of the sender” define if image manipulation isacceptable or not.
344
The students also accept image manipulation in some media, such as mag-azines, when the topic is “fashion, advertising and propaganda”. In fact severalstudents expect the use of image manipulation in these media. To “improve, sim-plify and enhance image quality” are also quite acceptable to many of the stu-dents in this group.
Does it show?The fifth question (“Can you see if an image is manipulated?”) was used to clar-ify to what extent students feel that they can see if an image is manipulated ornot. The answers from the 186 subjects may be put in three groups:
1. No, and denying answers. (60%) 2. Hesitating answers. (17%) 3. Yes, and affirmative answers. (23%)
Thus most of the subjects believe that they are not able to see if an imageis manipulated. However, almost one quarter of the subjects feel that they areable to see if an image is manipulated.
ValidityIt may be reasonable to assume that this group of students have the same, orsimilar, opinions as other groups of students and as the general public regardingthe definition of image manipulation. This would also be true for opinions aboutthe occurrence of image manipulation in various media. However, with respectto opinions about the occurrence of image manipulation this group may differfrom the general public. It is reasonable to assume that information design stu-dents are more aware about image manipulation, and how easy it is done, thanother groups of people. This would also be the case for opinions as well as if itis possible to see and detect if an image is manipulated or not.
Digital image manipulationDigitally manipulated photographs began to appear in the daily press in themid-1980s (Alling-Ode and Tubin, 1993; Becker, 1996; Paul, 2000). The intro-duction of digital pictures and electronic transmission of pictures has had a rad-ical effect on how pictures are dealt with at various stages of production (Pet-tersson, 2002) as well as on how readers perceive these pictures (Ritchin, 1990).Technical development has fundamentally changed our presumptions con-cerning credibility in photographs (Pettersson, 2001). Photos need no longerhave natural ties to the film-based original (Fetveit, 1997).
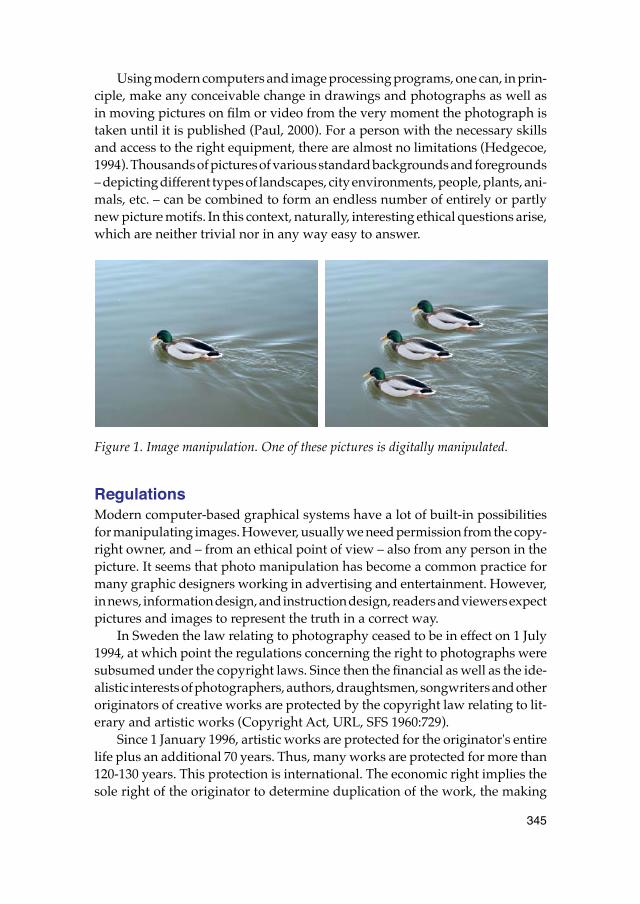
345
Using modern computers and image processing programs, one can, in prin-ciple, make any conceivable change in drawings and photographs as well asin moving pictures on film or video from the very moment the photograph istaken until it is published (Paul, 2000). For a person with the necessary skillsand access to the right equipment, there are almost no limitations (Hedgecoe,1994). Thousands of pictures of various standard backgrounds and foregrounds– depicting different types of landscapes, city environments, people, plants, ani-mals, etc. – can be combined to form an endless number of entirely or partlynew picture motifs. In this context, naturally, interesting ethical questions arise,which are neither trivial nor in any way easy to answer.
Figure 1. Image manipulation. One of these pictures is digitally manipulated.
RegulationsModern computer-based graphical systems have a lot of built-in possibilitiesfor manipulating images. However, usually we need permission from the copy-right owner, and – from an ethical point of view – also from any person in thepicture. It seems that photo manipulation has become a common practice formany graphic designers working in advertising and entertainment. However,in news, information design, and instruction design, readers and viewers expectpictures and images to represent the truth in a correct way.
In Sweden the law relating to photography ceased to be in effect on 1 July1994, at which point the regulations concerning the right to photographs weresubsumed under the copyright laws. Since then the financial as well as the ide-alistic interests of photographers, authors, draughtsmen, songwriters and otheroriginators of creative works are protected by the copyright law relating to lit-erary and artistic works (Copyright Act, URL, SFS 1960:729).
Since 1 January 1996, artistic works are protected for the originator's entirelife plus an additional 70 years. Thus, many works are protected for more than120-130 years. This protection is international. The economic right implies thesole right of the originator to determine duplication of the work, the making
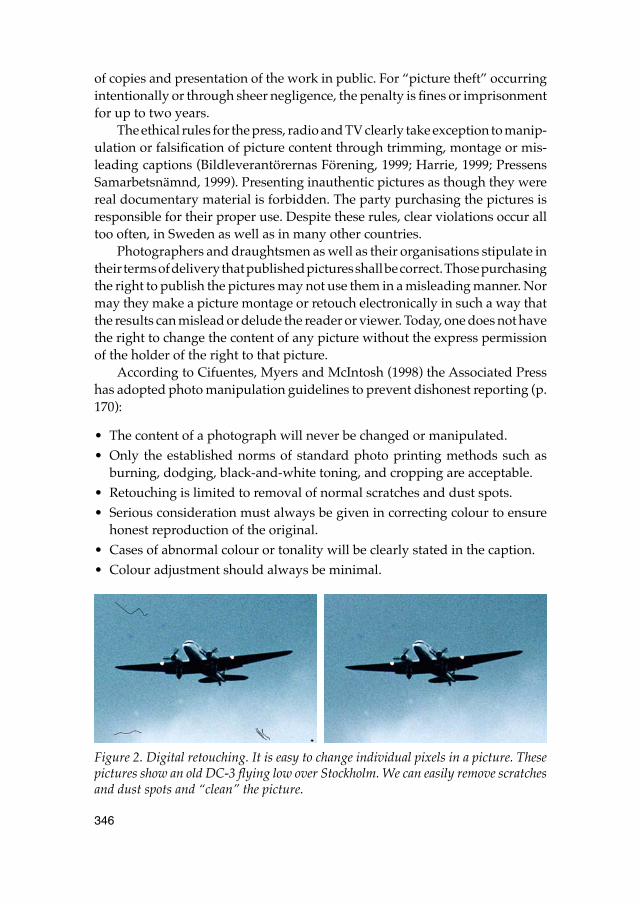
346
of copies and presentation of the work in public. For “picture theft” occurringintentionally or through sheer negligence, the penalty is fines or imprisonmentfor up to two years.
The ethical rules for the press, radio and TV clearly take exception to manip-ulation or falsification of picture content through trimming, montage or mis-leading captions (Bildleverantörernas Förening, 1999; Harrie, 1999; PressensSamarbetsnämnd, 1999). Presenting inauthentic pictures as though they werereal documentary material is forbidden. The party purchasing the pictures isresponsible for their proper use. Despite these rules, clear violations occur alltoo often, in Sweden as well as in many other countries.
Photographers and draughtsmen as well as their organisations stipulate intheir terms of delivery that published pictures shall be correct. Those purchasingthe right to publish the pictures may not use them in a misleading manner. Normay they make a picture montage or retouch electronically in such a way thatthe results can mislead or delude the reader or viewer. Today, one does not havethe right to change the content of any picture without the express permissionof the holder of the right to that picture.
According to Cifuentes, Myers and McIntosh (1998) the Associated Presshas adopted photo manipulation guidelines to prevent dishonest reporting (p.170):
• The content of a photograph will never be changed or manipulated.• Only the established norms of standard photo printing methods such as
burning, dodging, black-and-white toning, and cropping are acceptable.• Retouching is limited to removal of normal scratches and dust spots.• Serious consideration must always be given in correcting colour to ensure
honest reproduction of the original.• Cases of abnormal colour or tonality will be clearly stated in the caption.• Colour adjustment should always be minimal.
Figure 2. Digital retouching. It is easy to change individual pixels in a picture. Thesepictures show an old DC-3 flying low over Stockholm. We can easily remove scratchesand dust spots and “clean” the picture.
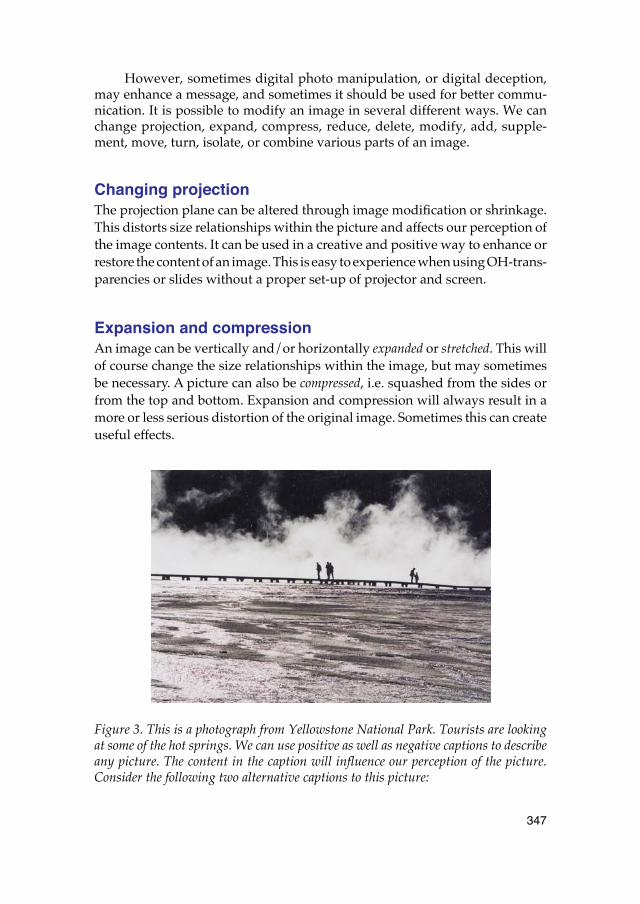
347
However, sometimes digital photo manipulation, or digital deception,may enhance a message, and sometimes it should be used for better commu-nication. It is possible to modify an image in several different ways. We canchange projection, expand, compress, reduce, delete, modify, add, supple-ment, move, turn, isolate, or combine various parts of an image.
Changing projectionThe projection plane can be altered through image modification or shrinkage.This distorts size relationships within the picture and affects our perception ofthe image contents. It can be used in a creative and positive way to enhance orrestore the content of an image. This is easy to experience when using OH-trans-parencies or slides without a proper set-up of projector and screen.
Expansion and compressionAn image can be vertically and/or horizontally expanded or stretched. This willof course change the size relationships within the image, but may sometimesbe necessary. A picture can also be compressed, i.e. squashed from the sides orfrom the top and bottom. Expansion and compression will always result in amore or less serious distortion of the original image. Sometimes this can createuseful effects.
Figure 3. This is a photograph from Yellowstone National Park. Tourists are lookingat some of the hot springs. We can use positive as well as negative captions to describeany picture. The content in the caption will influence our perception of the picture.Consider the following two alternative captions to this picture:
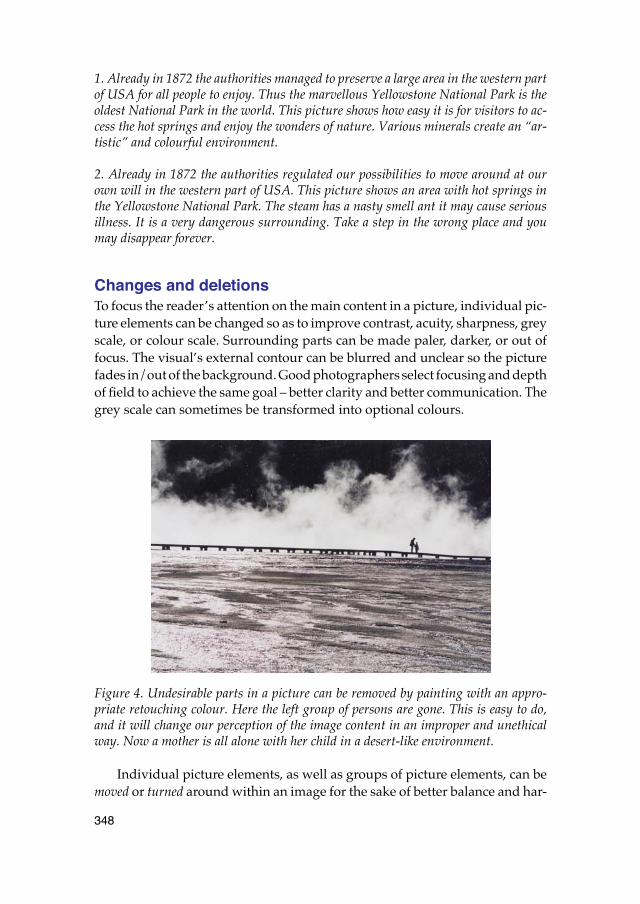
348
1. Already in 1872 the authorities managed to preserve a large area in the western partof USA for all people to enjoy. Thus the marvellous Yellowstone National Park is theoldest National Park in the world. This picture shows how easy it is for visitors to ac-cess the hot springs and enjoy the wonders of nature. Various minerals create an “ar-tistic” and colourful environment.
2. Already in 1872 the authorities regulated our possibilities to move around at ourown will in the western part of USA. This picture shows an area with hot springs inthe Yellowstone National Park. The steam has a nasty smell ant it may cause seriousillness. It is a very dangerous surrounding. Take a step in the wrong place and youmay disappear forever.
Changes and deletionsTo focus the reader’s attention on the main content in a picture, individual pic-ture elements can be changed so as to improve contrast, acuity, sharpness, greyscale, or colour scale. Surrounding parts can be made paler, darker, or out offocus. The visual’s external contour can be blurred and unclear so the picturefades in/out of the background. Good photographers select focusing and depthof field to achieve the same goal – better clarity and better communication. Thegrey scale can sometimes be transformed into optional colours.
Figure 4. Undesirable parts in a picture can be removed by painting with an appro-priate retouching colour. Here the left group of persons are gone. This is easy to do,and it will change our perception of the image content in an improper and unethicalway. Now a mother is all alone with her child in a desert-like environment.
Individual picture elements, as well as groups of picture elements, can bemoved or turned around within an image for the sake of better balance and har-
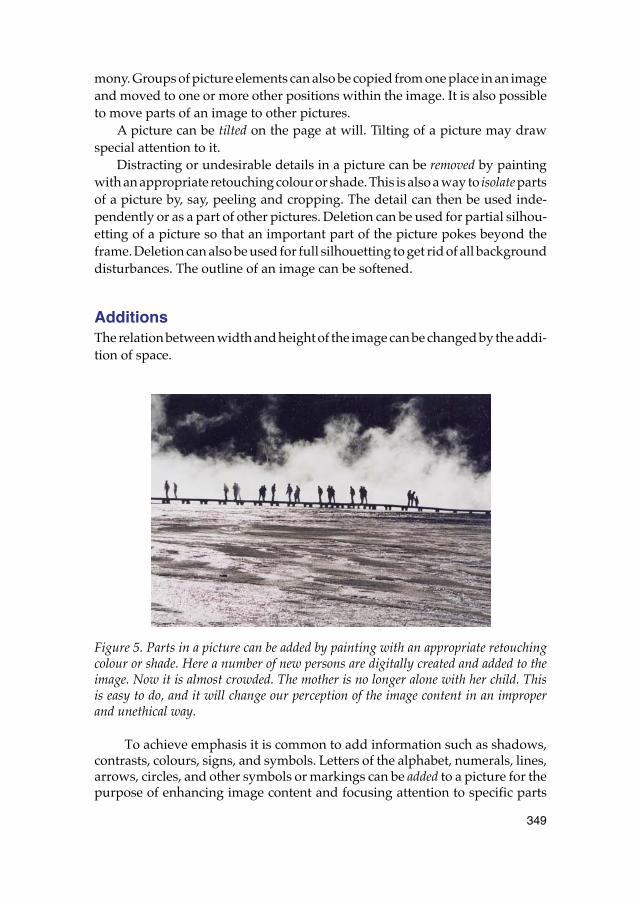
349
mony. Groups of picture elements can also be copied from one place in an imageand moved to one or more other positions within the image. It is also possibleto move parts of an image to other pictures.
A picture can be tilted on the page at will. Tilting of a picture may drawspecial attention to it.
Distracting or undesirable details in a picture can be removed by paintingwith an appropriate retouching colour or shade. This is also a way to isolate partsof a picture by, say, peeling and cropping. The detail can then be used inde-pendently or as a part of other pictures. Deletion can be used for partial silhou-etting of a picture so that an important part of the picture pokes beyond theframe. Deletion can also be used for full silhouetting to get rid of all backgrounddisturbances. The outline of an image can be softened.
AdditionsThe relation between width and height of the image can be changed by the addi-tion of space.
Figure 5. Parts in a picture can be added by painting with an appropriate retouchingcolour or shade. Here a number of new persons are digitally created and added to theimage. Now it is almost crowded. The mother is no longer alone with her child. Thisis easy to do, and it will change our perception of the image content in an improperand unethical way.
To achieve emphasis it is common to add information such as shadows,contrasts, colours, signs, and symbols. Letters of the alphabet, numerals, lines,arrows, circles, and other symbols or markings can be added to a picture for thepurpose of enhancing image content and focusing attention to specific parts
350
of the image and links to the legend. The super-imposition of text onto a pic-ture image usually impairs our ability to absorb the contents of both text andpicture.
Converting photos McDougall (1990, p. 32) noted that converting photos to art is a type of phototheft that picture editors should crack down on. It is far to common that artiststransform photographs to artwork for use as illustrations in newspapers andbooks. To transform a photo into a drawing is not only unethical, it is also oftenan infringement of copyright. McDougall writes: “The courts have held that awork of art which has been copied from another work which is copyrighted,regardless of alterations, is primafacie evidence of copyright infringement. Thecourts have also held that copying a work of art in a different medium such aschanging a photo into a drawing is still a violation.” There are, however, exam-ples also of the opposit.
Discussion Earlier people used to make retouch on photographs using a brush and Indianink. Today such operations can easily be performed in the computer. However,it is not enough to consider only these kind of surgical changes in pictures asimage manipulation. In my view we also need to consider two different typesof image manipulation.
1. No change of any picture elements. People's perception of reality can beinfluenced and steered in a desired direction through well-consideredselection of pictures, careful trimming as well as leading captions.
2. Change of certain picture elements in order to influence people's percep-tion of the reality the picture appears to depict.
Based on these distinctions I have proposed the following definition ofimage manipulation (Pettersson, 2002): “Image manipulation implies theimproper control of people's perception of a given reality through the use ofpictures.” Thus effective use of computers and digital technology for editingand production of good quality pictures do not have to mean image manipu-lation.
It is obvious that technical development has fundamentally changed con-ditions for our ability to use pictures in different contexts as well as for the cred-ibility of all pictures. In practice, individual newspaper readers and TV viewersno longer have any real opportunity to discover whether a published picturehas been manipulated or not. We can hardly assume that this situation will
351
improve in the future since computer technology is developing rapidly. Witheach passing year, it becomes easier for anyone to create and revise pictures,and make them accessible to others on the Internet.
Difficulties, as well as mistakes and deception, exist within news reporting.So far we don’t know how to answer the questions: “How can we best ‘protect’ourselves from being manipulated by, for example, news reporting? Can wetrust the pictures we see? How can we expose deception?” We can, of course,hope that the established media actually assume their responsibility and liveup to their own rules. Rules and ethical norms are already in place, but it isevident that all people working in media are not aware of the great responsibilitythey bear. In the long run this lack of responsibility could lead to a credibilitycrisis for the news media. If we become accustomed to deception, our trust inthe media will diminish.
Good rules and norms, however, are not enough. What is also needed isthat people working in media learn them, and that readers and viewers adopta critical approach to media. To achieve this, pictorial communication, criticalanalysis and source criticism must become a real and natural feature of teachingin school.
It is conceivable that future generations – growing up with increasinglyadvanced computers and learning to use them early in life – will develop a freerand more independent approach to pictures and pictorial communication thanthe one characterising adults of today. Children who learn to work with pictureson computers should find it easier to understand what can be done. When thesechildren are grown, pictures will no longer have any “natural credibility” forthem (Pettersson, 2001). They will not expect, for example, that advertisementpictures even attempt to reflect any form of objective reality. At this point, weknow little about how pictures function as communicative expressions. Thereis a great need for research, development work and education regarding therole of pictures.
ReferencesAlling-Ode, B. och Tubin, E. (1993). Falska kort? BILDEN I DATAÅLDERN.
Stockholm: Styrelsen för psykologiskt försvar. Becker, K. (1996). Pictures in the Press: Yesterday, Today, Tomorrow. I U. Carlsson
(Red. ). Medierna i samhället Igår idag imorgon. Göteborg: NORDICOM-SVERIGE.
Bildleverantörernas Förening. (1999). Rätt och Pris Handbok vid bildhantering och videoproduktion med BLF:S cirkaprislista. Tullinge: Bildleverantörernas Förening.
352
Cifuentes, L., Myers, L. J., & McIntosh, K. (1998). Selective Data Analyses, Photo Manipulation, and Honest Message Design. Journal of Visual Literacy, Autumn 1998, Volume 18, Number 2, 165-174.
Fetveit, A. (1997). The digitalized screen: revisiting the issue of indexicality. Paper presented at The 13th Nordic Conference for Research on Mass Communi-cation, August 9–12, Jyväskylä, Finland.
Harrie, A. (1999). Vardagsetik,. Stockholm: SJF, Svenska Journalistförbundet.Hedgecoe, J. (1994). John Hedgecoe’s New Book of Photography. London: Dorling
Kindersley Limited. McDougall, A. (1990). Picture editing & layout a guide to better visual communica-
tion. Viscom Press. School of Journalism. University of Missouri. Colum-bia.
Paul, H. (2000). Den bildjournalistiska etiken i praktiken. I R. Nordlund (Red.). Nyhetsbilder–etik–påverkan. Stockholm: Styrelsen för psykologiskt försvar. Meddelande 154.
Pettersson, R. (1993). Visual information. Englewood Cliffs. N. J. : Educational Technology Publications.
Pettersson, R. (2001). Trovärdiga bilder. Stockholm: Styrelsen för psykologiskt försvar. Meddelande 180.
Pettersson, R. (2002). Bildmanipulering. Stockholm: Styrelsen för psykologiskt försvar. Meddelande.
Pressens samarbetsnämnd. (1999). Spelregler för press, radio och TV. Stockholm: TU Service AB.
Ritchin, F. (1990). In Our Own Image. New York: Aperture. (In Swedish 1991: Bildens förändrade värld. Stockholm: Mediaproduktion. )
353
Paper 21
Attention
Abstract. We do not become conscious of all the stimuli detected by our sensoryorgans. The selective process that controls our awareness of events in the environmentis called attention. The process of attention determines which events we become con-scious of. Attention may be controlled (1) automatically, (2) by instructions, and (3)by the specific demands of the particular task at hand. The information designer mayuse various design principles and guidelines in order to facilitate the reader’s atten-tion processes, and subsequent processes for understanding and learning.
In the industrialised, cultural sphere, we are today living in mass-media soci-eties. Every day we are bombarded with information via the media, at home,in school, at work, and in the society in general. It is rather hard to avoid infor-mation and it may be just as hard to obtain the information that we really need.Audio, text, and visuals compete for our attention, or mental preparedness andreceptiveness. We will miss the information in which we are really interestedif we do not attend to it. We direct our attention to what we happen to be inter-ested in; to special sounds; to things that move; are large, bold, and clear; arenew; have bright colour, an unusual shape, or a good contrast; and that deviatefrom the surroundings or from familiar patterns. We direct our attention to con-tents that arouse feelings and needs.
Pashler (1995) remarked that attention is a common word in ordinary lan-guage as well as a name of a field of study. This cause misunderstandings.According to Pashler the concept of attention is part of what might be called afolk-psychological theory – that is, an informal set of propositions people relyon to explain their own and other people’s daily experience and behaviour. Mostpresent-day attention researchers work in the tradition sometimes called infor-mation-processing psychology. Their goal is not to characterise conscious experi-ence per se, but rather to trace the flow of information among different repre-sentational systems in the brain. However, the objective for this paper is toprovide a ground for design of better information materials. Thus the detailsof mental information-processing will not be addressed here. The paper pro-vides an “information design perspective” on attention. The informationdesigner may help people to notice the important information. One of the firstproblems for the information designer is to gain the attention of people, and there-after she or he has the continuing problem of holding their attention.
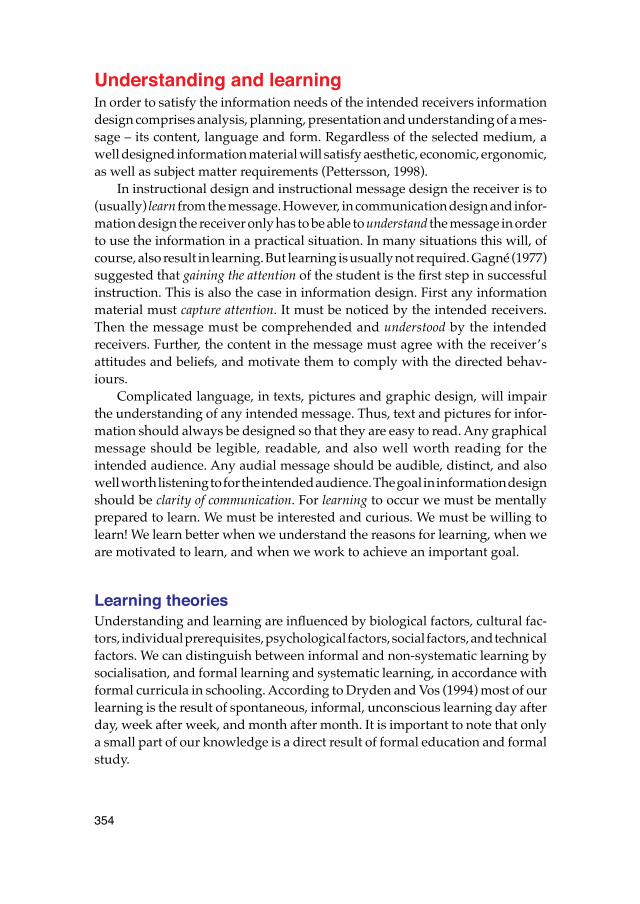
354
Understanding and learningIn order to satisfy the information needs of the intended receivers informationdesign comprises analysis, planning, presentation and understanding of a mes-sage – its content, language and form. Regardless of the selected medium, awell designed information material will satisfy aesthetic, economic, ergonomic,as well as subject matter requirements (Pettersson, 1998).
In instructional design and instructional message design the receiver is to(usually) learn from the message. However, in communication design and infor-mation design the receiver only has to be able to understand the message in orderto use the information in a practical situation. In many situations this will, ofcourse, also result in learning. But learning is usually not required. Gagné (1977)suggested that gaining the attention of the student is the first step in successfulinstruction. This is also the case in information design. First any informationmaterial must capture attention. It must be noticed by the intended receivers.Then the message must be comprehended and understood by the intendedreceivers. Further, the content in the message must agree with the receiver’sattitudes and beliefs, and motivate them to comply with the directed behav-iours.
Complicated language, in texts, pictures and graphic design, will impairthe understanding of any intended message. Thus, text and pictures for infor-mation should always be designed so that they are easy to read. Any graphicalmessage should be legible, readable, and also well worth reading for theintended audience. Any audial message should be audible, distinct, and alsowell worth listening to for the intended audience. The goal in information designshould be clarity of communication. For learning to occur we must be mentallyprepared to learn. We must be interested and curious. We must be willing tolearn! We learn better when we understand the reasons for learning, when weare motivated to learn, and when we work to achieve an important goal.
Learning theoriesUnderstanding and learning are influenced by biological factors, cultural fac-tors, individual prerequisites, psychological factors, social factors, and technicalfactors. We can distinguish between informal and non-systematic learning bysocialisation, and formal learning and systematic learning, in accordance withformal curricula in schooling. According to Dryden and Vos (1994) most of ourlearning is the result of spontaneous, informal, unconscious learning day afterday, week after week, and month after month. It is important to note that onlya small part of our knowledge is a direct result of formal education and formalstudy.
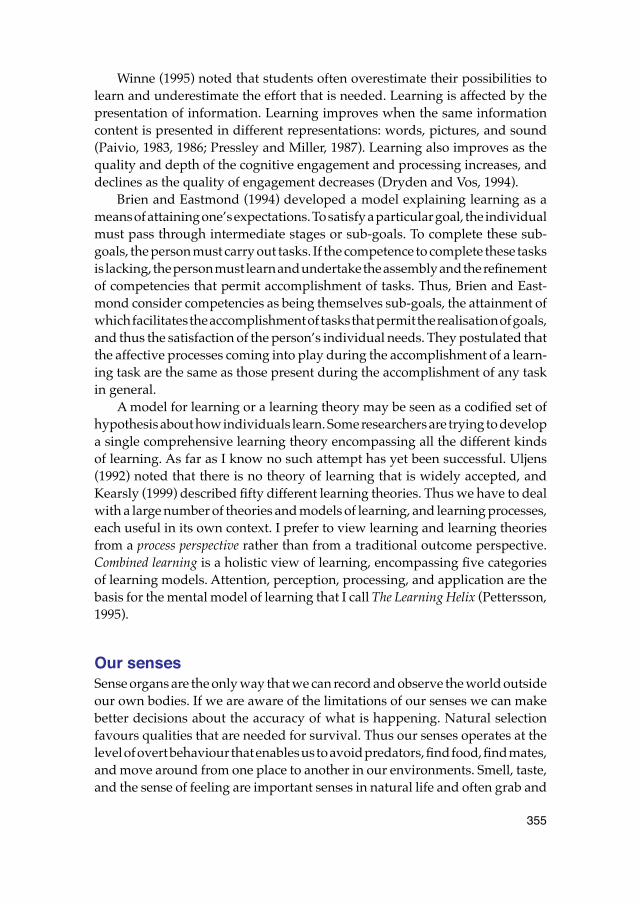
355
Winne (1995) noted that students often overestimate their possibilities tolearn and underestimate the effort that is needed. Learning is affected by thepresentation of information. Learning improves when the same informationcontent is presented in different representations: words, pictures, and sound(Paivio, 1983, 1986; Pressley and Miller, 1987). Learning also improves as thequality and depth of the cognitive engagement and processing increases, anddeclines as the quality of engagement decreases (Dryden and Vos, 1994).
Brien and Eastmond (1994) developed a model explaining learning as ameans of attaining one’s expectations. To satisfy a particular goal, the individualmust pass through intermediate stages or sub-goals. To complete these sub-goals, the person must carry out tasks. If the competence to complete these tasksis lacking, the person must learn and undertake the assembly and the refinementof competencies that permit accomplishment of tasks. Thus, Brien and East-mond consider competencies as being themselves sub-goals, the attainment ofwhich facilitates the accomplishment of tasks that permit the realisation of goals,and thus the satisfaction of the person’s individual needs. They postulated thatthe affective processes coming into play during the accomplishment of a learn-ing task are the same as those present during the accomplishment of any taskin general.
A model for learning or a learning theory may be seen as a codified set ofhypothesis about how individuals learn. Some researchers are trying to developa single comprehensive learning theory encompassing all the different kindsof learning. As far as I know no such attempt has yet been successful. Uljens(1992) noted that there is no theory of learning that is widely accepted, andKearsly (1999) described fifty different learning theories. Thus we have to dealwith a large number of theories and models of learning, and learning processes,each useful in its own context. I prefer to view learning and learning theoriesfrom a process perspective rather than from a traditional outcome perspective.Combined learning is a holistic view of learning, encompassing five categoriesof learning models. Attention, perception, processing, and application are thebasis for the mental model of learning that I call The Learning Helix (Pettersson,1995).
Our sensesSense organs are the only way that we can record and observe the world outsideour own bodies. If we are aware of the limitations of our senses we can makebetter decisions about the accuracy of what is happening. Natural selectionfavours qualities that are needed for survival. Thus our senses operates at thelevel of overt behaviour that enables us to avoid predators, find food, find mates,and move around from one place to another in our environments. Smell, taste,and the sense of feeling are important senses in natural life and often grab and
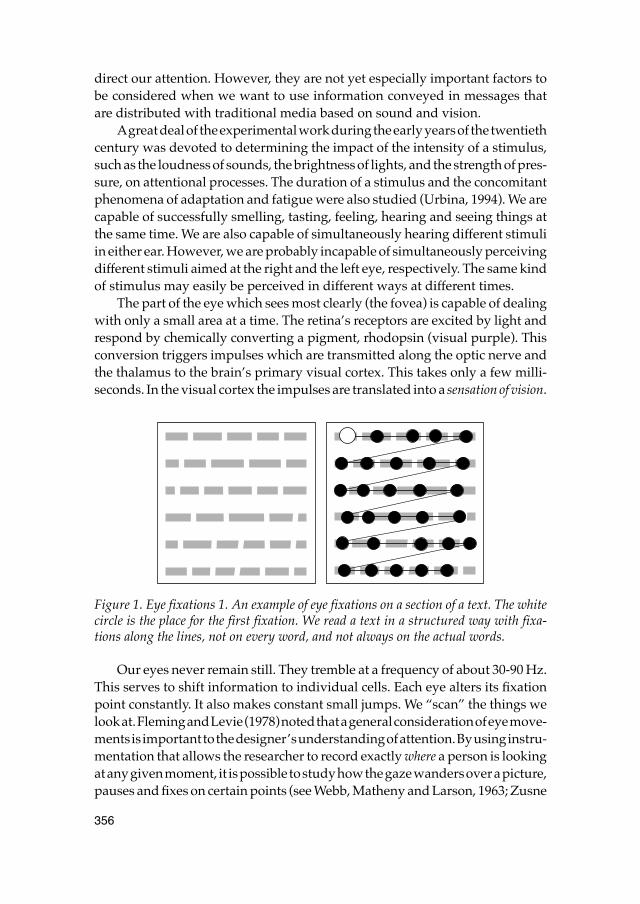
356
direct our attention. However, they are not yet especially important factors tobe considered when we want to use information conveyed in messages thatare distributed with traditional media based on sound and vision.
A great deal of the experimental work during the early years of the twentiethcentury was devoted to determining the impact of the intensity of a stimulus,such as the loudness of sounds, the brightness of lights, and the strength of pres-sure, on attentional processes. The duration of a stimulus and the concomitantphenomena of adaptation and fatigue were also studied (Urbina, 1994). We arecapable of successfully smelling, tasting, feeling, hearing and seeing things atthe same time. We are also capable of simultaneously hearing different stimuliin either ear. However, we are probably incapable of simultaneously perceivingdifferent stimuli aimed at the right and the left eye, respectively. The same kindof stimulus may easily be perceived in different ways at different times.
The part of the eye which sees most clearly (the fovea) is capable of dealingwith only a small area at a time. The retina’s receptors are excited by light andrespond by chemically converting a pigment, rhodopsin (visual purple). Thisconversion triggers impulses which are transmitted along the optic nerve andthe thalamus to the brain’s primary visual cortex. This takes only a few milli-seconds. In the visual cortex the impulses are translated into a sensation of vision.
Figure 1. Eye fixations 1. An example of eye fixations on a section of a text. The whitecircle is the place for the first fixation. We read a text in a structured way with fixa-tions along the lines, not on every word, and not always on the actual words.
Our eyes never remain still. They tremble at a frequency of about 30-90 Hz.This serves to shift information to individual cells. Each eye alters its fixationpoint constantly. It also makes constant small jumps. We “scan” the things welook at. Fleming and Levie (1978) noted that a general consideration of eye move-ments is important to the designer’s understanding of attention. By using instru-mentation that allows the researcher to record exactly where a person is lookingat any given moment, it is possible to study how the gaze wanders over a picture,pauses and fixes on certain points (see Webb, Matheny and Larson, 1963; Zusne
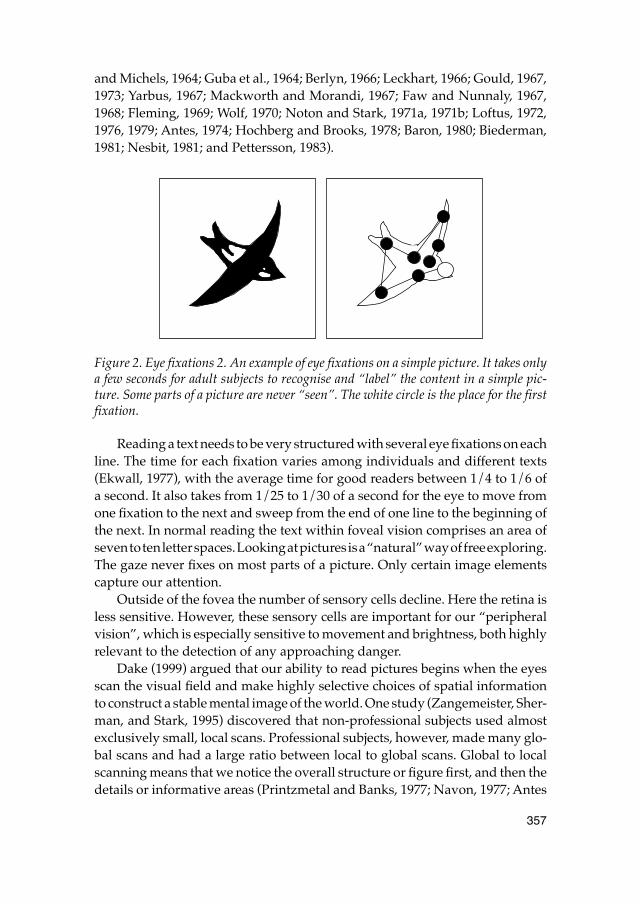
357
and Michels, 1964; Guba et al., 1964; Berlyn, 1966; Leckhart, 1966; Gould, 1967,1973; Yarbus, 1967; Mackworth and Morandi, 1967; Faw and Nunnaly, 1967,1968; Fleming, 1969; Wolf, 1970; Noton and Stark, 1971a, 1971b; Loftus, 1972,1976, 1979; Antes, 1974; Hochberg and Brooks, 1978; Baron, 1980; Biederman,1981; Nesbit, 1981; and Pettersson, 1983).
Figure 2. Eye fixations 2. An example of eye fixations on a simple picture. It takes onlya few seconds for adult subjects to recognise and “label” the content in a simple pic-ture. Some parts of a picture are never “seen”. The white circle is the place for the firstfixation.
Reading a text needs to be very structured with several eye fixations on eachline. The time for each fixation varies among individuals and different texts(Ekwall, 1977), with the average time for good readers between 1/4 to 1/6 ofa second. It also takes from 1/25 to 1/30 of a second for the eye to move fromone fixation to the next and sweep from the end of one line to the beginning ofthe next. In normal reading the text within foveal vision comprises an area ofseven to ten letter spaces. Looking at pictures is a “natural” way of free exploring.The gaze never fixes on most parts of a picture. Only certain image elementscapture our attention.
Outside of the fovea the number of sensory cells decline. Here the retina isless sensitive. However, these sensory cells are important for our “peripheralvision”, which is especially sensitive to movement and brightness, both highlyrelevant to the detection of any approaching danger.
Dake (1999) argued that our ability to read pictures begins when the eyesscan the visual field and make highly selective choices of spatial informationto construct a stable mental image of the world. One study (Zangemeister, Sher-man, and Stark, 1995) discovered that non-professional subjects used almostexclusively small, local scans. Professional subjects, however, made many glo-bal scans and had a large ratio between local to global scans. Global to localscanning means that we notice the overall structure or figure first, and then thedetails or informative areas (Printzmetal and Banks, 1977; Navon, 1977; Antes
358
and Penland, 1981; Biederman, 1981). Thus we quickly find out which detailsof a picture are the most informative ones, and then we concentrate our attentionto those parts. This global to local scanning would seem to indicate that to getmaximum impact from a picture, the writer or the presenter should introducethe image content before presenting the actual visual.
A number of scientists have found that pictures which are hard to interpretrequire more eye fixations than “easy” pictures (Webb et al., 1963; Zusne andMichaels, 1964; Berlyn, 1966; Leckhart, 1966; Faw and Nunnaly, 1967, 1968;Mackworth and Morandi, 1967; Hochberg and Brooks, 1978). Wolf (1970) deter-mined that “difficult” pictures require more fixations up to a certain point. Whena picture was extremely difficult, subjects tended to avoid looking at it orsearched for a visual centre. However, neither Baron (1980) nor Nesbit (1981)found any correlation between picture type and the number of fixations. Butthe two latter scientists did employ a different method in their studies than thepreviously mentioned authors.
AttentionAttention is closely related to the subject of consciousness and entails selectingparts from all available sensory information, and from memorised information,for further mental processing. The process of attention is the control mechanismthat determines which stimuli will be noticed and which will be ignored (Carl-son, 1993). Attention determines which events we become conscious of. Atten-tion can be considered as the activation of groups of cells in the brain stem, oneof the most primitive regions of the brain. Its functions are correspondingly basicones – primary control of physiological functions and automatic behavioursthat are important to survival, such as drinking, eating, sexual behaviour, andsleeping. Urbina (1994) defined attention (p. 111): “as a readiness on the partof the organism to perceive stimuli that surround it”.
Attention is never objective – it is always subjective. We direct our attentionto what we happen to be interested in; to special sounds; to things that move;are large, bold, and clear; are new; have bright colour, an unusual shape, a dis-tinct direction, or a good contrast; and that deviate from the surroundings orfrom familiar patterns. We direct our attention to contents that arouse feelingsand needs. Pashler (1995) noted that a task that is given full attention is accom-plished quickly and efficiently. Ordinarily attention is under the control of our“will”. However, external stimuli that are intense, novel, or significant maysometimes grab our attention and we turn toward the stimulus. If, however,the stimulus is repeated or continuous, the response will diminish. Tasks thatinitially required full attention may become so automatic that they can later becombined with other activities.
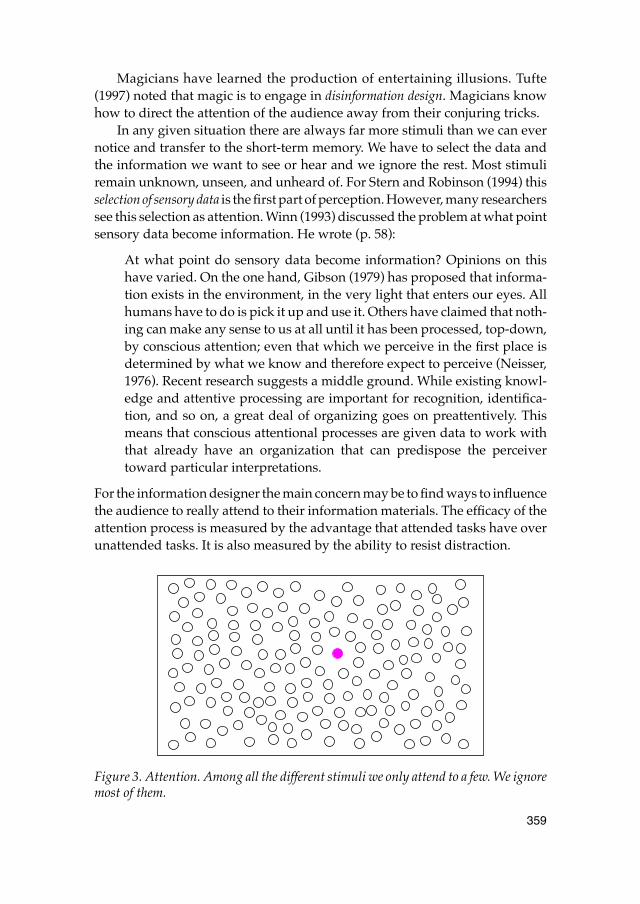
359
Magicians have learned the production of entertaining illusions. Tufte(1997) noted that magic is to engage in disinformation design. Magicians knowhow to direct the attention of the audience away from their conjuring tricks.
In any given situation there are always far more stimuli than we can evernotice and transfer to the short-term memory. We have to select the data andthe information we want to see or hear and we ignore the rest. Most stimuliremain unknown, unseen, and unheard of. For Stern and Robinson (1994) thisselection of sensory data is the first part of perception. However, many researcherssee this selection as attention. Winn (1993) discussed the problem at what pointsensory data become information. He wrote (p. 58):
At what point do sensory data become information? Opinions on thishave varied. On the one hand, Gibson (1979) has proposed that informa-tion exists in the environment, in the very light that enters our eyes. Allhumans have to do is pick it up and use it. Others have claimed that noth-ing can make any sense to us at all until it has been processed, top-down,by conscious attention; even that which we perceive in the first place isdetermined by what we know and therefore expect to perceive (Neisser,1976). Recent research suggests a middle ground. While existing knowl-edge and attentive processing are important for recognition, identifica-tion, and so on, a great deal of organizing goes on preattentively. Thismeans that conscious attentional processes are given data to work withthat already have an organization that can predispose the perceivertoward particular interpretations.
For the information designer the main concern may be to find ways to influencethe audience to really attend to their information materials. The efficacy of theattention process is measured by the advantage that attended tasks have overunattended tasks. It is also measured by the ability to resist distraction.
Figure 3. Attention. Among all the different stimuli we only attend to a few. We ignoremost of them.
360
Attention plays an important role in memory. By exerting control over theinformation that reaches the short-term memory, it determines what informa-tion ultimately becomes stored in our explicit, or declarative memory (Pines, 1986;Carlson, 1993). This is the memory for facts, the memory of which we are aware.We know that we have learned something, and we can discuss this with otherpeople. However, the storage of information in our implicit, or procedural mem-ory does not require conscious attention. This is the memory for skills. It is ourunconscious memory which is capable of controlling rather complex behav-iours.
Attention theoriesThere are several attention models and attention theories. Clements (1984) con-cluded that “the attentional process is relatively diffuse” (p. 146). Gestalt psy-chologists, associationists, behaviourists, and psychoanalytic theorists tendedto neglect attention in their postulations. Since the mid-1950s, however, therehas been a lot of interest in attention. Modern Russian psychologists studiedthe orienting reflex or orienting response, which consists of a cluster of physio-logical changes in the surroundings (Urbina, 1994).
Capacity theoriesBroadbent (1958) studied selectivity of attention and he proposed a filter theory.According to this theory we are not able to attend to more than one stimulusat a time. Broadbent suggested that while a large amount of sensory informationcan be absorbed at one time, a selective filter (the attention mechanism) reducesthe input from one source while that from another source is being analysed bythe brain. Here attention is a limited capacity channel that determines the serialprocessing of the perceptual system. The filter theory did not allow for the influ-ence of long-term memory or the meaning of the stimulus. However, subsequentexperiments showed that the content of an unattended message may be per-ceived if it is relevant. Semantic characteristics of the stimulus affect attention.Deutsch and Deutsch (1963), and Norman (1967) suggested that we analyse allinputs but only attend to pertinent stimuli.
Resource modelsNeisser (1967) outlined a two-process theory that made attention a matter ofdegree. Properties of the stimuli as well as properties of semantic factors playa role in attention. Neisser argued for a constructive view of cognition in whichperception is shaped by existing knowledge. Thus attention is influenced byexperience and knowledge.
361
Kahneman (1973) presented a model of attention with deliberate allocationof mental resources. In addition to unconscious processes, attention can be con-sciously focused. One example of this is our sudden attention when you hearsomeone in a crowd mention your own name. The model also introduced theidea of attention as a skill that can be improved. This skill may be used forimprovement of our learning processes.
Eysenck (1982) examined the relationship between attention and arousal andconcluded that there are two types of arousal: one passive and general systemthat can raise or lower the overall level of attention, and another specific, com-pensatory system that allows attention to be focused on certain tasks.
Wickens (1980, 1984, 1991), and Klapp and Netick (1988) suggested a multipleresource model of attention and further processing. Resource models based onindividually allocated pools of resources have been developed to explain theeffects of structural alteration and time sharing that cannot be effectivelyexplained by other attention models.
According to Sweller et al. (1990) all cognitive tasks place demands on apool of limited cognitive resources. When a task imposes a heavy load on the cog-nitive system, it will in turn interfere with learning by misdirecting attentionand limiting remaining resources that are necessary for construction of knowl-edge
Frames of referenceNew impressions are interpreted against the background of our previous expe-riences and learning, our attitudes and interests, our needs and feelings, andalso the prevailing situation.
The attention time spanAn attention span is the length of time a subject can focus on an object or a topic.Our attention will usually not last for long. Any information material and anypresentation must constantly redraw the attention to hold the interest of the viewer.A presentation may hold the viewer’s attention when the rhythm, layout, andpace are not predictable and boring. Ormrod (1989) pointed out that as childrengrow, their attention spans grow with them. They can concentrate on tasks forlonger periods of time, and can more easily “block out” objects and events thatare irrelevant to a task at hand. Young children may chose to pay attention eitherto a whole picture or to specific parts of it. For children until about nine yearsof age it might be difficult to switch attention between a part and the whole(Pettersson, 1989).
When people turn on their television set they might not be interested in theprogramme. In Japan, television-viewing habits were recorded for participantsin the Hi-OVIS project (Matsushita, 1988). During the first 30 seconds, people
362
sometimes switched between 15-20 different channels. Thus, people only spentone to two seconds viewing the television image and deciding if the programmewas interesting or not. Viewers did not take the time to actually listen to thesound. Their decisions were based on the pictorial style and the contents.According to Biederman (1995) people can usually interpret the meaning of anovel scene on television from a 100-millisecond exposure to it.
Commissioned by the Director's Guild in honour of its 50th anniversary in1986, the film Precious Images was a gift to the American movie audiences. Thisshort consists of a 6.5-minute assemblage of classic moments from 469 favouritemovies. Some moments linger for a few seconds but many are as short as eightframes (1/3 of a second), averaging 20 frames (less than a second). It is a strangeexperience to see this film. The carefully chosen images retain their meaningand emotional impact, and trigger your memory. However, in my view youneed to see the film several times in order to fully appreciate it.
Attention to noveltyFleming and Levie (1978) and Ormrod (1989) noted that novelty and whateverstands in contrast to immediate past experience or to life-long experience grabsour attention. Something unusual will capture our attention almost every time.Attention is not necessarily drawn to the excessively loud, bright, or extraor-dinary, only to what is quantitatively different from what has been attendedto previously. Thus, attention is drawn to changes. Fleming and Levie (1978)argued that in directing our attention, we seek a balance between novelty andfamiliarity, between complexity and simplicity, between uncertainty and cer-tainty. Familiarity in excess produces boredom, while novelty in excess pro-duces anxiety.
The competition for our attention is usually very fierce in advertising andin propaganda. In accordance with Key (1977), the average adult in the USAwas exposed to over 500 advertising messages daily in 1977, of which he or sheconsciously perceived around 75. Now, there are even more messages. Weilen-man (1999) reported that every person in Stockholm, Sweden, is exposed to over2 000 advertising messages daily in 1999. Here, it was not reported how manymessages people actually pay attention to.
Moriarty (1991, p. 5) sees an advertisement as a conversation with a customerabout a product. “It gets attention, it provides information, it tries to make apoint, and it encourages you to buy, try, or do something. It tries to create somekind of response or reaction. It speaks to the heart as well as the head”. Adver-tising is also a form of mass-communication, which is much more complex thana regular conversation.
Advertisements must be designed so that they will be noticed as easily aspossible. Therefore, it is important to choose a graphical form that arouses inter-est. Here, unusual and new typefaces can be useful. In advertising the graphical
363
form should stimulate attention, entice the reader to look at the pictures andbegin reading the text. Since there are over 60,000 different typefaces (with stillmore being introduced), it is easy to combine them in many ways (Mijksenaar,1997). Most of these typefaces are, however, limited in their usefulness.
Attention to movementAs previously noted our peripheral vision is especially sensitive to movementand brightness, both highly relevant to the detection of any approaching danger.According to Fleming and Levie (1978) this preattentive vision provides a global,holistic view of the visual field in which figures are separated from each other.Movement or change in a picture or in an event attracts our attention and there-fore causes many eye fixations. Hubel and Wiesel (1962) found that many sen-sory cells in vision responded only very weakly to uniform light but very vig-orously to changes in light intensity. This principle also applies to other sensorycells, i.e., the cells respond primarily to change. Sensory cells are also quicklyexhausted.
There seem to be different degrees of efficiency of attention in different sit-uations. When we look at a multi-image slide and film presentation it is obviousthat we only have a limited capacity for attention. As soon as the film starts,our attention is directed towards the movement in the film from the surroundingstills. It is just impossible for viewers not to be influenced by the movement.The fact that one must select information implies that there are limits to the abil-ity to perceive, think, or do several things at once.
Acuity falls rapidly outside of the fovea. However, some information canbe processed from peripheral vision. The gist of a picture or of an event can beunderstood after only a few eye fixations. Gibson (1966), Moray (1970), andmany of their successors (e.g., Edwards and Coolkasian, 1974) feel that move-ments detected in peripheral parts of our visual field automatically cause theeyeball to shift position to permit fixation and full attention of these movements.
Animation is common in several media, like video, computer games andon the Internet. The movement is powerful and attracts our attention (Ormrod,1989). Thus other information may be totally unseen and lost. The relation offigure to ground is particularly determinative of motion perception, which ishighly related to our perception of depth. Perception of motion is influencedby contextual variables.
Attention to colourIt is possible for us to see the difference between several million colour stimuliat simultaneous viewing (Evans, 1974). However, if not being seen simulta-neously, the number we can identify is much smaller, maybe 10,000–20,000(Hård and Sivik, 1981). It has been assumed that our perception of colours isa two-sided phenomenon. The discrimination capability represents our possi-
364
bility to differentiate a figure from its background. It is strongly influenced byand dependent on contextual variables such as lighting conditions and othersurrounding colours. The colour identification capacity makes us capable ofinterpreting “the quality” of the object we perceive.
Fleming and Levie (1978) noted that in visual displays containing severalfigures of one colour or one shape, a figure of a different colour or a differentshape attracts our attention. Ibison (1952), Rudisill (1952), Dwyer (1971), andSpangenberg (1976) all claim that even if colour is not adding any importantinformation to an image, it may still contribute to better learning because theinterest may increase, and learners may pay attention to the image. A black andwhite picture represents reality in a different way than colour pictures. In blackand white, all colours are transformed into values of grey. Hue adds the “colour-dimension”. Hue may also act as a formal element in a composition, and directthe attention of the viewer.
However, it should be remembered that colour blindness, or better still“anomalies of colour vision”, is a condition in which certain colour discrimi-nations cannot be made. Anomalies of colour vision is much more commonlyobserved among men than women, with estimates ranging as high as 8–10%of the male population (Hartley, 1987). Only 1% of the female population hasanomalous colour vision. The failure to distinguish between red and green ismost common. Unfortunately, red and green are quite often used as discrimi-nating colours in symbols and warnings.
Attention to oral communicationMany teachers spend most of their time in the classrooms talking to their classes(Gustafsson, 1980a, 1980b; Sigurgeirsson, 1990; Pettersson et al., 1991; Fer-rington, 1994). It appears that teachers generally teach the way they were taught,following the traditional approach to education, providing prepackaged infor-mation to students. No doubt, the lecture method has been the most commonmethod of instruction in western education for centuries. In its early forms, thelecture method was a practised art form, a form of theatrical performancedesigned to grab and to hold the attention of the students. Until the advent oflow-cost books, the lecture method was actually the most economical methodof transmitting information. However, modern teachers are usually not selectedfor their lecturing and theatrical skills. Thus the lecture method is under frequentattack.
Cochran (1987) concluded that humans cannot transfer ideas whole andintact from one person to another. Human communication depends upon aninteractive series of successive approximations presented in metaphors. Shefound “languaging” useful in directing attention to the actions of people as theyshare their own ideas, listen to others, or learn from technologically produced
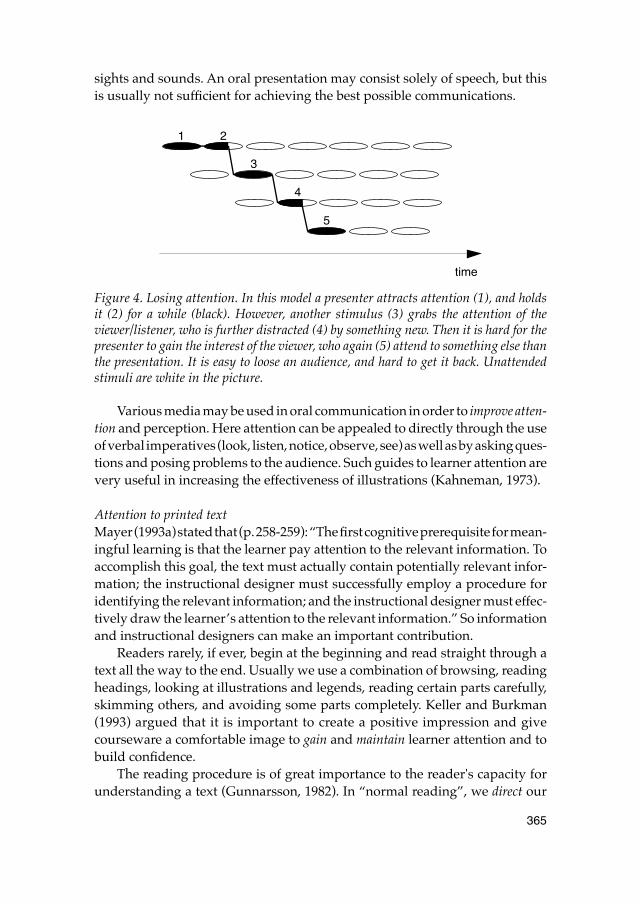
365
sights and sounds. An oral presentation may consist solely of speech, but thisis usually not sufficient for achieving the best possible communications.
Figure 4. Losing attention. In this model a presenter attracts attention (1), and holdsit (2) for a while (black). However, another stimulus (3) grabs the attention of theviewer/listener, who is further distracted (4) by something new. Then it is hard for thepresenter to gain the interest of the viewer, who again (5) attend to something else thanthe presentation. It is easy to loose an audience, and hard to get it back. Unattendedstimuli are white in the picture.
Various media may be used in oral communication in order to improve atten-tion and perception. Here attention can be appealed to directly through the useof verbal imperatives (look, listen, notice, observe, see) as well as by asking ques-tions and posing problems to the audience. Such guides to learner attention arevery useful in increasing the effectiveness of illustrations (Kahneman, 1973).
Attention to printed textMayer (1993a) stated that (p. 258-259): “The first cognitive prerequisite for mean-ingful learning is that the learner pay attention to the relevant information. Toaccomplish this goal, the text must actually contain potentially relevant infor-mation; the instructional designer must successfully employ a procedure foridentifying the relevant information; and the instructional designer must effec-tively draw the learner’s attention to the relevant information.” So informationand instructional designers can make an important contribution.
Readers rarely, if ever, begin at the beginning and read straight through atext all the way to the end. Usually we use a combination of browsing, readingheadings, looking at illustrations and legends, reading certain parts carefully,skimming others, and avoiding some parts completely. Keller and Burkman(1993) argued that it is important to create a positive impression and givecourseware a comfortable image to gain and maintain learner attention and tobuild confidence.
The reading procedure is of great importance to the reader's capacity forunderstanding a text (Gunnarsson, 1982). In “normal reading”, we direct our
1 2
3
4
5
time
366
attention towards how we shall interpret the meaning of a sentence. Studyingthe syntax becomes subordinate to orienting our thoughts amid the semanticand pragmatic relationships that form the text's warp and woof. Text compre-hension is a constructive process, in which the readers build their perceptionof the whole by integrating the text with their own experiences.
The structure of a text should be as clear as possible. Internal text structureis built into the text itself. External text structure relates to the embedded strat-egies which focus a learner’s attention on particular parts of the text (Jonassenand Kirschener, 1982). Headings should always be relevant and identify the sub-ject matter. The purposes of headings are to attract the attention of the readers,make the subject matter readily apparent, and indicate the relative importanceof items. To avoid too large masses of text, it is a good idea to divide the textinto sections and subsections. Jonassen (1982) noted that the headings on dif-ferent hierarchic levels will provide the readers with reference points and helpthem cognitively organise information for better retention and recall.
Winn (1993) noted that in text, attention is drawn to words or passages thatstand in contrast to the rest of the body of the text. To encourage readers to payattention to relevant information, text designers should help the reader to con-trol his or her cognitive processes during learning (Mayer, 1993b).
Attention to signs and symbolsAny warning, and any symbol, must attract attention and be readily understoodby the intended audience, the persons who need the information (Dewar andArthur, 1999). The message must be legible at the appropriate distance, and mustoften be legible when seen for a short period of time under bad lighting con-ditions. A driver on a highway may only have a second or two to read a signpost.Then the message in the warning must be mentally processed and understoodcorrectly. The action to be taken should be immediately obvious. Furthermorethe message in the warning must be able to motivate the intended receivers tocomply with the desired behaviour (Wogalter, 1999). Here, colour may be com-bined with shape and position. Complementary colours contrast and providea warm – cool effect. Colours may have many different meanings. Red, orangeand yellow are commonly used in warnings to indicate different levels of hazard(Wogalter, 1999). The choice of colour should also depend on the environmentin which the warning is placed (Young, 1991).
Carlson (1993) concluded that studies with visually presented informationindicate that attention can focus on location or on shape. We can pay attentionto particular objects or to stimuli that occur in a particular place. This is especiallyimportant for those who design warnings and symbols. Irregular and unpre-dictable shapes dominate basic and regular shapes. Such shapes attract moreattention than basic and regular shapes.
367
Most people can easily perceive the basic shapes, and there is a large degreeof perceptual constancy in the perception of shape. Shape constancy is our ten-dency to judge shapes as the same despite changes in distance, viewing angle,and illumination. This is one of the reasons that shapes like the circle, the oval,the triangle, the square, the rectangle, and the rhombus often are used in symbolsand icons.
Size constancy is our tendency to judge the size of an object as the same despitechanges in distance, viewing angle, and illumination. Colour constancy is ourtendency to judge the colour of an object as the same despite changes in distance,viewing angle, and illumination.
Attention to picturesWe know that visuals are perceived much more rapidly and readily than text(Fleming and Levie, 1978, 1993; Sinatra, 1986). Lester (1995, p. 73) noted that:“Visual messages are a powerful form of communication because they stimulateboth intellectual and emotional responses – they make us think as well as feel.”Many authors have suggested various roles, functions, objectives and purposesfor the use of illustrations – often without a great deal of evidence to supporttheir suggestions. Pettersson (1999) listed 169 opinions about image functions.More than one hundred different explanatory verbs were used by theseresearchers to express their opinions. According to scholars in the areas ofinstructional message design, visual literacy, and visual communication themost common or frequent opinions on functions of visuals concern attention:
• Attract attention to a given material or a given subject (Duchastel, 1978;Peters, 1978; Duchastel and Waller, 1979; Holliday, 1980; Heinich, Molendaand Russell, 1982; Levie and Lentz, 1982; Evans, Watson and Willows, 1987;Levin, Anglin and Carney, 1987; Pettersson, 1993; Keller and Burkman,1993; Wileman, 1993; Lester, 1995).
• Gain or get attention (Gagné, 1977; Duchastel, 1978; Duchastel and Waller,1979; Holliday, 1980; Levie and Lentz, 1982; Evans, Watson and Willows,1987; Levin, Anglin and Carney, 1987; Moriarty, 1991; Leshin, Pollock, andReigeluth, 1992; Keller and Burkman, 1993; Pettersson, 1993; Wileman,1993; Lester, 1995).
• Hold attention (Levin, Anglin and Carney, 1987)• Maintain attention (Peters, 1978); maintain learner attention (Keller and
Burkman, 1993).
These opinions may be summarized as (1) get attention, and (2) maintain atten-tion.
Other common explanatory verbs for image functions are: facilitate, provide,persuade, create (an interest in), illustrate, clarify, motivate, present, and reinforce
368
information (to someone). Among the students’ who took part in the study themost common opinions or purposes are to visualise, clarify, inform, attract atten-tion, facilitate reading, explain, and convey information.
Faw and Nunnaly (1967, 1968) found that new pictures require more eyefixations than pictures with which subjects were already familiar. When thelearner does not see, read, or hear what she or he expects to see, or can not findagreement between verbal and visual content, the message is likely to be mis-understood. We will pay attention to very large and to very small objects thatdiffer in size, as well as any object with a special, interesting, or unusual shapeor unusual colour in a picture, and in our surroundings.
Winn (1993) concluded that pictures play many roles in instruction. It istherefore necessary to know precisely what a picture’s function is intended tobe before it is designed. Cognitive and decorative functions should never beconfused or mixed (Pettersson, 1989, 1993). It should be remembered that pic-tures can have a negative effect on learning. At some point illustrations movefrom being engaging motivators to engaging distracters (Evans, Watson andWillows, 1987). When too many pictures are used, readers may ignore manyof them – the opposite of attention. Massoumian (1989, p. 19) noted that “hap-hazard use of visuals may lead to minimal or no instructional gain and gradualloss of effectiveness as an instructional tool”. In summary, many researcherspropose that pictures get and maintain attention of the reader/viewer. How-ever, this is not always the case.
Attention to text and pictures Vogel, Dickson and Lehman (1986) showed that visual presentation support ispersuasive. There is a picture facilitating effect. Presentations using visual aidswere more persuasive than unaided presentations. At the same time, researchin the area of reading indicates that the type of pictures that are used is an impor-tant variable in reading comprehension (Levin, Anglin and Carney, 1987). How-ever, unfortunately this becomes less important in reality since most studentsdo not attend to the visuals at all. Many pictures in textbooks obviously remain“unseen” (Reinking, 1986; Weidenmann, 1989; Pettersson, 1990; Peeck, 1993,1994). Neither teachers, nor students attend to these pictures.
Nelson-Knupfer and Stock-McIsaac (1992) studied the effects of grey shadesin instructional materials. Their results indicated that no group of subjectsremembered very much of the graphics at all. Along with similar reading speedbetween the groups, the results supported earlier claims that readers do notreally pay attention to visuals used in text.
Hannus (1996) used eye-movement equipment and studied how pupilspicked up information while learning from textbooks. He concluded that thelearning effects of textbook illustrations are slight because not enough attention
369
is paid to the illustrations in the books. Thus the learning functions of illustra-tions were less than he had expected.
In one opinion poll 93 information design students were asked to (1) lookat two food packages, and then (2) draw circles on a reply form, with imagesof the packages, to show were they first had looked at each package. The twopackages each displayed four information elements; one pictorial and three ver-bal:
1. A picture of the contents.2. The name of the product, a title.3. The trademark.4. The amount of contents in the package.
Only one of three subjects (33%) first looked at the pictures on the packages.Two of three (67%) first looked at some verbal information. Most of the 186 obser-vations (42%) were on the name of the product. The trademark was the third group(23%), followed by the amount of contents in the package (2%). I had expectedthat the pictures should attract more attention.
The picture facilitating effect can, however, be increased by making sure thatthe learners really attend to the pictures.
Attention to graphic designGraphic design is a tool with which we can manipulate the raw materials –words, empty space, illustrations, colour, paper and ink, and the final numberof pages – to achieve the best possible communications between people.
Man has an intuitive sense of balance. When a single element is too largeor too small, too light or too dark, too prominent or too indistinct, the entiredesign will suffer from this imbalance. A visual should usually display the bestpossible balance. Elements of the visual should fit together in an aesthetic andharmonious relationship in a manner which is interesting but not distracting.Imbalance creates an uncomfortable feeling in the reader and should often beavoided. Inappropriate use of graphical elements may direct learner attentionaway from essential learning cues and depress subsequent achievement (Pet-tersson, 1989, 1993).
According to Mullet and Sano (1995, p. 38) the most fundamental designtechnique is reduction. An elegant design must be reduced to its essential ele-ments and each element reduced to its essential form. Good design is simple,bold, and direct. It ensures that significant design elements will be noticed byremoving insignificant elements wherever possible. In information design thegoal for graphic design should be clarity of communication.
The most legible combination is a black text on a light yellow background.For text printed in black all paper surfaces are equally legible if they have a
370
reflectance of at least 70%. In a normal reading situation black print on whitepaper is over 10% more efficient than white on black (Pettersson, 1991).
In newspapers and magazines it is quite often a correlation between place-ment of pictures and perceived importance. The higher up on a page a pictureis placed, the more important it is considered to be by several of the readers(White, 1987).
When it comes to general information, the graphical form should basicallybe simple and “transparent” and not arouse any special interest or any attentionfor its own part. Thus the graphical form should not be too exciting or provoc-ative, nor should it be dull.
We know that common typefaces are easier to read than uncommon type-faces (Tinker, 1963; Benson, 1985). Serif typefaces are often considered to be eas-ier to read than sans serif typefaces, except for small letter sizes (Tinker, 1963).It is also known that running text should be in lower case letters. All-capitalprinting has been shown to markedly reduce the speed of reading (Poulton andBrown, 1968; Henny, 1981). Lenze (1991) noted that private documents mayinvite the use of ornate and stylish looking fonts. Professional documents, how-ever, require maximum legibility (Tinker, 1963; Braden, 1983; Benson, 1985).Type can be created in a variety of styles. A change in type style can signal achange of purpose, a new section, or another degree of importance. Typograph-ical techniques can alert learners to such things as main ideas, important con-cepts, rules, sections, subsections, and more. However, multiple type styles ona page tend to be confusing rather than facilitating. The decision of which fontor which fonts to use should rest largely on the purpose and audience of thedocument (Benson, 1985).
Glynn, Britton, and Tillman (1985) reviewed studies on the effect of “typo-graphic cueing” on learning. Typographic cueing generally refers to the use ofbold type, italic type, or underlining to signal the important ideas in a text. Thereis little doubt that this kind of cueing does work in drawing attention to thecued material. The consensus is that readers are more likely to remember cuedideas than uncued ideas (Hartley, 1987). Multiple cueing is of little value unlessthe information is processed in more than one way (Dwyer, 1978). In an exper-iment with 300 subjects Cisotto and Boscolo (1995) found that the use of para-graph headings improved learning. However, underlining of relevant infor-mation did not have the same effect, it did not improve learning. With respectto graphic design of statistical graphics Tufte (1983) concluded that (p. 87):
Graphical competence demands three quite different skills: the substan-tive, statistical, and artistic. Yet most graphical work today, particularlyin news publications, is under the direction of but a single expertise – theartistic. Allowing artist-illustrators to control the design and content ofstatistical graphics is almost like allowing typographers to control the
371
content, style, and editing of prose. Substantive and quantitative exper-tise must also participate in the design of data graphics, at least if statis-tical integrity and graphical sophistication are to be achieved.
Later, Tufte argued (1997, p. 48) that good design brings absolute attention to data.
Influencing attentionWe are almost always paying attention to something, whether it is informationin our environment or information already in our heads. Paying attentionrequires mental effort. Usually we can only attend to one thing at a time. Flemingand Levie (1978) stated that one of the message designer’s first problems is togain the attention of the audience, and thereafter she or he has the continuingproblem of holding the attention. A general attending is often insufficient, forattention must be directed narrowly and precisely to critical aspects of the sub-ject matter. Winn (1993) argued that a great deal of perceptual organisationoccurs preattentively, not under cognitive control. The way a message is orga-nised will have an important effect on the way the perceptual system structureswhat it detects and the perceiver will not be aware of how that information isinterpreted.
As previously noted attention is drawn to changes. This means that there isa need for creativity and innovation in information design, and a frequent intro-duction of change into the otherwise repetitive stream of data and information.Fleming and Levie (1978) noted that change and novelty should direct attentionto the most relevant ideas in a message rather than to the marginal or superficialcontent.
Tufte (1990) argued that the principles of information design are universal,and are not tied to unique features of any particular language or culture. Aspreviously noted the goal of communication-oriented message design shouldalways be clarity of communication. The message must be accurately developedand transmitted by the sender and then correctly interpreted and understoodby the receiver (Pettersson, 1998). Mullet and Sano (1995) noted that (p. 8): “Artis valued for its originality and expressiveness. Its focus is on individual arte-facts crafted through the manual and aesthetic virtuosity of the artist. Design,in contrast, is valued for its fitness to a particular user and task.”
The sender’s creative processes should be influenced by message designprinciples, and are performed with message design tools suitable for the typeof representation that has been selected. Message design principles can be seenas guidelines for design and development of a verbo-visual message. In myopinion the sender should adapt the verbo-visual message to human attention andto human perception in order to facilitate interpretation, understanding and learning
372
(Pettersson, 1997). In general one can state that information should be as simple,clear, and unambiguous as possible. However, in any presentation, informationcan be enriched with a wealth of details. The following lists provide “attention-oriented” guidelines that may be used in the design of information. Each guide-line will improve the possibilities for attention.
Text• Set text large enough (Ormrod, 1989; Wileman, 1993).• Set text bold enough (Mayer, 1993a; Wileman, 1993).• Use headings to make the subject matter readily apparent, and indicate the
relative importance of different items in the document (Jonassen, 1982;Mayer, 1993a; Cisotto and Boscolo, 1995).
• Set headings in different type versions to aid comprehension of the text con-tent (Jonassen, 1982; Mayer, 1993a).
• Use space and the actual placement of a heading to enhance the hierarchicstructure (Jonassen, 1982).
• Make the key words red or underline them (Fleming and Levie, 1978).• Use headings, italics, boldface, or a larger font to highlight the relevant
information (Mayer, 1993a).• Do not overuse accenting techniques in text. They may loose their meanings
(Bausell and Jenkins 1987; Dwyer, 1978; Hartley, Bartlett, and Branthwaite1980; Benson, 1985).
• Use white space between portions of a text as a cue to the learners that anew section follows (Waller, 1987).
• Use blinking and flashing text on a computer screen as an accenting tech-nique (Rambally and Rambally, 1987).
Pictures• Use pictures of the human figure, in particular the face (Goldsmith, 1984).• Use picture elements that are large enough to see (Wileman, 1993). • Make the most important part of the subject large and clear (Ormrod, 1989). • Use picture elements that are bold enough (Wileman, 1993).• Use several kinds of visual types, such as diagrams, drawings, photos to
increase interest in a material (Pettersson, 1989, 1993). • Pictures must be in colour so they resemble the real world (White, 1987).
373
Layout• Instruct the readers to really use the pictures (Reinking, 1986; Weidenmann,
1989; Pettersson, 1990, 1993; Peeck, 1993, 1994; Hannus, 1996).• Put pictures as close to the relevant text as possible (Lidman and Lund,
1972; MacDonald-Ross, 1977; Hartley and Burnhill, 1977; Haber and Hersh-enson, 1980; Wright, 1982; Braden, 1983; Benson, 1985; and Pettersson, 1989,1993).
• Put pictures between the appropriate paragraphs in the text to get maxi-mum impact (Pettersson, 1989, 1993).
• Put pictures on odd-numbered pages. They attract more attention than pic-tures on even pages (Pettersson, 1989, 1993).
• Use “bleed” (covering the entire page, with no margins) creatively toexpand the impact of attention-getting images (White, 1987).
• Tilt a picture in order to draw special attention to it (White, 1987). • Use bullets, arrows, icons, underlining, margin notes, repetition, and/or
white space to highlight the relevant information (Mayer, 1993a).• Use arrows in order to draw attention to a picture (Lamberski and Dwyer,
1983; Beck 1984).• Use lines in various colours in order to draw attention to a picture or to spe-
cific picture elements (Lamberski and Dwyer, 1983; Beck 1984; Pettersson,1993).
• Write a legend for each picture (Bernard, 1990; Pettersson, 1993)• Use legends to direct attention within pictures (Winn, 1993).
Colour
• Use bright and bold colours to capture attention (Ormrod, 1989).• Use colour as an accenting device (Katzman and Nyenhuis, 1972; Lamber-
ski, 1972; Christ, 1975; Dwyer, 1978; Whiteside and Blohm, 1985; Winn,1993; Wogalter, 1999).
• Use colour to clarify the structure of a text. Certain parts of the text may beprinted with colours or printed on top of backgrounds in different colours(Pettersson, 1989, 1993).
• Consider embedded meanings of different colours when using colours toaccent words in a text (Hartley, 1987).
• Use colour and grey scale to influence the perception of size. Open and lightforms are perceived as being larger than closed and darker forms of thesame shape (Winn, 1993).
• Use colour coding to improve attention. The number of colour codes shouldbe limited and they should always be explained (Pettersson, 1989, 1993).
374
Balance
• Use the composition to direct the viewers (Wileman, 1993).• Use imbalance within a picture or within a text (Fleming and Levie, 1978).• Use unexpected, irregular, and unstable design to attract attention (Fleming
and Levie, 1978). • Provide a good contrast between figure and ground (Wileman, 1993)• Use combinations of dark and bright, large and small, round and square, to
sharpen meaning (Pettersson, 1993).• Use informal balance to contribute to a feeling of dynamism (Pettersson,
1993).
Emphasis
• A dark dot in a light field and a jog in a line are two examples of emphasis.These contrasts attracts attention. Many different elements in a visual cancause emphasis. Such examples are:– Arrows– Complexity– Contrast– Change in size– Circles or ovals around objects– Colour against no colour – Detail against no detail– Directionality– Exaggerated features– Implied motion– Isolation– Light against dark – Line drawings in photos– Line intersections– Motion– Position or placement of elements,– Shaded areas– Stars– Tonal contrast– Words in pictures– Any other unexpected change or variation out of context will create em-
phasis, which will attract attention.
These aids must not be distracting, large, or ugly. Simple styles and fontsare more easily read than complex ones (Pettersson, 1993).
• Use adjunct questions to emphasise relevant information (Mayer, 1993a).
375
• Use statements of instructional objectives to emphasise relevant informa-tion (Mayer, 1993a).
• Box-in important messages to gain special attention (Pettersson, 1989). Ifthe lines are shorter the effect is even more obvious.
• Use arrows or lines in various colours in order to draw attention to a pictureor to specific picture elements (Lamberski and Dwyer, 1983; Beck 1984; Pet-tersson, 1993).
• Use humour as a visual pun to attract attention to the content or dramatisecertain portions of a visual. However, humour should be used with greatcare. Misuse of humour and “funny people” may ruin the intended mes-sage. This is sometimes referred to as the “vampire-effect” (Pettersson,1993).
• Exaggerate the shape of a known person or object, as in caricature or car-toons to draw attention to the whole figure or to particular relevant featuresof it (Fleming and Levie, 1978).
• Only draw the lines that are necessary to understand the intended contentin a picture. Our minds constantly fills in missing details and completeimages, most of the time without our realizing that it has happened (Pet-tersson, 1993).
Warnings
• Use a combination of pictographs and words in complex warning messages(Dewar and Arthur, 1999).
• Use a signal word such as “Danger”; a description of the hazard such as“Shallow water”; a description of the consequences that could occur; thespecific actions that should or should not be done, such as “No diving”(Wogalter, 1999).
• Make warning signs of high contrast relative to their background (Barlowand Wogalter, 1993).
• Use large, legible bold-faced alphanumeric characters on warning signs(Wogalter, 1999).
• Put warning signs close to the hazard (Wogalter, 1999).• Provide warning signs with properties that allow them to be seen in
degraded conditions such as low illumination, smoke, or fog (Lerner andCollins, 1983).
• Provide warning signs with adequate reflectance and good lighting (Sand-ers and McCormick, 1993).
376
SummaryThe process of attention determines which events we become conscious of.Attention may be controlled (1) automatically, (2) by instructions, and (3) bythe specific demands of the particular task at hand. A visual material must con-stantly redraw the attention to hold the interest of the viewer. Our perceptionvaries as a result of a number of factors. Visual information is processed quickly.Seeing is direct and effortless. We do not become conscious of all the stimulidetected by our sensory organs. The selective process that controls our aware-ness of events in the environment is called attention. The information designermay use various design principles and guidelines in order to facilitate thereader’s attention processes, and subsequent processes for understanding andlearning.
ReferencesAntes, J. R. (1974). The time course of picture viewing. Journal of Experimental
Psychology, 108, 62–70.Antes, J. R., & Penland, J. G. (1981). Picture context effects on eye movement
patterns. In D. F. Fisher, R. A. Monty, & J. W. Senders (Eds.). Eye Move-ments: Cognition and Visual Perception. Hillsdale, NJ: Lawrence Erlbaum Associates.
Barlow, T. and Wogalter, M. S. (1993). Alcoholic beverage warnings in maga-zine and television advertisements. Journal of Consumer Research, 20, 147-156.
Baron, L. J. (1980). Interaction between television and child-related character-istics as demonstrated by eye movement research. ECTJ, 28, 4, 267–281.
Bausell, R. B., & Jenkins, J. R. (1987). Effects on prose learning of frequency of adjunct cues and the difficulty of the material cued. Journal of Reading Behavior, 9, 227–232.
Beck, C. R. (1984). Visual cueing strategies: Pictorial, textual, and combination effects. Educational Communication & Technology Journal, 32, 207-216.
Benson, P. J. (1985). Writing visually: design considerations in technical pub-lications. Technical Communications Journal. Fourth Quarter. 35-39.
Berlyn, D. E. (1966). Curiosity and exploration. Science, 153, 25–33.Bernard, R. M. (1990). Using extended captions to improve learning from
instructional illustrations. British Journal of Educational Technology, 21, 215-255.
Biederman, I. (1981). On the semantics of a glance at a scene. In M. Kubovy, & J. R. Pomerantz (Eds.). Perceptual Organization. Hillsdale, NJ: Lawrence Erlbaum Associates.
377
Biederman, I. (1995). Visual Object Recognition. In S. M. Kosslyn and D. N. Osh-erson (Eds.) Visual Cognition, An Invitation to Cognitive Science, Second Edi-tion. MA: MIT Press.
Braden, R. (1983). Visualizing the verbal and verbalizing the visual. In R. Braden and A. Walker (Eds.). Seeing Ourselves, Visualization In a Social Context: Readings From The 14th Annual Conference Of The International Visual Literacy Association. Blacksburg VA. Virginia Polytechnic Institute and State Uni-versity.
Brien, R., & Eastmond, N. (1994). Cognitive Science and Instruction. Englewood Cliffs, NJ: Educational Technology Publications.
Broadbent, D. (1958). Perception and Communication. London: Pergamon Press. Carlson, N., R. (1993). Psychology, The Science of Behavior. Fouth Edition.
Needham Heights, MA: Allyn and Bacon. Christ, R. E. (1975). Review and analysis of color coding research for visual
displays. Human Factors, 17, 542–578.Cisotto, L., & Boscolo, P. (1995). Effects of paragraph subtitles and underlining on
written summaries. Presentation at the 6th European Conference for Research on Learning and Instruction. European Association for Research on Learning and Instruction. Nijmegen, August 26 - 31.
Clements, E. (1984). Attention: a theoretical perspective. In A. D. Walker, R. A. Braden, & L. H. Dunker. Visual Literacy – Enhancing Human Potential. Read-ings from the 15th Annual Conference of thje International Visual literacy Association, Virginia Polytechnic Institute and State University. Blacks-burg, VA.
Cochran, L. M. (1987). Visual/Verbal Languaging as Metaphor. Paper presented at the Symposium on Verbo-Visual Literacy: Research and Theory. Stock-holm, June 10–13.
Dake, D. (1999). Brain-Based Education For Visual Literacy. In R. E. Griffin, W. J. Gibbs, & B. Wiegman (Eds.) 1999: Visual Literacy In An Information Age. International Visual Literacy Association.
Deutsch, J. & Deutsch, D. (1963). Attention: Some theoretical considerations. Psychological Review, 70, 80-90.
Dewar, R. & Arthur P. (1999). Warning of water safety hazards with sequential pic-tographs. In H. J. G. Zwaga, T. Boersma, and H. C. M. Hoonhout (Eds.). Visual information for everyday use. Design and research perspectives. London, Philadelphia: Taylor & Francis.
Dryden, J., & Vos, J. (1994). The Learning Revolution. Auckland, New Zealand: Profile Books.
Duchastel, P. C. (1978). Illustrating instructional texts. Educational Technol-ogy, 18, 36–39.
Duchastel, P. C. (1983). Text llustrations. Performance and Instruction, 22, 3–5.Duchastel, P. C., & Waller, R. (1979). Pictorial illustration in instructional texts.
Educational Technology, 19, 20–25.
378
Dwyer, F. M. (1971). Color as an instructional variable. AV Communication Review, 19, 399–413.
Dwyer, F. M. (1978). Strategies for Improving Visual Learning. State College, PA: Learning Services.
Edwards, D. C., & Coolkasian, A. (1974). Peripheral vision location and kinds of complex processing. Journal of Experimental Psychology, 102, 244–249.
Ekwall, E. (1977). Diagnosis and Remediation of the Disabled Reader. Boston: Allyn and Bacon.
Eysenck, M. (1982). Attention and Arousal. NY: Springer-Verlag. Evans, R. M. (1974). The Perception of Color. New York: John Wiley.Evans, M. A., Watson, C., & Willows, D. M. (1987). A Naturalistic Inquiry into
Illustrations in Instructional Textbooks. In H. A. Houghton & D. M. Willows. (Eds.). The Psychology of illustrations: Vol 2. Instructional Issues, 53 - 85. NY: Springer-Verlag.
Faw, T. T., & Nunnaly, J. C. (1967). The effect on eye movements of complex-ity, novelty, and affective tone. Perception and Psychophysics, 2, 263–267.
Faw, T. T., & Nunnaly, J. C. (1968). The influence of stimulus complexity, nov-elty, and affective value on children’s visual fixation. Journal of Experimen-tal Child Psychology, 6, 141–153.
Ferrington, G. (1994). Keep your Ear-Lids Open. Journal of Visual Literacy, 14, 2, 51–61.
Fleming, M. L. (1969). Eye movement indicies of cognitive behavior. AV Com-munication Review, 17, 383–398.
Fleming, M. L., & Levie, W. H. (1978). Instructional Message Design. Englewood Cliffs, NJ: Educational Technology Publications.
Fleming, M. L., & Levie, W. H. (Eds.) (1993). Instructional Message Design (2nd ed.). Englewood Cliffs, NJ: Educational Technology Publications.
Gagné, R. W. (1977). The conditions of learning (3rd ed.). New York: Holt, Rine-hart, & Winston.
Gibson, J. J. (1966). The Senses Considered as Perceptual Systems. Boston: Hough-ton Mifflin.
Gibson, J. J. (1979). The ecological approach to visual perception. Boston: Hough-ton Mifflin.
Glynn, S. M., Britton, B. K., & Tillman, M. H. (1985). Typographic cues in text: Management of the reader’s attention. In D. H. Jonassen (Ed.). The Technol-ogy of Text: Principles for Structuring, Designing, and Displaying Text. Volume 2. Englewood Cliffs, NJ: Educational Technology Publications.
Goldsmith, E. (1984). Research into Illustration: An Approach and a Review. Cam-bridge, England: Cambridge University Press.
Gould, J. (1967). Pattern recognition and eye movement parameters. Perception and Psychophysics, 2, 399–407.
379
Gould, J. (1973). Eye movement during visual search and memory search. Journal of Experimental Psychology, 98, 184–195.
Guba, W., Wolf, W., deGroot, S., Knemeyer, M., Van Atta, R., & Light, L. (1964). Eye movements and TV viewing in children. AV Communication Review, 12, 381–401.
Gunnarsson, B-L. (1982). Lagtexters begriplighet. En språkfunktionell studie av medbestämmandelagen. Liber Förlag: Stockholm.
Gustafsson, C. (1980a). Läromedlens funktion i undervisningen. En rapport från utredningen om läromedelsmarknaden. DsU 1980:4.
Gustafsson, C. (1980b). Läromedlens funktion i undervisningen. Bilagedel. En rap-port från utredningen om läromedelsmarknaden. DsU 1980:5.
Haber, R. N., & Hershenson, M. (1980). The Psychology of Visual Perception. New York: Holt, Rinehart, & Winston.
Hannus, M. (1996). Oppikirjan kuvitus koriste vai ymmärtämisen apu (Textbook illustrations – decoration or an aid to understanding). Turku: Turun Ylio-piston Julkaisuja Annales Universtatis Turkuensis.
Hartley, J. (1987). Designing electronic text: The role of print-based research. Educational Communications and Technology Journal, 35, 3–17.
Hartley, J., Bartlett, S., & Branthwaite, A. (1980). Underlining can make a dif-ference—sometimes. Journal of Educational Research, 73, 218–223.
Hartley, J., & Burnhill, P. (1977). Fifty guidelines for improving instructional text. Programmed Learning and Educational Technology, 14, 65–73.
Heinich, R., Molenda, M., & Russell, J. D. (1982). Instructional Media and the New Technologies of Instruction. New York: Macmillan.
Henney, M. (1981). The effect of all-capital print versus regular mixed print as displayed on a micro-computer screen on reading speed and accuracy. Educational Communications and Technology Journal, 31, 126.
Hochberg, J., & Brooks, V. (1978). Film cutting and visual momentum. In J. Senders, D. Fisher, & T. Monty (Eds.). Eye Movements and the Higher Psycho-logical Functions. Hillsdale, NJ: Lawrence Erlbaum Associates.
Holliday, W. (1980). Using visuals to teach concepts. Science and Children, 17, 9–10.
Hubel, D. H., & Wiesel, T. N. (1962). Receptive fields, binocular interaction, and functional architecture in the cat’s visual cortex. Journal of Physiology, 160, 106–154.
Hård, A., & Sivik, L. (1981). NCS–Natural Color System: A Swedish standard for color-notation. Color Research and Application, 6, 3, 129–138.
Ibison, R. A. (1952). Differential Effect on the Recall of Textual Materials Associated with the Inclusion of Colored and Uncolored Illustrations. Unpublished Doc-toral Dissertation, Indiana University, Bloomington.
380
Jonassen, D. H. (1982). The Technology of Text, Principles for Structuring, Design-ing, and Displaying Text. Volume 1. Englewood Cliffs, NJ: Educational Tech-nology Publications.
Jonassen, D. H., & Kirschener, P. A. (1982). Introduction to section 2: Explicit techniques for structuring text. In D. H. Jonassen (Ed.). The Technology of Text: Principles for Structuring, Designing, and Displaying Text. Volume 2. Englewood Cliffs, NJ: Educational Technology Publications.
Kahneman, D. (1973). Attention and Effort. Englewood Cliffs, NJ: Prentice-Hall. Katzmann, N., & Nyenhuis, J. (1972). Color vs black and white effects on
learning, opinion, and attention. AV Communication Review, 20, 16–28.Kearsly, G. (1999). Explorations in Learning & Instruction: The Theory Into Prac-
tice Database. http://home.sprynet.com/~gkearsleyhttp://www.gwu.edu/~tip/theories.html
Keller, J., & Burkman, E. (1993). Motivation principles. In M. Fleming, & W. H. Levie (Eds.). Instructional Message Design: Principles from the Behav-ioral and Cognitive Sciences (2nd ed.). Englewood Cliffs, NJ: Educational Technology Publications.
Key, W. B. (1977). Subliminal Seduction. New York: Signet.Klapp, S. T., & Netick, A. (1988). Multiple resources for processing and storage
in short-term working memory. Human Factors, 30(5), 617-632.Lamberski, R. J. (1972). An Exploratory Investigation of the Instructional Effect of
Color and Black and White Cueing on Immediate and Delayed Retention. Masters Thesis, The Pennsylvania State University.
Lamberski, J. R., & Dwyer, F. M. (1983). The instructional effect of coding (color and black and white) on information acquisition and retrieval. ECTJ, 31 (1), 9–12.
Leckhart, B. T. (1966). Looking time: The effects of stimulus complexity and familiarity. Perception and Psychophysics, 1, 142–144.
Lenze, J. S. (1991). Serif vs. san serif type fonts: A comparison based on reader comprehension. In D. G. Beauchamp, J. Clark-Baca, & R. A. Braden (Eds.). Investigating Visual Literacy. Selected Readings from the 22nd Annual Con-ference of the International Visual Literacy Association. Blacksburg: Vir-ginia Tech University.
Lerner, N. D., & Collins, B. L. (1983). Symbol sign understandability when visibil-ity is poor. In Proceedings of the Human Factors Society 27th Annual Meeting, 944-946. Santa Monica, CA: Human Factors Society.
Leshin, C. B., Pollock, J., & Reigeluth, C. M. (1992). Instructional design strategies and tactics. Englewood Cliffs, NJ: Educational Technology Publications.
Lester, P, M. (1995). Visual Communication. Images with Messages. Belmont, CA: Wadsworth Publishing Company. A Division of International Thomson Publishing Inc.
Levie, W. H., & Lentz, R. (1982). Effects of text illustrations: A review of research. ECTJ, 30, 195–232.
381
Levin, J. R., Anglin, G. J., & Carney, R. N. (1987). On empirically validating functions of pictures in prose. In D. M. Willows & H. A. Houghton (Eds.). The Psychology of IIlustration: Vol. 1. Basic Research. New York: Springer-Ver-lag.
Lidman, S. , & Lund, A. M. (1972). Berätta med bilder. Stockholm: Bonniers.Loftus, G. R. (1972). Eye fixations and recognition memory for pictures. Cog-
nitive Psychology, 3, 521–551.Loftus, G. R. (1976). A framework for theory of picture recognition. In R. A.
Monty, & J. W. Senders (Eds.). Eye Movements and Psychological Processes. New York: John Wiley.
Loftus, G. R. (1979). On-line eye movement recorders: The good, the bad, and the ugly. Behavior Research Methods, & Instrumentation, 11, 188–191.
MacDonald-Ross, M. (1977). How numbers are shown: A review of research on the presentation of quantitative data in texts. AV Communication Review, 25 (4), 359–409.
Mackworth, N. H., & Morandi, A. J. (1967). The gaze selects informative details within pictures. Perception and Psychophysics, 2, 547–552.
Massoumian, B. (1989). Successful teaching via two-way interactive video. TechTrends, 34 (2), 16 -19.
Matsushita, K. (1988). A summary version of the Comprehensive Report on Hi-OVIS PROJECT Jul. ´78 — Mar.´86. Tokyo: New Media Development.
Mayer, R. E. (1993a). Problem-solving principles. In M. Fleming, & W. H. Levie (Eds.). Instructional Message Design (2nd ed.). Englewood Cliffs, NJ: Educational Technology Publications.
Mayer, R. E. (1993b). Illustrations that instruct. In R. Glaser (Ed.), Advances in instructional psychology, Volume 5. Hillsdale, JH: Erlbaum
Moray, N. (1970). Attention. New York: Academic Press.Moriarty, S. E. (1991). Creative Advertising. Theory and Practice. Englewood
Cliffs, NJ: Prentice Hall.Mullet, K. & Sano, D. (1995). Designing Visual Interfaces Communication Ori-
ented Techniques. Mountain View, California: SunSoft Press A Prentice Hall Title.
Navon, D. (1977). Forest before trees: The precedence of global features in visual perception. Cognitive Psychology, 9, 353–383.
Neisser, U. (1967). Cognitive Psychology. New York: Appleton-Century-Croft. Neisser, U. (1976). Cognition and reality. San Francisco: Freeman. Nelson Knupfer, N., & Stock McIsaac, M. (1992). The Effects of Gray Shades in
Instructional Materials Produced with Sesktop Publishing Software. In: J. Clark–Baca, D. G. Beauchamp, & R. A. Braden, (Eds.) 1992: Visual Communication: Bridging Across Cultures Selected Readings from the 23rd Annual Conference of the International Visual Literacy Association. International Visual Literacy Association. Blacksburg, VA. p. 25–37.
382
Nesbit, L. L. (1981). Relationship between eye movement, learning, and pic-ture complexity. ECTJ, 29(2), 109–116.
Norman, D. (1967). Memory and Attention. New York: Wiley. Noton, D., & Stark, L. (1971a). Scanpaths in eye movements during pattern
perception. Science, 171, 308–311. Noton, D., & Stark, L. (1971b). Eye movements and visual perception. Scientific
American, 225, 34–43. Ormrod, J. E. (1989). Using Your Head. An Owner’s Manual. Englewood Cliffs,
NJ: Educational Technology Publications.Paivio, A. (1983). The empirical case for dual coding. In J. C. Yuille (Ed.). Imag-
ery, Memory, and Cognition. Hillsdale, NJ: Lawrence Erlbaum Associates, 307-332.
Paivio, A. (1986). Mental representations: A dual coding approach. Oxford, England: Oxford University Press.
Pashler, H. (1995). Attention and Visual Perception: Analyzing Divided Attention. In S. M. Kosslyn and D. N. Osherson (Eds.) Visual Cognition, An Invitation to Cognitive Science, Second Edition. MA: MIT Press.
Peeck, J. (1993). Increasing picture effects in learning from illustrated text. Learning nand Instruction, 3, 227 – 238.
Peeck, J. (1994). Enhancing graphic effects in instructional texts: Influencing learn-ing activities. In W. Schnotz, R. W. Culhavy (Eds.). Comprehension of graph-ics. North Holland, Elsevier Science B. V.: Amsterdam.
Peters, J. M. (1978). Pictorial communication. Cape town: David Philip.Pettersson, R. (1983). Factors in visual language: Image framing. Visual Liter-
acy Newsletter, 9 and 10.Pettersson, R. (1989). Visuals for Information: Research and Practice. Englewood
Cliffs, NJ: Educational Technology Publications.Pettersson, R. (1990). Teachers, students, and visuals. Journal of Visual Literacy,
10, 1, 45–62. Pettersson, R. (1991). Describing picture context. Presentation at the 23rd
Annual Conference of the International Visual Literacy Association. Wash-ington, Oct. 9–13. In J. Clark-Baca, D. G. Beauchamp, & R. A. Braden (Eds.). Visual Communication: Bridging Across Cultures. Selected Readings from the 23rd Annual Conference of the International Visual Literacy Association. Blacksburg: Virginia Tech University.
Pettersson, R. (1993). Visual Information. Englewood Cliffs, NJ: Educational Technology Publications.
Pettersson, R. (1995). The Learning Helix. Paper presented at the 27th Annual Conference of the International Visual Literacy Association. Chicago, Oct. 18 – 22. 1995. Published in: R. E. Griffin. D. G. Beauchamp, J. M. Hunter & C. B. Shiffman, (Eds.) 1996: Eyes on the Future: Converging Images, Ideas and Instruction.
383
Selected Readings of the International Visual Literacy Association. International Visual Literacy Association.
Pettersson, R. (1997). Verbo-visual Communication – Presentation of Clear Mes-sages for Information and Learning. Göteborg: Valfrid Publishing Association and Research Centre for Library and Information Studies, Göteborg Uni-versity.
Pettersson, R. (1998). Information Design. Västerås: Mälardalens Högskola Research & Reports. Opuscula Nr 36.
Pettersson, R. (1999). Image Functions in Information Design. In R. E. Griffin, W. J. Gibbs, & B. Wiegman (Eds.): Visual Literacy In An Information Age. Inter-national Visual Literacy Association.
Pettersson, R., Metallinos, N., Muffoletto, R., Shaw, J. and Takakuwa, Y. (1991). The use of verbo–visual information in teaching of geography – views from teachers. Presentation at the 23rd Annual Conference of the International Visual Literacy Association. Washington, Oct. 9–13.Published in: J. Clark–Baca, D. G. Beauchamp & R. A. Braden, (Eds.) 1992: Visual Communication: Bridging Across Cultures Selected Readings from the 23rd Annual Conference of the International Visual Literacy Association. Inter-national Visual Literacy Association. Blacksburg, VA. p. 211–222.Also published 1993 in: ETR&D, Vol. 41, 1 101–107.
Pines, M. (1986). Landscapes of the mind. In R. M. Poole (Ed.), The incredible machine, 325–377. Washington, DC: National Geographic Society.
Poulton, E. C. , & Brown, C. H. (1968). Rate of comprehension of an existing teleprinter output and of possible alternatives. Applied Psychology, 52, 16–21.
Pressley, G. M., & Miller, G. E. (1987). Effects of illustrations on children’s lis-tening comprehension and oral prose memory. In D. M. Willows & H. A. Houghton (Eds.). The Psychology of Illustrations. Vol. 1. New York: Springer-Verlag.
Printzmetal, W., & Banks, W. P. (1977). Good continuation affects visual detec-tion. Perception and Psychophysics, 21, 389–395.
Rambally, G. K., & Rambally, R. S. (1987). Human factors in CAI design. Com-puting Education, 11(2), 149–153.
Reinking, D. (1986). Integrating graphic aids into content area instruction: The graphic information lesson. Journal of Reading, 30(2), 146–151.
Rudisill, M. (1951–1952). Children’s preferences for colour versus other qual-ities in illustrations. Elementary School Journal, 52, 444–457.
Sanders, M. S., and McGormick, E. J. (1993). Human Factors in Engineering and Design (7th edn). New York: McGraw-Hill.
Sigurgeirsson, I. (1990). The Use of Reference Materials, Other Books, Audio–Visu-als and Educational Equipment. Presentation vid konferensen Nordträff, 2–5 August 1990.
384
Sinatra, R. (1986). Visual Literacy Connections to Thinking, Reading, and Writing. Springfield, IL: Charles C. Thomas.
Spangenberg, R. (1976). Which is better for learning? Color or black and white? Audio Visual Instruction, 21(3), 80.
Stern, R, C., & Robinson, R. (1994). Perception and Its Role in Communication adn Learning. In D. M. Moore, & F. M. Dwyer (Eds.), Visual Literacy. A Spectrum of Visual Learning. Englewood Cliffs, NJ: Educational Technology Publica-tions.
Sweller, J., Chandler, P., Tierney, P., & Cooper, M. (1990). Cognitive load as a factor in the structure of technical material. Journal of Experimentel Psychol-ogy: General, 119(2), 176-192.
Tinker, M. A. (1963). The Legibility of Print. Ames: Iowa State University Press.Tufte, E. R. (1983). The Visual Display of Quantitative Information. Cheshire,
New Haven Conneticut: Graphics Press.Tufte, E. R. (1990). Envisioning Information. Cheshire, New Haven Conneticut:
Graphics Press.Tufte, E. R. (1997). Visual Explanations. Cheshire, New Haven Conneticut:
Graphics Press.Uljens, M. (1992). What is learning a change of? (1992:01): Department of Educa-
tion and Educational Research University of Göteborg.Urbina, S. P. (1994). Attention. In R. J. Corsini (1994). Encyclopedia of Psychology.
Second Edition. New York: John Wiley and Sons.Vogel, D. R., Dickson, G. W., & Lehman, J. A. (1986). Driving the audience
action response. Computer Graphics World, August.Waller, R. (1987). The Typographic Contribution to Language: Towards a Model of
Typographic Genres and Their Underlying Structures. Reading: University of Reading, Department of Typography, & Graphic Communication.
Webb, W. W., Matheny, A., & Larson, G. (1963). Eye movements and a para-digm of approach and avoidance behavior. Perceptual and Motor Skills, 16, 341–347.
Weidenmann, B. (1989). When good pictures fail: An information-processing approach to the effect of illustrations. In H. Mandl & J. R. Levin (Eds.). Knowl-edge Acquisition from Text and Pictures. Amsterdam: Elsevier.
Weilenman, L. (1999). Smygande reklam. Dagens Nyheter, April 11, p. A 20.White, J. (1987). New Strategies for Editing and Design. Presentations at Trialog
87, Stockholm.Whiteside, C., & Blohm, P. (1985). The effects of CRT text color and decision
making tasks on learners’ recall. In N. H. Thayer, & S. Clayton-Randolph (Eds.). Visual Literacy: Cruising into the Future. Readings from the 16th Annual Conference of the International Visual Literacy Association. Bloomington, IN: Western Sun Printing Co.
385
Wickens, C. D. (1980). The structure of attentional resources. In R. Nickerson (Ed.). Attention and performance VIII. Hillsdale, NJ: Erlbaum.
Wickens, C. D. (1984). Processing resources in attention. In R. Parasuraman, & D. Davis (Eds.). Varieties of attention. New York: Academic Press.
Wickens, C. D. (1991). Processing resources and attention. In D. Damos (Ed.). Multiple tasks performance. London: Taylor and Francis.
Wileman, R. E. (1993). Visual Communicating. Englewood Cliffs, NJ: Educa-tional Technology Publications.
Winn, W. (1993). Perception principles. In M. Fleming & W. H. Levie (Eds.). Instructional Message Design: Principles from the Behavioral and Cognitive Sci-ences (2nd ed.). Englewood Cliffs, NJ: Educational Technology Publica-tions.
Winne, P. (1995). Challenges to the development of self-regulated learning. Presen-tation at the 6th European Conference for Research on Learning and Instruction. European Association for Research on Learning and Instruc-tion. Nijmegen, August 26 - 31.
Wogalter, M. S. (1999). Factors influencing the effectiveness of warnings. In H. J. G. Zwaga, T. Boersma, and H. C. M. Hoonhout (Eds.). Visual information for everyday use. Design and research perspectives. London, Philadelphia: Taylor & Francis.
Wolf, W. (1970). A Study of Eye Movement in Television Viewing. Final Report. Columbus: Ohio State University. (ERIC Reproduction Service No. ED 046 254).
Wright, P. (1982). A user-oriented approach to the design of tables and flow-charts. In D.H. Jonassen (Ed.). The Technology of Text: Principles for Structur-ing, Designing, and Displaying Text. Englewood Cliffs, NJ: Educational Technology Publications.
Yarbus, A. (1967). Eye Movements and Vision. New York: Plenum Press.Young, S. L. (1991). Increasing the noticeability of warnings: effects of pictorial,
color, signal icon and border. In Proceedings of the Human Factors Society 35th Annual Meeting, 580-584. Santa Monica, CA: Human Factors Society.
Zangemeister, W. H., Sherman, K., & Stark, L. (1995). Evidence for a Global Scanpath Strategy in Viewing Abstract Compared with Realistic Images. Neuropsychologia, 33, 8, 1009–1025.
Zusne, L., & Michaels, K. (1964). Nonrepresentional shapes and eye move-ments. Perceptual and Motor Skills, 18, 11–20.

386
387
Paper 22
Interpreting image content
Abstract. More than 5000 statements from more than 300 subjects show that pic-tures can generate a great variety of associations in audiences. Different assignmentsto a picture will influence the meaning in the mind of the viewer. A picture mayalways be interpreted in different ways. In information design it is not sufficient tochoose and use good pictures. Pictures used in information materials always shouldhave captions to guide the understanding of their intended contents
Image functionsWe know that visuals are perceived much more rapidly and readily than text(Fleming and Levie, 1978, 1993; Sinatra, 1986). Lester (1995, p. 73) noted that:“Visual messages are a powerful form of communication because they stimulateboth intellectual and emotional responses – they make us think as well as feel.”Many papers have suggested various roles, functions, objectives and purposesfor the use of illustrations – often without a great deal of evidence to supportthe suggestions.
Pettersson (1998) presented hundreds of opinions about image functionsin communication. More than one hundred different explanatory verbs are usedin the literature to express these opinions. According to researchers in the areasof instructional message design, visual literacy, and visual communication themost common opinions on functions of visuals concern attention. Attract, gain,get, hold and maintain attention is mentioned by the researchers. Other commonexplanatory verbs are: facilitate, provide, persuade, create (an interest in), illustrate,clarify, motivate, present, and reinforce information (to someone).
The most common purposes of pictures in the school environment are to:show, explain, visualize, illustrate, clarify, inform, summarize, convey, mediate, elu-cidate, present, and give (perceptions), instruct, describe, and entertain. There seemto be different “fashions” in teaching practice, which differ from culture to cul-ture and may change over time within different cultures. Fashion in the use ofeducational media is partly related to the technology that is available in thatspecific culture at that time.
The most common purposes of pictures in information design are to visu-alize, clarify, inform, attract attention, facilitate reading, explain, and convey infor-
388
mation. The type of visual to be used in the production of materials for infor-mation and learning must often be determined in each case with a view tospecific demands on the visual, and also to the prevailing budget and timeframeworks.
There are many ways to depict even the simplest object. Many pictures areappropriate to and representative of a given designation, such as Easter, Christ-mas, flowers, children, horses, dogs, cats, etc. The depiction of, e.g., Jesus Christand Buddha is commonplace in the classical art of the respective religions. Thenumber of pictures capable of depicting a concept declines as the degree ofdescriptive detail increases. Many pictures may be regarded as “visual syn-onyms”. A message may always be expressed in different pictures.
We know that the information provider may have many different intentionswhen they use pictures. However, we do not usually know how people perceiveand interpret pictures?
Image interpretationSome researchers suggest that information is represented solely in the form ofpropositions. Images are said to be recorded into propositional format by a seriesof transformations (Pylyshyn, 1973, 1979). Others suggest more complex sys-tems in which a variety of storage formats co-exist in an interlinked manner(Anderson, 1978, 1983; Wender, 1989). The perception process is often assumedto consist of two stages. A fast overview is followed by a conscious analysis.When we first look at an image we only see that which is necessary to perceiveand identify objects and events in a reasonable and meaningful manner. Thisis Gibson’s “principle of economy” (Gibson, 1966).
Barry (1998) made a clear distinction between two independent mind sys-tems, one that feels and one that thinks. This explains why images may speakto us holistically and emotionally. Data about some images are only emotionallyprocessed. Other images are analyzed. In rational theory, people weigh thingsequally and then consciously decide on truth or logic. In reality, however, emo-tional response comes first. Barry concluded that we begin to respond to thevisual environment emotionally, below the level of or rational awareness, beforewe can critically analyze it. This makes it likely that much of cognition is actuallyrationalization to make unconscious emotional response acceptable to the con-scious mind. Pettersson (1987) found that simple line drawings accompaniedby various assignments caused different reactions in subjects and presented asimilar “dual view”. It was obvious that different assignments had caused per-ception and image interpretation on different cognitive levels.
In comparison to a written text, a visual contains an infinite amount of infor-mation. By selecting and utilizing different parts of the information in a picture
389
on different occasions, we can experience completely new and different per-ceptions when we re-see a picture in new contexts. Like other languages, pic-tures consist of coded messages that are comprehensible in a given social con-text. We often find it difficult to interpret the messages in pictures fromunfamiliar cultures and earlier ages.
The reader (viewer) has greater freedom in interpreting a visual messagethan a verbal message. Extraneous messages may compete with the messagesthat the sender regards as significant and important. Thus, pictures alwaysincorporate some ambiguity and numerous “correct” interpretations, althoughnot always a picture’s intended or anticipated interpretation.
Image associationsRussel (1991) studied how individuals make sense of their world through pho-tographs. A total of 163 children (11 – 12 years old) were given black and white,and colour photographs and were asked to write words and phrases which cameto mind as they viewed the images. The picture elicited more than 400 differentwords/phrases (associations). On average, each child gave a total of 17 words/phrases. Russel concluded that photographs could provide a unique view oflife, but the cultural environment and background experiences of the viewerinfluence the meaning in the mind of the viewer. In making sense of the worldthrough photographs each viewer internalizes the message to personal space,time and life experiences.
Later Russel described five categories for viewers contributions to photo-graphs (Russel, 1993). In observation the photograph is seen as a series of observ-able elements. In interpretation the photograph is seen as a stimulus for inter-pretation. Here the viewer tries to create meaning from the visible elements.In personal memories the photograph is seen as a stimulus to recall personal expe-riences. In participation the photograph is seen as a stimulus for imaginative par-ticipation. The viewer is participating in the scene in the image. In medium intru-sion the photograph is seen as a specific communication medium related to thephotographer and to the camera.
Pettersson (1994) studied what kind of associations people get from viewingslides and how people interpret pictures in advertisements. In the first study52 subjects generated 385 associations to six slides. In the second study 50 sub-jects provided 300 associations to six pictures in advertisements. Both studiesshowed that pictures could generate a great variety of associations in audiences.It was concluded that pictures used in information and instructional materials alwaysneed captions to guide the intended understanding of the content. There is oftena considerable disparity between the sender's “intended message” and thereceiver's “perceived message” (Pettersson, 1985, 1986, 1988). Indeed, it is some-
390
times doubtful whether the receiver has understood anything at all of what thesender wants to convey. Listeners and readers create their own associations andchains of associations. As far as ambiguous pictures are concerned, there is oftena major difference between their denotation, i.e., their literal meaning, and theirvarious connotations, i.e., their associative meanings, and their private associ-ations (Pettersson, 1993, 1994).
Research questionsIn order to further observe what kind of interpretations pictures may cause indifferent people I have designed and conducted another “Image AssociationStudy”. The main hypothesis is that different assignments to a picture will influencethe meaning in the mind of the viewer.
When we ask people a basic question like: “What does this picture repre-sent?” we should expect to get the same answer from different persons in thesame cultural environment. This should be an answer on an “immediate levelinterpretation”. At least we should expect to get rather similar answers fromdifferent persons. These answers might be rather short and distinct. The samewords would be used by a large number of people.
However, when we ask people a question like: “What do you think of whenyou see this picture?” we should expect to get a large number of differentanswers. This should be an answer on an “analytic level interpretation”. Theseanswers might be rather long and elaborated and subjects would be expectedto use many different words.
For this study I formulated the following five questions for our own studentsat the Department of Information Design at Mälardalen University.
• What does this picture represent?• What happens in the picture?• Where did you first look in the picture?• What do you think of when you see this picture?• Why do you think so?
The students were also asked to write a caption to each picture. This assign-ment is not further discussed in this paper.
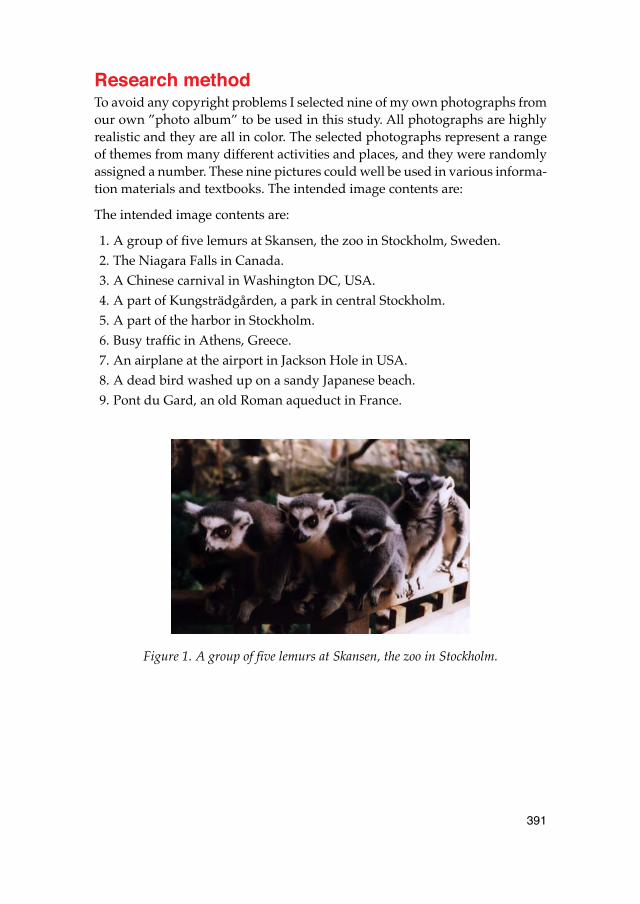
391
Research methodTo avoid any copyright problems I selected nine of my own photographs fromour own ”photo album” to be used in this study. All photographs are highlyrealistic and they are all in color. The selected photographs represent a rangeof themes from many different activities and places, and they were randomlyassigned a number. These nine pictures could well be used in various informa-tion materials and textbooks. The intended image contents are:
The intended image contents are:
1. A group of five lemurs at Skansen, the zoo in Stockholm, Sweden.2. The Niagara Falls in Canada.3. A Chinese carnival in Washington DC, USA.4. A part of Kungsträdgården, a park in central Stockholm.5. A part of the harbor in Stockholm.6. Busy traffic in Athens, Greece.7. An airplane at the airport in Jackson Hole in USA.8. A dead bird washed up on a sandy Japanese beach.9. Pont du Gard, an old Roman aqueduct in France.
Figure 1. A group of five lemurs at Skansen, the zoo in Stockholm.
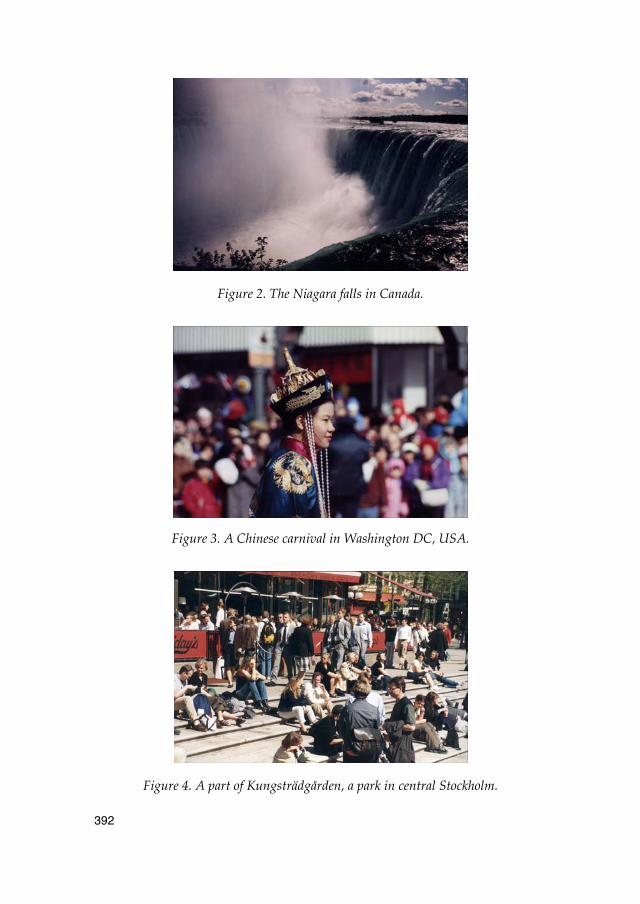
392
Figure 2. The Niagara falls in Canada.
Figure 3. A Chinese carnival in Washington DC, USA.
Figure 4. A part of Kungsträdgården, a park in central Stockholm.

393
Figure 5. A part of the harbor in Stockholm.
Figure 6. Busy traffic in Athens, Greece.
Figure 7. An airplane at the airport in Jackson Hole in USA.
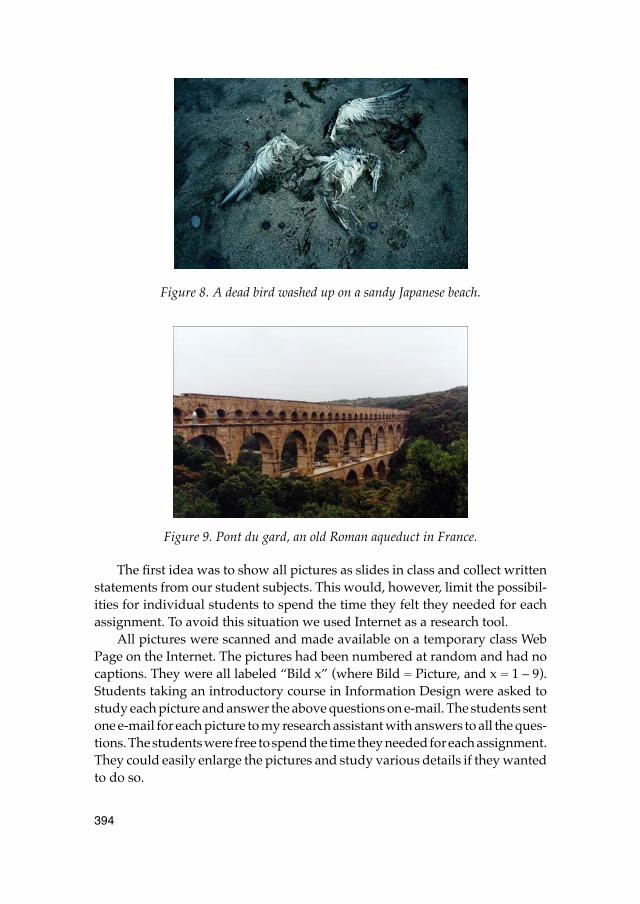
394
Figure 8. A dead bird washed up on a sandy Japanese beach.
Figure 9. Pont du gard, an old Roman aqueduct in France.
The first idea was to show all pictures as slides in class and collect writtenstatements from our student subjects. This would, however, limit the possibil-ities for individual students to spend the time they felt they needed for eachassignment. To avoid this situation we used Internet as a research tool.
All pictures were scanned and made available on a temporary class WebPage on the Internet. The pictures had been numbered at random and had nocaptions. They were all labeled “Bild x” (where Bild = Picture, and x = 1 – 9).Students taking an introductory course in Information Design were asked tostudy each picture and answer the above questions on e-mail. The students sentone e-mail for each picture to my research assistant with answers to all the ques-tions. The students were free to spend the time they needed for each assignment.They could easily enlarge the pictures and study various details if they wantedto do so.
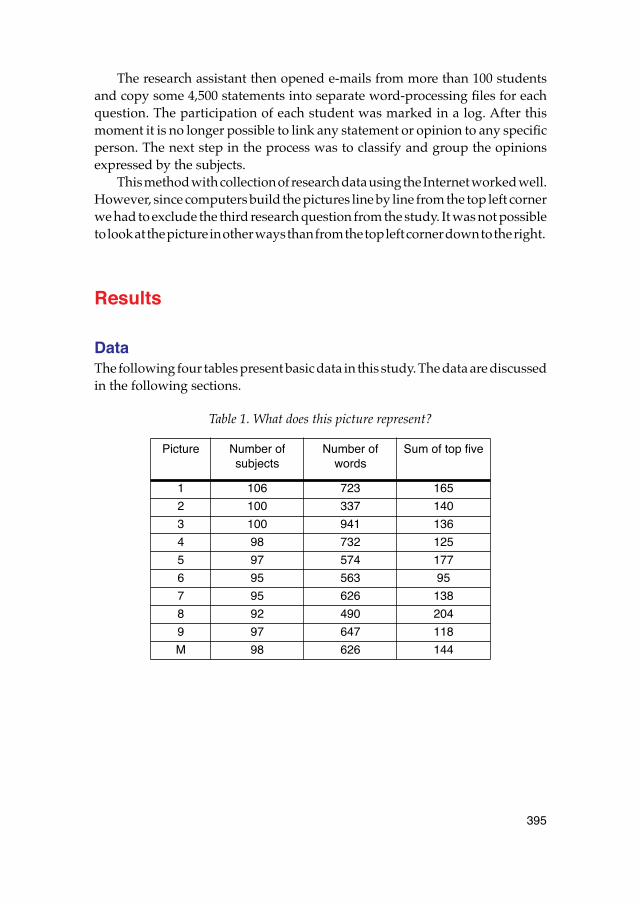
395
The research assistant then opened e-mails from more than 100 studentsand copy some 4,500 statements into separate word-processing files for eachquestion. The participation of each student was marked in a log. After thismoment it is no longer possible to link any statement or opinion to any specificperson. The next step in the process was to classify and group the opinionsexpressed by the subjects.
This method with collection of research data using the Internet worked well.However, since computers build the pictures line by line from the top left cornerwe had to exclude the third research question from the study. It was not possibleto look at the picture in other ways than from the top left corner down to the right.
Results
Data The following four tables present basic data in this study. The data are discussedin the following sections.
Table 1. What does this picture represent?
Picture Number of subjects
Number of words
Sum of top five
1 106 723 165
2 100 337 140
3 100 941 136
4 98 732 125
5 97 574 177
6 95 563 95
7 95 626 138
8 92 490 204
9 97 647 118
M 98 626 144
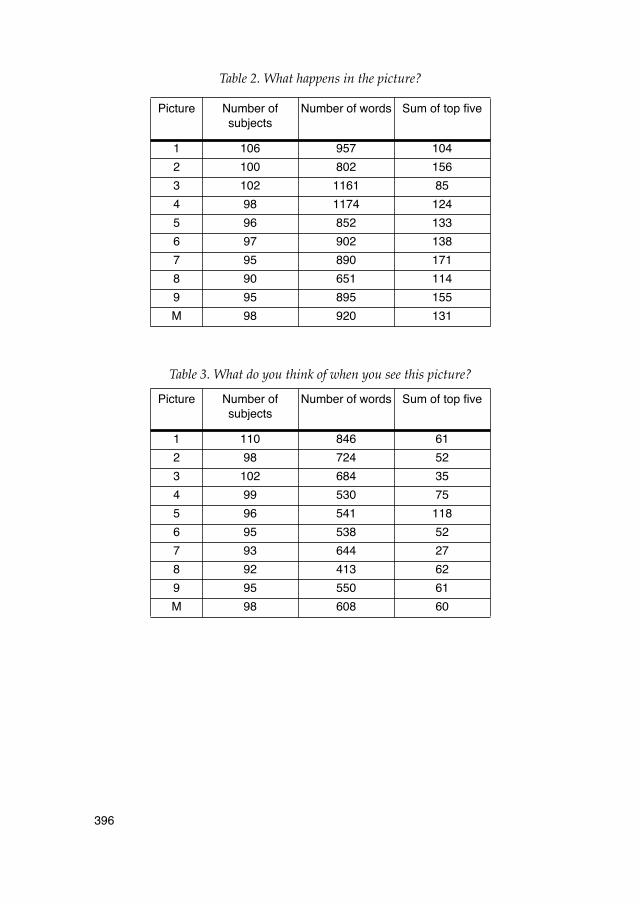
396
Table 2. What happens in the picture?
Table 3. What do you think of when you see this picture?
Picture Number of subjects
Number of words Sum of top five
1 106 957 104
2 100 802 156
3 102 1161 85
4 98 1174 124
5 96 852 133
6 97 902 138
7 95 890 171
8 90 651 114
9 95 895 155
M 98 920 131
Picture Number of subjects
Number of words Sum of top five
1 110 846 61
2 98 724 52
3 102 684 35
4 99 530 75
5 96 541 118
6 95 538 52
7 93 644 27
8 92 413 62
9 95 550 61
M 98 608 60
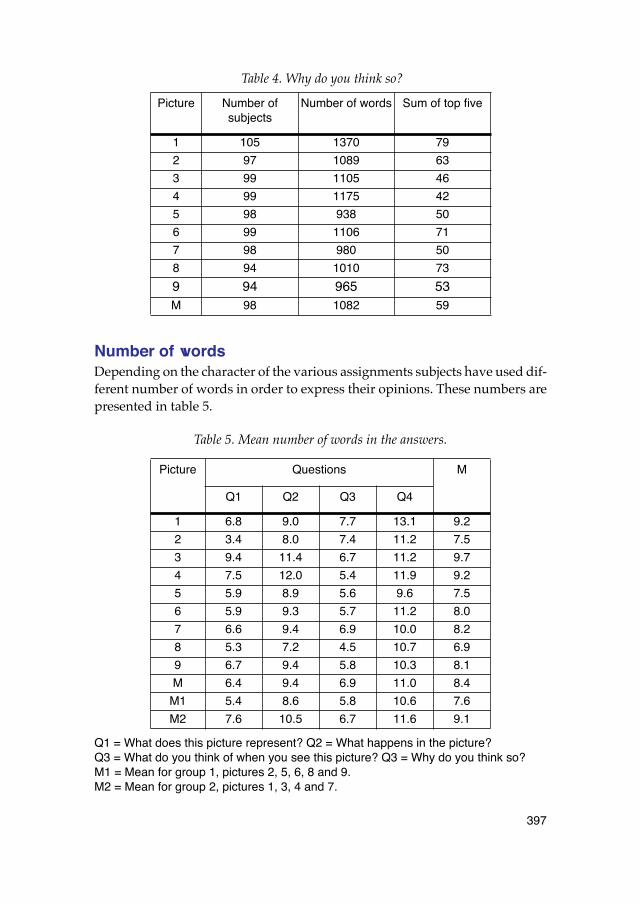
397
Table 4. Why do you think so?
Number of wordsDepending on the character of the various assignments subjects have used dif-ferent number of words in order to express their opinions. These numbers arepresented in table 5.
Table 5. Mean number of words in the answers.
Q1 = What does this picture represent? Q2 = What happens in the picture?Q3 = What do you think of when you see this picture? Q3 = Why do you think so?M1 = Mean for group 1, pictures 2, 5, 6, 8 and 9. M2 = Mean for group 2, pictures 1, 3, 4 and 7.
Picture Number of subjects
Number of words Sum of top five
1 105 1370 79
2 97 1089 63
3 99 1105 46
4 99 1175 42
5 98 938 50
6 99 1106 71
7 98 980 50
8 94 1010 73
9 94 965 53M 98 1082 59
Picture Questions M
Q1 Q2 Q3 Q4
1 6.8 9.0 7.7 13.1 9.2
2 3.4 8.0 7.4 11.2 7.5
3 9.4 11.4 6.7 11.2 9.7
4 7.5 12.0 5.4 11.9 9.2
5 5.9 8.9 5.6 9.6 7.5
6 5.9 9.3 5.7 11.2 8.0
7 6.6 9.4 6.9 10.0 8.2
8 5.3 7.2 4.5 10.7 6.9
9 6.7 9.4 5.8 10.3 8.1
M 6.4 9.4 6.9 11.0 8.4
M1 5.4 8.6 5.8 10.6 7.6
M2 7.6 10.5 6.7 11.6 9.1
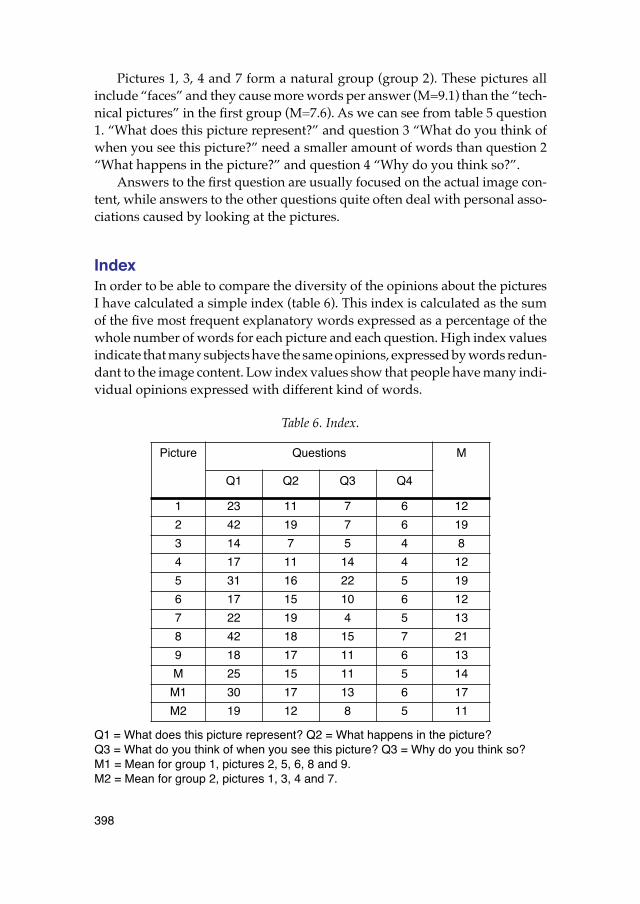
398
Pictures 1, 3, 4 and 7 form a natural group (group 2). These pictures allinclude “faces” and they cause more words per answer (M=9.1) than the “tech-nical pictures” in the first group (M=7.6). As we can see from table 5 question1. “What does this picture represent?” and question 3 “What do you think ofwhen you see this picture?” need a smaller amount of words than question 2“What happens in the picture?” and question 4 “Why do you think so?”.
Answers to the first question are usually focused on the actual image con-tent, while answers to the other questions quite often deal with personal asso-ciations caused by looking at the pictures.
IndexIn order to be able to compare the diversity of the opinions about the picturesI have calculated a simple index (table 6). This index is calculated as the sumof the five most frequent explanatory words expressed as a percentage of thewhole number of words for each picture and each question. High index valuesindicate that many subjects have the same opinions, expressed by words redun-dant to the image content. Low index values show that people have many indi-vidual opinions expressed with different kind of words.
Table 6. Index.
Q1 = What does this picture represent? Q2 = What happens in the picture? Q3 = What do you think of when you see this picture? Q3 = Why do you think so?M1 = Mean for group 1, pictures 2, 5, 6, 8 and 9. M2 = Mean for group 2, pictures 1, 3, 4 and 7.
Picture Questions M
Q1 Q2 Q3 Q4
1 23 11 7 6 12
2 42 19 7 6 19
3 14 7 5 4 8
4 17 11 14 4 12
5 31 16 22 5 19
6 17 15 10 6 12
7 22 19 4 5 13
8 42 18 15 7 21
9 18 17 11 6 13
M 25 15 11 5 14
M1 30 17 13 6 17
M2 19 12 8 5 11
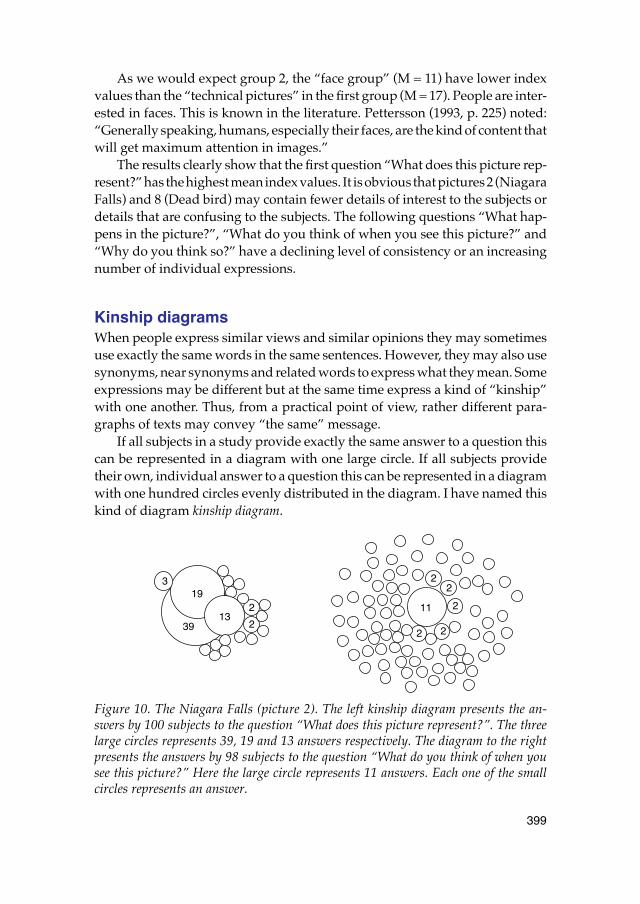
399
As we would expect group 2, the “face group” (M = 11) have lower indexvalues than the “technical pictures” in the first group (M = 17). People are inter-ested in faces. This is known in the literature. Pettersson (1993, p. 225) noted:“Generally speaking, humans, especially their faces, are the kind of content thatwill get maximum attention in images.”
The results clearly show that the first question “What does this picture rep-resent?” has the highest mean index values. It is obvious that pictures 2 (NiagaraFalls) and 8 (Dead bird) may contain fewer details of interest to the subjects ordetails that are confusing to the subjects. The following questions “What hap-pens in the picture?”, “What do you think of when you see this picture?” and“Why do you think so?” have a declining level of consistency or an increasingnumber of individual expressions.
Kinship diagramsWhen people express similar views and similar opinions they may sometimesuse exactly the same words in the same sentences. However, they may also usesynonyms, near synonyms and related words to express what they mean. Someexpressions may be different but at the same time express a kind of “kinship”with one another. Thus, from a practical point of view, rather different para-graphs of texts may convey “the same” message.
If all subjects in a study provide exactly the same answer to a question thiscan be represented in a diagram with one large circle. If all subjects providetheir own, individual answer to a question this can be represented in a diagramwith one hundred circles evenly distributed in the diagram. I have named thiskind of diagram kinship diagram.
Figure 10. The Niagara Falls (picture 2). The left kinship diagram presents the an-swers by 100 subjects to the question “What does this picture represent?”. The threelarge circles represents 39, 19 and 13 answers respectively. The diagram to the rightpresents the answers by 98 subjects to the question “What do you think of when yousee this picture?” Here the large circle represents 11 answers. Each one of the smallcircles represents an answer.
3
13
19
39
11
22
2
22
2
2
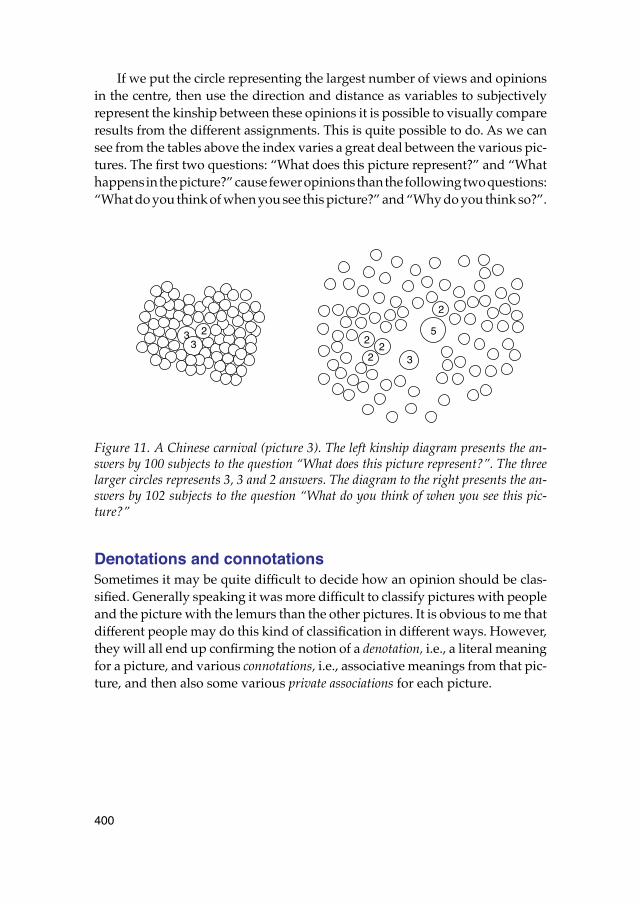
400
If we put the circle representing the largest number of views and opinionsin the centre, then use the direction and distance as variables to subjectivelyrepresent the kinship between these opinions it is possible to visually compareresults from the different assignments. This is quite possible to do. As we cansee from the tables above the index varies a great deal between the various pic-tures. The first two questions: “What does this picture represent?” and “Whathappens in the picture?” cause fewer opinions than the following two questions:“What do you think of when you see this picture?” and “Why do you think so?”.
Figure 11. A Chinese carnival (picture 3). The left kinship diagram presents the an-swers by 100 subjects to the question “What does this picture represent?”. The threelarger circles represents 3, 3 and 2 answers. The diagram to the right presents the an-swers by 102 subjects to the question “What do you think of when you see this pic-ture?”
Denotations and connotationsSometimes it may be quite difficult to decide how an opinion should be clas-sified. Generally speaking it was more difficult to classify pictures with peopleand the picture with the lemurs than the other pictures. It is obvious to me thatdifferent people may do this kind of classification in different ways. However,they will all end up confirming the notion of a denotation, i.e., a literal meaningfor a picture, and various connotations, i.e., associative meanings from that pic-ture, and then also some various private associations for each picture.
5
3
22
2
233
2
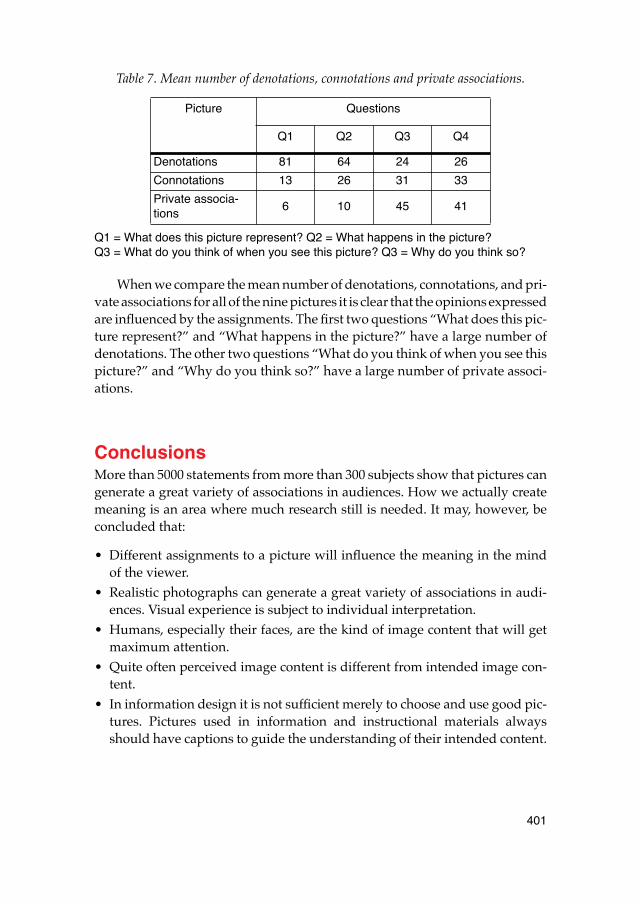
401
Table 7. Mean number of denotations, connotations and private associations.
Q1 = What does this picture represent? Q2 = What happens in the picture?Q3 = What do you think of when you see this picture? Q3 = Why do you think so?
When we compare the mean number of denotations, connotations, and pri-vate associations for all of the nine pictures it is clear that the opinions expressedare influenced by the assignments. The first two questions “What does this pic-ture represent?” and “What happens in the picture?” have a large number ofdenotations. The other two questions “What do you think of when you see thispicture?” and “Why do you think so?” have a large number of private associ-ations.
Conclusions More than 5000 statements from more than 300 subjects show that pictures cangenerate a great variety of associations in audiences. How we actually createmeaning is an area where much research still is needed. It may, however, beconcluded that:
• Different assignments to a picture will influence the meaning in the mindof the viewer.
• Realistic photographs can generate a great variety of associations in audi-ences. Visual experience is subject to individual interpretation.
• Humans, especially their faces, are the kind of image content that will getmaximum attention.
• Quite often perceived image content is different from intended image con-tent.
• In information design it is not sufficient merely to choose and use good pic-tures. Pictures used in information and instructional materials alwaysshould have captions to guide the understanding of their intended content.
Picture Questions
Q1 Q2 Q3 Q4
Denotations 81 64 24 26
Connotations 13 26 31 33
Private associa-tions
6 10 45 41
402
ReferencesAnderson, J. R. (1978). Arguments concerning representations for mental
imagery. Psychological Review, 85, 249–277.Anderson, J. R. (1983). The Architecture of Cognition. Cambridge: Harvard Uni-
versity Press.Barry, A-M. (1998). The Joe Camel Story: Tobacco Industry Manipulation and the
Necessity for Visual Intelligence. Paper presented at Viscom 12, Winter Park, CO, June 26.
Fleming, M. L. , & Levie, W. H. (1978). Instructional Message Design. Engle-wood Cliffs, NJ: Educational Technology Publications.
Fleming, M. L. , & Levie, W. H. (Eds. ) (1993). Instructional Message Design (2nd ed. ). Englewood Cliffs, NJ: Educational Technology Publications.
Gibson, J. J. (1966). The Senses Considered as Perceptual Systems. Boston: Hough-ton Mifflin.
Lester, P, M. (1995). Visual Communication. Images with Messages. Belmont, CA: Wadsworth Publishing Company. A Division of International Thomson Publishing Inc.
Pettersson, R. (1985). Intended and Perceived Image Content. Presentation at The 17th Annual Conference of the International Visual Literacy Association. Claremont. Nov. 1–2. I L. W. Miller (Ed.), Creating Meaning. Readings from the Visual Literacy Conference at California State Polytechnic University at Pomona. International Visual Literacy Association, Inc. 11–16.
Pettersson, R. (1986). Image – Word – Image. Journal of Visual Verbal Languag-ing. Fall 1986, 6, 2, 7–21.
Pettersson, R. (1987). Interpretation of Image Content. Paper presented at the 19th Annual Conference of the International Visual Literacy Association. Tulsa, Oct. 28 –Nov. 1. 1987.Published in: R.A. Braden, B. Braden, D.G. Beauchamp and L. Miller (Eds.) 1988: Visual Literacy in Life and Learning. Virginia Tech University. Blacksburg, Virginia, 233–246.A shorter version published 1988 in ECTJ, 36, 1, 45–55.
Pettersson, R. (1988). Interpretation of image content. ECTJ, 36, 1, 45–55.Pettersson, R. (1993). Visual Information. Englewood Cliffs. N.J.: Educational
Technology Publications.Pettersson, R. (1994). Associations from Pictures. Paper presented at the 26th
Annual Conference of the International Visual Literacy Association. Tempe, Oct. 12–16. 1994. Published in: D. G. Beauchamp, R. A. Braden & R. E. Griffin, (Eds. ) 1995: Imagery and Visual Literacy. Selected Readings. International Visual Literacy Association.
Pettersson, R. (1998). Image Functions in Information Design. Presentation at The 30th Annual Conference of the International Visual Literacy Association. The University of Georgia, Athens, Georgia, October 21- 25, 1998.
403
Published in: R. E. Griffin, W. J. Gibbs, & B. Wiegman (Eds. ) 1999: Visual Literacy In An Information Age. International Visual Literacy Association.
Pylyshyn, Z. W. (1973). What the mind’s eye tells the mind’s brain: A critique of mental imagery. Psychological Bulletin, 80, 1–24.
Pylyshyn, Z. W. (1979). Imagery theory: Not mysterious—just wrong. Behav-ioral and Brain Sciences, 2, 561–563.
Russel, A. (1991). Photographs: Perceptions of reality. Presentation at the Austra-lian Communications Association Conference, Sydney, July. 1991.
Russel, A. (1993). Viewers' Contributions to a Photograph. Paper presented at the 25th Annual Conference of the International Visual Literacy Association. Rochester, Oct. 13–17. 1993.
Wender, K. F. (1989). Mental models for spatial knowledge. In A. F. Bennet & K. M. McConkey (Eds.). Cognition in Individual and Social Contexts. Amster-dam: Elsevier.

404
405
Paper 23
Learning from visuals
Abstract. A visual material must constantly redraw the attention to hold the interestof the viewer. Our perception varies as a result of a number of factors. Visual infor-mation is processed quickly. Seeing is direct and effortless. Pictures reinforce ourknowledge when there is a need for them. Making and understanding visual messagesis natural to a point. The ability to read and understand pictures is learned. We mustacquire visual literacy skills.
IntroductionEvery day we are bombarded with information via the media: at home, in school,and at work. It is hard to avoid information, and it is just as hard to obtain theinformation that we really need. Most of the time, audio, text, and visuals com-pete for our attention. It is possible that we miss the information that we areinterested in. We always have a “frame of reference”. New impressions aredependent on and interpreted against the background of our previous experi-ence and learning, our attitudes and interests, our needs and feelings, and theprevailing situation.
Attention to visualsOne of the main reasons to use pictures is to draw attention to a specific material(Duchastel, 1978, 1983; Duchastel and Waller, 1979; Holliday, 1980; Levin, 1981;Levie and Lentz, 1982; Levin, Anglin, and Carney, 1987; Evans, Watson, andWillows, 1987; Pettersson, 1993). Attention is always subjective. We direct ourattention to things that move, are large, bold, and clear, have bright color, anunusual shape, or a good contrast that deviate from the surroundings or fromfamiliar patterns, to what we happen to be interested in at the moment, and tocontent that arouse feelings and needs. These factors are frequently used inadvertising and propaganda. Keates (1982) noted that discriminatory responsesto map symbols depend on contrast in form, dimension, and color. In the torrentof information that bombards us, we have to select the information we want tosee or hear and we ignore the rest of the information. Stern and Robinson (1994)
406
see “selection” of sensory data as the first step of perception. However, “selec-tion of data” may also be seen as a part of “attention”.
When we attend to something, we select that information for further mentalprocessing. In view of our limited capacity for handling simultaneous infor-mation (Miller, 1956), it is important to find out which factors determine theparts of the available information that will be processed. Which stimuli do weselect and why? When we first look at a visual, we only see what is necessaryto perceive. We identify objects and events in a reasonable and meaningful man-ner. This is Gibson’s “principle of economy” (Gibson, 1966). All cognitive tasksplace demands on a pool of limited cognitive resources. When a task imposesa heavy load on the cognitive system, it will in turn interfere with learning bymisdirecting attention and limiting the remaining resources that are necessaryfor construction of knowledge (Sweller et al. 1990). Clements (1984) concludedthat “the attentional process is relatively diffuse” (page 146). Wickens (1980,1984, 1991), and Klapp and Netick (1988) have suggested a multiple resourcemodel of attention and processing. Resource models based on individually allo-cated pools of resources have been developed to explain the effects of structuralalteration and time sharing that cannot be effectively explained by other atten-tion models, such as structural theories and capacity theories.
Vogel et al. (1986) showed that it is undeniable that visual presentation sup-port is persuasive. Presentations using visual aids were 43% more persuasivethan unaided presentations. At the same time, research in the area of readingindicates that the type of visuals that are used is an important variable in readingcomprehension (Levin et al. 1987). However, this becomes less important in real-ity since most students do not attend to the visuals unless they are instructedto do so (Reinking, 1986; Pettersson, 1990). Hannus (1996) used eye-movementequipment and studied how pupils picked up information while learning fromtextbooks. He concluded that the learning effects of textbook illustrations areslight because not enough attention is paid to the illustrations in the books. Thusthe learning functions of illustrations were less than expected.
It may be concluded that our attention will not last for long. A visual materialand a presentation must constantly redraw the attention to hold the interest ofthe viewer. Attention is sometimes seen as the first step of perception.
Perception of visualsThe perception process is often assumed to consist of two stages or levels. Infor-mation processing is tentative, fast, rough, and parallel in the first stage (Sinatra,1986). It comprises all kinds of analyses from physiological to cognitive pro-cesses. A number of different properties of a stimulus are identified simulta-neously. In many instances, one analysis is sufficient. The second stage of the
407
information analysis is conscious, demands attention, and it is detailed andsequential. Various hypotheses about a stimulus are weighed against oneanother, and tested. Information processing is more definite at this level.
Fleming and Levie (1978) noted over 50 principles, and Winn (1993) listedmore than 75 principles related to perception. Individuals differ in the waysthat they perceive a stimulus. One person may quickly assimilate it. Anothermay not pay attention at all. Human perception is sensitive to changes in stim-ulation. We actually perceive less than we see and hear, and much informationis never used. At the same time, we may perceive more than we see and hear.Our brains fill in missing information. Accurate identification can be made fromthe correct perception of a few parts. If the system arrives at clarity, then clarityserves as a reinforcement. Our perception of any image depends on our previousexperience, our mood, other visuals, texts and sound, as well as our personalinterests. When we look at a visual, we also “see” different details in the visualon different occasions. Consequently, a highly “saturated”, information-packedmessage may have something new to offer even after having been viewed manytimes.
Gestalt psychologists view our attempts to establish order as an innate fac-ulty carried out in accordance with certain “laws”. We perceptually constructrelationships, groupings, objects, and events. We see dots, lines, areas, light,dark, etc., in an organized way. One of the most simple perceptual organizationsis that of “figure and ground”. Some elements in a visual are selected as thefigure, and remaining elements constitute the background. The context in whicha visual message is presented has a major impact on the way it is perceived. Inmy experience, attention is on either the sound or on the image when we viewa film or a television program. This is even more obvious when we look at amulti-image slide and film presentation. As soon as the film starts, our attentionis directed towards the movement in the film, away from the stills. Animationis common in several media, like video, computer games and on the Internet.However, movement is very powerful and attracts our attention. Thus otherinformation may be totally unseen and lost.
Gestalt psychology shows that perceptually the meaning of a picturedepends on the relationship between the different parts in the picture. Prebleand Preble (1989) noted that “everyday visual perception” is a continuous flowof complex interrelations. In accordance with the “proximity law”, we groupobjects and events on the basis of their proximity to one another. Objects neareach other belong together. The eye tends to be attracted to groups rather thanto isolates. Thus several authors have recommended that pictures should beput as close to the relevant text as possible (Lidman and Lund, 1972; MacDonald-Ross, 1977; Hartley and Burnhill, 1977; Haber and Hershenson, 1980; Wright,1982; Braden, 1983; Benson, 1985; Pettersson, 1993; and Mayer et al., 1995).
408
It may be concluded that our perception varies as a result of a number offactors, such as cultural and social status, the time and stage of our development,mood, experience, memory, and other cognitive processes.
Processing of visualsIn accordance with Gazzaniga (1967), Sperry (1973, 1982), and Sinatra (1986),perception of two- or three-dimensional representations means parallel, simul-taneous, holistic, and fast processing (“right brain activity”).We notice the struc-ture first and then the details (Printzmetal and Banks, 1977; Navon, 1977; Antesand Penland, 1981; Biederman, 1981). This is called global to local scanning. Wequickly find out which details of a picture are the most informative ones, andthen we concentrate our attention to those parts. New impressions are processedand interpreted against a “frame of reference”; our previous experience, atti-tudes and interests. In order to make a match between visual cues and theirreferents in the learner’s cognitive schemata, translation or transforming activ-ities are needed (Salomon, 1979). Lodding (1983) concluded that the imagememory and processing capabilities of the human mind are extremely powerful.
Bertoline, Burton, and Wiley (1992) discussed three primary stages of visuallearning. These steps are: (1) visual cognition, (2) visual production, and (3)visual resolve. Visual cognition includes: (1) visual perception, the ability to men-tally comprehend visual information; (2) visual memory, the ability to mentallystore and retrieve visual information; and (3) visualization, the ability to men-tally create and edit visual information. Visual production includes (1) external-ization, the ability to create and edit visual products throughout a design pro-cess; (2) transmission, the ability to communicate information through visualproducts; and (3) reception, the ability to comprehend responses to visual prod-ucts. Visual resolve includes the ability to comprehend the termination of a designprocess.
Cohen, Ebeling, and Kulik (1981) made a meta-analysis of 74 studies whichcompared visual-based instruction with conventional instruction. They foundthat students learned slightly more from visual-based instruction than from tra-ditional teaching, but there was typically no difference between the two groupsin regard to course completion, student attitudes, or the correlation betweenattitudes and achievement. Visuals are very useful in learning tasks that involvememory. The information received from visuals appears to remain longer inmemory than information received from verbal information. Bagget (1989)stated that information obtained visually is more memorable and “bushier”(page 119): “Visual material creates in memory far broader nets of associationsfor already learned concepts. There are more connections in the memory rep-resentation when the input is visual”. Kozma (1991) contended that visual sym-
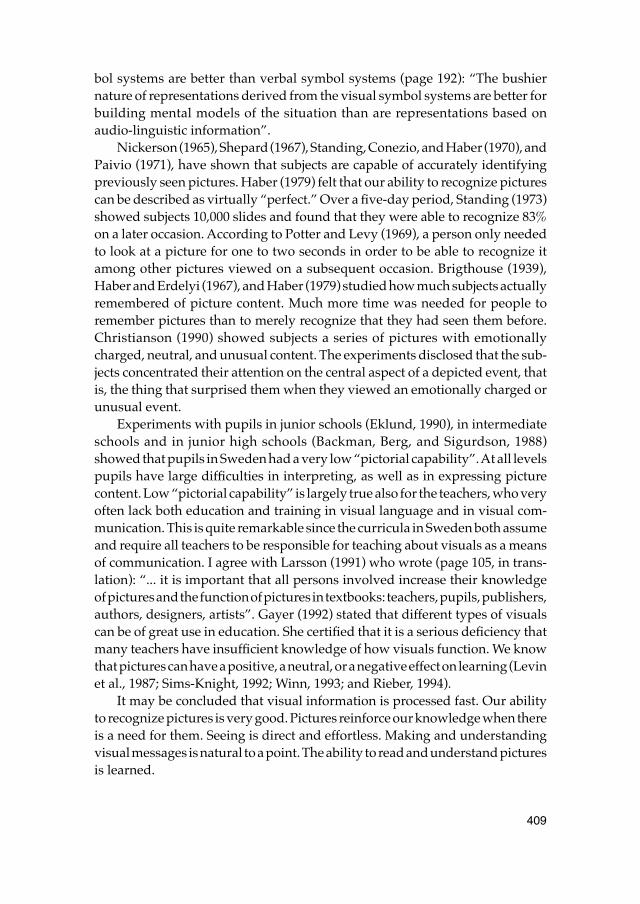
409
bol systems are better than verbal symbol systems (page 192): “The bushiernature of representations derived from the visual symbol systems are better forbuilding mental models of the situation than are representations based onaudio-linguistic information”.
Nickerson (1965), Shepard (1967), Standing, Conezio, and Haber (1970), andPaivio (1971), have shown that subjects are capable of accurately identifyingpreviously seen pictures. Haber (1979) felt that our ability to recognize picturescan be described as virtually “perfect.” Over a five-day period, Standing (1973)showed subjects 10,000 slides and found that they were able to recognize 83%on a later occasion. According to Potter and Levy (1969), a person only neededto look at a picture for one to two seconds in order to be able to recognize itamong other pictures viewed on a subsequent occasion. Brigthouse (1939),Haber and Erdelyi (1967), and Haber (1979) studied how much subjects actuallyremembered of picture content. Much more time was needed for people toremember pictures than to merely recognize that they had seen them before.Christianson (1990) showed subjects a series of pictures with emotionallycharged, neutral, and unusual content. The experiments disclosed that the sub-jects concentrated their attention on the central aspect of a depicted event, thatis, the thing that surprised them when they viewed an emotionally charged orunusual event.
Experiments with pupils in junior schools (Eklund, 1990), in intermediateschools and in junior high schools (Backman, Berg, and Sigurdson, 1988)showed that pupils in Sweden had a very low “pictorial capability”. At all levelspupils have large difficulties in interpreting, as well as in expressing picturecontent. Low “pictorial capability” is largely true also for the teachers, who veryoften lack both education and training in visual language and in visual com-munication. This is quite remarkable since the curricula in Sweden both assumeand require all teachers to be responsible for teaching about visuals as a meansof communication. I agree with Larsson (1991) who wrote (page 105, in trans-lation): “... it is important that all persons involved increase their knowledgeof pictures and the function of pictures in textbooks: teachers, pupils, publishers,authors, designers, artists”. Gayer (1992) stated that different types of visualscan be of great use in education. She certified that it is a serious deficiency thatmany teachers have insufficient knowledge of how visuals function. We knowthat pictures can have a positive, a neutral, or a negative effect on learning (Levinet al., 1987; Sims-Knight, 1992; Winn, 1993; and Rieber, 1994).
It may be concluded that visual information is processed fast. Our abilityto recognize pictures is very good. Pictures reinforce our knowledge when thereis a need for them. Seeing is direct and effortless. Making and understandingvisual messages is natural to a point. The ability to read and understand picturesis learned.
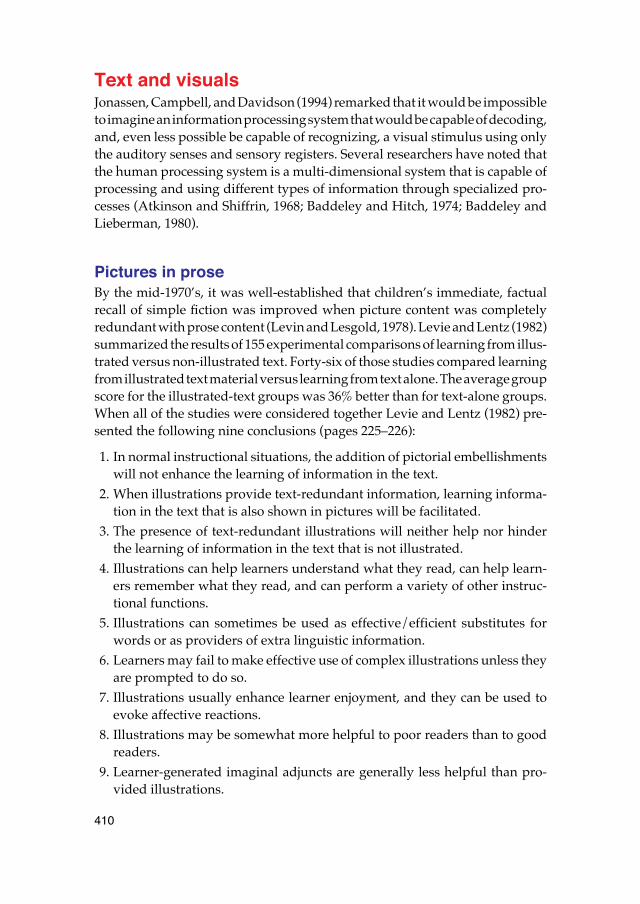
410
Text and visualsJonassen, Campbell, and Davidson (1994) remarked that it would be impossibleto imagine an information processing system that would be capable of decoding,and, even less possible be capable of recognizing, a visual stimulus using onlythe auditory senses and sensory registers. Several researchers have noted thatthe human processing system is a multi-dimensional system that is capable ofprocessing and using different types of information through specialized pro-cesses (Atkinson and Shiffrin, 1968; Baddeley and Hitch, 1974; Baddeley andLieberman, 1980).
Pictures in proseBy the mid-1970’s, it was well-established that children’s immediate, factualrecall of simple fiction was improved when picture content was completelyredundant with prose content (Levin and Lesgold, 1978). Levie and Lentz (1982)summarized the results of 155 experimental comparisons of learning from illus-trated versus non-illustrated text. Forty-six of those studies compared learningfrom illustrated text material versus learning from text alone. The average groupscore for the illustrated-text groups was 36% better than for text-alone groups.When all of the studies were considered together Levie and Lentz (1982) pre-sented the following nine conclusions (pages 225–226):
1. In normal instructional situations, the addition of pictorial embellishmentswill not enhance the learning of information in the text.
2. When illustrations provide text-redundant information, learning informa-tion in the text that is also shown in pictures will be facilitated.
3. The presence of text-redundant illustrations will neither help nor hinderthe learning of information in the text that is not illustrated.
4. Illustrations can help learners understand what they read, can help learn-ers remember what they read, and can perform a variety of other instruc-tional functions.
5. Illustrations can sometimes be used as effective/efficient substitutes forwords or as providers of extra linguistic information.
6. Learners may fail to make effective use of complex illustrations unless theyare prompted to do so.
7. Illustrations usually enhance learner enjoyment, and they can be used toevoke affective reactions.
8. Illustrations may be somewhat more helpful to poor readers than to goodreaders.
9. Learner-generated imaginal adjuncts are generally less helpful than pro-vided illustrations.
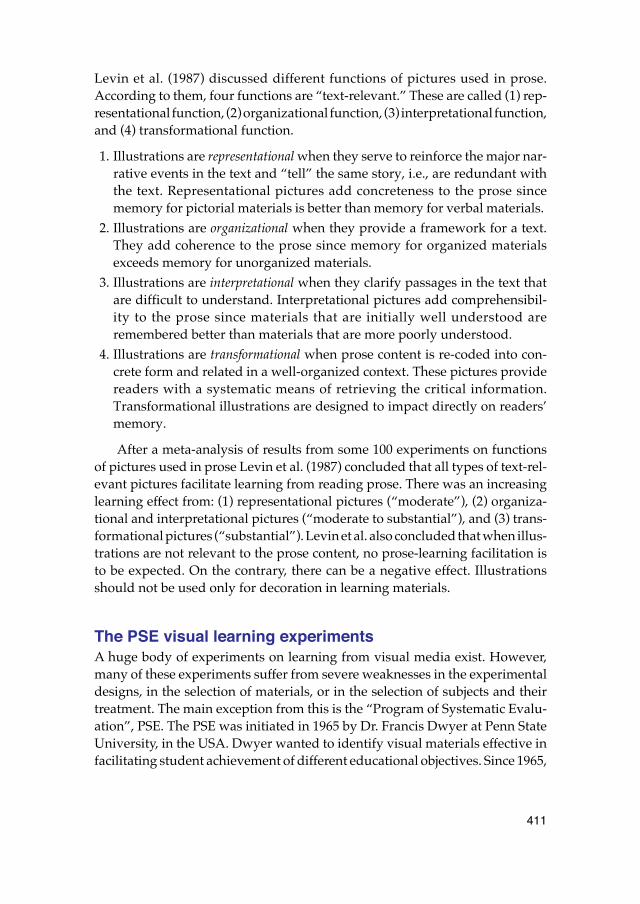
411
Levin et al. (1987) discussed different functions of pictures used in prose.According to them, four functions are “text-relevant.” These are called (1) rep-resentational function, (2) organizational function, (3) interpretational function,and (4) transformational function.
1. Illustrations are representational when they serve to reinforce the major nar-rative events in the text and “tell” the same story, i.e., are redundant withthe text. Representational pictures add concreteness to the prose sincememory for pictorial materials is better than memory for verbal materials.
2. Illustrations are organizational when they provide a framework for a text.They add coherence to the prose since memory for organized materialsexceeds memory for unorganized materials.
3. Illustrations are interpretational when they clarify passages in the text thatare difficult to understand. Interpretational pictures add comprehensibil-ity to the prose since materials that are initially well understood areremembered better than materials that are more poorly understood.
4. Illustrations are transformational when prose content is re-coded into con-crete form and related in a well-organized context. These pictures providereaders with a systematic means of retrieving the critical information.Transformational illustrations are designed to impact directly on readers’memory.
After a meta-analysis of results from some 100 experiments on functionsof pictures used in prose Levin et al. (1987) concluded that all types of text-rel-evant pictures facilitate learning from reading prose. There was an increasinglearning effect from: (1) representational pictures (“moderate”), (2) organiza-tional and interpretational pictures (“moderate to substantial”), and (3) trans-formational pictures (“substantial”). Levin et al. also concluded that when illus-trations are not relevant to the prose content, no prose-learning facilitation isto be expected. On the contrary, there can be a negative effect. Illustrationsshould not be used only for decoration in learning materials.
The PSE visual learning experimentsA huge body of experiments on learning from visual media exist. However,many of these experiments suffer from severe weaknesses in the experimentaldesigns, in the selection of materials, or in the selection of subjects and theirtreatment. The main exception from this is the “Program of Systematic Evalu-ation”, PSE. The PSE was initiated in 1965 by Dr. Francis Dwyer at Penn StateUniversity, in the USA. Dwyer wanted to identify visual materials effective infacilitating student achievement of different educational objectives. Since 1965,
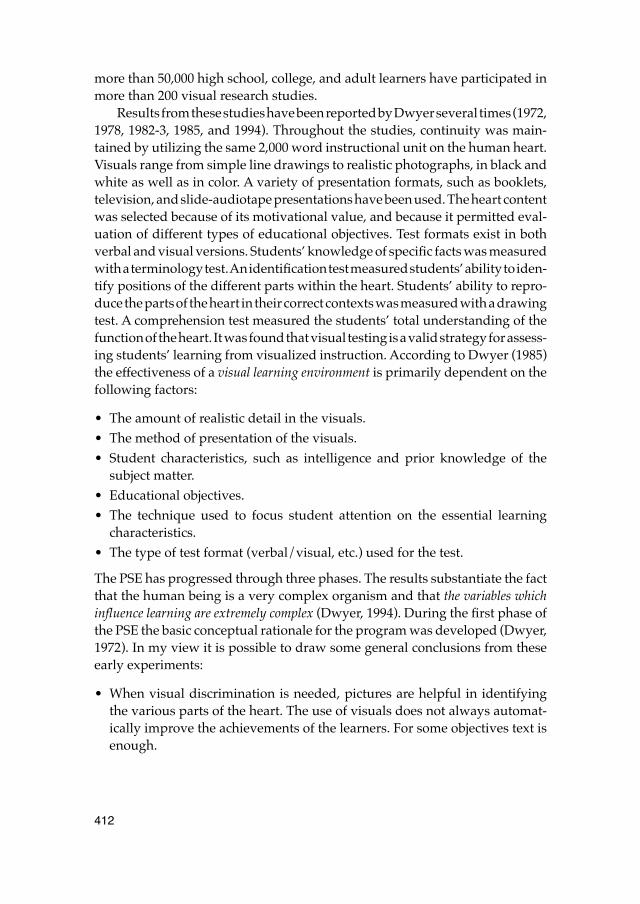
412
more than 50,000 high school, college, and adult learners have participated inmore than 200 visual research studies.
Results from these studies have been reported by Dwyer several times (1972,1978, 1982-3, 1985, and 1994). Throughout the studies, continuity was main-tained by utilizing the same 2,000 word instructional unit on the human heart.Visuals range from simple line drawings to realistic photographs, in black andwhite as well as in color. A variety of presentation formats, such as booklets,television, and slide-audiotape presentations have been used. The heart contentwas selected because of its motivational value, and because it permitted eval-uation of different types of educational objectives. Test formats exist in bothverbal and visual versions. Students’ knowledge of specific facts was measuredwith a terminology test. An identification test measured students’ ability to iden-tify positions of the different parts within the heart. Students’ ability to repro-duce the parts of the heart in their correct contexts was measured with a drawingtest. A comprehension test measured the students’ total understanding of thefunction of the heart. It was found that visual testing is a valid strategy for assess-ing students’ learning from visualized instruction. According to Dwyer (1985)the effectiveness of a visual learning environment is primarily dependent on thefollowing factors:
• The amount of realistic detail in the visuals.• The method of presentation of the visuals.• Student characteristics, such as intelligence and prior knowledge of the
subject matter.• Educational objectives.• The technique used to focus student attention on the essential learning
characteristics.• The type of test format (verbal/visual, etc.) used for the test.
The PSE has progressed through three phases. The results substantiate the factthat the human being is a very complex organism and that the variables whichinfluence learning are extremely complex (Dwyer, 1994). During the first phase ofthe PSE the basic conceptual rationale for the program was developed (Dwyer,1972). In my view it is possible to draw some general conclusions from theseearly experiments:
• When visual discrimination is needed, pictures are helpful in identifyingthe various parts of the heart. The use of visuals does not always automat-ically improve the achievements of the learners. For some objectives text isenough.
413
• The effectiveness of a visual depends on the medium, on the type of infor-mation, and also on the amount of time that learners are permitted to inter-act with the material.
• All types of visuals are not equally effective. Line drawings are most effec-tive in formats where the learner’s study time is limited. More realistic ver-sions of art work, however, may be more effective in formats where unlim-ited study time is allowed.
• The realism continuum is not an effective predictor of learning efficiencyfor all types of educational objectives. An increase in the amount of realisticdetail will not produce a corresponding increase in learning.
• Increasing the size of illustrations by projecting them does not automati-cally improve their effectiveness in facilitating the achievement of the learn-ers.
• Aesthetically pleasing visuals may deceive the learners about their instruc-tional value.
• The same visuals are not equally effective for learners in different grade lev-els, and for learners with different prior knowledge.
• At high school boys and girls learn equally well from visuals when they areused to complement oral instruction.
• For some learners and for some educational objectives, color improves theachievement of the learners. However, in some cases the added cost of colormay not be justified.
• Using questions to focus the attention of the learners on the relevant visuallearning cues does not improve the instructional potential of the illustra-tions.
In the second phase (Dwyer, 1978) the research findings emphasize the impor-tance of the interrelatedness of variables (for example the degree of realism,cueing techniques, the level of educational objectives, individual differences,the method of presentation, and the testing format) associated with the effectiveuse of visual materials. In my view, it is also possible to draw some general con-clusions from these experiments:
• Visuals designed to complement oral instruction does not always automat-ically improve the achievement of the learners.
• For certain types of educational objectives and for certain types of learners,oral instruction without visualization is as effective as visualized instruc-tion.
• All types of cueing techniques do not equally facilitate the instructionaleffectiveness of different types of visual illustrations in oral instruction.
414
In the third phase (Dwyer, 1994) the main topic of the research focused on howdifferent independent variables may be manipulated and combined to facilitateincreased student learning from visualized instruction. Also here it is possibleto draw some general conclusions:
• In computer-based instruction achievement is enhanced when embeddedcueing strategies are integrated.
• Visuals with varied degrees of realistic detail can be used to reduce differ-ences in the performance of learners with different levels of prior knowl-edge of the subject matter.
• Pre-program question cueing is more effective than motion and arrows infacilitating student achievement of specific educational objectives.
• Color coding improves attention, learner motivation, and memory.• Imagery strategies involving network or information chunking are effective
in assisting learners to process new information.• Externally-paced methods of pacing computer-based instruction were
more effective in promoting learner achievement than self-paced methods.• Different rehearsal strategies impact differentially in facilitating student
achievement of different educational objectives.• Learners who are given quality interaction opportunities spend more time
on learning, and achieve significantly more on tests measuring specific edu-cational objectives.
According to Dwyer (1994) the Program of Systematic Evaluation will be multi-focused in the future. Dwyer and his associates will continue to explore theinstructional effects of intervening variables. Eventually, the PSE will developprescriptive guidelines for the production of effective visual learning materials.
Oral presentations and visualsYarbus (1967) found that instructions given prior to viewing determined whatsegments of the picture received the most attention. The things we wish to seein a picture have a major impact on the location of eye fixations. Where we lookand why we look there determine what we see. Research concerning the effectsof verbal as well as visual modalities shows that children pay more attentionto visual than to verbal information. Zuckerman et al. (1978) found that childrentend to be more accurate in recognizing visual than auditory segments in tele-vision commercials. Hayes and Birnbaum (1980) showed pre-school childrencartoons in which the audio track either matched or mismatched the visual infor-mation. In both cases, children had a higher retention of the visual than of theauditory information. Pezdek and Stevens (1984) found that when children hadto choose which of two incompatible channels to process, they preferred the
415
video channel. The auditory information sustains attention and facilitates com-prehension. Pezdek and Hartmann (1983) found that video without soundreduced comprehension among preschool children. Rolandelli et al. (1985) con-cluded that children used the auditory component of television to direct atten-tion to important visual information, as well as to process auditory, especiallyverbal, content.
ConclusionsIt may be concluded that visual materials constantly must redraw the attentionin order to hold the interest of the viewer. Our perception varies as a result ofa number of factors. Visual information is processed quickly. Seeing is directand effortless. However, we must learn to “read pictures” in order to acquirevisual literacy skills, the ability to interpret visual messages accurately and tocreate such messages. Pictures reinforce our knowledge when there is a needfor them, when they do better than text.
ReferencesAntes, J. R., & Penland, J. G. (1981). Picture context effects on eye movement
patterns. In D. F. Fisher, R. A. Monty, & J. W. Senders (Eds.). Eye Move-ments: Cognition and Visual Perception. Hillsdale, NJ: Lawrence Erlbaum Associates.
Atkinson, R. C., & Shiffrin, R. M. (1968). Human memory: A proposed system and its control processes. In K. W. Spence & J. T. Spence (Eds.), The psychol-ogy of learning and motivation: Advances in research and theory, 2. New York: Academic Press.
Backman, J., Berg, T., & Sigurdson, T. (1988). Grundskoleelevers pro-duktion och reception av bilder. Umeå. Umeå universitet. Institutionen för bildlärarut-bildning. Rapport nr 7.
Baddeley, A. D., & Hitch, G.J. (1974). Working memory. In G. H. Bower (Ed.), The psychology of learning and motivation, Vol 8. New York: Academic Press.
Baddeley, A. D., & Lieberman K. (1980). Spatial working memory. In R. Nick-erson (Ed.), Attention and performance VIII. Hillsdale, NJ; Erlbaum.
Bagget, P. (1989). Understanding visual and verbal messages. In H. Mandl & J. Levin (Eds.), Knowledge acquisition from text and pictures. Elsevier: Amster-dam, The Netherlands.
Benson, P. J. (1985). Writing visually: Design considerations in technical pub-lications. Technical Communications Journal. Fourth Quarter, 35–39.
416
Bertoline, G. R., Burton, T. L., & Wiley, S. E. (1992). Technical graphics as a cat-alyst for developing visual literacy within general education. In J. Clark-Baca, D. G. Beauchamp, & R. A. Braden (Eds.). Visual Communication: Bridging Across Cultures. Selected Readings from the 23rd Annual Confer-ence of the International Visual Literacy Association. Blacksburg: Virginia Tech University.
Biederman, I. (1981). On the semantics of a glance at a scene. In M. Kubovy, & J. R. Pomerantz (Eds.). Perceptual Organization. Hillsdale, NJ: Lawrence Erlbaum Associates.
Braden, R. A. (1983). Visualizing the verbal and verbalizing the visual. In R. Braden, & A. Walker (Eds.). Seeing Ourselves: Visualization in a Social Con-text. Readings from the 14th Annual Confernce of the International Visual Literacy Association. Blacksburg: Virginia Tech University.
Brigthouse, G. (1939). A study of aesthetic apperception. Psychological Mono-graphs, 51, 1–22.
Christianson, S-Å. (1990). Vad minns vi av en fasansfull upplevelse? Forskning och Framsteg, 1/90, 14–19.
Clements, E. (1984). Attention: a theoretical perspective. In A. D. Walker, R. A. Braden, & L. H. Dunker. Visual Literacy – Enhancing Human Potential. Read-ings from the 15th Annual Conference of the International Visual literacy Association, Virginia Polytechnic Institute and State University. Blacks-burg, VA.
Cohen, P., Ebeling, B., & Kulik, J. (1981). A meta-analysis of outcome studies of visusal-based instruction. Educational Communications and Technology Journal, 29, 26-36.
Duchastel, P. C. (1978). Illustrating instructional texts. Educational Technology, 18, 36–39.
Duchastel, P. C. (1983). Text Illustrations. Performance and Instruction, 22, 3–5.Duchastel, P. C., & Waller, R. (1979). Pictorial illustration in instructional texts.
Educational Technology, 19, 20–25.Dwyer, F. M. (1972). A Guide for Improving Visualized Instruction. State College,
PA: Learning Services.Dwyer, F. M. (1978). Strategies for Improving Visual Learning. State College, PA:
Learning Services.Dwyer, F. M. (1982–83). The program of systematic evaluation–a brief review.
International Journal of Instructional Media, 10, 23–39.Dwyer, F. M. (1985). Visual literacy’s first dimension: Cognitive information
acquisition. Journal of Visual/Verbal Languaging, 5, 7-15.Dwyer, F. M. (1994). One Dimension of Visual Research: A Paradigm and Its Imple-
mentation. In D. M. Moore and F. M. Dwyer (Eds.), Visual Literacy. A Spec-trum of Visual Learning. Englewood Cliffs, NJ: Educational Technology Publications.
417
Eklund, S. (1990). Bedömning av kunskaper och färdigheter i bild, årskurs 2. Del av en nationell utvärdering av grundskolan. Umeå. Umeå Universitet. Institu-tionen för bildlärarutbildning. Rapport nr. 10.
Evans, M. A., Watson, C., & Willows, D. M. (1987). A Naturalistic Inquiry into Illustrations in Instructional Textbooks. In H. A. Houghton and D. M. Wil-lows. (Eds.). The Psychology of illustrations: Vol 2. Instructional Issues, 53 - 85. NY: Springer-Verlag.
Fleming, M. L., & Levie, W. H. (1978). Instructional Message Design. Englewood Cliffs, NJ: Educational Technology Publications.
Gayer, G. (1992). Att arbeta utan läromedel. Spov, 16, 17–39.Gazzaniga, M. (1967). The split brain in man. Scientific American, 217, 24-29.Gibson, J. J. (1966). The Senses Considered as Perceptual Systems. Boston: Hough-
ton Mifflin. Haber, R. N. (1979). How we remember what we see. Scientific American, 222,
104–115. Haber, R. N., & Erdelyi, M. H. (1967). Emergence and recovery of initially
unavailable perceptual material. Journal of Verbal Learning and Verbal Behav-ior, 6, 618–628.
Haber, R. N., & Hershenson, M. (1980). The Psychology of Visual Perception. New York: Holt, Rinehart, & Winston.
Hannus, M. (1996). Oppikirjan kuvitus koriste vai ymmärtämisen apu (Textbook illustrations – decoration or an aid to understanding). Turku: Turun Ylio-piston Julkaisuja Annales Universtatis Turkuensis.
Hartley, J., & Burnhill, P. (1977). Fifty guidelines for improving instructional text. Programmed Learning and Educational Technology, 14, 65–73.
Hayes, D. S., & Birnbaum, D. W. (1980). Preschoolers’ retention of televised events: Is a picture worth a thousand words? Development Psychology, 16, 5, 410–416.
Holliday, W. (1980). Using visuals to teach concepts. Science and Children, 17, 9–10.
Jonassen, D. H., Campbell, J. P., & Davidson, M, E. (1994). Learning with Media: Restructuring the Debate. Educational Technology, Research and Development, 42, 2, 31-39.
Keates, J. S. (1982). Understanding Maps. London and New York: Longman.Klapp, S. T., & Netick, A. (1988). Multiple resources for processing and storage
in short-term working memory. Human Factors, 30(5), 617-632.Kozma, R. B. (1991). Learning with media. Review of Educational Research, 61, 2,
179-212.Larsson, B. (1991). Sätt att se på. In L. Berglund (Ed.) Lärobok om läroböcker.
Stockholm: Läromedelsförfattarnas Förening.Levie, W. H., & Lentz, R. (1982). Effects of text illustrations: A review of
research. ECTJ, 30, 195–232.
418
Levin, J. R. (1981). On functions of pictures in prose. In F. J. Pirozzolo, & M. C. Wittrock (Eds.). Neuropsychological and Cognitive Processes in Reading. New York: Academic Press.
Levin, J. R., Anglin, G. J., & Carney, R. N. (1987). On empirically validating functions of pictures in prose. In D. M. Willows & H. A. Houghton (Eds.). The Psychology of Illustration: Vol. 1. Basic Research. New York: Springer-Ver-lag.
Levin, J. R., & Lesgold, A. M. (1978). On pictures in prose. ECTJ, 26, 233–243.Lidman, S. , & Lund, A. M. (1972). Berätta med bilder. Stockholm: Bonniers.Lodding, K. (1983). Iconic interfacing. Computer Graphics and Applications, 3, 2,
11–20.MacDonald-Ross, M. (1977). How numbers are shown: A review of research
on the presentation of quantitative data in texts. AV Communication Review, 25 (4), 359–409.
Mayer, R. E., Steinhoff, K., Boweer, G., & Mars, R. (1995). A Generative Theory of Textbook Design: Using Annotatated Illustrations to Foster Meaningful Learning of Science Text. ETR&D, 43, 1, 31-43.
Miller, G. A. (1956). The magical number seven, plus or minus two: Some lim-its on our capacity for processing information. Psychological Review, 63, 2, 81–97.
Navon, D. (1977). Forest before trees: The precedence of global features in visual perception. Cognitive Psychology, 9, 353–383.
Nickerson, R. S. (1965). Short-term memory for complex meaningful visual configurations: A demonstration of capacity. Canadian Journal of Psychol-ogy, 19, 155–160.
Paivio, A. (1971). Imagery and the Verbal Process. New York: Holt, Rinehart, & Winston.
Pettersson, R. (1990). Teachers, Students and Visuals. Journal of Visual Literacy, 10, 1, 45–62.
Pettersson, R. (1993). Visual information. Englewood Cliffs, NJ: Educational Technology Publications.
Pezdek, K., & Hartmann, E. (1983). Children’s television viewing: attention and comprehension of auditory versus visual information. Child Develop-ment, 51, 720–729.
Pezdek, K., & Stevens, E. (1984). Children’s memory for auditory and visual information on television. Developmental Psychology, 20(1), 212–218.
Potter, M. C., & Levy, E. I. (1969). Recognition memory for a rapid sequence of pictures. Journal of Experimental Psychology, 81, 10–15.
Preble, D., & Preble, S. (1989). Artforms. New York: Harper & Row.Printzmetal, W., & Banks, W. P. (1977). Good continuation affects visual detec-
tion. Perception and Psychophysics, 21, 389–395.
419
Reinking, D. (1986). Integrating graphic aids into content area instruction: The graphic information lesson. Journal of Reading, 30(2), 146–151.
Rieber, L. P. (1994). Computers, graphics, & Learning. Madison: Brown & Bench-mark Publishers.
Rolandelli, D. R., Wright, J. C., & Huston, A. C. (1985). Children’s Auditory and Visual Processing of Narrated and Non-narrated Television Programming. Paper presented at the Annual Meeting of the International Communication Association.
Salomon, G. (1979). Interaction of media, cognition, and learning. San Francisco: Jossey-Bass.
Shepard, R. N. (1967). Recognition memory for words, sentences, and pic-tures. Journal of Verbal Learning and Verbal Behavior, 6, 156–163.
Sims-Knight, J. E. (1992). To Picture or Not to Picture: How to Decide. Visible Language, 26, 3, 325-388.
Sinatra, R. (1986). Visual Literacy Connections to Thinking, Reading and Writing. Springfield. Illinois, Charles C. Thomas.
Sperry, R. (1973). Lateral specialization of cerebral functions in the surgically sepa-rated hemispheres. In F. J. McGuigan and R. A. Schoonever, (Eds.). The Psy-chophysiology of Thinking: Studies of Covert Processes. New York, Academic Press.
Sperry, R. (1982). Some effects of disconnecting the hemisphere. Science, 217, 1223-1226.
Standing, L. (1973). Learning 10,000 pictures. Quarterly Journal of Experimental Psychology, 25, 207–222.
Standing, L., Conezio, J., & Haber, R. N. (1970). Perception and memory for pictures: Single-trial learning of 2560 visual stimuli. Psychonomic Science, 19 , 99, 73–74.
Stern, R, C., & Robinson, R. (1994). Perception and Its Role in Communication and Learning. In D. M. Moore, & F. M. Dwyer (Eds.), Visual Literacy. A Spectrum of Visual Learning. Englewood Cliffs, NJ: Educational Technology Publica-tions.
Sweller, J., Chandler, P., Tierney, P., & Cooper, M. (1990). Cognitive load as a factor in the structure of technical material. Journal of Experimentel Psychol-ogy: General, 119(2), 176-192.
Vogel, D. R., Dickson, G. W., & Lehman, J. A. (1986). Driving the audience action response. Computer Graphics World, August.
Wickens, C. D. (1980). The structure of attentional resources. In R. Nickerson (Ed.). Attention and performance VIII. Hillsdale, NJ: Erlbaum.
Wickens, C. D. (1984). Processing resources in attention. In R. Parasuraman, & D. Davis (Eds.). Varieties of attention. New York: Academic Press.
Wickens, C. D. (1991). Processing resources and attention. In D. Damos (Ed.). Multiple tasks performance. London: Taylor and Francis.

420
Winn, W. (1993). Perception principles. In M. Fleming & W. H. Levie (Eds.). Instructional Message Design: Principles from the Behavioral and Cognitive Sci-ences (2nd ed.). Englewood Cliffs, NJ: Educational Technology Publica-tions.
Wright, P. (1982). A user-oriented approach to the design of tables and flow-charts. In D.H. Jonassen (Ed.). The Technology of Text: Principles for Structur-ing, Designing, and Displaying Text. Englewood Cliffs, NJ: Educational Technology Publications.
Yarbus, A. (1967). Eye Movements and Vision. New York: Plenum Press.Zuckerman, M., Zeigler, M., & Stevenson, H. V. (1978). Children’s viewing of
television and recognition of commercials. Child Development, 49, 96–104.
421
Paper 24
Information and knowledge
Abstract. It is more and more common that industry analysts state that knowledge isthe most important production factor. The transition to global markets has caused dif-ficult adjustment problems, as well as development problems, at both organisational,and enterprise levels. The rapid changing economical, technological, social and polit-ical conditions have upset previous stable business ideas as well as stable operationalideas. Turning information into corporate knowledge is a business imperative. Infor-mation and instruction designers may be important in this process by producing highquality information and learning materials that facilitate learning.
Basic conceptsThe main concepts: (1) information, (2) knowledge, (3) competence, (4) corpo-rate knowledge, and (5) corporate competence that are used in this paper arebriefly defined and discussed in this introduction.
Information. The term information is derived from the Latin noun infor-matio, which means a conception or an idea. Information has therefore longbeen synonymous with (1) data, details, facts, and intelligence. However, theterm information has acquired additional meanings. It may also refer to (2) theimport ascribed to specific data. Then information does not arise until thereceived data, e.g., a text or a picture, are interpreted by the receiver for for-mation or moulding of the mind.
The term information is also sometimes used for (3) data processed in a com-puter. Yet another meaning (4) is “an internal structure which regulates pro-cesses”. The latter meaning is used in computer science and in genetics.
According to The new Shorter Oxford English Dictionary on Historical Principles(Brown, 1993, p. 1364) the term information can also be used for (5) a formalwritten statement or accusation, (6) the action of informing against a person;and (7) the giving of a form or essential character to something; inspiration.The first two definitions (1 and 2) may be applied in this paper. Thus, here infor-mation is data, details, facts, and intelligence, and the import ascribed to specificdata.
422
The verb inform means to supply or convey information or to provide knowl-edge of something and is therefore a unidirectional process, e.g., from one per-son to another. To communicate entails interplay between two or more persons.
Knowledge. The term knowledge has several meanings. The Dictionary inthe 1999 Grolier Multimedia Encyclopedia lists the following six definitions: (1)The state or fact of knowing. (2) Familiarity, awareness, or understanding gainedthrough experience and study. (3) The sum or range of what has been perceived,discovered, or learned. (4) Learning; erudition: teachers of great knowledge.(5) Specific information about something. and (6) Carnal knowledge.
Four of these definitions (1, 2, 3 and 5) may be applied in this paper. Alsothe verb know has a number of meanings: v. tr. (1) To perceive directly; graspin the mind with clarity or certainty. (2) To regard as true beyond doubt. (3) Tohave a practical understanding of, as through experience; be skilled in. (4) Tohave fixed in the mind. (5) To have experience of. (6a) To perceive as familiar;recognize. (6b) To be acquainted with. (7) To be able to distinguish; recognizeas distinct. (8) To discern the character or nature of, and (9) Archaic. “To havesexual intercourse with”. As v. intr. (1) To possess knowledge, understanding,or information. (2) To be cognizant or aware. Except for (9) all the meaningsseem to be more or less applicable here.
The success of businesses in an increasingly competitive marketplacedepends critically on the quality of knowledge of diverse areas including rawmaterials, planning, manufacturing and distribution. Product developmentrequires knowledge of consumer requirements, marketing, science, and tech-nology.
It is, however, not enough to have access to important information and pos-sess the right knowledge. Staff members in any organisation need to have rel-evant competence.
Competence. There are many opinions about what competence is. Stockfelt(1987) argued that competence is a result of (1) having the necessary knowledgeat the right time, and (2) being willing to use it. From my own experience I wouldlike to add a third factor. It is also important to (3) be allowed by managementto actually use the necessary knowledge.
For Swieringa and Wierdsma (1992) competence is learning which corre-sponds to the goals of the individual learner. Ellström (1996) regarded compe-tence as the ability of the individual worker to do his or her work. Ellström dis-cussed four parts of the concept competence: (1) knowledge and intellectualabilities, (2) perceptual and manual skills, (3) social skills, and (4) attitudes andfactors related to personality. Ekman (1998) discussed three kinds of compe-tence: (1) vocational or professional competence, (2) social competence, and (3)learning competence. Ekman defined competence as the knowledge and theexperience of the individual as well as his or her ability to use these in the worksituation in interplay with the goals for the business.
423
The Dictionary in the 1999 Grolier Multimedia Encyclopedia lists the followingdefinitions of the term competence: (1a) The state of quality of being adequatelyor well qualified. (1b) A specific range of skill, knowledge, or ability. (2) Law.The quality or condition of being legally qualified to perform an art. (3) Sufficientmeans for a comfortable existence. (4) Microbiology. The ability of bacteria tobe genetically transformable. (5) Medicine. The ability to respond immunbio-logically to antigenetic agents. The first two definitions (1a and 1b) may beapplied when we discuss the process of turning information into corporateknowledge.
Corporate knowledge. Obviously, an organisation can only learn becauseits individual members learn. Corporate knowledge can not exist outside of theheads of the corporate staff. According to Juechter (1993), the ability to learnfaster and more efficiently than the competitor has become a new hallmark ofa successful organisation. Gaining and keeping a competitive advantage now-adays depends on the knowledge that people in the organisation possess andthe work that their knowledge enables them to do within the organisation.Learning at work is a business imperative. Reinhardt (1995) concluded that inthe information economy, knowledge is power. In my view corporate knowledgeis the sum of all the knowledge possessed by all the individuals in the organ-isation.
Knowledge management involves the identification and analysis of availableand required knowledge, and the subsequent planning and control of actionsto develop knowledge assets so as to fulfil organisational objectives.
Corporate competence. Swieringa and Wierdsma (1992) noted that collectivelearning is aimed at increasing the collective competence of the members of anorganisation or parts of an organisation. According to Swieringa and Wierdsma(p. 34): “It must be fairly obvious to anyone that collective competence is morethan the sum of individual competencies.” Corporate competence may be seenas the same as collective competence. It needs to be learned, and this requireseffort and time. Swieringa and Wierdsma concluded that, essentially, learningorganisations are not only capable of learning and organisational changes, butalso of learning to learn. Thus corporate competence may be defined as an abilityfor an organisation to develop and change.
TeachingSeveral educationalists have developed teaching theories and teaching modelsin order to illustrate the relationships between teachers and students. Basically,each such model is based on an outlook on mankind that encompasses whatthe human being is, has the capacity to be, and has the possibilities to developinto. Other prerequisites for each teaching model are well thought-out outlooks
424
on society, on information and on knowledge. Teaching can be defined as con-veying information to a person in an organised form. Educating, training andinstructing can be defined as conveying appropriate information to a personwho is to be active in a certain profession. The earliest mental-discipline theoriesof teaching were based on the premise that the main reason for teaching is notfor itself but for what it trains – attitudes, values, skills, and intelligence.
Whereas an individual can learn without a teacher, a person cannot teachwithout a student. There has been some debate among teachers as to whetherteaching also implies learning. Does a student have to learn for teaching to havetaken place? This is certainly not always the case. In most situations, studentsare responsible for their own learning. However, some definitions of teachingnow imply that students actually have to learn something as a result of teaching.Dryden and Vos (1994) noted that (p. 222):
Youngsters are their own best educators, parents their best teachers. Ourhomes, beaches, forests, playgrounds, zoos, museums and adventureareas are the world’s best schools.
Ekman (1998) studied the correlation between manufacturing efficiencyand operator competence in advanced manufacturing technology in mechan-ical engineering companies. He concluded that increased investments in edu-cation and competence development did not result in increased operator effi-ciency.
Traditional schooling is based on the assumption that students will learnwhen they are placed in specific classrooms and are led by expert teachers. Theschool and the teachers used to have a monopoly on the transfer of informationto students. Today, children, youth as well as adults get information from manydifferent sources, such as books, television programs and the Internet. Withrespect to learning, teaching, and studying Mellander (1993) wrote (p. 2):
Actually, learning is only difficult in connection with teaching and study-ing! Otherwise people seem to learn without much effort. How elsecould we have assimilated the enormous amount of knowledge that wepossess?
Many researchers have concluded that traditional teaching is (1) expensiveas well as (2) slow (Robert, 1993; Dryden and Vos, 1994; Reinhardt, 1995). Newtechnologies may make learning more productive (Dwyer, 1993). According toReinhardt (1995) centralised training in companies is now giving way to dis-tributed just-in-time learning. The result of this is increased flexibility, betterretention, and lowered costs.
Mellander (1993) stated that the management style of the 1990s is “man-agement by learning”. The boss is expected to train and to learn together withhis or her subordinates, and thus to share leadership responsibilities with them.
425
Here, the Japanese concept of continuous improvement (kaizen) may be a cru-cial factor. Imai (1986) called kaizen the single most important concept in Jap-anese management. Kaizen may be the key to Japanese competitive success.
It may be concluded that turning information into corporate knowledge,and into corporate competence requires learning, but not necessarily teachingor educating, training or instructing. However, management will have to createlearning opportunities for the staff members.
Models for learningLearning is an act of structuring and relating data and information. During men-tal processing of information, new groups of brain cells are activated and asso-ciated to each other (Dryden and Vos, 1994). The brain has 100 billion brain cells(neurones) and 900 billion supporting glia cells. Each neurone may be connectedto other brain cells via more than 20,000 structures called synapses. The braincells communicate with each other by transmitting electrical impulses throughthis gigantic network, which is constantly changed and adopted to new situ-ations. Old and new information is processed in an attempt to find possible rela-tionships or gestalts. Information is gradually converted into experience. Expe-rience is then converted into knowledge. Later, knowledge may be converted intoinsight, and eventually into wisdom.
Every day, spontaneous learning is a natural part of our lives. Mellander(1993) explained spontaneous learning in the following five steps: (1) attention,(2) information, (3) processing, (4) conclusions, and (5) application. Attentionmakes us receptive to information, which we process together with prior knowl-edge, until we arrive at conclusions and understanding, which we then apply andtest for confirmation. This series of mental processes is also what film directors,authors, and politicians base their presentations on, in order to capture and holdour attention and to convey their messages to us.
A learning theory or a model for learning may be seen as a codified set ofhypothesis about how individuals learn. Some researchers are trying to developa single comprehensive learning theory encompassing all the different kindsof learning. As far as I know, no such attempt has yet been successful. Uljens(1992) noted that there is no theory of learning that is widely accepted. Thuswe have to deal with a large number of theories and models of learning, andlearning processes, each useful in its own context. Theorists do not all agreeabout what learning is and how it comes about. Over the years that scholarshave been interested in the process, or rather the processes, of learning, manyelaborate theories of learning have been developed and tested. Kearsly (1999)described no less than fifty different learning theories.
426
For this paper it may be interesting to focus on social learning theory and thelearning models that can be associated with this category of learning theories(Pettersson, 1995). Thus (1) vicarious learning, (2) situated learning, (3) expe-riential learning, (4) collective learning, and (5) cognitive apprenticeship mayall be naturally related to the theme “turning information into corporate knowl-edge”.
Vicarious learningThe social-learning theory is concerned with human social interaction. It hasits origin in behaviourist studies of animal learning. Already the Soviet psy-chologist Lev Vygotsky stressed that much of what we learn, we learn from othersin a social setting. The social-learning theory focuses on the behaviour patternsthat people develop in response to their specific environments. It stresses theimportance of the cognitive processes. Some theoreticians emphasise the rolethat social processes play in heightening insight, understanding, and concep-tual thinking. People develop their capacity for thinking in the mutual exchangeof ideas with other people. Bandura (1977) noted the importance of human socialinteraction (p. 12):
Virtually all learning phenomena resulting from direct experience occuron a vicarious basis by observing other people’s behavior and its conse-quences for them.
Since people can represent situations symbolically, they are able to foreseethe probable consequences of their actions and to alter their behaviour accord-ingly. We learn behaviour by merely observing what other people do and howthey behave in different situations. The social-learning theory stresses theimportance of vicarious learning or observational learning and we observe themgetting rewards for engaging in that specific behaviour.
The social learning emphasises the role of models. Quite often, members ofgroups of people adopt the same attitudes, feelings, and emotions. Models maybe “real” people, but they may also be persons in movies and in television pro-grammes. A growing number of business experts are beginning to question thesaying that “experience is the best teacher”. According to leaders in the insur-ance industry, learning through trial and error is too expensive for them (Robert,1993). Most successful managers agree that it is easier for people to learn fromother people´s experiences and mistakes. Mentoring is an important way ofbuilding on the collective knowledge of past generations.
427
Situated learningLave (1988) argued that learning normally is a function of the (1) activity, (2)context and (3) culture in which it occurs. Learning is situated. Social interactionis a critical component of situated learning – learners become involved in a“community of practice”. This contrasts with most classroom learning activitieswhich involve knowledge which is abstract and out of context. In everyday sit-uations, people reason intuitively, based upon their experiences within specificcontexts, using a variety of methods to solve problems. According to Winn(1993), situated learning occurs when learners work on authentic tasks, whoseexecution takes place in a real-world setting. The content of the knowledge thatis constructed is defined by the environment where the learning occurs.
Situated learning has mainly been applied in the context of technology-based learning activities for schools that focus on problem-solving skills. Duringproblem solving, knowledge acquisition or learning takes place. Thus, learningappears as an activity that indirectly permits the individual to satisfy funda-mental needs and, in turn, to adapt to the environment. Since authentic tasksare often problem based, learners are better able to gauge what they are learningand how to use it (Collins, 1993). They learn, based on first-hand experience,when a particular method or strategy is appropriate in authentic contexts.Learners learn to respond to changes in circumstances that influence their ownproblem solving.
Brown, Collins, and Duguid (1989) found that knowledge would remainunder construction in each new situation, each new experience, and each newactivity. Memories often include the context in which the learning took place.When attempting to develop situated learning environments, instructiondesigners use media to provide rich contexts that reflect their interpretation ofthe real world. The act of observation intervenes and changes what is beingobserved. It is not possible to be an objective observer of reality, because ourmethods of observation interact with the process being observed. We cannotobserve reality objectively because we participate in it. So, we can not knowexactly why people learn. We do not doubt that they do, only that we can controland predict the process with some degree of certainty.
Perkins (1985) noted that many learners experience problems in utilisingthe knowledge and the skills acquired via formal learning to their everydaycontexts. Often the learning of facts is isolated from the contexts in which thesefacts actually derive their meaning. In formal education settings, such as tra-ditional classrooms, skills and knowledge are operationalized differently fromhow they later may be used in one or more real life situations. Choi and Hannafin(1995) found that learners may very well pass their exams but they are unableto apply the same knowledge in everyday life when they actually need theknowledge. Smith and Ragan (1999) pointed out that in situated learning testingshould be integrated into the task, not a separate activity.
428
Experiential learningThe process of active learning and real work experience is sometimes calledexperiential learning. To Rogers (1969) experiential learning is equivalent to per-sonal change and growth. The role of the teacher is to facilitate learning. Learningis facilitated when it primarily is based upon direct confrontation with practical,social, personal or research problems. Rogers noted that significant learningtakes place when the subject matter is relevant to the personal interests of thelearner. He also noted that learning proceeds faster when the threat to the selfis low.
One of the learning theories that has captured a lot of attention is Kolb’sexperiential learning theory. According to Kolb (1984), learning is based uponrepeated interactions between different cognitive processes and our direct expe-riences. Kolb developed a model of the styles of learning that people employwhen they approach new situations. The learning process is divided in the fol-lowing four phases: (1) concrete experience, (2) reflective observation, (3)abstract conceptualization, and (4) active experimentation. These four phasesare grounded on two dimensions, one is called the “active-reflective” axis, andthe other is called the “concrete-abstract” axis. Some years later Kolb, Rubinand Osland (1991) discussed learning organisations, and specified four steps, intheir continuous development. Their four steps are: (1) reflecting, (2) thinking,(3) deciding, and (4) doing. Reflecting is linked to a period of forming and reflect-ing on what has happened. Thinking is linked to education. Deciding is linkedto consulting, and doing is linked to training.
Learning on demand is a concept for continuing technical education and train-ing at your own workplace. Many large corporations use the public Internetor their own local Intranet as the distribution form, together with existingcourses. Intranet is one of the fastest expanding areas in the computer industry.Large companies, like Microsoft, Netscape, Lotus and Sun are creating toolsthat can be used in a wide variety of new corporate applications, such as col-laborative workgroups and intracompany communication.
Collective learningThere are many situations where we learn from each other, and learn togetherin collective learning, or co-operative learning. A collective learning process takesplace in and through interaction with and between a number of people. It maybe in our leisure hours, or at work. It may be a group of people attending a meet-ing, or people working together on a special assignment. It is possible to optimisepeople’s situations in groups and organisations, primarily by heightening allindividuals’ consciousness and deepening their insight into their own situa-tions. The 1990s were sometimes called the “decade of the individual”. There
429
grew, and there is a new kind of respect for the individual. Individual persons,not institutions, are society’s driving force.
Co-operative learning is a common classroom practice that enjoys consid-erable popularity in many schools (Johnson and Johnson, 1989; Sharan, 1980;and Slavin, 1989). Some educational guidelines encourage teachers to use co-operative learning and small-group techniques as a teaching approach(National Council of Teachers of Mathematics, 1989; Science for All Americans,1989).
Co-operative learning has become an important area in educational tech-nology and in instruction design. This is partly because students often mustwork together with a limited number of computers (Becker, 1986). However,studies conducted to examine the effect of implementing co-operative learningwith computer-assisted instruction have provided mixed results. Someresearchers have reported that student achievement increased when co-oper-ative strategies were used (Dalton et al., 1989; Hooper, Temiyakarn and Will-iams, 1993; and Johnson, Johnson and Stanne, 1985). However, Carrier and Sales(1987) did not find any significant effect for better achievement when learnersused co-operative computer-assisted instruction.
Loop-learningStockfelt (1987) noted that learning should not be concentrated to specific build-ings, or to specific classrooms. In a learning organisation learning takes place atwork. The learning processes are linked to the work processes. Any work-placemay also be a learning situation and any task may likewise be an exercise. Theemphasis should be on learning together in teams. And not just within a divi-sion, a department or a group, and not only at one level, but also between depart-ments, divisions, and groups and between the different levels in the organisa-tion.
Based upon a “theory of action” Argyris and Schön (1974), Argyris (1976),and Argyris and Schön (1978) discussed a “double loop learning theory”. Here,the focus is on solving problems that are complex and ill-structured. It is nec-essary to change underlying values and assumptions. An important aspect isthe distinction between what individuals think and what they actually do. Dou-ble loop learning is a theory of personal change that is oriented towards pro-fessional education, especially related to leadership in organizations. In doubleloop learning, assumptions underlying current views are questioned andhypotheses about behaviour tested publicly. The end result of double loop learn-ing should be increased effectiveness in decision-making and better acceptanceof failures and mistakes.
Swieringa and Wierdsma (1992) developed the “collective loop-learningtheory”. Collective learning means organisational changes. At the level of singleloop-learning this applies to changes in the rules, the agreements on how we
430
collaborate, what we must do or what we are allowed to do within the presentsystem. This may only result in a number of minor improvements. With doubleloop-learning people bring the shared insights forming the basis of the rulesinto play. Now people learn new principles. This means reasoning, theories andopinions. The double loop-learning may result in renewal of the structure orrenewal of the processes in the organisation. The triple loop-learning appliesto changes in the communally shared principles on which the organisation isbased. It represents collective learning at the level of courage and will, and itresults in development and major changes of the behaviour of the organisation.
Leymann and Gustavsson (1990) pointed out that group-dynamic learningin organisations can be both positive and negative. It is important to create work-ing environments that are conducive to learning and assignments that give theindividual the opportunity to develop his or her own learning capacity.Leontjew (1982) claimed that the situation in the workplace is primarily affectedby the tools that are used. The transfer of competence occurs as a result of theinteraction between people.
The TVI-MethodThe further education programme at the Norwegian University of Technologyin Trondheim has been very successful. Based on experiences from the TVI-method, Tutored Video Instruction, that was developed more than twenty yearsago at Stanford University, a method of team learning supported by media hasbeen developed.
The TVI-method is based on the common-sense notion that learners canlearn more from a lecture if they are free to interrupt it at places where theyneed more discussion or explanation of a point or a concept (Gibbons, Kincheloeand Down, 1977). The TVI-method supports the communication processes byproviding a tutor who acts as a catalyst between the individual learners. In var-ious workplaces in Norway, groups of people engage in this distance educationprogramme. Each team receives video cassettes with recordings from ordinarylectures in the university courses. The members of the teams view these record-ings, and interact in various group discussions and group activities. The learnersare active and motivated to learn. Hebnes (1995) reported that 90% of the mem-bers in three teams (30 persons) preferred this kind of media-supported teamlearning compared with traditional lectures with ordinary teachers. It wasclaimed that the factor of success is not the video as such, but the group interaction.
The TVI-method has been extended into a TMI-method, Tutored MediaInstruction, making use of other instructional media such as computer aidedinstruction and multimedia. The TMI-model provides a very flexible frame-work for the use of instructional media. It can be adapted towards regional,institutional, content specific, and above all it can effectively be adopted to
431
learner specific needs, individual learning experiences and various learningstyles, previous knowledge, and different cultural backgrounds.
Meta-learningMattsson (1995) concluded that it is important to create environments that giveemployees possibilities to learn by being stimulated as well as allowing for theconstruction of individual and collective knowledge. In a context of knowledge-intensive industry that is changing continuously, individual and organisationalroutines are needed to handle both cognitive and organisational imbalance anddramatic changes. When looking only at concrete contextual work, problemsoften result in limited and short-sighted effects for learning instead of for drasticchanges and improvements. Learning is put in focus, since people need to beable to handle changes.
Berg (1993) concluded that in the learning/modular/virtual/ boundary-less/permanently flexible organisations that are being promoted as the bestorganisational structures for today´s fast-changing environment, continuouslearning is a critical variable for success. Companies that excel will be those thatmake full use of their staff’s capacity to learn. In accordance with Berg (1993),the ideal employee is a person who loves learning, is flexible, acquires new skillsas needed, and is confident enough to devise new rules when the old ones donot work any longer. This is certainly a kind of person with a high competence.
As a society, we place too much faith in collecting facts. Experience suggeststhat there should be a correct way to do everything; as a result, we waste a greatdeal of time, money, and energy searching for this mythical right answer. Gath-ering insight and experience is only helpful if it leads to constructive action.Berg (1993) provided eight steps that organisations and individuals can taketo learn the lessons they will need for future success. These steps are:
• Assume nothing.• Give up the search for right answers.• Trash your taboos.• Devote time to learning.• Reward failure.• Do not do more of what does not work.• Do not put people into slots on an organisational chart.• Reward contribution, not position, longevity, or status.
According to Berg, the future belongs to those who question the pastassumptions, constantly innovate, and thrive on change.
As previously noted Swieringa and Wierdsma (1992) concluded that, essen-tially, learning organisations are not only capable of learning, but also of learningto learn. Learning to learn is meta-learning. In other words, learning organisations
432
are not only able to become competent but they are also able to remain com-petent. The basis for meta-learning is self-knowledge: in particular knowledgeabout how and why we are learning and why we wish to learn. According toSwieringa and Wierdsma a learning organisation is based on a philosophy inwhich its members consider themselves and each other as people who havethe will and the courage to take on responsibility for their own functioning inrelation to other people, and expect the same from them.
Cognitive apprenticeshipTraditionally people have learned to speak, learned to use tools, and learnedtheir crafts by observing and imitating their parents and their masters. Whenwe watch someone carrying out a skill the performance appears to be automatic,confident, consistent, easy, effective, efficient, fast, and smooth. When problemsarose in the everyday context of work, apprentices understood the reasons forthe problems in a natural way. They asked the necessary questions, and imitatedthe observed steps to solve the problems. Apprentices acquired their skillsthrough a combination of observation, coaching, and practice. This promoteddevelopment of mental models, scaffolding, and gradual self-reliance (Winn,1993).
Today apprentice settings have been largely replaced by formal education.Now activities often focus on superficial aspects of complex problems. Too littleattention is paid to the reasoning and reflective processes, and to the strategiesthat experts employ when they apply knowledge and perform complex andreal-life tasks. In accordance with Collins, Brown and Newman (1989), the cog-nitive apprenticeship model seeks to aid the learner in the construction of knowl-edge by embedding “the learning of skills and knowledge in their social andfunctional context” (p. 454). Brown, Collins and Duguid (1989) argued that cog-nitive apprenticeship supports learning in a domain by enabling learners toacquire, develop and use cognitive tools in authentic domain activity. Learning,both outside and inside school, advances through collaborative social interac-tion and the social construction of knowledge.
Cognitive apprenticeship focuses specifically on cognitive and meta-cog-nitive skills. Media can function as powerful tools within a cognitive appren-ticeship model, by facilitating the construction of knowledge through the pro-vision of mediated contexts. These contexts may not be fully recreated, onlysimulated. Cognitive apprenticeship emphasize relationships between the con-tent knowledge and thought processes that experts employ when they performcomplex tasks. According to Choi and Hannafin (1995) the “apprenticeship”concept emphasizes the importance of experiential activity in learning, andhighlights the inherently context-dependent, situated, and enculturated natureof learning.
433
The cognitive apprenticeship approach challenges the traditional behav-iourist assumption that behaviour can be understood by considering only exter-nal or environmental factors. In accordance with cognitivists, intelligence is theability of an organism to mentally represent aspects of the world and then tooperate on those mental representations rather than on the world itself. Thesemental operations are a kind of mental trial and error. Information is selectedfrom the environment and placed in a temporary buffer, called working mem-ory, and also short-term memory. Once selected, the information is subsequentlyeither discarded or processed more completely. Encoding occurs when new andexisting information is integrated in the working memory and then transferredinto the long-term memory.
Presentation of informationTurning data and information into corporate knowledge is a business imper-ative. All members of staff will have to make their contributions to this process.Here information designers may be quite important. Information designerswho understand the various learning processes may be able to produce highquality information and learning materials that facilitate learning for variousgroups of staff. Information designers are able to make complex informationeasier to understand for the intended receivers (Pettersson, 1998).
Providing a clear structure of a message, providing clarity, simplicity, andunity, securing a high quality of the message, and limiting the total costs areall important functional principles in information design. Harmony and propor-tion are important aesthetic principles. Usually a team of people with skills inthe different areas are working together. The task is usually too overwhelmingfor a single person. Art is valued for its originality and expressiveness. Its focusis on individual artifacts crafted through the manual and aesthetic virtuosityof the artist. Design, in contrast, is valued for its fitness to a particular user andto a particular task (Mullet and Sano, 1995, p. 8).
Clarity of communicationComplicated language, in both texts and pictures, will impair the understand-ing of any intended message. Thus, text and pictures for information shouldalways be designed so that they are easy to read. Any graphical message shouldbe (1) legible, (2) readable, and also (3) well worth reading for the intended audi-ence. Good legibility is usually easy to achieve. Any audial message should be(1) audible, (2) distinct, and also (3) well worth listening to for the intendedaudience.
434
Fleming and Levie (1978, 1993) provided about two hundred “principles”for instructional message design. Here the main focus is on the receiver. Theseprinciples are related to the receiver’s attention, perception, memory, conceptlearning, and attitude change. The literature on attention and perception is vastand ranges from fine-grained psycho-physiological work on pre-attentive pro-cesses to the more general study of the perception and interpretation of illus-tration, text, and speech.
Attention is closely related to the subject of consciousness and entails select-ing parts from all available sensory information, and from memorised infor-mation, for further mental processing. The process of attention is the controlmechanism that determines which stimuli will be noticed and which will beignored (Carlson, 1993). Attention determines which events we become con-scious of. Attention may be controlled (1) automatically, (2) by instructions, and(3) by the specific demands of the particular task at hand. Attention can be con-sidered as the activation of groups of cells in the reticular activating system inthe brain stem.
Fleming and Levie (1978) stated that one of the message designer’s firstproblems is to gain the attention of the audience, and thereafter she or he hasthe continuing problem of holding the attention. A general attending is often insuf-ficient, for attention must be directed narrowly and precisely to critical aspectsof the subject matter. Winn (1993) argued that a great deal of perceptual organ-isation occurs pre-attentively, not under cognitive control. The way a messageis organised will have an important effect on the way the perceptual systemstructures what it detects and the perceiver will not be aware of how that infor-mation is interpreted.
The information designer may use various design principles and guidelinesin order to facilitate the reader’s attention processes, and subsequent processesfor understanding and learning. Pettersson (1999) provided more than 50“attention-oriented” guidelines that may be used in the design of information.
Perception is always organized and it tends to be holistic rather than detail-oriented. We perceptually const-ruct relationships of objects, events, words, andpeople. We see dots, lines, areas, light, and dark in an organized way. One ofthe most simple perceptual organizations is that of “figure and background”,or simply “figure and ground”. Some elements in a picture are selected as thefigure, and the remaining elements constitute the back-ground.
The goal in information design and instruction design should always beclarity of communication. The message must be accurately developed and trans-mitted by the sender or information provider and then correctly interpretedand understood by the receiver or interpreter. Then the information designerhas succceded.
435
Learning materialsLearning improves when the same information content is presented in differentrepresentations: words, pictures, and sound (Paivio, 1983, 1986; Pressley andMiller, 1987). The representations shall have a redundant or a relevant relation-ship. Learning improves when the same information is presented in differentmedia. Learning improves as the quality and depth of the cognitive engagementand processing increases, and declines as the quality of engagement decreases.Regular exercise is reported to improve learning (Dryden and Vos, 1994).
When we design information and learning materials, it is very importantthat the materials are reviewed and approved by people with expert knowledgein the appropriate fields. From my own experience it is clear that low qualityteaching and learning materials include one or more of the following charac-teristics:
• The information set provides the wrong information. • It (the information set) is technically incorrect.• It is irrelevant for the situation and has “deadwood”, information that is not
essential or especially supportive in attaining learning goals.• It does not clearly identify critical prerequisite information and skills.• It is badly structured and therefore it is hard to understand.• It is not consistent throughout all its chapters and sections with respect to
text, pictures, typography and layout. Thus it is confusing to the reader.• It has confusing and misleading pictures, not at all relevant to the content
of the text.• It has poor legibility of text and pictures, and therefore it is hard to read.• It has poor readability of text and pictures, and therefore it is hard to under-
stand.• It has a writing style that is inconsistent and does not conform to an
expected standard.• It has low reading value, and it is not at all worth reading for the intended
audience.• It is un-grammatical, badly spelt, and incorrectly punctuated.
Unfortunately, all of these situations are quite common today. Using the“wrong” materials means spending extra time and extra money. In a companyor in any other organisation the technical departments should be responsiblefor ensuring that system descriptions, process descriptions, product descrip-tions, technical reports, course materials, and other documents to be used forlearning and training purposes are technically correct and relevant to the sit-uation. The training and competence development departments should beresponsible for ensuring that all learning materials are well-structured and
436
understandable, as well as highly legible and readable, and have a high readingvalue. The production departments should be responsible for ensuring that, inall learning materials:
• Language and style are used in a consistent fashion.• The correct terminology is used.• Typography and layout is correctly used.
The result of every such review should be that a document is either approvedor not approved. Documentation that is not technically correct and relevant tothe situation must not be used as learning materials or course materials. Suchmaterials should be barred. The documentation must be re-edited, and re-editedagain until it receives the appropriate approval.
The aim must always be that the learning materials and other documenta-tion to be used for learning and training purposes receives approval. That is,the legibility, readability, and reading value of the learning materials areapproved. It is a good principle in the production of information and learningmaterials to spend enough time and effort on editing text and pictures for bettercomprehensibility. As noted in the next section this will often pay back verywell in less time used for reading and learning.
ReferencesArgyris, C. (1976). Increasing Leadership Effectiveness. New York: Wiley. Argyris, C. , & Schön, D. (1974). Theory in Practice. San Francisco: Jossey-Bass. Argyris, C., & Schön, D. A. (1978). Organizational Learning: A Theory of Action
Perspective. Massachusetts Institute of Technology. Addison-Wesley Pub-lishing Co, Reading, MA.
Bandura, A. (1977). Social learning theory. Englewood Cliffs, NJ: Prentice Hall, Inc.
Becker, H. J. (1986). Instructional use of school computers: Report from the 1985 national survey (Issue no. 3). Baltimore MD: Johns Hopkins University, Center for Social Organization of Schools.
Berg, D. (1993). Experience can be the worst teacher. Journal for Quality & Par-ticipation, 16, 2, 24–26.
Brown, J. S., Collins, A., & Duguid. (1989). Situated cognition and the culture of learning. Educational Researcher, 18(1), 32-42.
Brown, L. (Ed.) (1993). The new Shorter Oxford English Dictionary on Historical Principles. Oxford: Clarendon Press.
Carlson, N., R. (1993). Psychology, The Science of Behavior. Fouth Edition. Needham Heights, MA: Allyn and Bacon.
437
Carrier, C. A., & Sales, G. C. (1987). Pair versus individual work on the acqui-sition of concepts in a computer-based instructional lesson. Journal of Com-puter-Based Instruction, 14, 11-17.
Choi, J-I. & Hannafin, M. (1995). Situated Cognition and Learning Environ-ments: Roles, Structures, and Implications for Design. ETR&D, 43, 2, 53-69.
Collins, A. (1993). Design issues for learning environments. (Technical report No. 27). New York, NY: Northwestern University, Center for Technology in Education. (ERIC Document Reproduction Service No. ED 357 733)
Collins, A., Brown, J. S., & Newman, D. (1989). Cognitive apprenticeship: Teaching the craft of reading, writing, and mathematics. In L. Resnick (Ed.). Knowing, learning and instruction: Essays in honor of Robert Glaser. Hillsdale, NJ: Lawrence Erlbaum Assosiates.
Dalton, D. W., Hannafin, M. J., & Hooper, S. (1989). Effects of individual and cooperative computer-assisted instruction on student performance and attitude. Educational Technology, Research and Development, 37, 2, 15-24.
Dryden, J., & Vos, J. (1994). The Learning Revolution. Auckland, New Zealand: Profile Books.
Dwyer, F. M. (1993). Visualization & Technology: A Global Perspective. Paper pre-sented at the 25th Annual Conference of the International Visual Literacy Association. Rochester, Oct. 13–17. 1993.
Ekman, S. (1998). Kompetens och effektivitet. En studie av tidsanvändning och tillverkningskvalitet i NC-arbete. Doktorsavhandling. Institutionen för Industriell Ekonomi och Organisation. Kungliga Tekniska Högskolan: Stockholm.
Ellström, P. E. (1996). Operatörskompetens–vad den är och hur den kan utvecklas. DUP–resultat. NUTEK: Stockholm.
Fleming, M. L., & Levie, W. H. (1978). Instructional Message Design. Englewood Cliffs, NJ: Educational Technology Publications.
Fleming, M. L., & Levie, W. H. (Eds.) (1993). Instructional Message Design (2nd ed.). Englewood Cliffs, NJ: Educational Technology Publications.
Gibbons, J. F., Kincheloe, W. R., & Down, K.S. (1977). Tutored Instruction: A new Use of Electronics Media in Education. Science, 195, 1139-1146.
Grolier (1999. Grolier Multimedia Encyclopedia Deluxe Edition. Grolier Interac-tive. Danbury, CT
Hebnes, I. (1995). Videostöttet laering. Norsk konferense om utdanning og laering. Universitetet i Trondheim. 3-4 februar 1995.
Hooper, S., Temiyakarn, C., & Williams. M- D. (1993). The effects of coopera-tive learning and learner control on high- and average-ability students. Educational Technology, Research and Development, 41, 4, 5-18.
Imai, M. (1986). Kaizen. Cambridge, Mass.: McGraw-Hill.Insko. C. A., & Cialdini, R. B. (1969). A Test of Three Interpretations of Attitu-
dinal Verbal Reinforcement. Journal of Personality and Social Psychology, 12, 333-341.
438
Johnson, R. T., & Johnson, D. W., Stanne, M. (1985). Effects of cooperative, competitive, and individualistic goal structures on computer-assisted instruction. Journal of Educational Psychology, 77, 668-677.
Jonassen, D. H. (1991). Objectivism vs. Constructivism: Do We Need a New Philosophical Paradigm? Educational Technology, Research and Development, 39(3), 5-14.
Juechter, W. M. (1993). The Ability to learn. In K. Mellander. The Power of Learning. Fostering Employee Growth. Homewood, Il: The American Society for Training and Development.
Kearsly, G. (1999). Explorations in Learning & Instruction: The Theory Into Prac-tice Database. http://home.sprynet.com/~gkearsleyhttp://www.gwu.edu/~ tip/theories.html
Kolb, D. A. (1984). Experiential Learning. Englewood Cliffs, NJ: Prentice Hall.Kolb, D. A., Rubin, I. M., & Osland, J. S. (1991). The Organizational Behavior
Reader. Englewood Cliffs, NJ: Prentice Hall.Lave, J. (1988). Cognition in Practice: Mind, mathematics, and culture in everyday
life. Cambridge, UK: Cambridge University Press.Leontjew, A. N. (1982). Tätigkeit, Bewusstsein, Persönlichkeit. Pahl-Rugenstein:
Köln.Leymann, H., & Gustavsson, B-G. (1990). Lärande i arbetslivet, Studentlittera-
tur, Lund.Mattsson, P. (1995). Generativt lärande – en miljöpedagogisk studie av kunskapsin-
tensiva industriföretag 1991– 1993. Industrilitteratur: Stockholm.Mellander, K. (1993). The Power of Learning. Fostering Employee Growth. Home-
wood. Il: The American Society for Training and Development.Mullet, K. & Sano, D. (1995). Designing Visual Interfaces Communication Ori-
ented Techniques. Mountain View, California: SunSoft Press A Prentice Hall Title.
National Council of Teachers of Mathematics. (1989). Curriculum and evalua-tion standards of school mathematics. Reston, VA: NCTM.
Paivio, A. (1983). The empirical case for dual coding. In J. C. Yuille (Ed.). Imag-ery, Memory, and Cognition. Hillsdale, NJ: Lawrence Erlbaum Associates.
Paivio, A. (1986). Mental representations: A dual coding approach. Oxford, England: Oxford University Press.
Perkins, D. N. (1985). Postprimary education has little impact on informal rea-soning. Journal of Educational Psychology, 77, 5, 562-571.
Pettersson, R. (1995). The Learning Helix. Paper presented at the 27th Annual Conference of the International Visual Literacy Association. Chicago, Oct. 18 – 22. 1995. Published in: R. E. Griffin. D. G. Beauchamp, J. M. Hunter & C. B. Shiffman, (Eds.) 1996: Eyes on the Future: Converging Images, Ideas and Instruction. Selected Readings of the International Visual Literacy Association. International Visual Literacy Association.
439
Pettersson, R. (1998). Information Design and Learning. Presentation at Vision Plus 5. Learning meets Information Design, Information Design meets Learning. International Institute for Information Design, Fachhochschul-Studiengänge-Vorarlberg, Austrian Federal Ministry of Science and Trans-portation, Ministry of Education and Art, UNESCO. Schwarzenberg, Vorarlberg, Austria, July 2-4, 1998.
Pettersson, R. (1999). Attention – an Information Design Perspective. Presentation at Vision Plus 6. Drawing the Process: Visual Planning and Explaining. International Institute for Information Design (IIID), Vienna, Austria, July 8-10.
Pressley, G. M., & Miller, G. E. (1987). Effects of illustrations on children’s lis-tening comprehension and oral prose memory. In D. M. Willows & H. A. Houghton (Eds.). The Psychology of Illustrations. Vol. 1. New York: Springer-Verlag.
Reinhardt, A. (1995). New Ways to Learn. Byte. March, 50-71.Robert, L. E. (1993). OPE: Learning from other people´s experience. Managers
Magazine, 68, 9, 10–13.Rogers, C.R. (1969). Freedom to Learn. Columbus, OH: Merrill. Science for All Americans, Summary, Project 2061. (1989). American Association
for the Advancement of Science.Sharan, S. (1980). Cooperative learning in small groups: Recent methods and
effects on achievement, attitudes, and ethic relations. Review of Educational Research, 50, 241-271.
Slavin, R. E. (1989). Cooperative learning and student achievement. In R. E. Slavin (Ed.) School and classroom organization. Hillsdale, NJ: Erlbaum.
Smith, P. L., and Ragan, T. J. (1999). Instructional Design. Merrill, Prentice Hall. Columbus, Ohio.
Stockfelt, T. (1987). Arbetslivets pedagogik. Timbro/Affärsledaren: Göteborg.Swieringa, J. & Wierdsma, A. (1992). Becoming a Learning Organization. Beyond
the Learning Curve. Wokingham: Addison-Wesley Publishers.Uljens, M. (1992). What is learning a change of? (1992:01): Department of Educa-
tion and Educational Research University of Göteborg.Winn, W. (1993) Instructional design and situated learning: Paradox or part-
nership? Educational Technology, 33(3), 16-21.Winne, P. (1995). Challenges to the development of self-regulated learning. Presen-
tation at the 6th European Conference for Research on Learning and Instruction. European Association for Research on Learning and Instruc-tion. Nijmegen, August 26 - 31.

440
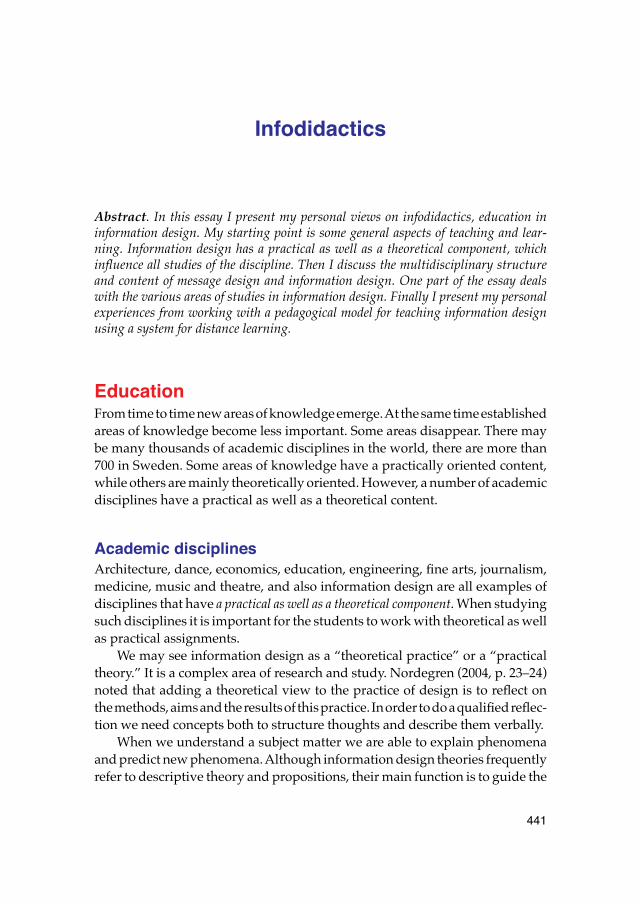
441
Infodidactics
Abstract. In this essay I present my personal views on infodidactics, education ininformation design. My starting point is some general aspects of teaching and lear-ning. Information design has a practical as well as a theoretical component, whichinfluence all studies of the discipline. Then I discuss the multidisciplinary structureand content of message design and information design. One part of the essay dealswith the various areas of studies in information design. Finally I present my personalexperiences from working with a pedagogical model for teaching information designusing a system for distance learning.
EducationFrom time to time new areas of knowledge emerge. At the same time establishedareas of knowledge become less important. Some areas disappear. There maybe many thousands of academic disciplines in the world, there are more than700 in Sweden. Some areas of knowledge have a practically oriented content,while others are mainly theoretically oriented. However, a number of academicdisciplines have a practical as well as a theoretical content.
Academic disciplinesArchitecture, dance, economics, education, engineering, fine arts, journalism,medicine, music and theatre, and also information design are all examples ofdisciplines that have a practical as well as a theoretical component. When studyingsuch disciplines it is important for the students to work with theoretical as wellas practical assignments.
We may see information design as a “theoretical practice” or a “practicaltheory.” It is a complex area of research and study. Nordegren (2004, p. 23–24)noted that adding a theoretical view to the practice of design is to reflect onthe methods, aims and the results of this practice. In order to do a qualified reflec-tion we need concepts both to structure thoughts and describe them verbally.
When we understand a subject matter we are able to explain phenomenaand predict new phenomena. Although information design theories frequentlyrefer to descriptive theory and propositions, their main function is to guide the
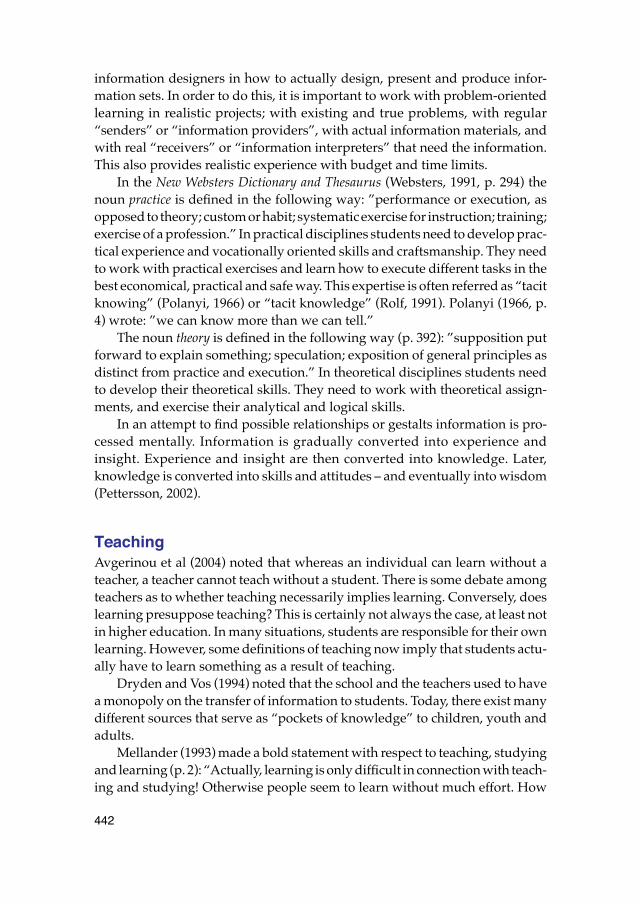
442
information designers in how to actually design, present and produce infor-mation sets. In order to do this, it is important to work with problem-orientedlearning in realistic projects; with existing and true problems, with regular“senders” or “information providers”, with actual information materials, andwith real “receivers” or “information interpreters” that need the information.This also provides realistic experience with budget and time limits.
In the New Websters Dictionary and Thesaurus (Websters, 1991, p. 294) thenoun practice is defined in the following way: ”performance or execution, asopposed to theory; custom or habit; systematic exercise for instruction; training;exercise of a profession.” In practical disciplines students need to develop prac-tical experience and vocationally oriented skills and craftsmanship. They needto work with practical exercises and learn how to execute different tasks in thebest economical, practical and safe way. This expertise is often referred as “tacitknowing” (Polanyi, 1966) or “tacit knowledge” (Rolf, 1991). Polanyi (1966, p.4) wrote: ”we can know more than we can tell.”
The noun theory is defined in the following way (p. 392): ”supposition putforward to explain something; speculation; exposition of general principles asdistinct from practice and execution.” In theoretical disciplines students needto develop their theoretical skills. They need to work with theoretical assign-ments, and exercise their analytical and logical skills.
In an attempt to find possible relationships or gestalts information is pro-cessed mentally. Information is gradually converted into experience andinsight. Experience and insight are then converted into knowledge. Later,knowledge is converted into skills and attitudes – and eventually into wisdom(Pettersson, 2002).
TeachingAvgerinou et al (2004) noted that whereas an individual can learn without ateacher, a teacher cannot teach without a student. There is some debate amongteachers as to whether teaching necessarily implies learning. Conversely, doeslearning presuppose teaching? This is certainly not always the case, at least notin higher education. In many situations, students are responsible for their ownlearning. However, some definitions of teaching now imply that students actu-ally have to learn something as a result of teaching.
Dryden and Vos (1994) noted that the school and the teachers used to havea monopoly on the transfer of information to students. Today, there exist manydifferent sources that serve as “pockets of knowledge” to children, youth andadults.
Mellander (1993) made a bold statement with respect to teaching, studyingand learning (p. 2): “Actually, learning is only difficult in connection with teach-ing and studying! Otherwise people seem to learn without much effort. How
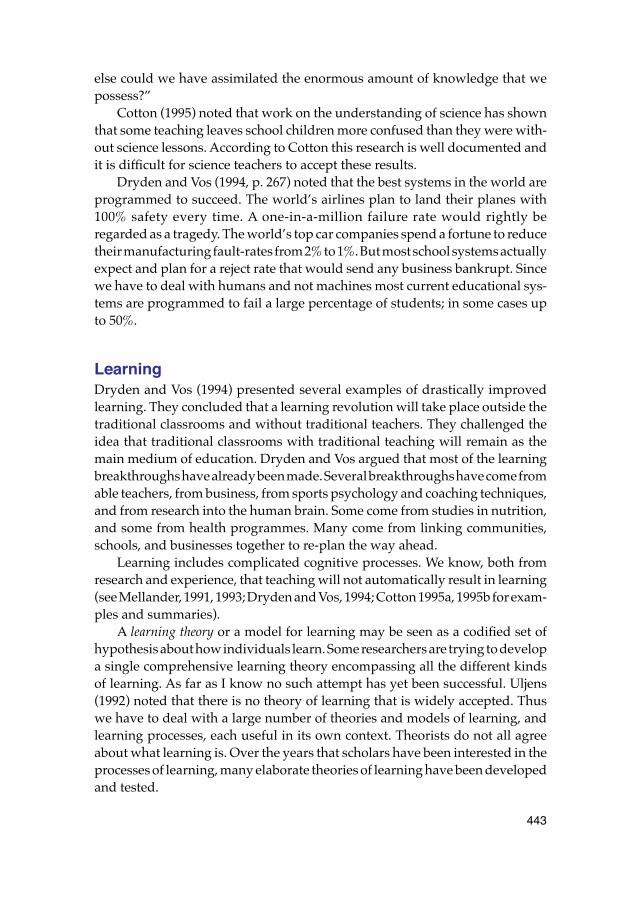
443
else could we have assimilated the enormous amount of knowledge that wepossess?”
Cotton (1995) noted that work on the understanding of science has shownthat some teaching leaves school children more confused than they were with-out science lessons. According to Cotton this research is well documented andit is difficult for science teachers to accept these results.
Dryden and Vos (1994, p. 267) noted that the best systems in the world areprogrammed to succeed. The world’s airlines plan to land their planes with100% safety every time. A one-in-a-million failure rate would rightly beregarded as a tragedy. The world’s top car companies spend a fortune to reducetheir manufacturing fault-rates from 2% to 1%. But most school systems actuallyexpect and plan for a reject rate that would send any business bankrupt. Sincewe have to deal with humans and not machines most current educational sys-tems are programmed to fail a large percentage of students; in some cases upto 50%.
LearningDryden and Vos (1994) presented several examples of drastically improvedlearning. They concluded that a learning revolution will take place outside thetraditional classrooms and without traditional teachers. They challenged theidea that traditional classrooms with traditional teaching will remain as themain medium of education. Dryden and Vos argued that most of the learningbreakthroughs have already been made. Several breakthroughs have come fromable teachers, from business, from sports psychology and coaching techniques,and from research into the human brain. Some come from studies in nutrition,and some from health programmes. Many come from linking communities,schools, and businesses together to re-plan the way ahead.
Learning includes complicated cognitive processes. We know, both fromresearch and experience, that teaching will not automatically result in learning(see Mellander, 1991, 1993; Dryden and Vos, 1994; Cotton 1995a, 1995b for exam-ples and summaries).
A learning theory or a model for learning may be seen as a codified set ofhypothesis about how individuals learn. Some researchers are trying to developa single comprehensive learning theory encompassing all the different kindsof learning. As far as I know no such attempt has yet been successful. Uljens(1992) noted that there is no theory of learning that is widely accepted. Thuswe have to deal with a large number of theories and models of learning, andlearning processes, each useful in its own context. Theorists do not all agreeabout what learning is. Over the years that scholars have been interested in theprocesses of learning, many elaborate theories of learning have been developedand tested.
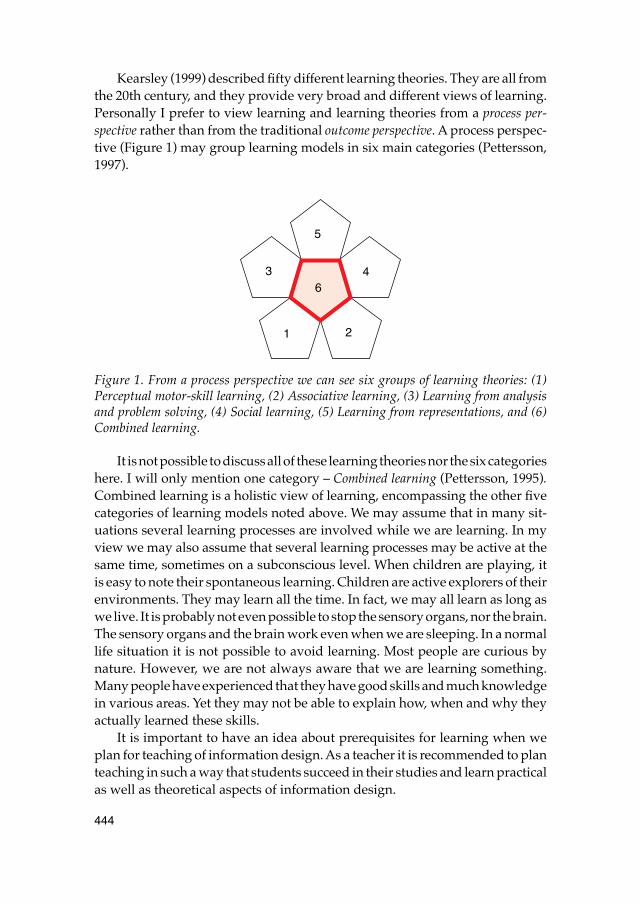
444
Kearsley (1999) described fifty different learning theories. They are all fromthe 20th century, and they provide very broad and different views of learning.Personally I prefer to view learning and learning theories from a process per-spective rather than from the traditional outcome perspective. A process perspec-tive (Figure 1) may group learning models in six main categories (Pettersson,1997).
Figure 1. From a process perspective we can see six groups of learning theories: (1)Perceptual motor-skill learning, (2) Associative learning, (3) Learning from analysisand problem solving, (4) Social learning, (5) Learning from representations, and (6)Combined learning.
It is not possible to discuss all of these learning theories nor the six categorieshere. I will only mention one category – Combined learning (Pettersson, 1995).Combined learning is a holistic view of learning, encompassing the other fivecategories of learning models noted above. We may assume that in many sit-uations several learning processes are involved while we are learning. In myview we may also assume that several learning processes may be active at thesame time, sometimes on a subconscious level. When children are playing, itis easy to note their spontaneous learning. Children are active explorers of theirenvironments. They may learn all the time. In fact, we may all learn as long aswe live. It is probably not even possible to stop the sensory organs, nor the brain.The sensory organs and the brain work even when we are sleeping. In a normallife situation it is not possible to avoid learning. Most people are curious bynature. However, we are not always aware that we are learning something.Many people have experienced that they have good skills and much knowledgein various areas. Yet they may not be able to explain how, when and why theyactually learned these skills.
It is important to have an idea about prerequisites for learning when weplan for teaching of information design. As a teacher it is recommended to planteaching in such a way that students succeed in their studies and learn practicalas well as theoretical aspects of information design.
1
36
5
4
2
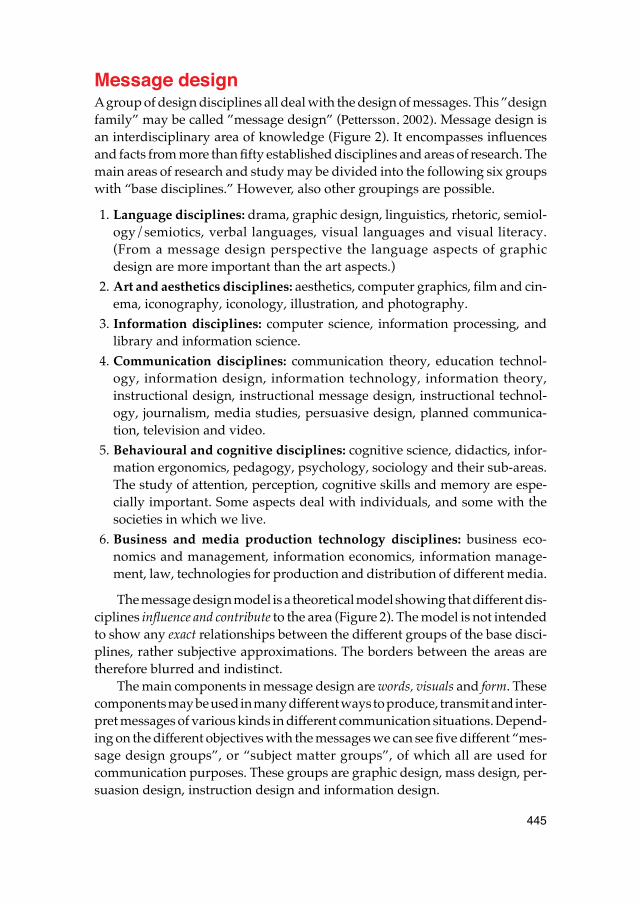
445
Message designA group of design disciplines all deal with the design of messages. This ”designfamily” may be called ”message design” (Pettersson, 2002). Message design isan interdisciplinary area of knowledge (Figure 2). It encompasses influencesand facts from more than fifty established disciplines and areas of research. Themain areas of research and study may be divided into the following six groupswith “base disciplines.” However, also other groupings are possible.
1. Language disciplines: drama, graphic design, linguistics, rhetoric, semiol-ogy/semiotics, verbal languages, visual languages and visual literacy.(From a message design perspective the language aspects of graphicdesign are more important than the art aspects.)
2. Art and aesthetics disciplines: aesthetics, computer graphics, film and cin-ema, iconography, iconology, illustration, and photography.
3. Information disciplines: computer science, information processing, andlibrary and information science.
4. Communication disciplines: communication theory, education technol-ogy, information design, information technology, information theory,instructional design, instructional message design, instructional technol-ogy, journalism, media studies, persuasive design, planned communica-tion, television and video.
5. Behavioural and cognitive disciplines: cognitive science, didactics, infor-mation ergonomics, pedagogy, psychology, sociology and their sub-areas.The study of attention, perception, cognitive skills and memory are espe-cially important. Some aspects deal with individuals, and some with thesocieties in which we live.
6. Business and media production technology disciplines: business eco-nomics and management, information economics, information manage-ment, law, technologies for production and distribution of different media.
The message design model is a theoretical model showing that different dis-ciplines influence and contribute to the area (Figure 2). The model is not intendedto show any exact relationships between the different groups of the base disci-plines, rather subjective approximations. The borders between the areas aretherefore blurred and indistinct.
The main components in message design are words, visuals and form. Thesecomponents may be used in many different ways to produce, transmit and inter-pret messages of various kinds in different communication situations. Depend-ing on the different objectives with the messages we can see five different “mes-sage design groups”, or “subject matter groups”, of which all are used forcommunication purposes. These groups are graphic design, mass design, per-suasion design, instruction design and information design.
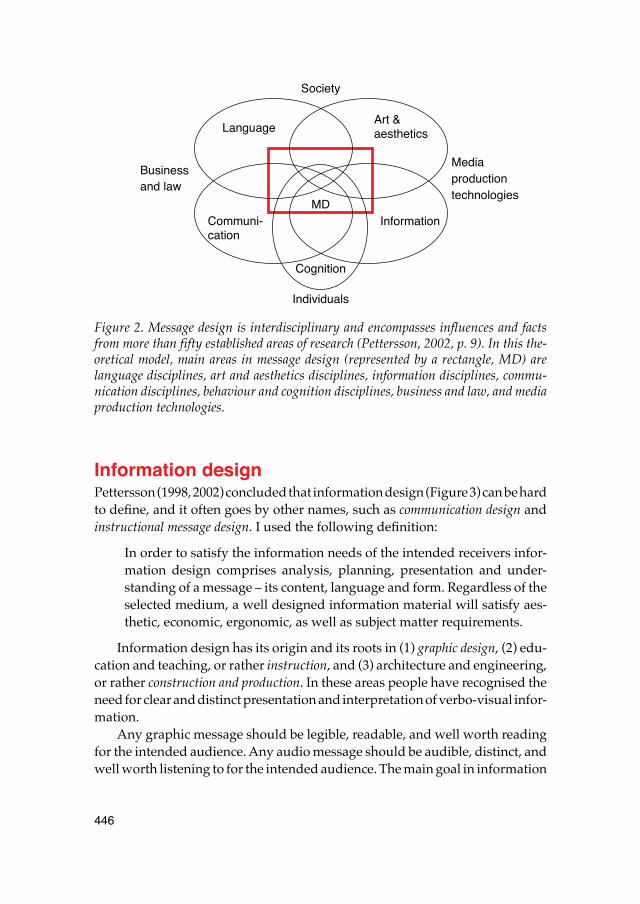
446
Figure 2. Message design is interdisciplinary and encompasses influences and factsfrom more than fifty established areas of research (Pettersson, 2002, p. 9). In this the-oretical model, main areas in message design (represented by a rectangle, MD) arelanguage disciplines, art and aesthetics disciplines, information disciplines, commu-nication disciplines, behaviour and cognition disciplines, business and law, and mediaproduction technologies.
Information designPettersson (1998, 2002) concluded that information design (Figure 3) can be hardto define, and it often goes by other names, such as communication design andinstructional message design. I used the following definition:
In order to satisfy the information needs of the intended receivers infor-mation design comprises analysis, planning, presentation and under-standing of a message – its content, language and form. Regardless of theselected medium, a well designed information material will satisfy aes-thetic, economic, ergonomic, as well as subject matter requirements.
Information design has its origin and its roots in (1) graphic design, (2) edu-cation and teaching, or rather instruction, and (3) architecture and engineering,or rather construction and production. In these areas people have recognised theneed for clear and distinct presentation and interpretation of verbo-visual infor-mation.
Any graphic message should be legible, readable, and well worth readingfor the intended audience. Any audio message should be audible, distinct, andwell worth listening to for the intended audience. The main goal in information
Individuals
Business
Society
and law
Media
technologiesproduction
Cognition
LanguageArt &
Communi- InformationMD
cation
aesthetics
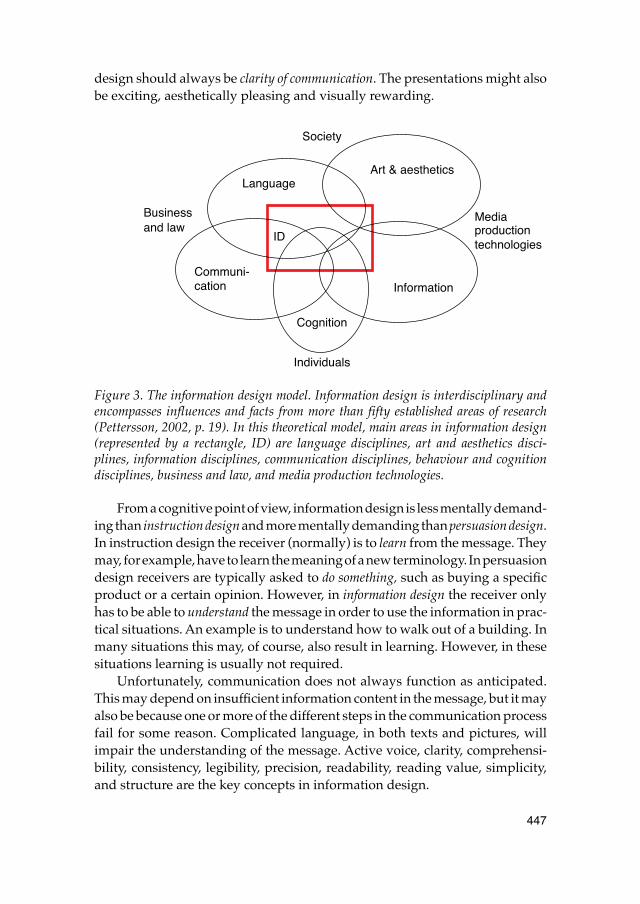
447
design should always be clarity of communication. The presentations might alsobe exciting, aesthetically pleasing and visually rewarding.
Figure 3. The information design model. Information design is interdisciplinary andencompasses influences and facts from more than fifty established areas of research(Pettersson, 2002, p. 19). In this theoretical model, main areas in information design(represented by a rectangle, ID) are language disciplines, art and aesthetics disci-plines, information disciplines, communication disciplines, behaviour and cognitiondisciplines, business and law, and media production technologies.
From a cognitive point of view, information design is less mentally demand-ing than instruction design and more mentally demanding than persuasion design.In instruction design the receiver (normally) is to learn from the message. Theymay, for example, have to learn the meaning of a new terminology. In persuasiondesign receivers are typically asked to do something, such as buying a specificproduct or a certain opinion. However, in information design the receiver onlyhas to be able to understand the message in order to use the information in prac-tical situations. An example is to understand how to walk out of a building. Inmany situations this may, of course, also result in learning. However, in thesesituations learning is usually not required.
Unfortunately, communication does not always function as anticipated.This may depend on insufficient information content in the message, but it mayalso be because one or more of the different steps in the communication processfail for some reason. Complicated language, in both texts and pictures, willimpair the understanding of the message. Active voice, clarity, comprehensi-bility, consistency, legibility, precision, readability, reading value, simplicity,and structure are the key concepts in information design.
Individuals
Business
Society
and lawMedia
technologiesproduction
Cognition
LanguageArt & aesthetics
Communi-Information
ID
cation
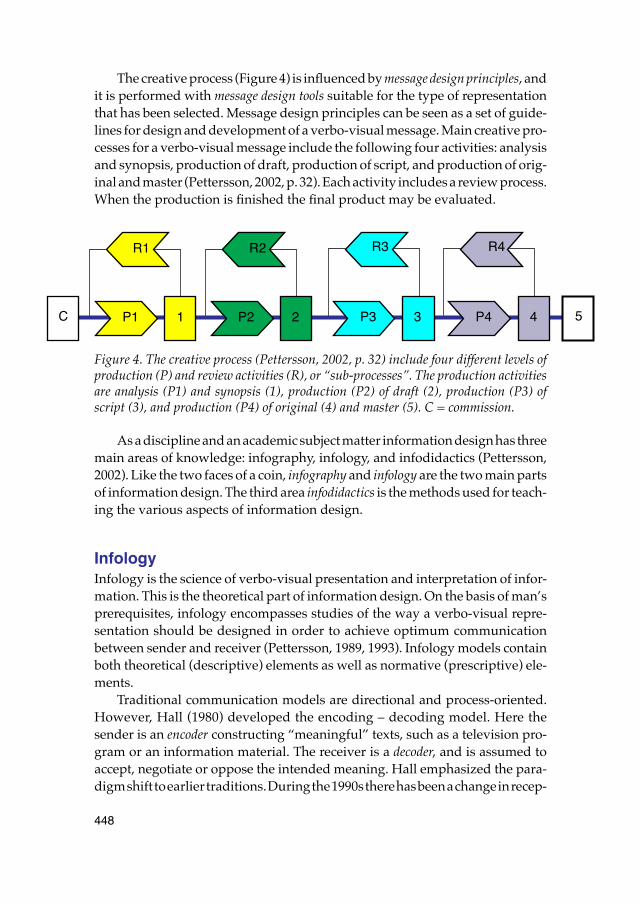
448
The creative process (Figure 4) is influenced by message design principles, andit is performed with message design tools suitable for the type of representationthat has been selected. Message design principles can be seen as a set of guide-lines for design and development of a verbo-visual message. Main creative pro-cesses for a verbo-visual message include the following four activities: analysisand synopsis, production of draft, production of script, and production of orig-inal and master (Pettersson, 2002, p. 32). Each activity includes a review process.When the production is finished the final product may be evaluated.
Figure 4. The creative process (Pettersson, 2002, p. 32) include four different levels ofproduction (P) and review activities (R), or “sub-processes”. The production activitiesare analysis (P1) and synopsis (1), production (P2) of draft (2), production (P3) ofscript (3), and production (P4) of original (4) and master (5). C = commission.
As a discipline and an academic subject matter information design has threemain areas of knowledge: infography, infology, and infodidactics (Pettersson,2002). Like the two faces of a coin, infography and infology are the two main partsof information design. The third area infodidactics is the methods used for teach-ing the various aspects of information design.
InfologyInfology is the science of verbo-visual presentation and interpretation of infor-mation. This is the theoretical part of information design. On the basis of man’sprerequisites, infology encompasses studies of the way a verbo-visual repre-sentation should be designed in order to achieve optimum communicationbetween sender and receiver (Pettersson, 1989, 1993). Infology models containboth theoretical (descriptive) elements as well as normative (prescriptive) ele-ments.
Traditional communication models are directional and process-oriented.However, Hall (1980) developed the encoding – decoding model. Here thesender is an encoder constructing “meaningful” texts, such as a television pro-gram or an information material. The receiver is a decoder, and is assumed toaccept, negotiate or oppose the intended meaning. Hall emphasized the para-digm shift to earlier traditions. During the 1990s there has been a change in recep-
R1 R2 R3 R4
P1 P2 P3 P4 C 1 2 3 4 5
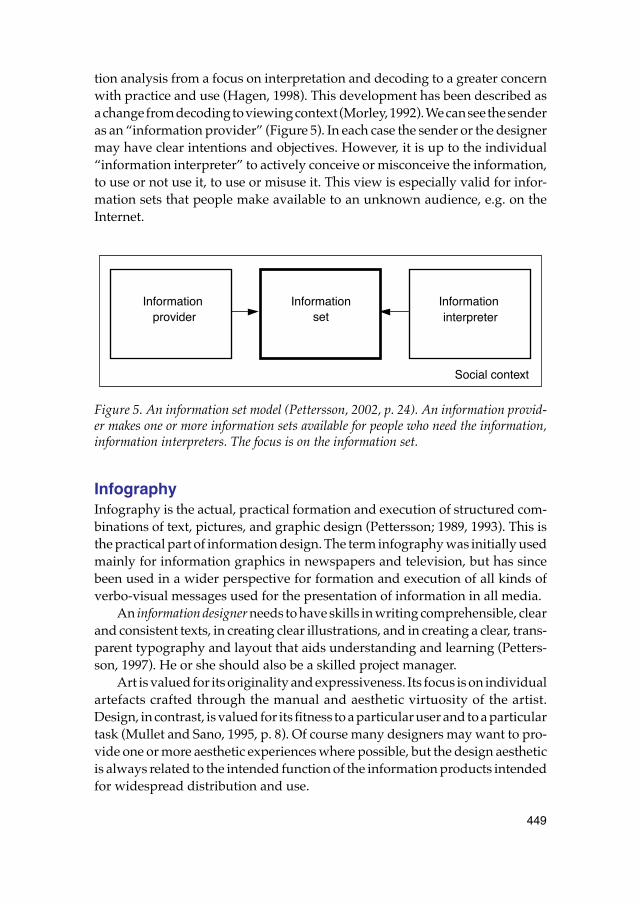
449
tion analysis from a focus on interpretation and decoding to a greater concernwith practice and use (Hagen, 1998). This development has been described asa change from decoding to viewing context (Morley, 1992). We can see the senderas an “information provider” (Figure 5). In each case the sender or the designermay have clear intentions and objectives. However, it is up to the individual“information interpreter” to actively conceive or misconceive the information,to use or not use it, to use or misuse it. This view is especially valid for infor-mation sets that people make available to an unknown audience, e.g. on theInternet.
Figure 5. An information set model (Pettersson, 2002, p. 24). An information provid-er makes one or more information sets available for people who need the information,information interpreters. The focus is on the information set.
InfographyInfography is the actual, practical formation and execution of structured com-binations of text, pictures, and graphic design (Pettersson; 1989, 1993). This isthe practical part of information design. The term infography was initially usedmainly for information graphics in newspapers and television, but has sincebeen used in a wider perspective for formation and execution of all kinds ofverbo-visual messages used for the presentation of information in all media.
An information designer needs to have skills in writing comprehensible, clearand consistent texts, in creating clear illustrations, and in creating a clear, trans-parent typography and layout that aids understanding and learning (Petters-son, 1997). He or she should also be a skilled project manager.
Art is valued for its originality and expressiveness. Its focus is on individualartefacts crafted through the manual and aesthetic virtuosity of the artist.Design, in contrast, is valued for its fitness to a particular user and to a particulartask (Mullet and Sano, 1995, p. 8). Of course many designers may want to pro-vide one or more aesthetic experiences where possible, but the design aestheticis always related to the intended function of the information products intendedfor widespread distribution and use.
Social context
Information interpreter
Information provider
Informationset
450
Areas of studyThe study of information design can be summarised as a multi-disciplinary,multi-dimensional and worldwide consideration. We can view, analyze,describe and discuss information design from various perspectives. Prominentperspectives on information design are areas of design, types of content, partsof communication, types of representation, and message contexts.
Areas of design In information design it is always important that the intended audience willbe able to understand the messages. The reader must always be able to distin-guish between figure and ground without any difficulty. Production of infor-mation materials is the opposite of camouflage, where the intention is to makea figure as much similar to the background as possible. In an oral presentationit may be better not to use any visuals at all than having to use low qualityimages. Poorly executed and poorly presented images will influence theunderstandings of the whole oral presentation. Simple pictures are “immedi-ate.” They speak to us holistically and emotionally. When readers get the“wrong impression” it may be very hard to change this later on.
Types of contentIt is important to understand the intended content in information materials.What is the message? What is the influence of culture? A “types of content per-spective” includes informative entertainment, brief messages, administrativedocumentation, factual information and instructions. We may also includeadvertising and propaganda as well as teaching aids in this group. All of thesetypes of content may be used in different fields such as consumer information,economic information, geographical information, product information, publichealth and pharmaceutical information, social information, technical informa-tion and tourist information.
Types of representationWords and pictures can be presented in different ways and with the aid of dif-ferent media. Likewise a verbo-visual representation can be designed in dif-ferent ways. Based on how the verbal information is presented to the receivers,we can distinguish three main types of verbo-visual representations (Pettersson,1989, 1993). We read the printed words in lexi-visual representations, such asmessages printed in a book or messages displayed on a computer screen. Welisten to the spoken words in audio-visual representations, such as oral pre-sentations with slides or overhead transparencies and in television pro-
451
grammes. We read printed words and listen to spoken words in a combinationof lexi-visual and audio-visual representations in multi-visual representations,such as interactive multimedia systems.
The presentation of all the information available in a field is seldom possible.Normally, information-providers and other writers make a selection. This selec-tion can be more or less subjective. The selection is seldom, or perhaps never,objective. This is difficult or even impossible. The different media have com-pletely different abilities to convey information.
Message contextsA context perspective on information design includes the inner context, the closecontext, and the social context. The inner context is an internal context. In a book,for instance, it is the relationship between various text elements, pictures andlayout. We may also discuss the relationships between the image elementswithin a single picture.
The entire communication situation, i.e., senders and their intentions forthe verbo-visual message, and receivers and their circumstances provide thesocial context. When we read a book or view projected images the lighting inthe room may exemplify the close context. The close context and the social con-text are both external contexts. The context in which a specific message is pre-sented has a major impact on the way that the message is perceived.
Work rangeThere are many information professions. Groups which mainly work with infor-mation, such as e.g. editors, information providers, journalists and marketers,all have similar knowledge of Man and knowledge of information and com-munications as starting points. They basically utilise the same methods andtechniques in their jobs. However, their roles differ in society. Professional rolesgive each group a special identity and make different demands on loyalty, expe-rience and know-how. The loyalty of an information-provider is to her/hisemployer. The loyalty of a journalist should be to her/his readers, listeners andviewers rather than to her/his employer.
Information designers can facilitate communication and the learning pro-cesses of the readers. Several activities are involved when an intended messageis communicated from a sender to a receiver, and received as an internalizedmessage. These processes are guided by principles, performed with the helpof tools and influenced by the social context. Information designers work in arange of activities: form and document design; wayfinding systems; interactiveand time-based infographics; digital content management; development of

452
knowledge structure and management systems; product and instructionaldesign; technical writing and publications; and information architecture. Theirwork ranges from overall strategies for information formation and transfer, tospecific solutions for data clarification and transfer. The main goal of informa-tion designers is to provide user-centered solutions, making the complex clearand relevant, and adding value to data and information.
In 2005 the partners of a federal US-EU Fund for the Improvement of Post-Secondary Education (FIPSE) grant for the Development of Core Competenciesand Faculty and Student Exchange in Information Design listed the followingessential competencies for an information designer. An information designershould be:
1. Able to identify the purpose and audience of a given project and explicitlydesign effective structures, information, and presentation appropriate tothat project.
2. Able to cooperate with specialists to understand knowledge structures andthe data/information in terms of content, topic and cultural context.
3. Able to organize content, including writing, editing, and schema technol-ogies.
4. Able to understand and use various communication models to form infor-mation in a manner appropriate and effective for the data and the user.
5. Able to determine and coordinate the best delivery method/mediarequirements to make the information accessible and useable by the givenaudience, including visual, haptic, and auditory delivery methods, andcomputational schema.
6. Able to use appropriate presentation systems and environments, includingsoftware, hardware, and digital presentation technologies.
7. Able to assess the success of a prototype, using established usability andaccessibility guidelines and testing methods.
8. Understand local, regional, national and global realities in problem assess-ment.
9. Understand and apply the business aspects of developing and deliveringinformation.
10. Understand the ethical challenges that arise in everyday work environ-ments and the necessary commitment to professional and ethical behav-iour.
Around the world academic programs in information design vary accord-ing to emphasis placed by faculty on areas that contribute to the overall program,including graphic design, interface/interaction design, technical communica-tion, communication models, linguistics, accessibility/usability, cognitive and
453
social sciences, statistics, computer science, network systems, and business. Pro-grams are both intra-disciplinary within art and design, and interdisciplinary,based on specific goals and objectives of the program.
Adams (1999, p. 19) concluded that it is a difficult task to design good infor-mation-giving materials. When faced with poorly designed information prod-ucts the users still largely blame themselves and not the information providers.However, the quality of the information sets can be greatly improved by appro-priate usability testing. According to Adams a push for a research-based infor-mation design must come from the information designers. In each case, mem-bers of the specific user group may be invited to evaluate preliminary texts andsketches for drawings and photographs.
A pedagogical model In this section I present the pedagogical model that we have used in several ofour information design classes, in traditional teaching as well as in distanceclasses with e-learning. So far we have had very positive responses from thestudents. However, since people are different it should be noted that this ped-agogical model does not work for all students. We have not been able to adjustthe pedagogical model for students with different learning styles. Furthermoremany of our students have usually been highly motivated. Maybe highly motivatedstudents will learn regardless of the system used.
Anyhow, our pedagogical model is based on the theories of combined learn-ing, with strong influences from areas like constructivism, learning from anal-ysis and problem solving, and cooperative learning. As previously noted wemay assume that, in many situations, several learning processes are involvedwhile we are learning. Our goal is to work with methods creating commitment,motivation and learning. The teacher becomes a supervisor and a co-workerrather than a traditional lecturer. The students own study of carefully selectedliterature is a base for discussions and understanding of the subject matter.
Active processes Constructivism is a philosophy of learning founded on the premise that, byreflecting on our experiences, we construct our own understanding of the worldwe live in (Funderstanding a, 2005). Each of us generates our own “rules” and“mental models,” which we use to make sense of our experiences. Learning,therefore, is simply the process of adjusting our mental models to accomodatenew experiences.
Constructivism is grounded on the philosophy of Dewey, Kant, and Vico,and the psychology of Piaget, Bruner, and Bartlett. In constructivism knowledge
454
is a function of how individuals interact, create and construct meaning fromtheir own experiences and their own physical and social context and environ-ment. Cooper (1993) traced the paradigm shifts in instructional design frombehaviourism to cognitivism and then to constructivism.
Constructivists emphasize situating cognitive experiences in authenticactivities (Thompson, Simonson, and Hargrave, 1996). Reality is neither unitarynor fixed, but constructed. The mind is central to the constructivist view. Ratherthan mapping concepts on the mind of the learner (as with objectivism) con-structivism attempts to help individual learners construct their own knowledgefrom their own experiences and their own understandings of reality.
The learner is the central focus in the constructivism model, not the instructoror the teacher. All individuals have a unique set of experiences, and differentperceptions of their own realities. Knowledge is constructed and developed bythe individual learner through interaction with her or his environment (Jonas-sen, 1991; Wheatley, 1991, Steffe and Gale, 1995). In our case learners worktogether in a cooperative learning environment. Thus they support one anotherwhen they learn. In our case learners work together in a cooperative learningenvironment. Thus they support one another when they learn. Each individualmind builds different symbols. Since each mind develops different symbolstructures, each mind perceives reality as well as all kinds of information mate-rials differently; although common understandings may occur.
In my view learning is an active process. Constructivist environments facil-itate learning through collaboration, interaction with information material, con-text, and construction of knowledge. A major assumption in constructivism isthat even though reality exists outside language, we can only know and com-municate about reality through formal speech and discussion. Media may sup-port constructivist learning environments, but they do not control it. Throughassimilation and accommodation, individuals use many elements of the learn-ing context and relate those elements to their own experiences; thus, creatingnew knowledge. At school the classroom holds no special status and it is usuallyimportant to improve the learning environment in the classrooms.
Kumar et al. (1994) noted that in hypermedia it would be possible to trackthe performance of individual learners. The flexibility of hypermedia docu-ments with their systems of nodes and links allows the learner to pursue heror his experiences in a self-directed, non-linear way. This is consistent with theconstructivist model of learning. Hypertext capabilities, different navigationalstructures, and content exercises are examples of information design featuresthat enable each individual student to construct knowledge in a constructivistmanner.
In traditional distance learning, like the Open University in the UK, muchwork is put into developing teaching materials. This requires heavy investmentand is based on the assumption that a large number of people shall learn the
455
same subject matter at the same time under the control of the teacher, directlyor in the way the learning material is designed. It takes between two and threeyears to develop such a course. The dialogue between the teacher and the stu-dent occurs primarily to secure that subject matter content is understood theway it was intended. With complete self instructed material no questions needsto be asked. The development of multimedia teaching programmes correspondswith this model. The material is not flexible, and the teaching is carried out basedon the needs of the teacher, not the needs of the students.
Slavin (1995) found that social interactions and problem-solving skills wereenhanced when cooperative learning was combined with technology. It alsoimproved the overall classroom climate.
Students work together Cooperative learning consists of instructional techniques that require positiveinterdependence between learners in order for learning to occur (Funderstand-ing b, 2005). In cooperative learning the dialogue is primarily between students,not with the teacher or with traditional teaching materials. However, a contin-uous dialogue with the teacher is desirable to secure understanding of the sub-ject matter content. According to Kristiansen et al. (1994), the ideal learning sit-uation includes (p. 23):
... the best possible contact with the fact about which one is to learn usingthe senses, the possibility of contact with people of the same ability whocan create a good learning environment and with whom one can discuss,the best possible professional and pedagogical preparation with a viewto learning and the opportunity for dialogue with helpers. And the mostimportant; a learner who is knowledgeable about the learning processand his own role in it, who is motivated for the learning work and whobelieves in himself.
Cooperative learning is effective for developing problem solving skills invarious content areas and grade levels (Johnson and Johnson, 1999; Chen andCaropreso, 2004). From a teaching philosophy perspective, cooperative learningis consistent with constructivism primarily due to the role of social interaction.According to some researchers learners who work together in a group co-con-struct more powerful understandings than individual learners can constructalone (Eggen and Kauchak, 2001). It should, however, be noted that there aredifferent styles of learning, and cooperative learning does not work well forall students.
In our pedagogical model the emphasis is on the learner, not on the teacheror the technology. Students have access to a Study guide with important infor-mation (Figure 6, 6a and 6b). They use a Virtual classroom when they work
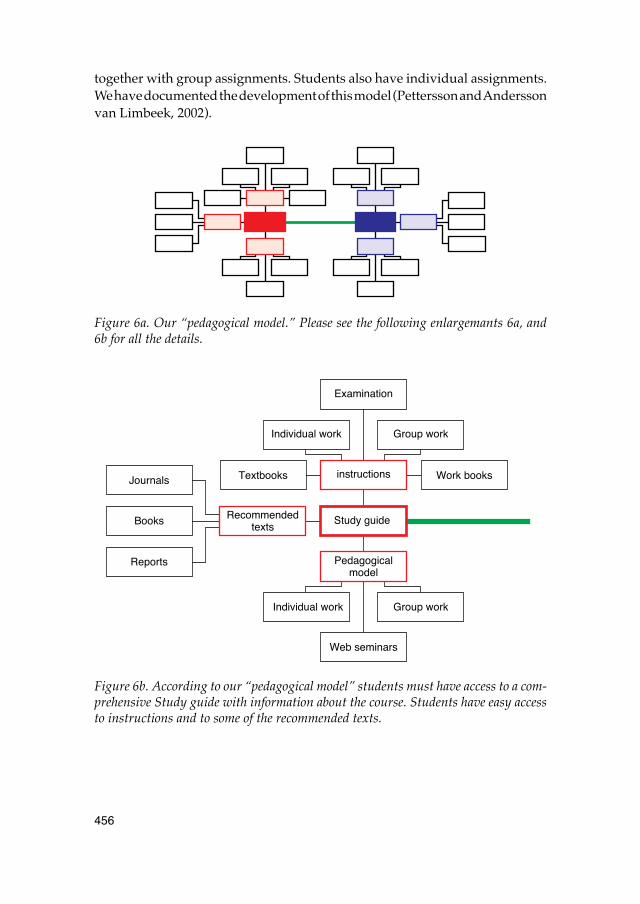
456
together with group assignments. Students also have individual assignments.We have documented the development of this model (Pettersson and Anderssonvan Limbeek, 2002).
Figure 6a. Our “pedagogical model.” Please see the following enlargemants 6a, and6b for all the details.
Figure 6b. According to our “pedagogical model” students must have access to a com-prehensive Study guide with information about the course. Students have easy accessto instructions and to some of the recommended texts.
Pedagogical
Web seminars
Individual work Group work
instructions
Examination
Individual work Group work
Study guide
Work booksTextbooks
RecommendedBooks
Reports
Journals
model
texts
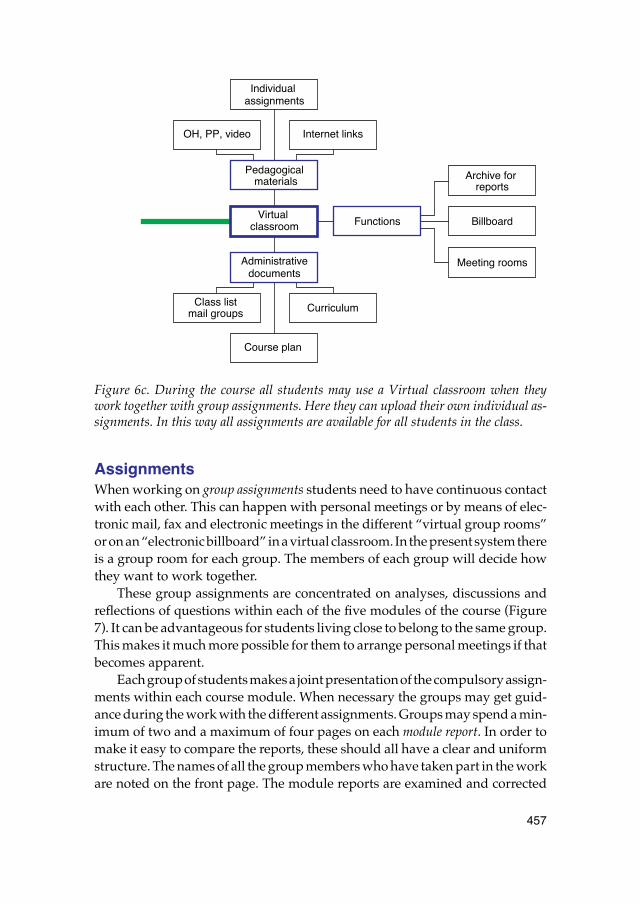
457
Figure 6c. During the course all students may use a Virtual classroom when theywork together with group assignments. Here they can upload their own individual as-signments. In this way all assignments are available for all students in the class.
Assignments When working on group assignments students need to have continuous contactwith each other. This can happen with personal meetings or by means of elec-tronic mail, fax and electronic meetings in the different “virtual group rooms”or on an “electronic billboard” in a virtual classroom. In the present system thereis a group room for each group. The members of each group will decide howthey want to work together.
These group assignments are concentrated on analyses, discussions andreflections of questions within each of the five modules of the course (Figure7). It can be advantageous for students living close to belong to the same group.This makes it much more possible for them to arrange personal meetings if thatbecomes apparent.
Each group of students makes a joint presentation of the compulsory assign-ments within each course module. When necessary the groups may get guid-ance during the work with the different assignments. Groups may spend a min-imum of two and a maximum of four pages on each module report. In order tomake it easy to compare the reports, these should all have a clear and uniformstructure. The names of all the group members who have taken part in the workare noted on the front page. The module reports are examined and corrected
Functions Billboard
Meeting rooms
Archive for
Administrative
Course plan
Class list Curriculum
Pedagogical
Individual
OH, PP, video Internet links
Virtual
reports
documents
mail groups
assignments
materials
classroom
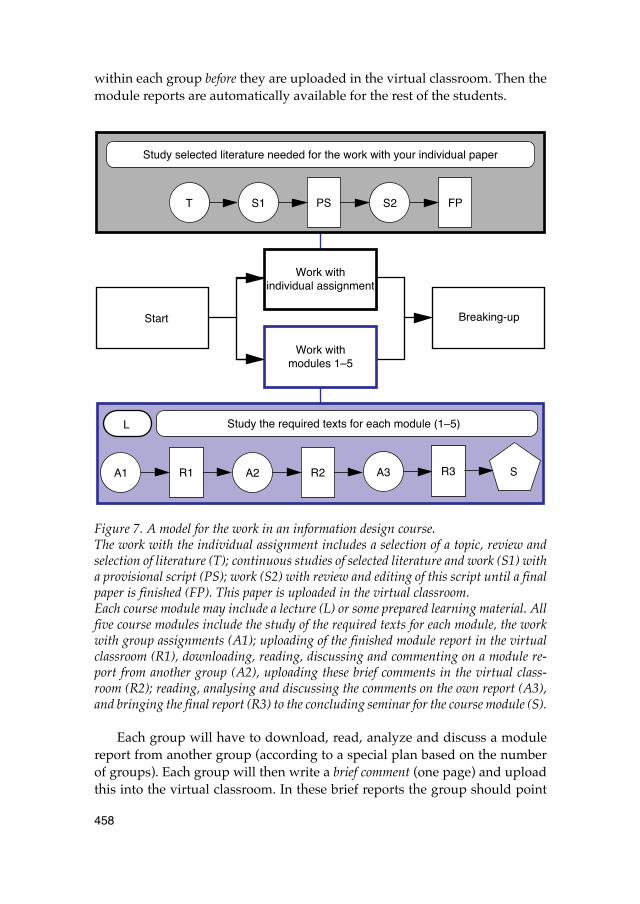
458
within each group before they are uploaded in the virtual classroom. Then themodule reports are automatically available for the rest of the students.
Figure 7. A model for the work in an information design course.The work with the individual assignment includes a selection of a topic, review andselection of literature (T); continuous studies of selected literature and work (S1) witha provisional script (PS); work (S2) with review and editing of this script until a finalpaper is finished (FP). This paper is uploaded in the virtual classroom.Each course module may include a lecture (L) or some prepared learning material. Allfive course modules include the study of the required texts for each module, the workwith group assignments (A1); uploading of the finished module report in the virtualclassroom (R1), downloading, reading, discussing and commenting on a module re-port from another group (A2), uploading these brief comments in the virtual class-room (R2); reading, analysing and discussing the comments on the own report (A3),and bringing the final report (R3) to the concluding seminar for the course module (S).
Each group will have to download, read, analyze and discuss a modulereport from another group (according to a special plan based on the numberof groups). Each group will then write a brief comment (one page) and uploadthis into the virtual classroom. In these brief reports the group should point
Work withmodules 1–5
Breaking-up
Work withindividual assignment
Start
R1A1 R2A2 A3 R3
L
PSS1 FPS2T
Study selected literature needed for the work with your individual paper
Study the required texts for each module (1–5)
S
459
out what is good and what is bad with the module reports without paying toomuch attention to formal and linguistic aspects. That is up to the writers them-selves. Each group will download and read the comments on their own reportbefore the seminar. In the seminars the groups will have direct contact to discussproblems related to the contents in the module.
According to this pedagogical model each student must take an active partin work with all group reports, all discussions and all reviews of reports fromother groups, and also write an individual essay (Figure 7). This is important forgrading.
ConclusionsIt may be easier to get an overview of the various conclusions if we bring allthe section conclusions together in one list. I believe that it is possible to createvaluable courses and programs in information design if we consider these con-clusions:
1. Information design students have different backgrounds and they use dif-ferent learning strategies. We should plan teaching in such a way that alarge part of the students actually learn what they are expected to learn.
2. Information design has a practical as well as a theoretical component. Mainareas are language disciplines, art and aesthetics disciplines, informationdisciplines, communication disciplines, behaviour and cognition disci-plines, business and law, and media production technologies.
3. An information designer needs to develop skills in writing comprehensi-ble, clear and consistent texts, in creating clear illustrations, and in creatinga clear, transparent typography and layout that aids understanding andlearning. The main goal in information design should always be clarity ofcommunication.
4. When students like to work together they may take part in and benefitfrom a cooperative learning process. In this case the teacher becomes a super-visor and a co-worker rather than a traditional lecturer.
5. The context in which a specific message is presented has a major impact onthe way that the message is perceived. We need to take into considerationthat even when we follow all information design principles the individual“information interpreter” may conceive or misconceive the information,may use or not use it, may use or misuse it.
6. Regardless of the selected medium, a well designed information materialwill satisfy aesthetic, economic, ergonomic, as well as subject matterrequirements. A well designed information material makes everyday lifeeasier for people, and it grants good credibility to the senders or sources.
460
ReferencesAdams, A. (1999). Usability testing in information design. In H. J. G. Zwaga, T.
Boersma, and H. C. M. Hoonhout (Eds.). Visual information for everyday use. Design and research perspectives. Taylor & Francis: London, Philadelphia.
Avgerinou, M. D., Griffin, R. E., & Pettersson, R. (2004). Some Experiences from Teaching Online: Extending Our Virtual Round Table Discussion To Incorporate The Student Perspective. Presentation at the 36th Annual Conference of the International Visual Literacy Association. Pilansberg game park, South Africa, October 4– 7, 2004. Published in: R. E. Griffin, S. B. Chandler & B.D. Cowden (Eds.) 2005. Visual Literacy and Development: An African Experience. Selected Readings of the International Visual Literacy Association. International Visual Literacy Association.
Chen, S., & Caropreso, E.J. (2004). The effects of personality on collaborative online learning: Communication type, task engagement, and communica-tion duration. Proceedings of the Association for Educational Communication and Technologies, USA, 27, 166-173.
Cooper, P. A. (1993). Paradigm Shifts in Designed Instruction: From Behavior-ism to Cognitivism to Constructivism. Educational Technology, 33(5), 12 - 19.
Cotton, J. (1995a). The Theory of Learning. An Introduction. London: Kogan Page.Cotton, J. (1995b). The Theory of Learners. An Introduction. London: Kogan Page.Dryden, J., & Vos, J. (1994). The Learning Revolution. Auckland, New Zealand:
Profile Books.Eggen, P., & Kauchak, D. (2001). Educational psychology: Windows on classrooms
(5th ed.). New Jersey, OH: Merrill Prentice Hall.Funderstanding a. (2005). Constructivism. <http://www.funderstanding.
com/constructivism.cfm> Accessed 2005-04-21. Funderstanding b. (2005). Cooperative learning. <http://www.funderstand-
ing. com/cooperative_learning.cfm> Accessed 2005-04-21. Hagen, I. (1998). Creation of Socio—Cultural Meaning. Media Reception Research
and Cognitive Psychology. In B. Höijer and A. Werner (Eds.). Cultural Cogni-tion. New perspectives in audience theory. NORDICOM: Göteborg University.
Hall, S. (1980). Encoding/Decoding. In S. Hall, D. Dobson, A. Lowe, and P. Willis (Eds. ). Culture, Media, Language. London: Hutchinson.
Johnson, D.W., & Johnson, R.T. (1999). Learning together and alone: Cooperative, competitive, and individualistic learning. Boston, MA: Allyn and Bacon.
Jonassen, D. H. (1991). Objectivism vs. Constructivism: Do We Need a New Philosophical Paradigm? Educational Technology, Research and Development, 39(3), 5-14.
Kearsley, G. (1999). Explorations in Learning & Instruction: The Theory Into Prac-tice Database. http://home. sprynet. com/~gkearsleyhttp://www. gwu. edu/~ tip/theories. html
461
Kemp, J. E. & Cochern, G. W. (1994). Planning for Effective Technical Training. Englewood Cliffs, NJ: Educational Technology Publications.
Kristiansen, T., Bjørgen, I, A. & Jørgensen, T, R. (1994). Norwegian Experiences in Flexible Distance Learning in View of Assumptions of and Barriers in the Present Educational Culture. Presentation at the Educational and Cultural Barriers to Open and Distance Learning University of Sheffield, June 1994.
Kumar, D. D., Helgeson, S, L., & White, A. L. (1994). Computer Technology – Cognitive Psychology Interface and Science Performance Assessment. Educational Technology, Research and Development, 42, 4, 6-16.
Mellander, K. (1991). Länge leve lärandet. Malmö: Celemi.Mellander, K. (1993). The Power of Learning. Fostering Employee Growth. Home-
wood. Il: The American Society for Training and Development.Morley, D. (1992). Television, Audiences and Cultural Studies. London: Rout-
ledge. Mullet, K. & Sano, D. (1995). Designing Visual Interfaces Communication Ori-
ented Techniques. Mountain View, California: SunSoft Press A Prentice Hall Title.
Nordegren, A. (2004). Design som teori och emperi. Ett designteoretiskt forskning-sprojekt med en prototyputveckling av ett symbolsystem för vinsmaker. Stock-holm: KTH Arkitekturskolan, Doktorsavhandling.
Pettersson, R. (1989). Visuals for Information: Research and Practice. Englewood Cliffs, NJ: Educational Technology Publications.
Pettersson, R. (1993). Visual Information. Englewood Cliffs, NJ: Educational Technology Publications.
Pettersson, R. (1995). Combined Learning. Axiom, 5, 37–58.Pettersson, R. (1997). Verbo-visual Communication – Presentation of Clear Mes-
sages for Information and Learning. Göteborg: Valfrid Publishing Association and Research Centre for Library and Information Studies, Göteborg Uni-versity.
Pettersson, R. (1998). Information Design. Västerås: Mälardalens Högskola Research & Reports. Opuscula Nr 36.
Pettersson, R. (2002). Information Design, An introduction. Amsterdam/Phila-delphia: John Benjamins Publishing Company.
Pettersson, R., & Andersson van Limbeek, C. (2002). Design of a Virtual Class-room. Presentation at the 34th Annual Conference of the International Visual Literacy Association. Breckenridge, Colorado, USA, Oct. 1-5. Pub-lished in: R. E. Griffin, V. S. Williams & J. Lee (Eds.) 2003. Turning Trees: Selected Readings of the International Visual Literacy Association. International Visual Literacy Association.
Polanyi, M. (1966). The Tacit Dimension. Garden City, New York: A Doubleday Anchor Book. Facsimile edition 1983, Glouchester, Mass.: Peter Smith.
462
Rolf, B. (1991). Profession, tradition och tyst kunskap. En studie i Michael Polanyis teori om den professionella kunskapens tysta dimension. Övre Dalkarlshyttan: Nya Doxa AB.
Reinhardt, A. (1995). New Ways to Learn. Byte. March, 50-71.Slavin, (1995). Cooperative learning: Theory, research, and practice (2nd ed.). Bos-
ton, MA: Allyn and Bacon.Steffe, L., & Gale, J. (1995). Constructivism and education. Hillsdale, NJ:
Erlbaum.Thompson, A. D., Simonson, M. R., & Hargrave, C. (1996). Educational Techno-
logy: A Review of the Research (2nd ed.). Washington D.C.: Association for Educational Communications and Technology (AECT).
Uljens, M. (1992). What is learning a change of? (1992:01): Department of Educa-tion and Educational Research University of Göteborg.
Websters (1991). The New Websters Dictionary and Thesaurus. New York, New York: Book Essentials, Inc.
Wheatley, G. H. (1991). Constructivist perspectives on science and mathemat-ics learning. Science Education, 75, 1, 9-21.
463
Paper references
1. Pettersson, R. (1996). Verbo-Visual Communication. Paper presented at The4th International Research Symposium on Visual Verbal Literacy, Processand Product: Media Education in Praxis, The Rijkshogeschool, IJselland,and the International Visual Literacy Association, Deventer, Holland,May 6– 11, 1996. Published in T. Velders (Ed.) (1996). Beeldenstorm inDeventer. Multimedia Education in Praxis. Selected Readings. Deventer.
2. Pettersson, R. (1998). What is Information Design? Presentation at VisionPlus 4. The Republic of Information. Carnegie Mellon University, Pitts-burgh, Pennsylvania, March 26 - 29. Published in Proceedings Book, The Republic of Information, Vision Plus 4.Carnegie Mellon University, School of Design & International Institute forInformation Design, 58 - 74.
3. Pettersson, R. (1999). The Objectives Dimension in Message Design. IVLA–Visual Forum 99. Mälardalen University, Eskilstuna, November 9–11. Published in T. Velders (Ed.) (1999). Selected readings from the 5th Sympo-sium Verbo Visual Literacy. Information Design. Deventer: Saxion Hoge-school IJselland.
4. Pettersson, R. (2003). Gearing Communications to the Cognitive Needs of Stu-dents: Findings from Visual Literacy Research. IIID, Preparing for the Futureof Knowledge Presentation, Chicago, USA, May 30-31, 2003. Published in Journal of Visual Literacy, 2004, 24, 2, 129–154.
5. Pettersson, R. (2005). Research in Information Design. Presentation atVision+ 11. Needs, Trends and Themes for Information Design, Interna-tional Institute for Information Design, Vienna, July 7–9, 2005.
6. Pettersson, R. (2000). Literacies in the New Millennium. Presentation at IIIMiedzynardowa Konferencja. Media a Edukacja, Uniwersytet im. AdamaMickiewicza w Poznaniu Zaklad Technologii Ksztalcenia, Poznan, April8–11. Published in W. Strykowski (Ed.). (2001). III Miedzynardowa Konferencja.Media a Edukacja. Poznan: Oficyna Edukacyjna Wy-dawnictwa eMPI2s.c.
7. Pettersson, R. (1993). Comprehensibility. Presentation at the 3rd Interna-tional Symposium of the International Visual Literacy Association. Verbo-
464
Visual Literacy: Understanding and Application of new EducationalCommunication Media Technologies. Delphi, Greece, June 25–29, 1993.Published in: N. Metallinos (Ed.) (1994). Verbo-Visual Literacy: Understand-ing and Application of new Educational Communication Media Technologies.Selected Readings from the 1993 Symposium of the International VisualLiteracy Association. Delphi, Greece, June 25–29, 1993. 3Dmt Researchand Information Center of Concordia University, Montreal, Quebec, Can-ada.
8. Pettersson, R. (1998). Credibility. Journal of Visual Literacy, Spring 1998, 18,(1), 61-72.
9. Pettersson, R. (2003). From Cave Art to CAVE Art. Presentation at the 35thAnnual Conference of the International Visual Literacy Association. New-port, Rhode Island, USA, October 1 – 5, 2003. Published in: R. E. Griffin, J. Lee & S. Chandler (Eds.) 2003. Changing Tides:Selected Readings of the International Visual Literacy Association. Interna-tional Visual Literacy Association.
10. Pettersson, R. (1997). Media and Learning. Presentation at the Media andEducation Conference, Poznan, April 7– 9. Published in W. Strykowski(Ed.). Media a Edukacja. Poznan: Uniwersytet im. Adama mickiewicza wPoznaniu Zaklad Technologii Ksztalcenia.
11. Pettersson, R. (2001). Visual Literacy in Message Design. Presentation at the33rd Annual Conference of the International Visual Literacy Association.Mälardalen University, Eskilstuna, Sweden, November 7–11, 2001. Published in: R. E. Griffin, J. Lee & V. S. Williams (Eds.) 2002: Visual Liter-acy in Message Design. Selected Readings of the International Visual LiteracyAssociation. International Visual Literacy Association.
12. Pettersson, R. (1998). Image Functions in Information Design. Presentation atThe 30th Annual Conference of the International Visual Literacy Associa-tion. The University of Georgia, Athens, Georgia, October 21- 25, 1998. Published in: R. E. Griffin, W. J. Gibbs, & B. Wiegman (Eds.) 1999: VisualLiteracy In An Information Age. International Visual Literacy Association.
13. Pettersson, R. (2000). Assessing Image Contents. Presentation at the 32ndAnnual Conference of the International Visual Literacy Association, IowaState University, Ames, Iowa, Oct. 11–14, 2000. Published in: R. E. Griffin, V. S. Williams & J. Lee (Eds.) 2001: Exploring theVisual Future: Art Design, Science & Technology. Selected Readings of the Inter-national Visual Literacy Association. International Visual Literacy Associa-tion.
14. Pettersson, R. (2002). Kinship Diagrams. Presentation at the 34th AnnualConference of the International Visual Literacy Association. Breckenridge,
465
Colorado, USA, Oct. 1–5. Published in: R. E. Griffin, V. S. Williams & J. Lee (Eds.) 2003. TurningTrees: Selected Readings of the International Visual Literacy Association. Inter-national Visual Literacy Association.
15. Pettersson, R. (1994). Associations from Pictures. Paper presented at the 26thAnnual Conference of the International Visual Literacy Association.Tempe, Oct. 12–16. 1994. Published in: D. G. Beauchamp, R. A. Braden &R. E. Griffin, (Eds.) (1995). Imagery and Visual Literacy. Selected Readingsfrom the 26th Annual Conference of the International Visual Literacy Associa-tion. International Visual Literacy Association. Also published in: R. Pettersson (1997). Verbo-visual Communication –12Selected Papers. Göteborg: Valfrid Publishing Association and ResearchCentre for Library and Information Studies, Göteborg University. Also published in: Journal of Visual Literacy, Spring 1997, 17, (1), 9–21.
16. Pettersson, R. (2000). Classification of Informative Messages–Proposal for aTaxonomy. Presentation at Expert Forum Manual Design. InternationalInstitute for Information Design (IIID), Eskilstuna, Sweden, November 6–8.
17. Pettersson, R. (1997). Circles, Triangles and Squares: Sacred Symbols in theMayan Culture. The 29th Annual Conference of the International VisualLiteracy Association. University Park, Pennsylvania, October 18 - 22. Published in: R. E. Griffin, C. B. Shiffman, & W. J. Gibbs (Eds.) 1998: Con-necting with the Community: Exploring Resources for Visual Learning &Expression. Selected Readings of the International Visual Literacy Association.International Visual Literacy Association. Also published in: Journal ofVisual Literacy, Autumn 1998, 18, (2), 137–148.
18. Pettersson, R. (1999). Graphic Symbols–Design And Meaning. Presentation atthe 31th Annual Conference of the International Visual Literacy Associa-tion. The University of Wyoming, Jackson Hole, Wyoming, Oct. 6–10,1999.Published in: R. E. Griffin, W. J. Gibbs, & V.S. Williams (Eds.) 2000: NaturalVistas Visual Literacy & The World Around Us. Selected Readings of the Inter-national Visual Literacy Association. International Visual Literacy Associa-tion.
19. Pettersson, R. (1995). Information Graphics at the Turn of Two Centuries.Presentation at the Ninth Annual Visual-Communication Conference.Flagstaff, Arizona, June 22–25. Published in Journal of Visual Literacy, Autumn 1997, 17, (2), 53–68.
466
20. Pettersson, R. (2002). Image Manipulation. Presentation at Media and Edu-cation, University of Adam Mickiewicz, Poznan, April 20–23. Published in Conference Proceedings Media and Education.
21. Pettersson, R. (1999). Attention–an Information Design Perspective. Presenta-tion at Vision Plus 6. Drawing the Process: Visual Planning and Explain-ing. International Institute for Information Design (IIID), Vienna, Austria,July 8–10, 1999. Published (2001) in Document Design 2(2), 114–130.
22. Pettersson, R. (2001). Interpreting Image Content. Presentation at the 33rdAnnual Conference of the International Visual Literacy Association.Mälardalen University, Eskilstuna, Sweden, November 7–11, November7–11, 2001. Published in: R. E. Griffin, J. Lee & V. S. Williams (Eds.) 2002: Visual Liter-acy in Message Design. Selected Readings of the International Visual LiteracyAssociation. International Visual Literacy Association.
23. Pettersson, R. (1997). Learning From Visuals. The 29th Annual Con-ference of the International Visual Literacy Association. UniversityPark, Pennsylvania, October 18–22. Published in: R. E. Griffin, C. B.Shiffman, & W. J. Gibbs (Eds.) 1998: Connecting with the Community:Exploring Resources for Visual Learning & Expression. Selected Rea-dings of the International Visual Literacy Association. InternationalVisual Literacy Association.
24. Pettersson, R. (2000). Turning Information into Corporate Knowledge. Presen-tation at Vision Plus 8. Turning Information into Corporate Knowledge/Innovative Information Management: A Design Challenge. InternationalInstitute for Information Design (IIID), Vienna, Austria, July 13–15.
25. Pettersson, R. (2005). Infodidactics – Information Design Education. Presenta-tion at the 2nd Information Design International Conference, The BrazilianSociety of Information Design, São Paulo, Brazil, September 8th - 10th,2005.