effects of reaction temperature and support composition on the mechanism of water–gas shift...
TRANSCRIPT

rXXXX American Chemical Society A dx.doi.org/10.1021/jp201773a | J. Phys. Chem. C XXXX, XXX, 000–000
ARTICLE
pubs.acs.org/JPCC
Effects of Reaction Temperature and Support Composition on theMechanism of Water�Gas Shift Reaction over Supported-Pt CatalystsChristos M. Kalamaras,† Ines D. Gonzalez,‡ Rufino M. Navarro,‡ Jos�e Luis G. Fierro,‡ andAngelos M. Efstathiou*,†
†Department of Chemistry, Heterogeneous Catalysis Laboratory, University of Cyprus, University Campus, P.O. Box 20537,CY 1678, Nicosia, Cyprus‡Instituto de Catalisis y Petroleoquímica (CSIC), Cantoblanco, 28049 Madrid, Spain
1. INTRODUCTION
The renewed interest in the water�gas shift (WGS) reaction(CO þ H2O T CO2 þ H2, ΔH
o = �41.1 kJ/mol) has grownsignificantly during the last years as a result of recent advances infuel cell technology and the need for developing fuel processorscapable of converting carbonaceous fuels into hydrogen.1�5 Therole of the WGS reaction in these fuel processors is to reduce thecontent of CO in the reformate gas with simultaneous furtherhydrogen production. Fe3O4/Cr2O3 catalysts are used for theindustrial production of hydrogen in the 593�723 K range totake advantage of the higher reaction rate at high temperatures(HT-WGS), whereas Cu/ZnO/Al2O3 catalysts are used in the473�523 K range (LT-WGS) to take advantage of the higherhydrogen concentration at equilibrium.5,6 These catalysts, how-ever, are pyrophoric and deactivate if exposed to air and condensedwater. Attempts are now focused toward the development of low-loading robust noble metal-based catalysts which are nonpyro-phoric with high activity at low temperatures and resulting in a COcontent of less than 10 ppm in hydrogen feed gas streams, whenthe latter are to be used in H2 fuel cells.
4,7
It is generally accepted that the WGS reaction over sup-ported metal catalysts operates in a bifunctional manner with
the participation of both the noble metal and the support. Twomain WGS reaction pathways have been proposed in theliterature5,6 over reducible metal oxide supported metal cata-lysts: (i) the “redox” or regenerative mechanism, and (ii) the“associative” or adsorptive mechanism (nonredox). In the redoxmechanism CO adsorbs on the noble metal surface which thendiffuses at the metal/support interface and reacts with latticeoxygen of support to form CO2(g), a step that results in theformation of oxygen vacant sites and thus reduction of support.Water adsorbs and dissociates mainly on the reduced supportsites, thus reoxidizing them and producing H2(g).
8�13 Inthe associative mechanism,14�18 CO and H2O are proposedto adsorb on catalyst active sites to form a surface “carbon-containing” intermediate, e.g., formate, carbonate, or bicarbo-nate, which further reacts or decomposes to form H2 andCO2. The chemical composition of this active carbon-con-taining intermediate and its true site location, e.g., support,
Received: February 23, 2011Revised: May 1, 2011
ABSTRACT: The present work reports on a detailed study of the effect of supportchemical composition and reaction temperature on themechanism of the water�gas shift(WGS) reaction over supported-Pt catalysts. The effect of the same parameters on thechemical composition and surface concentration of active reaction intermediates was alsodetermined for the first time, information that allowed elucidating also the site location ofthese intermediates, e.g., support versus metal or support�metal interface. The above-mentioned mechanistic information was rigorously provided by the application of steady-state isotopic transient kinetic analysis (SSTIKA) experiments coupled with massspectrometry (MS) and DRIFTS techniques, and by other transient isotopic experimentsdesigned. It was found that on Pt/CeO2 a switch of the WGS reaction mechanism from“redox” to a combination of redox and “associative formate with �OH group regenera-tion” is obtained after increasing the reaction temperature from 473 to 573 K. On theother hand, only the redox mechanism operates on Pt/TiO2 of similar Pt mean particlesize. Modification of titania support by the deposition of small crystallites of ceria in its pore structure enhanced significantly theactivity of WGS at T > 573 K compared to Pt/TiO2, whereas the operated mechanism resembles that occurring on Pt/CeO2. In allsupported-Pt catalysts investigated, the concentration of active “carbon-containing” intermediates found in the “carbon-path” wassignificantly lower than that found for the “hydrogen-containing” intermediates present in the “hydrogen-path”, the latter beinglabile OH andH species formed on the support, and which were found to depend on the support chemical composition and reactiontemperature. This study provides new important fundamental knowledge on the mechanism ofWGS over practical supported metalcatalysts which can be used for a better WGS catalyst design.

B dx.doi.org/10.1021/jp201773a |J. Phys. Chem. C XXXX, XXX, 000–000
The Journal of Physical Chemistry C ARTICLE
metal/support interface, or metal surface, still remain contro-versial issues.
There is an increasing demand for fundamental understanding atthe molecular level of the LT-WGS reaction in order to achieveoptimization of activity and stability under industrial conditionsfor the development of new suitable functional catalytic materialswhich will replace the existing ones that face several problems.5,6
Recently, Zhai et al.19 and previously Rodriguez et al.20 haveperformed very thorough experimental and theoretical investiga-tions to unravel the intrinsic reasons of the high activity exhibited byCeO2- or TiO2-supported Au and Pt nanoparticles toward the low-temperature WGS reaction. Both works found that stable and veryactive species along the periphery of the metal�support interfaceare formed during WGS reaction conditions, to mention Pt�Ox
(OH)y,19 while oxygen vacancies along and close to this interface
facilitate water dissociation, thus providing active �OH groups.20
Furthermore, it was demonstrated19 that the catalytic chemistryoccurs on the atomically dispersed Ptδþ or Auδþ species; thus, themetal nanoparticles act merely as spectators during reaction. Thus,such findings become extremely important for the proper design ofhighly active and stable low-temperature WGS catalysts.
The steady-state isotopic transient kinetic analysis (SSITKA)technique coupled with DRIFTS and mass spectrometry(operando) is a powerful tool to investigate key mechanistic andkinetic aspects of theWGS reaction.21�24 In particular, it is possibleto probe the chemical composition, structure, and site location22 ofactive reaction intermediates and of inactive (spectator) speciesfound in the “carbon path” of theWGS reaction (e.g., adsorbedCO,formate, or carbonate), estimate the individual rate of the reactionpath that involves each one of these intermediate species, and basedon this information to decide on the importance of each one of theseintermediates to the overall steady-state rate of WGS reaction. Thesurface concentration (μmol/g, θ (based on surface Pt)) of active“H-containing” (use of D2O) and “C-containing” (use of 13CO)reaction intermediates can also be measured by in situ SSITKA�mass spectrometry experiments,21,22 and this important kineticquantity allows for proper discussion of crucial mechanistic issuesof the reaction at hand, such as the rate-determining step.
The aim of this work was to apply SSITKA�DRIFTS andSSITKA�mass spectrometry techniques to gather importantfundamental information that would allow us to understandmore deeply the effect of reaction temperature and supportchemical composition on the mechanism of the heterogeneousWGS reaction on Pt/CeO2, Pt/TiO2, and Pt/CeO2�TiO2
catalysts in order to improve their formulation for optimumactivity.
2. EXPERIMENTAL SECTION
2.1. Catalyst Preparation and Characterization.Cerium oxide(CeO2) was prepared by coprecipitation of (NH4)2Ce(NO3)6(Alfa-Aesar, 99.5%) and La(NO3)3 3 5H2O (Alfa-Aesar, 99.9%)using urea (NH2)2CO(Alfa-Aesar, 99.5%) as a precipitating agent.25
The solid obtained was dried (383 K, 4 h) and then calcined in air(923K, 8 h). TheTiO2 support (titanium(IV) oxide, Alfa Aesar, 150m2/g BET area) was stabilized by thermal treatment at 773 K for 4 hbefore being used for Pt deposition. TheTiO2 supportmodifiedwithCe (CeO2�TiO2, Ce/Ti atom ratio = 0.032) was synthesized bywet impregnation of titania powders (TiO2, Alfa Aesar) with ceriumnitrate aqueous solution. The final loading of ceria in the TiO2
support was 6.6 wt %, which corresponds to 45% of surface mono-layer coverage of TiO2; a Ce/Ti atom ratio of 0.07 was reported to
correspond to one surface monolayer.26 The impregnated solidsupport was then calcined in air at 873 K for 8 h.The corresponding supported-Pt catalysts (0.5 wt % Pt) were
prepared by impregnating each of the supports with an aqueoussolution of H2PtCl6 3 xH2O (Johnson-Mattey, 40.78 wt % Pt).After drying at 393 K overnight, the samples were calcined in airat 773 K for 3 h. The samples are designated Pt/TiO2, Pt/CeO2,and Pt/CeO2�TiO2 for platinum supported on titania, ceria,and ceria�titania, respectively.The specific surface areas (m2
3 g�1) of the catalysts were esti-
mated by applying the BET method. N2 adsorption�desorptionisotherms were obtained at 77 K over the entire range of relativepressures using the Micromeritics ASAP 2100 device on samplespreviously outgassed at 423 K for 12 h. Platinum dispersion wasmeasured using a dynamic method described elsewhere.27 Prior toH2 chemisorption at 193 K, all samples were reduced under H2/Arflow (50 mL/min) for 1 h at 523 K and subsequently flushedin Ar flow for 15 min at 538 K. Metal dispersion was estimatedafter considering a hydrogen chemisorption stoichiometry ofH/Pt = 1.28 The crystal structure of the metal oxide supportsprepared was checked by powder X-ray diffraction using a Seifert3000P vertical diffractometer with a nickel-filtered CuKR radiation.For each sample, Bragg angles between 5 and 80� were scanned.Volume-averaged crystallite sizes were determined by applying theDebye�Scherrer equation.29
2.2. Catalytic Activity Measurements. Steady-state catalyticactivity measurements for theWGS reaction were carried out in aMicroreactivity Pro apparatus (ICP/CSIC, Spain) and using theexperimental setup previously described in detail.30 The reactionfeed composition used was 4.2 vol % CO/29.3 vol % H2O/66.5vol % He, and the total volume flow rate was 83.5 N mL/min,resulting in a GHSV of about 40 000 h�1 (L/Lcat/h). The catalystparticle size was between 0.1 and 0.2 mm, and the amount ofcatalyst sample used for each catalyst composition was 0.2 g. Thereactions were carried out at atmospheric pressure and attemperatures in the 473�603 K range over a prereduced catalystin H2/Ar flow at 523 K for 2 h. The effluent stream from thereactor was directed to a mass spectrometer (Omnistar, Balzer)for online measurements of H2, CO, and CO2 gases. The purityof all gases used in catalytic experiments (e.g., H2, Ar, CO, andHe, Linde Gas-Greece) was higher than 99.95%.2.2.1. SSITKA�DRIFTS Studies. Steady-state isotopic transient
kinetic analysis coupled with DRIFTS (SSITKA�DRIFTS) studieswere performed using a Perkin-Elmer Spectrum GX-II FTIR spec-trometer equipped with a high-temperature controllable DRIFTScell (Harrick, Praying Mantis) to record spectra under reactionconditions in an in situ manner. Signal averaging was set to 50 scansper spectrum, and the spectra were collected in the 4000�500 cm�1
range at the rate of 0.2 scans/s (MCT detector) and a 2 cm�1
resolution. The background spectrum of the solid was taken under29.3 vol % H2O/Ar flow (200 mL/min) at the desired reactiontemperature. The response time of the DRIFTS reactor cell(∼40 mg Pt/CeO2) under the present experimental conditions(200 mL/min, T = 473�573 K) was about 5 s. SSITKA�DRIFTSexperiments to follow the carbonpathofWGSwere performedusingthe DRIFTS reactor cell and involved the switch 4.2 vol % 12CO/29.3 vol%H2O/1 vol%He/Ar (T, 30min)f 4.2 vol% 13CO/29.3vol % H2O/Ar (T, t) (use of
13CO gas, 99.5 atom % 13C, SpectraGases). These studies allowed determining the chemical composi-tion and structure of active reaction intermediates and that of inactive(spectator) species of the WGS reaction. For the same SSITKAexperiment, the output of the DRIFTS cell could be connected to an

C dx.doi.org/10.1021/jp201773a |J. Phys. Chem. C XXXX, XXX, 000–000
The Journal of Physical Chemistry C ARTICLE
online mass spectrometer for operando studies. The temperatureused was 473 or 573 K. The collected DRIFTS spectra weresmoothed in order to remove high-frequency noise, if necessary,and further analyzed using the software Spectrum (PerkinElmer) forWindows. Deconvolution of the thus-derived DRIFTS spectra wasperformed according to reported guidelines.22,31
2.2.2. SSITKA�Mass Spectrometry Studies. The isotopes usedin the SSITKA�MS experiments were 13CO (99.5 atom % 13C,Spectra Gases) and deuterium oxide (D2O, 99.96 atom % D,Aldrich). SSITKA�MS experiments were performed using twoHPLC pumps (GILSON 307) for the addition of H2O and D2Oto the reactor feed stream in the apparatus described elsewhere.30
The SSITKA�MS technique was used to follow the hydrogenpath of reaction according to the gas switch 29.3 vol % H2O/4.2vol % CO/1 vol % Kr/Ar (T, 30 min)f 29.3 vol % D2O/4.2 vol% CO/Ar (T, t), and the carbon path according to the gas switch29.3 vol % H2O/4.2 vol %
12CO/1 vol % He/Ar (T, 30 min)f29.3 vol % H2O/4.2 vol %
13CO/Ar (T, t). The dry gas from theexit of a condenser (Peltier Gas Cooler, model ECP 1000, M&CTechGroup) placed downstream of the reactor was directed tothe mass spectrometer for online recording of the H2, CO, andCO2 normal and isotope-containing (D, 13C) gaseous species.The concentration (μmol/g) of active H-containing intermedi-ates was estimated based on the transient response curves of H2,HD, and Kr, the flow rate at the reactor outlet (200 N mL/min),and the mass of the catalyst (W = 0.025 g diluted with 0.175 g ofsilica) according to the mass balance equations reportedelsewhere.21,22,31,32 The quantification of the active C-containingintermediates was made in a similar manner to that used for theH-containing intermediates.22
3. RESULTS AND DISCUSSION
3.1. Catalyst Characterization. Table 1 shows the texturalproperties, metal (Pt) dispersion, and mean metal particle size(dPt, nm) of supported platinum catalysts. As shown in Table 1, allcatalysts exhibit similar specific surface areas, ca. 62�65 m2
3 g�1.
The X-ray diffractogram of CeO2�TiO2-supported Pt obtained33
showed reflections corresponding to the crystalline anatase phasewith two additional weak diffraction peaks corresponding to acrystalline ceria phase (strong lines at 28.5 and 33.1�, JCPDS34-394). Given the fact that the ceria loading of 6.6 wt %corresponds only to 45% of the theoretical surface monolayercoverage of TiO2, it is apparent that calcination of 6.6 wt %CeO2�TiO2 support at 873 K (see section 2.1) caused partly the
formation of a 3D ceria structure. The dispersion of platinum inthe reduced catalysts, as determined by H2 chemisorption, chan-ged only slightly (Table 1), thus the corresponding mean Ptparticle size (ca. 1.8�2.0 nm).3.2. Catalytic Activity Studies. The catalytic activity of the
0.5wt%Pt/CeO2, 0.5wt%Pt/TiO2, and 0.5wt%Pt/CeO2�TiO2
catalysts for the water�gas shift reaction was evaluated in the473�603 K range, and results in terms of CO conversion (XCO, %)are shown in Figure 1. Significant differences in WGS activity areobserved by varying the support chemical composition. The corre-sponding XCO versus T profile for thermodynamic equilibrium atthe present feed gas composition used is also given (Xeq, Figure 1).The thermodynamic equilibrium curve was derived using equilib-rium constant (Keq) values and appropriate mass balances asreported.32 This curve shows that below 473 K full CO conversioncan be achieved, whereas a minor decrease in the CO conversion byless than 1% unit is noticed at 603 K.In the 473�548 K range, Pt/CeO2 was found to be the least
active catalyst, whereas Pt/TiO2 was the most active (Figure 1). Attemperatures above 548 K, while Pt/CeO2 and Pt/CeO2�TiO2
approach equilibrium values, Pt/TiO2 shows a reduced activity.The latter result is not due to any external or internal mass and heattransport resistance effects as evidenced by the use of the criteriareported in our recent work.22 A similar behavior was also reportedfor the same catalysts after using the feed gas composition 28 vol %H2/0.1 vol % CH4/4.4 vol % CO/29.6 vol % H2O/N2.
33 It isspeculated that the long-term exposure of Pt/TiO2 at T > 548 Kunder the high level of water content present in the WGS reactionfeed stream may cause modifications in the surface structure oftitania, where, as will be shown later on, these would affect thereactivity and number density of active reaction sites of WGSformed in TiO2 support. In addition, accumulation of adsorbedcarbonate species (spectators) competing for the same catalyticsites as other active reaction intermediates does occur, as supportedby the present in situ SSITKA�DRIFTSand SSITKA�MSstudiesto be reported in the following sections.The higher CO conversion observed in Pt/TiO2 compared to
Pt/CeO2 atT < 548 K, where both catalysts have similar mean Pt
Table 1. Textural Properties and Metal Dispersion of Sup-ported-Pt Catalysts
sample
dc(nm)a SSA,m2 g�1
Pt
dispersion D
(%)
Pt mean
particle size dPt(nm)b
0.5 wt % Pt/
CeO2
13.0 62.0 54.0 2.0
0.5 wt % Pt/
CeO2�TiO2
20.0c 62.0 60.0 1.8
0.5 wt% Pt/TiO2 23.0d 65.0d 57.0 1.9aVolume average support crystallite size (see section 2.1). bUsing thefollowing formula: dPt (nm) = 1.1/D. cRelated to titania crystallites.dTitania support was treated at 773 K for 4 h before impregnation withPt solution (see section 2.1).
Figure 1. Effect of reaction temperature on the conversion of CO forthe WGS reaction over Pt/CeO2, Pt/CeO2�TiO2, and Pt/TiO2
catalysts. The CO conversion (Xeq) versus T curve for equilibriumconditions (yCO
in = 0.042 and yH2Oin = 0.293) is also shown. Experi-
mental conditions:Wcat = 0.2 g; feed composition 4.2 vol%CO, 29.3 vol%H2O, He balance gas; total flow rate, Q = 83.5 N mL/min; GHSV ∼40 000 h�1.

D dx.doi.org/10.1021/jp201773a |J. Phys. Chem. C XXXX, XXX, 000–000
The Journal of Physical Chemistry C ARTICLE
particle sizes (Table 1), is an important result given the fact thatPt/CeO2 is considered to be among the most effective catalystsfor low-temperature WGS reaction.8�10,34 It should be alsonoted that Pt supported on CeO2�TiO2 shows higher activitywith respect to Pt/TiO2 at T > 548 K. It was observed that Pt/CeO2�TiO2 catalyst showed the highest activity in terms of COconversion and TOF (s�1) when compared to Pt/CeO2 and Pt/TiO2 in the 490�575 K range after using a simulated reformategas mixture.33
The specific kinetic reaction rate (XCO < 20%) obtained for thePt/CeO2�TiO2 catalyst at 473 K was found to be 4.2 � 10�5
mol 3 s�1
3 gcat�1, whereas that for the Pt/CeO2 and Pt/TiO2 was
2.3 � 10�5 and 6.2 � 10�5 mol 3 s�1
3 gcat�1, respectively. The
value of the specific kinetic reaction rate obtained using the mixingrule, RCe�Ti = xRTi þ (1 � x)RCe, where x is the titania weightfraction in the TiO2�CeO2 support composition, and RCe�Ti, RTi,and RCe are the specific reaction rates of CO consumption(mol 3 s
�13 gcat
�1) for CeO2�TiO2-, TiO2-, and CeO2-sup-ported-Pt catalysts, respectively, was found to be 2.6 � 10�5
mol 3 s�1
3 gcat�1. The latter value is only 62% of the experimental
value estimated. This result indicates that Pt/CeO2�TiO2 doesnot behave as a physical mixture of Pt/CeO2 and Pt/TiO2 solids,but a positive synergy between the oxidic phases and the Pt metalsurface exists. The intrinsic reasons of such synergy will bediscussed in a subsequent section. A critical comparison of theobtained kinetic rates on the present Pt/CeO2 and Pt/TiO2
catalysts with corresponding ones reported in the literature ismeaningful only when this is performed for the same feed gascomposition and reaction temperature or with known reactionorders with respect to the reactants CO and H2O and kinetic rateconstant (k = A exp(�Eapp/RT)); thus, an extrapolation could bemade. Panagiotopoulou andKondarides35 reported a kinetic rate at493 K of 4.08 � 10�6 mol/g 3 s on a 0.5 wt % Pt/TiO2 catalyst,whereas for the present catalyst at the same temperature, a kineticrate of 9.0� 10�6 mol/g 3 s was estimated. However, in the presentstudy the H2O feed concentration was about three times larger andthe CO concentration was only 30% larger than the correspondingvalues used.35 Considering the facts that the reaction order withrespect to water was found to be unity,21 the kinetic rate does notdepend on the Pt particle size36 but on the primary crystal ofTiO2,
37 and the present TiO2 and that used (P25 Degussa)35 have
very similar primary crystal sizes (25 vs 23 nm (Table 1)), then it isestimated that the kinetic reaction rates obtained for the twocatalysts are in very good agreement. Kinetic rates of WGS onvarious Pt/CeO2 catalysts were reported in a review paper forvarious feed gas compositions (including H2 and CO2) andreaction temperatures.38 It is interesting to compare the kineticrates of the present 0.5 wt % Pt/CeO2 catalyst at 523 K with a0.5 wt % Pt/CeO2
39 which had a very similar Pt dispersion (46%)as the present one (54%) but largely different ceria textural andstructural properties (BET = 8 m2/g, dCeO2 = 18.5 nm to becompared to 62.0 m2/g and 13.0 nm, respectively). For the presentcatalyst, a kinetic reaction rate of 8.6� 10�5mol/g 3 s was obtained,whereas for the Pt/CeO2
39 a value of 2.0 � 10�5 mol/g 3 s wasobtained after correcting for the dependence of reaction rate onwater feed concentration (reaction order of unity). It is very clearfrom this comparison the strong dependence of reaction rate ofWGS on the structural properties of ceria support.3.3. SSITKA�DRIFTS Studies. In order to determine the
chemical composition of the active carbon-containing intermedi-ates found in the WGS reaction mechanism, SSITKA�DRIFTSexperiments were performed (see section 2.2.1). The IR bands
corresponding to a given vibrational mode of an active speciesmust show the red isotopic shift due to the replacement of12C-containing active intermediates with the corresponding13C-containing species during the switch 12CO/H2O f13CO/H2O. In the case that the particular species is not active,thus a spectator, the spectra under the isotope-labeled feedshould not exhibit the red isotopic shift, and therefore the samespectrum as that observed under the 12CO/H2O treatment willbe observed. However, an adsorbed spectator species formed onthe catalyst surface which could interact reversibly with theisotope reactant species (e.g., 13CO) would result in the observa-tion of the red isotopic shift. Thus, other experiments should beperformed to assign precisely the role of such an adsorbed speciesas being an active or spectator, as recently illustrated for theWGSreaction over supported-Pt catalysts.22�24
3.3.1. SSITKA�DRIFTS at 473 K. SSITKA�DRIFTS spectrarecorded under the 12CO/H2O feed stream at 473 K for the threecatalysts in the 2250�1850 cm�1 range, which corresponds to theC�O stretching vibrational mode of various types of Pt-boundcarbon monoxide, are presented in Figure 2a�c. Deconvolutedspectra under both reaction feed compositions are also shown. Allspectra recorded under the 12CO/H2O steady-state reactionconditions (30 min on stream) are presented by a solid line, whilethe deconvoluted ones corresponding to the 13CO/H2O treat-ment (30 min) are presented by a dashed line (bottom graph).The infrared bands centered at 2180 and 2120 cm�1, labeled as 1and 2, respectively, are due to the 12CO gas phase.40 For the Pt/CeO2 catalyst (Figure 2a), the intense band centered at 2058 cm
�1
(band 3) is related to a high-frequency (HF) linearly bound COon Pt. The wide IR band (2040�1900 cm�1) after deconvolutiongives a small infrared band at 2030 cm�1 (band 4), which isassigned to a low-frequency (LF) linearly bound CO on Pt atomspresent in small platinum particles (PS) of low coordination(dPt < 15 Å),41 and an infrared band 5 at 2000 cm�1, which isattributed to CO adsorbed on Pt sites of low coordination in verysmall particles (PVS).
41 Such Pt sites could be found at theperiphery of a metal�support interface. In general, linear-COadsorption does not lead to infrared bands in this spectral region.In fact, linear-CO adsorption gives bands in the 2100�2000 cm�1
range, whereas the ν(CO) region of bridging CO is located near1850 cm�1. Bazin et al.41 proposed that infrared band 5 is due toadsorption of CO on isolated very low-coordinated Pt atoms instrong interaction with the support.Similarly, the Pt/CeO2�TiO2 catalyst shows two IR bands
centered at 2080 and 2033 cm�1 (Figure 2b, bands 3 and 4) relatedto linear adsorbed CO on Pt0 and on small platinum particles (PS),respectively. In the case of Pt/TiO2 (Figure 2c), only the IR bandcorresponding to HF-linear adsorbed CO (band 3) centered at2062 cm�1 is observed, accompanied by a shoulder below2000 cm�1, which is due to LF-linear adsorbed CO. As depictedin Figure 2a�c (bottom graphs), all IR bands described above showthe red isotopic shift upon replacement of the 12CO with 13CO(SSITKA switch). Based only on the observed red isotopic shift, itcannot be safely said that these species are all active intermediates, aspreviously discussed. The reversible adsorption of COon Pt impliesthat the isotopic shift observed could be due also to the followingsimple exchange reaction: 12COads þ 13COgas T 13COads þ12COgas. However, in agreement with our previous studies,21,22,31
and what is mentioned in the literature,42 one adsorbed CO speciesmust at least be considered as an active intermediate of the C-pathof theWGS reaction. This species reacts at the Pt�support interfaceaccording to a bifunctionalmode catalytic process, where active sites

E dx.doi.org/10.1021/jp201773a |J. Phys. Chem. C XXXX, XXX, 000–000
The Journal of Physical Chemistry C ARTICLE
are present in both the metal and support. It is worth noting thedifferent CO infrared bands obtained for each catalyst, indicatingdifferent interactions between Pt particles of similar size (seeTable 1) and the CO species. These interactions depend on thesupport chemical composition. The Pt/CeO2�TiO2 catalyst showsthe presence of a HF-linear CO at 2080 cm�1 (band 3), the highestfrequency by 20 cm�1 compared to the other two catalysts (νCOofPt/CeO2 > νCO of Pt/TiO2), indicating that the mixed oxide
support is more electropositive than the bare oxides of ceria andtitania.Characteristic νCH stretching mode IR bands recorded in the
3000�2650 cm�1 range are due to adsorbed formate species(HCOO) formed under WGS reaction at 473 K (Figure 3a�c).Three infrared absorption bands are expected for a given type offormate adsorbed on a metal oxide. The most intense IR bandappears around 2850 cm�1 and is related to the combination ofδCH and νOCOas, a band at 2950 cm
�1 corresponds to the νCH
Figure 3. In situ DRIFTS spectra recorded in the 3000�2650 cm�1
range over (a) Pt/CeO2, (b) Pt/CeO2�TiO2, and (c) Pt/TiO2 catalystsunder SSITKAWGS reaction conditions at 473 K. Solid-line spectra: 4.2vol % 12CO/29.3 vol % H2O/Ar/He; dashed-line spectra: 4.2 vol %13CO/29.3 vol % H2O/Ar. Deconvolution and curve fitting of recordedDRIFTS spectra are also provided (bottom graphs).
Figure 2. In situ DRIFTS spectra recorded in the 2250�1850 cm�1
range over (a) Pt/CeO2, (b) Pt/CeO2�TiO2, and (c) Pt/TiO2 catalystsunder SSITKAWGS reaction conditions at 473 K. Solid-line spectra: 4.2vol % 12CO/29.3 vol % H2O/Ar/He; dashed-line spectra: 4.2 vol %13CO/29.3 vol % H2O/Ar. Deconvolution and curve fitting of recordedDRIFTS spectra are also provided (bottom graphs).
F dx.doi.org/10.1021/jp201773a |J. Phys. Chem. C XXXX, XXX, 000–000
The Journal of Physical Chemistry C ARTICLE
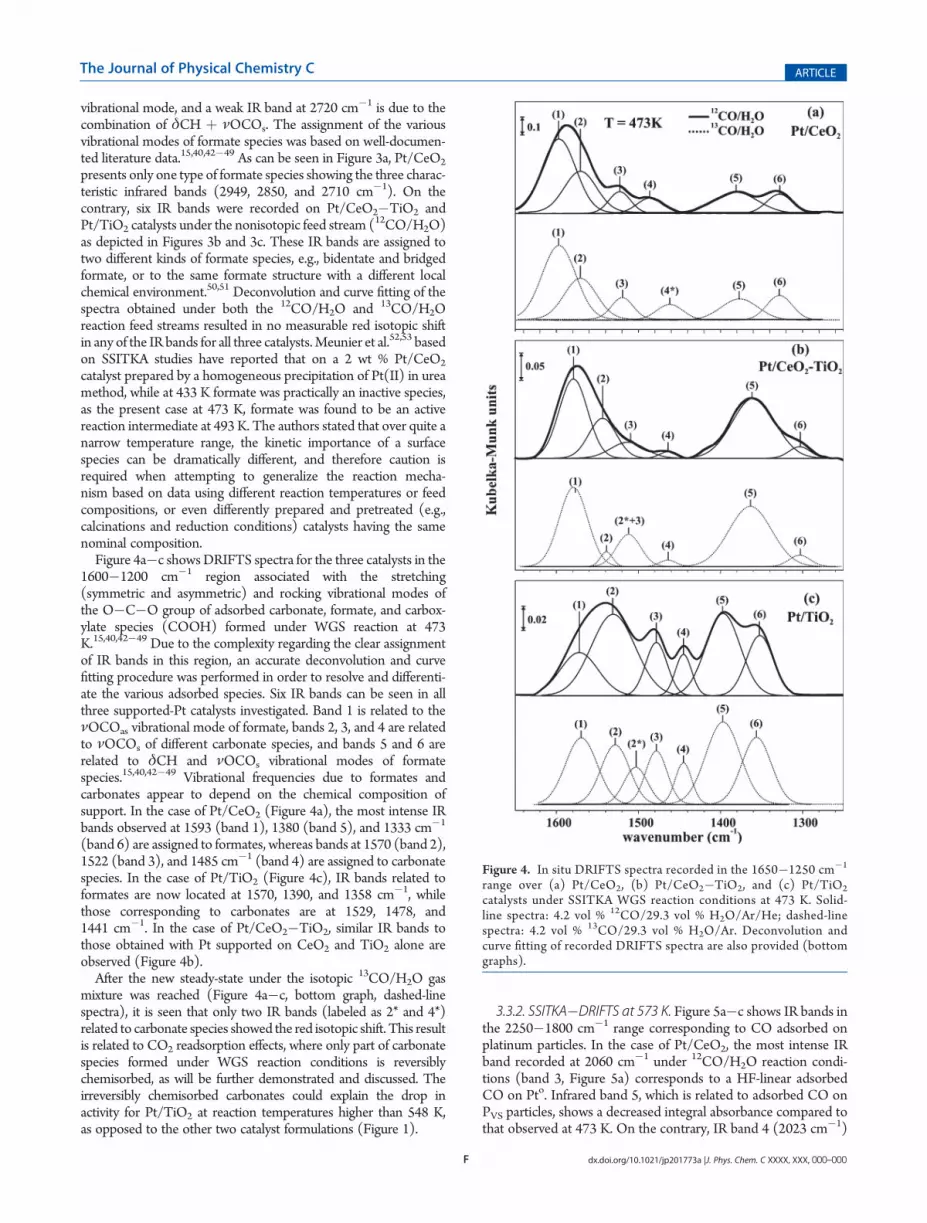
vibrational mode, and a weak IR band at 2720 cm�1 is due to thecombination of δCH þ νOCOs. The assignment of the variousvibrational modes of formate species was based on well-documen-ted literature data.15,40,42�49 As can be seen in Figure 3a, Pt/CeO2
presents only one type of formate species showing the three charac-teristic infrared bands (2949, 2850, and 2710 cm�1). On thecontrary, six IR bands were recorded on Pt/CeO2�TiO2 andPt/TiO2 catalysts under the nonisotopic feed stream (12CO/H2O)as depicted in Figures 3b and 3c. These IR bands are assigned totwo different kinds of formate species, e.g., bidentate and bridgedformate, or to the same formate structure with a different localchemical environment.50,51 Deconvolution and curve fitting of thespectra obtained under both the 12CO/H2O and 13CO/H2Oreaction feed streams resulted in no measurable red isotopic shiftin any of the IR bands for all three catalysts.Meunier et al.52,53 basedon SSITKA studies have reported that on a 2 wt % Pt/CeO2
catalyst prepared by a homogeneous precipitation of Pt(II) in ureamethod, while at 433 K formate was practically an inactive species,as the present case at 473 K, formate was found to be an activereaction intermediate at 493 K. The authors stated that over quite anarrow temperature range, the kinetic importance of a surfacespecies can be dramatically different, and therefore caution isrequired when attempting to generalize the reaction mecha-nism based on data using different reaction temperatures or feedcompositions, or even differently prepared and pretreated (e.g.,calcinations and reduction conditions) catalysts having the samenominal composition.Figure 4a�c showsDRIFTS spectra for the three catalysts in the
1600�1200 cm�1 region associated with the stretching(symmetric and asymmetric) and rocking vibrational modes ofthe O�C�O group of adsorbed carbonate, formate, and carbox-ylate species (COOH) formed under WGS reaction at 473K.15,40,42�49 Due to the complexity regarding the clear assignmentof IR bands in this region, an accurate deconvolution and curvefitting procedure was performed in order to resolve and differenti-ate the various adsorbed species. Six IR bands can be seen in allthree supported-Pt catalysts investigated. Band 1 is related to theνOCOas vibrational mode of formate, bands 2, 3, and 4 are relatedto νOCOs of different carbonate species, and bands 5 and 6 arerelated to δCH and νOCOs vibrational modes of formatespecies.15,40,42�49 Vibrational frequencies due to formates andcarbonates appear to depend on the chemical composition ofsupport. In the case of Pt/CeO2 (Figure 4a), the most intense IRbands observed at 1593 (band 1), 1380 (band 5), and 1333 cm�1
(band 6) are assigned to formates, whereas bands at 1570 (band 2),1522 (band 3), and 1485 cm�1 (band 4) are assigned to carbonatespecies. In the case of Pt/TiO2 (Figure 4c), IR bands related toformates are now located at 1570, 1390, and 1358 cm�1, whilethose corresponding to carbonates are at 1529, 1478, and1441 cm�1. In the case of Pt/CeO2�TiO2, similar IR bands tothose obtained with Pt supported on CeO2 and TiO2 alone areobserved (Figure 4b).After the new steady-state under the isotopic 13CO/H2O gas
mixture was reached (Figure 4a�c, bottom graph, dashed-linespectra), it is seen that only two IR bands (labeled as 2* and 4*)related to carbonate species showed the red isotopic shift. This resultis related to CO2 readsorption effects, where only part of carbonatespecies formed under WGS reaction conditions is reversiblychemisorbed, as will be further demonstrated and discussed. Theirreversibly chemisorbed carbonates could explain the drop inactivity for Pt/TiO2 at reaction temperatures higher than 548 K,as opposed to the other two catalyst formulations (Figure 1).
3.3.2. SSITKA�DRIFTS at 573 K. Figure 5a�c shows IR bands inthe 2250�1800 cm�1 range corresponding to CO adsorbed onplatinum particles. In the case of Pt/CeO2, the most intense IRband recorded at 2060 cm�1 under 12CO/H2O reaction condi-tions (band 3, Figure 5a) corresponds to a HF-linear adsorbedCO on Pto. Infrared band 5, which is related to adsorbed CO onPVS particles, shows a decreased integral absorbance compared tothat observed at 473 K. On the contrary, IR band 4 (2023 cm�1)
Figure 4. In situ DRIFTS spectra recorded in the 1650�1250 cm�1
range over (a) Pt/CeO2, (b) Pt/CeO2�TiO2, and (c) Pt/TiO2
catalysts under SSITKA WGS reaction conditions at 473 K. Solid-line spectra: 4.2 vol % 12CO/29.3 vol % H2O/Ar/He; dashed-linespectra: 4.2 vol % 13CO/29.3 vol % H2O/Ar. Deconvolution andcurve fitting of recorded DRIFTS spectra are also provided (bottomgraphs).

G dx.doi.org/10.1021/jp201773a |J. Phys. Chem. C XXXX, XXX, 000–000
The Journal of Physical Chemistry C ARTICLE
related to adsorbed CO on PS particles presents a significantlyincreased integral absorbance (compare Figures 2a and 5a).In the case of Pt/TiO2, the IR spectrum recorded under
12CO/H2O (Figure 5c) shows an infrared band at 2039 cm�1
(band 4) attributed to a LF-linear adsorbed CO on step sites ofPt. This band appeared as a shoulder of band 3 at 473K (Figure 2c).It is noted the red shift observed in the IR band associated with theHF-linear adsorbedCOobtained onPt/CeO2�TiO2 andPt/TiO2
catalysts at 573 and 473 K; 2055 and 2062 cm�1 compared to 2063and 2079 cm�1, respectively. This could be attributed to a surfacecoverage effect via an increase in the dipole�dipole coupling between
adsorbed CO species at neighboring sites.54,55 The Pt/CeO2�TiO2
catalyst shows IR bands (Figure 5b) corresponding to the same kindsof adsorbed CO as those observed in Pt/CeO2 (Figure 5a) andPt/TiO2 (Figure 5c) solids but with different ratios in their surfaceconcentration underWGS reaction conditions. As observed at 473 K(Figure 2a�c), all IR bands related to adsorbed CO showed also thered isotopic shift at 573 K (Figure 5a�c).
Figure 5. In situ DRIFTS spectra recorded in the 2250�1800 cm�1
range over (a) Pt/CeO2, (b) Pt/CeO2�TiO2, and (c) Pt/TiO2 catalystsunder SSITKAWGS reaction conditions at 573 K. Solid-line spectra: 4.2vol % 12CO/29.3 vol % H2O/Ar/He; dashed-line spectra: 4.2 vol %13CO/29.3 vol % H2O/Ar. Deconvolution and curve fitting of recordedDRIFTS spectra are also provided (bottom graphs).
Figure 6. In situ DRIFTS spectra recorded in the 3000�2650 cm�1
range over (a) Pt/CeO2, (b) Pt/CeO2�TiO2, and (c) Pt/TiO2 catalystsunder SSITKAWGS reaction conditions at 573 K. Solid-line spectra: 4.2vol % 12CO/29.3 vol % H2O/Ar/He; dashed-line spectra: 4.2 vol %13CO/29.3 vol % H2O/Ar. Deconvolution and curve fitting of recordedDRIFTS spectra are also provided (bottom graphs).

H dx.doi.org/10.1021/jp201773a |J. Phys. Chem. C XXXX, XXX, 000–000
The Journal of Physical Chemistry C ARTICLE
Three characteristic IR bands due to δCHþ νOCOas, νCH, andδCH þ νOCOs vibrational modes and which are related to onekind of formate formed on the CeO2 support were observed on Pt/CeO2 (Figure 6a) as in the case of reaction performed at 473 K(Figure 3a). Deconvolution and curve fitting of the spectra recordedat 573 K for Pt/CeO2�TiO2 (Figure 6b) resulted in six IR bandsassigned to two different kinds of adsorbed formate species as in thecase of WGS at 473 K (Figure 3b). Deconvolution of the spectrarecorded under the 13CO/H2O treatment of the Pt/CeO2 and Pt/CeO2�TiO2 catalysts (Figure 6a, b, dashed-line) clearly shows theisotopic red shift for all bands recorded, a result opposite to that seenat 473 K. On the contrary, the six IR bands recorded on Pt/TiO2
(Figure 6c) donot showany isotopic red shift under the 13CO/H2Otreatment of the catalyst as similarly observed in the case of WGSperformed at 473 K. As will be discussed also in section 3.5, formatespecies on Pt/TiO2 appear to be merely spectator species at bothlow-T (473 K) and high-T (573 K) of the WGS reaction. On theother hand, formate species appear to switch from being activeintermediates at 573 K to inactive species at 473 K over the Pt/CeO2 and Pt/CeO2�TiO2 catalysts.Similar IR bands to those obtained at 473 K (Figure 4a�c)
were recorded at the high-T of 573 K in the 1650�1250 cm�1
range (Figure 7a�c). Infrared bands 1, 4, 5, and 6 are assigned tothe vibrational modes of formates, whereas bands 2 and 3 tocarbonate species. The IR spectra recorded on Pt/CeO2 andPt/CeO2�TiO2 (Figure 7a, b) under the
13CO/H2O gas mix-ture showed the red isotopic shift. On the other hand, Pt/TiO2
shows a similar behavior to that obtained at 473 K (Figure 4c)having only the IR bands related to a carbonate species to exhibitthe red isotopic shift (band 2*, Figure 7c). Also, it is important tonote that a second kind of carbonate species formed does notprovide the red isotopic shift (band 3), clearly indicating that thiscarbonate should be considered as an inactive species.Based on the SSITKA�DRIFTS studies reported at 473 K
(Figures 2�4) and 573 K (Figures 5�7), it is apparent thatdepending on reaction temperature and catalyst support composi-tion, the chemical composition of the active species found inthe carbon path of the WGS reaction is different. As mentionedpreviously, the red isotopic shift by itself cannot be consideredas a safe criterion to assign whether the related adsorbed speciescan be considered as active reaction intermediates. Thus, eventhough carbonates (IR bands 2 and 3, Figures 4, 7) had giventhe red isotopic shift at both reaction temperatures, thesespecies may not be true active reaction intermediates as willbe discussed below.3.4. SSITKA�Mass Spectrometry Studies.The SSITKA�MS
experiments were used to follow the hydrogen path and carbonpath of the WGS reaction mechanism from the reactants (H2Oand CO) to the gas products (H2 and CO2) under kinetic regimeconditions (CO conversion <15%), following, respectively, the gasswitch H2O/CO/Ar/Kr (T, 30 min)f D2O/CO/Ar (T, t) andH2O/
12CO/Ar/He (T, 30 min) f H2O/13CO/Ar (T, t) at the
temperatures of 473 and 573 K.3.4.1. Carbon Path of the WGS Reaction. Figure 8a�c shows
normalized dynamic response curves, Z, of 12CO, 13CO, 12CO2,13CO2, and He recorded upon the isotopic switch over the Pt/TiO2
(Figure 8a), Pt/CeO2�TiO2 (Figure 8b), and Pt/CeO2 (Figure 8c)catalysts at 473 K. A relatively rapid decay of the 12CO2 signalaccompanied by an increase in 13CO2 was observed. Both curvescross each other atZ= 0.5 as predicted by the SSITKA theory.21,22,56
The concentration of C-containing active intermediates (μmol/gcat)is estimated via amaterial balance equation,22,31,32 which is proved to
be proportional to the area difference between the 12CO2 and Hetransient response curves. This concentration is related to allC-containing intermediates formed during WGS and leading tothe CO2(g) formation, such as adsorbed CO, carbonate, and/orformate. It is important to note that the 12CO2(g) and
13CO2(g)response curves are influenced by the kinetics of adsorption/desorption of CO2 on active and nonactive catalytic sites,
56 and thiswill be discussed in the following section 3.4.2. Table 2 summarizes
Figure 7. In situ DRIFTS spectra recorded in the 1650�1250 cm�1
range over (a) Pt/CeO2, (b) Pt/CeO2�TiO2, and (c) Pt/TiO2 catalystsunder SSITKAWGS reaction conditions at 573 K. Solid-line spectra: 4.2vol % 12CO/29.3 vol % H2O/Ar/He; dashed-line spectra: 4.2 vol %13CO/29.3 vol % H2O/Ar. Deconvolution and curve fitting of recordedDRIFTS spectra are also provided (bottom graphs).

I dx.doi.org/10.1021/jp201773a |J. Phys. Chem. C XXXX, XXX, 000–000
The Journal of Physical Chemistry C ARTICLE
the concentration of active C-containing intermediates in terms ofμmol/gcat or surface coverage, θ, the latter based on the exposedsurface area of Pt reported inTable 1 (D, %) for all three supported-Pt
catalysts, after correcting for CO2 readsorption effects (see section3.4.2). The mean residence time of the active carbon-containingspecies, τC-pool (s) is also provided in Table 3, and it was estimatedfrom the Z(t) versus time transient response curves of CO2 and He(Figure 8)56 after correcting for CO2 readsorption effects.As seen inTable 2, values of C-pool in terms ofθC are in the 0.3�7.2
range for all three catalysts at 473 and573K.For thehigh-Tof 573K, it isclear that a large part of the activeC-containing intermediates are formedalong the platinum-support interface and/or on sites present within anactive zone around the Pt nanoparticles. It is important to note that theconcentrationof these species at 573KonPt/TiO2 is larger by a factor of2.4 and 1.6, respectively, compared to Pt/CeO2�TiO2 and Pt/CeO2
catalysts, a result that is consistent with the activity order observed at573 K (Figure 1) at high CO conversions. The latter is true since a largeconcentration of an active reaction intermediate suggests that the sitereactivity (k, rate constant) associated with this species is low, and viceversa. This reasoning, however, should consider also the dependence ofthe reaction kinetic rate on the concentration of other important reactionintermediatesofWGS, suchas theH-containing, a subject tobediscussedin section 3.4.3.The concentration (μmol/gcat) of the reversibly adsorbed
12COads that is formed under WGS reaction conditions and isexchanged with gaseous 13COg according to the followingelementary reaction step 1
12COads þ 13COg T13COads þ 12COg ð1Þ
can be determined by applying the following material balanceequation
NCO ¼ FT:yCO
f ð1� XCOÞW
" #Z tf
0½ZCOðtÞ � ZHeðtÞ� dt ðmol=gcatÞ
ð2Þwhere FT is the total molar flow rate of the reaction mixture atthe exit of the reactor, yCO
f is the mole fraction of 12CO in the
Figure 8. SSITKA-mass spectrometry experiments performed to esti-mate the concentration of active carbon-containing (C-pool) reactionintermediates found in the carbon path of the WGS reaction on (a) Pt/TiO2, (b) Pt/CeO2�TiO2, and (c) Pt/CeO2 catalysts at 473 K. Gasdelivery sequence: 4.2 vol % 12CO/29.3 vol % H2O/Ar/He (30 min)f4.2 vol % 13CO/29.3 vol % H2O/Ar (t).
Table 2. Concentration of Active H-Containing, C-Containing,a and CO Precursor Reaction Intermediates Formed underSteady-State WGS Reaction (4.2 vol % CO/29.3 vol % H2O/He; 473 or 573 K) on Supported-Pt Catalysts
C-containing (μmol/gcat) or (θC)b CO precursor, NCO (μmol/gcat) or (θCO)
b H-containing (μmol H/gcat) or (θH)b
catalyst 473 K 573 K 473 K 573 K 473 K 573 K
Pt/CeO2 12.9 (0.9) 61.7 (4.5) 5 (0.4) 75 (7.4) 77 (5.6) 2816 (204)
Pt/TiO2 4.6 (0.4) 93.9 (7.2) 3 (0.3) 99 (7.6) 77 (5.9) 2250 (172)
Pt/CeO2�TiO2 3.2 (0.28) 39.0 (3.0) 6 (0.5) 46 (3.7) 57 (4.3) 2766 (225)aCorrected values from CO2 readsorption effects (see Figure 9 and section 3.4.2). b In terms of surface monolayers of platinum.
Table 3. Mean Residence Time, τC-ppol (s), of the ActiveCarbon-Containing (C-Pool) and τH-ppol (s) of Hydrogen-Containing (H-Pool) Intermediates of the WGS Reaction at473 and 573 K (4.2 vol % CO/29.3 vol % H2O/He) over the0.5 wt % Pt/CeO2, 0.5 wt % Pt/TiO2, and 0.5 wt % Pt/CeO2�TiO2 Catalysts
τC-pool (s) τH-pool (s)
catalyst 473 K 573 K 473 K 573 K
Pt/CeO2 10.5 3.5 66.8 64.7
Pt/TiO2 1.4 3.1 64.4 68.8
Pt/CeO2�TiO2 1.5 2.5 65.6 85.4
J dx.doi.org/10.1021/jp201773a |J. Phys. Chem. C XXXX, XXX, 000–000
The Journal of Physical Chemistry C ARTICLE
12CO/H2O feed stream, XCO is the CO conversion, W is themass (g) of catalyst used in the experiment, and ZCO(t) is anormalized concentration of 12CO given by the followingrelationship
ZCOðtÞ ¼ yCOðtÞyCO
s:s:ð3Þ
which is estimated based on the recorded signal of yCO(t) under the13CO/H2O gas mixture and the steady-state CO concentration,yCO
s.s., obtained at the reactor outlet. Table 2 reports the quantityNCO termed “CO precursor” intermediates in terms of μmol/gcator θCO. Since part of the adsorbed CO should be considered asactive precursor intermediate that leads to the WGS reactionproducts, as will be discussed later, part of NCO reflects the activeadsorbed CO which provides the red isotopic shift in the SSIT-KA�DRIFTS experiment. Based on the results of the latterexperiment (Figures 2 and 5), the red isotopic shift provided bythe adsorbed CO was indeed observed. However, it is not possi-ble to discriminate from these results which kinds of adsorbedCO must be considered as true active intermediates or spectatorspecies, and which follow the elementary reaction step 1. It is seenthatθCO = 0.3�0.5 at the low-T of 473 K, whereas it is significantlylarger than 1 (θCO = 3.7�7.6) at the high-T of 573 K. At the latterreaction temperature values of θCO larger than unity for NCO
strongly indicate that besides the adsorbed CO on Pt theremust beanother adsorbed species formed on the support under WGSreaction conditions and which is able to interact reversibly with13CO(g). It was reported9,21,31,32,42,45,57 that adsorbed CO canreact reversibly with �OH groups of the support to form formatespecies, and it can also react directly with support surface latticeoxygen to form carbonate species, the latter decomposing intogaseous CO2 according to the following elementary reaction steps:
COads þOH-s T HCOO-s ð4Þ
COads þ 2O�-s T ½CO3�2�-s ð5Þ
½CO3�2�-s T CO2ðgÞ þO�-sþ ð0=e�Þ ð6Þ
CO2ðgÞ þO2�-s T ½CO3�2�-s ð7Þwhere (0/e�) is an oxygen vacant site and s is a surface supportcatalytic site. In the case of Pt/TiO2, only carbonate speciesprovided the red isotopic shift (Figures 4c, 7c), strongly suggestingthat reactions 5�7 can take place. On the contrary, at the high-T of573 K, both Pt/CeO2 and Pt/CeO2�TiO2 catalysts must beconsidered to promote reactions 4�7 in agreement with theSSITKA�DRIFTS studies which showed that formates and car-bonates provided the red isotopic shift (Figures 6 and 7). Accord-ing to reactions 5 and 6, carbonate contributes to the reduction ofsupport. In addition, reaction step 6 is favored by the presence of Ptwhich participates in a charge transfer between Pt and O atoms ofsupport at the Pt�support interface, thus reducing the bondingstrength of Ce�O�Ce.15 In other words, reaction step 6 is largelyfacilitated at the Pt�ceria interface, and it may not occur ifcarbonates are formed on sites far distant from the Pt�ceriainterface. It is therefore suggested that at 473 K the NCO quantity(θCO= 0.3�0.5) obtained for all three supported Pt catalysts is dueto an active adsorbed CO precursor species leading to CO2 andH2
via the “redox” and “associative formate” routes as will be discussedin section 3.5.
3.4.2. CO2 Readsorption Effects. To check the reversibility ofCO2 chemisorption step 6 on Pt/CeO2 at 473 and 573 K, and toexplain correctly the red isotopic shift due to carbonate species,the following experiments have been designed and performed:(a) SSITKA�MS experiments similar to that presented in
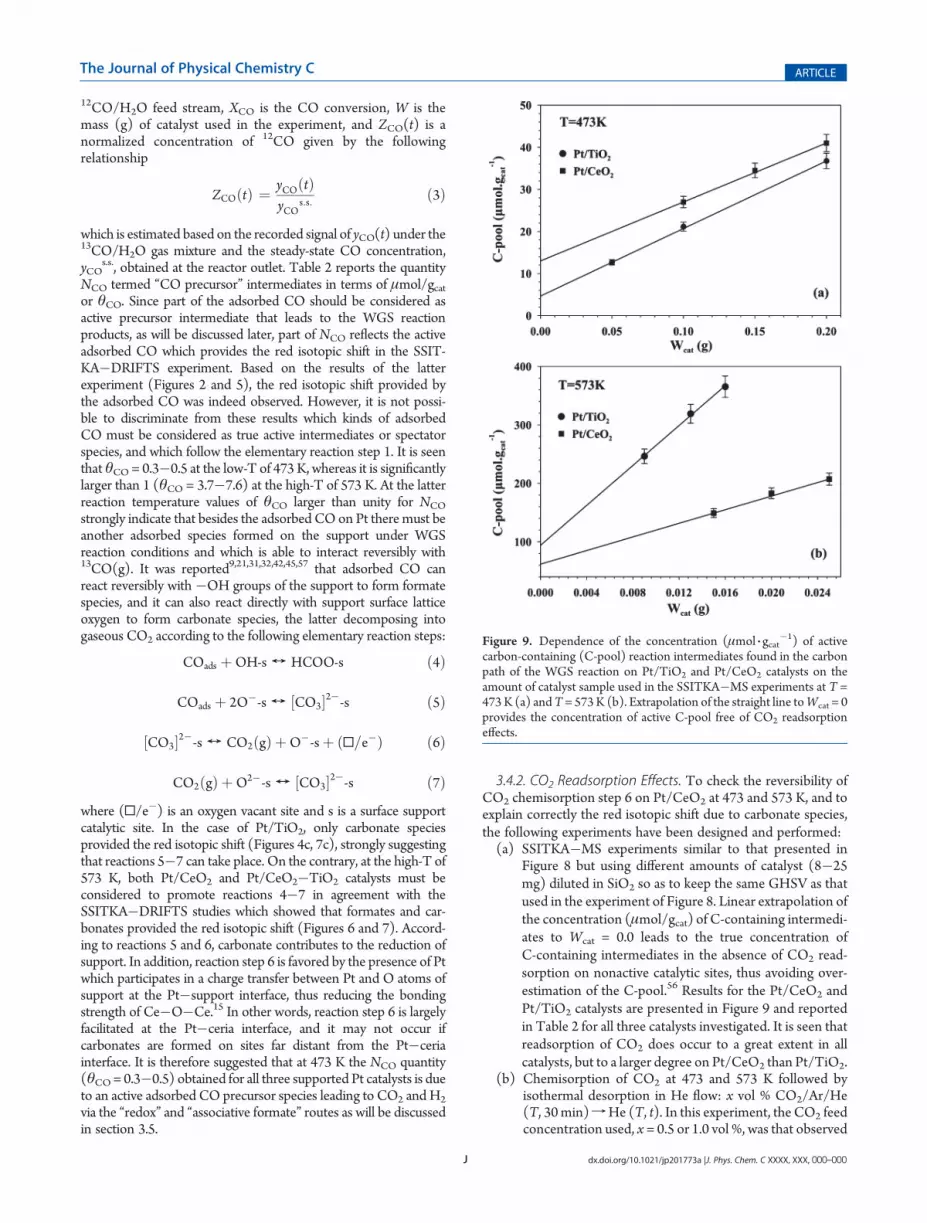
Figure 8 but using different amounts of catalyst (8�25mg) diluted in SiO2 so as to keep the same GHSV as thatused in the experiment of Figure 8. Linear extrapolation ofthe concentration (μmol/gcat) of C-containing intermedi-ates to Wcat = 0.0 leads to the true concentration ofC-containing intermediates in the absence of CO2 read-sorption on nonactive catalytic sites, thus avoiding over-estimation of the C-pool.56 Results for the Pt/CeO2 andPt/TiO2 catalysts are presented in Figure 9 and reportedin Table 2 for all three catalysts investigated. It is seen thatreadsorption of CO2 does occur to a great extent in allcatalysts, but to a larger degree on Pt/CeO2 than Pt/TiO2.
(b) Chemisorption of CO2 at 473 and 573 K followed byisothermal desorption in He flow: x vol % CO2/Ar/He(T, 30min)fHe (T, t). In this experiment, the CO2 feedconcentration used, x = 0.5 or 1.0 vol %, was that observed
Figure 9. Dependence of the concentration (μmol 3 gcat�1) of active
carbon-containing (C-pool) reaction intermediates found in the carbonpath of the WGS reaction on Pt/TiO2 and Pt/CeO2 catalysts on theamount of catalyst sample used in the SSITKA�MS experiments at T =473K (a) andT= 573K (b). Extrapolation of the straight line toWcat = 0provides the concentration of active C-pool free of CO2 readsorptioneffects.

K dx.doi.org/10.1021/jp201773a |J. Phys. Chem. C XXXX, XXX, 000–000
The Journal of Physical Chemistry C ARTICLE
under steady-state WGS for the SSITKA�MS experi-ment (Figure 8) at 473 and 573 K, respectively.
Figure 10 presents the isothermal adsorption (Figure 10a) anddesorption (Figure 10b) curves of CO2 and that of tracer Ar gasobtained at 473 K on Pt/CeO2 according to the experiment(b) described above. It is clearly seen that carbonate speciesformed upon CO2 chemisorption at 473 K decompose accordingto reaction step 6 in He flow at the same temperature. However,it was found that only 25% of adsorbed CO2 (Figure 10a,40 μmol/gcat) decomposes at 473 to CO2(g) (Figure 10b), whilethe extent of desorption at 573Kwas found to be significantly larger,85%. These results are in harmony with the SSITKA�DRIFTSexperiments (Figures 4a and 7a), where only part of the formedcarbonate IR band gave the red isotopic shift. Aswill be shown in thefollowing section 3.5, the redox mechanism involves the formationof a carbonate-type intermediate, which leads to CO2(g) and anoxygen vacant site. This intermediate must be considered as themost populated active reaction intermediate of the carbon path ofthe WGS reaction according to the results reported in Table 2. Re-versible chemisorption ofCO2(g) on the oxygen vacant sites cannotbe excluded.58
3.4.3. Hydrogen Path of the WGS Reaction. Figure 11a�cpresents transient concentration response curves of H2, HD, D2,and Kr obtained after the 12CO/D2O/Ar isotopic switch wasmade at 573 K over each of the three supported-Pt catalystsinvestigated. In all cases a large HD(g) signal was recorded, andthe H2(g) response curve lies well above that of Kr tracer gas.The appearance of HD(g) might be the result of (a) therecombination of adsorbed H and D on the Pt surface and (b)the exchange of H of�OH group of support with D from D2(g)and/or D2O(g) under the
12CO/D2O/Ar gas switch. These sideexchange reactions which would overestimate the size of theH-pool were carefully checked experimentally as follows:(a) A 30 vol% H2O/Ar mixture was passed over each of the
present supported-Pt catalysts (W = 0.025 g diluted with0.175 g of silica) for 30 min, followed by a switch to theequivalent 30 vol %D2O/Ar isotopic gasmixture at 573 K.
(b) The supported-Pt catalyst was first treated with 30%H2O/Ar at 573 K for 30 min, followed by Ar purge for10 min and then by 0.8 vol % D2/Ar treatment at 573 K.
During the 30 vol % D2O/Ar switch according to experiment(a) described above, no production of any HD or H2 gas wasobserved. Figure 12 presents results of the HD(g) and H2(g)response curves recorded under the Arf 0.8 vol % D2/Ar (t) gasswitch at 573 K according to experiment (b) described above. It isclearly seen that a similar HD response in shape and position asthat obtained under SSITKA (Figure 11) was observed. However,after integration of the HD and H2 responses an amount of 5.8μmol H/gcat is obtained, which is much smaller than the value of2816 μmol H/gcat estimated for the active H-pool reported inTable 2. Therefore, it is more than clear that the large size ofH-pool estimated at 473 and 573K (Table 2) represents the activeH-containing species that participate in the H-path of the WGSreaction and must be related to the support surface. It should benoted that any formation of HD(g) by exchange of H2/D2 on Ptduring the 350 s of the transient (Figure 11) will not affect thecorrect measurement of H-containing intermediates using the H2
andHDresponse curves, simply because reduction in theH2 signaldue to this exchange process would result in an equivalent increasein the HD signal.It is seen from Table 2 that for the low-T of 473 K the surface
coverage of activeH-pool is in the range of 4.3 <θH<5.9, and for Pt/CeO2 formate (H-containing species) cannot be considered as anactive intermediate (see section 3.4.1). Therefore, the active H-poolmust largely reside on the ceria support, and the chemical nature ofthese species is�OH/H (from water dissociation) according to theredoxmechanism to be presented in section 3.5. We have previouslyreported31 that a “reactive zone” around the Pt nanoparticles mustexist which contains the OH/H active species, where surfacediffusion toward Pt must occur in order to form the dihydrogengas product of the WGS reaction. In fact, by determining the totalspecific perimeter (cm/g) of supported-Pt particles (assuminghemispherical shape) as previously reported,22 and considering adistance of about 2 Å between two adjacent�OH groups, the con-centration of �OH groups present along the periphery of me-tal�support interface is estimated to be 3.2, 3.5, and 3.2μmol 3 gcat
�1
for Pt/CeO2, Pt/CeO2�TiO2, and Pt/TiO2, respectively. Thesevalues are smaller than the ones reported for the size of the activeH-pool (Table 2), clearly showing that there is a reactive zone
Figure 10. Transient isothermal (T = 473 K) dimensionless concentration (Z) response curves of CO2 and Ar (tracer) during adsorption (a) anddesorption (b) of carbon dioxide on a 0.5 wt % Pt/CeO2 catalyst. Gas delivery sequence: Hef 0.5 vol % CO2/3 vol % Ar/He (473 K, 10 min)fHe(473 K, t).

L dx.doi.org/10.1021/jp201773a |J. Phys. Chem. C XXXX, XXX, 000–000
The Journal of Physical Chemistry C ARTICLE
around each Pt metal particle within which active OH/H species areformed and participate in the H-path of the WGS.As the temperature of reaction increases to 573 K, the size of this
activeH-pool increases significantly (172<θH<225, Table 2). Evenin the case that formate is considered the main active carbon-containing intermediate at 573 K, the largest concentration of itcanonly be equivalent toθ=7.2 (Table 2), strongly indicating that at573K a significantly larger concentration ofOH/H species is formedon the ceria support which is energetically capable to participate intheH-path of theWGS reaction. At the highest reaction temperatureof 573 K, the concentration of H-containing intermediates increasesin the following order: CeO2�TiO2 > CeO2 > TiO2 (Table 2).3.4.4. Normal Kinetic Isotopic Effect. The SSITKA results re-
ported in Figure 11 show that the rate of D2 formation in the12CO/D2O/Ar reaction mixture is lower than the correspondingrate of H2 formation in the
12CO/H2O/Ar gas mixture, implying
the existence of a normal kinetic isotopic effect (NKIE). The rate ofH2 formation appears to be greater than that of D2 formation by afactor of 1.15, 1.14, and 1.18 for Pt/TiO2, Pt/CeO2�TiO2, and Pt/CeO2, respectively. The NKIE is related to the energy of chemicalbond(s) involved in the rate-determining step (RDS), which forthe present WGS reaction could be considered one of the follow-ing steps: (i) water dissociation on support (redox mechanism),(ii) formate (HCOO) decomposition (associative mechanism),(iii) surface diffusion of H/OH species (breaking of O�H bonds),and (iv) recombination of two adjacent adsorbedH species on Pt toform H2(g).ANKIEwas also reported for other supported-Pt catalysts.18,59,60
Ricote et al.49 proposed that the rate-determining step could be thatof formate decomposition on Pt to yield CO2, but in the presentwork formates cannot be considered as active intermediates at473K. It was reported thatwater promotes the rate ofWGS reactionon Pt/CeO2
61 by the formation of �OH groups adjacent to theformate active intermediate, thus “a reactant-promoted”mechanismwas proposed. Also, Grabow et al.62 have investigated the mechan-ism of WGS on Pt(111) via DFT, microkinetic modeling, andexperiments. The authors have shown that water can act as apromoter, making the low-energy COOH þ OH decompositionstep more accessible kinetically. Thus, water dissociation might beconsidered as a RDS in the case ofWGS at 573K on the present Pt/CeO2 and Pt/CeO2�TiO2 catalysts but also at 473 K for a redoxmechanism. Surface diffusion of H species from the �OH sitestoward themetal�support interfacemay also be considered as RDSof the present WGS reaction system at 473 K.3.5. Prevailing Mechanism of WGS—The Effect of Support
Composition and Reaction Temperature. The present work hasdemonstrated the strong influence of support chemical compositionand reaction temperature (ca. 473�573 K) on the chemical compo-sition and surface coverage of active intermediates found in theH-path and C-path of WGS, and also of spectator species oversupported-Pt catalysts. As mentioned in the Introduction section,four mechanistic routes have been reported for the WGS reaction,and these are outlined in Scheme 1: (A) redox, (B) carbonate, (C)associative formate with�OH group regeneration, and (D) associa-tive mechanism.10,16,18,21,22,60,63�65 Belowwe discuss the applicability
Figure 11. SSITKA�mass spectrometry experiments performed toestimate the concentration of active hydrogen-containing (H-pool)reaction intermediates found in the hydrogen path of WGS reactionon (a) Pt/TiO2, (b) Pt/CeO2�TiO2, and (c) Pt/CeO2 catalysts at573 K. Gas delivery sequence: 4.2 vol % CO/29.3 vol % H2O/Ar/Kr(30 min) f 4.2 vol % CO/29.3 vol % D2O/Ar (t).
Figure 12. Transient isothermal (T = 573 K) concentration responsecurves of HD and H2 gases recorded according to the following gasdelivery sequence: 30 vol % H2O/Ar (573 K, 30 min)f Ar (573 K, 10min) f 0.8 vol % D2/Ar (573 K, t) over a 0.5 wt % Pt/CeO2 catalyst.Wcat = 0.025 g; F = 100 N mL/min.

M dx.doi.org/10.1021/jp201773a |J. Phys. Chem. C XXXX, XXX, 000–000
The Journal of Physical Chemistry C ARTICLE
of these fourmechanisms at 473 and 573Kover the three supported-Pt catalysts investigated.3.5.1. Pt/CeO2 Catalyst. As illustrated in Scheme 1A, adsorbed
CO on a Pt site adjacent to an oxygen atom along the metal�sup-port interface should be considered as an active species of theredox mechanism as supported by the works of Meunieret al.,23,52,66 Bunluesin et al.,8 and a recent work from ourlaboratory22 for the WGS in the 523�573 K range. In fact, inthe latter work the redox mechanism over Pt/CeO2 (ceria samplewas a commercial one of low surface area, ca. 5.6 m2
3 g�1, whereas
Pt particle size was varied in the 1.3�8.0 nm range) was found topredominate over the associative formate with �OH groupregeneration mechanism (Scheme 1C), the latter being consid-ered to operate in parallel with the redox mechanism butcontributing to a lesser extent in the overall WGS reaction rate.Many published works44,61,65,67,68 have concluded that one of thetwo associative formate mechanisms (Scheme 1C or Scheme 1D)for the WGS operates on Pt/CeO2. However, in all these studiesno attempts were made to measure in situ the relative rates ofWGS reaction at steady state or at the beginning of reaction (initialrates) associated with the assumed mechanism (e.g., redox versusassociative formate) in order to provide strong support as to whichmechanism prevails. The latter was performed successfully inrecent works22,23 by SSITKA�DRIFTS�MS and other transientisotopic experiments.In Scheme 1D, formate intermediate decomposes to CO2
through a surface carbonate intermediate in the presence of water(water-promoted dissociation of formate). This mechanismimplies the presence of an active formate intermediate. However,the SSITKA�DRIFTS experiments showed that formate speciesis inactive at 473 K (Figure 3a). On the other hand, the carbonate
mechanism (Scheme 1B) can be considered as a special case ofthe redox mechanism, since the main difference is the lifetime ofthe carbonate on the surface and the extent to which the twosteps which involve reduction and reoxidation of support areseparated in time.38 For example, if both the decomposition ofcarbonate and reoxidation of support by water are fast steps, asoccurs at high temperatures, the steady-state concentration ofcarbonate may be so small that it cannot be observed. As pre-sented before, readsorption of CO2 gas product to form surfacecarbonate species does occur, and an equilibrium condition(eq 7) is established under steady-state WGS. We have pre-viously demonstrated22 in a transient isotopic experiment that noreaction of preadsorbed carbonate species on Pt/CeO2 at 573 Kwith adsorbed water did take place. Based on these findings, thecarbonate route must be excluded.Based on the above offered discussion, it can be concluded
that the redox mechanism is the only one operating on Pt/CeO2
at 473 K, whereas at 573 K the associative formate with �OHgroup regeneration mechanism also operates but to a lesserextent compared to the redox mechanism.22 Formate speciesformed at 473 K under WGS is simply a spectator species.Meunier et al.23,52,53,69 have recently applied an isotopic “oper-ando” methodology on a 2 wt % Pt/CeO2 catalyst where it wasfound that formate species was inactive at 433 K but became anactive intermediate at 493 K, a behavior similar to that observedin the present 0.5 wt % Pt/CeO2 and 0.5 wt % Pt/6.6 wt %CeO2�TiO2 catalysts.3.5.2. Pt/TiO2 Catalyst. According to the SSITKA�DRIFTS
results of Figure 3c and 6c, the associative formate with �OHgroup regeneration (Scheme 1C) and associative (Scheme 1D)mechanisms which involve the formation of formate species must
Scheme 1. Proposed Water�Gas Shift Reaction Mechanistic Pathways over Supported-Pt Catalysts.22,34,65

N dx.doi.org/10.1021/jp201773a |J. Phys. Chem. C XXXX, XXX, 000–000
The Journal of Physical Chemistry C ARTICLE
be excluded at bothWGS reaction temperatures. This is in harmonywith our previous studies21 performed on a different Pt/TiO2
catalyst (different textural properties for the titania support, andsimilar Pt particle size), where the redox mechanism (Scheme 1A)was proved to better describe the experimental results obtained at473 K. The carbonate mechanism (Scheme 1B) is also excluded bythe fact that even though the red isotopic shift produced bycarbonates was seen in the SSITKA�DRIFTS studies, the fact thatchemisorption of CO2 was proved to be reversible (see Figure 9)makes this route less possible especially at 473 K, where dehydrox-ylation or reduction of titania support by H2 is required. We haveperformed a TPD experiment inHe flow (use ofmass spectrometryas detector) where the present Pt/TiO2 catalyst was first treated in30 vol %H2O/He at 473 or 573 K for 1 h, followed by He purge to303 K before TPD. No formation of gaseous H2O was observedbelow 623 K. Thus, the rate of dehydroxylation depicted inScheme 1B is insignificant below 573K. Also, aH2-TPR experiment(1 vol % H2/He) performed on the preoxidized (773 K, 1 h, 20%O2/He) Pt/TiO2 catalyst resulted in two H2-TPR traces, onebelow 553 K and the other one in the 563�873 K range, in verygood agreement with the H2-TPR traces reported57 on a series of0.5 wt % Pt/TiO2 solids of different mean crystallite sizes for titania(16�35 nm). The rate of reduction at 573 K was estimated to besignificantly lower than the WGS reaction rate at 573 K. Theseresults suggest that reduction of titania under the presentSSITKA�MS WGS experimental reaction conditions is not sig-nificant. We have also reported21 that the presence of H2 underWGS reaction conditions inhibits reoxidation of partially reducedtitania. Based on all the above evidence, the carbonate route(Scheme 1B) is not favorable also on Pt/TiO2.3.5.3. Pt/CeO2�TiO2 Catalyst. According to the SSITKA�
DRIFTS results of Figures 3b and 4b, this catalytic system followsthe same characteristics regarding the nature of active reactionintermediates and inactive species formed as those of Pt/CeO2
and Pt/TiO2 catalysts. Thus, the redox mechanism is the onlyone operating under WGS at the low-T of 473 K. On the otherhand, at the high-T of 573 K, the catalyst follows the character-istics of Pt/CeO2 (see section 3.5.1); thus, the redox mechanismprevails over the associative formate with�OH group regenera-tion mechanism.3.6. Volcano-type Activity Profile over Pt/TiO2.The activity
results depicted in Figure 1 show the formation of maximumactivity at 548 K for the Pt/TiO2 catalyst under the examinedfeed gas composition. The loss of activity at T > 548 K indicatesthat some changes occurred in catalyst’s structure and/or in theadsorbed phase composition, which resulted in the decrease ofcatalyst’s activity. The SSITKA�DRIFTS experiments per-formed at 473 and 573 K showed no changes in the operatingmechanism in this temperature range. Based on the size of theC-pool at 473 and 573 K (Table 2), it is clear that the titaniasupport facilitates the population of an increased concentrationof CO precursor species related to inactive formate and carbo-nate species, as discussed in a previous section. It should also benoted that at 573 K a carbonate band (Figure 7c, band 2) did notprovide the red isotopic shift, strongly indicating that thiscarbonate species is inactive. Previous studies33 indicated thatdeactivation of Pt/TiO2 was not related to a sintering process ofplatinum particles under WGS reaction conditions but to anover-reduction of the titania support; the term over-reductionrefers to the fact that reoxidation of support is not taking place. Inearlier studies70,71 it was proposed that over-reduction couldprovoke the strengthening of binding energy of carbonate species
on the support surface, thus leading to an autopoisoning. It wasalso reported that carbonates adsorbed on the platinum surfaceor associated to Pt sites at the metal�support interface couldinfluence Pt surface electronic properties and accessibility toactivemetal sites.We suggest that inactive carbonate and formatespecies, and likely changes in the electronic properties ofplatinum nanoparticles at the metal support interface, contributeto the over-reduction phenomenon associated with the loss ofactivity of Pt/TiO2 at T > 548 K. In the case of Pt/CeO2�TiO2,addition of 6.6 wt % of cerium oxide was sufficient to avoid over-reduction of TiO2 at high temperatures.According to the SSITKA�DRIFTS and SSITKA�MS ex-
perimental results presented in Figures 2�8 and 11, and Table 2,the coverage by ceria of the 45% of titania surface resulted in acatalytic system that resembles that of Pt/CeO2 in terms of thenature of active reaction intermediates but which exhibitssignificantly lower surface concentrations for the active speciespresent in the C-path at 473 and 573 K, and in the H-path at 473K. This result could be interpreted as due to the enhancement ofsite reactivity of the active species imposed by the presence of aCe�O�Ti�O interface in contact with Pt nanoparticles. Thelatter is reasonable given the different electron density of oxygenanions in the Ce�O�Ti moiety compared to that in theCe�O�Ce and Ti�O�Ti moieties. Furthermore, electroncharge flow between the O of Ce�O�Ti and Pt is expected tobe different as compared to that for CeO2 and TiO2 supportsalone. The latter would influence the chemisorpive properties ofCO, thus the rate of WGS via the prevailing redox mechanism(Scheme 1A).
4. CONCLUSIONS
The following conclusions can be derived based on the resultsof the present work:• The mechanism of WGS on 0.5 wt % Pt (dPt = 1.8�2.0 nm)supported on CeO2, TiO2, and CeO2�TiO2 in the473�573 K range, and at conditions of a large waterconcentration (∼30 vol %) and a H2O/CO ratio of about7, was found to depend on reaction temperature andsupport chemical composition.
• In the case of CeO2 and 6.6 wt %CeO2�TiO2 supports of Ptnanoparticles, the prevailing mechanism is that of redox(Scheme 1A), with the mechanism of associative formatewith �OH group regeneration (Scheme 1C) to operate inparallel with the redoxmechanism but contributing to a lowerextent in the overall WGS reaction rate.22 On the contrary,TiO2 support promotes only the redox mechanism.
• The main active reaction intermediates found in both theredox and associative formate with �OH group regenera-tion mechanisms are located within a reactive zone aroundthe Pt nanoparticles (∼1.8�2.0 nm). Their concentrationlargely exceeds one surface monolayer based on the Ptsurface. Inactive species are formed, and these were found tobe two different kinds of formates and carbonates located onthe support.
• The Pt/CeO2 and Pt/CeO2�TiO2 solids did not show anyloss of catalytic activity after increasing the temperature inthe 473�603 K range, as opposed to the case of Pt/TiO2
which presents maximum at around 560 K. The latter is dueto the over-reduction of support existing phenomenon.

O dx.doi.org/10.1021/jp201773a |J. Phys. Chem. C XXXX, XXX, 000–000
The Journal of Physical Chemistry C ARTICLE
’AUTHOR INFORMATION
Corresponding Author*Tel. þ357 22 892776; fax þ357 22 892801; e-mail [email protected].
’ACKNOWLEDGMENT
The financial support of the Cyprus Research PromotionFoundation (PENEK/ENISX/0308/50), CAM (P2009/ENE-1743), MICINN (ENE 2010-21198-C04-01), and INTA isgratefully acknowledged.
’REFERENCES
(1) Basagiannis, A. C.; Verykios, X. E. Appl. Catal., A 2006, 308, 182.(2) Chernik, S.; French, R.; Feik, C.; Chornet, E. Ind. Eng. Chem. Res.
2002, 41, 4209.(3) Cortright, R. D.; Davda, R. R.; Dumesic, J. A. Nature 2002,
418, 964.(4) Fu, Q.; Saltsburg, H.; Flytzani-Stephanopoulos, M. Science 2003,
301, 935 and references therein.(5) Ratnasamy, C.; Wagner, J. P. Catal. Rev. 2009, 51, 325.(6) Jacobs, G.; Davis, B. H. Catalysis 2007, 20, 122.(7) Farrauto, R.; Hwang, S.; Shore, L.; Ruettinger, W.; Lampert,
J.; Giroux, T.; Liu, Y.; Ilinich, O. Annu. Rev. Mater. Res. 2003, 33, 1.(8) Bunluesin, T.; Gorte, R. J.; Graham, G. W. Appl. Catal., B 1998,
15, 107.(9) Gorte, R. J.; Zhao, S. Catal. Today 2005, 104, 18.(10) Hilaire, S.; Wang, X.; Luo, T.; Gorte, R. J.; Wagner, J. Appl.
Catal., A 2001, 215, 271.(11) Li, Y.; Fu, Q.; Flytzani-Stephanopoulos, M. Appl. Catal., B
2000, 27, 179.(12) Liu, W.; Flytzani-Stephanopoulos, M. J. Catal. 1995, 153, 317.(13) Silberova, B. A. A.; Mul, G.; Makkee, M.; Moulijn, J. A. J. Catal.
2006, 243, 171.(14) Chenu, E.; Jacobs, G.; Crawford, A. C.; Keogh, R. A.; Patterson,
P. M.; Sparks, D. E.; Davis, B. H. Appl. Catal., B 2005, 59, 45.(15) Jacobs, G.; Graham, U. M.; Chenu, E.; Patterson, P. M.; Dozier,
A.; Davis, B. H. J. Catal. 2005, 229, 499.(16) Jacobs, G.; Williams, L.; Graham, U.; Sparks, D.; Davis, B. H.
J. Phys. Chem. B 2003, 107, 10398.(17) Jacobs, G.; Williams, L.; Graham, U.; Thomas, G. A.; Sparks,
D. E.; Davis, B. H. Appl. Catal., A 2003, 252, 107.(18) Shido, T.; Iwasawa, Y. J. Catal. 1993, 141, 71 and references
therein.(19) Zhai, Y.; Pierre, D.; Si, R.; Deng, W.; Ferrin, P.; Nilekar, A. U.;
Peng, G.; Herron, J. A.; Bell, D. C.; Saltsburg, H.; Mavrikakis, M.;Flytzani-Stephanopoulos, M. Science 2010, 329, 1633 and referencestherein.(20) Rodriguez, J. A.; Ma, S.; Liu, P.; Hrbek, J.; Evans, J.; P�erez, M.
Science 2007, 318, 1757.(21) Kalamaras, C. M.; Panagiotopoulou, P.; Kondarides, D. I.;
Efstathiou, A. M. J. Catal. 2009, 264, 117 and references therein.(22) Kalamaras, C. M.; Americanou, S.; Efstathiou, A. M. J. Catal.
2011, 279, 287.(23) Meunier, F. C. Catal. Today 2010, 155, 164.(24) Efstathiou, A. M.; Verykios, X. E. Appl. Catal., A 1997, 151, 109.(25) Kundakovic, L.; Flytzani-Stephanopoulos, M. J. Catal. 1998,
179, 203.(26) Zhu, H.; Shen, M.; Kong, Y.; Hong, J.; Hu, Y.; Lin, T.; Dong, L.;
Chen, Y.; Jian, C.; Liu, Z. J. Mol. Catal. A: Chem. 2004, 219, 155.(27) Ojeda, M.; Granados, M. L.; Rojas, S.; Terreros, P.; García-
García, F. J.; Fierro, J. L. G. Appl. Catal., A 2004, 261, 47.(28) Pedrero, C.; Waku, T.; Iglesia, E. J. Catal. 2005, 233, 242.(29) Patterson, A. L. Phys. Rev. 1939, 56, 978.
(30) Polychronopoulou, K.; Costa, C. N.; Efstathiou, A. M. Appl.Catal., A 2004, 272, 37.
(31) Kalamaras, C. M.; Olympiou, G. G.; Efstathiou, A. M. Catal.Today 2008, 138, 228.
(32) Olympiou, G. G.; Kalamaras, C. M.; Zeinalipour-Yazdi, C. D.;Efstathiou, A. M. Catal. Today 2007, 127, 304.
(33) Gonz�alez, I. D.; Navarro, R. M.; Wen, W.; Marinkovic, N.;Rodrigu�ez, J. A.; Rosa, F.; Fierro, J. L. G. Catal. Today 2010, 149, 372.
(34) Jacobs, G.; Davis, B. H. Appl. Catal., A 2007, 333, 192.(35) Panagiotopoulou, P.; Kondarides, D. I. Appl. Catal., B 2011,
101, 738.(36) Panagiotopoulou, P.; Kondarides, D. I. Catal. Today 2006,
112, 49.(37) Panagiotopoulou, P.; Kondarides, D. I. J. Catal. 2004, 225, 327.(38) Burch, R. Phys. Chem. Chem. Phys. 2006, 8, 5483.(39) Panagiotopoulou, P.; Papavasiliou, J.; Avgouropoulos, G.;
Ioannides, T.; Kondarides, D. I. Chem. Eng. J. 2007, 134, 16.(40) Li, C.; Sakata, Y.; Arai, T.; Domen, K.; Maruya, K.-I.; Onishi, T.
J. Chem. Soc., Faraday Trans. 1 1989, 85, 929.(41) Bazin, P.; Saur, O.; Lavalley, J. C.; Daturi, M.; Blanchard, G.
Phys. Chem. Chem. Phys. 2005, 7, 187.(42) Azzam, K. G.; Babich, I. V.; Seshan, K.; Lefferts, L. J. Catal.
2007, 251, 153.(43) Jacobs, G.; Patterson, P. M.; Graham, U. M.; Sparks, D. E.;
Davis, B. H. Appl. Catal., A 2004, 269, 63.(44) Jacobs, G.; Patterson, P.M.;Williams, L.; Chenu, E.; Sparks, D.;
Thomas, G.; Davis, B. H. Appl. Catal., A 2004, 262, 177.(45) Jacobs, G.; Ricote, S.; Davis, B. H. Appl. Catal., A 2005, 284, 31.(46) Jacobs, G.; Ricote, S.; Davis, B. H. Appl. Catal., A 2006, 302, 14.(47) Li, C.; Sakata, Y.; Arai, T.; Domen, K.; Maruya, K.-I.; Onishi, T.
J. Chem. Soc., Faraday Trans. 1 1989, 85, 1451.(48) Martin, D.; Duprez, D. J. Phys. Chem. B 1997, 101, 4428.(49) Ricote, S.; Jacobs, G.; Milling, M.; Ji, Y.; Patterson, P. M.; Davis,
B. H. Appl. Catal., A 2006, 303, 35.(50) Iida, H.; Igarashi, A. Appl. Catal., A 2006, 303, 48.(51) Liao, L. F.; Lien, C. F.; Shieh, D. L.; Chen, M. T.; Lin, J. L.
J. Phys. Chem. B 2002, 106, 11240.(52) Meunier, F. C.; Tibiletti, D.; Goguet, A.; Shekhtman, S.;
Hardacre, C.; Burch, R. Catal. Today 2007, 126, 143.(53) Meunier, F. C.; Goguet, A.; Hardacre, C.; Burch, R.;
Thompsett, D. J. Catal. 2007, 252, 18.(54) Primet, M. J. Catal. 1984, 88, 273.(55) Primet, M.; Basset, J. M.; Mathieu, M. V.; Prettre, M. J. Catal.
1973, 29, 213.(56) Shannon, S. L.; Goodwin, J. G., Jr. Chem. Rev. 1995, 95, 677.(57) Panagiotopoulou, P.; Christodoulakis, A.; Kondarides, D. I.;
Boghosian, S. J. Catal. 2006, 114, 240.(58) Tejuca, L. G.; Bell, A. T.; Fierro, J. L. G.; Pe~na, M. A. Appl. Surf.
Sci. 1988, 31, 301.(59) Jacobs, G.; Crawford, A.; Williams, L.; Patterson, P. M.; Davis,
B. H. Appl. Catal., A 2004, 267, 27.(60) Shido, T.; Iwasawa, Y. J. Catal. 1992, 136, 493.(61) Jacobs, G.; Davis, B. H. Int. J. Hydrogen Energy 2010, 35, 3522.(62) Grabow, L. C.; Gokhale, A. A.; Evans, S. T.; Dumesic, J. A.;
Mavrikakis, M. J. Phys. Chem. C 2008, 112, 4608.(63) Fu, Q.; Weber, A.; Flytzani-Stephanopoulos, M. Catal. Lett.
2001, 77, 87.(64) Mhadeshwar, A. B.; Vlachos, D. G. J. Phys. Chem. B 2004,
108, 15246.(65) Azzam, K. G.; Babich, I. V.; Seshan, K.; Lefferts, L. J. Catal.
2007, 251, 153.(66) Meunier, F. C.; Reid, D.; Goguet, A.; Shekhtman, S.; Hardacre,
C.; Burch, R.; Deng, W.; Flytzani-Stephanopoulos, M. J. Catal. 2007,247, 277.
(67) Jacobs, G.; Khalid, S.; Patterson, P. M.; Sparks, D. E.; Davis,B. H. Appl. Catal., A 2004, 268, 255.
(68) Jacobs, G.; Crawford, A. C.; Davis, B. H. Catal. Lett. 2005,100, 147.

P dx.doi.org/10.1021/jp201773a |J. Phys. Chem. C XXXX, XXX, 000–000
The Journal of Physical Chemistry C ARTICLE
(69) Meunier, F. C.; Tibiletti, D.; Goguet, A.; Burch, R. Oil Gas Sci.Technol. 2006, 61, 497.(70) Goguet, A.; Meunier, F. C.; Tibiletti, D.; Breen, J. P.; Burch, R.
J. Phys. Chem. B 2004, 108, 20240.(71) Liu, X. S.; Ruettinger, W.; Xu, X. M.; Farrauto, R. Appl. Catal., B
2005, 56, 69.