effects of non-aqueous fluids-associated drill cuttings discharge on shelf break macrobenthic...
TRANSCRIPT
Environ Monit Assess (2010) 167:65–78DOI 10.1007/s10661-010-1518-0
Effects of non-aqueous fluids-associated drill cuttingsdischarge on shelf break macrobenthic communitiesin the Campos Basin, Brazil
Maria Fernanda L. Santos · Janete Silva ·Jandyra M. G. Fachel · Fernando H. Pulgati
Received: 15 December 2009 / Accepted: 19 April 2010 / Published online: 5 June 2010© Springer Science+Business Media B.V. 2010
Abstract This paper assesses the effects of non-aqueous fluids (NAF)-associated drill cuttings dis-charge on shelf break macrobenthic communitiesin the Campos Basin, off the southeast Brazil-ian coast, Rio de Janeiro State. Samples weretaken with a 0.25-m2 box corer from surround-ing two oil and gas wells on three monitoringcruises: before drilling, three months after drilling,and 22 months after drilling. Statistical method-ologies used Bayesian geostatistical and analy-sis of variance models to evaluate the effectsof the NAF-associated drill cuttings dischargeand to define the impact area. The results indi-cated that marked variations were not observedin the number of families between cruises, thoughthere were changes in the fauna composition.The changes seen in biological descriptors in bothcontrol and background situation areas were notconsidered significant, showing a temporal ho-mogeneity in means. The impact area presented
M. F. L. Santos (B) · J. SilvaNúcleo de Estudos do Mar, Universidade Federal deSanta Catarina, C.P. 476, 88.040-900,Florianópolis, SC, Brazile-mail: [email protected]
J. M. G. Fachel · F. H. PulgatiInstituto de Matemática, Universidade Federal do RioGrande do Sul, Av Bento Gonçalves, 9500,91.501-970, Porto Alegre, RS, Brazil
changes in biological descriptors of communitiesand trophic structure during the three cruises andsuch changes were correlated to chemical andphysical variables related to the drilling activi-ties, as a result of the mix of drill cuttings andsediment and the anoxic conditions establishedin the substrate. In that area, three months afterdrilling, a decrease in diversity and an increase indensity, motile deposit-feeders and Pol/Crp ratio,and dominance of opportunistic organisms, suchas the capitellid Capitella sp., were observed and,22 months after drilling, an increase of diver-sity, reduction of dominance of capitellid poly-chaete, changes in the fauna composition, and adominance of opportunistic burrowing and tube-building organisms were observed, indicating anecological succession process.
Keywords Shelf break · Macrobenthos ·Oil and gas exploration · Drilling fluids ·Environmental monitoring · Brazil
Introduction
During a petroleum well drilling process, fluidsare launched at high pressure in order to re-move coarse sediments and cuttings, thus allow-ing for better movement and penetration of thedrill into the ocean floor. Drilling fluids are usedto maintain well stability and prevent situations
66 Environ Monit Assess (2010) 167:65–78
of potential leakage. Drilling fluids can be clas-sified according to two basic types: water-basedfluids (WBF) and non-aqueous fluids (NAF).NAF include all the fluids with non-aqueous baseand non-water-dispersible base. They were clas-sified according to the type of base fluid in themud. Base fluids are in turn classified by theirsource and polycyclic aromatic hydrocarbon con-tent: oil-based fluid (OBF), low-toxicity mineraloil-based fluid, enhanced mineral oil-based fluid,and synthetic-based fluid (SBF). SBF are a rela-tively new class of drilling mud that is particularlyuseful for deepwater and deviated well. They weredeveloped to combine the technical advantages ofOBF with the low persistence and toxicity of WBF(Melton et al. 2000).
Most environmental regulating agencies do notallow discharge to the sea of NAF that are notassociated with cuttings. Discharge of WBF, onthe other hand, is allowed in most parts of theworld, except in highly sensitive areas. Dependingon local test requirements, some WBF formula-tions may be discharged in some countries butnot in others. Field studies on the discharge ofdrilling fluids and cuttings provide direct evalua-tion of impacts upon the marine environment andusually are used to determine the distribution andpersistence of the drilling fluids and cuttings in theseabed, as well as their impacts upon the benthiccommunities. The drill cuttings discharge may re-sult in physical smothering of benthic organismsregardless of the nature of cuttings. In addition,initial deposition of cuttings can physically affectbottom biota by altering sediment particle size.In the case of NAF, there is the additional factorof organic enrichment of the sediment, which canlead to anoxia/anaerobic conditions. Recovery ofthe benthic communities depends on the charac-teristics of the community affected, the thickness,areal extent, and persistence of the cuttings, andthe availability of colonizing organisms (Mairset al. 1999).
Various studies have been done to detect theeffects of oil and gas drilling discharge on benthiccommunities, but most have been restricted tocontinental shelf, such as the North Sea (Dicks1976; Hartley 1984; Addy et al. 1984; Davies et al.1984; Kingston 1992; Daan et al. 1996), southernGulf of Mexico (Hérnandez Arana et al. 2005),
northern Gulf of Mexico (Middleditch 1981;Rabalais et al. 1992; Montagna and Harper 1996),northwest shelf of Australia (Oliver and Fisher1999), and southeast Australia (Terrens et al.1998). On the other hand, the potential impact ofthe drilling activities on the shelf break benthicecosystems is scarce.
A few monitoring programs have been set upto assess the effect of offshore drilling activitieson the continental shelf off the Brazilian coast(Tararam 1993; Tommasi 1994a, b; Petrobrás2001, 2003). In this context, the EnvironmentalMonitoring of Offshore Drilling for PetroleumExploration (MAPEM) project was designed tocollect extensive data in an area of the shelf breakof the Campos Basin, off the southeast Braziliancoast; its main objectives were to evaluate theeffects of the NAF-associated drill cuttings dis-charge and to determine the degree of environ-mental impact of the drilling activities.
In the present study, the effects of NAF-associated drill cuttings discharge from theexploratory drilling activities on macrobenthiccommunities structure were analyzed in an area ofthe shelf break at Campos Basin, off the southeastBrazilian coast. For that, Bayesian geostatisticaland analysis of variance (ANOVA) models wereused to evaluate the extent and degree of impacton the composition, density, diversity, and trophicstructure of the communities.
Materials and methods
The study was conducted in the Bonito oil fieldof the Campos Basin, Rio de Janeiro, Brazil atthe southeast margin of the South Atlantic be-tween 20◦30′ S (Vitória High) and 24◦00′ S (CaboFrio High) where the wells BO-22 and BO-23are located. The water column depth ranges from170 to 270 m within a 2.500-m radius from wellBO-23, which is located at a 212-m water depth.Well BO-22 is located at 216 m water depth. Thestudy area shows previous drilling activities, whichbegan in the 1970 and extended up to 1998, whenthe drilling of the well located 348 m from wellBO-23.
Three sampling cruises were carried out in or-der to describe and assess the effects of drilling
Environ Monit Assess (2010) 167:65–78 67
cuttings discharge associated with NAF type III(SBF) on macrobenthic communities. The firstcruise was before drilling (MS1—July 2001), thesecond cruise was three months after drilling(MS2—September 2002), and third cruise was22 months after drilling (MS3—April 2004; thecode letters MS stand for “MAPEM SHAL-LOW”).
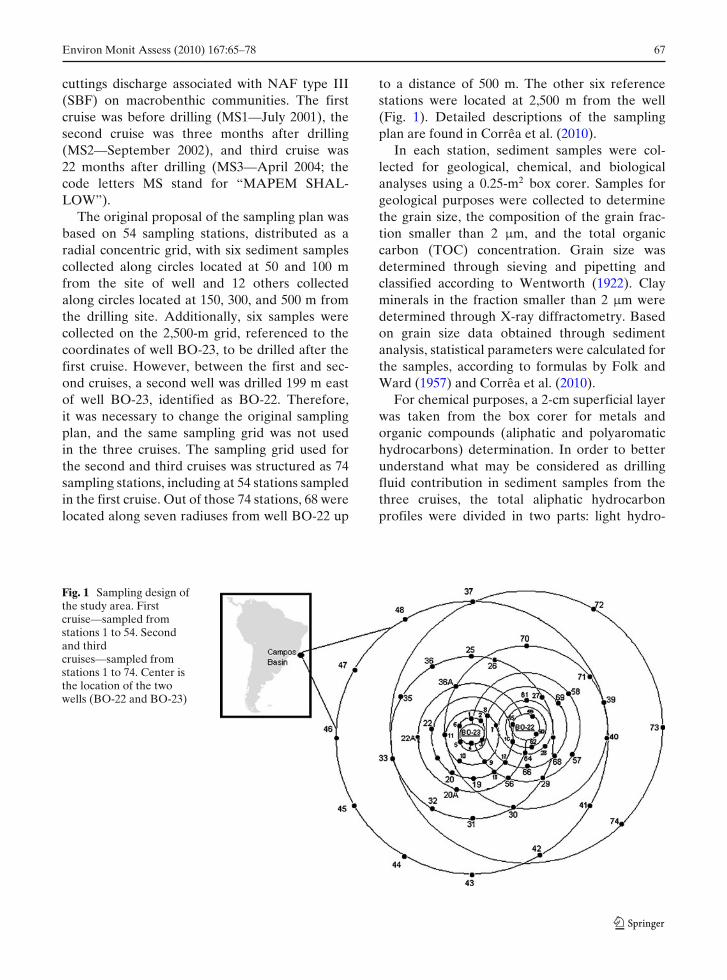
The original proposal of the sampling plan wasbased on 54 sampling stations, distributed as aradial concentric grid, with six sediment samplescollected along circles located at 50 and 100 mfrom the site of well and 12 others collectedalong circles located at 150, 300, and 500 m fromthe drilling site. Additionally, six samples werecollected on the 2,500-m grid, referenced to thecoordinates of well BO-23, to be drilled after thefirst cruise. However, between the first and sec-ond cruises, a second well was drilled 199 m eastof well BO-23, identified as BO-22. Therefore,it was necessary to change the original samplingplan, and the same sampling grid was not usedin the three cruises. The sampling grid used forthe second and third cruises was structured as 74sampling stations, including at 54 stations sampledin the first cruise. Out of those 74 stations, 68 werelocated along seven radiuses from well BO-22 up
to a distance of 500 m. The other six referencestations were located at 2,500 m from the well(Fig. 1). Detailed descriptions of the samplingplan are found in Corrêa et al. (2010).
In each station, sediment samples were col-lected for geological, chemical, and biologicalanalyses using a 0.25-m2 box corer. Samples forgeological purposes were collected to determinethe grain size, the composition of the grain frac-tion smaller than 2 μm, and the total organiccarbon (TOC) concentration. Grain size wasdetermined through sieving and pipetting andclassified according to Wentworth (1922). Clayminerals in the fraction smaller than 2 μm weredetermined through X-ray diffractometry. Basedon grain size data obtained through sedimentanalysis, statistical parameters were calculated forthe samples, according to formulas by Folk andWard (1957) and Corrêa et al. (2010).
For chemical purposes, a 2-cm superficial layerwas taken from the box corer for metals andorganic compounds (aliphatic and polyaromatichydrocarbons) determination. In order to betterunderstand what may be considered as drillingfluid contribution in sediment samples from thethree cruises, the total aliphatic hydrocarbonprofiles were divided in two parts: light hydro-
Fig. 1 Sampling design ofthe study area. Firstcruise—sampled fromstations 1 to 54. Secondand thirdcruises—sampled fromstations 1 to 74. Center isthe location of the twowells (BO-22 and BO-23)
68 Environ Monit Assess (2010) 167:65–78
carbons and heavy hydrocarbons. Light hydrocar-bons comprehend the C14–C20 linear hydrocar-bons plus the unresolved complex mixture (UCM)C14–C20 and heavy hydrocarbons represent theC21–C35 linear hydrocarbons plus the UCM C21–C35. Details of the processing and methodologyused on chemical samples are given in Peralbaet al. (2010).
Samples for biological analysis were collectedfrom a 0.1-m2 area (33 × 33 cm) to 10 cm depth,transferred to a plastic tray, and sieved through1 and 0.5 mm sieves. The retained material wastransferred to a plastic bottle (1 L), to whichan anesthetic was added (7% seawater solutionMgCl2) to a level approximately one third of thesample volume. The plastic bottle was closed andthe sample carefully stirred for mixing the anes-thetic to the sediment. After resting for 15–30 min,the anesthetic was removed through a 0.5-mmsieve. The sample was then fixed in 10% formalin,neutralized with borax and stored in polystyreneboxes. In the laboratory, the samples were sortedout and the organisms obtained were counted andidentified to family level.
The density was expressed as the number of in-dividuals per 0.1 m2, the abundance as sum of thenumber of individuals, the ratio between the num-ber of Polychaeta and Crustacea Peracarida asPol/Crp, and the number of taxa as number offamilies. The Shannon–Wiener diversity index H(expressed in bits) was also calculated. Familiesof macrobenthic organisms were classifiedinto functional groups based on the availableliterature (Fauchald and Jumars 1979; Gambiand Giangrande 1985; Gaston 1987; Gaston andNasci 1988) and help from specialists. Functionalgroups, taking into account mobility and feedingmodes, were recognized as motile carnivores (MC),motile deposit-feeders (MD), discretely motile car-nivores (DMC), discretely motile deposit-feeders(DMD), and discretely motile filter-feeders(DMF).
Bayesian geostatistical and ANOVA modelswere used to evaluate the effects of the NAF-associated drill cuttings discharge on biologicaldescriptors of macrobenthic community.
As the sampling stations were not repeatedthrough time, statistical methodologies adoptedBayesian geostatistical models, resolved through
the Monte Carlo simulation technique, to explorethe heterogeneity in the distribution of chemi-cal and geological parameters at each cruise inthe study area (Journel and Huijbregts 1978;Cressie 1991; Handcock and Stein 1993; Diggleand Ribeiro 2006).
Bayesian geostatistical models were used topredict the geographic distribution of the chem-icals variables observed and to identify and mapareas of higher or lower concentrations. The back-ground values of contaminants before drillingwere estimated for the total area and areas alteredby drilling activity were predicted, allowing for theresidual effects from previous drilling.
Mapping tracers of drilling activity, two aspectswere considered: the previous drilling and theresults of drilling wells BO-22 and BO-23. Thedrilling process was divided into three separatephases: the first, is characterized by the use ofwater; the second, using WBF, consisting of water,clays, and principally barium sulfate together withsome chemical additives; the third, using NAF,in this case, linear paraffins with low levels ofaromatics. Results from exploratory analyses in-dicated barium sulfate and light hydrocarbons astracers of the drilling phases. Light hydrocarbons,denoted in this paper by linear C14–C20 + UCMC14–C20, correspond to linear hydrocarbons fromC14 to C20 plus the UCM. Barium was associ-ated with the water-based (WBF) phase and lighthydrocarbons related to the non-aqueous (NAF)phase.
Using geostatistical models, it was possible toestablish groups of sampling stations with similarcharacteristics in terms of tracers, showing thedifferent drilling phases. A first group of samplingstations showed no significant change through-out the three cruises, and it was labeled controlarea. A second set of sampling stations showedevidence of previous drilling activity. The areadefined by this set was divided into two sub-areas.The first sub-area is a group of stations showingevidence of previous drilling but which did notreceive contributions from the two wells beingmonitored; this group was labeled backgroundsituation (BS) and was located toward the north ofthe sampling scheme. The second sub-area grouptogether stations that also showed evidence ofprevious drilling activity before drilling and reg-
Environ Monit Assess (2010) 167:65–78 69
istered barium and light hydrocarbon concentra-tions resulting from drilling wells BO-22 and BO-23. The label given to this area is BS_WBF_NAF(BS plus WBF plus NAF).
The third group of sampling stations did notshow any effects of previous drilling in the firstcruise but was characterized by significant lev-els of barium and light hydrocarbons resultingfrom drilling wells BO-22 and BO-23 in the sec-ond cruise (three months after drilling). Thisgroup of sampling stations continued to showeffects in terms of the two tracers in the thirdcruise (22 months after drilling) and was la-beled WBF_NAF area for contributions fromboth water-based and non-aqueous-based phasesof drilling. The fourth group of sampling stationsshowed no evidence of previous drilling in thefirst cruise, but three months after drilling, therewas a significant increase in barium concentration,which continued 22 months after drilling (thirdcruise). This group was labeled WBF area, indi-cating contribution from the water-based drillingphase.
With the spatial–temporal variability com-ponents defined by geostatistical models, theANOVA model was structured to test hypothesesabout possible changes in geological, chemical,and biological variables. The definition of areasaltered by previous drilling activity and physi-cal and chemical changes resulting from drillingthe new wells produced components of variancewhich are not reproduced in all three samplingcruises. Then, a hierarchy of components asso-ciated with the tracers within each of the largerareas, which were treated as fixed over time, wereconstructed. One area was identified as control; asecond, showing the effects of previous drilling,was termed BS; and a third, affected both byprevious drilling and drilling wells BO-22 and BO-23, was labeled impact.
In multifactorial designs, when the levels of thefactors being tested are similar, but not identical,for different levels of another factor, it is appro-priate to use a nested design in which the levelsof one factor are allocated within the levels ofanother (Montgomery 1997).
In the present study, the factors with their re-spective levels were defined. Cruise factor repre-sents the time component of the model with three
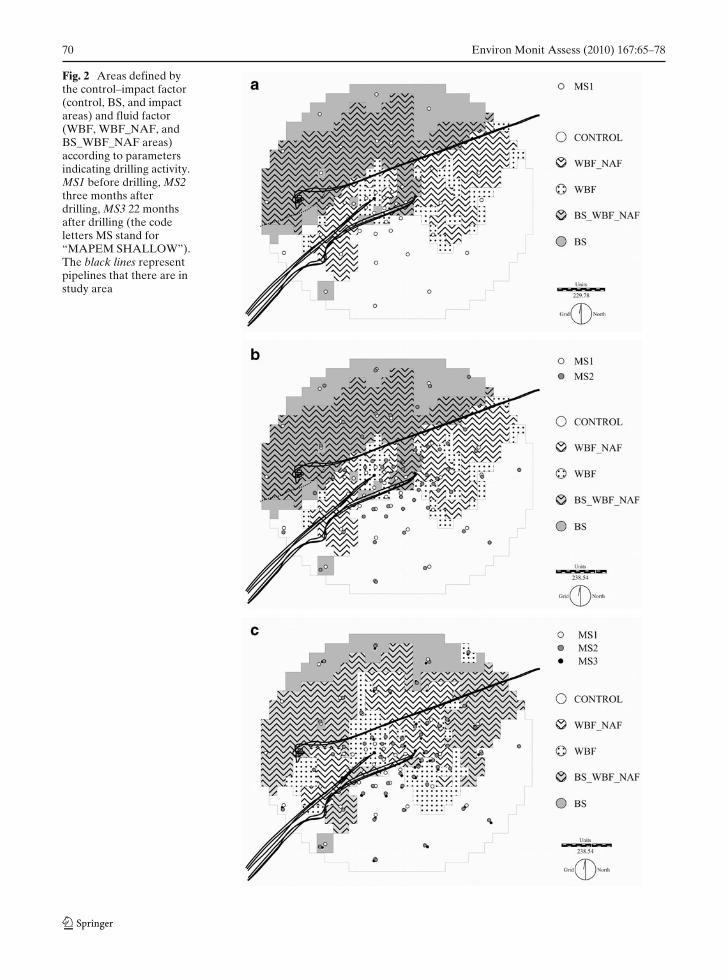
levels: first (MS1), second (MS2), and third (MS3)cruises. The fluid factor represents the stressorcomponent, evident through tracers of the drillingphases (WBF and NAF), and was described byfive-factor levels: control area (absence of bariumand light hydrocarbons), BS area (presence ofbarium and light hydrocarbons before drilling),WBF area (presence of barium after drilling),WBF_NAF area (presence of barium and lighthydrocarbons after drilling), and BS_WBF_NAFarea (presence of barium and/or light hydrocar-bons before drilling (BS) plus presence of bariumand light hydrocarbons after drilling). Althoughthey occur in all three cruises, the levels of thefluid factor do not remain the same over time.The control–impact factor represented the spatialcomponent in the model and was described bythree-factor levels: control, BS, and impact areas.The control area was defined by the absence ofdrilling fluid for all three cruises, the BS areawas characterized by previous presence of bariumand/or light hydrocarbons before drilling, and theimpact area was defined by the presence of bariumand light hydrocarbons three months after drilling(Fig. 2).
Multiple comparisons of the means for the in-teraction between cruise and control–impact fac-tors and cruise and fluid factors were done withTukey’s test and allowed checking the hypothesesabout changes in community structure due to theuse of WBF and NAF. Detailed descriptions ofthe statistical methodology are found in Pulgatiet al. (2010).
Principal component analysis (PCA) and ro-bust regression analysis were also employed toidentify and interpret the spatial and temporalchanges in macrobenthic communities related todrilling activity. Robust regression analysis wasused because it confers lesser weights to extremeobservations (outliers), making the results lesssensitive. In this analysis, the scores of stationsobtained in PCA were introduced, along with en-vironmental parameters gravel and silt plus claypercentages, as well as barium concentration, lighthydrocarbons, total linear hydrocarbons, total pe-troleum hydrocarbons (TPH), and total aromatichydrocarbons, and the level of significance of 0.05was used.
70 Environ Monit Assess (2010) 167:65–78
Fig. 2 Areas defined bythe control–impact factor(control, BS, and impactareas) and fluid factor(WBF, WBF_NAF, andBS_WBF_NAF areas)according to parametersindicating drilling activity.MS1 before drilling, MS2three months afterdrilling, MS3 22 monthsafter drilling (the codeletters MS stand for“MAPEM SHALLOW”).The black lines representpipelines that there are instudy area
Environ Monit Assess (2010) 167:65–78 71
Results
The sediments of the study area are typicallysandy with dominance of the very fine sand tex-ture and carbonate composition. It was noted thatthe mean values of sand were similar, with 58%(first cruise), 57% (second cruise), and 54% (thirdcruise). The values of silt were also similar atthree cruises, with 22% (first cruise), 25% (secondcruise), and 21% (third cruise). The mean valuesof clay were 16%, 18%, and 19% for the threecruises, respectively. The values of TOC were<2%, and the maximum value (1.9%) was foundat sampling station 27 three months after drilling.
For linear C14–C20 + UCM C14–C20 (light hy-drocarbons), it was found that the maximum val-ues ranged from 6.56 mg kg−1 before drilling,3,189.0 mg kg−1 three months after drilling to51.57 mg kg−1 22 months after drilling. Threemonths after drilling, the maximum values wereobtained at sampling stations 60 (3,189 mg kg−1),28 (1,908 mg kg−1), and 26 (1,131 mg kg−1),all of them located in the impact area. Theseresults indicated a significant contribution fromdrilling fluid-related hydrocarbons three monthsafter drilling (second cruise) in the impact area.However, 22 months after drilling (third cruise), atendency is found of returning to levels near thosedetermined in the first cruise.
TPH reached a maximum value of 3,189.4 mgkg−1 three months after drilling at sampling sta-tion 60 and showed a higher value at stations26 (1,131.9 mg kg−1) and 28 (1,908.5 mg kg−1),located in the impact area. However, 22 months
after drilling, the maximum value was reduced to57.83 mg kg−1 (sampling station 27), indicating areturn to 32.92 mg kg−1 found before drilling.
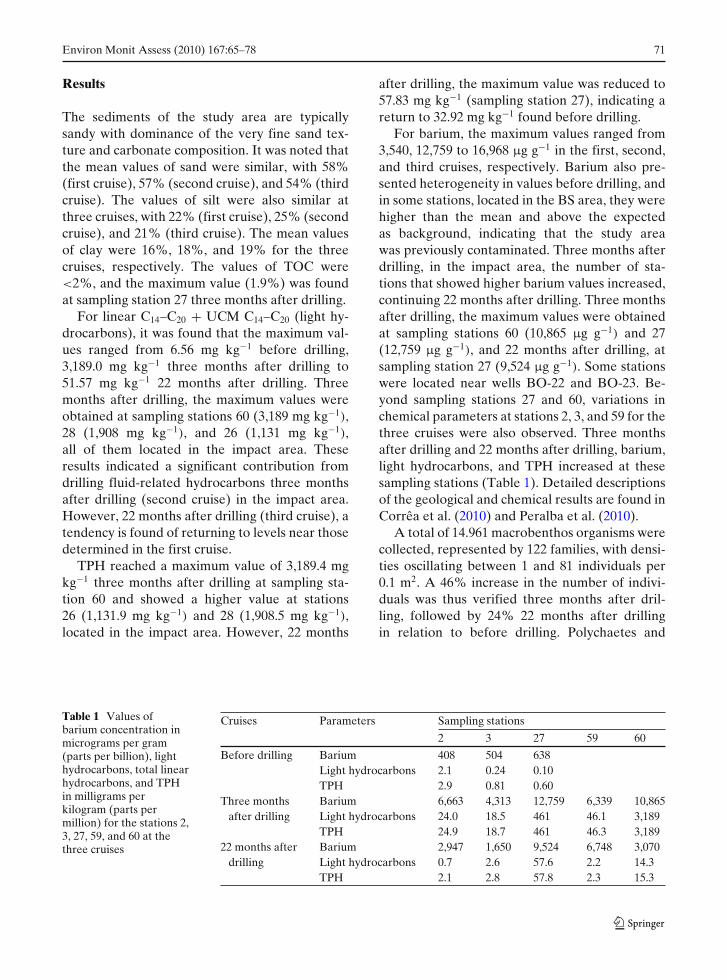
For barium, the maximum values ranged from3,540, 12,759 to 16,968 μg g−1 in the first, second,and third cruises, respectively. Barium also pre-sented heterogeneity in values before drilling, andin some stations, located in the BS area, they werehigher than the mean and above the expectedas background, indicating that the study areawas previously contaminated. Three months afterdrilling, in the impact area, the number of sta-tions that showed higher barium values increased,continuing 22 months after drilling. Three monthsafter drilling, the maximum values were obtainedat sampling stations 60 (10,865 μg g−1) and 27(12,759 μg g−1), and 22 months after drilling, atsampling station 27 (9,524 μg g−1). Some stationswere located near wells BO-22 and BO-23. Be-yond sampling stations 27 and 60, variations inchemical parameters at stations 2, 3, and 59 for thethree cruises were also observed. Three monthsafter drilling and 22 months after drilling, barium,light hydrocarbons, and TPH increased at thesesampling stations (Table 1). Detailed descriptionsof the geological and chemical results are found inCorrêa et al. (2010) and Peralba et al. (2010).
A total of 14.961 macrobenthos organisms werecollected, represented by 122 families, with densi-ties oscillating between 1 and 81 individuals per0.1 m2. A 46% increase in the number of indivi-duals was thus verified three months after dril-ling, followed by 24% 22 months after drillingin relation to before drilling. Polychaetes and
Table 1 Values ofbarium concentration inmicrograms per gram(parts per billion), lighthydrocarbons, total linearhydrocarbons, and TPHin milligrams perkilogram (parts permillion) for the stations 2,3, 27, 59, and 60 at thethree cruises
Cruises Parameters Sampling stations
2 3 27 59 60
Before drilling Barium 408 504 638Light hydrocarbons 2.1 0.24 0.10TPH 2.9 0.81 0.60
Three months Barium 6,663 4,313 12,759 6,339 10,865after drilling Light hydrocarbons 24.0 18.5 461 46.1 3,189
TPH 24.9 18.7 461 46.3 3,18922 months after Barium 2,947 1,650 9,524 6,748 3,070
drilling Light hydrocarbons 0.7 2.6 57.6 2.2 14.3TPH 2.1 2.8 57.8 2.3 15.3
72 Environ Monit Assess (2010) 167:65–78
crustaceans numerically dominated all samples,representing almost 88% and 12% of the totalfauna collected, respectively.
Regarding the functional groups, in general,MD and MC were the most abundant in thestudy area, accounting for 34.6% and 34.0% of thefauna, respectively. Besides those groups, DMDwere also abundant, representing 25.6% of thefauna. DMF and DMC corresponded to 3.2% and2.6% of the fauna, respectively, thus having littlerepresentation.
Analysis of variance: considering thespatial–temporal variability components
The hypothesis that there is no significant diffe-rence between the mean values of density, numberof families, diversity, Pol/Crp ratio, and functionalgroups was tested in relation to the cruise factor(before drilling [first cruise], three months af-ter drilling [second cruise], and 22 months afterdrilling [third cruise]), fluid factor (control, BS,WBF, WBF_NAF, and BS_WBF_NAF areas),and control–impact factor (control, BS, and im-pact areas).
For density and diversity, ANOVA results in-dicate that, for the control and BS areas, therewas homogeneity in means for the three cruises,and for the Impact area, mean density was higher,three months after drilling and 22 months af-ter drilling, compared with before drilling, andthe mean diversity was lower three months afterdrilling than before drilling and 22 months afterdrilling. Besides, mean density was higher in theimpact area than in the control area three months
after drilling. In contrast to density, it was possibleto attribute the decrease of mean diversity to anyone distinct fluid, since significant interaction wasfound between cruise and fluid factors, meaningthat the mean diversity was lower three monthsafter drilling than before drilling and 22 monthsafter drilling and occurred in the WBF_NAF areawithin the impact area (Tables 2, 3, and 4).
For the mean of the number of families andmeans of MC and DMD, the results indicate thatthere was no interaction between cruise, control–impact, and fluid factors, showing that the meandifferences only have a cruise effect, thus indicat-ing a temporal component (Table 2).
For the MD, the results indicate that the meansin both control and basal stimulus areas did notpresent significant differences between all threecruises. However, in the impact area, the meanwas higher three months after drilling than beforedrilling and 22 months after drilling.
Regarding DMC, in the control area, themean was higher 22 months after drilling thanthree months after drilling, and in the BS, waslower three months after drilling than before and22 months after drilling. The results also showedthat there was at least one significant differencebetween areas defined by tracers of the drillingfluids within the impact area (WBF, WBF_NAF,and BS_WBF_NAF) with time. Then, for theimpact area, the mean of the DMC was higherin the BS_WBF_NAF and WBF_NAF areasthree months after drilling and 22 months afterdrilling, respectively (Tables 2, 3, and 4).
For Pol/Crp ratio, the variance analysis re-sults indicated that there was homogeneity ofmeans in the control and BS areas in all three
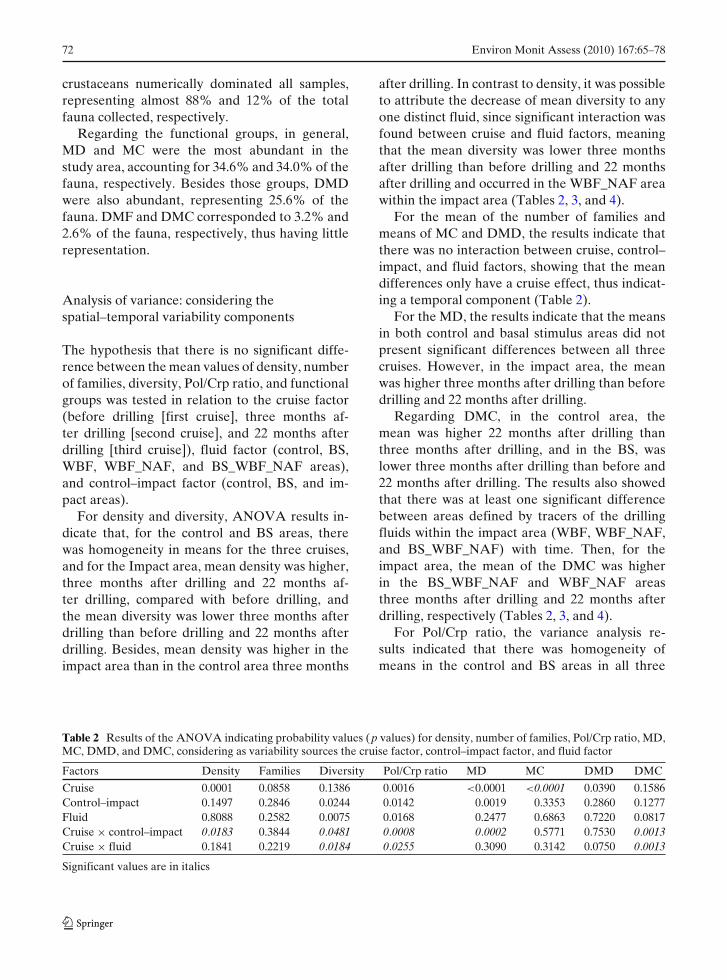
Table 2 Results of the ANOVA indicating probability values (p values) for density, number of families, Pol/Crp ratio, MD,MC, DMD, and DMC, considering as variability sources the cruise factor, control–impact factor, and fluid factor
Factors Density Families Diversity Pol/Crp ratio MD MC DMD DMC
Cruise 0.0001 0.0858 0.1386 0.0016 <0.0001 <0.0001 0.0390 0.1586Control–impact 0.1497 0.2846 0.0244 0.0142 0.0019 0.3353 0.2860 0.1277Fluid 0.8088 0.2582 0.0075 0.0168 0.2477 0.6863 0.7220 0.0817Cruise × control–impact 0.0183 0.3844 0.0481 0.0008 0.0002 0.5771 0.7530 0.0013Cruise × fluid 0.1841 0.2219 0.0184 0.0255 0.3090 0.3142 0.0750 0.0013
Significant values are in italics
Environ Monit Assess (2010) 167:65–78 73
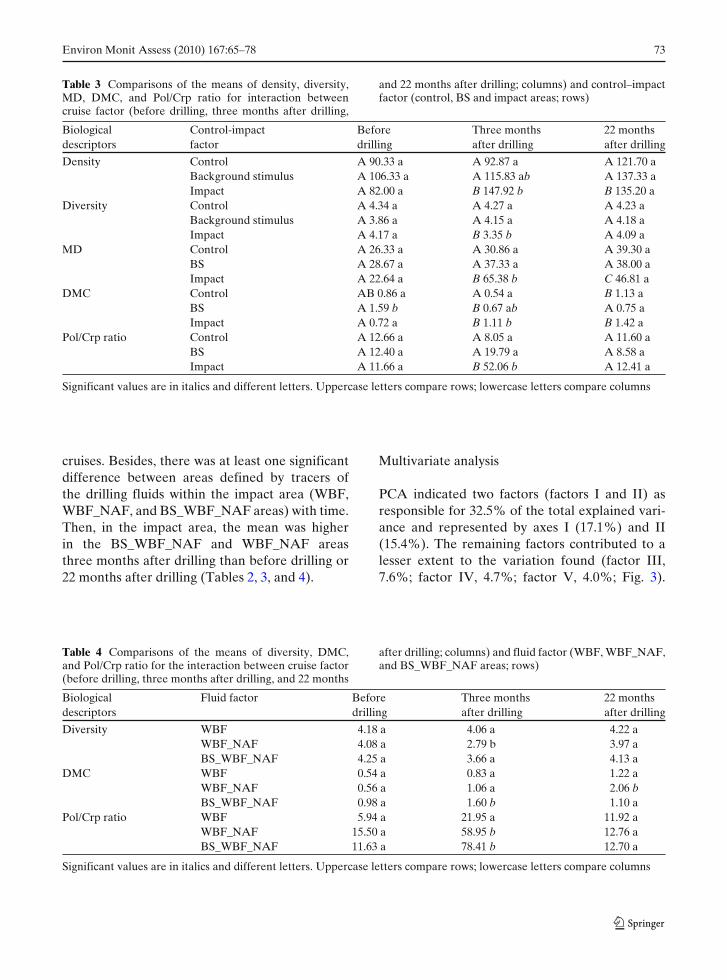
Table 3 Comparisons of the means of density, diversity,MD, DMC, and Pol/Crp ratio for interaction betweencruise factor (before drilling, three months after drilling,
and 22 months after drilling; columns) and control–impactfactor (control, BS and impact areas; rows)
Biological Control-impact Before Three months 22 monthsdescriptors factor drilling after drilling after drilling
Density Control A 90.33 a A 92.87 a A 121.70 aBackground stimulus A 106.33 a A 115.83 ab A 137.33 aImpact A 82.00 a B 147.92 b B 135.20 a
Diversity Control A 4.34 a A 4.27 a A 4.23 aBackground stimulus A 3.86 a A 4.15 a A 4.18 aImpact A 4.17 a B 3.35 b A 4.09 a
MD Control A 26.33 a A 30.86 a A 39.30 aBS A 28.67 a A 37.33 a A 38.00 aImpact A 22.64 a B 65.38 b C 46.81 a
DMC Control AB 0.86 a A 0.54 a B 1.13 aBS A 1.59 b B 0.67 ab A 0.75 aImpact A 0.72 a B 1.11 b B 1.42 a
Pol/Crp ratio Control A 12.66 a A 8.05 a A 11.60 aBS A 12.40 a A 19.79 a A 8.58 aImpact A 11.66 a B 52.06 b A 12.41 a
Significant values are in italics and different letters. Uppercase letters compare rows; lowercase letters compare columns
cruises. Besides, there was at least one significantdifference between areas defined by tracers ofthe drilling fluids within the impact area (WBF,WBF_NAF, and BS_WBF_NAF areas) with time.Then, in the impact area, the mean was higherin the BS_WBF_NAF and WBF_NAF areasthree months after drilling than before drilling or22 months after drilling (Tables 2, 3, and 4).
Multivariate analysis
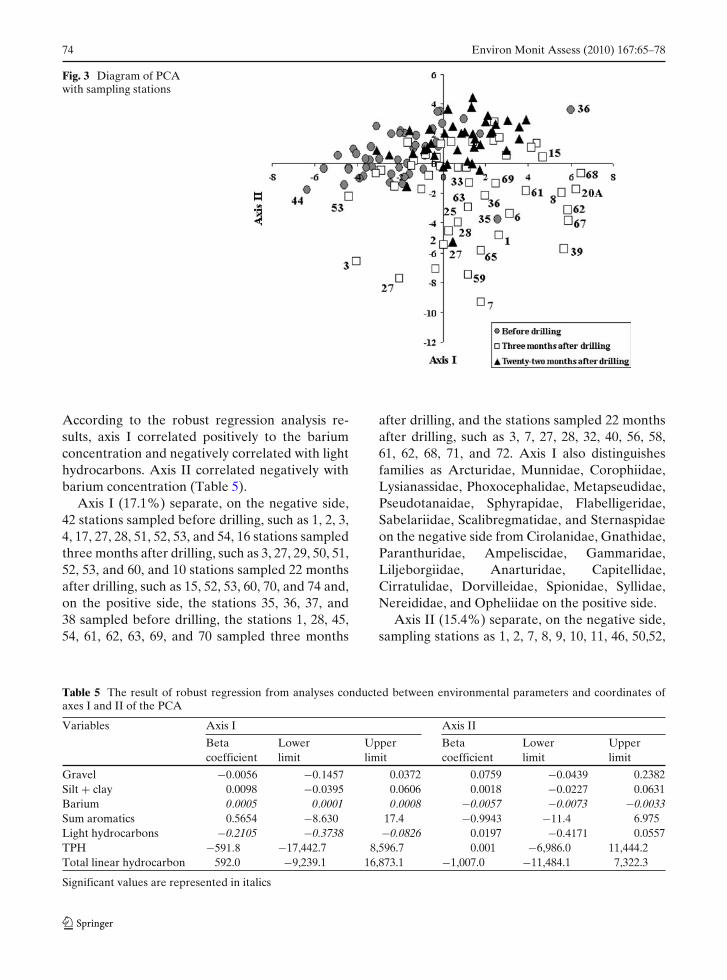
PCA indicated two factors (factors I and II) asresponsible for 32.5% of the total explained vari-ance and represented by axes I (17.1%) and II(15.4%). The remaining factors contributed to alesser extent to the variation found (factor III,7.6%; factor IV, 4.7%; factor V, 4.0%; Fig. 3).
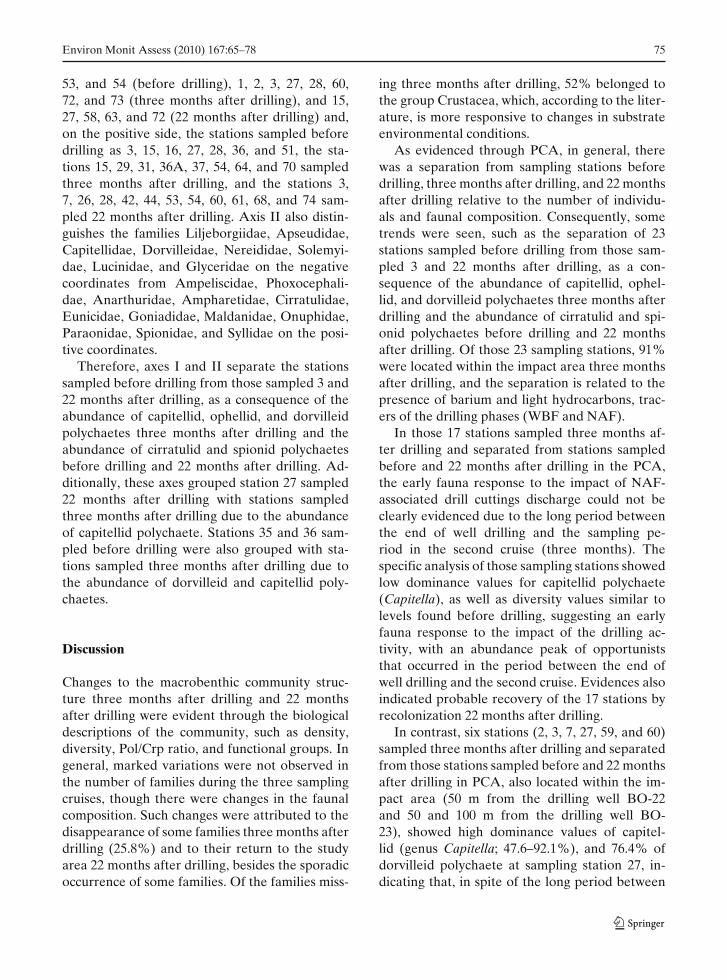
Table 4 Comparisons of the means of diversity, DMC,and Pol/Crp ratio for the interaction between cruise factor(before drilling, three months after drilling, and 22 months
after drilling; columns) and fluid factor (WBF, WBF_NAF,and BS_WBF_NAF areas; rows)
Biological Fluid factor Before Three months 22 monthsdescriptors drilling after drilling after drilling
Diversity WBF 4.18 a 4.06 a 4.22 aWBF_NAF 4.08 a 2.79 b 3.97 aBS_WBF_NAF 4.25 a 3.66 a 4.13 a
DMC WBF 0.54 a 0.83 a 1.22 aWBF_NAF 0.56 a 1.06 a 2.06 bBS_WBF_NAF 0.98 a 1.60 b 1.10 a
Pol/Crp ratio WBF 5.94 a 21.95 a 11.92 aWBF_NAF 15.50 a 58.95 b 12.76 aBS_WBF_NAF 11.63 a 78.41 b 12.70 a
Significant values are in italics and different letters. Uppercase letters compare rows; lowercase letters compare columns
74 Environ Monit Assess (2010) 167:65–78
Fig. 3 Diagram of PCAwith sampling stations
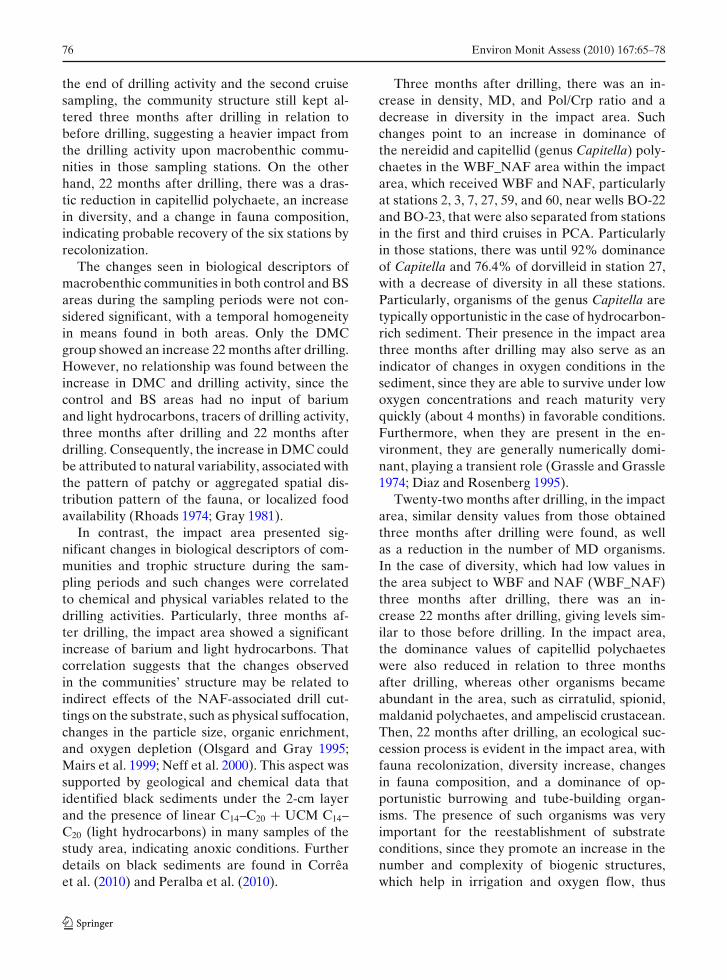
According to the robust regression analysis re-sults, axis I correlated positively to the bariumconcentration and negatively correlated with lighthydrocarbons. Axis II correlated negatively withbarium concentration (Table 5).
Axis I (17.1%) separate, on the negative side,42 stations sampled before drilling, such as 1, 2, 3,4, 17, 27, 28, 51, 52, 53, and 54, 16 stations sampledthree months after drilling, such as 3, 27, 29, 50, 51,52, 53, and 60, and 10 stations sampled 22 monthsafter drilling, such as 15, 52, 53, 60, 70, and 74 and,on the positive side, the stations 35, 36, 37, and38 sampled before drilling, the stations 1, 28, 45,54, 61, 62, 63, 69, and 70 sampled three months
after drilling, and the stations sampled 22 monthsafter drilling, such as 3, 7, 27, 28, 32, 40, 56, 58,61, 62, 68, 71, and 72. Axis I also distinguishesfamilies as Arcturidae, Munnidae, Corophiidae,Lysianassidae, Phoxocephalidae, Metapseudidae,Pseudotanaidae, Sphyrapidae, Flabelligeridae,Sabelariidae, Scalibregmatidae, and Sternaspidaeon the negative side from Cirolanidae, Gnathidae,Paranthuridae, Ampeliscidae, Gammaridae,Liljeborgiidae, Anarturidae, Capitellidae,Cirratulidae, Dorvilleidae, Spionidae, Syllidae,Nereididae, and Opheliidae on the positive side.
Axis II (15.4%) separate, on the negative side,sampling stations as 1, 2, 7, 8, 9, 10, 11, 46, 50,52,
Table 5 The result of robust regression from analyses conducted between environmental parameters and coordinates ofaxes I and II of the PCA
Variables Axis I Axis II
Beta Lower Upper Beta Lower Uppercoefficient limit limit coefficient limit limit
Gravel −0.0056 −0.1457 0.0372 0.0759 −0.0439 0.2382Silt + clay 0.0098 −0.0395 0.0606 0.0018 −0.0227 0.0631Barium 0.0005 0.0001 0.0008 −0.0057 −0.0073 −0.0033Sum aromatics 0.5654 −8.630 17.4 −0.9943 −11.4 6.975Light hydrocarbons −0.2105 −0.3738 −0.0826 0.0197 −0.4171 0.0557TPH −591.8 −17,442.7 8,596.7 0.001 −6,986.0 11,444.2Total linear hydrocarbon 592.0 −9,239.1 16,873.1 −1,007.0 −11,484.1 7,322.3
Significant values are represented in italics
Environ Monit Assess (2010) 167:65–78 75
53, and 54 (before drilling), 1, 2, 3, 27, 28, 60,72, and 73 (three months after drilling), and 15,27, 58, 63, and 72 (22 months after drilling) and,on the positive side, the stations sampled beforedrilling as 3, 15, 16, 27, 28, 36, and 51, the sta-tions 15, 29, 31, 36A, 37, 54, 64, and 70 sampledthree months after drilling, and the stations 3,7, 26, 28, 42, 44, 53, 54, 60, 61, 68, and 74 sam-pled 22 months after drilling. Axis II also distin-guishes the families Liljeborgiidae, Apseudidae,Capitellidae, Dorvilleidae, Nereididae, Solemyi-dae, Lucinidae, and Glyceridae on the negativecoordinates from Ampeliscidae, Phoxocephali-dae, Anarthuridae, Ampharetidae, Cirratulidae,Eunicidae, Goniadidae, Maldanidae, Onuphidae,Paraonidae, Spionidae, and Syllidae on the posi-tive coordinates.
Therefore, axes I and II separate the stationssampled before drilling from those sampled 3 and22 months after drilling, as a consequence of theabundance of capitellid, ophellid, and dorvilleidpolychaetes three months after drilling and theabundance of cirratulid and spionid polychaetesbefore drilling and 22 months after drilling. Ad-ditionally, these axes grouped station 27 sampled22 months after drilling with stations sampledthree months after drilling due to the abundanceof capitellid polychaete. Stations 35 and 36 sam-pled before drilling were also grouped with sta-tions sampled three months after drilling due tothe abundance of dorvilleid and capitellid poly-chaetes.
Discussion
Changes to the macrobenthic community struc-ture three months after drilling and 22 monthsafter drilling were evident through the biologicaldescriptions of the community, such as density,diversity, Pol/Crp ratio, and functional groups. Ingeneral, marked variations were not observed inthe number of families during the three samplingcruises, though there were changes in the faunalcomposition. Such changes were attributed to thedisappearance of some families three months afterdrilling (25.8%) and to their return to the studyarea 22 months after drilling, besides the sporadicoccurrence of some families. Of the families miss-
ing three months after drilling, 52% belonged tothe group Crustacea, which, according to the liter-ature, is more responsive to changes in substrateenvironmental conditions.
As evidenced through PCA, in general, therewas a separation from sampling stations beforedrilling, three months after drilling, and 22 monthsafter drilling relative to the number of individu-als and faunal composition. Consequently, sometrends were seen, such as the separation of 23stations sampled before drilling from those sam-pled 3 and 22 months after drilling, as a con-sequence of the abundance of capitellid, ophel-lid, and dorvilleid polychaetes three months afterdrilling and the abundance of cirratulid and spi-onid polychaetes before drilling and 22 monthsafter drilling. Of those 23 sampling stations, 91%were located within the impact area three monthsafter drilling, and the separation is related to thepresence of barium and light hydrocarbons, trac-ers of the drilling phases (WBF and NAF).
In those 17 stations sampled three months af-ter drilling and separated from stations sampledbefore and 22 months after drilling in the PCA,the early fauna response to the impact of NAF-associated drill cuttings discharge could not beclearly evidenced due to the long period betweenthe end of well drilling and the sampling pe-riod in the second cruise (three months). Thespecific analysis of those sampling stations showedlow dominance values for capitellid polychaete(Capitella), as well as diversity values similar tolevels found before drilling, suggesting an earlyfauna response to the impact of the drilling ac-tivity, with an abundance peak of opportuniststhat occurred in the period between the end ofwell drilling and the second cruise. Evidences alsoindicated probable recovery of the 17 stations byrecolonization 22 months after drilling.
In contrast, six stations (2, 3, 7, 27, 59, and 60)sampled three months after drilling and separatedfrom those stations sampled before and 22 monthsafter drilling in PCA, also located within the im-pact area (50 m from the drilling well BO-22and 50 and 100 m from the drilling well BO-23), showed high dominance values of capitel-lid (genus Capitella; 47.6–92.1%), and 76.4% ofdorvilleid polychaete at sampling station 27, in-dicating that, in spite of the long period between
76 Environ Monit Assess (2010) 167:65–78
the end of drilling activity and the second cruisesampling, the community structure still kept al-tered three months after drilling in relation tobefore drilling, suggesting a heavier impact fromthe drilling activity upon macrobenthic commu-nities in those sampling stations. On the otherhand, 22 months after drilling, there was a dras-tic reduction in capitellid polychaete, an increasein diversity, and a change in fauna composition,indicating probable recovery of the six stations byrecolonization.
The changes seen in biological descriptors ofmacrobenthic communities in both control and BSareas during the sampling periods were not con-sidered significant, with a temporal homogeneityin means found in both areas. Only the DMCgroup showed an increase 22 months after drilling.However, no relationship was found between theincrease in DMC and drilling activity, since thecontrol and BS areas had no input of bariumand light hydrocarbons, tracers of drilling activity,three months after drilling and 22 months afterdrilling. Consequently, the increase in DMC couldbe attributed to natural variability, associated withthe pattern of patchy or aggregated spatial dis-tribution pattern of the fauna, or localized foodavailability (Rhoads 1974; Gray 1981).
In contrast, the impact area presented sig-nificant changes in biological descriptors of com-munities and trophic structure during the sam-pling periods and such changes were correlatedto chemical and physical variables related to thedrilling activities. Particularly, three months af-ter drilling, the impact area showed a significantincrease of barium and light hydrocarbons. Thatcorrelation suggests that the changes observedin the communities’ structure may be related toindirect effects of the NAF-associated drill cut-tings on the substrate, such as physical suffocation,changes in the particle size, organic enrichment,and oxygen depletion (Olsgard and Gray 1995;Mairs et al. 1999; Neff et al. 2000). This aspect wassupported by geological and chemical data thatidentified black sediments under the 2-cm layerand the presence of linear C14–C20 + UCM C14–C20 (light hydrocarbons) in many samples of thestudy area, indicating anoxic conditions. Furtherdetails on black sediments are found in Corrêaet al. (2010) and Peralba et al. (2010).
Three months after drilling, there was an in-crease in density, MD, and Pol/Crp ratio and adecrease in diversity in the impact area. Suchchanges point to an increase in dominance ofthe nereidid and capitellid (genus Capitella) poly-chaetes in the WBF_NAF area within the impactarea, which received WBF and NAF, particularlyat stations 2, 3, 7, 27, 59, and 60, near wells BO-22and BO-23, that were also separated from stationsin the first and third cruises in PCA. Particularlyin those stations, there was until 92% dominanceof Capitella and 76.4% of dorvilleid in station 27,with a decrease of diversity in all these stations.Particularly, organisms of the genus Capitella aretypically opportunistic in the case of hydrocarbon-rich sediment. Their presence in the impact areathree months after drilling may also serve as anindicator of changes in oxygen conditions in thesediment, since they are able to survive under lowoxygen concentrations and reach maturity veryquickly (about 4 months) in favorable conditions.Furthermore, when they are present in the en-vironment, they are generally numerically domi-nant, playing a transient role (Grassle and Grassle1974; Diaz and Rosenberg 1995).
Twenty-two months after drilling, in the impactarea, similar density values from those obtainedthree months after drilling were found, as wellas a reduction in the number of MD organisms.In the case of diversity, which had low values inthe area subject to WBF and NAF (WBF_NAF)three months after drilling, there was an in-crease 22 months after drilling, giving levels sim-ilar to those before drilling. In the impact area,the dominance values of capitellid polychaeteswere also reduced in relation to three monthsafter drilling, whereas other organisms becameabundant in the area, such as cirratulid, spionid,maldanid polychaetes, and ampeliscid crustacean.Then, 22 months after drilling, an ecological suc-cession process is evident in the impact area, withfauna recolonization, diversity increase, changesin fauna composition, and a dominance of op-portunistic burrowing and tube-building organ-isms. The presence of such organisms was veryimportant for the reestablishment of substrateconditions, since they promote an increase in thenumber and complexity of biogenic structures,which help in irrigation and oxygen flow, thus
Environ Monit Assess (2010) 167:65–78 77
favoring the restoration of oxygenated conditionsin the deeper substrate layers (Gray 1981). Theimprovement in the environmental conditions ofsubstrate permitted the colonization of the impactarea by new families responsible for the diver-sity increase and the establishment of a recoveryprocess.
The effects of drilling activities located aroundthe drilling well, with drill cuttings influencingoxygen consumption and oxygen penetrationdepth in the sediment, presence of black sed-iments indicating anoxic conditions, with highnumber of capitellid polychaete, genus Capitella,the more specific fauna replaced by original fauna,and the establishment of a recovery process in ashort time frame have also been found by severalauthors, such as Smith and May (1991), Candleret al. (1995), Daan et al. (1996), Terrens et al.(1998), Fechhelm et al. (1999), Dalmazone et al.(2004) and Trannum et al. (2010), corroboratingthe results obtained in the present study.
Conclusions
The exploratory drilling activities did lead to mea-surable effects on the macrobenthic communitystructure related to NAF cuttings discharge. Sucheffects were much evident in the impact areasubjected to WBF and NAF (WBF_NAF area),particularly at stations 2, 3, 7, 27, 59, and 60,located 50 m from the drilling well BO-22 and50 and 100 m from the drilling well BO-23, andwere probably due to the mix of drill cuttingswith the sediment and anoxic conditions in thesubstrate, characterizing physical and chemicalimpact. Twenty-two months after drilling, the re-colonization resulted in the probable recoveryof the macrobenthic community in the impactarea, with diversity increase, fauna compositionchanges, and dominance of opportunistic burrow-ing and tube-building organisms.
Acknowledgements The authors thank the BrazilianMinistry of Science and Technology, the Brazilian Petro-leum and Gas Institute, and the Brazilian Fund for Petro-leum and Gas for the financial support and Robin T. Clarkefor the helpful comments on the manuscript.
References
Addy, J. M., Hartley, J. P., & Tibbetts, P. J. C. (1984). Eco-logical effects of low toxicity oil-based mud drillingin the Beatrice oilfield. Marine Pollution Bulletin, 15,429–436.
Candler, J. E., Hoskin, S., Churan, M., Lai, C. W., &Freeman, M. (1995). Seafloor monitoring for syntheticbased mud discharged in the Western Gulf of Mexico.SPE/EPA Exploration and Production Environmen-tal Conference, Houston, Texas. Paper number 29694-MS. doi:10.2118/29694-MS.
Corrêa, I. C. S., Toldo, E. E., & Toledo, F. A. L. (2010).Impacts on seafloor geology of drilling disturbancein shallow waters. Environmental Monitoring and As-sessment. doi:10.1007/s10661-010-1519-z.
Cressie, N. (1991). Modeling growth with random sets. InA. Possolo (Ed.), Spatial statistics and imaging. Lecturenotes-monograph series. Hayward: Institute of Mathe-matical Statistics.
Daan, R., Booij, K., Mulder, M., & Weerlee, E. M. (1996).Environmental effects of a discharge of drill cuttingscontaminated with ester-based drilling muds in theNorth Sea. Environmental Toxicology and Chemistry,15(10), 1709–1722.
Dalmazone, C. H., Blanchet, D., Lamoureux, S., Dutrieux,E., Durrieu, J., Camps, R., et al. (2004). Impact ofdrilling activities in Warm Sea: Recolonization capac-ities of seabed. Oil & Gas Science and Technology,59(6), 625–647.
Davies, J. M., Addy, J. M., Blackman, R. A., Blanchard,J. R., Ferbranche, J. E., Moore, D. C., et al. (1984).Environmental effects of the use of oil-based drillingmuds in the North Sea. Marine Pollution Bulletin, 15,363–370.
Diaz, R. J., & Rosenberg, R. (1995). Marine BenthicHipoxia: A review of its ecological effects and thebehavior responses of benthic macrofauna. Oceanog-raphy and Marine Biology: an Annual Review, 33, 245–303.
Dicks, B. (1976). Offshore biological monitoring. In J. M.Baker (Ed.), Marine ecology and oil pollution (pp.325–440). Barking: Applied Science Publishers.
Diggle, P. J., & Ribeiro, P. J. Jr. (2006). Model-basedgeostatistics. Springer series in statistics. New York:Springer.
Fauchald, K., & Jumars, P. A. (1979). The diet of worms: Astudy of polychaete feeding guilds. Oceanography andMarine Biology an Annual Review, 17, 193–284.
Fechhelm, R. G., Gallaway, B. J., & Farmer, J. M. (1999).Deepwater sampling at a synthetic drilling mud dis-charge site on the Outer Continental Shelf, NorthernGulf of Mexico. SPE/EPA Exploration and Produc-tion Environmental Conference, Austin, Texas. Papernumber 52744-MS. doi:10.2118/52744-MS.
Folk, R. L., & Ward, W. C. (1957). Brazos River bar: Astudy of the significance of grain size parameters. Jour-nal of Sedimentary Petrology, 27, 3–26.
Gambi, M. C., & Giangrande, A. (1985). Analisi dellastruttura trofica del popolamento dei policheti nei
78 Environ Monit Assess (2010) 167:65–78
fondi mobili di due aree del Mar Tirreno. Oebalia, 11,215–222.
Gaston, G. R. (1987). Benthic polychaeta of the MiddleAtlantic Bight: Feeding and distribution. Marine Ecol-ogy Progress Series, 36, 251–262.
Gaston, G. R., & Nasci, J. C. (1988). Estuarine macroben-thos in Calcasieu, Louisiana: Community and trophicstructure. Estuaries, 11, 201–211.
Grassle, J. F., & Grassle, J. P. (1974). Opportunistic lifehistories and genetic systems in marine benthic poly-chaetes. Journal Marine Research, 32, 253–284.
Gray, J. S. (1981). The ecology of marine sediments.Cambridge: University Press.
Handcock, M. S., & Stein, M. L. (1993). A Bayesian analy-sis of kriging. Technometrics, 35, 403–410.
Hartley, J. P. (1984). The benthic ecology of the fortiesoilfield (North Sea). Journal of Experimental MarineBiology and Ecology, 80, 161–195.
Hérnandez Arana, H. A., Warwick, R. M., Attrill, M.J., Rowden, A. A., & Gold-Bouchot, G. (2005). As-sessing the impact of oil-related activities on ben-thic macroinfauna assemblages of the Campeche shelf,southern Gulf of Mexico. Marine Ecology ProgressSeries, 289, 89–107.
Journel, A. G., & Huijbregts, C. J. (1978). Mining geosta-tistics. London: Academic Press.
Kingston, P. F. (1992). Impact of offshore oil productioninstallations on the benthos of the North Sea. ICESJournal of Marine Science, 49(1), 45–53.
Mairs, H., Smith, J., Melton, R., Pasmore, J., & Maruca,S. (1999). Environmental ef fects of cutting associatedwith non-aqueous f luids: Technical background. IBPSHE—Technical Committee.
Melton, H. R., Smith, J. P., Martin, C. R., Nedwed, T. J.,Mairs, H.L., & Raught, D. L. (2000). Of fshore dis-charge of drilling f luids and cuttings—A scientif ic per-spective on public policy. Rio oil expo and conference.Rio de Janeiro: Brazilian Petroleum Institute (IBP).
Middleditch, B. S. (1981). Environmental ef fects ofof fshore oil production. The Buccaneer gas and oilf iled study. New York: Plenum Press.
Montagna, P. A., & Harper, D. E. Jr. (1996). BenthicInfauna long-term response to offshore productionplatforms in the Gulf of Mexico. Canadian Jour-nal of Fisheries and Aquatic Sciences, 53, 2567–2588.doi:10.1139/cjfas-53-11-2567.
Montgomery, D. C. (1997). Design and analysis of experi-ments. New York: Wiley.
Neff, J. M. , Mckelvie, S., & Ayers, R. C. (2000). Environ-mental impact of synthetic based drilling fluids. US.Department of interior, Minerals Management Ser-vice, New Orleans, 1–118.
Oliver, G. A., & Fisher, S. J. (1999). The persistence andeffects of non-water based drilling fluids on Australia’sNorth West shelf: Progress findings from three Seabedsurveys. APPEA Journal, 39, 647–662.
Olsgard, F., & Gray, J. S. (1995). A comprehensive analy-sis of the effects of offshore oil and gas exploration
and production on the benthic communities of theNorwegian continental shelf. Marine Ecology ProgressSeries, 122, 277–306.
Peralba, M. C. R., Pozebon, D., Santos, J. H. Z., Maia,S. M., Pizzolato, T. M., Cioccari, G., et al. (2010).Metal and hydrocarbon behavior in sediments fromBrazilian shallow waters drilling activities using non-aqueous drilling fluids (NAFs). Environmental Moni-toring and Assessment. doi:10.1007/s10661-010-1516-2.
Petrobrás (2001). Monitoramento Ambiental da Atividadede Produção de Petróleo na Bacia de Campos. Etapade Pré-monitoramento, Final Report 1-180.
Petrobrás (2003). Monitoramento Ambiental da Atividadede Perfuração de Poços de Óleo e Gás da Baciade Campos. Caracterização e Monitoramento Pós-atividade, Final Report 1-189.
Pulgati, F. H., Ayup-Zouain, R. N., Landau, L., &Fachel, J. M. G. (2010). Development of the conceptof spatial–temporal mask for testing effects of dis-charge from well-drilling activities on biological com-munities. Environmental Monitoring and Assessment.doi:10.1007/s10661-010-1520-6.
Rabalais, N. N., McKee, B. A., Reed, D. J., & Means,J. C. (1992). Fate and effects of produced water dis-charges in Coastal Louisiana, Gulf of Mexico, U.S.A.In J. P. Ray, & F. R. Engelhar (Eds.), Produced water(pp. 355–369). New York: Plenum Press.
Rhoads, D. C. (1974). Organism–sediment relations on themuddy sea floor. Oceanography and Marine Biologyan Annual Review, 12, 263–300.
Smith, J., & May, S. J. (1991). Ula wellsite 7/12 environmen-tal survey 199. Report FSC/RC/13/91. Field StudiesCouncil Research Center, UK.
Tararam, A. S. (1993). Programa Ambiental da Bacia deCampos. Fundespa/Geomap. Technical Report 1-44.
Terrens, G. W., Gwyther, D., Keough, M. J., & Tait, R. D.(1998). Environmental assessment of synthetic baseddrilling mud discharges to the Bass Strait Australia. InProceedings of SPE international conference on health,safety and environment in oil and gas exploration andproduction, Caracas, Venezuela.
Tommasi, L. R. (1994a). Programa de MonitoramentoAmbiental Oceânico da Bacia de Campos, RJ. Fun-despa/Geomap, Cenpes-Petrobrás, Final Report 1-169.
Tommasi, L. R. (1994b). Diagnóstico Ambiental Oceânicoe Costeiro das Regiões Sul e Sudeste do Brasil. Petro-brás, Final Report v9.
Trannum, H. C., Nilsson, H. C., Schaanning, M. T., &Øxnevad, S. (2010). Effects of sedimentation fromwater-based drill cuttings and natural sediment onbenthic macrofaunal community structure and ecosys-tem processes. Journal of Experimental Marine Biol-ogy and Ecology, 383(2), 111–121.
Wentworth, C. K. (1922). A scale of grade and class termsfor clastic sediments. Journal of Geology, 30, 377–392.