pvd-—-drill-baby-drill-becoming-a-global-provider-of
TRANSCRIPT
[Please refer to important disclosures at the end of this report] Page 1
Initiation of coverage
June 4, 2019
PV DRILLING (PVD VN EQUITY)
Drill, baby, drill! Becoming a global provider of integrated drilling services
BUY Current price: VND 17,750
Target price: VND 24,535
Upside: 38.2%
Our view: PVD is an outstanding competitor with international peers due to its strong
safety record, solid management, and ability to provide integrated services. With four
jackup rigs already contracted overseas, FY2019E utilization should hit 95% (up 10ppt
YoY) with day rates up 7% YoY. PVD’s bid for a Brunei deep-water project could offer
stable work for TAD PVD-V for six years starting from 2020. We think the consensus is
ignoring a much-improved outlook, and we initiate coverage with a Buy rating on PVD.
Please click here to support Yuanta Vietnam in this year’s Asiamoney poll!
52-week Price Range (VND) Market
Capitalization
FY19E Dividend
Yield
Remaining Foreign
Room Free-float ADTV-3month
12,200-22,600 USD 307mn 0% 28% 38.3% USD3.0mn
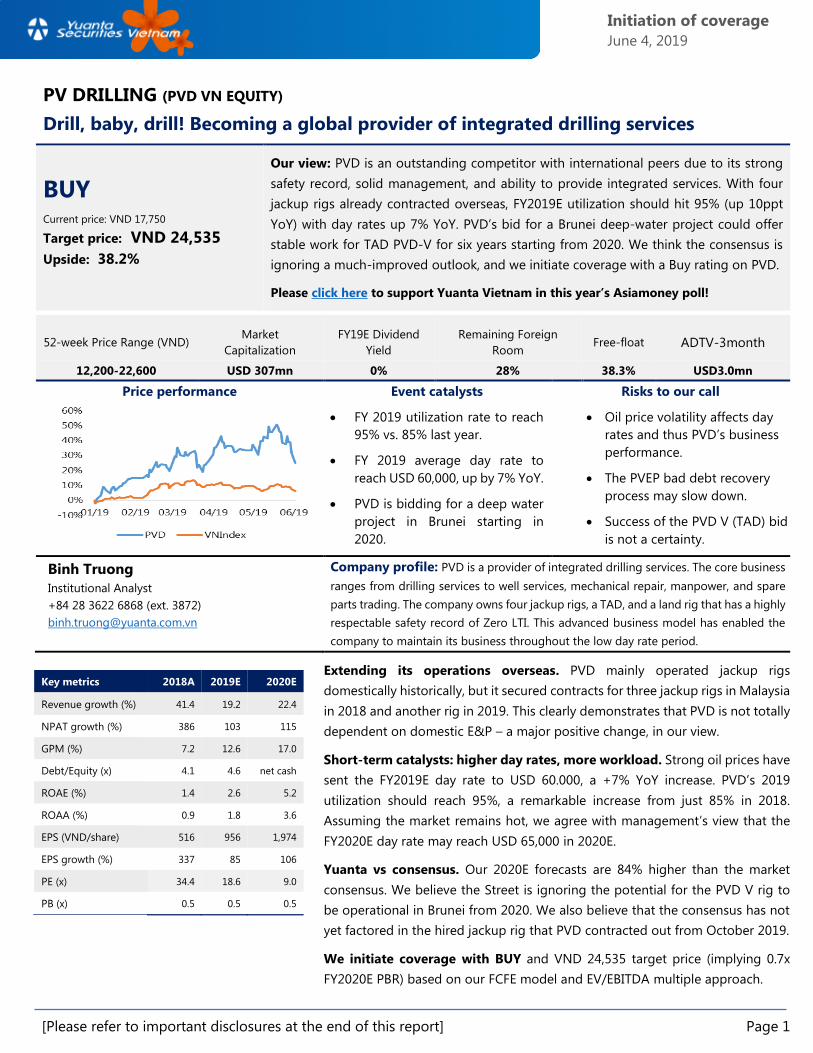
Price performance
Event catalysts
FY 2019 utilization rate to reach
95% vs. 85% last year.
FY 2019 average day rate to
reach USD 60,000, up by 7% YoY.
PVD is bidding for a deep water
project in Brunei starting in
2020.
Risks to our call
Oil price volatility affects day
rates and thus PVD’s business
performance.
The PVEP bad debt recovery
process may slow down.
Success of the PVD V (TAD) bid
is not a certainty.
Binh Truong
Institutional Analyst
+84 28 3622 6868 (ext. 3872)
Company profile: PVD is a provider of integrated drilling services. The core business
ranges from drilling services to well services, mechanical repair, manpower, and spare
parts trading. The company owns four jackup rigs, a TAD, and a land rig that has a highly
respectable safety record of Zero LTI. This advanced business model has enabled the
company to maintain its business throughout the low day rate period.
Extending its operations overseas. PVD mainly operated jackup rigs
domestically historically, but it secured contracts for three jackup rigs in Malaysia
in 2018 and another rig in 2019. This clearly demonstrates that PVD is not totally
dependent on domestic E&P – a major positive change, in our view.
Short-term catalysts: higher day rates, more workload. Strong oil prices have
sent the FY2019E day rate to USD 60.000, a +7% YoY increase. PVD’s 2019
utilization should reach 95%, a remarkable increase from just 85% in 2018.
Assuming the market remains hot, we agree with management’s view that the
FY2020E day rate may reach USD 65,000 in 2020E.
Yuanta vs consensus. Our 2020E forecasts are 84% higher than the market
consensus. We believe the Street is ignoring the potential for the PVD V rig to
be operational in Brunei from 2020. We also believe that the consensus has not
yet factored in the hired jackup rig that PVD contracted out from October 2019.
We initiate coverage with BUY and VND 24,535 target price (implying 0.7x
FY2020E PBR) based on our FCFE model and EV/EBITDA multiple approach.
Key metrics 2018A 2019E 2020E
Revenue growth (%) 41.4 19.2 22.4
NPAT growth (%) 386 103 115
GPM (%) 7.2 12.6 17.0
Debt/Equity (x) 4.1 4.6 net cash
ROAE (%) 1.4 2.6 5.2
ROAA (%) 0.9 1.8 3.6
EPS (VND/share) 516 956 1,974
EPS growth (%) 337 85 106
PE (x) 34.4 18.6 9.0
PB (x) 0.5 0.5 0.5
Page 2
PV Drilling
Becoming a global provider of integrated drilling
services
We view PVD as an outstanding and internationally competitive company due
to its respectable safety track record, strong management team, and ability to
provide integrated services. Currently all of its jackup rigs are contracted
overseas. This has sent PVD’s utilization ratio to 95% in 2019, up from 85% in
2018.
Worldwide marketed utilization is currently above 80%, near the 85% threshold
at which day rates typically kick off substantially. In the short-term, PVD is
already enjoying a +7% YoY hike in day rates, and this looks likely to continue
to rise based on current global trends.
Longer term, PVD is participating in the bidding process for a deep-water
project in Brunei, which may offer stable cashflows from its TAD PVD V for six
years starting from 2020E. We initiate coverage with a BUY recommendation
and target price of VND 24,535.
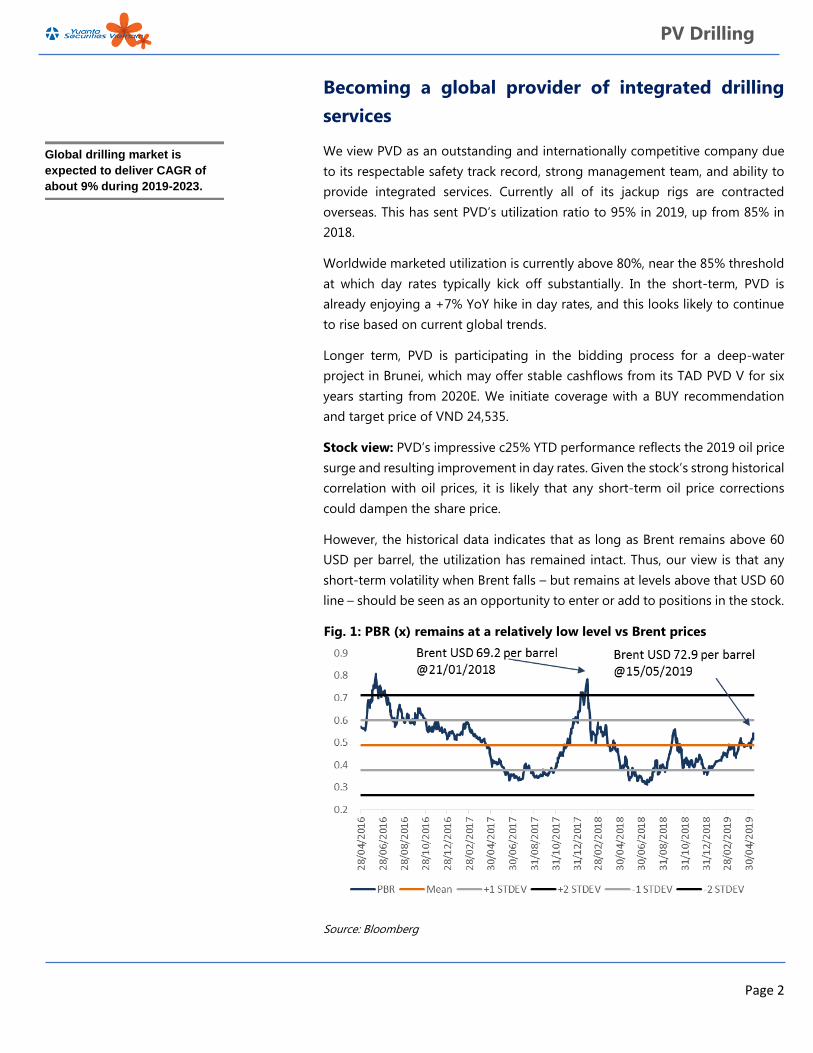
Stock view: PVD’s impressive c25% YTD performance reflects the 2019 oil price
surge and resulting improvement in day rates. Given the stock’s strong historical
correlation with oil prices, it is likely that any short-term oil price corrections
could dampen the share price.
However, the historical data indicates that as long as Brent remains above 60
USD per barrel, the utilization has remained intact. Thus, our view is that any
short-term volatility when Brent falls – but remains at levels above that USD 60
line – should be seen as an opportunity to enter or add to positions in the stock.
Fig. 1: PBR (x) remains at a relatively low level vs Brent prices
Source: Bloomberg
Global drilling market is
expected to deliver CAGR of
about 9% during 2019-2023.
Page 3
PV Drilling
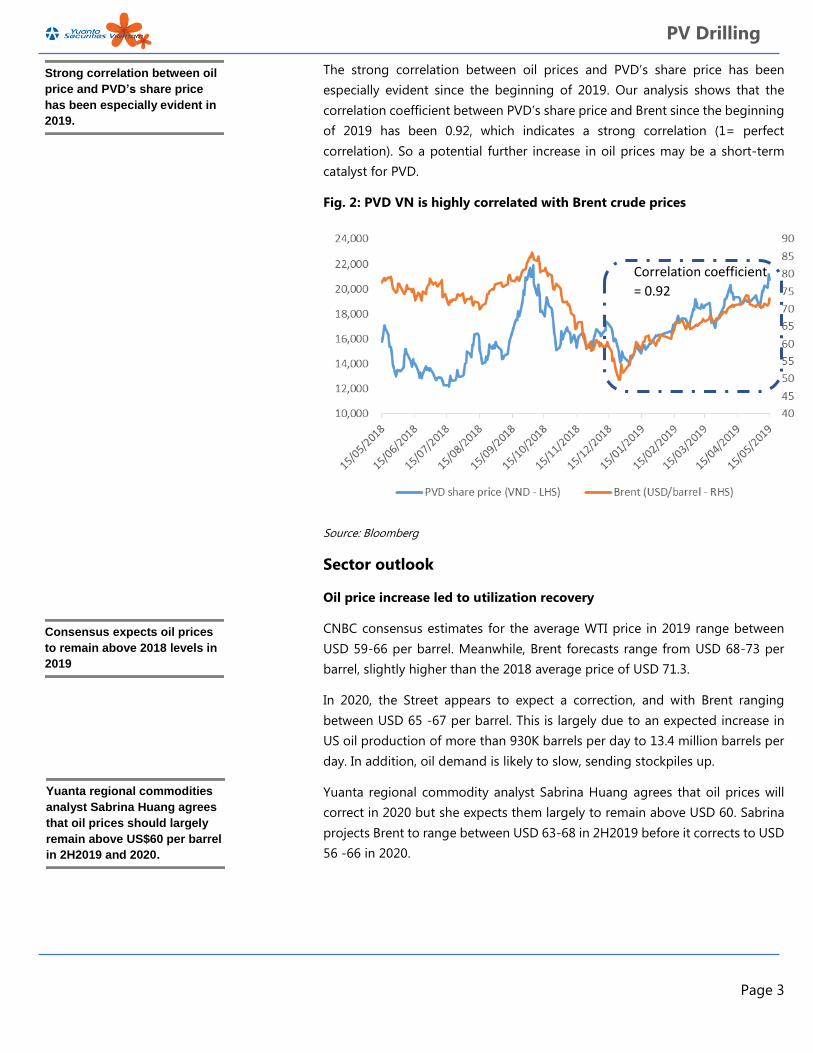
The strong correlation between oil prices and PVD’s share price has been
especially evident since the beginning of 2019. Our analysis shows that the
correlation coefficient between PVD’s share price and Brent since the beginning
of 2019 has been 0.92, which indicates a strong correlation (1= perfect
correlation). So a potential further increase in oil prices may be a short-term
catalyst for PVD.
Fig. 2: PVD VN is highly correlated with Brent crude prices
Source: Bloomberg
Sector outlook
Oil price increase led to utilization recovery
CNBC consensus estimates for the average WTI price in 2019 range between
USD 59-66 per barrel. Meanwhile, Brent forecasts range from USD 68-73 per
barrel, slightly higher than the 2018 average price of USD 71.3.
In 2020, the Street appears to expect a correction, and with Brent ranging
between USD 65 -67 per barrel. This is largely due to an expected increase in
US oil production of more than 930K barrels per day to 13.4 million barrels per
day. In addition, oil demand is likely to slow, sending stockpiles up.
Yuanta regional commodity analyst Sabrina Huang agrees that oil prices will
correct in 2020 but she expects them largely to remain above USD 60. Sabrina
projects Brent to range between USD 63-68 in 2H2019 before it corrects to USD
56 -66 in 2020.
Strong correlation between oil
price and PVD’s share price
has been especially evident in
2019.
Consensus expects oil prices
to remain above 2018 levels in
2019
Yuanta regional commodities
analyst Sabrina Huang agrees
that oil prices should largely
remain above US$60 per barrel
in 2H2019 and 2020.
Correlation coefficient
= 0.92
Page 4
PV Drilling
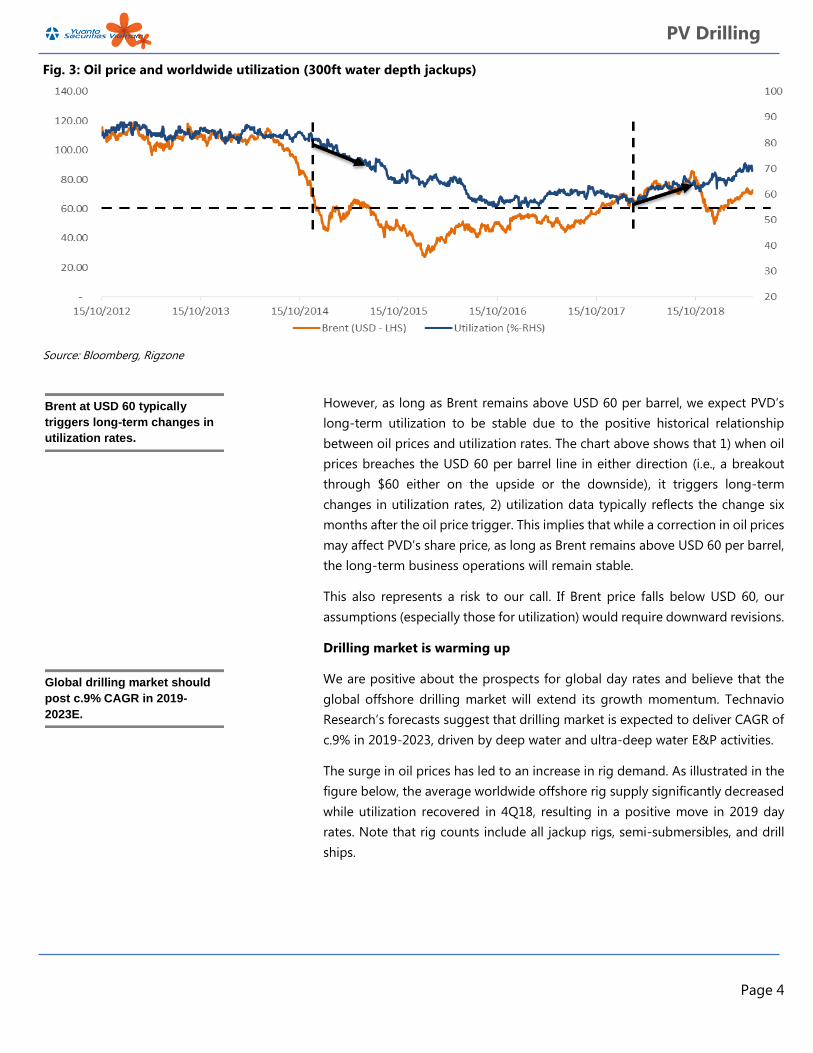
Fig. 3: Oil price and worldwide utilization (300ft water depth jackups)
Source: Bloomberg, Rigzone
However, as long as Brent remains above USD 60 per barrel, we expect PVD’s
long-term utilization to be stable due to the positive historical relationship
between oil prices and utilization rates. The chart above shows that 1) when oil
prices breaches the USD 60 per barrel line in either direction (i.e., a breakout
through $60 either on the upside or the downside), it triggers long-term
changes in utilization rates, 2) utilization data typically reflects the change six
months after the oil price trigger. This implies that while a correction in oil prices
may affect PVD’s share price, as long as Brent remains above USD 60 per barrel,
the long-term business operations will remain stable.
This also represents a risk to our call. If Brent price falls below USD 60, our
assumptions (especially those for utilization) would require downward revisions.
Drilling market is warming up
We are positive about the prospects for global day rates and believe that the
global offshore drilling market will extend its growth momentum. Technavio
Research’s forecasts suggest that drilling market is expected to deliver CAGR of
c.9% in 2019-2023, driven by deep water and ultra-deep water E&P activities.
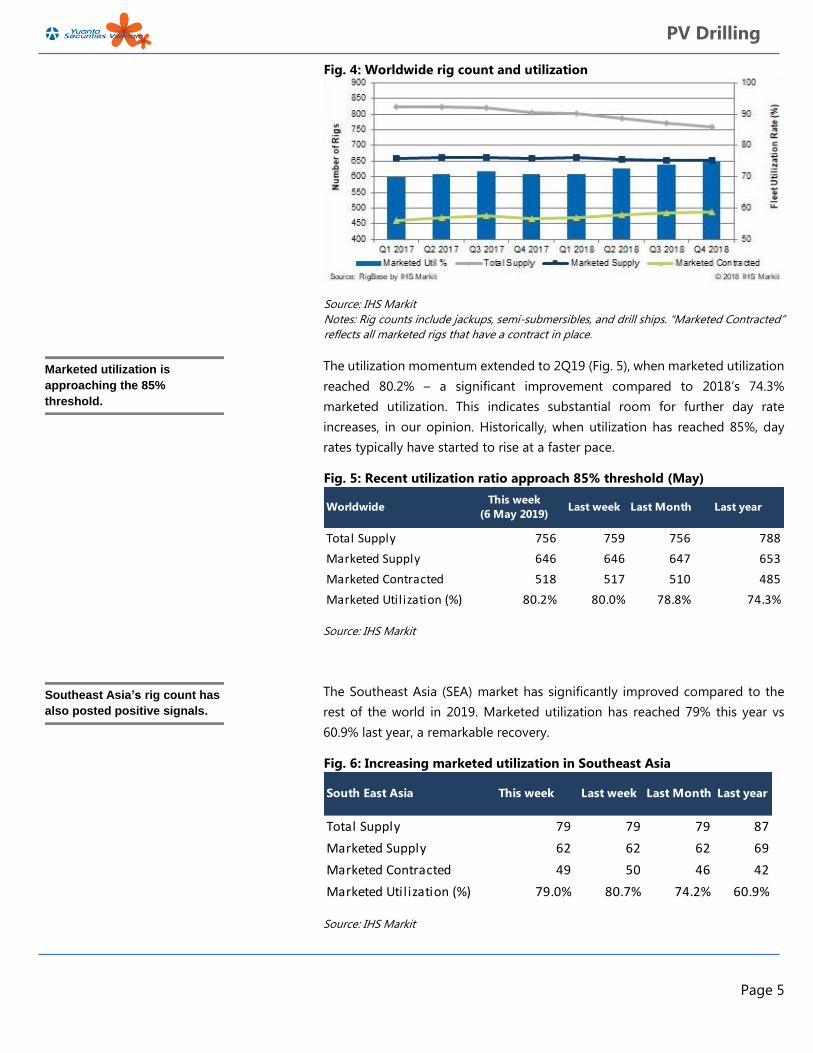
The surge in oil prices has led to an increase in rig demand. As illustrated in the
figure below, the average worldwide offshore rig supply significantly decreased
while utilization recovered in 4Q18, resulting in a positive move in 2019 day
rates. Note that rig counts include all jackup rigs, semi-submersibles, and drill
ships.
Brent at USD 60 typically
triggers long-term changes in
utilization rates.
Global drilling market should
post c.9% CAGR in 2019-
2023E.
Page 5
PV Drilling
Fig. 4: Worldwide rig count and utilization
Source: IHS Markit
Notes: Rig counts include jackups, semi-submersibles, and drill ships. “Marketed Contracted”
reflects all marketed rigs that have a contract in place.
The utilization momentum extended to 2Q19 (Fig. 5), when marketed utilization
reached 80.2% – a significant improvement compared to 2018’s 74.3%
marketed utilization. This indicates substantial room for further day rate
increases, in our opinion. Historically, when utilization has reached 85%, day
rates typically have started to rise at a faster pace.
Fig. 5: Recent utilization ratio approach 85% threshold (May)
Source: IHS Markit
The Southeast Asia (SEA) market has significantly improved compared to the
rest of the world in 2019. Marketed utilization has reached 79% this year vs
60.9% last year, a remarkable recovery.
Fig. 6: Increasing marketed utilization in Southeast Asia
Source: IHS Markit
Total Supply 756 759 756 788
Marketed Supply 646 646 647 653
Marketed Contracted 518 517 510 485
Marketed Utilization (%) 80.2% 80.0% 78.8% 74.3%
WorldwideThis week
(6 May 2019)Last week Last Month Last year
Total Supply 79 79 79 87
Marketed Supply 62 62 62 69
Marketed Contracted 49 50 46 42
Marketed Utilization (%) 79.0% 80.7% 74.2% 60.9%
South East Asia This week Last week Last Month Last year
Marketed utilization is
approaching the 85%
threshold.
Southeast Asia’s rig count has
also posted positive signals.
Page 6
PV Drilling
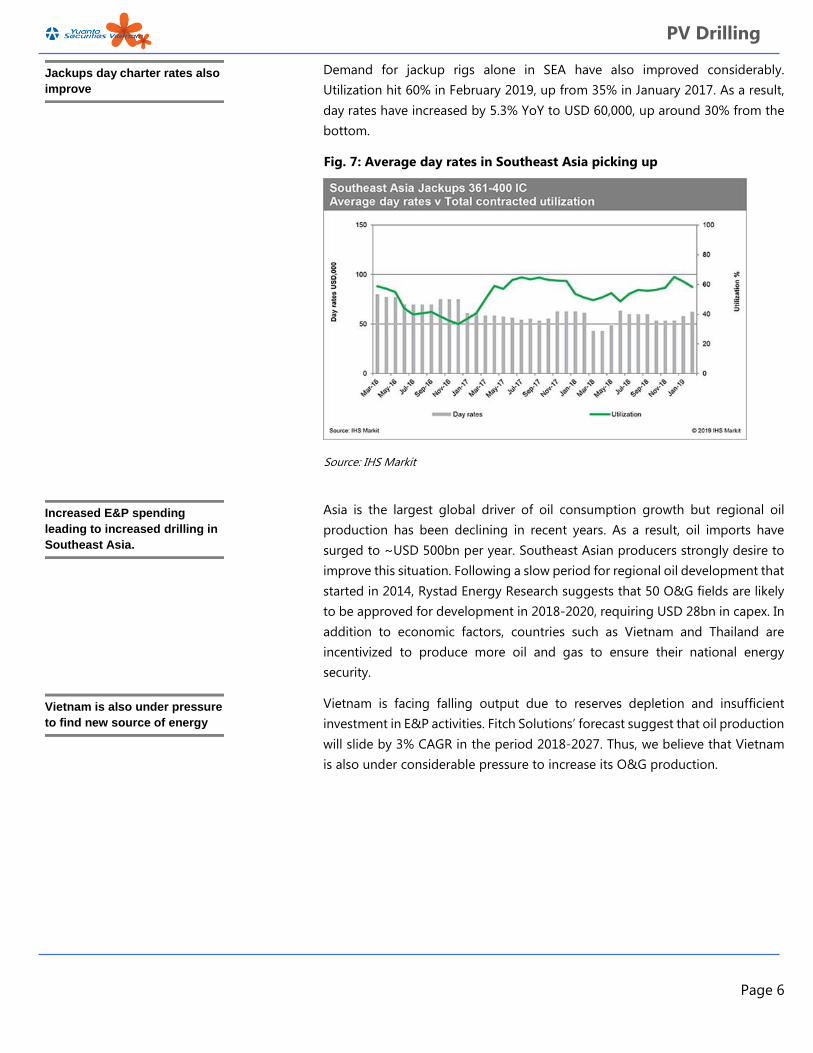
Demand for jackup rigs alone in SEA have also improved considerably.
Utilization hit 60% in February 2019, up from 35% in January 2017. As a result,
day rates have increased by 5.3% YoY to USD 60,000, up around 30% from the
bottom.
Fig. 7: Average day rates in Southeast Asia picking up
Source: IHS Markit
Asia is the largest global driver of oil consumption growth but regional oil
production has been declining in recent years. As a result, oil imports have
surged to ~USD 500bn per year. Southeast Asian producers strongly desire to
improve this situation. Following a slow period for regional oil development that
started in 2014, Rystad Energy Research suggests that 50 O&G fields are likely
to be approved for development in 2018-2020, requiring USD 28bn in capex. In
addition to economic factors, countries such as Vietnam and Thailand are
incentivized to produce more oil and gas to ensure their national energy
security.
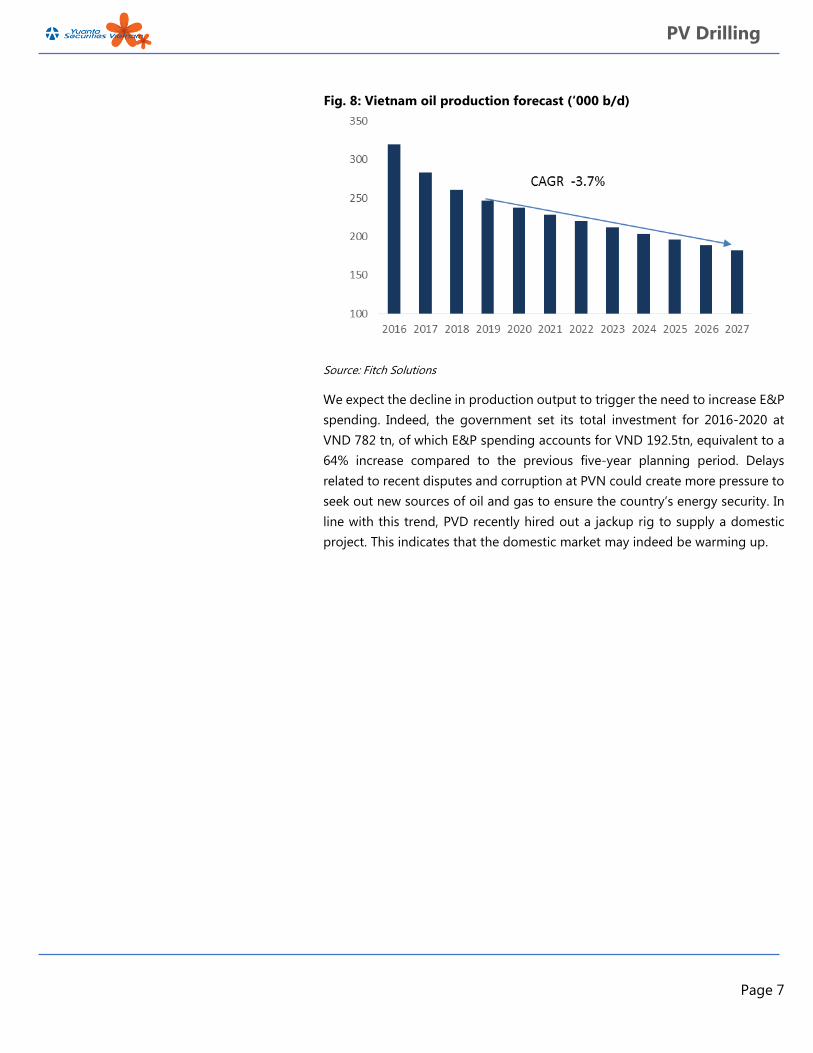
Vietnam is facing falling output due to reserves depletion and insufficient
investment in E&P activities. Fitch Solutions’ forecast suggest that oil production
will slide by 3% CAGR in the period 2018-2027. Thus, we believe that Vietnam
is also under considerable pressure to increase its O&G production.
Jackups day charter rates also
improve
Increased E&P spending
leading to increased drilling in
Southeast Asia.
Vietnam is also under pressure
to find new source of energy
Page 7
PV Drilling
Fig. 8: Vietnam oil production forecast (‘000 b/d)
Source: Fitch Solutions
We expect the decline in production output to trigger the need to increase E&P
spending. Indeed, the government set its total investment for 2016-2020 at
VND 782 tn, of which E&P spending accounts for VND 192.5tn, equivalent to a
64% increase compared to the previous five-year planning period. Delays
related to recent disputes and corruption at PVN could create more pressure to
seek out new sources of oil and gas to ensure the country’s energy security. In
line with this trend, PVD recently hired out a jackup rig to supply a domestic
project. This indicates that the domestic market may indeed be warming up.
Page 8
PV Drilling
PVD is becoming a global driller
Integrated services provider
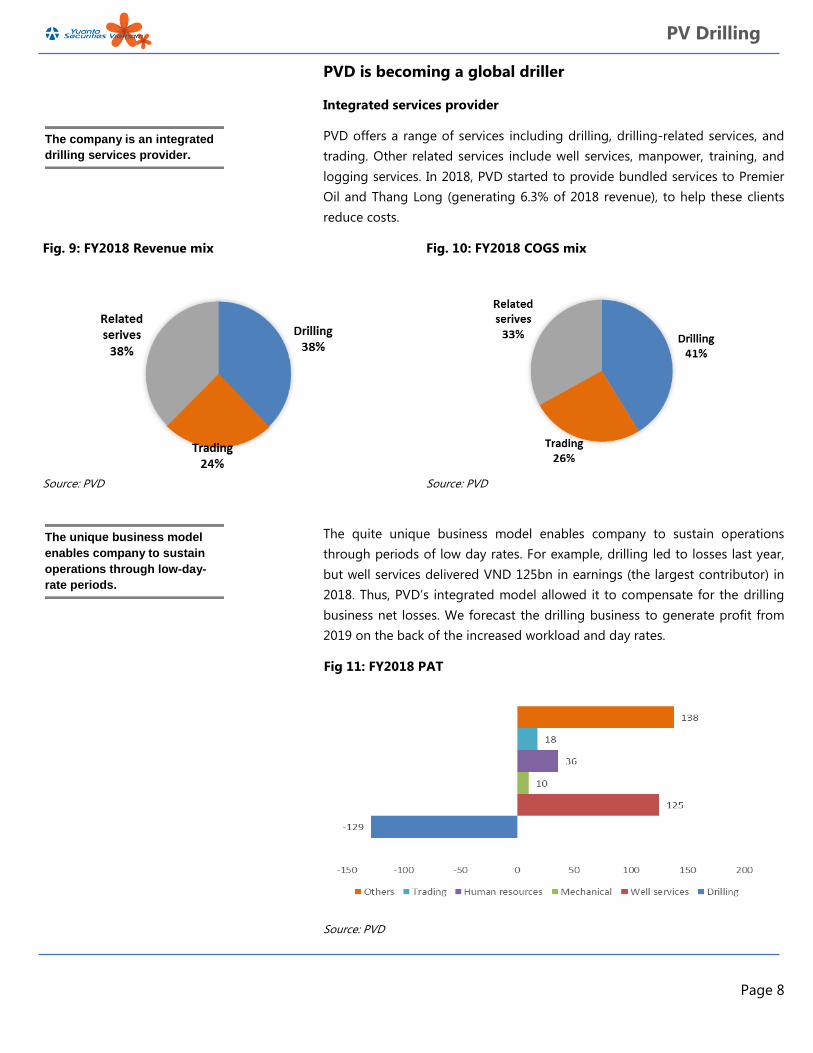
PVD offers a range of services including drilling, drilling-related services, and
trading. Other related services include well services, manpower, training, and
logging services. In 2018, PVD started to provide bundled services to Premier
Oil and Thang Long (generating 6.3% of 2018 revenue), to help these clients
reduce costs.
Fig. 9: FY2018 Revenue mix Fig. 10: FY2018 COGS mix
Source: PVD Source: PVD
The quite unique business model enables company to sustain operations
through periods of low day rates. For example, drilling led to losses last year,
but well services delivered VND 125bn in earnings (the largest contributor) in
2018. Thus, PVD’s integrated model allowed it to compensate for the drilling
business net losses. We forecast the drilling business to generate profit from
2019 on the back of the increased workload and day rates.
Fig 11: FY2018 PAT
Source: PVD
The company is an integrated
drilling services provider.
The unique business model
enables company to sustain
operations through low-day-
rate periods.
Page 9
PV Drilling
Drilling services: Shifting overseas
PVD owns four jackup rigs (PVD I, PVD II, PVD III, PVD VI), one land rig (PVD 11)
and one semi-submersible rig (PVD V or TAD). Historically, PVD mainly provided
services for domestic E&P projects (the exception is its land rig (PVD 11), which
has been operating largely in Algeria in recent years). Its traditional clients
include domestic upstream players Vietsopetro, Cuu Long, and Hoang Long–
Hoan Vu.
Since 2018, PVD has been operating jackup rigs in Malaysia. By the end of 2019,
all of PVD’s jackup rigs will be operating in several projects in Malaysia. In other
words, most of the company’s rigs have secured contracts for 2019, which we
expect to boost the utilization ratio to 95%, up 10ppt from the 85% ratio in
2018.
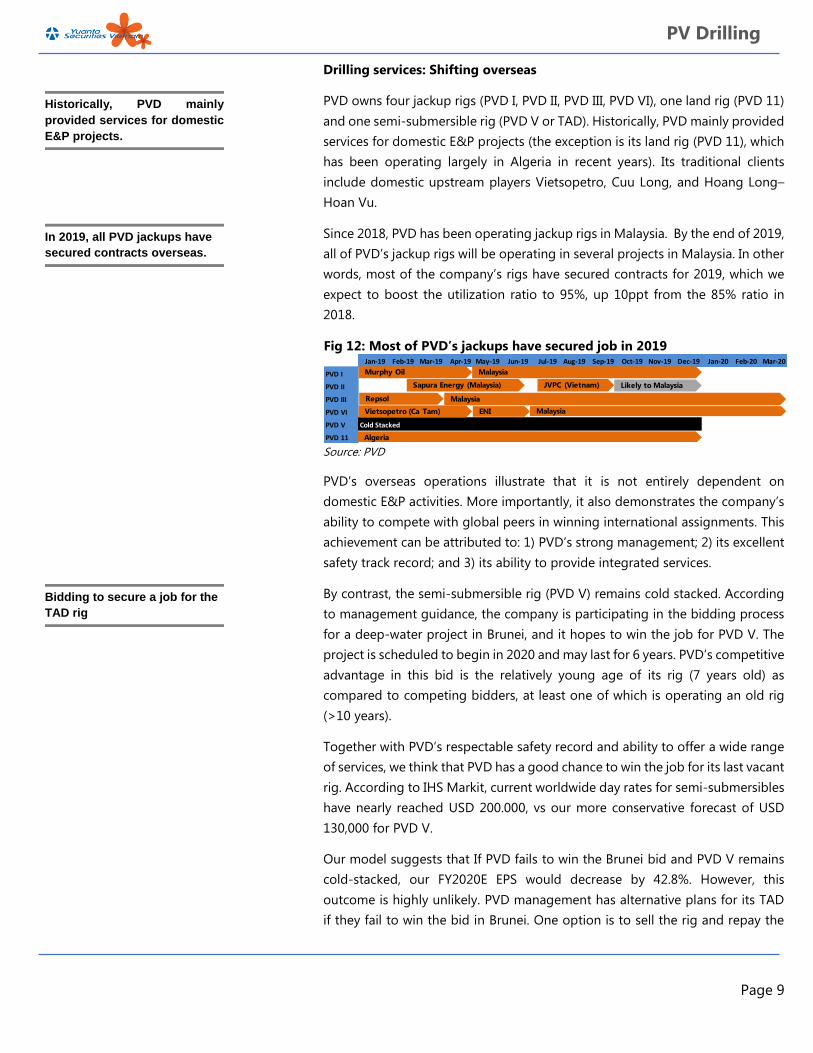
Fig 12: Most of PVD’s jackups have secured job in 2019
Source: PVD
PVD’s overseas operations illustrate that it is not entirely dependent on
domestic E&P activities. More importantly, it also demonstrates the company’s
ability to compete with global peers in winning international assignments. This
achievement can be attributed to: 1) PVD’s strong management; 2) its excellent
safety track record; and 3) its ability to provide integrated services.
By contrast, the semi-submersible rig (PVD V) remains cold stacked. According
to management guidance, the company is participating in the bidding process
for a deep-water project in Brunei, and it hopes to win the job for PVD V. The
project is scheduled to begin in 2020 and may last for 6 years. PVD’s competitive
advantage in this bid is the relatively young age of its rig (7 years old) as
compared to competing bidders, at least one of which is operating an old rig
(>10 years).
Together with PVD’s respectable safety record and ability to offer a wide range
of services, we think that PVD has a good chance to win the job for its last vacant
rig. According to IHS Markit, current worldwide day rates for semi-submersibles
have nearly reached USD 200.000, vs our more conservative forecast of USD
130,000 for PVD V.
Our model suggests that If PVD fails to win the Brunei bid and PVD V remains
cold-stacked, our FY2020E EPS would decrease by 42.8%. However, this
outcome is highly unlikely. PVD management has alternative plans for its TAD
if they fail to win the bid in Brunei. One option is to sell the rig and repay the
Jan-19 Feb-19 Mar-19 Apr-19 May-19 Jun-19 Jul-19 Aug-19 Sep-19 Oct-19 Nov-19 Dec-19 Jan-20 Feb-20 Mar-20
PVD I
PVD II
PVD III
PVD VI
PVD V Cold Stacked
PVD 11
Murphy Oil Malaysia
Sapura Energy (Malaysia)
Repsol
JVPC (Vietnam) Likely to Malaysia
Malaysia
Vietsopetro (Ca Tam) ENI Malaysia
Algeria
Historically, PVD mainly
provided services for domestic
E&P projects.
In 2019, all PVD jackups have
secured contracts overseas.
Bidding to secure a job for the
TAD rig
Page 10
PV Drilling
corresponding debt (USD 16.9 mn as at Dec 2018). Another option is to
transform the rig into a jackup unit that is suitable for domestic oil field
operations.
We believe that the Street is ignoring the possible Brunei deal and its
alternatives – all of which would add value to the business results. We think this
is a key reason for our 84% above-consensus 2020E forecasts – and we don’t
see our forecast as particularly aggressive given the recent trend of increasing
day rates for semi-submersible rigs.
Both utilization and day rates are improving
As mentioned above, average day rates in Southeast Asia have clearly improved
in 2019. PVD’s latest announcement suggests that its average day rate has
reached 59,000, +6% YoY. We expect that the average day rate of PVD’s jackup
rigs in 2019 may reach 60,000 USD, +7% YoY.
PVD’s management believes that the average day rate may reach 65,000 in
2020, an 8.3% YoY increase from our 2019 assumption. Given that regional
utilization is approaching 85%, we think that day rates are likely to reach USD
65,000 in 2020.
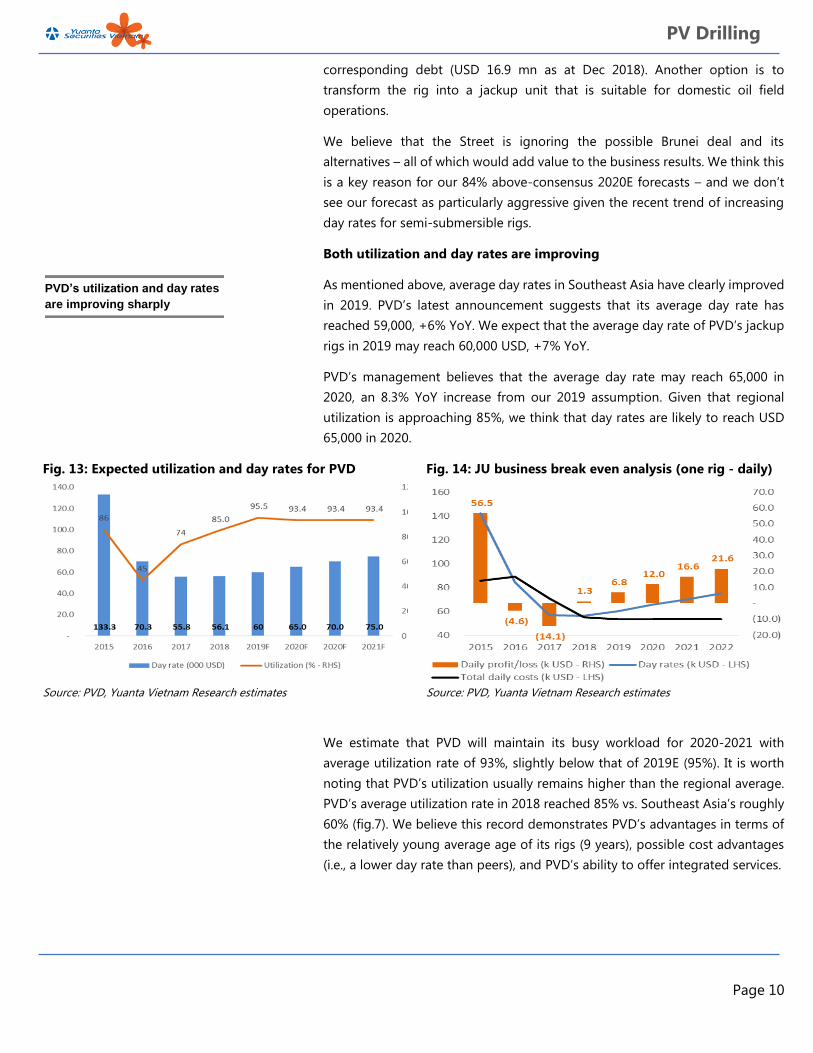
Fig. 13: Expected utilization and day rates for PVD Fig. 14: JU business break even analysis (one rig - daily)
Source: PVD, Yuanta Vietnam Research estimates Source: PVD, Yuanta Vietnam Research estimates
We estimate that PVD will maintain its busy workload for 2020-2021 with
average utilization rate of 93%, slightly below that of 2019E (95%). It is worth
noting that PVD’s utilization usually remains higher than the regional average.
PVD’s average utilization rate in 2018 reached 85% vs. Southeast Asia’s roughly
60% (fig.7). We believe this record demonstrates PVD’s advantages in terms of
the relatively young average age of its rigs (9 years), possible cost advantages
(i.e., a lower day rate than peers), and PVD’s ability to offer integrated services.
PVD’s utilization and day rates
are improving sharply
Page 11
PV Drilling
A respectable safety record
PVD’s managers are justifiably proud of their safety track record, as
demonstrated by lost time incident (LTI). This is the most important parameter
for a drilling company when participating in project bids.
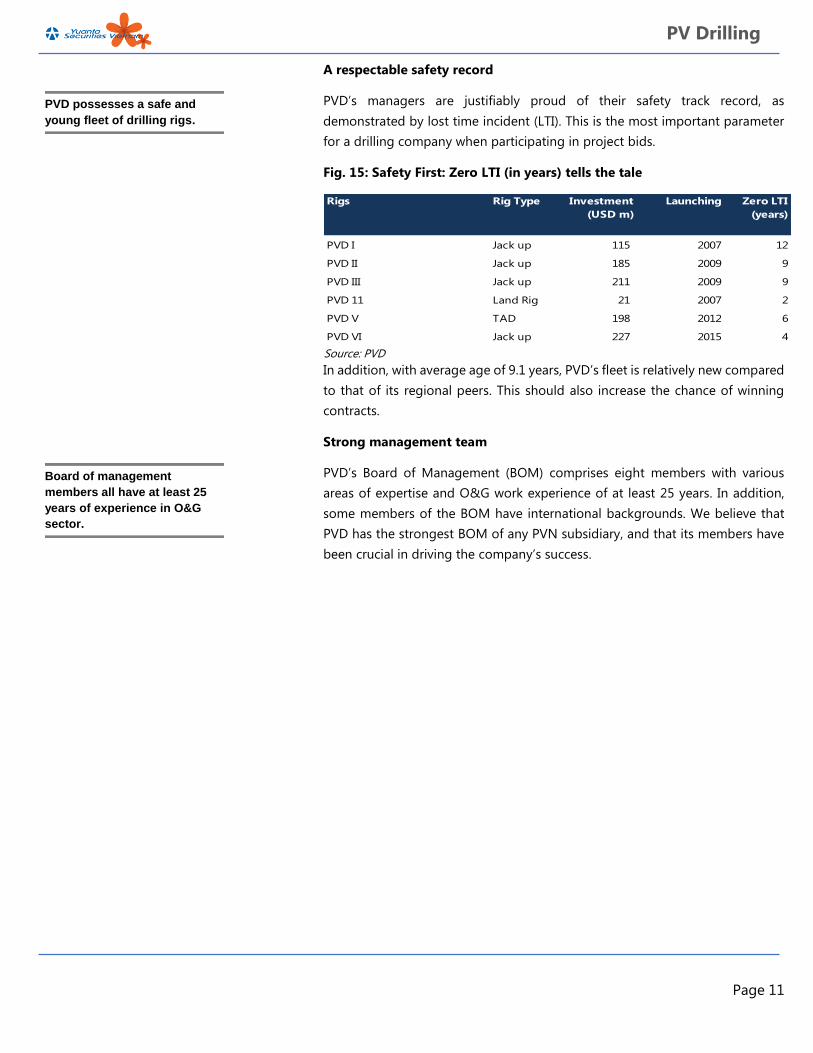
Fig. 15: Safety First: Zero LTI (in years) tells the tale
Source: PVD
In addition, with average age of 9.1 years, PVD’s fleet is relatively new compared
to that of its regional peers. This should also increase the chance of winning
contracts.
Strong management team
PVD’s Board of Management (BOM) comprises eight members with various
areas of expertise and O&G work experience of at least 25 years. In addition,
some members of the BOM have international backgrounds. We believe that
PVD has the strongest BOM of any PVN subsidiary, and that its members have
been crucial in driving the company’s success.
Rigs Rig Type Investment
(USD m)
Launching Zero LTI
(years)
PVD I Jack up 115 2007 12
PVD II Jack up 185 2009 9
PVD III Jack up 211 2009 9
PVD 11 Land Rig 21 2007 2
PVD V TAD 198 2012 6
PVD VI Jack up 227 2015 4
PVD possesses a safe and
young fleet of drilling rigs.
Board of management
members all have at least 25
years of experience in O&G
sector.
Page 12
PV Drilling
Financial analysis
We expect PVD’s FY2019 business performance to continue improving on the
back of the higher work load (in both drilling and related services) and higher
day rates. This is despite the fact that PVD V TAD remains cold stacked. Our
assumed day rates for FY2019, FY2020, and FY2021 are USD 60,000, USD 65,000
and USD 70,000, respectively. In addition, PVD added a hired jackup rig in
October for a long-term contract in a domestic project.
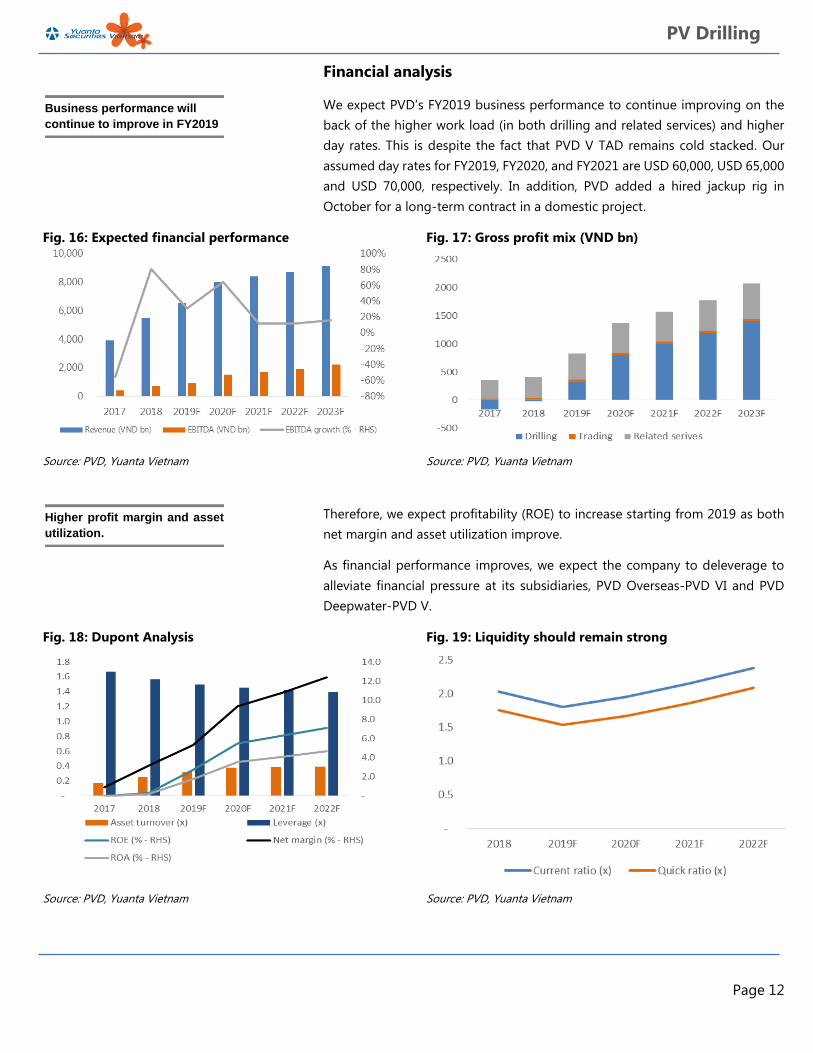
Fig. 16: Expected financial performance Fig. 17: Gross profit mix (VND bn)
Source: PVD, Yuanta Vietnam Source: PVD, Yuanta Vietnam
Therefore, we expect profitability (ROE) to increase starting from 2019 as both
net margin and asset utilization improve.
As financial performance improves, we expect the company to deleverage to
alleviate financial pressure at its subsidiaries, PVD Overseas-PVD VI and PVD
Deepwater-PVD V.
Fig. 18: Dupont Analysis Fig. 19: Liquidity should remain strong
Source: PVD, Yuanta Vietnam Source: PVD, Yuanta Vietnam
Business performance will
continue to improve in FY2019
Higher profit margin and asset
utilization.
Page 13
PV Drilling
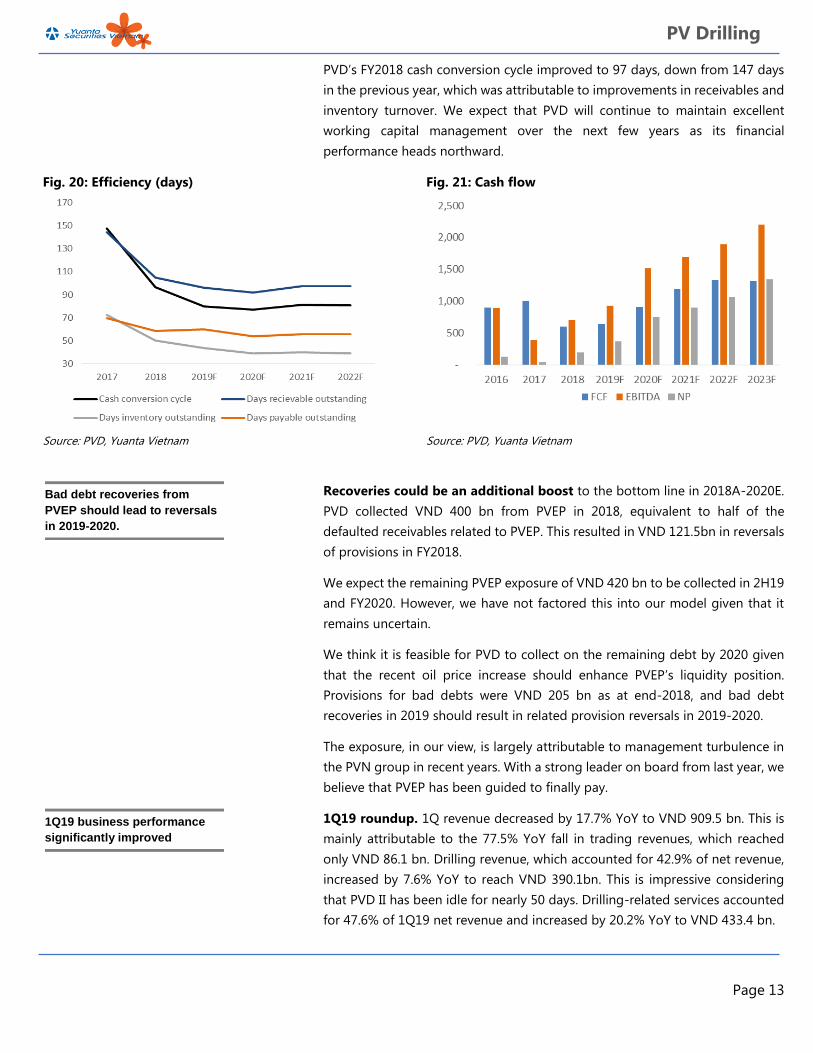
PVD’s FY2018 cash conversion cycle improved to 97 days, down from 147 days
in the previous year, which was attributable to improvements in receivables and
inventory turnover. We expect that PVD will continue to maintain excellent
working capital management over the next few years as its financial
performance heads northward.
Fig. 20: Efficiency (days) Fig. 21: Cash flow
Source: PVD, Yuanta Vietnam Source: PVD, Yuanta Vietnam
Recoveries could be an additional boost to the bottom line in 2018A-2020E.
PVD collected VND 400 bn from PVEP in 2018, equivalent to half of the
defaulted receivables related to PVEP. This resulted in VND 121.5bn in reversals
of provisions in FY2018.
We expect the remaining PVEP exposure of VND 420 bn to be collected in 2H19
and FY2020. However, we have not factored this into our model given that it
remains uncertain.
We think it is feasible for PVD to collect on the remaining debt by 2020 given
that the recent oil price increase should enhance PVEP’s liquidity position.
Provisions for bad debts were VND 205 bn as at end-2018, and bad debt
recoveries in 2019 should result in related provision reversals in 2019-2020.
The exposure, in our view, is largely attributable to management turbulence in
the PVN group in recent years. With a strong leader on board from last year, we
believe that PVEP has been guided to finally pay.
1Q19 roundup. 1Q revenue decreased by 17.7% YoY to VND 909.5 bn. This is
mainly attributable to the 77.5% YoY fall in trading revenues, which reached
only VND 86.1 bn. Drilling revenue, which accounted for 42.9% of net revenue,
increased by 7.6% YoY to reach VND 390.1bn. This is impressive considering
that PVD II has been idle for nearly 50 days. Drilling-related services accounted
for 47.6% of 1Q19 net revenue and increased by 20.2% YoY to VND 433.4 bn.
Bad debt recoveries from
PVEP should lead to reversals
in 2019-2020.
1Q19 business performance
significantly improved
Page 14
PV Drilling
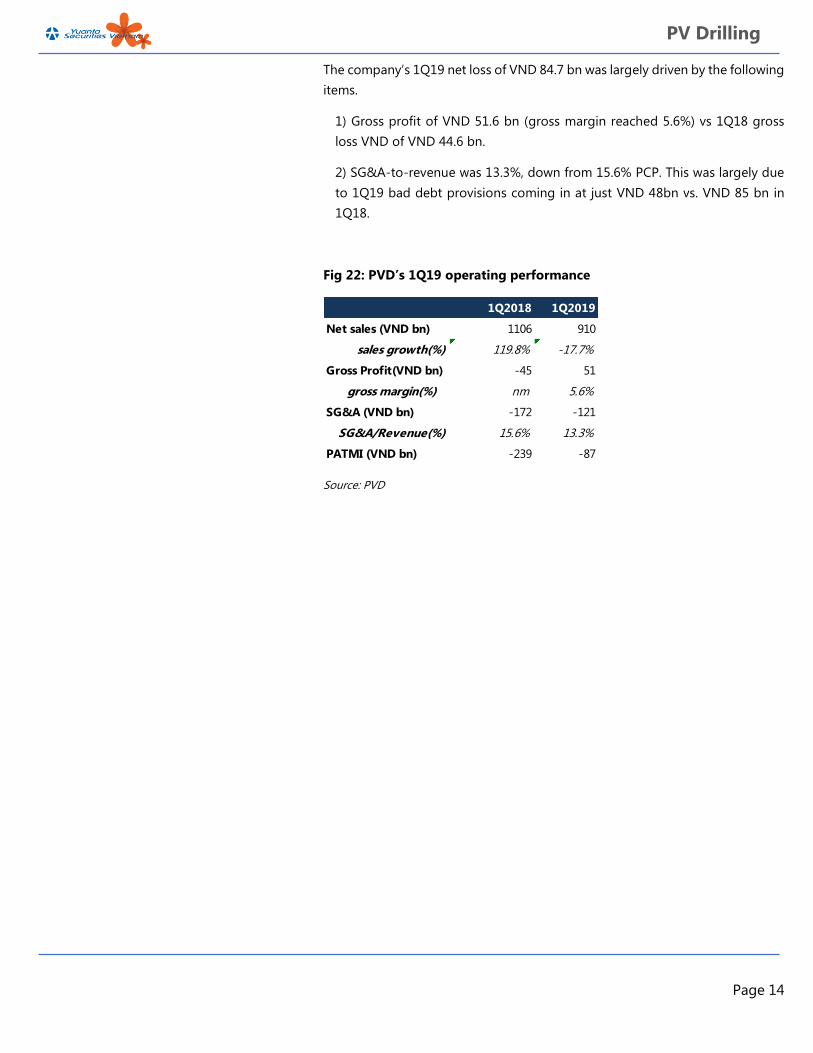
The company’s 1Q19 net loss of VND 84.7 bn was largely driven by the following
items.
1) Gross profit of VND 51.6 bn (gross margin reached 5.6%) vs 1Q18 gross
loss VND of VND 44.6 bn.
2) SG&A-to-revenue was 13.3%, down from 15.6% PCP. This was largely due
to 1Q19 bad debt provisions coming in at just VND 48bn vs. VND 85 bn in
1Q18.
Fig 22: PVD’s 1Q19 operating performance
Source: PVD
1Q2018 1Q2019
Net sales (VND bn) 1106 910
sales growth(%) 119.8% -17.7%
Gross Profit(VND bn) -45 51
gross margin(%) nm 5.6%
SG&A (VND bn) -172 -121
SG&A/Revenue(%) 15.6% 13.3%
PATMI (VND bn) -239 -87
Page 15
PV Drilling
OUR VIEW, VALUATION, AND RISKS TO OUR CALL
Our view
Favorable day rates as well as increase in workload are the main drivers of the
recent share price surge, in our view. We believe that high day rates will persist
through 2020 given our assumption of strong oil prices. Currently four jackup
rigs have contracts overseas, boosting the FY2019 utilization ratio to 95%, up
from 85% in 2018. In the short-term, PVD is enjoying a 7% YoY hike in day rates.
Longer term, PVD is participating in a bidding procedure with the hope of
winning a deep-water project in Brunei which may offer stable work for its TAD
PVD V for six years starting from 2020. In addition, PVD just hired a jackup rig
for a domestic project, indicating that more workload may be coming along.
The company’s competitive advantage over competitors can be identified by: 1)
its decent management team; 2) its ability to provide integrated services, and
3) its excellent safety track record.
Valuation
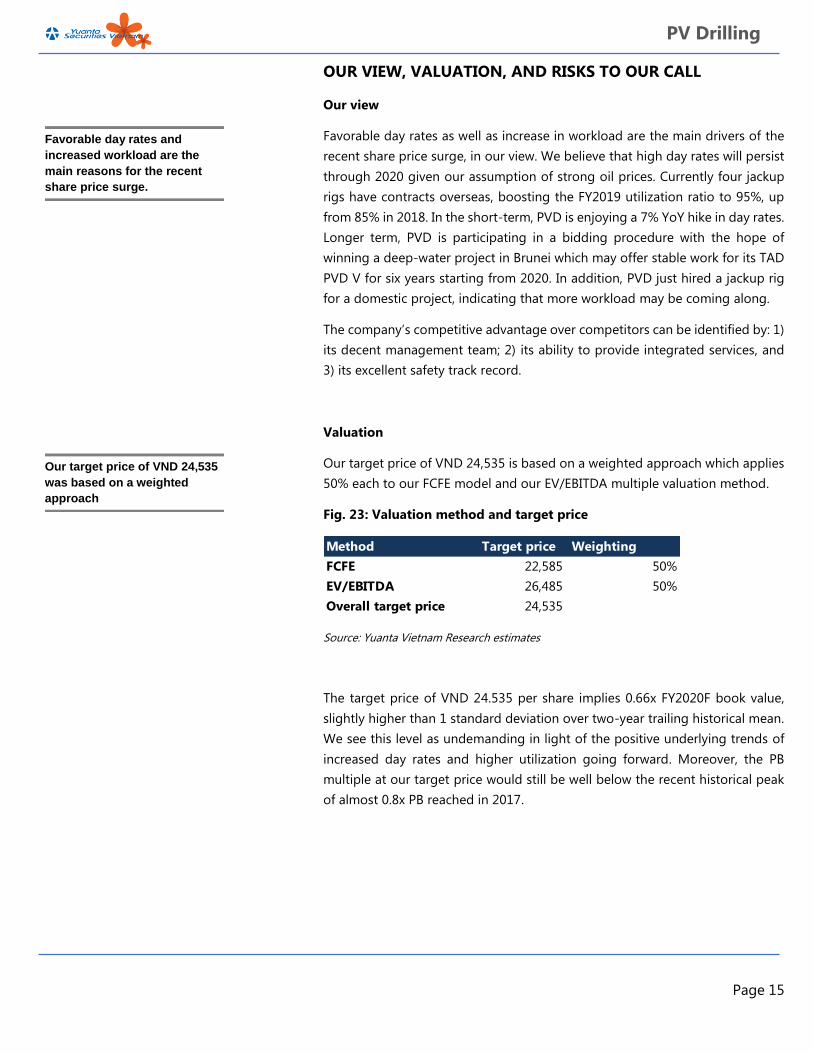
Our target price of VND 24,535 is based on a weighted approach which applies
50% each to our FCFE model and our EV/EBITDA multiple valuation method.
Fig. 23: Valuation method and target price
Source: Yuanta Vietnam Research estimates
The target price of VND 24.535 per share implies 0.66x FY2020F book value,
slightly higher than 1 standard deviation over two-year trailing historical mean.
We see this level as undemanding in light of the positive underlying trends of
increased day rates and higher utilization going forward. Moreover, the PB
multiple at our target price would still be well below the recent historical peak
of almost 0.8x PB reached in 2017.
Method Target price Weighting
FCFE 22,585 50%
EV/EBITDA 26,485 50%
Overall target price 24,535
Favorable day rates and
increased workload are the
main reasons for the recent
share price surge.
Our target price of VND 24,535
was based on a weighted
approach
Page 16
PV Drilling
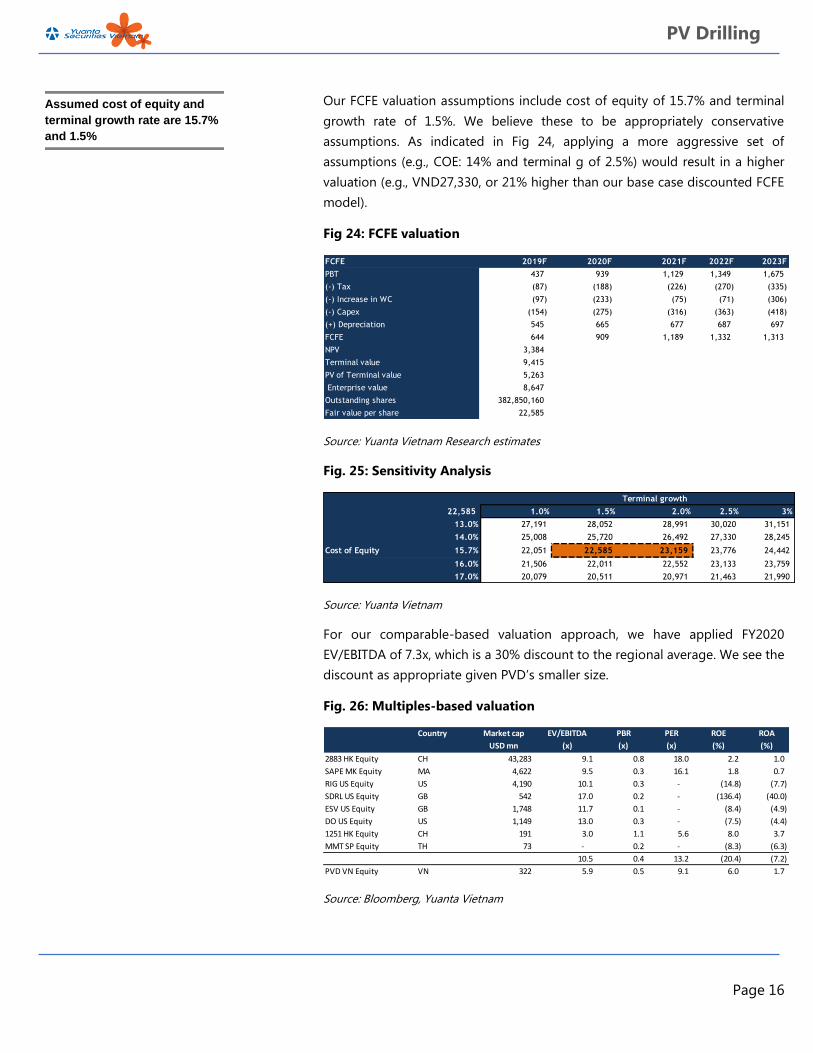
Our FCFE valuation assumptions include cost of equity of 15.7% and terminal
growth rate of 1.5%. We believe these to be appropriately conservative
assumptions. As indicated in Fig 24, applying a more aggressive set of
assumptions (e.g., COE: 14% and terminal g of 2.5%) would result in a higher
valuation (e.g., VND27,330, or 21% higher than our base case discounted FCFE
model).
Fig 24: FCFE valuation
Source: Yuanta Vietnam Research estimates
Fig. 25: Sensitivity Analysis
Source: Yuanta Vietnam
For our comparable-based valuation approach, we have applied FY2020
EV/EBITDA of 7.3x, which is a 30% discount to the regional average. We see the
discount as appropriate given PVD’s smaller size.
Fig. 26: Multiples-based valuation
Source: Bloomberg, Yuanta Vietnam
FCFE 2019F 2020F 2021F 2022F 2023F
PBT 437 939 1,129 1,349 1,675
(-) Tax (87) (188) (226) (270) (335)
(-) Increase in WC (97) (233) (75) (71) (306)
(-) Capex (154) (275) (316) (363) (418)
(+) Depreciation 545 665 677 687 697
FCFE 644 909 1,189 1,332 1,313
NPV 3,384
Terminal value 9,415
PV of Terminal value 5,263
Enterprise value 8,647
Outstanding shares 382,850,160
Fair value per share 22,585
Terminal growth
22,585 1.0% 1.5% 2.0% 2.5% 3%
13.0% 27,191 28,052 28,991 30,020 31,151
14.0% 25,008 25,720 26,492 27,330 28,245
Cost of Equity 15.7% 22,051 22,585 23,159 23,776 24,442
16.0% 21,506 22,011 22,552 23,133 23,759
17.0% 20,079 20,511 20,971 21,463 21,990
Country Market cap EV/EBITDA PBR PER ROE ROA
USD mn (x) (x) (x) (%) (%)
2883 HK Equity CH 43,283 9.1 0.8 18.0 2.2 1.0
SAPE MK Equity MA 4,622 9.5 0.3 16.1 1.8 0.7
RIG US Equity US 4,190 10.1 0.3 - (14.8) (7.7)
SDRL US Equity GB 542 17.0 0.2 - (136.4) (40.0)
ESV US Equity GB 1,748 11.7 0.1 - (8.4) (4.9)
DO US Equity US 1,149 13.0 0.3 - (7.5) (4.4)
1251 HK Equity CH 191 3.0 1.1 5.6 8.0 3.7
MMT SP Equity TH 73 - 0.2 - (8.3) (6.3)
10.5 0.4 13.2 (20.4) (7.2)
PVD VN Equity VN 322 5.9 0.5 9.1 6.0 1.7
Assumed cost of equity and
terminal growth rate are 15.7%
and 1.5%
Page 17
PV Drilling
Risks to our call
Oil price volatility may affect the share price in the short-term given the
very strong correlation between the price of PVD’s stock and that of
Brent. But the impact on the fundamentals would not be meaningful as
long as Brent remains above USD 60 per barrel.
However, if Brent falls below USD 60 per barrel, our assumptions
(especially regarding utilization) would require negative revisions.
PVEP bad debt recoveries are a short-term boost to earnings, but may
slow down going forward.
Intensified competition from other players.
The outcome of the bid to put PVD’s TAD PVD V to work in Brunei is
uncertain. It is possible that the rig may remain cold stacked in 2020.
As noted, the downside risk to our earnings if the rig remains idle is
42.8% for 2020E and 39.2% for 2021E.
Recoveries from the PVEP exposure represent a positive risk for our
earnings forecasts in 2019-2020. We have not factored in any further
recoveries despite our view that they are very likely to occur eventually.
Page 18
PV Drilling
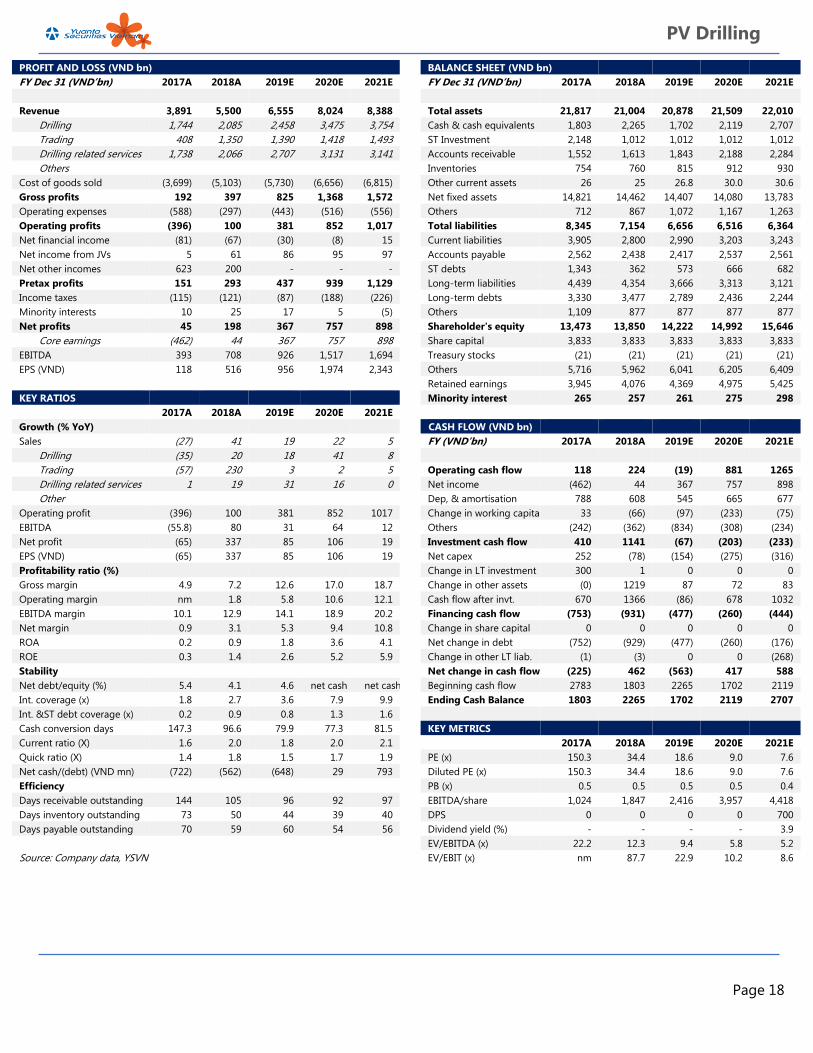
PROFIT AND LOSS (VND bn) BALANCE SHEET (VND bn)
FY Dec 31 (VND’bn) 2017A 2018A 2019E 2020E 2021E FY Dec 31 (VND’bn) 2017A 2018A 2019E 2020E 2021E
Revenue 3,891 5,500 6,555 8,024 8,388 Total assets 21,817 21,004 20,878 21,509 22,010
Drilling 1,744 2,085 2,458 3,475 3,754 Cash & cash equivalents 1,803 2,265 1,702 2,119 2,707
Trading 408 1,350 1,390 1,418 1,493 ST Investment 2,148 1,012 1,012 1,012 1,012
Drilling related services 1,738 2,066 2,707 3,131 3,141 Accounts receivable 1,552 1,613 1,843 2,188 2,284
Others Inventories 754 760 815 912 930
Cost of goods sold (3,699) (5,103) (5,730) (6,656) (6,815) Other current assets 26 25 26.8 30.0 30.6
Gross profits 192 397 825 1,368 1,572 Net fixed assets 14,821 14,462 14,407 14,080 13,783
Operating expenses (588) (297) (443) (516) (556) Others 712 867 1,072 1,167 1,263
Operating profits (396) 100 381 852 1,017 Total liabilities 8,345 7,154 6,656 6,516 6,364
Net financial income (81) (67) (30) (8) 15 Current liabilities 3,905 2,800 2,990 3,203 3,243
Net income from JVs 5 61 86 95 97 Accounts payable 2,562 2,438 2,417 2,537 2,561
Net other incomes 623 200 - - - ST debts 1,343 362 573 666 682
Pretax profits 151 293 437 939 1,129 Long-term liabilities 4,439 4,354 3,666 3,313 3,121
Income taxes (115) (121) (87) (188) (226) Long-term debts 3,330 3,477 2,789 2,436 2,244
Minority interests 10 25 17 5 (5) Others 1,109 877 877 877 877
Net profits 45 198 367 757 898 Shareholder's equity 13,473 13,850 14,222 14,992 15,646
Core earnings (462) 44 367 757 898 Share capital 3,833 3,833 3,833 3,833 3,833
EBITDA 393 708 926 1,517 1,694 Treasury stocks (21) (21) (21) (21) (21)
EPS (VND) 118 516 956 1,974 2,343 Others 5,716 5,962 6,041 6,205 6,409
KEY RATIOS Retained earnings 3,945 4,076 4,369 4,975 5,425
KEY RATIOS Minority interest 265 257 261 275 298
2017A 2018A 2019E 2020E 2021E
Growth (% YoY) CASH FLOW (VND bn)
Sales (27) 41 19 22 5 FY (VND’bn) 2017A 2018A 2019E 2020E 2021E
Drilling (35) 20 18 41 8
Trading (57) 230 3 2 5 Operating cash flow 118 224 (19) 881 1265
Drilling related services 1 19 31 16 0 Net income (462) 44 367 757 898
Other Dep, & amortisation 788 608 545 665 677
Operating profit (396) 100 381 852 1017 Change in working capital 33 (66) (97) (233) (75)
EBITDA (55.8) 80 31 64 12 Others (242) (362) (834) (308) (234)
Net profit (65) 337 85 106 19 Investment cash flow 410 1141 (67) (203) (233)
EPS (VND) (65) 337 85 106 19 Net capex 252 (78) (154) (275) (316)
Profitability ratio (%) Change in LT investment 300 1 0 0 0
Gross margin 4.9 7.2 12.6 17.0 18.7 Change in other assets (0) 1219 87 72 83
Operating margin nm 1.8 5.8 10.6 12.1 Cash flow after invt. 670 1366 (86) 678 1032
EBITDA margin 10.1 12.9 14.1 18.9 20.2 Financing cash flow (753) (931) (477) (260) (444)
Net margin 0.9 3.1 5.3 9.4 10.8 Change in share capital 0 0 0 0 0
ROA 0.2 0.9 1.8 3.6 4.1 Net change in debt (752) (929) (477) (260) (176)
ROE 0.3 1.4 2.6 5.2 5.9 Change in other LT liab. (1) (3) 0 0 (268)
Stability Net change in cash flow (225) 462 (563) 417 588
Net debt/equity (%) 5.4 4.1 4.6 net cash net cash Beginning cash flow 2783 1803 2265 1702 2119
Int. coverage (x) 1.8 2.7 3.6 7.9 9.9 Ending Cash Balance 1803 2265 1702 2119 2707
Int. &ST debt coverage (x) 0.2 0.9 0.8 1.3 1.6
Cash conversion days 147.3 96.6 79.9 77.3 81.5 KEY METRICS
Current ratio (X) 1.6 2.0 1.8 2.0 2.1 2017A 2018A 2019E 2020E 2021E
Quick ratio (X) 1.4 1.8 1.5 1.7 1.9 PE (x) 150.3 34.4 18.6 9.0 7.6
Net cash/(debt) (VND mn) (722) (562) (648) 29 793 Diluted PE (x) 150.3 34.4 18.6 9.0 7.6
Efficiency PB (x) 0.5 0.5 0.5 0.5 0.4
Days receivable outstanding 144 105 96 92 97 EBITDA/share 1,024 1,847 2,416 3,957 4,418
Days inventory outstanding 73 50 44 39 40 DPS 0 0 0 0 700
Days payable outstanding 70 59 60 54 56 Dividend yield (%) - - - - 3.9
EV/EBITDA (x) 22.2 12.3 9.4 5.8 5.2
Source: Company data, YSVN EV/EBIT (x) nm 87.7 22.9 10.2 8.6
Page 19
PV Drilling
APPENDIX I: TERMS FOR PROVISION OF REPORT, DISCLAIMERS AND
DISCLOSURES
Analyst Certification Each research analyst primarily responsible for the content of this research report, in whole or in part, certifies that with respect to each security or issuer that the analyst covered in this report: (1) all of the views expressed accurately reflect his or her personal views about those securities or issuers; and (2) no part of his or her compensation was, is, or will be, directly or indirectly, related to the specific recommendations or views expressed by that research analyst in the research report.
Ratings Total expected return within the next 12 months
BUY Above 10% HOLD Between -10% to +10% SELL Below 10%
BUY: We have a positive outlook on the stock based on our expected absolute or relative return over the investment period. Our thesis is based on our analysis of the company’s outlook, financial performance, catalysts, valuation and risk profile. We recommend investors add to their position. HOLD-Outperform: In our view, the stock’s fundamentals are relatively more attractive than peers at the current price. Our thesis is based on our analysis of the company’s outlook, financial performance, catalysts, valuation and risk profile. HOLD-Underperform: In our view, the stock’s fundamentals are relatively less attractive than peers at the current price. Our thesis is based on our analysis of the company’s outlook, financial performance, catalysts, valuation and risk profile. SELL: We have a negative outlook on the stock based on our expected absolute or relative return over the investment period. Our thesis is based on our analysis of the company’s outlook, financial performance, catalysts, valuation and risk profile. We recommend investors reduce their position. Under Review: We actively follow the company, although our estimates, rating and target price are under review. Restricted: The rating and target price have been suspended temporarily to comply with applicable regulations and/or Yuanta policies. Note: Yuanta research coverage with a Target Price is based on an investment period of 12 months. Greater China Discovery Series coverage does not have a formal 12 month Target Price and the recommendation is based on an investment period specified by the analyst in the report.
Global Disclaimer © 2018 Yuanta. All rights reserved. The information in this report has been compiled from sources we believe to be reliable, but we do not hold ourselves responsible for its completeness or accuracy. It is not an offer to sell or solicitation of an offer to buy any securities. All opinions and estimates included in this report constitute our judgment as of this date and are subject to change without notice. This report provides general information only. Neither the information nor any opinion expressed herein constitutes an offer or invitation to make an offer to buy or sell securities or other investments. This material is prepared for general circulation to clients and is not intended to provide tailored investment advice and does not take into account the individual financial situation and objectives of any specific person who may receive this report. Investors should seek financial advice regarding the appropriateness of investing in any securities, investments or investment strategies discussed or recommended in this report. The information contained in this report has been compiled from sources believed to be reliable but no representation or warranty, express or implied, is made as to its accuracy, completeness or correctness. This report is not (and should not be construed as) a solicitation to act as securities broker or dealer in any jurisdiction by any person or company that is not legally permitted to carry on such business in that jurisdiction. Yuanta research is distributed in the United States only to Major U.S. Institutional Investors (as defined in Rule 15a-6 under the Securities Exchange Act of 1934, as amended and SEC staff interpretations thereof). All transactions by a US person in the securities mentioned in this report must be effected through a registered broker-dealer under Section 15 of the Securities Exchange Act of 1934, as amended. Yuanta research is distributed in Taiwan by Yuanta Securities Investment Consulting. Yuanta research is distributed in Hong Kong by Yuanta Securities (Hong Kong) Co. Limited, which is licensed in Hong Kong by the Securities and Futures Commission for regulated activities, including Type 4 regulated activity (advising on securities). In Hong Kong, this research report may not be redistributed, retransmitted or disclosed, in whole or in part or and any form or manner, without the express written consent of Yuanta Securities (Hong Kong) Co. Limited.
Page 20
PV Drilling
YUANTA SECURITIES NETWORK
YUANTA SECURITIES VIETNAM OFFICE
Head office: 4th Floor, Saigon Centre, Tower 1, 65 Le Loi Boulevard, Ben Nghe Ward, District 1, HCMC, Vietnam
Institutional Research
Matthew Smith, CFA
Head of Research
Tel: +84 28 3622 6868 (ext. 3815)
Binh Truong
Deputy Head of Research (O&G, Energy)
Tel: +84 28 3622 6868 (3845)
Quang Vo
Analyst (Consumer)
Tel: +84 28 3622 6868 (ext. 3872)
Tam Nguyen
Analyst (Property)
Tel: +84 28 3622 6868 (ext. 3874)
Tanh Tran
Analyst (Banks)
Tel: +84 28 3622 6868 (3874)
Institutional Sales
Huy Nguyen
Head of Institutional sales
Tel: +84 28 3622 6868 (3808)
Duyen Nguyen
Sales Trader
Tel: +84 28 3622 6868 (ext. 3890)