effects of drugs on glucose measurements with handheld glucose meters and a portable glucose...
TRANSCRIPT

Clinical Chemistry / DRUG EFFECTS AND POINT-OF-CARE GLUCOSE TESTING
Effects of Drugs on Glucose Measurements With HandheldGlucose Meters and a Portable Glucose Analyzer
Zuping Tang, MD, Xiaogu Du, MD, Richard F. Louie, and Gerald J. Kost, MD, PhD
Key Words: Compensatory electrode; Critical care; Diabetes mellitus; Drug interference; Electrochemical biosensor; Glucose dehydrogenase; Glucose oxidase; Glucose test strips; Reflectance photometric; Whole-blood analysis
A b s t r a c t
Thirty drugs used primarily in critical care andhospital settings were tested in vitro to observeinterference on glucose measurements with 6 handheldglucose meters and a portable glucose analyzer. Paireddifferences of glucose measurements between drug-spiked samples and unspiked control samples werecalculated to determine bias. A criterion of ± 6 mg/dLwas used as the cutoff for interference. Ascorbic acidinterfered with the measurements on all glucose devicesevaluated. Acetaminophen, dopamine, and mannitolinterfered with glucose measurements on some devices.Dose-response relationships help assessment of druginterference in clinical use. High dosages of these drugs may be given to critically ill patients or self-administered by patients without medical supervision.Package inserts for the glucose devices may not provideadequate warning information. Hence, we recommendthat clinicians choose glucose devices carefully andinterpret results cautiously when glucose measurementsare performed during or after drug interventions.
Handheld glucose meters are used widely for point-of-care testing and for self-monitoring of blood glucose athome. The use of glucose meters in the care of critically illpatients is controversial.1-3 Surveys4,5 show that some hospi-tals do not allow handheld glucose meters in critical careunits. Kost et al,6 evaluated a new oxygen-insensitive,glucose dehydrogenase–based electrochemical biosensor andstudied the clinical performance of the new handheld glucosemeter system in critical care, hospitalized, and ambulatorypatients.6 Little research is available describing drug interfer-ence errors with the newest generations of point-of-careglucose devices. The objectives of this study were as follows:(1) to study how drugs commonly used to treat critically illpatients affect glucose measurements obtained with newglucose devices, (2) to introduce a quantitative error criterionfor drug interference, and (3) to determine the clinical rele-vance of drug interferences for point-of-care glucose testing.
Materials and Methods
Drugs and Drug Levels Tested
❚Table 1❚ lists the 30 drugs tested. Drugs administeredcommonly at the University of California Davis MedicalCenter were selected for relevance to critical care based on areview of drug dispensary statistics during a 6-month period.Drug information was obtained from a clinical pharmacologybook,8 a drug handbook,9 and the National Committee forClinical Laboratory Standards (NCCLS).10 The testedconcentrations in test level 1 were as follows: (1) the levelrecommended by NCCLS, (2) the toxic level or 10 times thetherapeutic level published in the clinical pharmacology
Am J Clin Pathol 2000;113:75–86 75© American Society of Clinical Pathologists

Tang et al / DRUG EFFECTS AND POINT-OF-CARE GLUCOSE TESTING
book,8 or (3) if both the drug therapeutic and toxic levelswere unknown, calculated according to the NCCLS guide-line,10 by distributing the highest therapeutic dosagepublished in the clinical pharmacology book8 or the drughandbook9 in 5 L of blood volume. The tested concentrationsin test levels 2 and 3 were chosen higher or lower than testlevel 1 to cover the concentration spectrum. Each drugconcentration listed in test levels 1, 2, and 3 was used toscreen for drug interference.
Glucose Devices Evaluated
❚Table 2❚ lists device characteristics. Four electro-chemical-based and 3 photometric-based systems wereused in the study: Accu-Chek Advantage H and Accu-Chek Advantage (Roche Diagnostics, Indianapolis, IN),Precision G and Precision QID (Abbott Laboratories,Bedford, MA), SureStepPro and One Touch (LifeScan,Milpitas, CA), and HemoCue B-Glucose (HemoCue,
Mission Viejo, CA). Test strips for the handheld photo-metric and electrochemical systems are constructed with 1or more membranes. Usually, a hydrophilic meshmembrane is on the top, and a reagent layer is on thebottom. The hydrophilic mesh membrane absorbs anddisperses the specimen quickly and uniformly to thereagent layer. The reagent layer contains glucose catalyticenzymes and chromogen in photometric-based systems.Glucose reacts with the enzymes to produce intermediateproducts, which then can oxidize the chromogen toproduce color. The handheld photometric systems measurethe color and convert it to a glucose level. The dye inten-sity is proportional to glucose concentration in the sampletested. The HemoCue B-Glucose portable analyzer uses 2wavelengths, 660 and 840 nm, to measure absorbance. Theelectrochemical-based systems have glucose catalyticenzymes, electron mediators, and electrodes in the reagentlayer. During glucose oxidation, the electrochemical
76 Am J Clin Pathol 2000;113:75–86 © American Society of Clinical Pathologists
❚Table 1❚Drugs and Concentrations*
Test Level
Generic Name Therapeutic Level Toxic Level NCCLS 1 2 3
Acetaminophen 10-20 150 200 200† 300 1,000Acetylsalicylic acid 20-100 150-300 500 500† 450 3,000Aminophylline 10-20 30-40 250 250† 240 40Ampicillin 5 NA 50 50† 2,500 3,750Ascorbic acid 8-12 NA 30 30† 240 300Cefazolin 400 NA 4,000 4,000† 3,200 8,000Cimetidine 1-10 NA 100 100† 7 14Dexamethasone NA NA NA 4‡ 20 60Digoxin >0.0008 0.0017-0.0033 NA 0.0033§ 0.003 0.08Dobutamine 35-50 NA NA 0.5 0.05 NADopamine NA NA 130 130† 60 NAEpinephrine NA NA NA 0.2‡ 0.7 1.4Erythromycin 2-20 NA 200 200† NA NAFurosemide 1-3 NA 20 20† 30 60Gentamicin 8-12 10-30 120 120† 30 NAGlipizide NA NA NA 4‡ 18 24Heparin sodium NA NA 8 8† 94 105Hydralazine 0.1 NA NA 1§ NA NALidocaine 1.5-6 9-14 60 60† 120 NAMannitol NA NA NA 20,000|| 24,000 NANitroglycerin 0.0012-0.011 NA NA 0.11§ 0.1 0.3Nitroprusside NA NA NA 7.5‡ 12 NANorepinephrine NA NA NA 10|| 15 NAPenicillin G potassium NA NA NA 2,400|| 7,000 NAPhentolamine NA NA NA 5|| 10 15Phenytoin 10-20 20-40+ 100 100† NA NAProcainamide 4-10 10-12+ 100 100† 40 20Quinidine 0.3-6 10 50 50† 60 76Regular insulin 100 or less NA NA 1,000§ 200 50Warfarin 1-10 NA 100 100† 180 NA
NA, not available; NCCLS, National Committee for Clinical Laboratory Standards.* Drug concentrations are expressed as micrograms per milliliter, except heparin sodium (units per milliliter) and regular insulin (microunits per milliliter). Dobutamine
therapeutic levels were incorrect in Goodman & Gilman’s The Pharmacological Basis of Therapeutics8 and were taken from Steinberg and Notterman.7
† Test level recommended by the National Committee for Clinical Laboratory Standards (NCCLS).10
‡ Estimated by distributing the highest dose published in Goodman & Gilman’s The Pharmacological Basis of Therapeutics8 in 5 L of blood volume. See “Methods and Materials.”
§ Toxic level or 10 times the therapeutic level published in Goodman & Gilman’s The Pharmacological Basis of Therapeutics.8
|| Estimated by distributing the highest dose published in The Critical Care Drug Handbook9 in 5 L of blood volume.

Clinical Chemistry / ORIGINAL ARTICLE
systems measure the current formed, the magnitude ofwhich is correlated with sample glucose concentration.
Whole-Blood Bench Glucose Analyzer
A whole-blood glucose analyzer (ABL 625 GL,Radiometer America, Westlake, OH) was used to determinethe initial glucose levels in the venous blood samples with nodextrose addition and in those to which dextrose was added.The ABL 625 analyzer also was evaluated for druginterference. These results will be reported separately.
Parallel Control Testing
Parallel testing was used to compare glucose measure-ments in the presence and in the absence of drugs. Samplesnot spiked with drugs were measured by each glucosedevice. These control measurements served as the referencemeasurements for each glucose system.
Study Design
A low glucose level (80-100 mg/dL) was used to screenfor potential drug interference. Samples spiked with drugs weredefined as the test samples. Samples serving as controls substi-tuted isotonic sodium chloride (0.9%) for the drug solution. Foreach drug test level listed in Table 1, we used 1 control sampleand 2 parallel test samples with same drug concentration.
Sample volume (2 mL) was composed of blood and analiquot of drug solution or isotonic sodium chloride. Thealiquot added was less than 10% of the total volume,according to recommendations by the International Federa-tion of Clinical Chemistry in guidelines for the evaluation ofdrug effects in clinical chemistry.11 Each sample wasmeasured in duplicate. The 2 glucose measurements from thecontrol samples were averaged. The 4 glucose measurementsfrom the 2 parallel test samples were averaged. The meandifference between the control and test samples was calcu-lated by subtracting the mean of control readings from themean of test samples:
Glucose Difference = Mean (Test Sample) – Mean (Control)
Dose-Response Relationships
If a mean difference of greater than ± 6 mg/dL wasobserved at any of the 3 test levels, an evaluation of the dose-response relationship using 5 drug concentrations from ther-apeutic to toxic was performed 3 times (n = 3) each at low(80-100 mg/dL) and at high (approximately 200 mg/dL)glucose levels. A plot of the glucose differences vs drugconcentrations was made to show interference and to deter-mine by interpolation the drug concentration at which a ± 6mg/dL bias was observed, based on the trend. For the
Am J Clin Pathol 2000;113:75–86 77© American Society of Clinical Pathologists
❚Table 2❚Characteristics of Glucose Measurement Devices
Electron Mediator or LinearityGlucose System Method Indicator Dye Enzyme (mg/dL) Manufacturer
Test strip systemsAccu-Chek Electrochemical Ferricyanide/ GD 20-600 Roche,Advantage H ferrocyanide Indianapolis, IN
Accu-Chek Electrochemical Ferricyanide/ GO 10-600 RocheAdvantage ferrocyanide
Precision G Electrochemical Ferricinium/ GO 20-600 Abbottferrocene Laboratory,
Bedford, MAPrecision QID Electrochemical Ferricinium/ GO 20-600 Abbott
ferrocene LaboratorySureStepPro Reflectance Naphthalene sulfonic GO 0-500 LifeScan
, photometric acid salt; 3-methy 2- Milpitas, CAbenzothiazolinone hydrazone, solubilized
One Touch Reflectance 3-methy 2- GO 0-600 LifeScanphotometric benzothiazolinone
hydrazone hydrochloride; 3- dimethylaminobenzoicacid
Cuvette systemHemoCue Absorbance MTT GD 0-400 HemoCue,B-Glucose photometric Mission Viejo
, CA
GD, glucose dehydrogenase; GO, glucose oxidase; MTT, 3–(4,5–dimethylthiazol-2–yl)-2,5–diphenyl-2H-tetrazolium bromide.

Tang et al / DRUG EFFECTS AND POINT-OF-CARE GLUCOSE TESTING
Accu-Chek Advantage system, the dose-response relation-ships reported herein were checked for test strips with recentminor modifications.
Procedure
The study was performed in accordance with guide-lines of the human subjects committee. Blood wasobtained from the forearm of fasting healthy volunteers.This blood was collected in seven 5-mL lithium heparinVacutainers (Becton Dickinson, Rutherford, NJ). Afterinverting the tube 20 times, the blood was pooled. Theglucose concentration then was measured with the benchwhole-blood analyzer (ABL 625 GL). Most of the drugstested were injectable solutions. Noninjectable drugs in theform of tablets (glipizide and aspirin) were ground into afine powder, then placed into preheated normal saline(37°C), and gently mixed until completely dissolved.
The target drug concentrations in the test samples
were obtained by placing aliquots of blood into tubescontaining predetermined amounts of drug or isotonicsodium chloride to achieve a total volume of 2 mL (drugplus blood). The high glucose level (200 mg/dL) wasachieved by adding 10% dextrose solution to the bloodpool. Testing was performed in parallel (control vs testsamples) to minimize the effects of glucose metabolism.The hematocrit of each blood sample was measured on amicrocentrifuge (Select-a-Fuge 24, Bio-Dynamics, Indi-anapolis, IN) by centrifuging the sample at 4,000 rpm for5 minutes.
Precision
Two or 3 levels of quality control solutions providedby the manufacturers were tested 20 consecutive times toassess within-day precision. Day-to-day precision of eachglucose meter was obtained by collecting quality controlsolution measurements during the individual drug inter-
78 Am J Clin Pathol 2000;113:75–86 © American Society of Clinical Pathologists
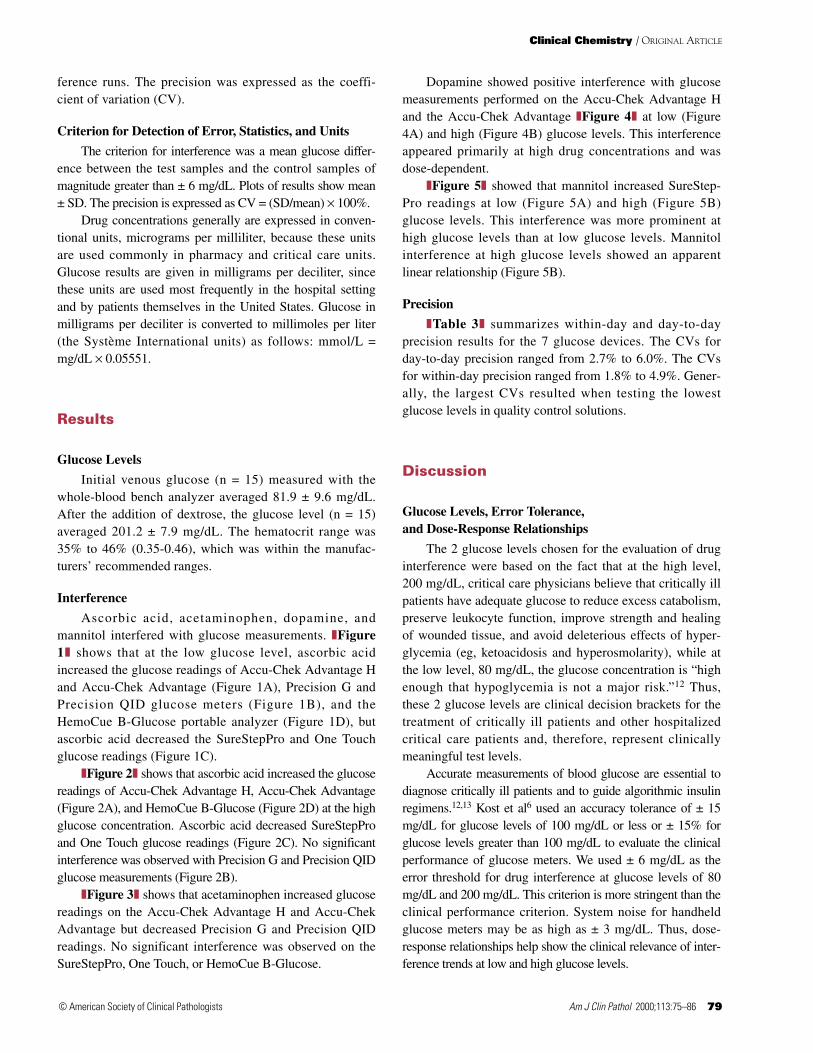
❚Figure 1❚ Ascorbic acid interference evaluated at the low glucose level. Concentrations at which glucose differences weregreater than ± 6 mg/dL were as follows: A, 90 µg/mL and 30 µg/mL for Accu-Chek Advantage H and Accu-Chek Advantage,respectively; B, 150 µg/mL and 240 µg/mL for Precision G and Precision QID, respectively; C, 90 µg/mL and 30 µg/mL forSureStepPro and One Touch, respectively; and D, 150 µg/mL for HemoCue B-Glucose. Mean difference ± SD is shown on allplots. The solid horizontal bar is the drug therapeutic level. The dashed line is the range of reported clinical drug concentra-tions that have been observed. For manufacturers of measurement devices, see Table 2.
75
60
45
30
15
0
–15
–30
–45
–60
–75
50 100 150 200 250 300
Ascorbic Acid (µg/mL)
Glu
co
se D
iffe
ren
ce (
mg
/dL) Accu-Chek Advantage H
Accu-Chek Advantage
75
60
45
30
15
0
–15
–30
–45
–60
–75
50 100 150 200 250 300
Ascorbic Acid (µg/mL)
Glu
co
se D
iffe
ren
ce (
mg
/dL)
Precision G
Precision QID
75
60
45
30
15
0
–15
–30
–45
–60
–75
50 100 150 200 250 300
Ascorbic Acid (µg/mL)
Glu
co
se D
iffe
ren
ce (
mg
/dL) SureStepPro
One Touch
75
60
45
30
15
0
–15
–30
–45
–60
–75
50 100 150 200 250 300
Ascorbic Acid (µg/mL)
Glu
co
se D
iffe
ren
ce (
mg
/dL) HemoCue B-Glucose
A B
C D
Clinical Chemistry / ORIGINAL ARTICLE
ference runs. The precision was expressed as the coeffi-cient of variation (CV).
Criterion for Detection of Error, Statistics, and Units
The criterion for interference was a mean glucose differ-ence between the test samples and the control samples ofmagnitude greater than ± 6 mg/dL. Plots of results show mean± SD. The precision is expressed as CV = (SD/mean) × 100%.
Drug concentrations generally are expressed in conven-tional units, micrograms per milliliter, because these unitsare used commonly in pharmacy and critical care units.Glucose results are given in milligrams per deciliter, sincethese units are used most frequently in the hospital settingand by patients themselves in the United States. Glucose inmilligrams per deciliter is converted to millimoles per liter(the Système International units) as follows: mmol/L =mg/dL × 0.05551.
Results
Glucose Levels
Initial venous glucose (n = 15) measured with thewhole-blood bench analyzer averaged 81.9 ± 9.6 mg/dL.After the addition of dextrose, the glucose level (n = 15)averaged 201.2 ± 7.9 mg/dL. The hematocrit range was35% to 46% (0.35-0.46), which was within the manufac-turers’ recommended ranges.
Interference
Ascorbic acid, acetaminophen, dopamine, andmannitol interfered with glucose measurements. ❚Figure1❚ shows that at the low glucose level, ascorbic acidincreased the glucose readings of Accu-Chek Advantage Hand Accu-Chek Advantage (Figure 1A), Precision G andPrecision QID glucose meters (Figure 1B), and theHemoCue B-Glucose portable analyzer (Figure 1D), butascorbic acid decreased the SureStepPro and One Touchglucose readings (Figure 1C).
❚Figure 2❚ shows that ascorbic acid increased the glucosereadings of Accu-Chek Advantage H, Accu-Chek Advantage(Figure 2A), and HemoCue B-Glucose (Figure 2D) at the highglucose concentration. Ascorbic acid decreased SureStepProand One Touch glucose readings (Figure 2C). No significantinterference was observed with Precision G and Precision QIDglucose measurements (Figure 2B).
❚Figure 3❚ shows that acetaminophen increased glucosereadings on the Accu-Chek Advantage H and Accu-ChekAdvantage but decreased Precision G and Precision QIDreadings. No significant interference was observed on theSureStepPro, One Touch, or HemoCue B-Glucose.
Dopamine showed positive interference with glucosemeasurements performed on the Accu-Chek Advantage Hand the Accu-Chek Advantage ❚Figure 4❚ at low (Figure4A) and high (Figure 4B) glucose levels. This interferenceappeared primarily at high drug concentrations and wasdose-dependent.
❚Figure 5❚ showed that mannitol increased SureStep-Pro readings at low (Figure 5A) and high (Figure 5B)glucose levels. This interference was more prominent athigh glucose levels than at low glucose levels. Mannitolinterference at high glucose levels showed an apparentlinear relationship (Figure 5B).
Precision
❚Table 3❚ summarizes within-day and day-to-dayprecision results for the 7 glucose devices. The CVs forday-to-day precision ranged from 2.7% to 6.0%. The CVsfor within-day precision ranged from 1.8% to 4.9%. Gener-ally, the largest CVs resulted when testing the lowestglucose levels in quality control solutions.
Discussion
Glucose Levels, Error Tolerance, and Dose-Response Relationships
The 2 glucose levels chosen for the evaluation of druginterference were based on the fact that at the high level,200 mg/dL, critical care physicians believe that critically illpatients have adequate glucose to reduce excess catabolism,preserve leukocyte function, improve strength and healingof wounded tissue, and avoid deleterious effects of hyper-glycemia (eg, ketoacidosis and hyperosmolarity), while atthe low level, 80 mg/dL, the glucose concentration is “highenough that hypoglycemia is not a major risk.”12 Thus,these 2 glucose levels are clinical decision brackets for thetreatment of critically ill patients and other hospitalizedcritical care patients and, therefore, represent clinicallymeaningful test levels.
Accurate measurements of blood glucose are essential todiagnose critically ill patients and to guide algorithmic insulinregimens.12,13 Kost et al6 used an accuracy tolerance of ± 15mg/dL for glucose levels of 100 mg/dL or less or ± 15% forglucose levels greater than 100 mg/dL to evaluate the clinicalperformance of glucose meters. We used ± 6 mg/dL as theerror threshold for drug interference at glucose levels of 80mg/dL and 200 mg/dL. This criterion is more stringent than theclinical performance criterion. System noise for handheldglucose meters may be as high as ± 3 mg/dL. Thus, dose-response relationships help show the clinical relevance of inter-ference trends at low and high glucose levels.
Am J Clin Pathol 2000;113:75–86 79© American Society of Clinical Pathologists

Tang et al / DRUG EFFECTS AND POINT-OF-CARE GLUCOSE TESTING
Interference Trends and Their Mechanisms
Ascorbic acid affected the glucose devices in varyingdegrees (Figures 1 and 2). Ascorbic acid is used frequentlyin clinical practice.14 The mechanism of ascorbic acid inter-ference on glucose measurements with electrochemicalstrips is that ascorbic acid is oxidized at the electrodesurface,15 resulting in the production of more electrons andthe generation of more current. There are 3 electrodes inthe Precision G and Precision QID electrochemical strips(active, background compensation, and reference elec-trode). The background compensation electrode lacksglucose oxidase but measures the signal from potentiallyinterfering substances. This nonspecific signal is used tomodify the signal produced by the primary active electrode.The results show that the third electrode compensates forthe ascorbic acid interference at the high glucose level butnot completely at the low glucose level.
The influence of ascorbic acid on glucoseoxidase–based photometric strips, such as SureStepPro andOne Touch devices, may be competition with the redoxindicator system. Ascorbic acid is a strong reducingsubstance that reacts with hydrogen peroxide. As hydrogenperoxide is consumed by ascorbic acid, less hydrogenperoxide is available to react with the dye on the test strips.Hence, dye color development is incomplete, resulting infalsely lower glucose readings.16 With different indicatordyes, such as the MTT (3-(4,5-dimethylthiazol-2-yl)-2,5-diphenyl-2H-tetrazolium bromide) used in the HemoCueB-Glucose analyzer,17 ascorbic acid increases the glucosereading instead of decreasing it. This suggests that theascorbic acid interference may be indicatordye–dependent.18
Acetaminophen interference with glucose measure-ments has been studied previously.15 Acetaminophen can
80 Am J Clin Pathol 2000;113:75–86 © American Society of Clinical Pathologists
❚Figure 2❚ Ascorbic acid interference evaluated at the high glucose level. Concentrations at which glucose differences weregreater than ± 6 mg/dL were as follows: A, 90 µg/mL for Accu-Chek Advantage H and Accu-Chek Advantage; B, 300 µg/mLfor Precision G; C, 90 µg/mL for SureStepPro and One Touch; and D, 90 µg/mL for HemoCue B-Glucose. Mean difference ±SD is shown on all plots. The solid horizontal bar is the drug therapeutic level. The dashed line is the range of reported clinicaldrug concentrations that have been observed. For manufacturers of measurement devices, see Table 2.
75
60
45
30
15
0
–15
–30
–45
–60
–75
50 100 150 200 250 300
Ascorbic Acid (µg/mL)
Glu
co
se D
iffe
ren
ce (
mg
/dL) Accu-Chek Advantage H
Accu-Chek Advantage
75
60
45
30
15
0
–15
–30
–45
–60
–75
50 100 150 200 250 300
Ascorbic Acid (µg/mL)
Glu
co
se D
iffe
ren
ce (
mg
/dL) Precision G
Precision QID
75
60
45
30
15
0
–15
–30
–45
–60
–75
50 100 150 200 250 300
Ascorbic Acid (µg/mL)
Glu
co
se D
iffe
ren
ce (
mg
/dL
) SureStepPro
One Touch
150
75
60
45
30
15
0
–15
–30
–45
–60
–75
50 100 200 250 300
Ascorbic Acid (µg/mL)
Glu
co
se D
iffe
ren
ce (
mg
/dL
) HemoCue B-Glucose
A B
C D

Clinical Chemistry / ORIGINAL ARTICLE
diffuse across a porous membrane to the electrode surfacewhere it is directly oxidized, producing an interferingcurrent that increases the glucose reading.19 The oxidationby acetaminophen is thought to be related to the freephenolic hydroxyl group present in acetaminophen.20
Acetaminophen can cause positive interference with elec-trochemical glucose test strips and a whole bloodanalyzer.15,20-22 In the present study, the devices that use 3electrodes (ie, Precision G and Precision QID) seemed toovercompensate for the interfering current, especially at thehigh glucose level.
With photometry methods, the mechanism ofdopamine [4-(2-aminoethyl) brenzcatechin-HCl] interfer-ence is assumed to be an inhibition of the chemical reactionon the test strips.23 Whether this mechanism applies toelectrochemical-based devices is unclear. An alternativeexplanation is that dopamine contains the same oxidizable
free phenolic hydroxyl group as acetaminophen; therefore,oxidation of this type of compound in the presence ofreduced flavin enzymes will produce a catalytic redoxcycle and chemical amplification of the oxidative signal.24
Mannitol introduced a positive bias on SureStepProglucose measurements and a negative bias with glucosemeasurements performed on the ABL 625 whole-bloodanalyzer.25 The mannitol effect may be a direct effect on thechemistry of the glucose test strip or an osmotic effect wherebywater is repartitioned between erythrocytes and plasma.Additional study of the mechanisms involved is needed.
Clinical Relevance
❚Table 4❚ lists the drug concentrations at which interfer-ence with glucose measurements was greater than ± 6mg/dL. Most of the drug concentrations are higher than thetherapeutic levels, with the exception of acetaminophen,
Am J Clin Pathol 2000;113:75–86 81© American Society of Clinical Pathologists
55
45
35
25
15
5
–5
–15
–25
25 50 75 100 125 150 175 200
Acetaminophen (µg/mL)
Glu
co
se D
iffe
ren
ce (
mg
/dL) Accu-Chek Advantage H
Accu-Chek Advantage
55
45
35
25
15
5
–5
–15
–25
25 50 75 100 125 150 175 200
Acetaminophen (µg/mL)
Glu
co
se D
iffe
ren
ce (
mg
/dL) Precision G
Precision QID
55
45
35
25
15
5
–5
–15
–25
25 50 75 100 125 150 175 200
Acetaminophen (µg/mL)
Glu
co
se D
iffe
ren
ce (
mg
/dL) Accu-Chek Advantage H
Accu-Chek Advantage
❚Figure 3❚ Acetaminophen interference evaluated at the low (A, B) and high (C, D) glucose levels. Concentrations at whichglucose differences were greater than ± 6 mg/dL were as follows: A, 100 µg/mL and 20 µg/mL for Accu-Chek Advantage Hand Accu-Chek Advantage, respectively; B, 200 µg/mL for Precision G and Precision QID; C, 100 µg/mL for Accu-Chek Advan-tage H and Accu-Chek Advantage; and D, 20 µg/mL for Precision G and Precision QID. Mean difference ± SD is shown on allplots. The solid horizontal bar is the drug therapeutic level. The dashed line is the range of reported clinical drug concentra-tions that have been observed. For manufacturers of measurement devices, see Table 2.
200150100
55
45
35
25
15
5
–5
–15
–25
25 50 75 125 175
Acetaminophen (µg/mL)
Glu
co
se D
iffe
ren
ce (
mg
/dL) Precision G
Precision QID
A B
C D

Tang et al / DRUG EFFECTS AND POINT-OF-CARE GLUCOSE TESTING
which in therapeutic concentrations increased Accu-ChekAdvantage and decreased Precision G and Precision QIDmeasurements at low and high glucose levels, respectively.The clinically toxic concentration of ascorbic acid is notestablished. High doses, ranging from 3 to 30 g/d,26-28 maybe recommended when treating patients with conditionssuch as the common cold,29 diabetes,30 critical illness,31,32
and cancer.26,33 Serum concentrations of ascorbate havebeen documented as high as 30 mmol/L (5,284 µg/mL).28
We tested a spectrum of ascorbic acid levels up to 300
µg/mL, based on published observations,33 to simulatemost clinical scenarios. The results showed that at highconcentrations, ascorbic acid can interfere with glucosemeasurements on all tested devices. Ascorbic acid is oneof the most common interfering substances that affects theaccuracy of glucose meters.14,15,34,35
Acetaminophen is taken extensively in the UnitedStates. Acetaminophen screening is warranted because ofthe frequency of occult presentation and the severity oftoxic effects.36 Drug overdose cases are reported often,
82 Am J Clin Pathol 2000;113:75–86 © American Society of Clinical Pathologists
65
55
45
35
25
15
5
–5
–15
–25
10 20 30 40 50 60 130
Dopamine (µg/mL)
Glu
co
se D
iffe
ren
ce (
mg
/dL) Accu-Chek Advantage H
Accu-Chek Advantage
❚Figure 4❚ Dopamine interference with glucose measurements. Concentrations at which glucose differences were greaterthan ± 6 mg/dL were as follows: A, 60 µg/mL and 20 µg/mL for Accu-Chek Advantage H and Accu-Chek Advantage, respec-tively, tested at the low glucose level; B, 40 µg/mL for Accu-Chek Advantage H and Accu-Chek Advantage, tested at the highglucose level. For clinical significance, see the “Discussion” section. Mean difference ± SD is shown on all plots. The solidhorizontal bar is the drug therapeutic level. The dashed line is the range of reported clinical drug concentrations that havebeen observed. For manufacturers of measurement devices, see Table 2.
65
55
45
35
25
15
5
–5
–15
–25
10 20 30 40 50 60 130
Dopamine (µg/mL)
Glu
co
se D
iffe
ren
ce (
mg
/dL) Accu-Chek Advantage H
Accu-Chek Advantage
A B
25,00020,000
55
45
35
25
15
5
–5
–15
–25
5,000 10,000 15,000
Mannitol (µg/mL)
Glu
co
se D
iffe
ren
ce (
mg
/dL) SureStepPro
❚Figure 5❚ Mannitol interference with glucose measurements performed on the SureStepPro. A, Glucose paired differenceswere greater than 6 mg/dL at a mannitol level of 15,000 µg/mL, tested at the low glucose level. B, Glucose paired differenceswere greater than 6 mg/dL at a mannitol level of 5,000 µg/mL, tested at the high glucose level. Mean difference ± SD isshown on all plots. The solid horizontal bar is the drug therapeutic level. The dashed line is the range of reported clinical drugconcentrations that have been observed. For manufacturers of measurement devices, see Table 2.
25,00020,000
55
45
35
25
15
5
–5
–15
–25
5,000 10,000 15,000
Mannitol (µg/mL)
Glu
co
se D
iffe
ren
ce (
mg
/dL) SureStepPro
A B

Clinical Chemistry / ORIGINAL ARTICLE
especially in children.37,38 On the basis of reports of theRocky Mountain Poison Control Center, at least 1 to 2cases of acetaminophen poisoning occur daily in theUnited States.39 Acetaminophen affects the results of notonly handheld glucose meters,16,21,22,36,40 but also whole-blood bench analyzers.19,41 In the patients with an over-dose, the acetaminophen blood concentrations were ashigh as 534 and 680 µg/mL (3,535 and 4,502 µmol/L).42,43
Unnecessary insulin therapy has been given42,43 because ofinaccurate glucose measurements. This interference is apotential risk if a therapeutic decision depends on erro-neous glucose meter results.
Dopamine increased Accu-Chek Advantage H andAccu-Chek Advantage glucose measurements at concen-trations much higher than the therapeutic level, less than0.2 µg/mL,44 and higher than those typically found clini-cally, 0.07641 µg/mL for dopamine at the infusion rate of3 µg/kg per minute.45 However, the blood concentration ofdopamine is titrated according to actual cardiovascularresponses. Therefore, higher doses of dopamine (50 µg/kgper minute) used in critically ill patients may generate highdrug levels in the blood.46 Also, since patients with hepaticand renal dysfunction show a significantly reduceddopamine clearance resulting in a steady-state plasmadopamine concentration approximately 8 times that ofpatients without renal and hepatic dysfunction,47,48 higherdrug concentrations could be reached during multipleorgan system failure in these patients.
Poor performance by glucose meters has beenobserved for patients who had inadequate tissue perfusion,
were hypotensive, or were in shock.1-3 High failure rateshave been reported in intensive care unit settings.49
Possibly, drug interference contributed to errors. Lowerglucose levels were found in capillary samples than invenous samples during adrenergic agonist interventions,2,3
and “in the patients in shock, it is possible that peripheralvasoconstriction with shunting of blood from peripheryand continued tissue glucose consumption can lead to thedecreased peripheral glucose levels.”2 These additionalclinical factors can increase glucose meter error rates inpatients with shock and must be considered when inter-preting glucose results.
Mannitol is an osmotic agent used for diuresis in cere-bral edema, toxin excretion, and glaucoma.9,50 Doses usedcan be as high as 6 g/kg per 24 hours.9 The therapeuticconcentration is 25 to 7,300 µg/mL,51 and the recom-mended blood concentration of mannitol is below 10,000µg/mL.52 Clinically, massive mannitol infusion has beenused and has caused renal failure.53-57 Hence, highmannitol blood concentrations can appear in patients withinadequate renal function. Knowledge of mannitol interfer-ence with glucose measurements is helpful in point-of-caretesting for patients with renal problems.
Conclusions
Ascorbic acid, acetaminophen, dopamine, andmannitol interfered with glucose measurements performedwith the latest generation of handheld glucose meter test
Am J Clin Pathol 2000;113:75–86 83© American Society of Clinical Pathologists
❚Table 3❚Precision Results for Glucose Measurement Devices*
Glucose Levels (mg/dL)
Low Middle High
Glucose System N Mean ± SD CV Mean ± SD CV Mean ± SD CV
Day-to-day precisionAccu-Chek Advantage H 30 65.5 ± 3.1 4.8 149.3 ± 6.6 4.4 342.0 ± 12.3 3.6Accu-Chek Advantage 30 64.4 ± 2.8 4.3 163.2 ± 6.3 3.9 298.7 ± 8.2 2.7Precision G 30 47.1 ± 2.8 6.0 — — 283.5 ± 13.1 4.6Precision QID 30 42.5 ± 2.3 5.5 — — 275.6 ± 12.3 4.5SureStepPro 30 41.4 ± 1.6 3.9 103.3 ± 4.0 3.9 325.5 ± 7.2 2.2One Touch 30 51.5 ± 1.9 3.6 109.5 ± 3.7 3.3 333.0 ± 7.6 2.3HemoCue B-Glucose 30 64.0 ± 1.9 2.9 — — 332.4 ± 7.9 2.4
Within-day precisionAccu-Chek Advantage H 20 67.0 ± 3.0 4.4 149.4 ± 5.3 3.6 342.5 ± 8.6 2.5Accu-Chek Advantage 20 64.9 ± 1.7 2.6 169.7 ± 2.8 1.8 301.2 ± 6.2 2.0Precision G 20 47.1 ± 2.2 4.6 — — 279.4 ± 9.3 3.3Precision QID 20 43.4 ± 2.1 4.9 — — 273.6 ± 8.8 3.2SureStepPro 20 41.2 ± 1.1 2.6 105.1 ± 2.6 2.5 327.9 ± 2.0 2.5One Touch 20 53.8 ± 1.4 2.7 108.9 ± 2.4 2.2 337.8 ± 6.3 1.9HemoCue B-Glucose 20 64.5 ± 1.7 2.6 — — 337.3 ± 7.5 2.2
CV, coefficient of variation.* Two quality control levels were evaluated for Precision G, Precision QID, and HemoCue B-Glucose. For manufacturers, see Table 2.

Tang et al / DRUG EFFECTS AND POINT-OF-CARE GLUCOSE TESTING
strips and, to a lesser extent, with the portable analyzer. Thesedrugs are used commonly for the treatment of critically illpatients and possibly in high doses. The package inserts ofglucose meters may not provide adequate information fordrugs used in critical care settings. Also, ascorbic acid andacetaminophen can be bought over the counter and may beingested in relatively high doses without medical supervision.
Understanding of clinical relevance is facilitated byknowledge of the patient’s drug regimen and concentration inthe blood in relation to the dose-response relationship of theinterfering substance. We recommend that dose-response rela-tionships be determined by clinical investigators of thesedevices and be part of interference evaluations required by theUS Food and Drug Administration.
Drug interferences potentially could mask the presence ofhypoglycemia or hyperglycemia and could lead to inappro-priate insulin therapy. Therefore, physicians and critical carestaff should choose handheld glucose devices carefully forpoint-of-care testing and should interpret results with currentknowledge of interfering substances and the patient’s drugregimen before treating hypoglycemia or hyperglycemia.
From the Departments of Medical Pathology and ClinicalChemistry, School of Medicine, University of California, Davis.
Supported in part by a Hugh Edmundson Fellowship (Mr Louie).
Address reprint requests to Dr Kost: Medical Pathology,3453 Tupper Hall, School of Medicine, University of California,Davis, Davis, CA 95616.
Acknowledgments: We appreciate the valuable contributionsof Michael Schivo, Sung Kong, Phong La, Roya Alcozai, MukeshSahu, and Leslie Cole Manace. We acknowledge the support of
the vendors for providing glucose devices and reagents and forcontributing to the Point-of-Care Testing Center for Teaching andResearch, where the work was performed.
References1. Maser RE, Butler MA, DeCherney GS. Use of arterial blood
with bedside glucose reflectance meters in an intensive careunit: are they accurate? Crit Care Med. 1994;22:595-599.
2. Atkin SH, Dasmahapatra A, Jaker MA, et al. Fingerstickglucose determination in shock. Ann Intern Med.1991;114:1020-1024.
3. Sylvain HF, Pokorny ME, English SM, et al. Accuracy offingerstick glucose values in shock patients. Am J Crit Care.1995;4:44-48.
4. Walker EA, Paduano DJ, Shamoon H. Quality assurance forblood glucose monitoring in health care facilities. DiabetesCare. 1991;14:1043-1049.
5. Bickford GR. Decentralized testing in the 1990s: a survey ofUnited States hospitals. Clin Lab Med. 1994;14:623-645.
6. Kost GJ, Vu HT, Lee JH, et al. Multicenter study of oxygen-insensitive handheld glucose point-of-care testing in criticalcare/hospital/ambulatory patients in the United States andCanada. Crit Care Med. 1998;26:581-590.
7. Steinberg C, Notterman DA. Pharmacokinetics ofcardiovascular drugs in children: inotropes and vasopressors.Clin Pharmacokinet. 1994;27:345-367.
8. Hardman JG, Limbird LE, Molinoff PB, et al. Goodman &Gilman’s the Pharmacological Basis of Therapeutics. 9th ed.New York, NY: McGraw-Hill; 1996:1570-1571.
9. Zaloga GP, Macgregor D. The Critical Care Drug Handbook.2nd ed. St Louis, MO: Mosby-Year Book; 1997.
10. Powers DM, Boyd JC, Glick MR, et al. Interference Testingin Clinical Chemistry. Proposed Guideline. Villanova, PA:National Committee for Clinical Laboratory Standards;1986. NCCLS publication EP7-P.
84 Am J Clin Pathol 2000;113:75–86 © American Society of Clinical Pathologists
❚Table 4❚Drug Interference Concentrations Associated With Glucose Differences of Greater Than ± 6 mg/dL*
Level Drug Interference Concentrations
At Low Glucose At High GlucoseGlucose System Drug Therapeutic Toxic Level Level
Accu-Chek Advantage H Ascorbic acid 8-12 — 90 90Acetaminophen 10-20 >150 100 100Dopamine <0.2 — 60 40
Accu-Chek Advantage Ascorbic acid 8-12 — 30 90Acetaminophen 10-20 >150 20 100Dopamine <0.2 — 20 40
Precision G Ascorbic acid 8-12 — 150 300Acetaminophen 10-20 >150 200 20
Precision QID Ascorbic acid 8-12 — 240 †Acetaminophen 10-20 >150 200 20
SureStepPro Ascorbic acid 8-12 — 90 90Mannitol <10,000 — 15,000 5,000
One Touch Ascorbic acid 8-12 — 30 90HemoCue B-Glucose Ascorbic acid 8-12 — 150 90
* All units are given as micrograms per milliliter. For manufacturers, see Table 2.† No interference observed in the tested concentration.

Clinical Chemistry / ORIGINAL ARTICLE
11. IFCC Guidelines to the Evaluation of Drug Effects inClinical Chemistry. Scand J Clin Lab Invest Suppl.1989;49:1-29.
12. Hirsch IB, Brunzell J, Paauw DS. Inpatient management ofadults with diabetes. Diabetes Care. 1995;18:870-878.
13. Queale WS, Seidler AJ, Brancati FL. Glycemic control andsliding scale insulin use in medical inpatients with diabetesmellitus. Arch Intern Med. 1997;157:545-552.
14. Siest G, Appel W, Blijenberg GB, et al. Drug interference inclinical chemistry: studies on ascorbic acid. J Clin Chem ClinBiochem. 1978;16:103-110.
15. Moatti-Sirat D, Velho G, Reach G. Evaluating in vitro andin vivo the interference of ascorbate and acetaminophen onglucose detection by a needle-type glucose sensor. BiosensBioelectron. 1992;7:345-352.
16. Rice GK, Galt KA. In vitro drug interference with homeblood-glucose-measurement systems. Am J Hosp Pharm.1985;42:2202-2207.
17. Ashworth L, Gibb I, Alberti KG. Hemocue: evaluation of aportable photometric system for determining glucose inwhole blood. Clin Chem. 1992;38:1479-1482.
18. White-Stevens RH. Interference by ascorbic acid in testsystems involving peroxidase, I: reversible indicators and theeffects of copper, iron, and mercury. Clin Chem. 1982;28:578-588.
19. Lindh M, Lindgren K, Carlström A, et al. Electrochemicalinterferences with the YSI glucose analyzer [letter]. ClinChem. 1982;28:726.
20. Kaufmann-Raab I, Jonen HG, Jähnchen E, et al.Interference by acetaminophen in the glucoseoxidase–peroxidase method for blood glucose determination. Clin Chem. 1976;22:1729-1731.
21. Lewis BD. Laboratory evaluation of the Glucocard™ bloodglucose test meter. Clin Chem. 1992;38:2093-2095.
22. Mayer M, Salpeter L. Toxic levels of acetaminophenproduce a major positive interference on Glucometer Eliteand Accu-chek Advantage glucose meters [letter]. ClinChem. 1998;44:893-894.
23. Keeling AB, Schmidt P. Dopamine influence on whole-bloodglucose reagent strips [letter]. Diabetes Care. 1987;10:532.
24. Thea J, Moore G, Gina Nam, et al. Chemically amplifiedvoltammetric enzyme electrodes for oxidizablepharmaceuticals. Anal Chem. 1994;66:3158-3163.
25. Nguyen T, Tang Z, Kost GJ. In vitro drug interference withglucose and lactate measurements obtained with the three-layer membrane electrochemical biosensors. Presented at:Oakridge Conference, American Association of ClinicalChemistry, San Jose, CA, April 23-24, 1999.
26. Cameron E, Campbell A, Jack T. The orthomoleculartreatment of cancer, III: reticulum cell sarcoma: doublecomplete regression induced by high-dose ascorbic acidtherapy. Chem Biol Interact. 1975;11:387-393.
27. Hoffer A. Ascorbic acid and toxicity [letter]. N Engl J Med.1971;9:635-636.
28. Badrick TC, Campbell B. Effects of intravenous infusion ofascorbic acid on common clinical chemistry tests [letter]. ClinChem. 1992;38:2160.
29. Luberoff BJ. Symtomectomy: a chat with Robert Cathcart,MD. Chemtech. February 1978:76-86.
30. Eriksson J, Kohvakka A. Magnesium and ascorbic acidsupplementation in diabetes mellitus. Ann Nutr Metab.1995;39:217-223.
31. Grant JP. Nutritional support in critically ill patients. AnnSurg. 1994;220:610-616.
32. Schorah CJ, Downing C, Piripitsi A, et al. Total vitamin C,ascorbic acid, and dehydroascorbic acid concentrations inplasma of critically ill patients. Am J Clin Nutr. 1996;63:760-765.
33. Cameron E, Campbell A. The orthomolecular treatment ofcancer, II: clinical trial of high-dose ascorbic acidsupplements in advanced human cancer. Chem Biol Interact.1974;9:285-315.
34. Breuer J. Report on the symposium “Drug Effects in ClinicalChemistry Methods.” Eur J Clin Chem Clin Biochem.1996;34:385-386.
35. Sylvester EC, Price CP, Burrin JM. Investigation of thepotential for interference with whole blood glucose strips.Ann Clin Biochem. 1994;31:94-96.
36. Sporer KA, Khayam-Bashi H. Acetaminophen and salicylateserum levels in patients with suicidal ingestion or alteredmental status. Am J Emerg Med. 1996;14:443-446.
37. Kumar A, Goel KM, Rae, MD. Paracetamol overdose inchildren. Scott Med J. 1990;35:106-110.
38. Buchanan PA, Buchanan N. Paracetamol poisoning inchildren and hepatotoxicity. Br J Clin Pharmacol.1991;32:143-149.
39. Arena JM, Drew RH. Poisoning: Toxicology, Symptoms,Treatments. Springfield, IL: Charles C. Thomas; 1986.
40. Cartier LJ, Leclerc P, Pouliot M, et al. Toxic levels ofacetaminophen produce a major positive interference onGlucometer Elite and Accuchek Advantage Glucose Meters[letter]. Clin Chem. 1998;44: 893-894.
41. Copland AM, Mather J, Ness A, et al. Apparenthyperglycaemia in paracetamol overdose [letter]. Br J GenPract. 1992;259-260.
42. Roddis MJ. Paracetamol interference with glucose analysis.Lancet. 1981;19:634-635.
43. Farah D A, Boag D, Moran F, et al. Paracetamol interferencewith blood glucose analysis: a potentially fatal phenomenon.Br Med J (Clin Res Ed). 1982;285:172.
44. D’Orazio P, Parker B. Interference by the oxidizablepharmaceuticals acetaminophen and dopamine atelectrochemical biosensors for blood glucose [abstract]. ClinChem. 1995;41(suppl):S156.
45. Pavoni V, Verri M, Ferraro L, et al. Plasma dopamineconcentration and effects of low dopamine doses on urinaryoutput after major vascular surgery. Kidney Int Suppl.1998;53:S75-S80.
46. Kalman S, Berg S, Lisander B. Combined overdose withverapamil and atenolol: treatment with high doses ofadrenergic agonists. Acta Anaesthesiol Scand. 1998;42:379-382.
47. Notterman DA, Greenwald BM, Moran F, et al. Dopamineclearance in critically ill infants and children: effect of ageand organ system dysfunction. Clin Pharmacol Ther.1990;48:138-147.
48. Zaritsky A, Lotze A, Stull R, et al. Steady-state dopamineclearance in critically ill infants and children. Crit CareMed. 1988;16:217-220.
49. Ting C, Nanji AA. Evaluation of the quality of bedsidemonitoring of the blood glucose level in a teaching hospital.CMAJ. 1988;138:23-26.
Am J Clin Pathol 2000;113:75–86 85© American Society of Clinical Pathologists

Tang et al / DRUG EFFECTS AND POINT-OF-CARE GLUCOSE TESTING
86 Am J Clin Pathol 2000;113:75–86 © American Society of Clinical Pathologists
50. Nissenson AR, Weston RE, Kleeman CR. Mannitol. West JMed. 1979;131:277-284.
51. Tryding N, Tufvesson C, Sonntag O. Drug Effects in ClinicalChemistry 1996. 7th ed. Stockholm, Sweden:Apoteksbolaget AB; 1996:22-23.
52. Dorman HR, Sondheimer JH, Cadnapaphornchai P.Mannitol-induced acute renal failure. Medicine.1990;69:153-159.
53. Rabetoy GM, Fredericks MR, Hostettler CF. Where thekidney is concerned, how much mannitol is too much? AnnPharmacother. 1993;27:25-28.
54. Weaver A, Sica DA. Mannitol-induced acute renal failure.Nephron. 1987;45:233-235.
55. Whelan TV, Bacon ME, Madden M, et al. Acute renalfailure associated with mannitol intoxication. Arch InternMed. 1984;144:2053-2055.
56. Goldwasser P, Fotino S. Acute renal failure followingmassive mannitol infusion. Arch Intern Med. 1984;144:2214-2216.
57. Rello J, Triginer C, Sánchez AN, et al. Acute renal failurefollowing massive mannitol infusion. Nephron. 1989;53:377-378.