effectively managing research evaluation in italy
TRANSCRIPT
Effectively managing Italian Research evaluation
Marco MalgariniANVUR
Science and Development ForumSofia, June 11 2014
2
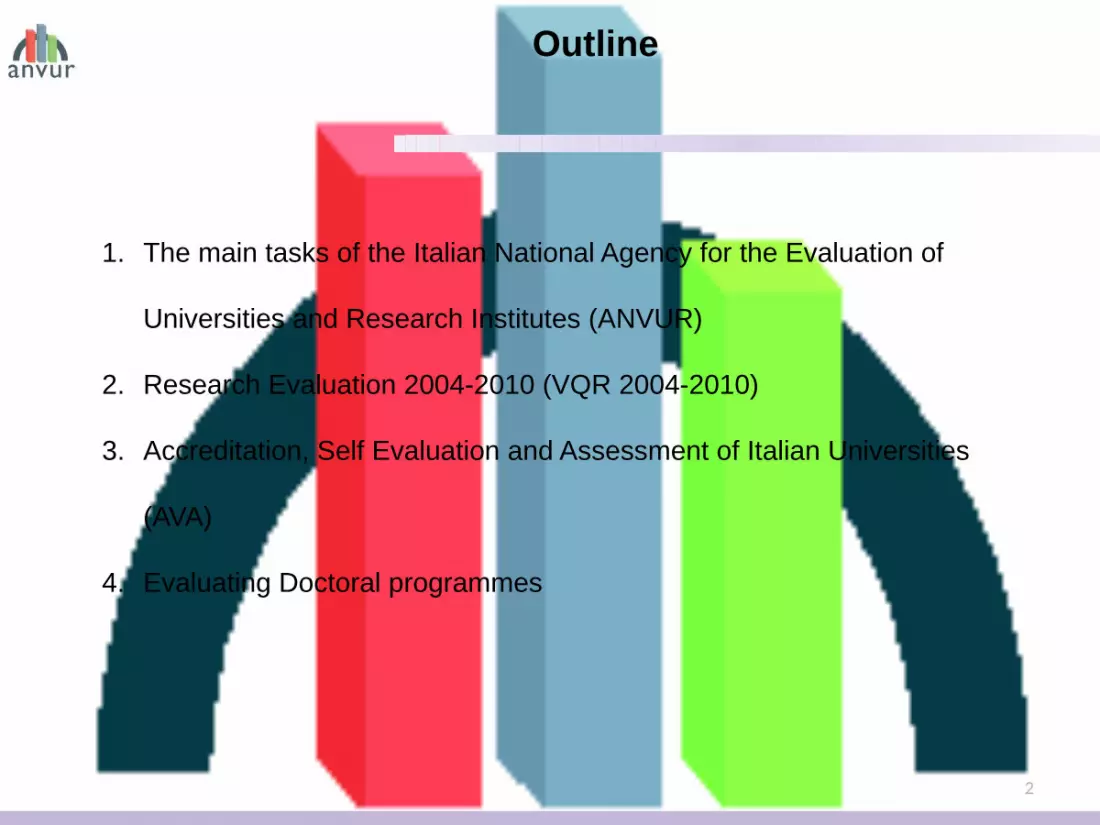
Outline
1. The main tasks of the Italian National Agency for the Evaluation of
Universities and Research Institutes (ANVUR)
2. Research Evaluation 2004-2010 (VQR 2004-2010)
3. Accreditation, Self Evaluation and Assessment of Italian Universities
(AVA)
4. Evaluating Doctoral programmes

3
The Italian National Agency for the Evaluation of Universities and Research Institutes
The Italian National Agency for the Evaluation of Universities and Research
Institutes (ANVUR) is in charge of evaluating the quality of activities of Universities
and research institutions
ANVUR main tasks include:
• Evaluating processes, results and products of all activities concerning
research, teaching and technological transfer;
• Defining methods and criteria to be used for periodical accreditation and
evaluation of Universities (undergraduate, postgraduate and Ph.D courses);
• Giving general advices for the activities of internal evaluation bodies;
• Evaluating public funding programs aimed at enhancing research and
innovation activities;
• Editing every two years a general Report on the state of the Italian Higher
Education system.
4
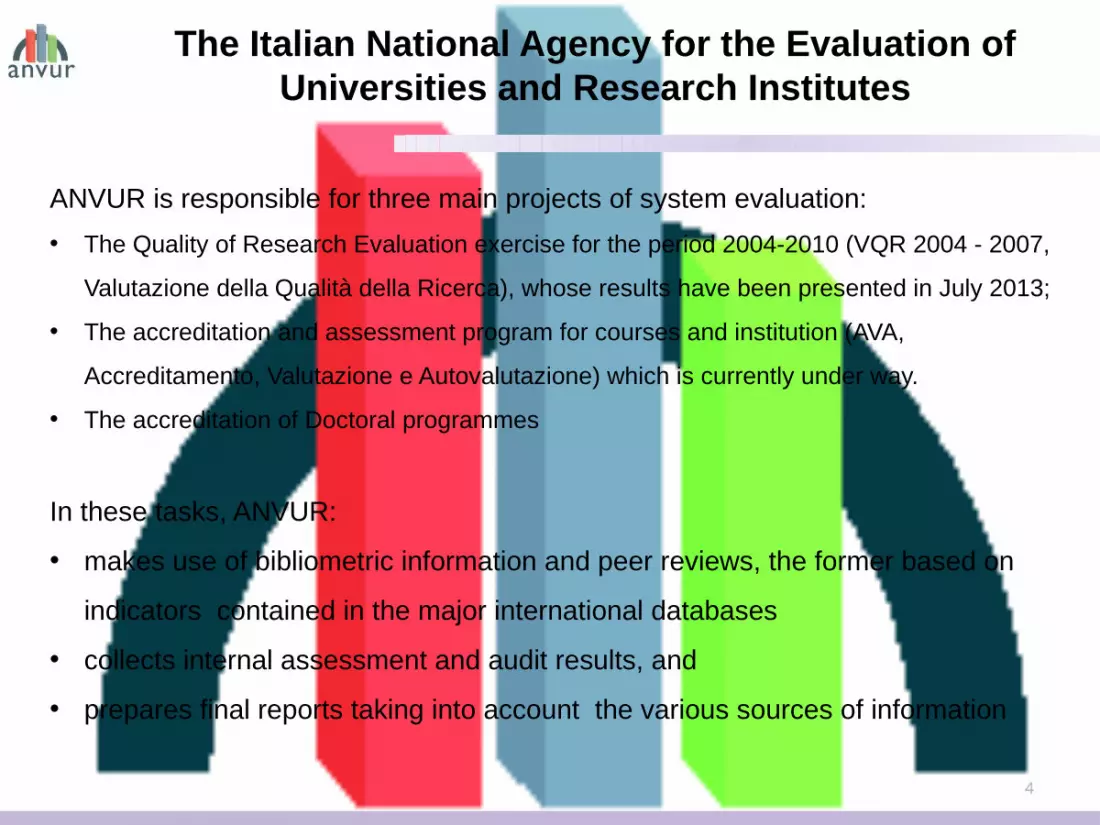
The Italian National Agency for the Evaluation of Universities and Research Institutes
ANVUR is responsible for three main projects of system evaluation:• The Quality of Research Evaluation exercise for the period 2004-2010 (VQR 2004 - 2007,
Valutazione della Qualità della Ricerca), whose results have been presented in July 2013;
• The accreditation and assessment program for courses and institution (AVA,
Accreditamento, Valutazione e Autovalutazione) which is currently under way.
• The accreditation of Doctoral programmes
In these tasks, ANVUR:
• makes use of bibliometric information and peer reviews, the former based on
indicators contained in the major international databases
• collects internal assessment and audit results, and
• prepares final reports taking into account the various sources of information
5
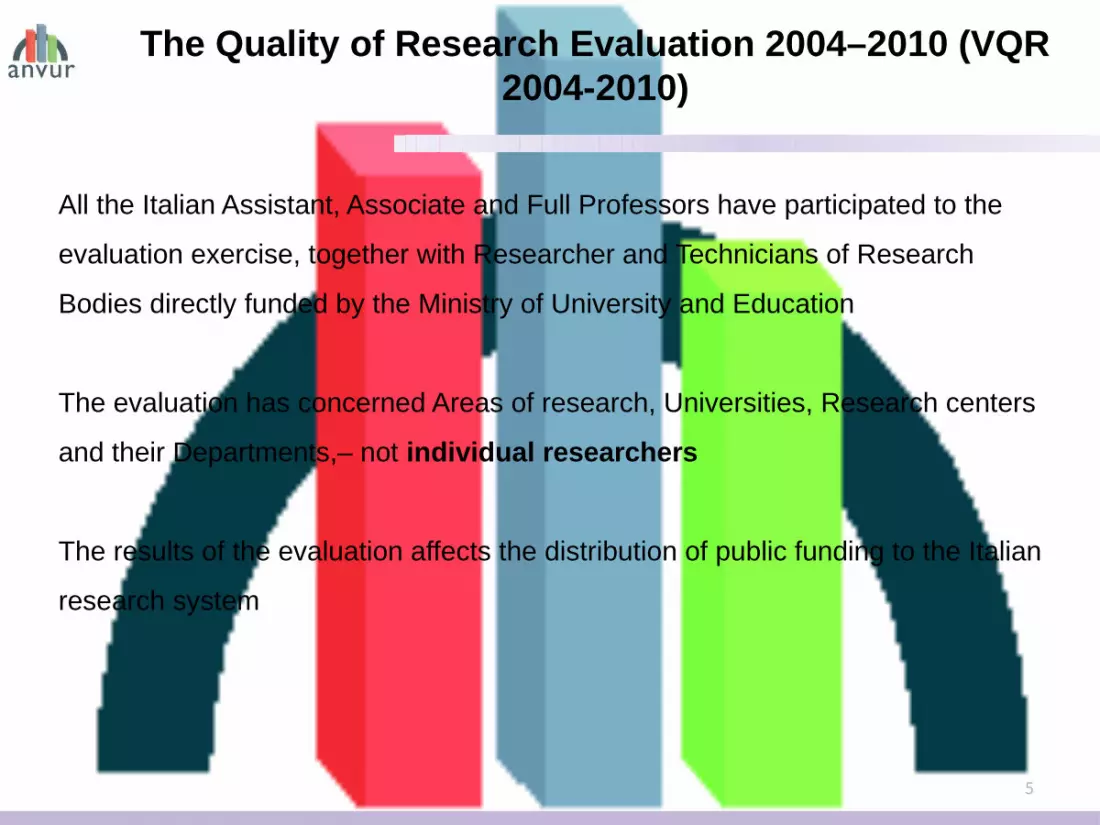
The Quality of Research Evaluation 2004–2010 (VQR 2004-2010)
All the Italian Assistant, Associate and Full Professors have participated to the
evaluation exercise, together with Researcher and Technicians of Research
Bodies directly funded by the Ministry of University and Education
The evaluation has concerned Areas of research, Universities, Research centers
and their Departments,– not individual researchers
The results of the evaluation affects the distribution of public funding to the Italian
research system

6
The Evaluation of Research 2004–2010 (VQR 2004-2010)
Each University and research body has chosen the three best research products
(six products for research centers) published in the 2004-2010 period by each
researcher working in that University or research center
Research outcomes (publications in the following considered for evaluation were:
• Articles
• Books, books chapters and proceedings (with ISBN code)
• Critical editions, translations, scientific comments
• Patents
• Design, Performances, dataset, softwares and a few other categories
Each publication was assigned to one of 16 Research Areas, derived from the
official organisation of Scientific Areas of research established by the National
University Council (CUN)

7
Italian Scientific Areas of Research
• The 16 Areas are:• Bibliometric Areas:
• Mathematics (Area 1)• Physics (Area 2)• Chemistry (Area 3)• Earth Sciences (Area 4)• Biology (Area 5)• Medicine (Area 6)• Agricultural and Veterinarian Sciences (Area 7)• Civic Engineering (Part of Area 8)• Industrial and communication Engineering (Area 9)• Psychology (Part of Area 11)• Economics and Statistics (Area 13)
• Humanities and Social Sciences: • Architecture (Part of Area 8)• Humanities (Area 10)• History and Philosophy (part of Area 11)• Law (Area 12)• Social Sciences (Area 14)

8
Institutions and experts involved
• Institutions involved in the VQR 2004-2010 include:• 67 + 28 public and private Universities• 12 Research Bodies under the control of the Ministry of Education
and University• 27 Research Bodies which have voluntary submitted an application
to be evaluated by ANVUR
• Evaluation has been performed by:• 450 national and international Scientific experts forming 14 Groups of
Experts of Evaluation (GEV) for the 14 Areas of Research• About 17,000 national and foreign reviewers
9
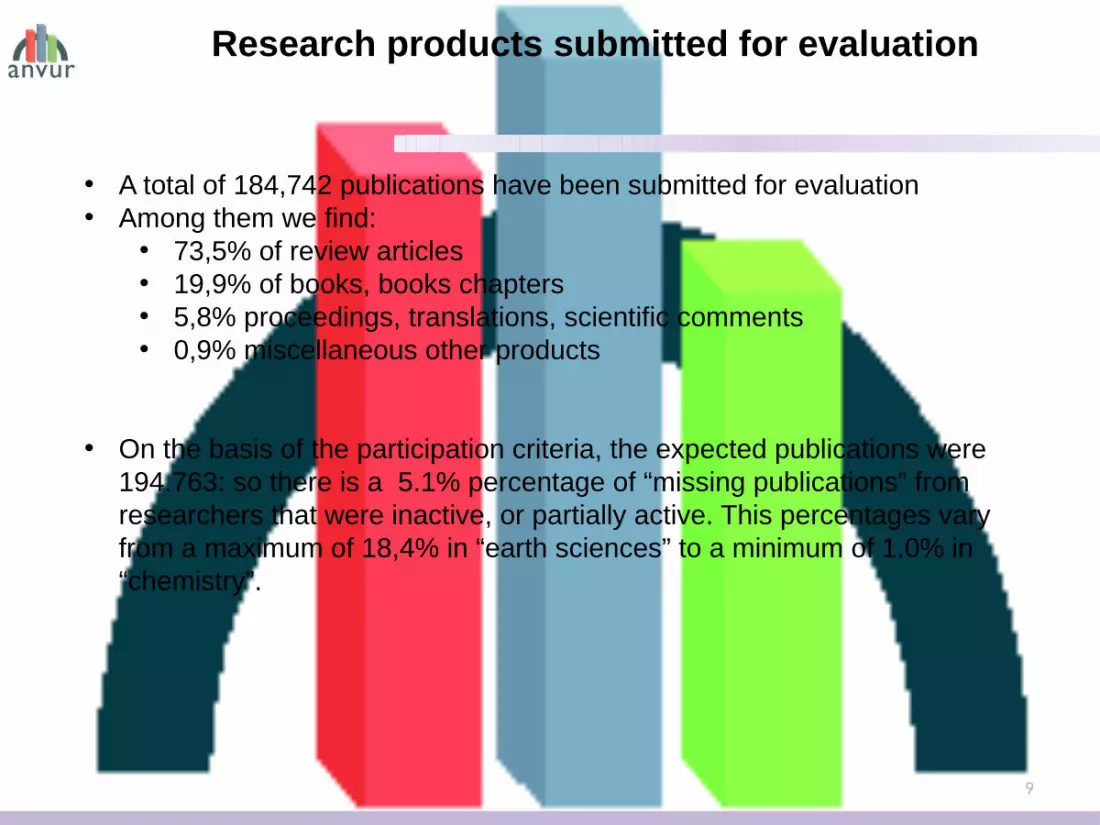
Research products submitted for evaluation
• A total of 184,742 publications have been submitted for evaluation• Among them we find:
• 73,5% of review articles• 19,9% of books, books chapters• 5,8% proceedings, translations, scientific comments• 0,9% miscellaneous other products
• On the basis of the participation criteria, the expected publications were 194.763: so there is a 5.1% percentage of “missing publications” from researchers that were inactive, or partially active. This percentages vary from a maximum of 18,4% in “earth sciences” to a minimum of 1.0% in “chemistry”.
10
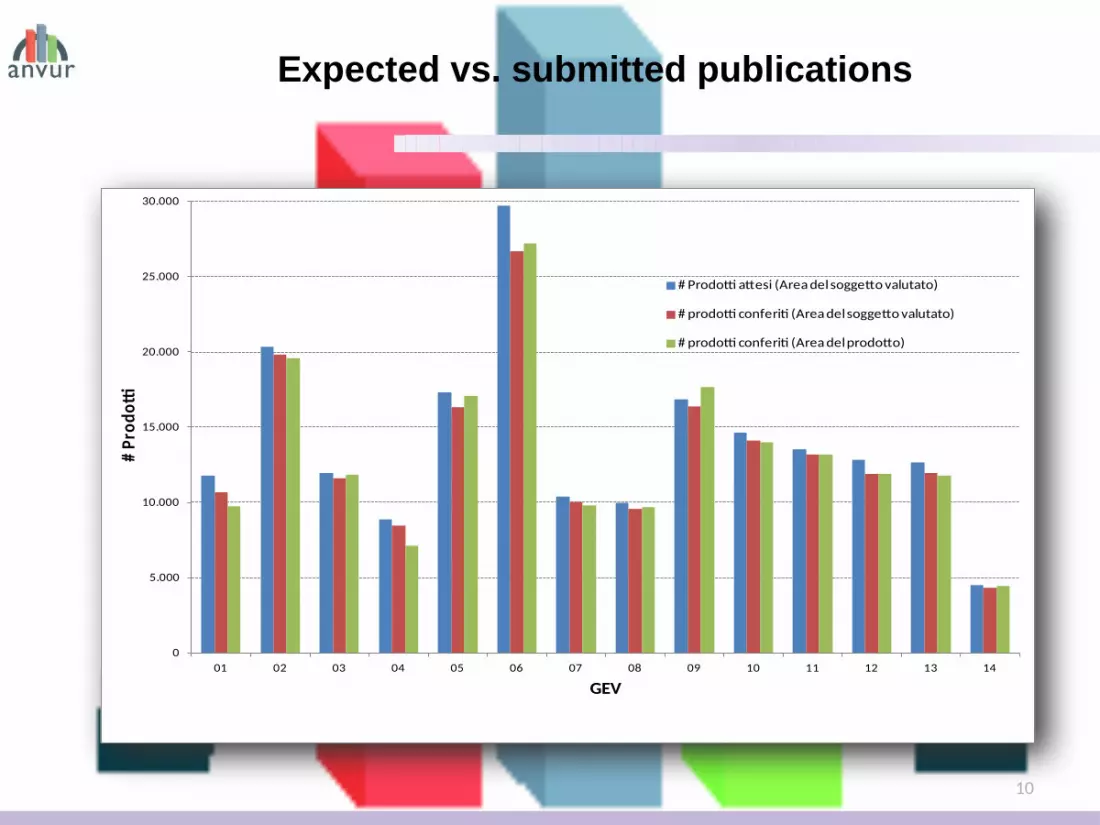
Expected vs. submitted publications
0
5.000
10.000
15.000
20.000
25.000
30.000
01 02 03 04 05 06 07 08 09 10 11 12 13 14
# Pr
odotti
GEV
# Prodotti attesi (Area del soggetto valutato)
# prodotti conferiti (Area del soggetto valutato)
# prodotti conferiti (Area del prodotto)

11
Submitted publications by type of publication and
Area (in % of total publications in the Area)
1 2 3 4 5 6 7 8 9 10 11 12 13 140%
10%20%30%40%50%60%70%80%90%
100%
Articles Books, chapters Proceedings Others
12
Language
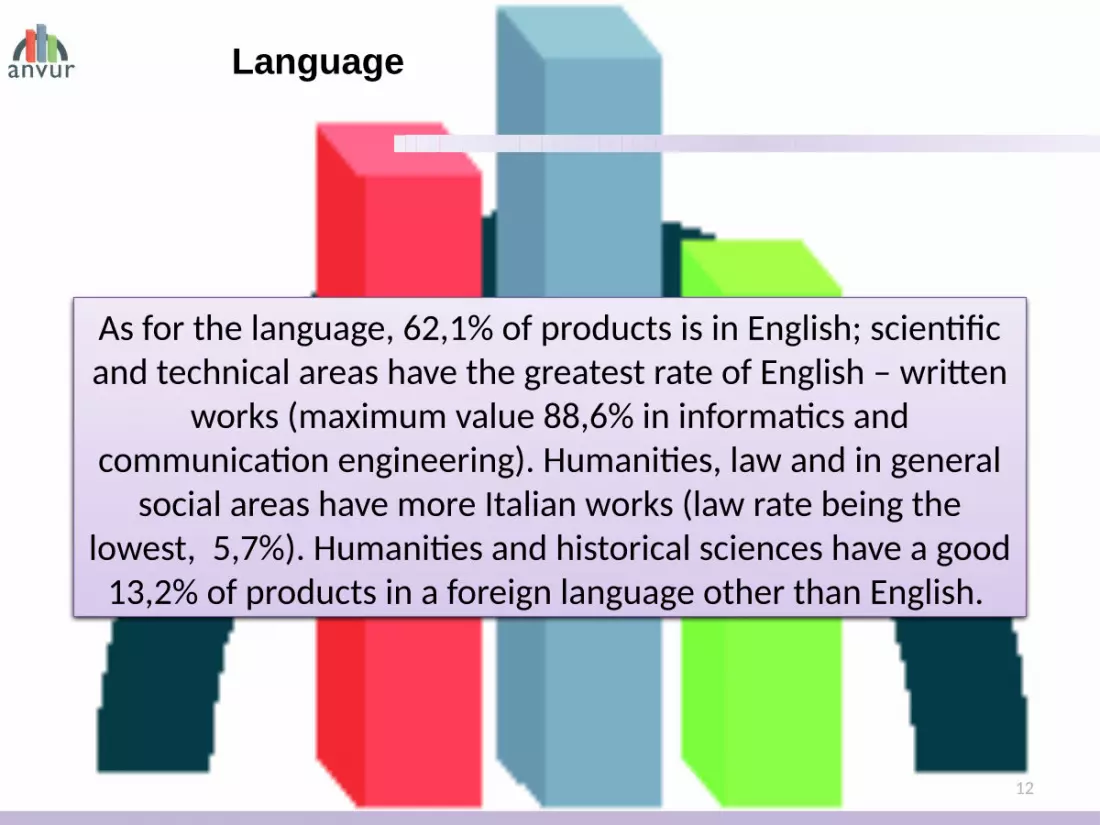
As for the language, 62,1% of products is in English; scientific and technical areas have the greatest rate of English – written
works (maximum value 88,6% in informatics and communication engineering). Humanities, law and in general
social areas have more Italian works (law rate being the lowest, 5,7%). Humanities and historical sciences have a good
13,2% of products in a foreign language other than English.
13
Evaluation criteria
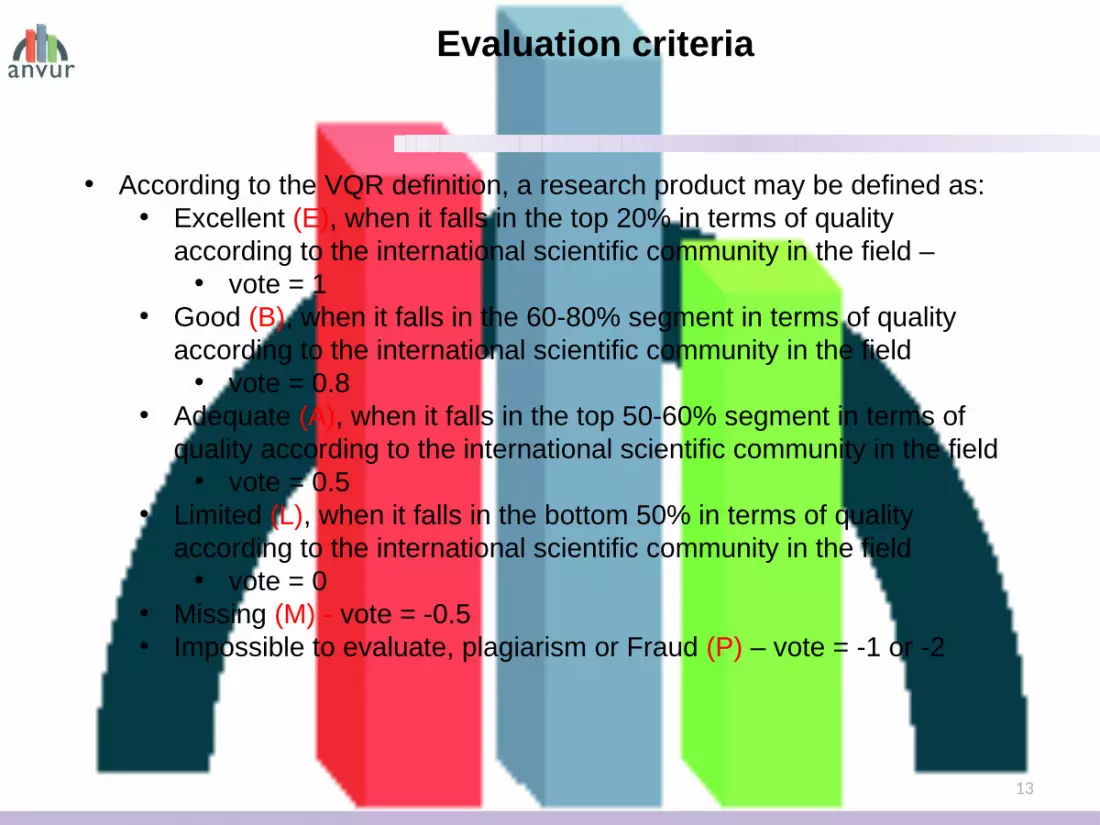
• According to the VQR definition, a research product may be defined as:• Excellent (E), when it falls in the top 20% in terms of quality
according to the international scientific community in the field – • vote = 1
• Good (B), when it falls in the 60-80% segment in terms of quality according to the international scientific community in the field
• vote = 0.8• Adequate (A), when it falls in the top 50-60% segment in terms of
quality according to the international scientific community in the field• vote = 0.5
• Limited (L), when it falls in the bottom 50% in terms of quality according to the international scientific community in the field
• vote = 0• Missing (M) - vote = -0.5• Impossible to evaluate, plagiarism or Fraud (P) – vote = -1 or -2

14
Evaluation Methods
• Evaluation was based on a combination of bibliometric and peer review methods
• Overall, more than 50% of the publications submitted for evaluation is subject to peer review
• In the bibliometric sectors defined above, there is an intense use of bibliometric methods
• Bibliometric evaluation concerns publications indexed either in Scopus or Web of Sciences databases

15
The calculation of bibliometric indicators
Threshold (# citations) for each evaluation class for some subject category according to the ISI database, year 2009• In bibliometric areas, the
classification of research products is performed in two steps:
1. Definition of the appropriate bibliometric indicators to be used
2. Definition of an appropriate algorithm assigning the value of the chosen indicator(s) to one of the defined class of merit (E; G; A; L)

16
The calculation of bibliometric indicators
• The indicators chosen for the VQR 2004-2010 are the following:
1. An indicator of the impact of the journal on which the research product has been published, such as Scimago Journal Rank or the Journal Impact Factor. Such an indicator provides information on the quality of the publication linked to:
a) The referee procedure to which the research product has been submitted tob) Refusal rates of the journalc) Diffusion of the journald) Reputation of the Journal
2. The number of citations received by the research product

17
The bibliometric alghorithm - 1
• For each article, we first identify the Journal, the year of publication and the scientific field
• We then calculate the empirical cumulative distribution of the SJR for all the Journals in a given scientific field in a given year
• The distribution is divided up in four areas, with probability of inclusion respectively equal to 0,2; 0,2; 0,1 and 0,5
1
IF
0.6
0.8
0.5
Th3 Th2 Th1
Cum. Distrib.

18
The bibliometric alghorithm - 2
• We then calculate the empirical cumulative distribution of the number of citations for all the articles in a given scientific field in a given year
• Also this distribution is divided up in four areas, with probability of inclusion respectively equal to 0,2; 0,2; 0,1 and 0,5
# of citations
1
0.6
0.8
0.5
Th3 Th2 Th1
Cum. Distrib.

19
The bibliometric alghorithm - 3
• As a result, we have two different classifications respectively based on the quality of the Journal (as measured by the SJR) and the number of citations of the paper
• Starting from these informations, we construct the 4x4 matrix shown here
• When the two indicators give equal indications, the class is settled
• When the two indicators give diverging indications, we may choose to give an higher weight either to the impact or to the citational indicator
A
B
C
D
# C
itatio
ns
1
2
3
4
1 2 3 4
Bibliometry (SJR)
20
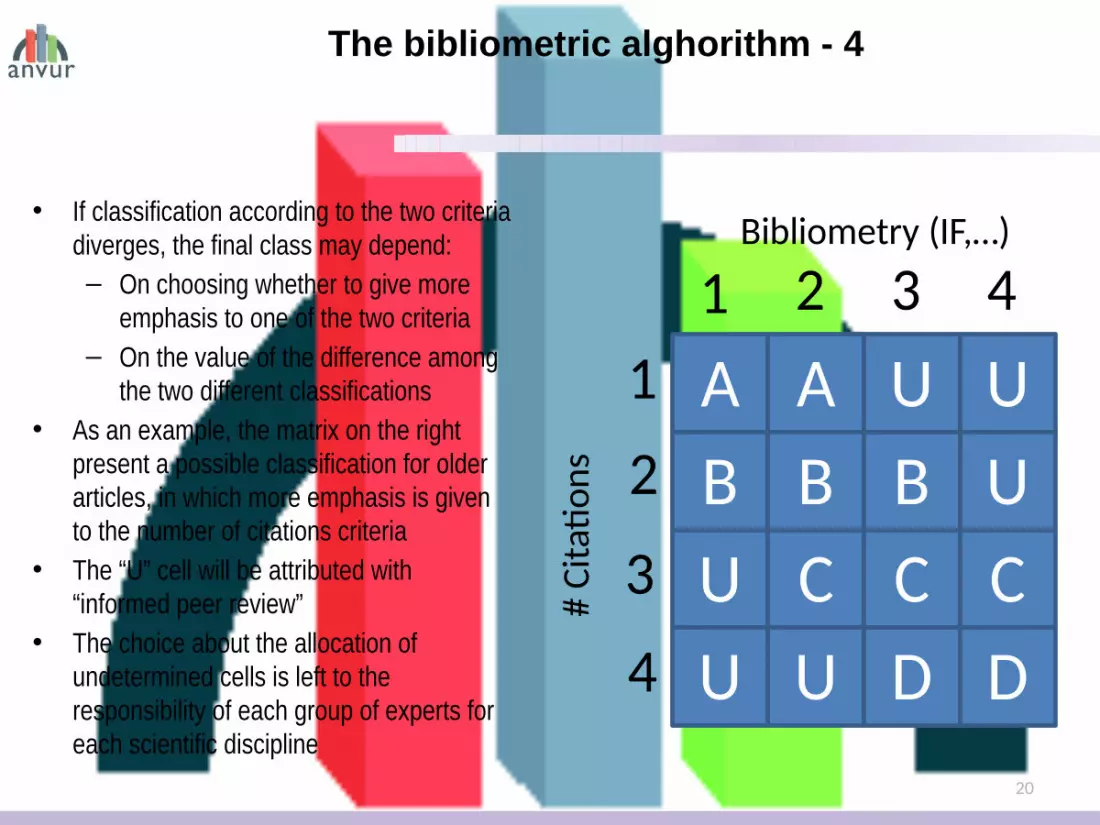
The bibliometric alghorithm - 4
• If classification according to the two criteria diverges, the final class may depend:– On choosing whether to give more
emphasis to one of the two criteria– On the value of the difference among
the two different classifications• As an example, the matrix on the right
present a possible classification for older articles, in which more emphasis is given to the number of citations criteria
• The “U” cell will be attributed with “informed peer review”
• The choice about the allocation of undetermined cells is left to the responsibility of each group of experts for each scientific discipline
A A U UB B B UU C C CU U D D
# Ci
tatio
ns
12
3
4
1 2 3 4Bibliometry (IF,…)

21
Bibliometric vs. peer review evaluation
• In order to check for the robustness of bibliometric evaluation with respect to peer review, we have extracted a representative sample of almost 10.000 outcomes submitted in bibliometric areas, which have been evaluated with both methods
Scientific Area Population Sample %
Mathematics and Informatrics6758 631
9,3
Physics 15029 1412 9,4
Chemistry 10127 927 9,2
Earth science 5083 458 9,0
Biology 14043 1310 9,3
Medicine 21191 1984 9,4
Agricoltural and veterinary science 6284 532 8,5
Civil engenireeng 2460 225 9,1
Industrial and Information engenireeng 12349 1130 9,2
Economics and Statistics 5681 590 10,4
Total 99005 9199 9,3
22
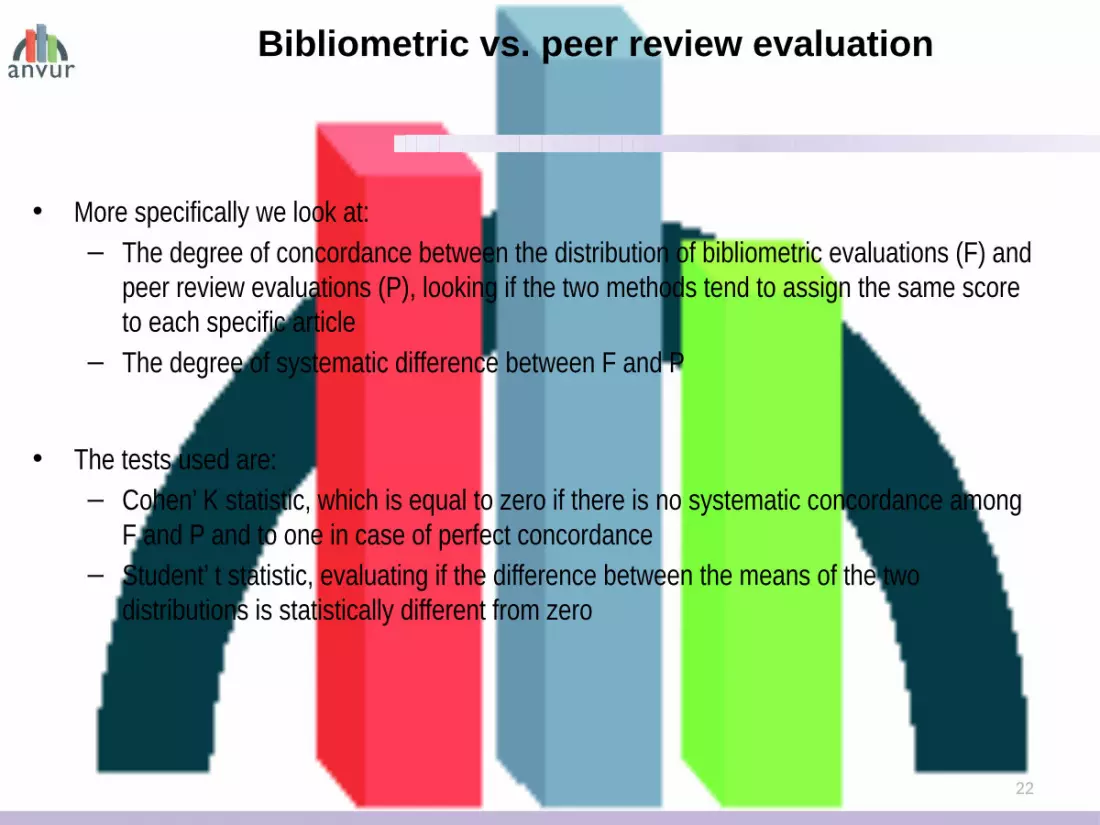
Bibliometric vs. peer review evaluation
• More specifically we look at:– The degree of concordance between the distribution of bibliometric evaluations (F) and
peer review evaluations (P), looking if the two methods tend to assign the same score to each specific article
– The degree of systematic difference between F and P
• The tests used are:– Cohen’ K statistic, which is equal to zero if there is no systematic concordance among
F and P and to one in case of perfect concordance– Student’ t statistic, evaluating if the difference between the means of the two
distributions is statistically different from zero

23
Cohen’ K statistic
Scientific Area F vs P P1 vs P2
Lower bound K Upper bound Lower bound K Upper bound
Total 0,30 0,32 0,33 0,26 0,29 0,31
Mathematics and Informatrics 0,24 0,32 0,40 0,27 0,36 0,45
Physics 0,19 0,23 0,27 0,18 0,23 0,29
Chemistry 0,17 0,22 0,28 0,19 0,25 0,31
Earth science 0,20 0,28 0,36 0,15 0,25 0,35
Biology 0,28 0,33 0,38 0,22 0,28 0,33
Medicine 0,26 0,30 0,34 0,20 0,25 0,29
Agricultural and veterinary science 0,21 0,28 0,34 0,07 0,16 0,24
Civil engenireeng 0,10 0,20 0,30 0,07 0,20 0,33
Industrial and Information engenireeng 0,12 0,16 0,20 0,13 0,19 0,25
Economics and Statistics 0,46 0,54 0,62 0,32 0,40 0,48
24
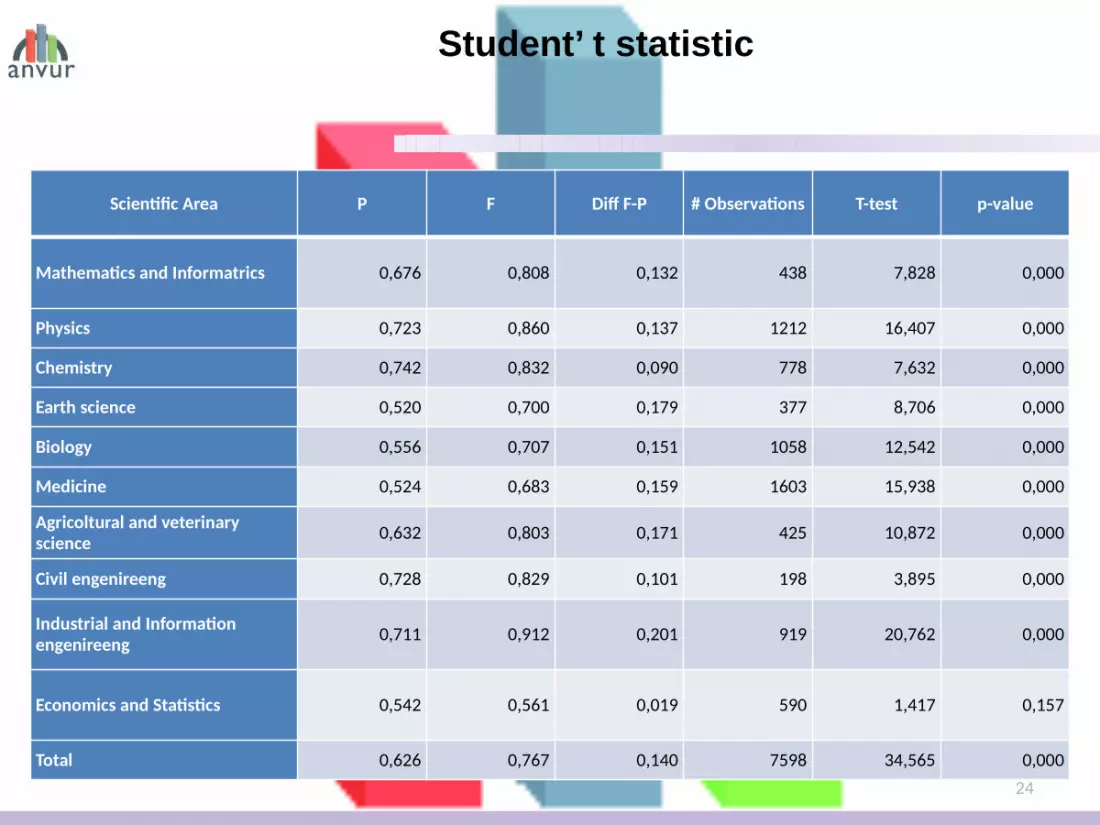
Student’ t statistic
Scientific Area P F Diff F-P # Observations T-test p-value
Mathematics and Informatrics 0,676 0,808 0,132 438 7,828 0,000
Physics 0,723 0,860 0,137 1212 16,407 0,000
Chemistry 0,742 0,832 0,090 778 7,632 0,000
Earth science 0,520 0,700 0,179 377 8,706 0,000
Biology 0,556 0,707 0,151 1058 12,542 0,000
Medicine 0,524 0,683 0,159 1603 15,938 0,000
Agricoltural and veterinary science 0,632 0,803 0,171 425 10,872 0,000
Civil engenireeng 0,728 0,829 0,101 198 3,895 0,000
Industrial and Information engenireeng 0,711 0,912 0,201 919 20,762 0,000
Economics and Statistics 0,542 0,561 0,019 590 1,417 0,157
Total 0,626 0,767 0,140 7598 34,565 0,000

25
Bibliometric vs. peer review evaluation
• The main conclusions from the analysis are: – There is a satisfactory degree of concordance among peer review
and bibliometric evaluations• Quite often, indeed, the concordance between F and P is higher
than that between two reviewers for the same outcome– There is a systematic difference among peer and bibliometric
evaluations; more specifically, the average score for bibliometric evaluations is statistically higher than that obtained from peer review
• Results obtained are broadly supportive of the choice of using a mix of bibliometric and peer review methods for research evaluation in Italy
26
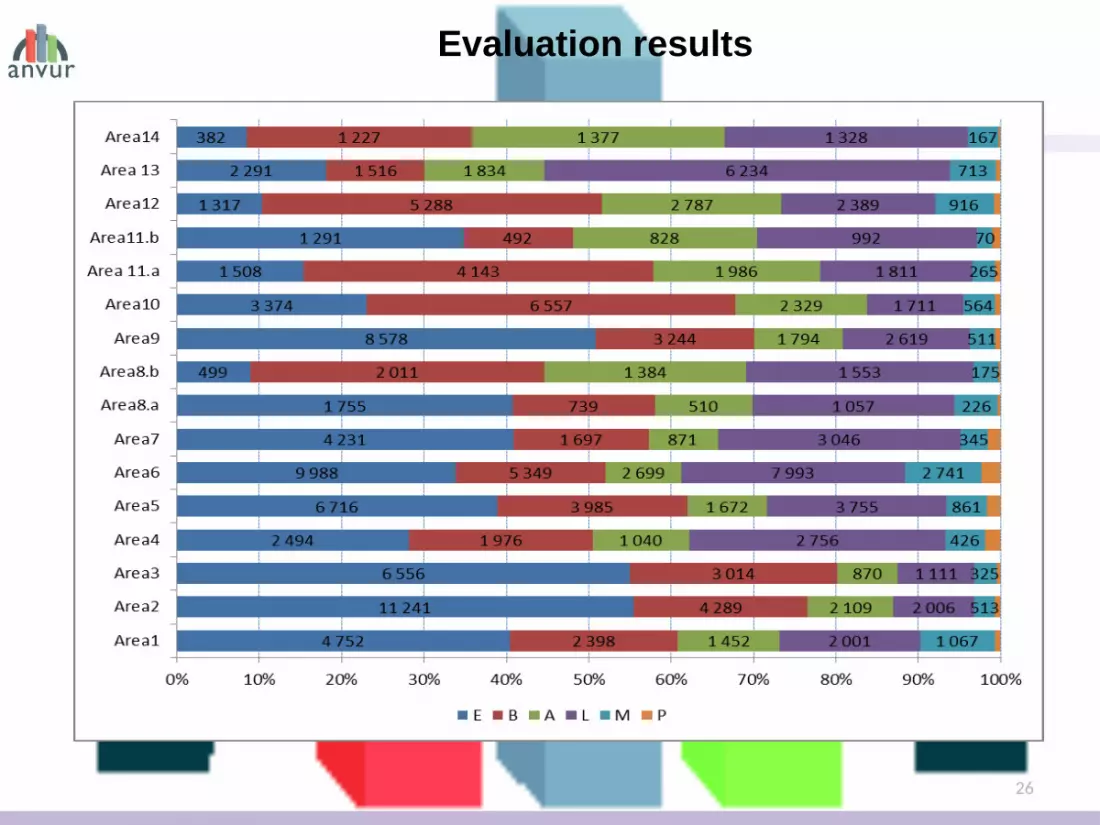
Evaluation results

27
• Comparisons of results are possible only in the same area, NOT between different areas, that have different evaluation criteria and standards
• Evaluation results are one of the components of the final assessment of the structures, with a weight of 50%
• The other indicators for final assessment were:
ability to attract funds in a number of competitive calls (10%) mobility index, calculating the results researches hired or promoted in the examined
period (10%) Internationalization index (incoming and outcoming researchers, publications with non
Italian co-authors), 10% High qualification index (number of ph.d. students, post graduation grants…), 10% Funds for research coming from the institution, 5% Improvement index, as a difference from the former evaluation process (5%)

• The Evaluation of Research Quality is scheduled to be performed every four years
• Evaluation results contribute to the determination of the amount of public funding to be assigned to Italian Universities each year
• In this sense, there is a need to have updated information about research quality for the years in between the release of two consecutives Evaluation exercises
• This kind of information comes from the system of Accreditation, self Evaluation and Assessment of Italian Universities (AVA), and in particular from the SUA-RD (Annual Summarizing Chart – Research)
VQR and the system of Accreditation, self evaluation and Assessment (AVA)
28

29
The structure of the SUA-RD chart
I. Objectives, management and assessment of departmental researchII. Human resources and infrastructures
III. Research results
V. Third Mission
IV. Scientific achievements
QA system
QA and Periodical evaluation Work in
progress

3030
How to calculate the relevant indicators
• Indicators will be calculated separately for each scientific area (16 Areas) and will be aggregated in a synthetic indicator following VQR’ rules
• For each Department and Area, the indicator will be expressed as a fraction of the total calculated for the Area

31
Indicators and Parameters to be used for evaluation
Indicators for the evaluation of research activities:
1. Percentage of inactives (i.e. those with zero publications in the last five years)
2. Number of Scientific publications by Area in the last 10 yerars 3. Number of National and international scientific awards4. Number of Fellowships in scientific bodies 5. Number of projects in competitive tenders per researcher in the last
10 years6. Number of scientific products with international co-authors in the
last 5 years7. Average number of Ph.D thesis per capita8. Number of months per capita of foreign teachers/students in the
Department9. VQR Results

32
Calculating the indicators
• We hence derive 5 indicators:
Univerity research indicator derived from the SUA-RD chart: IFRSUA-RD
University third mission indicator derived from the SUA-RD chart: IFTMSUA-RD
University research indicator derived from VQR: IFRVQR
University third mission indicator derived from VQR: IFTMVQR
Univerity indicator derived from SUA-RD: IFREDSUA-RD
33
Calculating the indicators
• Since VQR indicators are available every 4 years (2013 VQR 2004-2010; 2017 2011-2014), in order to obtain the final indicator we use a combination of the the aforementioned indicators, in which:
• VQR weights declines the farther you go from the publication of VQR results
• SUA weights increase at the same time
33

34
SUA-RD and VQR
From one VQR to the next
2014 20172015 20162013 2018
VQR 2004-2010SUA-RD 2011-2013
VQR 2004-2010SUA-RD 2013-2015
VQR 2004-2010
SUA-RD 2014-2016
VQR 2011-2014
SUA-RD 2015-2017
VQR 2011-2014SUA-RD 2016-2018
SUA-RD 2012-2014
VQR 2004-2010 …..
…..
…..
Testing period

• ANVUR is also responsible for the accreditation of Italian Doctoral programmes, with the final goal of increasing their overall quality and international profile
• More specifically, ANVUR is evaluating, among other things, the scientific qualification of the Doctoral Board and of its co-ordinator
• The indicator chosen for evaluation are: – The average score reached in the VQR 2004-2010 by the
member of the Board, calculated as a ratio with respect to the average score of its Scientific area
– The number of citations and publications of each member of the Board up to 2012, looking wether they are above the median values for the relevant Scientific Area
– The number of publications in the last five years– The curriculum vitae of the Scientific co-ordinator
Accreditation of Doctoral Programmes
35

36
THANK YOU FOR YOUR ATTENTION!