effect of pvc on ionic conductivity, crystallographic structural, morphological and thermal...
TRANSCRIPT
Ea
Sa
b
a
ARRAA
KPTcXSDT
1
iteiAkaesimb
blcopd
0d
Thermochimica Acta 511 (2010) 140–146
Contents lists available at ScienceDirect
Thermochimica Acta
journa l homepage: www.e lsev ier .com/ locate / tca
ffect of PVC on ionic conductivity, crystallographic structural, morphologicalnd thermal characterizations in PMMA–PVC blend-based polymer electrolytes
. Ramesha,∗, Chiam-Wen Liewb, Ezra Morrisb, R. Durairajb
Centre for Ionics University Malaya, Department of Physics, Faculty of Science, University of Malaya, Lembah Pantai, 50603 Kuala Lumpur, MalaysiaFaculty of Engineering & Science, Universiti Tunku Abdul Rahman, Setapak, 53300 Kuala Lumpur, Malaysia
r t i c l e i n f o
rticle history:eceived 15 December 2009eceived in revised form 18 July 2010ccepted 6 August 2010vailable online 13 August 2010
a b s t r a c t
In this paper, temperature dependence of ionic conductivity, crystallographic structural, mor-phological and thermal characteristics of polymer blends of PMMA and PVC with lithiumbis(trifluoromethanesulfonyl) imide (LiTFSI) as a dopant salt are investigated. The study on the tem-perature dependence of ionic conductivity shows that these polymer blends exhibit Arrhenius behavior.The highest ionic conductivity was achieved when 70 wt% of PMMA was blended with 30 wt% of PVC. X-ray diffraction (XRD) and scanning electron microscopy (SEM) reveal the amorphous nature and surface
eywords:olymer blendemperature dependence ioniconductivityRDEMSC
morphology of polymer electrolytes, respectively. In DSC analysis it was found that the glass transi-tion temperature (Tg) and melting temperature (Tm) decreased, whereas the decomposition temperature(Td) increased. In contrast, the shift towards higher decomposition temperature and decrease in weightloss of polymer electrolytes, in TGA studies, indicates that the thermal stability of polymer electrolytesimproved.
GA
. Introduction
Recent developments in solid state ionic conductors, such asnsertion compounds, fast/superionic conductors, polymer elec-rolytes, and the development of new solid state materials forlectrodes have drawn keen interest from the researchers work-ng in the area of electrical power generation and storage systems.mong these, the recent ones are the polymer electrolytes alsonown as polyelectrolytes [1]. Solid polymer electrolytes (SPEs)re promising materials because of its wider applications inlectrochromic windows (ECWs), modified electrodes, sensors,upercapacitors, electric vehicles (EV), high vacuum electrochem-stry, thermoelectric generators and fuel cells [1,2]. However,
uch attention had been focused on the secondary lithiumatteries.
SPEs are expected to replace conventional liquid electrolytesecause they tend to eliminate the problems of corrosive solvent
eakage and harmful gas production. They exhibit a wider electro-
hemical and thermal stability as well as low volatility [3–7]. Thether advantages of SPEs are viz., they are light in weight, easy torocess due to its flexibility, high energy density, high ionic con-uctivity and high automation process [8,9]. Many investigations∗ Corresponding author. Tel.: +60 3 7967 4391.E-mail address: [email protected] (S. Ramesh).
040-6031/$ – see front matter © 2010 Elsevier B.V. All rights reserved.oi:10.1016/j.tca.2010.08.005
© 2010 Elsevier B.V. All rights reserved.
on polymer blending [10,11], comb-branched copolymers [12,13],cross-linking polymer matrices [14,15], incorporation of additiveslike plasticizers [16,9], reinforcement by inorganic fillers [17,18],binary salt systems [19] and different preparation methods [20]were done in order to achieve higher ionic conductivity at ambienttemperature. Among all the above-mentioned techniques, polymerblending is the most feasible technique. This technique comple-ments the advantages from other techniques but also improves theelectrical and physical properties of polymer electrolytes [21].
The amorphous nature of polymer matrix is associated with thehigh ionic conductivity of SPEs at ambient temperature. Severalmethods including X-ray diffraction (XRD) and differential scan-ning calorimetry (DSC) were used to examine the crystal structuresand crystalline nature of the polymer matrix. Scanning electronmicroscopy (SEM) is widely used to characterize the structural,morphological and crystallite size of SPEs. DSC measurement pro-vides a quantitative study of thermal transitions of matrix polymerin polymer electrolytes by heating the polymer sample and an inertreference. Thermogravimetric analysis (TGA) is another versatilethermal analysis to investigate the thermal properties of SPEs as afunction of change in temperature by determining the thermal sta-
bility of polymer electrolytes. The temperature dependence of ionicconductivity is extensively used in the study of ionic conductionmechanism of SPEs.In the present work, the weight ratio of LiTFSI remains fixed in allthe samples and the PMMA is blended with PVC at different weight

imica
rt(cc
2
2
3iwwt
2
dmwtiosrwcfi
2
2
tfiiHtsS
2
udo
2
pat
energy to overcome the hydrostatic pressure which is imposed byits surrounding atoms. This results in the formation of voids andfacilitates the segmental transportation of charge carriers. Hencethere is an increase in ionic conductivity [9].
TC
S. Ramesh et al. / Thermoch
atios, so that we can find the optimum ratio of PMMA and PVChat exhibits the highest ionic conductivity. The structural studiesXRD and SEM) and thermal studies (DSC and TGA) of these polymeromplexes with different weight ratios of PMMA and PVC were thenonducted and is reported.
. Experimental
.1. Materials
In this study, PMMA with an average molecular weight of50,000 g mol−1 (Aldrich), high molecular weight of PVC (Fluka),
norganic dopant salt LiTFSI (Fluka) and solvent THF (J.T. Baker)ere used without further purification. Solution casting techniqueas used to prepare the thin films of polymer electrolytes used in
his study.
.2. Preparation of thin films
Prior to the preparation of the polymer electrolytes, LiTFSI wasried at 100 ◦C for 1 h to eliminate trace amounts of water in theaterial. The compositions prepared were [xPMMA–(1 − x)PVC],here x is 0.1, 0.5 and 0.7 and the weight ratio of polymer blend
o lithium salt is 90:10. Table 1 shows the compositions and des-gnations of particular polymer electrolytes. Appropriate amountsf PMMA, PVC and LiTFSI were dissolved in THF. The solution wastirred continuously for 24 h to obtain a homogenous mixture atoom temperature. The solution was cast on a glass Petri dish andas allowed to evaporate slowly inside a fume hood. This pro-
ess will produce a mechanically stable and a free standing thinlm.
.3. Characterizations
.3.1. Temperature dependence analysisThe prepared samples were subjected to AC-impedance spec-
roscopy for ionic conductivity studies. The thicknesses of the thinlms were measured by using a micrometer screw gauge. The
onic conductivities of the samples were determined, by usingIOKI 3532-50 LCR HiTESTER, over the frequency range of 50 Hz
o 1 MHz and from ambient temperature until 80 ◦C. Two stainlessteel (SS) blocking electrodes were used in this study with the conS/SPE/SS.
.3.2. X-ray diffraction (XRD)The amorphousity of polymer electrolytes was investigated
sing XRD. The XRD patterns were recorded on a Siemens D 5000iffractometer with Cu-K� radiation (� = 1.54060 A), over the rangef 2� = 5–80◦ at ambient temperature.
.3.3. Scanning electron microscopy (SEM)Using Leica’s SEM (model S440) at 10 kV, the morphology of
olymer blends at room temperature was studied. Insulators suchs pure PMMA, PVC and PMMA–PVC samples were coated with ahin layer of gold to prevent electrostatic charging.
able 1ompositions, designations, activation energy and DSC measurements of PMMA–PVC–LiT
Composition of PMMA and PVC (wt%) Designations Activation energy, Ea
PMMA PVC
70 30 PE 3 0.1202150 50 PE 5 0.1872410 90 PE 9 0.20393
Acta 511 (2010) 140–146 141
2.3.4. Differential scanning calorimetry (DSC)DSC analysis was carried out, under nitrogen flow rate of
50 ml min−1, using a METTLER TOLEDO Thermal Analyzer whichcomprised of DSC 823e as the main unit and STARe software. Sam-ples weighing approximately 2–3 mg were hermetically sealed ina 40 �l aluminum crucible. The samples were heated from 25 to105 ◦C to remove any traces of solvent and water. The temperaturewas then maintained at 105 ◦C for 2 min to ensure the completeevaporation. The samples were then cooled rapidly to 25 ◦C andthen reheated to 450 ◦C at a heating rate of 10 ◦C min−1. The finalheating scan was used to evaluate the Tg, Tm and Td. The mid pointof endothermic reaction is assigned as Tg. The endothermic peakpoint of melting and decomposition are assigned as Tm and Td,respectively.
2.3.5. Thermogravimetric analysis (TGA)TGA was carried out using a METTLER TOLEDO Thermal Gravi-
metric Analyser which comprised of TGA/SDTA851e as the mainunit and STARe software. Samples weighing 2–3 mg were placed ina 150 �l silica crucible. The samples were then heated from 30 to400 ◦C at a heating rate of 10 ◦C min−1 under nitrogen flow rate of10 ml min−1.
3. Result and discussion
3.1. Temperature dependence ionic conductivity studies
Fig. 1 depicts the Arrhenius plot of PE 3, PE 5 and PE 9 whichshows that the ionic conductivity increases with temperature. Thisis attributed to the expansion of polymer matrix. The polymermatrix expands with increase in temperature, which results in theformation of free volume and empty spaces for the migration ofions. This assists the mobility of ions and minimizes the effect of ionclouds at the electrode and electrolyte interface [22,23]. The vibra-tional mode of polymer segments also increases with the increasein temperature. As a result, the polymer segments have sufficient
Fig. 1. Arrhenius plot of ionic conductivity of PE 3, PE 5 and PE 9.
FSI based polymer electrolytes.
(eV) DSC measurements
Tg Tm Td
115.12 185.12 345.38, 388.0165.40, 125.09 192.13 335.16, 387.0566.23, 134.98 235.06 315.21, 386.31
1 imica Acta 511 (2010) 140–146
id
�
wcrfotoTbc53Pova
aicbfmdi
catcoatrlmtaribE
3
ppodTtPPPCifew
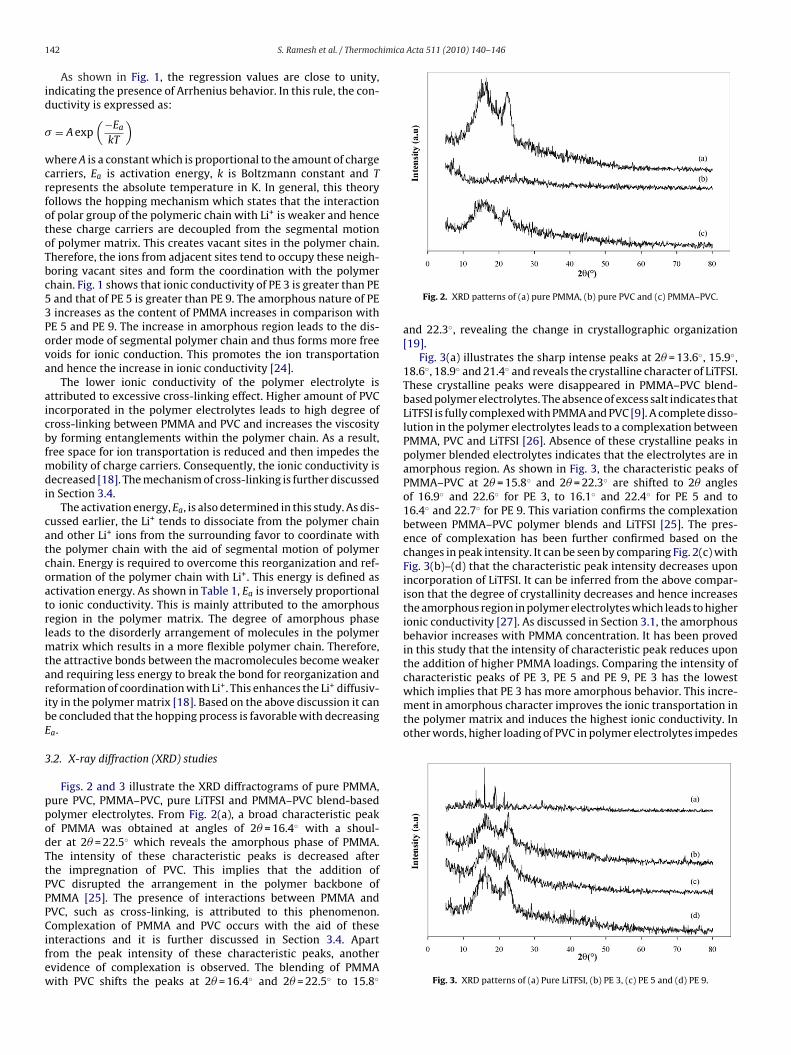
characteristic peaks of PE 3, PE 5 and PE 9, PE 3 has the lowestwhich implies that PE 3 has more amorphous behavior. This incre-ment in amorphous character improves the ionic transportation inthe polymer matrix and induces the highest ionic conductivity. Inother words, higher loading of PVC in polymer electrolytes impedes
42 S. Ramesh et al. / Thermoch
As shown in Fig. 1, the regression values are close to unity,ndicating the presence of Arrhenius behavior. In this rule, the con-uctivity is expressed as:
= A exp(−Ea
kT
)
here A is a constant which is proportional to the amount of chargearriers, Ea is activation energy, k is Boltzmann constant and Tepresents the absolute temperature in K. In general, this theoryollows the hopping mechanism which states that the interactionf polar group of the polymeric chain with Li+ is weaker and hencehese charge carriers are decoupled from the segmental motionf polymer matrix. This creates vacant sites in the polymer chain.herefore, the ions from adjacent sites tend to occupy these neigh-oring vacant sites and form the coordination with the polymerhain. Fig. 1 shows that ionic conductivity of PE 3 is greater than PEand that of PE 5 is greater than PE 9. The amorphous nature of PEincreases as the content of PMMA increases in comparison with
E 5 and PE 9. The increase in amorphous region leads to the dis-rder mode of segmental polymer chain and thus forms more freeoids for ionic conduction. This promotes the ion transportationnd hence the increase in ionic conductivity [24].
The lower ionic conductivity of the polymer electrolyte isttributed to excessive cross-linking effect. Higher amount of PVCncorporated in the polymer electrolytes leads to high degree ofross-linking between PMMA and PVC and increases the viscosityy forming entanglements within the polymer chain. As a result,ree space for ion transportation is reduced and then impedes the
obility of charge carriers. Consequently, the ionic conductivity isecreased [18]. The mechanism of cross-linking is further discussed
n Section 3.4.The activation energy, Ea, is also determined in this study. As dis-
ussed earlier, the Li+ tends to dissociate from the polymer chainnd other Li+ ions from the surrounding favor to coordinate withhe polymer chain with the aid of segmental motion of polymerhain. Energy is required to overcome this reorganization and ref-rmation of the polymer chain with Li+. This energy is defined asctivation energy. As shown in Table 1, Ea is inversely proportionalo ionic conductivity. This is mainly attributed to the amorphousegion in the polymer matrix. The degree of amorphous phaseeads to the disorderly arrangement of molecules in the polymer
atrix which results in a more flexible polymer chain. Therefore,he attractive bonds between the macromolecules become weakernd requiring less energy to break the bond for reorganization andeformation of coordination with Li+. This enhances the Li+ diffusiv-ty in the polymer matrix [18]. Based on the above discussion it cane concluded that the hopping process is favorable with decreasinga.
.2. X-ray diffraction (XRD) studies
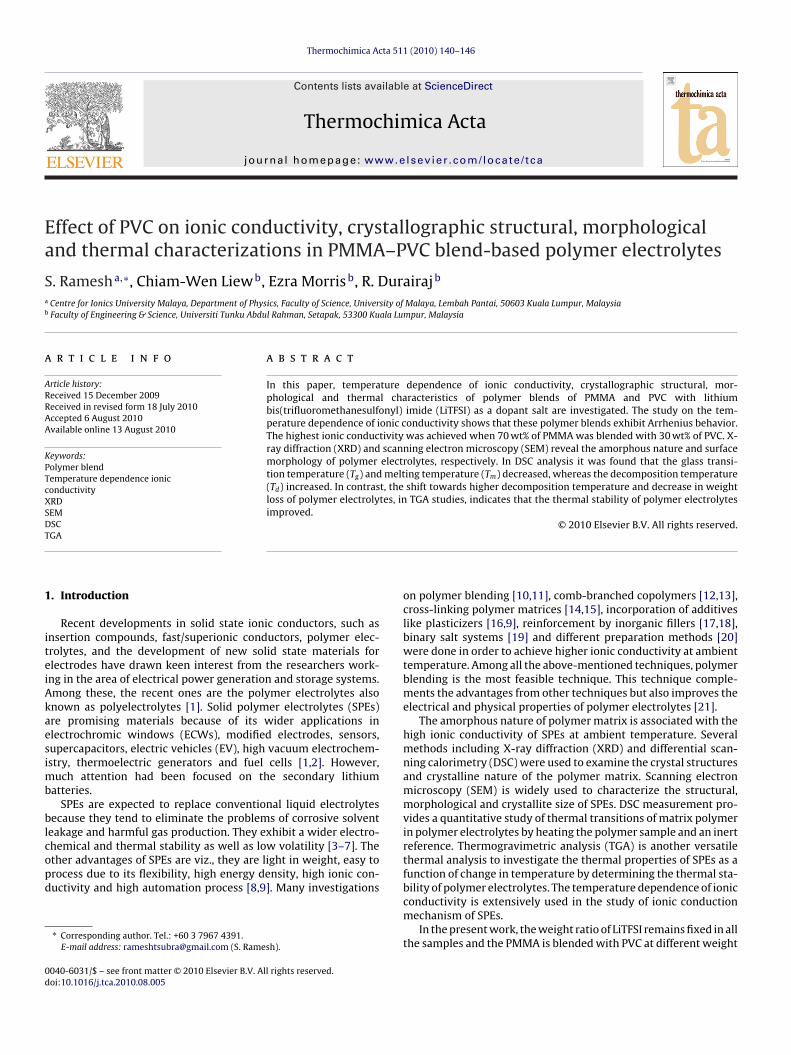
Figs. 2 and 3 illustrate the XRD diffractograms of pure PMMA,ure PVC, PMMA–PVC, pure LiTFSI and PMMA–PVC blend-basedolymer electrolytes. From Fig. 2(a), a broad characteristic peakf PMMA was obtained at angles of 2� = 16.4◦ with a shoul-er at 2� = 22.5◦ which reveals the amorphous phase of PMMA.he intensity of these characteristic peaks is decreased afterhe impregnation of PVC. This implies that the addition ofVC disrupted the arrangement in the polymer backbone ofMMA [25]. The presence of interactions between PMMA andVC, such as cross-linking, is attributed to this phenomenon.
omplexation of PMMA and PVC occurs with the aid of thesenteractions and it is further discussed in Section 3.4. Apartrom the peak intensity of these characteristic peaks, anothervidence of complexation is observed. The blending of PMMAith PVC shifts the peaks at 2� = 16.4◦ and 2� = 22.5◦ to 15.8◦
Fig. 2. XRD patterns of (a) pure PMMA, (b) pure PVC and (c) PMMA–PVC.
and 22.3◦, revealing the change in crystallographic organization[19].
Fig. 3(a) illustrates the sharp intense peaks at 2� = 13.6◦, 15.9◦,18.6◦, 18.9◦ and 21.4◦ and reveals the crystalline character of LiTFSI.These crystalline peaks were disappeared in PMMA–PVC blend-based polymer electrolytes. The absence of excess salt indicates thatLiTFSI is fully complexed with PMMA and PVC [9]. A complete disso-lution in the polymer electrolytes leads to a complexation betweenPMMA, PVC and LiTFSI [26]. Absence of these crystalline peaks inpolymer blended electrolytes indicates that the electrolytes are inamorphous region. As shown in Fig. 3, the characteristic peaks ofPMMA–PVC at 2� = 15.8◦ and 2� = 22.3◦ are shifted to 2� anglesof 16.9◦ and 22.6◦ for PE 3, to 16.1◦ and 22.4◦ for PE 5 and to16.4◦ and 22.7◦ for PE 9. This variation confirms the complexationbetween PMMA–PVC polymer blends and LiTFSI [25]. The pres-ence of complexation has been further confirmed based on thechanges in peak intensity. It can be seen by comparing Fig. 2(c) withFig. 3(b)–(d) that the characteristic peak intensity decreases uponincorporation of LiTFSI. It can be inferred from the above compar-ison that the degree of crystallinity decreases and hence increasesthe amorphous region in polymer electrolytes which leads to higherionic conductivity [27]. As discussed in Section 3.1, the amorphousbehavior increases with PMMA concentration. It has been provedin this study that the intensity of characteristic peak reduces uponthe addition of higher PMMA loadings. Comparing the intensity of
Fig. 3. XRD patterns of (a) Pure LiTFSI, (b) PE 3, (c) PE 5 and (d) PE 9.
S. Ramesh et al. / Thermochimica Acta 511 (2010) 140–146 143
PVC,
tv
3
s2aptPAadoibstl
I
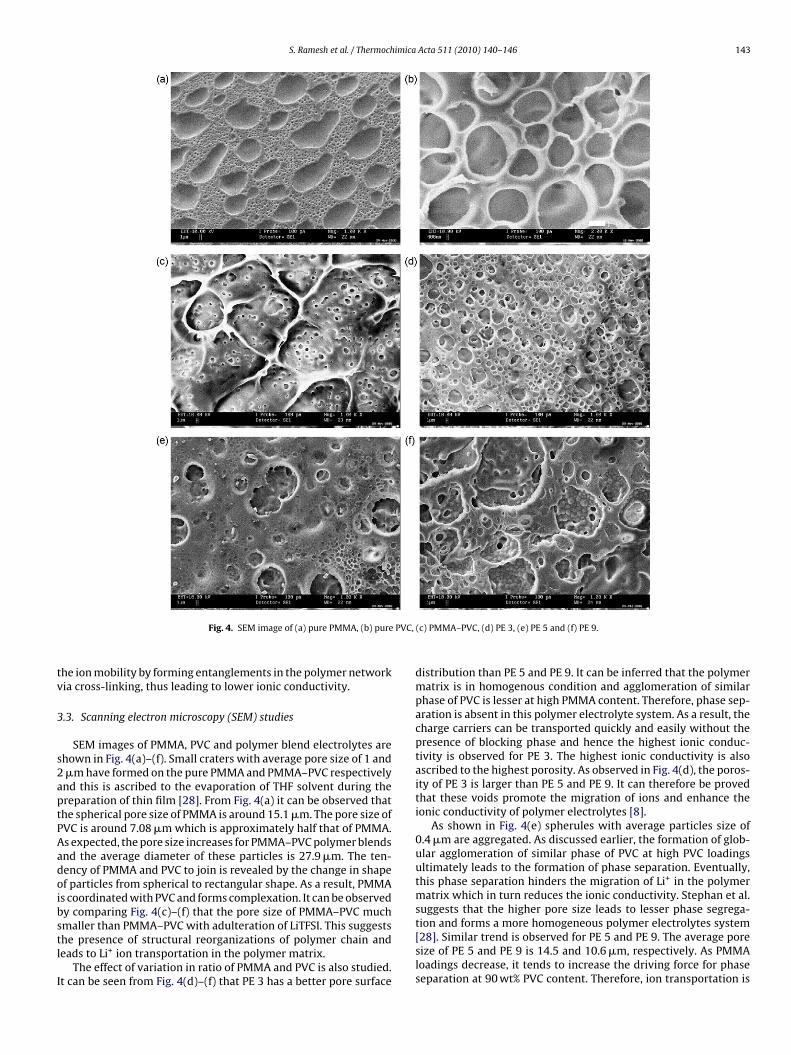
Fig. 4. SEM image of (a) pure PMMA, (b) pure
he ion mobility by forming entanglements in the polymer networkia cross-linking, thus leading to lower ionic conductivity.
.3. Scanning electron microscopy (SEM) studies
SEM images of PMMA, PVC and polymer blend electrolytes arehown in Fig. 4(a)–(f). Small craters with average pore size of 1 and�m have formed on the pure PMMA and PMMA–PVC respectivelynd this is ascribed to the evaporation of THF solvent during thereparation of thin film [28]. From Fig. 4(a) it can be observed thathe spherical pore size of PMMA is around 15.1 �m. The pore size ofVC is around 7.08 �m which is approximately half that of PMMA.s expected, the pore size increases for PMMA–PVC polymer blendsnd the average diameter of these particles is 27.9 �m. The ten-ency of PMMA and PVC to join is revealed by the change in shapef particles from spherical to rectangular shape. As a result, PMMAs coordinated with PVC and forms complexation. It can be observedy comparing Fig. 4(c)–(f) that the pore size of PMMA–PVC much
maller than PMMA–PVC with adulteration of LiTFSI. This suggestshe presence of structural reorganizations of polymer chain andeads to Li+ ion transportation in the polymer matrix.The effect of variation in ratio of PMMA and PVC is also studied.t can be seen from Fig. 4(d)–(f) that PE 3 has a better pore surface
(c) PMMA–PVC, (d) PE 3, (e) PE 5 and (f) PE 9.
distribution than PE 5 and PE 9. It can be inferred that the polymermatrix is in homogenous condition and agglomeration of similarphase of PVC is lesser at high PMMA content. Therefore, phase sep-aration is absent in this polymer electrolyte system. As a result, thecharge carriers can be transported quickly and easily without thepresence of blocking phase and hence the highest ionic conduc-tivity is observed for PE 3. The highest ionic conductivity is alsoascribed to the highest porosity. As observed in Fig. 4(d), the poros-ity of PE 3 is larger than PE 5 and PE 9. It can therefore be provedthat these voids promote the migration of ions and enhance theionic conductivity of polymer electrolytes [8].
As shown in Fig. 4(e) spherules with average particles size of0.4 �m are aggregated. As discussed earlier, the formation of glob-ular agglomeration of similar phase of PVC at high PVC loadingsultimately leads to the formation of phase separation. Eventually,this phase separation hinders the migration of Li+ in the polymermatrix which in turn reduces the ionic conductivity. Stephan et al.suggests that the higher pore size leads to lesser phase segrega-
tion and forms a more homogeneous polymer electrolytes system[28]. Similar trend is observed for PE 5 and PE 9. The average poresize of PE 5 and PE 9 is 14.5 and 10.6 �m, respectively. As PMMAloadings decrease, it tends to increase the driving force for phaseseparation at 90 wt% PVC content. Therefore, ion transportation is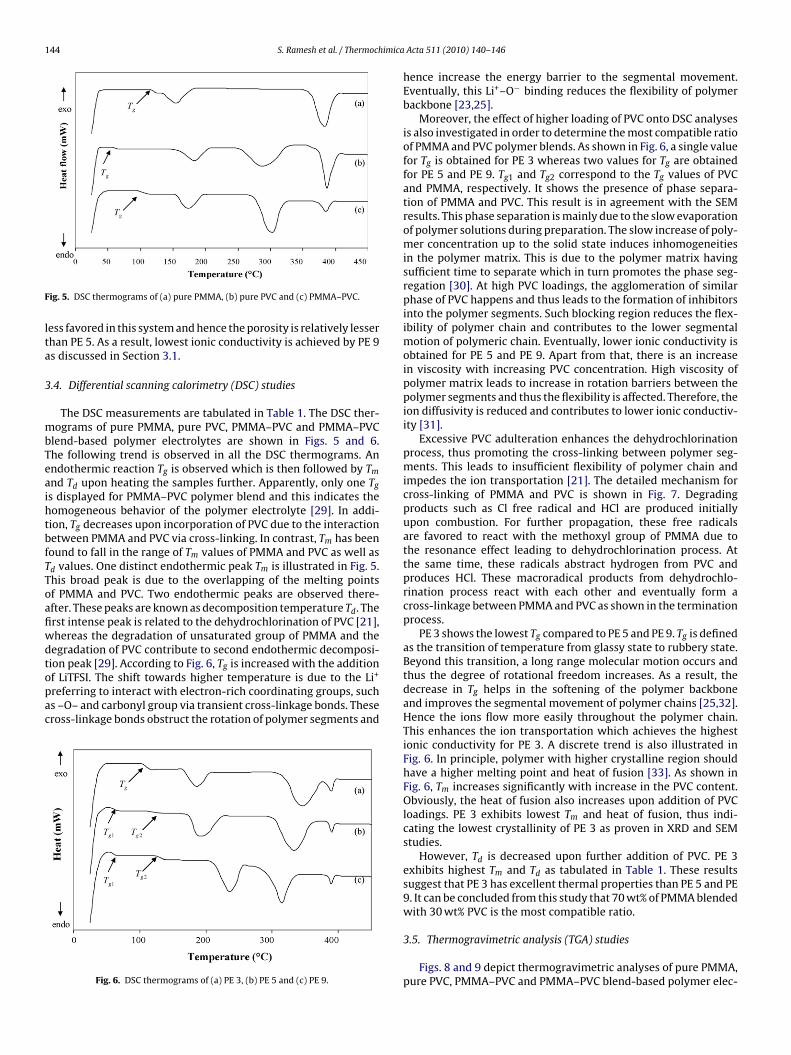
144 S. Ramesh et al. / Thermochimica
F
lta
3
mbTeaihtbfTToafiwdtopac
ig. 5. DSC thermograms of (a) pure PMMA, (b) pure PVC and (c) PMMA–PVC.
ess favored in this system and hence the porosity is relatively lesserhan PE 5. As a result, lowest ionic conductivity is achieved by PE 9s discussed in Section 3.1.
.4. Differential scanning calorimetry (DSC) studies
The DSC measurements are tabulated in Table 1. The DSC ther-ograms of pure PMMA, pure PVC, PMMA–PVC and PMMA–PVC
lend-based polymer electrolytes are shown in Figs. 5 and 6.he following trend is observed in all the DSC thermograms. Anndothermic reaction Tg is observed which is then followed by Tm
nd Td upon heating the samples further. Apparently, only one Tg
s displayed for PMMA–PVC polymer blend and this indicates theomogeneous behavior of the polymer electrolyte [29]. In addi-ion, Tg decreases upon incorporation of PVC due to the interactionetween PMMA and PVC via cross-linking. In contrast, Tm has beenound to fall in the range of Tm values of PMMA and PVC as well asd values. One distinct endothermic peak Tm is illustrated in Fig. 5.his broad peak is due to the overlapping of the melting pointsf PMMA and PVC. Two endothermic peaks are observed there-fter. These peaks are known as decomposition temperature Td. Therst intense peak is related to the dehydrochlorination of PVC [21],hereas the degradation of unsaturated group of PMMA and theegradation of PVC contribute to second endothermic decomposi-ion peak [29]. According to Fig. 6, T is increased with the addition
gf LiTFSI. The shift towards higher temperature is due to the Li+
referring to interact with electron-rich coordinating groups, suchs –O– and carbonyl group via transient cross-linkage bonds. Theseross-linkage bonds obstruct the rotation of polymer segments and
Fig. 6. DSC thermograms of (a) PE 3, (b) PE 5 and (c) PE 9.
Acta 511 (2010) 140–146
hence increase the energy barrier to the segmental movement.Eventually, this Li+–O− binding reduces the flexibility of polymerbackbone [23,25].
Moreover, the effect of higher loading of PVC onto DSC analysesis also investigated in order to determine the most compatible ratioof PMMA and PVC polymer blends. As shown in Fig. 6, a single valuefor Tg is obtained for PE 3 whereas two values for Tg are obtainedfor PE 5 and PE 9. Tg1 and Tg2 correspond to the Tg values of PVCand PMMA, respectively. It shows the presence of phase separa-tion of PMMA and PVC. This result is in agreement with the SEMresults. This phase separation is mainly due to the slow evaporationof polymer solutions during preparation. The slow increase of poly-mer concentration up to the solid state induces inhomogeneitiesin the polymer matrix. This is due to the polymer matrix havingsufficient time to separate which in turn promotes the phase seg-regation [30]. At high PVC loadings, the agglomeration of similarphase of PVC happens and thus leads to the formation of inhibitorsinto the polymer segments. Such blocking region reduces the flex-ibility of polymer chain and contributes to the lower segmentalmotion of polymeric chain. Eventually, lower ionic conductivity isobtained for PE 5 and PE 9. Apart from that, there is an increasein viscosity with increasing PVC concentration. High viscosity ofpolymer matrix leads to increase in rotation barriers between thepolymer segments and thus the flexibility is affected. Therefore, theion diffusivity is reduced and contributes to lower ionic conductiv-ity [31].
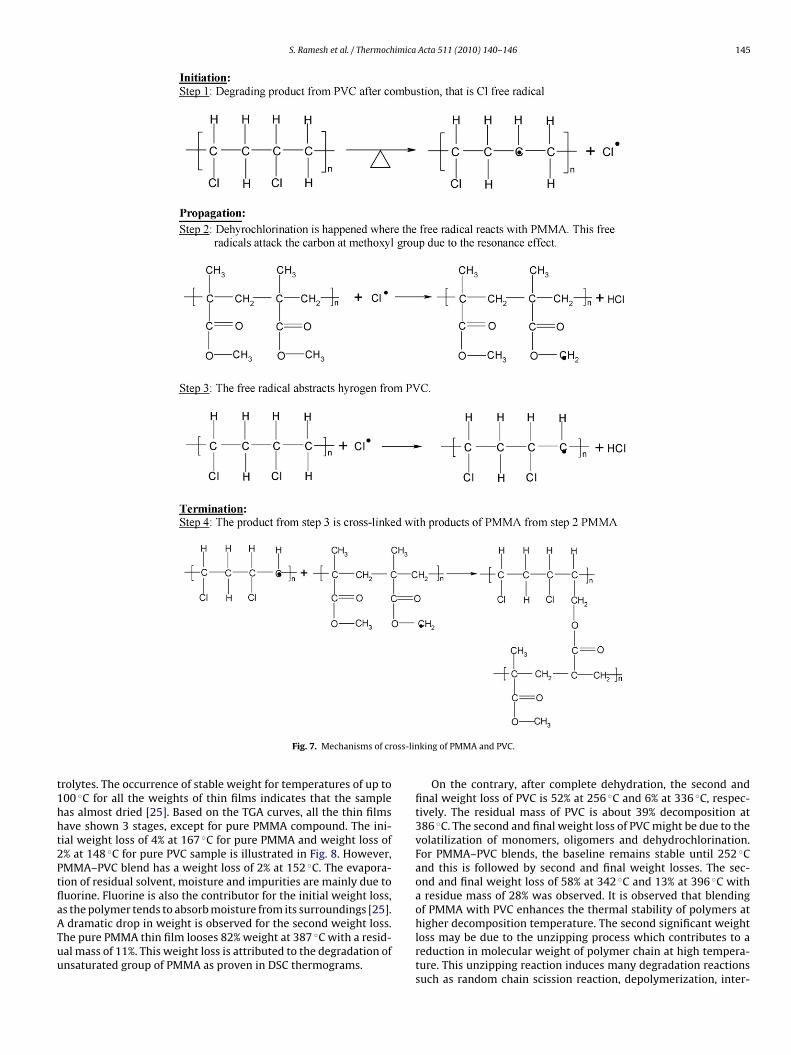
Excessive PVC adulteration enhances the dehydrochlorinationprocess, thus promoting the cross-linking between polymer seg-ments. This leads to insufficient flexibility of polymer chain andimpedes the ion transportation [21]. The detailed mechanism forcross-linking of PMMA and PVC is shown in Fig. 7. Degradingproducts such as Cl free radical and HCl are produced initiallyupon combustion. For further propagation, these free radicalsare favored to react with the methoxyl group of PMMA due tothe resonance effect leading to dehydrochlorination process. Atthe same time, these radicals abstract hydrogen from PVC andproduces HCl. These macroradical products from dehydrochlo-rination process react with each other and eventually form across-linkage between PMMA and PVC as shown in the terminationprocess.
PE 3 shows the lowest Tg compared to PE 5 and PE 9. Tg is definedas the transition of temperature from glassy state to rubbery state.Beyond this transition, a long range molecular motion occurs andthus the degree of rotational freedom increases. As a result, thedecrease in Tg helps in the softening of the polymer backboneand improves the segmental movement of polymer chains [25,32].Hence the ions flow more easily throughout the polymer chain.This enhances the ion transportation which achieves the highestionic conductivity for PE 3. A discrete trend is also illustrated inFig. 6. In principle, polymer with higher crystalline region shouldhave a higher melting point and heat of fusion [33]. As shown inFig. 6, Tm increases significantly with increase in the PVC content.Obviously, the heat of fusion also increases upon addition of PVCloadings. PE 3 exhibits lowest Tm and heat of fusion, thus indi-cating the lowest crystallinity of PE 3 as proven in XRD and SEMstudies.
However, Td is decreased upon further addition of PVC. PE 3exhibits highest Tm and Td as tabulated in Table 1. These resultssuggest that PE 3 has excellent thermal properties than PE 5 and PE9. It can be concluded from this study that 70 wt% of PMMA blendedwith 30 wt% PVC is the most compatible ratio.
3.5. Thermogravimetric analysis (TGA) studies
Figs. 8 and 9 depict thermogravimetric analyses of pure PMMA,pure PVC, PMMA–PVC and PMMA–PVC blend-based polymer elec-
S. Ramesh et al. / Thermochimica Acta 511 (2010) 140–146 145
oss-lin
t1hht2PtflaATuu
Fig. 7. Mechanisms of cr
rolytes. The occurrence of stable weight for temperatures of up to00 ◦C for all the weights of thin films indicates that the sampleas almost dried [25]. Based on the TGA curves, all the thin filmsave shown 3 stages, except for pure PMMA compound. The ini-ial weight loss of 4% at 167 ◦C for pure PMMA and weight loss of% at 148 ◦C for pure PVC sample is illustrated in Fig. 8. However,MMA–PVC blend has a weight loss of 2% at 152 ◦C. The evapora-ion of residual solvent, moisture and impurities are mainly due touorine. Fluorine is also the contributor for the initial weight loss,s the polymer tends to absorb moisture from its surroundings [25].
dramatic drop in weight is observed for the second weight loss.he pure PMMA thin film looses 82% weight at 387 ◦C with a resid-al mass of 11%. This weight loss is attributed to the degradation ofnsaturated group of PMMA as proven in DSC thermograms.
king of PMMA and PVC.
On the contrary, after complete dehydration, the second andfinal weight loss of PVC is 52% at 256 ◦C and 6% at 336 ◦C, respec-tively. The residual mass of PVC is about 39% decomposition at386 ◦C. The second and final weight loss of PVC might be due to thevolatilization of monomers, oligomers and dehydrochlorination.For PMMA–PVC blends, the baseline remains stable until 252 ◦Cand this is followed by second and final weight losses. The sec-ond and final weight loss of 58% at 342 ◦C and 13% at 396 ◦C witha residue mass of 28% was observed. It is observed that blendingof PMMA with PVC enhances the thermal stability of polymers at
higher decomposition temperature. The second significant weightloss may be due to the unzipping process which contributes to areduction in molecular weight of polymer chain at high tempera-ture. This unzipping reaction induces many degradation reactionssuch as random chain scission reaction, depolymerization, inter-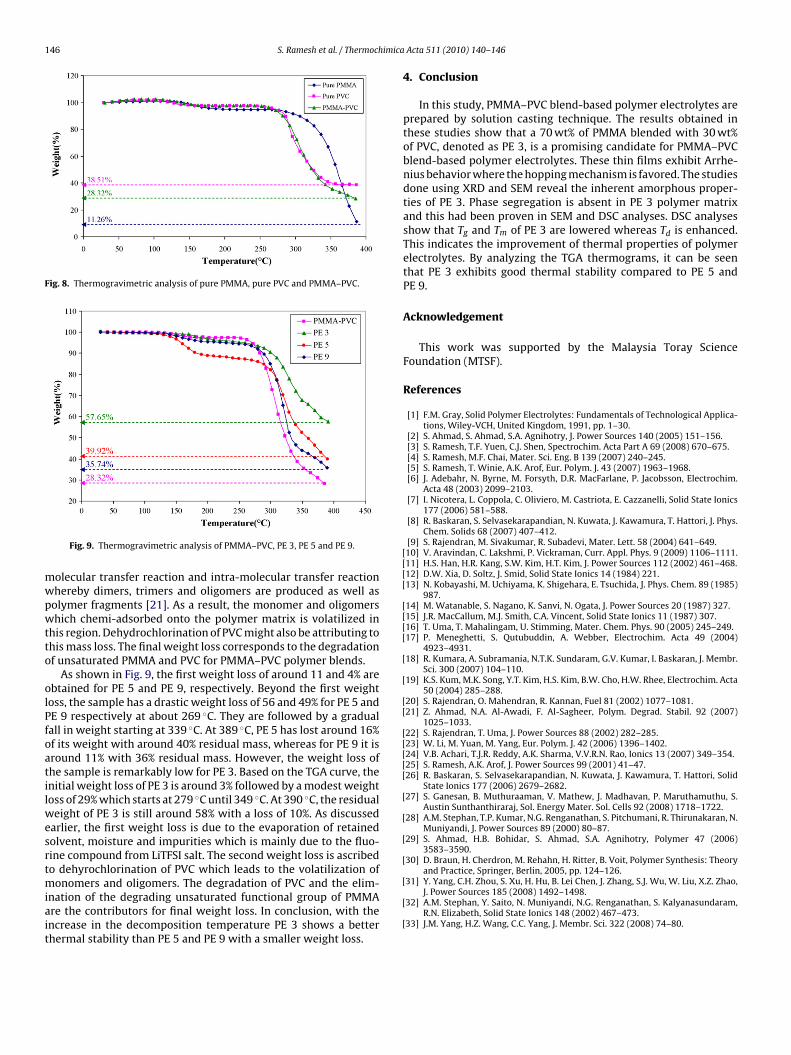
146 S. Ramesh et al. / Thermochimica
Fig. 8. Thermogravimetric analysis of pure PMMA, pure PVC and PMMA–PVC.
mwpwtto
olPfoatilwesrtmiait
[[[[
[[[[
[
[
[[
[[[[[
[
[
[
[and Practice, Springer, Berlin, 2005, pp. 124–126.
Fig. 9. Thermogravimetric analysis of PMMA–PVC, PE 3, PE 5 and PE 9.
olecular transfer reaction and intra-molecular transfer reactionhereby dimers, trimers and oligomers are produced as well asolymer fragments [21]. As a result, the monomer and oligomershich chemi-adsorbed onto the polymer matrix is volatilized in
his region. Dehydrochlorination of PVC might also be attributing tohis mass loss. The final weight loss corresponds to the degradationf unsaturated PMMA and PVC for PMMA–PVC polymer blends.
As shown in Fig. 9, the first weight loss of around 11 and 4% arebtained for PE 5 and PE 9, respectively. Beyond the first weightoss, the sample has a drastic weight loss of 56 and 49% for PE 5 andE 9 respectively at about 269 ◦C. They are followed by a gradualall in weight starting at 339 ◦C. At 389 ◦C, PE 5 has lost around 16%f its weight with around 40% residual mass, whereas for PE 9 it isround 11% with 36% residual mass. However, the weight loss ofhe sample is remarkably low for PE 3. Based on the TGA curve, thenitial weight loss of PE 3 is around 3% followed by a modest weightoss of 29% which starts at 279 ◦C until 349 ◦C. At 390 ◦C, the residual
eight of PE 3 is still around 58% with a loss of 10%. As discussedarlier, the first weight loss is due to the evaporation of retainedolvent, moisture and impurities which is mainly due to the fluo-ine compound from LiTFSI salt. The second weight loss is ascribedo dehyrochlorination of PVC which leads to the volatilization of
onomers and oligomers. The degradation of PVC and the elim-nation of the degrading unsaturated functional group of PMMAre the contributors for final weight loss. In conclusion, with thencrease in the decomposition temperature PE 3 shows a betterhermal stability than PE 5 and PE 9 with a smaller weight loss.
[
[
[
Acta 511 (2010) 140–146
4. Conclusion
In this study, PMMA–PVC blend-based polymer electrolytes areprepared by solution casting technique. The results obtained inthese studies show that a 70 wt% of PMMA blended with 30 wt%of PVC, denoted as PE 3, is a promising candidate for PMMA–PVCblend-based polymer electrolytes. These thin films exhibit Arrhe-nius behavior where the hopping mechanism is favored. The studiesdone using XRD and SEM reveal the inherent amorphous proper-ties of PE 3. Phase segregation is absent in PE 3 polymer matrixand this had been proven in SEM and DSC analyses. DSC analysesshow that Tg and Tm of PE 3 are lowered whereas Td is enhanced.This indicates the improvement of thermal properties of polymerelectrolytes. By analyzing the TGA thermograms, it can be seenthat PE 3 exhibits good thermal stability compared to PE 5 andPE 9.
Acknowledgement
This work was supported by the Malaysia Toray ScienceFoundation (MTSF).
References
[1] F.M. Gray, Solid Polymer Electrolytes: Fundamentals of Technological Applica-tions, Wiley-VCH, United Kingdom, 1991, pp. 1–30.
[2] S. Ahmad, S. Ahmad, S.A. Agnihotry, J. Power Sources 140 (2005) 151–156.[3] S. Ramesh, T.F. Yuen, C.J. Shen, Spectrochim. Acta Part A 69 (2008) 670–675.[4] S. Ramesh, M.F. Chai, Mater. Sci. Eng. B 139 (2007) 240–245.[5] S. Ramesh, T. Winie, A.K. Arof, Eur. Polym. J. 43 (2007) 1963–1968.[6] J. Adebahr, N. Byrne, M. Forsyth, D.R. MacFarlane, P. Jacobsson, Electrochim.
Acta 48 (2003) 2099–2103.[7] I. Nicotera, L. Coppola, C. Oliviero, M. Castriota, E. Cazzanelli, Solid State Ionics
177 (2006) 581–588.[8] R. Baskaran, S. Selvasekarapandian, N. Kuwata, J. Kawamura, T. Hattori, J. Phys.
Chem. Solids 68 (2007) 407–412.[9] S. Rajendran, M. Sivakumar, R. Subadevi, Mater. Lett. 58 (2004) 641–649.10] V. Aravindan, C. Lakshmi, P. Vickraman, Curr. Appl. Phys. 9 (2009) 1106–1111.11] H.S. Han, H.R. Kang, S.W. Kim, H.T. Kim, J. Power Sources 112 (2002) 461–468.12] D.W. Xia, D. Soltz, J. Smid, Solid State Ionics 14 (1984) 221.13] N. Kobayashi, M. Uchiyama, K. Shigehara, E. Tsuchida, J. Phys. Chem. 89 (1985)
987.14] M. Watanable, S. Nagano, K. Sanvi, N. Ogata, J. Power Sources 20 (1987) 327.15] J.R. MacCallum, M.J. Smith, C.A. Vincent, Solid State Ionics 11 (1987) 307.16] T. Uma, T. Mahalingam, U. Stimming, Mater. Chem. Phys. 90 (2005) 245–249.17] P. Meneghetti, S. Qutubuddin, A. Webber, Electrochim. Acta 49 (2004)
4923–4931.18] R. Kumara, A. Subramania, N.T.K. Sundaram, G.V. Kumar, I. Baskaran, J. Membr.
Sci. 300 (2007) 104–110.19] K.S. Kum, M.K. Song, Y.T. Kim, H.S. Kim, B.W. Cho, H.W. Rhee, Electrochim. Acta
50 (2004) 285–288.20] S. Rajendran, O. Mahendran, R. Kannan, Fuel 81 (2002) 1077–1081.21] Z. Ahmad, N.A. Al-Awadi, F. Al-Sagheer, Polym. Degrad. Stabil. 92 (2007)
1025–1033.22] S. Rajendran, T. Uma, J. Power Sources 88 (2002) 282–285.23] W. Li, M. Yuan, M. Yang, Eur. Polym. J. 42 (2006) 1396–1402.24] V.B. Achari, T.J.R. Reddy, A.K. Sharma, V.V.R.N. Rao, Ionics 13 (2007) 349–354.25] S. Ramesh, A.K. Arof, J. Power Sources 99 (2001) 41–47.26] R. Baskaran, S. Selvasekarapandian, N. Kuwata, J. Kawamura, T. Hattori, Solid
State Ionics 177 (2006) 2679–2682.27] S. Ganesan, B. Muthuraaman, V. Mathew, J. Madhavan, P. Maruthamuthu, S.
Austin Sunthanthiraraj, Sol. Energy Mater. Sol. Cells 92 (2008) 1718–1722.28] A.M. Stephan, T.P. Kumar, N.G. Renganathan, S. Pitchumani, R. Thirunakaran, N.
Muniyandi, J. Power Sources 89 (2000) 80–87.29] S. Ahmad, H.B. Bohidar, S. Ahmad, S.A. Agnihotry, Polymer 47 (2006)
3583–3590.30] D. Braun, H. Cherdron, M. Rehahn, H. Ritter, B. Voit, Polymer Synthesis: Theory
31] Y. Yang, C.H. Zhou, S. Xu, H. Hu, B. Lei Chen, J. Zhang, S.J. Wu, W. Liu, X.Z. Zhao,J. Power Sources 185 (2008) 1492–1498.
32] A.M. Stephan, Y. Saito, N. Muniyandi, N.G. Renganathan, S. Kalyanasundaram,R.N. Elizabeth, Solid State Ionics 148 (2002) 467–473.
33] J.M. Yang, H.Z. Wang, C.C. Yang, J. Membr. Sci. 322 (2008) 74–80.