education sector analysis methodological guidelines
TRANSCRIPT

VOLUME 2
International Institutefor Educational Planning
EDUCATION SECTOR ANALYSISMETHODOLOGICAL GUIDELINES

Nota beneThe ideas and opinions expressed in this document are those of the authors and do not necessarily reflect theviews of UNESCO, UNICEF, the World Bank or the Global Partnership for Education. The designations used in this publication and the presentation of data do not imply that UNESCO, UNICEF, theWorld Bank or the Global Partnership for Education have adopted any particular position with respect to thelegal status of the countries, territories, towns or areas, their governing bodies or their frontiers or boundaries.
ISBN: 978-92-806-4717-4September, 2014
Layout : by Reg’ - www.designbyreg.dphoto.com

With the financial support of:
International Institutefor Educational Planning
VOLUME 2
METHODOLOGICAL GUIDELINESEDUCATION SECTOR ANALYSIS
SUB-SECTOR SPECIFIC ANALYSES

2 EDUCATION SECTOR ANALYSIS METHODOLOGICAL GUIDELINES - Volume 2
CHAPTER 7EARLY CHILDHOOD DEVELOPMENT 15
Introduction and Conceptual Framework 19SECTION 1: MACRO LEVEL 26
1.1 Overview of the National Context 261.2 Political and Institutional Arrangements 271.3 ECD Costs and Financing 30
SECTION 2: MESO LEVEL: MAPPING ECD SERVICES 382.1 Identification of ECD Programmes 382.2 Description of ECD Programme Characteristics 412.3 Consolidation of the Information 43
SECTION 3: MICRO LEVEL: CHILDREN AND THEIR FAMILIES 443.1 Profile of Children and their Families 443.2 Access to and Use of ECD Services 47
SECTION 4: DISPARITIES IN ACCESS TO AND USE OF ECD SERVICES: SUPPLY AND DEMAND 50
4.1 Identification of Disparities 504.2 Analysis of Disparities: The Underlying Causes of Weak Access and Usage Rates 52
SECTION 5: QUALITY AND EFFICIENCY OF ECD SERVICES 545.1 Quality of ECD Services 545.2 Efficiency of ECD Services 56
CHAPTER 8HIGHER EDUCATION 69
Introduction 73SECTION 1: OVERVIEW OF RECENT TRENDS AND CURRENT STATUS 74
1.1 Historical Development of Higher Education 741.2 Description of Institutions and Subject-Areas 761.3 The Current Situation 78
SECTION 2: ORGANISATION AND DELIVERY, INTERNAL EFFICIENCYAND EQUITY 83
2.1 Operational Modalities and Characteristics of Different Institutions and Streams 832.2 Governance 932.3 Internal Efficiency of Institutions and Streams 942.4 Equity in Access to Higher Education 98
SECTION 3: COST AND FINANCING 1023.1 Institutional Budgets 1023.2 Financing Students’ Higher Education and Social Spending 1053.3 Structure of Unit Costs and Cost of a Graduate by Institution/Stream 1093.4 Equity in the Distribution of Resources 111
SECTION 4: RESULTS, PERFORMANCE AND QUALITY 1124.1 Scientific Research and Production 1134.2 External Efficiency 1144.3 Quality Control 118

Sub-Sector Specific Analyses 3
CHAPTER 9NON-FORMAL EDUCATION AND LITERACY 123
Introduction 126SECTION 1: DEFINITION OF NON-FORMAL EDUCATION 129
1.1 National and International Definitions of Formal, Non-formal and Informal Education 1291.2 The Supply and Structure of NFE 1311.3 The Programmes and Activities 134
SECTION 2: NEEDS AND PARTICIPATION 1392.1 Estimate of the Potential Demand for Non-formal Education 1392.2 Enrolment, Learning Careers and Internal Efficiency 1432.3 Staffing/Supervision 146
SECTION 3: COST AND FINANCING 1513.1 NFE Financing: Situation and Prospects 1513.2 Per Beneficiary Spending, by Programme 153
SECTION 4: RESULTS AND QUALITY AND RELEVANCE INDICATORS 1554.1 Evaluation of Learning Outcomes 1554.2 The Impact of NFE on Social Behaviour and Practices 1604.3 Social and Economic Integration 162
CHAPTER 10TECHNICAL AND VOCATIONAL EDUCATIONAND TRAINING (TVET) 165
Introduction 168SECTION 1: OVERVIEW OF TVET 170
1.1 What is TVET? 1701.2 Different TVET Provider Systems and Structures 1711.3 Data situation for TVET systems 177
SECTION 2: PERFORMANCE OF TVET 1792.1 Access 1792.2 Equity 1882.3 External Efficiency 195
SECTION 3: COSTS AND FINANCING 2043.1 Introduction 2043.2 Analysis of Public TVET Expenditure 2073.3 Analysis of other Funding Sources 2113.4 Structure of TVET Expenditure 2123.5 Unit Expenditure and Unit Costs 214
SECTION 4: INTERNAL EFFICIENCY AND QUALITY 2194.1 Analysis of Internal Efficiency 2194.2 Analysis of Quality of Training Delivery 223
INTRO
DU
CTION
TABLE OF CO
NTEN
TS

4 EDUCATION SECTOR ANALYSIS METHODOLOGICAL GUIDELINES - Volume 2
ANNEXES 235
CHAPTER 7 ANNEXES 236Annex 7.1: Description of Key Indicators 236Annex 7.2: Instruments to Evaluate the Quality of ECD Services 244Annex 7.3: External Efficiency of ECD Activities on Health, Nutrition and Hygiene 246Annex 7.4: Holistic Early Childhood Development Index (HECDI) 248Annex 7.5: Main ECD Evaluation Tests 251
CHAPTER 8 ANNEXES 252Annex 8.1: Semi-Structured Interview Guide - Management (Administrative and Scientific) 252Annex 8.2: Semi-Structured Interview Guide - Personnel Policies 254Annex 8.3: Semi-Structured Interview Guide - Quality Control 255Annex 8.4: Annual Investment Costs 256Annex 8.5: Double or Multiple count of Higher Education Enrolments 257Annex 8.6: Further Model Tables to Document Higher Education Trends and Status 258
CHAPTER 9 ANNEXES 260Annex 9.1: Literacy Assessment and Monitoring Programme (LAMP):
A Cornerstone of the LIFE Initiative 260Annex 9.2: Model Questionnaires/Interview Guides for the Evaluation of NFE Programmes 262Annex 9.3: The Variable Importance of Non-formal Education According to Each Country 267Annex 9.4: Potential Contents for Surveys of NFE Trainers Performed on a Sample of Operators
of Different Programmes 268Annex 9.5: Potential Contents for a Survey Module on Pedagogical Issues and Monitoring 269Annex 9.6: Potential Contents for a Survey Module on NFE Administration 270Annex 9.7: Compared Education and Social Outcomes of Non-formal and Formal Education
Programmes in the African Context 271Annex 9.8: Issues with the Analysis of Results and Quality and Relevance Indicators 273Annex 9.9: Evaluation of Literacy through Household Surveys 275
CHAPTER 10 ANNEXES 277Annex 10.1: Synopsis of Different Skills Development and Employment Promotion Schemes
and Initiatives in Kenya 277Annex 10.2: Example of a Questionnaire Used to Conduct a Baseline TVET Institutions Survey
in Cameroon 280Annex 10.3: Questionnaire Example for TVET Institution Cost/Expenditure Assessment 295Annex 10.4: Example of a Methodology to Calculate the Cost of Training One Trainee over
a Specified Time Period, for Each Kind of Training 297
BIBLIOGRAPHY VOLUMES 1 AND 2 302

Sub-Sector Specific Analyses 5
LIST OF EXAMPLES
EXAMPLE 7.1 29(ECD Context): Institutional Aspects ofIntersectoral ECD Coordination in Liberia
EXAMPLE 7.2 36Estimation of the Real Global Cost of an ECD Programme on the basis of a Sample of ECD Centres, Fictional Country
EXAMPLE 7.3 39(Identification of ECD Programmes): Coverage of ECD Services, by Sector andBeneficiary Group, Tanzania, 2012
EXAMPLE 7.4 42Consolidation of Key Information for aPreprimary Education Programme, based on the SABER-ECD Approach, FictionalCountry
EXAMPLE 7.5 46Parental Practices, Mauritania, 2010
EXAMPLE 7.6 48(Use of ECD Services): Access to EarlyChildhood Care and Education (ECCE),Tanzania and Selected East African countries,2012
EXAMPLE 7.7 51(Disparities in ECD Access):Disparities in ECD programme participation,Sierra Leone, 2010
EXAMPLE 7.8 53(Supply and Demand Factors Affecting ECD Attendance): Reasons for Not EnrolingChildren in Preprimary Education,Uzbekistan, 2009
EXAMPLE 7.9 60Participation in an ECD Programme and Child Development, Sierra Leone, 2010
EXAMPLE 7.10 61Econometric Modelisation of the Effect of Participation in an ECD/Early LearningProgramme, Sierra Leone, 2010
EXAMPLE 7.11 64(Effect of ECD on Primary Education): Factors Affecting EGRA Learning Outcomes,The Gambia, 2010
EXAMPLE 8.1 75Phases of Development and Reform in Higher Education, Algeria
EXAMPLE 8.2 77(Analysis of HE Coverage by Subject-Area):Higher Education Enrolment by Subject-Area/Faculty, Swaziland, 2000/01-2007/08
EXAMPLE 8.3 78(Analysis of HE Coverage): Higher Education Enrolment, Malawi, 2003-08 and sub-Saharan Africa
EXAMPLE 8.4 80Access to University Careers, by SecondarySchool Subject Specialisation, Malawi, 2008
EXAMPLE 8.5 84(HE Infrastructure and Equipment): Physical HE Facilities, Swaziland, 2005
EXAMPLE 8.6 86(HE Student-Staff Ratio): UniversitySupervision Rate, by Faculty, Malawi, 2008
EXAMPLE 8.7 90(Staffing of HE – Quality):Profiles of Academic Staff, Malawi, 2008
EXAMPLE 8.8 94Analysis of the Schooling Careers ofUndergraduate Economics Students, Fictional Country
EXAMPLE 8.9 96(Internal Efficiency in HE – Internal EfficiencyCoefficient): Computation of the InternalEfficiency Coefficient for UndergraduateEconomics Students, Fictional Country
EXAMPLE 8.10 97(Internal Efficiency in HE – Cost of Producing a Graduate): Cost-Efficiency of HE, by Faculty,Fictional Country
INTRO
DU
CTION
TABLE OF CO
NTEN
TS

EXAMPLE 8.11 99(Equity in HE – Gender): Gender Equity in HEEnrolment, Swaziland, 1992-2007
EXAMPLE 8.12 100Social Background of HE Students, by Parents’Occupation, Central African Republic (CAR),2003
EXAMPLE 8.13 101Social Background of HE Students, by Parents’ Sector of Employment, FictionalCountry
EXAMPLE 8.14 103(Analysis of HLI Budgets): Estimation ofUniversities’ Income and Expenditure, Malawi,2003/04-2006/07
EXAMPLE 8.15 106Distribution of Social University Spending,by Faculty, Fictional Country
EXAMPLE 8.16 108(Financing of HE – Student Loans): Financing of University Studies throughStudent Loans, Tanzania, 2010
EXAMPLE 8.17 109(HE Unit Costs): HE Unit Costs, by Universityand Faculty, Malawi, 2003/04-2006/07
EXAMPLE 8.18 116(External Efficiency of HE): Results of aGraduate Tracer Study, Malawi, 2008
-------------------------------------------------------------------
EXAMPLE 9.1 132(NFE Mapping): Map of the NonformalEducation Sub-sector, Morocco, 2007
EXAMPLE 9.2 133(Organisation of NFE): The Delegation ofResponsibilities Approach, Burkina Faso, 2010
EXAMPLE 9.3 135(NFE Programmes): Permanent FunctionalLiteracy Centres and Specific TechnicalTraining, Burkina Faso, 2010
EXAMPLE 9.4 140(Demand for NFE – Estimate of the IlliteratePopulation): Estimates of the IlliteratePopulation According to Different Surveys,Sao Tomé et Principe, 2001-10
EXAMPLE 9.5 141(Demand for NFE – Characteristics of theIlliterate Population): Analysis of the IlliteratePopulation, Madagascar, 2005
EXAMPLE 9.6 144(NFE Participation): Literacy Learner Statistics,by Gender, Burkina Faso, 1995-2008
EXAMPLE 9.7 147(Analysis of NFE training staff): NFE Personnel Characteristics, Mongolia, 2008
EXAMPLE 9.8 150(Supervision of NFE Programmes): Supervision and Support to NFE Centres byCommunity Agents, Uganda, 2001
EXAMPLE 9.9 154(NFE Unit Costs): Cost Structure and EstimatedUnit Costs per Literacy Centre Learner,Senegal, 2010/11
EXAMPLE 9.10 157(NFE Performance - Learning Outcomes): NFE Learner Performance in StandardAssessments, Uganda
EXAMPLE 9.11 159(NFE Performance): The Sustainability of Literacy, Central African Republic, 2000
EXAMPLE 9.12 161(NFE Performance - Impact on Behaviour): The Impact of Nonformal Education onBehaviour, Uganda, 1999
EXAMPLE 9.13 163(NFE Performance - Employment Outcomes):Employment Outcomes of ex NFE ProgrammeParticipants, Senegal, 2001
-------------------------------------------------------------------
EXAMPLE 10.1 175(Depicting pathways): Pathways in theEducation and Training System, Uganda, 2010
EXAMPLE 10.2 180(Enrolment in Different TVET ProviderSystems): Enrolment and Annual Intake,Fictional Country, 2007-11
EXAMPLE 10.3 181(Enrolment by Subject Area): Enrolment inDifferent Technical Institutions by SubjectArea, Tanzania, 2006/7 and 2009/10
6 EDUCATION SECTOR ANALYSIS METHODOLOGICAL GUIDELINES - Volume 2

Sub-Sector Specific Analyses 7
Area, Tanzania, 2006/7 and 2009/10
EXAMPLE 10.4 185(Comparison of TVET Enrolment betweenCountries): TVET Students per 100,000Inhabitants in Malawi, 2008, as Comparedwith Other SADC Countries, 2008
EXAMPLE 10.5 189(Female Participation Rates in Different TVETStreams): Enrolment by Gender and Type ofPublic Institutions, Uganda, 2009
EXAMPLE 10.6 193(Access to Student Loans): Student Loans, by Level and Type of Institution, Tanzania,2008/09
EXAMPLE 10.7 199(Comparison of Income of TVET Graduatesby Occupational Group to Analyse ExternalEfficiency): Mean Monthly Income of TEVETCompleters by Occupational Groups, Malawi, 2009
EXAMPLE 10.8 205(Stocktaking of Different Funding Sourcesin One Country): Sources of TEVET (Technical,Entrepreneurial, Vocational Education andTraining) Funding, Malawi, 2009
EXAMPLE 10.9 206(Depicting Sources of TVET Funding in a Flowof Funds Chart): Flow of Funds in Public TVET,Vietnam, 2007
EXAMPLE 10.10 208(Identification of Total Public Spending onSkills Development): Total Public Spending forTEVET, Malawi, 2007/08
EXAMPLE 10.11 209(Public Allocation to TVET as a Percentage of Total Education Sector Expenditure):Allocation to TVET of Public RecurrentEducation Expenditure, by coverage, Tanzaniaand Other African Countries, 2006
EXAMPLE 10.12 213(Structure of TVET Expenditure): Distributionof Public Recurrent Spending, Tanzania, 2001and 2009
EXAMPLE 10.13 215(Unit Costs in TVET): Unit Spending, Teachers
Salaries, PTR and Enrolment in DifferentEducation Levels, Sudan, 2009
EXAMPLE 10.14 216(Analysing Public Unit Spending inInternational Comparison): Public UnitSpending for TVET as a Percentage ofGDP/p.c., Uganda, 2009, Compared to OtherCountries
EXAMPLE 10.15 221(Analysing Examination Pass Rates to Assess Efficiency): Trade Testing Pass Rates inDifferent Occupational Fields, Uganda, 2009
EXAMPLE 10.16 223(Repetition Rates for Analysing Efficiency):Repetition Rates in Public Technical Educationby Occupational Field, Benin, 2003/04
EXAMPLE 10.17 226(Student/Teacher Ratio): Number of Teachers and STR in Different TVET Streams, Uganda, 2009
EXAMPLE 10.18 227(Teaching Staff by Qualification): Distribution of Teaching Staff in TechnicalEducation by Qualification, Tanzania, 2008/09
INTRO
DU
CTION
TABLE OF CO
NTEN
TS

8 EDUCATION SECTOR ANALYSIS METHODOLOGICAL GUIDELINES - Volume 2
Table 7.16 59Key Variables to Measure the Effet of ECDInterventions on Children’s Development
Table 7.17 61Modelisation of the Effect of ECD ProgrammeParticipation on ECD, MICS4 Sierra Leone, 2010
Table 7.18 63Key Variables to Explain the Effect of ECD onPrimary Education
Table 7.19 64Net Effect of Factors on Grade 3 Students’ EGRAScores, 2009/10
-------------------------------------------------------------------
Table 8.1 77Higher Education Enrolment, by Faculty, Swaziland,2000-07
Table 8.2 78HE Enrolment and Access Rate, by Gender, Malawi,2003-08
Table 8.3 80Distribution of 1st Year HE Students, by Type ofBaccalaureate Sat
Table 8.4 86University Student-Staff Ratios, by University/Faculty,Malawi, 2008
Table 8.5 88Effective Workload of HE Teaching Staff - ModelTable, Malawi, 2008
Table 8.6 88Full-Time Equivalent Computation of All TeachingStaff - Model Table, Malawi, 2008
Table 8.7 89Comparative Costs of Full-Time PermanentPositions, Overtime and Contract Staff - ModelTable, Malawi, 2008
Table 8.8 90Distribution of Personnel in Public and PrivateUniversities, by Status, Malawi, 2008
Table 8.9 91Distribution of Personnel in Public Universities andFaculties, by Qualification, Malawi, 2008
Table 8.10 94Enrolment, Repetition and Graduation ofUndergraduate Economics Sudents, FictionalCountry
Table 7.1 23Official Age of Preprimary Access and CycleDuration, African Countries, 2012
Table 7.2 26Macro Context ECD and Family BackgroundIndicators
Table 7.3 28Questions for the Analysis of ECD Political,Institutional, Financial and Regulatory Frameworks
Table 7.4 34Main Preprimary Public Expenditure Indicators
Table 7.5 35Five Steps for the Analysis of the Cost of ECDServices – The Ingredients Method
Table 7.6 36Annual Expenditure of a Sample of ECD Services(Illustrative Data)
Table 7.7 42Consolidated Characteristics of a PreprimaryEducation Programme (Illustrative Data)
Table 7.8 43Consolidation of Key Information on ECD ServicesAvailable Nationwide (Model Table)
Table 7.9 45Key Indicators to Describe Young Children and theirFamily Environment
Table 7.10 48Key Indicators to Describe Access to and Use of ECDServices, by Type
Table 7.11 48Preprimary School Provision, Tanzania and SelectedEast African countries, 2012
Table 7.12 49Access to Essential ECD Health Interventions in EastAfrica, 2006-10
Table 7.13 51Participation in Early Childhood Education andLearning, by Socioeconomic Characteristics,Sierra Leone, 2010
Table 7.14 53Reasons Mentioned by Parents for Not Enrollingtheir Children in Preprimary Education, Uzbekistan, 2009
Table 7.15 55Questions for the Analysis of the Quality of ECDProgrammes and Services
LIST OF TABLES

Sub-Sector Specific Analyses 9
Table 9.1 136Summary of NFE Programmes (Model Table)
Table 9.2 137Access Conditions to NFE Programmes andIncentives (Model Table and Illustrative Data)
Table 9.3 141Number and Share of Individuals Knowing How to Read, Write and Count, by Age Group,Madagascar, 2005
Table 9.4 142Share/Number of Illiterate Individuals, by AgeGroup, Gender and Area of Residence, Madagascar, 2005
Table 9.5 144Number of Enrolment and Access to LiteracyProgrammes, Burkina Faso, 1995-2008
Table 9.6 149NFE Teachers’ Monthly Salary (NFE Sector AnalysisSurvey Respondents), Mongolia, 2008
Table 9.7 150Numbers of CDA Supervisory/Support Visits, byDistance of Centre from Subcounty Headquarters,Uganda, 2001
Table 9.8 152Estimation of NFE Spending, by Programme(Model Table)
Table 9.9 154Cost Structure of a Literacy Centre (WorkingAccording to the Delegation Approach), Senegal,2010/11
Table 9.10 157Mean Scores on Three Tests in FAL and REFLECTProgrammes According to Different Levels ofSchooling, Uganda, 2001
Table 9.11 158Mean Scores for Primary School Pupils Comparedwith NFE Graduate Groups, Uganda, 2001
Table 9.12 159Literacy Level of Adults, According to their SchoolAttendance when Young, Central African Republic,2000
Table 9.13 162Share of Individuals Giving Modern Answers toAttitude Questions, by Group
Table 9.14 163Main Activity of ex-NFE Programme Participants,Senegal, 2001
Table 8.11 95Promotion Rate and Longitudinal Retention Profileof Undergraduate Economics Students
Table 8.12 95Proportion of Repeaters among UndergraduateEconomics Students, by Year, Fictional Country
Table 8.13 95Estimation of the Total Number of Student-YearsSpent on the Education of a Cohort ofUndergraduate Economics Students, FictionalCountry
Table 8.14 97Internal Efficiency and Graduate Unit Costs, byFaculty, Fictional Country
Table 8.15 100Distribution of HE Students, by Head of Household’sOccupation, Central African Republic, 2003
Table 8.16 101Distribution of HE Students, by Institution/Courseand Employment Sector of Head of Household,Fictional Country
Table 8.17 103Distribution of the University of Malawi Income, by Source and Faculty, 2004/05-2006/07
Table 8.18 104Distribution of University Spending, by Categoryand Institution, Malawi, 2003/04-2006/07
Table 8.19 106Distribution of Social University Spending, by Type and Faculty, Fictional Country
Table 8.20 109Unit Costs, by HLI, Malawi, 2003-06
Table 8.21 110Breakdown of Unit Costs, University of Malawi andMzuni University, Malawi, 2003/04-06/07
Table 8.22 115List of Potential Indicators to Describe theEmployment Status of Graduates
-------------------------------------------------------------------
INTRO
DU
CTION
TABLE OF CO
NTEN
TS

10 EDUCATION SECTOR ANALYSIS METHODOLOGICAL GUIDELINES - Volume 2
Table 10.18 213Value and Distribution of the Vocational Educationand Training Authority (VETA) Public RecurrentExpenditure, by Key Items, Tanzania, 2001 and 2009
Table 10.19 215Secondary Technical Education: Overview of State Education Spending and PTRsby State, Sudan, 2009
Table 10.20 222Suggested Table Format to Capture Dropout Rates
Table 10.21 223Repetition Rates in Public Technical Education by Occupational Field, Benin, 2003/04
Table 10.22 226Teachers and Instructors by Gender and Type of Public Institution, Uganda, 2009
Table 10.23 227Suggested Table to Capture the Ratio of Qualified Teachers
Table 10.24 227Distribution of TE Registered Teaching Staff, by qualification, Tanzania, 2008/09
Table 10.1 172Synopsis of “Typical” TVET Provider Systems
Table 10.2 173Formal, Non-formal or Informal TVET
Table 10.3 180Overview of TVET Enrolment and Annual Intakein ‘000 (Fictitious)
Table 10.4 181Enrolment in Technical Institutions, by Subject Area,Tanzania, 2006/07 et 2009/10
Table 10.5 182Overview of Sources to Establish Access in FormalTVET
Table 10.6 186Key Questions and Information Sources for AccessIssues
Table 10.7 188Potential Sources to Identify Access in Different(Non-Formal) Provider Systems
Table 10.8 189Enrolment by Gender and Type of Public Institutions,Uganda, 2009
Table 10.9 190Example of a Table to Compare FPRs Over Time, by Occupational Field
Table 10.10 192Summary of Key Questions to Assess Issues Relatedto TVET Access by the Poor
Table 10.11 193Social Expenditures, by Level and Type of Institution,Tanzania, FY 2008/09
Table 10.12 202Key Questions to Assess Availability and Use ofLabour Market Information in the TVET Context
Table 10.13 203Key Questions to Assess Labour Market MatchingServices
Table 10.14 205Overview of Typical Funding Sources of TVET
Table 10.15 205Sources of TEVET Funding by Training ProviderSystem, Malawi, 2009
Table 10.16 208Total Public Spending for TEVET 2007/08, MK
Table 10.17 211Data/Information Sources about TVET FundingSources

Sub-Sector Specific Analyses 11
Figure 9.1 132NFE and Literacy Organisational Structure, Morocco, 2007
Figure 9.2 140Figure 9.2: Literacy Rate (15 Years and Above),by Survey and Type of Survey, Sao Tome andPrincipe, 2001-10
Figure 9.3 147Number of NFE Centres and Teachers, Mongolia,1997-2008
Figure 9.4 148Number of NFE Teachers/Facilitators, by Level of Qualification, Mongolia, 2008
Figure 9.5 148Share of NFE Teachers/Facilitators, by Seniority,Mongolia, 2008
Figure 9.6 159Share (in %) of Fluently Literate Adult NFEProgramme Participants, by Level of EducationAttained in their Youth, Central African Republic,2000
-------------------------------------------------------------------
Figure 10.1 175Pathways in the Ugandan Education and TrainingSystem, 2010
Figure 10.2 185TVET Students per 100,000 Inhabitants in Malawiand Selected SADC Countries, 2008
Figure 10.3 199Mean Monthly Net Income of TEVET Completers,Malawi, 2008
Figure 10.4 207Core Flow of Funds Under Public TVET System(under MOLISA), Vietnam, 2007
Figure 10.5 209TVET’s Allocation of Public Recurrent EducationExpenditure, by Coverage, Tanzania andComparable African Countries, 2006 or MRY
Figure 10.6 216Public Unit Spending for TVET as a Share ofGDP/Capita, Uganda and 22 African Countries,2009
Figure 10.7 221DIT Pass Rates of Aggregate Test Registrants by Programme, Uganda, 2009
Figure 7.1 20Micro, Meso and Macro Factors Affecting ECD
Figure 7.2 21ECD Programme Areas and Beneficiaries
Figure 7.3 31Example of ECD Financing Sources and Mechanisms
Figure 7.4 39Nature of ECD Programmes, by Sector and Typeof Beneficiary, Tanzania, 2012
Figure 7.5 60Percentage of Children Aged 36 to 59 Monthswhose Development is on Track, Sierra Leone, 2010
-------------------------------------------------------------------
Figure 8.1 77Total HE Enrolment, by Faculty, Swaziland, 2000/01-2007/08
Figure 8.2 78HE Enrolment, Malawi and Sub-Saharan AfricanCountries, 2005/06
Figure 8.3 84Average Space per Student, by Campus, Swaziland, 1999-2005
Figure 8.4 85Usage Factor of Teaching Spaces, by Type,Swaziland, 2007
Figure 8.5 99Total Enrolment by Gender, and Degrees AwardedSwaziland, 1992-2007
Figure 8.6 99Share of Female Enrolment, by Faculty, Swaziland,2007/08
Figure 8.7 116Occupational Situation of HE Graduates, by Field of Study, Malawi, 2008
Figure 8.8 117Employment Rate (Modern Sector Only) of Higher-Education Leavers, by Age Group, Various African Countries, Malawi, 2008
Figure 8.9 117Mean Monthly Income of HE Graduates, by Field ofStudy, Degree, Gender and Employment Status,Malawi, 2008
LIST OF FIGURES
INTRO
DU
CTION
TABLE OF CO
NTEN
TS

12 EDUCATION SECTOR ANALYSIS METHODOLOGICAL GUIDELINES - Volume 2
Box 7.1 25Key ECD International Reference Tools andDocuments
Box 7.2 41Key Information to Collect on ECD Programmes and Services
Box 7.3 58The Early Learning and Development StandardsApproach
-------------------------------------------------------------------
Box 8.1 80Computation of the Global Access Rate to HigherEducation
Box 8.2 82Evolution of Social Demand for Higher Education in Francophone Africa and Analysis of Sustainability,2007
Box 8.3 119The African and Malagasy Council for HigherEducation
-------------------------------------------------------------------
Box 9.1 145Non-formal Education Management InformationSystem (NFE-MIS)
Box 9.2 156Research to Measure the Learning Outcomes ofLiteracy Programme Participants (RAMAA)
-------------------------------------------------------------------
Box 10.1 171Historical Determinants of TVET Development
Box 10.2 179Enrolment and Intake
LIST OF BOXES

© W
orld
Ban
k /
Régi
s L’
Hos
tis
Sub-Sector Specific Analyses 13
INTRO
DU
CTION
TABLE OF CO
NTEN
TS

14 EDUCATION SECTOR ANALYSIS METHODOLOGICAL GUIDELINES - Volume 2
© U
NIC
EF/B
AN
A20
13-0
0051
/Jan
natu
l Maw
a

Sub-Sector Specific Analyses 15
CHAPTER 7EARLY CHILDHOODDEVELOPMENT› Chapter Objective:To analyse in greater detail the early childhooddevelopment (ECD) sub-sector to enable itsmore harmonious, equitable and efficientdevelopment.
EARLY CHILDHOO
D DEVELOPM
ENT
CHA
PTER 7

16 EDUCATION SECTOR ANALYSIS METHODOLOGICAL GUIDELINES - Volume 2
1. MACRO LEVEL: THE NATIONAL ECD CONTEXT AND POLITICAL, INSTITUTIONAL ANDFINANCIAL SET-UP
ISSUEReview the national ECD context to understand the political, institutional and financialarrangements, to understand the government’s level of commitment to establishing a favourableenvironment for the sub-sector’s development.
OBJECTIVES• Describe the socioeconomic, demographic, health and education dimensions at the macro level;• Examine the political and institutional ECD environment;• Review the level of public and private financing of ECD and cost-sharing mechanisms among
the sub-sector’s players; and• Determine the level of ECD services’ and interventions’ unit costs.
METHODS• Analyse the state and evolution of socioeconomic and demographic indicators likely to affect
the development of the sub-sector;• Examine global health, nutrition and child development indicators;• Review the legal framework, sector coordination and monitoring and quality assurance
mechanisms at the national level;• Examine existing financing sources and mechanisms, public and private (families, communities,
NGOs and so on);• Describe the evolution of the ECD budget and the distribution of resources, by source and service
(education, health and other social spending); and• Determine and analyse the unit costs of different ECD programmes.
SOURCESNational statistical services and WDI (World Bank) and WEO (IMF) databases; national documentsof the relevant ministries (preprimary education, health, social services, family, justice and so on);development partners’ official documents and reports; SABER-ECD country reports; spendingexecuted by the different ministries for ECD activities; national household and spending surveys;public sector expenditure reviews and CSR and MBB (Marginal Budgeting for Bottlenecks) reports(See http://www.devinfolive.info/mbb/mbbsupport/).

Sub-Sector Specific Analyses 17
2. MESO LEVEL: MAPPING THE ECD SERVICE DELIVERY OPTIONS
ISSUE Review the provision of ECD services to better grasp its contours and identify its developmentpriorities.
OBJECTIVES• Provide a detailed mapping of ECD services and activities.
METHODS• Describe the key ECD service areas;• Identify the main delivery approaches;• Detail the programme boundaries of ECD services; and• Consolidate the above information in a summary table or graph.
SOURCES National documents from the relevant ministries; other official documents; development partners’official reports; SABER-ECD reports and specific surveys.
3. MICRO LEVEL: CHILDREN AND THEIR FAMILIES
ISSUEHow do children fare in terms of health, nutrition and physical, linguistic, cognitive andsocioemotional development? What are the characteristics of their home environment? What isthe level of access to and use of ECD services?
OBJECTIVES• Draw up a detailed picture of children and their home environments to determine their
development needs and ECD programme content; and • Better understand ECD service and programme access and use.
METHODS• Analyse children’s sanitary, nutritional and hygiene status;• Analyse children’s physical, linguistic, cognitive and socioemotional development indicators;• Analyse parental practices in caring for young children; and• Analyse the conditions of access to and use of ECD services.
SOURCESDHS (Demographic and Health), MICS (Multiple Indicator Cluster), CWIQ (Core Welfare IndicatorQuestionnaire) and living conditions type surveys; MBB (Marginal Budgeting for Bottlenecks) tools;specific surveys or qualitative KAP (Knowledge-Attitude-Practice) type studies (on parental care,nutrition, vaccination campaigns and so on) and administrative data from the ministries ofeducation, health, or any other related to ECD.
EARLY CHILDHOO
D DEVELOPM
ENT
CHA
PTER7

18 EDUCATION SECTOR ANALYSIS METHODOLOGICAL GUIDELINES - Volume 2
4. DISPARITIES IN THE ACCESS TO AND USE OF ECD SERVICES: SUPLLY AND DEMAND
ISSUEExplain the nature, magnitude and underlying causes of the disparities.
OBJECTIVES• Diagnose and quantify disparities in the access to ECD services; and• Understand the reasons for the disparities to propose corrective measures.
METHODS• Disaggregate key access, usage and care practice indicators according to children’s and families’
socioeconomic characteristics (area of residence, income, gender, vulnerability status and so on).
SOURCES DHS (Demographic and Health), MICS (Multiple Indicator Cluster), CWIQ (Core Welfare IndicatorQuestionnaire) and living conditions type surveys; KAP and user satisfaction surveys andadministrative ministry data.
5. QUALITY AND EFFICIENCY
ISSUEEvaluate the quality and external efficiency of key ECD services to provide information relevant tothe improvement of sub-sector management.
OBJECTIVES• Analyse the quality of ECD services and evaluate their impact on children’s development and
primary education.
METHODS• Evaluate the internal quality of ECD services on the basis of structural (inputs) and process quality
indicators through specific surveys;• Analyse the results of KAP, household and user satisfaction surveys; and• Examine the potential positive or negative impacts of ECD interventions on child development
and education indicators.
SOURCESDHS (Demographic and Health), MICS (Multiple Indicator Cluster) and living conditions typesurveys; ECD services’ internal documents; statistical yearbooks; administrative data and KAPstudies.

Sub-Sector Specific Analyses 19
Introduction andConceptual FrameworkPrevious chapters have already touched on some aspects of early childhood development(ECD), in particular with respect to preprimary education. However, ECD activities are notlimited to this dimension. As will be seen below, ECD interventions include a set of activitiesthat aim for the global development of children on the physical, linguistic, cognitive andsocioemotional levels, from their conception (pregnancy) through to the first years of theirprimary schooling (until aged eight years).
This chapter will therefore analyse the different aspects of ECD in all their key dimensionsin detail, with a particular focus on education, given the overall CSR-type approach coveredby this guide. However, as Figure 7.1 shows, ECD is strongly influenced by several macro,meso and micro factors. On the macro level, the macroeconomic, social, demographic,sanitary and political contexts largely determine authorities’ political and financialcommitment to ECD activities. The macro level also determines the service delivery andefficiency of social and family policies. Simultaneously, the micro context (familycharacteristics, parental care practices and beliefs, culture and so on) affects children’sdevelopment by directly impacting on the environment they grow up in. These two mainsets of factors interact with the quality and quantity of ECD services available in a countryat the local level, whose use will also be conditioned by cultural and social attitudes andpractices that are specific to the community where children and their families live. This isthe meso level.
EARLY CHILDHOO
D DEVELOPM
ENT
CHA
PTER7

20 EDUCATION SECTOR ANALYSIS METHODOLOGICAL GUIDELINES - Volume 2
Properly understanding what ECD is comprised of involves gaining a clear understandingof the aspects presented in Figure 7.1. Thus, after a brief overview of the mainmethodological concepts that underscore ECD and the rationale for the sub-sector’sdevelopment, the first three sections of this chapter propose tools that will aid in thedescription of the macro (See Section 1), meso (See Section 2) and micro (See Section 3)levels that constitute the context for ECD in a given country. Among other benefits, thisexercise will enable one to define the main dimensions of ECD and to identify the principalrequirements for its harmonious development. It will however need to be complementedby a more detailed analysis of equity in the provision and use of ECD services (See Section4), to better outline needs and target beneficiaries. The chapter ends with an analysis ofthe quality and external efficiency of ECD services (See Section 5), to better determine therelevance of the services offered and the utility of their potential expansion or scale-up.The order of presentation of these sections here should not necessarily determinethe order in which they are dealt with in the analysis. Indeed, each isinterdependent; the information offered in one section contributes to each of theothers.1
Definition of Early Childhood Development (ECD)
Defining ECD is a delicate task. Indeed, a variety of terms are used and different meaningsare given to each, all stemming from an overworked concept. The ECD term and its use,
FIGURE 7.1 - Micro, Meso and Macro Factors Affecting ECD
Children’s Development:- Physical- Motor - Linguistic- Cognitive- Socioemotional
Family Context:- Family characteristics- Parents’ education- Family income, etc.- Parental care practices
ECD Services andProgrammes- Parental education- Preprimary education- Health, nutrition and hygiene services- Social programmes (Social subsidies, etc.)- Community (Cultural and Social Practices)
National Context- Economic development and growth- Poverty- Political and institutional commitment to ECD- ECD financing- Cultural values
MICRO SPHEREMESO SPHERE MACRO SPHERE
FIGURE 7.1
MICRO SPHERE
Chil n’s amily Family Context:F
en’drChildr
actors
amily Context:
MESO SPHERE
arental education- PammesogrPr
ECD Services and
Meso and Macro F, - MicroFIGURE 7.1
Affecting ECD
CRO SPHERE MA
and growth- Economic developmentNational Context
actices
ev nt:ntev
otemotio- Socioemmotion
hDeveD
h lpmel enm
- Ph sicalm
- Soc a
Ph ale
alognit- Co- C
MM- LinL
- ysi
- Socioemotional pr
arental care- Pamily income- Farents’ education- P
acteristics charamily F-
gnitiveCognitiv- CognitivecsticuisticLing- Linguistic
otor - Motor - Motor ys- Physical
veloppmDevelopment:ChildChi sen sendrChildr
arental care
actices) and Social Pral - Community (Cultur
etc.),(Social subsidiesammes- Social progr
hygiene services nutrition and - Health,
- Preprimary educationarental education- P
etc.,amily incomearents’ education
acteristics
aluesal v- Cultur- ECD financing
to ECDinstitutional commitmentolitical and- Poverty- P
and growth
Source: Adapted from Vegas and Santibáñez, 2010.

Sub-Sector Specific Analyses 21
content and references vary according to countries, programmes, schools of thought anddevelopment partners involved in its programmes in each country.2 The only internationallyrecognised ECD norms today relate to the global approach, the age group or sub-groupsand the evidence of the return on investment.
On a conceptual level, ECD is considered as a global approach to the development of youngchildren that encourages their physical well-being, their cognitive and linguistic capacitiesand their social and emotional development. It includes any care defined as a process leadingto the creation of a favourable environment likely to contribute to children’s optimaldevelopment.3 Reflecting the multidimensional nature of children’s development, ECDservices are multisectoral. Activities aiming for the development of early childhood aretherefore found in various sectors (the main ones being education, health, hygiene, nutritionand social affairs) and in the legislation relating to each. Figure 7.2 below provides a visualrepresentation of the different areas of ECD interventions and their main beneficiaries.
Target Population Groups for ECD Services
ECD covers the period of a child’s life that spans from its conception to the age of eightyears, during which the essential stages of development take place. It is common to dividethis period into three phases that reflect specific stages of growth and for which specificservices are offered. Each of the three is critical for children’s development and far from
FIGURE 7.2 - ECD Programme Areas and Beneficiaries
Education:- Preprimary education (3 to 5 years)- Infant care services (0 to 2 years): day nurseries and child day-care services- Parental education
BENEFICIARIES
Children:- 0 to 2 years- 3 to 5 years- 6 to 8 years
Mothers: - Pregnant and Breastfeeding
Parents/Care-givers: Communication/education on good parental care practices
Protection:- Birth registration- Domestic violence- Legislation on the early marriage of girls, child labour, female genital mutilation, etc.
Health(infant, childand maternal)and hygiene:- Prenatal and postnatal care- Vaccination- Other preventive care and treatment of common child illnesses- Water, sanitation and hygiene
Nutrition- Exclusive breastfeeding- Dietary supplements- Vitamin A supplements- Iron supplements
Source: Adapted from Vegas and Santibáñez, 2010 in SABER-ECD, World Bank, 2011.
EARLY CHILDHOO
D DEVELOPM
ENT
CHA
PTER7

22 EDUCATION SECTOR ANALYSIS METHODOLOGICAL GUIDELINES - Volume 2
being exclusive or independent, they are incremental, each stage being consolidated by thefollowing (Naudeau et al., 2011).
(i) Children aged 0 to 2 years: This period is considered to be most critical for children’ssurvival and development and is the one where children are most vulnerable to thelack of appropriate care. The absence or lack of appropriate care and interventionsduring this stage of children’s life exposes them to sometimes irremediable damage,particularly in terms of their physical and cognitive development. Indeed, it is duringthis period that most of the brain’s development occurs, as well as related aptitudessuch as vision, hearing and emotional control. Appropriate nutrition, throughbalanced diets during pregnancy, exclusive breastfeeding until six months andcomplementary feeding thereafter are necessary to ensure the optimal developmentof these functions. Likewise, providing a stimulating, secure, protective and warmenvironment will enable children to develop strong relationships with their parentsand care-givers and give children the foundations they need to develop furtherabilities.
(ii) Children aged 3 to 5 years: During this stage progress is mainly in terms of cognitivedevelopment, language, socioemotional development and interaction with peers.More complex forms of linguistic and cognitive stimulation by parents and care-giversare important, in addition to continued attention to nutrition, health and protection.Preprimary education activities provide an appropriate framework.
(iii) Children aged 6 to 8 years: This phase is when the above aspects of children’sdevelopment are consolidated and when the transition to primary school takes place.In practice, this age group is often ignored by ECD practitioners, mainly due toprogramme constraints that transfer responsibilities to the formal education system,through primary schools. Yet, this phase is of upmost importance, especially incountries where preschooling is limited. For this age group, ensuring that the schoolis ready to host them will prove critical (See Britto's work on school readiness (Britto,2012)).
In the framework of this guide, these three age groups will be used where appropriate toabide with conventions. It is however worthwhile noting that this division is far from beinghomogenous and can vary from country to country, on the basis of the official ages of entryto preprimary and primary education and the duration of the former. Table 7.1 belowillustrates the diversity of preprimary access ages and durations in African countries.4
According to the country, the age of access to preprimary may vary from three to six years,and the duration of the cycle from one to three years.

Sub-Sector Specific Analyses 23
The Importance of Investing in ECD
The appropriate and early care of young children is of capital importance, as its absencejeopardises children’s future development. Such investment is all the more worthwhile thatit often carries strong positive externalities that are noted both in terms of individuals’ lives(better health, sociability, school readiness, retention, learning, increased income as an adultand so on) and for society at large (greater productivity of workers, economic growth, equity,reduced delinquency and risky behaviours and so on). Many studies show that the earlyinvestment in ECD activities is beneficial, through:
(i) Improving the internal efficiency of education by ensuring that children who enroll inprimary are well prepared to follow their lessons. Studies underline that schoolreadiness, beyond cognitive aptitude, depends on the mental, physical and emotionalhealth of children as well as their ability to develop relationships (Hair et al., inNaudeau et al., 2011).5 Numerous studies show that these faculties will be all themore developed once children have received appropriate care and stimulation in earlychildhood, contributing to better preparedness for school, better performance,reduced repetition and lower likelihood of early dropout (Jaramillo and Mingat, 2011;
Source: UNESCO Institute of Statistics database.
TABLE 7.1 - Official Age of Preprimary Access and Cycle Duration, African Countries, 2012
4 years
Botswana, Burkina Faso, Cape Verde, CAR, Chad, Comoros, Congo, Côte d’Ivoire, DRC, Gabon, Kenya, Lesotho, Liberia, Madagascar, Malawi, Mozam-bique, Nigeria, Sao Tomé and Principe, Sierra Leone, Somalia, Swaziland, Togo, Uganda, Zimbabwe
Burundi, Ethiopia, Guinea, Guinea Bissau, Niger, Rwanda, Senegal
Eritrea, Namibia, UR of Tanzania
Benin, Cameroon, Ghana, Seychelles
Angola
South Africa
3 years
4 years
5 years
6 years
1 year 2 years 3 years
Equatorial Guinea, The Gambia, Mali, Zambia
Preprimary Access Age
Duration of Preprimary Cycle
Mauritius
EARLY CHILDHOO
D DEVELOPM
ENT
CHA
PTER7

24 EDUCATION SECTOR ANALYSIS METHODOLOGICAL GUIDELINES - Volume 2
Garcia et al., 2011).6 It has also been shown that ECD services are particularlybeneficial for children from poorer backgrounds, enabling them to enter primary withthe necessary aptitudes and knowledge.7
(ii) Favouring the reduction of social and economic disparities, as the benefits of ECDactivities extend well beyond children’s primary education. Such investments, byoffering children from disadvantaged backgrounds a better transition to primary andimproved learning outcomes, help to break the inter-generational transmission ofpoverty through the increased productivity and income of individuals later in life. Forsociety at large, this translates into greater productivity in the workplace and sustainedeconomic growth, leading to an increase in the living standards of the entirepopulation.
(iii) Contributing to the improvement in sanitary and social outcomes, in particularthrough the positive impact on girls’ education, which is achieved through betterfertility control, responses to infant and child illnesses, hygiene practices, the morefrequent registration of births and so on.
(iv) Helping to reduce detrimental behaviour from adolescence to adulthood, throughpositive impacts on smoking, high-risk sexual behaviour, drug and alcohol abuse andcriminal activities, thanks to better levels of education and employability.
(v) Positive impact on girls’ education and mothers’ employment, thanks to day nurseryservices that provide mothers with the time and availability to work. Among otherfindings, studies carried out in Kenya have shown that the availability of ECD servicessuch as nurseries or preprimary schools have helped to improve the schooling of girlswho would otherwise have remained at home to care for their younger siblings(Lokshin et al., 2000).
Given the number and variety of such positive outcomes, investments in ECD are todayrecognised as being among the most beneficial for individuals and society, contributing toand accelerating the development of both.8 Numerous international tools today promoteand support ECD (See Box 7.1).

Sub-Sector Specific Analyses 25
Overall, the findings advocate for the quick development of articulated and sustainable ECDstrategies, in both financial and human terms. A first step consists in harnessing tools toachieve a global and relevant understanding of the sector as a whole and its mainstakeholders, which the following sections aim to provide.
BOX 7.1Key ECD International Reference Tools and Documents
• Convention on the Rights of the Child. Especially Article 5 on parents’ responsibility toensure children’s rights are respected, Article 18 on the responsibility of party states who shouldprovide parents with appropriate support and Article 24 on providing parents and children withappropriate information on health, nutrition and sanitation.
• Comment No.7 on the Convention on the Rights of the Child describes how the conven-tion should be interpreted in terms of early childhood.
• EFA Goal 1 aims to “Expand and improve comprehensive early childhood care and education,especially for the most vulnerable and disadvantaged children.”
• African Union’s plan for the Second Decade of Education that places ECD as its 8th priorityarea.
• EFA 2007 Report places emphasis on early childhood, stating that “Parental education pro-grammes have demonstrated their effectiveness in improving children’s family environment.”
• United Nations’ Secretary General’s Report on Early Childhood (August 2010) that high-lights the need for an integrated approach to ECD and parental education as a key strategy.
• WHO 2008 Report (A Powerful Equalizer) that provides a framework to understand theideal environment for optimal ECD.
• Recent research in child survival and development (Lancet Series and others).
Source: See each of the cited documents.
EARLY CHILDHOO
D DEVELOPM
ENT
CHA
PTER7

26 EDUCATION SECTOR ANALYSIS METHODOLOGICAL GUIDELINES - Volume 2
OVERVIEW OF THE NATIONAL CONTEXT
The starting point of the diagnosis is understanding the national context that affects childrenand their families. Table 7.2 provides an overview of the indicators to be used to describevarious dimensions of the macro context: socioeconomic, demographic, sanitary andeducation. This list is not exhaustive and can be complemented by other indicators to offera broader and more complete overview.
MACRO LEVELSECTION
1
1.1
TABLE 7.2 - Macro Context ECD and Family Background Indicators
Socioeconomic and Demographic Indicators
Target population, by age group (0 to 2 years, 3 to 5 years, 6 to 8 years) Number and % of the total populationGDP per capitaShare of households under the poverty line (%)Share of urban population (%)Adult literacy rate (%)Literacy rate of young women (15 to 24 years) (%)HIV/AIDS prevalence rate (%)Share of children registered at birth (%)Share of vulnerable children and orphans (%)Share of child workers (%)Prevalence of female genital mutilation (%)
Nutrition and Sanitation Indicators (Mothers and Children)
Infant mortality rate (per 1,000 live births)Child mortality rate (per 1,000 live births)Main causes of child mortalityMaternal mortality rate (per 1,000 live births)Malnutrition (0 to 5 years) Prevalence of wasting (%) Prevalence of stunting (%) Prevalence of underweight (%) Prevalence of overweight (%)
Education and Child Cognitive and Intellectual Development Indicators
MICS ECD Index (and its sub-components)Share of children entering school at the official school-age (%)Gross intake rate to primary (%)Primary completion rate (%)Mastery of reading and math at primary access (e.g. EGRA/EGMA scores)
Source: Authors.

Sub-Sector Specific Analyses 27
Where possible, it is interesting to observe the evolution of these indicators over time, butalso to compare them at a given point in time to countries of similar income levels.Comparing progress towards national or international goals (MDGs and so on) may also behelpful. Most of these indicators have already been dealt with in previous chapters of thisguide, such as Chapter 1 (Macroeconomic and Demographic Context), Chapter 2(Enrolment), Chapter 4 (Quality of Learning Outcomes) and Chapter 5 (External Efficiency).They will therefore not be explained here anew (See the quoted chapters for their descriptionand computation). The ECD index, an innovative indicator based on UNICEF’s MICS4 surveysand others are explained in greater detail in Annex 7.1.9
POLITICAL AND INSTITUTIONAL ARRANGEMENTS
The commitment of governments to establishing an environment conducive to thedevelopment of the ECD sub-sector can be appraised through an analysis of political,institutional and financial arrangements.
This analysis involves collecting information on the political and institutional instrumentsthat determine ECD interventions. Data on the various sources and amounts of funding(budgetary allocations, private funding, international aid and so on) will enrich thisapproach, in particular to assess the level of involvement of the state in ECD.
A survey may be conducted with key stakeholders, covering four main areas: the legalframework, sector-level coordination, financing and national monitoring and qualityassurance mechanisms.10 Among others, these different aspects enable the analyst todetermine the existence of an adequate legal and regulatory framework, the degree ofcoordination between sectors and between institutions, the availability of sufficient publicfinancing and the existence and enforcement of quality standards to ensure the integrationand quality of ECD services (SABER-ECD, World Bank, 2011).
The political framework is of utmost importance in as much as all other dimensions aredetermined by it. As underlined by Naudeau et al., 2011, the existence of a politicalframework for ECD, beyond increasing the visibility of related issues, enables one to clarifythe roles and responsibilities of different players and agencies, which is all the morenecessary given the multisectoral nature of activities and the multiplicity of players. It alsohelps with the mobilisation of both public and private resources by offering clear programmeorientations. Furthermore, it has been noted that ECD programmes will have greaterchances of support (not least from development partners) when related to other sectorprogrammes, including education and health (UNESCO, 2007).11
EARLY CHILDHOO
D DEVELOPM
ENT
CHA
PTER7
1.2

28 EDUCATION SECTOR ANALYSIS METHODOLOGICAL GUIDELINES - Volume 2
Key Questions
Legal Framework Is there a national policy, strategy or legal framework for child protection or ECD services?Is it enforced?Is there a high level political commitment?Are ECD programmes and activities included in national and sector frameworks (PRSP, education and health sector plans, etc.)?What were the stages of their development? Were stakeholders (communities, NGOs, private sector, etc.) involved?Does the strategy favour an integrated approach to childhood needs? Are services integrated? What programmes and activities are offered? What is their coverage?What age groups are covered by ECD? Are they covered by different institutions, and which ones?What is the official age of compulsory schooling?By law, are any ECD services free or compulsory (such as preprimary education, vaccination)? If so, which ones?What is the role of the private sector?Are the roles and responsibilities of different players (at the central and local levels) clearly defined?
Is there an inter-sectoral coordination structure for ECD activities?What were the stages of its development?What institution or ministry is responsible? Do stakeholders consider it to be legitimate?What is its composition? Are all players adequately represented?How is it implemented at the central and local levels?Does the country have a clearly defined national and inter-sectoral strategy?If so, are action plans available for its implementation nationwide?Has a communication strategy been elaborated?Is there an overlap in the activities carried out by different players?
What share of public financing is allocated to ECD in the areas of education, health, nutrition, water and sanitation, social spending, child protection? What are the short and long-term goals?What are the different funding sources (public/private) and their allocation mechanisms?Are public-private partnerships encouraged? What share of ECD spending is covered by households?Is international aid requested? If so, for which programmes? What is its share of total financing?
Have ECD quality standards been established?Are there standards for children-staff ratios, the number of children per group, the space per child, feeding programmes, staff qualifications and remuneration, programme duration and/or children’s achievements in terms of learning and early development?Is appropriate training compulsory for ECD staff and care-givers? What is the status of staff working in ECD?Is staff status determined at the national or local level? Is staff status enforced?Are there procedures for quality control and the enforcement of standards in ECD programmes and services?Is quality assurance based on inspection or certification? Are norms and standards enforced?
•
••
•
•
••
•
•
•
•
•••••••••
•
••
•
••
•
••
••
•
•
IntersectoralCoordination
Financing(See also Section 1.3)
National Monitoring and Quality AssuranceMechanisms
TABLE 7.3 - Questions for the Analysis of ECD Political, Institutional,Financial and Regulatory Frameworks
Source: Adapted from SABER-ECD, World Bank, 2011 and UNESCO, 2007.

EXAMPLE 7.1(ECD Context): Institutional Aspects of Intersectoral ECD Coordination in LiberiaSource: SABER-ECD, Republic of Liberia Country Report, 2012.
The National Intersectoral Policy on Early Childhood Development in Liberia (NIPECD) is anexplicitly multisectoral ECD policy. The NIPECD is the first of its kind in Liberia and illustrates thecountry’s commitment towards its younger citizens. The policy was officially launched in April2012, and the preparation of the implementation plan is underway. The primary objective ofthis policy is to favour the coordination and cohesion among the numerous ECD players to createa unified ECD system.
The NIPECD proposes an ambitious selection of objectives to intervene on the coverage, qualityand the implementation of an integrated ECD system. The following is a summary of theobjectives to be achieved in a five-year horizon:
• Build new ECD centres and provide an ECD service to cover 70 percent of the areas thatmost need it;
• Develop an ECD training framework and train at least 50 percent of the ECD teachers andother staff;
• Reduce child malnutrition from 20 percent to under 5 percent; and• Increase the rate of use of impregnated mosquito nets to fight malaria, from 45 percent to
80 percent.
The Education Office for Early Childhood was created to assume the institutional function ofcoordination of ECD among sectors. Based at the Ministry of Education, the staff was appointedin 2011, in a capacity of leadership of ECD in Liberia. As part of the NIPECD, the nationalIntersectoral ECD committee was created to lead the development of the policy and programmesat a national scale. The committee includes representatives of the Ministries of Education(presiding the committee), Health and Social Affairs, Gender and Development, Justice, Financeand Internal Affairs. The specific objectives of the committee are the following:
• Facilitate the management and coordination of the NIPECD under the leadership of theMinistry of Education;
• Initiate the preparation and review of policies, action plans, norms and decrees required inrelation to the implementation of the NIPECD;
• Ensure the availability of resources for the implementation of the NIPECD;• Manage the targeting of programmes to ensure that services reach disadvantaged groups;• Coordinate the required partnerships for the integrated supply of services;• Coordinate the implementation of information databases, as per needs;• Support and coordinate the implementation of inter-ministerial bodies at the sub-national
level; and• Prepare, monitor and evaluate the implementation plan.
Sub-Sector Specific Analyses 29
Table 7.3 above, partially inspired by the SABER-ECD work and UNESCO, 2007, providesan example of questions to answer in support of this institutional diagnosis.12 Example 7.1below illustrates the analysis of institutional considerations relative to ECD in Liberia.
EARLY CHILDHOO
D DEVELOPM
ENT
CHA
PTER7

30 EDUCATION SECTOR ANALYSIS METHODOLOGICAL GUIDELINES - Volume 2
ECD COSTS AND FINANCING
The analysis of the cost and financing of ECD programmes and services is a key exercise insector diagnosis in as much as any policy aimed at expanding the coverage or improvingthe quality of ECD services will depend in great part on their relative cost and on the publicand private financing available to the sub-sector, as well as the efficient use of thoseresources.
This section will aim to reconstitute the cost of ECD services and public and private spendingtowards them as exhaustively as possible. Two approaches are offered here, to establish: (i)the cost and volume of public financing; and (ii) the overall cost and financing of ECDservices. While the first is based on a classic analysis of the budgets executed by theministries responsible for ECD, the second aims to reconstitute the global cost on the basisof a representative sub-sample of the main ECD services, upon which basis it will be possibleto estimate the global volume of financing by source (public/private). This second approachhas the advantage of being able to establish the sub-sector’s main costs and financing in acontext where such information is not immediately available, especially when such servicesare offered by private providers, NGOs or communities.
Indeed, one of the characteristics of ECD is that the sources and financing mechanisms arenumerous, and unlike the financing of formal primary education, public ECD resources areusually not the main source of funds. Thus the correct identification of the differentfinancing sources and mechanisms is required to fairly establish the costs and financing ofthe sector.
Furthermore, the NIPECD has established inter-ministerial committees at the regional and locallevels. In the past, the ECD system in Liberia has had little targeting and weak coverage. Theimplementation of the NIPECD and the inter-ministerial committee provides a framework forcoordination and constitutes a first step towards an efficient and well integrated ECD system. Inaddition to ministerial representatives, the Liberian ECD system includes several other playerssuch as development partners, local and international NGOs, and representatives of civil society,personnel, communities and families.
1.3

Sub-Sector Specific Analyses 31
1.3.1 FINANCING SOURCES AND MECHANISMS
The collection of data relative to funding flows will be based on the information collectedfrom ECD services and programmes, as per Section 2 of this chapter (See Table 7.8). Thesource of financing should be identified for each of the different programmes. Naudeau etal., 2011 and UNESCO, 2007 offer an adaptation of the Belfield, 2006 diagram on thedifferent sources of ECD funding and mechanisms that can be helpful in this exercise.
EARLY CHILDHOO
D DEVELOPM
ENT
CHA
PTER7
FIGURE 7.3 - Example of ECD Financing Sources and Mechanisms
Public- International (Budget support)- National (central government)- Sub-national (State/Local authority)
Public-Private Partnerships- Government- Private enterprises - Foundations- FBOs, NGOs, etc.
External Financing- Development partners- Bilateral and multilateral agencies- International NGOs
Direct
curriculum development; or quality assurance systems
Indirect
Direct
Indirect
bodies, common financing of investment spending, etc.
and public institutions and programmes.
Private- Families- Community groups/FBOs/NGOs- Foundations- Private enterprises
FINANCING MECHANISMSSOURCES OF FINANCING
FIGURE 7.3
SOURCES OF FINANCING
Public
inancing Sources and Mechanisms
ect
- Example of ECD F
FINANCING MECHANISMS
Dir
inancing Sources and Mechanisms
FINANCING MECHANISMS
authority)- Sub-national (State/Local
al government)- National (centr- International (Budget support)
curriculum development;
ectIndir
ance systems or quality assur curriculum development;
shipsartnerPublic-Private P
ate enterprises- Privoundations- F
- Community groups/FBOs/NGOsamilies- F
Private
ectIndir
ectDir
etc., NGOs,- FBOsoundations- F
ate enterprises - Priv- Government
shipsartnerPublic-Private P
- International NGOsal agenciesal and multilater- Bilater
- Development partnersExternal Financing
common financing of investment spending,
and public institutions and progral agencies
, bodies etc.
.ammes and public institutions and progr
common financing of investment spending,
Source: Adapted from Belfield, 2006, in UNESCO, 2007, and Naudeau et al., 2011.

32 EDUCATION SECTOR ANALYSIS METHODOLOGICAL GUIDELINES - Volume 2
Three main sources of financing are available: public, private and foreign. Each is describedbelow. Information on cost and financing is often difficult to collect, on the one handbecause accounting systems are not tailored to capture costs, but only spending, and, onthe other hand, because the capacities of many countries’ information systems (on financingand service coverage) to collect the required information from local providers andconsolidate it at the regional and central levels are weak (Levin and Schwartz, 2012).Furthermore, where public expenditure is concerned, capital spending is rarely documentedfor ECD activities.
Public Resources
The flow of public funds from the central government can assume various forms, frompartial subsidies to the total coverage of services’ operational costs. Although in most casespublic financing is devoted to public ECD programmes and services, some private providersreceive subsidies as transfers. In other cases, public transfers are made to servicebeneficiaries, such as in the case of social allocations to families with young children. Suchinformation may be found in the executed budgets of the ministry responsible for preprimaryeducation, the ministry of social and family affairs, or the ministry of health in the case ofparental education programmes.13
In countries with decentralised administrative and funding systems, local governments mayassume a share of ECD expenditure. In Kenya for instance, the central government financesthe salaries of preprimary teachers whereas local authorities cover other operational andmaintenance costs for preprimary schools. In the absence of a centralised informationsystem, such data may be obtained from the executed budgets of municipalities, districtsand provincial governments.
Private Spending
Household spending may be particularly high due to the prevalence of private andcommunity provision of some ECD services such as preprimary education. Data may beconsolidated from household spending surveys’ education spending modules.14
Private sector contributions can assume a variety of forms, the most common being to coverthe cost of personnel (in nurseries and preschools) employed to take care of company staff’schildren. Furthermore, some private companies have in-house nurseries or preschoolsspecifically for their employees’ children. Although such data is difficult to obtain, it ispossible to make reasonable estimates when the unit costs of similar services and thenumber of children who benefit from the service are known. Data on the spending byprivate companies are to be obtained directly from them.

Sub-Sector Specific Analyses 33
NGOs and other faith-based and community organisations can play a significant role infinancing ECD services, some of which may be fully or partially financed by suchorganisations. In-kind contributions may also be provided (lending premises to the community,providing pedagogical materials, food, voluntary work and so on). Such data on monetaryand contributions in kind are generally very difficult to obtain.
External Funding
Bilateral and multilateral development partners and international NGOs may contribute tothe financing of some activities. Care should be taken to avoid duplication in accountingfor such funds when they are provided as budget or sector support, or are managed bylocal authorities or players15.
1.3.2 ANALYSIS OF PUBLIC FINANCING OF ECD SERVICES
Chapter 3 explains the approach and computation principles of the main public cost andfinancing indicators. Although the analysis focuses on the formal education sector, the toolsoffered are relevant to the analysis of the different ECD programme areas, such as health,nutrition or parental education.
This section aims to analyse the evolution of public ECD resources, distinguishing wherepossible between those devoted to each type of ECD programme or service. For eachprogramme, the analysis should be complemented by an examination of recurrent andcapital expenditure to appraise the degree of continuity of each. To assess governments’efforts and the priority given by the relevant ministry to the sub-sector, it is common tocompare the level of recurrent spending to a set of indicators, such as GDP, total recurrentspending (excluding debt service) or recurrent education expenditure. Where data permits,it will be worthwhile to disaggregate recurrent expenditure by nature, reviewing the sharethat is allocated to each key component (salaries, goods and services, subsidies and transfersand so on).
Whereas the evolution of public expenditure (global, recurrent and capital) devoted to ECDservices should be considered over a reasonable period (generally 10 years), thedisaggregation of expenditure by type should be carried out for the most recent year, giventhe work involved.16 Table 7.4 summarises the financial data that can be harnessed in thecontext of the analysis of public resources allocated to ECD.
EARLY CHILDHOO
D DEVELOPM
ENT
CHA
PTER7

34 EDUCATION SECTOR ANALYSIS METHODOLOGICAL GUIDELINES - Volume 2
1.3.3 ESTIMATION OF PUBLIC UNIT COSTS FOR THE MAIN ECD PROGRAMMES
The estimation of public unit costs (average public cost per beneficiary) is simply obtainedby dividing the total cost of public financing for a given service or programme by the numberof its beneficiaries. It is also common to provide the relative weight of such unit costs inrelation to GDP per capita for the year considered.
Although unit costs provide valuable information to governments, in particular in the lightof ECD expansion or quality improvement policies, they should be used with care. Indeedthe level of unit costs is heavily affected by: (i) the type of service delivery mode; (ii) thequality of the service (qualification and remuneration of staff, availability of learningmaterials, days/hours the service is provided and so on); (iii) geographic coverage (pilotproject, regional or national coverage and so on); or (iv) target areas and population groups(remote rural areas, urban centres and so on). Such differences should be kept in mind whenperforming comparisons.17
The exclusive analysis of public costs and expenditure carries two significant limitations: (i)given the multitude of providers and the often limited role of the public sector (both in theimplementation and financing of ECD programmes and services), it may lead to anunderestimation of the real operational costs of such programmes and of their totalfinancing; and (ii) it will fail to provide the required information where the scaling up orpartial financing (through subsidies for instance) of non-public ECD services and costs isbeing considered by the government.
Evolution of Public Expenditure Allocated to Preprimary (over a 10 Year Period) • Evolution of recurrent expenditure (in nominal and constant terms) • Evolution of capital expenditure (in nominal and constant terms) • Evolution of the share of recurrent expenditure in total expenditure (%)
Comparison of Recurrent Preprimary Expenditure (over a 10 Year Period) to: • GDP • Total public recurrent expenditure (excluding debt service) • Total recurrent education expenditure • Recurrent expenditure for other education sub-sectors
Share of Recurrent Preprimary Expenditure (for the Most Recent Year) Allocated to: • Salaries (%) • Goods, services and pedagogical inputs (%) • Transfers and support to families (%)
TABLE 7. 4 - Main Preprimary Public Expenditure Indicators
Source: Authors.

Sub-Sector Specific Analyses 35
1.3.4 ESTIMATION OF THE TOTAL COST OF MAIN ECD PROGRAMMES
One approach to the estimation of the total cost and financing of ECD services is theingredients method (Levin and Schwartz, 2012). This method is based on five practical stepsand consists in the identification of the main inputs/ingredients required by each programme(personnel, pedagogical materials, transport, premises, health, nutrition, games and so on),to then establish the real cost of each on the basis of market prices or other cost estimateapproaches.18 On this basis, the global cost of the service can be determined as well as itsunit cost and the respective contributions of the state, families, communities, NGOs and soon. Table 7.5 describes the five steps.
The exercise is completed by the reconstitution of the overall cost, by multiplying the unitcost of each service by the total number of estimated beneficiaries. To be comprehensive,it will be necessary to add any coordination, administration and monitoring and evaluationoverheads relating to central and decentralised management, be they public or private. Thiscan be done by estimating the personnel, input and premises costs of such bodies anddistributing them among the ECD programmes according to their respective budgets orcoverage (share of all beneficiaries).
On the basis of global cost and financing data, it will be possible to determine:
- The respective weights of the key players in the financing of ECD programmes andservices (government, families, communities, NGOs, the private sector, developmentpartners and so on);
EARLY CHILDHOO
D DEVELOPM
ENT
CHA
PTER7
1. Identify the services and their main characteristics Where significant differences exist (public/private, urban/rural), deal with each service separately
2. Determine the key ingredients and inputs Personnel, supplies, infrastructure, transport, quantity and quality of other inputs required for a given number of beneficiaries
3. Establish the cost of each of the ingredients/inputs listed in point 2 Based on market prices, real cost or other estimate
4. Determine the global cost of the programme and its unit cost per beneficiary Costs can be computed by region, type of programme or as a share of GDP
5. Identify the key sources of financing and any cost-sharing mechanisms Government (central and local), NGOs, families, volunteers, etc.
TABLE 7. 5 - Five Steps for the Analysis of the Cost of ECD Services –The Ingredients Method
Source: Levin and McEwan, 2001 in Levin and Schwartz, 2012.

Estimation of the Real Global Cost of an ECD Programme on the Basis of a Sample of ECD Centres, Fictional CountrySource: Inspired by Myers, 2008 (12 ECD centres catering for 325 children).
EXAMPLE 7.2
36 EDUCATION SECTOR ANALYSIS METHODOLOGICAL GUIDELINES - Volume 2
- The respective shares of recurrent and capital expenditure;
- The respective shares of personnel, goods and services and other transfer costs withinrecurrent expenditure; and
- The comparative importance of such financing levels with respect to the financing ofthe health or education sectors, or to GDP.
Example 7.2 provides an illustration of the application of the ingredients method, based onfictitious data.
Personnel 22,760
Care-givers
Supervision and administration
Other support staff
Central coordination
Pedagogical Material and Supplies
Games, books, colouring pens/pencils, etc.
Other goods and services
Feeding (Meals, Snacks, etc.)
Healthcare
Equipment
TOTAL ANNUAL EXPENDITURE (A)
Number of Beneficiaries (B)
Unit Cost per Beneficiary (C= A/B)
Total Enrolment Nationwide (D)
REAL GLOBAL COST (= C*D)
16,420
3,210
2,320
810
2,851
1,650
1,201
8,600
5,210
12,630
52,051
160.2
1,946,067
325
12,151
TABLE 7.6 - Annual Expenditure of a Sample of ECD Services (Illustrative Data)
Amount in Currency Unit
Table 7.6 provides the annual spending and unit cost estimates for a selection of 12 ECD centresproviding services to 325 children aged two to three years old. On the basis of this real spending,and knowing the total number of beneficiaries of this type of service nation-wide, the real globalcost of all such programmes can be estimated.

Sub-Sector Specific Analyses 37
The main difficulty in this type of analysis is the choice of the sample of ECD services. Thesevary considerably in terms of their programme content, quality and coverage, and willtherefore have significantly different unit costs. The main risk would therefore be to applya given cost to beneficiaries that in fact benefit from different services, leading toinappropriate estimations of the global cost of ECD services. In as much as it will not bepossible to examine the cost of each and every type of service, Levin and Schwartz (2012)suggest using a stratified sample of representative services, according to: (i) the type ofservice and delivery; (ii) location (urban/rural); and (iii) the type of provider (public/private).In doing this, it will be possible to estimate the global national cost by type of service,location and provider on the basis of the estimated number of beneficiaries of each service.Mapping ECD services will facilitate the sample selection (See Table 7.8). This can beperformed in parallel to activities aiming to appraise the quality of services, given that thesame ECD services and programmes will be visited (See Section 5.1).
The procedure followed is to:
1. Collect data from a sample of 12 ECD centres of a total of 180 that are attended by 12,151young children;
2. Consolidate the financial data, distinguishing between recurrent or running costs (personnel,supplies and so on) and capital costs (equipment);
3. Compute the average unit cost per child of 160.2 currency units by dividing the totalexpenditure of 52,051 by the 325 children that attend the 12 centres; and
4. According to school censuses, such ECD centres are attended by 12,151 children nationwide.Thus the total expenditure is equivalent to 1,946,067 currency units for this type of service(160.2 x 12,151).
EARLY CHILDHOO
D DEVELOPM
ENT
CHA
PTER7

38 EDUCATION SECTOR ANALYSIS METHODOLOGICAL GUIDELINES - Volume 2
This section aims to review the ECD services offered to identify the development prioritiesfor the sub-sector. ECD services and activities are highly varied, both in terms of objectives,target groups and delivery modes. In such a context, specific tools to identify and categorisethem will be valuable. In practice, various approaches may be adopted:
(i) By type of activity: The main types of service are maternal and child health (includinghygiene), nutrition, protection, parental education and preprimary education;19
(ii) By beneficiary age group: Distinction should be made between services offered tochildren under three years old and those aged three to five years.20 ECD programmestargeted at parents or care-givers (and mothers in particular) should also be dealtwith separately;21
(iii) By type of beneficiary: Children’s specific needs are then taken into account (orphansand vulnerable children, children with disabilities, children affected by or infectedwith HIV/AIDS and so on); and
(iv) By type of delivery: Making the distinction between home-based care, centre-basedcare, communication and media campaigns, conditional cash transfer schemes andso on.
The following sub-sections propose an approach to follow to facilitate the mapping of ECDservice delivery options. The exercise is concluded by the consolidation of the informationcollected.
IDENTIFICATION OF ECD PROGRAMMES
2.1.1 IDENTIFICATION BY TYPE OF PROGRAMME
The first step in mapping ECD services consists in the identification of the types ofprogramme and services offered and the delivery modes and location of each.22
MESO LEVEL: MAPPING ECD SERVICES
SECTION
2
2.1

EXAMPLE 7.3(Identification of ECD Programmes): Coverage of ECD Services, by Sectorand Beneficiary Group, Tanzania, 2012Source: Adapted from SABER-ECD, Tanzania Country Report, 2012.
FindingsAs presented in Figure 7.4, Tanzania has a range of ECD programmes established in each of theessential ECD sectors: education, health, nutrition and social and child protection. Interventionscater for pregnant women, young children and parents and care-givers. Yet, no programme perse on early stimulation exists so far.
Sub-Sector Specific Analyses 39
Example 7.3 below, borrowed from a national SABER-ECD report for Tanzania illustrates anexample of the mapping of early childhood interventions according to the different agegroups of beneficiaries.
2.1.2 IDENTIFICATION BY DELIVERY MODE
Regardless of the type of programme, four main delivery modes of ECD services arecommon:23
(i) Centre-based services: ECD services are organised by or in a centre that has beenspecially designed for them, such as basic healthcare centres, maternal and childhealth centres, nurseries, preprimary schools and so on. Centre-based services are
EARLY CHILDHOO
D DEVELOPM
ENT
CHA
PTER7
FIGURE 7.4 - Nature of ECD Programmes, by Sector and Type of Beneficiary, Tanzania, 2012
Parents/Caregivers
PregnantWomen
Children0-2
Children3-4
Children5-6
National Programme for Most Vulnerable Children
Programmes for Children with Special Needs
National Programme for Care & Support of People Living with HIV
PMTCT & Pediatric AIDS Care & Treatment
Immunisations
National programmes for Anemia,Iodine and Vitamin A Deficiency
National Programmes for Maternal and Child Nutrition
PublicPreschools
SOCIALAND CHILD
PROTECTION
NUTRITION
HEALTH
EDUCATION
Sect
or
Target Beneficiaries
- Nature of ECD ProgrammesFIGURE 7.4 ype of BeneficiaryT by Sector and , - Nature of ECD Programmes 2012anzania,T,of Beneficiaryy,
Sect
or
THHEALLT
NUTRITION
TECTIONPROOTAND CHILD
SOCIAL
National Programme for Most
Programmes for Children with Special Needs
National Programme for Care & Support of P
AIDS Care &
Immunisations
and VIodine National programmes for
ediatric PMTCT & P
ulnerable Children
Programmes for Children with Special Needs
eople Living with HIV
reatment
Immunisations
Deficiencyitamin A and VAnemia,National programmes for
TAIDS Care &
National Programme for Care & Support of P
VNational Programme for Most
egiversCarents/Par
TIONEDUCAAT
0-2enChildr
omenWegnantPr
arget Beneficiaries
National Programmes for Maternal and Child Nutrition
TTa
5-6enChildr
3-4enChildr
National Programmes for Maternal and Child Nutrition
PreschoolsPublic

40 EDUCATION SECTOR ANALYSIS METHODOLOGICAL GUIDELINES - Volume 2
variable, covering sanitary services, nutrition, parental information, education, andcommunication activities focused on health and hygiene and others. Integratedapproaches including all of the above also exist. Preprimary formal education is alsoincluded in this category.
(ii) Home-based care: Such services are mainly parental education, communication andadvice programmes offered by ECD professionals in beneficiaries’ homes, aiming toeducate and sensitise families (parents or other care-givers) about good parentingpractices. Some maternal and child health services are also included here (pre andpostnatal visits).
(iii) Communication and media campaigns: Such activities usually use the radio, television,newspapers, billboards, and so on. They target families with young children andsupport traditional ECD activities transversally, to improve their effectiveness.
(iv) Social support programmes (including cash transfers): Such activities usually targetpoor families with young children and generally consist in transfers (often of cash)made on the condition that beneficiaries ensure their children participate in seteducation, health or nutrition activities.24
2.1.3 IDENTIFICATION BY AREA
The area of residence plays a lead role in the delivery of ECD services. For instance, in thecase of education services, nurseries and preschools are predominant in urban areas. Suchservices are often in residential areas, mainly private, and target children from wealthierfamilies. However, more informal options do exist in rural areas, including community orhome-based services. It is therefore important to distinguish between rural and urbanservices.
To properly carry out this exercise involves meeting all the key ECD players: traditionalinstitutions (ministries of health, education, justice, social affairs and so on), civil society,private sector stakeholders and development partners.

Sub-Sector Specific Analyses 41
DESCRIPTION OF ECD PROGRAMMECHARACTERISTICS
Once the various types of programme and delivery modes have been identified, it isnecessary to review the organisational and programme dimensions of ECD services. Datashould be collected on a set of key characteristics, like the public, private or mixed natureof management, coverage or sources of financing. It is also important to determine theextent to which ECD services are equitable, specifically if they primarily target vulnerableareas and population groups where their coverage is not universal.
EARLY CHILDHOO
D DEVELOPM
ENT
CHA
PTER7
2.2
BOX 7.2Key Information to Collect on ECD Programmes and Services
1. The area covered and objectives: Where various services are offered, what areas do theycover? Are integrated approaches used? For instance, do sanitary and health services includeearly stimulation activities, or do preprimary education programmes have nutrition compo-nents?
2. Delivery mode: Are services centre-based, home-based, communication and advocacy-orien-ted, or a selection of the above? How often and for how long is the service available?
3. Scale of implementation, by programme type: Which are pilot programmes, or offernational or regional coverage? Are vulnerable areas covered? Indicate the coverage and num-ber of beneficiaries for each.
4. Target population group, by programme type: Indicate the age groups or specificities ofthe target beneficiaries, especially where children with special needs or vulnerable childrenare concerned, as well as age groups, including parents and care-givers.
5. Institutional set-up: Document the administrative nature of the programme. Is it public, pri-vate or community-based?
6. Financing modes and/or sources: Distinguish between public, private (parents, communi-ties, NGOs, faith-based organisations) and development partners; direct transfers, specifictaxes, subsidies, social transfers and so on; and between financing types (See Section 1.3 andFigure 7.3).
7. Control and quality assurance mechanisms: Do standards exist, are they followed, andwhat public institution is responsible? Are quality assurance mechanisms implemented?
Source: Adapted from SABER-ECD, World Bank, 2011.

42 EDUCATION SECTOR ANALYSIS METHODOLOGICAL GUIDELINES - Volume 2
Box 7.2 summarises the key information that it is appropriate to collect about ECDprogrammes and services.25 It can constitute the basis of a questionnaire to be used withthe identified programmes and services, providing complementary information to that madeavailable through surveys and censuses carried out yearly by the statistical services of theministries responsible for ECD.
Example 7.4 below, based on the SABER-ECD method (World Bank, 2011), offers anillustration of how programme information may be consolidated on the basis of the areasidentified above.
Consolidation of Key Information for a Preprimary Education Programme,Based on the SABER-ECD Approach, Fictional CountrySource: SABER-ECD, World Bank, 2011.
EXAMPLE 7.4
The ministry of education develops the programmes and curricula at the central level and is responsible for the expansion of coverage. Public preprimary schools are based within existing basic education schools or in separate premises.
Teachers’ salaries are paid by the ministry of education. Capital expenditure for building costs is covered by central and local government.
Preprimary teachers are civil servants from the ministry of education. Pre-service training of teachers includes four years of university study.
Objective
Brief Description
Target Group
Areas Covered
Coverage/Access
Institutional Set-up
Financing
Teachers/Care-givers
Preprimary Education Programme
Prepare children for primary school.
Children are offered preprimary supervision within the premises of existing primary schools.
Children aged four to six years.
Develop children’s pre-literacy and pre-numeracy skills and increase their cognitive stimulation.
Preprimary Gross Enrolment Rate of 39%.
Quality Assurance and Monitoring
Existing standards focus mainly on premises and other infrastructure rather than on programmes and teaching practice. The inspection of centres is infrequent and inspectors often have little knowledge of ECD programmes.
TABLE 7.7 - Consolidated Characteristics of a Preprimary Education Programme (Illustrative Data)

Sub-Sector Specific Analyses 43
CONSOLIDATION OF THE INFORMATION
Data should be collected on a national scale to provide as comprehensive a picture aspossible of the different ECD services. Once information has been obtained for a satisfactorynumber of ECD services, it should be consolidated according to common criteria to providea global view of available programmes. Table 7.8 can be used as a tool to consolidate theinformation. It presents the state of coverage of the ECD programmes and services (fromtheir inexistence to universal coverage) according to the area and type of intervention andtheir main provider. It is complemented by a summary of each intervention: (i) coveragerates; (ii) the areas/population groups covered (offering an appraisal of the targeting ofvulnerable areas/population groups); (iii) the main source of funding; (iv) the existence ornot of a quality control and monitoring mechanism, or the body in charge when such amechanism is in place.
EARLY CHILDHOO
D DEVELOPM
ENT
CHA
PTER7
NoServices
PilotProgramme
RegionalCoverage(Indicatewhich)
Coverage Number ofBeneficiaries
or AccessRatio for
the TargetGroup
Location(Urban/Rural/
Regions/Targeted
VulnerablePopulation)
MainSources
ofFinancing
MonitoringMechanismsand AgencyCountry-
wideCoverage*
UniversalCoverage
Health
Nutrition
Preprimary Education
Parental Education
Protection/Special Needs
TABLE 7. 8 - Consolidation of Key Information on ECD Services Available Nationwide(Model Table)
Source: Adapted from SABER-ECD, World Bank, 2011. * The targeting of beneficiaries might be selective.
2.3

44 EDUCATION SECTOR ANALYSIS METHODOLOGICAL GUIDELINES - Volume 2
The objective of Section 3 is to examine a set of indicators that will provide a detailed profileof children and their home environments to better identify their development needs andorient ECD programme elaboration. This is an extension of the global diagnosis of thesanitary and child development context proposed in Section 1.1 of this chapter. Two typesof indicators are offered: (i) on the characteristics of children and their families, includingparental practices; and (ii) on the access and use of ECD programmes.
In each case, it is advised to disaggregate the different indicators according to child (gender,vulnerability, age and so on) and household (area of residence, income level, education ofparents and so on) characteristics. This will enable a better determination of possibledisparities to propose corrective measures through the implementation of better targetedactivities, both in terms of beneficiaries and content. Such disaggregated information willbe illustrated in Section 4 on equity, below.
Where possible, it will be worthwhile to provide historical data for these indicators, but alsoto compare them at a given point in time to those in other countries of similar income levels.Placing them in the context of national or international goals (such as the MDGs or EFAgoals) may also be helpful.
PROFILE OF CHILDREN AND THEIR FAMILIES
Table 7.9 provides a list of some of the most easily available indicators that describe earlychildhood development and children (under eight years)’ family environments. In additionto the main ECD sectors, it covers the socioeconomic context that can be used as a proxyfor the quality of the family environment (See Annex 7.1 for a detailed description of theindicators).
MICRO LEVEL: CHILDREN AND THEIR FAMILIES
SECTION
3
3.1

Sub-Sector Specific Analyses 45
EARLY CHILDHOO
D DEVELOPM
ENT
CHA
PTER7
Health, Nutrition and Hygiene DPT3 vaccination rate Prevalence of stunting Prevalence of wasting Prevalence of underweight Prevalence of overweight/obesity Share of children receiving adequate healthcare when ill (fever, diarrhea, ARI - acute respiratory infection) Share of children that sleep under a insecticide-treated mosquito net Share of children that wash their hands after using the toilet
Education and Early learning Share of children participating in an early learning activity ECD Index and its sub-components Share of children starting primary at the official school age Mastery of basic reading and numeracy upon primary access (e.g. EGRA/EGMA scores)
Protection Share of children with a birth certificate Share of vulnerable children and orphans Share of children involved in productive activities
Socioeconomic Indicators Share of children living in a poor household Share of children whose household head is a woman Share of children whose household head is illiterate Highest education grade attained by the household head and/or the mother/tutor Socioprofessional category of the household head and/or the mother/tutor Household dependency rate Area of residence Average family size Share of household possessing a radio or TV
Health, Nutrition and Hygiene Share of women who practice exclusive breastfeeding for 6 months Share of women who give children food supplements after 6 months Share of households using iodised salt Share of households with access to safe drinking water Share of households with improved sanitation facilities Knowledge and attitudes towards sanitary risks Share of households that have soap for hand washing
Stimulation Activities Share of children owning toys at home Share of children owning books Share of children who benefit from stimulation activities at home Share of fathers involved in stimulation activities at home Share of children who have been engaged in activities with an adult to promote learning and school readiness Prevalence of explanatory, coercive or disciplinary practices
TABLE 7.9 - Key Indicators to Describe Young Children and their Family Environment
Child Characteristics (Children Aged under 8 Years)
Family Characteristics (Children Aged under 8 Years)
Source: Authors.

46 EDUCATION SECTOR ANALYSIS METHODOLOGICAL GUIDELINES - Volume 2
The analysis of these indicators will enable the analyst to establish the extent to whichchildren grow up in a family environment that is favourable to their development (preparingthem for school), even if the table is incomplete due to the lack of data in some areas.26
Indeed, sources of information to describe the quality of the home environment are rare,especially for the frequency and quality of interaction with parents, care-givers and peers;home-based stimulation and education activities; the type of stimulation activities; physicaland motor development; and language, cognitive and socioemotional development. MICSand DHS type surveys offer some data however. Some countries, to compensate for thislack of information, have carried out specific surveys on parental practices or other areas ofyoung children’s physical, language, cognitive or socioemotional development.27 Where theyexist, such surveys will be particularly helpful to orient ECD policy and programmes.
Example 7.5 below outlines the basic methodological principles and results of a survey ofparental practices conducted in Mauritania.
Parental Practices, Mauritania, 2010Source: UNICEF/Mingat and Seurat, 2011.
EXAMPLE 7.5
In the context of UNICEF support to the Mauritanian government in developing ECD activities,a household survey was conducted in 2010 with the main objective of providing a detaileddescription of parental practices and of the development of young children. This work had adouble perspective: (i) to gain knowledge of parents’ behaviour, and mothers’ in particular, withrespect to their children aged six months to six years; and (ii) to provide operational benchmarksin terms of family education and preprimary education activities, to support the Mauritaniangovernment’s national ECD programme.
The collection of data and the resulting analyses focused on aspects of parental practice relatingto the time spent by parents with their children, the role of the father, feeding, cognitivedevelopment and games, sleep, language and social development, health and perceptions ofdangers and female genital mutilation, among others. For these different dimensions, the surveywas based on the responses given by families (often mothers).
FindingsIn general terms, although parental education requires an active investment on behalf of parentsin children’s development, only 43 percent of parents believed that their role was significant, 23percent felt that their influence was limited and 34 percent that they had no influence on theirchildren’s development. This finding is also observed in mothers’ marked tendency tounderestimate their young children’s effective capacities: more than a third mentioned that it ispointless talking to a child before they reach the age of two years (the age at which childrenstart to reply), despite it being known how important mother-child contact is in children’ssocioemotional and language development from a very early age.

Sub-Sector Specific Analyses 47
ACCESS TO AND USE OF ECD SERVICES
Under the hypothesis that participation in ECD services provides beneficiary children withbetter health and preparation for school, the analysis of access and use of ECD services willprovide further elements of understanding about: (i) the capacity of a country to provide allchildren, regardless of their characteristics, with a good start in live; and (ii) the need toexpand the services provided to ensure their more equitable and efficient development.
Table 7.10 provides an overview of the indicators that are usually used to describe thelevel of access and use of the main ECD services. This list, far from being exhaustive, maybe complemented by other indicators where available to offer a broader and morecomplete overview of the issues. The mentioned indicators are described in greater detailin Annex 7.1.
Parental practices in terms of the social and cognitive development of children show that 30percent of mothers did not feel involved when their children failed in a given activity, and only18 percent said they adopt a positive attitude (providing help, advice and so on). Furthermore,59 percent of children under three years old do not participate in family activities (play and soon). In terms of discipline, 83 percent of mothers indicated that they set rules, but 70 percentclaim to do so through threats and other coercive approaches, whereas only 30 percent providechildren with explanations.
The practice of female genital mutilation, although becoming less common, is fairly widespread.About half of girls have undergone female genital mutilation, and 44 percent of mothers believethe practice should be maintained. Female genital mutilation is more common in rural, poor anduneducated households.
In terms of children’s hygiene, few mothers give their children a daily bath. In 42 percent ofcases, weekly baths are given. The data also show that 62 percent of children do not regularlywash their hands after using the toilet, and only 35 percent wash their hands before meals,however irregularly.
In terms of health and the perception of dangers, when children have a health issue such asfever or diarrhea for instance, 30 percent of mothers do not recognise the symptoms of feverand 41 percent do not know about administering oral rehydration salts in diarrhea cases, whichis a testimony to the scope for improvement in parental practices with respect to two illnessesresponsible for a significant share of child mortality.
3.2
EARLY CHILDHOO
D DEVELOPM
ENT
CHA
PTER7

48 EDUCATION SECTOR ANALYSIS METHODOLOGICAL GUIDELINES - Volume 2
Example 7.6, drawn from the Tanzania SABER-ECD country report, illustrates the situationin terms of preprimary access and the use of sanitary ECD services in Tanzania. The examplealso enables one to place the country in international perspective.
Share of pregnant women having had at least three prenatal appointments with qualified health personnel
Share of births assisted by qualified personnel
Vaccination coverage rate for children aged 12 to 23 months
Share of children with acute respiratory diseases receiving antiobotics
Share of children with diarrhea who are given ORT
Share of children with fever having received anti-malarial treatment
Vitamin A supplementation, %
Distance from home to the nearest health centre
Health and Nutrition Services
Preprimary and Primary Education Services
Protection Services
TABLE 7.10 - Key Indicators to Describe Access to and Use of ECD Services, by Type
Share of children attending an ECD education service (indicate the age group and provider):• Nursery, day-care centre• Preprimary schoolShare of children enrolled in preprimary education in public, private and community centres
Preprimary gross enrolment rate
Gross access rate to the first grade of primary
Distance from home to the nearest preprimary school
Share of registered births
Source: Authors.
(Use of ECD Services): Access to Early Childhood Care and Education (ECCE),Tanzania and Selected East African Countries, 2012Source: SABER-ECD, Tanzania Country Report, 2012.
EXAMPLE 7.6
Tanzania (2010) Ethiopia (2010) Kenya (2009) Uganda (2010)
Age of preprimary entry
Duration of preprimary
Gross enrolment rate (%)
Net enrolment rate (%)
Percentage of private enrolment
5 years old
2 years
33
33
5
4 years old
3 years
5
4
95
3 years old
3 years
52
29
38
3 years old
3 years
14
14
100
TABLE 7.11 - Preprimary School Provision, Tanzania and Selected East African countries, 2012

Sub-Sector Specific Analyses 49
FindingsIn Tanzania, preprimary school starts at 5 years old, for a duration of 2 years. In 2010, totalenrolment in preprimary school (public and private) was 33 percent and increased by 45 percentsince 2005 (based on data not displayed in the table). Despite the substantial increase in non-state enrolment, as of 2010, non-state enrolment accounted for less than five percent of allenrolment for children ages five to six years. If data were available to track enrolment for childrenbelow the age of five years, the relative proportion of enrolment in non-state ECCE would climbas all services for children below the age of five years are provided by non-state operators. AsTable 7.11 shows, in comparison to other countries in East Africa, gross and net enrolment ratesare low across the region. The portion of preprimary schooling provided by the private sector issignificantly lower than in all neighbouring countries.
Access to essential ECD health interventions in Tanzania is better than in neighbouring countriesbut could still be improved. Table 7.12 below shows the level of access to a selection of essentialECD health interventions for young children and pregnant women in Tanzania with regionalcomparisons. The level of access to essential health interventions is higher (or comparable) inTanzania than in neighbouring countries. In particular, Tanzania has had more success scalingup the coverage of insecticide-treated mosquito nets for children below the age of five years.Given that malaria is the leading killer of young children in Tanzania, this is a critical policyintervention. While Tanzania leads the region in terms of access to skilled attendants at birth,the data indicates that less than half of all women have access to a skilled attendant, which iscritical to ensuring safe deliveries.
Tanzania Ethiopia Kenya Uganda
Children under 5 with diarrhea who receive oralrehydration/continued feeding
(Percent)
Children aged 1 year oldimmunised against DPT
Children under 5 with suspected pneumoniawho receive antibiotics
Children under 5 sleeping under insecticide-treated mosquito nets
Children under 5 with fever who receiveanti-malarial treatment
Births attented by skilled attendants
HIV+pregnant women/exposed infants whoreceive ARV treatment for PMTCT
50
91
nd
64
59
49
59
15
90
5
33
10
6
-
43
93
50
47
23
44
43
39
60
47
33
60
42
-
TABLE 7.12 - Access to Essential ECD Health Interventions in East Africa, 2006-10
EARLY CHILDHOO
D DEVELOPM
ENT
CHA
PTER7

50 EDUCATION SECTOR ANALYSIS METHODOLOGICAL GUIDELINES - Volume 2
If at all possible, it will be helpful to disaggregate the indicators presented in Section 3.1according to child and family characteristics. Indeed, significant differences can exist inaccess to care, in the use of services, or in terms of parental practices, according to the areaof residence, household income or gender. The disaggregation of data will enable one tohighlight the differences between groups to offer a fairer understanding of the needs ofchildren and their families in terms of ECD services, facilitating the implementation of bettertargeted activities, both in terms of beneficiaries and programme content. Given thatChapter 6 of this guide offers a detailed description of the tools and methods used in themeasure of disparities, this section will be brief, providing a couple of illustrations of theissue. It may also be interesting to extend the diagnosis by researching the underlyingphenomena behind the disparities, to assist the implementation of more relevant correctivemeasures. As the following example shows, the source of disparities may be found in bothdemand and supply-side factors.
IDENTIFICATION OF DISPARITIES
Various dimensions can be considered to attempt to highlight the existence of disparities inthe coverage, access to and use of ECD services, as well as in parental practices. They mainlyinclude:
- Children’s age; - Children’s gender; - Household income;- The level of education of parents, and especially mothers; - The gender of the head of household; - The area of residence (urban/rural); and - The geographic location (region, district).
Example 7.7, drawn from the MICS4 report for Sierra Leone, illustrates disparities in termsof access to ECD programmes for children aged 36 to 59 months, according to gender, areaof residence, age, mothers’ education and household income.
DISPARITIES IN ACCESS TO AND USE OF ECD SERVICES:SUPPLY AND DEMAND
SECTION
4
4.1
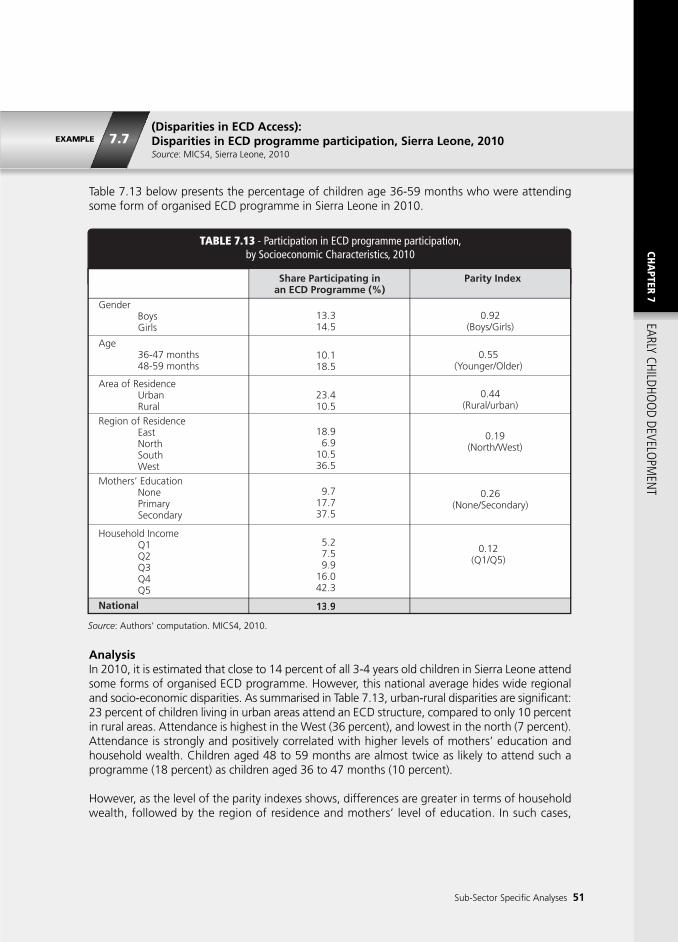
EXAMPLE 7.7(Disparities in ECD Access): Disparities in ECD programme participation, Sierra Leone, 2010Source: MICS4, Sierra Leone, 2010
Table 7.13 below presents the percentage of children age 36-59 months who were attendingsome form of organised ECD programme in Sierra Leone in 2010.
Share Participating inan ECD Programme (%)
Parity Index
TABLE 7.13 - Participation in ECD programme participation,by Socioeconomic Characteristics, 2010
Gender Boys Girls
Age 36-47 months 48-59 months
Area of Residence Urban Rural
Mothers’ Education None Primary Secondary
Household Income Q1 Q2 Q3 Q4 Q5
Region of Residence East North South West
National
13.314.5
10.118.5
23.410.5
18.96.9
10.536.5
9.717.737.5
5.27.59.9
16.042.3
13.9
0.92(Boys/Girls)
0.55(Younger/Older)
0.44(Rural/urban)
0.19(North/West)
0.26(None/Secondary)
0.12(Q1/Q5)
National 13.9
Sub-Sector Specific Analyses 51
EARLY CHILDHOO
D DEVELOPM
ENT
CHA
PTER7
AnalysisIn 2010, it is estimated that close to 14 percent of all 3-4 years old children in Sierra Leone attendsome forms of organised ECD programme. However, this national average hides wide regionaland socio-economic disparities. As summarised in Table 7.13, urban-rural disparities are significant:23 percent of children living in urban areas attend an ECD structure, compared to only 10 percentin rural areas. Attendance is highest in the West (36 percent), and lowest in the north (7 percent).Attendance is strongly and positively correlated with higher levels of mothers’ education andhousehold wealth. Children aged 48 to 59 months are almost twice as likely to attend such aprogramme (18 percent) as children aged 36 to 47 months (10 percent).
However, as the level of the parity indexes shows, differences are greater in terms of householdwealth, followed by the region of residence and mothers’ level of education. In such cases,
Source: Authors’ computation. MICS4, 2010.

52 EDUCATION SECTOR ANALYSIS METHODOLOGICAL GUIDELINES - Volume 2
targeting the most disadvantaged households in the most vulnerable regions (North and South)may provide a more equitable coverage of ECD services. Encouraging mothers’ literacyprogrammes may also have a favourable impact on the participation of children in ECDprogrammes, stimulating demand for such services.
ANALYSIS OF DISPARITIES: THE UNDERLYINGCAUSES OF WEAK ACCESS AND USAGE RATES
Analytically, the variables that explain disparities can be found to relate both to the supplyof services and the demand on behalf of beneficiaries and/or their families. On the supplyside, the distance to the services and their quality (the availability of inputs, the sufficientnumber of sufficiently qualified personnel, the condition of premises) are the main factorsthat influence the access to services and their use. On the demand side, various reasons arementioned by users, including the excessively high level of fees, the lack of interest in theservices offered due to their low quality or weak relevance, or ignorance about their well-foundedness.28 Household, KAP and other qualitative surveys may be particularly informativeabout these factors, shedding light on the reasons mentioned by families to justify theparticipation of their children in ECD services.
Example 7.8 below describes the main motives provided by parents for not having theirchildren attend preprimary education programmes in Uzbekistan.
4.2

EXAMPLE 7.8(Supply and Demand Factors Affecting ECD Attendance): Reasons for NotEnrolling Children in Preprimary Education, Uzbekistan, 2009Source: UNICEF, 2009 in SABER-ECD, World Bank, 2011.
Sub-Sector Specific Analyses 53
EARLY CHILDHOO
D DEVELOPM
ENT
CHA
PTER7
Area of Residence
Urban Rural Wealthy Poor
Income LevelTotal
No need
Child is too young
Programme is too expensive
Nursery is too far
Care provided is inappropriate/questionable
Opening hours are not convenient
Child’s state of health
Children are enrolled in school (when 6 years or above)
34
32
23
3
3
0.6
0.6
4
34
25
17
17
3
0.5
1
3
36
28
15
14
3
0.5
1
3
30
26
26
14
2
0.6
1
3
34
27
19
13
3
0.5
1
3
TABLE 7. 14 - Reasons Mentioned by Parents for Not Enrolling their Children in Preprimary Education,2009
Area of Residence
Urban Rural Wealthy Poor
Income LevelTotal(Percent)
More in-depth analysis can be carried out to better determine the supply and demandfactors affecting the access to and use of ECD services and disparities in parental practices.29
Using econometric models may be particularly worthwhile and relevant here, to highlightthe net effects of each of the variables considered. Illustrations of such models are presentedin Chapter 6 of this guide.
FindingsTable 7.14 shows that the first cause of children’s non attendance of preprimary education relatesto their parents’ lack of interest in such services (34 percent of cases). The age of children is thenmentioned by 27 percent of parents, which may reflect programmes’ lack of relevance tochildren’s development needs (see footnote 28). Access fees are felt to be too high in 19 percentof cases, especially for poor families (26 percent of cases), and 13 percent of respondents claimthe distance from their home to the centre is a disincentive to preprimary enrolment. The latterfinding is more common in rural areas (17 percent) than in urban ones (3 percent).

54 EDUCATION SECTOR ANALYSIS METHODOLOGICAL GUIDELINES - Volume 2
QUALITY AND EFFICIENCY OF ECD SERVICES
Any discussion on the supply and demand for ECD services implicitly involves quality andefficiency issues. However, unlike general education for which conventional qualityindicators and evaluation methods are available, there is no consensus in terms of whatconstitutes a quality service or in terms of a standardised approach to the evaluation ofquality for ECD. Some tools are however available to provide a first appraisal of thesedimensions, presented in the sections that follow.
QUALITY OF ECD SERVICES
The quality of ECD services is generally approached through two types of measure, qualifiedas structural and process (Currie, 2001; Mashburn et al., 2008, in Levin and Schwartz,2012). Structural measures generally focus on inputs such as the level of qualification andtraining of care-giving staff, class size, adult-children ratios or the quality of the physicalenvironment. Process measures focus on the relationship between care-giving personneland children, the use of class time, or the pedagogical and disciplinary approaches adopted.Whereas structural measures remain easy to establish as they are based on information thatcan be collected from secondary sources, process measures can be more complex, as theyrequire the direct observation of the service provided. Furthermore, there are no realstandards in terms of what constitutes quality interaction and no consensus in terms ofwhat a quality ECD service represents or on the inputs that best prepare children for primaryeducation.30
Nadeau et al., 2011 propose a practical division of such inputs and activities’ characteristicsinto four categories, covering structural characteristics, personnel characteristics, programmecharacteristics and process characteristics, to which a fifth is added relating to themonitoring and evaluation of children’s outcomes.
In the absence of an existing data system to provide such data, it may be helpful to conducta sample survey. A simple questionnaire may seek to appraise the quality of each of thecharacteristics deemed particularly relevant to each context. It may be conducted in unisonwith the cost estimation exercise presented above (see section 1.3.4), on the same sampleof programmes and activities.
Table 7.15 below proposes typical questions that help to draw a picture of the quality ofECD programmes based on these. They complement the questions already offered in Table
SECTION
5
5.1

Sub-Sector Specific Analyses 55
EARLY CHILDHOO
D DEVELOPM
ENT
CHA
PTER7
Key Questions
StructuralCharacteristics
What condition are the premises, classrooms and play areas in?Do they fulfill requirements in terms of hygiene, stimulation and learning?What is the availability of appropriate equipment (sanitary facilities) and pedagogical material (communication tools, stimulation games and so on)?What is the adult-child ratio? How large are classes?Are norms and standards adhered to (where they exist)?
What qualifications and training do the care-givers have? Are their qualifications and training specialised?Do their qualifications and training comply with standards (where they exist)?What is the professional status of care-givers? *What is the share of qualified care-givers?Have care-givers and other staff involved in the supervision of the youngest children been trained in holistic ECD best practices?What is the remuneration of care-givers? Does it comply with norms where they exist? How does it compare to that of other professions in terms of GDP per capita?
How intensive is the programme (number of hours per week, full/part time)? How many times are families visited each month?Are standards adhered to where they exist? Is there a partnership between parents/communities and the programme, or a mutual commitment? If so, in which area (management, administration, parental advisory committee, contributions to the building and equipment of the centre, preparation of pedagogical inputs, contribution to the elaboration of programmes, financing, supervision of children, etc.)?What is the teaching language (mother tongue, official language, both)?Are health and nutrition inputs available? If so, in what quantities?Does the curriculum adopt a holistic vision to children’s development, offering them a selection of appropriate, stimulating and pleasant learning tools (covering physical, socioemotional, cognitive and intellectual development)?
What pedagogical and disciplinary approaches are adopted?What is the frequency and quality of interactions between care-givers and children,and among children?
Do ongoing programme monitoring and evaluation and quality control mechanisms exist?Is quality assurance based on inspection or accreditation?
PersonnelCharacteristics
ProgrammeCharacteristics
ProceduralCharacteristics
Monitoring and Evaluation of Practices and Learning
TABLE 7.15 - Questions for the Analysis of the Quality of ECD Programmes and Services
Source: Adapted from Naudeau et al., 2011 and UNESCO, 2007. Note: * In developed countries a distinction is generally made between pedagogues, early childhood teachers, nursery workers,qualified or trained auxiliaries, family-day care workers, and non-qualified auxiliaries or volunteers (UNESCO, 2007).
7.3 in the context of the description of quality monitoring and control mechanisms. Eachquestion/item may be marked on a scale of 1 (inappropriate) to 5 (excellent). The sum ofthe marks obtained for each item would then provide a global score offering a syntheticmeasure of the quality of the service.

56 EDUCATION SECTOR ANALYSIS METHODOLOGICAL GUIDELINES - Volume 2
Many other tools have been developed to appraise the quality of ECD programmes, somein Africa. The most used is the revised version of the Early Childhood Environment RatingScale (ECERS-R), initially conceived to evaluate centre-based ECD programmes for childrenaged between two and a half and five years in the United States. It consists of 43 itemsdivided into seven broad areas that focus on the most easily measured structural dimensions(See Annex Table A7.3). The answers to the questions are coded on a scale of 1 to 10.31
Other tools exist, such as the Save the Children evaluation scale derived from the ECERS,the auto-evaluation instrument of the Association for Childhood Education, or theInternational Step by Step Association (UNESCO, 2007). A brief presentation of these toolsis offered in Annex 7.232.
EFFICIENCY OF ECD SERVICES
Evaluating the efficiency of ECD services is equivalent to examining the extent to which theyimprove the outcomes of the children who access them. The analysis of efficiency is basedon the finding that, in addition to the ECD services that children receive, children’sdevelopment is influenced by a great number of factors that encompass the micro, mesoand macro dimensions described above (See Figure 7.1). These must be correctly consideredin the analysis.
As mentioned in the introduction to this chapter, the impacts of ECD interventions fall intotwo categories:
- The direct impact on children’s physical, cognitive, socioemotional and linguisticdevelopment; and
- The medium to long-term impact on various aspects of an individual’s life: education(including the transition to primary), income, physical and mental health in adulthood,fertility, high-risk behaviours (smoking, alcohol consumption and so on).
These two levels of impact will be dealt with in turn in the following sections, with aparticular focus on primary education (access and schooling paths) in terms of the mediumterm impact. One further clarification is needed before proceeding with the analysishowever. The idea here is by no means to propose a rigorous method for the evaluation ofECD programmes’ impact on children’s development or in terms of other outcomes, notleast due to the lack of adequate data.33 It will be preferable to base the analysis on easilyavailable data (such as that collected by household surveys) to establish the level ofcorrelation (positive, negative, significance) between the participation in an ECD programme(in the broad sense) and children’s development. This section is thus devoted to theindicators and tools that may be readily available for the analysis.
5.2

Sub-Sector Specific Analyses 57
5.2.1 METHODOLOGICAL APPROACHES, TOOLS AND CONSTRAINTS
Two methods are commonly used to measure the cognitive, intellectual, socioemotionaland linguistic development of children, which can be used separately or jointly. The first isan indirect evaluation of the development of the child to be evaluated through questionsadministered to parents and care-givers (often mothers). Although easy to put into practice,this approach does not provide a precise evaluation of children’s development (See Section5.2.2 below and Annex 7.1).
The second approach is a direct evaluation of the development of young children asindividuals, through psychometric tools and techniques.34 When such tests are rigorouslyand objectively conducted, they enable one to evaluate children’s progress in areas as variedas behavioural attitudes, intelligence and cognitive, socioemotional and linguisticdevelopment, to establish a complete and precise picture of children’s development.
However, it is important here to warn readers of the limitations of this approach:
(i) The instruments use methods that are not always adapted to the age or specific needsof children or country and community contexts, in addition to being unconventionaland non-standardised. Indeed, attempts to evaluate the development of children oftenface multiple methodological constraints, especially when it is necessary to define,isolate and quantitatively measure different dimensions of children’s development in acontext where these are closely linked to or determined by a plethora of other factorssuch as the family environment, culture, household income, religious beliefs and so on;
(ii) The dimensions can be a source of bias if they are not considered appropriately;
(iii) To date, most of the tests carried out in African countries are pilot studies or academicresearch on small samples whose results cannot be easily generalised at the scale of acountry35.
In order to compensate for the absence of norms and standards adapted to the evaluationof early childhood and to specific country contexts, a recent approach, the Early Learningand Development Standards (ELDS) aims to define norms and standards with respect towhat a child should know and be able to do at a given age, accounting for its cultural andcommunity context and its specific needs.36 On this basis, it is possible to objectively evaluatechildren’s achievements in the different ECD areas. Box 7.3 briefly presents the foundationsand applications of the ELDS approach. Readers are strongly recommended to follow theevolution of these different tools to determine the extent to which these may be used insector analyses. Annex Table A7.6 provides a non-exhaustive overview of the main tests andthe countries where they have been used.37
EARLY CHILDHOO
D DEVELOPM
ENT
CHA
PTER7

BOX 7.3The Early Learning and Development Standards Approach
58 EDUCATION SECTOR ANALYSIS METHODOLOGICAL GUIDELINES - Volume 2
Since 2003, another approach to child assessment led in part by UNICEF has been for a countryto develop a set of standards or expectations about what every child should know and be ableto do at a certain age (before the child enters school) (Kagan & Britto, 2005).
Country teams (experts, policy makers, teachers and families) first define the most appropriatedomains for their country, possible sub-domains, and the age groups for which they wish todefine standards. The next step is for the country to develop a set of standards, or expectationsfor learning, that are appropriate to their cultural context. These standards, or desired results,can be linked with programme standards for a health or child care centre-based programme,resulting in a system of childhood assessment in which the expectations for children and theexpectations for programmes are aligned for maximum effectiveness.
The advantage of countries’ development of their own standards is that they cover items anddomains important to the country, as the approach requires each country to develop its own setof early learning standards that are culturally appropriate.
Early learning and development standards are used for many purposes:
• For individual children’s development: to help teachers or health workers assess what thechild can do and decide on a learning plan for the child’s development;
• For curriculum development: to decide on what kinds of lessons and experiences should beincluded;
• For programme quality: to design teacher training methods, supervision criteria, helpingGrade 1 pupils recognise what should be in their curriculum; developing systems foraccountability in the programme;
• For planning: to determine where resources are most needed, and allocating them there;
• For advocacy: to provide the public with greater understanding of child development needs,helping them recognise what children might be considered "ready for school";
• For monitoring and programme evaluation.
Source: Extract from Fernald et al., 2009.

Sub-Sector Specific Analyses 59
EARLY CHILDHOO
D DEVELOPM
ENT
CHA
PTER7
ECD Indicators
Child Characteristics
Household Characteristics
Family Practices
ECD Services
Indicators
Explanatory Variables
ECD global index (See Annex 7.1), and its components: Pre-literacy and pre-numeracy abilities Physical development Socioemotional development Learning abilities
GenderAgeRank among siblingsOVC statusIf child is handicappedIf child has a birth certificateHealth status (nutrition, illness, etc.)
Area of residenceRegion of residenceSize of familyHousehold income levelEducation level of head of householdGender of head of householdSocioprofessional status of head of householdAccess to improved sanitary facilitiesAccess to drinking water
Knowledge of and approaches to sanitary risks and child illness management If household owns soapIf household uses iodised saltIf child owns toys at homeIf child owns books at homeIf stories are read to childIf child benefits from stimulation activities at homeExplanatory, coercive or disciplinary practices at home
If child attends any form of early learning programme including preprimaryIf child receives medical care when illIf nutritional services are provided
TABLE 7.16 - Key Variables to Measure the Effect of ECD Interventionson Children’s Development
Source: Authors.
5.2.2 DIRECT IMPACT ON CHILDREN’S DEVELOPMENT
This section focuses on the effect of ECD activities on children’s cognitive, socioemotional,physical and linguistic development, which are key concerns of ECD activities (at least ofparental and preprimary education) given their importance for children’s futures, startingwith their schooling prospects. Annex 7.3 presents the method to estimate the positive ornegative effects of ECD activities on children’s health.

60 EDUCATION SECTOR ANALYSIS METHODOLOGICAL GUIDELINES - Volume 2
Indicators and Explanatory Variables
MICS4 type surveys, as indicated earlier, offer instruments to measure the development ofchildren aged 36 to 59 months, as well as the composite ECD index (See Annex 7.1). Theyalso provide information on a number of parameters related to children, their families andtheir environment that can be used to propose a first evaluation of the link between ECDpractices and the level of children’s development. Table 7.16 covers the ECD practices andchild and family characteristics that can most easily be collected through such surveys.
Firstly, a descriptive analysis can compare the results of ECD beneficiary children with thosenot having access to an ECD programme to establish if there are significant differencesbetween the two groups (this can be done through a Chi-squared test or the Student testof equal averages). Example 7.9 illustrates this approach.
Participation in an ECD Programme and Child Development, Sierra Leone, 2010Source: Sierra Leone MICS4 survey data, 2010. Authors’ computations.
EXAMPLE 7.9
5.3
42.1
63.6
73.2
60.9
79.8
61.1 62.9
13.9
46.8
90
60
30
0Pre-literacy +Pre-numeracy
Abilities
PhysicalDevelopment
LearningAbilities
SocioemotionalDevelopment
ECDIndex
Does Not Attend an ECD programme
Attends an ECD programme
FIGURE 7.5 - Percentage of Children Aged 36 to 59 Months whose Development is on Track,Sierra Leone, 2010
ercentage of Children
60
90
63.6
42.1
- PFIGURE 7.5 2010
79.8
60.9
73.2
63.6
,Sierra LeoneAged 36 to 59 Months whose Development is on ercentage of Children rack,
46.8
62.961.1
TAged 36 to 59 Months whose Development is on
DevelopmentAbilities
e-numeracyPre-literacy +Pr
0
30
42.1
Development
ogramme
SocioemotionalAbilities
ningLearDevelopment
Physical
Attends an ECD pr
ogrammeDoes Not Attend an ECD pr
Index
ogramme
ECDDevelopment
Socioemotional
Figure 7.5 shows the percentages of children aged 36 to 59 months deemed to be on track interms of their development38, depending on whether they attend an ECD programme or not.
FindingsChildren who attend an ECD programme show better results in terms of their intellectual, physicaland socioemotional development. This is particularly apparent in terms of pre-literacy, pre-

EXAMPLE 7.10Econometric Modelisation of the Effect of Participation in an ECD/EarlyLearning Programme, Sierra Leone, 2010Source: Sierra Leone MICS4 survey data, 2010 and Authors’ computations.
Table 7.17 presents the results of an econometric modelisation that analyses the effect of theparticipation in an ECD/Early learning programme on the development of young children in SierraLeone. A logistical model39 was used in as much as the explained variable (the ECD Index) is adummy variable equal to 1 if the child’s development is on track, or equal to 0 if not.
numeracy and learning abilities. Furthermore, the ECD index shows that 46.8 percent of childrenattending an ECD programme are on track in terms of their development, against just 13.9percent of those who do not attend.
Secondly, the use of statistical techniques such as the econometric regressions presented inAnnex 0 will enable the analyst to establish the extent to which the results in terms ofchildren’s development in the areas considered differ significantly according to whether thechild was exposed or not to given ECD activities and practices, while controlling for a seriesof other individual and family characteristics. Example 7.10 offers an illustration of theapproach.
EARLY CHILDHOO
D DEVELOPM
ENT
CHA
PTER7
Sub-Sector Specific Analyses 61
Variables Odds ratio Significance
Attendance of an ECD/Earlylearning Programme
Mother’s Education
Household Income
Age
Gender
Location
Pseudo R2 15.8%
3,178Number of observations
No
Yes
Ref.
4.12
Ref.
1.45
Ref.
1.21
Ref
0.90
Ref.
1.28
2.05
Ref.
1.19
1.42
1.71
3.66
36-47 Months
48-59 Months
Girl
Boy
Rural
Urban
None
Primary
Secondary
Q1(Poorest)
Q2
Q3
Q4
Q5 (Wealthiest)
***
***
**
**
**
***
***
***
***
TABLE 7.17 - Modelisation of the Effect of ECD Programme Participation on ECD, 2010
Note: *** Significant at the 1% level; ** Significant at the 5% level; * Significant at the 10% level.

62 EDUCATION SECTOR ANALYSIS METHODOLOGICAL GUIDELINES - Volume 2
5.2.3 EFFECT OF ECD INTERVENTIONS ON THE TRANSITION TO PRIMARY
As explained earlier, the medium and long-term impacts of ECD programmes cover a vastarray of areas that cannot all be analysed in a CSR-type analysis. One of the key goals ofECD activities today is to stimulate children’s development to better prepare their entry toschool, especially given the positive outcomes in terms of schooling (reduced dropout andrepetition, better learning outcomes). This section of the analysis will therefore focus onthe effect of ECD programmes on: (i) being prepared for school, which should translate intoan easier transition to primary; and (ii) primary schooling careers, which should be morefluid. The approach used here can, of course, be reproduced to analyse other aspects ofschooling (overall school-life expectancy, transition to secondary, exam results and so on)as well as the various socioeconomic dimensions of individuals’ adult lives.
Household or student surveys (such as the PASEC, SACMEQ and EGRA/EGMA) are valuableto deal with such issues, enabling the analyst to establish a link between the homeenvironment where children grow up, their exposure to ECD activities and practices andtheir current schooling.41 Chapter 4 provides further detailed analysis of the tools to measurepupils learning achievements. The method described in the previous sub-section is valid herealso.
Indicators
Given that information on children’s development when they enter primary is often rare indeveloping countries, proxy indicators borrowed from the primary cycle are used to appraisechildren’s degree of preparation for school. Similar indicators, although more focused onchildren’s schooling, can be found in the analysis of ECD activities on primary education.
Furthermore, a series of control variables are used to account for the effect of individual (ageand gender) and family (mother’s education and household income) characteristics. The resultsconsolidated in the table illustrate the odds ratios40 and their respective significance levels.
FindingsThe above regression results show a strong and significant effect of the attendance of an ECDprogramme on the better development of young children: those who attend an ECD programmeare four times more likely to be on track in terms of their development than their peers who donot, all other things being equal. Furthermore, it is no surprise that given family characteristicshave a highly significant impact on children’s development, such as the level of household incomeand mothers’ education: children from the wealthiest households (Q5) are up to 3.7 times morelikely to be on track than their poorest counterparts (Q1). Also, children whose motherscompleted secondary education are twice as likely to be on track than those of uneducatedmothers.

Sub-Sector Specific Analyses 63
Most of the explanatory variables described in Table 7.16 can also be used for this analysis.42
They should be complemented by information on the school environment (school, class andteacher characteristics, pedagogical approaches adopted in school and at home, communityinvolvement and so on) to offer a more balanced analysis.
EARLY CHILDHOO
D DEVELOPM
ENT
CHA
PTER7
Preparedness for School
PrimaryEducation Progress
Result Indicators
Age of entry to primaryIf child repeated 1st year of primaryIf child dropped out during 1st year or primaryReading level in 1st year of primary (e.g. EGRA score)Numeracy level in 1st year of primary (e.g. EGRA score)
Number of years repeated, or if child repeated a given gradeIf child completed the primary levelLevel of reading ability in Grade 3 (e.g. EGRA score)Level of numeracy in Grade 3 (e.g. EGRA score)Evaluation of learning outcomes (e.g. PASEC, SACMEQ, EGRA, EGMA...)Results in national tests and exams
FamilyPractices
School, Classand TeacherCharacteristics
ECD Service If child attended an ECD/Early learning programme (indicate type and duration)
Explanatory Variables
Knowledge of and approaches to sanitary and child illness managementIf child has toys at homeIf child has books at homeIf books are read to childPractice of stimulation activities at homeExplanatory, coercive or punitive practices at homeFollow-up of homework at homeLangage spoken at home
Double shiftsPupil-teacher ratioTeacher’s qualificationsTeacher genderTeacher and Pupil Absenteeism Teachers’ pedagogical practicesPedagogical inputs (number of tables, chairs and books per pupil)Community Involvement
TABLE 7.18 - Key Variables to Explain the Effect of ECDon Primary Education
Source: Authors’ elaboration, based on MICS4 data and learning outcome surveys.

64 EDUCATION SECTOR ANALYSIS METHODOLOGICAL GUIDELINES - Volume 2
Example 7.11, derived from The Gambia CSR, illustrates the effect of preprimary educationon Grade 3 EGRA test results through the use of econometric models.
(Effect of ECD on Primary Education):Factors Affecting EGRA Learning Outcomes, The Gambia, 2010Source: Adapted from The Gambia CSR, 2011.
EXAMPLE 7.11
Initial EGRA Score (School Level, 2007)
Female (Ref.Male)
Double Shift (Ref. No Shift)
Pupil-Teacher Ratio > 40 (Rf. PTR ≤ 40)
Student has already repeated a year
Student has attented government preschool
Student has attented madrassa preschool
Student was absent over the last week
Student practices reading in class
Student is encouraged when obtaining good results
48.6
57.1
50.4
30.7
18.7
47.1
21.9
29.2
75.6
64.1
+ 0.59 ***
- 3.14 **
+ 5.44 ***
- 3.67 *
- 4.44 ***
+ 3.74 ***
+ 5.75 **
- 4.63 ***
+ 6.92 ***
+ 3.69 *
Values (Mean / %)
Net Effect on Score (Points)
TABLE 7. 19 - Net Effect of Factors on Grade 3 Students’ EGRA Scores, 2009/10
(Points)
Factors that have a significant effect on the consolidated EGRA score of Grade 3 students in theGambia are presented in Table 7.19.
FindingsWhile certain school or class-related factors such as class size, teaching practices, teachercharacteristics, pedagogical choices, the availability of teaching and learning materials and soon depend on education policies, others do not, despite affecting learning achievements. Theseinclude student characteristics like gender, age and socioeconomic background, and certainschool characteristics such as location.
Preschool has a positive effect on student learning. Indeed, preschool attendance, be it in agovernment school or a madrassa, contributes to a five point average improvement in results.This is almost certainly due to the better state of preparation of children for school when theyenroll. The government’s efforts to expand the preprimary level should be sustained in the lightof this positive effect.
Note: *** Statistically significant at the 1% level. ** Statistically significant at the 5% level. * Statistically significant at the10% level. EGRA scores were adjusted to obtain an average value of 50 and a standard deviation of 15.

Sub-Sector Specific Analyses 65
EARLY CHILDHOO
D DEVELOPM
ENT
CHA
PTER7
NOTES
1 This chapter is greatly inspired by the work of the World Bank (See Naudeau et al., 2011 and the SABER team), UNESCO,2007 and UNICEF (especially its work on the Multiple Indicator Cluster Surveys - MICS).
2 ECD is the term most commonly used by countries and their development partners. Various other terms are common,such as ECCE (early childhood care and education), ECDE (early childhood development and education) or IDEC(integrated development of early childhood).
3 Greater attention is given today to young children’s learning and their transition to primary (UNESCO, 2007).
4 In addition to such formal preprimary education programmes, it should be noted that an increasing number of countriesalso offer ECD programmes and services for children before they reach the preprimary age.
5 School readiness is characterised by five key dimensions: (i) physical health and motor development; (ii) socioemotionaldevelopment; (iii) learning ability; (iv) linguistic development; and (v) cognitive development and general knowledge(See Kagan et al., 1995, in Naudeau et al., 2011).
6 One more percentage point in the preprimary GER translates into a 0.12 percentage point reduction in the primaryrepetition rate and a 0.317 increase in retention, 0.209 percentage points of which are directly attributable to preprimaryeducation, the rest being due to lower repetition (Jaramillo and Mingat, 2011a).
7 Children from disadvantaged backgrounds enter primary with many handicaps that are reflected in them falling behindin various aspects of their development, sometimes considerably. Children being behind in terms of language, andvocabulary in particular, is in great part related to the family environment and in particular to the quality and quantityof direct conversations with parents and care-givers, which tend to be poorer in terms of vocabulary and complexsentences in disadvantaged households. Such children also grow up in environments where sanitary and nutritionalpractices are weaker and where stimulation and learning opportunities are more limited. Children from such backgroundsoften enter primary on a weaker footing, jeopardising their entire schooling as a result (Abadzi, 2006; Fernald et al.,2009).
8 See Nobel Prize winner James Heckman’s work. The Lancet series has also dedicated two special editions (January 2007and September 2011) to ECD, including innovative studies on the positive outcomes of ECD interventions.
9 Annex 7.1 offers a more detailed description of ECD-specific indicators mentioned in this chapter, by key service areas.Work on the development of the holistic early childhood development index (HECDI) is also underway, providing astandardised approach to facilitate international comparisons (See Annex 7.4).
10 The quality of ECD services is dealt with in Section 5 of this chapter.
11 However, in many African countries such policies are still lacking, or are limited to statements that are not translatedinto concrete and financially sustainable programmes when they exist, the latter sometimes bearing little relation tosector policies or education sector plans. Many obstacles have been identified to explain the difficulties in theimplementation of ECD policies in Africa, including: (i) the weak political and financial commitment of governments toECD; and (ii) the structural organisation of the government itself, facing another fundamental challenge. Indeed, whereasECD policies should be holistic and multisectoral and follow an integrated approach to favour links and synergies insupport of children in a global sense, governments are organised by sectors and programmes and budgetary planningfollow suit. This hinders the emergence of a common vision and the integrated implementation of ECD approaches, aswell as the emergence of an easily accepted and recognised coordination mechanism (Aidoo, 2011).
12 A total of 123 questions are proposed by SABER–ECD to understand institutional issues.
13 The difference between budget allocations and executed budgets is detailed in Chapter 3.
14 Parents may also offer non-monetary contributions to ECD activities, such as through the management andadministration of services, advisory committees or parents’ associations, labour for the building of infrastructure, theelaboration of pedagogical material, participation in the definition of programme content, supervision of children andso on. Such activities are not accounted for in financial terms and are only partially considered in household surveys.
15 Annex 3.2 provides a questionnaire intended to capture development partners’ financing.
16 This information is sometimes available directly from the financial reports of the ministries of education, health or financefor various years.
17 For international comparisons, special care should be taken to ensure that unit costs pertain to similar or homogenousECD services.
18 It is common in such exercises to annualise the cost of infrastructure and apply depreciation rates to equipment. Voluntarywork, contributions in kind and gifts should be costed on the basis of local going market rates. Levin and McEwan(2001) describe methods for the estimation of economic costs. ▶

66 EDUCATION SECTOR ANALYSIS METHODOLOGICAL GUIDELINES - Volume 2
19 Parental education is defined as a set of activities targeting parents and care-givers that aim to improve the dailyinteraction between children and their parents to promote practices and behaviours that are considered to be positiveand reduce those considered to be detrimental (Pourtois et al., 1984). Parental education thus complements ECD servicestargeting children and reinforces their effectiveness. However, little information is available on such programmes, whichare often pilot programmes or included as a package with health or nutrition services. It is often necessary to conduct aspecific analysis of ministry, specific ECD programme or household survey data.
20 This segmentation may vary by country context.
21 Care-givers here include any person who is responsible for the child, whether there is a family relation or not.
22 Figure 7.2 above offers a sectoral organisation of ECD services into four areas: education, maternal and child health(including hygiene), nutrition and protection.
23 See Naudeau et al., 2011 for a more detailed analysis of each delivery mode.
24 Conditional cash transfer programmes are particularly common in Latin America (for instance the Brazilian Bolsa Família,the Columbian Familias en Acción or PATH in Jamaica). Some support particular ECD policies (social support or subsidiesto poor families with young children, maternity leave and so on). Although not yet widespread on the African continent,such programmes are generating increasing levels of interest in many African countries, where several pilot schemes arebeing implemented.
25 Some of the questions are based on the World Bank’s SABER-ECD. However, the SABER method includes a 12-pagequestionnaire to analyse the different dimensions of ECD service supply in depth. See also Table 7.16 for complementaryquestions on quality.
26 One of the key criteria in the choice of indicators is their availability. Many of those included are easily available throughhousehold surveys such as DHS and MICS, either through data analysis or from their narrative sections. Apart from thefact that such surveys have been conducted in many African countries, such surveys also enable the computation ofgenerally recognised standard indicators. Their limitations are related to timing (they are generally conducted only everyfive years), their coverage (they do not provide great geographic detail beyond the regional level) and their descriptionof services, which do not enable to closely or regularly monitor programmes. The administrative data available fromdifferent ministries, when providing reasonable statistical coverage, may also be collected, as well as qualitative analysisof the KAP (Knowledge, Attitudes and Practice) variety. The latter provide a wealth of information, enabling to betterunderstand the underlying constraints and motivations behind the adoption of given behaviours or practices.
27 See Fernald et al., 2009 for a detailed analysis of the tools developed to describe child development in these differentareas and UNICEF, 2011 for an illustration of this type of study, for Madagascar.
28 Indeed, in some cases ECD programmes can be ill-conceived and therefore not be appropriate to children’s age or specificneeds. This is the case for instance of preprimary institutions that offer curricula that are close to those of the first yearsof primary for children aged four to five years. This tendency is most common in pre-primary education systems that arerecently developing and as yet not mature.
29 In some cases it may be difficult to establish a distinction between supply and demand-side factors, especially where thequality and relevance of services are concerned, as they relate to both.
30 Although official norms and standards do exist in many countries for structural measures, their enforcement andmonitoring is often haphazard. It is therefore common to base the analysis on the inputs that should in principlecontribute to better quality service provision and children’s development.
31 When it is rigorously carried out, the ECERS-R evaluation method has the double advantage of offering an objective andglobal evaluation of the ECD service considered and to enable the comparability of results among different programmesoffering the same service.
32 See Myers, 2006 for a more detailed description.
33 Indeed, most studies (be they carried out in developing or developed countries) having attempted to rigorously evaluatethe impact of ECD services have generally used longitudinal analysis or randomised experimental evaluations. In bothcases, specific and carefully administered surveys were used. The longitudinal analysis involves following individuals overa relatively long period to be able to observe changes due to their participation in ECD programmes over time.Randomised experimental impact evaluations, on the other hand, involve using two samples of children (when the sampleis selected at the beginning of the programme) randomly distributed between a treatment group and a control group,enabling researchers to properly isolate the impact of the ECD programme. Furthermore, in most cases such studies arecarried out on reasonably small samples, leading to skepticism in terms of the general relevance of the results. For anillustration of a randomised experimental evaluation carried out in Mozambique, see Martinez et al., 2012.
34 This discussion does not cover anthropometric measurements of children’s development that are standardised. See Annex7.1 for the commonly used indicators, such as height for age, weight for age and so on.

Sub-Sector Specific Analyses 67
EARLY CHILDHOO
D DEVELOPM
ENT
CHA
PTER7
35 UNICEF’s regional office for West and Central Africa is working on a prototype instrument for testing children at theirentrance in primary school, covering various aspects of their development. This instrument has currently been tested inMadagascar, Mauritania and Cape Verde. Its coverage is nationwide.
36 Although still uncommon in Africa, this tool has been developed and successfully adapted in countries like Ghana, Malawiand South Africa.
37 Fernald et al., 2009 provides a detailed description of several of these tests and their limitations in terms ofimplementation.
38 See the definitions in Annex 7.1.
39 See Annex 0 for an introduction to econometrics.
40 See Section 1.6 of Chapter 6 on Equity and the analysis of disparities.
41 Early Grade Reading Assessment (EGRA) and Early Grade Mathematic Assessments (EGMA) consist in nationallyrepresentative surveys of children’s reading and math abilities in various grades of primary education, to inform educationpractitioners and policy makers of the quality of learning at school. EGRAs generally evaluate children in eight areas:letter name knowledge, phonemic awareness, letter sound knowledge, familiar word reading, unfamiliar non-wordreading, passage reading and comprehension and dictation. EGMAs evaluate children on six domains: numberidentification, number discrimination, missing number patterns, addition, subtraction and word problems.
42 Some questions are only set for children under five years. However, family practice variables are relevant even forhouseholds’ younger children, providing a global appraisal of the environment in which children are brought up, andhow favourable it is to learning.

68 EDUCATION SECTOR ANALYSIS METHODOLOGICAL GUIDELINES - Volume 2
© U
NIC
EF/IN
DA
2011
-004
68/V
ish
wan
ath
an

Sub-Sector Specific Analyses 69
CHAPTER 8HIGHER EDUCATION› Chapter Objective:To analyse the higher education (HE) sub-sector and all its components in detail,highlighting its specific characteristics, overand beyond the general information providedin earlier chapters of this guide where it hasbeen covered as a sub-sector.
HIGHER EDUCATIO
NCH
APTER
8

70 EDUCATION SECTOR ANALYSIS METHODOLOGICAL GUIDELINES - Volume 2
1. OVERVIEW OF RECENT TRENDS AND CURRENT STATUS
ISSUEWhat stages of the HE sub-sector’s development have determined its current configuration? Whatreforms have taken place, and what were the causes of their success or failure? What is the currentsituation in terms of access (transition from secondary, access by age) and service (type of providersand streams)? How diversified is the supply of HE (public/private, university/higher learning institute(HLI), class/distance based, short/long duration and so on)?
OBJECTIVES• Shed light on the steps that lead to the current configuration of the HE sub-sector, at the
institutional and operational levels; and• Define the array of supply options by institution and subject-area for use in the following
sections. If all HLIs cannot be covered, it will be important to ensure that at least the mostrepresentative are included.
METHODS• Perform a historical analysis of the structure of the HE sub-sector to understand its current
configuration (type of institution, financing and so on);• Highlight the key principles that have guided or limited reforms and identify scope for
development; and• Draw up an institutional panorama, being as comprehensive as data permits.
SOURCESNational documents (from ministries, national HE agencies and so on) and various historicaldocuments from the HLIs.
2. ORGANISATION AND DELIVERY, INTERNAL EFFICIENCY AND EQUITY
ISSUESHow is the delivery of higher education organised? What resources are available, both physicaland human? Are they accountably managed? How good is internal efficiency as a result? What isthe extent of disparities in terms of access to the cycle?
OBJECTIVES• To examine any specificities relating to service delivery in the higher education sub-sector not
covered in the earlier transversal chapters of this guide. These may include teaching issues, thequality of infrastructure, specific governance structures, internal efficiency and gender and socialequity issues.
METHODS• Describe organisational approaches (pedagogic, staff availability, certification and so on); • Estimate retention profiles and reconstitution of cohorts;• Use the above tools to estimate internal efficiency, by institution or subject-area; and• Approach equity questions through the estimation of retention profiles by type of student.
SOURCES Enrolment data available from the HLIs, if possible disaggregated by type of student.

Sub-Sector Specific Analyses 71
3. COST AND FINANCING
ISSUESHow does the cost of higher education, for the government and for families, vary by institutionor subject area? What are the main components of HE unit costs? What are the financing optionsavailable? In the light of the above, how do the distribution of resources and the financing ofeach HE institution and option affect internal efficiency and equity?
OBJECTIVES• Present the consolidated budgets for the sector, by institution or subject-area;• Perform a detailed analysis of per student spending by using the same techniques as in Chapter
3; and• Use the internal efficiency coefficients elaborated on in Section 2 to calculate the average cost
of producing a graduate in each institution, or for each subject-area to extend and deepen theunderstanding of internal efficiency and equity.
METHODS• Classic tables and methods (micro/macro) are used to reconstitute and/or consolidate the HLI
budgets by type of institution and/or subject-area.
SOURCESBudgets and budget execution documents for the HLIs and national HE budget, as part of theeducation sector budget.
4. RESULTS, PERFORMANCE AND QUALITY
ISSUESHow do the different HE institutions and subject-areas perform, especially in terms of externalefficiency? What quality assurance mechanisms exist to monitor and improve results (the relevanceand quality of training)?
OBJECTIVES• Consolidate information to evaluate the performance of the HE sub-sector, by institution or
subject-area, in terms of the number of graduates produced, and also to assess the economicrelevancy of the HE courses of training on offer; and
• Examine the arrangements which control the quality of training and provide career advice tograduates.
METHODS• Indirect measures of the quality of training through the evaluation of the status of graduate
employment. Tracer studies are extremely useful, but may not be available; so• Make imaginative use of any available qualitative or quantitative data to provide a perspective
on the results of training.
SOURCESEmployer satisfaction surveys, tracer studies, labour market surveys, studies on graduateemployment status and earnings, and so on.
HIGHER EDUCATIO
NCH
APTER
8

72 EDUCATION SECTOR ANALYSIS METHODOLOGICAL GUIDELINES - Volume 2

Sub-Sector Specific Analyses 73
IntroductionIn the context of an education sector analysis, higher education (HE) cannot be dealt withas a sub-sector independently from the entire education system, as can be done with literacy.How HE functions is determined in great part by the lower levels of the education pyramid,and constitutes a significant factor in the demand for education overall for many familiesand students. Indeed, the shape of the sub-sector, its service delivery options, financingopportunities for students and the opportunities it opens up will have a trickle-down effecton the demand for education at the secondary levels: graduate unemployment rates, incountries where they are high, can discourage families from enrolling their children even atlower levels; the quality and relevance of TVET can affect the demand for higher educationcourses, and so on.
The financing of higher education should also be considered in the light of sector allocationsas a whole, precisely because it affects the demand for education in a broad sense, but alsobecause it competes with other sub-sectors for scarce resources (See Volume 1 of this guide,where HE is dealt with in a sector-wide perspective).
This chapter, dedicated to higher education, offers complementary material to furtherexplore and analyse the issues that specifically affect it, and reviews appropriate sub-sectormanagement approaches that reflect the expectations of the entire education and trainingsector. It should help to improve the knowledge of the sub-sector and especially to facilitatea more informed discussion of potential reforms (access, content, financing and so on).
The chapter provides approaches to the description of the institutions and subject-areas ofhigher education in Section 1, as well as for a selection of key aspects of sector analysis:enrolment, service delivery in Section 2 (resources, governance, internal efficiency andequity), cost and financing in Section 3 (institutional budgets, social spending, direct supportto students) and results, performance, quality and external efficiency in Section 4. Theanalysis can help to identify areas for reform and implementation arrangements thatenhance their acceptability with all stakeholders.
HIGHER EDUCATIO
NCH
APTER
8

74 EDUCATION SECTOR ANALYSIS METHODOLOGICAL GUIDELINES - Volume 2
This section presents a historical overview of the higher education sub-sector, mentioningany reforms implemented in the past, as well as their results. This introductory section shouldinclude a summary of the current status of the sub-sector on the basis of the findings ofeach of the chapters of Volume 1 of this guide. It offers the opportunity to describe theinstitutional panorama of the sub-sector, explaining the type and number of institutions,the enrolment they respectively represent and the distribution of students by subject-areasor type of qualification/degree. This description will provide a useful referential frameworkfor the analysis in Sections 2, 3 and 4.
HISTORICAL DEVELOPMENT OF HIGHEREDUCATION
The history of the development of higher education, key reforms, successes and failures,are important ingredients to gain a more detailed knowledge of the sub-sector, itsphilosophy and stakeholders’ perceptions of it (decision-makers, teachers, students and soon). This knowledge is important to understand the current status of the sub-sector and toconsider appropriate reforms. Reforms should be acceptable to all stakeholders, regardlessof their relevance or ambition. Change will be more forthcoming in a higher educationsystem that is diversified, both in terms of the types of courses offered and their cost, thanin a system that is focused on university for the masses, supported by local authorities,where grants are considered a right. The history of reform also provides valuable informationon the attitude of authorities with respect to students and their families, as well as on thecapacity of the latter to consider collective constraints when deciding what to promote forthe sub-sector’s future. These different items should clearly orient the implementation offuture reforms (rhythm, timing, scaling-up, magnitude and so on). Example 8.1 illustratesthis approach with the case of Algeria.
OVERVIEW OF RECENT TRENDSAND CURRENT STATUS
SECTION
1
1.1

EXAMPLE 8.1Phases of Development and Reform in Higher Education, AlgeriaSource: Adapted and translated from the Report on Governance of Universities in Algeria (Rapport sur la Gouvernance des Universités en Algérie, 2012)
The history of higher education in Algeria is mainly divided into two phases: pre and post 1962independence. The first university to be created was in Algiers, in 1910. This was still the onlyuniversity in 1962, with annexes in Oran and Constantine. The only other higher learninginstitutions included the National School of Business (École Nationale Supérieure de Commerce),founded in 1900, the National Polytechnic School (École Nationale Polytechnique), founded in1925 and the National School of Agronomy (École Nationale Supérieure Agronomique), foundedin 1909.
Upon its independence in 1963, Algeria had barely more than 2,500 HE students. Since then,the system has undergone significant quantitative expansion and profound changes.
As early as 1962, changes were made to the management and recruitment to begin to adapthigher education to the new context of national sovereignty. Technology institutes were openedfrom 1969 onwards under the auspices of various ministries, to respond to increasing demandfor professionals and technicians. A decade after independence the sector underwent a moreprofound change. The beginning of the reform process in 1971 aimed to create an authenticallyAlgerian university system, integrated into the national development process to equate trainingand skills with labour market needs and employment.
A total rebuild of training programmes was proposed, whose main characteristics werediversification, specialisation and professionalisation. The objective sought was to focus moreon scientific and technical training. This was achieved through the organisation of newprogrammes and the creation of new degrees: the licence, equivalent to a bachelor’s degree,the higher education diploma (DES in French) and an engineering degree. Further amendmentswere made to this new structure from 1980 onwards, such as the restructuring of universitiesinto faculties and institutes, the creation of a student orientation service and the developmentof short courses.
One of the most important objectives of the current reform is the integration of graduates intothe job market. The employability of graduates is one of the best indicators of the quality of aHE training course, its relevance and its socioeconomic value.
The reform of higher education by the Ministry of Higher Education and Scientific Research(MESRS in French) mainly includes two components:
1. The updating, adaptation and harmonisation of pedagogical programmes, through:- The scaling-up of transversal teaching;- The flexibility of the teaching profession, introducing optional courses and promoting multi-
disciplinary diversification; and- A positive revaluation of practical classes, professional internships and students’ personal
projects and autonomous study.
Sub-Sector Specific Analyses 75
HIGHER EDUCATIO
NCH
APTER
8

76 EDUCATION SECTOR ANALYSIS METHODOLOGICAL GUIDELINES - Volume 2
DESCRIPTION OF INSTITUTIONS AND SUBJECT-AREAS
On the basis of the historical perspective presented and considering the availability of data,this section will provide a classification of HE institutions and subject-areas. Ideally, all existinghigher learning institutions (HLI) should be considered. If, however, the availability of dataor multiplicity of institutions constituted significant constraints, a sample of institutions canbe selected. In this case, it is preferable to cover the full range of service delivery modesrather than to seek out strict statistical representativity (in terms of enrolment, for instance)as the main purpose of this chapter should be to compare different HE streams in terms oftraining approaches and results. Depending on the available data, this section should seekto highlight the characteristics of HE institutions and study according to any/all of thefollowing factors: Diversity in terms of location (at home or abroad);43 the different types ofinstitutions (universities, polytechnic colleges, technical colleges, higher learning institutes,and so on); the level of training and education provided (undergraduate, postgraduate,tertiary, technical post-secondary and so on); and ownership (public/private).44 This sectionshould mainly lead to an overview of higher education in its current configuration.
2. The definition of a new training architecture through the introduction of the bachelor-master-PhD (BMD) classification of courses, based primarily on:
- The offer of general undergraduate-level training for all subject-areas (except medicine);- The increase of the vocational content of some training courses (vocational undergraduate
and postgraduate degrees); and- The introduction of a semester-long course unit system, with transferable credits.
With the introduction of the BMD degree classification during the 2004/05 academic year, 10areas of training were inaugurated in 10 higher learning institutions for a total number of 7,616students. Since then, universities bestow bachelors’ degrees at 180 credits, masters’ degrees ata further 120 credits, and a third cycle PhD. Bachelors’ and masters’ programmes can be followedaccording to two streams, academic or applied (meaning specialised/technical).
Furthermore, since 2008, a law has authorised private universities to function in Algeria. Theconditions for being granted a licence by the MESRS appear to be difficult to meet, however, interms of financial guarantees, administration and pedagogical approval. To date only oneapplication has been submitted, and it was refused. There is therefore no private HE training inAlgeria, although it is legally feasible.
1.2

EXAMPLE 8.2(Analysis of HE Coverage by Subject-Area): Higher Education Enrolment by Subject-Area/Faculty, Swaziland, 2000/01-2007/08Source: Adapted from the Swaziland CSR, 2009.
A graphical representation provides a clearer sense of the distribution and evolution of thefigures, such as in Figure 8.1 below.
FindingsEnrolments vary significantly across faculties, but it is clear that the Institute of Distance Education(IDE) drives much of the recent growth, followed by the Faculty of Agriculture (See Table 8.1above). The fact that IDE dominates enrolments is a positive development, given its lower unitcost, but its intake is also on the decline. IDE was able to accept close to 80 percent of qualifiedapplicants up to 2005; the share had dropped to below 40 percent by 2007.
TABLE 8.1 - Higher Education Enrolment, by Faculty, Swaziland 2000-07
Agriculture
Business
Education
Health Sciences
Humanities
Sciences
Social Sciences
Postgraduate Studies
Distance Education (IDE)
Total
FTE in IDE *
Total FTE
418
513
341
220
563
294
565
32
780
3,726
234
3,180
483
511
394
268
571
303
575
38
1,055
4,198
317
3,460
556
564
306
287
554
317
582
45
1,246
4,457
374
3,585
643
631
313
343
594
329
610
55
1,447
4,965
434
3,952
711
614
320
308
579
349
648
46
1,595
5,170
479
4,054
761
597
336
317
574
380
662
50
1,943
5,620
583
4,260
828
581
358
312
526
349
647
47
2,046
5,694
614
4,262
853
564
356
324
449
342
643
48
1,860
5,439
558
4,137
2000/01 2001/02 2002/03 2003/04 2004/05 2005/06 2006/07 2007/08
2,500
2,000
1,500
1,000
500
0
2000/01
2001/02
2002/03
2003/04
2004/05
2005/06
2006/07
2007/08
Agric
ultu
re
Busin
ess
Educ
atio
n
Heal
thSc
ienc
es
Hum
aniti
es
Scie
nces
Socia
lSc
ienc
es
Post
grad
uate
sSt
udie
s
Dist
ance
Educ
atio
n(ID
S)
FIGURE 8.1 - Total HE Enrolment, by Faculty, Swaziland, 2000/01-2007/08
Sub-Sector Specific Analyses 77
CHA
PTER8
Note: * Full time equivalent (FTE) is calculated by multiplying IDE enrolment by 0.3, since IDE programmes correspond to 30percent of a normal study load.
HIGHER EDUCATIO
N

78 EDUCATION SECTOR ANALYSIS METHODOLOGICAL GUIDELINES - Volume 2
THE CURRENT SITUATION
This section is the logical follow-up to the previous one inasmuch as the current situationand enrolment are the product of past reforms. The aim here is to create a direct link withthe presentation of the sub-sector provided in Volume 1 of this guide. At very least, thissection should underline the global importance of higher education in the country throughthe analysis of the access rate or the number of students per 100,000 inhabitants, as perExample 8.3, based on the case of Malawi (See also Chapter 2).
1.3
(Analysis of HE Coverage):Higher Education Enrolment, Malawi, 2003-08 and Sub-Saharan AfricaSource: Adapted from the Malawi CSR, 2010.
EXAMPLE 8.3
2003
2004
2005
2006
2007
2008
3,262
3,877
4,208
4,947
5,686
5,964
1,397
1,706
2,051
2,410
2,788
3,118
53
61
65
74
83
84
22
26
31
36
40
44
37
44
48
55
61
64
4,659
5,583
6,259
7,357
8,474
9,082
Male Female Total Male Female Total
TABLE 8.2 - HE Enrolment and Access Rate, by Gender, Malawi, 2003-08
Number Number/100,000 inhabitants
1,200
1,000
800
600
400
200
0
Mal
awi
Nig
er
Buru
ndi
CAR
Tanz
ania
Moz
ambi
que
Gui
nea
Burk
ina
Faso
Rwan
da
Mad
agas
car
Ethi
opia
Mal
i
Ango
la
Leso
tho
AV
ERA
GE
Gha
na
Nam
ibia
Swaz
iland
Nig
eria
Bots
wan
a
Cam
eroo
n
Mau
ritiu
s
Cape
Ver
de
Sout
h Af
rica
55
337
957
FIGURE 8.2 - HE Enrolment, Malawi and Sub-Saharan African Countries, 2005/06

Sub-Sector Specific Analyses 79
It can be helpful to go beyond the coverage indicator used throughout Volume 1 (numberof students per 100,000 inhabitants), for which the global access rate to higher educationcan be computed.
Box 8.1 below details the approach used to compute this indicator, on the basis of thesecondary completion rate, the success rate at the end-of-secondary exam and the transitionrate to higher education. Such an indicator is helpful to enable historical and internationalcomparisons, which are possible with most of the indicators used in education sectoranalysis. Therefore, it can also enable a prospective analysis of the likely pressure on HEservices as a result of the evolution of the education enrolment pyramid, specifically at thesecondary level.
HIGHER EDUCATIO
NCH
APTER
8
FindingsTotal university enrolment constitutes roughly 0.3 percent of students of the eligible age. Thedata show an increase in enrolment per 100,000 inhabitants, for both male and female students.The number of female students is much lower than the number of male students, however,which indicates a persistent gender disparity.
Malawi’s higher education system is still very small compared to those of other countries in theregion. Malawi, with an average of 55 students per 100,000 inhabitants for the 2005/06academic year, has the lowest proportional number of enrolled university students of all the Sub-Saharan African countries for which data was available.
• Key DefinitionGlobal Access Rate to Higher Education (GARHE) is the ratio between the number ofnew entrants in first year of higher education and the population of last grade of secondaryofficial school age.
GARHE =New entrants in 1st year of HE
Population of last grade of secondary official school age
BOX 8.1Computation of the Global Access Rate to Higher Education
When the following indicators are easily available, the computation of the global access rate tohigher education (GARHE) can combine:
• The transition rate to higher education (HTR), based on the subgroup of pupils who weresuccessful at the end of secondary exam, and could be admitted:
HTR =Number of new entrants in the 1st year of HE
Number of pupils passing the end of secondary exam
▶

80 EDUCATION SECTOR ANALYSIS METHODOLOGICAL GUIDELINES - Volume 2
Extending the preceding items of analysis and considering the parameters of access tohigher education, it is helpful to consider students’ schooling background, in particular thestream of secondary education followed (general, technical and so on), and determine thedegree of rigidity of the transition between the two levels.
• The success rate at the end-of-secondary/HE entry exam (SSE) in turn is based on thosestudents completing the cycle for whom the number of non-repeaters in the last grade is aproxy indicator:
• The secondary completion rate (SCR) is derived from the schooling profiles estimated andpresented in Chapter 2, which is effectively:
Overall, the global access rate to higher education is obtained by the following formula:
SSE =Number of pupils passing the end of secondary exam
Number of non - repeaters in the last grade of secondary
GARHE = HTR x SSE x SCR =Number of new entrants in the first grade of HE
Population of last grade of secondary official school age
SCR =Number of non - repeaters in the last grade of secondary
Population of last grade of secondary official school age
Access to University Careers, by Secondary School Subject Specialisation,Malawi, 2008Source: Authors.
EXAMPLE 8.4
Math
Science
Economics
Humanities
Business (Technical)
Industry (Technical)
10
10
20
50
5
5
100
8
5
35
44
2
4
100
25
25
30
10
7
3
100
64
35
-
-
-
1
100
90
7
3
-
-
-
100
70
30
_
_
_
_
100
90
10
_
_
_
_
100
50
35
10
2
3
-
100
Humanities Law EconomicSciences
Sciences Medicine Agronomy Engineering Business
TABLE 8.3 - Distribution of 1st Year HE Students, by Typeof Baccalaureate Sat
(Percent)
Total
Table 8.3 below presents the distribution of 1st year HE students according to their subjectspecialisation in secondary education, for a selection of disciplines.

AnalysisTable 8.3 indicates that any reorientation of flows from schools to universities (or part of theuniversity sub-sector) will first require the expansion of access to the scientific baccalaureates,indispensible for access to institutions with conditional admission, and possibly the creation ofnew streams more specifically tailored to those sitting non-science baccalaureates. The data alsoindicates that the technical baccalaureates, although providing an alternative to the pursuit oflong university studies, are not providing outcomes in the current higher education panorama,as the graduates from technical baccalaureates usually pursue university studies in thehumanities.
Sub-Sector Specific Analyses 81
If information on the type of secondary school exam sat by 1st year students in highereducation is not directly available from the HLIs, an estimation of the schooling careers ofHE students can be performed by utilising the employment balance approach (See Chapter5 and Annex 8.6). This approach involves comparing the distribution of 1st year studentsby subject-area and/or institution to the same academic year’s end-of-secondary examholders, by subject specialisation.45 This overview of the status of higher education couldbe completed by a simulation of the organic development of the sector (in the absence ofreforms), considering the existing dynamics in each stream/career, the evolution of thesecondary to HE transition rate and the approaches used for the regulation of student flowsto the sub-sector.46 Indeed, this will enable the appraisal of natural tendencies to expand,the sustainability of current resource sources (public and private) and the type of servicesprovided. Box 8.2 below highlights the findings of an analysis carried out in this perspectiveon the data of 18 countries of Francophone Africa.
It is important to note that the above analyses are mostly based on student data availablefrom each of the HLIs, or from HE statistical yearbooks where these exist and are exhaustive.Where no quality control system exists, as is the case in most developing country universities,it is advisable to give any data obtained a critical review. Indeed, enrolment figures are ofteninflated, as Annex 8.5 illustrates. Finally, this section may focus in greater detail than Volume1 on the institutions and mechanisms responsible for the steering of the sub-sector (specificHE ministry, chancellor’s office, consortium of institutions and so on). Each can be described,as well as the vision of the sub-sector they promote or represent and the tools that illustratethose positions (development plans, for instance).
HIGHER EDUCATIO
NCH
APTER
8

82 EDUCATION SECTOR ANALYSIS METHODOLOGICAL GUIDELINES - Volume 2
BOX 8.2Evolution of Social Demand for Higher Education in Francophone Africa andAnalysis of Sustainability, 2007
2,000,000
1,800,000
1,600,000
1,400,000
1,200,000
1,000,000
800,000
600,000
400,000
200,000
01990 1995 2000 2005 2010 2015
1991 - 2004
Linear Trend 2000 - 2004
Linear Trend 1991 - 2004
Exponential Trend (1991 - 2004)
Evolution of HE Student Enrolment and Projection of Demand
Whatever the assumption used, there is clearly a general expansion of enrolment. Consideringthe projection carried out on the basis of recent trends (2000-04), Francophone Africa wouldhave close to 1.4 million higher education students in 2015, double the number of 2007. Theaccess rate to HE for an average Francophone African country would jump from 323 studentsper 100,000 inhabitants to 522 students per 100,000 inhabitants.
For all the scenarios, the natural tendency to expand will be severely constrained by funding, onthe basis of current delivery methods and financing. Indeed, under the current deliveryapproaches (constant unit costs, no particular policy to stimulate further expansion of the privatesector, no cost-sharing strategy with the public sector), responding to the social demand for HEwill require a level of recurrent budgetary expenditure equivalent to 1.13 percent of GDPin 2015, on average for the 18 countries considered. This is considerable compared to the0.53 percent of GDP spent in 2004, an increase by a factor of 2.2. This level of spending is grosslyhigher than the resources (0.63 percent of GDP) that could reasonably be mobilised in 2015, ifno change in intra-sectoral public budgetary allocations is made. Under these assumptions, thefunding gap in public higher education would be close to 3 billion dollars (PPP of 2004)for the group of 18 Francophone countries over the 2004-15 period, a considerable amount.
Source: Brossard, Foko, 2007a
The figure below highlights the results of a simulation performed on data of 18 countries ofFrancophone Africa to appraise trends in the increase of HE students and project demand forplaces, assuming that current policies on the management of student flows to the sub-sectorare maintained.

Sub-Sector Specific Analyses 83
It firstly presents an overview of the learning environment resources available (not least theratio of teaching staff to students). Secondly it deals briefly with HE governance issues,including the scope for involvement of teachers and pupils in decisions that determine thefuture of the sub-sector. It then reviews relevant specific measures of internal efficiency andany related issues. Finally, disparities and equity are analysed to better understand who thestudents are who attend each institution.
OPERATIONAL MODALITIES AND CHARACTERISTICS OF DIFFERENTINSTITUTIONS AND STREAMS
Beyond their status (public/private) and admission procedures (open/closed sector, selectionmodes and so on) already considered above, HLIs and HE streams are characterised byspecific service delivery approaches that can be viewed from various complementaryperspectives:
• The quality of service delivery, considering the available infrastructure and equipment;
• The availability of teaching staff, and the ratio of teaching staff to students;
• The quality of teaching staff, their experience and level of qualifications; and
• Future needs in terms of teaching staff, in terms of both quality and quantity.
HIGHER EDUCATIO
NCH
APTER
8
The objective of this section is to analyse fairly precisely how the different HE institutionsand streams function in relation to students’ education careers.
ORGANISATION AND DELIVERY,INTERNAL EFFICIENCYAND EQUITY
SECTION
2
2.1

84 EDUCATION SECTOR ANALYSIS METHODOLOGICAL GUIDELINES - Volume 2
2.1.1 PHYSICAL RESOURCES, INFRASTRUCTURE AND EQUIPMENT
Although comfort and the quality of infrastructure and equipment are not usually the firstdeterminant of the quality of training, there are minimum requirements that are often notmet by HLIs in developing countries. Enrolment very often exceeds capacity quitedramatically, in both lectures and practicals, including for science courses where individualpractice is critical to learning.47 It is therefore helpful to produce indicators that enable thecomparison of capacities and enrolment, as well as to obtain information on innovativeapproaches to the management of theoretical and practical learning spaces (longer openinghours, better management of time-tables, use of specific resources and so on).
The description of key equipment provides further information on learning conditions andthe risk they may represent for the quality of outcomes. The use of documentary resourcesis of particular relevance here, and can be analysed along-side the availability of numericequipment. For some subject areas it will be necessary to consider the availability ofspecialised areas, rooms and equipment. It is advisable to present the indicators that bestenable one to appraise the effective teaching capacities of HLIs, for each institution. Example8.5 below illustrates this approach.
(HE Infrastructure and Equipment): Physical HE Facilities, Swaziland, 2005Source: Adapted from the Swaziland CSR, 2009.
EXAMPLE 8.5
FIGURE 8.3 - Average Space per Student, by Campus, Swaziland, 1999-2005
4.5
4.0
3.5
3.0
2.5
2.0
1.5
1.0
0.5
0.01999/00 2001/02 2002/03 2003/04 2004/05 2005/06
KwaluseniLuyengoMbabane
sq.M
per
stu
dent
Year
Given increases in enrolment and limited capital budgets, there have been concerns about theovercrowding of physical facilities and its potential impact on teaching and learning effectiveness.

FindingsBetween 1999 and 2005, the average surface area per student on the three campuses decreasedfrom 1.3 m² to 1.1 m² at Kwaluseni, from 2.0 m² to 1.3 m² at Luyengo, and from 3.9 m² to1.7 m² at Mbabane (See Figure 8.3). The available space per student at both the Luyengo andKwaluseni campuses is below the UNESCO recommended norm of 1.5 m² per student.Overcrowding seems particularly acute in the faculties of humanities and social sciences atKwaluseni. A report in 2006 by the University Physical Planner stated that “the area allocated tothe Faculties of Humanities and Social Sciences is inadequate even for one Faculty [Author’semphasis].” These two faculties had an average of only 0.5 m² per student in 2005.
However, a recent utilisation survey showed a different picture (See Figure 8.4).The numbers donot support a generalised concern with overcrowding. The use of nonteaching spaces (dininghalls and common rooms) is notable, but the overall situation does not point to a crisis in teachingspaces. For instance, science laboratories are used only 24 hours per week, primarily because itis traditional to have laboratory classes only in the afternoons. With better planning it may bepossible to expand the use of the expensive laboratories and thus allow for an increase in studentintake. However, it must be noted that, in addition to the teaching time, 4th year students usescience laboratories for individual project work. This may slightly increase the use factor, althoughnot to a level where it could be called efficient. The under-utilisation of computer laboratoriesfor teaching purposes, averaging only nine hours per week, or 15 percent of the available time,is striking, as the mastery of ICTs ought to be compulsory for all university students.
Sub-Sector Specific Analyses 85
HIGHER EDUCATIO
NCH
APTER
8
FIGURE 8.4 - Usage Factor of Teaching Spaces, by Type, Swaziland, 2007
100
90
80
70
60
50
40
30
20
10
0Science
laboratoryLecturetheater-large
Lecturetheater
-medium
Classroom-C7 small
Classroom-C8 small
Classroom-C12 small
Classroom-C1 small
Dining hall-large
Computerlaboratory
% a
vaila
ble
perio
ds (M
-F)
Note: Excludes Luyengo Campus. The usage factor is defined as the proportion of available class periods per week (Mondayto Friday, M-F in the graph) in which the teaching space was actually used for a class. The data refer to the first semester(August-December) of 2007/08. The maximum use possible is assumed to be 60 periods per week.

2.1.2 SUPPLY OF TEACHING STAFF
This section deals mainly with teaching staff, although non-teaching staff should also becovered in education sector analysis. The gaps in terms of non-teaching staff can beconsiderable, so it is important to define the situation of each institution and streamprecisely, and to question their relevance to the core business of higher education (studentresidences and restaurants, libraries and resource centers, laboratories, housing of centraladministrative services and so on).
Student-Staff Ratio
For teaching staff, the analysis may bear on quantitative, qualitative and prospectivedimensions. The analysis of staff issues and availability is generally complicated by the varietyand singularity of staff status in higher education, and the multiplicity of forms of personnelmanagement. Depending on the institution or subject-area, all teaching staff may not bepermanent and/or full-time and the use of overtime, contract and part-time associate staff isfrequent. The approach here should therefore consist in computing a student-staff ratio (SSR),or supervision ratio, on the basis of the number of students per member of teaching or otherstaff. Example 8.6 presents an example of the student-staff ratios in Malawian universities.
(HE Student-Staff Ratio):University Supervision Rate, by Faculty, Malawi, 2008Source: Adapted from the Malawi CSR, 2010.
EXAMPLE 8.6
Table 8.4 below shows the student-staff ratios for both academic and support staff and comparesthe current ratios to those in 2001.
University of Malawi
Bunda College of Agriculture
Chancellor College
College of Medicine
Kamazu College of Nursing
Polytechnic
MZUNI University
Adventist University
Catholic University
Livingstonia University
U. Shareworld
Mean
886
2,446
529
467
2,305
1,448
270
363
147
221
-
145
201
139
49
214
129
14
27
14
20
-
4
2
4
7
25
5
8
-
6
23
3
2
18
3
9
219
292
123
222
11
70
0
28
-
6
12
4
10
11
11
19
13
11
11
11
6
8
1
5
8
8
6
SupportStaff (c)
Ratio (a)/(b) Ratio (a)/(c)
2008 20082001 2001
TABLE 8.4 - University Student-Staff Ratios, by University/Faculty, Malawi, 2008
Students(a)
Lecturers(b)
86 EDUCATION SECTOR ANALYSIS METHODOLOGICAL GUIDELINES - Volume 2

Sub-Sector Specific Analyses 87
HIGHER EDUCATIO
NCH
APTER
8
FindingsThere have been marginal improvements in some colleges, but the ratios, averaging 11:1, arewell below those of other countries in SSA, which averaged about 20:1 in 2006 (Source: Pôlede Dakar Database). The previous CSR (2004) noted that the student-support staff ratios werevery low and contributed to high unit costs. The current data show improvements in thestudent-staff ratios for Chancellor College, Kamuzu College of Nursing, the Polytechnic andMzuni University, but not for the Bunda College of Agriculture. Yet the improved ratios are stilllow, meaning that the institutions still have the capacity to increase enrolments withoutnecessarily increasing their staff. This suggests inefficiencies in how staff are managed andutilised. Better utilisation of staff could go a long way towards reducing the current high unitcosts. Improvements at Mzuni University have been made through a freeze in the hiring ofsupport staff and an outsourcing of new noncore areas.
An alternative approach to the estimation of the supply of teaching staff is the computationof the full-time equivalent, considering the respective effective workloads of all teachers(permanent, contract) and overtime for the permanent staff. The positive consequences ofthe staff supply policy on costs can then be analysed by comparing total teaching staff costs(payroll, overtime, contract staff and so on) to the number of full-time equivalent (FTE) staff.
Full-Time Equivalent Teachers
HLI teaching staff generally include staff of both permanent and contractual status. Thenumbers of the former can be easily determined, although they may well perform additionalduties in overtime. Although it would be possible to determine the number of contract staff,in the absence of defined services that they are paid to provide, the most helpful informationfor the analysis is the annual number of hours of teaching to be covered. Table 8.5 providesa guide to the type of information that can be gathered.
Number of Staff CostNumber of Hours of Teaching per Year
Permanent Staff
Professors and Lecturers
Assistant Lecturers and Tutors
Assistants
Others (Associates, Guests etc.)
Sub-Total (Average)
Overtime Paid
Contract Staff
Number
Workload
50
120
230
40
440
120,000/year
80,000/year
40,000/year
35,000/year
200
200
250
250
(AWH=230.7)
16,500
(Total)
120
4,800
(Total)
Institution 1
(59,545/year)
100/hour
200/hour
— —
TABLE 8.5 - Effective Workload of HE Teaching Staff-Model Table, Malawi, 2008
(Data is illustrative)

88 EDUCATION SECTOR ANALYSIS METHODOLOGICAL GUIDELINES - Volume 2
Table 8.5 can be adapted to national particularities, considering the different grades ofseniority for permanent staff, for instance. The annual workload indicated in the thirdcolumn is for a full-time member of teaching staff. If there is part-time staff or staff of anyother status they should be added in further lines to the table. The volume of overtimeperformed by permanent staff may be difficult to extract from personnel spending files. Ifnecessary, an estimate may be made of the average number of hours of overtime performedby each lecturer through a quick poll.
Full-time equivalent (FTE) evaluations of teaching workloads are helpful to incorporateovertime into the teaching staff supply indicator, as well as the workload of contract staff.Firstly a referential annual service time must be determined for full-time permanent staff(Average Workload Hours or AWH). This may be the average of the service hours of eachof the permanent staff (PS) members (not including overtime). On the basis that PS workfull-time, the total number of FTE lecturers would then be defined by:
On the basis of the earlier data, this fictitious institution has 440 permanent full-timeteaching staff that each provide 230.7 hours of service, on average. The volume of overtimehours paid to PS over the year is equivalent to a further 71.5 FTE lecturer positions (16,500/ 230.7). The 4,800 hours of contract service provided, on the same basis, represent a further20.8 FTE lecturer positions ((4,800 / 230.7).
71.7
Numberof Staff
(a)
AnnualWorkload
(b)Per Staff Member
(c=b/230.7)Total
(d=c x a)
Permanent Staff
Professors and Lecturers
Assistant Lecturers and Tutors
Assistants
Others (Associates, Guests etc.)
Sub-Total (Average)
Overtime Paid
Contract Staff
Number
Workload
Total
50
120
230
40
440
(Total)
120
(Total)
—
200
200
250
250
—
—
0.87
0.87
1.08
1.08
(1.0)
—
—
—
—
43.3
104.0
249.3
43.3
440 (e)
—
532.3
TABLE 8.6 - Full-Time Equivalent Computation of All Teaching Staff-Model Table, Malawi, 2008
(Data is illustrative)Annual FTE Workload
(f=16,500/230.7)
20.8 (g=4,800/230.7)
(AWH=230.7)
16,500 hours
4,800 hours
FTE = Number of PS + + Number of Overtime Hours/Years
AWH
Number of Contract Hours/Years
AWH

Sub-Sector Specific Analyses 89
Overall, the illustrative institution would therefore require 532.3 full-time equivalentmembers of teaching staff, accounting for overtime and contract staff. The data collectedcan also enable one to determine the financial benefit to a HLI of their human resourcepolicies. Table 8.7 below follows through the theoretical approach and selected figures usedin Tables 8.5 and 8.6 above. Overtime paid throughout the year, equivalent in workload to71.5 full-time positions, only costs the equivalent of 27.7 (=16,500 x 100 / 59,545). In thisparticular illustrative example, this represents a saving of 2.61 million [=(71.5 - 27.7) x59,545]. Similarly, contractual staff work the equivalent of 20.8 full-time positions, but arepaid the equivalent of 16.1 (=4,800 x 200 / 59,545), a further illustrative saving of 279,015(=[(20.8-16.1) x 59,545]).
2.1.3 QUALITY OF TEACHING STAFF
The quality of teaching can be appraised by the effective hours of teaching a studentreceives, according to its type (lectures, practicals, tutorials and so on). Although no doubtmore complex, it can also be evaluated through the academic characteristics of the teachingstaff, clearly differentiating between status types, particularly between those qualified forlecturer positions (thesis holders) and those committed to research.
Teaching staff’s academic and professional qualifications should indeed be considered inaddition to issues of staff supply. The required research experience suggests that professors,lecturers and recognised and qualified vocational training staff are in short supply. Thisrepresents a challenge for the supervision of more junior staff (tutors, assistants, associatesand so on). In Africa today this pyramid is sometimes very imbalanced, with a very strongbase of relatively lowly qualified staff, as illustrated in Example 8.7.
HIGHER EDUCATIO
NCH
APTER
8
TABLE 8.7 - Comparative Costs of Full-Time Permanent Positions, Overtimeand Contract Staff-Model Table, Malawi, 2008
Overtime
Contract Staff
Total
Numberof Hours
(a)
HourlyRate
(b)
Total cost (Millions)
(c=a x b)
FTECost
(Millions)*(f=d x e)
FTEPositions
(d)
PermanentStaff Annual
Unit Cost(e)
Savings (millions)
(g=f-c)
16,500
4,800
21,300
100
200
—
1.65
0.96
2.61
71.5
20.8
92.3
59,545
59,545
—
4.26
1.24
5.50
2.61
0.28
2.89
Note: * This is the hypothetical cost if the workload covered by overtime and contractual staff had been assumed by additionalpermanent full-time staff.

90 EDUCATION SECTOR ANALYSIS METHODOLOGICAL GUIDELINES - Volume 2
(Staffing of HE - Quality):Profiles of Academic Staff, Malawi, 2008Source: Adapted from the Malawi CSR, 2010.
EXAMPLE 8.7
Table 8.8 shows the staffing of the different faculties of the University of Malawi and of keyprivate universities, by status. Table 8.9 shows the qualifications of the staff in public institutionsfor which such data was provided.
FindingsPublic universities face difficulties in securing adequately qualified staff at both undergraduateand postgraduate levels. The data show that public institutions use staff associates and assistantlecturers to meet staffing requirements. The percentage of such staff ranges from 13.8 percentat the Bunda College of Agriculture to 38.3 percent at the Polytechnic. The Kamuzu College ofNursing and the College of Medicine have staff associates and assistant lecturers as close to 25percent of their total staff. Given that nursing and medicine are very specialised areas, the useof under-qualified staff in these institutions should be a matter of concern. One third of the staffat Mzuni University are associates. The number of professors ranges from 0 percent at the Collegeof Nursing to 8.3 percent at the Bunda College of Agriculture. Mzuni University has only twoprofessors in its total staff of 129.
The data of Table 8.9 emphasises the lack of staff with senior qualifications in public institutions.Of particular note is the percentage of staff with PhDs at the Polytechnic (5.6 percent) and MzuniUniversity (11.6 percent). The low percentages of staff with PhD qualifications and professorsreduce the capacity of these institutions to support postgraduate programmes and conductresearch, especially in areas associated with economic growth, such as mathematics andengineering. A key action in relation to increasing enrolments at the university level is recruitingand training more adequate staff to 50 percent of current levels, with 70 percent at master’s
12
12
6
0
1
2
-
2
-
1
10
10
8
1
2
6
-
0
-
1
24
24
25
11
33
24
-
9
-
7
79
119
62
25
94
54
-
8
-
10
145
201
139
49
214
129
14
27
14
20
13.8 %
17.9 %
27.3 %
24.5 %
38.3 %
33.3 %
-
29.6 %
-
-
8.3 %
6.0 %
4.3 %
0.0 %
0.5 %
1.6 %
-
7.4 %
-
-
-
30
38
-
39
8
-
2
-
-
20
6
-
12
43
35
-
6
-
1
-
-
-
-
2
-
-
-
-
-
Prof
esso
r
Asso
ciat
e Pr
ofes
sor
Seni
or L
ectu
rer
Lect
urer
Assi
stan
t Lec
ture
r
Staf
f Ass
ocia
te
Inst
ruct
or
Tota
l
% o
f Pro
fess
ors
% o
f Sta
ff
Asso
ciat
es a
nd
Assi
stan
t Lec
ture
rs
(Number)
TABLE 8.8 - Distribution of Personnel in Public and Private Universities, by Status, Malawi, 2008
Malawi U.
Bunda College
Chancellor College
College of Medicine
Kamuzu College
Polytechnic
Mzuni U.
Adventist U.
Catholic U.
Livingstonia U.
Shareworld U.

Sub-Sector Specific Analyses 91
In all these analyses, it will be appropriate to keep in mind that the use of non-permanentstaff may have implications for quality (they may not have the same skills and respect thesame academic standards as permanent staff) as well as cost. If temporary staff have beeninvited from other institutions or businesses, their use may be a sign of good humanresource management on the other hand, aiming to offer students perspectives andapproaches that are at the heart of their future occupations.48 Inasmuch as informationmust be collected to measure the different dimensions of staffing (such as payroll andnumbers) and direct contact established, it may be worthwhile to organise an appointmentwith the human resource and recruitment officers to clarify the situation (activemanagement or, on the contrary, total passivity).49
It is also noteworthy that for all the analyses and indicators used above there are noreferences or benchmarks that enable one to appraise their relative value or their realcontribution to the quality of training. There will, of course, be extreme situations, as in theearlier examples of infrastructure and equipment, where the overall appraisal (be it negativeor positive) will be unarguable in terms of staff ratios or their academic and scientificqualifications. One potential approach would be to use international benchmarks, as highereducation tends to share the same definition and characteristics world-wide.
HIGHER EDUCATIO
NCH
APTER
8
level and 30 percent at PhD level. This would imply a total elimination of assistant lecturers andstaff associates, who comprise roughly 25.9 percent of current teaching staff in public universities.It will also require substantial resources, both in terms of upgrading staff qualifications and inremuneration for the additional and more highly qualified staff. Given the government’s intentionto reduce the percentage of the allocation to higher education over time, it is difficult to seehow this can be attained unless other sources of financing for higher education are mobilised.
University of Malawi
Bunda College
Chancellor College
Polytechnic
Mzuni University
Total
47
59
12
15
133
81
125
101
69
376
16
53
89
45
203
144
238
216
129
727
32.6 %
24.8 %
5.6 %
11.6 %
18.3 %
56.3 %
52.5 %
46.8 %
53.5 %
51.7 %
1
14
15
(Number) PhD Master’s Bachelor’s Diploma Total % with aPhD
% with aMaster’s
TABLE 8.9 - Distribution of Personnel in Public Universities and Faculties, by Qualification, Malawi, 2008

92 EDUCATION SECTOR ANALYSIS METHODOLOGICAL GUIDELINES - Volume 2
2.1.4 PROJECTION OF FUTURE TEACHING STAFF NEEDS
The qualification issues analysed above should be reviewed in the light of the age pyramidof teaching staff, to consider the student-staff ratio not only in terms of current stock, butin terms of future supply. Today, a good number of developing countries’ most qualifiedstaff members are quite old and management has not always been able to plan theirreplacement in sufficient numbers.
Given the expected growth in HE student enrolment, student-staff ratios should especiallybe considered from a prospective angle. This analysis should anticipate future causes of staffattrition in the light of the age pyramid of teaching staff and the qualifications of existinglecturers, to estimate the future expected staff needs on the basis of student numbers.50
These needs should then be compared to the pool of potential candidates.51 After havingdetermined the potential growth of student numbers on the basis of projections for theearlier education cycles, it will be straightforward to estimate the number of teaching staffrequired on the basis of the chosen student-staff ratios (either the past ratio, or one basedon comparable countries or international experience).
The consideration of the age pyramid of teaching staff in this dynamic exercise enables oneto know if the supervision structure can be easily implemented. Is the number of youngteaching staff of required rank sufficient? Is it likely to grow to a satisfactory level in theshort term? Or are the existing staff close to retirement age and in likely need of imminentreplacement? If this latter case applies, the implementation of an active recruitment policyfor high-level teaching staff should be recommended and financial provisions madeaccordingly: scholarships, support to compile the required documentation, subsidies for theplacement of national lecturers in foreign universities and so on.
The prospective analysis should consider how attractive the profession is, particularly interms of salary, compared to other occupations available for individuals with similar skilllevels, both at home and abroad. The international mobility of the most qualified individualswithin zones that share the same language represents a risk (brain drain) to the long-terminvestments required to train adequate candidates, and justifies having specific policies toavoid it.

Sub-Sector Specific Analyses 93
GOVERNANCE
This section on HE governance deals specifically with the representation of personnel andstudents’ interests in the strategic decisions that affect the administrative and pedagogicalfunctioning of their institution.
Governance arrangements of the institutions and streams of higher education are animportant element in the description of their operations and a possible explanation ofdifferences in their administrative and pedagogical performance, as well as in terms ofinternal and external efficiency. The description should examine the characteristics ofmanagement staff (profiles, appointment mechanisms, type and source of remuneration),but also those of the instances that support or control the activities of the institution’sdirector or board of directors. In this process, and within these instances, the representationand role of staff and students can be a distinctive feature that it is helpful to document,especially when reviewing future organisational options. This question is also of importancein the next section on the quality of education, especially in terms of students’ capacity toappraise the quality of the teaching received.
The approach to adopt is to present in summary form the key bodies in charge of the variousaspects of HLI operations (university life, management and administration, scientific activitiesand so on), indicating how staff and students are represented in each. Again, beyond theformal presentation of these bodies, it will be helpful to collect more qualitative informationon the effective activities of these instances from those responsible for them, as well as ontheir effective power to affect the strategic direction of institutions and course content.
In terms of the future development of HLIs and courses, it will be helpful to detail whichbodies are responsible for the medium-to long-term strategic vision of the institution, andappraise the extent of the articulation of this vision with national HE policies. The degree ofautonomy of each HLI with respect to the national authorities responsible for human,financial, academic and scientific resources should also be explained.
The approaches to the evaluation of course content by students should be exposed, as wellas the impact of these evaluations on the management of teaching staff. An example ofsemi-structured interview points for the key players is presented in Annex 8.1 of this chapter.
HIGHER EDUCATIO
NCH
APTER
8
2.2

94 EDUCATION SECTOR ANALYSIS METHODOLOGICAL GUIDELINES - Volume 2
INTERNAL EFFICIENCY OF INSTITUTIONS AND STREAMS
This section aims not only to retrace the schooling careers of students throughout highereducation, but also to analyse these careers (access, retention, graduation) in terms ofefficiency. What type of issues do the average schooling careers of students raise, and dothey vary by type of institution or subject area?
2.3.1 NUMBER OF STUDENT-YEARS REQUIRED TO PRODUCE A GRADUATE
To retrace the schooling careers of students, the techniques to use are those presented inChapter 2 on enrolment, particularly those estimating retention profiles and reconstructingcohorts on the basis of student numbers. Example 8.8 below uses a selection of indicatorsthat can be highlighted in the course of the analysis of students’ careers in a given streamof higher education.
2.3
Analysis of the Schooling Careers of Undergraduate Economics Students,Fictional CountrySource: Authors.
EXAMPLE 8.8
(Number)
2002/03 Enrolment(Including repeaters from 01/02)
2003/04 Enrolment(Including repeaters from 02/03)
2004/05 Enrolment(Including repeaters from 03/04)
2005/06 Enrolment(Including repeaters from 04/05)
Year 1 Year 2 Year 3 Graduactes
55,000(14,700)
33,000(7,900)
25,000(8,500) 14,000
14,300
15,000
15,200
26,000(8,700)
27,000(8,900)
28,000(9,100)
34,000(9,300)
35,000(9,700)
36,000(10,100)
56,500(15,200)
58,000(15,800)
59,600(16,500)
TABLE 8.10 - Enrolment, Repetition and Graduation of Undergraduate Economics Students,Fictional Country
This example illustrates the typical progression of a group of economics graduate studentsthrough the stages of the course.
The pass rate from one year to the next and the longitudinal retention profile (that describes theprogression of students through the course – pass, dropout or graduation) are calculated on thebasis of the methodology presented in Chapter 2 and displayed in Table 8.11.
FindingsThe results illustrate the average progression of students through this course. Only 38 studentsof every 100 enrolled in the first year obtain the degree. The first year is particularly selective,given that almost 40 percent either repeat or dropout. Only 61 [=(34,000 - 9,300) / (55,000 -14,700)] percent access Year 2.
On the basis of the data computed above, the proportion of repeaters is calculated in Table 8.12.

Effective Promotion Rate
Retention Profile
-
100.0
62.1
61.3
74.5
44.9
84.9
37.7
2002/03 2003/04 2004/05 2004/05
Year 1 Year 2 Year 3 Graduates
TABLE 8.11 - Promotion Rate and Longitudinal Retention Profile of Undergraduate Economics Students
(Percent)
Enrolment
Repeaters
Share of Repeaters
55,000
14,700
26.7
34,000
9,300
27.4
27,000
8,900
33.0
15,000
-
-
2002/03 2003/04 2004/05 2004/05
Year 1 Year 2 Year 3 Graduates
TABLE 8.12 - Proportion of Repeaters among Undergraduate Economics Students, by Year, Fictional Country
Sub-Sector Specific Analyses 95
2.3.2 INTERNAL EFFICIENCY COEFFICIENT
Data retracing the average schooling careers of students enable the evaluation of theinternal efficiency of different courses, the analysis of the causes and the proposal ofcorrective measures. HE internal efficiency is rarely dealt with in analysis beyondconsiderations in terms of financial and pedagogical management. However analysis of HEinternal efficiency can also potentially reveal reductions in student motivation due todecreasing prospects of finding employment after graduation (external efficiency issue). Thedetailed observation of HLI and course internal efficiency provides numerous elements thatwill help to define the basis of future reforms. The internal efficiency coefficient (IEC)synthesises the loss of student-years (and of resources, given that student-years have beenfinanced by the system, either publicly or privately) resulting from repetition and drop-out,by comparing the effective number used to the theoretical number required.52 Example 8.9illustrates the computation of the IEC for the cohort of undergraduate economics studentsexamined in Example 8.8 above.
HIGHER EDUCATIO
NCH
APTER
8
Finally, knowing the share of repeaters in each level, it is possible to compute the number ofstudent-years spent on the education of a cohort and compare that with the number ofgraduates. This computation is the direct application of the methodology to measure internalefficiency presented in Chapter 2.
TABLE 8.13 - Estimation of the Total Number of Student-Years Spent on the Education of a Cohortof Undergraduate Economics Students, Fictional Country
2004/05
Graduates
37.7
—
38
2002/03
Year 1
100.0
26.7
100 / (1-26.7%) = 136
2003/04
Year 2
61.3
27.4
61.3 / (1-27.4%) = 84
20004/05
Year 3
44.9
33.0
44.9 / (1-33.0%) = 67
Retention Rate (%)
Share of Repeaters (%)
Number of Student-Years
AnalysisThus, taking both repetition and dropout into account, the HE system will have dedicated a totalof 136 + 84 + 67 = 287 student-years to the education of 38 graduates, to be compared to anideal number of 113 (= 37.7 x 3) theoretically required.

96 EDUCATION SECTOR ANALYSIS METHODOLOGICAL GUIDELINES - Volume 2
The IEC values, as well as the indicators used in their computation (repetition and promotionrates for retention profiles, plus the dropout rate for reconstituted cohorts), when comparedwith those of other courses or the same course in a different institution, may point to thedebate on the relevance of the course organisation and content, and the financialimplications.
On the one hand, there is the common opposition between the pre-selection or openselection of students for HE courses. By selecting students on the basis of prior knowledgerelated to the course content and considering the risk of failure in examinations, someefficiency may be gained by avoiding dropout or repetition due to unsuitable subject choicesby students, or their not having the required academic level. If no selective admission ofstudents takes place, analysing the causes of individual failure, especially when it results insuch low internal efficiency as in the example above, is necessary. This will firstly require theanalysis of which disciplines and types of delivery are related to student failure, and assesswhether they are relevant to the content of the course. For instance, if economists do notgraduate because they fail math, the math course content should be validated as
(Internal Efficiency in HE – Internal Efficiency Coefficient): Computation of the Internal Efficiency Coefficient for Undergraduate Economics Students,Fictional Country Source: Authors.
EXAMPLE 8.9
The computation of the IEC in this example draws on the data presented and the computationsof Example 8.8 above. With 287 student-years SY having been dedicated to the education ofthe cohort instead of the 113 theoretically required years TRSY (3 years x 37.7 graduates), theIEC for this course is:
The partial dropout-related IECs require repeating the estimation of the total number of student-years performed in Table 8.13, without considering repetition. Thus SYNR would be equivalentto 206 (100 + 61.3 + 44.9). The dropout-related IEC (considering no repetition) is then:
And finally the repetition-related IEC (considering no dropout) is:
AnalysisThe dropout-related IEC indicates that the theoretical number of years is only 55 percent of thoseeffectively used (excluding repetition), meaning that dropout accounts for the remaining 45percent. The repetition-related IEC on the other hand indicates that 28 percent of the studentyears effectively used are spent on repetition. As a result, in the case of this course, it will benecessary to spend almost three times the theoretical cost of the course (with an IEC of just 39percent), to produce a graduate.
IEC =TRSY
SY= = 39%
113
287
IECDropout =TRSY
SYNR
= = 55%113
206
IECRepetition =SYNR
SY= = 72%
206
287

EXAMPLE 8.10(Internal Efficiency in HE - Cost of Producing a Graduate): Cost-Efficiency of HE, by Faculty, Fictional CountrySource: Authors.
Table 8.14 presents information on the internal efficiency of different faculties and unit costs, tocompute the effective cost per graduate of the courses offered.
The inverse of the IEC (1/IEC) is the factor by which the theoretical number of years required toproduce a graduate must by multiplied. The total cost per graduate is therefore the product ofunit costs, the inverse of IEC and the theoretical duration of each course.
FindingsThe hierarchy of courses established on the basis of the annual unit cost is almost inversed whenconsidering the effective cost per graduate. Indeed, the faculties with the lowest unit costs arealso those with the weakest internal efficiency (the Faculty of Humanities, in particular).
Humanities
Law
Sciences
Agronomy
Engineering
600,000
530,000
740,000
2,300,000
1,700,000
0.21
0.35
0.37
0.76
0.90
4.76
2.86
2.70
1.32
1.11
2,856,000
1,515,800
1,998,000
3,036,000
1,887,000
Unit Cost IEC 1/IEC Cost of a graduate (UC/IEC)
TABLE 8.14 - Internal Efficiency and Graduate Unit Costs, by Faculty, Fictional Country
Sub-Sector Specific Analyses 97
appropriate, and selection procedures reviewed. If it is confirmed that economists requirethe level of math expected of them in the exam, teaching should be reinforced in this subjectto reduce the exam failure rate in the course of secondary school, and/or candidates withinsufficient mastery of the subject should not be encouraged to apply.
2.3.3 FINANCIAL CONSIDERATIONS
Financial considerations are helpful to take into account when evaluating alternative HLIadmissions policies (open, or selective admission).53 In addition to the pedagogicalconsiderations dealt with above, it is helpful to directly compare the cost of producing agraduate that takes both internal efficiency (which is probably better with the selectiveadmission of students) and unit costs (lower where admissions are open because of highstudent numbers) into account. For instance, engineering faculties, which usually havecomparatively high unit costs, may show a comparatively low cost of producing a graduate(even compared to faculties with lower unit costs), thanks to a better internal efficiency.
HIGHER EDUCATIO
NCH
APTER
8

98 EDUCATION SECTOR ANALYSIS METHODOLOGICAL GUIDELINES - Volume 2
The analysis of internal efficiency does not only provide information on the delivery modesof each course, but also, in complement, on the behaviours of students. Economic theoriesof education do not condone letting demand for HE regulate itself, especially when the costis largely supported by society.
Indeed, when faced with highly reduced expectations of their employment prospects,students adopt behaviour that is individually rational but collectively inappropriate, whichinvolves a reduction of the time effectively devoted to their education. This is manifest inthe degradation over time of the internal efficiency of courses, which then becomes awarning signal of a significant reduction in levels of student motivation.
EQUITY IN ACCESSTO HIGHER EDUCATION
The data of the previous sections on the schooling careers of students can also serve tobetter understand the equity dimension (Who attends which institution? How do studycareers vary by socioeconomic characteristic?) Ideally, where data is available, thecharacteristics of the student population would be determined for each institution or course(nationality, gender, social status and so on), both in terms of its evolution and currentsituation.
2.4.1 GENDER EQUITY
The analysis by gender should disaggregate the key access indicators for girls and boys. Thisinvolves the computation of the number of students per 100,000 inhabitants, and the shareof them that are of each gender. This can also enable the comparison of the global accessrate to higher education GARHE and its components for each (the secondary completionrate, the end-of-secondary exam success rate and the promotion rate to higher education).
After having retraced the evolution of the respective proportions of boys and girls in studentenrolment over the past 10 to 15 years, the analysis may differentiate between numbersfor each gender for each of the HLIs or courses for a recent year, as in Example 8.11.
2.4

EXAMPLE 8.11(Equity in HE - Gender): Gender Equity in HE Enrolment, Swaziland, 1992-2007Source: Adapted from the Swaziland CSR, 2009.
6,000
5,500
5,000
4,500
4,000
3,500
3,000
2,500
2,000
1,500
1,000
500
0
1982
1983
1984
1985
1986
1987
1988
1989
1990
1991
1992
1993
1994
1995
1996
1997
1998
1999
2000
2001
2002
2003
2004
2005
2006
200
7
Enro
lmen
t
Graduates
Female
Male
FIGURE 8.5 - Total Enrolment by Gender, and Degrees Awarded, Swaziland, 1992-2007
Total
Sub-Sector Specific Analyses 99
HIGHER EDUCATIO
NCH
APTER
8
FindingsGender parity has been attained in overall access. The gender gap that persisted through thefirst decade considered here closed in the late 1990s, resurfaced in the early millennium, butseems to have closed again by 2007 (See Figure 8.5). However, women are substantiallyunderrepresented in the faculties of science, agriculture and business, and in postgraduatestudies (See Figure 8.6).
70
60
50
40
30
20
10
0
Perc
ent
Agric
ultu
re
Busin
ess
Educ
atio
n
Heal
th S
ci.
Hum
aniti
es
Scien
ce
Soc.
Sci.
P.G
.S.
IDE
Ave
rage
FIGURE 8.6 - Share of Female Enrolment, by Faculty, Swaziland, 2007/08
Women are overrepresented in humanities and education. Their dominance in fields with lowemployment opportunities—humanities particularly—risks perpetuating the gender-relatedinequities in earnings. It also endangers the achievement of the gender equity goal of the povertyreduction plan, while denying households the widely documented benefits of women’s economicpower. On the positive side, women dominate the domain of health, where regional and globaldemand is currently high, which may compensate for their absence in other scarce skills fields.However, these are still areas of lower earnings than other science-based specialisations.

Social Background of HE Students, by Parents’ Occupation, Central African Republic (CAR), 2003Source: Adapted from the CAR CSR, 2007.
EXAMPLE 8.12
Senior Professional
Mid-Level Professional
Administrative Employees
Qualified Workmen
Unqualified Workmen
Qualified Service Staff
Unqualified Service Staff
Farmers
Unknown
Total of Known Response
Overall Total
3,072
1,218
535
440
77
455
380
693
2,308
6,870
9,178
33.5
13.3
5.8
4.8
0.8
5.0
4.1
7.6
25.1
-
100.0
45.0
18.0
8.0
6.0
1.0
7.0
6.0
10.0
-
100.0
-
1.7
7.2
0.6
3.1
3.4
1.4
10.4
72.3
-
100.0
-
Numbers Share of Total Share of KnownResponses
Share of Active Pop.
TABLE 8.15 - Distribution of HE Students, by Head of Household’s Occupation, Central African Republic, 2003
(Percent)
Table 8.15 shows the distribution of CAR higher education students according to the socialbackground of their parents, as determined by their occupation in this instance.
FindingsThe table indicates that a third of students declare that their main working parent is a seniorwhite-collar professional, whereas this category of workers represents less than two percent ofthe active population. Despite some reservations with respect to potential bias in the answers(frequency of responses, sincerity of responses, differences between the social status of thebiological parents and the head of household), it appears that youth from the most advantagedhouseholds are largely over-represented in higher education, at the expense of children fromother categories.
100 EDUCATION SECTOR ANALYSIS METHODOLOGICAL GUIDELINES - Volume 2
2.4.2 SOCIAL DISPARITIES
Information on the social background of students is not as easily available as that on gender.To analyse this characteristic’s impact on the access of students to HE, when the data isavailable, the proportion of students with a given characteristic may be compared to theshare of the global population with that same feature (See Example 8.12).
In countries where this information is not available, or pending it being collected moresystematically, it may be necessary to compare less precise categories, like income quintiles,or students with a parent working in the modern sector against all the rest, as per Example8.13 below. The analysis can be extended to compare courses and institutions, by comparingthe most open courses (humanities, law) with the more closed ones (engineering andbusiness schools, agronomy) where almost all students are from households where the headis employed in the modern sector of the economy.

Sub-Sector Specific Analyses 101
EXAMPLE 8.13Social Background of HE Students, by Parents’ Sector of Employment, Fictional CountrySource: Authors.
FindingsThe comparison of the share of students whose head of household works in the modern sector(75 percent overall) and of the share of modern sector workers in the active population (20percent) provides evidence that access to HE is more frequent among students from moreadvantaged households.54
(Percent)
ModernSector
Other
Total
University Schools of
Humanities
TABLE 8.16 - Distribution of HE Students, by Institution/Course and Employment Sectorof Head of Household, Fictional Country
Law
32
100
68
Economics
25
100
75
Science
23
100
77
Medicine
8
100
92
Agronomy
4
100
96
Engineering
3
100
97
Commerce
9
100
91
Reference:Active
Population
Totalnumber
of students
25
100
75
80
100
20
35
100
65
HIGHER EDUCATIO
NCH
APTER
8
Table 8.16 below provides the distribution of higher education students by type of institutionand course, according to whether the head of household works in the modern sector of theeconomy or not.

102 EDUCATION SECTOR ANALYSIS METHODOLOGICAL GUIDELINES - Volume 2
The relative importance of the financing of HE (overall and by source) is examined in Chapter3. The objective of this section is to: (i) breakdown the cost of study for each of theinstitutions or courses, using approaches already used for other education levels; (ii) tohighlight and compare the key cost factors; and more generally (iii) reflect on the equityand efficiency dimensions of HE financing. Most of the computations presented in thissection are based on the elements presented in Chapter 3.
INSTITUTIONAL BUDGETS
The first stage of this analysis on the cost and financing of HE by HLI and course consists ofanalysing the budgets effectively executed by different institutions. It will be helpful to obtainthe budget directly from university chancellors to use effective spending in the analysis(rather than planned expenditure) and especially to consider the full array of the institution’sresources. Generally speaking, income should be disaggregated into public subsidies, ownresources (enrolment fees, income from services to students, income from the sale ofresearch and expertise services and so on), loans and development, and aid projects.
The work of recomposing a budget, presented in Chapter 3, is particularly importantinasmuch as it constitutes the basis of analytic differentiation between teaching expenditure,non-teaching salary spending, social spending (restaurants, accommodation, medical careand so on) and other recurrent operational and maintenance spending.55 Investmentexpenditure (buildings, heavy equipment) will be broken down and their cost annualisedaccording to their expected life-cycle.56
As always in the education sector, but more so here considering the greater complexity anddiversity of HE, particular care must be taken in the consolidation and allocation of teacherspending (See the methods offered in Chapter 3). The computation of total salary spendingand of average salary spending per student does not present any particular difficulties,beyond gaining access to the relevant data (exhaustive executed budgetary data). Totalteacher spending is the sum of all the forms of teaching activity remuneration (salaryspending for permanent staff, overtime if separate, remuneration of nonpermanent andcontract staff and so on). The average teacher spending per student is obtained by dividingthis total amount by the number of students enrolled. The interpretation of average teacherunit costs will not be quite as straightforward, given that they encompass both permanent
COST AND FINANCINGSECTION
3
3.1
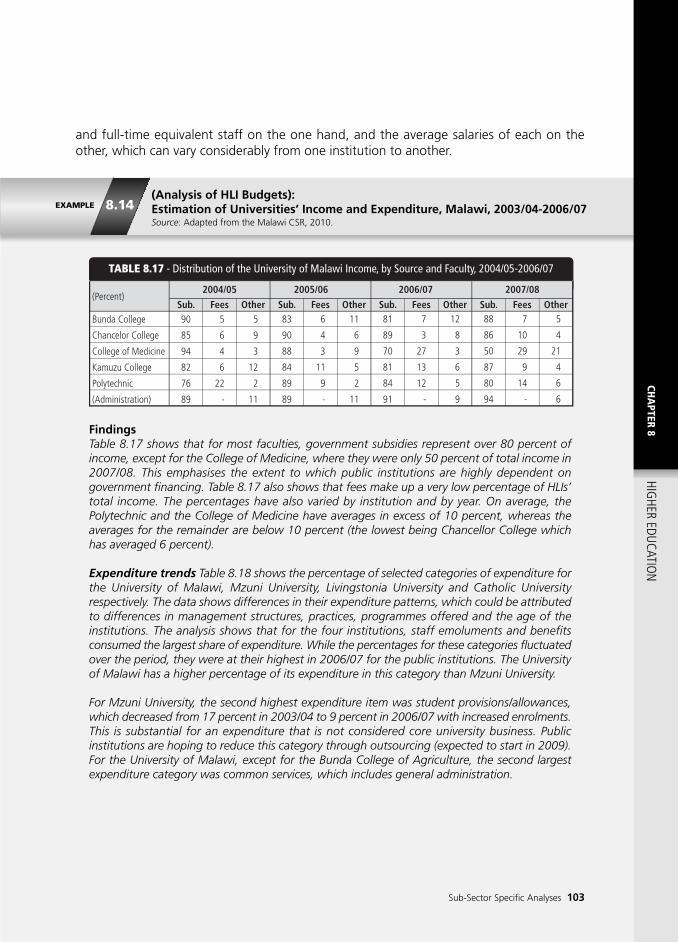
EXAMPLE 8.14(Analysis of HLI Budgets): Estimation of Universities’ Income and Expenditure, Malawi, 2003/04-2006/07Source: Adapted from the Malawi CSR, 2010.
Bunda College
Chancelor College
College of Medicine
Kamuzu College
Polytechnic
(Administration)
2004/05 2005/06 2006/07 2007/08
Sub. Fees Other Sub. Fees Other Sub. Fees Other Sub. Fees Other90
85
94
82
76
89
5
6
4
6
22
-
5
9
3
12
2
11
83
90
88
84
89
89
6
4
3
11
9
-
11
6
9
5
2
11
81
89
70
81
84
91
7
3
27
13
12
-
12
8
3
6
5
9
88
86
50
87
80
94
7
10
29
9
14
-
5
4
21
4
6
6
TABLE 8.17 - Distribution of the University of Malawi Income, by Source and Faculty, 2004/05-2006/07
(Percent)
FindingsTable 8.17 shows that for most faculties, government subsidies represent over 80 percent ofincome, except for the College of Medicine, where they were only 50 percent of total income in2007/08. This emphasises the extent to which public institutions are highly dependent ongovernment financing. Table 8.17 also shows that fees make up a very low percentage of HLIs’total income. The percentages have also varied by institution and by year. On average, thePolytechnic and the College of Medicine have averages in excess of 10 percent, whereas theaverages for the remainder are below 10 percent (the lowest being Chancellor College whichhas averaged 6 percent).
Expenditure trends Table 8.18 shows the percentage of selected categories of expenditure forthe University of Malawi, Mzuni University, Livingstonia University and Catholic Universityrespectively. The data shows differences in their expenditure patterns, which could be attributedto differences in management structures, practices, programmes offered and the age of theinstitutions. The analysis shows that for the four institutions, staff emoluments and benefitsconsumed the largest share of expenditure. While the percentages for these categories fluctuatedover the period, they were at their highest in 2006/07 for the public institutions. The Universityof Malawi has a higher percentage of its expenditure in this category than Mzuni University.
For Mzuni University, the second highest expenditure item was student provisions/allowances,which decreased from 17 percent in 2003/04 to 9 percent in 2006/07 with increased enrolments.This is substantial for an expenditure that is not considered core university business. Publicinstitutions are hoping to reduce this category through outsourcing (expected to start in 2009).For the University of Malawi, except for the Bunda College of Agriculture, the second largestexpenditure category was common services, which includes general administration.
Sub-Sector Specific Analyses 103
and full-time equivalent staff on the one hand, and the average salaries of each on theother, which can vary considerably from one institution to another.
HIGHER EDUCATIO
NCH
APTER
8

104 EDUCATION SECTOR ANALYSIS METHODOLOGICAL GUIDELINES - Volume 2
53.6
5.4
7.2
0.2
1.6
3.6
6.1
1.2
1.8
13.8
2.1
100
59.9
4.9
6.3
0.0
1.2
3.7
1.1
0.4
1.4
13.3
3.4
100
54.4
5.8
8.6
0.9
1.6
3.8
5.2
1.0
1.5
10.2
3.5
100
60.0
4.7
7.1
0.2
1.0
2.5
2.0
0.4
1.3
14.4
3.1
100
39.8
8.1
17.4
3.6
4.0
4.1
9.8
0.2
0.8
6.0
3.0
100
46.2
6.9
13.6
1.8
8.2
4.4
0.4
0.0
1.7
7.3
2.1
100
43.6
3.2
10.3
1.4
6.8
0.0
15.7
1.1
3.4
1.5
3.7
100
50.6
4.8
9.0
1.4
9.2
0.0
9.7
1.3
2.0
2.0
0.4
100
45.7
7.0
17.2
0.7
0.2
2.0
5.0
0.4
0.0
14.9
1.5
100
58.8
7.7
11.5
0.9
0.0
1.9
0.0
0.5
0.0
11.0
6.5
100
74.4
5.6
0.9
0.8
2.3
3.1
2.1
0.3
0.2
3.1
3.5
100
12.9
1.4
34.2
3.1
3.2
8.5
0.0
7.6
0.0
9.3
0.0
100
36.9
3.6
29.4
0.0
0.8
10.9
0.0
2.8
0.0
7.8
0.0
100
35.3
2.4
24.2
0.1
2.9
7.9
0.0
3.2
2.5
12.5
2.2
100
34.7
2.6
23.2
0.0
1.6
15.1
0.0
2.7
0.0
5.5
1.9
100
2003/04
2003/04
2004/05
2004/05
2005/06
2005/06
2006/07
2006/07
2006/07
2007/08
2008/09
2003/04
2004/05
2005/06
2006/07
(Percent)University of Malawi Mzuni University Catholic Livingstonia
Emoluments and Benefits
Utilities
Student Provision-Allowances
TeachingsMaterials-Equiment
Books and Periodicals
Travel Subsistence
Vehicle Maintenance
Repair of infrastructureand Equipment Lease Financing and Assets
Cleaning and Sanitation Materials
Training and Staff Development
Research, Publicationsand ConferencesCommon Services (GeneralAdministration)
Other
TOTAL
TABLE 8.18 - Distribution of University Spending, by Category and Institution, Malawi, 2003/04-2006/07
0.5 0.7 0.4 1.0 1.7 3.7 8.5 8.8 0.7 1.1 1.5 3.4 4.3 3.7 8.6
3.6 2.4 2.7 2.1 2.7 2.9 0.0 0.0 4.4 0.0 2.1 16.6 0.2 1.9 3.6
0.2 0.3 0.4 0.4 0.6 0.8 0.7 0.8 0.2 0.1 0.1 0.0 3.3 1.0 0.7
The University of Malawi’s student provisions/allowances fell into third place. The costs capturedin the data do not include all the additional administrative costs incurred by the central office. Ifthis was taken into account, the percentage for general administration would be higher. Provisionof common services was the third highest expenditure for Mzuni University, but has decreasedover time. Lease financing and the purchase of assets was Mzuni University’s fourth largestexpenditure category (except for 2004/05), closely followed by teaching materials/equipmentexpenditures. The increase in teaching materials/equipment is a step in the right direction becausethis is a core function.
Quality-related inputs such as teaching materials have shown low expenditure and the categoryhas remained one percent and below at the University of Malawi. Books and periodicals havealso not been a priority in both public institutions, especially at the University of Malawi, whereagain the allocation has remained below one percent, with no expenditure at all in 2003/04. Ananalysis of the expenditure patterns for the individual colleges shows that all colleges have spentvery little or nothing on these two important categories despite the great shortage of teachingmaterials, books and periodicals in these institutions.
Allocations for staff development are low for all institutions, falling below two percent.Publications and research allocations are also low and not conducive to promoting research.However, visits to the institutions have revealed that some research is being carried out, in somecases with funding from external sources. But reliance on donor support for research is notsustainable and work thus supported may not address Malawi’s research needs.

Sub-Sector Specific Analyses 105
FINANCING STUDENTS’ HIGHER EDUCATIONAND SOCIAL SPENDING
Student allocations, be they monetary (scholarships, grants, student loans and so on) orthrough subsidised services (accommodation, restaurants, medical care and so on) canconstitute an important share of recurrent expenditure in HE institutions. Care musttherefore be taken to precisely detail their admissions criteria and delivery and control modesbefore examining total and unit costs. This last analysis will also consider any HLI incomeand the share of the cost of HE borne by students and their families.
Ideally, this exercise should estimate the global amount of executed spending by type ofexpenditure and distribute this amount among beneficiary HLIs (using the number of studentbeneficiaries, for instance). The different components of each spending item must thus beidentified, as well as their beneficiaries, differentiating by institution. Scholarships andstudent loan systems, being services provided to individuals, should yield this data. Sourcesinclude the ministry of higher education, university chancellors or the national student loansoffice, for example.
3.2.1 SOCIAL SPENDING
Social spending generally covers common services provided to various institutions or courses(university infrastructure, for instance), but some HLIs may offer social services independently(accommodation, restaurants, transport and so on).
HIGHER EDUCATIO
NCH
APTER
8
It has not been possible to carry out an in-depth analysis of expenditure patterns in privateuniversities due to a lack of data. The expenditure pattern for Livingstonia University is somewhatdifferent from those of public institutions. One major difference is the percentage spent onremuneration (emoluments and benefits), which is much lower than in public institutions.
3.2

106 EDUCATION SECTOR ANALYSIS METHODOLOGICAL GUIDELINES - Volume 2
Distribution of Social University Spending, by Faculty, Fictional CountrySource: Authors.
EXAMPLE 8.15
TABLE 8.19 - Distribution of Social University Spending, by Type and Faculty, Fictional Country
Humanities
Science and Technology
Law and Political Science
Economics and Management
Agronomy
Polytechnic
Business School
School of Management
University Institue of technology
Health Sciences
Numberof
StudentsNumber Amount
(Currencyunits)
% of Benefi-ciaries
Total(Millions
ofcurrency
units)
Food/Other
Transport Total
13,680
4,864
8,308
3,427
328
1,212
1,256
1,745
542
750
2,897
622
733
243
171
190
151
224
153
336
1,101
236
279
92
68
75
63
94
64
166
704
250
428
176
17
62
65
90
28
39
986
351
599
247
17
62
65
90
28
39
282
100
171
71
380,000
380,000
380,000
380,000
395,000
395,000
420,000
420,000
420,000
495,000
21%
13%
9%
7%
52%
16%
12%
13%
28%
45%
264
36,738
176
5,896
14
1,873
14
2,497
106
2,344 624
67%
16%
600,000
Social SupportScholarships
InstitueOf Sports
Total
Table 8.19 below presents social university spending, by type and faculty, based on the experienceof a theoretical university.
FindingsScholarship spending has risen to 2.3 million currency units. The distribution of this amountamong HE faculties and colleges takes into account the number of scholarship beneficiaries byfaculty and the amount of the scholarship, which varies according to the course of study. The table provides further information on scholarship policy: the amount of the grant is muchhigher in specific job-oriented courses, and benefits a greater share of their students.
Source: Authors.
Accommodation can also be considered an individual service and thus make the relatedcosts easier to track. Other services (restaurants, medical care, transport) are moreanonymous and the distribution of the cost among different institutions and courses willgenerally be based on average spending and income per student. In this perspective, theaverage unit cost of university restaurants is obtained by dividing the total cost of this serviceby the number of students that are likely to benefit (all institutions and facultiesconsidered).57 The total cost of university restaurants by institution is then obtained bymultiplying the average unit cost of restaurants by the number of students in each HLI.

Sub-Sector Specific Analyses 107
The lucrative nature or the scarcity of such services (free medical care, for instance) can leadto abusive behaviour or misuse of resources. Particular care should be taken when reviewingthe evolution of global and unit costs for these services over recent years and their relationto student numbers. The conditions of eligibility and control should also be examined. Thesecriteria (especially for accommodation and university restaurants) can lead to differentstudents paying different prices for the same service. The analysis should also aim, especiallywhere public services are concerned, to highlight the referential cost of the service provided,and compare it to the average cost per student and the sale price. In terms ofaccommodation for instance, the average annual cost of the service should be comparedto the effective price charged to beneficiaries and to the average annual rent of similaraccommodation let privately. This will enable one to determine the level of subsidies in theservice. In the case of restaurants, the same analysis can be conducted by comparing theaverage cost of the service per student, the sale price and the price of a similar meal outsidethe university. Should they exist, private restaurants on the university campus should alsobe included.
3.2.2 DIRECT FINANCIAL SUPPORT
Direct financial support (grants, scholarships, subsidised loans and so on) should be dealtwith separately inasmuch as they may reflect different policies that have an effect on equityand efficiency. These types of support help finance higher education, but can also be toolsthat can serve to orient students towards courses and subject-areas which reflect a lack ofskills that society needs. It will therefore again be important to clearly detail eligibility criteria,the type (full or partial grant, amount of the loan, fixed or variable interest rates and so on)of support offered and the associated costs.
Loan systems’ operation and reimbursement conditions should be described, detailing theguarantees expected of beneficiaries. If the loans are provided by private institutions, it islikely that these will have obtained satisfactory guarantees from students or their families.Public loan systems, or those where governments provide default insurance to privatelenders, may effectively function as scholarship agencies, depending on their tolerance ofnon-repayment. In such cases, the financial consequences should be reviewed, as well asthe impact on the evolution of the system and the risks it carries in terms of access by non-eligible students.
HIGHER EDUCATIO
NCH
APTER
8

108 EDUCATION SECTOR ANALYSIS METHODOLOGICAL GUIDELINES - Volume 2
(Financing of HE – Student Loans):Financing of University Studies through Student Loans, Tanzania, 2010Source: Adapted from the Tanzania CSR, 2012.
EXAMPLE 8.16
FindingsCost-sharing strategies in Tanzania are a means to improve higher education access and equity.The current policy regarding the financing of higher education is based on the government givingstudents grants and loans that cover university fees and some basic living expenses, with families,parents and guardians providing the difference. Although the policy was initiated in 1982, costshave gradually been transferred to families; the first loans were offered in 1994 to help with thecost of meals and accommodations, responding to parents’ growing difficulty to cover the highercosts and the government’s inability to offer grants to an ever increasing number of students.
An autonomous parastatal agency (the Higher Education Student Loan Board, or HESLB) wasoperationalised in 2005 to provide loans to eligible students within eligible HLIs/programmes.For students who meet the basic administrative criteria, access to HESLB loans is based primarilyon merit, with greater leniency for students enrolled on priority subjects (teacher training andScience, in 2010). Secondly, students are means-tested to assess their relative need for the loan,and the proportion of the full loan amount they will receive. It has been established that mosthigher education students are from wealthier families and least in need of support.
The HESLB is today the main provider of loans, offering 97.4 percent of all student loans inTanzania (the Tanzania Education Authority, the private sector and some NGOs also supportstudents), to 81 percent of all higher education students. The effectiveness and sustainability ofthe student loan scheme relies heavily on the HESLB management’s capacity to recover amountslent. One of the board’s mandates is to recover loans issued since 1994, which have never beenreimbursed due to the lack of enforcement of the terms and the resulting perception bybeneficiaries that the loans offered were more like grants. The HESLB is now working closelywith firms and public services to identify and name former loan beneficiaries, who are given 10years to pay back, or face prosecution. T Sh 3.2 billion (6.3 percent) are estimated to have beenrecovered, of the T Sh 51 billion lent. The sustainability of the student loan system will heavilydepend on the effectiveness of the cost-recovery mechanism.
The distribution of study vouchers, that combine public financing with students’ free choiceconstitute something of an intermediate situation, mid-way between public and privatefinancing of university studies.

EXAMPLE 8.17(HE Unit Costs): HE Unit Costs, by University and Faculty, Malawi, 2003/04-2006/07Source: Adapted from the Malawi CSR, 2010.
Sub-Sector Specific Analyses 109
HIGHER EDUCATIO
NCH
APTER
8
STRUCTURE OF UNIT COSTS AND COST OF A GRADUATE BY INSTITUTION/STREAM
The elements considered in the previous sections of this chapter have already covered someaspects of the analysis of unit costs and their main components for higher educationinstitutions and courses.
This section will first compare the social cost with the pedagogical cost, beforedisaggregating each into different components. The differences in social unit costs couldbe analysed in terms of beneficiaries and the direct cost of the services (the share of grantbeneficiaries for instance). Differences in pedagogical unit costs will be explained, as inChapter 2, in terms of average teaching and non-teaching salaries and other academicspending. A reminder of the previously examined structure of the teaching body and theaverage salary cost of permanent or temporary staff may be provided here.
3.3
Table 8.20 shows the differences in average unit costs for higher education across institutions inMalawi and Table 8.21 provides the breakdown by expenditure categories.
FindingsUnit Cost by Institution The data shows variations in unit costs across institutions, the College ofMedicine having the highest unit costs each year. Unit costs for all institutions have varied fromyear to year but have shown an upward trend. Of particular note is the low unit cost of privatecompared to public universities, in particular Livingstonia University. One possible reason for its
University of Malawi
Bunda College of Agriculture
Chancellor College
College of medicine
Kamuzu College of Nursing
Polytechnic
Mzuni University
Adventist University
Catholic University
Livingstonia University
Shareworld University
15.0
10.3
48.2
18.9
9.7
15.4
2.1
-
-
-
21.1
10.4
41.8
14.2
8.7
18.2
1.4
-
-
-
23.9
12.6
56.2
19.8
16.9
25.0
4.5
-
-
-
28.8
14.4
52.3
31.5
16.3
27.7
5.0
13.6
6.6
7.9
(% of GDP per capita) 2003 2004 2005 2006
TABLE 8.20 - Unit Costs, by HLI, Malawi, 2003-06

110 EDUCATION SECTOR ANALYSIS METHODOLOGICAL GUIDELINES - Volume 2
254,822
26,955
2,258
209
56,639
239,538
37,788
3,212
4,104
45,077
329,891
44,591
2,428
1,210
85,214
404,965
47,594
6,519
1,374
96,899
222,496
96,990
9,460
20,226
33,774
306,233
90,346
24,668
12,039
48,132
395,920
93,668
77,093
12,737
14,013
508,378
90,948
88,148
14,307
19,636
2003/04 2004/05 2005/06 2006/07 2003/04 2004/05 2005/06 2006/07University of Malawi MZUNI University
TABLE 8.21 - Breakdown of Unit Costs, University of Malawi and Mzuni University, Malawi, 2003/04-06/07
(MK)
Emoluments and Benefits
Student Provisions and Allowances
Teaching Materials and Equipment
Books and Periodicals
Common Services (General Administration)
low unit costs is the nature of the programmes delivered. For instance, Livingstonia Universityprovides only education degrees and receives a lot of support from well wishers in cash, goodsand services. Unit costs are low because the college uses its small team to play various roles andhandle other responsibilities. Because private universities rely entirely on fees, they are morelikely to manage their resources better than public institutions, which receive much of theirmoney from the government. The trend of unit costs increasing with enrolments would suggestthat economies of scale are not being realised in these institutions.
Unit Cost by Expenditure Category Table 8.21 shows that the unit costs for emoluments andbenefits in both institutions have increased substantially for the period under review, with MzuniUniversity having higher unit costs than the University of Malawi, except in 2003/04. This showsa problem of staff usage in the institutions. With good management and efficient utilisation ofstaff, the unit cost of emoluments should decrease. The increase in this unit cost is also relatedto increases in salaries and benefits over this period. An analysis of enrolment data for MzuniUniversity shows that the institution offers courses to very small classes, especially in the newlyintroduced programme. Economies of scale that can be achieved from having large classes areobviously not being realised. A policy on the minimum number of students that are requiredbefore a class can be offered is needed. For example, Catholic University requires a minimum of12 students before a programme can be offered.

Sub-Sector Specific Analyses 111
EQUITY IN THE DISTRIBUTION OF RESOURCES
To conclude this section devoted to cost and financing, it is interesting to consider equity inthe financing of HE. If any changes are required in terms of financing, to regulate access toinstitutions or courses that are more or less useful to society or because of important gapswith the level of financing of equivalent courses, it is important to first draw all the possibleconclusions from the equity of current financing arrangements.
Firstly, the analysis can further detail the impact of cost, financing and attendance on equity.Secondly, on the basis of these elements, it can provide information on the likely impact onequity of any modification of the financing arrangements considered for cost-efficiencyreasons:
(i) The information on access to institutions and courses that is available disaggregatedby gender, income and area of residence, produced for Chapter 2 and sections of thischapter, should be consolidated. Distributive equity, liked to the attendance of differentlevels and the costs associated with each, studied in Chapter 6, can be complementedhere by considering the cost and financing of the different streams of HE. Thus, thedistributive equity noted on the basis of the average cost of other education levelscould in fact be much weaker if the most disadvantaged students, who already accessHE comparatively less, only enrolled in the least costly courses (less subsidised by publicresources).
(ii) In the light of the above, the analysis can review the general principles of HE financingand the level of equity they encompass.
Analysing possible changes to financing structures should first consider the degree of equityachieved by the current system, as well as that which would be achieved through thecontemplated changes, inasmuch as they will necessarily be discussed in the context of thereform debate. The fundamental question is who benefits from public financing of HE, andto what extent. Indeed, the analysis can focus, as it has done earlier for the entire educationsystem, more specifically on the consequences of different financing policies for HE (grants,scholarships, student loans, HLI subsidies and so on) on the total distributive equity, or onthe distributive equity by student population groups (social background, household incomeand so on).
HIGHER EDUCATIO
NCH
APTER
8
3.4

112 EDUCATION SECTOR ANALYSIS METHODOLOGICAL GUIDELINES - Volume 2
The objective of this final section is to consolidate any available information enabling theassessment of the quality and relevance of the courses offered. This relates to the deliveryof degrees and qualifications, but first and foremost to the economic relevance of HEtraining offered (employability of graduates, socio-professional status achieved, incomelevels and so on). At very least, this section should examine the mechanisms implementedfor the quality assurance of training and those that aim to offer graduates career guidance.
As for any terminal level of education (the one prior to employment), the real proof of therelevance of HE is the social and professional opportunities it offers graduates (employment,type of job, level of income, and so on). This information, while difficult to collect at thesector level, is even less available from each institution or faculty. HLIs are increasinglyshowing an interest in the future of their graduates, however, and improved approachesare spreading. Tracer studies are much more common today and provide detailedinformation on the employability rate of graduates from different institutions or courses.58
RESULTS, PERFORMANCEAND QUALITY
SECTION
4

Sub-Sector Specific Analyses 113
SCIENTIFIC RESEARCH AND PRODUCTION
Beyond the indicators for teaching staff qualifications presented earlier, it is now commonto consider the individual scientific research performed by individual HE staff, departmentor laboratory as an indirect measure of quality. In many countries, these indicators areconsidered in the ranking of university departments used to determine their level ofsubsidies.
The debate on the type of research that should be encouraged in HLIs is based largely onthe results of studies carried out on the theme of endogenous growth. Analytical worksuggests that developed countries’ investment in research should move closer to thetechnological barrier defined by the most advanced innovations. Developing countries, onthe other hand, should focus their research on the adaptation of existing technology thatis likely to be implemented more efficiently due to the low labour costs involved. This generalorientation, that should extract the greatest contribution of national research to growth,should not exclude fundamental research’s role as a form of training researchers, the bestof whom benefit from being connected to international networks and the opportunities ofexchange and ongoing training that they offer.
In this perspective, the analysis should distinguish between teaching staff’s aptitude forresearch, particularly as reflected by their qualifications (thesis, higher university degree andso on) and the ongoing research conducted by active university staff. The definition andthe accounting for the scientific production of lecturer-researchers is not, however, as simpleas it appears to be. To avoid all ambiguity, publications should be accounted for by typeand scientific credibility. Including articles that have simply been accepted for publicationcarries some risks and should be avoided. Works can be classified as scientific or general.The participation in conferences should be limited to those where the researcher gave apresentation.59
Beyond the issues raised by precisely determining content, it is often difficult to producesuch indicators if they are not already available from the institutions or the authoritiesresponsible for the careers of lecturers and researchers. However, this type of data is oftencollected on an individual basis by the laboratories or departments where research activitiesare managed, more and more of which are choosing to collect this type of information,ultimately to facilitate reporting on their scientific output. Service contracts for research andexpertise could provide a further valuable indication of the dynamism of the research teamsin each HLI.
HIGHER EDUCATIO
NCH
APTER
8
4.1

114 EDUCATION SECTOR ANALYSIS METHODOLOGICAL GUIDELINES - Volume 2
EXTERNAL EFFICIENCY
The measure of external efficiency is particularly delicate for HE, as it can raise questionsabout the level of public financing that the sub-sector receives. Given that existing studiesshow that at least 80 percent of the social benefits of education are obtained by the end ofsecondary, evidence of the real economic impact of HE is needed to justify the expenditure.In some relatively rare cases, the skills of graduates may have been directly measured. Interms of external efficiency, however, the principal point of interest is the performance ofgraduates in the workplace. The analysis of external efficiency with respect to the workplaceenables one to distinguish between the courses that lead to real professional opportunitiesand those that do not. Further complementary information should then be providedenabling the appraisal of working conditions in addition to employability. Methodologically,this evaluation is very similar to that presented in Chapter 5.
This analysis calls on data that is relatively rare and difficult to produce, especially wheneach institution and/or stream of higher education is to be dealt with separately. Most oftenthis data is available at a macro level on the basis of broad surveys that provide informationon the employment and income status of individuals with different levels of training(employment surveys, demographic census and so on). In these surveys, considering thesize of the samples used, it is generally not feasible to distinguish by degree, institution orstream. Analyses by type of training require specific data that is harder to gather. Specificsurveys of higher education, or those focusing on particular degrees may be required,whereas tracer studies that examine in detail the status of graduates at least a year aftertheir graduation may be most adapted.60
4.2

Sub-Sector Specific Analyses 115
These issues should not, however, be insurmountable obstacles. In most cases, collectingand consolidating information on the main types of training (literary/scientific courses, openadmissions/selective admission and so on) will be possible on the basis of the mainemployment surveys, and will provide helpful pointers for the diagnosis. Under thehypothesis of ideal data availability, it is helpful to consider graduate’s employment statusby: (i) course followed; (ii) the number of years of university; and (iii) crossing both abovedata sets. For each of the three dimensions; Table 8.22 above presents some of the potentialindicators that could be estimated and analysed according to the methods proposed inChapter 5.61
It is common to conclude this analysis of the external efficiency of HE by a review of thestrategies to give maximum value to graduates in the workplace. Often it will be appropriateto review the tradeoff between the quantity of graduates HE produces and the quality andrelevance of the HE services on offer. Reflections on a more equitable and efficient regulationand financing mechanism capable of solving this issue are often instructive. Likewise,discussions on the professionalisation of higher education, the involvement of the privatesector and the relevance of the courses offered to the economy may provide valuable insight.
HIGHER EDUCATIO
NCH
APTER
8
% of Active Graduates
% of Unemployment Length of Unemployment
For the active graduates:
- Underemployment Rate
- Unstable Employment Rate
- Informal Employment Rate
- % of Jobs Related to the Degree Obtained
- % of Jobs for which Graduates are Overqualified
- % of Graduates Seeking Better Remuneration
- % of Graduates Seeking more Relevant Position
- Average Salary as a % of the Average Salary of Graduates of the Same Level
- Average Salary as a % of the Average Salary of Graduates Working in their Field
TABLE 8.22 - List of Potential Indicators to Describe the Employment Statusof Graduates

(External Efficiency of HE):Results of a Graduate Tracer Study, Malawi, 2008Source: Adapted from the Malawi CSR, 2010.
EXAMPLE 8.18
FT employed
Own business
PT employed
Seeking employment
Other
Law
Engineering
Economics/Bus
Humanities
Total/Average
Social Sciences
Agriculture
Pure Science
ICT
Other
100.0
79.5
78.2
72.5
72.2
69.5
66.7
65.5
63.6
60.0
0% 50% 100%
FIGURE 8.7 - Occupational Situation of HE Graduates, by Field of Study, Malawi, 2008
In 2008 the GTZ and the World Bank carried out a graduate tracer study in Malawi, surveying492 graduates from five different HLIs.
116 EDUCATION SECTOR ANALYSIS METHODOLOGICAL GUIDELINES - Volume 2
Tracer Studies
Example 8.18 illustrates the use of the results of a tracer study conducted in Malawi, andthe use of international data on the employability of graduates.
FindingsOverall, it would seem that the higher education sector in Malawi is to a large extent successfulin preparing highly qualified human resources for employment. Graduates are well employedand have success upon entering the labour market. As Figure 8.7 shows, 85.3 percent of allrespondents found employment after graduating from higher education, the vast majority (72.2percent) in full time wage employment. Self-employment is small (2.1 percent), but a substantialshare of graduates are working part time (11 percent). A relatively high amount _ 9.9 percent _
is seeking employment, of whom the most recent graduates (2007) have the highestunemployment.
Figure 8.7 also shows relatively clear variations by field of study. Law fares best by far, bringingall graduates into regular full time employment; engineering, business/economics and,interestingly, humanities, show above average full-time employment rates. Information andcommunication technologies (ICT), social sciences, agriculture and pure sciences have belowaverage results. ICT also shows the highest unemployment rate, pointing to a possible saturationin the relevant labour market which calls for further analysis.

HIGHER EDUCATIO
NCH
APTER
8
100
90
80
70
60
50
40
30
20
10
0
Mal
awi
Moz
ambi
que
Chad
Burk
ina
Faso
Buru
ndi
Leso
tho
Zam
bia
Ugan
da
Ethi
opia
Gha
na
Mad
agas
car
Rwan
da
Sene
gal
Sier
ra L
eone
CAR
AV
ERA
GE
Cam
eroo
n
Mau
ritan
ia
Beni
n
Mal
i
Togo
Gui
nea-
Biss
au
Côte
d’Iv
oire
DRC
Gui
nea
Perc
ent
Age 25-34
Age 35-59
FIGURE 8.8 - Employment Rate (Modern Sector Only) of Higher-Education Leavers,by Age Group, Various African Countries, Malawi, 2008
Comparing data with other African countries shows a very high employment rate for academicallytrained Malawians and reflects the generally low higher education enrolment rates. Interestingly,Malawi is the only country with a markedly higher employment rate for younger rather thanolder graduates, suggesting an even higher recent labour market demand.
Sub-Sector Specific Analyses 117
160,000
140,000
120,000
100,000
80,000
60,000
40,000
20,000
0
Hum
aniti
es
Socia
l Scie
nces
Engi
neer
ing
Econ
omics
/Bus
ines
s
Pure
Scie
nce
Law
Agric
ultu
re ICT
Oth
er
AVE
RAG
E
Dipl
oma
Bach
elor
Mas
ter
Mal
e
Fem
ale
FT e
mpl
oyed
Self-
empl
oyed
PT e
mpl
oyed
PT +
ow
n bu
sines
s
Aver
age
of d
ropo
uts
MK
FIGURE 8.9 - Mean Monthly Income of HE Graduates, by Field of Study, Degree,Gender and Employment Status, Malawi, 2008
As shown in Figure 8.9, not surprisingly, the income distribution of graduates in employment ischaracterised by a very large range, from MK 9,000 to MK 640,000. The arithmetic mean permonth according to the tracer study was MK 83,681 in 2008. Eighty percent of all cases are

118 EDUCATION SECTOR ANALYSIS METHODOLOGICAL GUIDELINES - Volume 2
QUALITY CONTROL
A new set of analyses and activities have recently been initiated, falling under various names,including quality management, or quality assurance.
References to quality in the management of companies and organisations are abundant;the extension of the approach to higher education gains all its meaning when, just likecompanies, HLIs have to manage a significant pool of personnel, property and construction,sub-contracts for noncore services such as restaurants and transport and so on. In a relativelycompetitive local or regional context, HLIs also have to provide an attractive service to ensurefull enrolment. In companies, quality control activities rarely consider the actual output andare often limited to the establishment of rules and procedures whose respect is expected tobe a guarantee of the quality of the product or service. In education, quality controlapproaches must adapt to quite a different environment in which many HLIs, especially inFrancophone Africa, are under-financed, face little competition and whose configurationdiffers substantially as a result.
In this diagnosis of the sub-sector of higher education, the different quality control initiativesshould be mentioned, detailing their goals, procedures and noted results, considering thatsome of them are already present in the ongoing operations of the supervisory bodies ofvarious institutions (study committees, council of university life, board of directors, scientificcommittee and so on) and may, regardless of their managerial relevance, not be part of aspecific quality assurance strategy.
within the range of MK 30,000 to MK 150,000, with a median of MK 65,000. The mean incomeby study field (see Figure 8.9 below) suggests partly similar subject/occupational preferences,with a particularly high demand for lawyers and engineers. ICT and agriculture experts earn theleast. The high average income of the self-employed is an interesting finding, although basedon a very small number of cases that only point to the insignificance of self-employment forTVET graduates. The wage differences again demonstrate the superiority of qualified academicsin the labour market compared to HE dropouts.
Data, however, also shows marked income differences by gender. Male graduates earn onaverage 37 percent more than their female colleagues, which can partly (but not completely) beexplained by the fact that women are underrepresented in the better paid occupational fields.Available wage data also points to the good career promotion performance of academicallytrained people.
4.3

Sub-Sector Specific Analyses 119
HIGHER EDUCATIO
NCH
APTER
8
BOX 8.3The African and Malagasy Council for Higher Education
The African and Malagasy Council for Higher Education (CAMES) is a coordination committeefor the HE activities carried out in countries of Francophone Africa. It was created in 1972,replacing the Consultative Commission of Experts for the Reform of Higher Education in Africaand Madagascar, created in 1966 after independence. Today it has 16 member states.
The CAMES’ mission is:
• Promote and favour comprehension and solidarity between member states;
• Initiate permanent cultural and scientific cooperation among member states;
• Collect and share all university research: theses, statistics, examination results data, statisticalyearbooks, information on job applications and so on;
• Prepare convention proposals to member states on higher education and research, andcontribute to the promotion and enactment of agreements reached; and;
• Conceive and promote cooperation between partners to coordinate higher education andresearch systems, harmonise programmes and recruitment in HLIs, favour cooperationbetween institutions and exchange information.
CAMES is a think-tank for higher education and research reform for its member countries thatpromotes the quality of HE by directly managing a programme of accreditation of degrees andorganises competitions for PhD places in medicine, law and economic science.
This section should especially focus on the practices of institutions in terms of evaluation ofthe quality and relevance of their courses, in particular by considering the efforts in termsof graduate employability monitoring, contacts with alumni and so on. Likewise, adescription of the information system used by each institution, developed in response tonational statistics and for its own guidance, may constitute a valuable quality indicator.Among these activities, evaluation procedures involving personnel and studentrepresentatives merit particular attention.
The multiplication of courses, their diversification, the gradually increasing contribution ofthe private sector and the creation of qualifications that encourage student mobility havelead to an important need for information and its normalisation. The recognition of the roleof HE in growth and development by most of the international education conferences heldin recent years has systematically been accompanied by some insistence on the need thatHE be of quality and, especially, that it combine quality content with socioeconomicrelevancy. Indeed, various national and international organisations responsible for thecertification of degrees and training courses, like the African and Malagasy Council for

Higher Education (Conseil africain et malgache pour l’enseignement supérieur – CAMES –See Box 8.3) have been created to harmonise training courses and qualifications. Thisnormalisation, of course, targets contents and delivery modes more than it does graduates’performance in the workplace, but this last dimension is not excluded and HLIs will havethe opportunity to underline the good performance of their graduates where it exists.
The affiliation of HLIs to such certification authorities surely shows an institutional will togive their degrees and qualifications greater recognition, including in the eyes of nationalstudents. The gradual generalisation of Bachelor-Master-PhD higher education structuresand of the policy of breaking down courses into credits help to reinforce this tendency, themobility of students only being possible in a relatively transparent framework offeringminimum guarantees with respect to the quality and credibility of their graduates at homeand abroad. In the context of this diagnosis, available information on the accreditation andexternal recognition of courses and qualifications will be important to collect, as well as onall activities carried out to ensure the best possible guidance, welcome and follow-up ofstudents (information service, career advice, tutorials, social support to students in difficultyand so on). The multiplication of regional and continental normalisation authorities, stronglypromoted by intergovernmental unions, should lead to an improvement in the productionof indicators on the effectiveness of training, while at the same time facilitating the diagnosisof the sub-sector and offering possible benchmarks for comparison. It is hoped that thesedifferent data can also be harnessed in the context of analyses aiming to validate effectiveresults (mobility, employability and so on) and the relevance of the adopted norms.
Annex 8.3 of this chapter provides a semi-structured interview guide, similar to thatelaborated to collect data on the administrative and scientific bodies of HLIs, which may behelpful to collect the required information regarding quality.
120 EDUCATION SECTOR ANALYSIS METHODOLOGICAL GUIDELINES - Volume 2

Sub-Sector Specific Analyses 121
HIGHER EDUCATIO
NCH
APTER
8
NOTES
43 Data on students abroad can often be obtained by scholarship offices.
44 The recent evolution of enrolment by institution ownership often reflects new policies, especially in countries with astrong tradition of government higher education, common in Francophone countries, where financing difficulties havesometimes led to the growth of private sector provision. This phenomenon may be more marked still if considering thenumber of institutions rather than enrolment. The analysis of these developments, in particular in internationalperspective, should of course be performed taking care to mention national policy with respect to the opening of furtherhigher learning institutions.
45 It is important that in Chapter 2 on enrolment, precise information on the secondary to HE transition rate be included,to provide some analytical continuity with other education levels.
46 It is worth keeping in mind that HE enrolment is expected to double about every five years in Africa, with greaterexpansion still in many countries (UNESCO/CRESA, 2010).
47 For instance, the average number of students enroled for each 100 places in public African universities, on the basis ofresearch over the period, was 350 in Benin (2007), 134 in Morocco (late 1990s), 260 in Central African Republic (2006)and 220 in Cameroon (2006). See UNESCO/CRESA, 2010.
48 The temporary nature of recruitment is all the more prevalent in the vocational area, as the updating of knowledgehinges on a real and recent involvement in the considered economic activities.
49 See Annex 8.2 for a typical semi-structured interview guide with higher education human resource staff.
50 Annex Table A8.6 provides a model table for the distribution of permanent staff, by age and level of qualification. Thistype of table may be helpful to elaborate in the context of this chapter, to project teacher demand.
51 Many institutions are involved in a vicious cycle where their output of tertiary graduates is insufficient to supply the highlevel professors and researchers needed to provide HE services to an ever increasing number of students.
52 As ever in this type of approach, it is implicitly assumed that unfinished courses are without individual or collective benefit.Employability studies sometimes contradict this assumption, showing that students who have not graduated still farebetter in the work-place than their counterparts who did not study at all.
53 Open HLIs are those institutions that do not select their students (beyond requiring they pass the HE general entry exam,usually the end-of-secondary exam, or A-Levels). Selective admissions add further conditions (based on competitions,exam results, interviews). Conditional admissions have a direct effect (some candidates are refused a place) and anindirect effect (students that expect not to be accepted do not apply) on student characteristics.
54 All questions related to equity are dealt with in Chapter 6 that offers a selection of methodologies for its assessment.
55 Tables A8.3 and A8.4 of Annex 8.6 are models that can be used to present the different sources of HLI financing andtypes of recurrent spending.
56 Annex 8.4 presents a methodology to annualise investment costs.
57 Here the assumption is made that the restaurant service is common to various institutions. If an HLI has its own service,it should of course be excluded from the global computation and accounted for separately.
58 Annex 5.4 presents detailed information on the methodology and results of tracer studies.
59 The evaluation of research produced must of course consider variations between institutions, which is particularlyimportant in academic faculties and disciplines and less so in more professional institutions, whose teaching staff iscomposed of active professionals of the relevant sectors.
60 See Annex 5.2 for a detailed presentation of such surveys and the end of this guide for a related specimen questionnaire.
61 In addition to the analyses of contributions presented in Chapter 5.

122 EDUCATION SECTOR ANALYSIS METHODOLOGICAL GUIDELINES - Volume 2
© P
ÔLE
DE
DA
KA
R-U
NES
CO
/Rég
is L
’Hos
tis

Sub-Sector Specific Analyses 123
CHAPTER 9NON-FORMALEDUCATION AND LITERACY› Chapter Objective:Analyse the non-formal education and literacysubsector to enable its incorporation intoglobal education policies in the framework ofEducation for All and promote lifelong learning.
NO
N-FO
RMAL EDUCATIO
N AN
D LITERACYCH
APTER
9

124 EDUCATION SECTOR ANALYSIS METHODOLOGICAL GUIDELINES - Volume 2
1. DEFINITION OF NON-FORMAL EDUCATION
ISSUEHow is the non-formal education and literacy subsector to be defined in the national context? Howis the subsector organised? Who are the key players? How are non-formal and literacy programmesdesigned and implemented?
OBJECTIVES• Define, provide the framework for and describe the subsector and its links with the formal
education sector;• Present the key players, their programmes and the potential beneficiaries; and• Determine what it is appropriate to include in the education and training sector analysis.
METHODS• Compare national definitions for the subsector with those adopted by the international
community;• Adopt a historical approach to the description of providers and institutions and services
responsible for the organisation of the subsector; and• Present the delivery modes of different streams and courses.
SOURCESNational and historical documents from provider institutes and national authorities and ministries;specific surveys of players and beneficiaries.
2. NEEDS AND PARTICIPATION
ISSUEWho are the subsector’s potential beneficiaries (number and characteristics)? What are theenrolment figures for non-formal education programmes? Can internal efficiency be measured,and what information does the analysis provide for the management of the subsector? What isthe staff-to-learner ratio?
OBJECTIVES• Technically analyse non-formal education and literacy programmes as per other sub-sectors,
reviewing the target population, the effective beneficiaries, supervision rates and internalefficiency; and
• Provide basic statistical information to define the subsector.
METHODS• Evaluate needs on the basis of household surveys or census data to determine the number of
illiterate individuals;• Apply the methods explained in Chapter 2 for formal education to illustrate enrolment for the
different non-formal education streams, and measure internal efficiency and supervision rates(in terms of group size);
• Produce coverage rates where clear estimations of the potential demand to satisfy have beenmade; and
• Provide an appraisal of the statistical coverage of the sub-sector based on available data.
SOURCESDocuments published by the authorities responsible for the subsector and by training centers(statistical yearbooks).

Sub-Sector Specific Analyses 125
3. COST AND FINANCING
ISSUECan a financial balance sheet for the subsector be produced, that indicates the amounts, sourceand destination of financing? What is the cost of the training on offer and how is it broken down?In terms of cost, can the training offered be compared to formal education streams and othertypes of non-formal education, either at home or abroad?
OBJECTIVES• Consolidate the available information on global expenditure, and detail each type of spending,
as for formal education;• Construct a balance sheet that shows the different sources of financing and operations, to ensure
the analysis is coherent; and• Provide an appraisal of the existing statistical system covering costs and financing.
METHODS• Use the methods developed for the analysis of the costs and financing of formal education. Be
especially careful of omissions and duplications (thanks to the reconstituted balance sheet); and• Use a combination of macro and micro approaches for the breakdown of expenditure by type.
SOURCESThe budgets of financing institutions and training centers.
4. RESULTS AND QUALITY AND RELEVANCE INDICATORS
ISSUEWhat services provide non-formal education programmes? Is it feasible to consolidate informationregarding their quality, especially regarding the quality and sustainability of learning outcomesand the relevance of training (in response to beneficiaries’ and society’s expectations)?
OBJECTIVES• Rate the quality and relevance of the training offered (this is more important for non-formal
education than for formal education, given the non-standard nature of the former); and• Provide information of use to the management of the subsector, often based on subsidies to
training centers whose performance is variable.
METHODS• Measure the overall effectiveness of training, especially in literacy, on the basis of the impact on
the sustainable skills gained by beneficiaries and their social and health-related behaviours;• Review the quality and sustainability of learning outcomes on the basis of tests of learning
achievements; and• Appraise the relevance of training based on the opinions of beneficiaries and their entourages.
SOURCESHousehold surveys, specific literacy surveys and interviews with beneficiaries about theirexpectations and achievements.
NO
N-FO
RMAL EDUCATIO
N AN
D LITERACYCH
APTER
9

126 EDUCATION SECTOR ANALYSIS METHODOLOGICAL GUIDELINES - Volume 2
IntroductionA consolidated vision of education and training systems must cover non-formal education,especially literacy, which is generally its most important component. In developing countries,non-formal education offers a second chance to those who were unable to follow formaleducation when of the correct age. Given the shortcomings of formal education systems,many individuals may be in this situation. Adult illiteracy continues to be a structural issuein many developing countries, and represents a considerable risk to African countries’development strategies, as it continues to hinder development initiatives (contributing touncontrolled demography, poverty, weak productivity, waste and deterioration of naturalresources, bad governance and so on). Economic development and the related consolidationof formal education systems do not contribute to the disappearance of the non-formaleducation sector, as can be noted in developed countries where non-formal education isundergoing something of a rebirth in support of lifelong learning.
In most developing countries, and especially in Africa non-formal education (NFE) focusesmainly on the literacy of adults and out-of-school youth. This chapter often refers to thiscomponent of NFE, although many of the approaches used can be applied to other typesof NFE, which may be particularly common in some countries. The subsector as a wholevaries considerably in terms of importance from country to country (See Annex 9.3).
Broadly speaking, the analysis of the NFE subsector uses the same categories and tools asthose used in other chapters dealing with formal education as a whole: service delivery,financing and costs, relevance and results.
The subsector does, however, have some particularities that should be considered,particularly in terms of definitions and the sometimes unclear borders with formal education.NFE, and especially literacy, are usually poorly covered in terms of statistics, both in termsof service delivery and results. Obviously this limits the knowledge that can be gained ofthe subsector, but it also damages the confidence of potential investors, includinggovernments themselves.
In most developing countries, the needs are immense and activities do not appear to be atthe height of the challenge or in line with national and international policy commitments.Voluntary-type set-ups are used and goodwill is mobilised more than truly professionalorganisations, whereas the scale and sustainability of the challenge merit at least as muchprofessionalism in the management of NFE activities as for the formal education sector, ifnot more. Indeed, there is little investment in the activities themselves and less so still in theknowledge of pedagogical and management best practices that are likely to improve theefficiency of the subsector and thus reassure potential investors.

Sub-Sector Specific Analyses 127
NO
N-FO
RMAL EDUCATIO
N AN
D LITERACYCH
APTER
9
This situation relates to issues that are specific to the NFE sub-sector such as: the multiplicityof service delivery modes, types of training and goals, the weakness in the overallmanagement of the subsector that is often split in terms of responsibilities and so on.
A more systematic consideration of the different activities should thus enable both to betterknow and better integrate them into the overall management of the education sector toachieve broader human and economic development. The diversity of the subsector doesnot facilitate the definition of indicators that universally represent the main areas of analysisconsidered (i.e., service delivery, financing, results) and that can be used for internationalcomparisons and the definition of benchmarks for the organisation and management ofthe subsector. For instance, NFE unit costs can relate to vastly different course content,duration and learning quality. The significant variations in the most straightforward resultsindicators may, in fact, illustrate the difference in terms of the courses offered at least asmuch if not more than variations in terms of their service delivery modes, which may havedifferent levels of efficiency.
To be able to carry out international comparisons and update useful references for themanagement of the subsector, it is therefore necessary to use information that providessome context to the courses they describe in terms of goals, beneficiaries and duration, inaddition to the usual indicators. This is the main objective of this chapter. Thus referencewill often be made to a generally favourable situation in terms of statistical data, enablingthe direct, or at least indirect, computation of these different indicators. It is clear, however,that in many countries the collection of such data will be an exercise close in nature to astudy in its own right, that it will be necessary to carry out initially, and as quickly as possible,to systemise the production of basic information on the subsector.
Given the great variety of potential service delivery modes and beneficiary groups, theimpact and results of the different NFE activities are more important than in formaleducation, enabling a more direct appraisal of the interest in each of the programmes,potentially also considering their respective costs. Literacy programmes, despite theircomparatively lower teaching time, are often thought to provide results and benefits similarto those of formal education. In fact, the availability of indicators such as the share ofsustainably literate individuals and/or the share of individuals with a given set of acquiredskills may alone be sufficient, for a given beneficiary group, to deal with the relevance andefficiency of NFE activities and programmes.
If further efforts in terms of measuring results are needed in this specific area, it isundoubtably because the organisation of the subsector is often decentralised and sub-contracted. NFE rarely comprises a significant government sector managed by experienced

professionals, but more often is composed of a network of private or community providerswith weak support from the central government. The management of such networks(accreditation, subsidies and so on) and the identification and sharing of best practiceswould benefit greatly from a higher degree of professionalisation of managers and theimplementation of regular results evaluations.
In summary, the NFE subsector is characterised by three key dimensions: (i) greater financialconstraints; (ii) sub-par availability of human resources; and (iii) insufficient statistical visibility.The analysis of the subsector will explicitly deal with these three aspects in this chapter,through four sections:
(i) A descriptive analysis of non-formal education;
(ii) Needs in terms of non-formal education and literacy programmes, and participationin such programmes;
(iii) Costs and financing; and
(iv) Results and quality and relevance indicators.
128 EDUCATION SECTOR ANALYSIS METHODOLOGICAL GUIDELINES - Volume 2

Sub-Sector Specific Analyses 129
NO
N-FO
RMAL EDUCATIO
N AN
D LITERACYCH
APTER
9
The objective of this mainly descriptive first section is to define the subsector context andthe coverage of the subsector, which is more prone to national variations than formaleducation sub-sectors.. In this perspective, the chapter will aim to: (i) review the definitionof different NFE types, equating them to internationally recognised categories; (ii)understand institutional, administrative and financial links between players, providing aprecise mapping of the subsector; and (iii) describe the different programmes offered byeach provider in the context of their respective mandates. By way of a conclusion, this firstsection should propose and justify the selection of providers and programmes to be analysedin the following sections.
NATIONAL AND INTERNATIONAL DEFINITIONS OF FORMAL, NON-FORMAL AND INFORMALEDUCATION
Most definitions of the different forms of education and learning first and foremost includeformal education, which refers to the attendance of a classic, general and professionaleducation system, spanning preprimary to higher education, with clearly defined servicedelivery modes (i.e., standardised curricula, qualifications and so on). Formal education thusrefers to traditional education systems. Non-formal education is defined as any form oforganised and structured education outside the boundaries of the formal educationsystem.62 The use of the term informal education is limited to the systematic and cumulativelearning derived from ongoing activities such as daily tasks, the use of resources andinteraction with the environment, interaction with families or neighbours, work, business,reading, using the media and so on.
In developing countries, non-formal education is considered to include all education servicesthat aim to fulfill the education needs of population groups who do not benefit from theformal education system. Three main population groups are concerned: (i) children beforethe official primary entry age; (ii) out-of-school children of official and compulsory schoolage (typically those aged 6 to 14 years); and (iii) non-enrolled youth and adults aged 15years and above.
DEFINITION OF NON-FORMALEDUCATION
SECTION
1
1.1

• The first group is in a preparatory phase for a typical learning career. This phase includesearly childhood development services covering parental and preprimary education, dealtwith specifically in Chapter 7 of this guide.
• The second group includes out-of-school children in need of catch-up classes toreintegrate formal education and over-age children who are either too old to enroll inGrade 1 or who have repeated so many times that they are too old to pursue formaleducation. These children are targeted by second-chance school and street school typeprogrammes that provide them with a basic education that may enable them to resumesome kind of general or vocational formal education, or improve their employmentstatus.
• Youth and adults aged 15 years and above but not enrolled in the formal educationsystem are targeted by adult education programmes. These may be divided into twogroups: (i) literacy and basic-education equivalent programmes targeting adults whoseknowledge and skills do not meet basic education standards; and (ii) improvement andskills upgrading programmes for adults who have knowledge and skills equivalent tothose acquired through basic education, often known as ongoing training and lifelonglearning programmes.
In developing countries, in Africa in particular, where basic education is not available to alland where the vocational training of adults is still embryonic, non-formal education isgenerally limited to second-chance education opportunities offered to youth and youngadults with little or no schooling.
These reflections on the categories and definitions of different types of education are notdriven by semantics. On the contrary, they have a real policy impact. Where the NFEsubsector is recovery-oriented, which is most common in African countries, the shape,financing and beneficiaries of non-formal education are directly determined in reference toformal education. Indeed, each non-formal education activity or programme constitutes analternative answer to the shortcomings of formal education. Although adult literacyprogrammes are a palliative to the past failings of the formal education sector, NFEprogrammes for young adults or out-of-school children reflect current limitations. Thequestion raised is therefore that of the tradeoff between investing in an NFE system to caterfor those unable to attend or remain in school and further investing in the formal educationsystem to improve access, retention and quality to avoid the recurrence of such situationsin the future.
This section will therefore aim to define the objectives and potential beneficiary groups ofnon-formal education in the national context of the country being studied.
130 EDUCATION SECTOR ANALYSIS METHODOLOGICAL GUIDELINES - Volume 2

Sub-Sector Specific Analyses 131
NO
N-FO
RMAL EDUCATIO
N AN
D LITERACYCH
APTER
9
THE SUPPLY AND STRUCTURE OF NFE
The objective of this subsection is to describe NFE as precisely as possible to facilitate theunderstanding of how it relates to the education and training sector overall. It will focus onelaborating a general map of the subsector and cover the main types of programmes bysource of financing, ownership (public/private), goals and target beneficiaries, whilehighlighting bridges to formal education streams, be they general, technical or vocational.The overall picture provided should also indicate, where relevant to the common nationalservice delivery modes, existing control and governance mechanisms, at the central ordecentralised level.
The mapping of NFE should describe the general structure of the subsector by presentingthe main activities by group: second-chance and street children types of non-formalteaching for out-of-school children; adult literacy, including basic literacy and functionalliteracy for job seekers or workers; specific programmes (health, family planning, women’srights and so on) for targeted groups (young girls, rural women and so on). The exerciseshould highlight the status of different players and their institutional and administrativerelationships and facilitate an understanding of the national subsector’s organisationalmodel. The subsector may, for instance, include state-like institutions with governmentemployees under a central or decentralised public administration responsible forpedagogical or financial aspects, or at the other extreme, completely private organisationsboth in terms of their staff and coordination and regulatory bodies. The evolution of thesubsector has generally led to mixed models where public and private institutions mayfunction in parallel, or under an integrating institutional framework. The following examplepresents the Moroccan configuration of the NFE subsector in 2007, where a strategy ofdelegation is part of the national literacy framework and in which central and regionaladministrative authorities are responsible for the programmes and finance activities basedon the number of enrolled individuals. Private providers (NGOs) supply a service akin tothat usually supplied by traditional public providers (the ministry of education, the ministryof Islamic affairs and so on).63
1.2

132 EDUCATION SECTOR ANALYSIS METHODOLOGICAL GUIDELINES - Volume 2
EXAMPLE 9.1(NFE Mapping): Map of the Non-formal Education Subsector, Morocco, 2007Source: Adapted and translated from Cerbelle, 2010.
FIGURE 9.1 - NFE and Literacy Organisational Structure, Morocco, 2007
Secretary of State for Literacy and
Non-formal Education(SECAENF)
Department for Non-formal Education
(DENF)
Second-ChanceSchools
School ReintegrationProgramme (9-11 year-olds)
Employment Programme (12-16 year-olds)
DropoutPreventionProgramme
School-level support
School-levelmonitoring units
Social Inclusion Programme(Street children)
Programme for Rural Children
Department for the Reduction of
Illiteracy(DLCA)
General Programme(MEN)
NGOs
Companies
Public providers: Ministries of agriculture and rural development, Islamic affairs, youth,
energy and mining, the armed
65.7%
34.3%
FindingsIn 2007 the non-formal subsector was organised under the national responsibility of the Secretaryof State for Literacy and Non-formal Education (SECAENF), which has a liaison officer in each ofthe regional education and training administrative offices. The State Secretariat includes twodepartments, respectively in charge of NFE and adult literacy programmes (See Figure 9.1).
Non-formal education includes two main types of activity: second-chance education, which offersvarious age-appropriate programmes to out-of-school youth and a dropout prevention programmethat aims to avoid increasing out-of-school numbers.
Literacy is organised around a public national programme (with guides, textbooks and so on),according to a delegated approach. Traditional providers, the Ministry of Education (MEN), whichis responsible for the general programme and other public providers today account for fewerlearners than the NGOs. These generally operate according to a contract with the DLCA. Evenwhen no contract is signed, NGOs can nevertheless benefit from SECAENF textbooks.

Sub-Sector Specific Analyses 133
In addition, it is helpful to provide information on the administrative resources available tothe subsector. It is especially recommended that the number and profile of the individualsin charge of the subsector be established for each of the bodies mentioned in the mappingexercise. Such information would thus cover the main administrative body (where it exists),programme coordination entities and local authorities. The number of staff can be relatedto the number of providers (or beneficiaries), and compared with similar ratios for the formaleducation subsector (the number of administrative staff related to the number of schoolsor pupils, for instance).
Furthermore, basic statistics for the subsector are often lacking, especially in countries wherethe government has greatly delegated the delivery of programmes to NGOs. As the qualityof administration depends first and foremost on the existence of operational statisticalservices that provide the information required for the modern management of programmesand providers, it is also appropriate to evaluate (at least qualitatively) the capacities toproduce, mobilise and publish data for the subsector and produce and use specific analysisand research. For this analysis, a selection of questions to be put to a sample ofadministrative officers and institution managers are proposed in Annex 9.6.
EXAMPLE 9.2(Organisation of NFE):The Delegation of Responsibilities Approach, Burkina Faso, 2010Source: Adapted and translated from the national FONAENF Burkina Faso document.
NO
N-FO
RMAL EDUCATIO
N AN
D LITERACYCH
APTER
9
The NFE subsector in Burkina Faso is especially marked by the adoption of a delegation ofresponsibilities approach to boost literacy. Conscious of the fact that sustainable humandevelopment cannot be achieved if the majority of the population is illiterate, the Burkinabestate has sought appropriate literacy approaches and strategies to fight illiteracy.
Given the dynamism of civil society, the Burkinabe government decided to involve it in themanagement of literacy activities through a new delegated approach, adopted in 1999 duringthe first literacy forum. The strategy entered its implementation phase during the 2002-03campaign with the creation of the Fund for Literacy and Non-formal Education (FONAENF).
FindingsDelegation is defined as a strategy providing the government and partners (NGOs, charities,technical and financial partners and so on) with a tool for the distribution of roles in the executionof non-formal education and literacy programmes. The institutional set-up consists of enablingeach partner to play their corresponding role according to their comparative advantage. Theeffective implementation of the delegation approach has been facilitated by the creation of adedicated fund, the FONAENF.
Thus, the government is responsible for guidance missions, the monitoring, evaluation andsupervision of literacy activities and financial contributions. Charities and NGOs are responsiblefor the implementation of literacy activities in the field; these players are called literacy operators.Finally, the FONAENF, with the support of development partners and the government, is tomobilise the resources required for the implementation of literacy activities. The delegatedapproach has enabled the achievement of considerable results in terms of literacy and non-

formal education, with literacy rates improving from about 22 percent in 2002 to 28.7 percentin 2006.
Since the third literacy forum was held in 2009, focusing on the acceleration of the growth ofliteracy, the approach is referred to as the consolidated delegation approach, enabling theinclusion of new players such as local authorities, emerging actors and the private sector.
THE PROGRAMMES AND ACTIVITIES
Complementing the previous section, this part aims to describe the programmes, theirobjectives, access conditions and contents in detail. By way of a conclusion to this and theprevious part, a presentation of the programmes retained for further analysis (where not allare to be dealt with) may be offered, explaining the basis for the selection.
1.3.1 OBJECTIVES AND CERTIFICATION
The different programmes and activities can be presented in detail thanks to various tablesand variables. The objective is to produce an inventory of all the NFE and literacyprogrammes offered, regardless of their provider. For each institution, indications should beprovided as to whether they belong to the public or private sector (including NGOs) and oftheir delivery mode (be it in their own name or as the operator of another institution). Thislast characteristic is likely to vary from one programme to another. The description of theprogrammes should highlight their objective, target beneficiaries (including, where possible,a projection of enrolment), contents (what are the learning objectives?), total work-load(and its distribution by class where appropriate) and the language of instruction. Thecertification information should clarify whether the training will lead to a participationcertificate or a diploma. In the latter case, the type of examination should be explainedbriefly, as this will be further detailed for the main programmes in the section on themeasurement of the quality of learning. The following example, drawn from an analysis ofthe subsector in Burkina Faso illustrates the main programme information to collect, basedon the case of the main institutional player. In practice, this section should aim to cover asmany active stakeholders as possible.
134 EDUCATION SECTOR ANALYSIS METHODOLOGICAL GUIDELINES - Volume 2
1.3

Sub-Sector Specific Analyses 135
EXAMPLE 9.3(NFE Programmes): Permanent Functional Literacy Centers and SpecificTechnical Training, Burkina Faso, 2010Source: Adapted and translated from the national FONAENF Burkina Faso document
Literacy practices in Burkina Faso have mainly focused on a basic literacy cycle during a firstcampaign, followed by a complementary basic training cycle during a second campaign, afterwhich a learner is declared literate. To reinforce the functional nature of literacy, learners areadvised to follow a further technical and specific training cycle in a chosen activity area.
FindingsThe idea of experimenting with new curricula for the permanent functional literacy centers wasfirst discussed during the first NFE forum in 1999, which conducted a critical evaluation of theexisting curricula and their weaknesses. This analysis noted the following shortcomings, amongothers:
• Loss of momentum of literacy programmes that lacked appeal with learners, carrying thedirect consequence of high system dropout; and
• The lack of performance of the technical and specific training courses, despite them beingkey opportunities to apply the skills acquired.
The experimentation process was entrusted to the national department for NFE. It was initiatedin 2004 and continues to this day. The new curricula are organised around two literacy cycles:
• Cycle 1 (660 hours) - Basic Literacy Training: Includes two levels, Level 1 (Basic Literacy) andLevel 2 (Complementary Basic Training). Learners are declared literate at the end of this cycle;and
• Cycle 2 is an optional cycle with three streams: Level 1 (scientific and technical culture/600hours), Level 2 (fundamental and functional French/1,500 hours), and Level 3 (technical andspecific training/1-5 weeks).
The ongoing literacy training approach (Cycle 1 plus Cycle 2, including at least one technical andspecific training course) approved by all during the NFE forum, is yet to be fully implementedand generalised. Indeed, the degree of attrition between the first level (basic literacy) and thesecond (complementary basic training) is cause for concern, especially considering that the latteralone provides access to reemployment opportunities.
In addition, there are few courses offered given the under-financing of technical and specifictraining courses, and most of them do not satisfy a real demand on behalf of learners or cannotbe implemented due to the lack of a market or low relevance.
Furthermore, technical and specific training courses are randomly organised, according to thewhim of each provider, without structure. Such courses are not governed by an officialprogramme and curriculum, and as such have only been subject to approximate monitoring andevaluation on behalf of the state funding bodies. However, the multi-year TVET action plan doescontemplate coded modular short courses for neo-literates. It would therefore be appropriateto define benchmarks by craft, on the basis of the Vocational Qualification Certificate.
NO
N-FO
RMAL EDUCATIO
N AN
D LITERACYCH
APTER
9

To summarise the information on all the available programmes, a table such as Table 9.1may be used.
1.3.2 ACCESS TO PROGRAMMES - CONDITIONS AND INCENTIVES
Building on the previous discussion, it is interesting to present the selection procedure ofparticipants as well as the incentives used to stimulate demand for the programmes andretention within them. The importance of potential demand does not ensure the systematicenrolment of the target group in the activities designed for them. This is particularly true innon-formal education courses aimed at children who live in nontraditional social structuresor with working adults, who may not always perceive the value of the approach, or forwhom the economic, psychological or social cost may be too high. Incentives are oftencreated to stimulate demand, either in terms of course content (reading religious texts,initiation to family and social law and so on), or in the shape of social or financial advantages(free medical care, access to microcredit, and so on).
Beyond enrolment, it is often retention that constitutes the main problem for non-formaleducation programmes, and especially for literacy activities. The measurement and potentialcauses of this phenomenon will be dealt with later. At this stage, it is worthwhile notingthat the incentives are sometimes enhanced to stimulate access and retention, and it is
136 EDUCATION SECTOR ANALYSIS METHODOLOGICAL GUIDELINES - Volume 2
Finally, it is to be noted that even when they do respond to demand, courses enabling learnersto be involved in specific projects do not provide the expected results, due to lack of funding.Indeed, post-technical and specific training courses are completely marginal, subject to thegoodwill of partners, and are generally not recognised by the decentralised financial system,microcredit, and even less so by banks. Here again, it would be appropriate to establish a linkwith national funds if bridges are established for young neo-literates.
Non-formal Education
Literacy
Institution/Provider
Status DeliveryMode
SummaryObjective
TargetGroup
TrainingContents
Total Nb.of Hours
Language Type ofCertification
Institution/Provider
Status DeliveryMode
SummaryObjective
TargetGroup
TrainingContents
Total Nb.of Hours
Language Type ofCertification
Name of Programme 1
Name of Programme 2
Name of Programme 1
Name of Programme 2
TABLE 9.1 - Summary of NFE Programmes (Model Table)
Source: Authors.

Sub-Sector Specific Analyses 137
NO
N-FO
RMAL EDUCATIO
N AN
D LITERACYCH
APTER
9
therefore interesting to evaluate their effectiveness in terms of these two aspects ofindividual learning careers. A summary table may be used to present the conditions of accessto the programmes and the measures adopted to encourage enrolment and retention inthe activities on offer.
1.3.3 ACTIVITIES AND PROGRAMME CONTENT
This section aims to describe the pedagogical approaches of the different types of NFEactivity, including their structure and content. Common pedagogical practices are thenexamined as well as the type and nature of evaluations performed. A set of typical questionsare proposed below, which should enable documentation of each of the mentioned points,thanks to a direct survey of training institute directors and programme managers.
• What is the overall length of the training? How is time spent each month/week?
• Is the course part of a broader pedagogical approach (prior training required, furthertraining available and so on)?
• Does the course comply with a national programme, or is it specific to your institution?
• Is there an inspection procedure to validate the course content and delivery, at thenational or local level?
Open to womenaged 15-50 years.Option to repeatthe programme.
Programme 1
Programme 2
Programme 3
Programme 4
- Two 1 year cycles
- Three 2 hour sessions per week
Free medicalcheck at thebeginning andend of the cycle
Transport collectionpoint
- Attendance certificate- Follow-up with consolidation programmes
Men and womenaged 18 yearsor above.
One 1 year cycle None None - Attendance certificate- Access to vocational training programmes
School-aged children - One 2 year cycle- Two days per week
Monthly stipend Transport expensescovered
- Access to vocational training programmes- Access to formal education
Rural womenunder 40 years.
- One 1 year cycle- One day per week- One day for production training
Supply of trainingmaterials and oil
Religious education None
Eligibility Duration Incentives Other Benefits Outlook
TABLE 9.2 - Access Conditions to NFE Programmes and Incentives (Model Table and Illustrative Data)
Source: Authors.

• Are programme beneficiaries provided with textbooks?
• Are programme instructors provided with guide books?
• What is the nature of the main programme content:• Mainly school-type, disciplinary?• Mainly context-specific?
• How are sessions generally organised (place, type of facility, size and composition oflearner groups and so on)?
• What pedagogical approach is primarily used (general school-type pedagogicalapproach, adapted approaches for specific target groups and so on)?
• Are learning achievements evaluated? How? How often?
• Is a certificate provided to completers? Of what type? Does it consider the continuousassessment of learning?
The descriptive information provided by this section will be useful for the later comparisonof enrolment, retention and results of different training modes.
138 EDUCATION SECTOR ANALYSIS METHODOLOGICAL GUIDELINES - Volume 2

Sub-Sector Specific Analyses 139
NO
N-FO
RMAL EDUCATIO
N AN
D LITERACYCH
APTER
9
In this section the analysis should aim to estimate the needs of the population groupstargeted by non-formal education, as well as the extent to which each programme respondsto such needs, at least in quantitative terms.
ESTIMATE OF THE POTENTIAL DEMAND FOR NON-FORMAL EDUCATION
Estimating the potential demand for non-formal education (not including early childhooddevelopment activities) often amounts to estimating the size of the illiterate population.This includes school-aged children who have never attended school or dropped out early,and illiterate adults aged 15 years and above. The exact definition of these groups will varyaccording to the mandate given to the institutions responsible for NFE. The developmentand the relative precision of school statistics helps to account for the former, but informationon the latter (the level of literacy of out-of-school individuals) must be obtained from othersources. Exhaustive surveys such as censuses are often based on participants’ responses andself assessment of their level of literacy. In other sample surveys such as some householdsurveys (and specific, although rare, literacy surveys), the investigator assesses individuals’level of literacy on the basis of a reading and comprehension exercise (direct assessment).The first type of survey (self-assessment) tends to overestimate the literacy rate (See Annex9.9 for further information on each approach).
The following example illustrates how to present the demand for literacy programmes,comparing very different types of information, based on various household surveys,individuals’ own declarations and evaluations.
NEEDS AND PARTICIPATIONSECTION
2
2.1

140 EDUCATION SECTOR ANALYSIS METHODOLOGICAL GUIDELINES - Volume 2
EXAMPLE 9.4
(Demand for NFE – Estimate of the Illiterate Population): Estimates of the Illiterate Population According to Different Surveys, Sao Tomé et Principe, 2001-10Source: Adapted and translated from the Sao Tomé and Principe CSR, 2012.
In Sao Tomé and Principe, five household surveys were carried out between 2001 and 2010,each estimating the literacy rate of the population aged 15 years and above. Figure 9.2 presentsthe results obtained by each survey, differentiating between those based on participants’responses and those based on a direct evaluation.
FindingsThe three household surveys simply asked respondents if they knew how to read and write,estimating the literacy rate of individuals aged 15 years and above at 82.9 percent in 2001, 84.4percent in 2005 and 87.7 percent in 2010. However, when considering the surveys that actuallytested respondents, the rate is lower: the 2006 MICS survey found the literacy rate for the agegroup to be 69.9 percent and the 2009 DHS survey 72.2 percent. There is thus a difference ofabout 15 percentage points between the rates estimated by each type of survey, for comparableyears (between the 2005 CWIQ and the 2006 MICS, and between the 2009 DHS and the 2010IOF survey).
100%
90%
80%
70%
60%
50%
40%
30%
20%
10%
0%MICS2001
CWIQ2005
MICS2006
DHS2009
IOF2010
Respondents indicate thatthey know how to read andwrite in responseto a direct question
Surveyors estimatethat participants are literatebased on their performancein a reading text.
FIGURE 9.2 - Literacy Rate (15 Years and Above),by Survey and Type of Survey, Sao Tome and Principe, 2001-10
65.7%
34.3%
Beyond the estimate of the numerical magnitude of potential demand, it is helpful to studyits structure by age group, gender and geographic location. This information will of coursebe very helpful to target beneficiaries and intervention areas, and determine the trade-offsto be made.
Example 9.5 below, based on an analysis of the Malagasy situation, presents an estimationof the number of illiterate individuals, as well as their distribution by age, gender and areaof residence (urban/rural).

EXAMPLE 9.5
(Demand for NFE – Characteristics of the Illiterate Population):Analysis of the Illiterate Population, Madagascar, 2005Source: Adapted and translated from Analyse des besoins en alphabétisation, a presentation of the resultsof the illiteracy survey in Madagascar, ONG Education Network, 2010.
Sub-Sector Specific Analyses 141
NO
N-FO
RMAL EDUCATIO
N AN
D LITERACYCH
APTER
9
In the 2005 permanent household survey (PHS), three variables enable the identification of basicliteracy skills: (i) knowing how to read; (ii) knowing how to write; and (iii) knowing how to count.All three are based on participants’ responses. The results of the analysis of the variables for the6 to 14 years, 15 to 45 years and 46 years and above age groups is provided in Table 9.3.
FindingsThe results show, among other things, that of the 10.2 million individuals aged 15 years andabove in 2005:
(i) 73.0 percent declare that they know how to read, write and count;
(ii) 15.9 percent cannot read, write or count; and
(iii) 9.8 percent declare that they know how to count, but cannot read or write.
With respect to these three basic literacy skills, it can be derived that 27 (=100-73) percent ofthe Malagasy population (about 2.75 million) aged 15 years and above in 2005 is considered tolack some form of basic literacy.
Table 9.4 shows that with respect to the characteristics of the group: (i) The illiterate share of the population varies little by age group;
(ii) The share of illiterate women increases with age, unlike that of men. Thus, the literacygap between men and women increases with age, from 3.4 percentage points for the 15to 24 years age group to 7.7 percentage points for the 35 to 45 years age group. Innumbers, of all individuals aged 15 to 45 years, 1.12 million are women and 0.85 millionare men; and
Can Read Cannot Read
TotalCan
CountCannotCount
CannotCount
CannotCount
CannotCount
Can Count
Can Count
Can Count
Can Write Cannot Write Cannot WriteCan Write
3,223,671
63.9
5,934,016
75.1
1,499,314
65.7
7,433,330
73.0
6-14 Years
% of Total
15-45 Years
% of Total
46+ Years
% of Total
15+ Years
% of Total
69,695
1.4
25,730
0.3
7,253
0.3
32,983
0.3
36,361
0.7
46,131
0.6
19,080
0.8
65,211
0.6
45,296
0.9
13,970
0.2
11,045
0.5
25,015
0.2
13,179
0.3
9,871
0.1
4,667
0.2
14,538
0.1
3,169
0.1
3,673
0.0
2,208
0.1
5,881
0.1
204,395
4.1
735,030
9.3
258,409
11.3
993,439
9.8
1,450,047
28.7
1,135,813
14.4
478,561
21.0
1,614,374
15.9
5 045 813
100.0
7 904 234
100.0
2 280 537
100.0
10 184 771
100.0
TABLE 9.3 - Number and Share of Individuals Knowing How to Read, Write and Count,by Age Group, Madagascar, 2005

142 EDUCATION SECTOR ANALYSIS METHODOLOGICAL GUIDELINES - Volume 2
(iii) The share of illiterate individuals in rural areas is about 1.8 times higher than in urbanareas.
Men Men MenWomen Women WomenBy Gender
Share (in %)
Number
23.4
379,591
26.8
465,205
23.2
266,037
27.2
360,083
20.1
203,317
27.8
295,985
15 - 24 yearsBy age-group 25 - 34 years 35 - 45 years
Share (in %)
Number
25.2
844,796
25.3
626,120
24.1
499,302
Rural Rural RuralUrban Urban Urban
28.3
723,469
15.1
121,327
28.1
534,805
16.0
91,315
26.9
426,883
14.8
72,419
TABLE 9.4 - Share/Number of Illiterate Individuals, by Age Group, Gender and Area of Residence,Madagascar, 2005
By Area of Residence
Share (in %)
Number
Stock and Flow Needs
In addition to the estimates of the number of illiterate adults and youth, it may be interestingto differentiate between stock needs and flow needs. Indeed, a share of the potentialbeneficiaries of NFE programmes may reflect a need that can disappear in the short tomedium term, whereas others reflect a long-term requirement. For instance, it is commonin postconflict countries that a large proportion of school-aged children never attendedschool or had to drop out. At the end of the conflict, these children are therefore notenrolled and are often too old to follow traditional schooling, whereas younger children aremore easily enrolled at the normal age. The need for NFE for this age group is thus the stockof over-age children, which will not be renewed; their younger peers will attend school.Less extreme cases are found in most countries where primary retention, although improvingfast, is weak. There is therefore a decreasing stock of children who have dropped out ofschool early. On the other hand, the phenomenon of adults who have received an educationof relatively low quality and relapse to illiteracy after some years tends to be a long-termsituation, given the slow pace of quality improvement. In this instance there is a long-term,although decreasing, flow of new illiterate individuals in need of NFE.
The distinction between these two groups may be important inasmuch as it providesguidance on the need for the development of new programmes. More complex and costlysolutions are usually sought for flow needs rather than for stock needs, which may disappearafter some years.

Sub-Sector Specific Analyses 143
NO
N-FO
RMAL EDUCATIO
N AN
D LITERACYCH
APTER
9
ENROLMENT, LEARNING CAREERS AND INTERNAL EFFICIENCY
The analysis of NFE, as for other cycles of the education system, involves a detailed andcomparative review of the number of beneficiaries and their learning careers. The methodsused here are therefore those described in Chapter 2, to describe access, retention,completion, and in summary, the internal efficiency of NFE programmes.
Reflecting the earlier discussion on the difficulty of effectively determining the demand forNFE, care must be taken with the use of coverage indicators (enrolment, potentialenrolment) that will not have the same relevance as it does for formal education. On theother hand, it is nevertheless helpful to compare the numbers enrolled (consolidated ifvarious comparable programmes are offered) with the number of potential beneficiaries toappraise the quantitative and qualitative relevance of the programmes offered. This amountsto a gap analysis between potential and effective enrolment, possibly distinguishingbetween stock and flow needs. Likewise, the average characteristics of beneficiaries can becompared (age, gender and area of residence) to those of the target group. According tothe complexity of the subsector in the country context, it may be helpful to separate non-formal and literacy activities in the tables presented.
If the data is unreliable due to the irregularity of the programmes or weak data collectioncapacities, the team responsible for the analysis should take care to compute averages forthe available data over the most recent years to reduce the impact of the low quality of thedata on the appraisal. The following example illustrates the type of tables and analysis thatcan be developed for all NFE providers, although it is based on one Burkinabe operator. Inthe absence of, or in complement to statistics for each of the players, household surveysmay also provide items of information on the numbers of individuals enrolled in NFEprogrammes. It may also be feasible to carry out specific surveys of programme beneficiariesto compile a profile of service users (See Annex 9.2 for a model questionnaire used inMorocco).
2.2

144 EDUCATION SECTOR ANALYSIS METHODOLOGICAL GUIDELINES - Volume 2
The comparison of the number of beneficiaries that reach the end of a cycle (and receive acertificate when they have sat for final tests or exams) to the number of enrolled learnersprovides a direct measure of the internal efficiency of the programme.64
Review of the characteristics of the learners enables a direct appraisal of the capacity ofeach programme (and of all of them jointly) to reach their target groups. The indicators ofinternal efficiency (achievement and success rates) can be computed for different groupsto analyse the issue of success, as per the last section of this chapter.
In the context of non-formal education, obtaining such data is not always straightforwardand involves compiling information from diverse programme operators. This may befacilitated where a steering body exists (administration, federation and so on). Someparameters may be estimated through surveys of a sample of operators, covering
EXAMPLE 9.6
(NFE Participation): Literacy Learner Statistics, by Gender, Burkina Faso, 1995-2008Source: Adapted and translated from L’alphabétisation et l’éducation non formelle en Afrique - Burkina Faso: Approche de Tin Tua en AENF: l’éducation de base communautaire. Organisation internationale de la Francophonie, 2009.
Findings• Women represent 55.2 percent (calculated as per Table 9.5) of enrolment since 2000;
• Despite all constraints, the rate of attrition (dropout and failure) tends to drop over time, bothfor women and men;
• Trends in terms of participation show that women are more assiduous than men. The dropoutrate (calculated as 100% - Tested) was 21.5 percent overall in 1995-96 (23.0 percent for menand 19.1 percent for women) and 4.8 percent in 2007-08 (6.1 percent for men and 3.9 percentfor women);
• Learning trends show that despite the obstacles, the pass rates of both men and women havetended to increase. The pass rate (% passed) shows that skills for both women and men havebeen equivalent since 2006-07, whereas in 2000-01 only 61.5 percent of women passed(versus 69.8 percent of men); and
• The growth in women’s enrolment has been accompanied by an improvement in theirperformance.
13,754
15,517
17,062
12,064
17,668
8,507
16,322
21,607
15,354
23,532
1995-1996
2000-2001
2005-2006
2006-2007
2007-2008
Enrolled Tested Passed % Tested(Tested/Enrolled)
% Passed(Passed/Tested)
M F T M F T M M MF F FT T T
22,261
31,839
38,669
27,418
41,200
10,593
13,971
14,691
10,705
16,595
6,886
14,978
19,972
14,527
22,617
17,479
28,949
34,663
25,232
39,212
8,122
9,748
13,034
9,821
15,946
4,535
9,204
17,363
13,364
21,680
12,657
18,952
30,397
23,185
37,626
77.0
90.0
86.1
88.7
93.9
80.9
91.8
92.4
94.6
96.1
78.5
90.9
89.6
92.0
95.2
76.7
69.8
88.7
91.7
96.1
65.9
61.5
86.9
92.0
95.9
72.4
65.5
87.7
91.9
96.0
TABLE 9.5 - Number of Enrolment and Access to Literacy Programmes, Burkina Faso, 1995-2008

Sub-Sector Specific Analyses 145
NO
N-FO
RMAL EDUCATIO
N AN
D LITERACYCH
APTER
9
BOX 9.1Non-formal Education Management Information System (NFE-MIS)
The Non-formal Education Management Information System (NFE-MIS) is a system specificallydesigned for the management of information on non-formal education that collects, saves,processes, analyses and disseminates data and information on NFE for planning and managementpurposes. It includes the following components: a conceptual framework and methodologies toensure the census and follow-up of NFE, tool prototypes for data collection, a computeriseddatabase and a dissemination strategy that facilitates the circulation of information to and frombetween NFE stakeholders. The census here covers the location and identification of agenciesimplementing NFE activities, ongoing NFE programmes offered in a given area, the educatorsoperating in a given area (including their specialisations) as well as learners. As a result, itproduces a list, or a map of the items mentioned above.
The conceptual framework of the NFE-MIS includes four categories:
- NFE activity types- NFE operator types- NFE target group types- Target age group types
At the national level, the NFE-MIS aims at providing policy-makers and planners with reliable,relevant and timely data to allow for informed decision making, better planning and delivery ofNFE, as well as for monitoring and evaluation of NFE development. Thus, the objective is toimprove the co-ordination of existing NFE programmes between NFE providers and managers.The NFE-MIS also provides baseline information about learners that is useful for studies on theway their acquired knowledge and skills are used, and on the impact they have on their qualityof life.
Source: NFE-MIS Handbook – Developing a Sub-National Non-Formal Education Management Information System, UNLD-LIFE and UNESCO.
completion and success rates and the average characteristics of participants. However, toreach an informed management of the subsector, it is key that every effort be made toimplement a sustainable NFE information system (See Box 9.1).

STAFFING/SUPERVISION
Staff-student ratios are as much an issue in NFE as they are for any education cycle, andpossibly a more acute and complex one still. Indeed, there are generally no benchmarks forproviders (like those in the formal education sector), and the level of professionalism ofNFE’s managers is often modest.
2.3.1 PEDAGOGICAL SUPERVISION
In formal education streams, because activities are normalised to some degree, the level ofpedagogical supervision can be described by the pupil-teacher ratio or average class size. Innon-formal education, where homogeneity of programmes and target groups is muchlower, a learner-trainer type ratio is less appropriate. Indeed, it is possible that an importantnumber of trainers each do a limited number of hours of teaching. For this reason, in NFEit is preferable to refer to the average size of groups (and/or estimates of the full-timeequivalent).
A distinguishing feature of the quality of pedagogical supervision in NFE is the wide varietyof points of access for teachers of non-formal or literacy programmes (basic apprenticeships,vocational courses, social or religious training and so on) leading to an equally variedselection of specialties among teachers. However, one of the most striking differencesamong NFE programmes (and between them and formal programmes) relates to whetherteaching/training is the individual’s main job or an activity on the side. In the former, thenon-formal character of institutes is accompanied by real professionalism among theteachers (in terms of recruitment, training, career prospects and so on). In the latter theactivities may be temporary or sporadic, and the professional commitment of teachers willnecessarily be more limited.
To approach these elements that, despite their highly qualitative dimension, provide a fairlyprecise image of the subsector, the description of the profiles of trainers should not belimited to traditional variables (initial training, vocational training). Additional, finerdimensions should be integrated, such as the number of hours of work performed in a year,the level of yearly remuneration (referenced to the minimum wage or the primary schoolteacher’s starting salary), or whether trainers currently have another job. The followingexample, from Mongolia, presents some such information illustrating how the non-formaleducation subsector’s teaching staff can be described. In addition to the number of trainers,the example deals with their training, remuneration and job stability.
2.3
146 EDUCATION SECTOR ANALYSIS METHODOLOGICAL GUIDELINES - Volume 2

Sub-Sector Specific Analyses 147
EXAMPLE 9.7
(Analysis of NFE training staff): NFE Personnel Characteristics, Mongolia, 2008Source: Adapted from Non-formal education sector analysis, National center for Non-Formal and DistanceEducation, Mongolia, 2009.
This example illustrates a possible approach to the analysis of the characteristics of teaching staffin NFE programmes in Mongolia, including their numbers, type of job, qualification level,employment status and salary.
600
500
400
300
200
100
0
375
56 78
358
565
349
492458
1997 2000 2004 2008
NFE Centers
Teachers
FIGURE 9.3 - Number of NFE Centers and Teachers, Mongolia, 1997-2008
65.7%
34.3%
FindingsAs of 2008, 458 teachers/facilitators worked in Soum and district NFE Enlightenment Centers(Figure 9.3). More detailed data shows that, of these, 220 are full-time teachers (62.5 percent)and the rest are part-time. The part-time teachers include those working in formal schools inaddition to social workers. Furthermore, 130 NFE teachers/facilitators (28.4 percent) work in the10 independent NFE Enlightenment Centers. The other centers have only one teacher/facilitatoreach. These numbers indicate an insufficiency of NFE activities in the community. Thoughindependent NFE Enlightenment centers have difficultly providing training for adults with theircurrent capacity, courses for children and youth are being offered efficiently and sustainably. Inorder to improve the quality of NFE services it is necessary to increase the number of teachers inthe NFE centers, especially in rural areas.
Educational Qualifications of NFE Teachers. The educational qualifications of NFE teachers/facilitators is at the same level as formal school teachers (See Figure 9.4). The educational levelof NFE teachers in Mongolia is generally higher than in other countries in the Asia-Pacific region.Two thirds (65.7 percent) hold university degrees and a third (34.3 percent) have vocationalcollege degrees.
NO
N-FO
RMAL EDUCATIO
N AN
D LITERACYCH
APTER
9

148 EDUCATION SECTOR ANALYSIS METHODOLOGICAL GUIDELINES - Volume 2
400
300
200
100
0
301
157
Higher Education
Vocational Training
FIGURE 9.4 - Number of NFE Teachers/Facilitators, by Level of Qualification, Mongolia, 2008
65.7%65.7%
34.3%34.3%
65.7%
34.3%
FIGURE 9.5 - Share of NFE Teachers/Facilitators, by Seniority, Mongolia, 2008
9 years
8 years
7 years
6 years
5 years
4 years
3 years
2 years
1 year
0 5 15 25 35 45%
10 20 30 40
4
4
8
4
9
8
11
10
40
Sen
iori
ty
65.7%
34.3%
Sustainability of Teaching Staff.Another factor that influences NFE quality is the sustainability of teaching staff. Of the totalnumber of teachers working in NFE Enlightenment Centers, 163 (61 (=40+10+11) percent) havebeen working up to three years (See Figure 9.5). Teachers tend to work for shorter periods eitherafter their retirement from formal schools or while on the waiting list to become a formal schoolteacher. Based on data not displayed in the figure, of the 1,529 teachers/facilitators involved intraining organised by NCNFDE between 1998 and 2004, less than 20 percent continued to workin NFE. The high teacher turnover rate can be attributed to low salaries and the poor reputationand social welfare services available.
NFE Teacher Salary.The average salary of formal school teachers is 200,000 to 300,000 Togrogs/month(approximately US$ 165 to US$ 265). The table below shows that the average salary of an NFEteacher is similar, although they do not receive the subsidies that formal school teachers do.

Sub-Sector Specific Analyses 149
NO
N-FO
RMAL EDUCATIO
N AN
D LITERACYCH
APTER
9
170,000 - 200,000
201,000 - 230,000
231,000 - 260,000
261,000 - 290,000
300,000 and above
Total
Amount of Salary (Tog)Teachers
27
3
46
21
1
98
27.6
3.1
46.9
21.4
1.0
100.0
TABLE 9.6 - NFE Teachers’ Monthly Salary (NFE Sector Analysis Survey Respondents), Mongolia, 2008
Number Percent
Sustainable information systems providing such a detailed description of trainers may notbe available in the country under analysis. In addition to regular administrative surveys aimedat the publication of statistical yearbooks for the subsector, such information may becollected through centers’ registration or accreditation procedures or from representativebodies (federations, unions). If such sources are not available, a specific sample survey ofprogramme operators may be carried out by the sector analysis team to shed further lighton the quality of staff. Annex 9.4 provides the key themes (and questions) to be consideredby each center, to provide information on each of its teachers.
Pedagogical supervision also makes the workers responsible for the quality control oftraining activities. Beyond the number of inspectors, to be related to the number of institutesto be inspected, information should be provided on their status and body of affiliation. Thistask is sometimes bestowed on education inspectors from the formal education sector, butsome institutes may have an in-house inspector, especially in the case of large NGOs. Theinspection function may also be provided by subsector officials when it has its own publicor private administration. The inspection reports, where they can be consulted, may providean interesting source of information on the quality of programmes. It may be wise toincorporate such inspection data to specific questions on the activities of programmeoperators in the framework of a survey. Annex 9.5 provides an example of a survey modulerelating to pedagogical inspections.
Thus Example 9.8 presents, for Uganda, an analysis of the support and supervision visitsreceived by literacy centers, especially according to their distance from regional centers.

EXAMPLE 9.8(Supervision of NFE Programmes): Supervision and Support to NFE Centers byCommunity Agents, Uganda, 2001Source: Adapted from Adult Literacy Programme in Uganda, World Bank, 2001.
150 EDUCATION SECTOR ANALYSIS METHODOLOGICAL GUIDELINES - Volume 2
This example provides an analysis of inspection and support visits to literacy centers in Ugandaby a community development officer (CDO), and how they vary according to the center’s distancefrom the main regional town.
FindingsTwenty-nine percent [=32 / (32+27+29+21)] of centers were less than three kilometers (twomiles) from the subcounty headquarters and so could easily be visited on foot, but a fifth weremore than ten kilometers (six miles) away, which would indeed make regular visits difficultwithout transport. In fact, the reported number of visits by community development officers(CDOs) was very low. Only just over half had been visited at all by the CDO during the last year.The number of visits was clearly related to distance (See Table 9.7). Nearly half of those centerswithin three kilometers received three or more visits, compared to less than 15 percent of thoseseven kilometers or more away; indeed, nearly half of the latter received no visits at all.
While acknowledging transport difficulties, some instructors said that supervision by CDOs wasminimal. In Hoima, some instructors observed that "the CDOs do nothing in terms of support,"others that "those who used to support us went for further studies." FAL instructors in Mubendeobserved that CDOs rarely check classes. "In 1998 he checked only twice. When we need himhe is not available due to other activities he is engaged in. We need him to check on us in orderto boost our morale and that of learners. We elected a subcounty FAL committee in 1998, butit has never functioned." In Iganga, for example, one instructor said that "it is very rare to seethe community development officer. The last time I saw him was during the literacy daycelebrations." Some instructors, however, acknowledged that they received support in the formof materials, transport or funds for training from the District Office. Although this was sometimesquite substantial, it was irregular and the allocation for adult education activities was not receivedas budgeted: local councils tended to offer the excuse that tax collections were low, and hencebudgets could not be funded.
1 - 3 kms
4 - 6 kms
7 - 9 kms
10+ kms
32
27
29
21
25%
44%
48%
48%
28%
41%
35%
43%
47%
15%
17%
10%
Number ofInstructors/Centers No Visit 1 or 2 Visits 3 Visits or More
TABLE 9.7 - Number of CDO Supervisory/Support Visits, by Distance of Center from SubcountyHeadquarters, Uganda, 2001
Frequency of Visits

Sub-Sector Specific Analyses 151
NO
N-FO
RMAL EDUCATIO
N AN
D LITERACYCH
APTER
9
The first objective of this section is to develop a relatively comprehensive account of thesubsector’s expenditure and reflect on how funding may evolve in the future. The secondis to estimate the cost per beneficiary and by programme, and identify the causes of anyvariations. The methods to be used here are again similar to those identified in Chapter 3.Given the imperfect structure of the subsector and its likely dispersion among a plethora ofoperators, it is helpful, even more so than for other education sub-sectors, to use bothmacro and micro estimates of expenditure.
NFE FINANCING: SITUATION AND PROSPECTS
In reference to the global scheme and presentation of the sub-sectors’ different institutions,the analysis should provide a reasonably comprehensive account of the funding of non-formal education. Ideally, this account would consolidate the expenditure carried out by thegovernment (the ministry or authority responsible for NFE), the budgets of NFE institutions(federations, unions and so on), the spending supported by local authorities, that carriedout by companies and, finally, the direct contributions of the beneficiaries themselves. Asin Chapter 3, it will be preferable to use executed budget data (rather than budgetallocations) and to take care when consolidating the account to be aware of how effectivespending data and estimates are combined.
The account can be detailed by source of funding and type of income. This exercise allowsthe measurement of the financial weight of the subsector and comparison of it to otheractivities or to the same activity in other similar countries. The consolidation of spendingshould allow a separate review of those items relating to different programmes and keyactivities. That said, in the absence of an institution responsible for the majority of thefinancing of the subsector, it is likely that the elaboration of the account will first require anunderstanding of the spending at the programme level. The summary should include eachof the main spending types (personnel, running costs, investment costs and so on), as perTable 9.8.
COST AND FINANCINGSECTION
3
3.1

152 EDUCATION SECTOR ANALYSIS METHODOLOGICAL GUIDELINES - Volume 2
The main difficulty of the exercise resides in the frequent multiple activities of operators.This holds true in the case of:
• NGOs, who often offer non-formal education programmes in addition to other socialprogrammes. As in the case of the distribution of general administrative spending inthe context of the formal education sector, where NFE operators offer different typesof courses, the share of the global budget attributable to NFE (trainers, administration,supplies, investment and so on) should be calculated. Different breakdown keys areavailable (the pro rata of the specific personnel spending of each programme as shownin the table 9.8, the number of beneficiaries and so on). It is, of course, important toexplain how the calculation is made and to apply the same approach to all operatorswho provide the same type of service.
• Some public (or occasionally private) operators whose NFE activities complement othermain activities, such as school teachers who give literacy classes after school hours. Inthis case the only spending to be considered for NFE is that specifically incurred by thoseactivities, without having to distribute the general administrative costs.
AC1=Ax(F1/F) AC2=Ax(F2/F) ACn=Ax(Fn/F) AC
Programme 1 Programme 2
Personnel
Specific Administrative Spending
Distribution of Overhead
Specific Supplies
Distribution of Common Supplies Spending
Specific Running Costs
Distribution of Shared Running Costs
Miscellaneous
TotalProgramme n
F1
AS1
MS1
MC1=Mx(F1/F)
OS1
OC1=Ox(F1/F)
F2
AS2
MS2
MC2=Mx(F2/F)
OS2
OC2=Ox(F2/F)
Fn
ASn
MSn
MCn=Mx(Fn/F)
OSn
OCn=Ox(Fn/F)
F=F1+F2+…+Fn
AS=AS1+AS2+…+ASn
MS=MS1+MS2+…+MSn
MC
OS=OS1+OS2+…+OSn
OC
TABLE 9.8 - Estimation of NFE Spending, by Programme (Model Table)
Source: Authors.

Sub-Sector Specific Analyses 153
NO
N-FO
RMAL EDUCATIO
N AN
D LITERACYCH
APTER
9
PER BENEFICIARY SPENDING, BY PROGRAMME
On the basis of the consolidated spending by nature and programme, unit costs should becomputed to compare spending by beneficiary. However, due to the variety of programmedelivery modes, unit costs do not provide a solid basis to appraise operations, as they do inthe formal sector. The latter is indeed fairly homogenous, meaning that differences in unitcosts reflect different choices in terms of the delivery of education, all of which share thesame learning goal. They may reflect different decisions in terms of group size or theselection and remuneration of teachers.
In non-formal education, delivery modes can vary considerably, as can learning objectives.As such, effective teaching time and learning environments (classroom-based, activity-basedlearning and so on) can vary considerably. It is important to, at least, ensure that comparableprogrammes are dealt with together before comparing their unit costs. The mapping of NFEprogrammes completed in Section 1 will enable one to differentiate between groups ofprogrammes with similar types of activities and goals, each group providing a frameworkfor the comparison of costs. To solve the issue of programme content and goalcomparability, an estimation of the hourly cost per beneficiary may be computed. However,even more so than in the formal education sector, such financial data will only gain fullmeaning when related to result indicators (the quality, sustainability and relevance oflearning, beneficiary satisfaction, employability and so on). Example 9.9 illustrates theanalysis of unit costs based on the cost per hour of class of a literacy centre in Senegal.
3.2

EXAMPLE 9.9(NFE Unit Costs): Cost Structure and Estimated Unit Costs per Literacy Centre Learner, Senegal, 2010/11Source: Data is from the Youth and Adult Education Department of the Ministry of Education, Senegal.
154 EDUCATION SECTOR ANALYSIS METHODOLOGICAL GUIDELINES - Volume 2
The following table presents the cost structure and unit costs of a literacy centre in Senegalworking under the delegation approach. The centre has 10 classes and 10 facilitators for 300learners.
Recurrent Expenditure
Pedagogical Material
Arithmetic Textbooks (300)
Reading Textbooks (300)
Other Reading Materials (Library, Newspapers, etc.)
Supplies
Supervision and Evaluation
Staff Remuneration
Facilitators (10)
Supervisor/Inspector
Capital Expenditure (Equipment)
Sundry Equipment
Chalkboards
Building Subsidies
Connection to Services
TOTAL
Number of Learners
Average Per Learner Cost (CFAF)
Cost per Hour Per Learner - 360 hours (CFAF)
15,940,000
1,350,000
300,000
300,000
750,000
350,000
800,000
13,440,000
12,000,000
1,440,000
3,400,000
2,000,000
600,000
300,000
500,000
19,340,000
300
64,467
180
82%
7%
2%
2%
4%
2%
4%
69%
62%
7%
18%
10%
3%
2%
3%
100%
(13% of GDP per capita)
CFAF % of the Total
TABLE 9.9 - Cost Structure of a Literacy Centre (Working According to the Delegation Approach), Senegal, 2010/11
Findings• The average per learner cost reaches CFAF 64,467 for a programme of 360 hours distributed
over 10 months, equivalent to an hourly cost per learner of FCFA 180 (=64,467/360);• The cost structure shows that recurrent expenditure represents 82 percent of the total and
equipment the remaining 18 percent; and• Personnel remuneration constitutes the most important spending item, equivalent to 69
percent of total expenditure, or 84 percent of recurrent expenditure.
Again it is worth noting that such financial information on staff-learner ratios and runningcosts is far from being widely available in many countries. The analysis to be performed inthese sections may therefore often require specific research, whose relevance and potentialto be replicated will contribute to the establishment of stable statistical systems.

Sub-Sector Specific Analyses 155
NO
N-FO
RMAL EDUCATIO
N AN
D LITERACYCH
APTER
9
The diversity of goals and delivery modes in NFE and the weak knowledge of the subsector,especially in terms of best practices, limit the prospect of providing a one-dimensionalappraisal of each of the NFE programmes, not to mention the subsector as a whole. Moreso than in other education sectors, accounting for the results obtained is therefore anessential ingredient to evaluate the relevance of the activities offered, and a valuable guideto optimise management. The heterogeneous character of learning careers and the relativelyweak internal efficiency resulting from frequent dropout also mean that it is important torelate results to the cost of the activities, performing a cost-efficiency analysis. Theproduction of data on results and costs by operators should therefore be encouraged, as itconstitutes the basis for better management and improved efficiency, and encouragespotential investors. Annex 9.8 suggests some of the issues to keep in mind in the course ofthe analysis of this section, specifically in terms of the results to consider and how suchresults are produced, analysed and interpreted.
EVALUATION OF LEARNING OUTCOMES
Many NFE programmes, especially literacy programmes, aim to provide basic learning toadults who have never attended school. The evaluation of learning outcomes will thereforeaim to establish their mastery of such skills, both in reference to the course content followed,and also in absolute terms, by determining learners' ability to use their skills in everyday life(find their way, read and understand signs, keep simple accounts and so on). The conceptsof internal and external efficiency are again touched upon here. Evaluating learning inreference to course content allows one to determine the degree of success or dysfunctionof each programme, whereas the appraisal of basic skills in absolute terms enables acomparison of different programmes. With respect to this last point, the NFE subsectorwould benefit from the implementation of a common cross-country measurement of literacyoutcomes initiative, as exists in the formal education sector.65 The RAMAA initiative initiatedby the UNESCO Institute for Lifelong Learning (UIL) might prove to be an option for this.The issue of the sustainability of learning is particularly relevant to non-formal education,given that learning periods are relatively short, but also because of the negative impact ofoften unfavourable contexts (little educated environments, common language, scarcity ofpost-literacy programmes and so on).
RESULTS AND QUALITY AND RELEVANCE INDICATORS
SECTION
4
4.1

156 EDUCATION SECTOR ANALYSIS METHODOLOGICAL GUIDELINES - Volume 2
In the absence of data on the results of the different activities, it is advisable that thesubsector diagnosis provide the opportunity to organise some assessments of learningoutcomes, be they based on course content or effective skills. If the evaluation is toocomplex to implement in practice (either due to methodological complexities or time andresource constraints), it is now possible to refer to the experience of some countries thathave participated in international standardized evaluations of learning assessments. Wherethey exist, learning assessments of reading or math outcomes achieved in the formaleducation sector (EGRA, EGMA, PASEC, SACMEQ and so on) may be used for literacyprogrammes or their equivalent. This allows the use of national know-how and themeasurement of results in a way that is coherent with the formal sector, to compare theeffectiveness of different programmes.
BOX 9.2Research to Measure the Learning Outcomes of Literacy Programme Participants(RAMAA)
In some developing countries, the persistence of widespread illiteracy is reinforced by the absenceof a reliable steering mechanism of the quality of programmes, indispensible to guide policymakers and add credibility to national and international advocacy for adult literacy. In this context,the UNESCO Institute for Lifelong Learning (UIL) and UNESCO-BREDA have conducted activeresearch since 2010 to measure the learning outcomes of literacy programme participants(RAMAA). Five Francophone African countries were involved in the experimental phase: BurkinaFaso, Mali, Morocco, Niger and Senegal. The target groups are individuals aged 15 years andabove who have recently completed a literacy programme.
The issue of the quality of adult literacy programmes is dealt with by RAMAA from the angle ofresults, and focuses especially on the learning outcomes of individuals upon finishing a literacyprogramme. RAMAA aims to answer two specific questions:
1) What skills are acquired by adults upon their successful completion of a literacy programme?and
2) What factors determine the variations in the skills acquired by different individuals and/orthrough different programmes?
Methodologically, RAMAA refers to the profiles expected of adults at their completion of aliteracy programme, and thus constitutes an external evaluation of learning. The measuring toolsare developed independently of the curricula, on the basis of skills benchmarks which are in linewith the expected profiles, and that should be defined/elaborated by each country and comparedaccording to a harmonisation logic. RAMAA promotes a horizontal approach based on the activeparticipation of national teams in all the phases of the projects’ implementation.
Beyond the identification of best practices in the subsector, RAMAA aims to reinforce theevaluation culture in the adult literacy domain and to develop national capacities for the task onthe basis of validated measurement tools and through the promotion of South-Southcooperation. In practice, RAMAA should also enable the development of a toolkit, including the
▶

EXAMPLE 9.10(NFE Performance – Learning Outcomes): NFE Learner Performance in Standard Assessments, UgandaSource: Abstract adapted from Adult Literacy Programmes in Uganda, World Bank, 2001.
Sub-Sector Specific Analyses 157
NO
N-FO
RMAL EDUCATIO
N AN
D LITERACYCH
APTER
9
Furthermore, the Literacy Assessment Monitoring Programme (LAMP) offers a conceptualframework which may be helpful for specific country analysis (See Annex 9.1). The analysisof learning results can also enable the comparison of the impact of different programmes(See RAMAA in Box 9.2). In order to be more relevant, this comparison should consider thedifferent delivery modes of each programme and their respective costs. It may also allow,as per Example 9.10, the identification of those programmes that best respond to the needsof different population groups (defined by their age and their initial education level). Thisrequires the use of a standard test, to be administered to the participants of each NFEprogramme, as well as to school pupils, to obtain a comparison of the non-formal andformal education sectors.
measurement tools used, and an analytical approach to the identification of literacy programmequality determinants.
After a preliminary phase to set up the partnership framework, create national teams andelaborate capacity-building and communication plans, RAMAA is now in the process ofdeveloping tools for the evaluation of learning outcomes. This phase was initiated with a reviewof literature and the development of a national skills benchmark. Countries are now to discussand validate the framework of common skills to be assessed.
Numeracy Comprehension Writing
FAL REFLECT FAL REFLECT FAL REFLECT
45.3
58.1
76.9
28.4
64.7
86.3
27.2
35.6
57.6
22.2
52.9
73.5
25.6
29.6
44.0
17.9
35.8
47.3
No schooling
1-4 Years
5-8 Years
TABLE 9.10 - Mean Scores on Three Tests in FAL and REFLECT Programmes Accordingto Different Levels of Schooling, Uganda, 2001
This evaluation assessed the difference between the performance of participants in the FAL andREFLECT programmes.

158 EDUCATION SECTOR ANALYSIS METHODOLOGICAL GUIDELINES - Volume 2
Findings Table 9.11 compares the test results of children of Grade 3 or Grade 4 formal primary education,literacy programme graduates, literacy programme graduates who had never been in formalschool and those aged more than 50 years.
Note that one would not expect formal school pupils to do very well on the more complexcomprehension questions, which were clearly oriented toward adults, and even the writing taskswere more adult-oriented. Focusing only on the simple comprehension questions and thenumeracy questions, it can be seen that Grade 4 students surpass literacy programme graduatesonly in writing. This leads to the conclusion that under the prevailing conditions in the eightdistricts of Uganda, adults can acquire literacy skills thanks to literacy programmes rather fasterand more effectively than children enroled in formal primary education. Given that the overallsample performs better on this test than an apparently reasonable control group, one couldargue that a significant positive outcome of the literacy programmes has been demonstrated.
However, apart from the obvious point that Grade 5 children should have been tested, it remainsimportant to understand what affects performance at the test, and whether any of thoseinfluencing factors are amenable to policy intervention. In particular, there are quite largevariations between districts (not shown in the table). So, if all those in Arua district had performedas well as those in Hoima district for instance, the overall pass rate would have been much higher.A priori, one supposes that these differences are due to the way the programme wasimplemented in the different localities, but the question arises as to whether some of thesevariations can be explained by the characteristics of individual participants.
SimpleComprehension
Numeracy ComplexComprehension
Writing (Attempts Only)
Writing(All)
Grade 3 Primary Pupils
Grade 4 Primary Pupils
Literacy Programme Graduates
Literacy Programme Graduates with No School
Literacy Programme Graduates Aged 50+ Years
53.1
64.6
93.9
84.9
90.5
42.8
43.4
66.6
47.8
50.7
11.3
15.5
49.5
31.8
42.2
38.9
52.4
52.3
46.5
51.6
34.3
36.0
39.3
—
34.8
TABLE 9.11 - Mean Scores for Primary School Pupils Compared with NFE Graduate Groups, Uganda, 2001
Finally, the use of household survey data enables one, under certain assumptions, to providea comparison of the efficiency of formal and non-formal programmes in providingparticipants with sustainable literacy skills. Example 9.11 below illustrates this approachwith the case of the Central African Republic (See also Annex 9.7, which provides a summaryresult of this approach for 14 African countries).

Sub-Sector Specific Analyses 159
EXAMPLE 9.11 (NFE Performance): The Sustainability of Literacy, CAR, 2000Source: Adapted and translated from the Central African Republic CSR, 2008.
Reads fluently
Reads with difficulty
Cannot read
Total
No School(Percent)Attended School (Stream)
Overall
2
3
95
100
61
26
12
100
(Formal) (Non-formal)
10
22
69
100
37
17
46
100
TABLE 9.12 - Literacy Level of Adults, According to their School Attendance when Young,Central African Republic, 2000
10
120
100
80
60
40
20
0
% of Literate accordingto the number of formalschooling years achieved
% of literate amongadults having participatedto an NFE programme(no indication of duration)
FIGURE 9.6 - Share (in %) of fluently literate adults according to level of educationachieved in their youth and comparisons with those having participated to an NFE programme, 2000
Grades (Primary - Upper Secondary)
65.7%
34.3%
1 2 3 4 5 6 7 8 9 10 11 12
Table 9.12 and Figure 9.6 display the data of the MICS 2000 household survey, providing thedistribution of adults aged 22 to 44 years according to their literacy level at the time of the surveyand their school attendance when young, distinguishing between formal and non-formaleducation streams and comparing them to individuals who never attended school.
FindingsThe data indicates with no ambiguity that a great majority of adults who never attended schoolwhen young are illiterate (95 percent). Only five percent declared knowing how to read, of whichtwo percent declared they know how to read fluently. Among those having attended an NFEprogramme, the share of literate adults is higher than for adults having never been to school,but remains low: 32 (=10+22) percent can read, although just 10 percent fluently. Among thosewho attended formal education, 61 percent can read fluently. This figure no doubt correspondsto the majority of individuals in this category, but nevertheless, for 39 (=100-61) percent ofadults, having attended formal school was not sufficient to achieve sustainable literacy.
NO
N-FO
RMAL EDUCATIO
N AN
D LITERACYCH
APTER
9

160 EDUCATION SECTOR ANALYSIS METHODOLOGICAL GUIDELINES - Volume 2
Thus, even if following an NFE course has a positive impact on adults’ probability of knowinghow to read, it is clear that the attending formal schooling when young produces the bestchances of achieving sustainable literacy. However, formal schooling when young, much as it isa necessary condition for literacy, is nevertheless an insufficient one.
Table 9.12 provides general information on school attendance without entering into detailregarding the length of schooling careers. For non-formal education, the survey provides noindication of this. For formal education, on the other hand, it is possible to identify, among thosewho attended school, the duration of their schooling, via the highest grade attained.
The relationship between the number of years of formal school attended when young and theshare of adults who are fluently literate is quite clear (see Figure 9.6). It is also apparent that theliteracy level of individuals having followed some form of NFE is equivalent to that of those havingfollowed 1.5 years of formal schooling (the dotted line cross the bold curve around the value of1.5 grades).
THE IMPACT OF NFE ON SOCIAL BEHAVIOUR AND PRACTICES
Behavioural change in beneficiaries may be one of the central goals of NFE programmes,especially those that target marginalised youth in need of social skills and preparation forreintegration into more formal streams of training, be they general or vocational. This mayalso be the objective of some literacy programmes whose content is not limited to basiclearning, such as any programme aiming to impart social or professional skills. The analysisof the impact of NFE programmes on behaviour requires individual-level survey data thatidentifies both the programmes followed and the behaviours and practices of interest, whileproviding a direct comparison with reference population groups (illiterate individuals nothaving participated in an NFE programme, primary school-educated individuals and so on).66
Household surveys can also be used to measure the impact of non-formal education onbehaviours and practices (See Annex 9.2 for an example of a questionnaire aimed at ex-participants in NFE programmes). To measure the net impact of literacy programmes inthese areas, it is however appropriate to use econometric methods comparable to thoseused in the earlier analysis of the external efficiency of the formal education sector (SeeChapter 5).
It is, however, difficult in these types of general surveys to identify specific programmes,and hence also to analyse them. To achieve such a goal it is absolutely necessary toimplement dedicated specialised surveys (See Example 9.12 for a case of the use of a specificquestionnaire in Uganda).
4.2

EXAMPLE 9.12(NFE Performance – Impact on Behaviour): The Impact of Non-formal Education on Behaviour, Uganda, 1999Source: Abstract adapted from Adult Literacy Programmes in Uganda, World Bank, 2001.
Sub-Sector Specific Analyses 161
NO
N-FO
RMAL EDUCATIO
N AN
D LITERACYCH
APTER
9
This research was designed to answer the following broad questions:
• How effective are NFE programmes in terms of the levels of attainment and retention ofreading, writing, and arithmetic skills by graduates?
• How effective are NFE programmes in facilitating practical knowledge, attitude change, andskills, and in promoting income-generating activities?
Because the focus was on outcomes, particularly longer-term outcomes, in terms of skills,knowledge, attitudes and practices, the unit of analysis was the individual literacy graduate,not the literacy class. The implication is that the influence of individual instructors cannot beassessed. A total sample of 800 graduates was envisaged, comprising two equal groups: 400recent graduates and 400 who had graduated two or more years previously. The reason forincluding the latter was the desire to assess how well graduates retained their skills, utilisedtheir knowledge and changed their lives for the better.
As seen in the list below, the instruments used represent both qualitative and quantitativeapproaches:
• Structured interview questionnaires with mostly closed questions (see Table 9.13) for thegraduates and a control sample (those who have not attended any literacy programme);
• A test of arithmetic, comprehension, and writing administered to the graduates, and acontrol sample of primary school children from Grades 4 or 5 from one of the better schoolsin each sample district;
• Guides for focus group discussions with graduates (including literacy use and benefit analysis)and with those who have not attended any literacy programme; and
• Topic guides for obtaining information from district, subcounty and local community leaders,and from local district and subcounty officials.
Findings
On all 18 items more literacy programme graduates than the control group gave the correct(modern) response and on 12 of the items those listed in table 9.13, the margin of differencewas greater than five percentage points. An interval scale shows in more detail what themargins, measured between the lower of the graduate scores and the average scores of thosehaving not attended any literacy programme (control group), were:
• Less than five percentage points: five questions;
• Between five and 10 percentage points: nine questions;
• Between 11 and 15 percentage points: three questions; and
• Sixteen or more percentage points: one question.

SOCIAL AND ECONOMIC INTEGRATION
The measure of economic and social integration that can be attributable to NFE programmesshould be performed as described in Chapter 5, albeit with greater focus on the externaldimension. The effectiveness and quality of learning can be measured, new behavioursfacilitated by the training identified, and social and economic consequences of suchbehavioural changes noted. For literacy programmes that specifically aim to promote suchintegration, each of the levels considered may be measured separately (knowledge, attitudesand practices) according to the needs of the analysis. Example 9.13 presents theemployment outcomes of ex NFE-type programme participants in Senegal.
4.3
162 EDUCATION SECTOR ANALYSIS METHODOLOGICAL GUIDELINES - Volume 2
You should not plan your family as children are a gift from God. (Disagree)
Fruits are only for children. (Disagree)
Education no longer pays. (Disagree)
A man has the right to beat a woman if she doesn't obey him. (Disagree)
It is more useful for boys to go to school than girls. (Disagree)
Men and women should share equally in looking after the children. (Agree)
Women make as good village leaders as men. (Agree)
It is all right to drink as much as you like if you have the money. (Disagree)
If someone is arrested the police can beat him up as a punishment. (Disagree)
Breastfeeding is better than bottle feeding. (Agree)
If a woman earns money, she should give most of it to her husband. (Disagree)People shouldn't help people with AIDS because they are going to dieanyway. (Disagree)
Graduatedfrom theliteracy
program morethan 2 years
ago
All
70
87
95
60
81
91
88
86
50
89
70
88
55
82
88
49
75
84
84
80
38
77
64
79
76
91
97
63
82
92
87
88
50
90
67
90
71
84
96
61
83
93
90
86
55
89
74
89
TABLE 9.13 - Share of Individuals Giving Correct/Modern Answers to Attitude Questions,by Group, Uganda, 2001
Recently graduatedfrom the literacy
programme
Control group

EXAMPLE 9.13
(NFE Performance – Employment Outcomes): Employment Outcomes of ex NFE Programme Participants, Senegal, 2001Source: Adapted and translated from L’éducation non formelle au Sénégal: déscription, évaluation et perspectives,UNESCO, 2001.
Sub-Sector Specific Analyses 163
NO
N-FO
RMAL EDUCATIO
N AN
D LITERACYCH
APTER
9
Works in a modern company
Works with the mastercrafts person who trained them
Works for another boss
Is self-employed
Has no activity
Is following complementary education
Other (Activity more in tune with their vocation)
9%
36%
34%
13%
0%
3%
5%
TABLE 9.14 - Main Activity of ex NFE Programme Participants, Senegal, 2001
FindingsNone of the ex NFE programme participants surveyed remained inactive after their training. Thevast majority of ex-learners (83 (=36+34+13) percent) worked in crafts workshops, mostly asassistants, and others set up business independently. Most, however, are far from achieving thegoal they set themselves when embarking on their training. To satisfy their socioeconomic needs,their main motivation was to set-up their own workshop. Only 13 percent were effectively ableto do so, whereas 70 (=36+34) percent continue to work as assistants with the craftsmen thattrained them, or with another. A minority found employment in a modern company or continuedtheir education.
NOTES
62 As a term, non-formal education is recent. Beyond research circles, it has only been used since the early 1990s, followingthe Jomtien Education for All conference that coined it. According to the European Education Thesaurus of 1998, non-formal education includes “activities or programmes organised outside the established education system, butnevertheless directed at education sector goals.”
63 This relatively old description is based on the thesis work carried out by Sophie Cerbelle on the external evaluation ofliteracy in Morocco. Since then, the NFE sector in Morocco is no longer under a secretary of state but falls under theresponsibility of the national education ministry (See Sophie Cerbelle, 2010).
64 Repetition is not a distinguishing characteristic of NFE learner flows, but should be checked in each national context.
65 See for instance the Programme for International Student Assessment of the OECD (PISA) and its impact on educationpolicy in developed countries (www.ocde.org).
66 In the absence of such benchmarks, one can only do comparisons between different NFE programmes.

164 EDUCATION SECTOR ANALYSIS METHODOLOGICAL GUIDELINES - Volume 2
© P
ÔLE
DE
DA
KA
R-U
NES
CO
/Rég
is L
’Hos
tis

Sub-Sector Specific Analyses 165
CHAPTER 10TECHNICAL ANDVOCATIONALEDUCATION AND TRAINING (TVET)› Chapter Objective:To introduce key questions, issues andmethods to conduct an analysis of technicaland vocational education and training (TVET)as a specific education sub-sector.
CHA
PTER10
TVET

166 EDUCATION SECTOR ANALYSIS METHODOLOGICAL GUIDELINES - Volume 2
1. OVERVIEW OF TVET
ISSUETVET is often multi-faceted, diverse in organisation and delivery, and often fragmented.
OBJECTIVESUnderstand and identify the different TVET provider systems in a country.
METHODSIdentify and describe the different provider systems.
SOURCESReports on TVET; interviews with authorities in charge of TVET.
2. PERFORMANCE OF TVET
ISSUEDesigned to prepare students for employment, performance of TVET needs to be measured inrelation to labour market requirements. This includes access (how many and who is trained?),equity (are certain groups excluded?) and external efficiency (how well is TVET responding to theskills needs in the labour market?).
OBJECTIVESEvaluate access patterns for the different TVET provider systems, as well as equity patterns bygender. Understand basic issues related to equity by social status and location of origin. Analysethe extent to which the TVET system responds to the needs in the labour market, and whetherthe TVET management and delivery structures and labour market services facilitate a demand-driven skills development system.
METHODS • Establish enrolment in each provider system.• Calculate different access indicators (transition rate, proportion of TVET in secondary education,
private enrolment ratio and annual growth of TVET students).• Compute female participation rate; applying general equity indicators to TVET. • Compute different indicators to measure the labour-market relevance of TVET completers.• Analyse labour demand and supply matching mechanisms.
SOURCESEMIS, databases of regulatory authorities for TVET and TVET institutions, and registrar of schools;studies on TVET and more general economic development (e.g. Investment Climate Assessment);household and labour force surveys, labour market assessments; tracer studies; TVET institutionssurveys.

Sub-Sector Specific Analyses 167
3. COSTS AND FINANCING
ISSUEFunding sources of TVET are more diversified than in general education and vary from one toanother provider system. TVET is relatively expensive, but funding structures vary in differentdelivery systems. TVET is often underfunded, and unit expenditure do not match fundingrequirements.
OBJECTIVES• Obtain an overview about different financing systems for TVET.• Identify and quantify the different funding flows in TVET.• Assess unit expenditure and unit costs.• Benchmark TVET expenditure.
METHODS • Identify funding sources.• Identify flow of funds.• Establish public expenditure on TVET.• Analyse expenditure structures. • Calculate unit expenditure.• Apply different indicators to benchmark TVET funding.
SOURCESPublic budget; Budgets of ministries/authorities in charge of TVET; budgets from TVET institutions;enrolment data; TVET institutions surveys; TVET institutions expenditure assessments.
4. INTERNAL EFFICIENCY AND QUALITY
ISSUEInternal efficiency is dependent on quality of training, and on the type of delivery. Training qualitydepends largely on the extent of appropriateness of practical training. Facilities in many TVETinstitutions as well as limited practical skills of teachers often do not allow for the fullimplementation of the curriculum. TVET quality depends to a large extent on the involvement ofand the relationship with the world of work.
OBJECTIVES• Assess internal efficiency through various indicators. • Analyse the different determinants of training quality.• Assess to what extent employers are involved in TVET.
METHODS• Compute internal efficiency indicators: pass rate, drop-out rates, repetition rates, promotion
rates, success rate in final examinations, graduation rate and internal efficiency coefficient.• Compute selected quality indicators, such as the student-teacher ratio, ratio of qualified teachers
and satisfaction indicators.• Qualitatively assess quality assurance mechanisms.
SOURCESEnrolment figures over various years from EMIS and other sources; statistics on teachers andteachers qualifications; TVET institutions survey; interviews with TVET institutions and regulatory(quality assurance) bodies.
CHA
PTER10
TVET

168 EDUCATION SECTOR ANALYSIS METHODOLOGICAL GUIDELINES - Volume 2
IntroductionThis chapter provides an introduction into the analysis of technical and vocational educationand training (TVET) as part of an education sector analysis. Many performance indicatorsrelevant for TVET are included in other chapters of these guidelines analysing specific issuesacross education levels, notably in chapter 2 (enrolment and internal efficiency), chapter 3(finance), chapter 5 (external efficiency) and chapter 6 (equity). This chapter provides a moredetailed and in-depth introduction into the analysis of each of these aspects specifically forTVET highlighting the distinct organisational patterns of the sub-sector.
Recent years witnessed increasing efforts in the analysis of TVET systems and structures indeveloping countries. This reflects a growing interest of both governments and donors inskills development. Evidence suggests that skills are at the core of improving individuals’employment outcomes and increasing countries’ productivity and growth. As economiesmove up the technological ladder, skills become a more important determinant of businessdevelopment. Enterprise surveys conducted by the World Bank over the last 10 yearsdemonstrate that skills constraints impede firm performance, particularly in developingeconomies. Whereas in the OECD countries an average of 25 percent of firms were worriedabout inadequate worker education and skills, this percentage rises to 40 percent in Sub-Saharan Africa and 50 percent in East Asia and the Pacific. Research has also establishedpositive rates of return to skills development, often in two-digit percentage points.67
Comprehensive and adaptable skills development systems have therefore become anindispensable element for development policies in a growing number of countries.
Furthermore, structural changes in the education landscape in developing countries havenurtured a new interest in TVET. Previous success in raising access to basic educationresulting in large cohorts of primary school completers has directed attention of educationpolicy makers to post-primary education options. In this context skills development inpreparation for jobs has gained importance as an alternative career path to generalsecondary and tertiary education. As a consequence, public TVET budgets, often rathermarginal in the past, as well as donor commitment for skills development,68 are rising whichrequires more knowledge and understanding about TVET system and system performance.

Sub-Sector Specific Analyses 169
The following chapter addresses the major themes and challenges of a TVET sub-sectoranalysis within the framework of an education sector analysis. Due to its specific deliverypatterns, which are usually much more diverse than in general education, the TVET chapterwill provide a deeper, Sub-Sector Specific Analyses of the major broad analytical themes ofthe education sector analysis. Since performance of the TVET system is ultimately measuredin its ability to increase employability of its graduates and to provide the labour market withan appropriately skilled workforce, external efficiency of TVET warrants special attention.Section 2.3 of this chapter, therefore, shows possibilities to assess the external efficiency ofTVET. More broadly, Chapter 5 of these guidelines introduces the concept and analysis ofexternal efficiency of education in general, and demonstrates how education and TVET haveto be placed in the specific economic, social and labour market contexts of the countryunder analysis.
The first section (section 1) of the chapter provides an overview about the potentialstructures and delivery systems in TVET. Understanding the diversity of TVET provision - withdifferent parallel systems often found in one country – is important in order to appreciatethe methodological challenges in data collection and evaluation, and in comparative cross-country analysis. Section 2 deals with the core performance analysis of the TVET systemsuggesting indicators and methods to evaluate access and equity patterns and constraints,as well as external efficiency and labour market relevance of the TVET sub-sector. Section 3on costs and financing presents an introduction into funding and cost structures in TVETand options to track and analyse expenditure. Again, this section stresses the variety offunding models found in the developing world and the inherent data collection and analysischallenges. How to measure and evaluate internal efficiency and quality in TVET is the topicof section 4.
CHA
PTER10
TVET

170 EDUCATION SECTOR ANALYSIS METHODOLOGICAL GUIDELINES - Volume 2
OVERVIEW OF TVET
The main purpose of TVET is to develop occupation-specific and generic skills needed inthe economy, and which will help learners in finding employment (including self-employment). TVET is principally related to the labour market, and its performance mustultimately be assessed through its success in raising the skills level of a country’s workforcein response to changing economic and labour market structures.69
Skills requirements are usually diverse depending on occupational specialisation,technological requirements in different sectors and industries, level of comprehensiveness,or the composition of generic skills required in different segments of the labour market.This has generally nurtured a wide range of different ways to impart the specific mix of skillsrequired. As a general rule, TVET is much less uniform in its delivery patterns than generaleducation.
WHAT IS TVET?
According to UNESCO, TVET is defined as “those aspects of the educational processinvolving, in addition to general education, the study of technologies and related sciencesand the acquisition of practical skills, attitudes, understanding and knowledge relating tooccupation in various sectors of economic life”.70
In accordance with what has become common practice in most countries and internationaldiscussions, the term “technical and vocational education and training” (TVET) is used hereas an overarching denotation of the wide and diversified landscape of programmes andopportunities for work-related skills development. What constitutes TVET under thisdefinition is not limited to formal training or technical education programmes delivered aspart of the education system. It also includes non-formal and informal ways of skillsdevelopment delivered by a potentially broad range of public and private actors.
This definition may not always be common practice in all countries. Sometimes, there is aclear demarcation between vocational training and technical education, for example. Also,the horizontal and vertical scope of what is covered under TVET may vary. Agriculturetraining, health training or teachers training are examples at the limit of what may beunderstood as TVET. The delineation to higher education is another boundary that isdifferently defined. It is widespread practice to capture under TVET all programmes up totertiary but non-academic level (up to ISCED 4), but there is room for discretion. Some
SECTION
1
1.1

Sub-Sector Specific Analyses 171
countries (e.g., Tanzania and Kenya) consider introducing technical degree qualificationsunder the umbrella of TVET.
An analysis of TVET should initially seek to clarify what is specifically captured under TVETin the country under analysis, and should prepare from the outset a working definition andclarification of the scope of the analysis underway.
DIFFERENT TVET PROVIDER SYSTEMSAND STRUCTURES
Table 10.1 overleaf presents an overview of TVET provider systems/delivery types typicallyfound in developing countries. It shows that TVET is complex and multifaceted. In mostcountries, various delivery types co-exist side by side with different degrees of integrationor fragmentation. Some progress has been made during the last decades to fosterintegration of previously fragmented TVET provider systems through the development ofTVET authorities with the regulatory mandate for a broader range of TVET. Yet, unlike ingeneral education, TVET is hardly ever organised in one coherent system. CH
APTER
10TVET
BOX 10.1Historical Determinants of TVET Development
To understand the specific TVET landscape and challenges in a country, it may be useful to harkback to historical and cultural patterns and major players in its development. The state of TVETdevelopment and its organisational set-up may be influenced by features such as the educationalphilosophy of the former colonial powers, different influences of foreign donors over thedecades, industrial structures and industrial training cultures as well as patterns of previous TVETpolicies. It is not uncommon, for example, that changes in policy emphasis by differentgovernments have resulted in frequent shifts of the TVET sector between parent ministries, androllercoaster-like developments in the allocation of public resources to the sub-sector. This issometimes an explanation for neglected facilities (TVET institutions being built during one regime,afterwards being denied sufficient funding to maintain the institutional structure by thesucceeding regime). Frequent recent changes in the sector or ministerial association of TVETfurthermore often influences availability and consistency of TVET data.
1.2

172 EDUCATION SECTOR ANALYSIS METHODOLOGICAL GUIDELINES - Volume 2
Typical TVET Provider Systems
Delivery Mode
Initial and OngoingTVET andTarget Groups
Regulation/Certification/Quality Assurance
Ownership/Management of Providers
“Formal TVET”
(Formal) Technical andVocational Education
Formal Apprenticeship
“Non-formal TVET”
Skills Development Programmes
“Informal TVET”
Traditional Apprenticeship
Informal Learning
Mixed System
Firm-Based Training
TABLE 10.1 - Synopsis of “Typical” TVET Provider Systems
Long-term school-based training, post-primary and/or post-secondary; usually articulated with the general education qualification system in terms of pathways and defined equivalences; alternative route to educational progression
Student population, target labour market includes both formal and informal sectors, as well as public employment
Regulated under ministries, authorities or other public bodies in charge of TVET; leading to recognised national certificates; quality assured through formal mechanisms (accreditation, national curricula, national assessments)
Provided in accredited private and public institutions; public institutions normally under ministries or public bodies in charge of TVET, or under special sector ministries (e.g., agriculture, tourism)
Usually combination of on-the-job training in formal enterprises and school-based training in TVET institutions
School leavers, formal school certificate required, mainly preparing for formal sector employment
Regulated under TVET authorities, or Ministries of Labour leading to formal TVET certificates
Training jointly provided by companies in cooperation with formal TVET institutions under TVET authorities, or ministries of education or labor
Short or long-term, mostly provided in training institutions
Pre-employment training for out-of-school youth, unemployed and other target groups, or skills upgrading for existing workforce; targeting all employment and self-employment
Programmes often lead to trade testing certificates, or similar skills recognition; providers may be accredited by authorities
Provided by public training institutions under labour and other ministries (usually not including education ministries) and private profit and non-profit providers
On-the job training by master craftspersons in the informal sector
Out-of school youth including low educational achievers; preparation for work in the informal sector
Not regulated. Sometimes access to trade testing and other RPL opportunities available
Individual, usually non-standardised relationship between business owner and apprentice
On-the job training and other unstructured forms of learning (self-teaching)
Everybody, but often workers in both formal and informal sectors
No regulation of learning, certification sometimes possible through RPL opportuni-ties
N/A
Training in company-based training centers, long and short term
Company staff (in-service training) and prospective staff (pre-employment training), rarely also training for the general labour market
Registered by TVET authorities leading to formal qualifications, as well as non-formal training leading to in-house certificates
Owned and managed by firms

Sub-Sector Specific Analyses 173
The multiplicity of parallel institutions, owners, delivery forms, regulation and fundingarrangements creates considerable challenges to data collection, and experience shows thatit often requires some investigative creativity to obtain a comprehensive quantitative pictureof all skills development opportunities.
Some of the main distinguishing features of the different TVET provider systems can besummarised as follows:
Degree of Formalisation and Recognition
TVET is often clustered into formal, non-formal and informal training (see table 10.2). Exactdefinitions and delineations are often blurred and differ from country to country. They maybe based on the type of certificates or curricula. Usually, formal training comprises long-termprogrammes, delivered in accordance with recognised “national” curricula leading torecognised certification. Formal TVET is usually regulated by ministries in charge of TVET(often education or labour) or special TVET authorities, and delivered by public and accreditednon-public TVET institutions. Often formal TVET is considered part of the education sectorwith qualifications equivalent and/or articulated with general education qualifications.
CHA
PTER10
TVET
Conducted wholly or partly in training institution,or in cooperation with training institution
Having minimum educational entry requirements
Structured learning, using curriculum
Leading to national (formal) qualifications
Using national (formal) curriculum
Regulated by ministry/authority in charge of TVET
Integrated in clear pathway structure
Duration
Yes
Yes
Yes
Yes
Yes
Yes
Yes
No
No
No
No
No
No
No
Usually long-term
Set byprovider
Short and long-term
Characteristic Formal TVET
Non-formal TVET
Informal TVET
TABLE 10.2 - Formal, Non-formal or Informal TVET
Source: AuthorsNote: Matrix indicates frequently used delineations. Actual definitions vary from country to country.

174 EDUCATION SECTOR ANALYSIS METHODOLOGICAL GUIDELINES - Volume 2
Non-formal TVET usually includes all forms of structured skills development programmeswith fixed duration and curricula but not leading to recognised national certificates.Programmes can be short-term or long-term, usually offered by a wide variety of traininginstitutions. Even public institutions involved in formal TVET may offer non-formalprogrammes at spare times.
What is commonly called informal training is unstructured learning without curriculum andsyllabus. Traditional apprenticeship or on-the-job training are typical informal training systems.71
These delineations are often problematic in practice and differ from country to country. Forthe analysis it is important to reach at a pragmatic definition based on the terminology anduse of the terms within the country under analysis.
Duration and Type of Delivery
TVET programmes may be of longer or shorter duration. Formal training is usually long-term, while non-formal training is often (but not always) delivered through short-termprogrammes. School-/institution-based training, on the one hand, and on-the-job training,on the other hand, are typical alternative delivery modes. Formal apprenticeship trainingrepresents a special cooperative delivery mode where normally school-based training unitsare combined with structured on-the-job training in companies.72 Other distinct deliveryforms may include distance learning, e-learning, or training with production, among others.
Initial and Continuous TVET and Target Groups
Each TVET provider system may serve specific target groups and target segments of thelabour market. Programmes may provide pre-employment training for school leavers or skillsupgrading for the existing workforce. The latter is gaining importance to keep the workforceabreast of technological developments (life-long learning).
Formal training is usually exclusively targeted at school leavers. It can be provided at differentlevels, which usually target different age groups: primary school leavers in case of post-primary TVET programmes or secondary school certificate holders in case the TVETprogramme is designed as a post-secondary educational stream. In both cases, the targetlabour market may include both employment in the formal and informal sectors of theeconomy. In many developing countries, particular the informal sector is gaining importanceas a target labour market for TVET graduates, and programmes are reconfigured to betterprepare youth for the specific skills requirements of the informal sector.
Firm-based training is usually meant to directly prepare trainees for employment in the company,or to upgrade skills of the existing workforce. For pre-employment training, companies usuallyapply certain minimum requirement rules in terms of educational attainment of graduates.

EXAMPLE 10.1(Depicting Pathways):Pathways in the Education and Training System, Uganda, 2010Source: Authors.
GENERALEDUCATION
FORMALBTVET
NON-FORMALand INFORMAL
BTVET
LA
BO
UR
MA
RK
ET
Tertiary and highereducation
(diploma degreeprogrammes)
Tertiary BTVETdiploma/advanced
diploma programmes
Advanced Craftprogramme (Craft II)
Craft programme(Craft I)
Junior technicaleducation (UJTC)
Universal Primary Education (P1-P7)
Communitypolytech. (CPCE)
Senior secondary schoolS5-S6
LAB
OU
R M
AR
KE
T
Junior secondary schoolS1-S4
Non-Formal and informalTVET programmes
Leading to DITqualifications
(UICC, UCC andUMCC) and
othernon-formalcertificates
Tertiary BTVBTcertificate programmes
FIGURE 10.1 - Pathways in the Ugandan Education and Training System, 2010
Sub-Sector Specific Analyses 175
In the wide field of non-formal training each programme usually has its own specific targetgroup and target labour market. This segment usually caters extensively for out-of-schoolyouth and other marginalised groups, and prospective employment destinations ofprogramme completers vary. Traditional apprenticeships normally represent a career optionfor youth with low educational background and clearly prepares attendants for informalsector employment.
A specific case, not particularly dealt with in this chapter, are vocational programmesprovided as special subjects in general education, mainly at the secondary education level.
CHA
PTER10
TVET
Source: Author, based on Johanson and Okema, 2011 and Franz and Twebaze, 2011.Note: * This chart is an example. It represents the situation before the official introduction of the Ugandan VocationalQualifications Framework. Pathways are in transition at the moment.
The figure, specifically designed as an example for the purpose of these guidelines, takes stock ofthe different formal, non-formal and informal provider systems in the TVET system in Uganda andthe officially defined potential pathways between the different streams.

176 EDUCATION SECTOR ANALYSIS METHODOLOGICAL GUIDELINES - Volume 2
Regulatory and Quality Assurance Arrangements
There are different ways and institutional settings for regulating and supervising TVET.Sometimes different regulatory regimes operate side-by-side in one country. Typically, formalTVET programmes are run under ministries or authorities in charge of TVET, and theirexamination boards are in charge of assessments and certification. Sometimes, a paralleltrade testing system, typically under labour ministries, is charged with assessment andcertification for employment-oriented training programmes delivered through non-formaltraining programmes.
Sometimes, quality assurance (assessment/certification and accreditation of traininginstitutions) is conducted by foreign bodies. For example, City & Guilds qualifications arewidely used in many Anglophone countries. Foreign qualifications are also common inmodern (IT) occupations or higher levels qualifications, for example for accountants. Othertraining sub-systems, such as traditional apprenticeship systems, are entirely unregulated,despite catering for a considerable share of the entire national training supply.
Ownership and Management of Institutions/Providers
Public formal TVET is normally run and managed by either education or labour ministries,or under a public body in charge of TVET. Other sector ministries may complement the rangeof providers in the case of special training, for example in agriculture, tourism, roadconstruction, etc. A private training market as well as a segment of non-profit private trainingproviders (NGOs, faith-based organisations, etc) complements public training provision.
FindingsTechnical and vocational education streams in Uganda start at secondary level after completionof primary school. While there are options to move from general education into formal TVETprogrammes at all levels, the situation is more difficult the other way around. Only thecompletion of craft-level TVET programmes, which involves a cumulated post-primary educationof minimum 5 years, formally provides for re-entry into general education at higher secondarylevel. However, this option is in reality only open to those students who achieved the highacademic marks during their TVET programmes necessary to qualify for entry into this level ofsecondary general education. This, however, TVET students would rarely reach, because it isusually the academically weaker student who started in the TVET stream in the first place.
Within the TVET stream students can reach, provided the entry marks are achieved, into technicaldiploma level programmes. Thereafter, the career ladder stops. Entry from tertiary TVET (diplomalevel) into higher education is not foreseen, which is one important aspect contributing to therather low image of TVET among the student population. No recognition of non- and informallyacquired competencies, although certified within a parallel qualification system (DIT tradetesting), is possible within the formal TVET or education system.
Sub-Sector Specific Analyses 177
In many countries, the private training provider segment is larger than the public segmentin terms of operating institutions and aggregated enrolment. In Tanzania, for example,available data suggests a rapidly increasing role of the private training segment, which in2007 enrolled close to 80 percent of all vocational students.73 In many countries, largeparastatal or private companies represent an often high quality segment of the nationalTVET landscape. This includes the water and electricity sector, airline training and mining,among others.
Annex A10.1 shows the example of a stocktaking of the TVET provider landscape in Kenya,showing a relatively complex set-up of parallel programmes and courses, and qualifications.
This brief outline of different TVET provider systems demonstrates the diversity of TVET andillustrates the complexity of TVET analysis and data collection. It needs to be highlighted,though, that the worldwide trend to establish semi-autonomous or autonomous TVETauthorities and to build new unified qualification systems along qualification frameworksare usually meant to integrate at least the most important streams of TVET. Where such areform has progressed, data collection tends to be more straightforward.
An education sector analysis should aim to capture TVET in the analysis country ascomprehensively as possible, even if information in some segments is deficient. Theminimum focus of analysis should be on the formal public TVET system. However, takingstock of the wider TVET landscape and its alternative skills development options is importantto put access, equity and relevance issues into perspective.
DATA SITUATION FOR TVET SYSTEMS
The long neglect of TVET in public policies and the diversity of TVET system are the twomain factors that have contributed to statistical data on TVET being often not as easilyavailable as in the general education sector. In its analysis of TVET data availability of 2009,the UNESCO Bureau for Education in Africa identified a rather unsatisfactory availability ofquantitative TVET information in all Sub-Saharan African regions. The study establishedTVET data non-availability rates for various key indicators, which showed that data gaps areparticularly serious in West and Central Africa, and slightly better in East and SouthernAfrica. However, even in the latter part of Africa more than half of desired indicators cannotbe established due to data unavailability. For all African regions, data availability wasdecreasing over the years 2003 to 2006. The analysis also showed that data tend to bebetter for formal TVET, while non-formal and informal TVET provider systems are usuallynot well recorded. Furthermore, data are usually not well prepared for TVET at tertiary level,where data tends not to be disaggregated by technical and academic streams of learning.
CHA
PTER10
TVET
1.3

178 EDUCATION SECTOR ANALYSIS METHODOLOGICAL GUIDELINES - Volume 2
Nonetheless, the data situation appears to slowly improve, not least as a result of increasedefforts of UNESCO and other multi-national development agents to standardise indicatorsand to build data collection capacities in countries.
The following sections highlight in detail potential sources for various TVET key indicatorsto be obtained in the countries under analysis. A first glance on available data for the specificcountry and comparative cross-country data are also generally available from the UNESCOInstitute of Statistics (UIS) (http://www.uis.unesco.org) or the World Bank Africa RegionEducation Database.
In case of apparent data weaknesses, TVET researchers may consider conducting a baselinesurvey of TVET providers covering all relevant information on enrolments, programmesoffered, financial aspects, quality and relevance aspects. An example of a comprehensivequestionnaire for such a baseline survey used to assess the TVET landscape in Cameroon isattached in the annex (A10.2). Whether such a survey can be conducted as a census,covering the total population of public and private TVET institutions, or as a sample surveydepends on the size of the TVET sector in each country.

Sub-Sector Specific Analyses 179
To record initial access data a simple table as the one below may be used (see Example10.2).
CHA
PTER10
TVET
This section is divided into three sub-sections, addressing the analysis of access, equity andexternal efficiency, respectively. Reference is made to chapter 2 (enrolment and internalefficiency), chapter 5 (external efficiency) and chapter 6 (equity), which present the relevantanalysis for the overall education sector. In these chapters, TVET is also included as one sub-sector.
ACCESS
As discussed above, quantifying access comprehensively across the various provider systemsis challenging. Almost always gaps will remain that can only be filled by informed estimates.A detailed outline of the TVET landscape in the country under evaluation identifying thedifferent skills development paths and options as outlined in the previous section is a goodstarting point, because the identification of enrolment and intake quantities should usuallybe done separately for each provider system.
PERFORMANCE OF TVETSECTION
2
2.1
BOX 10.2Enrolment and Intake
In most TVET streams – notably in non-formal and informal TVET programmes and opportunities– training durations may vary from programme to programme and from level to level. It istherefore important to distinguish between enrolment and annual intake, because each indicatormay be used in different analysis contexts. For example, a unit cost analysis will require enrolmentfigures, i.e. a quantification of the number of students provided with training at a defined timeperiod. On the other hand, intake figures counting the number of students that started trainingin a particular year, is used to analyse transition rates from school to TVET, or between differentTVET programmes. Available data sources will usually use either one of these indicatorsdepending on the specific context, in which data are collected.

(Enrolment in Different TVET Provider Systems):Enrolment and Annual Intake, Fictional Country, 2007-11Source: Authors.
EXAMPLE 10.2
180 EDUCATION SECTOR ANALYSIS METHODOLOGICAL GUIDELINES - Volume 2
Table 10.3 includes fictitious figures and is an example for an initial stocktaking of the largerskills development access situation in a country. Note that the table may be complemented byextra columns showing the percentages of the individual provider system of the total enrolmentand intake.
Formal TVET post primary (3 years)
Formal TVET post secondary (3 years)
Parallel programmes in formal TVET institutions
NF training provided by NGOs/ other NF training providers*
Skills development programmes under the Ministry of Labour*
Firm-based training programmes(recorded minimum)*
Traditional apprenticeships*
Total estimated
Thousands Enrolment Annual intake
2007 2008 2009 2010 2011 2007 2008 2009 2010 2011
50.23
14.30
38.76
100.0
0.61
2.5
15.00
221.4
52.10
12.98
28.40
110.0
0.61
2.5
15.00
221.6
53.39
15.25
25.00
110.0
0.50
2.5
15.00
221.6
55.58
15.98
31.45
110.0
0.75
3.8
15.00
232.6
61.03
17.03
40.86
120.0
0.75
3.9
15.00
258.6
19.00
5.10
14.02
100.0
0.61
1.25
n/a
140.0
22.50
5.10
12.00
110.0
0.61
1.25
n/a
151.5
22.50
6.50
10.05
110.0
0.50
1.25
n/a
151.3
24.00
6.00
16.88
110.0
0.75
1.9
n/a
152.7
25.50
7.55
24.03
120.0
0.75
1.95
n/a
179.8
TABLE 10.3 - Overview of TVET Enrolment and Annual Intake in ‘000 (Fictitious)
Note: * rough estimates.
FindingsThe example by and large shows that only a smaller share of the entire TVET supply is providedby the formal TVET system, and that non-formal programmes provided by NGOs and privateproviders account for the single most important source of skills development. Roughly 120,000training places, measured as enrolment, are provided by the different streams of formal TVETin 2011 (including students in so-called parallel programmes, i.e. those who are not officiallyadmitted by government but taken on directly by institutions on a self-paying basis). The samenumber is recorded for NGOs, private providers and other non-formal providers. Slightly lessthan 10 percent can be attributed to informal training. However, it needs to be consideredthat data for informal training are weak and indicated figures most likely considerablyunderestimate the real capacities in this training segment. As formal training programmes lastthree years, annual intake at given training capacities is relatively lower than for non-formaland informal training schemes. Of 180,000 students who started training in 2011, less than60,000 were admitted to formal programmes, while the majority were catered for by non-formal and informal training segments.
Unless the ministry/authority in charge of monitoring skills development maintains anadvanced MIS and monitoring system, data for each provider system need to be assessedor estimated separately. Potential data sources and data collection problems are listed below.

EXAMPLE 10.3
Agriculture, Natural Resources and Environment
Business and Management
Engineering and Other Sciences
Health and Allied Sciences
Planning and Welfare
Total
Subject Enrolment Distribution of Learners, 2009/10
2006/07 2009/10
2,413
15,792
4,990
7,633
5,758
36,586
4,031
23,879
9,711
4,700
7,270
49,591
8.1 %
48.2 %
19.6 %
9.5 %
14.7 %
100.0 %
30.3 %
43.5 %
15.9 %
63.7 %
56.3 %
40.8 %
89 %
98 %
73 %
55 %
85 %
84 %
0.0 %
22.8 %
30.5 %
0.0 %
34.1 %
21.9 %
TABLE 10.4 - Enrolment in Technical Institutions, by Subject Area, Tanzania, 2006/07 and 2009/10
% bySubjectBoard
% ofFemale
Students
% in Public
Institutions
% on DegreeCourses
(Enrolment by Subject Area): Enrolment in Different Technical Institutions by Subject Area,Tanzania, 2006/7 and 2009/10Source: UNESCO/BREDA 2011, Tanzania CSR.
Table 10.4 presents enrolment figures by subject area (represented by Subject Boards) for twoacademic years in technical institutes under NACTE, the regulatory authority for higher technicaleducation in Tanzania.
Source: NACTE. Note: Figures refer to academic years (September to June).
Sub-Sector Specific Analyses 181
Until now, usually the formal, publicly financed and/or controlled TVET system representedthe main focus of the TVET analysis. This is owed to the fact that reasonably disaggregateddata over a significant time period are more often available for the formal system. Issuesaround the collection and analysis of access data in the formal TVET system will thereforebe the subject of more detailed elaboration. Nevertheless, it is good practice to developfurther information system analysis for the other TVET delivery modes.
2.1.1 ASSESSING ACCESS IN THE FORMAL (PUBLIC) TVET SYSTEM
Data Collection
Enrolment and annual intake data should be obtained for a reasonable time period, ifpossible in line with general education sector analysis time series (usually 5 years). Datashould be disaggregated by:
• Gender;• Level of training; and• Programme (trade or occupation), important to assess gender, quality and relevance issues.
CHA
PTER10
TVET

FindingsThe example shows that in the 2009/2010 academic year, business and managementprogrammes absorbed the majority of students (48%), followed by engineering (20%) andplanning and welfare (15%). All subject areas have witnessed growth as compared to three yearsbefore, except for health and allied science, which have seen the number of students drop by38% between 2007 and 2010.
182 EDUCATION SECTOR ANALYSIS METHODOLOGICAL GUIDELINES - Volume 2
EMIS data are usually the most comprehensive, but their reliability and comprehen-siveness is often limited reflecting the low status of TVET in many countries. It is important to verify, whether EMIS data only include public TVET institutions or publicly financed formal TVET, or the entire potential spectrum of formal training, which may also be provided and/or financed privately. For example, if formal TVET provision is publicly financed or subsidised, data often do not capture parallel training programmes, which are not funded by government but nevertheless considered formal, as they follow the formal curricula. Experience shows that in countries with weak EMIS and generally underdeveloped data collection culture, EMIS data is often incomplete. It is important to cross-check recorded data with other sources (see below). In cases, where formal TVET is not under the auspices of education ministries, but under a TVET authority, ministry of labour, or other providers, data may not at all be captured by EMIS. Also consider that there may be more than one formal provider system, which may not all be regulated by the same ministry or authority. For example, long-term school-based technical education may be under the education ministry (and as such most likely be included in EMIS), but formal apprenticeship training is regulated separately, for example by the labour ministry.EMIS rarely includes data disaggregated by occupational programmes.
EMIS
Source Comments
Parallel data sets, often collected through different methodologies, are usually available directly from the regulatory authorities, i.e. TVET authorities, or the ministries in charge. These are often based on school records and admission statistics, if admission to formal programmes is done centrally.
Regulatory authority
The office responsible for registration of private schools (often another unit in the education ministries) may avail data particularly of private schools, which is important if these are not recorded by public authorities. However, in rare cases these registers will contain enrolment and reliable capacity information. They may nevertheless allow for cross-checking the completeness of data provided by EMIS and regulatory authorities.
Registrar of schools
Training institutions
In any case it is advisable to cross-check central data directly at the level of training institutions, using a limited sample of institutions. In case, central data are very sketchy and incomplete, a survey of training institutions as suggested in Section 1 may be helpful. However, a survey would best need to cover the entire population of formal training institutions, as normally each institution has a very specific range of programmes and related size, making extrapolations based on sample surveys not reliable.
TABLE 10.5 - Overview of Sources to Establish Access in Formal TVET
Note: For more information, see UNESCO/BREDA, 2009.

Sub-Sector Specific Analyses 183
To establish the level of training the International Standard Classification of Education(ISCED) may be used to enhance international data compatibility.74 UNESCO classifies formalTVET at four different levels:
• vocational enrolment at lower secondary level (ISCED 2)• vocational enrolment at upper secondary level (ISCED 3)• vocational enrolment at post-secondary non-tertiary (ISCED 4)• enrolment at tertiary level (ISCED 5B).
The UNESCO Institute for Statistics (UIS) database contains TVET enrolment data by ISCEDlevel for a large group of countries, which may serve as a benchmark. However, data arebased on national statistics and are subject to potential inconsistencies and data gaps. Theydo not replace the need for an in-depth stocktaking of enrolment and intake figures usingin-country data sources. Another limitation of the UIS database is that it only capturestraining programmes that can be classified under ISCED, i.e., only those with specifiededucational background requirements. Usually the following in-country sources are availablein most countries to establish access base data for formal TVET.
CHA
PTER10
TVET
Indicators of Access
Labour market demands vary from country to country. It is therefore difficult to determinea generally applicable optimum level of participation in TVET. Enrolment rates according todifferent indicators vary widely among countries and regions.
• Indicators Suggested by UNESCO – TVET Access
The TVET transition rate is the number of new entrants admitted to the first year of a cycle inthe TVET system in a given year expressed as a percentage of the number of students enrolledin the final year of the preceding cycle in the previous year:
The Proportion of TVET in Secondary Education is the number of TVET students at ISCED 2and 3 as a percentage of the total number of students at the same level:
The Private enrolment ratio is the proportion of TVET students trained in the private sector ina given school year:
The Annual growth rate of TVET students:
New entrants in year one of a given TVET cycle in year N x 100
Number of students in the final year of the preceding TVET cycle in year N-1
(Number of students in TVET for year N) – (Number of students in TVET for year N-1) x 100
Number of students in TVET in year N-1
Number of students in private TVET institutions for year N x 100
Total number of students in TVET programmes for year N
Number of students in TVET at the secondary level x 100
Total number of students at the secondary education level
Source: UNESCO/Regional Bureau of Education for Africa, 2009. Regional Contribution to Statistical Information SystemsDevelopment for Technical and Vocational Education and Training. Diagnosis for Identifying Quality Improvement Strategies. Dakar.

For benchmarking purposes different indicators can be used. A list of indicators suggestedfor access analysis by UNESCO is presented here. Potential indicators, to be selected inaccordance with available data, include:
1) TVET as a share of secondary, which shows the TVET enrolment at a given educationlevel as a percentage of the total number of students enrolled in all programmes (TVETand general education) at that level. This indicator underlines the relationship betweenthe development of general secondary and that of TVET. The indicator can be computedfor each level, according to the specific organisational structure of TVET programmes;
2) Annual growth rate of TVET students measuring the development of TVETenrolment/access at given levels over the years;
3) Private enrolment ratio, which shows the proportion of TVET students trained in theprivate training sector. This indicator helps analysing the relative importance of publicand private training supply, and possibly changes over the years. The indicator can becomputed for all TVET learners or by level, according to data availability;
4) Number of TVET students per 100,000 inhabitants, as illustrated by Example 10.4below. The World Bank has compiled a considerable database for this indicator. Theadvantage of this indicator is that it uses TVET enrolment data at all levels and istherefore easier to administer in cases where ISCED classifications are not easy andclear-cut; and
5) The transition rate, that analyses the flow of learners through TVET and measuresthe effective mobility between different education system cycles.
TVET enrolment varies from country to country. Measured as a percentage share of totalsecondary enrolment, for example, 2006 UIS data show that average shares in Sub-SaharanAfrican countries were lower than in other parts of the world, albeit significantly growingbetween 1999 and 2007. Rates are generally higher in francophone countries, with thehighest shares in Rwanda (36 percent).75
184 EDUCATION SECTOR ANALYSIS METHODOLOGICAL GUIDELINES - Volume 2

EXAMPLE 10.4
(Comparison of TVET Enrolment between Countries): TVET Students per 100,000 Inhabitants in Malawi, 2008, as Compared with Other SADC Countries, 2008Source: Adapted from Malawi CSR, 2010.
Sub-Sector Specific Analyses 185
CHA
PTER10
TVET
FindingsRecorded enrolment figures for Malawi show that only 35 in every 100,000 inhabitants areenrolled in TVET programmes, which represents the lowest value of all countries, for whichcomparative data were recorded. According to available figures, the relative TVET supply inMauritius is 45 times higher than in Malawi. It is evident that those countries that show arelatively good supply situation, such as Mauritius, Botswana and South Africa, are all belongingto the higher income groups.
2,000
1,500
1,000
500
0
1,561
1,228
788
427
133 125 109 35
Mau
ritiu
s
Bots
wan
a
Zam
bia
Mad
agas
car
Moz
ambi
que
Leso
tho
Mal
awi
FIGURE 10.2 - TVET Students per 100,000 Inhabitants in Malawi and Selected SADC Countries, 2008
Sout
h Af
rica
Figure 10.2 presents comparative figures about enrolment in formal TVET as a share of thetotal population in selected African countries. Data was taken from a database compiled bythe World Bank through education sector analyses and other relevant analyses. It should benoted that the analysis of such a comparison is problematic mainly for the reasons that itcannot be guaranteed that for each country figures represent the entire training supply,including formal, non-formal and informal TVET. Data deficiencies, which occur often fornon/informal TVET lead to lower overall values.
Understanding Access Problems
Reflecting the increased interest in most countries in skills development, TVET enrolmentrates will often fall short of countries’ own targets leading to expansion policies. It is in thiscontext useful to undertake some analysis of the causes of low enrolment. Such an analysiswill often show that the aspirations of the target population and TVET managementstructures are often as much a problem as undersupply with TVET opportunities.
The most common reasons for low TVET enrolment rates are usually:

186 EDUCATION SECTOR ANALYSIS METHODOLOGICAL GUIDELINES - Volume 2
1. Insufficient training offers in terms of physical facilities and range of training offers byoccupation or level. Often, training supply differs considerably between rural and urbanareas, or between regions.
2. In many countries, a detailed look at supply structures and enrolment will revealcapacity underutilisation. What can best be evaluated through direct visits to traininginstitutions is the fact that often training programmes are not fully occupied, andtraining facilities grossly underused. This may be caused by:
• Lack of interest of the target group, related to an outdated range of programmesoffered in a supply-driven training organisation, to curricula that are not relevantto labour market needs, and/or to high costs of participation.
• Insufficient management of training capacities, whereby training programmes arecontinuously offered without effective demand or are under-resourced in terms ofteachers/instructors, training material and equipment. It is also common in publicformal TVET institutions that programmes are strictly offered in accordance withacademic calendars preventing flexible delivery structures that may raise enrolmentat a given resource level, through double shifts, weekend and holiday programmes,etc.
The following table provides a list of possible questions and information sources to identifypotential causes of low access:
TABLE 10.6 - Key Questions and Information Sources for Access Issues
Insufficient Training Supply
Access Problem
Key Questions to Identify Access Problems
Data Needed Data Sources
Are national TVET capacities sufficient to cater for the potential demand? (demand measured in national enrolment targets or other indicators).
- Actual training capacities - National enrolment targets for TVETCalculate the percentage of actual capacities in relation to enrolment targets.
EMIS; national enrolment statistics; education/TVET sector development plans (see above).
- Mapping of TVET institutions;- Location of TVET capacities by region or district;- Population distribution by region or district, or distribution of school- leaversCalculate percentage of TVET capacity relative to population for each region or district.
EMIS; information by TVET authority or responsible ministry; population statistics or school-leaver stats from EMIS.
EMIS; TVET regulatory authority or ministry; individual school visits; TVET institution survey.
- Policy on boarding- Actual availability of availability boarding facilities.
Are TVET institutions evenly distributed in the country in relation to the population distribution?
If TVET institutions are concentrated (typically in small countries), are boarding facilities sufficiently available that cater for students from outside?
▶

Sub-Sector Specific Analyses 187
TVETCH
APTER
10
Capacity Underutilisa-tion
Management Problems
Insufficient Interest of students in TVET
Insufficient Effective Demand for TVET
TVET regulatory authority or ministry; EMIS, national enrolment stats.
Data as above; TVET institution survey; interviews with selected training institutions.
See section 5;EMIS; TVET regulatory authority or ministry; tracer studies; Other TVET studies
EMIS; TVET institution survey; site-visits and interviews with TVET institutions
- Calculated overall enrolment capacity- Actual enrolment- Calculate actual enrolment as a percentage of capacities.
- Data as above, disaggregated by programmes (skill areas), level of training, and rural/urban- Calculation as above disaggrega- ted by listed criteria.
Do actual enrolment match enrolment capacities?
Are there notable differences between capacity utilisation between programmes, types of institutions or levels of TVET?
Are programmes offered in existing TVET institutions in line with demands from students and the labour market?
Are appropriate input resources (instructors/teachers, training material, workshops, equipment) available to offer all programmes in accordance with curricula?
Could TVET institutions increase their intake by better using their resources, i.e. through double shifts, more flexible training organisation, training provision in the evening, on weekends or during holidays? If not, what prevents them to do so?
Are TVET institutions allowed to modify the range of courses offered to respond to demand?
What is the reputation of TVET in general, and among school leavers in particular?
Are there any other known factors that prevent students from entering TVET programmes?
Do high fees (tuition and boarding) prevent school-leavers to enroll in TVET?
Are scholarships available for interested poor students to cover cost of training and possibly opportunity costs?
- Information on scholarships and accessibility rules - Data on actual scholarships- Data on actual training costs to be borne by students.
TVET regulatory authority or ministry; TVET financing and cost studies; TVET institution survey.
- Regulations and guidelines on TVET management.
- Perception and reputation of TVET.
- Information on actual fees, in relation to fees payable in general education;- Perception of impact on fee levels.
Relevant legislation (TVET Act, Education Act, management regulations); interviews with TVET managers at school level and TVET regulatory authority/ministry.
- Perception surveys; TVET sector studies and policy documents; interviews with stakeholders, instructors, parents and students.
Interviews with stakeholders, students, parents and teachers, special studies.
Accreditation bodies; TVET financing studies; TVET institution survey; interviews with stakeholders.
- Qualitative management information.
TVET Institutions Survey; interviews with TVET institutions.
- Data on external efficiency (see Section 5)- Range of programmes offered- Perception surveys- TVET policy studies.
- Data on TVET institution facilities and resources.
2.1.2 ASSESSING ACCESS TO NON-FORMAL AND INFORMAL TVET
As highlighted before, it may be difficult to quantify enrolment and intake in other thanformal TVET provider-systems to an extent that is sufficiently reliable and comprehensive tointegrate it into quantitative analysis. In cases, household surveys or labour force surveys willprovide indications about access of the labour force to skills development at an aggregated

level. In any case, an education sector analysis needs to make an attempt to capture allavailable information in order to demonstrate the extent to which alternative TVET pathscomplement the formal supply. The following table provides some indications about possibledata sources for the most important non/informal training streams found in many countries.
EQUITY
An important equity concern within an education sector analysis refers to access by gender.However, equity issues may also arise with respect to access of the poorest, of studentsliving in marginalised areas (such as less developed regions, rural areas or conflict-affectedareas), people with disability, and religious or ethnic minorities. The focus will thereforedepend on the specific country context. The following section introduces analytical questionsand methodologies with respect to gender equity, and subsequently briefly touches uponother equity issues, in particular related to social status.
Often, marginalised groups are specifically addressed by non- and informal TVET streamsprovided by non-public organisations. An equity analysis should therefore always take theentire TVET spectrum into consideration.
2.2.1 GENDER EQUITY
Indicators and Sources
Gender equity is usually measured by the female participation rate (FPR) expressing thepercentage of female students of the entire student population. The formula to be used is:
188 EDUCATION SECTOR ANALYSIS METHODOLOGICAL GUIDELINES - Volume 2
Non-Formal Skills Development Programmes Provided by Government Ministries and Institutions
Non-Formal Skills Development Programmes Provided by NGOs and the Private Training Market
Firm-Based (in-Company) Training
Traditional Apprenticeship
Data is rarely systematically recorded at an aggregate level. Previous sector studies may have captured relevant supply. Data can usually best be obtained directly in the relevant ministries and authorities. Typically these include ministries of labour, agriculture, trade and industry, health, tourism and transport, investment authorities, and the like, as well as public utility and other companies such as telecom, water and electricity corporations, airlines, etc. Budget appropriations for training under the relevant sectors may provide an initial starting point for identifying relevant organisations.
Register of accredited training providers with regulatory authorities (typically education and/or labour ministries, or TVET authorities); TVET provider directories; data compiled by private training provider associations, studies on non-formal training. Indirect sources also include trade test registration data or data from similar assessment and certification systems accessible for completers from non-formal training.
Studies on in-company training; Investment Climate Assessments; documents with chambers of commerce and employers organisations.
Studies conducted in the context of micro and small enterprise and informal sector development initiatives and traditional apprenticeship support, interviews with informal sector operators and business associations.
Provider Systems Potential Sources
TABLE 10.7 - Potential Sources to Identify Access in Different (Non-Formal) Provider Systems
2.2
Source: Author.

EXAMPLE 10.5(Female Participation Rates in Different TVET Streams): Enrolment by Gender and Type of Public Institutions, Uganda, 2009.Source: Adapted from Johanson and Okema, 2011.
Sub-Sector Specific Analyses 189
CHA
PTER10
TVET
All enrolment and intake statistics are usually gender disaggregated providing the mainsource for a gender analysis. In TVET, FPRs vary considerably by trade/occupation. As far asdata allows, the gender analysis should always include this dimension as well. Usually, FPRsalso vary considerably between different TVET levels, often based on the fact that typicalmale or female occupations are more or less frequently occurring at different levels. Lowerlevel TVET is often dominated by traditional technical trades, while modern officeoccupations, usually more attractive for girls, are often dominating the TVET supply at post-secondary level, as demonstrated in example 10.5.
• Key Definitions
Female Participation Rate (FPR):
Number of females enrolled in TVET (or the specific segment of TVET under consideration) x 100
Total number of enrolled students in TVET (or same specific segment)
Enrolment
Male Female Total
%Female
8,511
4,943
889
2,679
9,313
7,564
1,749
8,404
1,844
2,054
1,842
1,268
672
724
26,228
2,314
1,364
274
676
1,464
1,299
165
4,878
116
1,745
828
844
723
622
8,656
10,825
6,307
1,163
3,355
10,777
8,863
1,914
12,832
1,960
3,799
2,670
1,662
1,395
1,346
34,434
21
22
24
20
14
15
9
38
6
46
31
24
52
46
25
TABLE 10.8 - Enrolment by Gender and Type of Public Institutions, Uganda, 2009
Lower level- total
Technical Schools
Farm Schools
Comm. Polytechnics
Middle level- total
Technical Institutes
Voc. Training Institutes
Tertiary level- total
Technical Colleges
Colleges of Commerce
Health Institutions
Agriculture & Related
Cooperative Colleges
Management Institutes
Total
The table records enrolment in different formal TVET streams in Uganda by gender and calculatesthe female participation rate. A similar table may be constructed for main occupational areas(such as construction courses, agriculture, engineering, manufacturing, textile, office services,handicraft, etc.).

If EMIS statistics or data from the TVET regulatory authorities are not disaggregating byoccupations, data from examination boards on participation in assessments may be usedas a proxy.
While participation of girls in TVET may be on the rise in many countries, structural barriersmay still prevent them from being as successful as their male peers. A gender disaggregatedcomparison of examination pass rates may serve as a starting point to identify potentialgender-specific performance barriers. The Malawi CSR of 2010, for example, revealed thatfemale pass rates have constantly been between 10 percent and 20 percent below the ratesfor male students, indicating special performance problems of female students. A similaranalysis may be conducted with respect to drop-out rates, if data allow.
190 EDUCATION SECTOR ANALYSIS METHODOLOGICAL GUIDELINES - Volume 2
FindingsThe figures show a relatively uneven FPR between the three different levels of TVET, and betweendifferent types of schools. The FPR is with 14 percent on average particularly low at the middle-level (upper secondary level). This is a result of the dominance of traditionally male-dominatedfields of training in technical institutes and vocational training centers. Note also the enormousdifference in FPRs between technical colleges and Colleges of Commerce at tertiary level. Thiscan be explained by the fact that colleges of commerce offer more than any other type of TVETinstitution courses that are attractive to female students (secretarial, accountancy, management,and so on).
Total across occupational fields
Construction occupations
Engineering trades
Manufacturing
Office management/services
Agriculture
…
FPR in 2005 in % FPR in 2008 in % FPR in 2011 in %
TABLE 10.9 - Example of a Table to Compare FPRs Over Time, by Occupational Field
As gender equality has featured prominently in education policies in the past, time seriesfor FPRs are useful to analyse whether participation rates have actually been increasing inthe years under analysis. This should preferably be done by occupational areas, if data allow,in order to establish whether increasing FPRs are a result of a diversification in the range ofprogrammes offered, or of an increase in female enrolment in traditionally male trades.Table 10.9 suggests how such a table can be constructed.

Sub-Sector Specific Analyses 191
CHA
PTER10
TVET
Understanding Gender Issues in TVET
Gender dimensions in TVET are influenced by certain specific factors. An analysis of thefactors of growth of the parity indexes is therefore an important contribution to thedevelopment of pro-gender policies in TVET. These factors include:
1) Arguably, the most important determinant of female participation is the range oftrades/occupational areas, for which TVET is offered. By and large the traditionalgender segregation in occupations remains, although some countries have madeprogress in increasing the share of girls in traditional male trades (metalwork, welding,electrician). An analysis of what drives increasing FPR (more girls in traditionally maletrades, or more trades that are traditionally female) is an important input into thedevelopment of effective gender affirmative action policies in TVET.
2) Another factor may be the share of female TVET teachers/instructors, and theanalysis may also consider including an examination of correlations between thedevelopment of female participation and the share of female teachers/instructors inthe system.
3) Reasons for low performance and high drop-out rates of girls despite of increasing FPRsoften lie in an hostile learning environment for females. These are structurally thesame as in general education and include the low availability of female teachers (servingas role models), insufficient availability of dormitories and lavatories for girls as well asdiscriminatory practice and sexual harassment.
4) Dropping-out, as for general education, is often caused by pregnancy.
In most cases, such factors can only be identified through qualitative means (i.e. interviewswith headmaster and teachers, gender officers, female students).
2.2.2 OTHER EQUITY ISSUES
Equity in TVET also means that all students (and other potential target group for that matter)have the chances to attend training if they wish to irrespective of their social status andwhere they live or come from. The following paragraphs briefly touch upon some equityaspects relating to social status and locations.

Equity by Social Status
An education sector analysis should try to assess to what extent the poor have access toTVET programmes, and what determinants effect their chances to attend.
National statistics, such as household surveys, usually provide sufficient data to analyse thechances to access education and training at different levels of education by socialbackground of their households, measured in income quintiles. This analysis has beendescribed for the entire education sector in chapter 6. A more detailed analysis, allowingfor a more disaggregated analysis by TVET level and TVET providers systems may not bepossible, because often household survey data do not distinguish between different TVETstreams. Interesting is also a beneficiary incidence analysis estimating the distributionalimpact of public spending on TVET for different income groups. Reference is made againto chapter 6, which includes a discussion and methodological guide to such analysis.
Some factors explaining findings related to access to TVET by social status include:
1) High training costs may create a barrier for access by students from poor households. TVETprovision is more costly than primary and general education (see chapter 3), and this maytranslate into tuition fees that are above those due in the general education system. Ontop of this, TVET institutions are often away from where people live adding extra costs foraccommodation (boarding) and extra food. Furthermore, trade testing and otherexamination costs are due, and these are often more costly than in general education.
2) In many countries, state-funded scholarships (or stipends) are available for a selectednumber of students attending formal TVET. Scholarships act to ease the financial burdenfor the poor. However, often scholarships are awarded not on the basis of social need,but on merit, i.e. the best students win the stipend. Presumably, the economically betteroff students fare best in school (see also the analysis in chapter 6). In this case,
192 EDUCATION SECTOR ANALYSIS METHODOLOGICAL GUIDELINES - Volume 2
Are training costs prohibitively high and create an access barrier for the poor?
Are scholarships or other financial support schemes (loan schemes) available to TVET students to mitigate access problems through high training costs?
Are scholarship awarded purely on merit, or do the award rules include some positive discrimination (quotas, etc) in favour of the poor?
Are the poor discriminated in TVET because they are more likely to come from rural areas or less developed regions?
Are the poor discriminated in TVET because they are less likely to reach the educational entry requirements for TVET programmes?
How effective are positive discrimination schemes?
Are fees (total fees including tuition, boarding and other fees) in TVET higher than in the comparable stream in general education?
High Training Costs
Issue
Impact of Scholarships
Low Access to Education?
Key Questions
TABLE 10.10 - Summary of Key Questions to Assess Issues Related to TVET Access by the Poor

EXAMPLE 10.6(Access to Student Loans): Student Loans, by Level and Type of Institution, Tanzania, 2008/09 Source: Adapted from the Tanzania CSR, 2011.
Sub-Sector Specific Analyses 193
CHA
PTER10
TVET
scholarships do not act to counter discrimination on social grounds, but rather re-enforce them. This is also the case, if scholarships or loans are predominantly awardedto students in higher education streams (see Example 10.6).
3) In the same way, minimum educational attainment requirements for admission to TVET(depending on the TVET level either primary school, lower secondary school or uppersecondary school certificate) tend to discriminate against the poor, as students frompoor households are often less likely than students from better-off households to reacha higher level of schooling.
The table taken from the Tanzania CSR of 2011 indicates social expenditures in the highereducation and post-secondary technical education system that is given out as student loans.Three main factors determine the targeting of this kind of social expenditure: (1) the share ofstudents that benefit from loans; (2) the average amount of the student loan; and (3) the shareof that amount that is transferred directly to students for their expenses.
HigherEducation
TechnicalNonhigher
Total
47.9%
43.0%
65.4%
2.18
1.96
2.69
6.23
70.0%
74.2%
62.7%
56,798
39,858
16,940
1,034
1.3%
0.6%
3.9%
2.37
2.25
2.43
-
69.9%
76.1%
67.0%
398
133
265
0
38.50%
34.60%
52.60%
2.18
1.96
2.69
6.23
70.00%
74.20%
62.80%
57,196
39,991
17,205
1,034
TABLE 10.11 - Social Expenditures, by Level and Type of Institution, Tanzania, FY 2008/09
Share of Student Loan Beneficiaries (%)
in Government Institutions
In Nongovernmental Institutions
Amount of the Loan (Millions of T Sh)
Students in Government Institutions
Students in Nongovernmental Institutions
Overseas Scholarships
Share of the Loan Transferred Directly to Students
Students in Government Institutions
Students in Nongovernmental Institutions
Memo Items
Number of Loan Beneficiaries
In Government Institutions
In Nongovernmental Institutions
Overseas Scholarships
FindingsA total of 57,196 students benefited from the student loan scheme, representing 38.5 percentof all students in public and private postsecondary institutions. Approximately 70 percent of theaverage loan value was directly transferred to students. The value of the loan was in line withthe Tanzanian cost of living. However, the share of higher education students benefitting from

194 EDUCATION SECTOR ANALYSIS METHODOLOGICAL GUIDELINES - Volume 2
Relevant data for assessing the above-mentioned issues are provided through analysisdescribed in other chapters of the guidelines, notably chapter 3 for data on training costs,section 3 of this chapter specifically on training costs in TVET and chapter 6 for data oneducational attainment and success in school by social background of students. Informationon how scholarships are awarded is available with the granting authority in the TVETregulatory authority or ministry.
Access Constraints by Location and Urban/Rural
TVET institutions are often not equally distributed in countries. Some regions may beunderserved, and often supply is less in rural than in urban areas. This is usually caused bythe nature of TVET, which needs to be concentrated for efficiency reasons and gains frombeing close to industry. Yet, the spatial distribution of TVET supply is often a major politicalconcern leading to costly expansion plans by governments.
Factors that influence the spatial supply and need to be considered when looking at equityissues by location and rural/urban divide include:
1) The spatial distribution of TVET supply usually varies considerably between levels ofTVET. Basic training institutions providing lower level skills development may be morewidespread and also reaching the rural areas. In many countries TVET policies aregeared towards supply expansion with the aim of establishing decentralised TVETfacilities throughout the country. These programme usually target lower level TVET,such as post-primary training provided in skills development centers, youth polytechnics,etc. The situation is different in higher level TVET requiring more sophisticated facilitiesand offering more specialised programmes. Institutions are fewer and concentrated.
2) TVET institutions tend to be located in urban areas, simply because good quality TVETbenefits from the vicinity to markets and production. TVET institutions in rural set-upsencounter more difficulties to include business people in their governing boards, toorganise industrial attachment opportunities for their students, to market goods andservices produced during training for income generating purposes, to attract goodteachers and to increase the quality of the training services through interaction withreal producers. Political plans to place TVET institutions in rural areas in order to increaseaccess for the rural population and to increase the attractiveness of rural life thereforehave to consider the trade-off between accessibility and relevance.
the loan scheme (48%) was dramatically higher than the share of TVET students (1.3%). Theshare in higher education appears to be excessive and clearly inequitable considering the factthat less than 10 percent of postsecondary students’ families are from the poorest quintiles.

Sub-Sector Specific Analyses 195
CHA
PTER10
TVET
An education sector analysis should as a minimum attempt to map the TVET supplythroughout the country by level and, if possible, occupational field to produce evidenceabout the spatial supply.
EXTERNAL EFFICIENCY
TVET programmes are specifically designed to prepare completers for work.76 Externalefficiency indicates the relevance of TVET programmes vis-à-vis the skills and competencyrequirements of the labour market. A detailed description of the labour market context ofTVET will usually be included in the external efficiency chapter of the education sectoranalysis. Chapter 5 of these guidelines introduces more.
A well planned TVET system needs to be based on appropriate labour market analysis, andprogrammes need to be constantly fine-tuned and modified in order to meet changing skillsneeds and competence requirements in the world of work, i.e. through regular adjustmentsin curricula and in the selection of programmes offered. Programmes also stay relevant, ifthey are delivered close to the world of work and in close cooperation with industrial expertsand business representatives.
This section focuses on indicators to measure the relevance of training delivery, indicatorsto assess the match between qualifications and competencies obtained by TVET graduatesand needed in the labour market, and necessary analytical structures and services tosafeguard external efficiency.
Measuring external efficiency of TVET often faced considerable challenges in the past, dueto the fact that sufficiently disaggregated data about labour market outcomes in relationto TVET careers were weak or not available at all. With the growing interest in TVET bygovernment and development partners, this situation is slowly changing, with morecomprehensive tracer studies conducted, for example. A brief introduction into tracer studiesis provided in annex 5.5.
2.3.1 RELEVANCE OF TRAINING DELIVERY
The way TVET courses are structured and delivered has an impact on its relevance, i.e. thelikelihood that students will obtain those skills and attitudes that the labour market requiresleading to good employment chances of graduates, and to employer satisfaction with theoutcome of TVET.
2.3

International experience shows that training is more relevant the more companies areinvolved in training, and the more the curriculum is integrating workplace and jobexperience. Involvement of companies in training delivery can be organised throughindustrial attachment, or more strongly through cooperative training delivery modes, ofwhich formal apprenticeships represent the most advanced form. Alternatively, or in additionto sharing the responsibility for training delivery, TVET institutions may also integrate someworkplace exposure measures (e.g., regular enterprise visits) or incubator services into theiroperations. Running school businesses, as part of the training organisation or as extra-curricular activity may be another way to sensitise and better prepare students for theirfuture professional destinations.
To capture the relevance of training in this sense, UNESCO is suggesting (and compilinginternational comparable data on) some indicators to capture the relationships of TVETinstitutions and the world of work. Some of these indicators, listed and further explainedin the following UNESCO's key indicators:
1) The share of secondary/tertiary level students in dual training measures therelevance of TVET by assessing workplace vicinity in the TVET system. The indicatorassumes that dual (or cooperative) training is closer to the world of work than mereschool-based training;
2) The ratio of TVET courses with compulsory practical training in enterprisesmeasures the relevance of TVET in terms of workplace exposure, and the incorporationof this exposure in the curriculum;
3) The proportion of TVET institutions carrying out at least one visit to anenterprise every year measures the relevance of TVET by assessing the possibility ofobtaining exposure to the world of work. Data are obtained through TVET institutionsurveys; and
4) The ratio of TVET institutions with an enterprise incubator or any otherprofessional activity involving students measures the relevance of TVETprogrammes through assessing the availability of self-employment promotion servicesavailable to students. The data are obtained through TVET institution surveys. Thisindicator is particularly relevant in countries where the importance of self-employmentas an outcome for TVET graduates is high.
196 EDUCATION SECTOR ANALYSIS METHODOLOGICAL GUIDELINES - Volume 2

Sub-Sector Specific Analyses 197
CHA
PTER10
TVET
Data to compute these indicators can be obtained from the ministry/authority in charge ofTVET, or possibly through EMIS, in case of the first two indicators. Whether industrialattachment or not is mandatory, is usually a curricular issue. Note that mandatory industrialattachment may not always imply that attachment places are actually available for allstudents. Particularly in countries with a small industrial base TVET institutions find it oftendifficult to secure attachment places for the growing number of TVET students.77
2.3.2 VALUE OF TVET QUALIFICATIONS IN THE LABOUR MARKET
The best measurement for assessing the value – and more specifically the relative value ofdifferent TVET schemes in one country, if data allow for comparative analysis – of TVETqualifications in the labour market are jobs and wages.
Measuring Professional Integration and Conformity
It is suggested to compute two indicators to assess whether TVET graduates findemployment after training, and whether this employment is related to the actual programmethat graduates had attended:
• Key indicators suggested by UNESCO – TVET’s market responsiveness
The percentage of secondary/tertiary level students in dual training is the ratio of studentsenrolled in dual training programmes, where parts of the training is delivered in a company-context:
The ratio of courses in TVET with compulsory practical training in enterprises:
The proportion of TVET institutions carrying out at least one visit to an enterprise every year:
Ratio of TVET institutions with an enterprise incubator or any other professional activityinvolving students:
No students in dual training x 100
Total No of secondary/tertiary level students
No of TVET institutions with some type of professionalactivity involving students or support to self-employment x 100
No of TVET institutions
No of TVET institutions carrying out an annual visit to an enterprise x 100
Total No of institutions
No of TVET courses with compulsory practical training in enterprises x 100
Total No of TVET courses

1) The net integration rate after X years shows the percentage of TVET graduates whohave secured employment, measured after a specified number of years aftergraduation. The indicator measures the external efficiency of TVET, to assess the fieldsand sectors where professional integration occurs fastest and best. Data may beobtained from tracer surveys, possibly also household or labor force surveys. Jobsinclude formal and informal sector employment;
2) The conformity rate (or training-related employment rate) enables the assessmentof the match between training and employment. Data are available from HHS of LFS.It is also possible to compute this indicator in a modified way from tracer studies takingthe entire employed graduate population as a basis. It is best to disaggregate by fieldof study, and by formal/informal sector employment. Conformity between educationand employment is strong when the conformity rate exceeds 50%.
Net Integration Rate
Data required to calculate this indicator include employment status by TVET qualification,and year of qualification. Data availability may be the biggest challenge here. Labour forcesurveys (LFS) and household surveys (HHS) often provide comprehensive data sets onemployment status. The main bottleneck here is the availability, reliability andcomprehensiveness of base data on educational background. Often, TVET is not at allincluded as a distinct educational classification. Where it is, the level of disaggregation isoften an issue. TVET is often not classified by educational level, and rarely by type of TVET(formal/non-formal; long-term/short term). For example, data available for the CSR Malawionly allowed an analysis of completers of formal post-secondary TVET by employmentsector.78
The education sector analysis may also consider conducting a tracer survey of TVETgraduates (see annex 5.5), if this has not already been done by the ministries/authorities incharge of TVET. Tracer surveys usually contain more disaggregated information about labourmarket outcomes by programmes and occupational fields. Hence they allow to compare
198 EDUCATION SECTOR ANALYSIS METHODOLOGICAL GUIDELINES - Volume 2
• Key indicators suggested by UNESCO – Job integration of TVET graduates
The net integration rate after x years is the ratio of graduates who have secured employmentX years after obtaining their qualification:
The training related employment rate/conformity rate is the ratio of workers in jobs thatcorrespond to their initial field of study:
No of graduates (by sector or field of study)who completed school after, at most, X years and who now have jobs x 100
No of graduates per area or field of study in the cohort
No of persons plying a trade that corresponds to their training x 100
No of persons working in the area of activity

EXAMPLE 10.7
(Comparison of Income of TVET Graduates by Occupational Group to Analyse External Efficiency): Mean Monthly Income of TEVETCompleters by Occupational Groups, Malawi, 2009Source: Adapted from Malawi CSR 2010.
Sub-Sector Specific Analyses 199
CHA
PTER10
TVET
FindingsThe tracer study findings demonstrate considerable differences in the returns for TVET completersby field of study. Steel workers, specialised technicians (e.g., refrigeration) and those completersworking in modern office occupations earn relatively more than car mechanics, cooks orbricklayers indicating a higher demand for those specialists in the labour market. The findingscan partly also be explained by the fact that most of the below average paying occupationalspecialisations tend to lead to employment in the informal sector.
Figure 10.3 was constructed from results of a tracer study conducted among TEVET and highereducation completers in Malawi in 2008.
40,000
35,000
30,000
25,000
20,000
15,000
10,000
5,000
0
MK
Stee
l fixi
ng
Othe
r (sp
ecify
)
Refri
gera
tion
& Ai
r con
ditio
ning
Haw
ker
Com
pute
r Scie
nce
Secre
taria
t, Adm
in. &
Acc
ount
ing
Woo
d M
achi
ng/Fa
b. &
Weld
ing
Carp
entry
and
join
ery
Beau
ty Th
erap
y
Aver
age
Gene
ral F
ittin
g
Brick
Layin
g
Pain
ting
and
Deco
ratio
n
Electr
ical In
stalla
tion
Electr
onics
Car M
ainte
nanc
e
Tailo
ring
and
desig
ning
Plum
bing
Food
pro
ducti
on
Hosp
italit
y Ser
vices
Food
pro
cess
ing
FIGURE 10.3 - Mean Monthly Net Income of TEVET Completers, Malawi, 2008
external efficiency across programmes (i.e. apprenticeship vs. school-based programmes,long-term vs. short term), provider systems (i.e. private/public) or occupational fields. Assuch they are not only providing information about the external efficiency of TVET as awhole, but also assist in sector planning and priority setting in terms of training modes tobe specifically supported and training fields to be expanded or dropped.

Conformity Rate (or Training-Related Employment Rate)
Data to compute this indicator may be obtained from labour force surveys, or through tracersurveys.79 Again, tracer studies usually allow for a more precise disaggregation by field ofstudy and type of training programmes. In case a tracer study is conducted data will alsoallow for a simple tabulation of average wages earned by graduates by occupational field,which is instrumental in assessing the relative value of training by occupational field, as canbe seen in example 10.7.
Results for assessment of integration and conformity rates, and average wages, have to becarefully analysed with a view to labour market determinants. For example, a low integrationrate (i.e., a high unemployment rate of TVET graduates) may be explained by an oversupplywith qualified workers, or simply by the fact that employers, despite of demand, are notsatisfied with the skills, competencies and/or attitudes of the TVET graduates. In the formercase, the finding would indicate the need to down-size the TVET supply in the particularoccupational field. In the latter, the finding would point to the need to improve the qualityof training. A sudden drop in the integration rates may also be the result of an economicdownturn leading to increased unemployment.
Considerable wage differences between occupational fields, as indicated in the Malawiexample (see figure 10.3), may be caused by the fact that employment in some occupationalfields (e.g., food processing, car maintenance and tailoring) is predominantly in the informalsector where wages are generally below those gained in the formal or public sectors.
Rates of Return (ROR) to TVET
A comparative view of the rates of return to different levels of schooling provides evidenceof the economic value added to each additional educational level attained. Rates of return(ROR) are assumed to reflect the increased labour productivity induced by education. PrivateROR describe the average extra income gained by an individual through additional educationin relation to the cost of this education for the individual (including the foregone earningsdue to longer studies). The social ROR informs about the gain of society at large. It iscalculated by relating the additional expected income to the total cost involved in theeducation, both private and public.
An analysis of the rates of return to each level of schooling helps understand whetherinvestments in education for both private households and society are beneficial, and mayserve as a tool to analyse the appropriateness of educational investment.
The ROR methodology is explained in more detail in chapter 5 on external efficiency. Theanalysis of external efficiency of TVET would gain significance if ROR could be computedby level of TVET as well as type of programme/provider. If data allows, a ROR analysisaggregated by duration may also be instrumental in shedding more light on the frequentdiscussions about optimal durations of TVET programmes. Relevant data on training costs
200 EDUCATION SECTOR ANALYSIS METHODOLOGICAL GUIDELINES - Volume 2

Sub-Sector Specific Analyses 201
CHA
PTER10
TVET
and wages can be obtained through the TVET cost assessment described in section 3,through household or labour force surveys and possibly through tracer studies.
2.3.3 LABOUR MARKET INFORMATION AND SERVICES
Accurate and timely labour market information is essential for TVET planning. In particularthe following information is needed:
• Data on school leavers and potential other TVET target groups to establish the demandfor training in terms of quantity, and educational background;
• Information on skills deficits and unmet skill demand in the labour market, both informal and informal employment;
• Information on skills needs in the future, induced by emerging economic sectors;
• Indications for declining sectors and saturated labour market segments in occupationalgroups.
Often, considerable relevant labour market information is readily available. Potential sourcesfor such information include EMIS statistics, household and labour force surveys,establishment and employers’ surveys and other relevant surveys and studies, investmentclimate assessments, or sector-specific surveys.
However, the TVET sector often remains disconnected from such information sources, i.e.,relevant information is not appropriately prepared and translated into information to beused by TVET planners. The analysis may assess the situation around labour marketinformation and its use for TVET planning purposes in order to establish one importantelement of the framework conditions for labour-market orientation of TVET. Key questionsin this context are summarised in table 10.12.

2.3.4 LABOUR MARKET MATCHING SERVICES
The labour market relevance of the TVET system is also influenced by the availability andquality of those services that assist matching the supply of labour with the demand forskilled workforce in the labour market, notably vocational counseling and guidance (VCG)and job placement (JP) services. VCG services assist school leavers and other target groupsto make the right career choices when selecting a TVET programmes, while JP services helplabour markets entrants to get connected to future employers.
Good quality VCG and JP services, provided either by central agencies (e.g., ministries oflabour through labour exchange offices) or directly by TVET institutions are rare indeveloping countries, but considerable efforts, also supported by development partners,have been made in recent years to improve the availability of such services. An educationsector analysis may assess the availability and quality of such services guided by keyquestions summarised in Table 10.13.
2.3.5 SELF-EMPLOYMENT PROMOTION AND BUSINESS DEVELOPMENT SERVICES
Access to entrepreneurship training and business development services (BDS) are essentialwhen self-employment represents a significant target labour market for TVET graduates. Itmay be usually beyond the scope of an education sector analysis to undertake acomprehensive assessment of the landscape and quality of such services, but a quickstocktaking of whether and to what extent such services are available to TVET graduatesmay be instrumental to point to potential deficits in the labour-market orientation of TVETprogrammes. Key questions include:
202 EDUCATION SECTOR ANALYSIS METHODOLOGICAL GUIDELINES - Volume 2
Availability/Quality of Information
Use of Information by TVET Sector
What labour market information is available, who is collecting it and how reliable is it?Are base labour market data on employment and waged disaggregated by TVET qualifications?Are data on skills demand collected?How frequently are data updated?Are data available?Are reports generated?
To what extent are data and information available to TVET planners?In which processes of TVET planning are labour market data used? (e.g., curriculum development and revision, decision on introduction of new courses and cancellation of existing programmes, etc.)What institutional capacities for labour market analysis are available in the bodies in charge of TVET planning?Are there established communication mechanisms between TVET planning units and data collection organisations such as statistical offices, labour ministries, etc.?
Key Questions
TABLE 10.12 - Key Questions to Assess Availability and Use of Labour Market Informationin the TVET Context

Sub-Sector Specific Analyses 203
CHA
PTER10
TVET
Vocational Counseling and Guidance
Job Placement
What kind of VCG services are available?Who is providing them?Who are the addressees of VCG? School leavers, TVET students, others?What percentage of the defined target group has accessed services in the past year?What instruments are used, and are these regularly updated?Are instruments based on up-to-date labour market information?Do TVET institutions conduct open days?Are VCG services electronically available (electronic media or internet) to counselors or students?Do schools and TVET institutions have designated vocational counselors? Are they trained and receiving regular updating?Are sufficient budgets available to maintain the services?Is the VCG system regularly monitored?
What kind of JP services are available?Who is providing them?Who are the addressees? What percentage of the addressees are effectively targeted?Are placement officers trained and regularly re-trained?How is the information on vacancies organised? What parts of the labour market are targeted by the JP system?How successful are the system, i.e. how many school leaver or TVET graduates found employment through JP systems?How are companies interacting with placement officers?Do TVET institutions organise regular open days for industry?Are job fairs organised?Is the system regularly monitored?
Key questions
TABLE 10.13 - Key Questions to Assess Labour Market Matching Services
• What services are available to support TVET graduates venture into self-employment?Who is organizing them?
• What share of TVET graduates have access to services?
• Are financial and incubator services linked to comprehensive market information?
• Are follow-up services available for young entrepreneurs?
• How effective are the services (i.e. how many TVET graduates have actually ventured intoself-employment)?
• Is the impact of services regularly assessed, and are instruments and tools regularlyupdated on the basis of monitoring reports?

204 EDUCATION SECTOR ANALYSIS METHODOLOGICAL GUIDELINES - Volume 2
This section discusses the specific funding arrangements in TVET systems and theirimplications for an assessment of TVET cost and financing. It guides through the analysis ofpublic expenditure for TVET, the assessment of other funding sources, the analysis andevaluation of expenditure structures and the challenges involved in unit costs expenditure.It should be read together with Chapter 3 of the guidelines, which addressed the analysisof costs and financing for the whole education sector.
INTRODUCTION
TVET is generally considerably more expensive than general education. This is a result of(usually) lower student/teacher ratios and high costs of training material. Furthermore,development costs are much higher because of expensive workshops and laboratories.Funding constraints and under-funding are frequent, particularly in public TVET programmesleading to low quality of training delivery.
More than general education, TVET is usually funded through multiple sources. To copewith funding requirements in the course of TVET reform processes, which often aim at bothenrolment expansion and quality improvements, a further diversification of funding sourceshas featured prominently among TVET reform proposals more recently.
The diversity of funding sources poses some challenges to the analysis of costs and finances.Typical sources are outlined in Table 10.14 below.
COSTS AND FINANCING SECTION
3
3.1

FindingsTEVET in Malawi is principally funded through six different sources: the public budget, the levyfund, private households that mainly contribute through fees, companies involved in in-companytraining and apprenticeship training, through income generating activities by TEVET institutions
Public Budgetary Provision
TEVET Levy Fund (Paid by Public and Private Employers)
Base funding of TCs; funding of sector specific training (water, agriculture, medical, etc) and training for specific target groups (handicapped, etc)
Subsidy for training material of formal Technical, Entrepreneurial, Vocational Education and Training Authority (TEVETA)-sponsored apprentices, selected grants for capital investment, bursaries to students
Subsidies to (parastatal) providers with earmarked target group, e.g. MEDI
Funding of special programmes conducted by private institutions targeting mainly the informal sector
Part-reimbursement of cost of staff training programmes for levy-paying companies
Type of training
Sources
Training in Public TEVET Institutions
Training by Non-Public Providers
Training by Employers (In-House, Apprenticeship
and External)
TABLE 10.15 - Sources of TEVET Funding by Training Provider System, Malawi, 2009
Sub-Sector Specific Analyses 205
Each TVET provider system has different funding structures, which need to be identifiedand quantified as far as possible, as example 10.8 shows.
In most countries limited to funding public training institutions, however, increasingly also private institutions may benefit. The latter is particularly the case if public allocations are not paid as institutional base funding and teachers salaries, but through vouchers, per capita grants, etc.
Replacing or supplementing public allocations. Levy funds, where they exist, are usually sourced by companies.
Main direct contribution to training is through training and other (e.g., examination) fees. Other, indirect costs, such as cost of living, transport, etc. may be added to calculate private contribu-tions.
Apart from funding training through training levies and taxes, companies contribute through sponsoring staff training or direct support to training institutions.
May include “selling” of training services, but also sale of other products and services, which may, or may not be produced during the training.
Through contributions to the public budget, or direct support to training institutions or management structures.
Public Budgetary Allocation
Source
Training Levy Funds
Private Households
Companies
Income Generating Activities by Training Institutions
Donors
Remarks
TABLE 10.14 - Overview of Typical Funding Sources of TVET
EXAMPLE 10.8
(Stocktaking of Different Funding Sources in One Country): Sources of TEVET (Technical, Entrepreneurial, Vocational Education and Training)Funding, Malawi, 2009Source: Adapted from Malawi CSR 2010.
CHA
PTER10
TVET

The figure shows a flow of funds chart in the formal TVET system (under the Ministry of Labourand social Affairs (MoLISA) in Vietnam.
FindingsPublic TVET in Vietnam is mainly financed by public funds, only partly co-financed by households,which pay student fees. Companies are not involved. Rather, TVET institutions usually have topay companies to have students accepted for internships. Public funds are allocated to institutionsthrough various channels: direct disbursements to central level institutions through their parentministries, and provincial or district channels in case the institutions are under decentralisedmanagement. Investment funds are directly channeled to institutions from the Ministry of Financethrough specially earmarked investment programmes. Development partners channel theircontributions either directly to institutions, or through the government system as budget support.
206 EDUCATION SECTOR ANALYSIS METHODOLOGICAL GUIDELINES - Volume 2
and finally through contributions of development partners. Through the TEVET levy fund,companies are systematically involved in funding all major TVET provider systems. This source ismore important than direct public budgetary allocations, which by and large only co-finance theformal regular programmes provided in public TEVET institutions.
Private Households
Income Generating Activities
Companies
Foreign Donors
Common in public TEVET institutions
Indirectly co-financing through TEVET Levy, and offering apprentices places
No significant contribution at the moment; some special programmes are funded with donor support
Some foreign NGO and churches involved in funding of NGO training; some special programmes are funded with donor support; also programme funding of TEVETA
Direct financing of company training centers, and sponsorships of (in-house and external) staff training programmes
Tuition fees and boarding fees
Tuition fees. In case of private commercial providers these are cost-recovery fees
Common in NGO TEVET institutions, occasionally as well in private commercial
Indirectly co-financing through TEVET Levy
Acceptance of no or lower wages in case of traditional apprenticeship training
Creating a flow of funds chart may be useful to illustrate the various funding sources andtheir uses within the entire TVET system, see Example 10.9 below.
EXAMPLE 10.9
(Depicting Sources of TVET Funding in a Flow of Funds Chart):Flow of Funds in Public TVET, Vietnam, 2007Source: Franz, Jutta. 2007. Financing of Technical and Vocational Education and Training (TVET). Vietnam. DraftReport of a Fact Finding Mission. Prepared for German Technical Cooperation with Vietnam, Promotion of TVET

Sub-Sector Specific Analyses 207
TVETCH
APTER
10
ANALYSIS OF PUBLIC TVET EXPENDITURE
A TVET analysis should firstly establish total public spending in TVET, both recurrent andcapital/development. This includes all expenditure associated with formal general TVET,including management expenditure at all administrative levels, expenditure related toexamination and certification, teachers/instructors training and any allocations to a separatetraining fund, if applicable. Such expenditure are usually incurred with the ministry in chargeof TVET, i.e. education ministries or labour ministries.80 However, total public expenditurealso includes, as example 10.10 demonstrates, the (usually) considerable expenditureincurred in running specialised training institutions and/or staff training institutions underother ministries.
3.2
FIGURE 10.4 - Core Flow of Funds Under Public TVET System (under MOLISA), Vietnam, 2007
MOF&
MPI
Special InvestmentProgrammes (NTP-E)
MoLISA
DoLISA
Provinces
Districts
Families Employers
In- companyTraining
Attachmentplaces
Trainees
Central levelorganisations:
ministries, mass,orgs, etc.
Publicfinancing Households
Public TVET institutions
Income Generating Activities
Sub-contracting of training delivery
Costof living
Fees
Payments forattachment places
Special grants for investmentsand capacity building
Companies
International donors
- Core Flow of Funds Under Public FIGURE 10.4 TVET System (under MOLISA), - Core Flow of Funds Under Public 2007ietnam,VTVET System (under MOLISA),
MoLISA
DoLISA etc.
MPI
financingPublic
,orgs, mass,ministries
organisations:al levelCentr
&MOF
ovinces
amilies
ainees
of living
Households
Cost
rT
F
Pr
ainees
Households
s
aining
Companies
rTIn- company
Employer
and capacity building
ammes (NTP-E)
DoLISA
ants for investmentsSpecial gr
ogrPrSpecial Investment
ants for investments
eesDistricts
aining delivery
F
acting of trSub-contr
institutionsPublic TVET
attachment placesaining delivery
places
ayments forP
institutions
Attachment
sInternational donor
ating ActivitiesGenerIncome
ating Activities

208 EDUCATION SECTOR ANALYSIS METHODOLOGICAL GUIDELINES - Volume 2
(Identification of Total Public Spending on Skills Development):Total Public Spending for TEVET, Malawi, 2007/08Source: Adapted from SCR Malawi 2010.
EXAMPLE 10.10
TABLE 10.16 - Total Public Spending for TEVET 2007/08, MK
RECURRENT Malawi Kwachas
168,724,305
10,645,000
60,000,000
40,832,395
7,636,322
2,912,738
76,426
32,448,940
6,000,000
26,611,680
22,442,527
272,339,089
18,489,195
9,796,137
14,831,550
60,000,000
5,739,295
436,249,473
759,525,599
77,920,000
303,156,000
24,843,000
405,919,000
24,843,00024,843,000
Ministry of Education
Allocation to Technical Colleges
Administrative cost, Department of TVET
MOEST Subsidy to TEVETA
Staff Development Institute
TEVET share of global admin cost MOEST
MANEB, Share of TEVET
UNESCO National Commission, TEVET share
Ministry of Labour
Trade testing Department
Other Ministries
National College of Resources
Limbe Police Training School
Mtakataka Police Training School
Malawi Armed Forces Colleges
Malawi College of Forestry and Wildlife
Civil Aviation Training School
Marine Training College
MEDI
Works Training Unit
Sub-total
Total
CAPITAL
Village Polytechnics (MoL), donor contributions
Trade testing modernisation (MoL), donors
Trade testing modernisation MOL, GoM
Total identified budgeted
Total identified executed
FindingsThe figures clearly show that expenditure for formal TVET is only a lesser share of the totalGovernment of Malawi expenditure for training. 57 percent of all public recurrent expenditurefor TVET in the year under evaluation (2007/8) was under ministries other than the educationand labour ministries, which administered formal TVET and the related assessment/certificationsystems. The Malawi Armed Forces College received more public funds than any other individualinstitution or provider system. Its budget is only slightly less than the entire budget for all trainingrelated activities (training delivery plus regulatory functions) of the Ministry of Education.

EXAMPLE 10.11
FIGURE 10.5 - TVET’s Allocation of Public Recurrent Education Expenditure,by Coverage, Tanzania and Comparable African Countries, 2006 or MRY
18
16
14
12
10
8
6
4
2
00 200 400 600 800 1,000 1,4001,200
TVET Coverage (Students per 100,000 inhabitants)
TVET
Sha
re o
f Re
curr
ent
Educ
atio
n Ex
pend
iture
(%)
MainlandTanzania
y = 0.012 x + 2.0606
R² = 0.8065
(Public Allocation to TVET as a Percentage of Total Education SectorExpenditure): Allocation to TVET of Public Recurrent Education Ex-penditure, by Coverage, Tanzania and Other African Countries, 2006Source: UNESCO/BREDA, 2011. Tanzania CSR.
Sub-Sector Specific Analyses 209
The major source for the assessment of total public spending is usually the national budget.If the budget presentation is not sufficiently disaggregated to identify training budgets andallocations to training institutions, it may be necessary to obtain detailed budgets of theindividual ministries.
Note that the TVET sector often suffers from very low budget execution rates reflecting itslow status in the education sector or, in case public allocations were increased, lowabsorptive capacity. Actual budget data should therefore be used if possible.
Public expenditure for TVET lends itself to international comparison to provide policy-makerswith a benchmark for expenditure planning. An indicator for public TVET spending in thisregard is the percentage of TVET expenditure in total education expenditure, which is onlyuseful to apply if formal general TVET is considered an education sub-sector and accordinglyis run and financed under the education ministry. The UNESCO Institute of Statistics (UIS)as well as UNESCO/Africa have compiled international comparative data on this indicator.An example is presented below.
CHA
PTER10
TVET
Figure 10.5 shows TVET recurrent expenditure as a percentage of total recurrent educationexpenditure in relation to the coverage of the TVET system (students per 100,000 inhabitants).

210 EDUCATION SECTOR ANALYSIS METHODOLOGICAL GUIDELINES - Volume 2
FindingsThe figure clearly shows that the share of TVET expenditure of the entire education budget inMainland Tanzania is significantly above the average of comparable African countries indicatedin the trendline.
A list of the indicators suggested by UNESCO for the analysis of TVET public funding ispresented here. They include81:
1. The share of education budget allocated to TVET measures the importance of TVETin the public education and training budget;
2. The public expenditure on TVET as a percentage of total public expenditure oneducation measures the extent of state funding for TVET. If this percentage isconsiderably higher than the previous, it indicates that considerable expenditure forTVET is allocated by other ministries and public sectors;
3. The public expenditure on TVET per student as a percentage of GDP per capitaassesses the relative importance given, in the proportion of national wealth, to fundingfor TVET; and
4. The public expenditure on TVET by type of expenditure provides an overview ofthe structure of TVET expenditure. The specific country context may suggest furtherdisaggregation. For example, in countries where boarding costs are a topic ofdiscussion, in may be instructive to calculate boarding expenditure separately.
• Indicators Suggested by UNESCO – TVET public financing
Share of Education Budget Allocated to TVETRatio between public resources allocated to TVET and public resources allocated to education
Public expenditure on TVET as a Percentage of total public expenditure on education
Public expenditure on TVET per student as a percentage of GDP per capitaRatio between average TVET per student spending and the average per capital income in the country
Public expenditure on TVET by type of expenditureShare for different types of expenditure as a percentage of total public expenditure for TVET
Budget allocation for TVET x 100
Education budget
Amount of ordinary public expenditure allocated for TVET x 100
Total amount of ordinary expenditure allocated for education
Amount of ordinary public expenditure per TVET student x 100
GDP per capita
Public expenditure in TVET by type of expenditure x 100
Total public expenditure in TVET

Sub-Sector Specific Analyses 211
CHA
PTER10
TVET
ANALYSIS OF OTHER FUNDING SOURCES
A stocktaking and analysis of other funding sources of TVET is useful to obtain anunderstanding of the overall national resource base for skills development, and to informthe public discussion on funding diversification in TVET. The following table provides anoverview about where to obtain information about the most important funding sources:
3.3
TABLE 10.17 - Data/Information Sources about TVET Funding Sources
Private Households
Employers/Companies
Development Partners
Commercial Income of Training Institutions
Public Formal TVETEMIS data on income of recorded training institutions. Consider reliability problems of EMIS data for TVET. Assessment of budgets of individual training institutions, obtained either from the parent ministry, or directly from the institution. In this case, the analysis may need to be limited to a smaller number of “typical cases”. Fee information from regulatory authorities about formal training programmes. Consider that officially set fees often do not represent real contributions expected from households. It may be useful to conduct a detailed assessment of private costs in TVET institutions, which includes also items such as examination fees, school uniforms, boarding costs, other social costs, transport, etc.
Private Training Market The private training market is important to consider in this context, as these are usually exclusively financed through fee contributions from private households. Together with estimates about enrolment in private training institutions (distinguish between private commercial and NGO), information on average fees charged in private training institutions can provide an approximation of private contributions in this training segment. Information on fees charged in the private training market may be obtained from the public registration office, from associations of private training providers, or – most likely – only through a selected direct sample survey and/or pragmatic informa-tion collection methods such as screening newspaper advertisements. Selected studies may obtain information on financial arrangements in traditional apprenticeship training.
Aggregated national levelHousehold survey data may include data on education spending by level and type of education, which also include TVET. Consider that these data often combine very different kinds of TVET (formal, non-formal, teachers education, etc), so consider methodological inconsistencies.
Employers contribute mainly through training levies, financing of in-company training and sponsorship of staff training programmes provided outside. Apart from levy contributions, data is usually difficult to obtain. Data sources include:Data on levy contributions is usually well documented with the managing authority, i.e. the Training Fund, the TVET Authority, or else. Investment Climate Assessments (ICA) incorporate data on training expenditure of firms, limited to the type of companies investigated.Special studies on in-company training and employers involvement in training.Labour market surveys and establishment surveys may contain data on training expenditure.Data and information collected by employers’ association and chambers/business associations.
It is usually difficult to obtain a comprehensive overview about foreign sources of TVET funding. Many NGOs receive donations from foreign countries that are not recorded, for example. However, the most important foreign donations are usually recorded in the sector budget (in case of budget support), by directories of development cooperation programmes, or by the ministry in charge of registering development cooperation programmes. Other sources include donor coordination groups or interviews with individual donors.
Revenues from income generating activities constitute in times a considerable supplementary income source for TVET institutions. Information may be included in EMIS data, or available from institutional budgets collected in parent ministries. Often, however, direct interviews with management of TVET institutions is the only way of obtaining reasonably reliable data.
Funding Source Sources and Remarks

212 EDUCATION SECTOR ANALYSIS METHODOLOGICAL GUIDELINES - Volume 2
STRUCTURE OF TVET EXPENDITURE
An analysis of TVET expenditure structures, i.e. the percentages of major cost items of thetotal expenditure, is important to understand potential resource-induced factors that affecttraining quality. Cost structures in TVET differ from general education. Usually, the share ofcosts for training materials consumed in practical workshop training are supposed to berelatively high in TVET. An analysis of actual expenditure structures could show, for example,that actual expenditure for training material is falling short of what is expected under thegiven curricular structure, which would indicate problems in the quality of practicalinstructions. At the aggregate level, TVET expenditure structures are assessed in Chapter 3as part of the overall education expenditure analysis. The TVET analysis, however, shouldgo deeper into recurrent expenditure structures by disaggregating by TVET provider systemand/or individual institutions or type of institutions to identify differences in the expenditurestructures across provider systems and institutions. Results will inform, inter alia, the qualityassessment in section 4 of this chapter.
Recurrent expenditure may be divided into the broad categories:
• teaching staff, including salaries, benefits and staff development• management of training institution, including costs for management and support staff,
transport, etc.• institutional overheads, including utility costs, rental, office consumables, insurances,
and others,• training and teaching material, including workshop material, learning material,
maintenance of equipment, etc. • social benefits, including boarding and feeding costs, social events, stipends if relevant.
Each country uses their own broad structural classifications in line with budgetary structuresand the analysis should follow the classifications used in the country of analysis (see Example10.12). A template for a table to capture cost structures is presented in Table 10.18.
3.4

EXAMPLE 10.12
FindingsOver the decade, the expenditure structure in the VETA-administered training system changedconsiderably. Overall, VET recurrent administrative costs are very high. In 2009, the aggregateamount spent on VET sector management was close to 27 percent of recurrent expenditure,and a further 31 percent was devoted to VETA’s administrative, institutional and financial costs.Effectively, only 42 percent of the recurrent budget was used to fund actual training delivery.These overhead costs may appear high. However, it is important to emphasise that since 2004VETA provides considerable support to the VET sub-sector and other providers. This support iseither direct (capacity building, subsidies, supply of equipment), or indirect (quality assurance,labour market monitoring, etc).
TABLE 10.18 - Value and Distribution of the Vocational Education and Training Authority (VETA)Public Recurrent Expenditure, by Key Items, Tanzania, 2001 and 2009
2001 2009 RealChange
(%)
Training Expenses (VETA-owned Centers)
Long Courses
Personnel Emoluments
Training Materials
Boarding Expenses
Maintenance of Utilities and Facilities
Short Courses
VET Sector Management Costs
Administrative and Institutional Costs
Personnel Emoluments (VETA-HQ)
Maintenance of Utilities and Facilities
Production and Other Operations
Financial and Other Operating Expenses
Total Recurrent Expenditure
Value ValueShare(%)
Share(%)
10.44
8.02
3.46
1.38
0.39
2.79
2.42
0.00
5.60
1.85
1.10
2.65
1.11
17.15
60.9
46.8
20.2
8.1
2.2
16.3
14.1
0.0
32.7
10.8
6.4
15.5
6.4
100.0
10.26
8.70
3.97
1.72
0.66
2.35
1.56
6.58
7.43
2.55
1.19
3.70
0.24
24.52
41.9
35.5
16.2
7.0
2.7
9.6
6.4
26.8
30.3
10.4
4.8
15.1
1.0
100.0
-1.7 %
8.5 %
14.7 %
24.6 %
69.2 %
-15.8 %
-35.5 %
n.a.
32.7 %
37.8 %
8.2 %
39.6 %
-78.4 %
43.0 %
Constant 2009 T Sh (Billions)
Sub-Sector Specific Analyses 213
CHA
PTER10
TVET
The nature and level of disaggregation depends on data availability, on the TVET deliverystructure and the specific context of problems and policies in each country. If possible,different provider systems (formal and non-formal, apprenticeship training vs. full-timeschool-based training, public and private providers) should be compared and different typesof institutions (technical colleges, vocational centers, community polytechnics). If there areindications for considerably different levels of funding among institutions, or visibledifferences in the quality of training across institutions, the analysis should be done forindividual institutions, or a sample of institutions.
(Structure of TVET Expenditure): Distribution of Public Recurrent Spending, Tanzania, 2001 and 2009Source: Adapted from Tanzania CSR, 2011.

214 EDUCATION SECTOR ANALYSIS METHODOLOGICAL GUIDELINES - Volume 2
The main source for an analysis of expenditure structures are institutional budgets. It isimportant to use actual budget data, as actual expenditure structures may vary considerablyfrom budgeted structures, in particular if budget cuts occurred or if institutions were, forexample, faced with high inflation rates forcing them to re-allocate given resources acrossexpenditure items.
Budget data may be obtained from the parent ministry (e.g. Ministry of Education) ororganisation (e.g., TVET authority), or directly from institutions. If centrally available budgetinformation is used, cross-checking of information in selected institutions is advisable. Often,public budgets do not reflect re-allocations done at school level during the budget year, ordo not include external resources of the institutions, for example generated through incomegenerating activities.
If a TVET institutions survey as suggested in section 1 has been conducted, this survey willprovide the most comprehensive and comparable data across institutions and providersystems. As a last resort, institutional expenditure assessments may be conducted on a case-by-case basis, tracing expenditure in a selected small sample of typical institutions using astandard questionnaire. An example for a questionnaire of an expenditure assessment in aTVET institutions is provided in Annex 10.3.
UNIT EXPENDITURE AND UNIT COSTS
Unit expenditure refer to the amounts allocated by the government to TVET, by learner. Unitcosts include the entire effective cost of a training, potentially including householdcontributions, grants, external funding and so on.
3.5.1 UNIT EXPENDITURE
The calculation of public recurrent unit expenditure is used to compare public costs ofdifferent education streams. Aggregated expenditure are analysed in Chapter 3. The specificTVET analysis should concentrate on general TVET under the education or labour ministries,or separately calculate recurrent unit spending at individual ministries, if sufficiently reliableenrolment data for those TVET segments are available. Different TVET provider systemsusually show very distinct cost patterns leading to considerably different unit cost results.Only expenditure for so-called general TVET, however, represents expenditure for publiceducation service delivery to be compared with other educational streams.
3.5
• Key Definition
Public recurrent unit spending per year is calculated by dividing the entire established annualrecurrent expenditure for general TVET provision by the number of students enrolled in that year(full-time student equivalent):
Total Recurrent Expenditure
Total number of enrolled learners

EXAMPLE 10.13
TABLE 10.19 - Secondary Technical Education: Overview of State Education Spending and PTRs by State, Sudan, 2009
Secondary: TechnicalSecondary: TechnicalNumberof pupils
Group 1: high GERs
El Gezira
Khartoum
Northern
River Nile
White Nile
Group 2: intermediate GERS
El Gadarif
N. Kordofan
Sinnar
S. Kordofan
W. Darfur
Group 3: low GERS
Blue Nile
Kassala
N. Darfur
Red Sea
S. Darfur
Total
Pupil-teacher
ratio
Per pupilspending
(current SDG)
Teacher salariesas a multiple of GDP
per capita
777
669
567
911
1,174
564
681
881
848
778
354
542
838
1,137
478
608
1,194
773
2.6
2.9
2.5
2.4
2.7
2.6
2.7
2.8
2.6
3.0
2.4
2.6
2.5
2.2
2.4
2.3
3.1
2.6
15
16
21
11
10
18
17
14
12
13
26
21
15
8
23
14
14
15
3,302
7,336
1,256
1,968
2,507
2,409
2,211
706
309
620
614
1,414
1,696
1,074
1,233
28,655
(Unit Costs in TVET): Unit Spending, Teachers Salaries, PTR and Enrolment in DifferentEducation Levels, Sudan, 2009Source: Education CSR Sudan, 2010.
Sub-Sector Specific Analyses 215
International Comparison of Unit Costs
For international comparison of public expenditure, education sector analyses have used,as example 10.13 demonstrates, the indicator TVET public recurrent unit expenditure aspercentage of GDP/p.c. This indicator is calculated on the basis of formal TVET recordedunder the core regulatory ministries (education or labour). Data for a range of Africancountries has been compiled by the World Bank in recent years.
CHA
PTER10
TVET
The reliability of the indicator depends on the quality of enrolment data (see the previoussection). The calculation of public recurrent unit spending should be as disaggregated byeducation level as data allow. However, in many cases this will not be possible.82

700
600
500
400
300
200
100
020
48
175
612
Cape
Ver
de
Suda
n
Gha
na
Ugan
da
CAR
Cong
o
Mad
agas
car
Cam
eroo
n
Gui
nea
Mau
ritan
ia
Djib
outi
Gui
nea-
Biss
au
Burk
ina
Faso
Togo
Mal
i
Beni
n
Sene
gal
Tanz
ania
Buru
ndi
Côte
d'Iv
oire
Mal
awi
Liba
ria
Nig
er
Aver
age
FIGURE 10.6 - Public Unit Spending for TVET as a Share of GDP/Capita,Uganda and 22 African Countries, 2009
216 EDUCATION SECTOR ANALYSIS METHODOLOGICAL GUIDELINES - Volume 2
If enrolment and expenditure data are available (from the responsible ministry)disaggregated by individual schools (in countries with a low number of public TVETinstitutions), type of schools (e.g. technical schools, polytechnics) or occupational focus(technical, commerce, agriculture, etc.), a comparative public recurrent unit spendinganalysis should be conducted. This may point to considerable cost differences betweenschool types or occupational groups, or may reveal inefficiencies in allocation, if unitexpenditure vary considerably between different schools of the same type. In Malawi, forexample, the education sector analysis revealed in Technical Colleges all offering the samerange and level of TVET unit expenditure differences of almost 1,000 percent. It turned outthat public allocations were based on lump sum budgets independent of actual enrolment,with the consequence that low enrolling institutions, typically rural ones, operated withrelatively high unit expenditure, while high enrolling institutions, usually found in urban set-ups, experienced lower per student allocations.
FindingsThe table reveals considerable differences in unit spending by region in each of the differentlevels of technical education. These are predominantly dependent on the PTR, which indicatesdifferent levels of capacity utilisation in the different regions. The lower the PTR (indicating lowcapacity utilisation) the higher the unit spending. On the other hand, the influence of teachers’salaries (in relation to the GDP/per capita) on unit spending is not significant.
The analysis offered by Figure 10.6 was recently carried out in the context of an evaluation ofTVET in Uganda. The figure helps to illustrate the low level of unit spending in this country.
EXAMPLE 10.14
(Analysing Public Unit Spending in International Comparison): Public Unit Spending for TVET as a Percentage of GDP/p.c., Uganda, 2009,Compared to Other Countries.Source: Adapted from Franz and Twebaze, 2011.

FindingsThe comparison of public unit spending for TVET, measured as a percentage of GDP/per capita,in selected African countries demonstrates the relatively low public expenditure level for TVET inUganda. The country has budgeted less than 50 percent of its GDP/capita for each student inthe (formal) TVET system, which is less than one third of the average of the African countries,for which data were available. However, the ratio is particularly high in countries with a low percapita income, such as Niger, Liberia and Malawi.
Sub-Sector Specific Analyses 217
3.5.2 UNIT COSTS
Complementary to an assessment of public unit expenditure, an education sector analysisshould also attempt to assess full unit costs that calculate for different provider systems andtype of training institutions, ideally also for training in different occupational areas, allfinancial sources used for delivering TVET. Such unit cost assessments are useful to comparecosts in different provider systems.
The evaluation of unit costs is helpful to compare the effective costs of different types oftraining, but also represents the first step of a cost-effectiveness analysis.83 It is also anessential input into public TVET expenditure planning.
Unit-cost assessments consider only recurrent cost and primarily direct costs incurred at thelevel of TVET institutions. Indirect costs such as those related to instructors development,sector management at central level, etc. may be included as pro-rata costs (See Annex 3.1).
The most suitable data source in typical countries is information provided directly fromtraining institutions. Data may be collected through case studies, or through the TVETinstitutions’ survey (see chapter 1). However, experience with unit cost assessments throughsurveys points to considerable difficulties and inaccuracies due to reluctance of trainingproviders to reveal budgetary data. Case studies conducted by principal researchers maygenerate less comprehensive but more reliable information, if a trustful relationship withindividual training institutions can be built that understand the rationale of the evaluation.Sometimes, parent ministries of public training institutions collect and provide institutionalbudgets.84 However, as mentioned before, those budgets may not always incorporate allfunds available to the institutions, and they may not reflect unforeseen budgetary changesdue to fluctuating income levels of institutions and possible budget cuts. In case of non-governmental training institutions, direct data collection at school level is essential. Forinstitutions in the private commercial training market, fees may serve as a proxy to unitcosts, as these institutions are usually fully financed through fees.
CHA
PTER10
TVET

218 EDUCATION SECTOR ANALYSIS METHODOLOGICAL GUIDELINES - Volume 2
There are two options to calculate unit costs:
1. The cost of training one trainee over a specified time period, usually one year. Thesimplest way of calculation is to divide the full institutional cost over one year by thenumber of trainees enrolled. Note that not all trainees may be enrolled full-time, andnot every programme may run for one year or longer. In such cases, full-time/one-yearequivalences need to be established for those programmes that run shorter or part-time (or both). See in annex 10.4 a methodology for this approach.
2. Cost of producing one graduate. This may be useful, if different training schemes existin parallel in one country with different organisational patterns (e.g. duration), but withthe same output, i.e. leading to the same qualifications. This may be the case, whenthe same qualification can be obtained through formal apprenticeship programmes85
and at the same time through institution-based programmes.
It should be emphasised that a unit-cost assessment as outlined above is actually a unitexpenditure calculation based on actual or planned expenditure. It may represent a state ofunder-funding where unit expenditure are not dictated by requirements but resourceconstraints.86 It is possible that considerable higher unit spending would be required toensure training is delivered at desired quality levels.
In countries with considerable problems of underfunding, it may be useful to quantify thegap between actual and desired unit costs. For this purpose it is necessary to conduct acosting exercise. TVET authorities or parent ministries of training institutions may haveconducted such costing already for planning purposes. Other sources may be traininginstitutions directly.87
Different training organisational patterns usually lead to very different costs and coststructures in TVET. This is compounded by the cost differences between occupational groupsinduced by different costs of training material. For this reason, international comparison oftraining costs may be problematic. However, a unit cost assessment should, where possible,try to generate comparative average cost data for different provider systems in one country,in order to inform the discussion on cost-effective training delivery.
A special aspect in the unit cost analysis should be the effects of economies of scale in TVETand the implied possible trade-offs between cost and relevance. Concentrating TVET supplyin fewer and larger institutions will usually be more cost-effective, whereas decentralised,smaller institutions may be closer to the target groups and more attuned with labour marketrequirements.

Internal efficiency and quality are ongoing issues in TVET debates. Yet, data to measurethese are not available at the comprehensiveness typical for general education. This sectionwill suggest some quantitative and qualitative analytical steps to approach the assessment.
Testing and examination outcomes are key to the assessment of internal efficiency andquality. Unlike in general education, TVET often operates through parallel examinationsystems. In many countries, TVET examinations and certification are provided by theeducation examination authorities (or other examination bodies attached to theministries/authorities in charge of TVET), but also by trade testing bodies, often run underlabour ministries, targeting industry-based and non-formal training. In cases, TVETprogrammes prepare students for more than one assessment/certification. More recently,many countries are in the process of introducing national vocational qualificationframeworks and a reform of the training system towards competency-based and modulartraining, which are often supposed to replace the old qualification systems.
To fully understand issues around internal efficiency and quality of TVET, it is necessary tocarefully take stock of the different examination systems, their scope, rules and procedures.In most cases it will be useful to analyse internal efficiency for each of the parallel systemsseparately.
ANALYSIS OF INTERNAL EFFICIENCY
A considerable range of indicators can principally be used to measure internal efficiency.The table overleaf provides a list with selected indicators and their formulas suggested byUNESCO. Which indicators to use will principally depend on the specific country context,as well as on data availability. In the following, some frequently used indicators and theiruse are introduced.
An important indicator for internal efficiency in TVET are examination pass/failure rates.
INTERNAL EFFICIENCYAND QUALITY
SECTION
4
Sub-Sector Specific Analyses 219
TVETCH
APTER
10
4.1

220 EDUCATION SECTOR ANALYSIS METHODOLOGICAL GUIDELINES - Volume 2
Final Examination Success Rate
Time series data is usually available directly from the examination or trade testing authorities.Often, examinations in TVET are only conducted once at the end of the programme. In caseCBET (Competency-Based Education and Training) systems have been introduced, additionalmodular assessments may be conducted, which would allow, if data is centrally available atthe examination authority, for more in-depth analysis.
In order to compare efficiency across programmes and provider systems, pass/failure ratesshould be obtained by:
• Educational level of programme;• Occupational/trade focus of the programme;• Type of training institutions and/or provider sub-system;• Gender.
The graph in example 10.15 shows an example of pass rates disaggregated by occupationalfields of training from a TVET sub-sector analysis in Uganda.
• Indicators Suggested by UNESCO – TVET Internal Efficiency
The promotion rate and the repetition rate measure the internal efficiency of the system (seethe formulas in chapter 2).
Dropout rate: Percentage of students enrolled in TVET at a given grade that have dropped outat the end of a specific school year
Success rate in final examination: Ratio of students who pass the final examination in a givencycle compared to the number of students who sat the examination
Graduation rate: Ratio of final year students in a given cycle who pass the exam to the numberof students enrolled in the final year
Internal efficiency coefficient: Ratio between the number of student-years needed in theoryto complete a learning cycle, if there are no drop-outs and repeaters, and the number of studentyears that the cohort has actually spent to educate each of the graduates (see the formula inchapter 2).
Number of students in Grade G who drop out in Year N x 100
Number of students enrolled in Grade G during Year N
Number of candidates who pass the final exam in a given cycle x 100
Number of students who sat for that exam
Number of graduates from a cycle in Year N x 100
Number of students in the final year of the cycle for Year N

EXAMPLE 10.15
0% 10% 20% 30% 40% 50% 60% 70% 80% 90%
Catering & Hotel Mgt.
Motor Vehicule Mechanic
Plumber
Brick Laying
Average
Electronics Technician
Metal Machining & Fitting
Metal Fabricator
Tailor
Computer Application
Painter & Decorator
Auto Electrical
Electrical Installation
Carpentry & Joinery
Hairdresser
Secretary Studies
FIGURE 10.7 - DIT Pass Rates of Aggregate Test Registrants by Programme, Uganda, 2009
(Analysing Examination Pass Rates to Assess Efficiency): Trade Testing Pass Rates in Different Occupational Fields, Uganda, 2009.Source: Adapted from Johanson and Okema, 2011.
Sub-Sector Specific Analyses 221
TVETCH
APTER
10
The figure used pass rates for two rounds of trade testing in Uganda in 2009 under theDirectorate of Industrial Training. Trade testing is the typical examination for non-formal TVETprogrammes, and may also be attended by artisans who acquired their skills informally.
FindingsData shows some alarming results. Firstly, the average pass rate is below 70 percent, meaningthat almost one third of all candidates do not reach the set goal of the training undergone. Italso shows considerable differences in pass rates between the different occupational fields. Inthree of these fields not even half of the candidates were able to achieve the certification. Theexamination authority, from which these data were taken examines mainly non-formally acquiredskills obtained in training institutions that are often small and specialised in terms of occupationalfields. The finding would therefore suggest low training quality in a specific segment of trainingproviders, in particular for hairdressing and secretarial schools.

SchoolType
TechnicalColleges
BusinessColleges
A
Intake 1
B
Enrolment 2- repeaters
C
Enrolment 3- repeaters
D
Candidatesminus repea-ters year 3
(A-B) / Ax 100
(B-C) / Bx 100
(C-D) / Cx 100
(A-D) / Ax 100
TotalIntake
in Year 1
Enrolmentin Year 2
MinusRepeaters
Enrolmentin Year 3
MinusRepeaters
Candidatesfor Final
Examination
DropoutRate inYear 1
DropoutRate inYear 2
DropoutRate inYear 3
DropoutRate overthe Cycle
… … … …
TABLE 10.20 - Suggested Table Format to Capture Dropout Rates
222 EDUCATION SECTOR ANALYSIS METHODOLOGICAL GUIDELINES - Volume 2
Dropout Rate
A frequently used indicator are drop-out rates, which establish the percentage of studentsenrolled in TVET at a given grade that have dropped out at the end of a specific school year.The drop-out phenomenon can be established by analysing the student flow through thedifferent programmes. Enrolment data by year (grade) of training are required,disaggregated by the desired units of disaggregation (e.g. school type, level of training,occupational group, etc.). The table below suggests a table to establish drop-out rates fora TVET cycle over a period of three years.
Reasons for drop-out can be very different, and interviews with management and instructorsin TVET institutions may be the best source to obtain an understanding, if no special studyon drop-outs is available. Common reasons include financial problems of students orpregnancy in case of female students. Often however, students also drop-out of TVETbecause they were admitted to other more prestigious general education programmes(often a reason for early drop-out) or because they found employment on the basis of skillsalready acquired during training.
Repetition Rates
The phenomenon of repetition is more common in Francophone than in Anglophonecountries. Repetition rates measure the ratio of students enrolled in TVET at a specific gradewho stay at the same grade the following year, compare example 10.16. The calculation ofrepetition rates requires data on student enrolments and student promotion by year. Formore information compare Chapter 4 (internal efficiency), which discusses the calculationof repetition rates in more detail.
Internal Efficiency Coefficient
The analysis of repetition rates can be used to compute the internal efficiency coefficient, whichmeasures the ratio between the number of student-years needed in theory (without drop outsand repetition) to complete a learning cycle and the number of student years that the cohorthas actually spent. Compare Chapter 4 on internal efficiency in the education system for adetailed methodological description for computation of the internal efficiency coefficient.
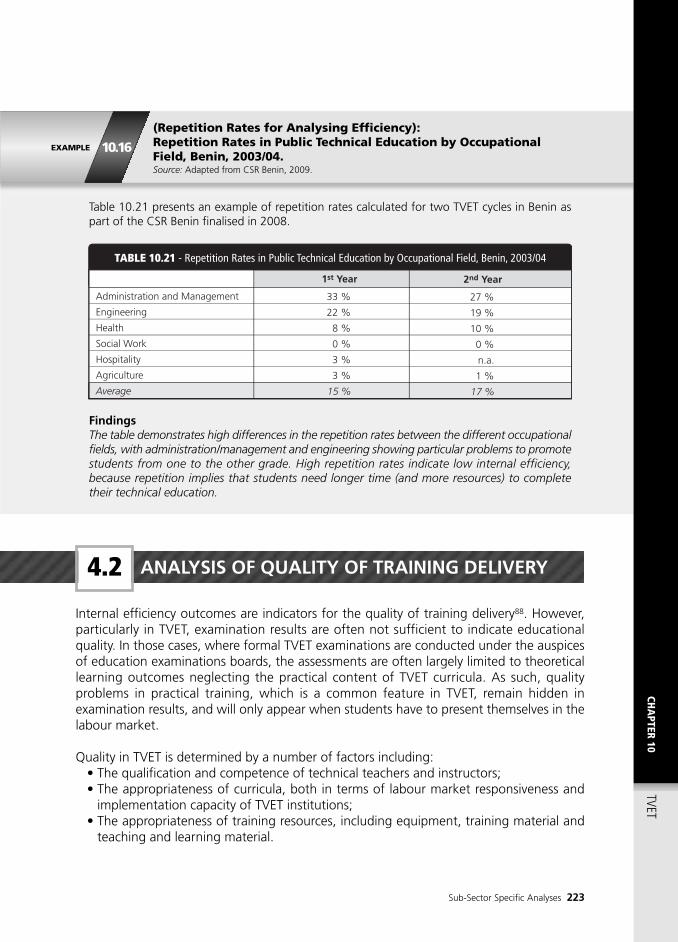
EXAMPLE 10.16
Administration and Management
Engineering
Health
Social Work
Hospitality
Agriculture
Average
1st Year
33 %
22 %
8 %
0 %
3 %
3 %
15 %
27 %
19 %
10 %
0 %
n.a.
1 %
17 %
2nd Year
TABLE 10.21 - Repetition Rates in Public Technical Education by Occupational Field, Benin, 2003/04
(Repetition Rates for Analysing Efficiency):Repetition Rates in Public Technical Education by OccupationalField, Benin, 2003/04.Source: Adapted from CSR Benin, 2009.
Sub-Sector Specific Analyses 223
ANALYSIS OF QUALITY OF TRAINING DELIVERY
Internal efficiency outcomes are indicators for the quality of training delivery88. However,particularly in TVET, examination results are often not sufficient to indicate educationalquality. In those cases, where formal TVET examinations are conducted under the auspicesof education examinations boards, the assessments are often largely limited to theoreticallearning outcomes neglecting the practical content of TVET curricula. As such, qualityproblems in practical training, which is a common feature in TVET, remain hidden inexamination results, and will only appear when students have to present themselves in thelabour market.
Quality in TVET is determined by a number of factors including: • The qualification and competence of technical teachers and instructors;• The appropriateness of curricula, both in terms of labour market responsiveness and
implementation capacity of TVET institutions;• The appropriateness of training resources, including equipment, training material and
teaching and learning material.
CHA
PTER10
TVET
Table 10.21 presents an example of repetition rates calculated for two TVET cycles in Benin aspart of the CSR Benin finalised in 2008.
FindingsThe table demonstrates high differences in the repetition rates between the different occupationalfields, with administration/management and engineering showing particular problems to promotestudents from one to the other grade. High repetition rates indicate low internal efficiency,because repetition implies that students need longer time (and more resources) to completetheir technical education.
4.2

224 EDUCATION SECTOR ANALYSIS METHODOLOGICAL GUIDELINES - Volume 2
The involvement of employers and industry experts (including experts from the informalsector) in the planning, monitoring and implementation of all elements of the TVET systemis a cross-cutting theme in the discussion on training quality. Principally, active participationof industry experts in standards and curriculum development, teachers’ and instructors’training and further training, training delivery as well as in assessment raises the quality oflearning in relation to the skills demand in the labour market. A TVET analysis shouldtherefore always reflect on policies, mechanisms and instruments for the integration ofexpertise from the world of work, if the specific system elements are analysed.
The indicators suggested by UNESCO for the assessment of these factors are presentedbelow. The list includes:
1) The rate of qualified teachers, to analyse the quality of the system’s teaching force;2) The average level of satisfaction with equipment, which can be obtained through
a user satisfaction survey and a point system;3) The average level of satisfaction with infrastructure, that could include classrooms,
laboratories, workshops and so on; and4) The share of teachers that upgrade their skills, which also enables one to assess
the quality of teachers.
• Indicators Suggested by UNESCO – TVET Quality
Student teacher ratioRatio between the number of full-time equivalent students who undergo training at a given levelof education and the number of full-time equivalent teachers for that same level, in a given year.
Ratio of qualified teachersRatio of teachers who have the necessary qualifications for their assigned field of teaching/learning
Average level of satisfaction with equipment
Average level of satisfaction with school infrastructure
Percentage of teachers who undergo retraining in new teaching/learning methods
Number of full time equivalent students at a given level of education x 100
Number of full-time equivalent teachers for that same level
Number of qualified teachers at a given level of education x 100
Total number of teachers teaching at that level of education
Aggregate score on satisfaction with equipment for each establishment x 100
Total number of establishments providing TVET
Aggregate score on assessment of infrastructure for each establishment x 100
Total number of establishments providing TVET
Number of teachers retrained in newteaching/learning methods at a given level of education x 100
Total number of teachers at that level of education

Sub-Sector Specific Analyses 225
4.2.1 TEACHERS AND INSTRUCTORS
Among others, a commonly used indicator, which also provides for interesting comparisonwith the other education sub-sectors to establish basic quality features is thestudent/teacher ratio (STR). It should be emphasised that target or standard STRs in TVETare often much lower than in general education, owed to the low optimum class size inpractical training. In Malawi, for example, the standard STR set by the Ministry of Educationwas 7:1. Data on established teachers and TVET instructors are usually included in EMISstatistics or available in the parent ministry (education or labour) and/or the public (oreducation) service commissions in charge of employing teaching staff in the TVET sector.STR analysis should be disaggregated, as far as data allows, by type of TVET institutions,and possibly by individual institution. A disaggregated analysis often reveals considerabledifferences in the STR by school, depending on the location (rural/urban) and theoccupational focus of the individual institution. It is common that for technical occupationswith a high demand in the labour market it is difficult to recruit sufficient instructors,because salaries in the teaching profession fall short of what experts can earn in industry.
Data collection for STR analysis in TVET may face some methodological problems, including:
• Official enrolment data may only capture regular, publicly funded students, leaving outthose students that are not considered regular and have enrolled on own costs. The STRtherefore understates the actual situation, unless these non-regular students are alsoaccounted for;
• TVET institutions often employ a considerable number of contract teachers financedout of fee income to cope with instructors’ shortages. These are not employed by thegovernment and thus usually not captured in central statistics. Information can normallyonly be obtained at institution level;
• A proper calculation of STR should take into account that some teachers are workingpart-time (e.g. professionals that train students for some hours per week). The commonway to address this is to compute a full-time equivalent number of teachers (see themethodology in chapter 8 on higher education).
• In TVET, instructors are often qualified for training programmes other than the onesoffered in the training institution. Many institutions carry on with instructors of tradeprogrammes that have been abandoned long ago. These instructors are often idle, whileother programmes suffer from undersupply of teaching staff.
The issues above are important to understand and interpret STRs in TVET correctly. Relevantdata and information usually require assessment through case studies conducted directly atthe level of training institutions.
CHA
PTER10
TVET

226 EDUCATION SECTOR ANALYSIS METHODOLOGICAL GUIDELINES - Volume 2
(Student/Teacher Ratio):Number of Teachers and STR in Different TVET Streams, Uganda, 2009Source: Adapted from Johanson and Okema, 2011.
EXAMPLE 10.17
Table 10.22 below shows an example of a simple STR calculation by type of training institutionin Uganda.
Lower level institutions
Technical Schools
Farm Schools
Community Polytechnics
Sub-Total
Middle level Institutions
Technical Institutes
Vocational Training Institutes
Sub-Total
Tertiary Institutions
Technical Colleges
Comm. & Business Colleges
Health Institutions
Sub-Total
512
57
293
862
654
107
761
n.a.
n.a.
n.a.
n.a.
Male
126
17
85
228
100
17
117
n.a.
n.a.
n.a.
n.a.
Female Total
Teachers Traineesper
Teacher
638
74
378
1,090
754
114
868
95
790
274
1,159
9.9
15.7
8.9
9.9
11.8
16.8
14.8
20.2
23.0
11.4
20.0
TABLE 10.22 - Teachers and Instructors by Gender and Type of Public Institution, Uganda, 2009
FindingsSTRs tend to be higher in higher level institutions. This can be explained by the fact thatprogrammes at higher level are more specific and advanced and it is difficult for the UgandaEducation Service Commission to recruit appropriately qualified teachers for these occupationalspecialisations at that level.
Average Class Size
To cope with the methodological and data problems mentioned above, the average sizeof a student group may be calculated as an alternative to STR for each level, type ofprogramme or occupational area. This helps to draw a better picture about actual sizes oflearning groups and the number of groups each teachers have to cater for. The methodologyfor this is attached in annex 10.4.

EXAMPLE 10.18(Teaching Staff by Qualification): Distribution of Teaching Staff in TechnicalEducation by Qualification, Tanzania, 2008/9Source: Adapted from the Tanzania CSR, 2011.
The example is taken from the 2011 Tanzania CSR and shows the formal qualifications ofteachers in technical education under the National Commission for Technical Education (NACTE),which comprises post-secondary technical education.
Sub-Sector Specific Analyses 227
CHA
PTER10
TVET
Type of Institution
Technical Colleges
Colleges of Commerce
……
Average
Total Number of Teachers/Instructors
Employed
Total Number of Teachers Employed who Meet the Minimum Qualification
or above
Ratio of Qualified Teachers
X
…
Sum (above) Xs
Y
…
Sum (above) Ys
Y / X x 100
…
Ys / Xs x 100
TABLE 10.23 - Suggested Table to Capture the Ratio of Qualified Teachers
The ratio can also be disaggregated by field of teaching/learning, or by level of TVET,depending on the country context and data availability. In the data collection, it is importantto consider that the regular teachers’ corps may include different categories of teachingstaff with different required minimum qualifications (e.g., teachers and instructors).
TABLE 10.24 - Distribution of TE Registered Teaching Staff, by qualification, Tanzania, 2008/09
Ph.D.
Master’s Degree
Bachelor’s Degree
Advanced Diploma
Ordinary Diploma
Full Technician Certificate
Ordinary Certificate
Total
Number
Male% Female
2.5
36.2
27.5
13.7
18.5
0.9
0.7
100.0
1,485
Total
2.8
36.5
29.3
13.6
16.0
1.2
0.5
100.0
1,128
1.4
35.0
21.8
14.3
26.3
0.0
1.1
100,0
357
Rate of Qualified Teachers
Given the difficulties to recruit qualified teachers, outlined above, another importantindicator to assess the quality of teaching and learning is the ratio of qualified teachers,which measures the percentage of teachers who have the necessary qualification for theirassigned field of teaching/instruction (see Table 10.23). Data needed to establish thisindicator is the number of teachers for a given level, school-type or field of learning byhighest formal qualification. Furthermore, information about the formally set minimumqualification is required, which can be obtained from the employing authority (e.g.education/public service commissions). A simple table to establish the ratio of qualifiedteachers by type of school is suggested below:

FindingsThe table shows that around 66 percent of all teaching staff in the technical education streamregistered under NACTE holds a degree qualification. Significant are the differences betweenthe male and female group of teachers. While female teachers account for less than a quarterof all teachers, they also tend to be less educated than their male colleagues. They areunderrepresented in the group of degree and Ph.D. holders, and increasingly overrepresentedas the qualification level gets lower.
228 EDUCATION SECTOR ANALYSIS METHODOLOGICAL GUIDELINES - Volume 2
Share of Teachers that Upgrade their Skills
UNESCO also suggests the indicator percentage of teachers undergoing retraining innew teaching/learning methods. If teachers/instructors further training programmesexist, this is a very good indicator, which is particularly important in countries, which areundergoing a TVET reform forcing teachers and instructors to get adjusted to new curriculaand delivery modes. It may be interesting to disaggregate this analysis by provider type,incorporating in particular non-formal and non-public TVET segments. Teachers andinstructors working in private institutions often do not have access to publicly fundedteachers upgrading schemes, and if they have, their employers may not promote theirparticipation. Relevant data may be obtained from the regulatory authority/ministry incharge of teachers training/further training, and from the TVET institutions survey, ifconducted.
Other Considerations
The indicators introduced above are merely concerned with formal teachers’ qualificationsand deployment. In TVET, however, it is a widespread phenomenon that teachers areformally qualified, however not sufficiently competent and skillful to teach the subject theyare supposed to teach, in particular with respect to practical workshop/lab instructions. Inparticular in the formal TVET system, practical industrial experience is usually not arequirement for employment. Technical teachers are frequently recruited directly fromteachers training institutions or technical colleges, which themselves are theory-biased andhardly in the position to impart relevant practical skills.
To what extent this issue is a problem in the country of analysis or not, cannot entirely beestablished through quantitative analysis. If a TVET institutions survey is conducted, aquestion of prior industrial experience of teachers may be included, and results computedaccordingly. Other, more qualitative key questions to assess the extent of the issues, include:
• Is industrial experience a requirement (or an additionally desired qualification) for therecruitment of TVET teachers? Information can be obtained from the employingauthorities (e.g. public or education service commissions).
• Are practical qualifications of TVET graduates considered adequate? Information is

Sub-Sector Specific Analyses 229
generated in the assessment of external efficiency, introduced in section 2.3 of this chapter.
• Do TVET institutions organise workplace attachments for teachers and instructors?
The problems around qualifications and competencies of TVET teachers and theappropriateness of number of teachers employed have to be analysed in the wider contextof TVET teacher deployment and management policies. In many countries, deployment ofTVET teachers is a central government responsibility. In such systems some common issuesoccur frequently:
• Recruitment of teachers is based on public service rules regarding qualifications, whichmay not consider experience and skills that are important in the TVET context (such asindustrial experience);
• Salaries are centrally set and inflexible, preventing special wage incentives to recruitskilled teachers in high demand occupations or in less attractive locations;
• Dismissal of redundant teachers is difficult, forcing training institutions to cope with acorps of teachers that is inadequately composed in relation to the occupationalprogrammes offered.
In the context of TVET reforms, the question of whether the recruitment of teachers shouldbecome a sole responsibility of TVET institutions, more or less delinked from public servicerules and requirements, has become an important point of discussion.
Finally, as in general education, teachers’ absenteeism is occurring in TVET with negativeconsequences on training quality and learning outcomes. To date, comprehensive analysesof the specific phenomenon of absenteeism in the TVET sub-sector are rare, but the issueclearly merits more attention. Chapter 6 of these guidelines provides an in-depth introductioninto issues and assessment methodologies.
4.2.2 CURRICULA
Quality training requires good curricula and its proper implementation in institutions. In TVET,more than in general education, curricula require frequent updating in line with changingworkplace requirements and technological developments. If TVET is integrated into the overalleducation system with established equivalences between general and TVET qualifications,curricula often include considerable shares of academic learning. A good curriculum thatenables learning with a view to employability needs to strike the difficult balance betweentheoretical and academic learning and practical skills and competence development. Animportant determinant of the appropriateness of curricula for the labour market is in thiscontext the involvement of employers in the curriculum development process.
CHA
PTER10
TVET

230 EDUCATION SECTOR ANALYSIS METHODOLOGICAL GUIDELINES - Volume 2
Yet another question is whether curricula are realistic in the sense that available TVETinstitutions have the capacities to implement it.
The analysis of the appropriateness of curricula needs to be assessed mainly by qualitativeresearch methods, through interviews with education and TVET stakeholders and employers.The analysis of external efficiency, notably through tracer studies, may provide valuableinsights into the satisfaction of employers with the learning contents of TVET programmes.
Key questions to assess the quality of curricula, and equally the process of curriculumdevelopment and revision, include:
• Are competency-based and modular curricula introduced, which orient learningcontents on labour market requirements?
• Are employers systematically involved in curriculum development processes?
• What is the relationship between practical and theoretical contents in the curricula?
• How often are curricula updated?
• Are practical skills examinable?
• Are TVET institutions allowed to modify and adjust curricula in line with local labourmarket needs?
4.2.3 TRAINING RESOURCES: EQUIPMENT, WORKSHOP/LAB FACILITIES,TEACHING AND LEARNING MATERIAL
The capacities of TVET institutions to implement good curricula and with good teachersalso depend on the quality of facilities, equipment and teaching and learning material.Systematic information on this is occasionally available through facility and resourceassessments in TVET institutions, conducted for example by the authorities in charge ofTVET. Alternatively, the TVET institution survey should include systematic questions in thisregard.
Assessing the adequacy of facilities, equipment and teaching and learning material posesthe challenge, that uniform standards are difficult to establish, because requirements dependon curricula and delivery methods. For example, apprenticeship systems systematicallyincorporate practical workplace learning in the programme. Consequently, equipment andworkshop requirements in TVET institutions may be less than in full-time school-basedtraining programmes, because practical skills are not developed primarily in the TVETinstitution, but in the workplace of the cooperating employer.

Sub-Sector Specific Analyses 231
UNESCO is suggesting in this context two useful indicators, data for which can be collectedthrough TVET institution surveys: average level of satisfaction with equipment, and theaverage level of satisfaction with school infrastructure. Both indicators are based onsatisfaction scoring by schools themselves.
4.2.4 QUALITY ASSURANCE AND MANAGEMENT
TVET reform efforts have increasingly been drawing attention to the need of establishingand improving systems for quality assurance in TVET and quality management at the levelof TVET institutions. Specifically, the following systems and instruments are consideredimportant:
• Registration and accreditation systems for TVET institutions to ensure that providersmeet minimum requirements in terms of inputs (facilities, teaching staff, etc) andmanagement capabilities to conduct training in accordance with set standards. Inmodern accreditation systems, input standards tend to become less important ascompared to standards relating to processes and management;
• Alternatively or in addition to accreditation of training institutions: accreditation oftraining programmes to establish whether curricula and other training resources(teachers, material, facilities) are adequate to deliver a specific training programme inaccordance with occupational standards;
• Quality management system for TVET institutions comprising a system of managementprocedures to help institutions building and maintaining quality standards, labourmarket responsiveness and client orientation in their operations. It is not uncommonnowadays that larger TVET institutions seek ISO certification. Alternatively, TVETauthorities develop national standard quality management procedures, which becomepart of the accreditation criteria;
• Quality assurance of training outcomes commonly done through examinations/assessments. Issues of importance in modern assessment systems include transparencyissues, appropriate methods to test practical competencies, competencies of assessorsand industry involvement in assessment. Assessments may be done at school level, orat accredited external assessment centers;
• Quality of the curriculum development process relating in particular to the involvementof workplace experts in the process and mechanisms of curriculum verification byemployers in order to ensure relevance.
CHA
PTER10
TVET

232 EDUCATION SECTOR ANALYSIS METHODOLOGICAL GUIDELINES - Volume 2
An Education sector analysis should assess the availability and state of development of suchquality assurance and management systems with the aim to assess whether:
• Systems and mechanisms are well defined with respect to procedures, roles andresponsibilities;
• Rules are regularly enforced; and
• Sufficient personnel (in terms of quantity and qualifications) is available in responsiblebodies to manage and implement the systems.
NOTES
67 See also World Bank, 2010. Stepping up Skills. For more jobs and higher productivity.
68 For example, new commitments for vocational training under education sector support by the World Bank increasedsharply after 2006. See Fasih Tazeen, 2010.
69 While Chapter 5 on external efficiency demonstrates how the labour market context is assessed, Section 2.3 of thischapter provides more guidance on how to assess the specific labour market relevance of TVET.
70 “Revised recommendation concerning Technical and Vocational Education”, from “Normative Instrument concerningTechnical and Vocational Education”, 2001, p.7.
71 See also the overview of different (but similar in principle) definitions of formal, non-formal and informal education andlearning in UNESCO/Regional Bureau for Education in Africa 2009.
72 The so-called “dual system”, which form the core of vocational training in German speaking countries, is a particularlywell established and formalised kind of apprenticeship system with strong influence and participation of employers.
73 UNESCO/BREDA, 2011. Tanzania Education Sector Analysis. Beyond Primary Education, the Quest for Balanced andEfficient Policy Choices for Human Development and Economic Growth, p. 88.
74 A detailed description of ISCED and its problems to apply the system in the TVET context see UNEVOC/UNESCO Instituteof Statistics, 2006. Participation in Formal Technical and Vocational Education and Training Programmes Worldwide. AnInitial Statistical Study.
75 See www.africaeconomicoutlook.org
76 Some TVET programmes are terminal, directly preparing students for entry into the job market after training. Otherprogrammes, particularly at the lower levels of the formal TVET segment, provide two options upon completion: (i)employment; and (ii) progression to higher levels of TVET or general education programmes. Also in the latter case, theskills and competencies acquired must be relevant to the requirements of the labour market, because they are thefoundation for acquiring a higher level of competence that ultimately leads to employment.
77 In this case it may be useful to establish – through the TVET institutions survey – the actual rate of students succeedingto be placed in attachment.

Sub-Sector Specific Analyses 233
TVETCH
APTER
10
78 Nevertheless, the analysis revealed very interesting and unexpected results including a very positive impact on meanincomes as compared to general education leavers, but also a very significant gap to income opportunities with highereducation qualifications.
79 If data is taken from a tracer survey, the indicator needs to be modified to reflect the share of employed TVET graduatesin a particular occupational field that have undergone relevant training.
80 The TVET share of the total administrative expenditure in education ministries, or for example in education examinationorganisations, is often not easily identifiable. In such cases the percentage of TVET students of the entire studentpopulation administered by the ministry or organisation may be taken as a proxy.
81 See UNESCO/BREDA, 2009.
82 It may be possible to disaggregate expenditure figures by educational level for some expenditure categories (such ascapitation grants and instructional material) and not for others (such as teacher salaries).
83 Due to a lack of data on training outcomes, a cost effectiveness analysis may not be possible in most cases.
84 In this case it is important to operate with actual (executed) budgets, if possible.
85 Assessing costs of apprenticeship programmes poses a particular challenge. Firstly, trainees are enrolled full time with atraining institutions, but are actually not in the institutions throughout the year. For the purpose of cost assessment theyhave to be treated as part-time students. Secondly, costs incurred in companies to provide the in-firm part ofapprenticeship training need to be added in a full-cost assessment. Here, it may be useful to distinguish between grossand net costs. Apprentices provide productive work during their in-firm training period, the value of which need to bededucted from gross costs to reach net costs. The value of work is usually calculated as the salary of a worker with thesame skill level and responsibility who would replace the apprentice if s/he would not be there.
86 This is particularly pronounced in public training institutions, but often prevalent also in private training markets, becausetraining institutions are bound to market fee levels, which may be lower than what would be needed to provide goodquality training.
87 Using budget request data from individual training institutions may be problematic though, at least in case of publicinstitutions, as such requests are often inflated to negotiate a higher budget allocation.
88 For measuring the quality of the TVET system as such, in terms of how well it serves national labour market needs, seeSection 2.3 on external efficiency.

© W
orld
Ban
k /
Régi
s L’
Hos
tis
234 EDUCATION SECTOR ANALYSIS METHODOLOGICAL GUIDELINES - Volume 2

Sub-Sector Specific Analyses 235
ANNEXES
AN
NEX
ES

236 EDUCATION SYSTEM ANALYSIS METHODOLOGICAL GUIDELINES - Volume 2
CHAPTER 7 ANNEXES
ANNEX 7.1:DESCRIPTION OF KEY INDICATORS
This annex firstly presents the key indicators for the coverage of ECD services in the areas of health,nutrition and hygiene, as well as for parental practices.89 A broad understanding of coverage shouldbe adopted here, including the access to and use of services, which are its determinants.
HEALTH INDICATORS
It is helpful to distinguish between indicators of maternal health (pre and postnatal care) and thoseof child health (vaccinations and other preventive and curative health care).
Maternal Health90
Indicators on the coverage of health services before, during and after birth are available.
The share of women (aged 15 to 49 years) having received prenatal care.
Pregnant women are advised to have at least four prenatal appointments in health centres withqualified health staff (WHO).91 Indeed, access to prenatal care plays a determining role in reducingmaternal and child mortality and morbidity in as much as it enables the early identification of issuesthat may threaten the life of mothers or their babies.
The indicator is computed as the number of women having received prenatal care in the course oftheir previous pregnancy, as a share of the total number of women having given birth to live childrenover the same period. The indicator can be adjusted by the number of visits (one to four), or bydistinguishing between the type of personnel who provided the service (doctors, nurses or midwives).
The effectiveness of prenatal care also depends on the type of care received and advice given. MICSsurveys provide such information. For instance, it is interesting to establish the share of women whowere vaccinated against tetanus or given advice during such visits, those who were provided withnutritional supplements when showing symptoms of undernourishment and those having undergonegiven medical examinations (blood pressure, blood and urine analyses).
Percentage of births (of women aged 15 to 49 years) assisted by qualified health personnel.
The presence of qualified health staff during birth delivery enables a precise diagnosis of health issuesand quick and appropriate responses where needed, reducing maternal and neonatal mortality. Theindicator is computed as the number of births assisted by qualified health staff, as a share of the totalnumber of births given over the same period. Again, DHS and MICS survey data establish if birthswere given in a health centre by qualified personnel, or at home with the help of a traditional midwife,a dangerous practice that is nevertheless common in rural areas.

Sub-Sector Specific Analyses 237
Infant and Child Health
Child health indicators are of two kinds: (i) indicators of vaccination coverage (computed for childrenaged 12 to 23 months); and (ii) indicators of services provided to children under the age of five yearssuffering from illness.
Vaccination coverage rate.
According to WHO standards, six vaccines are essential to fully protect children against tuberculosis,smallpox, polio, diphtheria, tetanus and whooping cough.92 All these vaccines should be administeredto children in the first 12 months following birth, so the data collected relate to the immunisationsgiven to children aged 12 to 23 months, during their first 12 months.
Percentage of children under 59 months presumed to have pneumonia that receive antibiotics.
Pneumonia is an acute respiratory disease affecting the lungs. It is the first cause of child mortality(WHO, 2011). Prevention is possible through immunisation, satisfactory nutrition and the improvementof environmental factors. Treatment is via antibiotics.
This indicator can be computed on the basis of DHS and MICS survey data to appraise the coverageof health services for children with the illness.
Percentage of children under five years with diarrhea and receiving a treatment of ORS andcontinuous feeding.
Diarrhea is the second cause of child mortality under five years in developing countries, afterpneumonia (WHO, 2009). The illness is contracted through contaminated water or food, or fromperson to person where hygiene is insufficient. Children who suffer from diarrhea are often found tobe close to malnourishment, which makes them more vulnerable to the illness. Each episode ofdiarrhea worsens malnutrition further due to dehydration, depriving children of the minerals requiredfor survival and growth. Good hygiene practices are one of the most effective prevention methods(See next section on hygiene indicators). Treatment is often provided in the form of oral rehydrationsalts (ORS).
Percentage of children under five years having suffered from fever who received antimalarialtreatment.
Malaria is also one of the main causes of under five mortality. It is also devastating in pregnant women,causing high rates of still-births and maternal mortality. It is to be noted that this indicator covers theantimalarial treatment of all feverish children and not only those confirmed to have malaria; it shouldtherefore be interpreted with care. On this level, it is also relevant to examine the coverage ofantimalarial prevention treatment. MICS surveys often provide estimates of the use of mosquito netsat home and on the use of prevention treatments by children and pregnant mothers.
AN
NEX
ES

Nutrition
Access to proper nutrition during early childhood is a determinant factor for children’s physical andmental development. Breast-feeding should be exclusive until children are six months old accordingto the WHO, and complementary foods should be provided after that age. Various indicators can bederived from household surveys to establish both nutritional practices and the coverage of ECDnutrition services.
Rate of exclusive breast-feeding during the first six months.
This indicator is computed as the number of babies under six months who are exclusively breast-fed,as a share of the total number of babies of that age group.
Vitamin A supplementation coverage rate among children aged 6 to 59 months.
Vitamin A supplementation plays a key role in the prevention of infant mortality, particularly for thoseborn with low birth weight or suffering from severe malnutrition. The indicator is computed as thenumber of children aged 6 to 59 months having received two doses (or one large dose) of Vitamin Asupplement, as a share of the total number of children of the same age group.
The percentage of households that use iodised salt.
According to the WHO, iodine deficiency is the main cause of brain damage, which can alter thecognitive and motor development of children, jeopardising their performance at school. It is particularlyimportant for pregnant women to have sufficient amounts of iodine in their diet for the developmentof the fetus. The indicator is computed as the percentage of households that consume an adequateamount of iodised salt.
Malnutrition
Undernourished children run a high risk of morbidity and mortality. Malnutrition also affects children’smental development. Three main indicators are used to evaluate the nutrition status of children.
The share of children under five years with low weight-for-height, or wasting.
This indicator is computed as the percentage of children whose weight-for-height is less than twostandard deviations below the median for the reference population. This type of malnutrition is theconsequence of insufficient feeding during the period immediately before the observation. It can alsobe the result of recent illness, especially diarrhea. Two states of malnutrition are generally used:moderate or acute/severe. The former is equivalent to a weight-for-height which is two to threestandard deviations lower than the median for the reference population. Moderately malnourishedchildren who do not receive appropriate help can evolve towards acute or severe malnutrition, whichis defined as being more than three standard deviations below the median, a life-endangeringcondition (WHO).93
The share of children under five years with low height-for-age, or stunting.
This indicator is computed as the percentage of children whose height-for-age is more than twostandard deviations below the median for the reference population.94 Stunting is the consequence of
238 EDUCATION SECTOR ANALYSIS METHODOLOGICAL GUIDELINES - Volume 2

Sub-Sector Specific Analyses 239
AN
NEX
ES
insufficient nutrition over a long period of time, or of repeated infections. It is generally noted beforechildren reach the age of two years, and its effects are largely irreversible (WHO). It carries the risk ofdelayed motor development, the deterioration of cognitive functions and low school performance(UNICEF).95
The share of children under five years with low weight-for-age, or underweight.
This indicator is computed as the percentage of children whose weight-for-age is more than twostandard deviations below the median for the reference population. This malnutrition status reflectsthe combined effects in children of stunting and wasting.
The share of children under five suffering from obesity, or overweight.
Long considered an issue relevant only to developed countries, obesity and overweight concern moreand more children in developing countries, especially in urban areas, and could become a public healthissue in the future. On the basis of DHS and MICS surveys, children whose weight for height is morethan two standard deviations above the median for the reference population are considered to beoverweight.
Access to Water, Sanitation and Hygiene
In addition to the earlier health and nutrition indicators, it is appropriate to analyse the indicators ofaccess to water and sanitation and hygiene practices. Indeed, the lack of access to drinking waterand inadequate hygiene practices are often the cause of detrimental illnesses in children, especiallyyoung ones.
The percentage of households having soap for hand washing.The percentage of households with access to an improved source of water.96
The percentage of households with improved sanitation.
This last indicator refers to households having a toilet connected to sewerage or a septic tank, a latrine,a composting toilet or ventilated improved pit design.
Good hygiene practices.
Various indicators may be available for the appropriate disposal of children’s stools in DHS and MICSsurveys, or for the adequate treatment of water for households without an improved water source,or hand washing (See below).

SCHOOLING INDICATORS
Education and schooling indicators generally cover parental education activities and preprimaryeducation.
Stimulation and Parental Education Activities
Parental practices that favour children’s development are generally difficult to appraise, due to theirintrinsically private nature. MICS4 surveys do however provide valuable information that enables theevaluation of the frequency and quality of a number of parental practices relating to ECD. They includeindicators on good parental practice in terms of: (i) stimulation; (ii) nutrition and hygiene; and (iii)parental practices in terms of dealing with children’s behaviour. They also enable the assessment ofthe father’s role in children’s education and the perception of parents of dangers that children maybe exposed to.
Playing games with young children and carrying out other stimulating activities provide them with anenvironment that is favourable to their intellectual development and generate interest in theirenvironment. Various indicators may be available to establish the extent to which young children(under five years) are provided with learning activities, games, reading, nursery rhymes, songs and soon by their families.
The percentage of children under five years owning at least two toys at home.The percentage of children under five years owning at least one book.The percentage of children aged 36 to 50 months who have been engaged in activities with anadult to promote learning and school readiness.
This indicator is computed as the percentage of children who are involved in stimulating activitieswith one of their parents or another adult member of the family in four or more of the followingactivities in the past 3 days: a) reading books to the child, b) telling stories to the child, c) singingsongs to the child, d) taking the child outside the home, e) playing with the child, and f) spendingtime with the child naming, counting or drawing things. The indicator can be disaggregated by agegroup, specific activity or the parent who participates in the activity with the child (mother or father).
The percentage of children under five years left alone or in the care of another child under 10 yearsfor more than an hour, at least once in the week before the survey.
Parental Practices in Terms of Hygiene, Health and Nutrition
Some parents have little or no knowledge of good hygiene, health or nutrition practices for theirchildren, such as hand washing before meals, or what to do when a child has diarrhea or fever.
The percentage of children who wash their hands before a meal.The percentage of children who wash their hands after using the toilet.Parental attitudes and actions when their child has diarrhea or a fever.
240 EDUCATION SECTOR ANALYSIS METHODOLOGICAL GUIDELINES - Volume 2

Sub-Sector Specific Analyses 241
AN
NEX
ES
Parental Practices Deemed Detrimental to Children’s Harmonious Development
It may also be interesting to examine the knowledge or attitudes of parents with respect to suchpractices. Household, MICS and KAP surveys may provide information on the prevalence of suchpractices and attitudes, in particular with respect to female genital mutilation, domestic violence andso on.
Explanatory, Coercive or Punitive Disciplinary Practices
Children’s learning starts with understanding of their environment. Adults, and parents first andforemost, must play an important role to help children understand their physical and socialenvironment, in particular by providing explanations. Also, children’s adoption of rules is often achievedby explanations of the well or ill-foundedness of good or bad behaviour, and occasionally by coerciveor punitive practices. These practices are an essential ingredient for children to correctly develop theircognitive and social abilities. Depending on the availability of data, these indicators may enable theassessment of such parental practices. MICS4 data enable to estimate a series of indicators of parents’coercive or punitive reactions to children’s detrimental behaviour, including forbidding or depriving achild of something, insults,degrading behaviour or excessive physical punishment, all of which maybe detrimental to children’s harmonious development.
The share of parents/care-givers who take the time to explain rules to their children aged 2 to 14years, or why their behaviour is detrimental.The share of parents/care-givers that punish children for detrimental behaviour.The share of parents who believe children must be physically punished to be properly raised.
Early Childhood Development
The early childhood development index
MICS4 surveys have introduced a new module for ECD (Module 6) whose aim is to measure thedevelopment of children in four areas: pre-reading and pre-numeracy abilities, physical development,socioemotional development and learning abilities, broadly speaking. On the basis of a series ofquestions, indicators on children’s progress have been determined for each of the four areas (SeeTable A7.1 below). The answers are then aggregated to establish the index, which is a weighted scoreof the four areas. This global index, that is representative at the national level, enables to assess theextent to which children are on track in terms of their development (when on track in at least threeout of the four considered dimensions).

There are however limitations to this approach: (i) The questions are of a screening nature, where thechild is not directly evaluated, but questions are answered by parents/care-givers (often mothers); and(ii) The same questions apply to all children, independently of their age, despite scores increasing withchildren’s age. It will be particularly important to control this dimension when computing theaggregate score to avoid age-based bias.
Pre-primary Education97
The indicators proposed here aim to analyse the evolution of preprimary enrolment over the past tenyears. As mentioned earlier, the provision of preprimary education may be divided into variouscategories according to age groups. The main ones are for children under three years (mainly nurseries,day-care centres, integrated ECD programmes and so on) and formal preprimary education for childrenaged three to five years. When the data permit, it is worthwhile to analyse the evolution of enrolmentfor each category.
The evolution of numbers attending ECD services for children under three years.
242 EDUCATION SECTOR ANALYSIS METHODOLOGICAL GUIDELINES - Volume 2
Indicators and their Components(Responses are binary)
Evaluation Criteria -Children are deemed on track if:
Literacy and NumeracyAbilities
PhysicalDevelopment
SocioemotionalDevelopment
Learning
At least two responses are positive
At least one response is positive
At least two responses are positive
At least one response is positive
TABLE A7.1 - Areas of Early Childhood Development (Children Aged 36 to 59 Months)Measured by MICS4 Surveys
Can the child:1. Identify or name at least 10 letters of the alphabet?2. Read at least four common simple words?3. Recognise and name the symbols for the numbers 0 to 9?
4. Can the child pick up a small object off the floor, such as a stone or a stick?5. Is the child sometimes too ill to play?
6. Does the child get on well with other children?7. Does the child kick, bite or hit other children?8. Is the child easily distracted?
9. Is the child able to follow simple instructions to correctly perform a task? Is the child capable of doing something independently when asked?
10.
Source: MICS4 questionnaires (childinfo.org) and preliminary survey results for Togo, 2011.

Sub-Sector Specific Analyses 243
AN
NEX
ES
Few countries in Africa have statistics on the number of beneficiaries of services for children underthree years. This exercise might therefore be the opportunity to collect this information. It will behelpful in doing so to use the information compiled in the course of the mapping of ECD services(See Section 1 of this chapter).
The evolution of numbers attending ECD services for children aged three to five years.
For this age group the main indicator of choice will be the preprimary gross enrolment rate (GER).This indicator may be worth disaggregating by provider (public, private, faith-based, community andso on), and comparing the evolution of enrolment for each.
The MICS4 survey also allows to know if children aged three to four participate to formal or informalstimulation activities outside the house. This information, coupled with the one related to theparticipation of five years old pre-school programme allows to compute for children aged three tofive a global pre-school/stimulation participation rate.
PROTECTION AND CHILDREN WITH SPECIAL NEEDS INDICATORS
Various indicators are available to assess the evolution of the coverage of ECD services in terms of: (i)protection (registration of births, child labour, female genital mutilation and so on); and (ii) providingfor children with special needs. The indicators below are the main ones available through householdsurveys (DHS and MICS) or from administrative data sources. It will be particularly helpful to providea historical perspective of practices such as birth registration and female genital mutilation.
The percentage of children under five years whose births were registered.
The registration of births is often considered as little more than an administrative formality. However,children whose births are not registered can be refused the right to an identity or to the fulfillment oftheir citizen’s rights. It is also possible that children’s access to health care, education and social servicesmay be conditioned to their having a birth certificate. Birth certificates also provide protection againstillegal adoption, early marriage, forced recruitment and trafficking and can help to reunite families inpost-conflict countries.
The percentage of children aged five to fourteen years involved in paid or unpaid economic activities,as per the ILO definition.98
The percentage of orphans and vulnerable children (OVC).
Orphans and other groups of vulnerable children are generally more exposed to risks than their peers.99
Indeed, such children are more exposed to out-of-school, morbidity and malnutrition than theirpeers.100
The percentage of girls under fourteen years having undergone a form of female genital mutilation.
It is worthwhile accompanying this indicator with a qualitative analysis of cultural and ethnic originand parents’ attitudes with respect to upholding the practice for their daughters. MICS data are usuallyvery helpful in this respect.
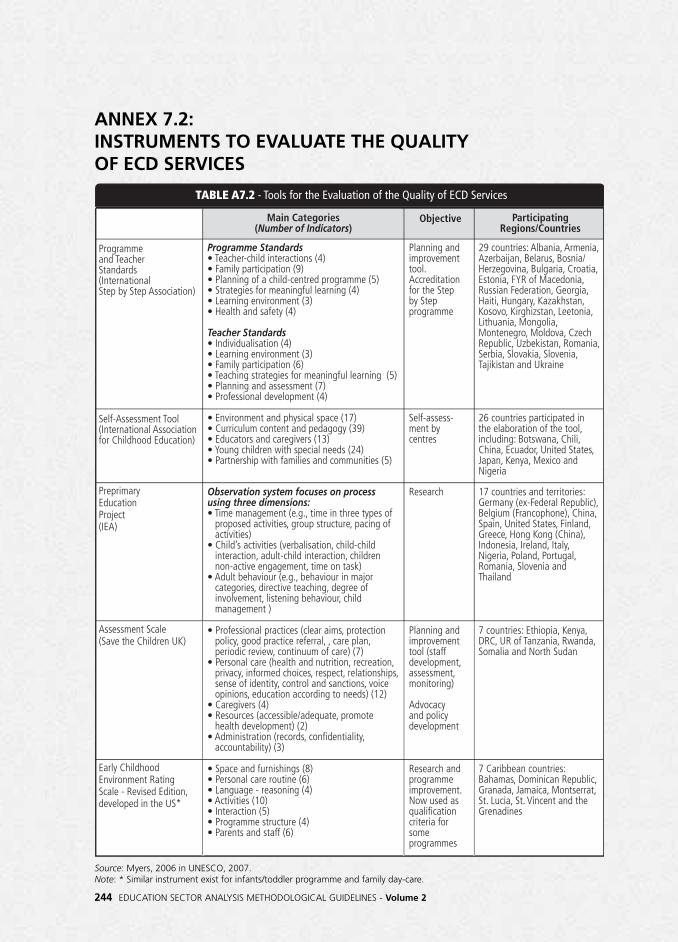
ANNEX 7.2:INSTRUMENTS TO EVALUATE THE QUALITY OF ECD SERVICES
244 EDUCATION SECTOR ANALYSIS METHODOLOGICAL GUIDELINES - Volume 2
Main Categories(Number of Indicators)
Objective ParticipatingRegions/Countries
Programme and TeacherStandards(International Step by Step Association)
Self-Assessment Tool(International Associationfor Childhood Education)
Preprimary Education Project(IEA)
TABLE A7.2 - Tools for the Evaluation of the Quality of ECD Services
Programme Standards• Teacher-child interactions (4)• Family participation (9)• Planning of a child-centred programme (5)• Strategies for meaningful learning (4)• Learning environment (3)• Health and safety (4)
Teacher Standards• Individualisation (4)• Learning environment (3)• Family participation (6)• Teaching strategies for meaningful learning (5)• Planning and assessment (7)• Professional development (4)
Planning and improvement tool. Accreditation for the Step by Step programme
29 countries: Albania, Armenia, Azerbaijan, Belarus, Bosnia/ Herzegovina, Bulgaria, Croatia, Estonia, FYR of Macedonia, Russian Federation, Georgia, Haiti, Hungary, Kazakhstan, Kosovo, Kirghizstan, Leetonia, Lithuania, Mongolia, Montenegro, Moldova, Czech Republic, Uzbekistan, Romania, Serbia, Slovakia, Slovenia, Tajikistan and Ukraine
Observation system focuses on process using three dimensions:• Time management (e.g., time in three types of proposed activities, group structure, pacing of activities)• Child’s activities (verbalisation, child-child interaction, adult-child interaction, children non-active engagement, time on task)• Adult behaviour (e.g., behaviour in major categories, directive teaching, degree of involvement, listening behaviour, child management )
Research 17 countries and territories: Germany (ex-Federal Republic), Belgium (Francophone), China, Spain, United States, Finland, Greece, Hong Kong (China), Indonesia, Ireland, Italy, Nigeria, Poland, Portugal, Romania, Slovenia and Thailand
Assessment Scale(Save the Children UK)
• Professional practices (clear aims, protection policy, good practice referral, , care plan, periodic review, continuum of care) (7)• Personal care (health and nutrition, recreation, privacy, informed choices, respect, relationships, sense of identity, control and sanctions, voice opinions, education according to needs) (12)• Caregivers (4)• Resources (accessible/adequate, promote health development) (2)• Administration (records, confidentiality, accountability) (3)
Planning and improvement tool (staff development, assessment, monitoring)
Advocacy and policy development
7 countries: Ethiopia, Kenya, DRC, UR of Tanzania, Rwanda, Somalia and North Sudan
Early ChildhoodEnvironment RatingScale - Revised Edition,developed in the US*
• Space and furnishings (8)• Personal care routine (6)• Language - reasoning (4)• Activities (10)• Interaction (5)• Programme structure (4)• Parents and staff (6)
Research and programme improvement. Now used as qualification criteria for some programmes
7 Caribbean countries: Bahamas, Dominican Republic, Granada, Jamaica, Montserrat, St. Lucia, St. Vincent and the Grenadines
• Environment and physical space (17)• Curriculum content and pedagogy (39)• Educators and caregivers (13)• Young children with special needs (24)• Partnership with families and communities (5)
Self-assess-ment by centres
26 countries participated inthe elaboration of the tool, including: Botswana, Chili, China, Ecuador, United States, Japan, Kenya, Mexico and Nigeria
Source: Myers, 2006 in UNESCO, 2007. Note: * Similar instrument exist for infants/toddler programme and family day-care.

Sub-Sector Specific Analyses 245
AN
NEX
ES
Space and Furnishing
Personal Care Routines
Language-Reasoning
Activities
Interaction
Programme Structure
Parents and Staff
1. Indoor space; 2. Furniture for routine care, play and learning; 3. Furnishings for relaxation and comfort; 4. Room arrangement for play; 5. Space for privacy; 6. Child-related display; 7. Space for gross motor play; 8. Gross motor equipment
9. Greeting/departing; 10. Meals/snacks; 11. Nap/rest; 12. Toileting/diapering13. Health practices; 14. Safety practices
15. Books and pictures; 16. Encouraging children to communicate; 17. Using language to develop reasoning skills; 18. Informal use of language
19. Fine motor; 20. Art; 21. Music/movement; 22. Blocks; 23. Sand/water24. Dramatic play; 25. Nature/science; 26. Math/number27. Use of TV, video, and/or computers; 28. Promoting acceptance of diversity
29. Supervision of gross motor activities; 30. General supervision of children (other than gross motor); 31. Discipline; 32. Staff-child interactions33. Interactions among children
34. Schedule; 35. Free play; 36. Group time37. Provision for children with disabilities
38. Provision for parents; 39. Provision for personal needs of staff40. Provision for professional needs of staff; 41. Staff interaction and cooperation42. Supervision and evaluation of staff;43. Opportunities for professional growth
Sub-Categories
TABLE A7.3 - The Items of the Revised Version of the Early Childhood Environment Rating Scale (ECERS-R)
Source: FPG Child Development Institute (http://ers.fpg.unc.edu/c-overview-subscales-and-items-ecers-r).

246 EDUCATION SECTOR ANALYSIS METHODOLOGICAL GUIDELINES - Volume 2
Birth
Mortality
Malnutrition
Antenatal and Natal Care
Immunisation
Treatment of Illnesses
Sanitation
Premature birthLow birth weight
Maternal mortality ratioNeonatal mortality rate (1st month)Infant mortality rate (1st year)Under five mortality rate
ObesityUnderweightStuntingWasting
Morbidity Diseases (Acute Respiratory Infections, Malaria, Diarrhea)
Attended at least once by skilled personnelAttended at least four times by skilled personnelSkilled attendant at deliveryPost natal health check for the new bornAnemia in mothers
TuberculosisPolio Diphtheria, pertussis and tetanus (DPT)Yellow fever, etc.
Malaria diagnostics usageChild sleeps under mosquito netUse of ORS in case of diarrhea in childrenUse of antibiotics in cases of acute respiratory infections
Use of improved drinking waterImproved sanitation facilitiesHand washing
Result Indicators
Explanatory Variables
Nutrition
ServiceUtilisation
HouseholdCharacteristics
ChildCharacteristics
Breastfeeding: Exclusive breastfeeding under 6 months Continued breastfeeding till age 2Introduction of solid, semi-solid or soft foodsIodised salt consumptionVitamin A supplementation
Distance to the nearest health centrePerception of the quality of services receivedUse of health services when children are illParticipation in an ECD programme (including nutrition programmes)
Area of residenceRegion of residenceSize of the familyHousehold income levelEducation of the father/motherGender of the head of household
GenderAgeRank among siblingsOVC statusIf child is handicapped
TABLE A7.4 - Example of Health, Nutrition and Hygiene Result Indicators
Source: Authors.
ANNEX 7.3:EXTERNAL EFFICIENCY OF ECD ACTIVITIES ON HEALTH,NUTRITION AND HYGIENE

Sub-Sector Specific Analyses 247
AN
NEX
ES
Indicators and Explanatory Variables
Most health-oriented ECD activities relate to immunisation, feeding and nutritional supplementation,neonatal health care, parental education and good hygiene practice programmes. It will be worthwhileto determine their efficiency or the effect of such programmes in terms of improving the health andnutritional status of beneficiary children.
These indicators are generally produced with data on the prevalence of child illnesses, anemia,underweight, stunting and so on. They are generally available through household surveys such as DHSand MICS. However, when appropriate, data from health ministries (on the characteristics ofprogrammes for instance) may also be used.
Methodology to Assess the Impact of ECD Activities on Health, Nutrition and HygieneIndicators
The key question to be answered here is: Have the living conditions of ECD activity beneficiary children(as per the indicators of Table A7.4) been improved thanks to their access to or use of ECD services(as per the indicators of Table A7.4)? The identification of the explanatory variables to be considereddoes however require reasonable prior knowledge of the epidemiological processes in play. Closecollaboration with the health ministry is necessary.
Initially, the results for ECD programme beneficiary children should be compared with those forchildren who did not benefit from such services to determine if significant differences exist betweenthe two groups. An econometric analysis will then enable to establish the net effects of the variables,all other things being equal.

248 EDUCATION SECTOR ANALYSIS METHODOLOGICAL GUIDELINES - Volume 2
ANNEX 7.4:HOLISTIC EARLY CHILDHOOD DEVELOPMENT INDEX(HECDI)101
The development of a holistic index for early childhood development (HECDI) is the result of a UNESCOled initiative with the collaboration of an inter-agency technical committee established in December2010 to implement the recommendations of the Moscow Action Framework adopted by the WorldConference for Education and Early Childhood Protection in 2009.102
Currently still in the conception phase, the HECDI aims to be a standardised and internationallycomparable indicator. Such an instrument should enable governments and international players toimprove their capacity to monitor and evaluate the performance of countries in providing equitableaccess to quality ECCE services and to closely monitor progress towards the achievement of theEducation for All (EFA) Goal 1: “Expanding and improving comprehensive early childhood care andeducation, especially for the most vulnerable and disadvantaged children.”
The HECDI is holistic in that it adopts a global vision of children’s development, from pregnancythrough to the age of eight years. It covers five key areas of ECD:
• The legal protection of children;
• The social protection of children and their well-being;
• Children’s cognitive and socioemotional development;
• Access to education and ECD services, and their quality; and
• Health and nutrition.
Table A7.5 provides a proposal of indicators to be included in the HECDI for each of the five areas.

Sub-Sector Specific Analyses 249
AN
NEX
ES
Areaof Focus
Level Data sourcePossible proxies or actual indicators Currently available
Health
Health
Health
Equity and Social Protection
Equity and Social Protection
Education
Education
Education
Education
Parent Support
Programmes& Services
Child Outcomes and Family Environment
Policies and Laws
Programmes& Services
Policies and Laws
Programmes& Services
Programmes& Services
Child Outcomesand Family Environment
Child Outcomes and Family Environment
Policies and Laws
Under 5 mortality rate
Use of ORS (diarrhea)Care-seeking for pneumonia Malaria diagnostics HIV
None
% of children registered at birth
% of children entering Grade 1 with PPE access
EDI scores for children aged 3 to 4 years
Nothing available for younger children
Presence of paid parental leave
% of children with access to comprehensive preventive and medical care, including well-baby checks, immunisation and responses to emergency needs
MICS
MICS
% children born with the assistance of a skilled birth attendant% mothers having attended at least 4 prenatal health checks
% of mothers with access to pregnancy and birth services
Under 5 mortality rate
% of children with frequent illnesses or chronic conditions
Country provides legal guarantee of rights regardless of religion, race, national origin, gender or disability
% of children with access to ECCE that meets the needs of working families, for infants/toddlers as well as preschoolers
% of children with access to quality ECCE
% of children entering Grade 1 with ECCE experience
UIS
% of children meeting developmental and learning goals
MICS
Share of coverage provided by policies for paid parental leave for newborns, in formal/informal settings
NATLEX *
% of children with access to clean water and sanitation
Health
Health
Programmes& Services
Programmes& Services
WHOWHO
SABER
SABER
TABLE A7.5 - Proposed Indicators for the Computation of the HECDI
Use of improved drinking water sourceUse of improved sanitation services
MICS MICS
MICS MICSMICS MICS
Immunisation ratesHealth care providers per 10,000 populationLevel of access to essential ECD health interventionsPresence of mandated ECCE services including health care
% of children registered at birth
WHO
UISSABERSABER
SABER
SABER
PPE teacher/child ratioExistence of learning standardsEstablished registration and accreditation procedures for ECCE Established infrastructure and service delivery standards – i.e., minimum number of hours per week; coverage of infrastructure standardsExistence of required teacher/child ratio for PPE
UISMICSSABER
SABER
Preprimary enrolment% children with access to preprimary Programmes that target all beneficiary groupsECD is adequate to meet the needs of the population
WHO
▶

250 EDUCATION SECTOR ANALYSIS METHODOLOGICAL GUIDELINES - Volume 2
% of children with low birth weight
% of children with adequate neuro-develop-ment status in last 1,000 days
Presence of policies to lift families out of poverty
Child poverty rates
Parent Support
Parent Support
Parent Support
Parent Support
Parent Support
Child Outcomes and Family Environment
Parent Support
Programmes& Services
Child Outcomes and Family Environment
Child Outcomes and Family Environment
Child Outcomes and Family Environment
Child Outcomes and Family Environment
Child Outcomes and Family EnvironmentChild Outcomes and Family EnvironmentChild Outcomes and Family EnvironmentChild Outcomes and Family Environment
Child Outcomes and Family Environment
Policies and Laws
Education levels
None
None
% of children left alone or in care of another child under 10 for more than an hour in the last week
% access to parent support and education services
Average years of maternal education
Maternal depression
% of children exposed to domestic violence
% of children with stimulating home learning environments
% of children with inadequate care
MICS
Programmes that target all beneficiary groupsCurrently no measure of the extent of access or quality of programmes for parents
SABER
Support for learning (4 or more activities to promote learning and school preparedness in last 3 days)% of children with 3 or more books; 2 or more toys
MICS
MICS
Programmes et services
Country or community monitors and responds to growth and nutritional status
% of obese children
% of stunted children
Nutrition
Nutrition
Nutrition
Nutrition
Poverty
Poverty
Health
Programmes established in all areas of focus (education, health, nutrition, social and child protection) None to directly measure access to nutrition programmes
% stunted
% Low Birth Weight
% of children living in poverty
SABER
WHO
WHO
DHS
Source: Draft HECDI description, HECDI Meeting, New York, June 21-22, 2012.Note: * NATLEX is a global database on family policy. ** IMDPE is the ECD measurement tool.

Sub-Sector Specific Analyses 251
AN
NEX
ES
ANNEX 7.5:MAIN ECD EVALUATION TESTS
TABLE A7.6 - Main ECD Evaluation Tests
Dir
ect
Eval
uat
ion
o
f C
hild
ren
Ind
irec
t Ev
alu
atio
n(A
cco
rdin
g t
o P
aren
ts/C
are-
giv
ers)
Name of the Test Age Group ECD Area Countries
2.5 years and above
2.5 years and above
2.5 years and above
3 to 6 years
3 to 6 years
3 to 6 years
4 to 7 years
36 to 59 months
1 to 42 months
Peabody Picture Vocabulary Test (PPVT) and Test de Vocabulario en Imagenes Peabody (TVIP)
Stanford-Binet Intelligence Scales
British Ability Scale (BAS), in the African Child Test (ACT) version
Stroop Test (Adapted)
Ages and Stages Questionnaire (ASQ) 1
Strengths and DifficultiesQuestionnaire
Early Development Instrument(EDI) 2
MICS4 (Module 6)
Bayley Scales of Infant Development (BSID I&II)
Linguistic Development
Cognitive Development
Multiple ECD areas
Multiple ECD areas and School Preparedness
Socioemotional Development
Executive Functions
Cognitive, Motor and Socioemotional Development
Cognitive, Motor Linguistic and Socioemotional Development
Madagascar, Mozambique
Madagascar
Madagascar
Mozambique
Mozambique
Algeria, CAR, Chad, DRC, Djibouti, The Gambia, Guinea-Bissau, Ghana, Kenya, Mali, Mauritania, Nigeria, Sierra Leone, Sudan, Swaziland, Togo and Tunisia
Madagascar
DRC, Egypt, Ethiopia, Kenya, Seychelles, South Africa, Tanzania
Zimbabwe, Kenya, Uganda, Zanzibar
Name of the Test Age Group ECD Area Countries
Source: Fernald et al., 2009 in Naudeau et al., 2011.Note: * This list is not exhaustive, presenting only the assessments carried out in Africa.1 Includes a direct assessment component administered to the child.2 Test administered to preprimary care-givers and primary Grade 1 teachers.

252 EDUCATION SECTOR ANALYSIS METHODOLOGICAL GUIDELINES - Volume 2
In your situation 1. Who sits on the board of directors?
2. How is each individual designated? Who appoints them?
3. What are the main bodies the management team relies on?• For financial and administrative management (steering committee for example):
- Name, - Key functions, - Composition and - How members are appointed (if by vote, the share of voters by college in the last elections)
• For scientific matters (scientific committee for example): - Name, - Key functions, - Composition and - How members are appointed (if by vote, the share of voters by college in the last elections)
• In terms of academic management and student life (study or academic committees for instance): - Name, - Key functions, - Composition, and - How members are appointed (if by vote, the share of voters by college in the last elections)
• Other bodies that support management: - Name, - Key functions, - Composition and - How members are appointed (if by vote, the share of voters by college in the last elections)
4. Development of the institution:• What management body is responsible for planning the institution’s development?
- Name, - Key functions, - Composition, - How members are appointed and - Documents produced (development plans, strategic vision and so on)
CHAPTER 8 ANNEXES
ANNEX 8.1:SEMI-STRUCTURED INTERVIEW GUIDE - MANAGEMENT(ADMINISTRATIVE AND SCIENTIFIC)
The goal of these interviews, apart from collecting information to briefly present the bodies andcouncils upon which HLIs’ management rely, is to appreciate main stakeholders’ views of theiroperations (directors, teaching staff and students). Where appropriate, an analysis of the commonbodies should be conducted before considering the particularities of each faculty and institution. Thepeople interviewed should be effectively involved in these bodies.
I. Interview with a Manager

Sub-Sector Specific Analyses 253
AN
NEX
ES
5. Autonomy of the institution: On a scale of 0 to 4, how autonomous would you say yourinstitution is in terms of:
- Institutional/organisation matters- Financial affairs- Recruitment and human resources- Academic and pedagogical matters- Scientific research
6. Frequency of conflicts• Number of days of teacher strike over the last 3 years (related to national conflict or institutional issues)• Number of days of student strike over the last 3 years (related to national conflict or institutional issues)
II. Interviews with Members of Management and Teacher and Student Representatives
For each management body identified above, this section of the questionnaire aims to triangulate theopinions of management, student and teacher representatives. One option would be to request thepresence of one of each within the highest governing body, like the steering committee for instance.Answers are coded on a scale of 1 to 5 (lowest to highest).
Management Teachers Students
Body No. 1Rank on a scale of 1 to 5: - The importance of the decision - The point of view of management - The point of view of teachers - The point of view of students
Body No. 2--
Body No. 3--
Main unsatisfied demands
Rank your associationon a scale of 1 to 5 in terms of: - Management decisions - Scientific choices - Decisions regarding studies and student life on campus
Globally, how would you rank the level of dialogue in your institutionon a scale of 1 to 5?
TABLE A8.1 - Information to be Collected from Management, Teacher and Student Representatives

254 EDUCATION SECTOR ANALYSIS METHODOLOGICAL GUIDELINES - Volume 2
ANNEX 8.2:SEMI-STRUCTURED INTERVIEW GUIDE - PERSONNEL POLICIESThis interview is to be conducted with a human resource official responsible for the institutions’teaching staff (personnel service, human resource department, chancellor). It aims to providequalitative feedback on policies in terms of teaching personnel management, their objectives,ambitions and coherence. The interviewer must first be equipped with data on student-teacher ratios(for both permanent and full-time equivalent staff) and be able to appreciate their particularitiescompared to other institutions.
• How many permanent teachers are employed by your institution?
• Does your institution face specific constraints in terms of student-staff ratios (for lectures, group practicals,specialised disciplines and so on), and if so: How important is the gap? Which type of staff do you lack?
• To what extent does your institution use overtime (number of hours of overtime performed by permanentstaff in addition to their usual workload)? (Rank from "Barely" to "Extensively")
• How would you qualify this situation: “Sui-generis” or “Managed”
• To what extent does your institution rely on non-permanent staff (associate lecturers, contract staff)? (Rankfrom "Barely" to "Extensively")
• How would you qualitfy this situation: “Sui-generis” or “Managed”
• Among such staff, what are the respective shares of associate lecturers and contract staff? How would youexplain this situation?
• Do you feel that your institution is today in the position to develop a real teaching personnel policy(recruitment, status, supervision rates, costs and so on)?
• Why?
• What teaching personnel policy do you think should be considered in the short-term for your institution?
• Why (recruitment, status, supervision rates, costs and so on)?
• What teaching personnel policy should be considered in the long-term for your institution?
• Why (recruitment, status, supervision rates, costs and so on)?
• Is there a unique (exemplary) situation in terms of personnel policy in your institution that you would like toshare and advocate?

Sub-Sector Specific Analyses 255
AN
NEX
ES
ANNEX 8.3:SEMI-STRUCTURED INTERVIEW GUIDE - QUALITY CONTROL
The objective of this interview with an official of HLI management is to establish the existence of aquality control mechanism and appraise its general relevance to management. Again, where acommon service exists for various HLIs, this should be considered before any of the specificarrangements that individual institutions or faculties may have. On the other hand, here it will benecessary to be equipped with knowledge of the regulatory bodies and framework at the regionaland national level.
1. What procedure applies for the creation of a new HLI?
• Is there a regional framework?• Is there a national framework?• What are the steps of the procedure?• What is your opinion of the procedure (strengths and weaknesses)?
2. What procedure applies for the creation of a new course?
• Is there a regional framework?• Is there a national framework?• What are the steps of the procedure?• What is your opinion of the procedure (strengths and weaknesses)?
3. What procedure must be followed to suspend or terminate a course?
• Is there a regional framework?• Is there a national framework?• What are the steps of the procedure?• What is your opinion of the procedure (strengths and weaknesses)?
4. What mechanisms exist within the institution to ensure that the courses offered reflect the needs of theworkplace?
• Are these mechanisms specific to your institution or nation-wide?• What is your opinion of the mechanism (strengths and weaknesses)?
5. Does your institution have a statistical service providing information on the following:
• Student enrolment, marital status, personal and family characteristics and academic history• Administrative follow-up and application of admissions procedures• Academic follow-up (exam and individual results)• Follow-up of alumni, including their employment status
6. Does your institution have a student guidance service?
• If so, what are its objectives, how does it work, and what do you think of it (strengths andweaknesses)?
7. Does your institution have a service to support students in social or academic difficulty?
• If so, what are its objectives, how does it work, and what do you think of it (strengths andweaknesses)?
8. Do students formally participate in the evaluation of teaching?
• If yes, how?• If yes, does this improve the quality of teaching, the recruitment of teaching staff and/or the dialogue
among the institutions’ stakeholders?
9. Would you say that you have implemented a quality management policy in your institution in recentyears?
• If so, what form did it take?• What are its objectives, supervisory bodies, operational modes, players and so on?

256 EDUCATION SECTOR ANALYSIS METHODOLOGICAL GUIDELINES - Volume 2
ANNEX 8.4:ANNUAL INVESTMENT COSTS
It is often helpful to determine the annual cost of equipment that has a life-cycle of more than a year.This is the amount that should be put aside at the end of each year after its purchase to cover thecost of its replacement. This annual amount is often called an annuity. The procedure of calculationof annuities is referred to as the calculation of annual investment costs. The approach used hereis the standard accounting approach. For an investment amount I, with an economic life-span T, spentin year 0 with a constant nominal rate of return on capital (interest rate offered by banks) an, theannuity Ak for year k is obtained thanks to the following formula:
Illustration
A machine is bought for a higher learning institution at a cost of 1 million. It has a life-span of 10years and the nominal capital return rate offered by banks is 9.1 percent.103
By applying the formula above the following annuities are reached:
Ak = + an (T - (k - 1))IT
IT
A1 = + 0.091 x (10 - (1 - 1)) x 1,000,00010
1,000,00010
Years 1 2 3 4 6 7 8 95 10
191,000 181,900 172,800 163,700 145,500 136,400 127,300 118,200154,600 109,100Ak
So, for year 1 for instance, the annuity is:

Sub-Sector Specific Analyses 257
AN
NEX
ES
ANNEX 8.5:DOUBLE OR MULTIPLE COUNT OF HIGHER EDUCATION ENROLMENTS
In the absence of an information system that follows the individual academic careers of students(thanks to a unique registration number for instance), the total number of Higher Education (HE)students may be overestimated. This happens when:
(i) Many students are enrolled in more than one course at once. In Benin for instance, a surveyconducted by the ministry of higher education in 2011 showed that approximately six percentof students in public universities were enrolled in two courses in their university in the academicyears 2005/06 and 2007/08. The ministry also noticed a steep increase in the number of double-enrolments, from 12 percent in 2008/09 to 14 percent in 2009/10, since public universities weredeclared fee-free in 2008; and
(ii) Students are simultaneously enrolled in a public institution (such as a university) and a privateone (a vocational school for instance). Such situations can become quite significant when theconditions of access to HE are particularly favourable (fee-free, study vouchers, scholarships andso on). Students can then register in public institutions to receive the benefits and advantages,and enroll in a private institution, lightening the opportunity cost of the choice.
A critical review of the available data is therefore necessary. An interview on the coverage and qualityof statistical data with the officers in charge of the statistical service, at central (ministry, national HEauthority) and decentralised (chancellors, HLI management) levels should help to identify the extentof the phenomenon.

258 EDUCATION SECTOR ANALYSIS METHODOLOGICAL GUIDELINES - Volume 2
Example of a table highlighting the sources of funding of a university:
Own Resources
Enrolment Fees
Training Contracts
Other104
Transfers/Subsidies from Government
Grants
Other Transfers
Total
38%
7%
17%
13%
59%
2%
1%
100%
TABLE A8.3 - Distribution of Sources of Financing - Model Table
Source: Calculations based on data from a public university and the Beninese Ministry of Higher Education.
Total Number of Students
Number of Masters and PhD Students
Number of Lecture Theatre Seats
Number of Classroom Seats
Number of Computers for Teaching Staff
Number of Places in Specialised Classes
Number of Internet/ADSL Connections
Number of Projectors
Number of Books on Loan
Number of Hours of Usage of Classrooms per Day
Number of Days of Usage of Classrooms per Week/Year
...
University Faculties Schools of
TABLE A8.2 - Learning Environments, by Institution or Course - Model Table
Hum
anit
ies
Law
Econ
omic
s
Scie
nce
Med
icin
e
Agr
onom
y
Engi
neer
ing
Busi
ness
ANNEX 8.6:FURTHER MODEL TABLES TO DOCUMENT HIGHEREDUCATION TRENDS AND STATUS
Example of a table highlighting the different basic information that could be collected from variousinstitutions for the analysis of the study conditions, by institution/stream:

Sub-Sector Specific Analyses 259
AN
NEX
ES
Example of a table highlighting the distribution of permanent teachers according to their age andlevel of qualification, required for the prospective analysis of teacher needs:
Example of a table highlighting a university’s recurrent spending:
Personnel
Permanent
Overtime
Contract Staff
Purchase of Goods and Services
Common Transfers
Other Ongoing Spending
Total
Memory Item: Total Spending (Currency)
67%
64%
1%
2%
26%
3%
4%
100%
6,910
TABLE A8.4 - Recurrent HLI Spending - Model Table
Source: Illustrative data and authors’ calculations.
Example of an origin/stream balance similar to an employment/training balance:
Humanities
Law and Economics
Health Sciences
Math-Physics-Science
Rural Development and Agronomy
Engineering and Technology
Total
382
318
53
204
84
-
1,041
20
28
52
-
45
50
262
402
346
105
204
129
50
1,303
508 (A Series)
285 (B Series)
747 (Math and science Series)
1,539
(Number) University StudyAbroad
Total Secondary SchoolLeavers
TABLE A8.5 - Academic Provenance of New Enrolments
Sources: Illustrative data and authors’ calculations.
25-29 years
30-34 years
35-39 years
40-44 years
45-49 years
50-54 years
55-59 years
60-64 years
65 years and above
Total
(Number) Professor Lecturer AssistantLecturer
AssociateLecturer
ClassAssistant
Assistant Other Total
2
31
656
1,488
1,458
750
272
33
4,690
2
47
238
223
72
15
3
600
6
179
814
947
1,031
623
299
56
10
3,965
49
98
137
63
73
48
26
2
5
501
55
283
1,126
2,062
2,854
2,221
1,115
333
54
10,103
89
146
32
9
1
2
3
282
2
8
7
3
4
24
5
4
7
24
1
41
TABLE A8.6 - Distribution of Permanent Staff, by Age and Qualification (for Staff Forecasting Purposes)Model Table
Source: Moroccan Ministry of Higher Education.

260 EDUCATION SECTOR ANALYSIS METHODOLOGICAL GUIDELINES - Volume 2
CHAPTER 9 ANNEXES
ANNEX 9.1:LITERACY ASSESSMENT AND MONITORING PROGRAMME(LAMP): A CORNERSTONE OF THE LIFE INITIATIVE
Context
In November 2005 UNESCO launched the Literacy Initiative for Empowerment, (LIFE). This initiativecontributes to achieving the Dakar goals, particularly goal 4 (a 50% improvement in levels of adultliteracy) and goal 5 (achieving gender equality in education). The purpose of LIFE is to support theEFA goals in the field of literacy. This initiative is designed, as a global strategic framework, to enableall stakeholders significantly increase their efforts for literacy. Countries, with a high rate of illiteracy105
or where the rate of literacy is under 50%,106 will be given priority for the implementation of LIFE.
There is, of course, consensus of opinion on the fact that literacy is essential for economic prosperity,health, cultural identity, community involvement and tolerance, and for the capacity of individuals touse their full potential in increasingly knowledge dependent societies. Measuring literacy in all itsdimensions therefore becomes de facto a functional and institutional necessity. For this reason,UNESCO considers LAMP as an essential tool to develop and implement policies deriving from theLIFE initiative, for it is true that the data "measuring" literacy in developing countries are fragmentedand mainly originate from indirect assessments.107
Declaredilliterate
33%
Total illiteracy(score 0)
36%
Level of semi-literacy(score between 0.75 and
12.75 points)
27% Basic qualificationlevel in literacy
4%
Averagequalification
level inliteracy
24%
Autonomouslevel oftraining
9%
Declaredliterate
67%
Usual measurement of literacy Differentiated measurement of literacy

Sub-Sector Specific Analyses 261
AN
NEX
ES
It is important to understand the distribution of literacy throughout the population, in order to defineadapted development policies. Measuring literacy does not only mean determining who can or whocannot read, since there are diverse levels of literacy skills ranging from knowing how to write one'sname on a form to understanding the instructions on a medicine label or being able to learn fromwritten texts.
The LAMP programme attempts to answer these needs by providing the different countries with themethodological and technical instruments for a survey aimed at measuring a wide range of literacylevels going from basic reading and writing to higher levels of literacy needed to fully participate in asociety where learning fills an increasingly important place.
LAMP Methodology
LAMP was developed to collect better quality literacy data through new household surveys108
conducted on a five or ten year cycle. The instruments have been validated in 6 countries including 3African countries.109 The data collected within the LAMP framework will be used to develop andimplement national action plans and better define adult literacy programmes.
LAMP is implemented in the different countries through a partnership grouping together nationalexpertise,110 UIS expertise and literacy assessment experts coming from Statistics Canada and ETS(USA).
LAMP's conceptual framework, which enables a comparative assessment of adult literacy, is adaptedfrom the Adult Literacy and Life Skills Survey (ALL). LAMP measures five levels of literacy (i) Level 1:for people who have very poor skills (e.g. those who are unable to determine the correct amount ofmedicine from the label on a package) (ii) Level 2: People who can only deal with simple, clearly laid-out tasks (iii) Level 3: considered a suitable minimum for dealing with daily life: this skill level is generallyrequired to successfully complete secondary education (iv) Levels 4 and 5: Respondents demonstratecommand of higher-order information processing skills.
The results of LAMP are expected to contribute to the political debate and at the same time fuelresearch on such questions as (i) How are skills distributed throughout the different sub-groups of thepopulation and what are the consequences in terms of mobilisation of resources? (ii) What is therelationship between illiteracy and social participation and /or economic integration? (iii) What impactdo adult education policies have on the degree of literacy in the populations? (iv) What is theeffectiveness of formal education? LAMP data is intended to serve a wide range of users, from civilsociety to policy decision-makers and civil servants in the ministries.

262 EDUCATION SECTOR ANALYSIS METHODOLOGICAL GUIDELINES - Volume 2
ANNEX 9.2:MODEL QUESTIONNAIRES/INTERVIEW GUIDES FOR THE EVALUATION OF NFE PROGRAMMESSource: Based on a survey conducted in Marrakesh in 2007 (See Cerbelle, 2010).
The following questionnaires can be completed by investigators on the basis of participants’ responses.
Questionnaire for Current Literacy Programme Beneficiaries
Beneficiary Id. Number:Investigator Id. Number:
I/ Programme1. What literacy programme do you participate in?
General programmeGovernment operated (Specify)Civil society or NGO operated (Specify)Privately operated (Specify)
2. How did you hear about the programme?3. Is this your first participation in such a programme? (Yes/No)
3.1 If not, how many times have you participated in a course?OnceTwiceThree timesFour timesMore than four times
3.2 What programme have you already followed?General programmeGovernment operated (Specify)Civil society or NGO operated (Specify)Privately operated (Specify)
3.3 Did you sit the final exam? (Yes/No)If so, did you pass? (Yes/No)
4. Why did you enroll in the programme?(List your reasons by order of importance)5. Did you receive supplies? (Yes/No)
5.1 What type of supplies?5.2 Did you receive DLCA textbooks? (Yes/No)
II/ Personal Characteristics6. Surname:7. Name:8. Gender:9. Age: 10. National Identity Card Number:11. Area of Residence (Urban/Rural):
11.1 How many years have you lived there?12. What is your mother tongue? (Arabic/Tamazight)

Sub-Sector Specific Analyses 263
AN
NEX
ES
13. What is your family situation? (Married/Single/Widow/Divorced)14. Total number of children:
Number of children aged 6 to 15 years:Number of children under 6 years:Number of children aged 6 to 8 years:Number of children aged 9 to 12 years:Number of children aged 12 years and above:
15. Does your partner read and write? (Yes/No)16. Were you ever enrolled at school (Yes/No)
16.1 If not, why?16.2 If you were, for how many years?16.3 If you were, why did you leave school?
17. Do you have a professional activity? (Yes/No)17.1 If so, what is it?18. Does your home have:
A sewerWaterElectricityTelevision (with cable?)
18.1 If so, do you often watch television? (Yes/No)18.2 Which programmes?
19. Average annual household income:20. Is not knowing how to read and write a daily issue? (Always/Sometimes/Never)
20.1 If always, why?20.2 If sometimes, why?20.3 If never, why?
Questionnaire for ex-Literacy Programme Participants
Beneficiary Id. Number:Investigator Id. Number:
I/ Programme
1. What literacy programme do you participate in?General programmeGovernment operated (Specify)Civil society or NGO operated (Specify)Privately operated (Specify)
2. How did you hear about the programme?3. Is this your first participation in such a programme? (Yes/No)
3.1 If not, how many times have you participated in a course?OnceTwiceThree timesFour timesMore than four times

264 EDUCATION SECTOR ANALYSIS METHODOLOGICAL GUIDELINES - Volume 2
4. Did you sit the final exam? (Yes/No)If so, did you pass? (Yes/No)
5. Why did you enroll in the programme?(List your reasons by order of importance)
II/ Personal Characteristics6. Surname:7. Name:8. Gender:9. Age: 10. National Identity Card Number:11. Area of Residence (Urban/Rural):
11.1 How many years have you lived there?12. What is your mother tongue? (Arabic/Tamazight)13. What is your family situation? (Married/Single/Widow/Divorced)14. Total number of children:
Number of children aged 6 to 15 years:Number of children under 6 years:Number of children aged 6 to 8 years:Number of children aged 9 to 12 years:Number of children aged 12 years and above:
15. Does your partner read and write? (Yes/No)16. Were you ever enrolled at school (Yes/No)
16.1 If not, why?16.2 If you were, for how many years?16.3 If you were, why did you leave school?
17. Do you have a professional activity? (Yes/No)17.1 If so, what is it?
18. Does your home have:A sewerWaterElectricityTelevision (with cable?)
18.1 If so, do you often watch television? (Yes/No)18.2 Which programmes?
19. Average annual household income:20. Is not knowing how to read and write a daily issue? (Always/Sometimes/Never)
20.1 If always, why?20.2 If sometimes, why?20.3 If never, why?
III/ Health21. Did you touch on health issues in your literacy programme? (Yes/No)
21.1.If so, which ones?22. Do you feel that the information provided was: (Sufficient/Insufficient)?
22.1 Why?23. Did the information shared lead you to change your behaviour in terms of health? (Yes/No)
23.1 If not, why not?23.2 If so, in which areas?23.3.Why did you change your behaviour?

Sub-Sector Specific Analyses 265
AN
NEX
ES
IV/ Politics24. Are you interested in politics? (Yes/No)
24.1 If so, in what aspects exactly?24.2 If not, why not?
25. Have you ever voted? (Where the individual is an adult) (Yes/No)25.1 If not, why not?
26. Have you ever touched on political issues in your literacy programme (such as the monarchy,the right to vote, the family code and so on)? (Yes/No)26.1 If so, which ones?
27. Do you feel that the information provided was: (Sufficient/Insufficient)27.1 Why?
28. Did the information you received lead you to change your behaviour in terms of politics? (Yes/No)28.1 If not, why not?28.2 If so, in which areas?28.3 Why did you change your behaviour?
29. Are you aware of the elections in September? (Yes/No)29.1 How did you know about them?29.2 Were they mentioned in your literacy programme? (Yes/No)
30. Will you vote? (Where the individual is an adult) (Yes/No)30.1 If so, why?30.2 If not, why not?
V/ Children’s Education31. Respond to the next questionnaire (Questionnaire on Children’s Education)33. Have you touched on the issue of children’s education in your literacy programme? (Yes/No)
33.1 If so, what did you discuss?34. Do you feel that the information provided was: (Sufficient/Insufficient)?
34.1 Why?35. Did the information you received lead you to change your behaviour in terms of your
children’s education? (Yes/No)35.1 If not, why not?35.2 If so, why?35.3 In what have you changed?
VI/ Employment Outcomes36. Did you have work while you followed your literacy programme? (Yes/No)37. If not, did literacy assist with your employment prospects? (Yes/No)
37.1 If so, why?37.2 If not, why not?
38. If so, what was your work?38.1 Has being literate improved your work conditions? (Yes/No)38.2 If so, why?38.3 If not, why not?

266 EDUCATION SECTOR ANALYSIS METHODOLOGICAL GUIDELINES - Volume 2
Questionnaire on Children’s Education (See Question 31 above)
Children Aged 15 Years and Above
Child Age Gender Current Schooling Prior Schooling
1.
2. ... ...
Yes/NoLevel attained:School:
Yes/NoNumber of years of education followed:School:Reasons for terminating education:
Children Aged 6 to 15 Years
Child Age Gender Current Schooling Prior Schooling
1.
2. ... ...
Yes/NoLevel attained:School:
Yes/NoNumber of years of education followed:School:Reasons for terminating education:
Child
Child Age Gender Current Schooling Prior Schooling
1.
2. ... ...
Yes/NoLevel attained:School:
Yes/NoNumber of years of educationfollowed:School:Reasons for terminating education:
Type of Activity
...
Yes/NoWhich activity:For how long:
Children Under 6 Years
Child Age Gender Current Schooling
1.
2. ...
Yes/NoLevel attained:School:

Sub-Sector Specific Analyses 267
AN
NEX
ES
ANNEX 9.3:THE VARIABLE IMPORTANCE OF NONFORMAL EDUCATIONACCORDING TO EACH COUNTRY
Table A9.1 displays the relative size of NFE in 21 Sub-Saharan African countries where a MICS surveyhas been carried out, based on the participation in a programme of the population aged 15 to 49years. On average, the size of NFE is relatively small, as only 3.5 percent of the group is concerned. Itis also highly variable among countries: it ranges from a minimum of 0.0 percent in countries withdeveloped formal education systems, to a maximum of 26.7 percent, in countries where the formalstream represents less than half of the sector. Clearly, in countries where access to formal educationis low, reliance on NFE is not a systematic policy, and is mostly very marginal. In Côte d’Ivoire forinstance, where the share of the group having attended formal education is only 51.6 percent, theshare of the group having followed an NFE course is no higher than 2.2 percent. This is also the casein Guinea Bissau, the Comoros and Sierra Leone. On the other hand, in other countries where theshare of formal education is low, the share of NFE beneficiaries is much higher than average (26.7percent in Burundi, 14.7 percent in Niger, 13.7 percent in the Gambia, 7.5 percent in Chad and 6.5percent in Senegal).
TABLE A9.1 - Distribution of the Population Aged 15 to 49 Years by Type of Education Received
Angola
Botswana
Burundi
Cameroon
CAR
Chad
Comoros
Côte d'Ivoire
DRC
Equatorial Guinea
Gambia, The
Guinea Bissau
Kenya
Lesotho
Niger
Rwanda
Sao Tomé and Principe
Senegal
Sierra Leone
Swaziland
Zambia
Average
24.4
13.1
25.7
20.9
40.6
59.3
52.1
46.1
18.3
12.6
48.0
59.1
11.9
11.6
65.2
26.7
12.1
54.5
68.9
16.2
17.7
33.7
0.0
0.0
26.7
0.2
0.2
7.5
1.7
2.2
0.8
0.0
13.7
0.5
0.2
0.3
14.7
0.1
0.0
6.5
0.3
0.7
0.0
3.5
75.6
86.9
47.6
78.9
59.2
33.2
46.2
51.6
80.9
87.4
38.3
40.4
87.9
88.1
20.1
73.2
87.9
39.0
30.9
83.1
82.3
62.8
100.0
100.0
100.0
100.0
100.0
100.0
100.0
100.0
100.0
100.0
100.0
100.0
100.0
100.0
100.0
100.0
100.0
100.0
100.0
100.0
100.0
100.0
(Percent) No Education Nonformal Formal All
Source: UNESCO-BREDA, Dakar + 7 Report.

268 EDUCATION SECTOR ANALYSIS METHODOLOGICAL GUIDELINES - Volume 2
ANNEX 9.4:POTENTIAL CONTENTS FOR SURVEYS OF NFE TRAINERSPERFORMED ON A SAMPLE OF OPERATORS OF DIFFERENTPROGRAMMES
This questionnaire may be complemented with questions on enrolment and financing if suchinformation is not available elsewhere.
Profile of Trainers/Teachers
Highest qualification held - A-Levels/Baccalaureate - Undergraduate degree - Postgraduate degreeAge - Under 25 years - 25 to 30 years - 31 to 40 years - 41 to 50 years - 51 to 60 years - 60 years and aboveGender - Male - FemaleExperience as a trainer in the NFE sector - Under 4 years - 5 to 10 years - 10 years or moreTeaching experience - Under 4 years - 5 to 10 years - 10 years or moreTraining as an NFE trainer - No - Yes, and duration of course Under 3 weeks 3 to 8 weeks 9 to 12 weeksQualified teaching diploma - Yes - NoIs the NFE trainer/teacher activity the individuals’ main one? - Yes - No
Average annual hourly workload of trainers/teachers
Average annual remuneration of trainers/teachers (Full-time equivalent) *
Number
Averages
Note: * Can be computed as a percentage of the average remuneration of a new primary teacher.

Sub-Sector Specific Analyses 269
AN
NEX
ES
ANNEX 9.5:POTENTIAL CONTENTS FOR A SURVEY MODULE ON PEDAGOGICAL ISSUES AND MONITORING
Is your institute responsible for the choice of its programmes?
Does your institute determine its course time-tables?
Is your institute free to manage its teaching practices?
Are your trainers/teachers monitored/inspected in class?
If so, who performs the control function: - The director of the institute or his delegate - An inspector belonging to your institute - An inspector from another institution (Which one?)
If so, how often is each teacher/trainer inspected?
Does the inspector monitor:Course contentRespect of the time-tableTeaching practicesTeachers/trainers’ attitudes with learners
Does the inspector hold meetings with teachers/trainers to assist/guide them in terms of pedagogical practices?
Are inspection results likely to affect teachers/trainers’ career development?
YesNo
YesNo
YesNo
YesNo
YesNo
Yes, favourablyYes, unfavourablyNo
(Multiple Choice)Yes/NoYes/NoYes/No (Name if Yes)
(Multiple Choice)Yes/NoYes/NoYes/No Yes/No

270 EDUCATION SECTOR ANALYSIS METHODOLOGICAL GUIDELINES - Volume 2
ANNEX 9.6:POTENTIAL CONTENTS FOR A SURVEY MODULE ON NFE ADMINISTRATION
Would you say that the NFE subsector is under-staffed on the administrative front?If so, how is this most apparent?
Would you say that the NFE subsector’s administration are less competent than their counterparts responsible for other education sectors/subsectors?
Would you say that the statistical coverage of the NFE subsector is good?
If so, does it cover all of NFE?
Is statistical coverage periodic?
Is there a statistical yearbook (Paper, or digital)
Are there data/statistical publications on learning outcomes?
Are there data/statistical publications on financing and the cost of NFE training?
Is there a service devoted to NFE?
Is there a service devoted to the publication of NFE guides and textbooks?
Is there a service devoted to NFE planning and strategy?
Is there a service devoted to pedagogical management in NFE?
Are there direct links between these administrative services and research?
Does your institute have enough administrative staff?
Apart from NFE courses, how many programmes does your institute offer?
Does your institute have staff competent in producing data/statistics on programme participants?
Directors of NFE Institutes
YesNo
YesNo
YesNo
YesNo
YesNo
YesNo
YesNo
YesNo
NoYes (How many staff?)
NoYes (How many staff?)
NoYes (How many staff?)
NoYes (How many staff?)
NoYes (How many staff?)
YesNo (What are the main consequences?)
NoYes, they lack experienceYes, they lack vocational trainingYes, they lack a stable institutional framework

Sub-Sector Specific Analyses 271
AN
NEX
ES
ANNEX 9.7:COMPARED EDUCATION AND SOCIAL OUTCOMES OFNONFORMAL AND FORMAL EDUCATION PROGRAMMESIN THE AFRICAN CONTEXT
In the absence of a direct measure of the efficiency of specific NFE programmes, it is interesting toexplore at least their impact on several education and social dimensions and compare this to thatachieved by groups with no education, or with formal education. The data used is usually available inMICS surveys carried out by UNICEF between 2000 and 2002. In these surveys, NFE includes adultliteracy activities and other nonformal education activities.
In almost all countries, the probability of literacy is much higher for individuals who followed an NFEcourse than for those without any education. The very high values noted for some countries such asChad and DRC illustrate the low share of sustainably literate individuals with no education at all. Ifthe equivalent number of years of formal schooling is low in Burundi, Côte d’Ivoire, CAR and GuineaBissau, it is high (between three and six years) in the other countries considered. This indicates that insome cases the benefit of nonformal education in literacy terms compares very favourably to thatachieved by completing primary school.
With respect to the impact of nonformal education on some social behaviours, the differencecompared to individuals with no education is not significant. Where some impact is noted, it is oftenspecific to a given country, pointing to differences in NFE course content from one country to another.
Burundi
Cameroon
CAR
Chad
Comoros
Côte d'Ivoire
DRC
Gambia, The
Guinea Bissau
Kenya
Lesotho
Niger
Rwanda
Senegal
Average
8.4
3.2
1.0
166.2
3.0
4.6
40.6
8.6
4.8
5.5
3.6
17.9
14.3
4.0
20.4
1.6
3.4
0.9
4.6
6.8
1.6
7.9
4.6
2.3
4.8
3.0
3.9
4.8
3.8
3.9
% of NFE Literates/% of Untrained Literates
Equivalent Number of Years of Formal Schooling
TABLE A9.2 - Impact of NFE on Literacy
Source: Computations based on MICS survey data.

272 EDUCATION SECTOR ANALYSIS METHODOLOGICAL GUIDELINES - Volume 2
The data suggest that nonformal education often enables reaching sustainable literacy, withouthowever guaranteeing some of the externalities that are usually associated with it when acquired inthe formal education stream. What most stands out from this brief overview is the disparity of results,no doubt related to the variety of programmes, objectives, delivery modes, contexts and participants.There is therefore scope in the NFE subsector for evaluations such as those carried out in the 1990s inprimary education and that have gradually enabled to distinguish between the impacts of differenttypes of course.
Birth registration
AIDS
Demographics
Use of modern contraception
Spacing of births
Maternal Health
Prenatal health checks
Anti-tetanus vaccination
Vitamin A supplementation
Assistance at childbirth
Child Health
Child’s weight
Child’s height
Fully vaccinated
Takes Vitamin A
1.1
1.1
1.8
1.0
––
1.0
1.0
1.5
1.0
1.0
1.2
1.2
1.0
1.4
––
––
0.8
1.0
––
1.0
––
––
1.4
1.0
1.0
1.0
2.5
1.0
1.0
1.0
1.0
1.2
1.0
1.1
1.0
2.4
0.6
1.1
1.0
1.0
1.0
1.1
1.0
––
––
1.0
1.1
1.2
1.0
1.0
1.0
1.4
1.4
1.0
1.7
1.0
1.0
1.2
1.1
1.0
1.1
––
––
1.0
1.0
0.9
1.0
1.0
1.0
––
1.4
0.6
0.5
1.0
0.6
1.0
1.0
0.4
––
––
––
––
Burundi Côte d'Ivoire Comoros Gambia Niger Senegal Chad
TABLE A9.3 - Impact of NFE on Social Behaviours, Compared to Uneducated Individuals
Source: MICS survey data and authors’ computations.

Sub-Sector Specific Analyses 273
AN
NEX
ES
ANNEX 9.8:ISSUES WITH THE ANALYSIS OF RESULTS AND QUALITYAND RELEVANCE INDICATORS
Which results to take into account?
The results to be considered in assessing the relevance of NFE activities are similar to those presentedin the Chapter 5 of this guide, including:
- Learning outcomes (Levels/nature/sustainability)- Behaviours and practices- Contributions to the economy and society
These different items can be approached on the basis of declarations of participants and their familyor work environment, or through the direct measure of learning outcomes, behaviours and so on (SeeAnnex 9.2 for a model questionnaire for participants based on Sophie Cerbelle’s work in Morocco).Reviewing NFE programme participants’ views can help to: (i) improve the day-today management ofcourse delivery; (ii) review how courses are organised and taught; (iii) provide an indication ofprogramme quality in terms of learning outcomes; (iv) provide a measure of programme utility andparticipants’ satisfaction. On the other hand, the direct measure of learning or the impact of NFEtraining on behavioural change requires more complex evaluation procedures and data processingmethods. The choice of results indicators will depend on the type of analysis sought: in a programmemanagement perspective the most external indicator should be used, the one that is mostrepresentative of the programme's basic goal. When the programme aims for instance to facilitatechange in health behaviours or to improve employment prospects, it may be wise to focus on eachof those particular dimensions rather than measure learning outcomes. On the other hand, in aperspective of knowledge or management of the choice between programmes, it may be helpful tomeasure the achievements of all programmes offered and to consider complementary objectives asdesignating contexts that may be more or less favourable to literacy.
How to produce and analyse the results?
If surveys of participants’ opinions on the impact of the courses followed are methodologically straight-forward, analyses based on the direct measurement of results are not. These are more complex todesign and implement; the data produced is also more delicate to process. As far as the quality andsustainability of learning outcomes are concerned, a review of any existing assessments of NFE andadult literacy programmes should first be performed. This can be based on the gross learning outcomesrelated to each programme, and preferably through econometric analysis enabling greatercomparability among programmes (beneficiary characteristics, contexts, incentives and so on) and toisolate the impact of the NFE course, all other factors being held constant.

274 EDUCATION SECTOR ANALYSIS METHODOLOGICAL GUIDELINES - Volume 2
How to assess the results?
The fact that the single measure of programme efficiency is insufficient to reach a full evaluation ofNFE programmes from an improved management perspective has been underlined several times. The results generally require being qualified to be interpreted. It is also important that they be relatedto programme cost. The qualification of results refers directly to the absence of an absolute benchmarkto appreciate participants’ levels upon completion of a programme, or their social and economicoutcomes. The qualification of results is produced by a comparison which enables to determine ifbetter results are obtained by a given approach, context, or participant profile. It is therefore importantto facilitate comparisons of the results achieved by different programmes, or to adopt an experimentalapproach in the research of best practices through the reasoned multiplication of programmes’ deliverycontexts. This has consequences for statistical systems that are important to promote, as well as onthe type of links that it may be appropriate to establish with national research. International evaluationsshould also be encouraged, being indispensible for benchmarking. This involves the production ofinternational surveys that enable to better identify and evaluate the different types of NFE programmes.
The value of cost-efficiency analyses was underlined earlier in the context of NFE, in reference to thefact that care must be taken in comparing courses in this subsector, which may have significantlydifferent contents, delivery modes and costs. To provide full meaning to the results, it is also necessaryto take the high level of attrition that characterises these activities into account. In the context ofrelatively variable internal efficiency, focus should be on those learners having completed their course,not least those having done so successfully. As for higher education that uses a cost per graduate tocompare different institutes of the open and closed sector, a weighting indicator (the inverse of theinternal efficiency coefficient) can be used to measure and compare the average cost per beneficiaryof NFE programmes.

Sub-Sector Specific Analyses 275
AN
NEX
ES
ANNEX 9.9:EVALUATION OF LITERACY THROUGH HOUSEHOLDSURVEYS
Most household surveys such as DHS, MICS and others include a section on literacy.111 Two approachesare generally used: self-assessed literacy and direct-assessed literacy.
The first consists of simply in asking respondents if they can read, write and understand a simple text.The question is often put to the head of household, who should answer Yes or No for each memberof the household aged five years and above. This approach, however easy to administer, produces ameasure of literacy skills that is both questionable and dichotomous. Indeed, the method has variouslimitations in terms of the precision of the data collected (respondents tend to overestimate their levelof literacy) and lacks detail in terms of the level of skills.
To overcome these deficiencies, the second approach aims to determine different literacy levelsthrough a series of tests set for respondents by investigators. Most often, individuals are asked toread a short text or sentence aloud. On the basis of the ability to do so, investigators code results inthree ways: (i) cannot read a word; (ii) can read part of the text; or (iii) can read all the text.
The results obtained by direct assessment provide more information and are more precise than self-assessment results. Indeed, empirical studies have demonstrated that self-assessed literacysystematically overestimates literacy rates by 15 percent on average, compared to direct-assessedliteracy.112
This direct approach can be improved and tests are available for multiple skill areas (reading, writing,simple arithmetic, in different languages and so on). Within each, different levels of skills can thus bedetermined. In reading for instance, the level of skill may be qualified as: (i) preliterate (the capacityto identify letters and some words of a simple sentence); (ii) basic literacy (the ability to fully read asimple sentence); (iii) functional literacy (the ability to read and understand a long text); and (iv) illiterate(the inability to recognise any word of a simple sentence).
Table A9.4 below summarises the different approaches and variables used in the main householdsurveys.

276 EDUCATION SECTOR ANALYSIS METHODOLOGICAL GUIDELINES - Volume 2
Definition, Pros and Cons Measures of Literacy andMain Source Surveys
Human Development andEmployment Indicators
Definition: Consists of asking respondents if they can read and write a simple textAge Group: All household members aged 5 years and abovePros: Easy to administer in terms of cost, time and human resourcesCons: -Subjective: provides the respondent’s opinion of their literacy. Prone to overestimation bias- Dichotomic: only two answers are contemplated (Literate/Illiterate)- Does not therefore allow to determine different literacy levels
Definition: Consists of a reading test set directly for respondents by investigators. Most often, individuals are asked to read a text or a sentence aloud.Age Group: 15 to 49 years (to 54 years for men)Pros: Provides wealthier and comparatively more precise informationCons: Costly in terms of time and financial resources, as:- The time involved in testing each individual and coding answers is greater- Investigators should be more highly qualified and have prior training in the use of reading tests- This reading test is not representative in as much as it only measures reading skills, at the expense of other dimensions of literacy (writing, arithmetic, etc.)
Typical Questions:- “Can you read and write?” (DHS and MICS)- “Can you read?” “Can you write?” (as two separate questions)- Some surveys include more specific questions: “Can you read a 1-page letter in English?” (Malawi HIS), or “Can you read and write a simple sentence in English or French?” (Cameroon ECAM)
Main surveys including this module:- Demographic and Health Survey (DHS 1-4) - Multiple Indicator Cluster Survey (MICS 1-3)- National living conditions type surveys (IHS, EMICOV, etc.) and CWIQ type surveys (Core Welfare Indicator Questionnaire)
Typical Question:“Can you please read the following sentence:”Literacy levels are coded:1. Cannot read at all2. Can read part of the sentence3. Can read all the sentence
Main surveys including this module:- Literacy modules of new surveys (DHS 5 and 6) use this approach- The most recent MICS surveys (IV) collect literacy data through the direct-assessment approach, but only for women aged 15 to 49 years
Health and human development indicators:- Child and infant mortality- Prenatal and postnatal health care- Birth assisted by qualified health personnel- Knowledge of family planning methods- Breastfeeding and good nutritional practice- Vaccination of newborns and young children- Use of safe drinking water- Knowledge of HIV/AIDS and sexual behaviour
Women’s’ Capacity building (DHS only):- Who makes decisions with respect to your finances?- Does the woman participate in decisions? - Women’s attitude with respect to beating
Wealth and possession of goods:- Wealth quintiles- Home characteristics (building materials, electricity, water, sanitation, etc.)
Employment variables:- Jobs held over the previous 12 months- Job status: permanent, temporary, season work, etc.
Self-
Ass
esse
d Li
tera
cyD
irec
t-A
sses
sed
Lite
racy
TABLE A9.4 - Main Variables Used in Household Surveys
Note: * Available in most surveys, unless otherwise indicated.

Sub-Sector Specific Analyses 277
AN
NEX
ES
CHAPTER 10 ANNEXES
ANNEX 10.1:SYNOPSIS OF DIFFERENT SKILLS DEVELOPMENT AND EMPLOYMENT PROMOTION SCHEMES ANDINITIATIVES IN KENYA
ProvidersType of Training / Employment Promotion Intervention
QualificationsAchieved
Target Groups / Target Labour Market
Formal post-secondary TIVETLong-term curriculum-based
Current enrolment in institutions under MoHEST:41,000 (of which 43% female) in formal programmes. Annual intake 15,000
Under NYS: 10,000 – 15,000Annual intake: 5,000
Private and specialised institutions: not known
Formal post-primary TIVET;Long-term curriculum-based
Current estimated enrolment: 50,000 (estimated30-35% female)
Pre-employment skill training programmes in various training institutions; short and long-term. Usually following set curricula (e.g. DIT trade testing curricula)
Total enrolment not known
Technical Institutes, Institutes of Technology and National Polytechnics under MoHEST;Registered private TIVET providers, including many faith-based institutions; National Youth Service (NYS); specialised training providers including those under other government agencies
Youth Polytechnics under MOYAS; private providers including faith-based institutions; selected TIs and higher level institutions (additional programmes); NYS, other specialised TIVET institutions
Private, including non-for-profit training providers; NGOs; public formal TIVET institutions (evening and part time courses)
DIT trade tests,Other in-house or specific qualifications
School leavers without access to formal TIVET; usually with at least primary school complete. Target labour market: formal and informal sector depending on occupation and level of training
Primary school leavers. Target labour market is mainly employment in the informal sector and self-employment.Training also qualifiesfor progression in TIVET system
Artisan certificate, KNECNAVCET/KNEC
Craft certificates, KNECdiplomas and advanced diplomas, KNECKASNET, and other certification bodies
School-leavers with O’Level below university entry level. Selected scholarships for needy students from MoHEST; access to poor school leavers often facilitated by faith-based institu-tions.Target labour market is formal sector employ-ment, and self-employ-ment.
▶

278 EDUCATION SECTOR ANALYSIS METHODOLOGICAL GUIDELINES - Volume 2
Skills upgrading training (including trade test preparation)
Estimated current enrolment:1,200 - 1,500 (DIT only)
On-the-job training
Enrolment not known
Traditional apprenticeship training (training by Jua Kali master-craftspersons)Informal mid- to long-term on-the-job training in the informal sector
Estimated enrolment: 150,000
Companies, under certain circumstances supported by DIT (indentured learner scheme)
Jua Kali operators, partly informally regulated/supervised by Jua Kali associations
No formal qualification; reference by master. Apprentices also sit for trade testing.
None New employees, existing employees
No specific educational attainment necessary. Traditionally targeting youth with low level of education. Selected indication that formal school certificate increasingly asked for by masters. Target labour market: Employment in the urban and rural Jua Kali sector.
DIT, occasionally formal TIVET institutions, companies, consultants, private training providers (often financed by employer)
Depending on programme, possibly trade tests, DIT proficiency certificates, or selected other (incl. in-house certificates (computer package)
Employees in formal sector;Jua Kali operators
Skills and business training embedded in market development initiativesUsually product/service/context-specific non-formal training
Enrolment/beneficiaries:Not known
Entrepreneurship and business management training programmes. Short-term programmes, often linked to other business development services such as credit, mentorship, market linkage facilitation, etc
Total enrolment: Not known
Public and private service providers, including unconventio-nal service providers; associations; consul-tants; companies along the value chain (embedded services)Often facilitated by value chain and market development programmes (government and donor-funded)
Part of the curriculum in most formal and non-formal TIVET programmes;Different public programmes run by MOYAS, MoLSD, MoT, MoI;Youth Enterprise Development Programme; Women Enterprise Fund, etc.NGOs and other organisations involved in business development (e.g. ISBI)
Non-formal certificates (where not part of formal TIVET curriculum)
No formal qualification, sometimes leading to market-specific certificates (e.g. Global Gap for farmers; trading or food handling certificates, etc).
Producers, service providers and other actors in targeted value chains, often farmers, traders, processors, micro manufacturers.
School leavers expected to venture into self-employment; existing micro entrepre-neurs; potential start-ups. Target labour market: self-employment

Sub-Sector Specific Analyses 279
AN
NEX
ES
Training – cum – internship
Enrolment in KYEP: 900 in first of eight planned cycles
Formal apprenticeship
Current enrolment (DIT):10,000
Training Vouchers(demand subsidisation)
Enrolment in TVVP:2,163 (50% received training voucher)
Beneficiaries of MSE Voucher Programme: 24,000
Companies, facilitated through: KYEP (WB-financed pilot programme)Internship to comple-ment formal TIVET facilitated through DIT
Formal TIVET institutions and companies; facilitated through DIT(dual training scheme in preparation by Eastlands Technical Training College/ISBI)
Technical and Vocational Voucher Programme (TVVP) (research programme);MSE Training Voucher Programme (completed)
Various, depending on training attended
Youth (TVVP)MSE operators (MSE programme)
Formal TIVET qualifica-tion, mainly diploma level
School leavers with above average O’Level, target labour market employment in the formal sector
School leavers in need of industrial exposure; participants of formal TIVET (mainly post O’Level); target group of KYEP are unemployed school leavers, minimum 8 yr. of school;Target labour market: employment, or employment in informal sector (depending on where internship was done)
No formal certificate
Source: Jutta Franz, 2011. Realizing the Youth Dividend in Kenya through Skills for the Informal Sector: Institutional Assessmentof Skills Development and Youth Employment Promotion Programmes and Projects. Prepared for the World Bank, Nairobi. June2011.

280 EDUCATION SECTOR ANALYSIS METHODOLOGICAL GUIDELINES - Volume 2
ANNEX 10.2:EXAMPLE OF A QUESTIONNAIRE USED TO CONDUCT A BASELINE TVET INSTITUTIONS SURVEY IN CAMEROON
COLLECTION OF DATA FROM PRIVATE AND PUBLICVOCATIONAL TRAINING INSTITUTIONS
Private and public vocational training institutes, Rural Arts and Craft/Home EconomicsCenters, Vocational Training Centers and apprenticeship centers
I. IDENTIFICATION AND LOCATION OF INSTITUTION
I.1. General Information (Do not fill out the boxes in the highlighted areas)
1101 Name of the Institution: ..............................................................................................................................................................................................................................................................................
Name of Promoter of Institution (Private institution) .....................................................................................................................................................................................................................................
Name of Head of Institution ........................................................................................................................................................................................................................................................................
1102
1103
1104
1105
1106
1107
1108
1109
1110
1111
1112
1113
1114
1115
1116
1117
1118
1119
Code of the Institution (Not to be filled out)
Region
Division
Subdivision
Sex of Head of Institution 1 = Male 2 = Female
Council
Zone :
Post box
Land occupied Area Land title ? 1 = YES, 2 = NO
Tenant ? 1 = YES, 2= NO Owner 1 = YES, 2= NO
m2
Ownership
Telephone :
Email :
Year of Creation
Year of last accreditation
1st Year of Accreditation Order no. of
Website (If any)
...............................................................................................
...............................................................................................
...............................................................................................
..................................................Town.................................................................
1 = Urban 2 = Rural
...Town.......................................................................................
Order no. of
To what type of institution does the training Institution belong?1=Public, 2=Private, 3= Denominational
Has the Institution been rehabilitated ? 1= Yes, 2= No
Has the Institution an agreement with the Government? 1= Yes, 2= No
Does your Institution have an operational internet connection? 1= Yes, 2= No
Does your Institution have an operational multimedia room? 1= Yes, 2= No
Respondent’s name and surname: .................................................................................................
Respondent’s status: ..........................................................................................................................
Respondent’s address: ......................................................................................................................

Sub-Sector Specific Analyses 281
AN
NEX
ES
II. T
OTA
L N
UM
BER
OF
LEA
RN
ERS
IN T
HE
INST
ITU
TIO
N
II.1
Sho
rt-T
erm
Pro
gra
mm
es (
Less
th
an 1
2 M
on
ths)
Occ
up
atio
n
Co
de
(1)
Occ
up
atio
n
Titl
e (1
)D
ura
tio
n o
f Tr
ain
ing
Nu
mb
er o
f D
ivis
ion
s /
Gro
up
s
Nu
mb
er o
f Le
arn
ers
Add
row
s if
nece
ssar
y
Rep
eate
rs
Tota
lTo
tal
Of
wh
ich
gir
lsO
f w
hic
h g
irls
Dat
eD
ate
Dat
eD
ate
II.2
Lon
g-T
erm
Pro
gra
mm
es (
12 M
on
ths
and
Ab
ove
)
II.2.
1 1
stYe
ar L
earn
ers
Occ
up
atio
n
Co
de
(1)
Occ
up
atio
n
Titl
e (1
)D
ura
tio
n o
f Tr
ain
ing
Nu
mb
er o
f D
ivis
ion
s /
Gro
up
s
Nu
mb
er o
f Le
arn
ers
Add
row
s if
nece
ssar
y
Rep
eate
rs
Tota
lTo
tal
Of
wh
ich
gir
lsO
f w
hic
h g
irls
Dat
eD
ate
Dat
eD
ate
(1):
If th
e oc
cupa
tion
is li
sted
, ref
er t
o th
e co
des
belo
w t
o fil
l out
the
occ
upat
ion
code
box
. If
not,
just
ent
er t
he o
ccup
atio
n tit
le.
(1):
If th
e oc
cupa
tion
is li
sted
, ref
er t
o th
e co
des
belo
w t
o fil
l out
the
occ
upat
ion
code
box
. If
not,
just
ent
er t
he o
ccup
atio
n tit
le.

282 EDUCATION SECTOR ANALYSIS METHODOLOGICAL GUIDELINES - Volume 2
II.2.
3 3
rdYe
ar L
earn
ers
II.2.
22nd
Year
Lea
rner
s
Occ
up
atio
n
Co
de
(1)
Occ
up
atio
n
Titl
e (1
)D
ura
tio
n o
f Tr
ain
ing
Nu
mb
er o
f D
ivis
ion
s /
Gro
up
s
Nu
mb
er o
f Le
arn
ers
Add
row
s if
nece
ssar
y
Rep
eate
rs
Tota
lTo
tal
Of
wh
ich
gir
lsO
f w
hic
h g
irls
Dat
eD
ate
Dat
eD
ate
(1):
If th
e oc
cupa
tion
is li
sted
, ref
er t
o th
e co
des
belo
w t
o fil
l out
the
occ
upat
ion
code
box
. If
not,
just
ent
er t
he o
ccup
atio
n tit
le.
(1):
If th
e oc
cupa
tion
is li
sted
, ref
er t
o th
e co
des
belo
w t
o fil
l out
the
occ
upat
ion
code
box
. If
not,
just
ent
er t
he o
ccup
atio
n tit
le.
Occ
up
atio
n
Co
de
(1)
Occ
up
atio
n
Titl
e (1
)D
ura
tio
n o
f Tr
ain
ing
Nu
mb
er o
f D
ivis
ion
s /
Gro
up
s
Nu
mb
er o
f Le
arn
ers
Add
row
s if
nece
ssar
y
Rep
eate
rs
Tota
lTo
tal
Of
wh
ich
gir
lsO
f w
hic
h g
irls
Dat
eD
ate
Dat
eD
ate
01 02 03 04 05 06 07
Code
sCo
des
Code
sCo
des
Occ
upat
ion
Occ
upat
ion
Occ
upat
ion
Occ
upat
ion
Acco
untin
g Cl
erk
Offi
ce A
utom
atio
n Se
cret
ary
Offi
ce E
mpl
oyee
Med
ical S
ecre
taria
l Wor
k
Elec
troni
cs
Build
ing
Elec
tricit
y
Refri
gera
tion
and
Air-C
ondi
tioni
ng
08 09 10 11 12 13 14
Elec
tro-M
echa
nics
Mas
onry
Build
ing
Plan
Tilin
g
Sani
tary
Fitt
ings
Cabi
netm
akin
g
Roof
Fra
min
g
15 16 17 18 19 20 21
Prod
uctio
n En
gine
erin
g
Boile
r-Mak
ing
Shee
t Met
al W
ork
Shar
peni
ng-S
awin
g
Build
ing
cons
truct
ion
Mec
hani
cal R
epai
r
Mot
or E
lect
ricity
22 23 24 25 26 27 28 29
Dies
el M
otor
Mec
hani
cs
Auto
mot
ive
Body
wor
k
Agric
ultu
re
Indu
stria
l Sew
ing
Hom
e Ec
onom
ics
Assis
tant
Bio
-Che
mist
Scul
ptur
e
Cera
mics
Occ
up
atio
n C
od
es

Sub-Sector Specific Analyses 283
AN
NEX
ES
III. LEARNERS’ ORIGIN
Date 1 Date 2 Date 3 Date 1 Date 2 Date 3
With no schooling (Who can neither read nor write)
Literate (Who can read and write)
Primary education
First cycle of general secondary education
First cycle of technical secondary education
Second cycle of general secondary education
Second cycle of technical secondary education
Higher education
Worker (in search of re-training or promotion)
Retired
Others (People seeking retraining)
Total
Learners’ Origin Aggregate Number
of LearnersOf which
Girls/Women

284 EDUCATION SECTOR ANALYSIS METHODOLOGICAL GUIDELINES - Volume 2
Dat
eD
ate
Dat
eD
ate
Dat
eD
ate
Occ
up
atio
n
Co
de
(1)
Occ
up
atio
n
Titl
e (1
)Pa
ssed
Tota
lTo
tal
Of
wh
ich
gir
lsO
f w
hic
h g
irls
Tota
lO
f w
hic
h g
irls
Reg
iste
red
Test
ed
(1):
If th
e oc
cupa
tion
is li
sted
, ref
er t
o th
e co
des
belo
w t
o fil
l out
the
occ
upat
ion
code
box
. If
not,
just
ent
er t
he o
ccup
atio
n tit
le.
01 02 03 04 05 06 07
Code
sCo
des
Code
sCo
des
Occ
upat
ion
Occ
upat
ion
Occ
upat
ion
Occ
upat
ion
Acco
untin
g Cl
erk
Offi
ce A
utom
atio
n Se
cret
ary
Offi
ce E
mpl
oyee
Med
ical S
ecre
taria
l Wor
k
Elec
troni
cs
Build
ing
Elec
tricit
y
Refri
gera
tion
and
Air-C
ondi
tioni
ng
08 09 10 11 12 13 14
Elec
tro-M
echa
nics
Mas
onry
Build
ing
Plan
Tilin
g
Sani
tary
Fitt
ings
Cabi
netm
akin
g
Roof
Fra
min
g
15 16 17 18 19 20 21
Prod
uctio
n En
gine
erin
g
Boile
r-Mak
ing
Shee
t Met
al W
ork
Shar
peni
ng-S
awin
g
Build
ing
cons
truct
ion
Mec
hani
cal R
epai
r
Mot
or E
lect
ricity
22 23 24 25 26 27 28 29
Dies
el M
otor
Mec
hani
cs
Auto
mot
ive
Body
wor
k
Agric
ultu
re
Indu
stria
l Sew
ing
Hom
e Ec
onom
ics
Assis
tant
Bio
-Che
mist
Scul
ptur
e
Cera
mics
IV. C
ERTI
FIC
ATE
S A
ND
ATT
ESTA
TIO
NS
IV.1
Cer
tifi
cate
s (p
rog
ram
mes
off
ered
in le
ss t
han
12
mo
nth
s). E
xam
inat
ion
s su
per
vise
d b
y M
INEF
OP
bet
wee
n 2
006/
2007
an
d20
08/2
009.

Sub-Sector Specific Analyses 285
AN
NEX
ES
Dat
eD
ate
Dat
eD
ate
Dat
eD
ate
Occ
up
atio
n
Co
de
(1)
Occ
up
atio
n
Titl
e (1
)Pa
ssed
Tota
lTo
tal
Of
wh
ich
gir
lsO
f w
hic
h g
irls
Tota
lO
f w
hic
h g
irls
Reg
iste
red
Test
ed
Dat
eD
ate
Dat
eD
ate
Dat
eD
ate
Occ
up
atio
n
Co
de
(1)
Occ
up
atio
n
Titl
e (1
)Pa
ssed
Tota
lTo
tal
Of
wh
ich
gir
lsO
f w
hic
h g
irls
Tota
lO
f w
hic
h g
irls
Reg
iste
red
Test
ed
(1):
If th
e oc
cupa
tion
is li
sted
, ref
er t
o th
e co
des
abov
e to
fill
out
the
occ
upat
ion
code
box
. If
not,
just
ent
er t
he o
ccup
atio
n tit
le.
IV.2
Cer
tifi
cate
s is
sued
(Pr
og
ram
mes
off
ered
in le
ss t
han
12
mo
nth
s). I
nte
rnal
exa
min
atio
ns
bet
wee
n 2
006/
2007
an
d 2
008/
2009
.
IV.3
En
d-o
f-co
urs
e ce
rtif
icat
es (
nat
ion
al e
xam
inat
ion
bet
wee
n 2
006/
2007
an
d 2
008/
2009
).

286 EDUCATION SECTOR ANALYSIS METHODOLOGICAL GUIDELINES - Volume 2
V. PERSONNEL CENSUS
V.1 Census of Administrative and Support Staff
Total Number of Instructors
1
2
3
4
5
6
7
8
10
11
Head of Training Institution
Demonstrator
Discipline Master
Section Supervisor
Bursar
Steward
Stores Accountant
Secretary
Teaching Counselor
Guidance Counselor
P.E. Coordinator
Employment Counselor
Social Worker
Officer in Charge of the Information andDocumentation Unit (IDU) or Librarian
Nurse
Security Officer
Others
Total
12
13
N° Staff categories
Men Women Total
V.2 Census of Training Staff
V.2.1 Instructors per Status
Male Female Total
Civil servants / Permanent
State Contract worker
School contract employee
Term employee
Others
Total
Instructor’s status

Sub-Sector Specific Analyses 287
AN
NEX
ES
V.2.2 Training Instructors per Occupation
Male Female
Total number of instructors
Total
Occupation Code (1)
Occupation Title (1)
01
02
03
04
05
06
07
Codes Codes Codes CodesOccupation Occupation Occupation Occupation
Accounting Clerk
Office Automation Secretary
Office Employee
Medical Secretarial Work
Electronics
Building Electricity
Refrigeration and
Air-Conditioning
08
09
10
11
12
13
14
Electro-Mechanics
Masonry
Building Plan
Tiling
Sanitary Fittings
Cabinetmaking
Roof Framing
15
16
17
18
19
20
21
Production Engineering
Boiler-Making
Sheet Metal Work
Sharpening-Sawing
Building construction
Mechanical Repair
Motor Electricity
22
23
24
25
26
27
28
29
Diesel Motor Mechanics
Automotive Bodywork
Agriculture
Industrial Sewing
Home Economics
Assistant Bio-Chemist
Sculpture
Ceramics
(1): If the occupation is listed, refer to the codes below to fill out the occupation code box. If not, just enter the occupation title.
V.2.3 Training Instructors per Vocational Certificate
Male Female Total
DIPENI
DIPLEG, DIPES II, CAPES, DIPLET, DIPET II
DIPCEG, DIPES I, DIPCET, DIPET I, CAPCEG, DIPENIA, ING TRAVAUX
DIPEPS / INGENIEUR/MASTER
BTS
CAPIEG, CAPIEMP, CAPI, CAPIET
CAPIAEG, CAPIA, CAPIAET
BEP, BP, BACC TECH, BACC PRO, BT
CAP / Vocational School Certificate
Others
No professional or vocational qualification
Total
Professional or Vocational Qualification

288 EDUCATION SECTOR ANALYSIS METHODOLOGICAL GUIDELINES - Volume 2
V.2.4 Classroom Teaching Staff per Academic Qualification
Male Female Total
DEA/DESS and above
Master’s Degree
Bachelor’s Degree
DEUG/DUT
BAC GEN / GCE Advanced Level
BEPC / GCE Ordinary Level
CEP/ FSLC
Other academic qualifications
No academic qualification
Total
Academic qualification
V.2.5 Further Training of Trainers
Male Female TotalMale Female TotalAcademic Qualification
Number of trainers who have undergonefurther training
Number of trainers trained in the"Competency-based Approach" (CBA)
Number of trainers trained in Information andCommunication Technologies (ICTs)
Number of trainers trained in the new assessmentsystem (based on the CBA)
Number of trainers trained in HIV- AIDSprevention methods
Number of trainers trained in first aid techniques
Total

Sub-Sector Specific Analyses 289
AN
NEX
ES
1 2 3 4 5 6 7 8 9 10 11 12 13 14 15 16 17 18 19 20 21N°
Nam
esG
ende
rG
rade
Id N
o.D
ate
of B
irth
Posi
tion
Seni
orit
yPo
siti
onPr
evio
usPo
stO
ccup
atio
nal
spec
ialis
atio
n H
ighe
stD
egre
e
V.2.
6 S
taff
Info
rmat
ion

290 EDUCATION SECTOR ANALYSIS METHODOLOGICAL GUIDELINES - Volume 2
VI. BUILDINGS AND EQUIPMENT
VI.1 Workshops, Laboratories, Specialised Rooms and Classrooms
Type of Building Quantity(Number)
Numberof Seats/
WorkStations
TemporaryBuilding
Permanent Semi-Permanent
Good State
Poor State
Good State
Poor State
Ordinary classrooms
Specialised classrooms
Workshops / laboratories
Multimedia resource units
Offices (buildings)
Documentation units
Staff rooms
Sick bays
Toilet rooms (latrine, WC)
Staff accommodation houses
Others
VI.2 Information on Other Equipment and Facilities of the Training Institution
1) Does the institution have an operational power connection? 1=Yes, 2=No
2) Does the institution have a potable water supply point? 1=Yes, 2=No
3) Does the institution have computers in perfect working condition? 1=Yes, 2=No
3.a) If the answer is yes, specify the number:
4) Does the institution have operating computers for trainers? 1=Yes, 2=No
4.a) If the answer is yes, specify the number:
4.b) If the answer is yes, are trainers trained in the use of computers? 1=Yes, 2=No
5) Does the institution have operating computers for learners? 1=Yes, 2=No
5.a) If the answer is yes, specify the number:
5.b) If the answer is yes, are learners trained in the use of computers ? 1=Yes, 2=No
6) Does the institution have playgrounds? 1=Yes, 2=No
7) Does the institution have a fire extinguisher? 1=Yes, 2=No If yes, how many
8) Do workshops/ laboratories have emergency exits? 1=Yes, 2=No
9) Does the institution have toilet rooms/latrines? 1=Yes, 2=No If no, go to 4306
10) Do girls have separate toilet rooms/ latrines from boys’? 1=Yes, 2=No
11) Is the training institution fenced? 1=Yes, 2=No
12) Does the institution have a medicine cabinet (health kit) provided with first aid materials? 1=Yes, 2=No
13) Is there a Parent Teacher Association (PTA) within the institution? 1=Yes, 2=No

Sub-Sector Specific Analyses 291
AN
NEX
ES
VI.3 Information and Documentation Unit (IDU) or Library
Occupation Code (1) Occupation Title (1) Number of Books Available
(1): If the occupation is listed, refer to the codes above to fill out the occupation code box. If not, just enter the occupation title.
VIII. WORKING CONDITION OF WORKSHOPS, SPECIALISED ROOMS AND LABORATORIES
Occupation Code (1)
Occupation Title (1)
Numberof OperatingWorkshops
General WorkingCondition of
Workshop Equipment
Availabilityof Workshop
Materials?
(1): If the occupation is listed, refer to the codes above to fill out the occupation code box. If not, just enter the occupation title.

292 EDUCATION SECTOR ANALYSIS METHODOLOGICAL GUIDELINES - Volume 2
IX. PARTNERSHIP AND RELATIONSHIP WITH THE EMPLOYMENT SECTOR
1) Does the institution have a relationship with the employment sector? 1=yes 2=no
1.a) If yes, specify the type of relationship 1=formal (based on an existing agreement); 2= informal
1.b) Specify the type of partners involved: r Public institutions r Private companies r SMEs
1.c) Specify the purpose of the partnership:
1.d) If your institution received financial assistance in 2009, specify the nature and amount of the assistance
r Professional organisationsr Civil society r Others....................................
r Financial assistance r Work-study programmer Seminar/conferencer Ongoing training of company personnel r Capacity buildingr Company visitr Others, specify
r Supply of equipment r In-company practicumr Open door daysr Internship r Professionals in the management committee r Technical projects with companies
NatureApprenticeship tax..............................................................................Donations...........................................................................................Grants................................................................................................Internship fees....................................................................................NEF subsidy.........................................................................................Scholarships........................................................................................Others.................................................................................................
Amount

Sub-Sector Specific Analyses 293
AN
NEX
ES
X. FUNDING AND INCOME GENERATING ACTIVITIES (2009)
1) Specify the amount of the State’s grant (in CFA F):
2) If the institution is government-owned, specify
2.a) Total operating budget amount...................................................... 2.a.1) Maintenance budget ........................................................ 2.a.2) Budget for workshop materials......................................... 2.b) Total investment budget amount....................................................
3) Specify the amount (CFAF) of PTA fees per learner:
4) Did your institution receive assistance for 2009? 1 = YES; 2 = NO
4.a) If the answer is yes, specify the donor (s),: 1 = Local councils; 2 = NGOs / CIGs; 3 = local elites; 4 = foreign partners; 5 = Companies; 6 = Others
4.b.) If the answer is yes, state the nature of the assistance ? (tick the appropriate box(es)
r Construction of classrooms/ buildingsr Workshopsr Equipmentr Playgroundsr Cash .............Amount:
r Installation kitsr Manuals and documentationr Benchesr Others
5) Self-financing (year 2009)
r Fabrication and sale of works/products Amount:r Further training for external staff Amount:r Services to individuals and companies Amount:r Others, please specify Amount:
XI- COST OF TRAINING
Occupation Code (1)
Occupation Title (1)
Duration of Training
Registration Fee
Tuition/ Training Fees
(1): If the occupation is listed, refer to the codes above to fill out the occupation code box. If not, just enter the occupation title.

294 EDUCATION SECTOR ANALYSIS METHODOLOGICAL GUIDELINES - Volume 2
XII- JOB PLACEMENT
Occupation Code (1)
Occupation Title (1)
Number of Learners Who Found a Job
2005/2006 2006/2007 2007/2008
(1): If the occupation is listed, refer to the codes above to fill out the occupation code box. If not, just enter the occupation title.
Questionnaire filling date (day/month/year) : / /
Signature and Stamp of the Head of Institution

Sub-Sector Specific Analyses 295
AN
NEX
ES
r under Ministry of.............................. r under (other organisation, e.g. trade union)................... r under prov. Department ofr company-owned (SOE)..................... r company-owned (private)r private not-for-profit r private for-profit r other, please indicate ................................................................................................................
1.1 Name of the Institution..........................................................................................................................1.2 Province............................................................................................................................................1.3 Address...............................................................................................................................................1.4 Tel. :........................................................................Fax:............................Email:...................................1.5 Ownership status:
Total Fees (Tuition Fees and Any other Fees)
Name of course Full-Timeor Part-Time?
Duration(Months/
Years)
Number of StudentsEnrolled in
FT PT Year 1 Year 2
r
r
r
r
monthsyears
monthsyears
monthsyears
monthsyears
Amount/yearAmount/course
Amount/yearAmount/course
Amount/yearAmount/course
Amount/yearAmount/course
Amount/yearAmount/course
r
r
r
r
r
r monthsyears
ANNEX 10.3:QUESTIONNAIRE EXAMPLE FOR TVET INSTITUTIONCOST/EXPENDITURE ASSESSMENT1. General information
2. Training programmes
Please list all training programmes that were provided during the last two years, and add the additionalinformation required. Please indicate actual enrolment, not planned enrolment. Please list allprogrammes that were actually provided in the institution, irrespective of whether they were formal,non-formal, contract-training, or others. Use more sheets, if necessary

296 EDUCATION SECTOR ANALYSIS METHODOLOGICAL GUIDELINES - Volume 2
Year 1 Year 2Source of Income
Government budget, state source (e.g. Min./Dep. of ....)
Total Government Budget
Training fees
Payment from organisations (employers, donors, etc) for tailor-made courses
Income from production and services (other than training services)
Grants From donors
From foreign/ international donors
Other, please indicate
TOTAL Revenues
3. Revenues
Please list all the income of the institution from the different sources indicated for the last two years(in local currency)
Year 1 Year 2Expenditure Item
RECURRENT
Salaries
Management/administration personnel
Training/teaching personnel (incl. part-time teachers)
Training material
Maintenance of buildings, equipment, machinery
Other operational costs
Rent/lease
Water
Power
Telecommunication
Other
Capital cost
Interest
Redemption
Other, please indicate
DEVELOPMENT/INVESTMENT
Equipment/machinery
Infrastructure
Staff training
Other
4. Expenditure
Please list all expenditure of the institution for the last two years (in local currency)

Sub-Sector Specific Analyses 297
AN
NEX
ES
ANNEX 10.4:EXAMPLE OF A METHODOLOGY TO CALCULATE THE COSTOF TRAINING ONE TRAINEE OVER A SPECIFIED TIMEPERIOD, FOR EACH KIND OF TRAINING
The approach developed throughout the chapter 3 enables the “direct” estimation of unit costs (thebudget allocated to an education level, divided by the number of trainees enrolled at that level).Although this is relatively straightforward for some education levels, this technique may not beappropriate for TVET when estimating unit costs by type of training (technical, professional and soon) or subject. This being an issue depends on the level of detail available in the budget. However, asTVET institutes generally offer various types of training, with teaching staff that covers several of them,the distribution of spending enabling the “direct” estimation of a specific budget for each type, andthe associated unit costs, remains complex.
On the other hand, the estimation of aggregate unit costs would not fully render justice to thesituation, as teaching conditions, operational expenses and so on can vary considerably according tothe type of training and the subject chosen. Industrial training for instance is generally much moreexpensive than tertiary training.
To take the estimation to another level, the breakdown of public expenditure per trainee can be used,as per Chapter 3 (see Box 3.2), for each type of training and possibly subject (or according to anyother relevant breakdown key). In first instance, by examining the unit costs of teaching salaries UCTS,the following applies (for further detail, see the box below):
UCTS = = x
This in turn, can be defined, for each training course i, as:
UCTSi = = x
Some terms of the equation are generally determined by considering that the values for the variablesfor the training course i are the same as those for the entire TVET sub-sector (which are more easilycalculated), such as the average teacher salary (ASTi = AST) and the weekly workload of teachers HTi,which can reasonably be approximated by:
HT =
The weekly workload of trainees HPi is known on the basis of the training programme i underconsideration. On the other hand, it is necessary to be able to determine the trainee-teacher ratioPTRi or the class size CSi for the training programme.
Enrolment statistics can directly provide a value for CSi. When this is not the case, PTRi can be obtained(if the number of training institutions is sufficient) through a linear regression (without constant),where the explained variable is the number of teachers, the explanatory variables are the number ofclasses (or pedagogical units) by type of training and subject, and observations are carried out on
AST
PTR
PTR x Hp
CS
AST
CSHP
HT
ASTi
PTRi
ASTi
CSi
HPi
HTi

298 EDUCATION SECTOR ANALYSIS METHODOLOGICAL GUIDELINES - Volume 2
each of the training institutions. The inverse of the coefficients obtained provides the pupil-teacherratio for each type of training.
The same approach can be used in terms of institutions’ administrative staff, to determine the traineeto non-teaching staff ratio PNTR, and to distribute operational costs OC per trainee, when they areavailable for each training institution (in this instance the coefficient directly provides the expense bytrainee and by training course).
However, this technique works only where there is effectively a relation between the staff deployed,the operational budget and the type of training. In fact, the type of training institution often has agreater impact on the number of staff deployed than the nature of the training course itself.
Consolidating the different unit costs by training course i according to the number of trainees enrolledshould provide the global unit cost. If this is not the case, a detailed examination of the results shouldhelp to identify the source of the discrepancy.
This approach can be applied to each subject and so on. However, other methods are of courseavailable, and in some cases preferable, but they depend primarily on the precision and exhaustivenessof available information, both in terms of budgets and ministry-level statistics.
BOXLink between the PTR and the size of a pedagogical group
The basic relationship of equality between the number of hours of teaching followed by studentsand the number of hours of teaching provided by teachers translates into:
Where:NC is the number of classes (or pedagogical units),HP is the workload of trainees (in hours),NT is the number of teachers,HT is the workload of teachers (in effective hours),NP is the number of trainees,PTR is the trainee-teacher ratio, andCS is class size.
NC x HP
NP=
NC x HP = NT x HT
NT x HT
NP
HP
PTR=
HT
CS
PTR = x CSHT
HP

Sub-Sector Specific Analyses 299
AN
NEX
ES
The trainee to teacher ratio integrates various dimensions, and can be broken down according to thenumber of hours of teaching received by learners, the number of hours of teaching effectively providedby trainers (generally less that their theoretical workload, and all the more so if training institutionsare small and their staff is highly specialised, which is often the case in TVET), as suggested by thebox above.
Therefore, if the information is available, it is relevant to analyse the following dimensions:
Analysis of the deployment of teaching staffThe deployment of trainers can be better analysed by relating the number of trainers (specialised inthe case of TVET) to the number of classes they teach, than by relating their numbers to the numberof learners, as is common practice for the primary cycle, whose teachers are more versatile.
Analysis of provider systemsSecondly, the size of classes (pedagogical units) can be analysed to determine if (i) teaching takesplace in acceptable conditions (class sizes are not excessively large), and (ii) if the organisation ofdelivery is efficient (class sizes are not minute, as the number of classes with just a few learners shouldbe limited).
The degree of utilisation of trainersOn the basis of the trainee-teacher ratio, class size and the number of teaching hours received bylearners (the theoretical course programme is often the best measure available), it is then feasible toestimate the average number of hours of teaching provided by teachers, and thus reach anapproximation of their utilisation rate, to be compared with the theoretical workload that applies totheir status.

300 EDUCATION SECTOR ANALYSIS METHODOLOGICAL GUIDELINES - Volume 2
NOTES
89 In practice, these indicators are available for the zero to five year age group, through DHS and MICS surveys.
90 Detailed information on maternal health is particularly abundant in MICS surveys. Such information includes women’saccess to health care, pre and postnatal care and birth delivery conditions. The examination of these indicators canhelp to identify gaps in the coverage of pregnancy and birth assistance services. They are also tools for the planningand evaluation of early childhood policies and health services.
91 Qualified or professional health personnel include doctors, nurses and midwives.
92 http://www.unicef.org/immunization/index_2819.html Recently, some countries have begun to administer the oralpentavalent vaccine instead of the whooping cough vaccine. This contains five antibodies against diphtheria, tetanus,whooping cough, hepatitis B and hemophilic influenza B.
93 http://www.who.int/nutrition/topics/moderate_malnutrition/fr/index.html
94 As above, stunting is considered to be severe if the child’s height for age is more than three standard deviations belowthe mean for the reference population.
95 http://www.unicef.org/progressforchildren/2007n6/index_41505.htm
96 Improved water sources include taps, aquifers, wells and bottled water.
97 Users of this guide are strongly advised to consult Chapter 2 for the definitions and analytical approaches to theindicators of school coverage, given that the same approach is adopted here.
98 The exact definition is provided in Chapter 5.
99 Such children include those infected with or affected by HIV/AIDS, handicapped children, street children, victims ofthe worst forms of child labour, children with legal issues, or those affected by armed conflict (child soldiers). In somecountries a further category is found, called local OVCs. These would include the Talibés in Senegal (children who begfor their religious leader, the Marabout), drug-addicted children in South Africa, or bewitched children in Benin andDRC (children disowned by their parents after being accused of witchcraft) for instance.
100 http://info.worldbank.org/etools/docs/library/237384/toolkitfr/howknow/definitions.htm
101 http://www.unesco.org/ulis/cgi-bin/ulis.pl?catno=189882&set=4D5E86D7_2_159&gp=1&lin=1&ll=1http://www.unesco.org/new/fr/media-services/single-view/news/better_monitoring_in_sight_for_the_well_being_of_young_children/
102 The inter-agency technical committee includes specialists in childhood development from the Bernard van LeerFoundation, Un Kilo de Ayuda (Mexico), Save the Children, UNESCO, UNICEF, WFP, WHO and the World Bank.
103 The nominal return on capital is ususally computed as the sum of inflation rate and the real rate of return on capital.
104 This category can be broken down into further categories where appropriate. Depending on contexts, it may includeexam fees, income from medical care, rental of accommodation, income from restaurants and university transport, orother income from in-house activities.
105 Over 10 million people.
106 35 countries including 18 in sub-Saharan Africa.
107 From DHS, MICS surveys etc.
108 On a sample representative of the geographical and linguistic national diversity.
109 Morocco, Niger and Kenya.
110 LAMP national team.
111 Literacy is defined as the ability to read and write a simple text with understanding, relating to daily life. It implieshaving ongoing reading and writing skills, and often includes basic arithmetic skills (UIS, 2006).
112 2008 Global Monitoring Report (UNESCO 2007).

AN
NEX
ES
© W
orld
Ban
k /
Régi
s L’
Hos
tis
Sub-Sector Specific Analyses 301

302 EDUCATION SECTOR ANALYSIS METHODOLOGICAL GUIDELINES - Volume 2
BIBLIOGRAPHYVOLUMES 1 & 2

Sub-Sector Specific Analyses 303
CSR type analysis of education systems
The publications listed below are CSR (Education Country Status Report) type reports, usually the fruitof a collaboration between a governmental team and development partners such as the UNESCO-IIEP Pôle de Dakar, the World Bank, UNICEF or other partners. Most of the examples provided in thisguide are drawn from these analyses. Most of the reports can be downloaded fromhttp://www.worldbank.org/afr/education and http://www.poledakar.org
Agence Française de Développement. 2009. Le système éducatif djiboutien : Diagnostic sectoriel etperspectives pour la politique éducative. Agence Française de Développement, Paris.
Government of The Gambia, World Bank and Pôle de Dakar (UNESCO-BREDA). 2011. The GambiaEducation Country Status Report. World Bank, Washington, DC.
Pôle de Dakar UNESCO-BREDA (United Nations Educational, Scientific and Cultural Organisation,Regional Office for Education in Africa). 2006. Eléments d’analyse du secteur éducatif au Togo. Pôlede Dakar UNESCO-BREDA, Dakar.
Pôle de Dakar UNESCO-BREDA. 2010a. Eléments de Diagnostic du Système Educatif Bissau-guinéen :Marges de Manoeuvre pour le Développement du Système Educatif dans une Perspectived’Universalisation de l’Enseignement de Base et de Réduction de la Pauvreté. Pôle de DakarUNESCOBREDA, Dakar.
Pôle de Dakar UNESCO-BREDA. 2010b. Rapport d’état sur le système éducatif national mauritanien.Pôle de Dakar UNESCO-BREDA, Dakar.
Pôle de Dakar UNESCO-BREDA. 2011a. La question enseignante au Bénin : Un diagnostic holistiquepour la construction d’une politique enseignante consensuelle, soutenable et durable. Pôle de DakarUNESCO-BREDA, Dakar.
Pôle de Dakar UNESCO-BREDA. 2011b. Relatorio do Estado do Sistema Educativo Nacional CaboVerde. Pôle de Dakar UNESCO-BREDA, Dakar.
Pôle de Dakar UNESCO-BREDA. 2012. Le système éducatif de Sao-Tomé et Principe : Une analysesectorielle pour une amélioration de l’efficacité du système. Pôle de Dakar UNESCO-BREDA, Dakar.
Republic of Yemen and the World Bank. 2010. Republic of Yemen Education Status Report: Challengesand Opportunities. World Bank, Washington, DC.
United Republic of Tanzania (Ministry of Education and Vocational Training) and the Pôle de DakarUNESCO-BREDA. 2011. Beyond Primary Education, the Quest for Balanced and Efficient Policy Choicesfor Human Development and Economic Growth. Pôle de Dakar UNESCO-BREDA, Dakar.
UNICEF and the Pôle de Dakar UNESCO-BREDA. 2011. Rapport d’état du système éducatif : Diagnosticdu système éducatif comorien pour une politique nouvelle dans le cadre de l’EPT. UNICEF and Pôlede Dakar UNESCO-BREDA, Dakar.
World Bank. 2000a. Contraintes et espaces de liberté pour le développement en quantité et en qualitéde l’éducation au Niger. World Bank, Washington, DC.
BIBLIOG
RAPH
Y

304 EDUCATION SECTOR ANALYSIS METHODOLOGICAL GUIDELINES - Volume 2
World Bank. 2000b. Coûts, financement et fonctionnement du système éducatif du Burkina Faso :Contraintes et espaces pour la politique éducative. World Bank, Washington, DC.
World Bank. 2001a. Education and Training in Madagascar: Towards a Policy Agenda for EconomicGrowth and Poverty Reduction. Africa Region Human Development Working Paper 12, World Bank,Washington, DC.
World Bank. 2001b. Le système éducatif Mauritanien : Eléments d’analyse pour instruire des politiquesnouvelles. Africa Region Human Development Working Paper 15, World Bank, Washington, DC.
World Bank. 2002. Le système éducatif Béninois : Performance et espaces d’amélioration pour lapolitique éducative. Africa Region Human Development Working Paper 19, World Bank, Washington,DC.
World Bank. 2003a. Cost and Financing of Education: Opportunities and Obstacles for Expanding andImproving Education in Mozambique. Africa Region Human Development Working Paper 37, WorldBank, Washington, DC.
World Bank. 2003b. Education in Rwanda: Rebalancing Resources to Accelerate Post-ConflictDevelopment and Poverty Reduction. Country Study Series. World Bank, Washington, DC.
World Bank. 2003c. Rapport d’état du système éducatif national Camerounais : Eléments de diagnosticpour la politique éducative dans le contexte de l’EPT et du DSRP. World Bank, Washington, DC.
World Bank. 2003d. Le système éducatif Togolais : Eléments d’analyse pour une revitalisation. AfricaRegion Human Development Working Paper 35, World Bank, Washington, DC.
World Bank. 2004a. Cost, Financing and School Effectiveness of Education in Malawi: A Future ofLimited Choices and Endless Opportunities. Africa Region Human Development Working Paper 78,World Bank, Washington, DC.
World Bank. 2004b. La dynamique des scolarisations au Niger : Evaluation pour un développementdurable. Africa Region Human Development Working Paper 40, World Bank, Washington, DC.
World Bank. 2004c. School Education in Nigeria: Preparing for Universal Basic Education. Africa RegionHuman Development Working Paper 53, World Bank, Washington, DC.
World Bank. 2004d. Strengthening the Foundation of Education and Training in Kenya: Opportunitiesand Challenges in Primary and General Secondary Education. World Bank, Washington, DC.
World Bank. 2004e. Public and Private Funding of Basic Education in Zambia: Implications of BudgetaryAllocations for Service Delivery. Africa Region Human Development Working Paper 62, World Bank,Washington, DC.
World Bank. 2005a. Education in Ethiopia: Strengthening the Foundation for Sustainable Progress.Country Study Series. World Bank, Washington, DC.
World Bank. 2005b. Primary and Secondary Education in Lesotho: A Country Status Report forEducation. Africa Region Human Development Working Paper 101, World Bank, Washington, DC.

Sub-Sector Specific Analyses 305
World Bank. 2005c. Rapport d’état du système éducatif Ivoirien : Eléments d’analyse pour instruireune politique éducative nouvelle dans le contexte de l’EPT et du PRSP. Africa Region HumanDevelopment Working Paper 80, World Bank, Washington, DC.
World Bank. 2005d. Le système éducatif Guinéen : Diagnostic et perspectives pour la politiqueéducative dans le contexte de contraintes macroéconomiques fortes et de réduction de la pauvreté.Africa Region Human Development Working Paper 90, World Bank, Washington, DC.
World Bank. 2005e. Le système éducatif de la République Démocratique du Congo : Priorités etalternatives. Africa Region Human Development Working Paper 68, World Bank, Washington, DC.
World Bank. 2005f. Namibia: Human Capital and Knowledge Development with Equity. Africa RegionHuman Development Working Paper 84, World Bank, Washington, DC.
World Bank. 2006a. Mauritanie : rapport d’état sur le système éducatif national (RESEN) - Elémentsde diagnostic pour l’atteinte des objectifs du millénaire et la réduction de la pauvreté. UnpublishedCSR, World Bank, Washington, DC.
World Bank. 2006b. Swaziland: Achieving Education for All; Challenges and Policy Directions. AfricaRegion Working Paper 109, World Bank, Washington, DC.
World Bank. 2007a. L’éducation au Mali : Diagnostic pour le renouvellement de la politique éducativeen vue d’atteindre les objectifs du millénaire. Africa Human Development Series, World Bank,Washington, DC.
World Bank. 2007b. Education in Sierra Leone: Present Challenges, Future Opportunities. AfricaHuman Development Series, World Bank, Washington, DC.
World Bank. 2007c. Le système éducatif Burundais : Diagnostic et perspectives pour une nouvellepolitique éducative dans le contexte de l’éducation primaire gratuite pour tous. Africa HumanDevelopment Series, Working Paper 109, World Bank, Washington, DC.
World Bank. 2007d. Le système éducatif Tchadien : Eléments de diagnostic pour une politiqueéducative nouvelle et une meilleure efficacité de la dépense publique. Africa Human DevelopmentSeries, Working Paper 110, World Bank, Washington, DC.
World Bank. 2007e. Le système éducatif Congolais : Diagnostic pour une revitalisation dans uncontexte macroéconomique plus favorable. Africa Human Development Series Working Paper 183,World Bank, Washington, DC.
World Bank. 2008a. Eléments de diagnostic du système éducatif Malagasy : Le besoin d’une politiqueéducative nouvelle pour l’atteinte des objectifs du millénaire et de la réduction de la pauvreté.Unpublished CSR, World Bank, Washington, DC.
World Bank. 2008b. Le système éducatif Centrafricain : Contraintes et marges de manoeuvre pour lareconstruction du système éducatif dans la perspective de la réduction de la pauvreté. Africa HumanDevelopment Series, Working Paper 144, World Bank, Washington, DC.
World Bank. 2009. Le système éducatif Béninois : Analyse sectorielle pour une politique éducativeplus équilibrée et plus efficace. Africa Human Development Series Working Paper 165, World Bank,Washington, DC.
BIBLIOG
RAPH
Y

306 EDUCATION SECTOR ANALYSIS METHODOLOGICAL GUIDELINES - Volume 2
World Bank. 2010a. Angola Education Policy Note: Quality Education for All. Unpublished CSR, WorldBank, Washington, DC.
World Bank. 2010b. The Education System in Malawi. Working Paper 182, World Bank, Washington,DC.
World Bank. 2010c. The Education System in Swaziland: Training and Skills Development for SharedGrowth and Competitiveness. Africa Human Development Series Working Paper 188, World Bank,Washington, DC.
World Bank. 2010d. Out of the Ashes: Learning Lessons from the Past to Guide Education Recoveryin Liberia. World Bank, Washington, DC.
World Bank. 2010e. Le système éducatif Malien : Analyse sectorielle pour une amélioration de laqualité et de l’efficacité du système. Africa Human Development Series, Working Paper 198, WorldBank, Washington, DC.
World Bank. 2010f. Les défis du système éducatif Burkinabé en appui à la croissance économique.Africa Human Development Series, Africa Region Human Development Working Paper 196, WorldBank, Washington, DC.
World Bank. 2011a. Education in Ghana: Improving Equity, Efficiency, and Accountability of EducationService Delivery. World Bank, Washington, DC.
World Bank. 2011b. Rwanda Education Country Status Report: Toward Quality Enhancement andAchievement of Universal Nine Year Basic Education; An Education System in Transition, a Nation inTransition. Education Sector Review, World Bank, Washington, DC.
World Bank. 2011c. The Status of the Education Sector in Sudan. Africa Human Development Series,World Bank, Washington, DC.
World Bank. 2011d. Le système éducatif de la Côte d’Ivoire : Comprendre les forces et les faiblessesdu système pour identifier les bases d’une politique nouvelle et ambitieuse. World Bank, Washington,DC.
World Bank. 2012a. Education in South Sudan: Status and Challenges for a New System. World Bank,Washington, DC.

Sub-Sector Specific Analyses 307
Other Bibliographical References
Abadzi H. 2006. Efficient Learning for the Poor. Insights from the frontier of Cognitive Neuroscience.World Bank. Washington, DC.
Akosua Aidoo A. 2011. Education et Soin à la Petite Enfance en Afrique Sub-Saharienne: Que Faut-ilpour Atteindre les Objectifs du Millénaire pour le Développement ? dans L’Avenir de l’Afrique, le Défisde l’Afrique. Savoir et Développement de la Petite Enfance en Afrique Sub-Saharienne. World Bank.Washington, DC.
Andersson M. 1999. The Early Childhood Environment Rating Scale (ECERS) as a tool in evaluatingand improving quality in preschools. Studies in Educational Sciences, 19.
Belfield C. 2006. Financing Early Childhood Care and Education: An International Review. Documentcommissioned for “Education for All Global Monitoring Report 2007: Strong Foundations: EarlyChildhood Care and Education”. UNESCO, Paris.
Britto P. 2012. School Readiness. A Conceptual Framework. UNICEF
Brossard M. 2003. Cibler les écoles primaires les plus défavorisées au Bénin. Propositions. Workingpaper. Pôle de Dakar, UNESCO, Africa Regional Bureau, Dakar.
Brossard M. and B. Foko. 2007a. Coûts et financement de l’enseignement supérieur en Afriquefrancophone. Africa Human Development Series. World Bank, Washington, DC.
Brossard M. and B. Foko. 2007b. Les acquisitions scolaires et la production d’alphabétisation de l’écoleprimaire en Afrique : approches comparatives. Pôle de Dakar, UNESCO, Africa Regional Bureau, Dakar.
Brossard M, E. Duret et B. Ledoux. 2005. Les indices écoles : un outil de gestion. Working paper. Pôlede Dakar, UNESCO, Bureau régional Afrique, Dakar.
Bruns B., A. Mingat and R. Rakotomalala. 2003. Achieving Universal Primary Education by 2015: AChance for Every Child. World Bank, Washington, DC.
Bryk A.S. and S.W. Raudenbush. 1992. Hierarchical Linear Models in Social and Behavioral Research:Applications and Data Analysis Methods. Sage Publications, Newbury Park, CA.
Cerbelle S. 2010. L’alphabétisation au Maroc : injonctions internationales, politique nationale et effetssur le terrain. PhD thesis in education science, Université Paris V.
Currie J. 2001. Early Childhood Education Programs. Journal of Economic Perspectives, 15 (2): 213-238.
De Landsheere G. 1992. Evaluation continue et examens. Précis de Docimologie. Editions Labor, Bruxelles.
DGSCN Togo and UNICEF. 2011. Enquête par grappes à indicateurs multiples (MICS) 2010. Résultatspréliminaires. Direction Générale de la Statistique et de la Comptabilité Nationale (DGSCN), TogoleseRepublic.
Duflo E. and A. Banerjee. 2008. The Experimental Approach to Development Economics. CEPRDiscussion Paper 7037 and BREAD Working Paper 196. BIBLIO
GRA
PHY

308 EDUCATION SECTOR ANALYSIS METHODOLOGICAL GUIDELINES - Volume 2
Education Network. 2012. Analyse des besoins en alphabétisation, présentation de l'enquête sur lasituation de l'analphabétisme à Madagascar. Ministère de l’Education Nationale, UNDP.
Fernald L., P. Kariger, P. Engle and A. Raikes. 2009. Examining Early Child Development in Low-IncomeCountries: A Toolkit for the Assessment of Children in the First Five Years of Life. World Bank,Washington, DC.
Filmer D. 2000. The Structure of Social Disparities in Education: Gender and Wealth. Policy ResearchWorking Paper 2268, World Bank, Washington, DC.
Foko B., F. Ndem and N. Reuge. 2004. L’efficacité externe de l’éducation au Sénégal : une analyseéconomique. Working paper. Pôle de Dakar, UNESCO, Africa Regional Bureau, Dakar.
Foko B. and M. Brossard. 2007. Couverture scolaire et impact sur la croissance économique. Workingpaper. Pôle de Dakar, UNESCO, Africa Regional Bureau, Dakar.
Foko B. 2007. Efficacité externe du système éducatif, module 6, formation PSGSE. Pôle de Dakar,UNESCO, Africa Regional Bureau, Dakar.
Franz J. 2011. Realizing the Youth Dividend in Kenya through Skills for the Informal Sector: InstitutionalAssessment of Skills Development and Youth Employment Programmes and Projects. Working paperprepared for the World Bank, Nairobi.
Franz J. 2007. Financing of Technical and Vocational Education and Training (TVET). Vietnam. Missionreport prepared for GTZ, Hanoi.
Franz J. and J. Twebaze. 2011. BTVET Policy and Management. Technical Paper 4 of the BTVETSubsector Analysis Uganda. Ugandan Ministry of Education and Sports, Kampala.
Garcia M., G. Virata and E. Dunkelberg. 2011. La Situation Actuelle des Jeunes Enfants en AfriqueSub-Saharienne. in L’Avenir de l’Afrique, le Défis de l’Afrique. Savoir et Développement de la PetiteEnfance en Afrique Sub-Saharienne. World Bank. Washington, DC.
Garcia M., A. Pence and J.L. Evans (Eds.). 2008. Africa's Future, Africa's Challenge: Early ChildhoodCare and Development in Sub-Saharan Africa. World Bank, Washington, DC.
Gasquet-More S. 1999. Plus vite que son nombre. Déchiffrer l’information. Seuil.
Gertler P. et al. 2011. Impact Evaluation in Practice. World Bank, Washington, DC.
Hair E., T. Halle, E. Terry-Humen, B. Lavelle and J. Calkins. 2006. Children’s School Readiness in theECLS-K: Predictions to Academic, Health, and Social Outcomes in First Grade. Early Childhood ResearchQuarterly 21 (4): 431–54.
Hanushek E. and L.Woessmann. 2007. The role of education quality for economic growth. PolicyResearch Working Paper Series 4122. World Bank, Washington, DC.
INSAE Bénin and ORC Macro. 2001. Enquête Démographique et de Santé (EDSB-II) Rapport desynthèse. Institut National de la Statistique et de l’Analyse Économique, Ministère du Développement,de l’Analyse Economique et de la Prospective.

Sub-Sector Specific Analyses 309
INSAE Bénin and ORC Macro. 2006. Enquête Démographique et de Santé (EDSB-III) RapportPréliminaire. Institut National de la Statistique et de l’Analyse Économique, Ministère duDéveloppement, de l’Analyse Économique et de la Prospective.
INSAE Bénin and ICF International. 2012. Enquête Démographique et de Sante (EDSB-IV) RapportPréliminaire. Institut National de la Statistique et de l’Analyse Économique, Ministère duDéveloppement, de l’Analyse Économique et de la Prospective.
Jaramillo A. and A. Mingat. 2011. Les Programmes de la Petite Enfance sont-ils Financièrement Viablesen Afrique ? In L’Avenir de l’Afrique, le Défis de l’Afrique. Savoir et Développement de la PetiteEnfance en Afrique Sub-Saharienne. World Bank. Washington, DC.
Jaramillo A. and K. Tietjen. 2002. Le développement de la petite enfance en Afrique: Meilleurespréstations à moindre coût. Impact et implications des centres préscolaires au Cap-vert et en Guinée.World Bank, Washington, DC.
Jarousse J.P. and B. Suchaut. 2001. Evaluation de l’enseignement fondamental en Mauritanie. IREDU(Institut de Recherche sur l’Education), Dijon.
Jarousse J.P., J.M. Bernard, K. Améléwonou, D. Coury, C. Demagny, B. Foko, G. Husson, J.Mouzon,B. Ledoux, F.Ndem and N.Reuge. 2009. La scolarisation primaire universelle en Afrique : le défienseignant. Pôle de Dakar. UNESCO Africa Regional Bureau. Dakar.
Johanson R. and J. Okema. 2011. BTVET Delivery. Technical Annex 5 of BTVET Sub-sector Analysis.Ugandan Ministry of Education and Sports, Kampala.
Jonhston J. and Di Nardo J.1997. Méthodes économétriques. 4ème édition. Economica. Translated fromEnglish by Bernard Guerrien.
Kagan S.L., E. Moore and S. Bredekamp (eds.). 1995. Reconsidering Children’s Early Development andLearning: Toward Common Views and Vocabulary. Report of the panel on national educationobjectives. Government Printing Office, Washington, DC.http://ceep.crc.uiuc.edu/eecearchive/digests/ed-cite/ed391576.html
Kagan S.L. and P. Britto. 2005. Report on Going Global. UNICEF, New York.
Levin H.M. and H.L. Schwartz. 2012. Comparing costs of Early Childhood Care and EducationPrograms: An International Perspective. Review of Public Economics, 201-(2/2012):39-65.
Levin H.M. and P. McEwan. 2001. Cost-effectiveness Analysis: Methods and Applications. SagePublications, Thousand Oaks, CA.
Lokshin M., Glinskaya EE., Garcia M., 2000, The effect of early childhood development programs onwomen's labor force participation and older children's schooling in Kenya. Policy Research Repost onGender and development. Working Paper Series, n° 10, World Bank Washington, DC.
Majgaard K. and A. Mingat. 2012. Education in Sub-Saharan Africa, A comparative analysis. WorldBank, Washington, DC.
BIBLIOG
RAPH
Y

310 EDUCATION SECTOR ANALYSIS METHODOLOGICAL GUIDELINES - Volume 2
Martinez S., P.A. Stansbery, S. Naudeau, V. Pereira, M. Kelly and J. Fonseca. 2012. The Promise ofPreschool in Africa: A Randomized Impact Evaluation of Early Childhood. Save the Children and WorldBank, Washington, DC.
Mashburn A.J., R.C. Pianta, B.K. Hamre, J.T. Downer, O.A. Barbarin, D.Bryant, M. Burchinal, D.M.Early and C. Howes. 2008. Measures of Classroom quality in Prekindergarten and Children’sDevelopment of Academic, Language, and Social Skills. Child Development, 79(3): 732-749.
Merle P. 1996. L’évaluation des élèves. Enquête sur le jugement professoral. Presses Universitaires deFrance, Paris.
Mingat A. and Suchaut B. 2000. Les systèmes éducatifs africains, une analyse économiquecomparative. De Boeck Université
Mingat A., Rakotomalala R. and Tan J.P. 2001. Rapport d'état d'un système éducatif national, Guideméthodologique pour sa préparation. World Bank, Washington, DC.
Mingat A. 2004. La rémunération/le statut des enseignants dans la perspective de l’atteinte desobjectifs du millénaire dans les pays d’Afrique subsaharienne francophone en 2015. World Bank,Washington, DC.
Mingat A., B. Ledoux and R. Rakotomalala. 2010. Developing Post-Primary Education in Sub-SaharanAfrica: Assessing the Financial Sustainability of Alternative Pathways”. World Bank, Washington, DC.
Mingat A. and A. Seurat. 2011. Pratiques parentales vis-à-vis des enfants de 0 à 6 ans en Mauritanie.UNICEF Mauritania, Nouakchott.
Ministère de l’Éducation, de l’Alphabétisation et des Langues Nationales (Mali), USAID/PHARE. 2010.Temps réel d’apprentissage. USAID, Washington, DC.
Myers R.G. 2006. Costing Early Childhood Care and Development Programmes. Online Outreach Paper5. Bernard van Leer Foundation, The Hague.
Mwaura P. and B.T. Mohamed. 2008. Madrasa Early Childhood Development Program: Making aDifference, in L’Avenir de l’Afrique, le Défis de l’Afrique. Savoir et Développement de la Petite Enfanceen Afrique Sub-Saharienne. World Bank. Washington, DC.
National Centre for Non-Formal and Distance Education (Mongolia). 2009. Non-formal educationsector analysis. UNESCO, Paris, France.
Naudeau S., N. Kataoka, A. Valerio, M.J. Neuman and K.L. Elder. 2011. Investing in Young Children:An Early Childhood Development Guide for Policy Dialogue and Project Preparation. World Bank,Washington, DC.
Nauze-Fichet E. and M. Tomasini. 2002. Diplôme et insertion sur le marché du travail : approachessocioprofessionnelle et salariale du déclassement. Economie et Statistique N° 354, pp 21-48.
Ndem F. and M. Brossard. 2005. Optimiser l’organisation scolaire au niveau local. Working paper. Pôlede Dakar, UNESCO, Africa Regional Bureau, Dakar.

Sub-Sector Specific Analyses 311
OMS. 2009. Diarrhea - Aide-mémoire n°330, August 2009.http://www.who.int/mediacentre/factsheets/fs330/fr/index.html
OMS. 2011. Pneumonia - Aide-mémoire n°331, October 2011.http://www.who.int/mediacentre/factsheets
Organisation Internationale de la Francophonie. 2009. L’alphabétisation et l’éducation non formelleen Afrique. OIF, Paris.
Pôle de Dakar UNESCO-BREDA (United Nations Educational, Scientific and Cultural Organisation,Regional Office for Education in Africa). 2005. Education pour Tous en Afrique : Repères pour l’action.Rapport Dakar+5. Pôle de Dakar UNESCO/BREDA, Dakar.
Pôle de Dakar UNESCO-BREDA. 2006. Education pour Tous en Afrique : Rapport Dakar +6. 2006.Pôle de Dakar UNESCO-BREDA, Dakar.
Pôle de Dakar UNESCO-BREDA. 2007. Education pour Tous en Afrique : L’urgence de politiquessectorielles intégrées. Rapport Dakar+7. Pôle de Dakar UNESCO-BREDA, Dakar.
Pourtois J.P. 1984. Éduquer les parents – Comment stimuler la compétence en éducation. Labor,Bruxelles.
Reinikka R. and J. Svensson. 2003. The power of information: Evidence from a Newspaper campaignto reduce capture. Policy Research Working Paper 3239, World Bank, Washington, DC.
Republic of South Africa, Ministry of Education. 2001. Education White Paper 5 On Early ChildhoodEducation. Meeting the Challenge of Early Childhood Development in South Africa. Pretoria,http://www.info.gov.za/view/DownloadFileAction?id=68783.
Reuge N. 2004a. Mesurer l’avancée vers la scolarisation primaire universelle. Working paper. Pôle deDakar, UNESCO, Africa Regional Bureau, Dakar.
Reuge N. 2004b. Les profils de scolarisation. Working paper. Pôle de Dakar, UNESCO, Africa RegionalBureau, Dakar.
Rosenthal R., L. Jacobson. 1973. Pygmalion à l’école : l’attente du maître et le développementintellectuel des élèves. Casterman.
Statistics Sierra Leone and UNICEF-Sierra Leone. 2011. Sierra Leone Multiple Indicator Cluster Survey2010, Final Report. Statistics Sierra Leone and UNICEF-Sierra Leone, Freetown.
Tazeen F. 2010. A Brief Review of the World Bank Engagement in Technical and Vocational Educationand Skills Development. Presentation, World Bank, Washington, DC.
UIS Data Centre (database). UIS, Montreal. http://stats.uis.unesco.org.
UIS. 2006. Participation in Formal Technical and Vocational Education and Training ProgrammesWorldwide. An Initial Statistical Study. UIS, Montreal.
BIBLIOG
RAPH
Y

312 EDUCATION SECTOR ANALYSIS METHODOLOGICAL GUIDELINES - Volume 2
UNESCO. 2001. L’éducation non formelle au Sénégal : description, évaluation et perspectives.UNESCO, Paris.
UNESCO. 2006. Bite Off Only as Much as You Can Chew: Gambia’s Policy for Early Childhood inUNESCO Policy Brief on Early Childhood. UNESCO, Paris.
UNESCO. 2007. EFA Global Monitoring Report 2007. Strong foundations. Early childhood care andeducation. UNESCO, Paris.
UNESCO-BREDA. 2009. Regional Contribution to Statistical Information Systems Development forTechnical and Vocational Education and Training. Diagnosis and Comparative Analysis for IdentifyingQuality Improvement Strategies. UNESCO/BREDA, Dakar.
UNICEF. 2009. Global Study on Child Poverty and Disparities in Uzbekistan. UNICEF Uzbekistan.
UNICEF. 2011. Développement des enfants de 0 à 6 ans et pratiques parentales à Madagascar. UNICEF,New York.http://www.hayzara.org/index.php?option=com_content&view=article&id=440%3Adeveloppement-des-enfants-a-pratiques-parentales-a-madagascar-0-a-6-ans-unicef-2011&catid=16%3Areports&Itemid=47&lang=en.
UNICEF. 2012a. The State of the World's Children 2012; Children in an Urban World. UNICEF, NewYork.
UNICEF. 2012b. Evolution of ECD indicators in UNICEF. What the Data Say. Evidence from the MultipleIndicator Cluster Surveys. Presentation, HECDI Meeting. UNICEF, New York.
UNICEF. 2012c, Conflict Analysis – Preparation for Country Offices - UNICEF Peacebuilding, Educationand Advocacy in Conflict-Affected Contexts Programme.
UNICEF WCARO, UNESCO IIPE 2011. Intégrer la réduction des risques de conflits et de catastrophesdans la planification du secteur de l’éducation. UNESCO, Paris.
UNICEF WCARO. 2012. Designing Pro-equities Strategies – Education Bottleneck Analysis and Costingfor WCAR countries, Draft Guidance notes. UNICEF WCARO, Dakar.
Van Ravens J. and C. Aggio. 2008. Expanding early childhood care and education: How much doesit cost? A proposal for a methodology to estimate the costs of early childhood care and education atmacro-level, applied to the Arab States. Working Paper No. 46. Bernard van Leer Foundation, TheHague.
Vegas E. and L. Santibáñez. 2010. The Promise of Early Childhood Development in Latin America andthe Caribbean. World Bank, Washington, DC.
Wooldridge J.M. 2009. Introductory Econometrics: A Modern Approach. South-Western College Pub.4th edition.
World Bank. 2001c. Adult Literacy Programs in Uganda. World Bank, Washington, DC.

Sub-Sector Specific Analyses 313
World Bank. 2006c. World Development Report 2006: Equity and Development. World Bank,Washington, DC.
World Bank. 2010g. Stepping up Skills. For more Jobs and Productivity. World Bank, Washington, DC.
World Bank. 2011e. SABER-ECD. Objectives, Conceptual Framework ad Methodological Approach.World Bank, Human development Network, Washington, DC.
World Bank. 2012b. SABER-ECD. Country report: Republic of Liberia. World Bank, Washington, DC.
World Bank. 2012c. SABER-ECD. Country report: Republic of Tanzania. World Bank, Washington, DC.
World Bank. 2012d. Rapport sur la gouvernance des universités en Algérie. World Bank, Washington,DC.
BIBLIOG
RAPH
Y


VOLUME 2
EDUCATION SECTOR ANALYSISMETHODOLOGICAL GUIDELINES
The purpose of these guidelines is to provide methods for comprehensive education sector analyses to support the preparation and monitoring of education sector plans.
They are an update of a 1999 document that has been used to support the preparation of approximately 70 Education Country Status Reports (CSR) in more than 40 countries.
The goal of the guidelines is to strengthen national capacities in order that Government teams can conduct education sector analyses with progressively less external support.
They were prepared by education economists and specialists from UNESCO‘s International Institute for Educational Planning-Pôle de Dakar, UNESCO’s Dakar Office, the World Bank, UNICEF and the Global Partnership for Education secretariat.
The guidelines are divided into two volumes. The present volume covers methodologies for analysing four education sub-sectors: early childhood development; higher education; literacy and non-formal education, and technical and vocational education and training. Volume 1 features methodologies for analysing six sector-wide thematic areas: context; access; costs and financing; quality, system capacity and management; external efficiency; and equity with an emphasis on the formal primary and secondary education sub-sectors.
The two volumes of the guidelines are available electronically, in English, French, Portuguese, Russian and Spanish atwww.globalpartnership.org, www.unicef.org/educationand www.iipe-poledakar.org
ContactsRaphaelle Martinez, Senior education specialist, Global Partnership for Education: [email protected] Husson, Head, UNESCO-IIEP Pôle de Dakar: [email protected] Ledoux, Program specialist, cost and financing, IIEP: [email protected] Coury, Program specialist, IIEP-UNESCO: [email protected] Francis Ndem, Education economist, UNICEF: [email protected] Brossard, Senior Advisor, Education, UNICEF: [email protected]