ecosystem functioning: the basis for restoration and management of a tropical coastal lagoon,...
TRANSCRIPT

Ea
ARJa
Mb
c
d
e
S
a
ARRAA
KEWCS
1
iwesniiamCK
0h
Ecological Engineering 65 (2014) 88–100
Contents lists available at ScienceDirect
Ecological Engineering
journa l h om epa ge: www.elsev ier .com/ locate /eco leng
cosystem functioning: The basis for restoration and management of tropical coastal lagoon, Pacific coast of Mexico
lejandro Yánez-Arancibiaa,∗, John W. Dayb,d, Patricia Sánchez-Gil c, Jason N. Dayd,obert R. Laneb,d, David Zárate-Lomelí c, Héctor Alafita Vásquezc, José L. Rojas-Galavizc,
osé Ramírez-Gordilloe
Unidad Ecosistemas Costeros, Red Ambiente y Sustentabilidad, Instituto de Ecología A. C., Km 2.5 Carretera Antigua a Coatepec 351 Xalapa, Ver 91070,éxicoDepartment of Oceanography and Coastal Sciences, School of the Coast & Environment, Louisiana State University, Baton Rouge, LA 70803, USAGPPA Consultores, Diomeda, 401 & 409. Zona Hotelera, M27, Lt 1-02, Condominal 54, Cancún, QRoo 77500, MéxicoComite Resources Inc. 11643 Port Hudson Pride Road. Zachary, LA 70790, USAInstituto de Protección Civil para Manejo Integral de Riesgos y Desastres del Estado de Chiapas.Km 1.9 Carretera Emiliano Zapata, Aeropuerto Franciscoarabia. Tuxtla Gutiérrez, Chis 29050, México
r t i c l e i n f o
rticle history:eceived 1 December 2012eceived in revised form 29 March 2013ccepted 29 March 2013vailable online 18 May 2013
eywords:cologic characterization
a b s t r a c t
Tropical coastal lagoons (TCL) are among the most productive coastal ecosystems, and they provide awide range of ecosystem goods and services that support productive economic activities. The objective ofthis paper is to present a comprehensive review of the ecosystem dynamics in Paraman Lagoon, a wave-dominated, meso-tidal coastal lagoon with an ephemeral inlet on the Pacific coast of Mexico. A conceptualmodel is used to describe the seasonal environmental cycle for the lagoon, which is characterized by threeperiods: Period 1 - disconnected from the sea, evaporation is much higher than freshwater input andsalinity can exceed 75 psu; Period 2 - disconnected from the sea, freshwater input is much higher than
ater budgetonceptual modelustainable restoration
evaporation and salinity drops to as low as 5 psu; and Period 3 - the inlet is open connecting the lagoonwith the ocean resulting in optimal estuarine conditions and moderate salinities between 15 to 25 psu.Hydrology and salinity regime in the lagoon are largely controlled by the amount of freshwater dischargethat changes the spatial and temporal distribution of environmental parameters. This information is usedto develop a conceptual model of the functioning of the lagoon that can be used to aid in decision-makingabout the restoration and management of the lagoon
Ktc1ssdstim
. Introduction
Seasonal closure of tidal inlets to coastal lagoons usually occursn micro to meso-tidal, wave-dominated coastal environments
here there is strong seasonal variability in environmental param-ters such as rainfall, river flow, groundwater input, and the nearhore wave regime. These ephemeral inlets close annually for aumber of months due to the formation of sandbars across the
nlet entrance and the lack of sufficient lagoon discharge to keep thenlet open (Yánez-Arancibia, 1978, 1987; Kjerfve, 1994; Ranasinghend Pattiaratchi, 2003). Lagoons with ephemeral inlets are com-
on worldwide including the Pacific coast of Mexico and southernalifornia (Lankford, 1977; Yánez-Arancibia, 1978; Liu et al., 1993;jerfve, 1986, 1994; Kjerfve and Magill, 1989; Schwartz, 2005;
∗ Corresponding author.E-mail address: [email protected] (A. Yánez-Arancibia).
or1
aaF
925-8574/$ – see front matter © 2013 Elsevier B.V. All rights reserved.ttp://dx.doi.org/10.1016/j.ecoleng.2013.03.007
© 2013 Elsevier B.V. All rights reserved.
ennish and Paerl, 2010). But there is relatively little known abouthe ecological responses of these coastal lagoon systems to extremeonditions (Yánez-Arancibia, 1978, 1987; Flores-Verdugo et al.,987, 1988). During the wet season, increased water levels fromeasonal runoff allow waves and swash processes to erode into theandbar from the ocean side and from the interior of the lagoonue to hydrostatic-head pressure causing filtration through theandbar, softening it (Liu et al., 1993). Thus, tropical and sub-ropical lagoon-estuarine systems display great seasonal variationn salinity regimes as a function of geomorphological processes that
aintain inlets, and there is a need to better understand elementsf environmental physiology, patterns of ecogeomorphology, andesponses to stress conditions in these types of ecosystems (Kjerfve,986, 1994; Day et al., 2008, 2013; Kennish and Paerl, 2010).
Coastal lagoons with ephemeral inlets such as Paraman Lagoonlso play a vital role in artisanal fisheries, production of salt, tourismnd other socioeconomic activities (Yánez-Arancibia et al., 2007;anning et al., 2011). The closure of a tidal inlet, either naturally or

A. Yánez-Arancibia et al. / Ecological Engineering 65 (2014) 88–100 89
F maged ted sol
atFibwcCD
1g
tmd
1
hiwi2ciparto1Ret1a
c2
1
wAsptwaJfMa
dedttosstm
toioptm
ig. 1. Map of the study area. Satellite image of the Pacific coast of Mexico. Lidar ietails in Fig. 2 and Box 2. Chalacatepec Lagoon and the San Nicolas River are loca
agoon.
rtificially, can result in significant negative economic impacts inhe region, as on the Pacific coast of Mexico (Yánez-Arancibia, 1978;lores-Verdugo et al., 1987, 1988). Although community interestn finding ways to keep these inlets permanently open has alwayseen high, sustainable engineering solutions to keep inlets openill require more insight into the morphological/hydrologic pro-
esses governing seasonal opening and closure of the inlets (e.g.,opper, 1990; Ranasinghe and Pattiaratchi, 2003; Schwartz, 2005;ay et al., 2009a; Yánez-Arancibia et al., 2009a).
.1. Background for restoration and ecosystem management:eomorphology and functional structure
Two main aspects must be considered to understand the func-ional structure in coastal lagoons with ephemeral inlets, e.g.,
orphology as related to species structure, and coupling amongifferent areas.
.1.1. Morphology and ecological affinitiesCoastal lagoons are dynamic and complex ecosystems that are
ighly productive. The explanation for this high productivity restsn the balance among morphodynamics, physical features, fresh-
ater input, and the adaptations of the biological communitiesn these lagoons (Day et al., 2008, 2013; Yánez-Arancibia et al.,011, 2013, and Rivera-Monroy et al., 2011). We develop thisase study for Paraman Lagoon (Figs. 1 and 2) by characteriz-ng typical seasonal changes in morphological and hydrodynamicrocesses (e.g., Kjerfve, 1994; Souza et al., 2003). Many tropicalnd subtropical lagoons have seasonally open inlets that lead toapid salinity shifts, wave influences, and tidal variability. In turn,hese factors influence and regulate levels of primary and sec-ndary production, trophic status, and biogeochemistry (e.g., Mee,979; Mandelli, 1981; Flores-Verdugo et al., 1987, 1988, 1990;ojas-Galavíz et al., 1992; Knoppers, 1994, and Rivera-Monroy
t al., 2011) and the seasonal succession of primary producershat regulate secondary production (Yánez-Arancibia et al., 1982,985, 1991, 1993, 1998). Over the last twenty five years, consider-ble information has become available on the ecology of tropicalD2tt
of Paraman Lagoon located in Jalisco state, and Lidar image of Paraman inlet. Seeuthwest of Paraman Lagoon. Inlet is clearly located in the North West end of the
oastal lagoons (Madden et al., 1988; Kjerfve, 1994; Schwartz,005; Kennish and Paerl, 2010; Rivera-Monroy et al., 2011).
.1.2. Form and functionSeveral terms of reference can be used to describe lagoons
ith ephemeral inlets on the Pacific coast of Mexico (Yánez-rancibia, 1978, 1981, 1987). The annual salinity cycle in theseystems is a function of lagoon depth, seasonal evaporation andrecipitation, and runoff volumes. The rainy season lasts from Junehrough October with maximum rainfall occurring in Septemberith occasional tropical storms and hurricanes, high temperatures
nd evaporation rates; the cold season lasts from November throughanuary with minor rainfall events associated with the passage ofrontal systems; and the dry season occurs from February through
ay with the lowest rainfall and highest evaporation and temper-tures (Fig. 3).
The inlets of these lagoons close at the end of the rainy seasonue to low net outflow of freshwater without sufficient force torode sediments that have accumulated in the sandbar. During thery season salinity may rise to 140 psu in the shallowest parts ofhe lagoon (e.g., Mee, 1979; Mandelli, 1981). Salinity drops withhe onset of the rainy season and there is extensive accumulationf freshwater in the lagoon basin. When the inlet is first opened, ahort period of high volume discharge of water and dissolved anduspended materials to the sea occurs, followed by periods whenidal exchange results in a wide range of salinities controlled by
ixing processes.More than four decades of research in lagoon-estuarine sys-
ems have clarified the relationship between geomorphology andther factors such as climate, size of drainage basin, and tide rangen the exchange of materials between the lagoon and the sea. Inrder to determine whether import or export predominates in aarticular system, one must take measurements over long periodso compensate for the irregular and infrequent effects of climatic-
eteorological forcing (i.e., Nixon, 1979; Yánez-Arancibia, 1987;
ay et al., 2013; Kennish and Paerl, 2010; Rivera-Monroy et al.,011). We suggest that the geomorphology of tropical lagoon sys-ems, tidal amplitude and the magnitude of freshwater input arehe three key factors that determine whether there will be import
90 A. Yánez-Arancibia et al. / Ecological Engineering 65 (2014) 88–100
Fig. 2. Paraman Lagoon base-map. Digital ortho photograph scale 1:75,000 (INEGI 1995), Universal Transversal Mercator Projection (UTM) Zone 13 North. Datum ITRF 92Ellipse WGRS 80. Coordinate North-west corner: East 464999, North 2183899, Coordinate South-east corner: East 476749, North 21699949. Pixel size 2. Sediment distributionm e siltl
oeia1
ilet
FscOtse
vMmF
ap: Zone 1 medium to thick mixed sands; Zone 2 black anaerobic mud; Zone 3 fin
r export over time. When an inlet first opens, there is a large netxport of water and materials to the sea. The amount of this exports affected by the relative productivity of the lagoon compared todjacent shelf waters and hydrodynamics (Flores-Verdugo et al.,990; Yánez-Arancibia and Day, 2006; Rivera-Monroy et al., 2011).
We present a comprehensive review of the ecosystem dynam-
cs that result from seasonal opening and closing of a coastalagoon inlet in a wave-dominated, meso-tidal coastal lagoon. Sci-ntific information derived from this characterization can be usedo inform decision-making for sustainable management of theseig. 3. Average historical data set for 30 years (1976 to 2006) used to establish theeasonal climatic pattern of Paraman Lagoon region (Yánez-Arancibia et al. 2009ited in text, based on IMTA, 2000, and CONAGUA, 2007). Rainy Season from June toctober with a maximum during September, tropical storms and hurricanes; high
emperature and evaporation. Cold Season from November to January with somehowers associated with fronts. Dry Season from February to May with the highestvaporation and temperatures.
2
2
1caagAawltiNPlcwtPfwr
y clay sediments. More information in text and Table 1.
aluable coastal ecosystems. The lagoons on the Pacific coast ofexico are good examples of where more comprehensive infor-ation can lead to better management (Yánez-Arancibia, 1978;
lores-Verdugo et al., 1987, 1988.)
. Methods
.1. Study area
Paraman Lagoon is located at 19◦43′21′′ north latitude and05◦16′7′′ west longitude (Fig. 1). It is a restricted meso-tidaloastal ecosystem with moderate wave energy, which originated as
depression on the inner shelf between two coastal promontoriesnd separated from the sea by a sand barrier. The shallow basin isenerally elongate in shape and oriented parallel to the coast. Usingrc-Sign 9.2 we calculated total lagoon water surface area, sand barrea, and the total area of the lagoon basin. We also calculated theater budget for the lagoon (Section 4, and Boxes 1 and 2). The
agoon has three main ecological zones characterized by sedimentypes, hydrology, and geomorphology (Fig. 2). Chalacatepec Lagoons adjacent to Paraman lagoon and receives inflow from the Rio Sanicolas (Fig. 1). Chalacatepec Lagoon is not currently connected toaraman Lagoon, but these two systems were part of a contiguousarger water body in the past. When the Paraman Lagoon inlet islosed and river discharge of the Rio San Nicolas is low, there is noater flow between the two lagoons. However, at the beginning of
he wet season when river discharge is high, river water can reach
araman Lagoon. Physical, chemical, and environmental conditionsor the three ecological zones (and three ecological periods), alongith a seasonal water budget are summarized in Tables 1 and 2,espectively.

A. Yánez-Arancibia et al. / Ecological Engineering 65 (2014) 88–100 91
Box 1: Equations for calculation and analysis of water budget, Paraman lagoon Mexico
1. V water surface area = [Sp × Pf]Where V = estimated water volume, Sp = area of water s, Pf = depth of water column2. Vh of water into wetland area = [Sh × Pf]Where Vh = estimated water volume in wetland area, Sh = wetland area.
In the case of water volume in wetland area, Sp change by Sh. The water volume in the wetland area was estimated based on:Sh=0.15 Km2, Pf = 0.20 m of water depth, (August, Period 2).
Volume [Vh] of water in wetland area August 2008: Vh = [Sh × Pf ]
Vh =[(150 × 103m2)(0.20 m)
]= 30 × 103 m3
3. Vt = V of water surface area + Vh of water in wetland area = [Sp × Pf ] + [Sh × Pf ]Where Vt = estimated total water volume (includingwetland area, only for August, Period 2).
Volume Total [Vt] of water August 2008: Vt = [V Zone 1 + V Zone 2 + V Zone 3 + Vh]
Vt = [(6718 × 103 m3) + (1827 × 103 m3) + (1107 × 103 m3) + (30 × 103 m3)] = 9682 × 103 m3
Volume Total [Vt] of water October 2008: Vt = [V Zone 1 + V Zone 2 + V Zone 3]
Vt =[(5695 × 103 m3) + (1449 × 103 m3) + (738 × 103 m3)
]= 7882 × 103 m3
Volume Total [Vt] of water November 2008: Vt = [V Zone 1 + V Zone 2 + V Zone 3]
Vt = [(5183 × 103 m3) + (1260 × 103 m3) + (554 × 103 m3)] = 6997 × 103 m3
Volume Total [Vt] of water December 2008: Vt = [V Zone 1 + V Zone 2 + V Zone 3]
Vt =[(5013 × 103 m3) + (1197 × 103 m3) + (492 × 103 m3)
]= 6702 × 103 m3
Volume Total [Vt] of water January 2009: Vt = [V Zone 1 + V Zone 2 + V Zone 3]
Vt =[(3836 × 103 m3) +
(1184.5 × 103 m3
)+
(395.6 × 10³ m3
)]= 5416 × 103 m3
Volume Total [Vt] of water March 2009: Vt = [V Zone 1 + V Zone 2]
Vt = [(1690 × 103 m3) + (313.5 × 10³ m3)] = 2005 × 103 m3
Volume Total [Vt] of water May-June 2009: Vt = [V Zone 1 + V Zone 2]
Vt = [(288 × 103 m3) + (91.8 × 10³ m3)] = 379.8 × 10³ m3
Water and salt balance (Wb) is modulated by: river discharge (R), ground water (S), precipitation (P), high tides (T1). Water loss isbecause of: evaporation (E) and exportation during low tides (T2). For equilibrium conditions, the amount of water from parametersintroducing water into the system must be equal with the amount of water going outside the system.
The equation is as follows:4. R + S + P + T1 + F2 = E + T2 + F1
Where F1 = filtration of water throughout the sandbar from the lagoon to the sea (from less to high salt concentration) and F2 isthe filtration from the sea to the lagoon.
Considering that Paraman Lagoon does not receive freshwater discharge from Rio San Nicolas (R), and does not have significantground waters (S) (Ing. Miguel Villasuso, fide RASALAND and GPPA personal communication), the following parameters wereeliminated:
River discharge (R)Ground water (S)High tide (T1) and low tide (T2) during Period-1 and Period-2.Filtration from the sea to the lagoon (F2) during Period-2Then the simplified equation is as follows:
5. Wb = [P] − [E + F1]Annual average evaporation (E) and annual average precipitation (P) for the three ecological periods can be seen in Tables 1 and 2.Balance of water and salt [Wb] August 2008: Wb = [P] − [E + F1]
Wb = [148.3] − [151.2 + 1.6] = −4.5 m3/s
Balance of water and salt [Wb] October 2008: Wb = [P] − [E + F1]
Wb = [68.6] − [135 + 1.5] = −67.9 m3/s

92 A. Yánez-Arancibia et al. / Ecological Engineering 65 (2014) 88–100
Balance of water and salt [Wb] November 2008: Wb = [P] − [E + F1]
Wb = [25.7] − [112.2 + 0.75] = −87.3 m3/s
Balance of water and salt [Wb] December 2008: Wb = [P] − [E + F1]
Wb = [10.5] − [99.8 + 0.25] = −89.6 m3/s
Balance of water and salt [Wb] January 2009: Wb = [P] − [E + F1]
Wb = [35.2] − [101.7 + 0.5] = −67 m3/s
Balance of water and salt [Wb] March 2009: Wb = [P] − [E]
Wb = [1.5] − [147.4] = −145.9 m3/s
Balance of water and salt [Wb] May-June 2009: Wb = [P] − [E]
Wb = [5.9] − [174.9] = −169 m3/s
Box 2: Sandbar (ephemeral inlet) in Paraman Lagoon system, Mexico
(1). The closed sandbar (inlet) in Paraman Lagoon. The shaded area shows the surface considered in this study to estimate waterfiltration volume from the lagoon to the adjacent ocean. The shaded area is 66,331 m2 (length of 589 m and width of 133 m).The water volume (m3) inside the sandbar is indicated in Tables 1 and 2. The saturation of water in the sandbar was 35% duringPeriod-2, considering the average depth of Zone 1. The salinity gradient in the sandbar changes in each ecological Period (1, 2, and3). For instance, during Period-2, salinity in the lagoon ranged from 5 psu, to 20 psu, compared to the sea at 35 psu. Arrows indicatethe direction of filtration during ecological Period-2 when lagoon salinity averaged 13 psu and the sea was 35 psu). Seasonality offiltration is shown in Tables 1 and 2.
(2). Seasonality (2008 to 2009) of water level difference between Period-2 and Period-1. In August the water level in the lagoon wasry-M
2
iMgcri
svg
m
1.5 m above sea level and filtration is very high. From Februalevel.
.2. Sampling stations and analytical methods
Surveys of the lagoon were conducted between 0800 and 1200n August, November and December 2008; and January, March and
ay/June 2009. Five sampling stations were selected (Fig. 2) to
ive good spatial coverage, as well as representing the variety ofonditions at any one time within the Lagoon (Fig. 2). Criteria rep-esentative of the ecological characteristics of the area were usedn selection of sampling stations and included water depth, waterU2am
ar to May-June, sea level was over 1 m above the lagoon water
urface area of the system during different seasons, seasonal windariability, whether the inlet was open or closed, and observedradients in salinity, temperature, and sediment type.
In situ measurements for physical-chemical parameters wereeasured using either a Sonde model YSI-556 or a Sonde Myron
ltrameter II, Model 6. Sediment samples were obtained with a0 by 25 cm vanVeen dredge. Water samples were obtained withvanDorn bottle and after filtration of 250 mL through What-an GF/F filters, they were analyzed for dissolved and particulate
A. Yánez-Arancibia et al. / Ecological Engineering 65 (2014) 88–100 93
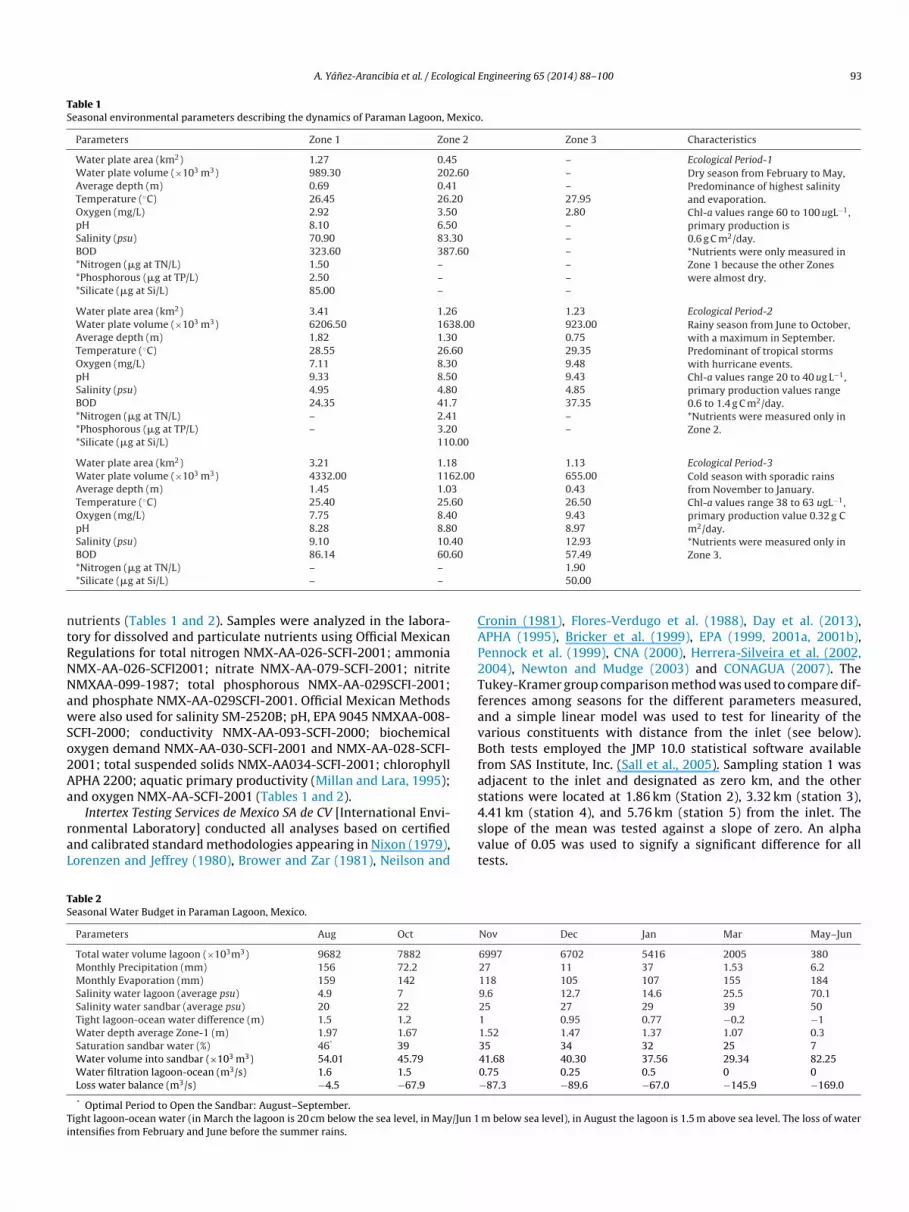
Table 1Seasonal environmental parameters describing the dynamics of Paraman Lagoon, Mexico.
Parameters Zone 1 Zone 2 Zone 3 Characteristics
Water plate area (km2) 1.27 0.45 – Ecological Period-1Water plate volume (×103 m3) 989.30 202.60 – Dry season from February to May,
Predominance of highest salinityand evaporation.Chl-a values range 60 to 100 ugL−1,primary production is0.6 g C m2/day.*Nutrients were only measured inZone 1 because the other Zoneswere almost dry.
Average depth (m) 0.69 0.41 –Temperature (◦C) 26.45 26.20 27.95Oxygen (mg/L) 2.92 3.50 2.80pH 8.10 6.50 –Salinity (psu) 70.90 83.30 –BOD 323.60 387.60 –*Nitrogen (�g at TN/L) 1.50 – –*Phosphorous (�g at TP/L) 2.50 – –*Silicate (�g at Si/L) 85.00 – –
Water plate area (km2) 3.41 1.26 1.23 Ecological Period-2Water plate volume (×103 m3) 6206.50 1638.00 923.00 Rainy season from June to October,
with a maximum in September.Predominant of tropical stormswith hurricane events.Chl-a values range 20 to 40 ug L−1,primary production values range0.6 to 1.4 g C m2/day.*Nutrients were measured only inZone 2.
Average depth (m) 1.82 1.30 0.75Temperature (◦C) 28.55 26.60 29.35Oxygen (mg/L) 7.11 8.30 9.48pH 9.33 8.50 9.43Salinity (psu) 4.95 4.80 4.85BOD 24.35 41.7 37.35*Nitrogen (�g at TN/L) – 2.41 –*Phosphorous (�g at TP/L) – 3.20 –*Silicate (�g at Si/L) 110.00
Water plate area (km2) 3.21 1.18 1.13 Ecological Period-3Water plate volume (×103 m3) 4332.00 1162.00 655.00 Cold season with sporadic rains
from November to January.Chl-a values range 38 to 63 ugL−1,primary production value 0.32 g Cm2/day.*Nutrients were measured only in
Average depth (m) 1.45 1.03 0.43Temperature (◦C) 25.40 25.60 26.50Oxygen (mg/L) 7.75 8.40 9.43pH 8.28 8.80 8.97Salinity (psu) 9.10 10.40 12.93
60
ntRNNawSo2Aa
raL
CAP2TfavBfas
TS
Ti
BOD 86.14 60.*Nitrogen (�g at TN/L) – –
*Silicate (�g at Si/L) – –
utrients (Tables 1 and 2). Samples were analyzed in the labora-ory for dissolved and particulate nutrients using Official Mexicanegulations for total nitrogen NMX-AA-026-SCFI-2001; ammoniaMX-AA-026-SCFI2001; nitrate NMX-AA-079-SCFI-2001; nitriteMXAA-099-1987; total phosphorous NMX-AA-029SCFI-2001;nd phosphate NMX-AA-029SCFI-2001. Official Mexican Methodsere also used for salinity SM-2520B; pH, EPA 9045 NMXAA-008-
CFI-2000; conductivity NMX-AA-093-SCFI-2000; biochemicalxygen demand NMX-AA-030-SCFI-2001 and NMX-AA-028-SCFI-001; total suspended solids NMX-AA034-SCFI-2001; chlorophyllPHA 2200; aquatic primary productivity (Millan and Lara, 1995);nd oxygen NMX-AA-SCFI-2001 (Tables 1 and 2).
Intertex Testing Services de Mexico SA de CV [International Envi-onmental Laboratory] conducted all analyses based on certifiednd calibrated standard methodologies appearing in Nixon (1979),orenzen and Jeffrey (1980), Brower and Zar (1981), Neilson and
4svt
able 2easonal Water Budget in Paraman Lagoon, Mexico.
Parameters Aug Oct
Total water volume lagoon (×103m3) 9682 7882
Monthly Precipitation (mm) 156 72.2
Monthly Evaporation (mm) 159 142
Salinity water lagoon (average psu) 4.9 7
Salinity water sandbar (average psu) 20 22
Tight lagoon-ocean water difference (m) 1.5 1.2
Water depth average Zone-1 (m) 1.97 1.67
Saturation sandbar water (%) 46* 39
Water volume into sandbar (×103 m3) 54.01 45.79
Water filtration lagoon-ocean (m3/s) 1.6 1.5
Loss water balance (m3/s) −4.5 −67.9
* Optimal Period to Open the Sandbar: August–September.ight lagoon-ocean water (in March the lagoon is 20 cm below the sea level, in May/Jun 1ntensifies from February and June before the summer rains.
Zone 3.57.491.9050.00
ronin (1981), Flores-Verdugo et al. (1988), Day et al. (2013),PHA (1995), Bricker et al. (1999), EPA (1999, 2001a, 2001b),ennock et al. (1999), CNA (2000), Herrera-Silveira et al. (2002,004), Newton and Mudge (2003) and CONAGUA (2007). Theukey-Kramer group comparison method was used to compare dif-erences among seasons for the different parameters measured,nd a simple linear model was used to test for linearity of thearious constituents with distance from the inlet (see below).oth tests employed the JMP 10.0 statistical software available
rom SAS Institute, Inc. (Sall et al., 2005). Sampling station 1 wasdjacent to the inlet and designated as zero km, and the othertations were located at 1.86 km (Station 2), 3.32 km (station 3),
.41 km (station 4), and 5.76 km (station 5) from the inlet. Thelope of the mean was tested against a slope of zero. An alphaalue of 0.05 was used to signify a significant difference for allests.Nov Dec Jan Mar May–Jun
6997 6702 5416 2005 38027 11 37 1.53 6.2118 105 107 155 1849.6 12.7 14.6 25.5 70.125 27 29 39 501 0.95 0.77 −0.2 −11.52 1.47 1.37 1.07 0.335 34 32 25 741.68 40.30 37.56 29.34 82.250.75 0.25 0.5 0 0−87.3 −89.6 −67.0 −145.9 −169.0
m below sea level), in August the lagoon is 1.5 m above sea level. The loss of water

9 gical E
idYiiru2t
3
3
sptTa9e1tlwz
3
svmfymd
3
rcihai(
pbanwvl11d(w
3
ffowiTt
t2tFgtcccwTNiPf6p
9wpah
3s
aradtwttco
4 A. Yánez-Arancibia et al. / Ecolo
Parameters used in the development of a water budget are givenn Box 1. Equations applied to the three ecological periods areescribed in Kjerfve (1990), Yánez-Arancibia and Day (2006), andánez-Arancibia et al. (2009a) and included in Box 1. Results are
ntegrated into Table 1 and the data used in the calculations arencluded in Table 2. Analysis of the water budget for the sand bar-ier (inlet) is presented in Box 2. In developing the water budget, wesed the methodology described in Yánez-Arancibia et al. (1991,007), and Yánez-Arancibia and Day (2006). The surface area forhe sand barrier was estimated from the figure in Box 2.
. Results
.1. Eco-geomorphologic characterization of Paraman Lagoon
Field investigations, historical satellite imagery, bathymetry,ediment type, salinity, oxygen, aquatic primary productivity, tem-erature, and seasonal water budget data were used to characterizehe ecosystem dynamics of the Paraman Lagoon (Tables 1 and 2).he Paraman system has an area of 6.30 km2 including the lagoonnd surrounding wetlands with a water volume that ranges from,682 × 10 m3 in August, to 380 × 10 m3 in May-June (Fig. 2). Thephemeral inlet has a sandbar area of 66,300 m2 (∼510 m long,30 m wide, or about 0.06 km) with a height about 2.5 m abovehe lagoon water level during the dry season (Box 2). When theagoon inlet is closed and river discharge is low, there is minimal
ater exchange among the three ecological zones (Fig. 2). The threeones are characterized as follows:
Zone 1 (3.53 km2) is adjacent to the inlet and has medium to coarsesandy sediments with fine sand 90%, mud 5%, and clay 5%. Wet-lands in the zone are sparse and are dominated by button bushConocarpus erectus and black mangrove Avicennia germinans.Zone 2 (1.38 km2) makes up the central basin of the lagoon sys-tem. The black muddy sediments produce hydrogen sulfide andare comprised of fine sand 30%, silty mud 25%, and clay 45%. Thedominant wetland vegetation is mixed hydrophytes with a fewtrees (Avicennia germinans).Zone 3 (1.24 km2) is adjacent to the mainland and near Cha-lacatepec Lagoon and the mouth of the Rio San Nicolas. Thesediments here contain less than 10% find sand and are mainlysilty mud ∼20%, and clay ∼70%, similar to results presented byFlores Verdugo et al. (2011).
.2. Ecological and dynamic characterization
The environmental variability of Paraman Lagoon results ineasonally stressful conditions and low biodiversity. The spatialariation of physical-chemical parameters is affected by turbulentixing of lagoon waters by seasonal winds and variation in rain-
all due to seasonal climatic conditions. Historical analysis of 30ears of climatic data (IMTA, 2000) was used to define annual cli-atic patterns (Fig. 3). The three climatic seasons described earlier
efine three ecological periods (Periods –3).
.2.1. Period-1, Hyper-saline, inlet closed to the seaFrom November to May, freshwater input was dramatically
educed, and the lagoon was isolated from the sea by thelosed inlet. During this period, evaporation exceeds freshwaternflow, the volume of water decreases, (Fig. 4), and it becomes
ypersaline with values exceeding 35 psu. Salt (NaCl) precipitatesnd is commercially exploited. Phytoplankton diversity is low,s characterized by nanoplankton with relatively high biomassChl-a concentrations between 60 to 100 ug L)−1 and primaryepMe
ngineering 65 (2014) 88–100
roduction about 0.6 g C m2 d−1. The lagoon ecosystem is stressedy high sediment deposition rates, hyper-salinity, eutrophication,nd low freshwater input. The biotic communities are predomi-antly from marine origin that entered the lagoon when the inletas open, and biodiversity of benthic macro fauna and fishes is also
ery low (Yánez-Arancibia et al., 2009a). The open water area of theagoon decreases during this period and water levels drop to nearly.5 m below the level of the adjacent ocean (Box 2). During Period-, total dissolved phosphorous (TP) was 2.5 ug-at L−1, while totalissolved silicate concentration was 85.0 ug-at L−1. Total nitrogenTN) concentration was 1.5 ug-at L−1 (Table 1). The N:P ratio in theater column was 0.6 indicating potential nitrogen limitation.
.2.2. Period-2, Hypo-Saline and inlet closed to the seaFrom May to September, the lagoon generally remains isolated
rom the sea, but in contrast to the previous period, the inflow ofreshwater is higher than evaporation. Salinities were hypo-saline,ften falling to less than 10 psu. Lagoon water volume and surfaceater area were maximum during this period (Fig. 5). Water levels
n the lagoon increased as much as 1.5 m above the adjacent ocean.his resulted in lagoon water filtering through the sand barrier tohe ocean, softening it and making it more susceptible to erosion.
Levels of nutrients increased in lagoon waters but Chl-a concen-rations were lower than in the previous period, ranging between0 and 40 ug l−1 and primary production, dominated by nanoplank-on at 109 cells per liter, ranged from 0.6 to 1.4 g C m−2 d−1.reshwater inflow during Period-2 was derived from rainfall,round water, river input, and local surface runoff. There was noidal influence due to inlet closure and there was no direct dis-harge from the Rio San Nicolas into Paraman Lagoon. Nutrientoncentrations were higher than in the previous period. The con-entration of total dissolved phosphorous (TP) was 3.2 ug-at L−1
hile total dissolved silicate concentrations were 110 ug-at L−1.he concentration of total nitrogen (TN) was 2.41 ug-at L−1 with-NH4. The N:P ratio in the water column remained low at 0.7
ndicating that the Lagoon was nitrogen limited at this time. Duringeriod-2, the total quantity of phosphorous in the lagoon increasedrom 1.5 to 5.0 metric tons while dissolved silicates increased from0 to 130 metric tons. Chl-a levels were lower compared to therevious period, ranging between 20 to 40 ug l−1.
During Period 2, daytime dissolved oxygen levels reached mg l−1, but then dropped dramatically at night near the sediment-ater interface. This contrasted with December when aquaticrimary productivity was lower due to increased water turbiditynd decreased temperature and oxygen concentrations were rarelyigher than 7 mg l−1.
.2.3. Period-3, Estuarine salinity conditions and inlet open to theea
From September to November, the inlet was periodically opennd there was tidal exchange between the lagoon and the oceanesulting in exchange of water, suspended and dissolved materials,nd organisms (Fig. 6). The inlet can open and close several timesuring this period depending on water levels in the lagoon andhe strength of marine processes. An estuarine salinity gradientas typically present at this time with values ranging from less
han 13 to 35 psu. When samples were obtained after heavy rains,he gradient ranged from 9 to 13 psu (Table 1). In most tropicaloastal lagoons during this period, there is normally a net exportf materials to the sea (e.g. Yánez-Arancibia, 1987; Flores-Verdugo
t al., 1987, 1988, 1990, and Rivera-Monroy et al., 2011). From ourrevious experience with coastal lagoons on the Pacific coast ofexico, seaward export of dissolved phosphorous and silicates wasstimated to be between 2 and 120 metric tons y−1, respectively,

A. Yánez-Arancibia et al. / Ecological Engineering 65 (2014) 88–100 95
Fig. 4. Period-1 Dynamics. The model shows the Paraman Lagoon system during hyper salinity conditions (adapted from the model of Yánez-Arancibia, 1978, 1987). Salinitiescan reach 75 psu or more. The system is closed without connection with the adjacent ocean. The lagoon water level is up to 1.5 m lower than level of the adjacent ocean. Thesystem accumulates sediments, nutrients and pollutants. Evaporation (E) is much higher than freshwater input from river discharge (R), ground water (S), or precipitation(P). Because the water volume (V) inside the lagoon is low, the water budget is negative and hyper salinity leads to salt precipitation. Filtration of water (F) from the sea tothe lagoon through the closed sandbar is very intense. Lagoon salinity is much higher than the ocean. Littoral drift and wind regime maintains the inlet closed. See Boxes 1and 2 for equations and calculations.
Fig. 5. Period-2 Dynamics. The model shows the Paraman Lagoon system during hypo salinity conditions (adapted from the model of Yánez-Arancibia, 1978, 1987). Thesystem is closed without connection with the adjacent ocean. The lagoon water level is up to 1.5 m higher than sea level. Salinities less than 15 psu. The system accumulatess ss thas hrougw tions
fpw
g
w
FwcEoee
ediments, nutrients, chlorophyll, and pollutants. Evaporation (E) is considerably lealinity is higher than the lagoon. Filtration of water (F) from the lagoon to the sea tind regimes maintain the inlet closed. See Boxes 1 and 2 for equations and calcula
or Paraman Lagoon. Chl-a ranged from 38 to 63 ug L−1 and aquatic3 −1
rimary productivity was about 0.32 g C m d . Dissolved silicateas 50 ug-at L−1 and total inorganic N was 1.9 ug-at L−1.Mean August 2008 temperature (28.5◦C) was significantly
reater (p-0.004) than the mean November 2008 value of 25.9◦C,
n(og
ig. 6. Period-3 Dynamics. The model shows the Paraman Lagoon system during its optimith the adjacent ocean (adapted from the model after Yánez-Arancibia, 1978, 1987). Sa
hanging daily due to tidal action and waves. The system exports sediments, nutrients, chvaporation (E) is in equilibrium with freshwater discharge by rivers (R), ground water (Sf water (Fo versus F1) from the lagoon to the sea is very minimal. The volume of water equilibrium. Littoral drift, winds regime, tidal effect (T1 low tide, and To high tide), plus tquation and calculations.
n freshwater discharge by rivers (R), ground water (S), and precipitation (P). Oceanh the closed sandbar is very intense. The water budget is positive. Littoral drift and.
hile the May/June 2009 temperature average (27.0 ◦C) was
ot significantly different from either summer or fall intervalsTable 3a). August (8.29 mg l−1) and November 2008 (8.55 mg l−1)xygen concentrations in the water column were significantlyreater (p = 0.0001) than observed in May/June 2009 (2.98 mg l−1).al estuarine conditions with intense physical, chemical and biological connectionlinity ranges from 15 to 35 psu. The lagoon water level is equal with sea level andlorophyll, and pollutants to the ocean, and receives macro benthic and fish fauna.), and precipitation (P). Ocean salinity is in equilibrium with the lagoon. Filtrationxported to the sea when the inlet is open is V2 (see Box 2). The water budget is inhe freshwater hydrostatic pressure maintain the inlet open. See Boxes 1 and 2 for

96 A. Yánez-Arancibia et al. / Ecological E
Table 3aResults of Tukey–Kramer group comparison analysis. Values indicate means andletters statistical significance (same letter indicates no significant difference).
Temp Oxygen Salinity pH BOD
Aug 08 28.48 AB 8.29 A 4.88 A 9.2 AB 33.02 A
Aa(wai(
ditn(ot
oswvtMl
4m
Lbetbtadwtlcftnsf
TRc
msflfr
notootacibsMeehli
idtaobwFaWwbpcpsga2nhwtaN
Nov 08 25.88 C 8.55 A 10.89 A 8.7 BC 344.93 BMay/Jun 09 27.00 BC 2.98 B 75.03 B 7.6 C 69.57 A
n opposite trend was observed for salinity, with August (4.88 psu)nd November 2008 (10.89 psu) values being significantly lessp = 0.0001) than those observed in May/June 2009 (75.03 mg l−1)hen hypersaline conditions were present at station 1. There were
lso significantly higher BOD concentrations(p = 0.0001) found dur-ng November 2008 (344.93 mg l−1) compared to August 200833.02 mg/l) and May/June 2009 (69.57 mg l−1).
Dissolved oxygen concentrations also increased with distanceuring August (p = 0.007) and November 2008 (p = 0.021), but not
n May/June 2009 (p = 0.845) (Table 3b). Salinity increased with dis-ance during November 2008 (p = 0.025), ranging from 9-13 psu, butot for the other two sampling periods. An increasing trend for pHp = 0.024) was detected during November 2008, but the range wasnly one pH unit. There were no significant trends observed foremperature or BOD.
From August (Period-2) to January (Period-3) the water volumef Paraman Lagoon diminished by 55%, and by the end of the dryeason in May-June (Period-1), much of the lagoon bottom was dryith a reduction of water volume by 96%. The reduction of water
olume is closely correlated with an increase in salinity concen-rations ranging from 4.9 psu in August to higher than 75 psu in
ay–June. This increase of 93% is a major source of stress for theagoon ecosystem.
. Ecosystem functioning: Synthesis towards a conceptualodel
We now present a synthesis of information about Paramanagoon and put it into the context of a general conceptual modelased on the lagoon geomorphology presented earlier, and thenvironmental cycle for the three ecological periods (Figs. 4-6 andhe general model in Fig. 7). This model was described earliery (Yánez-Arancibia, 1978), and later updated for several sys-ems (Yánez-Arancibia, 1987 for Mexico; Knoppers, 1994 for Brazil;nd Pollard, 1994 for Australia) to explain the physical-chemicalynamics of estuary-sea interactions of tropical coastal lagoonsith ephemeral inlets. This conceptual model demonstrates how
hese interactions result in enhanced aquatic fertility for both theagoon and the adjacent ocean. In general terms, the lagoon isharacterized by estuarine conditions, strong seasonality in thereshwater budget, an ephemeral connection with the sea, and aendency to accumulate sediments, organic matter, and contami-
ants. During Period-1 there is a net freshwater deficit in the lagoonystem. When the inlet is open, the flow is ebb-tide dominated thatacilitates a net export of water and materials to the ocean.able 3besults of linear regression analysis. Numbers indicate p-values and asterisks indi-ate statistical significance.
Aug 08 Nov 08 May/Jun 09
Temp 0.583 0.202 0.087Oxygen 0.007* 0.021* 0.845Salinity 0.405 0.025* 0.333pH 0.865 0.024* 0.401BOD 0.105 0.859 0.275
ommwtAK
4
os
ngineering 65 (2014) 88–100
In general terms, the ephemeral communication between Para-an Lagoon and the ocean is a major factor modulating ecosystem
tructure and functioning (Fig. 7). The balance of lagoon and marineorces determines whether the inlet is open or closed. These includeittoral currents, littoral sediment transport, waves, winds, tides,resh water input (from rivers, ground water flow, and local surfaceunoff), evaporation, and filtration through the sandbar.
Typical estuarine conditions with tidal exchange and a pro-ounced salinity gradient occur during Period-3 because the inlet ispen and there is regular tidal interaction. During Period-1, the sys-em is hyper saline and lagoon volume is greatly reduced. Becausef this, the system is most stressed during this time. The sequentialpening and closing of the inlet, especially for up to a month at aime, leads to a system that is more highly variable, ecologicallynd physically, in space and time than lagoons with a permanentonnection with the sea. The current hydrology of Paraman Lagoons partially a result of its unique history of human modifications tooth watershed and lagoon. Under natural conditions, seasonal clo-ure of lagoon inlets is common for lagoons along the Pacific coast ofexico (Yánez-Arancibia, 1981), and the United States (e.g., Sutula
t al., 2006; Fong and Kennison, 2010), but also in Vietnam (Tungt al., 2006), and Australia (Pollard, 1994). For Paraman Lagoon,owever, human modifications in the watershed of the San Nico-
as River and the poor connection with Chalacatepec lagoon havencreased the frequency and duration of closure of the lagoon.
Lagoons that close naturally in the dry season can vary in salin-ty from freshwater to hyper saline. This depends, in part, on theuration of closure, the elevation of lagoon with respect to sea level,he duration and magnitude of freshwater flow in the dry season,nd the importance of groundwater input. Once closed, high ratesf evaporation during the hot dry season result in higher salinitiesut there can still be spatial salinity gradients between the land-ard and marine ends of the lagoon (i.e., from Zone 1 to Zone 3 in
ig. 2). Dry season nutrient regimes can also be extremely variablend depending on the level of watershed input and internal cycling.here there is higher river input, sediments transported from theatershed and deposited in the lagoon during the wet season can
e a source of regenerated nutrients during the dry season, sup-orting blooms of primary producers. The alternation of open andlosed inlet results in higher variability in salinity, nutrients androductivity (Table 1). Chl-a concentration displayed significantpatial and temporal differences among the zones and seasons. Ineneral, mean Chl-a was lower with salinity reduction (e.g., Bricenond Boyer, 2010; Cloern and Jassby, 2010; Rivera-Monroy et al.,011). Rivera-Monroy et al. (2011) pointed out that other mecha-isms affecting Chl-a concentrations in tropical lagoons includedigh solar irradiance, high water temperature, shallow depths,ind induced mixing, and increased nutrient levels from freshwa-
er inflow. These hydrological changes affect ecological stabilitynd secondary production (Yánez-Arancibia, 1981; Pollard, 1994;ewton and Mudge, 2003; Koutrakis et al., 2009).
What is needed is a better understanding of the historicalr natural state of the lagoon so that more informed manage-ent decisions can be made. The development of sustainableanagement and restoration plans is more difficult for lagoonsith relatively low precipitation and high evaporation in conjunc-
ion with an ephemeral inlet (e.g., Longley, 1994; Pollard, 1994;lexander and Dunton, 2002; Powell et al., 2002; Tung et al., 2006;outrakis et al., 2009).
.1. Water budget
From August (Period-2) to January (Period-3) the water volumef Paraman Lagoon diminished by 55%, and by the end of the dryeason in May-June (Period-1), much of the lagoon bottom is dry

A. Yánez-Arancibia et al. / Ecological Engineering 65 (2014) 88–100 97
Fig. 7. Conceptual model for understanding the seasonal pattern of morphodynamics, environmental physiology, and ecological characterization of Paraman Lagoon. The“imbalance” of physical chemical parameters during Period-1 and Period-2 induces severe stress conditions for the biota and lowers biodiversity. This contrasts with morebalanced conditions during Period-3 with the optimal estuarine conditions (e.g. salinity 23 psu, water volume 5 million m3, average depth 1.10 m, pH 8, daytime oxygenconcentration about 8.5 ml/L). Future rehabilitation activities (e.g., ecotechnology and ecological engineering) should involve landscape enhancement, protection of wetlands,enhanced water quality, recovery of biodiversity, improved artisanal fisheries, and tourism associated with the lagoon system, and associated dunes and beaches in thea alcula
wvAb
ula2rodpsmii22
oama1MhrcLs
5
roEtitnO2tctB2
toecWpf2b
djacent region. (See Figs. 4–6, Tables 1 and 2, and Boxes 1 and 2 for equation and c
ith a reduction of water volume by 96%. The reduction of waterolume is closely related to an increase in salinity from 4.9 psu inugust to higher than 75 psu in May-June. This increase of 93% muste considered as a major source of stress for the lagoon ecosystem.
Information on hydrology, water budgets, and residence time isseful for developing a better understanding of a number of eco-
ogical processes in coastal systems (Mann, 2000; Yánez-Arancibiand Day, 2006; Rivera-Monroy et al., 2011; Yánez-Arancibia et al.,013) including a) flushing time, or residence time, of mixed estua-ine waters in the lagoon system, b) nutrient export to the adjacentcean either over a tidal cycle or seasonally, c) metabolism, i.e., pro-uction and consumption, and the seasonality of aquatic primaryroductivity, d) both retention -within the lagoon- and disper-ion/export of pollutants -to the adjacent ocean-, and e) to obtain aore comprehensive understanding of the ecosystem functioning
n terms of the coupling of physical and biological processes whichs key to ecosystem-based management (Yánez-Arancibia and Day,006; Kjerfve et al., 1996; Souza et al., 2003; Yánez-Arancibia et al.,013).
Considerable research has shown that altering the hydrologyf coastal systems has resulted in serious ecological repercussionsnd in some cases, led to decline in nutrient supplies, loss of land-ass in the lagoon, depletion of sport and commercial fisheries,
nd finally a decline in the human quality of life (e.g., Longley,994; Alexander and Dunton, 2002; Powell et al., 2002; Rivera-onroy et al., 2011). There are many factors that have altered the
ydrology and water balance of Paraman Lagoon. These include 1)
eduction in the connectivity between Paraman Lagoon and Chala-atepec Lagoon, 2) reduction in the connection between Paramanagoon and the adjacent ocean, 3) low precipitation during the dryeason, and 4) reduction in ground water input.har(
tions).
. Management implications
From an ecosystem-based management perspective, habitatesponse under extreme variability is modulated by the influencef climate as it affects biophysical components of the ecosystem.cosystem-based management (EBM) has emerged as an approachhat reflects the relationships among all ecosystem components,ncluding the influence of humans, and the environment in whichhey live. EBM has recently emerged as a guiding principle ofew ocean policy in the US and elsewhere (US Commission oncean Policy, 2004; Yánez-Arancibia et al., 2011; Fanning et al.,011). By placing humans in the landscape within the broader con-ext of the biological and physical environment, EBM ultimatelyombines ecology and human dimensions in an integrated wayhat is transdisciplinary ecosystem management (Convention oniological Diversity, 2005; Weinstein, 2007, 2008; Fanning et al.,011).
Because scientific understanding of ecosystem processes andhe underlying role of variability in maintaining the resiliencef ecosystems has improved in the past several decades,merging management approaches can begin to conform morelosely to ecological versus political constraints (Holling, 2000;
einstein, 2008). It is neither possible to maximize all com-eting uses nor ignore the differential economic and politicalorces that factor into management decisions (Weinstein, 2007,008). Because both ecological and socioeconomic aspects muste used in management, compromise and consideration of
abitat heterogeneity must be included in decision-making. Inddition, improving environmental quality benefits both natu-al, in terms of biodiversity for example, and social systemsWeinstein, 2008).
9 gical E
5
aeebopqtbTi
pcielmoesaeia((wblrtw
6
pntctPtomonatre
laiacrat
ilbeF
stetiwawnfflssi
A
mSooYerwapC
R
A
A
B
B
B
C
C
C
C
C
D
D
D
8 A. Yánez-Arancibia et al. / Ecolo
.1. System functioning as a management tool
Understanding system functioning is basic for sustainable man-gement of coastal ecosystems (Day et al., 1997; Yánez-Arancibiat al., 2009b, 2013). Climatic patterns affecting lagoon systems withphemeral inlets are one of the most important factors that shoulde considered in any coastal zone management plan for these typesf systems. It is also important to understand the ecological cou-ling between the lagoon and the adjacent ocean. An importantuestion is whether the inlet opening and closing can be managedo enhance ecological functioning. Such information is essentialefore deciding the direction that the management should take.he basic conceptual model described in Fig. 7 provides essentialnformation for comprehensive decision-making.
It is also possible, using information like that presented in thisaper, to better understand the ecological responses to physicalhanges. Input of organic matter and nutrients from the watershedn conjunction with prolonged closure of the inlet, leads to organicnrichment and low oxygen stress. The buildup of nutrients due to aack of flushing can lead to eutrophication and changes in algal com-
unities that do not support important fishery species. The resultsf these conditions have a number of consequences for the lagooncosystem: 1) seasonal hypoxic oxygen levels (<2.0 mg l−1) result intressed biological communities; 2) organic matter decompositioncts as a source of nutrients through remineralization, further exac-rbating over-enrichment; 3) algal productivity is high but changesn community structure can reduce secondary production of desir-ble species including nekton such as mullets (Mugil sp.), tilapiaOreocromis aureous), popoyote (Dormitator latifrons), and shrimpPenaeus vanamei); 4) low oxygen concentrations at the sediment-ater interface, and the low salinities characteristic of Period 2
ecome limiting factors for nekton and benthic organisms; and 5)ack of connection between the lagoon and the sea eliminates mate-ial exchange with the coastal ocean. Thus, the only period whenhe lagoon is in a relatively good ecological state is during Period-3hen the inlet is open.
. Conclusions
The analysis presented in this paper suggests that there are tworimary management issues for Paraman Lagoon. First, the con-ection between the river and Paraman has been reduced becausehe connection to Chalacatepec Lagoon is very restricted. Thus, aritical management action would be the restoration of freshwa-er flow from the Rio San Nicolas through Chalacatepec Lagoon toaraman Lagoon. A second issue concerns the limited time thathe inlet remains open. To resolve this issue, better understandingf the inlet/sand barrier morphodynamics is necessary to developanagement approaches to keep the inlet open for longer periods
f time. We recommend that techniques involving ecological engi-eering and ecotechnology be applied in both cases (e.g., Mitschnd Jorgensen, 2003; Day et al., 2009b). For example, ensuring thathe connection to the river is maintained will allow the flow ofiver water to maintain the inlet open for longer periods withoutxpensive activities such as dredging.
In summary, Paraman Lagoon currently has a number of prob-ems associated with the inlet being closed most of the time and
number of management needs. The problems in the lagoonnclude: lack of adequate flushing, increased sediment and pollut-nt accumulation, high biochemical oxygen demand in the water
olumn and sediments, very low secondary productivity despiteelatively high aquatic primary productivity, reduced biodiversitynd simplified biological communities both in structure and func-ion; and low potential for ecological recovery and the potential forD
ngineering 65 (2014) 88–100
ncreasing ecological disturbance if the lagoon remains closed forong periods of time. These problems have been cited for a num-er of other coastal lagoons on the Pacific coast of Mexico andlsewhere (Yánez-Arancibia, 1978; Yánez-Arancibia et al., 2007;lores-Verdugo et al., 1987, 1988)
From a management perspective, more frequent opening of theand barrier would be a crucial step to achieving ecological rehabili-ation (Yánez-Arancibia, 1978; Yánez-Arancibia et al.2007; Fanningt al., 2011). Any future land use change, hydrological manipula-ion, sediment and water quality improvement should, however,ncorporate the natural functions of the system as a basic frame-
ork. To achieve these goals, implementation of eco-technologynd ecological engineering practices would be crucial to the futureell-being of the Lagoon. As stated above, maintaining the con-ection with the river during high discharge would allow the net
reshwater flow to keep the inlet open for longer period. This wouldush the lagoon and reduce high biochemical oxygen demand andediment accumulation. This would allow more marine organisms,uch as finfish and shrimp, to enter the lagoon from the sea thusncreasing both biodiversity and secondary production.
cknowledgements
The authors acknowledge the support of Rasa Land Develop-ent (RLD) (Development Program in the Jalisco Coast), and GPPA
. C. (International Adviser and Planning Consultant Group) to carryut research activities from 2008 to 2010. This contribution is basedn two Unpublished Technical Reports: Day et al. (2009a), andánez-Arancibia et al. (2009a). Particularly we want to acknowl-dge Mr. Ricardo Santa Cruz from RLD his authorization to publishesults from our unpublished technical reports. Part of this paperas presented in the Special Symposium “Restoration Ecology in
Sustainable World” chaired by M. P. Weinstein and J. W. Day, asart of the 4th International ECOSUMMIT, 30 Sept. – 5 Oct, 2012,olumbus, Ohio, USA.
eferences
lexander, H.D., Dunton, K.H., 2002. Freshwater inundation effects on emergentvegetation of a hyper saline salt marsh. Estuaries 25 (6B), 1426–1435.
PHA, 1995. Standard Methods for Examination of Water and Wastewater. Ameri-can Public Health Association, Washington D.C.
riceno, H.O., Boyer, J.N., 2010. Climate control on phytoplankton biomass in asubtropical estuary, Florida Bay, USA. Estuar. Coast. 33, 541–553.
ricker, S.B., Clement, C.G., Pirhalla, D.E., Orlando, S.P., Farrow, D.R. G., 1999. Nationalestuarine eutrophication assessment: effects of nutrient enrichment in thenation’s estuaries. NOAA, National Ocean Service, Special Projects Office andthe National Center for Coastal Ocean Science. Silver Spring.
rower, J.E., Zar, J.H., 1981. Field and Laboratory Methods for General Ecology.W.M.C. Brown Co.
loern, J.E., Jassby, A.D., 2010. Patterns and scales of phytoplankton variability inestuarine-coastal ecosystems. Estuar. Coast. 33, 230–241.
NA., 2000. Ley de Aguas Nacionales y su Reglamento. Comisión Nacional del Agua.Secretaría de Medio Ambiente y Recursos Naturales SEMARNAT, México D. F.
ONAGUA (Ed.), 2007. Estadísticas del Agua en México. Secretaría de Medio Ambi-ente y Recursos Naturales SEMARNAT, México D.F.
onvention on Biological Diversity, 2005. Handbook of the Convention on BiologicalDiversity, second ed. Secretariat on the Convention on Biological Diversity. TransContinental Printing, Montreal, Canada.
opper, J.A.G., 1990. Ephemeral stream mouth bars at flood breach river mouths:comparison with tidal deltas at barrier inlets. Marine Geology 96, 57–70.
ay, J.W., Martin, J.F., Cardoch, L., 1997. System functioning as a basic for sustainablemanagement of deltaic ecosystems. Coastal Management 25, 115–153.
ay, J.W., Christian, R.R., Boesch, D.M., Yánez-Arancibia, A., Morris, J., Twilley, R.R.,Naylor, L., Schaffner, L., Stevenson, C., 2008. Consequence of climate change onthe Ecogeomorphology of coastal wetlands. Estuar. Coast. 31, 477–491.
ay, J.W., Linsley, J., Day, J.N., Lane, R., 2009a. Chalacatepec-Paraman wetland base-
line ecological study: Analysis of coastal restoration, wetland assimilation andcarbon sequestration, Unpublished Technical Report, Comite Resources Inc., andRASALAND, S.C. de C.V., Jalisco Mexico.ay, J.W., Yánez-Arancibia, A., Mitsch, W.J., 2009b. Management approaches toaddress water quality and habitat loss problems in coastal ecosystems and

gical E
D
E
E
E
F
F
F
F
F
F
H
H
HI
K
K
K
K
K
K
K
K
L
L
L
L
M
M
M
M
M
M
N
N
N
P
P
P
R
R
R
S
S
S
S
T
U
W
W
Y
Y
Y
Y
A. Yánez-Arancibia et al. / Ecolo
their watersheds: Ecotechnology and ecological engineering. Ocean Yearbook23, 389–402.
ay, J.W., Crump, B.C., Kemp, W.M., Yánez-Arancibia, A. (Eds.), 2013. Estuarine Ecol-ogy. , second ed. Wiley-Blackwell, John Wiley & Sons Inc., Publication, HobokenNJ.
PA., 1999. Ecological Conditions of Estuaries in the Gulf of Mexico. Environmen-tal Protection Agency, Office of Research and Development, National Healthand Environmental Effects Research Laboratory, Gulf Ecology Division, EPA620/R/98/004. U.S. Gulf Breeze, Florida.
PA, 2001a. Nutrient criteria. Technical Guidance Manual. Estuarine and CoastalWaters. Environmental Protection Agency. Office of water. EPA-822-B-01-003.Washington DC.
PA, 2001b. National Coastal Condition Report. Environmental Protection Agency.Office of Research and Development. EPA-620/R-01-005. Washington D. C.
anning, L., Mahon, R., Mc Conney, P. (Eds.), 2011. Towards Marine Ecosystem-BasedManagement in the Wider Caribbean. Amsterdam University Press, MARE Series,The Netherlands.
lores-Verdugo, F., Day, J.W., Briseno, R., 1987. Structure, litter fall, decomposi-tion, and detritus dynamics of mangroves in a Mexican coastal lagoon with anephemeral inlet. Mar. Ecol. Prog. Ser. 35, 83–90.
lores-Verdugo, F., Day, J.W., Mee, L., Briseno-Duenas, R., 1988. Phytoplanktonproduction and seasonal biomass variation of seagrass Ruppia maritima L. ina tropical Mexican lagoon with an ephemeral inlet. Estuaries 11, 51–56.
lores-Verdugo, F., González Farías, F., Ramírez, O.M., Amezcua, F., Yánez-Arancibia,A., Alvarez, M., Day, J.W., 1990. Mangroves ecology, aquatic primary produc-tivity, and fish community dynamics in Teacapan-Agua Brava lagoon estuarinesystem (Mexico). Estuaries 13 (2), 219–230.
lores Verdugo, F., Moroyoqui Rojo, L., Flores de Santiago, F., 2011. Ecologia yrestauracion de manglares y perfil de comunidades en la laguna costera deParamanXola, Costa Alegre, Jalisco. Primera etapa. Informe final. UnpublishedTechnical Report, RASALAND, S.C. de C.V., Jalisco Mexico.
ong, P., Kennison, R.L., 2010. Phase shifts, alternative stable states, and the status ofSouthern California lagoons. In: Kennish, M.J., Paerl, H.W. (Eds.), Coastal LagoonsCritical Habitats of Environmental Change. CRC Press Taylor & Francis Group,Boca Raton, pp. 227–252.
errera-Silveira, J.A., Medina, G.I., Colli, R., 2002. Trophic status on nutrient con-centrations scales and Primary producers community of tropical coastal lagoonsinfluenced by groundwater discharges. Hydrobiologia 476, 91–98.
errera-Silveira, J.A., Aranda Cirerol, N., Troccoli Ghinaglia, L., Comin, F.A., Madden,C., 2004. Eutrofizacion costera en la Peninsula de Yucatan, in: Caso, M., Pisanty,I., Ezcurra E. (Eds.), Diagnostico Ambiental del Golfo de Mexico. Secretaria deMedio Ambiente y Recursos Naturales, Instituto Nacional de Ecología, Institutode Ecologia A. C., Harte Research Institute for Gulf of Mexico Studies. Volume 2,pp. 823–850.
olling, C.S., 2000. Theories for sustainable future. Conservation Ecology 4, 7–13.MTA., 2000. Sistema de Información Climatológica SICLIM v1.0, 5319 Estaciones.
Anos 1921-1990. México: Instituto Mexicano de Tecnología del Agua.ennish, M.J., Paerl, H.W. (Eds.), 2010. Coastal Lagoons Critical Habitats of Environ-
mental Change. CRC Press Taylos & Francis Group, Boca Raton.jerfve, B., 1986. Comparative oceanography of coastal lagoons. In: Wolfe, D.A. (Ed.),
Estuarine Variability. Academic Press Inc, New York, pp. 63–82.jerfve, B., 1990, Manual for Investigation of Hydrological Processes in Man-
grove Ecosystems. UNESCO/UNDP Regional Project. Research and its Applicationto the Management of the Mangroves of Asia and the Pacific (RAS/86/120),79.
jerfve, B. (Ed.), 1994. Coastal Lagoon Processes. Elsevier Oceanography Series 60,Amsterdam.
jerfve, B., Magill, K.E., 1989. Geographic and hydrographic characteristics of shal-low coastal lagoons. Marine Geology 88, 187–199.
jerfve, B., Schettini, C.A., Knoppers, B., Lessa, G., Ferreira, H., 1996. Hydrology andsalt balance in a large hyper saline coastal lagoon: Lagoon Araruama, Brazil. Est.Coast. Shelf Sci. 42, 701–725.
noppers, B., 1994. Aquatic primary production in coastal lagoons. In: Kjerfve, B.(Ed.), Coastal Lagoon Processes. Elsevier Oceanography Series, 60, Amsterdam,pp. 243–286.
outrakis, E., Sylaios, G., Kamidis, N., Markous, D., Sapounidis, A., 2009. Fish faunarecovery in a newly re-flooded Mediterranean coastal lagoon. Est. Coast. ShelfSci. 83, 505–515.
ankford, R.R., 1977. Coastal lagoons of Mexico: their origin and classification. In:Wiley, M. (Ed.), Estuarine Processes. Academic Press Inc, New York, pp. 182–215.
iu, J.T., Stauble, D.K., Giese, G.S., Aubrey, D.G., 1993. Morphodynamic evolutionof a newly formed tidal inlet. In: Aubrey, D.G., Giese, G.S. (Eds.), Formation andEvolution of Multiple Tidal Inlets. Coastal and Estuarine Studies 44, Washington,pp. 62–94.
ongley, W.L. (Ed.), 1994. Freshwater Inflow to Texas Bays and Estuaries: EcologicalRelationships and Methods for Determination of Ne. Texas Water DevelopmentBoard and Texas Parks and Wildlife Department. Austin.
orenzen, C.J., Jeffrey, S.W., 1980. Determination of chlorophyll in seawater. UNESCOTech. Pap. Mar. Science 35, 1–20.
adden, C.J., Day, J.W., Randall, J.M., 1988. Freshwater and marine coupling in estu-
aries of the Mississippi River deltaic plain. Limnology and Oceanography 33 (4part 2), 982–1004.andelli, F.E., 1981. On the hydrographic and chemistry of some coastal lagoonsof the Pacific coast of Mexico. Proceedings Seminar Duke University Marine
Y
ngineering 65 (2014) 88–100 99
Laboratory. Beaufort NC, USA, UNESCO-IABO August 1978. UNESCO Tech. PaperMar. Science 33,81-95.
ann, K.H., 2000. Ecology of Coastal Waters, with Implications for Management,second ed. Blackwell Science, Massachusetts.
ee, L.D., 1979. Coastal lagoons. In: Riley, J.P., Chester, R. (Eds.), Chemical Oceanog-raphy, Volume7. Academic Press Inc, London, pp. 441–489.
illan Nunez, R., Lara-Lara, J.R., 1995. Primary productivity of phytoplankton in theMexican Pacific: a diagnosis [in Spanish]. In: Gonzalez Farias, F., De La Rosa Velez,J. (Eds.), Temas de Oceanografia Biologica en Mexico Volume II. UniversidadAutonoma de Baja California, Ensenada, Chapter 2, pp. 31–60.
itsch, W.J., Jorgensen, S.E., 2003. Ecological Engineering and Ecosystem Restora-tion. Wiley Interscience, John Wiley & Sons, New York.
ewton, A., Mudge, S.M., 2003. Temperature and salinity regimes in a shallow,mesotidal lagoon the Ria Formosa, Portugal. Est. Coast. Shelf Sci. 56, 1–13.
eilson, B.J., Cronin, L.E. (Eds.), 1981. Estuaries and Nutrients. Humana Press, Clifton,New Jersey.
ixon, S.W., 1979. Between coastal marshes and coastal waters: a review of twentyyears of speculation and research on the role of salt marshes in estuarine pro-ductivity and water chemistry. In: Hamilton, P., Macdonald, K.B. (Eds.), Estuarineand Wetland Processes. Plenum Press, New York, pp. 437–525.
ennock, J.R., Boyer, J.N., Herrera-Silveira, J.A., Iverson, R.L., Whitledge, T.E., BehzadMortazavi, T.E., Comin, F.A., 1999. Nutrient behavior and phytoplankton pro-duction in Gulf of Mexico estuaries. In: Bianchi, T.S., Pennock, J.R., Twilley, R.R.(Eds.), Biogeochemistry of Gulf of Mexico Estuaries. John Wiley & Sons, Inc, NewYork, pp. 109–162.
ollard, D.A., 1994. Opening regimes and salinity characteristics of intermittentlyopen coastal lagoons in the South coast New South Wales, Australia. WetlandsAustralia 13, 16–35.
owell, G.L., Matsumoto, J., Brock, D.A., 2002. Methods for determining mini-mum freshwater inflow need of Texas Bays and Estuaries. Estuaries 25 (6B),1262–1274.
anasinghe, R., Pattiaratchi, C., 2003. The seasonal closure of tidal inlets: cause andeffects. J. Coast. Eng. 45 (4), 601–627.
ivera-Monroy, V., Twilley, R.R., Mancera-Pineda, J.E., Madden, C.J., Alcantara-Eguren, A., Barry Moser, E., Jonsson, B.F., Cataneda-Moya, E., Casas-Monroy, O.,Reyes-Forero, P., Restrepo, J., 2011. Salinity and chlorophyll a as perfomancemeasures to rehabilitate a mangrove-dominated deltaic coastal region: the Cié-naga Grande de Santa Marta – Pajarales lagoon complex, Colombia. Estuar. Coast.34 (1), 1–19.
ojas-Galavíz, J.L., Yánez-Arancibia, A., Day, J.W., Vera-Herrera, F., 1992. Estua-rine primary producers: Laguna de Terminos a study case. In: Seeliger, U. (Ed.),Coastal Plant Communities in Latin America. Academic Press, Inc, New York, pp.141–154.
all, J., Creighton, L., Lehman, A., 2005. JMP Start Statistics: A Guide to Statistical anddata Analysis using JMP and JMP IN Software. Brooks/Cole-Thompson Learning,Belmont, CA, 560p.
chwartz, M.L. (Ed.), 2005. The Encyclopedia of Coastal Sciences. Springer, TheNetherlands.
ouza, M.F.L., Kjerfve, B., Knoppers, B., Landim de Souza, W.F., Damasceno, R.N., 2003.Nutrient budgets and trophic state in a hyper saline coastal lagoon: Lagoon
Araruama, Brazil. Est. Coast. Shelf Sci. 57, 843–858.utula, M., Kamer, K., Cable, J., Berelson, H., Mendez, J., 2006. Sediments as
an Internal Source of Nutrients to Upper Newport Bay, California. SouthernCalifornia Coastal Research Project, Technical Report 482. Westminster, CA.www.sccwrp.org
ung, T.T., Cat, V.M., Thanh, L.D., 2006. Conceptual model of seasonal open-ing/closure of tidal inlets and estuaries at the Central coast Vietnam. In:Vietnam-Japan Estuary Workshop, August 22–24, Hanoi, pp. 157–162.
S Commission on Ocean Policy, 2004. Preliminary Report. US Commission on OceanPolicy, Washington, DC.
einstein, M.P., 2007. Perspectives in estuarine and coastal science: linking restora-tion ecology and ecological restoration in estuarine landscape. Estuar. Coast. 30(2), 1–6.
einstein, M.P., 2008. Ecological restoration and estuarine management: placingpeople in the coastal landscape. J. Appl. Ecol. 45, 296–304.
ánez-Arancibia, A., 1978. Taxonomía, Ecología y Estructura de las Comunidades dePeces en Lagunas Costeras con Bocas Efímeras del Pacífico de México. UNAMPress CCML Publicación Especial 2, México.
ánez-Arancibia, A., 1981. The occurrence, diversity and abundance of fishes in twotropical coastal lagoons with ephemeral inlets on the Pacific coast of Mexico.Proceedings Seminar Duke University Marine Laboratory. Beaufort NC, USA,UNESCO-IABO August 1978. UNESCO Technical Paper Marine Sciences 33, 233-260.
ánez-Arancibia, A., Day, J.W., 2006. Hydrology, water budget and resident timein Terminos Lagoon estuarine system, Southern Gulf of Mexico, in: CoastalHydrology and Processes, American Institute of Hydrology, Water ResourcesPublications, LLC., Colorado, pp. 423-435.
ánez-Arancibia, A., 1987. Lagunas costeras y estuarios: cronología, criterios y con-ceptos para una clasificación ecológica de sistemas costeros, in: EcossistemasCosteiros de la Costa Sul e Sudeste Brasileira. Academia de Ciências São Paulo
Brazil. Publicac ão ACIESP 54 (3), 1.ánez-Arancibia, A., Lara-Domínguez, A.L., Sánchez-Gil, P., Vargas, I., Chavance,P., Amezcua, F., Aguirre, A., Díaz, S., 1982. Ecosystem dynamics and nichthe-meral and seasonal programming of fish community structure in a tropical

1 gical E
Y
Y
Y
Y
Y
Y
Y
Y
Y
agement of Terminos Lagoon, Campeche Mexico, in: Day, J.W., Yánez-Arancibia,
00 A. Yánez-Arancibia et al. / Ecolo
estuarine inlet, Mexico, in: Lasserre, P., Postma, H. (Eds.), Coastal Lagoons,France: Oceanologica Acta, Vol. Spec., 5, 417–429.
ánez-Arancibia, A., Lara-Domínguez, A.L., A’lvarez-Guillen, H., 1985. Fish commu-nity ecology and dynamic in estuarine inlets. In: Yánez-Arancibia, A. (Ed.), FishCommunity Ecology in Estuaries and Coastal Lagoons:Towards an EcosystemIntegration. UNAM Press, México, pp. 127–167.
ánez-Arancibia, A., Sánchez-Gil, P., Lara-Domínguez, A.L., 1991. Interaccionesecológicas estuario-mar: estructura funcional de bocas estuarinas y su efectoen la productividad del ecosistema. Academia de Ciências São Paulo Brasil.Publicac ão ACIESP 71, 49–83.
ánez-Arancibia, A., Lara-Domínguez, A.L., Day, J.W., 1993. Interactions betweenmangrove and sea grass habitats mediated by estuarine nekton assemblages:coupling of primary and secondary production. Hydrobiology 264, 1–12.
ánez-Arancibia, A., Sánchez-Gil, P., Lara-Domínguez, A.L., 1998. Functional groupsand ecological biodiversity in Terminos Lagoon, México. Revista Sociedad Mex-icana de Historia Natural 49, 163–172.
ánez-Arancibia, A., Lara-Domínguez, A.L., Sánchez-Gil, P., Day, J.W., 2007. Estuary-sea ecological interactions: A theoretical framework for management of coastalenvironment, in: Withers, K., Nipper, M. (Eds.), Environmental Analysis of theGulf of Mexico, Harte Research Institute for Gulf of Mexico Studies Texas A&MCorpus Christi, Special Publication Series 1, 271-301.
ngineering 65 (2014) 88–100
ánez-Arancibia, A., Day, J.W., Sanchez-Gil, P., Ramirez Gordillo, J.J., 2009a. Carac-terización ecológica del sistema lagunar Paraman-Chalacatepec: Estructura yfuncionamiento natural del sistema ecológico basado en su dinámica estacionaly fundamento para su rehabilitación, Unpublished Technical Report, CEMA Con-sultores, and RASALAND, S.C. de C.V., Jalisco Mexico.
ánez-Arancibia, A., Day, J.W., Currie-Alder, B., 2009b. The Grijalva-Usumacintariver delta functioning: Challenge for coastal management. Ocean Yearbook 23,473–501.
ánez-Arancibia, A., Day, J.W., Knoppers, B.A., Jiménez, J.A., 2011. Coastal lagoonsand estuaries: The ecosystem based management approach, in: Fanning, L.,Mahon, R., McConney, P. (Eds.), Towards Marine Ecosystem-Based Manage-ment in the Wider Caribbean, Amsterdam University Press, MARE Series, TheNetherlands, pp.241-256.
ánez-Arancibia, A., Day, J.W., Lara-Domínguez, A.L., Sánchez-Gil, P., Villalobos, G.J.,Herrera-Silveira, J., 2013. Ecosystem functioning: the basis for sustainable man-
A. (Eds.), The Gulf of Mexico Ecosystem-Based Management. The Gulf of MexicoOrigin, Water, and Biota Series Volume 4, Harte Research Institute for Gulf ofMexico Studies. Texas A & M University Press, College Station, TX. Chapter 9,167-200.