econometric modelling for modern marketers - metametrics
TRANSCRIPT

A GUIDE TO Econometric Modelling for Modern Marketers
Credible. Experienced. Honest. Expert.

2
A Guide to Econometric Modelling for Modern Marketers
About usWe’re MetaMetrics and we specialise in econometric modelling for marketing, helping our clients make better marketing decisions, prove and continually improve their results.
We’re a tight team of highly experienced, expert econometricians. We’re passionate about the figures and getting them right for you.
We wrote this paper so that Marketers would have a credible, readable, and accurate source for finding out what econometric modelling really is and how to use it effectively.
Do let us know what you think. We’re an approachable bunch.
Tom Lloyd, Philip Gaudoin and Sam Watts MetaMetrics Directors and expert Econometricians [email protected]
www. metametrics.co.uk
A Guide to Econometric Modelling for Modern Marketers
A GUIDE TO Econometric Modelling for Modern Marketers
Part 1 What is Econometric Modelling?
Part 2 Economagic: How Econometrics Works
Part 3 Vital Statistics: R2 and t
Part 4 Measuring Media: Adstock
Part 5 Measuring Media: Diminishing Returns
Part 6 Measuring Media: Paid Search (PPC)
Part 7 Measuring Media: Long-run Media Effects
Part 8 Should we do an Econometrics Project?
Part 9 How to Choose an Econometrics Supplier
Part 10 How to get an Econometrics Project Right
Conclusion
A Guide to Econometric Modelling for Modern Marketers
What is Econometric Modelling?Econometric Modelling is an approach to marketing attribution. The basic question it answers is, “What is driving my sales (or other KPI)?”
As these drivers are often referred to as the ‘marketing mix’, econometric modelling, when applied to sales and other commercial KPIs, has become known as Marketing Mix Modelling (MMM). Marketing, of course, covers the whole range of levers (price, promotion, placement) but the focus of MMM studies is often on the media element – identifying the contribution of media to sales, calculating the ROI of media, and optimising media budgets and deployment in the future.
And, of course, it’s the future that’s the ultimate goal.
It’s all well and good knowing how your marketing performed in the past, but where econometrics really becomes valuable is when we use it to shape our future plans – the activities we do, how much we do of them, when, where and how.
Part 1
Part 3
5
A Guide to Econometric Modelling for Modern Marketers
What is Econometric Modelling?Part 1
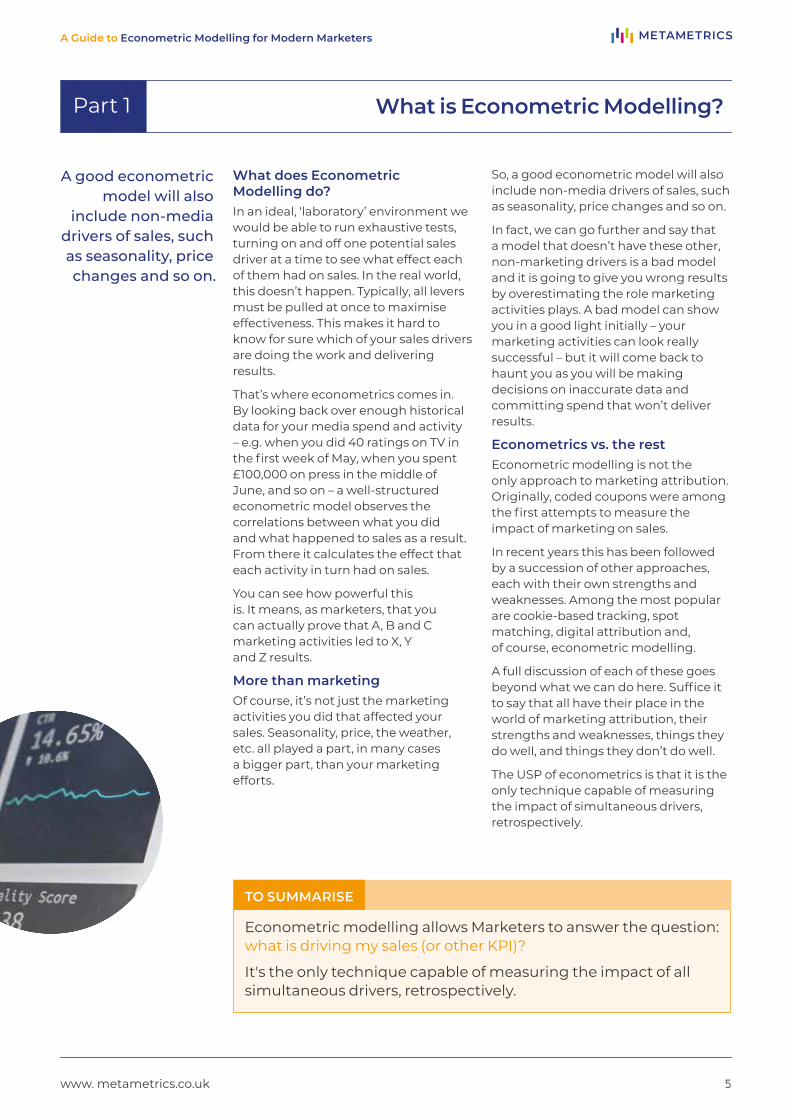
What does Econometric Modelling do?In an ideal, ‘laboratory’ environment we would be able to run exhaustive tests, turning on and off one potential sales driver at a time to see what effect each of them had on sales. In the real world, this doesn’t happen. Typically, all levers must be pulled at once to maximise effectiveness. This makes it hard to know for sure which of your sales drivers are doing the work and delivering results.
That’s where econometrics comes in. By looking back over enough historical data for your media spend and activity – e.g. when you did 40 ratings on TV in the first week of May, when you spent £100,000 on press in the middle of June, and so on – a well-structured econometric model observes the correlations between what you did and what happened to sales as a result. From there it calculates the effect that each activity in turn had on sales.
You can see how powerful this is. It means, as marketers, that you can actually prove that A, B and C marketing activities led to X, Y and Z results.
More than marketingOf course, it’s not just the marketing activities you did that affected your sales. Seasonality, price, the weather, etc. all played a part, in many cases a bigger part, than your marketing efforts.
So, a good econometric model will also include non-media drivers of sales, such as seasonality, price changes and so on.
In fact, we can go further and say that a model that doesn’t have these other, non-marketing drivers is a bad model and it is going to give you wrong results by overestimating the role marketing activities plays. A bad model can show you in a good light initially – your marketing activities can look really successful – but it will come back to haunt you as you will be making decisions on inaccurate data and committing spend that won’t deliver results.
Econometrics vs. the restEconometric modelling is not the only approach to marketing attribution. Originally, coded coupons were among the first attempts to measure the impact of marketing on sales.
In recent years this has been followed by a succession of other approaches, each with their own strengths and weaknesses. Among the most popular are cookie-based tracking, spot matching, digital attribution and, of course, econometric modelling.
A full discussion of each of these goes beyond what we can do here. Suffice it to say that all have their place in the world of marketing attribution, their strengths and weaknesses, things they do well, and things they don’t do well.
The USP of econometrics is that it is the only technique capable of measuring the impact of simultaneous drivers, retrospectively.
Econometric modelling allows Marketers to answer the question: what is driving my sales (or other KPI)?
It's the only technique capable of measuring the impact of all simultaneous drivers, retrospectively.
TO SUMMARISE
A good econometric model will also
include non-media drivers of sales, such as seasonality, price changes and so on.
www. metametrics.co.uk
6
A Guide to Econometric Modelling for Modern Marketers
Economagic: How Econometrics WorksThat’s the ‘what’. Now for the ‘how’.
Econometrics is a slightly strange beast in that it combines elements of mathematics, statistics and economics. Fortunately, others have gone before us who have done much of the hard work – proving theorems, solving equations – to develop for us what we have today. Others have, more recently, programmed computers to automate the handle-turning part.
If all that seems a bit daunting, then fear not. In this part and the one that follows we adopt an intuitive approach to explaining how econometrics works, and the handful of key concepts needed to understand what it does.
Part 2
Part 3
7
A Guide to Econometric Modelling for Modern Marketers
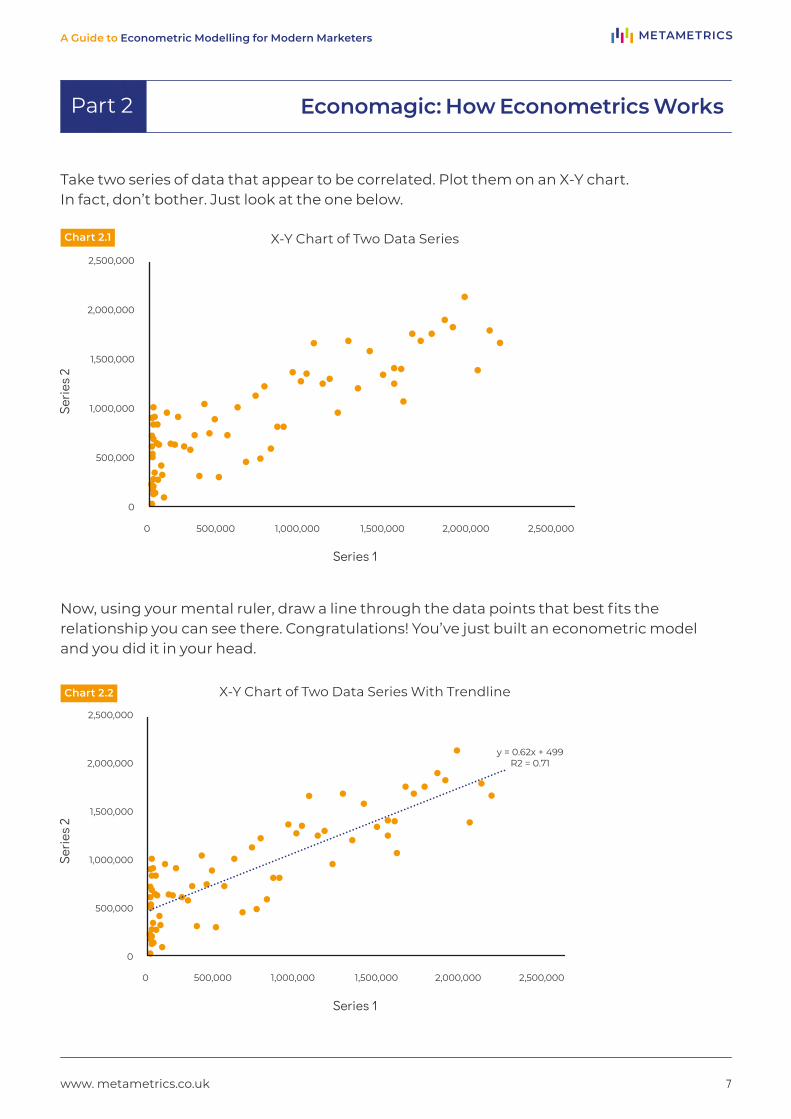
Take two series of data that appear to be correlated. Plot them on an X-Y chart. In fact, don’t bother. Just look at the one below.
Now, using your mental ruler, draw a line through the data points that best fits the relationship you can see there. Congratulations! You’ve just built an econometric model and you did it in your head.
Economagic: How Econometrics WorksPart 2
2,500,000
2,000,000
1,500,000
1,000,000
500,000
2,500,0002,000,0001,500,0001,000,000500,000
0
0
Series 1
Serie
s 2
y = 0.62x + 499R2 = 0.71
2,500,000
2,000,000
1,500,000
1,000,000
500,000
0
2,500,0002,000,0001,500,0001,000,000500,0000
Series 1
Serie
s 2
www. metametrics.co.uk
Chart 2.1
Chart 2.2
X-Y Chart of Two Data Series
X-Y Chart of Two Data Series With Trendline
8
A Guide to Econometric Modelling for Modern Marketers
If you’re someone who uses the trendline feature in Excel, then you should know that all Excel is doing is building an econometric model (a very basic econometric model, very quickly, in the background) and showing the result of it. In fact, that’s where the equation for the line in Chart 2.2 came from.
This works when we’re looking at the correlation between only 2 data series. What if we were to give you now a set of 20 data series, all of which are, to a greater or lesser degree, correlated with each other?
This is where our mental econometrics software fails us, chiefly because most of us don’t find it easy to visualise charts in 20-dimensional space.
Instead we need some calculus, some statistics and, above all, a good computer package to do the heavy lifting. But – and here’s the important thing – the calculus and the statistics and the computer package aren’t doing anything in principle that you didn’t just do a moment ago when you fitted your mental line through all those dots. It just does it for more data than we can manage, and, it has to be said, a little more accurately than our heads are capable of.
We are oversimplifying; there is loads more that a stats package does, a lot more efficiently. And, as people who cut their teeth running econometric models on pocket calculators in university exam halls, we’re profoundly grateful for the advances in computing over the last 25 years.
There’s another important point here, all stats packages fundamentally do the same thing. Give them the same data and they will all spit out the same results.
The clever part of building an econometric model is knowing what variables to put in your model, what permutations to test, how to interpret what the stats are telling you and so on. More of that later.
Economagic: How Econometrics WorksPart 2
The clever part of building an econometric model
is knowing what variables to put in your model,
what permutations to test, how to interpret what the
stats are telling you.
Econometrics takes a bunch of data (called variables) and works out the relationships between them, by analysing their correlation over time.
And that is it.
TO SUMMARISE
www. metametrics.co.uk

A Guide to Econometric Modelling for Modern Marketers
Vital Statistics: R2 and tEconometric models are only that – models. That’s not the same thing at all as the reality we are attempting to capture when we build an econometric model. Thus, there are good models and, well, less good models. Some are built by experienced and intelligent people, doing their best to work out how the world works. Others are not.
Which begs the question, “How do I know if MY model is any good?”
We can answer that in a number of ways. One is to ask whether the model we’ve built accurately represents the sample of data we have. Another is to ask whether we can use our model to make inferences about the true, underlying reality we are trying to capture.
The first is where R2 comes in and the second, t statistics.
Part 3
Part 3
10
A Guide to Econometric Modelling for Modern Marketers
3,500,000
3,000,000
2,500,000
2,000,000
1,500,000
1,000,000
500,000
2,500,0002,000,0001,500,0001,000,000500,000
0
0
y = 0.6216x + 998373R2 = 0.3821
1,400,000
1,600,000
1,800,000
1,200,000
1000,000
800,000
600,000
400,000
200,000
2,500,0002,000,0001,500,0001,000,000500,000
0
0
y = 0.6279x + 249593R2 = 0.9099
R2
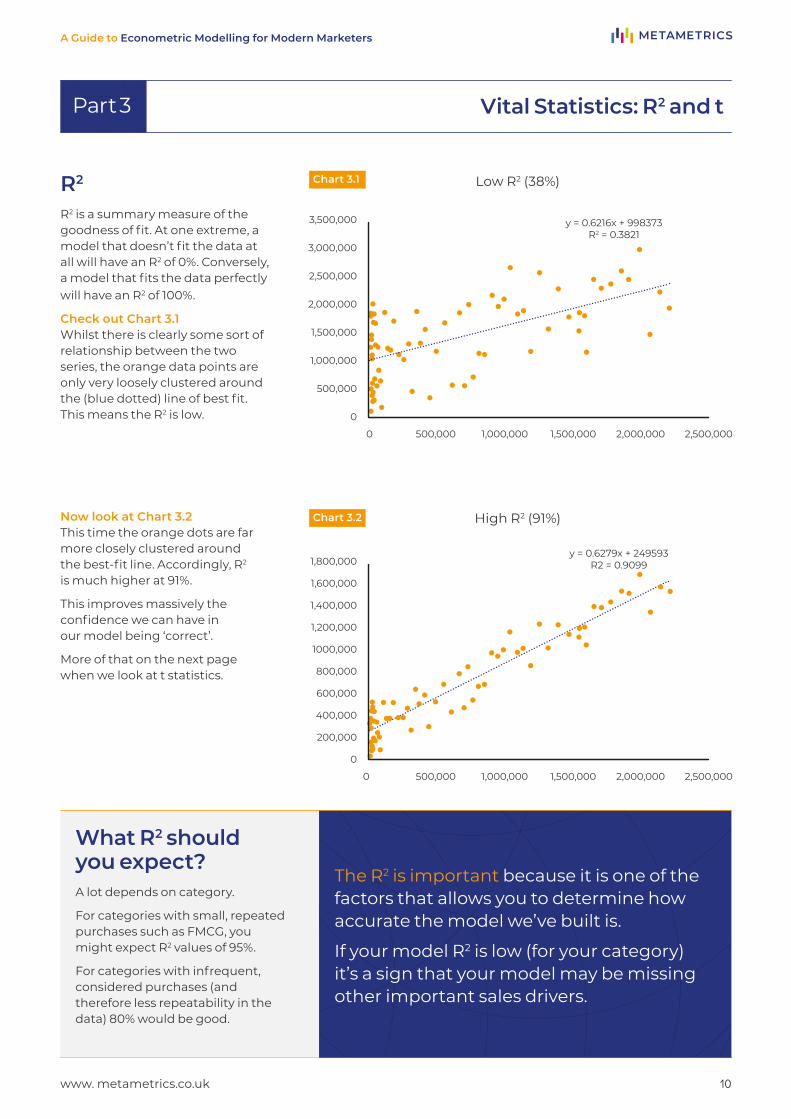
R2 is a summary measure of the goodness of fit. At one extreme, a model that doesn’t fit the data at all will have an R2 of 0%. Conversely, a model that fits the data perfectly will have an R2 of 100%.
Check out Chart 3.1Whilst there is clearly some sort of relationship between the two series, the orange data points are only very loosely clustered around the (blue dotted) line of best fit. This means the R2 is low.
Now look at Chart 3.2This time the orange dots are far more closely clustered around the best-fit line. Accordingly, R2 is much higher at 91%.
This improves massively the confidence we can have in our model being ‘correct’.
More of that on the next page when we look at t statistics.
Vital Statistics: R2 and tPart 3
Chart 3.1
Chart 3.2
Low R2 (38%)
High R2 (91%)
What R2 should you expect? A lot depends on category.
For categories with small, repeated purchases such as FMCG, you might expect R2 values of 95%.
For categories with infrequent, considered purchases (and therefore less repeatability in the data) 80% would be good.
The R2 is important because it is one of the factors that allows you to determine how accurate the model we’ve built is.
If your model R2 is low (for your category) it’s a sign that your model may be missing other important sales drivers.
www. metametrics.co.uk
Part 3
11
A Guide to Econometric Modelling for Modern Marketers
Vital Statistics: R2 and tPart 3
A high t stat means we can have confidence that we
have found a real finding, a truth about the world and
the way our business works
Note the limitations of R2:• It’s a summary measure that tells us about the model overall
– it doesn’t tell us anything about the composition of the model, and whether we’ve got any of that right.
• It’s prone to manipulation. Anyone building a model can get a fantastic R2 just by throwing in any number of drivers into their model, regardless of how important each of them is. Yes, that’s right. As you add variables to your model, R2 only goes one way – up.
t statisticst statistics go one stage further and indicate our ability to infer ‘truths’ about the world. When you build an econometric model, you are making inferences.
Think of it this way. Suppose the measurements you obtain from your particular sample of data are applicable only to that sample of data. It wouldn’t be a very useful model, would it? As soon as you went to use your model to guide decisions about what to do next week, it would crumble to pieces in your hands.
t statistics are a guide to how far we can use our model to make inferences about the real world.
A high t stat means we can have confidence that we have found something real, a truth about the world and the way our business works, that we can bank and use to inform our planning.
We are drastically simplifying here, of course.
There is a lot more to this business of inference (and the conditions under which inferences can properly be made) than most people need or want to know. The key point is that t stats are a good thing, and the higher they are (ideally greater than about 2 – you will have to trust us on that number) the more reliable and robust your ROIs will be.
So, ask to see the t stats and check they’re all at least 2. We’re always happy to share them with clients. Don’t be bound solely by them, but do make use of them to assure yourself that you’ve got a model worth having and that won’t let you down the first time you go to use it in anger.
Neither of these metrics are the final word in validating your econometric models, which is why you should, in the first instance, make every effort to make sure that the people building your models aren’t the wrong sort of econometricians.
www. metametrics.co.uk
R2 and t statistics are important diagnostic criteria for econometric models. Don’t be ruled by them but don’t ignore them either.
TO SUMMARISE

www. metametrics.co.uk 12
A Guide to Econometric Modelling for Modern Marketers
A well-structured econometric model observes the correlations between what you did and what
happened to sales as a result

13
A Guide to Econometric Modelling for Modern Marketers
Measuring Media: AdstockWe ALL remember ads that we saw years ago. Often these have become the iconic ads (Compare the Meerkat and good old Shake ‘n’ Vac) that stick in your memory and last the test of time.
What is true of the long term, is even more true of what might be called the ‘medium term’, that is the weeks and months immediately after an ad campaign has finished airing. We remember an ad and, in some cases, act on it after it has finished airing.
And it’s this ‘delayed acting’ that shows up as something called ‘adstock’ (or its occasional name ‘carry-over’). The standard approach to measuring adstock is to treat it as exponential decay, in effect like radioactive decay, where we believe that it becomes less and less powerful over time.
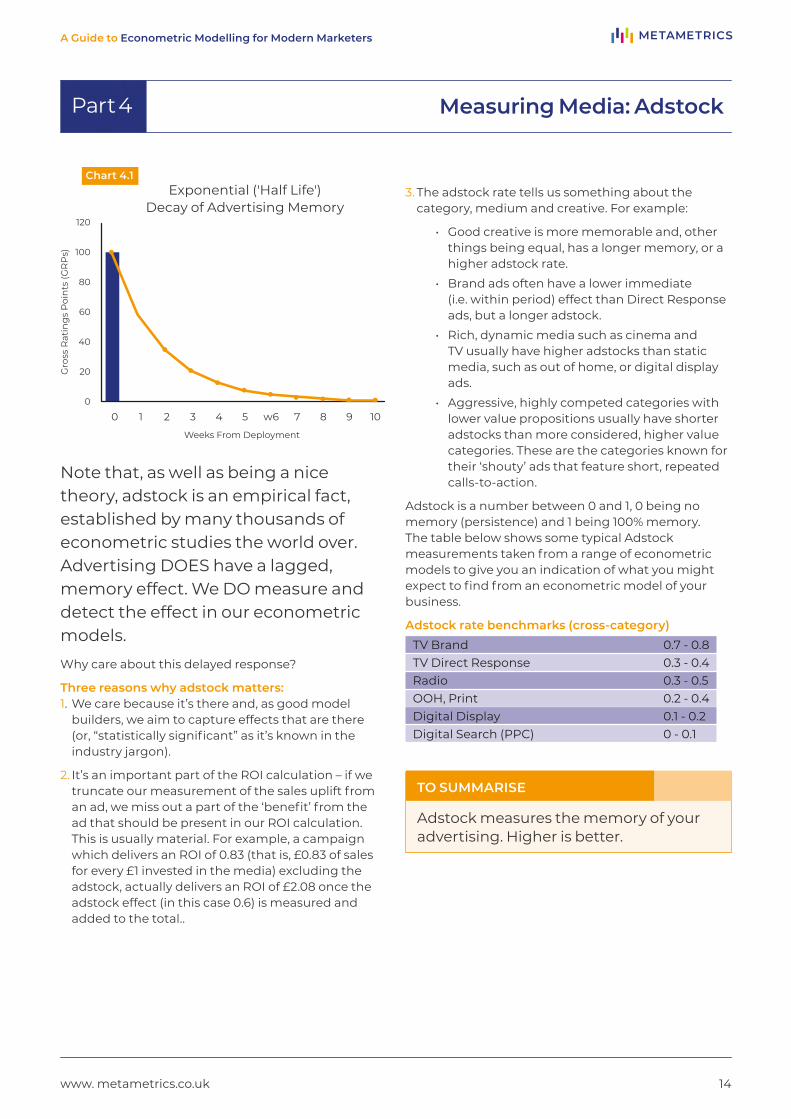
This is shown in in Chart 4.1, on the next page. 100 ratings, or Gross Rating Points (GRPs) of TV are deployed in week 0 (don’t worry if the idea of GRPs is new to you – think of them as the ‘amount’ of TV advertising you are doing in that week). The effect of that TV advert doesn’t vanish after that week, but instead persists into the following weeks, always decreasing, until by week 10 it has, to all practical purposes, completely decayed away. That gradual decay is shown by the orange line.
This persistence of an effect after the campaign ends is the adstock, and we measure the size of it with econometric modelling.
Part 4
14
A Guide to Econometric Modelling for Modern Marketers
Note that, as well as being a nice theory, adstock is an empirical fact, established by many thousands of econometric studies the world over. Advertising DOES have a lagged, memory effect. We DO measure and detect the effect in our econometric models.
Why care about this delayed response?
Three reasons why adstock matters:1. We care because it’s there and, as good model
builders, we aim to capture effects that are there (or, “statistically significant” as it’s known in the industry jargon).
2. It’s an important part of the ROI calculation – if we truncate our measurement of the sales uplift from an ad, we miss out a part of the ‘benefit’ from the ad that should be present in our ROI calculation. This is usually material. For example, a campaign which delivers an ROI of 0.83 (that is, £0.83 of sales for every £1 invested in the media) excluding the adstock, actually delivers an ROI of £2.08 once the adstock effect (in this case 0.6) is measured and added to the total..
3. The adstock rate tells us something about the category, medium and creative. For example:
• Good creative is more memorable and, other things being equal, has a longer memory, or a higher adstock rate.
• Brand ads often have a lower immediate (i.e. within period) effect than Direct Response ads, but a longer adstock.
• Rich, dynamic media such as cinema and TV usually have higher adstocks than static media, such as out of home, or digital display ads.
• Aggressive, highly competed categories with lower value propositions usually have shorter adstocks than more considered, higher value categories. These are the categories known for their ‘shouty’ ads that feature short, repeated calls-to-action.
Adstock is a number between 0 and 1, 0 being no memory (persistence) and 1 being 100% memory. The table below shows some typical Adstock measurements taken from a range of econometric models to give you an indication of what you might expect to find from an econometric model of your business.
Adstock rate benchmarks (cross-category)TV Brand 0.7 - 0.8TV Direct Response 0.3 - 0.4Radio 0.3 - 0.5OOH, Print 0.2 - 0.4Digital Display 0.1 - 0.2Digital Search (PPC) 0 - 0.1
120
100
Gro
ss R
atin
gs
Poi
nts
(GR
Ps)
Weeks From Deployment
80
60
40
20
0
0 1 2 3 4 5 w6 7 8 9 10
Measuring Media: AdstockPart 4
Exponential ('Half Life') Decay of Advertising Memory
www. metametrics.co.uk
Chart 4.1
Adstock measures the memory of your advertising. Higher is better.
TO SUMMARISE

15
A Guide to Econometric Modelling for Modern Marketers
Measuring Media: Diminishing Returns You might not realise it, but you'll already be familiar with the notion of diminishing returns from everyday life. Twice as much is not usually twice as good. That second helping of ice-cream isn’t quite as good as the first scoop, as taste buds are overwhelmed and appetites sated.
So it is with media. Twice as much is not twice as good. Doubling the deployment of media within a particular period will not, typically, result in a doubling of the sales driven by media.
Note that the concept of diminishing returns is time-related.
Doubling your media deployment in any given month won’t double the sales you get from it. However, doubling it over the course of a one-year period, say by scheduling a second campaign 6 months after the first one, might well double them. By the time the second campaign rolls around, customers who responded the first time may be ready for a second purchase (e.g. FMCG category), or new customers may have come into the market (e.g. car insurance).
Part 5
16
A Guide to Econometric Modelling for Modern Marketers
Measuring Media: Diminishing Returns Part 5
ROI is not a constant
The importance of the concept of diminishing returns concept is evident when we look at what it means in relation to ROI.
If your £500k campaign delivered £1m of incremental sales (i.e. an ROI of 2), then, because of diminishing returns, doubling your investment to £1m won’t deliver £2m of incremental sales. Instead, it will be lower, e.g. £1.8m (i.e. an ROI of 1.8). So we need to measure the rate of diminishing returns, which is what econometrics does for us.
What this shows us is that, because of diminishing returns, ROI itself is not a constant that holds true for every level of investment, but a number that varies with the level of spend (and the time it’s spend over).
This is why it is absolutely vital that any good econometric model measures the extent of diminishing returns.
The detail of how to measure diminishing returns with econometric modelling is beyond the scope of this book, but, essentially, an iterative approach is deployed, the modeller looping through various ‘sales response curves’ (as they’re known) until one is found that maximises the statistical fit of the model (best t-stat, highest R2 – see Part 3).
What about the opposite; increasing returns?
Ultimately, no, these don’t exist. Everything in our world is constrained – there are limits on budgets, appetites, time, energy and interest. But that doesn’t mean there can’t be ‘areas’ of increasing returns, which persist for a while, and then give way to diminishing returns.
The best way to understand how this happens is to think about your audience.
It is absolutely vital that any good econometric model
measures the extent of diminishing returns.
www. metametrics.co.uk
17
A Guide to Econometric Modelling for Modern Marketers
The first time they hear your message it is, by definition, new to everyone.
The second, third and fourth times it is not.
It may take 2 or 3 exposures for your audience to notice and ‘get it’ (hence, “cut-through” as it’s known), but once they have got it, subsequent exposures become less and less effective.
You’re really telling them something they already know and haven’t (yet) forgotten. Hence your returns (from doing more and more exposures) diminish. Hence diminishing returns.
Ultimately this has important implications for how we choose to laydown (“flight”) our media to maximise the sales we get from it. Under-cook your investment and you risk not cutting through to the space where you get the best ROI. Conversely, overdo it, and you’re spending unnecessary amounts of money, causing your ROIs to be suppressed.
And it’s not just the overall levels of investment that are at issue. With correct calibration of the sales response curves from an econometric model, we can undertake granular simulations of media laydown helping us identify the best weeks of the year in which to deploy our campaigns and how much we should spend on each medium in each week, to give us the most bang for our buck.
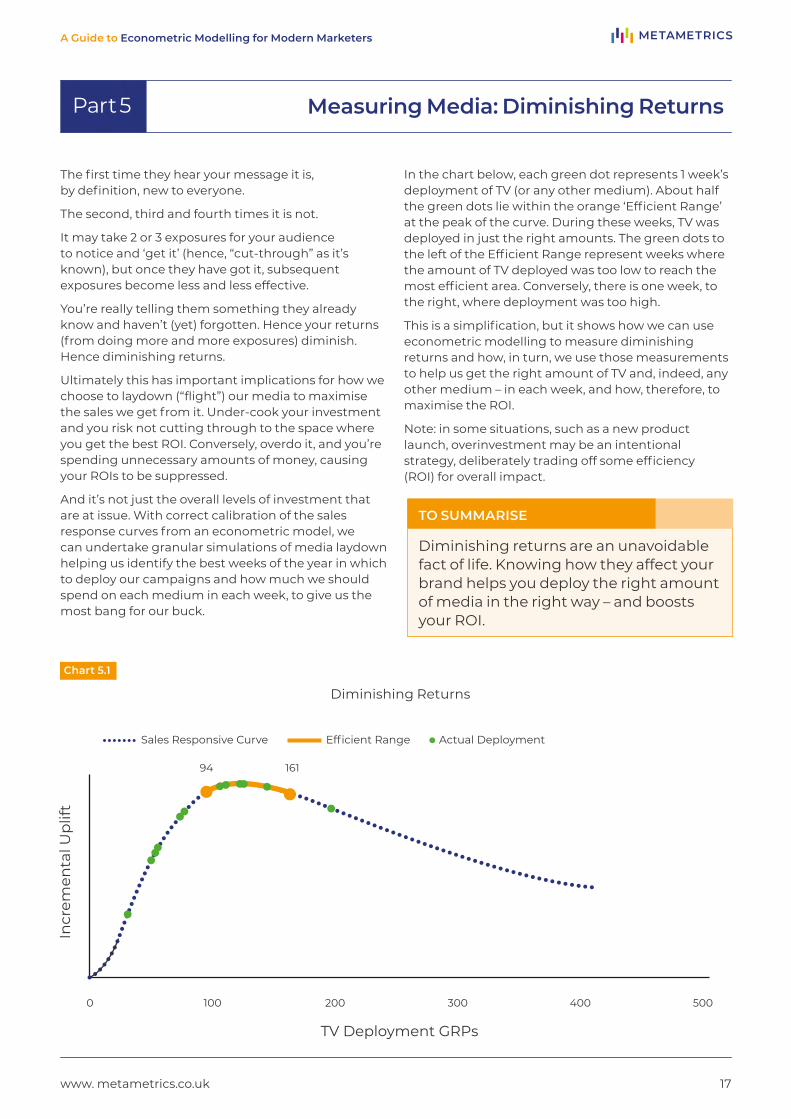
In the chart below, each green dot represents 1 week’s deployment of TV (or any other medium). About half the green dots lie within the orange ‘Efficient Range’ at the peak of the curve. During these weeks, TV was deployed in just the right amounts. The green dots to the left of the Efficient Range represent weeks where the amount of TV deployed was too low to reach the most efficient area. Conversely, there is one week, to the right, where deployment was too high.
This is a simplification, but it shows how we can use econometric modelling to measure diminishing returns and how, in turn, we use those measurements to help us get the right amount of TV and, indeed, any other medium – in each week, and how, therefore, to maximise the ROI.
Note: in some situations, such as a new product launch, overinvestment may be an intentional strategy, deliberately trading off some efficiency (ROI) for overall impact.
Measuring Media: Diminishing Returns Part 5
www. metametrics.co.uk
0
94 161
100 200 300 400 500
Actual DeploymentSales Responsive Curve Efficient Range
TV Deployment GRPs
Incr
emen
tal U
plif
t
Diminishing Returns
Chart 5.1
Diminishing returns are an unavoidable fact of life. Knowing how they affect your brand helps you deploy the right amount of media in the right way – and boosts your ROI.
TO SUMMARISE
www. metametrics.co.uk 18
A Guide to Econometric Modelling for Modern Marketers
Twice as much is not twice as good. Doubling the deployment of media within
a particular period will not, typically, result in a doubling of the sales driven by media

19
A Guide to Econometric Modelling for Modern Marketers
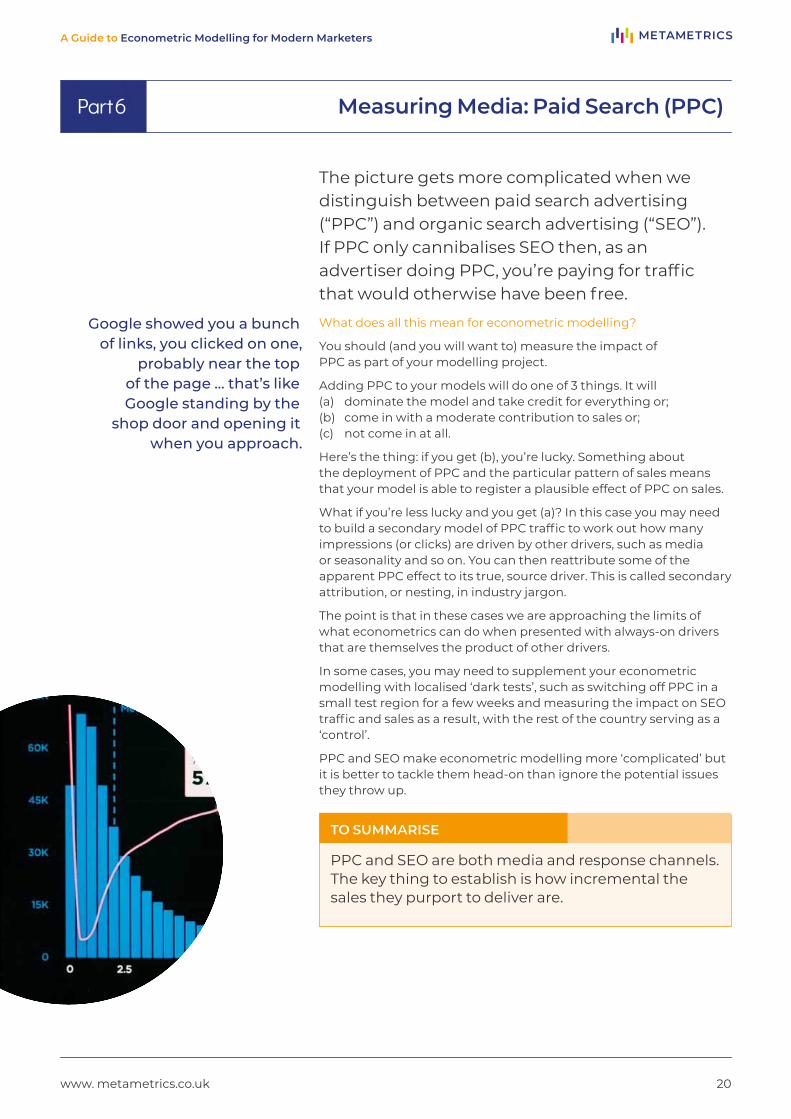
Measuring Media: Paid Search (PPC)There’s something a bit odd about Paid Search (“Google” to the masses, aka “Pay per Click” or “PPC”). How did you arrive at that website to buy a new TV? You got on Google, searched for “new TV” (a generic search) or “Curry’s TV” (a brand search), Google showed you a bunch of links, you clicked on one, probably one near the top of the page.
So, Google can take the credit for the sale, right? And, if you use any sort of ‘last-click’ digital attribution to track sales through your website, that’s what it will tell you.
But, weren’t you already searching for something already? All Google did was to channel your existing desire to buy a TV to a particular supplier of TV sets. In the real world, that’s like Google standing by the door of your local Curry’s and opening it when you approach. Helpful, and a nice gesture, but you probably would have made it inside anyway.
That is really the key question here: how incremental is your Paid Search activity? Or, put another way: What would we have sold without it?"
Part 6
20
A Guide to Econometric Modelling for Modern Marketers
The picture gets more complicated when we distinguish between paid search advertising (“PPC”) and organic search advertising (“SEO”). If PPC only cannibalises SEO then, as an advertiser doing PPC, you’re paying for traffic that would otherwise have been free.
What does all this mean for econometric modelling?
You should (and you will want to) measure the impact of PPC as part of your modelling project.
Adding PPC to your models will do one of 3 things. It will (a) dominate the model and take credit for everything or; (b) come in with a moderate contribution to sales or; (c) not come in at all.
Here’s the thing: if you get (b), you’re lucky. Something about the deployment of PPC and the particular pattern of sales means that your model is able to register a plausible effect of PPC on sales.
What if you’re less lucky and you get (a)? In this case you may need to build a secondary model of PPC traffic to work out how many impressions (or clicks) are driven by other drivers, such as media or seasonality and so on. You can then reattribute some of the apparent PPC effect to its true, source driver. This is called secondary attribution, or nesting, in industry jargon.
The point is that in these cases we are approaching the limits of what econometrics can do when presented with always-on drivers that are themselves the product of other drivers.
In some cases, you may need to supplement your econometric modelling with localised ‘dark tests’, such as switching off PPC in a small test region for a few weeks and measuring the impact on SEO traffic and sales as a result, with the rest of the country serving as a ‘control’.
PPC and SEO make econometric modelling more ‘complicated’ but it is better to tackle them head-on than ignore the potential issues they throw up.
Measuring Media: Paid Search (PPC)Part 6
Google showed you a bunch of links, you clicked on one,
probably near the top of the page … that’s like Google standing by the
shop door and opening it when you approach.
www. metametrics.co.uk
PPC and SEO are both media and response channels. The key thing to establish is how incremental the sales they purport to deliver are.
TO SUMMARISE
21
A Guide to Econometric Modelling for Modern Marketers
Measuring Media: Long-run Media EffectsLying just behind this question is the view (belief? hope?) that, as well as generating lots of extra sales in the here and now (eminently measurable with econometrics) our media should be, is, must be, doing something to grow the underlying sales of the business, what might be termed the ‘base’.
Putting to one side questions about the mental model we have of brand building (and it is both questionable and questioned), the question is whether an econometric model can measure this sort of subtle, long-term effect of media.
The answer is yes and no.
Part 7
22
A Guide to Econometric Modelling for Modern Marketers
The rub comes in making the leap from measuring the size of the trend growth to associating it with media, yet alone a particular ad that you ran on TV 6 months ago.
Here is a hard truth: there is no way in the world that any econometric model can convincingly associate a long-term growth trend with a particular campaign that may have caused it. It just can’t be done. All purported claims to be able to do so ultimately come down to making a leap of interpretation.
We’re not saying that leap is bad, but we must be honest. It IS a leap.
The right question is whether that leap is plausible and whether it is a leap shared across the organisation.
We’ve modelled businesses where there has been such a clear step change in underlying base sales from the time of a new creative, that there is no doubt that one had come from the other.
Conversely, we’ve worked in businesses where not only was there a new ad, but a whacking great promotion and a huge jump in distribution at the same time. We were more guarded in our conclusions.
Some econometricians multiply everything by 3. I know, that sounds weird, but it’s based (tentatively) on academic studies that have used various nefarious means to try and estimate a ‘long-run multiplier’.
Whether you do or not, whether you believe these studies or not, the important thing is to be transparent and consistent about what you’re doing to your numbers and why.
For our own part, we prefer not to apply such multipliers, at least until we’ve had a discussion with our client about the topic.
The important point here is not to go into an econometric project with the success or failure riding solely on whether you are able to get a read on this sort of effect. If you do the project for other, more definite outcomes, then any read you get on long-run media effects will be a welcome bonus.
Do go into an econometric project if you want:• to measure the short to medium-
term impact of your media and its efficiency (ROI)
• to identify other sales drivers that affect your business, such as seasonality, competitor activity
• to quantify the impact of these sales drivers.
We’ll look at this in more depth in Part 8 of our series.
Measuring Media: Long-run Media EffectsPart 7
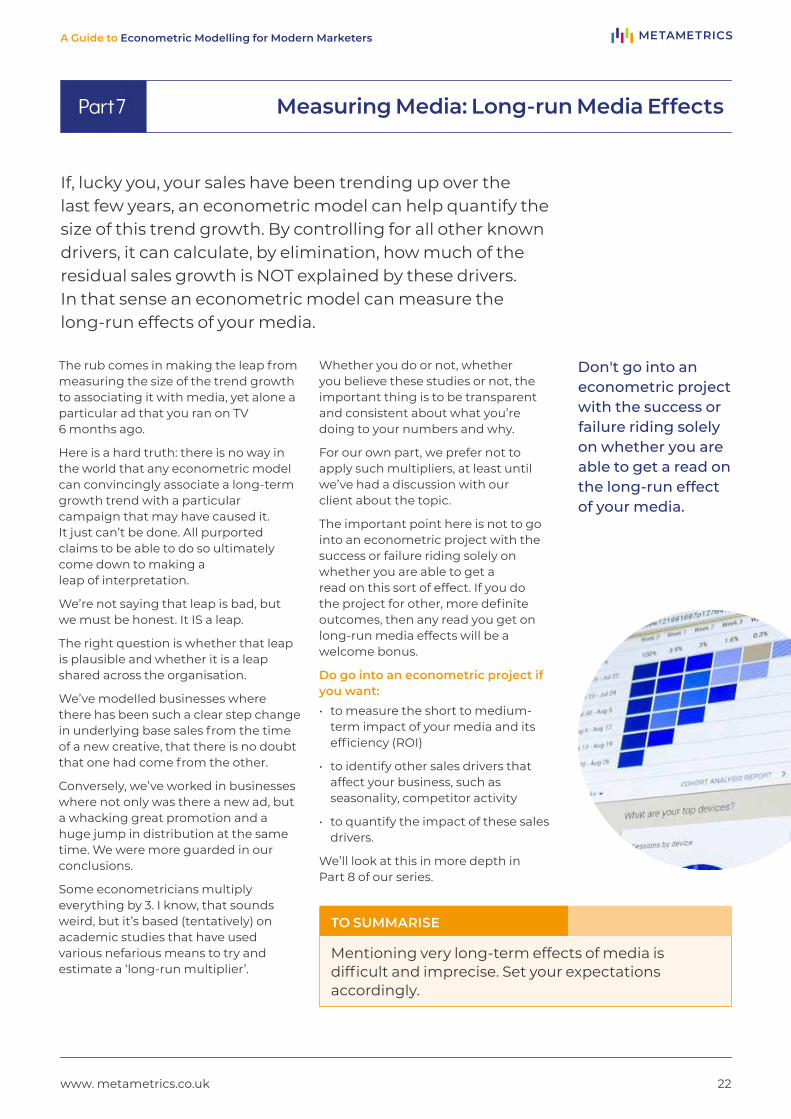
Don't go into an econometric project with the success or failure riding solely on whether you are able to get a read on the long-run effect of your media.
If, lucky you, your sales have been trending up over the last few years, an econometric model can help quantify the size of this trend growth. By controlling for all other known drivers, it can calculate, by elimination, how much of the residual sales growth is NOT explained by these drivers. In that sense an econometric model can measure the long-run effects of your media.
www. metametrics.co.uk
Mentioning very long-term effects of media is difficult and imprecise. Set your expectations accordingly.
TO SUMMARISE

www. metametrics.co.uk 23
A Guide to Econometric Modelling for Modern Marketers
Here is a hard truth: there is no way in the world that any
econometric model can convincingly associate a
long-term growth trend with a particular campaign that
may or may not have caused it. It just can’t be done.
24
A Guide to Econometric Modelling for Modern Marketers
Should we do an Econometrics Project?This may surprise you, but for people who make their living doing econometrics projects we don’t always answer this in the way you might expect. That reluctance, I think, is born of the experience we’ve all had of doing a project that ought never to have happened in the first place.
Looked at from a client’s perspective, there are a lot of great-sounding reasons for doing an econometric project:
“Measure our media performance!”
“Tell me what isn’t working!”
“Tell me how much to spend on each media channel in my marketing plan!”
“Show the board that the stuff I’ve spent the last 12 months doing has had an ACTUAL EFFECT on the business!”
Who wouldn't want some of that?
Part 8
25
A Guide to Econometric Modelling for Modern Marketers
If you’re saying any of the things above to yourself then you certainly should be at least considering commissioning an econometrics project. Those questions are all classic ones that can usually be addressed by an econometric project. But what about questions that can’t?
That leads nicely to the first of four rules of doing an econometrics project…
I. What are your questions?What are you hoping to learn?
In an organisation of any size there is usually a list of questions as long as your arm. Which ones will the proposed study answer? Which ones will it NOT answer? Which ones are in the middle?
From your long list of questions, which ones are deal-breakers, failure to answer which means a project fail?
Be rigorous. Solicit questions from across the organisation. Write them down. Discuss each one with your prospective modelling partner. Give them permission to say “no” and “maybe” as well as “yes”. Everyone likes positivity, but you should be aiming to finish a project positively, and not just start that way.
II. Is my media budget big enough?Econometrics can only measure what you’ve done. Have you spent enough to move the needle? Another way to look at it is the 10% rule. Suppose, very conservatively, an econometrics project generates a 10% improvement in your media ROI. If you’re spending £1m on media, then that amounts to £100,000 of extra value. How does that stack up against your proposed project fee?
III. Have I spent it in ways that are measurable?Sometimes we are approached by clients with unusual media mixes. Perhaps they have spent the majority of their budget sponsoring a football team. Or maybe they have invested heavily in a team of community managers to seed their social media feeds. Perhaps they have spent money on what might be called traditional activities – press, posters, TV and so forth – but it has been spent so idiosyncratically as to make measurement all but impossible.
The point is knowing, and discussing thoroughly, how you have invested the money you are trying to evaluate. This will increase the odds on your project being a success. Be willing to share what you have done with your proposed econometric modelling partner. Be wary if they don’t appear to have any interest in knowing.
Should we do an Econometrics Project?Part 8
Be willing to share what you have done with your
proposed econometric modelling partner. Be wary if they don’t appear to have
any interest in knowing.
www. metametrics.co.uk
26
A Guide to Econometric Modelling for Modern Marketers
IV. Have I got enough data?In the grand scheme of things, there is nothing ‘big’ about the data needed to do an econometric project. It doesn’t occupy millions of petabytes stored on an AWS server somewhere in the cloud. Supercomputers will not be required to build the models.
But, there’s no avoiding it, it does need data.
The starting point for most econometricians is 3 years of weekly data for the thing you are trying to model (sales, web visits, insurance quotes and so on) and the activity you have done to support it. Models can be built with less data (we've successfully delivered projects with as little as 26 weeks of data), but less data means less information, means fewer insights, means fewer of your questions answered.
Econometrics doesn’t in any sense manufacture data – it consumes it. That leads us to another issue about the past
and the future. Econometrics is fundamentally backward-looking. Yes, the resulting models can be used to make forecasts of the future, but the data on which the models are based in the first place must be there.
Again, raise this point early with your econometrics partner. Tell them what you have. Share (under NDA) a sample of data if you can. The more you do here to give your potential partner a real feel for the data they will be working with, the better aligned your expectations will be.
So, ask these 4 golden questions to help you decide whether or not an econometrics project might be right for you. We always discuss them when we are first approached by a prospective client – and sometimes, based on their answers, we might advise them that econometrics is not the right approach for them.
Should we do an Econometrics Project?Part 8
Less data means less information, means fewer
insights, means fewer of your questions answered
www. metametrics.co.uk
There are good reasons and bad for doing an econometric study. Take the time to think through why you think you need one.
TO SUMMARISE

27
A Guide to Econometric Modelling for Modern Marketers
How to Choose an Econometrics SupplierOur founder, Tom Lloyd, had the benefit of working client side for 25 years, before founding MetaMetrics in 2010.
We’re now giving him the floor for the last 2 parts of our series on econometric modelling.
Here are Tom’s Top Tips for choosing an econometrics supplier, from his years of hard-won experience.
Part 9
28
A Guide to Econometric Modelling for Modern Marketers
1. Do they fit with where you are on your econometrics journey?Don't appoint the World’s Largest Econometrics Agency for your first project. It will be way too complicated and expensive and will soon head down the route of live data feeds and API integration – is it really where you are? Are they incomprehensibly mathematical? You might be at a stage where you want that, or not. Do they have international coverage if that's what you want? If you are at the beginning of your econometrics journey then choose an agency or consultancy that understand that and are used to working with clients at this point. They should be prepared to share their knowledge, provide comprehensible explanations, and be asking for realistic levels of data and information from you.
2. ChemistryDo you like them? Do you trust them? Who is actually doing the modelling? One of my mentors at Kraft used to say there aren't good and bad companies, just good and bad modellers.
Find out specifically who will be building the models. I have to admit, at the time I thought this was a strange thing to ask, but I have since seen the wisdom, as so much econometric modelling is ‘handed out’ to recent graduates to do and then ‘reviewed’ by more experienced modellers. This leads to problems as new eyes can’t spot issues as they go along and a lot can get buried and lost in a model. Wise heads will pause model-building and return to you for clarification (or even to redesign the project) as needed.
Also, ask them: what will the problems with your project be? Are they honest about the issues? Do they seem to ‘get’ your situation?
Don’t look for perfection, but do look for commitment. When things don’t go to plan, an ounce of commitment will suddenly become worth a ton of technical know-how.
3. Do you like their sample outputs, do you understand them, are they clear? Get them to show you examples of their outputs. If you are sat there wondering what they mean, imagine now trying to explain an output like that to your colleagues or the board.
4. Are they interested in you?Do they expend the effort needed to understand your issues? Do you get the sense they will tailor their approach to your needs? Or do you think they will be turning the handle on the econometrics machine and spitting out ready-made charts into templated decks? While there are lots of similarities in econometric projects and, of course, rigorous approaches and methodologies that can and should be replicated, all clients and their data are different with differing variables. Your econometric partner should be acknowledging this and building their models to meet your needs.
5. Word of mouthTalk to colleagues who have used them, or, if possible, their other clients.
What do they have to say? Would they choose them again? Would they use them if they were in your situation?
Their good, and bad, experiences could save you a lot of trouble and lead to a better result.
You’ll know if you have chosen the right supplier. There should be a feeling of, ‘we’re in this together’ and honesty about what can be done and what is available. If you feel that the relationship isn’t working, then address it early on. Sometimes these things can be worked out and, if they can’t, it is better to stop the relationship sooner rather than later.
How to Choose an Econometrics SupplierPart 9
Do you get the sense they will tailor their approach to your needs? Or do you think they will be turning the handle on the econometrics machine and spitting out ready-made charts into templated decks?
www. metametrics.co.uk
The models are only part of the story. The people you choose to build them for you will determine whether or not your project is a success.
TO SUMMARISE
29
A Guide to Econometric Modelling for Modern Marketers
How to get an Econometrics Project RightEconometrics doesn’t come cheap. For sure, when done well it can identify all sorts of improvements and optimisations that pay-back the investment several times over, but the fact remains that you have to find several tens of thousands of pounds from your hard-won marketing budget and commit to a labour-intensive process that will draw scrutiny from across the organisation.
If that sounds daunting, here, courtesy again of Tom Lloyd, are a few pointers to improve your odds of success.
Part 10
30
A Guide to Econometric Modelling for Modern Marketers
1. Think about the problem you haveWhat specific decisions are you trying to inform? What decisions CAN you make? Write them down.
If you can't write it down, you don't know what it is with clarity.
If it's full of marketing waffle, ditto... "Elaborate the customer journey to synergise touchpoints" is not a problem definition, it's just waffle.
In econometrics we need to be specific about what we are doing. I know it involves effort to think clearly and be specific, but I guarantee you it will be worth the pain.
2. Get the business involved early and involve key stakeholders from key functions.That might include finance, sales, BI, your media agency and many more besides.
They need to be comfortable with the inputs and what we are doing and why. If you don't have buy-in at the start then, come the results, people will pick holes in it if they don't like what it’s saying.
Some people will not like what it's saying. Not every activity will have been a success, so you need to be prepared for that and have those conversations up front, not at the debrief.
3. Be realistic about timelines especially for a first project. It’s a different sort of project to others that you may have run, in that it involves assimilating data from all areas of the business that have probably never been aligned before. It takes time, there will be glitches; you have been warned! I would estimate that at least half of every econometrics project is spent commissioning, collecting and validating the data.
4. Stay involved in the process.Don't just pitch up to the debrief; have a core team that reviews progress. Ask for an initial discussion with your modelling partner, so you can kick the tyres. Whatever you do, don’t let the big presentation be the first time you are seeing the results. Not unless you like stress and have a vast capacity for thinking through technical issues on your feet.
And, of course, choose the right econometric partner to work with. This relationship is going to be crucial – see section 9 on how to do this.
How to get an Econometrics Project RightPart 10
www. metametrics.co.uk
The principles of good project management apply to an econometrics project as much as to any other. Follow them!
TO SUMMARISE
31
A Guide to Econometric Modelling for Modern Marketers
A Guide to Econometric Modelling for Modern MarketersOver ten sections, we’ve taken you on a journey to understanding econometric modelling for media spend.
We’ve looked at
• What is Econometric Modelling?
• Economagic: How Econometrics Works
• Vital Statistics: R2 and t
• Measuring Media: Adstock
• Measuring Media: Diminishing Returns
• Measuring Media: Paid Search (PPC)
• Measuring Media: Long-run Media Effects
• Should we do an Econometrics Project?
• How to Choose an Econometrics Supplier
• How to get an Econometrics Project Right
Our aim has been to inform you so that you can make better, more confident choices about how and when to use econometric modelling for your media spend and choose the right partner to do it with.
Ultimately, we’re people who are passionate about getting this right and get really frustrated when we see it done wrong. Hopefully, you’re now equipped to get your econometrics project ‘right’.
Tom, Philip and Sam MetaMetrics Directors and expert Econometricians
Conclusion