earth and environmental science - nsw education standards
TRANSCRIPT
NSW Education Standards Authority
Earth and Environmental Science
Additional sample examination questions
– 2 –
Contents
Introduction .................................................................................................... 3
Question List .................................................................................................. 4
Sample Questions
Module 5 Earth’s Processes ........................................................ 8
Module 6 Hazards ..................................................................... 33
Module 7 Climate Science ........................................................ 57
Module 8 Resource Management ............................................. 71
Earth and Environmental Science geological time scale............................. 84
– 3 –
IntroductionThe first HSC examination for the new Earth and Environmental Science Stage 6 syllabus will be held in 2019.
The syllabus and related assessment materials are available on the syllabus page of the NESA website.
The Assessment and Reporting in Earth and Environmental Science Stage 6 document provides the Earth and Environmental Science HSC examination specifications. The Earth and Environmental Science – Sample examination materials document indicates the layout and format of the HSC examination and provides examples of questions that may be found in HSC examinations, with annotations.
This document, Earth and Environmental Science – Additional sample examination questions, provides additional examples of questions that may be found in HSC examinations for Earth and Environmental Science. The document comprises new questions, as well as questions that have been published in the sample examination materials and some questions that have been drawn from previous HSC examinations.
The document has been developed to assist teachers to:
• create sample HSC examination papers • prepare revision exercises• model question design • consolidate understanding of the syllabus.
The sample questions are arranged by module. Examples of both objective-response questions and short-answer questions for each of the modules, Earth’s Processes, Hazards, Climate Science and Resource Management, are provided.
Each sample question has been mapped to show how the question relates to content, syllabus outcomes and bands. Questions may require candidates to integrate knowledge, understanding and skills from different content areas. Each question is mapped to the main content area(s) being assessed but may be relevant to one or more content areas. When a question has been mapped to multiple content areas, it has been placed under the topic deemed to be most relevant.
Answers for the objective-response questions and marking guidelines for the short-answer questions are also provided. The sample questions, sample answers and marking guidelines provide teachers and students with guidance as to the types of questions that may be included in the examination and how they may be marked. They are not meant to be prescriptive.
Note:
• In this set of sample questions, some stimulus material is used in more than one question. This illustrates how the same content area can be examined in different ways.
• The new Earth and Environmental Science Stage 6 syllabus includes content areas that were also part of previous syllabuses. Where this occurs, teachers and students may still refer to past HSC examination papers for examples of other types of questions that are relevant.
• In this document, ‘Bands’ means the performance bands targeted by the question.
– 4 –
Question List* denotes a multiple-choice question
Module 5 Earth’s Processes
Question Marks Content Syllabus Outcomes Bands
Mod 5 – 1* 1 Mod 5 Development of the Biosphere EES12–12 2–3
Mod 5 – 2* 1 Mod 5 Development of the Biosphere EES12–12 2–3
Mod 5 – 3* 1 Mod 5 Development of the Biosphere EES12–12 3–4
Mod 5 – 4* 1 Mod 5 Development of the Biosphere EES12–6, EES12–12 3–4
Mod 5 – 5* 1 Mod 5 Changes in the Geosphere, Atmosphere and Hydrosphere EES12–12 2–3
Mod 5 – 6* 1 Mod 5 Changes in the Geosphere, Atmosphere and Hydrosphere ESS12–4, EES12–12 3–4
Mod 5 – 7* 1 Mod 5 Changes in the Geosphere, Atmosphere and Hydrosphere EES12–12 4–5
Mod 5 – 8* 1 Mod 5 Changes in the Geosphere Atmosphere and Hydrosphere EES12–4, EES12–12 4–5
Mod 5 – 9* 1 Mod 5 Plate Tectonic Supercycle EES12–6, EES12–12 4–5
Mod 5 – 10* 1 Mod 5 Plate Tectonic Supercycle EES12–5, EES12–12 2–3
Mod 5 – 11* 1 Mod 5 Plate Tectonic Supercycle EES12–12 3–4
Mod 5 – 12* 1 Mod 5 Fossil Formation and Stratigraphy EES12–12 2–3
Mod 5 – 13* 1 Mod 5 Fossil Formation and Stratigraphy ESS12–4, EES12–12 3–4
Mod 5 – 14* 1 Mod 5 Fossil Formation and Stratigraphy ESS12–5, EES12–12 3–4
Mod 5 – 15* 1 Mod 5 Fossil Formation and Stratigraphy ESS12–4, EES12–12 5–6
Mod 5 – 16* 1 Mod 5 Fossil Formation and Stratigraphy EES12–4, EES12–12 4–5
Mod 5 – 17* 1 Mod 5 Fossil Formation and Stratigraphy EES12–5, EES12–12 5–6
Mod 5 – 18* 1 Mod 5 Fossil Formation and Stratigraphy EES12–6, EES12–12 5–6
Mod 5 – 19* 1 Mod 5 Fossil Formation and Stratigraphy EES12–6, EES12–12 5–6
Mod 5 – 20 4Mod 5 Development of the BiosphereMod 5 Plate Tectonic SupercycleMod 5 Fossil Formation and Stratigraphy
EES12–6, EES12–12 2–5
Mod 5 – 21 (a) 2 Mod 5 Development of the Biosphere EES12–5, EES12–12 2–4
Mod 5 – 21 (b) 3 Mod 5 Development of the Biosphere EES12–5, EES12–12 3–6
Mod 5 – 22 (a) 3 Mod 5 Changes in the Geosphere, Atmosphere and Hydrosphere
EES12–6, ESS12–7, EES12–12 2–5
Mod 5 – 22 (b) 3 Mod 5 Changes in the Geosphere, Atmosphere and Hydrosphere
EES12–6, ESS12–7, EES12–12 2–5
Mod 5 – 23 4 Mod 5 Changes in the Geosphere, Atmosphere and Hydrosphere ESS12–7, EES12–12 2–5
Mod 5 – 24 4 Mod 5 Changes in the Geosphere, Atmosphere and Hydrosphere
EES12–4, EES12–5, EES12–6, EES12–12 2–5
– 5 –
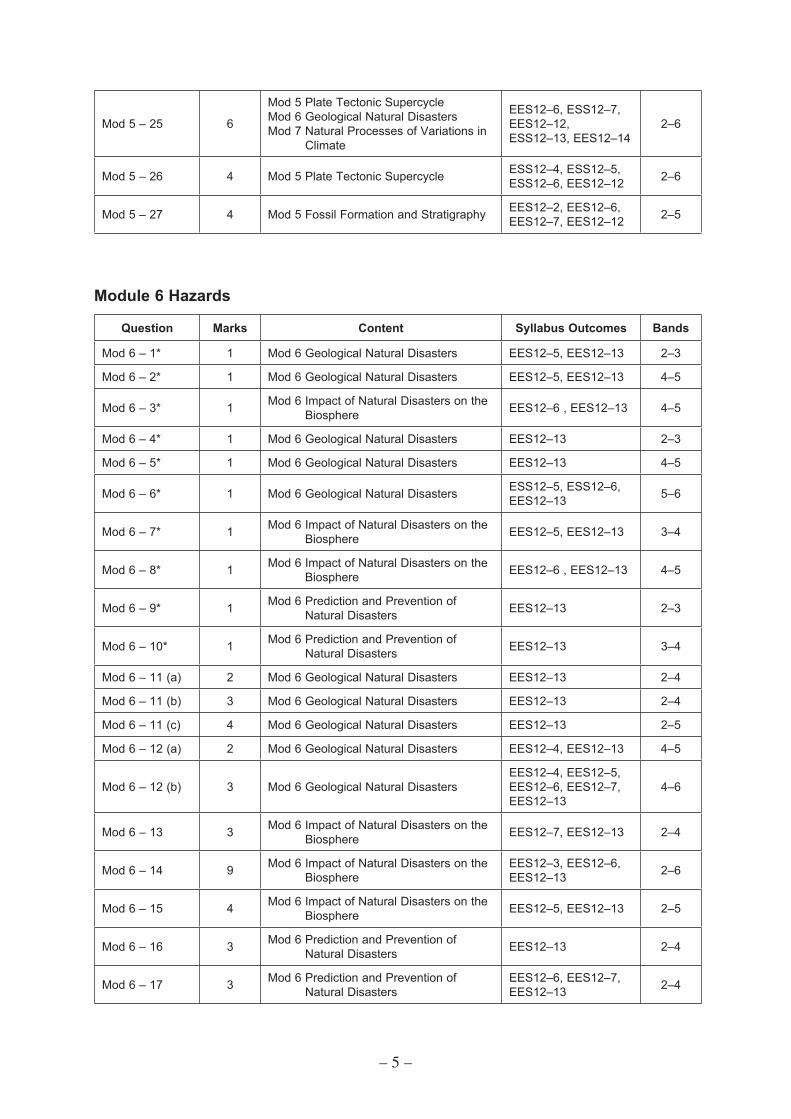
Mod 5 – 25 6
Mod 5 Plate Tectonic SupercycleMod 6 Geological Natural DisastersMod 7 Natural Processes of Variations in
Climate
EES12–6, ESS12–7, EES12–12, ESS12–13, EES12–14
2–6
Mod 5 – 26 4 Mod 5 Plate Tectonic Supercycle ESS12–4, ESS12–5, ESS12–6, EES12–12 2–6
Mod 5 – 27 4 Mod 5 Fossil Formation and Stratigraphy EES12–2, EES12–6, EES12–7, EES12–12 2–5
Module 6 Hazards
Question Marks Content Syllabus Outcomes Bands
Mod 6 – 1* 1 Mod 6 Geological Natural Disasters EES12–5, EES12–13 2–3
Mod 6 – 2* 1 Mod 6 Geological Natural Disasters EES12–5, EES12–13 4–5
Mod 6 – 3* 1 Mod 6 Impact of Natural Disasters on the Biosphere EES12–6 , EES12–13 4–5
Mod 6 – 4* 1 Mod 6 Geological Natural Disasters EES12–13 2–3
Mod 6 – 5* 1 Mod 6 Geological Natural Disasters EES12–13 4–5
Mod 6 – 6* 1 Mod 6 Geological Natural Disasters ESS12–5, ESS12–6, EES12–13 5–6
Mod 6 – 7* 1 Mod 6 Impact of Natural Disasters on the Biosphere EES12–5, EES12–13 3–4
Mod 6 – 8* 1 Mod 6 Impact of Natural Disasters on the Biosphere EES12–6 , EES12–13 4–5
Mod 6 – 9* 1 Mod 6 Prediction and Prevention of Natural Disasters EES12–13 2–3
Mod 6 – 10* 1 Mod 6 Prediction and Prevention of Natural Disasters EES12–13 3–4
Mod 6 – 11 (a) 2 Mod 6 Geological Natural Disasters EES12–13 2–4
Mod 6 – 11 (b) 3 Mod 6 Geological Natural Disasters EES12–13 2–4
Mod 6 – 11 (c) 4 Mod 6 Geological Natural Disasters EES12–13 2–5
Mod 6 – 12 (a) 2 Mod 6 Geological Natural Disasters EES12–4, EES12–13 4–5
Mod 6 – 12 (b) 3 Mod 6 Geological Natural DisastersEES12–4, EES12–5, EES12–6, EES12–7, EES12–13
4–6
Mod 6 – 13 3 Mod 6 Impact of Natural Disasters on the Biosphere EES12–7, EES12–13 2–4
Mod 6 – 14 9 Mod 6 Impact of Natural Disasters on the Biosphere
EES12–3, EES12–6, EES12–13 2–6
Mod 6 – 15 4 Mod 6 Impact of Natural Disasters on the Biosphere EES12–5, EES12–13 2–5
Mod 6 – 16 3 Mod 6 Prediction and Prevention of Natural Disasters EES12–13 2–4
Mod 6 – 17 3 Mod 6 Prediction and Prevention of Natural Disasters
EES12–6, EES12–7, EES12–13 2–4
– 6 –
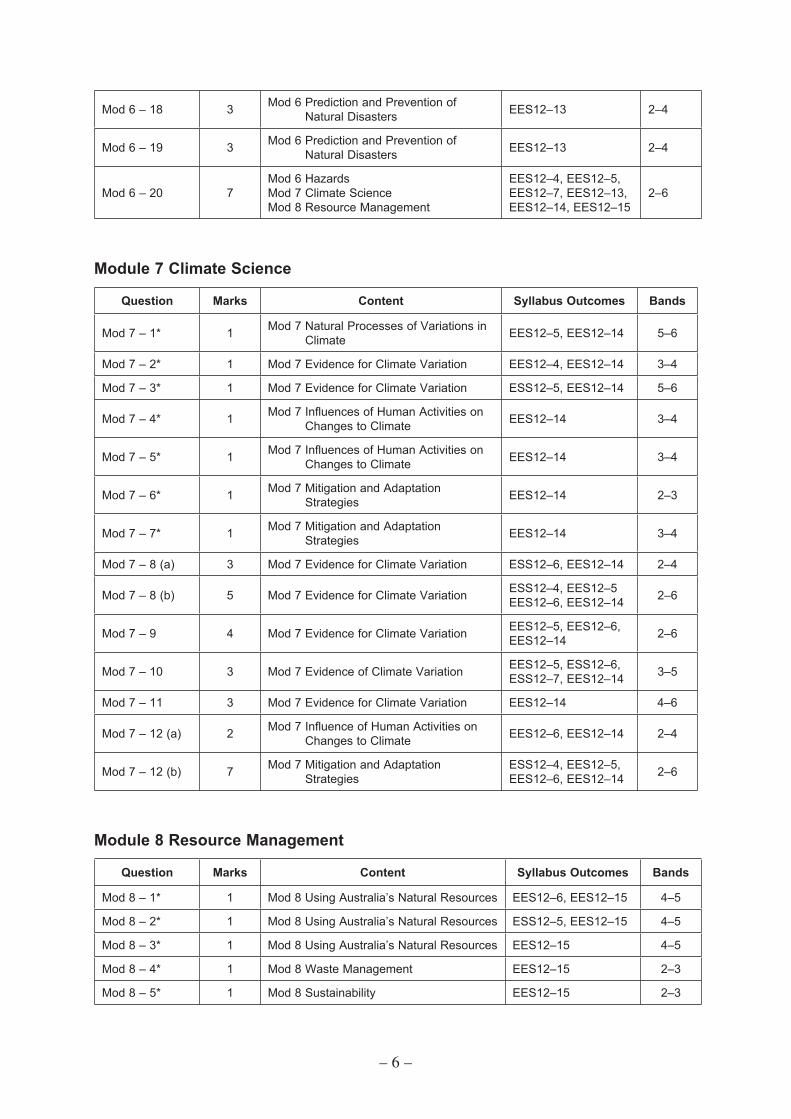
Mod 6 – 18 3 Mod 6 Prediction and Prevention of Natural Disasters EES12–13 2–4
Mod 6 – 19 3 Mod 6 Prediction and Prevention of Natural Disasters EES12–13 2–4
Mod 6 – 20 7Mod 6 HazardsMod 7 Climate Science Mod 8 Resource Management
EES12–4, EES12–5, EES12–7, EES12–13, EES12–14, EES12–15
2–6
Module 7 Climate Science
Question Marks Content Syllabus Outcomes Bands
Mod 7 – 1* 1 Mod 7 Natural Processes of Variations in Climate EES12–5, EES12–14 5–6
Mod 7 – 2* 1 Mod 7 Evidence for Climate Variation EES12–4, EES12–14 3–4
Mod 7 – 3* 1 Mod 7 Evidence for Climate Variation ESS12–5, EES12–14 5–6
Mod 7 – 4* 1 Mod 7 Influences of Human Activities on Changes to Climate EES12–14 3–4
Mod 7 – 5* 1 Mod 7 Influences of Human Activities on Changes to Climate EES12–14 3–4
Mod 7 – 6* 1 Mod 7 Mitigation and Adaptation Strategies EES12–14 2–3
Mod 7 – 7* 1 Mod 7 Mitigation and Adaptation Strategies EES12–14 3–4
Mod 7 – 8 (a) 3 Mod 7 Evidence for Climate Variation ESS12–6, EES12–14 2–4
Mod 7 – 8 (b) 5 Mod 7 Evidence for Climate Variation ESS12–4, EES12–5 EES12–6, EES12–14 2–6
Mod 7 – 9 4 Mod 7 Evidence for Climate Variation EES12–5, EES12–6, EES12–14 2–6
Mod 7 – 10 3 Mod 7 Evidence of Climate Variation EES12–5, ESS12–6, ESS12–7, EES12–14 3–5
Mod 7 – 11 3 Mod 7 Evidence for Climate Variation EES12–14 4–6
Mod 7 – 12 (a) 2 Mod 7 Influence of Human Activities on Changes to Climate EES12–6, EES12–14 2–4
Mod 7 – 12 (b) 7 Mod 7 Mitigation and Adaptation Strategies
ESS12–4, EES12–5, EES12–6, EES12–14 2–6
Module 8 Resource Management
Question Marks Content Syllabus Outcomes Bands
Mod 8 – 1* 1 Mod 8 Using Australia’s Natural Resources EES12–6, EES12–15 4–5
Mod 8 – 2* 1 Mod 8 Using Australia’s Natural Resources ESS12–5, EES12–15 4–5
Mod 8 – 3* 1 Mod 8 Using Australia’s Natural Resources EES12–15 4–5
Mod 8 – 4* 1 Mod 8 Waste Management EES12–15 2–3
Mod 8 – 5* 1 Mod 8 Sustainability EES12–15 2–3

– 7 –
Mod 8 – 6* 1 Mod 8 Sustainability EES12–15 3–4
Mod 8 – 7 (a) 3 Mod 8 Using Australia’s Natural ResourcesMod 8 Sustainability EES12–15 2–4
Mod 8 – 7 (b) 4 Mod 8 Sustainability EES12–15 2–5
Mod 8 – 8 (a) 1 Mod 8 Using Australia’s Natural Resources EES12–5, EES12–15 3–4
Mod 8 – 8 (b) 3 Mod 8 Using Australia’s Natural Resources EES12–6, EES12–15 3–5
Mod 8 – 9 (a) 2 Mod 8 Waste Management EES12–2, EES12–4, EES12–15 2–4
Mod 8 – 9 (b) 2 Mod 8 Waste Management EES12–2, EES12–15 2–4
Mod 8 – 9 (c) 2 Mod 8 Waste ManagementMod 8 Sustainability
EES12–5, EES12–6, EES12–7, EES12–15 3–5
Mod 8 – 10 7 Mod 8 Sustainability EES12–5, EES12–7, EES12–15 2–6
– 8 –
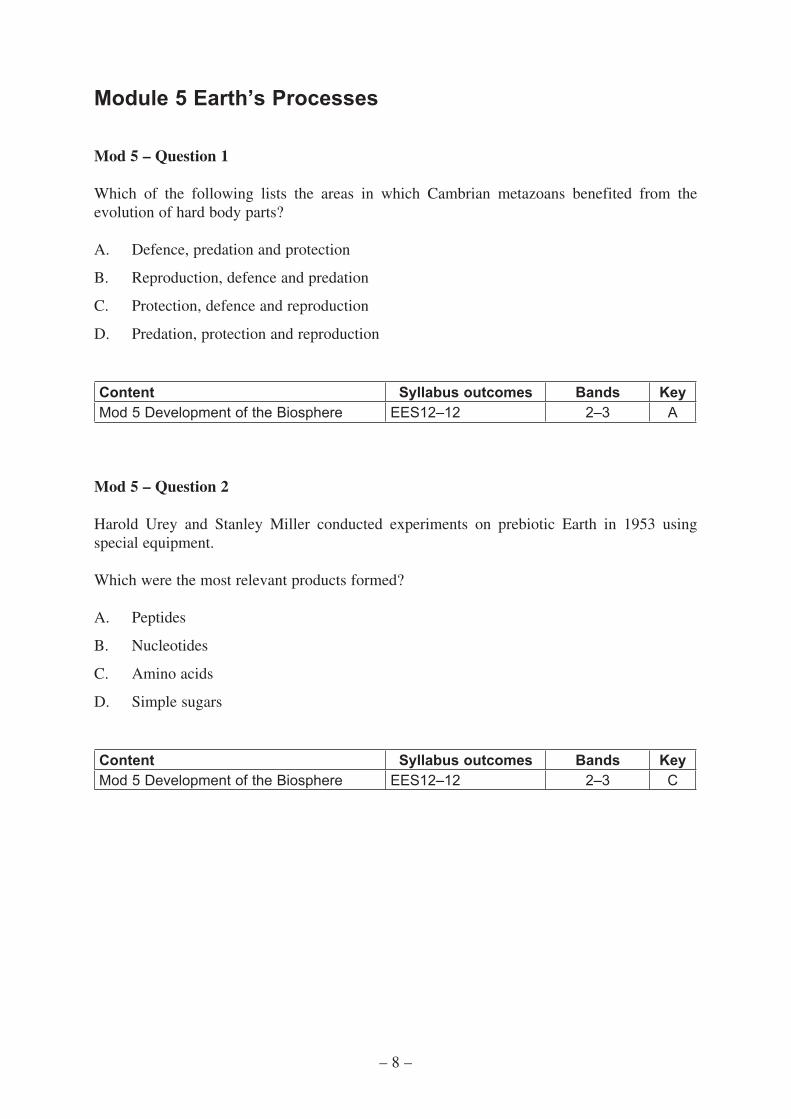
Module 5 Earth’s Processes
Mod 5 – Question 1
Which of the following lists the areas in which Cambrian metazoans benefited from the evolution of hard body parts?
A. Defence, predation and protection
B. Reproduction, defence and predation
C. Protection, defence and reproduction
D. Predation, protection and reproduction
Content Syllabus outcomes Bands KeyMod 5 Development of the Biosphere EES12–12 2–3 A
Mod 5 – Question 2
Harold Urey and Stanley Miller conducted experiments on prebiotic Earth in 1953 using special equipment.
Which were the most relevant products formed?
A. Peptides
B. Nucleotides
C. Amino acids
D. Simple sugars
Content Syllabus outcomes Bands KeyMod 5 Development of the Biosphere EES12–12 2–3 C
– 9 –
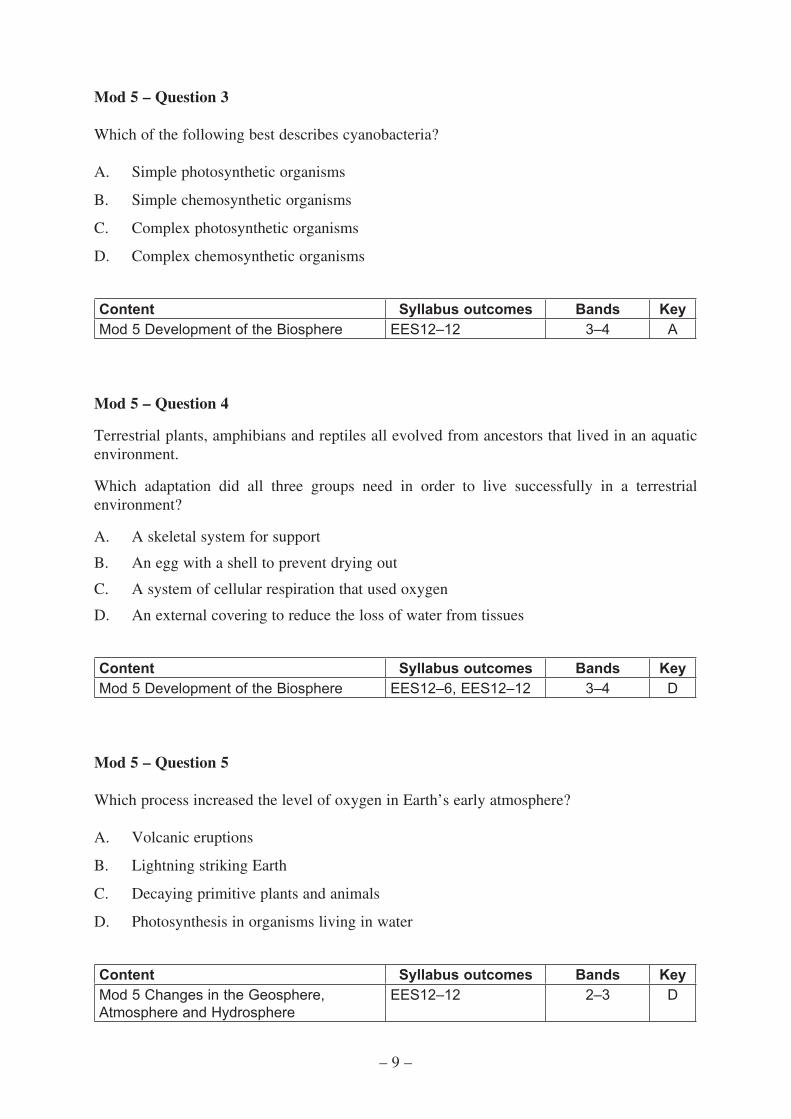
Mod 5 – Question 3
Which of the following best describes cyanobacteria?
A. Simple photosynthetic organisms
B. Simple chemosynthetic organisms
C. Complex photosynthetic organisms
D. Complex chemosynthetic organisms
Content Syllabus outcomes Bands KeyMod 5 Development of the Biosphere EES12–12 3–4 A
Mod 5 – Question 4
Terrestrial plants, amphibians and reptiles all evolved from ancestors that lived in an aquatic environment.
Which adaptation did all three groups need in order to live successfully in a terrestrial environment?
A. A skeletal system for support
B. An egg with a shell to prevent drying out
C. A system of cellular respiration that used oxygen
D. An external covering to reduce the loss of water from tissues
Content Syllabus outcomes Bands KeyMod 5 Development of the Biosphere EES12–6, EES12–12 3–4 D
Mod 5 – Question 5
Which process increased the level of oxygen in Earth’s early atmosphere?
A. Volcanic eruptions
B. Lightning striking Earth
C. Decaying primitive plants and animals
D. Photosynthesis in organisms living in water
Content Syllabus outcomes Bands KeyMod 5 Changes in the Geosphere, Atmosphere and Hydrosphere
EES12–12 2–3 D
– 10 –
Mod 5 – Question 6
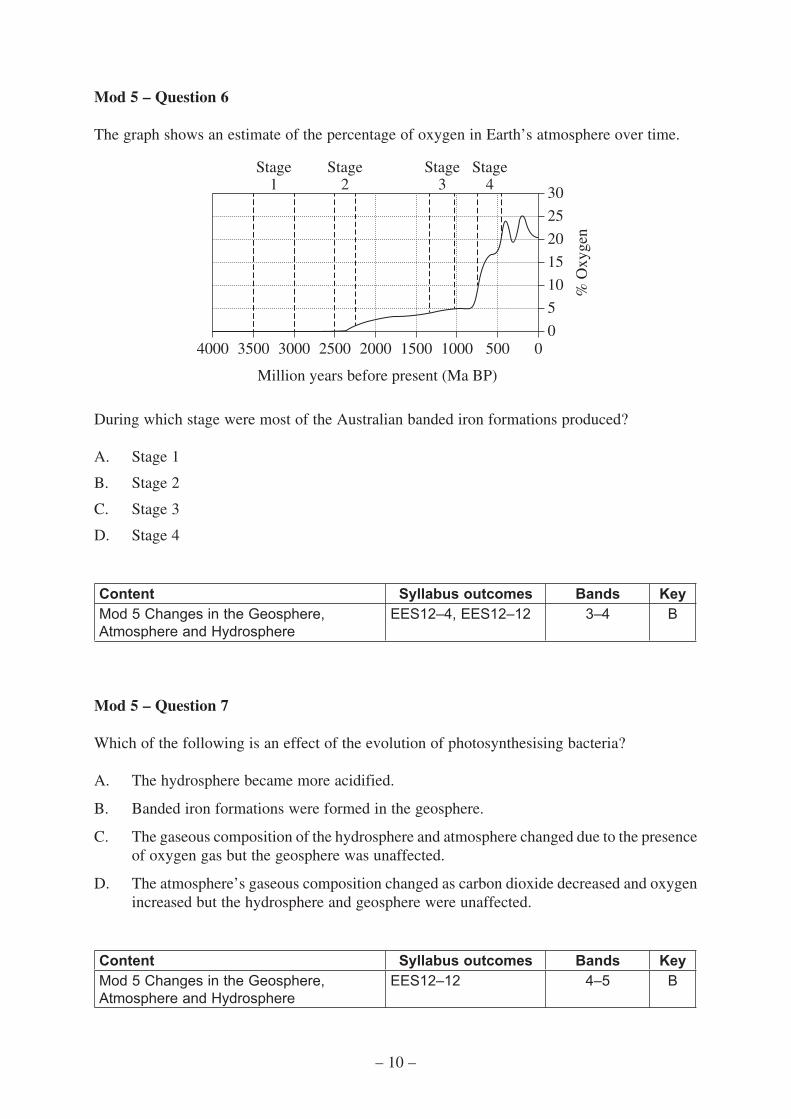
The graph shows an estimate of the percentage of oxygen in Earth’s atmosphere over time.
500 00
5
10
15
20
25
30
10001500
Million years before present (Ma BP)
% O
xyge
n
20002500300035004000
Stage4
Stage3
Stage2
Stage1
During which stage were most of the Australian banded iron formations produced?
A. Stage 1
B. Stage 2
C. Stage 3
D. Stage 4
Content Syllabus outcomes Bands KeyMod 5 Changes in the Geosphere, Atmosphere and Hydrosphere
EES12–4, EES12–12 3–4 B
Mod 5 – Question 7
Which of the following is an effect of the evolution of photosynthesising bacteria?
A. The hydrosphere became more acidified.
B. Banded iron formations were formed in the geosphere.
C. The gaseous composition of the hydrosphere and atmosphere changed due to the presence of oxygen gas but the geosphere was unaffected.
D. The atmosphere’s gaseous composition changed as carbon dioxide decreased and oxygen increased but the hydrosphere and geosphere were unaffected.
Content Syllabus outcomes Bands KeyMod 5 Changes in the Geosphere, Atmosphere and Hydrosphere
EES12–12 4–5 B
– 11 –
Mod 5 – Question 8
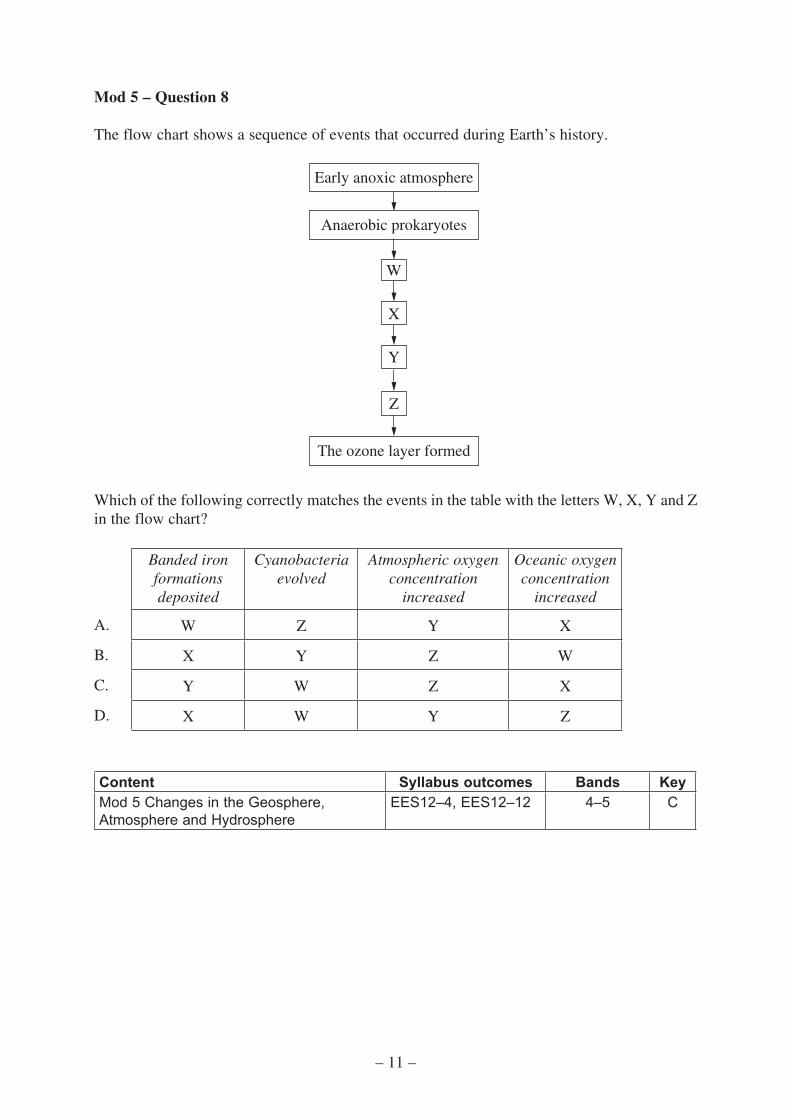
The flow chart shows a sequence of events that occurred during Earth’s history.
Early anoxic atmosphere
Anaerobic prokaryotes
W
X
Y
Z
The ozone layer formed
Which of the following correctly matches the events in the table with the letters W, X, Y and Z in the flow chart?
Banded iron formations deposited
Cyanobacteria evolved
Atmospheric oxygen concentration
increased
Oceanic oxygen concentration
increased
A. W Z Y X
B. X Y Z W
C. Y W Z X
D. X W Y Z
Content Syllabus outcomes Bands KeyMod 5 Changes in the Geosphere, Atmosphere and Hydrosphere
EES12–4, EES12–12 4–5 C

– 12 –
Mod 5 – Question 9
To develop a model to represent the plate tectonic supercycle, it would be necessary to include
A. an interactive 3D model of Earth’s crust.
B. the supercontinents Pangea, Laurasia and Gondwana.
C. a visual representation that shows a sequence of geological processes.
D. the six different supercycles that have occurred during Earth’s history.
Content Syllabus outcomes Bands KeyMod 5 Plate Tectonic Supercycle EES12–6, EES12–12 4–5 C
– 13 –
Mod 5 – Question 10
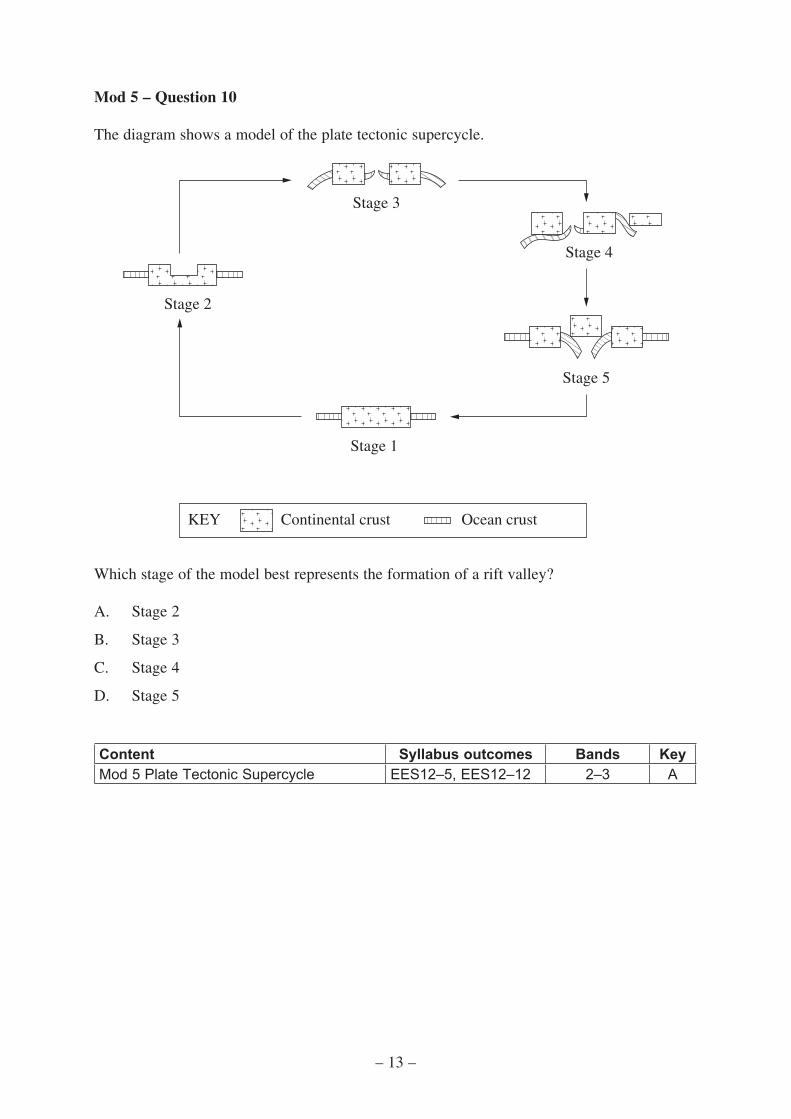
The diagram shows a model of the plate tectonic supercycle.
Stage 1
Stage 2
Stage 4
Ocean crustContinental crust
Stage 5
Stage 3
KEY
Which stage of the model best represents the formation of a rift valley?
A. Stage 2
B. Stage 3
C. Stage 4
D. Stage 5
Content Syllabus outcomes Bands KeyMod 5 Plate Tectonic Supercycle EES12–5, EES12–12 2–3 A

– 14 –
Mod 5 – Question 11
Which of the following is best explained by the plate tectonic supercycle?
A. Cyclical patterns of volcanic eruptions
B. Break-up and formation of supercontinents
C. Cycling of oceanic crust back into Earth’s mantle
D. Mass extinctions at the end of geological time periods
Content Syllabus outcomes Bands KeyMod 5 Plate Tectonic Supercycle EES12–12 3–4 B
Mod 5 – Question 12
Which technique is most useful in absolute dating of rock bodies?
A. Cross-cutting
B. Fossils
C. Inclusions
D. Radiometric
Content Syllabus outcomes Bands KeyMod 5 Fossil Formation and Stratigraphy EES12–12 2–3 D
– 15 –
Mod 5 – Question 13
Carbon-14 has a half-life of 5730 years. Charcoal removed from beneath a lava flow has 18
the
amount of carbon-14 as a living tree.
How old is the lava flow?
A. 2865 years
B. 11 460 years
C. 17 190 years
D. 45 840 years
Content Syllabus outcomes Bands KeyMod 5 Fossil Formation and Stratigraphy EES12–4, EES12–12 3–4 C
Mod 5 – Question 14
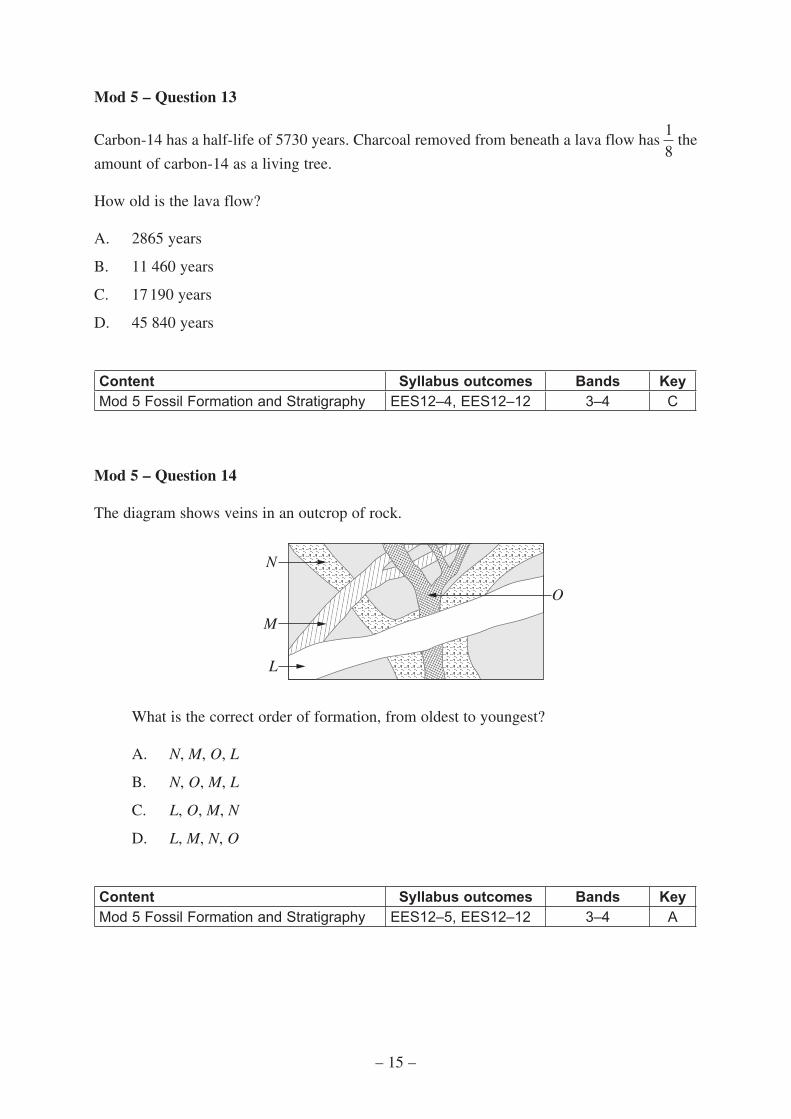
The diagram shows veins in an outcrop of rock.
N
M
L
O
What is the correct order of formation, from oldest to youngest?
A. N, M, O, L
B. N, O, M, L
C. L, O, M, N
D. L, M, N, O
Content Syllabus outcomes Bands KeyMod 5 Fossil Formation and Stratigraphy EES12–5, EES12–12 3–4 A

– 16 –
Mod 5 – Question 15
The table lists some isotopes and their half-lives.
Isotope Half-life (years)
Carbon-14 5730
Iodine-129 15.7 million
Uranium-235 704 million
Rubidium-87 50 billion
Which isotope is the best choice for dating a rock that was formed in the Cambrian period?
A. Carbon-14
B. Iodine-129
C. Uranium-235
D. Rubidium-87
Content Syllabus outcomes Bands KeyMod 5 Fossil Formation and Stratigraphy EES12–4, EES12–12 5–6 C
– 17 –
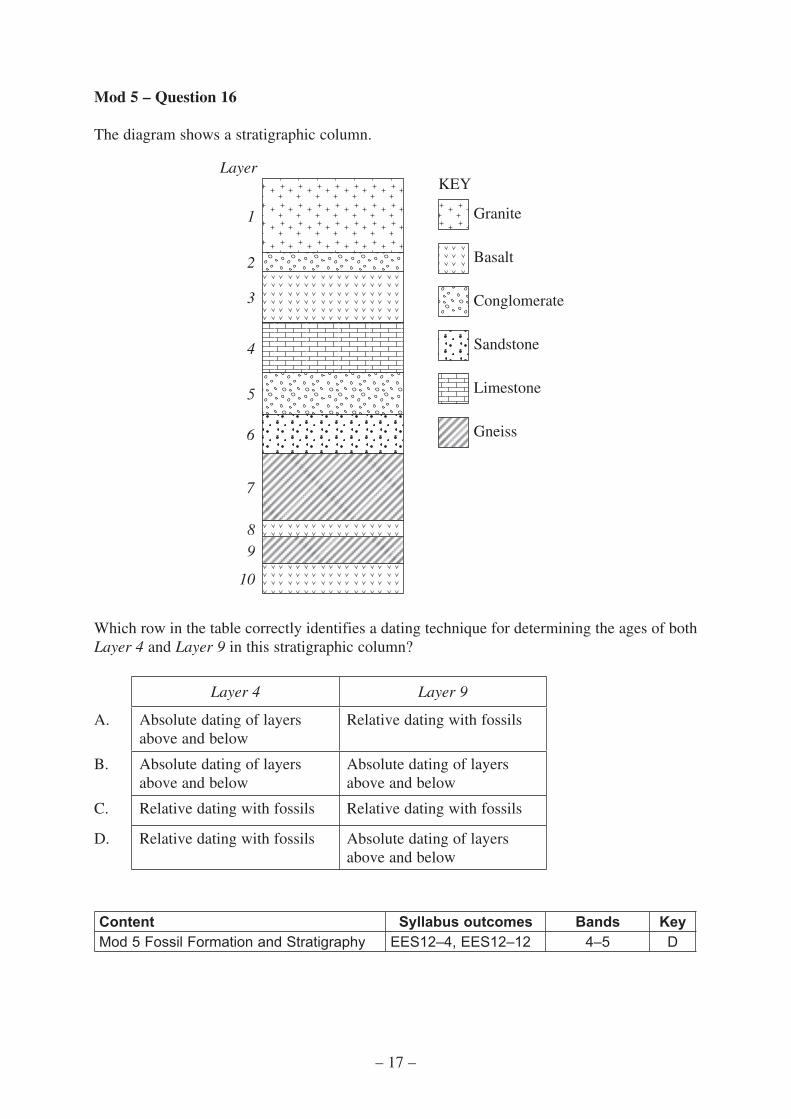
Mod 5 – Question 16
The diagram shows a stratigraphic column.
Granite
Basalt
Limestone
Conglomerate
Sandstone
Gneiss
1
2
3
4
5
6
7
89
10
KEYLayer
Which row in the table correctly identifies a dating technique for determining the ages of both Layer 4 and Layer 9 in this stratigraphic column?
Layer 4 Layer 9
A. Absolute dating of layers above and below
Relative dating with fossils
B. Absolute dating of layers above and below
Absolute dating of layers above and below
C. Relative dating with fossils Relative dating with fossils
D. Relative dating with fossils Absolute dating of layers above and below
Content Syllabus outcomes Bands KeyMod 5 Fossil Formation and Stratigraphy EES12–4, EES12–12 4–5 D
– 18 –
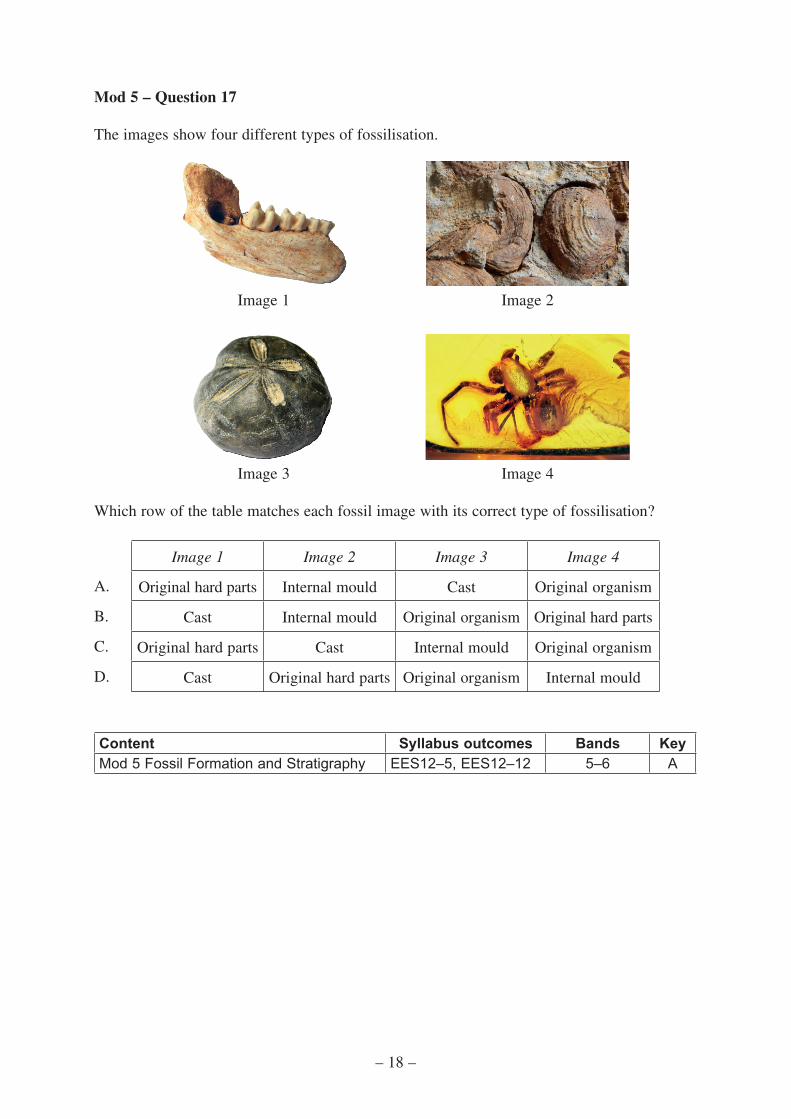
Mod 5 – Question 17
The images show four different types of fossilisation.
Image 1 Image 2
Image 3 Image 4
Which row of the table matches each fossil image with its correct type of fossilisation?
Image 1 Image 2 Image 3 Image 4
A. Original hard parts Internal mould Cast Original organism
B. Cast Internal mould Original organism Original hard parts
C. Original hard parts Cast Internal mould Original organism
D. Cast Original hard parts Original organism Internal mould
Content Syllabus outcomes Bands KeyMod 5 Fossil Formation and Stratigraphy EES12–5, EES12–12 5–6 A

– 19 –
Mod 5 – Question 18
Based on stable isotopic evidence, which of the following can be inferred to have existed approximately 3.8 × 10⁹ years ago?
A. Ediacaran fauna
B. Photosynthetic algae
C. Prokaryotic cyanobacteria
D. Bacteria-like cells lacking nuclei
Content Syllabus outcomes Bands KeyMod 5 Fossil Formation and Stratigraphy EES12–6, EES12–12 5–6 D
– 20 –
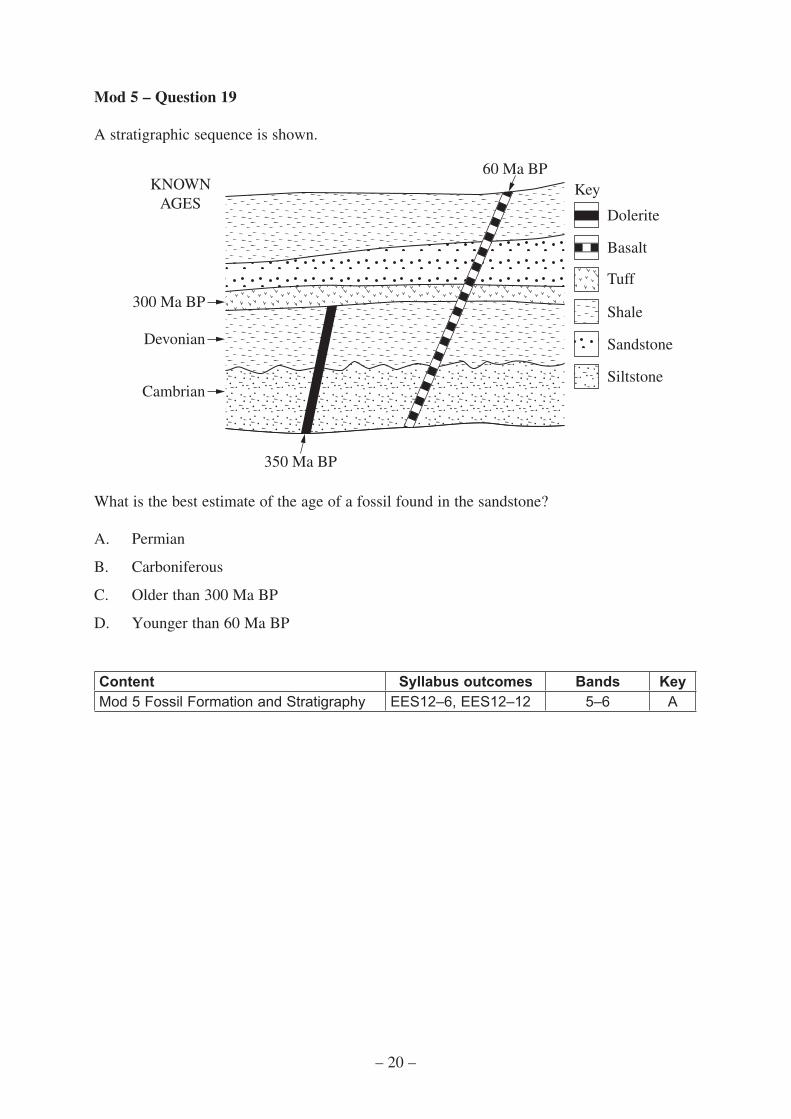
Mod 5 – Question 19
A stratigraphic sequence is shown.
Key
Dolerite
Tuff
Shale
Siltstone
Sandstone
Basalt
300 Ma BP
KNOWNAGES
Devonian
Cambrian
60 Ma BP
350 Ma BP
What is the best estimate of the age of a fossil found in the sandstone?
A. Permian
B. Carboniferous
C. Older than 300 Ma BP
D. Younger than 60 Ma BP
Content Syllabus outcomes Bands KeyMod 5 Fossil Formation and Stratigraphy EES12–6, EES12–12 5–6 A
– 21 –
Mod 5 – Question 20 (4 marks)
Using examples, explain why models are useful for studying the development of Earth.
Mapping gridContent Syllabus outcomes BandsMod 5 Development of the BiosphereMod 5 Plate Tectonic SupercycleMod 5 Fossil Formation and Stratigraphy
EES12–6, EES12–12 2–5
Marking guidelinesCriteria Marks• Explains why models are useful for studying the development of Earth
using relevant examples 4
• Identifies the main features of a model
• Outlines examples which use models to study the development of Earth3
• Identifies the main features of a modelOR• Outlines an example which uses a model to study the development of
Earth
2
• Identifies a feature of a model 1
Sample answer:
A model is a representation of an idea, an object, a process or a system. It can be used to describe and explain phenomena that cannot be experienced directly. For example, 3D images based on limited evidence such as a few fossil bones, can be constructed to study extinct organisms. Since the features are interpreted, the model gives a better understanding of extinct organisms.
Models may also be constructed to study the plate tectonic supercycle. Using the models, simulations may be designed to explain key concepts and processes, and explore the effect of the plate tectonic supercycle on large-scale phenomena.
4
– 22 –
Mod 5 – Question 21 (5 marks)
(a) Explain the significance of the Miller-Urey experiment.
(b) What is panspermia? Support your answer with an example.
Mapping grid (a):Content Syllabus outcomes BandsMod 5 Development of the Biosphere EES12–5, EES12–12 2–4
Marking guidelines (a):Criteria Marks• Explains the significance of the experiment 2• Provides some relevant information 1
Sample answer:
It showed that complex molecules, including amino acids, could have been generated from simple molecules in the environment that existed on early Earth. Amino acids are the building blocks of proteins, which in turn are necessary for life on Earth.
Mapping grid (b):Content Syllabus outcomes BandsMod 5 Development of the Biosphere EES12–5, EES12–12 3–6
Marking guidelines (b):Criteria Marks• Identifies the essential features of the idea of panspermia
• Uses a relevant example to support the idea of panspermia3
• Outlines the idea of panspermia
• Provides a relevant example 2
• Shows a basic understanding of the idea of panspermia 1
Sample answer:
The idea of panspermia is that life on Earth originated from microorganisms or chemical precursors of life present in outer space. Life was initiated when a suitable environment was reached. The fact that amino acids have been found on meteorites suggests that amino acids, which are necessary for life on Earth, could have been brought to early Earth. It also suggests that amino acids could have been formed in a variety of conditions, and not just those present on Earth.
2
3
– 23 –
Mod 5 – Question 22 (6 marks)
Earth’s geosphere, atmosphere and hydrosphere were changed as a result of the evolution of life on Earth.
(a) Draw a labelled diagram to show the atmospheric composition of early Earth and the atmospheric composition after evolution of the biosphere.
Early Earth After evolution of the biosphere
(b) Explain changes that occurred in the geosphere and hydrosphere as a result of the evolution of the biosphere.
Mapping grid (a):Content Syllabus outcomes BandsMod 5 Changes in the Geosphere, Atmosphere and Hydrosphere
EES12–6, EES12–7, EES12–12
2–5
Marking guidelines (a):Criteria Marks• Draws a labelled diagram showing the atmospheric composition of early
Earth and the atmospheric composition after evolution of the biosphere 3
• Draws a labelled diagram showing the atmospheric composition of early Earth
OR• Draws a labelled diagram showing the atmospheric composition after
evolution of the biosphereOR• Draws a labelled diagram showing change in level of one gas
2
• Provides some relevant information 1
Question 22 continues on page 24
3
3
– 24 –
Question 22 (continued)
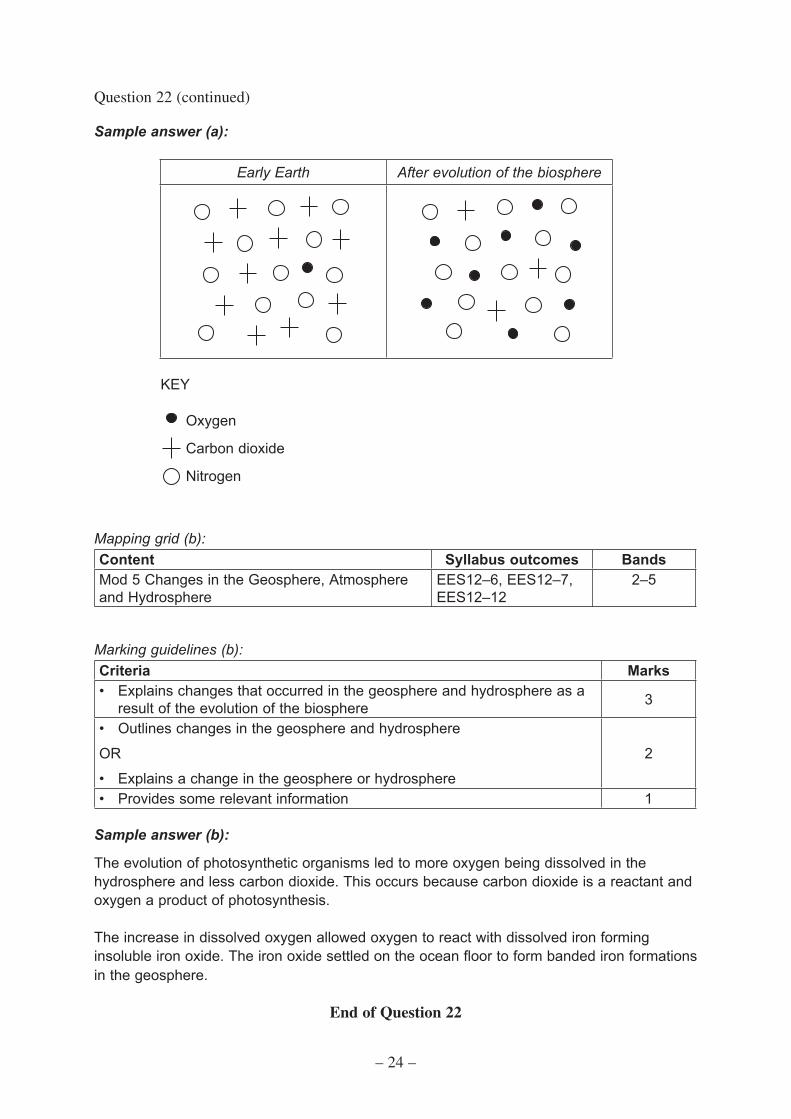
Sample answer (a):
Early Earth After evolution of the biosphere
KEY
Oxygen
Carbon dioxide
Nitrogen
Mapping grid (b):Content Syllabus outcomes BandsMod 5 Changes in the Geosphere, Atmosphere and Hydrosphere
EES12–6, EES12–7, EES12–12
2–5
Marking guidelines (b):Criteria Marks• Explains changes that occurred in the geosphere and hydrosphere as a
result of the evolution of the biosphere 3
• Outlines changes in the geosphere and hydrosphere
OR
• Explains a change in the geosphere or hydrosphere
2
• Provides some relevant information 1
Sample answer (b):
The evolution of photosynthetic organisms led to more oxygen being dissolved in the hydrosphere and less carbon dioxide. This occurs because carbon dioxide is a reactant and oxygen a product of photosynthesis.
The increase in dissolved oxygen allowed oxygen to react with dissolved iron forming insoluble iron oxide. The iron oxide settled on the ocean floor to form banded iron formations in the geosphere.
End of Question 22
– 25 –
Mod 5 – Question 23 (4 marks)
What do banded iron formations reveal about the evolution of the atmosphere?
Mapping grid:Content Syllabus outcomes BandsMod 5 Changes in the Geosphere, Atmosphere and Hydrosphere
EES12–7, EES12–12 2–5
Marking guidelines:Criteria Marks• Relates the formation of banded iron to the change in concentration of
oxygen in the atmosphere 4
• Outlines the formation of banded iron
• Links banded iron to the concentration of oxygen in the atmosphere3
• Outlines the formation of banded iron using oxygen 2• Provides some relevant information 1
Sample answer:
Banded iron gives us information about how oxygen concentrations in the atmosphere came about:
• free oxygen was rare or absent in pre-banded iron formation Earth
• oxygen combined with abundant iron ions in oceans to form the banded iron formations
• formation of abundant banded iron stopped once the majority of free iron ions in the ocean were used up.
This resulted in the build-up of oxygen in the water, which then escaped into the atmosphere.
4
– 26 –
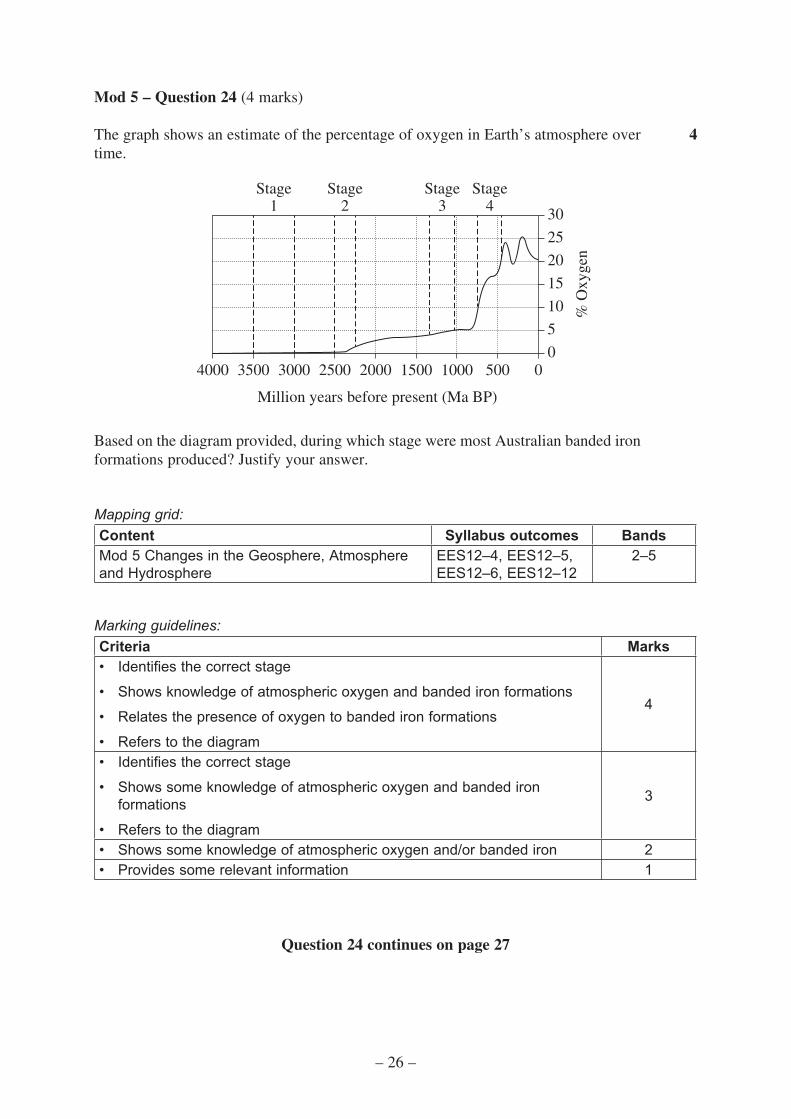
Mod 5 – Question 24 (4 marks)
The graph shows an estimate of the percentage of oxygen in Earth’s atmosphere over time.
500 00
5
10
15
20
25
30
10001500
Million years before present (Ma BP)
% O
xyge
n
20002500300035004000
Stage4
Stage3
Stage2
Stage1
Based on the diagram provided, during which stage were most Australian banded iron formations produced? Justify your answer.
Mapping grid:Content Syllabus outcomes BandsMod 5 Changes in the Geosphere, Atmosphere and Hydrosphere
EES12–4, EES12–5, EES12–6, EES12–12
2–5
Marking guidelines:Criteria Marks• Identifies the correct stage
• Shows knowledge of atmospheric oxygen and banded iron formations
• Relates the presence of oxygen to banded iron formations
• Refers to the diagram
4
• Identifies the correct stage
• Shows some knowledge of atmospheric oxygen and banded iron formations
• Refers to the diagram
3
• Shows some knowledge of atmospheric oxygen and/or banded iron 2• Provides some relevant information 1
Question 24 continues on page 27
4

– 27 –
Question 24 (continued)
Sample answer:
Stage 2
Oxygen started to accumulate in the atmosphere in Stage 2. Before this, cyanobacteria in the oceans were producing oxygen but most of it was used in chemical reactions, eg combining with iron salts dissolved in the water, to form insoluble iron oxides. These insoluble salts were laid down and formed the banded iron formations.
Once the available iron salts had reacted to form sediments, the oxygen that the cyanobacteria produced remained dissolved in the oceans until the concentration of oxygen became too great and the excess oxygen was released into the atmosphere.
The first occurrence of oxygen in the atmosphere indicates the end of the deposition of the banded iron formations.
End of Question 24

– 28 –
Mod 5 – Question 25 (6 marks)
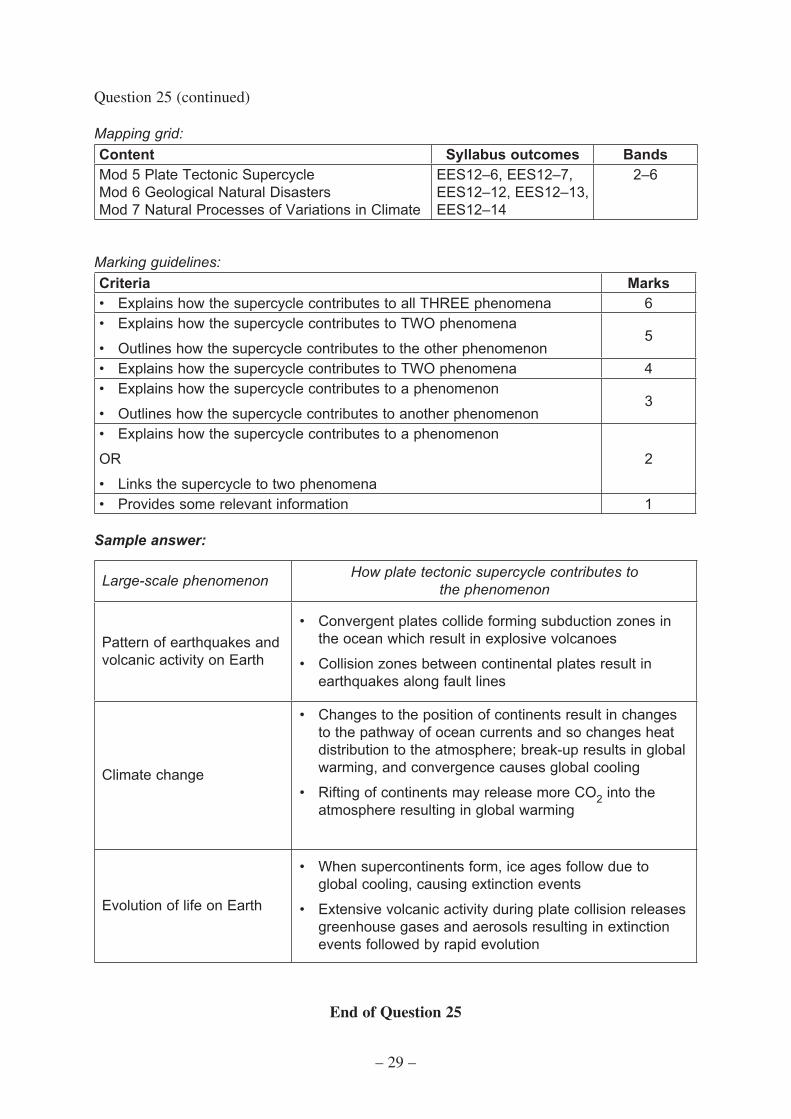
Complete the table to explain how the plate tectonic supercycle contributes to each of the large-scale phenomena.
Large-scale phenomenonHow plate tectonic supercycle contributes to
the phenomenon
Pattern of earthquakes and volcanic activity on Earth
Climate change
Evolution of life on Earth
Question 25 continues on page 29
6
– 29 –
Question 25 (continued)
Mapping grid:Content Syllabus outcomes BandsMod 5 Plate Tectonic Supercycle Mod 6 Geological Natural Disasters Mod 7 Natural Processes of Variations in Climate
EES12–6, EES12–7, EES12–12, EES12–13,EES12–14
2–6
Marking guidelines:Criteria Marks• Explains how the supercycle contributes to all THREE phenomena 6• Explains how the supercycle contributes to TWO phenomena
• Outlines how the supercycle contributes to the other phenomenon5
• Explains how the supercycle contributes to TWO phenomena 4• Explains how the supercycle contributes to a phenomenon
• Outlines how the supercycle contributes to another phenomenon3
• Explains how the supercycle contributes to a phenomenon
OR
• Links the supercycle to two phenomena
2
• Provides some relevant information 1
Sample answer:
Large-scale phenomenon How plate tectonic supercycle contributes to the phenomenon
Pattern of earthquakes and volcanic activity on Earth
• Convergent plates collide forming subduction zones in the ocean which result in explosive volcanoes
• Collision zones between continental plates result in earthquakes along fault lines
Climate change
• Changes to the position of continents result in changes to the pathway of ocean currents and so changes heat distribution to the atmosphere; break-up results in global warming, and convergence causes global cooling
• Rifting of continents may release more CO2 into the atmosphere resulting in global warming
Evolution of life on Earth
• When supercontinents form, ice ages follow due to global cooling, causing extinction events
• Extensive volcanic activity during plate collision releases greenhouse gases and aerosols resulting in extinction events followed by rapid evolution
End of Question 25
– 30 –
Mod 5 – Question 26 (4 marks)
‘The plate tectonic supercycle may have driven the evolution of life on Earth.’
Using your scientific understanding, assess the statement above.
Mapping grid:Content Syllabus outcomes BandsMod 5 Plate Tectonic Supercycle ESS12–4, ESS12–5,
ESS12–6, EES12–12 2–6
Marking guidelines:Criteria Marks• Makes an informed judgement about the role of the plate tectonic
supercycle in the evolution of life
• Supports argument with sound scientific understanding4
• Makes a judgement about the role of the plate tectonic supercycle in the evolution of life
• Supports argument with sound scientific understanding3
• Outlines the plate tectonic supercycle
OR
• Outlines evolution of life on Earth
2
• Provides some relevant information 1
Sample answer:
Plate movements are responsible for hydrothermal vents on the ocean floor. Near a plate boundary, seawater can seep into cracks, where magma heats it to hundreds of degrees, ejecting the hot water back into the ocean. Hydrothermal vents are home to diverse ecosystems, and some scientists have suggested that similar vents gave rise to the first life on Earth.
The supercycle creates volcanoes and hot springs that release gases into the atmosphere, causing a natural greenhouse effect. Earth’s stable temperature allows liquid water to exist and creates favourable conditions for life.
The plate tectonic supercycle involves continual creations and destruction of Earth’s crust. Uplift, erosion and volcanism refresh soil, allowing nutrient cycling to occur. Without large scale cycles, life would become extinct.
4
– 31 –
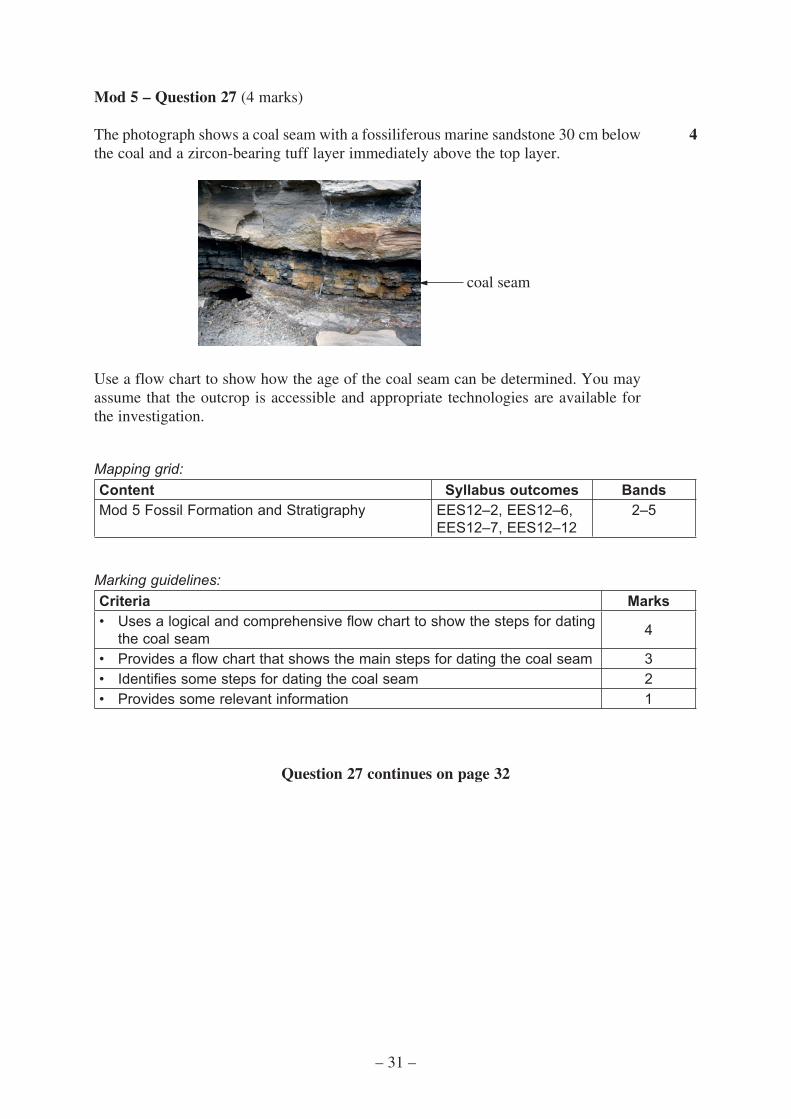
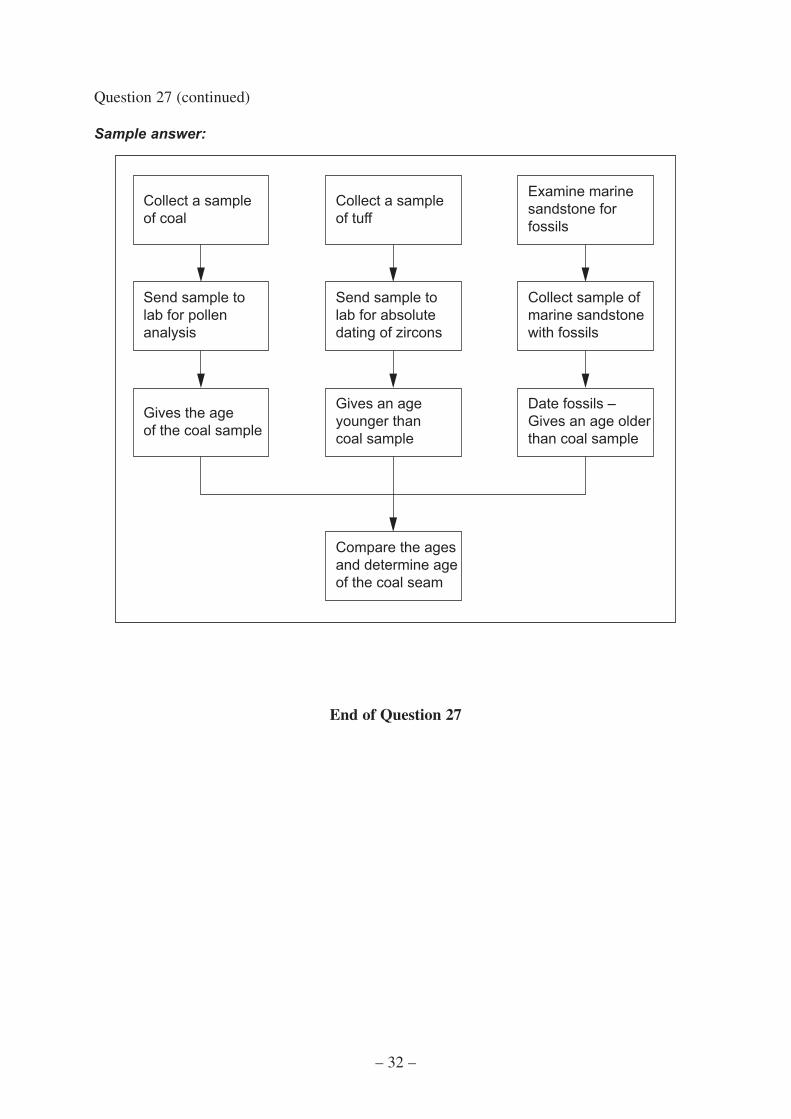
Mod 5 – Question 27 (4 marks)
The photograph shows a coal seam with a fossiliferous marine sandstone 30 cm below the coal and a zircon-bearing tuff layer immediately above the top layer.
coal seam
Use a flow chart to show how the age of the coal seam can be determined. You may assume that the outcrop is accessible and appropriate technologies are available for the investigation.
Mapping grid:Content Syllabus outcomes BandsMod 5 Fossil Formation and Stratigraphy EES12–2, EES12–6,
EES12–7, EES12–122–5
Marking guidelines:Criteria Marks• Uses a logical and comprehensive flow chart to show the steps for dating
the coal seam 4
• Provides a flow chart that shows the main steps for dating the coal seam 3• Identifies some steps for dating the coal seam 2• Provides some relevant information 1
Question 27 continues on page 32
4
– 32 –
Question 27 (continued)
Sample answer:
Collect a sample of coal
Send sample to lab for pollenanalysis
Gives the age of the coal sample
Collect a sample of tuff
Send sample to lab for absolute dating of zircons
Gives an age younger than coal sample
Examine marinesandstone for fossils
Collect sample of marine sandstonewith fossils
Date fossils – Gives an age older than coal sample
Compare the ages and determine ageof the coal seam
End of Question 27
– 33 –
Module 6 Hazards
Mod 6 – Question 1
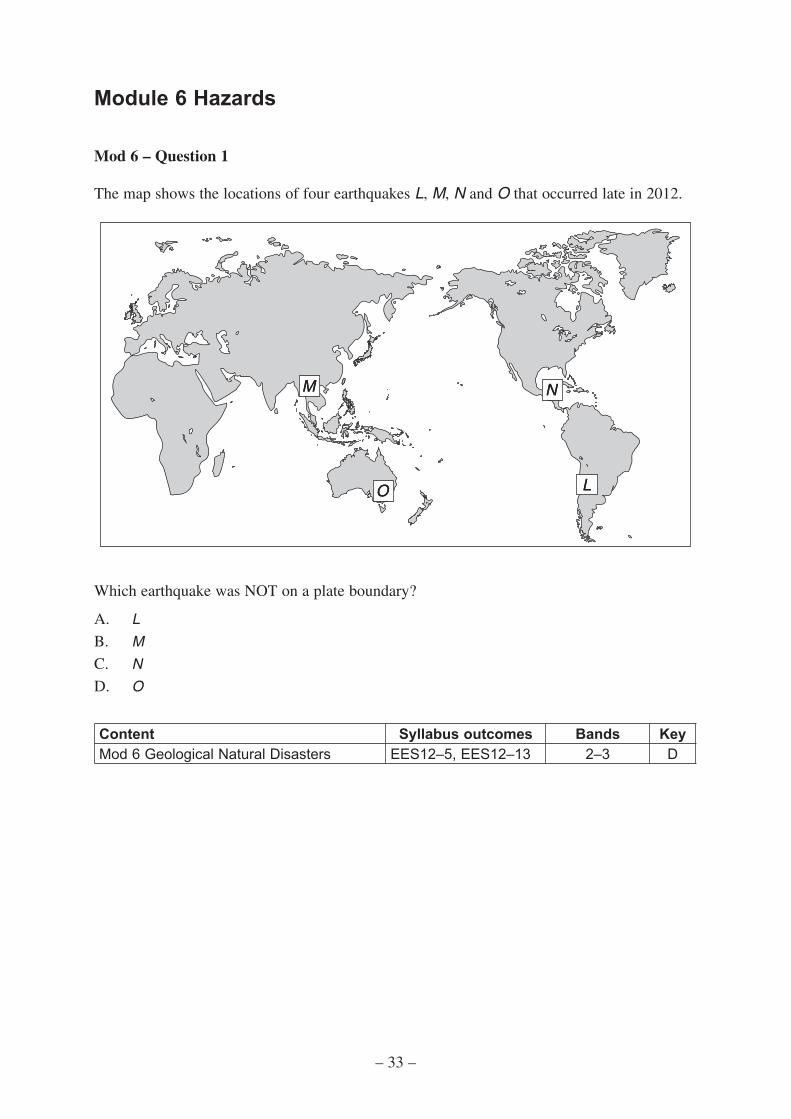
The map shows the locations of four earthquakes L, M, N and O that occurred late in 2012.
MM
OO
NN
LL
Which earthquake was NOT on a plate boundary?
A. L
B. M
C. N
D. O
Content Syllabus outcomes Bands KeyMod 6 Geological Natural Disasters EES12–5, EES12–13 2–3 D

– 34 –
Mod 6 – Question 2
The map shows the location of four volcanic regions W, X, Y and Z.
ZZ
XX
YY
WW
At which location would andesitic lava be found?
A. W
B. X
C. Y
D. Z
Content Syllabus outcomes Bands KeyMod 6 Geological Natural Disasters EES12–5, EES12–13 4–5 B
– 35 –
Mod 6 – Question 3
Brightly coloured sunrises and sunsets were seen for several years after the 1991 eruption of Mount Pinatubo in the Philippines.
The cause of this phenomenon was
A. the destruction of the ozone layer by the eruption.
B. the release of radioactive particles into the atmosphere.
C. the large amount of carbon dioxide released into the atmosphere.
D. the sulfur dioxide released formed reflective particles in the stratosphere.
Content Syllabus outcomes Bands KeyMod 6 Impact of Natural Disasters on the Biosphere
EES12–6, EES12–13 4–5 D
Mod 6 – Question 4
Where is a deep focus earthquake most likely to occur on the Australian–Indian Plate?
A. At the centre of the Sydney Basin
B. At the continental margin east of New South Wales
C. At the subduction zone along the northern plate boundary
D. At the mid-oceanic ridge along the southern plate boundary
Content Syllabus outcomes Bands KeyMod 6 Geological Natural Disasters EES12–13 2–3 C
– 36 –
Mod 6 – Question 5
Which of the following events is most likely to cause a tsunami?
A. A volcanic eruption in Hawaii producing a lava flow
B. An explosive volcanic eruption causing an earthquake in central Australia
C. An outpouring of magma at the southern edge of the Australian–Indian Plate boundary
D. A shallow focus earthquake along the northern edge of the Australian–Indian Plate boundary
Content Syllabus outcomes Bands KeyMod 6 Geological Natural Disasters EES12–13 4–5 D
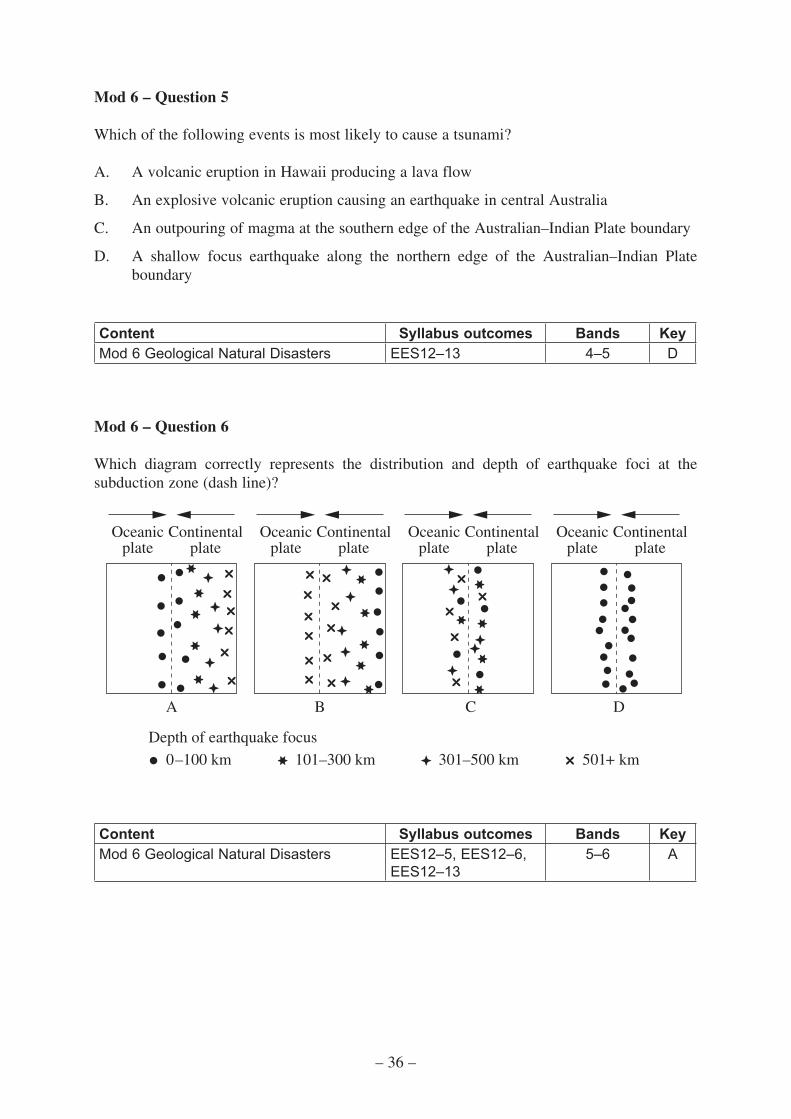
Mod 6 – Question 6
Which diagram correctly represents the distribution and depth of earthquake foci at the subduction zone (dash line)?
A C DB
Oceanicplate
Continentalplate
Oceanicplate
Continentalplate
Oceanicplate
Continentalplate
Oceanicplate
Continentalplate
0–100 km 101–300 km 301–500 km
Depth of earthquake focus
501+ km
Content Syllabus outcomes Bands KeyMod 6 Geological Natural Disasters EES12–5, EES12–6,
EES12–135–6 A
– 37 –
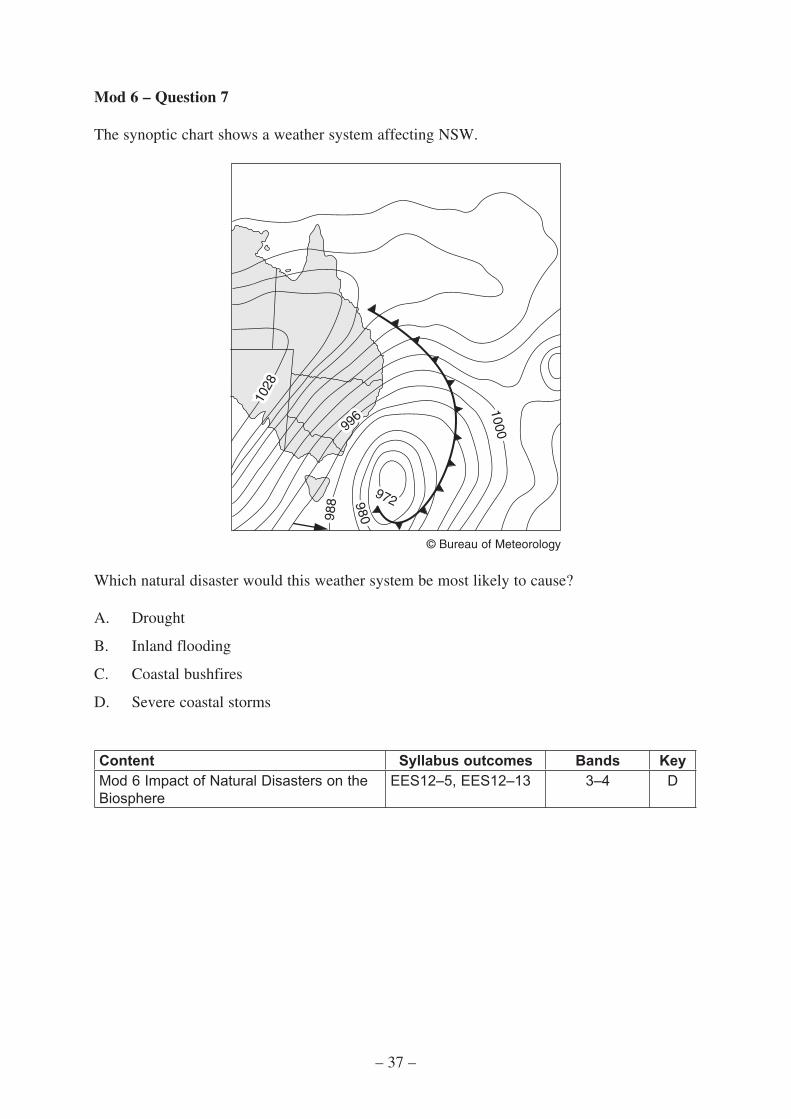
Mod 6 – Question 7
The synoptic chart shows a weather system affecting NSW.
972980988
996
1028
1000
© Bureau of Meteorology
Which natural disaster would this weather system be most likely to cause?
A. Drought
B. Inland flooding
C. Coastal bushfires
D. Severe coastal storms
Content Syllabus outcomes Bands KeyMod 6 Impact of Natural Disasters on the Biosphere
EES12–5, EES12–13 3–4 D
– 38 –
Mod 6 – Question 8
Which product of a large Plinian volcanic eruption, such as the Mt Pinatubo eruption in 1991, would have a cooling effect on global climate for the longest period of time?
A. Ash clouds that reached the stratosphere
B. Dacitic lava on the slopes of the volcano
C. Sulfur dioxide that reached up to 12 kilometres
D. Water vapour that absorbed heat from the atmosphere
Content Syllabus outcomes Bands KeyMod 6 Impact of Natural Disasters on the Biosphere
EES12–6, EES12–13 4–5 C
Mod 6 – Question 9
Which statement correctly describes earthquake building codes?
A. They are enforced in all countries with seismic risk.
B. They are the same for single-level and high-rise buildings.
C. They reduce the frequency of large magnitude earthquakes.
D. They statistically reduce the damage to buildings and harm to people.
Content Syllabus outcomes Bands KeyMod 6 Prediction and Prevention of Natural Disasters
EES12–13 2–3 D
– 39 –
Mod 6 – Question 10
The impact of earthquakes that can cause natural disasters has resulted in the development of technologies such as ground movement detectors and tsunami wave detectors.
Which of the following is true about these technologies?
A. They prevent natural disasters.
B. They require scientists to operate them from disaster zones.
C. They prevent natural disasters if linked to good communication systems.
D. They require support systems such as building codes and education in areas of high risk.
Content Syllabus outcomes Bands KeyMod 6 Prediction and Prevention of Natural Disasters
EES12–13 3–4 D
– 40 –
Mod 6 – Question 11 (9 marks)
Answer parts (a)–(c) in relation to ONE specific natural disaster associated with tectonic activity.
Name of specific natural disaster ..........................................................................
(a) Outline TWO features of the named natural disaster associated with tectonic activity.
(b) Explain the tectonic movement or process that resulted in this disaster.
(c) Justify TWO possible ways of minimising the effects of this type of natural disaster in the future.
Mapping grid (a):Content Syllabus outcomes BandsModule 6 Geological Natural Disasters EES12–13 2–4
Marking guidelines (a):Criteria Marks• Outlines TWO features of the named natural disaster associated with
tectonic activity 2
• Outlines ONE feature of the named natural disaster associated with tectonic activity
OR• Identifies TWO features of a natural disaster associated with tectonic
activity
1
Sample answer:
Japanese Earthquake 2011 – This disaster resulted in ground motion that caused some damage to the built environment but the largest impact of the resulting tsunami was the devastation of many coastal communities with wide scale flooding and destruction of the environment.
Mapping grid (b):Content Syllabus outcomes BandsModule 6 Geological Natural Disasters EES12–13 2–4
Question 11 continues on page 41
2
3
4
– 41 –
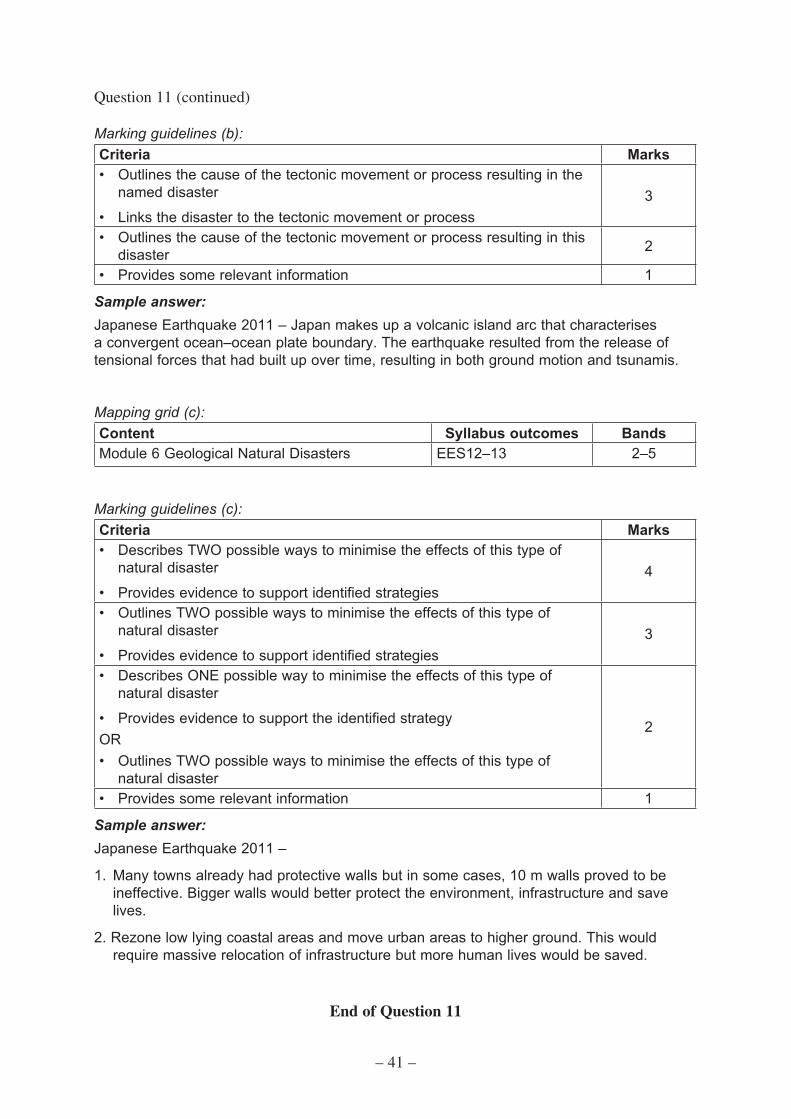
Question 11 (continued)
Marking guidelines (b):Criteria Marks• Outlines the cause of the tectonic movement or process resulting in the
named disaster
• Links the disaster to the tectonic movement or process3
• Outlines the cause of the tectonic movement or process resulting in this disaster 2
• Provides some relevant information 1
Sample answer:Japanese Earthquake 2011 – Japan makes up a volcanic island arc that characterises a convergent ocean–ocean plate boundary. The earthquake resulted from the release of tensional forces that had built up over time, resulting in both ground motion and tsunamis.
Mapping grid (c):Content Syllabus outcomes BandsModule 6 Geological Natural Disasters EES12–13 2–5
Marking guidelines (c):Criteria Marks• Describes TWO possible ways to minimise the effects of this type of
natural disaster
• Provides evidence to support identified strategies4
• Outlines TWO possible ways to minimise the effects of this type of natural disaster
• Provides evidence to support identified strategies3
• Describes ONE possible way to minimise the effects of this type of natural disaster
• Provides evidence to support the identified strategyOR• Outlines TWO possible ways to minimise the effects of this type of
natural disaster
2
• Provides some relevant information 1
Sample answer:Japanese Earthquake 2011 –
1. Many towns already had protective walls but in some cases, 10 m walls proved to be ineffective. Bigger walls would better protect the environment, infrastructure and save lives.
2. Rezone low lying coastal areas and move urban areas to higher ground. This would require massive relocation of infrastructure but more human lives would be saved.
End of Question 11
– 42 –
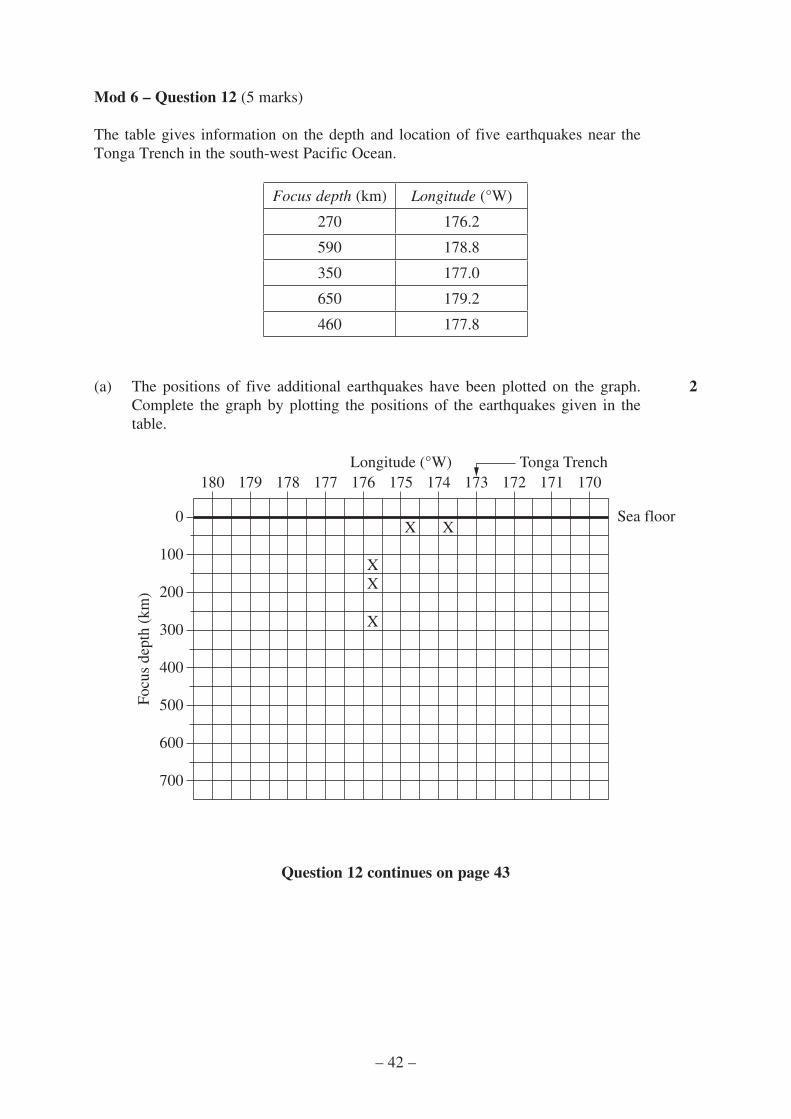
Mod 6 – Question 12 (5 marks)
The table gives information on the depth and location of five earthquakes near the Tonga Trench in the south-west Pacific Ocean.
Focus depth (km) Longitude (°W)
270 176.2
590 178.8
350 177.0
650 179.2
460 177.8
(a) The positions of five additional earthquakes have been plotted on the graph. Complete the graph by plotting the positions of the earthquakes given in the table.
700
600
500
400
300
Focu
s de
pth
(km
) 200
100
0
180 179 178 177 176 175Longitude (°W) Tonga Trench
174 173 172 171 170
Sea floorX X
XX
X
Question 12 continues on page 43
2

– 43 –
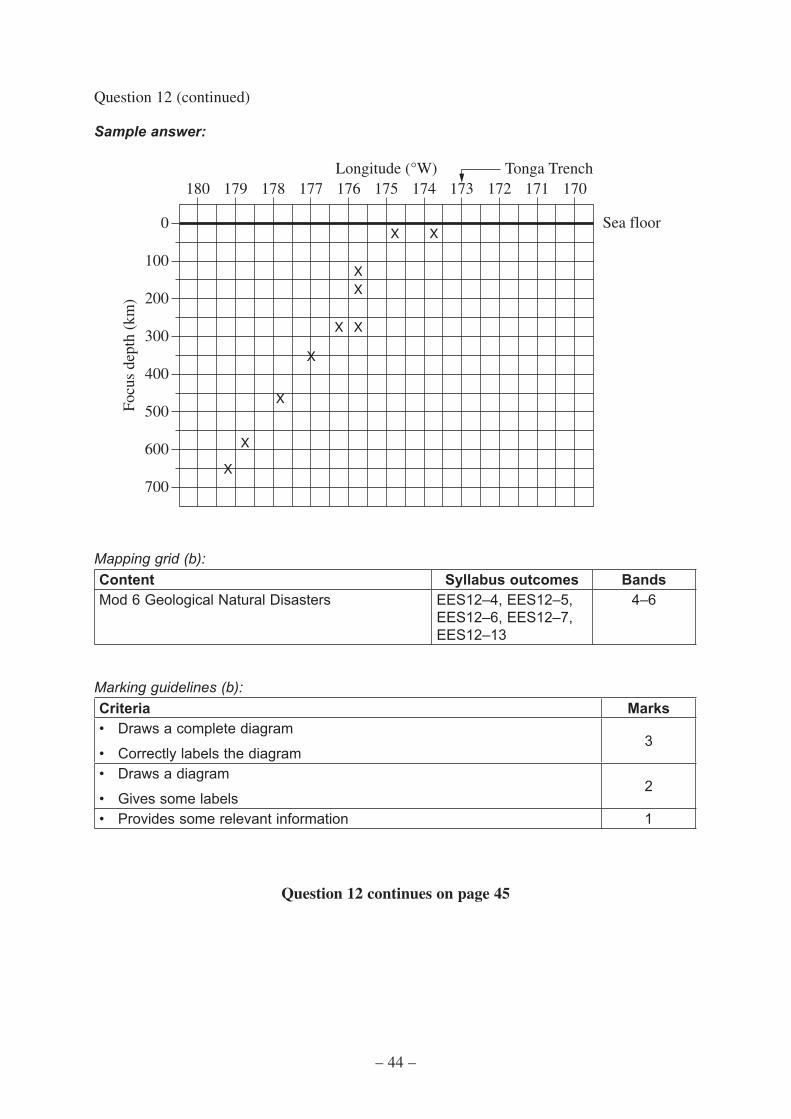
Question 12 (continued)
(b) Using the information from part (a), construct a detailed labelled cross-section to illustrate the tectonic process occurring at the Tonga Trench.
180Longitude (°W)
170
700
Focu
s de
pth
(km
)
0
Mapping grid (a):Content Syllabus outcomes BandsMod 6 Geological Natural Disasters EES12–4, EES12–13 4–5
Marking guidelines (a):Criteria Marks• Correctly plots all points on the graph 2• Plots some points on the graph 1
Question 12 continues on page 44
3
– 44 –
Question 12 (continued)
Sample answer:
700
600
500
400
300
Focu
s de
pth
(km
) 200
100
0
180 179 178 177 176 175Longitude (°W) Tonga Trench
174 173 172 171 170
Sea floorXX
XX
X X
X
X
X
X
Mapping grid (b):Content Syllabus outcomes BandsMod 6 Geological Natural Disasters EES12–4, EES12–5,
EES12–6, EES12–7, EES12–13
4–6
Marking guidelines (b):Criteria Marks• Draws a complete diagram
• Correctly labels the diagram3
• Draws a diagram
• Gives some labels2
• Provides some relevant information 1
Question 12 continues on page 45
– 45 –
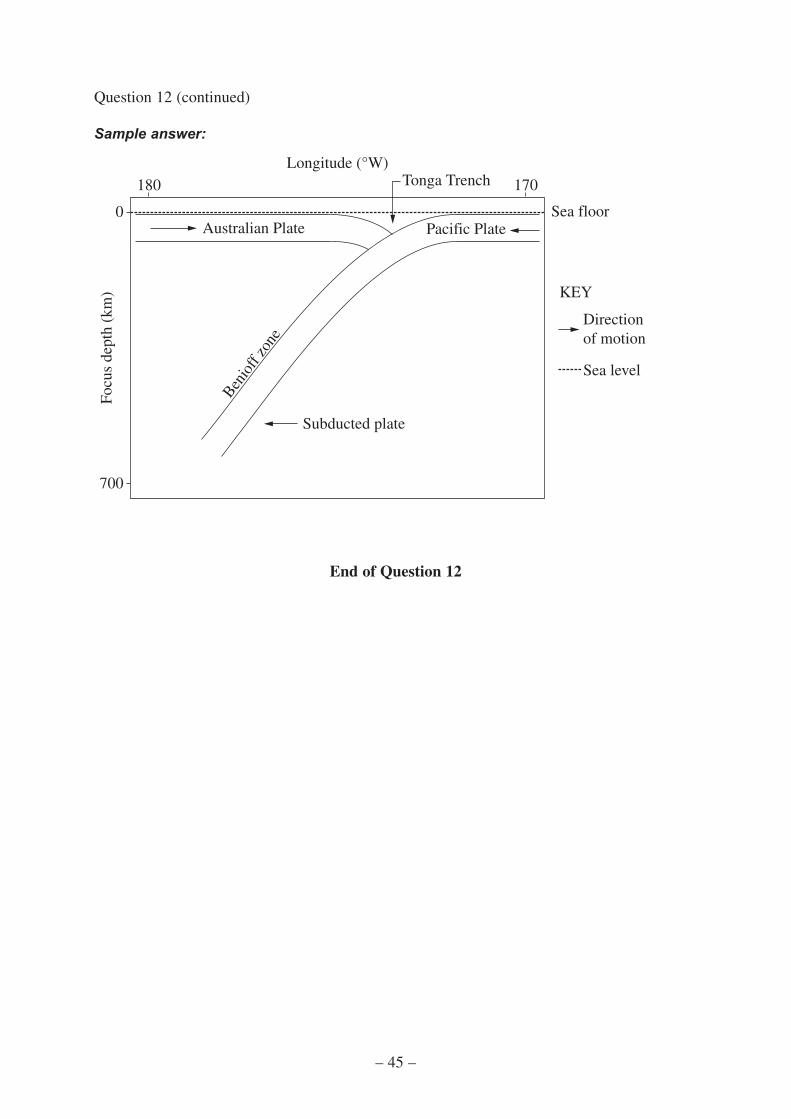
Question 12 (continued)
Sample answer:
180
Benio
ff zo
ne
Australian Plate Pacific Plate
Tonga Trench
Subducted plate
Longitude (°W)170
Sea floor
Directionof motion
Sea level
700
Focu
s de
pth
(km
)
0
KEY
End of Question 12

– 46 –
Mod 6 – Question 13 (3 marks)
Complete the following table to show the cause and physical impact of each climatic phenomenon in Australia.
Climatic phenomenon
Cause of phenomenon Physical impact on Australian ecosystems
East coast low
Drought
Bushfire
Mapping grid:Content Syllabus outcomes BandsMod 6 Impact of Natural Disasters on the Biosphere
EES12–7, EES12–13 2–4
Question 13 continues on page 47
3
– 47 –
Question 13 (continued)
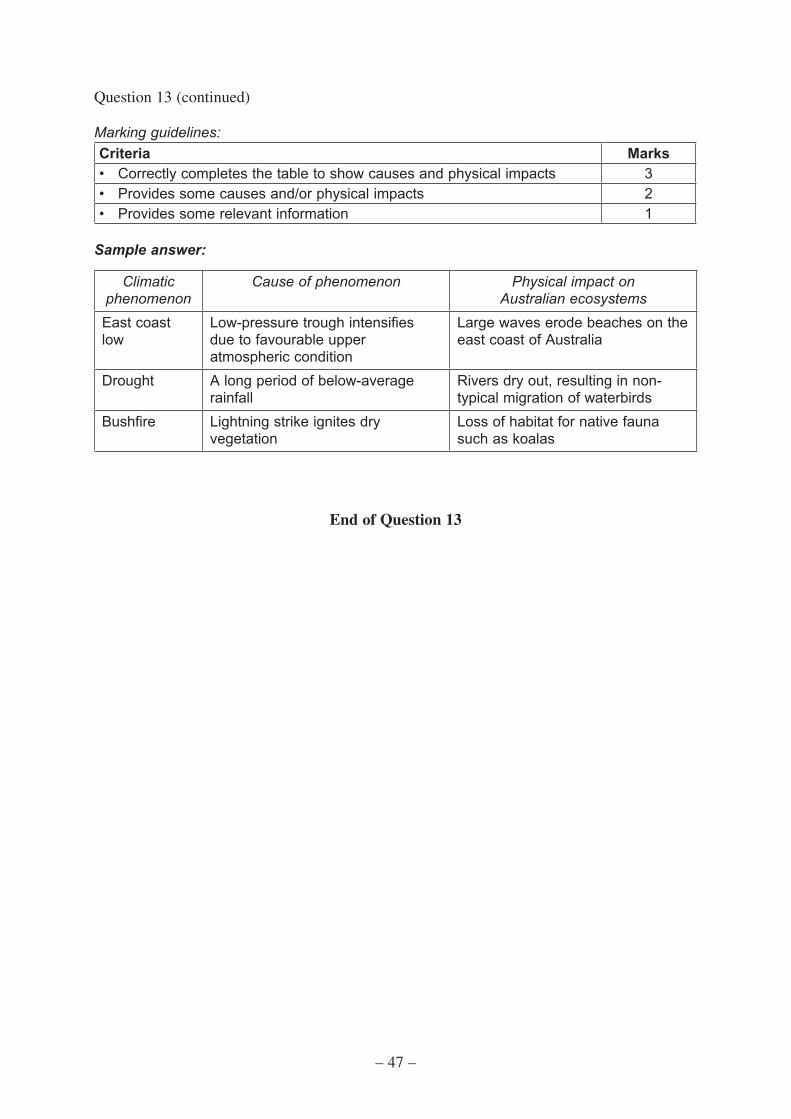
Marking guidelines:Criteria Marks• Correctly completes the table to show causes and physical impacts 3• Provides some causes and/or physical impacts 2• Provides some relevant information 1
Sample answer:
Climatic phenomenon
Cause of phenomenon Physical impact on Australian ecosystems
East coast low
Low-pressure trough intensifies due to favourable upper atmospheric condition
Large waves erode beaches on the east coast of Australia
Drought A long period of below-average rainfall
Rivers dry out, resulting in non-typical migration of waterbirds
Bushfire Lightning strike ignites dry vegetation
Loss of habitat for native fauna such as koalas
End of Question 13
– 48 –
Mod 6 – Question 14 (9 marks)
Answer this question with reference to the case study that you carried out to investigate one volcanic eruption that had a significant effect on the biosphere and atmosphere.
Name of volcanic eruption: .....................................................................................
Contrast the short-term impact and longer-term impact of the volcanic eruption on both the biosphere and atmosphere.
Mapping grid:Content Syllabus outcomes BandsMod 6 Impact of Natural Disasters on the Biosphere
EES12–3, EES12–6, EES12–13
2–6
Marking guidelines:Criteria Marks• Shows a comprehensive knowledge and understanding of both the short-
term impact and longer-term impact on the biosphere and atmosphere
• Clearly shows how the short-term impact and longer-term impact are different
9
• Shows a sound knowledge and understanding of both the short-term impact and longer-term impact on the biosphere and/or atmosphere
• Provides some indication of how the short-term impact and longer-term impact are different
7–8
• Outlines some short-term impact and some longer-term impact of the volcanic eruption on the biosphere and/or atmosphere 5–6
• Outlines some short-term and/or longer-term impact of the volcanic eruption on the biosphere and/or atmosphere 3–4
• Provides some relevant information about the volcanic eruption 1–2
Question 14 continues on page 49
9
– 49 –
Question 14 (continued)
Sample answer:
Name of volcanic eruption: Mount St Helens
The short-term impact of the eruption was very destructive. The eruption released millions of tonnes of ash and other materials into the atmosphere. The flows of superheated gas and rock debris killed an enormous number of living things in a huge area around the volcano. 57 people died (mainly of asphyxiation), hundreds of square kilometres of forest were destroyed, thousands of large game animals and millions of fish, birds and insects were killed within the first few hours of the eruption.
The initial landslide caused the north side of the volcano to collapse. As soon as this collapse happened the release of pressure over the magma chamber resulted in a plume of ash rising nearly 20 km into the sky. This plume of ash travelled throughout the immediate area and resulted in complete darkness up to 250 km away from the volcano.
The ash and fine particles remained suspended in the atmosphere and eventually rained down on surviving trees. The ash settled on leaves and reflected much of the light, which reduced the amount of photosynthesis, often resulting in trees and smaller plants dying months after the eruption.
The increased amount of volcanic ash in the atmosphere also reduced light absorption and atmospheric temperatures for several months.
In contrast, the longer-term impact was far more positive. The deposition of vast areas of volcanic ash, while initially blocking rivers, causing flooding and destruction of crops and livestock, has resulted in an increase in the fertility of the soil.
Many animal and plant species have been able to recolonise areas that were destroyed. Since they have not had their usual predators, they have repopulated, are healthy and are reproducing. For example, lupins, which can grow in nitrogen-low soils, have been a very successful recoloniser.
A number of smaller animals – particularly those that burrow – survived the eruption. They have also flourished due to the lack of larger predators.
The rock debris and plumes of ash that initially caused much of the devastation have actually enabled the recovery of the ecosystem, and there is no significant longer-term impact on the atmosphere.
End of Question 14
– 50 –
Mod 6 – Question 15 (4 marks)
Outline how human activities contribute to and how they could reduce the effects of TWO types of natural disaster.
Mapping grid:Content Syllabus outcomes BandsMod 6 Impact of Natural Disasters on the Biosphere
EES12–5, EES12–13 2–5
Marking guidelines:Criteria Marks• Identifies TWO types of disaster• Outlines how humans contribute to the effects of each disaster• Outlines how humans could reduce the effects of each disaster
4
• Identifies TWO types of disaster• Outlines how humans could reduce the effects of each disaster• Outlines how humans contribute to the effect of ONE disasterOR• Identities TWO types of disaster• Outlines how humans contribute to the effects of each disaster• Outlines how humans could reduce the effect of ONE disaster
3
• Outlines how humans contribute to the effects of ONE disaster• Outlines how humans could reduce the effects of ONE disasterOR• Identifies TWO types of disaster• Outlines how humans contribute to the effects of each disasterOR• Identifies TWO types of disaster• Outlines how humans could reduce the effects of each disaster
2
• Provides some relevant information 1
Sample answer:
The effects of bushfires can include the loss of property, life and habitats. Human activities that can decrease the effects are back burning and clearing of scrub. The likelihood of bushfires occurring and affecting people and habitats can increase when people throw cigarette butts into bushy areas or light campfires during hot, dry, windy weather.
Floods can also affect property, life and habitats. Human activities can increase the effects of flooding if dams are not managed correctly (eg if the spillway is not opened) or if houses are built on floodplains or low-lying areas. Humans can decrease the effects of flooding by building levees around the banks of rivers.
4

– 51 –
Mod 6 – Question 16 (3 marks)
Identify ONE technology that can be used to predict earthquakes, and explain how it works.
Mapping grid:Content Syllabus outcomes BandsMod 6 Prediction and Prevention of Natural Disasters
EES12–13 2–4
Marking guidelines:Criteria Marks• Identifies a relevant technology
• Relates the technology to the prediction of earthquakes3
• Outlines how a relevant technology works 2• Provides some relevant information 1
Sample answer:
A wire creep meter can be used to predict earthquakes. The length of a wire across a fault is measured as movement across the fault causes it to stretch. The more the wire stretches, the more strain is occurring within the rocks and the more likely an earthquake will occur.
3

– 52 –
Mod 6 – Question 17 (3 marks)
Explain how TWO technologies predict and prevent damage due to weather events.
Mapping grid:Content Syllabus outcomes BandsMod 6 Prediction and Prevention of Natural Disasters
EES12–6, EES12–7, EES12–13
2–4
Marking guidelines:Criteria Marks• Explains how TWO technologies predict and prevent weather damage 3• Outlines TWO technologies that predict and prevent weather damageOR• Identifies TWO relevant technologies and explains how ONE technology
predicts and prevents weather damage
2
• Provides some relevant information 1
Sample answer:
Satellites can be used to take infrared images of clouds over the Earth’s surface. These images can be used to monitor and track cyclones. People can be given several days warning about the impending cyclone and prepare for it. Another piece of technology is LIDAR, where laser light is used to detect the position of cloud cover and whether it will bring rain, hail or snow. This can be used to give people time to get inside, and to put cars under cover in the case of hail.
3

– 53 –
Mod 6 – Question 18 (3 marks)
Describe ONE technology that can be used to minimise the effect of volcanic eruptions.
Mapping grid:Content Syllabus outcomes BandsMod 6 Prediction and Prevention of Natural Disasters
EES12–13 2–4
Marking guidelines:Criteria Marks• Describes ONE relevant technology 3• Outlines ONE relevant technology 2• Provides some relevant information 1
Sample answer:
Seismic monitoring indicates when magma is moving through a volcano. Distinctive patterns of seismic activity indicate that an eruption is imminent. The technology could allow people to be evacuated before an eruption and allow aircraft movements to be changed to minimise damage from ash clouds.
3

– 54 –
Mod 6 – Question 19 (3 marks)
How could mobile phones and good network coverage play a role in minimising the effects of earthquakes?
Mapping grid:Content Syllabus outcomes BandsMod 6 Prediction and Prevention of Natural Disasters
EES12–13 2–4
Marking guidelines:Criteria Marks• Shows how mobile phones and network coverage could play a role in
minimising earthquake effects 3
• Outlines how mobile phones and/or network coverage could minimise earthquake effects 2
• Provides some relevant information 1
Sample answer:
Most people have individual mobile phones; these phones can be used as an advance warning system. If a mass SMS is sent to people who are affected by the earthquake, people can be better prepared, go to shelters or evacuate if needed so there would be fewer injuries and deaths. This can only work if there is good network coverage so that everyone is warned in time.
3
– 55 –
Mod 6 – Question 20 (7 marks)
Analyse the effects of BOTH natural processes and anthropogenic activities on the Australian environment.
Mapping grid:Content Syllabus outcomes BandsMod 6 Hazards
Mod 7 Climate Science
Mod 8 Resource Management
EES12–4, EES12–5, EES12–7, EES12–13, EES12–14, EES12–15
2–6
Marking guidelines:Criteria Marks• Shows a thorough knowledge and understanding of both natural
processes and anthropogenic activities in Australia
• Relates these processes and activities to their supposed effects on the Australian environment
• Draws out and relates implications of these effects
7
• Shows a sound knowledge and understanding of both natural processes and anthropogenic activities in Australia
• Relates these processes and activities to their supposed effects on the Australian environment
6
• Shows some knowledge and/or understanding of natural processes and/ or anthropogenic activities in Australia
• Links some of these processes and/or activities to their supposed effects on the Australian environment
4–5
• Outlines some features of natural processes and/ or anthropogenic activities 2–3
• Provides some relevant information 1
Question 20 continues on page 56
7
– 56 –
Question 20 (continued)
Sample answer:
The Australian environment is the product of both anthropogenic activities and natural processes.
The impacts of natural processes can be either negative or positive. For example, the earthquake that occurred in Newcastle in 1989 caused damage to infrastructure despite being short lived. Bushfires destroy native vegetation and floods remove soil – all negative. On the other hand, regeneration after bushfires allows younger and healthier plants to grow and deposition of sediment on flood plains increases fertility – both positive effects.
Many anthropogenic activities have, in the main, a negative impact on the environment. Overgrazing, poor land management practices and deforestation have immediate effects on the environment. There is a loss of habitat for native fauna and flora, which rapidly decrease in numbers and can become extinct. In addition, these activities have promoted erosion, increased salinity and higher sediment input to the oceans with serious negative impacts on features such as the Great Barrier Reef. One of the greatest negative impacts on the environment has been the combustion of fossil fuels. According to some scientific thinking, this has produced greenhouse gases that may have resulted in global climate change, which has flow-on effects such as acidification of the oceans and more extreme weather conditions. These may have far-reaching impacts on the biotic and abiotic features of the environment. The negative impacts of anthropogenic activities on the environment may affect our future unless different strategies are introduced.
End of Question 20
– 57 –
Module 7 Climate Science
Mod 7 – Question 1
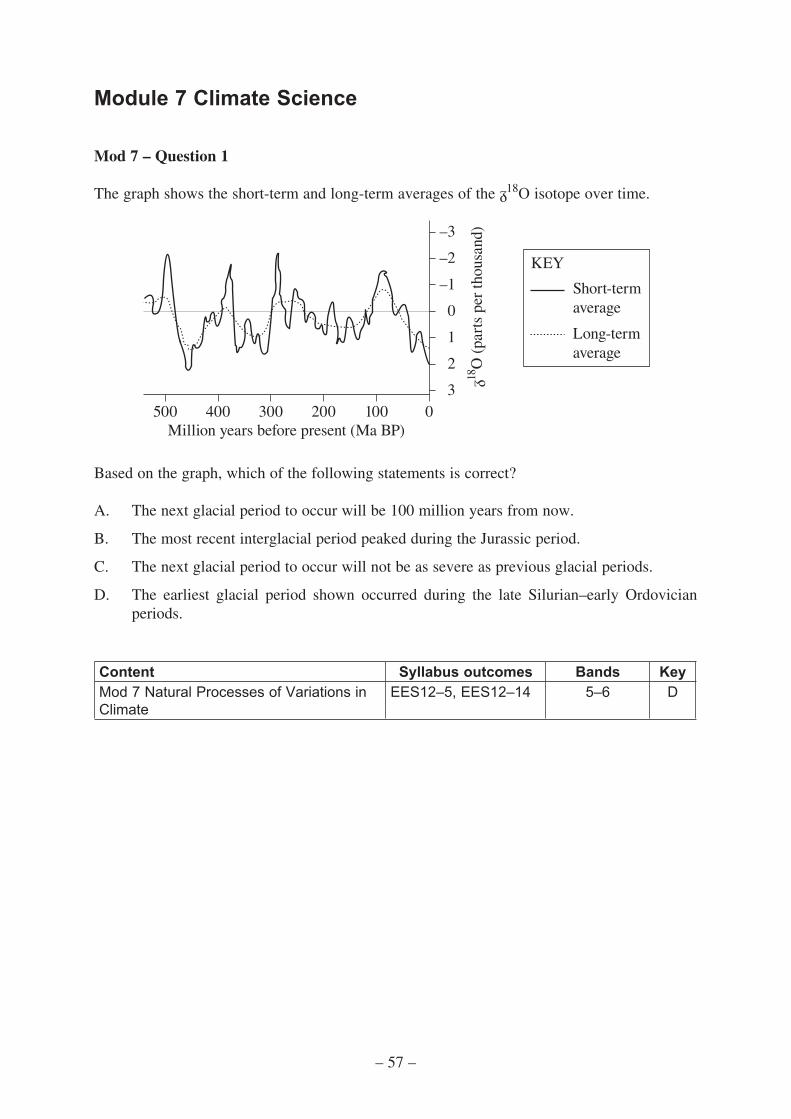
The graph shows the short-term and long-term averages of the ᵹ18O isotope over time.
30100200300400500
2
1
0
–1
–2
–3
Million years before present (Ma BP)
18O
(pa
rts
per
thou
sand
)
Short-termaverage
Long-termaverage
KEY
Based on the graph, which of the following statements is correct?
A. The next glacial period to occur will be 100 million years from now.
B. The most recent interglacial period peaked during the Jurassic period.
C. The next glacial period to occur will not be as severe as previous glacial periods.
D. The earliest glacial period shown occurred during the late Silurian–early Ordovician periods.
Content Syllabus outcomes Bands KeyMod 7 Natural Processes of Variations in Climate
EES12–5, EES12–14 5–6 D
– 58 –
Mod 7 – Question 2
A
B
C
D
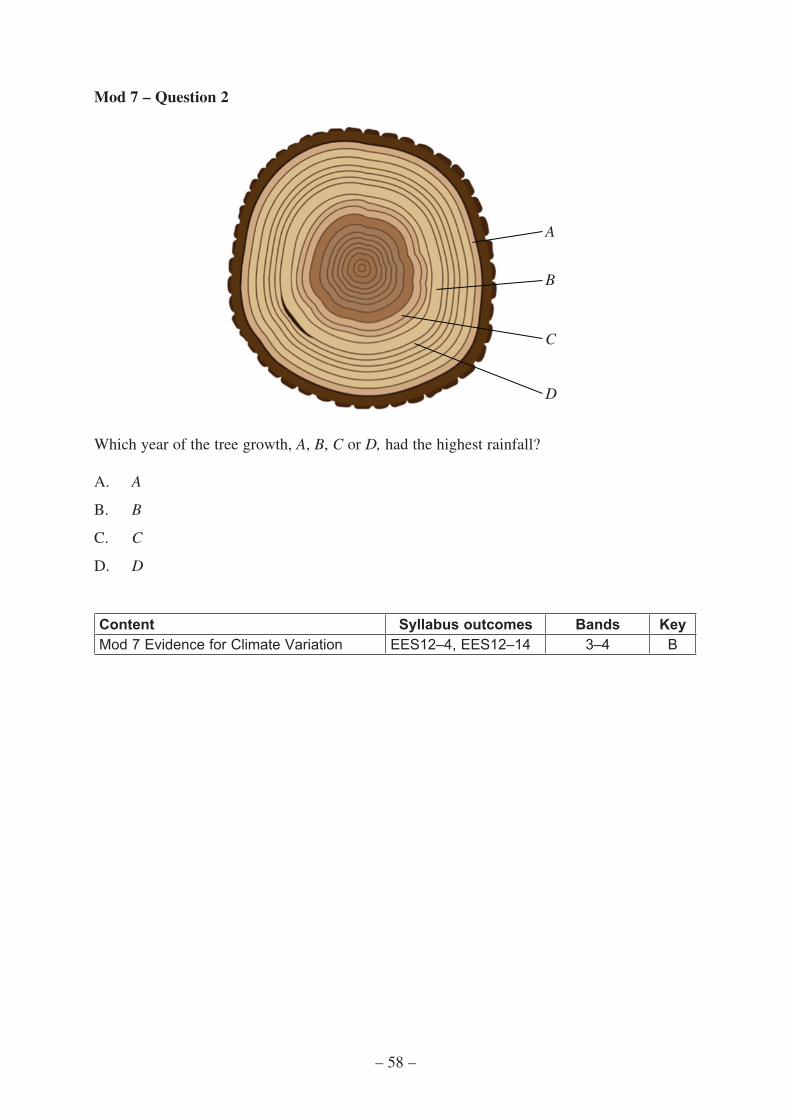
Which year of the tree growth, A, B, C or D, had the highest rainfall?
A. A
B. B
C. C
D. D
Content Syllabus outcomes Bands KeyMod 7 Evidence for Climate Variation EES12–4, EES12–14 3–4 B
– 59 –
Mod 7 – Question 3
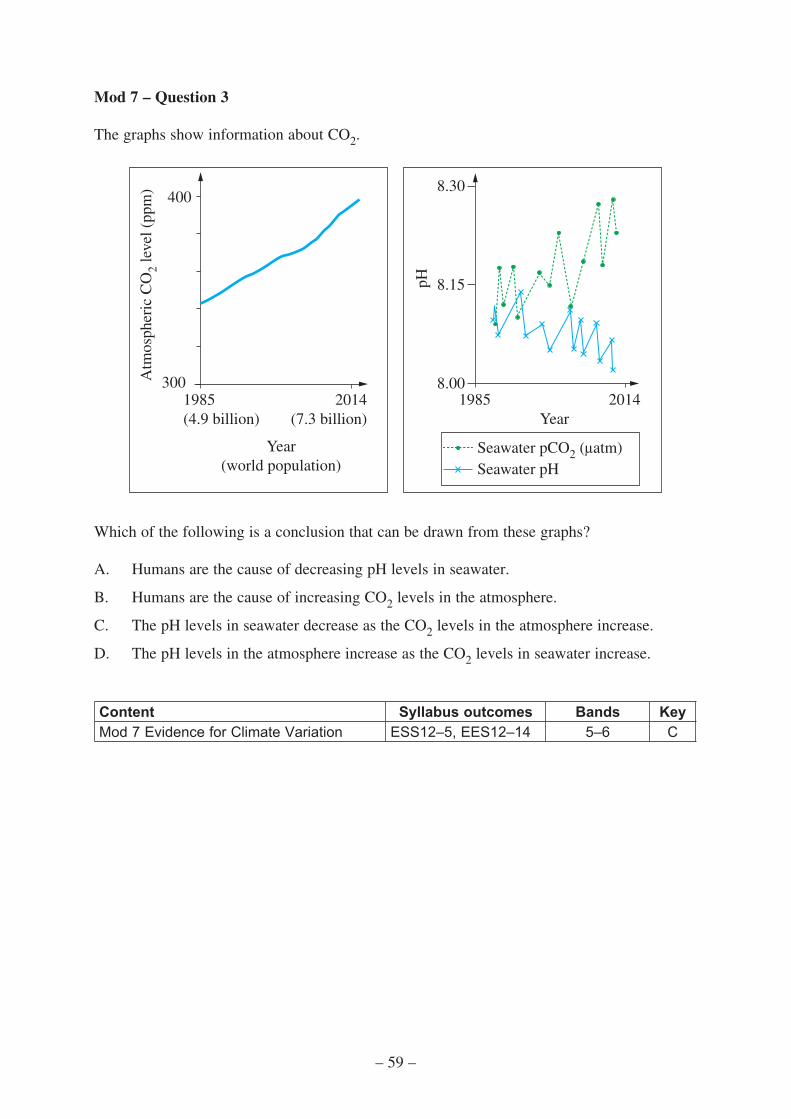
The graphs show information about CO2.
1985Year
Atm
osph
eric
CO
2 le
vel (
ppm
)
pH2014
400
3001985(4.9 billion)
2014(7.3 billion)
Year(world population)
8.30
8.15
8.00
Seawater pCO2 (matm)Seawater pH
Which of the following is a conclusion that can be drawn from these graphs?
A. Humans are the cause of decreasing pH levels in seawater.
B. Humans are the cause of increasing CO2 levels in the atmosphere.
C. The pH levels in seawater decrease as the CO2 levels in the atmosphere increase.
D. The pH levels in the atmosphere increase as the CO2 levels in seawater increase.
Content Syllabus outcomes Bands KeyMod 7 Evidence for Climate Variation ESS12–5, EES12–14 5–6 C
– 60 –
Mod 7 – Question 4
It has been claimed that climate variation is due to increasing levels of atmospheric CO2.
Which of following if true, would NOT support this claim?
A. Reduced acidification of the oceans
B. Reduced areas of glaciers and sea ice
C. Increased incidence of above average annual temperatures on Earth
D. Increased incidence of abnormal weather patterns and extreme weather events
Content Syllabus outcomes Bands KeyMod 7 Influences of Human Activities on Changes to Climate
EES12–14 3–4 A
Mod 7 – Question 5
Which chemicals react with each other to form a greenhouse gas?
A. Iron and water
B. Nitrous oxides and water
C. Sulfur trioxide and water
D. Hydrocarbons and oxygen
Content Syllabus outcomes Bands KeyMod 7 Influences of Human Activities on Changes to Climate
EES12–14 3–4 D
– 61 –
Mod 7 – Question 6
Which everyday activity may reduce a person’s contribution to the greenhouse effect?
A. Carpooling to get to work
B. Using less fertiliser on the lawn
C. Reducing the use of CFC aerosols
D. Watering the garden in the evening
Content Syllabus outcomes Bands KeyMod 7 Mitigation and Adaptation Strategies
EES12–14 2–3 A
Mod 7 – Question 7
Approximately 75% of the world’s energy needs are produced by the combustion of fossil fuels.
Which equation summarises the combustion of fossil fuels?
A. Methane + oxygen carbon monoxide + water + energy
B. Hydrocarbons + carbon dioxide oxygen + water + energy
C. Hydrocarbons + oxygen carbon dioxide + water + energy
D. Methane + hydrocarbons + oxygen carbon dioxide + water + energy
Content Syllabus outcomes Bands KeyMod 7 Mitigation and Adaptation Strategies
EES12–14 3–4 C
– 62 –
Mod 7 – Question 8 (8 marks)
The living world provides us with unexpected evidence of climate variation.
(a) Outline how the science of dendrochronology provides evidence for variations in climate.
(b) Explain how ancient and more recent evidence, other than dendrochronology, supports the belief that climate variation has occurred in the past.
Mapping grid (a):Content Syllabus outcomes BandsMod 7 Evidence for Climate Variation ESS12–6, EES12–14 2–4
Marking guidelines (a):Criteria Marks• Outlines how dendrochronology provides evidence for variations in
climate 3
• Shows some understanding of dendrochronology 2• Provides some relevant information 1
Sample answer:
Dendrochronology is the science of studying the pattern of growth rings in a cross-section of tree trunks. The number of rings is equal to the age of the tree in years. The varying width of the growth rings indicates the amount of growth each year which relates to the rainfall and climate at the time. So thinner growth rings indicate a dryer climate than thicker growth rings.
Question 9 continues on page 63
3
5
– 63 –
Question 8 (continued)
Mapping grid (b):Content Syllabus outcomes BandsMod 7 Evidence for Climate Variation ESS12–4, EES12–5,
EES12–6, EES12–142–6
Marking guidelines (b):Criteria Marks• Explains how ancient and more recent evidence supports the belief of
climate variation 5
• Outlines ancient and more recent evidence to support the belief of climate variation
• Explains at least one of them4
• Outlines ancient and/or more recent evidence to support the belief of climate variation 3
• Identifies ancient and/or more recent evidence to support the belief of climate variation
OR• Outlines ancient or more recent evidence to support the belief of climate
variation
2
• Provides some relevant information 1
Sample answer:
Marine microfossils, such as Formanifera, are evidence of the ocean temperature at the location where they were fossilized, as different species live in certain water temperatures. For example, Formanifera fossils of species found in Arctic waters today have been found off the coast of Britain, which must have had much colder water at the time. Also the ratio of oxygen-18 to oxygen-16 isotopes in their shells indicates the temperature of the sea as there is more oxygen-18 in colder seas, and hence in their shells.
Pollen grains fossilize very well for long periods of time due to their resistant cell walls. Their record in sedimentary beds over time is a good indicator of climate variation due to the specific requirements for temperatures and precipitation of the plants from which they came.
Aboriginal art is a record from the past for at least 28000 years. Their drawings include animals and environments that change with the age of the art, and so provide evidence for climate variation. In one location in Western Australia, 1600 km north of Perth, the progress of the ice age that occurred 22000 years ago can be traced through the art record, with land animals giving way to depictions of the marine species once the ice melted and the seas rose.
End of Question 8
– 64 –
Mod 7 – Question 9 (4 marks)
Explain how speleothems such as stalagmites and stalactites can be used as evidence for climate variation.
Mapping grid:Content Syllabus outcomes BandsMod 7 Evidence for Climate Variation EES12–5, EES12–6
EES12–14 2–6
Marking guidelines:Criteria Marks• Explains how speleothems can be used as evidence for climate variation
with reference to their formation and isotope ratio 4
• Outlines the formation of speleothems
• Links isotope ratio to climate variation 3
• Shows some understanding of speleothems 2• Provides some relevant information 1
Sample answer:
Two isotopes of oxygen, oxygen-16 and oxygen-18, exist in nature. Their ratio is temperature-dependent, so can be used as evidence for climate variation. For example, as the temperature becomes colder, the proportion of oxygen-18 increases. Formations called speleothems found in caves, such as stalagmites and stalactites, are formed when calcium carbonate is precipitated from water seeping through limestone rocks. When speleothems form, oxygen is trapped in their crystal structure, reflecting in the isotopic ratio of oxygen in the atmosphere at that time. As speleothems form very slowly, their isotopic ratios can be used as scientific evidence for variation in temperatures and rainfall for up to 200000 years.
4
– 65 –
Mod 7 – Question 10 (3 marks)
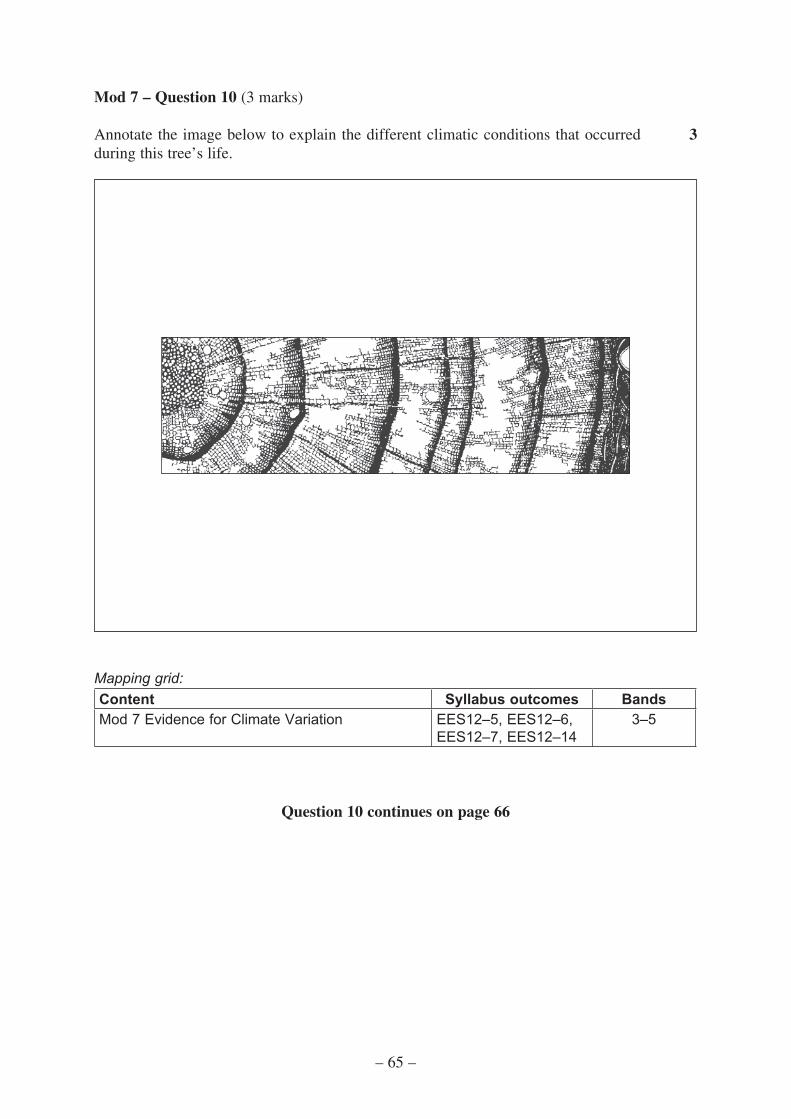
Annotate the image below to explain the different climatic conditions that occurred during this tree’s life.
Mapping grid:Content Syllabus outcomes BandsMod 7 Evidence for Climate Variation EES12–5, EES12–6,
EES12–7, EES12–143–5
Question 10 continues on page 66
3
– 66 –
Question 10 (continued)
Marking guidelines:Criteria Marks• Correctly annotates image to explain climatic conditions 3• Annotates image to indicate some climatic conditions 2• Provides some relevant information 1
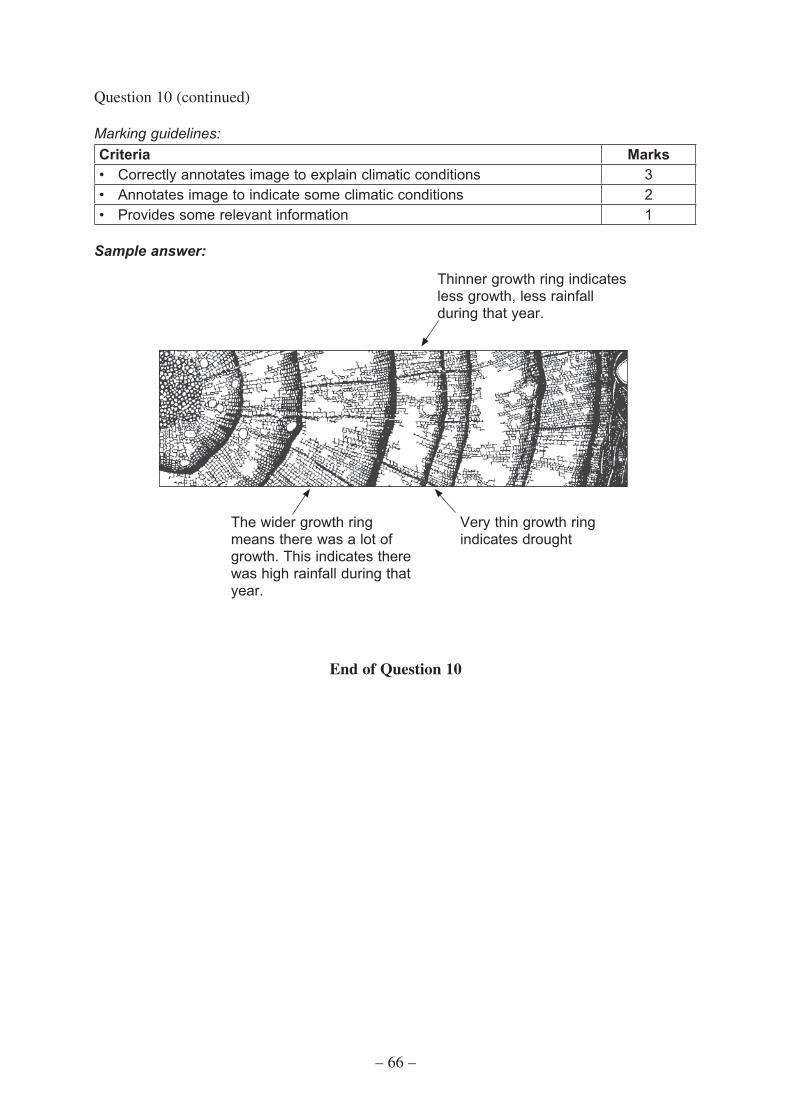
Sample answer:
The wider growth ring means there was a lot of growth. This indicates there was high rainfall during that year.
Very thin growth ring indicates drought
Thinner growth ring indicates less growth, less rainfall during that year.
End of Question 10
– 67 –
Mod 7 – Question 11 (3 marks)
The global temperature at the time of the formation of ice is calculated by using oxygen isotope levels in the ice.
Explain how the isotope levels reflect past temperatures.
Mapping grid:Content Syllabus outcomes BandsMod 7 Evidence for Climate Variation EES12–14 4–6
Marking guidelines:Criteria Marks• Explains how the isotope levels reflect past temperatures 3• Shows some understanding of 16O : 18O ratios 2• Provides some relevant information 1
Sample answer:
Oxygen gas contains two stable isotopes, oxygen 16 (16O) and oxygen 18 (18O). 16O is the more abundant isotope by far. 16O evaporates more easily from the ocean than the heavier 18O. During glacial periods (ice ages) more of the 16O evaporates from the sea and becomes locked up in glaciers after falling as snow. Thus ice cores showing a higher 16O : 18O ratio indicate lower temperatures.
3
– 68 –
Mod 7 – Question 12 (9 marks)
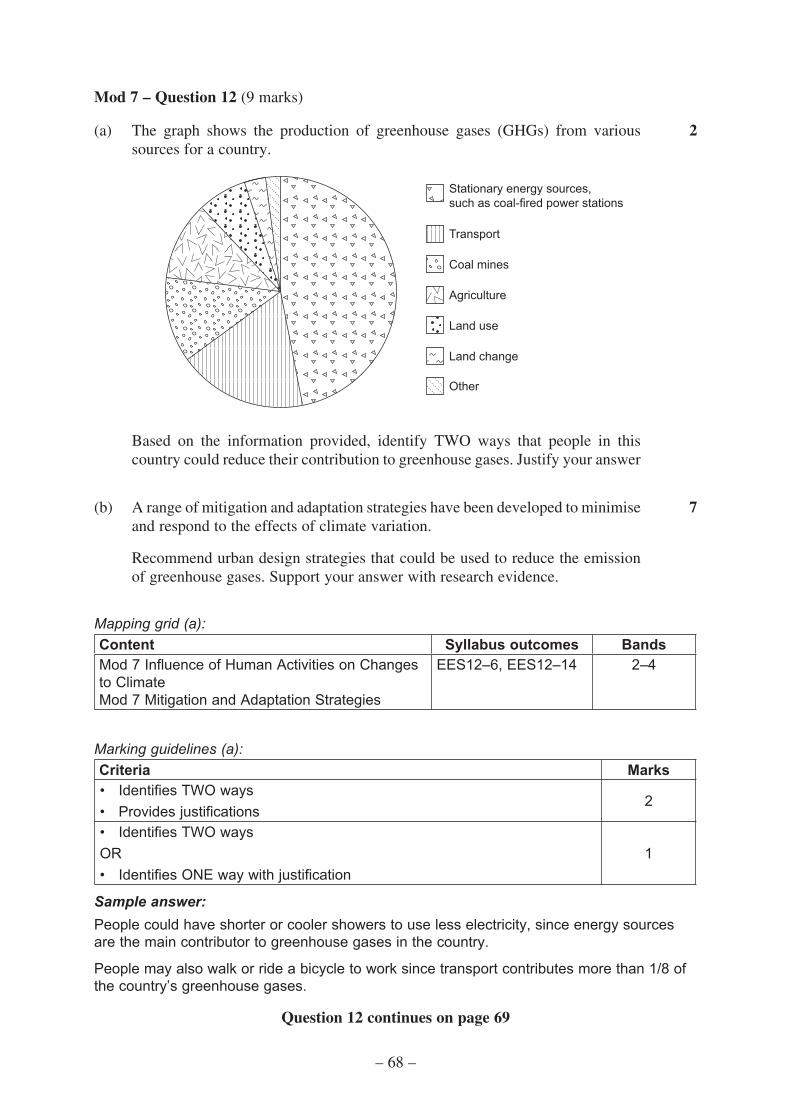
(a) The graph shows the production of greenhouse gases (GHGs) from various sources for a country.
Stationary energy sources, such as coal-fired power stations
Transport
Land change
Other
Land use
Coal mines
Agriculture
Based on the information provided, identify TWO ways that people in this country could reduce their contribution to greenhouse gases. Justify your answer
(b) A range of mitigation and adaptation strategies have been developed to minimise and respond to the effects of climate variation.
Recommend urban design strategies that could be used to reduce the emission of greenhouse gases. Support your answer with research evidence.
Mapping grid (a):Content Syllabus outcomes BandsMod 7 Influence of Human Activities on Changes to ClimateMod 7 Mitigation and Adaptation Strategies
EES12–6, EES12–14 2–4
Marking guidelines (a):Criteria Marks• Identifies TWO ways• Provides justifications
2
• Identifies TWO waysOR• Identifies ONE way with justification
1
Sample answer:People could have shorter or cooler showers to use less electricity, since energy sources are the main contributor to greenhouse gases in the country.
People may also walk or ride a bicycle to work since transport contributes more than 1/8 of the country’s greenhouse gases.
Question 12 continues on page 69
2
7

– 69 –
Question 12 (continued)
Mapping grid (b):Content Syllabus outcomes BandsMod 7 Mitigation and Adaptation Strategies ESS12–4, EES12–5,
EES12–6, EES12–142–6
Marking guidelines (b):Criteria Marks• Provides reasons in favour of urban design strategies that could be used
to reduce the emission of greenhouse gases
• Supports answer with relevant research evidence7
• Provides reasons in favour of urban design strategies that could be used to reduce the emission of greenhouse gases
• Includes some research evidence6
• Describes relevant urban design strategies
• Supports proposed strategies with justifications5
• Describes relevant urban design strategies
• Provides some justification4
• Identifies relevant urban design strategies
• Outlines at least one relevant strategy3
• Identifies relevant urban design strategiesOR• Outlines a relevant urban design strategy
2
• Provides some relevant information 1
Answers could include:• Many countries are beginning to consider ways of reducing GHG emissions when new
urban developments are being planned and built. Since energy and transport are two of the biggest contributors to greenhouse gases, urban designs that minimise the use of both are preferable. This means locating new urban developments close to resources needed for building and close to commercial and educational centres for commuters who will live in these new towns. Higher density living also has a smaller demand on resources per capita as less energy is used, less distance needs to be travelled due to better access to transport and infrastructure, fewer building materials are used and transported, and waste collection is more energy efficient. These designs also leave more land for agriculture that has a lower carbon footprint than housing. However, when building designs implement GHG mitigation strategies, valid, reliable and accurate data is essential for their success to be assessed.
Question 12 continues on page 70

– 70 –
Question 12 (continued)
• One study in Finland on the outskirts of Helsinki targeted the earthworks and building resources stage as an area for mitigating GHGs. The urban development covered 150Ha and would house 500000 residents when completed. Their research emphasised that planning is a critical stage for achieving measurable success. The researchers spent considerable time in liaising with local authorities and nearby towns and locating nearby building resources. They decided to use local stone which was the waste produced by building a 1 km tunnel for a transport corridor which was part of the city design. The stone was crushed and provided 85% of the structural stone needed for building, so reducing the additional amount to be transported to the site. Waste clay was also excavated from the site and, instead of being transported from the area, was used to landscape a hill nearby. Accurate figures were kept and, at the end of the project, an average of 40% of GHG emissions was saved by use of the recycled stone alone. Further GHG mitigation was also documented from the reuse of the clay. By planning and employing these mitigation strategies at the earthworks and building materials stage, this project was successful in demonstrating how urban design planning and use of mitigation strategies can significantly lower GHG emissions during urban development.
End of Question 12

– 71 –
Module 8 Resource Management
Mod 8 – Question 1
Which of the following should be used to rehabilitate a mine site contaminated with toxic metals?
A. Collect and remove acid rain
B. Treat tailings and wastewater
C. Seed the area with native vegetation
D. Place wooden barriers over old mine shafts
Content Syllabus outcomes Bands KeyMod 8 Using Australia’s Natural Resources EES12–6, EES12–15 4–5 B
– 72 –
Mod 8 – Question 2
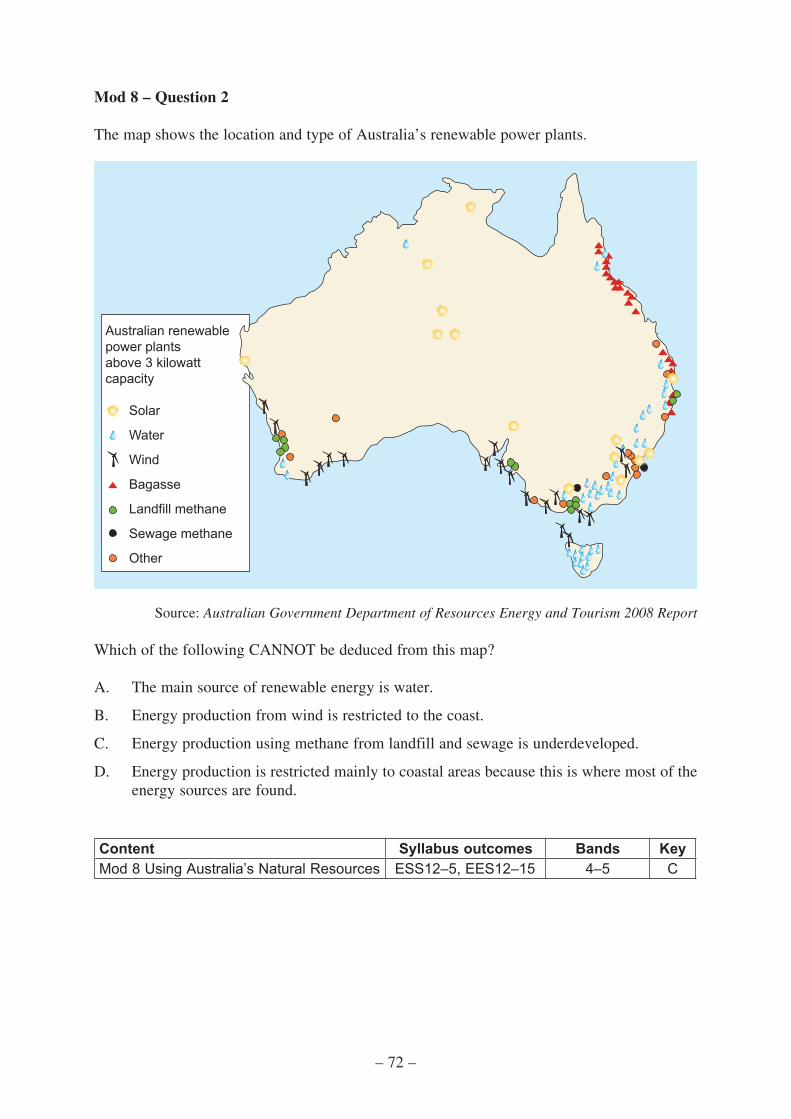
The map shows the location and type of Australia’s renewable power plants.
Australian renewablepower plantsabove 3 kilowattcapacity
Solar
Wind
Bagasse
Sewage methane
Landfill methane
Water
Other
Source: Australian Government Department of Resources Energy and Tourism 2008 Report
Which of the following CANNOT be deduced from this map?
A. The main source of renewable energy is water.
B. Energy production from wind is restricted to the coast.
C. Energy production using methane from landfill and sewage is underdeveloped.
D. Energy production is restricted mainly to coastal areas because this is where most of the energy sources are found.
Content Syllabus outcomes Bands KeyMod 8 Using Australia’s Natural Resources ESS12–5, EES12–15 4–5 C
– 73 –
Mod 8 – Question 3
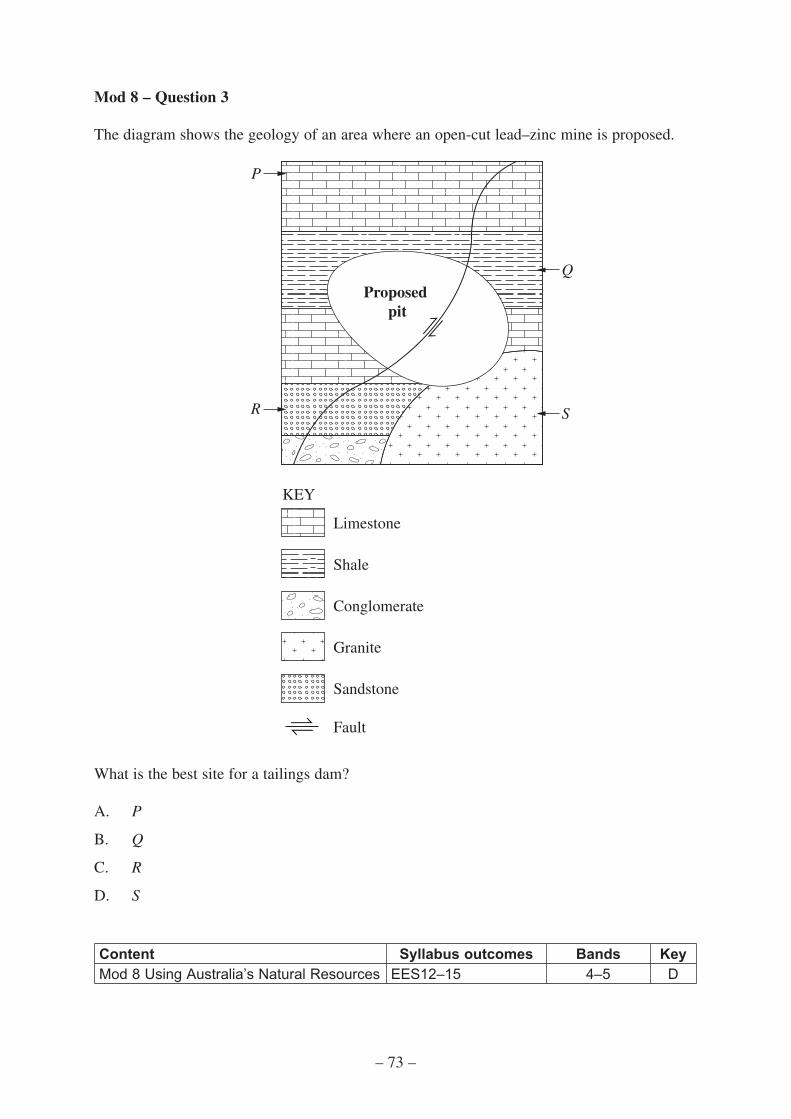
The diagram shows the geology of an area where an open-cut lead–zinc mine is proposed.
KEY
Limestone
Shale
Granite
Conglomerate
Sandstone
P
Q
R
Proposed pit
S
Fault
What is the best site for a tailings dam?
A. P
B. Q
C. R
D. S
Content Syllabus outcomes Bands KeyMod 8 Using Australia’s Natural Resources EES12–15 4–5 D

– 74 –
Mod 8 – Question 4
Which row of the table shows the most appropriate waste management option?
Waste Management option
A. Cardboard Soaked in water and pumped out into the river
B. Hazardous chemical Poured over landfills
C. Glass Broken up into smaller pieces and dumped in landfill
D. Tree trimming Mulched and placed in composting piles
Content Syllabus outcomes Bands KeyMod 8 Waste Management EES12–15 2–3 D
Mod 8 – Question 5
The practice of fire stick burning was used by Aboriginal people in the past and is still used today.
Why is fire stick burning considered a sustainable practice?
A. It promotes fish breeding.
B. It provides pathways for easier travel.
C. It initiates fresh growth of edible plants.
D. It changes the nature of both plant and animal species over time.
Content Syllabus outcomes Bands KeyMod 8 Sustainability EES12–15 2–3 C
– 75 –
Mod 8 – Question 6
A copper mine, closed more than twenty years ago, has since been abandoned. Toxic waste in the tailings has not been removed and toxic copper sulfide has been leaked into the river system since the mine’s closure. Today, there is no aquatic life for at least 7 km downstream. Clean-up and reclamation costs have been estimated to be between $20 and $50 million.
Which of the following would best address this type of problem?
A. Ask local communities to remove toxic waste from mining sites.
B. Require mine operators to conduct research and development into clean-up and reclamation.
C. Require mine operators to pay an environmental bond at the start of operations to cover clean-up and reclamation costs.
D. Require fencing to be erected around mining sites and surrounding rivers so that wildlife cannot drink contaminated water.
Content Syllabus outcomes Bands KeyMod 8 Sustainability EES12–15 3–4 C
– 76 –
Mod 8 – Question 7 (7 marks)
(a) Using examples, describe human activities that have negatively affected the sustainability of Australian resources.
(b) Explain why Aboriginal and Torres Strait Islander Peoples can be described as sustainable resource managers.
Mapping grid (a):Content Syllabus outcomes BandsMod 8 Using Australia’s Natural Resources
Mod 8 Sustainability
EES12–15 2–4
Marking guidelines (a):Criteria Marks• Provides relevant examples
• Uses the examples to describe human activities that have negatively affected the sustainability of Australian resources
3
• Provides relevant examples and shows some link between the examples and sustainability
OR
• Uses an example to describe human activities that have negatively affected sustainability
2
• Identifies a negative effect of human activities on sustainability 1
Sample answer:
Humans have over-logged old-growth forests. This has resulted in the destruction of animal and plant habitats as not enough trees remain to permit seed germination and regrowth.
Manufacturing activities, such as metal smelters, have released waste products including toxic elements into waterways, causing the death of fish populations. The fish cannot breed and the population is no longer sustainable.
Question 7 continues on page 77
3
4
– 77 –
Question 7 (continued)
Mapping grid (b):Content Syllabus outcomes BandsMod 8 Sustainability EES12–15 2–5
Marking guidelines (b):Criteria Marks• Explains why Aboriginal and Torres Strait Islander Peoples can be
described as sustainable resource managers 4
• Outlines activities practised by Aboriginal and Torres Strait Islander Peoples that contribute to sustainable resource management 3
• Identifies activities practised by Aboriginal and Torres Strait Islander Peoples that are related to sustainable resource management
OR
• Outlines an activity practised by Aboriginal and/or Torres Strait Islander Peoples that is related to sustainable resource management
2
• Provides some relevant information about Aboriginal and/or Torres Strait Islander Peoples’ culture 1
Sample answer:
Aboriginal and Torres Strait Islander Peoples’ culture has a deeply symbolic and emotional connection to ‘Country and Place’ and this underpins life activities. Food gathering relates to the seasons, with specific times for hunting, fishing and harvesting, especially to Torres Strait Islanders. The people move from area to area, maintaining sustainability, so no area is over-utilised. They have, more recently, used items that have been washed up on particular islands and repurposed them eg ghost netting to create art works.
In addition, fire is used to maintain areas of burnt land and regrowth, particularly in Aboriginal cultures. The philosophy behind the fires ensures they can plan and predict areas where animals will graze on grasslands, and areas with edible plants and fresh drinking water can be sustained, ensuring that there is always a supply of foods.
End of Question 7

– 78 –
Mod 8 – Question 8 (4 marks)
The table shows world energy usage in terawatts (TW = 1012 watts) from 1965 to 2005, and gives projected world energy usage for 2025 and 2055.
Year Oil
(TW)
Coal
(TW)
Gas
(TW)
Other energy sources(TW)
1965 2.0 2.0 0.8 0.1
1975 3.5 2.2 1.5 0.2
1985 3.7 2.7 2.0 0.4
1995 4.3 3.0 2.5 0.6
2005 5.0 3.8 3.3 0.9
2025 4.0 3.8 3.8 2.1
2055 1.5 3.9 4.3 4.4
(a) Using information in the table, predict ONE economic effect of projected world energy usage.
(b) Justify the use of ONE energy source other than oil, coal or gas in meeting future world energy demand.
Mapping grid (a):Content Syllabus outcomes BandsMod 8 Using Australia’s Natural Resources EES12–5, EES12–15 3–4
Marking guidelines (a):Criteria Marks• Gives a valid economic effect 1
Sample answer:
There will be increased investment in other energy sources to meet increasing demand.
Question 8 continues on page 79
1
3

– 79 –
Question 8 (continued)
Mapping grid (b):Content Syllabus outcomes BandsMod 8 Using Australia’s Natural Resources EES12–6, EES12–15 3–5
Marking guidelines (b):Criteria Marks• Identifies one other energy source
• Justifies its use in meeting future world energy demand
• Gives a point for or against its use
3
• Outlines one other energy source that may meet future world energy demand 2
• Provides some relevant information 1
Sample answer:
Solar energy can provide electrical energy from photovoltaic cells. This electricity can be substituted for electricity produced from fossil fuels, thus meeting some of the world’s energy needs for electricity. It also reduces pollution.
End of Question 8

– 80 –
Mod 8 – Question 9 (6 marks)
A practical investigation of the composition of household or organisational waste is to be carried out.
(a) Outline a method that can be used to carry out this investigation.
(b) Explain how ONE potential risk in this investigation can be managed.
(c) Explain how the results can be used to improve the management of this waste.
Mapping grid (a):Content Syllabus outcomes BandsMod 8 Waste Management EES12–2, EES12–4,
EES12–152–4
Marking guidelines (a):Criteria Marks• Outlines a suitable method 2• Provides some relevant information 1
Sample answer:
Separate waste into groups, eg plastic, paper, glass and organic. Count and record the amount (volume or weight) of each type of waste.
Mapping grid (b):Content Syllabus outcomes BandsMod 8 Waste Management EES12–2, EES12–15 2–4
Marking guidelines (b):Criteria Marks• Explains how ONE potential risk can be managed 2• Provides some relevant information 1
Sample answer:
Protective equipment such as closed shoes, gloves and safety glasses should be worn as there may be broken glass or other sharp objects in the waste.
Question 9 continues on page 81
2
2
2

– 81 –
Question 9 (continued)
Mapping grid (c):Content Syllabus outcomes BandsMod 8 Waste Management
Mod 8 Sustainability
EES12–5, EES12–6, EES12–7, EES12–15
3–5
Marking guidelines (c):Criteria Marks• Explains how the results can be used to improve the management of the
waste 2
• Provides some relevant information 1
Sample answer:
The results could show ways in which waste can be managed, eg if there is a lot of organic waste, producing compost would be a sustainable solution. If there is a lot of recyclable material, recycling services should be used.
End of Question 9
– 82 –
Mod 8 – Question 10 (7 marks)
Explain how human activities could affect the sustainability of Earth’s resources.
Mapping grid:Content Syllabus outcomes BandsMod 8 Sustainability EES12–5, EES12–7,
EES12–152–6
Marking guidelines:Criteria Marks• Shows a comprehensive understanding of the effects of human activities
on sustainability
• Clearly relates the effects of relevant human activities to the sustainability of Earth’s natural resources
7
• Describes how human activities could affect the sustainability of Earth’s natural resources
• Relates some effects of the activities to the sustainability of Earth’s natural resources
6
• Describes how human activities could affect the sustainability of Earth’s natural resources 5
• Outlines how human activities could affect sustainability of Earth’s natural resources 4
• Identifies human activities and/or factors that could affect sustainability
• Outlines how a human activity could affect sustainability3
• Identifies human activities and/or factors that could affect sustainabilityOR• Outlines a human activity or factor that could affect sustainability
2
• Shows a basic understanding of sustainability or Earth’s natural resources 1
Question 10 continues on page 83
7
– 83 –
Question 10 (continued)
Sample answer:
Water pollution could be catastrophic for entire eco-systems and could severely affect the sustainability of Earth’s natural resources. Water pollution could be caused by a variety of factors such as improper disposal of waste from wastewater treatment plants and factories, deforestation, mining, agriculture and oil spills. Water pollution could disrupt the breeding and feeding patterns of flora and fauna that lives in the waters. It may cause them to relocate to other habitats, or, more seriously, it may kill off the species.
As well as endangering the population of whole species, water pollution could have a greater knock-on effect on the food pyramid as a whole. When the main food source of an animal becomes endangered or extinct, that animal will have problem finding food or become poisoned through eating the same chemicals that killed its prey, leading to a chain effect.
Another human activity that could affect sustainability is water allocations or damming. For example, cutting the amount of water set aside for environmental flow to increase the amount of water released for farm irrigation could affect the sustainability of river systems. Environmental flows are an artificial release of water into a river system to maintain natural processes. Advantages of environmental flows include depositing sediments on top of decaying organisms, the stimulation of eggs to hatch for the breeding of fish, the encouragement of water birds back to an area, reducing salinity and preventing eutrophication.
As a result of cutting the amount of water set out for environmental flows, the sustainability of river systems could be affected. This is due to less oxygen being available for organisms as decaying organisms reduce the available oxygen and as a result fish can be deprived of oxygen. Eutrophication can also occur and limit light available for photosynthesising aquatic plants.
Flood irrigation methods used by some farmers may also increase salinity due to the rising water table, resulting in higher management and rehabilitation costs into the future.
End of sample questions
© 2019 NSW Education Standards Authority
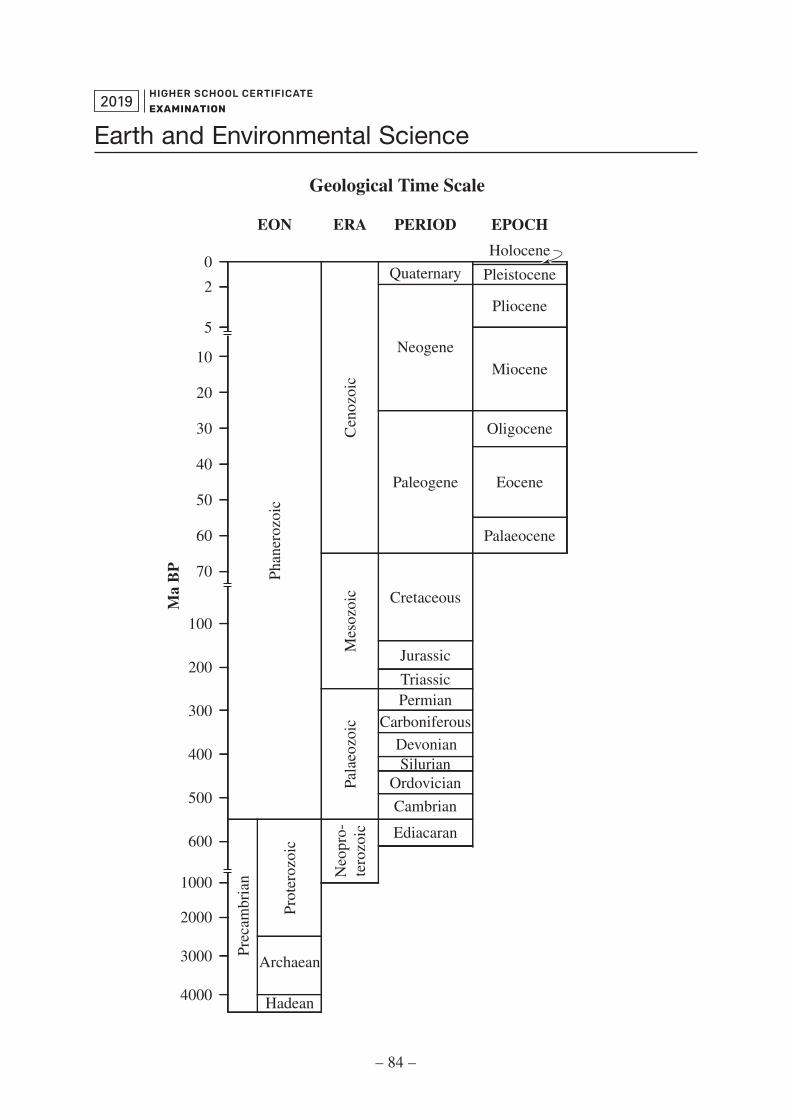
– 84 –
HIGHER SCHOOL CERTIFICATE
EXAMINATION2019
Earth and Environmental ScienceGeological Time Scale
0
2
5
10
20
30
40
50
60
70
100
200
300
400
500
600
1000
2000
3000
4000 Hadean
Archaean
EON ERA
Oligocene
Eocene
Pliocene
Pleistocene
EPOCH
Quaternary
PERIOD
Neogene
Cretaceous
Paleogene
Permian
Jurassic
Triassic
DevonianSilurian
Ordovician
Cambrian
Ediacaran
Carboniferous
Miocene
Palaeocene
Prot
eroz
oic
Prec
ambr
ian
Phan
eroz
oic
Cen
ozoi
cPa
laeo
zoic
Neo
pro-
tero
zoic
Mes
ozoi
c
Ma
BP
Holocene