dynamics of particles and cages in an experimental 2d glass
TRANSCRIPT
December 2009
EPL, 88 (2009) 66004 www.epljournal.org
doi: 10.1209/0295-5075/88/66004
Dynamics of particles and cages in an experimental2D glass former
S. Mazoyer, F. Ebert, G. Maret and P. Keim(a)
Fachbereich Physik, Universitat Konstanz - Universitatsstrasse 10, 78457 Konstanz, Germany, EU
received 30 July 2009; accepted in final form 25 November 2009published online 4 January 2010
PACS 64.70.kj – GlassesPACS 68.90.+g – Other topics in structure, and nonelectronic properties of surfaces and inter-
faces; thin films and low-dimensional structuresPACS 82.70.-y – Disperse systems; complex fluids
Abstract – We investigate the dynamics of a glass-forming 2D colloidal mixture and show theexistence of collective motions of the particles. We introduce a mean square displacement MSDwith respect to the nearest neighbors which shows remarkable deviations from the usual MSDquantifying the individual motion of our particles. Combined with the analysis of the self-partof the Van Hove function this indicates a coupled motion of particles with their cage as well asintra-cage hopping processes.
Copyright c© EPLA, 2009
Introduction. – Supercooled fluids near the glasstransition exhibit a range of interesting dynamical prop-erties such as non-exponential relaxation functions, twotime relaxation of the system or a dramatic increase of thetime scale for molecular motion close to the glass transi-tion [1]. Most of these features have been attributed tospatially heterogeneous relaxation [2–5] and cooperativemotion of particles [6–9]. For instance confocal microscopyin a colloidal supercooled fluid have evidenced the exis-tence of populations of fast and slow particles, formingclusters of a few tens of fast colloids [10]. Most of theseclusters are visible only on the time scale of the order ofthe α-relaxation.Further common features of the dynamics of super-
cooled fluids are the behavior of the self-part of the VanHove function and the non-Gaussian parameter [7,11–13].Both of them reflect the non-Brownian character of parti-cle motion and it is commonly accepted that the maximumof the non-Gaussian parameter corresponds to a maximumin the heterogeneity of the dynamics. More interestingmaybe is the shape of the self-part of the Van Hove func-tion [14] from which more quantitative information canbe extracted about the nature of the motion. The exis-tence of two dynamical populations was confirmed fromthis quantity in numerous systems like granular media,colloidal gels, and Lennard Jones mixtures [9,15,16] andthis behavior is also presented as a possible universal
(a)E-mail: [email protected]
feature of glass-forming systems [16]. Intensive studies ofdynamical heterogeneities have been performed by simu-lations, while experimental works in direct space remainquite rare [6,10]. In this paper we present results from astudy of a 2D experimental colloidal system which consistsof a binary mixture of superparamagnetic particles inter-acting via a dipole-dipole interaction. This system allowsto study the very nature of the glass transition in 2D. Inaddition some of the local features like geometrical frus-tration are easier to detect compared to 3D [17–20].The average glassy dynamics of this system has been
studied in [5,21]. Here we focus on the microscopic localfeatures of planar dynamics.The organization of the paper is as follows. First we will
briefly describe the experimental system. Second we willpresent experimental results and analysis of the dynamicsfor both the fluid phase and the supercooled phase.
Materials and methods. – The experimental setupis well established and has been described elsewhere[5,22].The system consists of a suspension of two kinds of
spherical superparamagnetic colloidal particles A and Bwith different diameters (dA = 4.5µm, dB = 2.8µm) andmagnetic susceptibilities per particle (χA ≈ 10 ·χB). Dueto their high mass density of ρm ≈ 1.5 g/cm3, particlesare confined by gravity to a water-air interface formedby a pending water drop suspended by surface tensionin a top sealed cylindrical hole (6mm diameter, 1mm
66004-p1
S. Mazoyer et al.
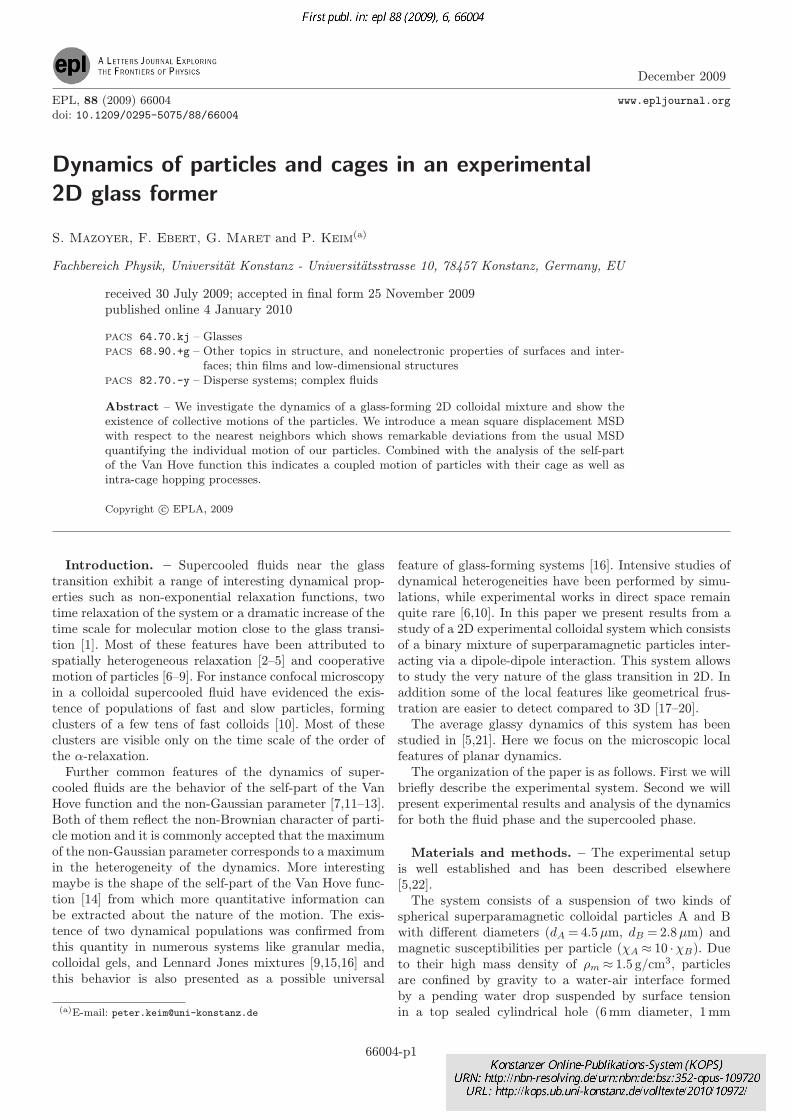
water
air
repulsive
Hm
glass
Fig. 1: (Colour on-line) Super-paramagnetic colloidal particlesconfined at a water-air interface due to gravity. The curvatureof the interface is actively controlled to be completely flat,and the system is considered to be ideally two dimensional.A magnetic field H perpendicular to the interface induces amagnetic momentM in each bead leading to a repulsive dipolarpair interaction.
depth) in a glass plate. This basic setup is sketched infig. 1. A magnetic fieldH is applied perpendicularly to thewater-air interface inducing a magnetic moment M= χHin each particle leading to a repulsive dipole-dipole pairinteraction.The parameter Γ quantifies the strength of the interac-
tion and is defined by the ratio between average magneticinteraction energy and thermal energy:
Γ =µ0
4π
H2 · (πρ)(3/2)kBT
(ξ ·χB +(1− ξ) ·χA)2,
where ξ denotes the relative number of small particles andρ is the 2D density,
ξ =NB
NA+NB.
The set of particles is visualized by video microscopyfrom below the sample and is recorded by an 8-bit CCDcamera. The gray scale image of the particles is thenanalyzed in situ with a computer. The field of view hasa size of ≈ 1mm2 containing typically 3× 10³ particles,whereas the whole sample contains about up to 105
particles. Standard image processing is performed to getsize, number, and positions of the colloids. A computer-controlled syringe driven by a micro-stage controls thevolume of the droplet to reach a completely flat surface. Toachieve a horizontal interface, the inclination of the wholeexperimental setup has to be aligned. This inclination iscontrolled actively by micro-stages with a resolution of∆α≈ 1µrad. After typically several weeks of adjustmentand equilibration best equilibrium conditions for long-time stability are achieved. During data acquisition theimages are analyzed with a frame rate down to 10Hz.Trajectories of all particles in the field of view can berecorded over several days providing the whole phase spaceinformation. The thermal activated “out of plane” motion
of the particles is expected to be in the range of a few tensof nanometer. Thus, the ensemble is considered as ideallytwo dimensional.Information on all relevant time and length scales is
available, an advantage compared to many other experi-mental systems. Furthermore, the pair interaction is notonly known but can also be directly controlled over a widerange.
Experimental observations. – The study of themean square displacement for this system has beenpresented earlier [5,21]. Here we only recall the mainfindings. At Γ= 25 the system is in a fluid state and themean square displacement is diffusive at all time for bothsmall and big particles. For Γ= 110 the system is in anintermediate phase, where the mean square displacementexhibits an inflexion point around t= 1000 s. For higher Γ,e.g, Γ = 338 and Γ= 390 the system is in a glass-formingphase and the mean square displacement has 3 clearlydistinct regimes. At early times, during the commonlycalled β-relaxation, it is diffusive. Then follows a plateauregime where the mean square displacement is almostconstant. And finally one observes again an increase ofthe MSD, commonly called α-relaxation.In order to get a better idea of microscopic dynamics
we will address the question of caging of particles by theirnearest neighbors. Particles escaping from their cage areoften believed to be responsible for the α-relaxation inthe MSD. Therefore we investigate the displacement ofa colloid with respect to the average displacement of itsnearest neighbors as a function of time. We define the cagerelative MSD as follows:
〈∆r2CR(t)〉= 〈[(�ri(t)−�ri(0))− (�r cagei (t)−�r cagei (0))]2〉,(1)
where 〈〉 is the ensemble average, �ri(t) is the position ofthe particle i at time t, and �r cagei the position of thecenter of mass of the initially nearest neighbors: �r cagei =1Nnn
∑Nnnj=1 (�rj(t)−�rj(0)), where j runs over the indices
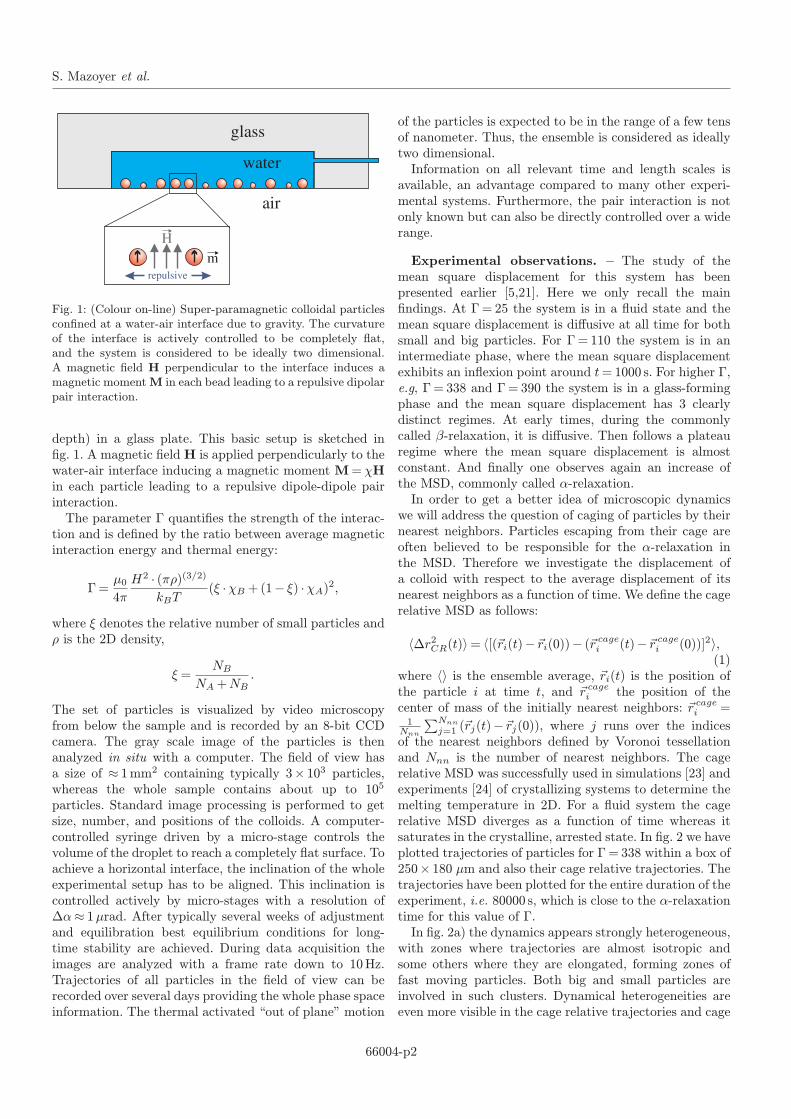
of the nearest neighbors defined by Voronoi tessellationand Nnn is the number of nearest neighbors. The cagerelative MSD was successfully used in simulations [23] andexperiments [24] of crystallizing systems to determine themelting temperature in 2D. For a fluid system the cagerelative MSD diverges as a function of time whereas itsaturates in the crystalline, arrested state. In fig. 2 we haveplotted trajectories of particles for Γ = 338 within a box of250× 180 µm and also their cage relative trajectories. Thetrajectories have been plotted for the entire duration of theexperiment, i.e. 80000 s, which is close to the α-relaxationtime for this value of Γ.In fig. 2a) the dynamics appears strongly heterogeneous,
with zones where trajectories are almost isotropic andsome others where they are elongated, forming zones offast moving particles. Both big and small particles areinvolved in such clusters. Dynamical heterogeneities areeven more visible in the cage relative trajectories and cage
66004-p2
Dynamics of particles and cages in an experimental 2D glass former
a) b)
Fig. 2: a) Trajectories of big (in green) and small (in red) particles in the supercooled phase (Γ= 338) within a box of 250× 180µmand over a duration of t= 80000 s. b) Same as in a) but the trajectories of the particles are calculated relatively to the centerof mass of their cage.
relative trajectories are also more compact. The existenceof such compact clusters of fast moving particles is inagreement with what has been found in other systems like3D colloidal glass [10] or molecular glass formers [25,26].Presence of a few string-like motion has to be noticed,as in quasi-2D colloidal system [6] or Lennard Jonesmixtures [3,9] but they do not represent a significant partof the rearranging clusters.In fig. 3 we have plotted both, the cage relative MSD and
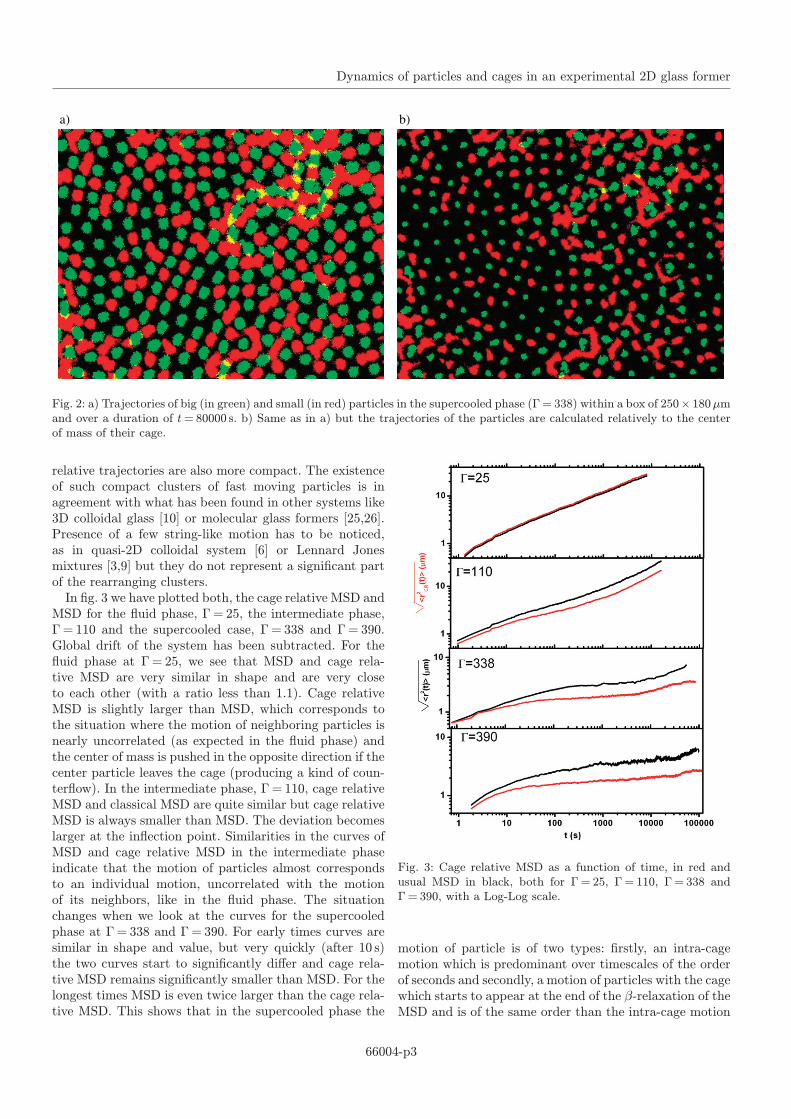
MSD for the fluid phase, Γ = 25, the intermediate phase,Γ = 110 and the supercooled case, Γ = 338 and Γ= 390.Global drift of the system has been subtracted. For thefluid phase at Γ= 25, we see that MSD and cage rela-tive MSD are very similar in shape and are very closeto each other (with a ratio less than 1.1). Cage relativeMSD is slightly larger than MSD, which corresponds tothe situation where the motion of neighboring particles isnearly uncorrelated (as expected in the fluid phase) andthe center of mass is pushed in the opposite direction if thecenter particle leaves the cage (producing a kind of coun-terflow). In the intermediate phase, Γ = 110, cage relativeMSD and classical MSD are quite similar but cage relativeMSD is always smaller than MSD. The deviation becomeslarger at the inflection point. Similarities in the curves ofMSD and cage relative MSD in the intermediate phaseindicate that the motion of particles almost correspondsto an individual motion, uncorrelated with the motionof its neighbors, like in the fluid phase. The situationchanges when we look at the curves for the supercooledphase at Γ= 338 and Γ= 390. For early times curves aresimilar in shape and value, but very quickly (after 10 s)the two curves start to significantly differ and cage rela-tive MSD remains significantly smaller than MSD. For thelongest times MSD is even twice larger than the cage rela-tive MSD. This shows that in the supercooled phase the
Fig. 3: Cage relative MSD as a function of time, in red andusual MSD in black, both for Γ= 25, Γ = 110, Γ = 338 andΓ= 390, with a Log-Log scale.
motion of particle is of two types: firstly, an intra-cagemotion which is predominant over timescales of the orderof seconds and secondly, a motion of particles with the cagewhich starts to appear at the end of the β-relaxation of theMSD and is of the same order than the intra-cage motion
66004-p3
S. Mazoyer et al.
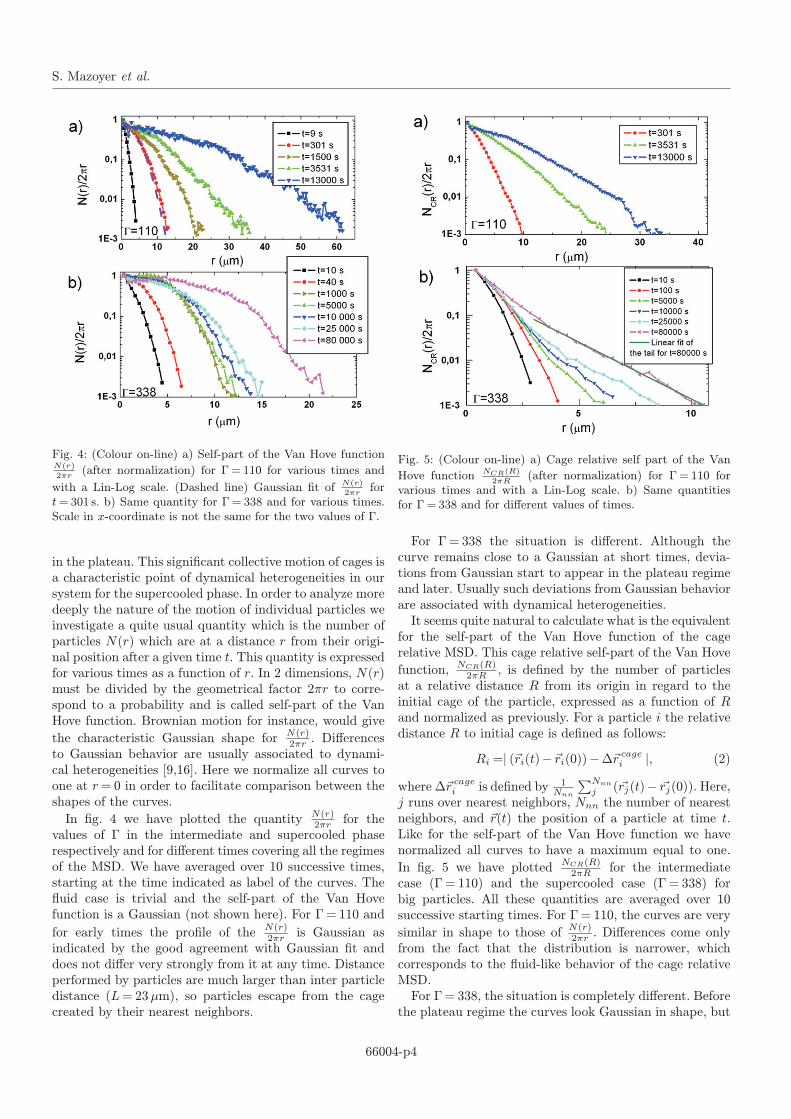
Fig. 4: (Colour on-line) a) Self-part of the Van Hove functionN(r)2πr
(after normalization) for Γ = 110 for various times and
with a Lin-Log scale. (Dashed line) Gaussian fit of N(r)2πr
fort= 301 s. b) Same quantity for Γ= 338 and for various times.Scale in x-coordinate is not the same for the two values of Γ.
in the plateau. This significant collective motion of cages isa characteristic point of dynamical heterogeneities in oursystem for the supercooled phase. In order to analyze moredeeply the nature of the motion of individual particles weinvestigate a quite usual quantity which is the number ofparticles N(r) which are at a distance r from their origi-nal position after a given time t. This quantity is expressedfor various times as a function of r. In 2 dimensions, N(r)must be divided by the geometrical factor 2πr to corre-spond to a probability and is called self-part of the VanHove function. Brownian motion for instance, would give
the characteristic Gaussian shape for N(r)2πr . Differencesto Gaussian behavior are usually associated to dynami-cal heterogeneities [9,16]. Here we normalize all curves toone at r= 0 in order to facilitate comparison between theshapes of the curves.
In fig. 4 we have plotted the quantity N(r)2πr for the
values of Γ in the intermediate and supercooled phaserespectively and for different times covering all the regimesof the MSD. We have averaged over 10 successive times,starting at the time indicated as label of the curves. Thefluid case is trivial and the self-part of the Van Hovefunction is a Gaussian (not shown here). For Γ= 110 and
for early times the profile of the N(r)2πr is Gaussian as
indicated by the good agreement with Gaussian fit anddoes not differ very strongly from it at any time. Distanceperformed by particles are much larger than inter particledistance (L= 23µm), so particles escape from the cagecreated by their nearest neighbors.
Fig. 5: (Colour on-line) a) Cage relative self part of the Van
Hove function NCR(R)2πR
(after normalization) for Γ = 110 forvarious times and with a Lin-Log scale. b) Same quantitiesfor Γ = 338 and for different values of times.
For Γ= 338 the situation is different. Although thecurve remains close to a Gaussian at short times, devia-tions from Gaussian start to appear in the plateau regimeand later. Usually such deviations from Gaussian behaviorare associated with dynamical heterogeneities.It seems quite natural to calculate what is the equivalent
for the self-part of the Van Hove function of the cagerelative MSD. This cage relative self-part of the Van Hove
function, NCR(R)2πR , is defined by the number of particlesat a relative distance R from its origin in regard to theinitial cage of the particle, expressed as a function of Rand normalized as previously. For a particle i the relativedistance R to initial cage is defined as follows:
Ri =| (�ri(t)−�ri(0))−∆�r cagei |, (2)
where ∆�r cagei is defined by 1Nnn
∑Nnnj (�rj(t)− �rj(0)). Here,
j runs over nearest neighbors, Nnn the number of nearestneighbors, and �r(t) the position of a particle at time t.Like for the self-part of the Van Hove function we havenormalized all curves to have a maximum equal to one.
In fig. 5 we have plotted NCR(R)2πR for the intermediate
case (Γ= 110) and the supercooled case (Γ= 338) forbig particles. All these quantities are averaged over 10successive starting times. For Γ= 110, the curves are very
similar in shape to those of N(r)2πr . Differences come onlyfrom the fact that the distribution is narrower, whichcorresponds to the fluid-like behavior of the cage relativeMSD.For Γ= 338, the situation is completely different. Before
the plateau regime the curves look Gaussian in shape, but
66004-p4

Dynamics of particles and cages in an experimental 2D glass former
their behavior changes at the beginning of the plateau(t≈ 100 s) when deviation from Gaussian behavior occurs:the central part seems to remain mainly unchanged buta tail starts to appear. For large enough times the tailbecomes exponential, as indicated by the linear fit in Lin-Log scale.Compared with results from classical self part of the
Van Hove function other systems, the behavior of its cagerelative version now matches what is observed usuallyin 3D systems. In ref. [16], Chaudhuri et al. describethe exponential tail as a possible universal feature forjammed systems and supercooled fluids exhibiting dynam-ical heterogeneities. Common idea about this tail is thatit corresponds to jumps of particles out of their cage. Inour case, displacement of the particles in the tail remainslargely lower than the average inter particle distance (L=23 µm), so jumping particles remain confined in their cage.This is also compatible with what has been previously seenin silica glass or Lennard-Jones mixtures [16].
Another interesting fact is that in NCR(R)2πR for Γ =
338, the Gaussian central parts seem to be very similarfor all times. We have checked (data not shown) that
if we subtract NCR(R)2πR taken at time t= 50 s from itscounterparts after t= 100 s we obtain in all cases curvescorresponding to a pure exponential decay (except atvery low r for which uncertainty of the data is toohigh). For low temperatures the residual motion belongingto the Gaussian part of the cage relative Van Hovefunction is that of a particle being trapped in a potentialminimum created by its neighbors. The standard deviationof the Gaussian probability distribution of positions of theparticle increases soon (within the β-relaxation regime)towards an asymptotic value. This nicely demonstrates thevalidity of the cage picture of mode coupling theory. Anyfurther increase of cage relative MSD may correspond tosome jumps (or hopping process) of the particles, indicatedby the tail of the cage relative self-part of the Van Hovefunction. This image is consistent with improvements ofMCT theory developed to describe hopping processes(see [27] for instance).Differences with classical self-part of the Van Hove
function are obvious: jumps of particles which may behidden by collective motion are visible in the cage relativeversion. This way, they are already visible in the plateauregime where collective unidirectional motion (included inthe measure of the classical MSD) may hide them.In fig. 6 a typical trajectory of a big particle for Γ = 390
is plotted. The particle belongs to the 5% fastest particlesand therefore to the tail of the cage relative self-partof the Van Hove function for t= 113000 s. It shows aclear intra-cage hopping process. During early times theparticle remains confined around its initial position andexplores the cage. After this phase of exploration theparticle performs a jump which takes about tjump ≈ 200 sand starts a new cage exploration around this position.The distance djump ≈ 10µm performed during the jumpis much smaller than the inter particle distance so the
Fig. 6: Trajectory of a single big particle chosen amongst the5% fastest particles for a sample at Γ= 390. The color coderanges from pure blue for early times to pure red for the latesttimes. The inset shows the projection of the density of presenceof the particle along the transversal axis of the trajectory.Red and blue curves are Gaussian fits of the peaks. The linerepresents the average interparticle distance and correspondsto L= 23 µm.
jump cannot be explained simply by a jump from one cageto another but must be a more subtle phenomenon. Thisbehavior was observed previously both in simulations [16],and experiments [10,28]. As noticed in refs. [16] and [10],the jump duration is very small compared to the timeneeded for a cage exploration. The nature of this jumpingprocess is still under debate and many authors [9,16]invoke cooperative motion of the particles forming thecage to justify displacement smaller than the average interparticle distance.
Conclusion. – In this work we have developed a newanalysis tool to provide evidence of two different kinds ofmotion in an experimental 2D glass former. The use ofthe cage relative mean square displacement (CR-MSD)allowed us to identify a typical cage dynamics of theparticles and dynamical heterogeneities are much morepronounced. In the short time limit, particles perform freediffusion until they start to feel the neighboring particles inthe supercooled stage. In regard to the cage made by thenearest neighbors, particles behave like Brownian parti-cles in a potential minimum corresponding to the plateauin the MSD. Most particles remain blocked inside thecage, while a few of them start to make some hoppingprocess already in the plateau regime. The tail of the cagerelative self-part of the Van Hove function, which corre-sponds to hopping processes becomes significant in the α-relaxation regime. But comparing the length scales of the
66004-p5
S. Mazoyer et al.
inter-particle distance and the plateau hight of the MSD,one finds that most of the fast particles do not completelyleave their neighborhood. This dynamical process, despitethe fact that it does not present any large string motionas in ref. [3,9], may correspond to cooperative rearrange-ments which are seen in most 3D systems. In additionto this, the difference between the classical MSD and thecage relative MSD has shown the presence of an impor-tant collective motion of particles with their cage which isespecially large in the plateau and the α-relaxation regime.This collective motion hides the contribution of the classi-cal cage dynamics of the particles to the MSD and, lookingat trajectories of fig. 2, is expected to have characteristiclength scale of several cage sizes.
∗ ∗ ∗This work was supported by the DFG (Deutsche
Forschungsgemeinschaft) in the frame of SFB TR6project C2 and we thank D. El Masri and L. Berthierfor fruitful discussion.
REFERENCES
[1] Ediger M. D., Angell C. A. and Nagel S. R., J. Phys.Chem., 100 (1996) 13200.
[2] Berthier L., Biroli G., Bouchaud J. P., CipellettiL., El Masri D., L’Hote D., Ladieu F. and PiernoM., Science, 310 (2005) 1797.
[3] Kob W., Donati C., Plimpton S. J., Poole P. H. andGlotzer S. C., Phys. Rev. Lett., 79 (1997) 2827.
[4] Berthier L., Chandler D. and Garrahan J. P.,Europhys. Lett., 69 (2005) 320.
[5] Konig H., Hund R., Zahn K. and Maret G., Eur.Phys. J. E, 18 (2005) 287.
[6] Cui B. X., Lin B. H. and Rice S. A., J. Chem. Phys.,114 (2001) 9142.
[7] Donati C., Douglas J. F., Kob W., Plimpton S. J.,Poole P. H. and Glotzer S. C., Phys. Rev. Lett., 80(1998) 2338.
[8] Russell E. V. and Israeloff N. E., Nature, 408 (2000)695.
[9] Appignanesi G. A., Fris J. A. R., Montani R. A. andKob W., Phys. Rev. Lett., 96 (2006) 057801.
[10] Weeks E. R., Crocker J. C., Levitt A. C.,
Schofield A. and Weitz D. A., Science, 287 (2000)627.
[11] Flenner E. and Szamel G., Phys. Rev. E, 72 (2005)011205.
[12] Zahn K. and Maret G., Phys. Rev. Lett., 85 (2000)3656.
[13] Odagaki T. and Hiwatari Y., Phys. Rev. A, 43 (1991)1103.
[14] Van Hove L., Phys. Rev., 95 (1954) 249.[15] Dauchot O., Marty G. and Biroli G., Phys. Rev.
Lett., 95 (2005) 265701.[16] Chaudhuri P., Berthier L. and Kob W., Phys. Rev.
Lett., 99 (2007) 060604.[17] Ebert F., Keim P. and Maret G., Eur. Phys. J. E, 26
(2008) 161.[18] Ebert F., Maret G. and Keim P., Eur. Phys. J. E, 29
(2009) 301.[19] Kawasaki T., Araki T. and Tanaka H., Phys. Rev.
Lett., 99 (2007) 215701.[20] Widmer-Cooper A. and Harrowell P., Phys. Rev.
Lett., 96 (2006) 185701.[21] Bayer M., Brader J. M., Ebert F., Fuchs M., Lange
E., Maret G., Schilling R., Sperl M. and WittmerJ. P., Phys. Rev. E, 76 (2007) 011508.
[22] Ebert F., Dillmann P., Maret G. and Keim P., Rev.Sci. Instrum., 80 (2009) 083902.
[23] Earnshaw J. C. et al., Europhys. Lett., 41 (1998)635.
[24] Zahn K. et al., Phys. Rev. Lett., 85 (2000) 3656.[25] Glotzer S. C., in 9th International Conference on the
Physics of Non-Crystalline Solids (PNS 1999), Tucson,Arizona, 1999, in J. Non-Cryst. Solids, 274 (2000) 342.
[26] Castillo et al., Nat. Phys., 3 (2007) 26.[27] Schweizer and Saltzman., J. Chem. Phys., 119 (2003)
1181.[28] Marty G. and Dauchot O., Phys. Rev. Lett., 94 (2005)
015701.
66004-p6